Scandura et al 2008 MEC European wild boar
18
Molecular Ecology (2008) 17, 1745–1762 doi: 10.1111/j.1365-294X.2008.03703.x © 2008 The Authors Journal compilation © 2008 Blackwell Publishing Ltd Blackwell Publishing Ltd Ancient vs. recent processes as factors shaping the genetic variation of the European wild boar: are the effects of the last glaciation still detectable? M. SCANDURA,* L. IACOLINA,* B. CRESTANELLO,†‡ E. PECCHIOLI,‡§ M. F. DI BENEDETTO,* V. RUSSO,¶ R. DAVOLI,¶ M. APOLLONIO* and G. BERTORELLE† *Dipartimento di Zoologia e Genetica Evoluzionistica, Università di Sassari, via Muroni 25, 07100 Sassari, Italy, †Dipartimento di Biologia, Università di Ferrara, via Borsari 46, 44100 Ferrara, Italy, ‡Centro di Ecologia Alpina, Viote del Monte Bondone, 38100 Trento, Italy, §Biosfera, Biologia della Conservazione, Ricerca e Didattica, 50122 Firenze, Italy, ¶DIPROVAL, Università di Bologna, Via Rosselli, 42100 Reggio Emilia, Italy Abstract The European wild boar is an important game species, subjected to local extinctions and translocations in the past, and currently enormously and worryingly expanding in some areas where management is urgently required. Understanding the relative roles of ancient and recent events in shaping the genetic structure of this species is therefore not only an interesting scientific issue, but it represents also the basis for addressing future management strategies. In addition, several pig breeds descend from the European wild boar, but the geographical location of the domestication area(s) and the possible introgression of pig genomes into wild populations are still open questions. Here, we analysed the genetic variation in different wild boar populations in Europe. Ten polymorphic microsatellites were typed in 252 wild boars and the mtDNA control region was sequenced in a subset of 145 individuals. Some samples from different pig breeds were also analysed. Our results, which were obtained considering also 612 published mtDNA sequences, suggest that (i) most populations are similarly differentiated, but the major discontinuity is found along the Alps; (ii) except for the Italian populations, European wild boars show the signature of a postglacial demographic expansion; (iii) Italian populations seem to preserve a high proportion of preglaciation diversity; (iv) the demographic decline which occurred in some areas in the last few centuries did not produce a noticeable reduction of genetic variation; (v) signs of human-mediated gene flow among populations are weak, although in some regions the effects of translocations are detectable and a low degree of pig introgression can be identified; (vi) the hypothesis of an independent domestication centre in Italy is not supported by our data, which in turn confirm that Central European wild boar might have represented an important source for domestic breeds. We can therefore conclude that recent human activities had a limited effect on the wild boar genetic structure. It follows that areas with high variation and differentiation represent natural reservoirs of genetic diversity to be protected avoiding translocations. In this context controlling some populations by hunting is not expected to affect significantly genetic variation in this species. Keywords: genetic diversity, microsatellites, mtDNA, phylogeography, population expansion, Sus scrofa Received 17 September 2007; revision received 27 November 2007; accepted 11 January 2008 Introduction Present-day levels and patterns of genetic variation are strongly affected by the characteristics of a species (e.g. dispersal rates), the landscape (e.g. geographical barriers), Correspondence: Massimo Scandura, Fax: +39 079 228665; E-mail: [email protected]
Transcript of Scandura et al 2008 MEC European wild boar

Molecular Ecology (2008) 17, 1745–1762 doi: 10.1111/j.1365-294X.2008.03703.x
© 2008 The AuthorsJournal compilation © 2008 Blackwell Publishing Ltd
Blackwell Publishing LtdAncient vs. recent processes as factors shaping the genetic variation of the European wild boar: are the effects of the last glaciation still detectable?
M. SCANDURA,* L . IACOLINA,* B . CRESTANELLO,†‡ E . PECCHIOLI ,‡§ M. F. DI BENEDETTO,* V. RUSSO,¶ R . DAVOLI ,¶ M. APOLLONIO* and G. BERTORELLE†*Dipartimento di Zoologia e Genetica Evoluzionistica, Università di Sassari, via Muroni 25, 07100 Sassari, Italy, †Dipartimento di Biologia, Università di Ferrara, via Borsari 46, 44100 Ferrara, Italy, ‡Centro di Ecologia Alpina, Viote del Monte Bondone, 38100 Trento, Italy, §Biosfera, Biologia della Conservazione, Ricerca e Didattica, 50122 Firenze, Italy, ¶DIPROVAL, Università di Bologna, Via Rosselli, 42100 Reggio Emilia, Italy
Abstract
The European wild boar is an important game species, subjected to local extinctions andtranslocations in the past, and currently enormously and worryingly expanding in someareas where management is urgently required. Understanding the relative roles of ancientand recent events in shaping the genetic structure of this species is therefore not only aninteresting scientific issue, but it represents also the basis for addressing futuremanagement strategies. In addition, several pig breeds descend from the European wildboar, but the geographical location of the domestication area(s) and the possible introgressionof pig genomes into wild populations are still open questions. Here, we analysed the geneticvariation in different wild boar populations in Europe. Ten polymorphic microsatelliteswere typed in 252 wild boars and the mtDNA control region was sequenced in a subset of145 individuals. Some samples from different pig breeds were also analysed. Our results,which were obtained considering also 612 published mtDNA sequences, suggest that (i)most populations are similarly differentiated, but the major discontinuity is found alongthe Alps; (ii) except for the Italian populations, European wild boars show the signature ofa postglacial demographic expansion; (iii) Italian populations seem to preserve a highproportion of preglaciation diversity; (iv) the demographic decline which occurred in someareas in the last few centuries did not produce a noticeable reduction of genetic variation;(v) signs of human-mediated gene flow among populations are weak, although in someregions the effects of translocations are detectable and a low degree of pig introgressioncan be identified; (vi) the hypothesis of an independent domestication centre in Italy is notsupported by our data, which in turn confirm that Central European wild boar might haverepresented an important source for domestic breeds. We can therefore conclude that recenthuman activities had a limited effect on the wild boar genetic structure. It follows that areaswith high variation and differentiation represent natural reservoirs of genetic diversity tobe protected avoiding translocations. In this context controlling some populations by huntingis not expected to affect significantly genetic variation in this species.
Keywords: genetic diversity, microsatellites, mtDNA, phylogeography, population expansion, Sus scrofa
Received 17 September 2007; revision received 27 November 2007; accepted 11 January 2008
Introduction
Present-day levels and patterns of genetic variation arestrongly affected by the characteristics of a species (e.g.dispersal rates), the landscape (e.g. geographical barriers),
Correspondence: Massimo Scandura, Fax: +39 079 228665; E-mail: [email protected]

1746 M . S C A N D U R A E T A L .
© 2008 The AuthorsJournal compilation © 2008 Blackwell Publishing Ltd
but also by different specific events that occurred in thepast (Avise 2004). For example, the genetic impact of thelast glaciation was relevant to several species (Hewitt2000), but many other processes with a potential effect onthe genetic variation certainly occurred since then. This isespecially true for game and domestic species because ofextensive human manipulation. In this study, we focusedon several European populations of wild boar (Sus scrofa),whose genetic variation patterns have been possiblyaffected by both domestication and hunting/managementactivities. We used a large set of molecular data in order todistinguish and estimate the effects of different processesthat occurred at different timescales. In addition, this dataset enabled us to test a specific hypothesis regarding thedomestication of the species in Europe.
The Eurasian wild boar is one of the most widely distrib-uted terrestrial mammals. Its geographical range, excludingrecent introductions, extends from Western Europe andNorthern Africa to Japan. Possibly originated in SoutheasternAsia, where the highest numbers of wild pig taxa areobserved (Lucchini et al. 2005), S. scrofa can be now subdividedinto at least two major genetic clades roughly correspondingin the domestic form to European and Asian pigs (Giuffraet al. 2000; Okumura et al. 2001; Alves et al. 2003; Larsonet al. 2005). The separation of these two clades can be datedback to between 0.5 and 0.9 million years ago, suggestingat least two independent domestication events (Giuffra et al.2000; Kijas & Anderson 2001; Alves et al. 2003). Subspeciesare usually classified into four major groups, with theEuropean wild boar corresponding to the so-called ‘Westernraces’ group (Oliver et al. 1993).
The quaternary climatic oscillations, and in particularthe last glaciation and the subsequent warm period, producedremarkable consequences on the levels and patterns ofgenetic variation in several species (Taberlet et al. 1998;Hewitt 2000; Petit et al. 2003; Hofreiter et al. 2004). As regardsthe European wild boar, however, at least four additionalprocesses related to human activities have occurred eversince: the domestication in the Neolithic; a severe bottleneckin different areas in the last few centuries; a demographicexpansion in the last 50 years; several more or less uncon-trolled introductions of individuals, which also occurred inthe last decades, to restock areas where wild boar wasextinct or present at low density.
Postglaciation dispersal
The model initially proposed for the population dynamicsof several species during the last glaciation (i.e. one or moresouthern refugia and postglacial re-expansion towardsnorthern areas) is probably too simplistic for some taxa(see for example Magri et al. 2006). However, the currentdistribution of the wild boar and its dispersal andreproductive potential suggest that the genetic variation in
this species should be initially investigated with this modelin mind. In fact, as the wild boar is being only sporadicallyobserved in northern areas like central and northern taiga(Briedermann 1990; Danilkin 2001), its presence in Centraland Northern Europe during the last Ice Age, when thepermafrost almost isolated Iberia, Italy, and the Balkans(Hewitt 2000), seems unlikely. In addition, unlike for exampleother ungulate species, the wild boar shows the typicalattributes of r-strategists: high ecological adaptability,opportunistic feeding, and very high reproductive potential(Boitani et al. 1995; Fernandez-Llario & Mateos-Quesada1998; Geisser & Reyer 2005). We can therefore suppose thatafter the last glaciation, the wild boar easily recolonizedCentral and Northern European forests, thus reaching analmost continuous and stable distribution modified onlyby seasonal variations (Jedrzejewska et al. 1997; Bieber &Ruf 2005).
Domestication and hybridization with pigs
Direct consequences on the wild populations during thedomestication process are expected to be limited, but recenteffects related to the co-existence of domestic and wildforms should be considered. In some areas, pigs are rearedin semi-wild conditions (e.g. in Bulgaria and Sardinia,Apollonio et al. 1988; Genov et al. 1991) and crossbreedingwith the wild form is possible. Furthermore, in other regions(e.g. Central Italy), pigs were occasionally crossed withwild boars in captivity, and hybrids were released forhunting purposes (Randi et al. 1989; I. Boschi, unpublishedreport). Therefore, divergent pig genomes, which weresubjected to strong selective and likely drift effects duringand after the domestication, could have introgressed intothe wild boar genetic variation.
Overhunting and demographic decline
In the last few centuries, loss of habitat and overhuntingdrove the wild boar to extinction in some European regionssuch as the British Isles, Scandinavia, and several Italianand Western Russian areas (Apollonio et al. 1988; Oliver et al.1993). A demographic decline was documented in manyother countries, and yet the genetic effects of this event,when analysed in a few geographically restricted areas,were surprisingly not evident (Vernesi et al. 2003).
Recent expansion
After the Second World War, the density and geographicaldistribution of the wild boar have increased almosteverywhere in Europe (Sáez-Royuela & Tellería 1986;Feichtner 1998; Danilkin 2001) as a consequence of severalfactors whose relative weight is uncertain. These factorsare: global warming, changes in agricultural practices,
G E N E T I C D I V E R S I T Y I N T H E E U R O P E A N W I L D B O A R 1747
© 2008 The AuthorsJournal compilation © 2008 Blackwell Publishing Ltd
setting up of artificial feeding sites, reduced numbers ofpredators, increase of mast seeding of beech, and restocking(Bieber & Ruf 2005; Geisser & Reyer 2005). Growth rates ofwild boar populations have been so high in some areas thatdamages to agricultural cultivations and natural ecosystemsare frequently reported (Singer et al. 1984; Welander 2000;Schley & Roper 2003; Geisser & Reyer 2004).
Translocations
The genetic variation in some wild boar populations haspossibly been affected also by artificial long-distancemigrations associated to uncontrolled and rarely documentedrestocking plans over the last 50 years. Restocking couldhave modified the genetic variation both by contributing tothe recent demographic expansion and by mixing geneticpools belonging to different subspecies or differentiatedpopulations. For example, wild boars from Central Europewere repeatedly introduced into Italy (Apollonio et al.1988). The genetic impact of such events in some areas iscontroversial, with authors suggesting either massive(Randi 2005) or limited (Vernesi et al. 2003) introgression.It is noteworthy that two opposite wild boar managementpolicies, none of which considering the conservation ofgenetic biodiversity as a priority, are often suggested bylocal authorities: eradication, which is meant to removethe problems from cultivated areas, and restocking, inorder to preserve traditional forms of ‘social’ huntingpractices.
All the five processes above have potentially left a signa-ture in the present-day wild boar genetic variation. Weused mitochondrial and nuclear markers to test whetherthey did or not, and which was the possible role of each ofthem. Considering the wild boar as a model, the results weobtained are also valuable for a better reconstruction of thehistorical events that affected other species. Therefore, ourresults have important and more general implications forthe development of management and conservation plansof game species.
Finally, we also addressed a topic which is not directlyrelated to the wild boar genetic structure, and yet it is rel-evant to the understanding of the origin and the numberof independent domestication events in this species.Archaeological evidences suggest that, like many otherdomestic animals, European pigs were domesticated in theNear East and selected breeds were subsequently introducedinto Europe by Neolithic farmers (Epstein & Bichard1984). However, two in loco domestication processes, onein Central Europe and the other in Italy, were recentlyhypothesized on the basis of the analysis of mitochondrialDNA sequences (Larson et al. 2005). This hypothesis,which is relevant also for the management of local breedsand the conservation of pig diversity, was tested using thesame large data set.
Materials and methods
Sampling and DNA isolation
Hair, skin, skeletal muscle, or ear tissue from 252 wildboars were collected in 15 different sampling areas acrossEurope (Fig. 1) and stored in 95% ethanol at –20 °C. Sampleabbreviations used later in the text are specified in Fig. 1.Additionally, 67 Italian domestic pigs from five historicalbreeds were sampled for comparison: Cinta Senese (codedPig 1), Sarda (Pig 2), Calabrese (Pig 3), Casertana (Pig 4)and Nera Siciliana (Pig 5). Five commercial pigs (LargeWhite, Pig 6) were also sampled. All the wild boar samplingareas in Italy, possibly with the exclusion of the CastelPorziano Presidential Reserve, and certainly at differentdegrees, had been subjected to occasional restocking withunknown genetic effects. The samples from four localities(IFlo, IMrp, ICpr and HDif) had already been used in aprevious study (Vernesi et al. 2003). Total genomic DNAwas extracted by using commercial kits (QIAGEN) or thestandard phenol–chloroform method (Sambrook et al. 1989),followed by concentration in Microcon-30 columns (Amicon),and kept at –20 °C.
Mitochondrial DNA sequencing
Almost the entire control region (CR) was amplified bypolymerase chain reaction (PCR) using two primersdeveloped by Alves et al. (2003) (Ss.L-Dloop 5′-CGCCATCA-GCACCCAAAGCT3′ and Ss.Hext-Dloop 5′-ATTTTGGGA-GGTTATTGTGTTGTA3′) anchoring at positions 16569 and1128 of the complete pig mitochondrial DNA (mtDNA)genome (GenBank Accession no. AF034253; Lin et al. 1999).Reactions were performed in an Applied Biosystems 2420thermal cycler, with amplification conditions set at 35cycles of 92 °C for 1 min, 62 °C for 1 min and 72 °C for 1 min,followed by a final extension step at 72 °C for 10 min. PCRproducts were purified by Exo/SAP digestion and a 411-bpfragment, including the hypervariable extended terminationassociated sequences (ETAS) domain (Sbisà et al. 1997),was directly sequenced using the forward primer SS.L-Dloop and the BigDye Terminator kit version 3.1 (AppliedBiosystems). This region was also selected to maximize thesize of possible alignments including already publishedGenBank sequences. Fragments were finally purifiedin columns loaded with Sephadex G-50 and run in anABI PRISM 3100 Avant automatic sequencer (AppliedBiosystems). Ambiguous positions were verified by re-sequencing the target region with the internal reverse primerSs.Hint-Dloop (5′-TGGGCGATTTTAGGTGAGATGGT3′),mapping at position 465 of the pig mtDNA. Sequenceswere obtained for a subsample of 145 wild boars (between8 and 12 per sampling location) and 47 domestic pigs fromthe Italian historical breeds (Pig 1 to Pig 5). Commercial

1748 M . S C A N D U R A E T A L .
© 2008 The AuthorsJournal compilation © 2008 Blackwell Publishing Ltd
pigs (Pig 6) were not analysed at this marker because ofthe large amount of data already available in GenBank.
Microsatellite genotyping
A panel of 10 polymorphic microsatellites was selectedfor the analysis: S026, S215, S355, SW72, SW461,SW857, SW1492, SW2021, SW2496, and SW2532 (details atwww.thearkdb.org). Five of them (S026, S215, S355, SW72,and SW857) are in the set recommended by the Food andAgriculture Organization (FAO) to analyse pig diversity(Barker et al. 1998), and the rest had been successfully usedto study genetic relationships among some European wildboar populations (Vernesi et al. 2003). This set was used to
genotype all the sampled wild boars and 40 pigs whichwere raised in wild boar sampling areas (Tuscany andSardinia). Each PCR was performed in a 10-μL reactionvolume, containing 3 μL of DNA solution, 0.5 U of Taq DNApolymerase (Euroclone), 1× PCR buffer (Euroclone), 2.5 mmMgCl2, 100 μm of each dNTP and 2 pmol of each primer.The forward primer of each pair was labelled with an ABIfluorescent dye (6-FAM, HEX or TET). The amplificationprofile was set up with an initial step of denaturation at95 °C for 3 min, followed by 35 cycles of 92 °C for 45 s, Ta(54–60 °C) for 45 s, and 72 °C for 30 s. A further extensionstep of 72 °C for 10 min concluded the reaction.
PCR-amplified microsatellite alleles were sized usingcapillary electrophoresis ABI PRISM automatic sequencers
Fig. 1 Geographical locations of wildboar samples. In (a), pie charts representproportions of each of the three mainmtDNA clades (E1, E2 and A) in eachsampling area. In (b), pie charts indicateproportions of membership of each sampledpopulation to the four clusters inferred bystructure analysis 2 (see text for details).The following abbreviations are used: IAre(Arezzo, Italy), IFor (Forì, Italy), ISie (Siena,Italy), ISal (Salerno, Italy), IFlo (Florence,Italy), IMrp (Maremma Regional Park,Italy), ISrp (San Rossore Regional Park,Italy), ICpr (Castel Porziano PresidentialReserve, Italy), ISar (Sardinia, Italy), IGor(Gorizia, Italy), SCot (El Coto, Spain),FHam (Haute Marne, France), ADif (Austria,different areas), PDif (Poland, differentareas), HDif (Hungary, different areas).Subspecies indications on the map are afterGroves (1981) and Apollonio et al. (1988).

G E N E T I C D I V E R S I T Y I N T H E E U R O P E A N W I L D B O A R 1749
© 2008 The AuthorsJournal compilation © 2008 Blackwell Publishing Ltd
and internal ROX-500 size standard (Applied Biosystems).The genemapper software (Applied Biosystems) was usedto analyse electrophoretic data.
Genotypes were obtained for all the 252 sampled wildboars, for a subsample of two historical Italian breeds(Pig 1 and Pig 2), and for the Italian commercial pigs (Pig 6).
Mitochondrial DNA data analysis
A total of 192 novel mtDNA CR sequences (411 bp) wereobtained (GenBank Accession nos: EU362409–EU362600)and aligned with 612 sequences available in GenBank(Ursing & Arnason 1998; Lin et al. 1999; Giuffra et al. 2000;Kijas & Andersson 2001; Okumura et al. 2001; Kim et al.2002; Randi et al. 2002; Alves et al. 2003; Yang et al. 2003;Gongora et al. 2004; Larson et al. 2005; Fang & Andersson2006; Fang et al. 2006) using the function clustal w(Thompson et al. 1994) implemented in mega 3.0 (Nei &Kumar 2000) and adjusted by eye. Overall, the alignedsequences corresponded to 1065 individual pigs from allover the world (including 231 European wild boars).Haplotypes were collapsed from the entire data set usingcollapse version 1.2 (D. Posada, available at http://darwin.uvigo.es), setting deletions as fifth state.
Number of different haplotypes, haplotype (h) andnucleotide (π) diversity, and the mean number of pairwisenucleotide differences between haplotypes (k) were com-puted using the software arlequin version 3.01 (Excoffieret al. 2005). Allelic richness [AR(r)] for each sampledpopulation was calculated from haplotype frequenciesusing the rarefaction method proposed by El Mousadik& Petit (1996) with the software rarefac (R. Petit,www.pierroton.inra.fr/genetics/labo/Software/Rarefac/index.html). The rarefaction size r was set to the smallestsample size among the groups included in the analysis.
A median-joining (MJ) network of haplotypes (Bandeltet al. 1999) was created with the software network 4.1.0.9(Fluxus Technology), using equal weights for all themutations and setting the parameter ε to zero, in order torestrict the choice of feasible links in the final network. Thisapproach is especially useful in reconstructing genealogiesamong closely related taxa, for example, for interpopulationanalysis (Bandelt et al. 1999). Distributions of pairwisenucleotide differences between haplotypes (mismatchdistributions), which are informative on the recent demo-graphic history of a population (Slatkin & Hudson 1991;Rogers & Harpending 1992), were analysed in wild boarand pig populations according to the sudden expansionmodel as implemented by arlequin. The age of the expan-sion was estimated using a generalized nonlinear least-squaremethod, which is based on the minimization of the sum ofsquared deviations between the observed and the expectedmismatch distributions (Schneider & Excoffier 1999). Con-fidence intervals are obtained using a parametric bootstrap
approach based on 1000 simulated samples (Schneider& Excoffier 1999). Finally, Tajima’s D (Tajima 1989) andFu’s FS (Fu 1997) were used to test the null hypothesisof demographic stability, under the common assumption(Avise 1995) that the mtDNA control region can be used asa marker of demographic processes, even though naturalselection (mainly at linked regions) cannot be excluded(Ballard & Kreitman 1995). The significance of these statisticswas evaluated with 1000 simulated samples as implementedin arlequin.
Microsatellite data analysis
In order to evaluate the levels of genetic variability in thesampled populations, observed and expected (unbiasedgene diversity, Nei 1987) heterozygosities were computedwith genetix version 4.05 (Belkhir et al. 2001). In addition,allelic richness and private allelic richness were calculatedper population using hp-rare (Kalinowski 2005), settingrarefaction according to the smallest sample size in eachcomputation. The possible effect of demographic bottle-necks on the microsatellite variation was tested using themethod implemented in the software bottleneck version 1.2(www.montpellier.inra.fr/URLB/bottleneck/bottleneck.html)(Cornuet & Luikart 1996). The test was performed underthree alternative models of microsatellite evolution:the infinite allele model (IAM), the stepwise-mutationmodel (SMM) and the two-phased model (TPM, set with10% IAM and 90% SMM). Following the authors’ sug-gestions, the Wilcoxon test was used to test the overalldifferences between the expected heterozygosity and theheterozygosity predicted from the number of alleles.
Deviations from Hardy–Weinberg equilibrium (HWE)were tested for each population and each locus using theMarkov chain method proposed by Guo & Thompson (1992),implemented in the software genepop version 3.4 (Raymond& Rousset 1995). Parameters of the Markov chain expressedas dememorizations/batches/iterations were 10 000/100/5000. The significance level was modified for multiple test-ing across populations and across loci using the sequentialBonferroni correction (Holm 1979). Deviation from linkageequilibrium (LE) was tested for each pair of loci in eachpopulation (810 tests in total) using the log-likelihood ratioapproach as implemented in the software fstat (Goudet2001) and a sequential Bonferroni correction (Holm 1979).The minimum significance level for the sequential Bonferronicorrection should be set to 0.05/810, when the tests areindependent, and to higher values when they are not. Toavoid excessive rejections of the linkage disequilibriumhypotheses due to nonindependent LE tests, we set thethreshold at 0.05/180, that is, we considered the numberof loci times the number of populations, as the effectivenumber of independent tests. This choice did not affect ourconclusions, since LE was the rule for our microsatellite

1750 M . S C A N D U R A E T A L .
© 2008 The AuthorsJournal compilation © 2008 Blackwell Publishing Ltd
markers. We used micro-checker version 2.2.3 (VanOosterhout et al. 2004) to detect signs of the possibleoccurrence of null alleles, that is, homozygote excess evenlydistributed among homozygote size classes at one locus.
In order to evaluate levels of genetic heterogeneity amongsampling areas, Weir and Cockerham’s estimator of FST(Weir & Cockerham 1984) was computed using the programgenetix. Significant deviations from zero were tested over1000 permutations. Molecular distances between allelesand corresponding indices such as RST (Slatkin 1995) werenot used for the analysis of microsatellites to avoid unpre-dictable results due to probable multiple-step mutations.FST values were also used to test the relationship betweengenetic and geographical distances, using the Mantel test(Mantel 1967) as implemented in arlequin version 3.01(Excoffier et al. 2005).
Pairwise genetic distances between sampling areas werecalculated by the program populations version 1.2.28(Langella 2002). A neighbour-joining (NJ) tree of populations,based on the DA distance (Nei et al. 1983), was used torepresent the relationships among groups. A consensus treewas obtained by bootstrapping (1000 replicates) distancevalues over loci.
A Bayesian cluster analysis was carried out using themethod implemented in structure version 2.1 (Pritchardet al. 2000). We first explored which value of K (number ofclusters) maximized the likelihood of the data [P(D|K)].Simulations were performed by replicating 10 runs for eachvalue of K comprised between 1 and 20, with the followingsettings: admixture model (initial α = 1.0), no populationinformation, correlated allele frequencies, burn-in length:20 000, Markov chain Monte Carlo (MCMC) length: 1 000 000.Selected burn-in and MCMC lengths allowed the con-vergence of the chain. All other parameters were set at theirdefault values. The results were then used to evaluate themost likely partition of our data set, adopting the method pro-posed by Evanno et al. (2005), which relies on the secondorder rate of change of the likelihood function with respectto K. Once defined the most reliable value of K, the geneticcontribution of each inferred cluster to the predefinedpopulations as well as to each individual was investigated.
The Bayesian analysis was also used to study the behaviourof each predefined population when the data set was splitinto a variable number of clusters, starting from K = 2 up tothe most reliable value of K. For each K, the run providingthe highest value of ln [P(D)] was used. In this descriptiveanalysis, original groups were assigned to different cladeswhen their composition can be unquestionably assigned toone of the inferred groups. Clearly, this analysis as well asall the tree-based representations implies that early splits(i.e. splits obtained at small K values) can be used to identifythe most relevant partitions.
Following the approach introduced by Sacks et al. (2004),we also considered the partition which better subdivided
the wild boar populations by virtue of their geographicallocations. The value of the ‘geographical index’ (i.e. theaverage geographical distance between individual loca-tions within clusters divided by the average pairwisedistance irrespective of clusters, Sacks et al. 2004), which canbe computed for each K, is expected to be close to 1 whengenetic clusters do not correspond to geographical groups,and lower when each of the K inferred groups includesadjacent populations. When the geographical index stopsto decrease for increasing values of K, the geographicallymeaningful number of groups is reached (Sacks et al. 2004).
Results
Mitochondrial DNA variation
A total of 192 mitochondrial CR sequences (411 nucleotides)were analysed: 98 from Italian wild boars, 47 from wildboars sampled in five other European countries, from Spainto Poland, and 47 from five Italian pig breeds. In total, 26haplotypes (14 of which had never been detected before)and 31 segregating sites (28 substitutions and 3 indels)were identified (see Table S1, Supplementary materials).Different estimates of mitochondrial variability in eachpopulation are shown in Table 1. Sample sizes are quite small,and a large variation is expected, and actually observed,across populations at a single locus. However, once wepool the samples into three major groups — wild boarsfrom Italy, wild boars from Europe excluding Italy, andpigs — a clear pattern emerges: genetic diversity in Italy issimilar to, or larger than variation observed when severalEuropean countries are jointly considered, while pigs showonly slightly lower levels of diversity (see Table 1). Sixteenout of 20 haplotypes observed in wild boars are detectedin Italy and only seven in the rest of Europe. Of the 28segregating sites observed in the wild populations, just oneis monomorphic in Italy, and 22 in Europe when Italy isnot considered. The expectations of these two measures ofvariation are affected by the sample size, which is clearlylarger in the Italian group. But the pattern does not changemuch when allelic richness, haplotype and nucleotidediversity (i.e. statistics whose expectations are not affectedby sample size) are considered (see Table 1).
The high diversity observed in Italian wild boars is dueto private mutations and haplotypes, which are mainlyrelated to the exclusive presence in Italy of the three majorSus scrofa mtDNA lineages: E1, E2, and A (see Fig. 1a and 2).The codes for these clades were introduced by Giuffra et al.(2000) and correspond to clades D1, D4 and D2, respectively,in Larson et al. (2005). Clades E1 and A are widely distributed,respectively, in Europe and eastern Asia, while E2 is asecond European mtDNA lineage, separated from E1 byfive fixed transitions. E2 haplotypes are not observedoutside Italy.

G E N E T I C D I V E R S I T Y I N T H E E U R O P E A N W I L D B O A R 1751
© 2008 The AuthorsJournal compilation © 2008 Blackwell Publishing Ltd
The sequences in our data set were then aligned with 612S. scrofa sequences available in GenBank and correspondingto European wild boars and pig breeds. In the overall dataset, composed of 804 sequences, a total of 114 differenthaplotypes (coded as H1–H114) were identified. A completelist of sequences and corresponding haplotypes used in thepresent study is reported in Table S2, Supplementarymaterial. Of the 70 haplotypes observed in European S. scrofa(n = 646 individuals), those with the highest frequencyand the widest geographical distribution are H22 (137individuals), H23 (64) and H29 (42), all of which belong toclade E1 and are shared by wild and domestic individuals(see the network in Fig. 2, singletons are not represented).Of the haplotypes classified in the clade E2, H11 (18) andH12 (13) are the most frequent and are both found in foursampling localities in continental Italy. The two most fre-quent haplotypes of clades E1 and E2 had been alreadyfound in a few Italian museum specimens (dating late18th–early 19th century) analysed by Larson et al. (2005).
The Asian clade (clade A) is present in European pig breedsand also in a few wild individuals. In Italy, this clade isobserved only in three wild boars from Southern Italy(ISal), all sharing the same haplotype H15. This sequence isnot uncommon in European pig breeds (see Fig. 2), and wasprobably transferred to the wild through hybridizationevents deliberately induced between domestic breeds andItalian wild boar stocks reared in captivity. The haplotypeH15 was excluded from further analyses on account ofits belonging to a divergent and exotic clade. The geneticvariation observed in ISal and overall in Italy when H15is excluded is also reported in Table 1: the previouslydescribed general pattern does not change. None of thepig samples, including those from the five Italian breedsanalysed in this study, shows E2 haplotypes (see Table S1).
The mismatch analysis was initially performed on the twogroups of samples which were most clearly differentiatedat mtDNA sequences according to the presence/absence ofclade E2: Italy and Europe excluding Italy. The distributions
Table 1 Genetic variability observed in mtDNA control region sequences (411 bp) in European wild boar populations and in five Italianpig breeds. Values in round brackets correspond to analyses performed excluding the Asian H15 haplotypes (see text). Rarefaction sizesused to compute the allelic richness for each wild boar population and for major groupings are reported in square brackets next to theestimated value
PopulationNo. of sequences
No. of different haplotypes
Allelic richness
No. of polymorphic sites
Haplotype diversity (h)
Nucleotide diversity (π)
IAre 8 4 3.00 [8] 12 0.821 0.013IFor 10 3 1.98 [8] 5 0.711 0.007ISie 8 1 0.00 [8] 0 0.000 0.000ISal 10 6 (5) 4.36 [8]
(4.00[7])20 (14) 0.889
(0.905)0.021 (0.013)
IFlo 10 4 2.78 [8] 11 0.778 0.008IMrp 11 2 0.99 [8] 9 0.436 0.010ISrp 10 2 0.80 [8] 9 0.200 0.004ICpr 10 3 1.80 [8] 2 0.600 0.002ISar 12 7 4.31 [8] 15 0.864 0.007IGor 9 1 0.00 [8] 0 0.000 0.000SCot 9 1 0.00 [8] 0 0.000 0.000FHam 10 2 0.80 [8] 1 0.200 0.000ADif 10 4 2.60 [8] 5 0.711 0.006PDif 8 2 1.00 [8] 2 0.571 0.003HDif 10 2 0.98 [8] 2 0.356 0.002WB Italy 98 16 (15) 10.94 [47]
(10.21 [7])27 (21) 0.874
(0.866)0.013 (0.012)
WB Europe (non-Italy) 47 7 6.00 [47] 6 0.829 0.005WB overall 145 20 (19) 13.08 [47]
(12.47 [47])28 (22) 0.902
(0.898)0.011 (0.010)
Pig 1 10 2 0.78 [5] 2 0.356 0.002Pig 2 5 3 2.00 [5] 4 0.800 0.005Pig 3 6 2 0.83 [5] 2 0.333 0.002Pig 4 11 2 0.88 [5] 1 0.436 0.001Pig 5 15 5 1.90 [5] 5 0.705 0.005DP overall 47 10 9.00 [47] 8 0.827 0.005
WB, wild boar; DP, domestic pig.

1752 M . S C A N D U R A E T A L .
© 2008 The AuthorsJournal compilation © 2008 Blackwell Publishing Ltd
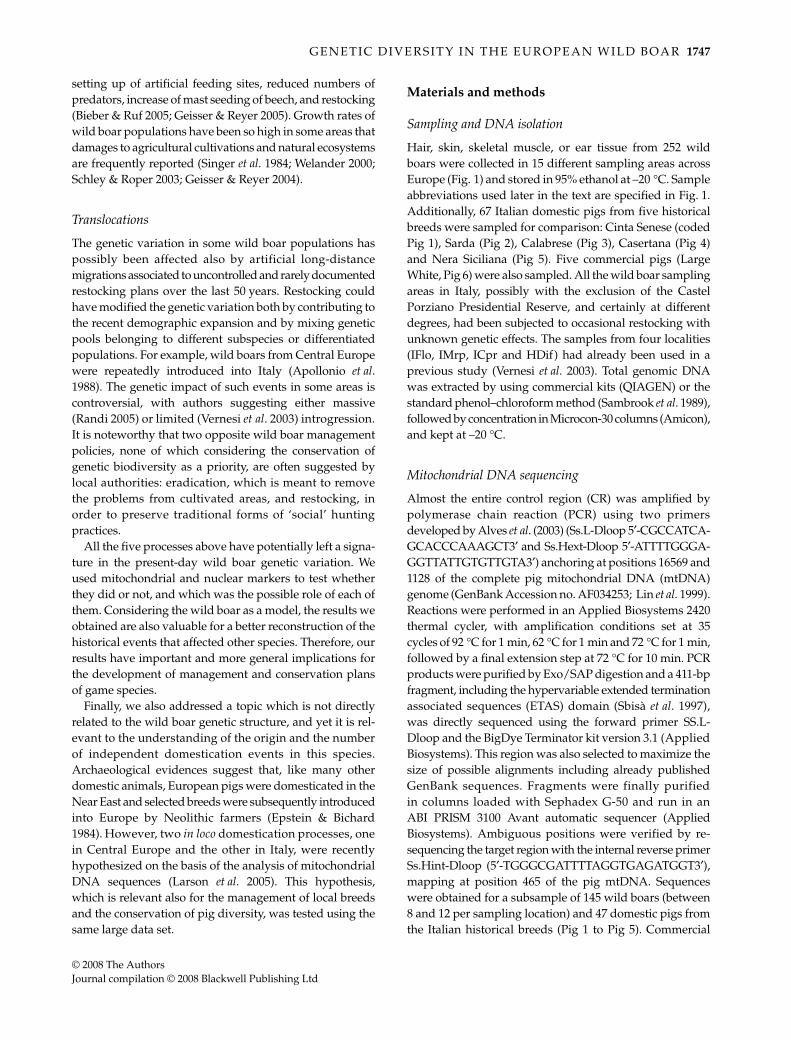
obtained either including or leaving out the GenBanksequences (which were possibly affected by non-randomsampling) are almost identical. Therefore, only the resultsobtained with the larger data set are presented. The mismatchdistribution in European wild boars (n = 109) is smoothand unimodal (Fig. 3a), as expected in the case of a pastdemographic expansion. The Fu’s neutrality test supportsthe expansion hypothesis (FS = –8.25, P < 0.01), whereasthe Tajima’s D is negative but not significant (D = –0.84,P = 0.22). The estimated expansion age is 1.36 mutationalunits (95% CI = 0.58–1.91). On the contrary, the shape ofthe distribution is clearly ragged and multimodal whenthe Italian samples are analysed, and the neutrality testsare not significant (Fig. 3b; n = 116; D = 0.95, P = 0.86;FS = –0.004, P = 0.56).
The possibility that the clades E1 and E2 observed inItaly simply correspond to two different populationswhich recently mixed was considered by performingseparate mismatch analyses on these clades. According tothe results (Fig. 3c, d), the pattern of E1 variation in Italyis not the same as in Europe, since the mismatch distribu-tions have different shapes and the neutrality tests providedifferent results (n = 78; D = –0.73, P = 0.23; FS = –2.30,P = 0.17). The mismatch distribution of the Italian cladeE2 is unimodal (Fig. 3d), but Tajima’s D and Fu’s FS arefar from significance (n = 38; D = –0.11, P = 0.48; FS = –0.88,P = 0.26).
Finally, the mismatch distribution was computed for twogroups of pig samples, the first including all the Europeanbreeds (still excluding the Asian clade) and the secondincluding the Italian breeds only. As regards the former
group (European breeds, Fig. 3e), the shape is very similar,although centred at slightly different pairwise differencevalues, to the distribution observed in the European wildboar (Fig. 3a). Again, neutrality tests point at a demographicexpansion (n = 305; D = –1.54, P < 0.05; FS = –26.2, P < 0.001),and the estimated expansion age is 0.85 mutational units(95% CI: 0.38–1.12). As regards the latter group (Italianbreeds, Fig. 3f), the shape of the distribution is very differentfrom that observed in the Italian wild boar. It partiallyresembles the European pig breeds distribution (althoughunusually flat in the central classes), whereas neutralitytests point at a different pattern of genetic variation anddo not support the expansion hypothesis (n = 47; D = 0.06,P = 0.57; FS = –2.40, P = 0.13).
Genetic variation at microsatellite loci
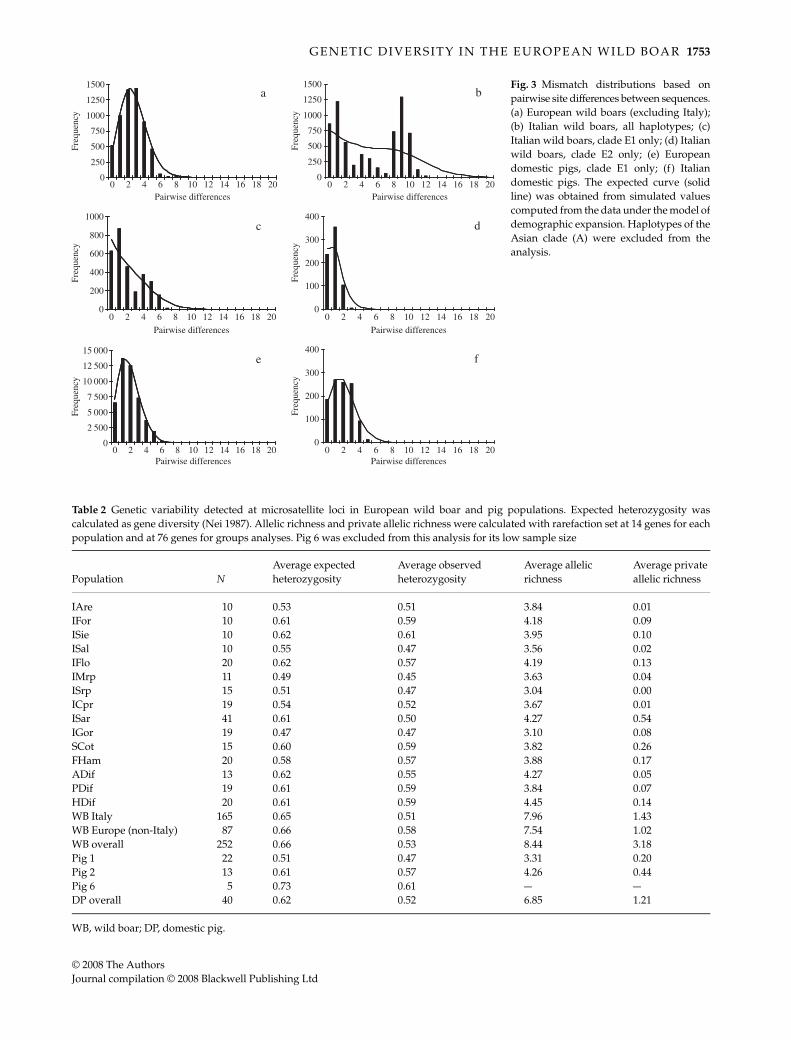
Between 7 (S026 and S215) and 22 (SW2496) alleles per locusare found across the 292 genotyped individuals. Meanlevels of heterozygosity (Table 2) are moderate, averaging0.57 (SD = 0.05) in the 15 wild boar populations and 0.62(SD = 0.11) in three pig breeds. Average levels of bothheterozygosity and allelic richness are relatively homo-geneous across wild boar populations, ranging between0.47 and 0.62 and between 2.6 and 3.5, respectively. Geneticvariation is similar or slightly higher in the joined Italiansamples than in the pooled European group (Table 2). Aninfluence on this pattern of individuals from ISal introgressedwith Asian pig genomes can be probably excluded. In fact,most populations show higher levels of genetic variationthan ISal (Table 2). As regards single populations, Sardinian
Fig. 2 Median-joining network (Bandeltet al. 1999) based on the joint mtDNA dataset (original and published sequences).Only haplotypes with a frequency ≥ 2 in thedata set were included. Circles indicatesequences observed in wild boar (white) ordomestic pig (black) individuals. Size ofcircles is proportional to the haplotypefrequency. Gray diamonds are medianvectors, that is haplotypes not observed inthe data. Solid branches connecting circlesrepresent single nucleotide changes; linesfragmented by i by dashes indicate i inferredchanges.
G E N E T I C D I V E R S I T Y I N T H E E U R O P E A N W I L D B O A R 1753
© 2008 The AuthorsJournal compilation © 2008 Blackwell Publishing Ltd
Fig. 3 Mismatch distributions based onpairwise site differences between sequences.(a) European wild boars (excluding Italy);(b) Italian wild boars, all haplotypes; (c)Italian wild boars, clade E1 only; (d) Italianwild boars, clade E2 only; (e) Europeandomestic pigs, clade E1 only; (f) Italiandomestic pigs. The expected curve (solidline) was obtained from simulated valuescomputed from the data under the model ofdemographic expansion. Haplotypes of theAsian clade (A) were excluded from theanalysis.
Table 2 Genetic variability detected at microsatellite loci in European wild boar and pig populations. Expected heterozygosity wascalculated as gene diversity (Nei 1987). Allelic richness and private allelic richness were calculated with rarefaction set at 14 genes for eachpopulation and at 76 genes for groups analyses. Pig 6 was excluded from this analysis for its low sample size
Population NAverage expected heterozygosity
Average observed heterozygosity
Average allelic richness
Average private allelic richness
IAre 10 0.53 0.51 3.84 0.01IFor 10 0.61 0.59 4.18 0.09ISie 10 0.62 0.61 3.95 0.10ISal 10 0.55 0.47 3.56 0.02IFlo 20 0.62 0.57 4.19 0.13IMrp 11 0.49 0.45 3.63 0.04ISrp 15 0.51 0.47 3.04 0.00ICpr 19 0.54 0.52 3.67 0.01ISar 41 0.61 0.50 4.27 0.54IGor 19 0.47 0.47 3.10 0.08SCot 15 0.60 0.59 3.82 0.26FHam 20 0.58 0.57 3.88 0.17ADif 13 0.62 0.55 4.27 0.05PDif 19 0.61 0.59 3.84 0.07HDif 20 0.61 0.59 4.45 0.14WB Italy 165 0.65 0.51 7.96 1.43WB Europe (non-Italy) 87 0.66 0.58 7.54 1.02WB overall 252 0.66 0.53 8.44 3.18Pig 1 22 0.51 0.47 3.31 0.20Pig 2 13 0.61 0.57 4.26 0.44Pig 6 5 0.73 0.61 — —DP overall 40 0.62 0.52 6.85 1.21
WB, wild boar; DP, domestic pig.
1754 M . S C A N D U R A E T A L .
© 2008 The AuthorsJournal compilation © 2008 Blackwell Publishing Ltd
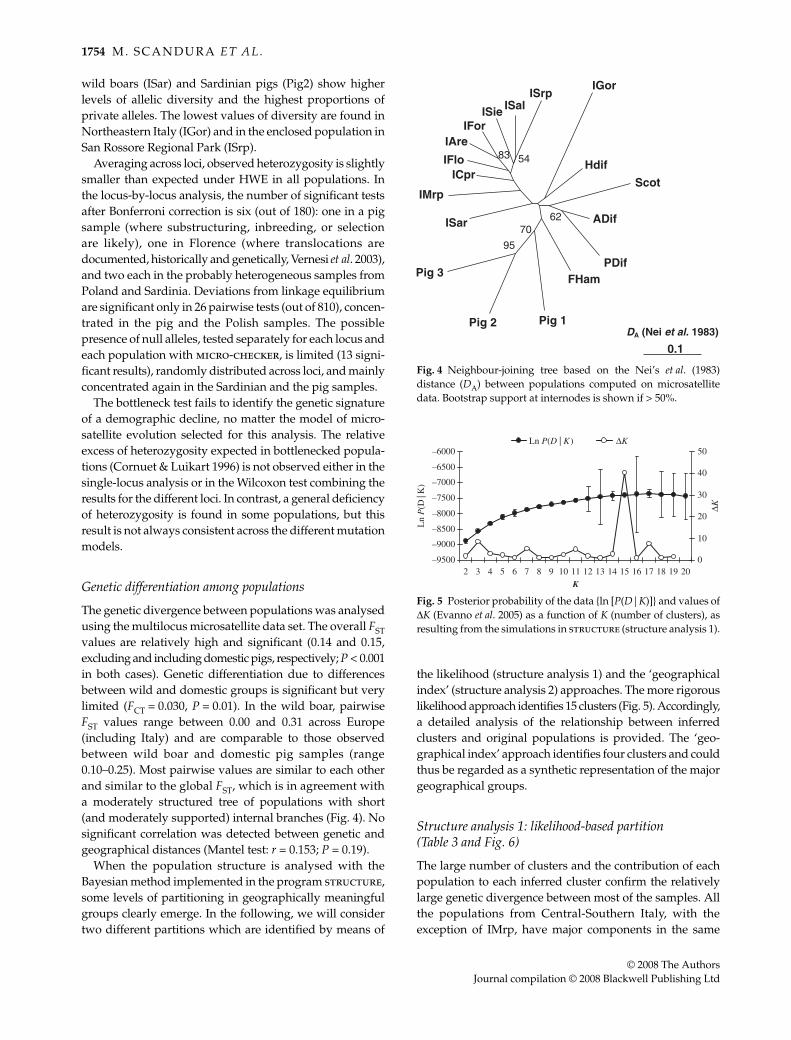
wild boars (ISar) and Sardinian pigs (Pig2) show higherlevels of allelic diversity and the highest proportions ofprivate alleles. The lowest values of diversity are found inNortheastern Italy (IGor) and in the enclosed population inSan Rossore Regional Park (ISrp).
Averaging across loci, observed heterozygosity is slightlysmaller than expected under HWE in all populations. Inthe locus-by-locus analysis, the number of significant testsafter Bonferroni correction is six (out of 180): one in a pigsample (where substructuring, inbreeding, or selectionare likely), one in Florence (where translocations aredocumented, historically and genetically, Vernesi et al. 2003),and two each in the probably heterogeneous samples fromPoland and Sardinia. Deviations from linkage equilibriumare significant only in 26 pairwise tests (out of 810), concen-trated in the pig and the Polish samples. The possiblepresence of null alleles, tested separately for each locus andeach population with micro-checker, is limited (13 signi-ficant results), randomly distributed across loci, and mainlyconcentrated again in the Sardinian and the pig samples.
The bottleneck test fails to identify the genetic signatureof a demographic decline, no matter the model of micro-satellite evolution selected for this analysis. The relativeexcess of heterozygosity expected in bottlenecked popula-tions (Cornuet & Luikart 1996) is not observed either in thesingle-locus analysis or in the Wilcoxon test combining theresults for the different loci. In contrast, a general deficiencyof heterozygosity is found in some populations, but thisresult is not always consistent across the different mutationmodels.
Genetic differentiation among populations
The genetic divergence between populations was analysedusing the multilocus microsatellite data set. The overall FSTvalues are relatively high and significant (0.14 and 0.15,excluding and including domestic pigs, respectively; P < 0.001in both cases). Genetic differentiation due to differencesbetween wild and domestic groups is significant but verylimited (FCT = 0.030, P = 0.01). In the wild boar, pairwiseFST values range between 0.00 and 0.31 across Europe(including Italy) and are comparable to those observedbetween wild boar and domestic pig samples (range0.10–0.25). Most pairwise values are similar to each otherand similar to the global FST, which is in agreement witha moderately structured tree of populations with short(and moderately supported) internal branches (Fig. 4). Nosignificant correlation was detected between genetic andgeographical distances (Mantel test: r = 0.153; P = 0.19).
When the population structure is analysed with theBayesian method implemented in the program structure,some levels of partitioning in geographically meaningfulgroups clearly emerge. In the following, we will considertwo different partitions which are identified by means of
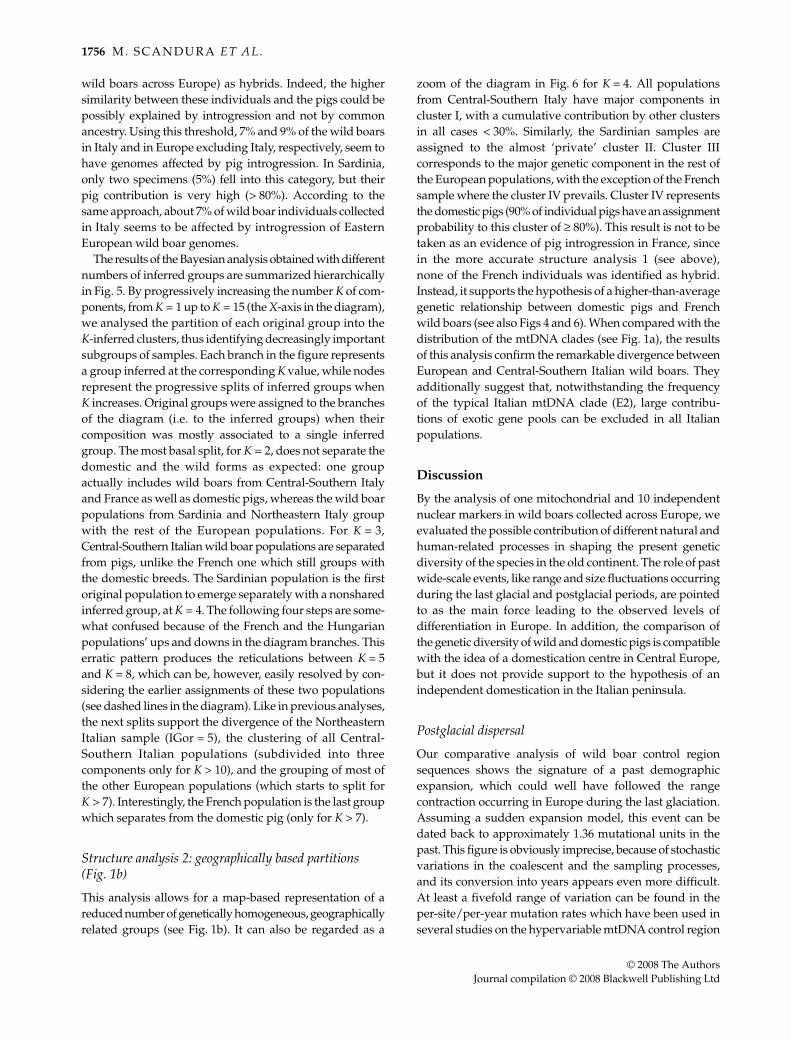
the likelihood (structure analysis 1) and the ‘geographicalindex’ (structure analysis 2) approaches. The more rigorouslikelihood approach identifies 15 clusters (Fig. 5). Accordingly,a detailed analysis of the relationship between inferredclusters and original populations is provided. The ‘geo-graphical index’ approach identifies four clusters and couldthus be regarded as a synthetic representation of the majorgeographical groups.
Structure analysis 1: likelihood-based partition (Table 3 and Fig. 6)
The large number of clusters and the contribution of eachpopulation to each inferred cluster confirm the relativelylarge genetic divergence between most of the samples. Allthe populations from Central-Southern Italy, with theexception of IMrp, have major components in the same
Fig. 4 Neighbour-joining tree based on the Nei’s et al. (1983)distance (DA) between populations computed on microsatellitedata. Bootstrap support at internodes is shown if > 50%.
Fig. 5 Posterior probability of the data {ln [P(D|K)]} and values ofΔK (Evanno et al. 2005) as a function of K (number of clusters), asresulting from the simulations in structure (structure analysis 1).

G E N E T I C D I V E R S I T Y I N T H E E U R O P E A N W I L D B O A R 1755
© 2008 The AuthorsJournal compilation © 2008 Blackwell Publishing Ltd
three inferred clusters (8, 10 and 15, see Table 3). IMrp hasone major component in cluster 13, poorly shared by all theother samples. Sardinian and northeastern Italian sampleshave almost ‘private’ components, namely clusters 2 and 6,and cluster 9, respectively. Of the European populations,the Spanish and the French samples correspond to privateclusters 5 and 3, respectively, while Hungarian, Polish andAustrian wild boars share three cluster components (1, 4,and 11). No one of the wild boar populations shows a
relevant proportion of any of the three clusters associatedto domestic pigs, although the analysis conducted on anindividual basis reveals some levels of admixture. Providedthat the three pig samples have a cumulative proportion ofclusters 7, 12, and 14, comprised between 78% and 91%,and that the homologous proportion in wild boar populationsaverages 6%, we arbitrarily classified single wild boarshaving a cumulative proportion of these clusters > 18%(three times the ‘background’ proportion observed in
Fig. 6 Diagram showing how populationssplit into the clusters inferred by the programstructure as the value of K increases.Populations are referred to as: A, IAre; B,IFor; C, ISie; D, ISal; E, IFlo; F, IMrp; G, ISrp;H, ICpr; I, ISar; J, IGor; K, SCot; L, FHam; M,ADif; N, PDif; O, HDif; P, Pig 1; Q, Pig 2; R,Pig 3. Splitting of one population or a groupof populations into multiple exclusive clustersis indicated by an asterisk. Reticulationsindicate that the attribution of some originalgroups is not consistent across all K values;dashed lines indicate likely solutions, basedon clustering at lower K values.
Table 3 Partition of the 18 sampled populations into the 15 clusters inferred by the program structure (structure analysis 1). This was themost supported value of K, obtained by simulated data assuming the admixture model and ignoring population information (10 replicatedruns, each with 1 000 000 iterations of data collection after a burn-in of 20 000 iterations). Proportions higher than 0.1 are in bold. Letter codesused in Fig. 6 are reported
Code Pop N
Inferred clusters
1 2 3 4 5 6 7 8 9 10 11 12 13 14 15
A IAre 10 0.057 0.020 0.016 0.018 0.058 0.015 0.050 0.019 0.006 0.370 0.019 0.020 0.016 0.029 0.286B IFor 10 0.040 0.009 0.039 0.019 0.028 0.011 0.015 0.075 0.005 0.328 0.008 0.019 0.096 0.044 0.265C ISie 10 0.020 0.007 0.010 0.036 0.050 0.025 0.010 0.082 0.013 0.331 0.013 0.007 0.030 0.014 0.353D ISal 10 0.024 0.013 0.029 0.009 0.012 0.017 0.010 0.257 0.019 0.245 0.011 0.010 0.060 0.007 0.276E IFlo 20 0.036 0.012 0.017 0.051 0.010 0.016 0.014 0.048 0.013 0.333 0.038 0.056 0.041 0.021 0.295F IMrp 11 0.016 0.009 0.015 0.007 0.014 0.036 0.014 0.064 0.038 0.057 0.007 0.011 0.652 0.009 0.052G ISrp 15 0.009 0.006 0.009 0.004 0.007 0.009 0.008 0.862 0.006 0.025 0.005 0.007 0.010 0.007 0.027H ICpr 19 0.048 0.015 0.012 0.013 0.015 0.080 0.033 0.083 0.030 0.251 0.009 0.020 0.043 0.041 0.308I ISar 41 0.020 0.529 0.013 0.010 0.015 0.232 0.016 0.021 0.031 0.011 0.034 0.027 0.013 0.018 0.011J IGor 19 0.011 0.007 0.005 0.006 0.019 0.009 0.010 0.005 0.893 0.005 0.006 0.005 0.006 0.006 0.006K SCot 15 0.015 0.014 0.013 0.015 0.802 0.008 0.007 0.054 0.008 0.012 0.012 0.010 0.012 0.005 0.013L FHam 20 0.020 0.010 0.702 0.030 0.029 0.015 0.016 0.010 0.009 0.009 0.011 0.055 0.036 0.037 0.010M ADif 13 0.181 0.020 0.055 0.178 0.040 0.012 0.032 0.016 0.034 0.019 0.196 0.035 0.133 0.029 0.022N PDif 19 0.115 0.012 0.020 0.363 0.061 0.012 0.008 0.022 0.031 0.010 0.294 0.007 0.015 0.019 0.011O HDif 20 0.549 0.016 0.044 0.010 0.026 0.017 0.030 0.037 0.093 0.031 0.033 0.019 0.029 0.034 0.031P Pig 1 22 0.013 0.011 0.011 0.011 0.007 0.006 0.015 0.011 0.012 0.014 0.014 0.063 0.009 0.790 0.014Q Pig 2 13 0.013 0.009 0.007 0.006 0.005 0.009 0.597 0.007 0.009 0.009 0.006 0.289 0.007 0.017 0.009R Pig 3 5 0.013 0.009 0.021 0.036 0.038 0.012 0.129 0.010 0.007 0.019 0.023 0.643 0.009 0.013 0.018
1756 M . S C A N D U R A E T A L .
© 2008 The AuthorsJournal compilation © 2008 Blackwell Publishing Ltd
wild boars across Europe) as hybrids. Indeed, the highersimilarity between these individuals and the pigs could bepossibly explained by introgression and not by commonancestry. Using this threshold, 7% and 9% of the wild boarsin Italy and in Europe excluding Italy, respectively, seem tohave genomes affected by pig introgression. In Sardinia,only two specimens (5%) fell into this category, but theirpig contribution is very high (> 80%). According to thesame approach, about 7% of wild boar individuals collectedin Italy seems to be affected by introgression of EasternEuropean wild boar genomes.
The results of the Bayesian analysis obtained with differentnumbers of inferred groups are summarized hierarchicallyin Fig. 5. By progressively increasing the number K of com-ponents, from K = 1 up to K = 15 (the X-axis in the diagram),we analysed the partition of each original group into theK-inferred clusters, thus identifying decreasingly importantsubgroups of samples. Each branch in the figure representsa group inferred at the corresponding K value, while nodesrepresent the progressive splits of inferred groups whenK increases. Original groups were assigned to the branchesof the diagram (i.e. to the inferred groups) when theircomposition was mostly associated to a single inferredgroup. The most basal split, for K = 2, does not separate thedomestic and the wild forms as expected: one groupactually includes wild boars from Central-Southern Italyand France as well as domestic pigs, whereas the wild boarpopulations from Sardinia and Northeastern Italy groupwith the rest of the European populations. For K = 3,Central-Southern Italian wild boar populations are separatedfrom pigs, unlike the French one which still groups withthe domestic breeds. The Sardinian population is the firstoriginal population to emerge separately with a nonsharedinferred group, at K = 4. The following four steps are some-what confused because of the French and the Hungarianpopulations’ ups and downs in the diagram branches. Thiserratic pattern produces the reticulations between K = 5and K = 8, which can be, however, easily resolved by con-sidering the earlier assignments of these two populations(see dashed lines in the diagram). Like in previous analyses,the next splits support the divergence of the NortheasternItalian sample (IGor = 5), the clustering of all Central-Southern Italian populations (subdivided into threecomponents only for K > 10), and the grouping of most ofthe other European populations (which starts to split forK > 7). Interestingly, the French population is the last groupwhich separates from the domestic pig (only for K > 7).
Structure analysis 2: geographically based partitions (Fig. 1b)
This analysis allows for a map-based representation of areduced number of genetically homogeneous, geographicallyrelated groups (see Fig. 1b). It can also be regarded as a
zoom of the diagram in Fig. 6 for K = 4. All populationsfrom Central-Southern Italy have major components incluster I, with a cumulative contribution by other clustersin all cases < 30%. Similarly, the Sardinian samples areassigned to the almost ‘private’ cluster II. Cluster IIIcorresponds to the major genetic component in the rest ofthe European populations, with the exception of the Frenchsample where the cluster IV prevails. Cluster IV representsthe domestic pigs (90% of individual pigs have an assignmentprobability to this cluster of ≥ 80%). This result is not to betaken as an evidence of pig introgression in France, sincein the more accurate structure analysis 1 (see above),none of the French individuals was identified as hybrid.Instead, it supports the hypothesis of a higher-than-averagegenetic relationship between domestic pigs and Frenchwild boars (see also Figs 4 and 6). When compared with thedistribution of the mtDNA clades (see Fig. 1a), the resultsof this analysis confirm the remarkable divergence betweenEuropean and Central-Southern Italian wild boars. Theyadditionally suggest that, notwithstanding the frequencyof the typical Italian mtDNA clade (E2), large contribu-tions of exotic gene pools can be excluded in all Italianpopulations.
Discussion
By the analysis of one mitochondrial and 10 independentnuclear markers in wild boars collected across Europe, weevaluated the possible contribution of different natural andhuman-related processes in shaping the present geneticdiversity of the species in the old continent. The role of pastwide-scale events, like range and size fluctuations occurringduring the last glacial and postglacial periods, are pointedto as the main force leading to the observed levels ofdifferentiation in Europe. In addition, the comparison ofthe genetic diversity of wild and domestic pigs is compatiblewith the idea of a domestication centre in Central Europe,but it does not provide support to the hypothesis of anindependent domestication in the Italian peninsula.
Postglacial dispersal
Our comparative analysis of wild boar control regionsequences shows the signature of a past demographicexpansion, which could well have followed the rangecontraction occurring in Europe during the last glaciation.Assuming a sudden expansion model, this event can bedated back to approximately 1.36 mutational units in thepast. This figure is obviously imprecise, because of stochasticvariations in the coalescent and the sampling processes,and its conversion into years appears even more difficult.At least a fivefold range of variation can be found in theper-site/per-year mutation rates which have been used inseveral studies on the hypervariable mtDNA control region

G E N E T I C D I V E R S I T Y I N T H E E U R O P E A N W I L D B O A R 1757
© 2008 The AuthorsJournal compilation © 2008 Blackwell Publishing Ltd
in mammals. For the analysis of ungulates in particular,Randi et al. (1998) suggested a range between 4% and 8%sequence divergence per site per million years, whileBirungi & Arctander (2000) suggested an interval between10% and 20%. Accordingly, if we consider only the errorsassociated to the calibration, the expansion age of the wildboar should be dated back to between 16 000 bp and 80 000bp. Several authors argued for a mutation rate closer to theupper limit of these intervals (e.g. Bradley et al. 1996 andKim et al. 2002 opted for a 15% rate), and we thereforebelieve that the molecular data we analysed support thehypothesis of a demographic expansion of the wild boarfollowing the last glaciation. Interestingly, the age of theexpansion estimated from the similarly unimodal mismatchdistribution in the European domestic pig data set (Fig. 3e)is about 40% younger, that is, 10 000 years ago using a20% rate. Considering the errors associated to these estimates,also for the reason that the method assumes a singledemographic event, these data appear consistent with apig Neolithic expansion associated to the domesticationprocess, or they might actually correspond to a sort of averagethat keeps also the signs of the postglaciation expansionof their wild ancestors.
Two additional results support the hypothesis that thepattern of genetic diversity in the European wild boar wasshaped by the last postglacial colonization event from oneor more southern refugia. First, the divergence betweenEuropean samples outside Italy is similar in different com-parisons, and no correlation is observed between geneticand geographical distances. This finding is not consistentwith a stable equilibrium between drift and migration (i.e.under isolation by distance), while it is expected in case ofa rapid colonization and a simultaneous demographicexpansion from a common source population. Second, themitochondrial variation in Italy is not compatible with ademographic expansion, and both mtDNA and nuclearmarkers show a similar or even higher level of variationin Italy than in the rest of the European regions jointlyanalysed. This result is remarkable at the mtDNA: twomajor clades, E1 and E2, separated by at least 50 000 years,are observed in Italy, whereas only E1 is found elsewhere.The simplest explanation for this pattern seems to be theprocess of contraction into southern refugia and the followingre-expansion towards northern areas. The recent finding(Larson et al. 2007) that E2 haplotypes were present in thepresent-day Croatia about 11 000 years ago is not unex-pected under this view, considering that Northern Adriaticwas not submerged during the last glaciation (Van Andel1989). According to this scenario, Italian diversity representsa large fraction of the wild boar preglaciation diversity,which was then preserved without any major impact bysubsequent demographic processes. Different hypothesesabout the location of source refugia appear equally likely:it could be Italy itself, with the loss of rare E2 haplotypes
during the colonization, or some other southern areas inEurope, or a combination of these two. Actually, the Italianpeninsula seems to have played for several species a minorrole in the recolonization processes than the Iberian andBalkan peninsulas, probably on account of the Alps beinga greater physical barrier to the dispersal of individuals(Hewitt 2000). A wider sampling in Iberia and in the Balkanswill be necessary to identify which refugium area contributedmost to the present gene pool of the European wild boar.Similarly, more locations throughout Europe should bescreened for the presence of E2 haplotypes, as to excludethat they occur outside Italy at low frequency.
Domestication and hybridization with domestic pigs
Wild boars and domestic pigs share the most commonmtDNA haplotypes and microsatellite alleles, and thepopulation tree (Fig. 4) only weakly resolves the two groups.Also the Bayesian clustering analysis confirms that wildand domestic forms are not more divergent than otherpairs of wild boar populations. It seems therefore that thedifferentiation from the wild boar during the domestication,remarkable at morphological traits and thus probably alsoat their genetic determinants, was not accompanied by astrong founder effect. As already suggested in relation toother domestication events which implied a long co-existencebetween the domestic and the wild forms (e.g. dog andcattle), occasional and/or deliberate hybridizations couldhave played a role in reducing their genetic divergence(Vilà et al. 2005; Beja-Pereira et al. 2006). A fraction between5% and 10% of the wild boar individuals we analysed showsthe effects of pig introgression, but the global contributionof pig genomes in the wild populations is clearly lower (assupported by the population analysis). Remarkably, weeven found wild boar individuals in Southern Italy withAsian pig mtDNA, usually observed in some amelioratedEuropean breeds crossbred with Asian pigs (Giuffra et al.2000). This evidence is consistent with the observationby Fang et al. (2006), who assayed an approximately 10-fold lower frequency of Asian haplotypes in wild boarpopulations than in domestic breeds in Europe (3% vs.30%). This result supports the view that some levels ofhybridization between wild boars and domestic pigsoccurred in the past and possibly still occur today.
Domestication: the origin of European breeds
The similarity between European pig breeds and wildboars, when considered in connection with the finding thatMiddle Eastern mtDNA lineages are not observed inEuropean pig breeds (Larson et al. 2005), unequivocallysuggests that modern breeds in Europe descend from localwild populations. Additionally, the population tree andthe Bayesian inference of population clustering based on

1758 M . S C A N D U R A E T A L .
© 2008 The AuthorsJournal compilation © 2008 Blackwell Publishing Ltd
nuclear markers indicate that the wild boar population tobe most closely related to the pig is located in northernFrance. This result is compatible with the hypothesis ofLarson et al. (2005, 2007) based on modern and ancientmtDNA sequences, whereby Central Europe was animportant domestication centre. A second domesticationcentre for the European breeds was actually proposed byLarson et al. (2005) to be located in Southern Europe, andmore specifically in mainland Italy. This hypothesis,although intriguing, was supported only by two museumSardinian specimens with possible feral origin showing E2mtDNA sequences. Similarly, Larson et al. (2007) found twoBronze Age Sardinian individuals morphologically classifiedas ‘domestic/feral’ showing E2 sequences, although allancient Italian samples firmly attributed to domesticpigs had European E1 haplotypes. In our analysis at bothmtDNA and nuclear markers, we do not find any specificrelationship between Italian pigs and Italian wild boars,and no E2 haplotype is found in the 47 pigs belonging tothe five local breeds we analysed. Although the pattern ofgenetic variation in the Italian breeds suggests a differentdemographic history from that of other European breeds(no signs of demographic expansion are detected), our dataseem to exclude an independent domestication event inItaly, or, at least, that pigs possibly domesticated in Italyhave left descendants in modern breeds.
Overhunting and demographic decline
The genetic impact of the demographic decline that affectedseveral wild boar populations in Europe during the lasttwo centuries seems to be extremely limited, if any.
In general, the level of genetic variations at the mtDNAsequences in the whole data set is within the range observedin other ungulate populations (Vernesi et al. 2002; Feulneret al. 2004; Randi et al. 2004). The average microsatelliteheterozygosity (0.66) is only slightly lower than the averagevalue observed in 14 non-endangered species (0.70) andmuch higher than the average value of 0.41 found across 14threatened taxa (Frankham et al. 2004). The genetic variation,as expected in nonpanmictic species, is lower within singlelocalities, with large differences between samples especiallyat the mtDNA region. This is probably a consequence of theincrease of drift effects due to the smaller effective populationsizes at this marker, and possibly this is also related toour small sample sizes. We note however that the levelsof variation are relatively high almost everywhere, alsowithin samples, with only two restricted groups in as manyregional parks (ISrp and IMrp) and one sample with anacknowledged history of recent recolonization (IGor),having very low variation both at mitochondrial andmicrosatellite loci.
More specifically, the mismatch analysis and two neutralitytests applied to mtDNA sequences are all indicative of
either stability or expansion, and a specific methoddeveloped to identify a bottleneck using microsatellitemarkers does not reveal the deviation expected in case ofdemographic decline. In other words, both the levels andthe patterns of diversity observed at mtDNA sequencesand microsatellites are consistent with the idea that thepopulation size and distribution range contractions did notaffect the overall genetic variability.
Recent expansions and translocations
The possibility to detect the genetic effects of the rapidgrowth occurred in the last 50 years in several regions isquestionable. Provided that a few generations of expansionare not sufficient to accumulate enough mutations in thegene genealogy, to capture statistically the reduced drifteffects which are typical of this process is very difficult.However, it is interesting to note that a first attempt toidentify these effects using an approximate Bayesiancomputation (ABC) approach (Beaumont et al. 2002), whichcan be used to model complex demographic processes,suggests that a large growth rate occurred in the last 10–20generations and was larger in Central Italy than anywhereelse in Europe (results not shown). Therefore a tentativeconclusion would be that Italy still preserves the preglaciationdiversity, which was not severely affected by the declineoccurred from the Middle Ages until the end of WorldWar II, and was recently frozen by the modern expansion.
As for the translocation events, it was suggested thatpoorly documented and usually uncontrolled restockingplans drastically affected genetic variation in Central andSouthern Italy, and also speeded up the recent expansionprocess (Randi 2005; Apollonio et al. in press). Since trans-locations were carried out using also animals from CentralEurope, this might have artificially contributed to the highergenetic variation observed in Italy. However, in agreementwith Vernesi et al. (2003), we can exclude a major impact ofsuch human-mediated migrations. If this phenomenonwere extensive, we would have observed (i) the clusteringof some Central and Southern Italian samples with someCentral European groups; (ii) the presence of inferredclusters (in the Bayesian analysis) shared by some Centraland Southern Italian and Central European groups; (iii) alarge proportion of individuals from Central and SouthernItaly assigned to other European populations. None of thesepredictions is met by our genetic analyses, and only alimited fraction (7%) of individuals sampled in Italy havesignificant proportions of their genomes that can be relatedto wild boar populations abroad. In addition, the plausiblehypothesis that the native boars in Italy had E2 haplotypes,while E1 haplotypes were introduced by recent translocationsof wild boars from Central Europe is contradicted by thefact that the variation patterns of E1 sequences in Italy andin the rest of Europe are different. We therefore conclude

G E N E T I C D I V E R S I T Y I N T H E E U R O P E A N W I L D B O A R 1759
© 2008 The AuthorsJournal compilation © 2008 Blackwell Publishing Ltd
that restocking from Central Europe had a limited geneticimpact and an accordingly a marginal role in the recoveryof the Italian population.
Conclusions and management implications
In conclusion, the most important event in shaping theobserved pattern of diversity seems to have been the lastglaciation, which was followed by a sudden demographicand spatial expansion from one or more southern refugia.The genetic signature of more recent processes, which weremostly related to human activities, can be detected but itappears marginal. Clearly, a wider sampling of Europeanpopulations, including several locations in the IberianPeninsula and in the Balkans, is necessary to better clarifypostglacial dynamics. However, our data point to a singlearea of discontinuity which corresponds to the Alps.Wild boars sampled south of this chain show, indeed,higher levels of overall genetic variation, a private mtDNAhaplogroup and endemic diversity at microsatellite loci.
The wild boar is a rather invasive species, with a relevantimpact on biodiversity, agriculture and livestock, and it isalso of large interest for hunters. Therefore, it is importantto consider the implications of our results for the manage-ment of this species. We believe that (i) Italian populationsrepresent a reservoir of genetic diversity in Europe whichshould be preserved; for example, following the argumentsin Petit et al. (1998), in the eventual case of extinction of thewild boar in Italy, the reduction of nuclear allelic richnesswould be about twice as much as in the case of the simul-taneous extinction in five other European regions (11%compared to 6%), and a high divergent mtDNA clade wouldbe lost; however, since almost all the Italian groups aregenetically very similar, and even documented demographicreductions did not affect significantly the genetic variation,hunting is still recommended to reduce the population sizein some areas; (ii) animals should not be translocated fromone European region to another, especially across the Alps;even though the level of differentiation is probably notenough to maintain the current subdivision into subspecies,some level of local adaptation is expected and should notbe compromised by hybridization; accidental escapesfrom wild boar farms should also be prevented for the samereason; (iii) artificial crossbreeding with domestic pigsshould be avoided and genetic controls in wild boar farmsshould be enforced. A different matter are those situationswhere the genetic exchange between wild and domesticpigs has a historical background, due to the long-lastingpractice to rear pigs in a natural state (e.g. in Sardinia).In these cases, the present genetic identity of the wildpopulation is influenced by the prolonged gene flowbetween the two forms, and thus, in absence of significantintrogressions from other areas, they can be referred to asa joint evolutionary unit.
Acknowledgements
We are deeply grateful to all those who collaborated with us incollecting samples: Henrik Okarma (Poland), Laszlo Sugar(Hungary), Juan Carranza (Spain), Franz Suchentrunk (Austria),Eric Baubet (France), Roberto Mazzoni Della Stella (Siena), StefanoAntonacci (Gorizia), Paolo Varuzza (Salerno), Luca Tonini (MaremmaRegional Park), Riccardo Bozzi and several local hunters and pigbreeders. The Istituto Nazionale per la Fauna Selvatica (INFS)kindly allowed us to collect samples from the Castel PorzianoPresidential Reserve. We also thank Lidia Migliori, GiovanniManca and David Caramelli for technical assistance, and UmbertoAlbarella for useful suggestions to an early draft of the manuscript.Three anonymous referees made constructive and valuable com-ments on this paper. The study was possible thanks to the financialcontribution of the Sardinian Regional Government, the Universityof Ferrara, The Italian Ministry for University Research (MIURPRIN 2005) the Centre for Alpine Ecology, and the AutonomousProvince of Trento. L. Iacolina benefited by a fellowship sponsoredby the Sardegna Resorts srl.
References
Alves A, Ovilo C, Rodriguez MC, Siliò L (2003) MitochondrialDNA sequence variation and phylogenetic relationships amongIberian pigs and others domestic and wild pig populations.Animal Genetics, 34, 319–324.
Apollonio M, Randi E, Toso S (1988) The systematics of the wildboar (Sus scrofa L.) in Italy. Bollettino Di Zoologia, 3, 213–221.
Apollonio M, Ciuti S, Pedrotti L, Banti P (in press) Ungulatemanagement in Italy in the XXI Century. In: Ungulate Managementin Europe in the XXI Century (eds Apollonio M, Andersen R,Putman R). Cambridge University Press, Cambridge, UK.
Avise JC (1995) Mitochondrial DNA polymorphism and a connectionbetween genetics and demography of relevance to conservation.Conservation Biology, 9, 686–690.
Avise JC (2004) Molecular Markers Natural History, and Evolution,2nd edn. Sinauer & Associates, Sunderland, Massachusetts.
Ballard JW, Kreitman M (1995) Is mitochondrial DNA a strictlyneutral marker? Trends in Ecology & Evolution, 10, 485–488.
Bandelt H-J, Forster P, Röhl A (1999) Median-joining networks forinferring intraspecific phylogenies. Molecular Biology and Evolution,16, 37–48.
Barker JSF, Hill WG, Bradley D, Nei M, Fries R, Wayne RK (1998)Measurement of Domestic Animal Diversity (MoDAD): OriginalWorking Group Report. FAO, Rome.
Beaumont MA, Zhang W, Balding DJ (2002) Approximate BayesianComputation in population genetics. Genetics, 162, 2025–2035.
Beja-Pereira A, Caramelli D, Lalueza-Fox C et al. (2006) The originof European cattle: evidence from modern and ancient DNA.Proceedings of the National Academy of Sciences, USA, 103, 8113–8118.
Belkhir K, Borsa P, Chikhi L, Raufauste N, Bonhomme F (2001)GENETIX 4.02, logiciel sous WindowsTM pour la génétique des popu-lations. Laboratoire Génome, Populations, Interactions. CNRSUMR 5000, Université de Montpellier II, Montpellier (France).Available from URL: http://www.genetix.univ-montpz.fr/genetix/genetix.htm
Bieber C, Ruf T (2005) Population dynamics in wild boar Sus scrofa:ecology, elasticity of growth rate and implications for themanagement of pulsed resource consumers. Journal of AppliedEcology, 42, 1203–1213.
1760 M . S C A N D U R A E T A L .
© 2008 The AuthorsJournal compilation © 2008 Blackwell Publishing Ltd
Birungi J, Arctander P (2000) Large sequence divergence ofmitochondrial DNA genotypes of the control region withinpopulations of the African antelope, kob (Kobus kob). MolecularEcology, 9, 1997–2008.
Boitani L, Trapanese P, Mattei L, Nonis D (1995) Demography of awild boar (Sus scrofa, L.) population, Tuscany, Italy. Gibier FauneSauvage, 12, 109–132.
Bradley DG, MacHugh DE, Cunningham P, Loftus RT (1996) Mito-chondrial diversity and the origins of African and European cattle.Proceedings of the National Academy of Sciences, USA, 93, 5131–5135.
Briedermann L (1990) Schwarzwild. VEB Deutscher Landwirt-schaftsverlag, Berlin, Germany.
Cornuet JM, Luikart G (1996) Description and power analysis oftwo tests for detecting recent population bottlenecks from allelefrequency data. Genetics, 144, 2001–2014.
Danilkin AA (2001) The wild boar: an unprecedented spread orrestoration of the species range? Doklady Biological Sciences, 380,457–460.
El Mousadik A, Petit RJ (1996) High level of genetic differentiationfor allelic richness among populations of the argan tree [Arganiaspinosa (L.) Skeels] endemic to Morocco. Theoretical and AppliedGenetics, 92, 832–839.
Epstein J, Bichard M (1984) Pig. In: Evolution of DomesticatedAnimals (ed. Mason IL), pp. 145–162. Longman, New York.
Evanno G, Regnaut S, Goudet J (2005) Detecting the number ofclusters of individuals using the software structure: a simulationstudy. Molecular Ecology, 14, 2611–2620.
Excoffier L, Laval G, Schneider S (2005) arlequin ver 3.0: an inte-grated software package for population genetics data analysis.Evolutionary Bioinformatics Online, 1, 47–50.
Fang M, Andersson L (2006) Mitochondrial diversity in Europeanand Chinese pigs is consistent with population expansions thatoccurred prior to domestication. Proceedings of the Royal SocietyB: Biological Sciences, 273, 1803–1810.
Fang M, Berg F, Ducos A, Andersson L (2006) Mitochondrialhaplotypes of European wild boars with 2n = 36 are closelyrelated to those of European domestic pigs with 2n = 38. AnimalGenetics, 37, 459–464.
Feichtner B (1998) Ursachen der Streckenschwankungen beim Schw-arzwild im Saarland. Zeitschrift für Jagdwissenschaft, 44, 140–150.
Fernandez-Llario P, Mateos-Quesada P (1998) Body size and repro-ductive parameters in the wild boar Sus scrofa. Acta Theriologica,43, 439–444.
Feulner PGC, Bielfeldt W, Zachos FE et al. (2004) MitochondrialDNA and microsatellite analyses of the genetic status of thepresumed subspecies Cervus elaphus montanus (Carpathian reddeer). Heredity, 93, 299–306.
Frankham R, Ballou JD, Briscoe DA (2004) A Primer of ConservationGenetics. Cambridge University Press, Cambridge, UK.
Fu YX (1997) Statistical tests of neutrality of mutations against popu-lation growth, hitchhiking and background selection. Genetics,147, 915–925.
Geisser H, Reyer H-U (2004) Efficacy of hunting, feeding, andfencing to reduce crop damage by wild boars. Journal of WildlifeManagement, 68, 939–946.
Geisser H, Reyer H-U (2005) The influence of food and temperatureon population density of wild boar Sus scrofa in the Thurgau(Switzerland). Journal of Zoology London, 267, 89–96.
Genov P, Nikolov H, Massei G, Gerasimov S (1991) Craniometricalanalysis of Bulgarian wild boar (Sus scrofa) populations. Journalof Zoology, London, 225, 309–325.
Giuffra E, Kijas JMH, Amarger V et al. (2000) The origin of the
domestic pig: independent domestication and subsequentintrogression. Genetics, 154, 1785–1791.
Gongora J, Fleming P, Spencer PBS et al. (2004) Phylogeneticrelationships of Australian and New Zealand feral pigs assessedby mitochondrial control region sequence and nuclear GPIPgenotype. Molecular Phylogenetics and Evolution, 33, 339–348.
Goudet J (2001) FSTAT, a Program to Estimate and Test Gene Diversitiesand Fixation Indices Version 2.9.3. Available from URL: http://www.unil.ch/izea/softwares/fstat.html.
Groves C (1981) Ancestors for the Pigs: Taxonomy and Phylogeny of theGenus Sus. Research School of Pacific Studies, Australian NationalUniversity, Canberra, Australia.
Guo SW, Thompson EA (1992) Performing the exact test of Hardy–Weinberg proportions for multiple alleles. Biometrics, 48, 361–372.
Hewitt G (2000) The genetic legacy of the Quaternary ice ages.Nature, 405, 907–913.
Hofreiter M, Serre D, Rohland N et al. (2004) Lack of phylogeographyin European mammals before the last glaciation. Proceedings ofthe National Academy of Sciences, USA, 101, 12963–12968.
Holm S (1979) A simple sequentially rejective multiple test procedure.Scandinavian Journal of Statistics, 6, 54–70.
Jedrzejewska B, Jedrzejewski W, Bunevich AN, Milkowski L,Krasinski A (1997) Factors shaping population densities andincreased rates of ungulates in Bialowieza Primeval Forest (Polandand Belarus) in the 19th and 20th centuries. Acta Theriologica,42, 399–451.
Kalinowski ST (2005) hp-rare 1.0: a computer program for per-forming rarefaction on measures of allelic richness. MolecularEcology Notes, 5, 187–189.
Kijas JMH, Andersson L (2001) A phylogenetic study of the originof the domestic pig estimated from the near-complete mtDNAgenome. Journal of Molecular Evolution, 52, 302–308.
Kim K-I, Lee J-H, Li K et al. (2002) Phylogenetic relationship ofAsian and European pig breeds determined by mitochondrialDNA D-loop sequence polymorphism. Animal Genetics, 33, 19–25.
Langella O (2002) populations 1.2.28. Population Genetic Software(Individuals or Populations Distances, Phylogenetic Trees). Availablefrom URL: http://www.bioinformatics.org/project/?group_id=84.
Larson G, Dobney K, Albarella U et al. (2005) Worldwide phylo-geography of wild boar reveals multiple centers of pig domestication.Science, 307, 1618–1621.
Larson G, Albarella U, Dobney K et al. (2007) Ancient DNA, pigdomestication, and the spread of the Neolithic into Europe.Proceedings of the National Academy of Sciences, USA, 104, 15276–15281.
Lin C-S, Sun Y-L, Liu C-Y et al. (1999) Complete nucleotide sequenceof pig (Sus scrofa) mitochondrial genome and dating evolutionarydivergence within Artiodactyla. Gene, 236, 107–114.
Lucchini V, Meijaard E, Diong CH, Groves CP, Randi E (2005)New phylogenetic perspectives among species of South-east Asianwild pig (Sus sp.) based on mtDNA sequences and morphometricdata. Journal of Zoology, 266, 25–35.
Magri D, Vendramin GG, Comps B et al. (2006) A new scenario forthe Quaternary history of European beech populations: palaeo-botanical evidence and genetic consequences. New Phytologist,171, 199–221.
Mantel N (1967) The detection of disease clustering and a generalizedregression approach. Cancer Research, 27, 209–220.
Nei M (1987) Molecular Evolutionary Genetics. Columbia UniversityPress, New York.
Nei M, Kumar S (2000) Molecular Evolution and Phylogenetics.Oxford University Press, Oxford, UK.

G E N E T I C D I V E R S I T Y I N T H E E U R O P E A N W I L D B O A R 1761
© 2008 The AuthorsJournal compilation © 2008 Blackwell Publishing Ltd
Nei M, Tajima F, Tateno Y (1983) Accuracy of estimated phylogenetictrees from molecular data. Journal of Molecular Evolution, 19,153–170.
Okumura N, Kurosawa Y, Kobayashi E et al. (2001) Genetic rela-tionship amongst the major non-coding regions of mitochondrialDNAs in wild boars and several breeds of domesticated pigs.Animal Genetics, 32, 139–147.
Oliver WLR, Brisbin IL, Takahashi S (1993) The Eurasian wild pig, Susscrofa. In Pigs, Peccaries and Hippos — Status Survey and Action Plan.(ed. Oliver WLR), pp. 112–121. IUCN/SSC, Gland, Switzerland.
Petit RJ, El Mousadik A, Pons O (1998) Identifying populations forconservation on the basis of genetic markers. ConservationBiology, 12, 844–855.
Petit RJ, Aguinagalde I, de Beaulieu J-L et al. (2003) Glacial refugia:hotspots but not melting pots of genetic diversity. Science, 300,1563–1565.
Pritchard JK, Stephens M, Donnelly P (2000) Inference of populationstructure using multilocus genotype data. Genetics, 155, 945–959.
Randi E (2005) Management of wild ungulate populations in Italy:captive-breeding, hybridisation and genetic consequences oftranslocations. Veterinary Research Communications, 29, 71–75.
Randi E, Apollonio M, Toso S (1989) The systematics of someItalian populations of wild boar (Sus scrofa L.): a craniometricand electrophoretic analysis. Zeitschrift für Säugetierkunde, 54,40–56.
Randi E, Mucci N, Pierpaoli M, Douzery E (1998) New phylogeneticperspectives on the Cervidae (Artiodactyla) are provided by themitochondrial cytochrome b gene. Proceedings of the Royal SocietyB: Biological Sciences, 265, 793–801.
Randi E, D’Huart JP, Lucchini V, Aman R (2002) Evidence of twogenetically deeply divergent species of waterhog, Phacochoerusafricanus and P. aethiopicus (Artiodactyla: Suiformes) in EastAfrica. Mammalian Biology, 67, 91–96.
Randi E, Alves PC, Carranza J, Miloševic-Zlantanovic S, SfougarisA (2004) Phylogeography of roe deer (Capreolus capreolus) pop-ulations: the effects of historical genetic subdivisions and recentnonequilibrium dynamics. Molecular Ecology, 13, 3071–3083.
Raymond M, Rousset F (1995) genepop (version 1.2): populationgenetics software for exact tests and ecumenicism. Journal ofHeredity, 86, 248–249.
Rogers A, Harpending H (1992) Population growth makes wavesin the distribution of pairwise genetic differences. MolecularBiology and Evolution, 9, 552–569.
Sacks BN, Brown SK, Ernest HB (2004) Population structure ofCalifornia coyotes corresponds to habitat-specific breaks andilluminates species history. Molecular Ecology, 13, 1265–1275.
Sáez-Royuela C, Tellería JL (1986) The increased population of thewild boar (Sus scrofa L.) in Europe. Mammal Review, 16, 97–101.
Sambrook J, Fritsch EF, Maniatis T (1989) Molecular Cloning: ALaboratory Manual, 2nd edn. Cold Spring Harbor LaboratoryPress, Cold Spring Harbor, New York.
Sbisà E, Tanzariello F, Reyes A, Pesole G, Saccone C (1997)Mammalian mitochondrial D-loop region structural analysis:identification of new conserved sequences and their functionaland evolutionary implications. Gene, 205, 125–140.
Schley L, Roper TJ (2003) Diet of wild boar Sus scrofa. WesternEurope, with particular reference to consumption of agriculturalcrops. Mammal Review, 33, 43–56.
Schneider S, Excoffier L (1999) Estimation of past demographicparameters from the distribution of pairwise differences whenthe mutation rates vary among sites: application to humanmitochondrial DNA. Genetics, 152, 1079–1089.
Singer FJ, Swank WT, Clebsch EEC (1984) Effects of wild pig
rooting in a deciduous forest. Journal of Wildlife Management,48, 464–473.
Slatkin M (1995) A measure of population subdivision based onmicrosatellite allele frequencies. Genetics, 139, 457–462.
Slatkin M, Hudson RR (1991) Pairwise comparisons of mitochondrialDNA sequences in stable and exponentially growing populations.Genetics, 129, 555–562.
Taberlet P, Fumagalli L, Wust-Saucy A-G, Cosson J-F (1998) Com-parative phylogeography and postglacial colonization routes inEurope. Molecular Ecology, 7, 453–464.
Tajima F (1989) Statistical method for testing the neutral mutationhypothesis by DNA polymorphism. Genetics, 123, 585–595.
Thompson JD, Higgins DG, Gibson TJ (1994) clustal w: improvingthe sensitivity of progressive multiple sequence alignment throughsequence weighting, position-specific gap penalties and weightmatrix choice. Nucleic Acids Research, 22, 4673–4680.
Ursing BM, Arnason U (1998) The complete mitochondrial DNAsequence of the pig (Sus scrofa). Journal of Molecular Evolution, 47,302–306.
Van Andel TH (1989) Late Quaternary sea-level changes andarchaeology. Antiquity, 63, 733–745.
Van Oosterhout C, Hutchinson WF, Wills DPM, Shipley P (2004)Micro-checker: a software for identifying and correcting geno-typing errors in microsatellite data. Molecular Ecology Notes, 4,535–538.
Vernesi C, Pecchioli E, Caramelli D et al. (2002) The genetic struc-ture of natural and reintroduced roe deer (Capreolus capreolus)populations in the Alps and central Italy, with reference to themitochondrial DNA phylogeography of Europe. MolecularEcology, 11, 1285–1297.
Vernesi C, Crestanello B, Pecchioli E et al. (2003) The genetic impactof demographic decline and reintroduction in the wild boar (Susscrofa): a microsatellite analysis. Molecular Ecology, 12, 585–595.
Vilà C, Seddon J, Ellegren H (2005) Genes of domestic mammalsaugmented by backcrossing with wild ancestors. Trends in Genetics,21, 214–218.
Weir BS, Cockerham CC (1984) Estimating F-statistics for theanalysis of population structure. Evolution, 38, 1358–1370.
Welander J (2000) Spatial and temporal dynamics of wild boar(Sus scrofa) rooting in a mosaic landscape. Journal of Zoology,252, 263–271.
Yang J, Wang J, Kijas J, Liu B, Han HYuM, Yang H, Zhao S, Li K(2003) Genetic diversity present within the near-complete mtDNAgenome of 17 breeds of indigenous Chinese pigs. Journal ofHeredity, 94, 381–385.
This research is a result of the collaboration among the Departmentof Zoology and Evolutionary Genetics of the University of Sassari,the Department of Biology and Evolution of the University ofFerrara, the Centre of Alpine Ecology in Trento, and the BiosferaAssociation in Florence. Massimo Scandura is a researcher andLaura Iacolina and M. Francesca Di Benedetto are PhD students,members of the team led by Marco Apollonio, interested in thebehavioural ecology and population genetics of wild mammals.Elena Pecchioli and Barbara Crestanello are researchers interestedin conservation genetics of wild vertebrates in mountainecosystems. Vincenzo Russo and Roberta Davoli work on geneexpression in cattle and pig breeds at the Zootechnical Center ofthe University of Bologna. Giorgio Bertorelle is interested in thereconstruction of demographic and selective processes usingpopulation genetics data in different species.

1762 M . S C A N D U R A E T A L .
© 2008 The AuthorsJournal compilation © 2008 Blackwell Publishing Ltd
Supplementary materials
The following supplementary material is available for this article:
Table S1 Segregating sites and different haplotypes observed atthe mtDNA control region (411 bp) of 145 European wild boar and47 pig samples sequenced in this study. Haplotype frequenciesobserved in wild boar sampling areas and pig breeds are shown.The following abbreviations are used for wild boar samplingareas: IAre (Arezzo, Italy), IFor (Forlì, Italy), ISie (Siena, Italy), ISal(Salerno, Italy), IFlo (Florence, Italy), IMrp (Maremma RegionalPark, Italy), ISrp (San Rossore Regional Park, Italy), ICpr (CastelPorziano Presidential Reserve, Italy), ISar (Sardinia, Italy), IGor(Gorizia, Italy), SCot (El Coto, Spain), FHam (Haute Marne,France), ADif (Austria, different areas), PDif (Poland, differentareas), HDif (Hungary, different areas). The following abbreviations
are used for domestic pig breeds: Pig 1 (Cinta Senese), Pig 2 (Sarda),Pig 3 (Calabrese), Pig 4 (Casertana) and Pig 5 (Nera Siciliana).
Table S2 List of the 804 Sus scrofa mitochondrial control regionsequences downloaded from GenBank or obtained by the authorswhich were used in the study.
This material is available as part of the online article from:http://www.blackwell-synergy.com/doi/abs/10.1111/j.1365-294X.2008.03703.x(This link will take you to the article abstract).
Please note: Blackwell Publishing are not responsible for thecontent or functionality of any supplementary materials suppliedby the authors. Any queries (other than missing material) shouldbe directed to the corresponding author for the article.