Scandinavian Tobacco Group PowerPoint Template - Investor
28
INVESTOR PRESENTATION THIRD QUARTER 2019 14 NOVEMBER 2019
-
Upload
khangminh22 -
Category
Documents
-
view
6 -
download
0
Transcript of Scandinavian Tobacco Group PowerPoint Template - Investor
INVESTORPRESENTATION
THIRD QUARTER 2019
14 NOVEMBER 2019
AGENDA
1. Quarterly Highlights
2. Royal Agio Cigars and Optimisation of Manufacturing Footprint
3. Divisional updates
4. Financials
5. Guidance 2019
6. Q&A
2
This presentation contains forward-looking statements. All statements other than statements of
historical fact included in the presentation are forward-looking statements. Forward-looking statements
give Scandinavian Tobacco Groups (“STG”) current expectations and projections relating to its financial
condition, results of operations, plans, objectives, future performance and business.
No representation, warranty or undertaking, express or implied, is made as to, and no reliance should
be placed on, the fairness, accuracy, completeness or correctness of the Information or the opinions
contained therein. The presentation has not been independently verified and will not be updated.
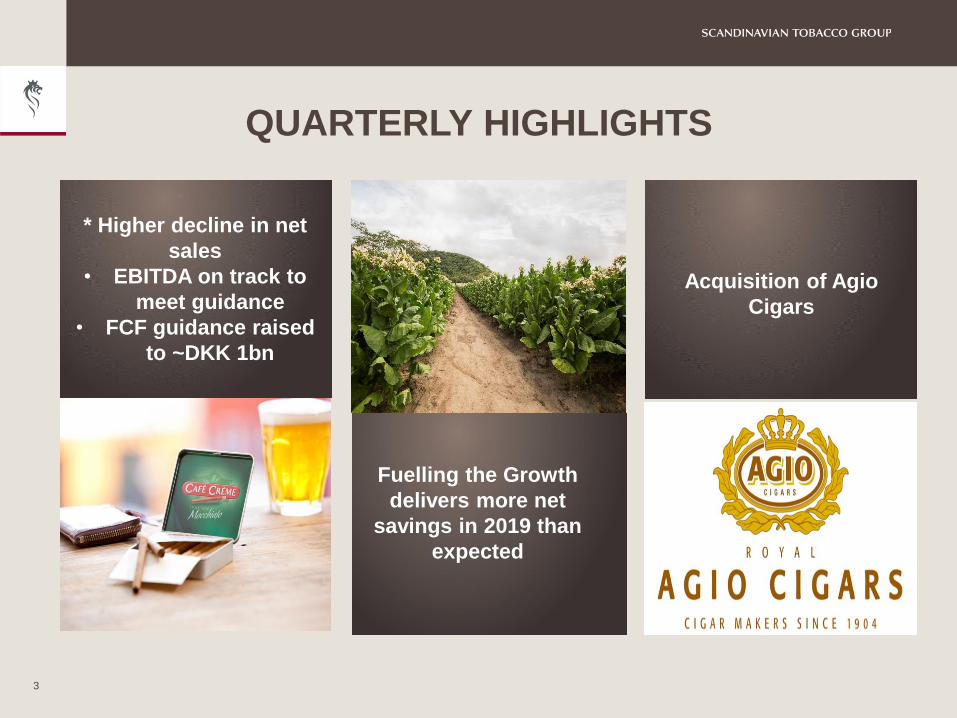
QUARTERLY HIGHLIGHTS
3
Acquisition of Agio
Cigars
* Higher decline in net
sales
• EBITDA on track to
meet guidance
• FCF guidance raised
to ~DKK 1bn
Fuelling the Growth
delivers more net
savings in 2019 than
expected

Q3 AND 9M 2019FINANCIAL HIGHLIGHTS
4
Net sales
EBITDA
before special items
Free cash flow
before acquisitions
DKK 5,127 millionorganic growth -2.4%
9M 2019
DKK 1,083 millionorganic growth 5.8%
DKK 819 million
Q3 2019
DKK 1,846 millionorganic growth -4.5%
DKK 446 millionorganic growth 5.4%
DKK 503 million

ACQUISITION ROYAL AGIO CIGARS
5
▪ Leading European producer and distributor of machine-made cigars based in Duizel, The
Netherlands.
▪ Family-owned by the Wintermans-family since 1904.
▪ 3,200 employees with production facilities in Belgium, The Netherlands, the Dominican Republic and
Sri Lanka.
▪ Strong brand portfolio spanning from premium machine- and handmade cigars to filter and flavoured
cigarillos
▪ Great geographic fit with important market positions
▪ Well-run business with passion for cigars and a strong culture and history
The contemplated transaction is subject to statutory employee consultation process in The Netherlands and approval from competition authorities

SELECTED NUMBERS
6
▪ The transaction value is about DKK 1.5 billion
(EUR 210 million)
▪ Royal Agio’s net sales in FY 2018 of EUR 133
million was about 1/7 of STG net sales
▪ Royal Agio’ s EBITDA margin was about 13%
versus STG’ s margin of 19.4%
▪ Since 2010, STG have invested approximately
EUR 470 million in 8 mergers & acquisitions
The contemplated transaction is subject to statutory employee consultation process in The Netherlands and approval from competition authorities
20112010 20142013 2018
partial merger

7
ORGANISATION
• FTE/net sales ratio
• Organisational layers from 10 to 7
• 100-120 white collar positions
GLOBAL LOGISTICS
• Manufacturing network
• Production allocation across factories
• Distribution efficiency and improve customer
service
OPERATIONAL COST EFFIENCY
• Product platforms
• SKU portfolio
• Capacity utilisation
FTG NET SAVINGS 250M (UNCHANGED)
~DKK 250 MILLION FULL-YEAR RUNRATE BY THE END OF 2021
>1/3 IN 2019 (PREVIOUSLY >1/4)
SPECIAL COSTS 250M (UNCHANGED)
~DKK 250 MILLION IN TOTAL (2018-2021)
DKK 182 MILLION IN 2018
~DKK ~35 MILLION IN 2019 (PRVEIOUSLY ~60M)
COMMERCIAL RESOURCES
• Four divisions anchored in Executive Board
• Customer service level
• Market shares in selected markets
• Number of active customers in online/catalogue business
FUELLING THE GROWTHUPDATE
GLOBAL PROCUREMENT
• A global procurement organisation
• Group purchases of DKK 4 billion
• The number of suppliers

MANUFACTURING FOOTPRINT 2016-2020
8
Production sitesHandmade
cigars
Nicaragua (Estelí)
Cigars
United States (Tucker)
Fine-cut tobacco, pipe
tobacco and machine-made
cigars
Honduras (Danli)
Cigars and box making
Dominican Republic
(Moca)
Wrappers and binders
Dominican Republic
(Santiago)
Cigars and box making
Indonesia (Pasuruan)
Wrappers and binders
Denmark (2 in Holstebro)
Fine-cut tobacco and
expanded fine cut and cigar
filler tobacco
Denmark (Nykøbing)
Cigars
Denmark (Assens)
Pipe and cigar filler tobacco
The Netherlands (Eersel)
Cigars
Belgium (Lummen)
Cigars
Machine-made cigars
making, finishing
& packing
Machine-made
wrappers and
binders
Fine-cut
tobacco and
pipe tobacco
Indonesia (Pandaan)
Cigars, wrappers and
binders
Belgium (Wuustwezel)
Cigars
X closed/planned closure
X
X
X

REGULATION UPDATE
9
• FDA
• Excise and tax
• Tobacco Products Directive
• Excise and tax

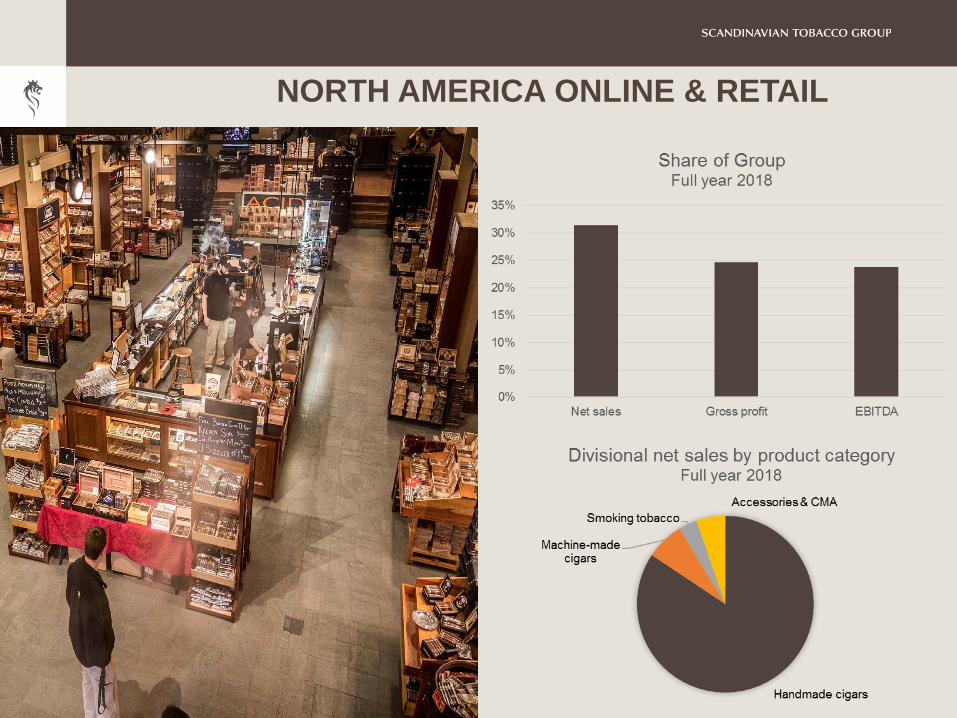
NORTH AMERICA ONLINE & RETAIL
10
Q3 2019
• Thompson: Integration will, as expected, be
finalised by the end of 2019
• Organic net sales: Volume growth off-set by
negative price/mix impact (product mix and
increased promotional activity)
• EBITDA margin (ex IFRS16): Slight
improvement despite negative price/mix
impact
• IFRS 16 improved the EBITDA margin by
0.8%-point in Q3
Note: Gross profit, EBITDA and related margins are all before special items
DKK million Q3 19 Q3 18 9M 19 9M 18 2018
excl IFRS 16 excl IFRS 16 excl IFRS 16
Net sales 648 626 1,803 1,534 2,111
Gross profit 246 238 687 572 793
EBITDA 113 103 274 219 310
Net sales growth 3.5% 54.9% 17.6% 36.6% 40.7%
- Organic growth1) -1.2% 5.5% 0.7% 8.0% 6.3%
Gross margin 37.9% 38.0% 38.1% 37.3% 37.5%
EBITDA margin 17.5% 16.4% 15.2% 14.3% 14.7%
Handmade cigars
Volume impact 5.6% 4.1% 3.4% 4.0% 1.6%
Price/mix impact -7.8% 3.8% -3.0% 4.2% 4.9%
Organic growth1) -2.2% 7.9% 0.4% 8.2% 6.5%
1) Excluding impact of currencies, acquisitions and IFRS 16.
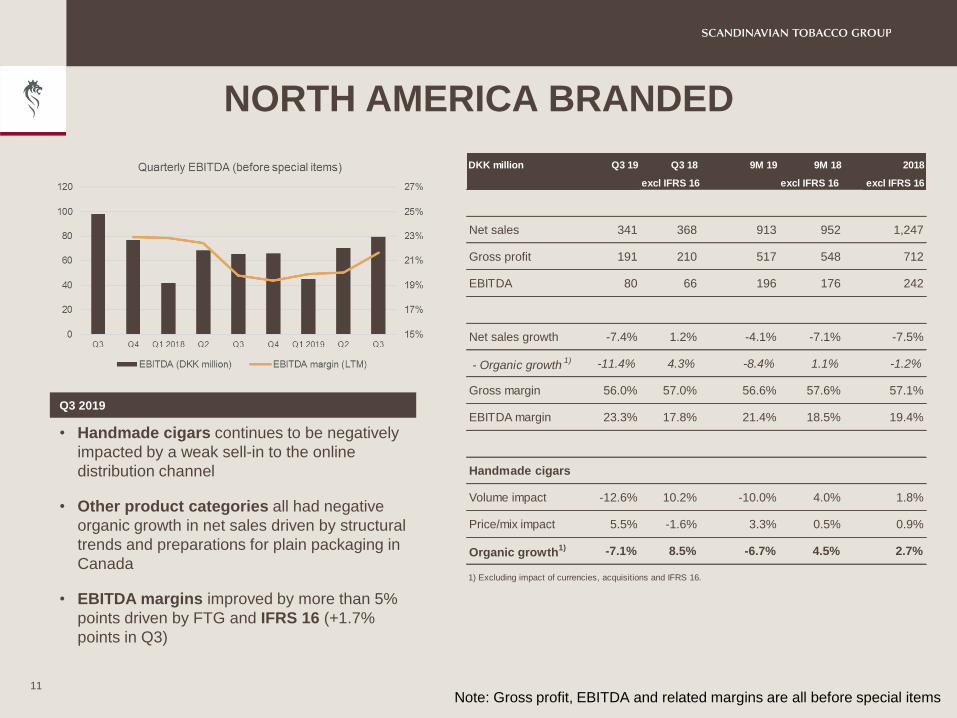
NORTH AMERICA BRANDED
11
Q3 2019
• Handmade cigars continues to be negatively
impacted by a weak sell-in to the online
distribution channel
• Other product categories all had negative
organic growth in net sales driven by structural
trends and preparations for plain packaging in
Canada
• EBITDA margins improved by more than 5%
points driven by FTG and IFRS 16 (+1.7%
points in Q3)
Note: Gross profit, EBITDA and related margins are all before special items
DKK million Q3 19 Q3 18 9M 19 9M 18 2018
excl IFRS 16 excl IFRS 16 excl IFRS 16
Net sales 341 368 913 952 1,247
Gross profit 191 210 517 548 712
EBITDA 80 66 196 176 242
Net sales growth -7.4% 1.2% -4.1% -7.1% -7.5%
- Organic growth1) -11.4% 4.3% -8.4% 1.1% -1.2%
Gross margin 56.0% 57.0% 56.6% 57.6% 57.1%
EBITDA margin 23.3% 17.8% 21.4% 18.5% 19.4%
Handmade cigars
Volume impact -12.6% 10.2% -10.0% 4.0% 1.8%
Price/mix impact 5.5% -1.6% 3.3% 0.5% 0.9%
Organic growth1) -7.1% 8.5% -6.7% 4.5% 2.7%
1) Excluding impact of currencies, acquisitions and IFRS 16.

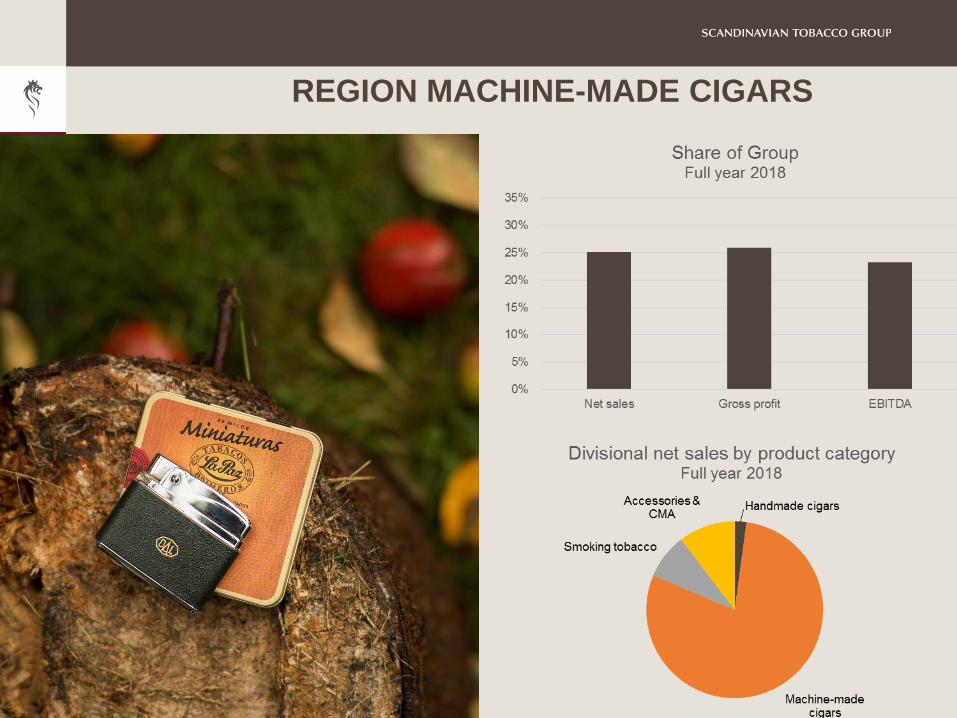
REGION MACHINE-MADE CIGARS
12
Q3 2019
• Organic growth: -2.3% with machine-made
cigars at -2.0% and positive growth in France
and the UK
• Market share: Top5 index slightly up vs. Q2
2019 and Q3 2018 driven by France
• EBITDA margin: Excluding IFRS 16 the
margin were slightly down compared with the
strong Q3 2018
• IFRS 16 improved the EBITDA margin by
1.7%-point in Q3
Note: Gross profit, EBITDA and related margins are all before special items
DKK million Q3 2019 Q3 18 9M 19 9M 18 2018
excl IFRS 16 excl IFRS 16 excl IFRS 16
Net sales 436 446 1,217 1,240 1,682
Gross profit 231 233 626 635 832
EBITDA 109 105 272 242 304
Net sales growth -2.3% -8.8% -1.9% -6.0% -6.4%
- Organic growth1) -2.3% -8.8% -2.1% -6.0% -6.4%
Gross margin 53.1% 52.2% 51.4% 51.2% 49.5%
EBITDA margin 25.0% 23.5% 22.4% 19.5% 18.0%
Machine-made cigars
Volume impact -1.4% -9.9% -2.1% -6.6% -7.8%
Price/mix impact -0.6% 1.0% -0.1% 1.3% 1.0%
Organic growth1) -2.0% -8.9% -2.2% -5.3% -6.8%
1) Excluding impact of currencies, acquisitions and IFRS 16.

REGION SMOKING TOBACCO & ACCESSORIES
13
Q3 2019
• Positive organic growth in net sales for pipe
tobacco and fine-cut. Negative growth in other
product categories
• EBITDA margin improved by more than 4 %-
points driven by an increase in the gross margin,
a lower OPEX ratio and by IFRS 16 (0.5%-point
in Q3)
• Sales companies in Slovenia and Croatia
terminated
Note: Gross profit, EBITDA and related margins are all before special items
DKK million Q3 2019 Q3 18 9M 19 9M 18 2018
excl IFRS 16 excl IFRS 16 excl IFRS 16
Net sales 421 447 1,194 1,227 1,677
Gross profit 231 236 627 627 882
EBITDA 156 147 399 381 545
Net sales growth -5.8% -3.7% -2.6% -6.1% -7.7%
- Organic growth1) -5.6% 6.3% -2.5% 4.6% 1.9%
Gross margin 54.8% 52.7% 52.5% 51.1% 52.6%
EBITDA margin 37.1% 32.9% 33.4% 31.1% 32.5%
1) Excluding impact of currencies, acquisitions and IFRS 16.

KEY DATAQ3 2019 AND 9M 2019
14
Q3 2019Q3 2018
ex IFRS 169M 2019
9M 2018
ex IFRS 16
DKKm DKKm Reported Organic1 DKKm DKKm Reported Organic
1
Net sales 1,846 1,887 (2%) (4.5%) 5,127 4,952 4% (2.4%)
Gross profit before special items 899 916 (2%) 2,457 2,382 3%
Gross margin before special items 48.7% 48.5% 47.9% 48.1%
EBITDA before special items 446 398 12% 5.4% 1,083 942 15% 5.8%
EBITDA margin before special items 24.2% 21.1% 21.1% 19.0%
Net profit 172 221 (22%) 469 515 (9%)
Free cash flow before acquisitions 503 327 819 464
1) Excluding impact of currencies, acquisitions and IFRS 16
Growth, % Growth, %
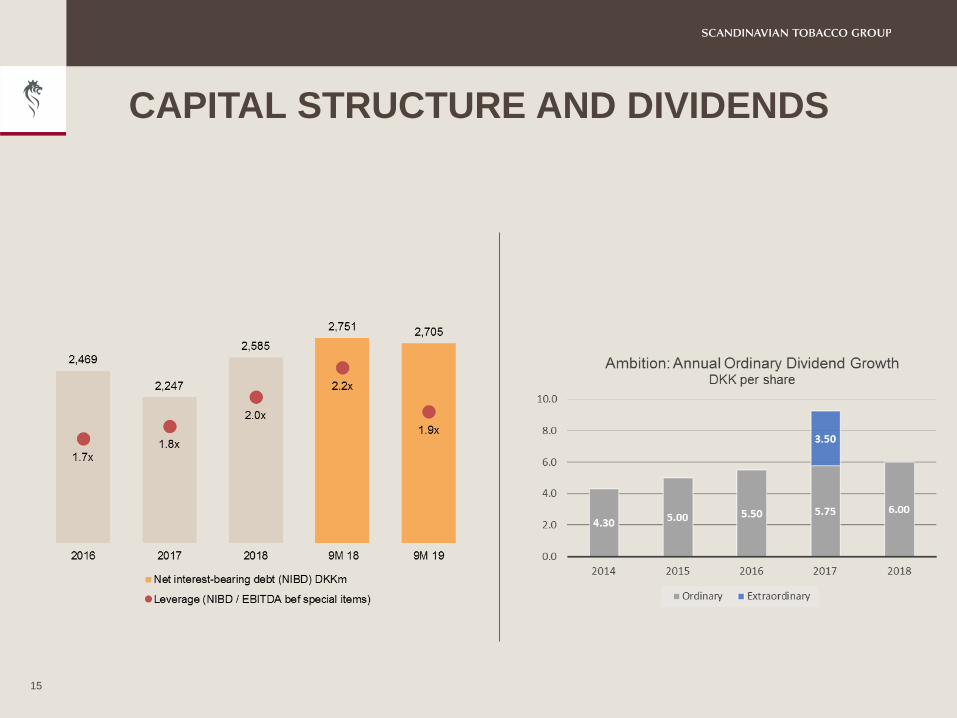
CAPITAL STRUCTURE AND DIVIDENDS
15
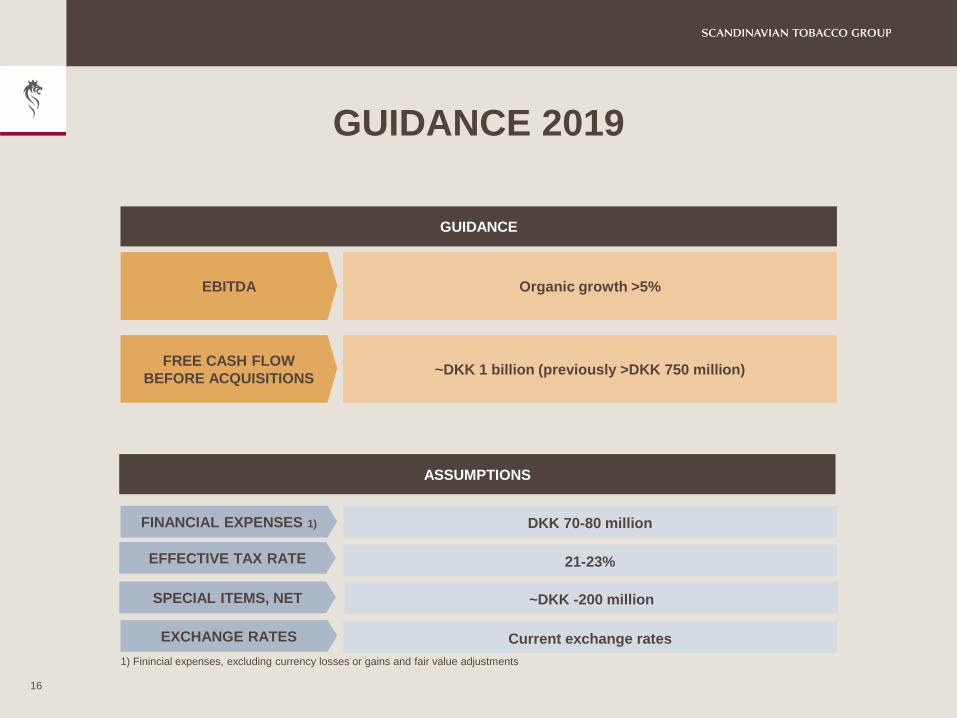
GUIDANCE 2019
16
GUIDANCE
Organic growth >5%
~DKK 1 billion (previously >DKK 750 million)
EBITDA
FREE CASH FLOW
BEFORE ACQUISITIONS
1) Finincial expenses, excluding currency losses or gains and fair value adjustments
ASSUMPTIONS
FINANCIAL EXPENSES 1) DKK 70-80 million
21-23%
~DKK -200 million
Current exchange rates
EFFECTIVE TAX RATE
SPECIAL ITEMS, NET
EXCHANGE RATES

Q&A
17

18
INVESTOR RELATIONS CONTACT FINANCIAL CALENDAR
Scandinavian Tobacco Group A/S
Sydmarken 42
2860 Søborg
Denmark
www.st-group.com
Torben Sand
Head of Investor Relations
Tel: +45 5084 7222
2020
5NOV
Annual report 2019*
Annual General Meeting
First quarter 2019*
Half year report 2020*
Nine months 2020*
* Silent period starts four weeks prior to interim report announcements
2020
27FEB
2020
26MAR
2020
20MAY
2020
28AUG
Annual General Meeting
First quarter 2020*
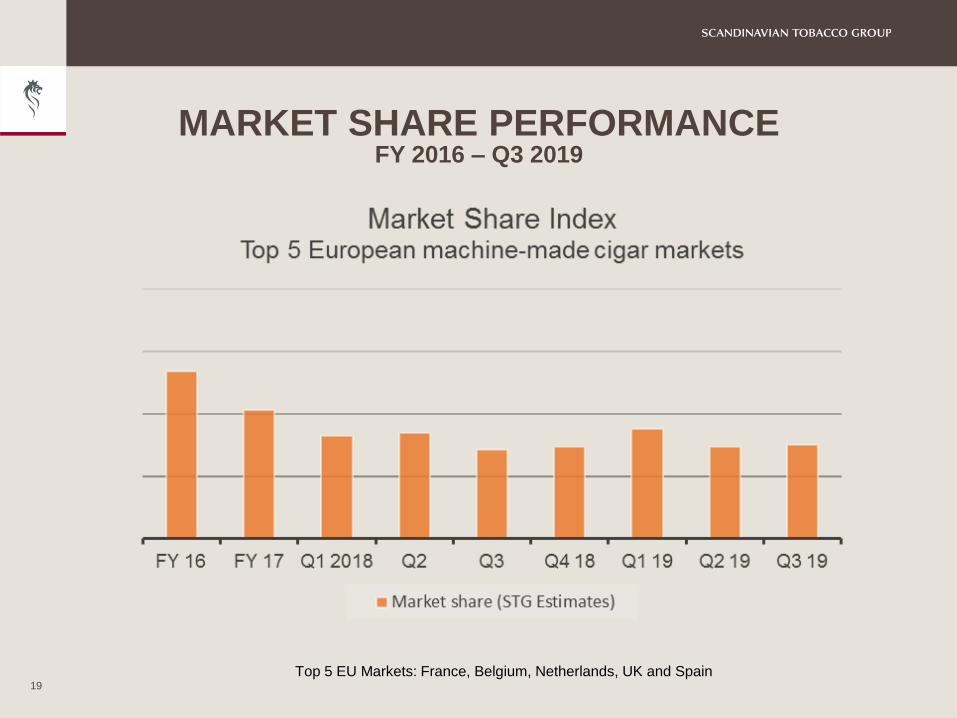
MARKET SHARE PERFORMANCEFY 2016 – Q3 2019
19
Top 5 EU Markets: France, Belgium, Netherlands, UK and Spain

KEY DATA
20
Q3 2019 Q3 2018 9M 2019 9M 2018 FY 2018
ex. IFRS 16 ex. IFRS 16 ex. IFRS 16
DKKm DKKm DKKm DKKm DKKm
Organic1 Organic1
Net sales 1,846 1,887 (2%) (4.5%) 5,127 4,952 4% -2.4% 6,718
Gross profit (before special items) 899 916 (2%) 2,457 2,382 3% 3,219
OPEX (ex other income) -459 -518 (11%) -1,379 -1,440 (4%) -1,915
Other income 6 0 6 0 0
EBITDA before special items 446 398 12% 5.4% 1,083 942 15% 5.8% 1,304
EBITDA margin before special items 24.2% 21.1% 3.1% 21.1% 19.0% 2.1% 19.4%
Special items -118 -23 -162 -37 -216
EBIT 229 292 (22%) 627 675 (7%) 738
Pre tax Profit 217 288 (25%) 598 666 (10%) 717
Net profit 172 221 (22%) 469 515 (9%) 666
Cash flow from operations 532 359 896 559 784
Free cash flow before acquisitions 503 327 819 464 668
1) Excluding impact of currencies, acquisitions and IFRS 16
Growth, % Growth, %

CASH FLOW DEVELOPMENT
21
Q3 2019 Q3 2018 9M 2019 9M 2018 FY 2018
DKKm DKKm DKKm DKKm DKKm
EBITDA before special items 446 398 1,083 942 1,304
Changes in working capital 113 17 21 -129 -101
Adjustments 13 -17 23 -36 -81
Special items, paid -40 -14 -130 -36 -103
Cash flow from operating activities before financial items 532 384 997 741 1,019
Financial items, net 23 -2 20 -3 -15
Tax payments -22 -24 -122 -179 -220
Cash flow from operating activities 532 359 896 559 784
Acquisitions -6 -13 -6 -401 -394
Divestments 22 - 22 - -
Investment in intangible and tangible assets, sales of PPE and div. -29 -31 -77 -95 -117
Cash flow from investing activities -13 -44 -61 -496 -511
Free cash flow 519 315 835 63 274
Repayment of lease liabilities -22 - -67 - -
Free cash flow before acquisitions 503 327 819 464 668

IFRS 16 – MATERIAL IMPACT ON RESULTS
22
IFRS 16 IMPACT ON DIVISIONAL FIGURES, 9M 2019
IFRS 16 IMPACT ON DIVISIONAL FIGURES, Q3 2019
DKK million
North
America
Online &
Retail
North
America
Branded
Region
MMC
Region
ST&A
Group
costs /
not
allocated Total
EBITDA before special items 113 80 109 156 -12 446
IFRS 16 impact -5 -6 -7 -2 -1 -22
EBITDA before special items
excl. IFRS 16108 74 102 154 -13 424
EBITDA margin before special
items17.5% 23.3% 25.0% 37.1% 24.2%
EBITDA margin before special
items excl. IFRS 1616.7% 21.7% 23.4% 36.6% 23.0%
DKK million
North
America
Online &
Retail
North
America
Branded
Region
MMC
Region
ST&A
Group
costs /
not
allocated Total
EBITDA before special items 274 196 272 399 -58 1,083
IFRS 16 impact -16 -17 -22 -8 -4 -67
EBITDA before special items
ex. IFRS 16259 178 250 391 -63 1,016
EBITDA margin before special
items15.2% 21.4% 22.4% 33.4% 21.1%
EBITDA margin before special
items ex. IFRS 1614.3% 19.5% 20.6% 32.8% 19.8%

SPECIAL ITEMSSPECIFICATION
23
DKK million Announced 2018 "2019-2021" Guidance Guidance
Total Actual Rest 2019 "old" 2019 "new"
Thompson ~60 33 ~27 ~27 ~27
Fuelling the Growth up to 250 182 up to 68 ~60 ~35
Agio Transaction Costs ~20 ~20 ~20
Tucker Factory, US ~120 ~120 ~120 ~120
Actual 2018 216
Guidance 2019 (Thompson+FtG) ~85
Guidance 2019 (Thompson+FtG+Tucker) ~205
New Guidance 2019 (Thompson+FtG+Tucker+Agio) ~200
NORTH AMERICA ONLINE & RETAIL
24

NORTH AMERICA BRANDED
25
REGION MACHINE-MADE CIGARS
26

REGION SMOKING TOBACCO & ACCESSORIES
27

FORWARD LOOKING STATEMENTS
This presentation contains forward-looking statements. All statements other than statements of historical fact included in
the presentation are forward-looking statements. Forward-looking statements give Scandinavian Tobacco Groups (“STG”)
current expectations and projections relating to its financial condition, results of operations, plans, objectives, future
performance and business. These statements may include, without limitation, any statements preceded by, followed by or
including words such as “target,” “believe,” “expect,” “aim,” “intend,” “may,” “anticipate,” “estimate,” “plan,” “project,” “will,”
“can have,” “likely,” “should,” “would,” “could” and other words and terms of similar meaning or the negative thereof. Such
forward-looking statements involve known and unknown risks, uncertainties and other important factors beyond STG’s
control that could cause STG’s actual results, performance or achievements to be materially different from the expected
results, performance or achievements expressed or implied by such forward-looking statements. Such forward-looking
statements are based on numerous assumptions regarding STG’s present and future business strategies and the
environment in which it will operate in the future.
No representation, warranty or undertaking, express or implied, is made as to, and no reliance should be placed on, the
fairness, accuracy, completeness or correctness of the Information or the opinions contained therein. The presentation
has not been independently verified and will not be updated. The Information, including but not limited to forward-looking
statements, applies only as of the date of this document and is not intended to give any assurances as to future results.
STG expressly disclaims any obligation or undertaking to disseminate any updates or revisions to the Information,
including any financial data or forward-looking statements, and will not publicly release any revisions it may make to the
Information that may result from any change in STG’s expectations, any change in events, conditions or circumstances on
which these forward-looking statements are based, or other events or circumstances arising after the date of this
document. Market data used in the Information not attributed to a specific source are estimates of STG and have not been
independently verified.
28