
Global Tobacco
92
www.ubs.com/investmentresearch This report has been prepared by UBS AG London Branch. ANALYST CERTIFICATION AND REQUIRED DISCLOSURES BEGIN ON PAGE 87. UBS does and seeks to do business with companies covered in its research reports. As a result, investors should be aware that the firm may have a conflict of interest that could affect the objectivity of this report. Investors should consider this report as only a single factor in making their investment decision. Global Research 23 May 2019 Global Tobacco Core growth is at an inflection point Is the combustible business broken? With all the focus on next generation products (NGPs), why are we talking about the combustible business? First, by this point of the year, cigarette price increases have been mostly achieved and there is clarity over tobacco tax plans; we see upside to expectations for this core cash generator. Second, the simultaneous weakness in combustible volume and NGP growth has led the market to a) attribute the weakness to NGPs (notably in the US), and b) see NGPs as an escape from structural decline rather than an additive opportunity. By changing the terms of that relationship, we continue to view a recovery in the growth of the core business as key to relative valuations (in addition to the main driver of earnings and cash). Cash generator set to return to growth While NGPs take up most of the discussions with investors, cash flows depend on the combustible business. The current legislative environment implies that the excise tax headwinds that drove volume declines and downtrading over 2013 to 1H18 will remain relatively benign. Based on our bottom-up modelling, this implies volume declines of ~2%; above the -3% five-year average and better than company guidance (~2.5%- 3%). This supports ~4-5% organic industry growth. A global model bringing together the insight of six UBS staples teams Our view is underpinned by a country by country view of the top 40 tobacco markets, bringing together the insight of nine analysts across six markets. This is built on the 50- country analysis of historical tax and regulatory structures in our primer ("A critical time for Tobacco"), and developed further in our PMI upgrade. In this note we go into detail on the US (including regulatory outlook), Indonesia, Japan, South Korea, India and Malaysia. We are constructive on the sector. Buy: PMI, BAT, ITC, HMSP, GG, and JT Based on the relationship between industry volumes and the tobacco sector relative valuation, our volume expectations imply approximately 20% upside to the current discount to staples. Supported by this outlook and (largely) improving execution in NGP portfolios, we see upside in BAT, PMI, and Japan Tobacco. Furthermore, volume declines are not a feature of all markets; recoveries in the volume outlook driving the upside for ITC (India, APAC Key Call), HM Sampoerna (Indonesia), and Gudang Garam (Indonesia). Figure 1: UBS Global Tobacco coverage (investment case for each inside) Source: UBS estimates. Global Staples under UBS coverage. *Weighted by € market cap. Priced to 21 May 2019 Calendarised to Dec Perf. UBS Target price P/E EV/EBITDA Equity FCF Dividend Yield Tobacco M.Cap (€m) Price YTD YTD (€) Rating 12 month Upside 2019E 2020E 2019E 2020E 2019E 2020E 2019E 2020E British American Tobacco 77,825 2,982 p 19.3% 22.0% Buy 4,000 p 34.2% 9.3 8.8 8.6 8.1 12.5% 12.0% 7.3% 7.4% Japan Tobacco 41,585 JPY 2,555 -2.4% 0.4% Buy JPY 3,400 33.1% 11.7 11.2 7.6 7.4 6.6% 6.3% 6.1% 6.3% Philip Morris International 119,359 $ 85.76 28.5% 31.9% Buy $ 101.00 17.8% 16.6 15.7 13.5 12.8 6.0% 6.1% 5.5% 5.6% Imperial Brands 23,272 2,144 p -9.8% -7.8% Neutral 2,400 p 12.0% 7.6 7.5 7.7 7.6 12.7% 12.8% 9.9% 10.7% HM Sampoerna 23,559 IDR 3,270 -11.9% -9.6% Buy IDR 4,500 37.6% 27.6 24.7 19.8 17.9 0.3% 3.0% 3.6% 4.0% ITC 47,403 INR 305 7.9% 10.9% Buy INR 375 22.8% 26.5 23.4 18.3 16.1 2.8% 3.4% 2.3% 2.6% Gudang Garam 9,459 IDR 79,375 -5.1% -2.6% Buy IDR 95,000 19.7% 16.4 14.8 11.1 10.2 3.3% 2.6% 3.9% 4.3% BAT (Malaysia) 2,046 MYR 33 -7.3% -6.1% Neutral MYR 38 13.6% 19.0 17.5 14.5 13.4 5.0% 5.4% 5.2% 5.6% KT&G 9,815 KRW 103,500 2.0% -2.3% Neutral KRW 105,000 1.4% 12.9 11.8 6.3 5.7 4.6% 5.9% 4.1% 4.1% Altria 87,076 $ 51.87 5.0% 7.9% Neutral $ 52.00 0.3% 12.5 11.9 8.3 8.3 8.2% 8.4% 6.3% 6.6% Global Tobacco* 441,399 14.2% 19.6% 15.1 14.1 11.4 10.7 7.3% 7.4% 5.7% 6.0% Global Staples 3,273,215 20.4% 5.7% 22.8 21.0 15.5 14.4 4.4% 5.0% 2.8% 3.0% Equities Global Tobacco Nik Oliver, ACA Analyst [email protected] +44-20-7568 4982 Robert Rampton Analyst [email protected] +44-20-7568 2014 Satsuki Kawasaki Analyst [email protected] +81-3-5208 6265 Sunita Sachdev Analyst [email protected] +91-22-6155 6062 Permada Darmono Analyst [email protected] +65-6495 3137 Jennifer Han Analyst [email protected] +82-2-3702 8802 Nicole Goh Analyst [email protected] +603-2781 1133 Robert Krankowski Associate Analyst [email protected] +44-20-7568 1152 Jihyun Lee Associate Analyst [email protected] +82-2-3702 8810
-
Upload
khangminh22 -
Category
Documents
-
view
0 -
download
0
Transcript of Global Tobacco
www.ubs.com/investmentresearch
This report has been prepared by UBS AG London Branch. ANALYST CERTIFICATION AND REQUIRED DISCLOSURES BEGIN ON PAGE 87. UBS does and seeks to do business with companies covered in its research reports. As a result, investors should be aware that the firm may have a conflict of interest that could affect the objectivity of this report. Investors should consider this report as only a single factor in making their investment decision.
Global Research 23 May 2019
Global Tobacco Core growth is at an inflection point
Is the combustible business broken? With all the focus on next generation products (NGPs), why are we talking about the combustible business? First, by this point of the year, cigarette price increases have been mostly achieved and there is clarity over tobacco tax plans; we see upside to expectations for this core cash generator. Second, the simultaneous weakness in combustible volume and NGP growth has led the market to a) attribute the weakness to NGPs (notably in the US), and b) see NGPs as an escape from structural decline rather than an additive opportunity. By changing the terms of that relationship, we continue to view a recovery in the growth of the core business as key to relative valuations (in addition to the main driver of earnings and cash).
Cash generator set to return to growth While NGPs take up most of the discussions with investors, cash flows depend on the combustible business. The current legislative environment implies that the excise tax headwinds that drove volume declines and downtrading over 2013 to 1H18 will remain relatively benign. Based on our bottom-up modelling, this implies volume declines of ~2%; above the -3% five-year average and better than company guidance (~2.5%-3%). This supports ~4-5% organic industry growth.
A global model bringing together the insight of six UBS staples teams Our view is underpinned by a country by country view of the top 40 tobacco markets, bringing together the insight of nine analysts across six markets. This is built on the 50-country analysis of historical tax and regulatory structures in our primer ("A critical time for Tobacco"), and developed further in our PMI upgrade. In this note we go into detail on the US (including regulatory outlook), Indonesia, Japan, South Korea, India and Malaysia.
We are constructive on the sector. Buy: PMI, BAT, ITC, HMSP, GG, and JT Based on the relationship between industry volumes and the tobacco sector relative valuation, our volume expectations imply approximately 20% upside to the current discount to staples. Supported by this outlook and (largely) improving execution in NGP portfolios, we see upside in BAT, PMI, and Japan Tobacco. Furthermore, volume declines are not a feature of all markets; recoveries in the volume outlook driving the upside for ITC (India, APAC Key Call), HM Sampoerna (Indonesia), and Gudang Garam (Indonesia).
Figure 1: UBS Global Tobacco coverage (investment case for each inside)
Source: UBS estimates. Global Staples under UBS coverage. *Weighted by € market cap. Priced to 21 May 2019
Calendarised to Dec Perf. UBS Target price P/E EV/EBITDA Equity FCF Dividend YieldTobacco M.Cap (€m) Price YTD YTD (€) Rating 12 month Upside 2019E 2020E 2019E 2020E 2019E 2020E 2019E 2020EBritish American Tobacco 77,825 2,982 p 19.3% 22.0% Buy 4,000 p 34.2% 9.3 8.8 8.6 8.1 12.5% 12.0% 7.3% 7.4%Japan Tobacco 41,585 JPY 2,555 -2.4% 0.4% Buy JPY 3,400 33.1% 11.7 11.2 7.6 7.4 6.6% 6.3% 6.1% 6.3%Philip Morris International 119,359 $ 85.76 28.5% 31.9% Buy $ 101.00 17.8% 16.6 15.7 13.5 12.8 6.0% 6.1% 5.5% 5.6%Imperial Brands 23,272 2,144 p -9.8% -7.8% Neutral 2,400 p 12.0% 7.6 7.5 7.7 7.6 12.7% 12.8% 9.9% 10.7%HM Sampoerna 23,559 IDR 3,270 -11.9% -9.6% Buy IDR 4,500 37.6% 27.6 24.7 19.8 17.9 0.3% 3.0% 3.6% 4.0%ITC 47,403 INR 305 7.9% 10.9% Buy INR 375 22.8% 26.5 23.4 18.3 16.1 2.8% 3.4% 2.3% 2.6%Gudang Garam 9,459 IDR 79,375 -5.1% -2.6% Buy IDR 95,000 19.7% 16.4 14.8 11.1 10.2 3.3% 2.6% 3.9% 4.3%BAT (Malaysia) 2,046 MYR 33 -7.3% -6.1% Neutral MYR 38 13.6% 19.0 17.5 14.5 13.4 5.0% 5.4% 5.2% 5.6%KT&G 9,815 KRW 103,500 2.0% -2.3% Neutral KRW 105,000 1.4% 12.9 11.8 6.3 5.7 4.6% 5.9% 4.1% 4.1%Altria 87,076 $ 51.87 5.0% 7.9% Neutral $ 52.00 0.3% 12.5 11.9 8.3 8.3 8.2% 8.4% 6.3% 6.6%Global Tobacco* 441,399 14.2% 19.6% 15.1 14.1 11.4 10.7 7.3% 7.4% 5.7% 6.0%
Global Staples 3,273,215 20.4% 5.7% 22.8 21.0 15.5 14.4 4.4% 5.0% 2.8% 3.0%
Equities
Global
Tobacco
Nik Oliver, ACA Analyst
[email protected] +44-20-7568 4982
Robert Rampton Analyst
[email protected] +44-20-7568 2014
Satsuki Kawasaki Analyst
[email protected] +81-3-5208 6265
Sunita Sachdev Analyst
[email protected] +91-22-6155 6062
Permada Darmono Analyst
[email protected] +65-6495 3137
Jennifer Han Analyst
[email protected] +82-2-3702 8802
Nicole Goh Analyst
[email protected] +603-2781 1133
Robert Krankowski Associate Analyst
[email protected] +44-20-7568 1152
Jihyun Lee Associate Analyst
[email protected] +82-2-3702 8810
Global Tobacco 23 May 2019
2
Contents
Executive summary .......................................................................... 4
Company investment cases ........................................................... 11
British American Tobacco (Buy, PT £40) ..................................................... 12
Japan Tobacco (Buy, PT JPY 3,400) ............................................................ 13
Philip Morris International (Buy, PT $101) ................................................... 14
Imperial Brands (Neutral, PT £24.00) .......................................................... 15
ITC (Buy, PT Rs375) .................................................................................... 16
Gudang Garam (Buy, PT Rp 95,000) .......................................................... 17
HM Sampoerna (Buy, PT Rp 4,500) ............................................................ 18
Altria (Neutral, PT $52) .............................................................................. 19
KT&G (Neutral, PT KRW 105,000) .............................................................. 20
BAT Malaysia (Neutral, PT RM 38.00) ......................................................... 21
Building a global tobacco model .................................................. 22
Global tobacco drivers ................................................................... 24
Volumes – record declines ......................................................................... 24
Revenue – struggling to offset declines ...................................................... 27
Tobacco industry outlook .............................................................. 28
Implications for organic growth – the model is fine .................................... 31
Volume upside – taking share from illicit? .................................................. 35
Who is gaining share? ................................................................... 36
PMI – iQOS is/will be the share driver ......................................................... 36
BAT – consistent share growth................................................................... 37
IMB – stable overall share .......................................................................... 38
JT – international business growing share .................................................. 39
Markets with UBS coverage .......................................................... 40
United States ............................................................................................. 40
Indonesia ................................................................................................... 46
Japan ......................................................................................................... 48
South Korea............................................................................................... 51
India .......................................................................................................... 53
Malaysia .................................................................................................... 55
Global outlook detail ..................................................................... 57
Macro context ........................................................................................... 58
Prevalence ................................................................................................. 64
Nik Oliver, ACA Analyst
[email protected] +44-20-7568 4982
Robert Rampton Analyst
[email protected] +44-20-7568 2014
Satsuki Kawasaki Analyst
[email protected] +81-3-5208 6265
Sunita Sachdev Analyst
[email protected] +91-22-6155 6062
Permada Darmono Analyst
[email protected] +65-6495 3137
Jennifer Han Analyst
[email protected] +82-2-3702 8802
Nicole Goh Analyst
[email protected] +603-2781 1133
Robert Krankowski Associate Analyst
[email protected] +44-20-7568 1152
Jihyun Lee Associate Analyst
[email protected] +82-2-3702 8810
Pinar Ergun, CFA Analyst
[email protected] +44-20-7568 6885
Charles Eden, ACA Analyst
[email protected] +44-20-7568 9622
Kate Rusanova Analyst
[email protected] +44-20 7568 9285
Global Tobacco 23 May 2019
3
Taxes ......................................................................................................... 69
Revenue and volumes ................................................................................ 74
Reference sheets ............................................................................ 80
Combustible market summary ................................................................... 81
Global volume country drivers .................................................................... 82
Global constant FX revenue growth country drivers ................................... 83
Global US$bn revenue growth drivers ........................................................ 84
Global Tobacco 23 May 2019
4
Executive summary We see opportunity in the sector
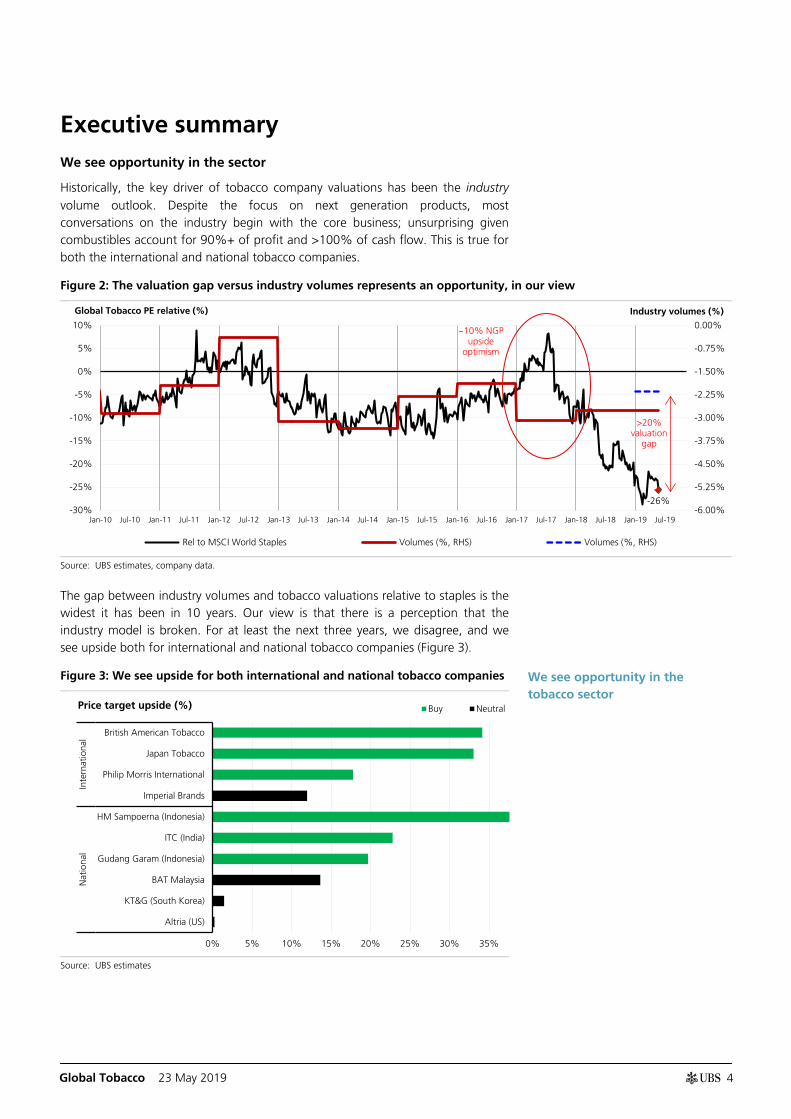
Historically, the key driver of tobacco company valuations has been the industry volume outlook. Despite the focus on next generation products, most conversations on the industry begin with the core business; unsurprising given combustibles account for 90%+ of profit and >100% of cash flow. This is true for both the international and national tobacco companies.
Figure 2: The valuation gap versus industry volumes represents an opportunity, in our view
Source: UBS estimates, company data.
The gap between industry volumes and tobacco valuations relative to staples is the widest it has been in 10 years. Our view is that there is a perception that the industry model is broken. For at least the next three years, we disagree, and we see upside both for international and national tobacco companies (Figure 3).
Figure 3: We see upside for both international and national tobacco companies
Source: UBS estimates
-26% -6.00%
-5.25%
-4.50%
-3.75%
-3.00%
-2.25%
-1.50%
-0.75%
0.00%
-30%
-25%
-20%
-15%
-10%
-5%
0%
5%
10%
Jan-10 Jul-10 Jan-11 Jul-11 Jan-12 Jul-12 Jan-13 Jul-13 Jan-14 Jul-14 Jan-15 Jul-15 Jan-16 Jul-16 Jan-17 Jul-17 Jan-18 Jul-18 Jan-19 Jul-19
Rel to MSCI World Staples Volumes (%, RHS) Volumes (%, RHS)
Global Tobacco PE relative (%) Industry volumes (%)
~10% NGP upside
optimism
>20% valuation
gap
0% 5% 10% 15% 20% 25% 30% 35%
British American Tobacco
Japan Tobacco
Philip Morris International
Imperial Brands
HM Sampoerna (Indonesia)
ITC (India)
Gudang Garam (Indonesia)
BAT Malaysia
KT&G (South Korea)
Altria (US)
Inte
rnat
iona
lN
atio
nal
Buy NeutralPrice target upside (%)
We see opportunity in the tobacco sector
Global Tobacco 23 May 2019
5
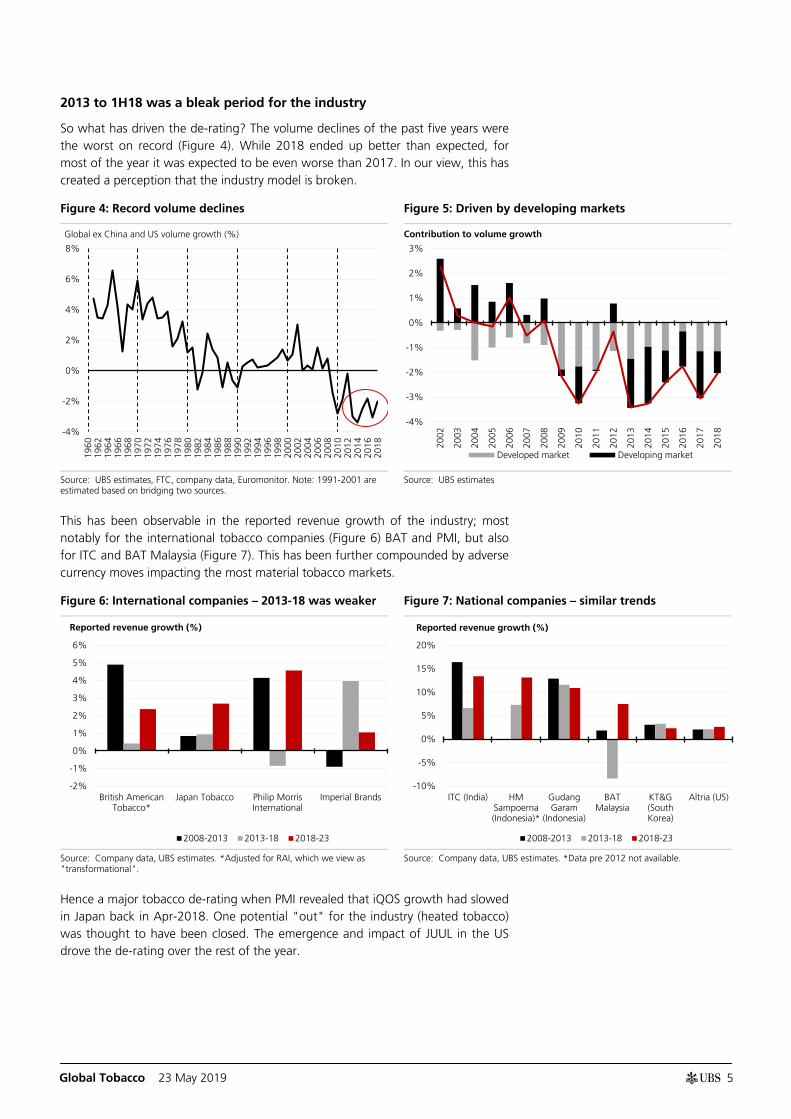
2013 to 1H18 was a bleak period for the industry
So what has driven the de-rating? The volume declines of the past five years were the worst on record (Figure 4). While 2018 ended up better than expected, for most of the year it was expected to be even worse than 2017. In our view, this has created a perception that the industry model is broken.
Figure 4: Record volume declines Figure 5: Driven by developing markets
Source: UBS estimates, FTC, company data, Euromonitor. Note: 1991-2001 are estimated based on bridging two sources.
Source: UBS estimates
This has been observable in the reported revenue growth of the industry; most notably for the international tobacco companies (Figure 6) BAT and PMI, but also for ITC and BAT Malaysia (Figure 7). This has been further compounded by adverse currency moves impacting the most material tobacco markets.
Figure 6: International companies – 2013-18 was weaker Figure 7: National companies – similar trends
Source: Company data, UBS estimates. *Adjusted for RAI, which we view as "transformational".
Source: Company data, UBS estimates. *Data pre 2012 not available.
Hence a major tobacco de-rating when PMI revealed that iQOS growth had slowed in Japan back in Apr-2018. One potential "out" for the industry (heated tobacco) was thought to have been closed. The emergence and impact of JUUL in the US drove the de-rating over the rest of the year.
-4%
-2%
0%
2%
4%
6%
8%
1960
1962
1964
1966
1968
1970
1972
1974
1976
1978
1980
1982
1984
1986
1988
1990
1992
1994
1996
1998
2000
2002
2004
2006
2008
2010
2012
2014
2016
2018
Global ex China and US volume growth (%)
-4%
-3%
-2%
-1%
0%
1%
2%
3%
2002
2003
2004
2005
2006
2007
2008
2009
2010
2011
2012
2013
2014
2015
2016
2017
2018
Developed market Developing market
Contribution to volume growth
-2%
-1%
0%
1%
2%
3%
4%
5%
6%
British AmericanTobacco*
Japan Tobacco Philip MorrisInternational
Imperial Brands
2008-2013 2013-18 2018-23
Reported revenue growth (%)
-10%
-5%
0%
5%
10%
15%
20%
ITC (India) HMSampoerna(Indonesia)*
GudangGaram
(Indonesia)
BATMalaysia
KT&G(SouthKorea)
Altria (US)
2008-2013 2013-18 2018-23
Reported revenue growth (%)
Global Tobacco 23 May 2019
6
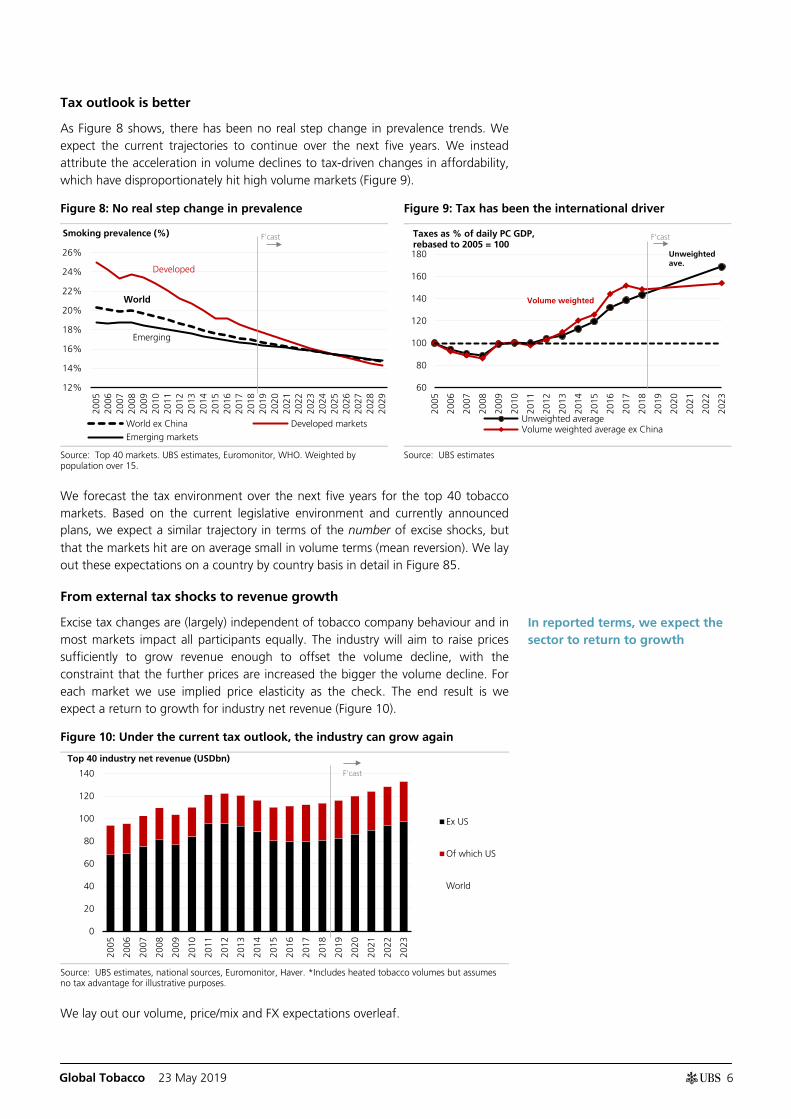
Tax outlook is better
As Figure 8 shows, there has been no real step change in prevalence trends. We expect the current trajectories to continue over the next five years. We instead attribute the acceleration in volume declines to tax-driven changes in affordability, which have disproportionately hit high volume markets (Figure 9).
Figure 8: No real step change in prevalence Figure 9: Tax has been the international driver
Source: Top 40 markets. UBS estimates, Euromonitor, WHO. Weighted by population over 15.
Source: UBS estimates
We forecast the tax environment over the next five years for the top 40 tobacco markets. Based on the current legislative environment and currently announced plans, we expect a similar trajectory in terms of the number of excise shocks, but that the markets hit are on average small in volume terms (mean reversion). We lay out these expectations on a country by country basis in detail in Figure 85.
From external tax shocks to revenue growth
Excise tax changes are (largely) independent of tobacco company behaviour and in most markets impact all participants equally. The industry will aim to raise prices sufficiently to grow revenue enough to offset the volume decline, with the constraint that the further prices are increased the bigger the volume decline. For each market we use implied price elasticity as the check. The end result is we expect a return to growth for industry net revenue (Figure 10).
Figure 10: Under the current tax outlook, the industry can grow again
Source: UBS estimates, national sources, Euromonitor, Haver. *Includes heated tobacco volumes but assumes no tax advantage for illustrative purposes.
We lay out our volume, price/mix and FX expectations overleaf.
12%
14%
16%
18%
20%
22%
24%
26%
2005
2006
2007
2008
2009
2010
2011
2012
2013
2014
2015
2016
2017
2018
2019
2020
2021
2022
2023
2024
2025
2026
2027
2028
2029
World ex China Developed markets
Emerging markets
Smoking prevalence (%) F'cast
Developed
Emerging
World
60
80
100
120
140
160
180
2005
2006
2007
2008
2009
2010
2011
2012
2013
2014
2015
2016
2017
2018
2019
2020
2021
2022
2023
Unweighted averageVolume weighted average ex China
Taxes as % of daily PC GDP, rebased to 2005 = 100
Unweighted ave.
Volume weighted
F'cast
0
20
40
60
80
100
120
140
2005
2006
2007
2008
2009
2010
2011
2012
2013
2014
2015
2016
2017
2018
2019
2020
2021
2022
2023
Ex US
Of which US
World
Top 40 industry net revenue (USDbn) F'cast
In reported terms, we expect the sector to return to growth
Global Tobacco 23 May 2019
7
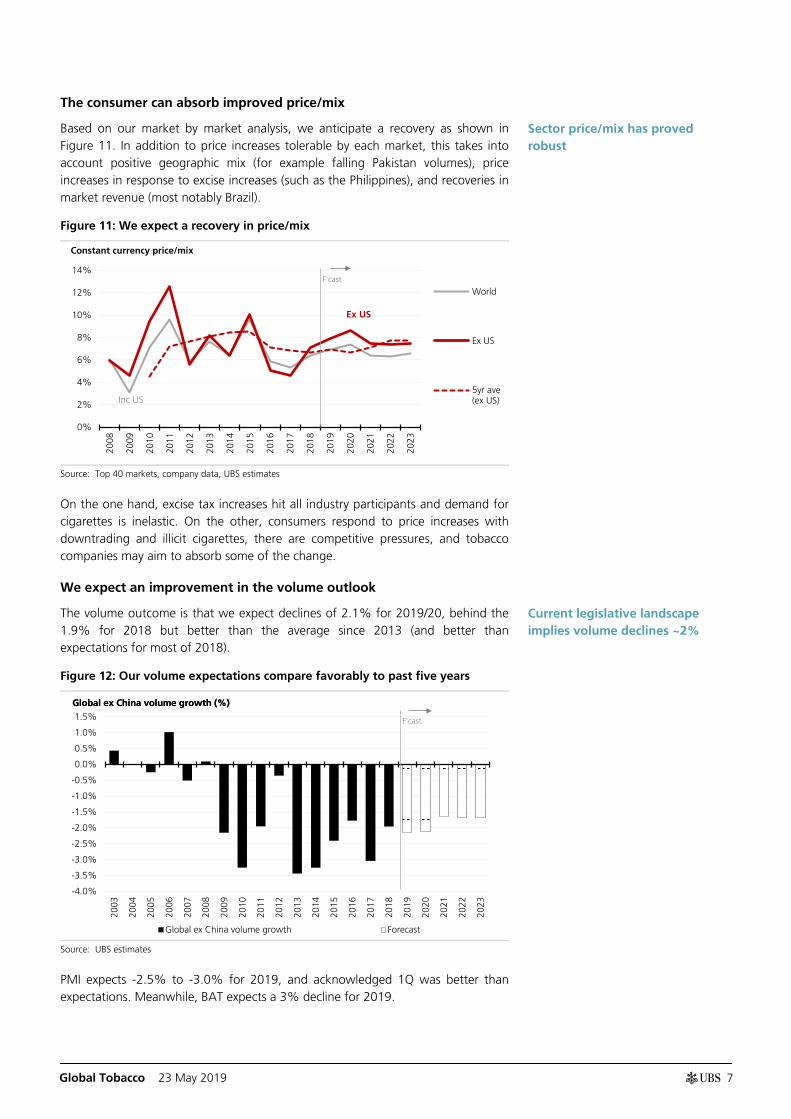
The consumer can absorb improved price/mix
Based on our market by market analysis, we anticipate a recovery as shown in Figure 11. In addition to price increases tolerable by each market, this takes into account positive geographic mix (for example falling Pakistan volumes), price increases in response to excise increases (such as the Philippines), and recoveries in market revenue (most notably Brazil).
Figure 11: We expect a recovery in price/mix
Source: Top 40 markets, company data, UBS estimates
On the one hand, excise tax increases hit all industry participants and demand for cigarettes is inelastic. On the other, consumers respond to price increases with downtrading and illicit cigarettes, there are competitive pressures, and tobacco companies may aim to absorb some of the change.
We expect an improvement in the volume outlook
The volume outcome is that we expect declines of 2.1% for 2019/20, behind the 1.9% for 2018 but better than the average since 2013 (and better than expectations for most of 2018).
Figure 12: Our volume expectations compare favorably to past five years
Source: UBS estimates
PMI expects -2.5% to -3.0% for 2019, and acknowledged 1Q was better than expectations. Meanwhile, BAT expects a 3% decline for 2019.
0%
2%
4%
6%
8%
10%
12%
14%
2008
2009
2010
2011
2012
2013
2014
2015
2016
2017
2018
2019
2020
2021
2022
2023
World
Ex US
5yr ave(ex US)
Constant currency price/mix
F'cast
Inc US
Ex US
-4.0%
-3.5%
-3.0%
-2.5%
-2.0%
-1.5%
-1.0%
-0.5%
0.0%
0.5%
1.0%
1.5%
2003
2004
2005
2006
2007
2008
2009
2010
2011
2012
2013
2014
2015
2016
2017
2018
2019
2020
2021
2022
2023
Global ex China volume growth Forecast
Global ex China volume growth (%) Global ex China volume growth (%)
F'cast
Sector price/mix has proved robust
Current legislative landscape implies volume declines ~2%
Global Tobacco 23 May 2019
8
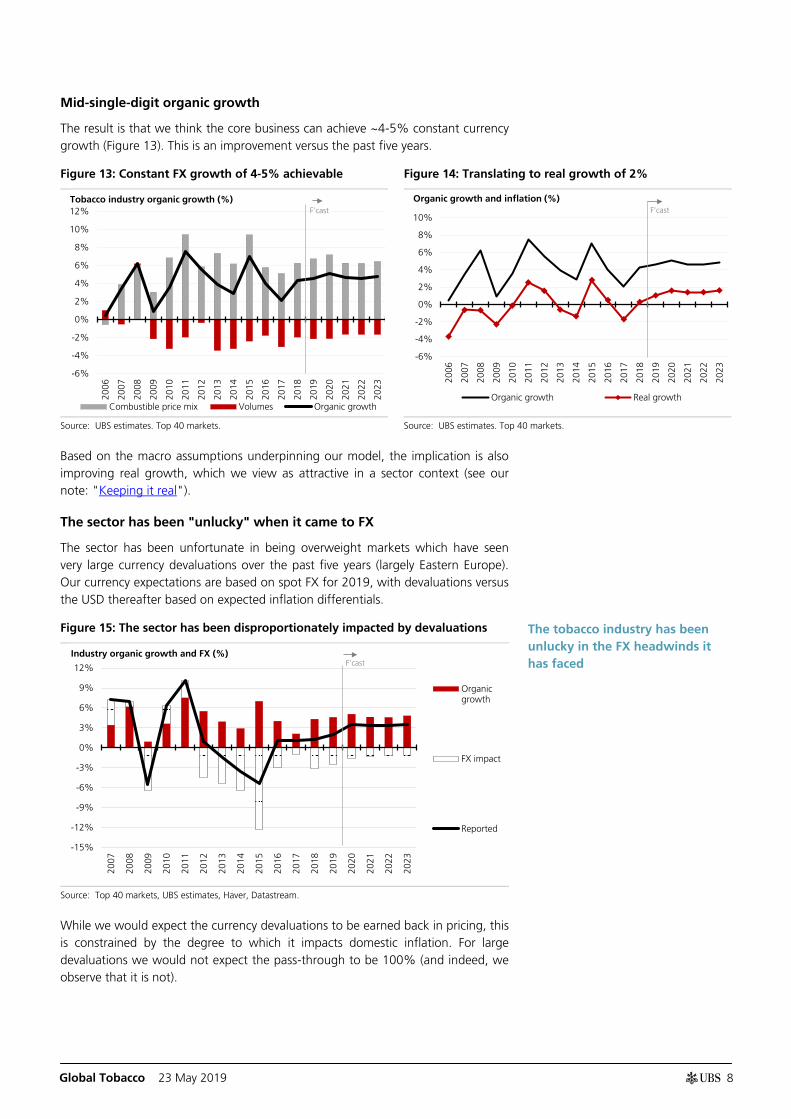
Mid-single-digit organic growth
The result is that we think the core business can achieve ~4-5% constant currency growth (Figure 13). This is an improvement versus the past five years.
Figure 13: Constant FX growth of 4-5% achievable Figure 14: Translating to real growth of 2%
Source: UBS estimates. Top 40 markets. Source: UBS estimates. Top 40 markets.
Based on the macro assumptions underpinning our model, the implication is also improving real growth, which we view as attractive in a sector context (see our note: "Keeping it real").
The sector has been "unlucky" when it came to FX
The sector has been unfortunate in being overweight markets which have seen very large currency devaluations over the past five years (largely Eastern Europe). Our currency expectations are based on spot FX for 2019, with devaluations versus the USD thereafter based on expected inflation differentials.
Figure 15: The sector has been disproportionately impacted by devaluations
Source: Top 40 markets, UBS estimates, Haver, Datastream.
While we would expect the currency devaluations to be earned back in pricing, this is constrained by the degree to which it impacts domestic inflation. For large devaluations we would not expect the pass-through to be 100% (and indeed, we observe that it is not).
-6%
-4%
-2%
0%
2%
4%
6%
8%
10%
12%
2006
2007
2008
2009
2010
2011
2012
2013
2014
2015
2016
2017
2018
2019
2020
2021
2022
2023
Combustible price mix Volumes Organic growth
Tobacco industry organic growth (%) F'cast
-6%
-4%
-2%
0%
2%
4%
6%
8%
10%
2006
2007
2008
2009
2010
2011
2012
2013
2014
2015
2016
2017
2018
2019
2020
2021
2022
2023
Organic growth Real growth
Organic growth and inflation (%) F'cast
-15%
-12%
-9%
-6%
-3%
0%
3%
6%
9%
12%
2007
2008
2009
2010
2011
2012
2013
2014
2015
2016
2017
2018
2019
2020
2021
2022
2023
Organicgrowth
FX impact
Reported
Industry organic growth and FX (%) F'cast
The tobacco industry has been unlucky in the FX headwinds it has faced
Global Tobacco 23 May 2019
9
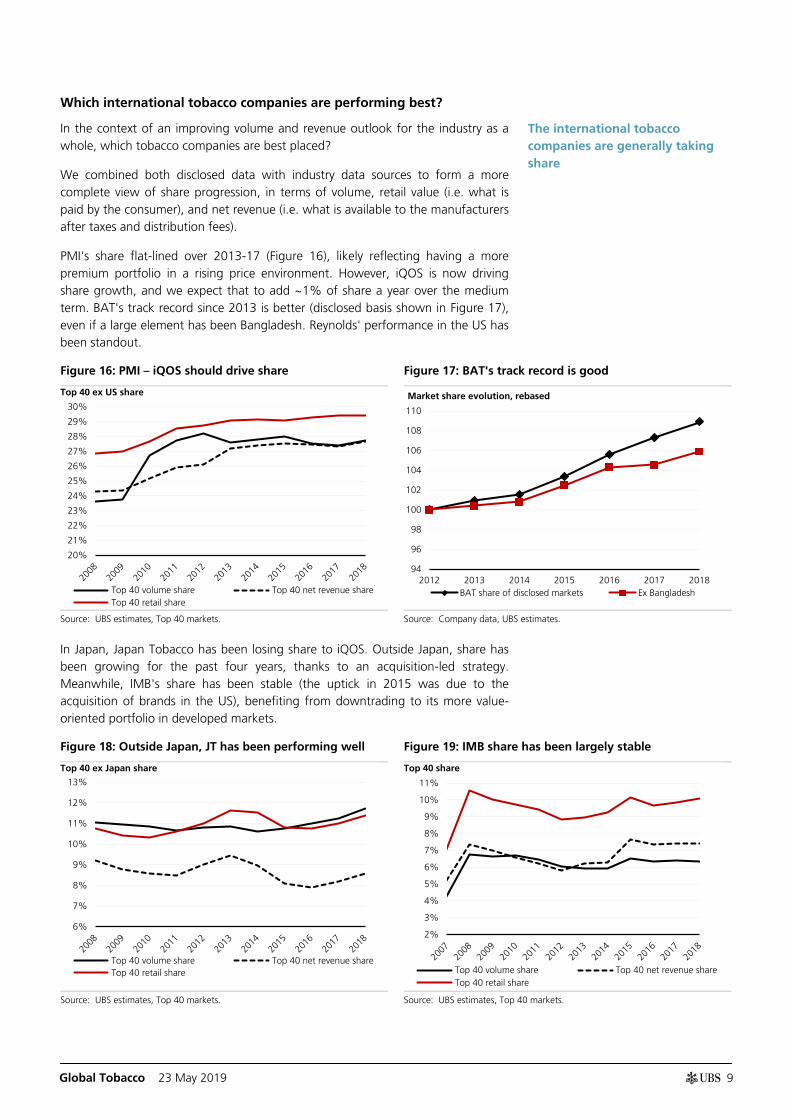
Which international tobacco companies are performing best?
In the context of an improving volume and revenue outlook for the industry as a whole, which tobacco companies are best placed?
We combined both disclosed data with industry data sources to form a more complete view of share progression, in terms of volume, retail value (i.e. what is paid by the consumer), and net revenue (i.e. what is available to the manufacturers after taxes and distribution fees).
PMI's share flat-lined over 2013-17 (Figure 16), likely reflecting having a more premium portfolio in a rising price environment. However, iQOS is now driving share growth, and we expect that to add ~1% of share a year over the medium term. BAT's track record since 2013 is better (disclosed basis shown in Figure 17), even if a large element has been Bangladesh. Reynolds' performance in the US has been standout.
Figure 16: PMI – iQOS should drive share Figure 17: BAT's track record is good
Source: UBS estimates, Top 40 markets. Source: Company data, UBS estimates.
In Japan, Japan Tobacco has been losing share to iQOS. Outside Japan, share has been growing for the past four years, thanks to an acquisition-led strategy. Meanwhile, IMB's share has been stable (the uptick in 2015 was due to the acquisition of brands in the US), benefiting from downtrading to its more value-oriented portfolio in developed markets.
Figure 18: Outside Japan, JT has been performing well Figure 19: IMB share has been largely stable
Source: UBS estimates, Top 40 markets. Source: UBS estimates, Top 40 markets.
20%
21%
22%
23%
24%
25%
26%
27%
28%
29%
30%
Top 40 volume share Top 40 net revenue shareTop 40 retail share
Top 40 ex US share
94
96
98
100
102
104
106
108
110
2012 2013 2014 2015 2016 2017 2018BAT share of disclosed markets Ex Bangladesh
Market share evolution, rebased
6%
7%
8%
9%
10%
11%
12%
13%
Top 40 volume share Top 40 net revenue shareTop 40 retail share
Top 40 ex Japan share
2%
3%
4%
5%
6%
7%
8%
9%
10%
11%
Top 40 volume share Top 40 net revenue shareTop 40 retail share
Top 40 share
The international tobacco companies are generally taking share
Global Tobacco 23 May 2019
10
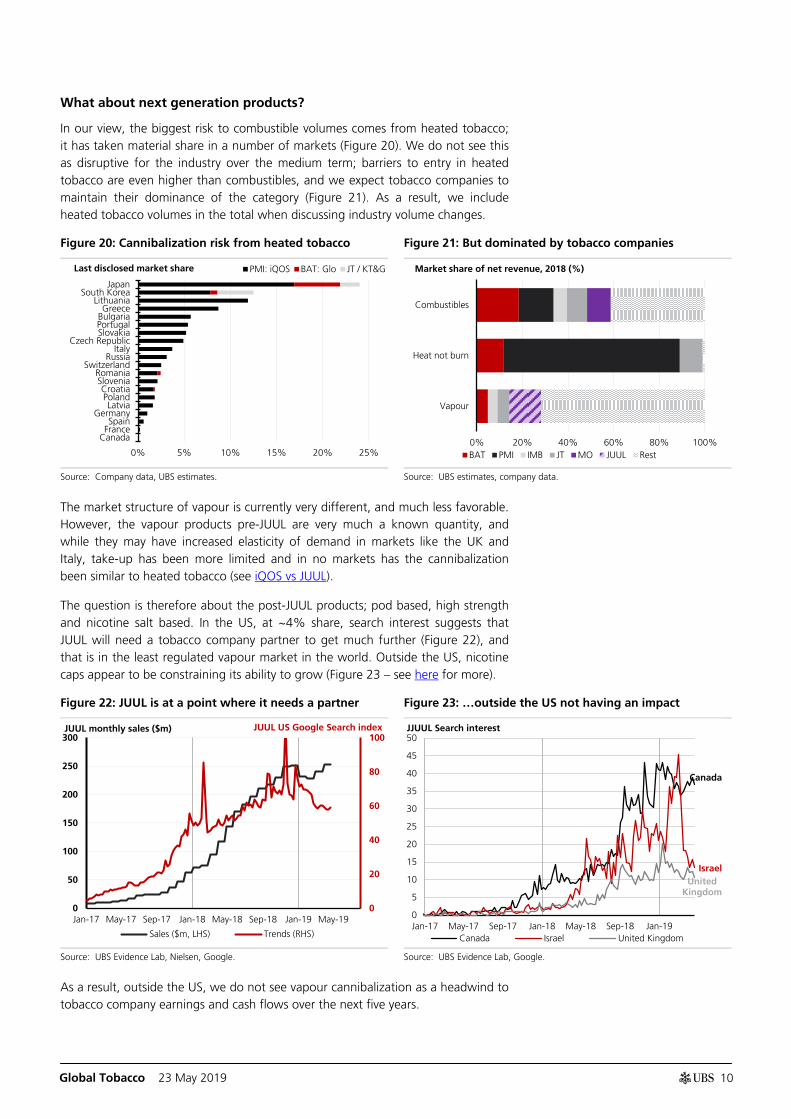
What about next generation products?
In our view, the biggest risk to combustible volumes comes from heated tobacco; it has taken material share in a number of markets (Figure 20). We do not see this as disruptive for the industry over the medium term; barriers to entry in heated tobacco are even higher than combustibles, and we expect tobacco companies to maintain their dominance of the category (Figure 21). As a result, we include heated tobacco volumes in the total when discussing industry volume changes.
Figure 20: Cannibalization risk from heated tobacco Figure 21: But dominated by tobacco companies
Source: Company data, UBS estimates. Source: UBS estimates, company data.
The market structure of vapour is currently very different, and much less favorable. However, the vapour products pre-JUUL are very much a known quantity, and while they may have increased elasticity of demand in markets like the UK and Italy, take-up has been more limited and in no markets has the cannibalization been similar to heated tobacco (see iQOS vs JUUL).
The question is therefore about the post-JUUL products; pod based, high strength and nicotine salt based. In the US, at ~4% share, search interest suggests that JUUL will need a tobacco company partner to get much further (Figure 22), and that is in the least regulated vapour market in the world. Outside the US, nicotine caps appear to be constraining its ability to grow (Figure 23 – see here for more).
Figure 22: JUUL is at a point where it needs a partner Figure 23: …outside the US not having an impact
Source: UBS Evidence Lab, Nielsen, Google. Source: UBS Evidence Lab, Google.
As a result, outside the US, we do not see vapour cannibalization as a headwind to tobacco company earnings and cash flows over the next five years.
0% 5% 10% 15% 20% 25%
JapanSouth Korea
LithuaniaGreece
BulgariaPortugalSlovakia
Czech RepublicItaly
RussiaSwitzerland
RomaniaSloveniaCroatiaPolandLatvia
GermanySpain
FranceCanada
PMI: iQOS BAT: Glo JT / KT&G Last disclosed market share
0% 20% 40% 60% 80% 100%
Combustibles
Heat not burn
Vapour
BAT PMI IMB JT MO JUUL Rest
Market share of net revenue, 2018 (%)
0
20
40
60
80
100
0
50
100
150
200
250
300
Jan-17 May-17 Sep-17 Jan-18 May-18 Sep-18 Jan-19 May-19
Sales ($m, LHS) Trends (RHS)
JUUL monthly sales ($m) JUUL US Google Search index
Canada
Israel United
Kingdom
0
5
10
15
20
25
30
35
40
45
50
Jan-17 May-17 Sep-17 Jan-18 May-18 Sep-18 Jan-19Canada Israel United Kingdom
JJUUL Search interest
Global Tobacco 23 May 2019
11
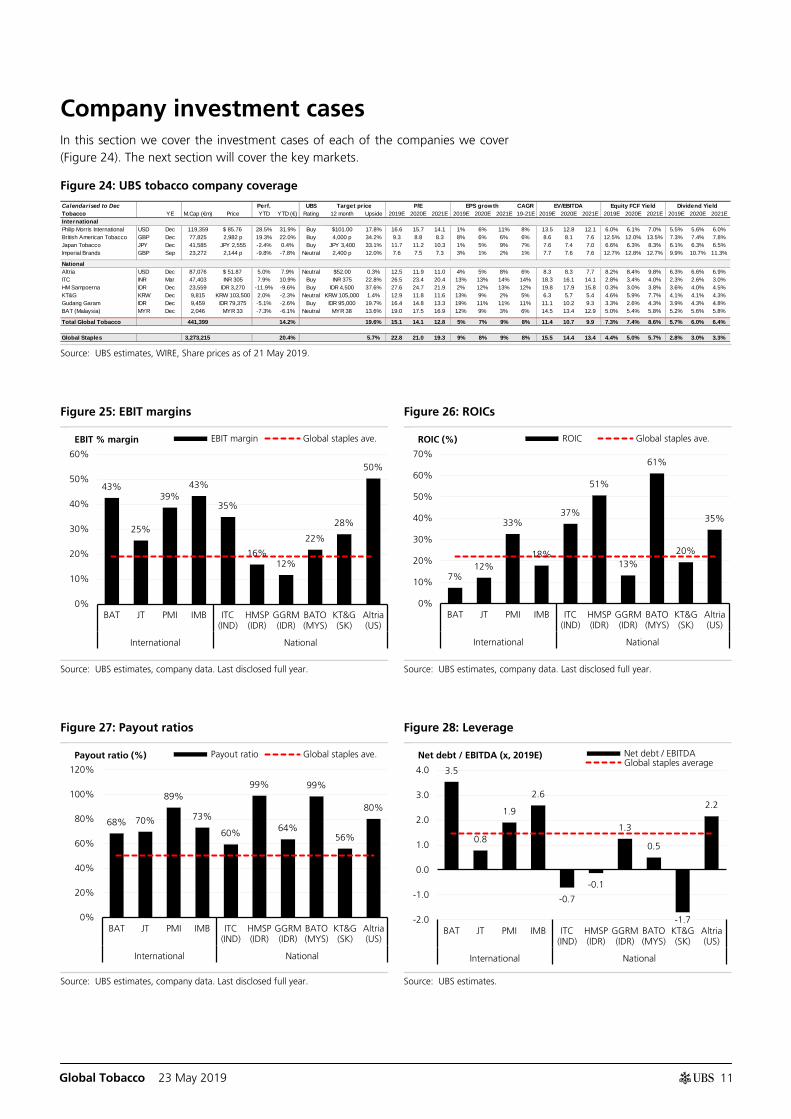
Company investment cases In this section we cover the investment cases of each of the companies we cover (Figure 24). The next section will cover the key markets.
Figure 24: UBS tobacco company coverage
Source: UBS estimates, WIRE, Share prices as of 21 May 2019.
Figure 25: EBIT margins Figure 26: ROICs
Source: UBS estimates, company data. Last disclosed full year. Source: UBS estimates, company data. Last disclosed full year.
Figure 27: Payout ratios Figure 28: Leverage
Source: UBS estimates, company data. Last disclosed full year. Source: UBS estimates.
Calendarised to Dec Perf. UBS Target price P/E EPS growth CAGR EV/EBITDA Equity FCF Yield Dividend Yield Tobacco YE M.Cap (€m) Price YTD YTD (€) Rating 12 month Upside 2019E 2020E 2021E 2019E 2020E 2021E 19-21E 2019E 2020E 2021E 2019E 2020E 2021E 2019E 2020E 2021EInternationalPhilip Morris International USD Dec 119,359 $ 85.76 28.5% 31.9% Buy $101.00 17.8% 16.6 15.7 14.1 1% 6% 11% 8% 13.5 12.8 12.1 6.0% 6.1% 7.0% 5.5% 5.6% 6.0%British American Tobacco GBP Dec 77,825 2,982 p 19.3% 22.0% Buy 4,000 p 34.2% 9.3 8.8 8.3 8% 6% 6% 6% 8.6 8.1 7.6 12.5% 12.0% 13.5% 7.3% 7.4% 7.8%Japan Tobacco JPY Dec 41,585 JPY 2,555 -2.4% 0.4% Buy JPY 3,400 33.1% 11.7 11.2 10.3 1% 5% 9% 7% 7.6 7.4 7.0 6.6% 6.3% 8.3% 6.1% 6.3% 6.5%Imperial Brands GBP Sep 23,272 2,144 p -9.8% -7.8% Neutral 2,400 p 12.0% 7.6 7.5 7.3 3% 1% 2% 1% 7.7 7.6 7.6 12.7% 12.8% 12.7% 9.9% 10.7% 11.3%
NationalAltria USD Dec 87,076 $ 51.87 5.0% 7.9% Neutral $52.00 0.3% 12.5 11.9 11.0 4% 5% 8% 6% 8.3 8.3 7.7 8.2% 8.4% 9.8% 6.3% 6.6% 6.9%ITC INR Mar 47,403 INR 305 7.9% 10.9% Buy INR 375 22.8% 26.5 23.4 20.4 13% 13% 14% 14% 18.3 16.1 14.1 2.8% 3.4% 4.0% 2.3% 2.6% 3.0%HM Sampoerna IDR Dec 23,559 IDR 3,270 -11.9% -9.6% Buy IDR 4,500 37.6% 27.6 24.7 21.9 2% 12% 13% 12% 19.8 17.9 15.8 0.3% 3.0% 3.8% 3.6% 4.0% 4.5%KT&G KRW Dec 9,815 KRW 103,500 2.0% -2.3% Neutral KRW 105,000 1.4% 12.9 11.8 11.6 13% 9% 2% 5% 6.3 5.7 5.4 4.6% 5.9% 7.7% 4.1% 4.1% 4.3%Gudang Garam IDR Dec 9,459 IDR 79,375 -5.1% -2.6% Buy IDR 95,000 19.7% 16.4 14.8 13.3 19% 11% 11% 11% 11.1 10.2 9.3 3.3% 2.6% 4.3% 3.9% 4.3% 4.8%BAT (Malaysia) MYR Dec 2,046 MYR 33 -7.3% -6.1% Neutral MYR 38 13.6% 19.0 17.5 16.9 12% 9% 3% 6% 14.5 13.4 12.9 5.0% 5.4% 5.8% 5.2% 5.6% 5.8%
Total Global Tobacco 441,399 14.2% 19.6% 15.1 14.1 12.8 5% 7% 9% 8% 11.4 10.7 9.9 7.3% 7.4% 8.6% 5.7% 6.0% 6.4%
Global Staples 3,273,215 20.4% 5.7% 22.8 21.0 19.3 9% 8% 9% 8% 15.5 14.4 13.4 4.4% 5.0% 5.7% 2.8% 3.0% 3.3%
43%
25%
39% 43%
35%
16% 12%
22%
28%
50%
0%
10%
20%
30%
40%
50%
60%
BAT JT PMI IMB ITC(IND)
HMSP(IDR)
GGRM(IDR)
BATO(MYS)
KT&G(SK)
Altria(US)
International National
EBIT margin Global staples ave.EBIT % margin
7% 12%
33%
18%
37%
51%
13%
61%
20%
35%
0%
10%
20%
30%
40%
50%
60%
70%
BAT JT PMI IMB ITC(IND)
HMSP(IDR)
GGRM(IDR)
BATO(MYS)
KT&G(SK)
Altria(US)
International National
ROIC Global staples ave.ROIC (%)
68% 70%
89%
73%
60%
99%
64%
99%
56%
80%
0%
20%
40%
60%
80%
100%
120%
BAT JT PMI IMB ITC(IND)
HMSP(IDR)
GGRM(IDR)
BATO(MYS)
KT&G(SK)
Altria(US)
International National
Payout ratio Global staples ave.Payout ratio (%)
3.5
0.8
1.9
2.6
-0.7
-0.1
1.3
0.5
-1.7
2.2
-2.0
-1.0
0.0
1.0
2.0
3.0
4.0
BAT JT PMI IMB ITC(IND)
HMSP(IDR)
GGRM(IDR)
BATO(MYS)
KT&G(SK)
Altria(US)
International National
Net debt / EBITDAGlobal staples average
Net debt / EBITDA (x, 2019E)
Global Tobacco 23 May 2019
12
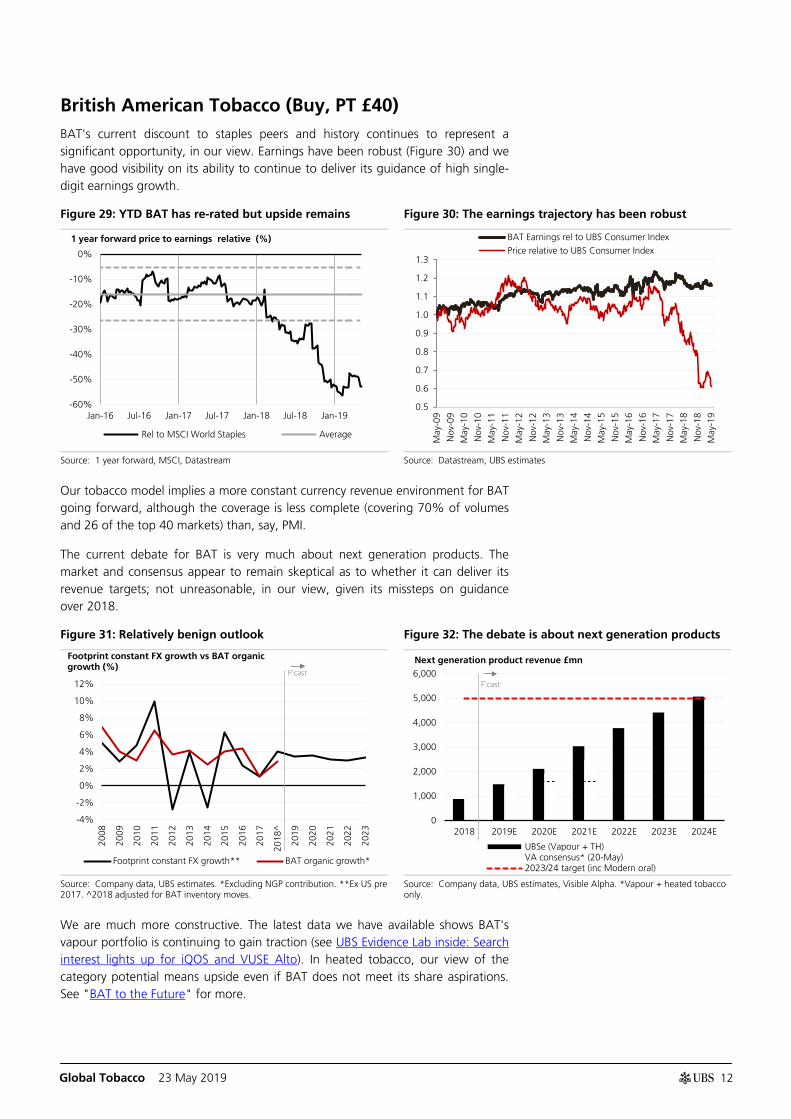
British American Tobacco (Buy, PT £40) BAT's current discount to staples peers and history continues to represent a significant opportunity, in our view. Earnings have been robust (Figure 30) and we have good visibility on its ability to continue to deliver its guidance of high single-digit earnings growth.
Figure 29: YTD BAT has re-rated but upside remains Figure 30: The earnings trajectory has been robust
Source: 1 year forward, MSCI, Datastream Source: Datastream, UBS estimates
Our tobacco model implies a more constant currency revenue environment for BAT going forward, although the coverage is less complete (covering 70% of volumes and 26 of the top 40 markets) than, say, PMI.
The current debate for BAT is very much about next generation products. The market and consensus appear to remain skeptical as to whether it can deliver its revenue targets; not unreasonable, in our view, given its missteps on guidance over 2018.
Figure 31: Relatively benign outlook Figure 32: The debate is about next generation products
Source: Company data, UBS estimates. *Excluding NGP contribution. **Ex US pre 2017. ^2018 adjusted for BAT inventory moves.
Source: Company data, UBS estimates, Visible Alpha. *Vapour + heated tobacco only.
We are much more constructive. The latest data we have available shows BAT's vapour portfolio is continuing to gain traction (see UBS Evidence Lab inside: Search interest lights up for iQOS and VUSE Alto). In heated tobacco, our view of the category potential means upside even if BAT does not meet its share aspirations. See "BAT to the Future" for more.
-60%
-50%
-40%
-30%
-20%
-10%
0%
Jan-16 Jul-16 Jan-17 Jul-17 Jan-18 Jul-18 Jan-19
Rel to MSCI World Staples Average
1 year forward price to earnings relative (%)
0.5
0.6
0.7
0.8
0.9
1.0
1.1
1.2
1.3
May
-09
Nov
-09
May
-10
Nov
-10
May
-11
Nov
-11
May
-12
Nov
-12
May
-13
Nov
-13
May
-14
Nov
-14
May
-15
Nov
-15
May
-16
Nov
-16
May
-17
Nov
-17
May
-18
Nov
-18
May
-19
BAT Earnings rel to UBS Consumer Index
Price relative to UBS Consumer Index
-4%
-2%
0%
2%
4%
6%
8%
10%
12%
2008
2009
2010
2011
2012
2013
2014
2015
2016
2017
2018
^
2019
2020
2021
2022
2023
Footprint constant FX growth** BAT organic growth*
Footprint constant FX growth vs BAT organic growth (%) F'cast
0
1,000
2,000
3,000
4,000
5,000
6,000
2018 2019E 2020E 2021E 2022E 2023E 2024E
UBSe (Vapour + TH)VA consensus* (20-May)2023/24 target (inc Modern oral)
F'cast
Next generation product revenue £mn
Global Tobacco 23 May 2019
13
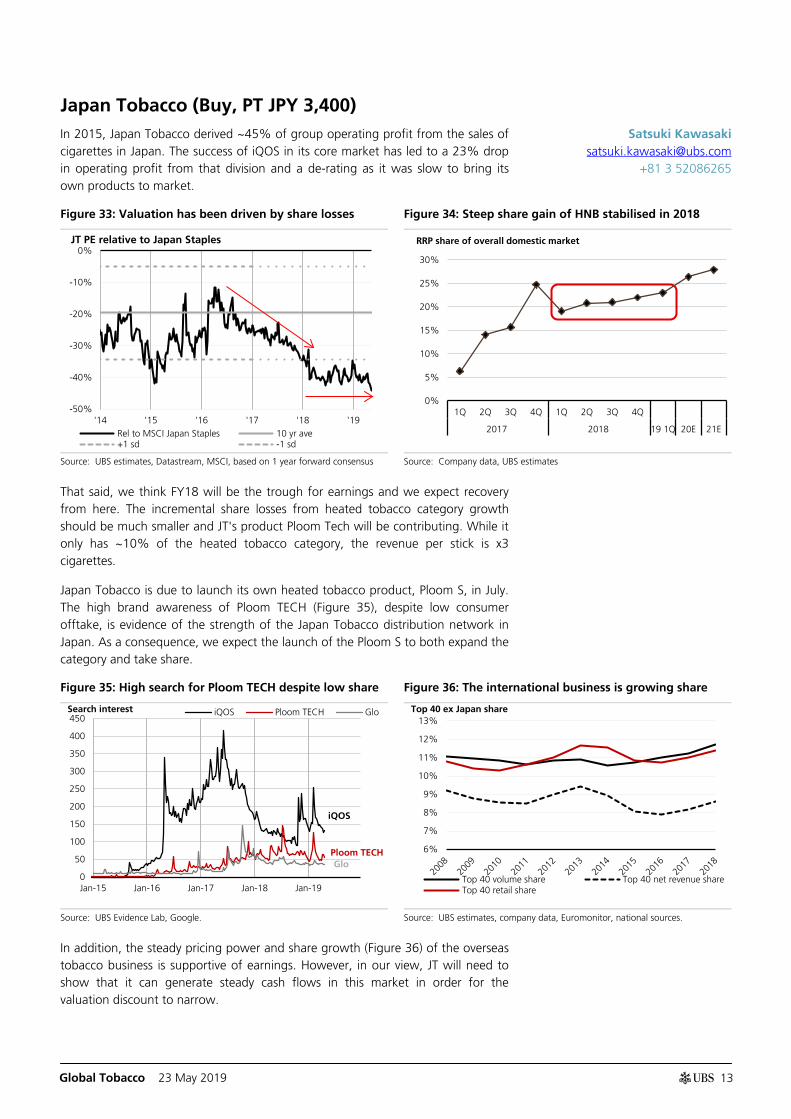
Japan Tobacco (Buy, PT JPY 3,400) In 2015, Japan Tobacco derived ~45% of group operating profit from the sales of cigarettes in Japan. The success of iQOS in its core market has led to a 23% drop in operating profit from that division and a de-rating as it was slow to bring its own products to market.
Figure 33: Valuation has been driven by share losses Figure 34: Steep share gain of HNB stabilised in 2018
Source: UBS estimates, Datastream, MSCI, based on 1 year forward consensus Source: Company data, UBS estimates
That said, we think FY18 will be the trough for earnings and we expect recovery from here. The incremental share losses from heated tobacco category growth should be much smaller and JT's product Ploom Tech will be contributing. While it only has ~10% of the heated tobacco category, the revenue per stick is x3 cigarettes.
Japan Tobacco is due to launch its own heated tobacco product, Ploom S, in July. The high brand awareness of Ploom TECH (Figure 35), despite low consumer offtake, is evidence of the strength of the Japan Tobacco distribution network in Japan. As a consequence, we expect the launch of the Ploom S to both expand the category and take share.
Figure 35: High search for Ploom TECH despite low share Figure 36: The international business is growing share
Source: UBS Evidence Lab, Google. Source: UBS estimates, company data, Euromonitor, national sources.
In addition, the steady pricing power and share growth (Figure 36) of the overseas tobacco business is supportive of earnings. However, in our view, JT will need to show that it can generate steady cash flows in this market in order for the valuation discount to narrow.
-50%
-40%
-30%
-20%
-10%
0%
'14 '15 '16 '17 '18 '19Rel to MSCI Japan Staples 10 yr ave+1 sd -1 sd
JT PE relative to Japan Staples
0%
5%
10%
15%
20%
25%
30%
1Q 2Q 3Q 4Q 1Q 2Q 3Q 4Q
2017 2018 19 1Q 20E 21E
RRP share of overall domestic market
iQOS
Ploom TECH Glo
0
50
100
150
200
250
300
350
400
450
Jan-15 Jan-16 Jan-17 Jan-18 Jan-19
iQOS Ploom TECH GloSearch interest
6%
7%
8%
9%
10%
11%
12%
13%
Top 40 volume share Top 40 net revenue shareTop 40 retail share
Top 40 ex Japan share
Satsuki Kawasaki [email protected]
+81 3 52086265
Global Tobacco 23 May 2019
14
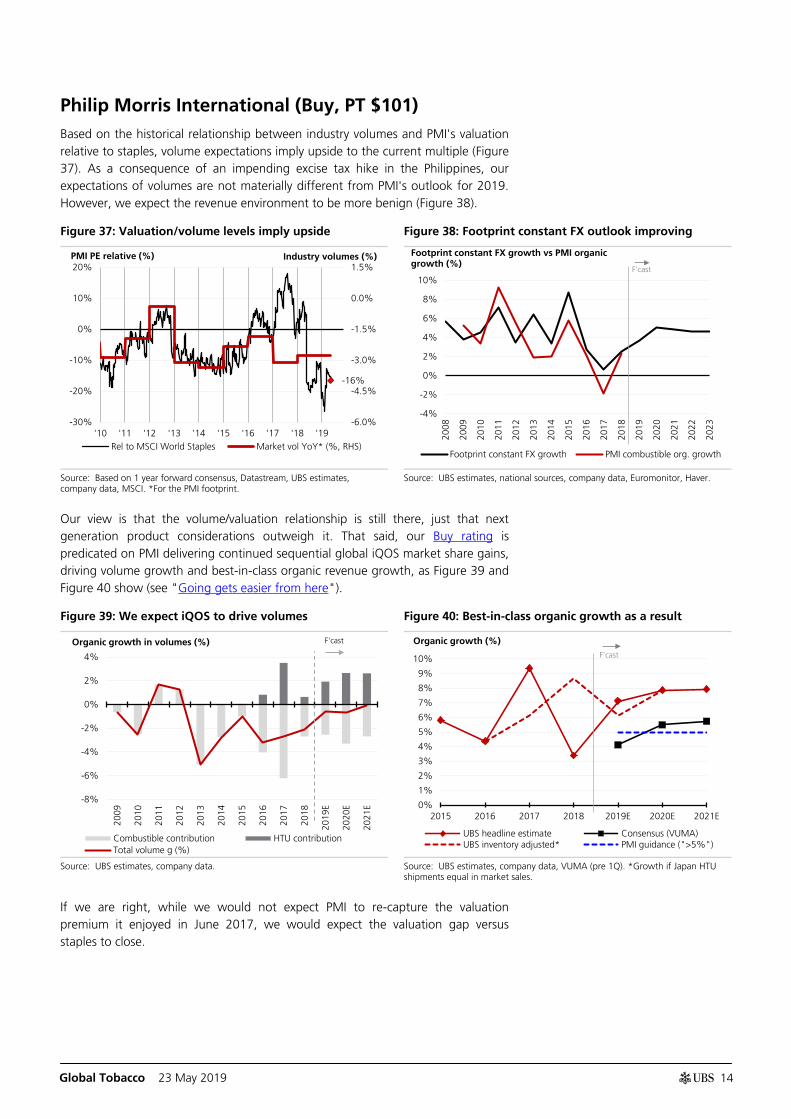
Philip Morris International (Buy, PT $101) Based on the historical relationship between industry volumes and PMI's valuation relative to staples, volume expectations imply upside to the current multiple (Figure 37). As a consequence of an impending excise tax hike in the Philippines, our expectations of volumes are not materially different from PMI's outlook for 2019. However, we expect the revenue environment to be more benign (Figure 38).
Figure 37: Valuation/volume levels imply upside Figure 38: Footprint constant FX outlook improving
Source: Based on 1 year forward consensus, Datastream, UBS estimates, company data, MSCI. *For the PMI footprint.
Source: UBS estimates, national sources, company data, Euromonitor, Haver.
Our view is that the volume/valuation relationship is still there, just that next generation product considerations outweigh it. That said, our Buy rating is predicated on PMI delivering continued sequential global iQOS market share gains, driving volume growth and best-in-class organic revenue growth, as Figure 39 and Figure 40 show (see "Going gets easier from here").
Figure 39: We expect iQOS to drive volumes Figure 40: Best-in-class organic growth as a result
Source: UBS estimates, company data. Source: UBS estimates, company data, VUMA (pre 1Q). *Growth if Japan HTU
shipments equal in market sales.
If we are right, while we would not expect PMI to re-capture the valuation premium it enjoyed in June 2017, we would expect the valuation gap versus staples to close.
-16%
-6.0%
-4.5%
-3.0%
-1.5%
0.0%
1.5%
-30%
-20%
-10%
0%
10%
20%
'10 '11 '12 '13 '14 '15 '16 '17 '18 '19Rel to MSCI World Staples Market vol YoY* (%, RHS)
PMI PE relative (%) Industry volumes (%)
-4%
-2%
0%
2%
4%
6%
8%
10%
2008
2009
2010
2011
2012
2013
2014
2015
2016
2017
2018
2019
2020
2021
2022
2023
Footprint constant FX growth PMI combustible org. growth
Footprint constant FX growth vs PMI organic growth (%) F'cast
-8%
-6%
-4%
-2%
0%
2%
4%
2009
2010
2011
2012
2013
2014
2015
2016
2017
2018
2019
E
2020
E
2021
E
Combustible contribution HTU contributionTotal volume g (%)
Organic growth in volumes (%) F'cast
0%
1%
2%
3%
4%
5%
6%
7%
8%
9%
10%
2015 2016 2017 2018 2019E 2020E 2021E
UBS headline estimate Consensus (VUMA)UBS inventory adjusted* PMI guidance (">5%")
Organic growth (%) F'cast
Global Tobacco 23 May 2019
15
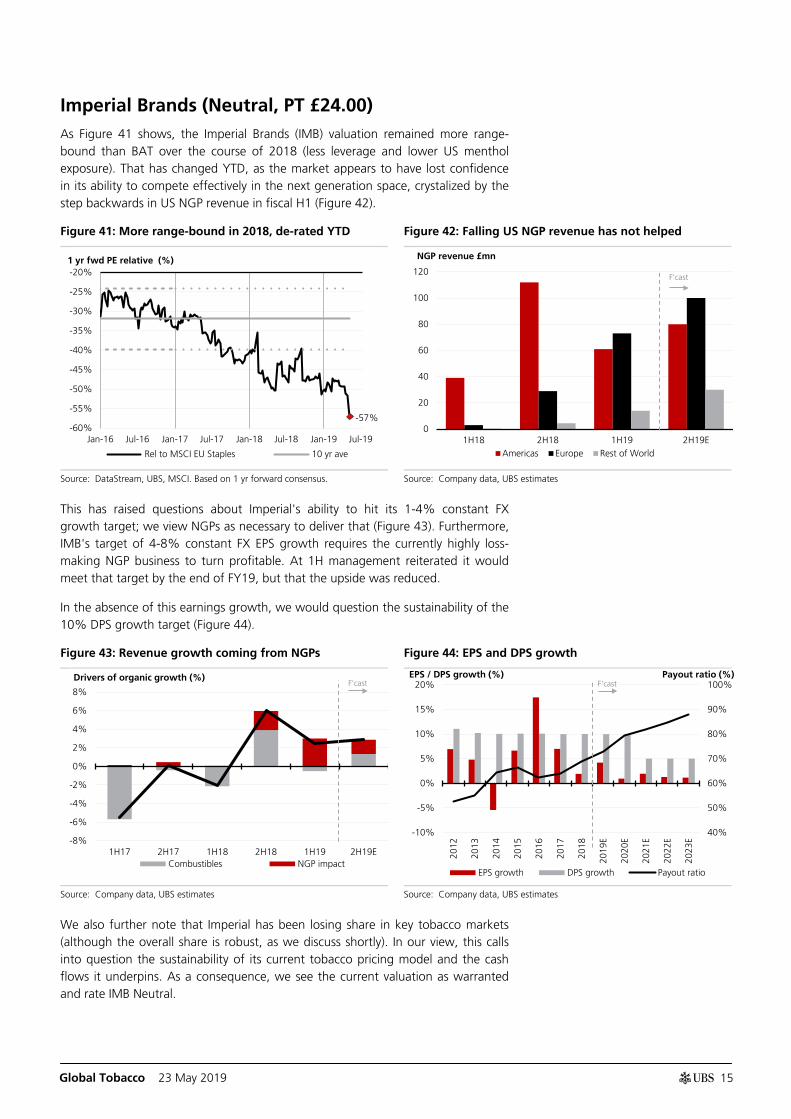
Imperial Brands (Neutral, PT £24.00) As Figure 41 shows, the Imperial Brands (IMB) valuation remained more range-bound than BAT over the course of 2018 (less leverage and lower US menthol exposure). That has changed YTD, as the market appears to have lost confidence in its ability to compete effectively in the next generation space, crystalized by the step backwards in US NGP revenue in fiscal H1 (Figure 42).
Figure 41: More range-bound in 2018, de-rated YTD Figure 42: Falling US NGP revenue has not helped
Source: DataStream, UBS, MSCI. Based on 1 yr forward consensus. Source: Company data, UBS estimates
This has raised questions about Imperial's ability to hit its 1-4% constant FX growth target; we view NGPs as necessary to deliver that (Figure 43). Furthermore, IMB's target of 4-8% constant FX EPS growth requires the currently highly loss-making NGP business to turn profitable. At 1H management reiterated it would meet that target by the end of FY19, but that the upside was reduced.
In the absence of this earnings growth, we would question the sustainability of the 10% DPS growth target (Figure 44).
Figure 43: Revenue growth coming from NGPs Figure 44: EPS and DPS growth
Source: Company data, UBS estimates Source: Company data, UBS estimates
We also further note that Imperial has been losing share in key tobacco markets (although the overall share is robust, as we discuss shortly). In our view, this calls into question the sustainability of its current tobacco pricing model and the cash flows it underpins. As a consequence, we see the current valuation as warranted and rate IMB Neutral.
-57% -60%
-55%
-50%
-45%
-40%
-35%
-30%
-25%
-20%
Jan-16 Jul-16 Jan-17 Jul-17 Jan-18 Jul-18 Jan-19 Jul-19
Rel to MSCI EU Staples 10 yr ave
1 yr fwd PE relative (%)
0
20
40
60
80
100
120
1H18 2H18 1H19 2H19EAmericas Europe Rest of World
NGP revenue £mn
F'cast
-8%
-6%
-4%
-2%
0%
2%
4%
6%
8%
1H17 2H17 1H18 2H18 1H19 2H19ECombustibles NGP impact
Drivers of organic growth (%) F'cast
40%
50%
60%
70%
80%
90%
100%
-10%
-5%
0%
5%
10%
15%
20%
2012
2013
2014
2015
2016
2017
2018
2019
E
2020
E
2021
E
2022
E
2023
E
EPS growth DPS growth Payout ratio
F'cast EPS / DPS growth (%) Payout ratio (%)
Global Tobacco 23 May 2019
16
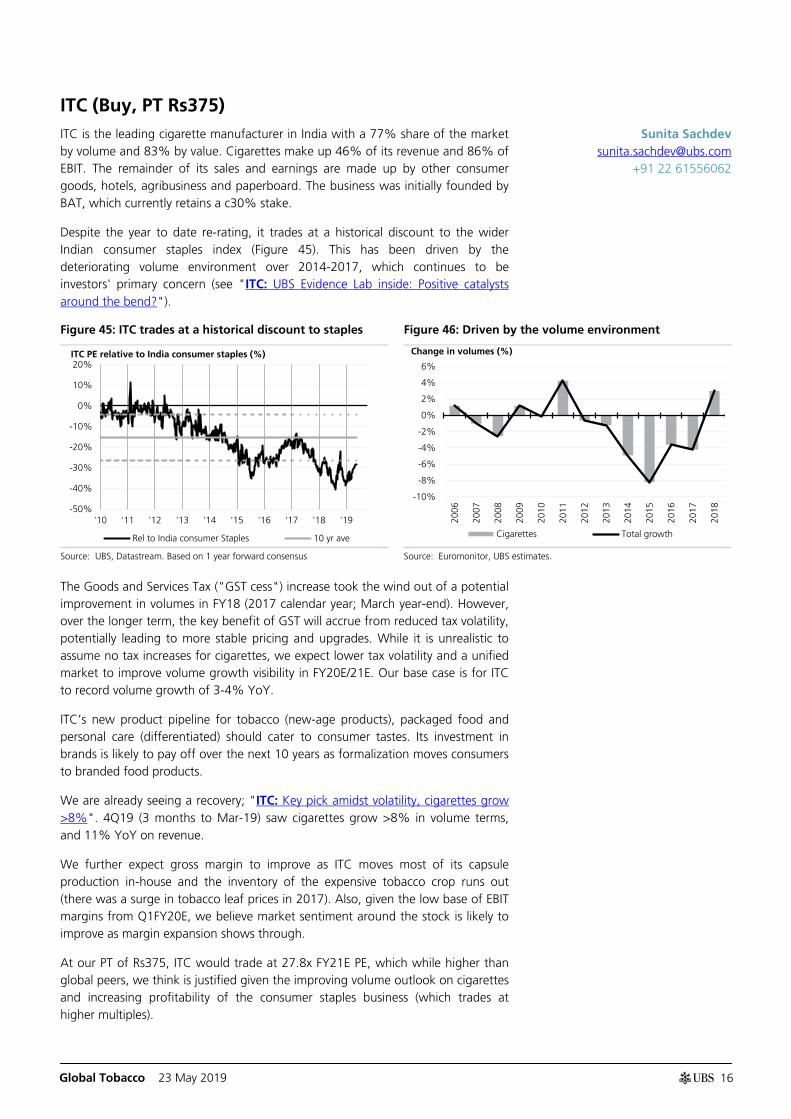
ITC (Buy, PT Rs375) ITC is the leading cigarette manufacturer in India with a 77% share of the market by volume and 83% by value. Cigarettes make up 46% of its revenue and 86% of EBIT. The remainder of its sales and earnings are made up by other consumer goods, hotels, agribusiness and paperboard. The business was initially founded by BAT, which currently retains a c30% stake.
Despite the year to date re-rating, it trades at a historical discount to the wider Indian consumer staples index (Figure 45). This has been driven by the deteriorating volume environment over 2014-2017, which continues to be investors' primary concern (see "ITC: UBS Evidence Lab inside: Positive catalysts around the bend?").
Figure 45: ITC trades at a historical discount to staples Figure 46: Driven by the volume environment
Source: UBS, Datastream. Based on 1 year forward consensus Source: Euromonitor, UBS estimates.
The Goods and Services Tax ("GST cess") increase took the wind out of a potential improvement in volumes in FY18 (2017 calendar year; March year-end). However, over the longer term, the key benefit of GST will accrue from reduced tax volatility, potentially leading to more stable pricing and upgrades. While it is unrealistic to assume no tax increases for cigarettes, we expect lower tax volatility and a unified market to improve volume growth visibility in FY20E/21E. Our base case is for ITC to record volume growth of 3-4% YoY.
ITC’s new product pipeline for tobacco (new-age products), packaged food and personal care (differentiated) should cater to consumer tastes. Its investment in brands is likely to pay off over the next 10 years as formalization moves consumers to branded food products.
We are already seeing a recovery; "ITC: Key pick amidst volatility, cigarettes grow >8%". 4Q19 (3 months to Mar-19) saw cigarettes grow >8% in volume terms, and 11% YoY on revenue.
We further expect gross margin to improve as ITC moves most of its capsule production in-house and the inventory of the expensive tobacco crop runs out (there was a surge in tobacco leaf prices in 2017). Also, given the low base of EBIT margins from Q1FY20E, we believe market sentiment around the stock is likely to improve as margin expansion shows through.
At our PT of Rs375, ITC would trade at 27.8x FY21E PE, which while higher than global peers, we think is justified given the improving volume outlook on cigarettes and increasing profitability of the consumer staples business (which trades at higher multiples).
-50%
-40%
-30%
-20%
-10%
0%
10%
20%
'10 '11 '12 '13 '14 '15 '16 '17 '18 '19
Rel to India consumer Staples 10 yr ave
ITC PE relative to India consumer staples (%)
-10%
-8%
-6%
-4%
-2%
0%
2%
4%
6%
2006
2007
2008
2009
2010
2011
2012
2013
2014
2015
2016
2017
2018
Cigarettes Total growth
Change in volumes (%)
Sunita Sachdev [email protected]
+91 22 61556062
Global Tobacco 23 May 2019
17
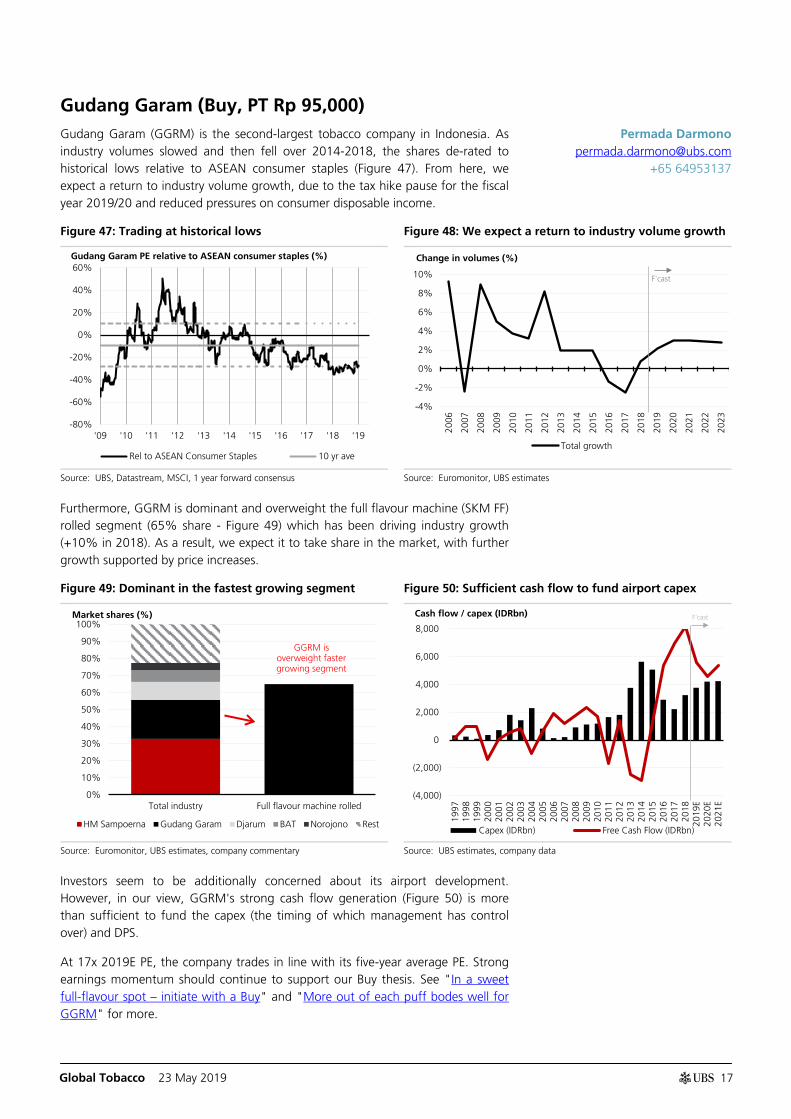
Gudang Garam (Buy, PT Rp 95,000) Gudang Garam (GGRM) is the second-largest tobacco company in Indonesia. As industry volumes slowed and then fell over 2014-2018, the shares de-rated to historical lows relative to ASEAN consumer staples (Figure 47). From here, we expect a return to industry volume growth, due to the tax hike pause for the fiscal year 2019/20 and reduced pressures on consumer disposable income.
Figure 47: Trading at historical lows Figure 48: We expect a return to industry volume growth
Source: UBS, Datastream, MSCI, 1 year forward consensus Source: Euromonitor, UBS estimates
Furthermore, GGRM is dominant and overweight the full flavour machine (SKM FF) rolled segment (65% share - Figure 49) which has been driving industry growth (+10% in 2018). As a result, we expect it to take share in the market, with further growth supported by price increases.
Figure 49: Dominant in the fastest growing segment Figure 50: Sufficient cash flow to fund airport capex
Source: Euromonitor, UBS estimates, company commentary Source: UBS estimates, company data
Investors seem to be additionally concerned about its airport development. However, in our view, GGRM's strong cash flow generation (Figure 50) is more than sufficient to fund the capex (the timing of which management has control over) and DPS.
At 17x 2019E PE, the company trades in line with its five-year average PE. Strong earnings momentum should continue to support our Buy thesis. See "In a sweet full-flavour spot – initiate with a Buy" and "More out of each puff bodes well for GGRM" for more.
-80%
-60%
-40%
-20%
0%
20%
40%
60%
'09 '10 '11 '12 '13 '14 '15 '16 '17 '18 '19
Rel to ASEAN Consumer Staples 10 yr ave
Gudang Garam PE relative to ASEAN consumer staples (%)
-4%
-2%
0%
2%
4%
6%
8%
10%
2006
2007
2008
2009
2010
2011
2012
2013
2014
2015
2016
2017
2018
2019
2020
2021
2022
2023
Total growth
F'cast
Change in volumes (%)
0%
10%
20%
30%
40%
50%
60%
70%
80%
90%
100%
Total industry Full flavour machine rolled
HM Sampoerna Gudang Garam Djarum BAT Norojono Rest
Market shares (%)
GGRM is overweight faster growing segment
(4,000)
(2,000)
0
2,000
4,000
6,000
8,000
1997
1998
1999
2000
2001
2002
2003
2004
2005
2006
2007
2008
2009
2010
2011
2012
2013
2014
2015
2016
2017
2018
2019
E20
20E
2021
E
Capex (IDRbn) Free Cash Flow (IDRbn)
F'cast Cash flow / capex (IDRbn)
Permada Darmono [email protected]
+65 64953137
Global Tobacco 23 May 2019
18
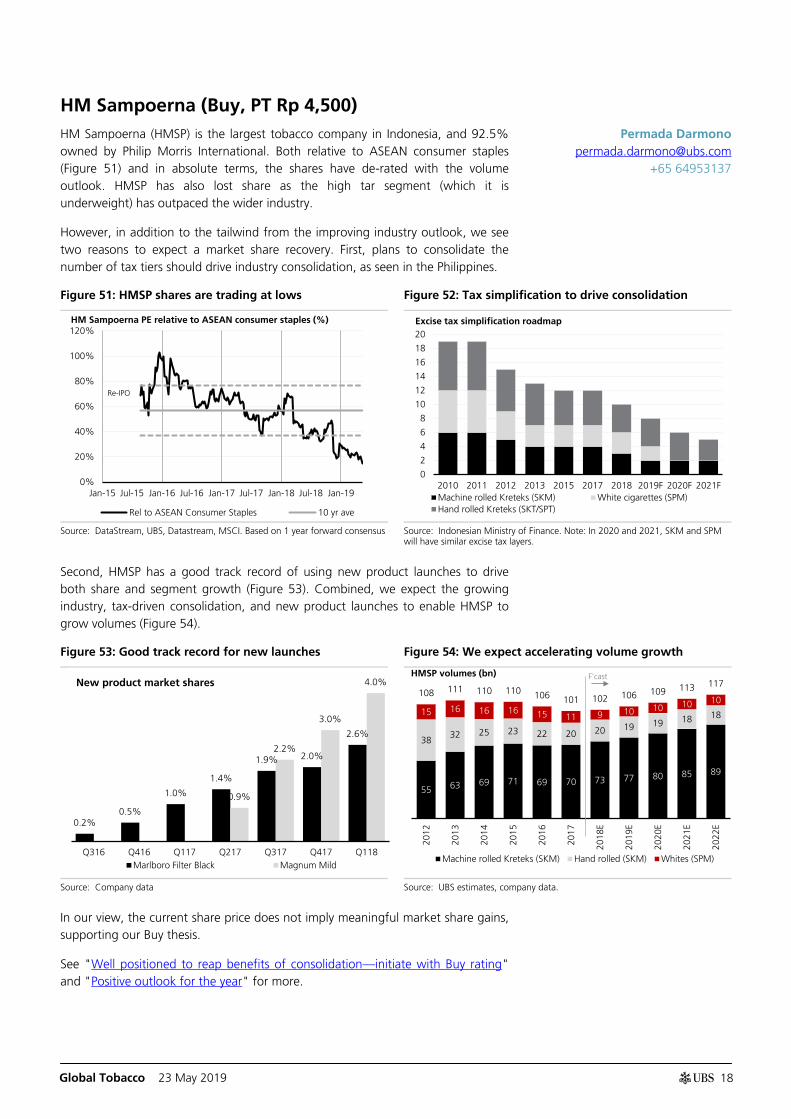
HM Sampoerna (Buy, PT Rp 4,500) HM Sampoerna (HMSP) is the largest tobacco company in Indonesia, and 92.5% owned by Philip Morris International. Both relative to ASEAN consumer staples (Figure 51) and in absolute terms, the shares have de-rated with the volume outlook. HMSP has also lost share as the high tar segment (which it is underweight) has outpaced the wider industry.
However, in addition to the tailwind from the improving industry outlook, we see two reasons to expect a market share recovery. First, plans to consolidate the number of tax tiers should drive industry consolidation, as seen in the Philippines.
Figure 51: HMSP shares are trading at lows Figure 52: Tax simplification to drive consolidation
Source: DataStream, UBS, Datastream, MSCI. Based on 1 year forward consensus Source: Indonesian Ministry of Finance. Note: In 2020 and 2021, SKM and SPM
will have similar excise tax layers.
Second, HMSP has a good track record of using new product launches to drive both share and segment growth (Figure 53). Combined, we expect the growing industry, tax-driven consolidation, and new product launches to enable HMSP to grow volumes (Figure 54).
Figure 53: Good track record for new launches Figure 54: We expect accelerating volume growth
Source: Company data Source: UBS estimates, company data.
In our view, the current share price does not imply meaningful market share gains, supporting our Buy thesis.
See "Well positioned to reap benefits of consolidation—initiate with Buy rating" and "Positive outlook for the year" for more.
0%
20%
40%
60%
80%
100%
120%
Jan-15 Jul-15 Jan-16 Jul-16 Jan-17 Jul-17 Jan-18 Jul-18 Jan-19
Rel to ASEAN Consumer Staples 10 yr ave
HM Sampoerna PE relative to ASEAN consumer staples (%)
Re-IPO
0
2
4
6
8
10
12
14
16
18
20
2010 2011 2012 2013 2015 2017 2018 2019F 2020F 2021FMachine rolled Kreteks (SKM) White cigarettes (SPM)Hand rolled Kreteks (SKT/SPT)
Excise tax simplification roadmap
0.2% 0.5%
1.0%
1.4%
1.9% 2.0%
2.6%
0.9%
2.2%
3.0%
4.0%
Q316 Q416 Q117 Q217 Q317 Q417 Q118Marlboro Filter Black Magnum Mild
New product market shares
55 63 69 71 69 70 73 77 80 85 89
38 32 25 23 22 20 20 19 19 18 18 15 16 16 16 15 11 9 10 10 10 10
108 111 110 110 106 101 102 106 109 113 117
2012
2013
2014
2015
2016
2017
2018
E
2019
E
2020
E
2021
E
2022
E
Machine rolled Kreteks (SKM) Hand rolled (SKM) Whites (SPM)
HMSP volumes (bn) F'cast
Permada Darmono [email protected]
+65 64953137
Global Tobacco 23 May 2019
19
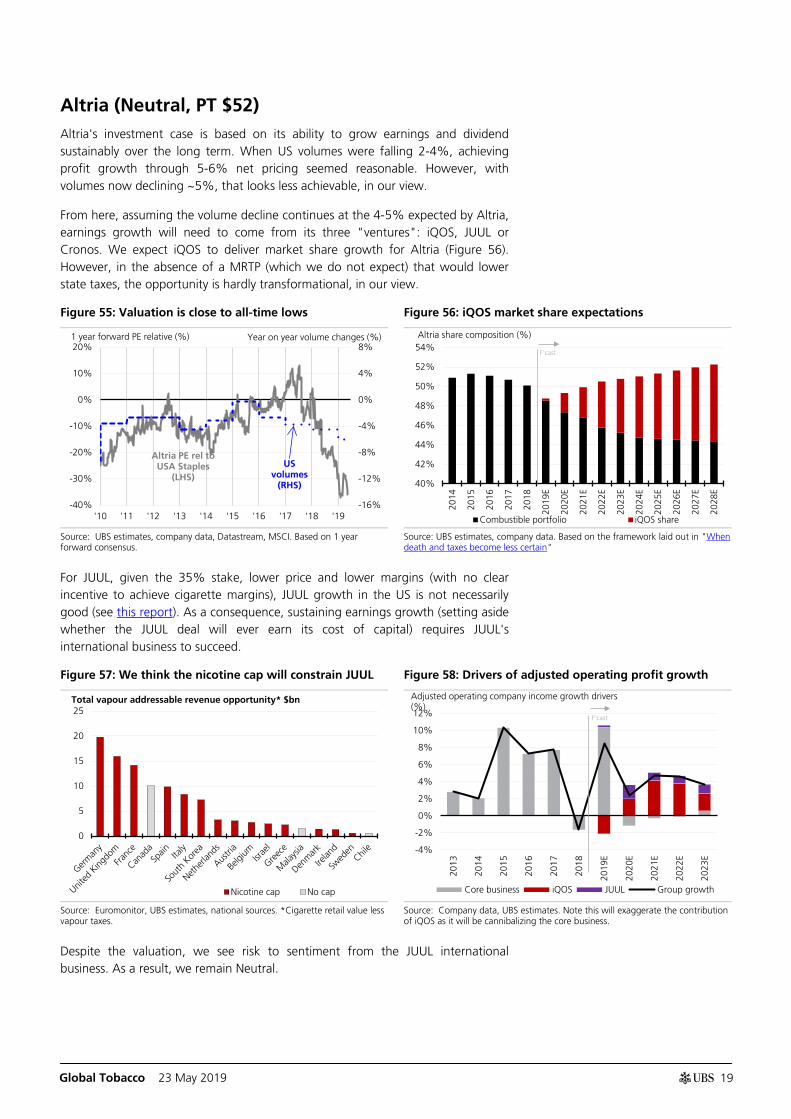
Altria (Neutral, PT $52) Altria's investment case is based on its ability to grow earnings and dividend sustainably over the long term. When US volumes were falling 2-4%, achieving profit growth through 5-6% net pricing seemed reasonable. However, with volumes now declining ~5%, that looks less achievable, in our view.
From here, assuming the volume decline continues at the 4-5% expected by Altria, earnings growth will need to come from its three "ventures": iQOS, JUUL or Cronos. We expect iQOS to deliver market share growth for Altria (Figure 56). However, in the absence of a MRTP (which we do not expect) that would lower state taxes, the opportunity is hardly transformational, in our view.
Figure 55: Valuation is close to all-time lows Figure 56: iQOS market share expectations
Source: UBS estimates, company data, Datastream, MSCI. Based on 1 year forward consensus.
Source: UBS estimates, company data. Based on the framework laid out in "When death and taxes become less certain"
For JUUL, given the 35% stake, lower price and lower margins (with no clear incentive to achieve cigarette margins), JUUL growth in the US is not necessarily good (see this report). As a consequence, sustaining earnings growth (setting aside whether the JUUL deal will ever earn its cost of capital) requires JUUL's international business to succeed.
Figure 57: We think the nicotine cap will constrain JUUL Figure 58: Drivers of adjusted operating profit growth
Source: Euromonitor, UBS estimates, national sources. *Cigarette retail value less vapour taxes.
Source: Company data, UBS estimates. Note this will exaggerate the contribution of iQOS as it will be cannibalizing the core business.
Despite the valuation, we see risk to sentiment from the JUUL international business. As a result, we remain Neutral.
-16%
-12%
-8%
-4%
0%
4%
8%
-40%
-30%
-20%
-10%
0%
10%
20%
'10 '11 '12 '13 '14 '15 '16 '17 '18 '19
1 year forward PE relative (%) Year on year volume changes (%)
Altria PE rel to USA Staples
(LHS) US
volumes (RHS) 40%
42%
44%
46%
48%
50%
52%
54%
2014
2015
2016
2017
2018
2019
E
2020
E
2021
E
2022
E
2023
E
2024
E
2025
E
2026
E
2027
E
2028
E
Combustible portfolio iQOS share
Altria share composition (%)
F'cast
0
5
10
15
20
25
Nicotine cap No cap
Total vapour addressable revenue opportunity* $bn
-4%
-2%
0%
2%
4%
6%
8%
10%
12%
2013
2014
2015
2016
2017
2018
2019
E
2020
E
2021
E
2022
E
2023
E
Core business iQOS JUUL Group growth
Adjusted operating company income growth drivers (%)
F'cast
Global Tobacco 23 May 2019
20
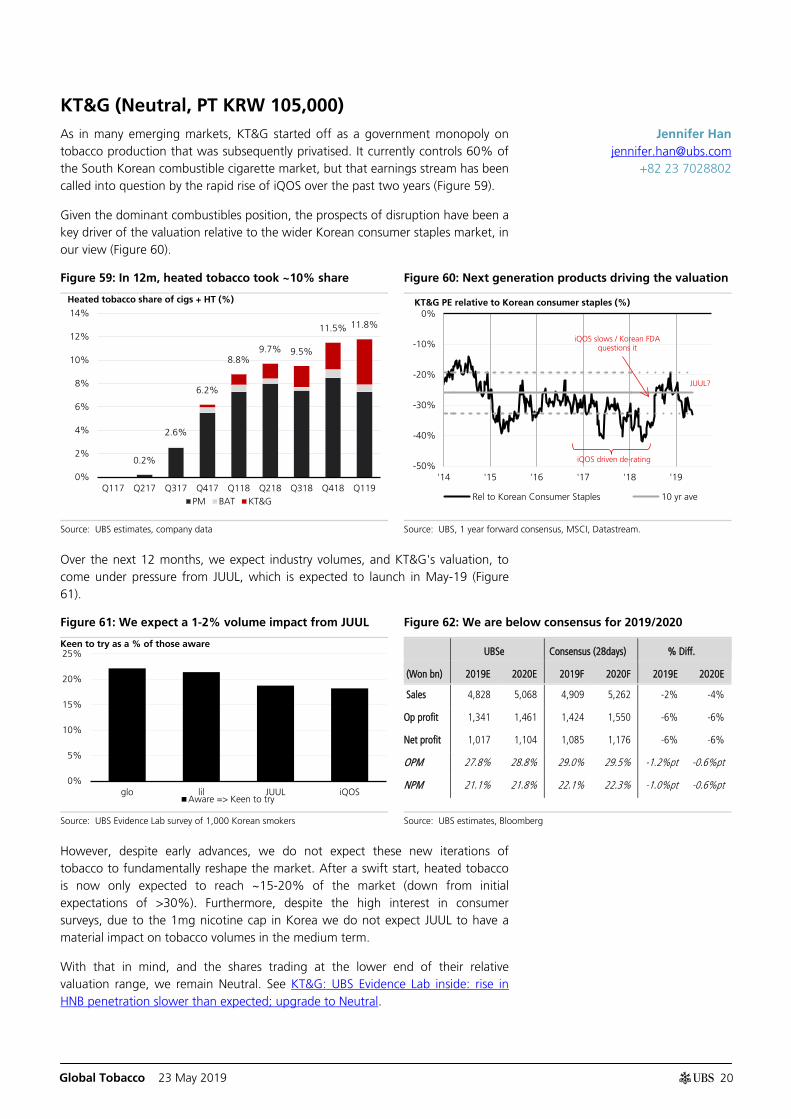
KT&G (Neutral, PT KRW 105,000) As in many emerging markets, KT&G started off as a government monopoly on tobacco production that was subsequently privatised. It currently controls 60% of the South Korean combustible cigarette market, but that earnings stream has been called into question by the rapid rise of iQOS over the past two years (Figure 59).
Given the dominant combustibles position, the prospects of disruption have been a key driver of the valuation relative to the wider Korean consumer staples market, in our view (Figure 60).
Figure 59: In 12m, heated tobacco took ~10% share Figure 60: Next generation products driving the valuation
Source: UBS estimates, company data Source: UBS, 1 year forward consensus, MSCI, Datastream.
Over the next 12 months, we expect industry volumes, and KT&G's valuation, to come under pressure from JUUL, which is expected to launch in May-19 (Figure 61).
Figure 61: We expect a 1-2% volume impact from JUUL Figure 62: We are below consensus for 2019/2020
UBSe Consensus (28days) % Diff.
(Won bn) 2019E 2020E 2019F 2020F 2019E 2020E
Sales 4,828 5,068 4,909 5,262 -2% -4%
Op profit 1,341 1,461 1,424 1,550 -6% -6%
Net profit 1,017 1,104 1,085 1,176 -6% -6%
OPM 27.8% 28.8% 29.0% 29.5% -1.2%pt -0.6%pt
NPM 21.1% 21.8% 22.1% 22.3% -1.0%pt -0.6%pt
Source: UBS Evidence Lab survey of 1,000 Korean smokers Source: UBS estimates, Bloomberg
However, despite early advances, we do not expect these new iterations of tobacco to fundamentally reshape the market. After a swift start, heated tobacco is now only expected to reach ~15-20% of the market (down from initial expectations of >30%). Furthermore, despite the high interest in consumer surveys, due to the 1mg nicotine cap in Korea we do not expect JUUL to have a material impact on tobacco volumes in the medium term.
With that in mind, and the shares trading at the lower end of their relative valuation range, we remain Neutral. See KT&G: UBS Evidence Lab inside: rise in HNB penetration slower than expected; upgrade to Neutral.
0.2%
2.6%
6.2%
8.8% 9.7% 9.5%
11.5% 11.8%
0%
2%
4%
6%
8%
10%
12%
14%
Q117 Q217 Q317 Q417 Q118 Q218 Q318 Q418 Q119PM BAT KT&G
Heated tobacco share of cigs + HT (%)
-50%
-40%
-30%
-20%
-10%
0%
'14 '15 '16 '17 '18 '19
Rel to Korean Consumer Staples 10 yr ave
KT&G PE relative to Korean consumer staples (%)
iQOS driven de-rating
iQOS slows / Korean FDA questions it
JUUL?
0%
5%
10%
15%
20%
25%
glo lil JUUL iQOSAware => Keen to try
Keen to try as a % of those aware
Jennifer Han [email protected]
+82 23 7028802
Global Tobacco 23 May 2019
21
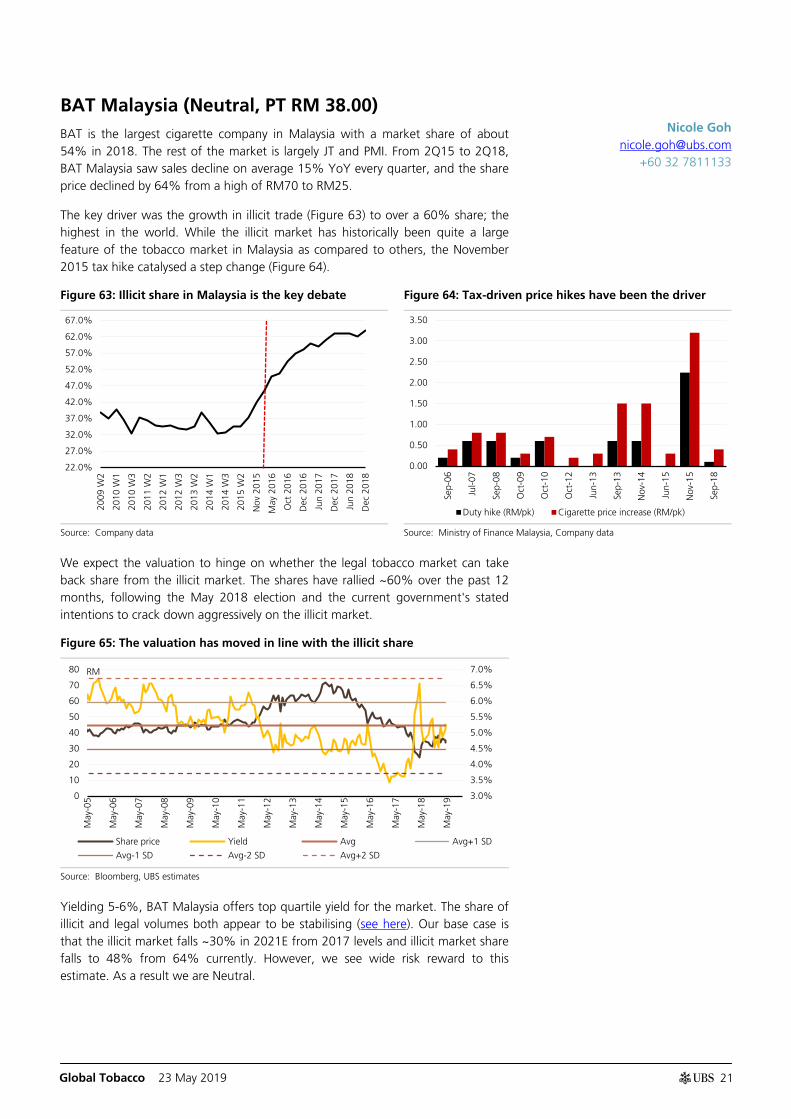
BAT Malaysia (Neutral, PT RM 38.00) BAT is the largest cigarette company in Malaysia with a market share of about 54% in 2018. The rest of the market is largely JT and PMI. From 2Q15 to 2Q18, BAT Malaysia saw sales decline on average 15% YoY every quarter, and the share price declined by 64% from a high of RM70 to RM25.
The key driver was the growth in illicit trade (Figure 63) to over a 60% share; the highest in the world. While the illicit market has historically been quite a large feature of the tobacco market in Malaysia as compared to others, the November 2015 tax hike catalysed a step change (Figure 64).
Figure 63: Illicit share in Malaysia is the key debate Figure 64: Tax-driven price hikes have been the driver
Source: Company data Source: Ministry of Finance Malaysia, Company data
We expect the valuation to hinge on whether the legal tobacco market can take back share from the illicit market. The shares have rallied ~60% over the past 12 months, following the May 2018 election and the current government's stated intentions to crack down aggressively on the illicit market.
Figure 65: The valuation has moved in line with the illicit share
Source: Bloomberg, UBS estimates
Yielding 5-6%, BAT Malaysia offers top quartile yield for the market. The share of illicit and legal volumes both appear to be stabilising (see here). Our base case is that the illicit market falls ~30% in 2021E from 2017 levels and illicit market share falls to 48% from 64% currently. However, we see wide risk reward to this estimate. As a result we are Neutral.
22.0%
27.0%
32.0%
37.0%
42.0%
47.0%
52.0%
57.0%
62.0%
67.0%
2009
W2
2010
W1
2010
W3
2011
W2
2012
W1
2012
W3
2013
W2
2014
W1
2014
W3
2015
W2
Nov
201
5
May
201
6
Oct
201
6
Dec
201
6
Jun
2017
Dec
201
7
Jun
2018
Dec
201
8
0.00
0.50
1.00
1.50
2.00
2.50
3.00
3.50
Sep-
06
Jul-0
7
Sep-
08
Oct
-09
Oct
-10
Oct
-12
Jun-
13
Sep-
13
Nov
-14
Jun-
15
Nov
-15
Sep-
18
Duty hike (RM/pk) Cigarette price increase (RM/pk)
3.0%
3.5%
4.0%
4.5%
5.0%
5.5%
6.0%
6.5%
7.0%
0
10
20
30
40
50
60
70
80
May
-05
May
-06
May
-07
May
-08
May
-09
May
-10
May
-11
May
-12
May
-13
May
-14
May
-15
May
-16
May
-17
May
-18
May
-19
Share price Yield Avg Avg+1 SD
Avg-1 SD Avg-2 SD Avg+2 SD
RM
Nicole Goh [email protected]
+60 32 7811133
Global Tobacco 23 May 2019
22
Building a global tobacco model How to approach the globally diversified tobacco companies?
The tobacco majors (BAT, IMB, PMI, and JT) are all highly diversified. With the exception of the US (which we cover in detail later in this note), no single market is sufficient to materially move the needle over time.
Furthermore, while there have been efforts to internationalise anti-smoking efforts, the legislative and tax context remain highly fragmented. Finally, the large changes in excise tax (which can lead to doubling of pack prices) can inject volatility into the core business on a year on year basis.
Estimate each of the key markets
We have built an explicit model for cigarette (and heated tobacco) consumption for the top 40 tobacco markets (shown overleaf). We cover each element in detail in the "Global Outlook Detail" section. The key inputs (which we forecast) are:
(1) Macro variables: factors such as population, GDP growth, inflation and currency depreciation. In our model we generally use UBS estimates and consensus views out to 2023.
(2) Prevalence: taken as a % of population over 15.
(3) Sticks per smoker: Our volume numbers are based on industry and company data. Where there are discrepancies, we defer to company data.
(4) Taxes per pack: our estimate of average tax per pack. This is based on industry data, as well as national sources (for instance, government websites).
(5) Distribution margin: unless we have information to indicate otherwise (for example Japan), we assume ~8% distribution take.
(6) Cigarette pack prices: based on a mixture of industry data, surveys, and tobacco inflation indexes.
The output of the above is a revenue number for a given market. There is also a heated tobacco overlay.
Important caveats
(1) Market shares: we use third-party industry data for market shares. We observe that it on average understates the market share of the tobacco companies when compared to national sources of disclosed shares.
(2) Company coverage: the top 40 (39 ex China) markets we cover represent ~60-80% of the international tobacco company volumes.
(3) Prices are market averages: our revenue estimates are based on market averages, but shares are based on volumes.
(4) Net revenue is an estimate: at a group level, we can square our estimates with company data (and divisionally for PMI), allowing for volume differences.
We have taken a view on the 40 largest tobacco markets globally
Glo
bal To
bacco
23 May 2019
23
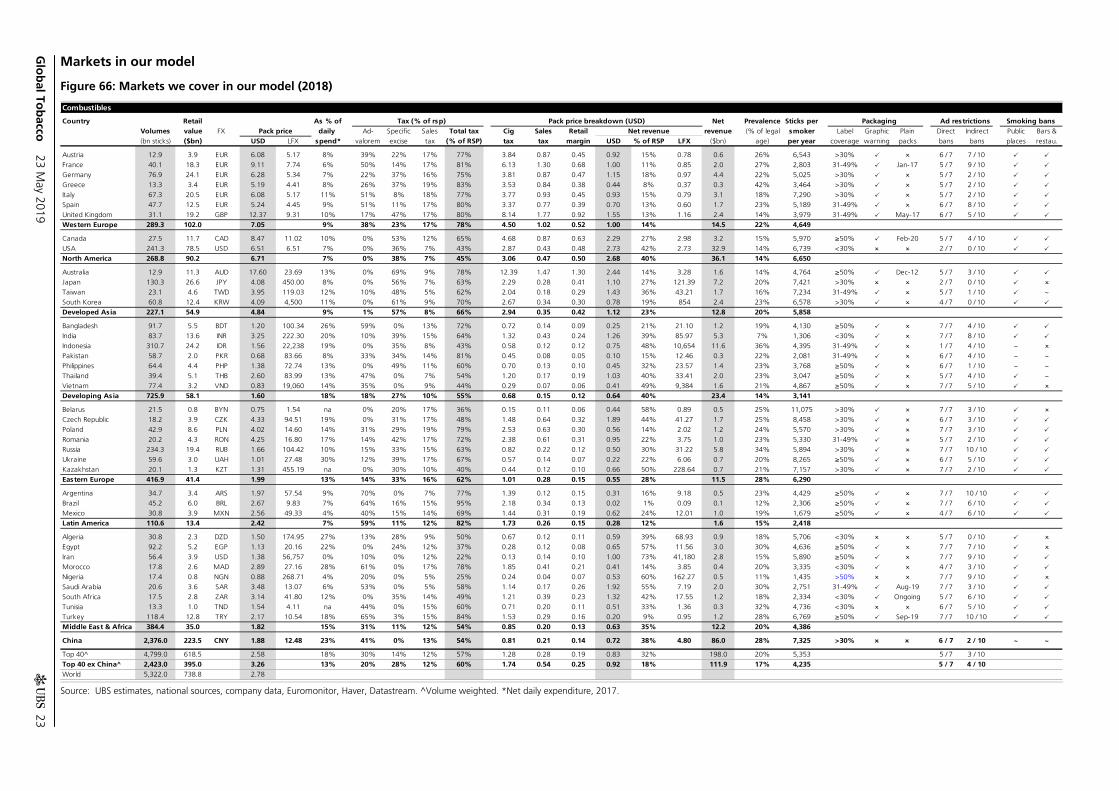
Markets in our model
Figure 66: Markets we cover in our model (2018)
Source: UBS estimates, national sources, company data, Euromonitor, Haver, Datastream. ^Volume weighted. *Net daily expenditure, 2017.
Combustibles
Country Retail As % of Tax (% of rsp) Pack price breakdown (USD) Net Prevalence Sticks per Packaging Ad restrictions Smoking bansVolumes value FX Pack price daily Ad- Specific Sales Total tax Cig Sales Retail Net revenue revenue (% of legal smoker Label Graphic Plain Direct Indirect Public Bars &
(bn sticks) ($bn) USD LFX spend* valorem excise tax (% of RSP) tax tax margin USD % of RSP LFX ($bn) age) per year coverage warning packs bans bans places restau.
Austria 12.9 3.9 EUR 6.08 5.17 8% 39% 22% 17% 77% 3.84 0.87 0.45 0.92 15% 0.78 0.6 26% 6,543 >30% 6 / 7 7 / 10
France 40.1 18.3 EUR 9.11 7.74 6% 50% 14% 17% 81% 6.13 1.30 0.68 1.00 11% 0.85 2.0 27% 2,803 31-49% Jan-17 5 / 7 9 / 10
Germany 76.9 24.1 EUR 6.28 5.34 7% 22% 37% 16% 75% 3.81 0.87 0.47 1.15 18% 0.97 4.4 22% 5,025 >30% 5 / 7 2 / 10
Greece 13.3 3.4 EUR 5.19 4.41 8% 26% 37% 19% 83% 3.53 0.84 0.38 0.44 8% 0.37 0.3 42% 3,464 >30% 5 / 7 2 / 10
Italy 67.3 20.5 EUR 6.08 5.17 11% 51% 8% 18% 77% 3.77 0.93 0.45 0.93 15% 0.79 3.1 18% 7,290 >30% 5 / 7 2 / 10
Spain 47.7 12.5 EUR 5.24 4.45 9% 51% 11% 17% 80% 3.37 0.77 0.39 0.70 13% 0.60 1.7 23% 5,189 31-49% 6 / 7 8 / 10
United Kingdom 31.1 19.2 GBP 12.37 9.31 10% 17% 47% 17% 80% 8.14 1.77 0.92 1.55 13% 1.16 2.4 14% 3,979 31-49% May-17 6 / 7 5 / 10
Western Europe 289.3 102.0 7.05 9% 38% 23% 17% 78% 4.50 1.02 0.52 1.00 14% 14.5 22% 4,649
Canada 27.5 11.7 CAD 8.47 11.02 10% 0% 53% 12% 65% 4.68 0.87 0.63 2.29 27% 2.98 3.2 15% 5,970 ≥50% Feb-20 5 / 7 4 / 10
USA 241.3 78.5 USD 6.51 6.51 7% 0% 36% 7% 43% 2.87 0.43 0.48 2.73 42% 2.73 32.9 14% 6,739 <30% 2 / 7 0 / 10
North America 268.8 90.2 6.71 7% 0% 38% 7% 45% 3.06 0.47 0.50 2.68 40% 36.1 14% 6,650
Australia 12.9 11.3 AUD 17.60 23.69 13% 0% 69% 9% 78% 12.39 1.47 1.30 2.44 14% 3.28 1.6 14% 4,764 ≥50% Dec-12 5 / 7 3 / 10
Japan 130.3 26.6 JPY 4.08 450.00 8% 0% 56% 7% 63% 2.29 0.28 0.41 1.10 27% 121.39 7.2 20% 7,421 >30% 2 / 7 0 / 10
Taiwan 23.1 4.6 TWD 3.95 119.03 12% 10% 48% 5% 62% 2.04 0.18 0.29 1.43 36% 43.21 1.7 16% 7,234 31-49% 5 / 7 1 / 10 ~
South Korea 60.8 12.4 KRW 4.09 4,500 11% 0% 61% 9% 70% 2.67 0.34 0.30 0.78 19% 854 2.4 23% 6,578 >30% 4 / 7 0 / 10
Developed Asia 227.1 54.9 4.84 9% 1% 57% 8% 66% 2.94 0.35 0.42 1.12 23% 12.8 20% 5,858
Bangladesh 91.7 5.5 BDT 1.20 100.34 26% 59% 0% 13% 72% 0.72 0.14 0.09 0.25 21% 21.10 1.2 19% 4,130 ≥50% 7 / 7 4 / 10
India 83.7 13.6 INR 3.25 222.30 20% 10% 39% 15% 64% 1.32 0.43 0.24 1.26 39% 85.97 5.3 7% 1,306 <30% 7 / 7 8 / 10
Indonesia 310.7 24.2 IDR 1.56 22,238 19% 0% 35% 8% 43% 0.58 0.12 0.12 0.75 48% 10,654 11.6 36% 4,395 31-49% 1 / 7 4 / 10 ~
Pakistan 58.7 2.0 PKR 0.68 83.66 8% 33% 34% 14% 81% 0.45 0.08 0.05 0.10 15% 12.46 0.3 22% 2,081 31-49% 6 / 7 4 / 10 ~ ~
Philippines 64.4 4.4 PHP 1.38 72.74 13% 0% 49% 11% 60% 0.70 0.13 0.10 0.45 32% 23.57 1.4 23% 3,768 ≥50% 6 / 7 1 / 10 ~ ~
Thailand 39.4 5.1 THB 2.60 83.99 13% 47% 0% 7% 54% 1.20 0.17 0.19 1.03 40% 33.41 2.0 23% 3,047 ≥50% 5 / 7 4 / 10 ~
Vietnam 77.4 3.2 VND 0.83 19,060 14% 35% 0% 9% 44% 0.29 0.07 0.06 0.41 49% 9,384 1.6 21% 4,867 ≥50% 7 / 7 5 / 10
Developing Asia 725.9 58.1 1.60 18% 18% 27% 10% 55% 0.68 0.15 0.12 0.64 40% 23.4 14% 3,141
Belarus 21.5 0.8 BYN 0.75 1.54 na 0% 20% 17% 36% 0.15 0.11 0.06 0.44 58% 0.89 0.5 25% 11,075 >30% 7 / 7 3 / 10
Czech Republic 18.2 3.9 CZK 4.33 94.51 19% 0% 31% 17% 48% 1.48 0.64 0.32 1.89 44% 41.27 1.7 25% 8,458 >30% 6 / 7 3 / 10
Poland 42.9 8.6 PLN 4.02 14.60 14% 31% 29% 19% 79% 2.53 0.63 0.30 0.56 14% 2.02 1.2 24% 5,570 >30% 7 / 7 3 / 10
Romania 20.2 4.3 RON 4.25 16.80 17% 14% 42% 17% 72% 2.38 0.61 0.31 0.95 22% 3.75 1.0 23% 5,330 31-49% 5 / 7 2 / 10
Russia 234.3 19.4 RUB 1.66 104.42 10% 15% 33% 15% 63% 0.82 0.22 0.12 0.50 30% 31.22 5.8 34% 5,894 >30% 7 / 7 10 / 10
Ukraine 59.6 3.0 UAH 1.01 27.48 30% 12% 39% 17% 67% 0.57 0.14 0.07 0.22 22% 6.06 0.7 20% 8,265 ≥50% 6 / 7 5 / 10
Kazakhstan 20.1 1.3 KZT 1.31 455.19 na 0% 30% 10% 40% 0.44 0.12 0.10 0.66 50% 228.64 0.7 21% 7,157 >30% 7 / 7 2 / 10
Eastern Europe 416.9 41.4 1.99 13% 14% 33% 16% 62% 1.01 0.28 0.15 0.55 28% 11.5 28% 6,290
Argentina 34.7 3.4 ARS 1.97 57.54 9% 70% 0% 7% 77% 1.39 0.12 0.15 0.31 16% 9.18 0.5 23% 4,429 ≥50% 7 / 7 10 / 10
Brazil 45.2 6.0 BRL 2.67 9.83 7% 64% 16% 15% 95% 2.18 0.34 0.13 0.02 1% 0.09 0.1 12% 2,306 ≥50% 7 / 7 6 / 10
Mexico 30.8 3.9 MXN 2.56 49.33 4% 40% 15% 14% 69% 1.44 0.31 0.19 0.62 24% 12.01 1.0 19% 1,679 ≥50% 4 / 7 6 / 10
Latin America 110.6 13.4 2.42 7% 59% 11% 12% 82% 1.73 0.26 0.15 0.28 12% 1.6 15% 2,418
Algeria 30.8 2.3 DZD 1.50 174.95 27% 13% 28% 9% 50% 0.67 0.12 0.11 0.59 39% 68.93 0.9 18% 5,706 <30% 5 / 7 0 / 10
Egypt 92.2 5.2 EGP 1.13 20.16 22% 0% 24% 12% 37% 0.28 0.12 0.08 0.65 57% 11.56 3.0 30% 4,636 ≥50% 7 / 7 7 / 10
Iran 56.4 3.9 USD 1.38 56,757 0% 10% 0% 12% 22% 0.13 0.14 0.10 1.00 73% 41,180 2.8 15% 5,890 ≥50% 7 / 7 9 / 10
Morocco 17.8 2.6 MAD 2.89 27.16 28% 61% 0% 17% 78% 1.85 0.41 0.21 0.41 14% 3.85 0.4 20% 3,335 <30% 4 / 7 3 / 10
Nigeria 17.4 0.8 NGN 0.88 268.71 4% 20% 0% 5% 25% 0.24 0.04 0.07 0.53 60% 162.27 0.5 11% 1,435 >50% 7 / 7 9 / 10
Saudi Arabia 20.6 3.6 SAR 3.48 13.07 6% 53% 0% 5% 58% 1.14 0.17 0.26 1.92 55% 7.19 2.0 30% 2,751 31-49% Aug-19 7 / 7 3 / 10
South Africa 17.5 2.8 ZAR 3.14 41.80 12% 0% 35% 14% 49% 1.21 0.39 0.23 1.32 42% 17.55 1.2 18% 2,334 <30% Ongoing 5 / 7 6 / 10
Tunisia 13.3 1.0 TND 1.54 4.11 na 44% 0% 15% 60% 0.71 0.20 0.11 0.51 33% 1.36 0.3 32% 4,736 <30% 6 / 7 5 / 10
Turkey 118.4 12.8 TRY 2.17 10.54 18% 65% 3% 15% 84% 1.53 0.29 0.16 0.20 9% 0.95 1.2 28% 6,769 ≥50% Sep-19 7 / 7 10 / 10
Middle East & Africa 384.4 35.0 1.82 15% 31% 11% 12% 54% 0.85 0.20 0.13 0.63 35% 12.2 20% 4,386
China 2,376.0 223.5 CNY 1.88 12.48 23% 41% 0% 13% 54% 0.81 0.21 0.14 0.72 38% 4.80 86.0 28% 7,325 >30% 6 / 7 2 / 10 ~ ~
Top 40^ 4,799.0 618.5 2.58 18% 30% 14% 12% 57% 1.28 0.28 0.19 0.83 32% 198.0 20% 5,353 5 / 7 3 / 10
Top 40 ex China^ 2,423.0 395.0 3.26 13% 20% 28% 12% 60% 1.74 0.54 0.25 0.92 18% 111.9 17% 4,235 5 / 7 4 / 10 World 5,322.0 738.8 2.78
Global Tobacco 23 May 2019
24
Global tobacco drivers In this section we lay out the drivers of recent global volume and revenue declines, and the prospects going forward.
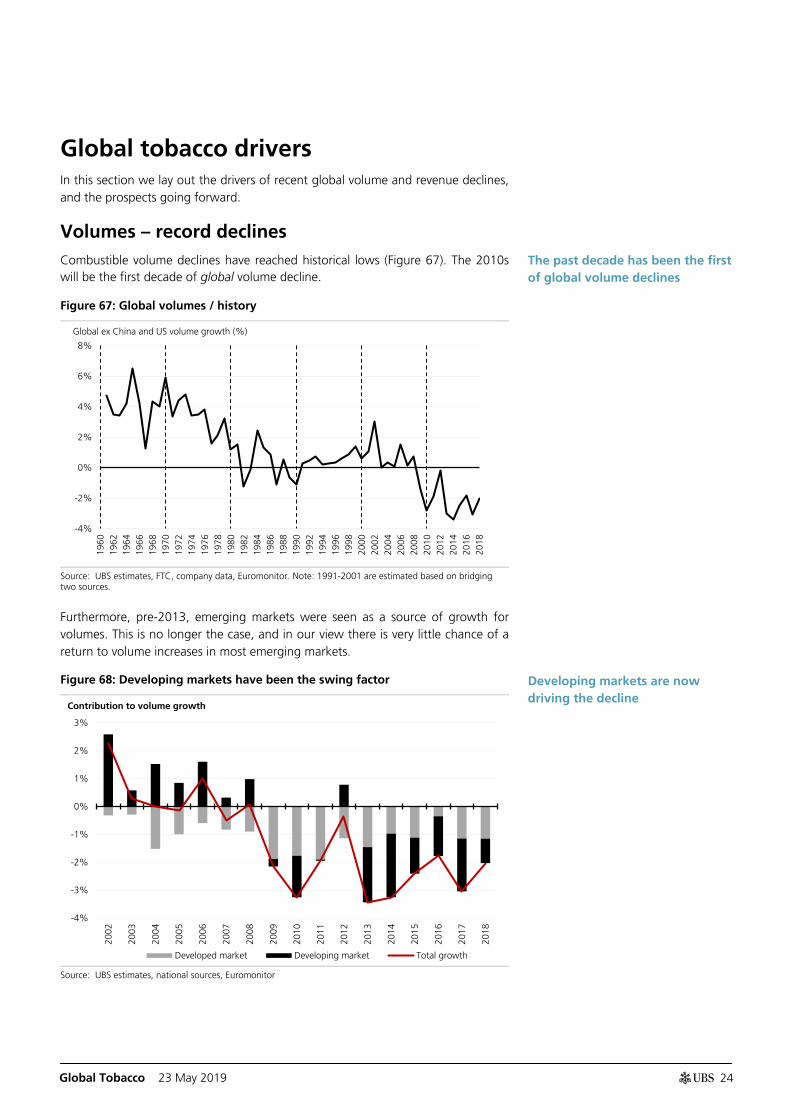
Volumes – record declines Combustible volume declines have reached historical lows (Figure 67). The 2010s will be the first decade of global volume decline.
Figure 67: Global volumes / history
Source: UBS estimates, FTC, company data, Euromonitor. Note: 1991-2001 are estimated based on bridging two sources.
Furthermore, pre-2013, emerging markets were seen as a source of growth for volumes. This is no longer the case, and in our view there is very little chance of a return to volume increases in most emerging markets.
Figure 68: Developing markets have been the swing factor
Source: UBS estimates, national sources, Euromonitor
-4%
-2%
0%
2%
4%
6%
8%
1960
1962
1964
1966
1968
1970
1972
1974
1976
1978
1980
1982
1984
1986
1988
1990
1992
1994
1996
1998
2000
2002
2004
2006
2008
2010
2012
2014
2016
2018
Global ex China and US volume growth (%)
-4%
-3%
-2%
-1%
0%
1%
2%
3%
2002
2003
2004
2005
2006
2007
2008
2009
2010
2011
2012
2013
2014
2015
2016
2017
2018
Developed market Developing market Total growth
Contribution to volume growth
The past decade has been the first of global volume declines
Developing markets are now driving the decline
Global Tobacco 23 May 2019
25
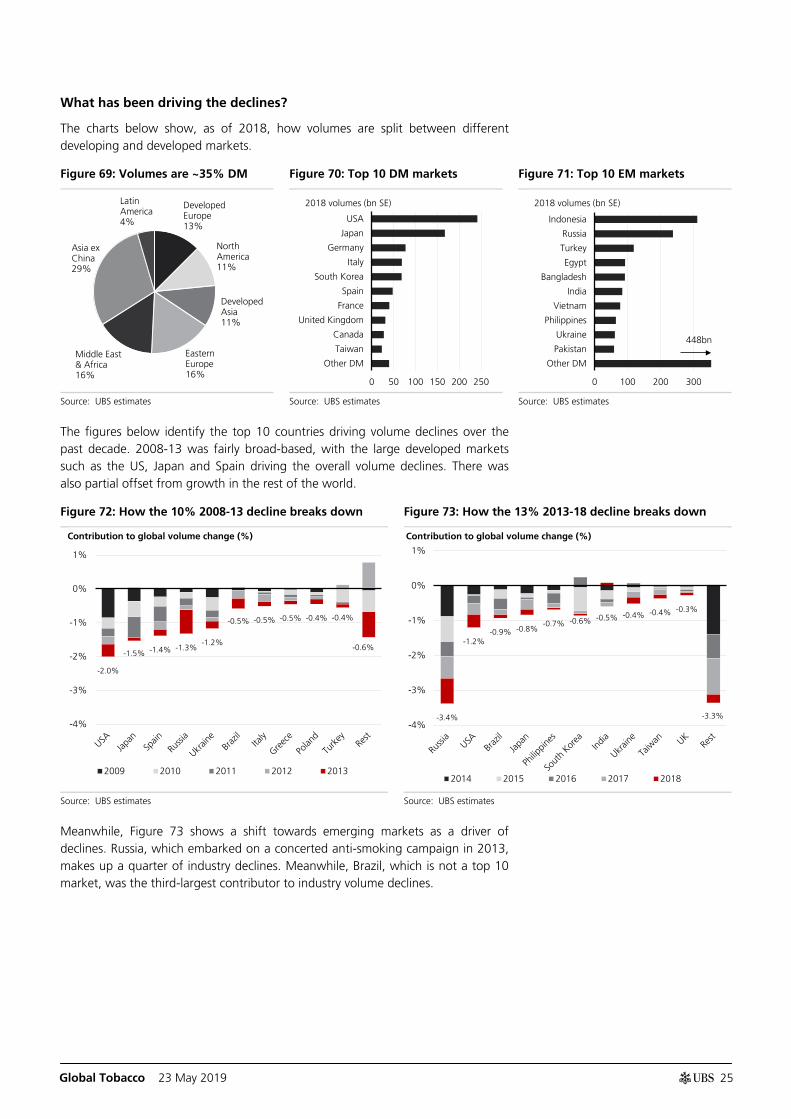
What has been driving the declines?
The charts below show, as of 2018, how volumes are split between different developing and developed markets.
Figure 69: Volumes are ~35% DM Figure 70: Top 10 DM markets Figure 71: Top 10 EM markets
Source: UBS estimates Source: UBS estimates Source: UBS estimates
The figures below identify the top 10 countries driving volume declines over the past decade. 2008-13 was fairly broad-based, with the large developed markets such as the US, Japan and Spain driving the overall volume declines. There was also partial offset from growth in the rest of the world.
Figure 72: How the 10% 2008-13 decline breaks down Figure 73: How the 13% 2013-18 decline breaks down
Source: UBS estimates Source: UBS estimates
Meanwhile, Figure 73 shows a shift towards emerging markets as a driver of declines. Russia, which embarked on a concerted anti-smoking campaign in 2013, makes up a quarter of industry declines. Meanwhile, Brazil, which is not a top 10 market, was the third-largest contributor to industry volume declines.
Developed Europe 13%
North America 11%
Developed Asia 11%
Eastern Europe 16%
Middle East & Africa 16%
Asia ex China 29%
Latin America 4%
0 50 100 150 200 250
USA
Japan
Germany
Italy
South Korea
Spain
France
United Kingdom
Canada
Taiwan
Other DM
2018 volumes (bn SE)
0 100 200 300
Indonesia
Russia
Turkey
Egypt
Bangladesh
India
Vietnam
Philippines
Ukraine
Pakistan
Other DM
2018 volumes (bn SE)
448bn
-2.0%
-1.5% -1.4% -1.3% -1.2%
-0.5% -0.5% -0.5% -0.4% -0.4%
-0.6%
-4%
-3%
-2%
-1%
0%
1%
2009 2010 2011 2012 2013
Contribution to global volume change (%)
-3.4%
-1.2% -0.9% -0.8%
-0.7% -0.6% -0.5% -0.4% -0.4% -0.3%
-3.3% -4%
-3%
-2%
-1%
0%
1%
2014 2015 2016 2017 2018
Contribution to global volume change (%)
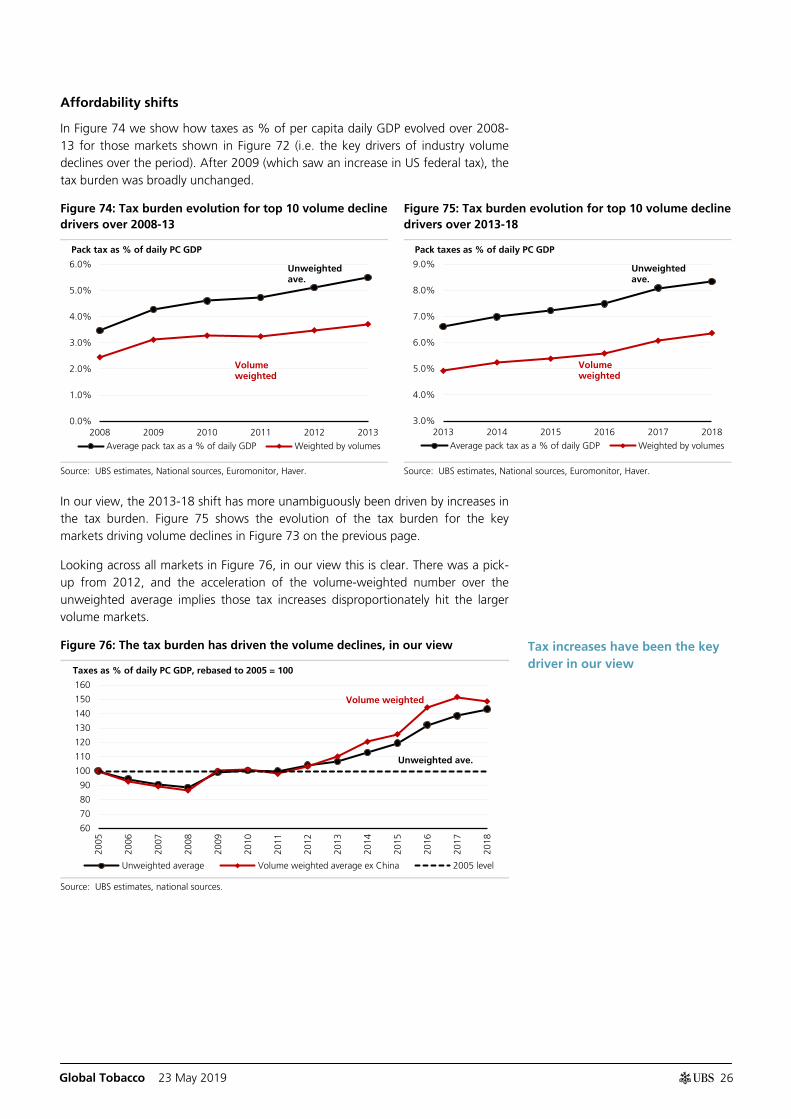
Global Tobacco 23 May 2019
26
Affordability shifts
In Figure 74 we show how taxes as % of per capita daily GDP evolved over 2008-13 for those markets shown in Figure 72 (i.e. the key drivers of industry volume declines over the period). After 2009 (which saw an increase in US federal tax), the tax burden was broadly unchanged.
Figure 74: Tax burden evolution for top 10 volume decline drivers over 2008-13
Figure 75: Tax burden evolution for top 10 volume decline drivers over 2013-18
Source: UBS estimates, National sources, Euromonitor, Haver. Source: UBS estimates, National sources, Euromonitor, Haver.
In our view, the 2013-18 shift has more unambiguously been driven by increases in the tax burden. Figure 75 shows the evolution of the tax burden for the key markets driving volume declines in Figure 73 on the previous page.
Looking across all markets in Figure 76, in our view this is clear. There was a pick-up from 2012, and the acceleration of the volume-weighted number over the unweighted average implies those tax increases disproportionately hit the larger volume markets.
Figure 76: The tax burden has driven the volume declines, in our view
Source: UBS estimates, national sources.
0.0%
1.0%
2.0%
3.0%
4.0%
5.0%
6.0%
2008 2009 2010 2011 2012 2013
Average pack tax as a % of daily GDP Weighted by volumes
Pack tax as % of daily PC GDP
Unweighted ave.
Volume weighted
3.0%
4.0%
5.0%
6.0%
7.0%
8.0%
9.0%
2013 2014 2015 2016 2017 2018
Average pack tax as a % of daily GDP Weighted by volumes
Pack taxes as % of daily PC GDP
Unweighted ave.
Volume weighted
60
70
80
90
100
110
120
130
140
150
160
2005
2006
2007
2008
2009
2010
2011
2012
2013
2014
2015
2016
2017
2018
Unweighted average Volume weighted average ex China 2005 level
Taxes as % of daily PC GDP, rebased to 2005 = 100
Unweighted ave.
Volume weighted
Tax increases have been the key driver in our view
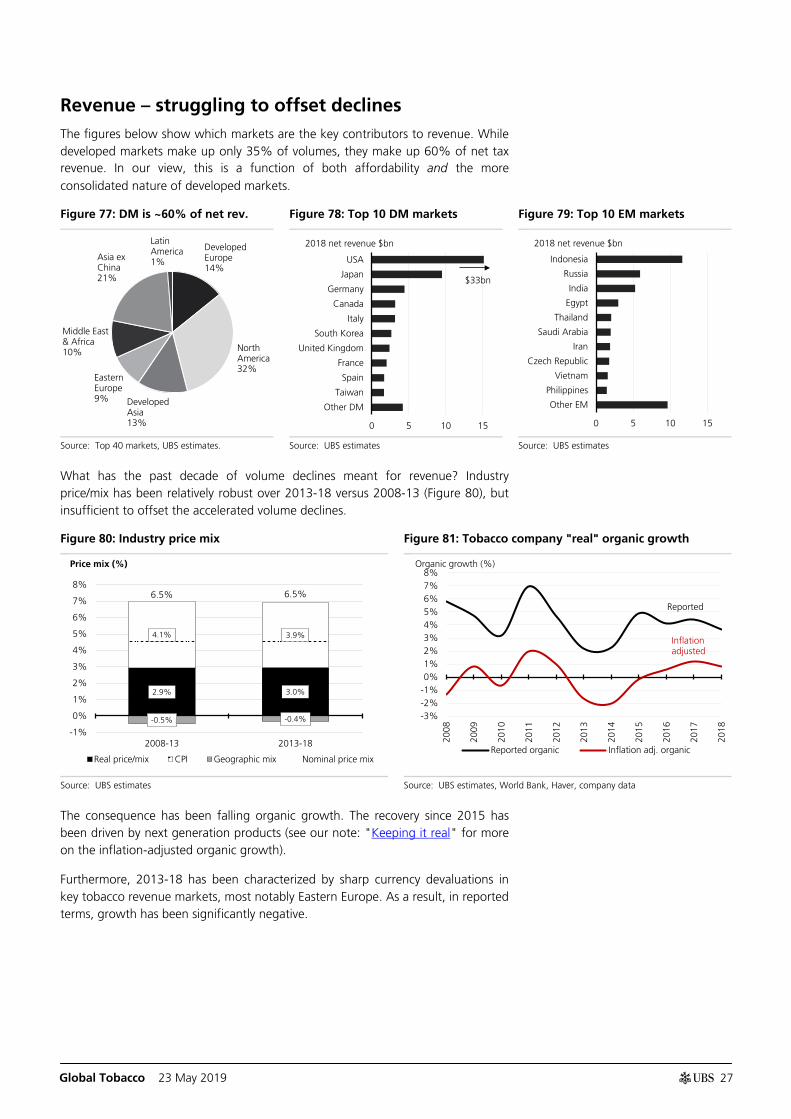
Global Tobacco 23 May 2019
27
Revenue – struggling to offset declines The figures below show which markets are the key contributors to revenue. While developed markets make up only 35% of volumes, they make up 60% of net tax revenue. In our view, this is a function of both affordability and the more consolidated nature of developed markets.
Figure 77: DM is ~60% of net rev. Figure 78: Top 10 DM markets Figure 79: Top 10 EM markets
Source: Top 40 markets, UBS estimates. Source: UBS estimates Source: UBS estimates
What has the past decade of volume declines meant for revenue? Industry price/mix has been relatively robust over 2013-18 versus 2008-13 (Figure 80), but insufficient to offset the accelerated volume declines.
Figure 80: Industry price mix Figure 81: Tobacco company "real" organic growth
Source: UBS estimates Source: UBS estimates, World Bank, Haver, company data
The consequence has been falling organic growth. The recovery since 2015 has been driven by next generation products (see our note: "Keeping it real" for more on the inflation-adjusted organic growth).
Furthermore, 2013-18 has been characterized by sharp currency devaluations in key tobacco revenue markets, most notably Eastern Europe. As a result, in reported terms, growth has been significantly negative.
Developed Europe 14%
North America 32%
Developed Asia 13%
Eastern Europe 9%
Middle East & Africa 10%
Asia ex China 21%
Latin America 1%
0 5 10 15
USA
Japan
Germany
Canada
Italy
South Korea
United Kingdom
France
Spain
Taiwan
Other DM
2018 net revenue $bn
$33bn
0 5 10 15
Indonesia
Russia
India
Egypt
Thailand
Saudi Arabia
Iran
Czech Republic
Vietnam
Philippines
Other EM
2018 net revenue $bn
2.9% 3.0%
4.1% 3.9%
-0.5% -0.4%
6.5% 6.5%
-1%
0%
1%
2%
3%
4%
5%
6%
7%
8%
2008-13 2013-18
Real price/mix CPI Geographic mix Nominal price mix
Price mix (%)
-3%-2%-1%0%1%2%3%4%5%6%7%8%
2008
2009
2010
2011
2012
2013
2014
2015
2016
2017
2018
Reported organic Inflation adj. organic
Organic growth (%)
Reported
Inflation adjusted
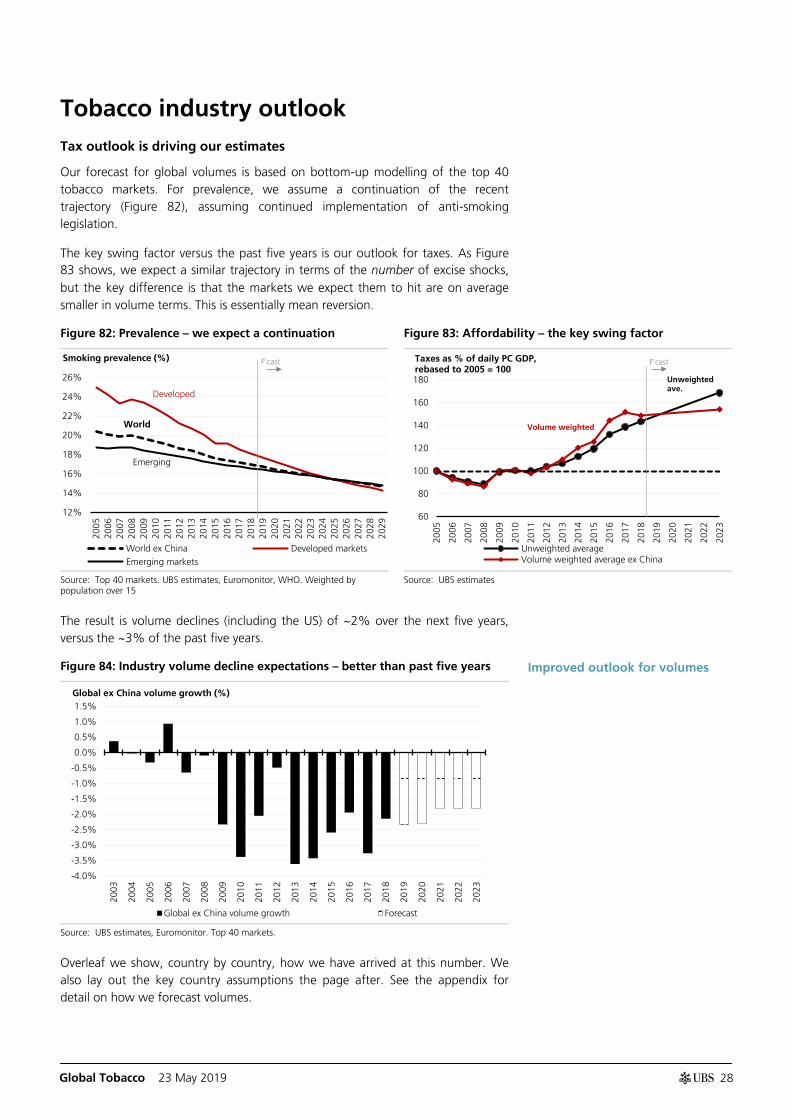
Global Tobacco 23 May 2019
28
Tobacco industry outlook Tax outlook is driving our estimates
Our forecast for global volumes is based on bottom-up modelling of the top 40 tobacco markets. For prevalence, we assume a continuation of the recent trajectory (Figure 82), assuming continued implementation of anti-smoking legislation.
The key swing factor versus the past five years is our outlook for taxes. As Figure 83 shows, we expect a similar trajectory in terms of the number of excise shocks, but the key difference is that the markets we expect them to hit are on average smaller in volume terms. This is essentially mean reversion.
Figure 82: Prevalence – we expect a continuation Figure 83: Affordability – the key swing factor
Source: Top 40 markets. UBS estimates, Euromonitor, WHO. Weighted by population over 15
Source: UBS estimates
The result is volume declines (including the US) of ~2% over the next five years, versus the ~3% of the past five years.
Figure 84: Industry volume decline expectations – better than past five years
Source: UBS estimates, Euromonitor. Top 40 markets.
Overleaf we show, country by country, how we have arrived at this number. We also lay out the key country assumptions the page after. See the appendix for detail on how we forecast volumes.
12%
14%
16%
18%
20%
22%
24%
26%
2005
2006
2007
2008
2009
2010
2011
2012
2013
2014
2015
2016
2017
2018
2019
2020
2021
2022
2023
2024
2025
2026
2027
2028
2029
World ex China Developed markets
Emerging markets
Smoking prevalence (%) F'cast
Developed
Emerging
World
60
80
100
120
140
160
180
2005
2006
2007
2008
2009
2010
2011
2012
2013
2014
2015
2016
2017
2018
2019
2020
2021
2022
2023
Unweighted averageVolume weighted average ex China
Taxes as % of daily PC GDP, rebased to 2005 = 100
Unweighted ave.
Volume weighted
F'cast
-4.0%
-3.5%
-3.0%
-2.5%
-2.0%
-1.5%
-1.0%
-0.5%
0.0%
0.5%
1.0%
1.5%
2003
2004
2005
2006
2007
2008
2009
2010
2011
2012
2013
2014
2015
2016
2017
2018
2019
2020
2021
2022
2023
Global ex China volume growth Forecast
Global ex China volume growth (%)
Improved outlook for volumes
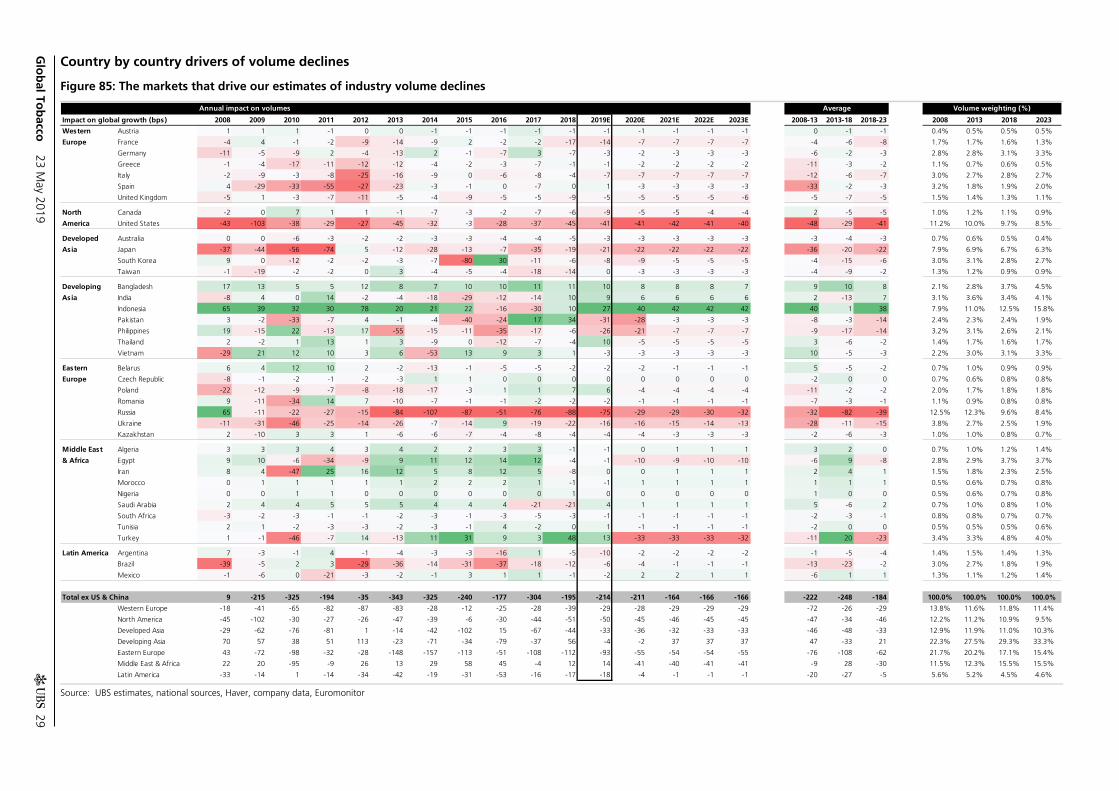
Glo
bal To
bacco
23 May 2019
29
Country by country drivers of volume declines
Figure 85: The markets that drive our estimates of industry volume declines
Source: UBS estimates, national sources, Haver, company data, Euromonitor
Annual impact on volumes Average Volume weighting (%)
Impact on global growth (bps) 2008 2009 2010 2011 2012 2013 2014 2015 2016 2017 2018 2019E 2020E 2021E 2022E 2023E 2008-13 2013-18 2018-23 2008 2013 2018 2023
Western Austria 1 1 1 -1 0 0 -1 -1 -1 -1 -1 -1 -1 -1 -1 -1 0 -1 -1 0.4% 0.5% 0.5% 0.5%
Europe France -4 4 -1 -2 -9 -14 -9 2 -2 -2 -17 -14 -7 -7 -7 -7 -4 -6 -8 1.7% 1.7% 1.6% 1.3%
Germany -11 -5 -9 2 -4 -13 2 -1 -7 3 -7 -3 -2 -3 -3 -3 -6 -2 -3 2.8% 2.8% 3.1% 3.3%
Greece -1 -4 -17 -11 -12 -12 -4 -2 -3 -7 -1 -1 -2 -2 -2 -2 -11 -3 -2 1.1% 0.7% 0.6% 0.5%
Italy -2 -9 -3 -8 -25 -16 -9 0 -6 -8 -4 -7 -7 -7 -7 -7 -12 -6 -7 3.0% 2.7% 2.8% 2.7%
Spain 4 -29 -33 -55 -27 -23 -3 -1 0 -7 0 1 -3 -3 -3 -3 -33 -2 -3 3.2% 1.8% 1.9% 2.0%
United Kingdom -5 1 -3 -7 -11 -5 -4 -9 -5 -5 -9 -5 -5 -5 -5 -6 -5 -7 -5 1.5% 1.4% 1.3% 1.1%
North Canada -2 0 7 1 1 -1 -7 -3 -2 -7 -6 -9 -5 -5 -4 -4 2 -5 -5 1.0% 1.2% 1.1% 0.9%
America United States -43 -103 -38 -29 -27 -45 -32 -3 -28 -37 -45 -41 -41 -42 -41 -40 -48 -29 -41 11.2% 10.0% 9.7% 8.5%
Developed Australia 0 0 -6 -3 -2 -2 -3 -3 -4 -4 -5 -3 -3 -3 -3 -3 -3 -4 -3 0.7% 0.6% 0.5% 0.4%
Asia Japan -37 -44 -56 -74 5 -12 -28 -13 -7 -35 -19 -21 -22 -22 -22 -22 -36 -20 -22 7.9% 6.9% 6.7% 6.3%
South Korea 9 0 -12 -2 -2 -3 -7 -80 30 -11 -6 -8 -9 -5 -5 -5 -4 -15 -6 3.0% 3.1% 2.8% 2.7%
Taiwan -1 -19 -2 -2 0 3 -4 -5 -4 -18 -14 0 -3 -3 -3 -3 -4 -9 -2 1.3% 1.2% 0.9% 0.9%
Developing Bangladesh 17 13 5 5 12 8 7 10 10 11 11 10 8 8 8 7 9 10 8 2.1% 2.8% 3.7% 4.5%
Asia India -8 4 0 14 -2 -4 -18 -29 -12 -14 10 9 6 6 6 6 2 -13 7 3.1% 3.6% 3.4% 4.1%
Indonesia 65 39 32 30 78 20 21 22 -16 -30 10 27 40 42 42 42 40 1 38 7.9% 11.0% 12.5% 15.8%
Pakistan 3 -2 -33 -7 4 -1 -4 -40 -24 17 34 -31 -28 -3 -3 -3 -8 -3 -14 2.4% 2.3% 2.4% 1.9%
Philippines 19 -15 22 -13 17 -55 -15 -11 -35 -17 -6 -26 -21 -7 -7 -7 -9 -17 -14 3.2% 3.1% 2.6% 2.1%
Thailand 2 -2 1 13 1 3 -9 0 -12 -7 -4 10 -5 -5 -5 -5 3 -6 -2 1.4% 1.7% 1.6% 1.7%
Vietnam -29 21 12 10 3 6 -53 13 9 3 1 -3 -3 -3 -3 -3 10 -5 -3 2.2% 3.0% 3.1% 3.3%
Eastern Belarus 6 4 12 10 2 -2 -13 -1 -5 -5 -2 -2 -2 -1 -1 -1 5 -5 -2 0.7% 1.0% 0.9% 0.9%
Europe Czech Republic -8 -1 -2 -1 -2 -3 1 1 0 0 0 0 0 0 0 0 -2 0 0 0.7% 0.6% 0.8% 0.8%
Poland -22 -12 -9 -7 -8 -18 -17 -3 1 1 7 6 -4 -4 -4 -4 -11 -2 -2 2.0% 1.7% 1.8% 1.8%
Romania 9 -11 -34 14 7 -10 -7 -1 -1 -2 -2 -2 -1 -1 -1 -1 -7 -3 -1 1.1% 0.9% 0.8% 0.8%
Russia 65 -11 -22 -27 -15 -84 -107 -87 -51 -76 -88 -75 -29 -29 -30 -32 -32 -82 -39 12.5% 12.3% 9.6% 8.4%
Ukraine -11 -31 -46 -25 -14 -26 -7 -14 9 -19 -22 -16 -16 -15 -14 -13 -28 -11 -15 3.8% 2.7% 2.5% 1.9%
Kazakhstan 2 -10 3 3 1 -6 -6 -7 -4 -8 -4 -4 -4 -3 -3 -3 -2 -6 -3 1.0% 1.0% 0.8% 0.7%
Middle East Algeria 3 3 3 4 3 4 2 2 3 3 -1 -1 0 1 1 1 3 2 0 0.7% 1.0% 1.2% 1.4%
& Africa Egypt 9 10 -6 -34 -9 9 11 12 14 12 -4 -1 -10 -9 -10 -10 -6 9 -8 2.8% 2.9% 3.7% 3.7%
Iran 8 4 -47 25 16 12 5 8 12 5 -8 0 0 1 1 1 2 4 1 1.5% 1.8% 2.3% 2.5%
Morocco 0 1 1 1 1 1 2 2 2 1 -1 -1 1 1 1 1 1 1 1 0.5% 0.6% 0.7% 0.8%
Nigeria 0 0 1 1 0 0 0 0 0 0 1 0 0 0 0 0 1 0 0 0.5% 0.6% 0.7% 0.8%
Saudi Arabia 2 4 4 5 5 5 4 4 4 -21 -21 4 1 1 1 1 5 -6 2 0.7% 1.0% 0.8% 1.0%
South Africa -3 -2 -3 -1 -1 -2 -3 -1 -3 -5 -3 -1 -1 -1 -1 -1 -2 -3 -1 0.8% 0.8% 0.7% 0.7%
Tunisia 2 1 -2 -3 -3 -2 -3 -1 4 -2 0 1 -1 -1 -1 -1 -2 0 0 0.5% 0.5% 0.5% 0.6%
Turkey 1 -1 -46 -7 14 -13 11 31 9 3 48 13 -33 -33 -33 -32 -11 20 -23 3.4% 3.3% 4.8% 4.0%
Latin America Argentina 7 -3 -1 4 -1 -4 -3 -3 -16 1 -5 -10 -2 -2 -2 -2 -1 -5 -4 1.4% 1.5% 1.4% 1.3%
Brazil -39 -5 2 3 -29 -36 -14 -31 -37 -18 -12 -6 -4 -1 -1 -1 -13 -23 -2 3.0% 2.7% 1.8% 1.9%
Mexico -1 -6 0 -21 -3 -2 -1 3 1 1 -1 -2 2 2 1 1 -6 1 1 1.3% 1.1% 1.2% 1.4%
Total ex US & China 9 -215 -325 -194 -35 -343 -325 -240 -177 -304 -195 -214 -211 -164 -166 -166 -222 -248 -184 100.0% 100.0% 100.0% 100.0%
Western Europe -18 -41 -65 -82 -87 -83 -28 -12 -25 -28 -39 -29 -28 -29 -29 -29 -72 -26 -29 13.8% 11.6% 11.8% 11.4%
North America -45 -102 -30 -27 -26 -47 -39 -6 -30 -44 -51 -50 -45 -46 -45 -45 -47 -34 -46 12.2% 11.2% 10.9% 9.5%
Developed Asia -29 -62 -76 -81 1 -14 -42 -102 15 -67 -44 -33 -36 -32 -33 -33 -46 -48 -33 12.9% 11.9% 11.0% 10.3%
Developing Asia 70 57 38 51 113 -23 -71 -34 -79 -37 56 -4 -2 37 37 37 47 -33 21 22.3% 27.5% 29.3% 33.3%
Eastern Europe 43 -72 -98 -32 -28 -148 -157 -113 -51 -108 -112 -93 -55 -54 -54 -55 -76 -108 -62 21.7% 20.2% 17.1% 15.4%
Middle East & Africa 22 20 -95 -9 26 13 29 58 45 -4 12 14 -41 -40 -41 -41 -9 28 -30 11.5% 12.3% 15.5% 15.5%
Latin America -33 -14 1 -14 -34 -42 -19 -31 -53 -16 -17 -18 -4 -1 -1 -1 -20 -27 -5 5.6% 5.2% 4.5% 4.6%
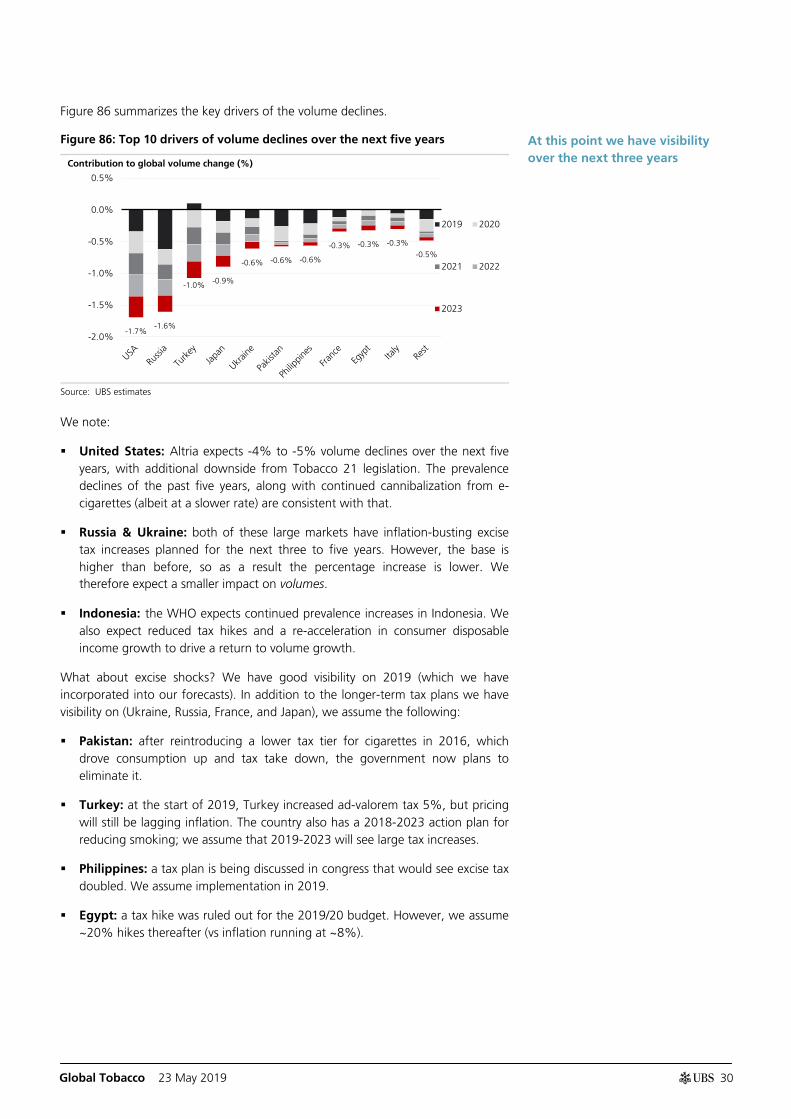
Global Tobacco 23 May 2019
30
Figure 86 summarizes the key drivers of the volume declines.
Figure 86: Top 10 drivers of volume declines over the next five years
Source: UBS estimates
We note:
United States: Altria expects -4% to -5% volume declines over the next five years, with additional downside from Tobacco 21 legislation. The prevalence declines of the past five years, along with continued cannibalization from e-cigarettes (albeit at a slower rate) are consistent with that.
Russia & Ukraine: both of these large markets have inflation-busting excise tax increases planned for the next three to five years. However, the base is higher than before, so as a result the percentage increase is lower. We therefore expect a smaller impact on volumes.
Indonesia: the WHO expects continued prevalence increases in Indonesia. We also expect reduced tax hikes and a re-acceleration in consumer disposable income growth to drive a return to volume growth.
What about excise shocks? We have good visibility on 2019 (which we have incorporated into our forecasts). In addition to the longer-term tax plans we have visibility on (Ukraine, Russia, France, and Japan), we assume the following:
Pakistan: after reintroducing a lower tax tier for cigarettes in 2016, which drove consumption up and tax take down, the government now plans to eliminate it.
Turkey: at the start of 2019, Turkey increased ad-valorem tax 5%, but pricing will still be lagging inflation. The country also has a 2018-2023 action plan for reducing smoking; we assume that 2019-2023 will see large tax increases.
Philippines: a tax plan is being discussed in congress that would see excise tax doubled. We assume implementation in 2019.
Egypt: a tax hike was ruled out for the 2019/20 budget. However, we assume ~20% hikes thereafter (vs inflation running at ~8%).
-1.7% -1.6%
-1.0% -0.9%
-0.6% -0.6% -0.6%
-0.3% -0.3% -0.3%
-0.5%
-2.0%
-1.5%
-1.0%
-0.5%
0.0%
0.5%
2019 2020
2021 2022
2023
Contribution to global volume change (%)
At this point we have visibility over the next three years
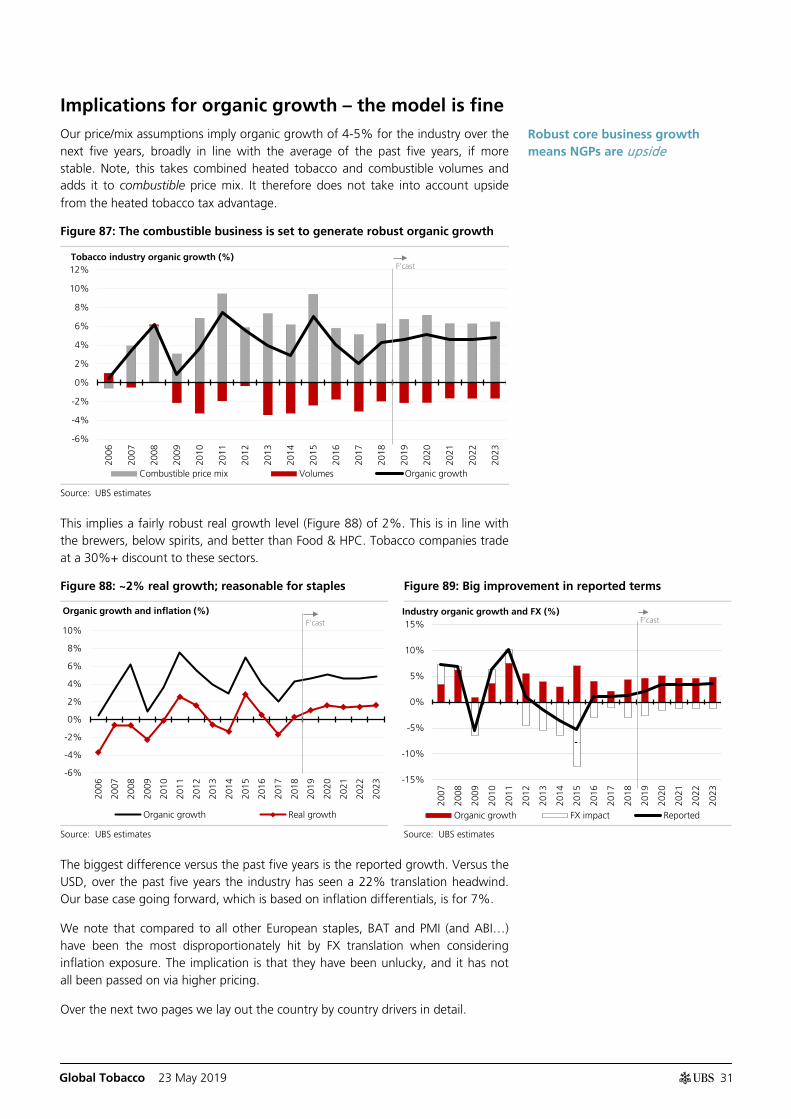
Global Tobacco 23 May 2019
31
Implications for organic growth – the model is fine Our price/mix assumptions imply organic growth of 4-5% for the industry over the next five years, broadly in line with the average of the past five years, if more stable. Note, this takes combined heated tobacco and combustible volumes and adds it to combustible price mix. It therefore does not take into account upside from the heated tobacco tax advantage.
Figure 87: The combustible business is set to generate robust organic growth
Source: UBS estimates
This implies a fairly robust real growth level (Figure 88) of 2%. This is in line with the brewers, below spirits, and better than Food & HPC. Tobacco companies trade at a 30%+ discount to these sectors.
Figure 88: ~2% real growth; reasonable for staples Figure 89: Big improvement in reported terms
Source: UBS estimates Source: UBS estimates
The biggest difference versus the past five years is the reported growth. Versus the USD, over the past five years the industry has seen a 22% translation headwind. Our base case going forward, which is based on inflation differentials, is for 7%.
We note that compared to all other European staples, BAT and PMI (and ABI…) have been the most disproportionately hit by FX translation when considering inflation exposure. The implication is that they have been unlucky, and it has not all been passed on via higher pricing.
Over the next two pages we lay out the country by country drivers in detail.
-6%
-4%
-2%
0%
2%
4%
6%
8%
10%
12%
2006
2007
2008
2009
2010
2011
2012
2013
2014
2015
2016
2017
2018
2019
2020
2021
2022
2023
Combustible price mix Volumes Organic growth
Tobacco industry organic growth (%) F'cast
-6%
-4%
-2%
0%
2%
4%
6%
8%
10%
2006
2007
2008
2009
2010
2011
2012
2013
2014
2015
2016
2017
2018
2019
2020
2021
2022
2023
Organic growth Real growth
Organic growth and inflation (%) F'cast
-15%
-10%
-5%
0%
5%
10%
15%
2007
2008
2009
2010
2011
2012
2013
2014
2015
2016
2017
2018
2019
2020
2021
2022
2023
Organic growth FX impact Reported
Industry organic growth and FX (%) F'cast
Robust core business growth means NGPs are upside
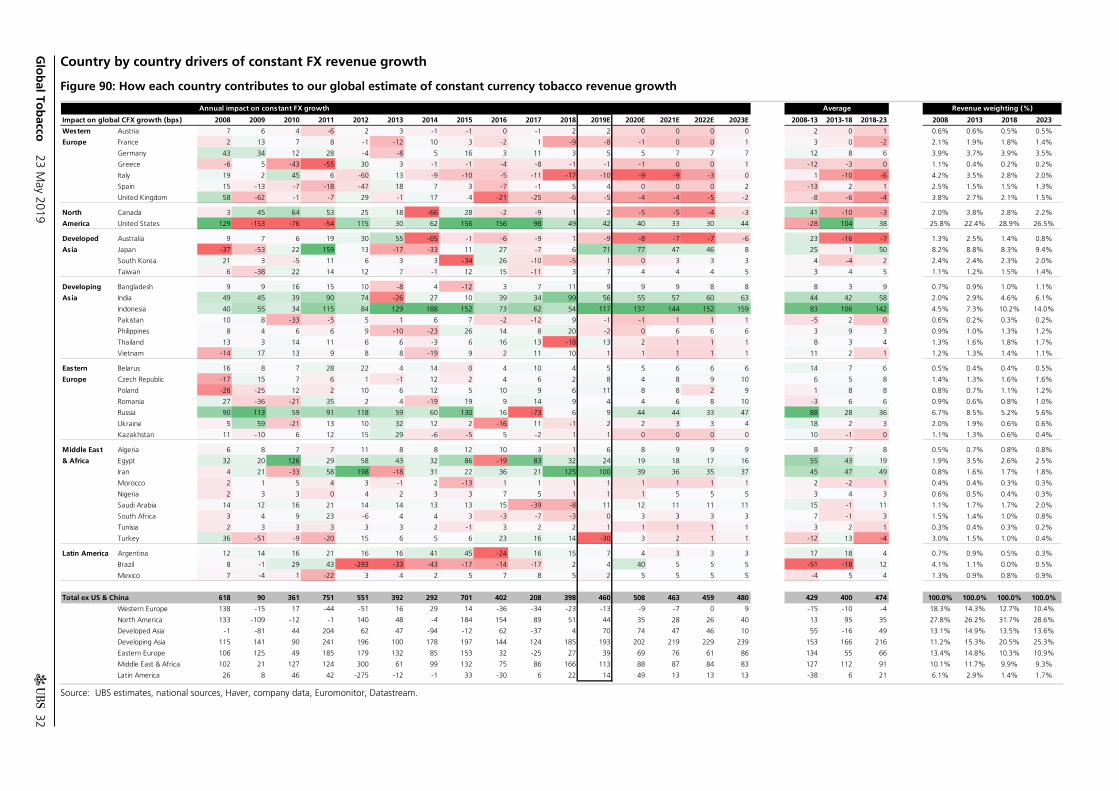
Glo
bal To
bacco
23 May 2019
32
Country by country drivers of constant FX revenue growth
Figure 90: How each country contributes to our global estimate of constant currency tobacco revenue growth
Source: UBS estimates, national sources, Haver, company data, Euromonitor, Datastream.
Annual impact on constant FX growth Average Revenue weighting (%)
Impact on global CFX growth (bps) 2008 2009 2010 2011 2012 2013 2014 2015 2016 2017 2018 2019E 2020E 2021E 2022E 2023E 2008-13 2013-18 2018-23 2008 2013 2018 2023
Western Austria 7 6 4 -6 2 3 -1 -1 0 -1 2 2 0 0 0 0 2 0 1 0.6% 0.6% 0.5% 0.5%
Europe France 2 13 7 8 -1 -12 10 3 -2 1 -9 -8 -1 0 0 1 3 0 -2 2.1% 1.9% 1.8% 1.4%
Germany 43 34 12 28 -4 -8 5 16 3 11 3 5 5 7 7 7 12 8 6 3.9% 3.7% 3.9% 3.5%
Greece -6 5 -43 -55 30 3 -1 -1 -4 -8 -1 -1 -1 0 0 1 -12 -3 0 1.1% 0.4% 0.2% 0.2%
Italy 19 2 45 6 -60 13 -9 -10 -5 -11 -17 -10 -9 -9 -3 0 1 -10 -6 4.2% 3.5% 2.8% 2.0%
Spain 15 -13 -7 -18 -47 18 7 3 -7 -1 5 4 0 0 0 2 -13 2 1 2.5% 1.5% 1.5% 1.3%
United Kingdom 58 -62 -1 -7 29 -1 17 4 -21 -25 -6 -5 -4 -4 -5 -2 -8 -6 -4 3.8% 2.7% 2.1% 1.5%
North Canada 3 45 64 53 25 18 -66 28 -2 -9 1 2 -5 -5 -4 -3 41 -10 -3 2.0% 3.8% 2.8% 2.2%
America United States 129 -153 -76 -54 115 30 62 156 156 98 49 42 40 33 30 44 -28 104 38 25.8% 22.4% 28.9% 26.5%
Developed Australia 9 7 6 19 30 55 -65 -1 -6 -9 1 -9 -8 -7 -7 -6 23 -16 -7 1.3% 2.5% 1.4% 0.8%
Asia Japan -37 -53 22 159 13 -17 -33 11 27 -7 6 71 77 47 46 8 25 1 50 8.2% 8.8% 8.3% 9.4%
South Korea 21 3 -5 11 6 3 3 -34 26 -10 -5 1 0 3 3 3 4 -4 2 2.4% 2.4% 2.3% 2.0%
Taiwan 6 -38 22 14 12 7 -1 12 15 -11 3 7 4 4 4 5 3 4 5 1.1% 1.2% 1.5% 1.4%
Developing Bangladesh 9 9 16 15 10 -8 4 -12 3 7 11 9 9 9 8 8 8 3 9 0.7% 0.9% 1.0% 1.1%
Asia India 49 45 39 90 74 -26 27 10 39 34 99 56 55 57 60 63 44 42 58 2.0% 2.9% 4.6% 6.1%
Indonesia 40 55 34 115 84 129 188 152 73 62 54 117 137 144 152 159 83 106 142 4.5% 7.3% 10.2% 14.0%
Pakistan 10 8 -33 -5 5 1 6 7 -2 -12 9 -1 -1 1 1 1 -5 2 0 0.6% 0.2% 0.3% 0.2%
Philippines 8 4 6 6 9 -10 -23 26 14 8 20 -2 0 6 6 6 3 9 3 0.9% 1.0% 1.3% 1.2%
Thailand 13 3 14 11 6 6 -3 6 16 13 -18 13 2 1 1 1 8 3 4 1.3% 1.6% 1.8% 1.7%
Vietnam -14 17 13 9 8 8 -19 9 2 11 10 1 1 1 1 1 11 2 1 1.2% 1.3% 1.4% 1.1%
Eastern Belarus 16 8 7 28 22 4 14 0 4 10 4 5 5 6 6 6 14 7 6 0.5% 0.4% 0.4% 0.5%
Europe Czech Republic -17 15 7 6 1 -1 12 2 4 6 2 8 4 8 9 10 6 5 8 1.4% 1.3% 1.6% 1.6%
Poland -26 -25 12 2 10 6 12 5 10 9 6 11 8 8 2 9 1 8 8 0.8% 0.7% 1.1% 1.2%
Romania 27 -36 -21 35 2 4 -19 19 9 14 9 4 4 6 8 10 -3 6 6 0.9% 0.6% 0.8% 1.0%
Russia 90 113 59 91 118 59 60 130 16 -73 6 9 44 44 33 47 88 28 36 6.7% 8.5% 5.2% 5.6%
Ukraine 5 59 -21 13 10 32 12 2 -16 11 -1 2 2 3 3 4 18 2 3 2.0% 1.9% 0.6% 0.6%
Kazakhstan 11 -10 6 12 15 29 -6 -5 5 -2 1 1 0 0 0 0 10 -1 0 1.1% 1.3% 0.6% 0.4%
Middle East Algeria 6 8 7 7 11 8 8 12 10 3 1 6 8 9 9 9 8 7 8 0.5% 0.7% 0.8% 0.8%
& Africa Egypt 32 20 126 29 58 43 32 86 -19 83 32 24 19 18 17 16 55 43 19 1.9% 3.5% 2.6% 2.5%
Iran 4 21 -33 58 198 -18 31 22 36 21 125 100 39 36 35 37 45 47 49 0.8% 1.6% 1.7% 1.8%
Morocco 2 1 5 4 3 -1 2 -13 1 1 1 1 1 1 1 1 2 -2 1 0.4% 0.4% 0.3% 0.3%
Nigeria 2 3 3 0 4 2 3 3 7 5 1 1 1 5 5 5 3 4 3 0.6% 0.5% 0.4% 0.3%
Saudi Arabia 14 12 16 21 14 14 13 13 15 -39 -8 11 12 11 11 11 15 -1 11 1.1% 1.7% 1.7% 2.0%
South Africa 3 4 9 23 -6 4 4 3 -3 -7 -3 0 3 3 3 3 7 -1 3 1.5% 1.4% 1.0% 0.8%
Tunisia 2 3 3 3 3 3 2 -1 3 2 2 1 1 1 1 1 3 2 1 0.3% 0.4% 0.3% 0.2%
Turkey 36 -51 -9 -20 15 6 5 6 23 16 14 -30 3 2 1 1 -12 13 -4 3.0% 1.5% 1.0% 0.4%
Latin America Argentina 12 14 16 21 16 16 41 45 -24 16 15 7 4 3 3 3 17 18 4 0.7% 0.9% 0.5% 0.3%
Brazil 8 -1 29 43 -293 -33 -43 -17 -14 -17 2 4 40 5 5 5 -51 -18 12 4.1% 1.1% 0.0% 0.5%
Mexico 7 -4 1 -22 3 4 2 5 7 8 5 2 5 5 5 5 -4 5 4 1.3% 0.9% 0.8% 0.9%
Total ex US & China 618 90 361 751 551 392 292 701 402 208 398 460 508 463 459 480 429 400 474 100.0% 100.0% 100.0% 100.0%
Western Europe 138 -15 17 -44 -51 16 29 14 -36 -34 -23 -13 -9 -7 0 9 -15 -10 -4 18.3% 14.3% 12.7% 10.4%
North America 133 -109 -12 -1 140 48 -4 184 154 89 51 44 35 28 26 40 13 95 35 27.8% 26.2% 31.7% 28.6%
Developed Asia -1 -81 44 204 62 47 -94 -12 62 -37 4 70 74 47 46 10 55 -16 49 13.1% 14.9% 13.5% 13.6%
Developing Asia 115 141 90 241 196 100 178 197 144 124 185 193 202 219 229 239 153 166 216 11.2% 15.3% 20.5% 25.3%
Eastern Europe 106 125 49 185 179 132 85 153 32 -25 27 39 69 76 61 86 134 55 66 13.4% 14.8% 10.3% 10.9%
Middle East & Africa 102 21 127 124 300 61 99 132 75 86 166 113 88 87 84 83 127 112 91 10.1% 11.7% 9.9% 9.3%
Latin America 26 8 46 42 -275 -12 -1 33 -30 6 22 14 49 13 13 13 -38 6 21 6.1% 2.9% 1.4% 1.7%
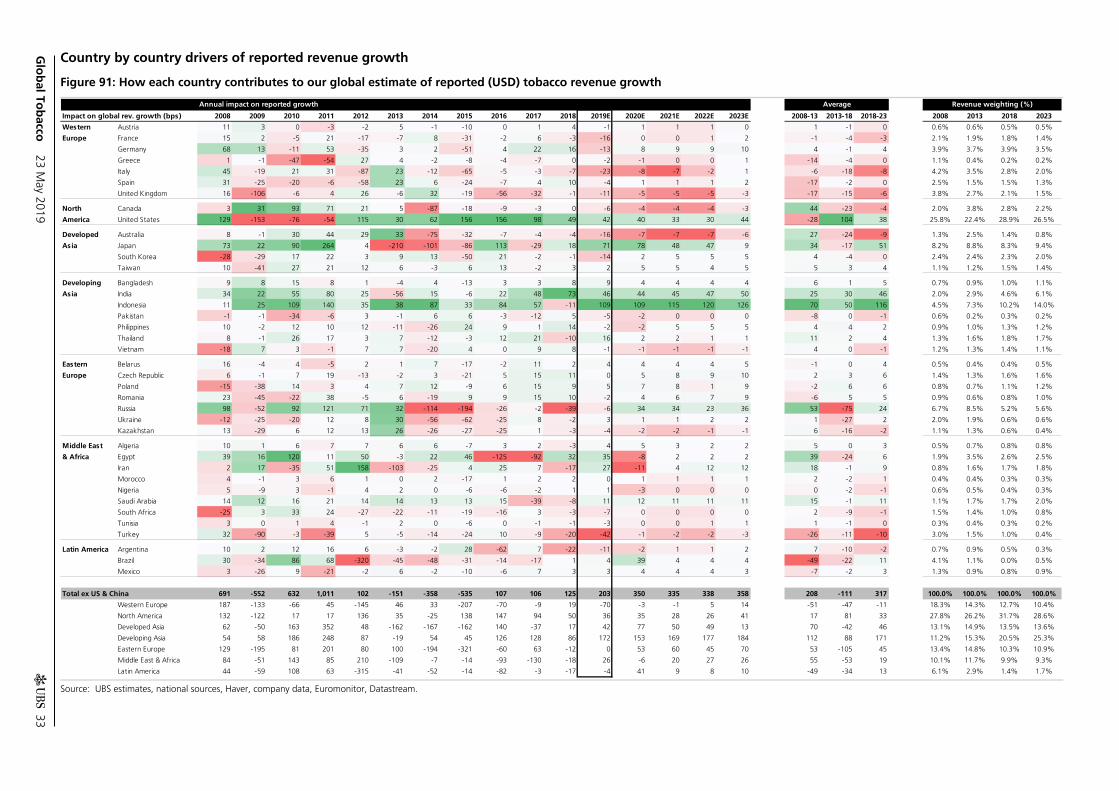
Glo
bal To
bacco
23 May 2019
33
Country by country drivers of reported revenue growth
Figure 91: How each country contributes to our global estimate of reported (USD) tobacco revenue growth
Source: UBS estimates, national sources, Haver, company data, Euromonitor, Datastream.
Annual impact on reported growth Average Revenue weighting (%)
Impact on global rev. growth (bps) 2008 2009 2010 2011 2012 2013 2014 2015 2016 2017 2018 2019E 2020E 2021E 2022E 2023E 2008-13 2013-18 2018-23 2008 2013 2018 2023
Western Austria 11 3 0 -3 -2 5 -1 -10 0 1 4 -1 1 1 1 0 1 -1 0 0.6% 0.6% 0.5% 0.5%
Europe France 15 2 -5 21 -17 -7 8 -31 -2 6 -3 -16 0 0 1 2 -1 -4 -3 2.1% 1.9% 1.8% 1.4%
Germany 68 13 -11 53 -35 3 2 -51 4 22 16 -13 8 9 9 10 4 -1 4 3.9% 3.7% 3.9% 3.5%
Greece 1 -1 -47 -54 27 4 -2 -8 -4 -7 0 -2 -1 0 0 1 -14 -4 0 1.1% 0.4% 0.2% 0.2%
Italy 45 -19 21 31 -87 23 -12 -65 -5 -3 -7 -23 -8 -7 -2 1 -6 -18 -8 4.2% 3.5% 2.8% 2.0%
Spain 31 -25 -20 -6 -58 23 6 -24 -7 4 10 -4 1 1 1 2 -17 -2 0 2.5% 1.5% 1.5% 1.3%
United Kingdom 16 -106 -6 4 26 -6 32 -19 -56 -32 -1 -11 -5 -5 -5 -3 -17 -15 -6 3.8% 2.7% 2.1% 1.5%
North Canada 3 31 93 71 21 5 -87 -18 -9 -3 0 -6 -4 -4 -4 -3 44 -23 -4 2.0% 3.8% 2.8% 2.2%
America United States 129 -153 -76 -54 115 30 62 156 156 98 49 42 40 33 30 44 -28 104 38 25.8% 22.4% 28.9% 26.5%
Developed Australia 8 -1 30 44 29 33 -75 -32 -7 -4 -4 -16 -7 -7 -7 -6 27 -24 -9 1.3% 2.5% 1.4% 0.8%
Asia Japan 73 22 90 264 4 -210 -101 -86 113 -29 18 71 78 48 47 9 34 -17 51 8.2% 8.8% 8.3% 9.4%
South Korea -28 -29 17 22 3 9 13 -50 21 -2 -1 -14 2 5 5 5 4 -4 0 2.4% 2.4% 2.3% 2.0%
Taiwan 10 -41 27 21 12 6 -3 6 13 -2 3 2 5 5 4 5 5 3 4 1.1% 1.2% 1.5% 1.4%
Developing Bangladesh 9 8 15 8 1 -4 4 -13 3 3 8 9 4 4 4 4 6 1 5 0.7% 0.9% 1.0% 1.1%
Asia India 34 22 55 80 25 -56 15 -6 22 48 73 46 44 45 47 50 25 30 46 2.0% 2.9% 4.6% 6.1%
Indonesia 11 25 109 140 35 38 87 33 84 57 -11 109 109 115 120 126 70 50 116 4.5% 7.3% 10.2% 14.0%
Pakistan -1 -1 -34 -6 3 -1 6 6 -3 -12 5 -5 -2 0 0 0 -8 0 -1 0.6% 0.2% 0.3% 0.2%
Philippines 10 -2 12 10 12 -11 -26 24 9 1 14 -2 -2 5 5 5 4 4 2 0.9% 1.0% 1.3% 1.2%
Thailand 8 -1 26 17 3 7 -12 -3 12 21 -10 16 2 2 1 1 11 2 4 1.3% 1.6% 1.8% 1.7%
Vietnam -18 7 3 -1 7 7 -20 4 0 9 8 -1 -1 -1 -1 -1 4 0 -1 1.2% 1.3% 1.4% 1.1%
Eastern Belarus 16 -4 4 -5 2 1 7 -17 -2 11 2 4 4 4 4 5 -1 0 4 0.5% 0.4% 0.4% 0.5%
Europe Czech Republic 6 -1 7 19 -13 -2 3 -21 5 15 11 0 5 8 9 10 2 3 6 1.4% 1.3% 1.6% 1.6%
Poland -15 -38 14 3 4 7 12 -9 6 15 9 5 7 8 1 9 -2 6 6 0.8% 0.7% 1.1% 1.2%
Romania 23 -45 -22 38 -5 6 -19 9 9 15 10 -2 4 6 7 9 -6 5 5 0.9% 0.6% 0.8% 1.0%
Russia 98 -52 92 121 71 32 -114 -194 -26 -2 -39 -6 34 34 23 36 53 -75 24 6.7% 8.5% 5.2% 5.6%
Ukraine -12 -25 -20 12 8 30 -56 -62 -25 8 -2 3 1 1 2 2 1 -27 2 2.0% 1.9% 0.6% 0.6%
Kazakhstan 13 -29 6 12 13 26 -26 -27 -25 1 -3 -4 -2 -2 -1 -1 6 -16 -2 1.1% 1.3% 0.6% 0.4%
Middle East Algeria 10 1 6 7 7 6 6 -7 3 2 -3 4 5 3 2 2 5 0 3 0.5% 0.7% 0.8% 0.8%
& Africa Egypt 39 16 120 11 50 -3 22 46 -125 -92 32 35 -8 2 2 2 39 -24 6 1.9% 3.5% 2.6% 2.5%
Iran 2 17 -35 51 158 -103 -25 4 25 7 -17 27 -11 4 12 12 18 -1 9 0.8% 1.6% 1.7% 1.8%
Morocco 4 -1 3 6 1 0 2 -17 1 2 2 0 1 1 1 1 2 -2 1 0.4% 0.4% 0.3% 0.3%
Nigeria 5 -9 3 -1 4 2 0 -6 -6 -2 1 1 -3 0 0 0 0 -2 -1 0.6% 0.5% 0.4% 0.3%
Saudi Arabia 14 12 16 21 14 14 13 13 15 -39 -8 11 12 11 11 11 15 -1 11 1.1% 1.7% 1.7% 2.0%
South Africa -25 3 33 24 -27 -22 -11 -19 -16 3 -3 -7 0 0 0 0 2 -9 -1 1.5% 1.4% 1.0% 0.8%
Tunisia 3 0 1 4 -1 2 0 -6 0 -1 -1 -3 0 0 1 1 1 -1 0 0.3% 0.4% 0.3% 0.2%
Turkey 32 -90 -3 -39 5 -5 -14 -24 10 -9 -20 -42 -1 -2 -2 -3 -26 -11 -10 3.0% 1.5% 1.0% 0.4%
Latin America Argentina 10 2 12 16 6 -3 -2 28 -62 7 -22 -11 -2 1 1 2 7 -10 -2 0.7% 0.9% 0.5% 0.3%
Brazil 30 -34 86 68 -320 -45 -48 -31 -14 -17 1 4 39 4 4 4 -49 -22 11 4.1% 1.1% 0.0% 0.5%
Mexico 3 -26 9 -21 -2 6 -2 -10 -6 7 3 3 4 4 4 3 -7 -2 3 1.3% 0.9% 0.8% 0.9%
Total ex US & China 691 -552 632 1,011 102 -151 -358 -535 107 106 125 203 350 335 338 358 208 -111 317 100.0% 100.0% 100.0% 100.0%
Western Europe 187 -133 -66 45 -145 46 33 -207 -70 -9 19 -70 -3 -1 5 14 -51 -47 -11 18.3% 14.3% 12.7% 10.4%
North America 132 -122 17 17 136 35 -25 138 147 94 50 36 35 28 26 41 17 81 33 27.8% 26.2% 31.7% 28.6%
Developed Asia 62 -50 163 352 48 -162 -167 -162 140 -37 17 42 77 50 49 13 70 -42 46 13.1% 14.9% 13.5% 13.6%
Developing Asia 54 58 186 248 87 -19 54 45 126 128 86 172 153 169 177 184 112 88 171 11.2% 15.3% 20.5% 25.3%
Eastern Europe 129 -195 81 201 80 100 -194 -321 -60 63 -12 0 53 60 45 70 53 -105 45 13.4% 14.8% 10.3% 10.9%
Middle East & Africa 84 -51 143 85 210 -109 -7 -14 -93 -130 -18 26 -6 20 27 26 55 -53 19 10.1% 11.7% 9.9% 9.3%
Latin America 44 -59 108 63 -315 -41 -52 -14 -82 -3 -17 -4 41 9 8 10 -49 -34 13 6.1% 2.9% 1.4% 1.7%
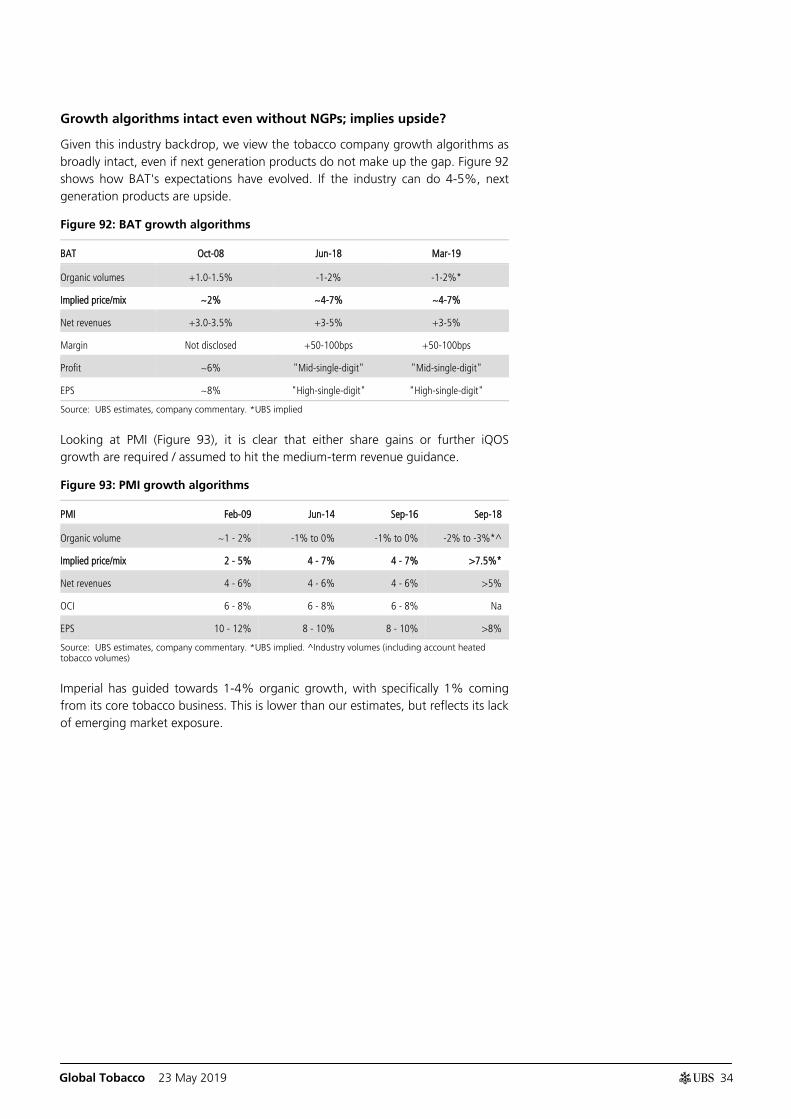
Global Tobacco 23 May 2019
34
Growth algorithms intact even without NGPs; implies upside?
Given this industry backdrop, we view the tobacco company growth algorithms as broadly intact, even if next generation products do not make up the gap. Figure 92 shows how BAT's expectations have evolved. If the industry can do 4-5%, next generation products are upside.
Figure 92: BAT growth algorithms
BAT Oct-08 Jun-18 Mar-19
Organic volumes +1.0-1.5% -1-2% -1-2%*
Implied price/mix ~2% ~4-7% ~4-7%
Net revenues +3.0-3.5% +3-5% +3-5%
Margin Not disclosed +50-100bps +50-100bps
Profit ~6% "Mid-single-digit" "Mid-single-digit"
EPS ~8% "High-single-digit" "High-single-digit"
Source: UBS estimates, company commentary. *UBS implied
Looking at PMI (Figure 93), it is clear that either share gains or further iQOS growth are required / assumed to hit the medium-term revenue guidance.
Figure 93: PMI growth algorithms
PMI Feb-09 Jun-14 Sep-16 Sep-18
Organic volume ~1 - 2% -1% to 0% -1% to 0% -2% to -3%*^
Implied price/mix 2 - 5% 4 - 7% 4 - 7% >7.5%*
Net revenues 4 - 6% 4 - 6% 4 - 6% >5%
OCI 6 - 8% 6 - 8% 6 - 8% Na
EPS 10 - 12% 8 - 10% 8 - 10% >8%
Source: UBS estimates, company commentary. *UBS implied. ^Industry volumes (including account heated tobacco volumes)
Imperial has guided towards 1-4% organic growth, with specifically 1% coming from its core tobacco business. This is lower than our estimates, but reflects its lack of emerging market exposure.
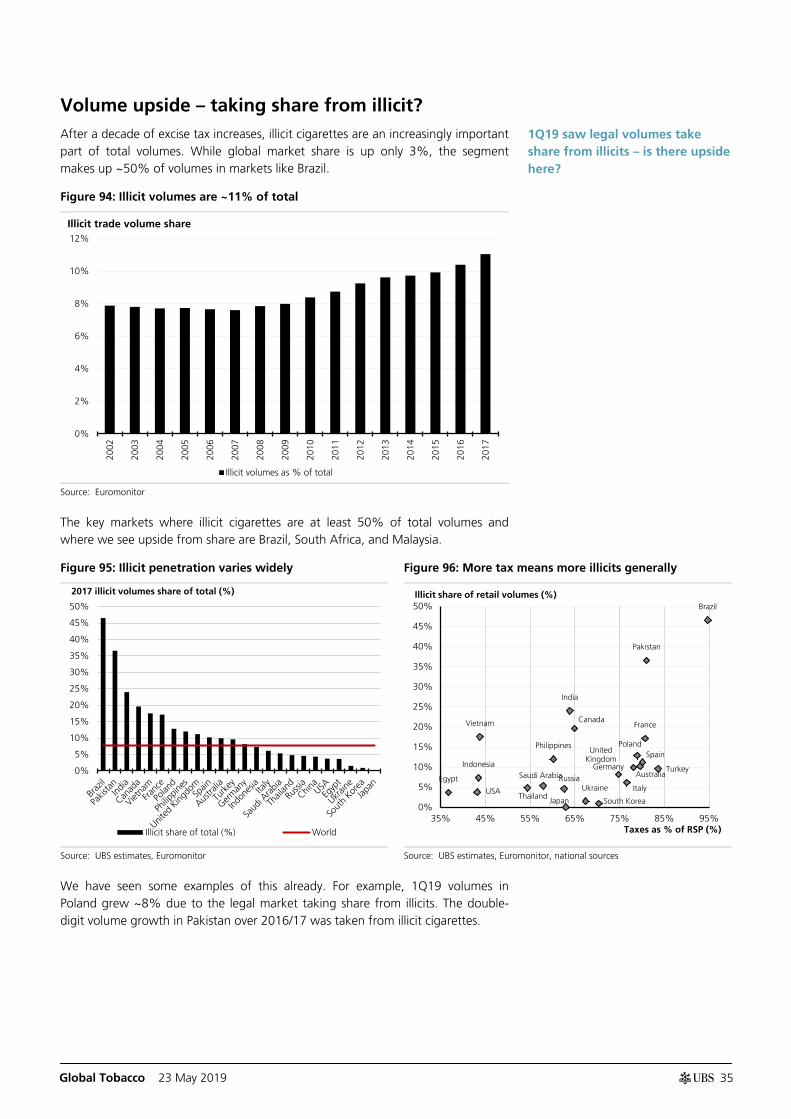
Global Tobacco 23 May 2019
35
Volume upside – taking share from illicit? After a decade of excise tax increases, illicit cigarettes are an increasingly important part of total volumes. While global market share is up only 3%, the segment makes up ~50% of volumes in markets like Brazil.
Figure 94: Illicit volumes are ~11% of total
Source: Euromonitor
The key markets where illicit cigarettes are at least 50% of total volumes and where we see upside from share are Brazil, South Africa, and Malaysia.
Figure 95: Illicit penetration varies widely Figure 96: More tax means more illicits generally
Source: UBS estimates, Euromonitor Source: UBS estimates, Euromonitor, national sources
We have seen some examples of this already. For example, 1Q19 volumes in Poland grew ~8% due to the legal market taking share from illicits. The double-digit volume growth in Pakistan over 2016/17 was taken from illicit cigarettes.
0%
2%
4%
6%
8%
10%
12%
2002
2003
2004
2005
2006
2007
2008
2009
2010
2011
2012
2013
2014
2015
2016
2017
Illicit volumes as % of total
Illicit trade volume share
0%
5%
10%
15%
20%
25%
30%
35%
40%
45%
50%
Illicit share of total (%) World
2017 illicit volumes share of total (%)
Indonesia
Russia
USA Japan
Turkey Egypt
India
Germany
Vietnam
South Korea
Italy Ukraine
Philippines
Brazil
Spain
Pakistan
France
Thailand
United Kingdom
Canada
Australia
Poland
Saudi Arabia
0%
5%
10%
15%
20%
25%
30%
35%
40%
45%
50%
35% 45% 55% 65% 75% 85% 95%
Illicit share of retail volumes (%)
Taxes as % of RSP (%)
1Q19 saw legal volumes take share from illicits – is there upside here?
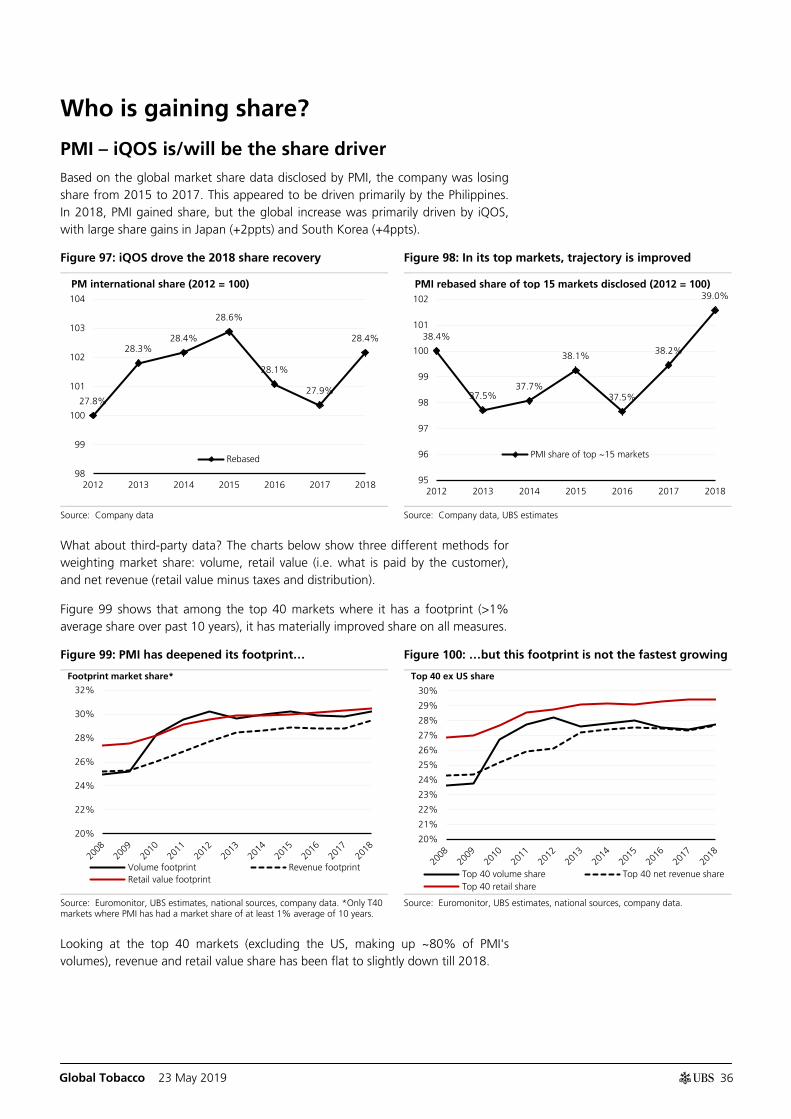
Global Tobacco 23 May 2019
36
Who is gaining share?
PMI – iQOS is/will be the share driver Based on the global market share data disclosed by PMI, the company was losing share from 2015 to 2017. This appeared to be driven primarily by the Philippines. In 2018, PMI gained share, but the global increase was primarily driven by iQOS, with large share gains in Japan (+2ppts) and South Korea (+4ppts).
Figure 97: iQOS drove the 2018 share recovery Figure 98: In its top markets, trajectory is improved
Source: Company data Source: Company data, UBS estimates
What about third-party data? The charts below show three different methods for weighting market share: volume, retail value (i.e. what is paid by the customer), and net revenue (retail value minus taxes and distribution).
Figure 99 shows that among the top 40 markets where it has a footprint (>1% average share over past 10 years), it has materially improved share on all measures.
Figure 99: PMI has deepened its footprint… Figure 100: …but this footprint is not the fastest growing
Source: Euromonitor, UBS estimates, national sources, company data. *Only T40 markets where PMI has had a market share of at least 1% average of 10 years.
Source: Euromonitor, UBS estimates, national sources, company data.
Looking at the top 40 markets (excluding the US, making up ~80% of PMI's volumes), revenue and retail value share has been flat to slightly down till 2018.
27.8%
28.3% 28.4%
28.6%
28.1%
27.9%
28.4%
98
99
100
101
102
103
104
2012 2013 2014 2015 2016 2017 2018
Rebased
PM international share (2012 = 100)
38.4%
37.5% 37.7%
38.1%
37.5%
38.2%
39.0%
95
96
97
98
99
100
101
102
2012 2013 2014 2015 2016 2017 2018
PMI share of top ~15 markets
PMI rebased share of top 15 markets disclosed (2012 = 100)
20%
22%
24%
26%
28%
30%
32%
Volume footprint Revenue footprintRetail value footprint
Footprint market share*
20%
21%
22%
23%
24%
25%
26%
27%
28%
29%
30%
Top 40 volume share Top 40 net revenue shareTop 40 retail share
Top 40 ex US share
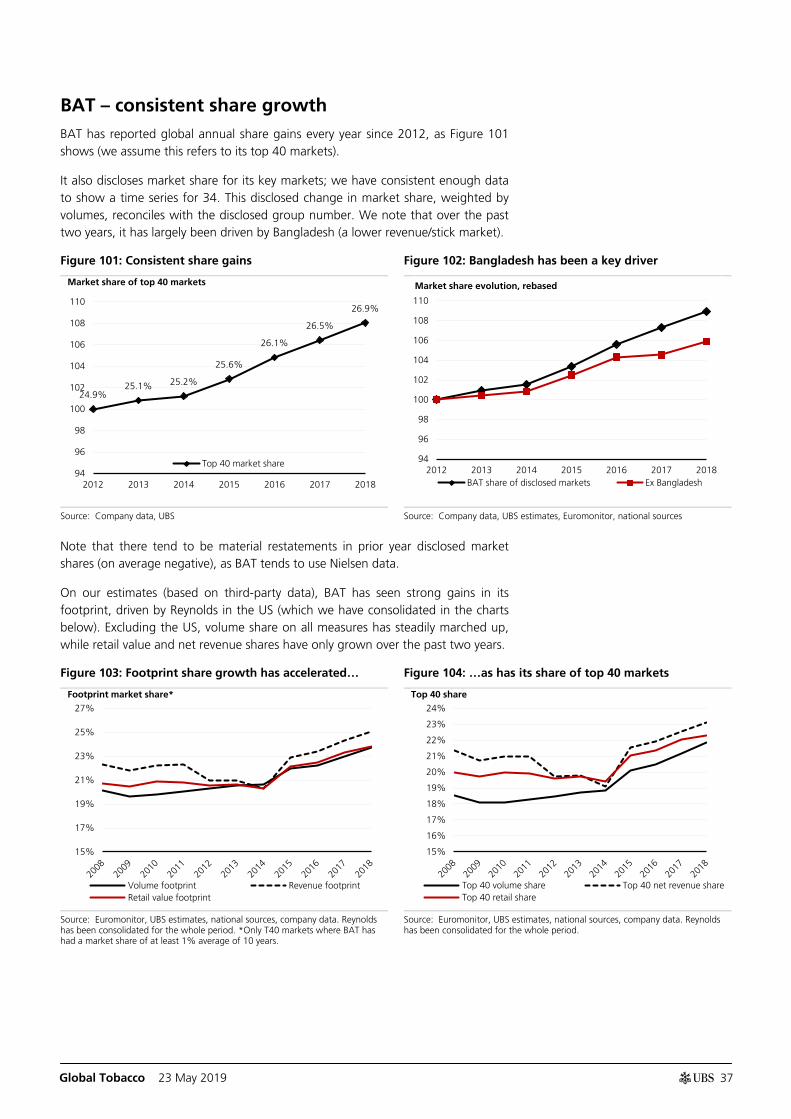
Global Tobacco 23 May 2019
37
BAT – consistent share growth BAT has reported global annual share gains every year since 2012, as Figure 101 shows (we assume this refers to its top 40 markets).
It also discloses market share for its key markets; we have consistent enough data to show a time series for 34. This disclosed change in market share, weighted by volumes, reconciles with the disclosed group number. We note that over the past two years, it has largely been driven by Bangladesh (a lower revenue/stick market).
Figure 101: Consistent share gains Figure 102: Bangladesh has been a key driver
Source: Company data, UBS Source: Company data, UBS estimates, Euromonitor, national sources
Note that there tend to be material restatements in prior year disclosed market shares (on average negative), as BAT tends to use Nielsen data.
On our estimates (based on third-party data), BAT has seen strong gains in its footprint, driven by Reynolds in the US (which we have consolidated in the charts below). Excluding the US, volume share on all measures has steadily marched up, while retail value and net revenue shares have only grown over the past two years.
Figure 103: Footprint share growth has accelerated… Figure 104: …as has its share of top 40 markets
Source: Euromonitor, UBS estimates, national sources, company data. Reynolds has been consolidated for the whole period. *Only T40 markets where BAT has had a market share of at least 1% average of 10 years.
Source: Euromonitor, UBS estimates, national sources, company data. Reynolds has been consolidated for the whole period.
24.9% 25.1% 25.2%
25.6%
26.1%
26.5%
26.9%
94
96
98
100
102
104
106
108
110
2012 2013 2014 2015 2016 2017 2018
Top 40 market share
Market share of top 40 markets
94
96
98
100
102
104
106
108
110
2012 2013 2014 2015 2016 2017 2018BAT share of disclosed markets Ex Bangladesh
Market share evolution, rebased
15%
17%
19%
21%
23%
25%
27%
Volume footprint Revenue footprintRetail value footprint
Footprint market share*
15%
16%
17%
18%
19%
20%
21%
22%
23%
24%
Top 40 volume share Top 40 net revenue shareTop 40 retail share
Top 40 share
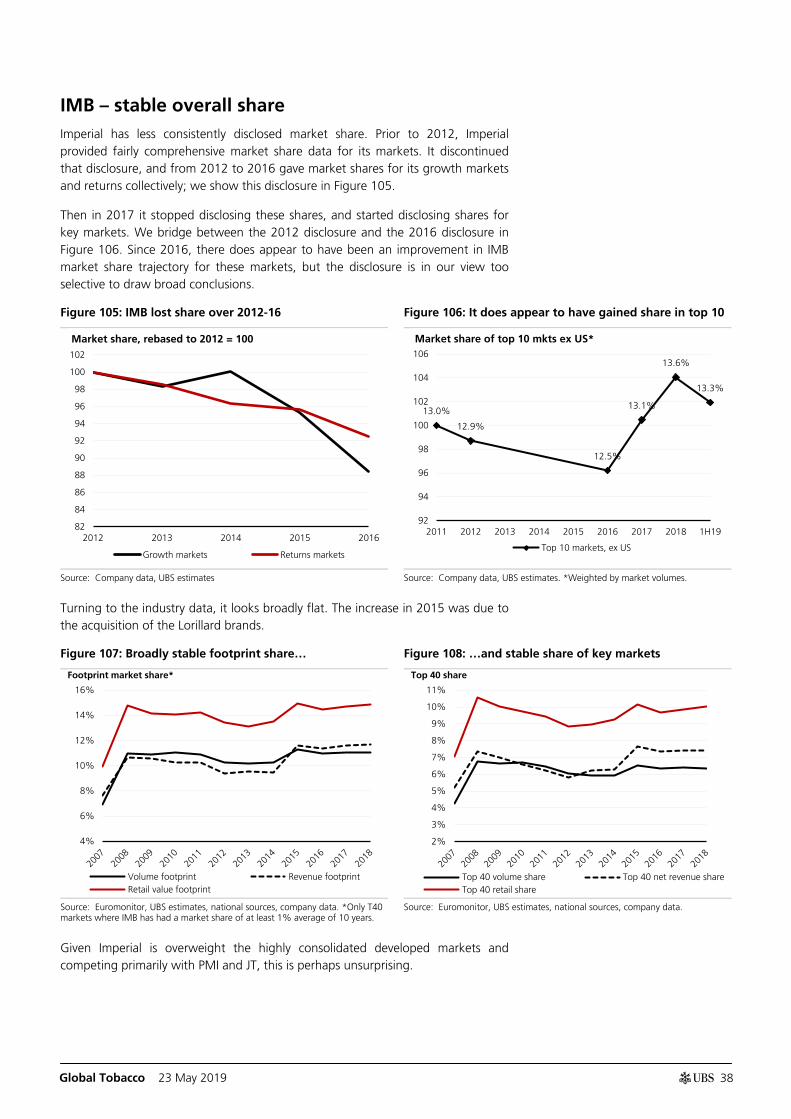
Global Tobacco 23 May 2019
38
IMB – stable overall share Imperial has less consistently disclosed market share. Prior to 2012, Imperial provided fairly comprehensive market share data for its markets. It discontinued that disclosure, and from 2012 to 2016 gave market shares for its growth markets and returns collectively; we show this disclosure in Figure 105.
Then in 2017 it stopped disclosing these shares, and started disclosing shares for key markets. We bridge between the 2012 disclosure and the 2016 disclosure in Figure 106. Since 2016, there does appear to have been an improvement in IMB market share trajectory for these markets, but the disclosure is in our view too selective to draw broad conclusions.
Figure 105: IMB lost share over 2012-16 Figure 106: It does appear to have gained share in top 10
Source: Company data, UBS estimates Source: Company data, UBS estimates. *Weighted by market volumes.
Turning to the industry data, it looks broadly flat. The increase in 2015 was due to the acquisition of the Lorillard brands.
Figure 107: Broadly stable footprint share… Figure 108: …and stable share of key markets
Source: Euromonitor, UBS estimates, national sources, company data. *Only T40 markets where IMB has had a market share of at least 1% average of 10 years.
Source: Euromonitor, UBS estimates, national sources, company data.
Given Imperial is overweight the highly consolidated developed markets and competing primarily with PMI and JT, this is perhaps unsurprising.
82
84
86
88
90
92
94
96
98
100
102
2012 2013 2014 2015 2016
Growth markets Returns markets
Market share, rebased to 2012 = 100
13.0%
12.9%
12.5%
13.1%
13.6%
13.3%
92
94
96
98
100
102
104
106
2011 2012 2013 2014 2015 2016 2017 2018 1H19
Top 10 markets, ex US
Market share of top 10 mkts ex US*
4%
6%
8%
10%
12%
14%
16%
Volume footprint Revenue footprintRetail value footprint
Footprint market share*
2%
3%
4%
5%
6%
7%
8%
9%
10%
11%
Top 40 volume share Top 40 net revenue shareTop 40 retail share
Top 40 share
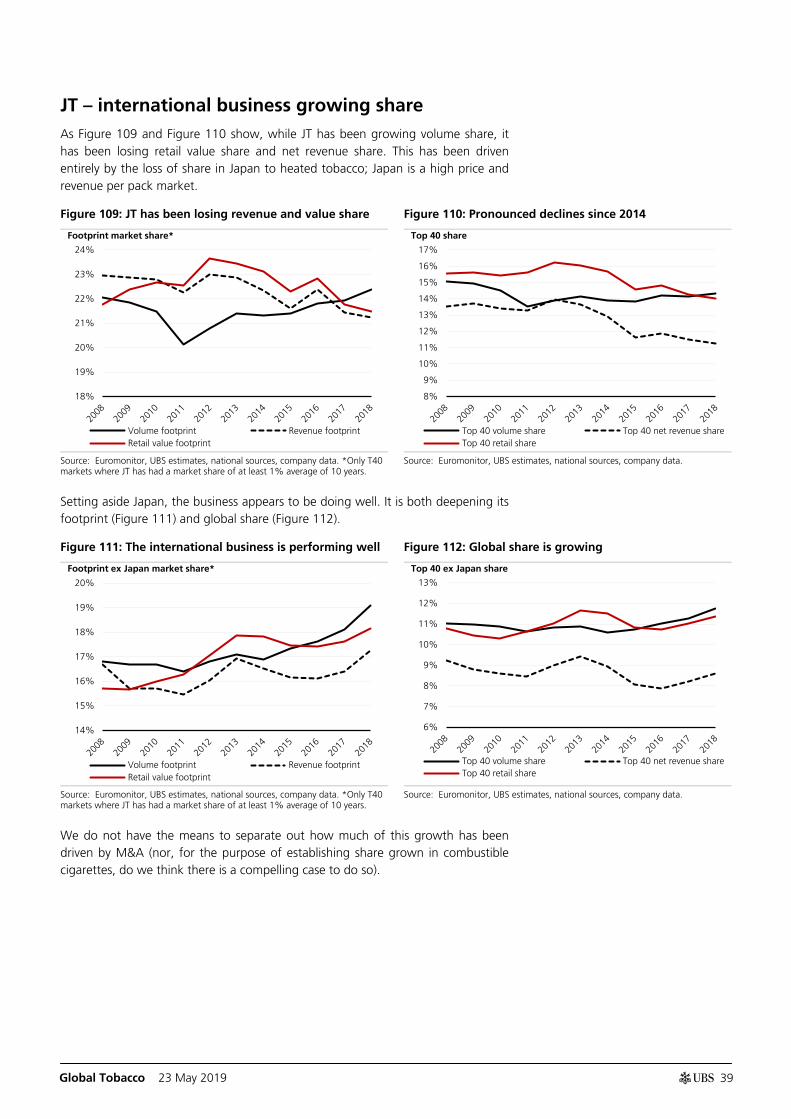
Global Tobacco 23 May 2019
39
JT – international business growing share As Figure 109 and Figure 110 show, while JT has been growing volume share, it has been losing retail value share and net revenue share. This has been driven entirely by the loss of share in Japan to heated tobacco; Japan is a high price and revenue per pack market.
Figure 109: JT has been losing revenue and value share Figure 110: Pronounced declines since 2014
Source: Euromonitor, UBS estimates, national sources, company data. *Only T40 markets where JT has had a market share of at least 1% average of 10 years.
Source: Euromonitor, UBS estimates, national sources, company data.
Setting aside Japan, the business appears to be doing well. It is both deepening its footprint (Figure 111) and global share (Figure 112).
Figure 111: The international business is performing well Figure 112: Global share is growing
Source: Euromonitor, UBS estimates, national sources, company data. *Only T40 markets where JT has had a market share of at least 1% average of 10 years.
Source: Euromonitor, UBS estimates, national sources, company data.
We do not have the means to separate out how much of this growth has been driven by M&A (nor, for the purpose of establishing share grown in combustible cigarettes, do we think there is a compelling case to do so).
18%
19%
20%
21%
22%
23%
24%
Volume footprint Revenue footprintRetail value footprint
Footprint market share*
8%
9%
10%
11%
12%
13%
14%
15%
16%
17%
Top 40 volume share Top 40 net revenue shareTop 40 retail share
Top 40 share
14%
15%
16%
17%
18%
19%
20%
Volume footprint Revenue footprintRetail value footprint
Footprint ex Japan market share*
6%
7%
8%
9%
10%
11%
12%
13%
Top 40 volume share Top 40 net revenue shareTop 40 retail share
Top 40 ex Japan share
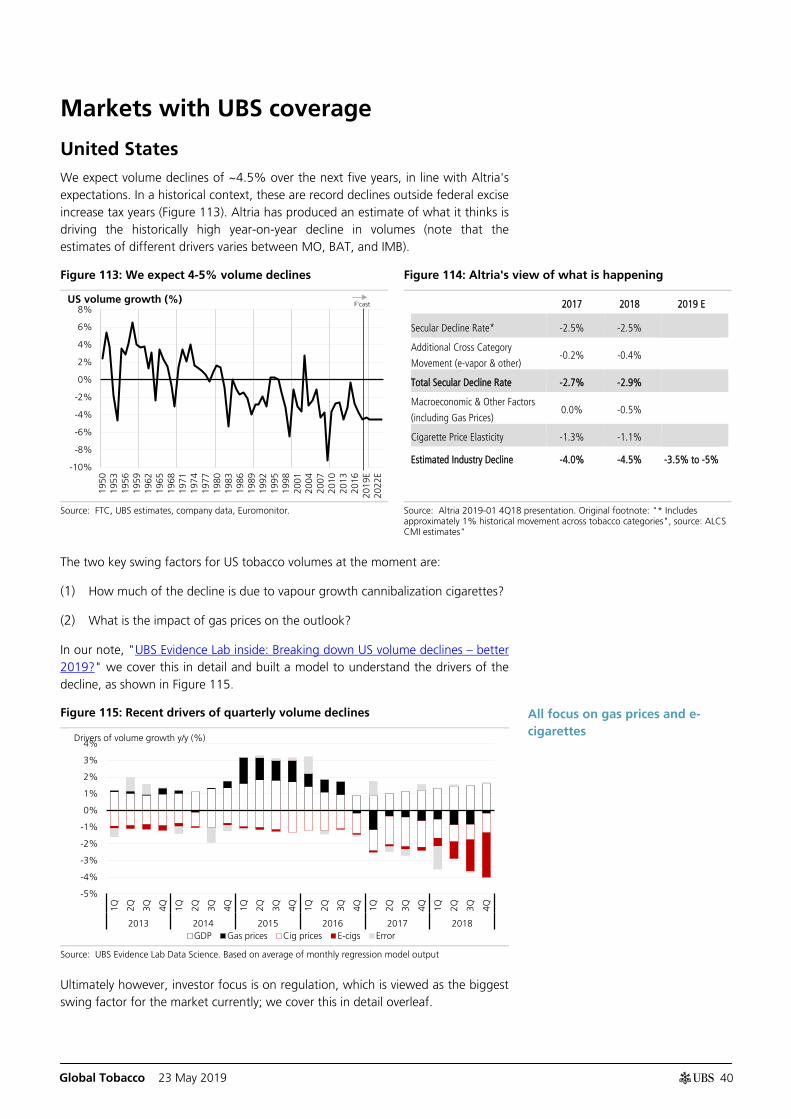
Global Tobacco 23 May 2019
40
Markets with UBS coverage
United States We expect volume declines of ~4.5% over the next five years, in line with Altria's expectations. In a historical context, these are record declines outside federal excise increase tax years (Figure 113). Altria has produced an estimate of what it thinks is driving the historically high year-on-year decline in volumes (note that the estimates of different drivers varies between MO, BAT, and IMB).
Figure 113: We expect 4-5% volume declines Figure 114: Altria's view of what is happening
2017 2018 2019 E
Secular Decline Rate* -2.5% -2.5%
Additional Cross Category
Movement (e-vapor & other) -0.2% -0.4%
Total Secular Decline Rate -2.7% -2.9%
Macroeconomic & Other Factors
(including Gas Prices) 0.0% -0.5%
Cigarette Price Elasticity -1.3% -1.1%
Estimated Industry Decline -4.0% -4.5% -3.5% to -5%
Source: FTC, UBS estimates, company data, Euromonitor. Source: Altria 2019-01 4Q18 presentation. Original footnote: "* Includes approximately 1% historical movement across tobacco categories", source: ALCS CMI estimates"
The two key swing factors for US tobacco volumes at the moment are:
(1) How much of the decline is due to vapour growth cannibalization cigarettes?
(2) What is the impact of gas prices on the outlook?
In our note, "UBS Evidence Lab inside: Breaking down US volume declines – better 2019?" we cover this in detail and built a model to understand the drivers of the decline, as shown in Figure 115.
Figure 115: Recent drivers of quarterly volume declines
Source: UBS Evidence Lab Data Science. Based on average of monthly regression model output
Ultimately however, investor focus is on regulation, which is viewed as the biggest swing factor for the market currently; we cover this in detail overleaf.
-10%
-8%
-6%
-4%
-2%
0%
2%
4%
6%
8%
1950
1953
1956
1959
1962
1965
1968
1971
1974
1977
1980
1983
1986
1989
1992
1995
1998
2001
2004
2007
2010
2013
2016
2019
E20
22E
US volume growth (%) F'cast
-5%
-4%
-3%
-2%
-1%
0%
1%
2%
3%
4%
1Q 2Q 3Q 4Q 1Q 2Q 3Q 4Q 1Q 2Q 3Q 4Q 1Q 2Q 3Q 4Q 1Q 2Q 3Q 4Q 1Q 2Q 3Q 4Q
2013 2014 2015 2016 2017 2018GDP Gas prices Cig prices E-cigs Error
Drivers of volume growth y/y (%)
All focus on gas prices and e-cigarettes
Global Tobacco 23 May 2019
41
US regulation – key debate
In this section we cover the pieces of US regulatory uncertainty:
(1) Vapour regulation: the measures the FDA is taking to restrict youth access.
(2) Heated tobacco regulation: implications and outlook for an iQOS launch.
(3) Raising the legal purchase age to 21: now supported by tobacco.
(4) Menthol tobacco ban: long discussed.
(5) Very low nicotine: the proposed plan to reduce nicotine in cigarettes to non-addictive levels.
Historically, the US has been a follower when it came to tobacco legislation, with the exception of (3) and (5).
E-cigarette regulation
The US is the least regulated vapour market in the world. On 13 March the FDA proposed the following measures to limit youth access:
(1) Bring forward the PMTA deadline for flavoured (i.e. ex tobacco, mint and menthol) products: In the US, e-cigarettes are only on the market because the FDA has chosen to delay enforcing certain rules till August 2022. Those rules would require Pre-Market Tobacco Applications (PMTA) to be submitted for essentially all vapour products. That deadline has been brought forward by 12 months for flavoured products.
(2) Essentially restricting flavoured product sales to age-restricted sites and venues: Most notably this would remove them from grocery stores.
The comment period closed 30-Apr. Implementation will be 30 days after the guidance is finalised. BAT believes measure (1) in particular will consolidate the market from 2021, opening up a "~£1bn contestable space".
Furthermore we note that on CNBC Scott Gotlieb suggested the FDA could require PMTAs for pod products (such as JUUL, Vuse Alto, and myBlu) earlier, saying "I think the marketability of pod-based products will be called into question if youth use rates continue to climb at the rates they’re climbing". In our view:
Moving forward the PMTA deadline is positive for BAT: (1) Competition may struggle to file in time (the aforementioned ~£1bn). (2) The wide variety of flavours is central to the vape store proposition to customers, and trade margins are much higher here. (3) Fewer flavours is likely to improve retention.
JUUL may struggle to file an early PMTA: The CDC has specifically called out JUUL for its "danger to youth". The measures undertaken by JUUL may well resolve this, but we presume it (along with better retail enforcement) will take time to have an effect. If this is the case, the earlier the deadline the harder it will be for JUUL to argue its product is positive for public health.
Legal challenges likely: The National Association of Convenience stores has already flagged its opposition to a ban on flavours in retail stores (source). In our view, potential lawsuits would likely delay rather than reverse the process.
Investor focus is on the US regulatory landscape
Regulation here is a barrier to entry
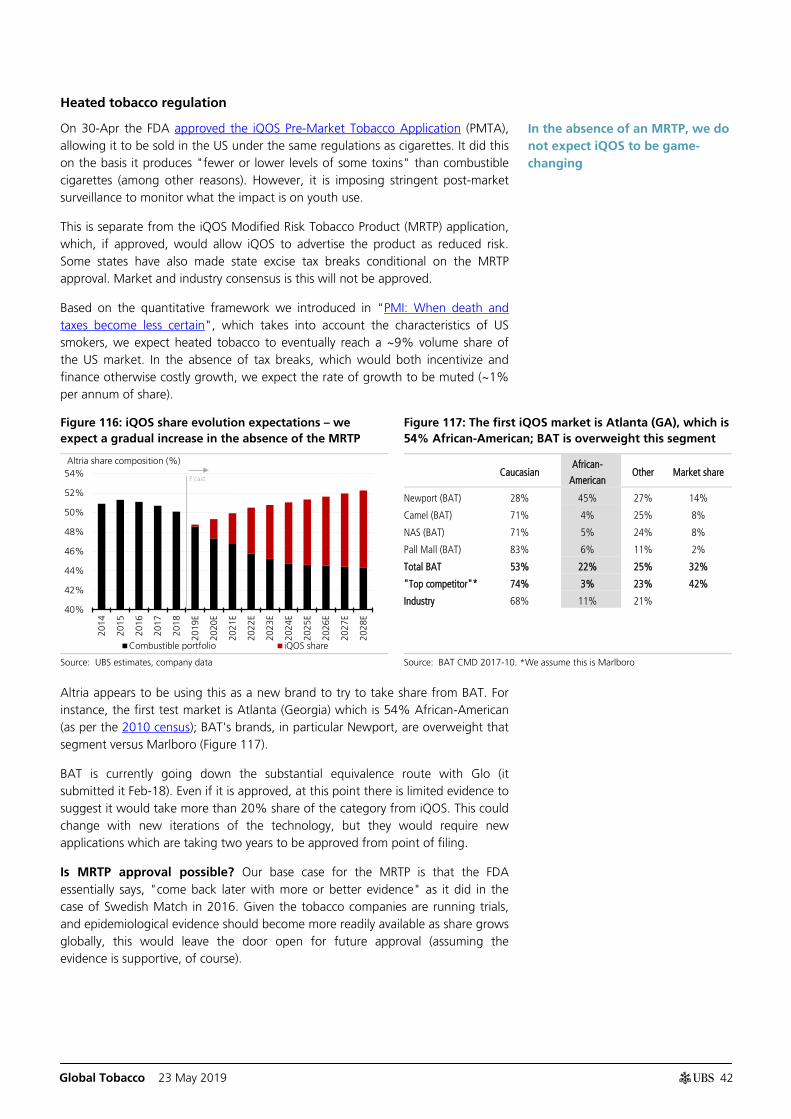
Global Tobacco 23 May 2019
42
Heated tobacco regulation
On 30-Apr the FDA approved the iQOS Pre-Market Tobacco Application (PMTA), allowing it to be sold in the US under the same regulations as cigarettes. It did this on the basis it produces "fewer or lower levels of some toxins" than combustible cigarettes (among other reasons). However, it is imposing stringent post-market surveillance to monitor what the impact is on youth use.
This is separate from the iQOS Modified Risk Tobacco Product (MRTP) application, which, if approved, would allow iQOS to advertise the product as reduced risk. Some states have also made state excise tax breaks conditional on the MRTP approval. Market and industry consensus is this will not be approved.
Based on the quantitative framework we introduced in "PMI: When death and taxes become less certain", which takes into account the characteristics of US smokers, we expect heated tobacco to eventually reach a ~9% volume share of the US market. In the absence of tax breaks, which would both incentivize and finance otherwise costly growth, we expect the rate of growth to be muted (~1% per annum of share).
Figure 116: iQOS share evolution expectations – we expect a gradual increase in the absence of the MRTP
Figure 117: The first iQOS market is Atlanta (GA), which is 54% African-American; BAT is overweight this segment
Caucasian African-
American Other Market share
Newport (BAT) 28% 45% 27% 14%
Camel (BAT) 71% 4% 25% 8%
NAS (BAT) 71% 5% 24% 8%
Pall Mall (BAT) 83% 6% 11% 2%
Total BAT 53% 22% 25% 32%
"Top competitor"* 74% 3% 23% 42%
Industry 68% 11% 21%
Source: UBS estimates, company data Source: BAT CMD 2017-10. *We assume this is Marlboro
Altria appears to be using this as a new brand to try to take share from BAT. For instance, the first test market is Atlanta (Georgia) which is 54% African-American (as per the 2010 census); BAT's brands, in particular Newport, are overweight that segment versus Marlboro (Figure 117).
BAT is currently going down the substantial equivalence route with Glo (it submitted it Feb-18). Even if it is approved, at this point there is limited evidence to suggest it would take more than 20% share of the category from iQOS. This could change with new iterations of the technology, but they would require new applications which are taking two years to be approved from point of filing.
Is MRTP approval possible? Our base case for the MRTP is that the FDA essentially says, "come back later with more or better evidence" as it did in the case of Swedish Match in 2016. Given the tobacco companies are running trials, and epidemiological evidence should become more readily available as share grows globally, this would leave the door open for future approval (assuming the evidence is supportive, of course).
40%
42%
44%
46%
48%
50%
52%
54%
2014
2015
2016
2017
2018
2019
E
2020
E
2021
E
2022
E
2023
E
2024
E
2025
E
2026
E
2027
E
2028
E
Combustible portfolio iQOS share
Altria share composition (%)
F'cast
In the absence of an MRTP, we do not expect iQOS to be game-changing
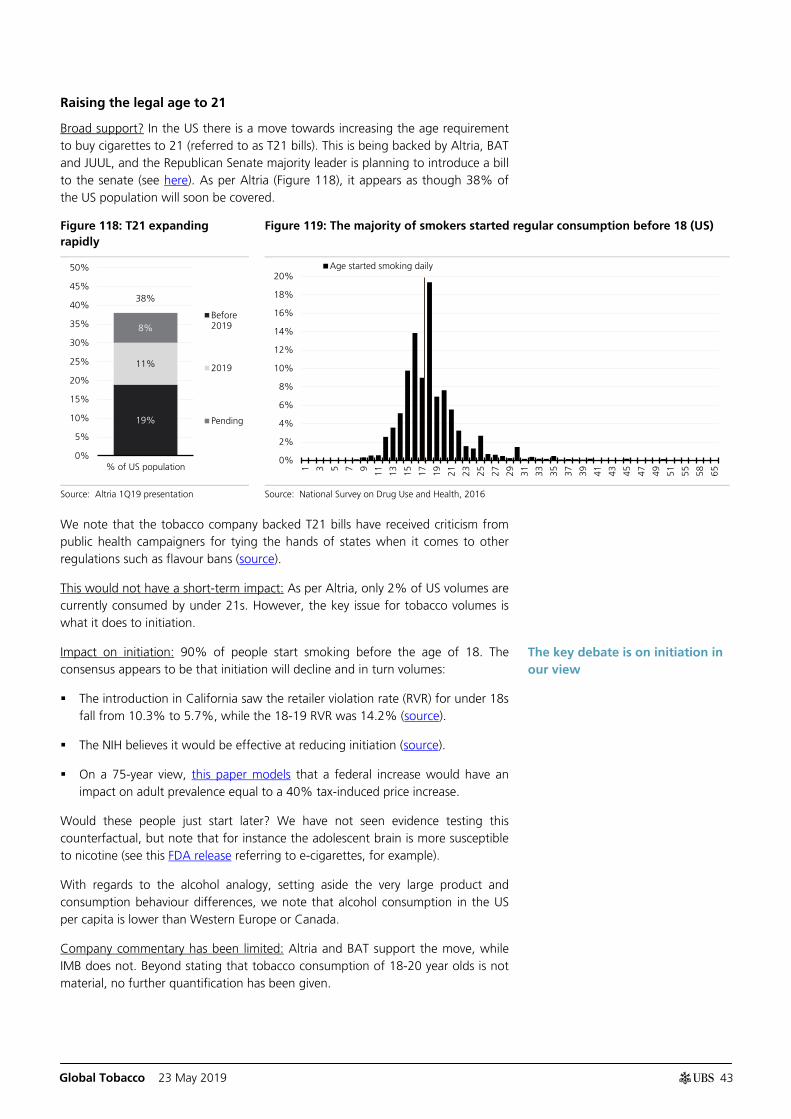
Global Tobacco 23 May 2019
43
Raising the legal age to 21
Broad support? In the US there is a move towards increasing the age requirement to buy cigarettes to 21 (referred to as T21 bills). This is being backed by Altria, BAT and JUUL, and the Republican Senate majority leader is planning to introduce a bill to the senate (see here). As per Altria (Figure 118), it appears as though 38% of the US population will soon be covered.
Figure 118: T21 expanding rapidly
Figure 119: The majority of smokers started regular consumption before 18 (US)
Source: Altria 1Q19 presentation Source: National Survey on Drug Use and Health, 2016
We note that the tobacco company backed T21 bills have received criticism from public health campaigners for tying the hands of states when it comes to other regulations such as flavour bans (source).
This would not have a short-term impact: As per Altria, only 2% of US volumes are currently consumed by under 21s. However, the key issue for tobacco volumes is what it does to initiation.
Impact on initiation: 90% of people start smoking before the age of 18. The consensus appears to be that initiation will decline and in turn volumes:
The introduction in California saw the retailer violation rate (RVR) for under 18s fall from 10.3% to 5.7%, while the 18-19 RVR was 14.2% (source).
The NIH believes it would be effective at reducing initiation (source).
On a 75-year view, this paper models that a federal increase would have an impact on adult prevalence equal to a 40% tax-induced price increase.
Would these people just start later? We have not seen evidence testing this counterfactual, but note that for instance the adolescent brain is more susceptible to nicotine (see this FDA release referring to e-cigarettes, for example).
With regards to the alcohol analogy, setting aside the very large product and consumption behaviour differences, we note that alcohol consumption in the US per capita is lower than Western Europe or Canada.
Company commentary has been limited: Altria and BAT support the move, while IMB does not. Beyond stating that tobacco consumption of 18-20 year olds is not material, no further quantification has been given.
19%
11%
8%
38%
0%
5%
10%
15%
20%
25%
30%
35%
40%
45%
50%
% of US population
Before2019
2019
Pending
0%
2%
4%
6%
8%
10%
12%
14%
16%
18%
20%
1 3 5 7 9 11 13 15 17 19 21 23 25 27 29 31 33 35 37 39 41 43 45 47 49 51 55 58 65
Age started smoking daily
The key debate is on initiation in our view
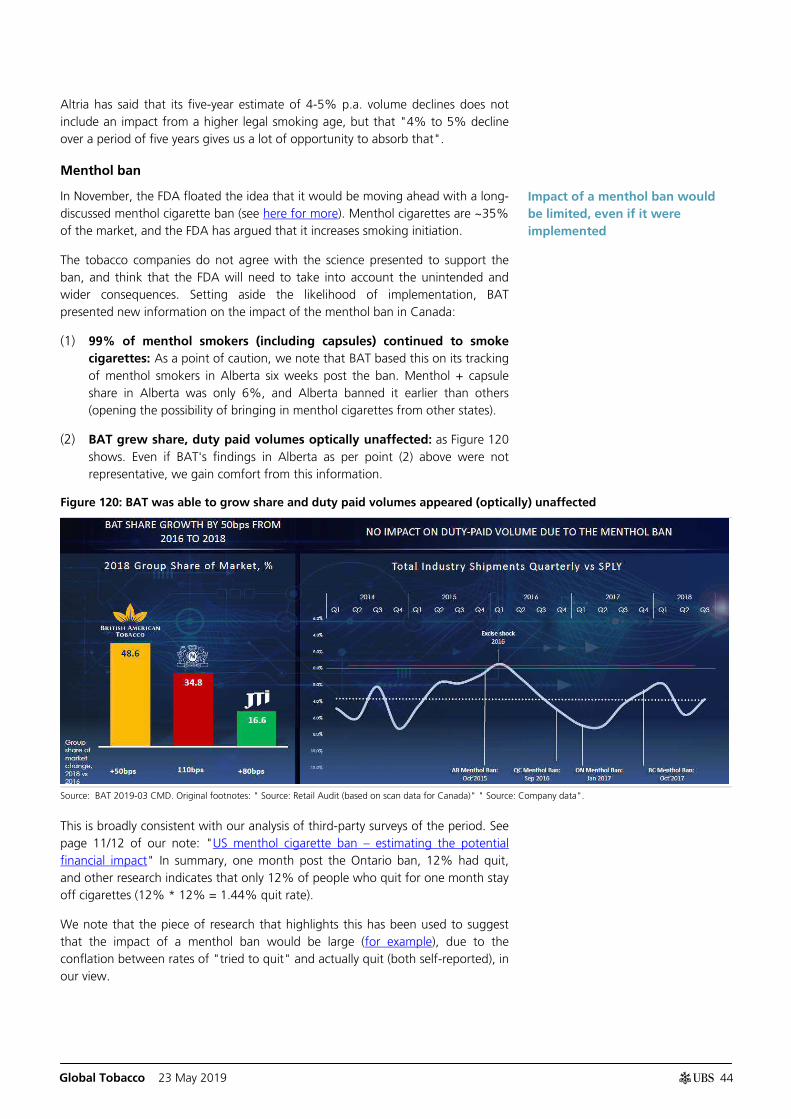
Global Tobacco 23 May 2019
44
Altria has said that its five-year estimate of 4-5% p.a. volume declines does not include an impact from a higher legal smoking age, but that "4% to 5% decline over a period of five years gives us a lot of opportunity to absorb that".
Menthol ban
In November, the FDA floated the idea that it would be moving ahead with a long-discussed menthol cigarette ban (see here for more). Menthol cigarettes are ~35% of the market, and the FDA has argued that it increases smoking initiation.
The tobacco companies do not agree with the science presented to support the ban, and think that the FDA will need to take into account the unintended and wider consequences. Setting aside the likelihood of implementation, BAT presented new information on the impact of the menthol ban in Canada:
(1) 99% of menthol smokers (including capsules) continued to smoke cigarettes: As a point of caution, we note that BAT based this on its tracking of menthol smokers in Alberta six weeks post the ban. Menthol + capsule share in Alberta was only 6%, and Alberta banned it earlier than others (opening the possibility of bringing in menthol cigarettes from other states).
(2) BAT grew share, duty paid volumes optically unaffected: as Figure 120 shows. Even if BAT's findings in Alberta as per point (2) above were not representative, we gain comfort from this information.
Figure 120: BAT was able to grow share and duty paid volumes appeared (optically) unaffected
Source: BAT 2019-03 CMD. Original footnotes: " Source: Retail Audit (based on scan data for Canada)" " Source: Company data".
This is broadly consistent with our analysis of third-party surveys of the period. See page 11/12 of our note: "US menthol cigarette ban – estimating the potential financial impact" In summary, one month post the Ontario ban, 12% had quit, and other research indicates that only 12% of people who quit for one month stay off cigarettes (12% * 12% = 1.44% quit rate).
We note that the piece of research that highlights this has been used to suggest that the impact of a menthol ban would be large (for example), due to the conflation between rates of "tried to quit" and actually quit (both self-reported), in our view.
Impact of a menthol ban would be limited, even if it were implemented
Global Tobacco 23 May 2019
45
Very low nicotine levels
One of the proposed FDA rules is reducing the level of nicotine to non-addictive levels (approximately 5-10% of current levels). The Centre for Tobacco Products (which does not necessarily "represent Agency position") views that the scientific literature was supportive of the proposed (VLNC) product standard, although it did not address the presence of illicit cigarettes, a key pushback.
Should implementation be a base case? Industry participants see implementation as 5-10 years away, if at all. We would expect litigation to act as a further obstacle even if it did get through the FDA rule-making process and White House review.
What if it is implemented? In our view, the FDA views VLNC regulation as a way to transition people to safer nicotine products. We note that ~$80bn is currently spent on cigarettes in the US; in our view material changes to the product may increase the risk of illicit trade in the absence of effective alternatives.
In our view, based on current regulatory trends, the US vapour market is on track to look radically different to the one today:
PMTAs to consolidate the market: From August 2022, the FDA will require all vapor product manufacturers to have submitted PMTAs for every SKU on the market. Currently, these cost low single digit millions to file. This looks highly likely to consolidate the market.
Distribution shift to convenience: A more consolidated market with limited SKUs is also likely to reduce the need and demand for specialized vape shops, consolidating more demand in the convenience channel.
Higher advertising restrictions and taxes: While there is limited discussion of advertising restrictions and vapour taxes at the federal level, states are moving in that direction. We view both taxes and advertising restrictions as key barriers to entry in tobacco.
Essentially, the market structure would look the same as the cigarette market now. Therefore, from the perspective of the tobacco industry, this does not appear to be an existential threat. The key questions about implementation are:
Which products are affected? Would heated tobacco fall under the requirements? What about snus?
What happens to total nicotine consumption? Replacing one delivery mechanism of nicotine with another, less harmful one, may not necessarily reduce total nicotine consumption.
Which tobacco companies take share? If we assume that only the tobacco companies can effectively compete in the new product segments, which one takes share?
We note of course this is just based on the current FDA plans.
The FDA is aiming to move people from cigarettes to alternatives
The alternative market is on track to look fundamentally different
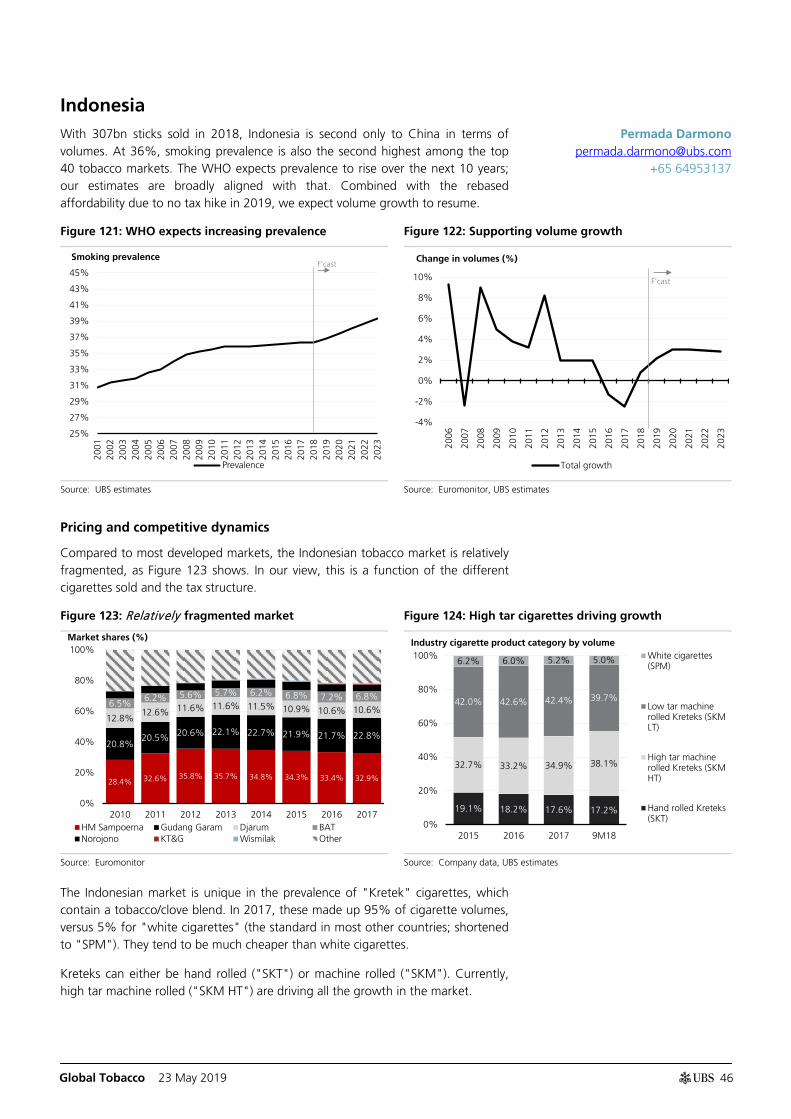
Global Tobacco 23 May 2019
46
Indonesia With 307bn sticks sold in 2018, Indonesia is second only to China in terms of volumes. At 36%, smoking prevalence is also the second highest among the top 40 tobacco markets. The WHO expects prevalence to rise over the next 10 years; our estimates are broadly aligned with that. Combined with the rebased affordability due to no tax hike in 2019, we expect volume growth to resume.
Figure 121: WHO expects increasing prevalence Figure 122: Supporting volume growth
Source: UBS estimates Source: Euromonitor, UBS estimates
Pricing and competitive dynamics
Compared to most developed markets, the Indonesian tobacco market is relatively fragmented, as Figure 123 shows. In our view, this is a function of the different cigarettes sold and the tax structure.
Figure 123: Relatively fragmented market Figure 124: High tar cigarettes driving growth
Source: Euromonitor Source: Company data, UBS estimates
The Indonesian market is unique in the prevalence of "Kretek" cigarettes, which contain a tobacco/clove blend. In 2017, these made up 95% of cigarette volumes, versus 5% for "white cigarettes" (the standard in most other countries; shortened to "SPM"). They tend to be much cheaper than white cigarettes.
Kreteks can either be hand rolled ("SKT") or machine rolled ("SKM"). Currently, high tar machine rolled ("SKM HT") are driving all the growth in the market.
25%
27%
29%
31%
33%
35%
37%
39%
41%
43%
45%
2001
2002
2003
2004
2005
2006
2007
2008
2009
2010
2011
2012
2013
2014
2015
2016
2017
2018
2019
2020
2021
2022
2023
Prevalence
Smoking prevalence F'cast
-4%
-2%
0%
2%
4%
6%
8%
10%
2006
2007
2008
2009
2010
2011
2012
2013
2014
2015
2016
2017
2018
2019
2020
2021
2022
2023
Total growth
F'cast
Change in volumes (%)
28.4% 32.6% 35.8% 35.7% 34.8% 34.3% 33.4% 32.9%
20.8% 20.5% 20.6% 22.1% 22.7% 21.9% 21.7% 22.8%
12.8% 12.6% 11.6% 11.6% 11.5% 10.9% 10.6% 10.6%
6.5% 6.2% 5.6% 5.7% 6.2% 6.8% 7.2% 6.8%
0%
20%
40%
60%
80%
100%
2010 2011 2012 2013 2014 2015 2016 2017HM Sampoerna Gudang Garam Djarum BATNorojono KT&G Wismilak Other
Market shares (%)
19.1% 18.2% 17.6% 17.2%
32.7% 33.2% 34.9% 38.1%
42.0% 42.6% 42.4% 39.7%
6.2% 6.0% 5.2% 5.0%
0%
20%
40%
60%
80%
100%
2015 2016 2017 9M18
White cigarettes(SPM)
Low tar machinerolled Kreteks (SKMLT)
High tar machinerolled Kreteks (SKMHT)
Hand rolled Kreteks(SKT)
Industry cigarette product category by volume
Permada Darmono [email protected]
+65 64953137
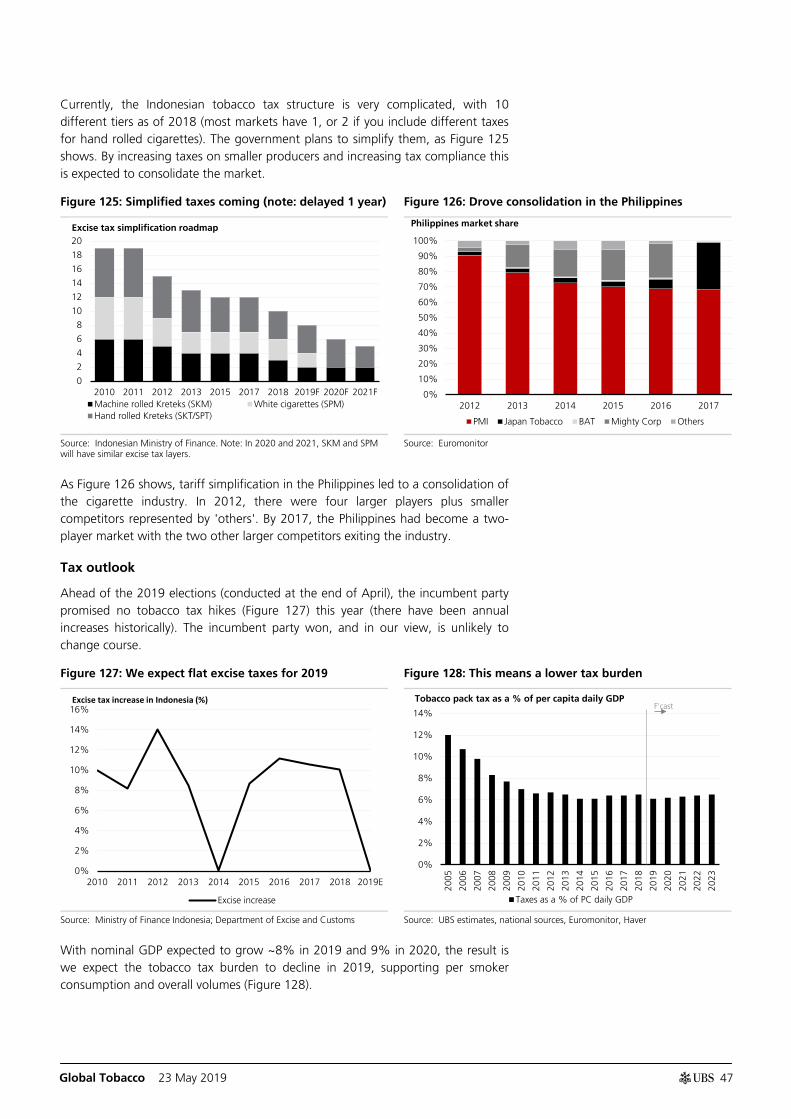
Global Tobacco 23 May 2019
47
Currently, the Indonesian tobacco tax structure is very complicated, with 10 different tiers as of 2018 (most markets have 1, or 2 if you include different taxes for hand rolled cigarettes). The government plans to simplify them, as Figure 125 shows. By increasing taxes on smaller producers and increasing tax compliance this is expected to consolidate the market.
Figure 125: Simplified taxes coming (note: delayed 1 year) Figure 126: Drove consolidation in the Philippines
Source: Indonesian Ministry of Finance. Note: In 2020 and 2021, SKM and SPM will have similar excise tax layers.
Source: Euromonitor
As Figure 126 shows, tariff simplification in the Philippines led to a consolidation of the cigarette industry. In 2012, there were four larger players plus smaller competitors represented by 'others'. By 2017, the Philippines had become a two-player market with the two other larger competitors exiting the industry.
Tax outlook
Ahead of the 2019 elections (conducted at the end of April), the incumbent party promised no tobacco tax hikes (Figure 127) this year (there have been annual increases historically). The incumbent party won, and in our view, is unlikely to change course.
Figure 127: We expect flat excise taxes for 2019 Figure 128: This means a lower tax burden
Source: Ministry of Finance Indonesia; Department of Excise and Customs Source: UBS estimates, national sources, Euromonitor, Haver
With nominal GDP expected to grow ~8% in 2019 and 9% in 2020, the result is we expect the tobacco tax burden to decline in 2019, supporting per smoker consumption and overall volumes (Figure 128).
0
2
4
6
8
10
12
14
16
18
20
2010 2011 2012 2013 2015 2017 2018 2019F 2020F 2021FMachine rolled Kreteks (SKM) White cigarettes (SPM)Hand rolled Kreteks (SKT/SPT)
Excise tax simplification roadmap
0%
10%
20%
30%
40%
50%
60%
70%
80%
90%
100%
2012 2013 2014 2015 2016 2017
PMI Japan Tobacco BAT Mighty Corp Others
Philippines market share
0%
2%
4%
6%
8%
10%
12%
14%
16%
2010 2011 2012 2013 2014 2015 2016 2017 2018 2019E
Excise increase
Excise tax increase in Indonesia (%)
0%
2%
4%
6%
8%
10%
12%
14%
2005
2006
2007
2008
2009
2010
2011
2012
2013
2014
2015
2016
2017
2018
2019
2020
2021
2022
2023
Taxes as a % of PC daily GDP
Tobacco pack tax as a % of per capita daily GDP F'cast
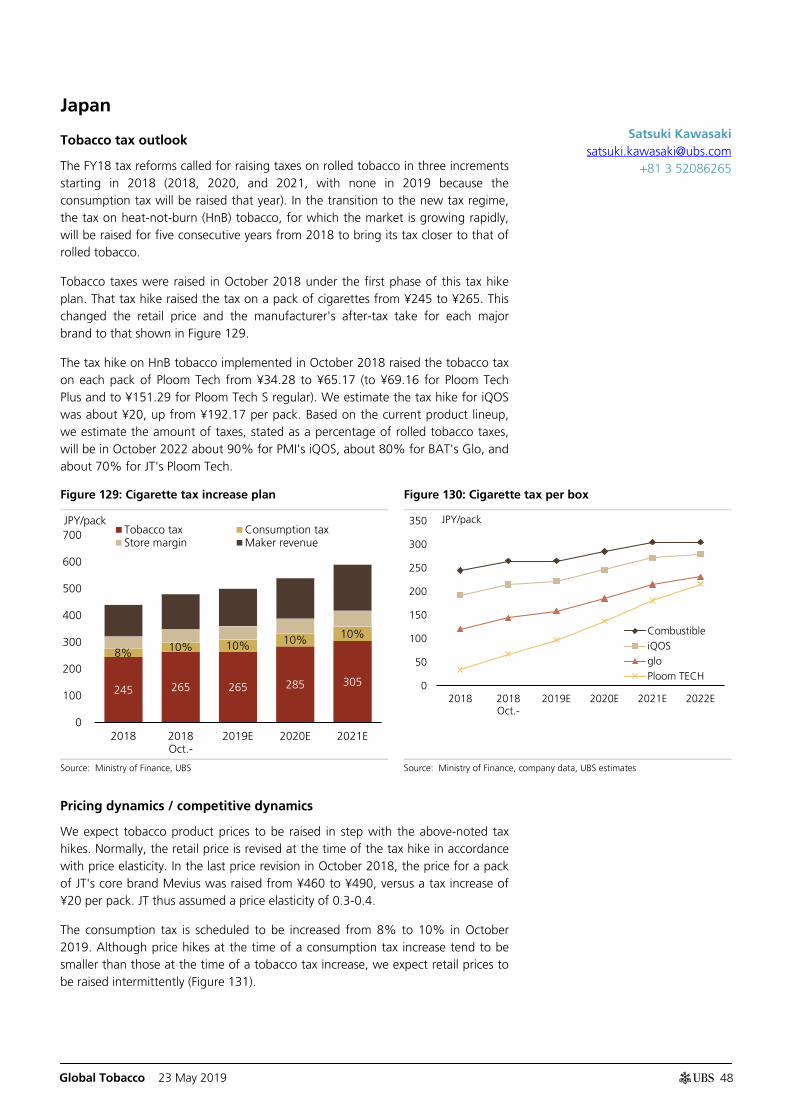
Global Tobacco 23 May 2019
48
Japan
Tobacco tax outlook
The FY18 tax reforms called for raising taxes on rolled tobacco in three increments starting in 2018 (2018, 2020, and 2021, with none in 2019 because the consumption tax will be raised that year). In the transition to the new tax regime, the tax on heat-not-burn (HnB) tobacco, for which the market is growing rapidly, will be raised for five consecutive years from 2018 to bring its tax closer to that of rolled tobacco.
Tobacco taxes were raised in October 2018 under the first phase of this tax hike plan. That tax hike raised the tax on a pack of cigarettes from ¥245 to ¥265. This changed the retail price and the manufacturer's after-tax take for each major brand to that shown in Figure 129.
The tax hike on HnB tobacco implemented in October 2018 raised the tobacco tax on each pack of Ploom Tech from ¥34.28 to ¥65.17 (to ¥69.16 for Ploom Tech Plus and to ¥151.29 for Ploom Tech S regular). We estimate the tax hike for iQOS was about ¥20, up from ¥192.17 per pack. Based on the current product lineup, we estimate the amount of taxes, stated as a percentage of rolled tobacco taxes, will be in October 2022 about 90% for PMI's iQOS, about 80% for BAT's Glo, and about 70% for JT's Ploom Tech.
Figure 129: Cigarette tax increase plan Figure 130: Cigarette tax per box
Source: Ministry of Finance, UBS Source: Ministry of Finance, company data, UBS estimates
Pricing dynamics / competitive dynamics
We expect tobacco product prices to be raised in step with the above-noted tax hikes. Normally, the retail price is revised at the time of the tax hike in accordance with price elasticity. In the last price revision in October 2018, the price for a pack of JT's core brand Mevius was raised from ¥460 to ¥490, versus a tax increase of ¥20 per pack. JT thus assumed a price elasticity of 0.3-0.4.
The consumption tax is scheduled to be increased from 8% to 10% in October 2019. Although price hikes at the time of a consumption tax increase tend to be smaller than those at the time of a tobacco tax increase, we expect retail prices to be raised intermittently (Figure 131).
245 265 265 285 305
8% 10% 10% 10% 10%
0
100
200
300
400
500
600
700
2018 2018Oct.-
2019E 2020E 2021E
JPY/packTobacco tax Consumption taxStore margin Maker revenue
0
50
100
150
200
250
300
350
2018 2018Oct.-
2019E 2020E 2021E 2022E
JPY/pack
CombustibleiQOSgloPloom TECH
Satsuki Kawasaki [email protected]
+81 3 52086265
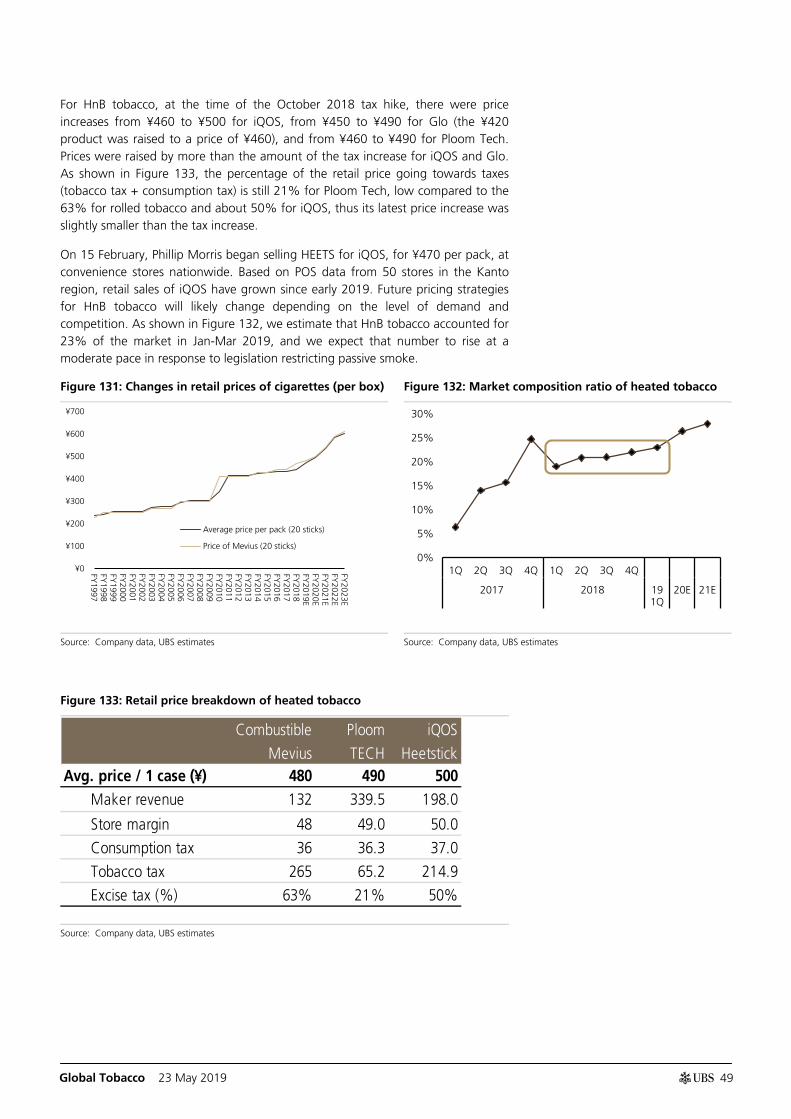
Global Tobacco 23 May 2019
49
For HnB tobacco, at the time of the October 2018 tax hike, there were price increases from ¥460 to ¥500 for iQOS, from ¥450 to ¥490 for Glo (the ¥420 product was raised to a price of ¥460), and from ¥460 to ¥490 for Ploom Tech. Prices were raised by more than the amount of the tax increase for iQOS and Glo. As shown in Figure 133, the percentage of the retail price going towards taxes (tobacco tax + consumption tax) is still 21% for Ploom Tech, low compared to the 63% for rolled tobacco and about 50% for iQOS, thus its latest price increase was slightly smaller than the tax increase.
On 15 February, Phillip Morris began selling HEETS for iQOS, for ¥470 per pack, at convenience stores nationwide. Based on POS data from 50 stores in the Kanto region, retail sales of iQOS have grown since early 2019. Future pricing strategies for HnB tobacco will likely change depending on the level of demand and competition. As shown in Figure 132, we estimate that HnB tobacco accounted for 23% of the market in Jan-Mar 2019, and we expect that number to rise at a moderate pace in response to legislation restricting passive smoke.
Figure 131: Changes in retail prices of cigarettes (per box) Figure 132: Market composition ratio of heated tobacco
Source: Company data, UBS estimates Source: Company data, UBS estimates
Figure 133: Retail price breakdown of heated tobacco
Source: Company data, UBS estimates
¥0
¥100
¥200
¥300
¥400
¥500
¥600
¥700
FY1997
FY1998
FY1999
FY2000
FY2001
FY2002
FY2003
FY2004
FY2005
FY2006
FY2007
FY2008
FY2009
FY2010
FY2011
FY2012
FY2013
FY2014
FY2015
FY2016
FY2017
FY2018
FY2019E
FY2020E
FY2021E
FY2022E
FY2023E
Average price per pack (20 sticks)
Price of Mevius (20 sticks)
0%
5%
10%
15%
20%
25%
30%
1Q 2Q 3Q 4Q 1Q 2Q 3Q 4Q
2017 2018 191Q
20E 21E
Combustible
Mevius
Ploom
TECH
iQOS
HeetstickAvg. price / 1 case (¥) 480 490 500
Maker revenue 132 339.5 198.0
Store margin 48 49.0 50.0
Consumption tax 36 36.3 37.0
Tobacco tax 265 65.2 214.9
Excise tax (%) 63% 21% 50%
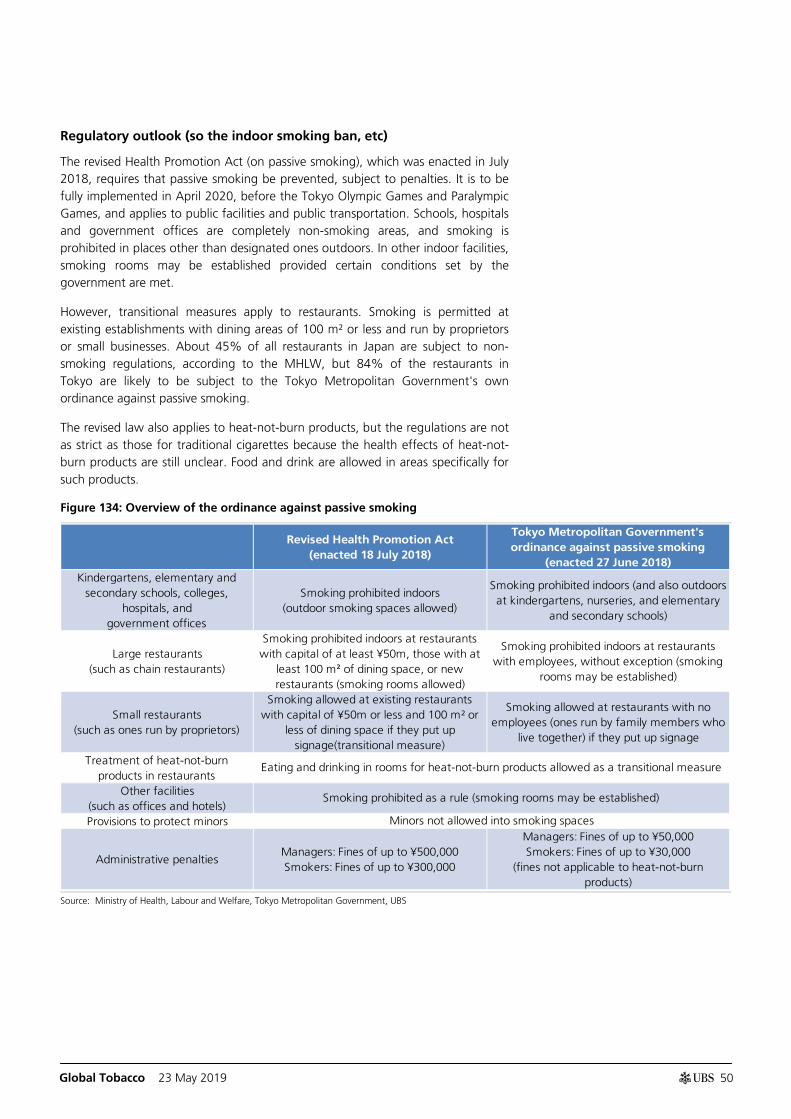
Global Tobacco 23 May 2019
50
Regulatory outlook (so the indoor smoking ban, etc)
The revised Health Promotion Act (on passive smoking), which was enacted in July 2018, requires that passive smoking be prevented, subject to penalties. It is to be fully implemented in April 2020, before the Tokyo Olympic Games and Paralympic Games, and applies to public facilities and public transportation. Schools, hospitals and government offices are completely non-smoking areas, and smoking is prohibited in places other than designated ones outdoors. In other indoor facilities, smoking rooms may be established provided certain conditions set by the government are met.
However, transitional measures apply to restaurants. Smoking is permitted at existing establishments with dining areas of 100 m² or less and run by proprietors or small businesses. About 45% of all restaurants in Japan are subject to non-smoking regulations, according to the MHLW, but 84% of the restaurants in Tokyo are likely to be subject to the Tokyo Metropolitan Government's own ordinance against passive smoking.
The revised law also applies to heat-not-burn products, but the regulations are not as strict as those for traditional cigarettes because the health effects of heat-not-burn products are still unclear. Food and drink are allowed in areas specifically for such products.
Figure 134: Overview of the ordinance against passive smoking
Source: Ministry of Health, Labour and Welfare, Tokyo Metropolitan Government, UBS
Revised Health Promotion Act (enacted 18 July 2018)
Tokyo Metropolitan Government's ordinance against passive smoking
(enacted 27 June 2018)Kindergartens, elementary and
secondary schools, colleges, hospitals, and
government offices
Smoking prohibited indoors(outdoor smoking spaces allowed)
Smoking prohibited indoors (and also outdoors at kindergartens, nurseries, and elementary
and secondary schools)
Large restaurants(such as chain restaurants)
Smoking prohibited indoors at restaurants with capital of at least ¥50m, those with at
least 100 m² of dining space, or new restaurants (smoking rooms allowed)
Smoking prohibited indoors at restaurants with employees, without exception (smoking
rooms may be established)
Small restaurants(such as ones run by proprietors)
Smoking allowed at existing restaurants with capital of ¥50m or less and 100 m² or
less of dining space if they put up signage(transitional measure)
Smoking allowed at restaurants with no employees (ones run by family members who
live together) if they put up signage
Treatment of heat-not-burn products in restaurants
Other facilities(such as offices and hotels)Provisions to protect minors
Administrative penaltiesManagers: Fines of up to ¥500,000Smokers: Fines of up to ¥300,000
Managers: Fines of up to ¥50,000Smokers: Fines of up to ¥30,000
(fines not applicable to heat-not-burn products)
Eating and drinking in rooms for heat-not-burn products allowed as a transitional measure
Smoking prohibited as a rule (smoking rooms may be established)
Minors not allowed into smoking spaces
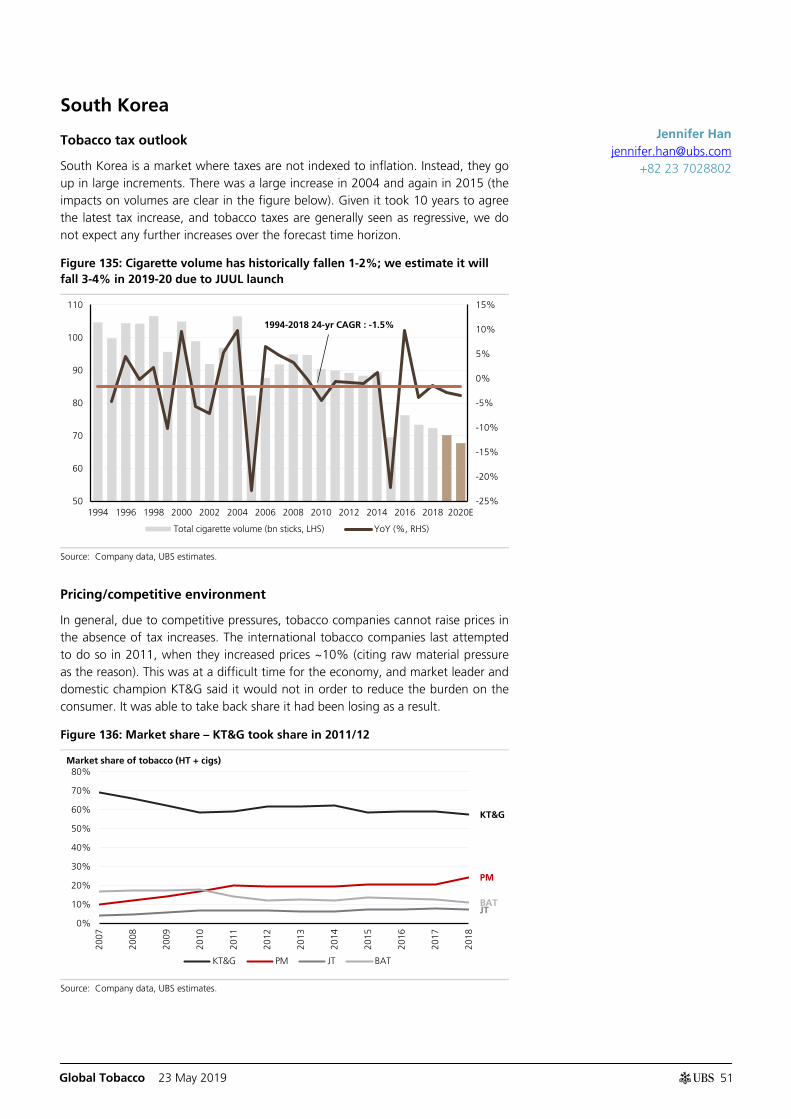
Global Tobacco 23 May 2019
51
South Korea
Tobacco tax outlook
South Korea is a market where taxes are not indexed to inflation. Instead, they go up in large increments. There was a large increase in 2004 and again in 2015 (the impacts on volumes are clear in the figure below). Given it took 10 years to agree the latest tax increase, and tobacco taxes are generally seen as regressive, we do not expect any further increases over the forecast time horizon.
Figure 135: Cigarette volume has historically fallen 1-2%; we estimate it will fall 3-4% in 2019-20 due to JUUL launch
Source: Company data, UBS estimates.
Pricing/competitive environment
In general, due to competitive pressures, tobacco companies cannot raise prices in the absence of tax increases. The international tobacco companies last attempted to do so in 2011, when they increased prices ~10% (citing raw material pressure as the reason). This was at a difficult time for the economy, and market leader and domestic champion KT&G said it would not in order to reduce the burden on the consumer. It was able to take back share it had been losing as a result.
Figure 136: Market share – KT&G took share in 2011/12
Source: Company data, UBS estimates.
-25%
-20%
-15%
-10%
-5%
0%
5%
10%
15%
50
60
70
80
90
100
110
1994 1996 1998 2000 2002 2004 2006 2008 2010 2012 2014 2016 2018 2020E
Total cigarette volume (bn sticks, LHS) YoY (%, RHS)
1994-2018 24-yr CAGR : -1.5%
KT&G
PM
JT BAT
0%
10%
20%
30%
40%
50%
60%
70%
80%
2007
2008
2009
2010
2011
2012
2013
2014
2015
2016
2017
2018
KT&G PM JT BAT
Market share of tobacco (HT + cigs)
Jennifer Han [email protected]
+82 23 7028802
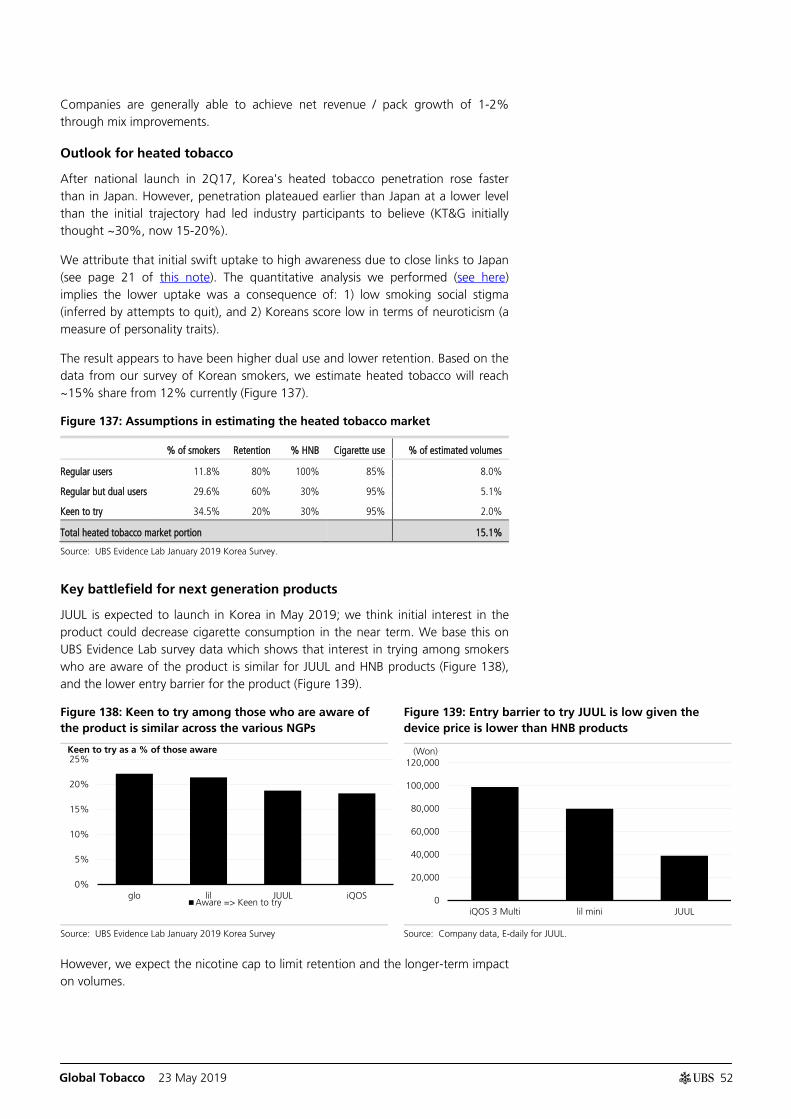
Global Tobacco 23 May 2019
52
Companies are generally able to achieve net revenue / pack growth of 1-2% through mix improvements.
Outlook for heated tobacco
After national launch in 2Q17, Korea's heated tobacco penetration rose faster than in Japan. However, penetration plateaued earlier than Japan at a lower level than the initial trajectory had led industry participants to believe (KT&G initially thought ~30%, now 15-20%).
We attribute that initial swift uptake to high awareness due to close links to Japan (see page 21 of this note). The quantitative analysis we performed (see here) implies the lower uptake was a consequence of: 1) low smoking social stigma (inferred by attempts to quit), and 2) Koreans score low in terms of neuroticism (a measure of personality traits).
The result appears to have been higher dual use and lower retention. Based on the data from our survey of Korean smokers, we estimate heated tobacco will reach ~15% share from 12% currently (Figure 137).
Figure 137: Assumptions in estimating the heated tobacco market
% of smokers Retention % HNB Cigarette use % of estimated volumes
Regular users 11.8% 80% 100% 85% 8.0%
Regular but dual users 29.6% 60% 30% 95% 5.1%
Keen to try 34.5% 20% 30% 95% 2.0%
Total heated tobacco market portion 15.1%
Source: UBS Evidence Lab January 2019 Korea Survey.
Key battlefield for next generation products
JUUL is expected to launch in Korea in May 2019; we think initial interest in the product could decrease cigarette consumption in the near term. We base this on UBS Evidence Lab survey data which shows that interest in trying among smokers who are aware of the product is similar for JUUL and HNB products (Figure 138), and the lower entry barrier for the product (Figure 139).
Figure 138: Keen to try among those who are aware of the product is similar across the various NGPs
Figure 139: Entry barrier to try JUUL is low given the device price is lower than HNB products
Source: UBS Evidence Lab January 2019 Korea Survey Source: Company data, E-daily for JUUL.
However, we expect the nicotine cap to limit retention and the longer-term impact on volumes.
0%
5%
10%
15%
20%
25%
glo lil JUUL iQOSAware => Keen to try
Keen to try as a % of those aware
0
20,000
40,000
60,000
80,000
100,000
120,000
iQOS 3 Multi lil mini JUUL
(Won)
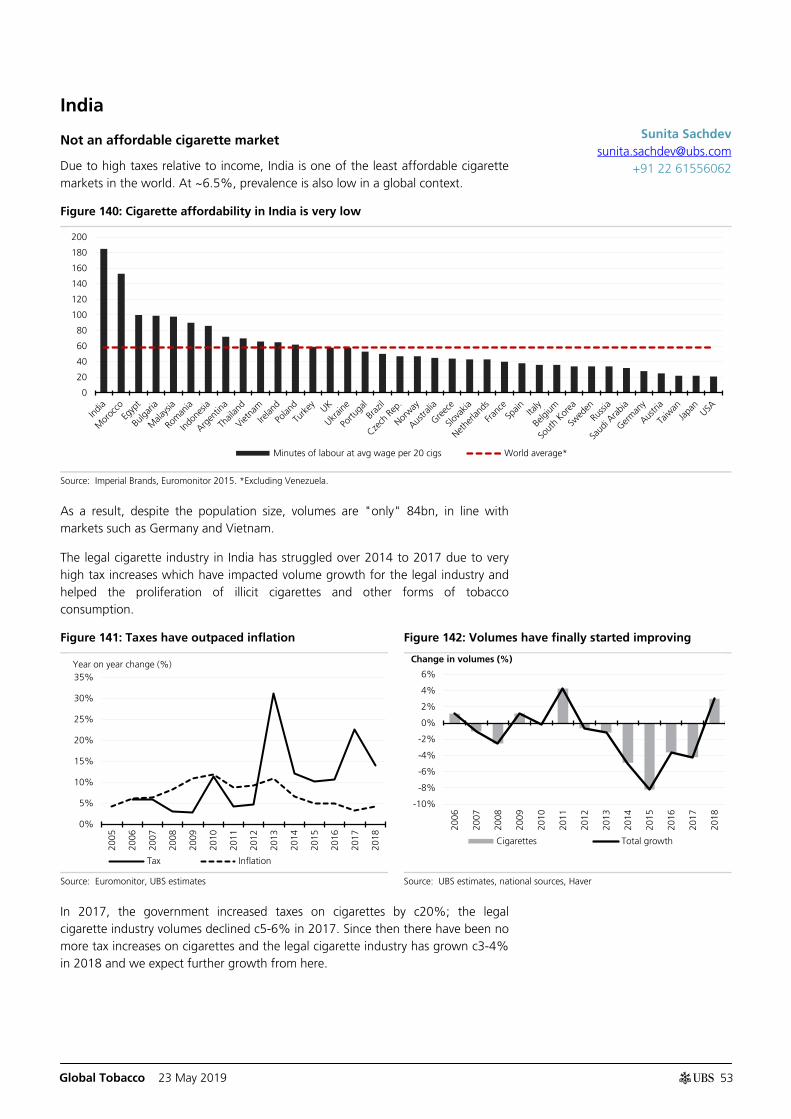
Global Tobacco 23 May 2019
53
India
Not an affordable cigarette market
Due to high taxes relative to income, India is one of the least affordable cigarette markets in the world. At ~6.5%, prevalence is also low in a global context.
Figure 140: Cigarette affordability in India is very low
Source: Imperial Brands, Euromonitor 2015. *Excluding Venezuela.
As a result, despite the population size, volumes are "only" 84bn, in line with markets such as Germany and Vietnam.
The legal cigarette industry in India has struggled over 2014 to 2017 due to very high tax increases which have impacted volume growth for the legal industry and helped the proliferation of illicit cigarettes and other forms of tobacco consumption.
Figure 141: Taxes have outpaced inflation Figure 142: Volumes have finally started improving
Source: Euromonitor, UBS estimates Source: UBS estimates, national sources, Haver
In 2017, the government increased taxes on cigarettes by c20%; the legal cigarette industry volumes declined c5-6% in 2017. Since then there have been no more tax increases on cigarettes and the legal cigarette industry has grown c3-4% in 2018 and we expect further growth from here.
0
20
40
60
80
100
120
140
160
180
200
Minutes of labour at avg wage per 20 cigs World average*
0%
5%
10%
15%
20%
25%
30%
35%
2005
2006
2007
2008
2009
2010
2011
2012
2013
2014
2015
2016
2017
2018
Tax Inflation
Year on year change (%)
-10%
-8%
-6%
-4%
-2%
0%
2%
4%
6%
2006
2007
2008
2009
2010
2011
2012
2013
2014
2015
2016
2017
2018
Cigarettes Total growth
Change in volumes (%)
Sunita Sachdev [email protected]
+91 22 61556062
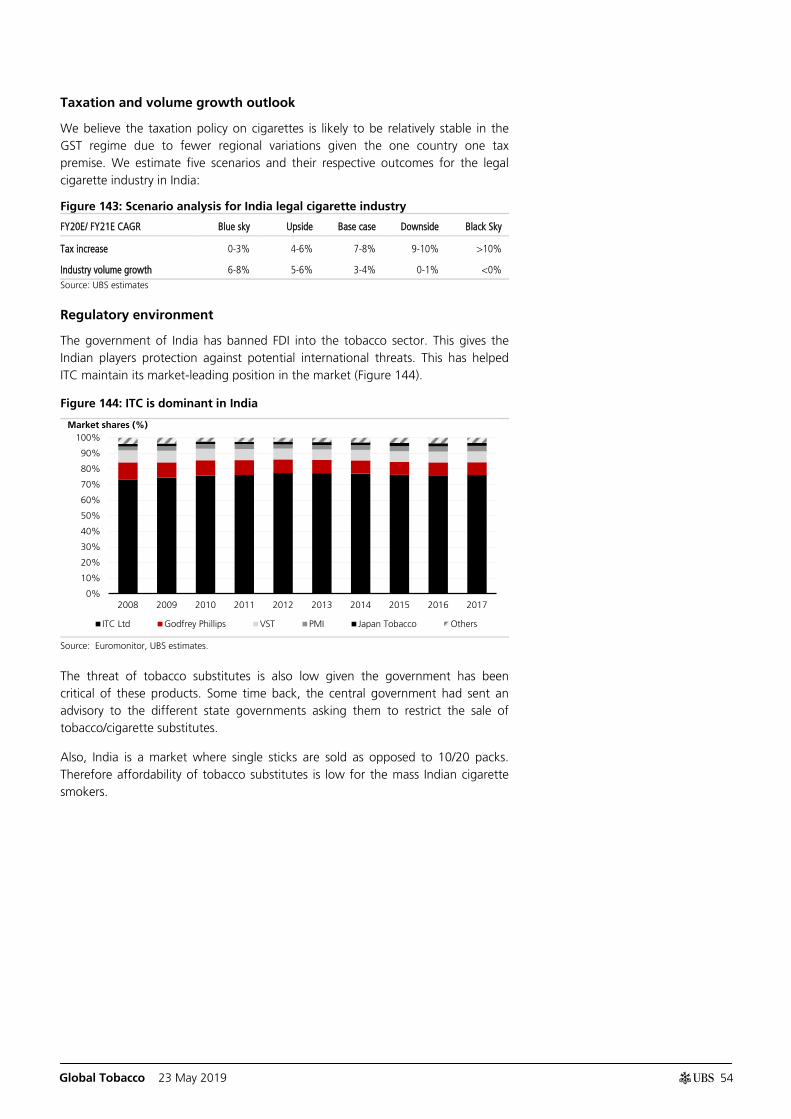
Global Tobacco 23 May 2019
54
Taxation and volume growth outlook
We believe the taxation policy on cigarettes is likely to be relatively stable in the GST regime due to fewer regional variations given the one country one tax premise. We estimate five scenarios and their respective outcomes for the legal cigarette industry in India:
Figure 143: Scenario analysis for India legal cigarette industry
FY20E/ FY21E CAGR Blue sky Upside Base case Downside Black Sky
Tax increase 0-3% 4-6% 7-8% 9-10% >10%
Industry volume growth 6-8% 5-6% 3-4% 0-1% <0%
Source: UBS estimates
Regulatory environment
The government of India has banned FDI into the tobacco sector. This gives the Indian players protection against potential international threats. This has helped ITC maintain its market-leading position in the market (Figure 144).
Figure 144: ITC is dominant in India
Source: Euromonitor, UBS estimates.
The threat of tobacco substitutes is also low given the government has been critical of these products. Some time back, the central government had sent an advisory to the different state governments asking them to restrict the sale of tobacco/cigarette substitutes.
Also, India is a market where single sticks are sold as opposed to 10/20 packs. Therefore affordability of tobacco substitutes is low for the mass Indian cigarette smokers.
0%
10%
20%
30%
40%
50%
60%
70%
80%
90%
100%
2008 2009 2010 2011 2012 2013 2014 2015 2016 2017
ITC Ltd Godfrey Phillips VST PMI Japan Tobacco Others
Market shares (%)
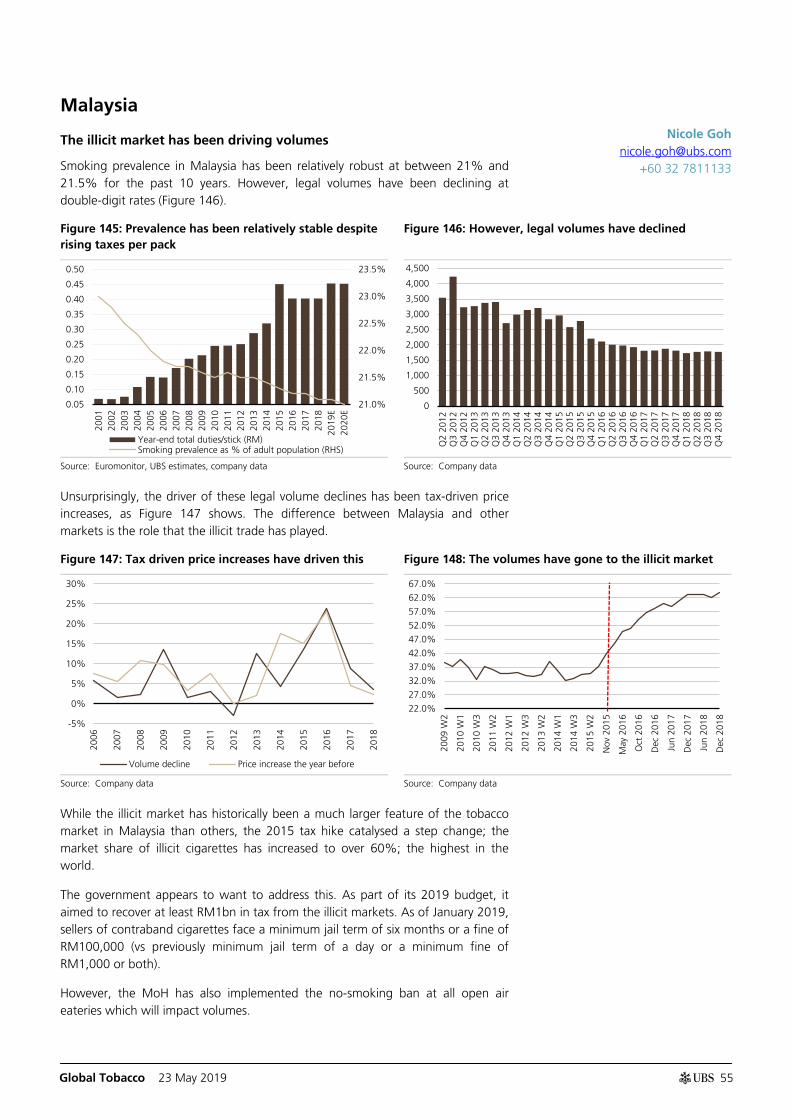
Global Tobacco 23 May 2019
55
Malaysia
The illicit market has been driving volumes
Smoking prevalence in Malaysia has been relatively robust at between 21% and 21.5% for the past 10 years. However, legal volumes have been declining at double-digit rates (Figure 146).
Figure 145: Prevalence has been relatively stable despite rising taxes per pack
Figure 146: However, legal volumes have declined
Source: Euromonitor, UBS estimates, company data Source: Company data
Unsurprisingly, the driver of these legal volume declines has been tax-driven price increases, as Figure 147 shows. The difference between Malaysia and other markets is the role that the illicit trade has played.
Figure 147: Tax driven price increases have driven this Figure 148: The volumes have gone to the illicit market
Source: Company data Source: Company data
While the illicit market has historically been a much larger feature of the tobacco market in Malaysia than others, the 2015 tax hike catalysed a step change; the market share of illicit cigarettes has increased to over 60%; the highest in the world.
The government appears to want to address this. As part of its 2019 budget, it aimed to recover at least RM1bn in tax from the illicit markets. As of January 2019, sellers of contraband cigarettes face a minimum jail term of six months or a fine of RM100,000 (vs previously minimum jail term of a day or a minimum fine of RM1,000 or both).
However, the MoH has also implemented the no-smoking ban at all open air eateries which will impact volumes.
21.0%
21.5%
22.0%
22.5%
23.0%
23.5%
0.05
0.10
0.15
0.20
0.25
0.30
0.35
0.40
0.45
0.50
2001
2002
2003
2004
2005
2006
2007
2008
2009
2010
2011
2012
2013
2014
2015
2016
2017
2018
2019
E20
20E
Year-end total duties/stick (RM)Smoking prevalence as % of adult population (RHS)
0
500
1,000
1,500
2,000
2,500
3,000
3,500
4,000
4,500
Q2
2012
Q3
2012
Q4
2012
Q1
2013
Q2
2013
Q3
2013
Q4
2013
Q1
2014
Q2
2014
Q3
2014
Q4
2014
Q1
2015
Q2
2015
Q3
2015
Q4
2015
Q1
2016
Q2
2016
Q3
2016
Q4
2016
Q1
2017
Q2
2017
Q3
2017
Q4
2017
Q1
2018
Q2
2018
Q3
2018
Q4
2018
-5%
0%
5%
10%
15%
20%
25%
30%
2006
2007
2008
2009
2010
2011
2012
2013
2014
2015
2016
2017
2018
Volume decline Price increase the year before
22.0%
27.0%
32.0%
37.0%
42.0%
47.0%
52.0%
57.0%
62.0%
67.0%
2009
W2
2010
W1
2010
W3
2011
W2
2012
W1
2012
W3
2013
W2
2014
W1
2014
W3
2015
W2
Nov
201
5
May
201
6
Oct
201
6
Dec
201
6
Jun
2017
Dec
201
7
Jun
2018
Dec
201
8
Nicole Goh [email protected]
+60 32 7811133
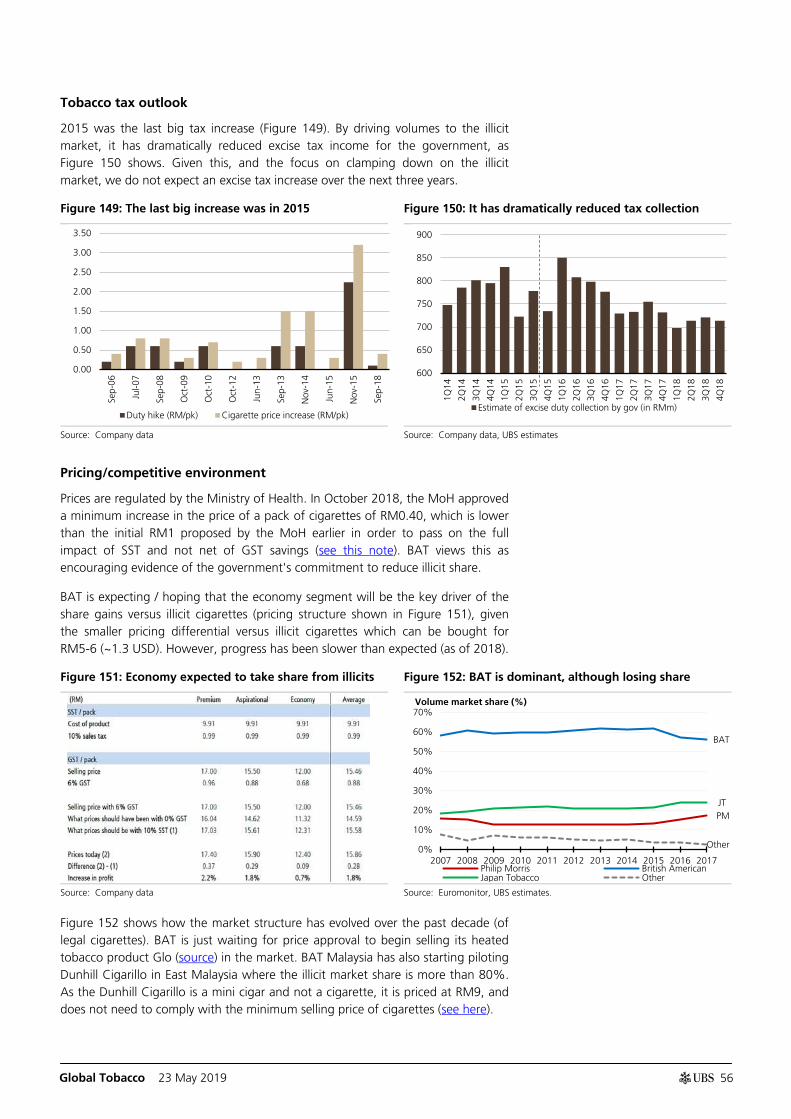
Global Tobacco 23 May 2019
56
Tobacco tax outlook
2015 was the last big tax increase (Figure 149). By driving volumes to the illicit market, it has dramatically reduced excise tax income for the government, as Figure 150 shows. Given this, and the focus on clamping down on the illicit market, we do not expect an excise tax increase over the next three years.
Figure 149: The last big increase was in 2015 Figure 150: It has dramatically reduced tax collection
Source: Company data Source: Company data, UBS estimates
Pricing/competitive environment
Prices are regulated by the Ministry of Health. In October 2018, the MoH approved a minimum increase in the price of a pack of cigarettes of RM0.40, which is lower than the initial RM1 proposed by the MoH earlier in order to pass on the full impact of SST and not net of GST savings (see this note). BAT views this as encouraging evidence of the government's commitment to reduce illicit share.
BAT is expecting / hoping that the economy segment will be the key driver of the share gains versus illicit cigarettes (pricing structure shown in Figure 151), given the smaller pricing differential versus illicit cigarettes which can be bought for RM5-6 (~1.3 USD). However, progress has been slower than expected (as of 2018).
Figure 151: Economy expected to take share from illicits Figure 152: BAT is dominant, although losing share
Source: Company data Source: Euromonitor, UBS estimates.
Figure 152 shows how the market structure has evolved over the past decade (of legal cigarettes). BAT is just waiting for price approval to begin selling its heated tobacco product Glo (source) in the market. BAT Malaysia has also starting piloting Dunhill Cigarillo in East Malaysia where the illicit market share is more than 80%. As the Dunhill Cigarillo is a mini cigar and not a cigarette, it is priced at RM9, and does not need to comply with the minimum selling price of cigarettes (see here).
0.00
0.50
1.00
1.50
2.00
2.50
3.00
3.50
Sep-
06
Jul-0
7
Sep-
08
Oct
-09
Oct
-10
Oct
-12
Jun-
13
Sep-
13
Nov
-14
Jun-
15
Nov
-15
Sep-
18
Duty hike (RM/pk) Cigarette price increase (RM/pk)
600
650
700
750
800
850
900
1Q14
2Q14
3Q14
4Q14
1Q15
2Q15
3Q15
4Q15
1Q16
2Q16
3Q16
4Q16
1Q17
2Q17
3Q17
4Q17
1Q18
2Q18
3Q18
4Q18
Estimate of excise duty collection by gov (in RMm)
PM
BAT
JT
Other 0%
10%
20%
30%
40%
50%
60%
70%
2007 2008 2009 2010 2011 2012 2013 2014 2015 2016 2017Philip Morris British AmericanJapan Tobacco Other
Volume market share (%)

Global Tobacco 23 May 2019
57
Global outlook detail
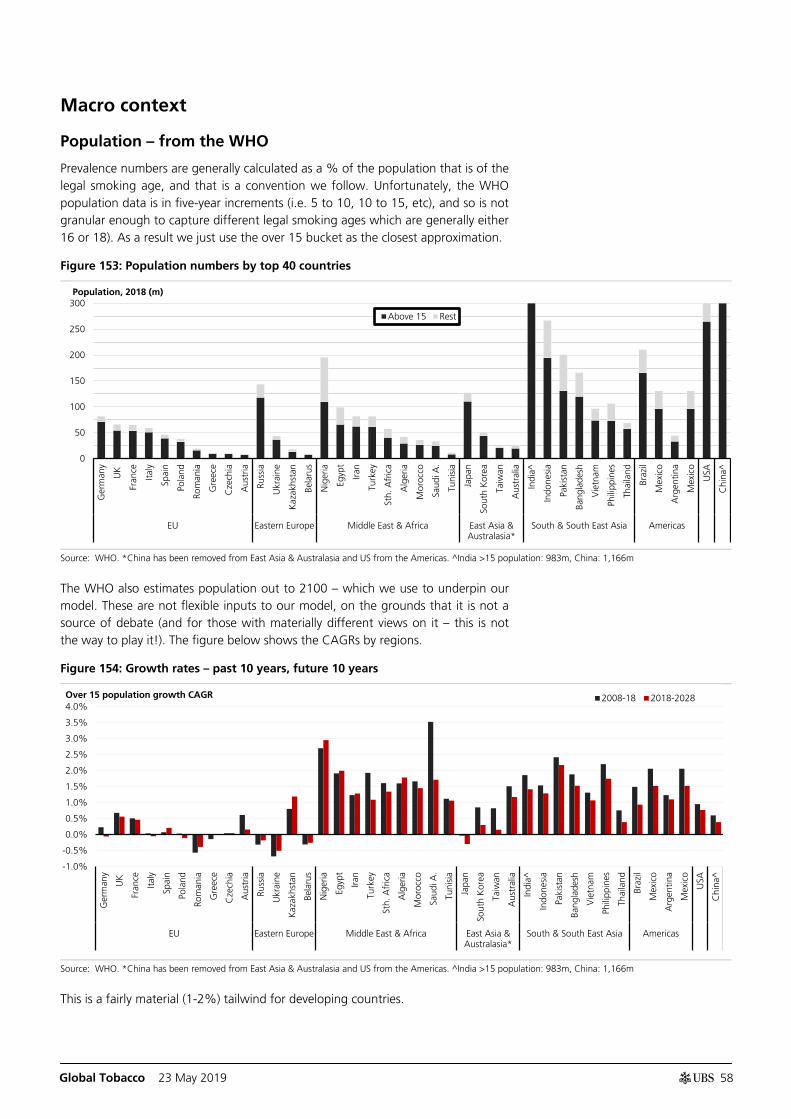
Global Tobacco 23 May 2019
58
Macro context
Population – from the WHO
Prevalence numbers are generally calculated as a % of the population that is of the legal smoking age, and that is a convention we follow. Unfortunately, the WHO population data is in five-year increments (i.e. 5 to 10, 10 to 15, etc), and so is not granular enough to capture different legal smoking ages which are generally either 16 or 18). As a result we just use the over 15 bucket as the closest approximation.
Figure 153: Population numbers by top 40 countries
Source: WHO. *China has been removed from East Asia & Australasia and US from the Americas. ^India >15 population: 983m, China: 1,166m
The WHO also estimates population out to 2100 – which we use to underpin our model. These are not flexible inputs to our model, on the grounds that it is not a source of debate (and for those with materially different views on it – this is not the way to play it!). The figure below shows the CAGRs by regions.
Figure 154: Growth rates – past 10 years, future 10 years
Source: WHO. *China has been removed from East Asia & Australasia and US from the Americas. ^India >15 population: 983m, China: 1,166m
This is a fairly material (1-2%) tailwind for developing countries.
0
50
100
150
200
250
300
Ger
man
y
UK
Fran
ce
Italy
Spai
n
Pola
nd
Rom
ania
Gre
ece
Cze
chia
Aus
tria
Russ
ia
Ukr
aine
Kaz
akhs
tan
Bela
rus
Nig
eria
Egyp
t
Iran
Turk
ey
Sth.
Afr
ica
Alg
eria
Mor
occo
Saud
i A.
Tuni
sia
Japa
n
Sout
h K
orea
Taiw
an
Aus
tral
ia
Indi
a^
Indo
nesi
a
Paki
stan
Bang
lade
sh
Vie
tnam
Phili
ppin
es
Thai
land
Braz
il
Mex
ico
Arg
entin
a
Mex
ico
USA
Chi
na^
EU Eastern Europe Middle East & Africa East Asia &Australasia*
South & South East Asia Americas
Above 15 Rest
Population, 2018 (m)
-1.0%
-0.5%
0.0%
0.5%
1.0%
1.5%
2.0%
2.5%
3.0%
3.5%
4.0%
Ger
man
y
UK
Fran
ce
Italy
Spai
n
Pola
nd
Rom
ania
Gre
ece
Cze
chia
Aus
tria
Russ
ia
Ukr
aine
Kaz
akhs
tan
Bela
rus
Nig
eria
Egyp
t
Iran
Turk
ey
Sth.
Afr
ica
Alg
eria
Mor
occo
Saud
i A.
Tuni
sia
Japa
n
Sout
h K
orea
Taiw
an
Aus
tral
ia
Indi
a^
Indo
nesi
a
Paki
stan
Bang
lade
sh
Vie
tnam
Phili
ppin
es
Thai
land
Braz
il
Mex
ico
Arg
entin
a
Mex
ico
USA
Chi
na^
EU Eastern Europe Middle East & Africa East Asia &Australasia*
South & South East Asia Americas
2008-18 2018-2028Over 15 population growth CAGR
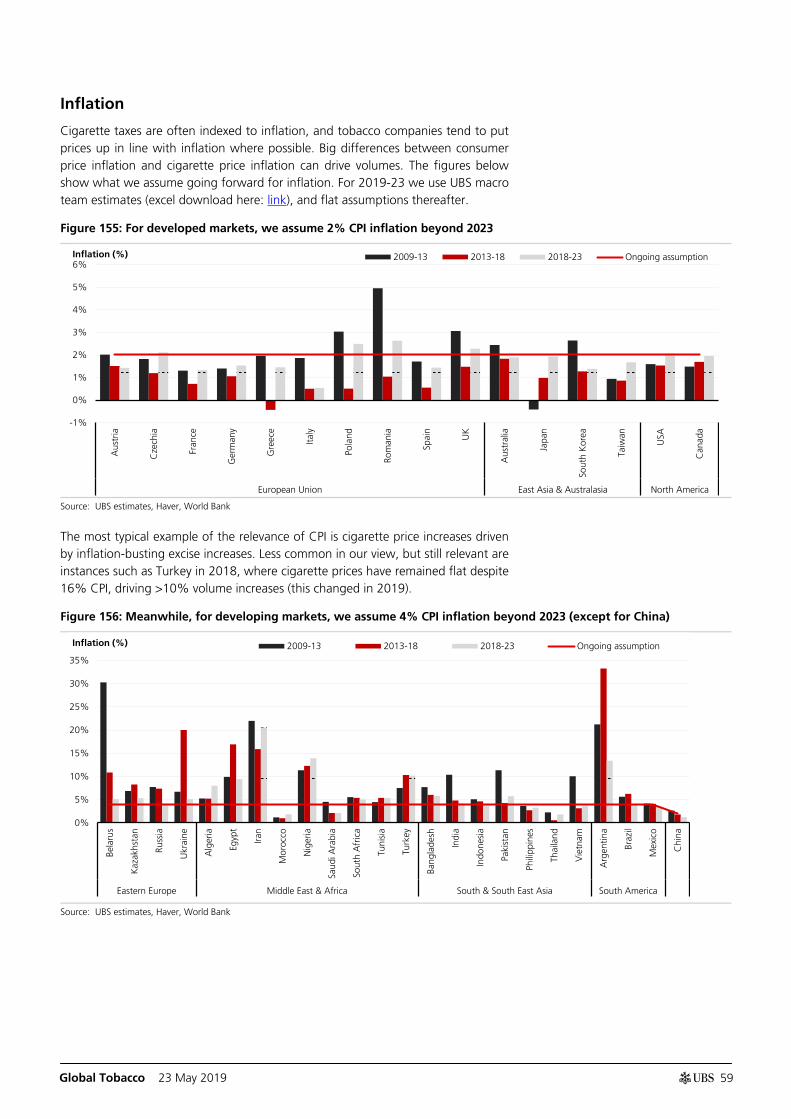
Global Tobacco 23 May 2019
59
Inflation
Cigarette taxes are often indexed to inflation, and tobacco companies tend to put prices up in line with inflation where possible. Big differences between consumer price inflation and cigarette price inflation can drive volumes. The figures below show what we assume going forward for inflation. For 2019-23 we use UBS macro team estimates (excel download here: link), and flat assumptions thereafter.
Figure 155: For developed markets, we assume 2% CPI inflation beyond 2023
Source: UBS estimates, Haver, World Bank
The most typical example of the relevance of CPI is cigarette price increases driven by inflation-busting excise increases. Less common in our view, but still relevant are instances such as Turkey in 2018, where cigarette prices have remained flat despite 16% CPI, driving >10% volume increases (this changed in 2019).
Figure 156: Meanwhile, for developing markets, we assume 4% CPI inflation beyond 2023 (except for China)
Source: UBS estimates, Haver, World Bank
-1%
0%
1%
2%
3%
4%
5%
6%
Aus
tria
Cze
chia
Fran
ce
Ger
man
y
Gre
ece
Italy
Pola
nd
Rom
ania
Spai
n
UK
Aus
tral
ia
Japa
n
Sout
h K
orea
Taiw
an
USA
Can
ada
European Union East Asia & Australasia North America
2009-13 2013-18 2018-23 Ongoing assumptionInflation (%)
0%
5%
10%
15%
20%
25%
30%
35%
Bela
rus
Kaz
akhs
tan
Russ
ia
Ukr
aine
Alg
eria
Egyp
t
Iran
Mor
occo
Nig
eria
Saud
i Ara
bia
Sout
h A
fric
a
Tuni
sia
Turk
ey
Bang
lade
sh
Indi
a
Indo
nesi
a
Paki
stan
Phili
ppin
es
Thai
land
Vie
tnam
Arg
entin
a
Braz
il
Mex
ico
Chi
na
Eastern Europe Middle East & Africa South & South East Asia South America
2009-13 2013-18 2018-23 Ongoing assumptionInflation (%)
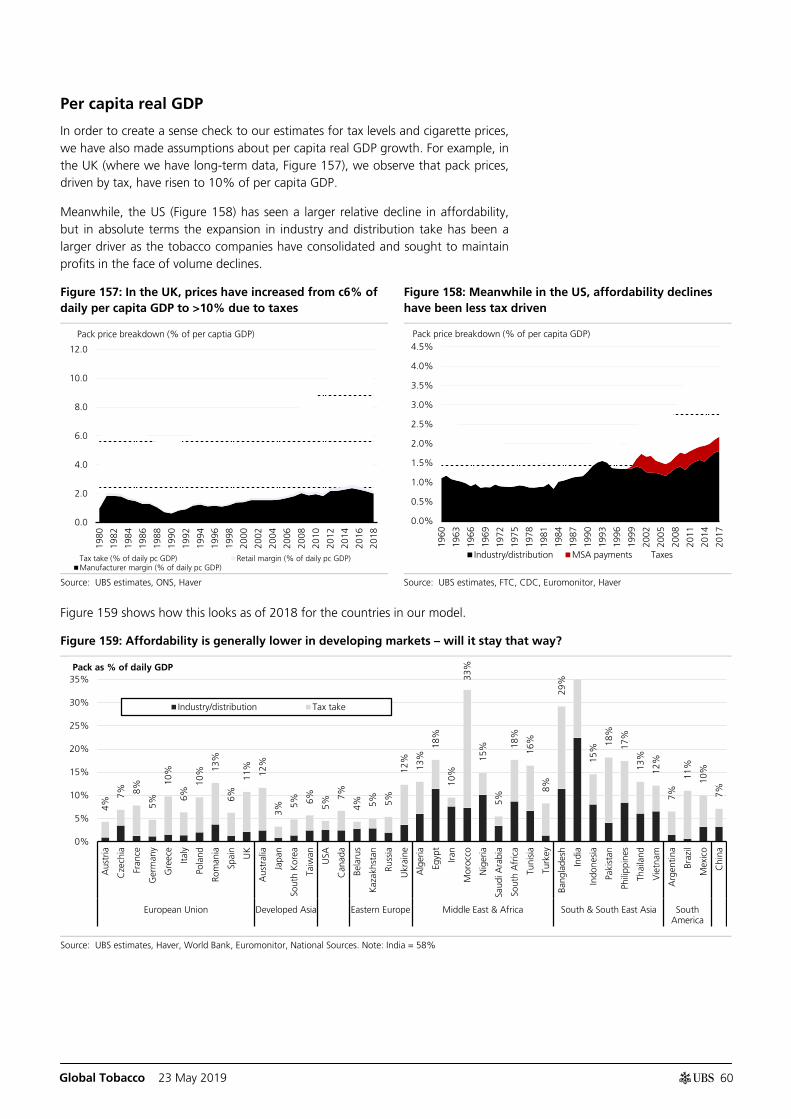
Global Tobacco 23 May 2019
60
Per capita real GDP
In order to create a sense check to our estimates for tax levels and cigarette prices, we have also made assumptions about per capita real GDP growth. For example, in the UK (where we have long-term data, Figure 157), we observe that pack prices, driven by tax, have risen to 10% of per capita GDP.
Meanwhile, the US (Figure 158) has seen a larger relative decline in affordability, but in absolute terms the expansion in industry and distribution take has been a larger driver as the tobacco companies have consolidated and sought to maintain profits in the face of volume declines.
Figure 157: In the UK, prices have increased from c6% of daily per capita GDP to >10% due to taxes
Figure 158: Meanwhile in the US, affordability declines have been less tax driven
Source: UBS estimates, ONS, Haver Source: UBS estimates, FTC, CDC, Euromonitor, Haver
Figure 159 shows how this looks as of 2018 for the countries in our model.
Figure 159: Affordability is generally lower in developing markets – will it stay that way?
Source: UBS estimates, Haver, World Bank, Euromonitor, National Sources. Note: India = 58%
0.0
2.0
4.0
6.0
8.0
10.0
12.0
1980
1982
1984
1986
1988
1990
1992
1994
1996
1998
2000
2002
2004
2006
2008
2010
2012
2014
2016
2018
Tax take (% of daily pc GDP) Retail margin (% of daily pc GDP)Manufacturer margin (% of daily pc GDP)
Pack price breakdown (% of per captia GDP)
0.0%
0.5%
1.0%
1.5%
2.0%
2.5%
3.0%
3.5%
4.0%
4.5%
1960
1963
1966
1969
1972
1975
1978
1981
1984
1987
1990
1993
1996
1999
2002
2005
2008
2011
2014
2017
Industry/distribution MSA payments Taxes
Pack price breakdown (% of per capita GDP)
4% 7%
8%
5%
10%
6% 10
%
13%
6%
11%
12%
3%
5%
6%
5% 7%
4%
5%
5%
12%
13%
18%
10%
33%
15%
5%
18%
16%
8%
29%
15%
18%
17%
13%
12%
7%
11%
10%
7%
0%
5%
10%
15%
20%
25%
30%
35%
Aus
tria
Cze
chia
Fran
ce
Ger
man
y
Gre
ece
Italy
Pola
nd
Rom
ania
Spai
n
UK
Aus
tral
ia
Japa
n
Sout
h K
orea
Taiw
an
USA
Can
ada
Bela
rus
Kaz
akhs
tan
Russ
ia
Ukr
aine
Alg
eria
Egyp
t
Iran
Mor
occo
Nig
eria
Saud
i Ara
bia
Sout
h A
fric
a
Tuni
sia
Turk
ey
Bang
lade
sh
Indi
a
Indo
nesi
a
Paki
stan
Phili
ppin
es
Thai
land
Vie
tnam
Arg
entin
a
Braz
il
Mex
ico
Chi
na
European Union Developed Asia Eastern Europe Middle East & Africa South & South East Asia SouthAmerica
Industry/distribution Tax take
Pack as % of daily GDP
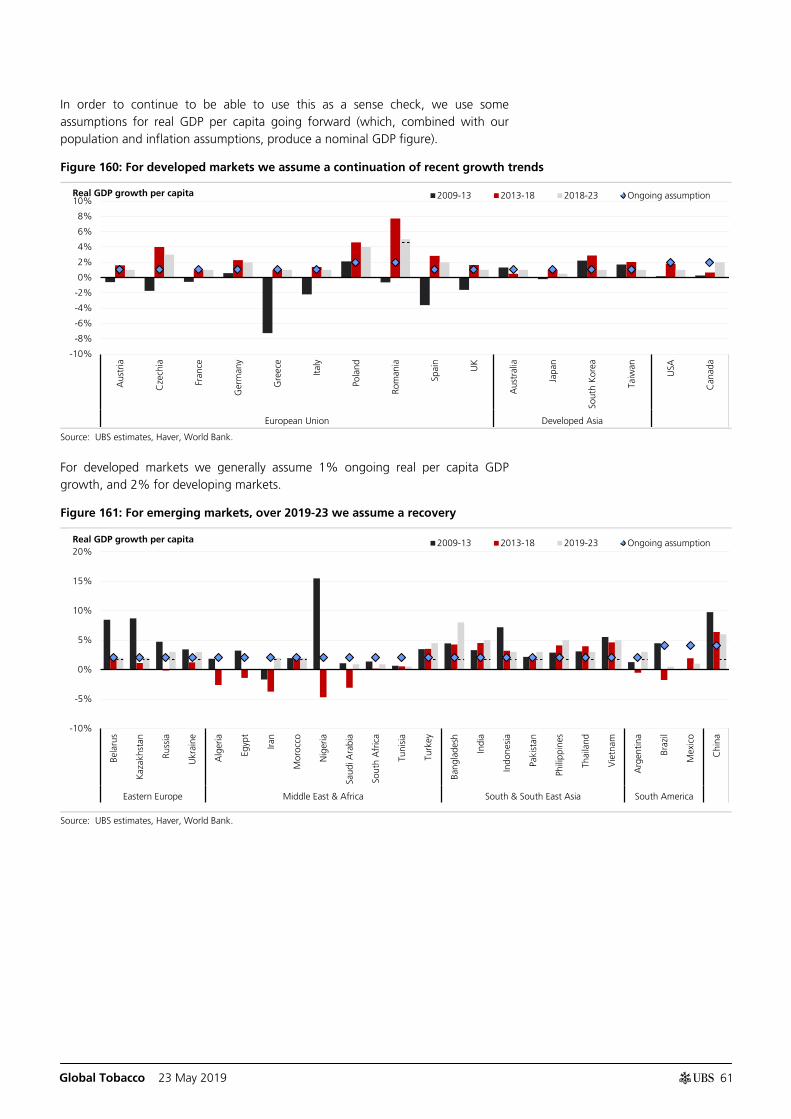
Global Tobacco 23 May 2019
61
In order to continue to be able to use this as a sense check, we use some assumptions for real GDP per capita going forward (which, combined with our population and inflation assumptions, produce a nominal GDP figure).
Figure 160: For developed markets we assume a continuation of recent growth trends
Source: UBS estimates, Haver, World Bank.
For developed markets we generally assume 1% ongoing real per capita GDP growth, and 2% for developing markets.
Figure 161: For emerging markets, over 2019-23 we assume a recovery
Source: UBS estimates, Haver, World Bank.
-10%
-8%
-6%
-4%
-2%
0%
2%
4%
6%
8%
10%
Aus
tria
Cze
chia
Fran
ce
Ger
man
y
Gre
ece
Italy
Pola
nd
Rom
ania
Spai
n
UK
Aus
tral
ia
Japa
n
Sout
h K
orea
Taiw
an
USA
Can
ada
European Union Developed Asia
2009-13 2013-18 2018-23 Ongoing assumptionReal GDP growth per capita
-10%
-5%
0%
5%
10%
15%
20%
Bela
rus
Kaz
akhs
tan
Russ
ia
Ukr
aine
Alg
eria
Egyp
t
Iran
Mor
occo
Nig
eria
Saud
i Ara
bia
Sout
h A
fric
a
Tuni
sia
Turk
ey
Bang
lade
sh
Indi
a
Indo
nesi
a
Paki
stan
Phili
ppin
es
Thai
land
Vie
tnam
Arg
entin
a
Braz
il
Mex
ico
Chi
na
Eastern Europe Middle East & Africa South & South East Asia South America
2009-13 2013-18 2019-23 Ongoing assumptionReal GDP growth per capita
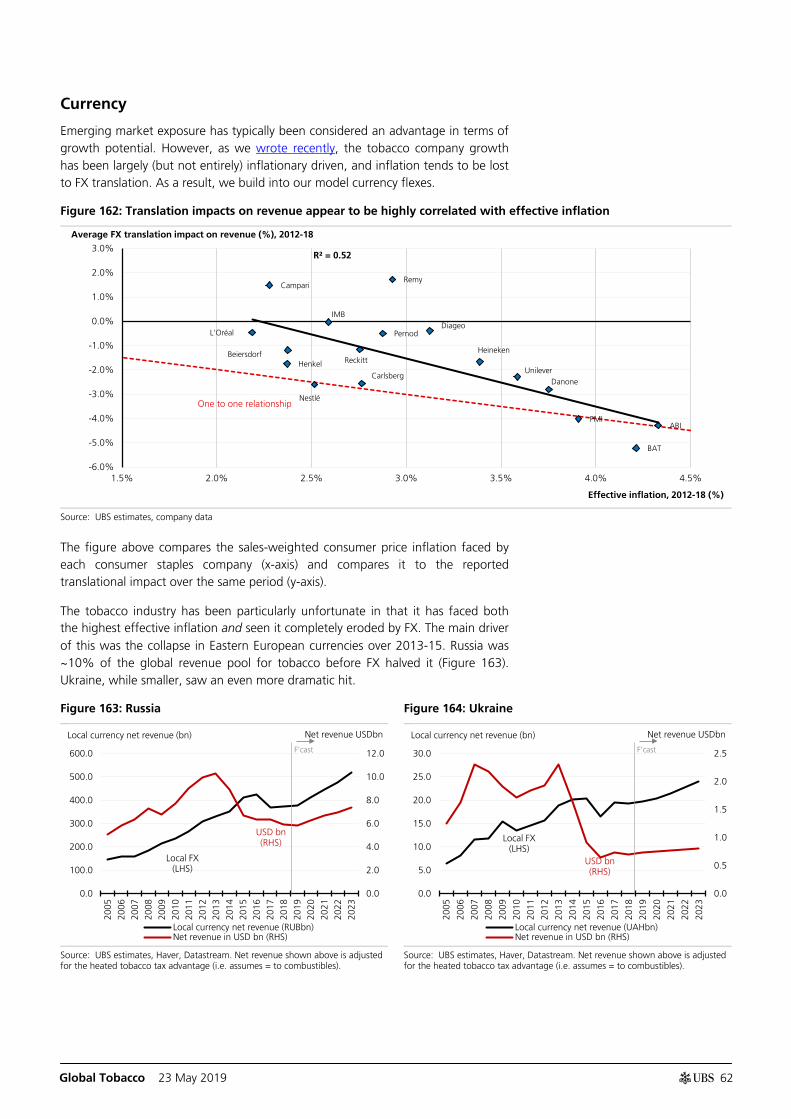
Global Tobacco 23 May 2019
62
Currency
Emerging market exposure has typically been considered an advantage in terms of growth potential. However, as we wrote recently, the tobacco company growth has been largely (but not entirely) inflationary driven, and inflation tends to be lost to FX translation. As a result, we build into our model currency flexes.
Figure 162: Translation impacts on revenue appear to be highly correlated with effective inflation
Source: UBS estimates, company data
The figure above compares the sales-weighted consumer price inflation faced by each consumer staples company (x-axis) and compares it to the reported translational impact over the same period (y-axis).
The tobacco industry has been particularly unfortunate in that it has faced both the highest effective inflation and seen it completely eroded by FX. The main driver of this was the collapse in Eastern European currencies over 2013-15. Russia was ~10% of the global revenue pool for tobacco before FX halved it (Figure 163). Ukraine, while smaller, saw an even more dramatic hit.
Figure 163: Russia Figure 164: Ukraine
Source: UBS estimates, Haver, Datastream. Net revenue shown above is adjusted for the heated tobacco tax advantage (i.e. assumes = to combustibles).
Source: UBS estimates, Haver, Datastream. Net revenue shown above is adjusted for the heated tobacco tax advantage (i.e. assumes = to combustibles).
ABI
Heineken
Carlsberg
Diageo Pernod
Campari Remy
BAT
PMI
IMB
Unilever Henkel
L'Oréal
Reckitt Beiersdorf
Nestlé
Danone
R² = 0.52
-6.0%
-5.0%
-4.0%
-3.0%
-2.0%
-1.0%
0.0%
1.0%
2.0%
3.0%
1.5% 2.0% 2.5% 3.0% 3.5% 4.0% 4.5%
Average FX translation impact on revenue (%), 2012-18
Effective inflation, 2012-18 (%)
One to one relationship
Local FX (LHS)
USD bn (RHS)
0.0
2.0
4.0
6.0
8.0
10.0
12.0
0.0
100.0
200.0
300.0
400.0
500.0
600.0
2005
2006
2007
2008
2009
2010
2011
2012
2013
2014
2015
2016
2017
2018
2019
2020
2021
2022
2023
Local currency net revenue (RUBbn)Net revenue in USD bn (RHS)
Local currency net revenue (bn)
F'cast
Net revenue USDbn
Local FX (LHS)
USD bn (RHS)
0.0
0.5
1.0
1.5
2.0
2.5
0.0
5.0
10.0
15.0
20.0
25.0
30.0
2005
2006
2007
2008
2009
2010
2011
2012
2013
2014
2015
2016
2017
2018
2019
2020
2021
2022
2023
Local currency net revenue (UAHbn)Net revenue in USD bn (RHS)
Local currency net revenue (bn)
F'cast
Net revenue USDbn
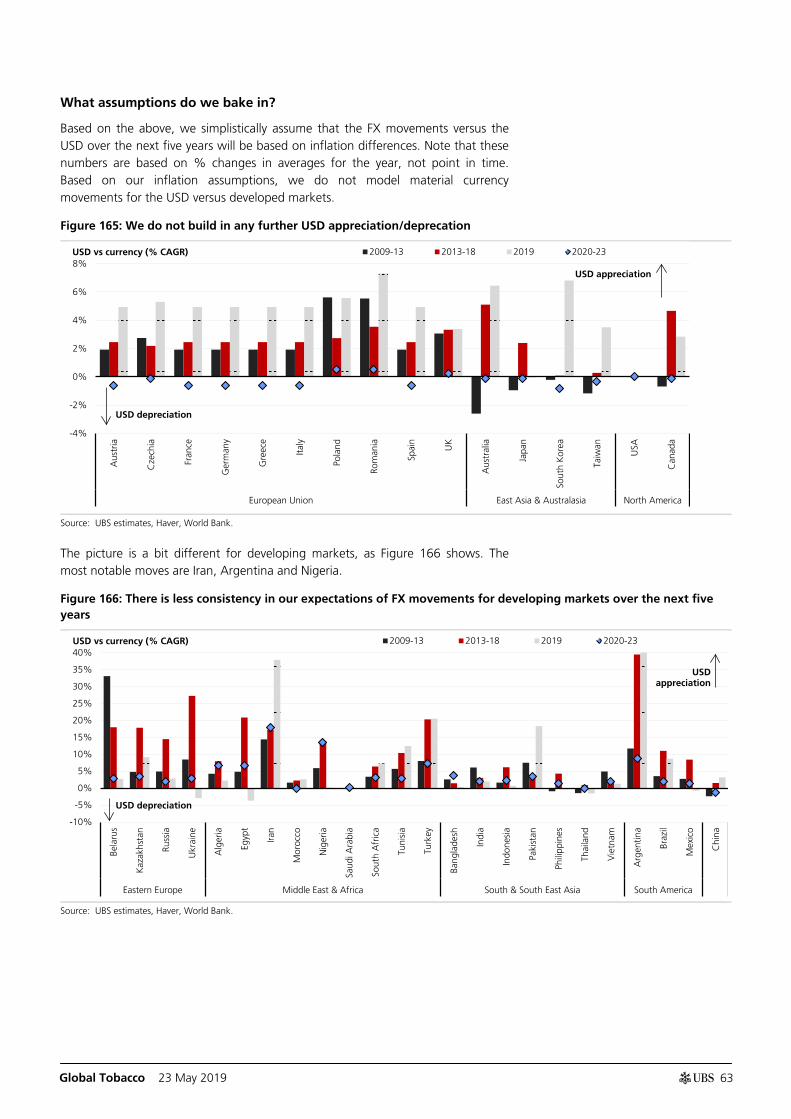
Global Tobacco 23 May 2019
63
What assumptions do we bake in?
Based on the above, we simplistically assume that the FX movements versus the USD over the next five years will be based on inflation differences. Note that these numbers are based on % changes in averages for the year, not point in time. Based on our inflation assumptions, we do not model material currency movements for the USD versus developed markets.
Figure 165: We do not build in any further USD appreciation/deprecation
Source: UBS estimates, Haver, World Bank.
The picture is a bit different for developing markets, as Figure 166 shows. The most notable moves are Iran, Argentina and Nigeria.
Figure 166: There is less consistency in our expectations of FX movements for developing markets over the next five years
Source: UBS estimates, Haver, World Bank.
-4%
-2%
0%
2%
4%
6%
8%
Aus
tria
Cze
chia
Fran
ce
Ger
man
y
Gre
ece
Italy
Pola
nd
Rom
ania
Spai
n
UK
Aus
tral
ia
Japa
n
Sout
h K
orea
Taiw
an
USA
Can
ada
European Union East Asia & Australasia North America
2009-13 2013-18 2019 2020-23USD vs currency (% CAGR)
USD appreciation
USD depreciation
-10%
-5%
0%
5%
10%
15%
20%
25%
30%
35%
40%
Bela
rus
Kaz
akhs
tan
Russ
ia
Ukr
aine
Alg
eria
Egyp
t
Iran
Mor
occo
Nig
eria
Saud
i Ara
bia
Sout
h A
fric
a
Tuni
sia
Turk
ey
Bang
lade
sh
Indi
a
Indo
nesi
a
Paki
stan
Phili
ppin
es
Thai
land
Vie
tnam
Arg
entin
a
Braz
il
Mex
ico
Chi
na
Eastern Europe Middle East & Africa South & South East Asia South America
2009-13 2013-18 2019 2020-23USD vs currency (% CAGR)
USD appreciation
USD depreciation
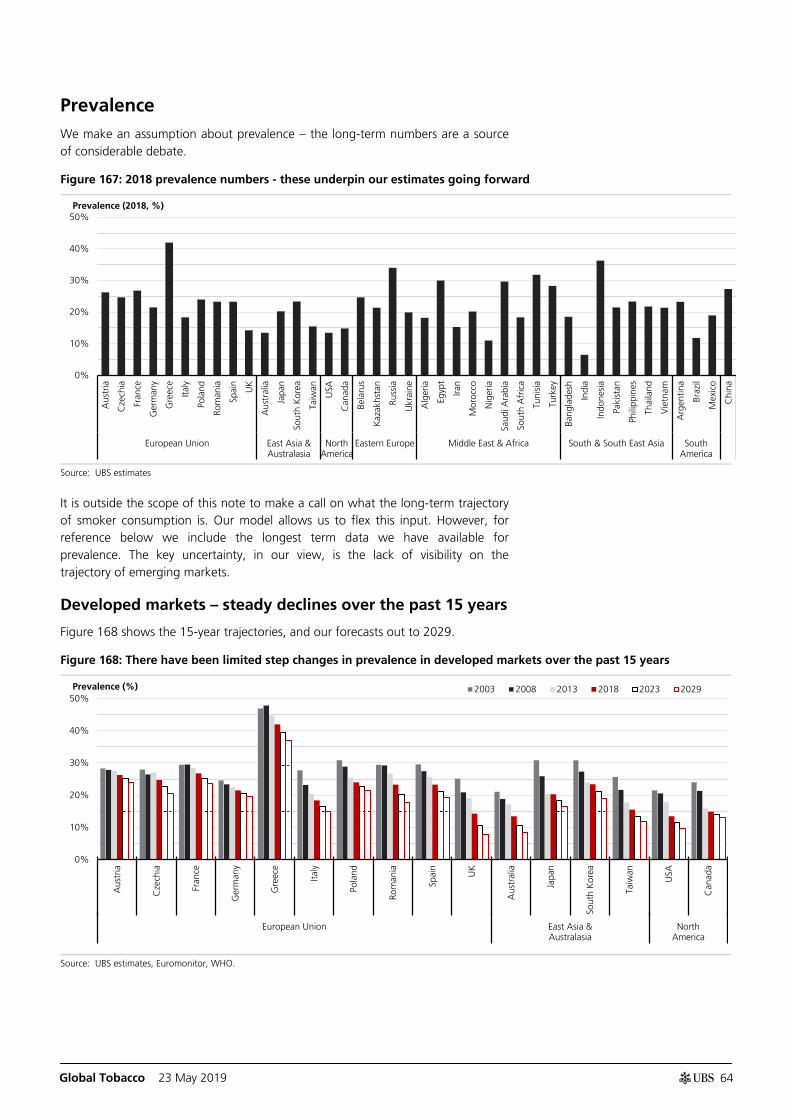
Global Tobacco 23 May 2019
64
Prevalence We make an assumption about prevalence – the long-term numbers are a source of considerable debate.
Figure 167: 2018 prevalence numbers - these underpin our estimates going forward
Source: UBS estimates
It is outside the scope of this note to make a call on what the long-term trajectory of smoker consumption is. Our model allows us to flex this input. However, for reference below we include the longest term data we have available for prevalence. The key uncertainty, in our view, is the lack of visibility on the trajectory of emerging markets.
Developed markets – steady declines over the past 15 years
Figure 168 shows the 15-year trajectories, and our forecasts out to 2029.
Figure 168: There have been limited step changes in prevalence in developed markets over the past 15 years
Source: UBS estimates, Euromonitor, WHO.
0%
10%
20%
30%
40%
50%
Aus
tria
Cze
chia
Fran
ce
Ger
man
y
Gre
ece
Italy
Pola
nd
Rom
ania
Spai
n
UK
Aus
tral
ia
Japa
n
Sout
h K
orea
Taiw
an
USA
Can
ada
Bela
rus
Kaz
akhs
tan
Russ
ia
Ukr
aine
Alg
eria
Egyp
t
Iran
Mor
occo
Nig
eria
Saud
i Ara
bia
Sout
h A
fric
a
Tuni
sia
Turk
ey
Bang
lade
sh
Indi
a
Indo
nesi
a
Paki
stan
Phili
ppin
es
Thai
land
Vie
tnam
Arg
entin
a
Braz
il
Mex
ico
Chi
na
European Union East Asia &Australasia
NorthAmerica
Eastern Europe Middle East & Africa South & South East Asia SouthAmerica
Prevalence (2018, %)
0%
10%
20%
30%
40%
50%
Aus
tria
Cze
chia
Fran
ce
Ger
man
y
Gre
ece
Italy
Pola
nd
Rom
ania
Spai
n
UK
Aus
tral
ia
Japa
n
Sout
h K
orea
Taiw
an
USA
Can
ada
European Union East Asia &Australasia
NorthAmerica
2003 2008 2013 2018 2023 2029Prevalence (%)
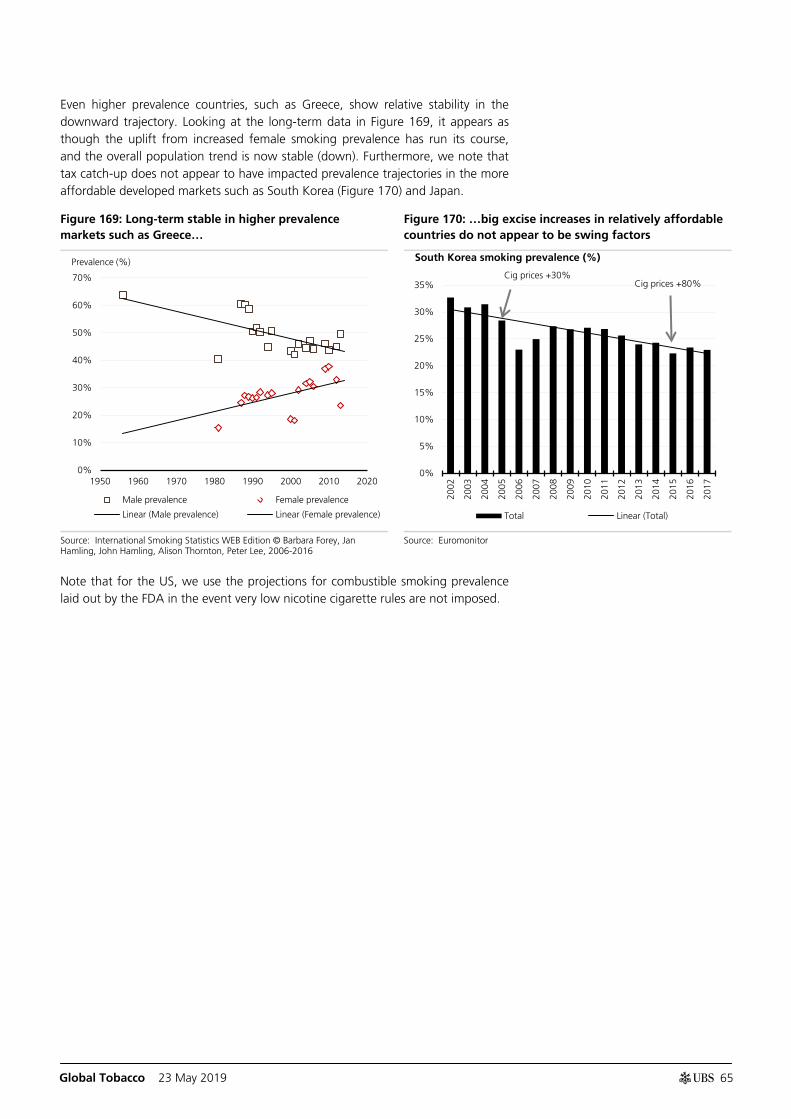
Global Tobacco 23 May 2019
65
Even higher prevalence countries, such as Greece, show relative stability in the downward trajectory. Looking at the long-term data in Figure 169, it appears as though the uplift from increased female smoking prevalence has run its course, and the overall population trend is now stable (down). Furthermore, we note that tax catch-up does not appear to have impacted prevalence trajectories in the more affordable developed markets such as South Korea (Figure 170) and Japan.
Figure 169: Long-term stable in higher prevalence markets such as Greece…
Figure 170: …big excise increases in relatively affordable countries do not appear to be swing factors
Source: International Smoking Statistics WEB Edition © Barbara Forey, Jan Hamling, John Hamling, Alison Thornton, Peter Lee, 2006-2016
Source: Euromonitor
Note that for the US, we use the projections for combustible smoking prevalence laid out by the FDA in the event very low nicotine cigarette rules are not imposed.
0%
10%
20%
30%
40%
50%
60%
70%
1950 1960 1970 1980 1990 2000 2010 2020
Male prevalence Female prevalence
Linear (Male prevalence) Linear (Female prevalence)
Prevalence (%)
0%
5%
10%
15%
20%
25%
30%
35%
2002
2003
2004
2005
2006
2007
2008
2009
2010
2011
2012
2013
2014
2015
2016
2017
Total Linear (Total)
South Korea smoking prevalence (%)
Cig prices +30% Cig prices +80%
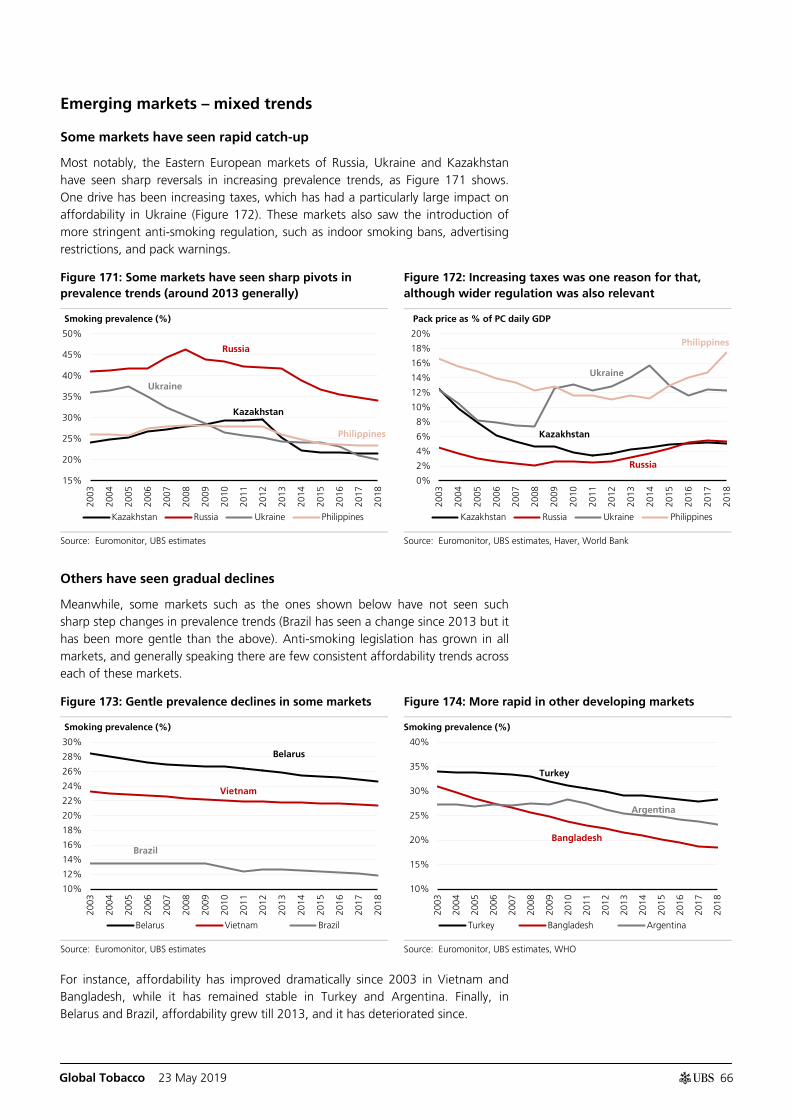
Global Tobacco 23 May 2019
66
Emerging markets – mixed trends
Some markets have seen rapid catch-up
Most notably, the Eastern European markets of Russia, Ukraine and Kazakhstan have seen sharp reversals in increasing prevalence trends, as Figure 171 shows. One drive has been increasing taxes, which has had a particularly large impact on affordability in Ukraine (Figure 172). These markets also saw the introduction of more stringent anti-smoking regulation, such as indoor smoking bans, advertising restrictions, and pack warnings.
Figure 171: Some markets have seen sharp pivots in prevalence trends (around 2013 generally)
Figure 172: Increasing taxes was one reason for that, although wider regulation was also relevant
Source: Euromonitor, UBS estimates Source: Euromonitor, UBS estimates, Haver, World Bank
Others have seen gradual declines
Meanwhile, some markets such as the ones shown below have not seen such sharp step changes in prevalence trends (Brazil has seen a change since 2013 but it has been more gentle than the above). Anti-smoking legislation has grown in all markets, and generally speaking there are few consistent affordability trends across each of these markets.
Figure 173: Gentle prevalence declines in some markets Figure 174: More rapid in other developing markets
Source: Euromonitor, UBS estimates Source: Euromonitor, UBS estimates, WHO
For instance, affordability has improved dramatically since 2003 in Vietnam and Bangladesh, while it has remained stable in Turkey and Argentina. Finally, in Belarus and Brazil, affordability grew till 2013, and it has deteriorated since.
15%
20%
25%
30%
35%
40%
45%
50%
2003
2004
2005
2006
2007
2008
2009
2010
2011
2012
2013
2014
2015
2016
2017
2018
Kazakhstan Russia Ukraine Philippines
Smoking prevalence (%)
Kazakhstan
Ukraine
Russia
Philippines
0%
2%
4%
6%
8%
10%
12%
14%
16%
18%
20%
2003
2004
2005
2006
2007
2008
2009
2010
2011
2012
2013
2014
2015
2016
2017
2018
Kazakhstan Russia Ukraine Philippines
Pack price as % of PC daily GDP
Kazakhstan
Ukraine
Russia
Philippines
10%
12%
14%
16%
18%
20%
22%
24%
26%
28%
30%
2003
2004
2005
2006
2007
2008
2009
2010
2011
2012
2013
2014
2015
2016
2017
2018
Belarus Vietnam Brazil
Smoking prevalence (%)
Belarus
Brazil
Vietnam
10%
15%
20%
25%
30%
35%
40%
2003
2004
2005
2006
2007
2008
2009
2010
2011
2012
2013
2014
2015
2016
2017
2018
Turkey Bangladesh Argentina
Smoking prevalence (%)
Turkey
Argentina
Bangladesh
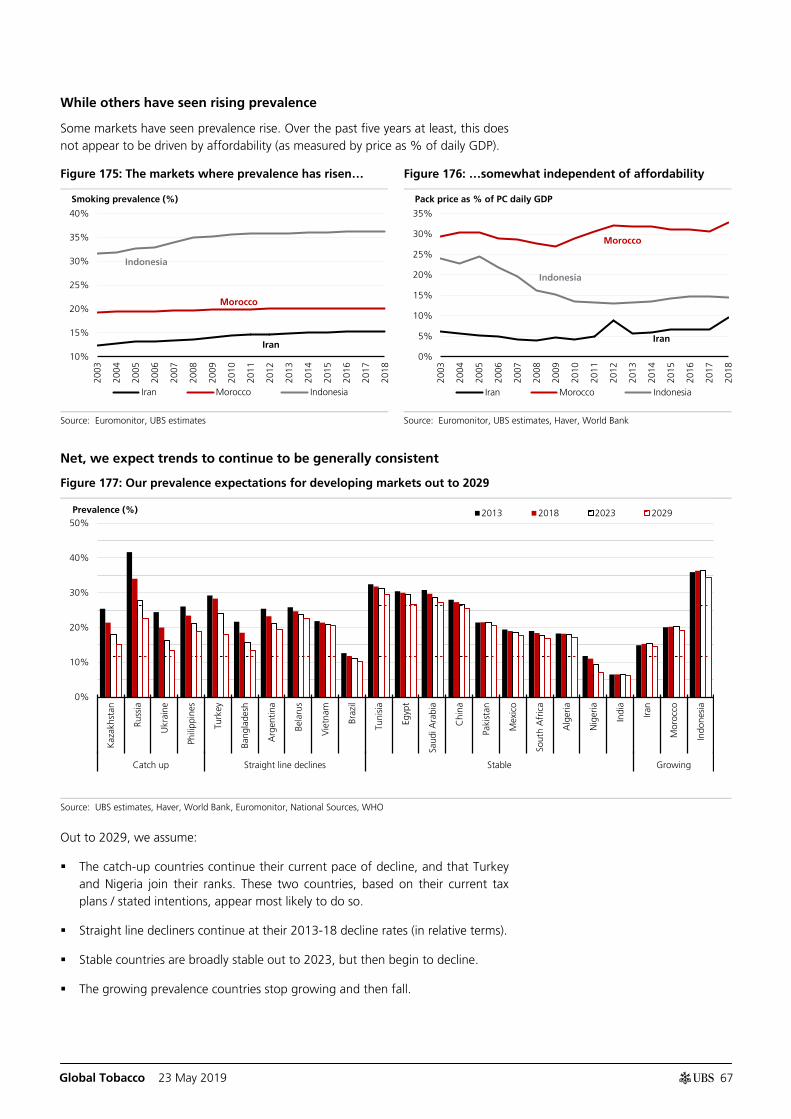
Global Tobacco 23 May 2019
67
While others have seen rising prevalence
Some markets have seen prevalence rise. Over the past five years at least, this does not appear to be driven by affordability (as measured by price as % of daily GDP).
Figure 175: The markets where prevalence has risen… Figure 176: …somewhat independent of affordability
Source: Euromonitor, UBS estimates Source: Euromonitor, UBS estimates, Haver, World Bank
Net, we expect trends to continue to be generally consistent
Figure 177: Our prevalence expectations for developing markets out to 2029
Source: UBS estimates, Haver, World Bank, Euromonitor, National Sources, WHO
Out to 2029, we assume:
The catch-up countries continue their current pace of decline, and that Turkey and Nigeria join their ranks. These two countries, based on their current tax plans / stated intentions, appear most likely to do so.
Straight line decliners continue at their 2013-18 decline rates (in relative terms).
Stable countries are broadly stable out to 2023, but then begin to decline.
The growing prevalence countries stop growing and then fall.
10%
15%
20%
25%
30%
35%
40%
2003
2004
2005
2006
2007
2008
2009
2010
2011
2012
2013
2014
2015
2016
2017
2018
Iran Morocco Indonesia
Smoking prevalence (%)
Iran
Indonesia
Morocco
0%
5%
10%
15%
20%
25%
30%
35%
2003
2004
2005
2006
2007
2008
2009
2010
2011
2012
2013
2014
2015
2016
2017
2018
Iran Morocco Indonesia
Pack price as % of PC daily GDP
Iran
Indonesia
Morocco
0%
10%
20%
30%
40%
50%
Kaz
akhs
tan
Russ
ia
Ukr
aine
Phili
ppin
es
Turk
ey
Bang
lade
sh
Arg
entin
a
Bela
rus
Vie
tnam
Braz
il
Tuni
sia
Egyp
t
Saud
i Ara
bia
Chi
na
Paki
stan
Mex
ico
Sout
h A
fric
a
Alg
eria
Nig
eria
Indi
a
Iran
Mor
occo
Indo
nesi
a
Catch up Straight line declines Stable Growing
2013 2018 2023 2029Prevalence (%)
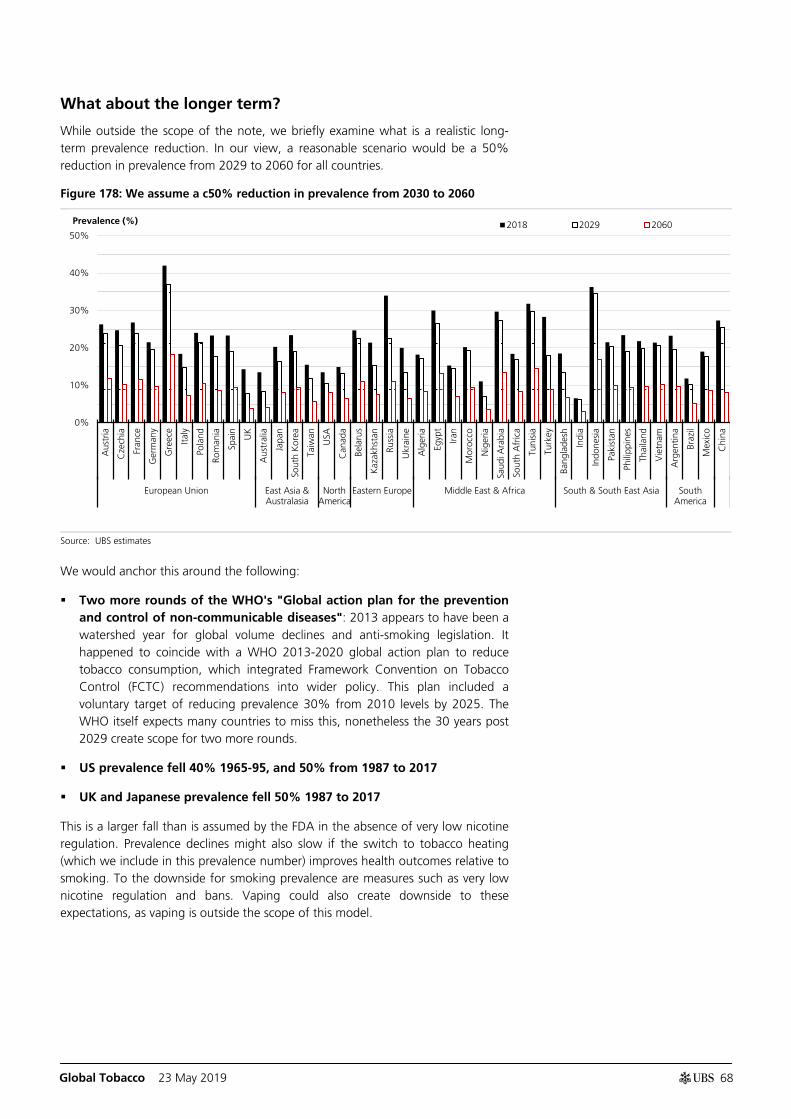
Global Tobacco 23 May 2019
68
What about the longer term?
While outside the scope of the note, we briefly examine what is a realistic long-term prevalence reduction. In our view, a reasonable scenario would be a 50% reduction in prevalence from 2029 to 2060 for all countries.
Figure 178: We assume a c50% reduction in prevalence from 2030 to 2060
Source: UBS estimates
We would anchor this around the following:
Two more rounds of the WHO's "Global action plan for the prevention and control of non-communicable diseases": 2013 appears to have been a watershed year for global volume declines and anti-smoking legislation. It happened to coincide with a WHO 2013-2020 global action plan to reduce tobacco consumption, which integrated Framework Convention on Tobacco Control (FCTC) recommendations into wider policy. This plan included a voluntary target of reducing prevalence 30% from 2010 levels by 2025. The WHO itself expects many countries to miss this, nonetheless the 30 years post 2029 create scope for two more rounds.
US prevalence fell 40% 1965-95, and 50% from 1987 to 2017
UK and Japanese prevalence fell 50% 1987 to 2017
This is a larger fall than is assumed by the FDA in the absence of very low nicotine regulation. Prevalence declines might also slow if the switch to tobacco heating (which we include in this prevalence number) improves health outcomes relative to smoking. To the downside for smoking prevalence are measures such as very low nicotine regulation and bans. Vaping could also create downside to these expectations, as vaping is outside the scope of this model.
0%
10%
20%
30%
40%
50%
Aus
tria
Cze
chia
Fran
ce
Ger
man
y
Gre
ece
Italy
Pola
nd
Rom
ania
Spai
n
UK
Aus
tral
ia
Japa
n
Sout
h K
orea
Taiw
an
USA
Can
ada
Bela
rus
Kaz
akhs
tan
Russ
ia
Ukr
aine
Alg
eria
Egyp
t
Iran
Mor
occo
Nig
eria
Saud
i Ara
bia
Sout
h A
fric
a
Tuni
sia
Turk
ey
Bang
lade
sh
Indi
a
Indo
nesi
a
Paki
stan
Phili
ppin
es
Thai
land
Vie
tnam
Arg
entin
a
Braz
il
Mex
ico
Chi
na
European Union East Asia &Australasia
NorthAmerica
Eastern Europe Middle East & Africa South & South East Asia SouthAmerica
2018 2029 2060Prevalence (%)

Global Tobacco 23 May 2019
69
Taxes In our view, the excise tax outlook is the biggest swing factor for volumes and revenue. It is also largely independent of company behaviour (that we can model). As a result, when forecasting volumes and price we start with the tax outlook.
Developed markets
Figure 179: Our expectations for per pack tax changes for developed markets
Source: UBS estimates, national sources, Euromonitor, Haver, World Bank
Our assumptions are based on the following:
A number of countries have already laid out multi-year tax plans: notably France and Japan have clear planned increases. Other countries such as the UK and Australia have set increases above inflation.
Other countries put through large increases and do so intermittently: Taiwan and South Korea have recently put through very large inflation-busting tax increases, so we do not expect any others in the forecast period.
We assume net increases continue as before out to 2023: i.e. if Austria has increased taxes net of CPI inflation by 2-3% for the past decade, we assume it will continue to do so out to 2023.
The figure below lays out what this means for taxes as a share of daily GDP. We acknowledge that this implies a relatively stable level. However, since 2013, the developed market tax burden has not materially changed – most came over the 2005-13 period.
-5%
0%
5%
10%
15%
20%
25%
Aus
tria
Cze
chia
Fran
ce
Ger
man
y
Gre
ece
Italy
Pola
nd
Rom
ania
Spai
n
UK
Aus
tral
ia
Japa
n
Sout
h K
orea
Taiw
an
USA
Can
ada
European Union East Asia &Australasia
NorthAmerica
2009-13 2013-18 2019-23Tax per pack changes (% CAGR)
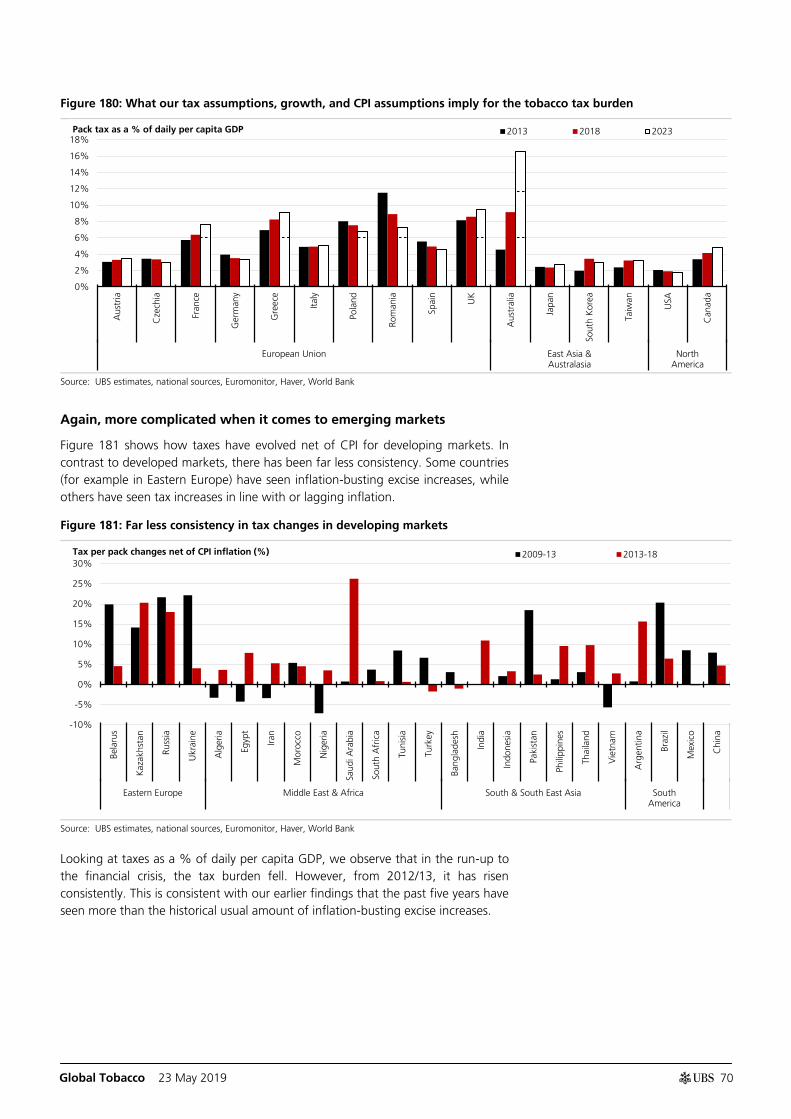
Global Tobacco 23 May 2019
70
Figure 180: What our tax assumptions, growth, and CPI assumptions imply for the tobacco tax burden
Source: UBS estimates, national sources, Euromonitor, Haver, World Bank
Again, more complicated when it comes to emerging markets
Figure 181 shows how taxes have evolved net of CPI for developing markets. In contrast to developed markets, there has been far less consistency. Some countries (for example in Eastern Europe) have seen inflation-busting excise increases, while others have seen tax increases in line with or lagging inflation.
Figure 181: Far less consistency in tax changes in developing markets
Source: UBS estimates, national sources, Euromonitor, Haver, World Bank
Looking at taxes as a % of daily per capita GDP, we observe that in the run-up to the financial crisis, the tax burden fell. However, from 2012/13, it has risen consistently. This is consistent with our earlier findings that the past five years have seen more than the historical usual amount of inflation-busting excise increases.
0%
2%
4%
6%
8%
10%
12%
14%
16%
18%
Aus
tria
Cze
chia
Fran
ce
Ger
man
y
Gre
ece
Italy
Pola
nd
Rom
ania
Spai
n
UK
Aus
tral
ia
Japa
n
Sout
h K
orea
Taiw
an
USA
Can
ada
European Union East Asia &Australasia
NorthAmerica
2013 2018 2023Pack tax as a % of daily per capita GDP
-10%
-5%
0%
5%
10%
15%
20%
25%
30%
Bela
rus
Kaz
akhs
tan
Russ
ia
Ukr
aine
Alg
eria
Egyp
t
Iran
Mor
occo
Nig
eria
Saud
i Ara
bia
Sout
h A
fric
a
Tuni
sia
Turk
ey
Bang
lade
sh
Indi
a
Indo
nesi
a
Paki
stan
Phili
ppin
es
Thai
land
Vie
tnam
Arg
entin
a
Braz
il
Mex
ico
Chi
na
Eastern Europe Middle East & Africa South & South East Asia SouthAmerica
2009-13 2013-18Tax per pack changes net of CPI inflation (%)
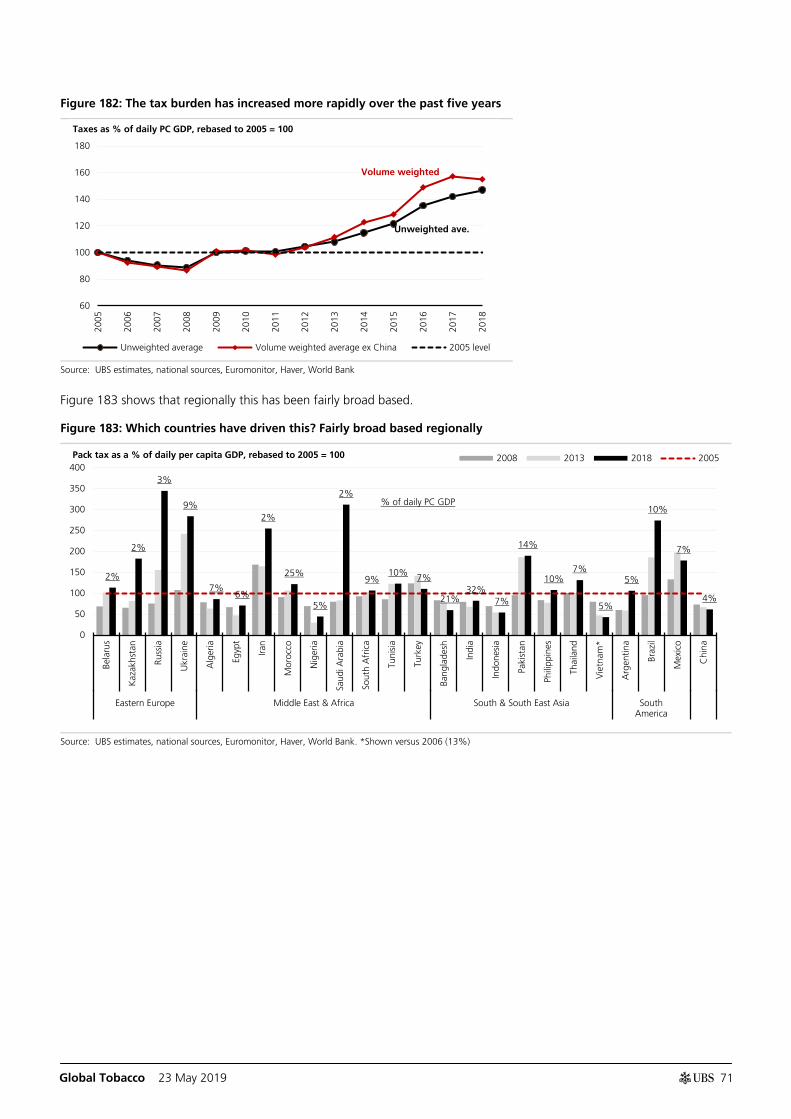
Global Tobacco 23 May 2019
71
Figure 182: The tax burden has increased more rapidly over the past five years
Source: UBS estimates, national sources, Euromonitor, Haver, World Bank
Figure 183 shows that regionally this has been fairly broad based.
Figure 183: Which countries have driven this? Fairly broad based regionally
Source: UBS estimates, national sources, Euromonitor, Haver, World Bank. *Shown versus 2006 (13%)
60
80
100
120
140
160
180
2005
2006
2007
2008
2009
2010
2011
2012
2013
2014
2015
2016
2017
2018
Unweighted average Volume weighted average ex China 2005 level
Taxes as % of daily PC GDP, rebased to 2005 = 100
Unweighted ave.
Volume weighted
2%
2%
3%
9%
7% 6%
2%
25%
5%
2%
9% 10% 7%
21% 32%
7%
14%
10% 7%
5%
5%
10%
7%
4%
0
50
100
150
200
250
300
350
400
Bela
rus
Kaz
akhs
tan
Russ
ia
Ukr
aine
Alg
eria
Egyp
t
Iran
Mor
occo
Nig
eria
Saud
i Ara
bia
Sout
h A
fric
a
Tuni
sia
Turk
ey
Bang
lade
sh
Indi
a
Indo
nesi
a
Paki
stan
Phili
ppin
es
Thai
land
Vie
tnam
*
Arg
entin
a
Braz
il
Mex
ico
Chi
naEastern Europe Middle East & Africa South & South East Asia South
America
2008 2013 2018 2005Pack tax as a % of daily per capita GDP, rebased to 2005 = 100
% of daily PC GDP
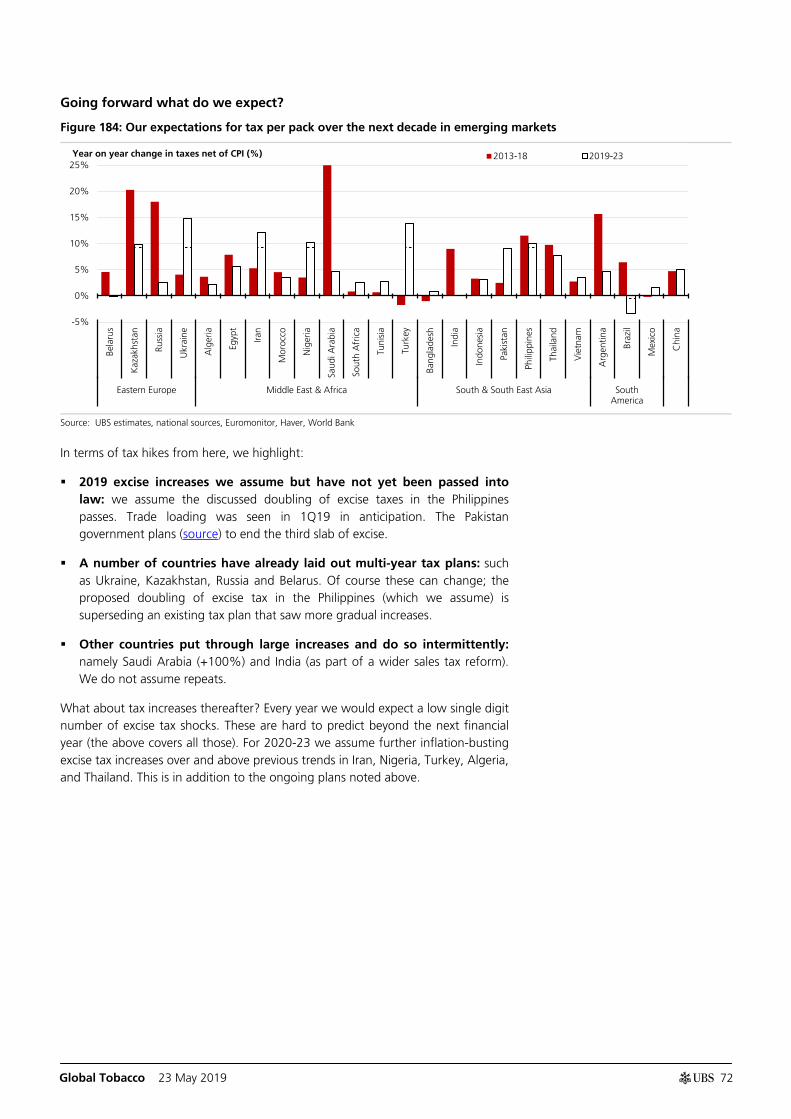
Global Tobacco 23 May 2019
72
Going forward what do we expect?
Figure 184: Our expectations for tax per pack over the next decade in emerging markets
Source: UBS estimates, national sources, Euromonitor, Haver, World Bank
In terms of tax hikes from here, we highlight:
2019 excise increases we assume but have not yet been passed into law: we assume the discussed doubling of excise taxes in the Philippines passes. Trade loading was seen in 1Q19 in anticipation. The Pakistan government plans (source) to end the third slab of excise.
A number of countries have already laid out multi-year tax plans: such as Ukraine, Kazakhstan, Russia and Belarus. Of course these can change; the proposed doubling of excise tax in the Philippines (which we assume) is superseding an existing tax plan that saw more gradual increases.
Other countries put through large increases and do so intermittently: namely Saudi Arabia (+100%) and India (as part of a wider sales tax reform). We do not assume repeats.
What about tax increases thereafter? Every year we would expect a low single digit number of excise tax shocks. These are hard to predict beyond the next financial year (the above covers all those). For 2020-23 we assume further inflation-busting excise tax increases over and above previous trends in Iran, Nigeria, Turkey, Algeria, and Thailand. This is in addition to the ongoing plans noted above.
-5%
0%
5%
10%
15%
20%
25%
Bela
rus
Kaz
akhs
tan
Russ
ia
Ukr
aine
Alg
eria
Egyp
t
Iran
Mor
occo
Nig
eria
Saud
i Ara
bia
Sout
h A
fric
a
Tuni
sia
Turk
ey
Bang
lade
sh
Indi
a
Indo
nesi
a
Paki
stan
Phili
ppin
es
Thai
land
Vie
tnam
Arg
entin
a
Braz
il
Mex
ico
Chi
na
Eastern Europe Middle East & Africa South & South East Asia SouthAmerica
2013-18 2019-23Year on year change in taxes net of CPI (%)
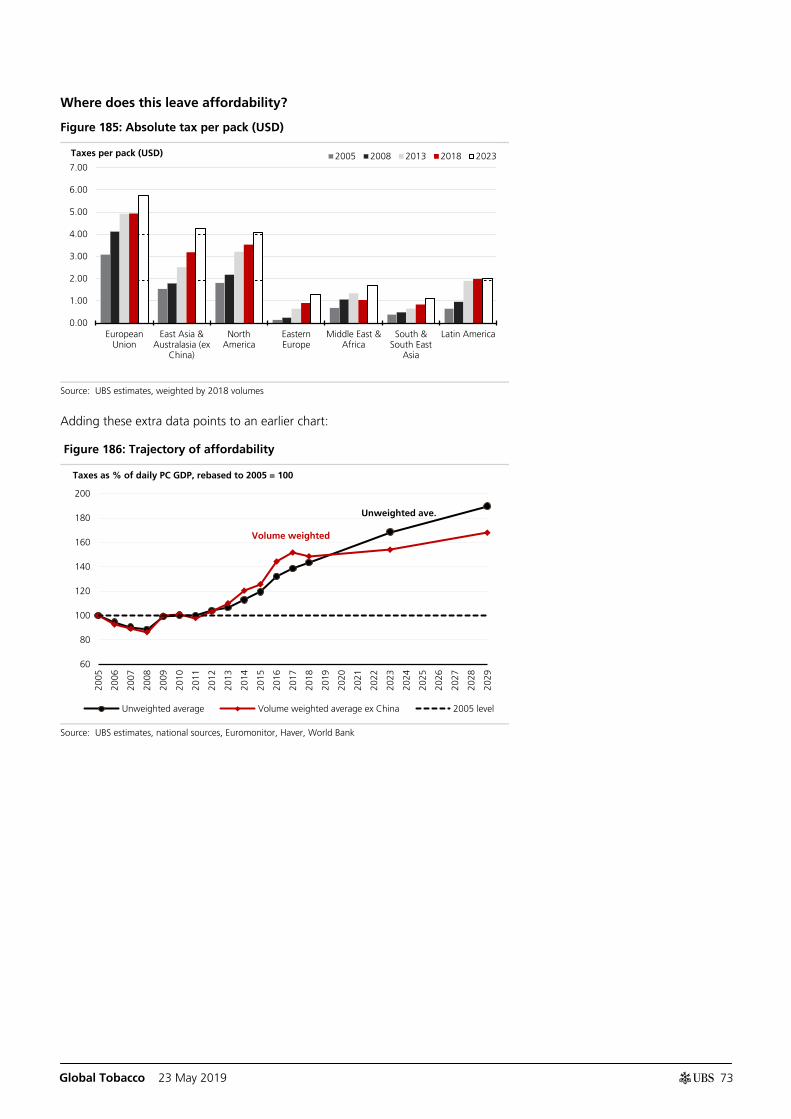
Global Tobacco 23 May 2019
73
Where does this leave affordability?
Figure 185: Absolute tax per pack (USD)
Source: UBS estimates, weighted by 2018 volumes
Adding these extra data points to an earlier chart:
Figure 186: Trajectory of affordability
Source: UBS estimates, national sources, Euromonitor, Haver, World Bank
0.00
1.00
2.00
3.00
4.00
5.00
6.00
7.00
EuropeanUnion
East Asia &Australasia (ex
China)
NorthAmerica
EasternEurope
Middle East &Africa
South &South East
Asia
Latin America
2005 2008 2013 2018 2023Taxes per pack (USD)
60
80
100
120
140
160
180
200
2005
2006
2007
2008
2009
2010
2011
2012
2013
2014
2015
2016
2017
2018
2019
2020
2021
2022
2023
2024
2025
2026
2027
2028
2029
Unweighted average Volume weighted average ex China 2005 level
Taxes as % of daily PC GDP, rebased to 2005 = 100
Unweighted ave.
Volume weighted
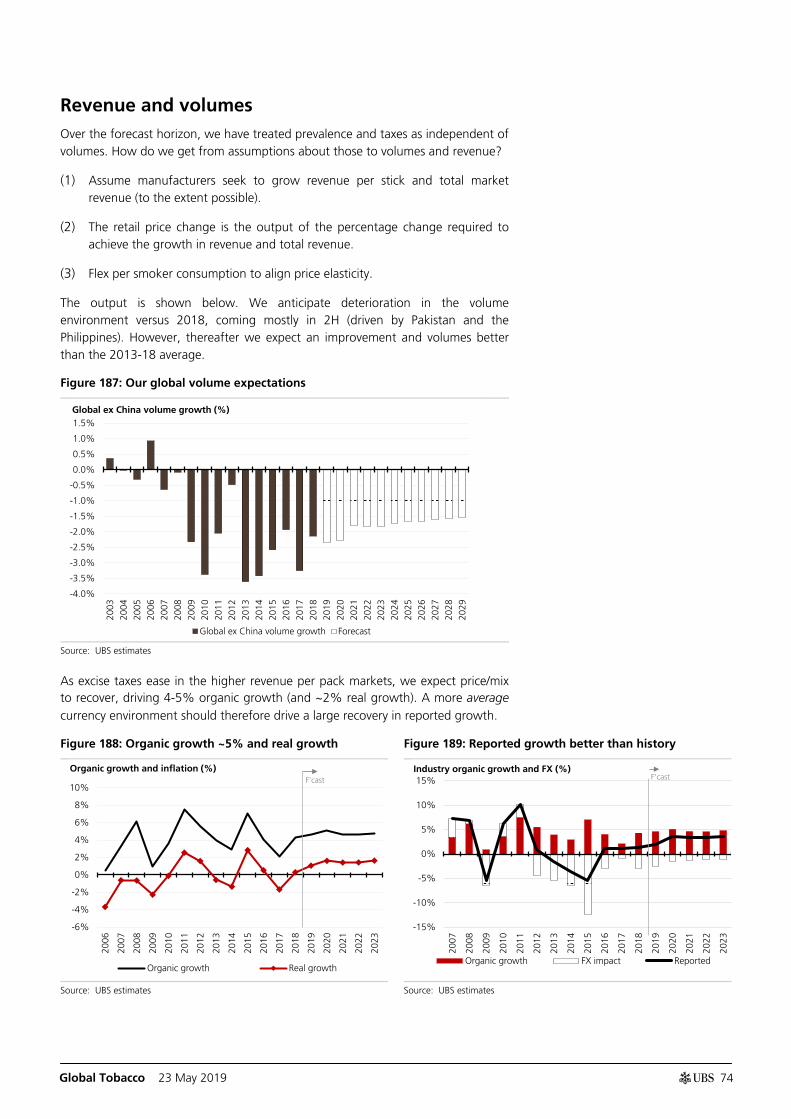
Global Tobacco 23 May 2019
74
Revenue and volumes Over the forecast horizon, we have treated prevalence and taxes as independent of volumes. How do we get from assumptions about those to volumes and revenue?
(1) Assume manufacturers seek to grow revenue per stick and total market revenue (to the extent possible).
(2) The retail price change is the output of the percentage change required to achieve the growth in revenue and total revenue.
(3) Flex per smoker consumption to align price elasticity.
The output is shown below. We anticipate deterioration in the volume environment versus 2018, coming mostly in 2H (driven by Pakistan and the Philippines). However, thereafter we expect an improvement and volumes better than the 2013-18 average.
Figure 187: Our global volume expectations
Source: UBS estimates
As excise taxes ease in the higher revenue per pack markets, we expect price/mix to recover, driving 4-5% organic growth (and ~2% real growth). A more average currency environment should therefore drive a large recovery in reported growth.
Figure 188: Organic growth ~5% and real growth Figure 189: Reported growth better than history
Source: UBS estimates Source: UBS estimates
-4.0%
-3.5%
-3.0%
-2.5%
-2.0%
-1.5%
-1.0%
-0.5%
0.0%
0.5%
1.0%
1.5%
2003
2004
2005
2006
2007
2008
2009
2010
2011
2012
2013
2014
2015
2016
2017
2018
2019
2020
2021
2022
2023
2024
2025
2026
2027
2028
2029
Global ex China volume growth Forecast
Global ex China volume growth (%)
-6%
-4%
-2%
0%
2%
4%
6%
8%
10%
2006
2007
2008
2009
2010
2011
2012
2013
2014
2015
2016
2017
2018
2019
2020
2021
2022
2023
Organic growth Real growth
Organic growth and inflation (%) F'cast
-15%
-10%
-5%
0%
5%
10%
15%
2007
2008
2009
2010
2011
2012
2013
2014
2015
2016
2017
2018
2019
2020
2021
2022
2023
Organic growth FX impact Reported
Industry organic growth and FX (%) F'cast
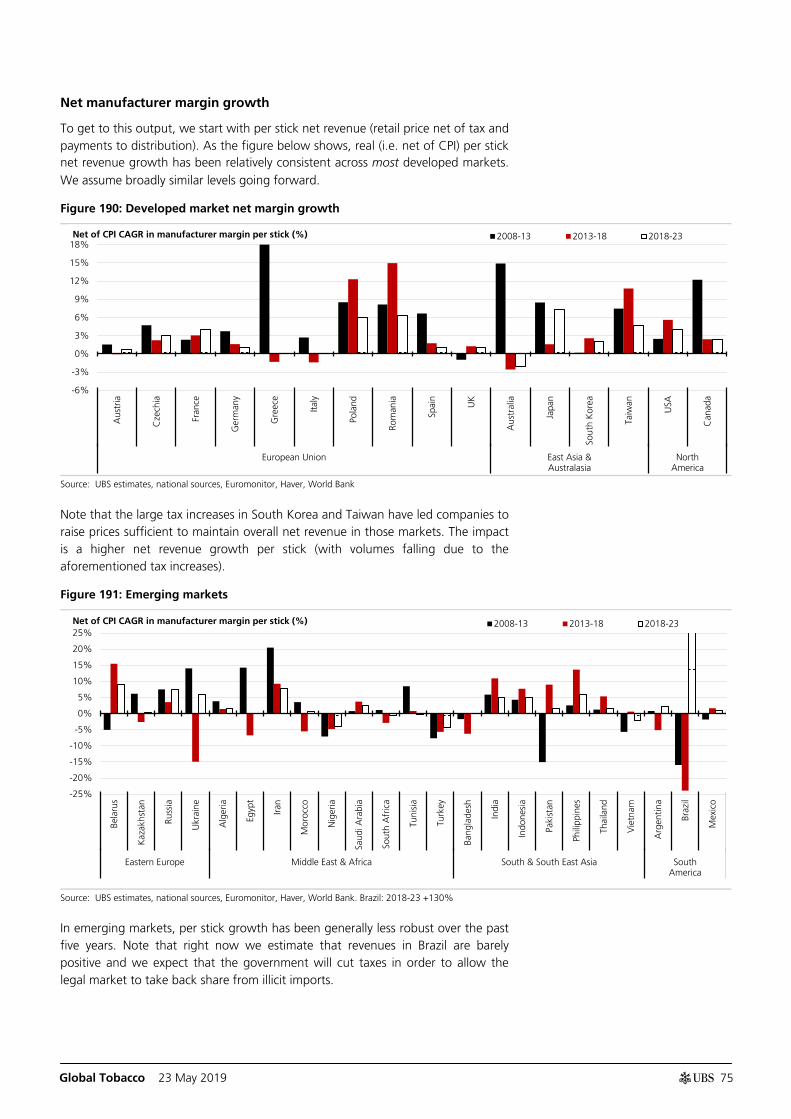
Global Tobacco 23 May 2019
75
Net manufacturer margin growth
To get to this output, we start with per stick net revenue (retail price net of tax and payments to distribution). As the figure below shows, real (i.e. net of CPI) per stick net revenue growth has been relatively consistent across most developed markets. We assume broadly similar levels going forward.
Figure 190: Developed market net margin growth
Source: UBS estimates, national sources, Euromonitor, Haver, World Bank
Note that the large tax increases in South Korea and Taiwan have led companies to raise prices sufficient to maintain overall net revenue in those markets. The impact is a higher net revenue growth per stick (with volumes falling due to the aforementioned tax increases).
Figure 191: Emerging markets
Source: UBS estimates, national sources, Euromonitor, Haver, World Bank. Brazil: 2018-23 +130%
In emerging markets, per stick growth has been generally less robust over the past five years. Note that right now we estimate that revenues in Brazil are barely positive and we expect that the government will cut taxes in order to allow the legal market to take back share from illicit imports.
-6%
-3%
0%
3%
6%
9%
12%
15%
18%
Aus
tria
Cze
chia
Fran
ce
Ger
man
y
Gre
ece
Italy
Pola
nd
Rom
ania
Spai
n
UK
Aus
tral
ia
Japa
n
Sout
h K
orea
Taiw
an
USA
Can
ada
European Union East Asia &Australasia
NorthAmerica
2008-13 2013-18 2018-23Net of CPI CAGR in manufacturer margin per stick (%)
-25%
-20%
-15%
-10%
-5%
0%
5%
10%
15%
20%
25%
Bela
rus
Kaz
akhs
tan
Russ
ia
Ukr
aine
Alg
eria
Egyp
t
Iran
Mor
occo
Nig
eria
Saud
i Ara
bia
Sout
h A
fric
a
Tuni
sia
Turk
ey
Bang
lade
sh
Indi
a
Indo
nesi
a
Paki
stan
Phili
ppin
es
Thai
land
Vie
tnam
Arg
entin
a
Braz
il
Mex
ico
Eastern Europe Middle East & Africa South & South East Asia SouthAmerica
2008-13 2013-18 2018-23Net of CPI CAGR in manufacturer margin per stick (%)
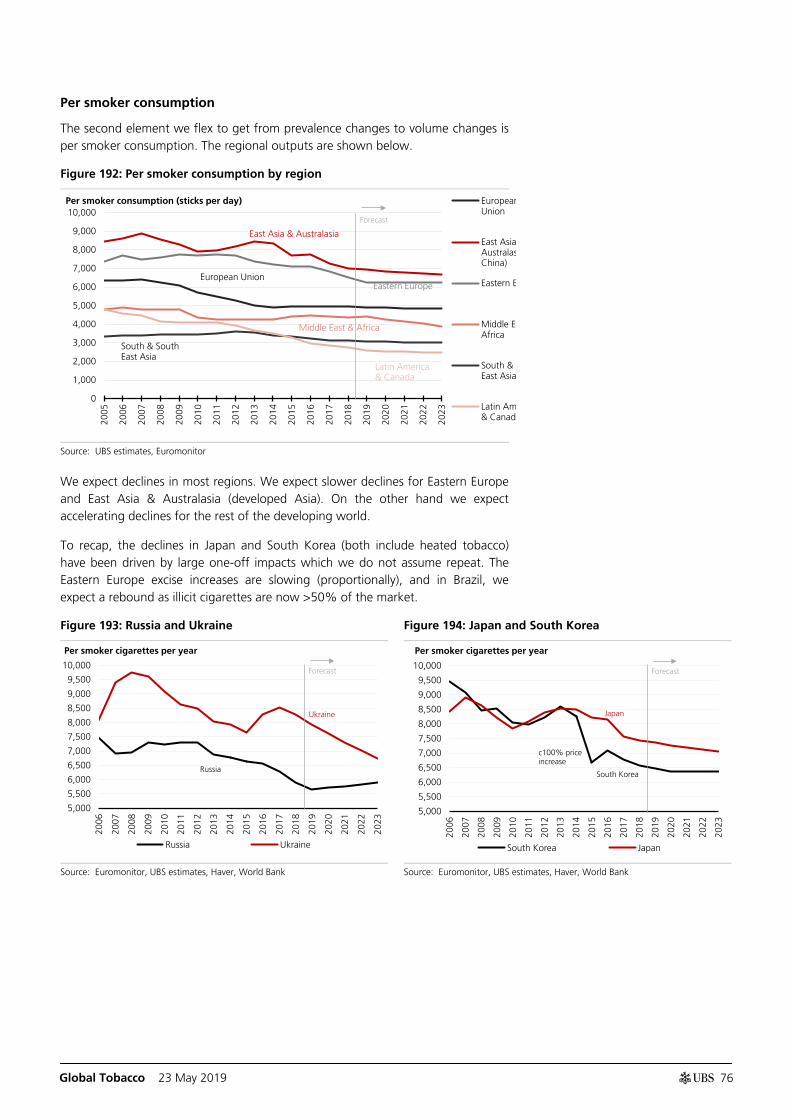
Global Tobacco 23 May 2019
76
Per smoker consumption
The second element we flex to get from prevalence changes to volume changes is per smoker consumption. The regional outputs are shown below.
Figure 192: Per smoker consumption by region
Source: UBS estimates, Euromonitor
We expect declines in most regions. We expect slower declines for Eastern Europe and East Asia & Australasia (developed Asia). On the other hand we expect accelerating declines for the rest of the developing world.
To recap, the declines in Japan and South Korea (both include heated tobacco) have been driven by large one-off impacts which we do not assume repeat. The Eastern Europe excise increases are slowing (proportionally), and in Brazil, we expect a rebound as illicit cigarettes are now >50% of the market.
Figure 193: Russia and Ukraine Figure 194: Japan and South Korea
Source: Euromonitor, UBS estimates, Haver, World Bank Source: Euromonitor, UBS estimates, Haver, World Bank
0
1,000
2,000
3,000
4,000
5,000
6,000
7,000
8,000
9,000
10,000
2005
2006
2007
2008
2009
2010
2011
2012
2013
2014
2015
2016
2017
2018
2019
2020
2021
2022
2023
EuropeanUnion
East Asia Australas China)
Eastern E
Middle E Africa
South & East Asia
Latin Am& Canad
Per smoker consumption (sticks per day)
European Union
East Asia & Australasia
Eastern Europe
Middle East & Africa
South & South East Asia
Latin America & Canada
Forecast
5,000
5,500
6,000
6,500
7,000
7,500
8,000
8,500
9,000
9,500
10,000
2006
2007
2008
2009
2010
2011
2012
2013
2014
2015
2016
2017
2018
2019
2020
2021
2022
2023
Russia Ukraine
Per smoker cigarettes per year
Ukraine
Forecast
Russia
5,000
5,500
6,000
6,500
7,000
7,500
8,000
8,500
9,000
9,500
10,000
2006
2007
2008
2009
2010
2011
2012
2013
2014
2015
2016
2017
2018
2019
2020
2021
2022
2023
South Korea Japan
Per smoker cigarettes per year
South Korea
Japan
Forecast
c100% price increase
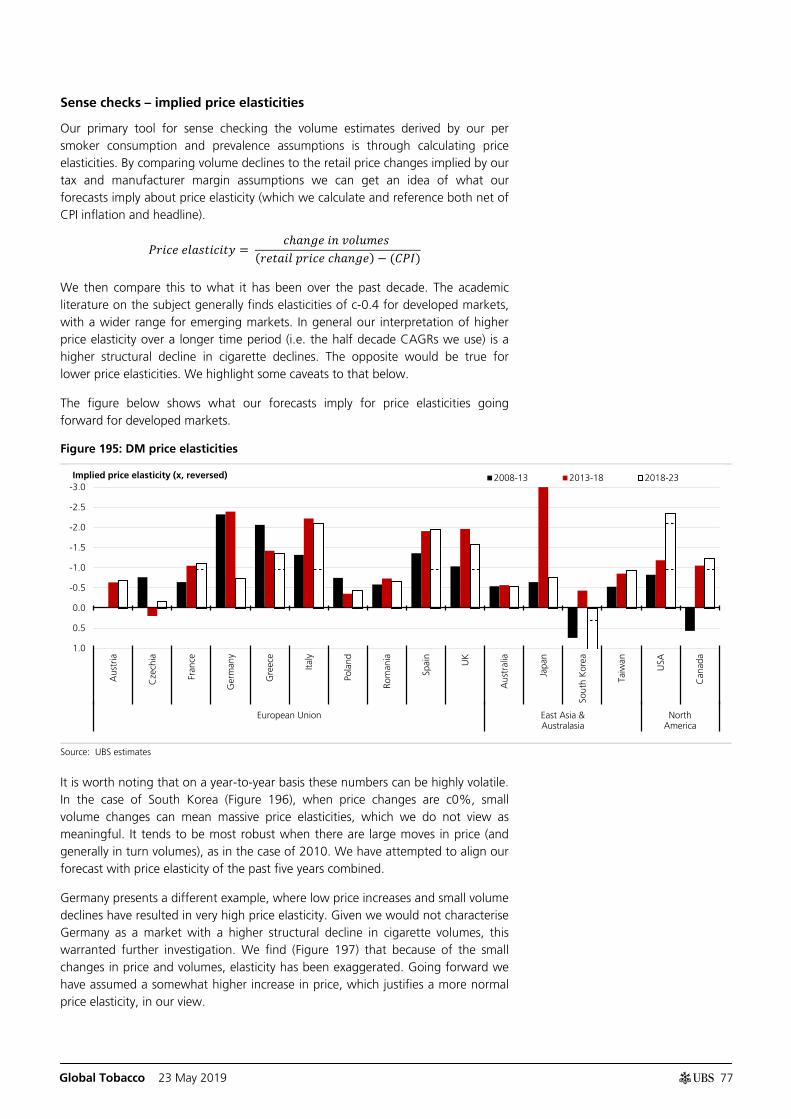
Global Tobacco 23 May 2019
77
Sense checks – implied price elasticities
Our primary tool for sense checking the volume estimates derived by our per smoker consumption and prevalence assumptions is through calculating price elasticities. By comparing volume declines to the retail price changes implied by our tax and manufacturer margin assumptions we can get an idea of what our forecasts imply about price elasticity (which we calculate and reference both net of CPI inflation and headline).
𝑃𝑃𝑃𝑃𝑃 𝑃𝑒𝑒𝑒𝑒𝑃𝑃𝑃𝑒𝑒 = 𝑃ℎ𝑒𝑎𝑎𝑃 𝑃𝑎 𝑣𝑣𝑒𝑣𝑣𝑃𝑒
(𝑃𝑃𝑒𝑒𝑃𝑒 𝑝𝑃𝑃𝑃𝑃 𝑃ℎ𝑒𝑎𝑎𝑃) − (𝐶𝑃𝐶)
We then compare this to what it has been over the past decade. The academic literature on the subject generally finds elasticities of c-0.4 for developed markets, with a wider range for emerging markets. In general our interpretation of higher price elasticity over a longer time period (i.e. the half decade CAGRs we use) is a higher structural decline in cigarette declines. The opposite would be true for lower price elasticities. We highlight some caveats to that below.
The figure below shows what our forecasts imply for price elasticities going forward for developed markets.
Figure 195: DM price elasticities
Source: UBS estimates
It is worth noting that on a year-to-year basis these numbers can be highly volatile. In the case of South Korea (Figure 196), when price changes are c0%, small volume changes can mean massive price elasticities, which we do not view as meaningful. It tends to be most robust when there are large moves in price (and generally in turn volumes), as in the case of 2010. We have attempted to align our forecast with price elasticity of the past five years combined.
Germany presents a different example, where low price increases and small volume declines have resulted in very high price elasticity. Given we would not characterise Germany as a market with a higher structural decline in cigarette volumes, this warranted further investigation. We find (Figure 197) that because of the small changes in price and volumes, elasticity has been exaggerated. Going forward we have assumed a somewhat higher increase in price, which justifies a more normal price elasticity, in our view.
-3.0
-2.5
-2.0
-1.5
-1.0
-0.5
0.0
0.5
1.0
Aus
tria
Cze
chia
Fran
ce
Ger
man
y
Gre
ece
Italy
Pola
nd
Rom
ania
Spai
n
UK
Aus
tral
ia
Japa
n
Sout
h K
orea
Taiw
an
USA
Can
ada
European Union East Asia &Australasia
NorthAmerica
2008-13 2013-18 2018-23Implied price elasticity (x, reversed)
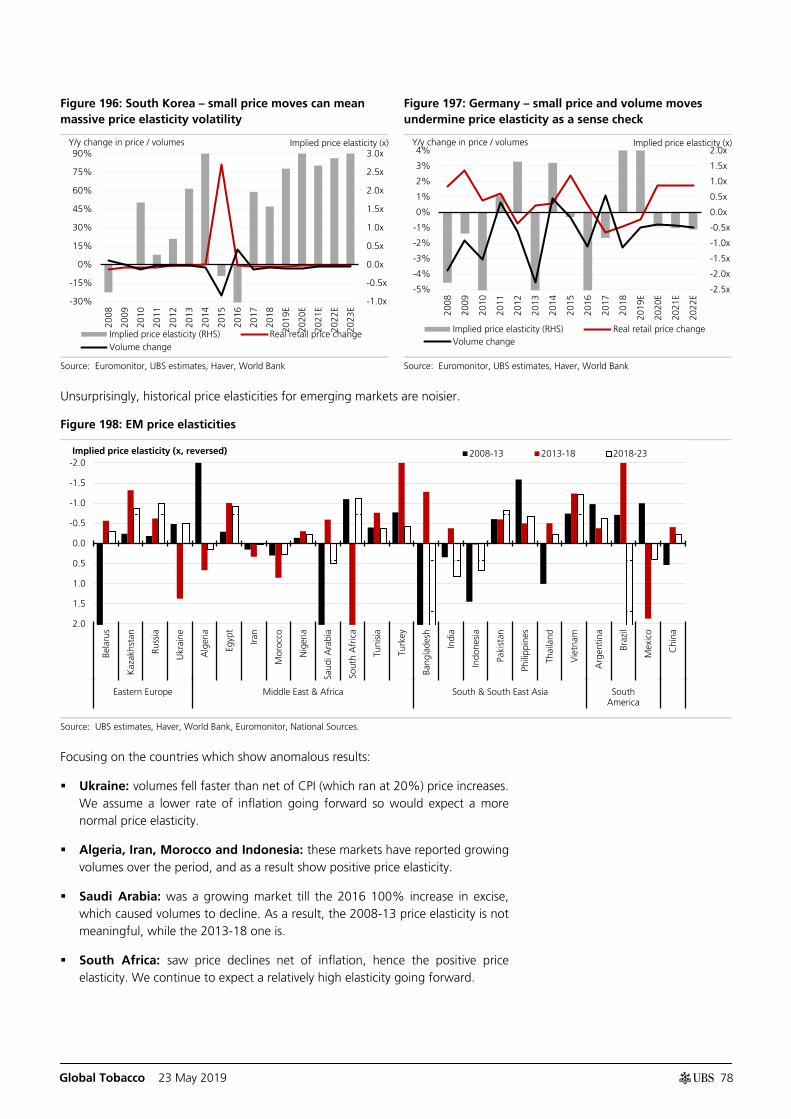
Global Tobacco 23 May 2019
78
Figure 196: South Korea – small price moves can mean massive price elasticity volatility
Figure 197: Germany – small price and volume moves undermine price elasticity as a sense check
Source: Euromonitor, UBS estimates, Haver, World Bank Source: Euromonitor, UBS estimates, Haver, World Bank
Unsurprisingly, historical price elasticities for emerging markets are noisier.
Figure 198: EM price elasticities
Source: UBS estimates, Haver, World Bank, Euromonitor, National Sources.
Focusing on the countries which show anomalous results:
Ukraine: volumes fell faster than net of CPI (which ran at 20%) price increases. We assume a lower rate of inflation going forward so would expect a more normal price elasticity.
Algeria, Iran, Morocco and Indonesia: these markets have reported growing volumes over the period, and as a result show positive price elasticity.
Saudi Arabia: was a growing market till the 2016 100% increase in excise, which caused volumes to decline. As a result, the 2008-13 price elasticity is not meaningful, while the 2013-18 one is.
South Africa: saw price declines net of inflation, hence the positive price elasticity. We continue to expect a relatively high elasticity going forward.
-1.0x
-0.5x
0.0x
0.5x
1.0x
1.5x
2.0x
2.5x
3.0x
-30%
-15%
0%
15%
30%
45%
60%
75%
90%
2008
2009
2010
2011
2012
2013
2014
2015
2016
2017
2018
2019
E
2020
E
2021
E
2022
E
2023
E
Implied price elasticity (RHS) Real retail price changeVolume change
Implied price elasticity (x) Y/y change in price / volumes
-2.5x
-2.0x
-1.5x
-1.0x
-0.5x
0.0x
0.5x
1.0x
1.5x
2.0x
-5%
-4%
-3%
-2%
-1%
0%
1%
2%
3%
4%
2008
2009
2010
2011
2012
2013
2014
2015
2016
2017
2018
2019
E
2020
E
2021
E
2022
E
Implied price elasticity (RHS) Real retail price changeVolume change
Implied price elasticity (x) Y/y change in price / volumes
-2.0
-1.5
-1.0
-0.5
0.0
0.5
1.0
1.5
2.0
Bela
rus
Kaz
akhs
tan
Russ
ia
Ukr
aine
Alg
eria
Egyp
t
Iran
Mor
occo
Nig
eria
Saud
i Ara
bia
Sout
h A
fric
a
Tuni
sia
Turk
ey
Bang
lade
sh
Indi
a
Indo
nesi
a
Paki
stan
Phili
ppin
es
Thai
land
Vie
tnam
Arg
entin
a
Braz
il
Mex
ico
Chi
na
Eastern Europe Middle East & Africa South & South East Asia SouthAmerica
2008-13 2013-18 2018-23Implied price elasticity (x, reversed)
Global Tobacco 23 May 2019
79
Turkey: volumes grew at a c5% CAGR over a period when real prices fell 2%. The key factor here has been 2018, where during a period of high CPI inflation cigarette prices have not changed, driving double-digit volume growth.
Brazil: we are expecting an improvement in volumes due to the higher presence of illicit cigarettes and growing pressure to do something about it.
Mexico: saw volume growth in spite of rising real cigarette prices. Our assumptions imply this will continue into the medium term.

Global Tobacco 23 May 2019
80
Reference sheets
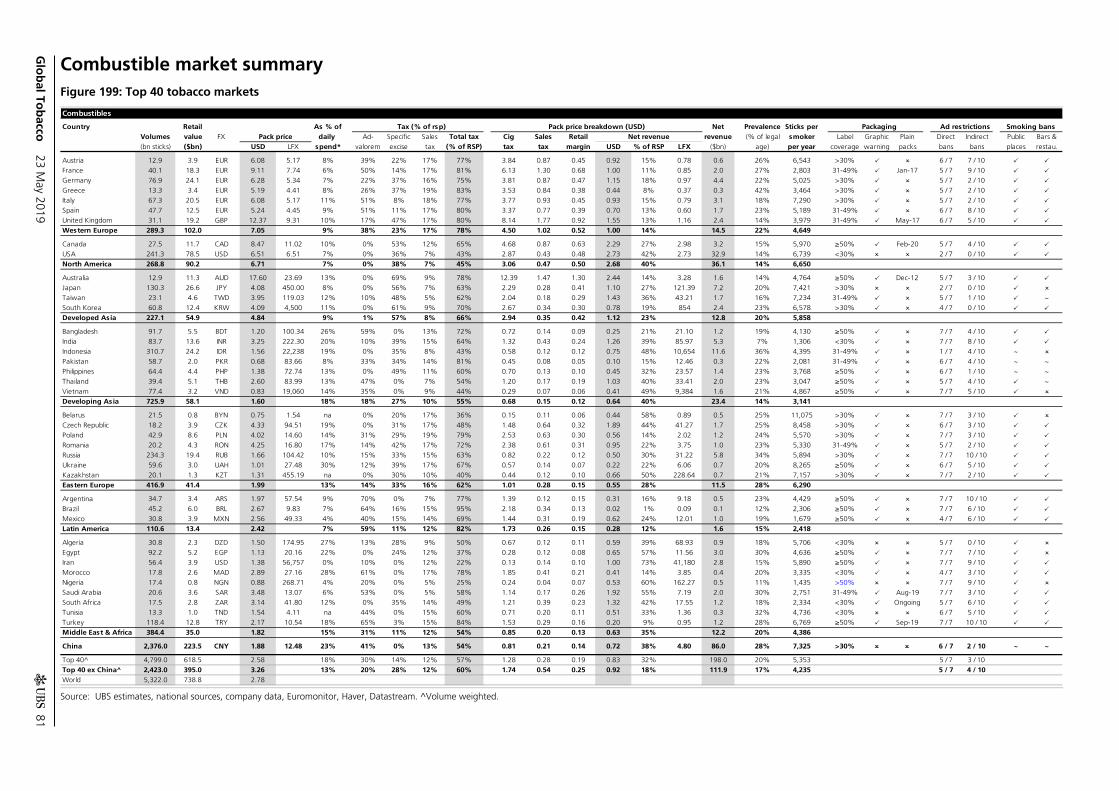
Glo
bal To
bacco
23 May 2019
81
Combustible market summary Figure 199: Top 40 tobacco markets
Source: UBS estimates, national sources, company data, Euromonitor, Haver, Datastream. ^Volume weighted.
Combustibles
Country Retail As % of Tax (% of rsp) Pack price breakdown (USD) Net Prevalence Sticks per Packaging Ad restrictions Smoking bansVolumes value FX Pack price daily Ad- Specific Sales Total tax Cig Sales Retail Net revenue revenue (% of legal smoker Label Graphic Plain Direct Indirect Public Bars &
(bn sticks) ($bn) USD LFX spend* valorem excise tax (% of RSP) tax tax margin USD % of RSP LFX ($bn) age) per year coverage warning packs bans bans places restau.
Austria 12.9 3.9 EUR 6.08 5.17 8% 39% 22% 17% 77% 3.84 0.87 0.45 0.92 15% 0.78 0.6 26% 6,543 >30% 6 / 7 7 / 10
France 40.1 18.3 EUR 9.11 7.74 6% 50% 14% 17% 81% 6.13 1.30 0.68 1.00 11% 0.85 2.0 27% 2,803 31-49% Jan-17 5 / 7 9 / 10
Germany 76.9 24.1 EUR 6.28 5.34 7% 22% 37% 16% 75% 3.81 0.87 0.47 1.15 18% 0.97 4.4 22% 5,025 >30% 5 / 7 2 / 10
Greece 13.3 3.4 EUR 5.19 4.41 8% 26% 37% 19% 83% 3.53 0.84 0.38 0.44 8% 0.37 0.3 42% 3,464 >30% 5 / 7 2 / 10
Italy 67.3 20.5 EUR 6.08 5.17 11% 51% 8% 18% 77% 3.77 0.93 0.45 0.93 15% 0.79 3.1 18% 7,290 >30% 5 / 7 2 / 10
Spain 47.7 12.5 EUR 5.24 4.45 9% 51% 11% 17% 80% 3.37 0.77 0.39 0.70 13% 0.60 1.7 23% 5,189 31-49% 6 / 7 8 / 10
United Kingdom 31.1 19.2 GBP 12.37 9.31 10% 17% 47% 17% 80% 8.14 1.77 0.92 1.55 13% 1.16 2.4 14% 3,979 31-49% May-17 6 / 7 5 / 10
Western Europe 289.3 102.0 7.05 9% 38% 23% 17% 78% 4.50 1.02 0.52 1.00 14% 14.5 22% 4,649
Canada 27.5 11.7 CAD 8.47 11.02 10% 0% 53% 12% 65% 4.68 0.87 0.63 2.29 27% 2.98 3.2 15% 5,970 ≥50% Feb-20 5 / 7 4 / 10
USA 241.3 78.5 USD 6.51 6.51 7% 0% 36% 7% 43% 2.87 0.43 0.48 2.73 42% 2.73 32.9 14% 6,739 <30% 2 / 7 0 / 10
North America 268.8 90.2 6.71 7% 0% 38% 7% 45% 3.06 0.47 0.50 2.68 40% 36.1 14% 6,650
Australia 12.9 11.3 AUD 17.60 23.69 13% 0% 69% 9% 78% 12.39 1.47 1.30 2.44 14% 3.28 1.6 14% 4,764 ≥50% Dec-12 5 / 7 3 / 10
Japan 130.3 26.6 JPY 4.08 450.00 8% 0% 56% 7% 63% 2.29 0.28 0.41 1.10 27% 121.39 7.2 20% 7,421 >30% 2 / 7 0 / 10
Taiwan 23.1 4.6 TWD 3.95 119.03 12% 10% 48% 5% 62% 2.04 0.18 0.29 1.43 36% 43.21 1.7 16% 7,234 31-49% 5 / 7 1 / 10 ~
South Korea 60.8 12.4 KRW 4.09 4,500 11% 0% 61% 9% 70% 2.67 0.34 0.30 0.78 19% 854 2.4 23% 6,578 >30% 4 / 7 0 / 10
Developed Asia 227.1 54.9 4.84 9% 1% 57% 8% 66% 2.94 0.35 0.42 1.12 23% 12.8 20% 5,858
Bangladesh 91.7 5.5 BDT 1.20 100.34 26% 59% 0% 13% 72% 0.72 0.14 0.09 0.25 21% 21.10 1.2 19% 4,130 ≥50% 7 / 7 4 / 10
India 83.7 13.6 INR 3.25 222.30 20% 10% 39% 15% 64% 1.32 0.43 0.24 1.26 39% 85.97 5.3 7% 1,306 <30% 7 / 7 8 / 10
Indonesia 310.7 24.2 IDR 1.56 22,238 19% 0% 35% 8% 43% 0.58 0.12 0.12 0.75 48% 10,654 11.6 36% 4,395 31-49% 1 / 7 4 / 10 ~
Pakistan 58.7 2.0 PKR 0.68 83.66 8% 33% 34% 14% 81% 0.45 0.08 0.05 0.10 15% 12.46 0.3 22% 2,081 31-49% 6 / 7 4 / 10 ~ ~
Philippines 64.4 4.4 PHP 1.38 72.74 13% 0% 49% 11% 60% 0.70 0.13 0.10 0.45 32% 23.57 1.4 23% 3,768 ≥50% 6 / 7 1 / 10 ~ ~
Thailand 39.4 5.1 THB 2.60 83.99 13% 47% 0% 7% 54% 1.20 0.17 0.19 1.03 40% 33.41 2.0 23% 3,047 ≥50% 5 / 7 4 / 10 ~
Vietnam 77.4 3.2 VND 0.83 19,060 14% 35% 0% 9% 44% 0.29 0.07 0.06 0.41 49% 9,384 1.6 21% 4,867 ≥50% 7 / 7 5 / 10
Developing Asia 725.9 58.1 1.60 18% 18% 27% 10% 55% 0.68 0.15 0.12 0.64 40% 23.4 14% 3,141
Belarus 21.5 0.8 BYN 0.75 1.54 na 0% 20% 17% 36% 0.15 0.11 0.06 0.44 58% 0.89 0.5 25% 11,075 >30% 7 / 7 3 / 10
Czech Republic 18.2 3.9 CZK 4.33 94.51 19% 0% 31% 17% 48% 1.48 0.64 0.32 1.89 44% 41.27 1.7 25% 8,458 >30% 6 / 7 3 / 10
Poland 42.9 8.6 PLN 4.02 14.60 14% 31% 29% 19% 79% 2.53 0.63 0.30 0.56 14% 2.02 1.2 24% 5,570 >30% 7 / 7 3 / 10
Romania 20.2 4.3 RON 4.25 16.80 17% 14% 42% 17% 72% 2.38 0.61 0.31 0.95 22% 3.75 1.0 23% 5,330 31-49% 5 / 7 2 / 10
Russia 234.3 19.4 RUB 1.66 104.42 10% 15% 33% 15% 63% 0.82 0.22 0.12 0.50 30% 31.22 5.8 34% 5,894 >30% 7 / 7 10 / 10
Ukraine 59.6 3.0 UAH 1.01 27.48 30% 12% 39% 17% 67% 0.57 0.14 0.07 0.22 22% 6.06 0.7 20% 8,265 ≥50% 6 / 7 5 / 10
Kazakhstan 20.1 1.3 KZT 1.31 455.19 na 0% 30% 10% 40% 0.44 0.12 0.10 0.66 50% 228.64 0.7 21% 7,157 >30% 7 / 7 2 / 10
Eastern Europe 416.9 41.4 1.99 13% 14% 33% 16% 62% 1.01 0.28 0.15 0.55 28% 11.5 28% 6,290
Argentina 34.7 3.4 ARS 1.97 57.54 9% 70% 0% 7% 77% 1.39 0.12 0.15 0.31 16% 9.18 0.5 23% 4,429 ≥50% 7 / 7 10 / 10
Brazil 45.2 6.0 BRL 2.67 9.83 7% 64% 16% 15% 95% 2.18 0.34 0.13 0.02 1% 0.09 0.1 12% 2,306 ≥50% 7 / 7 6 / 10
Mexico 30.8 3.9 MXN 2.56 49.33 4% 40% 15% 14% 69% 1.44 0.31 0.19 0.62 24% 12.01 1.0 19% 1,679 ≥50% 4 / 7 6 / 10
Latin America 110.6 13.4 2.42 7% 59% 11% 12% 82% 1.73 0.26 0.15 0.28 12% 1.6 15% 2,418
Algeria 30.8 2.3 DZD 1.50 174.95 27% 13% 28% 9% 50% 0.67 0.12 0.11 0.59 39% 68.93 0.9 18% 5,706 <30% 5 / 7 0 / 10
Egypt 92.2 5.2 EGP 1.13 20.16 22% 0% 24% 12% 37% 0.28 0.12 0.08 0.65 57% 11.56 3.0 30% 4,636 ≥50% 7 / 7 7 / 10
Iran 56.4 3.9 USD 1.38 56,757 0% 10% 0% 12% 22% 0.13 0.14 0.10 1.00 73% 41,180 2.8 15% 5,890 ≥50% 7 / 7 9 / 10
Morocco 17.8 2.6 MAD 2.89 27.16 28% 61% 0% 17% 78% 1.85 0.41 0.21 0.41 14% 3.85 0.4 20% 3,335 <30% 4 / 7 3 / 10
Nigeria 17.4 0.8 NGN 0.88 268.71 4% 20% 0% 5% 25% 0.24 0.04 0.07 0.53 60% 162.27 0.5 11% 1,435 >50% 7 / 7 9 / 10
Saudi Arabia 20.6 3.6 SAR 3.48 13.07 6% 53% 0% 5% 58% 1.14 0.17 0.26 1.92 55% 7.19 2.0 30% 2,751 31-49% Aug-19 7 / 7 3 / 10
South Africa 17.5 2.8 ZAR 3.14 41.80 12% 0% 35% 14% 49% 1.21 0.39 0.23 1.32 42% 17.55 1.2 18% 2,334 <30% Ongoing 5 / 7 6 / 10
Tunisia 13.3 1.0 TND 1.54 4.11 na 44% 0% 15% 60% 0.71 0.20 0.11 0.51 33% 1.36 0.3 32% 4,736 <30% 6 / 7 5 / 10
Turkey 118.4 12.8 TRY 2.17 10.54 18% 65% 3% 15% 84% 1.53 0.29 0.16 0.20 9% 0.95 1.2 28% 6,769 ≥50% Sep-19 7 / 7 10 / 10
Middle East & Africa 384.4 35.0 1.82 15% 31% 11% 12% 54% 0.85 0.20 0.13 0.63 35% 12.2 20% 4,386
China 2,376.0 223.5 CNY 1.88 12.48 23% 41% 0% 13% 54% 0.81 0.21 0.14 0.72 38% 4.80 86.0 28% 7,325 >30% 6 / 7 2 / 10 ~ ~
Top 40^ 4,799.0 618.5 2.58 18% 30% 14% 12% 57% 1.28 0.28 0.19 0.83 32% 198.0 20% 5,353 5 / 7 3 / 10
Top 40 ex China^ 2,423.0 395.0 3.26 13% 20% 28% 12% 60% 1.74 0.54 0.25 0.92 18% 111.9 17% 4,235 5 / 7 4 / 10 World 5,322.0 738.8 2.78
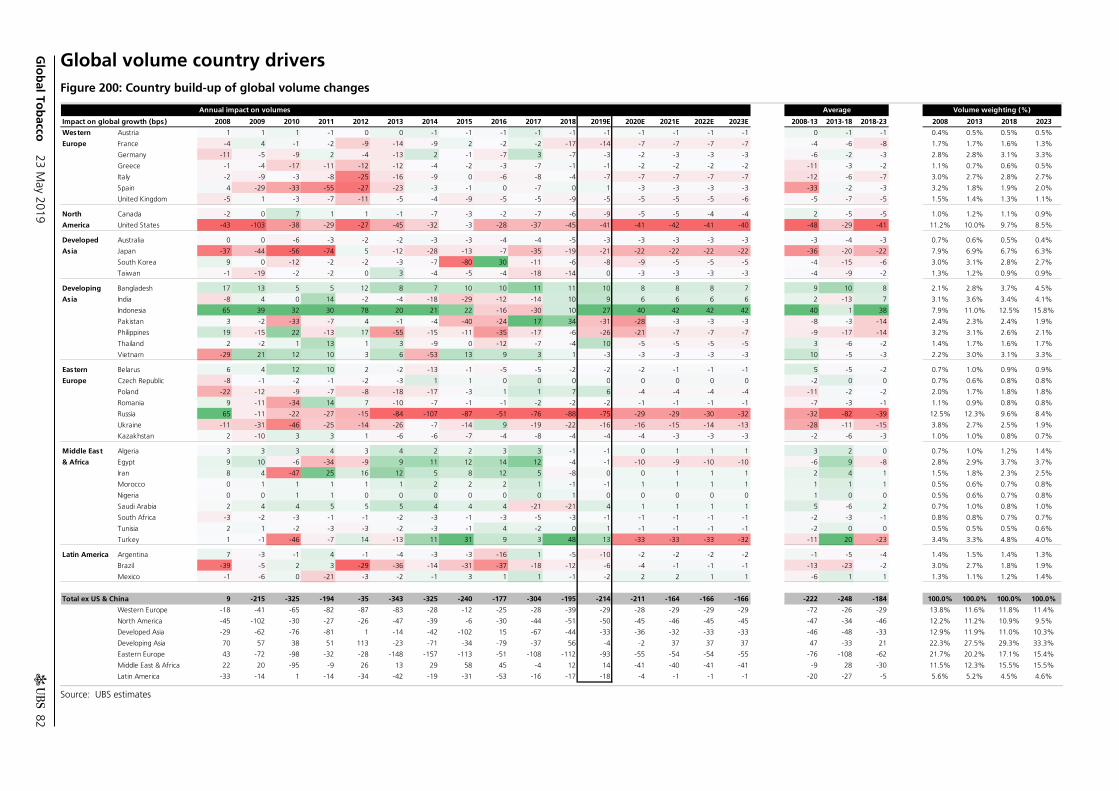
Glo
bal To
bacco
23 May 2019
82
Global volume country drivers Figure 200: Country build-up of global volume changes
Source: UBS estimates
Annual impact on volumes Average Volume weighting (%)
Impact on global growth (bps) 2008 2009 2010 2011 2012 2013 2014 2015 2016 2017 2018 2019E 2020E 2021E 2022E 2023E 2008-13 2013-18 2018-23 2008 2013 2018 2023
Western Austria 1 1 1 -1 0 0 -1 -1 -1 -1 -1 -1 -1 -1 -1 -1 0 -1 -1 0.4% 0.5% 0.5% 0.5%
Europe France -4 4 -1 -2 -9 -14 -9 2 -2 -2 -17 -14 -7 -7 -7 -7 -4 -6 -8 1.7% 1.7% 1.6% 1.3%
Germany -11 -5 -9 2 -4 -13 2 -1 -7 3 -7 -3 -2 -3 -3 -3 -6 -2 -3 2.8% 2.8% 3.1% 3.3%
Greece -1 -4 -17 -11 -12 -12 -4 -2 -3 -7 -1 -1 -2 -2 -2 -2 -11 -3 -2 1.1% 0.7% 0.6% 0.5%
Italy -2 -9 -3 -8 -25 -16 -9 0 -6 -8 -4 -7 -7 -7 -7 -7 -12 -6 -7 3.0% 2.7% 2.8% 2.7%
Spain 4 -29 -33 -55 -27 -23 -3 -1 0 -7 0 1 -3 -3 -3 -3 -33 -2 -3 3.2% 1.8% 1.9% 2.0%
United Kingdom -5 1 -3 -7 -11 -5 -4 -9 -5 -5 -9 -5 -5 -5 -5 -6 -5 -7 -5 1.5% 1.4% 1.3% 1.1%
North Canada -2 0 7 1 1 -1 -7 -3 -2 -7 -6 -9 -5 -5 -4 -4 2 -5 -5 1.0% 1.2% 1.1% 0.9%
America United States -43 -103 -38 -29 -27 -45 -32 -3 -28 -37 -45 -41 -41 -42 -41 -40 -48 -29 -41 11.2% 10.0% 9.7% 8.5%
Developed Australia 0 0 -6 -3 -2 -2 -3 -3 -4 -4 -5 -3 -3 -3 -3 -3 -3 -4 -3 0.7% 0.6% 0.5% 0.4%
Asia Japan -37 -44 -56 -74 5 -12 -28 -13 -7 -35 -19 -21 -22 -22 -22 -22 -36 -20 -22 7.9% 6.9% 6.7% 6.3%
South Korea 9 0 -12 -2 -2 -3 -7 -80 30 -11 -6 -8 -9 -5 -5 -5 -4 -15 -6 3.0% 3.1% 2.8% 2.7%
Taiwan -1 -19 -2 -2 0 3 -4 -5 -4 -18 -14 0 -3 -3 -3 -3 -4 -9 -2 1.3% 1.2% 0.9% 0.9%
Developing Bangladesh 17 13 5 5 12 8 7 10 10 11 11 10 8 8 8 7 9 10 8 2.1% 2.8% 3.7% 4.5%
Asia India -8 4 0 14 -2 -4 -18 -29 -12 -14 10 9 6 6 6 6 2 -13 7 3.1% 3.6% 3.4% 4.1%
Indonesia 65 39 32 30 78 20 21 22 -16 -30 10 27 40 42 42 42 40 1 38 7.9% 11.0% 12.5% 15.8%
Pakistan 3 -2 -33 -7 4 -1 -4 -40 -24 17 34 -31 -28 -3 -3 -3 -8 -3 -14 2.4% 2.3% 2.4% 1.9%
Philippines 19 -15 22 -13 17 -55 -15 -11 -35 -17 -6 -26 -21 -7 -7 -7 -9 -17 -14 3.2% 3.1% 2.6% 2.1%
Thailand 2 -2 1 13 1 3 -9 0 -12 -7 -4 10 -5 -5 -5 -5 3 -6 -2 1.4% 1.7% 1.6% 1.7%
Vietnam -29 21 12 10 3 6 -53 13 9 3 1 -3 -3 -3 -3 -3 10 -5 -3 2.2% 3.0% 3.1% 3.3%
Eastern Belarus 6 4 12 10 2 -2 -13 -1 -5 -5 -2 -2 -2 -1 -1 -1 5 -5 -2 0.7% 1.0% 0.9% 0.9%
Europe Czech Republic -8 -1 -2 -1 -2 -3 1 1 0 0 0 0 0 0 0 0 -2 0 0 0.7% 0.6% 0.8% 0.8%
Poland -22 -12 -9 -7 -8 -18 -17 -3 1 1 7 6 -4 -4 -4 -4 -11 -2 -2 2.0% 1.7% 1.8% 1.8%
Romania 9 -11 -34 14 7 -10 -7 -1 -1 -2 -2 -2 -1 -1 -1 -1 -7 -3 -1 1.1% 0.9% 0.8% 0.8%
Russia 65 -11 -22 -27 -15 -84 -107 -87 -51 -76 -88 -75 -29 -29 -30 -32 -32 -82 -39 12.5% 12.3% 9.6% 8.4%
Ukraine -11 -31 -46 -25 -14 -26 -7 -14 9 -19 -22 -16 -16 -15 -14 -13 -28 -11 -15 3.8% 2.7% 2.5% 1.9%
Kazakhstan 2 -10 3 3 1 -6 -6 -7 -4 -8 -4 -4 -4 -3 -3 -3 -2 -6 -3 1.0% 1.0% 0.8% 0.7%
Middle East Algeria 3 3 3 4 3 4 2 2 3 3 -1 -1 0 1 1 1 3 2 0 0.7% 1.0% 1.2% 1.4%
& Africa Egypt 9 10 -6 -34 -9 9 11 12 14 12 -4 -1 -10 -9 -10 -10 -6 9 -8 2.8% 2.9% 3.7% 3.7%
Iran 8 4 -47 25 16 12 5 8 12 5 -8 0 0 1 1 1 2 4 1 1.5% 1.8% 2.3% 2.5%
Morocco 0 1 1 1 1 1 2 2 2 1 -1 -1 1 1 1 1 1 1 1 0.5% 0.6% 0.7% 0.8%
Nigeria 0 0 1 1 0 0 0 0 0 0 1 0 0 0 0 0 1 0 0 0.5% 0.6% 0.7% 0.8%
Saudi Arabia 2 4 4 5 5 5 4 4 4 -21 -21 4 1 1 1 1 5 -6 2 0.7% 1.0% 0.8% 1.0%
South Africa -3 -2 -3 -1 -1 -2 -3 -1 -3 -5 -3 -1 -1 -1 -1 -1 -2 -3 -1 0.8% 0.8% 0.7% 0.7%
Tunisia 2 1 -2 -3 -3 -2 -3 -1 4 -2 0 1 -1 -1 -1 -1 -2 0 0 0.5% 0.5% 0.5% 0.6%
Turkey 1 -1 -46 -7 14 -13 11 31 9 3 48 13 -33 -33 -33 -32 -11 20 -23 3.4% 3.3% 4.8% 4.0%
Latin America Argentina 7 -3 -1 4 -1 -4 -3 -3 -16 1 -5 -10 -2 -2 -2 -2 -1 -5 -4 1.4% 1.5% 1.4% 1.3%
Brazil -39 -5 2 3 -29 -36 -14 -31 -37 -18 -12 -6 -4 -1 -1 -1 -13 -23 -2 3.0% 2.7% 1.8% 1.9%
Mexico -1 -6 0 -21 -3 -2 -1 3 1 1 -1 -2 2 2 1 1 -6 1 1 1.3% 1.1% 1.2% 1.4%
Total ex US & China 9 -215 -325 -194 -35 -343 -325 -240 -177 -304 -195 -214 -211 -164 -166 -166 -222 -248 -184 100.0% 100.0% 100.0% 100.0%
Western Europe -18 -41 -65 -82 -87 -83 -28 -12 -25 -28 -39 -29 -28 -29 -29 -29 -72 -26 -29 13.8% 11.6% 11.8% 11.4%
North America -45 -102 -30 -27 -26 -47 -39 -6 -30 -44 -51 -50 -45 -46 -45 -45 -47 -34 -46 12.2% 11.2% 10.9% 9.5%
Developed Asia -29 -62 -76 -81 1 -14 -42 -102 15 -67 -44 -33 -36 -32 -33 -33 -46 -48 -33 12.9% 11.9% 11.0% 10.3%
Developing Asia 70 57 38 51 113 -23 -71 -34 -79 -37 56 -4 -2 37 37 37 47 -33 21 22.3% 27.5% 29.3% 33.3%
Eastern Europe 43 -72 -98 -32 -28 -148 -157 -113 -51 -108 -112 -93 -55 -54 -54 -55 -76 -108 -62 21.7% 20.2% 17.1% 15.4%
Middle East & Africa 22 20 -95 -9 26 13 29 58 45 -4 12 14 -41 -40 -41 -41 -9 28 -30 11.5% 12.3% 15.5% 15.5%
Latin America -33 -14 1 -14 -34 -42 -19 -31 -53 -16 -17 -18 -4 -1 -1 -1 -20 -27 -5 5.6% 5.2% 4.5% 4.6%
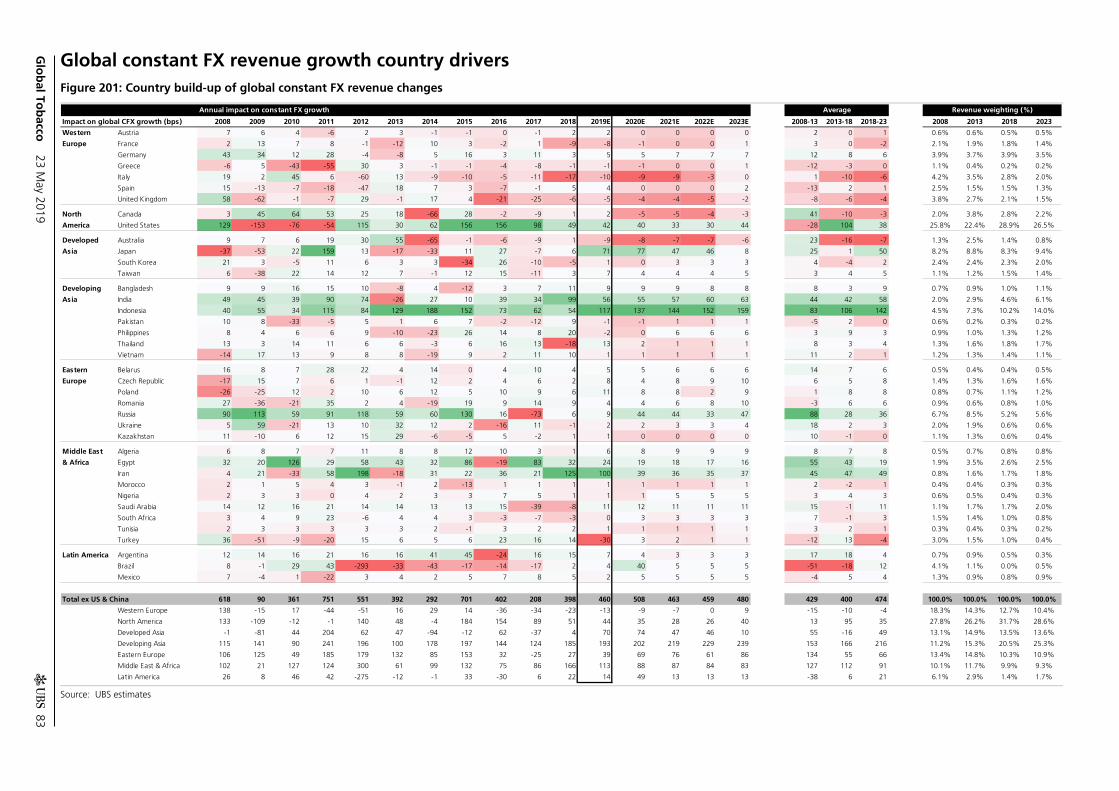
Glo
bal To
bacco
23 May 2019
83
Global constant FX revenue growth country drivers Figure 201: Country build-up of global constant FX revenue changes
Source: UBS estimates
Annual impact on constant FX growth Average Revenue weighting (%)
Impact on global CFX growth (bps) 2008 2009 2010 2011 2012 2013 2014 2015 2016 2017 2018 2019E 2020E 2021E 2022E 2023E 2008-13 2013-18 2018-23 2008 2013 2018 2023
Western Austria 7 6 4 -6 2 3 -1 -1 0 -1 2 2 0 0 0 0 2 0 1 0.6% 0.6% 0.5% 0.5%
Europe France 2 13 7 8 -1 -12 10 3 -2 1 -9 -8 -1 0 0 1 3 0 -2 2.1% 1.9% 1.8% 1.4%
Germany 43 34 12 28 -4 -8 5 16 3 11 3 5 5 7 7 7 12 8 6 3.9% 3.7% 3.9% 3.5%
Greece -6 5 -43 -55 30 3 -1 -1 -4 -8 -1 -1 -1 0 0 1 -12 -3 0 1.1% 0.4% 0.2% 0.2%
Italy 19 2 45 6 -60 13 -9 -10 -5 -11 -17 -10 -9 -9 -3 0 1 -10 -6 4.2% 3.5% 2.8% 2.0%
Spain 15 -13 -7 -18 -47 18 7 3 -7 -1 5 4 0 0 0 2 -13 2 1 2.5% 1.5% 1.5% 1.3%
United Kingdom 58 -62 -1 -7 29 -1 17 4 -21 -25 -6 -5 -4 -4 -5 -2 -8 -6 -4 3.8% 2.7% 2.1% 1.5%
North Canada 3 45 64 53 25 18 -66 28 -2 -9 1 2 -5 -5 -4 -3 41 -10 -3 2.0% 3.8% 2.8% 2.2%
America United States 129 -153 -76 -54 115 30 62 156 156 98 49 42 40 33 30 44 -28 104 38 25.8% 22.4% 28.9% 26.5%
Developed Australia 9 7 6 19 30 55 -65 -1 -6 -9 1 -9 -8 -7 -7 -6 23 -16 -7 1.3% 2.5% 1.4% 0.8%
Asia Japan -37 -53 22 159 13 -17 -33 11 27 -7 6 71 77 47 46 8 25 1 50 8.2% 8.8% 8.3% 9.4%
South Korea 21 3 -5 11 6 3 3 -34 26 -10 -5 1 0 3 3 3 4 -4 2 2.4% 2.4% 2.3% 2.0%
Taiwan 6 -38 22 14 12 7 -1 12 15 -11 3 7 4 4 4 5 3 4 5 1.1% 1.2% 1.5% 1.4%
Developing Bangladesh 9 9 16 15 10 -8 4 -12 3 7 11 9 9 9 8 8 8 3 9 0.7% 0.9% 1.0% 1.1%
Asia India 49 45 39 90 74 -26 27 10 39 34 99 56 55 57 60 63 44 42 58 2.0% 2.9% 4.6% 6.1%
Indonesia 40 55 34 115 84 129 188 152 73 62 54 117 137 144 152 159 83 106 142 4.5% 7.3% 10.2% 14.0%
Pakistan 10 8 -33 -5 5 1 6 7 -2 -12 9 -1 -1 1 1 1 -5 2 0 0.6% 0.2% 0.3% 0.2%
Philippines 8 4 6 6 9 -10 -23 26 14 8 20 -2 0 6 6 6 3 9 3 0.9% 1.0% 1.3% 1.2%
Thailand 13 3 14 11 6 6 -3 6 16 13 -18 13 2 1 1 1 8 3 4 1.3% 1.6% 1.8% 1.7%
Vietnam -14 17 13 9 8 8 -19 9 2 11 10 1 1 1 1 1 11 2 1 1.2% 1.3% 1.4% 1.1%
Eastern Belarus 16 8 7 28 22 4 14 0 4 10 4 5 5 6 6 6 14 7 6 0.5% 0.4% 0.4% 0.5%
Europe Czech Republic -17 15 7 6 1 -1 12 2 4 6 2 8 4 8 9 10 6 5 8 1.4% 1.3% 1.6% 1.6%
Poland -26 -25 12 2 10 6 12 5 10 9 6 11 8 8 2 9 1 8 8 0.8% 0.7% 1.1% 1.2%
Romania 27 -36 -21 35 2 4 -19 19 9 14 9 4 4 6 8 10 -3 6 6 0.9% 0.6% 0.8% 1.0%
Russia 90 113 59 91 118 59 60 130 16 -73 6 9 44 44 33 47 88 28 36 6.7% 8.5% 5.2% 5.6%
Ukraine 5 59 -21 13 10 32 12 2 -16 11 -1 2 2 3 3 4 18 2 3 2.0% 1.9% 0.6% 0.6%
Kazakhstan 11 -10 6 12 15 29 -6 -5 5 -2 1 1 0 0 0 0 10 -1 0 1.1% 1.3% 0.6% 0.4%
Middle East Algeria 6 8 7 7 11 8 8 12 10 3 1 6 8 9 9 9 8 7 8 0.5% 0.7% 0.8% 0.8%
& Africa Egypt 32 20 126 29 58 43 32 86 -19 83 32 24 19 18 17 16 55 43 19 1.9% 3.5% 2.6% 2.5%
Iran 4 21 -33 58 198 -18 31 22 36 21 125 100 39 36 35 37 45 47 49 0.8% 1.6% 1.7% 1.8%
Morocco 2 1 5 4 3 -1 2 -13 1 1 1 1 1 1 1 1 2 -2 1 0.4% 0.4% 0.3% 0.3%
Nigeria 2 3 3 0 4 2 3 3 7 5 1 1 1 5 5 5 3 4 3 0.6% 0.5% 0.4% 0.3%
Saudi Arabia 14 12 16 21 14 14 13 13 15 -39 -8 11 12 11 11 11 15 -1 11 1.1% 1.7% 1.7% 2.0%
South Africa 3 4 9 23 -6 4 4 3 -3 -7 -3 0 3 3 3 3 7 -1 3 1.5% 1.4% 1.0% 0.8%
Tunisia 2 3 3 3 3 3 2 -1 3 2 2 1 1 1 1 1 3 2 1 0.3% 0.4% 0.3% 0.2%
Turkey 36 -51 -9 -20 15 6 5 6 23 16 14 -30 3 2 1 1 -12 13 -4 3.0% 1.5% 1.0% 0.4%
Latin America Argentina 12 14 16 21 16 16 41 45 -24 16 15 7 4 3 3 3 17 18 4 0.7% 0.9% 0.5% 0.3%
Brazil 8 -1 29 43 -293 -33 -43 -17 -14 -17 2 4 40 5 5 5 -51 -18 12 4.1% 1.1% 0.0% 0.5%
Mexico 7 -4 1 -22 3 4 2 5 7 8 5 2 5 5 5 5 -4 5 4 1.3% 0.9% 0.8% 0.9%
Total ex US & China 618 90 361 751 551 392 292 701 402 208 398 460 508 463 459 480 429 400 474 100.0% 100.0% 100.0% 100.0%
Western Europe 138 -15 17 -44 -51 16 29 14 -36 -34 -23 -13 -9 -7 0 9 -15 -10 -4 18.3% 14.3% 12.7% 10.4%
North America 133 -109 -12 -1 140 48 -4 184 154 89 51 44 35 28 26 40 13 95 35 27.8% 26.2% 31.7% 28.6%
Developed Asia -1 -81 44 204 62 47 -94 -12 62 -37 4 70 74 47 46 10 55 -16 49 13.1% 14.9% 13.5% 13.6%
Developing Asia 115 141 90 241 196 100 178 197 144 124 185 193 202 219 229 239 153 166 216 11.2% 15.3% 20.5% 25.3%
Eastern Europe 106 125 49 185 179 132 85 153 32 -25 27 39 69 76 61 86 134 55 66 13.4% 14.8% 10.3% 10.9%
Middle East & Africa 102 21 127 124 300 61 99 132 75 86 166 113 88 87 84 83 127 112 91 10.1% 11.7% 9.9% 9.3%
Latin America 26 8 46 42 -275 -12 -1 33 -30 6 22 14 49 13 13 13 -38 6 21 6.1% 2.9% 1.4% 1.7%
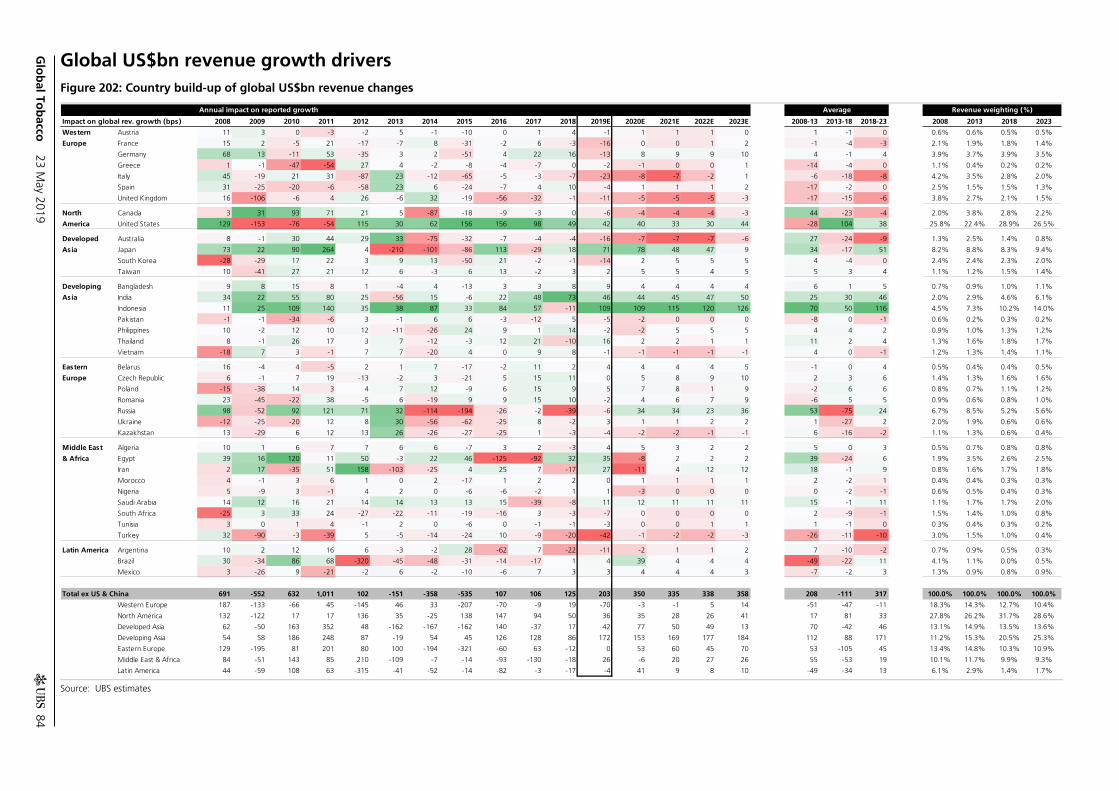
Glo
bal To
bacco
23 May 2019
84
Global US$bn revenue growth drivers Figure 202: Country build-up of global US$bn revenue changes
Source: UBS estimates
Annual impact on reported growth Average Revenue weighting (%)
Impact on global rev. growth (bps) 2008 2009 2010 2011 2012 2013 2014 2015 2016 2017 2018 2019E 2020E 2021E 2022E 2023E 2008-13 2013-18 2018-23 2008 2013 2018 2023
Western Austria 11 3 0 -3 -2 5 -1 -10 0 1 4 -1 1 1 1 0 1 -1 0 0.6% 0.6% 0.5% 0.5%
Europe France 15 2 -5 21 -17 -7 8 -31 -2 6 -3 -16 0 0 1 2 -1 -4 -3 2.1% 1.9% 1.8% 1.4%
Germany 68 13 -11 53 -35 3 2 -51 4 22 16 -13 8 9 9 10 4 -1 4 3.9% 3.7% 3.9% 3.5%
Greece 1 -1 -47 -54 27 4 -2 -8 -4 -7 0 -2 -1 0 0 1 -14 -4 0 1.1% 0.4% 0.2% 0.2%
Italy 45 -19 21 31 -87 23 -12 -65 -5 -3 -7 -23 -8 -7 -2 1 -6 -18 -8 4.2% 3.5% 2.8% 2.0%
Spain 31 -25 -20 -6 -58 23 6 -24 -7 4 10 -4 1 1 1 2 -17 -2 0 2.5% 1.5% 1.5% 1.3%
United Kingdom 16 -106 -6 4 26 -6 32 -19 -56 -32 -1 -11 -5 -5 -5 -3 -17 -15 -6 3.8% 2.7% 2.1% 1.5%
North Canada 3 31 93 71 21 5 -87 -18 -9 -3 0 -6 -4 -4 -4 -3 44 -23 -4 2.0% 3.8% 2.8% 2.2%
America United States 129 -153 -76 -54 115 30 62 156 156 98 49 42 40 33 30 44 -28 104 38 25.8% 22.4% 28.9% 26.5%
Developed Australia 8 -1 30 44 29 33 -75 -32 -7 -4 -4 -16 -7 -7 -7 -6 27 -24 -9 1.3% 2.5% 1.4% 0.8%
Asia Japan 73 22 90 264 4 -210 -101 -86 113 -29 18 71 78 48 47 9 34 -17 51 8.2% 8.8% 8.3% 9.4%
South Korea -28 -29 17 22 3 9 13 -50 21 -2 -1 -14 2 5 5 5 4 -4 0 2.4% 2.4% 2.3% 2.0%
Taiwan 10 -41 27 21 12 6 -3 6 13 -2 3 2 5 5 4 5 5 3 4 1.1% 1.2% 1.5% 1.4%
Developing Bangladesh 9 8 15 8 1 -4 4 -13 3 3 8 9 4 4 4 4 6 1 5 0.7% 0.9% 1.0% 1.1%
Asia India 34 22 55 80 25 -56 15 -6 22 48 73 46 44 45 47 50 25 30 46 2.0% 2.9% 4.6% 6.1%
Indonesia 11 25 109 140 35 38 87 33 84 57 -11 109 109 115 120 126 70 50 116 4.5% 7.3% 10.2% 14.0%
Pakistan -1 -1 -34 -6 3 -1 6 6 -3 -12 5 -5 -2 0 0 0 -8 0 -1 0.6% 0.2% 0.3% 0.2%
Philippines 10 -2 12 10 12 -11 -26 24 9 1 14 -2 -2 5 5 5 4 4 2 0.9% 1.0% 1.3% 1.2%
Thailand 8 -1 26 17 3 7 -12 -3 12 21 -10 16 2 2 1 1 11 2 4 1.3% 1.6% 1.8% 1.7%
Vietnam -18 7 3 -1 7 7 -20 4 0 9 8 -1 -1 -1 -1 -1 4 0 -1 1.2% 1.3% 1.4% 1.1%
Eastern Belarus 16 -4 4 -5 2 1 7 -17 -2 11 2 4 4 4 4 5 -1 0 4 0.5% 0.4% 0.4% 0.5%
Europe Czech Republic 6 -1 7 19 -13 -2 3 -21 5 15 11 0 5 8 9 10 2 3 6 1.4% 1.3% 1.6% 1.6%
Poland -15 -38 14 3 4 7 12 -9 6 15 9 5 7 8 1 9 -2 6 6 0.8% 0.7% 1.1% 1.2%
Romania 23 -45 -22 38 -5 6 -19 9 9 15 10 -2 4 6 7 9 -6 5 5 0.9% 0.6% 0.8% 1.0%
Russia 98 -52 92 121 71 32 -114 -194 -26 -2 -39 -6 34 34 23 36 53 -75 24 6.7% 8.5% 5.2% 5.6%
Ukraine -12 -25 -20 12 8 30 -56 -62 -25 8 -2 3 1 1 2 2 1 -27 2 2.0% 1.9% 0.6% 0.6%
Kazakhstan 13 -29 6 12 13 26 -26 -27 -25 1 -3 -4 -2 -2 -1 -1 6 -16 -2 1.1% 1.3% 0.6% 0.4%
Middle East Algeria 10 1 6 7 7 6 6 -7 3 2 -3 4 5 3 2 2 5 0 3 0.5% 0.7% 0.8% 0.8%
& Africa Egypt 39 16 120 11 50 -3 22 46 -125 -92 32 35 -8 2 2 2 39 -24 6 1.9% 3.5% 2.6% 2.5%
Iran 2 17 -35 51 158 -103 -25 4 25 7 -17 27 -11 4 12 12 18 -1 9 0.8% 1.6% 1.7% 1.8%
Morocco 4 -1 3 6 1 0 2 -17 1 2 2 0 1 1 1 1 2 -2 1 0.4% 0.4% 0.3% 0.3%
Nigeria 5 -9 3 -1 4 2 0 -6 -6 -2 1 1 -3 0 0 0 0 -2 -1 0.6% 0.5% 0.4% 0.3%
Saudi Arabia 14 12 16 21 14 14 13 13 15 -39 -8 11 12 11 11 11 15 -1 11 1.1% 1.7% 1.7% 2.0%
South Africa -25 3 33 24 -27 -22 -11 -19 -16 3 -3 -7 0 0 0 0 2 -9 -1 1.5% 1.4% 1.0% 0.8%
Tunisia 3 0 1 4 -1 2 0 -6 0 -1 -1 -3 0 0 1 1 1 -1 0 0.3% 0.4% 0.3% 0.2%
Turkey 32 -90 -3 -39 5 -5 -14 -24 10 -9 -20 -42 -1 -2 -2 -3 -26 -11 -10 3.0% 1.5% 1.0% 0.4%
Latin America Argentina 10 2 12 16 6 -3 -2 28 -62 7 -22 -11 -2 1 1 2 7 -10 -2 0.7% 0.9% 0.5% 0.3%
Brazil 30 -34 86 68 -320 -45 -48 -31 -14 -17 1 4 39 4 4 4 -49 -22 11 4.1% 1.1% 0.0% 0.5%
Mexico 3 -26 9 -21 -2 6 -2 -10 -6 7 3 3 4 4 4 3 -7 -2 3 1.3% 0.9% 0.8% 0.9%
Total ex US & China 691 -552 632 1,011 102 -151 -358 -535 107 106 125 203 350 335 338 358 208 -111 317 100.0% 100.0% 100.0% 100.0%
Western Europe 187 -133 -66 45 -145 46 33 -207 -70 -9 19 -70 -3 -1 5 14 -51 -47 -11 18.3% 14.3% 12.7% 10.4%
North America 132 -122 17 17 136 35 -25 138 147 94 50 36 35 28 26 41 17 81 33 27.8% 26.2% 31.7% 28.6%
Developed Asia 62 -50 163 352 48 -162 -167 -162 140 -37 17 42 77 50 49 13 70 -42 46 13.1% 14.9% 13.5% 13.6%
Developing Asia 54 58 186 248 87 -19 54 45 126 128 86 172 153 169 177 184 112 88 171 11.2% 15.3% 20.5% 25.3%
Eastern Europe 129 -195 81 201 80 100 -194 -321 -60 63 -12 0 53 60 45 70 53 -105 45 13.4% 14.8% 10.3% 10.9%
Middle East & Africa 84 -51 143 85 210 -109 -7 -14 -93 -130 -18 26 -6 20 27 26 55 -53 19 10.1% 11.7% 9.9% 9.3%
Latin America 44 -59 108 63 -315 -41 -52 -14 -82 -3 -17 -4 41 9 8 10 -49 -34 13 6.1% 2.9% 1.4% 1.7%

Global Tobacco 23 May 2019
85
Global Tobacco 23 May 2019
86
Valuation Method and Risk Statement
Risks to our price targets across our coverage could include material changes in: (a) General consumer preferences and/or government regulation pertaining to the consumption of Tobacco products (including taxation, restrictions on sales, the introduction or subsidization of substitute products, etc.); (b) Government regulation with respect to commerce and/or taxation in general; (c) Macroeconomic trends, interest rate, and/or credit environments within any of our companies' key markets; (d) Competitive intensity between Tobacco companies within any of our companies' key markets; (e) Customer (i.e., retailer) or supplier relationships as related to our coverage companies; (f) Commodity cost and/or foreign exchange fluctuations; (g) Our companies' own ability to execute, whether with respect to R&D, sales and marketing, and/or ongoing productivity efforts; (h) Our companies' stance towards M&A (whether related to acquisitions, JVs, divestments, or otherwise), or the prioritization of cash in general (whether related to organic business investment, dividends, share repurchases, etc.). Valuation Method: We utilize a DCF methodology for all names.
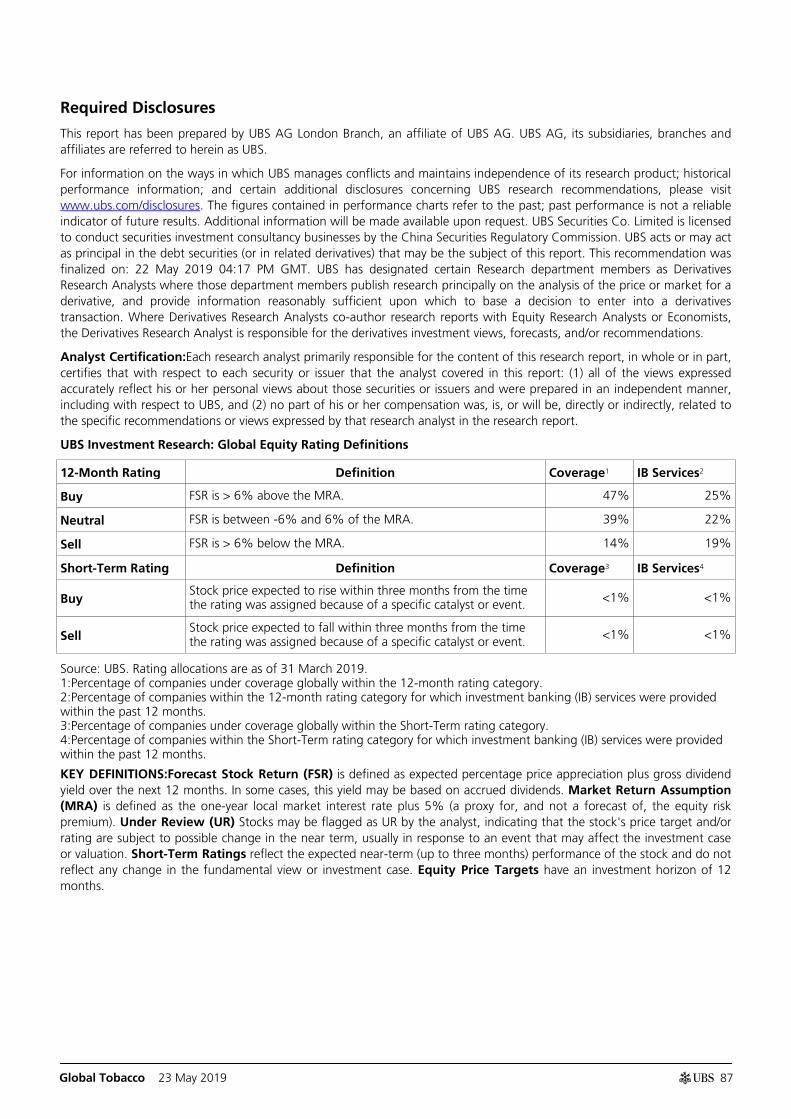
Global Tobacco 23 May 2019
87
Required Disclosures
This report has been prepared by UBS AG London Branch, an affiliate of UBS AG. UBS AG, its subsidiaries, branches and affiliates are referred to herein as UBS.
For information on the ways in which UBS manages conflicts and maintains independence of its research product; historical performance information; and certain additional disclosures concerning UBS research recommendations, please visit www.ubs.com/disclosures. The figures contained in performance charts refer to the past; past performance is not a reliable indicator of future results. Additional information will be made available upon request. UBS Securities Co. Limited is licensed to conduct securities investment consultancy businesses by the China Securities Regulatory Commission. UBS acts or may act as principal in the debt securities (or in related derivatives) that may be the subject of this report. This recommendation was finalized on: 22 May 2019 04:17 PM GMT. UBS has designated certain Research department members as Derivatives Research Analysts where those department members publish research principally on the analysis of the price or market for a derivative, and provide information reasonably sufficient upon which to base a decision to enter into a derivatives transaction. Where Derivatives Research Analysts co-author research reports with Equity Research Analysts or Economists, the Derivatives Research Analyst is responsible for the derivatives investment views, forecasts, and/or recommendations.
Analyst Certification:Each research analyst primarily responsible for the content of this research report, in whole or in part, certifies that with respect to each security or issuer that the analyst covered in this report: (1) all of the views expressed accurately reflect his or her personal views about those securities or issuers and were prepared in an independent manner, including with respect to UBS, and (2) no part of his or her compensation was, is, or will be, directly or indirectly, related to the specific recommendations or views expressed by that research analyst in the research report.
UBS Investment Research: Global Equity Rating Definitions
12-Month Rating Definition Coverage1 IB Services2
Buy FSR is > 6% above the MRA. 47% 25%
Neutral FSR is between -6% and 6% of the MRA. 39% 22%
Sell FSR is > 6% below the MRA. 14% 19%
Short-Term Rating Definition Coverage3 IB Services4
Buy Stock price expected to rise within three months from the time the rating was assigned because of a specific catalyst or event. <1% <1%
Sell Stock price expected to fall within three months from the time the rating was assigned because of a specific catalyst or event. <1% <1%
Source: UBS. Rating allocations are as of 31 March 2019. 1:Percentage of companies under coverage globally within the 12-month rating category. 2:Percentage of companies within the 12-month rating category for which investment banking (IB) services were provided within the past 12 months. 3:Percentage of companies under coverage globally within the Short-Term rating category. 4:Percentage of companies within the Short-Term rating category for which investment banking (IB) services were provided within the past 12 months.
KEY DEFINITIONS:Forecast Stock Return (FSR) is defined as expected percentage price appreciation plus gross dividend yield over the next 12 months. In some cases, this yield may be based on accrued dividends. Market Return Assumption (MRA) is defined as the one-year local market interest rate plus 5% (a proxy for, and not a forecast of, the equity risk premium). Under Review (UR) Stocks may be flagged as UR by the analyst, indicating that the stock's price target and/or rating are subject to possible change in the near term, usually in response to an event that may affect the investment case or valuation. Short-Term Ratings reflect the expected near-term (up to three months) performance of the stock and do not reflect any change in the fundamental view or investment case. Equity Price Targets have an investment horizon of 12 months.
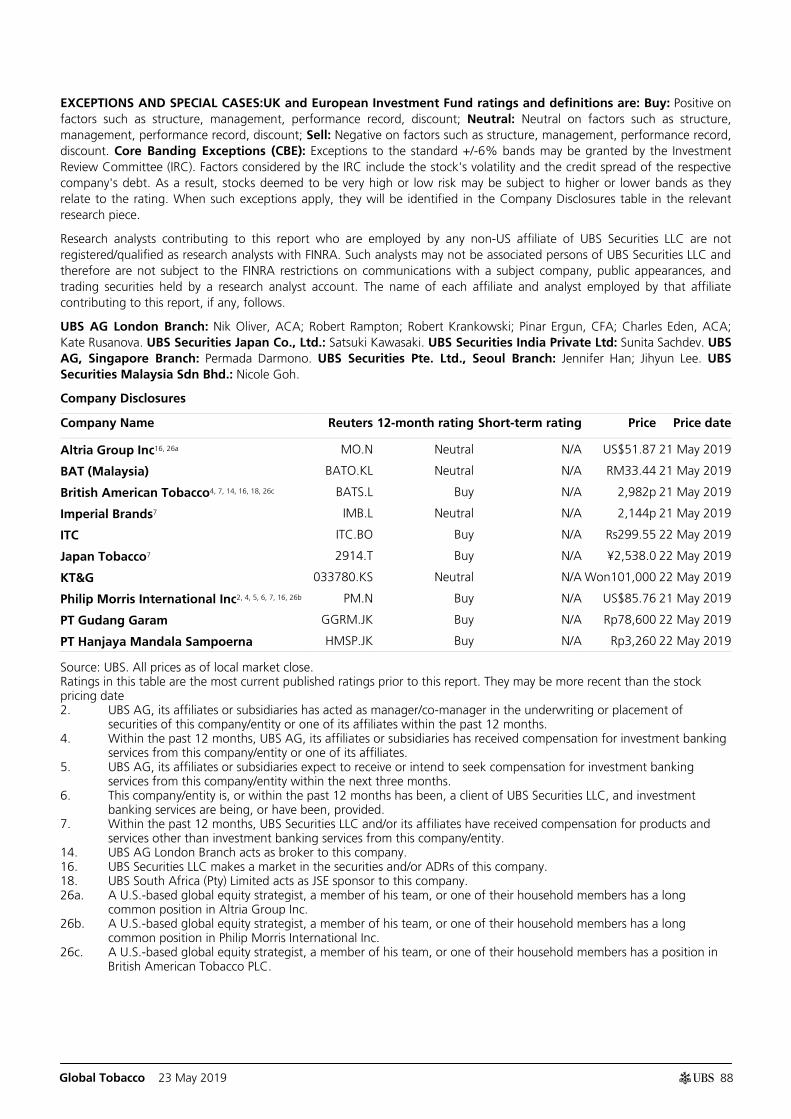
Global Tobacco 23 May 2019
88
EXCEPTIONS AND SPECIAL CASES:UK and European Investment Fund ratings and definitions are: Buy: Positive on factors such as structure, management, performance record, discount; Neutral: Neutral on factors such as structure, management, performance record, discount; Sell: Negative on factors such as structure, management, performance record, discount. Core Banding Exceptions (CBE): Exceptions to the standard +/-6% bands may be granted by the Investment Review Committee (IRC). Factors considered by the IRC include the stock's volatility and the credit spread of the respective company's debt. As a result, stocks deemed to be very high or low risk may be subject to higher or lower bands as they relate to the rating. When such exceptions apply, they will be identified in the Company Disclosures table in the relevant research piece.
Research analysts contributing to this report who are employed by any non-US affiliate of UBS Securities LLC are not registered/qualified as research analysts with FINRA. Such analysts may not be associated persons of UBS Securities LLC and therefore are not subject to the FINRA restrictions on communications with a subject company, public appearances, and trading securities held by a research analyst account. The name of each affiliate and analyst employed by that affiliate contributing to this report, if any, follows.
UBS AG London Branch: Nik Oliver, ACA; Robert Rampton; Robert Krankowski; Pinar Ergun, CFA; Charles Eden, ACA; Kate Rusanova. UBS Securities Japan Co., Ltd.: Satsuki Kawasaki. UBS Securities India Private Ltd: Sunita Sachdev. UBS AG, Singapore Branch: Permada Darmono. UBS Securities Pte. Ltd., Seoul Branch: Jennifer Han; Jihyun Lee. UBS Securities Malaysia Sdn Bhd.: Nicole Goh.
Company Disclosures
Company Name Reuters 12-month rating Short-term rating Price Price date
Altria Group Inc16, 26a MO.N Neutral N/A US$51.87 21 May 2019
BAT (Malaysia) BATO.KL Neutral N/A RM33.44 21 May 2019
British American Tobacco4, 7, 14, 16, 18, 26c BATS.L Buy N/A 2,982p 21 May 2019
Imperial Brands7 IMB.L Neutral N/A 2,144p 21 May 2019
ITC ITC.BO Buy N/A Rs299.55 22 May 2019
Japan Tobacco7 2914.T Buy N/A ¥2,538.0 22 May 2019
KT&G 033780.KS Neutral N/A Won101,000 22 May 2019
Philip Morris International Inc2, 4, 5, 6, 7, 16, 26b PM.N Buy N/A US$85.76 21 May 2019
PT Gudang Garam GGRM.JK Buy N/A Rp78,600 22 May 2019
PT Hanjaya Mandala Sampoerna HMSP.JK Buy N/A Rp3,260 22 May 2019
Source: UBS. All prices as of local market close. Ratings in this table are the most current published ratings prior to this report. They may be more recent than the stock pricing date 2. UBS AG, its affiliates or subsidiaries has acted as manager/co-manager in the underwriting or placement of
securities of this company/entity or one of its affiliates within the past 12 months. 4. Within the past 12 months, UBS AG, its affiliates or subsidiaries has received compensation for investment banking
services from this company/entity or one of its affiliates. 5. UBS AG, its affiliates or subsidiaries expect to receive or intend to seek compensation for investment banking
services from this company/entity within the next three months. 6. This company/entity is, or within the past 12 months has been, a client of UBS Securities LLC, and investment
banking services are being, or have been, provided. 7. Within the past 12 months, UBS Securities LLC and/or its affiliates have received compensation for products and
services other than investment banking services from this company/entity. 14. UBS AG London Branch acts as broker to this company. 16. UBS Securities LLC makes a market in the securities and/or ADRs of this company. 18. UBS South Africa (Pty) Limited acts as JSE sponsor to this company. 26a. A U.S.-based global equity strategist, a member of his team, or one of their household members has a long
common position in Altria Group Inc. 26b. A U.S.-based global equity strategist, a member of his team, or one of their household members has a long
common position in Philip Morris International Inc. 26c. A U.S.-based global equity strategist, a member of his team, or one of their household members has a position in
British American Tobacco PLC.
Global Tobacco 23 May 2019
89
Unless otherwise indicated, please refer to the Valuation and Risk sections within the body of this report. For a complete set of disclosure statements associated with the companies discussed in this report, including information on valuation and risk, please contact UBS Securities LLC, 1285 Avenue of Americas, New York, NY 10019, USA, Attention: Investment Research.
Company profile and fee and risk statement under the Japanese Financial Instruments & Exchange Law
Company Name etc: UBS Securities Japan Co., Ltd., Financial Instruments & Exchange Firm, Kanto Local Financial Bureau (Kinsho) No.2633
Associated Memberships: Japan Securities Dealers' Association, the Financial Futures Association of Japan, and Type II Financial Instruments Firms Association and Japan Investment Advisers Association
UBS Securities Japan Co., Ltd. will receive a brokerage fee (excluding tax) from clients of Wealth Management calculated by multiplying the executed amount by 1.00% at maximum (excluding tax) for trading domestic stocks; and by 1.25% at maximum (excluding tax) for trading foreign stocks. However, in the case of trading other than the auction market trading such as OTC trading and Tostnet trading, a higher fee may be charged based on an individual agreement with a client. The method of fee calculation is not explained here because fee varies depending on the market condition and the content of trading, etc. From the clients of the Investment Bank, UBS Securities Japan Co., Ltd. will receive a brokerage fee based on an individual contract and no standard upper limit or calculating method. For the trading of domestic stocks, consumption tax is added to the fee. For the trading of foreign stock, fee on the foreign stock exchange or foreign tax may be charged in addition to the domestic fee and tax. Those amounts may vary depending on the jurisdiction. There is a risk that a loss may occur due to a change in the price of the stock in the case of trading stocks, and that a loss may occur due to the exchange rate in the case of trading foreign stocks. There is a risk that a loss may occur due to a change in the price or performance of the properties in the portfolio in the case of trading REITs.
UBS Securities Japan Co., Ltd. will only receive the purchasing amounts for trading unlisted bonds (JGBs, municipals, government guaranteed bonds, corporate bonds) when UBS Securities Japan Co., Ltd. is the counterparty. There is a risk that a loss may occur due to a change in the price of the bond caused by the fluctuations in the interest rates, and that a loss may occur due to the exchange rate in the case of trading foreign bonds.
Global Tobacco 23 May 2019
90
Global Disclaimer This document has been prepared by UBS AG London Branch, an affiliate of UBS AG. UBS AG, its subsidiaries, branches and affiliates are referred to herein as UBS.
This Document is provided solely to recipients who are expressly authorized by UBS to receive it. If you are not so authorized you must immediately destroy the Document.
Global Research is provided to our clients through UBS Neo, and in certain instances, UBS.com and any other system or distribution method specifically identified in one or more communications distributed through UBS Neo or UBS.com (each a system) as an approved means for distributing Global Research. It may also be made available through third party vendors and distributed by UBS and/or third parties via e-mail or alternative electronic means. The level and types of services provided by Global Research to a client may vary depending upon various factors such as a client's individual preferences as to the frequency and manner of receiving communications, a client's risk profile and investment focus and perspective (e.g., market wide, sector specific, long-term, short-term, etc.), the size and scope of the overall client relationship with UBS and legal and regulatory constraints.
All Global Research is available on UBS Neo. Please contact your UBS sales representative if you wish to discuss your access to UBS Neo.
When you receive Global Research through a System, your access and/or use of such Global Research is subject to this Global Research Disclaimer and to the UBS Neo Platform Use Agreement (the "Neo Terms") together with any other relevant terms of use governing the applicable System.
When you receive Global Research via a third party vendor, e-mail or other electronic means, you agree that use shall be subject to this Global Research Disclaimer, the Neo Terms and where applicable the UBS Investment Bank terms of business (https://www.ubs.com/global/en/investment-bank/regulatory.html) and to UBS's Terms of Use/Disclaimer (http://www.ubs.com/global/en/legalinfo2/disclaimer.html). In addition, you consent to UBS processing your personal data and using cookies in accordance with our Privacy Statement (http://www.ubs.com/global/en/legalinfo2/privacy.html) and cookie notice (http://www.ubs.com/global/en/homepage/cookies/cookie-management.html).
If you receive Global Research, whether through a System or by any other means, you agree that you shall not copy, revise, amend, create a derivative work, provide to any third party, or in any way commercially exploit any UBS research provided via Global Research or otherwise, and that you shall not extract data from any research or estimates provided to you via Global Research or otherwise, without the prior written consent of UBS.
This document is for distribution only as may be permitted by law. It is not directed to, or intended for distribution to or use by, any person or entity who is a citizen or resident of or located in any locality, state, country or other jurisdiction where such distribution, publication, availability or use would be contrary to law or regulation or would subject UBS to any registration or licensing requirement within such jurisdiction.
This document is a general communication and is educational in nature; it is not an advertisement nor is it a solicitation or an offer to buy or sell any financial instruments or to participate in any particular trading strategy. Nothing in this document constitutes a representation that any investment strategy or recommendation is suitable or appropriate to an investor’s individual circumstances or otherwise constitutes a personal recommendation. By providing this document, none of UBS or its representatives has any responsibility or authority to provide or have provided investment advice in a fiduciary capacity or otherwise. Investments involve risks, and investors should exercise prudence and their own judgment in making their investment decisions. None of UBS or its representatives is suggesting that the recipient or any other person take a specific course of action or any action at all. By receiving this document, the recipient acknowledges and agrees with the intended purpose described above and further disclaims any expectation or belief that the information constitutes investment advice to the recipient or otherwise purports to meet the investment objectives of the recipient. The financial instruments described in the document may not be eligible for sale in all jurisdictions or to certain categories of investors.
Options, structured derivative products and futures (including OTC derivatives) are not suitable for all investors. Trading in these instruments is considered risky and may be appropriate only for sophisticated investors. Prior to buying or selling an option, and for the complete risks relating to options, you must receive a copy of "The Characteristics and Risks of Standardized Options." You may read the document at http://www.theocc.com/publications/risks/riskchap1.jsp or ask your salesperson for a copy. Various theoretical explanations of the risks associated with these instruments have been published. Supporting documentation for any claims, comparisons, recommendations, statistics or other technical data will be supplied upon request. Past performance is not necessarily indicative of future results. Transaction costs may be significant in option strategies calling for multiple purchases and sales of options, such as spreads and straddles. Because of the importance of tax considerations to many options transactions, the investor considering options should consult with his/her tax advisor as to how taxes affect the outcome of contemplated options transactions.
Mortgage and asset-backed securities may involve a high degree of risk and may be highly volatile in response to fluctuations in interest rates or other market conditions. Foreign currency rates of exchange may adversely affect the value, price or income of any security or related instrument referred to in the document. For investment advice, trade execution or other enquiries, clients should contact their local sales representative.
The value of any investment or income may go down as well as up, and investors may not get back the full (or any) amount invested. Past performance is not necessarily a guide to future performance. Neither UBS nor any of its directors, employees or agents accepts any liability for any loss (including investment loss) or damage arising out of the use of all or any of the Information.
Prior to making any investment or financial decisions, any recipient of this document or the information should take steps to understand the risk and return of the investment and seek individualized advice from his or her personal financial, legal, tax and other professional advisors that takes into account all the particular facts and circumstances of his or her investment objectives.
Any prices stated in this document are for information purposes only and do not represent valuations for individual securities or other financial instruments. There is no representation that any transaction can or could have been effected at those prices, and any prices do not necessarily reflect UBS's internal books and records or theoretical model-based valuations and may be based on certain assumptions. Different assumptions by UBS or any other source may yield substantially different results.
No representation or warranty, either expressed or implied, is provided in relation to the accuracy, completeness or reliability of the information contained in any materials to which this document relates (the "Information"), except with respect to Information concerning UBS. The Information is not intended to be a complete statement or summary of the securities, markets or developments referred to in the document. UBS does not undertake to update or keep current the Information. Any opinions expressed in this document may change without notice and may differ or be contrary to opinions expressed by other business areas or groups, personnel or other representative of UBS. Any statements contained in this report attributed to a third party represent UBS's interpretation of the data, information and/or opinions provided by that third party either publicly or through a subscription service, and such use and interpretation have not been reviewed by the third party. In no circumstances may this document or any of the Information (including any forecast, value, index or other calculated amount ("Values")) be used for any of the following purposes:
(i) valuation or accounting purposes;
(ii) to determine the amounts due or payable, the price or the value of any financial instrument or financial contract; or
(iii) to measure the performance of any financial instrument including, without limitation, for the purpose of tracking the return or performance of any Value or of defining the asset allocation of portfolio or of computing performance fees.
By receiving this document and the Information you will be deemed to represent and warrant to UBS that you will not use this document or any of the Information for any of the above purposes or otherwise rely upon this document or any of the Information.
UBS has policies and procedures, which include, without limitation, independence policies and permanent information barriers, that are intended, and upon which UBS relies, to manage potential conflicts of interest and control the flow of information within divisions of UBS and among its subsidiaries, branches and affiliates. For further information on the ways in which UBS manages conflicts and maintains independence of its research products, historical performance information and certain additional disclosures concerning UBS research recommendations, please visit www.ubs.com/disclosures.
Research will initiate, update and cease coverage solely at the discretion of UBS Research Management, which will also have sole discretion on the timing and frequency of any published research product. The analysis contained in this document is based on numerous assumptions. All material information in relation to published research reports, such as valuation methodology, risk statements, underlying assumptions (including sensitivity analysis of those assumptions), ratings history etc. as required by the Market Abuse Regulation, can be found on UBS Neo. Different assumptions could result in materially different results.
The analyst(s) responsible for the preparation of this document may interact with trading desk personnel, sales personnel and other parties for the purpose of gathering, applying and interpreting market information. UBS relies on information barriers to control the flow of information contained in one or more areas within UBS into other
Global Tobacco 23 May 2019
91
areas, units, groups or affiliates of UBS. The compensation of the analyst who prepared this document is determined exclusively by research management and senior management (not including investment banking). Analyst compensation is not based on investment banking revenues; however, compensation may relate to the revenues of UBS and/or its divisions as a whole, of which investment banking, sales and trading are a part, and UBS's subsidiaries, branches and affiliates as a whole.
For financial instruments admitted to trading on an EU regulated market: UBS AG, its affiliates or subsidiaries (excluding UBS Securities LLC) acts as a market maker or liquidity provider (in accordance with the interpretation of these terms under English law or, if not carried out by UBS in the UK the law of the relevant jurisdiction in which UBS determines it carries out the activity) in the financial instruments of the issuer save that where the activity of liquidity provider is carried out in accordance with the definition given to it by the laws and regulations of any other EU jurisdictions, such information is separately disclosed in this document. For financial instruments admitted to trading on a non-EU regulated market: UBS may act as a market maker save that where this activity is carried out in the US in accordance with the definition given to it by the relevant laws and regulations, such activity will be specifically disclosed in this document. UBS may have issued a warrant the value of which is based on one or more of the financial instruments referred to in the document. UBS and its affiliates and employees may have long or short positions, trade as principal and buy and sell in instruments or derivatives identified herein; such transactions or positions may be inconsistent with the opinions expressed in this document.
Within the past 12 months UBS AG, its affiliates or subsidiaries may have received or provided investment services and activities or ancillary services as per MiFID II which may have given rise to a payment or promise of a payment in relation to these services from or to this company.
Where Global Research refers to "UBS Evidence Lab Inside" or has made use of data provided by UBS Evidence Lab you understand that UBS Evidence Lab is a separate department to Global Research and that UBS Evidence Lab does not provide research, investment recommendations or advice.
United Kingdom: This material is distributed by UBS AG, London Branch to persons who are eligible counterparties or professional clients. UBS AG, London Branch is authorised by the Prudential Regulation Authority and subject to regulation by the Financial Conduct Authority and limited regulation by the Prudential Regulation Authority. Europe: Except as otherwise specified herein, these materials are distributed by UBS Europe SE, a subsidiary of UBS AG, to persons who are eligible counterparties or professional clients (as detailed in the Bundesanstalt fur Finanzdienstleistungsaufsicht (BaFin)Rules and according to MIFID) and are only available to such persons. The information does not apply to, and should not be relied upon by, retail clients. UBS Europe SE is authorised by the [European Central Bank (ECB)] and regulated by the BaFin and the ECB. France: Prepared by UBS Europe SE and distributed by UBS Europe SE and UBS Securities France S.A. UBS Securities France S.A. is regulated by the ACPR (Autorité de Contrôle Prudentiel et de Résolution) and the Autorité des Marchés Financiers (AMF). Where an analyst of UBS Securities France S.A. has contributed to this document, the document is also deemed to have been prepared by UBS Securities France S.A. Germany, Luxembourg, the Netherlands, Belgium and Ireland: Prepared by UBS AG, London Branch and distributed by UBS AG, London Branch and UBS Europe SE. Spain: Prepared by UBS Europe SE and distributed by UBS Europe SE and UBS Securities España SV, SA. UBS Securities España SV, SA is regulated by the Comisión Nacional del Mercado de Valores (CNMV). Turkey: Distributed by UBS AG, London Branch. No information in this document is provided for the purpose of offering, marketing and sale by any means of any capital market instruments and services in the Republic of Turkey. Therefore, this document may not be considered as an offer made or to be made to residents of the Republic of Turkey. UBS AG, London Branch is not licensed by the Turkish Capital Market Board under the provisions of the Capital Market Law (Law No. 6362). Accordingly, neither this document nor any other offering material related to the instruments/services may be utilized in connection with providing any capital market services to persons within the Republic of Turkey without the prior approval of the Capital Market Board. However, according to article 15 (d) (ii) of the Decree No. 32, there is no restriction on the purchase or sale of the securities abroad by residents of the Republic of Turkey. Poland: Distributed by UBS Europe SE (spolka z ograniczona odpowiedzialnoscia) Oddzial w Polsce regulated by the Polish Financial Supervision Authority. Where an analyst of UBS Europe SE (spolka z ograniczona odpowiedzialnoscia) Oddzial w Polsce has contributed to this document, the document is also deemed to have been prepared by UBS Europe SE (spolka z ograniczona odpowiedzialnoscia) Oddzial w Polsce. Russia: Prepared and distributed by UBS Bank (OOO). Switzerland: Distributed by UBS AG to persons who are institutional investors only. UBS AG is regulated by the Swiss Financial Market Supervisory Authority (FINMA). Italy: Prepared by UBS Europe SE and distributed by UBS Europe SE and UBS Europe SE, Italy Branch. Where an analyst of UBS Europe SE, Italy Branch has contributed to this document, the document is also deemed to have been prepared by UBS Europe SE, Italy Branch.South Africa: Distributed by UBS South Africa (Pty) Limited (Registration No. 1995/011140/07), an authorised user of the JSE and an authorised Financial Services Provider (FSP 7328). Israel: This material is distributed by UBS AG, London Branch. UBS Securities Israel Ltd is a licensed Investment Marketer that is supervised by the Israel Securities Authority (ISA). UBS AG, London Branch and its affiliates incorporated outside Israel are not licensed under the Israeli Advisory Law. UBS AG, London Branch is not covered by insurance as required from a licensee under the Israeli Advisory Law. UBS may engage among others in issuance of Financial Assets or in distribution of Financial Assets of other issuers for fees or other benefits. UBS AG, London Branch and its affiliates may prefer various Financial Assets to which they have or may have Affiliation (as such term is defined under the Israeli Advisory Law). Nothing in this Material should be considered as investment advice under the Israeli Advisory Law. This Material is being issued only to and/or is directed only at persons who are Eligible Clients within the meaning of the Israeli Advisory Law, and this material must not be relied on or acted upon by any other persons. Saudi Arabia: This document has been issued by UBS AG (and/or any of its subsidiaries, branches or affiliates), a public company limited by shares, incorporated in Switzerland with its registered offices at Aeschenvorstadt 1, CH-4051 Basel and Bahnhofstrasse 45, CH-8001 Zurich. This publication has been approved by UBS Saudi Arabia (a subsidiary of UBS AG), a Saudi closed joint stock company incorporated in the Kingdom of Saudi Arabia under commercial register number 1010257812 having its registered office at Tatweer Towers, P.O. Box 75724, Riyadh 11588, Kingdom of Saudi Arabia. UBS Saudi Arabia is authorized and regulated by the Capital Market Authority to conduct securities business under license number 08113-37. UAE / Dubai: The information distributed by UBS AG Dubai Branch is only intended for Professional Clients and/or Market Counterparties, as classified under the DFSA rulebook. No other person should act upon this material/communication. The information is not for further distribution within the United Arab Emirates. UBS AG Dubai Branch is regulated by the DFSA in the DIFC. UBS is not licensed to provide banking services in the UAE by the Central Bank of the UAE, nor is it licensed by the UAE Securities and Commodities Authority. United States: Distributed to US persons by either UBS Securities LLC or by UBS Financial Services Inc., subsidiaries of UBS AG; or by a group, subsidiary or affiliate of UBS AG that is not registered as a US broker-dealer (a ‘non-US affiliate’) to major US institutional investors only. UBS Securities LLC or UBS Financial Services Inc. accepts responsibility for the content of a document prepared by another non-US affiliate when distributed to US persons by UBS Securities LLC or UBS Financial Services Inc. All transactions by a US person in the securities mentioned in this document must be effected through UBS Securities LLC or UBS Financial Services Inc., and not through a non-US affiliate. UBS Securities LLC is not acting as a municipal advisor to any municipal entity or obligated person within the meaning of Section 15B of the Securities Exchange Act (the "Municipal Advisor Rule"), and the opinions or views contained herein are not intended to be, and do not constitute, advice within the meaning of the Municipal Advisor Rule. Canada: Distributed by UBS Securities Canada Inc., a registered investment dealer in Canada and a Member-Canadian Investor Protection Fund, or by another affiliate of UBS AG that is registered to conduct business in Canada or is otherwise exempt from registration. Mexico: This report has been distributed and prepared by UBS Casa de Bolsa, S.A. de C.V., UBS Grupo Financiero, an entity that is part of UBS Grupo Financiero, S.A. de C.V. and is a subsidiary of UBS AG. This document is intended for distribution to institutional or sophisticated investors only. Research reports only reflect the views of the analysts responsible for the reports. Analysts do not receive any compensation from persons or entities different from UBS Casa de Bolsa, S.A. de C.V., UBS Grupo Financiero, or different from entities belonging to the same financial group or business group of such. For Spanish translations of applicable disclosures, please go to www.ubs.com/disclosures. Brazil: Except as otherwise specified herein, this material is prepared by UBS Brasil CCTVM S.A. to persons who are eligible investors residing in Brazil, which are considered to be Investidores Profissionais, as designated by the applicable regulation, mainly the CVM Instruction No. 539 from the 13th of November 2013 (determines the duty to verify the suitability of products, services and transactions with regards to the client´s profile). Hong Kong: Distributed by UBS Securities Asia Limited and/or UBS AG, Hong Kong Branch. Please contact local licensed/registered representatives of UBS Securities Asia Limited and/or UBS AG, Hong Kong Branch in respect of any matters arising from, or in connection with, the analysis or document. Singapore: Distributed by UBS Securities Pte. Ltd. [MCI (P) 009/09/2018 and Co. Reg. No.: 198500648C] or UBS AG, Singapore Branch. Please contact UBS Securities Pte. Ltd., an exempt financial adviser under the Singapore Financial Advisers Act (Cap. 110); or UBS AG, Singapore Branch, an exempt financial adviser under the Singapore Financial Advisers Act (Cap. 110) and a wholesale bank licensed under the Singapore Banking Act (Cap. 19) regulated by the Monetary Authority of Singapore, in respect of any matters arising from, or in connection with, the analysis or document. The recipients of this document represent and warrant that they are accredited and institutional investors as defined in the Securities and Futures Act (Cap. 289). Japan: Distributed by UBS Securities Japan Co., Ltd. to professional investors (except as otherwise permitted). Where this document has been prepared by UBS Securities Japan Co., Ltd., UBS Securities Japan Co., Ltd. is the author, publisher and distributor of the document. Distributed by UBS AG, Tokyo Branch to Professional Investors (except as otherwise permitted) in relation to foreign exchange and other banking businesses when relevant. Australia: Clients of UBS AG: Distributed by UBS AG (ABN 47 088 129 613 and holder of Australian Financial Services License No. 231087). Clients of UBS Securities Australia Ltd: Distributed by UBS Securities Australia Ltd (ABN 62 008 586 481 and holder of Australian Financial Services License No. 231098). This Document contains general information and/or general advice only and does not constitute personal financial product advice. As such, the Information in this document has been prepared without taking into account any investor’s objectives, financial situation or needs, and investors should, before acting on the Information, consider the appropriateness of the Information, having regard to their objectives, financial situation and needs. If the Information contained in this document relates to the acquisition, or potential acquisition of a particular financial product by a ‘Retail’ client as defined by section 761G of the Corporations Act 2001 where a Product Disclosure Statement would be required, the retail client should obtain and consider the Product Disclosure Statement relating to the product before making any decision about whether to acquire the product. The UBS Securities Australia Limited Financial Services Guide is available at: www.ubs.com/ecs-research-fsg. New Zealand: Distributed by UBS New Zealand Ltd. UBS New Zealand Ltd is not a registered bank in New Zealand. You are being provided with this UBS publication or material because you have indicated to UBS that you are a “wholesale client” within the meaning of section 5C of the Financial Advisers Act 2008 of New Zealand (Permitted Client). This publication or material is not intended for clients who are not Permitted Clients (non-permitted Clients). If you are a non-permitted Client you must not rely on this publication or material. If despite this
Global Tobacco 23 May 2019
92
warning you nevertheless rely on this publication or material, you hereby (i) acknowledge that you may not rely on the content of this publication or material and that any recommendations or opinions in such this publication or material are not made or provided to you, and (ii) to the maximum extent permitted by law (a) indemnify UBS and its associates or related entities (and their respective Directors, officers, agents and Advisors) (each a ‘Relevant Person’) for any loss, damage, liability or claim any of them may incur or suffer as a result of, or in connection with, your unauthorised reliance on this publication or material and (b) waive any rights or remedies you may have against any Relevant Person for (or in respect of) any loss, damage, liability or claim you may incur or suffer as a result of, or in connection with, your unauthorised reliance on this publication or material. Korea: Distributed in Korea by UBS Securities Pte. Ltd., Seoul Branch. This document may have been edited or contributed to from time to time by affiliates of UBS Securities Pte. Ltd., Seoul Branch. This material is intended for professional/institutional clients only and not for distribution to any retail clients. Malaysia: This material is authorized to be distributed in Malaysia by UBS Securities Malaysia Sdn. Bhd (Capital Markets Services License No.: CMSL/A0063/2007). This material is intended for professional/institutional clients only and not for distribution to any retail clients. India: Distributed by UBS Securities India Private Ltd. (Corporate Identity Number U67120MH1996PTC097299) 2/F, 2 North Avenue, Maker Maxity, Bandra Kurla Complex, Bandra (East), Mumbai (India) 400051. Phone: +912261556000. It provides brokerage services bearing SEBI Registration Numbers: NSE (Capital Market Segment): INB230951431, NSE (F&O Segment) INF230951431, NSE (Currency Derivatives Segment) INE230951431, BSE (Capital Market Segment) INB010951437; merchant banking services bearing SEBI Registration Number: INM000010809 and Research Analyst services bearing SEBI Registration Number: INH000001204. UBS AG, its affiliates or subsidiaries may have debt holdings or positions in the subject Indian company/companies. Within the past 12 months, UBS AG, its affiliates or subsidiaries may have received compensation for non-investment banking securities-related services and/or non-securities services from the subject Indian company/companies. The subject company/companies may have been a client/clients of UBS AG, its affiliates or subsidiaries during the 12 months preceding the date of distribution of the research report with respect to investment banking and/or non-investment banking securities-related services and/or non-securities services. With regard to information on associates, please refer to the Annual Report at: http://www.ubs.com/global/en/about_ubs/investor_relations/annualreporting.htmlTaiwan: Distributed by UBS Securities Pte. Ltd., Taipei Branch which is regulated by the Taiwan Securities and Futures Bureau. Indonesia: This report is being distributed by PT UBS Sekuritas Indonesia and is delivered by its licensed employee(s), including marketing/sales person, to its client. PT UBS Sekuritas Indonesia, having its registered office at Wisma GKBI, 22nd floor, JL. Jend. Sudirman, kav.28, Jakarta 10210, Indonesia, is a subsidiary company of UBS AG and licensed under Capital Market Law no. 8 year 1995, a holder of broker-dealer and underwriter licenses issued by the Capital Market and Financial Institution Supervisory Agency (now Otoritas Jasa Keuangan/OJK). PT UBS Sekuritas Indonesia is also a member of Indonesia Stock Exchange and supervised by Otoritas Jasa Keuangan (OJK). Neither this report nor any copy hereof may be distributed in Indonesia or to any Indonesian citizens except in compliance with applicable Indonesian capital market laws and regulations. This report is not an offer of securities in Indonesia and may not be distributed within the territory of the Republic of Indonesia or to Indonesian citizens in circumstance which constitutes an offering within the meaning of Indonesian capital market laws and regulations.
The disclosures contained in research documents produced by UBS AG, London Branch or UBS Europe SE shall be governed by and construed in accordance with English law.
UBS specifically prohibits the redistribution of this document in whole or in part without the written permission of UBS and in any event UBS accepts no liability whatsoever for any redistribution of this document or its contents or the actions of third parties in this respect. Images may depict objects or elements that are protected by third party copyright, trademarks and other intellectual property rights. © UBS 2019. The key symbol and UBS are among the registered and unregistered trademarks of UBS. All rights reserved.


![[EGYPT TII – 2019] [0] - Global Tobacco Index](https://static.fdokumen.com/doc/165x107/6319f6d81e5d335f8d0b611d/egypt-tii-2019-0-global-tobacco-index.jpg)