Scaling metabolism from individuals to reef-fish communities at broad spatial scales
10
LETTER Scaling metabolism from individuals to reef-fish communities at broad spatial scales D. R. Barneche, 1 M. Kulbicki, 2,3 S. R. Floeter, 4 A. M. Friedlander, 5 J. Maina 6 and A. P. Allen 1 Abstract Fishes contribute substantially to energy and nutrient fluxes in reef ecosystems, but quantifying these roles is challenging. Here, we do so by synthesising a large compilation of fish metabolic- rate data with a comprehensive database on reef-fish community abundance and biomass. Indi- vidual-level analyses support predictions of Metabolic Theory after accounting for significant family-level variation, and indicate that some tropical reef fishes may already be experiencing thermal regimes at or near their temperature optima. Community-level analyses indicate that total estimated respiratory fluxes of reef-fish communities increase on average ~2-fold from 22 to 28 °C. Comparisons of estimated fluxes among trophic groups highlight striking differences in resource use by communities in different regions, perhaps partly reflecting distinct evolution- ary histories, and support the hypothesis that piscivores receive substantial energy subsidies from outside reefs. Our study demonstrates one approach to synthesising individual- and community-level data to establish broad-scale trends in contributions of biota to ecosystem dynamics. Keywords Allometry, climate change, ecosystem function, coral reef, metabolic theory of ecology, food web, acclimation. Ecology Letters (2014) INTRODUCTION Reef fishes are a diverse group of vertebrates, comprising > 6000 species (Parravicini et al. 2013). They play key roles in the flow of energy and nutrients through many reef ecosys- tems (Polovina 1984; Arias-Gonz alez et al. 1997; Bozec et al. 2004), but quantifying these roles, and how they may be affected by future climate change, remains an important research challenge (Wilson et al. 2010). An essential step in meeting this challenge entails characterising the trophic struc- tures and energy fluxes of reef-fish communities, and how they vary with broad-scale gradients in key variables such as tem- perature and productivity. Metabolic rate is a fundamental determinant of an organ- ism’s contribution to energy and nutrient flux in an ecosys- tem (Brown et al. 2004; Allen et al. 2005). The metabolic rate per unit body mass (i.e. mass-specific rate) generally declines with body mass, but increases with temperature (Gillooly et al. 2001; Brown et al. 2004). Consequently, given that the energy flux of a community is equal to the sum of the individual metabolic rates (Allen et al. 2005), changes in temperature, size structure and/or standing bio- mass of a given community may affect its energetics and resource use, and hence its contribution to ecosystem struc- ture and function (Sandin et al. 2008; Mora et al. 2011; McDole et al. 2012). Conversely, communities that are dis- tinct with respect to these variables may be energetically similar (Fig. 1). The Metabolic Theory of Ecology (MTE; Brown et al. 2004) yields predictions for how community abundance, biomass and energy flux should change with size structure, temperature and ecosystem productivity (Allen et al. 2005; Yvon-Durocher & Allen 2012; Trebilco et al. 2013), but there have been few attempts to test such predic- tions (but see Lopez-Urrutia et al. 2006; O’Connor et al. 2009; McDole et al. 2012), particularly at broad spatial scales. Here, we use MTE as a framework to synthesise individ- ual- and community-level data and analyses (Fig. 1) to esti- mate energy fluxes and trophic structures of reef-fish communities and how they change along broad gradients of temperature and productivity. Our approach builds on other recent studies that use MTE to quantify the energetics of marine communities and ecosystems (Lopez-Urrutia et al. 2006; O’Connor et al. 2009; McDole et al. 2012), and a much larger body of earlier work that yielded predictions on ecosystem dynamics by summing metabolic rates of individu- 1 Department of Biological Sciences, Macquarie University, 2109, Sydney, NSW, Australia 2 IRD (Institut de Recherche pour le D eveloppement), UR-CoR eUs, Laboratoire Arago, BP 44, 66651,Banyuls/mer, France 3 CESAB-FRB, Immeuble Henri Poincar e, Domaine du Petit Arbois, 13857, Aix-en-Provence Cedex 3, France 4 Departamento de Ecologia e Zoologia, Universidade Federal de Santa Catari- na, 88010-970, Florian opolis, Santa Catarina, Brazil 5 Fisheries Ecology Research Lab, Department of Biology, University of Hawaii, 96822, Honolulu, Hawaii, USA 6 ARC Centre of Excellence for Environmental Decisions (CEED), The University of Queensland, 4072, Brisbane, Qld, Australia *Correspondence: E-mail: [email protected] © 2014 John Wiley & Sons Ltd/CNRS Ecology Letters, (2014) doi: 10.1111/ele.12309
Transcript of Scaling metabolism from individuals to reef-fish communities at broad spatial scales
LETTER Scaling metabolism from individuals to reef-fish communities
at broad spatial scales
D. R. Barneche,1 M. Kulbicki,2,3
S. R. Floeter,4 A. M. Friedlander,5
J. Maina6 and A. P. Allen1
Abstract
Fishes contribute substantially to energy and nutrient fluxes in reef ecosystems, but quantifyingthese roles is challenging. Here, we do so by synthesising a large compilation of fish metabolic-rate data with a comprehensive database on reef-fish community abundance and biomass. Indi-vidual-level analyses support predictions of Metabolic Theory after accounting for significantfamily-level variation, and indicate that some tropical reef fishes may already be experiencingthermal regimes at or near their temperature optima. Community-level analyses indicate thattotal estimated respiratory fluxes of reef-fish communities increase on average ~2-fold from 22to 28 °C. Comparisons of estimated fluxes among trophic groups highlight striking differencesin resource use by communities in different regions, perhaps partly reflecting distinct evolution-ary histories, and support the hypothesis that piscivores receive substantial energy subsidiesfrom outside reefs. Our study demonstrates one approach to synthesising individual- andcommunity-level data to establish broad-scale trends in contributions of biota to ecosystemdynamics.
Keywords
Allometry, climate change, ecosystem function, coral reef, metabolic theory of ecology, food web,acclimation.
Ecology Letters (2014)
INTRODUCTION
Reef fishes are a diverse group of vertebrates, comprising> 6000 species (Parravicini et al. 2013). They play key roles inthe flow of energy and nutrients through many reef ecosys-tems (Polovina 1984; Arias-Gonz�alez et al. 1997; Bozec et al.2004), but quantifying these roles, and how they may beaffected by future climate change, remains an importantresearch challenge (Wilson et al. 2010). An essential step inmeeting this challenge entails characterising the trophic struc-tures and energy fluxes of reef-fish communities, and how theyvary with broad-scale gradients in key variables such as tem-perature and productivity.Metabolic rate is a fundamental determinant of an organ-
ism’s contribution to energy and nutrient flux in an ecosys-tem (Brown et al. 2004; Allen et al. 2005). The metabolicrate per unit body mass (i.e. mass-specific rate) generallydeclines with body mass, but increases with temperature(Gillooly et al. 2001; Brown et al. 2004). Consequently,given that the energy flux of a community is equal to thesum of the individual metabolic rates (Allen et al. 2005),changes in temperature, size structure and/or standing bio-mass of a given community may affect its energetics and
resource use, and hence its contribution to ecosystem struc-ture and function (Sandin et al. 2008; Mora et al. 2011;McDole et al. 2012). Conversely, communities that are dis-tinct with respect to these variables may be energeticallysimilar (Fig. 1). The Metabolic Theory of Ecology (MTE;Brown et al. 2004) yields predictions for how communityabundance, biomass and energy flux should change with sizestructure, temperature and ecosystem productivity (Allenet al. 2005; Yvon-Durocher & Allen 2012; Trebilco et al.2013), but there have been few attempts to test such predic-tions (but see Lopez-Urrutia et al. 2006; O’Connor et al.2009; McDole et al. 2012), particularly at broad spatialscales.Here, we use MTE as a framework to synthesise individ-
ual- and community-level data and analyses (Fig. 1) to esti-mate energy fluxes and trophic structures of reef-fishcommunities and how they change along broad gradients oftemperature and productivity. Our approach builds on otherrecent studies that use MTE to quantify the energetics ofmarine communities and ecosystems (Lopez-Urrutia et al.2006; O’Connor et al. 2009; McDole et al. 2012), and amuch larger body of earlier work that yielded predictions onecosystem dynamics by summing metabolic rates of individu-
1Department of Biological Sciences, Macquarie University, 2109, Sydney, NSW,
Australia2IRD (Institut de Recherche pour le D�eveloppement), UR-CoR�eUs, Laboratoire
Arago, BP 44, 66651,Banyuls/mer, France3CESAB-FRB, Immeuble Henri Poincar�e, Domaine du Petit Arbois, 13857,
Aix-en-Provence Cedex 3, France
4Departamento de Ecologia e Zoologia, Universidade Federal de Santa Catari-
na, 88010-970, Florian�opolis, Santa Catarina, Brazil5Fisheries Ecology Research Lab, Department of Biology, University of Hawaii,
96822, Honolulu, Hawaii, USA6ARC Centre of Excellence for Environmental Decisions (CEED), The University
of Queensland, 4072, Brisbane, Qld, Australia
*Correspondence: E-mail: [email protected]
© 2014 John Wiley & Sons Ltd/CNRS
Ecology Letters, (2014) doi: 10.1111/ele.12309
als (e.g. Polovina 1984). The community-level database weuse encompasses 49 reef sites in eight regions, 496 748 indi-viduals and 989 species. While a number of studies haveassessed spatial gradients in biomass and abundance for reeffishes (e.g. Mora et al. 2011), to our knowledge, no studieshave attempted to quantify energy fluxes of reef-fish commu-nities at such broad spatial scales.Our analysis entails two distinct components. First, we
quantify metabolic rates of fish and their primary determi-nants and, in so doing, test three predictions of MTE(hypotheses H1–H3 detailed in Methods). Second, we scaleup the individual-level scaling relationships to first estimateenergy fluxes of communities (e.g. Allen et al. 2005; Yvon-Durocher et al. 2012) (Fig. 1), and then derive and testpredictions on how community-level energy flux should varywith temperature and net primary productivity (NPP) ifspecific community- and ecosystem-level assumptions areupheld (hypotheses H4–H5). For this second component, wesynthesise individual- and community-level data and analysesusing a Bayesian approach, building on recent work (Yvon-Durocher & Allen 2012).
METHODS
Individual-level hypotheses
Hypothesis H1: Metabolic rate will increase sub-linearlywith body mass according to a power function with a scal-ing exponent a � 0.75.
The single best predictor of metabolism across the diversity oflife is body mass (Gillooly et al. 2001; Brown et al. 2004),which varies by > 6 orders of magnitude among reef fishes(Froese & Pauly 2012). The effect of individual body mass,Mi (g), on metabolic rate, Bi (g C d�1), can be characterisedby a power function of the form
Bi ¼ BoMai ; ð1Þ
where Bo is a metabolic normalisation (g C g�a d�1) that var-ies among taxa and with other variables (Brown et al. 2004).The dimensionless scaling exponent a is generally < 1 formetazoans, indicating sub-linear scaling with body mass, andalso varies among metazoan taxa, with an average of ~0.75
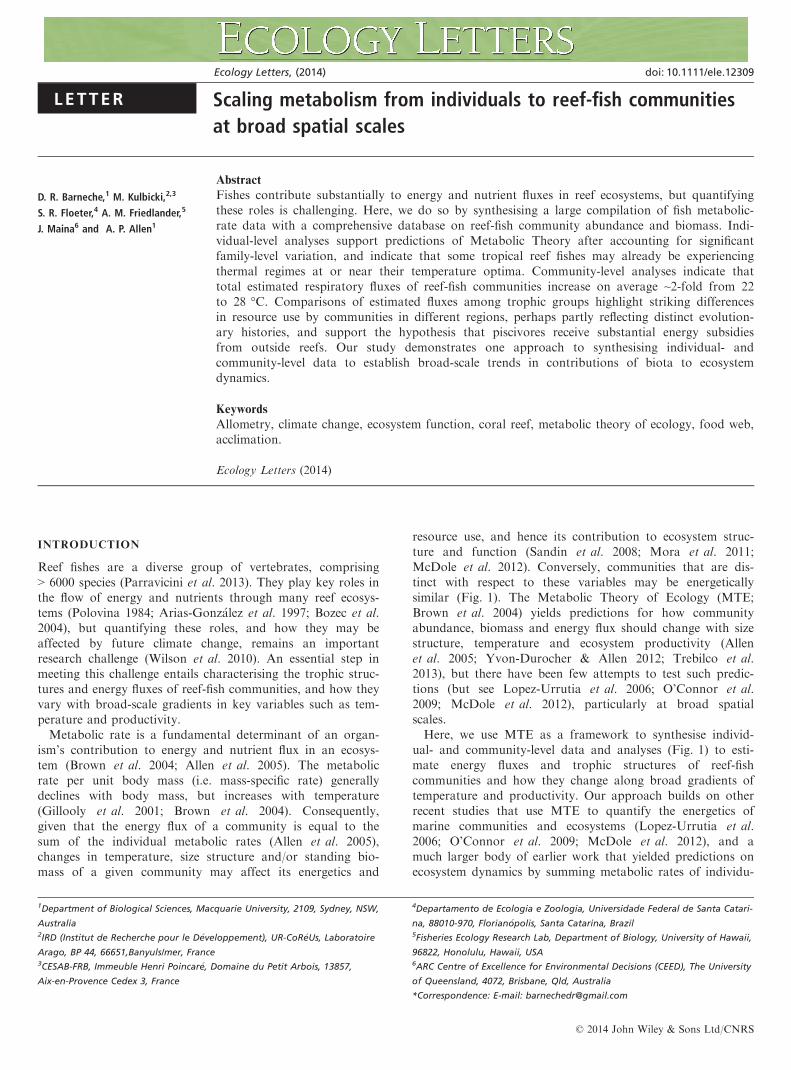
Figure 1 Scaling from individual-level metabolic rate (Bi) to total community-level respiration (RT). Individual-level rates (lower graphs) exhibit sub-linear
power-function scaling with body mass (Mi), implying that the scaling exponent a is < 1 and that respiratory capacity (depicted as mitochondria) per
unit body mass declines as size increases. Effects of temperature on rates are exponential well below the optimum. In the hypothetical example, ATP
turnover per mitochondrion (spirals) doubles from 20 °C (blue) to 28 °C (red). Community-level flux (in 1m2 area, upper graphs) is similar despite the
fact that communities differ in number of individuals (JT), standing biomass (MT), size-corrected biomass (MThMa�1i iT) and temperature. From left to
right, the first and second communities differ in size structure, but are very similar in MThMa�1i iT and environmental temperature (20 °C), and therefore
equivalent in terms of respiration. The third community has low MT, but is found at 28 °C, and therefore respires similarly. Equations 1–6 are detailed
in Methods.
© 2014 John Wiley & Sons Ltd/CNRS
2 D. R. Barneche et al. Letter

(Savage et al. 2004). Previous analyses suggest that basal met-abolic rates of fish may exhibit a somewhat steeper size scal-ing (i.e. a � 0.80; Clarke & Johnston 1999). Here, we assessthe scaling of routine metabolic rate, which corresponds to therate of energy expenditure required by a fish in the field tosustain survival, growth and reproduction.
Hypothesis H2: Metabolic-rate temperature dependencecan be approximated by the Boltzmann relationship withan activation energy Er � 0.6–0.7 eV at temperaturesbelow the optimum, Topt.
Another key determinant of metabolic rate is temperature.In general, metabolic rate exhibits a unimodal response (Huey& Stevenson 1979) such that the effects of temperature arepositive and exponential at temperatures well below the tem-perature optimum owing to biochemical kinetics (Gilloolyet al. 2001), but negative above this optimum owing to proteindenaturation and/or other processes that compromise biologi-cal function (bottom right plot of Fig. 1). Here, we modelthese effects of temperature on the metabolic normalisation,Bo from eqn 1, using the following expression (see Supplemen-tary Information),
Bo ¼ boðTcÞeEr1
kTc� 1
kTð ÞIðTÞ ð2Þ
I Tð Þ ¼ 1þ Er
Ei � Er
� �eEi
1kTopt
� 1kT
� � !�1
; ð3Þ
where bo(Tc) is the value of the metabolic normalisation atsome arbitrary absolute temperature Tc (K), and k is Boltz-mann’s constant (8.62 9 10�5 eV K�1). In this expression, theBoltzmann relationship, eEr
1kTc
� 1kTð Þ, describes temperature-
induced enhancement of rates using an activation energy, Er
(eV), consistent with previous MTE work (Gillooly et al.2001; Allen et al. 2005), whereas I(T) characterises declines inrates above Topt using an inactivation parameter Ei (School-field et al. 1981). The existence of a temperature optimumimplies that Ei>Er. Previous work indicates that Er variesamong taxonomic groups, with an average of ~0.65 eV, whichcorresponds closely to the average activation energy of meta-bolic reactions in the respiratory complex (Gillooly et al.2001). In the absence of temperature inactivation, this valuefor Er would imply a ~3.3-fold increase in individual energyflux over the range of temperatures experienced by reef fishes(~18–32 °C). However, if the upper bound of this range is ator near the temperature optimum for reef-fish species, as sug-gested by some recent work (Gardiner et al. 2010), the overalltemperature response will be weaker. We can evaluate thishypothesis by statistically comparing models fitted with andwithout the inactivation term, I(T), in eqns 2 and 3.
Hypothesis H3: The size- and temperature-corrected rateof metabolism, bo(Tc), is independent of average thermalregime.
While the exponential effects of temperature on biochemicalreaction rates have long been recognised, organisms utilisediverse physiological mechanisms to maintain homeostasis indifferent thermal regimes (Hochachka & Somero 2002).Consequently, some have argued that physiological acclima-
tion and/or evolutionary adaptation may allow organisms thatoccupy distinct thermal regimes to modulate acute tempera-ture effects, as expressed in eqns 2 and 3, through changes inbo Tcð Þ (Clarke & Fraser 2004). We can evaluate this hypothe-sis by fitting a function of the form
boðTcÞ ¼ boðTcÞ eEa h 1kTi� 1
kTcð Þ; ð4Þ
where boðTcÞ is the size- and temperature-corrected metabolicrate of an organism whose average thermal regime is ⟨1/kTc⟩,and Ea characterises any changes in this rate with averagethermal regime, ⟨1/kT⟩. We refer to Ea as an adaptationparameter (rather than an activation energy) because it cannotbe justified based on simple biochemical kinetics. Neverthe-less, it provides a useful benchmark for comparison with theactivation energy, Er, in eqns 2 and 3 above. The evolutionaryadaption hypothesis, as articulated by Clarke & Fraser(2004), proposes that bo(Tc) is generally higher for taxaadapted to cooler environments, implying that Ea > 0 in eqn4. By contrast, if Ea � 0, bo(Tc) is essentially independent ofthermal regime, as assumed in the original MTE formulation(Gillooly et al. 2001), meaning that temperature scaling ofrates is similar within and among taxa. Distinguishingbetween these alternative hypotheses is particularly relevanthere because the existence of temperature adaptation (Ea > 0)would imply that the overall temperature-induced enhance-ment of rates for communities that occupy warmer environ-ments is weaker than would be predicted based solely on theactivation energy Er.
Testing hypotheses H1–H3The predicted effects of body size (a � 0.75), temperature(Er � 0.6–0.7 eV) and thermal regime (Ea � 0 eV) can be eval-uated by combining eqns 1–4 and then taking logarithms toyield
lnBi ¼ ln boðTcÞ þ a lnMi þ Ea h 1kT
i � 1
kTc
� �
þ Er1
kTc� 1
kT
� �� ln 1þ Er
Ei � Er
� �eEi
1kTopt
� 1kT
� � !:
ð5ÞWe evaluate these predictions using metabolic-rate datacompiled in FishBase (Froese & Pauly 2012), along with addi-tional reef-fish data compiled from the recent literature(Supplementary Information). The FishBase data we analyseinclude all measurements of routine metabolic rate that haveaccompanying size and temperature data, except measure-ments denoted as being taken under stressful conditions. Toallow for the assessment of differences among families in thetemperature scaling of rates (described below), we only includedata from families with at least five metabolic-rate measure-ments over at least a 5 °C temperature range. Data for twofamilies (Carangidae and Coryphaenidae) were, however,excluded because preliminary analyses indicated that they wereoutliers with respect to scaling behaviour, and therefore pre-vented statistical models (described below) from converging onstable parameters estimates. In total, our compilation of meta-bolic-rate data encompasses 2036 measurements taken from 43
© 2014 John Wiley & Sons Ltd/CNRS
Letter Scaling of reef-fish communities 3

families and 270 species of marine and freshwater fish, includ-ing 40 reef-fish species.Effects of size and temperature were assessed by fitting eqn
5 to metabolic-rate data using non-linear mixed-effects model-ling in the R package lme4 (version 0.999999-0) (Bates et al.2014, Tables S1–S2). During model fitting, thermal regime(Ea) and temperature inactivation (Ei) were treated as havingfixed effects. Size (a), temperature activation (Er), optimumtemperature (Topt) and the size- and temperature-correctedrate (ln boðTcÞ) were treated as having both fixed effects andrandom effects that varied by family (Da, DEr, DTopt,Dln boðTcÞ). Random effects were assumed to be normally dis-tributed, with means of 0, so the fixed effects a, Er, Topt andln boðTcÞ correspond to family-level averages. Given that ther-mal regime, ⟨1/kT⟩, was calculated based on the average ofthe inverse absolute temperature measurements for each fam-ily, our approach is mathematically similar to the onedescribed by van de Pol & Wright (2009) for distinguishingwithin- vs. between-group effects using mixed-effects models.A parsimonious model that included only the most informa-
tive parameters was constructed using maximum likelihood(Zuur et al. 2009) (Table S1). This parsimonious model wasthen refitted using a Bayesian procedure by calling JAGS(version 3.3.0) from the R package R2jags (version 0.04-01)(Su et al. 2014) to determine posterior distributions and associ-ated 95% credible intervals (CIs) for the fitted parameters (Rcode available at https://github.com/dbarneche/ELEBarneche).A key advantage of the Bayesian approach for this analysis wasthat it allowed us to assess how statistical uncertainties in ourestimates for the size and temperature scaling of fish metabolicrates influenced the precision of community-level estimates ofsize-corrected biomass and energy flux (see hypotheses H4–H5below). When fitting the models in both JAGS and lme4, ratherthan estimate Er directly, we instead estimated the transformedquantity Er
0, where Er ¼ Ei= 1þ exp �Er0ð Þð Þ, to ensure that
Ei > Er in eqn 5 (Tables S2–S3).
Community-level hypotheses
Hypothesis H4: Holding ecosystem net primary productiv-ity constant, size-corrected biomass should decline withincreasing temperature.
Community-level flux is equal to the sum of the individualfluxes. Thus, annual respiratory carbon flux for a heterotrophcommunity comprised of JT individuals in an ecosystem ofarea A, RT (g C m�2 year�1), equals the sum of the time-inte-grated individual-level respiration rates,
R t¼st¼0 Bi tð Þdt, over the
time interval t = 0 day to t = s = 365 days,
RT ¼ 1=Að ÞXJTi¼1
Z t¼s
t¼0
Bi tð Þdt
¼ sbo Tcð ÞMThMa�1i iTheEr
1kTc
� 1kTð ÞIðTÞis; ð6Þ
where heEr1
kTc� 1
kTð ÞIðTÞis is time-averaged temperaturekinetics (Yvon-Durocher et al. 2012), which is calculatedby integrating temperature variation through time,
T(t) (= 1=sð Þ R t¼st¼0 e
Er1
kTc� 1
kT tð Þ
� �IðTðtÞÞdt). Community-level size
structure is characterised as MThMa�1i iT ¼ 1=Að ÞPJT
i¼1 Mai ,
where MT is total community biomass per unit area
(¼ 1=Að ÞPJTi¼1 MiÞ, and hMa�1
i iT is the biomass-weighted
average forMa�1i (=
PJTi¼1 M
ai
� �=PJT
i¼1 Mi
� �) (Allen et al. 2005).
We refer to the product MThMa�1i iT as ‘size-corrected bio-
mass’ because size correction, by hMa�1i iT, accounts for
declines in mass-specific metabolic rate, Bi/Mi, with increasingsize. This size-related decline is, in turn, predicted by MTE toreflect declines in respiratory capacity (Allen & Gillooly2009). Consequently, MThMa�1
i iT is predicted to be propor-tional to the total respiratory capacity of the community on aper-unit-area basis (Yvon-Durocher & Allen 2012). Thus, cal-culation of size-corrected biomass facilitates comparisons ofrespiratory capacity and energy flux among communities thatdiffer in size structure and standing biomass (Fig. 1).To derive hypothesis H4 using eqn 6, we note that the reef-
fish community garners some fraction, eT, of annual NPP,NT, meaning that eTNT = RT, and therefore that
lnMThMa�1i iT ¼ ln eT=bo Tcð Þ½ � þ lnNT
� lnheEr1
kTc� 1
kTð ÞIðTÞis:ð7Þ
Holding temperature constant, eqn 7 predicts a proportionalincrease in total size-corrected biomass with NPP owing togreater food availability, implying a slope of 1 for the secondterm, lnNT. Holding NPP constant, it predicts an inverserelationship with time-averaged temperature kinetics owing toincreases in per-individual metabolic demands, implying aslope of -1 for the third term. Importantly, these predictionsonly hold if the fraction of that carbon consumed by the fishcommunity, eT, and the size- and temperature-corrected meta-bolic rate, bo Tcð Þ, are both independent of thermal regime,and if reefs are relatively closed systems with respect to theproduction and consumption of reduced carbon. The closed-system assumption, in particular, may not hold true (Hamneret al. 1988; Hatcher 1990), but nevertheless provides a pointof departure for deriving and testing predictions. Thus, eqn 7provides a useful benchmark for assessing the extent to whichone or more of these assumptions have been violated.
Hypothesis H5: Size-corrected biomass should be lowestat the highest trophic level.
Energy is lost from the system as energy is transferredbetween trophic levels (Lindeman 1942). Owing to theselosses, if reef fishes consumed only autotrophs or other fishoccurring on the reef, the fraction of reef NPP garnered bypiscivorous fish (ePi) would be constrained by energy balanceto be lower than that of herbivorous fish (eH), meaning thatePi /eH < 1. Complications arise, however, because reef fishesconsume diverse prey items other than autotrophs and fish,including gastropods and zooplankton. Moreover, higher tro-phic levels, particularly top predators such as sharks, mayreceive substantial energy subsidies from outside the system(Trebilco et al. 2013).Despite these complications, we can extend eqn 7 to empiri-
cally assess whether energy fluxes of piscivores, RPi, are lowerthan those of herbivores, RH, using data on size-corrected bio-mass,
© 2014 John Wiley & Sons Ltd/CNRS
4 D. R. Barneche et al. Letter

lnRPi
RH¼ ln
MPihMa�1i iPi
MHhMa�1i iH
\0; ð8Þ
where MPihMa�1i iPi (¼ 1=Að ÞPJPi
i¼1 Mai Þ is the size-corrected
biomass for JPi piscivorous individuals in a defined area A,
and MHhMa�1i iH (¼ 1=Að ÞPJH
i¼1 Mai Þ is the size-corrected bio-
mass for JH herbivorous individuals in this same area. Impor-tantly, productivity, NT, and time-averaged temperature
kinetics, heEr1
kTc� 1
kTð ÞIðTÞsi, both drop out of eqn 8. Conse-
quently, ratios of size-corrected biomass for pairs of trophicgroups can be meaningfully compared among communitiesthat differ in size structure, NPP and temperature. Theseratios provide a useful, albeit indirect, means of assessing theimportance of prey items other than fish. If, for example, thesize-corrected biomass of invertivores was higher than that ofherbivores in a given community, this would represent directevidence that the fishes garner more of their energy frominvertebrates than from direct consumption of NPP.
Testing hypotheses H4–H5We evaluated hypotheses H4–H5 using community-level dataon reef-fish abundances and body lengths collected from 49 sites(islands, atolls and coastal contiguous reefs), including 14 sitesin the South-western Atlantic and its oceanic islands, 1 site inthe Caribbean, 2 sites in the Tropical Eastern Atlantic, 1 site inthe Tropical Eastern Pacific, 4 sites in the Central Pacific, 2 sitesin the South-eastern Pacific and 25 sites in the South Pacific(Table S4). Each species was assigned to one of five trophicgroups (herbivores, omnivores, planktivores, invertivores andpiscivores) using information in the published literature, onlinedatabases and expert judgment (Supplementary Information).Community-level estimates of size-corrected biomass were
inferred from the abundance and body length data by firstestimating wet weights of individuals using power-functionlength-weight conversion formulas compiled from the litera-ture and online databases (Supplementary Information).Fluxes were then estimated by combining size-corrected bio-mass values with weekly estimates of mean annual sea-surfacetemperature obtained from the CorTAD database between1997 and 2007 (Selig et al. 2010).Estimates of ecosystem-level reef NPP are scarce in the liter-
ature (Gattuso et al. 1998; Naumann et al. 2013). Indeed, weare aware of only one study that has estimated it (Odum &Odum 1955). Although many reef studies have reported esti-mates of net community productivity (NCP; Hatcher 1990),NCP does not represent the total energy available to the het-erotrophic community. Rather it is the fixed carbon thatremains after heterotrophic consumption (= gross ecosystemphotosynthesis – total ecosystem respiration). Consequently,we evaluated Hypothesis H4 for planktivorous fish (i.e. pela-gic consumers) using estimates of pelagic NPP (hereafter, NP,g C m�2 year�1) derived from SeaWIFS (Behrenfeld & Fal-kowski 1997). Cautious interpretation is, however, warrantedbecause planktivores may obtain primary production from alarger area owing to oceanic currents (Hamner et al. 1988).Data from Abrolhos (South-western Atlantic) were excludedfrom this analysis because no planktivores were recorded.Uncertainties in the scaling relationships of individual-level
metabolic rates were accounted for by calculating size-cor-rected biomass, MThMa�1
i iT, time-averaged temperature kinet-ics, heEr
1kTc
� 1kTð ÞIðTÞis, and community flux, RT (in g C m�2
yr�1), based on the joint posterior distribution for Er, Ei, Topt,a and ln boðTcÞ (Ea was not significant, see Results), as deter-mined using Bayesian methods in JAGS.We evaluated whether the size-corrected biomass of plankti-
vores increased with NP, and declined with increasing time-average temperature kinetics (hypothesis H4), using standardmultiple regression. Two-tailed t-tests were used to assesswhether the observed slopes differed from expected values.ANCOVA was used to assess whether log ratios of size-correctedbiomass (eqn 8) varied in response to temperature and amongtrophic groups (hypothesis H5). Overall differences in commu-nity structure among regions, as indexed by trophic-specific logratios of size-corrected biomass, were assessed using MANOVA,as is the standard procedure for analysing differences in com-positional data (Aitchison 2003). Due to a lack of plankti-vores, Abrolhos was also excluded from this analysis.
RESULTS AND DISCUSSION
Individual-level hypotheses H1–H3
The parsimonious metabolic-rate model yields estimates forthe overall size- and temperature-scaling relationships – repre-senting family-level averages – that closely match MTE Pre-dictions (Tables 1,S1–S3; Figs 2,S1–4). Consistent withhypothesis H1, the overall effect of size, characterized by thescaling exponent a, is statistically indistinguishable from 0.75,implying sub-linear scaling (i.e. a < 1), which provides theo-retical justification for ‘size-correcting’ biomass at the commu-nity level. Consistent with hypothesis H2, the activationenergy, Er, is statistically indistinguishable from the predictedrange ~0.6–0.7 eV. Consistent with hypothesis H3, the adapta-tion parameter Ea is not significant (likelihood ratio test:v2 = 0.98; d.f. = 1; P = 0.323; Table S1), and is thereforeexcluded from the parsimonious model (Tables 1, S1–S2).Thus, size- and temperature-corrected rates appear to be lar-gely independent of thermal regime.
Table 1 Average estimates and 95% credible intervals (of Bayesian poster-
ior distributions) for fixed-effects parameters in the parsimonious model
(model F2 in Table S1; see Table S3 for estimates of random effects).
Fixed-effect parameters include: a, the (family-level) average for the mass
dependence of metabolic rate; Er, the average for the temperature depen-
dence of metabolic rate; ln bo Tcð Þ, the average for the size-corrected meta-
bolic rate at temperature Tc = 20 °C; Topt, the temperature optimum of
fish metabolism and Ei, the inactivation energy describing the rate of
decline in metabolic rate at temperatures >Topt.
Parameter Estimate 2.5% CI 97.5% CI
Fixed effects
Size, a 0.760 0.676 0.842
Activation energy, Er (eV) 0.589 0.430 0.877
Normalisation,
In boðTcÞ (g C g�a d�1)
�5.714 �5.980 �5.274
Temperature optimum, Topt (K) 306.310 301.721 314.562
Inactivation energy, Ei (eV) 2.035 1.248 3.111
© 2014 John Wiley & Sons Ltd/CNRS
Letter Scaling of reef-fish communities 5

Importantly, however, the temperature inactivation termI(T) (eqn 3) is highly significant (likelihood ratio test:v2 = 17.04; d.f. = 6; P = 0.009), yielding evidence of a temper-ature optimum (Topt) for metabolic rates of fish (Fig. S4). Byincorporating these parameters into the metabolic-rate model,our analysis expands upon early MTE efforts that describedthe temperature dependence of biological rates based solely onthe Boltzmann relationship (e.g. Gillooly et al. 2001; Brownet al. 2004; Allen & Gillooly 2009), consistent with otherrecent MTE work (e.g. Amarasekare & Savage 2012).Of particular relevance, our estimate for the family-level
average for Topt, 33 °C (95% CI: 29–41 °C, Table 1), overlapswith the maximum temperature observed in our sampled tropi-cal reefs (maximum temperature at the sampled sites from Cor-TAD: 32.55 °C). Analyses of standard metabolic-rate datayield further evidence of a temperature optimum of similarmagnitude (Fig. S5). These findings represent independent evi-dence that at least some marine fish taxa are already experienc-ing thermal regimes at or near their temperature optima(Gardiner et al. 2010), perhaps constraining the capacity of fishcommunities (and reef ecosystems more generally) to respondto climate change (Rummer et al. 2013). Still, it is important torecognise that clear evidence of an optimum is only observedfor a subset of the families included in our analysis, which havedata that span a wide temperature range (e.g. Centrarchidae,Cyprinidae, Sparidae; Fig. S1). Moreover, the data in ouranalysis encompass a mixture of short-term acute temperatureresponses and longer term temperature acclimation, which canoccur over multiple generations (Donelson et al. 2012). Thus,our findings highlight the need for further investigations on thebiochemical mechanisms and timescales of temperature accli-mation and adaptation in fish.After accounting for overall trends using fixed effects, our
model reveals substantial family-level variation in size scaling(Da), temperature scaling (DEr, DTopt) and size- and tempera-ture-corrected rates ðD ln boðTcÞÞ (Figs. 2,S1). Thus, while ourmetabolic-rate model supports MTE predictions for fish as a
group, it also quantifies deviations from general trends byincorporating random effects attributable to taxonomy. Forexample, our estimate of 0.58 for the standard deviation ofDln boðTcÞ (Table S3) implies that metabolic rate varies, onaverage, by about 3-fold (� e290.58) among families afteraccounting for size and temperature. By explicitly accountingfor such deviations, modelling approaches such as ours mayhelp to resolve controversies surrounding the generality of met-abolic scaling relationships (e.g. Agutter & Wheatley 2004).While the parsimonious model does indicate family-level devia-tions from a and Er, 81% of the families had 95% CIs for size-scaling exponents that included the predicted 0.75, and 98% offamilies had 95% CIs for activation energies that included 0.6–0.7 eV. And, notably, scaling relationships for reef fishes aresimilar to those of other species (Fig. 2, blue circles).
Community-level hypotheses H4–H5
Propagation of the uncertainties from the individual-level met-abolic-rate model to community-level estimates of size-corrected biomass demonstrates that this source of uncertaintyintroduces error of small magnitude in the estimates oflnMThMa�1
i iT relative to variation among sites (represented by95% CI bars in Fig. S7). Posterior distributions were there-fore averaged to obtain the community-level estimates used insubsequent analyses.In disagreement with hypothesis H4 (eqn 7), the logarithm
of size-corrected biomass for planktivores ðlnMPhMa�1i iPÞ is
not correlated with time-averaged temperature kinetics
(ln heEr1
kTc� 1
kTð ÞIðTÞis) or near-pelagic NPP (lnNP) in a multiple
regression analysis (F = 0.65, P = 0.53). However, afterexcluding from our analysis six coastal sites in the South-wes-tern Atlantic (below 17 °S), all of which are exceptionallyturbid (Fig. S8), size-corrected biomass increases significantly(P < 0.001) and approximately proportionally with NP, inagreement with hypothesis H4, as indicated by a log–log slopenear 1 from the multiple regression model (1.74, t-test:
−5 0 5 10
−10
−5
0
5
ln(Mass) (g)
ln(R
ate
@ 2
0°C
) (g
C d
−1)
Reef fishes; n = 171
Other fishes; n = 1865
−3 −2 −1 0 1 2
−12
−10
−8
−6
−4
−2
0
2
Inverse temperature, 1/ kTc − 1/kT (1/eV)
ln(R
ate
@ 1
g) (g
C d
− 1)
0 5 10 15 20 25 30 35
Temperature (°C)(a) (b)
mean trend: y = −5.71 + 0.76xfamily−level variation
y = −5.71 + 0.59x
− ln⎛
⎝⎜1 + 0.41exp
⎡
⎣⎢2.04
⎛⎝⎜
1
k306−
1
kTc+ x
⎞⎠⎟⎤
⎦⎥⎞
⎠⎟
Figure 2 Scaling of routine metabolic rates of fish with respect to (a) body size and (b) temperature. Parameter estimates (listed in Table 1) were obtained
using Bayesian methods. The effect of temperature on routine metabolic rate was controlled for in (a) by standardising the temperature measures, T (in K),
to TC = 293.15 K (= 20 °C) based on family-level temperature scaling relationships, where k is the Boltzmann constant (8.62 9 10�5 eV K�1). The effect
of body mass was controlled for in (b) by standardising measures to 1 gram based on the family-level size scaling relationships. The size-corrected rate at
temperature Tc, ln boðTcÞ = �5.71 g C g�a d�1, corresponds to an average across families.
© 2014 John Wiley & Sons Ltd/CNRS
6 D. R. Barneche et al. Letter

P = 0.06; Fig. 3). These findings suggest that planktivoreabundances on reefs are constrained by NP provided thatturbidity is not so high that it hampers planktivore feeding
(Johansen & Jones 2013). More generally, they suggest that,despite evidence indicating that local, site-specific hydrody-namics can influence food availability to reef planktivores(Hamner et al. 1988), NP is nevertheless a useful proxy of foodavailability for reef planktivores at broad spatial scales.Excluding the six turbid sites, the log–log slope of the relation-ship between size-corrected biomass and time-averaged tem-perature kinetics is also highly significant in the multipleregression model (P = 0.004), but substantially steeper thanthe predicted �1 (�7.86, t-test: P = 0.01), implying that plank-tivorous reef fishes garner a progressively smaller fraction ofNP as water temperature increases (Fig. 3c).Community trophic structure, as indexed by four log ratios of
size-corrected biomass (piscivore-to-herbivore, invertivore-to-herbivore, planktivore-to-herbivore and omnivore-to-herbivore,following eqn 8), differs significantly between regions (MANOVA:P < 0.0001; Fig. 4), indicating striking differences inresource use among reef-fish communities. For example,size-corrected biomass of planktivores is proportionally higher inthe Tropical Eastern Atlantic (63%) than the other regions(≤ 15%; Fig. 4), supporting the idea that plankton can be impor-tant energy resources to reef fishes (Hamner et al. 1988).Remarkably, these differences in trophic structure are uncorrelat-ed with temperature regime (ANCOVA: P = 0.5440; Fig. S7), sug-gesting primary roles for unmeasured historical factors related todivergent evolutionary histories of distinct fish faunas (Bellwood& Wainwright 2002; Kulbicki et al. 2013). In addition, fishingpressure varies considerably among the sites included in ouranalysis, and can alter community structure (Jackson et al. 2001;Sandin et al. 2008; Mora et al. 2011; Friedlander et al. 2013) indiverse ways (Kronen et al. 2012). Disentangling human impactsrequires careful selection of sites along disturbance gradients(e.g. Sandin et al. 2008; McDole et al. 2012), and may beinformed by the energetic approach adopted here.Size-corrected biomass also differed among trophic groups,
as indicated by significant differences in the averages of thefour log ratios (one-way ANOVA: P < 0.0001). Consistent withhypothesis H5, the piscivore-to-herbivore log ratio (eqn 8), aswell as the planktivore-to-herbivore log ratio, had averages< 0 (two-sided t-tests: both P < 0.001), meaning that size-corrected biomass values (and hence energy fluxes) of bothgroups were less than those of herbivores. However, themean omnivore-to-herbivore and invertivore-to-herbivore logratios were not significantly different from 0 (two-sidedt-tests: P = 0.94 and P = 0.29 respectively). Post hoc analyses[Tukey HSD (Honestly Significant Difference)] of pair-wisedifferences among log ratios allow us to construct an average‘stoichiometry’ of size-corrected biomass: 4.17 invertivores;3.09 herbivores; 2.77 omnivores; 1.30 piscivores; 1 plankti-vore. Thus, in terms of size-corrected biomass, and henceenergetics, our results suggest that, on average, invertivoresare the most important trophic group in reef-fish communi-ties. These findings indicate that reef-fish communities gener-ally obtain more energy from consumption of invertebratesthan from direct consumption of NPP.Notably, our calculated stoichiometry for size-corrected bio-
mass implies that, on average, energy flux by piscivores is only~2.38-fold lower than that of herbivores (i.e. 2.38 � 3.09/1.30).This difference is markedly less than would be predicted if
NP(g C m−2 year−1)
MP
⟨Miα−
1 ⟩ P @
20°
C (g
α m−2
)
45 94 200 423 896
0.1
1
10
100
1000
Averaged temperature kineticsMP
⟨Miα−
1 ⟩ P
1.11 1.22 1.35 1.49 1.65
0.01
0.1
1
10
100
Temperature (°C)
ε P( =
RP
NP
)
22 24 26 28
0.0001
0.001
0.01
0.1
1
@ 2
00 g
C m
–2 y
ear−1
(gα m
–2)
(a)
(b)
(c)
ln(y) = 4.52 + 1.74ln(x 200)R2 = 0.38, P < 0.001
ln(y) = 4.52 − 7.86ln(x)R2 = 0.38, P < 0.001
ln(y) = 4.54 − 0.30x
r2 = 0.11, P < 0.030
Figure 3 Relationships of size-corrected biomass of planktivores to (a)
pelagic net primary production and (b) time-averaged temperature kinetics.
(c) Estimated fraction of pelagic net primary productivity respired by
planktivores plotted as a function of mean annual temperature. The fitted
models and associated statistics depicted in the figure were estimated using
multivariate (in a and b) and bivariate (in c) OLS (ordinary least squares)
regression, excluding six exceptionally turbid sites (Fig. S8) denoted by ‘X’
(n = 42 sites). The model intercept in panels a and b corresponds to the
estimated logarithm of size-corrected biomass for a planktivore community
receiving 200 g C m2 year�1 at 20 °C. Colours are used to denote sites in
different regions: South Pacific (yellow), Central Pacific (light blue), South-
eastern Pacific (black), Tropical Eastern Pacific (purple), Caribbean
(orange), South-western Atlantic (green), South-western Atlantic oceanic
islands (blue), Tropical Eastern Atlantic (red). Coral-dominated reefs are
depicted as circles and rock-dominated reefs are depicted as squares.
© 2014 John Wiley & Sons Ltd/CNRS
Letter Scaling of reef-fish communities 7

piscivorous reef fish directly or indirectly obtained all of theirenergy from herbivorous reef fish: assuming a difference of > 2trophic-position units between herbivores and piscivores (Hus-sey et al. 2014) and a Lindeman (1942) efficiency of ~0.10between adjacent trophic levels, the predicted difference wouldbe > 100-fold (i.e. > 0.102). Given that our size-corrected bio-mass estimates already account for changes in energy use andbiomass turnover related to size, body size alone appears insuf-ficient to account for the observation that some pristine reefs
are ‘top-heavy’, with most biomass in large, apex predators(Sandin et al. 2008; Friedlander et al. 2013). Rather, our resultssupport the hypothesis that such top-heavy pyramids arise pri-marily because higher trophic levels receive substantiallygreater energetic subsidies from sources other than reef fish(Trebilco et al. 2013). Contributing factors may include highmobility for large piscivores (Werry et al. 2014), which mayallow them to garner more energy from areas outside the reef.More detailed inspection of our size-corrected biomass
estimates highlights the importance of size correction forbroad-scale comparative analyses. For instance, the percentagestanding biomass of piscivores is very high (47%) at the quasi-pristine Isla del Coco (only site in the Tropical Eastern Pacific,Fig. 4a). This pattern reflects the relatively high abundance oflarge predators, such as the hammerhead shark Sphyrna lewini(average biomass of 29.5 kg/sampled individual), whichcomprises 5% of the standing biomass, but only 2% of thesize-corrected biomass. Conversely, the territorial damselfishStegastes arcifrons (average biomass of 0.078 kg/individual)contributes 5% of the standing biomass, but 9% of size-corrected biomass. Consequently, after size correction, relativebiomass of piscivores at Isla del Coco becomes significantlysmaller (Fig. 4b). These calculations support the assertion thatsmaller, more abundant fish (e.g. Gobiidae) are often theprimary contributors to energy flux in reef-fish communities(Ackerman et al. 2004; Depczynski et al. 2007).Total respiratory fluxes of fish communities (eqn 6) increase,
on average, ~2.3-fold from 22 to 28°C (Fig. 5). Similar resultsare obtained if regional effects are explicitly controlled for(Supplementary Information). These respiratory flux estimatesare conservative because they exclude contributions of noctur-nal fish and of fish < 10 cm (Fig. S6). Still, they exceed esti-mates of pelagic NPP for 10 of the 49 sites, consistent withobservations that the vast majority of primary production onreefs is benthic in origin (Polovina 1984; Naumann et al. 2013)and that reef productivity is often substantially higher than thesurrounding oceans (Hatcher 1990). The observed increase intotal rates of respiration by reef fish with temperature imposesimportant constraints on the dynamics of reef ecosystemsbecause it implies one or more of the following variables areincreasing moving towards warmer reefs: reef fish are garneringa larger fraction of reef NPP, reef NPP is increasing and/or reeffish are receiving greater energy subsidies. Distinguishingamong competing mechanisms will require far more extensivedata on reef NPP, which is estimated using an approach similarto the one adopted here by first characterising the photosyn-thetic rates and metabolic demands of autotrophic individuals,and then scaling these fluxes up to entire reef ecosystems (e.g.Odum & Odum 1955; Naumann et al. 2013). Thus, the hierar-chical statistical approach adopted here, which entails scalingfrom individuals to ecosystems by explicitly incorporatingboth idiosyncratic random effects (e.g. taxonomy) and generalphysiological constraints (e.g. body size, temperature), mayprove useful for other groups and applications.
CONCLUSIONS
Our study demonstrates how individual- and community-leveldata can be combined to identify important broad-scale trends
HerbivoresOmnivoresPlanktivoresInvertivoresPiscivores
Stan
ding
bio
mas
s (%
)
0
20
40
60
80
100
South
Pacific
Centra
l Paci
fic
South−
easter
n Paci
fic
Tropica
l East
ern Paci
fic
Caribb
ean
South−
western
Atlanti
c
Atlanti
c Ocea
nic isl
ands
Tropica
l East
ern Atla
ntic
25 4 2 1 1 9 4 2
17%
28%
23%
28%
43%
30%
16%
45%
17%
22%
25%
11%
47%
36%
44%
13%
22%
11%
57%
24%
34%
33%
21%
53%
20%
(a)
Size−c
orre
cted
bio
mas
s (%
)
0
20
40
60
80
100
South
Pacific
Centra
l Paci
fic
South−
easter
n Paci
fic
Tropica
l East
ern Paci
fic
Caribb
ean
South−
western
Atlanti
c
Atlanti
c Ocea
nic isl
ands
Tropica
l East
ern Atla
ntic
25 4 2 1 1 9 4 2
19%
30%
26%
18%
44%
29%
18%
48%
12%
19%
13%
31%
15%
14%
32%
43%
39%
19%
12%
59%
23%
36%
33%
15%
63%
18%
(b)
Figure 4 Average percentage allocations of (a) standing biomass and (b)
size-corrected biomass among trophic groups for communities in different
biogeographic regions. Means of each trophic group were calculated
based on log ratios using MANOVA. Numbers on top of the bars indicate
the number of sites sampled in each biogeographic region. Only
percentages higher than 10% are labelled.
© 2014 John Wiley & Sons Ltd/CNRS
8 D. R. Barneche et al. Letter

in energy flux (Fig. 1). At the individual level, our analyseshighlight both the generality of MTE predictions with regard tothe size and temperature scaling of metabolic rate, as well as thelimitations of these predictions when applied to particular taxo-nomic groups (Table 1). Our broad-scale comparativeapproach also yields evidence of a temperature optimum inmetabolic rate at ~33 °C for many fish taxa (Fig. 2), andthereby reinforces and extends previous work suggesting that atleast some tropical reef fishes are already experiencing tempera-tures near their thermal optima. At the community level, ourstudy highlights the importance and utility of size correction toassess broad-scale gradients in energy flux within and amongtrophic levels and communities (Fig. 3). Accounting for size inthis way reveals striking differences in trophic structure amongcommunities in different oceanic regions (Fig. 4). Finally, byquantifying community-level energy flux, our approach yieldsimportant constraints on ecosystem dynamics (Fig. 5).
ACKNOWLEDGEMENTS
We thank V Parravicini for helping with trophic categorisationof reef fishes, EL Rezende for insights into individual-levelanalyses, all field assistants who helped collecting the datathroughout the years and JF Bruno and two anonymousreviewers for insightful feedback on previous versions of thismanuscript. This project was supported by Macquarie Univer-
sity (PhD scholarship to D.R.B.), Australian Research Coun-cil’s Discovery Projects funding scheme (DP0987218 toA.P.A.), CESAB-FRB (Fondation pour la Recherche enBiodiversit�e), through the GASPAR program, SISBIOTA-Mar(PI: S.R. Floeter CNPq 563276/2010-0 and FAPESC 6308/2011-8), CAPES, Marinha do Brasil, Instituto Laje Viva andthe National Geographic Society. The authors declare noconflict of interest.
AUTHORSHIP
D.R.B. and A.P.A. designed the study and hypotheses, devel-oped scripts for data analyses and figures, analysed the dataand drafted the manuscript. M.K., S.R.F. and A.M.F. pro-vided reef-fish community data, and J.M. provided turbiditydata. All authors contributed substantially to revisions.
REFERENCES
Ackerman, J.L., Bellwood, D.R. & Brown, J.H. (2004). The contribution
of small individuals to density-body size relationships: examination of
energetic equivalence in reef fishes. Oecologia, 139, 568–571.Agutter, P.S. & Wheatley, D.N. (2004). Metabolic scaling: consensus or
controversy? Theor. Biol. Med. Model., 1, 13.
Aitchison, J. (2003). The Statistical Analysis of Compositional Data.
Blackburn Press, Caldwell, New Jersey, pp. 416.
Allen, A.P. & Gillooly, J.F. (2009). Towards an integration of ecological
stoichiometry and the metabolic theory of ecology to better understand
nutrient cycling. Ecol. Lett., 12, 369–384.Allen, A.P., Gillooly, J.F. & Brown, J.H. (2005). Linking the global
carbon cycle to individual metabolism. Funct. Ecol., 19, 202–213.Amarasekare, P. & Savage, V. (2012). A framework for elucidating the
temperature dependence of fitness. Am. Nat., 179, 178–191.Arias-Gonz�alez, J.E., Delesalle, B., Salvat, B. & Galzin, R. (1997).
Trophic functioning of the Tiahura reef sector, Moorea Island, French
Polynesia. Coral Reefs, 16, 231–246.Bates, D., Maechler, M., Bolker, B. & Walker, S. (2014). lme4: Linear
mixed-effects models using Eigen and S4. R package version 1.0-6.
Available at http://www.CRAN.R-project.org/package=lme4.
Behrenfeld, M.J. & Falkowski, P.G. (1997). Photosynthetic rates derived
from satellite-based chlorophyll concentration. Limnol. Oceangr., 42,
1–20.Bellwood, D.R. & Wainwright, P.C. (2002). The history and
biogeography of fishes on coral reefs. In: Coral Reef Fishes: Dynamics
and Diversity in a Complex Ecosystem (ed Sale, P.F.). Academic Press
San, Diego, pp. 5–32.Bozec, Y.-M., Gascuel, D. & Kulbicki, M. (2004). Trophic model of
lagoonal communities in a large open atoll (Uvea, Loyalty islands, New
Caledonia). Aquat. Living Resour., 17, 151–162.Brown, J.H., Gillooly, J.F., Allen, A.P., Savage, V.M. & West, G.B.
(2004). Toward a metabolic theory of ecology. Ecology, 85, 1771–1789.Clarke, A. & Fraser, K.P.P. (2004). Why does metabolism scale with
temperature? Funct. Ecol., 18, 243–251.Clarke, A. & Johnston, N.M. (1999). Scaling of metabolic rate with
body mass and temperature in teleost fish. J. Anim. Ecol., 68, 893–905.
Depczynski, M., Fulton, C.J., Marnane, M.J. & Bellwood, D.R. (2007).
Life history patterns shape energy allocation among fishes on coral
reefs. Oecologia, 153, 111–120.Donelson, J.M., Munday, P.L., McCormick, M.I. & Pitcher, C.R. (2012).
Rapid transgenerational acclimation of a tropical reef fish to climate
change. Nature Clim. Change, 2, 30–32.Friedlander, A.M., Ballesteros, E., Beets, J., Berkenpas, E., Gaymer,
C.F., Gorny, M. et al. (2013). Effects of isolation and fishing on the
Temperature (°C)
RT
(g C
m−2
yea
r−1 )
22 24 26 28
10
20
50
100
200
500ln(y) = 0.48 + 0.14x
r2 = 0.10, P < 0.03
Figure 5 Relationships of mean annual sea surface temperature to total
estimated respiratory flux of fish communities. The fitted dashed line and
associated statistics were estimated using OLS regression (n = 49 sites).
The fitted slope implies a ~2.3-fold increase in rates from 22 °C to 28 °C(i.e. e0.14 9 (28–22) � 2.3). Colours are used to denote sites in different
regions: South Pacific (yellow), Central Pacific (light blue), South-eastern
Pacific (black), Tropical Eastern Pacific (purple), Caribbean (orange),
South-western Atlantic (green), South-western Atlantic oceanic islands
(blue) and Tropical Eastern Atlantic (red). Coral-dominated reefs are
depicted as circles, and rock-dominated reefs are depicted as squares.
Variation in estimates of community-level flux introduced by statistical
uncertainties in the size-temperature scaling of metabolic rate are
represented by 95% CI bars in the figure.
© 2014 John Wiley & Sons Ltd/CNRS
Letter Scaling of reef-fish communities 9
marine ecosystems of Easter Island and Salas y G�omez. Chile. Aquat.
Conserv., 23, 515–531.Froese, R. & Pauly, D. (2012). FishBase. World Wide Web electronic
publication. Available at http://www.fishbase.org, (Version 12/2012).
Last accessed 20 January 2014.
Gardiner, N.M., Munday, P.L. & Nilsson, G.E. (2010). Counter-gradient
variation in respiratory performance of coral reef fishes at elevated
temperatures. PLoS ONE, 5, e13299.
Gattuso, J.P., Frankignoulle, M. & Wollast, R. (1998). Carbon and
carbonate metabolism in coastal aquatic ecosystems. Annu. Rev. Ecol.
Syst., 29, 405–434.Gillooly, J.F., Brown, J.H., West, G.B., Savage, V.M. & Charnov, E.L.
(2001). Effects of size and temperature on metabolic rate. Science, 293,
2248–2251.Hamner, W.M., Jones, M.S., Carleton, J.H., Hauri, I.R. & Williams,
D.M. (1988). Zooplankton, planktivorous fish, and water currents on a
windward reef face: Great Barrier Reef, Australia. Bull. Mar. Sci., 42,
459–479.Hatcher, B.G. (1990). Coral reef primary productivity. A hierarchy of
pattern and process. Trends Ecol. Evol., 5, 149–155.Hochachka, P.W. & Somero, G.N. (2002). Biochemical Adaptation:
Mechanism and Process in Physiological Evolution. Oxford University
Press, New York, pp. 480.
Huey, R.B. & Stevenson, R.D. (1979). Integrating thermal physiology and
ecology of ectotherms: a discussion of approaches. Amer. Zool., 19,
357–366.Hussey, N.E., MacNeil, M.A., McMeans, B.C., Olin, J.A., Dudley, S.F.J.,
Cliff, G. et al. (2014). Rescaling the trophic structure of marine food
webs. Ecol. Lett., 17, 239–250.Jackson, J.B., Kirby, M.X., Berger, W.H., Bjorndal, K.A., Botsford,
L.W., Bourque, B.J. et al. (2001). Historical overfishing and the recent
collapse of coastal ecosystems. Science, 293, 629–637.Johansen, J.L. & Jones, G.P. (2013). Sediment-induced turbidity impairs
foraging performance and prey choice of planktivorous coral reef
fishes. Ecol. Appl., 23, 1504–1517.Kronen, M., Pinca, S., Magron, F., McArdle, B., Vunisea, A., Vigliola,
L. et al. (2012). Socio-economic and fishery indicators to identify and
monitor artisanal finfishing pressure in Pacific Island countries and
territories. Ocean Coast. Manage., 55, 63–73.Kulbicki, M., Parravicini, V., Bellwood, D.R., Arias-Gonz�alez, E., Chabanet,
P., Floeter, S.R. et al. (2013). Global biogeography of reef fishes: a
hierarchical quantitative delineation of regions. PLoS ONE, 8, e81847.
Lindeman, R.L. (1942). The trophic-dynamic aspect of ecology. Ecology,
23, 399–417.Lopez-Urrutia, A., San Martin, E., Harris, R.P. & Irigoien, X. (2006).
Scaling the metabolic balance of the oceans. PNAS, 103, 8739–8744.McDole, T., Nulton, J., Barott, K.L., Felts, B., Hand, C., Hatay, M.
et al. (2012). Assessing Coral Reefs on a Pacific-Wide Scale Using the
Microbialization Score. PLoS ONE, 7, e43233.
Mora, C., Aburto-Oropeza, O., Bocos, A.A., Ayotte, P.M., Banks, S.,
Bauman, A.G. et al. (2011). Global human footprint on the linkage
between biodiversity and ecosystem functioning in reef fishes. PLoS
Biol., 9, e1000606.
Naumann, M.S., Jantzen, C., Haas, A.F., Iglesias-Prieto, R. & Wild, C.
(2013). Benthic primary production budget of a Caribbean reef lagoon
(Puerto Morelos, Mexico). PLoS ONE, 8, e82923.
O’Connor, M.I., Piehler, M.F., Leech, D.M., Anton, A. & Bruno, J.F.
(2009). Warming and resource availability shift food web structure and
metabolism. PLoS Biol., 7, e1000178.
Odum, H.T. & Odum, E.P. (1955). Trophic structure and productivity of
a windward coral reef community on Eniwetok Atoll. Ecol. Monogr.,
25, 291–320.
Parravicini, V., Kulbicki, M., Bellwood, D.R., Friedlander, A.M., Arias-
Gonzalez, J.E., Chabanet, P. et al. (2013). Global patterns and predictors
of tropical reef fish species richness. Ecography, 36, 1254–1262.van de Pol, M.V. & Wright, J. (2009). A simple method for distinguishing
within- versus between-subject effects using mixed models. Anim.
Behav., 77, 753–758.Polovina, J. (1984). Model of a coral reef ecosystem. Coral Reefs, 3, 1–11.Rummer, J.L., Couturier, C.S., Stecyk, J.A.W., Gardiner, N.M., Kinch,
J.P., Nilsson, G.E. et al. (2013). Life on the edge: thermal optima for
aerobic scope of equatorial reef fishes are close to current day
temperatures. Glob. Change Biol., 20, 1055–1066.Sandin, S.A., Smith, J.E., DeMartini, E.E., Dinsdale, E.A., Donner, S.D.,
Friedlander, A.M. et al. (2008). Baselines and degradation of coral
reefs in the northern Line Islands. PLoS ONE, 3, e1548.
Savage, V.M., Gillooly, J.F., Woodruff, W.H., West, G.B., Allen, A.P.,
Enquist, B.J. et al. (2004). The predominance of quarter-power scaling
in biology. Funct. Ecol., 18, 257–282.Schoolfield, R.M., Sharpe, P.J.H. & Magnuson, C.E. (1981). Non-linear
regression of biological temperature-dependent rate models based on
absolute reaction-rate theory. J. Theor. Biol., 88, 719–731.Selig, E.R., Casey, K.S. & Bruno, J.F. (2010). New insights into global
patterns of ocean temperature anomalies: implications for coral reef
health and management. Glob. Ecol. Biogeogr., 19, 397–411.Su, Y.-S. & Yajima, M. (2014). R2jags: A Package for Running jags from
R. R package version 0.04-01.
Trebilco, R., Baum, J.K., Salomon, A.K. & Dulvy, N.K. (2013).
Ecosystem ecology: size-based constraints on the pyramids of life.
Trends Ecol. Evol., 28, 423–431.Werry, J.M., Planes, S., Berumen, M.L., Lee, K.A., Braun, C.D. & Clua,
E. (2014). Reef-fidelity and migration of tiger sharks, Galeocerdo cuvier,
across the Coral Sea. PLoS ONE, 9, e83249.
Wilson, S.K., Adjeroud, M., Bellwood, D.R., Berumen, M.L., Booth, D.,
Bozec, Y.M. et al. (2010). Crucial knowledge gaps in current
understanding of climate change impacts on coral reef fishes. J. Exp.
Biol., 213, 894–900.Yvon-Durocher, G. & Allen, A.P. (2012). Linking community size
structure and ecosystem functioning using metabolic theory. Philos.
Trans. R. Soc. B, 367, 2998–3007.Yvon-Durocher, G., Caffrey, J.M., Cescatti, A., Dossena, M., del
Giorgio, P., Gasol, J.M. et al. (2012). Reconciling the temperature
dependence of respiration across timescales and ecosystem types.
Nature, 487, 472–476.Zuur, A.F., Ieno, E.N., Walker, N.J., Saveliev, A.A. & Smith, G.M.
(2009). Mixed Effects Models and Extensions in Ecology with R.
Springer, New York, p. 574.
SUPPORTING INFORMATION
Additional Supporting Information may be downloaded viathe online version of this article at Wiley Online Library(www.ecologyletters.com).
Editor, Boris WormManuscript received 15 January 2014First decision made 19 February 2014Manuscript accepted 12 May 2014
© 2014 John Wiley & Sons Ltd/CNRS
10 D. R. Barneche et al. Letter