Te Tokaroa Meola Reef intertidal reef ecological monitoring ...
44
Te Tokaroa Meola Reef Intertidal Reef Ecological Monitoring Programme: 2001 to 2017 Melissa M. Foley and Nicholas T. Shears March 2019 Technical Report 2019/004
-
Upload
khangminh22 -
Category
Documents
-
view
3 -
download
0
Transcript of Te Tokaroa Meola Reef intertidal reef ecological monitoring ...

Te Tokaroa Meola Reef Intertidal Reef Ecological Monitoring Programme: 2001 to 2017
Melissa M. Foley and Nicholas T. Shears March 2019 Technical Report 2019/004


Te Tokaroa Meola Reef intertidal reef ecological monitoring programme: 2001 to 2017 March 2019 Technical Report 2019/004
Melissa M. Foley Research and Evaluation Unit, Auckland Council
Nicholas T. Shears Institute of Marine Science, University of Auckland
Auckland Council Technical Report 2019/004
ISSN 2230-4525 (Print) ISSN 2230-4533 (Online)
ISBN 978-1-98-858984-8 (Print) ISBN 978-1-98-858985-5 (PDF)

This report has been peer reviewed by the Peer Review Panel.
Review completed on 8 March 2019 Reviewed by two reviewers
Approved for Auckland Council publication by:
Name: Eva McLaren
Position: Manager, Research and Evaluation (RIMU)
Name: Megan Carbines
Position: Manager, Air, Land and Biodiversity (RIMU)
Date: 8 March 2019
Recommended citation Foley, M. M. and N. T. Shears (2019). Te Tokaroa Meola Reef intertidal reef ecological monitoring programme: 2001 to 2017. Auckland Council technical report, TR2019/004
© 2019 Auckland Council
This publication is provided strictly subject to Auckland Council’s copyright and other intellectual property rights (if any) in the publication. Users of the publication may only access, reproduce and use the publication, in a secure digital medium or hard copy, for responsible genuine non-commercial purposes relating to personal, public service or educational purposes, provided that the publication is only ever accurately reproduced and proper attribution of its source, publication date and authorship is attached to any use or reproduction. This publication must not be used in any way for any commercial purpose without the prior written consent of Auckland Council.
Auckland Council does not give any warranty whatsoever, including without limitation, as to the availability, accuracy, completeness, currency or reliability of the information or data (including third party data) made available via the publication and expressly disclaim (to the maximum extent permitted in law) all liability for any damage or loss resulting from your use of, or reliance on the publication or the information and data provided via the publication. The publication, information, and data contained within it are provided on an "as is" basis.

Executive summary
Annual ecological surveys have been conducted at six sites on Te Tokaroa Meola Reef since 2001 by Auckland Council and the University of Auckland. At each site, we recorded the abundance of mobile macroinvertebrates, as well as estimated the per cent cover of sessile macroinvertebrates, macroalgae, and substrate type. This reef monitoring contributes to our regional state of the environment monitoring network. This report presents an update on the ecology of the reef and any changes detected in the community since 2001.
Between 2001 and 2017, oysters (Crassostrea gigas and Saccostrea glomerata) were the most abundant species found in our plots. While oysters are a relatively new foundation species for Te Tokaroa Meola Reef, they provide complex habitat for a host of other species. Abundance of oysters started to decline at the most seaward sites in 2012, which corresponded to a marked increase in the abundance of the predatory oyster borer snail (Haustrum scobina). The abundance of most macroinvertebrate and macroalgae species, as well as the overall community composition of our sites varied significantly in time and space.
The abundance of macroinvertebrates was cyclical, with peaks tending to occur during positive phases of the El Niño Southern Oscillation. Community composition at each site started to become less similar around 2011, mainly at sampling sites located farther into the Waitematā Harbour. The community composition at these sites was also more variable over time, and they were less similar to one another than sampling sites closer to the land. The greater variability in these communities is likely a result of dynamic water movement caused by tides and wind-driven waves, as well as their location on the shore with respect to mean low water. We also recorded an increase in sediment at most of our sites between 2001 and 2017, but the increase was most dramatic at sites on the western side of the peninsula.
Because the data are highly variable, it is difficult to detect significant trends in macroinvertebrate and macroalgal abundance over time. With the exception of the oyster borer snail and the red macroalgae Gelidium spp., we have seen sharp declines for most species since 2016. While these changes may be within the range of natural variability in the system, the community is likely being affected by multiple stressors, including increasing sediment deposition, high metal concentrations, and declining water quality in the upper Waitematā Harbour. Continued surveys that extend our long-term data set will allow us to analyse changes in community composition over time and space, as well as identify potential stressors that may be altering environmental conditions and intertidal communities. Continuing this monitoring is also important given the projected climate-related changes that are predicted to occur in the Auckland region over the next two generations.
Te Tokaroa Meola Reef intertidal reef ecological monitoring: 2001 to 2017 i

Table of contents
1.0 Introduction .................................................................................................................. 3
2.0 Methods....................................................................................................................... 6
2.1 Site locations ...................................................................................................... 6
2.2 Monitoring .......................................................................................................... 7
2.3 Statistical analyses ............................................................................................ 8
3.0 Results ...................................................................................................................... 10
3.1 Macroinvertebrate abundance and composition .............................................. 10
3.2 Cover of sessile macroinvertebrates, macroalgae, and substrate .................... 19
3.3 Oyster borer and oysters.................................................................................. 24
4.0 Discussion ................................................................................................................. 26
5.0 Recommendations for the monitoring programme .................................................... 29
6.0 References ................................................................................................................ 30
7.0 Appendix ................................................................................................................... 33
Intertidal macroinvertebrate counts ............................................................................... 33
Intertidal sessile macroinvertebrate, macroalgae, and substrate cover ......................... 37
Te Tokaroa Meola Reef intertidal reef ecological monitoring: 2001 to 2017 ii

1.0 Introduction
The Waitematā Harbour is a drowned river valley on the North Island of New Zealand and is surrounded by New Zealand’s largest city, Auckland. The harbour has been highly modified over time by human activities, including pollution, forestry, urbanisation, and fishing. Today, nearly 50 per cent of land use in the catchment is characterised as urban, with pastoral land and native forest making up a majority of the rest of the catchment at 26 per cent and 17 per cent of land area, respectively (Auckland Council, 2015). Due to its proximity to urban and industry influences, there are many potential sources of contaminants to the Waitematā Harbour. There are three main freshwater inputs into the harbour – Rangitopuni Stream, Henderson Creek, and Whau River – along with many stormwater outflow and wastewater overflow pipes, which are all potential sources of contaminants into the Waitematā Harbour (ARC, 2004; Green et al., 2004). The Port of Auckland is also located in the Waitematā Harbour and is one of New Zealand’s busiest ports. Because of the high amount of ship traffic, the Waitematā is a hotspot for non-indigenous species (Hayward, 1997) that have been transported on ship hulls or in ballast water. Of the over 300 non-indigenous species recorded in New Zealand (established and not established), more than 200 have been reported in the Auckland region, the highest number in the country (Inglis and Seaward, 2016). While many of these species do not become established in New Zealand, the ones that do often out-compete native species, potentially reducing biodiversity and altering ecosystems (Hayward, 1997). Because of the potential for ecological harm from contaminants, an extensive amount of long-term environmental monitoring has been conducted in the Waitematā Harbour. To measure the effects of contaminants and invasive species on the health of the harbour, the Research and Evaluation Unit (RIMU) at Auckland Council has been conducting long-term monitoring on a number of ecosystem components, including sediment chemistry, sediment contaminants, water quality, benthic soft sediment ecology, and intertidal and subtidal reef ecology. In addition, stream water quality and stream ecology sites are monitored at multiple locations within the catchment in order to assess the health and state of freshwater inputs that enter the Waitematā Harbour. Our state of the environment monitoring in these locations shows that water quality, habitat quality, and biodiversity are poor at many sites in the Waitematā catchment (Auckland Council, 2015). Estuary water quality is also poor at many sites in the Waitematā Harbour, particularly in the upper harbour, with water quality improving towards the entrance of the harbour (i.e., Chelsea) (Foley et al., 2018). The health of benthic communities tends to mirror sediment and water quality patterns, with poor health in the upper harbour and moderate health in the central harbour area (Auckland Council, 2015). As would be predicted based on the historical and current land uses around the Waitematā Harbour,
Te Tokaroa Meola Reef intertidal reef ecological monitoring: 2001 to 2017 3
there are elevated levels of metals and polycyclic aromatic hydrocarbons (PAHs) at nearly all of our sampling sites in the upper and central harbour (Auckland Council, 2015; HGF, 2017). Contaminant levels in the Waitematā Harbour are above thresholds for biological effects in many areas (Aguirre et al., 2016) and oyster and mussel tissue collected from the Waitematā Harbour have higher concentrations of metals (arsenic, cadmium, chromium, copper, lead, zinc) and other contaminants, including DDT, PCBs, PAHs, and pesticides (Stewart et al., 2013). While lead concentrations have decreased, copper and zinc concentrations are increasing at some sites. In the Waitematā, in particular, increasing levels of copper have been linked to the change in antifouling paint from tin-based products that were outlawed in 1988 to copper-based ones that are now used (Gadd and Cameron, 2012). There are also a number of emerging contaminants of concern, including pesticides, pharmaceuticals, and plastics that are now present and monitored in the harbour (Stewart et al., 2016). Te Tokaroa Meola Reef is a 28,000 year-old basalt volcanic flow that extends over two km into the central Waitematā Harbour. It is the largest and most conspicuous natural rocky reef system in the Waitematā Harbour, and it supports high biodiversity (Hayward et al., 1999) and a diverse range of habitats, including salt marsh, mangrove, rocky intertidal, and shallow subtidal. Mangroves populate the landward edge of the reef, while the outer reef is dominated by oysters in the intertidal and kelp in the subtidal. The hydrodynamics in the harbour are driven by semi-diurnal tides – two equal high and low tides each day – that flush the harbour with water from the Hauraki Gulf. The tidal exchange ranges between 1.9 and 2.9m (neap versus spring tides) and is important for the ecological communities because the tides brings larvae and nutrients to the reef that is otherwise sheltered from coastal waters. The intertidal community at Te Tokaroa Meola Reef has been monitored by Auckland Council since 2001 but researchers have been conducting surveys on the reef since the 1920s (Oliver, 1923). Long-term monitoring is critical to our understanding of how the biological community is changing, as well as identifying the likely drivers of change (Lindenmayer et al., 2012). Although land use patterns around the Waitematā Harbour are unlikely to change drastically from today’s state, continued human activity, as well as new activities and climate change (Pearce et al., 2018) have the potential to affect the biological communities on Te Tokaroa Meola Reef. It is only by having a long-term data record that we know what conditions are “normal” and what represents a departure from those conditions (Lindenmayer et al., 2012). Identifying changing conditions early is critical for preventing ecological tipping points from being crossed (Scheffer et al., 2009), as well as changing management strategies in a timely fashion so the ecosystem health of the Waitematā Harbour is not further compromised.
Te Tokaroa Meola Reef intertidal reef ecological monitoring: 2001 to 2017 4

The Te Tokaroa Meola Reef monitoring programme is an important component of the Waitematā Harbour state of the environment monitoring and was designed to:
• Measure trends in community composition change on the reef over time. • Contribute to and complement the regional intertidal monitoring network on the
east coast (not covered in this report). • Interpret community changes in the context of changes in environmental
variables, such as water quality, sedimentation, contaminants, and storm-and wastewater discharges.
This report presents monitoring results from 2001 to 2017, an addition of seven years of data since the last report (Shears, 2010). We present trends in abundance and spatial cover of individual species and overall community composition over this 16-year period.
Te Tokaroa Meola Reef intertidal reef ecological monitoring: 2001 to 2017 5

2.0 Methods
2.1 Site locations
Annual biological surveys were carried out at six intertidal sites, three on the eastern (IE1-IE3) and western (IW1-IW3) sides of the reef (Table 1, Figure 1). All sites have been surveyed since 2001, with the exception of E3 where sampling began in 2002. This site was added so there were an equal number of sites on the eastern and western sides of the reef. GPS positions reported here and in Shears (2010) differ from those reported in Ford and Pawley (2009). Because sites are permanently marked, it is likely that the actual site positions have remained constant over time and the discrepancies are due to more accurate GPS readings today. Table 1. Location of Te Tokaroa Meola Reef intertidal monitoring sites. GPS (WGS84) positions for intertidal sites taken at quadrat A at each site in October 2010. Wind fetch was calculated for each site by summing the distance to land for each 100 sector of the compass rose. Mean height above mean low water (MLW) for each site and the range in tidal height among plots within a site is taken from Ford and Pawley (2008).
Site Latitude Longitude Fetch (km) Mean height above MLW
(m)
Range in tidal height (m)
IE1 36° 50.826' S 174° 42.715' E 31.45 1.91 0.26
IE2 36° 50.778' S 174° 42.735' E 31.89 1.70 0.53
IE3 36° 50.556' S 174° 42.802' E 32.89 1.66 0.53
IW1 36° 50.949' S 174° 42.597' E 47.79 1.66 0.53
IW2 36° 50.688' S 174° 42.692' E 47.88 0.90 0.62
IW3 36° 50.562' S 174° 42.729' E 53.21 1.18 0.20
Intertidal sites on the western side of the reef are considerably more exposed to prevailing south-westerly winds and have a considerably higher fetch than sites on the eastern side of the reef (Table 1). Wind fetch also increases with distance offshore, such that the fetch at the most offshore western site (IW3) is more than one and half times that of the most inshore eastern site (IE1; Table 1). The effects of oceanic swells from the east are likely to be minimal at our sites because they are located in the inner reaches of the harbour. Thus, wind is the major source of wave generation and fetch is a reasonable metric for assessing wave exposure.
Te Tokaroa Meola Reef intertidal reef ecological monitoring: 2001 to 2017 6

Figure 1. Locations of intertidal monitoring sites at Te Tokaroa Meola Reef, Waitematā Harbour, New Zealand. The blue box encompasses Te Tokaroa Meola Reef; the yellow box encompasses the location of the intertidal sites. The star marks the location of the closest water quality monitoring site near the Chelsea sugar factory.
Intertidal sites were located in the mid- to upper-intertidal, ranging approximately one to two metres above mean low water (Table 1). Due to the slope of the reef, sites located farther offshore tended to be lower on the shore (i.e., closer to mean low water). There was also considerable variability in the height above mean low water within a single site (0.2 to 0.6 m; Table 1). Shore height and wave exposure are two major factors that influence the structure of intertidal communities (McQuaid and Branch, 1984; Stephenson and Stephenson, 1949) and likely reflects an important source of variation among sites on Te Tokaroa Meola Reef.
2.2 Monitoring
Intertidal surveys at Te Tokaroa Meola Reef were conducted between October and December every year. At each site, ten 0.25m2 permanent plots spaced approximately two to three metres apart were relocated and surveyed. Each plot was marked with two pegs that were cemented into the reef. Periodically these markers were vandalised or lost to the elements. If this occurred, maps and photos were used to determine the approximate location of the plot and it was remarked. The position of the permanent
Te Tokaroa Meola Reef intertidal reef ecological monitoring: 2001 to 2017 7

plots at each site has been consistent since 2009. However, due to loss of markers and previous changes in position, changes in species abundance and community composition at the quadrat level must be treated cautiously. Consequently, in this report we treat quadrats as random replicates through time and describe temporal and spatial patterns at the site level. Ford and Pawley (2008) provided a chronological synopsis of the methods used since the inception of the monitoring programme in 2001. Minor adjustments were made to the protocol in 2009 (Shears 2010) and sampling has been consistent since that time. Within each plot, per cent cover of sessile species and substrate were estimated, along with counts and measurements of macroinvertebrates (e.g., oysters). Per cent cover was estimated using a 50cm x 50cm quadrat divided into 10cm x 10cm squares, whereby each square represented four per cent of the plot. Cover types that were present in very small amounts were recorded as < 0.5 per cent. Counts and measurements of all macroinvertebrates in the quadrat were made by systematically working through each 10 x 10cm square. Highly abundant species were counted throughout the entire quadrat but only 100 individuals were measured. For oysters, 10 individuals per quadrat were measured, starting at the corner of the quadrat and working inwards. Prior reports have assumed all oysters were the Pacific oyster Crassostrea gigas based on early descriptions of changes on Te Tokaroa Meola Reef (Dromgoole and Foster 1983); however, Saccostrea glomerata were found in plots in 2018 (N. Shears pers. obs.). For the purposes of this report, oysters refers to both species.
2.3 Statistical analyses
We counted and measured the size of mobile macroinvertebrates and oysters to assess how their abundance, size, and assemblage changed over time at each site. We also estimated per cent cover of dominant sessile species (e.g., algae, barnacles and oysters) to assess changes in this community, as well as changes in non-biological cover groups, including bare rock and sediment. These last two cover groups are important for determining the health of the reef and identifying abiotic drivers that may be affecting the biological communities on the reef. We calculated yearly averages at each site and plotted abundance and cover over time to visualise changes in individual species and substrate types. We conducted multivariate analyses for each data set (abundance and cover) to explore patterns through time and among sites. In each case, these analyses were followed by univariate analyses on the dominant species or substrate types. Abundance and per cent cover data were log10(x+1) transformed prior to analysis to reduce the influence of highly abundant species. We excluded count data from 2002 and 2003 from our multivariate analyses because oyster counts were not done using the same technique
Te Tokaroa Meola Reef intertidal reef ecological monitoring: 2001 to 2017 8

as other years. We created resemblance matrices on the log-transformed data using Bray-Curtis similarity and then ran PERMANOVA (permutational multivariate analysis of variance) models to test for differences between sites (random) and years (fixed). We produced shade plots to visualise how individual species or substrate types differed across sites and years and used nMDS (nonmetric multidimensional scaling) ordination techniques to visualise how closely related community composition was across sites and years (sites more similar to each other plot closer together than sites less similar to each other). Finally, we ran univariate PERMANOVA models to test for differences between sites and years for the most abundant mobile and sessile species. All analyses were carried out in PRIMER v7 (Clarke and Gorley, 2015) with the PERMANOVA+ add-in (Anderson et al., 2008).
Te Tokaroa Meola Reef intertidal reef ecological monitoring: 2001 to 2017 9

3.0 Results
3.1 Macroinvertebrate abundance and composition
The presence and abundance of macroinvertebrates varied from 2001 to 2017 (Table 2, Figure 2). Changes in abundance were not linear for most species but rather cyclical with peaks in abundance between 2003 and 2004, 2009 and 2010, and 2013 and 2014 for many species (Figure 2). Oysters were the most abundant species in our plots, ranging from an average of 18 to 150 individuals per plot per year. Abundance was higher at the eastern sites than western sites throughout our sampling (Figure 2b). Abundance of oysters at IE3 and IW3 declined to nearly zero in 2014 and at IW2 in 2016 and has not recovered to previous levels. We first recorded Haustrum scobina (oyster borer; kaikai) in our plots in 2008. Abundance increased at most sites through 2017, particularly IE3 and IW3 (Figure 2d). We also recorded the presence of Musculista senhousia (Asian date mussel) and Mytilus galloprovincialis (Mediterranean mussel; kuku) for the first time between 2008 and 2010, respectively (Table 2). The abundances of these two species increased until 2012 and then declined through 2017. The rest of the species encountered in our plots had low abundances throughout our monitoring timeframe (Table 2).
For the univariate (single species) PERMANOVA analyses, year, site, and year x site were significant for all dominant species except Lunella smaragdus and Zeacumantus lutulentus (Appendix tables A1-A10). For Lunella and Zeacumantus, site and year x site were significant (Appendix tables A6, A10), but year was not significant. The site term also explained the highest proportion of variability in abundance for all dominant species in our plots.
Te Tokaroa Meola Reef intertidal reef ecological monitoring: 2001 to 2017 10

Tabl
e 2.
Ave
rage
abu
ndan
ce o
f dom
inan
t mac
roin
vert
ebra
tes
per p
lot (
0.25
m2 ) b
y sp
ecie
s an
d ye
ar. *
Roc
k oy
ster
s w
ere
assu
med
to p
redo
min
antly
be
Cra
ssos
trea
gig
as a
nd w
ere
reco
rded
as
such
thro
ugho
ut th
e m
onito
ring
prog
ram
me.
H
owev
er, r
ecen
t evi
denc
e su
gges
ts th
at th
e na
tive
oyst
er S
acco
stre
a gl
omer
ata
is p
rese
nt a
nd in
clud
ed in
thes
e co
ver
estim
ates
at s
ome
site
s.
Spec
ies
2001
20
02
2003
20
04
2005
20
06
2007
20
08
2009
20
10
2011
20
12
2013
20
14
2015
20
16
2017
Acan
thoc
hito
n ze
alan
dicu
s 0.
03
0.02
0.
3 0.
05
0.02
0
0 0
0.2
0.1
0.2
0 0.
2 0.
1 0.
02
0.03
0
Anth
ople
ura
aure
orad
iata
10
.1
8.3
10.0
24
.2
8.2
10.1
9.
7 15
.5
18.6
14
.1
30.3
17
.4
18.9
12
.8
9.9
15.7
19
.1
Asci
diac
ea (s
olita
ry)
0 0
0 0.
03
0.03
0
0 0.
2 0.
03
0.07
0.
4 0
0.02
0.
1 0.
2 0.
1 0.
08
Com
inel
la a
dspe
rsa
0.2
0.1
0.02
0.
1 0
0.1
0.1
0.05
0.
07
0.3
0.1
0.02
0.
03
0 0.
1 0
0
Com
inel
la g
land
iform
is 0.
8 0.
03
0.5
0.6
0.3
0.8
0.4
0.1
0.08
0.
07
0.02
0
0.05
0.
1 0.
02
0.1
0.07
Com
inel
la v
irgat
a 0
0 0
0.03
0
0.07
0
0.07
0.
02
0.2
0.05
0.
3 0.
2 0.
1 0.
05
0.08
0
Cras
sost
rea
giga
s*
104.
9 -
- 12
6.7
127.
4 12
7.9
123.
7 13
5 15
0.1
107.
7 83
.2
106.
8 10
2.9
77.5
70
.5
63.0
70
.9
Diad
umen
e lin
eata
0
0 0
0.5
0.7
1.5
0.4
1.0
1.1
0.8
0.6
0.02
0.
5 0.
2 0.
6 1.
2 0.
2
Dilo
ma
aeth
iops
7.
3 4.
8 6.
6 6.
9 4.
0 5.
2 5.
1 5.
1 4.
4 4.
0 6.
0 9.
9 7.
3 8.
5 8.
3 6.
6 2.
9
Dilo
ma
subr
ostr
ata
0.8
0.5
0.4
0 0.
02
0.2
0.2
0.07
0.
07
0.02
0
0.1
0.1
0 0
0 0.
02
Haus
trum
scob
ina
0 0
0 0
0 0
0 0.
02
0 0
0.3
0.4
1.7
3.8
6.0
5.9
7.0
Lune
lla sm
arag
dus
4.7
6.5
10.3
4.
3 2.
6 3.
8 3.
6 3.
7 6.
0 6.
5 6.
1 3.
4 3.
4 3.
6 6.
9 6.
8 4.
3
Mus
culis
ta se
nhou
sia
0 0
0.07
0
0 0
0 0
0 0.
4 0.
1 1.
3 0.
8 0.
1 0.
08
0.02
0.
02
Myt
ilus g
allo
prov
inci
alis
0 0
0 0
0 0
0 0.
02
0 0
0.02
0.
4 0.
2 0.
2 0.
2 0.
03
0
Onc
hide
lla n
igric
ans
1.7
1.3
3.5
1.7
0.6
2.0
2.3
2.8
6.3
0.7
1.2
0.9
3.0
0.7
0.5
0.6
0.9
Spiro
bran
chus
carin
iferu
s 0
0 0
0 0
0 0
0 0.
05
0.08
0.
9 0
0 0
0 0
0
Syph
aroc
hito
n pe
llise
rpen
tis
5.3
4.7
8.7
10.9
4.
7 7.
7 6.
4 5.
8 8.
6 10
.2
12.6
6.
8 6.
0 5.
8 5.
0 5.
9 3.
5
Xeno
stro
bus p
ulex
0.
7 1.
8 6.
3 12
.4
7.8
7.4
4.1
2.8
5.6
26.3
3.
3 68
.5
425.
0 15
.3
14.8
5.
6 0.
1
Zeac
uman
tus l
utul
entu
s 5.
3 2.
7 4.
1 7.
9 2.
9 5.
9 2.
2 2.
8 2.
5 4.
5 6.
0 4.
8 4.
2 1.
3 0.
2 0.
2 0.
9
Te T
okar
oa M
eola
Ree
f int
ertid
al re
ef e
colo
gica
l mon
itorin
g: 2
001
to 2
017
11
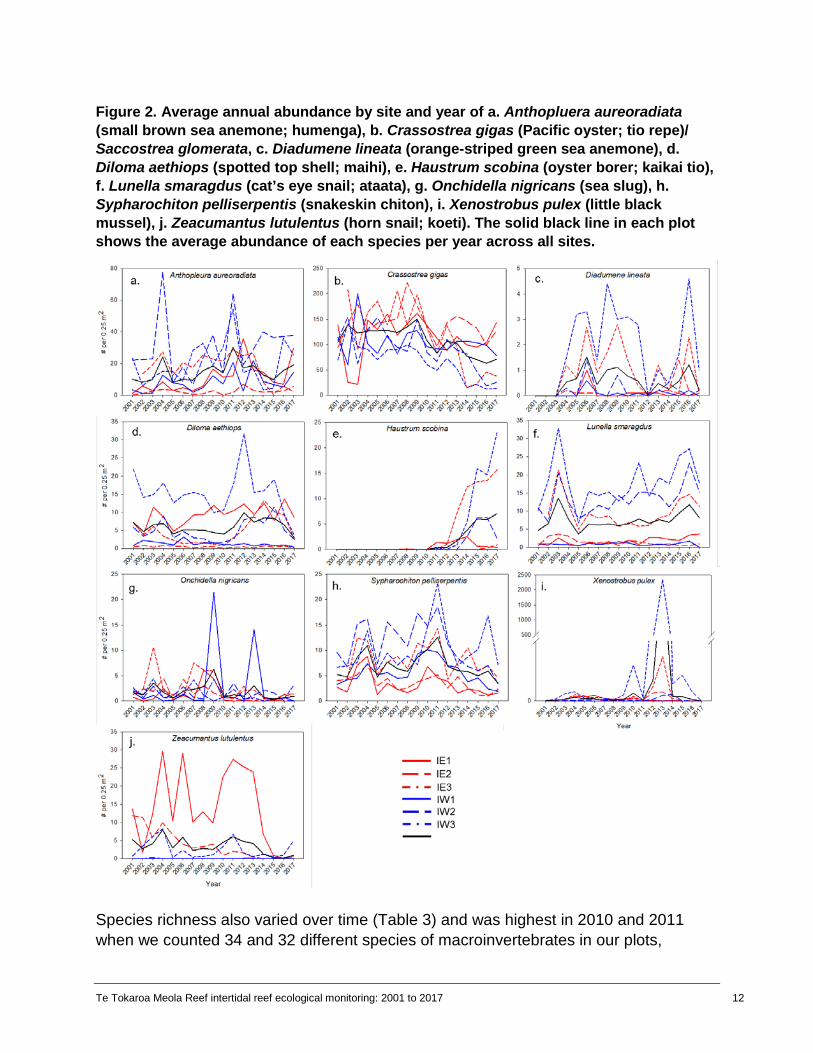
Figure 2. Average annual abundance by site and year of a. Anthopluera aureoradiata (small brown sea anemone; humenga), b. Crassostrea gigas (Pacific oyster; tio repe)/ Saccostrea glomerata, c. Diadumene lineata (orange-striped green sea anemone), d. Diloma aethiops (spotted top shell; maihi), e. Haustrum scobina (oyster borer; kaikai tio), f. Lunella smaragdus (cat’s eye snail; ataata), g. Onchidella nigricans (sea slug), h.Sypharochiton pelliserpentis (snakeskin chiton), i. Xenostrobus pulex (little black mussel), j. Zeacumantus lutulentus (horn snail; koeti). The solid black line in each plot shows the average abundance of each species per year across all sites.
Species richness also varied over time (Table 3) and was highest in 2010 and 2011 when we counted 34 and 32 different species of macroinvertebrates in our plots,
Te Tokaroa Meola Reef intertidal reef ecological monitoring: 2001 to 2017 12

respectively. The number of unique species was higher in the western plots than eastern plots two-thirds of the time. In the eastern plots, richness was consistently lower in IE2 than either IE1 or IE3. In all years but 2014, richness in the western plots was highest in IW3, the most exposed site. Macroinvertebrate composition at the community level varied across sites and years (Figure 3). IE1, IE2, and IW1 were less variable over time than IE3, IW2, and IW3 based on the spread of points in the nMDS ordination (Figure 3). The PERMANOVA showed that the individual effects of site and year were statistically significant (P < 0.001), along with the interaction between site and year (Table 4). The significant interaction between site and year means that community composition changed differently at each site over time. Figure 3. nMDS ordination based on Bray-Curtis resemblance on log10(x+1) transformed data showing the relationship between macroinvertebrate community composition across sites and years (2001, and 2004 to 2017). Points closer together are more similar to one another than points farther away from each other.
Te Tokaroa Meola Reef intertidal reef ecological monitoring: 2001 to 2017 13

Tabl
e 3.
Mac
roin
vert
ebra
te s
peci
es ri
chne
ss (n
umbe
r of u
niqu
e sp
ecie
s) a
t eac
h si
te, s
ide
of re
ef (e
ast o
r wes
t), a
nd a
cros
s al
l site
s by
sam
plin
g ye
ar. T
otal
s fo
r eas
t, w
est,
and
all s
ites
are
not a
dditi
ve b
ecau
se th
ere
coul
d be
ove
rlaps
in s
peci
es
betw
een
the
site
s. O
nly
the
num
ber o
f uni
que
spec
ies
is re
port
ed fo
r site
, sid
e, a
nd re
ef.
Site
20
01
2002
20
03
2004
20
05
2006
20
07
2008
20
09
2010
20
11
2012
20
13
2014
20
15
2016
20
17
IE1
11
9 14
11
9
11
12
12
10
16
12
18
12
11
12
12
14
IE2
10
12
10
10
11
12
11
10
9 9
10
11
9 10
8
10
11
IE3
NA
10
10
13
9 11
10
10
14
15
16
15
17
19
15
14
12
Ea
st
11
13
16
15
12
15
15
16
18
23
22
22
20
23
19
19
19
IW1
7 6
7 6
8 7
9 8
9 12
9
7 13
8
6 9
6 IW
2 9
6 11
15
10
9
10
11
14
10
17
13
17
18
13
12
10
IW3
11
13
11
18
10
12
10
15
13
22
20
14
19
15
15
18
15
Wes
t 13
13
12
21
12
13
12
18
19
28
25
18
26
20
17
21
18
To
tal
14
16
17
21
14
16
15
22
24
34
32
27
29
26
22
24
23
Tabl
e 4.
PER
MAN
OVA
resu
lts fo
r abu
ndan
ce d
ata
from
200
3 to
201
7, u
sing
par
tial s
ums
of s
quar
es a
nd p
erm
utat
ion
of
resi
dual
s un
der a
redu
ced
mod
el fo
r yea
r (fix
ed),
site
(ran
dom
), an
d ye
ar x
site
. df =
den
omin
ator
deg
rees
of f
reed
om, P
erm
=
tota
l num
ber o
f uni
que
poss
ible
per
mut
atio
ns, E
CV
= sq
uare
root
of t
he e
stim
ate
of c
ompo
nent
s of
var
iatio
n in
the
mod
el,
akin
to s
tand
ard
devi
atio
n in
uni
varia
te a
naly
ses.
Psu
edo-
F va
lues
are
the
mul
tivar
iate
ana
log
to th
e un
ivar
iate
F s
tatis
tic. P
va
lues
are
bas
ed o
n pe
rmut
atio
ns.
Fact
or
df
SS (I
II)
ECV
Psue
do-F
Pe
rm
P Ye
ar
14
8128
8 75
.15
4.07
99
6 0.
001
Site
5
2418
70
332.
06
144.
27
997
0.00
1 Ye
ar x
site
69
98
811
111.
52
4.27
99
7 0.
001
Res
idua
l 78
6 26
3540
33
5.3
Te
Tok
aroa
Meo
la R
eef i
nter
tidal
reef
eco
logi
cal m
onito
ring:
200
1 to
201
7 1
4

At the eastern sites, sites IE1 and IE2 were less variable and more similar to each other than IE3. At IE1 and IE2, there was a shift in macroinvertebrate community composition in 2015 that continued through 2017 (Figure 4a). At IE3, community composition changed in 2011 and continued to change substantially every year until 2017 (Figure 4a). At the eastern sites, abundance of oysters declined in 2014 (Figures 2b, 5a), and abundance of Xenostrobus and Zeacumantus also declined from 2015 (Figures 2i, 2j, 5a), driving some of the changes in community similarity between years. Some species, such as Cominella glandiformis were nearly lost from the east plots by 2008, while Haustrum scobina was encountered for the first time at the eastern sites in 2008 and abundance increased through 2017 (Figure 4a, Figure 5d).
At the western sites (IW1-IW3), macroinvertebrate community composition was distinct at each site (Figure 4b). Composition at IW1 changed very little over time, with the exception of 2009 and 2017. IW2 and IW3 also changed in 2009 but the communities at these sites did not return to their former state; they continued to change significantly through 2017, resulting in IW2 and IW3 being more similar to each other in 2017 than they were in 2001 when monitoring began (Figure 4b). The change at the western sites in 2009 was driven by changes in multiple species, including an increase in Anthopleura (Figures 2a, 5b), Diloma aethiops (Figure 2d, 5b), Sypharochiton (Figure 2h, 5b), and Xenostrobus (Figure 2i, 5b). The abundance of oysters started decreasing in 2014, likely driving some of the continued changes in community composition through 2017 (Figures 2b, 5b). Haustrum scobina appeared in the western plots in 2011 and was most abundant in 2017 (Figures 2d, 5b).
The similarity of the macroinvertebrate community at each site decreased over time except at IW1 (Figure 6a). Most sites remained between 80 to 90 per cent similar until 2010 when similarity started to decline. In 2017, most sites were between 60 to 75 per cent similar to their state in 2004 (Figure 6a).
Te Tokaroa Meola Reef intertidal reef ecological monitoring: 2001 to 2017 15

Figure 4. nMDS ordination showing the relationship between macroinvertebrate community composition for the east (a) and west (b) sites across years, including 2001 and 2004 to 2017. Points closer together are more similar to one another than points far away from each other. Points that deviate from the groups are marked with years and with a trajectory showing change over time.
Te Tokaroa Meola Reef intertidal reef ecological monitoring: 2001 to 2017 16

Figu
re 5
. Sha
de p
lot o
f abu
ndan
ce d
ata
(log 1
0(x+1
) tra
nsfo
rmed
) by
year
(200
1, 2
004
to 2
017)
, at (
a) e
ast s
ites
and
(b) w
est
site
s.
Te
Tok
aroa
Meo
la R
eef i
nter
tidal
reef
eco
logi
cal m
onito
ring:
200
1 to
201
7 1
7

Figure 6. Bray-Curtis similarity of each site to itself in 2004 for (a) abundance and (b) cover.
Te Tokaroa Meola Reef intertidal reef ecological monitoring: 2001 to 2017 18

3.2 Cover of sessile macroinvertebrates, macroalgae, and substrate
The major space occupiers in our plots were oysters, bare rock, and sediment (Table 4). Cover of oysters and sediment tended to be higher at the eastern sites, while bare rock cover was generally higher at the western sites (Figure 7). Oysters occupied between 40 and 53 per cent of space; bare rock ranged from 14 to 35 per cent; and sediment ranged from 8 to 27 per cent (Table 4). Many species were infrequent and were present in small amounts (Table 4). There was a lot of variability in cover estimates over time, but oysters and bare rock declined in many of our plots over time (Figures 7b 7c). Similar to macroinvertebrates, Gelidium cover peaked in 2002 and 2008; in 2016 it peaked at IW2 and has been steeply increasing at all sites since 2015 (Table 5, Figure 7d). Sediment was relatively steady between 2002 and 2011, but it has been increasing since then, particularly in the western plots in 2016 and 2017 (Figure 7e). For the univariate analyses (single cover type), year, site, and year x site were significant for all cover types (Appendix table A11-A15). Variability in the cover of bare rock and oysters were best explained by the year x site interaction (Appendix tables A11, A13), while the variability in barnacles, Gelidium, and sediment cover were best explained by sites differences (Appendix tables A12, A14, A15).
Te Tokaroa Meola Reef intertidal reef ecological monitoring: 2001 to 2017 19

Tabl
e 5.
Ave
rage
per
cen
t cov
er b
y sp
ecie
s an
d ye
ar fo
r ses
sile
spe
cies
and
sub
stra
te ty
pe. *
Roc
k oy
ster
s w
ere
assu
med
to
pred
omin
antly
be
the
Paci
fic o
yste
r Cra
ssos
trea
gig
as a
nd w
ere
reco
rded
as
such
thro
ugho
ut th
e m
onito
ring
prog
ram
me.
How
ever
, re
cent
evi
denc
e su
gges
ts th
at th
e na
tive
oyst
er S
acco
stre
a gl
omer
ata
is p
rese
nt a
nd in
clud
ed in
thes
e co
ver e
stim
ates
at s
ome
site
s.
Spec
ies
2001
20
02
2003
20
04
2005
20
06
2007
20
08
2009
20
10
2011
20
12
2013
20
14
2015
20
16
2017
Apop
hlae
a sp
p.
0 0
0 0
0 0
0 0
0 0
0 0
0.2
0.05
0
0 0
Asci
diac
ea (s
olita
ry)
0 0
0 0
0 0
0 0
0 0
0 0.
07
0.1
0 0
0 0
Bare
rock
29
.7
27.4
31
.3
35.2
34
.7
28.3
27
.8
33.4
21
.4
24.1
30
.4
24.3
23
.6
29.3
27
.0
23.2
13
.6
Aust
rom
iniu
s mod
estu
s 4.
9 3.
1 0.
7 2.
6 2.
5 7.
2 2.
8 1.
4 3.
3 4.
3 4.
0 4.
1 2.
1 6.
7 12
.7
7.2
5.3
Blac
k en
crus
ting
alga
e 0
0 0
0 0
0 0
0 0
0 0
0 0
0 0.
02
0 0
Carp
ophy
llum
m
asch
aloc
arpu
m
0 0
0 0.
03
0 0
0 0
0 0
0 0
0 0
0 0
0
Clad
opho
ra sp
p.
0 0
0 0
0 0
0 0
0.02
0.
03
0.07
0.
01
0.09
0.
3 0.
3 0.
1 0
Colp
omen
ia sp
p.
0 0
0 0
0 0
0 0
0 0
0 0
0.01
0.
02
0.03
0
0.05
Co
ralli
na o
ffici
nalis
0.
2 0.
07
0 0.
1 0.
3 0.
1 0.
08
0.2
0.1
0.6
0.2
0.1
0.3
0.2
0.3
0.2
0.1
Cras
sost
rea
giga
s*
39.9
51
.6
50.8
44
.6
46.5
46
.2
47.8
41
.8
52.7
50
.2
44.8
41
.0
41.4
36
.2
29.9
32
.3
32.9
Cr
usto
se c
oral
line
alga
e 0
0 0
0 0
0 0
0 0.
1 0.
5 0.
08
0.1
0.3
0.05
0.
1 0.
06
0 En
crus
ting
spon
ge
0 0
0 0
0 0
0 0
0 0
0 0.
03
0.05
0.
02
0 0
0 Ge
lidiu
m sp
p.
7.3
7.3
9.0
5.0
3.2
5.8
8.0
10.4
7.
0 6.
7 8.
1 8.
1 8.
4 7.
4 7.
2 12
.7
17.9
Gr
een
filam
ent
0 0
0 0
0 0
0 0
0 0
0 0
0 0
0 0
0.03
Ho
rmos
ira b
anks
ii 0.
3 0.
02
0.05
0
0 0
0 0.
01
0 0.
03
0 0.
1 0.
06
0.2
0.2
0.09
0.
2 Sp
irobr
anch
us c
arin
iferu
s 0
0 0
0 0
0 0
0 0.
01
0.1
0.02
0.
1 0.
09
0.1
0 0
0 Ra
lfsia
spp.
0
0 0
0.02
0
0 0
0 0.
1 0.
1 0
0 0
0 0
0 0.
03
Scyt
otha
mnu
s aus
tral
is 0.
7 0.
8 0
0.6
0.5
0.3
1.0
0.6
0.2
0.5
0.1
0.09
0.
8 0.
8 0.
7 0.
8 1.
4 Se
dim
ent
16.5
8.
7 8.
2 11
.8
11.9
11
.8
11.2
10
.5
13.5
10
.3
7.9
14.5
12
.0
14.1
16
.3
21.9
26
.8
Shel
l 0.
5 0.
8 0
0 0.
3 0.
3 1.
2 1.
7 1.
5 2.
3 4.
3 5.
2 6.
5 4.
5 4.
6 1.
5 0.
1 Sy
phar
ochi
ton
pelli
serp
entis
0
0 0
0 0
0 0
0 0
0 0
0 0
0 0
0 0.
05
Tere
belli
dae
0 0
0 0
0 0
0 0
0 0
0 0.
01
0 0
0 0
0 U
lva
spp.
0
0.13
0
0.02
0
0 0
0 0
0.05
0
0.07
0.
60
0 0
0 0.
03
Wat
ersip
ora
spp.
0
0 0
0 0
0 0
0 0
0 0
0 0.
07
0 0
0 0
Xeno
stro
bus p
ulex
0.
2 0.
2 0.
4 0.
6 0.
3 0.
2 0.
1 0.
09
0.2
0.9
0.1
2.4
5.3
0.6
0.6
0.2
0.05
Te T
okar
oa M
eola
Ree
f int
ertid
al re
ef e
colo
gica
l mon
itorin
g: 2
001
to 2
017
20

Figure 7. Average per cent cover by year and site: (a) Austrominius modestus (barnacle, tiotio), (b) bare rock, (c) Crassostrea gigas (Pacific oyster, tio repe)/Saccostrea glomerata, (d) Gelidium spp. (red turf algae), and (e) sediment. The solid black line in each plot shows the average per cent cover per year across all sites.
The overall composition of sessile species and substrate types varied significantly by site and year, and the interaction between the two factors was also significant (Table 6). The amount of overall variation in cover types at east and west sites was similar, but much of that variation was driven by IE3 and IW3 (Figure 8). At the eastern sites, IE1 remained the most similar from 2001 to 2017 (Figure 9a). IE3, on the other hand,
Te Tokaroa Meola Reef intertidal reef ecological monitoring: 2001 to 2017 21

was relatively stable until 2010 (points all relatively close together) after which community composition became highly variable from year to year and deviated from the composition recorded from 2002 to 2010 (points far away). The community composition at IE2 was relatively stable until 2013 when composition deviated and became more variable. The deviation and variability at IE2 was less than IE3, as evidenced by the distance between points (Figure 9a). At the western sites, composition of cover types at IW1 was relatively consistent through time (Figure 9b). IW2 became more variable in 2013, while IW3 started to diverge in 2012 and again in 2016 (Figure 9b). Table 6. PERMANOVA results for cover data, using partial sums of squares and permutation of residuals under a reduced model for year (fixed), site (random), and year x site. df = denominator degrees of freedom, Perm = total number of unique possible permutations, ECV = square root of the estimate of components of variation in the model, akin to standard deviation in univariate analyses. Psuedo-F values are the multivariate analog to the univariate F statistic. P values are based on permutations.
Factor df SS (III) ECV Psuedo-F Perm P Year 16 84751 8.72 6.26 996 0.001 Site 5 144760 13.21 138.48 998 0.001 Year x site 79 67015 8.05 4.06 997 0.001 Residual 894 186900 14.45
Figure 8. nMDS plot of average per cent cover of sessile macroinvertebrates, algae, and substrate per plot from 2001 to 2017.
Te Tokaroa Meola Reef intertidal reef ecological monitoring: 2001 to 2017 22

Figure 9. nMDS ordination showing the similarity in per cent cover community composition for the (a) east and (b) west sites across years. Points closer together are more similar to one another than points far away from each other. Points that deviate from the group are marked with years and a trajectory showing change over time.
At the eastern sites, 2011 marked the start of a slight decline in oysters at IE2 and an increase in sediment at IE3, as well as an increase in shell debris (Figures 7c, 7e, 10a). At the western sites, the composition changes in 2012 and 2013 at IW2 and IW3 correspond to increases in Gelidum spp., sediment, and shell debris in the plots (Figures 7d, 7e, 10b). The large changes at IW2 and IW3 in 2016 are likely attributable to an exponential increase in sediment at those sites that continued into 2017 (Figures 7e, 10b).
Te Tokaroa Meola Reef intertidal reef ecological monitoring: 2001 to 2017 23

Figure 10. Shade plot of cover data (log10(x+1) transformed) by year, comparing east sites (a) and west sites (b).
Sessile and substrate cover composition also decreased in similarity between 2004 and 2017 (Figure 6b). The decrease in similarity for cover was less than abundance for some sites, but the similarity at IE3, IW2 and IW3 decreased to 65 to 75 per cent in 2017 compared to their original composition in 2004.
3.3 Oyster borer (Haustrum scobina) and oysters (Crassostrea gigas/Saccostrea glomerata)
The oyster borer, Haustrum scobina, was first documented at our sites in 2008 and was consistently present starting in 2010 (Table 2, Figure 5). At the outer sites on each side of Te Tokaroa Meola Reef (IE3 and IW3), abundance increased quickly, reaching an average of 15 to 20 individuals per plot by 2017 (Figure 2d). Haustrum was much less abundant at the inner sites, reaching a maximum average of five individuals per plot at IW2. Haustrum is a predatory snail that primarily feeds on barnacles and shellfish, including oysters. As the abundance of Haustrum increased at some of our sites, we saw a shift in the dominant cover (Figure 11). In particular, we saw a sharp decrease in oyster cover at IE3, IW2, and IW3 between 2014 and 2015. We did not see a similar decline at our other sites where Haustrum was present in low abundances (IE1, IE2, IW1; Figure 11). Because our surveys are only conducted once a year, it is not possible to determine if the decline in oysters was caused by the increase in Haustrum or if additional factors were at play. For instance, oyster abundance had been slowly decreasing at IE3, IW2, and IW3 prior to the increase in Haustrum. In addition, we saw increased sediment cover at IW2 and IW3 that also coincided with the decrease in oyster cover. At sites where oyster cover decreased, bare rock, sediment, and Gelidium tended to be the replacement cover types (Figure 11).
Te Tokaroa Meola Reef intertidal reef ecological monitoring: 2001 to 2017 24

Figure 11. Change in average abundance (per 0.25 m2) of Haustrum scobina and average per cent cover of Crassostrea gigas/Saccostrea glomerata, sediment, bare rock, and Gelidium spp. between 2001 and 2017 at each site.
Te Tokaroa Meola Reef intertidal reef ecological monitoring: 2001 to 2017 25

4.0 Discussion
There were significant changes in the mobile and sessile macroinvertebrate species and substrate types at our Te Tokaroa Meola Reef sites between 2001 and 2017. These changes were varied, however, and many were not directional. There was a significant site by year interaction for abundance and cover metrics, suggesting that there was not a clear driver of ecosystem change that affected all sites equally at the same time. Site tended to explain the highest proportion of variance in macroinvertebrate abundance and cover of sessile species and substrate types. This was likely due to the range of conditions sites experienced along the length of the Te Tokaroa Meola Reef peninsula with variation in wave exposure (western sites more exposed than eastern sites), height on the shore (lower at western sites), tide height variability within a site, and distance into the harbour (IE3 and IW3 most distant sites from land) (Table 1). Oysters dominated the rocky intertidal on Te Tokaroa Meola Reef and these have been recorded as the Pacific oyster, Crassostrea gigas, since the monitoring programme began (Ford and Pawley, 2009). Crassostrea was introduced to New Zealand from Japan in the early to late 1960s and first documented in the Auckland region in 1970 (Dinamani, 1971). The introduction of Crassostrea drastically changed the habitat structure of Te Tokaroa Meola Reef (Dromgoole and Foster, 1983; Hayward, 1997). Prior to the invasion of Crassostrea, the reef was dominated by stands of Spirobranchus cariniferus (previously Pomatoceros), a calcareous tube worm (Dromgoole and Foster, 1983). Although complex in structure, the tube worm beds likely did not facilitate the settlement and survival of other species to the same degree as Crassostrea. While the complex structure of the oyster reef may benefit native species, it is likely to also benefit invasive species. The native rock oyster Saccostrea glomerata is still common on Te Tokaroa Meola Reef (N. Shears pers. obs., September 2018) and more careful inspection is needed to determine the relative abundance of the two species at the sampling sites. Additional non-native species, including Musculista senhousia, Mytilus galloprovincialis, and Diadumene lineata were introduced to New Zealand in the late 1900s (Creese et al., 1997; Dromgoole and Foster, 1983). While these species appear to be established at our sites on Te Tokaroa Meola Reef, their abundance has not significantly increased over time (Table 2). We don’t know why these non-native species have not become dominant organisms on Te Tokaroa Meola Reef like Crassastrea. Invasion success is difficult to predict and is influenced by a number of factors (Carlston, 1996). Te Tokaroa Meola Reef is the closest rocky reef to the Port of Auckland, the busiest international port in New Zealand, where the potential for arrival of invasive species on boats and in ballast water is high (Inglis and Seaward, 2016). Habitat conditions at Te Tokaroa Meola Reef are likely to not be suitable for all non-native species that arrive, and the composition of the existing community may prevent species from establishing and proliferating (Fridley et al., 2007).
Te Tokaroa Meola Reef intertidal reef ecological monitoring: 2001 to 2017 26

We first recorded Haustrum scobina, the oyster borer snail in our plots in 2008. Abundance increased at most sites until 2015, and continued to increase rapidly through 2017 at the two outermost sites (IE3 and IW3). Work by Jones (1992) and Scott (1993) showed that H. scobina was one of many neogastropod species sensitive to tri-butyl tin (TBT), an active biocide in antifouling paint used frequently on boats in the Waitematā Harbour. TBT is thought to have led to large declines in H. scobina populations and other whelks in the Waitematā Harbour (Hayward et al., 1997). TBT use was restricted in New Zealand starting in 1989 and banned outright in 2003. However, TBT can accumulate in sediment and remain in the ecosystem long after use ceases (Maguire, 2000). It is possible it took nearly twenty years after the start of TBT regulation for H. scobina to recover from TBT exposure. There are still many other heavy metals and poly-aromatic hydrocarbons (PAHs) present in the sediment around Te Tokaroa Meola Reef that are at levels above thresholds for biological effects (Aguirre et al., 2016), which may have contributed to the slow return of H. scobina at our sites. However, recent research has demonstrated reduced occurrence of TBT-induced imposex in H. scobina in the Waitematā Harbour (Jones and Ross, 2018), which may be contributing to the increase in abundance.
Abundance of many macroinvertebrate species followed a cyclical pattern at our sites with three peaks in abundance between 2001 and 2017: 2002-2003, 2009-2010, and 2015 (Figures 2 and 7). These peaks in abundance overlap with El Niño Southern Oscillation conditions that were present in 2002, 2004, 2009, and 2015. During El Niño conditions, sea surface temperature around New Zealand tends to be cooler than normal (Greig et al., 1988) and less rain falls on the northern North Island than during La Niña conditions (Salinger and Mullan, 1999). Cooler water and less rainfall could result in less thermal stress and lower freshwater discharge, which may indirectly reduce the number and concentration of pollutants (including sediment) to which organisms are exposed. Variability in recruitment, ocean currents, and/or wind patterns may have also contributed to variability in abundance.
Macroinvertebrate community assemblages were also variable over time. In general, sites IE1, IE2, and IW1 were less variable and most similar to themselves (Figure 3), whereas sites IE3, IW2, and IW3 were more variable (i.e., larger spread of points in nMDS ordination plot) and overlapped with each other (Figure 3). Sites IE1, IE2, and IW1 were closer to land and located at roughly similar tide heights. These were the three least diverse sites as well, with consistently lower species richness than the other three sites, which could explain why they are less variable than the other sites. IE3, IW2, and IW3, on the other hand, were farther into the harbour, and the western sites were more exposed than the eastern sites.
The community composition of sessile species and substrate types was more closely related between IE1, IE2, and IW1 than macroinvertebrate communities (Figure 8). Similar to the macroinvertebrate community, sites IE3, IW2, and IW3 were highly variable and consistently different from one another and the other three sites throughout the duration of the study, suggesting that hydrodynamics and location on the shore are likely driving differences in assemblages at these sites.
Te Tokaroa Meola Reef intertidal reef ecological monitoring: 2001 to 2017 27

We did not collect any accompanying environmental data between 2013 and 2017 at Te Tokaroa Meola Reef. The relationships found in previous reports between community composition and climatic variables and sedimentation are likely to still be important in shaping community composition (Ford and Pawley, 2009; Shears, 2010). A recent trend analysis on water quality in the Waitematā Harbour showed that water quality improved over much of this study period, but recent increases in suspended sediment and nutrients are driving a decrease in water quality (Foley et al., 2018). Sediment contaminant samples show the area to still be highly contaminated with heavy metals (Mills et al., 2012), and benthic ecology studies show an increase in the amount of fine sediment and mud depositing near Te Tokaroa Meola Reef (Townsend et al., 2010). There has also been an increase in seagrass cover from one ha to greater than 40ha near Te Tokaroa Meola Reef. The increase in seagrass habitat was accompanied by a change in macroinvertebrate composition and abundance (Lundquist et al., 2018). Although there is little overlap between species in seagrass and rocky intertidal habitats, increased habitat diversity could help facilitate species movements from outer Gulf locations into the Waitematā.
Because species and community composition data are highly variable at Te Tokaroa Meola Reef, we were not able to detect significant trends in macroinvertebrate and macroalgal abundance over time. However, since 2015, we have seen sharp declines in the abundance or cover of many macroinvertebrate and macroalgal species, which is cause for concern. While these changes may be within the range of natural variability in the system, the community is also likely being affected by a combination of multiple stressors that affect the recruitment, survival, and growth of intertidal species. We saw an increase in the amount of sediment at our sites, and other studies have documented ongoing high concentrations of metals, such as copper and zinc in nearby sediments and declining water quality in the upper Waitematā Harbour.
Te Tokaroa Meola Reef intertidal reef ecological monitoring: 2001 to 2017 28

5.0 Recommendations for the monitoring programme
We recommend continuing annual surveys in order to extend our long-term data set and analyse changes in community composition over time and space, as well as identify potential stressors that may be altering environmental conditions and intertidal communities. Continuing this monitoring is also important given the projected climate-related changes that are predicted to occur in the Auckland region by the end of the century, including increasing water temperature, ocean acidification, and extreme rain events (Pearce et al., 2018), as well as the potential for additional non-native species to establish populations in the Waitematā Harbour.
Increasing the frequency of monitoring to include additional seasons is unlikely to result in an increased ability to detect trends. Introducing seasonality into the surveys is likely to further increase variability and will reduce the power to detect a trend. Continued annual surveys result in additional data points that are directly comparable to the last 17 years of data and will be most useful in detecting future trends in species composition, abundance, and cover.
If annual monitoring is not feasible due to time or funding constraints, we recommend that full surveys be conducted every three years and photos be taken of each quadrat in the years between surveys so changes are documented and can be analysed at a later time, if necessary. Per cent cover of sessile macroinvertebrates and macroalgae will be easiest to estimate using the photos. If a measurement scale is included in the photo, individual sizes can also be estimated using imaging software. In addition, because we are currently seeing rapid increases in the abundance of Haustrum scobina and declines in oysters, it would be worthwhile to document the abundances of these species, particularly at the outer sites where changes have been most drastic. This re-establishing predator-prey relationship has the ability to fundamentally change the community composition of the reef by reducing the abundance of a habitat-forming species, so these species should be monitored closely for the next three years. The importance of this targeted monitoring should be revisited in three years to determine if annual monitoring is necessary.
Te Tokaroa Meola Reef intertidal reef ecological monitoring: 2001 to 2017 29

6.0 References
Auckland Council, 2015. The health of Auckland’s natural environment in 2015. Te oranga o te taiao o Tāmaki Makaurau. Auckland Council, Auckland, New Zealand.
Aguirre, J.D., Bollard-Breen, B., Cameron, M., Constantine, R., Duffy, C.A.J., Dunphy, B., Hart, K., Hewitt, J.E., Jarvis, R.M., Jeffs, A., Kahui-McConnell, R., Kawharu, M., Liggins, L., Lohrer, A.M., Middleton, I., Oldman, J., Sewell, M.A., Smith, A.N.H., Thomas, D.B., Tuckey, B., Vaughan, M., Wilson, R., 2016. Loved to pieces: Toward the sustainable management of the Waitematā Harbour and Hauraki Gulf. Regional Studies in Marine Science 8, 220-233. https://doi.org/10.1016/j.rsma.2016.02.009
Anderson, M., Gorley, R., Clarke, K., 2008. PERMANOVA+ for PRIMER: guide to software and statistical methods. Primer-E, Plymouth, UK.
ARC, 2004. Management and treatment of stormwater quality effects in estuarine areas, Auckland Regional Council, Technical Publication 237.
Carlton, J.T., 1996. Pattern, process, and prediction in marine invasion ecology. Biological Conservation, 78(1-2), pp.97-106.
Clarke, K., Gorley, R., 2015. PRIMER v7: User manual/tutorial. Plymouth routine in mulitvariate ecological research. Plymouth Marine Laboratory, UK.
Creese, R., Hooker, S., de Luca, S., Wharton, Y., 1997. Ecology and environmental impact of Musculista senhousia (Moilusca: Bivalvia: Mytilidae) in Tamaki Estuary, Auckland, New Zealand. New Zealand Journal of Marine and Freshwater Research 31, 225-236.
Dinamani, P., 1971. Occurrence of the Japanese oyster, Crassostrea gigas (Thunberg), in northland, New Zealand. New Zealand Journal of Marine and Freshwater Research 5, 352-357.
Dromgoole, F.I., Foster, B.A., 1983. Changes to the marine biota of the Auckland Harbour. Tane 29, 79-96.
Foley, M.M., Walker, J., Vaughan, M., Stanley, C.L., Hussain, E., 2018. Marine water quality state and trends in the Auckland Region from 2007 to 2016. Auckland Council Technical Report TR2018/015, 86.
Ford, R.B., Pawley, M.D.M., 2009. Meola Reef Ecological Monitoring, 2001-2008. Prepared by Auckland UniServices for Auckland Regional Council. Auckland Regional Council Technical Report TR 2009/020.
Fridley, J.D., Stachowicz, J.J., Naeem, S., Sax, D.F., Seabloom, E.W., Smith, M.D., Stohlgren, T.J., Tilman, D. and Holle, B.V., 2007. The invasion paradox: reconciling pattern and process in species invasions. Ecology, 88(1), pp.3-17.
Gadd, J., Cameron, M., 2012. Antifouling biocides in marinas: Measurement of copper concentrations and comparison to model predictions for eight Auckland sites. Auckland Council Technical Report TR2012/033.
Green, M., Timperley, M., Collins, R., Senior, A., Adams, R., Swales, A., 2004. Prediction of contaminant accumulation in the Waitemata Harbour. NIWA Client Report: HAM2003-087/1. Report prepared by NIWA for Auckland Council.
Greig, M.J., Ridgway, N.M., Shakespeare, B.S., 1988. Sea surface temperature variations at coastal sites around New Zealand. New Zealand Journal of Marine and Freshwater Research 22, 391-400. https://doi.org/10.1080/00288330.1988.9516310
Te Tokaroa Meola Reef intertidal reef ecological monitoring: 2001 to 2017 30

Hayward, B.W., 1997. Introduced marine organisms in New Zealand and their impact in the Waitemata Harbour, Auckland. Tane 36, 197-223.
Hayward, B.W., Morley, M.S., Stephenson, A.B., Blom, W.M., Grenfell, H.R., Prasad, R., Rogan, D., Thompson, F., Cheetham, J., Webb, M., 1999. Intertidal and subtidal biota and habitats of the central Waitemata Harbour. Auckland Regional Council Technical Publication 127, 40.
Hayward, B.W., Stephenson, A.B., Morley, M., Riley, J.L., Grenfell, H.R., 1997. Faunal changes in Waitemata Harbour sediments, 1930s-1990s. Journal of the Royal society of New Zealand 27, 1-20.
Hauraki Gulf Forum, HGF 2017. Hauraki Gulf/Tīkapa Moana/Te Moana-nui-a-Toi State of the Environmetn Report 2017. Hauraki Gulf Forum, pp. 127.
Inglis, G., Seaward, K., 2016. Indicators of non-indigenous species in marine systems. Prepared by the National Institute of Water and Atmostpheric Research for the Ministry of the Environment.
Jones, M.R.L., 1992. The effects of tributyltin upon Lepsiella scobina, Dicathais orbita, and Haustrum haustorium: their roles as indicators of tributyltin pollution (Masters of Science thesis). University of Auckland.
Jones, M.R.L., Ross, P.M., 2018. Recovery of the New Zealand muricid dogwhelk Haustrum scobina from TBT-induced imposex. Marine Pollution Bulletin 126, 396-401. https://doi.org/10.1016/j.marpolbul.2017.11.034
Lindenmayer, D.B., Likens, G.E., Andersen, A., Bowman, D., Bull, C.M., Burns, E., Dickman, C.R., Hoffmann, A.A., Keith, D.A., Liddell, M.J., 2012. Value of long‐term ecological studies. Austral Ecology 37, 745-757.
Lundquist, C.J., Jones, T.C., Parkes, S.M., Bulmer, R.H., 2018. Changes in benthic community structure and sediment characteristics after natural recolonisation of the seagrass Zostera muelleri. Scientific Reports 8, 13250. https://doi.org/10.1038/s41598-018-31398-2
Maguire, R.J., 2000. Review of the Persistence, Bioaccumulation and Toxicity of Tributyltin in Aquatic Environments in Relation to Canada’s Toxic Substances Management Policy. Water Quality Research Journal 35, 633-680. https://doi.org/10.2166/wqrj.2000.036
McQuaid, C.D., Branch, G.M., 1984. Influence of sea temperature, substratum and wave exposure on rocky intertidal communities: An analysis of faunal and floral biomass. Marine Ecology Progress Series 19, 145-151.
Mills, G., Williamson, B., Cameron, M., Vaughan, M., 2012. Marine sediment contaminants: Status and trends assessment 1998-2010, Prepared by Diffuse Sources Ltd for Auckland Council. Auckland Council technical report, TR2012/041.
Oliver, W.R.., 1923. Marine litorral plant and animal communities in New Zealand. Transactions of the New Zealand Institute 54, 496-545.
Pearce, P., Bell, R., Bostock, H., Carey-Smith, T., Collins, D., Fedaeff, N., Kachhara, A., Macara, G., Mullan, B., Paulik, R., Somervell, E., Sood, A., Tait, A., Wadhwa, S., Woolley, J.M., 2018. Auckland Region climate change projections and impacts. Revised January 2018, Prepared by the National Institute of Water and Atmospheric Research, NIWA, for Auckland Council. Auckland Council Technical Report, TR2017/030-2.
Salinger, M.J., Mullan, A.B., 1999. New Zealand climate: temperature and precipitation variations and their links with atmospheric circulation 1930-1994. International Journal of Climatology 19, 1049-1071.
Te Tokaroa Meola Reef intertidal reef ecological monitoring: 2001 to 2017 31

Scheffer, M., Bascompte, J., Brock, W.A., Brovkin, V., Carpenter, S.R., Dakos, V., Held, H., Van Nes, E.H., Rietkerk, M., Sugihara, G., 2009. Early-warning signals for critical transitions. Nature 461, 53.
Scott, I.R., 1993. The effects of tributyltin upon New Zealand neogastropods and the impact the partial ban has had on its usage (Masters of Science thesis). University of Auckland.
Shears, N.T., 2010. Meola Reef ecological monitoring program: 2001-2010 Prepared by Auckland UniServices for Auckland Regional Council. Auckland Regional Council Technical Report, TR 2010/031.
Stephenson, T.A., Stephenson, A., 1949. The universal features of zonation between tide-marks on rocky coasts. The Journal of Ecology 289-305.
Stewart, M., Gadd, J., Ballantine, D., Olsen, G., 2013. Shellfish contaminant monitoring programme: status and trends analysis 1987-2011. Prepared by NIWA for Auckland Council. Auckland Council technical report TR2013/054.
Stewart, M., Northcott, G., Gaw, S., Tremblay, L.A., 2016. An update on emerging organic contaminants of concern for New Zealand with guidance on monitoring approaches for councils, Prepared by Streamlined Environmental Ltd, Northcott Research Consultants Ltd, University of Canterbury, Cawthron Institute and the University of Auckland for Auckland Council, Greater Wellington Regional Council and Environment Canterbury Regional Council. Auckland Council technical report, TR2016/006.
Townsend, M., Lundquist, C., Hewitt, J., 2010. Central Waitemata Harbour Ecological Monitoring 2000 - 2010. Prepared by NIWA for Auckland Regional Council. Auckland Regional Council Technical Report 2010/060.
Wilkie, E.M., Bishop, M.J., O’Connor, W.A., 2012. Are native Saccostrea glomerata and invasive Crassostrea gigas oysters’ habitat equivalents for epibenthic communities in south-eastern Australia? Journal of Experimental Marine Biology and Ecology 420-421, 16-25. https://doi.org/10.1016/j.jembe.2012.03.018
Te Tokaroa Meola Reef intertidal reef ecological monitoring: 2001 to 2017 32
7.0 Appendix
Intertidal macroinvertebrate counts
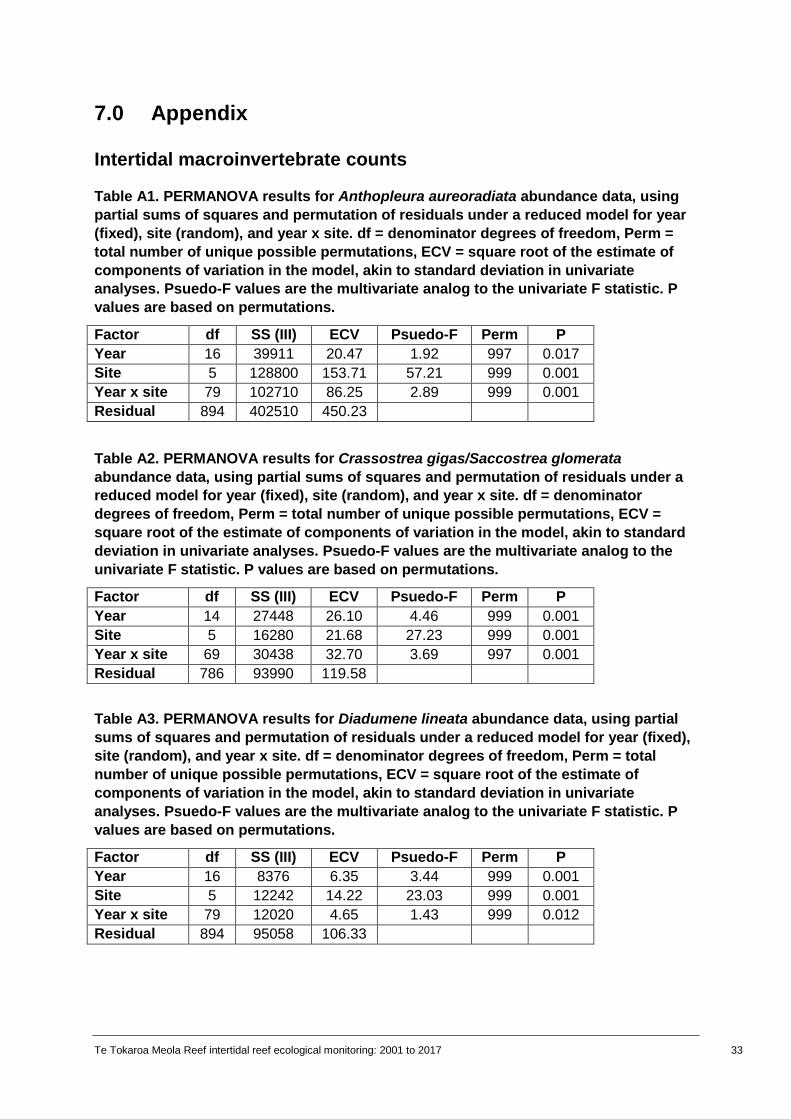
Table A1. PERMANOVA results for Anthopleura aureoradiata abundance data, using partial sums of squares and permutation of residuals under a reduced model for year (fixed), site (random), and year x site. df = denominator degrees of freedom, Perm = total number of unique possible permutations, ECV = square root of the estimate of components of variation in the model, akin to standard deviation in univariate analyses. Psuedo-F values are the multivariate analog to the univariate F statistic. P values are based on permutations.
Factor df SS (III) ECV Psuedo-F Perm P Year 16 39911 20.47 1.92 997 0.017 Site 5 128800 153.71 57.21 999 0.001 Year x site 79 102710 86.25 2.89 999 0.001 Residual 894 402510 450.23
Table A2. PERMANOVA results for Crassostrea gigas/Saccostrea glomerata abundance data, using partial sums of squares and permutation of residuals under a reduced model for year (fixed), site (random), and year x site. df = denominator degrees of freedom, Perm = total number of unique possible permutations, ECV = square root of the estimate of components of variation in the model, akin to standard deviation in univariate analyses. Psuedo-F values are the multivariate analog to the univariate F statistic. P values are based on permutations.
Factor df SS (III) ECV Psuedo-F Perm P Year 14 27448 26.10 4.46 999 0.001 Site 5 16280 21.68 27.23 999 0.001 Year x site 69 30438 32.70 3.69 997 0.001 Residual 786 93990 119.58 Table A3. PERMANOVA results for Diadumene lineata abundance data, using partial sums of squares and permutation of residuals under a reduced model for year (fixed), site (random), and year x site. df = denominator degrees of freedom, Perm = total number of unique possible permutations, ECV = square root of the estimate of components of variation in the model, akin to standard deviation in univariate analyses. Psuedo-F values are the multivariate analog to the univariate F statistic. P values are based on permutations.
Factor df SS (III) ECV Psuedo-F Perm P Year 16 8376 6.35 3.44 999 0.001 Site 5 12242 14.22 23.03 999 0.001 Year x site 79 12020 4.65 1.43 999 0.012 Residual 894 95058 106.33
Te Tokaroa Meola Reef intertidal reef ecological monitoring: 2001 to 2017 33

Table A4. PERMANOVA results for Diloma aethiops abundance data, using partial sums of squares and permutation of residuals under a reduced model for year (fixed), site (random), and year x site. df = denominator degrees of freedom, Perm = total number of unique possible permutations, ECV = square root of the estimate of components of variation in the model, akin to standard deviation in univariate analyses. Psuedo-F values are the multivariate analog to the univariate F statistic. P values are based on permutations.
Factor df SS (III) ECV Psuedo-F Perm P Year 16 40172 3.97 1.58 996 0.043 Site 5 586740 26.58 117.61 998 0.001 Year x site 79 125710 7.76 1.59 996 0.002 Residual 894 892030 31.59
Table A5. PERMANOVA results for Haustrum scobina abundance data, using partial sums of squares and permutation of residuals under a reduced model for year (fixed), site (random), and year x site. df = denominator degrees of freedom, Perm = total number of unique possible permutations, ECV = square root of the estimate of components of variation in the model, akin to standard deviation in univariate analyses. Psuedo-F values are the multivariate analog to the univariate F statistic. P values are based on permutations.
Factor df SS (III) ECV Psuedo-F Perm P Year 16 339120 17.44 6.23 998 0.001 Site 5 92994 10.52 49.97 999 0.001 Year x site 79 269510 17.56 9.16 995 0.001 Residual 894 332770 19.29
Table A6. PERMANOVA results for Lunella smaragdus abundance data, using partial sums of squares and permutation of residuals under a reduced model for year (fixed), site (random), and year x site. df = denominator degrees of freedom, Perm = total number of unique possible permutations, ECV = square root of the estimate of components of variation in the model, akin to standard deviation in univariate analyses. Psuedo-F values are the multivariate analog to the univariate F statistic. P values are based on permutations.
Factor df SS (III) ECV Psuedo-F Perm P Year 16 37551 2.27 1.15 997 0.316 Site 5 549580 25.73 117.21 999 0.001 Year x site 79 161820 10.62 2.18 998 0.001 Residual 894 838360 30.62
Te Tokaroa Meola Reef intertidal reef ecological monitoring: 2001 to 2017 34

Table A7. PERMANOVA results for Onchidella nigricans abundance data, using partial sums of squares and permutation of residuals under a reduced model for year (fixed), site (random), and year x site. df = denominator degrees of freedom, Perm = total number of unique possible permutations, ECV = square root of the estimate of components of variation in the model, akin to standard deviation in univariate analyses. Psuedo-F values are the multivariate analog to the univariate F statistic. P values are based on permutations.
Factor df SS (III) ECV Psuedo-F Perm P Year 16 140170 8.23 1.82 997 0.039 Site 5 81266 9.54 12.96 998 0.001 Year x site 79 380440 19.01 3.84 995 0.001 Residual 894 112070 35.41
Table A8. PERMANOVA results for Sypharochiton pelliserpentis abundance data, using partial sums of squares and permutation of residuals under a reduced model for year (fixed), site (random), and year x site. df = denominator degrees of freedom, Perm = total number of unique possible permutations, ECV = square root of the estimate of components of variation in the model, akin to standard deviation in univariate analyses. Psuedo-F values are the multivariate analog to the univariate F statistic. P values are based on permutations.
Factor df SS (III) ECV Psuedo-F Perm P Year 16 72207 7.80 4.75 999 0.001 Site 5 97186 10.67 27.92 998 0.001 Year x site 79 75171 5.09 1.37 996 0.007 Residual 894 622260 26.38
Table A9. PERMANOVA results for Xenostrobus pulex abundance data, using partial sums of squares and permutation of residuals under a reduced model for year (fixed), site (random), and year x site. df = denominator degrees of freedom, Perm = total number of unique possible permutations, ECV = square root of the estimate of components of variation in the model, akin to standard deviation in univariate analyses. Psuedo-F values are the multivariate analog to the univariate F statistic. P values are based on permutations.
Factor df SS (III) ECV Psuedo-F Perm P Year 16 246340 14.28 4.44 998 0.001 Site 5 427230 22.63 76.70 999 0.001 Year x site 79 274240 15.47 3.12 998 0.001 Residual 894 995920 33.38
Te Tokaroa Meola Reef intertidal reef ecological monitoring: 2001 to 2017 35

Table A10. PERMANOVA results for Zeacumantus lutulentus abundance data, using partial sums of squares and permutation of residuals under a reduced model for year (fixed), site (random), and year x site. df = denominator degrees of freedom, Perm = total number of unique possible permutations, ECV = square root of the estimate of components of variation in the model, akin to standard deviation in univariate analyses. Psuedo-F values are the multivariate analog to the univariate F statistic. P values are based on permutations.
Factor df SS (III) ECV Psuedo-F Perm P Year 16 61369 4.61 1.48 998 0.105 Site 5 563350 26.07 149.56 999 0.001 Year x site 79 205460 13.69 3.45 998 0.001 Residual 894 693480 27.45
Te Tokaroa Meola Reef intertidal reef ecological monitoring: 2001 to 2017 36

Intertidal sessile macroinvertebrate, macroalgae, and substrate cover
Table A11. PERMANOVA results for bare rock cover data, using partial sums of squares and permutation of residuals under a reduced model for year (fixed), site (random), and year x site. df = denominator degrees of freedom, Perm = total number of unique possible permutations, ECV = square root of the estimate of components of variation in the model, akin to standard deviation in univariate analyses. Psuedo-F values are the multivariate analog to the univariate F statistic. P values are based on permutations.
Factor df SS (III) ECV Psuedo-F Perm P Year 16 18449 3.20 2.08 998 0.009 Site 5 27851 5.70 26.38 998 0.001 Year x site 79 43825 5.90 2.63 998 0.001 Residual 894 18880 14.53
Table A12. PERMANOVA results for barnacle cover data, using partial sums of squares and permutation of residuals under a reduced model for year (fixed), site (random), and year x site. df = denominator degrees of freedom, Perm = total number of unique possible permutations, ECV = square root of the estimate of components of variation in the model, akin to standard deviation in univariate analyses. Psuedo-F values are the multivariate analog to the univariate F statistic. P values are based on permutations.
Factor df SS (III) ECV Psuedo-F Perm P Year 16 62487 5.41 1.78 999 0.015 Site 5 124190 38.79 435.62 996 0.001 Year x site 79 173470 12.84 3.85 998 0.001 Residual 894 509740 23.88
Table A13. PERMANOVA results for Crassostrea gigas/Saccostrea glomerata cover data, using partial sums of squares and permutation of residuals under a reduced model for year (fixed), site (random), and year x site. df = denominator degrees of freedom, Perm = total number of unique possible permutations, ECV = square root of the estimate of components of variation in the model, akin to standard deviation in univariate analyses. Psuedo-F values are the multivariate analog to the univariate F statistic. P values are based on permutations.
Factor df SS (III) ECV Psuedo-F Perm P Year 16 10955 2.83 3.15 999 0.001 Site 5 4509 2.27 17.23 999 0.001 Year x site 79 17227 4.10 4.16 999 0.001 Residual 894 46795 7.23
Te Tokaroa Meola Reef intertidal reef ecological monitoring: 2001 to 2017 37

Table A14. PERMANOVA results for Gelidium spp. cover data, using partial sums of squares and permutation of residuals under a reduced model for year (fixed), site (random), and year x site. df = denominator degrees of freedom, Perm = total number of unique possible permutations, ECV = square root of the estimate of components of variation in the model, akin to standard deviation in univariate analyses. Psuedo-F values are the multivariate analog to the univariate F statistic. P values are based on permutations.
Factor df SS (III) ECV Psuedo-F Perm P Year 16 174860 12.04 4.46 998 0.001 Site 5 431300 22.74 79.58 999 0.001 Year x site 79 193870 11.79 2.26 998 0.001 Residual 894 969030 32.92
Table A15. PERMANOVA results for sediment cover data, using partial sums of squares and permutation of residuals under a reduced model for year (fixed), site (random), and year x site. df = denominator degrees of freedom, Perm = total number of unique possible permutations, ECV = square root of the estimate of components of variation in the model, akin to standard deviation in univariate analyses. Psuedo-F values are the multivariate analog to the univariate F statistic. P values are based on permutations.
Factor df SS (III) ECV Psuedo-F Perm P Year 16 85253 7.46 2.57 998 0.002 Site 5 155830 13.58 39.59 999 0.001 Year x site 79 164270 11.45 2.64 998 0.001 Residual 894 703690 28.06
Te Tokaroa Meola Reef intertidal reef ecological monitoring: 2001 to 2017 38


Find out more: phone 09 301 0101, email [email protected] or visit aucklandcouncil.govt.nz and knowledgeauckland.org.nz