TE-RE-RD 2018
530
7 th International Conference on Thermal Equipment, Renewable Energy and Rural Development TE-RE-RD 2018
-
Upload
khangminh22 -
Category
Documents
-
view
1 -
download
0
Transcript of TE-RE-RD 2018
7th International Conference on Thermal Equipment, Renewable Energy and Rural Development
TE-RE-RD 2018

7th International Conference on
Thermal Equipment, Renewable Energy
and Rural Development
TE-RE-RD 2018
(CD-ROM)
ORGANIZERS:
University “POLITEHNICA” of Bucharest Faculty of Mechanical Engineering and Mechatronics -
Faculty of Biotechnical Systems Engineering -
National Institute Of Research – Development For Machines And Installations Designed To Agriculture And Food Industry – INMA
Romanian Agricultural Mechanical Engineers Society – SIMAR
Editors:
Prof.dr.ing. Gabriel-Paul NEGREANU
Senior Lecturer dr.ing. Iulian-Claudiu DUȚU
Drobeta Turnu Severin – Romania
31 May - 02 June 2018
ISSN 2457 – 3302,
ISSN-L 2457 - 3302
Editura POLITEHNICA PRESS
COVER: Gabriel-Paul Negreanu
SCIENTIFIC COMMITTEE
Dr. Atanas ATANASOV BULGARIA
Prof. Viorel BĂDESCU ROMANIA
Prof. Hristo BELOEV BULGARIA
Prof. Alexandru DOBROVICESCU ROMANIA
Dr. Cătălin DUMITRESCU ROMANIA
Prof. Iliya ILIEV BULGARIA
Prof. Ion V. ION ROMANIA
Prof. Krzysztof JESIONEK POLAND
Prof. Önder KABAŞ TURKEY
Dr. Mihai MATACHE ROMANIA
Dr. Igor KOVACEV CROATIA
Prof. Edmond MAICAN ROMANIA
Dr. Lucian MÂNDREA ROMANIA
Prof. Jaroslaw MILESKI POLAND
Prof. Prof. Mirjana LAKOTIC-PAUNOVIC SERBIA
Prof. Constantin PANA ROMANIA
Prof. Gigel PARASCHIV ROMANIA
Prof. Ionel PÎȘĂ ROMANIA
Dr. Ion PIRNĂ ROMANIA
Prof. Tudor PRISECARU ROMANIA
Prof. Violeta RASHEVA BULGARIA
Prof. Kemal Çağatay SELVİ TURKEY
Prof. Mariana Florentina ŞTEFĂNESCU ROMANIA
Prof. Marija TODOROVIC SERBIA
Prof. Rosen VASILEV BULGARIA
Prof. Gheorghe VOICU ROMANIA
ORGANIZING COMMITTEE
Chairman Prof. Lucian MIHĂESCU ROMANIA
Co-chairmen Prof. Sorin-Ştefan BIRIŞ ROMANIA
Prof. Gabriel-Paul NEGREANU ROMANIA
Dr. Valentin VLĂDUŢ ROMANIA
Dr. Iulian-Claudiu DUȚU ROMANIA

Members Dr. Cristian-Gabriel ALIONTE ROMANIA
Prof. Valentin APOSTOL ROMANIA
Prof. Mircea BĂDESCU ROMANIA
Dipl.Eng. Viorel BERBECE ROMANIA
Dr. Cristina COVALIU ROMANIA
PhD student ing. Iuliana GĂGEANU ROMANIA
Dr. Mihaela-Florentina DUȚU ROMANIA
Dr. Irina-Aura ISTRATE ROMANIA
Dr. Elena POP ROMANIA
Dr. Iulian VOICEA ROMANIA
Secretary
PhD student ing. Mariana MUNTEANU ROMANIA
PhD student ing. Cristina Mihaela CIOBANU ROMANIA
Dipl. ing. Gabriel GHEORGHE ROMANIA
M.B.A. Andreea CRISTESCU ROMANIA
CONFERENCE SPONSORS
Sos. Bucuresti - Magurele nr. 232
051434 Bucuresti 5, Romania Tel: +40 21 255 31 32 Fax: +40 21 255 30 66
Calea Basarabiei nr. 96B
Loc. Huşi, jud. Vaslui, Romania
Tel. / Fax. +40 335 426 839

CONFERENCE PROGRAMME
Thursday, May 31 Friday, June 01 Saturday, June 02
Breakfast Breakfast
15.00-16.00 Registration of participants
08.30-09.30 Registration of participants
09.00-12.00 Networking
16.00-16.30 Opening ceremony
09.30-11.00 Oral presentations
"Sections 1, 2"
12.00 Participants departure
16.30-18.30 Plenary session
11.00-11.30 Coffee break
19.00-21.00 Welcome Cocktail
11.30-13.00 Oral presentations
"Section 1, 2"
13.00-14.30
Lunch
14.30-16.30 Oral presentations
"Section 1, 2"
16.30-17.00 Coffee break
17.00-18.30 "Workshop”
19.30-22.00
Conference dinner

CONTENTS
SECTION 1: THERMAL EQUIPMENT AND RENEWABLE ENERGY
1. The wastewater treatment using ozone technologies
B. K. Aliyarov, Sh.A. Bakhtaev, S. B.Abdreshova, B. Ongar, K. Jesionek ……………… 1
2. Comparative analysis of possible solutions of using heat recovered from UPB-
CHP plant
D. Ban (Tuțică), P. Tudor, E. Minciuc, V.-E. Cenușă ……………………………………. 7
3. Comparative analysis of two solar driven cycles under clear and cloudy sky
conditions
B. Borcilă, C. Stanciu, M. Costea, S. Petrescu, M. Feidt …………….…………………… 10
4. The use of raw animal fats-butanol-diesel fuel blends at diesel engine
Al. Cernat, C. Pană, Gh. Lăzăroiu, N. Negurescu, Cr. Nuțu, A. Nicolici …..…….….…… 17
5. Experimental investigation of parabolic trough solar collector (PTC)
performance for water desalination
D. M. H. Al-Shamkhee, E. O. A. Al-Zaini, Q. A. Abed…………………………………... 21
6. Modeling of heating sector development with transition to biomass-based
generation scenario till 2050 in Ukraine
A.Epik, V. Zubenko ………………………………………………………………………. 27
7. Capillary-porous cooling systems for melting units
A. A. Genbach, N. O. Jamankulova, I. K. Iliev……………………………………………. 33
8. Investigation of porous coverage in cooling systems for turbine equipment
elements
A. A. Genbach, D. Yu. Bondartsev, I. K. Iliev …..……………………………………….. 37
9. Heating with heat pipes
A. A. Genbach, K. Olzhabayeva, K. Shokolakov, I. K. Iliev …………………………….. 43
10. Comparative analysis of the existing dust collectors with the designed capillary
porous dust collector with controlled geometry of micro-channels
A. Genbach, K. Shokolakov, A. Terziev ……….………………………………………… 49
11. Application of economizer in biomass boiler house in Boryspil airport: case study
S. Heletukha ……….……………………………………………………………………… 55
12. Performance analysis of a biogas-fueled gas turbine cogeneration system
I. V. Ion, F. Popescu, S.L. Paraschiv, S. Paraschiv ……………...……………………….. 59
13. Integration of micro-cogeneration systems into existing buildings
A. Ionescu, L. Barelli, Gh. Lăzăroiu ................................................................................... 63

14. Thermal energy storage for micro cogeneration systems
A. Ionescu, L. Barelli, Gh. Lazaroiu ................................................................................... 69
15. Correction of pollution emissions measurements on fuel combustion
I. Iordache, E. Pop, L. Mihăescu .......................................................................................... 75
16. Energy efficiency of buildings – legislation in the Republic of Serbia
M. Kovaćević, I. Tasić ......................................................................................................... 79
17. Energy efficiency of the receiver of solar energy in the territory of the Republic
of Serbia
M. Kovaćević, I. Tasić, J. Pekez .......................................................................................... 85
18. Experiments on the energy characteristics of poultry manure
Gh. Lăzăroiu, L. Mihăescu, I. Pîșă, G. Negreanu, D. Ciupăgeanu, A. Bondrea,
V. Berbece, V. Galbură, M. Tîrșu ........................................................................................ 91
19. Evaluation of erosion risk for a cogeneration steam turbine when steam
parameters change
G. Negreanu, I. Oprea, R. Băcanu, D. Baciu......................................................................... 95
20. The use of raw animal fats-buthanol-diesel fuel blends at diesel engine
Al. Cernat, C. Pana, Gh. Lazaroiu , N. Negurescu, C. Nutu, A. Nicolici……………… 101
21. A research on fuelling a car diesel engine with liquefied petroleum gas
N. C. Nutu, C. Pana, N. Negurescu, Al. Cernat, D. Fuiorescu, L. Nemoianu..................... 105
22. Low power cogeneration installation using solid vineyard waste biomass
I. Oprea ............................................................................................................................. 111
23. Modelling of desulphurization process with the scope of SO2 emissions decrease
and increase of synthetic gypsum quality
T. Prisecaru, M.M. Prisecaru, R. Lisnic ……………..……………………………….… 115
24. Energetic performance increase of an engine-electric generator group
P. Radoescu, C. Pana, N. Negurescu, Al. Cernat, C. Nutu……………………………….. 121
25. On the way to approximate diesel engines emissions: a literature review
B. Radu, Al. Racovitză........................................................................................................ 125
26. Results from an energy audit of a joint-stock company “Medica AD”, Bulgaria
V. Rasheva, V. Kamburova, M. Velikanov ........................................................................ 129
27. The use of low temperature geothermal energy at historical buildings – case
study for a hotel
P. Tudor, V.E. Cenușă, D. Ban (Tuțică), I.C. Duțu …………………................................ 135
28. Increasing the efficiency of thermal collectors by using thermal tubes
Kr. Uzuneanu ……….......................................................................................................... 139

29. Energy from biomass obtaining in the gasification process – modular
construction of the gasification machine
G. Wieczorkiewicz, K. Jesionek, M. Rychlik, R. Roszak................................................... 143
30. Analytical heat conduction solution for two-dimensional cartesian slab under the
effect of a laser pulse W. A. Abd Al-wahid, Q. A Abed....................................................................................... 149
31. Providing the isolated localities with various energy types at the acceptable cost
Ul. Zhalmagambetova, Al. Mergalimova, B. Aliyarov ..................................................... 155

SECTION 2: RURAL DEVELOPMENT AND RENEWABLE ENERGY
32. Biomass conversion by pyrolysis
I.D. Alexandru …………………………………………………………………………… 159
33. Technology for the recovery of zootechnical waste through the process of
anaerobic digestion
V. Bălan, I. Voicea, I. Găgeanu, D. Cujbescu, C. Persu, M. Dilea,
N. Ungureanu, C.I. Moga ……………………………………………………………….. 165
34. Superior valorification of lentil flour and application in bread products
A.E. Boeriu, Cr.M. Canja, Ad. Măzărel ............................................................................. 171
35. Experimental researches on determining the qualitative working indices for
vegetable and leguminous plants sowing machine on sandy soils
Gh. Bolintineanu, D. Cujbescu, C. Persu, I. Găgeanu, I. Voicea, G. Gheorghe,
L. Vlăduțoiu, I. Dumitru, R. Oprescu, N. Ungureanu, Cr. Vlad ………………………… 177
36. Printers contribution to indoor level of particulate matter and solution to reduce
this emissions
A. Bordaș, I. Istrate, M.G. Munteanu ................................................................................. 183
37. Research regarding the process of medicinal herbs drying technology
I.L. Caba, E.A. Laza, V. Vlăduţ, A. Păun ……………………………………………….. 189
38. The relations between Cultural Landscapes, Open Source Hardware and Open
Innovation in Rural Development
Al. Calcatinge …………………………………………………………………………… 193
39. Environmental protection in food industry through food waste control
C.M. Canja, Ad.E. Boeriu, A. Măzărel .............................................................................. 199
40. Aspects on the working process of the cement mills and dimensional
characteristics of the raw material
Cr. Ciobanu, Gh. Voicu, M.L. Toma, P. Tudor …………………………………….…… 205
41. Wastewater treatment by flotation using magnetic nanomaterials
Il.C. Covaliu, A. Bruneau, St. Kermade, G. Paraschiv, S.Șt. Biriş, C.I. Moga,
G. Petrescu, M.G. Matache, I. Filip ………………………………………...…….…….. 211
42. Modeling, simulation and study of loads and deformations in traction devices
A.C. Cristescu, L. Popa, V. Ștefan, Al. Angheleț .............................................................. 215
43. Considerations on the use of drones in precision agriculture
D. Cujbescu, C. Persu, I. Găgeanu, I. Voicea, G. Gheorghe, L. Vlăduțoiu,
I. Dumitru, R. Oprescu ....................................................................................................... 221
44. A review regarding models which predict landfill gas generation
M. Dincă, M. Ferdeş, B.Şt. Zăbavă, N. Ungureanu, G. Moiceanu, M. Ionescu ................ 227
45. Ozone and nitrogen oxides production in sterilized tap water by an ozone
generator type OZONFIX 8G
M. Dincă, M. Ferdeş, G. Paraschiv, B.Şt. Zăbavă, N. Ungureanu, L. Constantin ............. 233

46. Technology for cultivating bicolor sorghum for food or energetic purposes
I. Dumitru, I. Voicea, V. Vlăduț, I. Găgeanu, R. Oprescu, C. Persu,
N. Ungureanu, V. Bălan …………………………………………………………………. 239
47. Investigation of a digital hydraulic actuation system for a waste baling press
I.C. Duțu, S.Șt. Biriș, E. Maican, P. Tudor, R.I. Rădoi ...................................................... 245
48. Motor wheel modelling of a tractor
M.Fl. Duţu, M. Begea, I.C. Duţu, Al. Cȋrȋc, G. Simion ..................................................... 251
49. The growth behavior of E. COLI K12-MG1655 and the consumption of the
substrate in different sugar concentrations culture media
M. Ferdeș, M. Dincă, B.Șt. Zăbavă, G. Paraschiv ............................................................. 257
50. Benefits of using additives in the production of biomass pellets
I. Găgeanu, Gh. Voicu, D. Cujbescu, C. Persu, G. Gheorghe, I. Voicea ………………... 263
51. Considerations on improving biomass pellets quality by using additives
I. Găgeanu, Gh. Voicu, D. Cujbescu, C. Persu, O. Pandia …………………………..….. 267
52. Study on the automatic adjustment of the constructive and functional parameters
of the vibratory tillage tools
N.E. Gheorghiță, S.Șt. Biriș, N. Ungureanu, M. Ionescu, M.G. Munteanu ……………... 271
53. Considerations on sage culture technology and essential oils obtaining
I. Grigore, E. Sorica, Cr. Sorică, A.I. Grigore, L. Vladuţoiu ……………………………. 275
54. Studies and research regarding the technology of extracting volatile oils from
medicinal herbs
E.A. Laza, I.L. Caba, A. Păun, V. Vlăduţ ……………………………………………….. 279
55. The role of eco – marketing strategies concerning sustainable development of
Romanian tourism
A. Măzărel, L. Cismaru, A.E. Boeriu, Cr.M. Canja ……………...…………………..…. 285
56. Aspects regarding Miscanthus grinding process for peletization/briquetting
G. Moiceanu , G. Paraschiv, Gh. Voicu, M. Dincă, V. Vlăduț, I. Găgeanu …………..... 291
57. Structural and cinematic analysis of the elevating mechanism of a utility vehicle's
shutter
V. Moise, L. Dudici, Al. Rotaru, Şt. Moise ..................................................................... 297
58. Innovative model of vertical dryer for cereal seeds
A. Muscalu, P. Cârlescu Petru, Cr. Sorică, Vl. Arsenoaia, M. Bîrsan ………...……….. 303
59. Considerations on the construction and operation of a device for soil modelling in
interrupted furrows for weeding crops
M.R. Oprescu, S.Șt. Biriș, I. Voicea, D. Cujbescu, C. Persu, I. Găgeanu,
V. Vlăduț, I. Dumitru …………………………………………………………………… 309
60. Methods of arranging the knives on the chopping drum from the forage
harvester
R. Popa, V. Popa, S.Șt. Biriș............................................................................................... 315
61. Separation by size and extraction of valuable compounds from medicinal plants
of nettle
A. Pruteanu, L. David, M. Ferdeș, I. Voicea, M. Niţu, B.Şt. Zǎbavǎ .................................... 319
62. Robots for intervention and evaluation of the situation in disaster areas
R.I. Rădoi, Șt. Trache, A. Mocioi, I.C. Duțu ……………………………………………….. 325
63. Evaluation of environmental impact by using control lists
C.O. Rusănescu, S.Șt. Biriș, G. Paraschiv, M. Begea, Gh. Voicu, M. Rusănescu,
Al. Cîrîc, D. Stoica, M.Cr. Ţucureanu ................................................................................ 331
64. Methods of environmental impact assessment
C.O. Rusănescu, M.Cr. Ţucureanu ..................................................................................... 335
65. Wood-burning stoves with high efficiency
V.V. Safta, M.L. Toma, B.Șt. Zăbavă, A. Boureci ............................................................ 339
66. Electro-hydraulic stand for testing reliability of special materials
I.Al. Sărăcin, I.C. Duțu, Gh. Voicu .................................................................................... 345
67. Air quality monitoring for bakery units
G.Cr. Simion, M.Fl. Duţu .................................................................................................. 351
68. Noise measurement and directional curve determination for an portable power
generator
Cr. Sorică, E. Sorică, A.I. Grigore, M.R. Oprescu ............................................................ 355
69. Effects of wheat seeds characteristics on roller milling process – a review
M.E. Ştefan, Gh. Voicu, G.Al. Constantin, M. Munteanu, M. Ionescu ............................ 361
70. Sort variation process of power flow in a conical sieve oscillating
D. Stoica, Gh. Voicu, I.C. Duțu, M.Fl. Duțu .................................................................... 367
71. Changes in bulk density as indicator of soil compaction
N. Ungureanu, V. Vlăduţ, S.Șt. Biriș, B.Șt. Zăbavă, M. Dincă ………………………… 373
72. Reuse of wastewater for irrigation, a sustainable practice in arid and semi-arid
regions
N. Ungureanu, V. Vlăduţ, M. Dincă, B.Șt. Zăbavă .......................................................... 379
73. Study concerning technologies for obtaining oil from grape seeds
C. Vasilachi, S.Șt. Biriș .................................................................................................... 385
74. Rural policies in Romania prior and after Europe 2020
O. Vlăduţ, P. Mihai, M.Fl. Duţu, I.C. Duţu, D.I. Vlăduţ .................................................. 391

75. System for the extraction of bioactive compounds from plants with bio-insecticide
action in organic farming
I. Voicea, I. Găgeanu, D. Cujbescu, C. Persu, V. Bălan, L. Săvoiu ................................... 395
76. Flotation process in wastewater treatment
I. Voicea, C.I. Moga, I. Găgeanu, M. Matache, V. Vlăduț ................................................. 401
77. “Plant stress” – the first indication that a landfill gas (LFG) migration is taking
place near the MSW landfill
Gh. Voicu, D. Vieru, L. Toma, P. Tudor ............................................................................ 407
78. Equipments used in biomass pelletization process – a review
Gh. Voicu, M. Dincă, B.Șt. Zăbavă, N. Ungureanu, I. Găgeanu, P. Tudor ....................... 413
79. Wastewater disinfection by chlorination, ozonation and ultraviolet (UV) – a
review
B.Șt. Zăbavă, Gh. Voicu, G. Paraschiv, M. Dincă, N. Ungureanu, M. Ionescu ................ 419
80. Factors that influence the efficiency of the decanting process – a review
B.Șt. Zăbavă, Gh. Voicu, M. Dincă, N. Ungureanu, M. Ferdeș ........................................ 423
81. Design concepts of mobile robots for agriculture
G. Ipate, V. Moise, S.Șt. Biriș, Gh. Voicu, F. Ilie, G.Al. Constantin ................................ 427
82. Theoretical elements for the constructive optimization of the agro-food products
recipients
G. Milian, S.Șt. Biriş, V. Moise …………………………………………………............. 435

SECTION 3: DYNAMICS OF THE RATIO ELECTRICITY VERSUS HEAT
OBTAINED FROM RENEWABLE SOURCES
83. Modeling renewable energy share dynamics
D.A. Ciupăgeanu, Gh. Lăzăroiu………………………………………………………….. 441
84. Simulation of a small scale renewable energy system
D.A Ciupăgeanu, Gh. Lăzăroiu, A. Micu ………………………..………………......….. 447
85. Nanostructured materials for energy valorisation of used oils
M. Dragne, I. Pîşă, C. Covaliu, G. Lazaroiu ...................................................................... 453
86. Velocity distribution in simulated exhale air flow, with virtual breathing thermal
manikins
M. Ivanov, S. Mijorski ....................................................................................................... 457
87. Holistic of renewable energy sources impact and solutions for interconnection to
the power system
Gh. Lăzăroiu, C. Panait, L. Mihăescu, M. Tîrșu, V. Dumbravă, G. Negreanu, I. Pîșă …. 463
88. Bodies shape influence on the effects produced in liquid environments
L. Mândrea, C.A. Băbuțanu, C. Constantinescu ............................................................... 469
89. Comparative analyses of air flow characteristics, through two variants of
prototyped device for fine dust particles concentration measurement
S. Mijorski , M. Ivanov ..................................................................................................... 473
90. About the problems in lightning protection in photovoltaic power stations
I. Nedelchev ...................................................................................................................... 479
91. A study of the transient processes on commutation of low voltage loads
I. Nedelchev, H. Zhivomirov, Y. Rangelov, N. Nikolaev, R. Vasilev ............................. 485
92. Particle collection efficiency analysis of an electrostatic precipitator
L.S. Paraschiv, S. Paraschiv ............................................................................................. 491
93. Modelling and control of a DC motor
C.A. Sima, G. C. Lăzăroiu, V. Dumbravă, M. Tîrșu, V. Galbură .................................... 497
94. Construction log book – a web-based application that supports a building on its
entire life-cycle
I. Udrea, V. Kraus ............................................................................................................ 503
95. Study of renewable energy resources by use of it applications
T. Vătuiu, Gh. Lăzăroiu ................................................................................................... 509
96. Applications and perspectives of using drones in precision agriculture
D. Cujbescu, C. Persu, I. Găgeanu, I. Voicea, G. Gheorghe, L. Vlăduțoiu,
N. Ungureanu, Cr. Vlad ……………………………………………………….……….. 515

1
THE WASTEWATER TREATMENT
USING OZONE TECHNOLOGIES
Aliyarov B. K1., Bakhtaev Sh.A2., Abdreshova S. B3., Ongar B4., Jesionek K.5
1Doctor of technical sciences, Professor, academician of National Academy of Science
of RK, Almaty, Kazakhstan, [email protected]
2Doctor of technical science, professor Almaty, Kazakhstan
3Almaty University of Power Energineering and Telecommunication, Kazakhstan,
050012, Almaty, Baytursynov street, №126 [email protected], PhD, Student.
4Almaty University of Power Energineering and Telecommunication, Kazakhstan,
050012, Almaty, Baytursynov street, №126. [email protected], PhD, Student.
5 Doctor of Sciences, Professor, Wrocław University of Science and Technology,
Wybrzeże Wyspiańskiego 27, 50-370 Wrocław, Poland, [email protected]
ABSTRACT
The issues of using ozone technologies for wastewater treatment are considered. The
analysis of wastewater of complex composition from organic, chlororganic, organometallic
compounds were carried out. The general scheme of water treatment is presented.
The developed ozone-flotation wastewater treatment technology and the switching power
supply of ozonize is described, which allows increasing the specific ozone yield at lower power
consumption.
Keywords: ecology, chlorination, toxicity, ozone technologies, disinfection, sewage,
purification, ozone-air mixture, water treatment, flocculants, corona discharge, ozonization.
1. INTRODUCTION
Development of production activities in the energy sector, exploration of outer space,
exploration and exploitation of large oil fields, creation of mining and processing and
metallurgical industries, intensification of agricultural production and many others lead to an
inevitable and significant deterioration of the ecological situation in the territory of the Republic
of Kazakhstan.
The current state of affairs requires a new approach to epidemiological security and, in
particular, stimulates work to improve the old, create and introduce new technologies for water
purification and disinfection.
The real practical technologies that have been tested on existing large-scale water
purification facilities are chlorination and ozonization.
One of the main reasons why the applicability of the traditional method of disinfection
with chlorine is now being questioned is the formation of chlorine-organic compounds in water
under the influence of chlorine.
Organochlorine compounds according to numerous studies in relation to humans have
high toxicity, mutagenicity and carcinogenicity. Chlorination of wastewater before discharging
into water bodies leads to the fact that chlorine derivatives and residual chlorine, falling into
2
natural water bodies, have a negative effect on various aquatic organisms, causing them to have
serious physiological changes and even their death. In addition, organochlorine compounds are
also pollutants of drinking water, because, having high resistance, cause pollution of rivers at
considerable distances downstream, practically not being removed during the water treatment.
One of the most effective ways to solve the problem of disinfection of sewage with a
complex composition is the use of environmentally friendly, non-reagent methods, such as
ozonation, flotation, as well as the use of alternative types of impact on cleaned objects.
When disinfecting sewage, the use of combined and new electron-ion technologies is
most effective, the use of corona discharge to produce ozone and water-air ejectors for the non-
pressure introduction of the ozone-air mixture into the ozonized fluid flow.
The ability of many impurities in the aqueous medium to change its phase-dispersion
state under the influence of physical and chemical factors (pH, salt composition, temperature,
etc.) makes it possible to vary widely the methods and methods of regulating water treatment
processes [1].
When disinfecting sewage, the use of combined and new electron-ion technologies is
most effective, the use of corona discharge to produce ozone and water-air ejectors for the non-
pressure introduction of the ozone-air mixture into the ozonized fluid flow.
The ability of many impurities in the aqueous medium to change its phase-dispersion
state under the influence of physical and chemical factors (pH, salt composition, temperature,
etc.) makes it possible to vary widely the methods and methods of regulating water treatment
processes.
The basis of purification methods is oxidation, coagulation.
The purification technique consists in binding the ions to be eliminated in poorly soluble
and slightly dissociated compounds by means of reagents, where the importance of the product
of the solubility of the compounds formed is important.
When choosing the technological parameters of water treatment schemes, it is necessary
to determine the main elements of treatment plants, taking into account the individual
characteristics and composition of impurities of natural waters and industrial effluents [2].
An example is a reagent preparation unit and introducing them into the volume of the
treated solution, in which the higher the mass transfer rate in the ragent-worked solution system,
the lower the reagent consumption and the higher the quality of the resulting precipitate with the
high rate of the phase separation process.
2. EXPERIMENTAL STUDY
It is necessary to take into account the conditions of the course of chemical reactions,
since in reaction spaces of small and large sizes, flowing and stationary systems, the processes
can be quite different, and the simple increase in the magnitude of factors cannot be transferred
from laboratory studies to industrial design. An example of the influence of the reaction space
can serve as sedimentation processes of aggregated precipitation or optokinetic coagulation.
Here, even in a stationary medium, the rate of precipitation of the slurry is a function of the
thickness of the slurry layer in which the slurry precipitates. The influence of the diffusion
factors of the turbulence of the flows, the conditions of heat removal on the speed and nature of
the chemical and physical-chemical processes in the course of water treatment are currently
poorly understood, despite their importance in the modeling of technical processes.
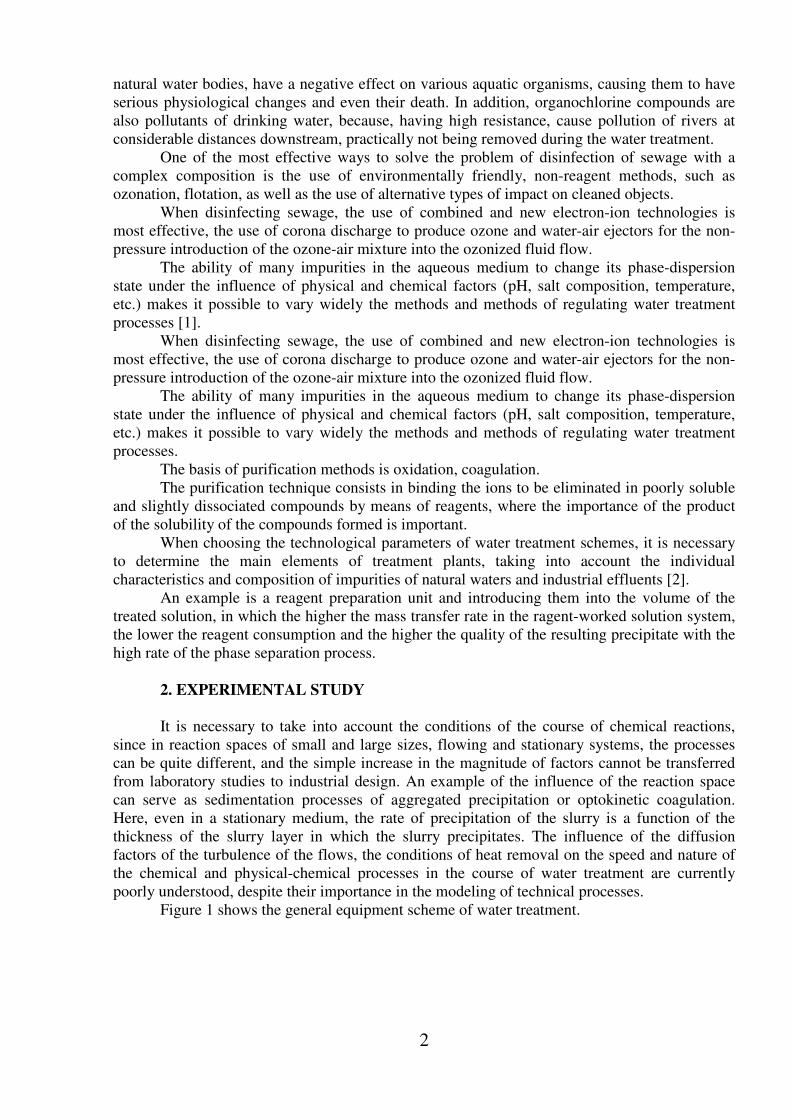
Figure 1 shows the general equipment scheme of water treatment.

3
When analyzing the trends in the development of water treatment technologies, there is, a
clear tendency to create complex schemes based on several processes that ensure the removal of
the entire amount of harmful impurities from water.
Figure 2 is a schematic diagram of the wastewater treatment technology to the required
conditions using an ozone-air mixture [3].
3. RESULTS AND DISCUSIONS
When developing a technological scheme for processing waters of different composition,
it is necessary to take into account the shortcomings inherent in each of the methods.
Complication of the surface water composition requires the abandonment of chlorine, as
the main oxidant and disinfectant, especially in the agricultural regions and areas where the oil
and gas production and chemical industries are located.
When interacting with organic substances (Figure 3), chlorine and ozone interact
differently. The formation of organochlorine compounds, which are toxicogens, carcinogens and
mutagens, already worsen the critical situation with drinking water.
The use of chlorination of sewage fecal waters leads to the formation of chloramine,
which has a low antibacterial activity, but high resistance, killing and depressing the vital
activity of the biological diversity of the water and near-water space. The effect of ozone and
chlorine on the pathogenic microflora is different.
1
2 3
4
5
6 7 8
To the consumer
1- tank of source water; 2-pump; 3- mechanical filter; 4-ejector;
2-5 - ozonizer; 6-filter with activated carbon; 7-intermediate tank; 8-pump water supply to the
consumer
Fig. 1. Equipment diagram of water treatment
4
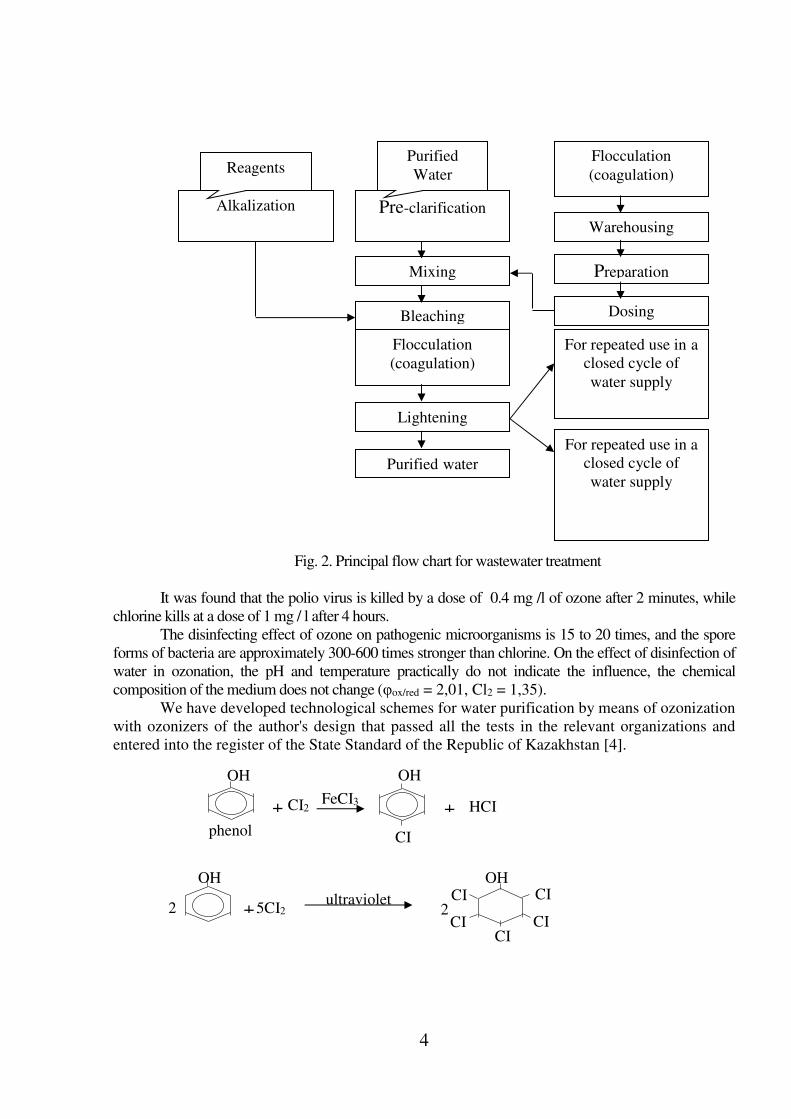
Fig. 2. Principal flow chart for wastewater treatment
It was found that the polio virus is killed by a dose of 0.4 mg /l of ozone after 2 minutes, while
chlorine kills at a dose of 1 mg / l after 4 hours.
The disinfecting effect of ozone on pathogenic microorganisms is 15 to 20 times, and the spore
forms of bacteria are approximately 300-600 times stronger than chlorine. On the effect of disinfection of
water in ozonation, the pH and temperature practically do not indicate the influence, the chemical
composition of the medium does not change (φox/red = 2,01, Cl2 = 1,35).
We have developed technological schemes for water purification by means of ozonization
with ozonizers of the author's design that passed all the tests in the relevant organizations and
entered into the register of the State Standard of the Republic of Kazakhstan [4].
OH
OH
CI
CI
CI CI
CI 2 + 5CI2 2
phenol
OH
+ CI2FeCI3
+
OH
CI
Alkalization
Reagents
Pre-clarification
Purified
Water
Mixing
Bleaching
Flocculation
(coagulation)
Lightening
Purified water
Flocculation
(coagulation)
Warehousing
Preparation
Dosing
For repeated use in a
closed cycle of
water supply
For repeated use in a
closed cycle of
water supply
ultraviolet
HCI

5
Fig. 3. Reactions of the interaction of chlorine and ozone with organic substances on the
example of toxic phenol (a) and ozone with humic substances (b)
In sewage treatment technologies containing a significant amount of organic substances
in the form of petroleum products, we have developed a purification technology using the
rupture of the continuity (homogeneity) of the aquatic medium with ozone-air mixture bubbles
[4, 5].
The essence of this method is that the ejector-dispersant, based on the use of the element
of the "Schott filter" type, saturates the water with the smallest bubbles and makes the solution
inhomogeneous, which is in a turbulent state. This causes cavitation phenomena, shock waves in
the volume of the treated solution.
The sum of these impacts releases a significant amount of energy contained in substances
in solution, far exceeding the exerted forces, leading to a synergistic effect [6-8].
This allows the ozone-air mixture to instantly penetrate into the entire volume of the
solution, which increases the ozone's useful utilization rate to 95-100%.
4. CONCLUSIONS
In practice, to purify natural and wastewater from mechanical and colloidal suspensions,
aluminum or iron sulfates are used as coagulants. According to modern ideas, the process of
coagulation is as follows: when they are added to the system during the first 30-180 sec,
hydrolysis occurs, resulting in the appearance of large cations such as [AI(OH)2]+, [AI(OH)]2+ or
[Fe(OH)2]+, [Fe(OH)]2+, which have a large adsorption potential, and adsorbed on the surface of
negatively charged particles reduce the charge and dispersion potential, and lead to coarsening of
the particles.
To eliminate these drawbacks and more complete removal of mechanical and colloidal
suspensions from drinking and waste water, flocculants are used together with coagulants.
Flocculants are substances of organic origin, which have a diphylic structure, i.e. contain
simultaneously polar and non-polar groups and are readily soluble in water. Flocculants,
depending on the application, are low-molecular, high-molecular, cationic, anionic, nonionic and
amphoteric [9].
The principle of the flocculant is as follows: when a certain amount of it is added to the
system, it can be adsorbed on the surface of the dispersions, forming so-called bridges between
Humic Apocrenic Crenate Low-colored
Non-toxic acids
б

6
adsorbed particles, and forming the ions consisting of several particles fixed by the
macromolecules of the flocculant.
A new approach to managing the purification of various waters from fine particles,
proposed by us, consists in using associates of water-soluble polymers with low and high-
molecular compounds [10]. In this case, the association of ions of surface active substances with
polyelectrolyte occurs not only on the surface of colloidal particles, but also in the regions of
macromolecules located between the aggregated particles of the disperse phase in the form of
bridges.
REFERENCES
1. Getmantsev S.V., Ecology of wastewater treatment by physical and chemical
methods. - M .: Publishing house of the Association of Construction Universities. - 2009, 186 p.
2. Laptev A.G., Water treatment and water purification in power engineering / AG
Laptev, ES Sergeeva // Water: chemistry and ecology. - 2011, No. 3.- pp.33-40.
3. Bakhtaev Sh.A., Almagambetov B.N., Abdreshova S.B. Development of electron-
ion technology for wastewater treatment // The 7th Anniversary International Scientific and
Technical Conference "Energy, Telecommunications and Higher Education in Modern
Conditions". - Almaty: AUPET, 2010. (in russian)
4. Bakhtaev Sh.A., Abdreshova S.B. Complex cleaning and disinfection of sewage and
oily waters with the use of ozone. Bulletin of AUES. - Almaty: AUCP. - 2013, No. 4 (23). - pp.
39-45
5. Bakhtaev Sh.A., Bokanova A.A., Ermagambetov S.B., Baymakhanova Z.A.,
Myrzabekova A.M., Abdreshova S.B. A method for controlling gas bubbles in a liquid //
Preprint RK, No. 14716, Byull. № 8, August 16, 2004.
6. Bakhtaev Sh.A., Abdreshova S.B., Application of ozone technology for wastewater
treatment // Materials of the International Scientific and Practical Conference "Creativity of
young scientists of the XXI century". - Petropavlovsk: SKGU, 2003. (in russian)
7. Bakhtaev Sh.A., Baymakhanova Z.A., Abdreshova S.B., Ozone purification and
disinfection of aquatic environments // Proceedings of the scientific conference "Science and
education is the leading factor of the" Kazakhstan-2030 "strategy. - Karaganda: KSTU, 2008. -
P.192-194. (in russian)
8. Bakhtaev Sh.A., Almagambetov B.N., Abdreshova S.B., Ozone purification and
disinfection of drinking and waste water // Journal of Ecology - Almaty: KazGU after named Al
Farabi, 2010. (in russian)
9. Bakhtaev Sh.A., Almagambetov B.N., Abdreshova S.B., Application of electronion
technology for wastewater treatment // The Bulletin of AUPET - Almaty: AUPET, 2010. (in
russian)
10. Jesionek K. J., Wpływ natleniania wody kotłowej na stan powierzchni elementów
zaworu regulacyjnego,(Effects of boiler feedwater oxygenation on the elements surface of a
steam turbine control valve), Inżynieria Chemiczna i Procesowa, Tom 27, Zeszyt 3/2, Wrocław
2006, pp. 1229-1240.(in Polish)

7
COMPARATIVE ANALYSIS OF POSSIBLE SOLUTIONS OF USING
HEAT RECOVERED FROM UPB-CHP PLANT
Diana BAN (TUȚICĂ)1, Paula TUDOR 2, Eduard MINCIUC1, Victor-Eduard CENUȘĂ1,
1University Politehnica of Bucharest, Power Engineering Faculty 2University Politehnica of Bucharest, Entrepreneurship, Business Engineering and
Management Faculty
ABSTRACT
The efficient use of cogeneration energy systems in Romania depends on the heat demand
variations and on the restrictions imposed by the related legislation. The paper presents a comparison
between two different solutions for the useful use of the recovered heat losses of a combined heat and
power plant, during the summer periods. The authors have performed a technical-economic analysis of
implementation of a trigeneration system dedicated to supply: a) a part of an University Campus and b)
a group of new buildings built near the plant. The results obtained from the calculation revealed that
for this specific case, the best solution to increase the power plant performances, is to generate, from the
recovered heat, cold water and to use it for space air conditioning in the residential buildings.
1. INTRODUCTION
The important role of cogeneration has been recognized at the European Union level
through dedicated Directives that support and promote the use of combined heat and power
(CHP) technologies in all sectors [1], [2]. At the present, cogeneration represents one of the
most efficient solution for rational utilization of fuel, its use leading to reduction of fossil fuels
consumption and diminuation of greenhouse gases emissions [3]. A very important problem
that cogeneration facilities face is that many energy consumers have large variations in energy
consumption [4]. In Romania, CHP benefits of a support scheme that foresees an amount of
mony (Bonus in €/MWh) for each unit of produced and sold electricity. To receive this subsidy,
a producer must cumulatively meet several mandatory conditions: a) the sizing of the CHP is
made so that the heat recovered from the power generating equipment ensures the coverage of
a useful heat load; b) the plant has to realise a fuel saving of at least 10%, in comparison to the
separate production and c) the overall efficiency must be greater than 75% [1], [5]. If the three
conditions are not met, there will be no bonus and therefore economic operation of the plant
will be seriously affected.
In this paper the authors analyzed the possibility to increasing the efficiency of a CHP plant
through a better utilization of available heat during summer time for cooling supply of two
possible existing consumers: the University it self or the new residential neighborhood.
2. CASE STUDY
The analyzed facility refers to a Combined Heat and Power Plant built to supply with
power and heat the University’s Politehnica of Bucharest Campus. The University’s
cogeneration power plant is equipped with two reciprocating engines using natural gas.
Together, the two engines generate 1.6 MWe of electricity. The power which exceeds the
University’s own consumption is sold on electricity market.
1Splaiul Independenței 313, Bucharest, Romania, 0723411052, [email protected]
8
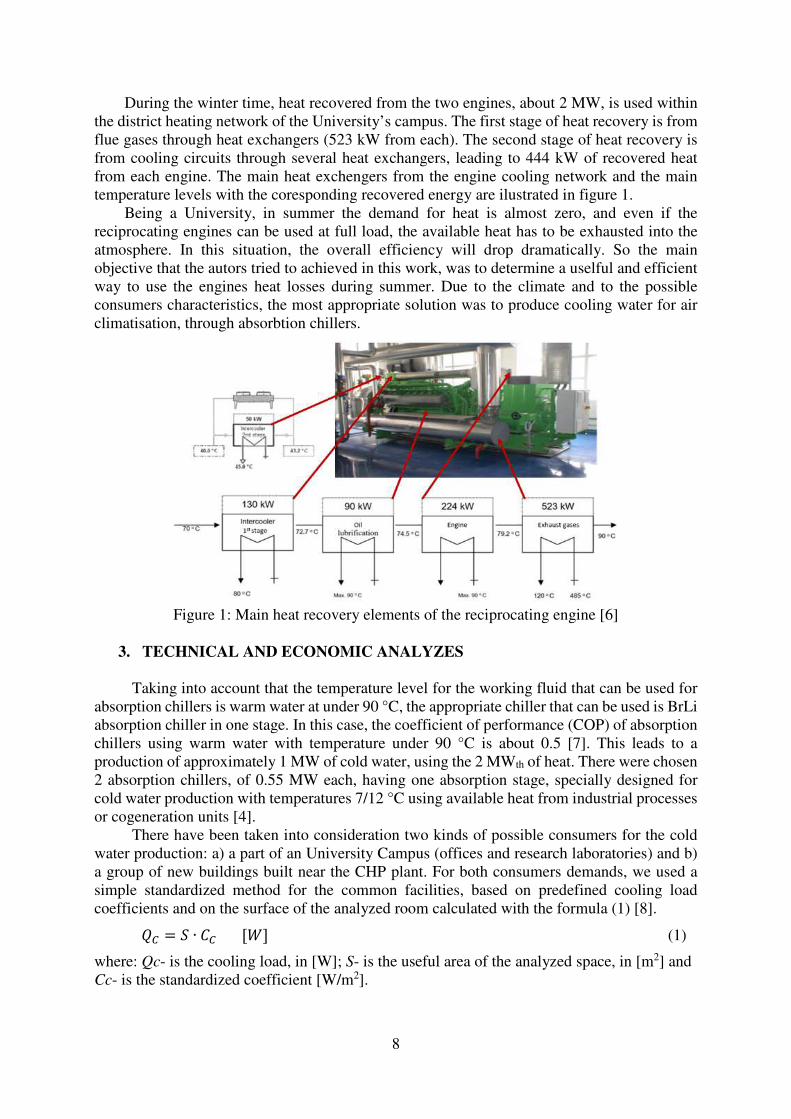
During the winter time, heat recovered from the two engines, about 2 MW, is used within
the district heating network of the University’s campus. The first stage of heat recovery is from
flue gases through heat exchangers (523 kW from each). The second stage of heat recovery is
from cooling circuits through several heat exchangers, leading to 444 kW of recovered heat
from each engine. The main heat exchengers from the engine cooling network and the main
temperature levels with the coresponding recovered energy are ilustrated in figure 1.
Being a University, in summer the demand for heat is almost zero, and even if the
reciprocating engines can be used at full load, the available heat has to be exhausted into the
atmosphere. In this situation, the overall efficiency will drop dramatically. So the main
objective that the autors tried to achieved in this work, was to determine a uselful and efficient
way to use the engines heat losses during summer. Due to the climate and to the possible
consumers characteristics, the most appropriate solution was to produce cooling water for air
climatisation, through absorbtion chillers.
Figure 1: Main heat recovery elements of the reciprocating engine [6]
3. TECHNICAL AND ECONOMIC ANALYZES
Taking into account that the temperature level for the working fluid that can be used for
absorption chillers is warm water at under 90 °C, the appropriate chiller that can be used is BrLi
absorption chiller in one stage. In this case, the coefficient of performance (COP) of absorption
chillers using warm water with temperature under 90 °C is about 0.5 [7]. This leads to a
production of approximately 1 MW of cold water, using the 2 MWth of heat. There were chosen
2 absorption chillers, of 0.55 MW each, having one absorption stage, specially designed for
cold water production with temperatures 7/12 °C using available heat from industrial processes
or cogeneration units [4].
There have been taken into consideration two kinds of possible consumers for the cold
water production: a) a part of an University Campus (offices and research laboratories) and b)
a group of new buildings built near the CHP plant. For both consumers demands, we used a
simple standardized method for the common facilities, based on predefined cooling load
coefficients and on the surface of the analyzed room calculated with the formula (1) [8].
�� = � ∙ �� [] (1)
where: Qc- is the cooling load, in [W]; S- is the useful area of the analyzed space, in [m2] and
Cc- is the standardized coefficient [W/m2].

9
The standardized coefficient (cold demand) has been estimated at 70 W/m2 for case b)
and at 90 W/m2 for the offices and 110 W/m2 for the laboratories and class rooms in case a).
Nomber and average area that lead to the total cooling demand (Qc) are centralized in table 1.
Table 1: Average cold demand for both analyzed cases
a) University Campus b) Residential buildings
Type of space No of app. S [m2] Type of space No of app. S [m2]
Class rooms 11 193 Studio 110 35
Research laboratories 90 30 2 rooms apartments 75 60
Offices 160 20 3 rooms apartments 55 100
Cold demand [MW] 0.96 Cold demand [MW] 0.97
Investement in the new components of the cooling absorbtion system is explaned in
table 2. The main equipemnts are the same in both analyzed cases (chilling machines, heat
exchangers, pompes etc.). The difference comes from the fact that for the University’s Campus
we don’t need new cooling pipes (heating and cooling are never supplied at the same time), but
we need inside ventilation units. Meanwhile, for the case of residential buildings, we have to
instal new insulated pipes of 219 mm x 5.00 mm, with a total cost of 55000 Euros and cold
water supply pumps for district cooling, totalizing 16500 Euros.
Table 2: Investment cost for chillers and auxiliary equipment necessary for both cases
Equipment Quantity
(Units)
Price
(€/ unit)
Total
price (€)
Absorption chiller BrLi, 0.55 MW 2 100150 200300
Heat exchanger primary fluid 90/70 °C, secondary fluid
87/63.7 °C, 951 kW 2 3500 7000
Chiller warm water supply pump, 600 l/min, 10 m 2 6100 12200
Cold water pump 35.2 l/s, 40 m, 2 12500 25000
Cooling tower in closed– 892 kW 1 35000 35000
Cold water insulated storage tank 2 4100 8200
Pumps’ automation equipment 1 3000 3000
Total costs of equipments 313400
Expansion tanks, buffer tank, valves, manometers, thermometers, filters, (5%
from equipment value) and installation (5% from equipment value) [5] 31340
Total including installation 344740
Other expenses (4% from total) 13790
Total value of the absorption chillers equipment (Euro) 358530
Another difference regarding the investment is generated by the need to instal new fun
coils in all climatized units from the Campus. For each room we chose machines with
refrigerant loads between 2 and 3.5 kW, the total investment value beeing of 150000 Euros
(installation included).
For case a) the average functioning period is obaout 500 h/year and the new fun coils will
replace old air conditioning equipements (being energy class B, the energy efficiency ratio is
2.7), and will lead to a consumtion economy of 450 kW of electricity. The annual energy saving
by implementing the new system, will be of 225 MWh (the net saving after internal
consumption is 189 MWh). By selling on the energy market this amount of electricity, the
University’s CHP Plant will earn 35910 Euros/year.
For the case b) total yearly operation period is of 1200 h/year at nominal capacity. This
means that for a price of 35 €/MWh of cooling, the total sold cooling capacity (1164 MWh/year)
will generate an income of 40.740 Euros/year (economic analysis in figure 2).

10
Case a) Case b)
Figure 2: Economic analysis of the proposed solutions for a 10-year period
4. CONCLUSIONS
In the paper there were presented several possible options of using thermal potential of the
tow reciprocating engines of UPB CHP, to generate cooling water, in order to supply a potential
consummer. According to the calculations both solutions are technicaly efficient, however the
first case (UPB Campus) has some special characteristics being an University. The most
important is the fact that the cooling is needed only 500 hours per year.
To better understand which solution is more cost-effective, an economic analysis based on
the Net Present Value (NPV) was realized for an operating period of 10 years. From figure 2,
we can observe that in the case a) for a cooling period of 500 hours, the investment can’t be
recovered during the life time period of the equipements. From the sensitivity analysis, the
minimum number of working hours should be 950, in order to reach, before the last year (10),
the value 0 for de NPV. Meanwhile for case b), the payback period is between 5 and 6 years.
In other words, if the consumption of UPB does not increase in the next period, the only
viable solution remains the one analyzed in case b.
Acknowledgements
This work has been funded by University Politehnica of Bucharest, through the
“Excellence Research Grants” Program, UPB – GEX 2017. Identifier: UPB- GEX2017, Ctr.
No. 139 /2017 (PERFOCET)”.
References
[1] *** Romanian Energy Regulatory Authority, Energy Efficiency Department, Energy: Efficiency Trends and
Policies in ROMANIA. 2015 Bucharest.
[2] El-Khattam W., Bhattacharya K., Hegazy Y., and Salama M. M. A., Optimal investment planning for
distributed generation in a competitive electricity market, IEEE Trans. Power Syst., pp. 1674–1684, Aug. 2004
[3] Siddiqui A. S., Marnay C., Bailey O., and LaCommare K. H., Optimal selection of on-site power generation
with combined heat and power applications, Int. J. Distrib. Energy Res., vol. 1, no. 1, pp. 33–62, Jan.–Mar. 2005.
[4] D. Tutica, P. Tudor, R. Patrascu, E. Minciuc, G. Darie, Energy saving and environmental protection by
integrating cogeneration in new residential buildings, SGEM2017 Vienna GREEN Conference Proceedings,
ISBN 978-619-7408-29-4 / ISSN 1314-2704, 2017, 527-534 pp; DOI: 10.5593/sgem2017H/63/S26.067
[5] Athanasovici, V. et al., Treaty of thermal engineering. Heat supply. Cogeneration (Tratat de inginerie termică.
Alimentări cu căldură. Cogenerare), AGIR, Bucharest, 2010.
[6] ***, Technical instructions of GE Jenbacher, Cogeneration Unit JMS 316 GS-N.LC, CEE/06472/05/O1, 2007
[7] Georgiana T.-D., Exergetic and economic optimization of trigeneration systems, PhD Thesis, 2012.
[8] Ilina, M. et al., Installation manual, Warming systems (Manualul de instalații, Instalații de înacălzire), Vol. 1,
ARTECNO, Bucharest, 2002.

11
COMPARATIVE ANALYSIS OF TWO SOLAR DRIVEN CYCLES
UNDER CLEAR AND CLOUDY SKY CONDITIONS
Bogdan Borcila1a, Camelia Stanciua, Monica Costeaa, Stoian Petrescua, Michel Feidtb aUniversity POLITEHNICA of Bucharest, Bucharest, Romania
bLorraine University, Nancy, France
ABSTRACT
The paper presents a comparative analysis of two solar powered systems aiming to produce
electricity. The potential user could be a duplex house or an office building. One system consists of an
Organic Rankine Cycle (ORC) modeled to operate at variable mass flow rate, constraint by the heat
source temperature which is provided by a parabolic dish collector. The second one is a Stirling engine
modeled by taking into account the internal and external irreversibilities, using the concentrated solar
radiation from dish collector, too. Both engines have to deliver the same electrical power (constraint),
according to the user’s daily energy consumption profile. The study considers the daily solar radiation
and ambient temperature variation under cloudy sky conditions, and the receiver heat losses
dependence on these data. The analysis results emphasize the required solar collector dimensions in
each case. The comparison is done to previous obtained results under clear sky conditions.
1. INTRODUCTION
In the recent past, the solar energy has proven to be an actual alternative and clean source
of energy for the sustainable development of the society worldwide. It is cheap, abundant and
everlasting as source of renewable energy and thus it can be integrated in different systems to
overcome the dependency of present society on conventional fuels [1-2].
Such integration of solar energy has given an opportunity for several studies based on the
energy and economic approaches of solar-powered Stirling engine system. Ferreira et al [3]
developed a methodology for the thermal-economic optimization of micro cogeneration units,
showing its great potential for applications in the residential sector, with a payback period of
approximately 10 years. As a performant solar radiation concentrator, the parabolic dish
coupled with a Stirling engine was modelled and its operation was simulated for insolation
conditions in Egypt [4] or in Brazil [5]. Both studies aimed to find the best performance in
terms of energy production and efficiency, and developed sensitivity analysis for the receiver
working fluid [4], or for collector diameter, wind speed and tilt angle of the cavity [5].
Among the under development micro-scale power generation technologies the ORC
concept is a promising solution for smaller units for domestic users [6-8]. The operation of a
solar power plant associated with a latent heat thermal storage and an ORC unit was simulated
under dynamic (time-varying) solar radiation conditions [9] showing that the system is able to
provide power in 78.5% of the time, with practical efficiency for the ORC unit. The working
fluid for ORC system is important to improve efficiency and achieve better economy [10].
In this paper, a comparative analysis of two solar powered systems performance for
residential consumers, one with Stirling engine, and the other with Organic Rankine Cycle is
done. The aim of the analysis is to provide information that could help the consumer to
choose the system that best suits his needs taking into account the two extrema for sky
conditions – cloudy and clear ones.
1Department of Engineering Thermodynamics, +40-21-4029339, [email protected]

12
2. DESCRIPTION OF THE TWO SOLAR DRIVEN SYSTEMS
The Stirling system consists of a Dish-Receiver assembly that will provide the
necessary heat input, a Stirling engine and an electrical generator, as shown in Fig. 1. The
power output of the electrical generator can be used directly by the consumer and the surplus
is stored in a battery, to be supplied for covering the pick consume or the periods without sun.
Figure 1: The Stirling system
Experimental data obtained from the V-160 Stirling engine [11] are used for the Stirling
engine modeling.
The Organic Rankine Cycle system is also driven by the assembly of a Dish
Receiver and coupled to a storage tank (ST), which will ensure a stable operation. The fluid is
circulated through the receiver of the dish solar collector and heated along the day,
simultaneously feeding the evaporator of the organic Rankine cycle, as presented in Fig. 2.
Figure 2: The Organic Rankine Cycle system
Therminol XP is chosen as heat transfer fluid in the solar receiver tubes, with a mass
flow rate of 0.7 kg/s. The storage tank module is a fully mixed one, assuring a uniform
temperature in its bulk volume, having a capacity of 100 kg.
The parabolic dish collector feeds the storage tank ST, to which the evaporator of the
Organic Rankine Cycle (ORC) is coupled ensuring the heat exchange between the organic
fluid (n-pentane in this case) and the ST fluid. A lower limit is set for ORC operation at 80°C
in order to avoid instability and poor operation. The ORC operates between ambient
condensation temperature and a vaporization level imposed by the ST fluid temperature,
higher than the lower set limit and lower than the optimum vaporization temperature for
maximum power output, 140°C [12]. The main target of this study is to compare the results
Electric
generator
Pel
ORC
turbine
ST
ORC
evaporator
Pump
Pump
ORC
condenser
Pump
Sink at Ta
Dish-
Receiver
system
Electric
generator
Pel
Pump
Dish-
Receiver
system
Stirling
engine

13
obtained with this technic arrangement under cloudy sky conditions, to previous results
obtained under clear sky conditions [13].
3. MODELLING OF THE TWO SYSTEMS
Stirling engine performance evaluation based on the Direct Method from TFS
In the frame of Thermodynamics with Finite Speed and using the Direct Method ,the
Stirling engine efficiency will be given by the equation [14]:
( )( )
, , , , ,
11
,
, , ,
, ,
1 /1 1 1
1 ln i
CC II irrev Topt powerII irrev X
L H SL L
SE CC II irev II irev P
H S H S
X T TT T
T T
η η η
η η η ηγ ε
∆
−−
Σ∆
− = ⋅ = − ⋅ + + − ����� ������������������
, (1)
where: - ηII, irrev – the second law efficiency cumulating the cycle irreversibility effect;
- TH,S – the receiver temperature (hot source);
- TL – the cold end temperature;
- ∆Topt, power – the optimum temperature difference at the source for maximum power
delivered by the Stirling engine;
- ηII, irrev,X – the second law efficiency due to incomplete regeneration of heat;
- γ – the specific heat ratio (= cp/cv);
- ε – the volumetric ratio, ε = Vmax/Vmin;
- ηII, irrev,∆P – the second law efficiency due to pressure losses, expressed as [14, 15]:
( ) ( )
εητ
ετγη
ln'
P
w..
w
wNln
w
w
SL
gR
S
SL
Pirrev,II i ⋅⋅
++
⋅++
−=Σ∆
5
1
2
104
0450940351
1 (2)
with:
( )
( )
1
1
111
−
−−
+⋅
−=
εγη
ln
T/TX
T
T'
S,HL
S,H
L (3)
and w – the average speed of the piston; wSL – the speed of the sound corresponding to the
sink parameters; τ – the ratio of the gas extreme temperature in the cycle (Tmax/Tmin); NS –
number of screens of the regenerator
Equation (1) emphasizes the main causes of irreversibility in actual Stirling Machines
that decrease the ideal cycle efficiency (equal with the Carnot cycle efficiency), namely heat
transfer at finite ∆T at the hot end, incomplete heat regeneration in the Regenerator evaluated
by the losses coefficient X [14, 15] that contains one of the adjustment coefficient of the
model, and pressure losses due to friction.
Finally, the analytical expression for the power output results as:
εη lnz
w
g,HmRTz
SEirrev,SEPower
2⋅⋅⋅= , (4)
where the second adjustment coefficient, z, accounts for the finite heat rate at the source. Its
value is equal to 0.55 or 0.8 [15].
ORC system performance evaluation
For the ORC system, the storage tank is a fully mixed one, characterized by a constant
heat loss coefficient (U)ST = 0.7 W/(m2K) [16]. The mathematical expression of the First Law
of Thermodynamics allows us to compute the storage tank temperature at the next time-step
(n + 1) based on the value from the previous time-step (n):

14
, (5)
The time-step Δτ = 10 min for the simulations along a day or more consecutive days.
The term is the useful heat rate absorbed by the receiver fluid, while
represents the heat rate transferred to the organic fluid in the organic Rankine cycle
evaporator. At system start-up, the initial storage tank temperature is set to ambient one
, while the ORC is turned off, so that . For each simulation day, the
computation is implemented for 24 hours starting from midnight.
The sky conditions are determined based on Meteonorm database [17], as 10-years-
averaged measured values, for Bucharest, thus including cloudy days radiation and ambient
temperature.
4. RESULTS
The results are presented for two consecutive days, July 15th and 16th (the 196th and 197th
days respectively out of 365 yearly days). The solar assembly is composed by the parabolic
dish and the associate receiver of 18 cm diameter aperture, the same for both systems. Heat
losses from the receiver to the surroundings, due to convection and radiation are considered.
Different values of the dish diameter were considered, namely 8m, 12m, and 16m, in order to
evaluate the most economical solution that suits to the consumer needs.
The Stirling engine system daily power output together with the consumption profile of
the user are illustrated in Fig. 3. One can see that the 16 m dish largely covers the pick
consumption of 2 kW, thus 12 m diameter would be a better choice, due to the battery use.
Figure 3: Stirling system power output with respect to the required one
Regarding the ORC system, the clear sky conditions revealed [13] that a dish diameter of
6m was sufficient to cover daily electric energy need of 8kWh. In the present study, authors
have found that, under the same system characteristics, at least 18m diameter should be used
(Fig. 4). Cloudy sky conditions imposed much lower solar radiation values and consequently
the ST fluid heated insufficiently to run the ORC at desired rate.
Due to obviously technical difficulties in using such very large diameter dish, authors
decided to modify some operating parameters in order to find a suitable solution. In this
regards, the simulations were redone for a mass flow rate of fluid circulating the receiver
reduced to 0.3kg/s and a period of two days charging the ST before ORC start-up. In this two-

15
days period, the ST fluid was heated, so that the ORC starts at an upper temperature level and
having a previously stored thermal energy.
Figure 4: ORC daily electric energy produced under cloudy sky (and same parameters used
for clear sky simulation in paper [13])
Figure 5: ORC daily electric energy produced under cloudy sky for a reduced value of
receiver fluid mass flow rate (0.3kg/s) and two charging days before ORC start;
12m diameter dish
The simulation was performed for different dish diameters and the most suitable results
were obtained for a dish diameter of 12m. Results are presented in Fig. 5. The ST fluid
temperature attaint 320°C after 40 hours of operation. ORC module was started in the third
day and produced 8.3 kWh electric energy in 24 hours. The next days, the ORC module
produced 5.56 kWh daily and the ST fluid temperature did not drop under 96°C, thus a stable
operation condition was met.
5. CONCLUSIONS
Performance of Stirling engine and Organic Rankine Cycle systems, in terms of electric
power, electrical energy provided by several dish diameter systems have been simulated,
namely 8m, 12m, 16m for Stirling, completed by 18m and 20m for ORC respectively.

16
The results have been compared to previously obtained ones under clear sky conditions
[13] and emphasized that the electric energy supply which is the closest to demand is
provided by a system with a much larger dish diameter for the same system parameters, in the
simulated case under cloudy sky. The ORC module requires a 18m dish diameter, compared
to 6m one, while the Stirling engine, a 12 m diameter parabolic dish, compared to 5m one.
Modifying operating parameters, the ORC module required a 12m diameter dish for
covering daily electric energy need and a two-days charging period of the ST before start.
Further development of the analysis for different values of other operating and technical
parameters and sink temperature levels (so that heat rejected could be used in cogeneration) is
in due course.
References
[1] Taylor, J.A., Dhople, S.V., Callaway, D.S., "Power systems without fuel", Renewable and Sustainable
Energy Reviews, 57, 1322-1336, 2016.
[2] Kaldehi, B.J., Keshavarz, A., Pirooz, A.A.S., Batooei, A., Ebrahimi, M., "Designing a micro Stirling engine
for cleaner production of combined cooling heating and power in residential sector of different climates",
Journal of Cleaner Production, 154, 502-516, 2017.
[3] Ferreira, A.C., Nunes, M.L., Teixeira, J.C.F., Martins, L.A.B.S., Teixeira, S.F.C.F., "Thermodynamic and
economic optimization of a solar-powered Stirling engine for micro-cogeneration purposes", Energy, 111, 1-17,
2016.
[4] Hafez, A.Z., Soliman, A., El-Metwally, K.A., Ismail, I.M., "Solar Parabolic dish Stirling engine system
design, simulation, and thermal analysis", Energy Conversion and Management, 126, 60-75, 2016.
[5] Caballero, G.E.C., Mendoza, L.S., Martinez, A.M., Silva, E.E., Almazan del Olmo, O., "Optimization of a
Dish Stirling system working with DIR-type receiver using multi-objective techniques", Applied Energy, 201,
271-286, 2017.
[6] Cioccolanti, L., Tascioni, R., Arteconi, A., "Simulation analysis of an innovative micro-solar 2kWe Organic
Rankine Cycle plant for residential applications", Energy Procedia, 142, 1629-1634, 2017.
[7] Taccani, R., Besong Obi, J., De Lucia, M., Micheli, D., Toniato, G., "Development and Experimental
Characterization of a Small Scale Solar Powered Organic Rankine Cycle (ORC)", Energy Procedia, 101, 504-
511, 2016;
[8] Freeman, J., Guarracino, I., Kalogirou, S.A., Markides, C.N., "A small-scale solar organic Rankine cycle
combined heat and power system with integrated thermal energy storage", Applied Thermal Engineering, 127,
1543-1554, 2017.
[9] Manfrida, G., Secchi, R., Stanczyk, K., "Modelling and simulation of phase change material latent heat
storages applied to a solar-powered Organic Rankine Cycle", Applied Energy, 179, 378-388, 2016.
[10] Kumar, A., Shukla, S.K., "Analysis and performance of ORC based solar thermal power plant using
benzene as a working fluid", Procedia Technology, 23, 454-463, 2016.
[11] Stine, W.B., Diver, R.B., "A Compendium of Solar Dish / Stirling Technology", California, USA, Sandia
Laboratories Report, SAND93-7026 UC-236, January 1994.
[12] Stanciu, C., Stanciu, D., Tănase, B., Gheorghian, A., Dobre, C., "Storage Tank Mass Control for Optimum
Solar-Powered Absorption Cooling System Operation", In: Proceedings of 2017 International Conference on
Energy and Environment CIEM 2017, Bucurest, Romania, IEEE Catalog Number: CFP17L60-ART:363-367.
[13] Borcila, B., Stanciu, C., Costea, M., Feidt, M., Petrescu, S., "Comparative Analysis of Constraint Operation
of Solar Stirling and ORC Cycles", Proceedings of ECOS’18 Conference, Guimares, Portugal, 2018.
[14] Petrescu, S., Costea, M., Harman, C., Florea, T., "Application of the Direct Method to Irreversible Stirling
Cycles with Finite Speed", International Journal of Energy Research, 26(7), 589-609, 2002.
[15] Petrescu, S., Costea, M., "Development of Thermodynamics with Finite Speed and Direct Method", AGIR
Publishing House, Bucharest, 2011.
[16] Tzivanidis, C., Bellos, E., Antonopoulos, K.A., "Energetic and financial investigation of a stand-alone
solar-thermal Organic Rankine Cycle power plant", Energy Conversion and Management, 126, 421-433, 2016.
[17] Meteonorm: Irradiation data for every place on Earth, www.meteonorm.com.

17
THE USE OF RAW ANIMAL FATS-BUTANOL-DIESEL
FUEL BLENDS AT DIESEL ENGINE
Cernat Alexandru1, Pana Constantin, Lazaroiu Gheorghe,
Negurescu Niculae, Nutu Cristian, Nicolici Adrian
University Politehnica of Bucharest
ABSTRACT
The use of the alternative fuels, even in partial substitution, may represent a viable solution to
reduce the diesel engine pollutant emissions and to maintain the diesel engines in service and in urban
traffic. The animal fats-butanol-diesel fuel blends are an alternative fuel which can be used at diesel
engines, in order to reduce the pollutant emissions. The main advantages of animal fats- diesel fuel
blends like cetane number and calorific value very close to diesel, higher oxygen content it
recommend it as a good alternative fuel for diesel engines, being renewable and energy efficient. The
results of experimental investigations show the animal fats and butanol effects on the combustion
parameters and on the pollutant emissions. Animal fats-butanol-diesel fuel blends can be considered a
viable alternative fuel for diesel engine, assuring the partial replace of the fossil fuels and resolving the
major problem of animal wastes
1. INTRODUCTION
After the 2015 Paris Climate Conference and the C40 Events-C40 Mayors Summit 2016
diesel engine pollution issue becomes a priority for some capital cities (Paris, Madrid, Athens
and Mexico City) which will not legally allow anymore the access of automotives with diesel
engines starting with year of 2020.
The use of alternative fuel obtained from renewable sources to diesel engines fuelling is a
viable solution for replace of the fossil fuels and for pollutants emissions and greenhouse
gases effect decrease. The animal fats have a high potential, due to their good combustion
properties and due to great reserves can be used with success at diesel engines. They are
oxygenated fuels, non toxic, sulphur free and contain more oxygen compare to diesel fuel [1].
The main disadvantages of animal fats are their high viscosity and poor volatility. Because of
their high viscosity, the preheating of animal fats results in a significant decrease of viscosity,
which allows the diesel engine fuelling without constructive modifications [2]. By use of
butanol in mixture with diesel fuel and animal fats the new fuel viscosity significant decreases
and the fuel atomization is improvement [3].
Animal fats are lipid materials, being composed of triglycerides. Animal fats are in more
parts constituted from tryglicerides and saturated monocarboxylic fat acids with number of
carbon atoms (C12-C18) in which palmitic and stearic acids are predominant [2]. Animal fats
have a lower content of carbon and hydrogen and higher oxygen content comparative to diesel
fuel. The viscosity of the animal fats is of 15 times greater than diesel fuel at 40oC, table 1,
[2]. At the raw animal fats use, the engine power is lower compared to diesel fuelling (the
lower heating value of animal fats is with almost 10% lower as the diesel fuel- table 1). By
increasing the cyclic fuel dose for the same air/fuel ratio, the engine power can be corrected
because of the higher oxygen content of animal fats than diesel fuel [2].
_______________________ 1Blvd. Splaiul Independentei no. 313, +40723470021, [email protected]

18
In the table 1 a presented some of the physic-chemical properties of diesel fuel and animal
fats:
Table 1: The physic-chemical properties of diesel fuel and animal fats
Specific properties of the fuels
Diesel
Fuel Animal Fat
Density [g/ml]
0.8495
0.92
Viscosity at 40 oC [mm2/s] 2.96 45
Thick point [oC] -12 6
Congealing point [oC] -16
Ignition point [oC] 74 170
Boiling point [oC] 191 344
Sulphur [% m] 0.036 0
Cetane number CN [-] 49.2 56
Caloric power Hi [MJ/kg] 42.9 39.77
Carbon [% m] 86.67 77.6
Hydrogen [% m] 12.96 12.3
Oxygen [% m] 0.33 12.5
Oxygen for combustion Ot [kmol/kg cb] 0.1045 0.0915
Experimental investigations of a diesel engine with a single cylinder, air cooled, with
direct injection, fuelled with fuel diesel and animal fat preheated to 70°C in mixture with
ethanol showed follow results comparative to diesel fuel engine: increase of the autoignition
delay; decrease of the exhaust gas temperature; decrease of NOx and smoke emissions level
[3, 4]. Same results were presented in others papers [5, 6, 7, 8].
In this paper are presented some results of preheated raw animal fats in mixture with
diesel fuel and butanol.
2. METHODOLOGY
The experimental investigations were carried on a CFR-IT9-3M experimental diesel
engine. The engine was firstly fuelled with diesel fuel and then with blends of diesel fuel-
animal fats –butanol for the same engine adjustments (13 °CA injection timing and ε=13.74
compression ratio). The fuel cyclic dose (28.9 mm3/cycle) was maintained constant at for all
experimental tests. The diesel engine was equipped with AVL pressure transducer line,
Kubler speed incremental transducer, real time AVL data acquisition system, AVL gas
analyzer and smoke meter, thermo resistances for engine cooling liquid temperature, engine
oil and air intake temperatures, and thermocouples for exhaust gas temperature. The high
viscosity and poor vaporization characteristics of animal fats need prior their heating and the
content limit in mixture with diesel fuel.
Was used the following methodology:
The animal fats are perfect soluble in diesel fuel at ~40 °C. At this temperature were
prepared diesel fuel-animal fats (5% and 10% vol.)- butanol (5% vol.) blends.
In figure 1-3 are presented the some effects of the animal fat and butanol in mixture with
diesel fuel.
In figure 1 the NOX emissions level variation with the animal fats content in mixture with
diesel fuel and butanol (xm) is presented.
The NOX formation is favored of the high temperature zone associated to the preformed
mixtures combustion. Decreasing of NOX emission with 65% at the increasing of fats content,

19
figure 1, is explained by reduction of the preformed mixtures quantity because of the
atomization aggravation, which leads to combustion temperature decrease comparative to
diesel engine fuelled with diesel fuel, figure 2.
0
100
200
300
400
500
600
0 0.02 0.04 0.06 0.08 0.1 0.12xm
NO
x [
pp
m]
ε=13.74
β=13 CA
Figure 1: NOX emissions level versus animal fats content
200
220
240
260
0 0.02 0.04 0.06 0.08 0.1 0.12xm
t gas
[oC
]
ε=13.74
β=13 CA
Figure 2: The gas temperature versus animal fats content
0
0.1
0.2
0.3
0.4
0.5
0.6
0.7
0 0.02 0.04 0.06 0.08 0.1 0.12xm
SM
OK
E
[k]
ε=13.74
β=13 CA
Figure 3: Smoke emissions level versus animal fats content

20
In figure 3 smoke emission level variations versus the percent of animal fats in mixture
with diesel fuel for same butanol content is presented. Reduction of smoke emission level
may be explained by carbon content reduction and oxygen content increase at molecular level
(the animal fats and butanol have higher oxygen content in their molecule). Comparative to
diesel fuel fuelled engine, a reduction with 87% of smoke emission level for xm=10% was
obtained.
3. CONCLUSIONS
The use of animal fats and butanol in mixture with diesel fuel at the diesel engine assures
pollutant emissions decrease. The NOX and smoke emissions level decreases. Animal fats can
be considered a good alternative fuel for diesel engine, they achieving the partial replace of
the fossil fuels and resolving the major problem of origin animal wastes from leather industry.
Acknowledgments
The authors address special thanks to AVL GmbH Graz Austria for providing the necessary
equipments. The work has been funded:
• by a grant of the Romanian Ministry of Research and Innovation, CCCDI-UEFSCDI, project
number PN-III-P1-1.2-PCCDI-2017-0404/31PCCDI/2018, within PNCDI III”
• by University Politehnica of Bucharest, through the “Excellence Research Grants”
Program, UPB – GEX 2017. Identifier: UPB- GEX2017, Ctr. No. 62 /2017
• by the Sectoral Operational Programme Human Resources Development 2007-2013 of the
Ministry of European Funds through the Financial Agreement POSDRU/159/1.5/S/134398
References
[1] Venkatraman, M., Devaradjane, G., ”Effect of Compression ratio, Injection Timing and Injection Pressure on
a DI Diesel engine for better performance and emission fueled with diesel-diesel biodiesel blends“, International
Journal of Applied Engineering Research, Vol. 1 , No 3 , 2010.
[2] Gheorghe Lazaroiu, Constantin Pană, Lucian Mihaescu, Alexandru Cernat, Niculae Negurescu, Raluca
Mocanu, Gabriel Negreanu, „Solutions for energy recovery of animal waste from leather industry, Energy
Conversion and Management”, pp: 1-11, ISSN: 0196-8904, June 2017.
[3] Oguzhan Dogan, The influence of n-butanol/diesel fuel blends utilization on a small diesel engine
performance and emissions, Fuel 90, pp. 2467–2472, 2011.
[4] Kerihuel, A., Kumar, M., S., Bellettre, J., Tazerout, M., “Investigations on a CI Engine Using Animal Fat
and Its Emulsions with Water and Methanol as Fuel”, SAE International, Paper Number 05P-95, 1995.
[5] Senthil, Kumar, M., Kerihuel , A., Bellettre, J., Tazerout, M., “A Comparative Study of Different Methods of
Using Animal Fat as a Fuel in a Compression Ignition Engine “ , Journal of Engineering from Gas Turbines and
Power, Vol. 128, October 2006.
[6] Cernat, A., Pana, C., Negurescu, N., Lazaroiu, Gh., Nutu, C., Aspects of the animal fat use at the diesel
engine fuelling, UPEC 2015 Proceedings of Staffordshire University, 2015.
[7] Srinivasa, Rao, K., Ramakrishna, Dr.A., Rao, P.V., Performance and emission characteristics of DI-CI diesel
engine with preheated chicken fat biodiesel, International journal of mechanical engineering and technology,
volume 4(3), 2013.
[8] Kumar, A., Kerihuel, J., Bellettre, M., Tazerout, M., The use of preheatead animal fat as fuel in a
compression ignition engines, Renewable Energy, volume 30(9), pp:1443-1456, 2005.

21
EXPERIMENTAL INVESTIGATION OF PARABOLIC TROUGH
SOLAR COLLECTOR (PTC) PERFORMANCE FOR WATER
DESALINATION
Dhafer Manea H. Al-Shamkhee 1, Essam. Oun Ali. Al-Zaini2, Qahtan A Abed3
1,2,3 Dr. Eng. Al-Furat Al-Awsat Technical University, Engineering Technical
College- Najaf, Iraq.
ABSTRACT
Due to depleting traditional energy resources, solar energy appears a promising alternative
renewable preference for many demonstrational applications including solar desalination plants. In this
respect, an experimental study on the performance of pre-designed and manufactured Lab-scaled water
desalination used parabolic trough solar collector PTC was carried out for the first time in Al-Najaf
City-Iraq (32° 1' N / 44° 19' E). The proposed designed is to enhance the production of the water still
by integrated with a parabolic trough solar. The used PTC with 90o-rim angle mirrored reflector that
focused the sun on its focal line of a copper tube with black chrome coating receiver. Primary results
reveal 11% improvement in system efficiency is obtained over the used vacuumed copper tube with
black chrome coating receiver. Results also confirm PTC facing North or South positions is best for
maintaining better system efficiency.
Keywords: Solar distillation, parabolic trough solar collector, condensation, Solar radiation.
1- INTRODUCTION
It is well known that worldwide regions with scarce sources of pure consumable water are
having abundant solar energy. Conventional technology of desalinating saline water in such
dry regions such as thermal processes is well discovered, implemented and developed. These
including multiple effects, multi-stage flash and more recently humidification
dehumidification process. Such practices are yet claiming high energy input rates due to the
vaporization phase change of saline water [1].
In this respect, utilizing solar energy technology for desalination appears as superior
choice of being renewable energy that promotes higher environmental and living standards
within such regions. In this respect, trough solar concentrator technology for desalination
applications is attractively growing research topic [2-5]. Parabolic trough solar collectors are a
type of concentrating collectors used in thermal power plants. They consist of a reflective
mirror in the shape of a parabola, a tubular receiver, and support structures. The collector uses
the solar incident rays from the sun, reflecting them onto a tubular receiver. The tubular
receiver is placed at the focal point of the parabola for effective reflection of the sun’s rays
onto the fluid inside the receiver [6].
Riffat and Mayere [2] investigated the performance of v-trough solar concentrator for
desalination applications. They reported that the v-trough solar concentrator is a superior
technique for small and medium water desalination, since the efficiency reaches 38% at 100oC
temperature of transfer fluid at the concentrator outlet. Joo and Kwak [3] conducted an
optimization study of solar thermal desalination over a small-scale multi effect distiller. Their
results revealed an optimal ratio of 2.0.
The performance evaluation of combining desalination systems with concentrated solar
power plants was conducted by Palenzuela et al. [4]. They concluded that a low temperature
3 Corresponding author, email [email protected]

22
multiple-effect distillation is more efficient than a low temperature multiple effect distillation
integrated with a thermal vapour compression. A multiple-effect distillation system was
investigated through a dynamic model generated by Calle et al. [5]. They reported that their
generated model could be used to optimize the operating control of such systems. Yanjuan
Wang et al. [7]. Carried out numerical simulation combining solar ray trace (SRT) method
and finite element method (FEM) to solve problem coupled with fluid flow, heat transfer and
thermal stress in a PTC system. Their results revealed that the circumferential temperature
difference (CTD) of the absorber decreases with the increases of inlet temperature and
velocity of the heat transfer fluid (HTF) and increases with the increment of the direct normal
irradiance (DNI). They also reported that the thermal stress and the deformations of the
absorber are higher than that of the glass cover. They concluded that their findings could
provide a fundamental reference for the development of the parabolic trough solar thermal
power plant in China.
The present study is focused on the amount of freshwater productivity of a solar still
integrated with the parabolic trough collector in natural mode. The system has been optimized
to increase the heat transfer coefficients by adding a heat exchanger coil.
2- EXPERIMENTAL SETUP
The experimental work involved experiments conducted on the solar parabolic trough
(PTC) with distillation system. The performance of a locally designed and build PTC for
water desalination application was investigated. Collected weather data including air
temperature, solar radiation and wind speed was well considered in the experimental work.
Where the work divided into two parts; the first part discusses efficiency of the parabolic
trough collector and the second part discusses water desalination by use of parabolic trough
collector. The PTC was made of a stainless-steel sheet in order to facilitate reflection and
concentration of sun radiations towards an absorber tube located at the focus line of the
parabolic. The receiver in turn is an absorber tube is made of copper at which point it absorbs
the incoming radiations and transforms them into thermal energy, the last being transported
and collected by a fluid medium circulating within a tank filled with saline water at which
point it evaporates. Pure water then collected as a result of water condensation. The
Specification of the used PTC are detailed in table1 below.
Table1. Specification for solar parabolic solar collector
Trough length(L) 1.99m
Aperture (a) 0.85m
Aperture area = L*a 1.99*0.85=1.6915m2
Height trough 1.74 m
Absorber material Black steel
Rim angle 90o
To achieve cost-effectiveness in mass production, the collector structure must feature not
only a high stiffness-to-weight ratio, to keep the material content to a minimum, but also to
consider low-labor manufacturing processes. A steel parabola framework was designed and
manufactured where it has been covered with a highly reflective Stainless-steel sheet as
shown in Figure 1. The PTC was positioned facing the south direction in order to ensure a
maximum amount of solar radiation to be received. Reflected solar radiation then directed to
the receiver tube in its focal line.

23
Figure 1. Experiment parabolic trough solar with the receiver
The second part of this work is the distillation collector (See figure 2). The temperatures
of the distilled water downstream of the pre-heating section, at the inlet and at the outlet of the
receiver and downstream of the heat exchanger are measured by thermocouples as well.
Figure 2. Photographic side view of the distillation water
3- RESULTS & DISCUSSION
Solar radiation affects the performance of the PTC due to the fact that its intense varied
along day cycle which in turn reflects its amount absorbed by the receiver. Figure 3,
highlights the solar radiation-temperature relationship over two days running. Obviously,
maximum radiation was recorded at 12:30 pm scoring as high as 962 where the highest
temperature of 40.5 oC was obtained at 3:30 pm on 15/5/2018. On another day, an optimal
radiation was reported at 12:10pm of 940 where highest temperature of 44.3oC obtained at
2:30pm.
Reflector

24
Figure 3. Solar radiation and ambient temperature variation with time at 10 and 15/5/2017
The experimental results of PTC with solar still for fresh water are reported and discussed
first. The daily thermal efficiency, for the PTC with solar still was acquired by the summation
of the total hourly condensate production for fresh water, multiplied by the latent heat of
water vaporization and divided by the product of daily solar radiation and the whole area of
the collector.
.
.
fg
d
M h
I Aη =
In the experimental results, Figure 4 shows the relationship between time and temperature
inlet, outlet and surface temperature of absorber pipe recorded on 10 and 15/5/2017
respectively. Generally, on 10/5/207, it should be mentioned that all temperatures were
increased with time. However, a 10oC decline in surface tube temperature at 12:10pm. This is
mainly due to poor contact between the temperature sensor and the tube surface. The error
was less pronounced on the results obtained on 15/5/2017 as can be shown in Figure 4.
10/5/2017 15/5/2017
10/5/2017 15/5/2017

25
Figure 4. Variation of the inlet, outlet and surface temperature of the PTC with Time
for two days
The Figure 5 displays the time-coil surface temperature relationship (T5- water in basin),
the temperature of the glass surface (T7- condensation surface) and temperature of moisture
air (T8) during the two experimental days 10/5/2018 and 15/5/2018. It can be noticed that the
glass surface temperature was the lowest compared to those for the coil surface and moisture
air. The difference in temperature also increased with time due to evaporation process takes
place in the basin as result of increased solar radiation.
Figure 5. The Relationship between Time and Temperature of Coil Surface (T5- Water in
Basin), The Glass Surface (T7- Condensation Surface) and Moisture Air (T8) of two days
The Figure 6 shows the relationship between time and productivity for two days
(10/5/2018 & 15/10/2018). It can be noticed that highest productivity was calculated at
12:00pm and lower of productivity at 10:30am on 10/5/2018. Similarly, highest productivity
was obtained at 12:00pm on 15/10/2018. Beyond 12:00pm, a noticeable reduction in system
productivity was recorded mainly due to reduced water evaporation effect as a result of
declined solar radiation.
10/5/2017 15/5/2017

26
Figure 6. Productivity of fresh water for two days (10/5/2018 and 15/10/2018)
4- CONCLUSIONS
This paper reports the performance of pre-designed and manufactured Lab-scaled parabolic
trough solar collector PTC for water desalination application for the first time in Al-Najaf City- Iraq
(32° 1' N / 44° 19' E). Experimental outcomes indicate that PTC with single slope solar still system
yields a relatively higher productivity of fresh water over traditional solar still systems
approaching 5%. It also reported a significant growth in system production could be achieved
with expanding the solar collecting space. In this respect, it can be concluded that PTC
desalination systems appears to be superior approach in country like Iraq.
References
[1] Fahad A. Al-Sulaiman, M.I.Z., Maimoon Atif, Palanichamy Gandhidasan, Salem A. Al-Dini,
Mohamed A. Antar, Humidification dehumidification desalination system using parabolic
trough solar air collector. Applied Thermal Engineering 2015. 75: p. 809-816.
[2] Riffat, S. and A. Mayere, Performance evaluation of v-trough solar concentrator for water
desalination applications. Applied Thermal Engineering, 2013. 50(1): p. 234-244.
[3] Joo, H.-J. and H.-Y. Kwak, Performance evaluation of multi-effect distiller for optimized solar
thermal desalination. Applied Thermal Engineering, 2013. 61(2): p. 491-499.
[4] Palenzuela, P., et al., Evaluation of cooling technologies of concentrated solar power plants and
their combination with desalination in the mediterranean area. Applied Thermal Engineering,
2013. 50(2): p. 1514-1521.
[6] De la Calle, A., et al., Dynamic modeling and performance of the first cell of a multi-effect
distillation plant. Applied Thermal Engineering, 2014. 70(1): p. 410-420.
[7] Mohamed S. Shahin, M.F.O., Faruk Uygul, Thermodynamic analysis of parabolic trough and
heliostat field solar collectors integrated with a Rankine cycle for cogeneration of electricity
and heat. Solar Energy, 2016. 136: p. 183-196.
[8]Yanjuan Wang, Q.L., Jing Lei, Hongguang Jin, Performance analysis of a parabolic trough solar
collector with non-uniform solar flux conditions. International Journal of Heat and Mass
Transfer, 2015. 82: p. 236-249.

27
MODELING OF HEATING SECTOR DEVELOPMENT WITH
TRANSITION TO BIOMASS-BASED GENERATION SCENARIO TILL
2050 IN UKRAINE
Epik A.1, Junior Researcher, Zubenko V1, Junior Researcher
ABSTRACT
Current work is devoted to the modeling calculation aimed on answering the question of how the heating sector
will look like after transformation from current fossil fuel generation to potential RES-based generation till 2050:
what equipment, fuel types will be used, how energy consumption will change, what are the limitations in the
sectors, drivers of development of RES in heating sector, needed investments, CO2 reductions and jobs created
according to the installations implemented. The results of such modeling could demonstrate principal possibility
of achieving of determined RES-based heat generation targets drawing up the heating sector architecture till
2050.
Keywords: renewable energy sources, heat generation, agrobiomass, total primary energy supply, gross final
energy consumption.
1. INTRODUCTION
Ukrainian heat generation sector is currently one of the most energy intensive sectors with the
large share of fossil fuel based generation (more than 90%). At the same time, the substantial
development of renewables is only observed in the heat generation sector as shown at
Figure 1. Total share of heat energy demand out of all energy demand in Ukraine is for 2016
more than 30% in total final energy consumption [1]. Despite number of latest state
programmes and plans [2], [3], [4], [5], [6], [7] of sector reform it is still unclear what is the
primary tendency of its development and the driving forces for the post-2020 period and how
exactly and to what state it can transform. In the meantime, while maximum projection
horizon for Ukraine is now 2035, there are new international realities which Ukraine already
encountered as the Associated EU Member State and a Party of Energy Community (Paris
Agreement, available plans on 100% RES in some of the EU member states, etc.). This
requires widening of the projection horizon at a minimum till 2050.
Electricity* – including large hydro power
Figure 1: Developments of RES in Ukraine according to official statistics, 2010-2016
Available prognoses are focused more on traditional fuel types and energy sources and are
sometimes contradictory with each other. There is no detailed sectoral specification thus they
could not serve as road map for heating sector development. Meanwhile one of the possible
and perhaps most economically plausible scenarios may be fuel switch from fossil fuel to
1 Institute of Engineering Thermophysics of NASU, Zhelyabova 2a street, tel.: +38 044 453 28 56,
e-mail: [email protected]; [email protected];
6,5% 6,5% 6,7%7,0%
7,4%
7,9%
7,8%
0%
1%
2%
3%
4%
5%
6%
7%
2010 2011 2012 2013 2014 2015 2016
6,5% 6,5% 6,7%
Electricity*
7,0%7,4%
7,9% 7,8%
2,4% 2,4% 2,6% 2,8%
Heat energy
3,4%
4,6%
6,2%
1,1%1,5% 1,3% 1,8%
2,0%
Transport
2,1% 2,1%
0%
1%
2%
3%
4%
5%
6%
7%
8%
9%
2010 2011 2012 2013 2014 2015 2016
RES share in TFC per sectors
RES share in total final
energy consumption (TFC)

28
biomass-based heat generation, for which from one hand the legislative and economic
preconditions are more or less already in place but signal for investors in form of some
strategic document is absent.
To improve current situation with post-2020 vision and providing well-grounded data for
decision making, more precisely estimate policies needed to reform district heating sector
with respect to increasing of renewable energy based heat generation it is crucial to discover
the details of heating sector development, what will be the principal structure of sector, heat
energy demands, sources of energy and their niches in the sector, equipment used for longer
planning horizon. The distribution of biomass and RES types used, respective heat prices and
how the technological competitiveness will influence the overall state of heating sector,
subsectors within it, interconnects with other sectors and changes over time for post-2020
period is necessary for understanding principal possibility or impossibility of achievement of
respective RES share in heat generation. Such work is the first step to demonstrate the
possibility of high level of RES implementation in heating sector of Ukraine, showing the
trajectories of how it could be achieved and biomass/RES types engaged.
2. APPROACH AND METHODOLOGY
The modeling touches only heating sector with inclusion of all generation-side installations
operating in the sector. The general idea of the modeling approach is based on the
identification of quantity of RES equipment and energy produced for each of 3 heating
subsectors (individual heating of population, district/budget heating (DH), industrial heating)
and for all currently eligible RES types (all kinds of biomass, biogas, MSW, solar heating and
heat pumps) for different equipment categories (individual stoves, small, all kind of biomass
boilers (medium and large scale hot water and steam boilers), CHPs MSW incineration,
biogas cogeneration on ICE basis, solar collectors (roof and stationary) and heat pumps
(aero)). The modeling is performed for the step of 5 years till 2050 with the iterations
performed on each step of calculation. At the beginning of calculation process, the matrix
including all eligible RES types for different equipment categories is built. The combinations
of pairs “biomass type”“technology used” have large number of possible solving
alternatives in time. The model is designed to narrowing the quantity of possible solving
trajectories and define so-called “balanced” trajectory of RES development on the basis of
integration of different constraints, limitations and thresholds for initial and final data
produced by the model (see the principal schematic diagram at Figure 2).
Figure 2: Schematic diagram of modeling approach

29
The first iteration of model may be simply performed for example as extrapolation of existing
statistical data. After obtaining of results of first iteration the output data is analyzed with
respect to contradiction of set limitations of the model. If at least one limitation is not
satisfied, the iteration is repeated once more. The final data on equipment and biomass types
used shall satisfy all integrated limitations (some of which are in contradiction with each other
which is narrowing the possible projected trajectory even more). The iterations of energy data
for each modeling step (5 years) is performed as long as all set limitations are satisfied
without any contradictions. After this calculation is deemed final. The main constraints and
limitations used in the model are presented on the diagram below on Figure 3.
Figure 3: Key assumptions, constraints and limitations used for model balancing.
Graphical representation of the modeling approach is represented at Figure 4. The blue line
represents the energy statistics with simple linear extrapolation serving as reference first
iteration. All next trajectory data is generating after applying of certain limitation packs which
adjust previous data arrays. The final scenario – so-called “balanced” shown by orange line at
Figure 4 is satisficing all applied limitations and so is deemed final.
Figure 4: Graphical representation of iteration-based method using different limitations packs
0%
10%
20%
30%
40%
50%
60%
70%
2010 2011 2012 2013 2014 2015 2016 2020 2025 2030 2035 2040 2045 2050
First iteration - extrapolation of statistics
Application of limitation pack # 1 (national plans)
Application of limitation pack # 2 (national plans+economic indicators)
Application of limitation pack # 3 (national plans+economic indicators+EU tendencies)
Application of limitation pack # 4 (national plans+economic indicators+EU tendencies+biomass potential)
Application of limitation pack # 5 (national plans+economic indicators+EU tendencies+biomass potential+GHG reduction effect) - balanced scenario
TPES trends for
each subsector
in heating
Maximum possible
substitution of fossil fuels
RES potentials for each type
FINAL DATA
ON RES
Specific sub-sectoral
thresholds
Ratio of heat energy from CHP/boiler
houses from RES in DH
Intermediary targets
on RES according to available
programmes, plans, strategies
Payback/investments for each technology
and RES type
GHG emission reduction effects

30
The model also calculates jobs and investments needed for achieving the respective scenario.
Investments are determined according to project specific data currently known and typical for
Ukrainian conditions prior to the iterations. For each technology/RES type the capital
investments are incorporated in model with tendency of decreasing through time. Also simple
payback is calculated on the basis of investments through standard method of dividing of
capital costs on operational savings appearing due to replacement of fossil fuels by RES
(difference between energy cost from RES and baseline – natural gas). It should be mentioned
also that total investments for sector and each subsectors are serving as additional threshold
per each iteration (making iteration cycling).
Jobs are calculated according to standard jobs factors multiplying the calculated heating
capacities for each technology/subsector/RES/type on the respective factors jobs/MWth
according to international and national level data [7], [8], [9].
For the purpose of modeling, natural gas consumption in all heating sector for all subsectors is
remaining stable (on the current level) for all steps of modeling till 2050.
3. CONSOLIDATED RESULTS AND DISCUSSION
To obtain final results for district heating sector it is necessary to determine the input of RES
for all heating subsectors in Ukraine, including district heating, industrial (processing) heating
and individual heating of population otherwise the RES input in DH subsector may be not
balanced (for example, overestimated for population and underestimated for district heating).
So the model is working on the level of all three subsectors, as specified above. Below the
results of the model iteration with application of above mentioned limitations are presented in
consolidated manner specifically for three subsectors.
Figure 5: Total installed capacity of RES (MWth) in heating sector
According to the final modeling data, total installed capacity of RES overall for heating sector
is increased from 5 GWth in 2015 to 35 GWth in 2050 (Figure 5) and the total primary energy
supply (TPES) from RES is increased from 2.6 Mtoe to 13.8 Mtoe in 2050 (Figure 6). RES
share overall for heating sector is increasing from 10% in 2015 to 57.4% for 2050.
According to calculation over 145 000 jobs in 2050 are to be created in heating sector: 60 000
in DH and public heating, 48 000 in industry, 38 000 in population individual heating. The
most job-intensive technologies are CHP on agroresidues and energy crops (9-11
jobs/MWth), MSW incineration (7-8 jobs/MWth), large industrial boiler houses (4
jobs/MWth), solar and heat pumps (3-5 jobs/MWth), the less job-intensive are individual
stoves and small biomass boilers (1-2 jobs/MWth). Total investments needed for the scenario
realization are on the level of 11.5 billion EUR for the period 2015-2050. The distribution of
1497512800
1067578502508 2845 3245 4200
8 8259 195
9 525
8 250
6 8505 225
3 1901 945
11 453
10 3609 248
7 935
5 168
2 785
1 045490
0
5000
10000
15000
20000
25000
30000
35000
40000
2015 2020 2025 2030 2035 2040 2045 2050
MWth
TOTAL DH + BUDGET
TOTAL INDUSTRY
TOTAL POPULATION

31
investments is variable for each 5 year periods achieving maximum during 2030-2035 and
then gradually decreasing.
Figure 6: TPES from RES (Mtoe) in heating sector
The RES types engaged in heat production are represented on Figure 7. It could be seen that
for 2050 13 Mtoe out of 13.8 Mtoe (more than 90%) is represented by different biomass
types, mainly agrobiomass. In 2015 80% of biomass used is different kinds of woody
biomass, in 2035 – 35%, in 2050 – only 20%. The utilization of woody biomass potential is
currently approaching to the maximum, so the lion share of developments in biomass-to-heat
generation in the future may be performed only with utilization of non-woody biomass types,
mainly agrobiomass (>50% in the TPES balance for 2050).
Figure 7: Heat production by different biomass types, solar collectors and heat pumps
4. CONCLUSIONS
The modeling of the RES-to-heat generation scenario till 2050 demonstrated the following
key indicators:
1. The overall heat production from RES is achieving 13.8 for 2050 comprising 57%
RES share: 5.2 Mtoe in individual heating, 3.8 Mtoe – in DH and budget/public
heating and 4.8 Mtoe – in industrial heating;
1,231,91
2,923,71
4,294,52
4,674,80
5,184,533,882,99
1,18 1,34 1,50 1,83
3,833,44
3,05
2,61
1,69
0,91
0,340,16
-
2,0
4,0
6,0
8,0
10,0
12,0
14,0
16,0
2015 2020 2025 2030 2035 2040 2045 2050
Mtoe
TOTAL DH + BUDGET
TOTAL INDUSTRY
TOTAL POPULATION
0
2
4
6
8
10
12
14
2015 2020 2025 2030 2035 2040 2045 2050
Mtoe Solar collectors
Heat pumps
Biogas from agrowaste and silage
MSW incineration
Energy crops (Pellets/briquettes )
Energy crops (chips)
Pellets/briquettes from agrowaste
Secondary agrowaste
Primary agrowaste (small bales)
Primary agrowaste (raw straw)
Primary agrowaste (large bales)
Wood pellets/briquttes
Wood chips, wood sawdust
Wood logs

32
2. The overall installed RES-to-heat generation capacities in 2050 are 36 GWth: 15 GWth
– individual heating, 11.5 – DH and budget/public heating, 9.5 – industrial heating;
3. The main increasing of RES-based heat generation in relative values is observed in the
district heating and budget/public heating (from 0.16 Mtoe in 2015 to 3.8 Mtoe in
2050 or more than in 20 times);
4. The largest absolute amount of RES-based heat generation is observed in the
individual heating of population (5.18 Mtoe in 2050);
5. Energy potential of RES is not fully exhausted, except of woody biomass (utilization
on the level of 110% of available potential), secondary agrowastes (98.8%) and
sunflower residues (80%); the main reserves for post-2050 developments are in wheat
straw and maize straw, energy crops, biogas from manure/agrowaste and MSW
incineration, non-biomass RES types – heat pumps and solar heating technologies;
6. Without agrobiomass (total share used in heating till 2050 from all RES over 60%)
and energy crops (approximately 20%) it is impossible to achieve targets of the high
RES utilization in heating according to the modeled scenario;
7. Agrobiomass and energy crops are main biomass types used in post-2030 period in
individual heating and DH, secondary and primary agrowastes, manure for biogas and
woody biomass are main types used in industry for same period;
8. Total investments for the scenario is 11.5 billion EUR overall for heating sector, out of
which 1.6 billion is invested in installations for individual heating, 5.0 billion – in DH
and budget/public heating, 4.9 billion – in industrial heating;
References [1] Energy Balance of Ukraine, 2016. Official issue:
https://ukrstat.org/en/operativ/operativ2017/energ/en_bal/Bal_2016_e.zip
[2] Heat Supply Concept of Ukraine (in effect, 18 August 2017):
http://zakon2.rada.gov.ua/laws/show/569-2017-%D1%80
[3] New Energy Strategy till 2035 “Efficiency, Security, Competiveness” (in effect, 18 August 2017):
http://mpe.kmu.gov.ua/minugol/control/uk/publish/article?art_id=245230270&cat_id=35109
[4] National Concept of Climate Policy Realization in Ukraine till 2030 (in effect, 2016):
http://zakon2.rada.gov.ua/laws/show/932-2016-%D1%80
[5] National Strategy of Regional Development for the period till 2020 (in effect, 2015)
http://zakon2.rada.gov.ua/laws/show/385-2014-%D0%BF
[6] National Renewable Energy Action Plan of Ukraine till 2020 (in effect, 2014)
http://saee.gov.ua/documents/NpdVE_eng.pdf
[7] National Energy Efficiency Action Plan till 2020 (in effect, 2014) :
http://saee.gov.ua/documents/NpdEE_eng.pdf
[8] The Stage of Renewable Energies in Europe. Edition 2016. 16th EurObserv’ER Report. Issued by:
EurObserv’ER:
https://www.eurobserv-er.org/16th-annual-overview-barometer/
[9] Renewable Energy and Jobs: Annual Review 2017, issued by IRENA:
https://www.irena.org/DocumentDownloads/Publications/IRENA_RE_Jobs_Annual_Review_2017.pdf
[10] Renewables 2016. Global Status Report. Issued by REN 21:
http://www.ren21.net/wp-content/uploads/2016/05/GSR_2016_Full_Report_lowres.pdf
[11] Geletukha G. Zheliezna T. State of the Art of Bioenergy Developments in Ukraine, Industrial Heat and
Power Engineering, Vol. 2, # 39, ISSN 0204-3602, 2017:
http://uabio.org/img/files/news/pdf/state-of-the-art-and-prospects-for-bioenergy-development-in-ukraine.pdf
[12] IRENA REMAP-2030 “Perspectives of RES Developments in Ukraine till 2030”:
http://saee.gov.ua/sites/default/files/UKR%20IRENA%20REMAP%20_%202015.pdf

33
CAPILLARY-POROUS COOLING SYSTEMS FOR MELTING UNITS
Alexander A. Genbach1, Nellya O. Jamankulova 2, Iliya K. Iliev3
1.2Almaty University of Power Engineering & Telecommunications,
Heat power engineering faculty, Republic of Kazakhstan, Almaty,
3Ruse University, Ruse, Bulgaria
ABSTRACT
A capillary-porous cooling system for caissons of melting units has been studied. The use of these
systems in metallurgical production is large-scale and multi-purpose. Devices in the form of box-type
caissons have a high intensity of heat transfer, remove high heat loads and provide explosion-proof
operating conditions for melting units. A new capillary-porous cooling system that contains a small
amount of coolant and is explosion-proof for operation of melting units has been developed and
investigated. Engineering calculation of operating and limiting characteristics of a capillary-porous
cooling system was done. The installation of box-type caissons in the slag zone of melting furnace and
installation of an evaporative and condensation capillary - porous cooling system of details (caissons)
are shown.
Key words: capillary-porous system, cooling system, caisson, heat flux, melting unit.
1. INTRODUCTION
The most important factor in the intensification of energy production is the rising of the
economy regime, taking into account the requirements of the environment. It is necessary to
meet the growing demand for fuel, energy and raw materials, mainly by saving material and
raw materials, improving the use of secondary resources. The solution of these problems can
be facilitated by porous systems.
Porous systems are beginning to be introduced in power installations. They allow to
remove and transport great heat fluxes with high intensity and reliability, to solve a number of
environmental problems as a result of anthropogenic impact on the environment, to promote
the saving of natural resources, water and oxygen, to reduce the amount of harmful emissions.
Capillary-porous systems are used in metallurgical production and have a multi-purpose
nature. In metallurgical units, parts and assemblies operate in a highly heat-loaded state and
require intensive cooling. Moreover, in the case of a cauldron burnout, the coolant enters the
melt and an explosion of the furnace may occur. In this case, a capillary-porous cooling
system can be effective; it contains a very small amount of liquid, is explosion-proof and has
a high forcing and a heat transfer rate [1-3].
2. METHODOLOGY
Methods for cooling of high-temperature elements in metallurgy are known, cooling is
carried out by technical water, when cold water passes through the cooled surface, taking
away the heat.
1 Professor Dr.Sc., AUPET, Republic of Kazakhstan, [email protected] 2 PhD Student, AUPET, Republic of Kazakhstan, e-mail: [email protected], cell: +77019303750 3 Professor, PhD, Ruse University, Bulgaria, e-mail: [email protected]

34
Small heating of water requires its high consumption and construction of powerful water
intake devices, equipment for cleaning, pumping and cooling water in the case of a reverse
water supply system. The salt content led to the deposition of sludge, scale and frequent
burnout of the cooled elements. The low water temperature at the outlet excludes the
possibility of utilizing the waste heat by water, although the heat transfer to one unit may
amount to tens of MW.
The cooling system becomes expensive due to bulky cooling devices with recycled water
supply or when cleaning it in the case of direct flow, in addition, it is necessary to take into
account the electrical energy consumption for pumping water.
New capillary-porous cooling system operating in the field of mass and capillary forces is
developed and investigated. In the porous structure, an underheated coolant is transported to a
saturation temperature with a forced speed. This makes it possible to increase the forcing of
heat loads, significantly expand the limits of their removal [1-3], and intensify heat transfer
processes [4-8]. Studies of the heat transfer crisis were carried out with the help of
holographic interferometry, the optical-polarization method (photoelasticity) [1], and the
thermoelasticity method [2,3]. Intensification of heat transfer processes [4] was achieved due
to control of thermal wave energy, boiling characteristics [5] and heat exchange parameters
[6]. The experimental data were generalized using the theory of similarity, modeling and
analogy of heat exchange phenomena [7]. This allowed us to calculate dependences tо define
the heat fluxes and thermal headings depending on the regime and structural parameters of
the structure and heat exchange surface [8]. We have considered the possibility of using
capillary-porous cooling systems for explosion-proof melting units.
As an example of capillary-porous systems for the cooling of melting aggregates for the
purpose of their explosion safety [9] is shown on figure 1.
Figure 2: Installation of evaporation-condensation
capillary-porous system for cooling of caissons
Figure 1: Installation of box-type
caissons in the slag zone of melting furnace

35
Figure 1 shows the installation of box-type caissons in the slag zone of melting furnace.
Installation consists of: 1 - furnace bottom; 2 - wall; 3 - caisson; 4,10 - upper and lower
shelves; 5 - arch; 6 - arch support beam; 7 - spring of the arch; 8 - framework rack; 9 -
turnbuckles.
Figure 2 shows the installation of a capillary-porous system for cooling of elements
(caissons): 1- cooled element; 2 - heat exchanger; 3 - feed supply tank; 4 - condensator of feed
line; 5- condensate pump; 6 - feed pump; 7 - contact manometer; 8 - level controller; 9 - back
flow valve; 10 - control valve; 11 - manometer; 12 - emergency repair tank; 13 - condensate
cooler.
Engineering calculation of the operating and limiting characteristics of the capillary
porous-cooling system can be carried out using a nomogram method. To construct the
characteristics, previously geometrical parameters of the cooling system and porous structure
is determined. Calculation is made on the basis of a ratio for thermal power
.W,
F
1
F
1
TTQ
CCEVEV
C
w
EV
w
α+
α
−= (1)
The value of the heat transfer coefficient of the evaporator EVα is determined by the
criterion equation obtained by us [7] or by the calculated dependences [3,6,8]. Setting the
temperature of the wall in the condensator C
WT = const for a number of vapor temperatures
VT , the necessary physical parameters of the liquid in the condensator are determined and the
graph of )T(f VC =α is constructed. From formula (2) the corresponding values of Q are
determined for a number of values of VT
,W),TT(FQC
LVCC −α= (2)
where C
LT = 0,5( VT +L
wT ).
Setting the several values of temperatureEV
wT , the parameters of the liquid in the
evaporator at the selected vapor temperature are determined and the graphs for )T(f EV
wEV =α
are plotted and defined by the above equations and formula
.Кm/W,F)ТT(
Q 2
EVV
EV
w
EV −=α (3)
The intersection point of the curves gives the required temperatureEV
wT . So, the graticule
of equidistant lines in the plane of )T(fQEV
w= for different values of C
wT , and it is necessary
to take into account the heat transfer capabilities limited by the crisis phenomena [2,3].
For constructing the nomogram it is also necessary to know the heat exchange laws of the
cooling system with the environment ( В
Cα = const). For this purpose, for example, heat
exchange coefficients with the external environment are set, or the conditions of creation of
environmental temperature ( ENVT = const) are accepted

36
.W),ТT(FQ ENV
C
wC
В
C −α= (4)
Then to each value of Q (or C
wT ) there corresponds a certain value C
wT (or Q).
Consequently, by changing the external conditions of heat exchange with the surrounding
environment, it is possible to regulate EV
wT for a given heat release. In case that the wall
temperature of the cooled element is set, it is necessary to specify a number of values of the
Reynolds criterion (Re), by which the values of the Stanton numbers are calculated and, after
determining the value of EVα , a temperature EV
wT is corrected. If the wall temperature exceeds
the specified value, it is necessary to reduce the value of Re and, consequently, the heat load
to be removed.
3. CONCLUSION
Thus, based on the fundamental research of the thermal and hydraulic heat transfer
characteristics carried out on the models and experiment, the required information was
obtained for the development, design, engineering calculation and operation of capillary-
porous systems in various thermal power plants and metallurgical production.
The further development of highly efficient devices with porous structures makes it
possible to convert energy production into environmentally friendly ones, improve labor
protection conditions, significantly save natural resources, intensify processes in alternative
sources, protect air, water and soil from pollution, including "thermal", to solve
methodological problems and long-term problems of generation, transport and accumulation
of energy.
References
[1] Polyaev V.M., Genbach A.N., Genbach A.A., An experimental study of thermal stress in porous
materials by methods of holography and photoelasticity, Experimental thermal and fluid science, avenue of the
Americas, New-York, V. 5, № 6, pp. 697-702, November 1992.
[2] Genbach A.A., Burmistrov A.V., Investigation of the thermal condition of the cylinders of steam
turbines, Industry of Kazakhstan, № 2 (65), pp. 91-93, 2011.
[3] Polyaev V. M., Genbach A.N., Genbach A.A., A limit condition of a surface at thermal influence,
Teplofizika vysokikh temperatur (TVT), V.29, No. 5, pp.923-934, 1991.
[4] Polyaev V.M., Genbach A.A., Control of Heat Transfer in a Porous Cooling System. Second world
conference on experimental heat transfer, fluid mechanics and thermodynamics, Dubrovnik, Yugoslavia, pp.
639-644, 23-28 June, 1991.
[5] Polyaev V. M . Genbach A. A., Management of internal characteristics of boiling in porous system,
Cryogenic equipment and conditioning: Collection of works of MGTU, Moscow, pp. 224-237, 1991.
[6] Polyaev V.M., Genbach A.A. Upravlenie teploobmenom v poristyh strukturah, Izvestija Rossijskoj
akademii nauk, Energetika i transport, V. 38, №6, pp. 105-110, 1992.
[7] Polyaev V.M., Genbach A.A., Heat transfer in a porous system operating under the joint action of
capillary and gravitational forces, Teploenergetika, № 7, pp. 55-58, 1993.
[8] Poliaev V.M., Genbach A.A., Limiting thermal loads in porous structures, Izvestiya vuzov.
Aviatsionnaya tekhnika, №.1.-pp. 33-37, 1991.
[9] Genbach A.A., Jamankulova N.O., Bekalay N.K., Poisk effektivnyh system ohlzhdeniya dlya
vzryvobezopasnyh plavil’nyh aggregatov, Vestnik KazNITU, №1(119), pp 230-234, 2017.
37
INVESTIGATION OF POROUS COVERAGE IN COOLING SYSTEMS
FOR TURBINE EQUIPMENT ELEMENTS
Alexander A. Genbach1, David Yu. Bondartsev2-Almaty University of Power Engineering
and Telecommunications, Department of Heat Engineering Installations,
Iliya K. Iliev3-University of Ruse, Department of Thermotechnics, Hydraulics and Ecology
ABSTRACT
The mechanism of destruction of metal vaporizing surfaces and poorly heat-conducting coatings
of low porosity made of natural mineral media (granite) has been described on the basis of the
problem of thermoelasticity and experimental data. Thermal flow dependences on time of their action
and depth of penetration of temperature perturbations were identified on the basis of analogy.
Capillary - porous systems have high intensity, high heat transport ability, reliability, compactness.
The results of calculations and experiment showed that the maximum thickness of the particles that
detach under the influence of compression forces for granite coatings is (0,25÷0,3) x10-2 m. Sections
of compression curves that determine the detachment of particles with dimensions of more than 0,3
x10-2 m for large thermal flows and short feed times, are screened by the melting curve, and in the case
of small thermal flows and time intervals - the expansion curve. The studies are aimed at creation of
porous coatings in cooling systems from well - and poorly conductive materials.
1. INTRODUCTION
Successful use of capillary-porous materials in engineering attracted many researchers
and inventors to create different devices on their basis. The intensity of heat-eliminating
systems and the forcing of processes taking place therein increased [1-3]. In addition to
cooling systems, the use of porous materials allowed the creation of units which addressed the
problems of explosion safety, labor protection and durability [4,6]. This was facilitated by the
ability to control evaporation processes due to excess fluid in pores and capillary structures,
formed by the combined action of capillary and mass forces [7-9].
In thermal power plants (TPPs), capillary-porous materials are used to cool highly-forced
detonation burner units [3], to create steam coolers in steam boilers [9], oil coolers that
prevent oil from entering cooling water and water from entering the bearing system [10] and
labyrinth seals [11], and are used in other devices [10]. The main areas of practical application
of capillary-porous systems are presented in [3,5,8-11].
Equipment and technological processes in the energy sector should be introduced from
the ecological and economic positions primarily. The proposed development of capillary-
porous systems will facilitate the implementation of processes, significantly improving and
preserving the natural environment.
The main advantages of capillary-porous systems include high intensity, high heat
transport ability, reliability, compactness, simplicity in manufacture and operation. These
systems improve operational and technological performance and have low capital and
operating costs. Based on the study of capillary-porous systems, new technical solutions have
been developed to improve the performance characteristics of the thermal power plant in
relation to the powerful power units of combined heat and power plants.
1 Professor DSc, AUES, Almaty, Kazakhstan, [email protected] 2 PhD Student, AUES, Almaty, Kazakhstan, [email protected], cell phone: +77015323661 3 Professor, PhD, Ruse University, Ruse, Bulgaria, e-mail: [email protected], cell phone: +359 887306898
38
The authors of [12] carry out a comparative analysis of methods for calculating the heat
transfer, based on the water boiling with underheating in vertical channels, and they consider
that the hot spot corrosion of fuel element claddings of nuclear reactor fuel elements is similar
to the capillary-porous structure [13,14]. However, no studies of heat transfer through a
regular structured surface have been carried out.
According to the authors' opinion [15,16], surface boiling on porous surfaces can
influence the development of corrosion due to the erosive action on the heat exchange surface,
when the bubbles of steam fall in an underheated liquid. Therefore, it is required to investigate
the evaporation of liquid in capillary-porous structures in the field of capillary and mass
forces, taking into account the velocity and underheating, which are formed by excess fluid.
An estimated intensity of heat transfer for liquid boiling in a large volume and thin films
on a smooth surface showed equal possibilities [12-14] at high thermal flow and higher heat
transfer parameters than that in systems with a capillary-porous coating [15-16]. It is required
to carry out investigations of the heat transfer capabilities of capillary-porous coatings
operating in the field of capillary and mass forces, and to establish ultimate (critical) load
values leading to the destruction of the heating surfaces.
The performed researches make it possible to give recommendations on the selection of
the heating-and-cooling medium, take into account the type of its circulation, determine the
geometry and material of apparatuses and heat exchange intensifiers, taking into account the
conditions and orientations of the system operation under pressure or underpressure, the
energy supply and type and the system orientation. Generalization of the experimental results
and calculation procedure for heat and mass transfer in capillary-porous systems in
accordance with, are presented in [17-21].
The investigation of various factors affecting the heat transfer in the structures show that
the critical states of the heating surface are of particular interest, when the system is capable
of carrying the maximum flows of energy and substance. In this case, however, the values of
thermal flows and thermal stresses are required to be known in order to ensure a reliable long-
term operation of the unit. Consequently, the maximum energy and substance transfer can be
obtained for the following conditions: a pure liquid circulating in a forced scheme in closed
elliptical heat exchangers under pressure in perforated and profiled heating surfaces made of
stainless steel is used. The system operates with an excessed fluid, and the presence of mass
forces ensures the forced flow of the heating-and-cooling medium with underheating. Energy
is supplied to the vertical surface along the perimeter, with a supersonic high-temperature
pulsating rotating torch [1,3,11,19].
2. AN EXPERIMENTAL METHOD
Experimental units allowing to investigate the following integral characteristics of heat
transfer have been developed: ultimate thermal flows (q), up to critical ones; liquid (ml) and
vapor (mv) flow rates; distribution of the temperature field along the height and the length of
the heat exchange surface. Studies are carried out in a capillary-porous cooling system which
can operate on the principle of a closed evaporative-condensation design, or to be open.
Various heat exchange conditions are studied, including: method of the coolant supply; the
extent of tightness of the capillary-porous structure; ability to feed up the micro-arterial
structure along the height of the heat exchange surface; orientation of the surface relative to
gravitational forces; geometry: flat, tubular and curved cooling surfaces; influence of pressure
up to manifestations of crisis with wall burning.
To study the mechanism of heat transfer, holography methods and the generalization of
similar and analogous phenomena are used [1,3,11,20,21]. The heat exchange is controlled
using the elliptical systems, by the combined action of capillary and mass forces [1,3].

39
The study of heat transfer is of a practical nature. It is intended for the creation of various
thermal power plants: steam attemperators of steam boilers, porous coatings of poorly heat-
conducting material, seals in steam turbines and a number of other power plants [1,3,7,10,19].
Figure 1 shows a cross section of a flat experimental unit with a perforated pressure plate
3 (Fig. 2), tubular arteries 4 and a capillary-porous structure 2.
Figure 1. Cross section of a flat experimental unit: 1 – pressing bar, 2 – capillary-porous
structure, 3 – perforated pressure plate, 4 – tubular artery, 5 – asbestos cement plate, 6 –
heater, 7 – insulation, 8 – plate, 9 – clamping nut, 10 – electrode, 11 – windows, 12 – heat
insulation, 13 – coolable wall, 14 – collector, 15 – stand.
Figure 2. Pressure scheme for the capillary-porous structure: 1 – plates, 2 – pressure screws,
3 – steam slots, 4 – fluid supply, 5 – pressure perforated plate, 6 – capillary-porous structure,
7 – heated wall, 8 – microartery.
The maximum possible error:
A) ± 0,6%, when measuring current; ± 1%, when voltage is dropped; power is ± 1,6%,
B) ± 3%, when determining the liquid flow rate, using a rate-of-flow meter.
The imbalance of the current-supplied heat and the heat led to circulation and excess
water, taking into account heat losses through the insulation, did not exceed ± 12%, and ±
70
0
50
0
30
0
15
0
1 2 3 4 5 6 7 8 9 10
11
12 1514 13
200
+h
1
2
3
4
5
6
7
8
А А
А-А

40
11% through circulating water. The discrepancy between the material balance between the
flow rate of the cooling liquid and drainage and condensate flow is no more than ± 10%. The
measurement procedure and the processing of experimental data were published in [2,4].
To study the boiling crisis, we also assembled the units made in the form of a rocket-type
flame-jet burner. The scheme of the experimental unit and the experimental conditions are
presented in [3]. Ignition chambers and supersonic nozzles were cooled using a capillary-
porous and water system. The thermoreactive burner was also used to study the critical state
of capillary-porous coatings made of natural mineral media (granite, quartz and teschenite
coatings). The thermal effect was realized by a supersonic (up to 2000 m/s) high-temperature
(up to 2500°C) pulsating torch.
3. MODEL OF A CAPILLARY-POROUS
To determine the critical thermal flows and stresses, the thermoelasticity problem
[3,9,10] is solved under the secondary limiting conditions for the one-dimensional equation of
nonstationary heat conductivity.
Let's consider a plate with the thickness of 2h. The constant ultimate thermal flow q is
supplied to the surface z = +h, starting from the timepoint t = 0. The bottom surface z = -h and
the plate side edges are thermally insulated.
Thermal conductivity equation with limiting and initial conditions can be written in
the form:
�� ������ = �
�, T = 0, τ < 0;
�� ���� = �, � = +ℎ; (1)
�� ���� = 0, � = −ℎ.
The temperature distribution along the thickness depends on the thermophysical
properties of the material, the thermal flow value and the feeding time:
� ��� ; �� = � � �
�(�� )" � + #$�%� &'$
% ())�� − *
+�� ∑ (())-.�/.0) 123 4−5� +���
*(�� )" �6 cos [.+� ��
� + 1�]=, ( 2)
where >=�"� ; n – positive numbers.
Using the known temperature distribution in the plate, we can find the thermal tension
and compression stresses arising at a certain time t at various depths from the surface δi = (h =
zi) for a given value of the thermal flow q, since the plate with a variable temperature is in the
plain stress condition.
?хх = ?AA = − BЕ()(D) Т ��� ; �� + )()(D)�� F �2HI� ��
� ; �� J�,&�(� (3)
where the first term is the component of the compression stress, and the second term is the
tension stress.
3.1. SOLUTION TO THE EQUATION (1).
If we are given the limiting values of tension and compression stresses for the rock
(porous coatings from the natural mineral medium) and the metal, we obtain the dependence
of the thermal flow required for destruction on the time of delivery and the depth of

41
penetration. In addition, equating the temperatures on the plate surface to the rock and metal
melting temperature, we find the values of the ultimate thermal flows necessary for melting
the surface layer for a different period of their action:
surface melting:
�) = ТKL M�(NOP)QR& �#M( ST�M ∑ (UV)-
-�W-XV YZ[\(.� T�M�S(NOP)QR]�^_.+` ; (4)
development of limiting compression stresses:
�� = (VUa)bcdeЕM�(NPO)"R&#$�
%� f'$% UVV�M ( ST�M ∑ (UV)-
-�W-XV YZ[\(.� T�M�S(NPO)QR][�^_-T� �$%&)�]
; (5)
creating ultimate tension stresses:
�g = (VUa)bcdeЕM�(NPO)"R . (6)
The dependences of q1, q2, q3 on time � for fixed particle size δ values for the coating,
or the penetration depth of temperature perturbations for the metal, were calculated on a PC
with respect to a plate made of quartz, granite and metal (copper and stainless steel).
4. CONCLUSIONS
A scientific method for studying and creating of capillary-porous
cooling systems and coatings for various heat and mass transfer conditions in
power equipment elements has been developed.
Based on the conducted studies in case of exposure with a torch of a
kerosene-oxygen burner of porous coating within working area, we have up to
4x10⁷ W/m2 corresponded to q of coatings of 0,4x10⁷ W/m2. The metals
destruction mechanism is fundamentally different from the rocks coatings
destruction mechanism. In the future, the studies of other porous natural
materials are required.
References
[1] Polyaev, Genbach A.A., Methods of Monitoring Energy Processes, Experimental Thermal and Fluid
Science, International of Thermodynamics. Experimental Heat Transfer, and Fluid Mechanics. Avenue of the
Americas, New York, USA, 1995, Vol. 10, pp. 273-286
[2] Polyaev, V.M., Genbach A.A., Heat Transfer in a Porous System in the Presence of Both Capillary and
Gravity Forces, Thermal Engineering, 40 (1993), 7, pp. 551-554
[3] Polyaev, V.M. Genbach A.A., A Limit Condition of a Surface at Thermal Influence (in Russian),
Teplofizika Vysokikh Temperatur, 29 (1991), 5, pp. 923-934
[4] Polyaev, V.M., Genbach A.A., Control of Heat Transfer in a Porous Cooling System. Proceedings, 2nd
World Conference on Experimental Heat Transfer, Fluid Mechanics and Thermodynamics, Dubrovnik,
Yugoslavia, 1991, pp. 639-644

42
[5] Polyaev, V.M., Genbach A.A., Processec in the Porous Elliptic Heat Exchanger (in Russian), Isvestiya
Vuzov, Mashinostroyenie, (1991), 4-6, pp. 73-77
[6] Genbach A.A., Bakhytzhanov I.B., Protection Against Earthquakes TPP Bases with the Help of Porous
Geo Screens (in Russian), Poisk, MES of RK, (2012), 1, pp. 289-298
[7] Genbach A.A., Danilchenko I., Porous Desuperheater Steam Boilers (in Russian), Promyshlennost
Kazakhstana, 70 (2012), 1, pp. 72-75
[8] Genbach A.A., Olzhabayeva K.S., Visualization of Thermal Impact on Porous Material in Thermal
Energy Installations of Power Plants, Bulletin of the National RK Engineering Academy, 45 (2012), 3, pp. 63-67
[9] Genbach A.A., Islamov F.A., Research of the Nozzle Fillets in Electrical Installations (in Russian),
Vestnik KazNTU, 97 (2013), 3, pp. 245-248
[10] Genbach A.A., Islamov F.A., Modeling Process Grazing Turbine (in Russian), Vestnik KazNTU, 100,
(2013), 6, pp. 235-240
[11] Polyaev, V.M., Genbach A.A., Control of Heat Transfer in Porous Structures (in Russian), Proceedings,
Russian Academy of Sciences, Power Engineering and Transport, 38 (1992), 6, pp. 105-110
[12] Jamialahmadi M., et al., Experimental and Theoretical Studies on Subcooled Flow Boiling of Pure
Liquids and Multicomponent Mixtures, Intern. J Heat Mass Transfer. 51 (2008), 9-10, pp. 2482-2493
[13] Ose Y., Kunugi T., Numerical Study on Subcooled Pool Boiling, Progr. In Nucl. Sci. and Technology 2,
(2011), pp. 125-129
[14] Krepper E., et al., CFD Modeling Subcooled Boiling-Concept, Validation and Application to Fuel
Assembly Design, Nucl. Eng. and Design, 237 (2007), 7, pp. 716-731
[15] Ovsyanik A.V., Modelling of Processes of Heat Exchange at Boiling Liquids (in Russian), Gomel State
Technical University named after P.O., Sukhoy, Gomel, Belarus, 2012
[16] Alekseik, O.S., Kravets V.Yu., Physical Model of Boiling on Porous Structure in the Limited Space,
Eastern-European Journal of Enterprise Technologies, 64 (2013), 4/8, pp. 26-31
[17] Polyaev, V.M., Genbach A.A., Analysis of Laws for Friction and Heat Exchange in the Porous Structure
(in Russian), Bulletin of MGTU, Mechanical Engineering Series, (1991), 4, pp. 86-96
[18] Polyaev, V.M., Genbach A.A., The Influence of Pressure on the Intensity of Heat Transfer in a Porous
System (in Russian), Isvestiya Vuzov, Mashinostroyenie, (1992), 4-6, pp. 68-72
[19] Polyaev, V.M., Genbach A.A., Field of Application of Porous System (in Russian), Isvestiya Vuzov,
Energetika, (1991), 12, pp. 97-101
[20] Genbach A.A., Jamankylova N.O., Bakic Vukman V. The processes of Vaporization in the Porous
Structures Working With The Excess of Liquid, Thermal Science: Year 2017, Vol 21, №1A, pp. 363-373.
DOI:10.2298/TSCI160326313G
[21] Genbach A.A., Olzhabayeva K.S., Iliev I.K., Boiling Process in oil Coolers on Porous Elements,
Thermal Science: Year 2016, Vol. 20. № 5, pp. 1777-1789. DOI:10.2298/TSCI150602166G

43
HEATING WITH HEAT PIPES
Alexander A. Genbach1, Karlygash Olzhabayeva 2, Kudajbergen Shokolakov3-
Almaty University of Power Engineering and Telecommunications,
Department of Heat Engineering Installations,
Iliya K. Iliev4-University of Ruse, Department of Thermotechnics, Hydraulics and Ecology
ABSTRACT
A heating device based on a heat pipe has been designed for heating viscous fluids and heating of
production premises in power stations. The appliance provides fire and electrical safety, heat transfer
intensification, forcing of heat exchange, reduces the metal elasticity and the mass of the appliance. The
capillary-porous structure was with dimensions of 0.4 x 0.55 and was determined experimentally. It is
established that for a heat output of 4 kW a pipe of diameter d = 13 mm is needed; the length of
the evaporation zone is levp = 0,1 m; and of the condenser lcond = 1.7 m, where the finned
coefficient is 5.
1. INTRODUCTION
The heating device can be used in power plants for heating viscous liquids, for example,
turbine oil, fuel oil for burning in steam and hot water boilers.
The device is also useful for the manufacture of construction and installation works on
power plants for heating industrial and domestic premises, such as structures for people, small
buildings, cabinets for dressing, heating room, rest, food, labor protection offices, red corners,
medical stations, inventory domestic facilities, dressing rooms, mobile control room.
There are known heating systems for industrial and domestic premises, individual
workplaces where it is permitted to use heating appliances or electric appliances with infrared
radiators operating periodically.
The disadvantage of such heating systems is the possibility of electric shock hazard
(electrical hazard) and high fire hazard. There is a known heating system for a passenger vehicle
(author's certificate of the USSR No. 742216, class B6ID27 / 00, 1980) containing a heating
object, primarily a locomotive driver's cab, a thermal energy source in the form of flue gas heat
with evaporation and condensation zones located at an angle to the source of thermal energy,
the handle, which moves the camera-accumulator.
However, in this form, the heating system can not be used in production and domestic
premises for the manufacture of construction and installation works, since these premises do
not have propulsion systems, waste gases, which are used as a heat source for evaporation of
the heat transfer in the heat pipe.
In addition, to remove heat in the cabin installation forced ventilation system, which
requires additional expenditure of electrical energy to power the fan motor. In general, the
republican economy is very large for ventilation, accounting for about 10% of all electricity
production, and therefore the issue of economy is topical. Possible breakthrough of hot exhaust
gases with a temperature of 400..5000С is associated with driver's damage and fire
contamination.
1 Professor DSc, AUES, Almaty, Kazakhstan, [email protected] 2 PhD Student, AUES, Almaty, Kazakhstan, [email protected], cell phone: +77015323661 3 РhD Student, AUES, Kazachstan, [email protected]
4 Professor, PhD, Ruse University, Ruse, Bulgaria, e-mail: [email protected], cell phone: +359 887306898

44
To ensure fire and electrical safety and intensification of heat transfer during heating of
viscous fluids and industrial - domestic premises in the conditions of construction and
installation works. The heater is made in the form of a heat pipe, located at an angle to the
source of thermal energy. It contains zones of evaporation and condensation, a source of thermal
energy that is located in the heat transfer of the evaporation zone of the heat pipe and is fixed
to its body, and the perforated shell surrounding the condensation zone has flexible cables
located along the perimeter of the pipe with high-conductivity branches, the area of the shell
holes , located below the axis of symmetry of the heat pipe, exceeds their area on the surface of
the shell, located above the axis of symmetry.
In addition, the zone of evaporation of the heat pipe, filled with a heat transfer, contains
thermal insulation, and for regions with a low outside air temperature, the coolant is a liquid
with a negative freezing temperature, for example, an aqueous solution of sodium chloride, and
the capillary-porous structure of the heat pipe is made of large cells of a grid lumen, for
example, from two layers of a grid of the form 0,4х0,55 [1].
2. AN EXPERIMENTAL METHOD
The condensation zone 14 (Fig. 1, a) of the heat pipe 4, installed at an angle to the source
of thermal energy, which is an electric heater 2, placed in the heat transfer 9, on the inner
surface contains a porous structure 5 of the form 0.4x0.55. The appearance of the porous
structure and its dimensions are determined experimentally.
The heat generated by the electric heater 2 in the evaporation zone 10 is expended on
vaporization of the heat transfer 9. The flow of the generated vapor II rushes to the area of the
condensation zone 14 cooled by the airflow 12 of room I. The vapor stream 15 condenses heat
to the wall of the heat pipe 4 and the condensate of the condensed vapor 13 returns to the
evaporation zone 10 of the heat pipe 4 again.
The heat of condensation is transmitted with high intensity through the porous structure 5
and the wall of the heat pipe 4 by an flexible cable 6 with high-conductivity branches 7 covered
by a perforated shell 8. There is a mixed air flow around the condensation zone 14: a part of the
air, due to the temperature difference, starts to flow inside the channel formed by the perforated
shell 8, longitudinally flowing high-conductor branches; another, a smaller part of the air, due
to the vertical thrust, will circulate between the branches and flow around them transversely.
The presence of a flexible cable further turbulizes the boundary layer due to its vibration, which
contributes to the destruction of stagnant air zones and a large area of openings in the shell 8
located below the symmetry of the heat pipe 4 will improve the natural draft of air through the
high-heat holes.
a) b)
Figure 1. Heating device: a) general form b) scheme of installation

45
The thermal insulation 3, covering the evaporation zone 10 with the heat transfer 9,
allows at ambient temperatures to protect the heat transfer 9 from freezing within a few days,
and in the case of very low temperatures and prolonged absence of workers, it is recommended
to use a liquid with a negative freezing point as the heat transfer 9, for example, an aqueous
solution of sodium chloride.
The economic effect takes place due to reduction of fire danger, reduction of material
consumption by 10% and installation weight - by 15%, reduction of capital costs for heating
system manufacture, simplification of device operation.
Social effect is achieved by eliminating people's electric shock and damage caused by
fires, which improves working conditions of workers, increases their productivity and quality
of work.
Fire and explosion safety is achieved due to the fact that the electric heater is located in
the coolant inside the evaporation zone of the heat pipe, therefore the temperature of the heat-
releasing elements (the turns of the wire) will be low [6], several degrees above the temperature
of the boiling heat-transfer agent, thus eliminating the fire hazard of the heater.
Since the turns of the wire are in a closed volume of the evaporation zone, and the
reliability and tightness of the electrical insulation has reached a very high value, as can be
judged by the example of electric kettles, frying pans and other domestic devices, therefore
excludes the locking of the electric heater wire between each other and the case.
As shown by the experimental studies of the authors, the selected porous structure has
a high heat transfer potential, several times larger than the corresponding ones, requires the
least cost for the production of a heat pipe, has several times less hydraulic resistance than
existing ones. The selected insulation prevents the water from freezing in the evaporation zone
of the heat pipe at an outside temperature of (-20°C) for 2.2 days, with very severe frost (-400С)
- 1.57 days, when used with a negative freezing temperature, for example, an aqueous solution
of sodium chloride . The absence of a fan saves energy, excluding from the heating system the
handle that moves the camera-drive, simplifies the operation of the device. We present
experimental studies on the determination of the type of a capillary-porous structure. In contrast
to the traditional capillary structures of heat pipes [4,5], which are recruited from fine-meshed
meshes, a capillary-porous structure of two mesh layers with a large cell size of 0.4x0.55 is
proposed, that is, two successively established layers with a cell width 3104,0 −⋅ and 31055,0 −⋅
m. This structure allows, firstly, to perform a more forced mode depending on the minimum
hydraulic resistance (Table 1) and, secondly, due to large cells. Capital and operating costs for
its manufacture and maintenance.
3. EXPERIMENTAL DATA
As seen from Table 1, the largest heat transfer ability has a porous structure 0,4x0,55.
Physically, this can be explained by the fact that due to the combined action of the capillary and
the mass forces in the porous structure creates a stable biphasic pulsing layer and large size grid
cells contribute to facilitate the removal of accumulating steam conglomerates than is the case
in the capillary - a porous structure in which the pore size even less, comes in 4 times less. A
similar phenomenon of crisis is also in thin-film evaporators, that is, on a smooth surface.

46
Table 1. Experimental data on heat transfer capabilities and wall overheating of
various capillary-porous structures of water heat pipes
Type of capillary-porous
structure
Heat transfer capability of heat pipe, 4 210 , /x W m
5 10 20 40 60 80
0,08х0,14х1 17 21 35 46 57 burnout of
the wall
0,14х0,14х0,14 17 25 40 47 53 -“-
0,4х0,55 19 30 42 57 60 65
Powder and fibrous structures 7 12 burnout of the wall
Thin-film evaporators
(without capillary-porous
structure)
10
15
burnout of the wall
For structures of sintered powders and cermets, the phenomenon of crisis is explained
by the fact that the emerging vapor bubbles clog small pores, stopping access to fresh portions
of liquid to the cooled wall. The boiling crisis occurs when heat flows 5 22 10 /W m≈ ⋅ .
With a specific heat flux 5 21 10 /W m≈ ⋅ and total electric heater power N 4000 W= ,
the surface of the evaporation zone will be 2 2
И 5
4000F 4 10
1 10m−= = ⋅
⋅, assuming the outer diameter
of the pipe 0,13 m , determine the length of the evaporation zone:
2
u
, 4 10l 0,0979
3,14 0,13
F иm
dпарπ
−⋅= = =⋅
.Finally, the length of the evaporation zone is determined
from the conveniences of mounting standard electric heaters.
Coefficient of heat transfer from the condensing steam to the inner wall of pipes
according to the criterion equation of heat transfer.
Regarding the heat transfer coefficient kd . We have
67,159,0
217,1
48,09,0
4,0
*
3,1
*
3
** RePr105,3
−−−
⋅
⋅⋅=
Ф
r
Ф
nap
xKF
F
F
FN
qCp
rCpG
εα (1)
Stanton number **k /dSt CpG=

47
−*G specific fluid flow
52
* 6 3
1 10 0,82122,9 / .
2,3 10 0, 29 10
нар
Ф
qFG kg с m
r Fε −
⋅ ⋅= = = ⋅⋅ ⋅ ⋅
(2)
5
2q 1 10
W
m= ⋅ − outer surface of condensation of heat pipe;
−нарF outer surface of condensation of heat pipe; 2
нар нарF d L 0,13 2 0,82 mπ π= = ⋅ ⋅ = ;
L 2 m= : (we accept in advance); −ФFε live section of the structure
3 3 2
ФF 0,7 0,13 1,02 10 0,29 10 ;нар фd mε επ δ π − −= = ⋅ ⋅ ⋅ ⋅ = ⋅ (3)
Complex
125,0101102,4
103,2
Cp
r4,0
53
64,0
*
=
⋅⋅⋅⋅=
q (4)
−Re Reynolds criterion to steam.
5,2351012104,2
5,013,0101Re
66
5
=⋅⋅⋅⋅⋅⋅== −
n
mp
r
qR
µ (5)
−mpR pipe radius
)( незmp RR ≈
( ) ;4,1365,235Re9,00,9 ==
=*Pr Prandtl criterion; ;07,275,1Pr 3,13,1
* ==
−pN pressure criterion, take working pressure in the pipe;
барPs 39,0= , which corresponds to the saturation temperature С075 . Then
3,162063,0
5,013,01039,0N
48,05
48,0
0,48
p =
⋅⋅⋅=
=
σmps RP
(6)
Where −σ surface tension coefficient.
Geometric simplexes
5
17,1
3
17,1
1016,91029,0
82,0 −−
−
−
⋅=
⋅=
ф
нар
F
F
ε (7)
−nF pipe cross-section

48
2
2 2
n
0,13F 0,0133
2mp
R mπ π = = ⋅ =
(8)
6
59,0
310
259,0
1061510414,01026,6
0133,0 −−
−−
−
⋅=
⋅⋅⋅=
ф
н
КF
F (9)
0,50,5
10 10 10 2b 0, 4754,305 10 4,305 10 6,26 10
d 0, 225К m
− − − = ⋅ = ⋅ = ⋅
(10)
where -db, hydraulic and average diameters of wire mesh structure 55,04,0 x
( )3 30, 475 10 ; 0, 225 10b m d m− −= ⋅ = ⋅ .
1,663 3 5 6 4 2
122,9 4,2 10 3,5 10 2,07 0,125 136,4 162,3 9,16 10 6,15 10 8,74 10 /к W m Кα − − − = ⋅ ⋅ ⋅ ⋅ ⋅ ⋅ ⋅ ⋅ ⋅ ⋅ ⋅ ⋅ = ⋅ (11)
The thermophysical properties of water and steam adopted by [ ]4 . Setting the finning
coefficient of elastic ropes and calculating by the traditional formula the heat transfer
coefficient by convection from the surface of the shell to air ( )КмВтb 2/42 = , the heat
transfer coefficient in the condensation zone is determined ( )КмВтК 2/20≈ . Then, for a
thermal power of 4 kW, a heat pipe with a diameter of 0.13 m, a length of the evaporation zone
of 0.1 m and a condensation zone of 1.7 m are required.
4. CONCLUSIONS
Thus, a heating device on a warm pipe provides fire safety, intensification of heat
transfer, forcing heat exchange, reduces the material consumption and mass of the installation.
A capillary-porous structure of the 0.4 × 0.55 type is determined experimentally and
provides a greater heat transfer capacity than the greenhouse and fibrous structures. For a
thermal power of 4 kW, a heat pipe with a diameter of 0.13 m is required, the length of the
evaporator zone is 0.1 m, the condensation zone is 1.7 m and with a finning coefficient of
flexible cables equal to 5.
References
[1] Genbach А.N., Genbach А.А., Tretyakova N.I. Heating device //Patent USSR №1557432. №14, 1990.
[2] Genbach А.А., Genbach N.А., Genbach I.А., Genbach An.А. Influence of the material and the
thickness of the porous structure on heat and mass transfer in heat exchangers of TPPs // Power engineering
telecommunications and higher education in modern conditions. – Proceedings of 3rd International scienfic-
technical conference – AUES. 2002. – 70-73 pp.
[3] Polyaev V.М., Genbach А.А. Heat transfer in a porous system operating under the combined action
of capillary and gravitational forces // Heat power engineering, №7. – 1993. – 55-58 pp.
[4] Dan P.D., Rei D.А. Heat pipes. – М.: Energy, 1973. – 272 pp.
[5] Voronin V.G. and other. Low temperature heat pipes for aircrafts. – М.: Mechanical engineering,
1976. – 200 pp.
[5] Daniela PANĂ, Ion V. ION, Marcel DRĂGAN, Metal heating furnace with flue gases condensation
- thermoeconomic analysis, The Annals of “Dunarea De Jos” University Of Galati, Fascicle Ix. Metallurgy and
Materials Science No. 4 – 2014, p.10-13, ISSN 1453 – 083x, http://www.sim.ugal.ro/Annals.htm
[6] GH. Lăzăroiu, L. Mihăescu, T. Prisecaru, I. Oprea, I. Pîşă, G. Negreanu, R. Indrieş, „Combustion of
pitcoal-wood biomass brichettes, in a boiler test facility”, Environmental Engineering and Management
Journal, “Gh. Asachi” Technical University of Iasi, Romania, September/October 2008, Vol.7, No.5, pp. 595-
601, http://omicron.ch.tuiasi.ro/EEMJ/

49
COMPARATIVE ANALYSIS OF THE EXISTING DUST COLLECTORS
WITH THE DESIGNED CAPILLARY POROUS DUST COLLECTOR
WITH CONTROLLED GEOMETRY OF MICRO-CHANNELS
Alexandr Genbach, Kudaibergen Shokolakov, Angel Terziev1
ABSTRACT
This is a comparative analysis of the standard dust collectors with nozzle-free capillary porous
devices with controlled geometry in a form of elastic composite materials joined with vibrator, which is
operated in accordance with the kinematic diagram of the reciprocating motions. This device helps to
increase hundred times a duration between regenerations, and reduce 1,5 times a consumption of foam
generator, fully utilize acoustic energy by decreasing three times a specific acoustic power. Hydraulic
and gas dynamic resistance will be decreased 1,5-2 times, and effectiveness of dust and gas collection
will be 99,9 %.
The simplified design, reduced consumption of materials, minimized power consumption for air
transfer, foam forming solution and steam generation are the reasons for reduced implementation costs
of the proposed foam generators and dust collectors.
Generally, the aero hydrodynamic constructive diagrams of the proposed nozzle-free foam generators
of air (steam) mechanical foam and dust-and-gas collectors on capillary porous structure meet the
operational sanitary requirements, safety in operations of different industrial companies, and are
considered reliable, easy-to- produce and maintain.
Study of the dust suppression and dust collection processes was implemented during the
educational process at the faculty of "Heat & Power Units" at the Almaty University of Energy and
Communications, at the Almaty Branch of MIRK Energo, as well as Trust Alma-AtaInzhstroi and
Almaty Heat & Power Plant-2.
1. INTRODUCTION
Development of the foam capillary porous generators and dust-and-gas collectors of new
type was derived from study of pure liquids boiled in the porous structures and managed by
different physical fields: mass (gravity and pressure forces), capillary, vibration and wave
(ultrasound) [1-5]. The different physical processes such as boiling, injection, suction
(condensation), bubbling, foam generation, pseudo fluidization were summarized with a single
criterial equation with accuracy ± 20% [2].
Foam generation and de-foaming processes, as well as collection of microscopic particles
are available in the upgraded capillary porous structures (grids or partitions), whereas foam
forming solution is sprayed with a nozzle-free foam generator, and either pure dusty air-gas-
foam-steam mechanical flows were used for the bubble blowing energy or electric power of
low voltage [3,5-12]. The internal features of multiphase flows, as well as bubble size,
dispersion, their growth speed, density of cores, intensity of drop entrainment, frequency of
silence and development, departure diameters, values of formation and time of their formation
and destruction determine a stability of multiphase pulse boundary layer and control of different
physical fields and constructive properties of devices [1-4, 7-9, 11-15].
A particular attention in comparative analysis is given to the foam nozzle-free capillary
porous dust-and-gas collectors with elastic composite materials in which geometry of micro
1 8 Kliment Ohridski blvd., Sofia, Bulgaria, phone: +359 895 58 60 70; email: [email protected]

50
channels is controlled by vibrator which is operated in accordance with the kinematic diagram
of the reciprocating motions [6].
Modern methods and devices used in dust suppression and dust collection with the help of
air (steam)-mechanical foam [16-19], and designed nozzle-free generators of air mechanical
foam and dust-and-gas collectors having a capillary porous structure are applicable to make
their assessment and analysis.
The studies performed for the optimization of porous structure give information about the
required sizes of vapor and gas bubbles where it is possible to achieve a maximum effectiveness
of dust collection, dust suppression against fire fighting, as well as values of effective head.
Also an issue about the efficiency of dust collection of minor fraction particles was solved in a
presenceof highly intensive condensation process of water enriched steam on surfaces with
capillary porous coating. Type of capillary porous structure was determined, mode and
geometric properties of the system, the respective engineering relations were provided [2, 3, 6-
8, 12, 15].
2. DESCRIPTION OF THE CASE STUDY
Generally, the proposed capillary porous structure of the aero-hydrodynamic constructive
diagrams of nozzle-free foam generators of air (steam) mechanical foam and dust-and-gas
collectors on capillary porous structure meet the operational sanitary requirements, safety in
operations of different industrial companies, and are considered reliable, easy to manufacture
and easy to operate and maintain.
Study of the dust suppression and dust collection processes was implemented during the
educational process at the faculty of "Heat & Power Units" at the Almaty University of Energy
and Communications, at the Almaty Branch of MIRK Energo, as well as Trust Alma-
AtaInzhstroi and Almaty Heat & Power Plant-2.
Investment costs for the implementation of foam generators and dust collectors will be
reduced because of the simplified design, reduced consumption of materials, minimized power
consumption for air transfer, reduced amount of foam solution and steam generation. Besides
consumption of foam forming solution is reduced, efficiency of devices due to the automatic
reasonable correlation of components under different operational modes of dust cleaning
equipment is increased. Social effect implies improvement of the environmental issues,
operational efficiency is increased, which leads to non-waste production.
3. COMPARATIVE ANALYSIS
Comparative analysis between standard dust collectors with highly effective capillary
porous device with controlled geometry of micro channels [6] (fig.1 A and B) here is presented.
This device helps to increase hundred times a duration between regenerations, and reduce 1,5
times a consumption of foam generator, which saves power for its transfer, fully utilize acoustic
energy by decreasing three times a specific acoustic power. In addition, the device operation is
simplified, duration between regenerations increases, and thus enhanced reliability and
operational life of the device, leading to reduced investment and operational costs. Hydraulic
and gas dynamic resistance will be decreased 1,5-2 times, and efficiency of the dust and gas
collection will be 99,9 %.

51
A) B)
Figure 1: A) Highly efficient porous device with controlled geometry of micro channels; B)
Capillary-porous material of dust and gas collector in a free (unloaded) state (a) and under the
influence of acoustic oscillations (b).
Legend of Figure 1 A and B: 1 – inlet nozzle of contaminated gas, 2 – outlet nozzle of
clean gas; 3 – capillary porous material (elastic polyurethane or elastic composite material with
set of required properties); 4 – capillaries and pores; 5 – sprayer in a ring form with opening; 6
– perforated plates; 7 – bolt joint; 8 – pressed clips; 9 – flexible plate; 10 – screws; 11 – vibrator;
12 – bar; 13 – kinematic diagram; 14 – sludge collector; 15 – dust-and-gas flow; 16 – clean gas;
17 – foam forming solution; 18 – mass (gravity and pressure forces) and capillary forces; 19 –
sludge; 20 – micro particles and micro drops; 21 – settled micro particles and micro drops.
4. RESULTS
Table 1 presents the properties of dust collectors based on the performed study.
The markings in column 9 of Table 1 are as follows: Ск – Keningem-Milliken correction
(average length of free path of gas molecules); D – diffusion rate, m2/s; dp – diameter of
particles, m; Е – electric field intensity, V/m; e – electrone value; 1,6*10-19 Q; G – mass flow
rate, kg/s; ni – ion concentration, I/m3; Тg – gas temperature, К; E0 – dielectric constant, 8,85
10-12 F/m; µg – dynamic viscosity of gas phase, Pa.s; Stokes criterion: ( )2 . /18p p r g
Stk d Vρ µ= ⋅
, where rV – relative gas velocity (in relation to drops, particles, streamlined bodies), m/s; p
ρ
- density of solid phase, 3/kg m .
General parameters of particle settling is as described in item 8 of Table 1: G – gravitational
, W – centrifugal; Stк – inertial; D – diffusional; KЕ – due to electric forces; K – due to
condensation of combined capillary and mass forces.

52
Table 1: Comparative Analysis of Different Dust Collectors
No
. Indicator
Chamb
er of
gravita
tional
dust
collecto
r
Inertial
(centrifug
al) dust
collector
Cyclone
(centrifugal
medium-pressure) Hose
(fiber)
filter
Granula
r filter
Wet
filter
Wet Dust
Collector
Electri
c filter
Wet filter
of Author Large
diamet
er
(1-3m)
Small
diameter
and
battery
type
Low
pressu
re
High
pressure
1 2 3 4 5 6 7 8 9 10 11 12 13
1 Hydraulic
resistance, Pa 100-200 200-300
700-
800 800-1250
750-
1500
1200-
1600
1000-
1800
750-
1500
5000-
12500
100-
400 500-1000
2
Minimum
size of
collected
particles, 10-
6m and
effectiveness
(ƞ%)
50-100 40-50 30-40 10-25 0,5 0,1-1 1-2 2-5 0,1-1 0,25-1 0,1-0,25
85 85 85 85 99 97 97 97 97 99 99
3
Maximum
admissible
temperature,
°С
400 400 400 400 <80
и
<250
for
glass
fibers
Not limited
<425 as
per gas
content
and
dust
properti
es
Not
limited (as per steel grade)
4 Gas low limit
temperature Over dew point Any
Over
dew
point
Any
5 Corrosion
resistance Too resistant
Resistant at temperature
exceeding dew point
Required corrosion
protection if acids
available in gases
Resistant at
temperature
exceeding dew point

53
6
Explosion
and Fire
Hazard
Minor
Major
(hazard
ous
Minor Minimum Major Minimum
7
Relative cost
of cleanup of
1000m3gas
1 1,5 2 3 3-3,75 2,5-4 7-10 2,5-5 5-15 7-15 1-2,5
8
Main settling
mechanism
G U U U at dr≤3x10⁻⁷m-D
at dr>3x10⁻⁷m-Stk Stk Stk KE D; K; Stk
9
Dependancy
of
effectiveness
from: ~d2
r Ck ~ d2r Ck
at dr≤3x10⁻⁷m~Ck/dr
at dr>3x10⁻⁷m~d2r/Ck
~d2r Ck ~dr Ck n, 7…9
а) particle
size
б)
temperature ~Ck/μг ~ Ck/μг
at dr≤3x10⁻⁷m~CkТг/μг
at dr>3x10⁻⁷m~Ck/μг n, 7…9
в)
concentration
No
impact
As per device diameter and
dust adhesion
Not over
2g/m3
As per water supply system
and power consumption
Limited
50 n, 8…11
(г/м3) (2500…15) (50…0,5)
г) humidity
upon
condensate of
water vapors
No impact Discharge might be
complicated
Fiber is
clogged
Improve
s settling
No
impac
t
No impact
Compli
cated
dust
remova
l
Improves
settling

54
3. CONCLUSIONS
The paper is a comparative analysis between the existing dust collector and designed one
with capillary porous structure with controlled geometry of micro-channel.
The proposed simplified design, reduced amount of material in production, reduced power
consumption for performing the air transfer, foam forming solution and steam generation are
the reasons for reduced implementation costs of the proposed foam generators and dust
collectors. Furthermore, consumption of foam forming solution is reduced, and efficiency of
devices is increased due to the automatic reasonable correlation of components under different
operational modes of dust cleaning equipment.
Last but not least, the suggested aero-hydrodynamic constructive diagrams of nozzle-free
foam generators and dust-and-gas collectors on capillary porous structure meet the operational
sanitary requirements, safety in operations of different industrial equipment, easy-to-
manufacture and easy-to-operate.
References
[1] Polyaev V.M., Genbach A.A. Upravlenie teploobmenom v poristih strukturah, Izvestiya Rossiiskoi akademii
nauk. «Energetika i transport»,1992,T.38, №6-S. 105-110.
[2] Polyaev V.M., Genbach A.A. Teploobmen v poristoi sisteme, rabotaushii pri sovmestnom deistvii kapillyarnih
i gravitacionnih sil, Teploenergetika, 1193, №7-S. 55-58.
[3] Genbach A.A., Kulbakina N.V. Pilepodavlenie i pileulavlivanie s pomoshu cirkuluacionnogo penogeneratora
s poristoi strukturoi, Energetika i toplivnie resursi Kazakhstana, 2010, №4-S. 62-65.
[4] Polyaev V.M., Genbach A.A. Upravlenie vnutrennimi harakteristikami kipeniya v poristoi sisteme //
Kriogennaya tehnika i kondicionirovanie: sbornik trudov MGTY, 1991.-S.224-237.
[5] Polyaev V.M., Genbach A.A. Primenenie poristoi sistemi v energeticheskih ustanovkah, Promishlennaya
energetika,1192, №1-S.40-43.
[6] Genbach A.A., Piontskovskii M.S. Poristii pilegazoulovitel s upravlyaemoi geometriei mikrokanalov,
Energetika i toplivnie resursi Kazahstana, 2010, №4 -S. 59-61.
[7] Polyaev V.M., Genbach A.A., Minashkin D.V. Processi v poristom ellipticheskom teploobmennike, Izvestiya
vuzov. Mashinostroenie, 1991.-№4-6.-S.73-77.
[8] Genbach A.A., Genbach N.A. Issledovanie penogeneratora s obogrevaemoi poverhnostu, Vestnik AIES.-
Almaty, 2009, №4, S.24-27.
[9] Genbach A.A., Genbach N.A. Issledovanie kapillyarno-poristih sistem v teplovih energeticheskih ustanovkah
elektrostancii, Vestnik AIES.-Almaty, 2011, №2 (13), S.57-62.
[10] Genbach A.A., Genbach N.A. Primenenie kapillyarno-poristih sistem v teplovih energeticheskih ustanovkah
elektrostancii, Vestnik AIES, Almaty, 2011, №3, (14), S.4-11.
[11] V.M. Polyaev, A.N. Genbach, A.A. Genbach. Methods of Monitoring Energy Processes, Experimental
thermal and fluid seience, International of Thermodynamics, Experimental Heat Transfer, and Fluid Mechanics.
Avenue of the Americas, New York, volum 10, april, 1995, p.273-286.
[12] Genbach A.A., Shokolakov K. Poristii pennii pileulovitel. MON RK, Mezhdynarodnii nauchnii zhurnal -
prilozhenie Respubliki Kazakhstan – Poisk №2 /2011 S. 266-271.
[13] Polyaev V.M., Genbach A.A. Plotnost centrov paroobrazovaniya i vibros kapel iz poristoi strukturi, Izvestiya
vuzov. Mashinostroenie, 1990, №9, S. 50-55.
[14] Poljaev V.M., Genbach A.A. Oblasti primenenija poristoj sistemy, Izvestija vuzov, Jenergetika, 1991, №12.
- S.97-101.
[15] Genbach A.A. Poristye teploobmenniki, Dep.ruk.VINITI. -1989. - №12 (218). - S.178. - (KazNIINTI. - 1989.
- №2818. - 194 s.).
[16] Romenskij L.G. Pena kak sredstvo bor'by s pyl'ju. - Kiev: Naukova dumka, 1976, 162s.
[17] Spravochnik po bor'be s pyl'ju v gornodobyvajushhej promyshlennosti/Pod red. A.S.Kuz'micha. – M.:Nedra,
1982, S.103.
[18] Idel'chik I.E. Spravochnik po gidravlicheskim soprotivlenijam. – M.: Mashinostroenie, 1975. – 559.
[19] Isachenko V.P. Teploobmen pri kondensacii. - M.: Jenergija. 1977, 240 s.

55
APPLICATION OF ECONOMIZER IN BIOMASS BOILER HOUSE IN
BORYSPIL AIRPORT: CASE STUDY
Sofiia Heletukha1, Lead engineer, Master's degree
ABSTRACT
Installation of economizer allows recovering significant part of physical and latent heat and reduce
greenhouse gas and dust emissions in flue gases. Energy and ecology efficiency increment calculations
for the 5 MW biomass boiler house in Boryspil Airport are described in this paper.
1. INTRODUCTION
According to the International Energy Agency, in preventing the global temperature
increasing on the Earth more than to 2°C, concerning to the preindustrial period, the most
important role in reducing CO2 emissions in the period up to the 2050 will be playing energy
efficiency (40%) and renewable energy (30%). Energy efficiency in biomass boiler house
concerns both and that's why is actual nowadays.
According to the Energy Strategy of Ukraine until 2035 [1], Ukraine is going to reduce
fossil fuels consumption and increase the share of renewable energy sources in the total primary
energy production from 4% (in 2016) to 25% (in 2035). In recent years, biomass sector has
accounted for about 80% of renewable energy in the country and is based mainly on utilization
of woody biomass in heat generation: wood logs and wood pellets mostly for population and
district heating, wood chips and residues mostly for industrial purposes, public heating and
power production [2].
There are different energy loses in biomass boiler houses. Among them: loses due to
chemical and physical incompleteness of combustion, loses by fencing structures etc. But most
of the energy loses in a boiler are because of the high temperature of the flue gas. Boilers
generally can lose 20% of heat of combustion. Thanks to the flue gas condensers boilers can
recover up to 50% of this heat loss [3]. Therefore, recovering the waste heat from flue gas is a
major area to increase the thermal efficiency of plants.
Average moisture content of wood chips used in the biomass boiler house is
40-60%. When combustion process starts, the fuel is heated up and water from the fuel starts
to evaporate. Evaporation requires energy and this energy together with wet flue gases is
released in atmosphere and is wasted. Part of this energy can be recovered if wet flue gasses
are directed through a technical device called economizer.
2. OBJECTIVES OF THE PROJECT
Municipality owned district heating company supplies district heat for
consumers in Boryspil Airport. Among the heat users there are terminals, public
buildings and commercial buildings. The company owns and operates
three boiler houses. Average efficiency of boiler houses is 85%.
In this boiler house there are six boilers with the total installed heat capacity 27 MW: five
natural gas boilers (with total capacity 32 MW) and one biomass boiler POJ INKA 5000 (with
5 MW capacity).
The POJ INKA biomass boiler is operated to cover peak loads. The natural gas boilers are
used to cover the base load and as back-up in case of emergency situations.
Economizer type Enerstena CEB 1000 (Figure 1) is installed in biomass boiler house.
1Institute of Engineering Thermophysics of NASU, Zhelyabova 2a street, tel.: +38 044 456 94 62,
e-mail: [email protected];

56
Figure 1: Economizer Enerstena CEB 1000 in biomass boiler house in Boryspil Airport
Flue gases through the inlet pipe are introduced in the condenser. First nozzle circuits are
located in the pipe. In the first step flue gases are cooled to temperature that is acceptable to
condense heat in the second part. Solid particles in fuel gases (still left after gas treatment in
the cyclone) are caught in the first nozzle circuit. The previously cooled flue gases are then
injected in the second part of the condenser. Gases are moving from the top to the bottom inside
the pipes and water is injected in intertubular space and moves towards gas. The purpose of the
second step is to perform deep cooling of flue gases and steam condensing. Consequently the
temperature of water injected through the second nozzles shall be as low as possible. The useful
heat from the condenser is then returned back to district heating system.
The objective of this project is to increase the efficiency of biomass use by installation of
economizer in biomass boiler house in Boryspil Airport.
3. ENERGY EFFICIENCY INCREMENT
The calculations are based on the following initial data:
− type of economizer: Enerstena CEB 1000,
− type of biomass boiler: POJ INKA 5000 (with nominal capacity 5 MWth, actual
capacity is 60% from nominal capacity),
− fuel: wood chips, The moisture content in the fuel is between 40-60% (for further
calculations the moisture content of wood chips were assumed 40%);
− return water temperature 40oC,
− flue gas temperature 100oC,
− no combustion air humidification is applied.
Heat loss and energy efficiency are calculated for low heating value (LHV) and high
heating value (HHV) for wood-chips-fired boiler POJ-INKA 5000 (Table 1) and system “wood-
chips-fired boiler – economizer” (Table 2).
Table 1: Thermal efficiency of wood-chips-fired boiler POJ-INKA 5000
LHV HHV Unit
heat
loss
with exhaust gas q2 5,92 20,4 %
with chemical combustion
incompleteness q3
1
0,85 %
with mechanical combustion
incompleteness q4
1,5
1,27 %
with external cooling q5 0,35 0,3 %
with ash heat q6 0,1 0,09 %
total heat loss Σq 8,9 22,9 %

57
efficiency factor η 91,1 77,1 %
fuel consumption with nominal capacity B 0,537 kg/s 1933,2 kg/h
fuel consumption with actual capacity Bр 0,316 kg/s 1137,6 kg/h
Table 2: Thermal efficiency of system “wood-chips-fired boiler – economizer”
LHV HHV Unit
heat
loss
with exhaust gas q2 -6,25 8,7 %
with chemical combustion
incompleteness q3
1
0,85 %
with mechanical combustion
incompleteness q4
1,5
1,27 %
with external cooling q5 0,35 0,3 %
with ash heat q6 0,8 0,68 %
total heat loss Σq -2,6 22,9 %
efficiency factor η 102,6 88,2 %
fuel consumption with nominal capacity B 0,47 kg/s 1692 kg/h
fuel consumption with actual capacity Bр 0,28 kg/s 998 kg/h
By establishing a economizer:
the amount of heat losses with exhaust gas decreases, which leads to increase of efficiency
of the system. Efficiency factor increased – by 11%, from 77% to 88% (by HHV) and from
91% to 103% (by LHV).
Fuel savings:
− with nominal capacity – 5000 kW): 241,2 kg/hour;
− with actual capacity – 2944 kW): 129,6 kg/hour;
with a constant fuel consumption in the system "boiler-economizer", the amount of useful
heat used in it:
− with nominal capacity – 5000 kW): 5,7 MWth;
− with actual capacity – 2944 kW): 3,35 MWth
4. ECOLOGY EFFICIENCY INCREMENT
The main pollutants formed during the energy use of biomass are nitrogen oxides (NOx),
carbon monoxide (CO), sulfur oxides (SOx), and solids calculations are shown in the
Figures 2,3.
Figure 2: NOx, СO, SOx pollutants in wood-chips-fired boiler POJ-INKA 5000 flue
gases, g/hour
1,674.4
4,081.4
0.0
5000
0.0
1000.0
2000.0
3000.0
4000.0
5000.0
6000.0
Nox СO Sox
Poll
uta
nts
, g/h
our
wood chips limit of maximum permissible concentration

58
Figure 3: Solids pollutants in wood-chips-fired boiler POJ-INKA 5000 flue gases in
different variants of cyclone and economizer installation, g/hour
Consequently, when burning wood chips in a 5000 kW biomass boiler, emissions of
nitrogen oxides (NOx), carbon monoxide oxides (CO), sulfur oxides (SOx) are acceptable,
and emissions of solids particles:
- without installing of cyclones and an economizer - are higher than the permissible norm:
- with the installation of cyclones, but without the establishment of the economizer - are
higher than the permissible norm:
- from the installation of the block of cyclones and the economizer - are permissible.
5. CONCLUSIONS
As a result of above analysis the key conclusions could be formulated as follow:
Installation of economizer allows:
− to increase overall efficiency and reducing wood chips consumption by 241 kg/hour
(with nominal capacity) and by 129,6 kg/hour (with actual capacity)
− to increase efficiency of the system. Efficiency factor increased – by 11%, from 77% to
88% (by HHV) and from 91% to 103% (by LHV).
When burning wood chips in a 5000 kW biomass boiler emissions of nitrogen oxides
(NOx), carbon monoxide oxides (CO), sulfur oxides (SOx) are acceptable, and emissions
of solids particles:
− without installing of cyclones and an economizer - are higher than the permissible
norm:
− with the installation of cyclones, but without the establishment of the economizer - are
higher than the permissible norm:
− from the installation of the block of cyclones and the economizer - are permissible.
References [1] International Energy Agency World Energy Outlook Special Report 2015: Energy and Climate Change
[2] National Renewable Action Plan till 2020 in force since 1 October 2014 (Decree of Cabinet of Ministers # 902-r)
[3] Geletukha G., Oliynyk E., Zheliezna T. Prospects for heat production from biomass in Ukraine – 6th Position Paper
of UABio (in English), Bioenergy Association of Ukraine, Kyiv, Ukraine, 2013, 22 p.
http://uabio.org/img/files/docs/position-paper-uabio-6-en.pdf
[4] Kemal Comakli, Meryem Terhan (2016). Energy and Economic Analysis of Heat Recovery from Boiler Exhaust
Flue Gas. International Journal of Energy and Power Engineering: World Academy of Science. pp. 450-456.
[5] 2. Jakobsen H.H. (1991). Flue Gas Condensation of Chip Fired Boiler at District Heating Plant: Danish Institute of
Forest Technology.
293
5,128
14,652
500
0
2000
4000
6000
8000
10000
12000
14000
16000
with cyclone and
economizer
with cyclone without cyclone
and economizer
Soli
ds
par
ticl
es,
g/h
our
wood chips limit of maximum permissible concentration

59
PERFORMANCE ANALYSIS OF A BIOGAS-FUELLED
GAS TURBINE COGENERATION SYSTEM
Ion V. Ion1, Florin Popescu, Simona Lizica Paraschiv, Spiru Paraschiv
“Dunarea de Jos” University of Galati, Romania
ABSTRACT
Economic viability of a biogas plant depends mainly on the energy efficiency of combined heat
and power plant, cost of fuel and green certificates and heat demands and price. When there is not heat
demand, one way to maintain the plant economic efficiency is to use the heat for electricity generation.
This can be done by combination of prime mover with steam or organic Rankine cycle (ORC) engine.
A biogas-fuelled gas turbine combined with ORC cycle for a biogas plant with capacity of 210 Nm3/h
can increase the electric efficiency to 49% from 40.6%, the electric efficiency of gas turbine CHP
plant. The investment cost can be recovered in 4.1 years.
1. INTRODUCTION
The number of biogas plants for the treatment of wet livestock wastes, from
wastewater treatment plants and landfill gas recovery is increasing in Europe and worldwide
due to the advantages of biogas use: biogas can be stored for later use; if converted into
electricity and/or heat, biogas plants reduce greenhouse gas (GHG) emissions, with reducing
of waste amount and generating valuable fertilizer; it can add energy independence, and hence
value, to the region where it is used and boost employment [1, 2, 3]. There were 17240 biogas
plants in Europe in 2015 with a production of about 0.57 EJ or 45% of world production [1].
The energy, environmental and economic performance of a biogas plant depends on the
overall energy efficiency of biogas plant and on how it is used the excess heat from biogas
plant [1].
Most biogas plants use a combined heat and power (CHP) system to convert biogas on
site into electricity and heat. A CHP system converts (35 – 40)% of the energy contained in
biogas into electricity and (40-45)% into heat. The heat is used to control the temperature of
the anaerobic digestion and for space heating of administration building and what remains is
sold. The excess heat that is not used compromises the economic performance of the biogas
plant. There are many biogas-fuelled CHP technologies, such as internal combustion engines,
gas turbines, steam turbines, Stirling engines, fuel cells and combined cycles.
The most widespread technology in USA in 2014 was gas turbine technology with 64%
capacity share, followed by steam turbines with 32.1% and internal combustion engine with
2.7% (over half of the CHP systems in place) [4].
Among these technologies, internal combustion engines show high power efficiency at
part-load operation, relatively low investment cost and operation on low-pressure gas, high
maintenance cost and need of cooling. The gas turbines achieve the highest electric efficiency
when operating in combined cycle, they need not cooling but require high pressure gas (or gas
compressor) and have poor efficiency at low loading. Steam turbines can use a large variety
of fuels, have long working life, but have very low power to heat ratio. Fuel cells have low
emissions and noise, high efficiency over load range and are less widespread due to the high
investment cost and the necessity of fuel processing. Stirling engines are considered as the
1111 Domneasca St.; +40740566214; [email protected]

60
most promising technology for micro-CHP applications due to their characteristics of low
emissions, high efficiency and reliability. They are still in the “early adaptors” phase due to
relatively high costs [5, 6, 7].
Gas turbines are a commercial technology in biogas applications with capacity in the
range of 25 kW to above 500 kW. The performance is highly influenced by two parameters:
the pressure ratio and the firing temperature. The thermodynamic efficiency increases with the
increase of compression ratio, which is dependent on the design. Gas turbines for power
generation can be either industrial (heavy frame) or aeroderivative designs. Industrial gas
turbines have lower pressure ratios – typically up to 18:1. Aeroderivative gas turbines operate
at higher compression ratios – up to 30:1, offer higher efficiency and lower emissions, but
have higher initial (capital) costs. The efficiency increases also by augmentation of the
temperature at which the turbine operates (firing temperature). However, this temperature is
limited by the maximum allowable temperature of the turbine blade metal alloy. It can be in
the range of 1200ºC to 1400ºC, but can reach 1600°C when blade coatings and cooling
systems are used. The energy conversion efficiency of a simple cycle gas turbine power plant
is typically about (30-40)%. By recovering the heat remained in the exhaust gas leaving the
turbine at 600ºC, to produce more useful work in a combined cycle configuration, gas turbine
power plant efficiency can reach (66 – 71)% [9].
In this study, energy and economic assessment of a biogas-based gas turbine system with
preheater and waste heat recovery is performed. The effects of waste heat recovery on the
energy and economic performance of a plant are studied.
2. METHODOLOGY
In the work, a gas turbine system for a biogas plant with capacity of 210 Nm3/h was
considered. For waste heat recovery were chose the simple way of recovery in a heat
exchanger and recovery in an Organic Rankine Cycle to generate electricity. The energy
simulation and optimisation was performed by using the Cycle-Tempo Release 5.1.5 software
in combination with the FluidProp software package, both developed by the Delft University
of Technology and by TNO, the Dutch Institute for Applied Research [10]. The system
configurations and energy assessment are given in Figures 1 and 2. The main thermodynamic
parameters of system are the following: pressure ratio 18:1; gas temperatures at the turbine
inlet 1600°C; air fuel ratio 22.38; gas temperatures at the turbine outlet 600°C; gas
temperatures at the stack 120°C. The working fluid for the ORC system was selected toluene
because it is most suitable for the thermal level of waste heat of gas turbine system.
In addition to energy efficiency and environmental performance, economic performance
of the energy systems is also important. The studies on internal combustion engine CHP
system fuelled by biogas have shown that the cost of fuel and green certificates are the most
important factors for economic viability of the system [11]. Study on a CHP plant based on
gas turbine using co-firing natural gas and biogas concluded that economic of the plant is
affected greatly by changes in fuel combination. Economic analysis of CHP and Combined
Cycle based on a 5 MW biogas fueled gas turbine, economically conducted with fixed fuel
composition concluded that CHP is generally more profitable especially at high heat demands
and prices [11].
The investment costs of a gas-turbine CHP plant ranges from 744 €/kWe to 1260 €/kWe,
with a typical cost figure of 825 €/kWe. The annual operation and maintenance (O&M) costs
are approximately 33€/kWe. The investment costs of a high temperature ORC module range
from 1000 €/kWe for 2 MW output to 3000 €/kW for 150 kW output [12, 13].
The energy and economic characteristics of both systems are given in Table 1.

61
ΦH = 486.14 kW
P = -1.06 kW
P = -985.27 kW
ηi = 88 %
Pm = 2182.87 kW
P = -637.75 kW
ηi = 88 %
Compressor
Pel = 1514.21 kW
Waste heat recovery
Fuel (biogas)
18.27 3816.97
-4502.01 0.067
1313
1212
4.000 70.02
293.35 3.855
1111
1010
3.950 100.00
419.28 3.855
99
1.100 120.00
-1584.77 1.567
88
1.150 400.00
-1274.94 1.567
1.150 400.00
-1274.94 1.567
77
1.200 600.00
-1040.48 1.567
66
18.00 1672.00
353.94 1.567
55
18.27 645.62
570.84 1.500
44 18.32 424.31
325.91 1.50033
22
1.013 15.00
-98.84 1.500 11
12
11
10
9
8
H
7
6
54
H
3
2
1
Air filter
Air
p T
h Φm
Φm = Massflow [kg/s]
p = Pressure [bar]
T = Temperature [°C]
h = Enthalpy [kJ/kg]
Pel = Electrical Power [kW]
P = Power [kW]
ηi = Isentropic efficiency [%]
∆pan = Pressure drop (anode) [-]
ΦH = Heat output [kW]
Figure 1. CycleTempo simulation of biogas-fuelled gas turbine cogeneration system.
P = -2.65 kW
Pm
= 144.91 kW
ΦH = 367.79 kW
P = -28.87 kW
P = -985.27 kW
ηi = 88 %
Pm = 2182.16 kW
P = -637.75 kW
ηi = 88 %
Compressor
Pel = 1513.52 kW
Pel = 140.56 kW
1.150 400.00
-1274.48 1.567
77
Fuel (biogas)
1919
16.95 110.00
-256.53 0.8631818
17.00 103.59
-269.09 0.863
17.00 103.59
-269.09 0.863
1717
0.8000 102.64
-272.00 0.863
0.8000 102.64
-272.00 0.8631616
0.8000 121.64
125.51 0.863 0.8000 121.64
125.51 0.863
1515
0.8500 130.00
138.06 0.863
1414
1313
1212
16.90 250.00
305.95 0.863
16.90 250.00
305.95 0.863 1111
3.000 70.00
293.19 2.917
1010
4.000 100.00
419.29 2.917
99
1.100 120.00
-1584.32 1.567
88
1.200 600.00
-1040.02 1.567
66
18.00 1671.68
353.94 1.567
55
18.27 645.62
570.84 1.500
44 18.32 424.31
325.91 1.50033
22
1.013 15.00
-98.84 1.500
11
17
15
14
13
H
12
1110
H
9
8
7
6
54
H
3
2
1
Waste heat recovery with ORC system (toluene)
Air filter
Air
p T
h Φm
Φm = Massflow [kg/s]
p = Pressure [bar]
T = Temperature [°C]
h = Enthalpy [kJ/kg]
Pel = Electrical Power [kW]
P = Power [kW]
η i = Isentropic efficiency [%]
∆pan = Pressure drop (anode) [-]
ΦH = Heat output [kW]
0.8500 130.00
138.06 0.863
Figure 2. CycleTempo simulation of biogas-fuelled gas turbine combined with ORC system.

62
Table 1. Energy and economic features of the biogas-fuelled gas turbine systems.
System
Parameter Gas turbine CHP system
Gas turbine combined
with ORC system
Investment costs, € 1032500 1214220
O&M costs, €/year 20000 25440
Electricity output, kWe 527.88 637.29
Heat output, kWt 486.14 367.79
Hours of plant operation, hrs/year 6000 6000
Electricity cost, €/kWe 0.12 0.12
Cost of green certificate, €/MWe 10 10
Payback period, years 3.5 4.1
3. CONCLUSIONS
A gas turbine system with preheater associated with a biogas plant with capacity of 210
Nm3/h was simulated and optimised, by using the Cycle-Tempo software, for two
configurations of heat recovery: in a heat exchanger and in an organic Rankine cycle system.
The electricity output for the second configuration increases by 29% and the heat output
decreases by 25%. For given cost of electricity and green certificates, the investment costs are
recovered in 3.5 years in first case and 4.1 years in the second case.
References
[1] Herbes C., Halbherr V., Braun L., Factors influencing prices for heat from biogas plants, Applied Energy
221 (2018), pp. 308–318.
[2] Zafar S., Trends in Utilization of Biogas, November 21, 2015,
https://www.bioenergyconsult.com/tag/biogas-turbine/
[3] Scarlat N., Dallemand J-F., Fahl F., Biogas: developments and perspectives in Europe, Renewable Energy
2018.
[4] U.S. Environmental Protection Agency, Catalog of CHP Technologies
https://www.epa.gov/sites/production/files/2015-07/documents/catalog_of_chp_technologies.pdf
[5] Gupta K.K., Rehman A., Sarviya R.M., Bio-fuels for the gas turbine: A review, Renewable and Sustainable
Energy Reviews, Vol. 14, Issue 9, 2010, pp. 2946-2955.
[6] The Energy Technology Systems Analysis Program (ETSAP), https://iea-etsap.org/E-TechDS/PDF/E04-
CHP-GS-gct_ADfinal.pdf
[7] Kim S., Sung T., Kim K.Ch., Thermodynamic Performance Analysis of a Biogas-Fuelled Micro-Gas
Turbine with a Bottoming Organic Rankine Cycle for Sewage Sludge and Food Waste Treatment Plants,
Energies, 2017, 10, 275.
[8] Rade M.C., Zoran K., Techno-Economic Analysis of Biogas Powered Cogeneration, Journal of Automation
and Control Engineering Vol. 2, No. 1, 2014.
[9] https://www.wartsila.com/energy/learning-center/technical-comparisons/gas-turbine-for-power-generation-
introduction
[10] Simulation software Cycle-Tempo (http://www.asimptote.nl/software/cycle-tempo/
[11] Barzegaravval H., Hosseini S.E., Wahid M.A., Saat A., Effects of fuel composition on the economic
performance of biogas-based power generation systems, Applied Thermal Engineering 128 (2018), pp.
1543–1554.
[12] The Energy Technology Systems Analysis Program (ETSAP), https://iea-etsap.org/E-TechDS/PDF/E04-
CHP-GS-gct_ADfinal.pdf [13] Lemmens S., Technological innovation in the energy sector: case of the organic Rankine cycle, PhD Thesis,
Universiteit Antwerpen, 2017.

63
INTEGRATION OF MICRO-COGENERATION SYSTEMS INTO EXISTING BUILDINGS
Alin IONESCU, Linda BARELLI, Gheorghe LAZAROIU,
University Politehnica of Bucharest, Faculty of Power Engineering
Università degli Studi di Perugia, Facoltà di Ingegneria
ABSTRACT
Because of the growing environmental awareness and the ratification of the Kyoto Protocol, combined heat and power receives again more attention as a way to contribute to the reduction of energy use and emissions. Buildings account for 40 % of total energy consumption in the European Union. The sector is expanding, which is bound to increase its energy consumption. Nowadays, micro-cogeneration systems became a true and good solution to sustain the energy demand of industrial and even domestic buildings. Them are operating between 0 kWh – 50 kWh. The district heating set up with a cogeneration system, concurs to attain energetic, economic and ambient benefits. It also provides to citizens a new service. The project strategy is based on the idea of supplying a portion of the necessary thermal power through a combustion alternative engine in cogeneration modality.
1. INTRODUCTION
Cogeneration system is an ultimate technology, which can reduce energy cost and improve the efficiency. The CHP system can provide both type of energy, electrical and thermal. The benefits of this type of technology are worldwide know:
a) Increase efficiency of resources use: It is the most efficient technology in conversing the fuel power into electrical and thermal energy, reaching approximatively 30% energy savings, compared with separately production of those two types of energy.
b) Reduce of carbon foot-print: Cogeneration is a technology with reduce carbon emissions, having the potential of reducing, up to 30% of emissions for fossil fuels or 100% when you are using renewable sources of energy (biomass, biogas, etc.)
c) Compatible solution with solar panels: This type of systems, CHP, can produce electricity in a constant and flexible way, even in winter periods during the night, when the solar panel system that are in stand-by, or when them are producing energy intermittently.
d) Safety of energy supply: This system may be used like a safety supply power plant, in this way it is improved the energy supply system, in some cases additional components are needed and other operational standards.
e) Plug and play: CHP systems are make part from the few energy savings technology, which can deliver heat at high temperature (more than 80 Celsius degree). Usually, between 85 and 95 % from primary energy consumed by the cogeneration power
plant, it is transformed in useful energy, which show us high efficiency, compared to other conventional systems. For this technology to be feasible form economical point of view, it is necessary that the CHP system should be operated 14 hours per day or 5000 hours per year.
Figure 1.2. The schematic diagram of a cogeneration system (internal combustion engine)

64
So, if you want to adopt this solution to produce energy, to the detriment of conventional
systems will go to these consequences: a) Low cost for electrical energy purchase (decrease the electrical energy
purchase from grid, savings with regular taxes on distribution network and other electrical taxes)
b) Extra incomes from incentives linked to cogeneration systems c) The opportunity to offer system services to electrical energy operator d) Improvement of carbon foot-print, reducing the environment pollution
Cogeneration or CHP units of 5-50 kWe are commercially available on the market. Most of these are based on reciprocating engine technology (gas engines), but also a few small appliances based on gas turbines can be found. They have a power-to-heat ratio of approximately 1:2, and the heat output of these units will generally then be within 15-120 kW. Internal combustion engines (ICE) dominate the market, but gas turbine is also a possible technology. The gas engines are spark ignited (Otto cycle) and operate either close to stoichiometric conditions allowing three-way catalysts to be used for emission reduction or are designed for lean-burn operation.
Often the system comprising a CHP unit also includes heat storage and additional boilers. The heat storage has several purposes, and the boilers are used for the heating demand when it exceeds the CHP heat output. To achieve the best electrical production efficiency and to benefit the most from the investment, the CHP units should (if possible) be operated at full load and for many hours per year. This means a sort of base load operation seen from a heat supply point of view. Ordinary and less costly boilers must then cover peak load heating periods or periods with low value for the electricity produced.
It is clear that the different technologies show a wide range of electric efficiency where the commercially available technologies, such as the Stirling engine unit and the combustion engine units, are less efficient. Fuel cells for micro CHP purposes are still in the development and field test phase, except for Japan where they have been available for everybody since 2009. The energy balance for single-family houses in north-western Europe (UK, the Netherlands, Germany and Denmark) with an annual demand of approximately 5,000 kWh electricity and 17,000 kWh heating and hot water is roughly as follows: The micro CHP unit (ηel=30%) produces 5,000 kWh electricity, of which half is exported to the grid, and 10,000 kWh heat to be used for heating and hot water.
2. HOW TO SELECT CHP SYSTEM FOR AN EXISTING BUILDING
Initiating a CHP evaluation is a decision that requires careful consideration. Key-aspects of this part of the process are as follows:
a) There must be a belief that the evaluation can lead to a viable project. b) The evaluation must be properly planned. c) It must be recognized that the evaluation will require investment in terms of
both time and resources. The CHP evaluation process tends to develop over time, the results of one stage defining
the needs of the next. Hence, it is difficult to predict accurately the skills required. The initial feasibility study can often be completed with relatively low levels of overall input.
An organization cannot always meet the CHP evaluation requirements from its available in-house resources. It is then appropriate to consider calling eternal expertise to support or carry out the work.
An initial feasibility study is mainly a desktop exercise designed to provide an estimate of the cost savings and financial returns that can be achieved by installing an appropriate CHP plant. The study does not need to be excessively long or complex, but is must be carried out thoroughly by someone who has the right evaluation skills and engineering knowledge.
2.1. ASSESSMENT OF SITE ENERGY
Demands: It is important to carry out the initial feasibility study using the best possible assessment of the site’s future energy consumption. Past consumption data, which can be obtained from site utility bills, usually provide a good indication of future demands, but it is also important to take site-specific factors into account.

65
Efficiency of energy use: It is important to ensure that energy is used as efficiently as possible. Future changes in site energy demands. Most sites undergo changes in energy use and equipment over relatively short periods of time, so a CHP plant must be assessed not only against present energy demands, but against those anticipated for the future. Use of heat to replace electricity. There may be opportunities to replace electrically driven refrigeration plant with heat-driven refrigeration plant that operates on an absorption cycle. This approach may be particularly relevant where older electrically driven plant is due for replacement, or where cooling and heating demands are seasonal and do not usually occur simultaneously. Timing of demands: Since CHP produces heat and power simultaneously it is essential to consider the extent to which the site has concurrent heat and power demands that can use the outputs of a CHP installation. This requires a time-based assessment of the site’s energy demands. For the purposes of the initial feasibility study, it is sufficient to consider site consumption over a one-year period, subdividing this period into a time bands, according to actual site demand conditions. This split would typically be based on distinction between:
a) Daytime and night-time. b) Weekday and weekend. c) Summer and winter.
The site supply data required include: a) The number of hours of the year allocated to each time period. This should
total 8,760, thereby representing demand over a full year. b) The average site electricity demand in kW for each time period. c) The average site heat demand in kW for each time period. d) The average cost per unit of electricity consumed in each time period. e) The quantity of fuel consumed on-site to provide the heat demand identified
above. f) The cost per unit of the fuel identified above.
The data can be used to make an initial assessment of the annual cost of meeting future site energy demands. These are the costs that a CHP plant would reduce by supplying the energy requirements more efficiently.
2.2. SELECTING CHP PLANT
Once the energy and cost data have been collected and tabulated, the next stage of the initial feasibility study is to select a potentially suitable CHP system. As a minimum, information obtained should include:
a) Electrical output, which should include data relating to the power consumption of the CHP plant’s own motors etc., so that the net output can be defined.
b) Heat output that can be recovered for use on-site, including data on the temperature and flow rate of the fluid in which the heat is contained.
c) Fuel consumption of the equipment, taking care to ensure that this can be expressed in gross calorific value terms.
d) The cost of supplying and installing the equipment. e) The dimensions and weight of the equipment. f) The approximate cost per kilowatt hour (kWh) generated that should be
allowed for servicing and maintaining the equipment. g) Any essential auxiliary items that are not contained within the scope of the
equipment. Sizing on heat demand will maximize energy and environmental savings. Depending on
the heat to power ratio of site energy demands, sizing to match the heat requirement will result in a scheme that may offer a surplus of electricity generation (eg. during the night) or may require top-up electricity supplies (eg. at times of peak electricity demand). The economics of exporting the electricity then becomes a key issue in determining economic CHP plant size.
Before sizing a CHP scheme around the thermal load or power requirement it makes sense for prospective sites to consider carefully all possible energy efficiency investments/measures that could reduce the overall heat and electricity requirements. Only when energy efficiency has been maximized should the CHP scheme be finally sized.

66
3. CASE STUDY
In the present study, we integrate and do the economic optimization of a micro-CHP system, composed of prime mover, fed by natural gas (NG), a TES and 3 heating boilers producing heat during the cold season, for a Hotel situated in Romania, city of Predeal. Two heat-led operational strategies have been implemented in order to evaluate the operation scheduling that maximizes the revenues for the energy cogeneration with respect to the separate generation. The first strategy limits the prime mover production to the user DHW request and the heat request it is covered by the heating boilers, while the second novel the prime movers try to cover all the heat request and the electrical energy produced in excess by the PM, it is feed into the grid. The analysis of the micro-CHP system has been realized using an algorithm developed by me and my coordinator, Linda Barelli, in Microsoft Excel. Next step it is to collect the data about the building. We start with the configuration of building and then the energy consumptions on the past year. 3.1. CONSTRUNCTION DETAILS
The Hotel it is formed by basement, ground floor, and four floors, which has 20 double rooms, a restaurant, a kitchen and a terrace. Our survey it applies for the Hotel without the terrace. For terrace, we assume a fixed consume at full house and then variates simultaneous with the occupancy level of the Hotel. It has the following characteristics:
Surface of windows area = 478.04 m2.To obtain the surface of walls, we first calculated
the hole exterior surface of hotel and decrease the windows area calculated upper, in this way we have the result, S walls=801.96 m
2. In addition, we determined the horizontal areas, S horizontal=
478.04 m2. Useful volume to heat, has this value V= 2058 m
3. With all of this initial data and
regulative regarding the thermo-technical calculation elements of buildings construction type, C-107/2005, we determined the global thermal insulation coefficient.
� = 1� ∗�(� ∗ ��) + 0.34 ∗ �
Where: G - global thermal insulation coefficient V – Useful volume need to heat A – Built area of building R’m - The average corrected thermal resistance of a building element on the whole building T - The correction factor for outdoor temperatures, and it is 0.9 for our case n - the ventilation speed or the number of air exchanges with the outside per hour, in our case has a value of n = 0.756. The values for T and n, are taken form the regulative C-107/2005, related to the building characteristics. Global thermal insulation coefficient = 2.000 3.2. BUILDING ENERGY CONSUMPTIONS ON THE PAST YEAR (2016)
Natural gas consumptions are obtained when the heating request, it is covered just by boilers and the electricity it is bought from grid. We took in consideration the terrace consumption, because both buildings are measured by the same gas meter. Applying the same algorithm to terrace in determining the gas consumption and sum it with the gas consumption determined for the Hotel, we could compare with the values recorded on bills, and have accurate results using the algorithm, with a total gas consumption of C = 547,819.21 kWh/year. We split the year in two seasons, the cold one, from September to April, and the hot one from May to August, and during the cold season we consider the interior temperature it is divided in 2 values, 22 Celsius degree between 6 AM – 10 PM and 18 Celsius degree between 11 PM - 5 AM. Electrical energy consumption has been recorded hourly during the entire year.
3.3. SYSTEM DESCRIPTION
The MCHP unit is the “XRGI 15” marketed by EC-POWER. An XRGI system consists of three main components – the Power Unit, Q Heat Distributor and the iQ Control Unit. The MCHP unit’s built-in generator provides a maximum electrical output of 15 kWel, which,
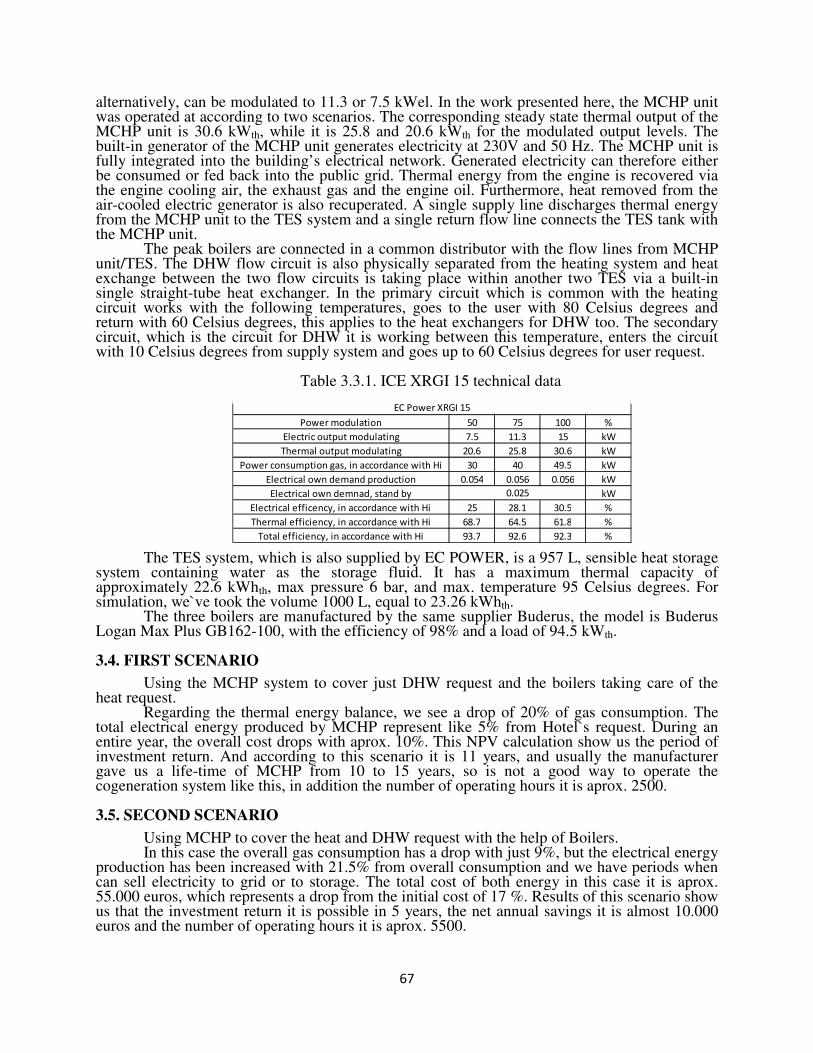
67
alternatively, can be modulated to 11.3 or 7.5 kWel. In the work presented here, the MCHP unit was operated at according to two scenarios. The corresponding steady state thermal output of the MCHP unit is 30.6 kWth, while it is 25.8 and 20.6 kWth for the modulated output levels. The built-in generator of the MCHP unit generates electricity at 230V and 50 Hz. The MCHP unit is fully integrated into the building’s electrical network. Generated electricity can therefore either be consumed or fed back into the public grid. Thermal energy from the engine is recovered via the engine cooling air, the exhaust gas and the engine oil. Furthermore, heat removed from the air-cooled electric generator is also recuperated. A single supply line discharges thermal energy from the MCHP unit to the TES system and a single return flow line connects the TES tank with the MCHP unit.
The peak boilers are connected in a common distributor with the flow lines from MCHP unit/TES. The DHW flow circuit is also physically separated from the heating system and heat exchange between the two flow circuits is taking place within another two TES via a built-in single straight-tube heat exchanger. In the primary circuit which is common with the heating circuit works with the following temperatures, goes to the user with 80 Celsius degrees and return with 60 Celsius degrees, this applies to the heat exchangers for DHW too. The secondary circuit, which is the circuit for DHW it is working between this temperature, enters the circuit with 10 Celsius degrees from supply system and goes up to 60 Celsius degrees for user request.
Table 3.3.1. ICE XRGI 15 technical data
The TES system, which is also supplied by EC POWER, is a 957 L, sensible heat storage system containing water as the storage fluid. It has a maximum thermal capacity of approximately 22.6 kWhth, max pressure 6 bar, and max. temperature 95 Celsius degrees. For simulation, we`ve took the volume 1000 L, equal to 23.26 kWhth.
The three boilers are manufactured by the same supplier Buderus, the model is Buderus Logan Max Plus GB162-100, with the efficiency of 98% and a load of 94.5 kWth.
3.4. FIRST SCENARIO
Using the MCHP system to cover just DHW request and the boilers taking care of the heat request.
Regarding the thermal energy balance, we see a drop of 20% of gas consumption. The total electrical energy produced by MCHP represent like 5% from Hotel`s request. During an entire year, the overall cost drops with aprox. 10%. This NPV calculation show us the period of investment return. And according to this scenario it is 11 years, and usually the manufacturer gave us a life-time of MCHP from 10 to 15 years, so is not a good way to operate the cogeneration system like this, in addition the number of operating hours it is aprox. 2500.
3.5. SECOND SCENARIO
Using MCHP to cover the heat and DHW request with the help of Boilers. In this case the overall gas consumption has a drop with just 9%, but the electrical energy
production has been increased with 21.5% from overall consumption and we have periods when can sell electricity to grid or to storage. The total cost of both energy in this case it is aprox. 55.000 euros, which represents a drop from the initial cost of 17 %. Results of this scenario show us that the investment return it is possible in 5 years, the net annual savings it is almost 10.000 euros and the number of operating hours it is aprox. 5500.
Power modulation 50 75 100 %
Electric output modulating 7.5 11.3 15 kW
Thermal output modulating 20.6 25.8 30.6 kW
Power consumption gas, in accordance with Hi 30 40 49.5 kW
Electrical own demand production 0.054 0.056 0.056 kW
Electrical own demnad, stand by kW
Electrical efficency, in accordance with Hi 25 28.1 30.5 %
Thermal efficiency, in accordance with Hi 68.7 64.5 61.8 %
Total efficiency, in accordance with Hi 93.7 92.6 92.3 %
EC Power XRGI 15
0.025

68
4. CONCLUSIONS
Having as reference the past year consumptions, we get the following results, the annual cost for both energy it is around 66.000 euros, and in separate values we have 21779.63 euros for thermal energy, representing 33% from total cost. Electrical energy it is 43941.12, representing 67% from total cost. Doing the simulation according to scenario 1, we obtained an annual cost of almost 60000 euros, which means a reduce of 10% from overall cost, reduce of 20% from gas cost and a reduce of 9% from energy cost. Given the balance of thermal and electrical energy from reference year and the fact that we want the production of electrical energy to be maximized, the result doesn`t fit to us. In addition, the investment return, it is too high, 12 years, because the manufacture give a life time to the ICE from 10 to 15 years. Following the results of scenario 3 simulation, we have a reduce of 17% from overall annual energy cost. If we check the gas cost, we see that, it is a small drop comparing to the first scenario where we had 20%, being just 9% from annual gas cost in this case. Electrical energy production has increased from 5% in first case to 21.5%, which give us an investment return in only 5 years.
Making an analysis of the obtained results, the best way to operate the MCHP system it is the second scenario, trying to maximize the electrical energy production, which gave us high annual savings. AKNOWLEDGEMENTS „This work was supported by a grant of the Romanian Ministery of Research and Innovation, CCCDI – UEFISCDI, project number PN-III-P1-1.2-PCCDI-2017-0404 / 31PCCDI/2018, and project number 37BMPNIII-P3-199/2016-I05.16.01, within PNCDI III”
References [1]T. Grecu ş.a. – Maşini Mecanoenergetice Editura didactică şi pedagogică, 1983. [2]Carabogdan, I. G., ş.a. - Manualul Inginerului Termotehnician, Editura Tehnică, Bucureşti, 1986 [3]Black & Veatch, – Power Plant Enginnering, Editura Springer Science+Business Media, Inc., 1996 [4]A. Badea ş.a. – Echipamente şi instalaţii termice, Editura Tehnică, 2003 [5]Barelli L, Bidini G, Gallorini F, Ottaviano A. Dynamic analysis of PEMFC-based CHP systems for domestic application. Applied Energy 2012;91(1):13–28. ISSN 0306-2619.1016/j.apenergy.2011.09.008. [6]L. Barelli *, G. Bidini, E.M. Pinchi, Implementation of a cogenerative district heating: Optimization of a simulation model for the thermal power demand [7]L. Barelli *, G. Bidini, E.M. Pinchi, Implementation of a cogenerative district heating system: Dimensioning of the production plant [8]* * * - Websites of some manufactures of energy equipment or paper work of them General Electric (http://www.gepower.com), Siemens (http://www.siemens.com), EC Power (https://www.ecpower.eu) etc.;

69
THERMAL ENERGY STORAGE FOR MICRO
COGENERATION SYSTEMS
Alin IONESCU, Linda BARELLI, Gheorghe LAZAROIU,
University Politehnica of Bucharest, Faculty of Power Engineering
Università degli Studi di Perugia, Facoltà di Ingegneria
ABSTRACT
To design a thermal energy storage system (TES) it is necessary to identify a reversible process which can exchange large amounts of thermal energy per unit of volume and mass. From aggregation state point of view, liquids are used, because gases had low density requires large volumes. Solids can`t be used as link agent between thermal energy source and storage systems or consumer. From a quantitative point of view, thermal energy storage processes allow energy on discharge to be comparable with the one received by TES at the charge. From a qualitative point of view, charge/discharge of TES can be done at low thermal levels differences (low exergy reduction), as well as to high thermal level differences (high exergy reduction). The energetic efficiency is good at TES, but in systems that requires to use mechanical work we have to consider the exergetic efficiency.
1. INTRODUCTION
Thermal energy storage systems are useful when source/consumer has important variations of producing/requesting heat. For example, this type of situation appear when:
1. Heat sources are flashing: • Industrial flashing processes; • Solar energy production (renewable energy sources); • Heat production from primary energy has important flashing variations
(biomass, biogas etc.) 2. Heat/cold consumer is urban:
• Heat request for domestic water is low (minimum during the night); • Heat request is high during the night for heating; • Cold request has an important grow (maximum during the day).
3. Electrical energy peak (possibility to sell electrical energy on a high price) it is different of thermal energy peak.
2. SENSITIVE HEAT STORAGE
In thermal storage systems that are using sensitive heat, storage media could be: liquid, (water, oil, melted salts, etc.) or solid (rocks, minerals, ceramic, etc.) Hasnain, (1998). Stored heat (Q) (1.1) is direct proportional with used media weight (m), average heat specific mass of used media at constant pressure (cp) and temperature difference (∆T = Tf - Ti) between final state (Tf) and initial state (Ti).
� = � � ∙ ��
�
��� = � ∙ �� ∙ �� − ��� = � ∙ �� ∙ ∆� (1.1)
� = the amount of stored heat, kJ � = storage media weight , kg
�� = heat specifc mass, average, of storage media,kJ
kg ∙ K
�� = initial temperature of storage media, K �� = +inal temperature of storage media, K
Increasing the temperature of media storage will grow the sensitive stored heat. We want to have a high specific heat, establishment on long term in thermal cycle and a reduced price [Hasnain, (1998)], this could be reported to kg or to kWhth of thermal stored energy. Considering that mass (m) is the product between density (ρ) and volume (V) (1.2), a huge mass of stored

70
media could represent a huge volume, wich increase investment into the tank and also in thermal insulation of it, increasing at the same time the surface of occupied filed. � = , ∙ - (1.2) where: � = density, /0
12; - = volume, �3 Storage media should be a good thermal conductor, so it should have an high thermal
conductivity (λ), to allow an fast heat tranfer during charge/discharge process. Therefore, is a need to choose storage media having high values for: - density (ρ); - specific heat mass, average, of storage media(��); - stored heat per volume unit (storage density of thermal energy) (
6
7);
- thermal conductivity (λ). Other characteristics that we chase when we are chosing media used in storage systems: - stabile at working temperatures; - low corrosion in contact with materials; - low price; - high degree of marketing; - low toxicity, non-explosive and environmentally friendly.
From equations (1.1) and (1.2) we obtain (1.3) și (1.4): � = , ∙ �� ∙ - ∙ ∆� (1.3) 6
7= , ∙ �� ∙ ∆� (1.4)
where: 6
7 – stored heat per volume unit,
/8
12, or, divided by 3600, /9:;
12 . The product between ρ and c=, is called specific volumetric heat (C) and represents the required quantity of heat needed by one cubic meter to increase it`s temperature by one Kelvin degree.
>?
@2∙A .
B = , ∙ �� (1.5) Therefore, storage density of thermal energy is linked to the specific volumetric heat (C), wich characterized the storage media properties from the point of view of heat storage and ∆� (1.6): 6
7= B ∙ ∆� (1.6)
In sensitive heat storage applications, the energy is stored by changing the storage media temperature used like water, air, oil, rocks bricks, sand or soil.
Any storage media has it`s own advantages and disadvantages, however the greatest continues to be water, because has a low price and a high specific heat. Yet at over 100 °C temperatures, are used oils, melted salts and liquid metals, etc. Into heating applications of air are used type materials „rock bed” [Sharma, ş.a. (2009)].
3. THERMAL STRATIFICATION
Observing density variation with temperature (Figure 3.1) it can be notice that when the
temperature is raising, value of density is dropping, therefore, into one tank, areas of low density (which have high temperature) will be situated on top of the tank, while at its base will be the one with higher density (and low temperature). This separation is natural, and between those two extreme areas will take shape a third area, called thermoclina (Figure 3.2). Thermal stratification is much more efficient if this third area has a small stretch. This thing happens when are not outside factors (like the mixing into tank of the storage media). In this way will be formed, two tanks of constant temperatures, but different; The separation being made by the thermoclina, which will have a very temperature gradient high (Figure 3.2.a). In case we have external disturbing factors, thermal stratification is losing its efficiency, also thermoclina will have a higher thickness and a greater weight in the total fluid volume (Figure 3.2.b).

71
Figure 3.1. Variation of water density with temperature (at atmospheric pressure)
a) high degree of stratification b) moderate stratification
Figure 3.2. Thermal stratification and axial distribution of temperature in the tank.
Diffusion systems of fluid into the heat storage should be designed and located such that may influence as little as possible thermal stratification, therefore the working fluid should have an laminar flow regime or at most transient.
Charge/discharge of the storage system takes in consideration the thermal stratification, such that, regardless of whether the tank is for heat or cold accumulation, the hot fluid is inserted at the top of the battery, and the cold on the bottom of it.
The storage system involves three stages: charge, storage and discharge. The tank has 3 diffusion slots both to introduce the fluid into the tank and to remove from it. In case of heat storage, during charging the tank (Figure 3.3.a), the hot fluid (hot water) is taken over from the heat source (for example: thermal engine which works in cogeneration) and scattered (introduced) in the battery at the top diffusion system, while the downstream diffusion system aspirates the cold fluid (cold water) from the battery and drains it out of it, from the battery and drains it out of it. During tank discharge (Figure 3.3.b), the cold fluid is taken from the circuit and inserted into the battery through the slots located at the bottom of the battery. In the same time, cold fluid is pulled, with the help of pumps, through the slots situated at the top of the battery and drained out, being sent to the consumer.

72
a) charging of heat battery
b) discharging of heat battery
Figure 3.3. Discharging and charging of heat [http://pacifictank.net]:
4. LATENT HEAT STORAGE
Latent energy storage involves the following phase changes: solid-solid (dipping; passing from one crystalline state to another), solid-liquid (melting), solid-gas (sublimation) and liquid-gas (vaporization). Practically, in the solid-solid version, the materials do not turn into a liquid state under normal conditions, they just soften or harden; it has been observed that they have transition temperatures and latent fusion heat suitable for thermal storage applications. Promising materials are organic solid solutions of pentaerythritol (melting point 188 °C, latent fusion heat 323 kJ/kg), pentaglycerol (melting point 81 °C, latent fusion heat 216 kJ/kg), Li2SO4 (melting point 578 °C, latent fusion heat 214 kJ/kg) and KHF2 (melting point 196 ° C, latent fusion heat 135 kJ/kg) [Garg, (1985)].
In Figure 4.1 graphically plot the temperature chart – specific enthalpy (specific thermal power) for ice-water-steam at at atmospheric pressure, highlighting the constant temperature thresholds when changing the phase and the amount of latent heat of melting/solidification and și evaporation / condensation.
Figure 4.1. Temperature chart – Specific enthalpy (specific thermal power)
for ice-water-steam at atmospheric pressure

73
5. CONCLUSIONS
The concept of energy storage has been in place for years, but, has recently become a research topic due to rapid technological progress in recent years. The main reasons for research and development of storage systems are: - the mismatch between demand and energy production; - using intermittent sources to cover energy demand; - high fluctuations in demand for thermal energy over short periods.
Thermal energy storage systems can be classified into three major categories: a) energy storage systems in the form of sensitive heat, b) energy storage systems in the form of latent heat and c) Heat storage systems in the form of chemical reactions.
Of the three categories of storage systems, sensitive ones are mature from a technological point of view, are integrated and used around the world (For example: in Romania, cogeneration plant CET Oradea has a heat accumulator, the storage medium is hot water at 90 ° C, water being chosen due to its good thermodynamic properties and reduced cost).
The usefulness of the heat accumulator is to use the stored energy to cover the thermal load peaks, resulting in fuel savings by reducing the peak boiler service life and optimally charging power generation systems.
Water is a good storage medium because it is cheap and has a high specific heat; however, at over temperature of 100 °C, oils are used, molten salts and liquid metals. By increasing the storage medium temperature, the amount of stored heat is also increased.
Latent heat storage systems using phase change storage media offer high energy density and have the potential to keep heat as a latent heat of fusion at constant temperature, which allows large volumes of energy storage for small volumes. The main advantages of systems using phase shift storage media are: a) high capacity of heat accumulators, relative to the storage media mass, compared to those of heating systems that use sensitive heat and b) a low operating temperature range. Their main drawback is given by the large volume variation specific to the phase change.
Thermo-chemical storage systems, that has an very high potential in depositing heat, can be used to storage and discharge on large periods of, with small losses. Reversible chemical interaction that appears between reactive components of materials or chemical species are essential into storage and thermal energy recovery in this process called thermo-chemical storage. Unfortunately, applications using materials used to store the thermo-chemical energy are at the stage of the laboratory prototype.
6. AKNOLODGEMENT
This work was supported by a grant of the Romanian Ministry of Research and Innovation, CCCDI – UEFISCDI, project number PN-III-P1-1.2-PCCDI-2017-0404 / 31PCCDI/2018, within PNCDI III

74
References
[1] Abhat, A. (1983). Low temperature latent heat thermal energy storage: heat storage materials. Solar energy, 30(4), 313-332. [2] Cenuşă, V. E., Darie, G., Tuţică, D., Norişor, M., Alexe, F. N., & Muşat, C. M. (2016). Energetic and exergetic analysis of Rankine cycles for solar power plants with parabolic trough and thermal storage. [3] Renewable Energy and Environmental Sustainability, 1, 10. [4] Dieckmann, J. H. (2006). Latent heat storage in concrete. University of Kaiserslautern, Germany. (http://www.eurosolar.org) [5] Fleischer, A. S. (2015). Thermal energy storage using phase change materials: Fundamentals and applications. Springer. [6] Garg, H.P., Mullick, S.C., Bhargava, A.K. (1985). Solar Thermal Energy Storage. Dordrecht, Holland: D. Reidel Publishing Co. [7] Giuliano, S., Buck, R., & Eguiguren, S. (2011). Analysis of solar-thermal power plants with thermal energy storage and solar-hybrid operation strategy. Journal of Solar Energy Engineering, 133(3), 031007. [8] González-Roubaud, E., Pérez-Osorio, D., & Prieto, C. (2017). Review of commercial thermal energy storage in concentrated solar power plants: Steam vs. molten salts. Renewable and Sustainable Energy Reviews, 80, 133-148. [9] Hagen, T. (2016). TES Tanks: When Theoretical Design Parameters Meet the Real World. The International District Energy Association (IDEA2016). 107th Annual conference & trade show, St. Paul, MN, June 20-23 (https://www.districtenergy.org/). [10] Haller, M. Y., Cruickshank, C. A., Streicher, W., Harrison, S. J., Andersen, E., & Furbo, S. (2009). Methods to determine stratification efficiency of thermal energy storage processes–review and theoretical comparison. Solar Energy, 83(10), 1847-1860. [11] Hasnain, S. M. (1998). Review on sustainable thermal energy storage technologies, Part I: heat storage materials and techniques. Energy conversion and management, 39(11), 1127-1138. [12] Herrmann, U., Geyer, M. and Kearney, D. (2006). Overview on thermal storage systems. Workshop on Thermal Storage for Trough Power Plants. FLABEG Solar International GmbH. [13] Iftime, V., Constantinescu, M., Pascaru, D. (2016). Încălzire urbană eficientă. COGEN, Forum Chișinău, 23 mai 2016 (http://cogen.ro/wp-content/uploads/2016/05/6.-Elsaco-Prezentare-Forum-COGEN-Chisinau-23.05.2016-RO.pdf) [14] Johnson, M., Vogel, J., Hempel, M., Dengel, A., Seitz, M., & Hachmann, B. (2015). High temperature latent heat thermal energy storage integration in a co-gen plant. Energy Procedia, 73, 281-288. [15] Johnson, M., Vogel, J., Hempel, M., Hachmann, B., & Dengel, A. (2017). Design of high temperature thermal energy storage for high power levels. Sustainable Cities and Society, 35, 758–763. [16] Osuna, R., & Fernández, V. (2001). 10 MW solar thermal power plant for southern Spain. Report no. NNE5/1999/356. E-41018 Sevilla: Solúcar SA, Avda. de la Buhaira 2. [17] Sharma, A., Tyagi, V. V., Chen, C. R., & Buddhi, D. (2009). Review on thermal energy storage with phase change materials and applications. Renewable and Sustainable energy reviews, 13(2), 318-345. [18] Sharma, S. D., & Sagara, K. (2005). Latent Heat Storage Materials and Systems: A Review. International Journal of Green Energy, 2(1), 1-56. [19] Wittmann, M. Molten Salt Systems - Higher thermal efficiencies by using salt instead of oil. [20] http://www.dlr.de/sf/en/desktopdefault.aspx/tabid-10647/18795_read-44147/ [21] http://mou-kraftvarme.dk/vort%20v%C3%A6rk.html [22] http://pacifictank.net/tank-services/tes-tanks/ [23] http://www.araner.com/blog/thermal-accumulation/ [24] http://www.archimedesolarenergy.com [25] https://www.dntanks.com/news/construction-update-baytown-tx/

75
CORRECTION OF POLLUTION EMISSIONS
MEASUREMENTS ON FUEL COMBUSTION
Ion Iordache, Elena Pop*, Lucian Mihăescu*,
*University POLITEHNICA of Bucharest, Faculty of Mechanical and Mechatronics
Engineering, Splaiul Independentei nr. 313, sector 6, Bucuresti 060042 Romania
ABSTRACT
The Flue Gas Analyzers perform an operation under the condensation of water vapor conditions, or otherwise expressed, the measurements comprise the composition of the dry flue gases. The difference between the value of a component measured in the dry flue gases and the reality assumed in the wet flue gases is even higher as the fuel is wetter. This category includes young coal, but also solid biomass of all categories. The paper approach the issue of the thermodynamic corrections needed to be performed on the measured data for minimizing the deviations.
1. CORRECTION OF EMISSION DATA FOR MOISTURE
The presence of moisture in a gas stream takes up space that would otherwise be occupied by pollutant, so the pollutant concentration expressed on a dry gas basis will always be higher than if it were expressed on a wet gas basis [3]. In the case of measurements of the combustion flue gas components, the flue gases are considered to be dry, the measuring apparatus allowing condensation of the water vapor in the flue gases. In this case, the dry flue gases will have a certain temperature, which in fact is the saturation temperature of the water vapors, corresponding to their partial pressure. For normal conditions, thermodynamic parameters are marked with 0p′ , 0V and 0T , where:
0p′ is the partial pressure of the components in the flue gases under normal conditions;
0V and 0T represent the volume and the temperature under normal conditions.
The relationship between the parameters will be expressed by the relation:
RTm
Vpµ
=′ 00
where: m is the mass of pollutant; µ is the molar mass of that pollutant.
For measurement requirements, it can be write the relationship:
RTm
Vpµ
=′

76
where: p′ is the partial pressure of the pollutant in the flue gas under the conditions of the
measurements; V is the volume of dry gas under the conditions of the measurements. Considering C the pollutant concentration, results:
mCV
m = and cCV
m =0
,
where the ratio of the corrected concentrations c
C to the measured ones mC results:
0
0
0
0
T
T
p
p
p
RT
RT
p
C
Cm
c
⋅′′
=′
⋅′
=µ
µ
Thus:
0
0
T
T
p
pCC
mc ⋅′′
⋅=
Considering p
p
p
p 00 =′′
, in the end it comes to:0
0
T
T
p
pCC
mc ⋅⋅=
where: 0p - is the normal pressure;
p - is the pressure before burning. Another method of correcting a component in the flue gases can also be achieved with the following relationship:
OHgu
gumc
VV
VCC
2+
= ,
where OHV
2 is the moisture content of the flue gases, calculated according to the components of
the dry gas analysis with the relation:
kgmVxWHV Na
i
t
i
OH /,00161,001242,0112,0 30
2++=
where x is the humidity of the air. For steam spraying, its share/participation will also be included
2. CORRECTION BASED ON OXYGEN CONCENTRATION
The measured concentration can be expressed by:

77
( ) 00 1 amgugu
m
VV
m
V
mC
−+==
λ
The corrected concentration under standard conditions can be expressed by:
( ) 00 1 astgu
st
gu
cVV
m
V
mC
−+==
λ
where : st
guV - volume of dry gas for 1=λ (stoichiometric);
0aV - volume of dry air for combustion of one kilogram of fuel with 1=λ (stoichiometric);
mλ - the excess air coefficient in the measurement conditions;
stλ - the excess air coefficient under combustion conditions.
From previous relationships, it follows:
( )( )
m
VV
VV
m
C
C amgu
astgu
m
c 00
00
1
1
−+⋅
−+=
λλ
or
( )( )
( )
( )0
0
0
0
00
00
11
11
1
1
gu
a
st
gu
a
m
astgu
amgu
m
c
V
V
V
V
VV
VV
C
C
−+
−+=⋅
−+−+
=λ
λ
λλ
Considering the approximation that can be made: 00
gua VV = , results:
st
m
m
c
C
C
λλ
=
where:
mmO221
21
−=λ and
ststO221
21
−=λ
In this situation, it follows:
m
stm
st
m
m
st
mmc
O
OC
O
OCCC
2
22
2 21
21
21
21
21
21
−−
=−
⋅−
==λλ
If there is a reference oxygen concentration, a correction will also be made with the already generalized relationships in the literature.

78
3. CONCLUSIONS
The paper presents considerations and calculation relationships to correct the measurements of flue gas components in the combustion processes for real conditions of moisture and oxygen concentration. References
[1] I. Iordache, I. Oprea,L. Mihăescu, T. Prisecaru, E. Popa, "Thermal nitrogen oxides emissions from fuel
combustion", Rev. Roum. Sci. Techn. – Électrotechn. et Énerg., 55, 1, p. 100–108, Bucharest, 2010 [2] E. Popa, I. Iordache, “Dynamics of nitrogen-bound fuel conversion to nitrogen oxides by biomass combustion”, Revue Roumaine des Sciences Techniques, Serie Electrotechique et Energetique, Tome 52,1 2007, Ed. Academie Roumaine, ISSN: 0035-4066 [3] Air Emissions Monitoring Guidance Note #3 (AG2), Revision3-published September 2017, Environmental Protection Agency Johnstown Castle Estate Wexford, Ireland, pg 69

79
ENERGY EFFICIENCY OF BUILDINGS –
LEGISLATION IN THE REPUBLIC OF SERBIA
dr Miodrag Kovaćević1, dr Ivan Tasić
Technical College of Applied Sciences in Zrenjanin, Republic of Serbia
University of Novi Sad Technical Faculty "Mihajlo Pupin" Zrenjanin, Republic of Serbia
ABSTRACT
The paper will present legal solutions in the Republic of Serbia related to the energy efficiency of
facilities in the sense of the Law on Energy and the Law on Planning and Construction of Facilities of
the Republic of Serbia and applicable regulations and standards in the subject area. Special attention
will be paid to the preparation of documentation for the construction of new facilities, but legal
solutions will be presented to increase the energy efficiency (EE) of existing facilities. The energy
efficiency (EE) of projects for the construction of new facilities should be identified as a primary
objective and with the application of cost-effective measures and methods for increasing energy
efficiency (EE) through the use of renewable energy sources (RES) and their application in facilities
or technical and technological systems that are being built together with facilities lighting, water
supply, heating water, heating, cooling, ventilation and air conditioning systems, etc.).
1. INTRODUCTION
Increasing the quality of life and the development of new technologies has also increased
human energy needs, which are largely ensured by combustion of fossil fuels (oil, coal,
natural gas, etc.). For the needs of households in the Republic of Serbia, thermal energy is
mainly obtained by transforming the chemical energy of a fuel (combustion) into heat energy.
In coal-fired power plants, about 60% of total electricity is generated. The disadvantages of
using fossil fuels are their limited quantity, and accelerated consumption, while combustion
products significantly pollute the environment. In the process of vigorous oxidation of fossil
fuels as combustion products, water, carbon dioxide, hydrocarbons and other materials
contained in fuel appear, and they represent significant potentials in terms of pollution of the
environment, acid rain, and global warming. In order to solve these problems, the decisive
role may be to reduce the use of fossil fuels in the process of obtaining other energy resources
that are used in households as well as in the industry.
Measures that can significantly reduce the use of fossil fuels can be classified in several
areas:
1. education, informing and combining incentive measures by state authorities of the Republic
of Serbia, drafting laws, regulations and standards;
2. the use of renewable energy sources to the maximum extent possible;
3. development and use of new environmentally friendly combustion and fuel technologies;
4. increasing energy efficiency and
4. energy saving measures. [1]
By applying these measures to the maximum possible extent, by combining them or by
determining the balance between the measures and real needs, it is possible to achieve the
1Miodrag Kovacevic, Djordja Stratimirovica 23, 23 000 Zrenjanin, Republic of Serbia,
+ 381 63 564 125, [email protected]

80
rational effects of the degree of energy efficiency of the appropriate systems for energy use in
building and industry. One of the many systems that requires an increase in the rationalization
of energy consumption, given the enormous increase in the number of inhabitants, is also the
building sector. According to the report of the Economic and Social Committee of the United
Nations states that the world's population from the current population of nearly 7.6 billion
increase to 8.6 billion by 2030, a number of people on Earth will rise to 9.8 billion by 2050
and about 11 , 2 billion by 2100. The number of people on Earth every year increases by 83
million people. Such a trend will continue, despite the fact that since the 1960s, fertility has
been continuously decreasing.
The concept of energy efficiency implies a set of measures that are undertaken in order to
reduce energy consumption, which does not undermine the working and living conditions. It
is necessary to conserve energy consumption to the minimum possible while maintaining or
increasing the level of comfort and comfort. It should be noted that there is a significant
difference between energy efficiency and energy saving. Energy saving implies certain
disclaimers, while efficient use of energy leads to an increase in quality of life.
2. ENERGY EFFICIENCY OF BUILDINGS THE REPUBLIC OF SERBIA
The negotiations on the accession of the Republic of Serbia to the European Union,
which include 35 thematic Chapters, are under way, until April 2018, the Republic of Serbia
opened 12 out of 35 chapters. The screening process (Explanatory and Bilateral Screening)
began in September 2013 and was completed by the end of March 2015. In the current
process of negotiation, it has been shown that in many hapters Serbian legislation is largely in
line with EU legislation. The disadvantage is the application of laws and accompanying
regulations in practice. For the Energy Chapter, a major problem will be the application of the
provisions of the Directive on the limitation of emissions of certain air pollutants from large
combustion plants and the Industrial Emissions Directive, which additionally limits the
emissions of air pollutants from large thermal power plants. These provisions directly
condition the operation of some blocks of our thermal power plants, so it is necessary as soon
as possible to begin the reconstruction and modernization of these thermocouples. The biggest
problems are expected in Chapter no. 27 Environment where it is estimated that bringing this
area into harmony with EU law could result in costs of € 13-15 billion, which the Republic of
Serbia does not have to invest in addressing environmental issues. In Chapter no. 15 Energy is
stated in the report on the conducted screening that it is necessary to make more efforts to
resolve the requirements in this area in the process of harmonization with EU legislation and
norms.
One of the strategic goals of the EU's energy policy until 2020, which promoted the
so-called policy 20-20-20, which implies: reducing CO2 emissions by at least 20% in relation.
1990; increase of energy efficiency by 20%; raising the share of energy produced from
renewable energy sources to 20% in total energy consumption in the EU. Realizing this policy
will be a major challenge for the Republic of Serbia. Energy efficiency is our biggest energy
resource that we need to activate and which we have not yet started to use in an adequate way.
One of the good approaches for improving the energy efficiency of a state is the existence of
state coercion and certain incentive measures.
A typical example of the state's coercion is the Netherlands, where so-called voluntary
contracts were imposed in the 1970s after the oil crisis, which obliged companies to work on
energy efficiency. Volunteerism was just that there was a choice: either the obligation would

81
be signed that each year concrete investments in energy efficiency measures would be paid, or
a high tax on the use of energy would be paid. By combining this and other measures and by
rigorous control of the implementation of the prescribed measures, it has been achieved that
the consumption of energy had a very slight increase in relation to a significant increase in
national income. In many countries, legislation is enacted or envisaged, requiring citizens to
apply certain measures to improve energy efficiency, such as, for example, the measure of a
gradual ban on the use of hot bulbs in households for the benefit of energy-efficient lamps.
The optimal development of the energy sector in the region of Southeastern Europe and the
Republic of Serbia within it, from the aspect of sustainability (which includes limited
sustainability in circumstances with natural disasters, the impact of fire, floods, earthquakes
and similar disasters) should start from real needs, technological progress, as well as
economic and environmental limitations. Improvement and affirmation of the profession in
which energy connective tissue remains the basic need. Through this interconnection of
intense energy needs and modern technologies (which, due to attractiveness, dominate over
conventional technologies) with sustainable development, the energy sector remains equally
vital and profitable and current.
Energy Development Strategy of the Republic of Serbia until 2025 with projections to
2030, is made by considering the existing structure of the energy sector and is based on the
energy balance of 2010 as the base year, assess the energy needs of the Republic of Serbia for
the period up to 2030, based on projections from the Strategy and Policy Development of the
Republic of Serbia Industry from 2011 to 2020, available energy resources, including the
potential of renewable energy sources (RES), population reduction projections, the Spatial
Plan of the Republic of Serbia with respect to all obligations of the Republic of Serbia arising
from the Agreement on energy community.
In 2006, the Republic of Serbia became a member of the Energy Community by
ratifying the Agreement on its establishment in accordance with its main goals in the field of
energy - ensuring safe energy supply, increasing the overall efficiency of the energy sector,
protecting the environment and developing renewable energy sources (RES), and the general
goal of joining the EU. Following the harmonization of time limits when applying the specific
provisions of the EU Directive in domestic legislation (Directive 2006/32 / EC, Directive
2010/31 / EU and Directive 2010/30 / EU) in domestic legislation, the provisions of those
Directives are implemented in two laws Republic of Serbia:
1. Law on Efficient Use of Energy;
2. Law on Planning and Construction and
3. Through the accompanying by-law regulations and three Energy Efficiency Action Plans of
the Republic of Serbia.
In October 2015, at the meeting of the Ministerial Council of the Energy Community,
the Republic of Serbia has accepted the energy efficiency obligations that apply to the EU, ie
the obligation to implement the new Directive 2012/27 / EU. Under this directive, the Energy
Community requires all members to adopt savings mechanisms in distribution and retail
energy companies, to promote efficiency in heating and cooling systems as well as
cogeneration systems.
On the basis of previously defined goals and fulfillment of assumed obligations under
the Treaty establishing the Energy Community, on the proposal of the Ministry of Mining and
Energy, on 15 March 2013, the National Assembly of the Republic of Serbia adopted the Law

82
on Efficient Use of Energy in the Republic of Serbia. The main goal of the adopted law is to
provide a rational and sustainable use of energy, thus contributing to more secure supply,
increasing the employment rate, the competitiveness of the economy and the environment.
The law introduces the Energy Management System (SEM) as one of the key mechanisms,
but it also predicts that all devices that directly or indirectly affect the energy consumption are
labeled during the placement on the market. In order to implement this legal solution deriving
from Directive 2010/30 / EU, the Government of the Republic of Serbia has adopted two
Regulations, and the Ministry of Mining and Energy has adopted nine regulations on the
labeling of energy efficiency of household appliances.
Applying the First Action Plan for Energy Efficiency in the period 2010-2012, savings
of around 81.5% of the planned savings have been achieved, which is satisfactory, bearing in
mind that the main mechanisms for achieving savings have not yet been legally adopted and
in force. The second action plan for the period 2013-2015 predicted savings at the level of
3.5% of domestic final energy consumption in 2008 (0.2952 Mtoe). With this action plan, the
building sector has been recognized as one of the largest energy consumers, and is therefore
expected to achieve 0.1387 Mtoe within the household sector and the public commercial
sector (where buildings are prevalent), representing about 35% of the total planned savings
for 2015. By the conclusion of the Government of the Republic of Serbia on 29 December
2016, the Third Action Plan for Energy Efficiency of the Republic of Serbia for the period
2017 - 2018 was adopted. The Law on Planning and Construction stipulates that buildings
depending on the type and purpose must be designed, constructed, used and maintained in a
way that ensures the prescribed energy properties, which are determined by issuing
certificates of energy properties of buildings, issued by an authorized organization, through
this law the provisions of Directive 2010/31EU on the energy characteristics of buildings are
transferred to the legal system of the Republic of Serbia. That Directive 2010/31EU has been
implemented in detail through the following documents:
1. Regulations on the energy efficiency of buildings;
2. Regulations on the conditions, content and method of issuing certificates on the energy
properties of buildings;
3. Regulations on the conditions, program and method of passing the professional exam in
spatial and urban planning, preparation of technical documentation and construction and
4. Regulations on the conditions and procedure for issuing and revoking the license for the
responsible urban planner, designer, contractor and responsible planner. [2]
According to the method of heating the buildings in the Republic of Serbia we can make
the following division: 26% of the total surface of the buildings is heated from the district
heating system and local boiler rooms with central heating (14% from the district heating
system and 12% from the local boiler rooms), 14% from the electricity system, 10% uses
natural gas as an energy source and about 50% of the total surface uses for heating solid fuels
in local furnaces (coal, firewood, agricultural biomass, waste, etc.). The average annual
specific energy consumption for buildings heated from the district heating system and local
boiler plants is as follows:
1. for residential buildings 171 kWh/m2, and for non-residential buildings 194 kWh/m
2 i
2. for the preparation of hot water in residential buildings 55 kWh/m2, and in non-residential
buildings 12 kWh/m2.

83
The average specific heat consumption for heating and hot water preparation in
residential and non-residential buildings is reduced to 1 m2 of net residential area of 228
kWh/m2. The average specific energy consumption for heating objects using other heating
methods is:
1. for electrically heated objects 130 kWh/m2;
2. for natural-heated objects 230 kWh/m2 and
3. for buildings heated by local furnaces to solid fuel 57 kWh/m2.
The number of households that heat on electricity is about 15% of the total, and only for
heating is consumed 24% of the total electricity consumption in all households. The residual
electricity in households of 10,500 GWh is used for the following purposes:
1. lighting - 735 GWh (7%);
2. storage boilers - 2,145 GWh (23%);
3. cookers and food preparation equipment - 3,150 GWh (30%);
4. washing machines and dishes - 893 GWh (8.5%);
5. refrigerators and freezers - 2,625 GWh (25%) i
6. for other needs - 952 GWh (6.5%).
The lag in energy efficiency in buildings in relation to European countries was
observed even in the early 1990s, confirming this claim data on the average final energy
consumption of 138 kWh/m2 in residential buildings in the EU for thermal purposes. In
Denmark, in buildings connected to district heating systems, the specific heat consumption for
heating is 96 kWh/m2, and in facilities using fuel oil or gas 131 kWh/m
2 and 106 kWh/m
2. In
buildings built according to new regulations in Poland where the climate is much sharper and
unfavorable than in Serbia, the specific energy consumption is 90-120 kWh/m2. In Sweden,
located in the north of Europe where winter temperatures are extremely cold and long with a
longer heating season, average consumption is 120 kWh/m2, and in newer buildings with the
lowest energy consumption requirements of 60 - 80 kWh/m2. [4]
According to the Law on Efficient Use of Energy, the obligation of local self-
government units (LGU) is to include in the tariff system for district heating services (as one
of the elements for calculating the price of heating) the measured or actually delivered
quantity of heat, and based on the Law on Energy Article 362), the Government of the
Republic of Serbia shall adopt a methodology for determining the price of the end customer's
supply of heat energy. Accordingly, the Ministry of Mining and Energy has prepared and the
Government of the Republic of Serbia has passed a decree determining the methodology for
determining the price of the end customer's supply of heat energy.
In accordance with the Law on Efficient Use of Energy, minimum energy efficiency
requirements must be met by new and revitalized plants for the production of electricity and
heat, electricity transmission systems, that is, systems for the distribution of electricity and
heat, as well as systems for transport and distribution of natural gas, depending on the type
and strength of these plants, or the size of the system.

84
Table 1: Basic data on centralized heat supply systems in the Republic of Serbia [3]
Data Unit of measure Quantity
Total number of apartments in the Republic of Serbia - 2.943.401
Surface area in the Republic of Serbia m2 199.204.252
Number of apartments with central heating installations - 720.495
Number of apartments connected to the heating plant - 481.660
The total area of dwellings connected to the heating plant m2 28.143.552
Total area of other dwellings and business units
connected to the heating plant m
2
8.852.993
Total area of apartments and business facilities
connected to the heating plant m
2
36.996.485
The share of dwellings with central heating installations
Compared to the total number of dwellings %
24,5
The share of dwellings connected to the heating
plant in relation to the total number of dwellings %
16
Number of heating plants - 292
Number of boilers - 660
Boiler capacity MW 5.506
Consumed power consumption MW 5.486
Annual fuel consumption toe 615.284
Length of the hot water network km 1.250
Total number of substations - 15.025
Number of substations in residential buildings - 9.484
3. CONCLUSIONS
In the building sector in the Republic of Serbia, most of the energy is spent on heating
the space, 24% of the final energy is consumed for heating. The consumption of heating
energy at the Serbian level is twice as low as the average for Europe, which is somewhat
expected if its geographical position is taken into account. Located in the south of Europe,
Serbia has far more favorable climatic conditions, shorter and milder winters than the
countries of northern Europe. Due to the extreme inefficiency in the consumption of heating
facilities in the Republic of Serbia, this segment of consumption should be urgent. The most
common reason is the worsening and energy inefficiency of the building envelope. With
concrete reasons for energy inefficiency, it is relatively easy to determine the cost-
effectiveness of investments in possible ways of their rehabilitation, and the choice of the
appropriate solution for a particular facility already leads to a higher quality energy
consumption for heating. Increasing energy efficiency does not only lead to more rational
energy consumption. The impact on the environment is equally important. Reduced emission
of harmful gases would create a healthier environment that would improve the quality of life.
References [1] Miletić M., Lukić N., Use of Final Energy in Households in Serbia, (2011), 42nd KGH Congress
[2] Handbook for Energy Managers for Building Energy Sector, United Nations Development Program (UNDP),
Belgrade, June 2017.
[3] Todorović M., Ristanović M., Efficient use of energy in buildings, University of Belgrade, 2015. Belgrade
[4] http://www.eea.europa.eu/

85
ENERGY EFFICIENCY OF THE RECEIVER OF SOLAR ENERGY
IN THE TERRITORY OF THE REPUBLIC OF SERBIA
dr Miodrag Kovaćević1, dr Ivan Tasić, dr Jasmina Pekez
Technical College of Applied Sciences in Zrenjanin, Republic of Serbia University of Novi Sad Technical Faculty "Mihajlo Pupin" Zrenjanin, Republic of Serbia University of Novi Sad Technical Faculty "Mihajlo Pupin" Zrenjanin, Republic of Serbia
ABSTRACT
The energy efficiency (EE) of the system for heating water from collector to accumulator solar boiler is in the range of 35 to 55 (%) depending on the performance of the collector, the materials used for the production of solar collectors and the manner of installation and maintenance. Low energy efficiency (EE) values refer to solar collectors that have poor design and thermal insulation characteristics. Such collectors, as a rule, have low values of absorption, and the heat emissivity values from the absorbent surface are significantly lower. Collectors that have such characteristics are collectors whose absorbers do not have good selective characteristics, therefore the value of the radiation emission coefficient is close to the value of the coefficient of absorption of radiation. This feature is directly influenced by the number and type of transparent coverings.
1. INTRODUCTION
Solar collectors are also tested for efficiency in conditions of equality of external air temperature
and temperature of absorber - fluid in absorber (zero efficiency). Zero efficiency is not relevant for a serious assessment of the efficiency of the solar collector. For this type of estimation, the characteristic of the efficiency curve, curve (or equation) of the dependence of the energy efficiency of the collector on the relationship between the difference in the characteristic flux/absorber and ambient temperature temperatures and solar radiation is very important for this type of assessment.
The crucial feature for selecting a solar collector from the point of view of its efficiency is that efficiency that is valid for the operation of the solar collector in dynamic (real) working conditions. The amount of heat that can be used with 1 (m
2) collector is about 900 (kWh).
Vacuum heat collectors have considerably greater efficiency, which manifests significantly during colder periods. The energy efficiency (EE) of vacuum solar collectors is based on the thermal insulation of the absorber. The energy efficiency of the system for heating water with vacuum collectors is about 40 (%) higher than the system with flat plate solar energy transfer if one year is observed. The price of installation of vacuum collector systems is almost 50 (%) higher than the price of installation of systems with classical receivers of solar energy. Bearing in mind these properties, vacuum collector systems are recommended for enclosures in buildings where there is a continuing need for hot water, or where large quantities of hot water are required. [4] The number of sunny hours in Serbia goes in average from a bit less of 2.000 hours (in the North) to more than 2.300 (in the South). It is a larger value than in the most European countries, but the solar potential is not used. The potential of solar energy presents 16,7% of overall usable potential of Renewable Energy Sources (RES) in Serbia. The energy potential
1Miodrag Kovacevic, Djordja Stratimirovica 23, 23 000 Zrenjanin, Republic of Serbia,
+ 381 63 564 125, [email protected]

86
of solar radiation is for about 30% bigger in Serbia than in Central Europe. The average daily energy of global radiation for a flat surface during winter period goes from 1,0 kWh/m2 in the North and 1,7 kWh/m2 in the South, and during summer season between 5,4 kWh/m2 in the North and 6,9 kWh/m2 in the South. The most favorable areas in Serbia record a great number of sunny hours, and the yearly ratio of real irradiation and overall possible irradiation is close to 50%. Serbia has one of the best solar resources in Europe. Solar radiation in average is bigger for about 40% of the European average. The lowest measured values of solar radiation in Serbia could be compared to the highest values in the countries leading in the use of solar radiation, such as Germany and Austria. For comparison, the average value of solar radiation for the German territory is around 1.000 kWh/m2, while for Serbia it is 1.400 kWh/m2. The number of sunny hours in Vojvodina goes from a bit less than 2.000 hours (Western part) up to 2.100 hours (Eastern part). According to "Valentin Energie Software – TSol Pro 4.5" the average annual value of global radiation for horizontal surface is between 1.294 kWh/m2 on the North of AP Vojvodina and 1.350 kWh/m2 on the South of Vojvodina, and 1.281 kWh/m2 on the West and up to 1.294 kWh/m
2 on the East of Vojvodina. This shows that on the same
source, the average yearly value of sun radiation over a horizontal area for the territory of AP Vojvodina is around 1.300 kWh/m2. The average daily energy of global solar radiation on horizontal surface at the territory of AP Vojvodina goes from 1,0 – 1,4 kWh/m2 during January, and from 6,0 – 6,3 kWh/m2 during July. At the territory of AP Vojvodina, the annual average of daily solar radiation energy on the surface leaned towards south under the angle of 30° results with 4,0 – 4,6 kWh/m2.[1]
2. ANALYSIS OF ENERGY EFFICIENCY OF SOLAR COLLECTORS
When examining the energy efficiency of solar collectors in dynamic operating
conditions it has been established that the heat transfer factor on the efficiency of the receiver is significantly influenced by the effectiveness of the receivers and the mass flow of the working fluid. The heat transfer factor from the receiver, under the same test conditions, is higher in the absorber whose tubes are in the form of a serpentine than in the receiver whose pipes are of the absorber in the form of a pipe register. In the case of an absorber of the type of pipe register, the factor of the discharged heat from the receiver is increasing if the mass flow of the fluid increases. With this type of absorber, by increasing the distance between the absorber tube, the heat removal factor from the receiver decreases until the diameter of the absorber tube has a significant effect on the increase in the heat removal factor from the receiver. In the case of an absorber whose tube is in the shape of a serpentine, the increase in flow affects the increase in the heat removal factor from the receiver. The heat removal factor has a higher value in the turbulent flow of the working fluid than in the laminar flow regime. The fluid flow regime can be influenced by an increase in the diameter of the tube of the absorber. By increasing the distance between the absorber tube, the heat removal factor decreases. The effectiveness of the receiver is in the function of constructive characteristics, and its mathematical form varies depending on the design of the absorber - that is, the concept of the performance of the absorber tube. By analyzing terms that define the effectiveness of the receiver, it can be concluded that all the parameters that depend on the construction of the receiver receivers for a particular receiver of solar energy, except for the convective loss coefficient that affects the thermal losses from the front - receiving side of the receiver and which depends on the inclination of the receiver, wind, temperature of the absorber and ambient temperature. Wind velocity and ambient temperature are climatic parameters, so the temperature of the absorber and, consequently, the thermal losses can be influenced by

87
regulating the flow of fluid through the absorption chambers - pipes. By increasing the mass flow of the working fluid, the temperature of the absorber decreases, thereby reducing the heat losses. In order to gain insight into the existing state of energy efficiency of flat heat receivers of solar energy on the market, a comparative analysis of 10 representative types of constructions has been carried out, which have been widely used in practice. The energy efficiency analysis was performed on the basis of the efficiency curve which is part of the project and certificate of the receiver of solar energy.
The general energy efficiency equation is given in the manufacturer's attestation and has
a form suitable for graphic presentation of the type:
G
Ta
∆−= 10ηη (1)
Based on the consideration of the analyzed representative receiver constructions, it has been found that the receiver's efficiency varies from 45 to 75% at ΔT / G of 0.05 K/m2W, depending on the design parameters. The results of the study show that thermal losses in different types of receivers are more dynamic than optical efficiency, and that these changes are caused by changing the value of the receiver's effectiveness. Total receiver losses are the most influential on the receiver's effectiveness. They make heat losses from the front, rear and side sides of the receiver, with the influence of heat losses on the front of the receiver dominant. Thus, the specific loss of heat from the upper side of the receiver is directly dependent on the coefficient of convective heat transfer between the absorber and the transparency, the heat loss coefficient of radiation from the absorber to the transparency, and the temperature of the transparency and the total heat loss coefficient from the receiving side, that is, the coefficient of convective heat losses (from the banners) due to the wind and the heat loss coefficient by radiating the banner to the sky. The character of its change depends on the working conditions and the constructive parameters of the receiver and is consistent with the physical character of the change in the influence parameters. The coefficient of convective heat transfer between the absorber and the transparency increases by 23% with an increase in the temperature of the absorber from 40 to 100 ˚C (at the absorption coefficient of 0,95) and 29% (in the absorption coefficient of 0,10). The coefficient of convective heat transfer between the absorber and the transparency depends on the type of gas in the interface between the absorber and the transparency and the inclination of the receiver. The coefficient of heat loss by radiation between the absorber and the transparency, in the case of a single transparency receiver, with an absorption coefficient of 0.95, increases with an increase in the absorber temperature from 40 to 100 ˚C by 53% - if there is no air flow and 43 % - at air velocity of 10 m/s. The total coefficient of heat losses from the receiving side of the receiver, in a calm air, and an increase in the temperature of the absorber from 40 to 100 ˚C , increase from 26,6% (in the absorption absorption coefficient of 0,95) to 24,5% apsorber absorption coefficient of 0,10). The coefficient of heat loss by radiating the banner to the sky increases with an increase in the temperature of the absorber and, consequently, the transparency by 18% at wind speeds of 0 m/s and 7,5% for wind speeds of 10 m/s, with an apsorber temperature rise of 40 to 100 ˚C, at a coefficient of absorption of the absorber of 0,95. The coefficient of convective heat losses from the windscreen transparency depends on the wind speed and the tilt of the receiver of the solar energy.

88
The practice has shown that at an absorber temperature of 40 ˚C the absorber turns about 60% of the received solar radiation into heat. By bringing the temperature of the absorber to the ambient temperature, it positively affects the reduction of both convective and heat loss due to radiation, and this can be achieved by regulating the mass flow of the working fluid. For the transfer of heat from the absorber to the working fluid, the constructive concept of the absorber is important, ie, the size of its contact surface with the working fluid and the way of achieving the connection of the absorber tube and absorbent plate, the coverage of the total surface of the absorber with the absorbent tubes and the conductive characteristic of the material of the absorber. On the other hand, we should aim to increase the coefficient of heat removal from the absorber, which depends on the effectiveness of the receiver and the mass flow of the working fluid.
By testing the efficiency of the solar energy receiver with steel, aluminum and copper absorber, thickness 0,15 mm, 0,30 mm and 0,60 mm, it was found that the receiver with a copper absorber was 0,6 mm had the highest energy efficiency value under the test conditions. By replacing the steel absorber with a thickness of 0,15 mm aluminum of the same thickness, the energy efficiency of the receiver increased by 17%. By replacing the aluminum absorber with a thickness of 0,15 mm - copper, the energy efficiency was increased by 6,5%. When the thickness of the absorber was increased to 0,3 mm, the replacement of the steel absorber with aluminum resulted in an increase in efficiency by 9,5%, and the replacement of the aluminum absorber with copper, increasing the efficiency of the receiver by 5%. By increasing the thickness of the absorber to 0,6 mm, the efficiency increased by 3% when the steel absorber was replaced by aluminum, and 1,5% when the aluminum absorber was replaced by copper. The receiver with an aluminum absorber with a thickness of 0,6 mm had the same efficiency as a receiver with a copper absorber with a thickness of 0,3 mm. The increase in the value of the absorption coefficient of the materials of the absorber, under the conditions of the tests, with values of 80 W/Mk (steel) to a value of 380 W/mK (copper), results in an increase in the energy efficiency of the receiver by 13%. The dependence of optical efficiency on the coefficient of conduction (in W/mK) is defined by the expression:
264
0 1013,110824,7553,0 λλη ⋅⋅−⋅⋅+= −− (2)
and the dependence of the thermal loss coefficient of the coefficient of conduction by the expression:
26
1 10325,700502,007413,4 λλ ⋅⋅−⋅+= −a (3)
Determining the number of absorbent tubes on the absorption board, which causes an
increase in the energy efficiency of the receiver, is reduced to the analysis of the distance between the absorption tubes. In this context, a better solution with a smaller distance between the pipes is better, as this increases the exchange surface and shortens the heat transfer path. Reducing the distance between the exchanger pipe is achieved by increasing the number of absorber tubes. The research found that the receiver with an absorber having 21 hoses has the highest value of efficiency, is the least distance between the tube, and hence the largest exchange surface, under the conditions of testing. The efficiency of the receiver of solar energy increases with the increase in the number of pipes of the absorber, so by changing the number of pipes from 4 to 21, the efficiency of the absorber by 21% is increased

89
for the investigated case, but the efficiency with the 16 pipe absorber is only 1% higher when the number of pipes increased to 21. The dependence of the change in optical efficiency on the number of absorber tubes is determined by the expression:
2
0 00123,004146,039427,0 nn ⋅−⋅+=η (4)
and the dependence of the heat loss coefficient on the number of tubes of the absorber by the expression:
2
1 01124,036754,032296,2 nna ⋅−⋅+= (5)
2
1 00129,007151,066729,5tata
lla ⋅+⋅−= (6)
In the case of a receiver whose tube is a serpentine absorber tube, the energy efficiency is
increased by 6%, by changing the mass flow rate from 0.9 [kg / min] to 1.66 [kg / min] under certain test conditions. The dependence of energy efficiency on the mass flow of the working fluid, for the receiver whose tube is the absorber in the form of a serpentine, is defined by the expression:
2
410*34848,51303,018485,44⋅
−⋅
⋅−⋅+= mmη (7)
Constant mass flow of working fluid causes an increase in the temperature of the
outgoing fluid, which results in a decrease in energy efficiency due to increased heat losses. This is especially true when the medium temperature of the working fluid is higher than the ambient temperature. The carried out testing found that in order to increase the temperature of the outlet fluid from 25 to 70 ˚C, the efficiency decreased by 35% under precisely determined conditions of testing.
0 5 10 15 20 25 30 35 40
0.44
0.46
0.48
0.50
0.52
0.54
0.56
0.58
0.60
η
To[0C]
Figure 1: The dependence of solar collector efficiency on ambient temperature
3. CONCLUSIONS
The influence of the ambient air temperature change on the efficiency of the receiver
was carried out under conditions with precisely determined test conditions where the ambient air temperature from 15 ˚C increased to 36 ˚C. The test found that the receiver's efficiency

90
was increased by 30%, which is the result of a decrease in the thermal losses of the receiver due to a decrease in the difference between the mean temperature of the working fluid and the ambient temperature. Based on the results of the research carried out on the type of fluid that shows the highest efficiency of the receiver, under precisely determined test conditions, it has been found that the working fluid - a mixture of water and ethylene glycol, with an ethylene glycol content of 16%, has a 0,8% higher efficiency than when a mixture of water with a propylene glycol content of 16% was used as the working fluid under the same test conditions. It has been found that the type of working fluid has a negligible influence on the energy efficiency of the receiver of solar energy. The results of the performed tests of more favorable values of the basic structural characteristics from the aspect of energy efficiency can be applied to all types of structures with a tube-type absorber type. The study found that:
1. Increasing the number of pipes of absorbers from 4 to 21 increases also efficiency up to 21%;
2. By replacing the steel absorber with a thickness of 0,15 mm with an aluminum absorber of the same thickness, the efficiency of the receiver by 17% was increased, and the replacement of the aluminum absorber with copper the same thickness increased the efficiency by 6,5% and
3. Energy efficiency was increased by 8.4%, while increasing the thickness of thermal conductivity 0.04 W/mK, from 10 to 60 mm) for the examined case of a flat receiver of solar energy.
Other constructive characteristics have negligible influence on the energy efficiency of the receiver of solar energy. For concrete cases of flat heat receivers of solar energy in exploitation, when it is not possible to change the constructive parameters, increasing the energy efficiency of the receiver can be achieved by regulating the mass flow of working fluid and accumulation - consumption. Conducted studies of the effect of the change in the flow on the efficiency of the receiver of solar energy have been determined that:
1. By increasing the mass flow rate from 4 kg/min to 30 kg/min, the efficiency increased by 15,4% for the receiver with the absorber in the form of a tube register and
2. Increasing the mass flow from 0,9 kg/min to 1,66 kg/min, energy efficiency increased by 6% for the receiver whose tube is absorbent in the form of a serpentine.
References
[1] STUDY ON THE ESTIMATION OF OVERALL SOLAR POTENTIAL - SOLAR ATLAS AND THE
POSSIBILITY OF "PRODUCTION" AND USE OF SOLAR ENERGY ON THE TERRITORY OF AP VOJVODINA, AP of Vojvodina, Provincial Secretariat for Energy and Mineral Resources, Novi Sad, 2011. [2] Pekez, J., Lambić, M., Grbić N., Comparative indicators of the influence parameters on the energy efficiency of solar collectors, Energy Technology, Vol. 3, No 1-2, 2006, 6-8, ISSN 1451-9070 [3] Pekez, J., Lambić, M., Tasić I., Increasing the Energy Efficiency of Solar Collectors by Controlling the Mass Flow of a Working Fluid, Energy Technology, Vol. 2, No 3, 2005, 49-51, ISSN 1451-9070.
[4] Lambić, M. et al., Energy Efficiency, Serbia solar, Zrenjanin, 2004.

91
EXPERIMENTS ON THE ENERGY
CHARACTERISTICS OF POULTRY MANURE
Gheorghe Lăzăroiu1, Lucian Mihăescu
1, Ionel Pîșă
1, Gabriel Negreanu
1,
Dana Ciupăgeanu1, Andreya Bondrea
1, Viorel Berbece
1, Victor Galbură
2, Mihai Tîrșu
2
1University Politehnica of Bucharest
2Power Enginnering Institute of the Academy of Sciences of Moldova
ABSTRACT
The paper presents the methodology for revealing the energy charactersitics of poultry manure,
collected from the storage facility of a chicken breedind farm. The collection of data on the possibility
of its combustion for economic or ecologic-energy purposes point of views was considered. Six tests
were performed, including technical analysis, elemental analysis, lower calorific value and ignition
temperature.
1. INTRODUCTION
Poultry chickens can be regarded as a fertilizer but also as a possible polluter depending
on the area and the amount of storage. Starting from ecological considerations, the issue of
burning it is raised in an energy system with support from a fossil fuel.
The chicken breeding technology requires a wood or straw bed, so that a manure and solid
biomass mixture occurs when removing the waste.
2. METHODOLOGY
The research was performed on poultry manure collected from for a chicken farm in
Moldova region (Romania), the bed being made of grain straw. The straws represent about
10-12 % of the total weight.
Figure 1 shows the appearance of the waste taken from the temporary warehouse located
next to the production halls. It was taken into consideration that a burning recovery would
appeal to the temporary storage facility.
Figure 1: Waste appearance in the temporary storage facility
1 email: [email protected].

92
The full energy features of the poultry manure include:
• technical analysis;
• elemental analysis;
• lower calorific value.
Six tests were run during the determinations to find the margin of dispersion of the
elements defining the characteristics presented. The average bulk density of waste was 98
kg/m3. Table 1 presents the results of the technical analysis at the initial condition:
Table 1 Results of technical analysis at initial condition
Test
Characteristic
I II III IV V VI
Moisture, Wit, % 36.1 35.6 37.2 38.1 39.1 40.3
Volatile, Vi, % 50.2 48.8 47.4 46.5 45.3 44.6
Ash, Ai, % 6.2 7.1 6.3 6.2 6.2 6.2
Fixed carbon, Cif, % 7.5 8.5 9.1 9.2 9.4 8.9
Analyzing the volatile content, it is noted that they have a very high percentage of oxygen,
resulting a low low combustible gas (CO, CH4).
Figure 2 shows the ballast (sum of humidity and ash) variation and fixed carbon according
to the results of the six tests).
Figure 2 Fixed carbon and ballast for each test
The appearance of ash is whitish with particles without agglutination. These conclusions
on ash demonstrate the possibility of evacuating it with classical installations at the outbreak
of a combustion plant. The results of elemental analysis for the six samples are presented in
Table 2.

93
Table 2 Energy characteristics of poultry manure
Test
Characteristic [%]
I
II
III
IV
V
VI
Ci 16.2 14.4 12.1 12.3 13.3 11.2
Hi 4.7 4.5 4.9 4.2 4.3 4.4
Sci 1.7 1.6 1.7 1.7 1.6 1.8
Oi
33.5 35.1 36.1 35.7 33.9 34.4
Ni
1.6 1.7 1.7 1.8 1.6 1.7
Ai
6.2 7.1 6.3 6.2 6.2 6.2
Wit 36.1 35.6 37.2 38.1 39.1 40.3
The lower calorific power variation for the six samples is presented in Table 3. The
calorific value was calculated by means of formula:
( ) [ ]kgkJWSOHCHit
ic
iiiii /1,251091029339 −−−+= (1)
Table 3 Lower calorific value (LCV) of the poultry manure
LCV - Hii, Test
I II III IV V VI
[kJ/kg] 5955.9 5172.9 4460.7 3829.2 4434.3 3795.5
The results of analyzes proved the following characteristics:
• high total humidity (Wit);
• high sulfur sulphur (Sic) content;
• high oxygen content (Oi);
• small LCV (Hii).
This LCV pool confirms the hypothesis of a sustained hydrocarbon combustion as heat
input and the use of an uncooled combustion chamber. This fuel has similarities with peat or
brown coals.
In order to find the ignition temperature specific to a combustion on the grate in an
uncooled furnace (surrounded with chamotte brick walls) was determined by introducing a
quantity of 200 g into such small furnace, provided with an electric heater behind the
chamotte. Figure 3 shows the appearance of ignition (the corresponding temperature was
measured in the range of 875-950 ºC).
Figure 3 Moment of poultry manure ignition

94
3. CONCLUSIONS
In conclusion, the analysis of the energy characteristics of poultry waste demonstrates the
possibility of its combustion as a production of energy in a certain amount compared to the
total obtained and with a thermal support fuel.
The combustion plant is expected to be equipped with a mobile-inclined grate, located in
a uncooled furnace provided with a chamotte inclined vault, in order to cause the ignition by
its radiation.
AKNOWLEDGEMENTS
„This work was supported by a grant of the Romanian Ministry of Research and Innovation,
CCCDI – UEFISCDI, project number PN-III-P1-1.2-PCCDI-2017-0404/31PCCDI/2018, and
project number 37BMPNIII-P3-199/2016-I05.16.01, within PNCDI III”
References
[1] Felipe Santos Dalolio ş.a.”Poultry as biomass energy: A review and future perspectives”, Renewable and
Sustainable Energy Reviews 76 (2017) 041-949
[2] Edwards DR, Daniel TC, „Environmental impacts of-farm poultry waste disposal – a review”, Biores
Technol 1992; 41:9-33, http:/dx.doi.org/10.1016/0960-8524(92)90094-E
[3] Garces A, Afonso SMS, Chilundo A, Jairoce CTS, „Evalution of different litter materials for broiler
production in a hot and humid environment: 1. Liter characteristic and quality. J Appl poult Res 2013;22:168-
76.http:/dx.doi.org/10.3382/japr.2012-00547
[4] Haapapuro ER, Barnard ND, Simon M. „Review: animal waste use as livestock feed:Dangerous to human
health. Prev Med 1997;26:599-602. http://dx.doiorg/10.1006/pmed.1997.0220.

95
EVALUATION OF EROSION RISK FOR A COGENERATION
STEAM TURBINE WHEN STEAM PARAMETERS CHANGE
Gabriel Negreanu1, Ion Oprea
1, Radu Băcanu
2, Dragos Baciu
2
1University Politehnica of Bucharest
2Elsaco Electronic Botoșani
ABSTRACT
The paper analyses the possibility of erosion risk increase for the last blade of a back-pressure
steam turbine when steam conditions before and after turbine are changing due to various operational
regimes. A complete verification “stage by stage” calculus has been performed, in order to reveal the
geometrical dimensions (average diameters, lengths of nozzles and blades, characteristic angles) and
operational ones (adiabatic and internal enthalpy drops, absolute and relative steam velocities, internal
efficiencies and powers). After that, a behavioral model for unrated charges was setup and boundaries
conditions (such as pressure and temperature of live steam or back-pressure) were modified, according
to real operational regimes. Some collected parameters (moisture, pressure, tip velocity) were
collected as inputs for several erosion criteria.
1. INTRODUCTION
Steam expansion in the turbine is a fast-moving thermodynamic process. The
condensation process does not start on the saturation curve (x=1), as in a quasi-static process,
but is delayed and starts on constant humidity curves known as Wilson curve. The delay of
the condensation phenomenon are characterized by the speed of expansion:
dx
dp
p
c
d
dp
pp a−=
τ−= 1
ɺ (1)
The Wilson curves corresponding to the different expansion rates (Figure 1) show that the
delay is even higher as the expansion speed increases.
Figure 1. Wilson curves for initiation of Figure 2. Velocity diagrams for wet steam
condensation in the turbine (index w – water droplets)
1email: [email protected]

96
At a certain moment in the turbine stage the humidity is in two forms:
• droplets driven by the vapor stream; the trajectory of these drops depends on the mode
of formation, size and drive speed;
• film on the surface of the nozzles and blades, formed by dropping, drifting in motion
at a low speed. The film breaks at the nozzle exit edge in the form of droplets of
relatively large diameter, in the order of magnitude of the thickness of the edge.
The fine droplets are trained at speeds and trajectories close to vapor, the large droplets in
the macrodispersion fraction have very different velocities and trajectories, their impact with
the pallet entrance edge causing its erosion (Figure 2).
Assessing the risk of erosion is difficult to do by using theoretical elements. Basically,
relatively simple criteria are used that take into account the amount of moisture, impact
energy and steam parameters.
The condensing turbines, in order to increase performance, work with low condenser
pressures, the lower limit being imposed by the coolant temperature or the risk of erosion. The
usual range of these pressures is pc = (0,07 ÷ 0,03) bar. The risk of erosion generally occurs at
the last step stage blades characterized by high humidity (y0> 0,05 respectively x0 <0,95) and
low p0 pressure <0,3 bar and the long blade length leads to high peripheral speeds in the range
u = (400 ÷ 550) m/s.
Under these conditions, the risk of erosion has to be assessed and measures taken to avoid
it, by protecting the edge of the blades, changing the parameters of the steam, intensifying the
internal collection of moisture. Changes in live steam parameters, such as temperature drop
(Figure 3) or increase in pressure (Figure 4), which increase the humidity at the turbine outlet,
must be accompanied by an erosion hazard assessment using criteria set by various turbine
manufacturers (Table 1).
Figure 3. Live steam temperature drop on Figure 4. Live steam pressure increase on
the final vapor content of the steam the final vapor content of the steam
The influence of the exhaust condensing pressure drop is very important too. Coolant
temperature is a natural limit to lowering condenser pressure in order to increase enthalpy
yield and fall. Another limit is given by the increase of steam humidity at the turbine
discharge, (decrease of the vapor fraction).
Operating with a higher exhaust pressure than the condensing rated value is so called
“worsened vacuum” regime and contributes to the decrease of the moisture (a positive effect
for the erosion), but produces also an efficiency drop for the last stage, due to the “breaking
effect”.

97
Table 1 Erosion criteria for the last stage blades of the steam turbines
Criterion Reference Equation Erosion risk assesment
Escher Wyss (1) [1] 2
20
400200
ηρ
= ucyE a E<1 no erosion risk
1≥E erosion risk;
blades should be
protected Escher-Wyss (2) [2,3] 4
20
100200
ηρ
= ucyE a
KWU [1]
2
0
20
3000
= nd
p
yE
E<0.2 no erosion risk
0,2<E<0.8 erosion risk;
E>0.5 blades should be
protected
Hitachi [2,3] ( ) 8,01
244,201,03,4 yuE ⋅−⋅⋅=
E<2 no erosion risk
2<E<4 erosion risk
E>4 very high erosion
risk
where: 0y [-] – humidity at stage inlet;
1y [-] – humidity between nozzles and blades;
ρ [kg/m3] – steam density, at the stage outlet;
η – coefficient of quality for the moisture reduction system: ( 1=η for modern
systems; 18,0 << η for old systems);
0p [bar] – pressure at stage inlet;
c1a [m/s] – axial velocity at nozzles outlet;
c2a [m/s] – axial velocity at blades outlet;
u [m/s] – peripheral velocity at blade’s tip.
2. METHODOLOGY
2.1. Turbine operating parameters
The analyzed steam turbine holds an impulse control stage and 16 reaction stages. The
main operating parameters are:
• Live steam nominal parameters: p0n=49,0 bar, t0n=447 °C;
• Minimal live steam pressure: p0min=44,0 bar; Minimal live steam temperature:
t0min=390 °C;
• Nominal steam mass flow rate: nm0ɺ =20,7 t/h; Maximal steam mass flow rate:
max
0mɺ =21,5 t/h: Minimal steam mass flow rate: min
0mɺ =8 t/h;
• Nominal parameters of the steam extraction for the deaerator: pD=5,75 bar; tD=217 °C;
Dmɺ =0,408 t/h;
• Condensing pressure: pCn=0,89 bar; pCmin=0,52 bar.
• Rotation speed: n= 9944 rot/min;
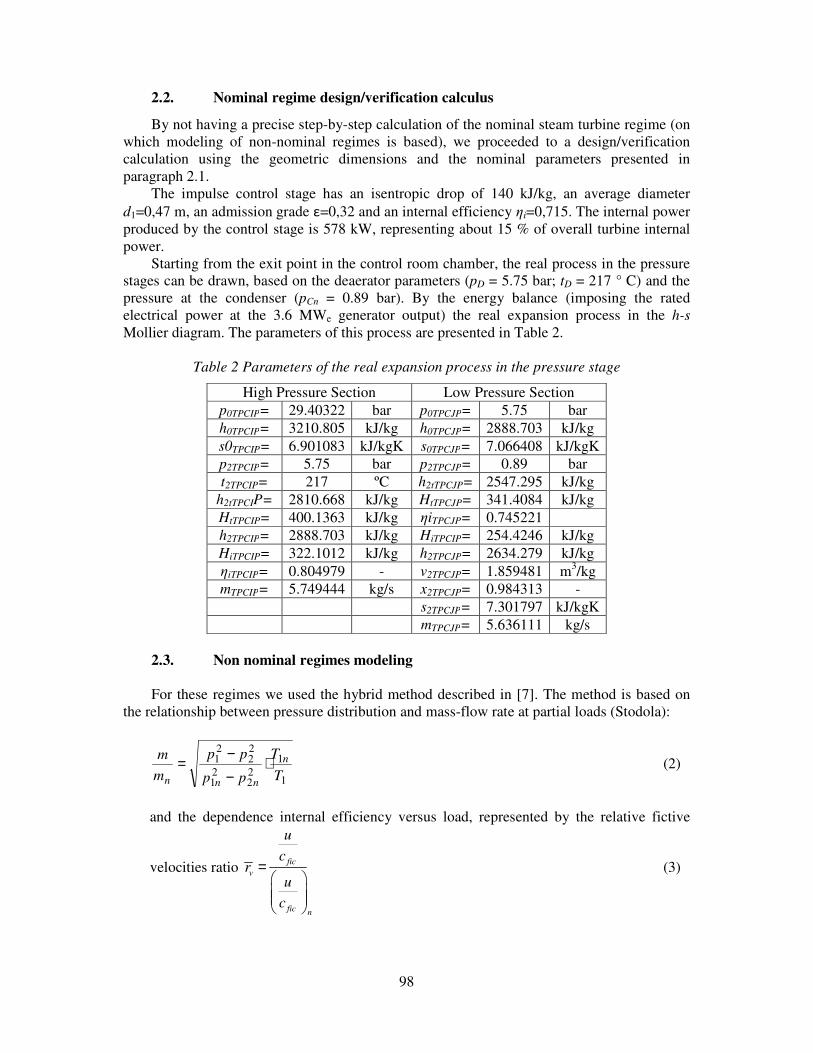
98
2.2. Nominal regime design/verification calculus
By not having a precise step-by-step calculation of the nominal steam turbine regime (on
which modeling of non-nominal regimes is based), we proceeded to a design/verification
calculation using the geometric dimensions and the nominal parameters presented in
paragraph 2.1.
The impulse control stage has an isentropic drop of 140 kJ/kg, an average diameter
d1=0,47 m, an admission grade ε=0,32 and an internal efficiency ηi=0,715. The internal power
produced by the control stage is 578 kW, representing about 15 % of overall turbine internal
power.
Starting from the exit point in the control room chamber, the real process in the pressure
stages can be drawn, based on the deaerator parameters (pD = 5.75 bar; tD = 217 ° C) and the
pressure at the condenser (pCn = 0.89 bar). By the energy balance (imposing the rated
electrical power at the 3.6 MWe generator output) the real expansion process in the h-s
Mollier diagram. The parameters of this process are presented in Table 2.
Table 2 Parameters of the real expansion process in the pressure stage
High Pressure Section Low Pressure Section
p0TPCIP= 29.40322 bar p0TPCJP= 5.75 bar
h0TPCIP= 3210.805 kJ/kg h0TPCJP= 2888.703 kJ/kg
s0TPCIP= 6.901083 kJ/kgK s0TPCJP= 7.066408 kJ/kgK
p2TPCIP= 5.75 bar p2TPCJP= 0.89 bar
t2TPCIP= 217 ºC h2tTPCJP= 2547.295 kJ/kg
h2tTPCIP= 2810.668 kJ/kg HtTPCJP= 341.4084 kJ/kg
HtTPCIP= 400.1363 kJ/kg ηiTPCJP= 0.745221
h2TPCIP= 2888.703 kJ/kg HiTPCIP= 254.4246 kJ/kg
HiTPCIP= 322.1012 kJ/kg h2TPCJP= 2634.279 kJ/kg
ηiTPCIP= 0.804979 - v2TPCJP= 1.859481 m3/kg
mTPCIP= 5.749444 kg/s x2TPCJP= 0.984313 -
s2TPCJP= 7.301797 kJ/kgK
mTPCJP= 5.636111 kg/s
2.3. Non nominal regimes modeling
For these regimes we used the hybrid method described in [7]. The method is based on
the relationship between pressure distribution and mass-flow rate at partial loads (Stodola):
1
1
22
21
22
21
T
T
pp
pp
m
m n
nnn
⋅−−
= (2)
and the dependence internal efficiency versus load, represented by the relative fictive
velocities ratio fic
v
fic n
u
cr
u
c
=
(3)

99
for control stage: ( )
⋅⋅−⋅⋅=
−
'
0
'
0
0
4
/0
10283,0
v
p
mkk cuRATEAUi
ɺη (4)
and pressure stages: ( )vvsi
i rr −⋅= 2η (5)
3. RESULTS AND CONCLUSIONS
We ran several tests, presented in table 3.
Table 3 Parameters of analyzed operating modes
Nr.crt [kg/s] p0[bar] t0[ºC] pC[bar]
OM1 5.75 49 447 0.89
OM2 2.22 49 390 0.43
OM3 2.22 29 350 0.43
OM4 2.22 47 445 0.89
• Operating mode 1 is the nominal mode, as a nominal flow of the district heating water
flows through the condenser; it is noted that the exit point in the turbine is above the
Wilson curve, which means that the water droplets have not yet formed and only the
last stage works partially under the saturation curve.
• Operating mode 2 is the mode in which the live steam flow is kept at the technical
minimum and its pressure is brought to its nominal value, while the temperature drops
with 57 degrees Celsius; it is the most unfavorable in terms of humidity, five stages
working with humid saturated steam. It has also the lowest evacuation vapor content
(0.948)
• Operating mode 3 is a start-up one, limited as duration; It is noted also that 5 stages
operate under the saturation curve
• Operating mode 4 is a partial mode with minimal steam flow at which nominal
pressure is maintained at the condenser by regulating the flow rate of district heating
water. It is noteworthy the operation of the last stage in brake mode with power
consumption and negative internal efficiency.
Table 4 Erosion criteria
Nr.crt xC EW(1) <1 EW(2) <1 KWU <0.2 Hitachi <2
[-]
OM1 0.986 0 0 0 0.0110
OM2 0.948 0.022 0.2629 0.0089 0.0311
OM3 0.949 0.0022 0.2568 0.0085 0.0306
OM4 0.958 0.0024 0.2829 0.0063 0.0261
No risk for erosion, all the criteria from Table 1 returned values less than limits. The red
curve of constant vapor content x=0.88 has never been touched by the expansion lines.
The expansion lines are presented in figure 5. The green curve represent the saturation line
(x=1), the brown one the Wilson curve.

100
OM1 OM2
OM3 OM4
Figure 5: Expansion lines in Mollier diagram for the four cases
AKNOWLEDGMENTS
„This work was supported by the project UPB: T-ME 16-17-01, financed by Elsaco Electronic
and by the grant of the Romanian Ministery of Research and Innovation, CCCDI – UEFISCDI,
project number PN-III-P1-1.2-PCCDI-2017-0404 / 31PCCDI/2018”
References [1] Grecu T., Cardu M., Nicolau, I., “Turbine cu abur”, Editura Tehnică, 1976
[2] Leyzerovich A. Sh., “Wet Steam Turbines for Nuclear Power Plants”, Penwell Corporation, Ed. I, 2005.
[3] Leyzerovich A. Sh., “Steam Turbines for Modern Fossil-Fuel Power Plants”, The Fairmont Press-Inc.,
2007.
[4] Negreanu G., Oprea I., Le calcul de verification pour le regim de project d'un etage de turbine qui utilise
de le vapeur humide, International Simposium on Nuclear Energy, București 1993.
[5] Oprea I, Contribuții privind curgerea aburului umed în treptele turbinelor, Sesiune de comunicãri
științifice, ICSITEE, București 1989.
[6] Oprea I., Negreanu G., Aspects of the Saturated Steam Turbine Calculation for Partial Loading,
International Simposium on Nuclear Energy, București 1993.
[7] Negreanu G, „Teoria și modelarea turbomașinilor”, Editura Printech 2007, ISBN 978-973-718-624-9.

101
THE USE OF RAW ANIMAL FATS-BUTHANOL-DIESEL FUEL
BLENDS AT DIESEL ENGINE
Cernat Alexandru1, Pana Constantin, Lazaroiu Gheorghe,
Negurescu Niculae, Nutu Cristian, Nicolici Adrian
University Politehnica of Bucharest
ABSTRACT
The use of the alternative fuels, even in partial substitution, may represent a viable solution to
reduce the diesel engine pollutant emissions and to maintain the diesel engines in service and in urban
traffic. The animal fats-buthanol-diesel fuel blends are an alternative fuel which can be used at diesel
engines, in order to reduce the pollutant emissions. The main advantages of animal fats- diesel fuel
blends like cetane number and calorific value very close to diesel, higher oxygen content it
recommend it as a good alternative fuel for diesel engines, being renewable and energy efficient. The
results of experimental investigations show the animal fats and buthanol effects on the combustion
parameters and on the pollutant emissions. Animal fats-buthanol-diesel fuel blends can be considered
a viable alternative fuel for diesel engine, assuring the partial replace of the fossil fuels and resolving
the major problem of animal wastes
1. INTRODUCTION
After the 2015 Paris Climate Conference and the C40 Events-C40 Mayors Summit 2016
diesel engine pollution issue becomes a priority for some capital cities (Paris, Madrid, Athens
and Mexico City) which will not legally allow anymore the access of automotives with diesel
engines starting with year of 2020.
The use of alternative fuel obtained from renewable sources to diesel engines fuelling is a
viable solution for replace of the fossil fuels and for pollutants emissions and greenhouse
gases effect decrease. The animal fats have a high potential, due to their good combustion
properties and due to great reserves can be used with success at diesel engines. They are
oxygenated fuels, non toxic, sulphur free and contain more oxygen compare to diesel fuel [1]..
The main disadvantages of animal fats are their high viscosity and poor volatility. Because of
their high viscosity, the preheating of animal fats results in a significant decrease of viscosity,
which allows the diesel engine fuelling without constructive modifications [2]. By use of
buthanol in mixture with diesel fuel and animal fats the new fuel viscosity significant
decreases and the fuel atomization is improvement [3].
Animal fats are lipid materials, being composed of triglycerides. Animal fats are in more
parts constituted from tryglicerides and saturated monocarboxylic fat acids with number of
carbon atoms (C12-C18) in which palmitic and stearic acids are predominant [2]. Animal fats
have a lower content of carbon and hydrogen and higher oxygen content comparative to diesel
fuel. The viscosity of the animal fats is of 15 times greater than diesel fuel at 40oC, table 1,
[2]. At the raw animal fats use, the engine power is lower compared to diesel fuelling (the
lower heating value of animal fats is with almost 10% lower as the diesel fuel- table 1). By
increasing the cyclic fuel dose for the same air/fuel ratio, the engine power can be corrected
because of the higher oxygen content of animal fats than diesel fuel [2].
In the table 1 a presented some of the physic-chemical properties of diesel fuel and
animal fats:

102
Table 1: The physic-chemical properties of diesel fuel and animal fats
Specific properties of the fuels
Diesel
Fuel Animal Fat
Density [g/ml]
0.8495
0.92
Viscosity at 40 oC [mm2/s] 2.96 45
Thick point [oC] -12 6
Congealing point [oC] -16
Ignition point [oC] 74 170
Boiling point [oC] 191 344
Sulphur [% m] 0.036 0
Cetane number CN [-] 49.2 56
Caloric power Hi [MJ/kg] 42.9 39.77
Carbon [% m] 86.67 77.6
Hydrogen [% m] 12.96 12.3
Oxygen [% m] 0.33 12.5
Oxygen for combustion Ot [kmol/kg cb] 0.1045 0.0915
Experimental investigations of a diesel engine with a single cylinder, air cooled, with
direct injection, fuelled with fuel diesel and animal fat preheated to 70°C in mixture with
ethanol showed follow results comparative to diesel fuel engine: increase of the autoignition
delay; decrease of the exhaust gas temperature; decrease of NOx and smoke emissions level
[4]. Same results were presented in others papers [5, 6, 7, 8].
In this paper are presented some results of preheated raw animal fats in mixture with
diesel fuel and buthanol.
2. METHODOLOGY
The experimental investigations were carried on a CFR-IT9-3M experimental diesel
engine. The engine was firstly fuelled with diesel fuel and then with blends of diesel fuel-
animal fats –buthanol for the same engine adjustments (13 °CA injection timing and ε=13.74
compression ratio). The fuel cyclic dose (28.9 mm3/cycle) was maintained constant at for all
experimental tests. The diesel engine was equipped with AVL pressure transducer line,
Kubler speed incremental transducer, real time AVL data acquisition system, AVL gas
analyzer and smoke meter, thermo resistances for engine cooling liquid temperature, engine
oil and air intake temperatures, and thermocouples for exhaust gas temperature. The high
viscosity and poor vaporization characteristics of animal fats need prior their heating and theit
content limit in mixture with diesel fuel.
Was used the following methodology:
The animal fats are perfect soluble in diesel fuel at ~40 °C. At this temperature were
prepared diesel fuel-animal fats (5% and 10% vol.)- buthanol (5% vol.) blends.
. In figure 1-3 are presented the some effects of the animal fat and buthanol in mixture
with diesel fuel.
In figure 1 the NOX emissions level variation with the animal fats content in mixture with
diesel fuel and buthanol (xm) is presented.
The NOX formation is favored of the high temperature zone associated to the preformed
mixtures combustion. Decreasing of NOX emission with 65% at the increasing of fats content,
figure 1, is explained by reduction of the preformed mixtures quantity because of the

103
atomization aggravation, which leads to combustion temperature decrease comparative to
diesel engine fuelled with diesel fuel, figure 2.
0
100
200
300
400
500
600
0 0.02 0.04 0.06 0.08 0.1 0.12xm
NO
x [
pp
m]
ε=13.74
β=13 CA
Figure 1: NOX emissions level versus animal fats content
200
220
240
260
0 0.02 0.04 0.06 0.08 0.1 0.12xm
t gas
[oC
]
ε=13.74
β=13 CA
Figure 2: The gas temperature versus animal fats content
0
0.1
0.2
0.3
0.4
0.5
0.6
0.7
0 0.02 0.04 0.06 0.08 0.1 0.12xm
SM
OK
E
[k]
ε=13.74
β=13 CA
Figure 3: Smoke emissions level versus animal fats content

104
In figure 3 smoke emission level variation versus the percent of animal fats in mixture
with diesel fuel for same buthanol content is presented. Reduction of smoke emission level
may be explained by carbon content reduction and oxygen content increase at molecular level
(the animal fats and buthanol have higher oxygen content in their molecule). Comparative to
diesel fuel fuelled engine, a reduction with 87% of smoke emission level for xc=10% was
obtained.
3. CONCLUSIONS
The use of animal fats and buthanol in mixture with diesel fuel at the diesel engine
assures pollutant emissions decrease. The NOx and smoke emissions level decreases. Animal
fats can be considered a good alternative fuel for diesel engine, they achieving the partial
replace of the fossil fuels and resolving the major problem of origin animal wastes from
leather industry.
Acknowledgments
The authors address special thanks to AVL GmbH Graz Austria for providing the necessary
equipments. The work has been funded:
• by a grant of the Romanian Ministry of Research and Innovation, CCCDI-UEFSCDI, project
number PN-III-P1-1.2-PCCDI-2017-0404, within PNCDI III”
• by University Politehnica of Bucharest, through the “Excellence Research Grants”
Program, UPB – GEX 2017. Identifier: UPB- GEX2017, Ctr. No. 62 /2017
• by the Sectoral Operational Programme Human Resources Development 2007-2013 of the
Ministry of European Funds through the Financial Agreement POSDRU/159/1.5/S/134398
References
[1] Venkatraman, M., Devaradjane, G., ”Effect of Compression ratio, Injection Timing and Injection
Pressure on a DI Diesel engine for better performance and emission fueled with diesel-diesel biodiesel
blends“, International Journal of Applied Engineering Research, Vol. 1 , No 3 , 2010.
[2] Gheorghe Lazaroiu, Constantin Pană, Lucian Mihaescu, Alexandru Cernat, Niculae Negurescu,
Raluca Mocanu, Gabriel Negreanu, Solutions for energy recovery of animal waste from leather
industry, Energy Conversion and Management, 2017, pp: 1-11, ISSN: 0196-8904, Available online 28
June 2017, https://doi.org/10.1016/j.enconman.2017.06.042, indexat ISI, WOS, Thomson Reuters, IF:
5.63 (2016).
[3] Oguzhan Dogan,The influence of n-butanol/diesel fuel blends utilization on a small diesel engine
erformance and emissions, Fuel 90 (2011) 2467–2472.
[4] Kerihuel, A., Kumar, M., S., Bellettre, J., Tazerout, M., “Investigations on a CI Engine Using
Animal Fat and Its Emulsions with Water and Methanol as Fuel”, SAE International, Paper Number
05P-95, 1995.
[5] M. Senthil Kumar , A. Kerihuel ,J. Bellettre , M. Tazerout , “A Comparative Study of Different
Methods of Using Animal Fat as a Fuel in a Compression Ignition Engine “ , Journal of Engineering
from Gas Turbines and Power, Vol. 128, October 2006.
[6] Cernat A, Pana C, Negurescu N, Lazaroiu Gh, Nutu ,. Aspects of the animal fat use at the diesel
engine fuelling, UPEC 2015 Proceedings of Staffordshire University 2015.
[7] Srinivasa Rao K, Ramakrishna DrA, Rao PV, Performance and emission characteristics of DI-CI
diesel engine with preheated chicken fat biodiesel, International journal of mechanical engineering and
technology 2013; 4(3).
[8] Kumar, A. Kerihuel,J. Bellettre, M. Tazerout, M. Senthyl, The use of preheatead animal fat as fuel
in a compression ignition engines, Renewable Energy 2005; 30(9):1443-1456.
http//sol3d.com/_backup/1.0/.../ak/preheating.pdf.

105
A RESEARCH ON FUELLING A CAR DIESEL ENGINE
WITH LIQUEFIED PETROLEUM GAS
Nikolaos Cristian Nutu1, Constantin Pana2, Niculae Negurescu
2,
Alexandru Cernat2, Dinu Fuiorescu
2, Liviu Nemoianu
2
1Automotive Engineering Department, University Politehnica of Bucharest, Romania
2Thermotechnics, Thermal Engines and Equipments, Refrigeration Instalations,
University Politehnica of Bucharest, Romania
ABSTRACT
The paper presents experimental investigations results of a car diesel engine fuelled with diesel
fuel and liquefied petroleum gas by diesel-gas method with the main purpose to reduce the level of the
nitrogen oxides emissions and the smoke emission. The use of LPG represents an efficient way to
reduce the classic fuels consumption, maintaining the energetic performances of the engine. The test
bed situated in the Thermotechnics, Engines, Thermal Equipments and Refrigeration Instalations
Department was adapted for liquefied petroleum gas fuelling of the diesel engine. The engine used for
investigations is a turbocharged 1.5 l diesel engine which run at 3500 rpm and 70% engine load. By
LPG fuelling of the investigated diesel engine a decrease has been achieved in the nitrogen oxides
emissions level and in the smoke emission level. Also the break energetic specific consumption
decreased compared to the standard diesel engine. The results of the experimental investigations
confirm the viability of using LPG as an alternative fuel for the diesel engine.
1. INTRODUCTION
Liquefied petroleum gas, shortly LPG, is a fuel composed generally of propane and
butane, in different ratios (usually 30% propane and 70% butane). The ratio of each
component depends on season because in general in the cold season the propane ratio should
be increased and also the ratio of the components is different between producing companies.
Being a fuel with good combustion properties and a very good price liquefied petroleum gas
is a viable alternative as a fuel for the compression ignition engines.
Some fundamental properties of LPG are presented in the table 1, compared with the
diesel fuel properties.
Table 1. Liquefied petroleum gas properties [1].
Properties
Diesel fuel
Propane
Butane
Density [kg/m³] 800-840 503 500
Self ignition
temperature [ºC]
355 481 544
Stoichiometric A/F
ratio [kg/kg]
15 15.71 15.49
Lower heating
value[MJ/kg]
42.5 46.34 45.55
Cetane number 40-55 -2 -2
Flame temperature 2054 1900 -
1phone: 0740634286; e-mail: [email protected]

106
Fuelling a diesel engine with LPG involves specific methodes given that the LPG self
ignition temperature is higher than diesel fuel and the cetane number is very low. In this paper
the authors chose the Diesel-Gas method, where the gaseous LPG is injected in the intake
manifold of the engine.
This method has been applied also by Tariq Miqdam in [2] with good results concerning
the brake specific energetic consumption and pollutant emissions. In the paper [ 3] the authors
chose for experimental investigations a car diesel engine, which was fuelled with LPG also
using the diesel-gas method. As a result for the experiments a reduction in the operating price
of the vehicle has been achieved. In the work [4] the authors decreased the level of the
nitrogen oxides emission fuelling the diesel engine with LPG. On the other hand the level of
unburned hydrocarbons increased but the authors managed to reduce this emission using a
glow plug with the main purpose to reduce the flame estinguishing phenomenon [4]. Also Pali
Rosha et al. in [ 5] by LPG fuelling a single cylinder diesel engine obtained a decrease in the
level of pollutant emissions. The level of nitrogen oxides emissions and carbon dioxide
emission decreased as against the standard diesel engine case, while emissions of unburned
hydrocarbons and carbon monoxide increased. In order to reduce these emissions the authors
used a percentage of recycled exhaust gas. Another example of a liquefied petroleum gas
diesel engine fuelling is presented in the paper [6] . The authors used liquefied petroleum gas
injection into the intake manifold of the engine and rapeseed oil which served as a pilot fuel
injection. The maximum substitute ratio of rapeseed oil with LPG was limited by cyclic
variability of the combustion process. The level of unburned hydrocarbons and carbon
monoxide emissions decreased but the level of nitrogen oxides emissions increased. To
reduce the emission of nitrogen oxides authors used also the exhaust gas recirculation.
This paper presents results of experimental investigations carried out on a car
compression ignition engine fueled with liquefied petroleum gas using the diesel-gas method.
The engine is located in one of the test beds of the Department of Thermotechnics,
Engines, Thermal Equipments and Refrigeration instalations .
2. EXPERIMENTAL STUDY
The experimental study was carried out on a car compression ignition engine type K9K,
with 4 cylinders in line. The specifications and performances of the engine are presented in
the table 2.
The test bed consist of: K9K 792 1.5 dCi diesel engine, equipped with a LPG fuelling
system. Laboratory equipments (figure 1) are: 1 – 1.5 dci diesel engine; 2 – engine cooling
system; 3 – engine water cooler; 4 – intercooler fan; 5 – engine angular encoder; 6 –AVL
piezoelectric pressure transducer; 7 – diesel fuel injector; 8 – LPG injector; 9 – Turbocharger;
10 – intake air drum; 11 – intake air flow meter; 12 – exhaust gas recirculation; 13 –Schenck
E90 dyno; 14 – dyno-engine coupling; 15 –Schenck E 90 dyno cooling water pump; 16 –dyno
cooling system; 17 –AVL Dicom 4000 gas analyzer; 18 –AVL Dicom 4000 Opacimeter; 19 –
AVL charge amplifier; 20 – PC + AVL data acquisition system; 21 –Schenck E 90 dyno
controller; 22 – temperatures displays: a) – exhaust gas; b) – intake air; c) – engine oil; d) –
engine cooling liquid; e) – engine oil pressure; 23 – diesel fuel and LPG injection control
Laptop; 24 – diesel fuel tank; 25 – diesel fuel mass flow meter; 26 – fuel filters; 27 – high
pressure pump for common Rail; 28 –Common Rail; 29 – LPG tank; 30 – LPG mass flow
meter; 31 – LPG vaporizer; 32 –LPG ECU; 33 –diesel engine ECU; 34 –intercooler; 35-
supercharge pressure measuring system; 36- throttle actuator. The test bed diagram is
presented in the figure 1.

107
Table 2. Specifications and performances of the K9K engine.
Number of cylinders 4
Bore 76 mm
Stroke 81 mm
Displacement 1.5 l
Compression ratio 18.3
Rated power 55 kW/3900 rpm
Maximum torque 156 Nm/2000 rpm
Admision type turbocharged
Figure 1. The test bed diagram.
First time was determined the reference, fuelling the engine only with diesel fuel, than
the diesel fuel was partially substituted with liquefied petroleum gas with the purpose to
maintain the same engine power like in the standard case of fuelling with diesel fuel and to
reduce the pollutant emissions. For each substitute ratio investigated, the diesel fuel cycle
quantity was reduced and the LPG cycle quantity was increased. The energetic substitute ratio
mathematical relation is:
dieselfuelLPG
LPG
idieselfueliLPG
iLPG
cHmHm
Hmx
+= (1)
Where: ����- the LPG dose;
��������-the diesel fuel dose;
Hi- the lower heating value.
The investigated energetic substitute ratios of the diesel fuel with LPG was situated between
[0-40.63] %. and the working regimen was 70% engine load and 3500 rpm.
3. RESULTS AND DISCUSIONS
The pressure inside the cylinder increased for all the investigate substitute ratios of diesel
with LPG because of the intensification of the burning process due to the presence of LPG-air

108
mixture in the combustion chamber and because LPG has a higher flame speed. The in-
cylinder maximum pressure variation is presented in the figure 1.
Fig. 1. The maximum in-cylinder pressure.
The maximum rate of pressure rise also increased for all the cases because the flame has
a high speed in the homogeneous air-LPG mixture. The figure 2 presents the maximum rate of
pressure rise for the investigated cases.
Fig. 2. The maximum rate of pressure rise.
The nitrogen oxides emission level decreased for all the investigated substitute ratios of
diesel fuel with LPG because liquefied petroleum gas has a lower flame temperature than
diesel fuel and because the combustion takes place in a shorter time, thus the nitrogen oxides
formation decreases. The nitrogen oxides emission is presented in the figure 3.
40
50
60
70
80
90
0 5 10 15 20 25 30 35 40 45ma
xim
um
pre
ssu
re [
ba
r]
xc[-]
0
0.5
1
1.5
2
2.5
3
3.5
4
0 5 10 15 20 25 30 35 40 45
dp
/dα
ma
x[b
ar/
CR
A]
xc [-]

109
Fig. 3. The nitrogen oxides emission.
For substitute ratios up to 26% the smoke emission level decreased for all the
investigated substitute ratios of diesel fuel with LPG because in the case of LPG fuelling the
burning rate of diffusive mixtures decreases and the burning rate of preformed mixtures
increases. For substitute ratios higher than 26% the smoke emission level increased due to the
lack of air, LPG being injected in the intake manifold and replace a part of air, in order to
reduce the smoke emission for higher substitute ratios the supercharging pressure must be
increased. The figure 4 presents the measured smoke emission level, evaluated by the opacity.
Fig. 4. The smoke emission level.
The brake specific energetic consumption decreased in the case of LPG fuelling. Figure 5
presents the brake specific energetic consumption variation.
Fig. 5. The energetic specific fuel consumption.
200
250
300
350
400
450
0 5 10 15 20 25 30 35 40 45
NO
x[p
pm
]xc [-]
5.2
5.4
5.6
5.8
6
6.2
6.4
6.6
0 5 10 15 20 25 30 35 40 45
op
ac
[%]
xc [-]
11500
11600
11700
11800
11900
12000
12100
12200
0 5 10 15 20 25 30 35 40 45
Ce
[kJ/
kW
h]
xc [-]

110
4. CONCLUSIONS
At the LPG engine fuelling were observed the following:
1. The brake specific energetic consumption decreased with ~5% when the substitute ratio
was xc=40.63.
2. The nitrogen oxides emission decreased with ~23% for the substitute ratio xc=40.
3. The smoke emission level decreased for substitute ratios of diesel fuel with LPG lower than
26 increased for higher substitute ratios because of the worsening of intake process.
4. The maximum pressure and the maximum rate of pressure rise increased in the case of LPG
fuelling.
5. ACKNOWLEDGEMENTS
The authors would like to thank to AVL List GmbH Graz, Austria, for providing the
possibility to use the research equipments.
This work has been funded:
• by University Politehnica of Bucharest, through the “Excellence Research Grants”
Program, UPB – GEX 2017. Identifier: UPB- GEX2017, Ctr. No. 62 /2017.
• by a grant of the Romanian Ministry of Research and Innovation, CCCDI-
UEFSCDI, project number PN-III-P1-1.2-PCCDI-2017-0404, within PNCDI
III/31PCCDI/2018”.
6. REFERENCES
[1]. Popa, M. G., Negurescu, N., Pana, C., Motoare Diesel, Matrix ROM, Bucuresti 2003.
[2]. Miqdam, T., Exhaust analysis and performance of a single cylinder diesel engine run on dual
fuels mode, Journal of Engineering, Nr. 4, Vol. 17, 2011.
[3]. Michal, J. et al, Analysis of engine parameters at using diesel-lpg and diesel-cng mixture in
compression-ignition engine, Acta Universitatis Agriculturae Et Silviculturae Mendelianae Brunensis,
vol. 62, nr. 1, 2014.
[4]. Vijayabalan, P., Nagarajan, G., Performance, Emission and Combustion of LPG Diesel Dual Fuel
Engine using Glow Plug, Jordan Journal of Mechanical and Industrial Engineering, Volume 3,
Number 2, June. 2009 ISSN 1995-6665 Pages 105 – 110.
[5]. Rosha, P., Bharj, R.S., Gill, K., Performance and emission characteristics of Diesel+LPG dual
fuel engine with exhaust gas recirculation, International Journal of Science, Engineering and
Technology Research (IJSETR), Volume 3, Issue 10, October 2014.
[6]. Tira, H.S, Herreros, J.M., Tsolakis, A., Wyszynski, M.L., Characteristics of LPG-diesel dual
fuelled engine operated with rapeseed methyl ester and gas-to-liquid diesel fuels, Energy, Volume 47
(2012) 620-629.

111
LOW POWER COGENERATION INSTALLATION
USING SOLID VINEYARD WASTE BIOMASS
Ion Oprea1
University POLITEHNICA of Bucharest
ABSTRACT
Our country owns important vineyard cultivated surfaces. Along with other forms of biomass,
vineyards have the necessary energy characteristics to be used as renewable fuel in electrical / thermal
energy producing in small power plants. This paper aims to demonstrate the viability of a low power
cogeneration power plant when using such a resource.
1. INTRODUCTION
The use of biomass for energy production is an important way to reduce the impact of
energy systems on the environment and to implement the rules brought in this field by
European Union. Although the biomass has a considerable share in renewable energy in our
country, it has a reduced use for the production of electricity and heat, whether centralized or
collective-decentralized. The installed production capacity was 130.4 MW on April 1, 2018,
and prospects for the next three years are given in Table 1 [2].
Table 1. The evolution of net power available for biomass [MW]
2018 2019 2020
150 160 180
Biomass is commonly used in rural areas for heating and for food preparation. We
generally talk about low efficiency and high emission installations. About 14% of the biomass
energy is generated in modern facilities.
The paper considers the solid biomass from the vineyards that is the grapevines obtained
from the autumn and spring cuttings. Vines can be used energetically after drying, either by
chopping them or as pellets.
2. VINE ROOTS - RENEWABLE ENERGY FUEL
Vines are obtained from the maintenance process of the vineyards, from the autumn and
spring cuttings. Together with grape stones, the vines represent the renewable energy source
of wine cultures. The area planted with vines was approximately constant in recent years,
being 177.150 ha in 2017 [4, 5] and providing a safe source of raw material. However, in our
country we cannot speak of a tradition in energy recovery of vineyard byproducts. This is due
to the wide spread of crops, the lack of harvesting and baling machines, and the lack of drying
and storage infrastructure. In this context, the energy recovery of vineyards must also take
into account solutions that allow combustion together with wood waste, agricultural biomass
and biomass from energy crops (energy willow, poplar etc.) in the form of pellets, briquettes
or chopped.
1 Splaiul Independentei nr. 313, sector 6, Bucharest, ROMANIA, PC RO-060042, +4021 4029158, [email protected]

112
In order to be handled, stored and processed, the vines are harvested and packed with a
special machine (Fig. 1). The typical dimensions of a bale are: diameter = 40 cm / length = 60
cm and weight of 15 kg/bale being easy to handle. During storage, the vines are dried, and
when the humidity drops below 20 percent, bales can be cut or milled to serve as fuel in
heating systems, or can be made into pellets. Upon cutting the vines have an average relative
humidity of 35% and the lower calorific value is Qiw ≈ 12400 kJ/kg and, after drying, at 10%
humidity Qi ≈ 16560 kJ/kg [9, 16]. By storage and drying, the vineyards reach an average
moisture content of 10%, optimal for storage, burning or gasification, with a lower average
calorific value Qi ≈ 19000 kJ/kg; the price is about 0.50 RON/kg.
One hectare of vineyard cultivation has an average of 4000-5000 vine stocks that
produce (0.5-1) kg of biomass/vine stock with relative humidity in the range of 30% to 40%,
so between (2000-5000) kg/ha.year [9, 14]. These values can vary widely depending on
variety, soil and climatic conditions. Estimating minimum mass of cut vines of about 2000
kg/ha, it follows that the minimum annual energy potential of one hectare is Epcv = 24.8
GJ/ha.year.
At national level, taking into account an area of at least 100,000 hectares of vineyards
in production, the energy potential in the biomass from vines is Epcv ≈ 2480 TJ/year, which
corresponds to an annual consumption of 43,000 tons of diesel and to reducing CO2 emissions
by 128,000 tCO2/year which are appealing results.
3. LOW POWER COGENERATION INSTALLATION
The energy recovery of grapevines or mixtures of grapevines and logs can be done by
using chopped material or pellets in low-power cogeneration systems with a back-pressure
turbine or in ORC installations using organic fluid cycles.
Back-pressure turbines best meet the requirements of low-power cogeneration plants
through efficiency, gauge and simplicity of the thermal circuit. The major disadvantage of
back-pressure turbines is the dependence of their operation on the heat consumer. In the
absence of the heat consumer, the turbine must be switched off or provided with a reduced
cooling bypass system. Low thermal loads also reduce the plant's efficiency.
ORC installations using organic fluid cycles typically consist of two main modules:
- a module that ensures the burning of solid biomass and generates heat;
- a module that produces electrical and thermal energy in which the working fluid is organic.
The interface between the two modules is a heat exchanger. Such an installation can be
used for both residential and small-scale heating. Power generation is achieved with a turbine
that can be axial or radial-centripetal.
The proposed cogeneration plant recovers the energy potential of vines as such or in
blends with waste / wood waste. This plant is designed for local heat supply of residential or
small-scale enterprises. At the same time, the plant produces electricity to be injected into the
national grid. The plant is destined for the Vrancea region, an important wine region with an
area planted with vineyards of about 17,000 ha [4].
The construction type of the installation has been chosen taking into account the
following main elements:
- the required heat load - a low-power plant was chosen to locally recover the energy
potential of the vine. The potential heat consumer may be a woodworking or an agricultural
products processing enterprise to which hot water is supplied. If an outlet pressure reduction
and cooling station is provided, it could also feed residential consumers. For industrial
consumers, the outlet pressure is 6 bar. In the case of a residential complex for the summer
period, the heat consumption will be significantly reduced, which will affect the performance
of the plant, and the outlet pressure will be 1.2 bar. We chose the 6 bar outlet pressure, while

113
the electrical and thermal loads are to be determined by system calculation according to the
available heat provided by the burning of the vines.
- combustion mode of biomass - In principle, two types of boilers can be selected: with
grate burning or with burning in suspension. Installations and studies show that grate burning
allows for higher thermal and electric loads of about 2 MWt and 250 kWe, while the burning
in suspension required a 1.2 MWt and 140 kWe boilers. The way of preparing the biomass
differs depending on the two solutions, namely on the grate it is burned in the form of pieces,
pellets or briquettes, while in suspension it is burned as splinters or powder. Vines can be
prepared for both combustion modes. For the solution calculated, we selected a boiler with a
burning suspension of chopped vines alone or mixed with chopped wood. Boiler parameters
for steam produced are in the ranges po = (20 ÷ 60) bar; to = (250 ÷ 450) oC. We opted for live
steam parameters po = 30 bar; to = 300 ° C
- type of energy machine - you can choose between a steam turbine or an organic fluid
turbine if you opt for an installation that also integrates an ORC cycle.
Due to the fact that the plant is low power, according to the live steam parameters adopted,
the steam flow will be reduced, although the specific volume is relatively high, which can
cause problems with the intake section. Adopting a high speed may partially offset this
shortcoming, but it is necessary to use a gear box to drive the electric generator. The steam
turbine can be axial type with one or more stages, or axial radial type recommended for small
enthalpy drops. In this situation we have chosen axial radial type a speed of 9000 rpm.
- a simpler heating circuit, which reduces the cost of the plant and is easy to operate.
Choosing a back-pressure turbine simplifies the thermal circuit compared to a condensing
turbine. We have opted for the lack of preheating of the supply water; in the heating circuit,
only a pressure degasser is provided, 6 bar, which is supplied from the turbine exit orfrom the
live steam by means of a pressure reduction; the supply water temperature will
correspondingly be about 160 oC. For the safety of the heat supply to the heat consumer, there
is also a cooling reduction device in the circuit that bypasses the turbine.
4. PRELIMINARY CALCULATIONS
The following input data is considered:
- the amount of available biomass - given that, presently, the energetic recovery of the vine
rows is happening randomly in very low power plants, we considered the harvesting of the
vines on an area of about 15% of the potential of the Vrancea region, 2550 ha respectively.
For a vine waste production of 3000 kg/ha.year, the annual quantity will be 7650 t/year.
Under these conditions, the amount of heat available for an annual heat supply of 8400 hours /
year and a calorific value of 12400 kJ/kg of vineyards is 93744 GJ/year
- the characteristic parameters of the thermal cycle are:
• estimated boiler efficiency ηcaz = 0,80
• live steam parameters po = 30 bar, to = 300 oC
• turbine outlet pressure pe = 6 bar
• water supply temperature taa= 160 oC
• water supply pressure paa = 36 bar
- the steam flow rate corresponding to these parameters is 1.083 kg/s.
The installed electric power is 0.179 MWe and the thermal power is 2.326 MWt.
The cogeneration plant is expected to operate 8400 hours per year, producing heat and
electricity at nominal capacity. The winter operating time is 4400 hours/year, summer 4000
hours/year. Annually, 1504 MWh/year and 19538 MWt will be produced.
The value of the investment is estimated to be 3,750,000 RON and includes a solid
biomass boiler, a back-pressure turbine (fully equipped), degasser, heat exchangers, pumps

114
(condensation, water supply, district heating), auxiliary (control, pipelines, fittings), bunker
storage, civil buildings, facilities, personal training
The economic analysis period is 10 years. The purchase price of the vines waste is 500
RON/ton, the selling price of electric power is 150 RON/MWe, and the selling price of
thermal energy is a variable that dictates the profitability of the project; a value of
250 RON/MWht was chosen; the return rate of investment r = 10%.
5. RESULTS AND CONCLUSIONS
The solid waste of vineyard can be used in combined heat and power small power plants,
responding to the strategy of distributed energy production, with economical and social
benefits of local community.
The economic performances of the analyzed cogeneration plant show the viability of the
solution. The net present value is 1,211,177 RON; the internal rate or return is 15.71 %, the
investment is recovered in 6.5 years and the ratio benefit/cost is 1.33.
Acknowledgments This work was supported by a grant of the Romanian Ministery of Research and Innovation,
CCCDI – UEFISCDI, project number PN-III-P1-1.2-PCCDI-2017-0404 / 31PCCDI/2018,
and project number 37BMPNIII-P3-199/2016-I05.16. 01, within PNCDI III
References
[1] Mihăescu L., Ceclan M., Oprea I., Prisecaru T., Pîşă I., Ene A., Prisecaru M., Pop E.;„Instalaţii termice
neconvenţionale”, Ed. Perfect, Bucureşti 2002;
[2] Transelectrica, date privind producţia; http://www.transelectrica.ro/web/tel/productie;
[3] Ministerul Agriculturii şi dezvoltării rurale; www.madr.ro/horticultura/viticultura-vinificatie.html;
[4] Anuarul Statistic al României 2015;
[5] Ambros T. "Surse Regenerabile de Energie " - Ed. Tehnică 1999;
[6] Dragan V., Burchiu V., " Energiile regenerabile şi utilizarea acestora" Ed. Ceres 2012;
[7] Victor Emil Lucian "Resurse energetice regenerabile. Ghid practic de proiectare, montaj, exploatare şi
întreţinere a sistemelor de conversie care folosesc resurse regenerabile" – Ed. "Universitara"-2011;
[8] Maican E., Murad E., Haraga G., Biriş S-Şt., „Utilizarea Potenţialului Energetic al corzilor de viţă”,
Camera de Comert si Industrie Râmnicu Vâlcea - iulie 2010.
[9] https://phys.org/news/2015-06-renewable-energy.html#jCp;
[10] Planul naţional de acţiune 2016-2020 privind schimbările climatice;
[11] REN 21 RENEWABLE 2016 · GLOBAL STATUS REPORT;
[12] IEA, World Energy Statistics and Balances, 2015 edition (Paris: 2015);
[13] Begalli, D., Codurri, S., Gaeta, D.: Bio-energy from winery by-products: a new multifunctional tool for
the Italian wine districts. Paper presented at the 113th EAAE Seminar: Belgrade, Republic of Serbia;
[14] Cavalli R., Grigolato St., „Recolta e transformatione dei sarmenti di vite in cippato: disponobilita
potenziale e technica in provincia di Treviso” Universita degli studi di Padova;
[15] Franciscato V., Golfetto M., „Il cippato di vita nella caldaia annulla i costi per gasolio o gpl”, Biomasse,
Analisi delle carrateristiche chimico-energetiche e delle emissioni, Supplemento a L’informare Agrario,
nov. 2010. ;
[16] Barella L., Paniz A., Antonini E., „L’uso energetic dei sarmenti della vite”, Valutazioni tecnico-
economiche di filiere significative, Studio di fattibilitŕ a cura di Veneto Agricoltura e Associazione Italiana
Energie Agroforestali, 2010
MODELLING OF DESULPHURIZATION PROCESS WITH THE
SCOPE OF SO2 EMISSIONS DECREASE AND INCREASE OF
SYNTHETIC GYPSUM QUALITY
Tudor Prisecaru1
1University POLITEHNICA of Bucharest, Faculty of Mechanical Engineering and
Mechatronics, 313 Splaiul Independentei Street2CEPROCIM S.A., 6 Preciziei Street, Bucharest, Romania
An experimental model for wet flue
presented. The model was used to study the modelling of desulphurization process from which
synthetic gypsum it is formed. Results further showed that the process must be controlled in order that
gypsum is settling in good conditions.
Keywords: fluid dynamics, mass transfer,
1. INTRODUCTION
Flue gases desulphurization
for decreasing sulphur dioxide (SO
fossil fuels, with the scope of complying with the emission limit values (ELV).
desulphurization also allows obtaining high quality co
materials [4] in different fields. The objective of the study is the removal of SO2 through
chemical and physical procedures
and co-products [7-9] into the economic value chain. A dynamic model has been developed to
simulate system performance using the operating data provided by a coal
2. METHODOLOGY
For performing laboratory tests an experimental installation was acquired for
desulphurization of gases.
Figure 1. a) and b) Flue gas
MODELLING OF DESULPHURIZATION PROCESS WITH THE
EMISSIONS DECREASE AND INCREASE OF
SYNTHETIC GYPSUM QUALITY
1, Malina Mihaela Prisecaru
1, Razvan Lisnic
2*
University POLITEHNICA of Bucharest, Faculty of Mechanical Engineering and
Mechatronics, 313 Splaiul Independentei Street, Bucharest, Romania
CEPROCIM S.A., 6 Preciziei Street, Bucharest, Romania
ABSTRACT
An experimental model for wet flue gas desulfurization process with a limestone
presented. The model was used to study the modelling of desulphurization process from which
Results further showed that the process must be controlled in order that
m is settling in good conditions.
fluid dynamics, mass transfer, wet FGD, SO2 emissions, synthetic gypsum
esulphurization [1-3] is a technique through which flue gases are treated
for decreasing sulphur dioxide (SO2) concentration produced during combustion process of
fossil fuels, with the scope of complying with the emission limit values (ELV). Flue gases
esulphurization also allows obtaining high quality co-products that can be used as raw
The objective of the study is the removal of SO2 through
chemical and physical procedures [5,6], as well as the integration of waste water management
into the economic value chain. A dynamic model has been developed to
ate system performance using the operating data provided by a coal-fired power plant.
For performing laboratory tests an experimental installation was acquired for
a)
Flue gas desulphurization experimental installation
MODELLING OF DESULPHURIZATION PROCESS WITH THE
EMISSIONS DECREASE AND INCREASE OF
University POLITEHNICA of Bucharest, Faculty of Mechanical Engineering and
, Bucharest, Romania
desulfurization process with a limestone slurry is
presented. The model was used to study the modelling of desulphurization process from which
Results further showed that the process must be controlled in order that
gases are treated
concentration produced during combustion process of
Flue gases
products that can be used as raw
The objective of the study is the removal of SO2 through
], as well as the integration of waste water management
into the economic value chain. A dynamic model has been developed to
fired power plant.
For performing laboratory tests an experimental installation was acquired for
b)
experimental installation

116
For maximizing the efficiency of flue gases desulphurization and increasing of
synthetic gypsum quality influencing the following parameters was considered:
depressurization, interaction time (flowing rate of desulphurization solution) and oxidizing
atmosphere (oxidizing conditions) for ensuring the transformation of sulphite ions into
sulphate ions. Limestone dosing into the aqueous suspension was imposed at 20% and 30%.
Further measurements of gypsum quality will restrict dosing range.
To assess the interfacial mass transfer CFD models prepared were post processed and
reaction rates were represented alongside several axes within the tank, as it is shown in fig 2.
Figure 2. Axes for which reaction rates were processed
These axes are located at three points at 100mm, 300mm and 400mm heights. From their
location point of view three of them are on the symmetry plan of the tank and three are in
lateral at 50 mm from the wall of the secondary reactor’s tank.
In figures 3-8 reaction rates for gypsum forming are presented after all six axes described
above.
Figure 3. Reaction rate for gypsum forming after asymmetrical axis 1

117
Figure 4. Reaction rate for gypsum forming after asymmetrical axis 2
Figure 5. Reaction rate for gypsum forming after asymmetrical axis 3
Figure 6. Reaction rate for gypsum forming after central axis 1c
Figure 7. Reaction rate for gypsum forming after central axis 3c
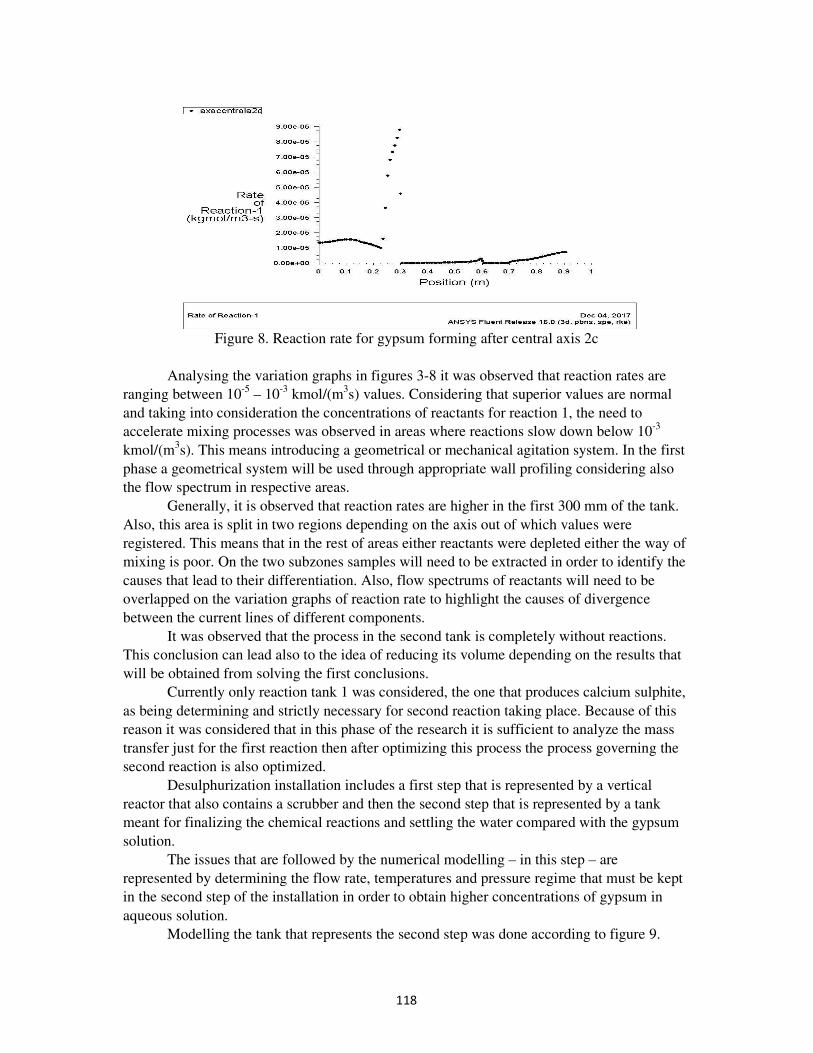
118
Figure 8. Reaction rate for gypsum forming after central axis 2c
Analysing the variation graphs in figures 3-8 it was observed that reaction rates are
ranging between 10-5
– 10-3
kmol/(m3s) values. Considering that superior values are normal
and taking into consideration the concentrations of reactants for reaction 1, the need to
accelerate mixing processes was observed in areas where reactions slow down below 10-3
kmol/(m3s). This means introducing a geometrical or mechanical agitation system. In the first
phase a geometrical system will be used through appropriate wall profiling considering also
the flow spectrum in respective areas.
Generally, it is observed that reaction rates are higher in the first 300 mm of the tank.
Also, this area is split in two regions depending on the axis out of which values were
registered. This means that in the rest of areas either reactants were depleted either the way of
mixing is poor. On the two subzones samples will need to be extracted in order to identify the
causes that lead to their differentiation. Also, flow spectrums of reactants will need to be
overlapped on the variation graphs of reaction rate to highlight the causes of divergence
between the current lines of different components.
It was observed that the process in the second tank is completely without reactions.
This conclusion can lead also to the idea of reducing its volume depending on the results that
will be obtained from solving the first conclusions.
Currently only reaction tank 1 was considered, the one that produces calcium sulphite,
as being determining and strictly necessary for second reaction taking place. Because of this
reason it was considered that in this phase of the research it is sufficient to analyze the mass
transfer just for the first reaction then after optimizing this process the process governing the
second reaction is also optimized.
Desulphurization installation includes a first step that is represented by a vertical
reactor that also contains a scrubber and then the second step that is represented by a tank
meant for finalizing the chemical reactions and settling the water compared with the gypsum
solution.
The issues that are followed by the numerical modelling – in this step – are
represented by determining the flow rate, temperatures and pressure regime that must be kept
in the second step of the installation in order to obtain higher concentrations of gypsum in
aqueous solution.
Modelling the tank that represents the second step was done according to figure 9.

119
Figure 9. Geometrical model of reactor’s
second step
Figure 10. Modelling with hexahedral
synthesis elements of reactor’s second step
Modelling was based on a discretization in a number of approximately 1.5 million pyramidal
elements. For a reduction of calculation volume, it was chosen to group the pyramidal
elements into hexahedral elements according to figure 10.
The process inside step two of the installation consists in the penetration of a gas-
water emulsion composed of nitrogen, carbon dioxide, oxygen, sulphur dioxide, and water as
liquid.
This emulsion was introduced with a rate of 0.7 m/s to not generate a higher
turbulence and to disturb the settling process. The emulsion flow was correlated for an
average equivalent regime of the pilot burning point of 750 kWt. After performing numerical
simulation tests the following results were obtained regarding gypsum formation, as it is
observed in figure 11-13.
Figure 11. Late formation of gypsum.
Figure 12. Rapid formation of gypsum at high turbulence.

120
Figure 13. Normal formation of gypsum.
3. CONCLUSIONS
In figure 11 we can see the gypsum is formed late and settling will be difficult to be achieved.
In figure 16 gypsum is formed immediately but this is due to a turbulence increase, which
makes the separation difficult. In figure 17 a normal gypsum formation process is observed
which allows its settling in good conditions.
Acknowledgement
This work was supported by a grant of the Romanian National Authority for Scientific
Research and Innovation, CNCS/CCCDI – UEFISCDI, project number PN-III-P2-2.1-PED-
2016-0867, within PNCDI III.
References
[1] R. Lisnic, S. I. Jinga, Study on current state and future trends of flue gas desulphurization
technologies: a review, Romanian Journal of Materials 2018, 48 (1), 83 – 90 [2] Patricia Córdoba, Status of Flue Gas Desulphurisation (FGD) systems from coal-fired
power plants: Overview of the physic-chemical control processes of wet limestone
FGDs, Fuel, Vol. 144, March 2015, 274-286
[3] Sectorial Guidelines for EIA: Projects for Flue Gas Desulphurization Installations
in large combustion plants, Joint Assistance to Support Projects in European Regions,
Romania, 2014
[4] A-M Dragomir, R. Lisnic, T. Prisecaru, M. M. Prisecaru, C. A. Vîjan, D. C. Năstac, Study
on synthetic gypsum obtasined from wet flue gas desulphurisation in thermal power plants,
Romanian Journal of Materials 2017, 47 (4), 551 – 556
[5] M. Ploscaru, A.S. Sandulescu, Studiu privind utilizarea tehnologiilor de desulfurare la
CTE din bazinul Oltenia, SERMSTudo, CD-ROM, ISBN:978-606-10-0592-5, 2013
[6] Flue gas desulpurization wet limestone-gypsum process, KC Cottrell Co., Ltd., 2016
[7] M. C. Caillahua, F. J. Moura, Technical feasibility for use of FGD gypsum as an additive
setting time retarder for Portland cement, Journal of Material Research and Technology, 2017
[8] G. Tzouvalas, G. Rantis, S. Tsima, Alternative calcium-sulfate-bearing materials as
cement retarders: Part II. FGD gypsum, Cement and Concrete Research, 34 (11), 119-125,
2004
[9] R. P. Borg, C. Briguglio, V. Bocullo, D. Vaičiukynienė, Preliminary investigation of
geopolymer binder from waste materials, Romanian Journal of Materials 2017, 47(3),370-378

121
ENERGETIC PERFORMANCE INCREASE OF
AN ENGINE-ELECTRIC GENERATOR GROUP
Radoescu Petrisor1, Pana Constantin, Negurescu Niculae, Cernat Alexandru, Nutu Cristian
University Politehnica of Bucharest
ABSTRACT
The main objective of the paper is the energetic performance increase of a diesel engine that
drives an electric generator, the engine-generator group being destined to be used in isolated areas.
In this sense, the authors recommend two solutions: the use of LPG as fuel for engine and the
use of heat from the engine cooling and exhaust gas systems for domestic hot water / heating for a
single dwelling place. Because of the high self-ignition resistance of LPG (CN = -2 ... 3) a diesel
engine with the displacement of 2,216 L was converted into a spark ignition engine, the compression
ratio being reduced from 23.3: 1 to 12.25: 1. A simulation of the thermo-gas dynamics processes into
engine cylinder with AVL Boost software has been carried to highlight the LPG influences on engine
operation. The results of the modeling revealed both the increase of engine thermal efficiency as and
the sharp reduction of the pollutants emissions, especially the NOx concentration.
1. INTRODUCTION
The energetic performance increase of a diesel engine that drives an electric generator can be
achieved by next solutions use: the use of LPG as unique fuel and use of heat from the engine
cooling and exhaust gas systems for domestic hot water / heating for a single dwelling place.
The use of LPG at the diesel engine is recommended for the fossil fuels replacing and
for the pollutants emissions level decrease. The LPG is a good alternative fuel for diesel
engine due to the following aspects [1], [2]: the NOx emission level is lower; CO2 emission is
maintained to the same level; the engine power is the same or can increases; the HC and CO
emissions level decreases; the infrastructure for LPG distribution already exists [3]. Because the high self-ignition resistance of LPG is lower (CN = -2 ... 3) the LPG diesel engine
fuelling can be achieved by the next methods: diesel –gas method or its converting in a spark ignition
engine [3]. At the first method use, LPG is injected in gaseous phase in the engine intake and one
pilot of diesel fuel is injected into combustion chamber assuring the ignition of the air-LPG
mixture and the flame propagates in this mixture [3]. At the second method use, the diesel engine
is converted in a spark ignition engine, the compression ratio being reduced but LPG is a single fuel
[4]. The researches were works performed at University POLITEHNICA from Bucharest on
an automotive diesel engine with LPG fuelled by diesel-gas. The experimental investigations
results showed the NOx and smoke emissions level decrease (NOx emissions level decreases
with 35 % and smoke emission decreases with 40 % ) comparative to diesel fuelling [3, 4].
The paper presents some theoretical results obtained by authors from a research developed for
a diesel engine converted in ignition spark ignition fuelled wit LPG. Are presented influences
of the LPG upon energetic and pollution performance. For the recovery of heat from the
engine cooling system (~ 15% of the available heat) and the exhaust gases (~ 40% of the
available heat) the authors recommend the construction of a system consisting of
appropriately sized heat exchangers, [5].
1Blvd. Splaiul Independentei no. 313, +40721208201, [email protected]
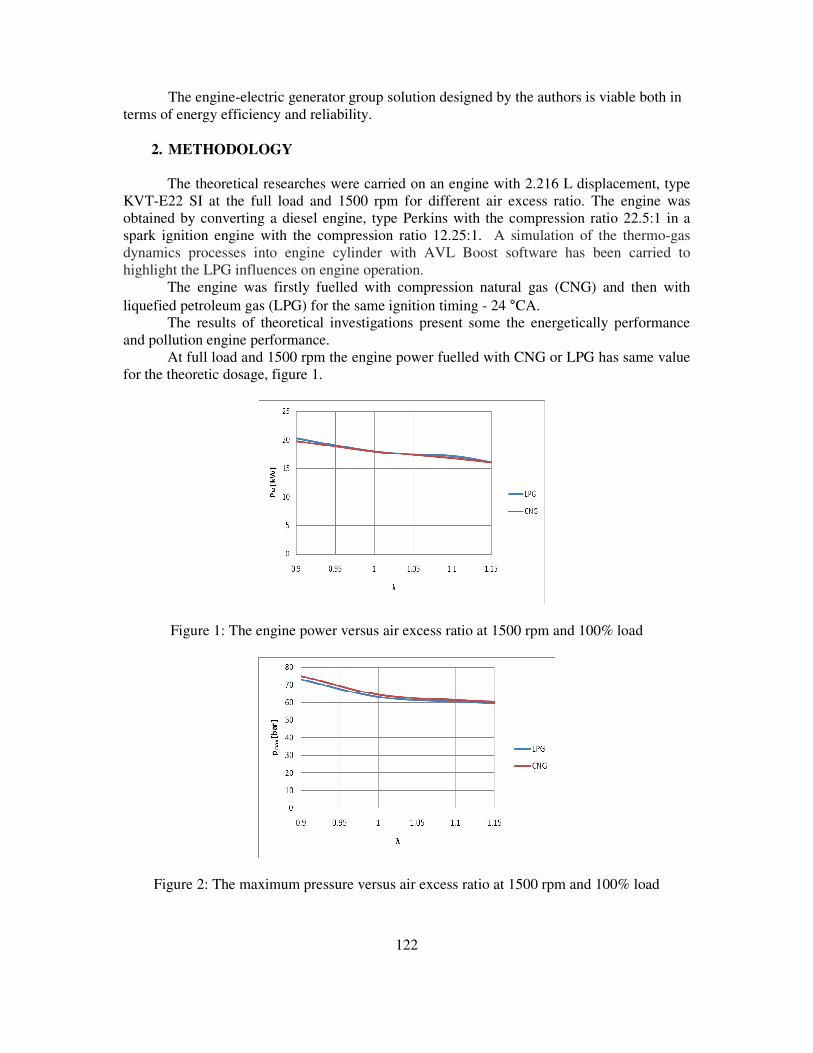
122
The engine-electric generator group solution designed by the authors is viable both in
terms of energy efficiency and reliability.
2. METHODOLOGY
The theoretical researches were carried on an engine with 2.216 L displacement, type
KVT-E22 SI at the full load and 1500 rpm for different air excess ratio. The engine was
obtained by converting a diesel engine, type Perkins with the compression ratio 22.5:1 in a
spark ignition engine with the compression ratio 12.25:1. A simulation of the thermo-gas
dynamics processes into engine cylinder with AVL Boost software has been carried to
highlight the LPG influences on engine operation.
The engine was firstly fuelled with compression natural gas (CNG) and then with
liquefied petroleum gas (LPG) for the same ignition timing - 24 °CA.
The results of theoretical investigations present some the energetically performance
and pollution engine performance.
At full load and 1500 rpm the engine power fuelled with CNG or LPG has same value
for the theoretic dosage, figure 1.
Figure 1: The engine power versus air excess ratio at 1500 rpm and 100% load
Figure 2: The maximum pressure versus air excess ratio at 1500 rpm and 100% load

123
At the CNG use the maximum pressure and the maximum pressure rise rate slight
increase due to easy smaller heat release on volume unit, figures 2 and 3.
Figure 3: The maximum rate rise pressure versus air excess ratio at 1500 rpm and 100% load
Figure 4: Brake specific fuel consumption versus air excess ratio at 1500 rpm and 100% load
Figure 5: The gas temperature versus air excess ratio at 1500 rpm and 100% load

124
In the figure 4 is presented the brake specific fuel consumption (BSFC) variation with
the air excess ratio. At the CNG engine fuelled, BSFC slight increases due to its smaller
combustion rate comparative with LPG. The NOX emission level is smaller at the CNG
engine fuelled, figure 6 because the gas temperature decreases, figure 5 (the flame
temperature is smaller for CNG).
Figure 6: NOx emissions level versus air excess ratio at 1500 rpm and 100% load
3. CONCLUSIONS
The theoretical study shows the main characteristics of the spark ignition engine
converted from diesel engine running at the fuelling with LPG. Use of LPG for engine
fuelling assures its energetic performance impromevent without constructive modifications
comparative to CNG use. Another advantage of LPG use is the distribution infrastructure
developed.
ACKNOWLEDGMENTS
The authors address special thanks to AVL GmbH Graz Austria for providing the necessary
equipments. The work has been funded:
• by a grant of the Romanian Ministry of Research and Innovation, CCCDI-UEFSCDI, project
number PN-III-P1-1.2-PCCDI-2017-0404/31PCCDI/2018 , within PNCDI III”
• by University Politehnica of Bucharest, through the “Excellence Research Grants”
Program, UPB – GEX 2017. Identifier: UPB- GEX2017, Ctr. No. 62 /2017
References
[1] Vijayabalan, P., Nagarajan, G., “Performance, Emission and Combustion of LPG Diesel Dual Fuel Engine
using Glow Plug”, in http://jjmie.hu.edu.jo
[2] Pana, C., Negurescu, N., Popa, M.G., Cernat, A., Despa, P., Bujgoi, Fl.,, “Aspects of the LPG Use in Diesel
Engine by Diesel-Gas Method”, FISITA World 2008, Munchen, 2008.
[3] Pana, C., Negurescu, N., Popa, M. G., Cernat, A., “LPG – Ecological Fuel for Automotive Diesel Engine”, –
“CONAT 2010 –International Congres son Automotive and Transport Engineering”,–Proceedings Volume III,
Automotive Vehicles and Environment, pp 55-64, ISSN 2069-0401, 2010.
[4] Panǎ, C., Negurescu, N., Popa, M.G., Racovitzǎ, A., Boboc, G.,, Improvement of Heavy-duty Diesel Engine
Operation When Using Methanol-Diesel Double Injection Fueling Method” , 5th
International Colloquium
FUELS 2005”, January 12-13, 2005, Technische Akademie Esslingen, Germania, ISBN 3-924813-59-0, pp.137
-142, 2005.
[5] ***pliant-gas-chp-10--72-kWe-2015-R1.pdf, by www.zyraxes.ro

125
ON THE WAY TO APPROXIMATE DIESEL ENGINES
EMISSIONS: A LITERATURE REVIEW
Bogdan Radu
1 and Alexandru Racovitză
2
University “POLITEHNICA” Bucharest, Faculty of Mechanical Engineering
Dept. of Thermodynamics, Engines, Thermal and Refrigerant Machines
ABSTRACT
There is a wide-spread and highly motivated preoccupation in order to offer new perspectives on limiting the
main emissions of Diesel engines. Many researchers try to give a global solution concerning a multi-valuable
model in predicting the emissions’ genesis as a result of engine processes development. The effective
measurement of emissions is basically a slow procedure, depending on a large number of variables and featuring
a limited precision. Therefore, simulation models and results based on approximation functions as variations of
the most sensitive engine factors could be preferable for the combustion process control. The proposed paper is
offering a review of these solutions based on highly advanced modeling programs, proposed by certain authors.
Finding optimal methods to adjust the combustion for reaching desirable efficiency and emissions results is
presumed to highlight itself as the main goal of the presented work.
Key Words: Diesel Engine, Combustion and Emissions Control, Advanced Simulation, Efficiency
1. INTRODUCTION
Numerous research activities have strongly certified that modern Diesel engines are to
accomplish complex and meanwhile opposite aims not only in stationary, but mainly in
transient operating conditions, meaning that they are requested to rate high performance, to
generate low emissions and featuring high operation efficiency.
The allowable limits for NOx and soot Diesel emissions have drastically decreased
from Euro 1 down to Euro 6d standards, despite the fact that representative driving cycles
have not significantly changed related to the applied technology update, such as the use of
Diesel Oxidation Catalyst, Cooled EGR, Diesel Particulate Filter or Lean NOx Trap [1]. In
order that Diesel engines main simulation emissions comply with those of real drive
measurement, engines calibration made in the area of steady-state speeds and loads must
extend upon the driving transient behavior, driver disturbances and transient ambient
conditions.
Corresponding to a first view, phenomenological models may predict the values for
the indicated mean effective pressure (IMEP) according to the rated torque and to the NOx
and smoke emissions on a cycle-by-cycle analysis. Results show a well prediction for the
emissions resulted from stationary operating conditions (speeds within 1500 and 3000 rpm
and IMEP values between 2.5 and 7.5 bar) and a slight deviation in case of smoke emissions
for transient operation, explained by a low pass characteristics of the measurement apparatus
1 Assoc. Prof., PhD, Eng, 313 Splaiul Independentei, sect.6, 060042, Bucharest, tel.: 0040-21-4029451,
e-mail: [email protected] 2 Sr. Lect., PhD, Eng, 313 Splaiul Independentei, sect.6, 060042, Bucharest, tel.: 0040-21-4029451,
e-mail: [email protected]

126
[2,3]. Following these ideas, charting engine maps of fuel use according to imposed values for
performance and emissions referring to transient driving cycles’ conditions is a novel way to
cover a range of various vehicles operation. Thus, the availability of accurate engine maps
across a number of vehicles (DAF, Chevrolet Cruze and Volkswagen Golf) has been verified
under specific conditions, like those stipulated by the main Urban Dynamometer Driving
Schedule (UDDS), by Federal Test Procedure (FTP), Highway Fuel Economy Test (HWFET)
and by the high speed and aggressive US06 driving cycle [4]. These maps include: the
insights into how control technologies can be tuned to reduce emissions under real driving
conditions, the development of the in-use emissions factors, the identification of driving
conditions corresponding to the most significant and incidental of fuel use and emissions
events and the adjustment of the air-fuel mixture formation, using simulated per second
emissions for vehicles operating in the urban environment or on certain road segments.
An example of a new strategy calculates set points for the Engine Management
System (EMS) for controllable fuel quantities with the purpose to minimize fuel consumption
for a given engine speed and requested torque profile, while keeping accumulated emissions
below given limits. There were followed three (EMS) evaluating approaches, using a
complete Diesel engine vehicle system model and simulating the NEDC driving cycle (the
injected fuel varied from 0 to 35 mg, while speed values were taken between 750 and 2250
rpm): one is based on the steady-state methodology and two others use explicit transient
compensations in terms of boost pressure and Oxygen fractions as feedback signals [5]; the
conclusions were that large differences were noticed between the first and those last
approaches while small differences were characterizing the results in-between the transient
approaches. Much further, following the new 5-cylinders Volvo Diesel (2-liters) engine
testing, a globally optimized, smoothed and regressive parameter based B-Spline function was
applied in order to fit data measured in static conditions, with engine speed and injected fuel
as input signals [6]. It was noticed that under the transient driving conditions the developed
model was able to replicate only partially the emissions results.
For real-time applications, it is not reasonable to model the emissions only by
phenomenological models, because of the large complexity of the physical and chemical
reactions in the cylinder of an ECU-controlled engine. Therefore, beside phenomenological
and map-based models there are semi-empirical models concerning NOx and soot estimation.
These ones are based on polynomial functions, where the influence of each input parameter
should be known from steady-state engine behavior [7,8,9].
There are also other modeling techniques called Artificial Neural Networks (ANN),
developed as parallel processing algorithms, such as Multi-Layer Perceptron (MLP)[10], or
Time-Delay Recurrent (TDNN) [11]. These networks rely upon each input data to be labeled
with a target output to achieve. For a given structure, a network algorithm can be expressed
by an equation whose parameters are calculated by a training process. Training a neural
network means to involve input patterns from which particular adjustments derive, based on
the performance of the network in that point of time [12,13]. One more example consists in
the use of a Self Organizing Map (SOM). One of the SOM’s advantages is the fact that the
distribution of the “neurons” can be adjusted according to the requirements of the given task.
It covers also statistics, signal processing and control theory [14].
Next paragraph is offering an analysis of various functions to determine emissions
values, using experimental data and results obtained by advanced modeling programs.
Finding certain methods to adjust the combustion for reaching desirable efficiency and
emissions results represents also another goal of the presented work.

127
2. MATHEMATICAL MODELS TO EXPRESS THE EMISSIONS
The theoretical calculation of nitrogen oxides and soot formation is a far complicated
issue, due not only to their genesis mechanism, largely known, but mostly because to the fact
that these reactions occur in very special zones of the combustion chamber. There are two
empirical formulas based on a large number of experiments in order to evaluate the two type
emissions as a function of the cylinder conditions and the pressure diagram characteristics
[15,16]:
(1)
(2)
in which the symbols have the following meaning: K1, K2 are the proportionality coefficients,
each for each emission type; ZV is the autoignition delay; α1 is the angle formed with the
horizontal axis by the line between the combustion starting point and the highest point of the
heat release characteristic; α2 is the angle formed with the horizontal axis by the line between
the combustion ending point and the highest point of the heat release characteristic (see
Figure 1); (dp/dφ)max is the maximum rate of the pressure increase, peaked from the pressure
diagram; O2 is the oxygen concentration from the exhaust gas; (mair/mfresh charge) is the ratio
between the air quantity and the entire fresh charge;
Fig.1.Diesel Engine heat release characteristic
Other studies, relying on numerous experimental points obtained by testing a 4-stroke,
single cylinder, L70 Diesel engine (4,5 kW output at 3000 rpm) and fueled also by Palm-tree
Oil based Biodiesel established high-confidence prediction equations for NOx and soot
formation [g/kWh], as for the engine BSFC [g/kWh] and Rated Power [kW], expressed as
linear combinations between certain of the engine most influencing parameters, for each of
the tested fuels (Diesel and Biodiesel) [17]:
NOx ,Soot ,BSFC,Rated Power= Fk(ES, AF ,CR,HD ,RP, IT ,EC, II ) (3)
in which: ES is the engine speed [rpm], AF is the air-fuel ratio [-], CR is the compression
ratio [-], HD is the injector hole diameter [mm], RP is the rail pressure [bar], IT is the
injection timing [ºCA ATDC], EC is the exhaust valve clearance [mm] and II is the intake
inner valve seat [mm].

128
3. CONCLUSIONS
Nowadays, the trend in estimating the impact of the emissions’ levels is to train massive
neural networks build on high-scale numbers of experimental reference points. As main
variables, besides engine types and engine parameters, other completely new influences are
studied, as changing driving cycles’ operations and users’ behavior, during non-stationary
conditions.
Other conventional approaches maintain certain sorts of mathematical functions in order
to provide by reasonable prediction range the emissions numbers related to particular engine
types and their operation, steady-state or transient.
The authors of this proposed work inscribe all along their efforts to join nevertheless the
second research point of view which is by the time well enough conclusive when reasonably
limiting the more increasing number of the analysis variables.
References
[1] COMMUNICATION FROM THE COMMISSION TO THE EUROPEAN PARLIAMENT, THE COUNCIL,
THE EUROPEAN ECONOMIC AND SOCIAL COMMITTEE AND THE COMMITTEE OF THE REGIONS
CARS 2020: Action Plan for a competitive and sustainable automotive industry in Europe, http://eur-
lex.europa.eu/legal-content/EN/TXT/?uri=celex%3A52012DC0636
[2] Makovicki, T., Bitzer, M., Kotman, P., Graichen, K. – A Combustion Cycle Model for Stationary and
Transient Engine Operation, IFAC Papers OnLine 49-11 (2016), pp.469-475. [3] Makovicki, T., Bitzer, M., Godde, S., Graichen, K. – Cycle-by-Cycle Optimization of the Combustion
During Transient Engine Operation, IFAC – Papers OnLine, 50-1 (2017), pp.11046-11051. [4] Bishop, J.D.K., Stettler, M.E.J., Molden, N., Boies, A.M. – Engine Maps of Fuel Use and Emissions from
Transient Driving Cycles – ELSEVIER Applied Energy 183 (2016), pp.202-217. [5] Grahn, M., Johansson, K., McKelvey, T. – A Transient Diesel EMS Strategy for Online Implementation,
Proceedings of the 19-th World Congress of IFAC, Cape Town, South Africa, August 24-29, 2014, pp.11842-
11847. [6] Velmurugan, D.V., Grahn, M., McKelvey, T. – Diesel Engine Emissions Model Transient Cycle Validation,
IFAC Papers OnLine, 49-11 (2016), pp.001-007. [7] Tschanz, F., Amstutz, A., Onder, C.H., Guzzella, L. – A Real-time Soot Model for Emissions Control of a
Diesel Engine, 6-th IFAC Symposium of Advances in Automotive Control, 2010, pp.222-227. [8] Mrosek, M., Sequenz, H., Isermann, R. – Control Oriented NOx and Soot Models for Diesel Engines, 6-th
IFAC Symposium of Advances in Automotive Control, 2010, pp.234-239. [9] Tschanz, F., Amstutz, A., Guzzella, L., Barro, C., Obrecht, P., Boulouchos, K. – Control of the PM and NOx
Emissions in Diesel Engines Using a Virtual Soot Sensor – 21-st Aachen Colloquium in Automobile and Engine
Technology, 2012, pp.1261-1286. [10] https://en.wikipedia.org/wiki/Multilayer_perceptron
[11] https://en.wikipedia.org/wiki/Time_delay_neural_network
[12] Arsie, I., Marra, D., Pianese, C., Sorrentino, M. – Real-time Estimation of Engine NOx Emissions via
Recurrent Neural Networks, 6-th IFAC Symposium of Advances in Automotive Control, 2010, pp.228-233. [13] Henningson, M., Tunestal, P., Johansson, R. – A Virtual Sensor for Prediciting Diesel Engine Emissions
from Cylinder Pressure Data, 2012 IFAC Workshop on Engine and Powertrain Control, Simulation and
Modelling, pp.424-431. [14] Fischer, M. – Transient NOx Estimation Using Artificial Neural Networks, The 7-th IFAC Symposium on
Advances in Automotive Control, Sept.4-7, 2013, Tokyo, Japan, pp.101-106. [15] Wenzel, S.,P., Modellierung der Russ und NOx Emissionen des Dieselmotors, Dissertation zur Erlangung
des akademischen Grades Doktoringenieur, Magdeburg Universitat 2006. [16] Radu, B., Chiriac, R., Racovitza, A., Soot and smoke emissions numerical evaluation for a direct injection
(DI) Diesel engine, MSE International Conference, June 2017, ULBS, Sibiu, ROMANIA. [17] Jo-Han, Ng., Jing, H.K., Wong, K.W., Srithar, R., Chang, C.T., Statistical Analysis of Engine System-Level
Factors for Palm Biodiesel Fueled Diesel Engine Responses, The 7-th International Conference of Applied
Energy – ICAE 2015, Energy Procedea 75(2015), pp.99-104

129
RESULTS FROM AN ENERGY AUDIT OF A
JOINT-STOCK COMPANY “MEDICA AD”, BULGARIA
Violeta Rasheva1, Veselka Kamburova
2, Michail Velikanov
3
1University of Food Technologies, Bulgaria,
2University of Ruse “Angel Kanchev”, Bulgaria;
3Encon Services International, USA
ABSTRACT
The proposed energy efficiency project includes modernization of the indoor air conditioning and
ventilation systems and a solar water heating system in company produces medical supplies. Some of
the company’s main products include band-aids and bandages. The total investment is EUR 560,136.
As a result of the investment, the energy usage declines by 413 MWh per year or by 35,4% and CO2
emissions decline by 159 tons CO2 per year or by 32,2%.
1. INTRODUCTION
Europe's energy policy forms part of the overall objectives of the EU's economic policy.
The starting points of the European energy policy are three: limiting climate change,
promoting growth and jobs, and limiting EU dependence on imported natural gas and
petroleum products. European policy is geared towards ensuring security of energy supply
and introducing an integrated approach to energy efficiency. Energy saving is the most direct
and economically effective way to address these energy challenges [13 , 14]. That is why the
Bulgarian national policy follows the priorities and the long-term goals of the European
policy for sustainable energy development [4, 5].
The aim of this study is to establish the possibilities for reduction of energy consumption
and CO2 emissions in “Medica JSC” through implementation of appropriate cost effective energy
conservation measures (ECM) and to ensure the normative parameters in the working premises.
2. METHODOLOGY
The subject of study is the pharmaceutical company “Medica JSC”. The company is
located in the town of Sandanski, located in southwestern Bulgaria, about 156 km away from
Sofia. Some of the company’s main products include band-aids and bandages. The company
is a legal entity with an annual turnover of EUR 9,635,807 and total assets of EUR
13,771,647. The total number of staff is 236. The company is classified as a SME.
The one-storey building occupies an area of 1,811 m2 and
the heated volume of the
building is 5,434 m3. The energy audit and model study of the building was done according to
the standardized method for determination of annual energy consumption in buildings BDS
EN 13790 and was carried out with EAB software in compliance with the normative
documents in the field of energy efficiency [3, 8, 9, 10, 11]. The conversion factor of final energy
to primary energy is 3 for electricity and 1.1 for LPG and conversion factor of final energy to
CO2 emissions is 0.683 tCO2/MWh for electricity and 0.272 tCO2/MWh for LPG [1, 6].
For the purpose of the model study, the building is considered an integrated system with
the main components: building envelope structures and elements, microclimate maintenance
systems, internal heat sources, occupants and climatic conditions [2, 3, 7].
1Professor PhD
University of Food Technologies, Bulgaria; tel:+359897910737; e-mail: [email protected]

130
3. ANALYSIS OF THE TECHNICAL CONDITIONS AND OPERATION OF
BUILDING AND EQUIPMENT INSTALLED IN IT
Energy consumption: "Medica JSC" consumes electricity and LPG (propane-butane). The
analysis of energy consumption is based on data provided by the accounting department of the
company. The annual energy consumption for the period 2011 - 2013 is presented in Table 1. Fig. 1 shows the monthly distribution of the electricity consumed for the same period. The
monthly consumption of LPG for the period 2011 - 2013 is presented in Fig. 2.
Table 1: The electricity and LPG consumption for the period 2011 - 2013
Year Electricity propane-butane
MWh/wear t/wear
2011 1,522,922 77.48
2012 1,785,955 98.18
2013 1,597,384 70.50
Figure 1: Electricity monthly consumption for the period 2011 - 2013
Figure 2: LPG monthly consumption for the period 2011 - 2013
The highest electricity consumption is observed during the summer months (June and
July), which is related to the air conditioning of the work premises. In August, most of the
staff has its annual leave, and some of the work premises do not work for a certain amount of
time, that is why less energy is consumed during this month. Energy consumption during the
winter months (January and February) rises due to lower outside temperatures. In December,
the energy consumption is lower than in other winter months due to the closure of work
premises for Christmas and New Year holidays.

131
LPG as an energy carrier is used to produce steam with the parameters required for the
technological lines. Besides for industrial purposes, heat is also consumed for heating and
domestic hot water (DHW). The analysis of LPG consumption for the 2011-2013 period shows
that the smallest consumption is in August, which is related to the staff annual leave and
shutdown the equipments for a certain amount of time. The biggest consumption of LPG is in
winter months when the heat produced by boilers is used for premises heating.
The building and the production facility operates 5 days per week for 9 hours per day. It
is heated using an existing propane-butane fired steam boiler (efficiency assumed to be 90%).
The building’s design indoor temperature during the heating season is +22oC. The company
uses the existing LPG fired boiler for heating DHW. The estimated energy consumption for
heating is 16,936 kWh per year (or 18,630 kWh/yr. primary energy equivalents).
The building is cooled using the existing ventilation and air conditioning system (for
cooling only, EER=2.2 W/W). The building’s design indoor temperature during the cooling
season is +25oC. Various production areas have different requirements for air purity and air
exchange. The mounted ventilation system has a total fans output of 137 kW. The building interior is lit by luminescent and halogen lamps, depending on the desired light
conditions in each specific production area. The total installed lighting capacity is 18.382 kW.
The annual energy use for space heating is estimated to be 184,460 kWh. The annual
energy use for heating the fresh air for ventilation is estimated to be 537,489 kWh or in total
722,309 kWh/yr. energy from LPG and 794,540 kWh in primary energy equivalents.
The annual energy use for cooling is estimated to be 51,275 kWh. The annual energy use
for cooling the fresh air for ventilation is estimated to be 376,432 kWh or in total 427,707
kWh/yr. of in primary energy equivalents 1,283,121 kWh/yr.
The existing system’s estimated total annual energy consumption for all the systems is
1,166,952 kWh (or 2,096,291 kWh/yr. of primary energy). The annual CO2 emissions are
488.59 tons. The data of present energy consumption are presented in Table 2.
Table 2: Present energy consumption
Sector Energy consumption Primary Energy Consumption CO2 Emissions
- kWh/yr. kWh/yr. tCO2/yr.
Heating 722,309 794,540 196.5
Cooling 427,707 1,283,121 292.1
Domestic hot water 16,936 18,630 4.61
Total 1,166,952 2,096,291 493.2
Building envelope: The outside walls of the building are constructed of thermo-insulated
panels made of an insulating material, covered by inner and outer metal sheets.
The floor of the building is made of reinforced concrete plates, which are 15 cm thick.
Under the plates is a layer of rammed earth (15 cm in thick).
The roof is made of insulated plates. There is hydro-insulation installed on the outer side
of the plates.
The windows and the doors: The building’s windows have PVC frames and double
glazing. The total area of the windows is 13 m2. There are two doors with PVC frames with
insulating material between the frames. The total area of these doors is 15 m2.
In general, the condition of the building shell (facades, floor, roofs and windows) is good.
The building shell’s heat transfer coefficients do meet the current requirements, set on [12].
The area, the heat transfer coefficients and direction of the elements of the building shell
are presented in Table 3.

132
Table 3: The area, the heat transfer coefficients and direction of the building shell elements
Building
shell
elements
U values Directions
south-east north-east south- west north-west
W/m2K m
2
Walls 0.20 309 87 90 296
Windows 2.25 6 3 0 4
Doors 2.70 0 0 0 15
Floor 1.00 1,811
Roof 0.35 1,811
4. SUGGESTIONS FOR ENERGY EFFICIENCY IMPROVING
Two energy saving measures (ECM) are foreseen:
ECM 1: Replacement of air conditioning and ventilation system
The building has an existing heating, ventilation and air conditioning system (HVAC),
but it has not been renovated since it was first installed in 2002. It does not meet the modern
requirements for thermal comfort and process conditions, which is why its replacement is
recommended. There is no system for recovery of exhaust air. The installation of heat exchangers for heat recuperation will reduce the cost of building
heating and cooling. The project envisages renovating and replacing portions of the building’s
space heating, water heating and cooling and ventilation systems as well as installation of a
new modern building management system.
The company intends to reduce the energy consumption of the building by installing: New
chiller; New ceiling-mounted four way convection units; New ventilation grids; New
Building Monitoring System (BMS) for monitoring and controlling the building’s indoor
climate systems; New piping required to ensure the normal functioning of the new convection
units; New ventilation air-preparation units for the different indoor climate zones; Heat
recovery unit; New auxiliary items, needed for normal functioning of the new systems
The project will replace the existing chiller system and will include all the necessary
auxiliary piping and control systems, as well as indoor cooling and heating units. This will
allow the use of a more advanced chiller, with a higher EER (Energy Efficiency Ratio). The
new chiller will significantly reduce the energy required for cooling the water for air
conditioning. In combination with the new and improved ventilation system the total energy
consumed for air conditioning and cooling of fresh air for ventilation will decrease.
As for the building’s heating needs, the project includes a heat recovery system to further
reduce energy consumption. Since the company will use their existing LPG boiler the effect
of the heat recovery system will be to reduce the energy consumption by preheating the fresh
air with the exhaust air that would otherwise be released into the atmosphere, during the
heating season.
ECM 2: Installation of new solar collectors for DHW. DHW for dressing rooms and
other living rooms is heated with steam-water heat exchanger. That’s way it is proposed to be
installed solar collectors, which will lead to the saving of propane butane.
Solar panels for heating domestic water will be installed on the roof of the building, as well
as all necessary system components and will decrease the energy required for heating water.
5. RESULTS
According to the calculation model, after the building improvements, the annual energy
consumption for heating is 185,664 kWh and for heating the fresh air is 243,431 kWh The
total energy consumption for heating will decrease to 429,075 kWh/yr. or primary energy
equivalent of 471,983 kWh/yr.

133
The energy savings from domestic hot water (DHW) after the installation of the new
solar system is 6,464 kWh/yr. (or 7,110 kWh/yr. primary energy). This will result in decrease
of LPG used by the boiler by 498.8 kg/yr. In addition, electricity consumption will increase
due to the solar system’s pump, required for its normal functioning. The amount of this
increase will be 847 kWh/yr. or 2,541 kWh/yr. in primary energy.
For cooling the required energy will decrease to 37,601 kWh/yr. and for cooling the fresh
air from the ventilation system - 276,050 kWh/yr. The total energy consumption for cooling
will decrease to 313,651 kWh/yr. or in equivalent primary energy – 940,953 kWh/yr.
The LPG consumption will decrease to 439,547 kWh/yr. and the electricity consumption
for cooling and hot water will decrease to 314,498 kWh/yr. The total energy consumption will
decrease to 754,045 kWh/yr. or in equivalent primary energy to 1,424,454 kWh/yr. The total
energy savings from LPG are 299,698 kWh/yr. or (329,668 kWh/yr. primary energy), while
the electricity savings are 113,209 kWh/yr. The data about expected energy consumption after
ECMs are presented in Table 4 and expected energy savings are presented in Table 5. The
Project’s cost breakdown is presented in Table 6.
Table 4: Expected energy consumption
Sector Energy consumption Primary Energy
Consumption CO2 Emissions
- kWh/yr. kWh/yr. tCO2/yr.
Heating 429,075 471,983 116.7
Cooling 313,651 940,953 214.2
Domestic hot water 11,319 14,060 3.4
Total 754,045 1,424,454 334.4
Table 5: Annual energy savings
Final energy Primary energy CO2 Emissions
kWh/yr. kWh/yr. tCO2/yr.
Old equipment 1,166.9 2,096.3 493.2
New equipment 754.1 1,424.5 334.4
Savings 412.9 671.8 158.8
Savings 35.38 % 32.05% 32.2%
Table 6: Project Cost Breakdown
Project Costs*) BGN EUR
Heating and cooling centers 311,718 159,379
Solar system for DHW 8,827 4,513
Ventilation in clean rooms 153,295 78,378
Ventilation in industrial area 93,943 48,032
Ventilation in weaving section 60,661 31,015
Ventilation in storage and sterilization area 128,250 65,573
Ventilation in auxiliary rooms 14,259 7,290
Building management system (BMS) 324,579 165,955
Total Project Cost 1,095,136 560,136
Note: * w/o VAT

134
The system will not increase production, because the proposed equipment is not related to
the plant’s production process.
6. CONCLUSIONS
An Energy Audit of "Medica JSC" was completed. The project will improve the energy
efficiency of the company. The building’s installations renovation will save significant
amounts of energy and reduce CO2 emission. For all the systems to function efficiently the
project includes a new state-of-the-art building monitoring system (BMS). This will further
decrease the building’s energy consumption by optimizing the work regimes of the different
components as well as the interactions between them.
The final energy savings from LPG are 299,698 kWh per year (or 329,668 kWh/yr.
primary energy), while the final electricity savings are 113,209 kWh per year (or 339,627
kWh/yr. primary energy). The total energy savings are 412,907 kWh per year (or 671,836
kWh/yr. primary energy). Energy saving ratio is 35.4%. Energy savings were calculated
using data about the working regimes of the company and electricity consumption of old and
new equipment.
The CO2 emissions savings from LPG are 81.52 tCO2/yr. while the CO2 emissions
savings from electricity are 77.32 tCO2/yr. The total CO2 emissions savings are 158.84 tons
per year or 32.2%.
The estimated lifetime of the implemented equipments is 15 years (based on the typical
life of such equipment).
Another possibility for reduction of energy costs is the gasification of the plants. Thus,
LPG, which is transported to the plant, will be replaced by natural gas.
References [1] Electricity Emission Factors Review, November 2009, developed by MWH S.p.A и Commission Decision
of 29.01.2004 Establishing guidelines for the monitoring of green house gas emissions pursuant to Directive
2003/87/EC of the European Parliament and of the Council.
[2] Iliev, I, N. Kaloyanov, P. Gramatikov, V. Kamburova, A. Terziev, I. Palov, S. Stefanov, K. Sirakov. Energy
Efficiency and Energy Management Handbook, Bulgaria Energy Efficiency for Competitive Industry Financing
Facility (BEECIFF): Project Preparation, Capacity Building and Implementation Support. Sofia, Ministry of
Economy, Energy and Tourism (“MoEET”), 2012.
[3] Kaloianov, N., V. Sharankov and others. Guide to Energy Efficiency Audits and Certification of Buildings.
TU - Sofia, 2006.
[4] Law of energetics, https://www.me.government.bg/bg/library/zakon-za-energetikata-256-c25-m0-1.html
[5] Law on energy efficiency, http://www.seea.government.bg/documents/ZEE_30.12.2016.pdf
[6] Methodology for determining the harmful gases emitted into the atmosphere in balance method issued by the
Ministry of Environment and Water in 2000.
[7] Rasheva, V., Energy-technological analyses of industrial systems. Academic Publishing House of UFT,
Plovdiv, 2011 (in Bulgarian).
[8] Regulation № E- РД-04-05 of September 8, 2016 for the determination of energy consumption indicators,
energy performance of enterprises, industrial systems and external lighting systems, as well as for setting the
terms and conditions for conducting energy efficiency audits and preparation of energy savings assessment;
[9] Regulation № Е-РД-04-1 of 22.01.2016 on energy efficiency audits, certification and assessment of energy
savings of buildings;
[10] Regulation № E-РД-04-2 from 22.01.2016 on the indicators for energy consumption and energy
performance of buildings;
[11] Regulation № РД-16-932 of 23 October 2009 on terms and conditions for carrying out the verification of
energy efficiency for hot water boilers and air conditioning installations under article 27, al. 1 and article 28, al.1
of the law on energy efficiency and for establishing, maintenance and use of the basis data about them;
[12] Regulation № 7 of 2004 on Energy Efficiency of Buildings.
[13] https://ec.europa.eu/energy/en/topics/energy-strategy-and-energy-union/2030-energy-strategy
[14] htpp://www.seea.government.bg/

135
THE USE OF LOW TEMPERATURE GEOTHERMAL ENERGY AT
HISTORICAL BUILDINGS - CASE STUDY FOR A HOTEL
Paula TUDOR1, Victor-Eduard CENUȘĂ2
, Diana BAN (TUȚICĂ)3, Iulian DUȚU
4
University Politehnica of Bucharest
ABSTRACT
The use of geothermal low-temperature sources in historic buildings depends both on the
geothermal potential of the area and on the restrictions imposed by the protection of the building's
artistic elements. The paper presents various solutions for the heat supply of a historic building by
using geothermal low temperature potential. The paper also details the results obtained from the
calculation of the sizing of the floor heating system and the heat exchange surface between the
geothermal fluid and the secondary fluid that transmits the heat inside the building.
1. INTRODUCTION
The use of renewable energies in historic buildings must take into account a number of
factors including: the potential of renewable sources in the area, the climate characteristic of
the area to which the building is part, the legislation on historical buildings by keeping intact
the architectural elements [1, 2], the energy efficiency of the building and the search for ways
to increase it [4, 5], etc. Also, the use of heat pumps increases the thermal level of heat
utilization, its quantity and the possibility of using them for cooling [5]. Solutions for the
production of several forms of energy need to be considered according to local requirements
[6]. It is therefore necessary to carry out case studies that take into account the characteristics
of each historic building and the energy potential of the area in which it falls.
2. CASE STUDY
The analyzed building, in the case study, is part of a tourist complex located in Baile
Herculane resort, in south-western Romania. It was built in the 18th century and rebuilt in
1906. Currently, the building is declared a historic monument and is part of a rehabilitation
process. In figure 1 is presented a picture that highlights both the exterior appearance of the
building and the degree of degradation of the facade, as well as the size, which is done on 6
levels in the structure: basement, ground floor, mezzanine and 3 floors.
Near the building, which is part of the imperial center of the Herculane Baths, there is a
source of geothermal water from two drillings with a temperature of about 55 °C. Taking into
account this particularity of the site, the solutions proposed in this paper for the achievement
of the heating are as follows:
A. Floor heating + radiant panels:
- floor heating, using the heat of the water from the geothermal wells;
- use of radiant panels to cover peak thermal demand;
B. Floor heating + heat pumps:
- underfloor heating, using heat from geothermal wells;
Splaiul Independenței 313, Bucharest, Romania, +0214029434, [email protected], [email protected],
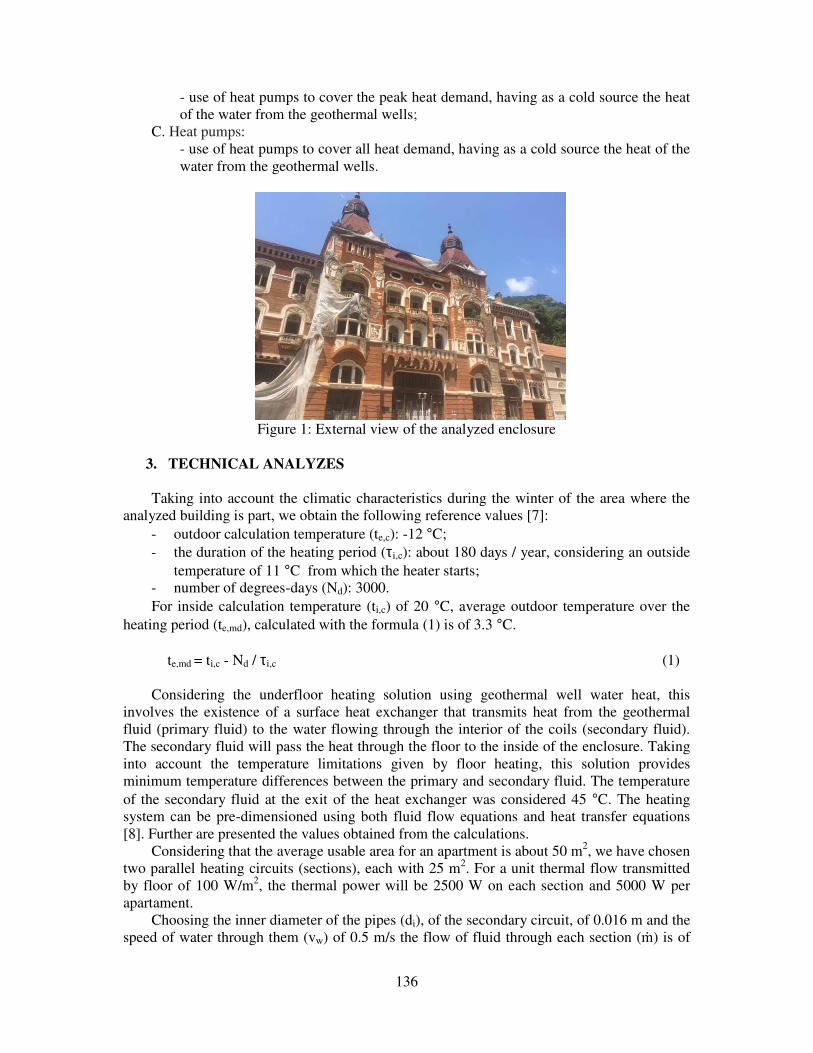
136
- use of heat pumps to cover the peak heat demand, having as a cold source the heat
of the water from the geothermal wells;
C. Heat pumps:
- use of heat pumps to cover all heat demand, having as a cold source the heat of the
water from the geothermal wells.
Figure 1: External view of the analyzed enclosure
3. TECHNICAL ANALYZES
Taking into account the climatic characteristics during the winter of the area where the
analyzed building is part, we obtain the following reference values [7]:
- outdoor calculation temperature (te,c): -12 °C;
- the duration of the heating period (τi,c): about 180 days / year, considering an outside
temperature of 11 °C from which the heater starts;
- number of degrees-days (Nd): 3000.
For inside calculation temperature (ti,c) of 20 °C, average outdoor temperature over the
heating period (te,md), calculated with the formula (1) is of 3.3 °C.
te,md = ti,c - Nd / τi,c (1)
Considering the underfloor heating solution using geothermal well water heat, this
involves the existence of a surface heat exchanger that transmits heat from the geothermal
fluid (primary fluid) to the water flowing through the interior of the coils (secondary fluid).
The secondary fluid will pass the heat through the floor to the inside of the enclosure. Taking
into account the temperature limitations given by floor heating, this solution provides
minimum temperature differences between the primary and secondary fluid. The temperature
of the secondary fluid at the exit of the heat exchanger was considered 45 °C. The heating
system can be pre-dimensioned using both fluid flow equations and heat transfer equations
[8]. Further are presented the values obtained from the calculations.
Considering that the average usable area for an apartment is about 50 m2, we have chosen
two parallel heating circuits (sections), each with 25 m2. For a unit thermal flow transmitted
by floor of 100 W/m2, the thermal power will be 2500 W on each section and 5000 W per
apartament.
Choosing the inner diameter of the pipes (di), of the secondary circuit, of 0.016 m and the
speed of water through them (vw) of 0.5 m/s the flow of fluid through each section (ṁ) is of

137
0.1 kg/s and water temperature difference in the secondary circuit (Δt) of 6 °C. It was
considered that the density of water, at the average pressure and temperature in the pipes, is
990 kg/m3. For di = 0.014 m, results ṁ = 0.076 kg/s and Δt = 7.8 °C, if the same water flow
rate is considered. For vw = 0.6 m/s temperature differences of 4.98 °C are obtained,
respectively of 6.5 °C and water flows of 0.12 kg/s, respectively of 0.091 kg/s. Any of the
previous variants can be selected, but taking into account that the optimal temperature
difference is 5 ° C, we choose the variant: di = 0.016 m, vw = 0.6 m/s, ṁ = 0.12 kg/s.
Figure 2: LMTD vs. geothermal fluid outlet temperature
Figure 3: Heat transfer area vs. geothermal water outlet temperature
Therefore, the temperatures of flow and return of the secondary fluid will be 45 °C,
respectively of about 40 °C. For the sizing of the heat exchanger, we will make calculations
for a reference heating surface of 1000 m2, equivalent to 20 apartments. The total secondary
fluid flow will be 4.8 kg / s in this case and the total thermal power required for heating the
considered area will be about 100 kW. The Reynolds number of about 15000 indicates a
turbulent flow regime inside the heat exchanger pipes.
The variation of the logarithmic mean temperature difference (LMTD) with the
geothermal fluid outlet temperature has been showed in the Figure 2.
5
6
7
8
9
10
11
12
43 44 45 46 47 48 49 50 51 52
LM
TD
[°C
]
Geothermal fluid outlet temperature [°C]
5
6
7
8
9
10
11
12
13
14
15
43 44 45 46 47 48 49 50 51 52
Hea
t tr
an
sfer
are
a [
m2
]
Geothermal fluid outlet temperature [°C]
U = 1.2
U = 1.4
U = 1.6

138
Considering the heat exchanger overall heat transfer coefficient (U) between 1.2 and 1.4
kW/m2/K, the total heat transfer area has been computed depending on the geothermal fluid
outlet temperature from the heat exchanger and U (Figure 3).
4. CONCLUSIONS
In the paper there were presented several possible options of heating a hotel ranked as a
historic building, using the area's low-temperature geothermal potential. The building
analyzed in the case study is part of the Imperial center of Herculane Baths.
According to the calculations both the floor heating system and heat exchange surface
required to take heat from the geothermal fluid, were dimensioned. It has been observed that
for the heating of 20 rooms, the size of this area varies between 5 şi 15 m2, depending on the
choice of the geothermal fluid temperature at the heat exchanger (between 43 °C and 52 °C)
and the global exchange coefficient (between 1.2 and 1.4 kW /m2/K).
Acknowledgements
This work has been funded by University Politehnica of Bucharest, through the
“Excellence Research Grants” Program, UPB – GEX 2017. Identifier: UPB- GEX2017, Ctr.
No. 106 /2017 (EFIHIST).
References
[1] Tuţică D., Cenuşă V.E., Alexe, F.N., Darie G., Increasing energy efficiency and thermal comfort in historical
buildings – Case study for Romania, 17th International Multidisciplinary Scientific GeoConference SGEM
2017, Albena, 29 June - 5 July, 2017, Vol. 17, Issue 42, pp 345-352.
[2] Tudor, P., Tuţică, D., Ionescu, S.C., Cenuşă, V.E., Grigore, M.C., Thermal comfort assurance in historical
buildings study case for touring facility, 17th International Multidisciplinary Scientific GeoConference SGEM
2017, Vienna, 27 - 29 November, 2017, Vol. 17, Issue 63, pp 717-724.
[3] Ionescu, C., Baracu, T., Vlad, G. E., Necula, H., Badea, A., The historical evolution of the energy efficient
buildings, Renewable and Sustainable Energy Reviews, Vol. 49, pp 243-253, 2015.
[4] Minciuc, E., Pătraşcu, R., Diaconescu, I., Tanasiev, V., Energy Management for Local Communities, Quality
- Access to Success, Vol. 17, Issue 155, pp. 106-110, Dec. 2016.
[5] Yilmaz, C. Thermodynamic and economic investigation of geothermal powered absorption cooling system
for buildings. Geothermics, Vol. 70, pp. 239-248, 2017.
[6] Norişor, M., Bădicu, A., Minciuc, E., Necula, H. Increasing the operational efficiency of a heat engine plant
through implementation of trigeneration. 2017 International Conference on ENERGY and ENVIRONMENT
(CIEM), pp. 520-523, IEEE, 19-20 Oct. 2017.
[7] Athanasovici, V. et al., Treaty of thermal engineering. Heat supply. Cogeneration (Tratat de inginerie
termică. Alimentări cu căldură. Cogenerare), AGIR, Bucharest, 2010.
[8] Ilina, M. et al., Installation manual, Warming systems (Manualul de instalații, Instalații de înacălzire), Vol. 1, ARTECNO, Bucharest, 2002.

139
INCREASING THE EFFICIENCY OF THERMAL
COLLECTORS BY USING THERMAL TUBES
Krisztina Uzuneanu
“Dunarea de Jos” University of Galati, Faculty of Engineering
47 Domneasca St., Galati, Romania
ABSTRACT
To achieve a maximum efficiency of solar energy collection, thermal tubes are used associated
with a highly effective alternative, namely the inclusion of thermal tube inside the vacuum tubes
which minimize the energy losses in the external environment. Thus the most effective solar power
devices are achieved. Using thermal tubes in the solar panels is a very effective solution due to their
obvious advantages in terms of heat transfer with the highest density of the heat flow.
The paper presents thermodynamic analysis of the processes in thermal tubes for solar collectors.
1. INTRODUCTION
Many benefits of renewable energy are known: they contribute to combat climate change,
they are a secure supply of energy and serve economic interest for a long time. Solar energy is
the most important form of renewable energy. Solar radiation can be converted into electricity
or into heat by solar collectors. These ones can be non-concentrating or concentrating and
they can be stationary or tracking the sun.
Flat plate collectors deliver energy at low temperatures and for some applications it is
necessary to deliver energy at higher temperatures. This is possible by interposing an optical
device between the source of radiation and absorber, to raise the level of incidence radiation
on the relatively small absorber. The efficiency of solar collector depends on many factors:
design, construction, position, orientation, climatic condition of the place, application for they
are used.
The sun’s position during one day and the collector orientation highly influence the
performance of the collectors. The best solution to collect solar radiation for a long time
during the light day is to use tracking systems to follow the sun. However this solution is not
preferred because of the cost of these systems and the supplementary needs for maintenance.
2. THERMAL MODELING OF A THERMAL TUBE
Thermal modeling of a gravity heat tube is generated by applying a simple electrical
analogy. Total heat flow is proportional to the temperature difference between the evaporation
area �� and the condensation area �� and is inversely proportional to the equivalent thermal
resistance between the two areas. By analogy with Ohm's law it can be written [19], [20]:
�� =���
�� (1)
The equivalent thermal resistance between the hot source (where vaporization takes
place) and the cold one (where vapors condense) is given by the relation:
�� = �� + �� + �� + �� + �� + �� + �� + �� (2)

140
The thermal model is given in the figure below [21], [19]:
Figure 1: Thermal model of the conventional thermal tube
Thermal resistances are given by the following relations:
- Thermal resistance between the heat source and the external surface of the evaporator
�� =�
������ (3)
where:
��� - external surface area of the vaporization zone [m2];
ℎ�� - heat exchange coefficient by convection [W/m2K].
- Thermal resistance in the evaporator wall:
�� =��
��
�
�!"�# (4)
where:
De, Di – outer and inner diameter of the wall [m];
Le – length of the vaporization zone [m];
k – thermal conductivity [W/mK].
- Inner thermal resistance of the fluid at the boiling point:
�� =�
�� ��
(5)
where:
Aei – internal surface area of the vaporization zone [m2];
hei- heat exchange coefficient by convection [W/m2K].
- Thermal resistance due to vapor pressure drop between the vapor and condensation
zones. This resistance is the ratio of temperature drop between the evaporator and condenser
and the heat flow:
�� =�$%�
& (6)
R8
Con
den
sati
o
n
Ad
iab
ati
c
sect
ion
E
vap
ora
ti
R1 R2
R6
R7
R3
R5
R4

141
- Thermal resistance along the thermal tube:
�� ='.� "�)"%)'.� "
�# (7)
where:
Le, La, Lc – length of the vaporization adiabatic and condensing zone [m]
- Internal thermal resistance of the condensed fluid :
�� =�
� �
(8)
where:
Aci - internal surface area of the condensing zone [m2];
hci- heat exchange coefficient by convection [W/m2K].
- Thermal resistance in the condenser wall:
�� =��
��
�
�!"# (9)
where:
De, Di – outer and inner diameter of the wall [m];
Lc – length of the condensing zone [m];
- Thermal resistance on the external surface of the condenser:
�� =�
������ (10)
where:
Ace - external surface area of the condensing zone [m2];
hce - heat exchange coefficient by convection [W/m2K].
3. ADVANTAGES OF USING HEAT - PIPE SOLAR PANELS
Using thermal tubes/heat pipes in the solar panels is a very effective solution due to their
obvious advantages in terms of heat transfer with the highest density of the heat flow.
To achieve a maximum efficiency of solar energy collection, heat pipes are used
associated with a highly effective alternative, namely the inclusion of heat pipe inside the
vacuum tubes which minimize the energy losses in the external environment. This is the most
effective solar power devices are achieved.
The vacuum tubes capture and convert solar radiation into heat, warming the lower end of
the heat pipes acting as vaporizer for the heat agent within it. Heat is then transported to the
top of the heat tube by the vapors in the evaporator and it is subsequently sent to the fluid
outside the tube by condensing the vapors (Fig.2.).
The heated fluid, which is usually propylene glycol resistant to frost, is circulated in
closed circuit by a pump flow between solar collector where it picks up the heat and the
storage tank, where it gives the heat off.
From this storage tank heat is transmitted to the hot water circuit for the final users.

142
Figure 2: Vacuum tube and heat tube collector
4. CONCLUSIONS
Thermal tubes have advantages, such as:
They work regardless of outside temperature, even in winter;
Vacuum tubes provide good performance during cloudy days, being able to capture
infrared rays penetrating the clouds;
A heat- pipe solar collector can be up to 40% more efficient than traditional flat solar
heater;
Heat pipe solar collectors remove the need for antifreeze additives due to the very good
insulation provided by the vacuum and can work up to at least –300 C;
The panel still works even if one or more tubes are broken;
Damaged tubes are easy to change;
Provide energy efficiency all year round and provides zero-cost with conventional fuels
for at least 5 months per year;
The energy provided by the panels is clean/ecologic energy and do not pollute the
environment;
They feature the best quality - price ratio on the market.
References
[1] H. Moghadam, et al., „Optimization of solar flat collector inclination”, Desalination, 2010.
[2] Adnan Shariah, M-Ali Al-Akhras, I.A. Al-Omari , „Optimizing the tilt angle of solar collectors” , Renewable
Energy 26, 2002.
[3] Kamal Skeiker, „Optimum tilt angle and orientation for solar collectors in Syria”, Energy Conversion and
Management 50, 2009.
[4] Huseyin Gunerhan, Arif Hepbasli, „Determination of the optimum tilt angle of solar collectors for building
applications” , Building and Environment 42, 2007.
[5] Hamdy K. Elminir, Ahmed E. Ghitas, F. El-Hussainy, R. Hamid, M.M. Beheary, Khaled M. Abdel-Moneim,
„Optimum solar flat-plate collector slope: Case study for Helwan, Egypt”, Energy Conversion and Management
47, 2006.
[6] Mohd Azmi bin Hj Mohd Yakup , A.Q. Malik, „Optimum tilt angle and orientation for solar collector in
Brunei Darussalam”, Renewable Energy 24, 2001.
[7] Runsheng Tang, Maogang Wu, Yamei Yu, Ming Li, „Optical performance of fixed east–west aligned CPCs
used in China”, Renewable Energy 35, 2010.
[8] J.M. Pinazo, J. Canada, F. Arago, „Analysis of the Incidence Angle of the Beam Radiation on CPC”, Solar
Energy 49, 1992.
[9] Boletim Actinometrico de Portugal, Instituto Nacional de Meteorologia e Geofisica, ISSN 0870– 4740, 1989.
[10] Robert E. Parkin „Solar angles revisited using a general vector approach”, Solar Energy 84, 2010.
[11] J.A. Duffie, W. A. Beckman „Solar Engineering of Thermal Processes”, 1980.

143
ENERGY FROM BIOMASS OBTAINING IN THE GASIFICATION
PROCESS – MODULAR CONSTRUCTION OF THE GASIFICATION
MACHINE
Grzegorz Wieczorkiewicz1, Krzysztof Jesionek
2, Michał Rychlik
3, Robert Roszak
3
11CAD-MECH Company Ltd, Poland, 2Faculty of Technical and Engineering Wroclaw
University of Science and Technology, Poland, 3 Department of Virtual Engineering Poznan
University of Technology, Poland
Abstract- The paper presents an innovative solution of modern equipment for gasification of biomass and
production of electric power. Motivation to develop this installation were European Union directives
related to waste management and supporting activities for reducing problems related to the "low emission".
Demonstration installation called “EKOMPAKT” was performed as part of the project Demonstrator +
under the title "Developing and testing on a demonstration scale an innovative, compact module for the
production of power from biomass".
The article presents the process of gasification used in the project and describes the concept and operation
scheme of the device. Furthermore the machine was started and the selected parameters and the results of
the tests were presented and discussed in the work.
Keywords- Biomass, Economic efficiency, Gasification process, Light mobility installation
1. INTRODUCTION
The researches for alternative energy sources have been studied in the world for many years.
Nowadays, works has been carried out with particular emphasis on obtaining energy from waste
and biomass. As a result, many technical solutions for conducting the process of biomass
gasification were created. Usually, most of the professional devices are large stationary
installations, capable of processing large amounts of biomass, acting alone or in cogeneration with
systems based on fossil fuels.
Such systems, have usually status of "ECO" (acronym: ecology), but are ecologically only
from theoretical point of view, because they are based on the processing of biomass supplied to
the gasification site with systems based on fossil fuels. In addition, the rising costs of extraction
and transport of fossil fuels result in increasingly inexpensive waste processing and
simultaneously minimizing environmental waste production.
The paper presents an innovative solution of modern equipment for gasification of biomass
and production of electric power. Motivation to develop this installation were European Union
directives related to waste management and supporting activities for reducing problems related to
the "low emission". Demonstration installation called “EKOMPAKT” was performed as part of
the project Demonstrator + under the title "Developing and testing on a demonstration scale an
innovative, compact module for the production of power from biomass".
Additionally strong motivation element to develop a demonstration plant for gasification
of biomass is a noticeable and increasingly prominent issue in the European Union's
structures related to waste management, renewable energy supporting the development of
distributed sources of electricity (including renewable energy sources) and supporting
activities significantly reducing problems related to the so- "Low emission". Consequently,
1 CAD-MECH Company Ltd, Poland, tel.: +48 71 797 52 83, e-mail: [email protected]

144
the objectives of the project have adopted the main assumptions for the current local and
strategic needs of the directions set out in the EU directives. These directives are: Directive
2008/50 / EC on air quality and cleaner air for Europe; Directive 2008/98 / EC on waste and
repealing certain directives; Directive 2009/28 / EC on the promotion of the use of energy
from renewable sources;
• Utilization of waste at their place of origin and hence a significant reduction of waste
disposal costs by reducing the need for waste transport to waste treatment plants and
thereby significantly reducing "low emissions" (particles smaller than 10μm)
• Consumption of energy (heat and electricity) produced from biomass at the place of its
production and hence reduction of costs of purchasing power from the central power
grid, reduction of transmission charges, reduction of CO2 emissions, additional
revenue from the sale of electricity and heat,
• The consumption of heat in the immediate vicinity of its production by inserting it into
the local heating network, or by direct supplying, for example, utilities, significantly
affects the local reduction of "low emissions"
• The possibility of connecting the system to the main power energy grid and thus
obtaining additional revenue from the sale of generated electricity.
Demonstration installation was performed as part of the project Demonstrator + -
"Developing and testing on a demonstration scale an innovative, compact module for the
production of power from biomass" called “EKOMPAKT”. Project co-financed by the
European Union from the European Regional Development Fund, Project implemented in
cooperation with the Faculty of Mechanical Engineering of the Wroclaw University of
Technology. As part of the project, it is assumed that, on the basis of the experience gathered,
it will be designed and tested in complete simulations and then built innovative, compact and
mobile module for converting biomass (especially waste) into the power energy. In this
context, it will be possible to completely recycle the heat generated, with the aim of
eliminating the conversion of "waste into the waste" At the same time, it provides a great
opportunity for individual modifications of the installation.
2. GASIFICATION PROCESS OF BIOMASS
According to [1], [7] gasification is a process in which solid or liquid raw materials are
converted into more useful and convenient gas fuel. The resulting gas is used to generate of power
energy. Gasification, unlike combustion, involves the formation of chemical bonds in gaseous
products to produce the power energy, while burning involves destroying these bonds to produce
energy. The gasification process adds hydrogen and collects carbon from the raw material thus
creating a gas with a higher hydrogen to carbon ratio.
Typical gasification processes include the parts:
• desiccation
• thermal decomposition or pyrolysis
• partial combustion gases, vapors and decolourizing coal
• gasification of products decay
Gasification requires a factor gasification to change the structure of the gas to be converted
into gas or liquid The gasifying factor reacts with coal and hydrocoal to transform it into low
molecular weight gases such as CO or H2, therefore the gasification factor is essential for
gasification. Oxygen, steam and air are the most common. Oxygen is a very popular gasifier,
although it is primarily used during the combustion stage. It can be applied to the gasifier in pure

145
form or in the form of air (confuse of oxygen and nitrogen). The three-component scheme (Fig. 1)
present the pathways for the formation of different combustion products depending on the amount
of hydrogen carbon and oxygen in the fuel and depending on the gasification factor used. If pure
oxygen is used as the gasification agent, the conversion path is shifted towards the corner with
oxygen (right bottom corner in Fig. 1). Then the combustion products contain CO for a small
amount of oxygen and CO2 for more oxygen. When the amount of oxygen exceeds a certain
(stoichiometric) value, the process changes from gasification to combustion, and consequently gas
is produced instead of gas. In this case, neither the combustion gases nor the combustion products
have a significant calorific value when cooled. Providing more oxygen leads to a reduction in the
amount of hydrogen and an increase in the amount of carbon compounds - ie CO and CO2, as the
gasification product. If air is used instead of oxygen, the nitrogen atom significantly weakens the
calorific value of gasification products. instead of oxygen, steam is used as the gasifying agent,
then the gasification path in Fig. 1 will move to the hydrogen corner. Gasification products then
contain more hydrogen per unit of carbon. Sometimes indirect reaction products (ie, CO, H2) also
help in the coal gasification process [1],[2],[3],[7]
Figure 1. Scheme of the biomass conversion and power generation process [7] and principle
scheme of biomass gasification plant [6]
The choice of the gasification factor is therefore of paramount importance in the gasification
process because it represents the calorific value of the gas obtained after the process. The
estimated gas calorific value of the gas depending on the gasification factor is given in Table 1
[1], [2].
Table 1. Calorific value of gaseous products depending on the gasification factor (Basu P., 2010)
(Zhang W., 2010)
№ Gasification factor Calorific value
1 Air 4-7
2 Steam 10-18
3 Oxygen 12-28
The typical gasification process follows the steps below. The diagram of biomass
gasification is shown in Figure 1. The basic process of gasification of biomass assumes
preheating (drying of biomass) followed by thermal degradation or pyrolysis. Pyrolysis
products (ie gas, solid and liquid) react with each other and with the gasification agent to form
gasification products. In most gasification machines available in the industry, the heat energy
required for drying biomass, pyrolysis and endothermic reactions is derived from the
exothermic combustion reactions produced in the gasifier machines [4], [5], [6].
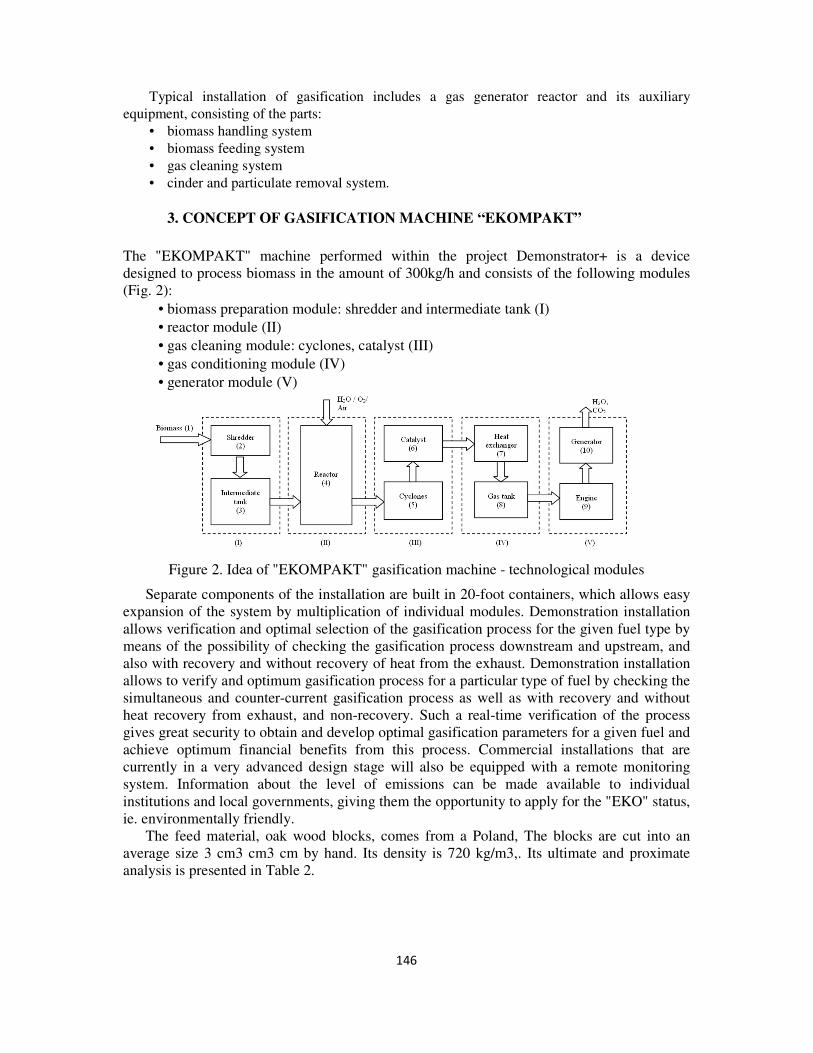
146
Typical installation of gasification includes a gas generator reactor and its auxiliary
equipment, consisting of the parts:
• biomass handling system
• biomass feeding system
• gas cleaning system
• cinder and particulate removal system.
3. CONCEPT OF GASIFICATION MACHINE “EKOMPAKT”
The "EKOMPAKT" machine performed within the project Demonstrator+ is a device
designed to process biomass in the amount of 300kg/h and consists of the following modules
(Fig. 2):
• biomass preparation module: shredder and intermediate tank (I)
• reactor module (II)
• gas cleaning module: cyclones, catalyst (III)
• gas conditioning module (IV)
• generator module (V)
Figure 2. Idea of "EKOMPAKT" gasification machine - technological modules
Separate components of the installation are built in 20-foot containers, which allows easy
expansion of the system by multiplication of individual modules. Demonstration installation
allows verification and optimal selection of the gasification process for the given fuel type by
means of the possibility of checking the gasification process downstream and upstream, and
also with recovery and without recovery of heat from the exhaust. Demonstration installation
allows to verify and optimum gasification process for a particular type of fuel by checking the
simultaneous and counter-current gasification process as well as with recovery and without
heat recovery from exhaust, and non-recovery. Such a real-time verification of the process
gives great security to obtain and develop optimal gasification parameters for a given fuel and
achieve optimum financial benefits from this process. Commercial installations that are
currently in a very advanced design stage will also be equipped with a remote monitoring
system. Information about the level of emissions can be made available to individual
institutions and local governments, giving them the opportunity to apply for the "EKO" status,
ie. environmentally friendly.
The feed material, oak wood blocks, comes from a Poland, The blocks are cut into an
average size 3 cm3 cm3 cm by hand. Its density is 720 kg/m3,. Its ultimate and proximate
analysis is presented in Table 2.

147
Table2. Proximate and ultimate analysis of oak wood blocks
4. SCHEME OF OPERATION
The biomass by transport system (1) is transported to the shredder (2), which processing the
biomass to produce a material up to 3x3x3 cm in size (Fig. 2). This size of material allows for
a smooth gasification process. From the shredder (2) the fuel is transported to the intermediate
tank (3), where it is premixed to pre-homogenize the fuel, which also has a significant effect
on the smooth gasification process. In this tank, the fuel can be pre-heated to increase the
efficiency of the gasification process and additionally dried to obtain an optimum level of fuel
humidity. From the tank (3) the fuel is transported to the reactor (4), where the gasification
process occurs. Depending on the type of fuel, additional carrier gases H2O or O2 or air are
added to the reactor. Mineral compounds remaining after gasification are removed from the
gasifier outside the installation. Syngas from the reactor (4), due to the possibility of
contamination with solid particles, is transported to the cyclones system (5), where it is
cleansed. From cyclones (5), the syngas is transported to a catalyst (6), which is used to
interception of the particles that have not been trapped in cyclones and shorten the
hydrocarbon chains to a level that will remain gas when the temperature of the syngas
decreases. Syngas from cyclones (6) are transported to a heat exchanger (7) in which the gas
is shocked cooled to prevent re-forming of long hydrocarbon chains that remain liquid or tar
at ambient temperature. From the heat exchanger (7), the gas is transported to the set of tanks
(8), in addition it is mixed, in order to homogenize its chemical composition, to ensure stable
operation of the internal combustion engine (9). Internal combustion engine powered by
Syngas drives the generator (10) that generates power electricity. The installation is described
as a self-sufficient installation, which, when activated and powered by biomass, generates
heat and power electricity for its own use and sale.
Figure 3. Real construction of gasification machine "EKOMPAKT"
Parameter Value
Moisture content (wt% wet basis)
Higher heating value (kJ/kg)
8
20,540
Proximate analysis (wt% dry basis)
Volatile matter
Fixed carbon
Ash
82
17.16
0.55
Ultimate analysis (wt% dry basis)
C (carbon)
H (hydrogen)
O (oxygen)
N (nitrogen)
S (sulfur)
50.54
7.08
41.11
0.15
0.57

148
The presented idea of operation was used in the final stage to build a real machine. On figure
3 the construction of the machine is presented. The energy efficiency of the “EKOMPAKT”
machine is 1kW/1kg of biomas. The calorific value of gas obtained during tests from the
gasification process was at the level of 11MJ/m3.
5. CONCLUSION
Demonstration gasification machine "EKOMPAKT", through to its container construction, is
a mobile device and easily scalable. This is consistent with the development strategy defined by
the European Union directive. It also responds to local and social needs related to waste reduction
and low emission reduction. In addition, the gasification machine "EKOMPAKT" device reduces
the cost of the enterprises involved in waste disposal and also reduces the costs associated with
the purchase of energy. For local governments, as well as entrepreneurs, the "EKOMPAKT"
installation is a demonstration of the policy of conducting business in an environmentally friendly
way. Currently, the device works using oak wood as fuel for technical testing purposes. Further
tests with other types of biomas (fuels) are in preparation.
6 ACKNOWLEDGEMENT
Project Co-financed by the European Union from the European Regional Development Fund
GRANTS FOR INNOVATIONS - Demonstrator+ Program Project title: "Developing and testing
on a demonstration scale an innovative, compact module for the production of power from
biomass"
7. REFERENCES
[1] Basu P. (2010). Biomass gasification and pyrolysis – practical design and theory. Book
of Elsevier, Burlington, USA, 27-40
[2] Zhang W. (2010). Automotive fuels from biomass via gasification. Fuel Process Technol.
2010;91(8):866–76.
[3] Catallo WJ. & Shupe TF. & Eberhardt TL. (2008). Hydrothermal processing of biomass
from invasive aquatic plants. Biomass Bioenerg, 32(2), 140–5
[4] Sun Y-I. & Yoon SJ. & Kim YK. & Lee J-G. (2011). Gasification and power generation
characteristics of woody biomass. Biomass Bioenerg, 35(10), 4215–20
[5] Akhtar J. & Amin N. (2011). A review on process conditions for optimum bio-oil yield in
hydrothermal liquefaction of biomass. Renew Sust Energ Rev, 15(3), 1615–24.
[6] G. Jankes*, M. Trninić, M. Stamenić, T. Simonović, N. Tanasić, And J. Labus,
Biomass Gasification With Chp Production, A Review of the State-of-the-Art
Technology and Near Future Perspectives, THERMAL SCIENCE, 2012, Vol. 16, pp.
S115-S130
[7] T. Methling, N. Armbrust, T. Haitz, M. Speidel, N. Poboss, M. Braun-Unkhoff, H. Dieter,
B. Kempter-Regel, G. Kraaij, U. Schliessmann, Y. Sterr, A. Wörner, T. Hirth, U. Riedel,
G. Scheffknecht, Power generation based on biomass by combined fermentation and
gasification – A new concept derived from experiments and modelling, Bioresource
Technology, 2014; 169, pp 510-517.

149
ANALYTICAL HEAT CONDUCTION SOLUTION FOR TWO-
DIMENSIONAL CARTESIAN SLAB UNDER THE EFFECT OF A
LASER PULSE Wisam A. Abd Al-wahid
1, Qahtan A Abed
2
1,2 Dr. Eng. Al-Furat Al-Awsat Technical University, Engineering Technical
College- Najaf, Iraq.
Abstract The analytical solution of two-dimensional transient heat conduction in two slabs
bounded to each other presented in this paper appears. They are exposed to the pulse of the
laser beam. The heat transfer coefficients of the two slabs are supposed to change with
direction. The separation of variables method is used in the sense it is easy and effective with
these types of problems. The results showed an easy and elegant analytical solution. These
results compared with the data obtained by the numerical solution of the same problem by
using COMSOL Multiphysics 5.2. They showed a good agreement with the numerical
solution, the behaviour of the heat propagation occurs over time in the field. Keywords: conduction heat transfer, separation of variables, transient, directional conduction
coefficient.
1- INTRODUCTION
A great attention given to study multi-layers combinations of different materials due to
their wide applications in industry. Heat conduction takes greatest share of that attention for
these combinations weather the materials were isotropic or anisotropic, steady or transient.
Therefore, many kinds of analytical and numerical solutions appeared due to that attention.
Focus on analytical solutions taken, since present work is in that field. One can find books
dealing with kinds of analytical solutions for enormous cases [1 and 2]. However, accurate
details in the application cases led to different kinds of solutions in literatures for each case.
Weather solutions were steady [3, 4, and 5], or transient [6, 7, 8, 9, 10, 11, 12, and 13],
Cartesian [3, 5, 7, 8, 10, and 13], cylindrical [4, 6, 11, and 12], or spherical coordinates [9],
analytical solution changes according to nature of each case. Solution may be based on series
[5, 9, and 13], transformation [3, 6, 7, 8, and 11], or by using separation of variables [3, 10,
and 12]. However, it is appeared hear that analytical solutions need mathematical skills to
conduct the complex solution of complex geometries or boundary and initial conditions.
Nevertheless, still, these kinds of solutions are attractive due to their elegance and accuracy.
In present work, anisotropic, two-dimensional, Cartesian, two-layered slab taken under
influence of a pulse of laser beam in center of that slab as shown in figure 1.
Figure 1. Problem of the present work.
2 Corresponding author, email [email protected]

150
The solution conducted is analytical by the use of separation of variables, where the
solution compared to numerical procedure to validate the solution.
2- MATHEMATICAL ANALYSIS
The problem solved analytically starting from basic equations of Fourier's equation of
conduction heat transfer for two- dimensional Cartesian coordinates:
1 1 11 1 1h v p
T T Tk k C
x x y y tρ ∂ ∂ ∂∂ ∂ + = ∂ ∂ ∂ ∂ ∂
(1)
1 2 22 2 2h v p
T T Tk k C
x x y y tρ ∂ ∂ ∂∂ ∂ + = ∂ ∂ ∂ ∂ ∂
(2)
Where: hk and
vk are directional heat conduction coefficient [W/ (m. K)]. p
C is heat transfer
capacity [J/kg. K]. T is temperature [K].
Note that heat transfer coefficient anisotropic with direction. Boundary and initial
conditions according to the problem are:
11 1 1
( , , )( , , )h
T l y tk hT l y t
x
∂ − = −∂
(3)
12 2 2
( , , )( , , )h
T b y tk h T b y t
x
∂ =∂
(4)
1 21 2
(0, , ) (0, , )h h
T y t T y tk k
x x
∂ ∂=∂ ∂
(5)
11 2 1
(0, , )(0, , ) (0, , ) 2 h
T y tT y t T y t bk
x
∂− =∂
(6)
1( ,0, )0
T x t
y
∂ =∂
(7)
2 ( ,0, )0
T x t
y
∂ =∂
(8)
1( , , )0
T x d t
y
∂ =∂
(9)
2 ( , , )0
T x d t
y
∂ =∂
(10)
With initial conditions:
2 ( ,0, ) 0T x t = (11)
1
( ) 0( ,0, )
0
y F yT x t
y d
φ εε
= ≤ ≤= ≤ ≤
(12)
Where: h is heat convection coefficient 2.
W
m K. F is pulse parameter. ε is thickness of laser
beam m .
The above initial condition (12) assumes opaque slab and no penetration in deep layers
of slab. In addition, initial condition is not continuous where a sharp change in formula at
boundaries. For this reason, the formula changed by an equivalent Fourier series as shown
below:
(13)

151
In order to solve differential equations (1) and (2), separation of variables proposed by
following assumption:
and
Substation the above assumptions in the differential equations led to:
(14)
(15)
Where: , , and
In order to solve differential equations (14 and 15), Eigen parameters introduced to
help in solution, which leads to the following sub-differential equations:
(16)
(17)
(18)
(19)
(20)
(21)
Where: and
The solutions of differential equations (16-21) are:
(22)
(23)
(24)
(25)
(26)
(27)
Substitution of boundary conditions (7-10) in equations (26 and 27) lead to:
(28)
(29)
Where Eigen values: and
Substitution of boundary conditions (3-6) in differential equations (24 and 25) lead to:
(30)
(31)
Where: and
Application of boundary conditions (3 and 4), lead to:
(32)
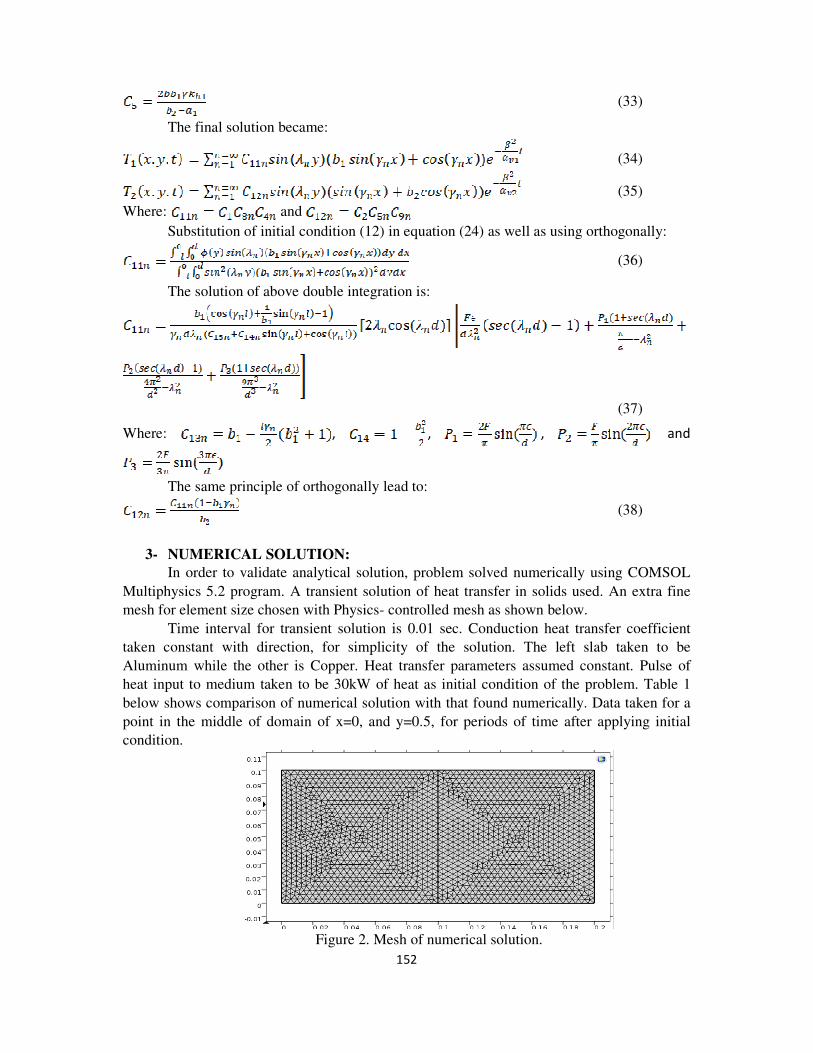
152
(33)
The final solution became:
(34)
(35)
Where: and
Substitution of initial condition (12) in equation (24) as well as using orthogonally:
(36)
The solution of above double integration is:
(37)
Where: , , , and
The same principle of orthogonally lead to:
(38)
3- NUMERICAL SOLUTION:
In order to validate analytical solution, problem solved numerically using COMSOL
Multiphysics 5.2 program. A transient solution of heat transfer in solids used. An extra fine
mesh for element size chosen with Physics- controlled mesh as shown below.
Time interval for transient solution is 0.01 sec. Conduction heat transfer coefficient
taken constant with direction, for simplicity of the solution. The left slab taken to be
Aluminum while the other is Copper. Heat transfer parameters assumed constant. Pulse of
heat input to medium taken to be 30kW of heat as initial condition of the problem. Table 1
below shows comparison of numerical solution with that found numerically. Data taken for a
point in the middle of domain of x=0, and y=0.5, for periods of time after applying initial
condition.
Figure 2. Mesh of numerical solution.

153
Table 1. Comparison of numerical solution with that found numerically
time Numerical solution Analytical solution
0 293.15 293.15
30 293.16 293.158
60 293.17 293.169
90 293.17 293.169
120 293.17 293.169
The data show a slight increase in temperature, and a settling after 30 seconds. The most
important thing is closeness of numerical and analytical solutions.
4- RESULTS AND DISCUSSIONS:
A good agreement of analytical solution with that of numerical suggest showing more
transient results of domains of solution. Figures 3 show transient temperature distribution with
a time interval of 15 seconds. Heat spread in as half circular shape within first interval, then
isothermal lines starts to progress in a shape of parallel line due to insulation of top and
bottom boundaries. After a minute and a half, first domain show to reach a uniform
temperature distribution, while the second domain still suffering from heat progress in parallel
isotherms. Whole process does not go out of common sense about the behavior of temperature
progress, where results are only shown to expand the base of data presented. Solution may
have extended, in future work, for a multiple laser pulses, or to use materials have some
temperature dependent heat transfer coefficients.
Figure 3. Transient temperature distribution for two domains of problem.

154
Conclusion:
In present work, two slabs connecting vertically and one of them subjected to laser
beam pulse. Heat transfer coefficient of conduction for both slabs changing with direction.
The problem assumed to be time dependent in order to study heat conduction transfer.
Separation of variables shown to be efficient method to solve such problems. It found that to
be easy to have an analytical solution based on separation of variables and Fourier series to
simulate the laser pulse on the side of the slab and overcome discontinuity of the pulse. As it
known, heat diffusion depends on conduction heat transfer coefficient to shape the spread of
heat.
References:
1- Arpaci, Vedat S., "Conduction heat transfer", Addison-Wesley publishing company, 1966.
2- Sen, Mihir, "Analytical heat transfer", University of Notre Dame, 2015.
3- Moitsheki, Raseelo J., and Rowjee, Atish, "Steady heat transfer through a two-dimensional rectangular
straight fin", Mathematical problems in engineering volume, 2011.
4- Floris, Francesco, etal. ,"A multi-dimensional heat conduction analysis: analytical versus F.E. methods
in simple and complex geometries with experimental results comparison", Energy Procedia, vol.81, pp.
1055-1068, 2015.
5- Ramos, C. Avilles, et. al. , "Exact solution of heat conduction in composite materials and applications
to inverse problems", Transactions of the ASME, vol. 120, August, 1998.
6- Abdul Azeez, M. F., and Vakakis, A. F. , "Axisymmetric transient solutions of the heat diffusion
problem in layered composite media", International journal of heat and mass transfer, vol. 43, pp. 3883-
3895, 2000.
7- Cole , K. D., and McGahan, W. A., "Theory of multilayers heated by laser absorption", Journal of heat
transfer, ASME, 1993.
8- Buikis, A., et. al. , "Analytical two-dimensional solutions for heat transfer in a system with rectangular
fin", Heat transfer VIII, B. Suden, 2004.
9- Jain, Prashant K., et. al. , " An exact analytical solution for two-dimensional, unsteady, multilayer heat
condition in spherical coordinates", International journal of heat and mass transfer, vol. 53, pp. 2133-
2142, 2010.
10- Mikhalov, M. D., and Ozisik, M. N., "Transient conduction in a three-dimensional composite slab",
Int. j. Heat Mass Transfer, vol. 29, pp. 340-342, 1986.
11- Watt, D. A., "Theory of thermal diffusivity by pulse technique", Brit. J. Appl. Phys., vol.17, 1966.
12- Milosevic, N. D., and Raynaud, M., "Analytical solution of transient heat conduction in a two-layer
anisotropic cylindrical slab excited superficially by a short laser pulse", International journal of heat
and mass transfer, vol. 47, pp. 1627-1641, 2004.
13- Mahmoudi, Seyed Reza, and Toljic, Nikola, "Exact solution of two-dimensional hyperbolic heat
conduction equation with combined boundary conditions and arbitrary initial condition", Proceeding of
the ASME, Heat transfer summer conference, 2009.

155
PROVIDING THE ISOLATED LOCALITIES WITH VARIOUS
ENERGY TYPES AT THE ACCEPTABLE COST
Ultuar Zhalmagambetova 1
, Almagul Mergalimova2, Birlesbek Aliyarov
3
Almaty University of Power Engineering and Telecommunications
Heat power engineering faculty, Republic of Kazakhstan, Almaty.
ABSTRACT
The features of the power supply for the remote isolated settlements with the different types of
the energy and territorial and climatic features consideration are reviewed in this article.
A suggested technology is adapted to the conditions of a locality and working on the solid fuel.
At the same time, the cost of the electricity, heat and gaseous fuels for the cooking will be more
acceptable for a family with the middle and small income.
The proposed technology is based on the extraction of gaseous, so-called combustible volatile,
with an acceptable heat of the combustion (from coal and wood). The presence of the gaseous fuel
makes it possible to transfer cooking for the fuel supply from a single source. The resulting gaseous
fuel also makes it possible to obtain electrical energy by the using gas turbines of a special design.
Residual heat is directed to the combustion chamber to produce heat energy.
1. INTRODUCTION
The problem of the reliable and high-quality power supply to sparsely populated and
remote settlements was acute in social, technical and economic aspects for the many
countries. There are numerous remote villages in Kazakhstan and Russia that do not have
access to a common supply system for the various types of the energy. Parts of the territories
are characterized by the cold climatic conditions and a long heating period. The construction
of the systems to provide by the various types of the energy in remote settlements is
complicated by the high costs, and the difficult of the delivery of the goods, including the
fuel, especially liquid, is not always cost-effective [1]. For example, providing a remote group
of the buildings (housing of shepherd, mine settlements and others) with the electricity from
the centralized sources, where the losses in the networks (especially the relative losses, that
are directly related to the amount of the transported energy) were very high. [2]
The shortage of the energy and its high cost limit the possibilities of the providing a
comfortable living and restrain economic growth in such regions. [3]
In the world practice there is a successful experience of increasing energy efficiency and
the development of renewable energy sources. After all, increasing the efficiency of the
electricity supply to isolated consumers is made through the use of the renewable energy
sources (RES). But with such methods it is necessary to take into account the climatic
conditions and the economic feasibility of applying RES.
1 PhD Student, AUPET, Republic of Kazakhstan, [email protected]. +7 777 340 11 31
2 PhD Student, AUPET 3 Professor Dr.Sc., AUPET

156
At the present time, in Kazakhstan, the supply of the various types of the energy to
remote the isolated settlements is often carried out in a traditional way. In particular: the
supply of heat energy and cooking is produced from individual solid fuel furnaces with the
increased financial and labor costs (fuel preparation for the whole season, preparation of the
fuel for the combustion, etc.), electric power is supplied by individual sources of the liquid
fuel with a high cost).
2. METHODOLOGY
There are various proposals on the market to provide of the remote settlements with the
different types of the energy. The one is independent generating sets that are: gasoline, diesel
or gas power plants. And in spite of the fact that in the greater territory of the country, it is
economically more expedient to use of the coal as the main fuel.
An alternative to the above methods of providing remote of the objects with the all types
of the energy may be a new technology that is adapted to the conditions of a particular village,
operating on solid fuel. This technology provides:
- supply by the heat energy for the heating and hot water needs;
- supply by the gaseous fuel for the cooking;
- supply by the electrical energy.
It is known that it is possible to obtain gaseous fuel from solid fuel. This extraction of the
gaseous, so-called combustible volatiles, with an acceptable heat of the combustion (from
coal and wood). The presence of the gaseous fuel makes it possible to transfer for the cooking
the fuel supply from a single source (for this village). The resulting gaseous fuel also makes it
possible to obtain of the electrical energy by the using gas turbines of a special design (with
the reduced wear of the blades).
The proposed technology can be demonstrated in this way. In the village (if there is
enough solid fuel in sufficient quantity), a volatile substance generator (from the coal or wood
(pre-dried in a special device) is installed). The combustible volatile substances are
accumulated in a special receiver or fed to a local gas network (for the cooking). Then that
gaseous from the receiver are also fed into the combustion chamber of a gas turbine driving
the electric generator. That makes it possible to divide the production of electric and thermal
energy and use of the volatiles in (after gas turbines), is sent to the combustion chamber to
generate heat (primarily for the supply of hot water (through its local network). Coal, from
which a certain amount of the volatile matter has been extracted, is fed to another boiler
where it is burned (as rules in a furnace with the bed combustion) to produce of the heat
energy (for the heating). The expert evaluation shows that with this separation of the coal
combustion (firewood) emissions of the gaseous pollutants into the atmosphere (especially -
oxides of nitrogen and sulfur) is the significant reduced. Thermal energy for the heating is
supplied to each house via a local heating network.
Structural scheme of the suggested technology is demonstrated on figure 1, where next
elements are shown: coal warehouse, coal classifier, coal heater, layer furnace, firebox with
the pulverized combustion, receiver, gas turbine, LHWS (line of the hot water supply), LGS
(line of the gas supply) and LES (line of the electricity supply). Wind energy can be used as
the power for the pump.
Harnessing of this new direction in the development of the new technologies for the
providing of the isolated remote settlements with the electric and thermal energy (for the
heating of the houses and water) is provided by the scheme. As a result of a step-by-step study
of each element, the scheme will acquire a specific form.

157
Preliminary experiments for three types of solid fuels, whose deposits are located in
Kazakhstan, suggest the optimal temperature for the heating of the coal to obtain the required
concentration of the combustible components.
Figure 1: Technology of providing and isolated villages with various types of energy.
The composition and total yield of the combustible components of the gas, from the
brown coal of Shubarkulsky (blue), Maykubensky (red), Sariadyrskoye (green) deposits are
investigated.
1.2
4.56
12.32
18.71
0.9
3.22
8.41
10.85
0.5
2.13
5.2
6.7
300 400 500 600
Figure 2: The total yield of CO, H2, CH4 (in% vol) as a function of the heating
temperature, ° C.

158
The diapason of the temperature at the which researches were conducted is from the 300
to 600 ° C (horizontal axis). Reason of that is that the heating to the higher temperature will
increase cost so that this method of the supplying isolated objects can make it unprofitable.
The obtained experimental data allow to determine of the optimum heat of the
combustion of the produced gas.
Such a method of the autonomous supply by the various types of the energy involves the
development of the technology and design of a generator for the production of the volatile
substances from the coal or firewood in the required quantity, as well as a receiver of the
necessary capacity to store gaseous fuel. The main element of the new power supply
technology for a small settlement will be a gas turbine (with a reduced cost), capable of
operating on un-purified volatile substances, with the increased suitability for the replacing
blades and possibly of the repairing of the the combustion chamber. A gas turbine of this
design will work with the less energy efficiency in the production of the electrical energy
(however, the total energy use will not change because the residual heat will be converted into
heat in the boiler).
3. CONCLUSIONS
Taking into account the simplification in the proposed technology of the gas turbine
design and the elimination of the system for cleaning combustible volatile substances, the cost
of the electricity, heat energy and gaseous fuel for the cooking will be quite acceptable for a
family with an average and small income.
The technology being developed will make it possible to provide of the remote villages
with a relatively small population by the most types of the consumed energy at an affordable
cost. Technology will be in demand for the countries with the large territories with the low
population density.
References
[1] Aliyarov B.K., Mergalimova A.K. On the advantages of using gas for firing boiler units // Proceedings
of the International Scientific and Practical Conference dedicated to the 20th anniversary of ENU, Astana 2016.
[2] S.K. Abdaliev, B.K. Aliyarov, M.B. Aliyarova Liquefied gas (associated or natural) and a local
network - an acceptable alternative (pipe and / or balloon) gasification of small settlements in Kazakhstan //
Bulletin of the National Academy of Sciences of the Republic of Kazakhstan 2011, No.2.
[3] Bashmakov IA Improving the energy efficiency of energy supply in the northern regions of Russia. //
"Energy Saving", 2017, No. 12
[4] Kuntal Jana, SudiptaDe. Polygeneration using agricultural waste: Thermodynamic and economic
feasibility study, Renewable Energy 74, February 2015(648-660)
[5] AvishekRay, Kuntal Jana. Polygeneration for an off-grid Indian village: Optimization by economic
and reliability analysis. Applied Thermal Engineering Volume 116, April 2017(182-196)
[6] Rudachenko A.V. Gas-turbine plants for natural gas transport: textbook / А.В. Rudachenko, N.V.
Chukhareva; National Research Tomsk Polytechnic University. - Tomsk: Publishing house TPU, 2010.
[7] M.C.Barmaa R.Saidurbc. A review on boilers energy use, energy savings, and emissions reductions,
Renewable and Sustainable Energy Reviews 79, November 2017(970-973)
[8] YulongZhaoaShixueWang. Analysis of thermoelectric generation characteristics of flue gas waste
heat from natural gas boile, Energy Conversion and Management148, 2017(820-829)
[9].Askarova, A. S.; Messerle, V. E.; Ustimenko, A. B.Reduction of noxious substance emissions at the
pulverized fuel combustion in the combustor of the BKZ-160 boiler of the Almaty heat electropower station
using the "Overfire Air" technology thermophysics and aeromechanics 23,jan 2016 (125-134)

159
BIOMASS CONVERSION BY PYROLYSIS
Ph.D. Eng. Alexandru Isabela Doina – INMA Bucharest; [email protected]
Biomass represents the biodegradable fraction of agricultural products, waste and residues, includingvegetal and animal substances, forestry and related industries, as well as the biodegradable fraction ofindustrial and urban waste.
One of the forms of energy recovery of biomass is its thermochemical conversion by pyrolysis.Currently, pyrolysis is considered a technology that leads to low emissions of potential pollutants.
1. INTRODUCTIONDefined as “the biodegradable fraction of biological products, waste and residues in
agriculture (including vegetal and animal substances), forestry and related industries, includingfisheries and aquaculture, as well as the biodegradable fraction of industrial and urban waste”, thebiomass is the main contributor to renewable energy in the world.
Biomass is the only renewable source that can be used for all energy purposes, namelyelectricity, heat and transport fuel.
Biomass can come from [2]: conventional crops for non-food use: starch crops (corn, wheat, barley), oil seed crops
(rapeseed, sunflower seeds) and sugar crops (sugar beet, sweet sorghum); dedicated crops: short-production cycle wood crops (willow, poplar) and herbaceous
crops (herbs); forest by-products: residues from exploitation; agricultural by-products: straw, manure, etc.; industrial by-products: residues from the food and wood industries; biomass waste: demolition wood waste, sewage sludge and organic fraction from solid
municipal waste.EU Directive 2008/98/EC [7] defines the difference between by-product and waste: “waste” means any substance or object which the holder discards or intends or is required
to discard; “by-product” is the substance or object that can be used directly without any further
processing other than normal industrial practice and is produced as an integral part of aproduction process.
Currently, forest and agricultural waste as well as municipal waste are the main rawmaterials for electricity and heat generation from biomass. A small portion of sugars, cereals andvegetable oil is used as raw material for the production of liquid biofuels.
The amount of residues produced by a given crop may vary depending on agriculturalpractices, species or local climatic conditions.
The biomass represented by the energy crops (annual and perennial herbaceous plants,oleaginous, lignocellulosic plants) is obviously coming from the agricultural and forestry sectors.
Biomass types from agricultural crop residues are shown in Table 1 [4].

160
Table 1Agricultural crop Biomass types
Residues from herbaceous cropsWheat, barley, oat StrawCorn Stalks, cobsRape StalksSunflower Stalks and leaves
Residues from tree cropsFruit trees Cut partsVines Cut parts
The annual volume of manure and dejections differs greatly from one species to anotherdepending on age and weight. Considering the possibilities of collecting and using manureenergy (keeping animals outdoors or in small farms), only 50% can be considered available forenergy production. Animal manure and dejections can come from cattle, pigs, horses, chickens,turkeys, ducks and sheep.
Secondary forest products are the total biomass resulting from forests during forestryactivities. These include wood bark and chips resulting from tree tops and branches, as well aslogs and thinning chips.
The main municipal waste is wood products, metal scraps, paper, cardboard, plastics, rubber,textiles, leather, household products, food scraps, broken dishes and glass, debris from interiorrepairs, foliage, amorphous substances (ash) etc.
Industrial waste includes industrial wood waste from timber factories, wood processingplants, and cellulose and paper factories. Nevertheless, much of the industrial waste comes fromthe food industry (fats, proteins, wet cellulosic material).
2. METHODOLOGY
There are several technologies for converting residues and waste into energy (heat,electricity, biofuel, biogas):
- direct combustion;- co-firing;- gasification;- pyrolysis;- anaerobic digestionThe choice of processing technology depends on the nature and structure of the biomass that
constitutes the raw material or on the resulting products. Thus, direct combustion or gasificationare used to produce heat and electricity, while anaerobic digestion for gas. Thermal pyrolysis canbe used for all types of products (heat, electricity, gas, liquids, solids).
The diagram below highlights the major biomass conversion technologies, their raw materialrange and major fuel products for energy and heat use.

161
Figure 1 - Biomass-to-energy conversion technologies [6]
Table 2 presents a comparative analysis of the different technologies for the production ofenergy from biomass, taking into account various parameters.
Table 2 [6]Parameter Combustion Anaerobic
digestionGasification Pyrolysis
Resource Mainly solidbiomass
Wet biomass Mainly solidbiomass
Mainly solidbiomass
Row material Wood logs andchips,
agriculturalresidues, energy
crops
Manure andsewage sludge
Wood chips andpellets andagricultural
residues
Wood chips andpellets andagricultural
residues
Temperature ͦ C 700-1400 Not applicable 500-1300 380-530Pressure (MPa) >0,1 >0,1 0,1-0,5
Drying Not essential Not essential Necessary Necessary
Pyrolysis consists of the thermal decomposition of biomass in the absence of oxygen. It is afundamental chemical reaction that is the precursor of combustion and gasification processes.Products resulting from biomass pyrolysis include biofuel, bio-oil and gases, including methane,hydrogen, carbon monoxide and carbon dioxide.
The biomass for pyrolysis is generally composed of three main groups of natural polymericmaterials: cellulose, hemicellulose and lignin. Primary products obtained from the decomposition

162
of hemicellulose and cellulose are condensable (liquid) vapors and gas. Lignin decomposes insolid, liquid and gas products.
Figure 2 Process conditions for pyrolysis of biomass [3]
Biomass is usually pre-treated before pyrolysis. Biomass pre-treatment technologies can bedivided into five categories: mechanical (grinding, chopping, extruding), thermal (steamexplosion, microwave irradiation), chemical (treatment with acids, bases and ionic liquids),biological (fungi) and combinations thereof.
Depending on the thermal environment and the final temperature, pyrolysis can generateeither a solid substance rich in carbon, called carbon, biochar, coal or coke, at low temperatures(below 450°C) when the heating rate is slow, or volatile substances at high temperatures (higherthan 800°C) with fast heating rates. Volatile substances can be partially condensed to obtain aliquid fraction leaving a so-called “non-condensable” gas mixture.
Char is a solid carbon residue with low ash content.At an intermediate temperature and at relatively high heating rates, the liquid product
resulting from biomass pyrolysis is bio-oil. It is characterized by a complex chemicalcomposition: carboxylic acids, aldehydes, alcohols, water vapour and tar.
The gaseous product is synthesis gas (syngas) composed of carbon dioxide, carbonmonoxide, methane, hydrogen, and hydrocarbons with two carbon atoms in different proportions.
Pyrolysis processes can be classified in slow pyrolysis and fast pyrolysis.Both types of pyrolysis generate solid biofuel products with different characteristics, even
when produced from the same raw biomass material. The most significant differences include:the specific surface evolution resulting from the development of a porous structure during thepyrolysis process, the average pore size and pore size distribution (i.e., the micropores andmacropores fraction). [5]
Fast pyrolysis is a thermochemical process during which a lignocellulosic biomass is rapidlyheated to about 500°C in the absence of oxygen and then rapidly cooled in a reactor. The processconverts biomass into carbohydrate-based compounds that include condensable vapors which arethen condensed into liquid bio-oil, the primary product of fast pyrolysis.

163
Fast pyrolysis is characterized by high heating speeds and short vapour retention times. Thisgenerally requires a raw material prepared in the form of a small particle sizes and a form whichrapidly removes the vapors from the hot solids. There are a number of different reactorconfigurations that can do this: ablative systems, fluidised beds, agitated or moving beds, andvacuum pyrolysis systems.
Pyrolysis also produces carbon (coal or biochar), flammable gases and vapors (includingmethane, hydrogen and carbon monoxide), which can be burned to heat the reactor, thussupporting the fast pyrolysis process. Thus, fast pyrolysis produces approx. 60% bio-oil, 20%biochar and 20% syngas.
Among the advantages of fast pyrolysis are:- The process of obtaining bio-oil is relatively simple and fast;- All biomass components can be transformed into a fuel product;- Pyrolysis reactors are relatively simple.Slow pyrolysis is characterized by lower heating rates, relatively long retention times of
solids and vapors, and occurs at a lower temperature than fast pyrolysis, usually 400°C.Low temperature and higher exposure time favours the formation of the solid product.Slow pyrolysis produces approx. 30% bio-oil, 35% biochar and 35% syngas.The two processes are schematically shown in Fig. 3
Figure 3 [1]
slow pyrolysis fast pyrolysis
3. CONCLUSIONS
Biomass is the only renewable source that can be used for all energy purposes, namelyelectricity, heat and transport fuel.
Currently, forest and agricultural waste as well as municipal waste are the main rawmaterials for biomass electricity and heat generation.

164
Pyrolysis consists of the thermal decomposition of biomass in the absence of oxygen.Products resulting from biomass pyrolysis include biofuel, bio-oil and gases, including methane,hydrogen, carbon monoxide and carbon dioxide.
Depending on the thermal environment and the final temperature, pyrolysis can generateeither a solid substance rich in carbon or volatile substances.
Pyrolysis processes can be classified in slow pyrolysis characterized by lower heating rates,relatively long retention times of solids and vapors and fast pyrolysis with high heating rates andshort retention times of vapors.
Among the advantages of pyrolysis are: the use of waste such as the one resulting from wood processing (bark, sawdust, etc.) or
agricultural residues (straw, manure, etc.); converting low energy into biomass into high energy density liquid fuels; potential to produce chemical substances from biological resources.
References[1] David A. Laird, Robert C. Brown, James E. Amonette, Johannes Lehmann, Review of the pyrolysis platform forcoproducing bio-oil and biochar, John Wiley & Sons, Ltd 2009[2] Cigolotti V.-Biomass and Waste as Sustainable Resources, Springerlink, 2012[3] Salman Z. – Biomass Pyrolysis Process, Bioenergy Consult, 2015[4] Manual-Renewable Energy Sources, Bucharest 2012[5] http://biocharforcarboncapture.com/research/fast-and-slow-pyrolisis[6] www.technavio.com/blog/five-processes-being-used-to-turn-waste-into-energy, 2015[7] Directive 2008/98/EC of the European Parliament and of the Council of 19 November 2008 on waste andrepealing certain Directives

165
TECHNOLOGY FOR THE RECOVERY OF ZOOTECHNICAL WASTETHROUGH THE PROCESS OF ANAEROBIC DIGESTION
Eng. Bălan Vică 1), PhD. Eng. Voicea Iulian2), PhD. Stud. Eng. Găgeanu Iuliana2), PhD. Stud.Eng. Cujbescu Dan2), PhD. Stud. Eng. Persu Cătălin2), PhD. Eng. Dilea Mirela3), PhD. Eng.
Ungureanu Nicoleta3) PhD. Eng. Moga Corina Ioana4)
1)Mido Rom Electronic SRL, 2)INMA Bucharest, 3) University Politehnica Bucharest4) DFR SYSTEMS SRL
E-mail: [email protected]
ABSTRACT
An important consequence of animal farming is represented by the production of importantquantities of manure or organic residues. Normally, these organic residues from animal husbandry arerecovered, mainly as an important source of organic matter and mineral elements for agricultural soils,but for their adequate degradation is also possible to use anaerobic fermentative processes, thusobtaining biogas (bioenergy) and digestate which can be used as fertilizer. Anaerobic digestion is abiochemical process through which, organic complex substrates (plant biomass and waste, manure,organic waste, residual water, sludges from sewer systems, etc.) are decomposed, in the absence ofoxygen up to the state of biogas and digestate, by various types of anaerobic bacteria. The gaseousmixture formed by CH4 (max. 80%) and CO2 (min 20%) together with small quantities of H2, H2S,mercaptans, water vapours and traces of NH3, N2, constitutes biogas.
INTRODUCTION
Fossil fuels are limited resources, concentrated in few geographical areas of our planet.This creates, for countries outside these areas, a permanent and insecure state of dependenceon the import of energy resources. Most European countries are highly dependent on fossilenergy imports from regions rich in fossil fuels such as Russia and the Middle East.Developing and implementing renewable energy systems, such as biogas from anaerobicdigestion based on national and regional resources will increase the sustainability and securityof national energy reserves and reduce dependence on energy imports [1, 2]. The use of fossilfuels, such as lignite, anthracite, raw oil and natural gas, converts carbon stored for millions ofyears into the Earth's crust and releases carbon dioxide (CO2) into the atmosphere.
The increase of atmospheric CO2 concentration has as consequence the globalwarming effect because carbon dioxide is a greenhouse gas (GHG). Biogas combustion alsoreleases CO2. However, the main difference compared to fossil fuels is that of the origin ofbiogas carbon, which is recently taken from the atmosphere, by the photosynthetic activity ofthe existing plants. Therefore, the carbon cycle in biogas is closed within a very short periodof time (between one and several years). Biogas production through the process of anaerobicdigestion also reduces emissions of methane (CH4) and nitrogen oxide (N2O) resulting fromthe storage and use of animal manure as a fertilizer. The greenhouse effect potential ofmethane is 21 times higher and the nitrogen oxide is 296 times higher compared to carbondioxide, [3]. Therefore, the use of biogas instead of fossil fuels for the production andtransport of energy reduces CO2, CH4 and N2O emissions, thus contributing to the reductionof global warming. Anaerobic digestion is a biochemical process through which complex
1 Bucharest street Petre D.Ionescu, nr.51., tel: 0762618596, e-mail: [email protected]

166
organic substrates (plant biomass and waste, manure, organic waste, wastewater, sewagesludge, etc.) are decomposed, in the absence of oxygen up to the state of biogas and digestate,by various types of anaerobic bacteria. The use of animal manure as raw material for theanaerobic digestion process has some advantages due to its properties:
Content in inoculant of natural anaerobic bacteria. High water content (4-8% DM in liquid manure), acting as solvent for the
other co-substrates and ensuring adequate biomass homogeneity and fluidity. Cheap and easy accessible, being collected as residue from zootechnical farms.
In recent years, another type of raw material has been tested and introduced to undergothe anaerobic digestion process: the so-called energy plants, which are grown especially forthe purpose of producing energy / biogas. Energy plants are represented by herbaceous plants(Miscanthus, corn, rapeseed, etc.) and woody plants (willow, poplar, oak), although for thelatter, it is necessary to apply a special pre-treatment for delignification, [4, 5].Substrates of the anaerobic digestion process can be classified according to their origin, drymatter content (DM), methane production, and other criteria. When substrates with a drysubstance content smaller than 20% are used, the process is called wet digestion or wetfermentation. In this category are included manure and organic waste from the food industry.When using substrates with dry substance content higher than 35%, the digestion type iscalled dry digestion or dry fermentation. Dry digestion is typical in the case of energy cropsand silage materials, [2, 6]. The choice of the type and quantity of raw material for obtainingthe mixture of substrates subjected to the anaerobic digestion process depends on dry mattercontent, as well as carbohydrate, lipid and protein content.
During the anaerobic digestion process, a very small amount of heat is generated,compared to the case of aerobic decomposition (in the presence of oxygen), such ascomposting. The energy contained in the chemical bonds of the substrate mainly remainsstored in the biogas produced, in the form of methane, [7, 8]. The process of biogas formationis the result of successive stages in which the initial substances are continuously decomposedinto smaller molecules. Specific groups of micro-organisms are involved in each stage. Fourmain stages have been highlighted in the anaerobic digestion process: hydrolysis,acidogenesis, acetogenesis and methanogenesis. During hydrolysis, relatively small amountsof biogas are produced. Biogas production reaches its peak during methanogenesis.Methanogenesis is a critical stage of the entire digestion process, consisting of the slowestbiochemical reactions in the process, [8]. Methanogenesis is strongly affected by workingconditions. Raw material composition, charge rate, temperature and pH are examples offactors influencing methanogenesis. Overheating the digester, temperature variations or amassive penetration of oxygen usually causes methane production to stop [9].
Therefore, biogas produced through the process of anaerobic digestion is cheap andconstitutes a source of renewable energy, producing, after combustion, neutral CO2 andoffering the possibility to treat and recycle an entire variety of agricultural residues and by-products, various bio-residues, organic residual waters from the industry, household watersand sewage sludges in a sustainable and environment friendly manner. Simultaneously, biogasbrings a great number of social-economic benefits, not only for farmers directly involved inits production, but also for the entire society. For all these reasons, biogas resulted fromanaerobic digestion processes constitutes one of the main priorities of the European Strategyon biofuels and renewable energy.
METHODOLOGY
In order to conduct the experimental tests, an experimental model of modularinstallation for obtaining bioenergy through advanced dry and wet methanogenesis – MGA,was used. The two digesters, fitted inside the modular container, used for obtaining biogas

167
(bioenergy) through the process of wet anaerobic digestion (Reactor 1 - fig. 1) andrespectively dry anaerobic digestion (Reactor 2 - fig. 1) are actively monitored and controlledusing a programable logic controller (PLC), programmed through the means of a graphicoperator interface, represented by an operation terminal – OT. Thus, in order to ensure amesophilic fermentation regime, the PLC will allow the heating of the two digesters up to theoptimal temperature chosen by the user. After processing the entry data received from the 6temperature sensors, the control of the recirculation pump with heating agent will beperformed sequentially. During the process of dry and wet anaerobic digestion, depending onpH evolution in the two digesters, the PLC will automatically adjust the value set for pH,switching on the pump that recirculates pH correcting solution by opening and closing electrovalve 5 (EV-%). When it will be needed to add pH correction solution to reactor 1 (wetdigestion process), electro valve 7 (EV 7) will also be opened and when pH correction isneeded in reactor 2 (dry digestion process), electro valve 6 (EV 6) will be opened. In order tohomogenize the mixture in reactor 1, the PLC will automatically and sequentially control theagitation / homogenization system, comprised of a gearmotor and agitator with pallets, at aninterval predetermined or set by the user. In the case of reactor 2, the liquid accumulated anddeposited at the bottom of the vessel will be percolated by means of pump P3 and introducedagain in the digester by means of nozzles; the percolation process is also achieved andcontrolled by the PLC of the advanced methanogenesis modular installation (MGA). Whenthe pressure of biogas resulting from dry and wet anaerobic digestion processes will exceed0.75-1 bar, value indicated by the pressure sensor (PT) on the operation terminal (OT), thePLC will command the drive of a vacuum pump (P5) and the opening of electro valve 8 (EV8), thus allowing biogas accumulation in the reservoir.
Figure 1. Process diagram on the operation of the modulated experimental installation for theproduction of bioenergy through advanced methanogenesis of agricultural waste - MGA
The raw material for the process of dry anaerobic digestion was: 50% hash made of35% chopped straws with 65% Miscanthus, in combination with 50% sugar sorghum. For theprocess of wet anaerobic digestion, the raw material was represented by manure (55%) mixedwith food organic waste 45% (potato peel, fruit residues, etc.) generated within a agro-zootechnical micro-farm. These materials were used in order to demonstrate the utility andfunctionality of this type of reduced scale biogas installation for an agro-zootechnical micro-farm. The operating characteristic of the two bioreactors (digesters), component parts of themodular installation, is that they have a discontinuous operation, consisting in supplying themwith the two types of raw materials described above, thus feeding them with batch that will

168
undergo anaerobic digestion, after which it is completely evacuated, and then a new portion isintroduced into the digester and the process is repeated, therefore the type of anaerobicfermentation is discontinuous or in batches. Material supply is achieved at the upper part ofdigesters and evacuation is performed at the bottom part. Temperature inside digesters shouldbe maintained constant and therefore, it needs to be permanently monitored. The necessaryenergy for the operation of the modular installation is ensured by a system with photovoltaicpanels fitted above the container and equipped with a battery group for storing energy. Afterthe fermentation process generates biogas, it is consumed using a biogas generator, resultingenergy that is stored in the same battery system.
The parameters of the anaerobic digestion process chosen to be monitored andcontrolled using the installation’s automation system were the following ones:
the temperature of the anaerobic digestion process was 40oC; the pH of the process was set and maintained at 7.5; the retention time in the digesters was 40 days; C/N ratio in the two digesters was 21; moisture of the mixture in the wet fermentation digester was 90%; moisture of the mixture in the dry fermentation digester was 40%.
The experimental research of analysing the composition of biogas resulting from theprocess of dry anaerobic digestion was conducted using a system for determining biogascomposition. - COMBI IR. The Mentor/ComIR Series. The system uses the latest miniatureinfrared technology for the detection of CH4 and CO2. Each sensor has a 0-100% volumerange which is necessary for the biogas application. The use of infrared sensors means that thelevel of CO2 can be measured accurately and the CH4 sensor cannot be disrupted if high levelsof H2S are present. The unit is fitted with the following sensors: 0-100% Volume CH4
(infrared), 0-100% Volume CO2 (infrared), 0-200 ppm H2S. The testing methodologyrequired biogas composition to be determined 3 times per day for 40 days, as long as theexperiment was conducted. The average volume of CH4 per fermentation day, the averagevolume of H2S per fermentation day, respectively the average percentage volume of CO2 perfermentation day were determined.
In figures 2 and 3 are presented the graphic representation obtained by processing,using Microsoft Excel program, the preliminary data on the composition of biogas obtainedthrough the process of dry, respectively wet anaerobic digestion.
Figure 2. Graphic representation on the composition (CH4, H2S, CO2) of biogas resulted fromthe process of wet anaerobic digestion

169
Figure 3. Graphic representation on the composition (CH4, H2S, CO2) of biogas resulted fromthe process of dry anaerobic digestion
The maximum H2S concentration in the composition of biogas obtained through theprocess of wet anaerobic digestion was 162 ppm and was recorded in the 13th fermentationday, while in the case of dry anaerobic digestion, the maximum hydrogen sulphideconcentration was 115 ppm, being recorded in the 14th fermentation day. The maximum CO2
concentration in the composition of biogas obtained through the process of wet anaerobicdigestion was 61 ppm, and the average value for the 40 days of digestion was 33 ppm. For theprocess of dry anaerobic digestion, the average CO2 value recorded in biogas composition inthe 40 days of dry anaerobic digestion was 28 ppm, with a maximum value of 52 ppm,recorded in day 14.
CONCLUSIONS
Based on the experimental data resulted, the following conclusions can be drawn:1. Maximum CH4 concentration in the composition of biogas obtained through the
process of wet anaerobic digestion was 72% and it was recorded in day 25 offermentation. In comparison, in the case of dry anaerobic fermentation, the maximumCH4 concentration recorded was 81% in day 26 of fermentation.
2. Average CH4 value recorded in the composition of biogas for the 40 days dryanaerobic digestion experiment was 44%, and in the case of wet anaerobic digestion,the average methane value was 41%.
3. Wet anaerobic digestion generated in the 40 days of the experiment a total quantity of10.97 m3 of biogas, with an average daily value of 0.27 m3.
4. Dry anaerobic digestion generated a total quantity of 10.26 m3 of biogas, with anaverage daily value of 0.26 m3.
5. Thus, the biogas resulting from the two anaerobic fermentation processes presented achemical composition that allowed its successful burning in a biogas generator and its

170
conversion into electricity that can be used in various applications within an agro-zootechnical micro-farm.
Acknowledgement: This work was supported by a grant of the Romanian National Authority forScientific Research and Innovation, CNCS/CCCDI –UEFISCDI, project number PN-III-P2-2.1-BG-2016-0266, within PNCDI III, project entitled "Optimizing the composition of biomass mixtures forobtaining high quality pellets", ctr. 24 BG / 2016, a grant of Romanian National Authority forScientific Research and Innovation, CNCS/CCCDI –UEFISCDI, project number PN-III-P2-2.1-PTE-2016-0183 (25/2016 –Improved flotation treatment technology for heavily loaded wastewaters) withinPNCDI III and of Romanian National Authority for Scientific Research and Innovation,CNCS/CCCDI –UEFISCDI, project number PN-III-P1-1.2-PCCDI-2017- 0566 (ctr. Nr. 9PCCDI/2018- COMPLEX SYSTEM OF INTEGRAL VALUABILITY OF AGRICULTURALSPECIES WITH ENERGY AND FOOD POTENTIAL, COMPONENT PROJECT 3 -Valuation of theenergy potential of certain species of agricultural plants).
References
[1]. Hagos K., Zong J., Li D., Liu C., Xiaohua L., Anaerobic co-digestion process for biogas production:Progress, challenges and perspectives, Renewable and Sustainable Energy Reviews, vol. 76, pp. 1485-1496,2017;[2]. Chiumenti A, Borso F, Limina S., Dry anaerobic digestion of cow manure and agricultural products in afull-scale plant: Efficiency and comparison with wet fermentation, Waste Management, vol. 71, pp. 704-710,2018;[3]. Kothari R, Pandey A.K., Kumar S., Tyagi V.V., Tyagi S.K., Different aspects of dry anaerobic digestion forbio-energy: An overview, Renewable and Sustainable Energy Reviews, vol. 39, pp. 174-195, 2014;[4]. Zhang C, Su H., Baeyens J., Tan T., Reviewing the anaerobic digestion of food waste for biogas production,Renewable and Sustainable Energy Reviews, vol. 38, Pages 383-392, 2014;[5]. Mao C., Feng Y, Wang X., Ren G. Review on research achievements of biogas from anaerobic digestion,Renewable and Sustainable Energy Reviews, vol. 45, pp. 540-555, 2015;[6]. Zhang Q., Hu J., Lee D., Biogas from anaerobic digestion processes: Research updates, Renewable Energy,vol. 98, pp. 108-119, 2016;[7]. Divya D., Gopinath R, Merlin Christy P., A review on current aspects and diverse prospects for enhancingbiogas production in sustainable means, Renewable and Sustainable Energy Reviews vol. 42, pp. 690-699,2015.[8]. Maria D.F., Barratta M., Bianconi F., Placidi P, Passeri D., Solid anaerobic digestion batch with liquiddigestate recirculation and wet anaerobic digestion of organic waste: Comparison of system performances andidentification of microbial guilds, Waste Management, vol. 59, pp. 172-180, 2017;[9]. Kakuk B., Kornél L. K., Szuhaj M., Rákhely G., Bagi Z., Adaptation of continuous biogas reactorsoperating under wet fermentation conditions to dry conditions with corn stover as substrate. Anaerobe, vol. 46,pp. 78-85, 2017.
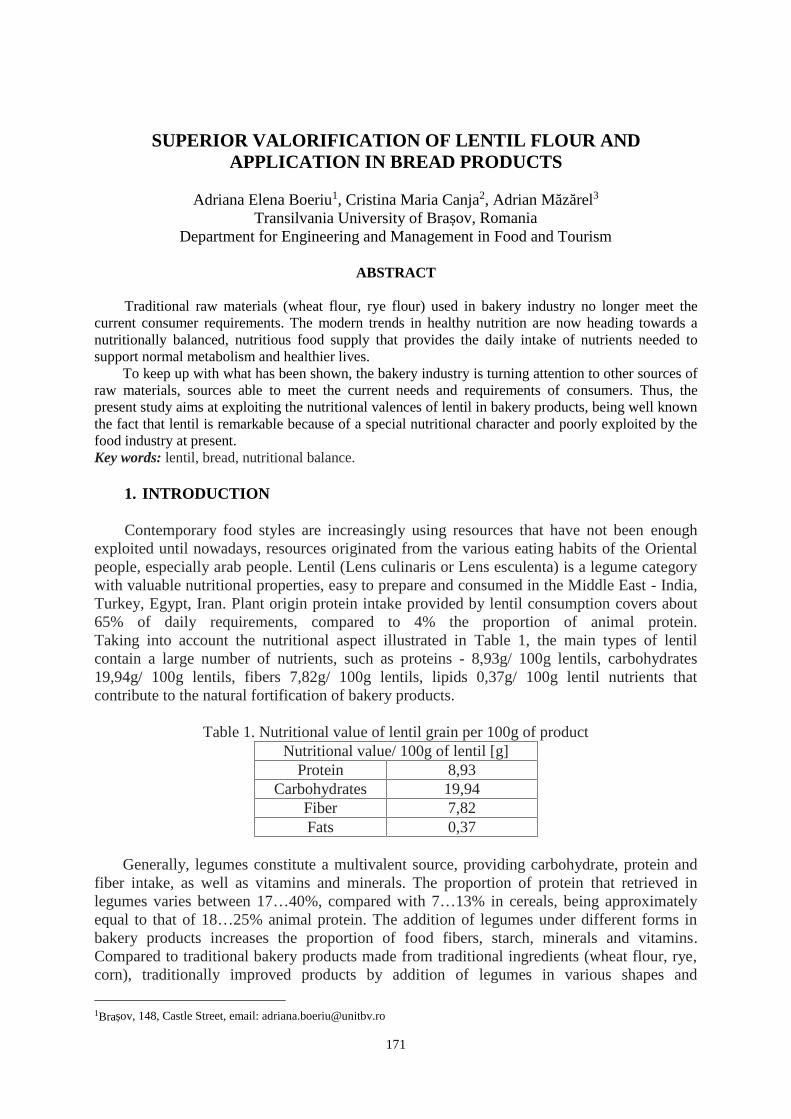
171
SUPERIOR VALORIFICATION OF LENTIL FLOUR ANDAPPLICATION IN BREAD PRODUCTS
Adriana Elena Boeriu1, Cristina Maria Canja2, Adrian Măzărel3
Transilvania University of Brașov, RomaniaDepartment for Engineering and Management in Food and Tourism
ABSTRACT
Traditional raw materials (wheat flour, rye flour) used in bakery industry no longer meet thecurrent consumer requirements. The modern trends in healthy nutrition are now heading towards anutritionally balanced, nutritious food supply that provides the daily intake of nutrients needed tosupport normal metabolism and healthier lives.
To keep up with what has been shown, the bakery industry is turning attention to other sources ofraw materials, sources able to meet the current needs and requirements of consumers. Thus, thepresent study aims at exploiting the nutritional valences of lentil in bakery products, being well knownthe fact that lentil is remarkable because of a special nutritional character and poorly exploited by thefood industry at present.Key words: lentil, bread, nutritional balance.
1. INTRODUCTION
Contemporary food styles are increasingly using resources that have not been enoughexploited until nowadays, resources originated from the various eating habits of the Orientalpeople, especially arab people. Lentil (Lens culinaris or Lens esculenta) is a legume categorywith valuable nutritional properties, easy to prepare and consumed in the Middle East - India,Turkey, Egypt, Iran. Plant origin protein intake provided by lentil consumption covers about65% of daily requirements, compared to 4% the proportion of animal protein.Taking into account the nutritional aspect illustrated in Table 1, the main types of lentilcontain a large number of nutrients, such as proteins - 8,93g/ 100g lentils, carbohydrates19,94g/ 100g lentils, fibers 7,82g/ 100g lentils, lipids 0,37g/ 100g lentil nutrients thatcontribute to the natural fortification of bakery products.
Table 1. Nutritional value of lentil grain per 100g of productNutritional value/ 100g of lentil [g]
Protein 8,93Carbohydrates 19,94
Fiber 7,82Fats 0,37
Generally, legumes constitute a multivalent source, providing carbohydrate, protein andfiber intake, as well as vitamins and minerals. The proportion of protein that retrieved inlegumes varies between 17…40%, compared with 7…13% in cereals, being approximatelyequal to that of 18…25% animal protein. The addition of legumes under different forms inbakery products increases the proportion of food fibers, starch, minerals and vitamins.Compared to traditional bakery products made from traditional ingredients (wheat flour, rye,corn), traditionally improved products by addition of legumes in various shapes and
1Brașov, 148, Castle Street, email: [email protected]

172
proportions are distinguished by a higher nutritional value. In addition to wheat flour, ryeflour, commonly used for bakery products, legumes are also used to obtain flours withdifferent granulations which will be later used in various technological processes to obtainnew products with improved characteristics.
Table 2. Vitamins and nutrients content of lentil grain per 100g of productType of vitamin Amount [mg] Type of nutrient Amount [g]
Vitamin B1 0,33 Copper 0,50Vitamin B2 0,14 Iron 6,59Vitamin B3 2,10 Magnesium 71,28Vitamin B6 0,35 Manganese 0,98Vitamin B12 0,00 Phosphorus 356,4Vitamin C 2,97 Potassium 730,6Vitamin E 0,22 Sodium 3,96
The natural fortification of bakery products supports nutrition of people with varioushealth deficiencies. According to WHO and FAO worldwide, there are over 2.5 billion peoplewith various deficiencies that can be solved by and with the help of food fortifiers. Foodfortification is, according to the research conducted by Svetlana Popel (2010), the mosteffective and accessible way to provide the population with the amount of vitamins andmicronutrients needed for proper development. The additional fortification of consumer foodproducts, especially wheat flour, bread and bakery products, is the one that achieves in theeasiest mode the goal, reaching to the most of the population.
Fortification of food is done deliberately in order to improve their nutritional quality andto bring health benefits. At the same time, in the view of some specialists (Valeria Turfani,Valentina Narducci, Alessandra Durazzo, Vincenzo Galli, Marina Carcea), this practice isconsidered an intervention that can unbalance the nutritional profile of foods, vitamins andminerals artificially added to a product, being modified from a biological point of view, beingdifficult to assimilate by the body. The most consumed and affordable foods are bread andbakery products. In this context, the present study emphasizes the natural fortification ofbread by the superior valorization of the lentil, which is concretized by the substitution of avariable quantity of wheat flour with flour obtained from three types of lentils - red lentils -Roseus Lens Culinaris, brown lentils - Brunus Lens Culinaris and Venetus Lens Culinaris -green lentils.
2. METHODOLOGY
The working protocol of the researches carried out to concrete the present study wascarried out according to Figure 1 and in the first stage it was aimed at obtaining lentil flour,taking as a raw material the three types of lentil – red, green and brown, obtaining the mixtureof wheat flour and lentil and obtaining the types of bread.
The sensory aspects of the obtained samples have been evaluated with scoring pointsusing the hedonic scale of taste counted 1 – 9 taking into account the appearance – crust andcrumb, taste, flavour.

173
The lentil flour used was obtained in the General Technologies in the Food IndustryLaboratory of the Faculty of Food and Tourism and had as a raw material three types of lentilspurchased from specialized store - red lentils, green lentils and brown lentils. This was milledwith the laboratory mill and mechanically separated on the Makarov laboratory device. Forthe research, the fraction of lentil flour with the same granulation (75…80µm) as that ofbaking wheat flour (75…80µm) (Table 2 - Technological characteristics of wheat flour) wasused.
Table 3. Technological characteristics of wheat flour
No.Determinedparameter
Valueobtained
Minimal valueaccording to
STAS
Maximum valueaccording to
STAS1. Acidity, oT 2,73 2,6oT 2,8oT
2.Wet glutencontent, %
31,9 26% -
3.Hydration
capacity, %68,9 60% -
4. Moisture, % 14,6 14,5%
The bakery products under study were obtained using a 3:1 mixture of wheat flour withlentil flour as the main raw material, bakery yeast, salt, vegetable fat (olive oil) and water.The method used for dough obtaining was the direct method, being created four types ofbread having the characteristics shown in Table 3 and plotted in Figure 1.
Table 4. Physico – chemical properties of breadType ofbread
Weight(g)
Volume(cm3)
Moisture(%) Acidity(oT)
Ash(%)
Proteins(g)
M 241,6 297,6 41 2,8 1,25 13P1 243,2 289,3 45,7 2,4 1,20 25P2 251,1 289,5 45,5 2,2 1,29 24,8P3 244,7 288,9 46 2,5 1,23 25,5
Fig. 1. The working flow diagram

174
Taking into account the codification, M represents the bread obtained 100% of wheatflour, P1 with red lentil flour, P2 with green lentil flour, and P3 with brown lentil flour.
According to the experimental research, the results from Table 4 were obtained, whichshow that from the physical point of view all three types of bread studied have improvedvalues with a significant increase in moisture. Increased moisture provides a much longer(72h) degree of freshness, which makes it easier to consume loafed bread under normalconditions. The addition of lentil flour worsened the volume of samples, comparing to theblank sample, fact that is due to the decrease of gluten amount that is not able under thesecircumstances to form its tridimensional protein structure. The reduced quantity of glutenavailable to form the dough, reduced the ability to retain ferment gas during leavening, aspectthat is reflected in the lower porosity and lower volume of bread with lentil flour addition.
Samples of bread were visually analyzed 10 days after production and no signs ofdisease (mold, stretch disease) were observed.
Fig. 2. Weight determination
Fig. 7. Protein content of samples
241.6243.2
251.1
244.7
235
240
245
250
255
PM P1 P2 P3
Weight (g)
297.6
289.3 289.5 288.9
280
285
290
295
300
PM P1 P2 P3
Volume (cm3)
Fig. 3. Volume determination
41
45.7 45.5 46
38
40
42
44
46
48
PM P1 P2 P3
Moisture (%)
Fig. 4. Moisture determination Fig. 5. Acidity determination
1.25
1.2
1.29
1.23
1.15
1.2
1.25
1.3
PM P1 P2 P3
Ash (%)
Fig. 6. Ash determination
13
25 24.8 25.5
0
10
20
30
PM P1 P2 P3
Protein (g)
2.82.4 2.2
2.5
0
1
2
3
PM P1 P2 P3
Acidity (oT)

175
Taking into account the protein content, all bread samples obtained show considerablecontent of protein, the highest contribution being made by the green lentil.
The ash content of the obtained bread is largely influenced by the addition of lentil flour.Comparing with the blank sample with 1,25% ash, the sample with addition of green lentilflour – P2 had a higher ash content 1,29%. (Muste et al., 2015)
The acidity of bread was also sensitively influenced by the addition of lentil flour. Thisparameter increases with the addition of lentil flour in the dough from 2.8 to 2.2 oT. Duringthe baking process, crumb acidity increased with addition of lentil flour, so the samplesbecame more palatable and thick. None of the samples denoted an undesirable value oftitratable acidity. The highest acidity has been developed in case of the addition of green lentilflour.
From the sensorial point of view, the flavor of bread fortified with lentil flour is greatlyenhanced, the brown lentil bringing the aroma to that of traditional bread made with acidleaven. Bread made from red lentil flour had a distinctive orange color derived from the lentilpigment that holds its intensity during processing and baking. During the sensory evaluation,it has been concluded that the addition of lentil flour had a considerably influence concerningthe colour, texture, flavour and taste of core related to the type of flour used. The totalacceptability condition of bread with addition of lentil flour was considered as better or asgood as blank sample.
3. CONCLUSIONS
Research in this paper demonstrates that the use of legumes with enhanced nutritionalproperties such as lentil has proven to be appropriate.
The natural fortification of bakery products with the three types of lentil flour - red,brown and green, has many nutritional advantages. The products thus obtained have a highercontent in protein, fiber and carbohydrates.
The maximum protein level is reached by bakery products enriched with brown lentilflour P3, followed by P1 and P2.
From a technological point of view, all types of bread obtained by fortification with lentilflour have improved properties with increased moisture, which leads to increased productionyields, implicitly to increased productivity. The volume of the products obtained shows a
Fig. 8. Sensory evaluation of samples

176
slight decrease, fact that is observed from a sensorial point of view, but corrected by theimprovement of the flavor and the appearance of both the shell and the core. The productsthus obtained are much like the traditional products obtained with acid leaven.
The addition of lentil flour in bread products could constitute an important factor,contributing to the improvement of daily vegetable intake without affecting the nutritionalcustoms of the actual consumer.
References
[1] Shyam S. Yadav,David L. McNeil,Philip C. Stevenson, ”Lentil: An Ancient Crop for Modern Times”,Springer, 2007.[2] U. Hedrick, ”Cyclopedia of Hardy Fruits”, The McMilan Company, revised, 1995.[3] Moldovan O., Păucean A., Vlaic R., Borș M. D., Muste S., ”Preliminary assessment of the nutritional qualityof two types of lentils (lens culinaris) by near infrared reflectance spectroscopy technology (nirs)” BulletinUASVM Food Science and Technology 72(1) / 2015.[4] Turfani V., Narducci V., Durazzo A., Galli V., Carcea M., “Technological, nutritional and functionalproperties of wheat bread enriched with lentil or carob flours”, LWT - Food Science and Technology Volume78, May 2017, Pages 361-366.[5] Brennan J. G., „Food Processing Handbook”, WILEY-VCH Verlag GmbH & Co. KGaA, Weinheim, 2006.[6] Jago W., “The technology of breadmaking”, The northern publishing CO, Liverpool, 1998.[7] Lazaridou, A. – Duta, D. – Papageorgiou, M. – Belc, N. – Biliaderis, C. G.. “Effects of hydrocolloids ondough rheology and bread quality parameters in gluten-free formulations”. In Journal of Food Engineering,vol. 79, 2007, p. 1033 – 1047, 2007.[8] Wieser, H. “Chemistry of gluten proteins. In Food Microbiology”, vol. 24, 2007, p.115-119, 2007.[9] Utrilla-Coello, R. G. – Osorio-Dcaz, P. – Bello-Pcbrez, L. A. Alternative use of chickpea flour inbreadmaking: Chemical composition and starch digestibility of bread. In Food Science and TechnologyInternational, vol. 13, 2007, p. 323-327, 2007.[10] BOJŇANSKÁ T. - CHLEBO P. - GAŽAR R. - HORNA A. 2009. Buckwheat enrichment bread productionand its nutrition benefits. In European Journal of Plant Science and Biotechnology, Global Science Books, vol.3,2009, p. 49-55. ISSN 1752-3842, ISBN 978-4- 903313-42-9, 2009.

177
EXPERIMENTAL RESEARCHES ON DETERMINING THEQUALITATIVE WORKING INDICES FOR VEGETABLE AND
LEGUMINOUS PLANTS SOWING MACHINE ON SANDY SOILS
Bolintineanu Gheorghe1, Cujbescu Dan, Persu Cătălin, Găgeanu Iuliana, Voicea Iulian,Gheorghe Gabriel, Vlăduțoiu Laurențiu, Dumitru Iulian, Oprescu Remus,
Ungureanu Nicoleta2, Vlad Cristina3
1INMA Bucharest / Romania, 2PU – Bucharest, 3ICEADR – Bucharest
ABSTRACT
Sowing is the agricultural work consisting in the introduction of seeds in the soil, at depthsaccording to the agro-biological requirements imposed by each crop, evenly distributed, their coveringwith loose soil and the compaction or levelling of the soil, thus creating seed emerging and plantdevelopment conditions. The latest practice for vegetables is to granulate small seeds in order toensure a distribution as even as possible when sowing with using machines (seed by seed), achievingat the same time a better nutritive environment and constant moisture during emergence. The paperpresents a series of experimental researches conducted for determining seed flow, seed feed degree,optimal disc rotation speed, norm per hectare, sowing precision, seeding depth and the energeticindices for a machine destined for sowing vegetable and leguminous crops on sandy terrains, beingable to operate with 45 HP of 65 HP tractors.
1. INTRODUCTION
Sowing is the work that conditions at a great extent the level and quality of theproduction obtained, representing the work by which the seeds are incorporated into the soilwhere, under favourable conditions of moisture, heat and aerating, they emerge into newplants [1,3,7]. An adequate sowing work implies the simultaneous compliance of severalconditions, starting with the preparation of the germination bed, but also the use of sowingmachines that respect the highest quality working indices required for this work [2,5]. Whensowing, the requirements for soil moisture and temperature, the depth of sowing specific toeach crop, etc. are taken into consideration [6,8]. For this purpose, the optimal sowing season,the distance between rows and between plants per row and the seed quantity that ensures theestablished density must be complied with [4].
2. METHODOLOGY
The vegetable sowing machine is destined for the sowing of leguminous plants andvegetables and hoeing crops on sandy terrains. It can operate on other types of soil where theland was previously well prepared.. The main requirements to be met by hoeing plants sowingmachines are: to maintain a constant sowing depth; not to produce harm to seeds; to ensuredistribution uniformity on the working with and length; to allow the adjustment of sowingdepth and of the distance between rows; to allow to adjust seed norms within wide limits;
During the experiments, the following qualitative working indices were determined: seedflow rate; degree of feeding seeds; characteristics of the distribution disc and of the workingregime; norm per hectare; sowing precision; sowing depth; energetic indices.

178
Laboratory tests were conducted for establishing the working regime of the distributiondisc and the quality of distribution, depending on seed particularities.
The main characteristics of seeds for which laboratory tests were conducted are presentedin table 1.
Table 1: Main characteristics of seeds used during experiments
No. CropGermination
(%)
Dimensions (mm) Mass of athousand
seedsgr/1000seeds
L l g
1. Carrot 78 2.10 1.45 0.80 1.032. Tomato 70-85 3.70 2.70 1.05 1.553. Cucumber 80-90 8.66 3.86 1.48 27.764. Okra 70-90 5.11 - 4.21 54.665. Pumpkin 90 19.52 11.90 4.74 347.666. Salad 94 3.3 1.1 0.55 0.887. Onion 80-95 2.50 1.80 1.60 3.198. Cabbage 70-90 2.2 1.95 1.72 4.549. Bell pepper 75-90 4.2 3.8 1.07 6.85
The seed quantity discharged by the distributor in the unit of time is determined by thenumber of seeds unloaded by the distribution disc in one complete rotation, the mass of seedsand the number of rotation of the disc in the unit of time. The number of seeds unloaded atcomplete disc rotation is theoretically equal with the number of orifices in the disc.
NMMBn
q 100
(1)
where - q is the quantity of seed unloaded by the distributor in the unit of time (g/min.);- MMB is the mass of 1000 seeds (g);- n is the number of orifices on the disc (-);- N is the number of rotations of the distribution disc (rot/min).
It results that, theoretically, the quantity of seeds distributed in the unit of time, for thesame values of n and MMB is directly proportional with the number of rotations of thedistribution disc in the unit of time. Laboratory determinations have shown that thedistributor’s disc flow rate varies depending on the disc’s rotation speed, by a curve, differentto the theoretical one.
In figure 1 is presented the variation of flow with the number of rotations of thedistribution disc per minute for bell pepper seeds, for the normal working regime of theexhauster.
Figure 1: Variation of flow with the number of rotations of the distribution disc

179
Is deduced that up to a certain rotation speed of the distribution disc, the real flow rate ishigher than the theoretical one and that as the speed increases, the real flow rate decreasesbelow the value of the theoretical flow rate.
The difference between the value of the theoretical flow rate and the real flow rateobtained through experiments is due to the variation of the degree of feeding seeds (G) by thedistribution disc, which is given by the ratio between the number of seeds discharged by thedisc in one complete rotation and the theoretical number (equal with the number of orifices onthe disc).
At low speeds of rotation on the disc, the degree of feeding can have values higher than 1(because 2-3 seeds can adhere to one orifice), and at higher speeds of rotation, the degree offeeding decreases due to orifices without any seeds adhering to them.
In table 1 are presented the average results obtained from laboratory experiments, for anumber of five crops.
Table 2: Average degree of feeding seeds
No. CropNumber oforifices on
disc
Transmissionratio
Discorifice
diameter(mm)
Averagenumber of seedsdebited by the
disc in onerotation
Degree offeedingseeds
1. Cucumber 14 0.8 2.5 18.0 1.282. Tomato 30 0.43 0.75 29.8 0.993. Pumpkin 7 0.43 5.0 11.1 1.594. Carrot 80 0.8 0.75 109 1.355. Okra 14 1.48 2.5 14.2 1.02
At the same speed of rotation of the distribution disc, the degree of feeding is influencedby the diameter of the disc orifice, as resulting from the graph in figure 2. It is observed thatthe degree of feeding the disc is smaller for orifices smaller orifices and increases for discswith larger orifice diameter. The degree of feeding decreases by increasing disc speed. At thesame diameter of disc orifices, the degree of feeding is influenced by seeds mass and theircharacteristics.
Figure 2: Variation of the degree of feeding the distribution disc depending on the disc orificediameter and by its rotation speed for bell pepper crop

180
Based on experiments conducted on flow rate variation of the distributor, the optimalspeeds of rotation and the diameter of disc orifices were established for the main vegetablecrops (table 3).
Table 3: Optimal disc rotation speeds and disc orifice diameter for the main type of vegetablecrops
No. CropDisc orifice
diameter(mm)
Optimal discrotation speed
(rot/min)1. Salad 0.50 802. Carrot 0.50 703. Tomato 0.75 604. Onion 1.0 805. Cabbage 1.0 506. Bell pepper 1.25 507. Cucumber 1.75 508. Beet 1.75 40
Taking into consideration the agrotechnical demands for the distance between plants onrow, the working speed and the transmission ratio at which the distribution disc has theoptimal rotation speed, the minimum number of orifices on disc was established for eachcrop, according to the relation:
ia
Ln
(2)
where - n is the number of orifices on the disc;- L is the space covered at one complete rotation of the drive wheel (cm);- a is the distance between plants on row(cm);- i is the transmission ratio.
From the laboratory tests resulted the following seed norms per hectare for the inferiorand superior limits of distances between seeds per row, presented in table 4.
Table 4: Seeds norms per hectare for the inferior and superior limits of distances betweenseeds per row
No. CropSpeedKm.h-1
Orificediameter
(mm)
Number oforifices on
disc
Transmissionratio( i )
Resultednormkg/ha
Usualnormskg/ha
1. Salad 8.2 0.75 8 1.09 1.84 2.02. Carrot 8.05 0.75 30 1.09 3.69 4.03. Tomato 6.62 1.0 7 0.80 0.87 1.04. Cabbage 6.66 1.0 5 0.80 0.36 0.45. Onion 6.50 1.0 30 1.09 5.10 6.06. Bell pepper 6.62 1.5 12 1.09 369.7 375.07. Beet 7.80 2.0 10 0.80 9.27 10.08. Cucumber 5.40 1.5 10 0.58 4.84 5.0
Flow instability on the coulter was determined for each crop, using the following relation:
1001
)(1
m
n
im
qn
i (3)

181
where - qm is the average flow rate of the coulter;- qi is the flow rate obtained in one repetition;- n is the number of repetitions.
From the determination on the seed flow rate on the coulter results that flow instabilityhas the following values, presented in table 5.
Table 5: Flow instability on the coulter
No. CropDistributor
flow(gr/min)
Flow instability (%)
On rowOn working
width1. Salad 4.75 1.76 -2. Carrot 13.60 2.16 -3. Tomato 7.70 3.00 3.84. Onion 29.00 1.96 -5. Cabbage 6.90 1.56 3.76. Bell pepper 35.47 0.42 -7. Beet 38.26 0.65 4.08. Cucumber 32.13 2.90 3.9
Laboratory and field tests were conducted in the purpose of establishing the qualitative indicesof the sowing machine in the field. Determinations were conducted after plants emerged.
The indices that were established were the following ones: sowing precision as number ofseed in one pocket; sowing depth; energetic indices.
In order to determine the seeding precision as number of seeds in one pocket,measurements were conducted on a distance ensuring sowing on a minimum of 100 seeds.Sowing precision as number of seeds in one pocket was given by the percentage of pocketswhere a number of seeds equal with the one adjusted (1 seed) was found. The average resultsobtained after processing the experimental data are presented in table 6.
Table 6: Sowing precision as number of seeds per pocket
No. Crop
Adjusteddistance
between pockets(cm)
Speed(km.h-1)
Sowing precision as number of seeds per pocketPockets with
one seed(%)
Pockets withmultiple seeds
(%)
Pocketswithout seeds
(%)
1. Carrot 3.05.3 53.7 36.3 10.06.8 43.0 23.0 34.0
2. Tomato 13.05.3 85.3 8.0 6.76.8 74.3 8.3 17.46.8 74.3 9.7 16.0
3. Okra 8.05.3 97.0 1.0 2.06.8 85.0 4.7 10.3
4. Cucumber 15.05.3 85.3 14.7 -6.8 72.6 13.7 13.7
Depth of burring the seeds was determined after emergence by unearthing seeds andmeasuring the distance from the seed up to soil surface, for a number of 100 seeds in threerepetitions. For determining the degree of uniformity of the sowing depth, were considered asgood depth those found at the adjusted depth as well as those having a ± 1 cm deviationcompared to the adjusted depth. Results are presented in table 7.

182
Table 7: Sowing precision
No. CropWorking
speed(Km h-1)
Adjusteddepth(cm)
Averageachieved depth
(cm)
Average deviation fromthe adjusted depth
(cm)
Seed burialuniformity
(%)
1. Carrot5.3 2 2.34 0.34 95.56.8 2 2.12 0.12 93.7
2. Tomato5.3 3 3.10 0.10 98.46.8 3 3.05 0.05 96.26.8 3 3.10 0.10 96.8
3. Cucumber5.3 2 2.43 0.43 97.86.8 2 2.21 0.21 95.7
3. CONCLUSIONS
Laboratory determinations have shown that the distributor flow rate varies according tothe rotational speed of the disc, following a curve, specific for each crop, which is differentfrom the theoretical one. It is deduced that up to a certain speed of rotation of the distributiondisk, the flow rate is higher than the theoretical, but as the disc speed increases, the real flowrate decreases below the theoretical flow rate.
Instability of flow on coulter varies between 0.43% for bell pepper crop and 3.0% fortomato crop, and on the working width varies between 3.7% and 4%.
Sowing precision as number of seeds in one pocket varies depending the working speed,decreasing along with increasing speed and shows value between 53.7% and 43% for carrotcrop, between 85.3% and 74.3% for tomato crops and between 85.3% and 72.6% forcucumber crop.
Working depth is maintained around the depth adjusted, the deviation ranging between0.05 and 0.43 cm. The uniformity of burying seeds varies with the working speed and isranging between 93.7% and 98.4%.
ACKNOWLEDGEMENT
This work was funded by the Ministry of Research and Innovation, within the project entitledPN 18 30 01 01: “Experimental research on the aerial mapping of agricultural cropscorresponding to the Agriculture 4.0 concept”, ctr. 18N/16.03.2018
References
[1] Brencu Molder L., Marin E. (2011). Experimental researches of complex technical equipment sowing corn innarrow strips. INMATEH International Symposium, ISSN: 978-973-0-11614-4, pp. 37-44;[2] Cârdei P., Manea D., Popescu S., Lazar S. Mathematical model of the distribution device operating on themechanical-pneumatic sowing machine SDC / Model matematic al procesului de lucru efectuat de aparatului dedistribuţie al semănătorii mecano-pneumatice SDC, INMATEH - Agricultural Engineering, ISSN: 2068 – 2239,vol. 34, no. 2 / 2011, pp 5-12;[3] Cojocaru, I., Marin, E., Manea, D., Ecological technology of soil working in conservative system andsubsoilage by the performance of a technical equipment for the big power tractors, Proceedings of the union odscientists, House af Anghel Kunchev University of Rousse, pp. 384-389, 2006;[4] Cujbescu D., Vlăduţ V., Voicu Gh., Ungureanu N., Researches on obtaining higher qualitative indices forthe sowing work, Engineering for Rural Development, 15 th International Scientific Conference Engineering forRural Development, 25.-27.05.2016 Jelgava, LATVIA, ISSN 1691-5976, pp. 1305 – 1311;[5] Fornstrom, K. J., and S. D. Miller. (1989). Comparison of sugar beet planters and planting depth with twosugarbeet varieties. J. Am. Soc. Sugar beet Technol. 26 (3&4): 10-16;[6] Mitroi A., Agricultural mechanization, University manual, USAMV, DID, Bucharest, 2003;[7] Paraschiv ,G., ş.a., Machines for working the soil, sowing and crop maintenance, Printech Pub. House, ISBN973-718-374-6, Bucharest, 130 pp., 2005;[8] Păunescu D., Brătucu Gh., Păunescu S., Atanasov At. (2010). Research regarding the use of the GPS inmonitoring agricultural sowing. INMATEH - Agricultural Engineering, vol. 31 (2), pp. 79-86;

183
PRINTERS CONTRIBUTION TO INDOOR LEVEL OF PARTICULATEMATTER AND SOLUTION TO REDUCE THIS EMISSIONS
Bordaș Adriana1, Istrate Irina1, Mariana-Gabriela Munteanu1
University Politehnica of Bucharest, Faculty of Biotechnical Systems Engineering
ABSTRACT
According to the United States Environmental Protection Agency (USEPA), indoor air pollutionis in the top five risks to public health due to the negative impact to human health.
In some cases, the indoor pollution can be more than ten times higher than the outdoor airpollution, and in the case of harmful substances, their concentrations may even exceed the admissiblenorms by up to 100 times, even the indoors level of cancerous chemicals are between 5 and even up to70 times higher than outdoors.
Considering these alarming statistics, our study was conducted to determinate how printersinfluence the level of particulate matter in indoors office buildings and the contribution of thisconcentration to outdoor pollution, as well as the presentation of economical and reliable ways toreduce the concentration of particulate matter in the indoor environment.
1. INTRODUCTION
PM stands for particulate matters and they are a widespread air pollutant.Particulate matters represent the sum of all solid and liquid particles suspended in air,
whose physical and chemical characteristics varying by location, being known byaerodynamic properties as following: large particles (between 2.5 and 10 µm), fine particles(smaller than 2.5 µm) and ultrafine particles (smaller than 0.1 µm) [1].
Common chemical constituents of particulate matter include sulfates, nitrates,ammonium, other inorganic ions such as ions of sodium, potassium, calcium, magnesium andchloride, organic and elemental carbon, metals (including cadmium, copper, nickel, vanadiumand zinc) and polycyclic aromatic hydrocarbons (PAH). In addition, biological componentssuch as allergens and microbial compounds are found in PM [2].
The size of particles has been directly linked to their potential for causing healthproblems, for this reason it is important to identify and to limit all the sources generating suchparticles, especially because in most locations from Europe, PM2.5 constitutes 50–70% ofPM10 [2,3].
Another alarming fact it is that 92% of the world population was living in places wherethe WHO air quality guidelines levels were exceeded.
In Romania, the air has an annual average of 19 µg/m3 of PM2.5 particles, that is 90%more than WHO safe level, and in Bucharest, the air has an annual average of 23 µg/m3 ofPM2.5 particles, that means 2,3 times WHO safe level. Moreover, in Romania, 14 497 peopledie because of an air pollution-related disease each year, among of these 88 are children [4].
Taking account these alarming statistics, this study investigated PM emissions fromprinters, which can significantly affect the submicrometer particle concentration levels in theoffice.
According with this fact, Queensland Institute of Technology shows that the averageparticle number concentration during working time is about 5 times higher than during non-working time in the office.
We chose this study because people who are living in urban areas spend up to 85–90 %of their time indoors where, at least, one printer is located, often without knowing that theymight be continuously exposed to air pollution.

184
2. METHODOLOGY
2.1. AIR POLLUTION IN BUCHARESTBucharest is one of the most polluted cities in Romania, frequently registering
exceedances of limit values and recommended limits (Table 1).
Table 1: Limite value for PM2.5 and PM10 [5]Național limits (EU Air Quality Directive) WHO Guidelines
PollutantAveraging
periodLimit value
(μg/m3)Comments
Limit value(μg/m3)
PM2.5 Daily - 25
PM10 Daily 50Not to be exceeded on more than
35 days per year.50
PM2.5 Annual 25 10PM10 Annual 40 20
In Bucharest, cars traffic represents the major source of PM (50%). High emissions alsooccur from combustion for energy production in households and industry (40%) and otherurban and industrial activities. There is no doubt that only a small part of the 10% isrepresented by indoor sources. The indoor pollution equipment has a local influence, at theemission source, and is affecting the users directly.
Although the level of pollution is among the highest in the country, in the last 10 yearstheir concentration has fluctuated.
This decrease is due to the pressure from the European Union regarding the alignmentwith the recommended level for the protection of human health applying a series of measuresimposed since joining the EU regarding the reduction of discharges from significant sources,aimed at: reducing the use of high-pollutant fuels (coal, oil), equipment with containmentfilters, catalysts and other types of pollutant containment installations, etc.
According to the data expose in the Air Quality Plan for Bucharest 2018-2022, theannual average values of PM10 concentrations measured during 2017 are lower than obtainedin the previous monitoring period, reaching in 6 of the 8 existing stations values lower thanthe limit value. However, at traffic station the values are maintained higher than limits, andthe values measured at stations in the city show fluctuation and some periods in which thelimit value is exceeded.
The limit value of PM10 is exceeded on small areas in the northern, central andsoutheastern part of Bucharest. The contribution of industrial operators to VL overruns issignificant. Higher concentrations of PM10 (35-40 μg/m3) were obtained on central area,adjacent areas and in arteries with high circulation. In peripheral areas, the annual averageconcentrations are between 30-35 μg/m3. In peri-urban areas, annual mean concentrations arein the range of 25 to 30 μg/m3.
The limit value for PM2,5 is exceeded by extended areas in all sectors of Bucharest. Themain sources responsible for the high values obtained are cars traffic (on main and secondaryarteries) and residential heating, but the larger spatial dimension of overtaking is mainly dueto the existence of an increased regional fund (over 65% of VL).
Concentration values range from 25 to 30 μg/m3 in the central area, adjacent areas and inarteries with high circulation, while values exceeding 30 μg/m3 are found in limited areas. Inthe residential areas which are not crossed by the heavily circulated arteries, the averageannual concentrations are between 20-25 μg/m3. In peri-urban areas, annual meanconcentrations are below 20 μg/m3.

185
2.2. PRINTERS TYPE AN CHEMICAL COMPOSITION OF PRINTING INK
There are two types of printers on the market (generally): inkjet printers that use thermalenergy to emit ink particles and laser printers (electro-photographic devices).
The first type of printers uses ink cartridges, and the second type uses solid toner(particles of 5-30 μm) stored in the stored in the toner pool and is composed of two mainingredients, pigments and plastic particles [6].
In general, the laser printers are more used because they have a superior print speed asagainst inkjet printer and are ideal for office activities where a large amount of documents areprinted in a relatively short time.
2.2.1. Printer inkInject cartridges contain minute ink nozzles (about 400), located in the printer head, from
which ink is dispensed onto the paper. During printer use, the microscopic ink nozzlesdispense ink onto the paper (4-5 picolitres/nozzle) according to the date command.Regardless of what cartridge is used, indoor ink can withstand 300 degrees due to itscomposition, subject to repeated heating/cooling cycles [6].
For maintain all the qualities of the printing process it is necessary to add specialsubstances into the mix inside the ink cartridge. The major substances that modern inkcartridges contain are: deionized water (95%); ethylene glycol, it prevents the ink nozzlesfrom clogging up and prolongs the life of the ink inside the ink cartridge especially throughperiods of insufficient use; ethylene-diamine-tetraacetic acid (EDTA), it forms a type ofchemical trapping structure which catches the metal contaminants from the adhesive strip andprevents them from entering the cartridge or the printing head; ethoxylated acetylene diols, itkeep the surface tension of the solution in the ink cartridge at the right level; three dyes -Yellow 23, Blue 199, Red 23 (contains copper in large amounts); cyclohexanone, it help theink stick to the paper and not slide off or get smudged, and butyl urea for prevent cellulosefibres of the paper to form new H – bonds [7].
2.2.2.Solid toner cartridgeElectro-photographic printers are using a low-power laser beam to capture an image and
to reproduce it by means of a solid pigmented substance based on carbon powder, substancecalled toner. The light source determines the selective electrostatic charge of aphotoconductive drum. The latent image is then developed by covering it with toner, istransferred onto the paper and is fixed [6].
A laser toner cartridge contains a mix of solids which isn't even the same in all laserprinters; the mix may variate from a model of printer to another even if they are produced bythe same manufacturer.
However, the basic components in all of them will remain the same, such us: polyester(85-95%); polypropylene wax, it prevents the toner from sticking to the rollers; carbon black,it imparts the colour black to polyester; pigment yellow, it is made up of a benzimmidazolonecompound; pigment red; pigment blue; fumed silica, it makes particles less prone to stickingto each other, and charge control agents which could include zinc, chromium, or iron [7].
2.3. CONTRIBUTION OF PARTUCULATE MATTER FROM PRINTERS IN INDOORENVIRONMENT
The principal factors governing particle concentration levels in indoors are: thecontributions determinated by the indoor sources (printers, PC, electrical equipments) and theones from the outside air, the deposition rate of particles, the air exchange rate and

186
coagulation (although in this case, the particle coagulation rate is significantly lower theemission rate and it is insignificant).
Researches in this domain found an increase of particulate matters in indoors with theintroduction of electrical devices (about 5 times higher than outdoors concentration)particularly printers and photocopy machines. More critical is the fact that many of the officesare not adequately ventilated to reduce the consequences of direct exposure.
In their study, Congrong H. et al., showed a clear diurnal variation in the indoorconcentrations, with the average concentration of 6.5 μg/m3 at one normal utilization on theprinter (in a air conditioned office building). If we add this concentration to the existing levelin Bucharest, the risk of office workers, where the limit value are exceeded, increasesconsiderably without taking into account other internal sources.
Much worse is the fact that the exposure level of typography workers can reach twice thelimit value, as Suhaimi S., Nurulilyana S. et al. demonstrated, after studying 46 typography.
The results of the study shows that particle emissions start immediately after the printerstarts operating and the size distributions of the particles generated by the printer aremonodisperse. More than that, the offices with air-conditioner show a higher concentration ofparticulate matters than those without mechanical ventilation (Table 2).
The particulate matter level of indoor air pollution was explained by: the dimension ofthe shop (10.9%), the number of sheets printed daily (6.8%) and by the total number ofphotocopy machine inside the shop (6%).
Table 2: Particulate matters level measured in typography [8]Mean (μg/m3)
PM2.5 31.1Typography with air-conditioner 37.5
Typography without air-conditioner 20.6PM2.5 82.1
Typography with air-conditioner 85.2Typography without air-conditioner 77.2
Among the factors that influence particle emission rates are: printer type, cartridge ageand existence of filters (to 3D printers).
The printer operating with an old cartridge generated a lower total number of particlesthan when operating with a new cartridge, it generated more of the smaller particles, in thesize range below 25 nm [8].
2.4. THE INFLUENCE ON THE HUMAN HEALTH OF PARTICULATE MATTERParticulate matter is a key indicator of air pollution. Due to low aerodynamic diameter,
small particles can travel over long distances in the atmosphere and they can cause a widerange of diseases that lead to a significant reduction of human life. The size of particles hasbeen directly associated to their potential for causing health problems, such that, the smallerthe particles are, the deeper they get into the body to deposit into the respiratory tract. Amongthe natural protective barriers to these particle located in nasal-breathing are the cilia and themucus whith act as a very effective filter for most particulates exceeding 10 μm in diameter.But, at high exposure, it tends to lodge in the trachea (upper throat) or in the bronchi [9].
At the moment, particles that have the most impact on human health effects have beenacknowledged to be those less than 10 μm in diameter. These particles can penetrate withinthe respiratory tract beginning with the nasal passages to the alveoli, deep within the lungsdue to their excessive penetrability. Particles between approximately 5 and 10 μm are most

187
likely deposited in the tracheobronchial tree, while those between 1 and 5 μm are deposited inthe respiratory bronchioles and the alveoli, which can affect gas exchange within the lungsand can even penetrate the lung [9].
Finally, these particles will pervade into the blood stream to produce significant healthproblems. Particles, smaller than 1 μm, usually, behave similar to gas molecules and willtherefore penetrate down to the alveoli (deposition by diffusion forces), and can translocatefurther into the cell tissue and/or circulation system [9].
The health effects of particulate emissions depend on the size of the particles, like [10]:cardiovascular disease (when diameter is smaller that 0,1 μm), tumors (1 – 0.1 μm), skin andeye disease (1 – 2.5 μm), decreased lung function (2.5 - 10 μm).
In increase of PM2,5 level with 10 μg/m3 in short-term (<24 h) increases the relative riskof daily cardiovascular mortality by 0.4% to 1%. Long term exposure to particulate matter isassociated with incidence of coronary events, and this association persists at levels ofexposure even below the current European limit values (Table 1).
It was also concluded that with a 5 μg/m3 increase in estimated annual mean PM2.5 wasassociated with a 13% increased risk of coronary events, and a 10 μg/m3 increase in estimatedannual mean PM10 was associated with a 12% increased risk of coronary events [11].
More than that, estimates of the health impacts attributable to exposure to air pollutionindicate that PM2.5 concentrations in 2013 were responsible for about 467 000 prematuredeaths originating from long-term exposure in Europe [12].
For these reasons, the air quality target and limit values set by the EU Air Quality havebeen transposed into national legislation, but what really needs to be considered are the safetylimits identified by the World Health Organization which are much lower than the limits inthe legislation (Table 1).
All of these effects may occur at people who use the printer frequently, alarming beingthat the mass deposition of particles emitted by printers into a human lung has been identifiedas 1.732 μg/m2 • min [12].
2.5. SOLUTIONS TO REDUCE PARTICLES CONCENTRATIONIn order to reduce the particle level due to indoor emission sources, can be used
mechanical air cleaning sources, natural solutions involving the use of phytoremediation andnatural ventilation.
Mechanical sources involve extra costs and, in some cases, a device like this can causehearing disruption, affecting the workers in the office.
Alongside conventional techniques to clean indoor air, environmental biotechnologysuch as phytoremediation, in which growing plants with associated microorganisms take uppollutants and degrade or detoxify them, may also be employed. Compared to the technicalmethods, phytoremediation technology is cheaper, environmentally friendly and can be usedfor a wider range of both organic and inorganic impurities. Studies have shown thatornamental plants have the ability to absorb, distribute and/or transport organic pollutants tomicroorganisms associated with higher plants living both in the rhizosphere and phyllosphere[14].
Their absorption capacity is influenced by leaf size, structure, the ticker layer of waxes,pubescence and surface roughness, and are recognized by the name "spider" (known inRomania as the "veil of the bride") - Chlorophytum comosum. The total amount of PMaccumulated on the leaves of the spider plant ranged from 13.62 to 19.79 μg/cm2, and thegravity forces were not involved in PM accumulation on leaf blades. The amount of fineparticulate matters was higher accumulated, because they are easier to photostabilizer [14].
In the case of the room's natural ventilation the danger can appear in certain timeintervals, the concentration of particles introduced with fresh air to be very high due to intense

188
traffic or special events which can happened. For this reason, you should carefully select theoptimal ventilation range and how to dispose internal pollutant equipment to minimizeexposure.
3. CONCLUSIONS
The indoor concentration level of the particulate matter is significantly influenced by theuse of printers, contributing to the overall pollution level by an average of 6,5 μg/m3,representing about 23% of the total emission average recorded in 2017. Practically, the indoorexposure level (considering only external sources and printer contribution when they areused) may fluctuate between 16.6 and 41.9 μg/m3. The most affected people being thosewhose offices are in the central area and the adjacent areas as well as along the large trafficarteries. Effects increase when the workspace is smaller because the dispersion will be done ina narrow space, increasing the direct exposure of workers (an increase of 1 m2 dimension ofthe office will reduce 1.07 μg/m3 of PM2.5 indoor air pollution levels).
In order to limit direct exposure, it is indicate to put plants in the immediate vicinity ofthe printer and ventilate the room for the dispersion of the emitted particles.
References
[1] Gawronska H., Bakera B., Phytoremediation pf particulate matter from air by Chlorophytum comosum L.Plants, Air Quality Atmosphere & Health, 2014;[2] World Health Organization, Health effects of particulate matter - Policy implications for countries in easternEurope, Caucasus and central Asia, publicat în WHO Regional Office for Europe, 2013;[3] World Health Organization media center, Ambient (outdoor) air quality and health, site: www.who.int,access data: 25.03.2018;[4] WHO Global Platform on Air Quality & Health, Breathelife, site: www.breathelife2030.org, access data:25.03.2018;[5] S.C. WESTAGEM S.A., Planul Integrat de Calitate a Aerului în Municipiul București 2018-2022, Bucharest2018;[6] Baruch, Z., Sisteme de intrare/ieșire și echipamente periferice, Cluj-Napoca, site: www.users.utcluj.ro,access data: 19.03.2018;[7] Office Hacks, What do ink cartridges contain?, publicat în 2015, site: www.blog.inkjetwholesale.com.au,access data: 20.03.2018;[8] Congrong H., Morawska L., Len Taplin, Particle Emission Characteristics of Office Printers, InternationalLaboratory for Air Quality and Health, Queensland University of Technology, Brisbane, Australia, 2006;[9] Ki-Hyun K., Kabir E., A review on the human health impact of airborne particulate matter, published inEnvironment International, 2015;[10] Brüning Thomas, Assessment of the Health Effects of Toner Particles on People in the Workplace, BGResearch Institute for Occupational Medicine, 2006;[11] Yixing D, Xiaohan X., Air particulate matter and cardiovascular disease: the epidemiological, biomedicaland clinical evidence, Jurnal of Thoracic Disease, 2016;[12] European Environment Agency, Air quality in Europe report, 2016;[13] Suhaimi S., Nurulilyana S., Najib M., Ahmad F., Predictive Factors of Particulate Matter Indoor AirPollution and its Effect on Workers` Lung, Asia Pacific Environmental and Occupational Helth Jurnal, 2017;[14] Gawronska H., Bakera B., Phytoremediation pf particulate matter from air by Chlorophytum comosum L.Plants, Air Quality Atmosphere & Health, 2014.

189
RESEARCH REGARDING THE PROCESS OF MEDICINAL HERBSDRYING TECHNOLOGY
PhD. Eng. Caba Ioan Ladislau1, Phd. Stud. Eng. Laza Evelin-Anda1
Phd. Eng. Vlăduţ Valentin2, PhD. Eng. Păun Anişoara2
1)INMA Bucharest – Sucursala Timisoara / Romania2)INMA Bucharest / Romania
Tel: 0256.499.336, E-mail: inmatm_caba @yahoo.com
ABSTRACT
This paper aims at studying the technological process of dehydration of medicinal and aromaticcrop plants and spontaneous flora, in order to determine the most suitable drying process and thetechnical-functional equipment. The artificial dehydration of food products medicinal and aromaticplants, although it is characterized by relatively high costs, is widely used because dried products havethe weight and volume reduced and may be retain and use for a long time after harvest, maintainingfood quality or the therapeutic quality (in the case of medicinal plants). At the same time can ensure therigorous control of technological operations, so the final product complies with current food safetyregulations.
1. INTRODUCTION
Artificially drying of food products, medicinal and aromatic plants, is widely used becausedried products have low weight and volume, can be easily stored and retains much betternutritional and therapeutic qualities. At the same time can assure a rigorous control oftechnological operations, so the final products comply with current food safety regulations [8,10, 11, 12].
The teas constitute the most efficient way for extracting the active ingredients from theplant and, unlike the drugs do not cause unwanted side effects. But medicinal and aromaticplants are a source of raw materials for the extraction of active ingredients and oils, withparticular value for many industries [3, 4, 8, 10, 11, 12].
The main areas for use of the medicinal and aromatic plants as well as products and activeingredients extracted from them are: in food in the form of teas, food additives, spices,colorings, sweeteners, preservatives, alcoholic or non-alcoholic drinks, for flavoring foodproducts (chewing gum, chocolate) or nonfood (detergents) and maintenance for medicaltreatments, including aromatherapy cosmetics and perfume industry, deodorants products,shampoos, bath lotions, toilet soaps, toothpaste, mouthwash and as natural pesticides for plantprotection [3, 8, 10, 11, 12].
Convection drying was and is the most widespread method of removing moisture from theplants because of the simplicity of the technological process and the many variants applicable(including the possibility of association with another drying principle), in short time and with arelatively low cost [2, 4, 5, 6, 9, 10, 11, 12].
Warm air constitutes the heating agent of the drying process, but he has the role of drivingthe processed material moisture evaporated. Heat and mass transfer during the drying processis conditioned by the drying agent parameters (speed, temperature and relative humidity of thewarm air) and the linkage between the moisture and material [7, 9, 10, 11, 12].

190
The duration the dehydration process is chosen according to the physic and chemicalcharacteristics of the plant so that after drying the moisture content not exceeding generally14%. For plants rich in oils (like peppermint, thyme, or basil) drying temperature should notexceed 35 °C [1, 9, 10, 11, 12].
2. METHDOLOGY
Installation for dewatering of medicinal and aromatic plants on which have been madestudies consists of a metal frame, trays placing the material to be dehydrated, enclosure wallsand partitions, doors, and inspection cover, heat exchanger, a whole of the water supply, axialfan, valves for air control, electrical installation for command and control, measurement devicesfor the drying process parameters.
1. Metal frame1. 2. Trays2. 3. Walls3. 4. Doors and covers
5. Heath Exchanger
6. Whole of the water supply7. Axial fan8. Air dampers9. Electrical installation10. Measuring instruments
Figure 1: Technological scheme of dehydrating medicinal and aromatic plants installation
Functioning of installation for dehydrating medicinal and aromatic plants is illustrated intechnological scheme shown in Fig.1.
The Installation for dehydration works in batches, the duration of dehydration of a batchdepends on the type of vegetable material is vegetable it’s being dried, being lower for largerherbaceous plants and fruit. As it is shown in the technological scheme, the axial fan providesairflow through the radiator battery, which is heated by the hot water provided by boiler andthen through plant material stacked in trays into the drying room. Because the bottom of thetrays are provided with holes, some of the air flows vertically passing through the vegetablematerial placed on the trays, so that the drying process takes place in the entire volume of theproduct
After prescribing drying parameters, automatic drying cycle was started. At the end of theprocess, the fan and the water pump was stopped.

191
The amount of air circulated through the installation can be adjusted, during operation ofthe installation in automatic mode, using inverter or handling dampers. Air velocity throughtrays product is an important parameter, especially for medicinal and aromatic plants drying,too high speed can lead to lighter fragments with high degree of dehydration.
Recirculated air mode was obtained by the partial opening of the register control over thedrying chamber and partial closing the admission register.
3. RESULTS
In the first experiment was use a herb called Chrysanthemum (Chrysanthemum), it has adetoxifying action and immunostimulatory over the body [11].
The plant was placed in the drawers by 600 g in each drawer, the initial sample weightbeing 9 kg. To keep the plant active principles, it was dried at 40 ° C.
Table 1: Sizes measured while performing the first experiment
Deno.
Drying time [min]
Power[%Pn]
Mediumtemperature
[°C]
Measured sizes Calculated sizes
Obs.Betweenmeasurements
∆tCumulated
Tablesamplem [g]
Qty ofevaporatedwater in themeasurementrange∆m [g]
Humidity[%]
Dryingspeed
[%humid/min]
1 30 30 36 37 99.5 0.5 67.178 0.08Preheating
2 30 60 36 40 94.63 4.87 60.33 0.33 60 120 36 40.1 82.35 7.28 54.28 2.143
Constantspeeddrying
4 60 180 36 40 71.57 10.78 44.11 2.1435 60 240 36 39.9 58.44 13.13 35.4 2.1436 60 300 36 40.1 49.02 10.42 22.83 2.1437 60 360 36 40.2 42.32 6.7 20.49 0.80 Final
drying8 60 420 36 40 37.50 4.82 12.92 0.339 60 480 - 29 35.47 2.03 7.92 0.06 Cooling
During the second experiment has been use a different type medicinal plant Aloe Vera (AloeBarbadensis) this herbs are used for its antiseptic and anti-inflammatory properties [11].
The total amount of plant introduced into the dryer was 10.8 kg. The plant has beendistributed in the dryer drawers each 720 g / drawer.Registrations performed on the first experiment measured values are presented in table 3.
Table 2: Sizes measured while performing the second experiment
De.no.
Drying time (min)
Power(% Pn)
Mediumtemperature
(0C)
Measured sizes Calculated sizes
Observation
Betweenmeasurements
∆tCumulated
Tablesamplem (g)
Qty. ofevaporatedwater in the
measurementrange
∆m (g)
Humidity(%)
Dryingspeed
(%humid/min)
1 20 20 36 38 99.58 0.41 75.98 0.06Preheating
2 30 50 36 39 95.71 10.21 75.05 0.273 60 110 36 40 85.45 10.46 73.7 2.674 60 170 36 41 76.58 10.85 70.9 2.67

192
5 60 230 36 41.3 63.08 13.55 65.66 2.67 Constantspeeddrying
6 60 290 36 41.5 52.46 10.62 56.30 2.677 60 350 36 41.6 44.78 10.68 48.81 2.678 60 410 36 42 35.85 10.93 36.03 2.679 60 470 36 41.7 30.58 5.27 24.05 0.9 Final
drying10 60 530 36 40 26.96 3.62 14.98 0.3411 60 590 - 30 25.04 1.93 8.42 0.06 Cooling
4. CONCLUSIONS
The products of medicinal and aromatic plants represent a high economic value on bothdomestic and foreign markets because they have a wide range of use. To achieve them areunnecessary especially when local resources are exploited the parameters of heating agent (hotwater) ensures high enough temperatures for the drying agent in order to dry plants with higherand lower moisture and plants and those plants that present a wood structure. At the same timethere are sufficient reserves as temperature and flow of heat to dehydrate fruits and vegetablesproperly prepared, if necessary even by slicing.
REFERENCES
[1]. Banu C. & Colective, "Manual of the Food Industry Engineer, Vol. I", Technical PublishingHouse, Bucharest 1998.[2]. Catana L. & Colective, "Guidance for the establishment of a dehydration unit for vegetablesand fruits", Ed. Printech, Bucharest 2008.[3]. Coiciu Evdochia, „Medicinal plants in perspective”, C.D.A., Bucharest, 1967.[4] .David P. "Test report of Prototype Technology and Modernized Plant for Drying of Fruitand Vegetables", Program Relansin, Contract No. 1530 / 04.12.2001, 2004.[5]. Despa Gh. The technological study of the process of primary processing of medicinal andaromatic plants and the extraction and primary processing of active substances, NucleusProgram, contract no. 15 N / 27.02.2009.[6]. Dănescu A. „Thermotechnics and thermal installations in agriculture”, Didactic andPedagogical Publishing House, 1967[7]. Dăscălescu D., „Drying and its industrial applications”, Technical Publishing House,1964.[8]. Dihoru Al., Dihoru Gh., „Plants used in digestion in humans and animals”, Ed. ArsDocenti, Bucharest, 2008.[9]. Fader T. „Test report of the prototype Plant for Dehydrated Fruit”, Relansin Program,contract no. 1485 / 08.02.2001;[10]. Mihăilă C. „Processes and industrial drying installations”, Technical Publishing Houseof Bucharest, 1982[11]. Laza E-A., Andrei S., Pop A., Manea D., Matache M. „Studies and research regardingthe process of herbs drying technology”, ISB INMA TEH’ 2015, International Symposium:Agricultural and Mechanical Engineering, Bucharest 2015.[12]. Paun E. & Collective, „Treated Medicinal and Aromatic Herbs, 1-2”, Ed. AcademicsR.S.R. Bucharest.,1998.

193
The relations between Cultural Landscapes, Open Source Hardware andOpen Innovation in Rural Development
Alexandru Calcatinge, PhD1
“Ion Mincu” University of Architecture and Urbanism, Bucharest, Faculty of Urbanism,Department of Urban Planning and Territorial Development
ABSTRACT
There are three strong concepts in this paper's title: cultural landscapes, open source hardwareand open innovation. All of these concepts have, in my opinion, a strong relation to the ruraldevelopment, and I will demonstrate this in the following paper. The cultural landscapes are thecombined works of nature and humans, the open innovation is represented by the combined internaland external ideas that shape development based on new technologies, and open source hardware isthe combination of readily available materials, open infrastructure and open design tools. All thoseconcepts stand for freedom of ideas and principles used to develop the environment. Thus, this paperwill create the missing link between them and rural development, building on the principles of opensource.
1. INTRODUCTION – THE NEW OPEN INNOVATION PARADIGM
One might wonder what does all the concepts from the paper’s title have to do withrural development, and it is a fair question. In the previous TE-RE-RD paper I’ve built uponconcepts as “Open Source Culture”, “Open Source Ecology”, “Open Source Urbanism” and“Open Source Hardware” and DIY in rural development. This paper is about to create themissing link between those concepts and “Open Innovation” at a Cultural Landscape scale.
But first, let me emphasize a little on the concepts that I am going to use here and on thestructure of the paper. In the first chapter I will review the concepts described in the previouspaper, as those two were created as being part of a whole, connecting the Open Sourceparadigms with the Cultural Landscapes paradigms. The link with the rural development ismuch needed, as this is the “site” where innovation should take place. In the last part of thepaper, there will be an analytical link constructed on how all those relate to each other andbenefit the local and regional communities.
The main paradigm that this paper will address will be the “open innovation” one, as theother paradigms were already discussed in detail in the last TE-RE-RD paper. First, what isopen innovation? Without looking for any definitions, we must connect the term to the “opensource” one, as those are strongly related. The term “open source” defines an open mentalityin relation with the computer software production. Thus, an open source software product hasit’s source code open to anyone that is interested in studying it or further developing it. Thiskind of mentality and culture was the key to delivering one of the most important open sourceproject in the world: the operating system kernel named Linux. Since 1991 when it’s sourcecode was made available on the Internet, the project is in constant growth and was aninspiration to other important open source software projects [1a] . Some projects you mighthave heard of, like most know Linux distributions Fedora, Debian or Ubuntu, but there arealso smaller but influential ones, that can be put alongside the open innovation process, like
1 UAUIM, str. Academiei nr. 18-20, 010014, București, România.

194
Hadoop – an open source software that is used for reliable, scalable and distributed computingand was developed by Yahoo and Apache, but now it is used and developed by companieslike Google, Facebook, IBM, Twitter, Amazon and any other company that is working withBid Data. Git is another important project. It is a distributed version control system and isused by developers around the world for working on open source projects. TensorFlow,developed by Google, is an extensible neuron-based machine learning library, which ismearly scratching the surface of the machine learning potential, but nevertheless it is a greatpeace of software. Hyperledger is an open source software that develops modular tools basedon the blockchain technology to solve big commercial problems [1b]. All those projectsdiscussed here had a strong impact on the way computation and collaboration in developingcode is done. They are a living example that open source collaboration is the key to producinginnovative assets.
Let us get back to the term of open innovation now. What does it mean really? Well,Henry Chesbrough said that “Open Innovation means that valuable ideas can come frominside or outside the company and can go to market from inside or outside the company aswell” [2]. Chesbrough is believed to be the one that “invented” the term “open innovation”and in contrast to his approach, the creator of the Linux kernel, Linus Torvalds stated duringthe Open Source Leadership Summit of 2017, that “the real work is in the details” [3] and thathe is a strong believer of the view that successful projects are 99 percent perspiration and onlyone percent innovation. Nevertheless, both views are important for a healthy process ofinnovation. Nowadays, the main question is not if you should innovate or not, but more abouthow to innovate and how to manage that process. And the key to this process is thecommunity. This community is comprised of creators, just like computer programmers,architects, builders, engineers, artists and others.
Dealing with open innovation, there is one important aspect that we will not discuss inthis paper: intellectual property. We will only discuss on the tools and the issues of accessingexisting knowledge and technology. Thus, in the following chapters, I will emphasize on therelations between community and open source outcomes/projects and how they relate to thecultural landscapes and rural development.
2. THE COMMON PARADIGMS IN BUILDING RELATIONS
During the process of building the relations between cultural landscapes, open sourceopen innovation and rural development, there are several new concepts that I would like toemphasize on. Those are: service learning, and open source appropriate technology. Besidesthose, I will shortly bring into discussion previously discussed concepts like open sourcehardware and open source urbanism, in order to create a clear binding relation between all ofthose that relate to the cultural landscapes and rural development.
First, let us get back on the issue of accessing existing knowledge and technology. AsJulien Penin stated, “open innovation paradigm does not focus on the condition of availabilityof existing technologies. (…) Openness is central in the case of upstream research. Thoseresearchers must be open, in the sense that everybody should be allowed to use them withoutdiscrimination in order to create a dynamics where each stakeholder can use and enrich theopen knowledge pool” [4]. Thus, the way we can access the already existing knowledge is avery important aspect of the open innovation paradigm.
Let us take the example of the Free/Libre Open Source Software movement. In this case,the access to knowledge is absolutely free and is also governed by permissive licences such asthe General Public License (GPL) and LGPL. But the most important thing is that the FLOSSis a purely distributed process (around the entire world and between many companies,

195
individuals and different projects) and that it is fundamentally open. Even thought some of thecompanies involved in FLOSS manage to capitalize on their projects, the importance of beingopen over being free is greater. Thus “to foster cumulative innovation it is important thatformer knowledge and innovation are easily accessible for everybody under conditions thatare not too difficult to meet and not discriminatory. They must remain open, but notnecessarily free of charge, if the price of access is reasonable”[5].
If you are not familiar with the FLOSS operations, I will emphasize on the story of RedHat, the worlds most successful open source provider. Red Hat products are paid for andenterprise targeted, but they are also open source and have free variants too. The paid forproduct is called Red Hat Enterprise Linux (but is open source and has its code freelyavailable) and has several versions for server, desktop and cloud, but the same company (RedHat) offer Fedora Linux, which is a community driven project that offer best in class, leadingedge software solutions that are completely open source and free as in no cost. Besides thisproject, there is CentOS (Community Enterprise OS) that is a free rebuild of Red HatEnterprise Linux (RHEL) and is free of charge and open source too. Based on CentOS andRHEL you can also find Oracle Linux, developed by Oracle and Scientific Linux that isdeveloped by the scientists at CERN. Even though you can use those products free of chargeand they are open source, the Red Hat as a company is the first company that managed to passthe 2.5 billion dollars revenue mark this year [6]. And remember, we are talking about opensource software. This is a huge deal, and this is placing the company among the topcompanies in the world in terms of income and revenue values. Contrary to Red Hat’sapproach, other important projects among FLOSS such as Debian, are not concentrated onmaking profit, but more on creating an healthy open source ecosystem on which otherprojects can thrive, without being governed by a commercial entity. Their model is anexample of meritocratic organisation based on clear and transparent democratic rules thatgovern the open source and free paradigms.
In this respect, Julien Penin stated that “open innovation must encompass threeconstitutive elements: (I) voluntary knowledge disclosure from <<participants>>; (II)knowledge being open; and (III) continuous and dynamic interactions among<<participants>>”[7]. Now, those participants must rely on two basic levels of innovation:hardware and software. Mainly, the second level is the most important one, as any hardwarecan be useless without specialized software that make it work the way it was intended at first.Nevertheless, the hardware part is equally important, as this is the part where ingenuity indesign and engineering is actually running the innovation process.
This is where the open source appropriate technology (OSAT) comes into place. Now, letus elaborate more on this and see what OSAT is. “OSAT refers to, on the one hand,technology designed with special consideration to the environmental, ethical, cultural, social,political, and economic aspects of the community it is intended for. On the other hand, OSATis developed in the open and licensed in such a way as to allow their designs to be used,modified and distributed freely” [8]. OSAT is the missing link between rural development andopen innovation, as it creates a new paradigm of an open knowledge ecosystem based oncontributing ideas, designs and code. OSAT is the one that links open source hardware asdescribed in the previous article on this matter and the cultural landscape developmentthrough open innovation. OSAT refers to local maker communities that are the motors forlocal economies. Those communities are comprised of both producers and consumers. Mostof the activities are achieved by service learning, which is “an educational approach thatcombines learning objectives with community service in order to provide a pragmatic,progressive learning experience while meeting societal needs” [9]. To be more specific, typesof service learning are more known as volunteering, community service, internships or fieldeducation.

196
The community involvement is also the motor for diverse spatial outcomes in urban andrural areas, thus defining the degrees of openness of a particular area. Saskia Sassen refer tothis “as the incompleteness of cities, which means that they can constantly be remade, forbetter or for worse” [10] Thus, to be complete, an urban or rural entity can appeal to opensource tools to create a better environment, one that is desired by the community not only bythe powerful stakeholders or actors that are looking for profit.
Open source tools are the ones that can become the main assets of cultural landscape(re)modelling in rural areas. In this respect, I would like to emphasize on several importantprojects that are based on the open source culture. First, there is Appropedia, a collaborativework on sustainability, appropriate technology, poverty reduction and permaculture [11].Secondly, there is the WikiHouse project, an “open source project to reinvent the way wemake homes. It is being developed by architects, designers, engineers, inventors,manufacturers and builders, collaborating to develop the best, simplest, most sustainable,high-performance building technologies, which anyone can use and improve” [12].
Those projects are cornerstones in open source innovation, the ones that are meant toshift the way innovation is going to become a part of any local community strategy’s involvedin the development of the rural areas. Furthermore, each community needs to borrow somepractices that only large scale companies use to innovate. In this respect, each communitymust have both, a culture of innovation – meaning that they are willing to always bringsomething new to their participants, and a well thought infrastructure of innovation – meaningthat they are able to create the necessary systems to link people and technology to theirparticipants’ needs [13]. More, each community of creators must be open to experimentation.None should be scared by this innate aspect of innovation. Everett Harper stated that “testinga prototype in the market, creating a new business model, or learning new automation mightreveal that the <<real>> innovation is in the process not the product” [14]. This is true forrural community development too.
Now, going from Appropedia and WikiHouse, I must also say something about anotheropen source hardware project, the XYZ Spaceframe vehicles [15]. This project featuresunique designs for small vehicles designated for persons or goods transportation. There is alsothe open source hardware called Global Village Construction Set (GVCS) developed by theOpen Source Ecology team, which is a modular low-cost platform that allows the applicantsto create over fifty mechanical structure that would support a sustainable living (discussed inthe previous TE-RE-RD paper) and can be used to develop the local cultural landscapes [16].
Another cornerstone project is the FarmBot, an open source farming machine that isused to grow food by a large number of people, and it has also been used to create an opensource innovative production system for NASA [17]. Even though the FarmBot machines arenot free (they cost more than $3000) their schematics are freely available online, thus one can3D print all the components or even try to buy them separately online. Similar to FarmBot,there is FarmHack, a worldwide community of farmers that use open source tools for theirfarming [18]. They also produced their own “operating system”, called farmOS [19]. It is aweb-based application based on Drupal, which is an open source content management systemused and developed by millions of individuals (myself included).
Closely related to the open source actions, we must tackle the planning process too,because this is the part which almost everybody hates [20], starting from the professionalsdown (or up) to the community members. The first ones hate the system that is toobureaucratic and highly politicised, and the others hate it because, as Alastair Parvin said, “thesystem seems to be locked into a Faustian pact with speculative property developers – largecompanies building poor quality, unaffordable homes for considerable profit” [21]. Thus,what are the solutions at hand?

197
2. CONCLUSIONS
First of all, we need to involve the communities, alongside professionals, into creatingthe new infrastructure for innovation at the local and regional scale, in order to develop theircultural landscapes. This is a major aspect, as nobody knows the local cultural landscapesbetter than the local communities do. To be able to do this, knowledge assimilation is animportant aspect, and the open source aspect is playing a major role. Being free and opensource, this type of knowledge is the foundation of open innovation and local culturallandscapes development.
For example, picture how local rural community would thrive by using free and opensource tools, like the ones used for creating the WikiHouse or the XYZ Bike, the FarmBot orFarmHack. It would be a great thing to see, but knowledge is the main player here, as thelocal rural communities lack the knowledge needed to use those open source tools. Imagine alocal farmer from Romania do a C/C++ or Python script for the FarmBot, for example. It isunimaginable actually. Nevertheless, this is a great way to create local community groups thatcan fight the young people migration from rural to the urban areas. We could create someSpecial Interest Groups (SIGs) that can bring knowledge through local manufacturing coursesand even low level software development for the young ones. Knowing that all youngchildren do programming in high school (mostly C and C++) this could be a great way tomotivate them stay into their local rural communities and help developing them through opensource solutions and tools. Another beneficial output would consist in the opportunity for theyoung ones to learn about open source and thus start using this type of tools from an earlyage. This will certainly shape the way they will look at software and hardware assets fromthen on.
Another positive outcome from this kind of approach would be the way young citizenswill perceive the planning process. Thus, the community involvement in the local culturallandscape development will improve the overall user experience with regard to the localprocesses. In this respect, for example, there is an Open Planning initiative in the UK, wherelocal councils and members of the local communities help developing a smartphone app thatwould help citizens view ongoing or proposed planning applications on a map, allowing usersto find detailed information about every planning project that is taking place in their areas.
Thus, local communities become incubators and accelerators of innovation. Being open,it is a greater thing, as they will foster a healthy local development using local material andimmaterial resources to contribute to the cultural landscape’s equilibrium.
Thus, the relations between the cultural landscapes, open source hardware/software andopen innovation are clearly generated by the efficient use of resources and the production ofknowledge. The way and scale those two are leveraged will determine the level of innovationachieved. In this respect, I constantly advice my students enrolled in my Cultural Landscapesand Development course to see the cultural landscapes as infinite sources of knowledgeproduction and (re)generation, and that all the answers for a local development lay inside thearea to be developed. Starting from local materials, workforce and ultimately, knowledge.Moreover, as the World Heritage Convention states, the cultural landscapes “are thecombined works of nature and of man” and that they “often reflect specific techniques ofsustainable land-use, considering the characteristics and limits of the natural environment theyare established in, and a specific spiritual relation to nature” [22]. Now, those techniques caneasily be seen as open source generated, specific to the 21st Century, and the spiritual relationto nature is thus more likely to be present for the local population/community rather than to anoutsider trying to develop some for-profit project.

198
References
[1a] https://www.linuxfoundation.org/blog/the-10-most-important-open-source-projects-of-2011/[1b] https://hackernoon.com/top-6-open-source-projects-in-2017-db34b9d034a2[2] Chesbrough, H., Open Innovation: The new imperative for creating and profiting fromtechnology. Boston: Harvard Business School Press, 2003, p.43.[3]https://www.theregister.co.uk/2017/02/15/think_different_shut_up_and_work_harder_says_linus_torvalds/[4] Penin, J., More open than open innovation? Rethinking the concept of openness ininnovation studies, BETA UMR 7522, Document de Travail no. 2008 – 18, p.2.[5] Penin, J., More open than open innovation? Rethinking the concept of openness ininnovation studies, BETA UMR 7522, Document de Travail no. 2008 – 18, p.6.[6] https://www.redhat.com/en/about/press-releases/red-hat-reports-third-quarter-results-fiscal-year-2018.[7] Penin, J., More open than open innovation? Rethinking the concept of openness ininnovation studies, BETA UMR 7522, Document de Travail no. 2008 – 18, p.8.[8] https://en.wikipedia.org/wiki/Open_source_appropriate_technology.[9] https://en.wikipedia.org/wiki/Service-learning.[10] https://www.domusweb.it/en/opinion/2011/06/29/open-source-urbanism.html.[11] http://www.appropedia.org/Welcome_to_Appropedia.[12] https://wikihouse.cc/about[13]https://www.forbes.com/sites/everettharper/2018/04/16/a-culture-of-innovation-is-not-enough/#7ffe396a3baa[14] https://www.forbes.com/sites/everettharper/2018/04/16/a-culture-of-innovation-is-not-enough/2/[15] http://www.n55.dk/manuals/spaceframevehicles/spaceframevehicles.html[16] https://www.opensourceecology.org/gvcs/[17] https://farm.bot/[18] http://farmhack.org/tools[19] http://farmos.org/[20] https://medium.com/wikihouse-stories/the-future-of-planning-98b3b7a53e9a[21] ibidem[22] https://whc.unesco.org/en/culturallandscape/

199
ENVIRONMENTAL PROTECTION IN FOOD INDUSTRY THROUGHFOOD WASTE CONTROL
Cristina Maria Canja1, Adriana Elena Boeriu2, Adrian Măzărel3
Transilvania University of Brașov, RomaniaDepartment for Engineering and Management in Food and Tourism
ABSTRACT
The close link between the food industry and the environment can be analyzed for a doublepurpose. Thus, taking into account the point of view of the resources of raw materials and auxiliariesthat the food industry processes, the environment, through its components - soil, water, climate is theone that greatly influences its success rate. From the other point of view, the food industry through thewaste it generates daily, through the use of technological waters, food products created and not sold ina timely manner, food waste of the population or public food is one of the worst sectors of theindustry.
In this context, the present study aims to measure the main ways in which the environmentnaturally supports the food industry, as well as the measures and means that are recommended to beused by all players involved in the food chain to conserve and revaluate good environmentalconditions.Key words: waste of food, environmental protection, food chain, food industry.
1. INTRODUCTION
The food industry is one of the most dynamic and important industries in Europe, beingalso the main industrial area through the European Union.
Analyzing the previous decade, most European countries have not subjected the foodindustry to environmental legislation, with regard to emissions that have been considered tobe relatively favorable, compared to many other industrial sectors. The main target of thisindustry is focused towards enhancing environmental performance by maximizing the use ofraw and auxiliary materials, industrial byproducts, solutions that subsequently lead tominimizing the amount of waste that causes pollution.
The food industry's mission is to provide consumers with safe, quantitative and high-quality food. To the same extent, the food industry in indebted to its consumers to assess andcorrect the effects they exert on environmental factors. Therefore, all food producers,regardless of production size, geographical location or technological stage: from primaryproduction to the marketing stage and to the last consumer, should consider and apply thehighest food safety standards, in compliance with the rules concerning legal environmentprotection.
Food industry is supervised by compressive and very detailed legislation related to thefood chain, being under pressure not only in terms of food safety, but also in enhancingenvironmental performance.
A series of "clean and friendly" technologies for food processing have been developedprecisely to enable producers to better understand the effects of their activities on theenvironment and to adopt practical measures to achieve sustainable production.
1Brașov, 148, Castle Street, email: [email protected]

200
From a technological point of view, the food industry faces two major problems related toenvironmental protection - energy management and waste management.
Food industry is a great energy consumer for technological processes and, in the sametime, being a large waste generator: waste derived from production processes, food productsand residues of food products dumped as solid municipal waste, packaging.
2. THE ENVIRONMENT – SUPPORT FOR FOOD INDUSTRY
The environment, through all its elements, is a direct and indispensable support to thefood industry to develop and produce safe and healthy food for consumers.
Agriculture constitutes the leading supplier of raw materials for the food industry, itsresults being influenced to a great extent by the quality of soil, water and air. In this context,the responsibility of the food industry and all those involved in the food chain is increasing interms of measures and actions taken to environmental protection.
Soil. Soil is the component of the environment that supports the food industry concerningthe raw materials of vegetable origin (cereals, vegetables, fruits, etc.) that can be both sourcesof food for the population and animals.
Water. Water represents an indispensable element for life, representing an importantfactor for almost all the industrial production processes.
In the food industry, water has multiple uses in the technological process such as: raw orauxiliary material; washing water; sorting water; water cooling and transport of variousmaterials.
The water used in technological processes in the food industry must correspond tofeatures that ensure adequate food quality, be of drinking and have appropriate organolepticcharacteristics. The taste and smell of water depend on chemical composition, temperatureand the presence of volatile substances.
Air. Air contamination can be highlighted by two physical aspects of atmosphericpollution: solid or liquid (aerosol) active chemical or biological particles, moleculestransmitted by gas chemical pollution. These contamination, which presents a wide variety ofaspects, nature, behaviors and effects, have a common characteristic: they are all invisible tothe naked eye (excepting the particles in enormous concentrations such as colonies or smoke).This invisibility is the main cause of inappropriate perception of the dangers that may arisedue to these contamination. Thus, the basic hygiene rules (hand washing, use of masks whennecessary) or the use of more complex measures (filtration, white halls, isolated spaces) areoften not respected.
The air contains a large number of substances that come from natural processes, erosion,wind, sea evaporation, earthquakes, volcanic eruptions. To the extra elements are addedparticles of anthropogenic origin, which come from industrial combustion products, powdersfrom nuclear exploitations, forest fires, engine exhausts, etc.
3. SOURCES OF ENVIRONMENTAL POLLUTION IN FOOD INDUSTRY
As shown in the introduction of this study, environmental pollution in food industry isdue to the large amount of waste it generates. One of the waste generators is the weakmanagement of technological processes, technological processes that generate significantamounts of waste through waste and waste of materials, leakage, defective products orinadequate design.

201
3.1. Surplus of materials
When we talk about the excess of materials in most cases we refer to the hard-appreciateddimensions of the materials for food packaging even with the best operating equipment foraccurately approximating the overplus of materials, the packaging of products will inevitablyexceed the limits imposed by the product that is intended to be packed. Due to its economicsignificance, the surplus is monitored by mass control devices, either continuously orstaggered.
3.2. Waste of raw materials and materials
The waste of products results from the inadequacy of products for human consumptionand is considered to be loss or waste. Repeated generation of loss during production indicatesan inadequate process or defective machine maintenance.
3.3. Drainage of liquids
A large number of equipment used in food industry is working on leaking liquids, whichcan be an important source of waste material, a source of loss if it is not properly recovered.
3.4. Faulty products - returned products
Products that do not meet the qualitative specifications imposed by the rules in force,whether or not they have been shipped or returned from marketing, may constitute a majorsource of material or waste if they are not properly recovered or annihilated. Also included inthis group are products that have exceeded their shelf life.
3.5. Inappropriate design losses
Some process equipment, even with modern technology, can cause material and wastelosses due to inappropriate design.
4. FOOD WASTE
The waste of food has reached such an important dimension that it can be considered aglobal problem that has repercussions on all links in the food supply chain, from field toconsumer. According to data recorded since 1974 to date, it is estimated that global foodwaste has increased by 50%. Waste of food is recorded in agricultural fields, processingindustry, distribution companies and consumer housing; food is wasted in industrializedcountries and developing countries. Food waste gives rise to a parallel field to the productionline and generates a long series of negative effects. The issue of food waste is opposed to thefundamental problem of food supply, which is severely compromised by a number of factors,including limited natural resources in relation to the growing population of the world and lowaccess to food of the poorest population groups. This results in a series of analyzes andreflections on how we use the foods at our disposal.
A recent FAO study highlights alarming data, especially with regard to the industrializedworld: European and North American citizens waste each year between 95 and 115 kg of percapita food compared to sub-Saharan Africa, wasting between 6 and 11 kg. Causes of foodwaste are not always the same; they differ according to the stage of the food supply chain, the

202
type of product and the place where the food is wasted. If the food chain is divided into fivesectors (agricultural production, management, storage, processing, distribution andconsumption), one can see how different behaviors in each sector lead to the elimination ofperfectly edible food: starting with harvesting losses during harvesting and storage, to unsafetransport, labeling errors, and end-user habits when purchasing and using food.
As far as industrialized countries are concerned, most of the waste of food takes place inthe final stages, that is to say in the distribution and consumption stages, in particular becauseof the overfunding of food products, while in developing countries the waste of food is mainlytaking place in the early stages due to the lack of advanced agricultural technologies, efficienttransport systems and infrastructure (for example continuous keeping at a low temperature)and the possibility of safe food storage. These data highlight the fact that currently producedfood can in fact be reused for food purposes instead of being disposed of as waste, which hasecologically and economically significant effects and generates ethical implications.
Combating food wastage must become a priority on the European political agenda, theCommission, the Council and the Member States must create concrete strategies and measuresto divide in half until 2025 the quantity of food that is wasted throughout the supply chain,increase the efficiency of industry and raise public awareness of a topic ignored in manyways. Citizens need to be informed not only about the causes and consequences of food wastebut also about ways in which it can be reduced; a scientific and civic culture based on theprinciples of sustainability and solidarity must be promoted in order to encourage morevirtuous conduct. Experience has shown that spontaneous initiatives by associations, whethervoluntary or professional, to promote and implement a culture to combat food waste, havebeen a significant success in the areas where they have taken place.
Food waste involves environmental and ethical issues as well as economic and socialcosts that create challenges for the internal market for both businesses and consumers. It isalso emphasized the need for a political agreement to find solutions to food waste; urges theCommission, as part of the European political agenda, to give priority to all aspects of foodwaste; calls on the Commission, in consultation with the Member States, to set targets forreducing food waste; calls on the Member States and all stakeholders to take practical steps tomeet these objectives.
Food waste is responsible for generation of about 170 Mt of CO2 eq. in the EU eachyear. In order to assess all the environmental benefits of food waste reduction initiatives, onemust consider not only the fact that food waste treatment is reduced but that the foodprocessing and other upstream steps of the life cycle are avoided too.
0 20 40 60 80 100 120
European and North America
sub - Saharian Africa
maxmimum estimated value minimum estimated value
Fig. 1. Food waste compared Europe and North America and sub – Saharian Africa

203
For that reason, the environmental impacts of the life cycle of food waste werequantified, not only those linked to the treatment of food waste, but also those generatedduring the other steps of the life cycle before they become waste. A life cycle approach wasused. Without carrying out new life cycle analysis (LCA), the approach focused onidentifying available research and extracting data from which extrapolations could be madeusing the findings of this study. The results are presented for each of the four sectorsconsidered in this study. The system boundaries for each of them are summarised in the figurebelow. It should be noted that while agricultural food waste is outside of the scope of thisstudy, the environmental impacts of agriculture in the food supply chain were neverthelesstaken into account when assessing the life cycle environmental impacts of food wastegenerated by the four relevant sectors (see diagram below).
The studies conducted by the national associations such as Romanian ConsumerProtection, InfoCons and the Association of the Great Commercial Networks in Romania -AMRCR have highlighted the causes that lead to waste of food. Thus, fast degradation offood (26%), erroneous estimation of the quantities of food consumed for a meal (21%) andexcess purchases (14%) are the first.
The same study highlights the ranking of the most wasted foods - the first place beingcovered by cooked meals (25%), followed by bread and pastries (21%), vegetables (19%) andfruits (16%).
The approach of food waste worsens considerably, urgent measures are needed to bein line with what is being done in the context of a national strategy to tackle the risk of foodand waste management. The necessary measures are aimed at the next, as well as the near ordistant future and target all sectors of the food industry, the entire food chain, public cateringservices and final consumers. Legislative measures in the field must be designed to preventfood waste from being passed on to household consumers or the industrial environment.
5. CONCLUSION
Environmental protection means efficient resource management, avoiding imbalances bypreserving nature, avoiding environmental pollution. Environmental protection measures have
Fig. 2. Life cycle considered for each sector

204
one purpose - to maintain the ecological balance in order to ensure better living and workingconditions for future generations. In the same context, the food industry is also closely relatedto environmental protection as a resource for the environment, as well as its major pollutant.
Statistics say global food waste is over 750 billion dollars, which is six times higher thanthe one used to help people living in poverty worldwide. From the strict environmental pointof view, food waste is responsible for producing 45% of greenhouse gas emissions. By way ofcomparison, global air traffic emissions represent about half of the greenhouse gas emissionsgenerated by food waste.
References
[1] Ministry of Agriculture and Rural Development, http://www.madr.ro/docs/ind-alimentara/risipa_alimentara/bio_foodwaste_report.pdf.[2] Ministry of Agriculture and Rural Development, http://www.madr.ro/docs/ind-alimentara/risipa_alimentara/UNEP-FW-Guidance-Prevention-and-reduction-food-waste.pdf.[3] Ministry of Agriculture and Rural Development, http://www.madr.ro/docs/ind-alimentara/risipa_alimentara/trebuie-sa-spunem-STOP-risipei-de-alimente.pdf.[4] Waldron, K., „Handbook of waste management and co-product recovery in food processing. Volume 1.”,CRC Press, England, 2007.[5] Waldron, K., „Handbook of waste management and co-product recovery in food processing. Volume 2.”,CRC Press, England, 2007.[6] Hung Y. T., „Handbook of Environment & Waste Management. Volume 2.”, World Scientific, London,2012.[7] Lawrence K. Wang,Yung-Tse Hung,Howard H. Lo,Constantine Yapijaki, „Waste Treatment in the FoodProcessing Industry”, Taylor & Francis, London, 2013.[8] Vasso Oreopoulou,Winfried Russ, „Utilization of By-Products and Treatment of Waste in the FoodIndustry”, Springer, Greece, 2007.[9] Maria Kosseva,Colin Webb, „Food Industry Wastes: Assessment and Recuperation of Commodities”,Elsevier, London, 2013.[10] Ioannis S. Arvanitoyannis, „Waste Management for the Food Industries”, Elsevier, London, 2008.

205
ASPECTS ON THE WORKING PROCESS OF THE CEMENT MILLSAND DIMENSIONAL CHARACTERISTICS OF THE RAW MATERIAL
Cristian CIOBANUa, Gheorghe VOICUb1, Magdalena–Laura TOMAb, Paula TUDORb
a CEPROCIM Bucharest, b POLITEHNICA University of Bucharest
ABSTRACT
In essence, this paper presents some aspects regarding the technological process of grinding of thePortland cement components and the working process of ball tubular mills, including its componentparts. The particle size distribution for clinker, limestone and gypsum, which are the basic componentsof the cement determined on the flow of a cement plant in Romania, is presented and their regressionanalysis is done, with known distribution functions in order to estimate the average particle size of themixture subject to grinding.
Keywords: cement mill, raw material, particle size distribution
1. INTRODUCTION
Cement is obtained by crushing together clinker and admixtures (gypsum, limestone, slagetc.). Grinding of the clinker and additives is generally performed in a tubular ball mill operatedin closed circuit divided into two rooms.
Cement clinker is a compact material with a porosity of less than 8% and is very rough. Itis obtained by combustion of raw materials (a mixture of limestone 75 – 77% and 23 – 25%clay) at the temperature of 1450 – 1500ºC, [1, 4 – 7].
The clinker and the crushed admixtures, deposited in silos or feeding hoppers of the cementmill, are extracted and gravimetrically dosed (depending on the type of cement that is desiredto be obtained). The sum of all these quantities gives the wet productivity of the mill. Knowingthe humidity of the feedstock mixture (determined in the laboratory), dry productivity iscalculated. The dosing components are taken up by conveyor belt relays and then dischargedonto the collector belt feeding the cement mill. At the mill exit, the material is picked up by apneumatic gutter and transported to a vertical elevator, which through another pneumatic gutter,feeds a dynamic separator, where the separation of fine particles and coarse particles takesplace. The fine fraction (cement) is further taken up in pneumatic gutters and transported to thecement silos via a conveyor belt relays (or other type of carrier). The coarse part (tail) returnsto the mill to continue grinding and bringing the particles to fine size, [1 – 4].
The mill is continuously fed and operates in a closed circuit, the material that does notmeet the particle size requirements of the cement returns to the mill.
The retention time of the material in the mill differs depending on the grinding ability ofthe materials entering the mill (how easily it is milled), the fineness of grinding (fineness of thefinished product, cement).
2. METHODOLOGY
The principle flowchart for grinding components and obtaining Portland cement is shownin Figure 1.
1Splaiul Independentei 313, Sector 6, Bucharest, 0724715585, [email protected]

206
Figure 1: The flowchart of cement grinding [5, 6]
The tubular mill is loaded with about 30% milling bodies (steel or high alloy cast ironballs).
Figure 2: Diagram of a tubular ball mill for cement [5, 6]
Milling takes place as a result of the material particles being struck by the grinding bodies,with the armour (which lining inside the walls of the mill and are of several types) or betweenthem (autogenous grinding) following the rotation of the mill. The grinding of cement mix is ahigh-energy operation. In order to reduce the particle size from 30 mm to 3 mm, an averageenergy of 2 kWh/t is consumed, for crushing from 3 mm to 0.3 mm it is consumed about 6kWh/t, in exchange for crushing from 0.3 mm to 0.03 mm and a specific surface about 3500cm2/g it is consumed approximately 24 kWh/t, [1 – 5].
Tubular mills are generally equipped with sensors (of various types) that indicate thedegree of filling in each room. Depending on their indications and the amount of tail that isreturned to the mill, the amount of clinker and fresh feed to feed the mill is determined. Thedischarge of the grinder from the inside of the mill is made by means of a stream of air flowingover the load, the optimum speed being between 1.4 - 2.2 m/s. Ventilation of the mill is alsonecessary for its de-dusting and cooling. During grinding, the temperature of the materials andthe friction between the bodies in the mill cause the temperature to rise inside. A too hightemperature damages the quality of the finished product (undesirable chemical changes mayoccur) and can even lead to mechanical defects of the mill (through excessive bearing and rollertemperature). The temperature from the mill evacuation should be within 90 – 110°C for properdehydration of the gypsum, [1 – 5].

207
Figure 3: The working principle of tubular ball mill for cement [5, 6]
The partition wall between the two rooms and the wall at the exit of the mill are providedwith slots of different dimensions. The milled material, which has reached the correspondinggranulometric dimensions, passes from one room to another and leaves the mill through theseslots and through the ventilation ring. Material samples are taken manually or automaticallyfrom/off conveyors (pneumatic gutters/conveyor belts). They will be manually removed onlyafter stopping the grinding flow and under specific conditions with regard to health and worksafety.
At the mill exit, material does not comply with required grinding fineness (grinding is notcomplete), it is necessary to separate the fine particles from the coarse ones. This is done withthe help of a second-generation dynamic separator.
The tail is the coarse part of the material at the separator exit. The flour is the finest part ofthe material at the separator exit, in this case, the finished product, i.e. cement. The left andright gutters are pneumatic conveyors, named after their position (to the left or right of theseparator). The particle size analysis for the material fed into the mill is made by passing it ontoa series of screens and meshes of different sizes and making calculations that take into accountthe quantity that passes and that which remains on the screen.
Particle size analysis of material exiting the mill is made either by passing it on a sieveclassifier or by using particle size gauges based on laser granulometry. Laser diffraction iswidely used as a particle size analysis technique for materials ranging from several hundreds ofnanometres to several millimetres.
The temperature of the material is measured manually or automatically using contactthermometers or various distance measuring devices (pyrometers). The temperature of thematerial at mill exit and the temperature of the cement are usually measured.
For various studies, technological audits, etc., the temperature can also be measured inother points (e.g. the exit gutters of the cement or the tail, the classifier feeding gutter, thematerial fed into the mill).
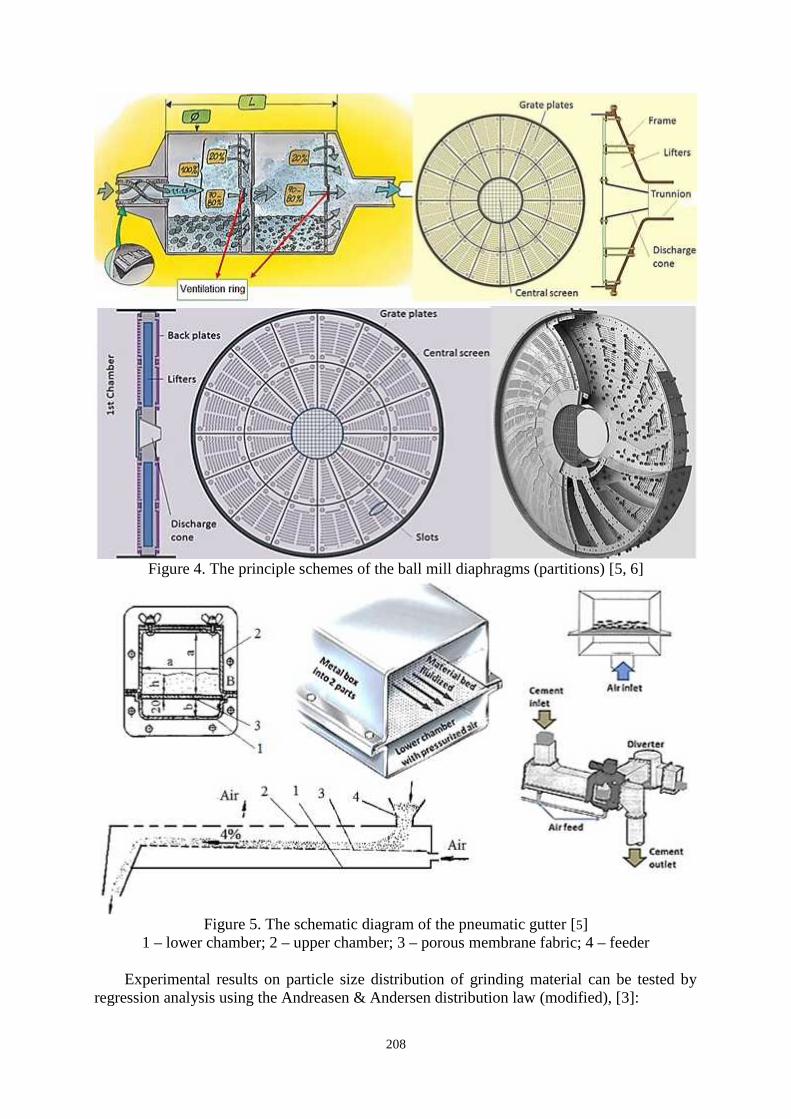
208
Figure 4. The principle schemes of the ball mill diaphragms (partitions) [5, 6]
Figure 5. The schematic diagram of the pneumatic gutter [5]1 – lower chamber; 2 – upper chamber; 3 – porous membrane fabric; 4 – feeder
Experimental results on particle size distribution of grinding material can be tested byregression analysis using the Andreasen & Andersen distribution law (modified), [3]:

209
( ) = 100 ∙ (1)
where: Di is the current particle size of the material; Dmin, Dmax – the minimum and maximumdimensions of the particulate material; n – experimentally determined exponent.
For an amount of material equal to the unit, if particle is considered as spherical of diameterd and if the intrinsic density of the material is known, the specific surface area of a powdermixture of particles can be determined by calculation as follows:= ∙ =
= ∙ =
(2)
3. RESULTS
To determine the characteristics of the material being ground and obtaining Portlandcement determinations were made at one of the cement factories in Romania during the 2017audit. The results for the size distribution are shown in Table 1.
Table 1. Particle size distribution for cement components and raw mixture
Sieve holes size, mm 40 30 25 15 10 7 5 3 1 0
Fraction, %
Clinker 1.25 1.60 2.10 9.30 13.45 17.6 8.60 21.95 10.70 13.45Limestone 1.55 1.10 2.15 5.10 7.65 8.10 6.65 15.95 22.60 29.15Gypsum 8.10 8.25 9.45 13.80 10.95 9.35 5.80 12.15 8.90 13.25Mix 1.90 2.14 2.77 9.21 12.54 15.73 8.12 20.36 11.94 15.29
The variation curves for the material separated by sieves, as well as for the unseparatedand the cumulative fractions were drawn based on the results presented (Figure 6).
Figure 6. The particle size distribution of the components subjected to grindingfor cement manufacture
The variation curves follow an exponential rate as can be seen from the analysis of thefigure. Table 1 shows that maximum values on a 40 mm sieve were obtained for gypsumparticles (8.15%), while the finest particles were obtained for the limestone component of thematerial mix (29.15% having dimensions below 1 mm). For the entire mixture, the calculatedvalues for the fractions considered ranged between 1.90% over 40 mm and 20.36% for particles

210
between 3 and 5 mm. The percentages of cement manufacturing components were 75.89%clinker, 11.33% limestone, 8.66% gypsum and 4.12% furnace dust, only the first three wereground. After milling, at the mill exit, the material had the following characteristics: R90μm =17.36% (recommended value of about 25%), R200μm = 0% and Blaine specific surface area(SSB) was 3174 cm2/g. The mill power consumption was 32.6 kWh/t, and the separatorrecirculation rate of 1.57 (the ratio between the separator feed rate and the tail return flow tothe mill). After separation in the separator and mixing with the filter dust, the final cementexhibited SSB = 4776 cm2/g and R90μm = 1.22%.
Calculated as weighted media from the feed material, the mean particle size of the materialhad the following values: 8.45 mm for clinker, 6.02 mm for limestone and 15.39 mm forgypsum.
4. CONCLUSIONS
The manufacture of cement is a high-energy consuming process, involving a proper dosingof the components according to the manufacturing recipe (clinker, slag and limestone, gypsum)and grinding them into tubular ball mills. In the final grind, which has to meet the requirementsregarding the average particle size and the specific surface area, well-defined proportions ofkiln dust is added as well as filter dust obtained during the grinding and separation process.
If the mill output, the grounded material has a Blaine surface area of 3174 cm2/g, the finalcement has a SSB of 4776 cm2/g, the size of the cement is much smaller compared both to thematerial subjected to grinding and the ground material, because it is subjected to a separationoperation and, in addition, a filter dust is added.
The manufacturing recipe should lead to the framing of the manufactured cement withinthe limits of Portland cement. Regarding the dimensions of the raw materials particles used inthe manufacture of cement, they have been found to have average values of 6-15.5 mm, bothfor clinker and for limestone or gypsum.
The data presented in the paper may be useful to the experts, and other users of the tubularball mills and designers of such machines.
AcknowledgementThe authors thank the management of the Fieni cement factory, Romania, where the audit
activities, the observations and the experimental determinations took place, as well as to theindependent accreditation and accreditation laboratory of CEPROCIM, Romania.
References
[1]. Arvaniti, E.C., Juenger, M.C.G., Bernal, S.A., Duchesne, J., Courard, L., Leroy, S., Provis, J.L., Klemm, A.,De Belie, N., Determination of particle size, surface area, and shape of supplementary cementitious materialsby different techniques, Materials and Structures, vol. 48, iss. 11, pp. 3687 – 3701, 2015.
[2]. Ferraris, C.F., Hackley, V.A., Aviles, A.I., Measurement of particle size distribution in portland cementpowder: Analysis of ASTM round robin studies, Cement, Concrete and Aggregates, vol. 26, iss. 2, pp. 1 – 11,Paper ID CCA11920, 2004.
[3]. Mehdipour, I., Khayat, K.H., Effect of particle-size distribution and specific surface area of different bindersystems on packing density and flow characteristics of cement paste, Cement and Concrete Composites, vol.78, pp. 120 – 131, 2017.
[4]. Weibel, M., Mishra, R.K., Comprehensive understanding of grinding aids, ZKG International, vol.6, pp. 28– 39, 2014.
[5]. *** - www.alibaba.com/product-detail/ball-pebble-grinding-mill-pebble-ball_60238322430.html
[6]. *** - www.thecementgrindingoffice.com, The Cement Grinding Office, 2012 – 2015
[7]. Valic, M.I., Stepisnik, J., Gabrijelcic, M., Vuk, T., Rescic, L., Setting times measurements of portland cementswith pulsed USWR method, Kovine, Zlitine, Tehnologije vol.33, no.1-2, pp.83-86, 1999.
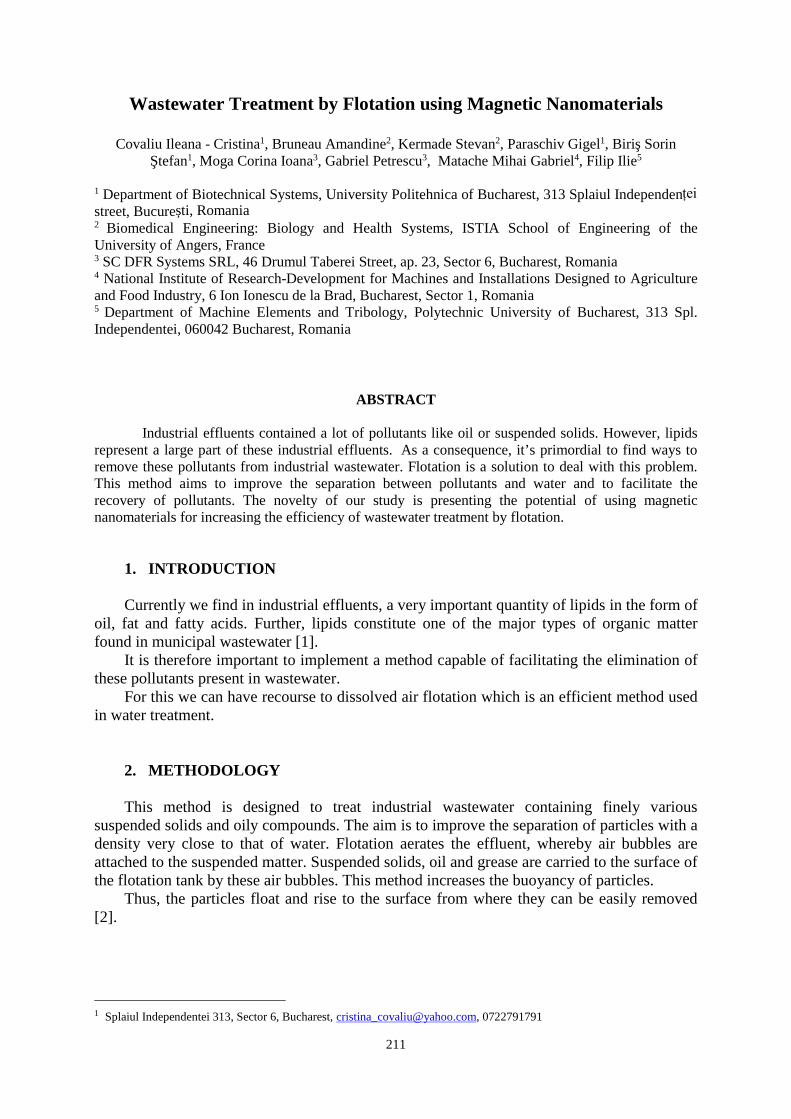
211
Wastewater Treatment by Flotation using Magnetic Nanomaterials
Covaliu Ileana - Cristina1, Bruneau Amandine2, Kermade Stevan2, Paraschiv Gigel1, Biriş SorinŞtefan1, Moga Corina Ioana3, Gabriel Petrescu3, Matache Mihai Gabriel4, Filip Ilie5
1 Department of Biotechnical Systems, University Politehnica of Bucharest, 313 Splaiul Independențeistreet, București, Romania2 Biomedical Engineering: Biology and Health Systems, ISTIA School of Engineering of theUniversity of Angers, France3 SC DFR Systems SRL, 46 Drumul Taberei Street, ap. 23, Sector 6, Bucharest, Romania4 National Institute of Research-Development for Machines and Installations Designed to Agricultureand Food Industry, 6 Ion Ionescu de la Brad, Bucharest, Sector 1, Romania5 Department of Machine Elements and Tribology, Polytechnic University of Bucharest, 313 Spl.Independentei, 060042 Bucharest, Romania
ABSTRACT
Industrial effluents contained a lot of pollutants like oil or suspended solids. However, lipidsrepresent a large part of these industrial effluents. As a consequence, it’s primordial to find ways toremove these pollutants from industrial wastewater. Flotation is a solution to deal with this problem.This method aims to improve the separation between pollutants and water and to facilitate therecovery of pollutants. The novelty of our study is presenting the potential of using magneticnanomaterials for increasing the efficiency of wastewater treatment by flotation.
1. INTRODUCTION
Currently we find in industrial effluents, a very important quantity of lipids in the form ofoil, fat and fatty acids. Further, lipids constitute one of the major types of organic matterfound in municipal wastewater [1].
It is therefore important to implement a method capable of facilitating the elimination ofthese pollutants present in wastewater.
For this we can have recourse to dissolved air flotation which is an efficient method usedin water treatment.
2. METHODOLOGY
This method is designed to treat industrial wastewater containing finely varioussuspended solids and oily compounds. The aim is to improve the separation of particles with adensity very close to that of water. Flotation aerates the effluent, whereby air bubbles areattached to the suspended matter. Suspended solids, oil and grease are carried to the surface ofthe flotation tank by these air bubbles. This method increases the buoyancy of particles.
Thus, the particles float and rise to the surface from where they can be easily removed[2].
1 Splaiul Independentei 313, Sector 6, Bucharest, [email protected], 0722791791

212
Figure 1: Schematic diagram of flotation [3]
As we can see on diagram from figure 1, the elimination of pollutants is obtained byintroducing very small air bubbles into the wastewater. The bubbles adhere to oil and increaseits buoyancy. This technique accelerates the speed at which the oil floats to the surface of thewater and is then removed.
Exiting approach
1) Dispersed-air flotation
Air bubbles are formed by introducing the air directly into the liquid phase. Then,the bubbles incorporate the suspended matter or oil. As a result of this fixation, the suspendedmatter/oil can float to the surface of the water where it will be removed by a skimmingdevice. It is look like dissolved air flotation but the difference is the size of the bubbles whichis larger. They have a diameter of about 1 mm which leads to the creation of turbulence thatbreaks down the particles [4].
2) Dissolved air flotation
Dissolved air flotation (DAF) is a technique that can treat and clarify wastewater from oilrefineries, chemical plants etc. DAF remove oil, grease, fats or total suspended solids. Tomake this remove, air is dissolving under pressure in wastewater. After that, this air isreleasing at atmospheric pressure in a flotation tank. Bubbles take form by this released airand adhere to the suspended matter/oil. So, this suspended matter can float to the surface ofthe wastewater and will be remove by a skimming device. Here bubbles have a micron size.
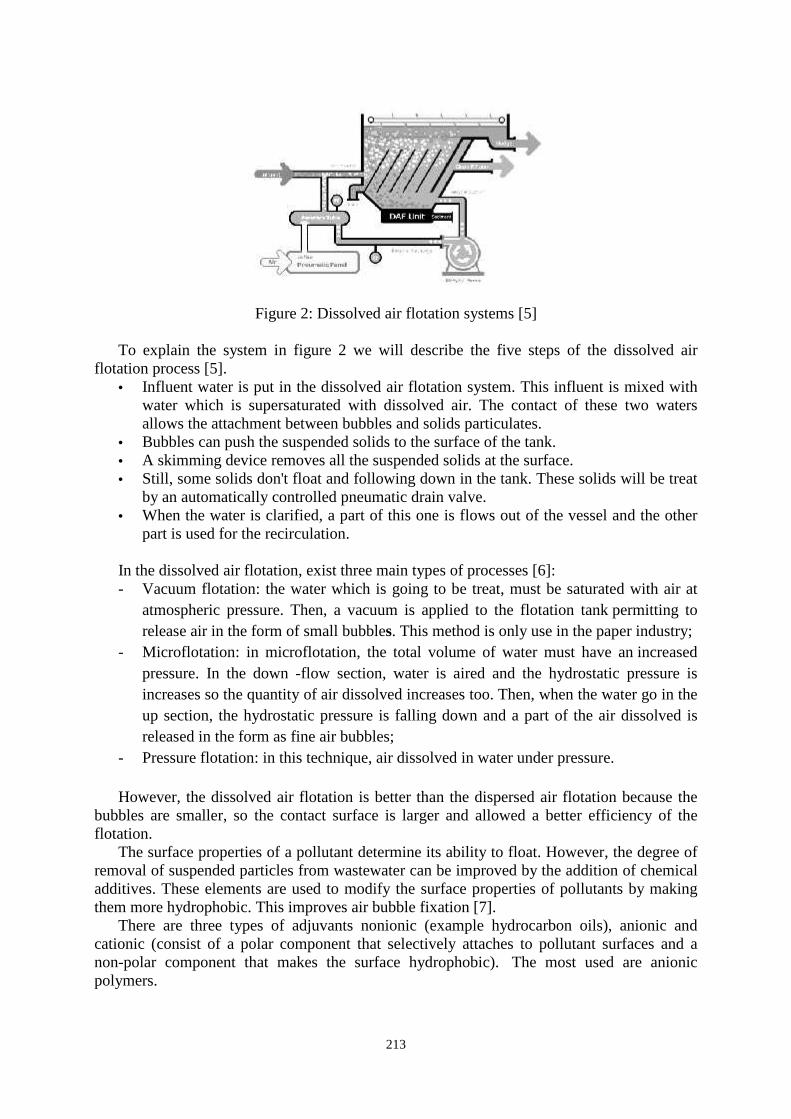
213
Figure 2: Dissolved air flotation systems [5]
To explain the system in figure 2 we will describe the five steps of the dissolved airflotation process [5].
Influent water is put in the dissolved air flotation system. This influent is mixed withwater which is supersaturated with dissolved air. The contact of these two watersallows the attachment between bubbles and solids particulates.
Bubbles can push the suspended solids to the surface of the tank. A skimming device removes all the suspended solids at the surface. Still, some solids don't float and following down in the tank. These solids will be treat
by an automatically controlled pneumatic drain valve. When the water is clarified, a part of this one is flows out of the vessel and the other
part is used for the recirculation.
In the dissolved air flotation, exist three main types of processes [6]:- Vacuum flotation: the water which is going to be treat, must be saturated with air at
atmospheric pressure. Then, a vacuum is applied to the flotation tank permitting torelease air in the form of small bubbles. This method is only use in the paper industry;
- Microflotation: in microflotation, the total volume of water must have an increasedpressure. In the down -flow section, water is aired and the hydrostatic pressure isincreases so the quantity of air dissolved increases too. Then, when the water go in theup section, the hydrostatic pressure is falling down and a part of the air dissolved isreleased in the form as fine air bubbles;
- Pressure flotation: in this technique, air dissolved in water under pressure.
However, the dissolved air flotation is better than the dispersed air flotation because thebubbles are smaller, so the contact surface is larger and allowed a better efficiency of theflotation.
The surface properties of a pollutant determine its ability to float. However, the degree ofremoval of suspended particles from wastewater can be improved by the addition of chemicaladditives. These elements are used to modify the surface properties of pollutants by makingthem more hydrophobic. This improves air bubble fixation [7].
There are three types of adjuvants nonionic (example hydrocarbon oils), anionic andcationic (consist of a polar component that selectively attaches to pollutant surfaces and anon-polar component that makes the surface hydrophobic). The most used are anionicpolymers.

214
Finally, aluminum and ferric salts or polymer coagulant are chemical coagulants added toimprove the efficiency of the flotation process [2].
Regarding the wastewater treatment by flotation using magnetic nanomaterials we havetested the copper ferrite nanomaterial for removal of oil [8]. The investigation was done withand without copper ferrite nanomaterials and were observed the following advantages:- The decreasing of time needed for wastewater treatment when the copper ferrite particleswere utilized in the flotation process;- The increasing of stability of the formed foam when were used copper ferrite nanoparticlesin the flotation process which is important for the large-scale wastewater treatment processeswhen is required sufficient time to remove the foam having the pollutant on the surface ofwastewater;- A wastewater efficiency treatment of 100 % only in the testes in which was used copperferrite nanomaterial.
3. CONCLUSIONS
Flotation technology is an effective method for removing pollutants. There are twomethods used, dispersed-air flotation and dissolved air flotation with a similar operation.However, the second method is more effective because it allows the formation of smallerbubbles (in the micron range), with a larger contact surface.
Finally, to improve this method different compounds can be added in the experiment. Forexample, the addition of coagulating agents such as aluminum and ferric salts or polymercoagulant improves the efficiency of the flotation process.Magnetic nanomaterials also have interesting properties which can be used in flotationtechnology, they help reduce the time needed to treat wastewater and allow the foam formedto remain stable. For that reason, the elimination of pollutants is therefore facilitated.
AcknowledgementsThis work was supported by a grant of the Romanian National Authority for Scientific Research and Innovation,CNCS/CCCDI – UEFISCDI, project number PN-III-P2-2.1-PTE-2016-0183, no. 25/2016.
References
[1] Quéméneur M, Marty Y., Fatty acids and sterols in domestic wastewaters, Water Res,28(5):1217-26, 1994[2] Mondal P, Flotation: As Primary Treatment of Waste Water (explained with diagram), Your Article Library,2014[3] Beychok M, Schematic flow diagram of the hydraulic version of the Induced gas flotation (IGF) process,Citizendium, 2011[4] Salam J. AlMaliky, Hayder A. AlAjawi, Nidaa A. AlBayati, Study of Induced Air Flotation for the removalof Oils from the effluents of Sweets and Dairy Industries, The Iraqi Journal For Mechanical And MaterialEngineering, Special Issue (C)[5] JWC Environmental, What is a DAF? How does a DAF Work? Dissolved Air Flotaiton, JWCE, Availableon : https://www.jwce.com/knowledge-center/what-is-a-daf/[6] Zabel TF, Flotation in Water Treatment, Innovations in Flotation Technology Springer, 1992[7] ArrMaz, Flotation reagents & collectorsFlotation, Available on: https://arrmaz.com/products/mining-chemicals/flotation-reagents-collectors/[8] Covaliu C. I., Moga I. C., Vasile E., Matache M. G., Petrescu G., Effect of CuFe2O4 Nanoparticles on FronthStability in Wastewater Treatment by Flotation, Revista de Chimie, 68, 12 , 2796-2798, 2017.

215
MODELING, SIMULATION AND STUDY OF LOADS ANDDEFORMATIONS IN TRACTION DEVICES
Ing. Cristescu Andreea-Catalina.1, Dr. Ing. Popa Lucretia1, Drd. Ing. Stefan Vasilica1,Ing. Anghelet Alexandra1
National Institute of Research - Development for Machines and Installations Designed toAgriculture and Food Industry – INMA, Bucharest1
ABSTRACT
This paper aims to simulate the stresses and deformations occurring in the traction elements,depending on the material used in the manufacture, but also depending to the chosen shape. Thepurpose of the paper is to determine an optimal variant which can withstand the loads arising duringuse. The coupling devices have been designed and tested for resistance using a finite element, namelySolidWorks Simulation, to determine if rupture or deformation results from the stresses that occurduring the movement.
1. INTRODUCTION
The system of coupling devices for tractors, trailers and agricultural equipment is notisolated from the rest of the system and from the rest of the physical system of the equipmentcomponents. Coupling systems and the machine-binding system are binding throughcomponents of different types to the other components of the physical system (machine).Finally, the last link of the system, in the most general sense, is the coupler, which is thesource of the system's excitation, in order to optimize the moment by changing the inputelements [1, 2]. Couplings made permanent or intermittent connection between twoconsecutive elements of a transmission, in order to transmit the rotational movement andtorque without changing the law of motion [3, 8].
The conditions that couplings have to fulfill are: safety in operation; reduced gaugedimensions; easy assembly and dismantling; statically and dynamically balance; insurance ofhigh durability. Couplings transmit shocks and vibrations, mounting it with the condition ofrespecting the coaxiality of the shafts.
For coaxing axles, assembly and/or operation, which have coaxial deviations, rigidmobile clutches are used- or elastic assemblies – which, thanks to the elastic element, cushionshock and vibration are absorbed. In addition, to taking a deviation into certain limits, thefrequency of the system, which determines this frequency beyond the speed range, changes.In this way, the effect of the dynamic loads is diminished, the energy of these loads beingtemporarily stored in the form of a potential energy in the elastic element and rendered, uponthe termination of the dynamic load action, to the system of the coupling [4, 5].
Classification of coupling systems for tractors, trailers and agricultural and forestryequipment
If a number of types and possibilities of locating are identified for coupling systemsmounted on the tractor vehicle, three trailer coupling possibilities are known for the towedvehicle (trailers, agricultural or forestry equipment) after as follows:
• coupling through the eye (s) of tow;• coupling by towing vehicle;• coupling via the coupling triangle [6].Towing eye is a coupling system intended in general to equip the trailers and sometimes,
also the agricultural or forestry equipment, on a case-by-case basis, having differentconstructional shapes, with the exception of the actual coupling element which is standardized
1Street Libertatii, No. 7, Slatina, Olt, Romania, 0760968356, [email protected]

216
at national level and at European level. A situation will be detailed in the following chapters.Figure 1 shows the two representative types of towing eye [7].
Figure 1: Towing eye
2. METHODOLOGY
In order to carry out the study, two towing eyes of different shapes were designed inSolidWorks, each one with two materials: Alloyed steel 40C10 and High Quality CarbonSteel C45, in order to define the best solution.
Study 1: Towing eye Type A, Alloyed steel 40C10Properties:
Material: Alloyed steel 40C10 (EN 10083-20 Mass / Volume 7.47 kg / 0.000957776 m3
Table 1: Load
Loadname
Selection set Loading type
Force/Torque-1
On 2 Edges, 38 Faces apply force -10000 kgf normal to reference planewith respect to selected reference Face< 1 > using uniform distribution
SequentialLoading
Gravity-1 Gravity with respect to Top Plane with gravity acceleration -9.81 m/s^2normal to reference plane
SequentialLoading
Study Results
Figure 2: Towing Eye Type A, Alloyed steel 40C10 - Stress, Displacement and Strain

217
Table 2: Default ResultsName Type Min Location Max Location
Stress1 VON: vonMises Stress
9.44402e+006N/m^2Node: 48222
(-237.822 mm,-34.8256 mm,-35.4543 mm)
6.80312e+009N/m^2Node: 1608
(22.5 mm,32.5 mm,-22.5 mm)
Displacement1 URES:ResultantDisplacement
0 mNode: 1453
(22.5 mm,-32.5 mm,22.5 mm)
0.0064697 mNode: 49973
(-256.553 mm,-35.3454 mm,0.08228 mm)
Strain1 ESTRN:EquivalentStrain
5.21043e-005Element: 11282
(-242.743 mm,-22.7902 mm,3.86527 mm)
0.0177479Element: 17803
(20.322 mm,31.3121 mm,-20.6672 mm)
Study 2: Towing eye Type A, High Quality Carbon Steel C45
Properties: Material: High Quality Carbon Steel C45 (EN 10277-2-2008) Mass: 7.47 kg; Volume: 0.000957776 m3
Table 3: LoadLoad name Selection set Loading type
Force/Torque-1 <Towing EyeType A>
On 2 Edge(s), 38 Face(s) apply force -10000 kgf normal toreference plane with respect to selected reference Face< 1 >using uniform distribution
SequentialLoading
Gravity-1 Gravity with respect to Top Plane with gravity acceleration -9.81 m/s^2 normal to reference plane
SequentialLoading
Study Results
Figure 3: Towing Eye Type A. High Quality Carbon Steel C45 - Stress, Displacement Strain

218
Table 4: Default ResultsName Type Min Location Max Location
Stress1 VON: vonMises Stress
9.44402e+006N/m^2Node: 48222
(-237.822 mm,-34.8256 mm,-35.4543 mm)
6.80312e+009N/m^2Node: 1608
(22.5 mm,32.5 mm,-22.5 mm)
Displacement1 URES:ResultantDisplacement
0 mNode: 1453
(22.5 mm,-32.5 mm,22.5 mm)
0.0064697 mNode: 49973
(-256.553 mm,-35.3454 mm,0.08228 mm)
Strain1 ESTRN:EquivalentStrain
5.21043e-005Element:11282
(-242.743 mm,-22.7902 mm,3.86527 mm)
0.0177479Element:17803
(20.322 mm,31.3121 mm,-20.6672 mm)
Study 3: Towing eye Type B, Alloyed steel 40C10
Properties: Material: Alloyed steel 40C10 (EN 10083-2) Mass: 7.78 kg; Volume: 0.000997362 m^3
Table 5: LoadLoad name Selection set Loading type
Force/Torque-1 <Towing Eye Type B>
On 27 Face(s) apply force 10000 kgf along axial. withrespect to selected reference Face< 1 > using uniformdistribution
SequentialLoading
Gravity-1 Gravity with respect to Top Plane with gravityacceleration -9.81 m/s^2 normal to reference plane
SequentialLoading
Study Results
Figure 4: Towing Eye Type B Alloyed steel 40C10 - Stress, Displacement Strain

219
Table 6: Default ResultsName Type Min Location Max Location
Stress1 VON: vonMises Stress
1.18743e+007N/m^2Node: 7471
(239.547 mm,8.00132 mm,-4.24447 mm)
5.6055e+009N/m^2Node: 11563
(171.673 mm,2.48971 mm,-23.7502 mm)
Displacement1 URES:ResultantDisplacement
0 mNode: 174
(234 mm,-1.11022e-013mm,-24 mm)
0.00131547 mNode: 13303
(-202.792 mm,17.0022 mm,0.935685 mm)
Strain1 ESTRN:EquivalentStrain
4.06887e-005Element: 1975
(223.895 mm,-2.82805 mm,1.69866 mm)
0.0150321Element: 2180
(170.903 mm,19.4192 mm,12.1113 mm)
Study 4: Towing eye Type B, High Quality Carbon Steel C 45
Properties: Material: High Quality Carbon Steel C45 (EN 10277-2-2008) Mass: 7.77 kg; Volume: 0.000997362 m^3
Table 7: LoadLoad name Selection set Loading type
Force/Torque-1 <Towing eye Type B>
On 27 Face(s) apply force 10000 kgf along axial.with respect to selected reference Face< 1 > usinguniform distribution
SequentialLoading
Gravity-1 Gravity with respect to Top Plane with gravityacceleration -9.81 m/s^2 normal to reference plane
SequentialLoading
Study Results
Figure 5: Towing eye Type B, High Quality Carbon Steel C45 –Stress, Displacement and Strain
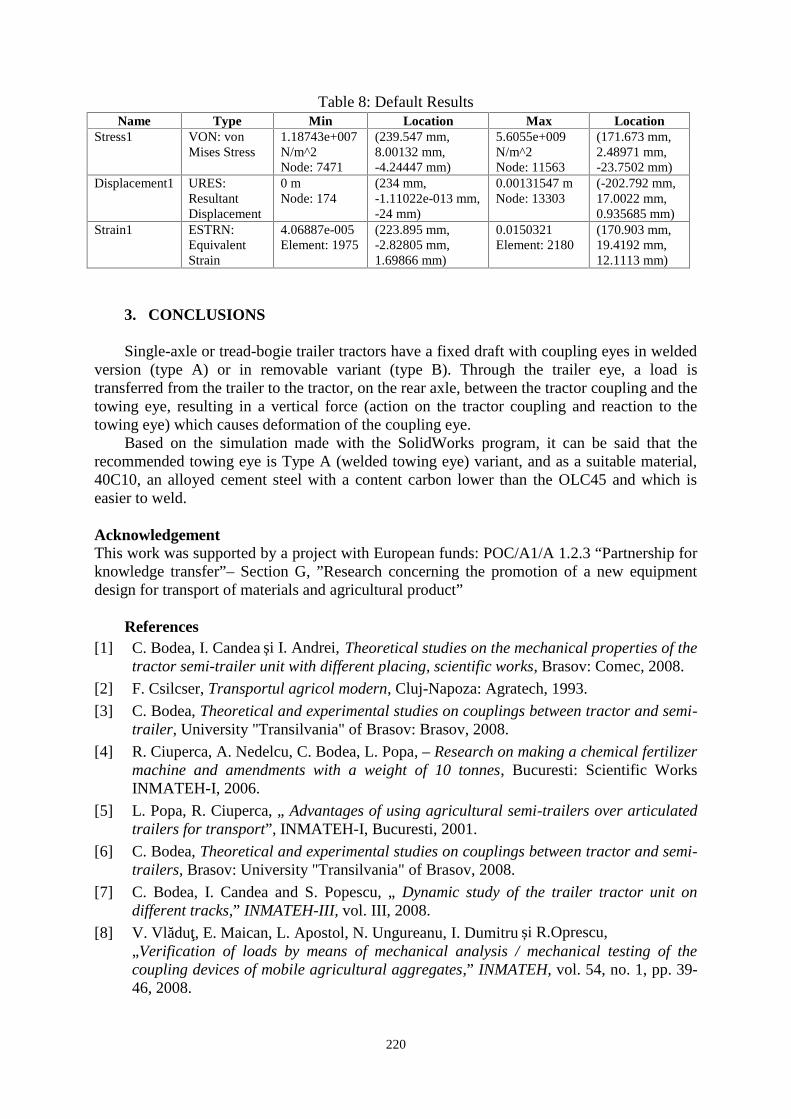
220
Table 8: Default ResultsName Type Min Location Max Location
Stress1 VON: vonMises Stress
1.18743e+007N/m^2Node: 7471
(239.547 mm,8.00132 mm,-4.24447 mm)
5.6055e+009N/m^2Node: 11563
(171.673 mm,2.48971 mm,-23.7502 mm)
Displacement1 URES:ResultantDisplacement
0 mNode: 174
(234 mm,-1.11022e-013 mm,-24 mm)
0.00131547 mNode: 13303
(-202.792 mm,17.0022 mm,0.935685 mm)
Strain1 ESTRN:EquivalentStrain
4.06887e-005Element: 1975
(223.895 mm,-2.82805 mm,1.69866 mm)
0.0150321Element: 2180
(170.903 mm,19.4192 mm,12.1113 mm)
3. CONCLUSIONS
Single-axle or tread-bogie trailer tractors have a fixed draft with coupling eyes in weldedversion (type A) or in removable variant (type B). Through the trailer eye, a load istransferred from the trailer to the tractor, on the rear axle, between the tractor coupling and thetowing eye, resulting in a vertical force (action on the tractor coupling and reaction to thetowing eye) which causes deformation of the coupling eye.
Based on the simulation made with the SolidWorks program, it can be said that therecommended towing eye is Type A (welded towing eye) variant, and as a suitable material,40C10, an alloyed cement steel with a content carbon lower than the OLC45 and which iseasier to weld.
AcknowledgementThis work was supported by a project with European funds: POC/A1/A 1.2.3 “Partnership forknowledge transfer”– Section G, ”Research concerning the promotion of a new equipmentdesign for transport of materials and agricultural product”
References[1] C. Bodea, I. Candea și I. Andrei, Theoretical studies on the mechanical properties of the
tractor semi-trailer unit with different placing, scientific works, Brasov: Comec, 2008.
[2] F. Csilcser, Transportul agricol modern, Cluj-Napoza: Agratech, 1993.
[3] C. Bodea, Theoretical and experimental studies on couplings between tractor and semi-trailer, University "Transilvania" of Brasov: Brasov, 2008.
[4] R. Ciuperca, A. Nedelcu, C. Bodea, L. Popa, – Research on making a chemical fertilizermachine and amendments with a weight of 10 tonnes, Bucuresti: Scientific WorksINMATEH-I, 2006.
[5] L. Popa, R. Ciuperca, „ Advantages of using agricultural semi-trailers over articulatedtrailers for transport”, INMATEH-I, Bucuresti, 2001.
[6] C. Bodea, Theoretical and experimental studies on couplings between tractor and semi-trailers, Brasov: University "Transilvania" of Brasov, 2008.
[7] C. Bodea, I. Candea and S. Popescu, „ Dynamic study of the trailer tractor unit ondifferent tracks,” INMATEH-III, vol. III, 2008.
[8] V. Vlăduţ, E. Maican, L. Apostol, N. Ungureanu, I. Dumitru și R.Oprescu,„Verification of loads by means of mechanical analysis / mechanical testing of thecoupling devices of mobile agricultural aggregates,” INMATEH, vol. 54, no. 1, pp. 39-46, 2008.

221
CONSIDERATIONS ON THE USE OF DRONES IN PRECISIONAGRICULTURE
Cujbescu Dan1, Persu Cătălin, Găgeanu Iuliana, Voicea Iulian, Gheorghe Gabriel, VlăduțoiuLaurențiu, Dumitru Iulian, Oprescu Remus
1INMA Bucharest / Romania
ABSTRACT
The drone (unmanned aerial vehicle - UAV), is a flying device lacking the human pilot,being guided either by a digital automatic pilot situated on board or through the means of aremote control from a control center situated on ground. The paper presents a classification ofthe drones used in precision agriculture, taking into consideration that their more frequent usein precision agriculture has the objective of obtaining higher and more qualitativeproductions, of optimizing economic profits and of achieving integrated environmentalprotection.
1. INTRODUCTION
Modern agriculture continues to make significant progress in increasing the capacity ofthe food producing industry as response to increased population and demand. For example,progresses registered in chemical engineering, fertilization, irrigation, soil analysis andequipment (hardware and software) have revolutionized plant production and associatedsystems. In this evolution of agricultural techniques, modern agriculture has transformed moreand more the technological progress throughout the entire agricultural flow such as: sowing,cultivating and harvesting crops, which require a large range of equipment, machinery,chemical products, etc.
In the field of precision agriculture, agricultural drones – the so called unnamed aerialvehicles (UAV) are used for studying terrains and/or for capturing extremely precise imagesof the fields and crops, due to the capacity to cover hundreds of hectares in a single flight.Images obtained are analyzed, processed and transformed through the means of softwareprograms in one or more ortho-mosaic images with the help of which are established thevegetation indices and the degree of crop irrigation is evaluated, etc. [7]. This way,considerable potential savings can be made, plants can be healthier and better yields can beobtained for the monitored crops. This is a model of situation where everyone has benefits: amanner of practicing agriculture using technology. It is a money saving and very effectiveway, contributing to environmental protection and ensuring food for the entire planet [4].
Monitoring of resources and vegetation state is conducted using contactless sensors,automated data acquisition being correlated with GPS coordinates (data georeferentiation) andtheir processing in the GPS system (Geographic Information System) for achieving the mapsnecessary for spatial and precision management [9].
Nowadays, in the common farmers’ practices, sensor-based monitoring for plant growththroughout the season and nitrogen absorption uses devices fitted on the tractor, allowingnitrogen applications with variable flow rates correlated with the working speed [8, 10]. Theuse of drones instead of tractors offer an option for agricultural lots with difficult conditions,for example wet soils, where tractors cannot be driven without causing soil compaction [5].Currently, drone development in agriculture experiences a continuous growth, existing a
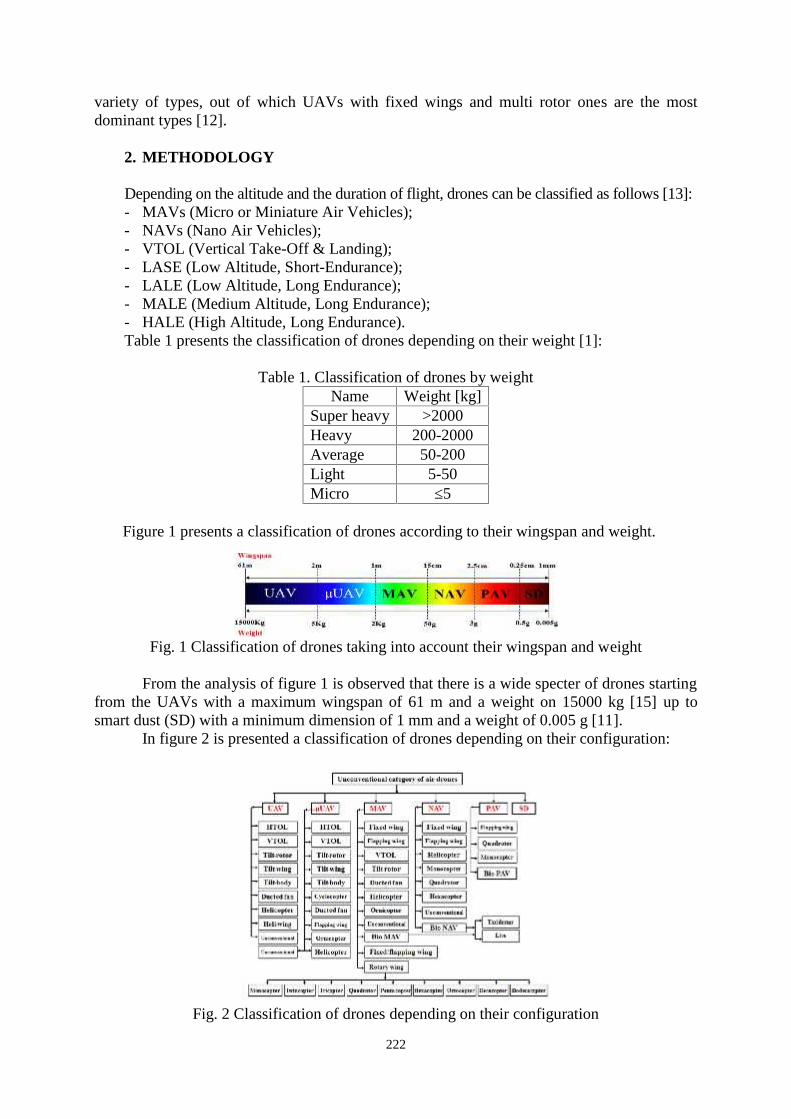
222
variety of types, out of which UAVs with fixed wings and multi rotor ones are the mostdominant types [12].
2. METHODOLOGY
Depending on the altitude and the duration of flight, drones can be classified as follows [13]:- MAVs (Micro or Miniature Air Vehicles);- NAVs (Nano Air Vehicles);- VTOL (Vertical Take-Off & Landing);- LASE (Low Altitude, Short-Endurance);- LALE (Low Altitude, Long Endurance);- MALE (Medium Altitude, Long Endurance);- HALE (High Altitude, Long Endurance).Table 1 presents the classification of drones depending on their weight [1]:
Table 1. Classification of drones by weightName Weight [kg]
Super heavy >2000Heavy 200-2000Average 50-200Light 5-50Micro ≤5
Figure 1 presents a classification of drones according to their wingspan and weight.
Fig. 1 Classification of drones taking into account their wingspan and weight
From the analysis of figure 1 is observed that there is a wide specter of drones startingfrom the UAVs with a maximum wingspan of 61 m and a weight on 15000 kg [15] up tosmart dust (SD) with a minimum dimension of 1 mm and a weight of 0.005 g [11].
In figure 2 is presented a classification of drones depending on their configuration:
Fig. 2 Classification of drones depending on their configuration
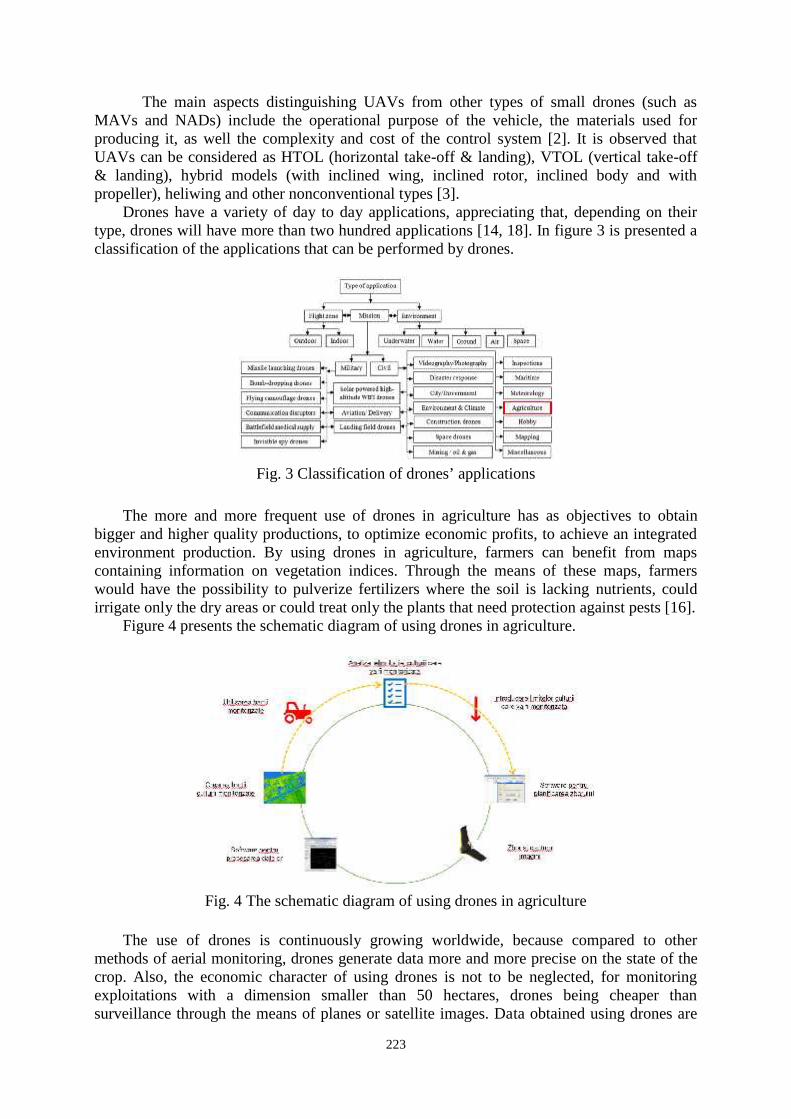
223
The main aspects distinguishing UAVs from other types of small drones (such asMAVs and NADs) include the operational purpose of the vehicle, the materials used forproducing it, as well the complexity and cost of the control system [2]. It is observed thatUAVs can be considered as HTOL (horizontal take-off & landing), VTOL (vertical take-off& landing), hybrid models (with inclined wing, inclined rotor, inclined body and withpropeller), heliwing and other nonconventional types [3].
Drones have a variety of day to day applications, appreciating that, depending on theirtype, drones will have more than two hundred applications [14, 18]. In figure 3 is presented aclassification of the applications that can be performed by drones.
Fig. 3 Classification of drones’ applications
The more and more frequent use of drones in agriculture has as objectives to obtainbigger and higher quality productions, to optimize economic profits, to achieve an integratedenvironment production. By using drones in agriculture, farmers can benefit from mapscontaining information on vegetation indices. Through the means of these maps, farmerswould have the possibility to pulverize fertilizers where the soil is lacking nutrients, couldirrigate only the dry areas or could treat only the plants that need protection against pests [16].
Figure 4 presents the schematic diagram of using drones in agriculture.
Fig. 4 The schematic diagram of using drones in agriculture
The use of drones is continuously growing worldwide, because compared to othermethods of aerial monitoring, drones generate data more and more precise on the state of thecrop. Also, the economic character of using drones is not to be neglected, for monitoringexploitations with a dimension smaller than 50 hectares, drones being cheaper thansurveillance through the means of planes or satellite images. Data obtained using drones are
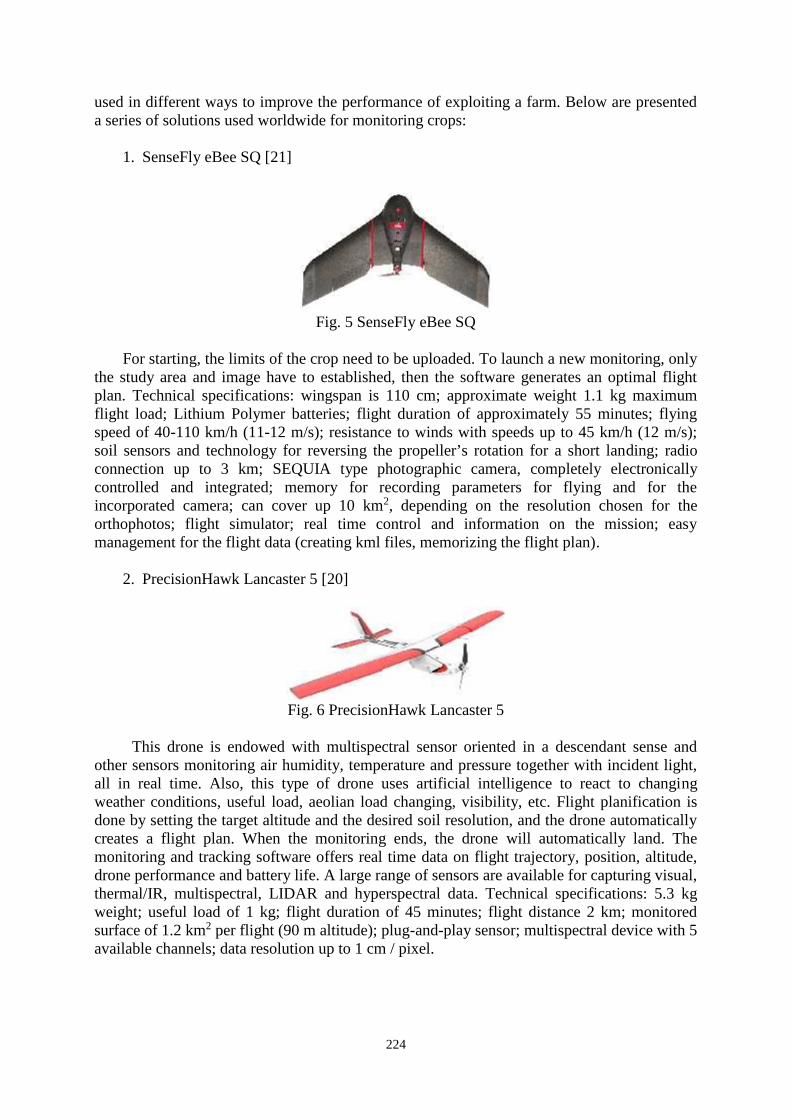
224
used in different ways to improve the performance of exploiting a farm. Below are presenteda series of solutions used worldwide for monitoring crops:
1. SenseFly eBee SQ [21]
Fig. 5 SenseFly eBee SQ
For starting, the limits of the crop need to be uploaded. To launch a new monitoring, onlythe study area and image have to established, then the software generates an optimal flightplan. Technical specifications: wingspan is 110 cm; approximate weight 1.1 kg maximumflight load; Lithium Polymer batteries; flight duration of approximately 55 minutes; flyingspeed of 40-110 km/h (11-12 m/s); resistance to winds with speeds up to 45 km/h (12 m/s);soil sensors and technology for reversing the propeller’s rotation for a short landing; radioconnection up to 3 km; SEQUIA type photographic camera, completely electronicallycontrolled and integrated; memory for recording parameters for flying and for theincorporated camera; can cover up 10 km2, depending on the resolution chosen for theorthophotos; flight simulator; real time control and information on the mission; easymanagement for the flight data (creating kml files, memorizing the flight plan).
2. PrecisionHawk Lancaster 5 [20]
Fig. 6 PrecisionHawk Lancaster 5
This drone is endowed with multispectral sensor oriented in a descendant sense andother sensors monitoring air humidity, temperature and pressure together with incident light,all in real time. Also, this type of drone uses artificial intelligence to react to changingweather conditions, useful load, aeolian load changing, visibility, etc. Flight planification isdone by setting the target altitude and the desired soil resolution, and the drone automaticallycreates a flight plan. When the monitoring ends, the drone will automatically land. Themonitoring and tracking software offers real time data on flight trajectory, position, altitude,drone performance and battery life. A large range of sensors are available for capturing visual,thermal/IR, multispectral, LIDAR and hyperspectral data. Technical specifications: 5.3 kgweight; useful load of 1 kg; flight duration of 45 minutes; flight distance 2 km; monitoredsurface of 1.2 km2 per flight (90 m altitude); plug-and-play sensor; multispectral device with 5available channels; data resolution up to 1 cm / pixel.
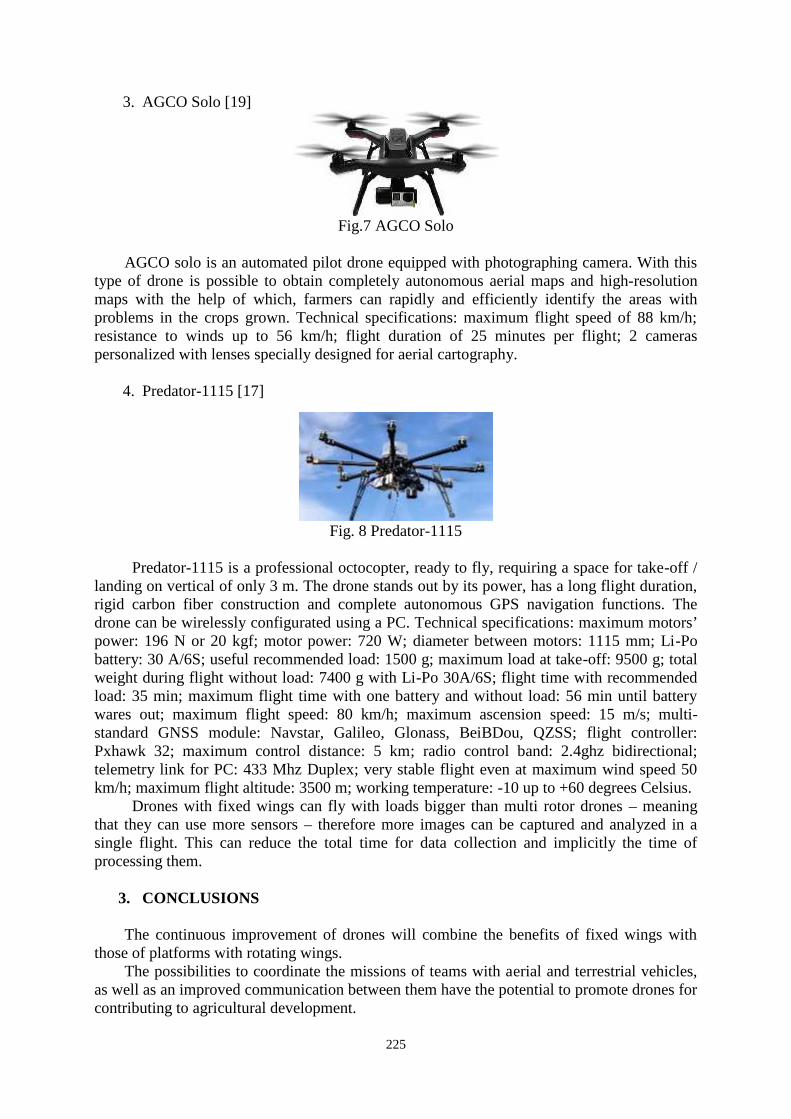
225
3. AGCO Solo [19]
Fig.7 AGCO Solo
AGCO solo is an automated pilot drone equipped with photographing camera. With thistype of drone is possible to obtain completely autonomous aerial maps and high-resolutionmaps with the help of which, farmers can rapidly and efficiently identify the areas withproblems in the crops grown. Technical specifications: maximum flight speed of 88 km/h;resistance to winds up to 56 km/h; flight duration of 25 minutes per flight; 2 cameraspersonalized with lenses specially designed for aerial cartography.
4. Predator-1115 [17]
Fig. 8 Predator-1115
Predator-1115 is a professional octocopter, ready to fly, requiring a space for take-off /landing on vertical of only 3 m. The drone stands out by its power, has a long flight duration,rigid carbon fiber construction and complete autonomous GPS navigation functions. Thedrone can be wirelessly configurated using a PC. Technical specifications: maximum motors’power: 196 N or 20 kgf; motor power: 720 W; diameter between motors: 1115 mm; Li-Pobattery: 30 A/6S; useful recommended load: 1500 g; maximum load at take-off: 9500 g; totalweight during flight without load: 7400 g with Li-Po 30A/6S; flight time with recommendedload: 35 min; maximum flight time with one battery and without load: 56 min until batterywares out; maximum flight speed: 80 km/h; maximum ascension speed: 15 m/s; multi-standard GNSS module: Navstar, Galileo, Glonass, BeiBDou, QZSS; flight controller:Pxhawk 32; maximum control distance: 5 km; radio control band: 2.4ghz bidirectional;telemetry link for PC: 433 Mhz Duplex; very stable flight even at maximum wind speed 50km/h; maximum flight altitude: 3500 m; working temperature: -10 up to +60 degrees Celsius.
Drones with fixed wings can fly with loads bigger than multi rotor drones – meaningthat they can use more sensors – therefore more images can be captured and analyzed in asingle flight. This can reduce the total time for data collection and implicitly the time ofprocessing them.
3. CONCLUSIONS
The continuous improvement of drones will combine the benefits of fixed wings withthose of platforms with rotating wings.
The possibilities to coordinate the missions of teams with aerial and terrestrial vehicles,as well as an improved communication between them have the potential to promote drones forcontributing to agricultural development.

226
Due to the fact that drones handling, as well as data processing is still a rathercomplicated process, the implementation of online services for processing data and generatingapplication maps, will facilitate the process of generating information, thus simplifying aneasy use of data even by unexperimented users. Future direction of development for dronesused in precision agriculture should be directed on producing completely autonomous drones.
ACKNOWLEDGEMENT
This work was funded by the Ministry of Research and Innovation, within the project entitledPN 18 30 01 01: “Experimental research on the aerial mapping of agricultural cropscorresponding to the Agriculture 4.0 concept”, ctr. 18N/16.03.2018
References
[1]. Arjomandi A, Agostino S., Mammone M., Nelson M., Zhou T., Classification of Unmanned Aerial Vehicle ,Report for Mechanical Engineering class, University of Adelaide, Adelaide, Australia, 2006.[2]. Cai G., Dias J, Seneviratne L., A survey of small-scale unmanned aerial vehicles: recent advances and futuredevelopment trends, Unmanned Syst. 2 (02), pp.175–199, 2014;[3]. Cavoukian A., Privacy and Drones: Unmanned Aerial Vehicles, Information and Privacy Commissioner ofOntario, Canada, pp. 1–30, 2012;[4] Geipel J., Implementation and Improvement of an Unmanned Aircraft System for Precision FarmingPurposes, Dissertation, Institute of Crop Science, University of Hohenheim, Department of Agronomy, 2016[5] Gnyp M. L., Panitzki M., Reusch S., Jasper J., Bolten A., Bareth G., Comparison between tractor-based andUAVbased spectrometer measurements in winter wheat, Proceedings of the 13th International Conference onPrecision Agriculture, Missouri, pp. 1-10, USA, 2016[6]. Hassanalian M., Abdelkefi A., Classifications, applications, and design challenges of drones: A review,Progress in Aerospace Sciences 91, pp. 99–131, 2017[7]. Kahn J.M., Katz R.H, Pister K.S., Next century challenges: mobile networking for Smart Dust, in: Proceedings ofthe 5th annual ACM/IEEE international conference on Mobile computing and networking, ACM, pp. 271–278, 1999;[8] Lammel J., Wollring J., Reusch S., Tractor based remote sensing for variable nitrogen fertilizer application.In: Horst, W.J. et al (Eds.), Plant nutrition – Food security and sustainability of agro-ecosystems (pp. 694-695).Dordrecht Klumer Academic Publishers, 2001[9] Luculescu M. C., Applications of advanced mechatronic systems in agriculture, industry and medicine,Habilitation thesis, University Transylvania of Brașov, 2017[10] Mistele B., & Schmidthalter U., Tractor-based quadrilateral spectral reflectance measurements to detectbiomass and total aerial nitrogen in winter wheat. Agronomy Journal, 102 (2), pp. 499-506, 2010[11] O'Connor R. M., Di Federico I. G., AGRICULTURAL CROP ANALYSIS DRONE, Patent ApplicationPublication, No.: US 2017/0015416 Al, 2017[12] Pircher M., Geipel J., Kusnierek K., Korsaeth A., Development of a hybrid uav sensor platform suitable forfarm-scale applications in precision agriculture, The International Archives of the Photogrammetry, RemoteSensing and Spatial Information Sciences, Volume XLII-2/W6, International Conference on Unmanned AerialVehicles in Geomatics, pp. 297-302, Bonn, Germany, 2017[13]. Watts A.C., Ambrosia V.G, Hinkley E.A, Unmanned aircraft systems in remote sensing and scientificresearch: classification and considerations of use, Remote Sens. 4 (6), pp. 1671–1692, 2012[14]. http://air-vid.com/wp/20-great-uav-applications-areas-drones[15]. https://en.wikipedia.org/wiki/Boeing_Condor[16]. http://www.asro.ro/?p=4000[17] http://fae-drones.com/produse/Drona-FAE-1115-Octa-PREDATOR-40.html[18]. https://www.microdrones.com/en/applications[19] https://www.pages05.net/agco/SOLO_UAV/[20]. http://www.precisionhawk.com/agriculture#package-details[21]. https://www.sensefly.com/drones/ebee-sq.html

227
A REVIEW REGARDING MODELS WHICH PREDICT LANDFILLGAS GENERATION
Mirela Dincă1, Mariana Ferdeş, Bianca – Ştefania Zăbavă, Nicoleta Ungureanu, GeorgianaMoiceanu, Mariana Ionescu
University Politehnica of Bucharest, Romania
ABSTRACT
Once organic waste is landfilled, it starts decomposing under anaerobic conditions and generateslandfill gas, a mixture of methane (CH4) and carbon dioxide (CO2). Since methane has a higher globalwarming potential than carbon dioxide, production of methane is important in estimating the greenhousegas emissions from landfilled waste. Methane generation can be predicted using mathematical models.Most of these models were developed on Monod equation, and first – order kinetics are often used inmethane production models, such as LandGEM, GasSim, Afvalzorg, EPER, etc. The purpose of thisstudy is to describe the landfill gas generation stages and the most used models which predict methanegas generation over time from a mass of waste.
1. INTRODUCTION
The act of dumping wastes on landfill sites represents the oldest, cheapest and mostcommon form of waste management [1]. According to Directive 1999/31/EC on the landfill ofwaste, the European Union Member States have adopted a general waste management policyin which landfilling is the least desired option [2].
Landfill gas is obtained during the anaerobic decomposition of organic substances foundin municipal solid waste stored in a landfill. Landfill gas is generated as a result of physical,chemical and microbial processes occurring within the waste [3].
The biogas obtained from landfill consists mainly of methane (CH4) and carbondioxide (CO2). These two gases are known as greenhouse gases, CH4 having a global warmingpotential 34 times that of CO2 over the 100 year time period [4]. Also, landfill gas containssome byproducts resulted from the biological decomposition process, such as ammonia (NH3)and hydrogen sulphide (H2S) [5].
Figure 1: Landfill gas (LFG) emissions generated from landfilled organic waste [6]
1Splaiul Independentei 313, Sector 6, Bucharest, 0761938017, [email protected]

228
In order to avoid the emission into the atmosphere, methane gas may be collected, treatedand used for generation of electricity or upgraded to power homes, buildings and vehicles.Landfill gas contains 50% methane (CH4), 45% carbon dioxide (CO2) and 5% nitrogen (N2)and other gases including trace amounts of non- methane organic compounds [7]. However, thelandfill gas quality varies from time and degradation phase, location and gas collection. Thus,the gas composition is not constant [5].
The purpose of this study is to describe the landfill gas generation stages and the most usedmodels which predict methane gas generation over time from a mass of waste.
2. METHODOLOGY
Landfill gas productionThe biological processes leading to the generation of methane from landfills have been
well known for many years. Bacterial action leads to the generation of methane from organicsubstrates (eq. 1) [8].
nC6H10O5 + nH2O 3nCH4 + 3nCO2 (1)
In figure 2 is presented the landfill gas generation curve, with the 8 th stages.
Figure 2: Landfill gas generation curve [9]
Phase I is an aerobic one, last for a few days to a number of months and depends on somefactors such as temperature and moisture content. In phase II acts populations of facultativeand anaerobic bacteria, which produce volatile acids, CO2 and H2. Phase III involvesmethanogenic bacteria producing CH4. In this stage, the H2 and CO2 concentrations start to fall.During the phase IV, the remaining H2 is used by methanogenic bacteria in the reduction ofCO2 to CH4 and H2O. Typical landfill gas collected in this phase consists of 40 – 65 % byvolume of CH4 with most of the composition made up by CO2. In phase V, the rate ofmethanogenic activity begins to fall as substrate is used up. During the phase VI, the rate of airincrease and the rates of methanogenesis have achieved low levels. Phase VII involves the returnto aerobic conditions. Anaerobic decomposition becomes inhibited by the ingress of O2. At this

229
point, the rate of landfill gas formation has almost stopped because of substrate limitation. Thefinal phase, VIII, occurs when degradable organic matter has been oxidised [9].
3. RESULTS AND DISCUSSION
One of the most important parameter in assessing the methane generation potential is thewaste components, the maximum volume of biogas generation could be attributed to thequantity and type of organic material within the waste [4]. Studies have shown that temperature,climate, moisture content, pH and particle size also affect the reaction kinetics and theprediction of landfill gas production [10-12].
The gas extraction system design can also have an important impact on the gas generationcycle. Methane generation can be predicted using mathematical models. These models use various inputparameters such as assumed half – life of waste degradation and waste composition which determinethe amount of carbon in the waste mass that can be transformed into methane and carbon dioxide[13]. Most of these models were developed on Monod equation, and first – order kinetics areoften used in methane production models, such as LandGEM, GasSim, Afvalzorg, EPER, etc.
Methane yield values used in models are estimated based on assumption about the amountof waste disposed, the composition of the waste and its biodegradability [12, 13].
The Landfill Gas Emissions Model (LandGEM) is an automated estimation tool with aMicrosoft Excel interface that can be used to estimate emission rates for total landfill gas,methane, carbon dioxide, nonmethane organic compounds, and individual air pollutants frommunicipal solid waste landfills [14]. LandGEM is based on the following first-orderdecomposition rate equation and is able to estimate annual emissions over a specific time period[14]: = ∑ ∑ ∗. (2)
where: QCH4 = annual methane generation in the calculation year (m3/year);i = 1 year time increment;n = (calculation year) – (initial year of waste acceptance);j = 0.1 year time increment;k = methane generation rate (year-1);L0 = potential methane generation capacity (m3/Mg);Mi = mass of waste accepted in the ith year (Mg);tij = age of the jth section of waste mass Mi accepted in the ith year (decimal years, eg.
3.2 years).
Inputs of LandGEM are: design capacity of the landfill; amount of waste in place; themethane generation rate constant, k, and methane generation potential, L0; the years of wasteacceptance and acceptance of hazardous waste at the landfill. The outputs are the following:emission rate for methane; two sets of default values for emissions calculations are incorporatedin the model; landfill closure estimates based on the landfill capacity and waste acceptance rate;emissions for individual pollutants and graphs of emissions for individual pollutants [13].
Lagos et al. [15] reformulated the LandGEM’s equation in order to include two types ofrefuse, fast decaying refuse and slow decaying refuse, whose fractions and key modelingparameters k and L0 were optimized independently for three periods in the life of the Montreal-CESM landfill. They analyzed three scenarios and were compared to actual biogas collectiondata, namely: two-variable vcenario, where k and L0 were optimized for a single type of refuse;six-variable scenario, where three sets of k and L0 were optimized for the three periods and fora single type of refuse; and seven-variable scenario, whereby optimization was performed fortwo sets of k and L0, one associated with fast decaying refuse and the second with slow decaying
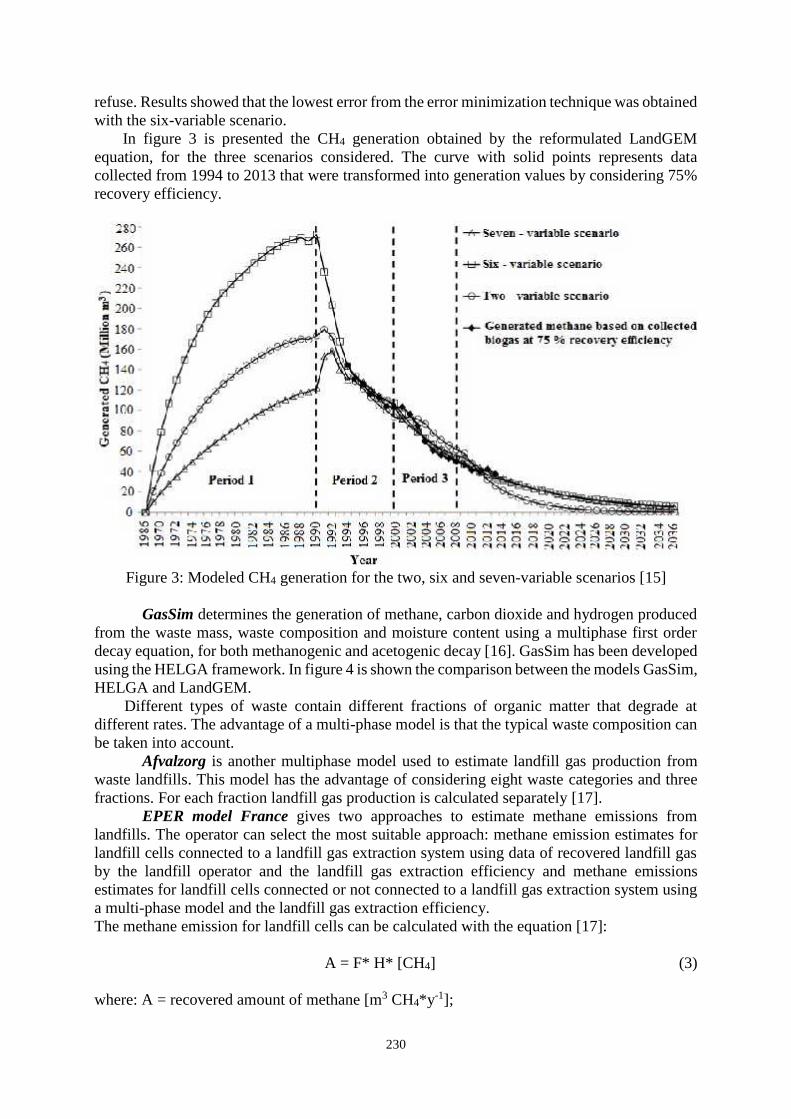
230
refuse. Results showed that the lowest error from the error minimization technique was obtainedwith the six-variable scenario.
In figure 3 is presented the CH4 generation obtained by the reformulated LandGEMequation, for the three scenarios considered. The curve with solid points represents datacollected from 1994 to 2013 that were transformed into generation values by considering 75%recovery efficiency.
Figure 3: Modeled CH4 generation for the two, six and seven-variable scenarios [15]
GasSim determines the generation of methane, carbon dioxide and hydrogen producedfrom the waste mass, waste composition and moisture content using a multiphase first orderdecay equation, for both methanogenic and acetogenic decay [16]. GasSim has been developedusing the HELGA framework. In figure 4 is shown the comparison between the models GasSim,HELGA and LandGEM.
Different types of waste contain different fractions of organic matter that degrade atdifferent rates. The advantage of a multi-phase model is that the typical waste composition canbe taken into account.
Afvalzorg is another multiphase model used to estimate landfill gas production fromwaste landfills. This model has the advantage of considering eight waste categories and threefractions. For each fraction landfill gas production is calculated separately [17].
EPER model France gives two approaches to estimate methane emissions fromlandfills. The operator can select the most suitable approach: methane emission estimates forlandfill cells connected to a landfill gas extraction system using data of recovered landfill gasby the landfill operator and the landfill gas extraction efficiency and methane emissionsestimates for landfill cells connected or not connected to a landfill gas extraction system usinga multi-phase model and the landfill gas extraction efficiency.The methane emission for landfill cells can be calculated with the equation [17]:
A = F* H* [CH4] (3)
where: A = recovered amount of methane [m3 CH4*y-1];

231
F = extraction rate of landfill gas - LFG [m3 LFG*h-1];H = compressor yearly hours in operation [h* y-1];[CH4] = methane concentration in landfill gas [m3 CH4*m3LFG].
Figure 4: Comparison of GasSim, LandGEM and HELGA simulations [16]
4. CONCLUSIONS
The most important stage in the design of landfill gas system is to know the amount ofbiogas that can be generate in the landfill site. Since methane has a higher global warmingpotential than carbon dioxide, production of methane is important in estimating the greenhousegas emissions from landfilled waste. One of the most important parameter in assessing themethane generation potential is the waste components. Methane generation can be predictedusing mathematical models. Most of these models were developed on Monod equation, andfirst – order kinetics are often used in methane production models, such as LandGEM, GasSim,Afvalzorg and EPER etc.
LandGEM is the most used automated estimation tool with a Microsoft Excel interfacethat estimate emissions rates for total landfill gas, methane, carbon dioxide, nonmethaneorganic compounds, and individual air pollutants from municipal solid waste landfills.
References[1] Dada, O., Mbohwa, C., Biogas upgrade to biomethane from landfill wastes: a review, Procedia
Manufacturing, vol. 7, pp. 333-338, 2017.[2] Report from the Commission to the European Parliament, the Council, the European economic and social
committee and the committee of the regions on the implementation of the EU waste legislation, https://eur-lex.europa.eu/legal-content/EN/TXT/?uri=CELEX%3A52013DC0006.
[3] Yechiel, A., Shevah, Y., Optimization of energy generation using landfill biogas, Journal of Energy Storagevol. 7, pp. 93–98, 2016.
[4] Pearse, L.F., Hettiaratchi, J.P., Kumar, S., Towards developing a representative biochemical methanepotential (BMP) assay for landfilled municipal solid waste – A review, Bioresouce Technology, vol. 254, pp.312-324, 2018.
[5] Rettemberger, G., Evolution in landfill biogas management concepts, pp.193-197, Sardinia Symposium – 30th Anniversary Book, Ed. Cossu, R, Stegmann, R., 2017, ISBN 978-886-265-0113.
[6] Lee, U., Han, J., Wang, M., Evaluation of landfill gas emissions from municipal solid waste landfills for thelife-cycle analysis of waste-to-energy pathways, Journal of Cleaner Production, vol. 166, pp. 335-342, 2017.

232
[7] Jaramillo, P., Matthews, H.S., Landfill-Gas-to-Energy Projects: analysis of net private and social benefits,Environ Sci Technol., vol. 39 (19), pp.7365-7373, 2005.
[8] Augenstein, D., Pacey, J., Modeling landfill methane generation, Proceedings Sardinia 91, Third InternationalLandfill Symposium, pp. 198-224, in Sardinia Symposium – 30 th Anniversary Book, Ed. Cossu R, StegmannR., 2017, ISBN 978-886-265-0113.
[9] Timoney, F., Estimates of methane recovery in landfill gas flaring and utilisation, EPA Climate ResearchProgramme 2007 – 2013, Environmental Protection Agency, 2009, ISBN 978-1-84095-326-8.
[10] Krause, M.J., Chickering, G.W., Townsend, T.G., Pullammanappallil, P., Effects of temperature and particlesize on the biochemical methane potential of municipal solid waste components, Waste Management, vol. 71,pp. 25-30, 2018.
[11] Liu, C-F., Yuan, X-Z., Zeng, G-M., Li, W-W., Li, J., Prediction of methane yield at optimum pH for anaerobicdigestion of organic fraction of municipal solid waste, Bioresource Technology, vol. 99, pp. 882–888, 2008.
[12] Emkes, H., Coulon, F., Wagland, S., A decision support tool for landfill methane generation and gascollection, Waste Management, vol. 43, pp. 307 – 318, 2015.
[13] Kamalan, H., Sabour, M., Shariatmadari, N., A review on available landfill gas models, Journal ofEnvironmental Science and Technology, vol. 4(2), pp. 79-92, 2011.
[14] Alexander, A., Burklin, C., Singleton, A., Landfill Gas Emissions Model (LandGEM), version 3.02 user’sguide, United States Environmental Protection Agency, EPA-600/R-05/047, May 2005,https://www3.epa.gov/ttncatc1/dir1/landgem-v302-guide.pdf.
[15] Lagos, A.D., Heroux, M., Gosselin, R., Cabral, A.R., Optimization of a landfill gas collection shutdown basedon an adapted first-order decay model, Waste Management, vol. 63, pp. 238 – 245, 2017.
[16] Attenborough, G.M., Gregory, R.G., Hall, D.H., McGoochan, L., Development of a landfill gas riskassessment model: GasSim, Available athttp://www.lqm.co.uk/uploads/general/files/GasSim%20SWANA%202002.pdf.
[17] Scharff, H., Jacobs J., Oonk, H., Hensen, A., Methods to ascertain methane emission of landfills,http://www.afvalzorg.nl/Libraries/Publications_Methane_emissions/Paper_methods_to_ascertain_methane_emission.sflb.ashx.

233
OZONE AND NITROGEN OXIDES PRODUCTION IN STERILIZEDTAP WATER BY AN OZONE GENERATOR TYPE OZONFIX 8G
Mirela Dincă1, Mariana Ferdeş, Gigel Paraschiv, Bianca – Ştefania Zăbavă, NicoletaUngureanu, Liviu Constantin
University Politehnica of Bucharest, Romania
ABSTRACT
The UV absorption spectra are important for understanding the composition of ozonated water. Acommercially available ozone generator was used to obtain ozonated water by a bubbling method. Avolume of 200 mL of sterilized tap water was treated with the gaseous mixture resulted from the ozonegenerator. The UV absorption spectra were recorded between 200 - 300 nm and the ozoneconcentration was determined by the iodometric method. The results showed that after 60 min ofozonization there are still present all the reactive species of O2 and N2. This could explain also thestrong decrease of pH values, after one hour of water ozonation. The iodometric analysis methodshowed the synthesis of some agents with strong oxidative potential, which can be both ozone andnitrogen oxides. The UV absorption spectra, concentration of ozone (g·L-1) determined by traditionaliodometric method and the evolution of pH values were assessed.
1. INTRODUCTION
Disinfection is considered to be the primary mechanism for the inactivation/destructionof pathogenic organisms to prevent the spread of waterborne diseases to downstream usersand the environment [1]. Ozone is an excellent disinfectant and can even be used to inactivatemicroorganisms such as protozoa which are very resistant to conventional disinfectants.Proper rate constants for the inactivation of microorganisms are only available for six species(E. coli, Bacillus subtilis spores, Rotavirus, Giardia lamblia cysts, Giardia muris cysts,Cryptosporidium parvum oocysts) [2]. The concentration of ozone which kills bacteria hasbeen variously reported to be 0.04 to 0.1 ppm (volume), whereas the toxicity for smallanimals is 3 to 12 ppm [3]. Humans experience headache, and most people can detect the odorat 0.02 to 0.04 ppm. For ozone generation, there are four recognized methods: coronadischarge, ultraviolet radiation, electrolysis and radiochemical method. The electricaldischarge method is the most common energy source used to produce ozone. Extremely dryair or pure oxygen is exposed to a controlled, uniform high-voltage discharge at a high or lowfrequency. The gas stream generated from air will contain about 0.5 to 3.0% ozone by weight,whereas pure oxygen will form approximately two to four times that concentration [1].
A recent survey in Switzerland among water works that apply ozone has shown that for90% of these plants the main reason for its application is disinfection [4]. Prabakaran M. etcolab. have analyzed ozone treatment by applying to human pathogenic bacteria such asEscherichia coli and Pseudomonas fluorescens, Salmonella typhi and Klebsiella pneumoniae.Among the treated bacterial species, E.coli revealed high sensitivity to ozone treatmentcompared to other bacterial strains [5].
In the present paper, were evaluated physico - chemical changes produced in sterilizedtap water through gas bubbling generated by corona discharge using an ozone generator typeOZONFIX 8G.
1Splaiul Independentei 313, Sector 6, Bucharest, 0761938017, [email protected]

234
2. METHODOLOGY
Ozone productionOzone was produced by a mobile ozone generator type OZONFIX 8G, with the following
characteristics: ozone production 8 g·h-1, power 16 W, air cooling, gas flow (measured) 2.5L·min-1, used for air and water treatment. All the experiments were conducted at temperatureof 20 °C. Tap water was sterilized in an autoclave for 15 minutes at 121 ° C.
MethodsThe gas resulted from the ozone generator with a flow rate of 2.5 L·min-1 was bubbled in
a volume of 200 mL sterilized tap water in a 30 cm cylindrical vessel, through a ceramic fritwith dimensions of 3 x 1.8 cm, different times, between 1 minute and 1 hour. At these timeintervals, water samples with a volume of 5 mL were collected. The pH was measured using apH meter type InoLab Multilevel 1 and the UV absorption spectra were plotted between 200and 300 nm, using a T92+ UV VIS spectrophotometer, PG Instruments with quartz cuvettes.There were collected samples from the same water volume, at intervals of 5 minutes for 1hour after the ozone generator was stopped. Samples were also collected after one week ofstorage in a vessel hermetically sealed at room temperature.
For determination of the formed ozone and oxidizing agents in the liquid medium, thetraditional iodometric analysis method was used [6]. The gas produced by the ozone generatorwas bubbled through the ceramic frit into 200 mL of 0.2 M KI solution in a cylindrical vessel,thus the height of the liquid was 15 cm. Generated ozone as well as any other oxidizing agentsreacted with iodide to form iodine. Samples of 10 mL were taken after 30 seconds to 20minutes. The solution with formed iodine is poured into the titration vessel, it is acidified by 1mL of 2 M HCl and then it is titrated by 0.05 M Na2S2O3 solution until the decoloration. Tomake this reaction more sensitive, a starch solution is added before the end of the titration.The amount of ozone is determined from the consumed solution of thiosulfate (1 mL of 0.05M Na2S2O3 solution corresponds to 1.2 mg ozone).
3. RESULTS AND DISCUSSION
The accumulation of ozone and nitrogen oxides was monitored for 1 hour by recordingthe UV absorption spectra and determining the absorbance values specific to ozone andnitrogen oxides at 205 nm (specific for nitrogen oxides) and 260 nm (specific for ozone).The absorption spectra for the first 15 minutes of water treatment with the gas produced bythe ozone generator are shown in Figures 1 - 4.
Figure 1: UV absorption spectra of ozonated water after 1 min

235
Figure 2: UV absorption spectra of ozonated water after 5 min
Figure 3: UV absorption spectra of ozonated water after 10 min
Figure 4: UV absorption spectra of ozonated water after 15 min
In figure 5, the absorption spectra for all samples taken at intervals of 1, 5,.., 60 min areshown. It is noted that for treatment times greater than 20 minutes, the absorbance values aregreater than 10 units, which means that the reactive species of ozone and nitrogen oxides havea relatively high concentration. The absorption spectra in UV have demonstrated that theconcentration of reactive species increases proportionally over time, reaching a value of 0.024for ozone. Also, it was observed a shift in the maximum characteristic of nitrogen oxides tothe right.

236
Figure 5: UV absorption spectra of ozonated water for 1 to 60 minutes
The absorbance values at 205 nm and 260 nm are shown at different times in Table 1.
Table 1: The absorbance values at 205 nm and 260 nmTime [minutes] 205 [nm] 260 [nm]1 0.483 0.005 0.953 0.0010 1.592 0.0015 1.635 0.0020 1.655 0.00325 1.682 0.00530 1.708 0.00535 1.734 0.00840 1.749 0.01045 1.775 0.01450 1.799 0.01755 1.817 0.02060 1.828 0.024
In figure 6 it is noticed that although water ozone treatment was stopped, the absorbancevalues recorded at 5 minutes for one hour, for ozone and nitrogen oxides did not changesignificantly, and the graphs appear almost overlapped.
The presence of reactive species in sterilized tap water was tested also after a week ofstored treated water, in a vessel hermetically sealed at room temperature. The water samplewas diluted 1: 1000 and the absorption spectra were recorded between 200 and 300 nm asshown in figure 7. It is noticed that the reactive species are still present and theirconcentration seems to have not decreased.
In parallel with the absorption spectra in UV technique, the usual titrimetric method wasused in order to observe the production of oxidizing agents.
The accumulation of ozone and possible oxidant agents in solution was monitored by thetraditional iodometric method, depending on time. In figure 8 it is noticed that theaccumulation of ozone and, eventually, of nitrogen oxides (resulted from the oxidation ofatmospheric nitrogen entered into device) begins after the first 30 seconds. This aspect hasbeen highlighted, also, by the fact that the 0.2 M potassium iodide solution started to becomelight yellow after this period. The ozone and nitrogen oxides showed an increasingconcentration over time, reaching up to an equivalent value of 1650 mg O3·L-1.

237
Figure 6: UV absorption spectra of ozonated water after ozone treatment was stopped
Figure 7: UV absorption spectra of ozonated water after one week of storage
After 20 minutes, the oxidation process was so strong that it determined the precipitationof I2 from the KI solution.
The main reactions that occur according to method are presented below [7]:
O3 + 2 I- = I2 +O2 +O-. (1)
I2 +2S2O32- = 2I- + S4O6
2- (2)
The high concentration of oxidants is explained by the characteristics of the device and bythe low volume of KI in which the gas from the ozone generator was bubbled.
Taking into account the fact that the absorption spectra in UV are explained by nitrogenoxides formation, their accumulation in sterilized tap water probably as nitric acid was testedby recorded the pH values.
After gas bubbling in sterilized tap water, it was found that the pH decreases drasticallyfrom 7.4 units to 1.9 units after 60 minutes. The decrease is very pronounced in the first 5minutes up to a value of 3.3 units, and then the decrease is slower (Figure 9). This isexplained by the reaction of nitrogen oxides with water and the formation of nitric acid andother unknown acidic compounds. Thus, after 60 minutes from ozone generator stopped aswell as after 1 week, the pH value maintained at 1.9 units.

238
Figure 8: Variation of ozone concentration in time Figure 9: pH values in ozonated water
CONCLUSIONS
Using titrimetric method, high concentrations of oxidative compounds were foundreaching a value of about 1.6 mg·mL-1 expressed as ozone concentration.
The ozonated water contained high concentrations of nitric oxides and relatively lowconcentration of O3, as determined in the UV absorption spectra between 200-300 nm.
Determination of pH values in ozonated water was in correlation with absorption spectraand suggests the presence of nitric acid and other acidic compounds formed after thetreatment.
References[1] U.S. Environmental Protection Agency (EPA). Office of Water Washington, D.C. EPA 832-F-99-063,
September 1999.[2] Urs von Gunten. Ozonation of drinking water: Part II. Disinfection and by-product formation in presence of
bromide, iodide or chlorine. Water Research. vol. 37, pp. 1469-1487, 2003.[3] McNair Scott, D.B., Lesher, E.C., Effect of ozone on survival and permeability of Escherichia Coli,
Journalof Bacteriology, pp.567-576, 1962.[4] Courbat, R., Ramseier, S., Walther, J.L., Gaille, P., Jordan, R., Kaiser, H-P., Revelly, P., Stettler, R., von
Gunten, U., Utilisation de l’ozone pour traitement des eaux potables en Suisse. Gas Wasser Abwasser, vol.79, pp. 843–52, 1999.
[5] Prabakaran, M., Selvi, S.T., Merinal, S., Panneerselvam, A., Effect of ozonation on pathogenic bacteria.Advances in Applied Science Research, vol. 3, pp. 299-302, 2012.
[6] Oh, J.S., Yajima, H., Hashida, K., Ono, T., Ishijima, T., Serizawa, I., Furuta, H., Hatta, A., In-situ UVabsorption spectroscopy for observing dissolved ozone in water. Journal of Photopolymer Science andTechnology, vol. 29, pp.427-432, 2016.
[7] International ozone association, Quality Assurance Committee, Revised Standardized Procedure 001/96,Iodometric method for dtermination of ozone in a process gas, Available at:http://www.otsil.net/articles/iodimetry%20method%20of%20ozone%20measurement.pdf.

239
TECHNOLOGY FOR CULTIVATING BICOLOUR SORGHUM FORFOOD OR ENERGETIC PURPOSES
Eng. Dumitru Iulian1), PhD. Eng. Voicea Iulian1), PhD. Eng.Vlăduț Valentin, PhD. Stud. Eng.Găgeanu Iuliana1), PhD. Stud. Eng. Oprescu Remus1), PhD. Stud. Eng. Persu Cătălin1),
PhD. Eng. Ungureanu Nicoleta2), Eng. Balan Vică3)
1) INMA Bucharest, 2) University Politehnica of Bucharest , 3)Mido Rom Electronic SRL
E-mail: [email protected]
ABSTRACT
Sorghum originates from Africa where it is grown for more than 3000, appearing in Europearound the 15th, and in Romania is grown for more than 50 years. Now, the large ranges of sorghumvarieties that can be grown in our country can be used for producing sugar, vinegar, beer, juices,flours, alcohol, medicines, but also for producing biogas and bio-ethanol (ethanol is obtained fromsweet sorghum syrup). Sorghum nutritive qualities and production costs recommend it as a goodreplacement for corn. Sorghum is a heat loving plant being able to easily withstand temperaturesup to 40oC, the minimum germination temperature being over 10oC. Sorghum crops have highdraught resistance, being able to survive low precipitation conditions and can be grown in typesof soil where other plants have low yields. Sorghum crops can be both annual and perennial. Forsoil preparation, sowing, crop maintenance as well as for harvesting, sorghum requires the samerange of equipment used for cereal crops. Seed sorghum is harvested when seeds reach maturity,using cereal harvesting machines, fodder sorghum is harvested using fodder harvesters when plantsare 40÷50 cm tall, and for sorghum hay harvesting is done when the spices appear. The paperpresents an overview of technologies for the cultivation of bicolor sorghum crops for energeticand food purposes.
INTRODUCTION
The sorghum is grown throughout the world and used for: food (flour, juice, syrup, vinegar,etc.) for animal feed in the form of pasture, hay, silo, pellets and last but not least in the industryfor the production of fuels, energy, alcohols, textiles and plastics, paper, construction materials,brooms, brushes, wickerworks, building materials. Sorghum is a plant in the grass family Poaceae,monocotyledonous, with fasciculated root, the root system is strongly developed and can reachover 1m depth [5], spreading sideways to 1.5m [2, 4,1]. The stem reaches an average of up to 2.5m [6] (there are different varieties that have a stem of 0.5 m while other varieties reach up to 6 m.[2, 4]) The stems can be dry or succulent. Juice from the sorghum stem can be sweet or insipid.[2]. The stems are made up of nodes and internodes, with an ear-like inflorescence [6].Inflorescence can reach up to 60 cm long [2, 1] and a width of 5-25 cm [2, 3]. Some varieties have
1 6, Ion Ionescu de la Brad Blvd., e-mail: [email protected]
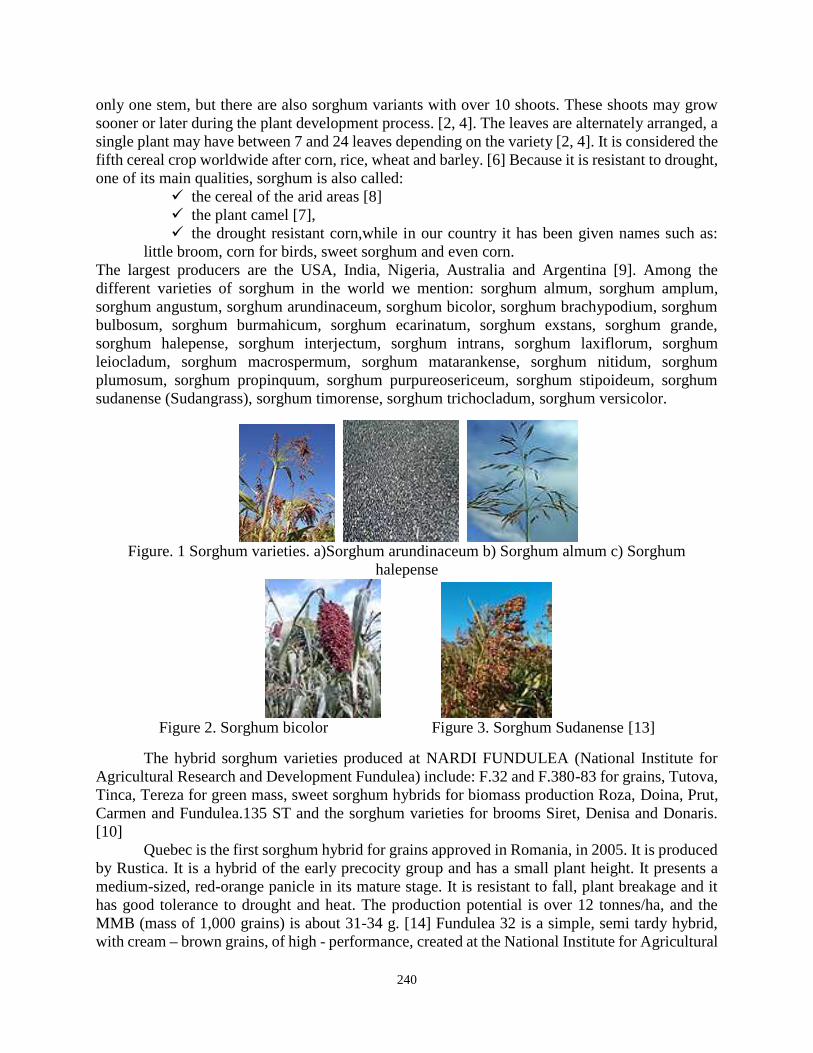
240
only one stem, but there are also sorghum variants with over 10 shoots. These shoots may growsooner or later during the plant development process. [2, 4]. The leaves are alternately arranged, asingle plant may have between 7 and 24 leaves depending on the variety [2, 4]. It is considered thefifth cereal crop worldwide after corn, rice, wheat and barley. [6] Because it is resistant to drought,one of its main qualities, sorghum is also called:
the cereal of the arid areas [8] the plant camel [7], the drought resistant corn,while in our country it has been given names such as:
little broom, corn for birds, sweet sorghum and even corn.The largest producers are the USA, India, Nigeria, Australia and Argentina [9]. Among thedifferent varieties of sorghum in the world we mention: sorghum almum, sorghum amplum,sorghum angustum, sorghum arundinaceum, sorghum bicolor, sorghum brachypodium, sorghumbulbosum, sorghum burmahicum, sorghum ecarinatum, sorghum exstans, sorghum grande,sorghum halepense, sorghum interjectum, sorghum intrans, sorghum laxiflorum, sorghumleiocladum, sorghum macrospermum, sorghum matarankense, sorghum nitidum, sorghumplumosum, sorghum propinquum, sorghum purpureosericeum, sorghum stipoideum, sorghumsudanense (Sudangrass), sorghum timorense, sorghum trichocladum, sorghum versicolor.
Figure. 1 Sorghum varieties. a)Sorghum arundinaceum b) Sorghum almum c) Sorghumhalepense
Figure 2. Sorghum bicolor Figure 3. Sorghum Sudanense [13]
The hybrid sorghum varieties produced at NARDI FUNDULEA (National Institute forAgricultural Research and Development Fundulea) include: F.32 and F.380-83 for grains, Tutova,Tinca, Tereza for green mass, sweet sorghum hybrids for biomass production Roza, Doina, Prut,Carmen and Fundulea.135 ST and the sorghum varieties for brooms Siret, Denisa and Donaris.[10]
Quebec is the first sorghum hybrid for grains approved in Romania, in 2005. It is producedby Rustica. It is a hybrid of the early precocity group and has a small plant height. It presents amedium-sized, red-orange panicle in its mature stage. It is resistant to fall, plant breakage and ithas good tolerance to drought and heat. The production potential is over 12 tonnes/ha, and theMMB (mass of 1,000 grains) is about 31-34 g. [14] Fundulea 32 is a simple, semi tardy hybrid,with cream – brown grains, of high - performance, created at the National Institute for Agricultural

241
Research and Development Fundulea). The hybrid has 140 cm plant height and increasedresistance to drought, shaking, diseases and pests. The panicle is spiked and has a length of 20 -21 cm, with 1900 - 2100 grains/panicle and MMB of 20 - 21 g. [14] Armida is an early hybrid,with white grains, of ultra-high performance, created by Euralis Semences SAS France. It is asemi-early hybrid, with zero tannin content. It is characterized by the stay-green effect, the semi-open panicle, the very high resistance to drought and shaking, as well as the very rapid drying ofthe grains towards the end of the vegetation period. The yield potential of this hybrid reaches upto 11,000 kg/ha. [14]
Figure 6. Sorghum Armida crop [12]
In terms of panicle and grains morphology, sorghum consists of two types: with spikedpanicle (such as saccharatum, technicum Fig. 7a) and compact panicle (such as the sudanensevariety Fig. 7b)).
Figure 7 a). Sorghum saccharatum, technicum Figure 7 b). Sorghum sudanense [11]
From the life cycle point of view, there are sorghum varieties with a one-year (annual) lifecycle and a smaller number of perennial varieties. [2, 4]. From the nutritional point of view,sorghum varieties are divided, based on the tannin content, in 3 categories:
1. Low tannin content : <0.2%,2. Medium tannin content: 0.2-0.6%,3. High tannin content:> 0.6% [16].
Sorghum is predominantly self-pollinated [2, 1]. Lately, in the world as well as in Europe,there is a lot of interest in the promotion of sorghum crops. In 2016, on November 3, the EuropeanSorghum Congress was held in Bucharest and it was attended by experts on sorghum cultivationand capitalization.
METHODOLOGYSorghum should not be absent from the crop rotation practiced on the sandy, alkaline and
saline soils, or on the sloping lands, for its high adaptability to drought (transpiration coefficient =158-274), alkalinity (pH = 59) and soil salinity or from the prevention of deflation on sandy soils.

242
In order to obtain a high production it is necessary to put this crop in a rational rotation, ensuringpreplants that leave a weed clear land in order to avoid the danger of weeds growing during theplants’ first stages of vegetation. In the culture areas favourable to sorghum, the best preplants arethe straw cereals, sunflower, sugar beet and corn. Cultivating sorghum after perennial legumes orperennial grasses is not advisable because the maintenance works in the early stages of vegetationare carried out with increased difficulty as the root fragments, both of the preplant culture (lucerne)and the perennial weeds, generate many shoots.
Fertilisation. In areas favourable to this culture, the use of fertilizers is directly conditionedby soil water. The degree of fertilizer utilization also depends on the type of soil. Administrationof organic fertilizers proves to be effective, sorghum reacts favourably if the fertilization is carriedout in autumn with 3040 t/ha of fermented manure. It should not be neglected that unfermentedmanure is a powerful source of weed growing, especially in irrigated or wetter areas. Sorghumrequires a soil loosened to a higher depth, well-grinded, large water reserve and free of weeds. Inorder to meet the requirements of small seeds and the more difficult germination of this plant,increased attention will be paid to soil works. If the sorghum is cultivated after straw cereals,annual legumes, a deep summer plow at 2830 cm will be carried out, in aggregate with the stellarharrow. Its efficiency is higher if it is done immediately after harvesting the preplant, as it reduceswater losses in the soil.
Seed. Quality indexes of sorghum seed depend largely on how it is preserved, thebiological purity of populations and hybrids cultivated. In order to achieve the maximumgermination capacity it is necessary to harvest the sorghum panicles at physiological maturity anddry them in suitable storage or storehouse so that the humidity of the grains is reduced to 1012%.In order to ensure the seed resistance at different pests or diseases a specific treatment will beapplied.
Sowing.The sorghum sowing period is conditioned by the thermal regime of the differenttypes of soils, knowing that this plant is very demanding for heat. The minimum germinationtemperature is 1415C. Sowing too late has the disadvantage that the soil water reserve isdiminished and the vegetation period is deferred too much in the dry season, which leads to adecrease in green mass production and creates the risk that the seeds will not reach physiologicalmaturity until the first frosts in the autumn. In the years when climate conditions are normal in thesouth and southwest of the country, sorghum is sown in the last decade of April and the first decadeof May, respectively 23 days after the optimal sowing time of the corn for grains.
The sowing of sorghum at the optimum time also greatly contributes to the ease ofmaintenance works, especially the more vigorous weed control and the increase in the resistanceto the attack of aphids and the infection with various bacterioses. The sowing depth is determinedaccording to the granulometric composition and the soil water reserve. In the steppe regions it willbe sowed at a depth of less than 4-5 cm, and in soils with sandy or sandy-loam texture it will besowed deeper, at 5-6 cm. The plant density is conditioned by the size of the sorghumpopulations and hybrids, the fertility and the water regime of the different soil types. (Table 1)
Table 1 Sorghum density according to soil type, sorghum variety and irrigation conditionsSoil type Non-irrigated Irrigated
Sorghumgrains
Sweetsorghum
Sorghumx Sudan
Sorghumbrooms
Sorghumgrains
Sweetsorghum
Sorghumx Sudan
Sorghumbrooms
Normal 125175 100125 450500 100 225275 125150 600750 125150Salty 80125 80100 300350 80 175200 100125 500600 100125

243
Sandy 75100 7580 250300 70 150175 100125 500600 100125
On the fertile land in the steppe area of our country, sorghum has been grown frequentlyat a density of 150200,000 plants harvestable per hectare. On less fertile land, the density wasreduced to 100,000 plants harvestable per hectare.
The amount of seed required to ensure an optimal density of 160,000 - 200,000 plantsharvestable per hectare is 8-10 kg/ha, if the germination is at least 90%. If the seeds have a weakergermination, seed quantities will be increased so as to ensure optimum density.
The use of large amounts of seed well above the calculated norm creates problems for theplant emergence, the consumption of labour, in order to ensure an optimal growth and developmentspace, is exaggerated and economically unjustifiable.Sorghum crop maintenance works.
Sorghum, the same as sorghum for grains, is one of the most pretentious plants in terms ofmaintenance works. At this plant there is a danger of the crop being compromised due to the soilcrust and because of the weed growing after the sunrise, because of the low growth rate of theplants in the first vegetation phase. There is also the danger that young plants are strongly attackedby aphids. To prevent these shortcomings, all measures must be taken to ensure that the soil is asthoroughly prepared, ground and free of weeds. After sowing, rolling ensures a very good plantemergence. The sorghum is very demanding in the works of maintenance in the first 4045 dayssince the emergence due to the plant poor emerging power and the poor development power of theyoung plants.
After emergence, when the sorghum has 45 leaves, up to the height of 1520 cm, the soilcan be worked with rotating hoe, respecting some rules in its use (with the teeth turned) to avoidthe danger of plant uprooting. The most important maintenance work for sorghum crop is thehoeing. Typically 23 mechanical hoeing and 12 hand hoeing passes are executed. At mechanicalhoeing, to protect the sorghum roots of being cut, the protection area next to the plant row is leftlarger than in the case of corn. If the active parts cut off the lateral roots on the soil surface, theplants would be hindered to grow and develop.Also, the hand hoeing on the row must be done withgreat care not to damage the plants. In order to reduce the workforce, soil chemical weeding isused before sowing on the whole surface or on the row in the same time with the sowing work. Inthe case of aphids attack, aphid control is a mandatory measure when the attack is strong and it isachieved by treatments with organophosphorus products. At least two-times spraying are requiredat 1015 days. In case there is manual force, it is possible to carry out the work of removing theshoots from the sorghum plants, thus generating the vigorous growth and development of the plantsand obtaining of high quality productions.Sorghum harvesting
The varieties of sorghum hybrids must be selected so that the crop can reach the floweringstage in July and the ripe stage by October 15. Sorghum quality depends largely on the time ofharvesting. For example, sorghum crops for juice should be harvested when the maximum amountof sugar is in the plant, with the highest percentage of sucrose. As the plant matures, the quality ofthe juice improves by increasing the sucrose percentage and lowering the glucose one. Increasingthe percentage of sucrose gives the possibility to obtain sugar from this plant beside the syrup. Ingeneral, sorghum harvesting for juice takes place when the grains are already mature. The wholeplant is used to extract the juice, after the panicles have been harvested at the last internode.Removing panicles with the last internode can be made mechanically and is necessary becausethey contain very little sugar and have some salts that give a bad taste to the juice. It is advisable

244
for the stems to be cut as close as possible to the ground, since the lower internodes contain thelargest amount of juice. Sorghum harvesting is generally mechanized. Depending on the type ofcultivated sorghum and its use after harvesting, specific harvesting machines are used. If we wantto obtain grains, in the first phase, sorghum seeds are harvested with straw harvesters. When thegrain humidity reached 13-14%, they are threshed, then passed through the cleaning machines andthen stored. If the sorghum stems are harvested, plant mass harvesters are used. The materialresulting from the harvester as fragmented green mass is transported in order to obtain the productsfor which it was grown.
CONCLUSIONSSorghum is a plant that needs to be given greater importance in the context of global
warming and multiple uses in both human food, to obtain green energy, animal feed and industry.It is necessary to improve or modify existing technologies according to farmers’ needs andresources. It is a plant of the future due to its special resistance to drought. Sorghum can becomea new source of raw material for the production of bioenergy; in human food, sorghum has becomeincreasingly used foodstuff, offering a great variety of uses going entering well into combinationswith other food.
Acknowledgement: This work was supported by a grant of the Romanian National Authority for ScientificResearch and Innovation, CNCS/CCCDI –UEFISCDI, project number PN-III-P1-1.2-PCCDI-2017- 0566(ctr. Nr. 9 PCCDI/2018- COMPLEX SYSTEM OF INTEGRAL VALUABILITY OF AGRICULTURALSPECIES WITH ENERGY AND FOOD POTENTIAL, COMPONENT PROJECT 1 - DEVELOPMENTOF INNOVATIVE CULTIVATION TECHNOLOGIES FOR SPECIES WITH ENERGY POTENTIALFOR BIOMASS).
References
[1] Balole, T. V.; Legwaila, G. M.; Brink, M.; Belay, G., editors. Plant Resources of Tropical Africa 1. Cereals andPulses. Wageningen, Netherlands: Backhuys Publishers; 2006. p. 165–175[2] Jiří Hermuth, Dagmar Janovská, Petra Hlásná Čepková, Sergej Usťak, Zdeněk Strašil and Zdislava Dvořáková,
Sorghum and Foxtail Millet—Promising Crops for the Changing Climate in Central Europe, Chapter 1, World's largestScience, Technology & Medicine Open Access book publisher.[3] Kimber, C. T. Origins of domesticated sorghum and its early diffusion to India and China. In: Smith, C. W.;
Frederiksen, R. A., editors. Sorghum: Origin, History, Technology, and Production. USA: John Wiley & Sons, Inc.;2000. p. 3–98.[4] National Research Council. Lost Crops of Africa. Vol. 1. Grains. Washington, DC: National Academy Press.[5] http://www.referatul.ro/referate/sorgul-sorghum-bicolor-moench.html[6] https://ierburiuitate.wordpress.com/2014/02/20/sorgul/[7] https://www.revista-ferma.ro/articole/agronomie/paduchele-verde-al-cerealelor-inamicul-sorgului[8] http://www.incda-fundulea.ro/anale/75/75.8.pdf[9]http://agrointel.ro/5462/tufa-din-care-se-fac-maturile-mai-foloseste-la-biogaz-sau-ca-furaj-si-aduce-profit-pe-
timp-de-seceta/[10] http://www.incda-fundulea.ro/anale/75/75.8.pdf[11] https://ierburiuitate.wordpress.com/tag/sorg/[12] https://www.stiriagricole.ro/tehnologia-de-cultivare-a-sorgului-una-dintre-cele-mai-bune-alternative-la-cultura-
porumbului-in-zonele-secetoase-32420.html[13] https://ro.wikipedia.org/wiki/Sorg[14] https://www.stiriagricole.ro/tehnologia-de-cultivare-a-sorgului-una-dintre-cele-mai-bune-alternative-la-cultura-
porumbului-in-zonele-secetoase-32420.html[15] http://www.incda-fundulea.ro/50ani/rezgen.html
[16] http://www.sorghum-id.com/content/uploads/2017/09/1-2-cf-the-assets-of-sorghum-grain-in-feed-pptx-5.pdf.

245
INVESTIGATION OF A DIGITAL HYDRAULIC ACTUATIONSYSTEM FOR A WASTE BALING PRESS
Iulian-Claudiu DUȚU1*, Sorin-Ștefan BIRIȘ*, Edmond MAICAN*,Paula TUDOR*, Radu-Iulian RĂDOI**
* University Politehnica of Bucharest** Hydraulics and Pneumatics Research Institute, Bucharest
ABSTRACT
Energy efficiency of modern industry machinery imply using adaptive electronic drivingmodules, based on digital processing units, in order to offer superior machine capabilities throughfirmware updating. It is a well-known fact that classic hydraulics installations mounted on industrialmachinery are sometimes too complex and difficult to reconfigure and in some cases impossible.Industrial machines need to be flexible and energy efficient, leading to real challenges for industrialdesigners. Standardized hydraulics equipment and digital driving electronic modules are still asolution to modern industrial needs, but the energy efficiency is poor. Complexity of hydraulicsinstallations has been, somehow, passed to electronics driving modules but leaded to a rapid increasein control system’s complexity. Hydraulics manufacturing companies promote nowadays the conceptof digital hydraulics systems as the answer to modern technical challenges. In this paper, the authorshave investigated the possibility of using the digital hydraulics concept in replacing conventionalelectrohydraulic directional valves, in the case of a waste baling press. It will be underlined mainadvantages and disadvantages of digital hydraulics over classic hydraulics.
1. INTRODUCTION
Digital hydraulics technical concept has entered the international scientific communityaround 1999, as an alternative to classic hydraulic driving circuits using proportional or servoequipment. However, strong inertia of the scientific community made the concept to developvery slowly. In present, digital hydraulic valves are slightly to be found in the commercialoffer of traditional hydraulic manufacturers, but there are several functional models ready tobe delivered to the market. There are a few among large hydraulic manufacturers havetechnical knowledge and capabilities to produce custom digital hydraulics equipment.Research laboratories of universities or institutes are continuously trying to optimize existingvalves, but the greatest challenge still remains the development of capable software controlalgorithms or proper adjustment of certain constructive parameters of valves or theirelectromagnets – depending on which technical solution is adopted. Digital hydraulics havetwo alternative solutions to classic equipment both having the benefit of reducing generalenergy consumption of the hydraulic driving system: high frequency PWM switching orparallel connection of several 2/2 hydraulic directional valves (very similar to valve-islands)electrically controlled independently. In the second case, the valves are smaller, havingreduced installation and maintenance costs over proportional equipment. They are also robust.In P.E.T. waste presses, the main problem is energy management due to the fact that thehydraulic pumping module must always operate at almost full capacity. This means highenergy consumption in normal operating mode even if there are certain functional phases thatdoes not require so much energy. There are made some experimental studies (Finland) on afully functional digital hydraulic equipment, mounted on an excavator boom that revealed an
1No. 313 Splaiul Independentei, 0040214029633, [email protected]
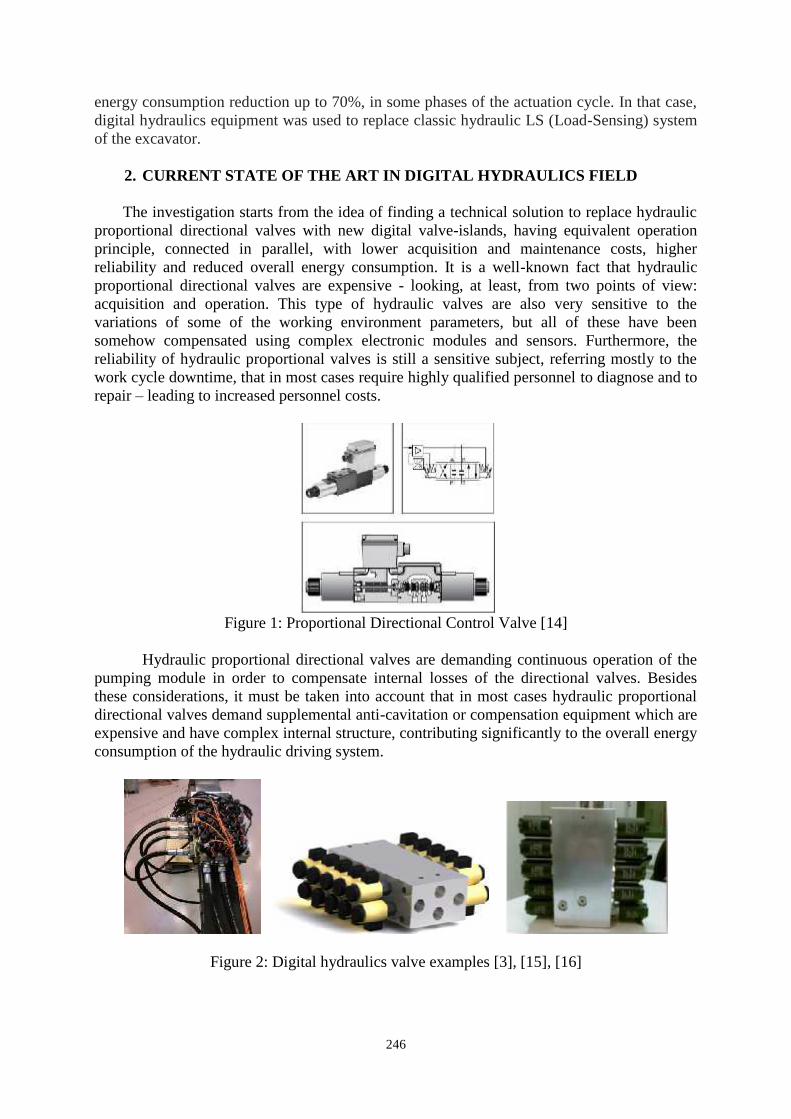
246
energy consumption reduction up to 70%, in some phases of the actuation cycle. In that case,digital hydraulics equipment was used to replace classic hydraulic LS (Load-Sensing) systemof the excavator.
2. CURRENT STATE OF THE ART IN DIGITAL HYDRAULICS FIELD
The investigation starts from the idea of finding a technical solution to replace hydraulicproportional directional valves with new digital valve-islands, having equivalent operationprinciple, connected in parallel, with lower acquisition and maintenance costs, higherreliability and reduced overall energy consumption. It is a well-known fact that hydraulicproportional directional valves are expensive - looking, at least, from two points of view:acquisition and operation. This type of hydraulic valves are also very sensitive to thevariations of some of the working environment parameters, but all of these have beensomehow compensated using complex electronic modules and sensors. Furthermore, thereliability of hydraulic proportional valves is still a sensitive subject, referring mostly to thework cycle downtime, that in most cases require highly qualified personnel to diagnose and torepair – leading to increased personnel costs.
Figure 1: Proportional Directional Control Valve [14]
Hydraulic proportional directional valves are demanding continuous operation of thepumping module in order to compensate internal losses of the directional valves. Besidesthese considerations, it must be taken into account that in most cases hydraulic proportionaldirectional valves demand supplemental anti-cavitation or compensation equipment which areexpensive and have complex internal structure, contributing significantly to the overall energyconsumption of the hydraulic driving system.
Figure 2: Digital hydraulics valve examples [3], [15], [16]

247
Digital hydraulics valves are simpler being materialized by parallel connection of 2/2poppet valves. In theory, these type of hydraulic directional valves have zero losses, leadingto the idea that is not necessary for the pumping module to operate continuously, reducingoverall energy consumption. There is not needed anymore a large, complex and low-energyefficiency pumping module, where digital hydraulics valves can properly operate with smallerpumping modules having in their structure one or more hydraulic accumulators (pressurestorage reservoir). From the start we can observe an improvement of the energy efficiency ofthe system.
Figure 3: Equivalences between 2-way hydraulic valves, classic vs. digital [2]
Hydraulic 2/2 poppet valves, main components of the valve-islands, have smallphysical dimensions, they are robust and having lower acquisition, maintenance and operationcosts than the proportional valves. Supposing that one of the poppet valves in the valve-islandis not functional anymore, the automated electronic driving module will dynamicallyreconfigure the remaining operational valves of the valve-island in order to maintain processparameters near the setpoint values. Considering the case of hydraulic proportional directionalvalves, when one valve is defective, in most cases, the entire process will be shut down or cancause serious damages or life-threatening situations.
Main technical challenges encountered in the discussion classic vs. digital valves willbe described in the following. The size of digital hydraulic valves is a delicate issue beingapproximated three times larger than regular hydraulic proportional directional valves. Thereis an obvious need for several parallel connected valves to make a valve-island in order toobtain the same operating function as in a hydraulic proportional directional valve [3]. Aquestion arises over the reliability and cost factors of such a digital valve configuration. Beinga relatively new concept, digital hydraulics equipment are highly priced and rare whenreferring to already existing models of hydraulic proportional valves. On long term thisdrawback will be overcame due to the benefits of mass production, but nowadays it is veryimportant to take into consideration that digital hydraulics is a pioneering field of science andtechnology. Having a relatively large number of valves in the valve-island configuration thatneed to be controlled independently, it is required to develop a proper model control strategy,

248
directly dependent to the number of poppet valves in the valve-island. Considering that n isthe number of parallel poppet valves in the valve-island configuration, there will be amaximum of 2n possible control values for main digital valve’s output. In the first place, mainproblem here will not be the value of n, but the speed of the electronic controller modulewhen computing and trying to obtain an optimum combination of control values for a certaingiven state of the hydraulic system.
Figure 3: Example of a Digital Flow Control Unit (DFCU),hydraulics schematic and control coding [2]
There is a direct correlation between the value of n and valve’s output, a large numberof parallel valves in the construction of the digital valve result in a large range of possibleoutput values, in the same time directly influencing the characteristic curve of the digitalvalve. The digital valve will always have an exact number of outputs that will always beobtained in the same conditions thus improving precision. Optimal control is also a delicateissue in digital hydraulics: when defining the objective functions it can be found that these arepursuing opposite goals, such as a short transient regime of the working pressures, higheroutput flow resolution, higher energy efficiency, lower market costs – still an important aspectdue to the novelty degree of the digital hydraulics field (implying higher costs), lower noiseand vibration generated by the poppet valves themselves, being in a continuous switchingworking regime – where the amplitude value of the switching noise is relatively close to thevalue of response time. Referring to the case of classic hydraulic proportional directionalvalves, the switching noise is given by the constructive particularities of those.
Probably one of the most important advantages of digital valves over classic valves istheir programmability, meaning that same digital valve can be used for different purposes [2],by simply reprogramming its software controller. In the case of digital valves, availablenumber of functions that a valve can perform depends mostly on the software than itsmechanical structure. Control software can be easily updated to give new functionalities to thevalve. This new concept of digital hydraulics, has the benefits of working in real time andhydraulic losses reducing, depending on the application, digital valve reduces losses 30-98%[2]. In the Figure below, it is shown a very short technological progress of the hydraulics fieldover the years. From the 1960’s where the energy losses were significantly higher than theuseful work, energy efficiency was at a maximum value of 10%, the technical field ofhydraulics has progressed towards LS (Load Sensing) systems and officially starting fromyear 2006 towards Digital Hydraulics. A load-sensing hydraulic pump will always operate ina negative feedback control loop, establishing a new pressure drop every time the value ofload pressure is changing.

249
Figure 4: Relative energy usage in hydraulics [2]
Digital hydraulics has already encountered three phases of scientific and technicaldevelopment, progressively reducing the energy losses, obtained through scientific researchand laboratory experiments. Limitations of current approaches in the digital hydraulics fieldare directly related to the novelty degree of the thematic, causing in the same time an inertiain the scientific community, still adherent to classical hydraulics solutions. There are knownvery strong opinions that criticize the digital hydraulics field, on the difficulty to develop ahighly intelligent control algorithms for digital hydraulics valves, on the limited valveresolution given by the limited number of directional valves in the valve-island, or on the stilllarge physical dimensions vs. weight of the valve-islands or number of electrical wires andhydraulic hoses. The general trend of the industry is to miniaturize its equipment and digitalhydraulics is not – nowadays – a part of that trend.
Some of the current technical approaches suggest instead of reinventing the field ofhydraulics through digital hydraulics concept, to properly adjust the functional parameters ofthe existing hydraulic equipment available on the market, while promoting new functionalmodels and intelligent control techniques in order to gain on the energy efficiency field.However, digital hydraulics tends to replace classic hydraulic circuits with their digitalequivalent, using switching equipment and having significantly lower costs and higherefficiency. More or less, the limitations of the current approaches in digital hydraulics fieldare directly related to the costs of researches, still in the state of development andimprovement, which implies the allocation of important funding of R&D departments oftraditional hydraulic equipment manufacturers.
3. CONCLUSIONS
Current researches in the field of efficient P.E.T. waste pressing led to analyzing the ideaof retrofitting a classic hydraulic baling press, using the digital hydraulics concept. Digitalvalve-islands made of 2/2 hydraulic directional valves seems to be a feasible solution overheavy and expensive load-sensing systems. The field of digital hydraulics is still inpioneering, researchers are still performing laboratory tests and formulating scientifichypotheses, their focus being on the development of optimal control strategies and valvedevelopment. Digital hydraulics can find the answer to some existing problems in hydraulicsfield, especially in energy efficiency and in the near future will replace available solutions.Still, digital hydraulics systems are using only one digital equipment in their configuration,such as directional valves, motors or pumps, and the others are classic or proportionalequipment. When retrofitting an existing hydraulic system, fixed or mobile, it must be takeninto account technical criteria such as available sensors, valves, power generators, functioningcycles, energy efficiency, control strategies, but also the economic criteria such as total costcontrol of the retrofitting and payback time. As a general conclusion, digital hydraulics hastwo strong advantages over classic hydraulics: energy efficiency and higher reliability.

250
4. ACKNOWLEDGMENTS
This work has been funded by University Politehnica of Bucharest, through the“Excellence Research Grants” Program, UPB – GEX 2017. Identifiers: UPB-GEX2017, Ctr.No. 56 /2017 (DIGIPRESS) and UPB-GEX2017, Ctr. No. 106 /2017 (EFIHIST).
References
[1] Boström, P., Matti Linjama, Lionel Morel, Lauri Siivonen, Marina Walden, Design and Validation of DigitalControllers for Hydraulics Systems, TUCS Technical Report, No 800, December 2006.[2] Linjama, M., Digital Hydraulics, Tampere University of Technology (TUT), Department of IntelligentHydraulics and Automation (IHA).[3] Sethson, M., The digital hydraulic challenge, to switch or not to switch, Division of Fluid and MechatronicSystems, Linköping University Sweden.[4] Linjama, M., & Huhtala, K., Digital hydraulic power management system–towards lossless hydraulics,Proceedings of the Third Workshop on Digital Fluid Power. pp. 13-14, 2010.[5] Dell’Amico, Al. et al., Investigation of a Digital Hydraulic Actuation System on an Excavator Arm, 13thScandinavian International Conference on Fluid Power; June 3-5; Linköping; Sweden. No. 092. LinköpingUniversity Electronic Press, 2013.[6] Jelali, M., & Kroll, A., Hydraulic servo-systems: modelling, identification and control, Springer Science &Business Media, 2012.[7] Cristescu, C., Dumitrescu, C., Vrânceanu, G., Dumitrescu, L., Considerations on energy losses in hydraulicdrive systems, ”Hidraulica” Journal, ISSN 1453-7303, Romania, No.1, pp.36-46, 2016.[8] http://www.hydraulicspneumatics.com[9] http://www.directindustry.com[10] ***http://www.valmet.com, Digital Hydraulics, Technical Paper Series, U.S.A., March 2016, accesat înAprile 2017.[11] https://eu.hsm.eu[12] Linjama, M., Paloniitty, M., Tiainen, L., Huhtala, K., Mechatronic Design of Digital Hydraulic Micro ValvePackage, Procedia Engineering, Elsevier, vol. 106, pp. 97 – 107, 2015.[13] Linjama, M., Huova, M., Bostöm, P., Laamanen, A., Siivonen, L., Morel, L., Walden, M., Vilenius, M,Design and Implementation of Energy Saving Digital Hydraulic Control System, Vilenius, J. & Koskinen, K.T.(eds.) The Tenth Scandinavian International Conference on Fluid Power (SICFP’07), May 21-23, TampereFinland, 2 , pp. 341-359, 2007.[14] https://www.hydradynellc.com/product/d1fxe01ckndj00/series-dfx[15] http://www.tut.fi/interface/articles/2009/1/hydraulics-enters-the-digital-age[16] http://hightech.dimecc.com/results/digital-hydraulics-in-paper-machine-lines

251
MOTOR WHEEL MODELLING OF A TRACTOR
Duţu Mihaela Florentina1, Begea Mihaela, Duţu Iulian Claudiu,Cȋrȋc Alexandru, Simion Gabriela
University Politehnica of Bucharest
ABSTRACT
The article presents the MathCAD engine modeling of the tractor wheel for two types of tires used on theU-650M tractor, one manufactured in Romania and one manufactured by Good Year. The paper presents thecharacteristics of these two types of wheels studied. For these, they studied the oscillations of the engine wheelfor slow and fast speeds of the tractor on agricultural land.
1. INTRODUCTION
The tractor is a complex mechanical system in which vibrations are transmitted from thetrack to the driver of the tractor during the movement. The vibration level determines thedegree of comfort of the tractor driver and normal wheel reactions. [1]
Disturbances in the trailer suspension system caused by the terrain micro-plot have arandom character. These perturbations can be considered to vary according to laws close tothe period. Runway irregularities give rise to shocks on wheels, shocks that are transformedinto oscillations by means of tires. After studying the model with a degree of freedom of thetractor wheel, a modeling program for the tractor engine wheel in MathCAD was developed.[7]
The following paper presents the modeling of two motor wheels used on the U-650Mtractor, a tire wheel made in Romania and a Good Year tire wheel.
METHODOLOGY
Using the modeling program, two engine wheels used on the U-650M were analyzed,namely:
• a tire motor made in Romania;• a Good Year tire engine wheel. [3]For each engine wheel, for the 1.2 bar pressure and 12000 N load, the ground contact
surface, free wheel radius, radial deformation and lateral deformation were measured. Theresults obtained are shown in Table 1.
From the experimental data presented in Table 1 it results that the contact surfacebetween the wheel and the ground, measured by planimetry, is higher for the wheel producedin Romania, the radial and lateral deformation being higher than for the Good Year wheel.
1Spl.Independentei, no.313, sect.6, Bucharest, 0214029637, [email protected]

252
Table 1: Characteristics of the engine wheels studiedTire Pressure
[bar]Load[N]
Surfacesupport[cm2]
Freebeam[m]
Radialdeformation
Lateraldeformation
[mm] [%] [mm] [%]16,9 – 38Romania
1,2 12000 1470 0,838 33,2 3,96 37 8,5
16,9 – 38GoodYear
1,2 12000 1365 0,838 27,3 3,25 12 2,8
The elastic constants (k) and the damping coefficients (c) for the two engine wheels are:• engine wheel Romania: 350700k N / m; 8000c ;• Good Year: 427300k N / m; 8827c .The tractor wheel modeling program was run for the slow and fast speeds of the U-
650M tractor for both types of runways: farmland and country road.The tractor speeds are:
slow speeds:
hkmv
hkmv
hkmv
hkmv
hkmv
/18,18
/68,7
/78,5
/16,4
/58,2
5
4
3
2
1
fast speeds:
hkmv
hkmv
hkmv
hkmv
hkmv
/94,26
/38,11
/56,8
/17,6
/83,3
5
4
3
2
1
The characteristics of the agricultural land are:
The height of the irregularities 025,00 h m
lungimea neregularităţilor 208,0l m.
The profile of the track for slow tractor speeds is shown in Figure 1.

253
Figure 1: The agricultural land profile for the slow speeds of the U-650M tractor
The displacement of the engine wheel manufactured in Romania is shown in Figure 2and the Good Year wheel in Figure 3.
Figure 2: Oscillation of the engine wheel manufactured in Romania on agricultural landand slow speeds
Figure 3: Oscillation of the Good Year engine wheel on farmland and slow speeds

254
For the fast speeds of the tractor, the profile of the tread pattern is shown in Figure 4.
Figure 4: The agricultural land profile for U-650M tractor speeds
The oscillatory motion of the engine wheel manufactured in Romania when travelingon the agricultural land with the fast speeds of the U-650M is shown in Figure 5, and for theGood Year engine wheel in Figure 6.
Figure 5: The oscillation of the engine wheel made in the country on agricultural land atthe fast speeds of the tractor

255
Figure 6: Oscillation of the Good Year engine wheel on farmland at the fast speeds oftractor
3. CONCLUSIONS
When moving the U-650M slow engine speeds, it is noted that the oscillation amplitudeis higher for the Good Year wheel at the minimum speed hkmv /8,2 , and for the other fourspeeds, the oscillations amplitudes of the two tested wheels are very close. Running themodeling program for hkmvhkmv /94,26,/58,2 maxmin , for the two types of wheels,
shows that the wheel oscillations produced in Romania are smaller than the Good Year at theminimum speed and are identical for the maximum speed (Figure 7).
In Figure 7, 1z and 2z represents the elongation of the engine wheel oscillations
manufactured in Romania for the minimum and maximum speeds, and also 11z and 12z theelongations of the Good Year for the minimum or maximum speed respectively.
Figure 7. Comparison of engine wheel oscillations on agricultural land
The variation of the amplification factor (B) for the country-produced engine wheel and(B1) for the Good Year engine wheel according to the speed of travel on the agricultural landis shown in Figure 8.

256
Figure 8. Variation of the speed-dependent amplification factor for the two types of motor wheelswhen traveling on farmland
It can be seen that the maximum value of the amplification factor is obtained for theminimum travel speed ( 6,2B for the country-made wheel and 3,21 B for the Good Yearwheel) and for the other speeds the values are close and very low.
References
[1] Bratu P. – Mecanică teoretică, Editura Impuls, Bucureşti, 2006.[2] James M.L., Smith G.M., Wolford J.C., Whaley P.W. – Vibration of Mechanical and Structural Systems withMicrocomputer Applications, Harper and Row, New York, 1989.[3] Jolobeanu C., Roşa I – MATHCAD. Probleme de calcul numeric şi statistic, Editura Albastră, Cluj-Napoca,1995.[4] Magheţi I., Savu M. – Vibraţii mecanice – teorie şi practică, Editura Bren, Bucureşti, 2004.[5] Munteanu M. – Introducere în dinamica oscilaţiilor solidului rigid şi a sistemelor de solide rigide, EdituraClusium, Cluj-Napoca, 1997.[6] Munteanu M. – Introducere în dinamica oscilaţiilor solidului rigid şi a sistemelor de solide rigide, EdituraClusium, Cluj-Napoca, 1997.[7] Scheiber E., Lixăndroiu D. – MathCAD prezentare şi probleme rezolvate, Editura Tehnică, 1994.

257
THE GROWTH BEHAVIOR OF E. COLI K12-MG1655 AND THECONSUMPTION OF THE SUBSTRATE IN DIFFERENT SUGAR
CONCENTRATIONS CULTURE MEDIA
Mariana Ferdes1, Mirela Dinca, Bianca Zabava, Gigel ParaschivUniversity “Politehnica” of Bucharest
ABSTRACT
Escherichia coli K12-MG1655 was cultivated in minimal media containing differentconcentrations of glucose, at 27 °C, on an orbital incubator, at 150 rpm. The growth curvesdemonstrated that the OD at 600 nm correlated to the cell density depends on the concentration of thecarbon source, being higher for 1% and 0.5% glucose. The exponential phase stops after 10-12 hoursfor the lowest concentrations of glucose (0.02% and 0.05%) and continues for up to 16-17 hours forthe highest concentrations, that can be explained by the nutrient limitation. The results of glucoseconsumption showed a slow decrease in glucose concentration for the first 4-5 hours corresponding tolag phase of growth. In the next 10 hours, the glucose consumption is high, and after 14 hours theconcentration of this nutrient decreases to 1.5% after 11 hours for the initial concentration of 0.05%,and to 6% after 14 hours for 0.1% initial concentration of glucose.
1. INTRODUCTION
A major goal for the food processing industry is to provide safe, wholesome andacceptable food to the consumer, and the control of microorganisms is essential. The controlis exerted through processing and preservation techniques which eliminate microorganisms orprevent their growth [1].
Microbiological quality is among key attributes to indicate integrity of food products andhygiene of food processing [2]. Lack of proper hygiene and using low quality raw materialscause high presence of food-borne pathogens in food products [3].
Approximately 200 foodborne illnesses are recognized worldwide, butenterohemorrhagic Escherichia coli (EHEC) is considered among the most importantbacterial pathogens to date. EHEC was recognized as a human pathogen in 1982, and stillremains important to clinicians, researchers, and the general public [4, 5].
E. coli can contaminate food originating from warm-blooded animals and can befound in milk and dairy products, meat products, and different food products containing milkand meat [6].
The bacteria belonging to the species Escherichia coli are commonly found in theintestinal microflora of human and animals and are recognized as non-pathogenicmicroorganisms. However, some strains may become opportunistic pathogen and causedisease such as different diarrheal diseases, wound infections, meningitis, septicemia,artherosclerosis, hemolytic uremic syndrome and immunological diseases [7].
Escherichia coli, which is ubiquitous in the environment, is considered a globalindicator of fecal pollution [8]. E. coli is a cause of foodborne illness and its infection often
1University Politehnica of Bucharest, 0729821256, [email protected]

258
leads to hemorrhagic diarrhea, and occasionally to kidney failure, especially in young childrenand elderly [9]. E. coli are non-pathogenic in normal conditions, but if present in excess, willbecome causative agent of various diseases like urinary tract infection, diarrhoea, vomitingetc. [10]. Escherichia coli are the most commonly present bacterium in the human intestine,which helps in preventing the entry of pathogenic microorganisms [10, 11]. Shiga toxinproducing Escherichia coli is one of the most common cause of food-borne diseases in theworld [12].
E. coli is a Gram-negative, non-sporulating, flagellated, rod-shaped and facultativeanaerobic bacterium of the Enterobacteriaceae family [13]. Escherichia comprises cells in theform of straight rods (l x 3 µm), motile or nonmotile, mesophile. It is found in the intestinalcontents of humans, warm-blooded animals, and birds. Many strains are nonpathogenic, butsome strains pathogenic to humans and animals and involved in foodbome diseases. Amongthe classes of pathogenic E. coli, EHEC is perhaps the most important because of its virulenceand its association with life-threatening complications such as hemolytic uremic syndrome.[14, 15].
The ability of microorganisms (except viruses) to grow or multiply in a food isdetermined by the intrinsic factors and extrinsic environment of food, respectively. Intrinsicfactors of a food include nutrients, growth factors, and inhibitors (or antimicrobials), wateractivity, pH, and oxidation-reduction potential [14, 16]. Temperature is also an importantextrinsic factor affecting microbial growth and, consequently, the safety of food [17]Microbial growth is accomplished through the synthesis of cellular components and energy.The necessary nutrients for this process are derived from the immediate environment of amicrobial cell and, if the cell is growing in a food, it supplies the nutrients. These nutrientsinclude carbohydrates, proteins, lipids, minerals, and vitamins.
Foods from plant sources are rich in carbohydrates but can be poor sources of proteins,minerals, and some vitamins. All microorganisms normally found in food metabolize glucose,but their ability to utilize other carbohydrates differs considerably. This is because of theinability of some microorganisms to transport the specific monosaccharides and disaccharidesinside the cells and the inability to hydrolyze polysaccharides outside the cells [14]. E. colican be grown in a minimal medium containing only an organic carbon source such as glucoseand a source of nitrogen such as (NH4)2SO4 and other minerals [18].
2. METHODOLOGY
Bacterial strainE. coli K12-MG1655 belonging to the Culture Collection of Microbiology Laboratory,
Faculty of Biotechnical Systems Engineering, was cultivated in tubes on Luria Bertani agarmedium and kept in refrigerator until use.
InoculumStandardized inoculum was prepared from a single colony of E coli after growing in Petri
dishes. For growth experiments, a standardized inoculum of 2% (v/v) from a liquid cultureprepared into Luria Bertani medium, 16-20 hours old (with OD 600nm of 1.4-1.9) has beenused. The inoculum was grown in Erlenmeyer flasks, at 27 °C, on an orbital incubator, at 150rpm.
Culture mediaThe bacterial strain was cultivated in a minimal liquid medium containing glucose as sole
carbon source, macro and microelements with the following composition: Na2HPO4 6g/L,KH2PO4 3g/L, NaCl 5g/L, NH4Cl 1,0g/L, Tween 80 1 ml/L, autoclaved at 121 °C for 15 min.2ml of 1M MgSO4 (2mM) (sterile filtered, on 0.22 µm membrane) and different volumes of20% glucose (sterile filtered, on 0.22 µm membrane) were added after cooling. The second

259
solution, containing low concentrations of salts with the formula: 5g EDTA, 0.8g FeCl3, 0.05gZnCl2, 0.01g CuCl2, 0.01g CoCl2, 0.01g H3BO3, 1.6g MnCl2, with pH 7.0 was sterilized bymembrane (0.22 µm pore) filtration and kept chilled. Before use, this stock solution wasdiluted x100 in distilled sterile water.
Methods. Cultures were grown in minimal medium comprising different concentration ofsugar (0.02%; 0.05%; 0.1%; 0.2%; 0.5% and 1%), at 27 °C, on rotary incubator, at 150 rpm,for 18 hours, at 27 °C. From hour to hour, the samples were analyzed for OD at 600 nm, andglucose concentration. Glucose analysis was done using a Glucose Colorimetric Assay Kit,QuantiChrom from BioAssay Systems. The analysis of total number of survival cells wasperformed in Petri dishes on Luria Bertani agar medium.
Results and discussionThe growth curves for different concentrations of glucose presented in figure 1 are
characterized by the specific phases for multiplication of bacterial cells in liquid medium.The first growth phase, namely lag phase, takes 3 or 4 hours, the necessary time for cells
to adapt to the new conditions of culture. For all the six concentrations of glucose, this phaseseems to be the same. The values of optical densities are low, due to the small number of thecells. Because the minimal medium is different from the inoculum medium (that is LuriaBertani), the enzymes are forced to use new type of nutrients.
In the second phase, the exponential phase, when bacterial cells are growing and dividingat the maximal rate possible, the glucose concentration has a significant influence on the E.coli multiplication. This phase stops after 10-12 hours for the lowest concentrations ofglucose (0.02% and 0.05%) and continues for up to 16-17 hours for the highestconcentrations. The stationary phase was attained for lower concentrations of glucose muchearlier than for 0.5 and 1% glucose concentration. This can be explained by the nutrientlimitation; if an essential nutrient is severely depleted, population growth is slowed.
0
0.5
1
1.5
2
2.5
1 2 3 4 5 6 7 8 9 10 11 12 13 14 15 16 17 18 19 20
OD600nm
Time, hours
0.02%
0.05%
0.10%
0.20%
0.50%
1%
Figure 1: E. coli growth curves in media with 0.02%; 0.05%; 0.1%; 0.2%; 0.5% and 1%glucose concentration

260
The substrate consumption was analyzed through the determination of glucoseconcentration in culture at different time intervals. With the Glucose Colorimetric Assay Kit,QuantiChrom, a calibration curve was plotted and used for the analysis of substrateconsumption, as see in figure 2.
y = 0.014x - 0.002R² = 0.999
00.05
0.10.15
0.20.25
0.30.35
0.40.45
0.5
0 20 40 60 80 100 120 140 160 180 200 220 240 260 280 300
OD600nm
Glucose, mg/dLFigure 2: Glucose calibration curve
Figure 3 shows the curves for glucose consumption for initial concentrations of 0.05%and 0.1%. In both cases is noticed a slow decrease in glucose concentration for the first 4-5hours, corresponding to the lag phase of growth. In the next 10 hours, the glucoseconsumption is high, and after 14 hours the concentration of this nutrient decreases to 1.5%after 11 hours for the initial concentration of 0.05%, and to 6% after 14 hours for 0.1% initialconcentration of glucose.
y = -0.633x2 + 4.079x + 45.75R² = 0.988
y = -0.660x2 + 3.911x + 96.22R² = 0.996
0
20
40
60
80
100
120
0 1 2 3 4 5 6 7 8 9 10 11 12 13 14
Glucoseconcentration,
mg/dL
Time, hours
Glc 0.05%
Glc 0.1%
Poly. (Glc 0.05%)
Poly. (Glc 0.1%)
Figure 3: Substrate consumption curves for media containing 0.05% and 0.1% glucoseconcentration
The correlation between maximal OD values after 18 hours and the initial glucoseconcentration is shown in figure 4, where the curve is a logarithmic one.
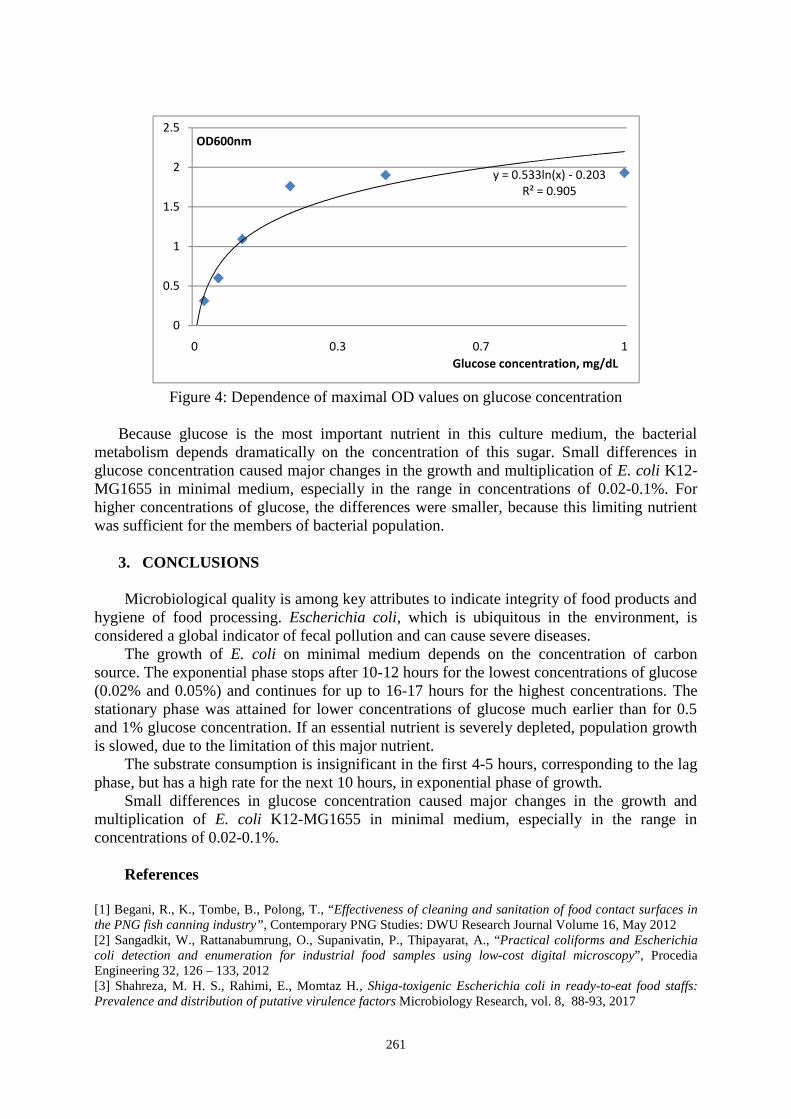
261
y = 0.533ln(x) - 0.203R² = 0.905
0
0.5
1
1.5
2
2.5
0 0.3 0.7 1
OD600nm
Glucose concentration, mg/dL
Figure 4: Dependence of maximal OD values on glucose concentration
Because glucose is the most important nutrient in this culture medium, the bacterialmetabolism depends dramatically on the concentration of this sugar. Small differences inglucose concentration caused major changes in the growth and multiplication of E. coli K12-MG1655 in minimal medium, especially in the range in concentrations of 0.02-0.1%. Forhigher concentrations of glucose, the differences were smaller, because this limiting nutrientwas sufficient for the members of bacterial population.
3. CONCLUSIONS
Microbiological quality is among key attributes to indicate integrity of food products andhygiene of food processing. Escherichia coli, which is ubiquitous in the environment, isconsidered a global indicator of fecal pollution and can cause severe diseases.
The growth of E. coli on minimal medium depends on the concentration of carbonsource. The exponential phase stops after 10-12 hours for the lowest concentrations of glucose(0.02% and 0.05%) and continues for up to 16-17 hours for the highest concentrations. Thestationary phase was attained for lower concentrations of glucose much earlier than for 0.5and 1% glucose concentration. If an essential nutrient is severely depleted, population growthis slowed, due to the limitation of this major nutrient.
The substrate consumption is insignificant in the first 4-5 hours, corresponding to the lagphase, but has a high rate for the next 10 hours, in exponential phase of growth.
Small differences in glucose concentration caused major changes in the growth andmultiplication of E. coli K12-MG1655 in minimal medium, especially in the range inconcentrations of 0.02-0.1%.
References
[1] Begani, R., K., Tombe, B., Polong, T., “Effectiveness of cleaning and sanitation of food contact surfaces inthe PNG fish canning industry”, Contemporary PNG Studies: DWU Research Journal Volume 16, May 2012[2] Sangadkit, W., Rattanabumrung, O., Supanivatin, P., Thipayarat, A., “Practical coliforms and Escherichiacoli detection and enumeration for industrial food samples using low-cost digital microscopy”, ProcediaEngineering 32, 126 – 133, 2012[3] Shahreza, M. H. S., Rahimi, E., Momtaz H., Shiga-toxigenic Escherichia coli in ready-to-eat food staffs:Prevalence and distribution of putative virulence factors Microbiology Research, vol. 8, 88-93, 2017

262
[4] Robinson, A., McKillip, J., Biology of Escherichia coli O157:H7 in human health and food safety withemphasis on sublethal injury and detection, Formatex Publisher, 2010[5] McClure PJ1, Hall S Survival of Escherichia coli in foods Symp Ser Soc Appl Microbiol., 29, 61-70, 2000[6] Olsvik, O., Waterson, Y., Lund A., Homes E., Pathogenic Escherichia coli found in food, InternationalJournal of Food Microbiology, Vol. 12, Issue 1, 103-113, January 1991[7] Branco, P., M., P., Fernandes, A., Cangani M., T., de Souza-Polo, A., de Lucas, J., do Amaral, L., A., Effectsof sugarcane juice addition on the population dynamics of Escherichia coli and the presence of Shiga-toxigenicE. coli during the anaerobic codigestion of dairy cattle manure, http://dx.doi.org/10.1590/0103-8478cr20170382[8] Belluco, S., Barco, L., Roccato, A., Ricci, A., Escherichia coli and Enterobacteriaceae counts on poultrycarcasses along the slaughterline: A systematic review and meta-analysis, Food Control, 60, 269-280, 2016[9] umaran, S., Deivasigamani, B., Alagappan, K., Sakthivel, M., Karthikeyan, R., Antibiotic resistantEsherichia coli strains from seafood and its susceptibility to seaweed extracts, Asian Pacific Journal of TropicalMedicine, 977-981, 2010[10] Amrita, V., Sonal D., Shalini R., Antibacterial Effect of Herbs and Spices Extract on Escherichia coliElectronic Journal of Biology,, Vol. 5(2), 40-44, 2009[11] Saxena, T., Kaushik, P., Mohan, M., K., Prevalence of E. coli O157:H7 in water sources: an overview onassociated diseases, outbreaks and detection methods, Diagnostic Microbiology and Infectious Disease, 82,249–264, 2015[12] Saeedi, P., Yazdanparast, M., Behzadi E., Salmanian, A., H., Mousavi, S., L., Nazarian, S., Amani, J., Areview on strategies for decreasing E. coli O157:H7 risk in animals, Microbial Pathogenesis, 103,186-195, 2017[13] Gomesa, T., Elias, W., Scaletskya, I., Gutha, B., Rodriguesc, J., Piazzab, R., Ferreirac, L., Martinez, M.,Diarrheagenic Escherichia coli, Brazilian journal of microbiology, 47, 3–30, 2016[14] Ray, B., Bhunia A, Fundamental Food Microbiology, Fourth Edition, CRC Press, USA, 2008[15] Baker, C., Rubinelli, P., Park, H., Carbonero, F., Ricke S., Shiga toxin-producing Escherichia coli in food:Incidence, ecology, and detection strategies, Food Control, 59, 407-419, 2016[16] Bandary, B., Hussain, Z., Kumar, R., Effect of carbon and nitrogen sources on Escherichia coli bacteria inremoving dyes, Materials Today: Proceedings 3, 4023–4028, 2016[17] Veys, O., de Oliveira, S., Sampers, I., Tondo E., C., Modelling the growth of Salmonella spp. andEscherichia coli O157 on lettuce, Procedia Food Science, 7, 168 – 172, 2016[18] Jay, J., Loessner, M., Golden, D., Modern Food Microbiology, Seventh Edition, Springer Science, USA,2005

263
BENEFITS OF USING ADDITIVES IN THE PRODUCTION OF BIOMASSPELLETS
Găgeanu Iuliana11), Voicu Gheorghe2), Cujbescu Dan1), Persu Cătălin1), Gheorghe Gabriel1),Voicea Iulian1),
1)INMA Bucharest / Romania; 2)University Politehnica of Bucharest / Romania
ABSTRACT
The use of renewable energy has become a large concern in the last decades due to the rapid andinevitable depletion of fossil fuels combined with population growth that led to increased fuelconsumptions. Out of the numerous forms of renewable energy, biomass is one of the easiest to use, dueto its characteristics that are very similar to those of fossil fuels. One of the main problems in usingbiomass as a source of renewable energy is represented by that fact that it is hard to be used in its originalstate, therefore it has to be first treated and processed. Pelleting is one of the most common ways toprocess biomass and obtain solid biofuels. The paper presents a series of researches for determining thebenefits of using additives for improving the quality of biomass pellets obtained for energetic purposes.
1. INTRODUCTION
The benefits of biofuels, compared to traditional fuels, are aimed at greater energy security, lowerenvironmental impact, financial savings and socio-economic aspects related to the rural sector. Theconcept of sustainable development embodies the idea of inter-connectivity and balance betweeneconomic, social and environmental concerns. [1]
The composition of cellulosic biomass types: cellulosic biomass is composed of cellulose,hemicellulose, lignin and an extractive percentage, as shown in Figure 1 for a number of representativeexamples of agricultural residues, wood, municipal waste and herbaceous plants.
Figure 1: Composition of the most common types of biomass [2]
Usually, biomass is burned in its original state to generate heat and electricity, or it can be used asraw material for the production of biofuels (liquid biofuels such as biodiesel and bioethanol, or solidbiofuels, such as pellets and briquettes) and some chemical compounds. Biomass is a biodegradable and
16, Ion Ionescu de la Brad Blvd., tel.: +40762676642, e-mail: [email protected]

264
renewable energy resource. Biomass production represents an expanding field due the increasing interestin alternative energy sources [3-6].
In table 1 are presented the main categories of plant biomass.
Table 1Main categories of plant biomass [3]
Biomass category ContentBiomass from primaryagricultural crop
Total potential biomass from agricultural crops
Plant waste Biomass from the secondary production and other plant waste
Biomass from fodder plants Biomass from the production of fodder plantsGreen fodder from naturalpastures
Biomass from animal pasture
Wood Wood harvested from wood-based products
Given the enormous demand for pellets, as well as the wide availability and diversity of biomassfrom the waste resulting from processing agricultural and forestry products, new types of pellets arecurrently entering the market. In particular, we highlight the pellets mixed with corn cobs, pelletsobtained from the waste from the paper industry, as well as all types of cardboard, pellets obtained fromhay, with many types of straws, with the remains of sunflower plant, corn, branches of any kind, wastefrom vineyards, ornamental shrubs, nut shells, hazelnuts, crushed almonds, cherry stalks, peaches,apricots, grape seed, etc[7-8].
Besides these, there are also leaves, grass, as well as all other plant waste from forest cleansing, aswell as many other plant waste that can be used in the production of pellets. These new types of pellets arestill in the experimental phase, and there are not yet well-defined regulations that demonstrate compliancebased on standards. However, all alternative resources that can replace traditional fuels are welcome, whileguaranteeing recycling of waste that remains unused [10].
If the raw material does not have sufficient pressing properties, additives from biological materialsused in the mixture are needed. The paper presents a series of researches conducted for determining thebenefits brought by using additives in the production of agricultural biomass pellets, namely on handling,transportation and storage and characteristics.
2. METHODOLOGY
In order to determine the benefits of using additives in the biomass recipes pelleted on the finalquality of the products, a series of tests were conducted on pellet samples. All pellets were producedusing the same pelleting machine (a ring die pelleting machine with 9 mm orifices in the die) and thesame particle sizes for all biomass materials, respectively <9 mm, obtained by grinding the biomass.
The determinations were conducted on pellets obtained only from one material (wheat straws andrapeseed stalks) as well as on two types of pellets obtained from mixes between these materials, in orderto assess the differences between using only one material and using the same materials in combinationPellets made from the combination between rapeseed stalks and straws had a 50% material from bothbiomass types. Pellets from wheat straws + corn starch had 95% straws and 5% starch.
Figure 2 shows the pellet samples used for tests.

265
Figure 2: Pellet samples used for determinations
The following storage and transportation quality parameters were determined for the final products:length, diameter, bulk and single pellet density, dust formation.
Pellet length and diameter was determined by measuring pellets using electronic callipers.Dust formation during handling, transportation and storage was determined according to the method
described in standard SR EN ISO 17831-1:2016 – Solid biofuels – Determination of mechanicaldurability of pellets and briquettes – Part 1: Pellets.
Bulk density BDp (kg m-3) was determined using a cylinder with known volume, and a precisionscale, according to the method described in standard SR EN ISO 17828:2016 – Solid biofuels –Determination of bulk density [9].
Single pellet density SDp (kg m-3) was calculated using the pycnometer, by determining the volumedisplaced by introducing the pellet in distilled water and calculating the density using the formula:
= ( + − ) × (1)
where:m1 – mass of the pellet (kg);m2 – mass of pycnometer filled with distilled water (kg);m3 – mass of pycnometer plus distilled water with the pellet (kg);dw – water density at working temperature (kg m-3).
The results from the determinations are shown in table 2. The data in table represents the averagevalue from 3 determinations (for bulk density, single pellet density ad dust formation) or the averagefrom 30 determinations (for length and diameter) conducted on the same type of pellet samples.
Table 2: Results from the tests conducted on agricultural biomass pellets
No. Pellet sampleLength[mm] Diameter
[mm]
Bulk density[kg/m3]
Single pelletdensity[kg/m3]
Dustformation
[%]1. Wheat straws 100% 15.83 9.46 544.53 970.12 8.222. Rapeseed stalks100% 15.43 9.68 495.17 897.72 9.12
3.Wheat straws 50% +rapeseed stalks 50%
16.27 9.22 558.66 1019.63 7.45
4.Wheat straws 95%+corn starch 5%
30.21 9.01 637.78 1212.78 4.28

266
Figure 3: Comparison between the most important handling, transportation and storage characteristics
From table 2 and figure 3 it results that when combining the 2 types of materials and using cornstarch in the recipe, we obtained good results in terms of length, diameter, bulk and single pellet density,as well as for dust formation, compared to the pellets obtained only from wheat straws or rapeseed stalks.
3. CONCLUSIONS
Based on the experimental data resulted, the following conclusions can be drawn:1. The combinations between two types of materials tested showed that it is better to use materials suchwheat straws or rapeseed in combination with other materials to obtain pellets with better quality;2. The use of starch brought a significant improvement for all parameters measured, increasing pelletlength, reducing pellet diameter (meaning that pellets expand less after exiting the pelleting die),increasing both bulk and single pellet density and reducing dust formation.3. The use of material combinations as well as using a cheap and common additive can bring importantbenefits to the production, handling, transportation and storage of pellets, contributing to a sustainabledevelopment and use of energy, without affecting human and animal food necessities.
AcknowledgementThis work was funded by the Executive Agency for Higher Education, Research, Development and
Innovation Funding, within the project entitled "Optimizing the composition of biomass mixtures forobtaining high quality pellets", ctr. 24 BG / 2016 (code PN-III-P2-2.1-BG-2016-0266).
References
[1] Demirbas A. -Progress and recent trends in biodiesel fuels, Energy Conversion and Management 50, 2009, pp. 14–34;[2] Popa V. I. – Biomass as source of energy and chemical products, Technical University “Gheorghe Asachi” Iasi;[3] Material flows and economy development in Romania, National Statistics Institute, 2014, ISSN: 2067-2195;[4] Danciu A. et al. (2010). Technology for solid agricultural and forestry biomass capitalization for obtaining cleanenergy and reducing greenhouse effect gas emissions. Research Report, contract 21-008, INMA Bucharest;[5] Găgeanu I., Voicu Gh., Vlădut V., Voicea I. (2017). Experimental research on the influence of recipes used on the quality of biomasspellets, Proceedings of 16th International Scientific Conference Engineering for Rural Development – Jelgava, pp. 785-791;[6] Berkesy L., Begea M., Berkesy C., Crăciun M., Suciu L. Qualitative aspects regarding biomass destined for heating,Ecoterra, no. 30, 2012, pp. 64;[7] Jezerska L., Zajonca O., Rozbroja J., Vyletěleka J., Zegzulka J. (2014). Research on Effect of Spruce Sawdust with AddedStarch on Flowability and Pelletization of the Material, IERI Procedia 8, pp. 154–163;[8] Stelte W., Sanadi A.R., Shang L., Holm J.K., Ahrenfeldt J., Henriksen U.B. Recent developments in biomass pelletization– A review. BioResources 7(3), 2012, pp. 4451-4490;[9] SR EN ISO 17828:2016 - Solid biofuels - Determination of bulk density;[10] http://www.tatanoassistenza.eu/RO/Utenti/FAQ/combustibili.htm.

267
CONSIDERATIONS ON IMPROVING BIOMASS PELLETS QUALITYBY USING ADDITIVES
Găgeanu Iuliana11), Voicu Gheorghe 2), Cujbescu Dan1), Persu Cătălin1), Pandia Olimpia3)
1) INMA Bucharest / Romania; 2) University Politehnica of Bucharest / Romania;3)UASVMB – Faculty of Management, Economic Engineering and Rural Development / Romania
ABSTRACT
Biomass represents the most important source of renewable energy that can lead to producingbiofuels with very similar properties to fossil fuels. In order to obtain biofuels based on biomassmaterials, they first need to processed and brought to the desired parameters depending on the biofuelthat will be obtained. One of the most important biofuels obtained from biomass are pellets.Unfortunately, not all biomass (for example the most part of agricultural biomass) has adequate pelletingproperties and therefore it was necessary to find ways to use these materials for obtaining good qualitypellets. One way to ensure good quality pellets from agricultural biomass is to use additives in thepelleting recipe. The paper presents a research on the most important additives used that the influencethe final quality of pellets resulting from the pelleting process.
1. INTRODUCTION
Biomass represents the plant component of nature. As a form of keeping the Sun's energyin chemical form, biomass is one of the most popular and universal resources on earth. Itprovides not only food, but also energy, building materials, paper, fabrics, medicines andchemicals. Biomass is used for energy purposes since fire was discovered by humans. Today,biomass fuel can be used for various purposes - from space heating to the production ofelectricity and fuel for cars and planes [1].
Biomass is the biodegradable fraction of products, waste and residues from agriculture,including vegetal and animal substances, forestry and related industries, and the biodegradablefraction of industrial and urban waste.
Biomass heating is the oldest and best-established form of energy supply in the world and isinherently linked to the development of the human race. However, it was largely redundant dueto the high energy density of fossil fuels, and its application to modern energy systems, especiallyin industrialized countries, has so far declined. A renewed interest in biomass-based energysystems comes from a variety of reasons. They are dominated by the interest in reducinggreenhouse gas emissions, the emergence of new efficient biomass conversion technologies, andrising fossil fuel prices [2].An increase in the biomass share in the energy mix could bring the following benefits:- the diversification of Europe's energy supply;- significant reduction of greenhouse gas emissions;- direct jobs for people;- potential for lower oil prices as a result of lower demand.
This means that under the conditions of an adequate industrial processing, fresh biomasscan be converted into products similar to natural gas or liquid or solid fuels. By applying varioustransformation processes such as burning, gasification or pyrolysis, biomass can be transformedinto "bio-fuels" for transport, "bio-heat" or "bio-electricity" [3].
16, Ion Ionescu de la Brad Blvd., tel.: +40762676642, e-mail: [email protected]

268
Biomass combustion of is not only the oldest form of combustion used, but it is also one of themost complex management systems since it involves the use of solid fuels in a multi-phase reactionsystem with extensive interactions between thermal fluxes and mass, processes that have beenproperly analysed just recently and used in simulations to design efficient combustion systems. Thekey to understanding solid fuel combustion processes is to recognize that only gaseous fuels burnand release heat, and liquids and solids do not burn, but actually consume heat in the drying andvolatile processes needed to convert them into gaseous fuel (fig. 1) [4].
Fig. 1 – Diagram of biomass combustion and the closed carbon circuit [4]
One of the best methods to transform biomass into biofuels is represented by the pelletingprocess, which involves subjecting biomass to high pressures and forcing it through thecylindrical holes of a die. When exposed to appropriate conditions, biomass "merges" to forma solid mass. If the raw material does not have sufficient pressing properties, additives areneeded to be used in the mixture.
The paper presents a research on the most important additives used that the influence thefinal quality of pellets resulting from the pelleting process.
2. METHODOLOGY
Agricultural residues are an abundant and cheap source of energy from renewable sources.Agricultural residues are the most abundant (in terms of mass) biomass raw material in theworld. About 1500 million tonnes of grain crops are produced annually worldwide. Due to theavailability of this enormous amount of plant stalks and straws, it has recently been consideredas a potential raw material for biofuel production. However, biomass from wheat straw andother crops has the disadvantage of having high porosity and low bulk density. Straw strain isof great importance for performing better handling, transport and storage operations [1].
Densification can increase the volumetric calorific value and the uniformity of physicalproperties leading to the production of denser, uniform, cleaner, and more energy-stable pelletsas an ecological fuel.
In the production of pellets, various by-product materials can be used as additives orbinding agents to improve their quality. The quality of the pellets (fig. 2) is determined byseveral key parameters such as moisture content, calorific value, fine particle size, mechanicaldurability, density, ash content and ash melting point. The values of these parameters arespecified in regulations and standards. They define fuel classes, testing and samplingconditions, quality assurance methods and systems for supply and sales chains [5].

269
Figure 2: Pellets qualitygood (left); average (center); weak (right) [5]
The production of agricultural biomass pellets and the increase of their quality withadditives is a more economical and ecological transition to energy generation from biomassresidues. This approach uses existing power plant equipment without major changes, makingthe transition process more economical. [6]
A series of researchers have looked into the process of obtaining agricultural biomasspellets using additives for improving the pelleting process (lower energy consumption, lowerpelleting time, etc.) as well as the final quality of products obtained (improved length, diameter,surface properties, higher calorific value, etc.).
Table 1 presents the most common used additives used for obtaining agricultural biomasswith improved quality.
Table 1: Common additives used in pelleting recipesNr.crt. Additives and binders Percentage usually added
to the total mass1 Lignosulfonate 0 - 5%2 Bentonite 0 - 5%3 Glycerol 0 - 5%4 Corn starch 0 - 5%5 Potato starch 0 - 5%
Paraffin 0 - 5%Palmityl 0 - 5%Dolomite 0 - 5%Untreated wood residues 0 - 30%Microwave pre-treated waste wood 0 - 30%Waste wood pre-treated in microwave with 5% glycerol 0 - 30%
Wood waste has a higher lignin content compared to agricultural straws and stalks andcould be used as a good natural binder. Wood pellets such as wood sawdust or sawdust havebeen popular in European countries in the last decade. Wood pellets have good structuralstrength and lower dust and ash content. The recycling of wood waste is environmentallyfriendly and can also solve the problem of disposal. Generally, softwood has a higher lignincontent than hardwood [7].
Chemical agents such as NaOH and calcium oxide have been added to wheat straw to reducethe fiber resilience properties to soften and enhance the interlocking ability of the particles toincrease the durability of pellets. The key role of the NaOH pre-treatment solution is to interruptthe ester linkages between lignin and carbohydrates resulting in lignin solubility. The chemicaland microwave pre-treatment was significantly proven to be able to disintegrate the

270
lignocellulosic structure of the wheat and barley strains and to increase the heating value, densityand resistance of the pellets produced from these materials [2].
Grape pomace and tomato waste could be a valuable raw material for the production ofbiofuels. Mixing these residues with agricultural biomass can be a promising result for energyrecovery. In fact, the mixture with ground biomass reduces the ash content, while densificationleads to increased energy density. However, gas emissions are higher and are heavily affectedby boiler operation parameters. Therefore, these parameters, such as the mass flow of water inthe heat exchanger, the mass flow of the fuel, the primary and secondary air flow rates, must beadapted to each agri-food residue in order to benefit from this energy from renewable sources,without leading to a negative impact on the environment [8].
3. CONCLUSIONS
The physical and thermal parameters of the pellets are influenced by the use of differentbinders or additives added to the manufacturing process. According to EU standards, additivesthat improve fuel quality, reduce gas emissions or stimulate combustion efficiency can be addedup to a maximum of 5% of the total mass of wood pellets. Also, considering the profitability ofthe production process and safety at work, it is very practical to use additives agents.
In the process of obtaining pellets, additives act as a lubricant, increase production andlower energy consumption per unit of product. Starch additives reduce the final moisturecontent of the pellets to a much greater extent than the lignosulphonate additives. In any case,too much starch will make the final product extremely dry, which affects the mechanicalstrength of wood pellets. Lignosulphonate addition results in improved mechanical durability.Starch and dolomite are the most efficient in reducing pellets density. Bentonite, paraffin,palmityl reduce dust formation during pelleting.
All these additives bring certain benefits to the pelleting process and further researchesshould be conducted to asses their influence, both beneficial and harmful on the process and onthe final product.
AcknowledgementThis work was funded by the Executive Agency for Higher Education, Research,
Development and Innovation Funding, within the project entitled "Optimizing the compositionof biomass mixtures for obtaining high quality pellets", ctr. 24 BG / 2016 (code PN-III-P2-2.1-BG-2016-0266).
References
[1] Gaber M., Handlos M., Metschina Ch. – Biomass manual. Quality assurance systems and quality control measures;[2] Tabil L., Adapa P., Kashaninejad M., - In biomass feedstock pre-processing: densification, Biofuel’s EngineeringProcess Technology, M. A. Dos Santos Bernardes, Ed., pp. 439–464, InTech, New York, NY, USA, 2011;[3] Jezerska L., Zajonca O., Rozbroja J., Vyletěleka J., Zegzulka J., - Research on Effect of Spruce Sawdust with AddedStarch on Flowability and Pelletization of the Material, IERI Procedia 8, pp. 154 – 163, 2014;[4] Overend R. – Direct combustion of biomass, renewable energy sources charged with energy from the sun andoriginated from earth-moon interaction, Vol. 1;[5] Kofman P.D. - The production of wood pellets, Processing / Products No. 10, Coford Connect, Dublin, Ireland, 2010;[6] Satyanarayana Narra, Yonggui Tao, Claudia Glaser, Hans-Jörg Gusovius, Peter Ay - Increasing the Calorific Valueof Rye Straw Pellets with Biogenous and Fossil Fuel Additives, Energy Fuels 2010, 24, 5228–5234 :DOI:10.1021/ef100823b, Published on Web 08/31/2010;[7] European Pellet Council, Handbook for the Certification of Wood Pellets for Heating Purposes, European PelletCouncil, Brussels, Belgium, 2011;[8] Nesrine Kraiem, Marzouk Lajili, Lionel Limousy, Rachid Said, Mejdi Jeguirim, „Energy recovery from Tunisianagri-food wastes: Evaluation of combustion performance and emissions characteristics of green pellets prepared fromtomato residues and grape marc”, Energy 107 (2016) 409-418.
271
STUDY ON THE AUTOMATIC ADJUSTMENT OF THECONSTRUCTIVE AND FUNCTIONAL PARAMETERS OF THE
VIBRATORY TILLAGE TOOLS
N.E. Gheorghiță1, S.Șt. Biriș, N. Ungureanu, M.Ionescu, M.G. MunteanuUniversity POLITEHNICA of Bucharest, Faculty of Biotehnical Systems Engineering
ABSTRACT
Increasing the tillage process efficiency is a very important aspect to be considered in agriculturalresearch. The use of self-vibrating active tools in the tillage process is attempted, primarily because theagricultural soil is not homogeneous.The paper presents a technical solution that will allow the automaticadjustment of the constructive and functional parameters of the active vibratory tillage tools to the soilresonance frequency.
1. INTRODUCTION
Mechanical soil processing is a process involving high energy consumption. The purposeof soil processing is to create favorable conditions and an environment conducive to the growthof crop plants by altering the apparent density, granulometric composition of aggregates andother attributes[4]
The energy required for soil tillage is largely influenced by the physical properties of thesoil, the exploitation characteristics of the agricultural aggregates and the geometric parametersof the working tools. Reducing energy consumption in soil cultivation is of particularimportance given the significant share of energy consumption in harvesting. Due to the highenergy consumption involved in soil treatment, even a small economy is significant.[2]
Soil processing organs usually carry out multiple processes simultaneously: displacement,stretching, compression, bending, twisting. Soil tools have the role of transferring a quantity ofsoil energy, following some desired effects such as cutting, shredding, overturning and soildisplacement. Taking into account the reduction of energy consumption in soil processing, thedesign of optimal tools from the qualitative and economical point of view of the paper is beingpursued. [3]
2. METHODOLOGY
By inclination is meant, the relative angular tilt to the horizon or perpendicular. Anydeviation from this home position (perpendicular) can be detected quickly and precisely withinclinometers. Inclinometers make use of the local gravity i.e. acceleration of gravity for themeasurement of angular tilt. The MEMS technology (Micro-Electro-Mechanical-Systems) onwhich the inclinometer is based, enables multiple application solutions for machines, roboters,vehicles and airplanes, agricultural and construction machinery. [8]
The core piece of the inclinometer is a micromechanical capacitive sensor element. Acapacitive accelerometer basically consists of two parallely arranged “plate” electrodes with adielectric placed in the middle. If the sensor is accelerated, the dielectric moves and thus thecapacity relation between both electrodes is changed.[8]
1 Splaiul Independenței nr 313, București, 0726453269, [email protected]
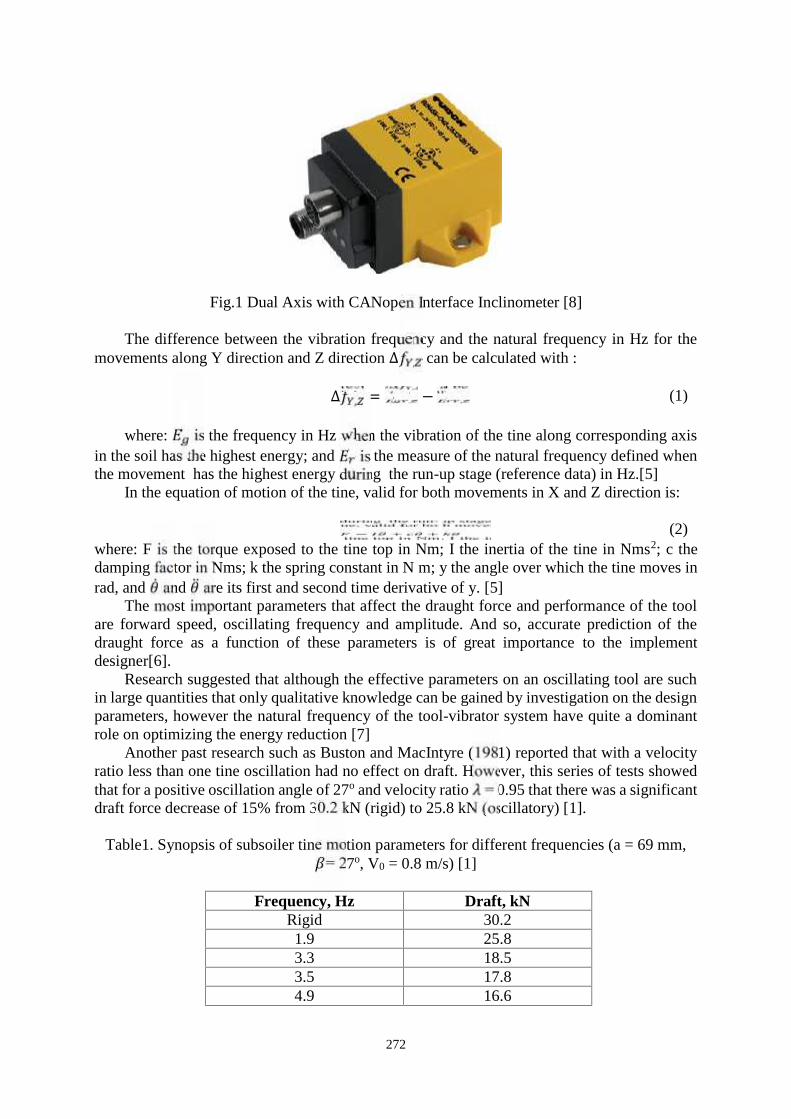
272
Fig.1 Dual Axis with CANopen Interface Inclinometer [8]
The difference between the vibration frequency and the natural frequency in Hz for themovements along Y direction and Z direction ∆ , can be calculated with :∆ , = , − , (1)
where: is the frequency in Hz when the vibration of the tine along corresponding axisin the soil has the highest energy; and is the measure of the natural frequency defined whenthe movement has the highest energy during the run-up stage (reference data) in Hz.[5]
In the equation of motion of the tine, valid for both movements in X and Z direction is:= ̈ + ̇ + (2)where: F is the torque exposed to the tine top in Nm; I the inertia of the tine in Nms2; c thedamping factor in Nms; k the spring constant in N m; y the angle over which the tine moves inrad, and ̇ and ̈ are its first and second time derivative of y. [5]
The most important parameters that affect the draught force and performance of the toolare forward speed, oscillating frequency and amplitude. And so, accurate prediction of thedraught force as a function of these parameters is of great importance to the implementdesigner[6].
Research suggested that although the effective parameters on an oscillating tool are suchin large quantities that only qualitative knowledge can be gained by investigation on the designparameters, however the natural frequency of the tool-vibrator system have quite a dominantrole on optimizing the energy reduction [7]
Another past research such as Buston and MacIntyre (1981) reported that with a velocityratio less than one tine oscillation had no effect on draft. However, this series of tests showedthat for a positive oscillation angle of 27o and velocity ratio = 0.95 that there was a significantdraft force decrease of 15% from 30.2 kN (rigid) to 25.8 kN (oscillatory) [1].
Table1. Synopsis of subsoiler tine motion parameters for different frequencies (a = 69 mm,= 27o, V0 = 0.8 m/s) [1]
Frequency, Hz Draft, kNRigid 30.21.9 25.83.3 18.53.5 17.84.9 16.6

273
3. RESULTS AND DISCUSSION
The study highlighted that the most likely technical solution which have the possibility toautomatically adjust pretensioning and to provide elastic constants adapted to the requiredvalues is the one with helical spring mounted on the tool support. The spring can be mountedhorizontally or vertically.
Fig.2 Types of helical springs: a-horizontal, b-vertical
Inclinometers attached to the superior part of the tines measure the angle and momentstransferred from the tine to the framework.[8]
Fig.3 Vibratory working tool equipped with inclinometer
The draft force is well influenced by the constructive parameters of the vibratory tool, oneof these being the settlement angle of the tool towards the direction of movement. Automaticspring pretensioning can best be done with an electrically controlled system.

274
4. CONCLUSIONS
A vibratory tillage tool is an effective way of decreasing the draft force required to pull itthrough the soil. The draft force reduction is dependent on the combination of operatingparamaters and soil conditions. It is thus necesary to optimise the vibratory implement fordifferent conditions.
The challenge of future research is to build a technical solution for the automatic adaptationof parameters so that the tool’s effect on the soil to achieve maximum crumbling, which isproduced for tool vibration frequencies close to the soils natural frequency.
The study highlighted that the most likely technical solution which have the possibility toautomatically adjust pretensioning and to provide elastic constants adapted to the requiredvalues is the one with helical spring mounted on the tool support.
References
[1]. Buston, M.J., MacIntyre, D., 1981. Vibratory soil cutting: 1-soil tank studies on draft and power requirements.J. Agric. Eng. Res. 26 (4), 409–418.
[2]. Fechete T. L. V., Ros V., Coţa C., Nagy M., Optimizarea paramerilor geometrici ai unei scule active de lucratsolul, Acta Technica Napocensis Series: Applied Mathematics And Mechanics, Vol. V, Nr. 50, p. 461-464, 2007
[3].Ghereş M.I., Cercetări privind optimizarea parametrilor geometrici şi funcţionali ai sculelor de lucrat solul învederea reducerii consumului de energie, Teză de doctorat, Universitatea Tehnică din Cluj-Napoca, 2001
[4].Ivan I., Deac T., Analiza posibilităţilor de creştere a randamentelor agricole în Romania, Acta TechnicaNapocensis Series: Applied Mathematics And Mechanics, Vol. V, Nr. 50, p. 457-460, 2007
[5].Mouazen A.M., Duerinckx K., Ramon H., Anthonis J., Soil influences on the mechanical actions of a flexiblespring tine during selective weed harrowing, Biosystems Engineering ,Volume 96, Issue 1, p. 7-18, 2007
[6].Razzaghi, E., Sohrabi, Y., Vibratory soil cutting a new approach for the mathematical analysis, Soil and TillageResearch, 159, 33-40, 2016.
[7].Verma, B.P., Oscillating soil tools—a review. Trans. ASAE 14 (6), 1107–1121. Yow, J., Smith, J.L., 1976.Sinusoidal vibratory tillage. J. Terramech. 13 (4), 211–226, 1970
[8].Inclinometer for slope angles, http://www.turck.ro

275
CONSIDERATIONS ON SAGE CULTURE TECHNOLOGY ANDESSENTIAL OILS OBTAINING
Ion Grigore1), Elena Sorica1), Cristian Sorică1), Andreea Iulia Grigore 1), Laurenţiu Vladuţoiu1)
1) National Institute of Research - Development for Machines and Installations Designed to Agriculture andFood Industry - INMA, Bucharest, Romania, [email protected]
ABSTRACT
This paper presents aspects on sage (Salvia officcinalis) cultures technology, whichincludes all agrotechnical works necessary in the production process for the establishment,maintenance and harvesting of the crop, as well as the importance of cultivating this plant forthe pharmaceutical industry, the cosmetic industry as well as the food industry. It alsopresents the main production elements of sage, some quality indices achieved in differentways of harvesting the stolons, as well as the production of plant mass and volatile oil fromthe cultivated sage.
Key words: sage, technology, essential oil, distillation, treatments
1. INTRODUCTION
Salvia officcinalis (fig.1) is a member of Lamiaceae family and native to theMediterranean region, also cultivated in our country in gardens, as decorative and medicinalspecies. Its popular name is garden sage. Its leaves are petiolated, ovate, fine whitish hairy,while the flowers are violet. [1] Sage name comes from the Latin word “salvare” (to heal).
Figure 1: Salvia officcinalis [5]
It grows spontaneously on dry and stony land, on pastures and downhill. It grows ingardens, reaching a height of 30-70 cm; its violet flowers are arranged vertically, so in acircle, around a common axis; the leaves are opposite, white-woolly, shimmering silver andhaving a slightly bitter, aromatic fragrance. In winter, to save it from frost, the sage must becovered because it is sensitive to low temperatures. [2] Sage is a melliferous plant. The sageleaves contain an essential oil represented by terpenic substances, thujone, thuyol, sabinol.The leaves also contain tannins, bitter principles, vitamin B1, C, potassium salts, glycosides,polyphenols and resins [4].

276
Salvia has been known and used as a medicinal plant since antiquity by the Greeksand by the Romans. Thus, due to the complex action it exerted on the human body, it wasgiven special therapeutic properties, being considered a universal panacea. Today it is used asinfusion in the treatment of dental diseases and inflammations, in laryngitis and pharyngitisand as a remedy against angina, bronchitis, flu and pneumonia. It is also used in the treatmentof chronic biliary disorders and dyspepsia. The leaf decoction is used as a disinfectant, anti-inflammatory and healing agent in stomatitis and upper respiratory tract infections. Intraditional medicine, sage was used in the treatment of tuberculosis, digestive diseases, biliarylithiasis and as a remedy against hemorrhoids. Sage is widely used in the perfume andcosmetics industries. In some countries, it is used as a spice for dishes. [3] Sage leaf productsare used to combat excessive sweating in various conditions. Sage products are also useful inabdominal meteorism conditions, biliary dyskinesia, as an adjuvant in treating diabetesmellitus, in some abdominal pain, inflammation of the mucous membranes (stomatitis,gingivitis, pharyngitis, tonsillitis) and skin or acne. [4]
Blooming takes place in May and lasts until September. The harvest is done at thebeginning of the blooming (May-June) by cutting the green peaks, or gathering the leaves asmany times as necessary between June and September, but in the first year the sage leaves areharvested only once. Drying of plant material will be done in the shade, sheds, bridges or byartificial drying at temperatures up to 35ºC. The drying rate is 4:1.
Sage can be placed in semi-shady or bright areas, being a resistant, perennial plant. Itis planted in spring, obtained from seeds or by dividing the root of a plant having grown morethan one year. After seedling or sowing, the ground is watered. Later it is only sporadicallywatered, in the hot summers. Excess watering may cause leaves yellowing and falling.
2. MATERIAL AND METHOD
The soil where sage is planted must be freshly loosened and manure or gardensubstrate fertilized, but not excessively, otherwise the plants leaves will grow more and theywill bloom less. If the crop is to be established in the autumn, then before sowing, the soil willbe very well ground and levelled with the disc harrow in the aggregate with an adjustableharrow and levelling bar. If sowing or planting is done in the spring, then the soil can be leftin a raw furrow over the winter and will be prepared before establishing the crop, with a discharrow and then with a combinator. [6]
Sage propagation can be done in two ways:a) separating the root of a plant that has already grown for a year; it can be
transplanted together with the soil on the root,b) through seeds that are purchased from flower shops or stores having as a field of
activity the sale of plant seeds, or from the seeds harvested from the flowers in the garden.The entire inflorescence is collected when the calyx (the tube at the bottom of the flower withthree teeth at the top) has lost its blue or red colour, depending on the variety of sage.
It is planted or sown in autumn, and in the same year it will bloom. Once planted, thesage produces flowers annually and the diameter of the plant grows very little, 1-3 cm peryear, without needing to cut the stems. [5] Sage culture requires longer distances betweenrows. The recommended distance is 60-70 cm between the rows, while the distance betweenplants per row is recommended to be 45-50 cm.
However, research shows that row spacing greatly influences the production of herband essential oil. It was found that the optimal distance between the rows was 62.5 cm, theproduction a dry herb obtained being over 4 tonnes/ha and that of essential oil was over 75litres/ha, respectively 6% and 19% more than in the case of sage sowed at a distance of 70 cm

277
between the rows. It is also recommended to sow at the surface when winter is about to come(1-2 cm) and deeper in the spring (3-4 cm). [3]
Maintenance works are carried out in the spring, when the rows are contoured,weeding is done on the row and the hoeing between the rows with a cultivator fitted withprotective discs. When the plants form the third pair of leaves, their thinning must be made ata distance of 25 cm. In the first year of vegetation, the growth of the plants is slow, so it isnecessary to control the weeds in time, performing weeding on the row and hoeing, 3 or 4times, between the rows. In the following years, maintenance work is done as needed. Thus,in the second year of vegetation, the growth rate is intensifying and the plants form a largenumber of shoots. They lignify and must be removed from the culture during all vegetationyears, because on these aged shoots the leaves formed have smaller dimensions, which leadsto a lower amount of raw material and of lower quality. Therefore, starting with the secondyear of vegetation, in the spring, before the plants start vegetation, the lignified stems areremoved from the culture by cutting them at a height of 8-10 cm.
Harvesting is carried out manually (or by cutting with special equipment forharvesting medicinal plants) and they are placed in baskets without being pressed. The seedharvesting is recommended to be carried out in the second year of vegetation. From the seedcrop, the leaves are not harvested until the seed is harvested. Sage seeds ripe step by step andfall easily. Harvesting is recommended to start at the stage when the calyx of the flowers inthe lower part of the inflorescence begins to dry.
For the production of essential oil, steam distillation is the most commonly usedmethod.
The process consists in the passage of water vapours obtained in certain steamgenerators, in special boilers at temperatures above 100°C and various pressures in thevegetative mass (flowers, grass, etc.), placed on some sites or in special baskets.
3. RESULTS
The highest essential oil content was registered in the case of dried leaves, and themaximum yield of essential oil was obtained from the dried shoots.
Steam distillation is the most widespread method and is applied in most countriesproducing essential oils.
The components of the distillation plant are: the steam source, the boiler in which theraw material is placed, the cooling vessel and the Florentine vessel for the separation ofessential oil and flower water.
Figure 2: Technological scheme of the equipment for obtaining essential oils throughsteam distillation

278
The main technical characteristics of the installation for obtaining essential oilsthrough distillation are presented in Table 1:
Table 1No. Characteristics Values1. Vessel working capacity approx. 700 l (90kg - 120kg)2. Working pressure 0.18 – 0.2 bar3. Working temperature 103 - 105C
In order to conduct experimental research, freshly harvested plants of Mentha piperitavariety were used and we obtained the following results presented in Table 2:
Table 2
Charge weight Distillationtime
Oil obtained(litres)
Flower water(litres)
90 kg 95 min. 1.65 28100 kg 105 min 1.80 32120 kg 125 min 2,12 35
The amount of sage that can be obtained from a well maintained culture is approx.3500-4000 kg/ha green mass and after distillation by steam distillation method, 70-75 litres ofessential oil can be obtained.
CONCLUSIONS
Sage is one of the plants that should not be missing from the Romanians’ home.Research over time has shown that this wonderful plant is also an excellent medicine withextraordinary therapeutic qualities for digestive system, nervous system, and many others. Itis noted for many beneficial properties, but perhaps the most notable of them is theantiperspirant effect. Through an efficient processing, an amount of about 70-75 l of essentialoil can be obtained of this plant, on a 1ha culture, which has a recognized therapeutic valuebeing antifungal, antibacterial and antiviral, noted for the amelioration of various skinproblems. It is also appreciated for the lipolytic and anti-cellulite effect.
References
[1] http://www.horticultorul.ro/plante-medicinale/cultivarea-salviei-salvia-officinalis/[2] http://planteeco.blogspot.ro/2012/02 jalesul.html /[3] http://www.agrimedia.ro articole/tehnologia-de cultivare-pentru-jales- salvia-officinalis salvie / --[4]http://www.csid.ro/plante-medicinale-fitoterapice-si-gemoterapice/salvia-salvia-officinale-11492253/)[5] https://www.renovat.ro/cultivarea-salviei-in-gradina-p-1070/[6] http://www.informatii-agrorurale.ro/agropedia/cine-salvie-gradina-isi-salvata-viata/

279
STUDIES AND RESEARCH REGARDING THE TECHNOLOGY OFEXTRACTING VOLATILE OILS FROM MEDICINAL HERBS
Phd. Stud. Eng. Laza Evelin-Anda1, PhD. Eng. Caba Ioan Ladislau1PhD. Eng. Păun Anişoara2, Phd. Eng. Vlăduţ Valentin
1)INMA Bucharest – Sucursala Timisoara / Romania2)INMA Bucharest / Romania
Tel: 0256.499.336, e-mail: [email protected]
ABSTRACT
At present, volatile oils have a wide range of applications, being used in cosmetics andmedicine,especially in the treatment known as aromatherapy, nutrition, plant protection. These oils arecalled volatile because they usually evaporate at low temperatures, mostly at room temperature, andgive a pleasant smell. In the literature, volatile oils are also referred to as essential oils or essential oils
1. INTRODUCTION
Volatile oils have been used since ancient times, 6,000 years, for their special qualities, forperfume, for massage oil or for other therapeutic purposes. In ancient Greeks, essences andperfumes have played a big role in medicine, which have an antiseptic role. From the Greeks,the perfumes went to the Romans, and then their production and use expanded.[2]These oils are called volatile because they usually evaporate at low temperatures, mostly atroom temperature, and give a pleasant smell. In the literature, volatile oils are also referred toas essential oils or essential oils.[1,2]
At present, volatile oils have a wide range of applications, being used in cosmetics andmedicine, especially in the treatment known as aromatherapy, nutrition, plant protection, etc.[1,2]
Figure 1: Areas of use of medicinal and aromatic plants
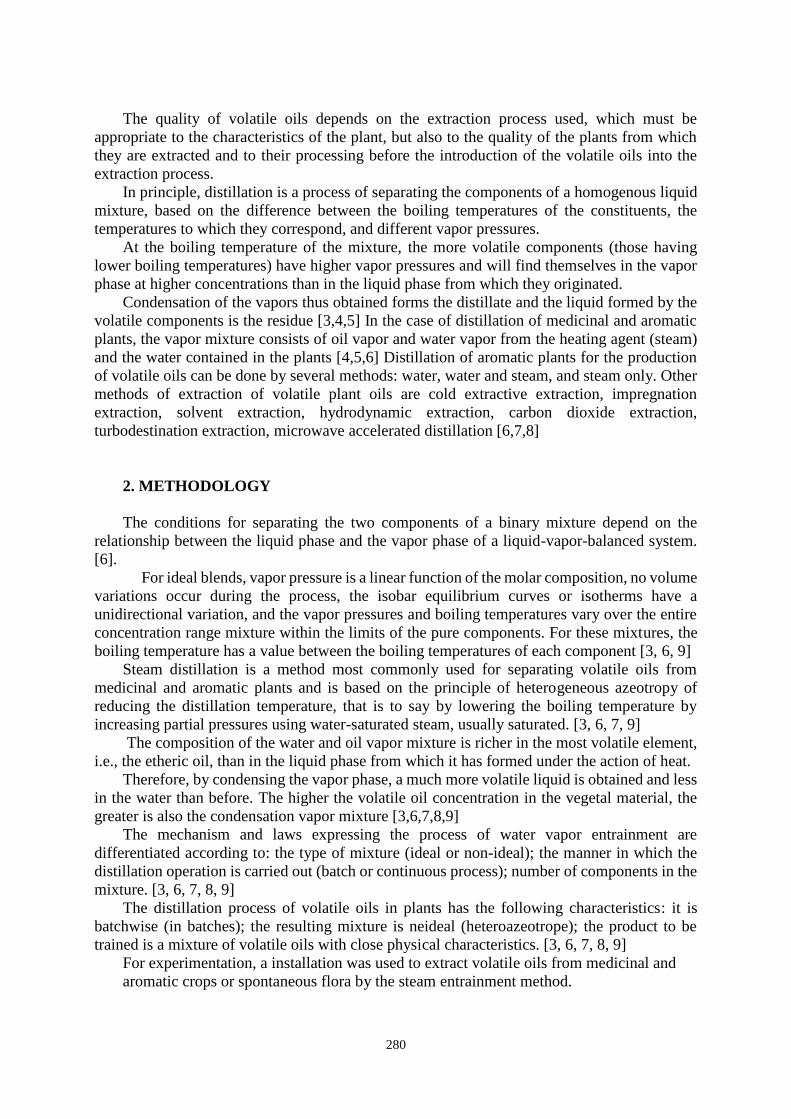
280
The quality of volatile oils depends on the extraction process used, which must beappropriate to the characteristics of the plant, but also to the quality of the plants from whichthey are extracted and to their processing before the introduction of the volatile oils into theextraction process.
In principle, distillation is a process of separating the components of a homogenous liquidmixture, based on the difference between the boiling temperatures of the constituents, thetemperatures to which they correspond, and different vapor pressures.
At the boiling temperature of the mixture, the more volatile components (those havinglower boiling temperatures) have higher vapor pressures and will find themselves in the vaporphase at higher concentrations than in the liquid phase from which they originated.
Condensation of the vapors thus obtained forms the distillate and the liquid formed by thevolatile components is the residue [3,4,5] In the case of distillation of medicinal and aromaticplants, the vapor mixture consists of oil vapor and water vapor from the heating agent (steam)and the water contained in the plants [4,5,6] Distillation of aromatic plants for the productionof volatile oils can be done by several methods: water, water and steam, and steam only. Othermethods of extraction of volatile plant oils are cold extractive extraction, impregnationextraction, solvent extraction, hydrodynamic extraction, carbon dioxide extraction,turbodestination extraction, microwave accelerated distillation [6,7,8]
2. METHODOLOGY
The conditions for separating the two components of a binary mixture depend on therelationship between the liquid phase and the vapor phase of a liquid-vapor-balanced system.[6].
For ideal blends, vapor pressure is a linear function of the molar composition, no volumevariations occur during the process, the isobar equilibrium curves or isotherms have aunidirectional variation, and the vapor pressures and boiling temperatures vary over the entireconcentration range mixture within the limits of the pure components. For these mixtures, theboiling temperature has a value between the boiling temperatures of each component [3, 6, 9]
Steam distillation is a method most commonly used for separating volatile oils frommedicinal and aromatic plants and is based on the principle of heterogeneous azeotropy ofreducing the distillation temperature, that is to say by lowering the boiling temperature byincreasing partial pressures using water-saturated steam, usually saturated. [3, 6, 7, 9]
The composition of the water and oil vapor mixture is richer in the most volatile element,i.e., the etheric oil, than in the liquid phase from which it has formed under the action of heat.
Therefore, by condensing the vapor phase, a much more volatile liquid is obtained and lessin the water than before. The higher the volatile oil concentration in the vegetal material, thegreater is also the condensation vapor mixture [3,6,7,8,9]
The mechanism and laws expressing the process of water vapor entrainment aredifferentiated according to: the type of mixture (ideal or non-ideal); the manner in which thedistillation operation is carried out (batch or continuous process); number of components in themixture. [3, 6, 7, 8, 9]
The distillation process of volatile oils in plants has the following characteristics: it isbatchwise (in batches); the resulting mixture is neideal (heteroazeotrope); the product to betrained is a mixture of volatile oils with close physical characteristics. [3, 6, 7, 8, 9]
For experimentation, a installation was used to extract volatile oils from medicinal andaromatic crops or spontaneous flora by the steam entrainment method.
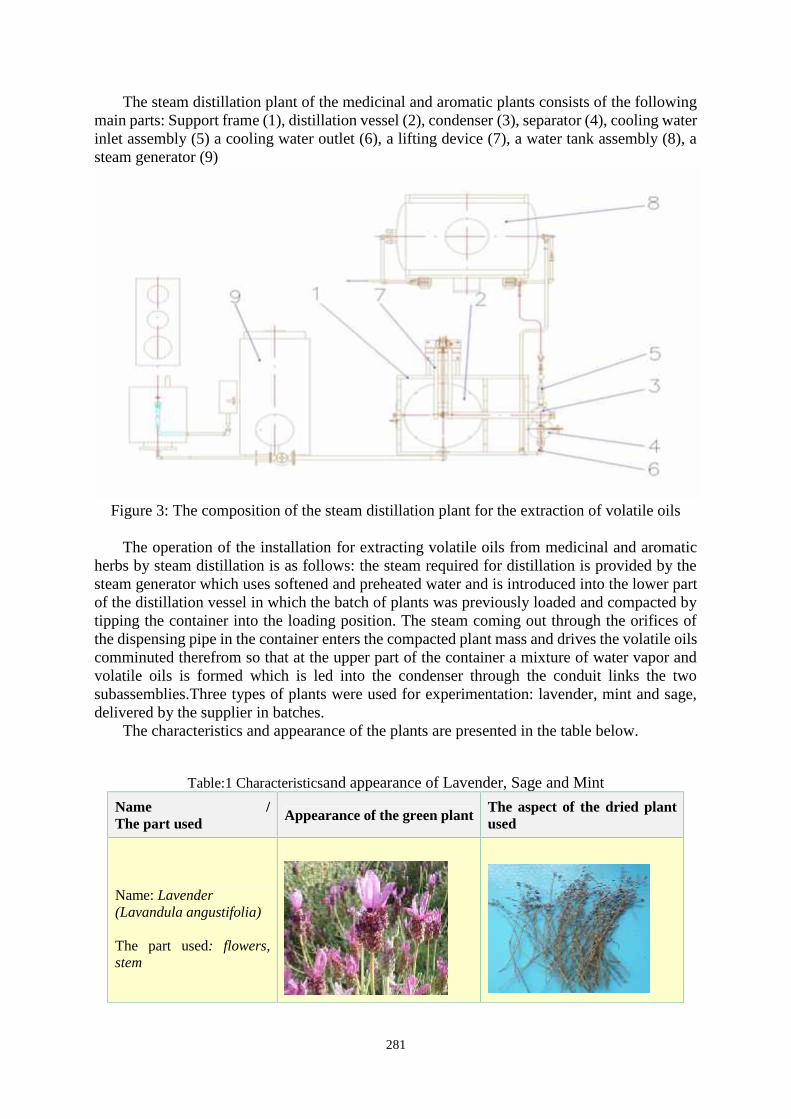
281
The steam distillation plant of the medicinal and aromatic plants consists of the followingmain parts: Support frame (1), distillation vessel (2), condenser (3), separator (4), cooling waterinlet assembly (5) a cooling water outlet (6), a lifting device (7), a water tank assembly (8), asteam generator (9)
Figure 3: The composition of the steam distillation plant for the extraction of volatile oils
The operation of the installation for extracting volatile oils from medicinal and aromaticherbs by steam distillation is as follows: the steam required for distillation is provided by thesteam generator which uses softened and preheated water and is introduced into the lower partof the distillation vessel in which the batch of plants was previously loaded and compacted bytipping the container into the loading position. The steam coming out through the orifices ofthe dispensing pipe in the container enters the compacted plant mass and drives the volatile oilscomminuted therefrom so that at the upper part of the container a mixture of water vapor andvolatile oils is formed which is led into the condenser through the conduit links the twosubassemblies.Three types of plants were used for experimentation: lavender, mint and sage,delivered by the supplier in batches.
The characteristics and appearance of the plants are presented in the table below.
Table:1 Characteristicsand appearance of Lavender, Sage and Mint
Name /The part used Appearance of the green plant The aspect of the dried plant
used
Name: Lavender(Lavandula angustifolia)
The part used: flowers,stem

282
Name: Sage(Salvia officinalis)The part used: leaves,flowers, stem
Name: Mint(Mentha piperita)
The part used: leaves,flowers, stem
Since the experimental period did not correspond to the plant harvest period, these were done onlywith dried plants. It is right that by drying the medicinal and aromatic plants lose a small part of thevolatile oil content, instead the efficiency of the crate distillation process due to the larger quantity ofplants entering the container at the distillation of a batch.
Prior to processing, the main physical characteristics of plants used for experimentation weredetermined by measurements or by visual assessment. The data obtained are presented in the table below
Table:2 Main physical characteristics of plants used for experimentation: Lavender, Sage, MintName of the plant U.M. Lavender Sage MintHumidity [%] 10,17 10,25 9,15
Hectolitric mass (in bag) [kg/m3] aprox. 52 Aprox. 22aprox.45
Average plant size [cm] 24 ÷ 28 30 ÷ 40 20 ÷ 22Content of impurities [%] - cca. 0,5 cca. 1The degree of depreciation [%] - - cca. 3Average batch size [kg] 14 10 26
3. RESULTS
During the operation of the plant, the parameters of the distillation process werepermanently monitored by the measuring apparatus and their variation over time was recorded.The table below shows the average values of the technological parameters recorded for the threetypes of distilled plants after adjustments and stabilization of the distillation process.
Table:3 Measured values and characteristics of Lavander, Sage, MintNo.crt.
Characteristic U.M.Measured value
Lavender Sage Mint1 The size of the batch of plants kg 14 10 262 Steam pressure bar 0,6 0,6 0,73 Steam temperature (saturated) oC 112 112 1154 Vapor temperature at condenser inlet oC 98-99 99-100 98-99
This image cannot currently be displayed.

283
No.crt.
Characteristic U.M.Measured value
Lavender Sage Mint5 Condensation temperature oC 60-65 60-70 55-60
6Coolant water temperature atcondenser inlet
oC 18 19 21
7Coolant water temperature atcondenser outlet
oC 55-60 60-70 60-65
8Cooling water pressure at thecondenser inlet
bar 0,3 0,2 0,3
9Coolant water pressure at thecondenser outlet
bar 0,15 0,1 0,15
10 The amount of cooling water used l 320 305 330
11The average flow rate of coolingwater
l/min 3,6 3,7 3,3
12The duration of the distillationprocess
min 90 90 90
From the analysis of the data presented in the table above, the following conclusions canbe drawn:
The vapor temperature at the condenser inlet is too high, sometimes even at 100 ºC. Thisis explained, on the one hand, by the fact that the plants used have been very dry and have notabsorbed heat and for evaporating the water contained therein, which would have led to thecooling of the steam.
Due to the rigidity of the dried plant stems, uniform plant mass densification in thecontainer was not achieved and, instead of representing a hydraulic resistance to the flow ofsteam, the plants allowed it to create flow channels. Therefore, the distillation of the plants inthe container was only partially done, which is reflected in the rather low extraction rate. Inorder to homogenize the vegetal mass in the container, it is necessary to pre-strain the strains,especially the most rigid ones.
We assume that this problem does not arise in the distillation of freshly harvested plantsthat can be arranged much more compactly in the container.
The condensation temperature as well as the cooling water temperature at the condenseroutlet were too high compared to the admissible values and therefore the extraction rate of thevolatile oils was relatively low. In order to achieve a clear layering and a good separation of thewater in the pot, the literature recommends that the condensate temperature should not exceed45 ºC.
This temperature could not be obtained because the condenser cooling water flow wasinsufficient and a balance between the vapor and the cooling water flow could not be achievedexcept at very low steam flows. The plant batches used in the experiments were quite different in size due to differentcharacteristics, but also to the degree of loading of the container. The smallest processed batchwas that of sage, at which the lowest bulk density was measured.
4. CONCLUSION
It can be considered that under the conditions of complete filling of the distillation vesseland the proper preparation (grinding) and uniform compaction of the vegetable mass, theaverage size of a batch of processed dry plants is at least 25 kg and for fresh and higher plants.

284
But additional plant preparation is reflected in the longer duration of the distillationcycle. The average processing time of a batch of dried plants is 90 ... 120 minutes, whichincludes also the auxiliary time required to prepare the plants, as well as the loading andunloading of the distillation vessel. This means that the plant allows the distillation of 4-5batches of plants in a normal exchange of 8 hours, ie 80-100 kg of dried plants. For fresh plantsthe processing capacity will certainly be higher.
REFERENCES
[1]. Banu C. and others. „Manual of the Food Industry Engineer” Vol. I, Technical PublishingHouse, Bucharest, 1998[2]. Douglas M., Heyes J., Smallfield B. “Herbs, spices and essential oils: post-harvestoperations in developing countries” Publishing Management Service, Information Division,FAO 2005,[3]. Ferhat M.A., Meklati B.Y., Smadja J., Chemat F. “An improved microwave Clevengerapparatus for distillation of essential oils from orange peel” Journal of chromatography. A,April 21, - Volume 1112, Issue 1-2, 2006.[4]. MacTavish H., Harris D. “A case study comparing non-UK lavender/ lavandin productionand peppermint/spearmint production with UK production techniques and costs” ADASConsulting Ltd., January 2002.[5]. Moţa C., Roşu A., Câmpeanu Gh. „Bioactive compounds of plant origin. Biotechnologicalapproaches” University of Agronomic Sciences and Veterinary Medicine Bucharest, Facultyof Biotechnologies.[6]. Răşenescu I. „Operations and machinery in the food industry. Vol. II” TechnicalPublishing House, 1972[7]. Rus F. „ Basics of Food Industry Operations” Transilvania Publishing House, Braşov,2001[8]. Tannous P., Juliani R., Mingfu Wang, Simon J. “Water balance in Hydrosol ProductionVia Steam Distillation” The State University of New Jersey, February 09, 2004.[9]. PN 06-20 03 04 “Research, scientific substantiation and optimization of the technology anda plant for the extraction of volatile oils in plants, for the efficient use of local agriculturalproducts” INMA Bucharest branch Timisoara, 2007.

285
THE ROLE OF ECO – MARKETING STRATEGIES CONCERNINGSUSTAINABLE DEVELOPMENT OF ROMANIAN TOURISM
Adrian Măzărel1, Laura Cismaru2, Adriana Elena Boeriu3, Cristina Maria Canja4
Transilvania University of Brașov, RomaniaDepartment for Engineering and Management in Food and Tourism
ABSTRACT
The ability of the tourist destination to remain competitive against all problems, the ability toattract visitors for the first time and their loyalty, the effort to remain unique from the cultural point ofview and to be in constant balance with the environment represent the most important landmarks ofsustainable tourism. As a micro-level perception, within the hospitality structures, environmentalactivities generate considerable tangible benefits, and beyond the economic efficiency, it creates theimage of an eco-friendly business. The present study is emerging as an analysis of the needs of thebusiness environment concerning the hospitality area in Centre Region of Romania regarding thecapitalization of the eco potential at the level of the enterprise. The conclusions of the study reflect thetop management of hospitality companies regarding the implementation of an environmentalmanagement system, the utility of an eco-label and the development of a strategy for the disseminationof good environmental practices among staff, customers and suppliers. (w-151, c-960).Key words: sustainable tourism, eco - marketing, environmental management system.
1. INTRODUCTION
Tourism is one of the economic fields that is directly related to the major objectives ofterritorial development: sustainable development, all levels economic competitiveness, socialcohesion (interaction of local communities with tourists, access to tourism for disadvantagedgroups), development of new technologies. In the view of the World Tourism Organization(WTO), sustainable tourism means the ability of the tourist destination to remain competitiveagainst all problems, to attract visitors for the first time and to attract them to become loyalafterwards, to remain unique from the cultural point of view and to be in constant balancewith the ambient environment.
The origins of the sustainable development concept are derived from Brundtland Report(1987), World Environment and Development Commission (WCED), which defines fourfundamental principles - Strategic planning and interaction between sectors, Importance ofpreserving the main ecological processes, The need to preserve both human and humanbiodiversity, Assume and avoid resource depletion.
A nationally recognized definition issued by the Ecotourism Association of Romania,adopted after the WTO definition, is that ecotourism is a form of tourism where the mainobjective is to observe and to realize the value of local nature and traditions and to meet thefollowing conditions: to contribute to the preservation and protection of nature, to use localhuman resources, to have educational character, respect for nature - the awareness of touristsand local communities, to have minimal negative impact on the natural and socio-culturalenvironment
Sustainable tourism strategy involves three important aspects: quality, continuity andbalance. Sustainable tourism must provide a valuable experience for visitors, while improving
1Brașov, 148, Castle Street, email: [email protected]
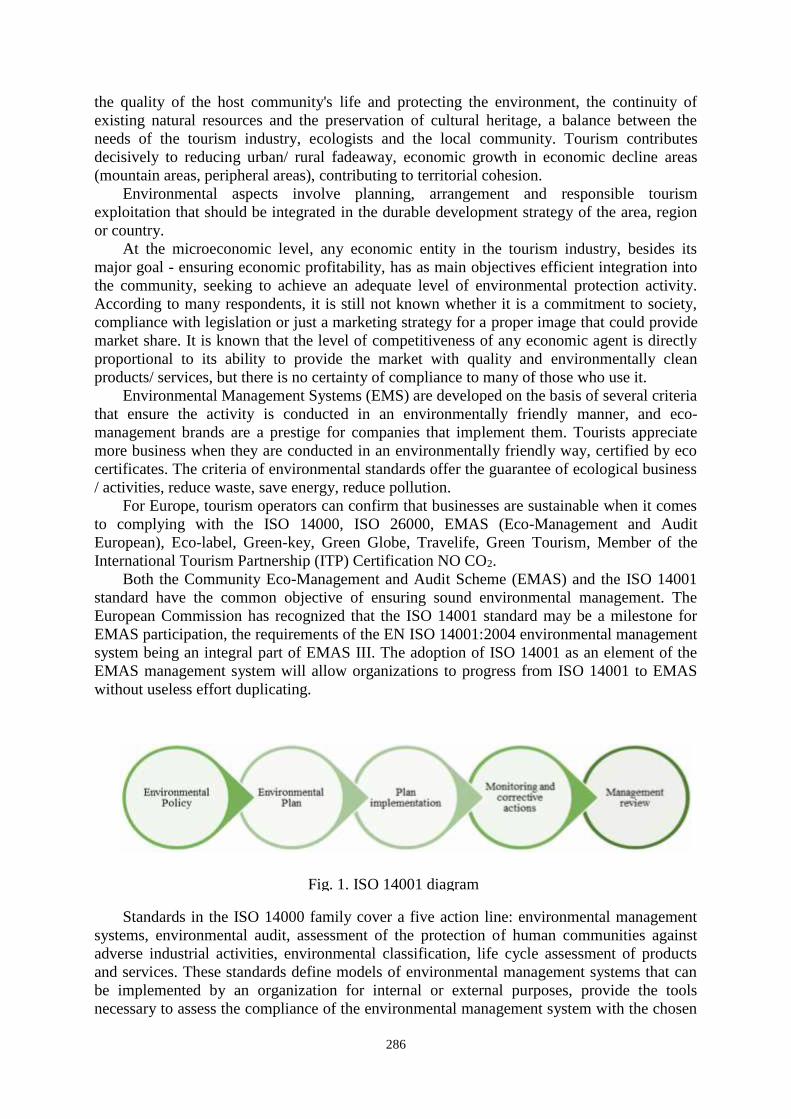
286
the quality of the host community's life and protecting the environment, the continuity ofexisting natural resources and the preservation of cultural heritage, a balance between theneeds of the tourism industry, ecologists and the local community. Tourism contributesdecisively to reducing urban/ rural fadeaway, economic growth in economic decline areas(mountain areas, peripheral areas), contributing to territorial cohesion.
Environmental aspects involve planning, arrangement and responsible tourismexploitation that should be integrated in the durable development strategy of the area, regionor country.
At the microeconomic level, any economic entity in the tourism industry, besides itsmajor goal - ensuring economic profitability, has as main objectives efficient integration intothe community, seeking to achieve an adequate level of environmental protection activity.According to many respondents, it is still not known whether it is a commitment to society,compliance with legislation or just a marketing strategy for a proper image that could providemarket share. It is known that the level of competitiveness of any economic agent is directlyproportional to its ability to provide the market with quality and environmentally cleanproducts/ services, but there is no certainty of compliance to many of those who use it.
Environmental Management Systems (EMS) are developed on the basis of several criteriathat ensure the activity is conducted in an environmentally friendly manner, and eco-management brands are a prestige for companies that implement them. Tourists appreciatemore business when they are conducted in an environmentally friendly way, certified by ecocertificates. The criteria of environmental standards offer the guarantee of ecological business/ activities, reduce waste, save energy, reduce pollution.
For Europe, tourism operators can confirm that businesses are sustainable when it comesto complying with the ISO 14000, ISO 26000, EMAS (Eco-Management and AuditEuropean), Eco-label, Green-key, Green Globe, Travelife, Green Tourism, Member of theInternational Tourism Partnership (ITP) Certification NO CO2.
Both the Community Eco-Management and Audit Scheme (EMAS) and the ISO 14001standard have the common objective of ensuring sound environmental management. TheEuropean Commission has recognized that the ISO 14001 standard may be a milestone forEMAS participation, the requirements of the EN ISO 14001:2004 environmental managementsystem being an integral part of EMAS III. The adoption of ISO 14001 as an element of theEMAS management system will allow organizations to progress from ISO 14001 to EMASwithout useless effort duplicating.
Standards in the ISO 14000 family cover a five action line: environmental managementsystems, environmental audit, assessment of the protection of human communities againstadverse industrial activities, environmental classification, life cycle assessment of productsand services. These standards define models of environmental management systems that canbe implemented by an organization for internal or external purposes, provide the toolsnecessary to assess the compliance of the environmental management system with the chosen
Fig. 1. ISO 14001 diagram

287
reference, environmental performance assessment, preliminary analysis and environmentalassessment of the organization's sites.
The transition from ISO 14001 to EMAS can be done easily, obtaining ISO 14001certification means that the most important steps have already been taken to register underEMAS. Through additional requirements are included: initial environmental review,government approval for legal compliance of employers and openness to the public: a verifiedenvironmental statement. Implementation of an environmental management system has begunto be a major concern for many organizations. Being aware of the benefits of the organizationthrough the introduction of competitive environmental management, they have increasinglyallocated more financial, material and human resources to build such a management system.Environmental activities generate tangible benefits such as reduced running costs (forexample due to improved energy efficiency of the building). In addition, they improve theircompetitiveness by implementing modern technical solutions that enable better ownership andstaff management. Functioning according to the idea of sustainable development, it createsthe image of an ecological business and increases the attractiveness of the region, whichtranslates into the interest of tourists for unity.
Ecommerce aims to define, address and interrelate areas such as product sales,environmental protection, consumer education, etc. Ecomarketing attempts to present a newphilosophy on the way in which production and consumption unfold, philosophy that puts theelement of education as a central issue of its concerns. According to the results of researchcurrently available, tourists are willing to choose tourist facilities that can demonstrate theirenvironmental efforts, or have certificates attesting compliance with environmentalmanagement standards.
2. THE PURPOSE OF THE STUDY
As there is a low visibility of eco-brands in the promotion of tourist units, it wasconsidered important to investigate and evaluate perceptions of operational management,sustainable development, environmental management systems, eco-brands and ecomarketingstrategies developed. The study was based on qualitative research, focus group, realized withthe involvement of the master students from the study program Management in Hospitalityand Eco-Tourism of the Faculty of Food and Tourism in Brasov. 5 interviews were planned inBrasov, Sibiu, Alba Iulia, Tusnad, Covasna, Târgu Mureș, with 74 persons with managementpositions in the operational management team of hotel/ tourist accommodation units,classified from 2 to 4 stars, according to Order 65/2013.
3. RESULTS AND DISCUSSIONS
At the level of the tourism company, the maketing strategy capitalizes on the essentialelements for consumers - the image and the benefits of the tourist destination and the strengthof the brand built around the infrastructure classified according to the methodology in force.Other elements such as the quality/ service marks offered to the market (ISO 9001), the trademarks (Booking, TripAdvisor), the food safety marks (ISO 22000/ HACCP), theenvironmental respect (ISO 14001/ EMAS) Occupational Health and Safety (OHSAS) aremore or less known logos. For an effective communication should be developed a strategy ofmarketing planning, individualization needs to be done, strategies and channels of informationmust be carefully selected and specific. The coherence and capability of marketing strategies/programs depend on how the tourist product is viewed and its valences correlated withcustomer expectations. Ecological aspects of tourism, activities carried out according to theprinciples of sustainable development, preservation of cultural and natural heritage, care for

288
the being - outline a symbolic value of tourism products. The involvement of the tourismcompany in sustainable development must be organized and structured in effective messages,focused on customer - driven channels.
The methodology of the qualitative research conducted allowed a series of elements:• identifying the perceptions of the employees involved in coordinating the main
management processes in tourism companies;• assessing attitudes of hospitality organizations towards environmental protection;• knowledge of topical concepts such as: environmental management, environmental
management systems or ISO 14001, EMAS, eco-branding, eco-marketing;• identifying the factors that determine the implementation, or not, of an environmental
management system.Among the 74 people participating in the study, coming from different units from the 5
representative cities in the center area, only 8% have an idea how an environmentalmanagement system works, because the organizations they are based on have an EMSimplemented/ certified. Most consider that an EMS implemented is less relevant, as long asthere are tasks of an environmental representative covered by another post, if there areinternal instructions and actions to provide the company with non-conformities to specificlegislation. EMAS is inoperable in this case, ISO 14001 was easier to implement with ISO9001 implementation, with specialist support from consultant firms. Low levels of eco-marketing and environmental management systems have been found to be lacking, due to lackof specific professional training, but also a limited degree of confidence in the power ofecomarketing to increase customer numbers or to stabilize customers over a period of time.The communication of ecological activities is not enough, represented by short messages sentdirectly through leaflets/ signs placed in the info-advertising materials at the receptions or theroom. In fact, investments and environmental activities are more extensive, with evidence ofdomestic water treatment, air filtration, waste oil collection, thermo-sound insulation ofbuildings, the use of energy-efficient equipment, the use of green energy sources, selectivecollection of waste.
The reasons why EMAS/ EMS according to ISO 14001 are not definitively in tourismcompanies are diffused as operative and financial. The main identified reasons that do notwish to implement/ certify an EMS are:
• ”We consider that there are no advantages for our kind of business";• "Unrealistic, it does not bring a specific, guaranteed profit";• "We do not have people prepared to manage an Environmental Management System";• "High cost of consulting services";• "High Costs for Certification Services";• "The financial situation of the firm does not allow any investment";• "Lack of Compliant Infrastructure";• "Structure of the reduced organization";• "Too much bureaucracy";• "Many papers to fill in (forms/ recordings)".Even if there were several reasons for not certifying an EMS, it is still aware of and
reflects on the benefits that can be gained by the organization:• Image Vector;• Increasing customer satisfaction;• Employee responsibility, improve communication and motivation;• Increasing success in public auctions by differentiating from competitors;• Improving productivity and efficiency;• Identification of non-compliant activities and products;• Increase product value in customer understanding;

289
• Coordinating and managing the organization's entire eco-activities in a systematic andplanned manner;
• Cost reduction;• Better measurement of environmental performance.The eco-related aspects of the marketing strategies of the units in the analyzed sample are
the actions against food wastage, the use of signaling to reduce energy consumption (panelingin common elevators/ rooms/ spaces), the use of signaling to reduce the consumption ofdetergent, water, washing linen/ towels and use of green energy signaling.
Revision of international ISO standards, including ISO 14001, has proven to be anotherimpediment to the decision of designing, implementing, and certify a management system inthe tourism business area. The adoption of new requirements of the standard and the newrecommended structure of an environmental management system could create difficultiesamong specialists/ auditors without a prior training session.
According to the majority of respondents, the need for external expertise was identified,with the involvement of a non-profit tourism organization or the National Tourism Authority.A joint project to support Central Region operators would be appropriate for the sustainabledevelopment of the area. The project's contribution could target financial issues, which wouldsubsidize consultancy costs and certification fees, access and support for specialists to shiftthe know-how needed to develop eco-marketing strategies. The present study providedinformation on the tourism market of the center area that justified the justification of a fundedproject funded by POCU / 227/3/8 Mysmis 117664, which was declared admitted and will beimplemented in June 2018. The project aims at developping performance professional andcompetence enhancement for 510 people as entrepreneurial managers and employees inhuman resources departments by providing customized training programs and other activities,model courses, innovative and sustainable relevant practices geared to increasing mobility,sustainable development opportunities and the degree of adaptability of the activity in thesector with competitive potential Tourism and Ecotourism in the Central Region.
Organizations consider certification as "a public tool for independent and rigorouscalibration of environmental standards," and that certification would enable existingcustomers to be conserved and increase their chances of attracting new customers. However,there occurred some inadvertences, which did not necessarily relate to standards, but rather totheir application. Most of the findings are related to documentary issues, excess in this senseruining the effectiveness of the approach to an EMS.
4. CONCLUSIONS
The foundation of the company's ecomarketing strategy involves adapting and adoptinginnovative elements in its culture and practice, defined by technological excellence.Technological excellence, defined as a form of management that relates to innovation,environmental protection and profitability, is, in fact, the result of a desire to be a leader in thefield of environmental protection. Also, technological excellence requires the use of organicmanagement and marketing as indispensable tools in the competitive struggle. This"ecological competitiveness" implies the implementation of concrete actions, such as:provision, anticipation of changes, obtaining an "ecological reflex" by: designing a typicalmanagement system for each company, integration of ecological concerns among theperformance criteria of managers; to raise the awareness of the company's staff to the currentconcerns and trends in the field; to include in the professional training programs theenvironmental protection elements.
Ecological information is an element that involves at least two components: From atechnical point of view, information transferred to users or interested persons must be of good

290
quality, transmission can be done on any form of support, communicating with the public andchanging the mindset in relation to the environment. Organic behavior is only obtained byknowing the issue in its totality and complexity.
References
[1] Ioncică Maria (coord), ”Strategia de dezvoltare a sectorului terțiar”, Editura Uranus, București, 2004.[2] Stănciulescu Gabriela, ”Managementul turismului durabil în centrele urbane“, Editura All Beck, Bucureşti,2004.[3] Costencu M, “Tendințe de piața turismului durabil”, Revista de turism nr.3, 2010.[4] Bran Fl., T. Simon, P. Nistoreanu – “Ecoturism” – Editura Economică, Bucuresti, 2000, 2.[5] Glăvan V., „Turismul si protectia mediului – probleme prioritare ale României viitoare”, în Turismul încontextul dezvoltării durabile, A.S.E. Bucuresti, 2002.[6] UNEP, Green Economy and Trade. Trends, Challenges and Opportunities, pag 275 http://www.unep.org/greeneconomy/ Portals/ 88/ GETReport/ pdf/ FullReport.pdf), 2013.[7] Ministère de l'Environnement, de l'Energie et de la Mer, http://www.developpement-durable.gouv.fr/-Tour-d-horizon,2745-.html[8] Acces la dreptul Uniunii Europene, http://www.eur-lex.europa.eu/.[9] Comisia Europeana, http://ec.europa.eu/environment/index_en.htm.[10] Comisia Europeana, http://ec.europa.eu/clima/.[11] Comisia Europeana, http://ec.europa.eu/green-papers/index_en.htm.[12] Comisia Europeana, http://europa.eu/eu-law/legislation/index_en.htm.[13] Ministerul Slovaciei, http://www.mos.gov.pl/.[14] Ministerul Poloniei, http://www.ekoportal.gov.pl/home/index.html.[15] Guvernul Spaniei, http://www.boe.es/diario_boe/.[16] Guvernul Ialiei, http://www.minambiente.it/archivionormative.[17] Guvernul Belgiei, http://www.moew.government.bg/.[18] Guvernul Germaniei, http://www.umweltbundesamt.de/.[19] Guvernul Germaniei, http://www.izu.bayern.de/.[20] Guvernul Frantei, http://www.vedura.fr/developpement-durable/reglementation.[21] Guvernul Frantei, http://www.developpement-durable.gouv.fr/-Tour-d-horizon,2745-.html.[22] Comisia Europeana, http://responsalliance.eu/rplearn/?page_id=1135&lang=ro.
291
ASPECTS REGARDING MISCANTHUS GRINDING PROCESS FORPELETIZATION/BRIQUETTING
Georgiana MOICEANU1, Gigel PARASCHIV1, Gheorghe VOICU1, Mirela DINCĂ1,Valentin VLĂDUȚ2, Iuliana GĂGEANU2
1University Politehnica of Bucharest, 2INMA - Bucharest
ABSTRACT
Biomass is a renewable source of energy that has an important contribution in reducing the use ofconventional fuels and in reducing greenhouse gas emissions to the atmosphere. Pelleting andbriquetting processes have been used for many years to produce densified biomass for fuelapplications. Pellets produced from biomass (wood, energy plants and agricultural residues) present ahigher energy density feedstock than wood chips or bales, and thus reduce the costs of handling,transport and storage throughout the supply chain. The aim of the present paper was to determine theenergy consumption necessary for Miscanthus x giganteus biomass grinding using a hammer mill typeMC-22 equipped with sieve with ϕ10 mm orifice sizes, four types of hammers and the rotor speedranged from 2400 rpm to 3000 rpm.
1. INTRODUCTION
Biomass is the third-largest energy resource in the world, after coal and oil. The mostimportant advantages of biomass consumption are its renewability and sustainability and thefact that can significantly reduce carbon emissions comparing with fossil fuels [1]. In order touse biomass energy source effectively, the density of biomass must be increased. The biomassdensification process is done by pelleting and briquetting processes. Pellets produced frombiomass (wood, energy plants and agricultural residues) present a higher energy densityfeedstock than wood chips or bales, and thus reduce the costs of handling, transport andstorage throughout the supply chain [2]. Pellets are made from dry, untreated, biomass that ishammermilled into fine pieces then reformed into small, cylindrical pellets under highpressure and temperature [3]. During storage and transportation, it is important to observevariation in the physical properties of the wood pellets, including dimension, density,moisture content and hardness. For example, moisture absorption can increase the biologicaldegradation of biomass, this aspect leading to spontaneous combustion of wood pellets inlarge-scale storage and transportation [4, 5]. Size reduction is an important stage in pelletingprocess; this could affect the compaction, contact between particles, friction in the die and theflow rate of material [6, 7]. Hammer mills are the most suitable equipments for size reduction.There is a limitation on the size of the input material, which has to have a diameter less than2.54 cm to be processed [8].
Lignocellulosic crops like Miscanthus x giganteus, wich is a C4 perennial rhizomatousgrass, and willow (Salix viminalis) can have an interesting future in European countries asenergy crops [9]. Noorfidza and Muhammad [10] reported that particle size contributes to themechanical strength of biomass pellets: biomass pellets made with smaller particle sizeshowed high yield stress and density. They tested the particle size of biomass in range of 150-300, 300- 425 and 425-600 μm.
Chitoiu et al. [11] also conducted experiments regarding the grinding process ofenergetic willow - Salix viminalis. The authors concluded that the particles dimension aftergrinding contribute to the quality of the finished product (briquettes or pellets).
11Splaiul Independentei 313, Sector 6, Bucharest, 0745201365, [email protected]

292
Daraban et al. [12] determined the capability of mixing Miscanthus x giganteus biomasswith other vegetable biomass (straw, wood sawdust, or other energetic plants) to obtainbriquettes and pellets. Different characteristics were studied as: percentage of variablebiomass mixed with Miscanthus (30%, 50% and 70%), humidity variation (wt = 9 – 13%) andquality of final product. The authors reported that energy crops are suitable to be mixed withother biomass (wood or agricultural residues), in order to provide locally sustainable products(briquettes and pellets) as solid biofuel for small scale heating systems.
The aim of the present paper was to determine the energy consumption necessary forMiscanthus x giganteus biomass grinding using a hammer mill type MC-22 equipped withsieve with ϕ10 mm orifice sizes, four types of hammers and the rotor speed ranged from 2400rpm to 3000 rpm.
2. METHODOLOGY
In order to achieve the main goal of this paper, experimental research took place atINMA Bucharest. As biomass for testing, miscanthus stalks were used. The initial materialwas shredded when it was harvested and the particle sizes chips had an average length ofapproximately 125 mm. The chopped material particles were subjected to milling processusing a hammer mill type MC -22 with articulated hammers, with 500 mm rotor length,hammer distribution diameter ϕ220 mm, and grinding chamber diameter of ϕ500 mm. Thesieve used in experiments was a sieve with ϕ10 mm orifice sizes.
Also, functional parameters such as rotor`s speed of revolution which ranged from 2400rpm to 3000 rpm (in steps of 150 rpm) and hammer types (A – with an edge; B – with twoedges; C – with three edges and D – with beveled corners) were modified during tests. Takingthe fact that dried Miscanthus stems are light and bulky, experiments were realized with eachprobe weighing 5 kg, and material moisture at grinding time had an average value of 9.74–11.05% for Miscanthus x giganteus biomass.
Figure 1. Constructive MC 22 hammer mill design [13]1.calming cyclon; 2. concave; 3. hinged case; 4. feeding chamber; 5. electric motor; 6. belt
conveyance; 7. exhauster 8. belt conveyance; 9. rotor; 10. fixed case; 11. bag mouth
After the end of the milling process the biomass particles resulted were subjected to agranulometric sorting process using the sieves of a classifier type AS 200 basic, the grindingtime being about two minutes.

293
Also, the energy consumption necessary for the grinding process was researched andpresented in this paper.
3. RESULTS AND DISCUSSIONS
In table 1 are presented the results obtained for the energy consumption during millingprocess after experimental research.
Table 1: Variation of grinding energy depending on the hammer mill function parameters
Rotor speed ofrevolution [rpm]
Hammertype A[kJ/kg]
Hammertype B[kJ/kg]
Hammertype C[kJ/kg]
Hammertype D[kJ/kg]
3000 59.63 102.83 94.96 71.962850 51.79 99.59 72.36 91.572700 47.73 96.19 88.19 114.212550 64.42 69.59 67.11 100.312400 35.71 97.64 96.52 88.46
In table 2 the values of the material percentages considering each classifier sieves arepresented. Based on these results, using MS Excel the data was processed, thus thedistribution curves of the grinded material were plotted depending on the rotor speed and onthe used hammer type.
Table 2: Experimental results regarding the grinded material size distribution for the millsieve of 10 mm
Rotor speed ofrevolution
[rpm]
Percentage of material in the classifier sieve [%]
Particle size < 5mmParticle size
between 5 ÷ 10 mmParticle size > 10
mmA B C D A B C D A B C D
3000 76 62 75 65 61 56 52 60 42 39 36 392850 63 69 73 46 48 61 64 68 45 44 34 542700 61 60 65 58 50 65 62 52 32 48 39 432550 54 54 64 59 50 60 61 59 51 45 42 612400 39 64 69 49 55 56 56 67 73 50 39 66
Analyzing both table 2 and figure 1, it can be seen that the highest percentage of materialparticles was registered for particle smaller than 5 mm. Also, when analyzing the entireparticle percentage distribution on sieves from table 2, it can be said that for fraction smallerthan 5 mm the percentage is higher compared to the other fractions and similar for fractionhigher that 10 mm the particle distribution percentage is lower, in both cases disregarding thetype of hammer used for testing. If the type of hammer is taken into consideration whenanalyzing the grinded particle distribution, it has to be said that type A hammer showspercentage values between 39 – 76 % comparing to hammer type C for which the percentagevalues distribution is between 34 – 42 %. As it can be seen for type B hammer the materialpercentage distribution is higher for particles smaller than 5 mm and lower for fractions above10 mm.
In order to better understand the fraction distribution after experimental research apolynomial regression analysis was done. The type of regression was chosen so that all curvesfit best and thus being able cu compare to each other for every group of fractions. Also, when

294
applying other regression analyze it was necessary to change the type of regression each timea certain parameter was taken into consideration for analysis. As shown in figure 1 thecorrelation coefficient for hammer type A had values above 0.81 and for hammer type C thecorrelation coefficient had values between 0.56 and 0.81. The highest value for correlationcoefficient was recorded for type A hammer R2=0.94.
y = -3E-05x2 + 0,2401x - 338,81R² = 0,9431
y = 3E-05x2 - 0,1658x + 274,88R² = 0,1399
y = 7E-05x2 - 0,3504x + 519,45R² = 0,8169
y = 2E-05x2 - 0,0925x + 163,68R² = 0,1345
30
35
40
45
50
55
60
65
70
75
80
2300 2400 2500 2600 2700 2800 2900 3000 3100 3200
Gri
nded
mat
eria
l[%
]
Speer of revolution [rpm]
Material particles smaller than 5 mm
A
B
C
D
y = 0,0001x2 - 0,5911x + 837,46R² = 0,8498
y = -9E-05x2 + 0,4668x - 566,83R² = 0,875
y = -1E-04x2 + 0,5323x - 650,23R² = 0,799
y = 7E-05x2 - 0,3615x + 550,39R² = 0,2007
30
35
40
45
50
55
60
65
70
75
2300 2400 2500 2600 2700 2800 2900 3000 3100 3200
Gri
nded
mat
eria
l[%
]
Speed of revolution [rpm]
Material particles between 5 and 10 mm
A
B
C
D
y = 0,0002x2 - 1,2537x + 1792,7R² = 0,8695
y = -3E-05x2 + 0,1213x - 95,719R² = 0,8119
y = -7E-06x2 + 0,0309x + 9,2247R² = 0,5691
y = 3E-05x2 - 0,197x + 372,23R² = 0,7143
25
35
45
55
65
75
85
2300 2400 2500 2600 2700 2800 2900 3000 3100 3200
Gri
nded
mat
eria
l [%
]
Speed of revolution [rpm]
Material particles > 10 mm
A
B
C
D
Figure 1: Particle distribution of grinded material depending on the hammer type and thehammer mill speed

295
Regarding aspects referring to energy consumption during milling process, the variationresulted is presented in figure 2, the data being plotted with MS Excel program. Analyzingfigure 2 and also table 1, it can be said that the highest value of energy consumption wasrecorded for hammer type D at 2700 rpm followed by hammer type B at a speed of revolutionof 3000 rpm.
If the values in table 1 are analyzed it can be seen that for type A hammer all values ofthe energy consumption are lower than the other types of hammers disregarding the rotor`sspeed of revolution.
The average energy consumption taking all function parameters into consideration isaround 80.5 kJ/kg.
0
20
40
60
80
100
120
A B C D
Ene
rgy
cons
umpt
ion
duri
ng m
illin
g pr
oces
s[k
J/kg
]
Hammer type
25 mm sieve
3000 rpm
2850 rpm
2700 rpm
2550 rpm
2400 rpm
Figure 2: Energy consumption variation depending on the rotor speed
3. CONCLUSIONS
Considering all requirements for biomass processing and the requirements for the finiteproduct it is necessary to analyze and make optimizations for each stage of the processingphases. Thus, taking into consideration this aspect, the grinding process of biomass it stillneeds many more experimental researches in order to improve each aspect that is involved inthe process. In this paper the correlation between function parameters and the milling processwere analyzed. The tested biomass consisted of Miscanthus x giganteus which has aninteresting future in European countries as energy crops.
The experimental research done showed a correlation between all parties (hammer type,sieve orifices diameter, rotor`s speed of revolution) which had an impact on the grindedmaterial fractions and on the energy consumption during grinding process. It can beconcluded that type A hammer shows material distribution percentage values between 39 – 76% disregarding the speed of revolution used for testing and the highest value for correlationcoefficient R2=0.94. Also, for type A hammer all energy consumption values were lower thanother types of hammers, between 35.71 and 64.42 kJ/kg, while the energy consumptionrecorded for type D hammer had values between 71.96 and 114.21 kJ/kg with two energyconsumption values above 100 kJ/kg for a speed of revolution of 2550 and 2700 rpm.

296
Acknowledgements
This work was funded by the Executive Agency for Higher Education, Research,Development and Innovation Funding, within the project entitled "Optimizing thecomposition of biomass mixtures for obtaining high quality pellets", ctr. 24 BG / 2016 (codePN-III-P2-2.1-BG-2016-0266).
References
[1] Cengiz Akdeniz, R., Haghighat Shishvan, S., The requirement for new biomass pelletizing test device,Agricultural Engineering, vol. 2 (154), pp. 25 – 34, 2015.[2] Whittaker, C., Shield, I., Factors affecting wood, energy grass and straw pellet durability – a review.Renewable and Sustainable Energy Reviews, vol. 71, 2017, pp. 1-11.[3] Karkania, V., Fanara, E., Zabaniotou, A., Review of sustainable biomass pellets production – A study foragricultural residues pellets’ market in Greece, Renewable and Sustainable Energy Reviews, vol. 6(3), pp. 1426– 1436, 2012.[4] Wang, S., Yuan, X., Li, C., Huang, Z., Leng, L., Zeng, G., Li, H., Variation in the physical properties ofwood pellets and emission of aldehyde/ketone under different storage conditions, Fuel, vol. 183, pp. 314-321,2016.[5] Kymalainen, M., Makela, M.R., Hilden, K., Kukkonen, J., Fungal colonisation and moisture uptake oftorrefied wood, charcoal, and thermally treated pellets during storage, Eur J. Wood Wood Prod., vol. 73, pp.709–717, 2015.[6] Jezerska, L., Zajonc, O., Vyletelek, J., Zegulka, J., Mechanical material properties effect on pelletization,Wood Research, vol. 61(2), pp. 307-320, 2016.[7] Castellano, J.M., Gomez, M., Fernandez, M., Esteban, L.S., Carrasco, J.E., Study on the effects of rawmaterials composition and palletization conditions on the quality and properties of pellets obtained fromdifferent woody and non woody biomasses, Fuel, vol. 139, pp. 629 – 636, 2015.[8] Garcia-Marver, A., Carpio, M., Biomass palletization process, Transactions on State of the Art in Scienceand Engineering, vol. 85, 2015, WIT Press.[9] Venturi, P., Gigler, J.K., Huisman W. Economical and technical comparison between herbaceous(Miscanthus x giganteus) and woody energy crops (Salix viminalis), Renewable Energy, vol. 16 (1-4), 1999, pp.1023-1026, 1999.[10] Noorfidza, Y.H., Muhammad, T.A., Effect of particle size on mechanical properties of pellets made from
biomass blends, Procedia Engineering, vol. 148, pp. 93-99, 2016.[11] Chiţoiu, M., Moiceanu, G., Voicu, Gh., Paraschiv, G., Vlăduţ, V., Găgeanu I., Aspects regarding biomassfrom energeic plants (energetic willow – salix viminalis) grinding process for pelletization, Analele Universităţiidin Craiova, seria Agricultură – Montanologie – Cadastru (Annals of the University of Craiova - Agriculture,Montanology, Cadastre Series, 2015.[12] Daraban (Oros), A.E., Jurcoane S.,Voicea I., Voicu Gh., Miscanthus giganteus biomass for sustainableenergy in small scale heating systems, Agriculture and Agricultural Science Procedia, vol. 6, pp. 538 – 544,2015.[13] Carte tehnică MC 22 Bonțida, http://tractorul.ro/moara-cu-ciocane-mc-22.html;
297
STRUCTURAL AND CINEMATIC ANALYSIS OFTHE ELEVATING MECHANISM OF
A UTILITY VEHICLE'S SHUTTER
Victor MOISE, Luciana DUDICI, Alexandra ROTARU, Ştefan MOISE
ABSTRACT
In the present paper the structural and kinematic analysis of the elevating mechanism of autility vehicle's shutter is made. For each of the the mechanism module, kinematiccomputation procedures were developed, procedures that were used in a main computingprogram. The results were presented in tabular and diagrams forms, to give a clearer picture ofthe kinematic parameters of the mechanism elements
INTRODUCTION
In order to facilitate utility machines loading with different products, the folding shutters[11] are used. These subassemblies are mounted in the rear of the machine and arehydraulically or pneumatically driven. Typically, these mechanisms have a variable structure,making them easy to use to achieve the intended purpose.
METHODOLOGY
Figure 1 shows the kinematic schematic of the elevating mechanism of a utility vehicle.On the element 4 of the mechanism is rigidly mounted the platform on which the materialswill be loaded.
To determine the kinematic parameters of the mechanism elements, the modular groupsunderlying the mechanism must be established, thus the structural analysis of the elevatingmechanism must be made.
The mechanism has a variable structure, for the two operating phases (lifting the platformto the level of the body and ramping the platform in positive direction).
1. Structural analysis of the mechanism
Figure 1 shows the kinematic scheme of the lifting mechanism of the utility vehicles.Taking into account the relative movements between the elements, it is noted that the
mechanism has the following inferior joints: )32(),21(),10( 12 TCRBRA , )03( RD ,
)41(14 RB , )54( RE , )65( TF şi )06( RG .
The number of superior joints is zero.The moving elements of the mechanism are: ),,,(1 1412 BBA ),(2 12 CB , ,),(3 DC
),,(4 14 EB ),,(5 FE ),(6 GF .
Given the number of moving elements and the number of kinematic joints, the degree ofmobility of the mechanism results, namely: M = 2, ie two independent parameters are required,so that the elements of the mechanism have unique determined movements.
Figure 2 shows the kinematic schematic of the lifting mechanism with the BT platform atthe body level.
In order to establish the modular groups from which the mechanism is constituted, thestructural and multipolar schemas presented in Figure 3 are drawn. From Figure 3, it is

298
observed that the mechanism consists of the base Z(0), and the motor dyads RRTaR(1,2,3)and RRTaR(4,5,6).
BODYWORK
A
C
D
E
F
G
1
23
45
6
0
T
Fig. 1. The kinematic scheme of the lifting mechanism,with the BT platform at the bottom
BODYWORK
A
B
C
D
E
F
G
12
3
4
5
60
T
Fig. 2. The kinematic scheme of the lifting mechanism,with the BT platform at the body level
RRTaR
(0)Z
(0)Z +
C
(1,2,3) +
12B
(1,2,3)RRTaR
DB
G
14
A
a) b)
F
DG
C
B12
B14
E1
2
3
4
5
60
RRTaR
EF
(4,5,6)
RRTaR (4,5,6)
Fig. 3. a) the structural scheme of the mechanism; b) multipolar scheme and structuralrelationship
In the lifting process of the shutter, the mechanism has a variable structure. In this respect,to keep the shutter in a horizontal position, the hydraulic cylinder formed by elements 5 and 6is locked to the size equal to the length AB (Fig3). Since the AG and BE distances are equal,the ABEG parallelogram is formed, making the BT platform horizontal. Figure 4 shows the

299
modular groups that make up the mechanism at this stage.When the platform reached the machine's body level and the pallet was unloaded, the
hydraulic cylinder 2-3 is locked and the point B becomes fixed (the ABD triangle is formed).In this case, the kinematic, structural and multipolar diagrams of the mechanism are shown inFigure 5.
A
BC
D
E
G
1
23
45
0
T
Fig. 3. The kinematic scheme of the climbing mechanism,with cylinder 5-6 locked to length AB
RRTaR
(0)Z
(0)Z +
C RRR
RRR
(4,5)
(1,2,3) +
12B
(4,5)
E
(1,2,3)RRTaR
D B
G
14A
AB12B14
C
DG
E
12
3
4
5
0
a) b)Fig. 4. a) the structural scheme of the mechanism; b) multipolar scheme; c) the structural
relationship
BODYWORK
B
E
F
G
4
5
6
RRTaR
(0)Z
(0)Z +
RRTaR
Ga)
b)
B14
EF
B14
E
G0
4
5 F
6(4,5,6)
(4,5,6)c)
0
T
Fig. 5. The shutter lifting mechanism at the beginning of the ramping phasea) the kinematic scheme of the mechanism; b) structural scheme;
c) multipolar scheme and structural relationship
2. The kinematic analysis of the mechanism
For the kinematic analysis of the mechanism are known several stages, namely:a) composing the calculation program for the determination of the kinematic parameters
of the mechanism’s links;

300
b) tabular presentation of the angular values made by the vectors GBBEDBAB ,,, ,attached to the mechanism’s links, with the positive sense of the AX axis;
c) drawing the variation diagrams of the angular velocities and accelerations of themechanism’s links, according to the position of the mechanism.
The kinematic analysis of the mechanism consists in the determination of the position,velocity and acceleration parameters, adequate to all the links. For this, are called theA2PVA.m, d1pva.m, A1R.m, and A1RALFA.m functions, developed by the authors inMATLAB syntax.
In figures 6 and 7 are presented the kinematic schemes of the lifting and foldingmechanism of the shutter, with the emphasis of the position parameters.
1
4
5 2
A
BC
D
E
F
G
1
23
45
6
0
T
Fig. 6. Definition of the position kinematic parameters of the mechanism (lifting phase)
4
5
B
E
F
G
4
5
60
T
BODYWORK
Fig. 7. Definition of the position kinematic parameters of the mechanism (folding phase)
3. Numerical exampleFor the analysis of the mechanism, are known:a) the kinematic scheme of the mechanism;b) the dimensions of the links and the positions of the joints adjacent to the base, as
follows: AB = 0.700 m, BE= 0.1581 m, XA = 0.0 m, YA = 0.0 m, XD = 0 m, YD = -0.150 m, XG = -0.050 m, YG = -0.150 m, = 1.89 rad.
c) the initial position of the mechanism: 600.001 initBDs m, GE=AB = 0.700 m
(lifting phase of the platform), 700.002 initGEs m (folding phase of the platform);
d) the relative velocities in the joints C and F: 100.023 v m/s, 100.045 v m/s;
e) the relative accelerations in the joints C and F: 100.023 a m/s2, 100.045 a m/s2;
f) the active strokes of the cylinders: cursa1=0.200 m, cursa5=0.220 m.The calculations were made for 20 equidistant positions of the link 2 in relation to link 3

301
and 22 equidistant positions of the link 4 in relation to link 5, starting from the initial position.In table 1 are presented the position parameters of the mechanism’s links, for the lifting
phase of the platform, as well as for its folding phase.Table 1
poz fi1 fi2 fi4 fi5==================================0 5.4704 -0.6400 4.3906 5.47041 5.5509 -0.5484 4.3906 5.55092 5.6271 -0.4632 4.3906 5.62713 5.7003 -0.3828 4.3906 5.70034 5.7711 -0.3063 4.3906 5.77115 5.8403 -0.2329 4.3906 5.84036 5.9083 -0.1618 4.3906 5.90837 5.9755 -0.0927 4.3906 5.97558 6.0423 -0.0250 4.3906 6.04239 6.1090 0.0416 4.3906 6.1090
10 6.1758 0.1073 4.3906 6.175811 6.2432 0.1727 4.3906 6.243212 6.3113 0.2379 4.3906 6.311313 6.3805 0.3033 4.3906 6.380514 6.4511 0.3691 4.3906 6.451115 6.5236 0.4359 4.3906 6.523616 6.5984 0.5040 4.3906 6.598417 6.6761 0.5738 4.3906 6.676118 6.7574 0.6462 4.3906 6.757419 6.8435 0.7218 4.3906 6.843520 6.9356 0.8020 4.3906 6.935621 6.9356 0.8020 4.3906 6.935622 6.9356 0.8020 4.4942 6.917323 6.9356 0.8020 4.5849 6.902924 6.9356 0.8020 4.6677 6.891325 6.9356 0.8020 4.7448 6.881826 6.9356 0.8020 4.8179 6.874027 6.9356 0.8020 4.8881 6.867628 6.9356 0.8020 4.9560 6.862529 6.9356 0.8020 5.0222 6.858530 6.9356 0.8020 5.0872 6.855531 6.9356 0.8020 5.1513 6.853432 6.9356 0.8020 5.2149 6.852233 6.9356 0.8020 5.2782 6.851834 6.9356 0.8020 5.3415 6.852135 6.9356 0.8020 5.4050 6.853236 6.9356 0.8020 5.4690 6.855137 6.9356 0.8020 5.5338 6.857638 6.9356 0.8020 5.5996 6.860939 6.9356 0.8020 5.6667 6.865040 6.9356 0.8020 5.7355 6.869841 6.9356 0.8020 5.8064 6.875542 6.9356 0.8020 5.8800 6.882043 6.9356 0.8020 5.9568 6.8896
In figures 8 and 9 are presented the variation diagrams of the angular velocities andaccelerations of the mechanism’s links.

302
0 10 20 30 40 50-0.05
0
0.05
0.1
0.15
i
Vit.
ungh
.1,
2,
4,
5[ra
d/s]
+++ 1;--- 2;
ooo 4;
xxx 5;
0 10 20 30 40 50-0.01
-0.005
0
0.005
0.01
0.015
i
Acc
. ung
h. 1
,2, 4
si
5[ra
d/s2 ]
+++ 1 ;
---- 2 ;
ooo 4 ;
xxx 5 ;
Fig. 8. The angular velocities charts Fig. 9. The angular accelerations chartsof the mechanism’s links of the mechanism’s links
CONCLUSIONS
The kinematic analysis of the mechanism stands at the basis of kinetostatic computation.From the numerical data analysis, as well as the variation charts of the angular velocities andaccelerations, the designer of such a mechanism can choose the most convenient solutions fora silent running of the mechanism. The values of these parameters can be used also in the caseof kinetostatic computation of the mechanism, for the determination of the reaction forcesfrom the kinematic joints, as well as for the driving forces in the hydraulic cylinders. Knowingthe reaction forces allows the appropiate dimensioning of the kinematic links.
BIBLIOGRAPHY
1. Artobolevski, I.I., Theorie des mecanismes et des machines, Mir, Moscou, 1977.2. Demidovitch, B., Maron, I. - Elements de calcul numeriques, Mir, Moscou, 1976.3. Dorn, W.S., Mc Cracken, D.D., Numerical methods with programs in FORTRAN,
Technical Publishing House, Bucharest, 1976.4. Duca, C., Buium, Fl., Părăoanu, G., Mechanisms, Gh. Asachi, Iaşi, 2003.5. Moise, V., Maican, E., Moise, Şt. I., Numerical methods in engineering, Bren,
Bucharest, 2003.6. Moise, V., Simionescu, I., Ene, M., Neacşa, M., Tabără, I.A., The applied mechanisms
analysis, Printech, Bucharest, 2007.7. Pelecudi, Chr., Precision of the mechanisms, Academy R.S.R., Bucharest, 1975.8. Pelecudi, Chr., Simionescu, I., Moise, V., Ene, M., The design of the mechanisms, The
Politehnic Institute, Bucharest, 1981.9. Pelecudi, Chr., Maroş, D., Merticaru, V., Pandrea, N., Simionescu, I., Mechanisms,
Didactic and Pedagogical Publishing House, Bucharest, 1985.10. Simionescu, I., Moise, V., Mechanisms, Technical Publishing House, Bucharest,
1999.11. Voicu, Gh., Equipment for communal household greening of settlements, MatrixRom,
Bucharest, 2007.

303
INNOVATIVE MODEL OF VERTICAL DRYER FOR CEREAL SEEDS
PhD. Stud. Eng. Muscalu Adriana1,3), PhD. Eng. Cârlescu Petru2), PhD. Eng. Sorică Cristian1),PhD. Eng. Arsenoaia Vlad 2), PhD. Stud. Eng. Bîrsan Mariana1,3)
1)INMA Bucharest,2)Department of Pedotechnics, University of Agricultural Sciences and Veterinary MedicineIaşi,3)University Politehnica Bucharest - Faculty of Biotechnical Systems Engineering
ABSTRACT
Generally, after harvesting, healthy cereal seeds are subjected to conservation technologies, themost common being drying. This is a complex energy-intensive process of heat and mass transfer, theinstallations used having high energy consumption per kilogram of product, as well as a long dryingtime. In order to properly optimize the drying process, it is necessary to deeply know the phenomenarelated to the behavior of wet materials (seeds) in the drying installations. To this is added thehighlighting of the decisive influence of their specific parameters on the decrease of moisture.
The paper presents a synthesis of mathematical modelling and simulations conducted in order toidentify and determine a series of parameters based on which was dimensioned and designed theinnovative Model of vertical dryer with heat recovery (MIUV-0).
1. INTRODUCTION
Reducing post-harvesting loses contributes to the increase of food safety and depends onthreshing, cleaning, drying and depositing seeds. Drying represents removing moisture so thatit allows seeds depositing for long periods, as well as satisfying the quality conditions thequality conditions imposed for seeds destined for consumptions or sowing, thus adequatelyresponding to handling and processing [4].
Drying is the most intense energy process in the food industry. That is why, in the case ofseed dryers, it is necessary to manage the thermal regime thoroughly by knowing theirtechnical and functional parameters. Reducing energy consumption and ensuring high quality,with minimal increase in economic inputs, have become the targets for the continuousmodernization of these machines [2,12]. Heating intensity and the energy consumptiondepend on the dimensions and on the initial temperature, the moisture of the bodies, themicrostructural characteristics of porous materials, their anisotropy, the content and theaggregate state of the water inside them, the temperature and moisture values of the heatingmedium, etc. [11]
In general, the model is considered as a simplified (material or symbolic) representationof the objective reality (sometimes of an abstract theory) that is subordinated to the purpose ofthe research. The purpose of mathematical modeling is to build a tool (mathematical) thatprovides a comprehension of the action that raises interest and to make accurate predictionson its evolution. Always, the complexity of a model implies a balance between its simplicityand its accuracy of representation [1, 5, 6].
The innovative vertical dryer model with heat recovery (MIUV-0) was dimensioned anddesigned based on mathematical modeling and simulations conducted to identify anddetermine a series of specific parameters.
16, Ion Ionescu de la Brad Bd., tel: 0726234242, e-mail:[email protected]

304
2. METHODOLOGY
In order to estimate and track the evolution of temperature and moisture fields over timeat any point of the product layer (cereal seeds) subjected to the drying process, a mathematicalmodel was developed using CFD (Computational Fluid Dynamics) simulation and alaboratory dryer, which can be equipped with two drying boxes: rectangular (fig.1) orcylindrical (fig.2). The equipment allows the control and monitoring of the drying processparameters, which can be selected by the operator before or during the drying process [2, 3].
Figure 1: Diagram and general view of the laboratory drier [2]With rectangular box With cylindrical box
1 - ventilator; 2 – temperature sensor; 3 – moisture sensor; 4 – insulation layer; 5 – controlpanel; 6 – electrical resistance; 7 – cold air; 8 - body; 9 – hot air; 10 – speed sensor; 11 –
drying cells.12 – moisture sensor for the drying agent
used.12 – fixed cover; 13 – mobile cover; 14 –
section changing.
The process of drying cereal seeds is carried out by convection, the heat being broughtinto the layers of material (considered porous), through the means of hot air (the dryingagent). Once it enters the cereal mass, mass transfer (water) begins from the inside of theproduct towards its surface. The water moves both under the influence of capillary forces aswell as due to the contraction of the product during dehydration, easily reaching the surfacewhere the evaporation phenomenon occurs. Air is the transfer medium that takes up thevapors produced. Towards the end of the drying process, water transfer is slower due to thedry layer formed on the surface of the product [2, 3, 7, 8].
The mathematical model of the convective drying process is based on the theory of fluidsdynamics, mass balance and energy. During the drying process, moisture decreasescontinuously, following complex variation laws [2].
Heat agent flow was simulated numerically for both types of dryers. For the cylindricalcase, the current lines of thermal agent obtained had a laminar flow at the entrance to the box,and the thermal agent had a uniform distribution in the layers of seeds subjected to drying alongthe cylindrical sieve (fig. 3). This had favorable consequences in terms of the drying time,which was of a lower duration as well as on the uniformity of drying (fig.4). For cereal seeds isnot recommended to use aggressive drying conditions, characterized by high temperatures andlow moisture content of the drying agent, because they negatively influence the initial quality ofthe material, expressed mainly by the gluten content [2, 3]. The values of the temperature, therelative moisture of the drying agent and its speed (parameters of the drying regime) influenceboth the drying process and the quality of the material to be dried [2, 3, 7, 8].
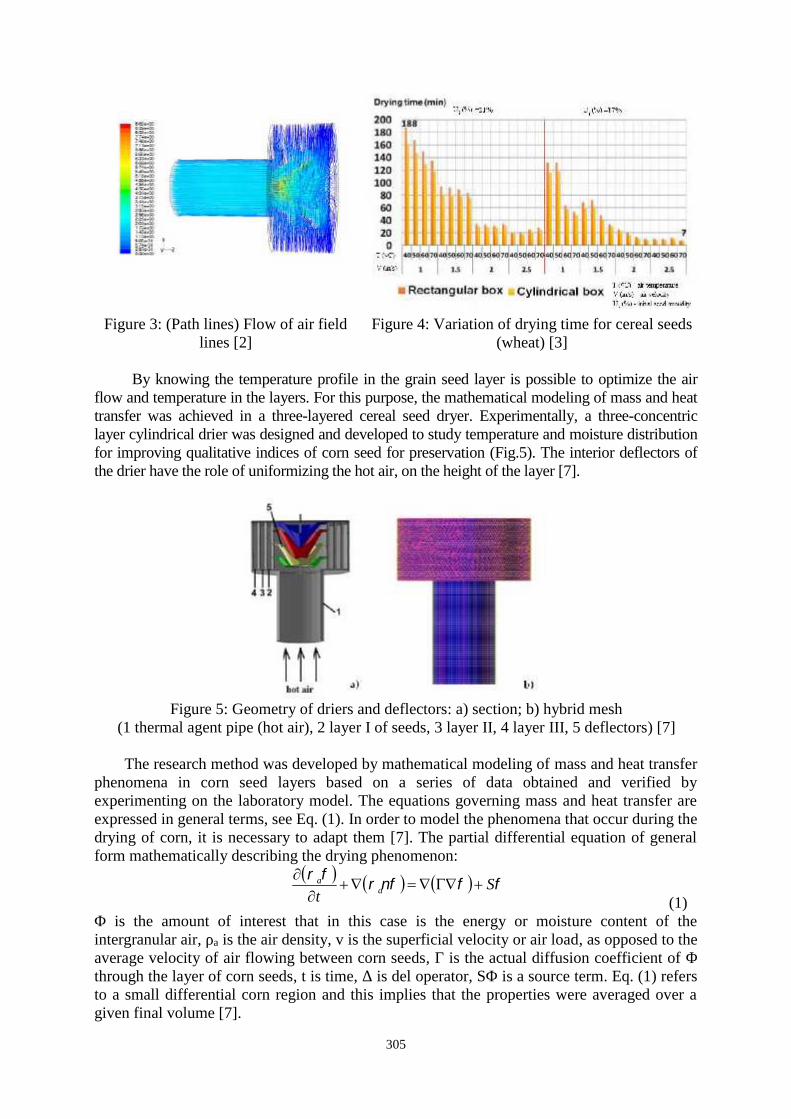
305
Figure 3: (Path lines) Flow of air fieldlines [2]
Figure 4: Variation of drying time for cereal seeds(wheat) [3]
By knowing the temperature profile in the grain seed layer is possible to optimize the airflow and temperature in the layers. For this purpose, the mathematical modeling of mass and heattransfer was achieved in a three-layered cereal seed dryer. Experimentally, a three-concentriclayer cylindrical drier was designed and developed to study temperature and moisture distributionfor improving qualitative indices of corn seed for preservation (Fig.5). The interior deflectors ofthe drier have the role of uniformizing the hot air, on the height of the layer [7].
Figure 5: Geometry of driers and deflectors: a) section; b) hybrid mesh(1 thermal agent pipe (hot air), 2 layer I of seeds, 3 layer II, 4 layer III, 5 deflectors) [7]
The research method was developed by mathematical modeling of mass and heat transferphenomena in corn seed layers based on a series of data obtained and verified byexperimenting on the laboratory model. The equations governing mass and heat transfer areexpressed in general terms, see Eq. (1). In order to model the phenomena that occur during thedrying of corn, it is necessary to adapt them [7]. The partial differential equation of generalform mathematically describing the drying phenomenon:
St aa
(1)Φ is the amount of interest that in this case is the energy or moisture content of theintergranular air, ρa is the air density, v is the superficial velocity or air load, as opposed to theaverage velocity of air flowing between corn seeds, Γ is the actual diffusion coefficient of Φthrough the layer of corn seeds, t is time, Δ is del operator, SΦ is a source term. Eq. (1) refersto a small differential corn region and this implies that the properties were averaged over agiven final volume [7].

306
Thus, the standard CFD package has been modified to be used to simulate the transfer ofmoisture (mass) and heat occurring during the corn drying process. Characteristics thatspecifically apply to bulk dried corn have been adapted to operator defined functions (UDFs).These have been translated into ''C'' language and then inserted into the FLUENT software [7].
For CFD simulation, the geometry of the drying zone and its discretization in the form ofa hybrid meshing having 938,000 elements (Fig.5b), using the GAMBIT software. Both forthe experimental version and the CFD simulation were imposed the same initial conditions forseeds, and for seed initial moisture, the drying agent temperature, drying speed and dryingtime were considered the same values. After post-processing of CFD simulations, the mainparameters of interest in the color scheme of the corn seed drying process for each calculationnode were presented as temperature fields or by showing the flow of air through the lines ofcurrent depending on its speed and temperature. Subsequent processing was performed for thethree layers of corn seeds following temperature and moisture distribution, see Fig. 6 [7].
Figure 6: Vertical drier: a) temperature field K; b) absolute moisture fieldkg water vapors / kg dry product; I first layer; II second layer, III-third layer.
(v = 2 m s-1; T = 343 K=70 ° C) [7]
Following the mathematical modeling of mass and heat transfer and of the use ofexperimental data, CFD simulation resulted in an optimum thickness of 0.1 m corn layer inthe dryer.
Based on mathematical modeling, the use of experimental data and CFD simulations,calculations were performed (energy balance, pneumatic transport, sizing, resistance, etc.) fora cereal seed dryer with heat recovery, modulated, of cylindrical shape, for which wereconsidered: the maximum temperature of the drying agent 70oC; atmospheric air temperatureof 20oC; relative air moisture 50%, etc. The hourly heat quantity required for the operation ofthe installation was evaluated, dimensioning the air current generating ventilator, the systemfor heating the medium, the pneumatic system for feeding the seed dryer and the supportingframe elements were evaluated. [9,10].
After evaluating the execution documentation, MIUV-0 was constructed. In order tosolve the heat flow and heat transfer problems inside the vertical drier, the CFD simulationmethod was used. The complex construction geometry of the innovative vertical drying modelwith heat recovery for drying cereal seeds (Figure 7) was simplified for CFD simulation, sothat the inner flow areas of the thermal agent and the transfer of heat that occurs during drying(Figure 8) cab be visualized. The dimensions of the dryer used in the CFD simulation wereidentical with those of the built-in model, and the simplifications of the vertical driergeometry did not influence the physical phenomena occurring during the drying process

307
(height - 3 m, diameter - 1 m, layer thickness - 0.1 m, module height - 0.4 m; Φ hot-air inlet -0.2 m) [8].
Figure 8: Vertical drier geometry forCFD simulation 1, 2, 3 drying sections;4, 5 cooling sections; 6 grain seed layer;7 warm air inlet for drying; 8 nozzle; 9
deflector cones [8]
Figure 7: Innovation vertical drier with heatrecovery
CFD simulation allowed the temperature fields to be drawn in point of the vertical dryer(fig. 9), which would not be allowed by placing a large number of temperature transducers [8].
Figure 9: Temperature fieldon the vertical section (°C)
Figure 10: Velocity field onthe vertical section (ms-1) [8]
Figure 11: Path lines field onthe vertical section [8]
By introducing the five cones inside the drier, air velocity distribution in the three dryingzones became uniform, and the velocity vector was directed from inside the drier to theoutside (fig. 10). In the two cooling regions at the bottom of the drier, the insertion of theinjector made it possible to orient the velocity vector from the outside to the inside byabsorbing the cold air from the atmosphere to cool the cereal layer. The air velocity at theentrance of the dryer was 6 m s-1, and in the cereal layer was 1...2 m s-1 [8].

308
The distribution of current lines from the exterior and the thermal agent inside the verticaldryer (fig. 11) shows the role of deflector cones and of injector nozzle formed inside the drier.By the construction formation of the injector and by placing it in the lower part of the dryer, alocal pressure drop occurs, leading to the absorption of air from the atmosphere through the twolower cooling regions of the dryer, causing cooling of the dried cereals. Thus, part of the heatthey accumulated through the drying process was recovered and reintroduced into the dryer'sgeneral circuit. The temperature obtained by CFD simulation had an error of ± 5% compared tothe experimental determinations, representing an acceptable level in the heat transfer domain.
CONCLUSIONS
Following the CFD simulations on the pilot installation, the calculations and the design, amodular Innovative Vertical Dryer Model with heat recovery was developed, equipped withheating / cooling agent equalizing devices. Modulated construction offers the possibility ofassembly and adequate adjustments inside the dryer, at the level of devices for temperatureand velocity parameters uniformity. The development of the machine contributes to thedevelopment of research in the field of additional devices for guiding airflow towards thecereals layers, because vertical driers that are currently available on the market, are notprovided with such endowments.
ACKNOWLEDGEMENTSThis work was supported by a grant of the Romanian National Authority for Scientific
Research and Innovation, CNCS/CCCDI – UEFISCDI, project number PN-III-P2-2.1-PED-2016-1357, within PNCDI III, contract no.18PED/2017.
References
[1] Andrei N., Essay on Fundamentals of Informatics, Yes Pub. House, Bucharest, 2006.[2] Arsenoaia V.N, Cârlescu P., Corduneanu O., Diaconu A., Țenu I. CFD Simulation of the Hot Air Flow UsedFor Cereal Seed Drying, ISSN 1454 – 8003, Proceedings International Conference on Hydraulics andPneumatics – HERVEX, pg. 298-302, Baile Govora, Romania November 9-11, 2016.[3] Arsenoaia V., Carlescu P., Rosca R,. Tenu I., Studies Regarding the Technological Effect of a New DryingMethod on the Quality of Wheat Seeds, International Symposium ISB-INMA TEH – AGRICULTURAL ANDMECHANICAL ENGINEERING, Bucharest, ISSN 2344-4126, pg. 303-308, 26-28 October 2017;[4] Bala B. K. Drying and Storage of Cereal Grains, Print ISBN:9781119124238, Online ISBN:9781119124207DOI:10.1002/9781119124207, John Wiley & Sons, Ltd. 2016.[5] Bistriceanu E., Stănăşilă O. Mathematics and Reality, Matrix Rom Pub. House, Bucharest, 2009.[6] Cârlescu P. M, Modelling and Numerical Simulation of Industrial Physic Processes Performantica Pub.House, Iași, 2005.[7] Cârlescu P.M. , Arsenoaia V. N, Tenu I., Muscalu A., Birsan M. Researches of Mass and Heat Transfer of anInnovative Vertical Dryer, Proceeding of the 46-th International Symposium Actual Task on AgriculturalEngineering, Opatija, Croatia, pg. 407-417, 27-th February - 1-st March 2018.[8] Cârlescu P.M., Arsenoaia V. N, Tenu I., Muscalu A., Vladut V. CFD Simulation of an Innovative VerticalDryer for Agricultural Seeds Dryer Proceeding of the 46-th International Symposium Actual Task onAgricultural Engineering, Opatija, Croatia, pg. 419-427, 27-th February - 1-st March 2018.[9] Cernăianu C. Considerations on optimizing the heat balance of the fluid bed seed drying plant. Termotehnica(AGIR), pg.41-46, no. 1-2/2005;[10] Costin I. Miller’s Book, Technical Pub. House, Bucharest 1988;[11] Deliiski N. Transient Heat Conduction in Capillary Porous Bodies, Convection and Conduction HeatTransfer, Dr. Amimul Ahsan (Ed.), ISBN: 978-953-307-582-2, October 2011;[12] Doymaz, I., İsmail, O., Drying Characteristics of Sweet Cherry. Food and Bioproducts Processing, 89(1),pg. 31-38, 2011.

309
CONSIDERATIONS ON THE CONSTRUCTION AND OPERATION OFA DEVICE FOR SOIL MODELLING IN INTERRUPTED FURROWS
FOR WEEDING CROPS
Oprescu Marius Remus1), Biris Stefan Sorin2), Voicea Iulian 1), Cujbescu Dan1), PersuCătălin1), Găgeanu Iuliana1), Vlăduț Valentin 1) Dumitru Iulian1),
1) INMA – Bucharest / Romania, 2)University Politehnica of Bucharest / RomaniaE-mail: [email protected]
ABSTRACT
Lately, there is a decrease in the arable land, while the population grows, so it is necessary toincrease the agricultural production per unit of surface in order to meet the food needs. Waterresources are reduced; therefore, it is important to promote techniques and technologies that efficientlyuse water from various sources, with low energy consumption. In the case of weeding crops, directingwater along the plant row or uniform storage is achieved with continuous or interrupted(compartmentalized) furrows. The present paper aims to analyse the construction and operation of adevice for soil modeling in interrupted furrows for weeding crops, simultaneously on 5 intervals -DMBC5-0.
INTRODUCTION
For soil supply with additional water to those naturally received by precipitation,quantities established according to the pedoclimatic conditions and the requirements of theplants, it is necessary to establish additional works in the respective technologies.Determination of the extra amount of water should be made in such a way that the soil layerin which the roots develop maintains optimum humidity. Due to the fact that the arable area isdecreasing while the population is growing, the increase in agricultural production per surfaceunit remains the main solution to meet the growing and better quality demands of food.
The achievement of large agricultural output is influenced by several factors(mechanization, fertilization, weed control, pests control, soil biological potential, seedquality), each with its importance, but the lack of soil water over periods overlapping thecritical phases in plant development, diminishes the harvest, even reaching its totalcompromise as a result of drought.
In Romania, the area with economic irrigable potential is estimated at 3 million hectares,of which 1.5 million ha with high economic efficiency. In this context, irrigation will becomethe most important water consumer in agriculture and one of the main consumers nationwide,requiring on average 35-45% of the country exploitable water resources. Water resources inRomania are low, with a value of about 1660 m3/inhabitant, while in other Europeancountries they are 2.5 times bigger and therefore it is important to promote techniques andtechnologies that efficiently capitalize water from various sources, with low energyconsumption. Soil water and its circulation are of interest, as approximately 41% of ourcountry’s arable land is affected, during certain periods of the year, by excessive humidity inapproximately half of the arable area, while during the same year longer or shorter periods ofdrought are recorded; then it is necessary to apply watering with variable norms, and the soilerosion phenomena appear on 35% of the total agricultural area.
Water resources in Romania are modest compared to other countries in Europe (11thplace for local resources and 21st place for the ones formed on its territory). [3] Gravitation is
1 6, Ion Ionescu de la Brad Blvd., tel: 0766580791, e-mail: [email protected]

310
the oldest form of irrigation. The surface draining consists in the fact that water is distributedon the ground by free flowing on the furrows or strips; during the draining, water alsoinfiltrates in the soil. The method has expanded to weeding crops sown in strips or at biggerdistances between rows with a minimum slope required for water free draining on the furrow.[4] Opening the interrupted furrows is necessary in the following situations: on lands set up for water spraying by fixed or mobile installations and which have
bumps or slopes that cause water to drain and to form puddles in micro depressions; on lands with small slopes, not adapted for irrigation and where the precipitation water
drains rapidly downstream, not being used by the plant and producing the erosionphenomenon.
Farmers are interested in soil moisture conservation and have sought methods ofcollecting and storing a maximum amount of water in the soil to meet crop needs. They admitthat crop yields have been limited over several years because of droughts in almost all areasof the country. Precipitation falls randomly and the amount of water is not in line with plantneeds. Most precipitations in the vegetation season fall during high-intensity rainfalls. Only asmall part of this rain water infiltrates the soil, the rest causes excessive draining and erosion.One way to accumulate water from rainfall is through crop practices, consisting in theexecution of compartmentalized furrows [8]
Compartmentalized furrow is the result of a mechanical soil work that leaves furrowsinterrupted by soil mounds at adjustable intervals to form small water accumulation basins.During rainfall, excess water is accumulated in these basins so that it can be slowly absorbedby the soil, eliminating the possibility of draining outside the cultivated area. This isespecially important because, during rainfalls, the precipitation intensity often exceeds therate of water infiltration in the soil. [8] Experience has shown that wind erosion can also bereduced. On sloping land, by practicing the interrupted furrows, prevention and reduction ofpuddle forming also occurs in the low areas of the cultivated land.
METHODOLOGYWatering is both an important technological sequence in the crop plant
agrotechnology, as well as the most important technical means of eliminating the water deficitin the soil, constituting the infrastructure of sustainable development. Technologies to combatthe effects of climate change have evolved to reduce the water consumption of plants(dripping, micro-spraying), to obtain high water capitalisation by reducing losses andassociating with other works (fertilization, chemical weeding, etc.) and to use other sources ofwater (waste water from animals or rural, urban and industrial environment). Furrows used inagriculture are of great importance for agricultural production and are a major component ofthe agricultural ecosystem [5],[6],[7],[8]. It is estimated an increase in agricultural productionper hectare by 20% in agricultural crops with interrupted furrows. This is explained by theinfiltration of a larger amount of water at the plant roots and by the reduction of the soilerosion phenomenon [3].
In the case of continuous or interrupted furrows it is intended to obtain sections of thefurrow as large as necessary to carry and accumulate as much water as possible. In soils withpoor drainage, growers prefer to use alternative furrows.
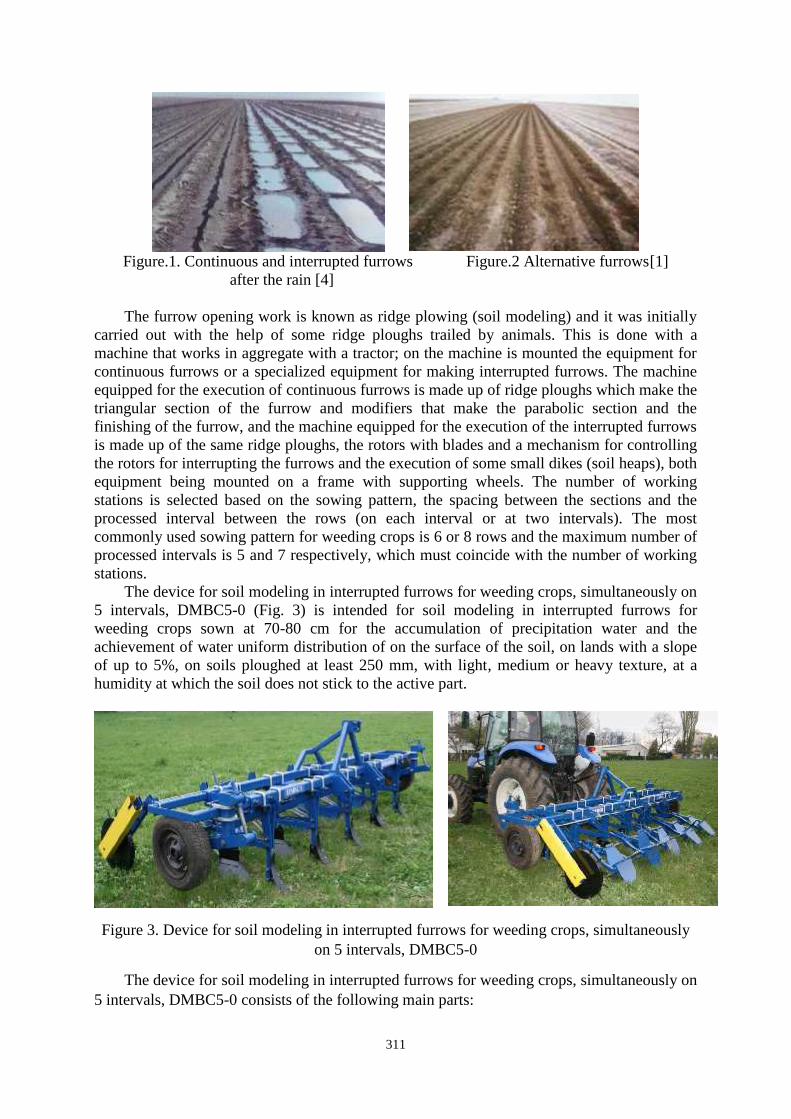
311
Figure.1. Continuous and interrupted furrows Figure.2 Alternative furrows[1]after the rain [4]
The furrow opening work is known as ridge plowing (soil modeling) and it was initiallycarried out with the help of some ridge ploughs trailed by animals. This is done with amachine that works in aggregate with a tractor; on the machine is mounted the equipment forcontinuous furrows or a specialized equipment for making interrupted furrows. The machineequipped for the execution of continuous furrows is made up of ridge ploughs which make thetriangular section of the furrow and modifiers that make the parabolic section and thefinishing of the furrow, and the machine equipped for the execution of the interrupted furrowsis made up of the same ridge ploughs, the rotors with blades and a mechanism for controllingthe rotors for interrupting the furrows and the execution of some small dikes (soil heaps), bothequipment being mounted on a frame with supporting wheels. The number of workingstations is selected based on the sowing pattern, the spacing between the sections and theprocessed interval between the rows (on each interval or at two intervals). The mostcommonly used sowing pattern for weeding crops is 6 or 8 rows and the maximum number ofprocessed intervals is 5 and 7 respectively, which must coincide with the number of workingstations.
The device for soil modeling in interrupted furrows for weeding crops, simultaneously on5 intervals, DMBC5-0 (Fig. 3) is intended for soil modeling in interrupted furrows forweeding crops sown at 70-80 cm for the accumulation of precipitation water and theachievement of water uniform distribution of on the surface of the soil, on lands with a slopeof up to 5%, on soils ploughed at least 250 mm, with light, medium or heavy texture, at ahumidity at which the soil does not stick to the active part.
Figure 3. Device for soil modeling in interrupted furrows for weeding crops, simultaneouslyon 5 intervals, DMBC5-0
The device for soil modeling in interrupted furrows for weeding crops, simultaneously on5 intervals, DMBC5-0 consists of the following main parts:

312
frame with the triangle for coupling to the tractor; wheels for adjusting and limiting the device working depth; knives for soil loosening before the ridge ploughs; ridge ploughs; equipment for furrows interruption.
The frame of the device is made of two square cross-section pipes, parallel to each other,welded to the ends by welded beams. The triangle for three-point coupling to the tractor (ISOII) is welded to the front of the frame. On the sides of the frame are mounted some removablerods that will increase the working width of the device from 3600 mm to 5200 mm. The frameclearance will be adjusted according to the height of the plants by means of the looseningknives, respectively of the ridge ploughs, holders.
The wheels for adjusting and limiting the working depth are of metallic or rubber bandtype, currently used in soil working machines. The wheels have a diameter of 500 mm and aremounted on the equipment frame, on the sides. The working depth of the active parts iscontinuously adjusted by lifting or lowering the wheels by means of a spindle screw actuatedby a crank. The lateral demountable bars and support wheels are positioned on the frame,respectively on the interval between the plant rows. A working station consists of a looseningknife, a ridge plough and a pallet rotor with control equipment.
Figure 4. Working section Figure 5. Loosening knife Figure 6. Ridge plough
The 3, 4 or 5 loosening knives are fastened by means of special clamps and cases of thesquare pipe. The knives are chisel type and can penetrate into the soil at a depth of maximum20 cm. The cases allow the vertical slide of knife holders; they can be adjusted to the plantheight. Fixing the knife in a certain position is done by turning a screw. The 3, 4 or 5 ridgeploughs have the holders fastened by means of clamps and cases on the second square pipe,behind the loosening knives and are mounted at variable distances on the device frame,according to the furrow pattern. The ridge plough consists of a removable knife, a ridge-carrying support, two breasts and a vertical support. The breasts can be mobile or fixed,making a variable or fixed opening. The ridge-carrying support will be fastened by means oftwo screws to the ridge plough support, which adjusts the angle of ridge plough penetrationinto the soil and constitutes the overload safety device. The ridge ploughs are made ofproperly treated manganese sheet. The angle of ridge plough penetration into the soil can beadjusted by rotating the ridge-carrying support about the vertical support. The verticalsupport, which is a rectangular cross-section pipe, is fastened by means of special two clampsand one case to the second rear pipe of the frame. Adjusting the vertical support in thefastening case allows the frame to pass over the plants in the weeding crops. When theagricultural machine passes, the plants must not exceed 60 cm in height in order not to
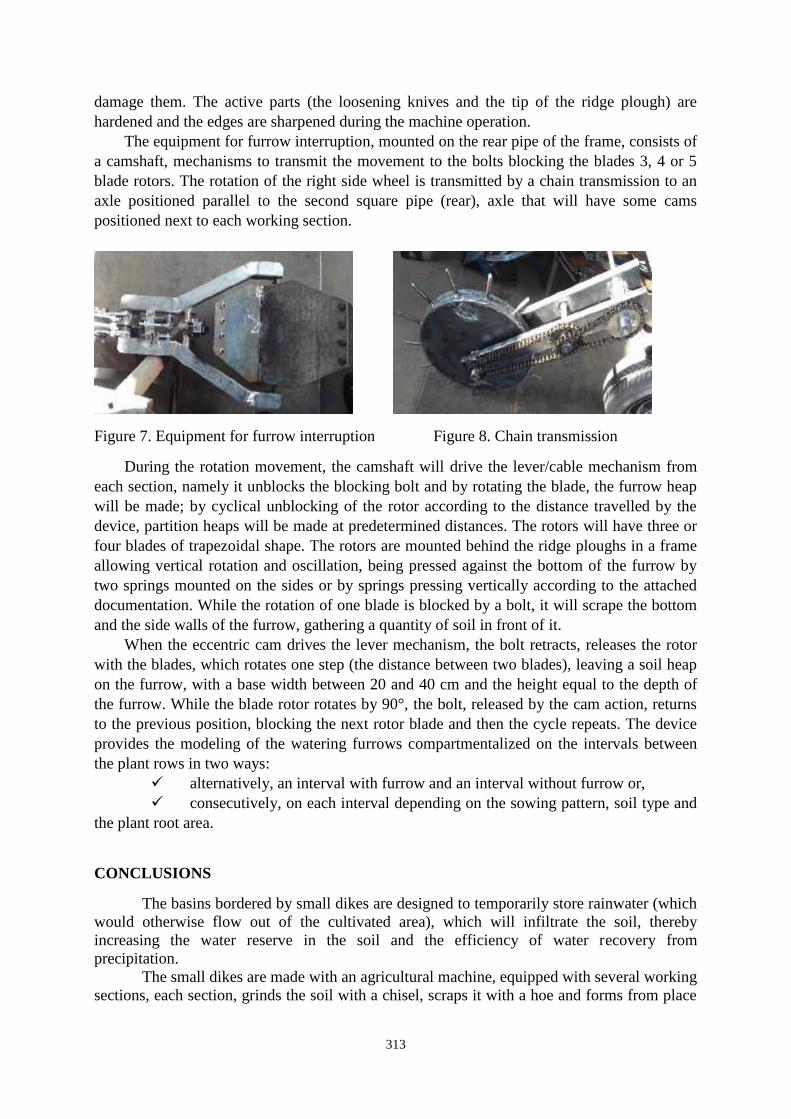
313
damage them. The active parts (the loosening knives and the tip of the ridge plough) arehardened and the edges are sharpened during the machine operation.
The equipment for furrow interruption, mounted on the rear pipe of the frame, consists ofa camshaft, mechanisms to transmit the movement to the bolts blocking the blades 3, 4 or 5blade rotors. The rotation of the right side wheel is transmitted by a chain transmission to anaxle positioned parallel to the second square pipe (rear), axle that will have some camspositioned next to each working section.
Figure 7. Equipment for furrow interruption Figure 8. Chain transmission
During the rotation movement, the camshaft will drive the lever/cable mechanism fromeach section, namely it unblocks the blocking bolt and by rotating the blade, the furrow heapwill be made; by cyclical unblocking of the rotor according to the distance travelled by thedevice, partition heaps will be made at predetermined distances. The rotors will have three orfour blades of trapezoidal shape. The rotors are mounted behind the ridge ploughs in a frameallowing vertical rotation and oscillation, being pressed against the bottom of the furrow bytwo springs mounted on the sides or by springs pressing vertically according to the attacheddocumentation. While the rotation of one blade is blocked by a bolt, it will scrape the bottomand the side walls of the furrow, gathering a quantity of soil in front of it.
When the eccentric cam drives the lever mechanism, the bolt retracts, releases the rotorwith the blades, which rotates one step (the distance between two blades), leaving a soil heapon the furrow, with a base width between 20 and 40 cm and the height equal to the depth ofthe furrow. While the blade rotor rotates by 90°, the bolt, released by the cam action, returnsto the previous position, blocking the next rotor blade and then the cycle repeats. The deviceprovides the modeling of the watering furrows compartmentalized on the intervals betweenthe plant rows in two ways:
alternatively, an interval with furrow and an interval without furrow or, consecutively, on each interval depending on the sowing pattern, soil type and
the plant root area.
CONCLUSIONS
The basins bordered by small dikes are designed to temporarily store rainwater (whichwould otherwise flow out of the cultivated area), which will infiltrate the soil, therebyincreasing the water reserve in the soil and the efficiency of water recovery fromprecipitation.
The small dikes are made with an agricultural machine, equipped with several workingsections, each section, grinds the soil with a chisel, scraps it with a hoe and forms from place

314
to place at predetermined distances soil dikes to collect water from precipitation. The machineis used on a low slope land in arid and semi-arid areas where crops lack water.
The practice has been widely adopted due to new watering technologies, as well as tothe equipping of agricultural machinery with devices for making interrupted furrows. Theyusually make, in the furrow, small dikes at intervals of 1-2m. Some growers do not openfurrows on the range trailed by tractor wheels during chemical weeding or other agriculturalworks.
ACKNOWLEDGEMENTThis work was funded by the Ministry of Research and Innovation, within the project entitledPN 18 30 01 01: “Experimental research on the aerial mapping of agricultural cropscorresponding to the Agriculture 4.0 concept”, ctr. 18N/16.03.2018
References[1]. Edwin C. and Alexander U.U. (1986), Texas Agricultural Extension Service; ** Texas AgriculturalExperiment Station, 1986.[2]. AQUAPROIECT SA., Device for soil modeling in interrupted furrows in two constructive solutions.Financing contract no. 4639/2017.[3]. Biolan I., Serbu I., Mardare F., Biolan C., Modern irrigation techniques for agricultural crops, AGIRpublisher, 2015;[4]. Biolan I., Serbu I., Tusa G.C., Mardare F., Agricultural crops irrigation, technologies, AGI publisher, 2016.[5]. Guo X.N., Hu T.S., Tan G.M., Farmland drainage standard based on multi-attribute analysis, Transactionsof the Chinese Society of Agricultural Engineering, 25, pp. 64-70, 2009.[6]. He X.C., Shao D.G., Liu W.Y., Research progress and prospect of resource utilization of farmlanddrainage, Transactions of the Chinese Society of Agricultural Engineering, vol. 22 pp.176-179, 2006.[7]. Li Y.H., A review of environmental effect and ecosystem function of farmland drainage ditch. Heilongjiang
Science and Technology Information, 2016;[8]. Song C.J., Li Q., Wang Y., Research overview of ecosystem effect of farmland drainage ditch, Modern
Agricultural Sciences and Technology vol. 2 pp. 201-203, 2014.
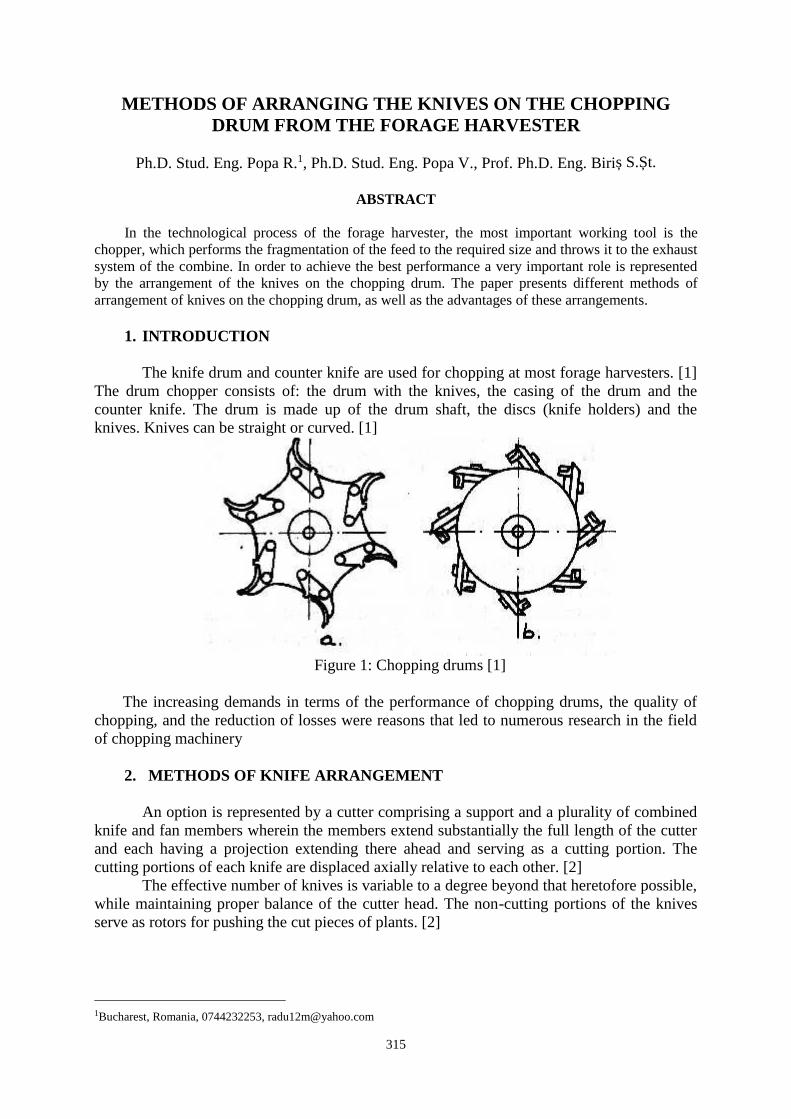
315
METHODS OF ARRANGING THE KNIVES ON THE CHOPPINGDRUM FROM THE FORAGE HARVESTER
Ph.D. Stud. Eng. Popa R.1, Ph.D. Stud. Eng. Popa V., Prof. Ph.D. Eng. Biriș S.Șt.
ABSTRACT
In the technological process of the forage harvester, the most important working tool is thechopper, which performs the fragmentation of the feed to the required size and throws it to the exhaustsystem of the combine. In order to achieve the best performance a very important role is representedby the arrangement of the knives on the chopping drum. The paper presents different methods ofarrangement of knives on the chopping drum, as well as the advantages of these arrangements.
1. INTRODUCTION
The knife drum and counter knife are used for chopping at most forage harvesters. [1]The drum chopper consists of: the drum with the knives, the casing of the drum and thecounter knife. The drum is made up of the drum shaft, the discs (knife holders) and theknives. Knives can be straight or curved. [1]
Figure 1: Chopping drums [1]
The increasing demands in terms of the performance of chopping drums, the quality ofchopping, and the reduction of losses were reasons that led to numerous research in the fieldof chopping machinery
2. METHODS OF KNIFE ARRANGEMENT
An option is represented by a cutter comprising a support and a plurality of combinedknife and fan members wherein the members extend substantially the full length of the cutterand each having a projection extending there ahead and serving as a cutting portion. Thecutting portions of each knife are displaced axially relative to each other. [2]
The effective number of knives is variable to a degree beyond that heretofore possible,while maintaining proper balance of the cutter head. The non-cutting portions of the knivesserve as rotors for pushing the cut pieces of plants. [2]
1Bucharest, Romania, 0744232253, [email protected]

316
Figure 2: Cutter head with offset cutting edges [2]
An alternative forage harvester was developed to reduce machine energy requirementsby utilizing an upward cutting cut-and- throw configuration. The cutterhead was invertedfrom its conventional orientation so that the knives entered the mat of uncut material frombelow. This upward cutting concept allowed the chopped material to be thrown directly out ofthe cutterhead without the subsequent friction loss of sliding the chopped material one-halfrevolution around the cutterhead housing as typical with conventional cut-and- throwconfigurations. [3]
Conventional downward cutting cutterhead Experimental upward cutting cutterhead
Figure 3: Schematic of different cutting configurations for cut and throw forage harvesters [3]
Experiments were performed to compare the upward cutting cut-and- throw machineto the cut-and- blow machine and a conventional cut-and- throw machine. The upward cuttingcut-and- throw reduced the energy requirements by 31 and 37% compared to the conventionalcut-and- throw and cut and-blow machines, respectively. [3]

317
Table 1: Energy requirements of upward cutting cut-and-throw, conventional cut-and-throw,and conventional cut-and-blow harvesters [3]
MachineConfiguration
MoistureContent (%)
FeedRate(t/ h)
SpecificEnergy
(kWh /t)
Mean Lengthof Cut(mm)
Cut-and-blow 63.4 13.5 1.98 10.9
Conventionalcut-and-throw
64.0 13.8 1.80 11.4
Upwardcutting cut-and-throw
64.0 13.3 1.25 12
The upward cutting cut-and- throw reduced overall machine energy requirementsbecause the blower was eliminated and friction loss in the cutterhead housing was virtuallyeliminated.
Nowadays, most manufacturers use V-shaped knife configuration to ensure aconsistent chopping of the crop. Most choppers also feature automatic knife sharpeningsystems.
Figure 4: Class V-Max chopping drum [4]
V-shaped curved knife configuration advantages:• Optimal cutting precision ;• Extremely smooth, energy-saving action;• High strength due to the way the curved blades are mounted, the
cutting forces are taken directly by the star-shaped cylinder. [4]
Figure 5: Fendt chopping drum [5]

318
Another option used by current manufacturers is the arrangement of knives in cascade.
Figure 6: John Deere 800 Series chopping drum [6]
The knives are mounted on straight supports to provide a vertical cut, directly throughthe material, which results in a uniform flow of material across the entire width of the counterknife, the grain breaker and the blower housing. [6]
3. CONCLUSIONS
Nowadays, most manufacturers use V-shaped knife configuration to ensure a consistentchopping of the crop. Also systems with cascade knives are also used.
To reduce the energy demands of choppers, the knives can be mounted so as to enter thecrop from the below.
In order to maintain the proper balance of the chopper, the cutting portions of each knifemay be displaced axially from one another.
References
[1] Neculăiasa V., Procese de lucru şi maşini agricole de recoltat, Editura A 92 Iaşi, 1995;[2] M. L. HOCH, Forage harvester having cutter head with offset cutting edges, 1968;[3] K. J. Shinners, An upward cutting cut-and- throw forage harvester to reduce machine energy requirement,
American Society of Agricultural Engineers, 1991;[4] http://www.claasofamerica.com/product/forage-harvesters/jaguar980-930;[5] http://www.fendt.com/int/7712.asp.[6] https://www.deere.com/en_US/products/equipment/hay_and_forage_equipment/forage_harvesters/8000_s
eries_self_propelled_forage_harvesters/8000_series_spfh.page;

319
SEPARATION BY SIZE AND EXTRACTION OF VALUABLECOMPOUNDS FROM MEDICINAL PLANTS OF NETTLE
Pruteanu A.1), David L.2), Ferdeș M.2), Voicea I.1), Niţu M.1), Zǎbavǎ B. Şt.2)
1)INMA Bucharest; 2) UPB BucharestE-mail: [email protected]
ABSTRACTNettle (Urtica dioica L.) is a well-known plant species medicinally and is used extensively in
pharmaceutical formulations and is also used for a variety of human ailments. This crop has gained theinterest both scientifically and commercially because it is the source of many added-value natural productsby exploiting all the plant parts (stem, leaves, roots and seeds).
The technological processing of medicinal plants comprises the technological operations of drying,chopping, separating the cut plants, extracting active principles in different solvents, using differentextraction methods, etc. In the production of medicinal plants, the quality of phyto-therapeutic products isgiven by the quality of the plant raw material, by the quality of the processing works and by the content andquantity of active principles in the plant.
This paper presents experimental data on the separation by size of dried and chopped plants andextraction of valuable active principles from nettle (Urtica dioica L.) in water by the percolation process.
Through the application of modern processing operations by producers and processors, many types ofmedicinal plants can be valorized in a superior manner.
1. INTRODUCTION
Nettle (Urtica dioica L., Urticaceae), fig. 1, is a perennial herb that grows up to 2 m tall froma creeping rootstock. The stem is square, the leaves are opposite and sharply toothed, and both arecovered with stinging hairs. The small greenish flowers are found in clusters in the leaf axils, withmale and female flowers on separate plants [11].
Figure 1 Urtica dioica [4]
Nettle is common around sloughs, along stream banks, in waste places and moist woods. Itprefers damp, rich soil, pH 6 - 7, in full sun or partial shade, and lots of moisture. Extra nitrogenwill increase yields. Nettle is said to increase the oil content of valerian, sage, marjoram, mint andangelica if planted 1 nettle:10 of the other plant, and will activate decomposition in compost piles[11].

320
Seeds of nettle are hard to germinate. Root divisions in the fall are the best method ofpropagation, using 10 cm pieces of root. The plants are harvested before they flower, while stilltender, so the whole plant can be used. If the plants are larger and woody, only the leaves can beused. Two or three harvests are possible in a year. The plants should be kept in a dark place afterdrying (they are non-stinging after they are dried). Fresh yields of about 20.000 kg/ha are expected[11].
Scientific literature reports the presence of flavonoids (patuletin, rutin and other heterosides ofkaempferol, quercetin and isorhamnetin), coumarins (scopoletin), phenolcarboxilic acids, (0.5%caffeoylmalic acid in Urtica dioica [6].
Nettle has great medicinal potential. It has antioxidant, antimicrobial, antiulcer and analgesicproperties. Its extract shows in vitro inhibition of several key inflammatory events that cause thesymptoms of seasonal allergies. The herb is used as a tea for anemic children. Nettle is nutritionallyhigh in vitamins A, C and D, also minerals iron, manganese, potassium and calcium. It is popularlycooked green in many areas due to its high protein contents [2].
Various parts of the fiber nettle plant can be used as food, fodder and as raw material fordifferent purposes in cosmetics, medicine, industry and biodynamic agriculture. Organicallyproduced fibers are in demand by the green textile industry and show potential that is economicallypromising [8].
This paper presents experimental data on the separation by size of dried and chopped plantsand extraction of valuable active principles from nettle (Urtica dioica L.) in water by thepercolation process.
2. METHODOLOGY
Nettle (Urtica dioica L.), used in experiments was identified and harvested from spontaneousflora according to morphological and biological characteristics [1, 3] of the species. Herb wasnaturally dried, in the shadow up to storing humidity (13 %, at most), cleaned of foreign bodies(inorganic materials or other plants, damaged parts) according to provisions from Pharmacopoeia[9,10], then it was chopped in bulk by medicinal plants chopper of HerbCut model TS (fig.3 a) ,equipped with a knife of gate shear type set at 4 mm size.
In order to determine the dimensional characteristics of the chopped plant material, fivesamples were analyzed, for each sample was weighed on the precision scales a quantity of 120 gof plant material that was sieved on the sieve classifier (fig.3 b), at the amplitude of 50 mm, for 5minutes. On each sieve was found a quantity of plant material that represented the totality offragments with smaller sizes than the meshes of the upper sieve, and with larger sizes than themeshes of the sieve through which it passed.
For thyme chopped at 2 mm, the sieve setting was the following one: collector – 2.2 – 3.15 –4.5 – 6.3 mm, and the collecting of material on sieves in presented in figure 2.
Figure 2 – Nettle fragments separated on sieves with different meshes

321
After setting the dimensional fractions, was passed to the extraction of bioactive substances ineach fraction. The aqueous extract was obtained by percolation using a Timatic percolator, (fig. 3c). They were weighed by 0.5 kg of nettle, for each of the four fractions, these were introduced oneat a time in a special cloth bag and then inserted into the 12 liter percolating compartment, addingdistilled water to the appropriate level. The extraction time was 180 minutes, at a pressure of 3 bar.
For extracts obtained from each fraction were made dilutions and were measured quantitativelythe spectra of absorption with the UV-VIS spectrometer with double fascicule.
For the analysis of extracts with the spectrometer, was first performed a correction to thebaseline of 380-780 nm with distilled water, then the extracts were diluted with the dilution factor500/1 and 1000/1 for water extracts.
a) Chopped with HerbCutModel TS [5]
b) Separation with vibratorysieve shaker AS 200 basic[7,12]
c) Extraction with Timaticpercolator [13]
Figure 3 – Equipments for processing medicinal plants of nettle
3. RESULTS
Mass and percentage values obtained after classifying are shown in table 1.
Table 1 – Distribution by fraction sizes of nettle fragments
Limits ofdimensional
fractions of nettle[mm]
Fraction Sample number[g] Averageof
samples[g]
Percen-tages[%]
1 2 3 4 5
0.1-2.8 I 17.10 16.08 17.09 16.18 15.46 16.38 13.652.9-4.0 II 70.46 72.14 68.26 71.18 73.85 71.18 59.324.1-5.6 III 20.34 17.90 21.67 19.85 18.55 19.66 16.395.7-8.0 IV 12.10 13.87 12.98 12.79 12.14 12.78 10.65
Sample average [g] 120 120 120 120 120 120 100
After analyzing the spectra of absorption obtained, it was possible to state the concentration foreach extract obtained from the thyme fractions.
The spectra of absorption for the extracts obtained from nettle fractions in water are shown infigure 4 with dilution factor 1/500.

322
Fraction I
Fraction II
Fraction III
Fraction IVFigure 4 - Spectrograms with dilution 1/500 in water for nettle fractions
The spectra of absorption for the extracts obtained from nettle fractions in water are shown infigure 5 with dilution factor 1/1000.

323
Fraction I
Fraction II
Fraction III
Fraction IVFigure 5 - Spectrograms with dilution 1/1000 in water for nettle fractions

324
4. CONCLUSIONS
From analyzing the dates of the table 1 on the distribution by fraction sizes of nettle fragmentsdepending on the mesh size of the classifier, recommendations can be given regarding the processof sorting medicinal plants
Fragments and sizes of fractions can be identified: between 0.1 - 2.8 mm fraction I, between2.9 - 4.0 mm fraction II, between 4.1 - 5.6 mm fraction III and between 5.7 - 8.0 mm fraction IV.
From table 1 is observed the maximum percentage was obtained in fraction II (59.32 %),followed by fraction III (16.39 %), then fraction I (13.65%) and fraction IV (10.65 %).
Data obtained from spectrograms offers information regarding the qualitative and quantitativeanalysis of water extracts from the nettle. The qualitative analysis is identified through the spectrumof absorption from which structural information can be deducted on the basis of peaks. Thequantitative analysis is identified from the amplitude of absorption and depends on theconcentration of the main substance in the solution, the substance (phenolic compounds) withantioxidant, antimicrobial, anti-inflammatory character etc.
The spectra from diluted water extracts of nettle show a maximum absorbance of 2.6 forfraction II, 2.4 for fraction I, 1.6 for fraction III and 1.45 for fraction IV at a dilution of 500/1. Fordilution of 1000/1 the maximum absorbance show at fraction II (abs. = 1.1), at fraction I (abs. =1.0), at fraction III (abs. = 0.8) and at fraction IV (abs. = 0.75).
General conclusion is that dry bulk nettle at 4 mm is well separated on the site with the holesdimensions of 2.9-4.0 mm. Extracts in water obtained from nettle fragments of these dimensionshave a high concentration in phenolic compounds.
The sorting of medicinal plants on dimensional fractions is an important premise for makingquality phyto-therapeutic products.
Knowing the dimensional characteristics of the plant material is important for improvming theprocesses of separation and extraction, for building specialized equipment with high performancesin processing medicinal plants.
References
[1] Ardelean A., Mohan Gh., Romanian Medicinal Flora, All Publishing House, Bucharest, 2008.[2] Bisht S., Bhandari S., Bisht N. S., Urtica dioica (L): an undervalued, economically important plant, AgriculturalScience Research Journals Vol. 2(5); pp. 250-252, May 2012.[3] Bojor O., Guide of medicinal and aromatic plants from A to Z, Ed. Fiat Lux, Bucharest, 2003.[4] Chirilǎ M., Cioarǎ I., Nettle fiber (Urtica dioica), between myth and reality, Buletinul AGIR nr. 3/ iulie – septembrie2016, pp. 19-25.[5] Muscalu A., Prutenu A., David L., Chopping of medicinal and aromatic plants, ISB-INMATEH Agricultural andMechanical Engineering 2014, Bucharest, pp. 103-110.[6] Nencu I., Vlase L., Istudor V., Tamas M., Preliminary research regarding Urtica urens L. and Urtica dioica L.,Farmacia, 2015, Vol. 63, 5, pp. 710-715.[7] Pruteanu A., David L., Vlăduţ V., Muscalu A., Researches on quality of nettle (Urtica dioica) screening process inorder to obtain bioactive extracts, U.P.B. Scientific Bulletin, Series D, Vol. 79, Issue 1, 2017, pp. 267-278.[8] Vogl C.R., Hartl A., Production and processing of organically grown fiber nettle (Urtica dioica L.) and its potentialuse in the natural textile industry: A review, Volume 18, Number 3, 2003, American Journal of Alternative Agriculture,pp. 119-128.[9] *** European Pharmacopoeia , The Fifth Edition, 2005.[10] *** Romanian Pharmacopoeia, Edition X, Medical Publishing House, 1993.[11] https://www.gov.mb.ca/agriculture/crops/production/stinging-nettle.html[12] https://www.retsch.com/products/sieving/sieve-shakers/as-200-basic/function-features/[13] http://www.timatic.it/index.php/en/products/extractors-of-active/timatic-duo

325
ROBOTS FOR INTERVENTION AND EVALUATION OF THE SITUATION INDISASTER AREAS
Radu-Iulian Rădoi1, Ștefan Trache2, Alin Mocioi2, Iulian-Claudiu Duțu3
1INOE 2000 – IHP Bucharest;2“Alexandru Ioan Cuza” Police Academy – Fire Department;
3University Politehnica of Bucharest - Faculty of Biotechnical Systems Engineering
ABSTRACT
Periodically in the world take place disasters such as explosions followed by fires,earthquakes, industrial or nuclear accident. The intervention of rescuers afterdisasters is oftendangerous. It is dangerous for people to get into the scene immediately because at that timethere may be an earthquake replica or, in case of fires, an explosion of combustible gascontainers or leakage of dangerous substances.In some countries mobile robots have developed that can enter in places where man can not.These robots are equipped with various sensors for collecting information. Informationobtained with specialized robots enables rescue experts to reduce response time and interveneon-site without risk to personnel.The paper presents some robot models, an example of a block diagram with components andtypes of missions that disaster intervention robots can perform.
1. INTRODUCTION
Robots developed by research of firms or universities from US, Japan, EU, Russia andothers, have different sensors, obstacle detection systems, high resolution cameras, datatransmission systems and teleoperation systems. Robots can be configured as required withdifferent sensors and modules to participate in different types of missions. Some variants haveautonomous navigation systems or based on a predefined route. These robots are operated byteams that collaborate with the intervention teams (firefighters, rescuers, volunteers) [1].Information obtained through specialized robots enables rescue experts to reduce responsetime and intervene on-site without risk to personnel. Some robot models have been used innuclear contaminated areas (e.g. Fukushima power plant).
2. MODELS OF INTERVENTION ROBOTS REALIZED IN THE WORLD
The PackBot robot (figure 1) is a multi-mission robot developed and manufactured byEndeavor Robotics [2]. It was designed for use by fighters in dangerous missions in areas ofhigh-threat combat. The robot can perform surveillance and reconnaissance missions, CBRNdetection, the release of objects on roads or buildings, the handling of explosive objects andthe inspection of vehicles and people.
The robot has a length of 68.6 cm with the front tracks being folded and 88.9 cm with thefront tracks extended. The height without the manipulating arm is 17.8 cm and the width withfront tracks is 52.1 cm. It weighs about 10.89 kg without batteries.
1Cutitul de Argint street, No. 14, Bucharest, Romania, Tel. +4021 336 39 91, [email protected] Morarilor, No. 3 Bucharest, Romania, tel. +4021 25556683313 Splaiul Independentei, Bucharest, Romania , [email protected]

326
The robot is equipped with a wide-angle inspection camera, a large zoom camera, andwhite and infrared light sources.
The robot is equipped with a 2.4 / 4.9 GHz digital communication system, two way radiosystem and GPS receiver. Robot operation is done remotely by two game-style handcontrollers. The operator control unit can store high-resolution images and display thelocation and status of the battery. The two Li-ion batteries provide robot operation for 4 hours.This robot moves at 9.3 km / h and can climb 60 degrees slopes.
Fig. 1 Endeavor Robotics Packbots for emergency situations (Photo: army-technology.com)
Another robot named Octopus (figure 2) developed by Waseda University for DisasterResponse wanted to be mobile and to be able to remove the debris from the collapsedbuildings [3]. It is provided with 4 arms with grippers for removing debris. The 4 foldingtracks allow it to overcome obstacles and provide stabilization in situations where there is adanger of rollover. The 4 arms can also be used to stabilize it in certain situations. The robotis hydraulically driven and is operated by two operators.The robot arms can each raise about 200 kg. The robot can carry extra equipment, including aremotely operated chain saw and a laser capable of cutting through the stone.
Fig. 2 Octopus, developed by Waseda University in Japan (Photo: Waseda Univ.)
The Mastiff robot (figure 3) is designed with tracks that allow it to cross obstacles includingstairs [4]. It is a versatile robot that can be equipped with 360 degree camera, LED lights andmulti-axis arm. The robot arm allows the operator to open doors, move debris and inspection

327
of objects. Various options are available for the robot, such as: gripper tools, HAZMATsensors and storage case. The operating time can reach 8 hours, the maximum travel speed is~ 2 km / h, the ground clearance is 50 mm, the dimensions of robot are: W ~ 500 mm, L ~1000 mm, H ~ 660 mm. The optional arm can be with 4 or 6 axes, and the full load with thefully extended arm is ~ 9 kg.
Fig. 3 The rescue robot HD2 - “Mastiff” developed by the SDR Tactical(Photo: sdrtactical.com)
3. STRUCTURE OF THE INTERVENTION ROBOTS
Robots for intervention or field data collection in areas of disaster have a structure accordingto the scheme of Figure 4. They are made in the form of a mobile platform built as a housingwith tracks, wheels and suspension system, electric motors, transmission, brakes, andclutches. The power source is a Li-ion battery that provides a few hours of autonomy. Thecontrol system contains a series of navigation / positioning sensors such as GPS receiver, 3-axis accelerometer, gyroscope, magnetometer, atmospheric pressure sensor. The platform canbe equipped with an obstacle detection system that helps the operator in certain situationswhen the visibility is not good or with an autonomous navigation system for return to thestarting point in case of radio link loss. In this case the system uses the log with previouslystored GPS coordinates.
Fig. 4 Example for a block diagram of an intervention robot

328
For remote control, the robot can be equipped with a 2.4 GHz digital radio communicationsystem that can receive the information transmitted by the robot sensors and providecommands for moving, lighting, directing video cameras or to various optional modules. Therobot may be equipped with optional modules to perform specific tasks: gas detection,radiation, fire detection, finder for surviving people, area recognition, or multi-axis armequipped with a gripper to drive devices or move objects. For mounting optional modules, therobot platform is equipped with mechanical fastening systems and connectors for electricalsignal coupling. Optional modular equipment for the robot can be: high resolution videocamera (Figure 5) [5], high zoom inspection camera, IR or UV camera (Figure 6) [6], Multigas detector, radiation sensor, microphone, LED projector, aerosol fire extinguishing system,etc.
Fig. 5 Camera full HD Toshiba IK-HR1D Fig. 6 UV industrial camera(Photo: visionconnection.com)
Remote control of robots is done via radio link with a control unit equipped with screen andvarious control switches. Radio communication can be done via 2.4 GHz Wi-Fi, via digitalcoded channels or by GSM network (gprs, 3G). The COFDM encoding system is immune tointerference being used in DVB broadcasts and also introduced in military surveillance [7].COFDM (Coded Orthogonal Frequency Division Multiplexing) is a modulation scheme thatdivides a single digital signal across multiple carriers simultaneously. The signals are sent atright angles to each other (hence, orthogonal) so they do not interfere with each. This givesresilience to multpath fading. Such a control unit is that of figure 7 made by Sdr Tactical inthe USA. This is included in a Pelican briefcase of dimensions 360 x 300 x 200 mm, beingweather resistant and durable.
Fig. 7 Operator control unit - OCU (Photo: robotshop.com)
The unit uses COFDM radio system and has a 7 "color display. The user interface is madewith Industrial Joysticks and includes the following components: Video Server, Decoder,

329
Data Control Bridges, Network Switches, etc. The internal battery has a 4 hour autonomy andan external battery or a source for extended deployments can be used. As an indicator, the unitcontains: radio status, signal strength indicator and 4 line data LCD for robot and remotestatus and setup.
3. MISSIONS THAT CAN BE PERFORMED BY ROBOTS FOR DISASTERINTERVENTION
The basic mission of the robots for site disaster intervention and assessment is to collectfield information with the help of specialized sensors configured specifically for each type ofmission and the preliminary processing of the information obtained from the place ofintervention, at the command center. The information obtained by the operational team can beused as informational support. The commander of the intervention can make on-site decisionsand the information can be later transmitted to the dispatcher for off-line processing.
The missions that such a robot can perform are: Specific mission to enter buildings affected by explosions or disasters (collapse of
installations construction or amenities)For this type of mission, the robotic mobile platform is equipped with: operating arm for
various devices or objects, video camera, UV / IR camera, LED projector, microphone andgas detector.
A specific task of seeking victims in burned buildings, in rooms adjacent to the burnedones
For this type of mission, the robotic mobile platform is equipped with: operating arm forvarious devices or objects, video camera, UV / IR camera, LED projector, microphone andgas detector and extinguishing agent with aerosol.
Accidents and technological damageFor this type of mission, the robotic mobile platform is equipped with: operating arm forvarious devices or objects, video camera, UV / IR camera, LED projector, microphone andgas detector and extinguishing agent with aerosol.
Accidents involving the transport of dangerous goodsFor this type of mission, the robotic mobile platform is equipped with: operating arm for
various devices or objects, video camera, UV / IR camera, LED projector, microphone andgas detector and extinguishing agent with aerosol.
Detection of potentially explosive atmospheresFor this type of mission, the robotic mobile platform is equipped with: operating arm for
various devices or objects, video camera, UV / IR camera, LED projector, microphone andgas detector and extinguishing agent with aerosol.
Detection of hazardous chemicalsFor this type of mission, the robotic mobile platform is equipped with: operating arm forvarious devices or objects, video camera, UV / IR camera, LED projector, microphone andgas detector and extinguishing agent with aerosol.
Radiation detectionFor this type of mission, the robotic mobile platform is equipped with: operating arm forvarious devices or objects, video camera, UV / IR camera, LED projector, microphone andgas detector and extinguishing agent with aerosol.

330
5. CONCLUSIONS
Disaster intervention robots can enter into tight spaces or places dangerous for people, rightafter the disasters occur.
Robots can collect information that is helpful in making quick decisions about theintervention of the evacuation teams.
These robots can be equipped with various equipment for detection of hazardous substancesor radiation, aerosol fire extinguisher device, as well as with multi-axis arm for handlingobjects.
Through video cameras, images can be captured from the spot in the visible, IR or UVspectrum, images that can help identify survivors or imminent dangers.
References
[1] http://robohub.org/robots-to-the-rescue/[2] http://endeavorrobotics.com/products#510-packbot[3] https://www.waseda.jp/top/en-news/24089[4] https://www.robotshop.com/en/superdroid-hd2-s-mastiff-tactical-surveillance-robot-w-5dof-arm.html[5] http://www.toshibacameras.com/products/prod_detail_ikhr1d.jsp[6] http://visionsconnection.com/UV-Camera.html[7]https://www.enterprisecontrol.co.uk/UserFiles/Next%20Generation%20COFDM%20Microwave%20Links%20for%20Military%20Surveillance(1).pdf
331
EVALUATION OF ENVIRONMENTAL IMPACT BY USINGCONTROL LISTS
Rusănescu Carmen Otilia1, Biriș Sorin Stefan1, Paraschiv Gigel1, Begea Mihaela1,Voicu Gheorghe1, Rusănescu Marin2, Cîrîc Alexandru1, Stoica Dorel1
Ţucureanu Marina Cristinela1
Polytechnic University of Bucharest of Romania, Faculty of Biotechnical SystemsEngineering; Splaiul Independentei, no.313, District 6, Bucharest, Romania
1) Polytechnic University of Bucharest, Faculty of Biotechnical Systems Engineering / Romania;2)Valplast Industry Bucharest
E-mail:[email protected]
ABSTRACT
This paper describes the method of environmental impact assessment using the control lists.Control lists contains a series of questions that will be considered to identify whether or not theproject under consideration has significant environmental effects. Control lists are: simple, descriptive,questionnaires, scale control lists, weighting. Control lists are used to evaluate the quality of the reportto the assessment study for the purpose of making the decision to issue the environmental agreement;to improve the environmental impact assessment process.
1. INTRODUCTION
The control lists is useful in the environmental impact assessment process. The user ofthe checklist will analyze whether the report to the evaluation study fulfills two objectives: itprovides the decision makers with all the information necessary to make the decision to issueor reject the environmental agreement; allows effective communication with stakeholders andthe general public so that they can make a useful comment on the project and itsenvironmental effects [2] Control lists can be used in two purposes: to assess the quality ofthe report to the assessment study for the decision to issue the environmental agreement; toidentify the need to improve the environmental impact assessment process [1].
2. METHODOLOGY
Checklists allow the ordering of ideas, facilitate the collection of data and information,and allow the viewing of large amounts of information and data, so that the impact can bebetter located.
Control lists can describe the impact on the environment, can be achieved through thedevelopment phase of the anthropic project (planning and design phase, construction phase,management phase, closure phase) identifies the issues to be considered in the EIA process:description of the location of the development project, the scale of design, its design and itstype (industrial, residential); topography and land use within and in the vicinity of the site,land use history, possible contamination or historical pollution (heavy metals pollution with ahigh environmental retention, soil pollution generated by an unplanned landfill); proximity ofthe site in relation to residential areas, factories, schools, hospitals, communication routes,protected areas, lakes, rivers; the history of extreme natural events (seismicity, volcanism);geomorphological risks (landslides, soil erosion); hydrological aspects (river flow and

332
configuration, water runoff on the slopes, lakes) and hydrological risks (flood risks or surfacewater pollution); local ecology (diversity or rarity of flora, fauna); air pollution and noisepollution due to project development; aesthetics of the development project (aestheticlandscape modification, fragmentation and alteration of the visual landscape structure); theeconomic impact of project development (improving quality of life, increasing income,lowering unemployment); the planning regulations and the legislative requirements to be metby the proposed development project.These aspects can fit into the environmental change that can be monitored and correctedthrough a series of actions:- establishing an acceptable time interval between sampling, measurements or observations(one month after starting anthropogenic activity, one year or more if the observed changeswere minor or insignificant);-Repeatable measurements and observations in time and space;-protected and correctly observed environmental sampling procedures;-using comparable analytical and supervisory techniques;There are five types of checklists [3]:Simple control lists are lists of standardized environmental components based on project types(energy production installations, transport systems) or areas (marine, coastal);Descriptive control lists provide for each component considered impact forecast;The questionnaires consist of questionnaires related to project activities and their effects onenvironmental components;Scale control lists provide techniques for hierarchy of the examined alternatives according tothe expected impact on each component;Weighting lists provide techniques for measuring, weighing and aggregating elementalimpacts in synthetic impact indices.The simple, descriptive, control lists, questionnaires are qualitative lists and are designed toprevent the neglect of some fundamental aspects of impact.
The list of questions provides, for each type of impact, references to the appropriateforecasting technique and sometimes to the measurement of changes in environmental factors.There are questions grouped by impact categories (physical characteristics of the land,ecological characteristics, modeling of the area, infrastructures, social services, pollution)divided into subcategories (soil, water, climate, occupation, labor supply), [4].List of questions about the soil component component [5, 6]:a) Are the geology of the area problematic in the context of the type of project beingexamined?b) Does the project involve excavations or land movements that may have adverseconsequences, such as soil erosion?c) How are soils classified from the agricultural point of view?Scale and weight control lists are, quantitative lists that also involve a scoring criterion, with adetailed impact description. Checklists of this type are operational tools for impact assessmentphases.The checklist includes a number of questions that will be considered to identify whether ornot the project under consideration has significant environmental effects. The control list isorganized in two parts: the first two selection criteria of the framing phase [4, 7]:a) the characteristics of the project;b) location of the project.On both sides there is a number of main questions in column 1, each of which is followed byother questions. The main questions relate to the possibility of an effect as a consequence ofproject placement both in the construction phase and in the phases of operation anddecommissioning. The one who uses the list will respond to each subsidiary question with

333
one of the following 4 possible answers: Yes - if an effect may occur; No - if an effect is notexpected; whether an effect is likely to occur or not; NC (not applicable) - if the question isnot relevant to the project in question. Responses are entered in column 2.For "yes" responses, the next step is to decide if the effect is likely to be significant.Identifying the possibility that the effect is significant [4,7].For each effect in which column 2 is answered by "Yes" questions will be asked (The natureof the effect - the impact is particularly complex or is it unusual in the area? The size orimportance of the effect - how much will the existing situation change? geographic effect - onwhich area the effect will be felt? How many people or how many other receptors will beaffected? Are resources or other valuable or rare features of the environment affected? Is therea risk of overcoming environmental standards? Impact will be in the short, medium or longterm? Will the impact be permanent or temporary?) and the answer will be entered in column3 of the controllist.After completing column 3, it will be decided whether the project will be subject to anenvironmental impact assessment.It may be required to carry out the environmental impact assessment if there is only one "Yes"answer in Column 3. As there are more "Yes" answers, the more justified is the request for theenvironmental impact assessment. The presence of "?" in columns 2 or 3 indicates that thereare uncertainties about the occurrence or significance of the effect, in which case theenvironmental impact assessment is required because this process will lead to clarification ofthe uncertainties.
Table 1: Ramping stage checklist [4,7]Project features
QuestionsYes /
No / ? /NC
The effect issignificant? Why?
Question - Will the project involve any of the following actions that will create changes in thearea as a result of the new investment?1. Permanent or temporary change of land use, coverage or
topography?2. Release of existing land of vegetation and buildings?3. New land use?4. Preliminary investigation of the construction phase (eg
soil tests, drillings)?Summary of comments on the characteristics of the project indicating that an environmentalimpact assessment is required and a report on the assessment study.
Environmental impact assessment depends on interactions between activities andenvironmental components. The environmental impact assessment is made according to thefollowing rules: 3 criteria of appreciation for which scores 1, 3 or 5 will be assigned,according to the tables below.
Table 2: Expansion and control (E) [4,7]Punctual Impact is limited to work Score: 1Local The impact is limited to the location of the unit Score: 3General Impact exceeds the location of the unit Score: 5

334
Table 3: Gravity (G): extent of impacts [4,7]Small The effect on the environment disappears on its own within a day Score: 1
Moderate Eliminating effects requires moderate efforts and durations Score: 3Major Effects persist and their removal requires investment Score: 5
Table 3: Frequency (F): probability of occurrence [4,7]Low Pollution occurs sporadically (quarterly or annually) Score: 1
Average Pollution occurs weekly or monthly Score: 3Great Pollution occurs continuously or daily Score: 5Impact value calculationV= E x G x F (1)
The calculation of the impact value (V) is made by the formula (1) after which the followinginterpretations will be made:Table 4: Meaning of Environmental Impact [4,7]
Impactvalue
Level Significance
V ≤ 9 Acceptable (No specific actions required) Environmental Impactinsignificant (IN)
9 < V ≤ 27 Moderate (Limited scale upgrades required) Environmental Impactsignificant (IS)V > 27 Critical (Major improvements required)
3. CONCLUSIONS
This paper describes the environmental impact assessment using the control lists. List of controlincludes a series of questions that will be taken into account to identify whether or not the projectunder consideration has significant environmental effects. Lists of control are: simple, descriptive,questionnaires, scale control lists, weighting. Lists of controls are used to assess the quality of thereport to the assessment study for the purpose of taking the decision to issue the environmentalagreement; to identify the need to improve the environmental impact assessment process. The formulafor calculating the environmental impact is also presented according to the severity and frequency ofthe environmental impact.
ACKNOWLEDGEMENTThis work was supported by Romanian national project PN-III-P2-2.1-BG-2016-0238 /Contract 22BG - Utilization in agriculture of by-products resulted from the manufacture ofbaker's yeast.
References
[1] Rusănescu, C.O., Ecological Impact Assessment, Matrix Rom Bucureşti Publishing House, 2016[2] Muntean, O.,L., Methods of environmental impact assessment, Cluj-Napoca, 2009.[3] Gisotti, G., Bruschi S. Valutare l’ambiente, Guida agli Studi dell ’Impatto Ambientale, La Nuova ItaliaScientifica, Roma, 1990.[4] Clark, B.D., Chapman, K., Disset, R., Waltern, P., Barret, M. , A Manual for the Assessment of MajorDevelopment Proposals, London, 1981.[5] Dee N. et. al., An Environmental Evaluation System for Water Resource Planning, Battelle – ColumbusLaboratories, 1972.[6]Duke K.M. et al., Environmental Quality Assessment in Multiobjective Planning, Battelle – ColumbusLaboratories, 1977.[7]. Carmen Otilia Rusănescu, Cosmin Jinescu, Marin Rusanescu, Mihaela Begea, Olimpia Ghermec, Evaluationof Air Pollution by NO2, SO2, PM10 in Bucharest, Revista de chimie, nr. 10/2017
335
METHODS OF ENVIRONMENTAL IMPACT ASSESSMENT
Rusănescu Carmen Otilia, Țucureanu Marina-Cristinela
Polytechnic University of Bucharest of Romania, Faculty of Biotechnical SystemsEngineering; Splaiul Independentei, no.313, District 6, Bucharest, Romania
ABSTRACT
Technological hazards are currently a topical feature of industrial activities. By the devastatingeffects of the environment, as well as on the economy or the safety of life, they directly affect theeconomic and social development of the exposed regions. The major accidents that can occur atindustrial sites are explosions, fires and toxic emissions. The production of such accidents can havecatastrophic consequences, as they result in human losses, "ecological" damage to the naturalenvironment and damage to the property [5].
1. INTRODUCTION
Depending on the industrial plant model and the substance used, there are a variety ofrisk analysis and identification methods worldwide. Methods of risk analysis and assessmentcarry out hazard identification and risk assessment [5].
The objective of risk analysis is to produce outputs that can be used to evaluate thenature and distribution of risk and to develop appropriate strategies to manage the risk.
Qualitative methods use descriptive terms to identify and record the consequences andprobability of events and resultant risk. Quantitative methods identify likelihoods asfrequencies or probabilities. They identify consequences in terms of relative scale (orders ofmagnitude) or in terms of specific values (for example, estimates of cost, number of fatalitiesor number of individuals lost from a rare species) [3].
Qualitative methods are the most commonly applied, as they are quick and relativelyeasy to use. Broad consequences and probability can be identified and can provide a generalunderstanding of the comparative risk of events, using a risk matrix separate events into riskclasses (ratings) [3].
Semi-quantitative approaches are widely used in an effort to overcome some of theshortcomings associated with qualitative approaches. They are intended to provide a moredetailed prioritisation of risks than qualitative risk assessments and take the qualitativeapproach a step further by attributing values or multipliers to the likelihood and consequencegroupings [3].
There are many tools and techniques available in identifying risks processes used inproject management and some of them are:
The LOPA method consists on identifying (semi-quantitatively) the estimatedprobability and (qualitatively) the severity level of an initiating event, and calculating themodified probability of the hazardous event reduced by the presumption of failure of existingindependent protection layers (IPL) [1].
The ARAMIS methodology was developed in an European project co-funded in thefifth Framework Programme of the European Commission with the objective to answer thespecific requirements of the SEVESO II directive. It offers an alternative to purelydeterministic and probabilistic approaches to risk assessment of process plants [7].
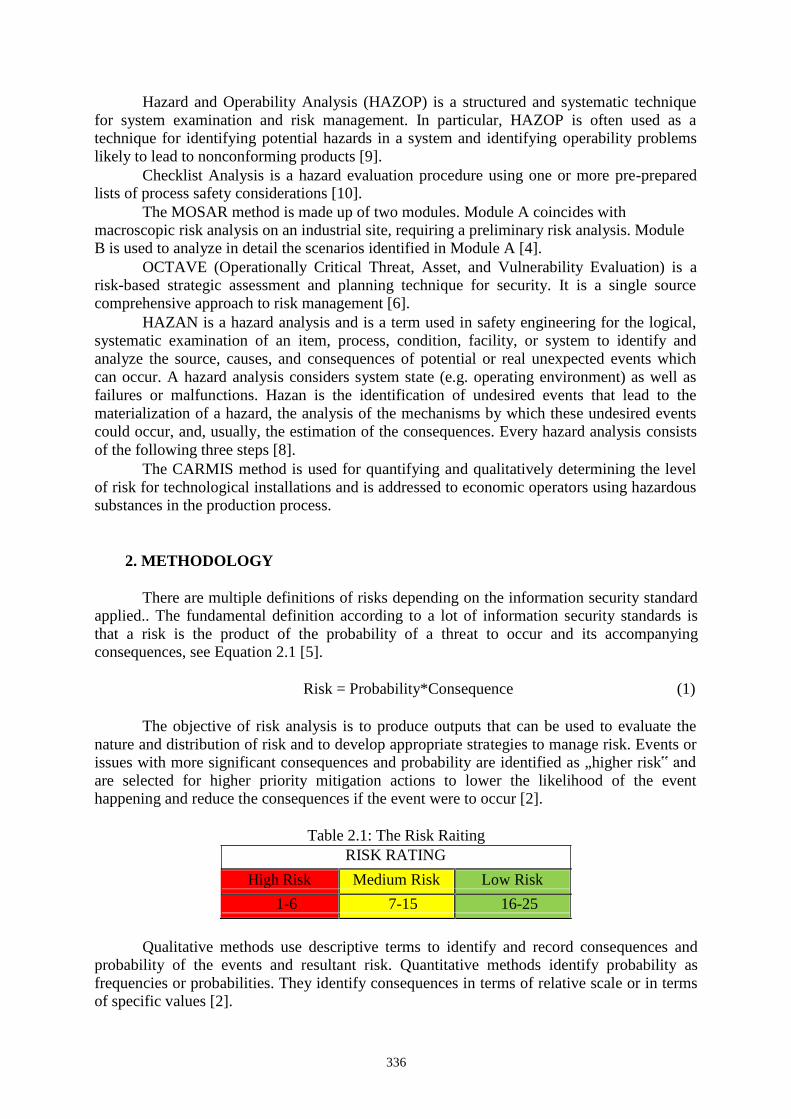
336
Hazard and Operability Analysis (HAZOP) is a structured and systematic techniquefor system examination and risk management. In particular, HAZOP is often used as atechnique for identifying potential hazards in a system and identifying operability problemslikely to lead to nonconforming products [9].
Checklist Analysis is a hazard evaluation procedure using one or more pre-preparedlists of process safety considerations [10].
The MOSAR method is made up of two modules. Module A coincides withmacroscopic risk analysis on an industrial site, requiring a preliminary risk analysis. ModuleB is used to analyze in detail the scenarios identified in Module A [4].
OCTAVE (Operationally Critical Threat, Asset, and Vulnerability Evaluation) is arisk-based strategic assessment and planning technique for security. It is a single sourcecomprehensive approach to risk management [6].
HAZAN is a hazard analysis and is a term used in safety engineering for the logical,systematic examination of an item, process, condition, facility, or system to identify andanalyze the source, causes, and consequences of potential or real unexpected events whichcan occur. A hazard analysis considers system state (e.g. operating environment) as well asfailures or malfunctions. Hazan is the identification of undesired events that lead to thematerialization of a hazard, the analysis of the mechanisms by which these undesired eventscould occur, and, usually, the estimation of the consequences. Every hazard analysis consistsof the following three steps [8].
The CARMIS method is used for quantifying and qualitatively determining the levelof risk for technological installations and is addressed to economic operators using hazardoussubstances in the production process.
2. METHODOLOGY
There are multiple definitions of risks depending on the information security standardapplied.. The fundamental definition according to a lot of information security standards isthat a risk is the product of the probability of a threat to occur and its accompanyingconsequences, see Equation 2.1 [5].
Risk = Probability*Consequence (1)
The objective of risk analysis is to produce outputs that can be used to evaluate thenature and distribution of risk and to develop appropriate strategies to manage risk. Events orissues with more significant consequences and probability are identified as „higher risk‟ andare selected for higher priority mitigation actions to lower the likelihood of the eventhappening and reduce the consequences if the event were to occur [2].
Table 2.1: The Risk RaitingRISK RATING
High Risk Medium Risk Low Risk
1-6 7-15 16-25
Qualitative methods use descriptive terms to identify and record consequences andprobability of the events and resultant risk. Quantitative methods identify probability asfrequencies or probabilities. They identify consequences in terms of relative scale or in termsof specific values [2].

337
For both qualitative and quantitative methods it is important to invest time indeveloping appropriate rating scales for likelihood, consequence and resultant risk. The fullrange of risk situations likely to be encountered within the scope of the exercise should beconsidered when developing rating scales [2].
Qualitative approaches to risk assessment are the most commonly applied. Qualitativerisk assessment methods are quick and relatively easy to use as broad consequences andprobability can be identified and they can provide a general understanding of comparative riskbetween risk events, and the risk matrix can be used to separate risk events into risk classes. Alogical systematic process is usually followed during a qualitative risk assessment to identifythe key risk events and to assess the consequences of the events occurring and the probabilityof their occurrence [2].
Table 2.2: Classification of risks
Probability
Consequence L1 L2 L3 L4 L5Almost
Likely Possible Unlikely Rarecertain
C1 - Catastrophic 1 2 4 7 11
C2 - Major 3 5 8 12 16
C3 - Moderate 176 9 13 20
C4 - Minor 2110 14 18 23
C5 - Insignificant 2415 19 22 25
Environmental impact assessment methods include the following steps:1. Setting up the evaluation team;2. Defining the Analysis System;3. Field analysis and identification of risk factors in the system;4. Drawing up and consultation of checklists;5. Elaboration of fault trees;6. Evaluating risk factors identified from the point of view of gravity;7. Evaluating the frequency of initiating events and confidence levels of security barriers;8. Elaboration of the accident scenario;9. Estimation of the direct impact on: goods, data and information, infrastructure, people;10. Evaluation of existing protection, compensation and recovery factors;11. Evaluating the performance of existing security barriers;12. Drawing up the security report as a support document for the security management
system.

338
CONCLUSIONS
The most delicate issue is the identification of risk, due to the diversity of events.Estimates of the probability of industrial risks can be determined by statistical studies, but thechances of obtaining reliable results based on the theoretical relationships are very low.However, the risk analysis remains a problem of great complexity and difficulty.
The CARMIS Method has been materialized by combining the other assessmentmethods like HAZOP, HAZAN, LOPA, OCTAVE, MEHARI, ARAMIS, Checklist. Usingthis method, a full degree of risk assessment has been achieved, understanding how the riskmay affect the population, employees, the environment and the assets and data belonging tosociety.
REFERENCES
[1] Alejandro Torres-Echeverria, On the Use of LOPA and Risk Graphs for SIL determination, 17th AnnualInternational Symposium, October 28-30, College Station, Texas, 2014[2] Amo Paithankar, Hazard Identification and Risk Analysis in Mining Industry, Department of MiningEngineering National Institute of technology, Rourkela, 2010-2011[3] Australian Government, Risk Management- Leading Practice Sustainable Development Program for theMining Industry, September 2016[4] Băbuţ Gabriel, Moraru Roland, Băbuţ Monica Crinela, Metode integrate de evaluare a riscurilor (II), Quality- Access to Success, 2010, Vol. 11 Issue 1/2, p87-91. 5p. 1 Diagram.[5] Băbuţ Monica Crinela, Metode de analiză şi evaluare a riscurilor aplicabile pentru aplasamenteleindustriale de tip Seveco, Editura Focus, Petroşani, 2011[6] Manolis Fragkos, Risk Analysis–A valuable tool for organizations/comparative analysis, Obrela SecurityIndustries, February 2006[7] Olivier Salvi, BrunoDebray, A global view on ARAMIS, a risk assessment methodology for industries in theframework of the SEVESO II directive, Journal of Hazardous MaterialsVolume 130, Issue 3, 31 March 2006,Pages 187-199[8] http://ispatguru.com/hazard-hazid-hazan-and-hazop-part-of-safety-and-risk-management/[9] http://pqri.org/wp-content/uploads/2015/08/pdf/HAZOP_Training_Guide.pdf[10] https://www.oshatrain.org/notes/4bnotes07.html
339
WOOD-BURNING STOVES WITH HIGH EFFICIENCY
Safta Victor - Viorel1, Toma Magdalena - Laura1, Zăbavă Bianca-Ştefania1, Boureci Adrian2
1University POLITEHNICA of Bucharest, Department of BIOTECHNICAL SYSTEMS2Captain NICOLAE PLEŞOIANU High School of Râmnicu Vâlcea
ABSTRACT
In this paper there are reviewed modern versions of wood-burning stoves with high efficiency,presenting the principles of operation and construction structures and highlighting the benefits of usingthem both in terms of thermal yield and in terms of reducing polluting emissions into the atmosphere.
This issue is of particular importance by providing modern, viable solutions to ensure thermalenergy in rural households.
Keywords: wood-burning stoves, high thermal efficiency, low pollutant emissions
1. INTRODUCERE
In households in rural Romania, wood stoves are commonly used to heat homes andsometimes to produce hot water or cooking.
The use of wood as a fuel is in ecological harmony with the environment, since by correctburning of wood is emitted the same amount of carbon dioxide (CO2) as the decomposition ofwood by rotting. The amount of carbon dioxide obtained by combustion or natural decompositionof the vegetable mass corresponds to the amount of carbon dioxide that the plant mass is able toreceive from the environment throughout its lifetime and converts it into oxygen released into theatmosphere and carbon which is synthesized in its own structure, which represents about half ofits mass [1].
Unlike wood, considered renewable fuel, the use of non-renewable fossil fuels (coal, oil,gas) for the production of combustion thermal energy releases and emits enormous amounts ofcarbon dioxide in the atmosphere, accumulated in millions of years in which these fossil fuelshave formed, resulting in an atmosphere global warming through the greenhouse effect.
The wood burning process is as follows: by external heating, the temperature increases andthe cellulosic structure of the wood starts to pyrolyze (that is, to decompose by thermal process),some of the decomposition products remaining inside the wood material and others leave thewood material, being released as gases. These gases react with each other, but especially withoxygen from the air, and ignite and burn with flame releasing a great amount of heat. Under theaction of heat, the pyrolytic process intensifies resulting a chain reaction in continuousexpansion, which leads to the ignition and combustion of the wood [2].
Depending on the combustion conditions (temperature, oxygen concentration, humidity,presence of fireproof products, pH, etc.), the wood pyrolysis process can take place in two waysdepending how the wood cellular structure bonds are broken throughout, namely:
- wood combustion with tar formation (see Figure 1a), which takes place at a temperature of300°C and is the "normal" way of wood burning, in which pyrolysis produces a large amount oftar, especially levoglucosan, which decomposes easily in the combustion gases under theinfluence of heat;
1 Splaiul Independentei 313, Sector 6, Bucharest, 0724017310, [email protected]

340
- wood combustion with char formation (see Figure 1b), in which cellulose is firsttransformed into unstable "active" cellulose, which then decomposes resulting carbon dioxide,water and char, which is the "backbone "of cellulose containing a large amount of carbon.
Figure 1: Wood pyrolysis methods [4]
The wood pyrolysis process also depends on certain external factors, such as heating mode,warming-up rate of the material, etc. Therefore, wood products do not have an explicit ignitiontemperature; the ignition takes place in a certain temperature range where the ignition probabilitybecomes large enough. So the piloted ignition temperature of wood is usually about 350°C, whilespontaneous ignition requires a temperature of about 600°C.
From the normal wood burning, the following products results [3]:
- combustion gases containing mainly carbon dioxide CO2, carbon monoxide CO, hydrogenH2, as well as a small amount of hydrocarbons, especially methane CH4, components whichoccur at a temperature of approx. 200°C, pirolignoic products (70% water, 20% acetic acid, 5%propionic acid, 3% formalin, etc.), which occur at a temperature of approx. 200°C and disappearat a temperature of approx. 350°C and tars which are complex products containing more than 100different organic compounds in very variable proportions with high calorific value (20000 –30000 kJ/kg) occurring at temperatures above 200°C; along with the combustion gases inentrained soot too, made in fact from unburned carbon particles;
- ashes (carbonaceous residue), i.e. substances in the fuel, inert in terms of combustion(lignin, in the case of the wood) in a proportion of 15 – 25% of the initial wood mass;
- heat reaction, which is taken up and transported by the combustion gases.
Wood burning is considered complete (perfect or theoretical) if it is characterized by thefact that exhaust gases no longer contain combustible elements (e.g. carbon monoxide or soot).
The wood burning may be incomplete if it is characterized by the fact that the exhaust gascontain combustible components. Incomplete combustion may be chemically incompletecombustion, characterized by the fact that the exhaust gases contain combustible gases (e.g.carbon monoxide) or mechanically incomplete combustion, characterized by the fact that theexhaust gases contain combustible solid particles (e.g. soot). Generally, incomplete combustionproduce smoke, which is the visible mixture of liquids in the form of very fine droplets and / orsolid particles in suspension. Enhancing the wood burning process means in fact producing asmuch heat as possible using a certain amount of wood, through a burning as complete as possible.

341
2. METHODS TO EFFICIENT WOOD BURNING STOVES FUNCTIONINGPROCESS
The ways to make wood stoves more efficient refer both to achieve a firmer combustionprocess (complete combustion) and to reduce their pollutant and toxic emissions.
The wood burning process is mainly influenced by the following factors:
- the quality and condition of wood used for combustion;- the way in which the burning process takes place;- the way in which the heat produced during burning is transferred to the environment.
The quality and condition of wood are extremely important factors in the efficiency of woodstoves. Thus, the quality of the firewood depends on the species from which it comes: theresinous wood (fir, spruce, etc.) is easier to ignite, while the hardwood (beech, oak, etc.) providesa higher quantity of heat. The condition of firewood is strongly influenced by the moisturecontent: the freshly cut or wet firewood has specific combustion energy of approx. 1 kWh/kg, thefirewood with 60% moisture content has specific combustion energy of approx. 3 kWh/kg and thenatural dry firewood with 25% moisture content has a specific combustion energy of approx. 4.5kWh/kg. When burning wood with high humidity, besides their low combustion energy, theirhigh water content will prevent ignition of combustion gases, allowing them to escape unburned,producing up to 50% potential heat loss and atmospheric pollution. Wood burning with theappropriate humidity can bring important savings (up to 70% in wood volume) with the sameburning efficiency in the stoves [5].
The way the combustion process takes place must ensure efficient combustion of both thewood and the resultant pyrolysis products, producing their oxidation as complete as possible.Through the constructive design and the advanced burning processes, modern stoves aim at thefollowing objectives:
- up to 50% more energy efficient;- to reduce by 70% the amount of wood to obtain the same amount of combustion heat;- to reduce creosote accumulation and risk of clogging or the occurrence of fire in chimneys;- significant reduction of emissions into the atmosphere of carbon dioxide CO2 and methane
CH4, which are greenhouse gasses involved in global warming;- to reduce soot at allowable levels both inside the stoves and in their emissions, thus
preventing the pollution with solid particles of the atmosphere with major health benefits inpreventing cancers, bronchial asthma and other serious conditions;
- significant savings in money, time and resources.
To fulfil these goals, two general approaches have been developed: one based on the non-catalytic combustion of wood and the other on the catalytic combustion of wood. Both approachesproved to be effective, but there are differences in performance in favour of catalytic combustionstoves. Although, most modern stoves on the market are non-catalytic, but the stoves usingcatalytic combustion are of high quality and are suitable for people who want to introduce newtechnologies and who are ready to operate and maintain stoves accordingly so that they continueto work with maximum performance.
Non-catalytic stoves (see Figure 2a) have a constructive structure designed to provide anoptimum environment for a complete combustion. The typical characteristics of these stoves arethe fireplace insulation; the entry and circulation of the combustion air inside the stove so that it

342
is preheated and produces both the direct heating and combustion of the wood at the bottom ofthe furnace (main combustion) as well as the burning of pyrolysis products released by woodheating in the upper part of the furnace (secondary combustion), as well as the circulation andevacuation of the resulted combustion gases as efficiently as possible for heating by radiation tothe environment and to preheat the combustion air.
a b
Figure 2: Schemes of modern high-efficiency stoves [5]
Catalytic stoves (see Figure 2b) have as particularity the introduction into the constructivestructure of a honeycomb type catalytic reactor through which the combustion gases and the sootare passed, which ignite and burn in order to ensure the most complete combustion. Also allcatalytic stoves are provided with a catalytic reactor bypass damper that opens during ignitioninitiation after loading wood into the furnace. It should be noted that the catalytic reactordegrades over time and needs to be replaced. Its durability depends mainly on the user whooperates the stove. So, if the stove is properly operated, the catalytic reactor can last for sixseasons. Instead, if the stove is overheated, if inadequate fuel quality (treated wood or garbage) isused, if the cleaning and periodic maintenance is not carried out, the catalytic reactor can degradeafter only two seasons. Of course, the circulation and preheating of the combustion air (primaryand secondary) and the circulation and evacuation mode of the combustion gases have beencarefully studied and determined in order to achieve the highest efficiency of these stoves.
Typical emissions of wood burning released into the atmosphere are mainly carbon dioxide(CO2) and water (H2O), but other types of chemical products may also be emitted depending onthe quality of the combustion. So, the products resulting from wood burning, significant for theatmospheric pollution, are: smoke, carbon dioxide CO2, carbon monoxide CO, toxic gasesresulting from burning wood treated with fire retardants in order to improve the fire performance.
Smoke pollutes the atmosphere with solid particles and significantly diminishes itstransparency and quality, smoke production being dependent on the quality and type ofcombustion, the quality and condition of the wood, oxygen supply and others. In comparisonwith other materials (plastics, rubber, etc.), the burning wood smoke production is minor, butnevertheless it constitutes a measure of the efficiency of the modern wood-burning stoves.
In U.S.A., Environmental Protection Agency (E.P.A.) has imposed performance standardsfor wood stoves in which the maximum permissible limit for smoke emission is currently 4.5 g/hand will be 2 g/h beginning with 2020. At present, the wood stoves producers, admitted byE.P.A., sell on the market products with smoke production between 1 – 4 g/h [6].
From the carbon dioxide CO2 emission point of view, an efficient wood burning stove mustprovide a combustion quality in which the amount of heat produced is obtained with a minimum

343
amount of wood, reducing to a minimum the pollutant emission of carbon dioxide.Emissions of carbon monoxide CO, a particularly toxic gas in the atmosphere, are mainly
related to the combustion ventilation (a well-ventilated combustion produces an amount of lessthan 10 g CO/kg of burned wood, whereas an unventilated combustion produces quantities of theorder of 100 g CO/kg of burnt wood). In addition, temperature is a significant factor because ithas a strong effect on the course of all chemical reactions during burning.
When burning wood treated with retardants or flammable substances, it is necessary tomonitor any resulting toxic products to keep their release within acceptable limits.
3. HIGH PERFORMANCE WOOD BURNING STOVE MODELS
As previously shown, modern wood stoves with high efficiency have been developed intotwo major categories: non-catalytic wood stoves and catalytic wood stoves.
Non-catalytic wood stoves favour both the primary combustion of wood and, in particular,the secondary burning of pyrolysis products through adequate ventilation and preheating of thecombustion air. The circulation of combustion air and combustion gases has been routed toachieve the most complete combustion and high thermal efficiency. Figure 3 shows three modelsof high efficiency non-catalytic stoves.
Figure 3: High efficiency non-catalytic wood stove models [7]
Catalytic stoves are equipped with honeycomb catalytic reactors in which completecombustion of wood pyrolysis products takes place resulting heat and emissions containingcarbon dioxide CO2 and water H2O, the minimum possible air pollutants (see Figure 4).
Figure 4: Operation of the catalytic reactor [8] Figure 5: Catalytic wood stove model [9]

344
Figure 5 shows a high efficiency catalytic stove model.Figure 6 shows a hybrid high efficiency stove model that produces both an additional
combustion of the pyrolysis products at the upper part of the furnace and a passage through acatalytic reactor of the gases resulting from the primary and secondary combustion.
Figure 6: High efficiency hybrid stove model [10]
4. CONCLUSIONS
In the paper are first presented general considerations about wood burning, then theprinciples of operation and the constructive structures of modern stoves with high efficiency,highlighting the benefits of their use in terms of both thermal efficiency and pollutants emissionreductions in the atmosphere.
Then, several representative models of non-catalytic and catalytic high-efficiency woodburning stoves are reviewed.
The problem of introducing and using modern, high efficiency wood stoves is also extremelyimportant for our country because in rural areas the production of thermal energy for heatinghouseholds is made mainly using wood stoves.
References
[1] Diaconu-Şotropa, D., Burlacu, L., Burning phenomena, Review AICPS no. 1/2007, Bucharest, 2007.[2] Mădărăşan, T., Fuels combustion, course support http://www.termo.utcluj.ro/termo/06ardere.pdf[3] Cubleșan, V., Fighting processing to solid fuel materials in the field of thickness, doctoral thesis, U.T.C.B.,Bucharest, 2011.[4] ***Burning of wood, http://virtual.vtt.fi/virtual/innofirewood/stateoftheart/database/burning/ burning.html[5] ***Choosing the Right Wood Stove, https://www.epa.gov/burnwise/choosing-right-wood-stove#emission-limits[6] *** List of EPA Certified Wood Stoves, https://www.epa.gov/compliance/list-epa-certified-wood-stoves[7] *** Canyon™ ST310 Iron Strike Stove, https://woodstoves.net/ironstrike/canyon-st310-wood-stove.html[8] *** FIRECATTM, http://firecatcombustors.blogspot.ro/2013/02/here-is-how-catalytic-combustor-works.html[9] *** Catalytic vs Non-Catalytic Wood Stoves: What’s right for you?, http://www.alsips.ca/catalytic-vs-non-catalytic-wood-stoves-whats-right-for-you/[10] *** Wood Stove Decathlon, https://insteading.com/blog/wood-stove-decathlon

345
ELECTRO-HYDRAULIC STAND FOR TESTINGRELIABILITY OF SPECIAL MATERIALS
Ioan-Alexandru SĂRĂCIN1*, Iulian-Claudiu DUȚU1, Gheorghe VOICU1
1 Biotechnical Systems Department, University Politehnica of Bucharest, no.313 SplaiulIndependenței, 060042, Bucharest, Romania
*E-mail of corresponding author: [email protected]
ABSTRACT
The paper investigates the possibilities and the technical manner in which it can berealized, as a functional model, an electro-hydraulic stand for testing the reliability of somespecial materials, used for example in manufacturing dental drills, in the process of machiningnoble or non-noble metals, without taking into consideration the use and the reliability of themechanical components.
1. INTRODUCTION
The electro-hydraulic testing stand that the authors propose here, which isshown in the figure 1, it is considered to be useful for testing noble or non-noblematerials, having well known mechanical properties or yet unknown, in order to beused in technical fields such as mechanical engineering [3], [4], [5], dental medicine,orthopedics and other related fields. The stand must simulate rotary and translationalmotion of tested samples.
Fig. 1. Brief schematic of the electro-hydraulic testing stand
By following the structure of an industrial system, there are many simplifiedsubsystems whose components are in relative movement of sliding, rolling, pivotingor combinations of them subjected to tribological stresses. Tribologically required

346
materials may cause damage caused by contact deformation (Hertz's theory), frictionand wear.
The essential functions of the mechanical systems with relative contact surfaces inrelative motion and corresponding tribological examples (DIN 50.323) are: transmission of motion (bearings); braking of the movement (brakes); power and energy transmission; information transmission materials transportation; rail and road transport; mechanical machining by cutting.Friction (as well as wear) is not a material but is a system property, the size of
which depends on many parameters. The coefficients of friction of certain pairs ofmaterials must be determined experimentally indicating in advance the parameters ofthe tribological system in accordance with the research rules (e.g DIN50320, SR ISO7148/1, SR ISO/TR — 7147, STAS 10293-83, STAS 8069-87, STAS 8618-79 and therecommendations of ISO 9000 quality standards). The process of friction betweensurfaces in contact with the elements of the system results in: the loss of energymanifested by the heat produced and wear. Wear is the continuous loss of materialfrom the surface of an element, due to mechanical causes, meaning relative and relativedrag relative to another solid, liquid or gaseous element (tribological demand DIN50320).
In contradistinction to the resistance properties that are characteristic of thematerial, the wear occurring at tribological stress results from the contribution of allcomponents of a technical system involved in the wear process, it can only be describedwith "system specific" wear characteristics. Loss of material leads to changes in thedimensions and shape of the contact surfaces. Under certain temperature conditions,structural changes of superficial layers may occur simultaneously, which may lead tothe formation of superficial layers with specific characteristics (it is possible to modifythe fine structure of the surface in contact due to the destruction).
To study and elucidation of phenomena occurring during wear of metal surfaces incontact in relative movement have proposed various systems for classifying types ofwear, in relation to the processes that take place during the friction of solid surfaces,observed in practice about the appearance and the degree of deterioration. GermanStandard DIN 50320 has a model that can be used to characterize different types ofwear depending on the factors that determine the initiation and development of thewear process. Correspondingly to this general presentation, wear processes areessentially influenced by the following set of parameters: the set of request conditions, composed of the type of motion or motion
kinematics(slip, roll or run, crash or strike, flow), the evolution of themovement in time (continuous, oscillating, intermittent), the characteristics ofthe request (load, speed, temperature, duration of request);
the structure of the tribological system, specifying the components involved inthe wear process (casing 1, spindle 2, lubricant 3, environment 4), properties ofthe elements (the properties of the material, the shape of the elements),tribological interactions between system elements (contact status, type offriction, wear mechanisms).

347
In the case of friction wear of solids, practice shows that any movement or relativemovement of two bodies in contact is accompanied by strong forces or couplesdetermined by the physical nature of the contact areas located on the two bodies. Theseresistances have received the general name of "friction". In rest, they have a variablemagnification up to a certain limit, after which the relieving motion of the bodies isbrought into contact. In a first approximation, the limit value of the resistances isproportional to the normal reaction in the contact area considered. After starting therelative movement of the two bodies, the value of the resistors can be considered, alsoin a first approximation constant and equal to the maximum value in the resting state.
These states of experimental nature have as a first physical explanation that thecontact areas of the two bodies in contact are harsh and deformable rather than stiffand rigid. So friction is a physical phenomenon that can be represented by a system offorces that oppose the relative movement or relative movement of two bodies incontact. This results in sliding friction and rolling friction of solid bodies leading tomaterial wear, loss of material or even damage to technical systems.
When studying sliding friction, let consider two bodies in contact C1 and C2. Thereaction force in the contact point has normal and tangential components. If thetangential component exceeds a certain limit, there is a relative movement between thetwo bodies and the friction then bears the name of the dynamic slip friction. Thetangential component in this case bears the name of the dynamic friction force (STAS1814-83), and its effect is to slow the motion of one of the bodies relative to the other.At the contact on an area (surface) reaction R of the area is inclined with an angle φ tothe normal at the surface: component T = R | sin φ | of the reaction balance the Fcomponent of the resultant external forces (active) applied to the body, being equal anddirectly opposite to it. This is the adhesion friction and its upper limit (equal to thelowest value for which the body C1 opposes the movement of the body C2) is equalto the dynamic slip rub at the beginning of the slip. Angle φ is called friction angle. Itsvalue when the body C1 is on the point of slipping on the contact surface (equilibriumat the limit) is called the friction limit angle (for metals φ < 10°).
The cone having the peak in the contact point considered as a normal axis at thispoint, and the tip at the top φ is called a friction cone. Friction is a complex physical-mechanical phenomenon and the laws are established experimentally for each coupleof bodies in contact,Coulomb's laws, experimentally established at the end of the eighteenth century, canbe summed up as follows:
a. maximum friction force is directly proportional to the normal N reactionmodulus; the proportionality coefficient bears the name of the coefficient offriction;
b. static slip coefficient (adhesion coefficient) μ0 ; φ0 is determined using therelation:≤ | || | (1)
c. dynamic slip coefficient μ is determined using the formula:= | || | (2)

348
where is the frictional force, and is the normal force.d. maximum sliding friction force does not depend on the size of the surfaces in
contact;e. maximum slippage force depends on the nature of the bodies in contact;f. slippage friction force is independent of the relative sliding speed of the two
bodies in contact.Given the above, there can be made some critical remarks on Coulomb's laws, asfollows:
a. the proportionality of the friction force with the normal reaction is true only fornot too high values of ; for higher values the friction increases faster thanwith the first power;
b. the coefficient of friction is dependent on speed. The friction force generallydecreases as the speed increases. An experimental formula for calculating thecoefficient of slip friction is:= ( + ) + (3)
where a, b, c, and d are constants, which are determined experimentally,v is the slip rate and is based on natural logarithms;
c. coefficient of friction depends on the quality of the surfaces in contact with thetwo bodies. This conclusion is valid only up to a certain level of quality ofsurfaces; if they are very finely processed there are forces of attraction betweenthe molecules of the two bodies in contact and the coefficient of frictionincreases again;
d. size of the surfaces in contact as well as the pressure between them does nothave precise influences;
e. value of the friction coefficient is lower as the temperature of the contact areais higher; the explanation is that the asperities of the surfaces in contact becomesofter, thus opposing a lower resistance;
f. surfaces that stay for a long time in contact with each other travel relativelymore weight than if they are not left in contact for a long time. Thisphenomenon is explained by the interpenetration asperities in contact and thephysic-chemical changes of the surface superficial layers in contact. Anexperimental equation showing this addiction is given by:= ( − ) (4)
where t is the pressing time, μ0 the static slippage coefficient at t = 0, μ∞ thedynamic slippage coefficient at t = ∞ (asymmetric value) and n is a constant tobe determined experimentally;
g. the coefficient of slippage friction (static and dynamic) depends very much onthe conditions in which the experiment took place;
h. in the case of point contact between the two bodies to move in differentdirections passing through the point of contact there are different coefficientsof sliding friction; this case is called anisotropic sliding friction, characteristicof anisotropic bodies.

349
The coefficient of slippage friction reaches its extreme values in the two directionsμ1 and μ2 and referred to as the main directions of the considered point friction andresultant support of the friction force in the contact point does not coincide with themovement of the point holder. Thus appear the tensor character of the slip frictioncoefficient in the anisotropic friction occurs.
2. METHODOLOGY
The authors propose in this paper an electro-hydraulic testing stand, having thediagram presented in Fig. 1.
The electro-hydraulic testing stand will be equipped with an electric drive used to varyrotational speed from 3000 to 30 000 rpm, a mechanical support used to fix the handles of twoelectric motors, an electric speed changer, an electric distributor and a support table for testedsamples of materials to be studied. On the testing stand there will be also mounted hydraulicmotor used for generating the rotation movement of the tested samples and one linear hydraulicmotor (cylinder) in order to obtain a linear movement for the samples’ support table. Themechanical support for the samples themselves has the possibility to move in vertical planehaving attached a few additional weights used to provide a certain value for the pressing forceon each sample.
Operation of the stand is considered to be simple and it is described in the following.After making the test samples according to the validation standards, measurements are takenand their weighing is carried out. The type of cutters to be used for determinations shall bedetermined, weighted and photographed at a macro level at a scale of 100: 1, and then mountedin the handles and inserted into the mandrels of the handles. Measured and weighed samplesare mounted on the support table where the sample clamping chucks are provided to ensurethe rotation movement. After that, there is performed an adjustment of the force of the cutterson the specimens and place the appropriate notches on the mandrels of the handles.
Afterwards, time is set for the test, in this way it is determined the speed at which thecutters will work. The next step is to set the samples’ speed and displacement speed and travelof the support table of samples.
After the test time has elapsed, measurements of the dimensions and weighing of boththe samples and the cutters will be carried out. At the same time, the chips resulting from thesamples will be collected and the size of these will be determined, this being influenced by thespeed of the drills and the travel of the samples table.
The experimental results will be noted in a table, as presented in Table 1.
Table 1. Experimental results
Testnr.
Drill type Samplematerial
Testtime[min]
Drillspeed[rpm]
Samplespeed[rpm]
Tablespeed[ms-1]
Pressingforce[N]
Chipsize[aspect]
1
Super-Tech (Co-Cr)
HeraeniumCE*
15 30000 2 10-3 3*10-4 superfină
Super-Tech (Co-Cr)
GialloyPA**
15 30000 2 10-3 3*10-4 extrafină
Super-Tech (Co-Cr)
Wirobond*** 15 30000 2 10-3 3*10-4 fină
2 MILLI-MICRON (Co-Cr)
HeraeniumCE*
15 30000 2 10-3 3*10-4 superfină

350
MILLI-MICRON (Co-Cr)
GialloyPA**
15 30000 2 10-3 3*10-4 extrafină
MILLI-MICRON (Co-Cr)
Wirobond*** 15 30000 2 10-3 3*10-4 fină
3
Tittano (Ti)HeraeniumCE*
15 30000 2 10-3 3*10-4 superfină
Tittano (Ti)GialloyPA**
15 30000 2 10-3 3*10-4 extrafină
Tittano (Ti)Wirobond*** 15 30000 2 10-3 3*10-4 fină
*Co 63,5%, Cr 27,8%,W 10% Mo 6,6 %, Si 1%, Mn 0,6%Alial Cr-Co indicat pentru realizarea protezelor shceletizate. • Densitate 8,0 g/cm³ • Duritate 380 HV10 • Interval de topire:1330°C-1380°C • Temperatură de turnare 1530 °C**Cr 30,1%, Co 61,5%, Mo 5,5 %, Si 1,0%, C 0,6%Aliaj Cr-Co indicat pentru realizarea protezelor scheletizate. • Duritate 460HV10 • Densitate 8,25 g/cm³ • Interval de topire:1320oC-1380oC***Co 63.3%, Cr 24,8%, Mo 5.1% W 5,3%Aliaj Cr-Co indicat pentru realizarea coronae si punti metalo-ceramice.Duritate 310 HV010 Interval De topire 1370-1420 C
Based on the results in the sample table above, there will be determined the mechanical weardegree of the samples and of the drills, during testing, taking into account the rotational speed, thetranslational speed and the pressing force.
3. CONCLUSIONS
The testing stand that the authors propose in this paper is relatively simple and can beconstructed using devices and equipment available on the current market. In some cases, somesmall modifications are needed, that are going to be performed on specialized electro-mechanical workshops.
Using the stand, it can easily be determined several mechanical properties of tested materials. It was intended to obtain a testing stand that is easy to use and do not need highly trained
personnel to operate.
References
[1] Croitoru, Gh., Rusu, I., Carbon nanotube/cement composites, International Scientific ConferenceULGALMAT, 2009.
[2] Țuculina, M., Lucrări practice de odontoterapie, Ed. Medicală Universitară, Craiova, 2009.[3] Mitar, P., Alumina powder properties obtained by neutralization process of sodium aluminate,
International Scientific Conference ULGALMAT, 2009.[4] Potecașu, O., The assessing of mechanical characteristic of the steals, International Scientific
Conference ULGALMAT, 2009.[5] Sărăcin, I., Mecanica și rezistența materialelor, Ed. AIUS, Craiova, 2007.

351
AIR QUALITY MONITORING FOR BAKERY UNITS
Simion Gabriela Cristina1, Duţu Mihaela FlorentinaUniversity Politehnica of Bucharest / Romania
ABSTRACT
This paper assess the effect of exposure to flour dust on respiratory symptoms and lung functionof bakeries workers. Workers protection and a good quality of air is realized if there are good systemsof ventilation and vacuum cleaner.
1. INTRODUCTION
The bakery industry occupies an important place in the production of romanian consumergoods, primarily because bread is a basic food that is consumed daily.
Pollution is the contamination of the environment with materials that interfere withhuman health, the quality of life or the natural function of ecosystems. Pollutants from theworking environment may be gaseous or particulate solids or liquids in suspension,generically called aerosol.
The food industry and especially the milling and bakery industries pollute air with dustresulting from the grinding of the cereals and flour manipulation and the odorous gasesresulting from the fermentation of the products of vegetable origin. A bread factory, pollutesair with dust, VOC - ethanol, acetaldehyde, esters, acids.
2. EXPOSURE TO FLOUR DUST AND WORKERS PROTECTION
In food industrial environments, the name of powder is the most widely used. Suspendedpowders in the industrial environment generally differ in size and effects on the human bodyin sedimentary and inhalable particles. Sedimentary powders are particulate sizes anddensities that favor their deposition. Suspended powders are dust that remain in the air for along time and are dispersed systems with a solid dispersion phase and gaseous dispersionmedium. [10] These types of polydisperse systems in physics are called aerosols. Airbornedust is generally considered to be aerosolized, with diameters between 0.001 and 100μm anda mass between 9 and 10 g / m3 of gas. One of most dangerous factor for health , in bakeryindustry is exposure to flour dust( particulates with diameters 1 µm to 80 µm).It is known tocause allergic rhinitis, occupation asthmas . Flour and grain dust acts as an irritant, it mayprovoke nasal and eye symptoms and it is the second most cited agents associated withoccupational asthma [1].SCOEL (Scientific Committee on Occupational Exposure Level)concluded that exposures [dust] ≤ 1 mg / m3 of inhalable flour powder would protect mostworkers.
Wheat flour is a complex organic dust with a large diversity of antigenic or allergiccomponents [3]. The antigens involved can be wheat flour proteins, flour parasites, silica,fungi, insects or technical additives such as enzymes [4]. Multiple allergens exist in theprotein fraction of wheat flour that are responsible for respiratory dysfunctions and baker’sasthma[5]. Wheat flour consists of water soluble albumins, salt-soluble globulins, gliadinsand glutens. Albumins and globulins appear to be the most important proteins contributing toimmediate hypersensitivity reactions to wheat proteins Flour dust is a hazardous substance; it
1Spl.Independentei, no.313, sect.6, Bucharest, 0214029637, [email protected]

352
is a respiratory sensitizer and is known to cause allergic rhinitis and occupational asthmaamong bakers and millers. Asthma arising from workplace exposure to cereal flour (bakers’asthma) is one of the commonest types of occupational asthma [5,6]. It is also an irritant andmay give rise to short term respiratory, nasal and eye symptoms or it may provoke anasthmatic attack in individuals with pre-existing disease and also lead to chronic bronchitis Inaddition, flour and / or grain mill workers have been reported to exhibit a variety of clinicalmanifestations including wheezing, febrile reactions, grain fever, lung fibrosis, allergicalveolitis, impairment of lung function and chronic obstructive pulmonary disease. Inoccupational respiratory disease, spirometry is one of the most important diagnostic tools.Measurement of dynamic lung functions is more important than of static lung volumes. Lungfunction tests are beneficial in the early recognition of pulmonary dysfunctions even if theworkers may be normal clinically.
A study for exposure to flour dust in bakeries is made function of bakery size or onworkers categorized by job grouping.
Table 1: Inhalable dust exposure for workers with different job[2]Job category Workers
NumberDust(mg/m3)
Median Value Max Value 75th percentile
Baker/table/dough baker 108 3,6 47 7,1
Mixer/siever/weigher 59 5,2 30,6 9,7
Cleaner 6 4,4 14,3 10
Others 35 2,1 30,8 4,1
Table 2: Inhalable dust exposure for workers categorized by bakery size[2]Bakery size(number of employes)
Number ofbakeries
Dust(mg/m3)Median Value Max Value 75th percentile
Micro(1-9) 22 3 28,1 5,5
Small(10-49) 20 2,2 30,6 5,7
Medium(50-249) 6 5,2 47 10,4
Large(>250) 7 7,6 27,7 12
Bakery size is the major influencing factor on exposure level. Bakeries and individualsemploy must have good working practices with correct use of local exhaust ventilationsystems. Poor ventilation can be a major factor in the development of heart, lung, mental, aswell as many threats to our health. The centralized evacuation mechanical systemcontinuously evacuates the polluted air from rooms where much moisture is generated.
Thus, fresh air is passively introduced from the outside to the halls and rooms, thuscreating a fresh, clean airflow across the entire location. The air circulates through theterminal units and the pipes hidden in the false ceiling to the central unit. The system isdesigned to be integrated into the construction to be hidden from view. The vast majority ofsystems in the market also have the 'boost' option to increase the ventilation process whennecessary, for example, when the rhythm of the work is increased, when the furnace is used tothe maximum.
The main features and advantages of a mechanical ventilation system are: Compact units that can be easily mounted and disguised
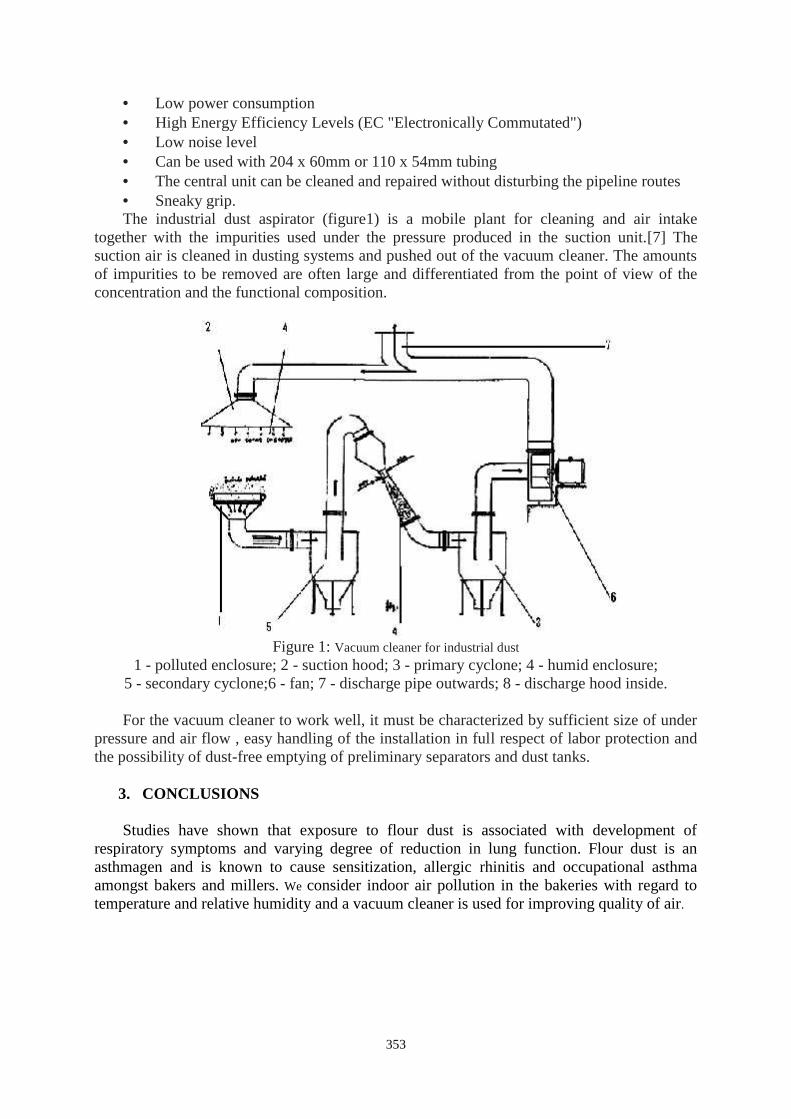
353
Low power consumption High Energy Efficiency Levels (EC "Electronically Commutated") Low noise level Can be used with 204 x 60mm or 110 x 54mm tubing The central unit can be cleaned and repaired without disturbing the pipeline routes Sneaky grip.The industrial dust aspirator (figure1) is a mobile plant for cleaning and air intake
together with the impurities used under the pressure produced in the suction unit.[7] Thesuction air is cleaned in dusting systems and pushed out of the vacuum cleaner. The amountsof impurities to be removed are often large and differentiated from the point of view of theconcentration and the functional composition.
Figure 1: Vacuum cleaner for industrial dust1 - polluted enclosure; 2 - suction hood; 3 - primary cyclone; 4 - humid enclosure;
5 - secondary cyclone;6 - fan; 7 - discharge pipe outwards; 8 - discharge hood inside.
For the vacuum cleaner to work well, it must be characterized by sufficient size of underpressure and air flow , easy handling of the installation in full respect of labor protection andthe possibility of dust-free emptying of preliminary separators and dust tanks.
3. CONCLUSIONS
Studies have shown that exposure to flour dust is associated with development ofrespiratory symptoms and varying degree of reduction in lung function. Flour dust is anasthmagen and is known to cause sensitization, allergic rhinitis and occupational asthmaamongst bakers and millers. We consider indoor air pollution in the bakeries with regard totemperature and relative humidity and a vacuum cleaner is used for improving quality of air.

354
References
[1].Ross DJ, Keynes HL, McDonald JC(1997)Surveilance of work related and occupational respiratory inUK,Occup.Med:47:377-81.[2].Elms J., Robinson E.,Rahman S., Garrod A. Exposure to flour dust in UK: Current Use of Control Measures ,Occup.Med:49 No 1 pp 85-91(2005).[3] E. Zuskin, B. Kanceljak, E.N. Schachter, J. Godnic-Cvar, J.Mustabegovic, A. Budak, Respiratory functionand immunological status in cocoa and flour processing workers, Am. J. Ind. Med. 33 (1) (1998) 24–32.[4] M.N. Kolopp-Sarda, N. Massin, B. Gobert, et al, Humoral immune responses of workers occupationallyexposed to wheat flour, Am. J. Ind. Med. 26 (1994) 671–679.[5] A.S. Tatham, P.R. Shewry, Allergens to wheat and related cereals, Clin. Exp. Allergy 38 (2008) 1712–1726.
exposure, Occup. Med. 49 (1999) 237–241.[6] P. Maestrelli, P. Boschetto, L.M. Fabbri, C.E. Mapp, Mechanisms of occupational asthma, J. Allergy Clin.Immunol. 123 (2009) 531–542.[7] M.S. Dykewicz, Occupational asthma: current concepts in pathogenesis, diagnosis, and management, J.Allergy Clin.Immunol. 123 (2009) 519–528..

355
NOISE MEASUREMENT AND DIRECTIONAL CURVE DETERMINATION FOR ANPORTABLE POWER GENERATOR
Cristian Sorică1), Elena Sorică1), Andreea Iulia Grigore1) Marius Remus Oprescu1)
1) National Institute of Research - Development for Machines and Installations Designed to Agriculture andFood Industry - INMA, Bucharest, Romania, [email protected]
Keywords: acoustic pressure, acoustic power level, directional curve, portable power generator
ABSTRACT
Noise is a complex of different sounds and frequencies and different intensity overlapping randomly.A low level of acoustic pollution leads to the environmental and consumer health protection satisfactionlevel and thus increases the quality of marketed products. 2000/14/E Directive it requires manufacturers toapply to each equipment introduced on market the guaranteed value of the acoustic power.
In this regard, the paper consists of measuring the acoustic power level of an electric currentgenerator as well as the measurement of the acoustic pressure level in order to highlight the noisepropagation directions.
Also, in the paper will be specified choosing the method, number of the used microphones,calculating the average of the acustic pressure, functioning conditions, and measurement uncertainty.
1. INTRODUCTION
2000/14/EC directive belongs to improving air quality category and is part of the chapter- “Airquality, targeting emissions management outside buildings”. Air quality is an environment priority issue andany kind of is recorded in regulations.
2000/14/CE directive establishes provisions (noise limits, public information regarding to noisesproduced by equipment, conformity assessment procedures etc.) related to equipment sound emissions forusing outside the buildings. The directive follows in a general manner the principles and concepts of themodules for different conformity assessment procedures stages and rules, applying EC con-formitymarking [1].
The equipment subjected to the provisions and regulations of 2000/14/EC directive are set out in art.12 and 13 of this Directive:
- equipment subjected to noise limitations;- equipment not subjected to noise limitations, only marking of this level. [2]Under the 2000/14/EC directive, a number of technical equipments are summarized, subjected to
limitation or marking sound power level, which include portable power generators for domestic purposes tosupply electricity at places where electricity grid does not exist or where a temporarily electricity cut off ispresent.
According to the directive, power generators with electric power <400 kW are subjected to soundlevel limitations and electric power generators 400 kW are only subjected to noise marking. [1]
In order to determine the directional curves, the sound pressure level will be measured in 12 pointsequidistant in the horizontal plane, on a circle (at 30 degrees angles).
2. MATERIAL AND METHOD
The sound pressure level represents the pressure of the waves with which the sound moves in anenvironment and we can say that is what the human ear perceives as sound. The unit of sound pressure is

356
(dB), the human ear perceiveing values above 0 dB (audibility limit) and up to 120dB (the value at whichsound produces physical pain). [10]
The sound power level of a noise source is determined using acoustic pressure (p). This represents afluctuating pressure due to the presence of sound presence overlapped on the static pressure and isexpressed in Pascals (Pa).
Sound pressure level (Lp) is ten times the logarithm to the base 10 of the ratio between the square ofthe measured sound pressure and the square of the reference sound pressure (20 μPa).
Sound pressure level averaged over the measurement surface is given by: [3]
N
i
Lp
pi
NL
1
'1,0101
lg10' , [dB] (1)
where N is the number of measuring points;
piL' - sound pressure level measured in the i position of the microphone
Sound pressure level averaged over the measurement surface and corrected is:
21' kkLL ppf (2)
where k1 - is the correction for background noise;k2 - the correction for the reflected sound (it applies to enclosed spaces).
The sound power level is given by:
0
lg10S
SLL pfw
, [dB] (3)
where S is the measurement surface area;S0 = 1 m2. [3], [7]In view of determining the acoustic power level it is used a modern equipment that in fact measures
the acoustic pressure on measuring surface, makes the necessary corrections and then calculates the acousticpower level by the above formula. [4]
The researches to determine the sound power level were performed on a Power Generator R-PowerGE 2500 S (Fig. 1) with the power of 2.5 kW, subjected to limitation of noise because the power is less than400 kW.
Fig. 1 – Power Generator R-Power GE 2500 S
In table no. 1 are presented the measuring devices used:Table 1
No. Name of instrument ordevice
Measuring range Measurement uncertainty/Permissible error
1. Measuring roulette 08 m 0,5+10 -4mm
2.Integrating Sound LevelMeter type 2237 2020000 Hz 0,3 dB
3.Anemometer Testovent4000 type 0,440m/s
measurement uncertainty0,35m/s

357
4. Thermohygrometer DH 50humidity: 595%
temperature: - 2080C
0,1 %measurement uncertainty
0,5oCFigure 2 shows the anemometer Testovent 4000 type used to measure wind speed, while Figure 3
shows thermohygrometer DH 50, used for measuring air temperature and humidity:
Fig. 2 - Anemometer Testovent 4000 type [8] Fig. 3 – Digital thermohygrometer DH 50
The equipment used to determine the sound power level is a measurement and analysis system based onPC - "System Type 3569 C PULSE multi-analysis" produced by Bruel & Kjaer, wich consists in 12microphones with preamp, amplifier and signal conditioning module with 12 measuring channels, assisted by anotebook computer and software required for the acquisition, processing, interpretation and presentation of datain tabular form. [5] Also, includes a calibration module type 4231 wich generates on the frequency of 1 kHz, anoise level of 94 dB or 114 dB. The calibration value of 114 dB is used when measurements are made in a noisyenvironment (noise level> 50 dB). [6]
Calibration of measuring channels is performed at the beginning of each set of measurementsrequired to measure a noise source. In order to do that, one must first activate the calibration program, thatwill automatically sense the presence of the microphone calibrator connected to the PULSE systemmeasurement channels. When the calibrator is detected, the required correction is performed to theamplification channel and then, the calibrator is searched on other microphones connected at the system andthe procedure repeats again.
After the last measurement channel calibration, the calibration program is closed and the dataacquisition program is opened, according to the number of measuring channels. After its execution, we needto run another program that takes the data from the previous one and processes them according to SR ENISO 3744 which refers to the determination of sound power levels of noise sources using sound pressure.
In order to determine the sound power level, the following operations were performed, necessary forpreparing the product for tests:
• measuring the noise source dimensions;• calculating the surface area;According to 2000/14/EC directive up to 12 microphones may be used to determine the sound power
level using hemispherical measurement surface or up to 9 microphones for parallelepiped surfacemeasurement. The number of the microphones may be reduced to six, but positions 2, 4, 6, 8, 10 and 12 aremandatory in all cases, as required by clause 7.4.2 of EN ISO 3744:2010. [2]

358
In this case we used six microphones (2, 4, 6, 8, 10, 12) positioned on a hemispherical measurementsurface (Fig. 2) according to D 2000/14/EC directive. [7]
Fig. 2 - Microphone positions for hemispherical measurement surface with 6 microphones [7]
In order to determine the directional curves, 3 sets of records will be performed in 12 measuringpoints simultaneously with the PULSE type 3560 system. (fig. 3).
Fig. 3 – Location of the measurement points
The purpose of the determination is to highlight the noise propagation directions by measuring theacoustic pressure in the 12 points placed equidistant in the horizontal plane on a circle (at 30 degrees angles)having in the center the noise source and radius “r” (choosed to cover the technical equipment inside thecircle) arranged at the level “h” of the main noise source.
3. RESULTS
Weather conditions: temperature: 16,7C; humidity: 52.6%;

359
wind speed: 0.8 m/s
In table 2 are presented acoustic pressure level for every microphone and acoustic power level, inaccordance with EN ISO 3744:2010:
Table 2Sample Lp1
[dB]Lp2
[dB]Lp3
[dB]Lp4
[dB]Lp5
[dB]Lp6
[dB]Averageacoustic
pressure levelper sample
[dB]
Acousticpower
level Lw
[dB]
Averageacousticpowerlevel[dB]
Sample 1 80,3 78,6 78,4 80,7 80,1 81,4 80,05 94,194,3Sample 2 80,3 78,7 78,3 80,8 80,2 81,5 80,11 94,1
Sample 3 80,7 79 78,8 81 80,6 81,8 80,45 94,5
Lp1, Lp2, Lp3, Lp4, Lp5 si Lp6 - represent the determined sound pressure level in each of the 6 measurementpoints in Fig. 2.
Lw – represents the sound power level that is calculated by the PULSE system using the formula (Eq. 3)Lw=94 ± 0.38 dB;
The assigned uncertainty is the expanded uncertainty obtained by multiplying the standarduncertainty with the expansion factor k = 2 and was estimated according to GUM.[9]
Table 3 presents the sound pressure level measured simultaneously in the 12 points at the distanced=1m and height h=0.2m:
Tabelul nr. 3Measuring angle
[degrees]00 300 600 900 1200 1500 1800 2100 2400 2700 3000 3300
Background noise[dB (A)]
47.28
SoundPressure
level[dB (A)]
Sample1
87.7 88.8 87.8 88.5 88.2 87.4 86.5 86.1 87.9 89.5 88.3 87.7
Sample2
87.8 89 88.1 88.8 88.8 87.8 86.7 86.4 88.5 90.1 88.4 87.7
Sample3
87.9 89.1 88.3 89.1 88.9 88.2 86.8 86.5 88.8 90 88.5 87.8
Average of themeasured values
87.8 88.9 88.1 88.8 88.6 87.8 86.7 86.3 88.4 89.9 88.4 87.3
Based on the results obtained above, figure 4 shows the directivity curve of the Power Generator R-Power GE 2500 S, at a distance of 1 m from the main noise source:

360
Fig. 4 Determination of the directivity curve of the Power Generator R-Power GE 2500 SCONCLUSIONS
According to the 2000/14/EC Directive, the power generators with electric power <400 kW aresubjected to sound level limitations and the power generators with electric power 400 kW are onlysubjected to noise marking.
The noise level emitted by the R-Power GE 2500 S Generator, which was subjected to the test, as setout in Directive 2000/14 / EC, is 94 dB, falls within the required limits and may be labeled accordingly.
Although the directivity curve does not have a special meaning for the end-user, it can still be veryuseful for the maker of such equipment, providing relevant information to improve the product throughoutthe production cycle to permanently improve its quality and functionality.
References
[1] Directive 2000/14/EC of the European Parliament and of the Council of 8 May 2000 on the approximation of the laws of theMember States relating to the noise emission in the envi-ronment by equipment for use outdoors, Official Journal. L 162 (2000)0001-0078;[2] V. Vladuţ, S. Biriş, S. Bungescu, At. Atanasov, D. Gafiţianu, Analysis of the methods and regulations in force, harmonizedwith EU legislation regarding the noise emission of equipment with outdoor operation, INMATEH. I (2006) 143-152;[3] SR EN ISO 3744:2011 - Acoustics. Determination of the acoustic power and energy levels for noise sources, using acousticpressure. Technical methods of closed conditions of those of an empty field above a reflecting plane;[4] M. Ganga, S. Bajenaru, V. Vladut, S. Bungescu, Bikic S., Measurement equipment for the acoustic power level and theevaluation of the uncertainty of the measurement, INMATEH. I (2007) 20-25;[5] *** PULSE Multi-analyzer System Type 3560 – technical documentation;[6]. *** Sound Level Calibrator type 4231 – technical documentation;[7] Postelnicu E., Vladut V., Sorica C., Cardei P. and Grigore I. - Analysis of the sound power level emitted by portable electricgenerators (outdoor powered equipment) depending on location and measuring surface, Applied Mechanics and Materials, Vol.430 (2013), pp 266-275, ISBN 978-3-03785-877-6;[8] Technical documentation - Anemometer Testovent 4000 type;[9] SR GUIDE ISO/CEI 98-3:2010 - The measuring uncertainty. Part 3: Guide for expression of uncertainty in measurement(GUM: 1995);[10] Munteanu R. T. - Sunetul în sistemele de ventilaţie şi calculul nivelului de zgomot, Buletinul AGIR nr. 1/2011 ianuarie-martie;
361
EFFECTS OF WHEAT SEEDS CHARACTERISTICS ON ROLLERMILLING PROCESS – a review
Mădălina-Elena ŞTEFAN1, Gheorghe VOICU, Gabriel-Alexandru CONSTANTIN, MarianaMUNTEANU, Mariana IONESCU
University Politehnica of Bucharest, Faculty of Biotechnical Systems Engineering
ABSTRACT
Factors affecting the wheat flour milling process in a roller mill are: the design and operation ofthe roller mill (rolls speed, roll gap, roll disposition, differential, flutes profile), wheat variety andwheat physical and mechanical characteristics (shape and size of the seeds, mass, volume, moisturecontent, porosity, density, bulk density, resistance to crushing, hardness). The effects of wheat seedscharacteristics are manifested by the particle size distribution as well as the compositional distributionof the grist (large particle are very rich in the coating, while the small particles are only endosperm).Knowing the factors that influence the milling process in the roller mills (operation of grinding rolls)allows the choice of the most suitable technological process and the most efficient working regimeresulting in high productivity, high quality grist products and as well as significant savings in energyconsumption.
Key words: characteristics, roller mill, wheat seeds, wheat flour, milling.
1. INTRODUCTION
The milling process aims to break the seeds and separate the endosperm from the otherstructural parts, namely germ and bran. The main purpose of the grinding process for wheatseeds is to achieve a maximum yield of white flour. Studies on the physical and mechanicalproperties of wheat and grist products are carried out by numerous researchers in order toobtain high yields and significant savings in energy consumption.
In the roller mills the grinding of cereal seeds is accomplished by the action of thecompression and friction forces of the material between the two rolls in rotation motion. Thesurface of the grinding rolls may be smooth or fluted. Grinding rolls with fluted surface areused to fragment the seed and to remove the endosperm, and the smooth surface rolls have therole of reducing the size of the endosperm particles and turning them into fine flour particles.Thus, in the grinding process, it must take into account the difference in the structure of themain components of wheat seed (bran and endosperm). The endosperm is friable and easilymilled, while the bran is more plastic.
The physical and mechanical characteristics of wheat seeds (seed shape and size, volume,moisture, porosity, density, bulk density, resistance to deformation, hardness, etc.) directlyinfluence the crushing process in roller mills to transform them into flour. Thus, thegeometrical characteristics of the flutes and their mutual position for the two milling rolls, thediameter and the speed of the rolls, are also influenced by the physical properties of thegrinding material and thus also of the seeds, [1].
The wheat flour quality depends on the physical, chemical and mechanical characteristicsof the wheat seeds in relation to the processing technologies and the constructionalcharacteristics of the machinery.
1Splaiul Independentei, 313, District 6, Bucharest, Romania, 0726043472, [email protected]

362
The value of the working capacity and the extraction coefficient of the flour aredetermined by the grinding characteristics of the wheat seeds, which in turn are influenced bythe physical and mechanical characteristics of the endosperm, [2].
2. PHYSICAL CHARACTERISTICS
Shape, size, volumes, density, specific surface, humidity of seeds are important physicalproperties in analysis the behavior of grain during grinding process, including in roller mills,[3]. Knowing the main dimensions of the seeds, the shape and the mass of each wheat seed isimportant in the conditioning process (separation on the sieves; correct choice of the shapesand sizes of the separating machinery holes) and in calculating of the power required for thegrinding, [4,5,6,7,8]. The seeds that are large in size contain a higher percentage ofendosperm, so a higher extraction coefficient is obtained. During the grinding process withthe roller mill, the working parameters of the rolls must be adjusted according to the seed size,[9]. When the seeds to be grinded are of very wide size, the small seeds passes through themilling rolls (the first pair of milling rolls) without being crushed or only partially crushed,thus requiring a further grinding process. If the seeds size do not varies widely (there isuniformity), then the seeds are ground uniformly, resulting in a flour extinction coefficientgreater, [9,10].
The porosity of the seeds is mostly influenced by their shape and size. When the seedshave a uniform size, their porosity is higher than when the seeds do not have a uniform size.Seeds of small size occupies the spaces between the seeds of larger size, resulting the lowerthe porosity, [11].
The volume and density of each seed influences how the flutes of grinding rolls attack theseed in the grinding process and the number of shear points during grinding, [1]. Thedifference in density between grains and impurities allows the cleaning of the grains in theconditioning process and the specific mass difference between the anatomical components ofthe grains (endosperm, bran, germ) allows the cleaning in the technological processes ofprocessing.
Higher density wheat seeds contain a higher percentage of endosperm, compared tosmaller and less dense seeds. Therefore, from the higher weight seeds results a larger quantityof flour, as opposed to lower seeds weight, [12].
The influence of the geometrical sizes, volume and mass of the seeds is manifestedmainly on the working process of the grinding rolls of the mill, thus, on the degree of grindingof the seeds, and the size distribution of the grinded material, [13].
The bulk density of a granular mixture is the mass of the material relative to the totalvolume it occupies in its natural state. This property is considered one of the basic qualitativeindexes using in determining extraction flour, [14,15]. Wheat flour yield is closely related tothe bulk density.
The moisture content of wheat seeds is one of their most important qualities, having aspecial role in the processing process, [16]. The moisture content of the wheat seeds isdifferentially distributed between the endosperm and the bran, which greatly influences thegrinding process. Wheat seeds with low moisture content (12.5% - 12.8%) having a lowelastic characteristic on dynamic loads, are fragile and easily to broke, requiring low energyconsumption for crushing, [17]. At moisture contents ranging from 17-18%, the seeds behavelike the elastic bodies, the particle diameter is larger, the flattening phenomenon occurs, theendosperm does not break [17,18,19]. The excessive wetting of the wheat seeds decreases theworking capacity of the machines on the technological flow of the milling unit, because theseeds soften and the wet endosperm adheres to work surfaces. On the other hand, insufficient

363
wetting also negatively influences the milling process, as it causes the crushing of the branand the appearance of an inseparable mixture of flour, [15,19].
It is known that the main mechanisms of fracture (grinding) of the material in thegrinding process, in roller mills, are those crushing (compressive) and shear.
Figures 1 and 2 are shown the behavior of wheat seeds with low moisture content and,respectively, with high moisture content, subjected to compression and shear stresses.
angular particlesand dust
dust and smallparticles
breaking random
compression shear
Figure 1: Grinding of wheat seeds with low moisture content (dry), [20]
When a wheat seed has a low moisture content, it is fragile, and when the grinding forcesare applied, it is broken into coarse particles of polyhedral form, fines and very fine particles.If the application of force continues, the seeds begin to deform elastically, then the forcesproduce some plastic deformations before they crack or break. This is caused by the crackpropagation at the application points, which are normally the contact points, [20].
Applying forces to seeds with higher moisture content results in a wide range of nearbyparticle sizes, few fine particles, and even flat aggregates (figure 2).
few significantbreaks few
fine particles
shear plan
compression shear
Figure 2: Grinding of wheat seeds with higher moisture content (wet), [20]
A wet wheat seed is relatively soft, and at the moment of applying a force it deforms, to acertain extent, elastic. Even if the applied force increases, a seed is able to maintain the plasticdeformation, before breaking, more than a dry one, [20]. The application of shear tends tobreak the wet seeds along of different fracture planes, [20].
Knowing the value of the friction coefficient of cereals on different materials (metal,plastic, glass, rubber, wood, etc.) is of particular importance in the process of moving them ondifferent surfaces, both in the transport and in the separation process, as well and tocharacterize bulk flow and storage properties [11]. The value of the coefficient of frictiondepends on the nature of the materials of the two bodies, the state of the surfaces, the contactpressure between them, [21,22].
The texture of wheat seed is an important factor in the process of grinding, in roller mills.Depending on the texture, wheat varieties are classified into two categories, namely: durumwheat and soft wheat. Between durum wheat varieties and soft wheat varieties are significant

364
differences regarding the conduct of grinding process. [7]. Hard texture is a genetic featuregiven by the compactness of the endosperm and the presence of a strong bond betweenproteins and starch, [23].
3. MECHANICAL CHARACTERISTICS
The values of the mechanical properties of wheat seeds (regardless of the variety) arenecessary in estimating the behaviour of the grinding, the estimation of the energy consumedfor deformation and crushing, and the estimation of the power of the machinery in the cerealmills.
Hardness is defined as a mechanical property of the seed grain to resist deformations orbreakage, by the action of external forces and tensions. The crushing resistance of wheatseeds increases with increasing moisture content and glassiness, requiring a more intensivegrinding process and implicitly higher energy consumption, [11,15]. The hardness occurs inthe behavior of the seeds during the grinding process, influencing the force required to breakthe wheat, the way the seeds fragment, the size of the particles resulting from the breakage,and also the yield of the flour extraction, [12,23,24,25,26,27,28,29].
An example of fissures propagation in the case of durum wheat seeds was given by A.T.J.Gonzalez in the paper [23] and is shown in the figure 3.
Figure 3: The way of breaking (fracture) the endosperm of a durum wheat seed during thegrinding process, [23]
An important difference between soft wheat and durum wheat seeds is the limitations ofendosperm fragmentation. In the case of durum wheat seeds, the endosperm is broken alongthe aleuronic layer (starch granules), resulting in a higher amount of flour, [23,25,30]. Theendosperm of the durum wheat seed may be removed (easier) and more efficiently from thesurface of the bran particles when the cutting forces applied by the milling rolls are directedalong the boundaries between the cell walls of the endosperm. When they reach the skinlayer, some forces are diverted along the interface of the aleuronic layer - the endosperm, it isthus facilitate separation of the bran particles, [25,30].
In the case of soft wheat variety, the process of grinding in roller mills presents realdifficulties. In this case, much of the aleuronic layer remains attached to the endosperm,which is more difficult to remove from the surface of the bran. The cutting forces that havereached the endosperm are not redirected to the bran. This is described in the diagram of theaction of the forces on the wheat endosperm during the grinding process, in figure 4, [25].The largest arrow at the bottom of the diagram indicates the direction of shear force given bythe differential velocity of the grinding rollers.

365
Figure 4: The action of forces on the endosperm cells of a wheat seed during the grindingprocess, [25]
A - the aleuronic layer; B - the bran layer; W - endosperm cell walls; E – endosperm
In the case of durum wheat, cell contents behave as a unit, and therefore the cell is totallybroken off the aleuronic layer. In the case of soft wheat, the shear force passes through thecontents of the cell, as indicated by the dotted arrow, [25]. Subsequent grinding with smoothsurface rolls of grain particles resulting from soft wheat seeds is not as easy as when madefrom hard wheat seeds because of their flattening tendency, losing their granulr characterbefore their grinding is complete, [23,25,30]. After grinding, the particles of flour derivedfrom soft wheat varieties are lightweight and have a smaller size-distribution, while durumwheat seeds break in the particle size within very wide limits, [12].
Another important factor influencing the grinding process is the physical condition of theseeds subjected to external forces and treatments during technological processes ofharvesting, transportation, storage and conditioning [31,32]. Grain seeds are frequentlyaffected by the operation of agricultural machinery during harvesting and transport. They arealso damaged during post-harvest processing due to internal stresses induced by highhumidity slopes occurring during the process of wetting and drying. Broken seeds arecharacterized by reduced mechanical strength and an easier crushing tendency during post-harvesting than seed without such damage. A consequence of these phenomena is thedecrease in seed quality, [32].
4. CONCLUSIONS
For the grinding process to be carried out with maximum efficiency, it is necessary toknow precisely the characteristics of the products subject to grinding (the properties of theraw materials, the required quality conditions, the properties related to the texture of grindedproducts) and their influence on the grinding process.
The theoretical and experimental results on the physical and mechanical characteristics ofthe milling products from the technological flow of a wheat mill (porosity, bulk density,density, natural slope angle, granulometric analysis, hardness, etc.) are used to further choosethe surface type of the milling rolls, correlation with the technological characteristics of theequipment on the technological flow (flute angle, flute position, roll speed, distance betweenmilling rolls) and the characteristics of the screen surfaces of the frame plane sieves.
References[1] Fang Q., Hanna M., Haque E., Spillman C., Neural network modelling of energy requirements for sizereduction of wheat, Transactions of the ASAE 43(6), 2000, p.947-952. [2] Gash, R., Twele, J., Wind PowerPlants, James & James, London, 2002.[2] Blazek J., Jirsa O., Hruskova M., Prediction of wheat milling characteristics by near-infrared reflectancespectroscopy, Czech Journal of Food Science, vol.23, nr, 4, 2005, p. 145-151.[3] Song A., Chung D.S., Apillman C.K., Eckhoff S.R., Physical properties of various fractions in commercialcorn samples. American Association of Cereal Chemists, vo.67(4), 1990, p.322-326.

366
[4] Dziki D., Mechanical properties of single kernel of wheat in relation to debraning ratio and moisturecontent, Acta agrophysica, 4(2), 2004, p.283-290.[5] Fang Q., Haque E., Spilman C.K., Reddy P.V., Steel J.L., Energy requirements for size reduction of wheatusing a roller mill, Transaction of the ASAE, Vol.41(6), 1998, p.1713-1720.[6] Kheiralipour K., Karim M., Tabatabaeefar A., Naderi M., Khoubakht G., Heidarbeigi K.,Moisture-dependphysical properties of wheat (Triticum aestivum L.), Journal of Agricultural Technology, 4(1), 2008, p. 53-64.[7] Martin J.M., Meyer F.D., Morris C.F., Giroux M.J., Pilot Scale Milling Characteristics of TransgenicIsolines of a Hard Wheat Over-Expressing Puroindolines, Crop Science, vo.7, no. 2, 2007, p. 497-504.[8] Wilhelm L.R., Suter D.A., Brusewitz G.H., Food & Process Engineering Technology, Amer Society ofAgricultural, 2005.[9] Dziki D., Laskowski J., Influence of kernel size on grinding process of wehat at respective grinding stages,Polish Journal of Food and Nutrition Sciences, Vol. 13/54, Nr.1, 2004, pg. 29-33.[10] Byung-Sam Y., Wade B.B., Conrad P.L., Value of Increasing Kernel Uniformity, Western AgriculturalEconomics Association Annual Meetings, Logan, Utah, 2001.[11] Mohsenin N.N., Physical properties of plant and animal materials, vol I (Structure, physical characteristicsand mechanical properties), Gordon and Breach Science publishers, N.Y., 1970.[12] Alka Sh., Wheat grain structure, quality and milling, Post Graduate Diploma in Bakery Science andTechnology.[13] Voicu Gh., Tudosie E-M., Paraschiv G., Voicu P., Ipate G., Testing certain distribution laws regardingsome physical characteristics of grinded wheat seed mixture inside milling units and the connection betweenthem, Proceedings of the 39. International Symposium on Agricultural Engineering, Actual Tasks onAgricultural Engineering. ISI – Index to Scientific & Technical Proceedings, Opatija, Croația 2011, p.427-435.[14] Costin I., Cartea morarului, Editura Tehnică, București, 1988.[15] Panainte M., Moșneguțu E., Savin C., Nedeff V., Echipamente de proces în industria alimentară.Măruntirea produselor agroalimentare, Editura Meronia, 2005.[16] Thierer L.V., Determinarea calității produselor agricole vegetale (Tehnica analizelor de laborator,stabilirea perisabilităților și a valorii produselor), Editura Ceres București, 1971.[17] Brătucu Gh., Influența automatizării echipamentelor de condiționat asupra procesului de măcinat grâul,INMATEH, vol.27, nr.1, 2009, p. 110-116.[18] Lupu M., Rus F., The influence of humidity of grain grinding process, Proceeding of the InternationalConference BIOATLAS 2010 Transilvania University of Brasov, p. 60-64.[19] Voicu Gh., Ştefan E.M., Constantin G.Al. - Milling of different moisture content wheat in mills with flutedrolls, Buletinul Universitatii Petrol-Gaze din Ploiesti, Vol. LXV, No.1, p. 35-42, ISSN 1224-8495, 2013.[20] Clarke B., Rottger A., Small mills in Africa. Selection, installation and operation of equipment, Food andAgriculture Organization of the United Nations, Roma 2006.[21] Voicu Gh., Tudosie E-M., Căsăndroiu T., Biriș S-S, Some aspects of physical properties of seeds and wheatproducts obtained from a roller mill, Buletinul Institutului Politehnic din Iași, Universitatea Tehnică ”GheorgheAsachi” din Iași, Tomul LVI (LX), Fasc.4B, Iași 2010, pg.477-488, ISSN 1843-5246.[22] Voicu Gh., David M.F., Biriș S-Ș.,Tudosie E-M., Some physico-mechanical characteristics of the wheatgrist in the breakage phase during milling process, Bulletin UASVM Agriculture, Cluj, 66(2), 2009, p.524-531.[23] Jimenz G.A.T., Milling process of durum wheat, CIHEAM – Options Mediterraneennes.[24] Afkari Sayyah A.H., Minaei S., Behavior of Wheat Kernels under Quasi-Static Loading and its Relationto Grain Hardness, J.Agric. Sci. Technol., Vol.6, 2004, p.11-19.[25] Colin W., Harold C., Charles E.W., Encyclopedia of Grain Science, Elsevier Academic Press, 2004.[26] Dexter J.E., Doust M.A., Raciti C.N., Lombardo G.M., Effect of durum wheat (Triticum turgidum L.var. durum) semolina extraction rate on semolina refinement, strength indicators and pasta properties, CanadianJournal of Plant Science, 84, 2004, p.1001-1013.[27] Fang C.,Campbell G.M., Effect of measurement method and moisture content on wheat kernel densitymeasurement, Institution of Chemical Engineers Trans. Ichem, vo.78, Part.C, 2000, p.179-186.[28] Greffeuille V., Abecassis J., Rousset M., Oury F-X., Faye A., Bar L`Helgouac`h, Lullien- Pellerin V.,Grain Characterization and milling behaviour of near-isogenic lines differing by hardness, Theor ApplGenet, 114, 2006, p.1-12.[29] Pomeranz Y., Martin C.R., Rousser R., Brabec D., Lai F.S., Wheat Hardness Determined by a Single KernelCompression Instrument with semiautomated Feeder,Cereal Chem. vo.65(2), p.86-94.[30] Bailey C.H., The relation of certain physical characteristics of the wheat kernel to milling quality, TheJournal of Agricultural Science, vol. 7, 1916, p.432-442.[31] Wozniak W., Mechanical properties of wheat grain in relation to internal cracks, Int. Agrophysics, 15,2001, p.59-64.[32] Wozniak W., The effect of two types of moisture treatment of wheat grain on endopserm damage, Int.Agrophysics, 9, 1995, p.165-170.
367
SORT VARIATION PROCESS OF POWER FLOW IN A CONICALSIEVE OSCILLATING
Dorel Stoica1, Gheorghe Voicu1, Iulian-Claudiu Duțu1, Mihaela Florentina Duțu1
1 University Politehnica Bucharest, Biotechnical Faculty of Engineering, SplaiulIndependentei, 313, District 6, Bucharest, Romania, [email protected]
ABSTRACT
The objective of this paper is to present the influence of material feed flow on the separationprocess for a conical sieve with vertical axis and oscillating circular motion. Intensity separatingcurves of seeds of rape through circular aperture of sieve were traced by regression analysis of thequantities of material separated at different distances of the central axis of the sieve, using Lorentzdistribution law. Coefficients of the regression equation and correlation coefficient of the distributionfunction with experimental data shows a high correlation between them. Material motion on sieve andseparation process, generally, was assessed by peak position of the distribution curve, depending onthe feed flow of material.Key words: conical sieve, degree of sorting, oscillation frequency, regression analysis, power flow.
1. INTRODUCTIONRemoving the hazardous impurities from seed mass deposited and reducing or preventing
of damage caused by impurities on the quality of seed crops lead to increase of the storageperiod and reduce of storage losses. In paper [1], was analyzed the influence of impurities onmicrobial activity and storage quality, at a temperature of 30oC and 80-90% relativehumidity, in conditions of storage simulated. The results showed that the remaining impuritiesin the wheat seeds had a negative effect on the quality of their storage. Microbial activity tookplace faster and storage quality of wheat suffered. Therefore, impurities must be separated asmuch as possible before storing wheat, in order to reduce negative effects on grain qualityduring storage.On the sieve of equipments for cleaning and sorting of seed crops, seeds are separated due tothe state of sifting imprinted by oscillation movement of sieves and, eventually of a current ofair that passes through the material layer on the sieve, from bottom to top. Material separationis a complex process influenced by many factors, such as: physical properties of componentssubjected to separation, separation surface geometry, kinematics and functional parameters ofthe sieve [2].Shape and geometric characteristics of the sieve are chosen depending on the particle size ofthe material which must be separated. Feed mode and thickness of material on the sieve mustbe ensured by a uniform feed flow, at a flow too high being risk that in refusing of sieve tofind and under-sized particles which must be sifted and did not meet the conditions ofseparation (to get into contact with the sieve and to have the time necessary for involvementin passing by apertures). Also, the length of the path traveled by the particles on the sieve isone factor that influences directly proportional the quality of separation.
Inclination angle of sieves and material particle shape subjected to sifting is also factorsthat indicate (shows) the effectiveness of sifting, [3,4].Geometrical dimensions of particles and their distribution, as well as ratio between averageparticle size and characteristic size of sieve apertures influence the separation process, asfollows: for values of average particle size d smaller than 0.7 a (a – diameter of sieveapertures or the small side of apertures elongated), particles easily pass through apertures, andfor values d higher than 1.5a, particles pass rapidly over the sieve and do not impede particlespassing through small size apertures. For dimensions of particles d, ranging between 0.7a –1.5a, they have a tendency to clog the apertures of sieve, in this case being need to haveapertures with the dimension a higher with 10–15%, for an adequate separation [4,5].

368
Product temperature should be as close to ambient temperature or below, because it influencesinversely proportional the separation capacity, in this regard the products are cooled forseparation [4,5]. Electrical conductivity and static electricity influence negatively the sievingcapacity of sieves [4,5]. Speed of displacement and character of motion on sieve materialdirectly influences the material separation process, which is given by kinematics regime ofscreening block. In case of stationary sieves, displacement of particles occurs due inclinationof sieve and only small impurities can be separated, without being able to make an adequateseparation after the width or thickness of the particles [4,5].Description of seeds separation on sieves with oscillatory motion was made by variousauthors in two different ways.Some takle the stochastic description of the separation process, through mathematical modelswhich results on base of correlation with the results obtained in experiments of somefunctions or distribution laws existing in mathematical statistics [6]. Stochastic models candescribe both the separation intensity of the material on sieve length, as well as cumulativeseparation of material at various distances from the feed end of the scisve along its length [6].The second way of describing the separation process on sieve, is deterministic model thattakes into account the main parameters that characterize the separation process, themathematical model is determined by applying the theory of dimensional analysis, based onexperimental research results for determining of dimensionless similarity criteria values andthe coefficients of the mathematical model.
The paper presents the influence of material feed flow on the material motion and ofseparation process for a sieve with vertical conical outer work surface, having horizontaloscillating motion, for a preset oscillation frequency and four values of sieve oscillationamplitude.
2. METHODOLOGYExperimental stand, presented in detail in papers [7,8] is composed of a conical sieve
suspended with the separation surface of sheet with apertures perforated at 4.2 mm, with aninclination to the horizontal of 80, actuated in oscillatory motion by an eccentric mechanismdisposed tangentially at a distance d (variable), from the center of sieve. Sieve is suspended atthe top and bottom using three metal cables with diameter 1.5 mm disposed circular at 120o.
Experiments were performed with rape seeds with dimensions between 1.25–2.5 mm(in percentage of over 95%) and moisture content of 8.05%. In the seed mixture subject toseparation were introduced straw particles with sizes between 3-4 mm in a percentage ofapproximately 3% [7,8].
Sieve oscillation amplitude was measured on the horizontal in the connecting point ofsieve with arm 6, for maximum opening of connecting rod of actuator mechanism, [7,8].
Fig.1. Scheme of suspended conical sieve used in experiments (views at 90o)1. conical sieve with apertures 4.2 mm; 2. feed funnel adjustable for height; 3. steel elastic wire cables; 4. actuator
mechanism with oscillating coulisse; 5. collecting box with concentric compartments; 6. connecting lever (arm) with theactuator mechanism connecting rod

369
Actuation system with eccentric allowed the modification of oscillation frequency inthree steps (250, 520 and 790 min-1) and of oscillations amplitude in four steps. Diameter atbasis of sieve cone was 430 mm, and the specific number of circular apertures on the surfaceof separation was 2.25 apertures/cm2 (active surface of sieve around 31%), aperture diameterof sieve feed funnel 25 mm. Simplified scheme of the experimental installation is shown inFigure 1.
To express the influence of feed flow over separation process on conical sieve, seedsseparated by sieve apertures were collected in a box with several concentric compartments forcollecting. The mass of seeds collected in each compartment was reported at the initial massof the sample (which was 0.500 kg), the results being presented in percentage compared to it.Feed flow was calculated reporting the mass of seeds of the sample at the drain time of thematerial from the funnel, which could be adjusted through the distance between the exhaustoutlet and sieve. It should be noted that during the experimental measurements, it was foundthat straw impurities from mass of seeds were separated completely beyond the bottom of thesieve, at all tests performed, so that the process of separation is shown through the distributionof separate material along the length of basic cone radius of the sieve. Experimental resultsare presented in Table 1.
Were drawn, comparative (on the same chart), distribution curves of frequencyseparation of on the generatrix of sieve for three values of feed flow used in experiments, incondition in which the other parameters of the working regime (oscillation amplitude A andoscillation frequency F) were maintained constant. Based on experimental data, separationcurves were drawn through nonlinear regression analysis using Lorentz law expressed byequation 1:
(1)
where: px(%)represents the percentage weight of material separated on an interval of length(radius) of sieve. According to mathematical statistics in equation (1) „ yo, A” represents theregression coefficients that depend on the parameters of the operating mode, „xc” is the radiusof sieve corresponding to the maximum percentage of seeds separated (or average fromLorentz distribution function), and „w” represents the dispersion from the position ofmaximum. These coefficients depend on the parameters of working regime of the sieve and isdetermined from regression analysis together with correlation coefficient R2.
The data summarized in Table 1 were processed and synthetic ordered by the values offeed flow and after oscillation amplitude at one of the three oscillation frequencies used inexperiments (F=520 min-1).
Table 1. Variation of the quantity of material collected under the sieve (%),for oscillation frequency F=520 min-1 and foursieve oscillation amplitudes at three material feed flows
Nr.crt.
F2 =520 osc/min, Mp = 500gIntervalul de sită
de pe care se colectează seminţe (m)
Amplitudineaoscilaţiilor
Debitul dealimentare
Seminţeseparate
0 0,04 0,07 0,1 0,13 0,16 0,205Pestesită
1
A1 = 3,58 mm
Q1 = 0,02 kg/sg 0 113 120 140 125 2 0 0% 0 22,6 24 28 25 0,4 0 0
2 Q2 = 0,033kg/sg 0 104 131 108 99 56 2 0% 0 20,8 26,2 21,6 19,8 11,2 0,40 0
3 Q3 = 0,042 kg/sg 0 104 131 108 99 56 2 0% 0 20,8 26,2 21,6 19,8 11,2 0,40 0
4A2 = 3,74mm
Q1 = 0,02 kg/sg 0 201 215 84 0 0 0 0% 0 40,2 43 16,8 0 0 0 0
5 Q2 = 0,033kg/sg 0 133 157 88 55 30 17 20% 0 26,6 31,4 17,6 11 6 3,40 4
2 2
2(%)
4x o
c
A wp y
x x w

370
6 Q3 = 0,042 kg/sg 0 114 141 90 70 39 21 25% 0 22,8 28,2 18 14 7,80 4,20 5
7
A* =3,91 mm
Q1 = 0,02 kg/sg 0 195 210 94 1 0 0 0% 0 39 42 18,8 0,2 0 0 0
8 Q2 = 0,033kg/sg 0 136 162 91 57 25 13 16% 0 27,2 32,4 18,2 11,4 5 2,6 3,2
9 Q3 = 0,042 kg/sg 0 115 150 88 65 36 20 26% 0 23 30 17,6 13 7,2 4 5,2
10
A3 = 4,10 mm
Q1 = 0,02 kg/sg 0 187 208 102 3 0 0 0% 0 28 36,6 19 12 4 0,4 0
11 Q2 = 0,033kg/sg 0 140 183 95 60 20 2 0% 0 28, 36,6 19 12 4 0,40 0
12 Q3 = 0,042 kg/sg 0 115 155 90 59 34 19 28% 0 23 31 18 11,8 6,8 3,8 5,6
Based on the percentages of material collected under the sieve at different distancesfrom the vertical axis of oscillation were drawn the charts shown in Figure 2, for the fouramplitudes.
Each of the four charts shows three curves of distribution of material on the sievecollecting radius, representing the variation of the percentage of seeds separated depending onfeed flow preset and used in experiments.
This separation curves were drawn by regression analysis of experimental data withLorentz distribution function (eq 1), the allure of these curves is approximately the same, butwith differences more or less significant depending on the working regime parameters used inexperiments, respectively with feed flow.
Regression equation coefficient values (eq. 1, Ao, xc, w), and the correlationcoefficient values 2 and R2 for the four amplitudes of oscillation at each of the three feedflows are shown in Table 2.
Fig.2. Feed flow influence on the process of separation of seeds on generatrix of conical sieve, at the frequency of oscillationF = 520 min-1 and four amplitudes of oscillation
0
5
10
15
20
25
30
35
40
0 0.03 0.06 0.09 0.12 0.15 0.18 0.21
Raza de colectare, m
Sem
inte
sep
arat
e, %
Q1=0.02 kg/sQ2=0.033 kg/sQ3=0.042 kg/s
A1= 3.58 mmF2=520 osc/min
0
5
10
15
20
25
30
35
40
45
0 0.03 0.06 0.09 0.12 0.15 0.18 0.21Raza de colectare, m
Sem
inte
sep
arat
e, %
Q1=0.02 kg/sQ2=0.033 kg/sQ3=0.042 kg/s
A2 = 3.74 mmF2 = 520 osc/min
0
5
10
15
20
25
30
35
40
45
0 0.03 0.06 0.09 0.12 0.15 0.18 0.21
Raza de colectare, m
Sem
inte
sep
arat
e, %
Q1=0.02 kg/sQ2=0.033 kg/sQ3=0.042 kg/s
A*= 3.91 mmF2= 520 osc/min
0
5
10
15
20
25
30
35
40
45
0 0.03 0.06 0.09 0.12 0.15 0.18 0.21Raza de colectare, m
Sem
inte
sep
arat
e, %
Q1=0.02 kg/sQ2=0.033 kg/sQ3=0.042 kg/s
A3 = 4.10 mmF1 = 520 osc/min

371
Analyzing the data in Tables 1 and 2 and the charts in Figure 2, it is found that theposition of maximum separation curves for the three feed flows, Q1 = 0.020 kg/s, Q2 = 0.033kg/s, Q3 = 0.042 kg/s, changes at each of the four amplitudes of oscillation.
Thus, if position point at the maximum separation curve is at 0.078 m by centralvertical axis of oscillation of sieve for the amplitude of oscillation A1 = 3.58 mm, and flowQ1, for increasing flow of material (Q2, Q3), this point approaches the vertical axis of thesieve, influenced values, we suppose, and of sieve aperture sizes.It notes, however, a slight increase of material dispersion on the sieve, represented by wcoefficient values in Table 2, for flow Q1.
Table 2. Coefficients of the regression equation (eq. 1) Ao, xc, w and corelation coefficients 2 and R2 with experimental datafor three material feed flows, at the frequency of oscillation F = 520 min-1 and four sieve oscillation amplitudes
No. sampleLorentz function
Working regime Ao xc w χ2 R2
1A1 = 3.58 mm
Q1 = 0.020 kg/s 43.281 0.078 0.029 24.569 0.9602 Q2 = 0.033 kg/s 38.624 0.066 0.032 10.231 0.9713 Q3 = 0.042 kg/s 34.784 0.066 0.033 18.749 0.9284
A2 = 3.74mmQ1 = 0.020 kg/s 42.485 0.069 0.030 13.578 0.978
5 Q2 = 0.03 3kg/s 33.076 0.068 0.037 20.901 0.9146 Q3 = 0.042 kg/s 27.244 0.074 0.042 26.058 0.8347
A* = 3.91 mmQ1 = 0.020 kg/s 42.540 0.067 0.030 9.344 0.980
8 Q2 = 0.033 kg/s 28.112 0.074 0.044 31.851 0.8159 Q3 = 0.042 kg/s 25.737 0.077 0.045 23.861 0.83310
A3 = 4.10 mmQ1 = 0.020 kg/s 42.835 0.066 0.030 8.336 0.982
11 Q2 = 0.033 kg/s 25.814 0.080 0.049 30.284 0.78712 Q3 = 0.042 kg/s 23.728 0.082 0.049 20.659 0.832
If the amplitude of oscillation increases to A2 = 3.74 mm or A* = 3.91 mm and then atA4=4.10 mm for higher flows feed, respectively Q2 = 0.033 kg/s or Q3 = 0.042 kg/s, it appearsthat the material dispersion on sieve also increases.
For the amplitude of oscillation A2 = 3.74 mm, if at feed flow Q1 and Q2 separationcurve at the maximum position does not change significantly, at feed flow Q3 = 0.042 kg/s,maximum separation curve moves to the edge of sieve at xc = 0.074 m as against 0.069 m,how is at feed flow Q1.
Under the same conditions by increasing material dispersion on the surface of sieve,percentages of material separated at the point of maximum of the separation curve decreaseswith the increase of feed flow (see fig.2,b).
From the analysis of separation curves from figure 2, c, at the same frequency ofoscillation F = 520 min-1, but at a slightly higher oscillation amplitude, A* = 3.91 mm, thematerial dispersion on the collecting radius of sieve increases with increasing of feed flow,percentages of material separated at the point of maximum decrease slightly, but maximum ofseparation curve moves significantly from the vertical axis of the sieve to the edge of its.
Thus, if at feed flow Q1 = 0.02 kg/s, position of maximum of separation curve is at xc
= 0.067 m from the axis of oscillation of sieve, at feed flow Q2 = 0.033 kg/s maximum ofseparation curve moves from 0.074 m, to xc = 0.077m for feed flow Q3 = 0.042 kg/s, where itcan be assumed that the sieve can work at a much higher load of material at this oscillationamplitude for review oscillation frequency (F = 520 min-1).
The same phenomenon can be observed from the analysis of separation curves fromfigure 2, d for oscillation amplitude A4 = 4.10 mm.
We note that the position of maximum of separation curve in relation to collectingradius of sieve, moves from oscillation axis to the edge of sieve with the increase of feed flowfrom 0.066 m (for Q1 = 0.02 kg/s) to xc = 0.082 m (for Q3 = 0.042 kg/s). It is to be noted that,(as well as the amplitude A3) percentages of material separated at higher feed flows decreasesignificantly with increasing of material dispersion separated on generatrix of sieve.

372
3. CONCLUSIONSA vertical conical sieve with circular apertures and oscillating motion on the
horizontal was used to analyze the process of sifting and separation of rape seeds throughapertures, for three different feed flows and four oscillation amplitudes of sieve.
From the data presented in this paper, it was found that the position of maximum ofdistribution curve of separation changes with modification of feed flow and with oscillationamplitude of sieve. At low feed flows (Q1=0.02 kg/s), maximum of separation curveapproaches the axis of oscillation of sieve with the increase of amplitude oscillation, while forhigher feed flows, this point moves away from the axis of oscillation at increasing ofamplitude oscillation.
Separation curves were drawn by regression analysis of experimental data withGaussian distribution function, allure of these curves being approximately the same, but withdifferences more or less significant depending on the working regime parameters used in theexperiments, respectively with feed flow.
We can say that at small feed flows (Q1 = 0.02 kg/s, Q2 = 0.033 kg/s) and lowoscillation frequencies (as the one we presented previously, F = 520 min-1) in experimentalconditions performed in this paper, losses of material over the outer edge of the sieve areminimal (in table 2 these are equal with zero for flow Q1 and Q2).The data presented in this paper can provide a reference base for specialists (designers andusers of equipments) in the processing field of seeds crops and, in particular, those in thecleaning and conditioning of them before storage and industrial processing.
References
1. Căsăndroiu, T.; Voicu Gh.; Maican E.; A Mathematical model for the seed looses prediction on the cleaningsystem sieves of the harvesting combines, Modelling and optimization in the machines building field MOCM –14, vol.2, Romanian Technical Sciences Academy, University of Bacău, 2008.2. Elfverson, C.; Regnér, S.; Comparative precision of grain sieving and pneumatic classification on a singlekernel level, Applied Engineering in Agriculture, VOL. 16(5): 537-541.3. Căsăndroiu, T.; Voicu Gh.; Curba de separare a materialului pe lungimea sitei superioare la sistemul decurăţire al combinelor de cereale, Bucureşti, 1992.4. Stoica, D.; Stanciu, G.; Influence the degree of sorting the separation process a conical sieve: Digest Journalof Nanomaterials and Biostructures , ISSN 1842 - 3582 , Vol. 8, No. 2, April - June 2013, pp. 513 – 518.5. Stoca, D.; Voicu, Gh.; Ungureanu, N.; Voicu, P.; Carp-Ciocardia, C.D.; Influence of oscilations amplitudeof sieve on the screening process for a conical sieve with oscillatory circular motion, Journal of Engineeringstudies and research, Bacău, 2011, pp 83-89.6. Voicu, Gh.; Căsăndroiu, T.; Ţuţuianu, G.D.; Aspects regarding the powering by vibration generators withrotation masses of the classifying plane sieves blocks, Modelling and optimization în the machines building fieldMOCM-9, vol.1, Technical Sciences Academy of Romania, 2003, pp.111-116.7. Târcolea, C.; Căsăndroiu, T.; Voicu, G.; Stochastic models for simulating seed separation process on sieves,Proceedings of the 36th International Symposium ”Actual tasks on agricultural engineering”, Opatija, Croatian,2008, pp.293-306.8. Letoşnev, N.M.; Maşini agricole (traducere din lb. rusă), Editura Tehnică, Bucureşti, 1963.9. Stoica, D.; Contribuţii la studiul fenomenelor vibratorii privind utilajele din domeniul prelucrării produseloragricole, teză de doctorat, Bucuresti, 2011.10. Stoica, D., Rusănescu C.O., Research on the Influence of Vibration Frequencyon A Conical SieveSuspended – Metalurgia International, vol.XVIII (2013), nr.3, ISSN 1582 – 2214, pp 84-86.11. Stoica D., Rusănescu C.O., Research on Variation of Displacements, Velocities and Accelerations at a SiteSelector Blocks (Fanner) Grain - Magazine of Hydraulics, Pneumatics, Tribology, Ecology, Sensorics,Mechatronics, “HIDRAULICA” (No. 3/2013), ISSN 1453 – 7303, p 38-42.12. Stoica, D., Voicu, Gh., Rusănescu, C.O., Influence of vibration amplitude oscillations on the conical sievesuspended, Bulletin of University of Agricultural Sciences and Veterinary Medicine Cluj-Napoca. Agriculture,volum 69, nr 1 , 2012/12/11.13. Rusănescu, C.O., Rusănescu, M.T., Iordănescu, Fl., Anghelina, V., Mathematical relation ships betweenalloying elements and technological deformability indexes, Journal of optoelectronics and advanced materials,Vol. 15, No. 7-8, 2013, p. 718-723.

373
CHANGES IN BULK DENSITY AS INDICATOR OF SOIL
COMPACTION
Nicoleta UNGUREANU1, Valentin VLĂDUŢ2, Sorin-Ștefan BIRIȘ1, Bianca-Ștefania
ZĂBAVĂ1, Mirela DINCĂ1 1Politehnica University of Bucharest, Faculty of Biotechnical Systems Engineering, Romania;
2INMA Bucharest, Romania
ABSTRACT
Soil compaction consists in the increase of bulk density, respectively the decrease of porosity due
to natural causes, such as: particle size variability, raindrops impact, soil wetting, internal soil water
tensions, seasonal cycles, or artificial causes: agricultural machinery traffic and animal trampling. In
compacted soils, high mechanical resistance limits the absorbtion of water and nutrients by the plants
and reduces the development of roots. Hence, both agricultural production and food safety, and the
welfare of farmers are affected not only due reduced yields but also due to the costs to reduce soil
compaction. This paper presents the results of experimental research conducted on a plot of white
clover, aiming to determine one of the most important indicator of compaction, namely the bulk
density of soil at depths between 0-45 cm, in increments of 5 cm and to determine the degree of soil
compactness.
1. INTRODUCTION
Soil compaction is a form of soil degradation, described by the packing effect of a
mechanical force on the soil, resulting in the decrease of the volume occupied by pores and
increase of the density and strength of the soil mass. Furthermore, the number of large pores
decreases, which slows the rate of infiltration and drainage from the compacted layer. This
occurs because large pores are the most effective in transporting water when the soil is saturated
[4].
Within agriculture, compaction of soil is induced by trampling of animals and by the
repeated traffic of heavy machinery and this affects nearly all soil functions. All farming
operations, starting with seedbed preparation, fertilizer and chemical applications, harvesting
and transport increase the risk of artificial compaction of the agricultural soil. Nowadays, the
risk of soil compaction increased and it has significant negative effects both on the environment
and agriculture.
The driving force behind the compaction problem is the efforts of farming to remain
economically viable in a society where salaries are generally high. Reduction of the workforce
involved in farming operation requires larger and more efficient machinery. In the developed
and industrialized countries, modern agriculture is characterized by an intense mechanization
that allows for production of food at affordable prices. The pressures on the soil system are
increased by frequent traffic and/or heavy machinery [10].
Common indicators of soil compaction are bulk density and penetration resistance [5, 7,
8]. Bulk density determines the degree of loosening or compaction of the soil (Table 1).
The term compactness is sometimes used for the resulting density state of the soil following
compaction. Since soil bulk density is the mass of dry soil per unit volume, then the relationship
between soil compaction and its capacity to store and transport water or air is obvious. For this
1Splaiul Independenţei 313, sector 6, Bucharest, 0724086492, [email protected]

374
reason the dry soil bulk density is the most frequently used parameter to characterize the state
of soil compactness. However, in swelling/shrinking soils the bulk density should be
determined at standardized moisture contents, to prevent problems caused by water content
variations [5].
Table 1: Classes of bulk density [11]
Type Bulk density [kg/m3] for mineral soils with texture:
Sandy Sandy- loam Loamy- sand Loamy Loamy-
clay Clayey
Extremely low
(very loose soil) < 1.28 < 1.21 < 1.18 < 1.13 < 1.05 < 0.94
Very low (moderate
loose soil) 1.28 – 1.40 1.21 – 1.34 1.18 – 1.31 1.13 – 1.25 1,05 – 1.18 0,94 – 1.07
Low (weak loose
soil) 1.41 – 1.53 1.35 – 1.47 1.32 – 1.45 1.26 – 1.39 1.19 – 1.31 1.08 – 1.20
Average (low
compacted soil) 1.54 – 1.66 1.48 – 1.61 1.46 – 1.58 1.40 – 1.53 1.32 – 1.45 1.21 – 1.34
High (moderate
compacted soil) 1.67 – 1.79 1.62 – 1.75 1.59 – 1.72 1.54 – 1.66 1.46 – 1.58 1.35 – 1.47
Very high (strong
compacted soil) 1.79 > 1.75 > 1.72 > 1.66 > 1.58 > 1.47
According to [10], strictly speaking, the indicators would rather reflect compactness than
compaction, which by definition is a process and not a state. Quantification of the soil density
indicator can be done by sampling of undisturbed soil samples or by indirect methodologies
(e.g., gamma-ray (density) and penetration resistance measurements.
Bulk density characterizes each type of soil, depending on its textural class. Soil resistance
also depends on its moisture, texture and bulk density. The higher the bulk density of a soil
type, the greater will be the resistance it opposes to the agricultural works. In soils with high
bulk density, there are affected processes such as: water infiltration, the activity of soil
microorganisms, porosity, and availability of nutrients necessary for plants, root penetration
into the soil, hence processes that in turn will affect soil productivity and farmers welfare.
Figure 1: Agronomic effects of soil compaction: restricted root elongation and visible
compacted areas with poor plant emergence [12]
Soil bulk density refers to the density of the soil as a whole, including solid particles as well as
pores. It is determined on oven-dry undisturbed samples. The value of soil bulk density range
between 1000 kg/m3 to 2650 kg/m3. A compacted soil achieves bulk density in excess of 2300
kg/m3. Most mineral soils have bulk densities between 1100-1600 kg/m3 [6].
To make results more comparable between soils, the bulk density can be expressed relative
to a reference value, i.e. the bulk density obtained in a standardized procedure, such as a Proctor
test or a uniaxial compression test [1]. Typically, soil density increases with depth because
375
lower soil layers are more compact, with lower content of organic matter, and in these layers
the penetration resistance encountered by plant roots is higher, unlike in the upper layers with
higher porosity.
It is generally accepted that nearly 80% of the compaction caused by wheeled traffic occurs
on the first pass. This is the basis for suggesting the same track be used for repeated passes
(controlled traffic) [4]. However, this response to traffic is related to the initial level of soil
compaction and the distribution in deep layers [3].
Crop yields are reduced when soil compaction decreases crop emergence, crop growth,
and nutrient uptake. Some researchers estimate soil compaction can reduce yield as much as
60%. In Romanian soils, Canarache et al. found that for each 100 kg/m3 increase in bulk density,
a decrease in maize grain yields was 18% less than yields on a non-compacted plot. These
authors showed that changes in soil physical properties, as well as the yield of maize grain,
were shown to be related to the number of tractor passes. Most of the changes were recorded
between 0 and 8–10 passes, while with more than 15–20 passes changes became negligible [2].
Although there have been numerous research in the field of soil compaction and its effects
on agricultural crops, it is difficult to estimate the economic impact of this phenomenon, as
agricultural soils differ by their type, crop rotation and climatic conditions. Constant
measurement of the indicators of soil compaction, such as penetration resistance and bulk
density, allows making recommendations to the farmers with regard to the technologies and
agricultural equipment to use in order to reduce the risk of soil compaction. Besides, the rooting
depth, and the depth until which the compaction takes place or the depth of the hardpan layer
can be established.
Rooting depth influences the ability of plants to access water and nutrients. Literature
studies on the root depth distribution of white clover are limited, but have found up to 70 % of
the total root mass occurs in the topsoil at 10–15 cm [9]. However, in compacted soils, white
clover roots can expand down to 50 cm deep as they find their way in cracks and fissures [13].
The tests undertaken in this study aimed to determine the bulk density of soil on two plots
of white clover, in order to evaluate the depth at which compaction, which could impede root
growth and penetration, is found.
2. METHODOLOGY AND RESULTS
In the first set of tests, carried out on a plot of white clover, soil samples to determine the
bulk density were taken in three points, in increments of 5 cm, to a depth of 45 cm, and in each
of these points, soil moisture was measured using the FieldScout TDR 300 capacitive portable
moisture analyzer.
Determination of bulk density was performed according to the methodology described in
STAS 12836-90, "Tractors and Agricultural Machinery. Methods for determining the
conditions for field testing" and the related standard STAS 7184 / 9-79, "Soils. Determination
of density and bulk density".
The experimental data on the bulk density of the soil tested at three moisture contents, as
well as the values obtained through mediation are presented in Table 2. Also, it was determined
the degree of compactness of agricultural soil at each depth, for which we propose the following
calculation formula:
[%]max
max
0max
max
za
aefa
a
aefaGC
(1)
where: 𝜌𝑎 𝑚𝑎𝑥 is maximum bulk density [kg/m3]; 𝜌𝑎 𝑒𝑓0 is effective bulk density at soil surface
[kg/m3]; 𝜌𝑎 𝑒𝑓𝑧 is effective bulk density at depth z in the soil [kg/m3].

376
Table 2: Bulk densities measured on the clover plot and the degree of compactness
Soil depth
[cm]
Soil moisture [%] Average moisture [%] Degree of
compactness
[%]
29 37.7 36 34.23
Bulk density [kg/m3] Average bulk density
[kg/m3]
0 1020 1090 1064 1058 -
5 1127 1138 1200 1155 5.61
10 1240 1210 1286 1245 10.81
15 1318 1300 1378 1332 15.84
20 1380 1386 1439 1402 19.89
25 1512 1437 1570 1506 12.89
30 1572 1514 1600 1562 29.15
35 1628 1580 1640 1616 32.27
40 1683 1676 1683 1680 35.97
45 1721 1738 1730 1729 38.8
Based on the measured data, the curves of bulk density variation with the depth of the
agricultural soil were graphically plotted. Figure 2 highlights the increase in bulk density of
clover plot with increasing soil depth and soil moisture.
Figure 2: Variation of bulk density with soil depth at different moisture content
The second set of tests aimed to determine soil bulk density prior to the passage of 40 kN
New Holland tractor (control sample), and after one pass, respectively after two passes on
another plot. The degree compactness was calculated (Eq. 1) under these conditions. The results
are given in Table 3 and the variation of bulk density with soil depth after each passage is
graphically represented in Figure 3. It can be seen that, relative to the experimentally obtained
values on the control field, the most significant increase in bulk density occurred after the first
pass, and the bulk density values obtained after the second passage had a slower increase
compared to the values obtained after the first pass. This confirms the data from the literature,
according to which the most pronounced compaction occurs after the first pass of the
agricultural machine on the soil compared to the compaction due to subsequent passages.
1000
1200
1400
1600
1800
2000
0 5 10 15 20 25 30 35 40 45 50
Bu
lk d
ensi
ty [
kg
/m3]
Soil depth [cm]
w=29% w=37.7% w=36%

377
Table 3: Bulk densities and degree of compactness after repeated passes of the tractor
Soil depth
[cm]
Number of tractor passes After 2nd passes
0 1 2
Bulk density [kg/m3] Average bulk
density [kg/m3]
Degree of
compactness [%]
0 1130 1230 1276 1212 -
5 1183 1280 1340 1267 3.26
10 1200 1300 1364 1288 4.51
15 1320 1348 1392 1353 8.37
20 1340 1396 1438 1391 10,63
25 1362 1428 1458 1416 12.12
30 1396 1446 1518 1453 14.32
35 1480 1586 1640 1568 21.15
40 1549 1660 1673 1627 24.65
45 1600 1700 1750 1683 27.98
Figure 3: Variation of bulk density with soil depth at different number of passes
Although in Figures 2 and 3 the tendency is linearly increasing for bulk density on a depth
of 0-45 cm, there is an area where the variation is random or presents a slightly sinusoidal
variation, which may lead to the conclusion that the soil does is not completely homogeneous
in terms of moisture, structure and texture, but it is very likely that these variations are due to
the existence of stiffness barriers of consistency.
Also it can be seen that in the first set of experiments, at 20-25 cm deep there is a jump of
the bulk density values, which again can lead to the conclusion that there is a denser layer of
soil in this area resulting from soil processing by agricultural work on the depth 0-20 (0-25) cm
and leading to the appearance of the hardpan.
It is possible that, at a depth of 20-25 cm, the composition of the soil, i.e. its stratification,
will change from loamy-clay to clayey-loam. Hardpan presence also influences the distribution
of stresses in the soil. In uniform soil, stresses will propagate deeper into the subsoil, causing
compaction of these soil layers. In the case of stratified soil, the presence of hardpan resulting
from soil works at the same depth each year is beneficial for limiting the propagation of stresses
to greater depths, so it will limit depth compaction.
1000
1100
1200
1300
1400
1500
1600
1700
1800
1900
0 5 10 15 20 25 30 35 40 45 50
Bu
lk d
ensi
ty [
kg
/m3]
Soil depth [cm]
0 passes 1 pass 2 passes

378
3. CONCLUSIONS
Bulk density is one of the most important indicators of soil compaction. This parameter
has linear increasing variation with soil depth.
Tests revealed that in the topsoil (between 0-20 cm), bulk density has relatively small
values, but they grow beyond this depth. The increase of bulk density on the 20-25 cm depth
indicates the presence of hardpan, which can restrict root growth above this layer, altering root
architecture and their ability to uptake water and nutrients.
Regarding the influence of the number of passes of the tractor on the clover plot, the most
obvious increase of bulk density was recorded after the first pass.
The degree of soil compaction increases with depth. On the clover plot the highest
compaction values were obtained, between 5.61% (at 5 cm depth) and 38.8% (at a depth of 45e
cm). After the second pass of the tractor, the degree of compaction varied between 3.26% (at 5
cm depth) and 27.98% (at a depth of 45 cm).
ACKNOWLEDGEMENT
This work has been funded by University Politehnica of Bucharest, through the
“Excellence Research Grants” Program, UPB–GEX2017, Ctr. No. 61/25.09.2017, internal
number IS 25.17.03/2017 (COMPSOL)”.
References
[1] Arvidsson J., Hakansson I., Response of different crops to soil compaction—Short-term effects in Swedish field
experiments, Soil & Tillage Research, vol. 138, pp. 56–63, 2014.
[2] Botta G.F., Rivero D., Tourn M., Bellora Melcon F., Pozzolo O., Nardon G., Balbuena R., Tolon-Becerra A.,
Rosatto H., Stadler S., Soil compaction produced by tractor with radial and cross-ply tyres in two tillage regimes,
Soil & Tillage Research, vol. 101, pp. 44-51, 2008.
[3] Botta G. F., Tolon Becerra A., Bellora Tourn F., Effect of the number of tranctor passes on soil rut depth and
compaction in two tillage regimes, Soil & Tillage Research, vol. 103, 2009, pp. 381-386.
[4] Guclu Yavuzcan H., Vatandas M., Gurhan R., Soil strength as affected by tillage system and wheel traffic in
wheat -corn rotation in central Anatolia, Journal of Terramechanics, vol. 39, pp. 23–34, 2002.
[5] Hamza M.A., Anderson W.K., Soil compaction in cropping systems. A review of the nature, causes and possible
solutions, Soil & Tillage Research, vol. 82, pp. 121-145, 2005.
[6] Lestariningsih I. D., Hairiah Widianto K., Assessing soil compaction with two different methods of soil bulk
density measurement in oil palm plantation soil, Procedia Environmental Sciences, vol. 17, pp. 172 – 178, 2013.
[7] Leung Y-F., Meyer K., Soil compaction as indicated by penetration resistance: a comparison of two types of
penetrometers, Technology for Resource Management, pp. 370-375, 2003.
[8] Mari G.R., Changying J., Influence of agricultural machinery traffic on soil compaction patterns, root
development, and plant growth, overview, American-Eurasian Journal Agriculture & Environment Science, vol.
3(1), pp. 49-62, 2008.
[9] Nichols S.N., Crush J.R., Woodfield D.R., Effects of inbreeding on nodal root system morphology and
architecture of white clover (Trifolium repens L.), Euphytica, vol. 156, pp. 365–373, 2007.
[10] Stolte J., Tesfai M., Øygarden L., Kværnø S., Keizer J., Verheijen F., Panagos P., Ballabio C., Hessel R., JCR
Technical Reports – Soil threats in Europe. Status, methods, drivers and effects on ecosystem services. A review
report, deliverable 2.1 of the RECARE project, 2016.
[11] Ungureanu N., Contributions to the modelling of artificial compaction of agricultural soil. Doctoral thesis,
2015. University Politehnica of Bucharest, Romania.
[12] Ungureanu N., Vlăduț V., Dincă M., Zăbavă B.Șt., Vlăduț D.I., Bolintineanu Gh., Artificial compaction given
by penetration resistance in soils with different use, Annals of the University of Craiova – Agriculture,
Montanology, Cadastre Series. Vol. XLVII/2, pp. 438-446, 2017.
[13] Vidrih T., Soil compaction and growth of roots on grass/white clover pasture
(http://www.fao.org/docrep/v2350e/v2350e0v.htm).

379
REUSE OF WASTEWATER FOR IRRIGATION, A SUSTAINABLE
PRACTICE IN ARID AND SEMI-ARID REGIONS
Nicoleta UNGUREANU1, Valentin VLĂDUŢ2, Mirela DINCĂ1, Bianca-Ștefania ZĂBAVĂ1 1Politehnica University of Bucharest, Faculty of Biotechnical Systems Engineering, Romania;
2INMA Bucharest, Romania
ABSTRACT
The problem of water resources is aggravating as a result of accelerated urbanization, population
growth, industrial and agricultural development. In addition to these factors, climate changes represent
a substantial risk because it affects considerably both water resources and crops. Globally, agriculture
is the largest consumer of water, accounting for approximately 70% of all freshwater. Farmers in many
arid and semiarid areas are forced to find solutions to irrigate their crops, so they often must use treated,
untreated or undiluted wastewater which is cheaper than other water sources. Increasing water needs
(for drinking, food and irrigation) make the use of effluents (treated wastewater) an effective solution
to solve the problem of water scarcity, to save significant quantities of drinking water, to reduce the use
of chemical fertilizers (nutrients in the wastewater can replace conventional fertilizers), thereby
protecting the environment and improving crop yield.
1. INTRODUCTION
The volume of wastewater generated by domestic, industrial and commercial sources has
increased with population, urbanization, improved living conditions, and economic
development.
Droughts and water scarcity are major issues not only in dry lands, but also in world
regions where freshwater is abundant [9]. Many regions around the world are already facing
these problems, for example the southern states of the USA, North Africa, the Middle East and
Australia, and half of the European countries are facing water stress with water scarcity [4]. It
is estimated that more than 40% of the world's population is now experiencing water stress [7]
and will face scarcity within the next 50 years, a serious incentive to achieve sustainable
management options of the water resources [20].
Romania is relatively poor in water resources, with only 1870 m3 of water /inhabitant /year,
compared to the average of 4000 m3 of water /inhabitant /year in Europe. In 2014, Romania’s
water demand was 7.21 billion m3/year. According to Eurostat, in 2013 the water exploitation
index was 15.2%, which is below the 20% water stress threshold of the Member States. A
significant part of Romania's agricultural area already shows the negative effects of the drought
and of poorly functioning irrigation systems. The total irrigated area in Romania is 2.99 million
hectares, out of which 85% uses water from the Danube. Between years 2011 and 2015, the
irrigated soil surface in Romania represented less than 300000 ha (1%) of total arable land,
consuming about 1 million m3 water/ year [8].
Romania's accession to the European Union requires compliance with European
requirements, and the reuse of wastewater effluents is in line with Objective 6 of the European
Union's Sustainable Development Strategy. In Romania, reuse of irrigated water is not largely
practiced (there is a low demand for the global use of treated wastewater), and different
wastewater treatment methods for reuse are only addressed at the experimental level. Although
1Splaiul Independenţei 313, sector 6, Bucharest, 0724086492, [email protected]

380
the Romanian legislation does not prohibit the use of irrigated waste water, the relatively low
number of users connected to the irrigation system does not stimulate investment in new waste
water treatment technologies in order to use them as irrigation water. However, in the long term,
the interest in reuse of irrigated water could increase, as Romanian agriculture continues to be
dependent on climatic factors.
As the domestic demand for clean water increases and drought conditions become
frequent, it is essential to think about non-conventional water resources to satisfy the increased
rates of demand for freshwater. The main (re)uses of treated wastewater are: irrigation (both
agricultural and landscape), recharge of aquifers, seawater barriers, industrial applications,
dual-distribution systems for toilet flushing, and other urban uses.
An increasingly common practice encouraged by governments worldwide is the on the
recovery and reuse of treated wastewater for irrigation of vegetable and energy crops. Despite
strong government support, treated wastewater use in irrigation has faced several constraints,
chief among them being problems of social acceptance, agronomic considerations and
sanitation, and restrictive regulations that have tended to limit its full potential for development
[17]. Unlike clean water, wastewater flows do not vary with seasons, climatic conditions, or
precipitation levels, thus allowing farmers to grow crops throughout the year.
The reuse of treated wastewater is a valid option, in some cases urged by the absence of
viable alternatives and also due to costly wastewater treatment for discharge. Nevertheless,
untreated streams are still commonly used in several developing countries lacking collection
and sanitation services [18]. In order to safely reuse treated municipal wastewater for irrigation
purposes, all environmental, chemical, geological, and public health parameters related to land
use ecology should be considered [5].
Irrigation with raw, partially and treated wastewater is a widespread practice in many arid
and semiarid zones and it has potential for both positive and negative environmental impacts.
With proper planning and management, the use of treated wastewater in agriculture can be
beneficial to the environment.
With respect to the positive impacts, irrigation with treated wastewater can reduce the use
of natural water resources; wastewater reuse will also reduce the discharge of effluents into
freshwater ecosystems [4]. As half of the global water bodies are seriously contaminated,
wastewater treatment and reuse promote environmental security by alleviating the pollution of
freshwater resources, while providing more water for irrigation [6]. In addition, wastewater
contains high amounts of organic matter and nutrients (like nitrogen and phosphorous) which
are beneficial for plants [2] and hence avoids fertilizer usage.
Some long-term negative impacts are: the content on heavy metals which are toxic to
plants beyond a certain limit; increasing soil salinity due to high concentrations of soluble salts
transported by the wastewater, causing soil sealing, solidification and sodium accumulation,
which could cause increased electrical conductivity, run off and soil erosion [16]. Excessive
soil salinity imposes hyper-osmotic, oxidative stress and ion toxicity, constituting a limiting
factor for plant growth, development and productivity. On the other hand, soil solidification
affects negatively the stability of soil aggregates and soil structure, leading to an increase of
soil compaction, loss of soil permeability and reduction of hydraulic conductivity [4].
It seems that the microbial pathogens contained in the wastewater (bacteria, viruses,
protozoa, and nematodes) can pose environmental and health risks, but these pathogens can be
removed by physical and biochemical treatment processes.
Nevertheless, the direct and indirect uses of untreated wastewater in irrigation especially
in arid and semi-arid countries are increasing due to increasing global water scarcity,
inappropriate wastewater treatment and disposal and escalating fertilizer costs [13].

381
2. METHODOLOGY
It is estimated that presently 70% of world water use including the water diverted from
rivers and pumped from underground is used for agricultural irrigation, so that the reuse of
treated municipal wastewater for agricultural and landscape irrigation reduces the amount of
water that needs to be extracted from natural water sources as well as reducing discharge of
wastewater to the environment [12].
The traditional irrigation not only causes huge waste of water resources, but is unable to
meet the irrigation requirements, as agricultural crops have various varieties, and different
requirements for irrigation water volumes, locations, and irrigating methods [21].
The earliest documented sewage treatment units applying wastewater for agricultural use
were constructed in the 16th and 17th centuries in Germany and Scotland [3]. In developed
countries, irrigation with treated wastewater is already a sustainable practice. In many
developing countries, wastewater treatment is still limited, as investments in treatment facilities
have not kept pace with persistent increase in population and the consequent increase in
wastewater volume. Thus, much of the wastewater generated is not treated, and much of the
untreated wastewater is used for irrigation by small-scale farmers with little ability to optimize
the volume or quality of the wastewater they receive [15]. The productive use of wastewater
has increased, as millions of small-scale farmers in urban and peri-urban areas of developing
countries depend on wastewater or wastewater polluted water sources to irrigate high-value
edible crops for urban markets, often as they have no alternative sources of irrigation water
[14].
Usually, municipal wastewater and/or farm wastewater, untreated, diluted or treated is used
for the irrigation of vegetable crops and energy crops. At least 10% of the global population
consumes foods produced by irrigation with wastewater and over 20 million hectares (10% of
all irrigated land) are irrigated with untreated, partly treated/diluted or treated wastewater
around the world (Fig. 1). It also has been reported that over 200 million farmers in
approximately 44 countries are reusing over 15 million m3/day of reclaimed water for irrigation
purposes [7].
Figure 1: Wastewater reuse and the hydrologic cycle [22]
Conventionally, the rational utilization of wastewater in rural areas, together with the
protection of the environment, can be made after at least partial purification, ideally complete

382
(primary and secondary treatment). Choosing of the treatment method is influenced not only by
the polluting load of wastewater, the technological possibilities and costs of water treatment,
but also by the particularities of agricultural crop to be irrigated.
In developed countries, the reuse of municipal wastewater is normally based on the upgrade
of existing wastewater treatment plants (WWTP) with the introduction of tertiary treatments.
Several pilot studies and full scale installations have shown that a number of different
technologies are suitable for producing reclaimed municipal effluents complying with the
standards for reuse [18]. The quality of treated wastewater depends to a great extent on the
quality of the municipal water supply, nature of the wastes added during use and the degree of
treatment the wastewater has received [12]. Also, high quality effluent requires water treatment
shift from less developed methods toward advance methods that imply higher costs.
The wastewater treatment plants (WWTP) are designed to decrease the environmental
impacts of municipal and industrial discharges. In addition to the mandatory primary and
secondary treatments, in the last decades the WWTP completed their facilities with advanced
(tertiary) treatment, facilitating the wastewater recycling and reuse. Figure 2 presents the types
and levels of wastewater treatment processes that are currently applied in most regions of the
world [19].
Figure 2: Types and levels of wastewater treatment processes [19]
However, there cannot be a single design solution for a WWTP that produces quality
effluent for irrigation, as there are wide differences between locations, not only in climate and
physical environment, but also in social acceptance, economic and technical opportunities and
perceptions related to the use of treated and untreated wastewater [5].
In agriculture, special attention must be paid to ensure the safe use of wastewater to irrigate
vegetable crops, mainly because of the potential chemical and microbiological contamination.
In most literature studies, the suitability of treated municipal wastewaters for irrigation is
mainly based on salinity and pathogen removal. Only few studies make a complete evaluation

383
of the suitability of produced effluent for irrigation taking all four main parameters into account,
and include constructed wetlands and integrated systems, which include successive treatment
steps using MBR, gravel filter, granulated ferric hydroxide absorber for heavy metals and UV
[11].
The reuse of tertiary wastewater is encouraged as a general principle, although the actual
laws do not differentiate the wastewater according to the risk associated with the different types
of reuse [1]. The irrigated energy crops are a typical case of a relatively low level of chemical
and microbiological contamination risk because they do not require the same water quality than
food crops.
The reuse of treated industrial wastewater in irrigation is rarely adopted, due to the potential
hazard of non-biodegradable compounds that may be present in these streams, depending on
their origin. However, treated agro-industrial effluents may be considered for reuse, due to
relatively steady composition (depending on the industrial processes) and more limited
microbiological contamination with respect to municipal sewage [18]. Recovery and reuse of
agro-industrial effluents is especially relevant in Southern European countries, where the
economy is strongly based on irrigated agriculture.
Salinity, pathogens, nutrients and heavy metals are the main parameters considered
important for the quality of irrigation water. Irrigation of with low quality water, especially drip
and subsurface irrigation, can potentially lead to contamination of groundwater when irrigation
water contains high numbers of faecal microorganisms and pathogens, enteric viruses, and
protozoa parasites [10].
Suitable irrigation methods can effectively mitigate negative environmental effects.
Depending on the irrigation method used, flood irrigation can seriously pollute an entire field.
For spray irrigation, wastewater at least meets secondary treatment standards of disinfection to
reduce aerosol and health risks. Drip irrigation constitutes the most environmental friendly
approach. Underground drip irrigation can mitigate environmental risks and can decrease
nitrate leaching rates (reached 70%) [22].
3. CONCLUSIONS
As a result of rapid population growth and industrialization with increased water
demand, domestic and industrial wastewater amounts have increased considerably. In the same
time, worldwide, due to climate change, the areas affected by drought and water scarcity are
increasing daily with a concerning rate.
Wastewater, as a substitute for freshwater, contributes to agricultural irrigation to address
the global water deficit. This nutrient-rich wastewater is viewed as a valuable resource to urban
farmers seeking a consistently available source of irrigation water.
There is a considerable interest in the long-term effects of treated wastewater on crops
intended for human consumption. Health and environmental aspects are very sensitive issues
and important prerequisites, since wastewater effluent must not be used and/or accepted to
replace conventional or possibly other non-conventional water sources for irrigation, unless it
is adequately treated and safely applied.
ACKNOWLEDGEMENT
This work has been funded by the Ministry of National Education and Research, through
the UEFISCDI, within the project entitled „Innovative technologies for crop irrigation in arid,
semi-arid and sub-dry climate", contract no. 27 PCCDI / 2018.

384
References
[1] Alcalde-Sanz, L., Gawlik, B., Water Reuse in Europe, relevant guidelines, needs for and barriers to innovation,
JRC Sience and policy reports. EUR –Scientificand Technical Research series 2014.
[2] Al-Hamaiedeh, H., Bino, M., Effect of treated grey water reuse in irrigation on soil and plants, Desalination,
vol. 256 (1–3), pp. 115–119, 2010.
[3] Almuktar, S.A.A.A.N., Abed, S.N., Scholz, M., Recycling of domestic wastewater treated by vertical-flow
wetlands for irrigation of two consecutive Capsicum annuum generations, Ecological Environment, vol. 107, pp.
82-98, 2017.
[4] Becerra-Castro, C., Lopes, A.R.,Vaz-Moreira, I., Silva, E.I., Manaia., C.M., Nunes,O.C., Wastewater reuse in
irrigation: a microbiological perspective on implications in soil fertility and human and environmental health,
Environment International, vol. 75, pp. 117-135, 2015.
[5] Cakmak, B., Apaydin, H., Review. Advances in the management of the wastewater in Turkey: natural
treatments or constructed wetlands, Spanish Jourmal of Agricultural Research, vol. 8(1), pp. 188-201, 2010.
[6] Corcoran, E., Nellemann, C., Baker, E., Bos, R., Osborn, D., Savelli, H., Sick Water? the Central Role of
Wastewater Management in Sustainable Development. A Rapid Response Assessment, United Nations
Environment Programme, UN-HABITAT, GRID-Arendal, Norway 2010.
[7] Elgallal, M., Fletcher, L., Evans, B., Assessment of potential risks associated with chemicals in wastewater
used for irrigation in arid and semiarid zones: a review, Agricultural Water Management, vol. 177, pp. 419-431,
2016.
[8] EU-level instruments on water reuse. Final report to support the Commission’s Impact Assessment.
Luxembourg: Publications Office of the European Union, 2016.
[9] FAO, Coping with water scarcity. An action framework for agriculture and food security, FAO Water Reports.
Food and Agriculture Organization of the United Nations (FAO), Rome 2012.
[10] Lonigro, A., Rubino, P., Lacasella, V., Montemurro, N., Faecal pollution on vegetables and soil drip irrigated
with treated municipal wastewaters, Agricultural Water Management, vol. 174, pp. 66-73, 2016.
[11] Norton-Brandao, D., Scherrenberg, S.M., van Lier, J.B., Reclamation of used urban waters for irrigation
purposes – a review of treatment technologies, J. Environ. Manage., vol. 122, pp. 85–98, 2013.
[12] Pedrero, F., Kalavrouziotis, I.,Alarcon, J.J., Koukoulakis, P., Asano, T., Use of treated municipal wastewater
in irrigated agriculture – review of some practices in Spain and Greece, Agricultural Water Management, vol. 97,
pp. 1233-1241, 2010.
[13] Qadir, M., Wichelns, D., Raschid-Sally, L., Minhas, P.S., Drechsel, P., Bahri, A., McKornick, P., Agricultural
use of marginal quality water - opportunities and challenges. In: D. Molden (Ed.), Water for Food, Water and life:
A Comprehensive Assessment of Water Management in Agriculture, Earthscan, London, 2007.
[14] Qadir, M., Wichelns, D., Raschid-Sally, L., McCornick, P.G., Drechsel, P., Bahri, A., Minhas, P.S., The
challenges of wastewater irrigation in developing countries, Agricultural Water Management, vol. 97, pp. 561-
568, 2010.
[15] Sato, T., Qadir, M., Yamamoto, S., Endo, T., Zahoor, A., Global, regional, and country level need for data
on wastewater generation, treatment, and use, Agric. Water. Manag., vol. 130, pp. 1–13, 2013.
[16] Shakir, E., Zahraw, Z., Al-Obaidy, A.H.M.J., Environmental and health risks associated with reuse of
wastewater for irrigation, Egyptian Journal of Petroleum, vol. 26, pp. 95–102, 2017.
[17] Shetty S, Treated wastewater use in Tunisia: lessons learned and the road ahead, International Water
Management Institute (IWMI), India 2004.
[18] Vergine, P., Saleron, C., Libutti, A., Beneduce, L., Gatta, G., Berardi, G., Pollice, A., Closing the water cycle
in the agro-industrial sector by reusing treated wastewater for irrigation, Journal of Cleaner Production, vol. 164,
pp. 587-596, 2017.
[19] Vo, P.T., Ngo, H.H., Guo, W., Zhou, J.L., Nguyen, P.D., Listowski, A., Wang, X.C., A mini-review on the
impacts of climate change on wastewater reclamation and reuse, Sci. Total Environ., vol. 494, pp. 9–17, 2014.
[20] WHO, Guidelines for the Safe Use of Wastewater, Excreta and Greywater, vol. 2. World Health Organization
(WHO), France 2006.
[21] Xu, M., Bai, X., Pei, L., Pan, H., A research on application of water treatment technology for reclaimed water
irrigation, International Journal of Hydrogen Energy, vol. 41, pp. 15930-15937, 2016.
[22] Zhang, Y., Shen, Y., Wastewater irrigation: past, present, and future, Wiley Periodicals, Inc, WIREs Water,
pp. 1-6, 2017.
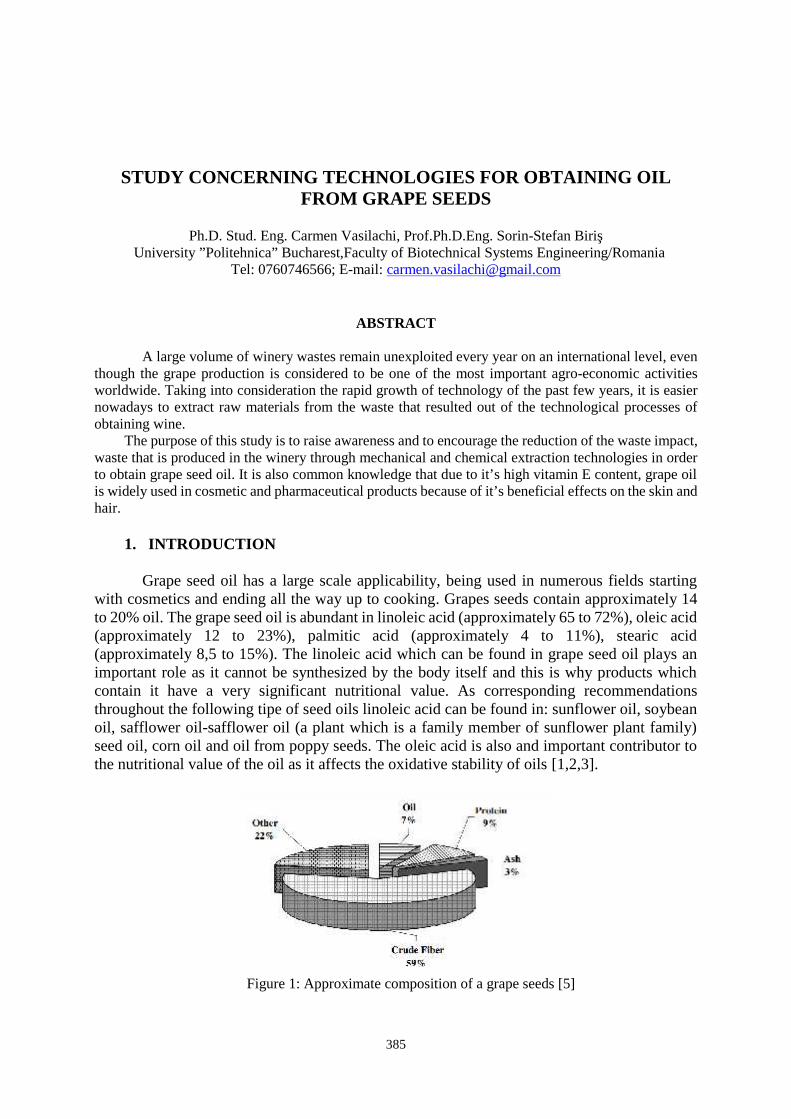
385
STUDY CONCERNING TECHNOLOGIES FOR OBTAINING OILFROM GRAPE SEEDS
Ph.D. Stud. Eng. Carmen Vasilachi, Prof.Ph.D.Eng. Sorin-Stefan BirişUniversity ”Politehnica” Bucharest,Faculty of Biotechnical Systems Engineering/Romania
Tel: 0760746566; E-mail: [email protected]
ABSTRACT
A large volume of winery wastes remain unexploited every year on an international level, eventhough the grape production is considered to be one of the most important agro-economic activitiesworldwide. Taking into consideration the rapid growth of technology of the past few years, it is easiernowadays to extract raw materials from the waste that resulted out of the technological processes ofobtaining wine.
The purpose of this study is to raise awareness and to encourage the reduction of the waste impact,waste that is produced in the winery through mechanical and chemical extraction technologies in orderto obtain grape seed oil. It is also common knowledge that due to it’s high vitamin E content, grape oilis widely used in cosmetic and pharmaceutical products because of it’s beneficial effects on the skin andhair.
1. INTRODUCTION
Grape seed oil has a large scale applicability, being used in numerous fields startingwith cosmetics and ending all the way up to cooking. Grapes seeds contain approximately 14to 20% oil. The grape seed oil is abundant in linoleic acid (approximately 65 to 72%), oleic acid(approximately 12 to 23%), palmitic acid (approximately 4 to 11%), stearic acid(approximately 8,5 to 15%). The linoleic acid which can be found in grape seed oil plays animportant role as it cannot be synthesized by the body itself and this is why products whichcontain it have a very significant nutritional value. As corresponding recommendationsthroughout the following tipe of seed oils linoleic acid can be found in: sunflower oil, soybeanoil, safflower oil-safflower oil (a plant which is a family member of sunflower plant family)seed oil, corn oil and oil from poppy seeds. The oleic acid is also and important contributor tothe nutritional value of the oil as it affects the oxidative stability of oils [1,2,3].
Figure 1: Approximate composition of a grape seeds [5]
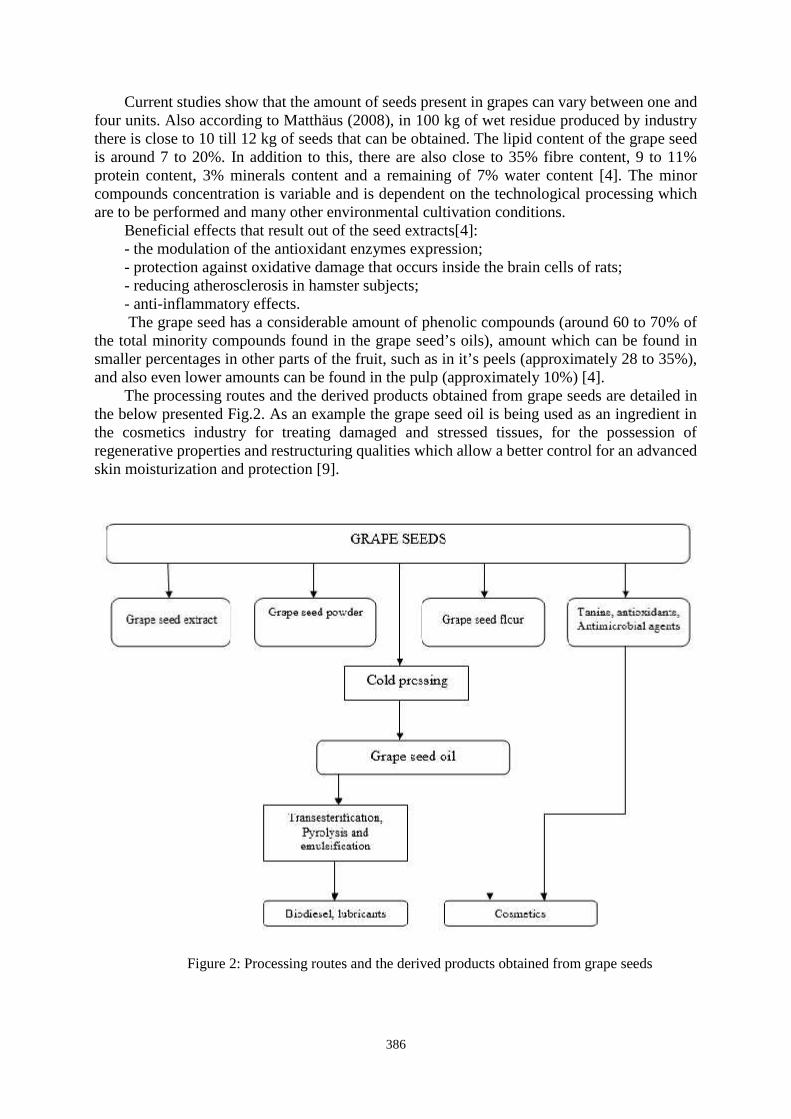
386
Current studies show that the amount of seeds present in grapes can vary between one andfour units. Also according to Matthäus (2008), in 100 kg of wet residue produced by industrythere is close to 10 till 12 kg of seeds that can be obtained. The lipid content of the grape seedis around 7 to 20%. In addition to this, there are also close to 35% fibre content, 9 to 11%protein content, 3% minerals content and a remaining of 7% water content [4]. The minorcompounds concentration is variable and is dependent on the technological processing whichare to be performed and many other environmental cultivation conditions.
Beneficial effects that result out of the seed extracts[4]:- the modulation of the antioxidant enzymes expression;- protection against oxidative damage that occurs inside the brain cells of rats;- reducing atherosclerosis in hamster subjects;- anti-inflammatory effects.The grape seed has a considerable amount of phenolic compounds (around 60 to 70% of
the total minority compounds found in the grape seed’s oils), amount which can be found insmaller percentages in other parts of the fruit, such as in it’s peels (approximately 28 to 35%),and also even lower amounts can be found in the pulp (approximately 10%) [4].
The processing routes and the derived products obtained from grape seeds are detailed inthe below presented Fig.2. As an example the grape seed oil is being used as an ingredient inthe cosmetics industry for treating damaged and stressed tissues, for the possession ofregenerative properties and restructuring qualities which allow a better control for an advancedskin moisturization and protection [9].
Figure 2: Processing routes and the derived products obtained from grape seeds

387
The chosen method for oil extraction depends on the nature of raw material. The traditionalway used for extracting grape seed oil is through the cold pressing method in which the wholeseeds are put in discontinuous hydraulic presses or they are milled and heated in a screw press.It is an important matter that the seed’s moisture percentage won’t exceed 10% [3]. The coldpressing extraction method is a mild process that facilitates obtaining a good quality of oil.
After recent developments alternative methods are being suggested to obtain grape seedoil, without the presence of organic solvents, like hot water extraction, supercritical fluidextraction (SFE), supercritical CO2 extraction, pressurized liquid extraction (PLE) andultrasound assisted extraction.
2. METHODOLOGY
There are two different ways of obtaining grape seed oil that are presented in thesestudies and these are as follows: the cold pressing method and the extraction with supercriticalcarbon dioxide. Several other methods can be used to obtain grape seed oil, as they can beseen presented in Figure 3 [11].
Figure 3: Processing procedures for grape seed oil extraction
Expression or cold pressing is the oldest extraction method known to be used in suchcircumstances and is known to be used almost exclusively for the production of oil. This method
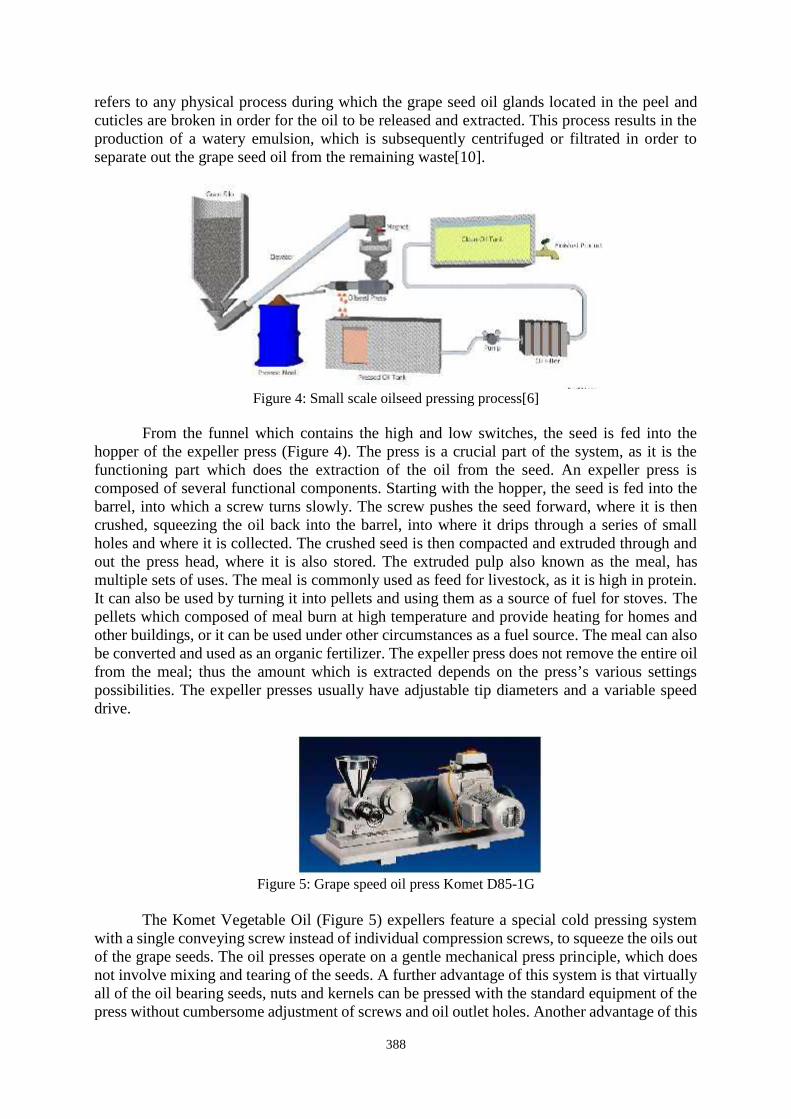
388
refers to any physical process during which the grape seed oil glands located in the peel andcuticles are broken in order for the oil to be released and extracted. This process results in theproduction of a watery emulsion, which is subsequently centrifuged or filtrated in order toseparate out the grape seed oil from the remaining waste[10].
Figure 4: Small scale oilseed pressing process[6]
From the funnel which contains the high and low switches, the seed is fed into thehopper of the expeller press (Figure 4). The press is a crucial part of the system, as it is thefunctioning part which does the extraction of the oil from the seed. An expeller press iscomposed of several functional components. Starting with the hopper, the seed is fed into thebarrel, into which a screw turns slowly. The screw pushes the seed forward, where it is thencrushed, squeezing the oil back into the barrel, into where it drips through a series of smallholes and where it is collected. The crushed seed is then compacted and extruded through andout the press head, where it is also stored. The extruded pulp also known as the meal, hasmultiple sets of uses. The meal is commonly used as feed for livestock, as it is high in protein.It can also be used by turning it into pellets and using them as a source of fuel for stoves. Thepellets which composed of meal burn at high temperature and provide heating for homes andother buildings, or it can be used under other circumstances as a fuel source. The meal can alsobe converted and used as an organic fertilizer. The expeller press does not remove the entire oilfrom the meal; thus the amount which is extracted depends on the press’s various settingspossibilities. The expeller presses usually have adjustable tip diameters and a variable speeddrive.
Figure 5: Grape speed oil press Komet D85-1G
The Komet Vegetable Oil (Figure 5) expellers feature a special cold pressing systemwith a single conveying screw instead of individual compression screws, to squeeze the oils outof the grape seeds. The oil presses operate on a gentle mechanical press principle, which doesnot involve mixing and tearing of the seeds. A further advantage of this system is that virtuallyall of the oil bearing seeds, nuts and kernels can be pressed with the standard equipment of thepress without cumbersome adjustment of screws and oil outlet holes. Another advantage of this

389
system is that the press cake (remains) extrudes out of the oil press in the shape of pellets thatare easy to store and handle [12].
The utilization of the supercritical technology to extract oil seems economically justifiedwhen obtaining an added-value final product such as how the grape seed oil could be enrichedin poly-unsaturated fatty acids. Actually, the case is that the supercritical extraction processcould be coupled to a partial fractionation of the extracted matter based on the differentsolubility of the oil constituents.
For extracting oil from grape seeds with the help of the supercritical carbon dioxidemethod the seeds need to be washed and oven-dried at 55°C for 4 to 6 h. After all of that iscompleted then they need to be grinded using a mill and then sieved using a sieve screens thathas the gap diameter between 10 and 100 mesh. The grinded seeds samples of particle sizes areranging between 0.15 to 2.0 mm.[8].
Figure 5: Supercritical carbon dioxide oil extraction process from grape seeds [9]
Embodiments of the invention are as follows: (see Figure 5). The technical process ofoil extraction is made up of two steps: a first step, grape seed extract. Wash dried and pulverizedto a particle size of 20 to 40 mesh grape seed enter the cartridge into the extraction vessel 1 toopen the high-pressure pump 10 and draw in fresh CO2 enters into the condenser 7 through thehigh pressure pump 10 after the preheater 11 and into the to the extraction vessel 1, the controlpressure within the extraction vessel 1 has to be set to 27 ± 2Mpa, the temperature 60 ℃, forabout 2 to 4 hours of extraction, the condenser temperature was 7 ℃, the extract stream throughthe heater 2 is heated to 65 ℃, into two series grapeseed oil is then collected within the separator(3,4), then stream 7 through the condenser is circulated.
Step Two: anthocyanin original re-extracted oligomers. Modifier actuated pump 9 after2 to 4 hours of extraction, the modifying agent in the modifying agent tank 8, i.e. acetone: waterin the proportion of 70:30 as a modifier also enters the preheater 11, through the control ofgrape seed extract than the oil stream with a modifying agent was 4 to 22-25Mpa of pressure,a temperature of 60 ℃, after the extraction the process of injection through the heater intoanother set of two separators in series after 2 (5,6 ) in order to start separating the procyanidinoligomers[13].

390
3. CONCLUSIONS
Our preliminary study indicates and sustain that the extraction with supercritical carbondioxide technique may certainly be used to enhance oil extraction in comparison with pressing.
The advantage of the extraction through supercritical carbon dioxide is that the process issimple and reliable, grape seed oil has a purity of 97% or more yield of 15%, the purity ofprocyanidin oligomers are up to more than 95%, the yield is up to 14%.
Also, both methods could be used together for a good extraction and yield.
References
[1] Jaromír Lachman, Alena Hejtmankova, Jan Taborský, Zora Kotíkova, Vladimír Pivec , RadomíraStralkova, Alena Vollmannova, Tatiana Bojnanska,Martin Dedina, Evaluation of oil content and fattyacid composition in the seed of grapevine varieties, LWT - Food Science and Technology, 2015[2] JAKOBOVIĆ, Stela JOKIĆ, Snježana JAKOBOVIĆ, Darko KIŠ, Utilization of winery by-productsinto high added value products – grape seed oil and defatted meal, Polytechnic in Pozega, Croatia, 2016[3] Evangelia I. Sotiropoulou. V. Varelas, M. Liouni, E. T. Nerantzis, GRAPE SEED OIL: FROM AWINERY WASTE TO A VALUE ADDED COSMETIC PRODUCT-A REVIEW, Laboratory of IndustrialChemistry, Dept. of Chemistry, University of Athens, Greece 2015[4] Fernanda Branco SHINAGAWA, Fernanda Carvalho de SANTANA, Lucillia Rabelo OliveiraTORRES, Jorge MANCINI-FILHO, Grape seed oil: a potential functional food?, Universidade de SãoPaulo – USP, São Paulo, SP, Brazil, 2015[5] Tobar P., Moure A., Soto C., Chamy R., Zuniga M.E.: Winery solid residue revalorization into oiland antioxidant with nutraceutical properties by an enzyme assisted process. Water Science andTechnology. 51, 47-52,2005.[6] Douglas Schaufler, Small-scale Oilseed Processing Guide, University of Vermont,2013.[7] Duba, K. S, Fiori, L.: Supercritical CO2 extraction of grape seed oil: Effect of process parameterson the extraction kinetics. The Journal of Supercritical Fluids. 98, 33-43 (2015).[8] Jirawat Eiamwat, Paramee Pengpreecha, Benjaporn Tiensong, Sorada Walapa, Kulapatr Wachirasiri,and Sukit Kampruengdet, EXTRACTION OF OIL FROM GRAPE SEEDS WITH SUPERCRITICALCARBON DIOXIDE, Food technology department, Thailand Institute of Scientific and TechnologicalResearch, Thailand 2013[9] Neranzis, E., Tataridis, P., Integrated Enology- Utilization of winery by-products into high addedvalue products, e-Journal of Science & Technology (e-JST), No. 3, 2006.[10] Victor R. Preedy, Essential oil n food preservation, falavor and safery, Department of Nutritionand Dietetics, London, UK,2016.[11] Anne-Gaëlle Sicaire, Maryline Abert Vian, Frédéric Fine, Patrick Carré, Sylvain Tostain, FaridChemat, Ultrasound induced green solvent extraction of oil from oleaginous seeds, Universitéd’Avignon et des Pays de Vaucluse, INRA, UMR408, GREEN Extraction Team, 84000 Avignon,France, 2016[12] http://www.oekotec.ibg-monforts.de/index.php/en/oil-presses/oil-press-d85-1g[13] Supercritical carbon dioxide extraction process of grape seed oil and cyanine oligomer, patentsCN1241623A

391
RURAL POLICIES IN ROMANIA PRIOR AND AFTER EUROPE2020
Oana Vlăduţ1, Petruţa Mihai 2, Mihaela-Florentina Duţu3, Iulian-Claudiu Duţu4, Daniel-Ion Vlăduţ5
University Politehnica of Bucharest
ABSTRACT
Romania's accession to the European Union in 2007 also involved the adaptation of our country'spolicies in all areas to the requirements of the European community. Considering the importance of thenatural environment, with all its components, policies in this area have become priorities for institutionsworking in the environmental field. The rural environment has been given special attention, so the paperaims at briefly presenting the evolution of rural policies, from Romania's accession to the EuropeanUnion, as well as in the perspective of the years to come.
1. INTRODUCTION
The Romanian rural space benefits from a significant potential for development, yet stillnot capitalized on, as it is not paid the due attention to, while considering that almost 50% ofthe Romanian population lives in the rural areas and these areas take up to circa 90% of thetotal surface area of the country. The analysis of the implementation of the rural developmentmeasures is rather essential, as well as the examination of their effects upon the developmentof the rural space.
Romania has a valuable potential of development, but still poorly used. At the regionallevel, a balanced distribution of the territory among the 6 regions can be noticed (14.33% NW,14.30% Center, 15.46% NE, 15% SE, 14.45% S-Muntenia, 12.25% SW-Oltenia, 13.44% W),while Bucharest-Ilfov only takes 0.76% of the territory. In terms of geographical areas(mountains, hills and fields), the territory is distributed in relatively balanced percentages, withthe rural areas having considerable resources for development.
The rural population is not evenly distributed, as it has a high percentage in certain regions(S-Muntenia – 58.6%, NE – 56.8% and SV Oltenia – 51.9%), excepting Bucharest-Ilfov. Suchdisparities have an impact upon the social and economic development of the areas and the lifequality of the rural population.[4] This population witnesses a demographic decline, as it iscontinuously lowering in number and aging.
2. PAPER CONTAIN
The new philosophy of the rural space development is based on the concept of durable ruraldevelopment, which involves the harmonious conjunction between the component of theagricultural and forestry component and the one pertinent of the non-agricultural ruraleconomy, grounded on the following principles:
- harmonization between the rural economy and the environment;- durable development programs need to include a medium and long time horizons;- greening of the rural space by maintaining the natural environment as untouched as
possible;
1 Splaiul Independentei nr.313, sector 6, Bucharest and [email protected] Splaiul Independentei nr.313, sector 6, Bucharest and [email protected] Splaiul Independentei nr.313, sector 6, Bucharest and [email protected] Splaiul Independentei nr.313, sector 6, Bucharest and [email protected] Splaiul Independentei nr.313, sector 6, Bucharest and [email protected]

392
- anthropized environment should be the closest possible to the natural environment;- use of the local natural resources in the rural economic activity, with a priority of the
renewable resources;- diversification by pluriactivity of the agricultural economy structure, through extension
of the agro-food, of the non-agricultural economies and services.The strategy of rural development of Romania for the following years is aligned with the
context of reform and development that the EU intends to comply with, as per Europe 2020strategy, which is the advancement strategy of the European Union for 2010-2020.
The National Rural Development Program (NRDP) for 2014-2020 contributes to a smartdevelopment by supporting the partnership among the research area, agricultural workers andother actors of the rural economy, and also by assistance of the professional training, acquisitionof competences and information dissemination.[2]
NRDP also considers a durable development that is focused on the lowering of the carbonemission caps and on aid provided to the environment-friendly agricultural practices. Last butnot least, the assistance given to the investments in the rural infrastructure and economy leadsto less poverty and creating employment in the rural areas, thus contributing to an evolutionfavorable to inclusion.
The agricultural sector and the rural economy generally have a sizable growth potential,still underutilized.
The business development at a small scale is an important source of employment and,implicitly, of earnings. Among the active SMEs of a non-agricultural nature, a low numbershows in the rural sector, which confirms their low percentage in conducting such activities(industry, services and rural tourism). The analysis of the SMEs in the rural sector proves theirpoor ability to create employment for population.
In spite of the fact that the micro-enterprises operating non-agricultural activities in therural sector were also sustained through NRDP 2007-2013, the density of the SMEs is muchlower than nationwide.[1] In regards to the tourism infrastructure, the accommodation capacityhas recorded an increase, mainly for the agro-tourism boarding houses, thanks to the assistanceprovided by the European Agricultural Fund for Rural Development.
Nevertheless, the rural tourism has not reached a satisfactory level in terms of quality ofthe infrastructure of support and services, mainly recreation, since the access of the SMEs tofinancing is rather precarious. As for territoriality, the enterprises in the rural and agriculturalsectors find it difficult to access the financial services, due to the high financing fees. Althoughthere were financial mechanisms, eg guarantee funds, some beneficiaries who signed financingagreements in NRDP 2007 – 2013 were not able to access credits for investments, since therewas not a loan type adjusted to the agricultural context.
The main difficulties in carrying out the projects for the basic infrastructure, mainlyintegrated, were: a high level of complexity (including the inadequate understanding of theconcept of integrated project), the long duration of the execution, the lack of clear regulations,along with the impossibility of the beneficiaries to support the investment until its final stages.The investments required obtaining a large number of permits issued by different authorities,which slowed down the implementation. The basic services do not respond to the needs of therural population, and the deficit of the conditions for the development of the rural space from asocial perspective has a negative effect upon the economic evolution of such areas in Romania.
The reduction in the number of shops for services and of the handmade cooperative unitshas triggered a severe cutback of the social economy in the rural sector.
The early childhood and preschool education (kindergartens) are facing a major deficit interms of infrastructure. The cultural identity of the Romanian village is an essential source oflocal development, described by a varied cultural, tangible and intangible heritage. In the ruralarea, the access of the inhabitants in villages and communes to culture is rather limited, in

393
comparison with the urban area. The cultural heritage in the rural regions shows a high level ofdeterioration, which calls for investments required for its reclaim. The monastery sites are anintegrant part of the cultural heritage in Romania. Their purpose is in fact the preservation ofthe national identity and tradition through craft practices, culinary, agricultural customs andconservation of the architectural styles that are specific to the respective areas.
The 2020 digital agenda foresees a minimum level of 30 Mbps versus the expected 1-4Mbps speed. At the end of first semester in 2014, 15.5% of the total of broadband connectionsin the rural area represents connections at higher speeds or equal with 30 Mbps.[5] ForRomania, it is only 42% of the households that have internet connection and 23% accessing thebroadband. This unsatisfactory rate of penetration in the rural regions derives from low income,lack of personal computers, poor DSL (Digital Subscriber Line) coverage conditions. Thewireless internet is almost inexistent.
The natural environment in Romania is described by a good preservation state of the naturalresources of soil and water, by a variety in the traditional landscape and a remarkable biologicaldiversity. A part of the resources is subjected to certain pressure factors, with an impact uponthe environment value and on their fruitful potential from a quantity and quality perspective. Interms of the biological diversity, Romania is the most important countries in the EuropeanUnion, since it hosts the largest number of bio-geographical regions herein.
The fresh water resources of our country are few and unevenly distributed, thus placingRomania in the category of the countries with scarce water resources.[3] The national strategyand policy in the water management aims towards a durable water administration as in line withthe EU directives, including the following specific objectives:
• improvement in the surface and underground waters through implementing themanagement plans of the current water catchment areas, in accordance with the WaterFramework Directive of EU;
• implementation of the National Flood Risk Management Strategy and carrying out thespecific measures, in line with the Flood Directive;
• drafting the Guidelines for Water Catchment Areas Development for the water use, inorder to reduce the negative effects of the natural phenomena;
• implementation of the Plan of protection and rehabilitation of the Romanian Black SeaShore, including the stipulations in the ‚Protection and rehabilitation of the coastal area”master plan;
• consolidating the cross-border and international partnership, in order to monitor theimplementation degree of the international agreements and promotion of the jointproject.
The disadvantaged areas hold a significant percentage in the total surface area of ourcountry, since they have unfavorable environment characteristics as a result of certainbiological and physical factors (climate, edaphic, landscape) that bring a limitation to the usualagricultural activity by obtaining low production, short vegetation period, increase in theproduction costs, etc.
By 2020, Romania must have 24% in the energy derived from renewable sources inagriculture, out of final gross energy consumption, where the biomass covers circa 50% of thepotential of renewable sources in the country agriculture. The production and use of the energycoming from renewable sources in agriculture are low – 2.5% of the total production came fromagriculture in 2011, compared to 9.8% in the EU. On the other hand, circa 69.1% in therenewable energy at the national level in 2011 resulted from the forestry sector, versus 48.3%in the EU 27.
3. CONCLUSIONS

394
The research in Common Agricultural Policy starting in 2007, the year when Romaniaacceded to the European Union, has proven a continuity in its evolving implementation inagriculture and rural development, as the desired objectives and the measures taken to reachthem are explicitly presented, as well as the necessary financial sources.
Between 2007 and 2013, Romania allotted to the farmers an average of 90 €/ha in the formof financial aid, by means of the single surface payment plan, thus placing itself on theantepenultimate place in the hierarchy of the new member states, with the last two places takenby Latvia and Estonia.
What is important for the support and development of the environment-friendly agriculturalpractices in constrained areas has been the financial aid for the farmers as direct paymentswithin the National Rural Development Program 2007 – 2013 (Axis II, Measures 211, 212,214) and NRDP 2014 – 2020 (Measures 10, 11, 13, 15).
To increase the attraction level of the funds meant for the rural development, theresponsible factors in Romania need to mainly focus on the cash management quality. Themajor causes with negative effects in the absorption process of funds for the rural developmentare the lack of transparency, diminished experience, insufficient information, excessivebureaucracy, poor project management, frequent and last-moment changes in the guidelines ofthe measures, delays in signing the contracts, low possibility of providing the advance paymentor covering the private contribution by the beneficiaries.
The measures taken to reduce poverty and to further the economic development in the ruralarea, including employment increase, should find a solution in expanding the financing levelfor the non-agricultural activities.
The requirements stipulated by the banking institutions to access the funds (for exampleguarantees) are similar to any other company or SME and difficult to meet. The too lowspecialization of the refund services has been visible in the credit guarantee systems foragriculture, as it has not been used as planned and, implicitly, in the limited accessing level ofthe program and in the increased rate of terminated projects among the selected beneficiaries.
References
[1] The Academy of Romania, Strategia de dezvoltare durabilă pe termen mediu şi lung a agriculturii şi spaţiuluirural din România, Bucharest, 2008.[2] Ministry of Agriculture and Rural Development, Strategia de dezvoltare rurală a României 2014-2020,Bucharest, 2013.[3] Német Attila, Analiza potenţialului de dezvoltare rurală a Regiunilor Vest şi Centru prin intermediul PoliticiiAgricole Comune, PhD thesis, Cluj-Napoca, 2016.[4] http://www.fonduri-ue.ro/pndr-2014.[5] http://www.fonduri-ue.ro/por-2014.
395
SYSTEM FOR THE EXTRACTION OF BIOACTIVE COMPOUNDSFROM PLANTS WITH BIO-INSECTICIDE ACTION IN ORGANIC
FARMING
PhD. Eng. Voicea Iulian11), PhD. Stud. Eng. Găgeanu Iuliana1), PhD. Stud. Eng. CujbescuDan1), PhD. Stud. Eng. Persu Cătălin1), Eng. Bălan Vică2), Eng. Săvoiu Lucian3)
1)INMA Bucharest, 2)Mido Rom Electronic SRL, 3)Agricola Medicinale 2000
ABSTRACT
Organic agriculture promotes sustainable, diversified and balanced production systems, in theview of preventing crop and environment pollution.. The discovery of these new compounds is possibleby studying various plant extracts obtained through extraction processes from the variety of plantsavailable on the earth’s surface. Within the paper, for obtaining compounds with bio-insecticide action,an extraction experimental model – EXTBIO was developed, operating on the principle of extractingbioactive substances under the action of variable hydrostatic pressure in the extraction chamber,controlling solvent temperature. For an optimal control of the extraction process, a micro-PLC withgraphic interface is used, through which the working parameters can be programmed. Hydrostaticpressure in the extraction chamber is obtained through the means of a pneumatic cylinder fed withcompressed air from a compressor integrated in the equipment.
1. INTRODUCTION
Organic agriculture can be defined as a production system that avoids or widelyexcludes the use of synthetically composed fertilizers, growth regulator and additives in animalnutrition. Organic agriculture systems are based on crop rotation, on the use of crop residues,animal dejections, manure, organic waste from outside the farm, [1]. Organic agriculture has apositive contribution in a variety of fields, contributing to the preservation of soil structure,earthworms, microorganisms, insects, to soil and environment protection. The number anddiversity of organisations within the organic movement reflecting internationally, both in termsof number as well as in terms of opinions that differ in an obvious manner, are renowned inIFOAM (International Federation of Organic Agriculture Movement). IFOAM establishes thebase standards that will be adopted by national organizations and monitors these nationalstandards for allowing participation in international trade. The idea situated at the basis oforganic agriculture arose in the year 1920, and after it evolved considerably and continues toevolve as new scientific researches become available, but still retains the fundamentalphilosophical perspective to work with natural systems and to respect the environmentsupporting us all, [2]. The organic movement announces a change in agriculture that appearssimultaneously in any developed agricultural nation in the world. Organic agriculture is farfrom being a return to the past, wanting to be an agriculture for the future.
1 6, Ion Ionescu de la Brad Blvd, e-mail: [email protected]

396
Insects react to smell, vapours, gases, smoke, heat, oils, soap, etc., and organicinsecticides take into consideration all these aspects. For example, strong smell of garlic,tobacco, rhubarb and other plants has a repellent effect on insects. Hot peppers, alcohol, saltand other substances can burn or destroy pests. Oils suffocate certain insects, and soap ordetergents added to mixtures have the role of making the substances of the solution to stick toleaves and stalks, [3].
Along with the highly increasing organic demands worldwide, were elaboratedtechnologies for the submerged cultivation of microorganisms and technologies for extractingbioactive substances with biofertilization role. Out of the bio-mixtures used for soil fertilization,we name Azotobacterin containing bacteria in the genus Azotobacter chroococcum stimulatingcellulolytic development. Fosfobacterin is a bio-mixture containing Bacillus megaterium varphosphoaticus bacteria and exerts a stimulating action on bacteria fixing nitrogen.
The success of using the microbial mixtures in stimulating plant growth and protectiondepends on the form of the mixture, which is achieved in the fallowing manners:
powders– mixture of microbial biomass with addition of substances (talc, kaolin,bentonite, etc.);
humidifying powders – suspensions with water; Granular mixtures – biomass-soaked granules granule; Water plant solutions and extracts, hydro alcoholic extracts, [4].
In the field of microbial fertilizers and extracts with bioactive substances withbiofertilization role, a major problem is constituted by the handling of plant microorganisms /extracts used in the agricultural field, their manner of transportation, preservation and use.
The participation of biofertilizers in the energy balance of agricultural crops has gainedspecial importance, both due to their effect on the increase of agricultural production, as wellas on the ecological effect they have on the atmosphere. The use of bio-mixtures for agriculturalpurposes, made on the basis of plant extracts with bioactive substances acting as biofertilizersby extraction from different medicinal, aromatic, cultivated or perennial plants, is an importantorientation in the current agriculture due to the advantages they present, namely, [5]:
Reducing pollution in the aquatic and terrestrial environment, Avoiding the emergence of pest populations resistant to phyto-sanitary treatments, Lack of secondary effects on humans and animals, etc.
Bio-mixtures / biofertilizers obtained based on bacteria / bioactive substances (extracts)actually have multiple action on crop plants, these complex actions are due to the specificbiological character of products and is constituted in potential a useful resource, littleacknowledged, and in consequence, little exploited right now.
Worldwide, the use of microbial mixtures / plant extract with biofertilization role forstimulating growth and crop plant protection, was made to a small extent, because someprevious researches were finalized semi-industrially or industrially, [6].
Extracts obtained from medicinal plants can be classified by various criteria, as can beobserved from table 1:
Table 1. Classification of extracts
No.Classification
criteriaExtract name
1.By solventnature
Water extract (by extracting active principles in water: macerates,infusions, decoctions)

397
Hydro alcoholic extract - tincture (extracts in various dilutions ofethylic alcohol) Oil extract (obtained by extracting liposoluble principles in oil orother natural lipids) Medicinal vinegars (macerated in vinegar) Medicinal wines (macerated in wine)
2.By extractionmethod
Selective extract – obtained by eliminating compounds which donot make the object of selection (pure volatile oils – are obtainedby entraining with water vapours: distillation, pharmaceuticalproducts based on plants, obtained by neutralizing toxic substances)
Nonselective extracts (infusion, tinctures, macerates, decoctions,etc.)
Extract obtained by pressing or centrifugation (juice from leaves,fruits, vegetable)
3.Bypreparationmethod
Simple extract (obtained through a single operation) Successive extract (obtained by repeating the same operation –
homeopathic tinctures) Multiple extract (obtained by applying multiple techniques for the
raw material - macerate + infusion, infusion + decoction, etc.)
4.
By the parts ofthe plantsubjected toextraction
Partial extract (leaves, roots, aerial part) Total extract (Whole plant)
5.By plantmoisture
Extract obtained from the dried plant Extract obtained from the fresh plant
Solvent extraction is the most widely used type of extraction for bioactive compoundsin plants. This separation technique involves the extraction of components from a solid or semi-solid sample in a suitable solvent. In the extraction operation, the choice of solvent is madedepending on the nature of the substance to be extracted and on the nature of the feedstock, [7].The actual solubilization of the bioactive compounds is achieved by treating the finely groundplants with water, saline solutions, hydro-alcoholic solutions, etc.
2. METHODOLOGY
Within INMA Bucharest was developed an Experimental model for obtainingorganic biofertilizers / bio-insecticides - EXTBIO, which can be used in the purpose ofobtaining plant bioactive extracts.
The equipment for obtaining organic biofertilizers / bio-insecticides – EXTBIO operateson the principle of extracting bioactive under the action of variable hydrostatic pressure in theextraction vessel, with solvent temperature control. In the purpose of achieving optimal controlof the extraction process is used a microPLC with graphical interface, through the means ofwhich is possible to program the working parameters. Hydrostatic pressure in the extractionchamber is obtained through the means of a pneumatic cylinder fed with compressed air comingfrom an compressor integrated in the equipment. All components are fitted of a frame formedby V shaped profiles.
The operational diagram of the equipment for obtaining organic biofertilizers / bio-insecticides – EXTBIO is presented in figure 1.

398
Figure 1. Principle diagram of the equipment for obtaining organic biofertilizers / bio-insecticides – EXTBIO (1-extraction vessel, 2-loading charging tank, 3 – final product
unloading tank, 4-heating mantle with thermostat, 5-recirculation pump, 6-electro-valves, 7-double piston cylinder, 8- pneumatic distributor, 9-pressure regulator, 10 – compressor, 11 –
Pt100 thermo-resistance, 12 – pressure transducer)
The system for monitoring and controlling the extraction process is formed by thefollowing components: microPLC AL2 – 14 MR – D with extension for analogical outlets AL2-2DA, interface module RS232 AL2-GSM-CAB and signal adapter Pt100 AL2-PT-ADP,operation terminal GT1050 – QBBD with connection cable GT01-C10R4-8P, power source incommutation 24Vcc type PSU 50, bipolar safety C32, relay bloc Omron, metallic box, safetybutton, rail, metallic riglet, feeding cable Φ 1.5 mm – 20 ml, feeding cable 3x1.5 mm – 10 ml.the monitoring and control system receives information from the temperature sensor Pt100, thepressure sensor and graphic user interface represented by the operation terminal and transmitscommands to the execution elements of the integrated extraction systems and the heatingmantle.
The program installed in the PLC allows the control of the following components:compressor, heating mantle, recirculation pump, electro-valves, pneumatic distributor, pressureregulator. The reference values of working parameters can be set by the operator using theoperation terminal.
The equipment has the following circuits in its componence:1. pneumatic circuit: from the compressor to the pneumatic cylinder2. hydraulic circuit: from the feeding tank to the extraction tank, to the emptying tank
and to the hydraulic cylinder.3. electric circuit: for powering compressor, PLC, operation terminal, pneumatic
distributor, pressure regulator and the heating mantle.
In the microPLC equipped on the monitoring and control system of the EXTBIOexperimental model was achieved a control software of the integrated extraction system settingthe parameters for the following procedure (parameters), according to figures 2 and 3:
extraction time: 5600 seconds;high extraction pressure: 8.7 bar;low extraction pressure: 1.25 bar;numbers of cycles at high pressure: 5 cycles;numbers of cycles as low pressures with quasi-dynamic variation between 0 and1.25 bar: 5 cycles with 5 quasi-dynamic cycles each;
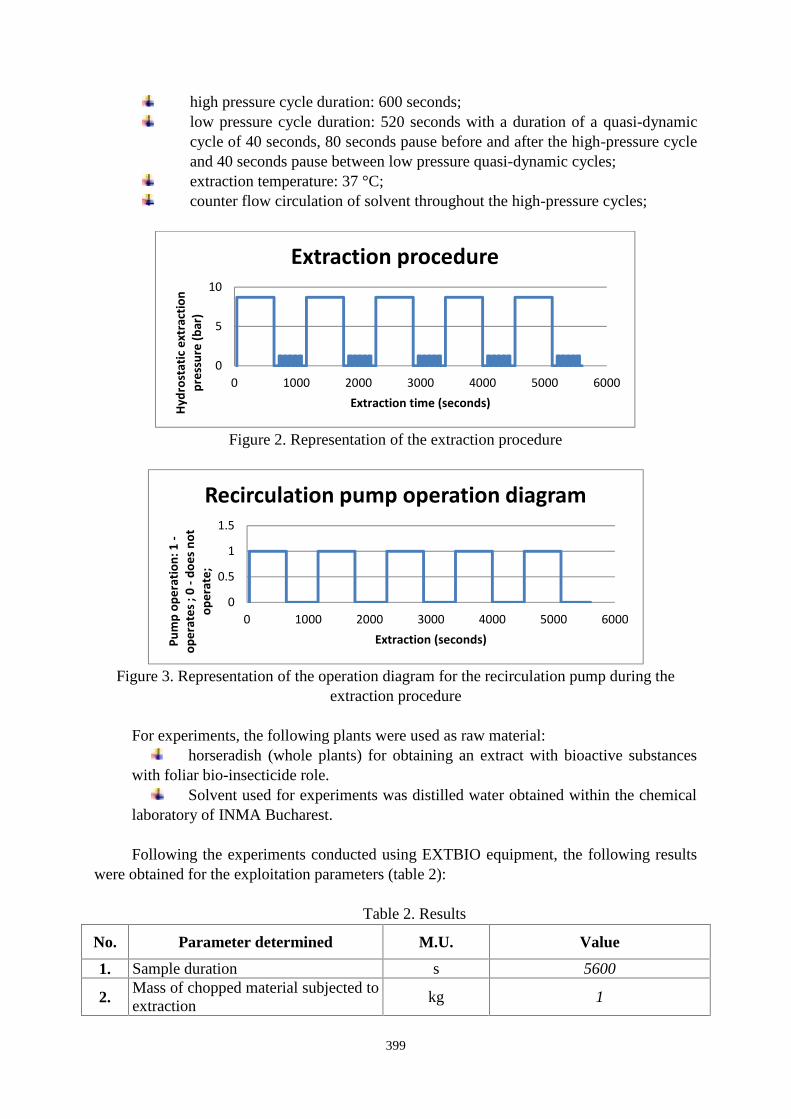
399
high pressure cycle duration: 600 seconds;low pressure cycle duration: 520 seconds with a duration of a quasi-dynamiccycle of 40 seconds, 80 seconds pause before and after the high-pressure cycleand 40 seconds pause between low pressure quasi-dynamic cycles;extraction temperature: 37 °C;counter flow circulation of solvent throughout the high-pressure cycles;
Figure 2. Representation of the extraction procedure
Figure 3. Representation of the operation diagram for the recirculation pump during theextraction procedure
For experiments, the following plants were used as raw material:horseradish (whole plants) for obtaining an extract with bioactive substances
with foliar bio-insecticide role.Solvent used for experiments was distilled water obtained within the chemical
laboratory of INMA Bucharest.
Following the experiments conducted using EXTBIO equipment, the following resultswere obtained for the exploitation parameters (table 2):
Table 2. Results
No. Parameter determined M.U. Value
1. Sample duration s 5600
2.Mass of chopped material subjected toextraction
kg 1
0
5
10
0 1000 2000 3000 4000 5000 6000
Hydr
osta
tic e
xtra
ctio
npr
essu
re (b
ar)
Extraction time (seconds)
Extraction procedure
0
0.5
1
1.5
0 1000 2000 3000 4000 5000 6000
Pum
p op
erat
ion:
1-
oper
ates
; 0
-doe
s not
oper
ate;
Extraction (seconds)
Recirculation pump operation diagram

400
3.State of the raw material subjected toextraction
- dry
4.Moisture of the sample subjected toextraction
% 10.75
5. Degree of extracting active principles % 34.45
3.CONCLUSIONS
According to the rules imposed by the legislation in the field, the use of fertilizers /insecticides without traces of chemical synthesis substances is absolutely mandatory in thepractice of ecological / organic farming. Thus, the discovery of new substances and compoundswith fertilizer / insecticide action represents a continuous challenge for the field of agriculturalresearch in the 21st century. The discovery of these new chemical compounds is possiblethrough the study of various plant extracts obtained from the variety of plants available on theearth's surface. Depending on their biochemical composition, these plant extracts can be usedas substances with biofertilizer / bio-insecticide role with use in organic farming. Their qualityis influenced by the fact that they are not dangerous for humans, plants, soil and the environmentin general. They can be made from handy substances and therefore do not have very exorbitantprices. They can be used when infestation has occurred or can be preventively applied.
The degree of extracting active principles was calculated after the samples were kept insidethe oven set at 105oC for 22 hours.
As organic pesticide, it is good to use singular horseradish extract or in combination withhot pepper, against pests and foliar diseases. The are applied against aphids, white muskets,caterpillars, Colorado beetle, etc.
Horseradish can also be as organic fungicide. It prevents blistering attack on tree leaves. Itis used against mildew on various crop plants, by spraying repeatedly at several days.
Acknowledgement: This work was supported by a project PNCDI III and of Romanian NationalAuthority for Scientific Research and Innovation, CNCS/CCCDI –UEFISCDI, project number PN-III-P1-1.2-PCCDI-2017- 0566 (ctr. Nr. 9 PCCDI/2018- COMPLEX SYSTEM OF INTEGRALVALUABILITY OF AGRICULTURAL SPECIES WITH ENERGY AND FOOD POTENTIAL,COMPONENT PROJECT 3 -Valuation of the energy potential of certain species of agricultural plants).
References
[1]. Arun KS., Bio-fertilizers for sustainable agriculture. Mechanism of P-solubilization, Agribios Publishers,Jodhpur, India, pp.196-197, 2007.[2]. Bhardwaj D., Mohammad W. A., Ranjan K., Narendra T., Biofertilizers function as key player in sustainableagriculture by improving soil fertility, plant tolerance and crop productivity, Microbial Cell Factories , pp 13-66,2014.[3]. Mishra DJ, Rajvir S., Mishra U.K., Kumar S.S., Role of bio-fertilizer in organic agriculture: a review,Research Journal of Recent Sciences, Vol. 2(ISC-2012), pp.39-41, 2013.[4]. Romdhane M., Gourdon C., Investigation in solid–liquid extraction: influence of ultrasound. JOURNALChemICAL. EngINEER, nr. 87, pp. 11–19, 2002.[5]. Samuil C., Tehnologii de agricultură ecologică, suport de curs, usamv Iași, pp. 35-58, 2007.[6]. Wang L., Weller C.L., Recent advances in extraction of nutraceuticals from plants. TRENDS FOOD SCI.TECHNOL. 2006, 17, pp. 300–312, 2006.[7]. Pruteanu A., Muscalu A.., Voicea I., Ferdes M., Current stage of experimental research on extraction ofbiologic active substances from medicinal and aromatic plants / Stadiul actual al cercetarilor experimentaleprivind extractia substantelor biologic active din plante medicinale si aromatice, INTERNATIONALSIMPOSYUM _ISB-INMA TEH', pp.465-475, 2014.

401
FLOTATION PROCESS IN WASTEWATER TREATMENT
PhD. Eng. Voicea Iulian1), PhD. Eng. Moga Corina Ioana2), PhD. Stud. Eng. GăgeanuIuliana1), PhD. Eng. Matache Mihai1), PhD. Eng. Vlăduț Valentin1),
PhD. Eng. Covaliu Cristina3)
1)INMA Bucharest, 2) DFR SYSTEMS, 3) University Politehnica of BucharestE-mail: [email protected]
ABSTRACT
Flotation is the process of entraining particles suspended in a liquid at its surface by means of gasbubbles adherent to these particles. Flotation as a technological process is applied in two versionsdepending on particle density. In the case of larger density particles, which settle rapidly, flotation isonly possible with fine granulation (maximum diameter of 0.4 mm); for these materials is operated withlarge bubbles (having average diameters of 2 mm) to which the solid particles adhere. In the case oflow-density particles floating on the surface or between layers, or which are very difficult to deposit,flotation can be carried out under more favourable conditions; the ascending force required to raise aparticle to the surface is smaller, one or more fine bubbles are sufficient. The purpose of this procedureis to separate from the wastewater oils, grease or other substances lighter than water, which rise to thesurface in tranquil areas and with a low horizontal speed.
1. INTRODUCTION
Flotation can be described as the process of separating solid suspensions by forming aparticle-bubble conglomerate of a specific weight smaller than the specific weight of the waterand which is raised to the surface of the water from where it is removed. Depending on themanner they are carried out, flotation processes are divided in:
Natural flotation where the difference of specific weight is sufficient forremoving suspensions; Assisted flotation where certain compounds that improve particle separation
are added; Provoked flotation where the specific weight of particles is bigger than the
specific weight of water and is necessary to introduce air for eliminating them.
Water oxygenation processes are encountered in wastewater treatment and epurationplants, in the food, fish and chemical industries. Oxygen dissolved in water is known asdissolved oxygen (fig. 1) and is conventionally measured in milligrams of oxygen / litre.
Figure1. Molecular structure of water dissolved oxygen
1 Bucharest street Petre D.Ionescu, nr.51., tel: 0752161780, e-mail: [email protected]

402
Figure 1 shows that each molecule of water consists of an oxygen molecule to which twohydrogen molecules are bound (a black sphere coupled with two white spheres), and betweenthe molecules of water there are oxygen molecules (black spheres) constituting the dissolvedoxygen. The maximum quantity of air that can be dissolved (absorbed in water) depends onmultiple physical-chemical factors:
the pressure exerted on water; water temperature; water salinity (quantity of salt existing in the water); water clarity.
Factors leading to a decrease in the air dissolved in water are ii care: increased water temperature; low pressure on the water; water pollution with petrol, oil, detergents; presence of ice; water depth;
The quantity of oxygen absorbed in water varies depending on: atmospheric pressure; water temperature; different quantity in mineral salts; organic substances.
Physical and chemical treatment of urban effluents from variable population resortsIt is known that the use of ordinary biological treatments on effluents does not allow
satisfactory treatment in case of rapid population growth. Water treatment through flotation hasthe advantage of a reduced size of installations that require a substantially lower land area. Thisis all the more important as the cost of land in urban and tourist areas is higher. The physical-chemical treatment applied by flotation applied to household effluent reduces 95% of suspendedmatter, eliminates 95% phosphates, 80% detergents and has a deodorizing effect, [1,2,3,4].Flotation also ensures the possibility of treating drinking water in tandem with the use of highlyfine sand filters. The amount of generally lightweight materials suspended in surface water canbe highly reduced, also allowing the removal of micropollutants such as detergents. The choiceof sedimentation or flotation as a method of separating impurities from wastewater is based ontechnical and economic criteria. In the case of floatation, operating costs are higher than in thecase of sedimentation due to the energy required to produce air bubbles. On the other hand, theinvestment costs are lower, the separation productivity is higher and the machines’ size is lower,[5]. The volume of sludge produced by flotation is also 3-4 times lower than in the case ofsedimentation, as the resulting sludge moisture can be reduced more quickly and easily.Flotation separation is effective for wastewater from the food industry, the pulp and paperindustry, etc., but has not proven to be effective in treating sewage waters. This is why the costsare also increased due to the need for flocculation treatments prior to flotation. Separation bydecantation has as drawbacks: increased moisture of the obtained sludge (98-99 %) and theoccurrence of unpleasant odour due to putrefaction phenomena occurring in the wastewater,[6].
2. METHODOLOGY
Removing fats from wastewater is a vital measure for biological treatment in aeration tanks.The presence of fats in the aeration tanks prevents (stops) the transfer of oxygen from air towater due to changes occurring at the interface between the two fluids. In addition, the recycling

403
of fats and oils extracted from flotation wastewater can be a profitable operation, taking intoaccount the large quantities of oil discharged into the sewage.
In the case of flotation processes applied for the separation (concentration) of ores, it isnecessary to add foaming agents in order to reduce the superficial tension and to facilitate theformation of a stable foam. Foaming agents are surfactants, polar or non-polar, which reducesurface tension due to the accumulation trend at the liquid-gas interface. Added substances areadsorbed to the surface of air bubbles by covering them with a very thin film that makes thebubbles flexible and stable, [7,8].
The basic conditions for separating solid impurities by flotation are: the adhesion ofimpurities particles to the air bubble and the displacement of the bubble - particle assembly at thesurface of the liquid. The phenomenon of adhesion of particles to the surface of the bubbles isbased on the degree of wetting of the solid particles.
Solid surfaces are only wetted by some liquids. Wetting depends both on the nature of thesolid particle and on the nature of the liquid phase. The degree of wetting is measured by theangle of contact between the tangent to the solid-liquid, liquid-gas plane and solid-gas interface,measured to include the liquid phase.
The value of the wetting angle (junction or edge) is determined by the equilibrium of thethree superficial tensions of the three interfaces encountered in the wetting perimeter: σLS (liquid-solid); σSG (solid-gas); σLG (liquid-gas). The first tends to decrease the liquid-solid contact surface,the second to increase it in order to reduce the solid-gas interface, and the third tends to decreasethe fluid interface with the gas. For determining the conditions for the flotation process, examinethe gas bubbles fixed on the solid particles in the liquid. At the solid / liquid interface (in the caseof impurities in water) the molecular interactions are manifested, [7,9].
The forces of attraction between the liquid molecules and the solid impurity (or liquid – forexample oil) are called adhesion forces. If the adhesion forces are greater than the cohesion forcesbetween the molecules of the fluid subjected to clarification, then the liquid humidifies (wets) thesolid surface. The particles are lyophile (hydrophilic in the case of water), [10,11].
In exchange, if the forces of cohesion are stronger, the particles are lyophobic (hydrophobicin the case of water), meaning that they are not wetted by the liquid. The measure of thesebehaviours is given by the wetting angle (contact or edge).
The wetting angle can be calculated from the equilibrium condition at the interface, given bythe Young-Laplace relation (fig. 2).
Figure 2: Action of superficial tensions at the solid – liquid – gas interface
The solid particle has a higher degree of wetting - it is lyophile (hydrophilic in water) -the smaller the angle θ (0 <θ <90ºC) and becomes lyophobic (hydrophobic in the case of water)if the angle θ is higher (90 <θ).

404
Figure 3: Wetting manner at solid-liquid interface: a. hydrophile surface 0 < θ < 90º; b.hydrophobic surface θ > 90º
It can be seen from the Young - Laplace relation that the contact angle θ depends only onthe interface conditions (liquid-gas, solid-liquid and solid-gas), being independent of thediameter of the gas bubble (air). The magnitude of the contact angle increases with the increasein the surface tension at the liquid (water) - bubble (air), σLG interface and / or the increase fromthe solid (particle) - gaseous (air) interface which implies a high hydrophobia for the surface ofthe solid particle.
The second flotation condition, by which the solid particle and the air bubbles rise and floatto the surface, is given by the relation between the forces acting on the bubble-particleaggregate. On the bubble-particle aggregate acts an ascending force FA (ascension), whichcauses the aggregate to rise to the surface, and the gravitational force G.
For the flotation to occur, the following condition needs to be complied with [7]:≥= ( − ) × ≥ ( − ) × (1)
where:ρL – liquid density (example water); ρS – solid particle density; ρG – density of the gas in thebubble (example air); VG – volume of the gas bubble;
If we replace VS=mS/ρS in relation (1), it results:= × −−= (2)= 6 × −−In three-phase systems, the specific energy of adhesion of solid particles to the air bubble
is given by the relation: = + − = (1 − cos ) = 2 /2 (3)
Therefore, the flotation capacity of a solid material is determined by the adhesion energyand increases in proportion to the angle of contact and hydrophobicity. A larger contact angle

405
θ is characteristic for materials that cannot be wetted and can only be achieved by very finebubble contact, which requires more energy. The conditions required for the bubble-particleaggregate to rise or float is that the ascent force of the bubble is superior to the weight of thegranule and the viscous resistance force. Flotation therefore employs the ability of theimmiscible solid or liquid particles to attach to the gaseous bubbles with the formation ofaggregates with a lower net density in ratio to the density of the liquid.
For larger density particles - such as metal deposits, which sediment rapidly, flotation canonly be applied to particles with a diameter of less than 0.2 mm. In this case, flotation agentsare used to produce large carrier bubbles (about 2 mm).
Due to the high cost of foaming agents, the process only applies for the separation ofvaluable metal ores. For low-density particles that float or deposit very slowly (fibrous, fat orflocculated particles), flotation takes place under more favourable conditions. In this case, thegravitational force is smaller and therefore smaller bubbles are required. If these bubbles havea lower contact angle, their adhesion force is higher and therefore flotation can be achievedunder conditions of maximum efficiency. The flocculated particles can be well separated byflotation because they can be easily captured by the air bubbles. Colloidal substances can beremoved by artificial flotation only after a pre-flocculation. Artificial flotation can also removefat emulsions because they adhere to the gas-liquid interface, [10,11, 12,14].
An important problem for flotation is the stability of the foam layer. If it has low stability,immediate removal is required, while a too great stability implies the need for additionaltreatments.
3. CONCLUSIONS
Flotation separation has the following advantages:is not sensitive to toxic agents;is efficient for separating specific pollutants: fats, hydrocarbons, detergents;ensures the deodorisation of waters treated;allows excellent concentration of the separated sludge;is applied in easy exploitation conditions;offers the possibility of being applied in various fields: treating industrialeffluents, urban waters, treating drinking water;the sludge obtained is much drier and concentrated in solid matters than in thecase of static decantation.the consumption of electric energy is relatively low, but slightly higher than inthe case of separation by decantation. If the concentration of solid matter floatedis smaller than 2 g/l, electric energy consumption is situated between 100-200Wh/m3. For superior concentrations, consumptions rise up to 50-100 Wh/kg ofsolid matter extracted. For electro-flotation, consumption depends on theliquid’s resistivity, therefore on salinity, which, for the same intensity, requiresa tension as higher as resistivity is higher.
In air flotation, temperature influences the maximum air solubility, but at the same time,the dissolution kinetics increases with the temperature. Flotation allows, along with theelimination of insoluble compounds, including pre-flocculated colloidal particles, the partialelimination of dissolved pollutants. It is known that certain dissolved compounds areconcentrated on the gas-liquid interface and that this phenomenon is related to superficialtension. This phenomenon used for foaming concentration allows physicochemical treatmentby flotation with remarkable elimination yields. In order to increase flotation efficiency or toseparate impurities that would not normally be eliminated by flotation, flotation reagents areadded in the liquid medium: frothers, collectors or depressants.

406
AcknowledgementThis work was supported by a grant of the Romanian National Authority for Scientific Research andInnovation, CNCS/CCCDI –UEFISCDI, project number PN-III-P2-2.1-PTE-2016-0183 (25/2016 –Improved flotation treatment technology for heavily loaded wastewaters) within PNCDI III and projectctr. nr..7PS. / 09.11.2017 -PLAN SECTORIAL MCI (INCDPM Buc.)- Valorization technologies forresulted sludge from wastewater treatment city stations and waste from landfill sites.
References
[1]. Li Y., Mei H., Fang H., A review of treating oily wastewater, Arabian Journal of Chemistry, Volume 10,Supplement 2, pp. 1913-1922, 2017.
[2]. Amaral J., Filho A., Azevedo R., Etchepare J., Removal of sulfate ions by dissolved air flotation (DAF)following precipitation and flocculation, International Journal of Mineral Processing, Vol. 149, pp 1-8, 2016.
[3]. Shahryar J., 6: Treatment of Oily Wastewater, Book chapter Petroleum Waste Treatment and PollutionControl, pp. 185-267, 2017.
[4]. Bendicho C., Lavilla I., Sewage. Reference Module in Chemistry, Molecular Sciences and ChemicalEngineering, 2014.
[5]. Qidian Z., Shujie L., Chunping Y., Fuming C., Songlin L., Bioreactor consisting of pressurized aeration anddissolved air flotation for domestic wastewater treatment. Separation and Purification Technology, Vol. 138,pp. 186-190, 2014.
[6]. Jincai R., Jiongtian L., Chunjuan Z., Dengyue W., Xiaobing L. Experimental investigation and modeling offlotation column for treatment of oily wastewater, International Journal of Mining Science and Technology,Vol. 23, Issue 5, Pages 665-668, 2013.
[7]. Racoviteanu G., Teoria decantarii si filtrarii apei, Editura MATRIX ROM, ISBN 973-685-541-4, pp.55-63,2003.
[8]. Ritesh P., Subrata K. M., Anugrah S., Flotation technique: Its mechanisms and design parameters, ChemicalEngineering and Processing - Process Intensification, Vol. 127,, Pages 249-270, 2018.
[9]. Scholz M., Chapter 9 – Flotation Systems, Wetlands for Water Pollution Control (Second Edition)., pp 55–59,2016.
[10]. Michał G., Andrzej P., Grzegorz B., Wastewater treatment by means of advanced oxidation processes basedon cavitation – A review, Chemical Engineering Journal, Volume 338, pp.599-627, 2018.
[11]. Mohammad H. D., Behrooz K., Mohammad S. R., The effect of aeration on advanced coagulation, flotationand advanced oxidation processes for color removal from wastewater, Journal of Molecular Liquids, Vol.223, pp. 75-80, 2016.
[12]. Universitatea Tehnică din Cluj-Napoca, Procedee fizico-mecanice de separare a poluanţilor, Note de Curs.[13]. Universitatea Politehnica Bucureşti, Facultatea Energetica, Flotaţia, Referat.
(https://www.scribd.com/document/77807669/FLOTATIA).[14]. Wojciech D., Radosław Ż., Paweł M., Evaluation of energy consumption during aerobic sewage sludgetreatment in dairy wastewater treatment plant, Environmental Research Vol. 153, pp. 135-139, 2017.

407
“PLANT STRESS” – THE FIRST INDICATION THAT A LANDFILLGAS (LFG) MIGRATION IS TAKING PLACE NEAR THE MSW
LANDFILL
Gheorghe Voicu1, Dănilă Vieru1, Laura Toma1, Paula Tudor1
1 University “Politehnica” of Bucharest
ABSTRACT
Climate change and greenhouse effect are issues that cause unexpected phenomena suchas: temperature increase above the annual average in temperate continental and arctic areas,desertification in areas with predictable rainfall, the occurrence of tornadoes and tropical stormsin temperate continental climate.
It is widely accepted that the “plant stress” phenomenon also originates in the unfriendlymanagement of all types of waste generated by industrial, agricultural and domestic activities,as well as by deforestation beyond the regeneration possibilities of the forest. The increase inthe concentration of greenhouse gases in the atmosphere leads to the increase of the ambienttemperature, to the increase of the evapotranspiration phenomenon, practically to the death ofspontaneous and planted vegetation. Studies published by renowned researchers attest to thefact that non-maintenance of LFG generated by MSW landfill, whether compliant or not, lackof collection and treatment facilities or inefficient operation of existing facilities are responsiblefor the global warming phenomenon with a percentage ranging from 3 – 5%. At the same time,the migration of LFG in the landfill vicinities produces vegetal stress phenomena but can alsogenerate explosions or fires in case they accumulate in non-aerated closed spaces.
The paper presents a LFG collection system with vertical extraction wells, the calculationof the pressure drop (vacuum) required for transporting the LFG stream through the pipe systemat the source, and, after it has been cleaned, at the consumers (flame burner, motor with internalcombustion, domestic users or hot water boiler). In addition, the collection and managementcondensation system is presented in the paper as part of a good functioning of the LFGcollecting system.
1. INTRODUCTION
Municipal solid waste (MSW) landfills complying with environmental legislation are andwill be used as a disposal method in the future [1]. Finding locations for landfill is a concern ofall local, regional and central environmental authorities. MSW storage will accompany allactions related to environmentally friendly management such as recycling, recovery, reuse, useas a fuel for thermal power plants, cement industry operators, or simply lowering the volumeby incineration in plants with environmental integrated licence.
The fact that MSW landfills generate LFG’s containing greenhouse gases leads to theretention of LFG at source and the use of components with energy content for economicpurposes. LFG contains CH4, CO2, VOC, NMOC and other gases. Major interest is given tomethane, a strong greenhouse gas (21 times more powerful than CO2). The methane content ofLFG has economic interest even though it has a lower energy value than methane from naturalgas [2]. However, LFG containing CH4 also has important disadvantages, such as: it can escapefrom the body of the landfill, it can accumulate in uncovered spaces generating explosions, maycause fires, can cause the vegetation stress [2]. The impact of a landfill refers to environmental

408
factors, health and toxicity issues, vegetation stress, greenhouse gases, odorous gases, andpotential hazards such as explosions and fires.
Through the contained gases, other than CH4 and CO2, such as H2S, NMOC, mercaptans,LFG is extremely dangerous for human health. Moreover, in the case of H2S, olfactory sensitivemercaptans, there is a danger of fire, and in high concentrations can cause the death ofmaintenance personnel. Figure 1 schematically presents the impact on air, vegetation, waterbodies (groundwater) of the migration of LFG containing CH4, CO2 and other gases, as well asthe migration of the leachate into a body of underground water [3].
Figure 1: The potential impact of a landfill on groundwater and vegetation
It is observed that in vegetation support layer, under the action of methanogenic bacteria,the CH4 stream is decomposed into CO2 and H2O by O2 consumption. That can be explainedthe plant stress due to LFG migration.
It is to be noticed that besides the influence of CH4, which consumes O2 from the aeratedsoil, CO2 also increases the naturally occurring CO2 gradient leading to the displacement of O2,H2O and CO2 from air around the plant roots [3-5]. As a solution to diminishing the LFG-generated greenhouse effect through CH4, N2O and other chemical compounds, it is proposedto build composting stations in the landfill. It is important to note that the appearance ofvegetation stress [3, 6] (yellowing of the leaves, appearance of black spots on the surface of theleaves, root inhibition, reduction of the canopy, reduction in the size of the leaves etc.) is anindication that the cover of the landfill begins to crack and massive leakage of LFG appears.Because of the subject's complexity, the issue of managing LFGs in safe environmental andhealth conditions far exceeds the space allocated to this article. In addition to LPG’s containinggreenhouse gases, other pollutants such as SO2, suspended particulate matter, NOx generatedifferent types of pollution in atmosphere.
2. ADVANCED RESEARCH ON THE LANDFILL IMPACTON ENVIRONMENTAL FACTORS
This paper summarizes the results of some researchers on the landfill impact through LFGand leachate on vegetation and water bodies. The objective of these researches was:
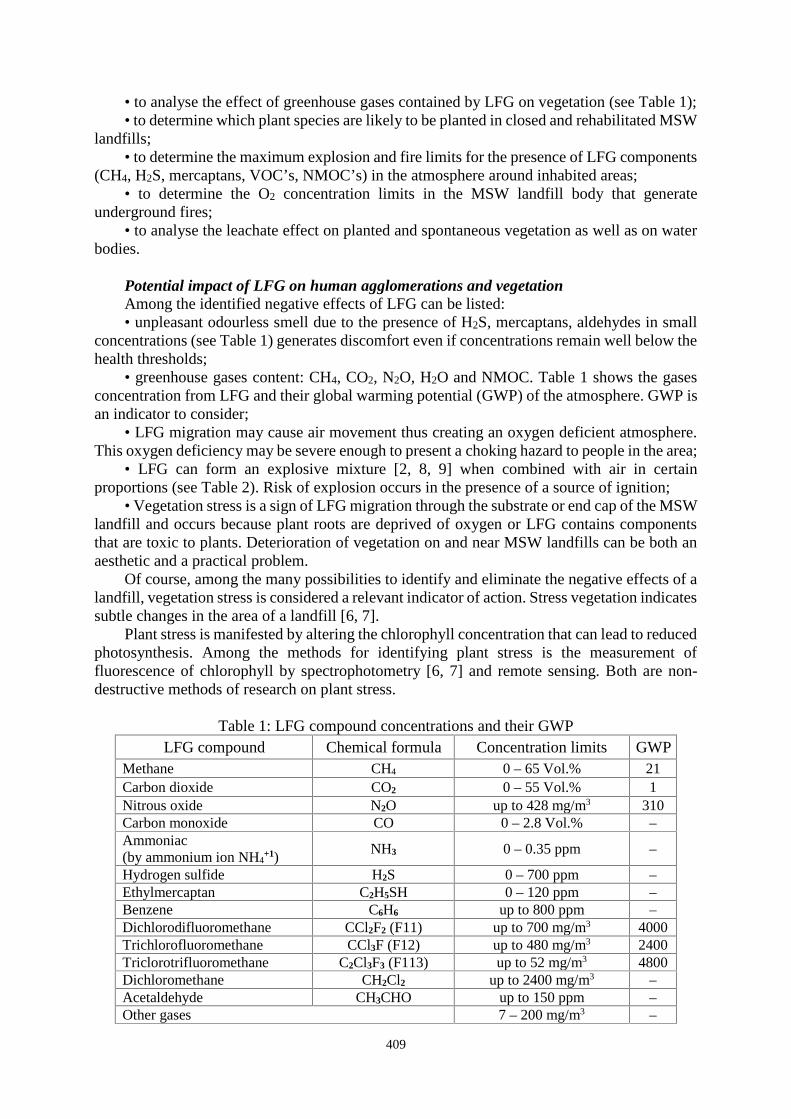
409
• to analyse the effect of greenhouse gases contained by LFG on vegetation (see Table 1);• to determine which plant species are likely to be planted in closed and rehabilitated MSW
landfills;• to determine the maximum explosion and fire limits for the presence of LFG components
(CH4, H2S, mercaptans, VOC’s, NMOC’s) in the atmosphere around inhabited areas;• to determine the O2 concentration limits in the MSW landfill body that generate
underground fires;• to analyse the leachate effect on planted and spontaneous vegetation as well as on water
bodies.
Potential impact of LFG on human agglomerations and vegetationAmong the identified negative effects of LFG can be listed:• unpleasant odourless smell due to the presence of H2S, mercaptans, aldehydes in small
concentrations (see Table 1) generates discomfort even if concentrations remain well below thehealth thresholds;
• greenhouse gases content: CH4, CO2, N2O, H2O and NMOC. Table 1 shows the gasesconcentration from LFG and their global warming potential (GWP) of the atmosphere. GWP isan indicator to consider;
• LFG migration may cause air movement thus creating an oxygen deficient atmosphere.This oxygen deficiency may be severe enough to present a choking hazard to people in the area;
• LFG can form an explosive mixture [2, 8, 9] when combined with air in certainproportions (see Table 2). Risk of explosion occurs in the presence of a source of ignition;
• Vegetation stress is a sign of LFG migration through the substrate or end cap of the MSWlandfill and occurs because plant roots are deprived of oxygen or LFG contains componentsthat are toxic to plants. Deterioration of vegetation on and near MSW landfills can be both anaesthetic and a practical problem.
Of course, among the many possibilities to identify and eliminate the negative effects of alandfill, vegetation stress is considered a relevant indicator of action. Stress vegetation indicatessubtle changes in the area of a landfill [6, 7].
Plant stress is manifested by altering the chlorophyll concentration that can lead to reducedphotosynthesis. Among the methods for identifying plant stress is the measurement offluorescence of chlorophyll by spectrophotometry [6, 7] and remote sensing. Both are non-destructive methods of research on plant stress.
Table 1: LFG compound concentrations and their GWPLFG compound Chemical formula Concentration limits GWP
Methane CH4 0 – 65 Vol.% 21Carbon dioxide CO2 0 – 55 Vol.% 1Nitrous oxide N2O up to 428 mg/m3 310Carbon monoxide CO 0 – 2.8 Vol.% –Ammoniac(by ammonium ion NH4
+1)NH3 0 – 0.35 ppm –
Hydrogen sulfide H2S 0 – 700 ppm –Ethylmercaptan C2H5SH 0 – 120 ppm –Benzene C6H6 up to 800 ppm –Dichlorodifluoromethane CCl2F2 (F11) up to 700 mg/m3 4000Trichlorofluoromethane CCl3F (F12) up to 480 mg/m3 2400Triclorotrifluoromethane C2Cl3F3 (F113) up to 52 mg/m3 4800Dichloromethane CH2Cl2 up to 2400 mg/m3 –Acetaldehyde CH3CHO up to 150 ppm –Other gases 7 – 200 mg/m3 –

410
Table 2: Concentrations and characteristics of LFG componentsTypes of
gases in LFGVolumepercent
Characteristics
CH4 35 – 60
Methane (CH4) is a natural gas. It is colourless and odourless. Extremelyexplosive when mixed with air at a volume of LEL1 of 5% and of UEL2 of15%. At concentrations below 5% and above 15%, methane is notexplosive.
CO2 40 – 50Naturally, it is found at low concentrations in the atmosphere (0.033%). It
is colourless, odourless and slightly acidic. It is not flammable or explosive.
N2 2 – 5Nitrogen comprises about 78% of the atmosphere. It is odourless, tasteless
and colourless. It is not flammable or explosive.
O2 0.1 – 1Oxygen comprises about 21% of the atmosphere. It is odourless, tasteless
and colourless. It is not flammable or explosive.
AmmoniumNH4
+1 0.1 – 1Ammonia is colourless gas with a viscous and flammable odour. LEL is
15% and UEL is 28%. However, ammonia is unlikely to be collected in aconcentration high enough to present an explosion hazard.
NMOC 0.01 – 0,6
NMOCs may occur naturally or may be formed by chemical reactions.The most common NMOCs include acrylonitrile, benzene, 1,1–dichloroethane, 1,2–cis dichloroethylene, dichloro-methane, carbonylsulphide, ethylbenzene, hexane, methyl ethyl ketone, tetrachloroethylene,toluene, trichloroethylene, vinyl chloride and xylene. Potential explosivehazards will vary depending on the chemical. For example, benzene LEL1is 1.2% and UEL2 is 7.8%. However, benzene and other NMOC substancesare unlikely to be collected at concentrations sufficiently high to representexplosion hazards.
Compoundswith S
(example: H2S,(CH3)2S,
mercaptans)
0 – 1
The compounds with S are natural gases that make LFG smell like rottenegg. They can cause unpleasant odours even at very low concentrations.Hydrogen sulphide is flammable. LEL is 4% and UEL is 44%. However,in most landfills it is unlikely to collect H2S in a concentration high enoughto be a danger of explosion.
1 LEL – Lower explosion limit; 2 UEL – Upper explosion limit
What is remote sensing? Remote sensing technologies can be used to evaluate vegetationand plant health and stress monitoring due to pollutants contained in LFG and leachate.
Also, this aspect is strictly related to soil acidity, pH affecting the metals mobility in thesoil. Multispectral and hyperspectral sensors are instruments that record the electromagneticenergy emitted or reflected by different study objects at multiple wavelength ranges calledspectral bands or spectral domains (ultraviolet, visible, near and far infrared, thermal infrared).Multi- and hyperspectral sensors are also incorporated into field or laboratoryspectrophotometers. The data obtained with these multi- and hyperspectral sensors are calledspectral responses that are unique information about those objects or phenomena studied, sinceeach object has its own spectral response. Leaves represent the main surface of the tree crownwhere energy exchange processes take place, and their optical properties are essential inunderstanding photon transport within a leaf [10].
Remote sensing [3] is the practice of obtaining remote data on the object of interest. InFigure 3 is represented a way to obtain data from a landfill area related to soil, water, vegetation.Existing pollutants in soil, water, or tree leaves will transmit information that will betransformed into images by processing after collection.
Each pollutant has a specific response and forms absorption bands at certain wavelengths.In Figure 2 can be seen that soil, through the pollutant content, transmits signals at certainwavelengths; the water bodies and vegetation do the same [3].
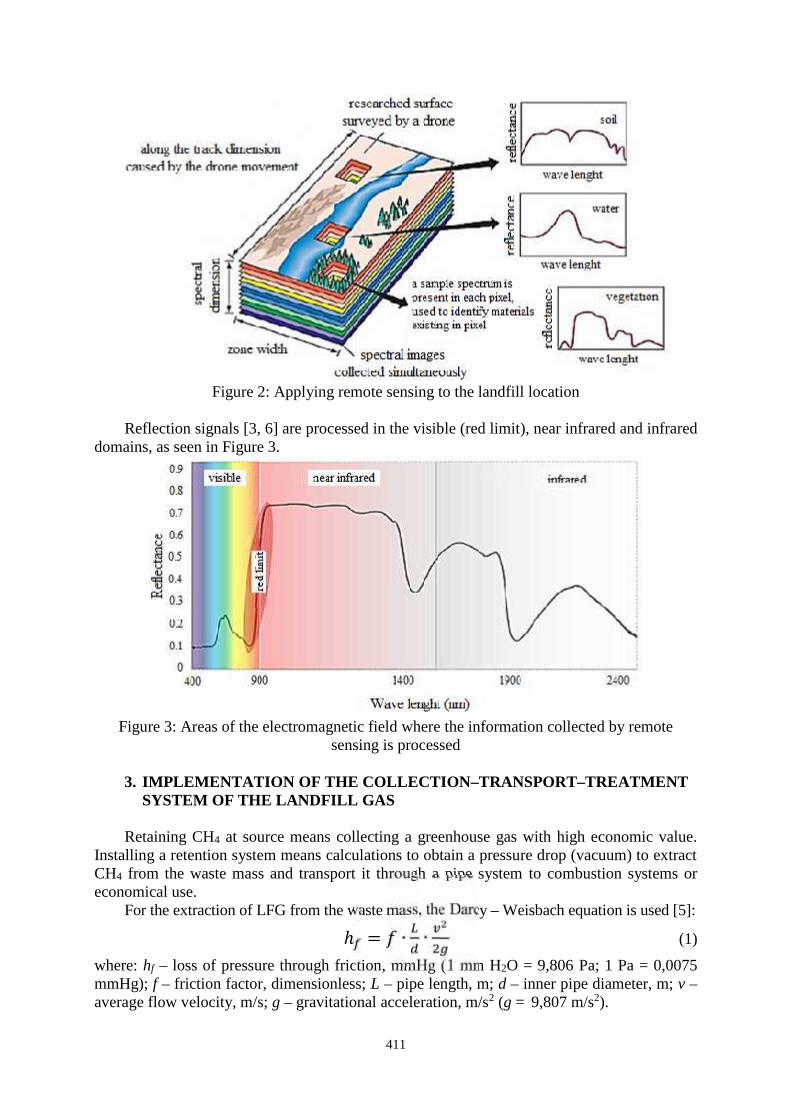
411
Figure 2: Applying remote sensing to the landfill location
Reflection signals [3, 6] are processed in the visible (red limit), near infrared and infrareddomains, as seen in Figure 3.
Figure 3: Areas of the electromagnetic field where the information collected by remotesensing is processed
3. IMPLEMENTATION OF THE COLLECTION–TRANSPORT–TREATMENTSYSTEM OF THE LANDFILL GAS
Retaining CH4 at source means collecting a greenhouse gas with high economic value.Installing a retention system means calculations to obtain a pressure drop (vacuum) to extractCH4 from the waste mass and transport it through a pipe system to combustion systems oreconomical use.
For the extraction of LFG from the waste mass, the Darcy – Weisbach equation is used [5]:ℎ = ∙ ∙ (1)
where: hf – loss of pressure through friction, mmHg (1 mm H2O = 9,806 Pa; 1 Pa = 0,0075mmHg); f – friction factor, dimensionless; L – pipe length, m; d – inner pipe diameter, m; v –average flow velocity, m/s; g – gravitational acceleration, m/s2 (g = 9,807 m/s2).

412
The following relationship is used to determine the pressure drop during the LFG transportthrough the collection pipes: ∆ = ∙ ∙ ∙ (2)
where: ΔP – pressure drop, mmHg or Pa; ρg – LFG density, kg/m3; ρw – density of manometricliquid, kg/m3.
4. REMOVAL OF THE WATER VAPOUR FROM THE LFG
Separation of water vapours contained by LFG is mandatory [5]. The project establishesthe amount of water vapours collected in order to size the storage tanks.
The psychometric diagram is used to estimate the amount of water vapour. Water vapourconcentration varies for different temperatures, as follows:
- at 32ºC (305 K), LFG contains 0.030 kg water vapours/kg;- at 21ºC (294 K), LFG contains 0.015 kg water vapours/kg.For this reason, the condensate pump is sized for various flows.
5. CONCLUSIONS
LFG collection systems allow for the reduction of the greenhouse effect generated by LFGthrough CH4. A well-designed and operated collection system in accordance with themanufacturer's instructions (of pipelines, valves, fittings, blowers, condensate pumps, flameburners) installed on a landfill, in compliance with the legal provisions in force, ensures a LFGcollection efficiency of about 75%.
After treatment, CH4 obtained from LFG has the same qualities as natural CH4. Given thehigh installation costs, the state needs to be fully or at least 70% involved.
It should be made aware that not only the greenhouse effect generated by landfills mattersbut also the management of odorous gases, VOCs and non-methane gases. By findingenvironmentally and rationally ways to manage CO2, products of economic interest can beobtained even if CO2 is a natural constituent of the surrounding atmosphere.
Making graphs on the evolution of the greenhouse effect at each landfill will lead toinforming potential investors, but also to the state's interest in recovering the substantialamounts of CH4 (green energy resource) generated by landfills.
References
[1]. Voicu, Gh., Ingineria depozitarii ecologice a deseurilor, Editura Politehnica Press, Bucuresti, 2016.[2]. * * *, Landfill Gas Management Facilities Design Guidelines, British Columbia Ministry of Environment,
Prepared pursuant to Section 7 of the Landfill Gas Management Regulation, March 2010.[3]. Sukharia, R., Vegetation based assessment and monitoring tools for landfill leachate treatment and fugitive
plumes, Masters Theses, 2017, http://scholarsmine.mst.edu/masters_theses/7662.[4]. * * *, Operating Manual for Landfill Gas Collection and Control System for the Sudbury Road Landfill - City
of Walla Walla, Washington, Prepared by CB&I Environment and Infrastructure, April 2017.[5]. * * *, Landfill gas collection and treatment systems, U.S Army Corps of Engineers, EM 200-1-22, 2013.[6]. Lazar A.L., Contaminarea cu metale grele a solurilor în zona Rosia Montana si stresul indus asupra
vegetatiei, PhD Thesis, Cluj-Napoca, 2013.[7]. Lazar, A.L., Baciu, C., Pop, I.C., Aplicatiile spectrometrului portabil ASD-Terraspec VNIR-SWIR in
monitorizarea stresului vegetatiei, Ecoterra, no. 28, 2011[8]. Guidelines “Capacity strengthening of the SWMCG by introducing applicable methods for assessing landfill
gas potential at the existing dumpsites in Georgia”, www.inogate.org/activities/391?lang=en.[9]. * * *, Vorgehensweise bei der Planunund Bau einer Zwangsentgasung auf Deponien für Siedlungsabfall und
sonstigen gasproduzierenden Abfalldeponien, http://www.dmskroeger.de/engdefault.htm.[10].Jacquemoud, S., Ustin, S.L, Leaf optical properties: a state of the art, Proc. 8th International Symposium
Physical Measurements & Signatures in Remote Sensing, Aussois (France), CNES, 2001, pp. 223-232.
413
EQUIPMENTS USED IN BIOMASS PELLETIZATION PROCESS– A REVIEW
Gheorghe Voicu1, Mirela Dincă1, Bianca – Ștefania Zăbavă1, Nicoleta Ungureanu1,Iulia Găgeanu2, Paula Tudor1
1 Politehnica University of Bucharest, Romania2 INMA Bucharest, Romania
ABSTRACT
Biomass is a renewable source of energy that has an important contribution in reducing the use ofconventional fuels and in reducing greenhouse gas emissions to the atmosphere. Densified biomassfuels such as pellets are preferred as they provide better economic viability for transport, storage andhandling. Processing biomass and shaping it into pellets allows to convert organic matter into astandard form of fuel, which can be easily obtained, transported and used. The types of biomass usedin the production of pellets are quite varied, which affects the physicochemical properties of the finalproduct. For the transformation of vegetal remains into pellets, the pelletization operation is used. Theaim of this review is to present the main equipments used in the pelletization process.
1. INTRODUCTION
The world’s energy markets rely heavily on the fossil fuels coal, petroleum crude oil, andnatural gas as sources of thermal energy; gaseous, liquid, and solid fuels; and chemicals.Since millions of years are required to form fossil fuels in the earth, their reserves are finiteand subject to depletion as they are consumed. The only natural, renewable carbon resourceknown that is large enough to be used as a substitute for fossil fuels is biomass [1].
Biomass is a renewable source of energy that has an important contribution in reducingthe use of conventional fuels and in reducing greenhouse gas emissions to the atmosphere. Inthis context, an increasing attention is given to the production and use of environmentallyfriendly biofuels: pellets and briquettes, biogas, biodiesel and bioethanol. Densified biomassfuels such as pellets are preferred as they provide better economic viability for transport,storage and handling [2]. The pellets have other advantages, such as: a higher energy density,low transportation and storage costs and due to their size and composition, they can be easilyused for feeding in domestic and industrial boilers. Processing biomass and shaping it intopellets allows to convert organic matter into a standard form of fuel, which can be easilyobtained, transported and used. The types of biomass used in the production of pellets arequite varied, which affects the physicochemical properties of the final product. The maincharacteristics that determine the quality of pellets are the energy value, the emission ofcombustion gases (sulphur oxides, nitrogen oxides, hydrogen chloride, volatile dust) andfactors that affect proper functioning of furnace [3]. Level of sulphur, chlorine and nitrogenare particularly relevant to the individual recipients, because of the health aspects ofconsumers and the longevity of heating systems, which are exposed to excessive corrosion.
Several studies have been conducted regarding the pelletizing. Miranda et al.[4] studiedpelletizing of forest wastes from oak forest cleaning. Filbakk et al. [5] analyzed the effect ofbark content in wild pine pellets by using different proportions of wood and bark, observingbetter mechanical properties and higher ash percentage in those made from pure bark.Zamorano et al. [6] and García-Maraver et al. [7] assessed the influence of the mainpelletizing parameters on different wastes from olive pruning. The aim of this review is topresent the main equipments used in the pelletization process.
1Splaiul Independentei 313, Sector 6, Bucharest, 0744371574, [email protected]

414
2. METHODOLOGY
For the transformation of vegetal remains into pellets, the pelletization operation is used.This is a method of agglomeration, or particle size enlargement, in which material fines areprocessed into pellets or granules.
Choosing the car pelletizing and power systems, mixing and conditioning of biomassentrance of the car must be made according to the type, range and humidity of the biomass, aswell as the way of preparing it in the equipment used before the introduction in the pelletizedmachine [8]. Pelletizing processes consist of multiple steps (Figure 1) that include rawmaterial pretreatment, pelletization and post-treatment. Pre-treatment technology steps dependa lot on the raw material characteristics and consist generally of size reduction, drying andconditioning. After pelletization, the pellets are transferred into a pellet cooler and screenedfor small particles [9].
Figure 1: Process stages of biomass pellet production [10]
The schematic of biomass pelleting process is given in Figure 2. The cost of pelleting ismainly dependent on the energy consumption, throughput, and capital costs associated withthese unit operations.
Figure 2: Schematic of the pelletization process [11]

415
Technoeconomic analysis indicated efficient moisture management is critical forreducing the preprocessing costs of biomass. Sakkampang and Wongwuttanasatian [12] intheir study on glycerin-biomass briquettes indicated that drying takes about 2.25 MJ/kg,whereas briquetting takes about 0.05–0.10 MJ/kg for different feedstocks (saw dust,sugarcane bagasse, sugarcane leaf, and rice husk). Yancey et al. [13] indicated that the type ofthe biomass has an impact on the drying, and pelleting costs. One way to reduce the highdrying costs in pellet production process is to pellet biomass at high moistures and then drythe high-moisture pellets using low capital and low temperature drying methods like grain orbelt dryer. Studies on pelleting corn stover, ammonia fiber explosion pretreated corn stover,and municipal solid waste at high-moisture content of about >20% in a flat die and ring diepellet mill indicated that good quality pellets, in terms of density and durability, can beproduced.
Pellets are produced in a pellet mill that generally consists of a die with cylindrical presschannels and rollers that force the biomass to flow into and through the channels. Due to thefriction between the steel surface and the biomass in the press channel, a high back pressure isbuilt up and heat is generated. The physical forces built up in the press channel of a pellet millare crucial for understanding and optimizing the pelletizing process, and have been the subjectof multiple studies [14, 15]. A die with press channels and roller(s) are the basic parts of apellet mill. Figure 3 shows the pelletisation process in a fixed die-casting machine and rotarypressing roller. The die can either be in the shape of a ring or a flat plate.
Figure 3: Typical pellet mill design a) ring die and b) flat die [16]
Either the die or the rollers can be rotating, and due to that movement the biomassparticles are squeezed into the openings of the press channel.
In figure 4 it’s presented the principle of operation of the pressing machine with flat die.The flat-bottomed pelletizer was the first pellet press that was designed at the beginning of the20th century, based on flat molds. Generally, there are two types of plane molds on themarket, the rotary die and the rotating roller. The first type has a stationary roller and a rotarydie, and the second type has a stationary die, while the roller rotates. By adopting the verticalprinciple, the raw material falls by its own weight in the pelletizing chamber where it iscompressed between the rollers and the mold forming the pellets by passing through the moldholes. On the whole, flat-bed pelletisers are generally used to process materials with highadhesion forces to produce both pellets for both fuel and animal feed, on a small and mediumscale. They are known due to their features such as safe operation, high mobility, low noise,low energy consumption, and low productivity compared to the ring-shaped pelletizer.

416
Figure 4: The operating principle of the flat die press machine [17]
Figure 5 shows the process of forming the pellets in the flat mold of the ECO-10installation. The ECO-10 flat die pellet mill incorporates the same simple and economical beltdrive system, and it is built to withstand heavy to severe duty applications. The ECO-10 isequipped with a 13-phase motor, and an optional variable speed drive is available. This unit israted at 30 to 150 lbs per hour, depending on material, and is intended for research anddevelopment, pilot scale, as well as small production scale applications.
Figure 5: Schematic showing expansion of the high moisture pellet during compression andextrusion in a flat die pellet mill [18]
In the flat-bottomed pellet machine of Figure 6, the biomass hopper and auger conveyorfor biomass feed are equipped with flexible tape type heating, temperature regulators andthermocouples for preheating biomass. The die and the snail are equipped with a variablefrequency unit to control the rotational speed of the die and to adjust the feed rate in the mill.Horizontal cooler is designed to cool the hot pellets immediately after their exit from themold. Both the hopper and feeder are provided with flexible heating tape and J-type

417
thermocouples and controllers to preheat the biomass both in the hopper and the feeder at aconstant temperature. The die of the pellet mill is provided with a variable frequency drive tocontrol the rotational speed of the die.
Figure 6: Flat-die pellet mill [19]
The main factor, based on which the most suitable method of pelleting can be selected, isthe specificity of the finished product for the finished granular product. The granulometriccomposition and the form of primary particles and granules as well as the requirements for theuse of binders in the agglomeration process also represent a number of criteria on the basis ofwhich one may choose to adopt a particular pelletization process.
The characteristics and condition of the primary material, in turn, are criteria forchoosing the agglomeration method, and if the primary material is in paste form, the extrusiongranulation process is used. If the primary materials are sensitive to moisture (they are slightlysoluble), the dry compaction method is used by pressing.
3. CONCLUSIONS
Densified biomass fuels such as pellets are preferred as they provide better economicviability for transport, storage and handling. Processing biomass and shaping it into pelletsallows to convert organic matter into a standard form of fuel, which can be easily obtained,transported and used.
For the transformation of vegetal remains into pellets, the pelletization operation is used.This is a method of agglomeration, or particle size enlargement, in which material fines areprocessed into pellets or granules.
The characteristics and condition of the primary material, in turn, are criteria forchoosing the agglomeration method, and if the primary material is in paste form, the extrusiongranulation process is used. If the primary materials are sensitive to moisture (they are slightlysoluble), the dry compaction method is used by pressing.
ACKNOWLEDGEMENTS
This work was funded by the Executive Agency for Higher Education, Research,Development and Innovation Funding, within the project entitled "Optimizing the

418
composition of biomass mixtures for obtaining high quality pellets", ctr. 24 BG / 2016 (codePN-III-P2-2.1-BG-2016-0266), Romania.
References
[1] DONALD L. KLASS Entech International, Inc. Barrington, United States Biomass for Renewable Energyand Fuels, 2004
[2] I. Obernberger, G. Thek, Physical characterisation and chemical composition of densified biomass fuels withregard to their combustion behaviour, Biomass Bioenergy 27 (2004) 653–669.
[3] Hiegl W., Janssen R., Pichler W. (2009), Advancement of pellets-related European standards, WIPRenewable Energies, Munich/Vienna, http://bape.com.pl/LinkClick.aspx?fileticket=zv64RqEj-5E%3D&tabid=312&mid=697
[4] Miranda, M.T.; Arranz, J.I.; Rojas, S.; Montero, I. Energetic characterization of densified residues fromPyrenean oak forest. Fuel 2009, 88, 2106–2112
[5] Filbakk, T.; Jirjis, R.; Nurmi, J.; Hoibo, O. The effect of bark content on quality parameters of Scots pine(Pinus sylvestris L.) pellets. Biomass Bioenergy 2011, 35, 3342–3349
[6] Zamorano, M.; Popov, V.; Rodríguez, M.L.; García-Maraver, A. A comparative study of quality properties ofpelletized agricultural and forestry lopping residues. Renew. Energy 2011, 36, 3133–3140
[7] García-Maraver, A.; Rodríguez, M.L.; Serrano-Bernardo, F.; Díaz, F.; Zamorano, M. Factors affecting thequality of pellets made from residual biomass of olive trees. Fuel Process. Technol. 2015, 129, 1–7.
[8] Vlăduț, V., Danciu, A., Nicolescu, M., Postelnicu, E., Tehnologii pentru obtinerea si utilizarea biomasei,Editura Terra Nostra, Iași, 2002.[9]Obernberger, I.; Thek, G. In: The pellet handbook ‐ The production and thermal utilisation of biomass pellets;Earthscan: London, 2010
[10] Larsson, S. H. In: Fuel pellet production from reed canary grass ‐ Supply potentials and process technology.PhD thesis, Swedish University of Agricultural Science: Umeå, 2008.
[11] Alakangas, E.; Paju, P. In: Wood pellets in Finland, technology, economy and market. OPET 5 report. VTTTechnical Research Centre of Finland: Espoo, 2002.
[12] Sakkampang, C., Wongwuttanasatian, T., 2014. Study of ratio of energy consumption and gainedenergy during briquetting process for glycerin –biomass briquette fuel. Fuel. 115, 186–189
[13] Yancey, N., Tumuluru, J. S., Wright, C. T., 2013. Grinding and densification studies on raw andformulated woody and herbaceous biomass feedstocks, Journal of Biobased Materials and Bioenergy. 7,549–558.[14] Holm, J. K.; Henriksen, U. B.; Wand, K.; Hustad, J. E.; Posselt, D. Experimental verification of novel pelletmodel using a single pelleter unit. Energy & Fuels. 2007
[15] Stelte, W.; Holm, J. K.; Sanadi, A. R.; Ahrenfeldt, J.; Henriksen, U. B. Fuel pellets from biomass: theimportance of the pelletizing pressure and its dependency on the processing conditions. Fuel. 2011, 90,3285‐3290.[16] FAO. 1980. Fish feed technology, Lectures presented at the FAO/UNDP Training Course in Fish FeedTechnology, held at the College of Fisheries, University of Washington, Seattle, Washington, U.S.A., 9 October-15 December 1978, United Nations Development Programme, Food and Agriculture Organization of the UnitedNations, Rome, ADCP/REP/80/11.
[17] Ghid pentru furnizorii de bio-combustibil, Proiect de energie şi biomasă în Moldova, 2012;[18] Jaya Shankar Tumuluru, Specific energy consumption and quality of wood pellets produced using high-moisture lodgepole pine grind in a flat die pellet mill, INL/JOU-15-34655, 2015.
[19] Amber N. Hoover, Jaya Shankar Tumuluru, Farzaneh Teymouri, Janette Moore, Garold Gresham Effect ofpelleting process variables on physical properties and sugar yields of ammonia fiber expansion pretreated cornstover, Bioresource Technology 164 (2014) 128–135

419
WASTEWATER DISINFECTION BY CHLORINATION, OZONATIONAND ULTRAVIOLET (UV) – A REVIEW
Bianca-Ștefania ZĂBAVĂ1, Gheorghe VOICU, Gigel PARASCHIV, Mirela DINCĂ,Nicoleta UNGUREANU, Mariana IONESCU
Politehnica University of Bucharest, Faculty of Biotechnical Systems Engineering, Romania
ABSTRACT
Human exposure to wastewater discharged into the environment has increased within the past 15 to 20years with the rise in population and the greater demand for water resources for recreation and otherpurposes. The organisms of concern in domestic wastewater include enteric bacteria, viruses, andprotozoan cysts. Disinfection is considered to be the primary mechanism for the inactivation/destruction of pathogenic organisms to prevent the spread of waterborne diseases to downstream usersand the environment. The aim of this paper is to present the main types of disinfection used for thetreatment of wastewater containing microorganisms.
1. INTRODUCTION
Human exposure to wastewater discharged into the environment has increased within thepast 15 to 20 years with the rise in population and the greater demand for water resources forrecreation and other purposes. The organisms of concern in domestic wastewater includeenteric bacteria, viruses and protozoan cysts [1]. Untreated and secondary treated effluentcontains a range of pathogenic microorganisms that pose a potential risk to the health ofhumans and livestock. Bacteria are the most common microbial pathogens found inwastewater. They are often used as an indicator of pathogen contamination and as a surrogateindicator to assess the efficacy of treatment and disinfection methods. However, as bacteriaare generally the most sensitive group to disinfection and have high infective doses, theypresent a relatively low health risk [2].
Treating dirty water, whether it comes from sewage lines or a chemically polluted lake,costs a relative fortune. If a poor country, and especially small villages in that country, can'tafford to produce clean drinking water, they certainly can't afford to produce clean water forirrigation purposes. For example, in poor villages, farmers use water from rivers polluted withsewage or runoff from livestock farms, industry and other contaminated sources to irrigatetheir cropland. This allows bacteria make it into the food, and people and animals who live offthis produce can become ill [3].
Disinfection is considered to be the primary mechanism for the inactivation/ destructionof pathogenic organisms to prevent the spread of waterborne diseases to downstream usersand the environment. The three most common methods of disinfection in the U.S. arechlorination, ozonation, and ultraviolet (UV) disinfection. All three disinfection methodsdescribed above can effectively meet the discharge permit requirements for treatedwastewater. It is important that wastewater be adequately treated prior to disinfection in orderfor any disinfectant to be effective. However, the advantages and disadvantages of each mustbe weighed when selecting a method of disinfection [4]. In the following, there are presentedthese three most commonly used types of disinfection.
1 Splaiul Independentei 313, Sector 6, Bucharest, 0731538941, [email protected]

420
2. METHODOLOGY
Prior to discharging into the environment, wastewater is disinfected to ensure pathogensare inactivated for environmental and human safety reasons [5].
ChlorinationChlorine is one of the most practical and widely used disinfectants for wastewater.
However, effluent chlorination results in the formation of mutagenic/ carcinogenicdisinfection by products (DBPs) deriving from the reaction of the chlorine with organiccompounds in wastewater [6]. Therefore, dechlorination followed by chlorination should bedone, or alternative safe disinfectant should be used.
Chlorine may be applied in a number of forms such as chlorine gas, sodium hypochloriteor chlorine dioxide [7]:
(1)
The advantages of using chlorination are: chlorine is reliable and effective against a widespectrum of pathogenic organisms; chlorine is more cost-effective than UV or ozonedisinfection; the chlorine residual that remains in the wastewater effluent can prolongdisinfection even after initial treatment and can be measured to evaluate the effectiveness;dosing rates are flexible and can be controlled easily. Like any other method, chlorination alsohas some disadvantages, such as: the chlorine residual is toxic to aquatic life and the systemmay require dechlorination, even when low concentrations of chlorine are used; all forms ofchlorine are highly corrosive and toxic; chlorine reacts with certain types of organic matter inwastewater, creating hazardous compounds.
Chlorine dosage may be established from either bench scale laboratory testing, or actualmeasurement of field results from known plant operation [8].
OzonationOzone has been proved to be one of the most effective disinfectants and is widely used to
inactivate pathogens in drinking water, especially in Europe, USA and Canada [9]. Ozone isan unstable gas that can destroy bacteria and viruses. It is formed when oxygen molecules(O2) collide with oxygen atoms to produce ozone (O3). Ozone is generated by an electricaldischarge through dry air or pure oxygen and is generated on site because it decomposes toelemental oxygen in a short amount of time. After generation, ozone is fed into a down-flowcontact chamber containing the wastewater to be disinfected. From the bottom of the contactchamber, ozone is diffused into fine bubbles that mix with the downward flowing wastewater.Ozonation process diagram is shown in Figure 1. Ozone disinfection is generally used atmedium- to large-sized plants after at least secondary treatment.
Figure 1: Ozone disinfection drocess diagram [10]
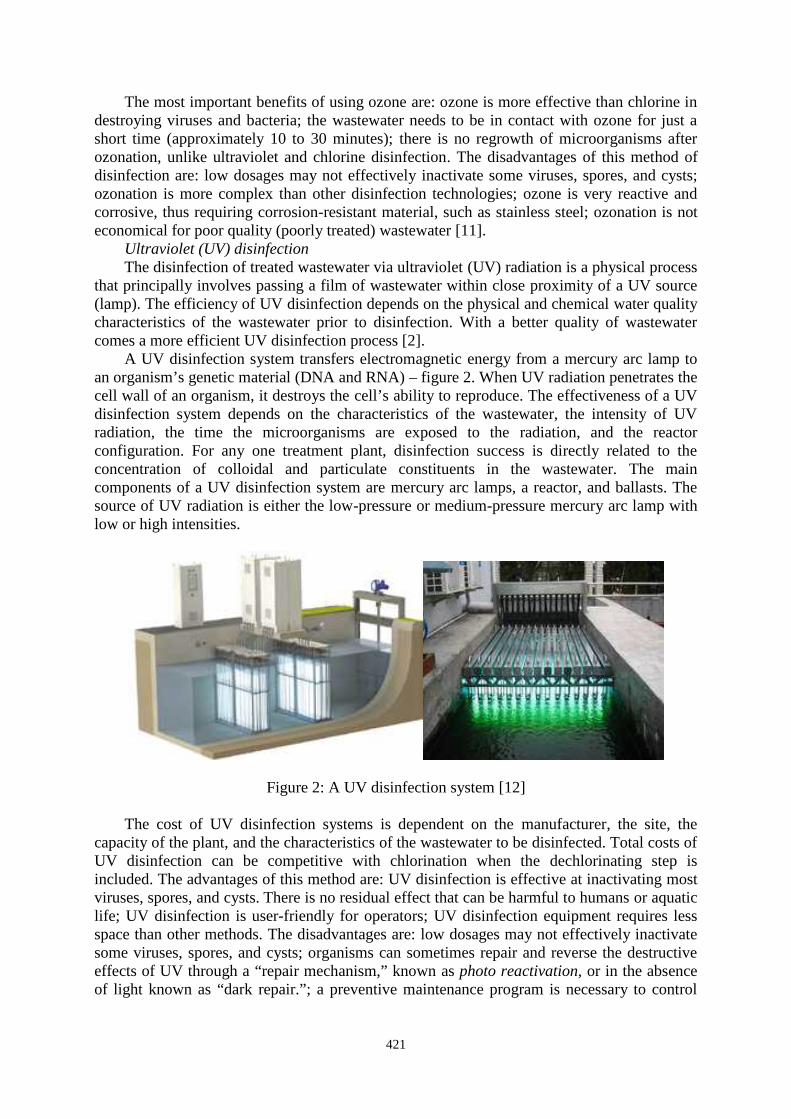
421
The most important benefits of using ozone are: ozone is more effective than chlorine indestroying viruses and bacteria; the wastewater needs to be in contact with ozone for just ashort time (approximately 10 to 30 minutes); there is no regrowth of microorganisms afterozonation, unlike ultraviolet and chlorine disinfection. The disadvantages of this method ofdisinfection are: low dosages may not effectively inactivate some viruses, spores, and cysts;ozonation is more complex than other disinfection technologies; ozone is very reactive andcorrosive, thus requiring corrosion-resistant material, such as stainless steel; ozonation is noteconomical for poor quality (poorly treated) wastewater [11].
Ultraviolet (UV) disinfectionThe disinfection of treated wastewater via ultraviolet (UV) radiation is a physical process
that principally involves passing a film of wastewater within close proximity of a UV source(lamp). The efficiency of UV disinfection depends on the physical and chemical water qualitycharacteristics of the wastewater prior to disinfection. With a better quality of wastewatercomes a more efficient UV disinfection process [2].
A UV disinfection system transfers electromagnetic energy from a mercury arc lamp toan organism’s genetic material (DNA and RNA) – figure 2. When UV radiation penetrates thecell wall of an organism, it destroys the cell’s ability to reproduce. The effectiveness of a UVdisinfection system depends on the characteristics of the wastewater, the intensity of UVradiation, the time the microorganisms are exposed to the radiation, and the reactorconfiguration. For any one treatment plant, disinfection success is directly related to theconcentration of colloidal and particulate constituents in the wastewater. The maincomponents of a UV disinfection system are mercury arc lamps, a reactor, and ballasts. Thesource of UV radiation is either the low-pressure or medium-pressure mercury arc lamp withlow or high intensities.
Figure 2: A UV disinfection system [12]
The cost of UV disinfection systems is dependent on the manufacturer, the site, thecapacity of the plant, and the characteristics of the wastewater to be disinfected. Total costs ofUV disinfection can be competitive with chlorination when the dechlorinating step isincluded. The advantages of this method are: UV disinfection is effective at inactivating mostviruses, spores, and cysts. There is no residual effect that can be harmful to humans or aquaticlife; UV disinfection is user-friendly for operators; UV disinfection equipment requires lessspace than other methods. The disadvantages are: low dosages may not effectively inactivatesome viruses, spores, and cysts; organisms can sometimes repair and reverse the destructiveeffects of UV through a “repair mechanism,” known as photo reactivation, or in the absenceof light known as “dark repair.”; a preventive maintenance program is necessary to control

422
fouling of tubes; turbidity and total suspended solids (TSS) in the wastewater can render UVdisinfection ineffective [12].
ACKNOWLEDGEMENT
This work has been funded by the Ministry of National Education and Research, throughthe UEFISCDI, within the project entitled „Innovative technologies for crop irrigation in arid,semi-arid and sub-dry climate", contract no. 27 PCCDI / 2018.
3. CONCLUSIONS
Disinfection is considered to be the primary mechanism for the inactivation/ destruction ofpathogenic organisms to prevent the spread of waterborne diseases to downstream users and theenvironment. The three most common methods of disinfection in the U.S. are chlorination,ozonation, and ultraviolet (UV) disinfection.
Chlorine is one of the most practical and widely used disinfectants for wastewater. Thedosage of that may be established from either bench scale laboratory testing, or actualmeasurement of field results from known plant operation. Chlorine is more cost-effective thanUV or ozone disinfection.
Ozone has been proved to be one of the most effective disinfectants and is widely used toinactivate pathogens in drinking water, especially in Europe, USA and Canada. Ozone isgenerated by an electrical discharge through dry air or pure oxygen and is generated onsitebecause it decomposes to elemental oxygen in a short amount of time.
The disinfection of treated wastewater via ultraviolet (UV) radiation is a physical processthat principally involves passing a film of wastewater within close proximity of a UV source(lamp). The efficiency of UV disinfection depends on the physical and chemical water qualitycharacteristics of the wastewater prior to disinfection.
References
[1] Crites, R. and Tchobanoglous, G., Small and Decentralized Wastewater Management Systems. The McGraw-Hill Companies. New York, New York, 1998.[2] Guidelines for environmental management disinfection of treated wastewater, EPA Victoria 40 City Road,Southbank Victoria 3006 AUSTRALIA Publication 730 ISBN 0 7306 7623 4, 2002.[3] https://science.howstuffworks.com/environmental/earth/geophysics/wastewater-agriculture.htm[4 Ultraviolet Disinfection Project funded by the U.S. Environmental Protection Agency under AssistanceAgreement No. CX824652[5] U.S. Environmental Protection Agency, Office of Water Washington, D.C., EPA 832-F-99-064, 1999.[6] Sun, YX, Wu, QY, Hu, HY, Tian, J., Effects of operating conditions on THMs and HAAs formation duringwastewater chlorination. J HazardMater;168:1290‑1295, 2009.[7]httpwww.yourarticlelibrary.comwaste-managementadvanced-waste-water-treatment-methods-waste-management27495[8]Wastewater Treatment Plant Operator Certification Training, Module 5: Disinfection and Chlorination,http://files.dep.state.pa.us/Water/BSDW/OperatorCertification/TrainingModules/ww05_disinfection_chlorinati_wb.pdf, 2016.[9] Xu, P., Janex, M.-L., Savoye, P., Cockx, A., Lazarova, V., Wastewater Disinfection by Ozone: Mainparameters for Process Design. Water Res., 36(4), 1043-1055, 2002.[10] U.S. Environmental Protection Agency (EPA). Design Manual: Municipal Wastewater Disinfection. EPAOffice of Research and Development. Cincinnati, Ohio. EPA/625/1-86/021. 1986.[11] Ozone Disinfection Project funded by the U.S. Environmental Protection Agency under AssistanceAgreement No. CX824652 ETI Environmental Technology Initiative Fact Sheet A General Overview, availableat http://www.nesc.wvu.edu/pdf/WW/publications/eti/Ozone_Dis_gen.pdf[12] Ultraviolet Disinfection Project funded by the U.S. Environmental Protection Agency under AssistanceAgreement No. CX824652.

423
FACTORS THAT INFLUENCE THE EFFICIENCY OF THEDECANTING PROCESS– A REVIEW
Bianca-Ștefania ZĂBAVĂ1, Gheorghe VOICU, Mirela DINCĂ, NicoletaUNGUREANU, Mariana FERDEȘ
Politehnica University of Bucharest, Faculty of Biotechnical Systems Engineering, Romania
ABSTRACT
Sedimentation is perhaps the oldest and most common water treatment process. On the surface, asedimentation tank appears to be a simple phase separating device, but down under an intricatebalance of forces is present. Many factors clearly affect the capacity and performance of asedimentation tank: surface and solids loading rates, tank type, solids removal mechanism, inletdesign, weir placement and loading rate. Sedimentation (settling) is the separation of suspendedparticles that are heavier than water. Sedimentation is widely used in wastewater treatment systems.This paper presents the results obtained in some research focused on wastewater decanting processesin settling tanks.
1. INTRODUCTION
Industrially used water, also called „waste water” or „residual water” comes fromdifferent production and processing processes, from a physical point of view, they representmultiphase fluids (mixtures). When stopping, the phases are separated by gravity by adownward movement (gravimetric separation), due to the differences in specific mass of theparticles in the suspension, thus achieving a sedimentation or decantation process [1].
Enhancing the efficiency of the settling tanks is one of the most economical approachesfor refining water. On the surface, a sedimentation tank appears to be a simple phaseseparating device, but down under an intricate balance of forces is present. Many factorsclearly affect the capacity and performance of a sedimentation tank: surface and solidsloading rates, tank type, solids removal mechanism, inlet design, weir placement and loadingrate [2]. Experimental and numerical investigations show that the performance of thesedimentation basins is influenced by velocity field variations and the geometry of the tank,especially, the location of the inlet, medium and outlet baffles. Sedimentation tanks aredivided into two main categories in type and concentration of sludge and particles which areavailable in them. Primary settling tanks have low influent concentration. Flow field in themis not much influenced by concentration field and buoyancy effects can be negligible.Secondary or final-settling tanks have higher influent concentration. They usually are placedafter primary tanks and activation tanks [3]. Depending on the type and concentration of thedispersed solid particles as well as on their tendency of agglomeration, the decanting processof the mixtures takes place in four distinctive ways [4]: type I sedimentation, applicable in thecase of granulated solid particles; type II sedimentation characteristic for particles tending toagglomerate; type III- mass sedimentation; type IV- compacting or settling.
Krebs (1995) investigated the effects of the inlet and intermediate baffles on the flowfield in final clarifiers. His research was mainly based on experiments, numerical modeling aswell as on analytical relations [6]. Zârnoianu D. et al. have made a research focused onwastewater decanting processes in a pilot test rig using 3 constructive variants of decanters:with tangential inlet and free exit, with tangential inlet and a discharge threshold and withdeflection plates and a discharge threshold, respectively. The results showed that the bestefficiency is that of the decanter with deflection plate [7].
1 Splaiul Independentei 313, Sector 6, Bucharest, 0731538941, [email protected]

424
Figure 1: Decantation phases [5]
This paper presents the results obtained in some research focused on wastewaterdecanting processes in settling tanks.
2. METHODOLOGY
Enhancing the efficiency of the settling tanks is one of the most economical approachesfor refining water. There are many works that have been published regarding simulation ofsettling process. The most representative are presented below
Margarita Jover-Smet et al. have made a study for the purpose to obtain a greaterunderstanding of the influence of operational parameters, such as surface overflow rate,hydraulic retention time, and temperature, on the removal efficiency of suspended solids andorganic matter by the measurement of chemical oxygen demand (COD) and biochemicaloxygen demand (BOD5) in the primary sedimentation process. The research was carried out ina semi-technical primary settling tank which was fed with real wastewater from a wastewatertreatment plant. The physical process was strictly controlled and without the intervention ofchemical additives. As a first step in analyzing the performance data it was decided to obtainan efficiency-overflow rate relationship. The removal efficiency (E) of SS, COD and BOD5,obtained in the process at different surface overflow rates, is indicated in Figure 2.
Figure 2: Effect of q on SS, COD Figure 3: Efficiency at Different SSiand BOD5 Efficiency [8] Ranges [8]
The second analysis, as shown in Figure 3, was performed on the original data groupedinto SS influent (SSi) ranges (300–400 mg/L and 400–500 mg/L). It can also be observed thatthe SS concentration influent (SSi) had an effect on the removal efficiency, since flocculationis more significant at higher SS levels, different authors have described the same influence.
The results obtained show that the elimination efficiency can be increased by 11% for SSand 9% for chemical oxygen demand and biochemical oxygen demand, for variations in thesurface overflow rate of around ±0.6 m3/m2 ·h and variations in hydraulic retention time ofaround ±2 h [8].

425
Podoleanu E. has studied programs that indicate the process of sedimentation oflongitudinal horizontal decanters and their efficiency. Experimental measurements were madeat plant no. 4 of Timisoara and the Water Treatment Laboratory at the Hydraulic EngineeringFaculty (in terms of suspension mass dependence according to the turbidity of the water)during spring and summer of 2006 (at various flows and turbidity). Mass suspension ofexisting in different water samples was determined using two methods of working. The firstmethod consisted of filtering a volume of 1 litter of water on a filter paper (HF) and then HFwith suspensions remaining on HF were dried in the oven until complete evaporation of water(3 hours at 105ºC). The second approach, considered safer, with less errors and faster is thatto measure water volume (1 litter) and placing it in a special dish in the oven for completeevaporation of water. The results obtained were analyzed using a polifit function of Matlabprogram that approximates a data set with a polynomial of degree n, were plotted distributioncurves of concentration at different depths (H) on basin length (L). After running the programhave obtained curves of the graph in Figure 4.
Figure 4: Changes in concentration Figure 5: Efficiency variationdepending on the length of the in time of the settling tank [9]settling tank to different depths [9]
To calculate the settling tank efficiency have done a program eficient.m in Matlab in thatare defined the following: geometric parameters of the settling tank, Hn and Cn, ,T - timeconstant of the process, Kr-amplification factor of regulator, Ti - time constant integration ofthe regulator for PI (PID) case is taken 0.1, the period in which we study EF [%], set EF [%]before settling tank to work, introduce input concentrations C1 = [80 60 40], EF(k) = 70% - isrequired C1 = [80 60 40], EF(k) = 50% is required. The result of running the program isshown in Figure 5.
From graphic analysis of concentration distribution (Figure 5) the conclusion is that inthe first half of the settling tank is an intensification of sedimentation processes of floatersinfluenced by the water distribution system in the settling tank. So it can say that the thicknessof the deposits of mud in studied settling tank it’s in the first half of this, which is visuallychecked at the clearing and washing of the settling tank [9].
The experimental investigations of Taeby-Harandy and Schroeder (1995) on primarydecanters have shown that placement of an intermediate sicane, installed near the middle ofthe decanter and extended from the radiator up to a depth of one third, had no significanteffect on efficiency decantation. They believed that the difference between the outcome oftheir studies and the other works is probably due to the difference in flow patterns in the sense
426
that if the dominant current is a surface current, a surge that extends from the top mayimprove the removal efficiency of solids [10].
3. CONCLUSIONS
Enhancing the efficiency of the settling tanks is one of the most economical approachesfor refining water. Sedimentation is perhaps the oldest and most common water treatmentprocess.
There are many works that have been published regarding simulation of settling process.Margarita Jover-Smet et al. have made a study for the purpose to obtain a greaterunderstanding of the influence of operational parameters. The results obtained show that theelimination efficiency can be increased by 11% for SS and 9% for chemical oxygen demandand biochemical oxygen demand, for variations in the surface overflow rate of around ±0.6m3/m2 ·h and variations in hydraulic retention time of around ±2 h. Another study uses someprograms that indicate the process of sedimentation of longitudinal horizontal decanters andtheir efficiency. It was found conclusion that in the first half of the settling tank is anintensification of sedimentation processes of floaters influenced by the water distributionsystem in the settling tank.
ACKNOWLEDGEMENT
This work has been funded by the Ministry of National Education and Research, throughthe UEFISCDI, within the project entitled „Innovative technologies for crop irrigation in arid,semi-arid and sub-dry climate", contract no. 27 PCCDI / 2018.
References
[1] Daniela Zârnoianu, Simion Popescu, Carmen Brăcăcescu Theoretical and experimental research on theseparation process of impurities from waste water through decantation, 6th International ConferenceComputational Mechanics and Virtual Engineering, COMEC, 2015, Braşov, Romania[2] A. H. Ghawi, J. Kriš “A Computational Fluid Dynamics Model of Flow and Settling in SedimentationTanks”, Slovak University of Technology, Slovakia, 2005[3] A. Razmi1, B. Firoozabadi1, and G. Ahmadi, Experimental and Numerical Approach to Enlargement ofPerformance of Primary Settling Tanks, Journal of Applied Fluid Mechanics, Vol. 2, No. 1, pp. 1-12, 2009[4] Robescu, Diana et al. Tehnici de epurare a apelor uzate, Editura Tehnica, Bucuresti, 2011[5] Safta, V.V., Toma, M.L., Ungureanu, N., Experiments in water treatment domain, PRINTECH Publishing,2012[6] Krebs, P. (1995). Success and shortcomings of clarifier modeling. Journal of Water Science and Technology31(2), 181-191[7] Zârnoianu Daniela, PhD Student,1 Prof. Simion Popescu, Marin Radu, The influence of constructive factorsand working conditions of decanters on wastewater processing efficiency, 3rd International Conference -Research & Innovation in Engineering - COMAT 2014 16- 17 October 2014, Brasov, Romania[8] Margarita Jover-Smet , Jaime Martín-Pascual and Arturo Trapote, Model of Suspended Solids Removal inthe Primary Sedimentation Tanks for the Treatment of Urban Wastewater, 2017[9] Podoleanu Corneliu Eusebiu - Optimization of the longitudinal horizontal settling tanks exploitation within adrinking surface water stations, Buletinul Ştiinţific al Universităţii "POLITEHNICA" din Timişoara, Tom55(69), Fascicola 2, 2010[10] Taebi-Harandy, A. and E.D. Schroeder, 1995. 33. Khademi, M., M.H. Omid and A. Hourfar, 2007. Analysisof structural features on performance of Experimental and numerical investigation of the secondary clarifiers.Journal of Environmental effect of submerged baffle on the trap efficiency, Engineering, 121(12): 911-919

427
DESIGN CONCEPTS OF MOBILE ROBOTS FOR AGRICULTURE
George IPATE1, Victor MOISE, Sorin-Stefan BIRIS, Gheorghe VOICU, Filip ILIE, GabrielAlexandru CONSTANTIN
University POLITEHNICA of Bucharest
ABSTRACT
This paper presents the basic mathematical models used in the development of an agriculturalrobot composed of chassis with contact sensors, two-engine drive group, manipulator arm for harvestingproducts and a working platform with webcam.
A prototype machine that includes some of this configuration was built to carry out variousagricultural works. The machine consists of a Cartesian manipulator mounted on a crawler mobilechassis. A camcorder is used to guide the travel direction, plant inspection, locating the products andstraightening the robotic arm to them. The prehension device fix the product to be transported. Hardwarearchitecture for real-time control consists of a development platform with microcontroller Atmega 328of the family AVR and a large number of connectors for attaching other peripheral modules fordetection, planning and control.
The aim of this paper is to present the basic principles used in design, conceiving robots, as wellas the calculations necessary to determine their position and orientation in the three-dimensional space,in relation to a reference axis system.
Keywords: agriculture robotic, robotic arm, camera sensor, mechatronics, Matlab
1. INTRODUCTION
In present, the science of robotics is experiencing a significant increase not only inuniversity and scientific research institutions, but also in pre-school, primary and secondaryeducation. We are at the beginning of the fourth industrial revolution, and the latest studies inthe field show that, where it happened, robotization will stimulate the emergence of new jobs,and at the same time, will support raising the employee’s standard of living.
According to statistical data, the average robotic level in Eastern Europe is 60 units per 10thousand workers, much over our country, where we have a fairly low density, of only 15 robotsto 10 thousand employees. Although it has made major progress, Romania is still quite far awayof a robotization in the true sense of the word. Our country would need in the coming years ofover 10,000 robots integrated in the industry to remain competitive in the region. To get closerto these figures, industrial producers from Romania need massive investment in automation, soas to be able to adapt to market conditions.
Robotic farming is a combination of advanced technologies for detection, mobility,navigation, computation and interaction implemented in order to carry out various types ofagricultural works, [1]. Use of robotics in the agricultural sector has significantly improvedoverall production and product quality, be it cereals, legume, fruits and other agriculturalproducts. Soil monitoring, proper irrigation, precise sowing or harvesting of the cultivated fieldare some of the main areas where agricultural robots work, [2,3].
According to the Economic Commission of the United Nations, expects the global marketfor agricultural robots to grow with an annual growth rate of 21.1% in the period 2017-2024.
1Corresponding author email : [email protected]

428
Also, it is forecast that the turnover of agricultural robots in the global market will reach fromUS $ 3.2 billion in 2016, to over $ 16.2 billion by the end of 2024.
In this context, the wider concern of researchers in the field is justified, for the continuousimprovement of robots with applications in agriculture [4]. Research in the field of agriculturalmachinery development, with autonomous navigation must meet two major requirements: toachieve both a physical structure to operate in the agricultural environment, as well as a capableelectronic architecture to integrate different and new electronic devices.
The purpose of this paper is to study the development of a mobile robot equipped with avideo camera and a manipulating arm who can perform various agricultural works such ascultivation and harvesting of vegetables, fruits and more or monitoring pedoclimatic factors.The main objectives in the realization of the prototype are: (i) a rigid mechanical structure; ii)the ability to move on well-defined directions; iii) optimal energy consumption; (iv) the abilityto identify the product with your camcorder and to grab him in the jaws of the manipulator.
2. MATHEMATICAL MODELLING OF MECHATRONIC SYSTEMS
Mathematical modelling is in essence the implementation of mathematics in realmechatronic system in obtaining, analysing and validating data which are necessary for a betterknowledge and the achievement of reliable mechatronic systems [5].
2.1 Kinematic modelling of manipulator robots
Kinematic modelling of manipulator robots with flat robots is useful, much simpler andraises few problems from a mathematical point of view, [6].
Elements lengths, l1, l2 are constant and define the robot geometry, while the angles θ1,θ2 are variable and determine the relative positions of kinematic elements.
In figure 1 the kinematic scheme is presented, the versorial scheme and the multipolarscheme of a two-degree mobility handler (manipulator with basic structure RR).
2e
2e
21
2n
1e
10
B
)a
A
1e
T
2
2n
0n
Tr
)( i
1
01 ne
)( k
)( j 1e
1n
0n
)b
1n2e
T)0(Z )1(R )2(R
A B
)c
Fig. 1. Manipulator with two degrees ofmobility
a) the kinematic scheme; b) versorial scheme;c) multipolar scheme
Fig. 2. Solution of matrix equation forangles 1 and 2
0 0.5 1 1.5 2-2
-1
0
1
2
Un
gh
iuri
le:
1,2
[ra
d]
+++ 1
*** 2
t [s]

429
For kinematic analysis of the manipulator from figure 1 the matrix-vector method isused [7]. They are known:
- 10, 21, 10 , 21, 10 , 21 - generalized coordinates in active couples A, B;
- 2/010 [rad]; 00
21 [rad] - the initial position of the mechanism;
- 2/1 - the angle of crossing between versors 1e and 2e ;
- m045.01 OBs - axial displacement on direction of 1e ;
- 01 a - distance between versors 1e and 2e ;
- 060.02 BTa [m] - distance from the point B to the tracer point T, measured in
the direction of normal 2n ;
- transmission functions in motor couples are combined functions (trigonometric withpolynomial);
t – the time period during which the movement takes place.
Vectorial equation of the tracer point T is given by the relationship:
2211 naesrT (1)
Making the projection of the vector equation on the axes of the coordinate system OXYZ,the position of the tracer point is shown:
,
;
;
221
22
22
FasZ
EaY
DaX
T
T
T
(2)
where functions D2 , E2 and F2 have, for the considered manipulator model, the followingexpressions:D2 = cos10 cos21 , E2 = sin10 cos21 , F2 = sin21
. (3)
For the matrix solving of the kinematics of the manipulator (determination of positions
TTT ZYX ,, of the tracer point T, the following relationship is written:
P.AST TTT ZYX (4)
where:
322
3221
3221
10
0
0
=P
CCF
BBEE
AADD
(5)
0020AS 1T sa (6)
Solution of matrix equation for angles 1 and 2 is presented in fig. 2. The results wereobtained by running the simulation program made in the environment MATLAB knowing thelaw of motion.
2.2 Robots' manipulator type workspace
The workspace of a manipulator is the space which contains all the points that can bereached by the final end of the last kinematic element of positioning mechanism or a point ofthe orientation mechanism, but not the end effector [8].

430
Workspace depends on the number of degrees of freedom, by kinematic parameters, by thelength of the arms, the mass of the manipulated object, etc. Total workspace is the volume thatcontains all the points that can be reached by the final effector, in at least one orientation thereof.
Fig. 3. Simulation program interfaceof the camcorder manipulation arm
kinematics
Fig. 4. Total inspection room space
Viewing camera attached to the end of the item can be considered as a final effector. Whichis important as the load of the manipulator is the Cartesian position of the goal, along with thedirection the camera is shooting; rotation around the camera axis does not matter. Thus, thecamera configuration can be described by five coordinates: (x; y; z) for the Cartesian positionof the camcorder and the spherical coordinates (ϕ; θ) to describe the direction in which thecamera is shooting. Assuming that all the joints rotate the maximum 180º, to determine theworkspace, we must track all the locations that the ultimate effector can achieve. Using thesimulation program made in Matlab shown in the figure 3, we can get the camcorder total workspace, as can be seen in the figure 4. Volume and shape of the workspace are very importantfor the robot application, because they determine its possibilities.
2.3 Movement of rigid bodies
In the study of robotics we are constantly confronted with the problem of locating objectsin three-dimensional space. These objects are kinematic elements of the manipulator or themanipulated object, as well as other objects in the operating environment of the manipulator.The issue of real interest is the manner in which we represent these quantities and theirmathematical modeling.
A rigid body is fully described in three-dimensional space by its position and orientationin relation to a reference system. Special Euclidian Group (SE3), also known as the group ofrigid body movements or the homogeneous transformation matrix in space R3, is the set of allreal matrices 4x4 T of form [9]:
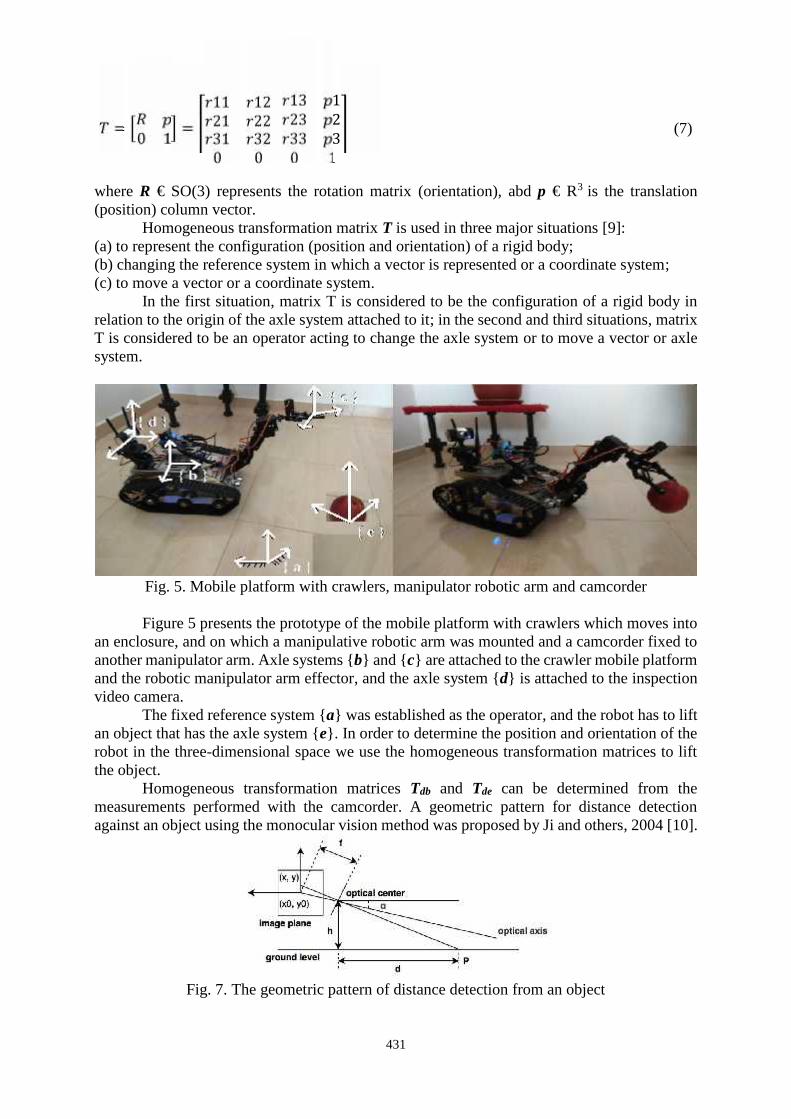
431
= 0 1 = 11 1221 22 13 123 231 320 0 33 30 1 (7)
where R € SO(3) represents the rotation matrix (orientation), abd p € R3 is the translation(position) column vector.
Homogeneous transformation matrix T is used in three major situations [9]:(a) to represent the configuration (position and orientation) of a rigid body;(b) changing the reference system in which a vector is represented or a coordinate system;(c) to move a vector or a coordinate system.
In the first situation, matrix T is considered to be the configuration of a rigid body inrelation to the origin of the axle system attached to it; in the second and third situations, matrixT is considered to be an operator acting to change the axle system or to move a vector or axlesystem.
Fig. 5. Mobile platform with crawlers, manipulator robotic arm and camcorder
Figure 5 presents the prototype of the mobile platform with crawlers which moves intoan enclosure, and on which a manipulative robotic arm was mounted and a camcorder fixed toanother manipulator arm. Axle systems {b} and {c} are attached to the crawler mobile platformand the robotic manipulator arm effector, and the axle system {d} is attached to the inspectionvideo camera.
The fixed reference system {a} was established as the operator, and the robot has to liftan object that has the axle system {e}. In order to determine the position and orientation of therobot in the three-dimensional space we use the homogeneous transformation matrices to liftthe object.
Homogeneous transformation matrices Tdb and Tde can be determined from themeasurements performed with the camcorder. A geometric pattern for distance detectionagainst an object using the monocular vision method was proposed by Ji and others, 2004 [10].
Fig. 7. The geometric pattern of distance detection from an object
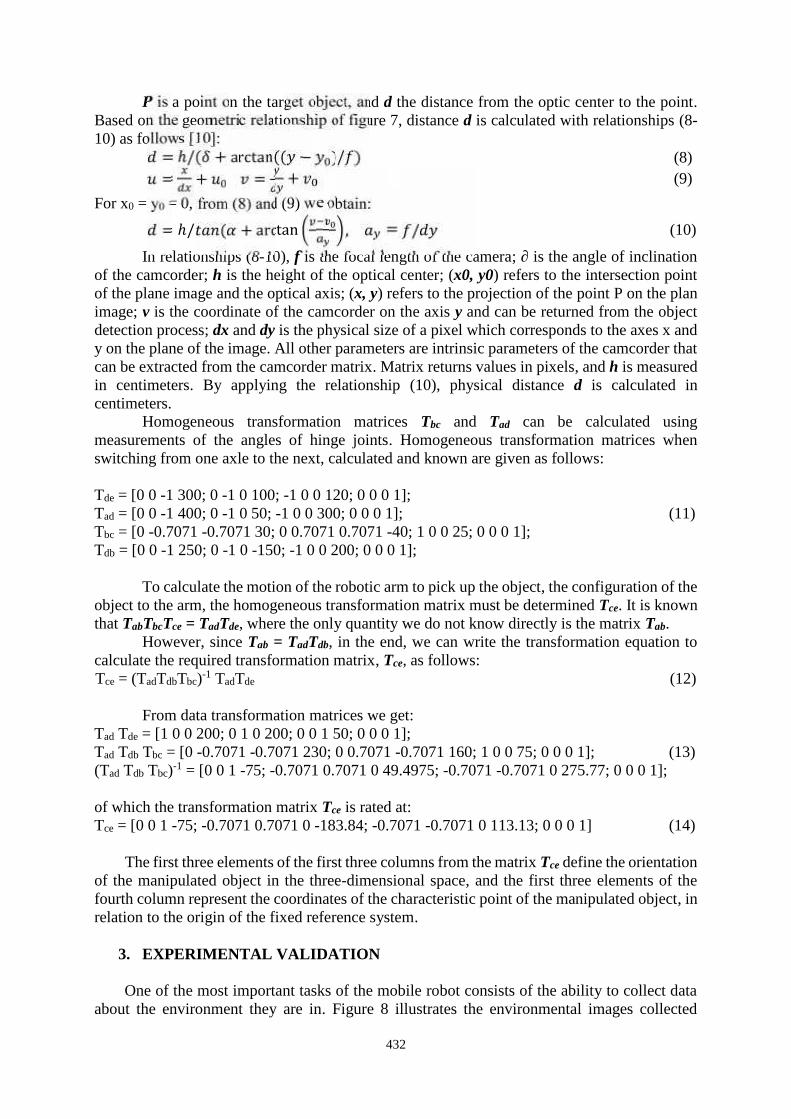
432
P is a point on the target object, and d the distance from the optic center to the point.Based on the geometric relationship of figure 7, distance d is calculated with relationships (8-10) as follows [10]:= ℎ/( + arctan(( − )/ ) (8)= + = + (9)
For x0 = y0 = 0, from (8) and (9) we obtain:= ℎ/ ( + arctan , = / (10)
In relationships (8-10), f is the focal length of the camera; ∂ is the angle of inclinationof the camcorder; h is the height of the optical center; (x0, y0) refers to the intersection pointof the plane image and the optical axis; (x, y) refers to the projection of the point P on the planimage; v is the coordinate of the camcorder on the axis y and can be returned from the objectdetection process; dx and dy is the physical size of a pixel which corresponds to the axes x andy on the plane of the image. All other parameters are intrinsic parameters of the camcorder thatcan be extracted from the camcorder matrix. Matrix returns values in pixels, and h is measuredin centimeters. By applying the relationship (10), physical distance d is calculated incentimeters.
Homogeneous transformation matrices Tbc and Tad can be calculated usingmeasurements of the angles of hinge joints. Homogeneous transformation matrices whenswitching from one axle to the next, calculated and known are given as follows:
Tde = [0 0 -1 300; 0 -1 0 100; -1 0 0 120; 0 0 0 1];Tad = [0 0 -1 400; 0 -1 0 50; -1 0 0 300; 0 0 0 1]; (11)Tbc = [0 -0.7071 -0.7071 30; 0 0.7071 0.7071 -40; 1 0 0 25; 0 0 0 1];Tdb = [0 0 -1 250; 0 -1 0 -150; -1 0 0 200; 0 0 0 1];
To calculate the motion of the robotic arm to pick up the object, the configuration of theobject to the arm, the homogeneous transformation matrix must be determined Tce. It is knownthat TabTbcTce = TadTde, where the only quantity we do not know directly is the matrix Tab.
However, since Tab = TadTdb, in the end, we can write the transformation equation tocalculate the required transformation matrix, Tce, as follows:Tce = (TadTdbTbc)-1 TadTde (12)
From data transformation matrices we get:Tad Tde = [1 0 0 200; 0 1 0 200; 0 0 1 50; 0 0 0 1];Tad Tdb Tbc = [0 -0.7071 -0.7071 230; 0 0.7071 -0.7071 160; 1 0 0 75; 0 0 0 1]; (13)(Tad Tdb Tbc)-1 = [0 0 1 -75; -0.7071 0.7071 0 49.4975; -0.7071 -0.7071 0 275.77; 0 0 0 1];
of which the transformation matrix Tce is rated at:Tce = [0 0 1 -75; -0.7071 0.7071 0 -183.84; -0.7071 -0.7071 0 113.13; 0 0 0 1] (14)
The first three elements of the first three columns from the matrix Tce define the orientationof the manipulated object in the three-dimensional space, and the first three elements of thefourth column represent the coordinates of the characteristic point of the manipulated object, inrelation to the origin of the fixed reference system.
3. EXPERIMENTAL VALIDATION
One of the most important tasks of the mobile robot consists of the ability to collect dataabout the environment they are in. Figure 8 illustrates the environmental images collected

433
through the robot's colour camcorder. Other common tasks that robots might encounter includeweed identification, plant diseases or the presence of insects.
Fig. 8. Inspection of plants in an enclosure
Fig. 9. Moving the robot to the work area
Robot field testing has demonstrated that the robot can navigate autonomously along therows of plants and ensuring the preservation of crop plants. The two independent drive motors,have the ability to develop a traction force enough to ensure the robot's locomotion and theequipment installed on it and manoeuvre it very easily, as shown in Figure 9. To achieve goodperformance in a variety of field configurations and for various objects, it is necessary to usethe most appropriate strategy. Experiments demonstrate that different modes of exploitation ofenvironmental constraints succeed in different conditions. So, the main objective is to maintainthe arm's handling (and vehicle mobility when handling a mobile handler) to as high a level aspossible, thus allowing the arm (and to vehicle when it is used) to respond effectively tounknown environmental conditions and simultaneously to different co-operation tasks [11]. Itcan be concluded that the trend of development for guidance systems for agricultural vehicleswill be represented by digital technologies.
4. CONCLUSIONS
This paper provides a brief review of research on the implementation of mathematicalmodels in the design of a robot for agricultural operations.
To simulate, plan and control robotic manipulation tasks using mathematical models, weneed an understanding of (at least) three elements: the contact kinematic, forces applied by

434
contacts and rigid body dynamics. By multiplying all transformation matrices is describedcomplete transformation from the base frame to the final effector.
Farm robots equipped with inspection camera can move and provide visual information toidentify different plant diseases or microorganisms which can produce different processes, socan answer to specific tasks. Major issues in their design are locomotion, power source,communication and instrumentation required.
ACKNOLEDGEMENT
The work has been funded by Ministry of National Education and Research through theExecutive Agency for Higher Education, Research, Development and Innovation Funding,within the project entitled „ Base of agro-mechanical practical applications with intelligentmonitoring systems in gardens, solariums and orchards (BAPRAGROSIM)”, CNFIS-FDI-2018-0086.
References
[1] Blackmore, B. S., Stout, W., Wang, M., and Runov, B., Robotic agriculture – the future of agriculturalmechanisation?, 5th European Conference on Precision Agriculture. ed. J. Stafford, V. The Netherlands,Wageningen Academic Publishers. pp.621-628, 2005.[2] Pedersen, S. M., Fountas, S. and Blackmore, S., Agricultural Robots – Applications and EconomicPerspectives, Chapter from the book Service Robot Applications, InTechOpen, 2008.[3] Kushwaha, H. L., Sinha, J. P., Khura, T. K., Kushwaha, D. K., Ekka, U., Purushottam, M. and Singh, N., Statusand Scope of Robotics in Agriculture, International Conference on Emerging Technologies in Agricultural andFood Engineering, 27 – 30th December, IIT Kharagpur, 2016.[4] Yaghoubi, S., Akbarzadeh, N.A., Bazargani, Sh.S., Bazargani, Sa.S., Bamizan, M., Asl, M.I., AutonomousRobots for Agricultural Tasks and Farm Assignment and Future Trends in Agro Robots, International Journal ofMechanical & Mechatronics Engineering IJMME-IJENS Vol:13 No:03, 2013.[5] Crnokić, B., Grubišić, M. and Volarić, T., Different applications of mobile robots in education, InternationalJournal on Integrating Technology in Education (IJITE) Vol.6, No.3, September 2017.[6] Moise, V., Cinematica si controlul mecanismelor manipulatoare cu 4 grade de mobilitate, Teza de doctorat,Universitatea POLITEHNICA din Bucureşti, 1986.[7] Moise, V., Simionescu, I., Ene, M., Sinteza optimală a mecanismelor cu came, Editura Printech, Bucureşti,2011.[8] Doroftei, I.D., Bazele roboticii, Curs revizuit, Universitatea Tehnica “Gh. Asachi” Iaşi, 2016.[9] Lynch, K.M., Park, C.F., Modern Robotics - Mechanics, planning, and control, Cambridge U. Press, 2017.http://modernrobotics.org[10] Ji, C.J., Guo, L., Libibing, L., Rongben, W., et al, Study on Method of Detecting Preceding Vehicle Based onMonocular Camera, IEEE Intelligent Vehicles Symposium University of Parma Pama, Italy, pp. 751-755, 2004.[11] Beran, T.N., Ramirez-Serrano A., Robot Arm-Child Interactions: A Novel Application Using Bio-InspiredMotion Control, Chapter from the book Robot Arms, InTechOpen, 2011.

435
THEORETICAL ELEMENTS FOR THE CONSTRUCTIVEOPTIMIZATION OF THE AGRO-FOOD PRODUCTS RECIPIENTS
Ph.D. Stud. Eng. Gabriela Milian1, Prof.Ph.D.Eng. Sorin-Stefan Biriş, Prof.Ph.D.Eng. Victor MoiseUniversity ”Politehnica” Bucharest, Faculty of Biotechnical Systems Engineering, Romania
ABSTRACT
The paper presents the results and calculation methods to determine the constructive parameters of thecontainers, more precisely the determination of the minimum surface area for a given volume usinganalytical calculation algorithms with Lagrange's multiplier method. These research has been highlightedusing Mathlab and SolidWorks. The purpose of this paper is to highlight shortening design and obtainingreliable solution at a low cost.
KEYWORDS: Minimum surface area, Container, Numerical analytical methods, Agro-food products,Solidworks, Mathcad , FEM
1. INTRODUCTIONShorten design times and get a reliable solution at a low cost led to research on optimization
methods. What has become indispensable in making the right decision on the solution to beadopted to the manufacture of containers for agri-food products.
Analysis of the research stage in the field of constructive optimization containers foragri-food products (tanks-container) is made for both shipping and storage vessels liquidmaterials, as well as for those in solid state (granular material, powdery material).
Agro-food products that can be stored , stored and transported using tank containers are: milk,wine, honey, alocool of various concentrations, seeds (hemp, sunflower, e.g.), cereals (wheat,barley, oats), e.g. [8]
Agro-food products such as milk and dairy products are the basic foods in human food, beingconsidered the most complete natural food of animal origin, due to its complex and balancednutritional composition. Chemical composition of milk varies according to species, race, food,age, housing conditions, animal health status,e.g. [8]
The main milk components are: water (87.5%, 12 - 13% total dry substance), fat (3.8%),colorants, gases and immune bodies (antibodies). Appreciation of grain quality used to obtain theflour is made according to physical criteria, chemical and technological processes. The quality ofthe cereals received at the mill must correspond to the minimum conditions established by statestandards. Quality assessment is based on: general indices and technological attributes of cereals.[8]
General indices refer to the senses of the cereals (appearance, color, smell, taste).Technological indices refer to how the technological process is being carried out for the
preparation of flour (the size of the grains, the degree of humidity, mineral content, grainhardness). Finally he concluded that the maximum force to which the half-full tank is subjectedmay be significantly less than half the force to which the full tank is subjected. [8]
All of these features and physico-chemical properties of these agri-food products determinedthe design and the implementation of some optimal constructive features , so these their propertyis not damaged during storage and transport, reaching a good condition to the recipient and the
user.Over time, finding the right and reliable solution in the field of storage containers and
transportation of agri-food materials led to researches such as: George W.Housner (1963)discussed the relation between the motion of the water with respect to the tank and the motion ofthe whole structure respect to ground. He has considered three basic conditions of tank for theanalysis i.e fully filled, empty and partially filled. He said that if water tank is fully filled
1No. 313 Splaiul Independentei, tel: 0766 453 970; e-mail:[email protected]

436
condition i.e without free board then the sloshing effect of water is neglected and if the tank isempty then there is no sloshing effect. In the above two cases water body in the tank will behaveas one-mass structure. But in third case i.e water tank is partially filled, the effect of sloshingshould be considered. In the case the water body will behave as two-mass structure. Finally heconcluded that the maximum force to which the half-full tank is subjected may be significantlyless than half the force to which the full tank is subjected. [2]
R.Livaoglu (2007) evaluate the dynamic behavoir of fluid-tank-soil/fundation systemwith a simple and fast seismic analysis procedure. Housner’s two mass approximations are usedfor fluid and cone model is used for soil/fundation system. This approch candetermine;deplacement at the heigt of the impulsive mass, the sloshing displacement and baseforces for the soil/fundation system conditions including embedment and incompressible soilcases. In addition to this, some comparisons are made on base forces and sloshing responses forthe cases of embedment and without embedment conditions by changing soil/fundationconditions. The results shows that displacements and base shear forces are generally decreaseswith decreasing soil stiffmess. However, embedment, wall flexibility and SSI did not affect thesloshing displacements. [4]
M.Moslemi and M.R.Kianoush(2012) investigates the dynamic response of cylindricalopen top ground-supported tanks. The main focus of this study is to identify the major parametersaffecting the dynamic response of such structurea and to address the interaction between theseparameters. Parameters considered for the study are sloshing of liquid free surface, tank wallflexibility, vertical ground acceleration, tank aspect ratio, and base fixity. Dynamic resultsobtained from rigorous FE method are compared with those obtained based on ACI codeprovisions. Both time history and free vibration analyses are carried out on concrete tank modelswith different aspect ratios. It is concluded that the current design procedure based on ACI codeprovisions in estimating the hydrodynamic pressure is too conservative. Finite element methodcan be accurately employed in both free vibration and transient analysis. [3]
M.V.Wghmare and S.N.Madhekar(2013) studied behavoir of tank under sloshing effect.Different parameters have been considered such as hight of container, depth of fluid in tank(30%, 50%,70% and full) and height of staging e.g. It is observed that sloshing of fluid in tankdepends not only on the volume of fluid in tank but also on staging height and aspect ratio (h/D).[5]
Dona Rose K.J. and Sreekumar M. et al. (2015) investigates the behavoir of overheadtanks under dynamic loading. Tanks of various capacities with different staging height ismodelled using ANSYS software. The analysis is carried out for two cases i.e, tank full and halflevel condition. The sloshing effect along with hydrostatic effect are considered for the study. Itis concluded that the peak displacement from the time history analysis increases with stagingheights. But the displacement first decreases and then increases with tanks are taken into accountincorporating wall flexibility. The results show that the wall flexibility and fluid dampingproperties have a major effect on seismic behavoir of liquid tanks and should be considered indesign criteria of tanks. [1]
Pavol Lengvarsky (2015) static structural analysis of the tank as part of the truck bodywas performed. The tank was modelled from the stainless steel as 3D body. The finite analysiswas performed by commercial computer program. Three different thicknesses (3mm,5mm,8mm)were taken into account. The displacement plots and the von Misses stress plots served forcomparision of results. Displacements and stresses were very high in basic design so sevenmodified structures were proposed in order to find the best one. All results of these variants weregiven in tables. For the 7th variant, which was chosen for manufacturing, we got the maximaldisplacement 2.791mm,1.480mm,1.047mm and the maximal von Misses stress 145.379Mpa,68.091Mpa, 49.252Mpa for thickness 3mm,5mm and 8mm, respectively. [3]
A tank is formed of one or more cylindrical parts closed to the extremities (watertight tanks)whose capacity is over 1m3, mounted on the same frame of resistance, complete with serviceequipment.
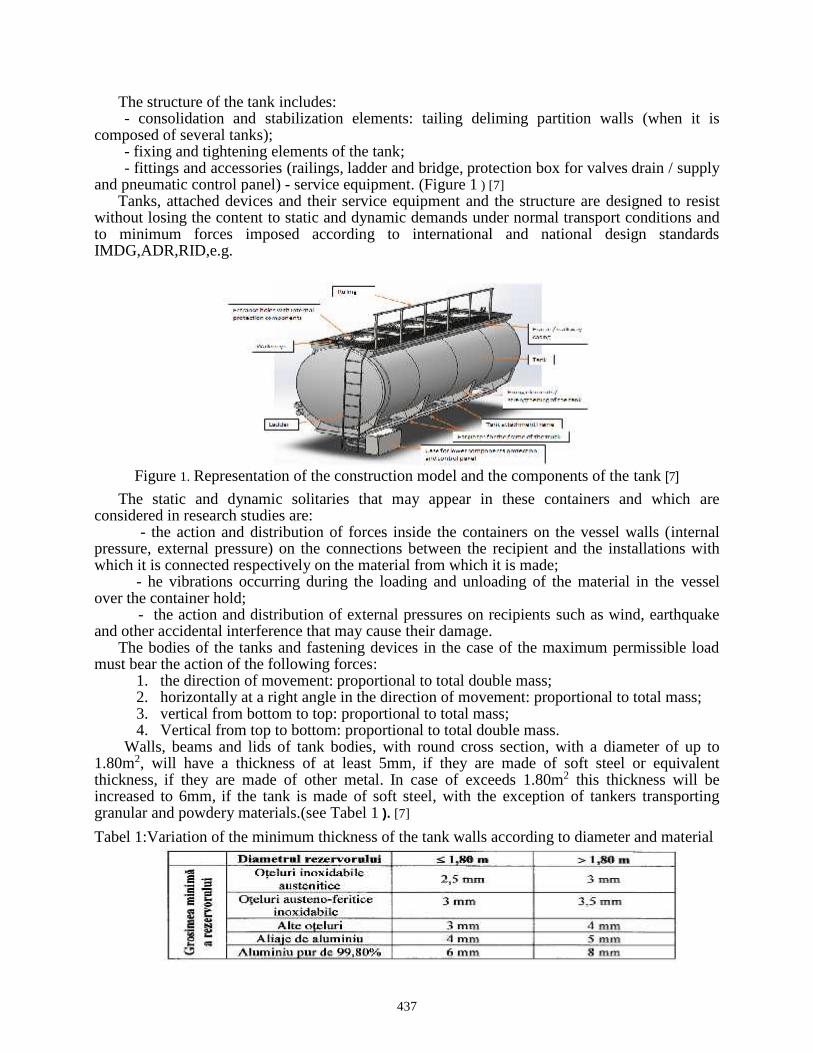
437
The structure of the tank includes:- consolidation and stabilization elements: tailing deliming partition walls (when it is
composed of several tanks);- fixing and tightening elements of the tank;- fittings and accessories (railings, ladder and bridge, protection box for valves drain / supply
and pneumatic control panel) - service equipment. (Figure 1 ) [7]Tanks, attached devices and their service equipment and the structure are designed to resist
without losing the content to static and dynamic demands under normal transport conditions andto minimum forces imposed according to international and national design standardsIMDG,ADR,RID,e.g.
Figure 1. Representation of the construction model and the components of the tank [7]
The static and dynamic solitaries that may appear in these containers and which areconsidered in research studies are:
- the action and distribution of forces inside the containers on the vessel walls (internalpressure, external pressure) on the connections between the recipient and the installations withwhich it is connected respectively on the material from which it is made;
- he vibrations occurring during the loading and unloading of the material in the vesselover the container hold;
- the action and distribution of external pressures on recipients such as wind, earthquakeand other accidental interference that may cause their damage.
The bodies of the tanks and fastening devices in the case of the maximum permissible loadmust bear the action of the following forces:
1. the direction of movement: proportional to total double mass;2. horizontally at a right angle in the direction of movement: proportional to total mass;3. vertical from bottom to top: proportional to total mass;4. Vertical from top to bottom: proportional to total double mass.
Walls, beams and lids of tank bodies, with round cross section, with a diameter of up to1.80m2, will have a thickness of at least 5mm, if they are made of soft steel or equivalentthickness, if they are made of other metal. In case of exceeds 1.80m2 this thickness will beincreased to 6mm, if the tank is made of soft steel, with the exception of tankers transportinggranular and powdery materials.(see Tabel 1 ). [7]
Tabel 1:Variation of the minimum thickness of the tank walls according to diameter and material

438
Tanks will be constructed and manufactured in accordance with the provisions of theapproved technical regulations so as to the choice of the material and the determination of thethickness of the walls are made according to temperatures of design and operating.
These tank containers are made of corrosion resistant materials with certain physico-chemical properties that do not allow their interaction with the fluids transported to alter theirquality.
Tank are constructed from aluminum, carbon steel, stainless steel, or fiberglass-reinforcedplastic, depending on the product being transported by the truck.
Food grade tank-container are required to meet stringent safety and sanitation codes beforethey are certified to transport foods.
In the paper are presented the results and the calculation methods for determining theconstructive parameters of the agro-food containers, more precisely determining the minimumsurface area for a given volume using Mathlab program.
In order to achieve optimal optimization of the construction parameters, they have been takeninto consideration both dynamic forces, and also static forces, what works on containers.
With the help of the results obtained from the analytical calculation algorithms by themethod of Lagrange’s multipliers, use in Mathlab program, they can be modeled in 3DSolidworks. Which leads to the exact observation of problems and restrictions, what can appearin designing agri-food containers subjected to both static solitaire, as well as dynamics.(seeFigure 2 and Figure 3) [1] [9]
Figure 2. The 3D model of the agro-food tank
Figure 3. The 3D model of the agro-food tank
2. METHODS OF ANALYSIS AND OPTIMIZATIONDetermination of the minimum surface area of the agro-food containers for a given volume
by the Lagrange multipliers method using the Mathlab program.

439
Considering a cylindrical (tank) container having the geometric shape of the hemisphericalbeads, is required to determine the minimum area for a given volume.(see Figure 4) [6]
I
L
RD
Figure 4. Tank container with hemispherical beads
The total surface of the tank is:242 RRLS (1)
The volume of the tank is:
32
3
4RLRV (2)
Relationship (1) is the objective function of the problem,and relationship (2) is theequality-type restriction. Also the conditions of non-negativeness of the variables also exist.
The mathematical model of the problem is:Minim(S) (3)
with restrictions:
03
4 32 VRLR (4)
0L ; 0R (5)If the notations are made Lx 1 , Rx 2 , the mathematical model becomes:
Minim( 2221 42 xxx ) (6)
with restrictions:
03
4 321
22 Vxxx (7)
71 x ; 02 x . (8)where : L - is the length of the tank;
R- is the beam of the tank.If the Lagrange multipliers method is used, to determine the minimum surface of the tank at a
given volume, the Lagrange function of form is formed:
),7(
)3
4(42),,,,(
2112
321
221
222112121
wx
VxxxxxxwxxL
(9)
where: 1 , 2 is Lagrange multipliers and 1w is variable varies.The extreme function (9) is determined by solving the system of nonlinear equations obtained
from the zero equation of the partial derivatives of the function (9), in relation to parameters
12121 ,,,, wxx .The partial derivatives of the function (9) have the form:
01
x
L ; 02
x
L ; 01
L ; 0
2
L ; 0
1
w
L (10)
Applying relations (10) to function (9), it is obtained:02 2
2212 xx ;
0)42(82 2212121 xxxxx ;

440
03
4 321
22 Vxxx ; (11)
07 211 wx ;
.02 22 wRelationships (11) form a system of nonlinear equations, in the unknown 2121 ,,, xx and
1w .The system of nonlinear equations (11) is solved by a suitable numerical method (Newton-Raphson, gradient, etc.)
For a tank volume V = 26 m3 the following results were obtained (see Tabel 2):
Tabel 2. Tabel results for determination of the minimum surface area of the agro-food containersfor a given volume by the Lagrange multipliers method using the Mathlab program
Tabel resultsL R lambda1 lambda2 w1
======================================7.0005 1.0000 -1.2222 2.4411 0.0000
Figure 4. Results for determination of the minimum surface area of the agro-food containers withhemispherical beads
3. CONCLUSIONUsing the numerical and analytical methods (Matlab program), the desired solution can be
obtained faster then it can be traced immediately in 3D design programs, resulting in a goodprototype for execution.
Finite Element Method (FEM) is simple and fast for complex geometries. By using FEM asan analysis tool, the results obtained are very close to the actual measured value with only minordeviations (measurement error).
Hence by using FEM, it’s easy to predict the pressure vessel limit load closer, the damagescontainer tank to actual measurement and it can be done at different preferred location as perrequirement.
4. REFERENCES[1] Pavol Lengvarsky, Miroslav Pastor, Josef Bocko,” Static Structural Analysis of Water Tank”American Journal of Mechanical Enginnering,Vol.3, No.6, 230-234,2015;[2] Shilja Sureshkumar, Asha Joseph, “ Review on structural performance of water tanks under dynamic loading”International Research Journal of Enginnering and Technology,Vol.4, Issue 4, ISSN:2395-0056,Apr- 2017;[3] K.J. Dona Rose and Sreekumer M. et al, “A study of overhead water tanks subjected to dynamic loads”International Journal of Enginnering trends and technology, Elsevier, ISSN:344-348, 2015;[4] Younghi Wang and J.Y Richard Liew et al, “Structural performance of water tank under static and dynamicpressure loading” International Journal of Impact Engineering, Elsevier, ISSN:110-123, 2015;[5] R.Davis,H.Keith, “Finite element analysis of pressure vessels”, Journal of Basic Enginnering,94(2), ISSN:401-405,1972;[6] Victor Moise, Marinela Moise,Gheorghe Iaciu „Metode de optimizare neliniara ”, editura Printech,Bucuresti,2008[7] “Anexa regulamentului ADR si prescriptii tehnice pentru constructia, omologarea de tip a cisternelorfixe,container-cisterna a caror rezervoare sunt constituite din materiale metalice”[8] “Ordinul ministerul agriculturii si de dezvoltarii rurale nr.228/2017 privind Manualul de gradare pentru semintede consum “11.07.2017[9]https://videohive.net/item/truck-tank-3d-wire-frame/9423651

441
MODELING RENEWABLE ENERGY SHARE DYNAMICS
Dana-Alexandra Ciupăgeanu, Gheorghe Lăzăroiu
University Politehnica of Bucharest
ABSTRACT
Accurate forecasts of electricity demand are extremely important to achieve successful energy
management considering the continuously increasing uncertainty of power generation, due to the
steady growth of renewable energy share. This article proposes a state space model for an energy
system, based on momentary recordings of generation and consumption for the past decade in
Romania, as a first order linear dynamic system. The variables taken into account as inputs were the
ambient temperature, insolation, wind speed and demand records. System's state a certain moment is
defined by the share of renewable energy sources in meeting electricity demand, and its output is
regarded as total power generation within the grid. Data processing and system identification were
performed employing Matlab software; transfer functions for each input are presented. According to
the results obtained, the described system is naturally stable in some hypothesis, the poles of the
transfer functions having a negative real part.
1. INTRODUCTION
Fluctuant power generation sources integration causes the electricity supply to exhibit
unprecedented challenges in meeting demand, their volatility overlapping the intermittency of
consumption. Even so, many states facilitate rising renewable energies share by unfailingly
promoting eco friendly energy policies, facing electricity retailers to the uncertainty of
matching generation and demand. European Union targets a 20% renewables share in energy
consumption by the end of 2020 [1].
A possible way to mitigate the effects of power fluctuations, to which research interest in
the area focuses lately is through demand response [2], [3]. This sort of approach requires a
complex and efficient monitoring infrastructure, wide databases to assess electricity demand
patterns for each category of consumer connected to the grid depending on several variables,
such as ambient temperature [3], [4]. Based on this information, possible load reductions and
their financial and technical advantages can be estimated for different time horizons [2].
Power demand flexibility may be considered similar to functional energy storage, with
the charging capacity determined by the flexible load and the maximum duration of the
intervention, reflecting the change in normal demand pattern. Various sectors of the market
can differently contribute in demand response, studies carried out on this regard being
actually numerous [2], [3].
Still, due to constraints of technical, economic and social nature, large scale
implementation of demand response is currently confined. Hence, in the perspective of
widespread deployment of efficient solutions such as those mentioned above, modeling and
simulation of energy systems can provide useful information regarding their steady and
dynamic behavior characteristics [1-3]. Furthermore, simulations results help spotting
variables which influence most the output or disturb the control objectives [4], [5].
Given the potential increasing discrepancies between power supply and demand,
modeling theirs both dynamics is particularly useful. This paper introduces a state-space
modeling approach to assess the unsteady behavior of electricity demand and renewable
energy production interaction, without any control. The study relies on historical records for
the past decade from Romanian power system [6].

442
2. METHODOLOGY
2.1. Primary data processing
Based on the momentary recordings of electricity generation by sources (coal,
hydrocarbons, hydro, nuclear, wind energy, photovoltaic and biomass) and consumption a
first data set was built, by concatenating all records. The renewable energy share in meeting
electricity demand at each time step, further considered to define the state of the dynamic
system, resulted by adding the registrations for renewable sources power production and
dividing the sum thus obtained by the corresponding demand.
According to previous approaches of demand dynamics modeling and renewable energy
forecasting presented in scientific literature [7], [8], we considered the following inputs of the
model system: insolation, wind speed, ambient temperature (as meteorological factors
interfering with the renewable energy plants output) and electricity demand, as the
representative quantity of the power system. The last input variable establishes the necessary
of energy to be generated, which we have considered dynamic system's output.
In order to match input vector dimensions to the state vector (since the records from the
power system had an average time resolution of 10 minutes, totaling 473651 elements, and
the climatic ones were on hourly basis) a re-sampling of available data for temperature, wind
speed and insolation was needed.
Dynamic modeling requires knowing the coefficient matrices that fit the behavior of the
system having certain input and output in each state. In this research, starting from the state of
the system, its first order time derivative and the matching inputs and output we aim to
calculate the coefficient matrices, as it shall be presented in the following section.
2.2. System identification
As described above, the dynamic system state is described at each moment by the
renewable energy share in meeting electricity demand, Figure 1 illustrating its block diagram.
Figure 1: Block diagram of the modeled dynamic system
( )sH 1
( )sH 2
( )sH 3
( )sH 4
Temperature
Wind speed
Irradiance
Electricity
Demand
Power
Generation
+ +
+
+

443
In order to identify the transfer functions for each input variable, the matrices coefficients
describing the system, as in (1), had to be determined first, starting from the data sets built as
described previously.
=⋅+⋅=⋅+⋅=
= 0ttxx
uDxCy
uBxAx
0
ɺ
(1)
where +∈ Rx is the state vector, 4Ru ∈ represents the vector containing the inputs,
+∈ Ry is the output and RA∈ , 4RB ∈ , RC ∈ , 4
RD ∈ are the coefficient matrices (here, vectors).
Regarding the dependence between sizes of the aforementioned vectors it is stated that:
( ) 1)xdim(xdim)Adim( =×=
( ) 41)udim(xdim)Bdim( ×=×=
( ) 1)ydim(ydim)Cdim( =×=
( ) 41)udim(ydim)Ddim( ×=×=
The inputs vector 14)udim( ×= has the following elements:
=
yDemandElectricit
Irradiance
WindSpeed
eTemperatur
u
Given the discrete nature of the state vector, first order derivative in time was calculated
as the difference between every two consecutive records. To determine the four coefficient
matrices having an only two equations system, we made the following suppositions:
• case 1
]1[CA == and vectors B and D resulted as:
( )2
T
u
uxxB
⋅−=ɺ
( )2
T
u
uxyD
⋅−=
Average values of their elements, used to identify the dynamic system:
[ ]0011452.0000279.0002439.0001617.0B −−−−=
[ ]022673.00053946.0040917.0029926.0D =
The transfer function corresponding to each input, as illustrated in Figure 1:
1s
03154.0s02993.0)s(H 1 −
−⋅=
1s
04336.0s04092.0)s(H 2 −
−⋅=

444
1s
005674.0s005395.0)s(H 3 −
−⋅=
1s
02382.0s02267.0)s(H 4 −
−⋅=
• case 2
[ ]1111DB == and vectors A and C resulted as:
x
uBxA
⋅−=ɺ
x
uDyC
⋅−=
Average values of their elements, used in identifying the dynamic system:
]5692.3165[A −=
]7371.3148[C −=
The transfer functions corresponding to each input are the same:
3166s
83.16s)s(H)s(H)s(H)s(H 4321 +
+====
2.3. Results discussions
According to the previous section, in the hypothesis of Case 1, the system is naturally
unstable, having a positive real part of the pole (s=1+j0). However, in Case 2, with all the
inputs having the same transfer function to the output, the system is stable, even failing
control.
Whereas we have used a linear representation of the system in open loop, both Bode
and Nyquist plots can be employed to address its frequency response and stability.
(a) (b)
Figure 2: Frequency response (a) case 1; (b) case 2
As shown in Figure 2, even if transfer functions in case 1 are particular for each input,
the differences in terms of frequency response are small, both for magnitude and phase. The

445
output is delayed with ( )°÷ 4525 , constantly almost the entire frequency range; the magnitude
of the output is amplified up to ~1.22 (1.75 dB) times for the second input around the
frequency of 1 rad/s (0.159 Hz). With respect to the frequency response of the system in Case
2, it can be noticed that the phase delay decreases with frequency, reaching zero near 105 rad/s
(~16 kHz); the amplification of the input goes far up to 104 (~80 dB).
(a) (b)
Figure 3: Nyquist plot (a) case 1; (b) case 2
Figure 3 pictures the Nyquist plots for the two cases, in neither of the two the graph
encircling the critical point.
3. CONCLUSIONS
The dynamics of energy systems are very complex and given the variability of renewable
energy sources, with an increasing share in meeting electricity demand, assessment of their
unsteady behavior is critically important. This paper addresses a state space modeling of such
systems and analyses simulation results lacking control, to evaluate their natural response.
According to the results presented, the model system is stable in some hypothesis; we shall
consider in further research implementing additional control in order to improve their
evolutionary course.

446
ACKNOWLEDGMENT
This work was supported by a grant of the Romanian Ministry of Research and Innovation,
CCCDI – UEFISCDI, project number PN-III-P1-1.2-PCCDI-2017-0404 / 31PCCDI/2018 and
37BMPNIII-P3-199/2016-I05.16.01, within PNCDI III.
References
[1] Ahmed, N.A., Miyatake, M., Othman, A.K., Power fluctuations suppression of stand-alone hybrid
generation combining solar photovoltaic/wind turbine and fuel cell systems, Energy Conversion and
Management, Vol. 49, 2008
[2] Feuerriegel, S., Neumann, D.,Measuring the financial impact of demand response for electricity retailers,
Energy Policy, Vol. 65, 2014
[3] Gils, H.C., Assessment of the theoretical demand response potential in Europe, Energy, Vol. 67, 2014
[4] Veit, A., Goebel, C., Tidke, R., Doblander, C., Jacobsen, H.A., Household Electricity Demand Forecasting –
Benchmarking State-of-the-Art Methods, ACM e-Energy 2014, 5th
International Conference of Future Energy
Systems
[5] Singh, A.K., Ibraheem, K.S., Muazzam, M., An Overview of Electricity Demand Forecasting Techniques,
2013 National Conference on Emerging Treends in Electrical, Instrumentation & Communication Engineering
[6] www.transelectrica.ro
[7] Harvey, A., Koopman, S.J., Forecasting Hourly Electricity Demand Using Time-Varying Splines, Journal of
the American Statistical Association, Vol. 88, 1993
[8] De Felice, M., Catalano, F., Alessandri, A., Seasonal climate forecasts for medium-term electricity demand
forecasting, Applied Energy, Vol. 137, 2015

447
SIMULATION OF A SMALL SCALE RENEWABLE ENERGY SYSTEM
Dana-Alexandra Ciupăgeanu, Gheorghe Lăzăroiu, Ana Micu
University Politehnica of Bucharest
ABSTRACT
Energy generation from renewable energy sources has exceeded even the most optimistic
expectations. Among the most widespread technologies, wind energy and photovoltaic involve many
stochastic related issues. Fuel cells proved to be a promising solution towards mitigating these
problems. This paper aims to analyze the behavior of a small scale hybrid energy system consisting of
a 12.9 kW photovoltaic array as generating unit, a 6 kW proton exchange membrane fuel cell as
storage device and a load. The simulations were performed using Matlab/Simulink environment,
representing the components using Simscape/SimPowerSystems blocks. Steady and dynamic behavior
of the hybrid system was thus observed, the interaction between the fuel cell and the PV array being
analyzed in terms of power output variation.
1. INTRODUCTION
The variability of renewable energy sources generation gives rise to significant problems
having system-wide implications. Mitigating their inherent intermittency caused by the
natural dependence on weather conditions is, therefore, an extremely important goal in order
to achieve both increasing renewables share in the global energy mix and adequate levels of
reliability of supply [1], [2].
Integration of energy storage systems together with renewable power plants, as
photovoltaic (PV) or wind energy for instance, can overcome the previously mentioned
difficulties. Such hybrid systems, capable of accumulating the production exceeding demand
at a certain point and use it to supply the load in energy shortage conditions, improves power
quality [3]. Among available storage technologies, choosing the one best fitting a particular
application must consider several technical and economical factors to ensure optimal overall
performance of the installation [4].
Compared with other alternatives, hydrogen energy storage shows promising advantages
in terms of ease of installation and reduced losses. Moreover, it has a low environmental
impact, which represents a very attractive feature in the context of increasingly restrictive
environmental policies worldwide [3].
Exploiting each renewable energy source by itself generates unacceptable power output
fluctuations from consumers' perspective. Employing instead hybrid systems, it is possible to
efficiently operate each integrated resource, according to its particularities, prevailing
individual limitations and enhancing global yield [1-3].
Correlated with society progress, energy demand increases; given that fossil fuel
depletion is a stringent concern, research naturally focused past decades on renewable energy
sources [2].
The role of fuel cells, converting chemical energy directly to electrical energy, is to
compensate the power fluctuation of the renewable source, within the hybrid system [5]. The
reliability of fuel cells is a major asset, among available technologies Proton Exchange
Membrane Fuel Cell (PEMFC) standing out as very suitable for small scale application. High
investment costs caused by Platinum electrodes and the necessity of pure Hydrogen as fuel
are still a drawback [6], [7].

448
Table 1 presents the general characteristics of fuel cells, providing the limits of their
variation ranges. Among the applications of PEMFC in power systems, we must mention
back up power and small distributed generation [8].
Table 1: General characteristics of fuel cells [8]
Quantity Measurement unit Value
Energy density 3dmWh 500 ÷ 3000
Power density 3dmW ≈ 500
Specific energy kgWh 150 ÷ 10000
Specific power kgW 5 ÷ 800
Power rating MW ≤ 60
Rated energy capacity MWh ≤ 0.312
Daily self discharge % ≈ 0
Lifetime years 5 ÷ 20
Cycling times cycles 1000 ÷ 20000
Discharge efficiency % 59
Cycle efficiency % 20 ÷ 66
Response time s ≤ 5∙10-3
Suitable storage duration Medium to long (hours ÷ months)
Discharge time at power rating Seconds to hours
Power capital cost kW$ 500 ÷ 3000
Given the advantages previously presented of exploiting renewable energy power plants,
such as PV systems, in hybrid architectures alongside storage technologies, namely PEMFC,
this paper presents a simulation model for estimating the responses characteristics of such a
system in several particular scenarios of interest.
2. METHODOLOGY
2.1. Simulation model
The simulation model is represented using Simulink/Simscape PowerSystems blocks
and includes:
i. a 12.9 kWp PV array, consisting of ten parallel strings of six 215 Wp modules
each. The voltage at its terminals reaches the maximum value of V8.217Vmax = , in
open circuit, and V174VMPP = at the maximum power point.
ii. a 6 kW PEMFC, having a voltage output of V45VPEMFC = . The flow rate was
considered as varying signal for control purposes.
iii. a generic DC load.
iv. the DC bus, modeled as a generic capacitive bus.
v. the power electronics interface connecting the generating subsystem to the load,
comprising two boost converters (for the connection of the PV array and PEMFC
to the DC bus).
vi. the low-pass filters.
vii. the measurement sensors.
viii. the control subsystem, grasping the converters control and the power flow
management within the hybrid system.

449
Figure 1 pictures the block diagram of the simulation model, which does not comprise the
electrolyzer providing the fuel to the PEMFC. Here we consider solely the interaction
between the PV array, the PEMFC and the load, as a standalone system.
The irradiance input for the PV array was set according to statistical data available
regarding average insolation in Bucharest, Romania [9].
Figure 1: Overall structure of the system
2.2. Control algorithms
Considering the continuous variability of the irradiance, a control algorithm ensuring the
maximum power yield at the terminals of the PV array must be implemented. In this
configuration, an algorithm relying on incremental conductance principle was employed; for
better response, a variable duty cycle reference and integral component were used.
Algorithm's parameters resulted from simulation in open circuit and at nominal load.
Figure 2: MPPT algorithm block diagram
The flow rate regulator purpose is to adjust fuel flow, based on a current input signal, in
order to obtain a constant output. In this regard, the nominal Hydrogen utilization was of
99%, with 99.5% pure H2 composition and 1.5 bar pressure. The fuel cell operates at 65 0C.
The regulator, illustrated in Figure 3, establishes the flow according to (1):

450
pcf
anT10551.2Q c9
⋅⋅⋅⋅
⋅= − ɺɺ (1)
where T [K] is cell's temperature, nc [-] is the number of cells, a [L/s] is the air flow, f [-]
is the nominal utilization of H2 (the fuel), c [-] is its composition and p [bar] represents fuel
pressure.
Figure 3: Flow rate regulator
The boost converter connecting the fuel cell to the DC bus has a variable duty cycle
reference, depending on the quote between the FC voltage output and the DC bus measured
voltage.
The general control logic, here implemented through the Matlab function in Figure 1,
is based on the principle that the FC supplies to the load any power shortage due to irradiance
variation. PV generation exceeding the demand at any time is used by the electrolyzer, not
represented in this model.
2.3. Simulation scenarios framework
In order to picture the circumstances when the FC has to provide the load, which we
have considered to be constant during simulation time span (ts=5 s), the difference between
the PV generation and the current demand, we simulated following scenarios:
• the irradiance is constant and equal to the minimum average, according to Table 2:
kW8.4PmW398I PV2 =→=
• the irradiance changes suddenly at t=1.5 s, dropping with 0.5 p.u.
=→=
=→==
kW4.2PmW199I
kW8.4PmW398II
2PV
22
1PV
21
• the irradiance changes suddenly at t=1.5 s, increasing with 0.5 p.u.
=→=
=→==
kW2.7PmW597I
kW8.4PmW398II
2PV
22
1PV
21

451
Table 2: Monthly irradiance [9]
Month Maximum average daily irradiance [W/m2]
January 432
February 586
March 786
April 931
May 978
June 995
July 957
August 904
September 816
October 658
November 460
December 398
2.4. Simulation results
Figure 4: (a) FC power output; (b) PV array power output
As shown in Figure 4, the power output at the terminals of the FC compensates the
variation of PV array production in order to meet the demand. It can be noticed that the
transient time is very short, the dynamic response stabilizing fast.
3. CONCLUSIONS
Storage technologies integrated in hybrid architectures with renewable energy sources
mitigate their power fluctuations, improving the quality and reliability of the supply. PEMFC
has showed a good dynamic performance compensating output variability of PV arrays
consequently irradiance intermittency.
Acknowledgment
This work was supported by a grant of the Romanian Ministry of Research and Innovation,
CCCDI – UEFISCDI, project number PN-III-P1-1.2-PCCDI-2017-0404 / 31PCCDI/2018 and
37BMPNIII-P3-199/2016-I05.16.01, within PNCDI III.

452
References [1] Ahmed, N.A., Miyatake, M., Othman, A.K., Power fluctuations suppression of stand-alone hybrid generation combining solar photovoltaic/wind turbine and fuel cell systems, Energy Conversion and
Management, Vol. 49, 2008
[2] Huang, P.H., Kuo, J.K., Wu, Z.D., Applying small wind turbines and a photovoltaic system to facilitate electrolysis hydrogen production, International Journal of Hydrogen Energy, Vol. 41, 2016
[3] Agbossou, K., Kolhe, M., Hamelin, J., Bose, T.K., Performance of a Stand-Alone Renewable Energy System Based on Energy Storage as Hydrogen, IEEE Transactions on Energy Conversion, Vol. 19, 2004
[4] Eskander, M.N., El-Shater, T.F., El-Hagry, M.T., Energy flow and management of a hybrid wind/PV/fuel cell generation system, Energy Conversion and Management, Vol. 47, 2006
[5] Desideri, U., Lazaroiu, G., Zaninelli, D., Lazaroiu, C., A Matlab-Simulink Analysis of Hybrid SOFC Dynamic Behavior, 3rd International Conference on Fuel Cell Science, Engineering and Technology, Ypsilanti, Michigan,
USA, 23-25 May, 2005
[6] Wang, C., Nehrir, M.H., Power Manangement of a Stand-Alone Wind/Photovoltaic/Fuel Cell Energy System,
IEEE Transaction on Energy Conversion, Vol. 23, 2008
[7]Onar, O.C., Uzunoglu, M., Alam, M.S., Modeling, control and simulation of an autonomous wind turbine/photovoltaic/fuel cell/ultra-capacitor hybrid power system, Journal of Power Sources, Vol. 185, 2008
[8] Luo, X., Wang, J., Dooner, M., Clarke, J., Overview of current development in electrical energy storage
technologies and the application potential in power system operation, Applied Energy, No. 137, 2015
[9] http://re.jrc.ec.europa.eu

453
NANOSTRUCTURED MATERIALS FOR
ENERGY VALORISATION OF USED OILS
Mihai Dragne, Ionel Pîşă*, Cristina Covaliu, Gheorghe Lazaroiu
*University Politehnica of Bucharest, Romania, [email protected]
ABSTRACT
One of the most important issues of today's society is the decontamination of soil, water and
atmosphere. The paper proposed the development of advanced, integrated technologies for advanced
materials with properties of nanostructured adsorbents, ions changeable and catalytically from raw natural
zeolites (minerals) and hydrotalcite type compounds and the use of these materials in processes of waste
oil recovery with remediation effect and energy recovery.
1. INTRODUCTION
One of the most important issues of today's society is the decontamination of soil, water
and atmosphere. The paper proposed the development of advanced, integrated technologies for
advanced materials with properties of nanostructured adsorbents, ions changeable and
catalytically from raw natural zeolites (minerals) and hydrotalcite type compounds and the use of
these materials in processes of waste oil recovery with remediation effect and energy recovery.
After 1990, the quantity of waste oils collected for regeneration in Romania dropped by
almost 20 times, up – at the end of 2000 to less than 1000 tones, although the national park by
motor vehicles has increased (are currently 4,800,000 registered cars), the number of eating fast
food and big stores virtually exploded, the remaining quantity of waste oils, in particular in the
industry, dropping slightly. The quantities of waste oils forgone are a major source of pollution to
soil and water. This situation is because users have been able to procure the necessary lubricants
from Romanian or foreign firms – which we have never pretended to surrender used oil-then –
situation that remains today.
One of the directions of the research is to obtain advanced materials for the purification
activity through modulating capacities of adsorption, ion exchange and catalysis of hydrotalcite
type compounds and clinoptilolite (available as local natural resource), using different
pretreatment techniques in order to obtain material with predetermined properties (tailored)
selective for different pollutants. The technology of advanced materials preparation must allow
the recovery of oils so as a friendly working environment methodology.
The another research area is oriented to the use of advanced materials obtained in the cleaning of
waste oils coming from different sources, in order to achieve the objectives set by national and
international standards to ensure the conservation and sustainable management of resources at the
same time ensuring low costs and energy consumption.
Currently the technology of purification of waste oils used as changeable, anions and cations on
the basis of organic resins synthesis involves the appearance of highly toxic waste. These types of
changeable replacement of ions with minerals (cations) and hydrotalcite (anions, which can be
obtained by the methods of synthesis of relatively inexpensive and less polluting or even from
natural sources such as hydrotalcites deposits) leads to lower the risk of environmental
contamination by the ion exchangers technology. In this project, it will try to eliminate traces of
transitional metals (Ni, Pb, Cd, Cu, Zn, Cr) and organic pollutants (phenols and phenolic

454
compounds; benzene and its derivations, colorants, etc) by coupling the processes of adsorption
and ion exchange (process with low energy consumption, environmental friendly processes)
using as adsorbents/ion exchanger advanced materials obtained by modifying the properties of
natural zeolites clinoptilolite type and hydrotalcite type [16].The final research area aims to
capitalize on used advanced materials in remediation processes for decreasing the amount of
waste, in compliance with the basic principles of environmentally friendly processes. For this
purpose, it will examine the possibility of using advanced materials used (due to the retention of
metallic ions by adsorption/ion exchange), by using them as catalysts for remediation of
contaminated gaseous streams or even use the natural component with adsorbed metallic ions as
addition in basic material for highways construction.
2. ADSORBENT MATERIALS
Minerals of the group structure of the stratified natural clays, such as montmorillonit and
bentonite represents attractive adsorbing materials due to low price and wide spreading area.
Compared with active coal, bentonite can be a more economical adsorbent for the treatment of
waste water of textile industry. The nature of the porous structure and chemical properties are
decisive for the adsorption ability of bentonite. The hydrophilic properties induced by metal
cations that can be substituted with other cations by ion exchange are not favorable for organic
compounds adsorption. Published studies show possibility of improving adsorption capacity by
the application of some treatments to modify the surface properties of bentonite. Depending on
the chemical composition, bentonite clays are grouped in bentonite sodium (Na-BENT) and
bentonite calcium (Ca-BENT). Bentonite clay with higher montmorillonit content has
advantageous properties for adsorption [1].
Adsorption ability of bentonite can be improved through modifications with organic
compounds involving the impregnation of organic molecules on the surface. The process of with
an organic compound by impregnation is achieved through replacement of inorganic cations
(Na+, K
+, Ca
2 +, Al
3+) with organic cations, mostly with quaternary ammonium cations (R4N
+).
Organic functional groups interaction with hydroxyl surface groups has the effect of changing the
hydrophilic character of bentonite and getting a natural material with hydrophobic or
organophilic properties [3], [4]. At the same time, the capacity of the bentonite adsorption for
certain pollutants can be improved by treatment with inorganic acids (HCl or H2SO4) at high
temperatures. The application of such acidic activation process must be managed with caution
taking into account the possible effects of alteration of the structure, chemical composition and
physical properties of bentonite (Figures 1 and 2) [2].
0
200
400
600
800
1000
1200
1400
1600
1800
2000
0.0 0.2 0.4 0.6 0.8 1.0 1.2
Relative pressure (p/po)
Volu
me
adso
rbed
(cc
/g)
NaB
NaB-S1
NaB-S3
-0.0001
0
0.0001
0.0002
0.0003
0.0004
0.0005
0.0006
0.0007
0.0008
0.0009
0 20 40 60 80 100
Pore diameter (nm)
Dv(d
) (c
c/n
m/g
)
NaB
NaB-S1
NaB-S3
Fig.1. Adsorption/desorption isotherms Fig.2. Pores distribution curves in bentonite samples

455
In Table 1 are presented the characteristics of bentonite coming from Romanian mineral
deposits [2]. Notice that the bentonite highbrow Gurasada has a very low Fe2O3 content (0,53-
1,69%). Compared to other deposits, bentonite Gurasada contains a less quantity of clay minerals
(64-88%). Montmorillonit is the main mineral in bentonite Gurasada composites [5], [6].
Table 1: The chemical characteristics of the bentonites in Romania
Chemical
composition
(% wt)
Bentonite coming from Romanian mineral deposits
Valea
Chioarului
Petresti Gurasada Orasul Nou
SiO2 66,11-77 70-74 70.40-72.99 60.62-71.46
Al2O3 10,94-16,09 12.5-13.5 12.60-14.65 15.40-23.55
Fe2O3 1.60-2.08 1.15 0.53-1.69 0.84-2.34
CaO 1.01-2.10 2 1.60-2.73 1.18-1.86
MgO 1.10-2.22 2.7 2.62-3.69 0.54-2.05
Na2O 0.55-1.60 0.6 0.00-1.11 0-0.3
K2O 0.00-1.35 1.5 0.0-1.0 0.25-2.16
TiO2 0.50-0.62
MnO 0.03-0.05
P.C 5.9 6.29-9.69 8.69-12.4
3. USED OIL REGENERATION TECHNOLOGIES
There are many technologies in the world for regenerating used oils. Basically, they are
based on the principles of vacuum distillation, chemical treatments and thermal treatments. There
are some (most advanced) technologies with the advantages and disadvantages of each.
In Mohawk technology (vacuum distillation) the used oil is chemically pretreated to avoid
precipitation of contaminants which can cause corrosion and fouling of the equipment. The
distillate is hydropurified at high temperature and pressure in the presence of catalytic bed. The
technology is applied in North Vancouver, California, Indonesia and Australia.
In Blowdec technology (cracking/separation) the process is based on separation of
hydrocarbons from the waste oil in a hot whirling bed created by solid particles (hot sand) in a
reactor. Simultaneously with the separation, visbreaking process of hydrocarbons occurs. In
Markuŝovce, Slovak Republic is applied.
In Dunwell WFE technology (wipe film evaporation) the used oil from collectors is
separated from water and solid particles by centrifuging, then heated to temperature around 150
°C and sent to a flash evaporator for removing water and light hydrocarbons. The technology is
applied in Yuen Long Industrial Estate, Hong Kong.
In Prop technology (chemical treatment/distillation/clay treatment/hydrofinishing) the used
oil is treated by water solution of diammonium phosphate for separation of metals and ash-
forming components. For this purpose, preheating mixture of used oil and treating agent is sent to
contractor where water solution salt is dispersed into the oil. Metallic phosphates formed in the
chemical reaction are removed by filtration. Some plants were built, but now they are not in
operation because of financial difficulties.
The technology proposed is aimed for the process of revitalization of residual oils (from
different sourcing) by contacting them semi-dynamic, with natural/modifies nanostructured
compounds. Under these conditions for the recycling of waste oils in the laboratory facility is
proposed in Figure 3. In principle, the process consists in residual oil recirculation, stashed in the
vessel 1, after a preliminary filtration through the filter hopper 2 (which will retain mechanical
impurity), with the help of the centrifugal pump 3 in the adsorber vessel 4. Recirculation of the

456
residual oil through the centrifugal distributor 6,
seeks an intimate contact between the liquid phase
(residual oil) and solid phase (nanostructured
adsorbent), introduced in the adsorber 4 through a
spilling system 7. Revitalized oil is stored, after
filtration through the filter hopper 2 ' (for retention
of solid adsorbent material) in the revitalized oil
tank 5.
4. CONCLUSIONS
• The novelty of this paper is the
implementation in practice of innovative
technologies simple and accessible to obtain
modified nanostructured materials used in
treating a wide range of waste oils.
• This technology contributes to international research efforts to develop synthesis
technologies for zeolite materials. The complexity of the proposed solutions is high,
involving on one hand the use of techniques for obtaining modified nanostructured
materials and to characterize the systems of revitalizing waste oils, and, on the other hand,
implementation in practice of a flexible technology that can be operated easily under
certain conditions imposed by the dynamics of the process and the quality of raw
materials.
• This process is more cost-effective than the conventional method of treatment as the raw
material is easy to find, the technology is simple and very effective.
„This work was supported by a grant of the Romanian Ministery of Research and
Innovation, CCCDI – UEFISCDI, project number PN-III-P1-1.2-PCCDI-2017-0404 /
31PCCDI/2018, and project number 37BMPNIII-P3-199/2016-I05.16.01, within PNCDI
III”
References
1. C. Orha, A. Pop, C. Lazau, I. Grozescu, V.Tiponut, F. Manea, Structural characterization and
the sorption properties of the natural and synthetic zeolite, Journal of optoelectronics and
advanced materials, Vol. 13, No. 5 , 544 –549, IF = 0.457
2. Dr.hab.Vasile RUSU, ADSORBANŢI MINERALI NATURALI. PROSPECŢIUNI, Akademos-
Chimie, nr.3 (18), septembrie 2010, 101-104
3. Udonne J. D , A comparative study of recycling of used lubrication Oils using distillation, acid
and activated charcoal with clay methods, Department of Chemical and Polymer Engineering,
Lagos State University, Lagos, Nigeria, J.Petroleum Gas Eng.
4. Naveed Anwar, Syed Shahid Ali, s.a., Recycling of Automotive Lubricating Waste Oil and Its
Quality Assessment for Environment-Friendly Use Res. J. Environ. Earth Sci., 912-916, 2012
5. R.Ganea, N.Natu, C.Marinescu, I.R.Tamas, I.Popescu, Gr.Pop, Catalizator perfectionat pe
baza de nanomateriale pentru indepartarea noxelor din instalatiile de emailare, A00889/2011
(12.09.2011).
6. Tetisan I.,, Studii si cercetari privind utilizarea tufurilor zeolitice din zona Bârsana în tehnologii
neconventionale de epurare a apelor uzate, teza de doctorat, Cluj-Napoca, 2010

457
VELOCITY DISTRIBUTION IN SIMULATED EXHALE AIR FLOW,
WITH VIRTUAL BREATHING THERMAL MANIKINS
Ivanov M.1, Mijorski S.
2
1Senior Assist. Professor, PhD, Technical University of Sofia, FPEPM, Department:
”Hydroaerodynamics and Hydraulic Machines”, Sofia 1000, Bulgaria 2PhD, SoftSim Consult Ltd., Consultant at Technical University of Sofia, FPEPM,
Department: ”Hydroaerodynamics and Hydraulic Machines”, Sofia 1000, Bulgaria
ABSTRACT
The presented paper illustrates a CFD based study on the velocity distribution in simulated exhale
air, by two different types of virtual breathing thermal manikins. The used manikins differ mainly in
their shape. The first one represents physiologically identified female body, with high degree of
geometrical accuracy. The second manikin is constructed by simplified polygonal shapes, designed to
match the overall 95th percentile of the anthropometric size of a standard person. A performance
comparison between the two manikin models is made, by velocity distribution analyses in the
simulated exhale air. Also, different steady state and transient modelling techniques (RANS, URANS,
DES, and LES) are implemented and compared. The numerical results showed in general a good
correlation with the reality, and high degree of similarity, between the different flow patterns.
However, there is a tendency for over-prediction of the manikins’ thermal plume impact over the
exhaled air flows in the steady state numerical results.
1. INTRODUCTION
Producing experimental studies with real Thermal Manikins (TMs) is literally cost and
time consuming, and may require highly skilled labour (Madsen, 1999). It is explained by the
fact that TMs are modern, expensive and complex tools for measurement and analyses of the
convective flows around human bodies in different conditions, without excessive risk of
human exposure (Nilsson, 2006; Bjørn, 1999). They are used for assessment of the human
thermal comfort, as well as for analyses of the indoor air quality in the occupied spaces. In
terms of functionality, TMs are not just used for simulation of different levels of physical
activity (through surface heat losses), but also for simulating other human actions such as
breathing, sweating, sneezing, coughing and others.
Consequently, the use of Virtual Thermal Manikins (VTMs) appears to be an appropriate
alternative to the actual manikins’ experiments, especially at the design stage of the indoor
environment (Ivanov, 2015). Recent studies indicate sufficient advances in this area. For
example, the study of Villafruela et.al. (2016) summarizes that in the last years,
Computational Fluid Dynamics (CFD) simulation tools have been used to study the diffusion
of inhaled and exhaled contaminants from different ambient environments. Also, complex
airborne infection routes have been studied with CFD, including the sneezing and coughing
mechanisms (Villafruela et.al., 2016).
But still, a need exists for rather inexpensive and easy to construct and use real TMs,
especially when numerical models have to be verified and validated with experimental
measurement data. Therefore, the authors have previously proposed a simplified polygonal
construction of TM with breathing function (Ivanov and Mijorski, 2017-2), which would
1Sofia 1000, Bulgaria, “Kliment Ohridski” Blvd. #8, Technical University – Sofia, +359898240221, [email protected]

458
present an opportunity for manikin’s production cost and experiment maintenance
optimizations. However, a numerical performance analysis of the developed model is
required, in order to confirm its accuracy and feasibility at this design stage.
Therefore, the objective of the presented study is to examine the geometrical
characteristics’ impact over the velocity distribution in the modelled exhalation flow, with the
previously developed breathing thermal manikins – the physiologically identical one (called
Humanoid Manikin) and the proposed simplified shape one (called Polygonal Manikin). The
differences or the similarities in the velocity fields between the two shapes will provide initial
assessment measure for the both models performance. Also, different steady state and
transient modelling techniques and boundary conditions have to be implemented and
compared, due to the fact that the breathing process in humans is highly transient and the
breathing flow parameters are changing completely and rapidly in relatively short period of
time.
2. 3D GEOMETRY SET-UP
The presented Humanoid Manikin is multifaceted, 3D female manikin, specially
remodelled and adapted for the purpose of the study. It represents with high degree of
physiological identity a real female human, has an approximate surface area of 1.8 m2, and
height of 1.65 m. The nasal valve opening was built according to the study of Lin (2015) and
was initially used by the authors in Ivanov and Mijorski (2017). The nasal opening area is 7.3
x 10-5
m2, as shown on Fig.1. The normal to the nasal opening was specified to 45 degrees
from the vertical body axis. Furthermore, exhaust walls from the nasal valve to the nose end
were inclined to 15 degrees according to Nilsson (2006) and Lin (2015). The Humanoid
Manikin is used only in the cases with steady state modelling conditions.
The Polygonal Manikin represents the overall 95th
percentile of the anthropometric size
of a standard person. It is constructed to meet the basic requirements of the ergonomic design
area. It has an approximate surface area of 2 m2 and height of 1.75 m. The nasal valve
opening is constructed in the same way as in the base model, described above. This polygonal
manikin is proposed for use in real research applications, as well as for educational purposes,
complying with the requirements for: high degree of manufacturability; high degree of
mobility; availability in different scales and open design. For the purpose of the study, the
Polygonal Manikin is used in simulations with steady state modelling conditions, as well as in
the cases with transient modelling conditions.
Figure 1: 3D models and nasal valve geometry details

459
3. NUMERICAL MODEL SET-UP AND BOUNDARY CONDITIOS
3.1. STEADY STATE MODELLING CONDITIONS
For the cases with steady state modelling conditions, the 3D models of the virtual
thermal manikins were placed inside rectangular shaped room with dimensions: 3 m height, 4
m width and 4 m depth, with introduced symmetry plane through the centre of the room, thus
having only one nasal valve opening in the domain. The spatial discretization was completed
with snappyHexMesh utility, part of an HELYX® (www.engys.com) software package,
which provides an enhanced version of the CFD code OpenFoam® (www.openfoam.com).
In all numerical grids was followed one and the same meshing logic, i.e. defining base
cell size to 4 10-2
m and increasing the refinement level to 6.25 10-4
m in the nasal valve zone,
in order to capture the detailed geometrical features. Also, the numerical models were well
refined at the surfaces of the manikins, with a first layer height of approximately 0.5 10-3
m.
These refinements were dictated from the requirement for low y+ values over the manikin
surfaces, recommended in the work of Spalart (2001). The total number of computational
cells used is 1139195 for the Humanoid Manikin, and 1417722 cells for the Polygonal
Manikin.
Figure 2: Model set-up and boundary conditions for the steady state and for the transient
simulations
In total of six Reynolds-Averaged Navier–Stokes (RANS) CFD simulations were
performed, three for each individual virtual manikin. The three phases of the human breathing
cycle were simulated, including: inhaling, exhaling and no breathing (the free convection flow
case). The implemented solver for all simulations was buoyantBoussinesqSimpleFoam. This
solver models a buoyant turbulent flow of incompressible fluids with combinations of Semi-
Implicit Method for Pressure-Linked Equations (SIMPLE) algorithms. The turbulent features
of the resulted buoyant flows were modelled with introduction of the Shear Stress Transport
(SST) k-ω turbulence model suggested by Menter (1993). This model is based on a two-
equation eddy-viscosity approach, where the SST model formulation combines the use of a k-
ω in the inner parts of the boundary layer, but also switches to a k-ε behavior in the free-
stream regions of the solutions. In the work of Menter (2011) are provided further details of
the selected turbulence model.
The buoyant flows were modelled with the same material properties for the air. These
were derived for reference conditions of 101325 Pa for the pressure and 20 oC for the air
temperature. Thus the air density was specified to 1.204kg/m3, the dynamic viscosity to 1.82
10-5
kg/(m s), kinematic viscosity to 1.51 10-5
m2/s, and specific heat to 1006.0 J/(kg·K).

460
Details regarding the adopted boundary conditions in the CFD simulations are provided
in Fig.2. The heat fluxes specified for the manikins’ surfaces were derived from the study of
Nilsson (2006). These were calculated for total heat load of 110 W from the whole manikin
surface. The velocity inlet for the exhale phase and outlet for the inhale were specified at the
nasal valve openings. The approximated flow rates for one nasal valve (6.29 10-4
m3/s for the
inlet flow rate and 6.91 10-4
m3/s for the outlet flow rate) were calculating based on the study
of Lin (2015). The turbulent intensity for the nasal velocity inlet was approximated to 6.8 %
by Reynolds number calculation with proposed by Lin (2015).
3.2. TRANSIENT MODELLING CONDITIONS
For the cases with the transient modelling conditions, the computational domain was
significantly reduced by introducing two symmetry planes, at the both sides of the manikin.
This measure was considered with clear understanding of the flow restrictions that will be
introduced, but with an aim of simulation time reduction. As shown in Fig. 2, the model
comprised just 0.1 m section of the manikin, including the two nasal valve openings, head and
manikin body, excluding the hands and legs.
The base cell size was defined to 2.5 10-2
m and to capture the nasal valve zones
geometrical features the maximum level of cells refinement reached to 8.0 10-4
m.
Additionally the manikin’s surfaces were refined with the introduction of prism layers. By
first layer height of 0.4 10-4
m, the y+ values over manikin surfaces were below 4 as
recommended in the work of Spalart (2001). Thus, the models matched the basic requirements
of LES method for resolving accurately the turbulent flow over object surfaces.
Three unsteady/transient 3D simulations were performed, covering two different phases
of the human breathing cycle. These included no breathing or the free convection flow case
for time duration of 20 seconds (allowing to get the solutions to a fully developed convective
flow around the manikin and room space) and sequentially 2 seconds of exhale phase. In
order to keep maximum Courant number below 1, the simulations were run with different
time steps, as for former case it was set to Δt = 1.0 10-3
seconds, while for the lather it was
reduced to Δt = 0.25 10-3
seconds.
The solver for the transient buoyant turbulent flow of incompressible fluids
buoyantBoussinesqPimpleFoam is used with combinations of PIMPLE algorithm for
pressure-linking. The PIMPLE represents a merged Semi-Implicit Method for Pressure-
Linked Equations (SIMPLE) and Pressure Implicit with Splitting of Operator (PISO)
algorithms, thus offering an improved solution and faster convergence for the transient
solutions.
The Unsteady Reynolds-Averaged Navier–Stokes (URANS) simulations were run with
the Shear Stress Transport (SST) k-ω turbulence model initially proposed by Menter (1993).
For the Detached Eddies Simulations (DES), the Spalart-Allmaras turbulent model was
implemented. Initially, the standard Spalart-Allmaras model was proposed by Spalart and
Allmaras (1994), and then its DES formulation was proposed by Shur et al. (1999). The
model uses the distance to the closest wall as the definition for the length scale, which plays a
major role in determining the level of production and destruction of turbulent viscosity of the
flow.
And finally, the Large Eddies Simulations (LES) were run with k-equation eddy
viscosity Sub-Grid-Scale (SGS) model formulation. The model is well described in the work
of Chai and Mahesh (2012). The one-equation eddy viscosity model for large-eddy simulation
has an additional transport equation for SGS kinetic energy.

461
4. CFD RESULTS
For the purpose of the comparative study, the numerical results are presented by velocity
iso-line contours only for the exhalation phase, at a section on the symmetry plane of the
manikin models, for the steady state simulations (see Fig. 3), while for the unsteady transient
models, at the centre of the computational domain (see Fig. 4). In both cases, this is a plane
through the centre of the manikins’ nose.
Figure 3: Velocity iso-lines for the steady state simulations
Figure 4: Velocity iso-lines for the transient simulations
5. DISCUSSION AND CONCLUSIONS
A CFD based study of the exhalation flow velocity distribution is performed, under
steady state and transient conditions. The analyses of the results assisted the understanding of
the implications caused by the geometrical characteristics of the presented manikin models, as
well as the different numerical methods and implemented boundary conditions in the CFD
simulations. However, the comparative analyses between smooth surface manikin and
polygonal with many sharp edges and openings by itself is a difficult task. The Humanoid
Manikin model would be characterized with more laminar flow along the surfaces, while the
polygonal with more turbulent flow and mixing at the upper zones of the model. That fact
would explain the achieved differences in the resulting velocity patters.

462
It is considered that the steady state models may over-predict the manikins’ thermal
plume impact over the exhaled air flows in the breathing zone, as suggested by the results.
Implementing transient conditions further improve the presented model and give a more
accurate representation and a possibility for a more accurate prediction of the dynamic
processes in the VTM’s breathing zone.
The comparison analysis has shown better correlation between DES and LES simulation
results for the modelled exhalation phase in the breathing zone away of the nasal openings.
However, the implementation of this two more advanced CFD techniques requires
significantly higher computational resources compared to URANS. Also, these two methods
are sensible to selection of boundary conditions, such as symmetry planes, which can alter the
modelled flow by restricting large eddies generation. Nevertheless, URANS simulations have
demonstrated good results in the breathing zone for the exhale phase with slight
underprediction of the air velocity.
Acknowledgements
The presented study is supported by “RDS” at TU-Sofia, as part of the activities under
the "Perspective leaders" project, with Contract № 181ПР0005-02, entitled: “Experimental
comparison of the air jet characteristics during exhalation, with numerical results from
developed virtual breathing thermal manikin”.
References
[1] Bjørn E., Simulation of human respiration with breathing thermal manikins, Proceedings of the 3rd
international meeting on thermal manikin testing 3IMM, Stockholm, Sweden, 12–13 October, 1999.
[2] Chai X., Mahesh K., “Dynamic k-equation model for large-eddy simulation of compressible flows”, Journal
of Fluid Mechanics, vol. 699, pp. 385-413, 2012;
[3] Ivanov M., Compact Breathing Simulation System, Developed as Additional Functionality for Thermal
Manikins, “Romanian Journal of Building Services”, Vol.1, No.3, ISSN: 2393-5154, pp. 1-12, 2015.
[4] Ivanov M., Mijorski S., CFD modelling of flow interaction in the breathing zone of a virtual thermal
manikin, “Energy Procedia” Journal, Volume 112, pp. 240-251, ISSN: 1876-6102, Elsevier, 2017.
[5] Ivanov M., Mijorski S., „Geometrical characteristics’ impact over the thermal plume modelling with
breathing thermal manikins“, 15th International Conference on Environmental Science and Technology, ISSN
1106-5516, Manuscript ID: cest2017_00414, Rhodes, Greece, 31 August to 2 September 2017 - 2.
[6] Lin S., Nasal Aerodynamics, Chief Editor: Arlen D Meyers, MD, MBA,
http://emedicine.medscape.com/article/874822-overview#a1, Updated: May 14, 2015.
[7] Madsen T., Development of a breathing thermal manikin, Proceedings of the 3rd
international meeting on
thermal manikin testing 3IMM, Stockholm, Sweden, 12–13 October, 1999.
[8] Menter F., Zonal Two Equation k-ω Turbulence Models for Aerodynamic Flows, AIAA Paper 93, 1993.
[9] Menter F., Turbulence Modelling for Engineering Flows, ANSYS Inc., 2011.
[10] Mijorski S, Ivanov M., „Comparison of different CFD techniques for transient modelling of virtual
breathing thermal manikins“, 15th International Conference on Environmental Science and Technology, ISSN
1106-5516, Manuscript ID: cest2017_00415, Rhodes, Greece, 31 August to 2 September 2017;
[11] Nilsson H., How to Build and Use a Virtual Thermal Manikin Based on Real Manikin Methods, Sixth
International Thermal Manikin and Modelling Meeting, “Thermal Manikins and Modelling”, ISBN: 962-367-
534-8, 2006;
[12] Shur M., Spalart P., Strelets M., Travin A, "Detached-Eddy Simulation of an Airfoil at High Angle of
Attack", 4th International Symposium on Engineering Turbulence Modeling and Experiments, Corsica, France,
1999);
[13] Spalart P. and Allmaras S., "A One-Equation Turbulence Model for Aerodynamic Flows," Recherche
Aerospatiale, No. 1, pp. 5-21, 1994;
[14] Spalart P., Young-person’s guide to detached-eddy simulations grids, NASA/CR-2001-21103, Boeing
Commercial Airplanes, Seattle, Washington, 2001;
[15] Villafruela J., Olmedo I., San Jose J., “Influence of human breathing modes on airborne cross infection
risk”, Building and Environment 106, pp. 340-351, 2016.

463
HOLISTIC OF RENEWABLE ENERGY SOURCES IMPACT AND
SOLUTIONS FOR INTERCONNECTION TO THE POWER SYSTEM
Gheorghe LAZAROIU1, Cornel PANAIT
2, Lucian MIHAESCU
1, Mihai TIRSU
3,
Virgilius DUMBRAVA1, Gabriel NEGREANU
1, Ionel PISA
1
1) Universitatea POLITEHNICA Bucuresti,
2)Universitatea Maritima Constanta,
3)Academia de Ştiințe a Moldovei
ABSTRACT
This paper disseminates the research project, of wide impact, regarding HOLISTICS OF THE
RENEWABLE ENERGY SOURCES ON ENVIRONMENT AND CLIMATE - HORESEC is to
develop new instruments, methods, models, and technologies. These ones, based on evaluating the
increase of share of renewable energy sources in the energy production and dynamics of the ratio
between thermal and electrical energy, will lead to minimize the costs and maximize the efficiency.
The project will present solutions tested on a pilot installation for adapting the renewable energy
sources system to the dynamics of renewable energy share increase in the total energy production,
including through long-term storage solutions. The HORESEC improvement of institutional capacity
facilitates delivering high quality research services and, in the same time, increases the visibility at
national and international level by disseminating the results.
1. INTRODUCTION
The present paper deals with the project HOLISTICS OF THE RENEWABLE ENERGY
SOURCES ON ENVIRONMENT AND CLIMATE – HORESEC, in agreement with
framework P1 of the plan PNIII, subprogram 1.2. This project deals with improvement of
institutional performances of four universities (University Maritime of Constanta, University
Stefan cel Mare of Suceava, University POLITEHNICA of Bucharest, Technical University
of Cluj-Napoca), two national research-development institutes (National Institute for
Research and Development in Electrochemistry and Condensed Matter – INCEMC
Timisoara, National Institute for Research and Development in Electrical Engineering ICPE-
CA Bucharest) and an institute of Romanian Academy (Geography institute). The partners are
covering a wide national area, through 5 development regions (S-E, Bucharest-Ilfov, N-E,
West, Center).
The HORESEC project supports smart specialization in energy domain through a holistic
analysis of the impacts of energy sources on climate change and meeting both the objectives
of sustainable development and advanced and progressive knowledge. The increased
integrating process of renewable energy sources (RESs) has been driven by a rapid reduction
of the exploitation costs of these technologies.
Increasing the share of RES complicates the functioning of current systems requiring new
long-term storage measures and solutions, developed in the HORESEC project. These
solutions will be tested on a pilot plant to adapt the system to the growth dynamics of
renewable energy share in energy production, including long-term storage solutions.
The main objectives are:

464
- Establishing the main climatological and environmental parameters with impact on RES
and vice versa;
- The realization of the mathematical model of the evolution of the analyzed factors,
identifying the climatological, environmental and social indicators associated with the
RES dynamics, which will be subsequently verified on the developed pilot installation;
- Efficiency of energy production through new technologies and algorithms to optimize
the RES response, developing new methods and measurement models;
- Use of biomass in an integrated stream with hydrogen production and storage and
methanisation, and sustainable reduction of CO2 emissions [1-3];
- Finding innovative storage solutions on medium and long term;
- Demonstration of the project feasibility by experimental determinations on a pilot
plant, facilitating the takeover of the research results by the industrial environment.
2. METHODOLOGY
The work-plan of the five projects is in agreement with the specific objectives of the
general project, carried out in stages, from concept development to functional model
verification, and until the validation of the experimental model, both on individual
components and on the pilot plant. The main components of the project are described in the
following.
1. The influence of the increasing of the renewable energy sources share on the
environment and climate evolution.
The aim is to establish the main climatological and environmental parameters with
impact on renewable sources and vice versa. An analysis of the environmental impact factors
associated with the exploitation of renewable energy sources at regional level for a sustainable
development of the energy sector is being pursued in line with "Directive 2009/28/CE" which
establishes that by 2020 the power produced from renewable energy sources to represent 20%
of power consumed in the EU and 10% of power consumed in the transport sector.
The energy potential approach will be integrated, taking into account all renewable
energy sources in the study area. The territorial variation of direct solar radiation is very high,
depending on the relief forms and the dominant direction of air circulation. The distribution of
the average wind speed on the Romanian territory highlights that the main area with high
wind energy potential is that of the mountain peaks where the wind speed can exceed 8 m/s.
Also, the geographic zoning of Romania's micro-hydro-potential indicates higher values in the
mountain area.
The energy production is dependent on the variation of the climatic parameters with
energy potential, the tendency for them to evolve before and after the infrastructure
installation of the exploitation/efficient use of the renewable energy sources is evaluated.
Thus, the level of energy autonomy must be maintained regardless the climatic variations at
regional level.
A database will be created to present the average values and the trend of these
parameters, both before and after the installation of new renewable sources. By realizing the
mathematical model of the evolution of the analyzed factors, we will identify climatological,
environmental and social indicators associated with the RES dynamics, which will be
subsequently verified locally and on the developed pilot plant.
2. The adaptation of photovoltaic and wind sources to the dynamics of renewable
energy increase in total energy production.

465
The proposed objective is to make this energy more efficient through new
technologies and optimization algorithms for RES response. The energetics based on
renewable energy sources (RES) is the cheapest and most affordable way to reduce polluting
gases emissions to the production of heat and electricity with the help solar, wind and
biomass. Each of these technologies has found a development niche and the field in which
they can have a high yield, being able to compete with known technologies of obtaining
energy from fossil fuels. Wind energy is expected to take up a significant share of the energy
produced by nuclear power plants and fossil fuel plants.
The use of renewable energy sources has a significant impact on the national power
system, requiring studies on the take-up of power produced by wind turbines, micro-
hydropower and cogeneration using biomass in the future transport and distribution network
as smart grids, and also the construction of new power generation units with high operating
flexibility in order to counteract and/or limit negative effects.
According to Romania's energy strategy for 2007-2020, the annual theoretical
potential of the main renewable energy sources is: Thermal solar energy - 60x106 GJ,
Photovoltaic energy - 1.2 TWh, Wind energy - 23 TWh, Biomass - 318x106 GJ. The usable
potential of these sources is much lower due to technological limitations, economic efficiency
and environmental restrictions. The disadvantages that have slowed down the large-scale
implementation of RES, namely the fact that the energy produced is dispersed which
determines a high cost of the final energy production facilities, the uneven distribution over
time, and especially the lack of storage and of energy reserves.
New measurement methods and models will be developed and also suitable
monitoring sensors for the main electrical measures. New topological network structures,
efficient solar and biomass conversion solutions and new models of energy conversion
generators, respectively efficient storage and use of renewable energy will be developed.
Expansion of storage systems at an energy system level as well as for the electric cars
supply still requires important milestones, especially for increasing the energy density and the
number of charging/discarding cycles. Energy, by its nature, can affect sustainability both
through pollution and contributing to the depletion of resources. Energy innovation can
contribute to the rational use of energy without reducing the quality of life, quality of goods
and products developed over time.
3. Dynamics of the ratio between thermal and electrical energy produced from
biomass.
In order to analyze the future possibilities of including biomass in the national RES
balance, a country database will be developed, especially for agricultural biomass and
secondary forestry biomass [4-7]. By mapping the biomass resources in the country, a
database of national interest will be created which will allow correlation with the national
primary balance of energy fuels.
Bio-energy fuels of the future will also be established and the possibilities of blending
with other categories of fuels will be analyzed [8]. A comparative energy analysis will be
carried out for the potential of agricultural biofuels and those derived from biomass. Particular
attention will be paid to the complex modeling of combustion, experimental combustion tests
in boilers and diesel engines with the analyzed biofuels categories will be made. The feasible
combustion technologies will be defined for the analyzed biofuels categories.
The utilization of biomass will be achieved in an integrated stream with the production
and storage of methane hydrogen and finally a sustainable reduction of CO2 emissions.

466
Analysis of the dynamics of the ratio between the thermal and the electric energy will
allow the economic direction of biofuels towards the two energy flows, depending on the
territorial resources as a whole, economic transport opportunities, socio-economic
requirements. The analysis will be completed with data regarding the human potential of
national agricultural and forestry areas, potential that influence the development of energy
production and use in the territory.
In the overall development of the project, the efficient combustion of biofuels will
represent a use of the hydrogen flux (H2) that is produced from other renewable resources
such as wind, solar, thus resulting a holistic integration in the overall design of the project.
The hydrogen from the production and storage stream developed by wind and solar energy
sources will be used not only for combustion of biofuels but for diesel engines as well as for
methanisation. Obtaining methane gas CH4 from hydrogen and carbon dioxide achieves
maximum environmental protection with the complete closure of the holistic concept
regarding the use of renewable energy resources for the energy-environment-climate trinom.
4. Evolution of long-term storage solutions for environmentally sustainable energy.
Increasing the share of RES has the effect of transforming the energy system so that it
can absorb the production variations of the diverse RES components and implicitly to find
medium and long term storage solutions. The new electrolysis and methanisation technologies
presented in Fig. 1 are producing hydrogen and methane, which can then also be used to
produce energy [9]. These technologies are in the research and testing phase and the project
will make an important contribution to its development, including innovative decarbonisation
technologies.
Research into catalytic methanisation processes involves two options: the use of CO or
CO2 as raw material. CO methanisation is an exothermic process in which raw materials - CO
and H2 - are used to produce CH4 and H2O; the use of CO2 with H2 is also an exothermic
process. If the used H2 comes from electrolytic sources, the CO2 methanisation allows the
transformation of electrical energy into chemical energy (the Power-to-gas process).
Established methanisation processes include: fixed bed adiabatic methanisation, fixed bed
methanisation, fluidized bed methanisation, three-phase methanisation.
Catalytic methanisation takes place at temperatures above 250 °C. The chosen type of
catalyst is influencing the design of the reactor used in the process, and its activity and
selectivity are very important in the process. Especially metals from groups 8-10 fixed to a
suitable substrate Al2O3, SiO2 and TiO2 are used.
One of the possible variants is biological methanisation with methanogenic
microorganisms. This process involves the conversion of H2 and CO2 to methane through a
reaction that is similar to that proposed by Sebatier. Biological methanisation is an alternative
to metallic catalytic thermal methanisation. Studies on biological methanisation cover a wide
range of experimental conditions and conclusions. These differ depending on the method, the
operating parameters and the raw material used.
Another possibility to obtain SNG is the photocatalytic reduction of CO2, the methane
formation yields are much lower than the ones in the case of natural photosynthesis or
photocatalytic generation of H2. The interest in this research field has grown heavily in recent
years, as is shown by the growing number of published works. The heterogeneous
photocatalytic reduction of CO2 cannot yet be implemented in practice. The electrochemical
reduction of CO2 with the formation of hydrocarbons and alcohols is another variant that
would allow the conversion of renewable energy sources into fuels and chemicals.
If CO2 can be electrochemically reduced to hydrocarbons then any of the renewable
electricity sources can be used for this and a very large step towards storing the energy of

these intermittent resources will be made.
methanisation reactors, the reaction conditions (temperature, pressure) and the catalysts in
order to obtain a higher efficiency for
prototype model of a methanizer
5. Transformations of the energy system by maximizing the energy production from
renewable sources - verification based on a pilot plant.
The scientific and technical novelties of the project are represented by the design o
the pilot plant in order to maxim
time, the pilot plant will be the experimental model in which measurements and experimental
determinations will be carried out for the calibration of the theoretical models.
The essential goal is to demonstrate the feasibility of the project through experimental
determinations on a pilot installation
environment. Following the stages o
applied using the descriptive and inferential statistical analysis of data
from the network.
In order to make the right and opportune decision regarding
energy production in the energy system, an analysis must be
and on the equipment importance within it for the d
experimental determinations and
Initially we determine the state of the parameters and the possibilitie
the electrical equipments in order to know
economic sustainability, the possible architectures
gap and transmission capacity, the experimental model is dec
and heterogeneous communication system is implemented using TCP, UDP, IEC 61850
protocols.
Figure
3. CONCLUSIONS
The scientific novelty of the project is
production methods from renewable and verifiable
experimental pilot installation. The
including sustainable high-efficiency renewable sources, power storage and energy storage
devices that can provide an energy
467
these intermittent resources will be made. We will study the possibilities of using the
ethanisation reactors, the reaction conditions (temperature, pressure) and the catalysts in
order to obtain a higher efficiency for methanisation and finally to realize
within the INCEMC Timisoara.
Transformations of the energy system by maximizing the energy production from
verification based on a pilot plant.
The scientific and technical novelties of the project are represented by the design o
in order to maximize the energy production in the energy system. At the same
time, the pilot plant will be the experimental model in which measurements and experimental
determinations will be carried out for the calibration of the theoretical models.
goal is to demonstrate the feasibility of the project through experimental
terminations on a pilot installation, disseminating the obtained results towards
. Following the stages of the knowledge process, procedures and methods are
applied using the descriptive and inferential statistical analysis of data that is taken directly
der to make the right and opportune decision regarding the maximization of
energy production in the energy system, an analysis must be made on the technical
importance within it for the defined purpose. Measurements,
experimental determinations and program development are carried out.
the state of the parameters and the possibilities for monitoring
the electrical equipments in order to know the technical condition, and function
possible architectures can be designed. Depending on the time
gap and transmission capacity, the experimental model is decided. Then a modular, adaptable
and heterogeneous communication system is implemented using TCP, UDP, IEC 61850
Figure 1: HORESEC Configuration
The scientific novelty of the project is represented by the identification of the energy
production methods from renewable and verifiable energy sources by
The RES generation system is a complete and secure system
efficiency renewable sources, power storage and energy storage
devices that can provide an energy-efficient architecture.
FUEL CELLS
METHANIZER
CELLS
We will study the possibilities of using the
ethanisation reactors, the reaction conditions (temperature, pressure) and the catalysts in
realize a functional
Transformations of the energy system by maximizing the energy production from
The scientific and technical novelties of the project are represented by the design of
ize the energy production in the energy system. At the same
time, the pilot plant will be the experimental model in which measurements and experimental
goal is to demonstrate the feasibility of the project through experimental
disseminating the obtained results towards industrial
and methods are
that is taken directly
the maximization of
technical state basis
efined purpose. Measurements,
s for monitoring
function of the
. Depending on the time
ided. Then a modular, adaptable
and heterogeneous communication system is implemented using TCP, UDP, IEC 61850
the identification of the energy
sources by realizing the
generation system is a complete and secure system
efficiency renewable sources, power storage and energy storage

468
Validation on a pilot plant of the original model proposed, the Energy System regarding
Power Maximization, represents the core and essence of the objectives and results of the
HORESEC project. The proposed storage and testing solutions will increase the
maneuverability of the system, proportionate and concomitant with the share and efficiency of
renewable energy sources, which can function to the maximum extent permitted by
environmental and climate factors. The project includes biomass and thermal-photovoltaic
regenerative hybrid solar systems in a total electrical and thermal energy balance, and
assesses the impact of renewable energy on the environment and climate.
HORESEC objectives have an indirect and international impact on interconnections
between Member States or between their energy networks. Considering the high level of the
produced energy control energy and the medium and long term storage capabilities, the
project achievements will contribute to smooth the load profile and implicitly to the cost
reduction.
The HORESEC project proposes a viable solution to achieve the EU's medium and long-
term objective of integrating a large proportion of renewable energy, in particular by using
variable energy sources that can be viable up to 90% in a stable and safe state.
Through the knowledge transfer made under the HORESEC project, a number of
companies with the headquarters in EU will be able to offer on the market competitive
products and services for the next 5 years - 10 years after the end of the project. A number of
physical products will be developed, and a number of algorithms and methods will be
developed and combined to provide new services. The non-academic partners of the
consortium can further develop these services to reach the market level within 5-10 years, as
most of them will reach the TRL5 or TRL6 phases according to the
application/implementation plan of each project.
The project presents a holistic approach to the interaction of energy with the environment
and the climate as well as a multidisciplinary one, so the project improves the concept of
innovation.
ACKNOWLEDGMENT
„This work was supported by a grant of the Romanian Ministery of Research and Innovation, CCCDI – UEFISCDI, project number PN-III-P1-1.2-PCCDI-2017-0404 / 31PCCDI/2018 and 37BMPNIII-P3-199/2016-I05.16.01, within PNCDI III”.
References [1] Innovative Energy Vector Hydrogen-Solid Biomass, PN-II-ID-PCE-2011-3-0698, Framework IDEI 2011, Grant IDEI-2011 no. 30/05.10.2011. [2] Lazaroiu, G., Pop, E., Negreanu, G., Pisa, I., Mihaescu, L., Bondrea, A., & Berbece, V. (2017). Biomass combustion with hydrogen injection for energy applications. Energy, 127, 351–357 [3] Pisa I., Lazaroiu G., Prisecaru T. (2014). Influence of Hydrogen Enriched Gas Injection upon Polluting Emissions from Pulverized Coal Combustion. International Journal of Hydrogen Energy, 39, 17702–17709 [4] Non-Polluting Technology for energy generation through intensified combustion in suspension/pulverized of sawdust – TAISRUG, Grant no. 22103/01.10.2008, CNMP Partnerships. [5] Lazaroiu G., Oprea I., Mihaescu L., Prisecaru T., Pisa I., Negreanu G., Mocanu C.R.(2012). Biomass Briquettes From Pitcoal-Wood: Boiler Test Facility Combustion Case Study. Journal of Environmental Protection and Ecology, 13, 1070-1081 [6] Alternative technologies to replace gaseous fuels through sustainable combined use of forestry and coal resources – TAIGUDREFOC, Grant no. 187, CEEX 2006 [7] Lazaroiu G., Mihaescu L., Pisa I., Pop E., Negreanu G., Berbece V. (2014). Hydrogen - An Energy Vector In Efficient Combustion of Energy Willow. 49th International Universities Power Engineering Conference (UPEC), Cluj-Napoca, Romania [8] Lazaroiu, G., Pană, C., Mihaescu, L., Cernat, A., Negurescu, N., Mocanu, R., & Negreanu, G. (2017). Solutions for energy recovery of animal waste from leather industry. Energy Conversion and Management, 149, 1085–1095 [9] Integrated energy module of 5kW based on fuel cells – Mener-5, Grant no. 21-034/18.09.2007.

469
BODIES SHAPE INFLUENCE ON THE EFFECTS PRODUCED
IN LIQUID ENVIRONMENTS
Lucian MÂNDREA1, Corina Alice BĂBUȚANU2, Cristian CONSTANTINESCU3 1Politehnica University of Bucharest,
Splaiul Independenței nr.313, sector 6, Bucharest, Romania 2National Institute for Research and Development in Electrical Engineering ICPE-CA,
Splaiul Unirii nr.313, sector 3, Bucharest, Romania 3Deo Design
ABSTRACT
The authors used three types of bodies which were rotated inside a vessel with water. The effects produced by each device were determined, using experiments. Conclusions about the practical utilization of each object for industrial use were obtained. The first one was a Rushton turbine, the second one a propeller with two blades and the third a body like a flying saucer. Each one has a different effect in a rotating fluid. The momentum and the power consumption were determined. Conclusions about how useful every type of object can be were drawn.
1. INTRODUCTION
According to the different necessities of a variety of industrial processes, different types of objects can be used to move fluids. Three objects with three different effects were used by the authors. The Rushton turbine and the two blades propeller can be used in mixing reactors. They create different types of mixing flows. The third object, like a flying saucer, is supposed to influence less the mixing process. Different types of impellers were used by the authors to study mixing processes before [1]. Aspects of mixing processes could be seen in articles published by other authors [2, 3, 4, 5, 6, 7]. The flying saucer can be used, instead, to warm the fluid from the inside. One of the effects of an impeller rotation is the increase of the fluid temperature. A tangential shear stress between the fluid layers leads to energy loss as heat. We can calculate the total amount of energy transformed into heat by rotating a disk with the diameter D in a cylinder as follows [1]. The disk placed at the distance h1 from the superior part of a cylinder and at the distance h2 from the bottom of the cylinder rotates in the water with the density ρ and the dynamic viscosity µ. If the rotating speed of the disk is n, the angular speed is ω and the tangential speed is v in a laminar flow, then the shear stress is given by the Newton law:
h
r
h
v ωµµτ == (1)
The momentum as Svτ and, then, the total power lost in the cylinder can be obtained [1]:
1Barlea 26, Bucharest, +40728098421, [email protected], [email protected]

470
( ) 5321160
DP ρωςςπ += (2)
With the value of this power, the total amount of heat produced in a certain time can be calculated.
2. METHODOLOGY
Three sets of experimental measurements were carried out in an experimental plant
presented in [1]. The experimental setup used is shown in Figure 1. It consists of a transparent cylindrical vessel with the ratio D/H of about 1.5 and a capacity of 0.126 m3. It is equipped with a variable speed motor on whose shaft bodies of different types and sizes can be fitted.
It has an electronic speed control and a panel which displays the rotational speed and the momentum produced by the bodies studied. Tap water was used under atmospheric pressure at a temperature of 20° C.
a. b.
Figure 1: The experimental setup: the two blades propeller (a) and the Rushton turbine (b).
Three bodies of significantly different shapes were used: a Rushton turbine with 105
mm diameter and 20 mm width, a two blades propeller with 160 mm diameter and 30 mm width and an ellipsoidal body with 160 mm diameter and 30 mm width in the center (a flying saucer shape). The bodies were tested in a speed range between 60 rpm and 600 rpm.
The measurements were made in six different points, vertically located on the center axis of the vessel, at 125, 135, 145, 155, 165 respectively 175 mm from the vessel bottom. For each body the mean value of the momentum was determined, for the specified speed range.
The momentum values obtained and the power consumption for each body are presented in Table 1.

471
Table 1: Momentum and power consumption for the objects studied
N [rpm]
Rushton turbine Two blades propeller Ellipsoidal body
Momentum mean value * 100
[N·m] P [W]
Momentum mean value * 100
[N·m] P [W]
Momentum mean value * 100
[N·m] P [W]
60 2.28 0.143 2.10 0.132 2.00 0.126 100 2.95 0.309 2.40 0.251 2.15 0.225 150 4.25 0.668 2.80 0.440 2.35 0.369 200 5.60 1.173 3.38 0.709 2.55 0.534 250 7.35 1.924 4.17 1.091 2.85 0.746 300 9.40 2.953 5.10 1.602 3.05 0.958 350 11.92 4.368 6.38 2.340 3.35 1.228 400 7.87 3.295 3.50 1.466 450 3.70 1.744 500 3.90 2.042 550 4.15 2.390 600 4.35 2.733
The variation of the power consumption depending on the engine speed and the shape of
the rotated body is shown in Figure 2.
Figure 2: The variation of the power consumption for the objects studied The Rushton turbine pushes the water mainly along the radius of its horizontal disk and needs higher power consumption, as we can see in Figure 2. The two blades propeller has a certain degree of reaction and sends the water downwards. Because the water is moved to the bottom of the vessel, less effort is made. It consumes less power, as shown in Figure 2. The flying saucer has the minimum effect in moving the water. Therefore, this ellipsoidal body requires minimum momentum and minimum power consumption. Instead, it is very

472
useful to heat slowly a fluid from the inside. More precisely, it can do that from the center of the fluid to the exterior. We would like to underline this important aspect, because fluids are usually heated from the exterior. The values of the resulting temperature variation calculated for 24 hours of functioning are shown in Table 2.
Table 2: The temperature variation for the ellipsoidal body
n [rpm] 60 100 150 200 250 300 350 400 450 500 550 600
∆t=Q/mc [°]
0.026 0.046 0.076 0.110 0.154 0.198 0.253 0.303 0.360 0.422 0.493 0.564
More than that, in the third case, the increase in temperature can be very slow. Or, if precise calculus is made, by rotating continuously the flying saucer inside the fluid, the temperature can be kept constant as long as the heat produced is equal with the heat lost through the vessel walls.
3. CONCLUSIONS
This paper presents the effects produced in a mixing vessel by rotating three bodies of different shapes. The best object that has been used in our study on mixing fluids was the Rushton turbine. Because it requires higher power consumption, the mixing effect will be better.
The second one, useful in mixing fluids is the two-blade propeller. It also has an increased capacity to rotate the fluid inside the vessel in the vertical plane.
The flying saucer is not so useful for mixing. Instead, it can be used for accurately heating a fluid from the inside to the outside.
Acknowledgement The research was conducted within NUCLEUS Program, contract no. PN18240202, Drives, analysis and control systems for increasing the energy efficiency of industrial equipment and
installations used in electrical engineering, mechatronics and fluidics financed by the Romanian Executive Agency for Higher Education, Research, Development and Innovation Funding.
References
[1] Mândrea L., Băbuţanu C., Oprina G., Impellers shape influence on the heat induced in liquid environments, proceedings of the 6th International Conference on Thermal Equipment, Renewable Energy and Rural Development TE-RE-RD 2017, 8-10 iunie 2017, Moeciu, România, ISSN 2359 – 7941 p. 77-82. [2] Butcher M., Eagles W., 2002, Fluid mixing re-engineered, Chemical Technology Journal, https://www.tcetoday.com/~/media/Documents/TCE/Articles/2002/733/733mixing1.pdf [3] Rashid T., Rizvi S.Z.H., Malik S.R, Study the effect of impeller design on power consumption, February2013, International Journal of Chemical and Environmental Engineering, Volume 4,No. 1, p. 21-24. [4] Furukawa H., Kato Y., Inoue Y., Kato T., Tada Y. and Hashimoto S., Correlation of Power Consumption for
Several Kinds of Mixing Impellers, Hindawi Publishing Corporation International Journal of Chemical Engineering, ISSN: 1687-8078 (Online), Volume 2012, Article ID 106496, 6 pages, doi:10.1155/2012/106496. [5] Adamiak R., Karcz J., Effects of type and number of impellers and liquid viscosity on the power
characteristics of mechanically agitated gas—liquid systems, J. Chem. Pap. (2007) 61: p. 16-23, doi:10.2478/s11696-006-0089-6. [6] Yoshida M., Ito A., Yamagiwa K.,OhkawaA.,Abe M., TezuraS. and ShimazakiM.,Effect of impeller
clearance on power consumption of unsteadily forward-reverse rotating multiple impellers in an unbaffled
agitation vessel, 2002, Latin American applied research,vol. 32, no, 2, ISSN online 1851-8796 p. 189-194. [7] Rao D. and Mahey C., Studies on Impeller Design on Power Consumption from Temperature Rise Data
In a Stirred Tank, AIChE Annual Meeting, Philadelphia PA, November 16-21, 2008, North American Mixing Forum (06), paper #434a, https://aiche.confex.com/aiche/2008/techprogram/S6955.HTM

473
COMPARATIVE ANALYSES OF AIR FLOW CHARACTERISTICS,
THROUGH TWO VARIANTS OF PROTOTYPED DEVICE FOR FINE
DUST PARTICLES CONCENTRATION MEASUREMENT
Mijorski S1., Ivanov M.
2
1PhD, SoftSim Consult Ltd., Consultant at Technical University of Sofia, FPEPM,
Department:”Hydroaerodynamics and Hydraulic Machines”, Sofia 1000, Bulgaria 2Senior Assist. Professor, PhD, Technical University of Sofia, FPEPM,
Department:”Hydroaerodynamics and Hydraulic Machines”, Sofia 1000, Bulgaria
ABSTRACT
In the recent years, it was documented that the main problem with the urban environment air
quality in Bulgarian cities are the exceeded concentrations of fine particulate matter and associated
human health related issues. With this, the need of gathering more detailed data and raising the city
population awareness for the ambient conditions in close to their homes have grown.
This paper presents an innovative measuring device, designed to raise the awareness of the
population about ambient air quality in the urban environment. A main aim of the study was better
understanding of the air flow through the prototyped device, in order to improve its performance with
means of numerical simulations. To achieve the goal, two design versions of the protective box were
assessed with CFD modelling. In the first one, there is a so-called “protective cavity” – a free volume
of air prior to the main sensor position. In the second design, this cavity does not exist and the sensor
contacts through extruded circular opening with the environment. A comparative analysis of the two
variants is represented by velocity and relative pressure fields’ visualizations.
1. INTRODUCTION
According to a recent World Health Organization (WHO) report, over 18 000 people die
prematurely every year in Bulgaria, as a result of the polluted air breathed during their lives
(WHO, 2016). The quality of the urban environment air is monitored by the Ministry of
Environment and Water, through the National Monitoring, Control and Information System.
However, there is no official data in the country, on the link between air pollution and the
citizen’s health (Melteva, 2016). In a number of reports from various departments, it is stated
that the main problem with the quality of the ambient air at the national level is the exceeded
concentrations of Fine Particulate Matter (FPM). According to European statistics, some of
the Bulgarian cities take the first places in Europe, considering the high levels of dust
concentration in the air (Melteva, 2016; Nikolova et. al., 2014).
FPMs are dangerous to human health and are most often associated with pulmonary
diseases. According to the European Lung Foundation (ELF), lung diseases account for 1/6 of
the total mortality in the world and are one of the most significant health problems both in
Europe and worldwide. It was documented that more than 600 000 people die of lung disease
in the EU Member States every year (ELF, 2013). However, it is also known that there is a
risk of occurrence of these illnesses even 30 years after the exposure to high levels of air
pollution.
2Sofia 1000, Bulgaria, “Kliment Ohridski” Blvd. #8, Technical University – Sofia, +359898240221, [email protected]

474
Moreover, it is important to mention, that between 1.5 and 2 million deaths per year were
reported globally, due to the polluted air in the indoor areas. The level of ambient air pollution
is directly related to the quality of the indoor air, inhaled by the occupants. In many cases,
more than 900 types of hazardous compounds are present in the indoor air, considered as
pollutants from different sources. The concentration of some of these pollutants can reach up
to 5 times higher than in the outside air. According to the WHO and ELF organisations, the
polluted air in the indoor environment is the eighth risk factor for disease occurrence and is
responsible for 2.7% of all diseases worldwide (ELF, 2013; WHO, 2016).
All mentioned in the above reveals the need for development of various engineering
solutions for better understanding of these issues. New, broad-based approaches are needed to
raise the awareness of the people for the quality of the air inside and outside of their homes.
This pointed to the purpose of the presented paper - to demonstrate an innovative solution for
increased awareness, by introducing an electronic measuring device, as well as the application
of Computational Fluid Dynamics (CFD) technologies to evaluate its performance in regards
of air flow characteristics assessment.
2. “DUST COUNTER” PROJECT
"Dust Counter" is an innovative project developed by Greenpeace Bulgaria
(www.greenpeace.org/bulgaria/bg/), together with "For the Earth" (www.zazemiata.org) and
"Robotev" (www.robotev.com), which aims to raise public awareness for the quality of
ambient air in the urban environment („Greenpeace-Bulgaria”, 2018). The global purpose of
the devices is to alert users for the presence of FPM air pollution above the pre-set limits in
close to their homes. However, these devices are nonprofessional, built on an open platform
(Arduino, https://www.arduino.cc/) and are fully oriented towards the citizens, not for the
scientific community.
The primary sensor for measurement of FPM from 2.5μm to 10μm - GP2Y1010AU0F
(Sharp) is compact and commercially available. It has been tested with the MIE pDR-1500
(Thermo Scientific) laboratory-calibrated professional measuring instrument and both devices
showed similarity in the response to the changes in the degree of dustiness in the tested
medium. However, due to the specifics of the project of this “do it yourself” device, the
measured data cannot be considered scientifically accurate and directly compared to
laboratory or professional calibrated instruments.
In January 2017, several pilot devices have been installed on the territory of Sofia, one of
them being at the Technical University of Sofia. The device was assembled by the team of
"Engineering Design Lab" (http://design.tu-sofia.bg/) and the design of the protective box was
created by Assoc. Prof. Georgi Chervadinev. The laboratory is able to prove the associated
design quality of the device, as shown in Georgieva, (2011), but the outer casing of the device
still needs to be assessed. It is the device's protective box that is the subject of the study in the
presented paper.
The shape and the type of the "Dust Counter" box are entirely open for free interpretation
by the users, which is the major inspirational idea in the project itself. The main components
of the device, such as the microcontroller circuit board, the Wi-Fi module, the FPM sensor,
the fan, the battery, and the wiring are fixed, but the boxes are open for interpretation. The
only requirement is that the FPM sensor and the fan contact freely with the environment. But
also, in order to ensure proper operation of the main sensor, the manufacturer imposes a
specific mounting position relative to the air flow through the sensor, which must also be
taken into consideration. It means that the correct design of the "Dust Counter" protective box
is a key factor for optimal performance of the device. This determines the aim and the tasks of
the presented numerical study.

475
3. AIM OF THE PRESENTED STUDY
The aim of the present study is to analyse the air flow through two versions of a
prototyped instrument for measurement of the ambient air FPM concentration. A comparative
analysis, based on the CFD methods, is performed to achieve the goal.
Two design variants of the outer case have been studied. In the first variant a so-called
“protective cavity” is introduced, which ensures an additional free volume of air before the
positioning the main sensor. In the second option, this cavity does not exist and the sensor
contacts through extruded circular opening with the environment. The comparative analysis of
the two variants of the protective box is represented by velocity and relative pressure fields
visualizations.
4. GEOMETRICAL MODEL AND BOUNDARY CONDITIONS
Two steady state simulations were conducted, to perform the comparative analysis
between the two versions of the prototyped device. In both simulations, an ENGYS®
(www.engys.com) version of the OpenFoam® computational code (www.openfoam.com)
was implemented. The numerical model used in the study is based on the Reynolds Averaged
Stress equations (RANS) method in combination with the k-ω turbulent SST (Shear Stress Transport) (Menter, 2011).
To ensure steady state conditions, 4000 iterations with simpleFoam solver
(OpenFOAM® UG, 2016-1) were conducted to reach a converged solution. An additional
1000 iterations were after that performed, to average and refine the fluctuations of the
simulated field values. The calculation and linking of the velocity and pressure equations was
accomplished by the SIMPLE algorithm. Detailed algorithm and solution relaxation factors
information is presented in (OpenFOAM® UG, 2016-3).
The computational domain is confined inside the prototyped device and protective box. It
comprises the beginning of the fan body, top cavity, protective cavity, and expansion box at
the bottom of the inlet port (Figure 1). The expansion box under the inlet port is designed to
reduce the impact of the CFD domain boundary conditions to the flow at the inlet section of
the device.
Figure 1. Geometrical model and computational domain

476
The computational domain was discretised with use of 1 730 000 control volumes for the
prototype with a protective cavity and 950 000 control volumes for the second prototype
without a protective cavity. The base cell size in the grid was 5 mm, but in order to precisely
simulate the geometry in the box, the cell size in this area was reduced to 0.155 mm and in the
boundary layer of the wall surfaces down to 0.0745 mm.
Three different boundary conditions were defined: smooth surface for all walls with
specified roughness of 0.001 m (sand grain roughness); fan area with outlet flow rate of 1.4
l/s; opening (free inlet/outlet) boundary condition at the inlets of the expansion box with a
defined relative pressure of 0 Pa and turbulent flow characteristics of 5.0%.
5. CFD RESULTS
The results from the numerical simulations are presented on Fig. 2 and 3, by the
visualized velocity and relative pressure fields. The visualisation of the numerical fields of the
prototyped device demonstrated a presence of a recirculation and low velocity zones in the
"protective cavity". This effect could contribute to stagnation and accumulation of particulate
matter in the protective cavity, which in turn could be a prerequisite for a faulty operation of
the FPM sensor and increased differential pressure the fan component of the device has to
overcome, leading to reduced flow of ambient air. These need to be considered in the design
and development of the "Dust Counter" protective boxes.
Figure 2. Velocity fields for the two prototyped devices
Overall, the numerical results do not show significant differences in the flow in the top
cavity of the box, just before the fan. Considering the small dimensions of the device and the
boundary condition for the smooth surface of the walls, there are no significant differences in
the pressure fields (Figure 3). The resulting flow pressure losses in both variants are identical,
taking into account the above mentioned boundary conditions. Additional studies, under
different boundary conditions would help to fine-tune the fan characteristics and to optimize
the overall performance of the device. This also would help in quantifying the differential
pressure that the fan has to overcome and whether this will lead to significant flow rate
reduction through the device in the assessed protective box models.

477
Figure 3. Pressure fields for the two prototyped devices
In order to completely assess the effect of the "protective cavity", an additional analysis is
needed, by means of the "Age of Air" parameter and passive scalar field calculation. This
additional processing module will visualize the "protective cavity" areas in which the air
would last for longer time and the FPM would stagnate and accumulate. Also, for a complete
assessment of the device performance, it is advisable to carry out a study with tracer particles
in the mainstream, which includes a modelling of FPM distribution.
6. CONCLUSIONS
Air flow, through two variants of a prototyped device for FPM concentration
measurement, was studied and a comparative CFD based analysis was performed.
Two variants of the design of the protective box were considered - with and without
"protective cavity", prior to the main sensor positioning. The comparative analysis between
the two variants demonstrates the presence of a low velocity in the box and a recirculation
zone in the "protective cavity". This effect would contribute to stagnation and accumulation
of particulate matter in the cavity, which in turn could be a prerequisite for improper
functioning of the FPM sensor.
The numerical results do not show significant differences in the flow in the top cavity of
the box, prior to the fan. Taking into account the small dimensions of the device and the
boundary condition for smooth surface on the walls, there are no significant differences in the
pressure fields. The resulting flow pressure losses in the two variants are identical, within the
assumed boundary conditions.
It is believed that the presented research study will facilitate the future development of the
protective boxes for the presented devices for measurement FPM concentration in the ambient
air.

478
References
[1] Georgieva B., “Theoretical Aspects of application of Engineering Value Analysis to
evaluation of design products”, 8th International Congress „Machines, Technologies,
Materials”, 18–21.09.2011, Varna, Bulgaria, year V, issue 8/2011, рр. 14-17, ISSN 1313-
0226, 2011;
[2] „Greenpeace-Bulgaria”, project: „Dust Counters“, http://www.greenpeace.org /bulgaria/
bg/novini/2016/prahobroyachi/, last visit: 25.03.2018г.;
[3] European Lung Foundation, “Lung health in Europe – facts and figures”, Report, ISBN 978-1-
84984-058-3, 2013;
[4] Melteva B., “Annually, over 18 thousand become victims of the polluted air in Bulgaria”,
www.dnevnik.bg, publication – 16. February. 2016г.;
[5] Menter F., “Turbulence Modelling for Engineering Flows”, ANSYS Inc. , 2011;
[6] Nikolova D., Tsvetkov А., Ganev P., Aleksiev Y., Slavova Z., „Regional profiles:
Development Indicators, Institute for Market Economics, ISBN 978-954-8624-40-4, 2014г.
[7] OpenFOAM® User Guide: 3.5 Standard solvers. http://cfd.direct/openfoam/user-
guide/standard-solvers/, 2016;
[8] OpenFOAM® User Guide: 4.5 Solution and algorithm control.
http://cfd.direct/openfoam/user-guide/fvSolution., 2016;
[9] World Health Organization, “Monitoring Health for the Sustainable Development Goals”,
Report, ISBN 978 92 4 156526 4, 2016;
479
ABOUT THE PROBLEMS IN LIGHTNING PROTECTION IN
PHOTOVOLTAIC POWER STATIONS
Ivaylo Nedelchev1
Technial University of Varna
ABSTRACT
One of the most used source of energy in so-called ”green power stations” are photovoltaic
stations (PVS). They are the main type of installations for generating energy from the Sun. Due to the
outdoor installation of the PVS equipment the forces of nature have influence on it and respectively
there is a risk of some kind of rejections or even material losses. The landscape environment such as
high hills, trees or ponds placed in dangerous proximity, often causes risk of direct or indirect
lightning strikes during the storm weather. This paper overview the physical aspect in case of big
lightning strike, considering the crucial factors which influence the process and gives a main approach
for preventing or restriction the damages in that type of incidents.
1. INTRODUCTION
One of the most used source of energy in so-called ”green power stations” are
photovoltaic stations (PVS). They are the main type of installations for generating energy
from the Sun. Due to the outdoor installation of the PVS equipment the forces of nature have
influence on it and respectively there is a risk of some kind of rejections or even material
losses. Well known fact is, that the surface of the PVS are spread onto a vast area. For big
PVS with peak power of 10 - 50 MWp are needed about 20 - 110 ha [1]. The PVS often are
located nearby hills, mountains or in a close proximity of the ponds or high objects: trees,
lines of the electro distributing companies. This landscape environment causes risk of direct
or indirect lightning strikes during the storms. According the standard IEC 62305-1,3:2006,
for the lightning protection levels (LPL from I to IV), the risk of lightning strike is between
1% and 16% [2]. The different statistical data show, that 5% - 15% from all lightning strikes,
which depends on the earth landscape, exceed 100 kA peak current [3, 4]. For minimizing the
risk for PVS equipment from overvoltage and inducted electrical and magnetic field of the
lightning strike, surge protection devices (SPD) with gas discharged tube (GDT) or metal-
oxide varistor element (MOV) are used [5]. There exist cases, when lightning strikes directly
within the area of the PVS. This causes a massive inflow of the charge into the ground, as
well as large conductive currents. This paper overview the physical aspect of the problem and
gives a main approach for preventing or restriction the damages in that type of cases.
2. OVERVIEW OF THE PROBLEM
In the PVS, the earthing system often is executed, as the net from welded metal busbars,
buried deep (1 m.) under the ground surface [1]. The lightning protection system (LPS)
consists of metal rods, on the spike of which, devises based on the early streamer emission
(ESE) technology are mounted [5]. Both earthing and lightning protection systems are not
connected with galvanic bond. Their earthing electrodes must be separated on the safety
1 Varna, Bulgaria, Technical University of Varna, 1 Studentska str., phone number +35952 383 249 email:

480
distance. In the precautions of the working regulation standards for designing the PVS, is used
term “safety insolation distance” [3, 6]. This is the distance between lighting protection
earthing electrode and close located metal element of the construction, which can prevent the
influence from the lightning, as flashover or inducted overvoltage. This distance is not strictly
defined. In some standards is mentioned to be minimum 2.5 - 5 m. This is crucial point in
case of accidental and extremely increasing discharge, which could be formed by lightning
strike. If the lightning current exceed the middle statistical value, then the supposed safety
distance, could be not sufficient for preventing damages in the equipment.
Probability distributions during the peak current of the lightning strikes to the ground’s
objects shows average peak current of 51 kA for negative and 38 kA for positive strikes.
Usually the number of the negative strikes on the ground is much more than the positive [3].
The main possibility of the influence over the PVS equipment includes two main ways:
• Inducted overvoltage. It occurs, when close located PVS elements (electrical or
constructive), are formed as a loop and placed close to the lightning protection system rods
(LPS).
• Via electrostatic field in the ground. The soil with its specific electrical parameters,
distribute the charge inflow in order to generate electrical potentials in buried metal parts
under the ground.
The more the number of the LPS rods is, the more the number of possible charge sources
in the PVS area are. The ESE technology minimizes the number of lightning rods in the area
of the PVS. If the earthing points of the LPS are not safety distanced from the parts of the
PVS equipment, then could be expected higher risk of the inducted overvoltage.
The main question is: in typical PV panels distribution within the area of the PVS, how can be
defined and calculated the safety distance between LPS electrodes from one side and parts of
the power equipment and earthing system from the other side.
An example distribution of the main units in the area of the PVS is given in the figures
below (Figure 1 a, b). Protective lightning rods are marked, including safety insolating
distances D1 from the metal construction of the PV panels and distance D2 from the closest
points of the foundation grounding net (FGN). These cases are the most common and
therefore the most important is to consider the interaction between this both systems -
earthing and lightning protection.
a) b)
Figure 1: Similar distribution of the ESE lightning rods into the PV panels area in one PVS
with insolation distances (D1) (a). Insolation distances (D2) of the LPS rods from the closest
points of the main element of the earthing system – foundation grounding net (FGN) (b).

481
Figure 2: Interaction of the LPS rod over the parts of the PVS
The position of the rods of the LPS is chosen, taking into account two main
requirements: the protective zones must cover the whole area of PVS and LPS rod’s shadows,
which fallen over the PV panels must reduce the generated power with minimum effect. The
distance between earthing points of the LPS and FGN, must be so large in order to reduce
lightning charge, distributed under the ground via soil resistivity [5]. The diagram of the
location and interaction between the LPS rod and PV system connected to FGN is shown on
the Figure 2. This is a typical case, which illustrate the electrostatic and the electromagnetic
interaction. The crutial factor influencing on the PV panels is the shape of the lightning
current, which main parameters are:
• peak current - Ip, kA - maximum value of the lightning current;
• rising time - τ1, µs - time for reaching peak current;
• fail time - τ2, µs - time to decay from peak to half-peak [4].
According IEC standard 61643-11 for testing surge protection devices, the main ratio for
τ1/τ2 should be exppressed with the next values: 10/350 µs and 8/20 µs [7].
3. PHYSICAL BASE OF THE LIGHTNING INFLUENCE
From Figure 2 is obvious that the metal frame of the PV panel construction is influenced
by the lightning current flowing through the LPS and by the voltage of the equipotential
surfaces formed into the soil under the ground. This process consists of two impacts:
• Influence due to the generated potential difference between two points, which belong
to the equipment of the PVS (e.g. grounded construction and conductive electrical line).
• Influence of the magnetic field of the current, passing through the LPS rod.
3.1. Influence of the electrical potential
The question about the distribution of the charge into the ground is very complex. To
simplify the situation it is assumed cylindrical form of the LPS rod, which will creates the
shape of the equipotential surfaces into the ground, composed geometrically of cylindrical and
half-sphere surfaces, as it is shown on the Figure 2 [8]. According the Ohm’s Law, the electric
field strength (E) could be expressed as the product of soil resistivity (ρ) and lightning current
density (j): jE ⋅= ρ . Therefore, with this type of LPS rod and shape of the equipotential
surfaces, the current density can be obtained as:

482
222 2.2 DHD
ij
⋅+⋅=
ππ, (1)
where i is the lightning current, D2 is the distance from the LPS rod, H is the depth of the LPS
rod. If the electrical potential in the far space point is accepted to be zero, than for the soil can
be written [8, 9]:
( )
+⋅
⋅⋅−=
⋅+⋅⋅== 1ln
222 222
22
22D
H
H
idD
DD
iEdDD
πρ
ππρϕ . (2)
The statistical data show that 5% of the lightning strokes are greater than 100 kA [3]. The
soil resistivity ρ depends on its type, salinity, moisture, temperature etc. It manifests
impedance behavior, which is frequency depending value. For surface type of soils its
average limit values for resistivity are assumed to be between 50 and 200 Ω·m [10, 11]. If the
depth of the LPS rod H is 2 m., can be calculated electrical potential into the ground. The
obtained results for the absolute value of the generated potentials ( )2Dϕ are represented in
the Table 1 and Figure 3. It is obvious that obtained values for the potentials exceed much
more the breakdown voltage of the PVS equipment.
Table 1: Electrical potential (φ(D2) )by resistivity 50 Ω·m and 200 Ω·m
ρ = 50 Ω·m ρ = 200 Ω·m
Ip, kA 51
( )2Dϕ , кV 104 68 37 26 19 415 273 148 102 77
D2, m 3 5 10 15 20 3 5 10 15 20
Ip,kA 100
( )2Dϕ , кV 203 134 73 50 38 813 536 290 199 152
D2, m 3 5 10 15 20 3 5 10 15 20
Figure 3: Dependence of the ground potential (φ) on the distance (D2) from the LPS rod
3.2. Influence of the magnetic field.
One of the main factors for the damages in the PVS is the slope of the lightning current
( dtdiS I = ). According to the standard lightning’s rising and decay times (τ1/τ2 = 10/350 µs)
and assumed average peak current (Ip = 51 kA), the front (SIF) and decay (SID) slopes are
calculated as: skAS IF µ 1.5= , skA 146.0 µ=IDS . The statistical data for less than 5% of the
lightning strikes show front current steepness above 100 kA/µs [3]. These values are most

483
important for estimation the influence of the current’s magnetic field, generated from the
lightning. The total inducted magnetic flux in the loop with sizes m/n (Figure 2) placed into
the PV panels area can be calculated as [8]:
+
+⋅⋅⋅=Φ
1
10 2
ln2 D
ma
Dni
πµ
(3)
where m (width) and n (height) are dimensions of the wiring loop, a is width of the PV panel,
D1 is distance to the LPS rod (Figure 2 a), µ0 is permeability of vacuum (4π·10-7
H/m). Thus,
the inducted electromotive voltage e(t) on the terminals of the loop with sizes m/n (Figure 2),
placed into the PV panel’s construction frame will be:
( )dt
di
D
ma
Dn
dt
dte ⋅
+
+⋅⋅−=Φ−=
1
10 2
ln2π
µ (4)
Depending on hookup configuration of the PV panels, the sizes and respectively the area
of the loop can vary in wide span. The average sizes of the panels are: a = 1 m., b = 1.5 m [1].
The maximum loop sizes m/n according the position of the panel’s junction box are: m ≈ a, n
= (0.7 ÷ 0.9)·b [1]. Thus m/n ≈ 1/1.2 m. The results for inducted maximum of the
electromotive voltage (EM) in distance domain D1, for two different sizes of the loop m/n =
1/0.1 m. and m/n = 1/1.2 m. are given in the Table 2 and Table 3 and respectively on the
graphs shown in the Figure 4 a), b).
Table 2: Results for EM by loop sizes m/n = 1/0.1 m.
D1, m 3 5 10 15 20
EM,V (by di/dt = 5.1 kA/µs) 41.4 26.8 14.3 9.7 7.4
EM,V (by di/dt = 100 kA/µs) 811 525 280 191 145
EM,V (by di/dt = 200 kA/µs) 1622 1050 559 381 289
a) b)
Figure 4: Dependence of the EM on the distance (D1) from the LPS rod (a). Dependence of the
EM on the distance (D1) from the LPS rod (b)

484
Table 3: Results for EM by loop sizes m/n = 1/1,2 m.
D1, m 3 5 10 15 20
EM,kV by di/dt = 5.1 kA/µs 0.5 0.32 0.17 0.12 0.09
EM,kV by di/dt = 100 kA/µs 9.73 6.3 3.35 2. 9 1.74
EM,kV by di/dt = 200 kA/µs 19.5 12.6 6.71 4.57 3.47
According to the SPD parameters, rated surge voltage (Us) is between 1.5 kV and 6 kV;
the lightning protection class define lightning current span from 3 kA to 200 kA [5]. The
obtained results show, that even by big loop area on average steepness of the lightning current
(5.1 kA/µs), SPD can suppress the inducted overvoltage, which is less than rated surge
voltage. Contrariwise, the case by big loop area combined with lightning current (with
steepness above 100 kA/µs) requires both: PVS equipment to be located more than 10 - 15 m.
from the LPS rod and usage of the higher class lightning protection devices.
4. CONCLUTIONS
The considered general cases of the extremely powerful lightning strikes represent one
physical interpretation of the typical incidents during the operation of the PVS, taking into
account accepted European lightning protection standards.
In the design process of each PVS, the influence of the next main factors on the equipment
and respectively on the power production must be considered:
• Type of the landscape – the proximity of the highest objects nearby the PVS;
• Parameters of the soil - moisture, resistivity, salinity, variation of the temperature
during the seasons;
• Steepness of the lightning current (regional statistical data).
• Peak of the lightning current (regional statistical data).
• The sizes of the conductive loops formed by the construction and electrical wires.
• The proper distribution of the LPS rods in order to be defined appropriate safety distances (D) – as much as it is possible.
Thus the risk form extremely high inducted overvoltage will be decreased to less than 1%
and the equipment losses could be minimized.
References
[1] Messenger R., Ventre J., “Photovoltaic Systems Engineering”, CRC Press, 2004
[2] IEC 62305-1 “Protection against lightning – Part 1: General principles”, IEC – standard, 2003
[3] International Council on Large Electric Systems. Available online: http://www.cigre.org/
[4] F.Heidler, Z.Flisowski, W.Zischank, Ch.Bouquegneau, C.Mazzetti “Parameters of Lightning Current Given
in IEC 62305-Bckground, Experience and Outlook”, 29-th International conference on Lightning Protection,
June 2008, Upsala.
[5] “Lightning protection guide”, Dehn&Söhne, 2014
[6] “Ordinance № 4 of 22 december 2010 on the protection of buildings, external equipment and open spaces”,
MRDPW, State Gazette No 6 of 11 January 2011.
[7] IEC 61643-11 “Low-voltage surge protective devices - Part 11: Surge protective devices connected to low-
voltage power systems - Requirements and test methods”, IEC – standard, 2011.
[8] R.G.Carter, “Electromagetism for Electronic Engineers”, Springer, 1992.
[9] Lilyanova I., Analytical approach for calculation of the electric field induced by an axisymmetric current
exciter, ”Electrical engineering”, ISSN 0861-4717,2015, vol.5-6, pp.2-8
[10] Md. Abdus Salam, Quazi Mehbubar Rahman, Swee Peng Ang, Fushuan WEN, “Soil resistivity and ground
resistance for dry and wet soil”, Mod. Power Syst. Clean Energy, 2017 vol.5, issue 2, pp.290–297.
[11] H. Zhivomirov, I. Iliev. Impedance Frequency Response Measurement with Matlab Implementation. Journal
of the Technical University of Gabrovo, ISSN: 1310-6686, 2016, vol. 52, pp. 61-65.

485
А STUDY OF THE TRANSIENT PROCESSES ON COMMUTATION OF
LOW VOLTAGE LOADS
Ivaylo Nedelchev1, Hristo Zhivomirov, Yulian Rangelov, Nikolay Nikolaev, Rosen Vasilev
Technical University of Varna
ABSTRACT
In the real-world operation of the common public consumer of energy is increasingly
encountered cases where the loads expressed capacitive or inductive type of features or generate
higher order frequency harmonics. Under these conditions, it is a common situation in which a sudden
change of the operation regime releases a large amount of stored energy in a short time and generates a
self-inductive voltages and high inrush currents. This paper examines the main parameters of the
transient processes which occurred during the commutation of the most common loads in the practice.
1. INTRODUCTION
Presently the common public consumer of energy is increasingly encountered cases
where the load has highly reactive type impedance or generates large bandwidth of harmonics
[1, 2, 3]. Under these conditions, is a common situation in which a sudden change of regime
releases a large amount of stored energy in a short period of time, generate self-inductive
voltages and high inrush currents. Change of the operating mode of the load is always
accompanied by a transient process, which consists in adding the transient component current
and voltage to their stationary component that depending on the parameters of the circuit has
critically-aperiodic, aperiodic or pseudo-periodic type [1, 2, 3]. This transitional component is
often expressed as generating pulses with high amplitude and fundamental frequency different
from the frequency of the power source. This makes circuit of the load and switch devices as
a source of interference with parameters that could affect the operation of close located
devises or cause damage and failures in nearby consumers or equipment. In this relation is
also staying the problem with the reaction of the conventional switching-protective devices.
Often it has slower reaction compared to the rise time of the inrush currents in the chain. This
report examines the main parameters of the occurred transient processes and interference
generated in the circuits, including various loads by type and power. Using data acquisition
system (DAQ), in real time are investigated transient processes which origin during the
commutation of the most common loads in practice.
2. STATEMENT
In this paper are considered the cases in which loads are switched at a nominal operating
voltage of 220/380 V. In the circuits of power distribution systems, the impedance of the load
most often has a mixed resistive-inductive character [1, 3]. One important element in such a
system is its power supply element – the transformer. It is a common case of the interruption
of the voltage of the power transformer. Important stages of the transient process are the
moments of commutation and the establishment of a static component. During the switching
1 Varna, Bulgaria, Technical University of Varna, 1 Studentska str., phone number +35952 383 249 email:
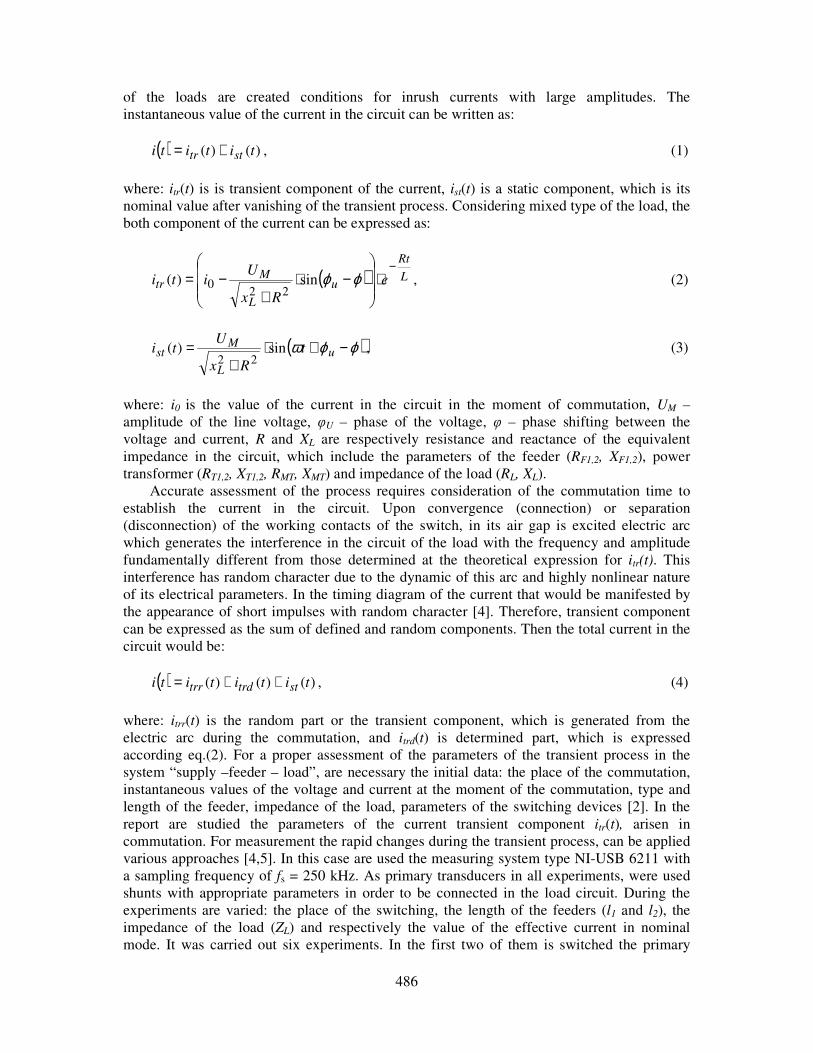
486
of the loads are created conditions for inrush currents with large amplitudes. The
instantaneous value of the current in the circuit can be written as:
( ) )()( tititi sttr += , (1)
where: itr(t) is is transient component of the current, ist(t) is a static component, which is its
nominal value after vanishing of the transient process. Considering mixed type of the load, the
both component of the current can be expressed as:
( ) L
Rt
u
L
Mtr e
Rx
Uiti
−⋅
−⋅
+−= ϕϕsin)(
220 , (2)
( )ϕϕω −+⋅+
= u
L
Mst t
Rx
Uti sin)(
22, (3)
where: i0 is the value of the current in the circuit in the moment of commutation, UM –
amplitude of the line voltage, φU – phase of the voltage, φ – phase shifting between the
voltage and current, R and XL are respectively resistance and reactance of the equivalent
impedance in the circuit, which include the parameters of the feeder (RF1,2, XF1,2), power
transformer (RT1,2, XT1,2, RMT, XMT) and impedance of the load (RL, XL).
Accurate assessment of the process requires consideration of the commutation time to
establish the current in the circuit. Upon convergence (connection) or separation
(disconnection) of the working contacts of the switch, in its air gap is excited electric arc
which generates the interference in the circuit of the load with the frequency and amplitude
fundamentally different from those determined at the theoretical expression for itr(t). This
interference has random character due to the dynamic of this arc and highly nonlinear nature
of its electrical parameters. In the timing diagram of the current that would be manifested by
the appearance of short impulses with random character [4]. Therefore, transient component
can be expressed as the sum of defined and random components. Then the total current in the
circuit would be:
( ) )()()( titititi sttrdtrr ++= , (4)
where: itrr(t) is the random part or the transient component, which is generated from the
electric arc during the commutation, and itrd(t) is determined part, which is expressed
according eq.(2). For a proper assessment of the parameters of the transient process in the
system “supply –feeder – load”, are necessary the initial data: the place of the commutation,
instantaneous values of the voltage and current at the moment of the commutation, type and
length of the feeder, impedance of the load, parameters of the switching devices [2]. In the
report are studied the parameters of the current transient component itr(t), arisen in
commutation. For measurement the rapid changes during the transient process, can be applied
various approaches [4,5]. In this case are used the measuring system type NI-USB 6211 with
a sampling frequency of fs = 250 kHz. As primary transducers in all experiments, were used
shunts with appropriate parameters in order to be connected in the load circuit. During the
experiments are varied: the place of the switching, the length of the feeders (l1 and l2), the
impedance of the load (ZL) and respectively the value of the effective current in nominal
mode. It was carried out six experiments. In the first two of them is switched the primary
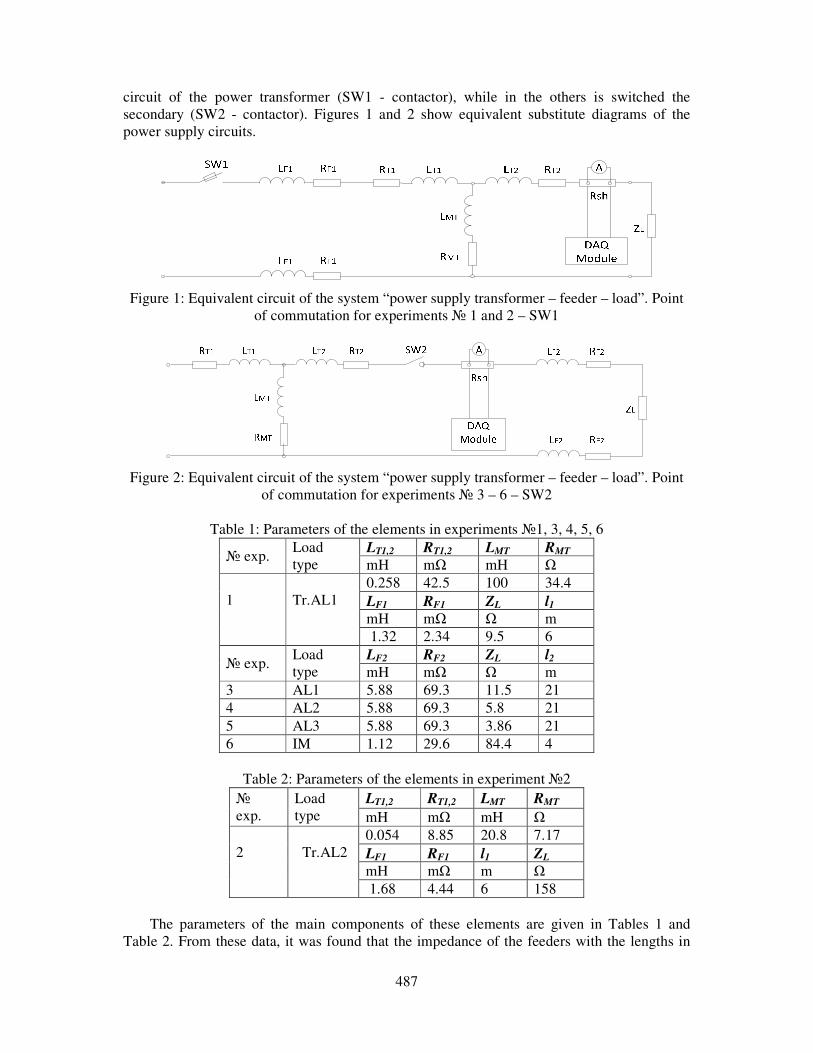
487
circuit of the power transformer (SW1 - contactor), while in the others is switched the
secondary (SW2 - contactor). Figures 1 and 2 show equivalent substitute diagrams of the
power supply circuits.
Figure 1: Equivalent circuit of the system “power supply transformer – feeder – load”. Point
of commutation for experiments № 1 and 2 – SW1
Figure 2: Equivalent circuit of the system “power supply transformer – feeder – load”. Point
of commutation for experiments № 3 – 6 – SW2
Table 1: Parameters of the elements in experiments №1, 3, 4, 5, 6
№ exp. Load
type
LT1,2 RT1,2 LMT RMT
mH mΩ mH Ω
1
Tr.AL1
0.258 42.5 100 34.4
LF1 RF1 ZL l1
mH mΩ Ω m
1.32 2.34 9.5 6
№ exp. Load
type
LF2 RF2 ZL l2
mH mΩ Ω m
3 AL1 5.88 69.3 11.5 21
4 AL2 5.88 69.3 5.8 21
5 AL3 5.88 69.3 3.86 21
6 IM 1.12 29.6 84.4 4
Table 2: Parameters of the elements in experiment №2
№
exp.
Load
type
LT1,2 RT1,2 LMT RMT
mH mΩ mH Ω
2
Tr.AL2
0.054 8.85 20.8 7.17
LF1 RF1 l1 ZL
mH mΩ m Ω
1.68 4.44 6 158
The parameters of the main components of these elements are given in Tables 1 and
Table 2. From these data, it was found that the impedance of the feeders with the lengths in

488
the experiments (l1, l2), are much smaller than those of the power transformer and loads.
Therefore, a major influence on the transient process would have the loads, transformer and
the point of switching in the circuit.
In experiments №1 and 2 the transformer is burden with resistive load (Tr.AL1,2), which
due to the highly inductive nature of the transformers practically is manifested as a reactive
load. In experiments № 3 - 5 is switched resistive load (AL1-3) in the secondary circuit of the
transformer and in experiment №6 - induction motor (IM).
The basic parameters of the current transient component in the circuit are:
- maximum of determined part of the current transient component - IMtrd;
- peak value of the current - IP - the maximum level of the current during the transient
process (by absolute value). This is the maximum value of the current transient
component IMtr;
- dynamic span of the transient process - DI - difference between the maximum and
minimum current value during the transient process;
- time constant of the transient process - τ1 - this is the time for attenuation of the IMtrd e
times;
- time to establish nominal mode - τ2 – this is the period between starting of the
commutation and the moment when in the chain is established nominal parameters.
Transient current component is completely vanished and it exist only the static
component;
- commutation time - Δτ - time to fully closing contacts of the contactor;
For clarity of the data, all defined peak parameters of the current (IP, IMtrd and DI) are
normalized by the amplitude of the current of the static component ist(t) - IMN.
3. RESULTS AND TIMING DIAGRAMS
The results obtained after conducting all experiments reveal the basic parameters of
transient process at the common cases in practice. In Figures 3 to 6 are presented
instantaneous values of the current during the commutations, and specific moments of
development of the transient processes for each of the six experiments.
a) b)
Figure 3: The moment of the switching the load Tr.AL1 on. Experiment №1(a). The both
components of the itr(t): itrr(t) and itrd(t) in the current timing diagram (b).
a) b)
Figure 4: The moment of switching the load Tr.AL2 on (a) and off (b). Experiment №2

489
a) b)
Figure 5: Transient process during the experiments № 3-5 (a); the moment of switching the
load AL1 on experiment №3 (b).
The received data for the main parameters of the transient process are summarized in
Table 4. The data show that the main parameters of the transient process are highly dependent
on the type of the load, and much less from the length of the feeder. In all experiments in the
current timing diagram is visible the appearance of the electric arc at the initial moment of
commutation. It is expressed by a series of short duration pulses added to ist(t) at the time
before switching - ist(-0) (Figure 3 b).
a) b)
Figure 6: Switching the induction motor (IM) on - transient component (a) and switching the
inductor motor off - the moment of commutation (b). Experiment №6
In the time domain are clearly visible both ingredients of the current transient component
- itrr(t) and itrd(t).Since the arc commutation is the nonlinear element connected in serial in the
substitute diagram and its dynamically changing parameters, these local peaks actually are
short, low-energy pulses before start of itr(t).
Table 3: Summarized data for the main parameters of the transient process
№ exp. IP/IМN DI/IМN IMtrd/IМN τ1 τ2 Δτ
- - - ms ms ms
1 on 38.6 45.3 5 200 1000 15
1 off 81.6 93.3 - - 40 5
2 on 32.1 54.3 6 10 66 20
2 off 13.2 13.2 - - 31 3
3 10.7 10.7 - - 1.5 1.5
4 2.65 2,65 - - 2 2
5 on 1.9 1.9 - - 2 2
5 off 1.15 1.15 - - 30 2.5
6 on 14.8 31.16 14.5 1250 1500 2
6 off 16.4 23.4 - - - 2
Actually, taking into account the duration of the transient process by the timing diagram
of the current for the origin could be considered the pulses generated by the arc and for the

490
end complete attenuation of itr(t). These peaks vanish after establishment of the full contact
between the working surfaces of the switching devices [6]. For the value of IP, IMtrr and τ2 is
essential the energy stored in the parts of the chain, which is determined by the self-
inductance of the load and the transformer. IMtrr and τ1 can be accurately indicated only in
experiments № 1, 2 and 6 in the switching on mode, because then the transition process is
more prolonged. In these cases, the reporting of these two parameters is impractical due to the
highly distorted nature of stationary and transient components of the process. In other cases
(exp. № 2, 3, 4 and 5), DI coincides with the IP, due to the rapid attenuation of itrd(t) to the
level of the rated current during the one period (Figure 5 b).
In experiments № 1, 2 and 6 (highly inductive nature of the load) transient processes last
comparatively for long periods and τ2 reaches values up to 1 – 1.5 s. When switching of the
resistive loads (exp. № 3 - 5), this period is much shorter - about 30 ms. The most heavy
mode for start-protecting equipment in terms of the duration of the transient process is
switching the inductor motor (exp. № 6).
4. CONCLUSION
Survey of the transient processes in the circuits supplied by transformers burden with
loads with inductive and resistive character of the impedance, indicates that in practice often
creates conditions for occurrence of commutation currents to the transient components whose
amplitudes and duration in many cases exceed the nominal parameters of the switching and
protective devices. This requires a special approach in the design of the power distribution
systems, taking into account the basic parameters of the transient process, the length of
feeders and type of load. Proper selection and point of commutation of the switching
equipment and the installation of appropriate protective elements would prevent damage in
the more sensitive consumers during unwanted switching operations. The results of
measurements provide guidance about the possibilities and limitations of using DAQ systems
in the study of complex processes in real physical models of electric power systems in the
laboratory.
Acknowledgements
This paper is a results from project “Study of the electric power system stability and
frequency control at a predominant share of renewable energy generation” grant
DN07/27/15.12.2016 from the Bulgarian National Science Fund.
References
[1] Gerasimov Kr., Kamenov Y., Modeling in the electrical power systems – lectures, Avangard Prima, Sofia
2007, ISBN 978-954-323-252-9.
[2] Notov P., Gerasimov Kr., Transient processes in electrical power systems, TU-Sofia 1997, ISBN 954-438-
205-4, 1997
[3] Preve C., Protection of Electrical Networks, ISTE Ltd 2006, ISBN-13: 978-1-905209-06-4.
[4] Nedelchev I., Zhivomirov H., Vasilev R. Processing of random signals, obtained by investigation of the
plazma coating systems with LabView software, Proceedings of International Scientific Symposium Electrical
Power Engineering 2014, pp. 143 - 147, ISBN: 978-954-20-0497-4, September 11 – September 13 2014.
[5] Rangelov, Y., Marinov A., Nikolaev N., Measurement and data logging system for specialized high voltage
equipment, SIELA 2016, 29 May -1 June 2016, Bourgas, Bulgaria. Proceedings of Digests, pp. 159-160, ISBN
978-619-160-648-1.
[6] Gerasimov Kr., Gerasimov K., Short-circuits in electrical power systems, TU-Varna 2016, ISBN 978-954-
20-0758-6.

491
PARTICLE COLLECTION EFFICIENCY ANALYSIS OF AN
ELECTROSTATIC PRECIPITATOR
Lizica-Simona Paraschiv1, Spiru Paraschiv
“Dunarea de Jos” University of Galati
ABSTRACT
Electrostatic precipitator is a highly efficient device for cleaning exhaust gases from industrial
processes. The present numerical study implies the calculating of the collection efficiency of an
electrostatic precipitator as a function of the electric field strength and particle migration velocity.
There are also presented the effects of particle size changes on calculated collection efficiency.
1. INTRODUCTION
Electrostatic Precipitators (EPS) have a wide use in various industries for pollution
control. Although large investments are necessary compared to other gas cleaning methods,
the cost of maintenance, high collection efficiency and the ability to operate under severe
conditions make the ESP the best solution for dedusting gases in power plants, cement
industry, steel industry and in the glass industry. The performance of electrostatic
precipitators depends on the properties of particulate matter, especially resistivity and particle
size.
The electrostatic precipitator works by applying energy to the particles that are collected
without significantly affecting the gas flow.
The electrostatically charged particles in the gas stream are attracted and deposited on the
collection plates. When enough particles have accumulated on the collection devices, they are
shaken off by mechanical devices. The particles fall into a hopper at the bottom of the device
where a conveyor system carries them away for disposal or recycling.
The most basic model of the precipitator consists of a row of thin vertical wires and a
stack of large flat metal plates (Fig.1). The distance between plates varies between 1 and 18
cm, depending on the application. The gas flows between the vertical flat plates and over the
wires. An electric charge of several thousand volts is applied between wires and plates to
remove impurities from the gas stream.
2. PRINCIPLES OF ELECTROSTATIC PRECIPITATOR
Electrostatic precipitation is a method of dust collecting using electrostatic forces and
consists of discharge wires and vertical flat plate collectors. A high voltage is applied to the
discharge wires to form an electric field between the wires and the collecting plates, which
results in ionization of the gas. When the gas containing solid particles flows between the
collecting plates and the discharge wires, the gas particles are charged with by the ions. The
Coulomb force produced by the electric field determines the collection of ionized particles on
the collecting plates, thus leading to gas purification (Fig. 2).
Electrostatic precipitators are important devices in the process of cleaning the flue gases.
They are very effective in reducing particle pollution, removing particles whose diameter can
1 [email protected]; Tel.: +40-766-255-759

492
be 0.01 microns. In addition, they can handle large volumes of gas at different temperatures
and variable flow, removing solid particles or liquid droplets.
Figure 1: Schematic diagram of a wire-duct electrostatic precipitator
Figure 2: Schematic diagram of particle motion in electric field (top view)
The precipitator efficiency is calculated using the simplified version of the Deutsch
equation is often applied:
1 expeff
Aw
Vη = − −
ɺ (1)
weff – effective migration rate
Grounded collector plates
Gas flow
Negatively charged electrodes
Plate + + + + + + + + + + +
Plate
Gas flow Discharge wire

493
Figure 3: Saturation charge as a function of electrical field strength
Figure 4: Migration velocities as a function of electrical field strength
The particle migration velocity is the most important parameter and is dependent on a
large number of features, such as: electric field strength, particle diameter, gas viscosity and
dust properties. The particle transport due to electric field strength is influenced by the
particle velocity due to the electrostatic force:
3
t
Q Ew
dπ η⋅=
⋅ ⋅ (2)
wt – theoretical migration velocity
Q – saturation charge
η - dynamic coefficient of gas viscosity
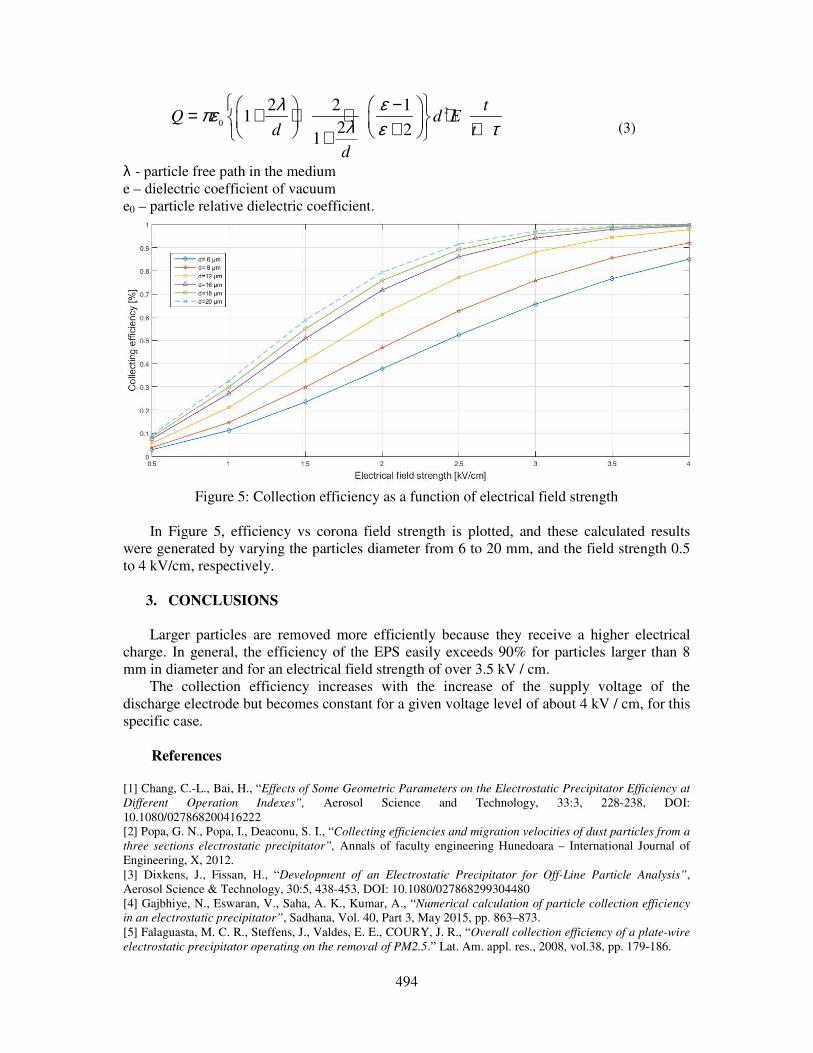
494
2
0
2 2 11
2 21
tQ d E
d t
d
λ επε λ ε τ − = + + ⋅ ⋅ + + + (3)
λ - particle free path in the medium
e – dielectric coefficient of vacuum
e0 – particle relative dielectric coefficient.
Figure 5: Collection efficiency as a function of electrical field strength
In Figure 5, efficiency vs corona field strength is plotted, and these calculated results
were generated by varying the particles diameter from 6 to 20 mm, and the field strength 0.5
to 4 kV/cm, respectively.
3. CONCLUSIONS
Larger particles are removed more efficiently because they receive a higher electrical
charge. In general, the efficiency of the EPS easily exceeds 90% for particles larger than 8
mm in diameter and for an electrical field strength of over 3.5 kV / cm.
The collection efficiency increases with the increase of the supply voltage of the
discharge electrode but becomes constant for a given voltage level of about 4 kV / cm, for this
specific case.
References
[1] Chang, C.-L., Bai, H., “Effects of Some Geometric Parameters on the Electrostatic Precipitator Efficiency at
Different Operation Indexes”, Aerosol Science and Technology, 33:3, 228-238, DOI:
10.1080/027868200416222
[2] Popa, G. N., Popa, I., Deaconu, S. I., “Collecting efficiencies and migration velocities of dust particles from a
three sections electrostatic precipitator”, Annals of faculty engineering Hunedoara – International Journal of
Engineering, X, 2012.
[3] Dixkens, J., Fissan, H., “Development of an Electrostatic Precipitator for Off-Line Particle Analysis”,
Aerosol Science & Technology, 30:5, 438-453, DOI: 10.1080/027868299304480
[4] Gajbhiye, N., Eswaran, V., Saha, A. K., Kumar, A., “Numerical calculation of particle collection efficiency
in an electrostatic precipitator”, Sadhana, Vol. 40, Part 3, May 2015, pp. 863–873.
[5] Falaguasta, M. C. R., Steffens, J., Valdes, E. E., COURY, J. R., “Overall collection efficiency of a plate-wire
electrostatic precipitator operating on the removal of PM2.5.” Lat. Am. appl. res., 2008, vol.38, pp. 179-186.

497
MODELLING AND CONTROL OF A DC MOTOR
Catalina Alexandra Sima1, George Cristian Lazaroiu
1,2,
Virgil Dumbrava1, Mihai Tirsu
3, Victor Galbura
3
1University POLITEHNICA of Bucharest, Romania
2University MARITIMA of Constanta, Constanta, Romania
3Institute of Power Engineering, Academy of Sciences of Moldova, Moldova
ABSTRACT
In this paper, the modelling and control of a DC motor using MATLAB software (Simulink and
SISO Design Tool) is carried on. The Simulink environment is used for modeling the motor and SISO
Design Tool is used for controlling the motor by automate tuning of the controllers. The tuned
controllers are PI (Proportional-Integral), PD (Proportional-Derivative) and PID (Proportional-
Integral- Derivative). The controllers need to be tuned for improving the performance of a system and
designing the controller requires system mathematical modeling.
1. INTRODUCTION
A DC motor is a rotary electrical machine that converts direct current into mechanical
energy, being the first type widely used as are powered from existing DC distribution
systems. The speed of a DC motor can be controlled by means of a variable supply voltage or
by modifying the magnitude of the winding current. It is important to control the considered
motor by choosing the suitable type of the controller and tune it properly in order to increase
the system’s performance. In this paper, for controlling the DC motor, two cases are
considered: first one is where motor’s inductance is neglected and the resulted function is a
1st order function, while the second one is where the motor’s inductance is not neglected and
the resulted function is a 2nd
order one. In order to be able to design the controller it is
necessary to model the system first. In this paper, the modeling and control of a DC motor is
described. The electric circuit of the DC motor is presented in Fig. 1. The battery is
represented by a voltage source with voltage Vs.
There are many types of controllers that can be used for controlling the desired system. It
is important to be able to choose the type that provides the best performance of the considered
system. In this paper, three controllers are considered, PI (proportional-integral), PD
(proportional-derivative) and PID (proportional-integral-derivative). These controllers are
simple and popular for industrial applications and for SISO systems. The tuning process
represents the adjustment of the controller’s parameters (gains KP, KI and KD) in order to
satisfy the analyzed motor, each gain is corresponding to each type of the considered
controllers. By the increasing of the proportional gain K� the rise time is modifing and with
the increase of the integral gain KI the steady-state error is smaller but the overshoot is
increasing. The derivative gain KD is improving the dynamic component (the overshoot and
the settling time), but it introduces a large steady-state error. It can be noticed that by
combining the effects of components P, I and D the system shows superior performances in
both steady-state and transient regimes. It is known that for obtaining an increasing
performance of the system, to use a PID controller is recommended [1-3].
Simulink environment and SISO Design Tool from MATLAB software are used for
modeling and controlling of the motor. Simulink is a graphical environment for modeling,
simulating and analyzing systems. SISO Design Tool is an application in which is possible to

design and analyze single-input, single
tuning models. The equations that characterize the function of the DC motor will be described
in the following [5-7].
Figure 1: Electric circuit that describes the DC motor
2. MODELLING AND CONTROL
Starting with the scheme illustrated
following:
- expression of the motion (Electrical)�� � �� � �� � �where Ve – back electromotive force (back
voltage at resistor’s terminals; V
through the DC motor; K� – back
- expression of motion (Mechanical) �where T – torque; T – motor bearings torque;
dissipation (viscous friction in motor bearings); J
- Thus, the combined equations of
�- Hence: � ����� ������ � ���
where s – Laplace operator; Ω – angular velocity in s
The equation of motion (Mechanical) ��� Thus, the combined equations of motion������� ����
����� ∙ �� � �� � ��� By neglecting the impedance� ! 0 # �� ∙
498
input, single-output controllers using graphical and automated
tuning models. The equations that characterize the function of the DC motor will be described
Figure 1: Electric circuit that describes the DC motor
LING AND CONTROL
illustrated in Fig. 1, the DC motor model is determined as the
motion (Electrical) - Kirchhoff’s Law: �$ 0 # �� � � %�%& � �� � �'( 0
force (back-emf); VL – voltage at inductor’s terminals; V
voltage at resistor’s terminals; Vs – voltage source; L – inductance; R – resistance;
back-emf constant; ω – angular velocity in time-domain.
of motion (Mechanical) – Torque Balance:
� � * # ��� � ( � %(%&
motor bearings torque; T+ – load torque; K, – torque constant; b
dissipation (viscous friction in motor bearings); J – moment of inertia.
equations of motion are:
�� %�%& � �� � �'( ��� %(%& � ( ��� -
� � � ����� � ����� � �$��� 0� ������ � ����� � �'��� 0- angular velocity in s-domain.
of motion (Mechanical) – Torque Balance is: � ��� ���� � *�������� � Ω��� ��Ω���-
equations of motion are: � � � ����� � �.��� �������� � �s� ������ - #
� � �0 ∙ � � � � ���'� 01 Ω��� ��� �������� � � ∙ Ω��� ������ - impedance can be obtained: ∙ � � � � ���'� 01 Ω��� ��� �����
rollers using graphical and automated
tuning models. The equations that characterize the function of the DC motor will be described
model is determined as the
(1)
voltage at inductor’s terminals; VR –
resistance; I – current
domain.
(2)
torque constant; b –
(3)
(4)
(5)
(6)
(7)
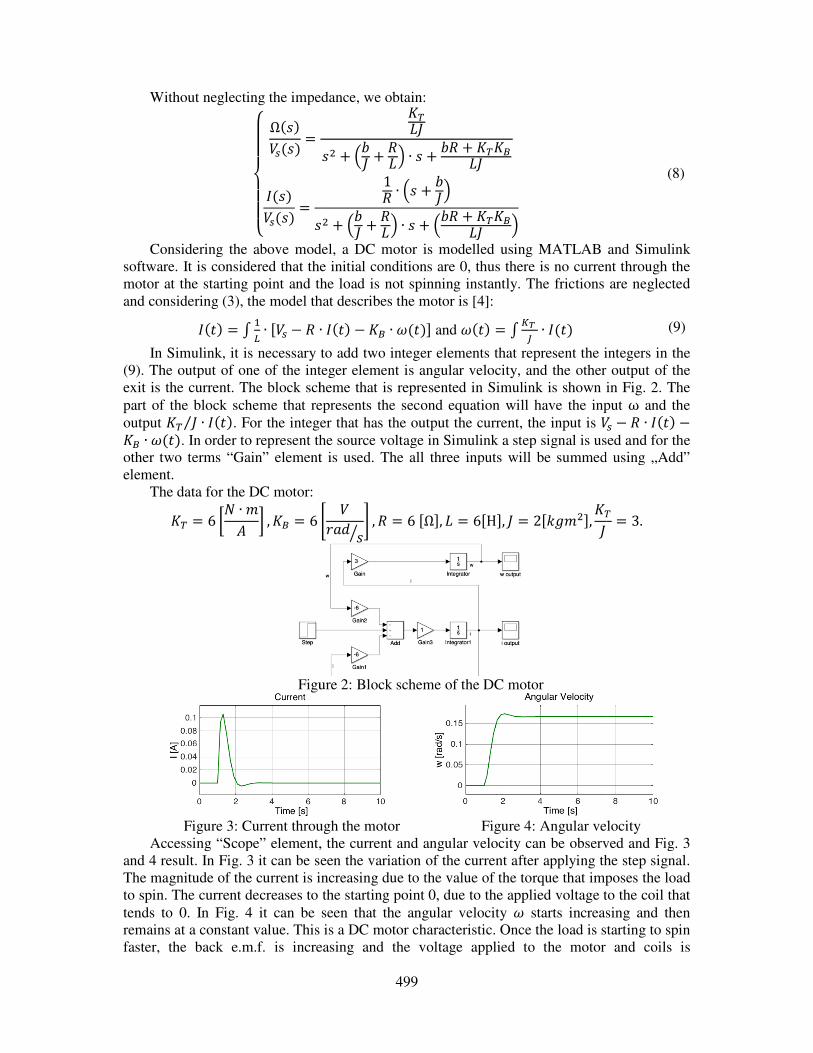
Without neglecting the impedance,
⎩⎪⎪⎨⎪⎪⎧ Ω��������
��������� �Considering the above model,
software. It is considered that the initial conditions are 0, thus there is no current through the
motor at the starting point and the load is not spinning instant
and considering (3), the model that describes the motor is��&� 7 8� ∙ 9�� � � ∙In Simulink, it is necessary to add two integer elements
(9). The output of one of the integer element
exit is the current. The block scheme that is represented in Simulink
part of the block scheme that represent
output �� �⁄ ∙ ��&�. For the integer that has the output the current, the input is �' ∙ (�&�. In order to represent the source voltage in Simulink a step signal
other two terms “Gain” element is
element.
The data for the DC motor: �� 6 �< ∙ => 1 , �' 6 @
Figure 2
Figure 3: Current through the motor
Accessing “Scope” element, the current and angular velocity can be observed and Fig. 3
and 4 result. In Fig. 3 it can be seen the variation of the current after applying the step signal.
The magnitude of the current is increasing due to the value
to spin. The current decreases to the starting point 0, due to the applied voltage
tends to 0. In Fig. 4 it can be seen that the angular velocity
remains at a constant value. This is a DC motor characteristic.
faster, the back e.m.f. is increasing and the voltage applied to the motor and coils is
499
impedance, we obtain: � ������ � A � � ��B ∙ � � � � ���'��1� ∙ A� � �B�� � A � � ��B ∙ � � A � � ���'�� B
- Considering the above model, a DC motor is modelled using MATLAB and Simulink
the initial conditions are 0, thus there is no current through the
motor at the starting point and the load is not spinning instantly. The frictions are neglected
that describes the motor is [4]: ∙ ��&� � �' ∙ (�&�D and (�&� 7 EF * ∙ ��&�
it is necessary to add two integer elements that represent the integ
The output of one of the integer element is angular velocity, and the other output of the
The block scheme that is represented in Simulink is shown in Fig. 2
scheme that represents the second equation will have the input
For the integer that has the output the current, the input is �the source voltage in Simulink a step signal is used and for the
“Gain” element is used. The all three inputs will be summed using „Add”
@ �HI% �J K , � 6 9ΩD, � 69HD, � 29NO=�D, ���
Figure 2: Block scheme of the DC motor
Figure 3: Current through the motor Figure 4: Angular velocity
Accessing “Scope” element, the current and angular velocity can be observed and Fig. 3
it can be seen the variation of the current after applying the step signal.
The magnitude of the current is increasing due to the value of the torque that imposes the load
to spin. The current decreases to the starting point 0, due to the applied voltage to the coil that
it can be seen that the angular velocity ( starts increasing and then
e. This is a DC motor characteristic. Once the load is starting to spin
the back e.m.f. is increasing and the voltage applied to the motor and coils is
(8)
ng MATLAB and Simulink
the initial conditions are 0, thus there is no current through the
ns are neglected
(9)
the integers in the
and the other output of the
is shown in Fig. 2. The
the input ω and the �� � � ∙ ��&� �is used and for the
he all three inputs will be summed using „Add”
D � 3.
velocity
Accessing “Scope” element, the current and angular velocity can be observed and Fig. 3
it can be seen the variation of the current after applying the step signal.
of the torque that imposes the load
to the coil that
starts increasing and then
Once the load is starting to spin
the back e.m.f. is increasing and the voltage applied to the motor and coils is

500
decreasing. The angular velocity reach a steady state value when the voltage applied to the
coil is 0 and the back e.m.f. is big enough. The current is 0 due to the fact that the voltage
through the coils is 0. This is an ideal model and the friction is not modelled, thus the load
will not continue to spin like it’s happening to a real model. In this case, the value of the
angular velocity will decrease and the value of the current won’t be 0. The value will be high
enough in order to overcome the friction, in this case the friction is neglected so the current is
0, due to the fact that the once the motor is rotating it is not necessary to add extra energy to
maintain the motor rotating.
For the control of the DC motor it is used “SISO Design Tool” from MATLAB software.
This tool can automatically tune the considered controllers of the DC motor. It is considered a
closed-loop for designing the controllers. The value that is controlled is the motor speed. The
DC motor will be represented by a transfer function that describes a mathematical view of the
inputs and outputs of a DC motor and the way they influence each other. The input of the
system is the voltage source and the output of the system is angular velocity.
From (7) results the first order transfer function of the DC motor with the impedance and
friction neglected and the second order function of the DC motor where only the friction is
neglected: Ω�������� ����� � �� ∙ �'
Ω�������� ������ � � �� � �� ∙ �'��
(10)
Three types of controllers are simulated. The controllers were tuned automatically with
the help of „SISO Design Tool” from MATLAB software. The admissible bandwidth is
considered ±10%yUV. In the analyzed cases yUV 1.
The overshoot and steady-state error are computed with: W XY�Z � Y[\]Y�Z X ∙ 100 9%D ^�Z _Y`$a � Y�ZY`$a _ ∙ 100 9%D (11)
where ybcd – the maximum value of the output signal; yUV – steady state output signal; W –
overshoot; ^�Z – steady-state error.
In the following PI, PD and PID controllers are automatically tuned with „SISO Design
Tool”. Table 1 reports the controller’s characteristics. Analyzing Figs. 5-8 and Table 2, it can
be seen that the PID controller provides the best system response. PD controller provides the
smallest settling time (tt) and overshoot but the steady-state error is not 0. Regarding these
aspects, PID controller is recommended for controlling a DC motor due to the fact that it is
characterized by the smallest values for the settling time and overshoot, also with no steady-
state error.
Table 1: Controller characteristics
Controller �e �f �g Transfer Function
PI 6,20 56,31 - h��� 56,31 ∙ 1 � 0,11��
PD 425,56 - 0 h��� 425,46
PID 8,03 48,1 -0,09 h��� 48,124 ∙ �1 � 0,068�� ∙ �1 � 0,19����1 � 0,088��

The results of the simulation considering the first order function
8.
Figure 5: The response to step command
with PI tuned controller
Figure 7: The response to step command
PD tuned controller
Table 2
Controller ^�Z9PI 0
PD 1,4
PID 0
The results of the simulation considerin
9-11.
Figure 9: The response to
step command with PI tuned
controller
It can be seen that the PID controller provides the
for the second order function. The gains values are different due to the order of the transfer
function. Table 3 reports the characteristics of the tuned controllers and Table 4 provides the
system performance. Analyzing Fig
provides the best system response. PID controller has no steady
settling time. The smallest overshoot is provided by the PI controller, but it has a bigger
PD
response
system
response
PI
response
system
response
501
The results of the simulation considering the first order function are illustrated in Figs. 5
Figure 5: The response to step command
with PI tuned controller
Figure 6: The response to step command
with PID tuned controller
The response to step command with
tuned controller
Figure 8: The system response to step
command with PD tuned controller
Table 2: System performance 9%D &Z 9�D W9%D Y[\] Y`$a Y�Z
0 0,76 13,8 1,138 1 1
1,4 0,01119 0 0,986 1 0,986
0 0,32 7,83 1,0783 1 1
The results of the simulation considering the second order function are illustrated in Figs.
Figure 10: The system
response to step command
with PD tuned controller
Figure 11: The
response to step command
with PID tuned controller
at the PID controller provides the most performing system
for the second order function. The gains values are different due to the order of the transfer
the characteristics of the tuned controllers and Table 4 provides the
system performance. Analyzing Figs. 9-11 and Table 4, it can be seen that the PID controller
provides the best system response. PID controller has no steady-state error and the smallest
settling time. The smallest overshoot is provided by the PI controller, but it has a bigger
PI
response
system
response
response
system
response
are illustrated in Figs. 5-
Figure 6: The response to step command
tuned controller
response to step
tuned controller
are illustrated in Figs.
Figure 11: The system
response to step command
D tuned controller
system response also
for the second order function. The gains values are different due to the order of the transfer
the characteristics of the tuned controllers and Table 4 provides the
be seen that the PID controller
state error and the smallest
settling time. The smallest overshoot is provided by the PI controller, but it has a bigger
PID
response
system
response

502
settling time compared to the PID controller. Regarding these aspects, the PID controller
determines the best system response.
Table 3: Controller characteristics
Controller �e �f �g Transfer Function
PI 5,66 18,285 - h��� 18,285 ∙ 1 � 0,31��
PD 667,96 - 16,03 h��� 667,96 ∙ 1 � 0,024�1
PID 12,9 38 1,09 h��� 38,021 ∙ �1 � 0,34� � �0,17�����
Table 4: System performance
Controller ^�Z9%D &Z 9�D W9%D Y[\] Y`$a Y�Z
PI 0 0,5 6,35 1,0635 1 1
PD 0 0,0245 20,6 1,206 1 1
PID 0 0,3073 7,83 1,06 1 1
3. CONCLUSIONS
For improving the system performance, it is necessary to consider the type of the
controller and its tuning. For a DC motor the suited type of the controller is the PID one due
to the performant system response. The stability of the system is observed through the figures
resulted from the simulation. Before it is possible to consider the control of the system it is
necessary to model it. In this paper, the modelling and the control of a DC motor are
presented. The friction is neglected and two types of transfer functions that describe the motor
are considered. The first one is a 1st order one where the inductance is neglected, and the
second one is 2nd order one were the inductance is not neglected. Considering the inductance,
the model is becoming more complex and the response of the system is more accurate and
improved, but the resulted type of the controller is the same, the PID controller.
Acknowledgement
This work was supported in part by a grant of the Romanian Ministry of Research and
Innovation, CCCDI – UEFISCDI, project number PN-III-P1-1.2-PCCDI-2017-
0404/31PCCD/2018, within PNCDI III and 37BMPNIII-P3-199/02.09.2016.
References [1] Ababei, S., Systems theory and automation elements (in Romanian: Teoria sistemelor si elemente de reglaj
automat, Publishing House TEHNICA-INFO, Chisinau, 2006.
[2] Voicu, M., Analysis techniques of automation systems (in Romanian: Tehnici de analiza a stabilitatii
sistemelor automate), Publishing House TEHNICA, Bucharest, 1986.
[3] *** Fixed structure controllers P, PI, PD, https://www.scribd.com/doc/124897696/Teoria-sistemelor-de-
reglare-automata-regulatoare-PI-si-PID
[4] Hover, F., Gossard, D., Barbastathis, G., Dynamics and Control II, https://ocw.mit.edu/courses/mechanical-
engineering/2-004-systems-modeling-and-control-ii-fall-2007/
[5] Balestrino, A., Crisostomi, E., Advanced PID controllers in MIMO systems, Power Electronics Electrical
Drives Automation and Motion (SPEEDAM), August, 2010.
[6] Osorio, L., Mendes, J., Araujo, R., Matias, T., A comparison of adaptive PID methodologies controlling a
DC motor with a varying load, October, 2013.
[7] Naung, Y., Schagin, A., Oo, H. L., Ye, K. Z., Khaing, Z. M., Implementation of data driven control system of
DC motor by using system identification process, IEEE Conference of Russian Young Researchers in Electrical
and Electronic Engineering (EIConRus), Moscow and St. Petersburg, 2018.

503
CONSTRUCTION LOG BOOK – A WEB-BASED APPLICATION THAT
SUPPORTS A BUILDING ON ITS ENTIRE LIFE-CYCLE
Ioana Udrea*1
, Valeru Kraus2
1,2ASC-Romania, 9 Stefan Marinescu Street, District 6, 060121, Bucharest, Romania
ABSTRACT
According to the Romanian legislation, Construction Log Book (CLB) contains, in a
standardized form, information related to the entire life-cycle of a building. This paper presents a web-
based application designed to improve CLB document management. For each specific CLB project,
the system proposes a standardized structure of documents with mandatory and optional entries.
Legislative references and a synthesis of them (necessary documents, completion forms, standard
forms) are given for various types of documents. The documents are indexed according to many
attributes and a complex search system is developed. Based on a requirement study, a concept model
of information flow in Acceptance upon Work Completion and Final Acceptance was developed.
CLB sustains construction projects on entire building life cycle and in all construction phases. It
realized an intelligent structure of documents that could be useful to architects, engineers,
constructors, building developers, owners of buildings and others. Similar documents could be
compared easily and application generated reports related to different CLB projects. Also, the data
included in CLB could be the necessary information for development of Building Information Models
(BIM).
1. INTRODUCTION
In the last years an increase of informatization in knowledge management in construction
industry can be noticed [1]. In the past there has been no structured approach to learning from
construction projects once they are completed. In [2] Tupenaite declares that the importance
of information management in construction fields is observed in development of Web-based
distributed document management applications. In [3] authors present a business case in the
construction sector, where they have designed and prototyped an innovative Web-based
distributed document management application. They opened the document management
services to other information systems, especially the ones used internally by some of their
partners. Another research [4] presents a web database for document management in small
and medium-sized enterprises of the construction sector in Spain. A survey was conducted to
define the rules on how to organize all the information related to a project. In the end, a
concept model of information flow was developed and implemented in a web-based tool,
designed according to current standards and theories of classification and organization of
information related to construction.
Concerning the need of centralized database related to Romanian construction industry, there
is a need for developing an integrated management system for Construction Log Book.
The new Romanian Legislation, “Regulation Related to Construction Reception”, enforce as
of 2017 [5] and approved by [6], specifies that for new constructed building and for all
existing buildings (after January 2018), CLB must exist and be done in accordance with the
new Regulation. For this purpose, we developed a Web-based application that responds to this
need.
* Corresponding author: PhD. Ioana Udrea Tel.: +040 744 661303
E-mail address: [email protected]
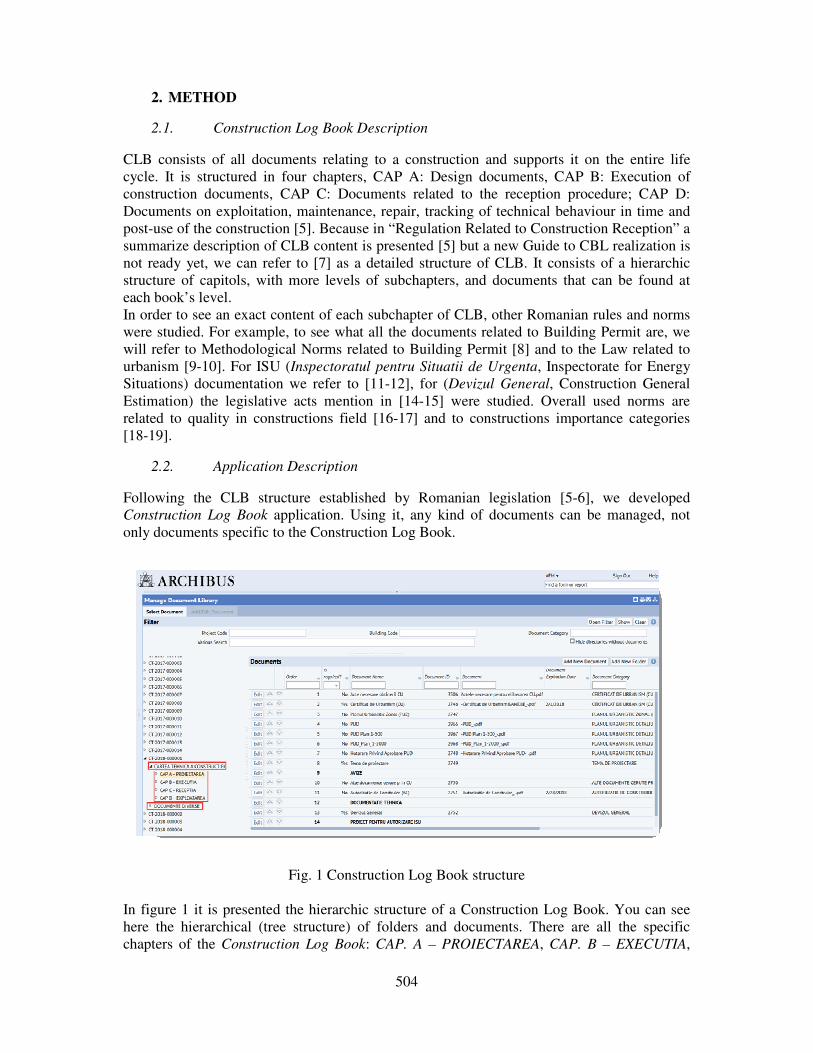
504
2. METHOD
2.1. Construction Log Book Description
CLB consists of all documents relating to a construction and supports it on the entire life
cycle. It is structured in four chapters, CAP A: Design documents, CAP B: Execution of
construction documents, CAP C: Documents related to the reception procedure; CAP D:
Documents on exploitation, maintenance, repair, tracking of technical behaviour in time and
post-use of the construction [5]. Because in “Regulation Related to Construction Reception” a
summarize description of CLB content is presented [5] but a new Guide to CBL realization is
not ready yet, we can refer to [7] as a detailed structure of CLB. It consists of a hierarchic
structure of capitols, with more levels of subchapters, and documents that can be found at
each book’s level.
In order to see an exact content of each subchapter of CLB, other Romanian rules and norms
were studied. For example, to see what all the documents related to Building Permit are, we
will refer to Methodological Norms related to Building Permit [8] and to the Law related to
urbanism [9-10]. For ISU (Inspectoratul pentru Situatii de Urgenta, Inspectorate for Energy
Situations) documentation we refer to [11-12], for (Devizul General, Construction General
Estimation) the legislative acts mention in [14-15] were studied. Overall used norms are
related to quality in constructions field [16-17] and to constructions importance categories
[18-19].
2.2. Application Description
Following the CLB structure established by Romanian legislation [5-6], we developed
Construction Log Book application. Using it, any kind of documents can be managed, not
only documents specific to the Construction Log Book.
Fig. 1 Construction Log Book structure
In figure 1 it is presented the hierarchic structure of a Construction Log Book. You can see
here the hierarchical (tree structure) of folders and documents. There are all the specific
chapters of the Construction Log Book: CAP. A – PROIECTAREA, CAP. B – EXECUTIA,
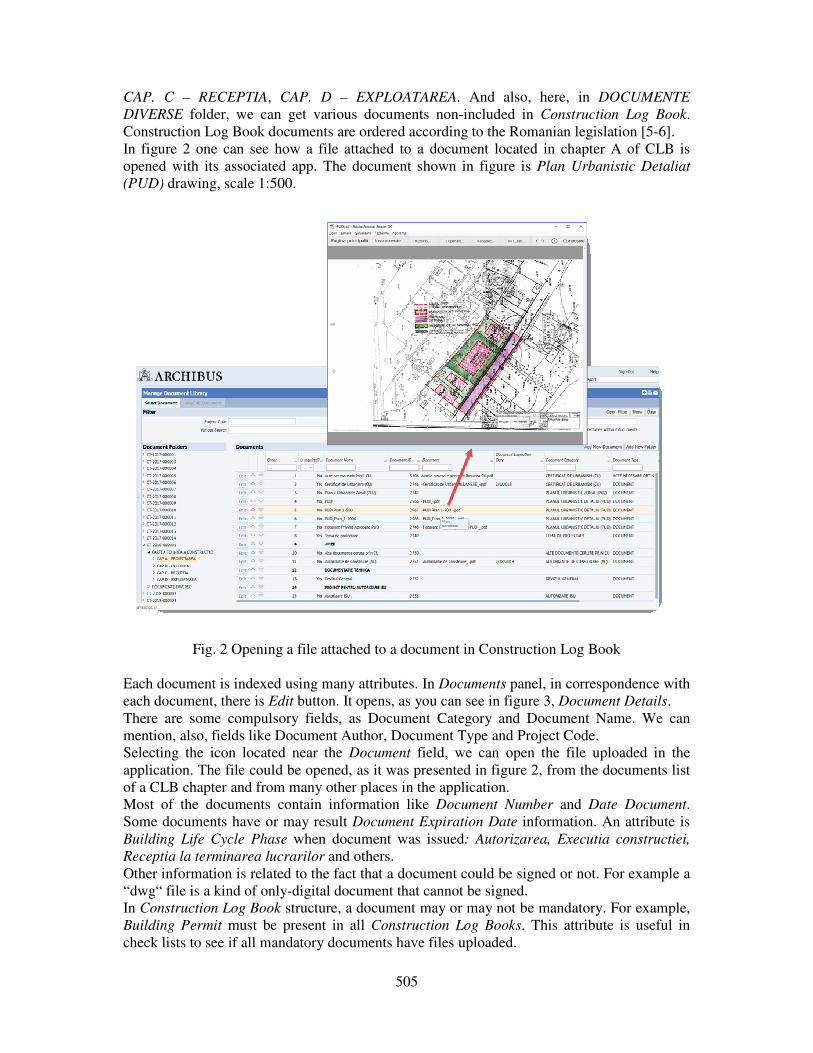
505
CAP. C – RECEPTIA, CAP. D – EXPLOATAREA. And also, here, in DOCUMENTE
DIVERSE folder, we can get various documents non-included in Construction Log Book.
Construction Log Book documents are ordered according to the Romanian legislation [5-6].
In figure 2 one can see how a file attached to a document located in chapter A of CLB is
opened with its associated app. The document shown in figure is Plan Urbanistic Detaliat
(PUD) drawing, scale 1:500.
Fig. 2 Opening a file attached to a document in Construction Log Book
Each document is indexed using many attributes. In Documents panel, in correspondence with
each document, there is Edit button. It opens, as you can see in figure 3, Document Details.
There are some compulsory fields, as Document Category and Document Name. We can
mention, also, fields like Document Author, Document Type and Project Code.
Selecting the icon located near the Document field, we can open the file uploaded in the
application. The file could be opened, as it was presented in figure 2, from the documents list
of a CLB chapter and from many other places in the application.
Most of the documents contain information like Document Number and Date Document.
Some documents have or may result Document Expiration Date information. An attribute is
Building Life Cycle Phase when document was issued: Autorizarea, Executia constructiei,
Receptia la terminarea lucrarilor and others.
Other information is related to the fact that a document could be signed or not. For example a
“dwg“ file is a kind of only-digital document that cannot be signed.
In Construction Log Book structure, a document may or may not be mandatory. For example,
Building Permit must be present in all Construction Log Books. This attribute is useful in
check lists to see if all mandatory documents have files uploaded.
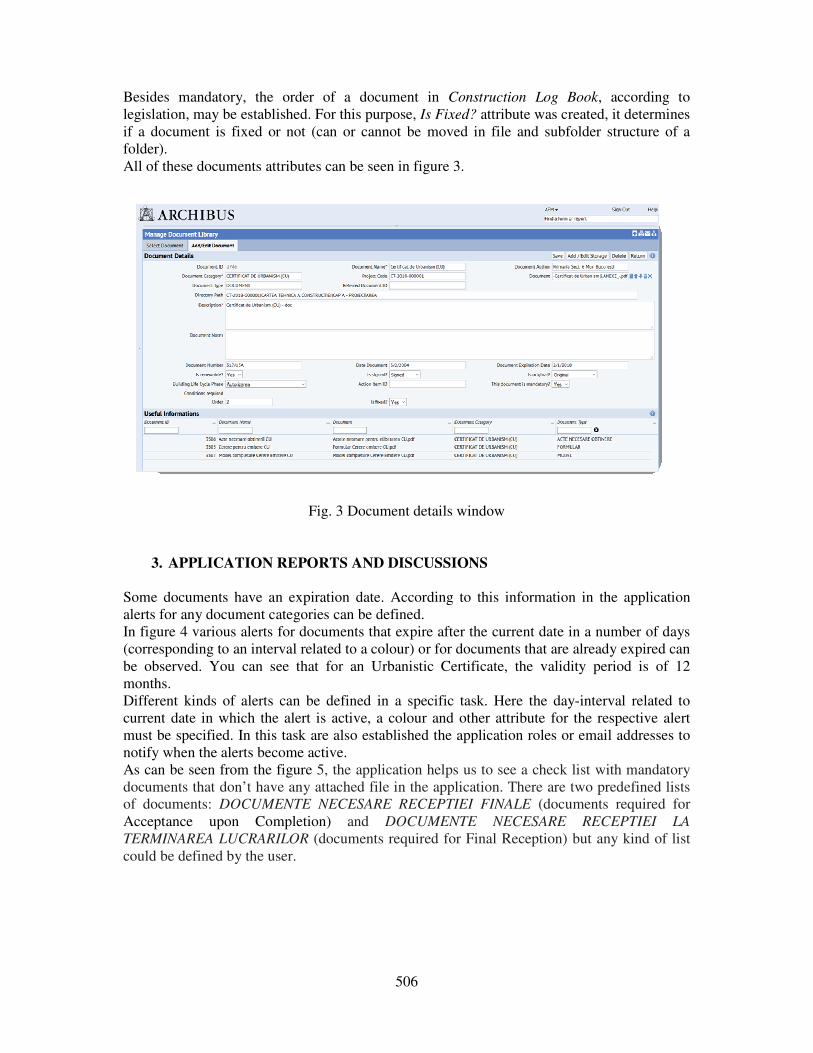
506
Besides mandatory, the order of a document in Construction Log Book, according to
legislation, may be established. For this purpose, Is Fixed? attribute was created, it determines
if a document is fixed or not (can or cannot be moved in file and subfolder structure of a
folder).
All of these documents attributes can be seen in figure 3.
Fig. 3 Document details window
3. APPLICATION REPORTS AND DISCUSSIONS
Some documents have an expiration date. According to this information in the application
alerts for any document categories can be defined.
In figure 4 various alerts for documents that expire after the current date in a number of days
(corresponding to an interval related to a colour) or for documents that are already expired can
be observed. You can see that for an Urbanistic Certificate, the validity period is of 12
months.
Different kinds of alerts can be defined in a specific task. Here the day-interval related to
current date in which the alert is active, a colour and other attribute for the respective alert
must be specified. In this task are also established the application roles or email addresses to
notify when the alerts become active.
As can be seen from the figure 5, the application helps us to see a check list with mandatory
documents that don’t have any attached file in the application. There are two predefined lists
of documents: DOCUMENTE NECESARE RECEPTIEI FINALE (documents required for
Acceptance upon Completion) and DOCUMENTE NECESARE RECEPTIEI LA
TERMINAREA LUCRARILOR (documents required for Final Reception) but any kind of list
could be defined by the user.

507
Fig. 4 Alerts for two different types of document categories
First of all, a project must be chosen and after that a list must be selected. In Document
Checklist panel appears the desired list with all of the selected project documents, highlighted
if the respective document has a file attached and is mandatory and red highlighted according
to table 1 colour definition.
Table 1 Colour list corresponding to different kind of records Colour Sinification
Mandatory documents with attached file
Mandatory documents without attached file
Not mandatory documents
Fig. 5 Documents checklist window

508
3. CONCLUSIONS
In this paper a Web-based application which meets the requirements of Construction Log
Book according to Romanian Legislation was developed. It supportss construction projects on
entire building life cycle and in all construction phases. It is not only a document repository
that could be consulted by the factors which are related to the construction, but CLB is an
intelligent application that can help the users see alerts about documents expiration. It could
also be used to check the existence of receptions required documents. It has a flexible
structure that allows its administrators to adapt the application to business requirements.
The documents are indexed according to many arguments and the application is provided with
complex search and filtering facilities, allowing quick access to various information.
Also, CLB contain the necessary information for development of Building Information
Models (BIM) and could be integrated to a BIM.
In future research, the developed application could be extended as an on-cloud application.
References
[1] Kanapeckiene L., Kaklauskas A., Zavadskas E. K., Seniut M., Integrated Knowledge Management Model and System for Construction Projects, Engineering Applications of Artificial Intelligence 23 (2010) 1200–1215 [2] Tupenaite L., Kanapeckiene, L., Naimaviciene J., Knowledge Management Model for Construction Projects, The 8th International Conference “RELIABILITY and STATISTICS in TRANSPORTATION and COMMUNICATION - 2008” [3] Kubicki S., Dubois E., Halin G., Guerriero A. (2009) Towards a Sustainable Services Innovation in the Construction Sector. In: van Eck P., Gordijn J., Wieringa R. (eds) Advanced Information Systems Engineering. CAiSE 2009. Lecture Notes in Computer Science, vol 5565. Springer, Berlin, Heidelberg [4] Forcada, N., Casals, M., Roca, X., Gangolells, M. Adoption of web databases for document management in SMEs of the construction sector in Spain. "Automation in construction", Juliol 2007, vol. 16, núm. 4, p. 411-424. [5] Regulamentul privind recepţia construcţiilor (Regulation Related to Construction Reception), published in MO, Part I no. 406 - 30/05/2017 (annex to HG no. 343/2017); [6] Hotărârea nr. 343/2017 pentru modificarea Hotărârii Guvernului nr. 273/1994 privind aprobarea Regulamentului de recepţie a lucrărilor de construcţii şi instalaţii aferente acestora, publicata in MO, Partea I nr. 406 din 30/05/2017 [7] (2004), Ghid pentru intocmirea Cartii Tehince a Constructiei (Guide for drawing up the Construction Log Book), Revised Edition, SC COCC-SA, 2004 [8] Ordinul Ministerului Dezvoltarii Regionale si Locuintei nr. 839/2009 pentru aprobarea Normelor metodologice de aplicare a Legii nr. 50/1991 privind autorizarea lucrarilor de constructii [9] Legea nr. 221/2011 pentru modificarea alin. (2) al art. 29 din Legea nr. 350/2001 privind amenajarea teritoriului și urbanismul [10] Norme Metodologice din 26 februarie 2016 de aplicare a Legii nr. 350/2001 privind amenajarea teritoriului şi urbanismul şi de elaborare şi actualizare a documentaţiilor de urbanism [11] Hotarare nr. 1739 din 6 decembrie 2006 pentru aprobarea categoriilor de constructii care se supun avizarii si/sau autorizarii privind securitatea la incendiu. [12] Hotărârea Guvernului nr. 571/2016 pentru aprobarea categoriilor de construcţii şi amenajări care se supun avizării şi/sau autorizării privind securitatea la incendiu [13] Legea nr. 307/2006 privind apararea impotriva incendiilor, publicata in MO nr. 633 din 21 iulie 2006 [14] Hotararea de Guvern nr. 28/2008 privind aprobarea continutului-cadru al documentatiei tehnico-economice aferente investitiilor publice precum si a structurii si metodologiei de elaborare a devizului general pentru obiective de investitii si lucrari de interventii [15] Hotarare nr. 44 din 22 ianuarie 2004 pentru aprobarea Normelor metodologice de aplicare a Legii nr. 571/2003 privind Codul fiscal [16] Legea nr. 163/2016 pentru modificarea și completarea Legii nr. 10/1995 privind calitatea în construcții, publicata in MO, Partea I, nr. 561 din 25 iulie 2016 [17] Legea nr. 177/2015 pentru modificarea si completarea Legii nr. 10/1995 privind calitatea in constructii, publicata in MO nr. 484/2.07.2015; [18] HG 766, an.3 categ. imp., (1997), Hotarare nr. 766 din 21 noiembrie 1997 (actualizata 10 octombrie 2008) pentru aprobarea unor regulamente privind calitatea in constructii, Anexa 3-REGULAMENT privind stabilirea categoriilor de importanta a constructiilor [19] Met. categ. imp., (1996), Regulament Privind Stabilirea categoriei de Importanţă a Construcţiilor Metodologice de Stabilire a Categoriei de Importanţă a Construcţiilor, INCERC, Laborator SCB – BAP, 1996

509
STUDY OF RENEWABLE ENERGY RESOURCES
BY USE OF IT APPLICATIONS
Vatuiu Teodora, Associate Professor Ph.D. at „Titu Maiorescu” and researcher at
„Polytechnic University” of Bucharest,1
Lazaroiu Gheorghe, Professor Ph.D. at „Polytechnic University” of Bucharest
ABSTRACT
An undeniable consequence of the industrialization of states is the growing dependence of the
world's economies on the depleting energy resources of the planet. Given the fact that the world
economy still depends largely on oil as a central energy resource, it is crucial to reduce EU greenhouse
gas emissions and its dependence on fossil fuels and imported energy and thus contribute to the
security of its energy supply.
In addition, renewable energy can play an important role as a driver of sustainable development
in Romania. In our article, we found that there are potential synergies between renewable energy
policy and funds designed to facilitate sustainable development, but the renewable resource
management must be sustained by a computerized system that achieves efficient monitoring and
analysis of energy produced from these sources.
1. INTRODUCTION
Renewable energy is energy generated from renewable, non-fossil based energy sources
which are replenished in a human lifetime. Thus, the security of energy supply and the
conservation of the traditional resources are ensured while the imports of primary energy
resources are reduced significantly2.
Moreover, the usage of renewable energy stimulates the economic development at local,
regional and global levels and creates new employment opportunities. Reducing
environmental pollution is the major benefit of using renewable energy.
Using more renewable energy is crucial if the EU is to reduce its greenhouse gas
emissions in order to comply with the 2015 Paris Agreement on Climate Change. Increasing
the use of renewable energy could also reduce the EU’s dependence on fossil fuels and
imported energy, thus contributing to the security of its energy supply.
In an increasingly globalized economy, a country's energy policy is carried out in the
context of developments and changes taking place globally.
The vision of today's European energy policy is in line with the concept of sustainable
development and focuses on a number of key issues such as access for consumers to
affordable and stable energy sources, sustainable development of energy production, transport
and consumption, security of supply , reducing greenhouse gas emissions.
2. RENEWABLE ENERGY RESOURCES AND THEIR POTENTIAL
Aware of the fact that "traditional" energy resources are limited and that in the future
mankind will have to move towards renewable energy sources, a strategy aimed at the
1Stefan cel Mare Street, no. 1, 0723660566, [email protected]
2 Ion Lungu, Adela Bâra, George Cărutasu, Alexandru Pîrjan, Simona-Vasilica Oprea, Prediction Intelligent
System in the field of Renewable Energies through Neural Networks, Economic Computation and Economic
Cybernetics Studies and Research, Issue 1 Vol. 50, 2016, pag. 86

510
production and gradual use of green energy needs to be implemented to save scarce resources
and their replacement in the future.
Renewable energy is energy generated from renewable, non-fossil based energy
sources which are replenished in a human lifetime. Renewable energy sources include solar
and wind energy, marine energy and hydropower, geothermal energy and bioenergy3.
The main types of renewable energy, relevant technologies and typical applications are
shown in Figure 1.
Figure 1: Renewable energy sources, technologies and applications
4
Romania has an important potential for renewable resources: hydroelectric power,
biomass, solar, wind and geothermal energy.
The economically feasible hydropower potential is estimated at 23-25TWh, with an
installed capacity of about 8000 MW. in 2005, the level of recovery reached about 80%
of the economic potential, and hydro-energetic facilities are built, amounting to an
installed capacity of about 600 MW, with a production potential of 1,870 GWh / year.
The biomass energy potential is about 7,594 thousand toe / year, of which 15,5% is
forestry and firewood residues, 6,4% sawdust and other wood waste, 63,2% agricultural
waste, 7,2 % household waste and 7.7% biogas.
The energy potential of solar-thermal systems is estimated at about 1,434 thousand
tep / year, and that of photovoltaic systems at about 1,200 GWh / year.
The technically feasible wind potential is estimated at 8 TWh / year.
Romania has a potential of about 167 thousand tep / year of low enthalpy geothermal
resources, of which at present it consumes about 30 thousand toe / year.
Energy balance indicators are developed and presented in the final energy system, a
system used by EU countries and most countries in the world. Under these circumstances,
the data contained in this section allows direct comparison without equivalence
calculations with energy data from international statistics.
3 Bioenergy energy produced from biomass. Biomass is the biodegradable fraction of products, waste and
residues from biological origin from agriculture, including vegetal and animal substances, forestry and related
industries including fisheries and aquaculture, as well as the biodegradable fraction of waste, including industrial
and municipal waste of biological origin 4 http://publications.europa.eu/webpub/eca/special-reports/renevable-energy-5-2018/en/

511
The final energy system expresses all flows based on the energy potential of each
resource, showing the amounts of energy actually made available to users.
The unit of measurement used is tons of oil equivalent, this being a conventional fuel
with a calorific value of 41868 kJ / kg (10000 kcal / kg).
Primary energy resources include:
• production of primary energy carriers (net coal, crude oil, usable natural gas,
firewood, hydropower, wind and solar photovoltaic, nuclear power and non-
conventional sources);
• import of primary and transformed energy;
• stocks of primary energy carriers on 1 January at both producer, consumer and
distribution plants.
Figure 2: Production of primary energy, EU-28, 2015
5
In the statistical documents, biomass sources include wood and other solid biofuels;
biogas, liquid biofuels; and renewable (biodegradable) wastes.
Primary electricity is the sum of hydroelectric, nuclear, wind and solar photovoltaic, as
well as electricity imports.
For hydroelectric, wind, solar photovoltaic and imported electricity, conversion to
conventional fuel was based on the actual energy potential of the electricity (0.086 kg
equivalent oil / kWh or 3600 kJ / kWh).
For nuclear power, primary energy is the fissionable material's energy equivalent to the
output produced (considering the plant's efficiency of 35.11%, as recommended by the
International Energy Agency).
The spectrum of energy resource depletion in the coming years has been a serious alarm
signal and has led to the identification of the possibilities of substitution of depleting
resources, the reduction of environmental imbalances caused by the exploitation, processing
and utilization of the resources used so far.
This alarm signal has led mankind to operate with a new concept, the concept of energy
security. For most specialists, energy security means producing the necessary energy in their
own country and a reduced import dependence.
5% of total, based on tonnes of oil equivalent

512
Romania stands in this context as a Member State of the European Community, as a state
with an industry largely based on the consumption of depleted resources, but also as a state
with real possibilities to develop a renewable energy based energy structure.
Table 1: The theoretical potential of renewable energy sources in Romania 6:
Renewable source Annual potential Application
Solar energy 60 PJ/h Thermal Energy and Electricity
Wind power 23 TWh Electricity
Hydro energy of which
under 10 MW
36TWh
3,6TWh
Electricity
Biomass and biogas 318 PJ Thermal Energy and Electricity
Geothermal energy 7 PJ Thermal energy
Table 2: Production of electricity from renewable energy sources in the medium term7
Renewable sources of energy 2010 (GWh) 2015 (GWh)
Solar energy 1,860 11,600
Wind power 314 1.001
Hydro - total energy, of which: low power hydro
power (max. 10 MW)
18.200
1.100
18.700 1.600
Biomass 1.134 3.654
Geothermal energy - -
Total 19.650 23.367
ESRE share in electricity consumption 30,00% 30,40%
Figure 3 : Map of renewable resource potential
6 Source: Romania's Energy Strategy for 2007-2020
7 Eurostat, Energy production and imports(http://ec.europa.eu/eurostat/statistics-xplained/index.php/Energy_production)

513
On the map, we highlight the following areas:
• Danube Delta (solar energy);
• Dobrogea (solar and wind energy);
• Moldova (plains and plateau - microhydro, wind and biomass);
• Carpathian Mountains (biomass, microhydro);
• Transylvanian Plateau (microhidro);
• Western Plain (geothermal energy);
• Subcarpathians (biomass, microhydro);
• South Plain (biomass, geothermal and solar energy).
3. FACILITIES OFFERED BY EXCEL FOR RENEWABLE ENERGY
RESOURCES ANALYSIS
One of the most important facilities offered by Excel for this analysis is the graphical
representation in the form of diagrams of the numerical data present in a certain area of the
spreadsheet.
A graph illustrates better numerical data in a spreadsheet. Graphic representations allow
better visualization of relationships, trends, anomalies established between data to the extent
they are illustrated by drawn shapes (lines, bars, surfaces, etc.). In this way, the data is easier
to view and interpret than the mere tabular presentation of the figures studied.
The graphical representation is dynamic, ie when the data that was the basis of the graph
is updated, the graphic representation is automatically updated, adjusting to the new values.
Graphical representations under Excel are generated on the basis of an analysis table
representing a well-defined field bounded spreadsheet, which in turn contains numerical data
organized in series of data.
For the construction of a chart, the data to be graphically represented is edited and then
selected, in selecting the domain that will form the basis of the graph generation, some
elements (text but not only) that will constitute the diagram legends and the labels axis of the
abscissa.
4. CONCLUSIONS
Once considered as inexhaustible, energy and raw material resources are generally
limited and unevenly distributed across the Earth.
There is also a resource scarcity law, which is that the volume, structure and quality of
economic resources and goods are changing more slowly than the volume, structure and
intensity of human needs. In recent years, the issue of the depletion of energy resources and
energy security dominates the agendas of state leaders.
The EU's renewable energy targets of 20% final energy consumption from renewable
sources by 2020, rising to at least 27% by 2030, are to be continued meth.
Renewable energy production is projected to grow steadily, from 86 TWh in 2030 to 129
TWh in 2050.
Total biomass and waste biomass production shows a consistent increase in all scenarios:
from 45 TWh (14%) in 2015 to 48 TWh (16%) in 2030 and 68 TWh (24%) in 2050.
Increases will record by 2050 wind, solar and geothermal energy (currently almost non-
existent).
It will also increase nuclear power production with a view to building Cernavoda reactors
3 and 4, while the hydropower sector will remain at the same level.

514
Coal production would drop from 55 TWh (18%) to just 12 TWh (4%) in 2050, with the
international trend being less favorable to lignite and coal, amid a rise in the price for
emissions certificates.
These new resources need to gradually replace traditional exhaustible resources, ensuring
the protection of the natural environment and energy security. The energy sector is of vital
importance for economic and social development and for improving the quality of life of the
population.
Ensuring sufficient energy supply and widespread access to energy services, especially
green energy from renewable sources, is a basic requirement of sustainable development.
ACKNOWLEDGEMENTS: This work was supported by a grant of the Romanian
Ministery of Research and Innovation, CCCDI – UEFISCDI, project number PN-III-P1-1.2-
PCCDI-2017-0404 / 31PCCDI/2018, within PNCDI III.
References
[1] Bara, A., Lungu, I., Oprea, S. V., Carutasu, G., Botezatu, C. P., Botezatu C, Design Workflow for Cloud
Service Information System for Integration and Knowledge Management Based in Renewable Energy, Journal of
Information Systems & Operations Management, Universitară Publishing; vol.8, no.2, ISSN 1843-4711, 2014.
[2] Ellabban O., Abu-Rub H., Blaabjerg F., Renewable energy resources: Current status, future prospects and
their enabling technology, Renewable and Sustainable Energy Reviews. 39: 748–764, 2014.
[3] Freris, L., Infield D., Renewable Energy in Power Systems, Wiley, 2008.
[4] Herczeg, M., Renewable energy support schemes in Europe, Copenhagen Resource Institute, 2012.
[5]Herczeg, M., Climate Policy Info Hub, Renewable Energy Support Policies in Europe
(http://climatepolicyinfohub.eu/renewable-energy-support-policies-europe), 2014.
[6] Lazaroiu G., Traista E., Badulescu C., Orban M., Plesea V, Sustainable combined utilization of Renewable
Forest Resources and Coal in Romania, Environmental Engineering and Management Journal, ISSN: 1582-
9596, eISSN: 1843-3707, Volume: 7, Issue: 3, Pages: 227-232, 2008.
[7] Lungu, I., Bara, A., Oprea, S. V., Carutasu, G., Pîrjan, Al., Oprea S.-V., Prediction Intelligent System in the
field of Renewable Energies through Neural Networks, Economic Computation and Economic Cybernetics
Studies and Research, Issue 1 Vol. 50, 2016.
[8] Oanta E.M., Panait C., Lazaroiu G., Dascalescu A.-E., Computer Aided Instrument to be used as an
Automatic Design Component, Advanced Materials Research, ISSN: 1022-6680, ISBN: 978-303835255-6,
Pages 1017-1022, Volume 1036, www.scientific.net/AMR.1036.1017, 2014.
[9] Vătuiu Teodora, Ghencea Adrian, Popeangă Vasile Nicolae, The Integration and Interactivity of Computer
Applications, a Fundamental Requirement for Creating and Maintaining the Competitive Advantage of
Organizations, Proceedings of the 2011 3rd International Conference on Future Computer and Comunication
(ICFCC 2011), Iasi, June, 2011, published in the conference proceeding by ASME, and included in the ASME
Digital Library, and indexed by Ei Compendex andThomson ISI Proceeding, http://www.icfcc.org/, 2011.
[10] Schaubach, K., Lauer, M., Bioenergy Development in Germany and implications of the 2017 Renewable
Energy Act, Bundesministerium für Wirtschaft und Energie, 2017.
[11] COM 759, Proposal for a Regulation of the European Parliament and of the Council on the governance of
the Energy Union (https://ec.europa.eu/energy/en/news/commission-proposes-new-rules-consumer-centred-
clean-energy-transition), 2016
[12] COM 767, Proposal for a Directive on the promotion of the use of energy from renewable sources, 2016
[13] Eurostat, Energy production and imports (http://ec.europa.eu/eurostat/statistics-
explained/index.php/Energy_production_and_imports).
[14] COM 57 „Report on progress in the field of energy from renewable sources”, pg. 4 and 9, 2017
[15] http://ec.europa.eu/eurostat/statistics-explained/index.php/Renewable_energy_statistics).
[16] https://en.wikipedia.org/wiki/Renewable_energy

515
APPLICATIONS AND PERSPECTIVES OF USING DRONES INPRECISION AGRICULTURE
Cujbescu Dan1, Persu Cătălin, Găgeanu Iuliana, Voicea Iulian, Gheorghe Gabriel, VlăduțoiuLaurențiu, Ungureanu Nicoleta 2, Vlad Cristina3,
1INMA Bucharest, 2PU Bucharest, 3ICEADR – Bucharest
ABSTRACT
Modern applications used in precision farming require databases with high spatial andtemporal resolution. The purpose of this paper is to show the development, applicability,perspectives and need of unmanned aerial vehicles (drones) as sensors platforms that offerboth easy and accurate coverage of the analysed surfaces. At present time, remote detectionthrough drones plays an important role in crop monitoring and has high efficiency, highresolution, low costs and risks.
1. INTRODUCTION
Remote detection through drones is mainly used for crop classification, disastermonitoring, crop density, agronomic parameter estimation [5,6].
In the researches regarding crop classifications, drones acquire data mainly regardingdifferent types of sowed surfaces in order to facilitate crop management and taking thecorresponding decisions [4,8].
Monitoring in case of disaster includes both monitoring pests on the analysed surface, aswell as abnormal crop growth caused by external factors [1,2].
Crop density was estimated using image processing algorithms and RGB images. RGB isan additive colour model where light is emitted, and by overlapping primary colours (red,green, blue) are obtained the secondary colours. By uniting the three colour is possible toobtain white. Each of the primary colours has 256 shades, totalizing 16777216 colour shades(R: 256 x G: 256 x B:256) [7,10].
Currently, the industry of drones used in agriculture experiences a continuous growth,disposing of various platforms, out of which, fixed wings drones and multi-rotor drones beingpredominant [3,9].
Figure 1: Integrated a multispectral sensor on fixed wings drones or on multi-rotor drones

516
2. METHODOLOGY
The stages of using drones in precision agriculture are: planning – a region of the map is added and the optimized mission for points is
automatically generated. Depending on the sensor attached, the desired altitude above the soilis specified, the system indicating the resolution of the vertical and horizontal image, theestimated flight time, as well as the perimeter or the researched area.
Figure 2: Flight planning [13]
flying – the drone is launched in the air, and the operator will monitor the flight,through the means of the drone’s automated flight control system which also achieves its safelanding.
Figure 3: Flight realization [13]
data transfer and analysis – after finalizing the flight, aerial photographs or NIRimages are transferred from the drone to the portable soil command station for an additionalimage analysis. Through the means of a specialized software, images can be combined inlarge mosaics or it is even possible to create 3D parcels / altitude profiles for the researchedarea.
Figure 4: Image analysis [13]

517
result – after analysing and processing the resulting data is possible, for example, todetect the stress of crops analysed (depending on the intensity of irrigation and the degree ofwater availability), the chlorophyll content or to detect water leaks, the final result of theanalysis depends on the agrotechnical requirements of the monitored crop.
Figure 5: Result from analyzing and interpreting images [13]
Monitoring programs provide information on the evolution of crops in real time in orderto assess areas of different productivity through the means of the Vegetation Index. TheVegetation Index is a mathematical transposition of the values of light reflected in the visiblespectrum and in the infrared spectrum, is correlated with chlorophyll content, the totalbiomass quantity and plant photosynthesis activity. Beyond the visible spectrum, sensorsfitted on the satellites are also sensitive to the spectrum of radiation that is imperceptible tothe human eye. Near infrared (NIR) spectrum is the most used part of electromagneticradiation used for vegetation monitoring.
Figure 5: Light reflected in the visible spectrum and in infrared spectrum [14]
Also, with the help of multispectral and multiangle images provided by satellites, themonitoring system process, interpret and monitor the parameters of the agricultural terrain,the state and evolution of vegetation. Maps in the form of pixels are obtained in two ways: atabsolute scale for comparing crops in different stages of development and at adjusted scaledefined by the minimum and maximum values in the analysed crop.

518
Figure 6: Maps in the form of pixels [11]
3. CONCLUSIONS
In the past, capturing multispectral data was achieved through the means of an aircraftwith crew or by waiting for a satellite to fly over the surface to be monitored. Both options donot allow a big flexibility, are limited in terms resolution and can be affected by cloudscovering the ski, which can damage the data. Now, along with a rapid expansion of theindustry of commercial drones, anyone can fly a multispectral sensor over a crop and canrapidly detect the stress, not only at the level of the monitored crop, but also at the level ofindividual plants.
On-site research uses visual inspection to assess the condition of crops from theground. Unfortunately, such techniques based on ground-level investigation are limited towhat the human eye can perceive. Innovative technologies using multispectral quadrants andimaging have an extraordinary potential to complete on-site research.
Satellite images still have too high costs, satellites that offer high (1-5 m) and veryhigh resolution (<1 m) spatial resolution are few (eg. WorldView 2 & 3, Quickbird, Pleiades).Satellites with the optical sensors listed above cannot capture clear ground surface imagesunder unfavorable atmospheric conditions (fog, clouds, low light, etc.), temporal resolution iscurrently low (they have high revision periods of several days).
Drones offer images at lower costs, as clear and even at better spatial resolution thanmost existing satellites, field mapping is performed much faster, and only for areas of interest,images can be taken under less favorable conditions (drones fly under the skyscraper, whilesatellites cannot do this), have more flexibility with regard to the equipment used (is possibleto add or change sensors, measuring devices, eg. LIDAR, spectral filters, etc.).
ACKNOWLEDGEMENTThis work was funded by the Ministry of Research and Innovation, within the project entitledPN 18 30 01 01: “Experimental research on the aerial mapping of agricultural cropscorresponding to the Agriculture 4.0 concept”, ctr. 18N/16.03.2018
References
[1]. Castaldi, F.; Pelosi, F.; Pascucci, S.; Casa, R. Assessing the potential of images from unmanned aerialvehicles (UAV) to support herbicide patch spraying in maize. Precis. Agric., 18, 76–94, 2016[2]. Li, Z.; Chen, Z.; Wang, L.; Liu, J.; Zhou, Q. Area extraction of maize lodging based on remote sensing bysmall unmanned aerial vehicle. Trans. Chin. Soc. Agric. Eng., 30, pp. 207–213, 2014

519
[3] Pircher M., Geipel J., Kusnierek K., Korsaeth A. Development of a hybrid uav sensor platform suitable forfarm-scale applications in precision agriculture. The International Archives of the Photogrammetry, RemoteSensing and Spatial Information Sciences, Volume XLII-2/W6, pp. 297-302, 2017[4]. Primicerio, J.; Gennaro, S.F.D.; Fiorillo, E.; Genesio, L.; Lugato, E.; Matese, A.; Vaccari, F.P. A flexibleunmanned aerial vehicle for precision agriculture. Precis. Agric., 13, pp. 517–523, 2012[5]. Sankaran, S.; Khot, L.R.; Carter, A.H. Field-based crop phenotyping: Multispectral aerial imaging forevaluation of winter wheat emergence and spring stand. Comput. Electron. Agric. 2015, 118, pp.372–379.[6]. Senthilnath, J.; Dokania, A.; Kandukuri, M.; Ramesh, K.N.; Anand, G.; Omkar, S.N. Detection of tomatoesusing spectral-spatial methods in remotely sensed RGB images captured by UAV. Biosyst. Eng., 146, pp. 16–32,2016[7]. Sugiura, R.; Tsuda, S.; Tamiya, S.; Itoh, A.; Nishiwaki, K.; Murakami, N.; Shibuya, Y.; Hirafuji, M.; Nuske,S. Field phenotyping system for the assessment of potato late blight resistance using RGB imagery from anunmanned aerial vehicle. Biosyst. Eng., 148, pp. 1–10, 2016[8]. Tian, Z.; Fu, Y.; Liu, S.; Liu, F. Rapid crops classification based on UAV low-altitude remote sensing.Trans. Chin. Soc. Agric. Eng, 29, 109–116, 2013[9]. Vega, F.A.; Ramírez, F.C.; Saiz, M.P.; Rosúa, F.O. Multi-temporal imaging using an unmanned aerialvehicle for monitoring a sunflower crop. Biosyst. Eng., 132, pp.19–27., 2015[10]. Watts A.C.; Kobziar L.N.; Percival H.F. Unmanned Aircraft Systems for Wildland Fire Monitoring andResearch. In Proceedings of the 24th Tall Timbers Fire Ecology Conference: The Future of Fire: PublicAwareness, Health, and Safety, Tallahassee, FL, USA, 11–15 January 2009; pp. 86–90.[11]. https://www.airinov.fr/en/[12]. https://www.micasense.com/atlas/[13] http://www.uas-europe.se/index.php/applications/agriculture[14]. http://www.vantage-ro.com/geoscan/