Glasses and glass-ceramics in the oxyfluoride ternary system Pb(PO 3) 2WO 3-PbF 2
Upload
lightsourceCategory
view
0download
0
Chapter 36
Samarium Doped Borophosphate Glassesand Glass-Ceramics for X-ray RadiationSensing
D. Tonchev, I. Kostova, G. Okada, T. Pashova, G. Belev, G. Patronov,T. Eftimov, T. Wysokinski, D. Chapman, and S.O. Kasap
Abstract Samarium fluoride (SmF3) and samarium oxide (Sm2O3) doped Zn- and
Sr-borophosphate glasses with mixed oxide-fluoride matrix structures were pre-
pared. The synthesized materials were studied by differential scanning calorimetry
(DSC) and temperature-modulated DSC (TMDSC) to determine their glass trans-
formation properties before and after various thermal treatments. X-ray diffraction
(XRD) analysis was performed to characterize the structure, that is, whether the
synthesized materials have a glass or polycrystalline structure, or is composed of a
heterogeneous mixture. We observed that under certain conditions several post-
treated materials are partially nanostructured, i.e. the formation of nanocrystals
takes place within a glass matrix. The samarium doped materials were irradiated by
different types of LEDs and laser light in the UV-NIR wavelength range to examine
D. Tonchev (*) • I. Kostova
Department of Electrical and Computer Engineering, University of Saskatchewan,
Saskatoon, SK S7N 5A9, Canada
Department of Chemical Technology and Department of Optics and Nuclear Physics,
Plovdiv University “Paisii Hilendarski”, Plovdiv 4000, Bulgaria
e-mail: [email protected]
G. Okada • S.O. Kasap
Department of Electrical and Computer Engineering, University of Saskatchewan,
Saskatoon, SK S7N 5A9, Canada
T. Pashova • G. Patronov • T. Eftimov
Department of Chemical Technology and Department of Optics and Nuclear Physics,
Plovdiv University “Paisii Hilendarski”, Plovdiv 4000, Bulgaria
G. Belev
Department of Electrical and Computer Engineering, University of Saskatchewan,
Saskatoon, SK S7N 5A9, Canada
Canadian Light Source (CLS), University of Saskatchewan, Saskatoon,
SK S7N0X4, Canada
T. Wysokinski • D. Chapman
Canadian Light Source (CLS), University of Saskatchewan, Saskatoon,
SK S7N0X4, Canada
© Springer Science+Business Media Dordrecht 2015
P. Petkov et al. (eds.), Nanoscience Advances in CBRN Agents Detection,Information and Energy Security, NATO Science for Peace and Security
Series A: Chemistry and Biology, DOI 10.1007/978-94-017-9697-2_36
347

the photoluminescence (PL) induced and also to study the changes in the PL signal
before and after exposure to high-dose X-ray synchrotron irradiation due to a
possible reduction of Sm3+ to Sm2+. The different PL signatures of the two
Sm-ions allow such materials to be used as x-ray dosimeters with optical readout.
The X-ray induced luminescence (XL) spectra were also recorded. We discuss the
experimental results in terms of established models for the behavior of rare-earths
in glasses, crystalline solids and in nanocrystalline glass-ceramics.
Keywords Nano- and polycrystalline structures • Glass ceramics • Rare-earth
doping • Scintillators • Thermal properties • DSC • TMDSC • Photoluminescence
• X-ray luminescence
36.1 Introduction
Rare-earth (RE) doped crystalline and some glass-ceramics materials posses useful
scintillating and storage properties and have received considerable attention due to
their potential applications involving sensors, optical and X-ray detectors, wave-
guides, lasers etc. [1]. RE-doped crystals such as CsI, Cd2O2S etc. for digital X-ray
imaging form a commercialized technology for digital X-ray imaging; however
RE-doped glasses and glass ceramics make up a new, technology under develop-
ment which has been shown to possess a great potential for high resolution x-ray
imaging [2, 3]. In addition, this method has also the potential for measuring high
dose radiation, e.g. radiation from a synchrotron light source since some rare-earth
ions within the medium are reduced under irradiation, e.g. Sm3+ is converted to
Sm2+ upon irradiation in certain glass hosts [4]. It was previously reported that in
fluorite glass ceramics (GC) such as flurochlorozirconate (FCZ) based GCs, the
active RE ions are embedded in nanocrystals, which are dispersed in the glass
matrix. Heat treatment and annealing of the starting RE-doped FCZ glasses in
various gaseous atmospheres are critically important to the formation and control of
the nanocrystals [5–7]. The formation of nanocrystals, their structure and size, play
an important role in the photoluminescence of rare-earth ions in FCZ-based GCs
and some other glasses such as barium borophosphates [8].
In this work we report on the synthesis and characterization of samarium fluoride
(SmF3) and samarium oxide (Sm2O3) doped Zn- and Sr-borophosphate glasses with
mixed oxide-fluoride glass matrix structures. We studied the synthesized materials
by differential scanning calorimetry (DSC) and by temperature-modulated DSC
(TMDSC) to determine their glass transformation and crystallization properties
before and after thermal treatment (annealing) process. Additionally, X-ray dif-
fraction (XRD) and scanning electron microscopy (SEM) analysis were used to
characterize the structure, that is, whether the synthesized materials possess a
glassy or polycrystalline structure or are a heterogeneous mixture; under certain
conditions post-treated materials are nanostrucrured, i.e. the formation of
nanocrystals takes place. The above RE-doped materials were irradiated by
348 D. Tonchev et al.
different types of LEDs and laser light in the UV-VIS wavelength range to induce
photoluminescence (PL) before and after exposure to X-ray synchrotron irradiation.
We also recorded the X-ray induced luminescence (XL) spectra. The experimental
results are c discussed in terms of established models for the behavior of rare-earths
in glasses, crystalline solids and nanocrystalline glass-ceramics.
The main goal of synthesizing different materials with various compositions was
to obtain homogenous and transparent glasses, and to look for compositional effects
on the photoluminescence and x-ray luminescence properties. We eventually hoped
to obtain X-ray sensing properties, for example, through the conversion of Sm3+ to
Sm2+ ions after high energy irradiation. Their distinctly different properties provide
a means to identify the converted amount of Sm2+ ions and hence the amount of
incident radiation.
36.2 Experimental Procedure
The conventional melt-quenching technique in air was applied to form RE-doped
glass, glass-ceramic and polycrystalline samples; subsequently these materials were
thermally treated at different temperatures to obtain nanocrystalline structures if
possible.
We used commercial grade high purity SmF3 and Sm2O3 (both 99.99 %) as
doping materials. The amounts of rare earth (RE) doping were varied in the range
0.05–1.3 mol. %. We used reagent grade stoichiometric amounts of ZnO (99.9 %),
ZnF2 (99 %) and SrCO3 (99 %) with B2O3 (99.98 %) and P2O5 (98 %) to perform
solid-state reactions and to obtain different Zn and Sr borophosphates as summa-
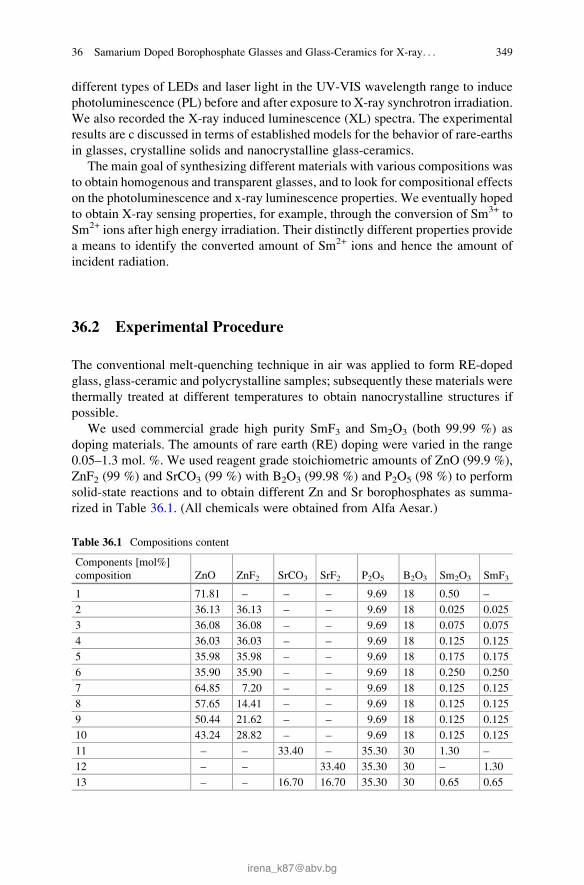
rized in Table 36.1. (All chemicals were obtained from Alfa Aesar.)
Table 36.1 Compositions content
Components [mol%]
composition ZnO ZnF2 SrCO3 SrF2 P2O5 B2O3 Sm2O3 SmF3
1 71.81 – – – 9.69 18 0.50 –
2 36.13 36.13 – – 9.69 18 0.025 0.025
3 36.08 36.08 – – 9.69 18 0.075 0.075
4 36.03 36.03 – – 9.69 18 0.125 0.125
5 35.98 35.98 – – 9.69 18 0.175 0.175
6 35.90 35.90 – – 9.69 18 0.250 0.250
7 64.85 7.20 – – 9.69 18 0.125 0.125
8 57.65 14.41 – – 9.69 18 0.125 0.125
9 50.44 21.62 – – 9.69 18 0.125 0.125
10 43.24 28.82 – – 9.69 18 0.125 0.125
11 – – 33.40 – 35.30 30 1.30 –
12 – – 33.40 35.30 30 – 1.30
13 – – 16.70 16.70 35.30 30 0.65 0.65
36 Samarium Doped Borophosphate Glasses and Glass-Ceramics for X-ray. . . 349

Differential scanning calorimetric (DSC) and temperature-modulated DSC
(TMDSC) experiments were performed using a TA Instrument DSC Q100 with
an attached fast air cooling system (FACS) with a heating rate of 2 K/min,
modulation amplitude of �1 K/min and modulation period of 60 s. Details regard-
ing the thermal measurement procedures with TMDSC and DSC have been
described elsewhere (e.g. [9]). The evaluation of DSC and TMDSC results was
performed by TA Instruments Universal Analysis (UA) software.
The photoluminescence (PL) spectra of the synthesized glasses were measured
by a fiber optic coupled CCD Aventes spectrometer AveSpec-2048 with gratings in
the range 250–1,100 nm. Laser diodes (LD) and Light Emitting Diodes (LED) from
the UV to the NIR range were used as excitation sources. 3D graphs were generated
using a Matlab software.
In order to investigate the valence reduction of Sm ions by x-irradiation,
as-prepared and heat-treated samples were exposed to radiation from a x-ray tube
(43855D, Faxitron) set to 110 kV with a filament current of 3 mA. PL before and
after X-ray irradiation was recorded by a spectrometer EPP2000. In order to test the
conversion of Sm ion, the irraditation was performed for 60 min, which is equiv-
alent to 3,000 Gy in air. X-ray luminescence (XL) was recorded under intense X-ray
irradiations at the Biomedical Imaging and Therapy beamline (BMIT, 05B1-1) at
the CLS. The dose rate was experimentally measured to be approximately 1.6 Gy
s�1 at 250 mA of the storage ring current using an ionization chamber (96030,
Keithley). The white x-ray beam was filtered by Cu filter with an effective thickness
of 1.1 mm, which results in the spectrum with a peak energy ~50 keV.
36.3 Results and Discussion
Nearly all synthesized materials were visually homogenous and fully transparent
glasses. Some samples containing Sr were found to be partially polycrystalline and
opaque. It is important to measure the glass transition temperatures of the glass
samples in order to estimate their stability and to schedule proper thermal treatment
procedures. In order to obtain more accurate data of the for glass transformation
properties we measured the glass transition temperatures (Tg) not only by conven-
tional DSC (heat flow vs. temperature) but also by its temperature-modulated
TMDSC (heat capacity vs. temperature). Figures 36.1 and 36.2 show that the
observed trends in the dependence of Tg on the Sm-doping in Zn-borophosphate
glasses are the same. The differences between DSC and TMDSC, and the advan-
tages of TMDSC have been discussed previously [9]. The Tg values extracted for
glasses from TMDSC measurements show very little dependence on aging and
thermal history [10] in contrast to data from conventional DSC measurements;
TMDSC thus provides a more reproducible means of characterizing the glass
transition for a given frequency of modulation.
As apparent from Fig. 36.1, there is an initial decrease in Tg with increasing
SmF3 content. However, at about 0.175 mol% SmF3 Tg increases with increasing
350 D. Tonchev et al.

SmF3 content; around 0.20 mol%, Tg is approximately the same than that of that of
glasses only doped with Sm2O3 (no SmF3). Possibly, samarium and fluorine ions
have an opposite effect on the thermal properties of these glasses. Looking at the
dependence of the glass transition temperatures on the amount of ZnF2, as shown in
Fig. 36.2, there is a clear and almost linear decrease in Tg.Prior to any thermal annealing, samples with different compositions were tested
with a number of different LEDs with emission wavelengths at 370, 395, 405, 410,
415, 425, 435, 450, 470, 490, 505, 515, 525, 535, 565, 572, 590, 605, 615, 632,
660 and 700 nm for their photoluminescence characteristics. The LED peak power
and the illumination area were approximately the same; the results were normalized
by the software used. The photoluminescence (PL) response results are shown in
Fig. 36.3 as a function of the excitation wavelength.
Figure 36.3 represents a 3D graph of the PL emission intensity as a function of
the excitation wavelength (all LEDs) and the emission wavelength for composition
number 7 (Table 36.1). The 3D spectra of other compositions are similar; all show
Fig. 36.1 Dependence of
the glass transition
temperature on the
Samarium fluoride (SmF3)
doping of
Zn-borophosphate glasses
Fig. 36.2 Dependence of
the glass transition
temperature on the amount
of ZnF2 in
Zn-borophosphate glasses
36 Samarium Doped Borophosphate Glasses and Glass-Ceramics for X-ray. . . 351

photoluminescence activities which are very strong in the UV and blue regions but
less in the other visible spectral regions. Notice that the peak PL intensity varies
significantly with the excitation wavelength. It also depends on the sample compo-
sition (not shown).
We investigated the effect of thermal treatments on the characteristics of the
above glasses. Initially, below (450 �C) and also around the glass transition
temperature (500, 520 and 530 �C) the annealing time was varied from 1 to 48 h.
There were no any significant visible changes. The XRD signal of a treated sample
(Fig. 36.4a) indicates the same amorphous state as for non treated sample. The
samples remained transparent and homogeneous. The DSC and TMDSC results are
almost the same and not shown here.
However, when the annealing temperature was increased to a value close to the
crystallization temperatures of these glasses (650 �C and higher), the samples
crystallized and became visually opaque. A phase separation of polycrystalline
and amorphous fractions of treated materials was observed at elevated temperatures
and after an annealing time of 1 h. Heat treated samples consist of crystalline
particles embedded in a glassy matrix. This is the reason why most of the high-
temperature treated and most of the Sr-containing samples show similar glass
transition temperatures of around 500 �C similar to other fully glassy materials
but with significantly reduced relaxation enthalpies, due to the reduction in the
glassy phase.
0
Sample 7 Normalized
Excitation wavelength, nm
Emission Wavelength (nm)
-5
-10
-15
400
PL
inte
nsi
ty (
dB
)
450
500
550
600
650
700 800700
600500
400300
Fig. 36.3 Photoluminescence (PL) intensity vs excitation and emission wavelength of a
Zn-borophosphate glass composition (# 7)
352 D. Tonchev et al.
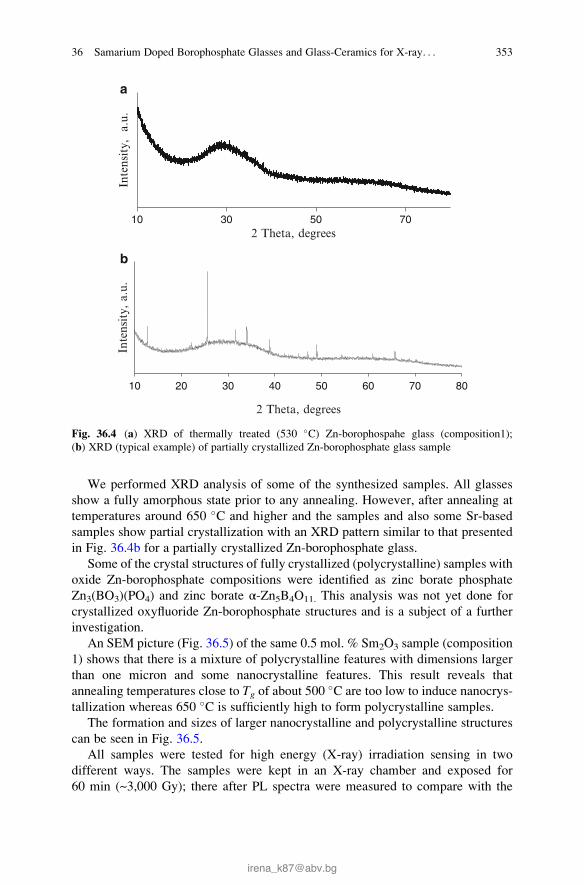
We performed XRD analysis of some of the synthesized samples. All glasses
show a fully amorphous state prior to any annealing. However, after annealing at
temperatures around 650 �C and higher and the samples and also some Sr-based
samples show partial crystallization with an XRD pattern similar to that presented
in Fig. 36.4b for a partially crystallized Zn-borophosphate glass.
Some of the crystal structures of fully crystallized (polycrystalline) samples with
oxide Zn-borophosphate compositions were identified as zinc borate phosphate
Zn3(BO3)(PO4) and zinc borate α-Zn5B4O11. This analysis was not yet done for
crystallized oxyfluoride Zn-borophosphate structures and is a subject of a further
investigation.
An SEM picture (Fig. 36.5) of the same 0.5 mol. % Sm2O3 sample (composition
1) shows that there is a mixture of polycrystalline features with dimensions larger
than one micron and some nanocrystalline features. This result reveals that
annealing temperatures close to Tg of about 500�C are too low to induce nanocrys-
tallization whereas 650 �C is sufficiently high to form polycrystalline samples.
The formation and sizes of larger nanocrystalline and polycrystalline structures
can be seen in Fig. 36.5.
All samples were tested for high energy (X-ray) irradiation sensing in two
different ways. The samples were kept in an X-ray chamber and exposed for
60 min (~3,000 Gy); there after PL spectra were measured to compare with the
10 30 50 70
Inte
nsity,
a.
u.
2 Theta, degrees
a
10 20 30 40 50 60 70 80
Inte
nsity,
a.u
.
2 Theta, degrees
b
Fig. 36.4 (a) XRD of thermally treated (530 �C) Zn-borophospahe glass (composition1);
(b) XRD (typical example) of partially crystallized Zn-borophosphate glass sample
36 Samarium Doped Borophosphate Glasses and Glass-Ceramics for X-ray. . . 353

PL of non-irradiated samples. In addition, samples were directly tested for X-ray
luminescence (XL) at the CLS synchrotron facility.
Figure 36.6 shows the PL signal before and after X-ray irradiation of a glass
sample (composition 11). There is a typical Sm3+ emission signal. However, no
conversion from Sm3+ to Sm2+ is observed after X-ray irradiation for this sample.
Most of the glass samples reveal a similar response. When the same samples are
partially crystalized and then subjected to the same X-ray exposure, there is a clear
indication for the conversion of some of Sm3+ to Sm2+ seen in PL spectrum as is
shown in Fig. 36.7. Obviously, the crystalline portion of these materials allows the
reduction of Sm3+ ions; however polycrystalline samples are fully opaque. X-ray
imaging and dosimetry plates need to be transparent. The only way to combine the
necessary transparency with the presence of crystalline structures is to induce the
formation of crystals of nanometer size within the glass matrix, which is a subject of
current studies.
Fig. 36.6 Glass sample photoluminescence (excitation wavelength 405 nm) before and after
X-ray irradiation for 60 min (composition 11)
Fig. 36.5 SEM of partially crystallized Zn-borophosphate sample (composition 1)
354 D. Tonchev et al.

The Sr-borophosphate with composition 11, which is SrCO3 based and doped by
Sm2O3, is different if compared to composition 12 by the fluorine component
introduced in identical amounts; in the latter, SrF2 replaces SrCO3 and SmF3replaces Sm2O3. as dopant. A different shape (width) of the emission of Sm2+
around 700 nm converted from Sm3+. When the PL is excited at 405 nm this
conversion peak is week (not shown) but it is very clear when the PL is excited
by 535 and 470 nm light (Figs. 36.8 and 36.9).
It was observed, that shown in Figs. 36.8 and 36.9 the excitation wavelength of
470 nm does not induce strong PL from Sm3+ but it induces very strong PL from
Sm2+. Another reason is that this wavelength is more efficient in the excitation of
Sm2+ PL [11].
Glass samples of compositions 11, 12 and 13 were further exposed to synchro-
tron X-rays available at CLS (05B1-1 beam); the resulting X-ray induced lumines-
cence (XL) spectra were measured for different times. The XL spectra obtained are
Fig. 36.7 Photoluminescence (excitation wavelength 405 nm) of a polycrystalline sample before
and after X-ray irradiation for 60 min (composition 11)
Fig. 36.8 Polycrystalline sample photoluminescence (excitation wavelength 535 nm) before and
after X-ray irradiation for 60 min (composition 12)
36 Samarium Doped Borophosphate Glasses and Glass-Ceramics for X-ray. . . 355

shown in Fig. 36.10. The XL intensities of the samples were compared by their
integrated signals. For all the samples the XL intensities decrease with the irradi-
ation time. We think that this is due to creation of defect centers by the X-ray
irradiation, which results in a darkening of glass matrix. Among our samples tested,
Sample 12 seems to show less X-ray-induced darkening. Some additional research
is needed to find a composition with less x-ray induced discoloration, which are
more suitable for radiation sensing applications like a dosimeter for the microbeam
radiation therapy (MRT) described previously [4] or for other types of high energy
high dose ionizing radiation sensing as well.
36.4 Conclusions
Homogeneous, transparent, non-hygroscopic and stable samarium doped
Zn-borophosphate and Sr-borophosphate glasses with mixed oxide-fluoride glass
matrix structures were synthesized and studied. The following results were
obtained:
1. The thermal analysis by DSC and MDSC reveals Tg values around 500�C which
do not depend on the annealing temperature and time but on the fluorine content
(ZnF2, SrF2 and SmF3);
2. All Sm-doped glasses exhibit a typical Sm3+ photoluminescence, which depends
on the excitation wavelength;
3. When annealed around 650 �C, the glasses crystallized with a mixed nanocrys-
talline /polycrystalline structure, as shown by SEM and XRD;
4. Polycrystalline and glass-ceramic samples are shown to convert Sm3+ to Sm2+
after X-ray irradiation better than glass samples of the same composition;
Fig. 36.9 Polycrystalline sample photoluminescence (excitation wavelength 470 nm) after X-ray
irradiation for 60 min (composition 12)
356 D. Tonchev et al.

Fig. 36.10 X-ray luminescence of compositions 11, 12 and 13 recorded at BMIT (CLS)
synchrotron beam line facility and the corresponding photo darkening effect
36 Samarium Doped Borophosphate Glasses and Glass-Ceramics for X-ray. . . 357

5. It was shown that conversion peaks (Sm3+ to Sm2+) are different for oxide and
oxifluoride compositions;
6. X-ray luminescence was induced by a synchrotron light source with a
photodarkening effect that depends on the composition.
References
1. EdgarA (2006) Luminescent materials. In: Kasap S, Capper P (eds) Springer handbook of
electronic and photonic materials, vol 40. Springer, p 983
2. Edgar A, Williams GVM, Sgara PKD, Secu M, Schweizer S, Spaeth JM, Hu X, Newman PJ,
MacFarlan DR (2003) J Non-Cryst Solids 326&327:489
3. Riesen H, Kaczmarek W (2007) J Inorg Chem 46:7235
4. Belev G et al (2011) Phys Status Solidi C 8:2822
5. Koughia C et al (2011) J Non-Cryst Solids 357:2272
6. Tonchev D, Belev G et al (2011) In: Reithmaier JP, Paunovic P, KulischW, Popov C, Petkov P
(eds) Nanotechnological basis for advanced sensors, NATO Science for Peace and Security
series-B: physics and biophysics. Springer, Dordrecht, p 241
7. Tonchev D, Belev G (2009) In: Reithmaier JP, Petkov P, Kulisch W, Popov C (eds)
Nanostructured materials for advanced technology applications, NATO Science for Peace
and Security series-B: physics and biophysics. Springer, Dordrecht, p 377
8. Tonchev D et al (2012) J Univ Chem Technol Metall 4:439
9. Kasap SO, Tonchev D (2001) J Mater Res 16:2399
10. Tonchev D, Kasap SO (2002) Mater Sci Eng A 328(1–2):62
11. Okada G et al (2014) J Am Ceram Soc 97:2147
358 D. Tonchev et al.
Copyright © 2022 FDOKUMEN