ISSN 2076-6300 (versión impresa) ISSN 2077-4168 (versión ...
Upload
khangminh22Category
view
1download
0
SAFEGREECE CONFERENCE PROCEEDINGS
SafeGreece 2021 – 8th International Conference on Civil Protection & New Technologies 24-26 November, on-line | www.safegreece.gr/safegreece2021 | [email protected]
ISSN 2654-1823
24-26.11proceedings

Publisher: SafeGreece [www.safegreece.org]
Editing, paging: Katerina – Navsika Katsetsiadou
Title: SafeGreece 2021 on‐line Proceedings
Copyright © 2021 SafeGreece
SafeGreece Proceedings
ISSN 2654‐1823

SafeGreece 2021 on-line Proceedings | ISSN 2654-1823
SafeGreece 2021 – 8th International Conference on Civil Protection & New Technologies 24-26 November, on-line | www.safegreece.org/safegreece2021 | [email protected]
index about committes 2 topics 5 thanks to 7 agenda 9 oral presentations 23
Ermioni Gialiti | Region of Crete, Greece Natural Hazards - New Technologies in Civil Protection: the Active Role of Citizens
25
Maria Gaspari | World Bank (GFDRR) Social Vulnerability Assessment through Census-Based Indicators: the Case Study of Lefkada Town
29
Ermelinda Toska, Stavros Kalogiannidis, Fotios Chatzitheodoridis, Efstratios Loizou | University of Western Macedonia, Greece Climate Change and the Adaptation Strategy of Greece
33
Eleni Verouti, Dimitrios Gavathas, Anastasios Mavrakis | Municipality of Aspropyrgos; University of Patras; West Attica Secondary Education Directorate, Greece PM10 Contribution to Daily Air Quality Stress Index in the Socio-Environmentally Stressed City of Aspropyrgos (Attica – Greece)
37
Evi Georgiadou, Dimitra Pinotsi, Theoni Koukoulaki, Konstantina Kapsali | Hellenic Institute for Occupational Health and Safety (ELINYAE), Greece Management of COVID -19 in the Workplace: a Study in Greece
41
Theodore M. Giannaros, George Papavasileiou, Konstantinos Lagouvardos, Vassiliki Kotroni, Stavros Davis, Athanassios Karagiannidis |National Observatory of Athens, Greece Early Warning of Extreme Pyroconvective Events: Lessons Learned from the Early August 2021 Wildfires in Greece
45
Alexis Apostolakis, Stella Girtsou, Giorgos Giannopoulos, Charalampos Kontoes | National Observatory of Athens, Greece Next Day Forest Fire Risk Prediction in Greece Using Machine Learning
49
Konstantina Efthymiou, Vasileios Martzaklis | National & Kapodistrian University of Athens, Greece The Incorporation of ISO 31000:2018 on Risk Management and ISO 22301:2012 on Business Continuity into the Xenocrat Civil Protection Plan for the Optimal Response to Natural Disasters in Greece
53
Dimitrios Menemenlis, Palaiologos Palaiologou, Kostas Kalabokidis | University of the Aegean, Greece Atmospheric Conditions that Contributed to the Blowup of the Large Wildfire in Kalamonas, Rhodes Island, on August 1st 2021
57
1

SafeGreece 2021 on-line Proceedings | ISSN 2654-1823
SafeGreece 2021 – 8th International Conference on Civil Protection & New Technologies 24-26 November, on-line | www.safegreece.org/safegreece2021 | [email protected]
Ioannis Papadopoulos, Triantafyllos Falaras, Aliki Petani, Pavlos Krassakis, Andreas Karavias, Despoina Bafi, Ioanna Tselka, Ioannis Gkougkoustamos, Maria Nikolidaki, Issaak Parcharidis | Harokopio University of Athens, Greece Greece 2021 Wιldfιres: Operatιonal Mappιng Usιng Geospatιal Ιntellιgence and Restoratιon-Needed Knowledge Dιssemιnatιon through a Cloud-Based Platform
61
Panagiotis Symeonidis, Theodoros Vakkas, Simeon Taskaris, Dimitris Melas, Serafim Kontos, Dafni Parliari | Geospatial Enabling Technologies (GET Map); Aristotle University of Thessaloniki, Greece Development of an Operational Heat Health Warning System Using Advanced Modelling and ICT Tools
65
Paraskevi Begou | University of Ioannina, Greece Preliminary Analysis of the 2021 Heat Wave in Greece. The Importance of Planning Preventive and Response Strategies
69
Marina Bresta, Vasileios Martzaklis | National & Kapodistrian University of Athens, Greece Codification of the New Building Fire Protection Regulation (Presidential Decree 41/2018). Conclusions and Recommendations for an Effective Implementation
73
Miranda Dandoulaki, Ioannis Kapris | Region of Attica, Greece Emergency Service 112 for Alert and Information in Greece
77
Areti Plessa, Miranda Dandoulaki | Region of Attica, Greece International Approaches in Emergency Evacuation in Case of a Disaster, Focusing on Community Engagement
81
Lazaros Filippidis, P.J. Lawrence, L. Hulse, A. Veeraswamy, D. Blackshields | University of Greenwich, U.K. Large-Scale Evacuations: They Worked Last Time. Will they Work Again?
85
Ioannis Zikeloglou, Efthymios Lekkas, Stylianos Lozios, Maria Stavropoulou | National & Kapodistrian University of Athens, Greece Human Behaviour During Wildland Urban Interface Fire the Evacuation of North East Attica 03/08/2021
89
Michael Foumelis, Jean-Philippe Malet, Philippe Bally, Floriane Provost, Elena Papageoriou, Aline Deprez, Fabrizio Pacini |Aristotle University of Thessaloniki, Greece; CNRS/EOST, France; ESA; Université Laval, Canada; TerraDue, Italy Affordable Earth Observation Services on Cloud-Based and High-Performance Computing Environments in Support of Geohazard Risk Assessment
93
Varvara Tsironi, Athanassios Ganas, Ioannis Karamitros, Eirini Efstathiou, Ioannis Koukouvelas, Efthimios Sokos | National Observatory of Athens; University of Patras, Greece Detection of Active Landslides in Achaia (central Greece) through InSAR Time Series Analysis
97
Georgia Kalousi, Manon Besset, Virginie Lafon, Aurelie Dehouck, Konstantinos Mytakidis, Evagelos Fryganiotis |Terra Spatium SA, Athens, Greece; i-Sea, Bordeaux, France Watching out Large-Scale Waterline and Coastal Changes in Greece: the Space for Shore Project, under ESA’s Coastal Erosion Project
101
Grigorios Tsinidis, Sotiria Stefanidou, Anna Karatzetzou, Olga Markogiannaki | Aristotle University of Thessaloniki, Greece Towards Effective Risk Assessment of Greek Roadway Networks in a Multi‐Hazard Environment
105

SafeGreece 2021 on-line Proceedings | ISSN 2654-1823
SafeGreece 2021 – 8th International Conference on Civil Protection & New Technologies 24-26 November, on-line | www.safegreece.org/safegreece2021 | [email protected]
Konstantinos Papatheodorou | International Hellenic University Improving Earthquake Emergency Response with Decision Supporting Systems – the Redact Example
109
Denis Istrati, Ian Buckle | University of Nevada, Reno, U.S.A. Deciphering the Tsunami-Induced Hydrodynamic Loads on Coastal Bridges Based on Large-Scale Physical Modeling
113
Ignacio Castro-Melgar, Janire Prudencio, Jesús Ibáñez, Theodoros Gatsios, Issaak Parcharidis | University of Granada, Spain; Harokopio University of Athens; National & Kapodistrian University of Athens, Greece; Operational Monitoring of a Volcano Before Entering in Unrest Phase Using Sentinel 1 DINSAR and MTINSAR: the Case of La Palma Volcanic Island
117
George Papathanassiou, Sotiris Valkaniotis, Athanassios Ganas, Riccardo Caputo | Aristotle University of Thessaloniki; Democritus University of Thrace; National Observatory of Athens, Greece; University of Ferrara, Italy A New Protocol for Post-Earthquake Reconnaissance Survey; Case Study of Thessaly, Greece March 2021 Liquefaction Phenomena
121
Ioanna Triantafyllou, Gerasimos A. Papadopoulos | National & Kapodistrian University of Athens, Greece; International Society for the Prevention & Mitigation of Natural Hazards The Predictive Value of the Foreshock Activity Preceding the 27 September 2021 Strong Earthquake (Mw6.0) in Crete Isl., Greece
123
Nikolaos Theodoulidis, Basil Margaris, Christos karakostas, Vassilis Papanikolaou, Kiriaki Konstantinidou, Elena Zargli, Can Zulfikar, Dragos Toma-Danila | Institute of Engineering Seismology and Earthquake Engineerits (ITSAK), Greece; Aristotle University of Thessaloniki, Greece; Gebze Technical University,Turkey; Ovidius University of Constanta, Romania Rapid Earthquake Damage Assessment System: Harmonization of Ground Motion Parameters
124
Kyriazis Pitilakis, Evi Riga, Stefania Apostolaki, Anna Karatzetzou | Aristotle University of Thessaloniki, Greece The Role of Seismic Hazard In Seismic Risk Assessment of Industrial Facilities: Application to Industrial Areas in Greece
128
Dimitris Pitilakis, Chiara Amendola, Kyriazis Pitilakis | Aristotle University of Thessaloniki, Greece Risk Assessment of Cities: Should we Include Site-Effects and SSI in our Analyses?
132
Nikolaos Klimis, George Papathanassiou, Georgios Panagopoulos, Emmanouil Kirtas, Christos Karakostas, Konstantinos Papatheodorou | Democritus University of Thrace, Aristotle University of Thessaloniki, International Hellenic University, Institute of Engineering Seismology & Earthquake Engineering, Greece REDA System: Earthquake Triggered Geotechnical Hazard and Risk Assessment of Building Stock in Black Sea Basin Cross-Border Areas
136
Anna Fokaefs, Kalliopi Sapountzaki | Harokopio University of Athens, Greece Seismic Risk Perception of Emergency Managers and First Responders in Greece: a Public Survey
140
Kyriaki Makri, Vassiliki Kotroni, Konstantinos Lagouvardos | National Observatory of Athens/ΙERSD, Greece The Content of Meteorology in Greek Geosciensces's Textbook: Preliminary Results
144

SafeGreece 2021 on-line Proceedings | ISSN 2654-1823
SafeGreece 2021 – 8th International Conference on Civil Protection & New Technologies 24-26 November, on-line | www.safegreece.org/safegreece2021 | [email protected]
Christos Stefanis, Elpida Giorgi, Konstantinos Kaletzis, Athanasios Tselemponis, Evangelia Nena, Theodoros Konstantinidis, Eugenia Bezirtzoglou | Democritus University of Thrace, Greece Bibliometric Analysis as a Tool to Reveal Research Trends in Civil Protection: the Case of Greece
148
Ana María Aldea Reyes, Marta Burgos González, Susana Izquierdo Funcia | Escuela Española de Salvamento y Detección con Perros, Spain Ethics in Catastrophes, Extraordinary Decisions
152
Stavros Kalogiannidis, Ermelinda Toska, Fotios Chatzitheodoridis, Vaios Zygouris | University of Western Macedonia, Greece Investigating the Impact of Civil Protection on Economic Growth and Development. Case Study of Kozani City Greece
156
Ioanna Kyriopoulou | Ministry of Infrastructure and Transport, Greece, Greece Implications of Major Natural Disasters on National Budget
159
Asimina Kourou, Maria Panoutsopoulou, Maria Manousaki | Earthquake Planning and Protection Organisation, Greece Telemachus Project: the Case of EPPO‘ s Εducation Action Plan
163
Stavros Kalogiannidis, Evgenia Marneri, Stavroula Savvidou, Olympia Papaevangelou | University of Western Macedonia; Ministry of Education, Greece Leveraging School’s Systems as a Locus for Risks and Disaster Management. A Case Study of Greece
167
Georgia Korakidi, Sotirios Giannopoulos, Evangelos C. Papakitsos, Anastasios Mavrakis | West Attica Secondary Education Directorate; University of West Attica; NGO Z–My Grand Road; Greek Ministry of Education Teaching ‘Road Safety’ – A Systemic Approach Used at West Attica Secondary Education Directorate
170
Georgia Korakidi, Evangelos C. Papakitsos, Sotirios Giannopoulos, Christina Papavasileiou, Anastasios Mavrakis | West Attica Secondary Education Directorate; University of West Attica; NGO Z–My Grand Road; National & Kapodistrian University of Athens; Greek Ministry of Education Teaching ‘Road Safety’ Using “Experiential Learning” at West Attica Secondary Education Directorate
174
Yorgos Vosinakis, Aristidis Dadoukis, Athanasios Douklias, Maria Krommyda, Dimitra Dionysiou, Spyros Athanasiadis, Lazaros Karagiannidis, Eleftherios Ouzounoglou, Angelos Amditis | Institute of Communication and Computer Systems, Greece Technologies for First Responders and Search and Rescue Operations: Focusing on Field Communications
178
Theodore D. Katsilieris | Federation of Telecommunication Engineers of the European Community – FITCE Radio Planning Investigation of DMR Trunked System for the PPDR Authorities in Attica Region
182
Filip Sever, Pauli Mikkonen, Veli-Pekka Anttonen, Jaakko Schroderus | Kajaani University of Applied Sciences; Kainuu Rescue Services, Finland Building Situation Tool: Indoor Disaster Scene Overview
186
Stavroula Charalampidou, Apostolos Zeleskidis, Ioannis Dokas, Anastasios Panagiotis Psathas, Vasileios Dimitriou, Alexandros Pechtelidis| Democritus University of Thrace, Greece Applying Preliminary Hazard Analysis in a Crisis Management Data Collection System: a Case Study
190

SafeGreece 2021 on-line Proceedings | ISSN 2654-1823
SafeGreece 2021 – 8th International Conference on Civil Protection & New Technologies 24-26 November, on-line | www.safegreece.org/safegreece2021 | [email protected]
Panagiotis Michalis | Disaster Risk Innovation Cluster (DRIC) Defkalion, Greece Disaster Risk Innovation Cluster (Dric) Defkalion – The First Interdisciplinary And Collaborative Action in Greece in the Field of Protection Against Natural Hazards and Climatic Risks
194
Georgios Sotiriadis | International Hellenic University, Greece Data Collection in Emergency Crises. The Case of Halkidiki’s Storm in 2019
197
Evangelos Skoubris, George Hloupis | University of West Attica, Greece Low-Cost Water Level Meter with Imaging Capability Aimed for Flood Early Warning Systems
201
Dimitra Angra, Kalliopi Sapountzaki | Harokopio University of Athens, Greece Climate Change Εffect on Forest Fire and Flood Risk - Theoretical Suggestions, Empirical Data and Public Perceptions in Central and South Greece
205
Christina Natalia Patsioti, Andreas Antonakos, Isaak Parcharidis | Harokopio University of Athens, Greece Flood Mapping of the Kalamas River Basin Using Satellite Earth Observation Data
209
Triantafyllos Falaras, Michalis Diakakis, Kostas Lagouvardos, Efthymios Lekkas, Issaak Parcharidis | Harokopio University of Athens; National & Kapodistrian University of Athens; National Observatory of Athens, Greece Confluence of Operational Tracking of Flood Events in Western Thessaly’s Basin (Greece) in September 2020 Based on Sequence of Optical and Radar of Copernicus Satellite Imagery
213
Sofia Lalikidou, Eirini Efraimidou, Apostolos Vasileiou, Michail Spiliotis, Panagiotis Angelidis, Christos Akratos | Democritus University of Thrace, Greece Determination of the Role of Vegetation in Flood Routing with the Usage of Geographical Information Systems and Hechms & Hecras Software Packages. The Case of the Kimmeria Watershed
217
Nikolaos Ziagkos | National & Kapodistrian University of Athens, Greece Geomorphic Impact of the Flash Flood of Mandra (West Attica, Greece, November 15, 2017)
221
poster presentations 225
Chrysoula Chatzichristaki, Georgia Kalantzi, Vasileios Alexandridis | OMIKRON SA Environmental Consultant, Greece An Integrated Approach for Wildfire Hazard Mapping and Vulnerability Assessment
227
Ioannis Logothetis, Christina Antonopoulou, Georgios Zisopoulos, Adamantios Mitsotakis, Panagiotis Grammelis | Centre for Research and Technology Hellas, Chemical Process and Energy Resources, Greece The Impact of Wildfires of Southwestern Turkey and Rhodes Island on the Air Quality of Rhodes City in The Summer of 2021
231
Georgios Alatsakis, Asimina Kourou | 2nd Vocational School of Rethymno, EPPO, Greece The Importance of Prevention and Preparedness in Risk Reduction. Case Study: The School Units of Heraklion and Rethymno Prefectures
235
Tomasz Lachacz, Przemyslaw Wrzosek | Police Academy in Szczytno, Poland FASTER Technologies to Ensure the Safety of First Responders
239

SafeGreece 2021 on-line Proceedings | ISSN 2654-1823
SafeGreece 2021 – 8th International Conference on Civil Protection & New Technologies 24-26 November, on-line | www.safegreece.org/safegreece2021 | [email protected]
Aspasia Tzeletopoulou, Alexios Vlachopoulos, Harris Georgiou, Panagiotis Kasnesis, Christos Chatzigeorgiou, Dimitris Kogias, Charalampos Patrikakis | Hellenic Rescue Team of Attica (HRTA) - University of West Attica, Greece Field trials of emergency alerting, ad-hoc networking and smart textiles at the Afidnes Training Center (ATC)
243
Georgia Gioltzidou, Thomai Baltzi, Sofia Karekla, Ioanna Kostarella, Antonios Skamnakis | Department of Journalism and Mass Communication, Aristotle University of Thessaloniki, Greece #EUGreenDeal: Sustainable Development in Greece the Case of the European Green Deal Public Consultation
247
Maria V. Mavrakis, Anastasios Mavrakis | Department of Public and One Health, University of Thessaly, West Attica Secondary Education Directorate, Greece Health Units and Occupational Safety in Thriasio Plain Area, Greece
251
Ilias Argyris, Sofia Karma, Milt Statheropoulos, Spyros Georgiou, Ioannis Boukis, Dimitrios Menemenlis, Nektarios Floskakis | Municipality of Rhodes, National Technical University of Athens, European Center for Forest Fires, Ministry for Climate Crisis and Civil Protection, Fire Brigade, Greece Wildfire Preparedness and Response Amidst COVID-19 Pandemic Crisis. Case study: the Evacuation of the Butterflies Valley in Rhodes during the Wildfires of August 2021
254
SafeGreece 2021 on-line Proceedings | ISSN 2654-1823
SafeGreece 2021 – 8th International Conference on Civil Protection & New Technologies 24-26 November, on-line | www.safegreece.org/safegreece2021 | [email protected]
about Organised by:
Supported by:
Under the auspices of:
ΔΗΜΟΣ ΚΕΝΤΡΙΚΗΣ ΚΕΡΚΥΡΑΣ
Page 1 of 269

SafeGreece 2021 on-line Proceedings | ISSN 2654-1823
SafeGreece 2021 – 8th International Conference on Civil Protection & New Technologies 24-26 November, on-line | www.safegreece.org/safegreece2021 | [email protected]
committees Honorary Committee
Christos Stylianides Minister of Climate Crisis & Civil Protection Kostas Agorastos Regional Governor of Thessaly Stavros Arnaoutakis Regional Governor of Crete Nikolaos Voulgaris, Dr National & Kapodistrian University of Athens, Vice Rector for
Research and Lifelong Learning Spyridon Mamalis, Dr Geotechnical Chamber of Greece, President Vassilios Papageorgiou Civil Protection Secretary General Dimitrios Papastergiou Central Union of Greek Municipalities, President Spyridon Pavlides, Prof. Geological Society of Greece, President Apostolos Tzitzikostas Association of Greek Regions, President Andreas Tsokos Hellenic Survey of Geology & Mineral Exploration, General
Director
Page 2 of 269

SafeGreece 2021 on-line Proceedings | ISSN 2654-1823
SafeGreece 2021 – 8th International Conference on Civil Protection & New Technologies 24-26 November, on-line | www.safegreece.org/safegreece2021 | [email protected]
Scientific Committee
Annunziato Allessandro, Dr.
Joint Research Centre, European Crisis Management Laboratory, Head
Vallianatos Filippos, Prof.
National & Kapodestrian University of Athens, Faculty of Geology & Geoenvironment
Dandoulaki Miranda, Dr Region of Attica, Civil Protection Division Diakakis Michalis, Dr National & Kapodistrian University of Athens, Faculty of Geology
& Geoenvironment Evelpidou Niki, Prof. National & Kapodistrian University of Athens, Faculty of Geology &
Geoenvironment Kalabokidis Konstantinos, Prof.
University of Aegean, Department of Geography
Kalogiannidis Stavros, Dr.
Mass Media and Public Communications
Karamanou Aspasia, Dr. Region of Attica, Civil Protection Division, Planning Office, Head | North Aegean Region, Internal Operations, General Director
Karymbalis Efthymios, Prof.
Harokopion University of Athens, Department of Geography
Katsaros Nikolaos, Dr. NCRS Demokritos, former Director of Research | New York College, Dept.of Biomedicine, Director
Kolydas Theodoros, Dr. National Meteorological Service, National Meteorological Center, Director
Koukouvelas Ioannis, Prof.
University of Patras, Department of Geology
Kourou Asimina, Dr Earthquake Planning and Protection Organisation of Greece, Training Department, Head
Lekkas Efthymios, Prof. Earthquake Planning and Protection Organisation of Greece, President
Makri Kiriaki, Dr National Observatory of Athens, Postdoctoral Research Fellow Committee of GEOsciences Didactics of the Geological Society of Greece, President
Martzaklis Vasilios, PhD C.
Hellenic Fire Brigade, Ind. Area of Patras Fire Service, Commander
Menemenlis Dimitrios, PhD C.
Hellenic Fire Brigade, Rhodes Island Fire Service, Dep. Commander
Papadopoulos Gerasimos, Dr
Chair, International Society for the Prevention & Mitigation of Natural Hazards
Partsinevelos Panagiotis, Assoc. Prof.
Technical University of Crete, School of Mineral Resources Engineering
Parcharidis Issaak, Prof. Harokopion University of Athens, Department of Geography Pikridas Christos, Prof. Aristotle University of Thessaloniki, Department of Rural and
Surveying Engineering, Sector of Geodesy and Surveying
Page 3 of 269
SafeGreece 2021 on-line Proceedings | ISSN 2654-1823
SafeGreece 2021 – 8th International Conference on Civil Protection & New Technologies 24-26 November, on-line | www.safegreece.org/safegreece2021 | [email protected]
Pitilakis Kyriazis, Prof. Aristotle University of Thessaloniki, Department of Civil Engineering
Pyrros I. Dimitrios, MD, EMDM
National Emergency Center, Medical Services, Director
Sipsa Vana, Assoc. Prof. National & Kapodistrian University of Athens, Epidemiology & Biostatistics Laboratory
Sipsas Nikolaos, MD, Prof.
National & Kapodistrian University of Athens, Pathologist - Infectious Diseases Specialist COVID-19 pandemic managing team in Greece
Organising Committee
Argyris Ilias, MSc, Municipality of Rhodes Civil Protection Office, Head, Applied Geo-Informatics in Environmental & Risk Management Kalogiannidis Stavros,
PhD. Mass Media and Public Communications
Katsetsiadou Katerina - Navsika, MSc.
Natural Disasters Prevention and Management, National and Kapodistrian University of Athens
Vorrias Nikolaos, MSc. Municipality of Chios, Civil Protection Department, Head Gkountromichou Chrysa, MSc.
European Emergency Response Coordination Centre (ERCC)
Dimegeli Maria Municipality of Corfu, Civil Protection Department, Head Kleanthi Maria, MSc. Disaster Recovery Division, General Director Kokolakis Konstantinos, MSc.
Decentralized Administration of Macedonia, Civil Protection Division, former Director
Manoussaki Maria, MSc. Earthquake Planning and Protection Organisation of Greece, Emergency & Prevention Planning Department
Marselos Aris National and Kapodistrian University of Athens, Video Capturing & Editing
Marselos Sotiris National and Kapodistrian University of Athens, Video Capturing & Editing
Naoum Georgios Region of Ionian Islands, Corfu Civil Protection Department, Head, Ηygienist
Triantafyllou Ioanna, MSc. National & Kapodistrian University of Athens, Faculty of Geology & Geoenvironment
Cholevas Konstantinos Ministry of Infrastructure and Transport, Civil Protection Expert
Chouvardas Konstantinos, MSc.
Region of Eastern Macedonia & Thrace, Civil Protection Department, Head
Page 4 of 269

SafeGreece 2021 on-line Proceedings | ISSN 2654-1823
SafeGreece 2021 – 8th International Conference on Civil Protection & New Technologies 24-26 November, on-line | www.safegreece.org/safegreece2021 | [email protected]
topics Special Sessions
COVID-19: studies, actions, best practices, consequences, challenges
Multi-hazard Crisis Management
Prediction and Forecasting / Early Warning Systems: technology, applications, crisis management, social dimensions, methods, success-stories, lessons learned, social dimensions (Meteorology, climate change, earthquakes, tsunamis etc.)
Regular Topics
Natural Disasters: causes, prevention, management, best practices, lessons learned
Technological & Man-made Disasters: causes, prevention, management, best practices, lessons learned
Natech (Mixed Natural & Technological) Disasters: causes, prevention, management, best practices, lessons learned
Marine, Road, and Air Accidents:Prevention and management, lessons learned
Innovative technology and methods on disaster study, prevention and management (Decision Support Systems, 3D-Printing, Artificial Intelligence, Applications, Remote Sensing etc)
Climate Change/Crisis and its impact on Natural Phenomena and Human Culture
Human Activity and its impact on Natural Phenomena (Hydrocarbon Research, Mining etc)
Biodiversity: the impact of Climate Change/Crisis and destructive Phenomena on Biodiversity
Security: Critical Infrastructure protection from malicious actions, terrorist acts management, Cyberprotection
Crises Management Issues
Institutional & Legislative Framework for Civil Protection
Training: to citizens, volunteers, teachers, students, staff
Search & Rescue, Humanitarian Aid
Page 5 of 269
SafeGreece 2021 on-line Proceedings | ISSN 2654-1823
SafeGreece 2021 – 8th International Conference on Civil Protection & New Technologies 24-26 November, on-line | www.safegreece.org/safegreece2021 | [email protected]
Civil Protection & Media: Information dissemination and interdependent relationship between the bodies and the media
Civil Protection - Insularity - Tourism
Civil Protection & Disability / Third Age
Civil Protection & Cultural Heritage
Volunteering: Role, work, Institutional Framework, Challenges
Economic dimension of disasters, crises, prevention
Civil Protection & GDPR (EU General Data Protection Regulation)
Transnational level: International, European and Mediterranean Programmes and Civil Protection synergies
Page 6 of 269

SafeGreece 2021 on-line Proceedings | ISSN 2654-1823
SafeGreece 2021 – 8th International Conference on Civil Protection & New Technologies 24-26 November, on-line | www.safegreece.org/safegreece2021 | [email protected]
thanks to:
Page 7 of 269

SafeGreece 2021 on-line Proceedings | ISSN 2654-1823
SafeGreece 2021 – 8th International Conference on Civil Protection & New Technologies 24-26 November, on-line | www.safegreece.org/safegreece2021 | [email protected]
Profile Satways Ltd. is a privately held organization founded in May
2006 and is based in Athens, Greece. The company is dedicated
to develop integrated Geospatial command and control
solutions for Security and Public Safety applications for police,
coast guard, emergency medical service, civil protection and fire
& rescue operations, critical public infrastructure protection,
transportation security and border monitoring.
With core technology built on open standards, we offer an
unmatched range of mission critical enterprise solutions
empowering governments and businesses around the world to
make better and faster operational decisions.
Our product line includes C2 and C3I enterprise software
packages that respond to different operational requirements of
Public Safety Agencies such as Distributed Geospatial Data
management, Operational Resources Tracking, Incident
Management and dispatch, Physical Security Information
Management and Natural & Technological Hazards Crisis
Management respectively. The common goal though, is to
provide effective decision support, to simplify operations, to
provide a Common Operational Picture (COP) and collaboration
tools across organizations, to collect and disseminate data in the
field and to coordinate response units and system users.
Satways is ISO 9001:2008 certified for the development of
geospatial command and control products and solutions.
Mission Our mission is to provide integrated solutions for the Security
and Safety business sectors that enable the fusion, orchestration
and seamless access of vast amounts of complex data from
disparate information sources, tools and methods to coordinate
the interaction between people, technologies, and responses.
Through advanced software, and hardware we facilitate our
customers to command, control assets and infrastructure by
combining distributed software technologies, mobile data and
geomatics with superior voice and data communication
networks. SATWAYS is committed to delivering next generation
geospatial security solutions to people, businesses and
governments. We seek to earn the respect and trust of our
customers through a total commitment to their success,
industry expertise, and technical innovation.
Commitment We are committed to enhance the operational efficiency of our
customers by providing them with affordable, modular and
expandable solutions that meet their business requirements
and ensure the future value of their investments. Today's diverse
voice and data networks demand ICT solutions that leverage
existing infrastructure and adapt to the business goals of each
customer. We consider each customer as a unique case and our
solutions unique characteristics is the flexibility to map different
business rules, operations and policies under a common
platform reducing the implementation time of cost-efficient
solutions.
Expertise and Experience Our expertise lies in delivering end-to-end integrated solutions,
in implementing large scale turn-key projects and in providing a
wide range of engineering professional services. Our
competitive advantage is based on our experience to deliver
Nation-wide mission critical civil security and safety projects. Our
products have been designed and developed to accommodate
incongruent information sources, vast amounts of data, multi-
agency and multi-site installations and a multitude of voice and
data networks. Our Vision is to apply our insight of public safety
and security issues, policies and approaches to the enterprise
security management market that includes border monitoring,
transportation and critical infrastructure protection.
Solutions Our product lines include software systems for Incident
Command and Response, Decision support, telematics, physical
security, mobile data as well as state-of-the- art decision support
tools. Our advanced and cost-effective solutions enable our
customers to preserve operational integrity, to harness the
power of geospatial information systems and to concentrate on
operations rather that complex ICT integration and
interoperability issues.
www.satways.net
Page 8 of 269

SafeGreece 2021 – 8th International Conference on Civil Protection & New Technologies 24-26 November, on-line | www.safegreece.gr/safegreece2021 | [email protected]
1
09:30 - 09:35 Welcome
Gerasimos Papadopoulos, EU and UNESCO Scientific Collaborator, SafeGreece President
9:35 – 10:30 Welcome Greetings Panagiotis Plakentas, Mayor of Eordea Meropi Hydraiou, Mayor of Central Corfu Stavros Arnaoutakis, Region of Crete, Governor Ioannis Leontarakis, Region of Crete, Deputy Governor for Civil Protection Emmanouil Paravolidakis, Region of Crete, Civil Protection Coordinator Voula Patoulidou, Region of Central Macedonia Deputy Governor for Metropolitan Thessaloniki Giorgos Kaminis, ΚΙΝ.ΑΛ. - Movement for Change Parliament Group, Deputy Head of Civil Protection Chara Kafantari, ΣΥ.ΡΙΖ.Α. - Progressive Alliance Parliament Group, Deputy Head of Civil Protection Christos Stylianides, Minister of Climate Crisis & Civil Protection
24.11 OPENING
Page 9 of 269

SafeGreece 2021 – 8th International Conference on Civil Protection & New Technologies 24-26 November, on-line | www.safegreece.gr/safegreece2021 | [email protected]
2
Session 1.1 24.11
Chair: Miranda Dandoulaki | Region of Attica, Greece 10:30 – 10:45 Ermioni Gialiti | Region of Crete, Greece
Natural Hazards - New Technologies in Civil Protection: the Active Role of Citizens
10:45 – 11:00 Ioannis Verykokidis | Region of Crete, Greece CivilCrete Talos (Τάλως): Application for Mobile Devices
11:00 – 11:15 Dimitris Diagourtas | Satways, Greece Decision Support Tools for Civil Protection
11:15 – 11:30 Maria Gaspari | World Bank (GFDRR) Social Vulnerability Assessment through Census-Based Indicators: the Case Study of Lefkada Town
11:30 – 11:45 Ermelinda Toska, Stavros Kalogiannidis, Fotios Chatzitheodoridis, Efstratios Loizou | University of Western Macedonia, Greece Climate Change and the Adaptation Strategy of Greece
11:45 – 12:00 Giannis Kontos, Anastastia Mavridaki | Marathon Data, Greece Free Available Digital Data Using ArcGIS Online & Living Atlas of the World
12:00 – 12:15 Antonis Kostaridis | Satways, Greece Multi-Agency Collaboration during response
12:15 – 12:30 Eleni Verouti, Dimitrios Gavathas, Anastasios Mavrakis | Municipality of Aspropyrgos; University of Patras; West Attica Secondary Education Directorate, Greece PM10 Contribution to Daily Air Quality Stress Index in the Socio-Environmentally Stressed City of Aspropyrgos (Attica – Greece)
12:30 – 12:45 Evi Georgiadou, Dimitra Pinotsi, Theoni Koukoulaki, Konstantina Kapsali | Hellenic Institute for Occupational Health and Safety (ELINYAE), Greece Management of COVID -19 in the Workplace: a Study in Greece
12:45 – 13:00 Break
Page 10 of 269
SafeGreece 2021 – 8th International Conference on Civil Protection & New Technologies 24-26 November, on-line | www.safegreece.gr/safegreece2021 | [email protected]
3
Session 1.2 24.11
Chair: Ioannis Koukouvelas | University of Patras, Greece INVITED TALK 13:00 – 13:30 Efthymios Lekkas | National & Kapodistrian University of Athens, Earthquake Planning and
Protection Organisation, Greece Risks and Crises: an Emerging Global Phenomenon
13:30 – 13:45 Theodore M. Giannaros, George Papavasileiou, Konstantinos Lagouvardos, Vassiliki Kotroni, Stavros Davis, Athanassios Karagiannidis |National Observatory of Athens, Greece Early Warning of Extreme Pyroconvective Events: Lessons Learned from the Early August 2021 Wildfires in Greece
13:45 – 14:00 Alexis Apostolakis, Stella Girtsou, Giorgos Giannopoulos, Charalampos Kontoes | National Observatory of Athens, Greece Next Day Forest Fire Risk Prediction in Greece Using Machine Learning
14:00 – 14:15 Konstantina Efthymiou, Vasileios Martzaklis | National & Kapodistrian University of Athens, Greece The Incorporation of ISO 31000:2018 on Risk Management and ISO 22301:2012 on Business Continuity into the Xenocrat Civil Protection Plan for the Optimal Response to Natural Disasters in Greece
Chair: Ilias Argyris | Municipality of Rhodes, Greece 14:15 – 14:30 Dimitrios Menemenlis, Palaiologos Palaiologou, Kostas Kalabokidis | University of the
Aegean, Greece Atmospheric Conditions that Contributed to the Blowup of the Large Wildfire in Kalamonas, Rhodes Island, on August 1st 2021
14:30 – 14:45 Ioannis Papadopoulos, Triantafyllos Falaras, Aliki Petani, Pavlos Krassakis, Andreas Karavias, Despoina Bafi, Ioanna Tselka, Ioannis Gkougkoustamos, Maria Nikolidaki, Issaak Parcharidis | Harokopio University of Athens, Greece Greece 2021 Wιldfιres: Operatιonal Mappιng Usιng Geospatιal Ιntellιgence and Restoratιon-Needed Knowledge Dιssemιnatιon through a Cloud-Based Platform
14:45 – 15:00 Panagiotis Symeonidis, Theodoros Vakkas, Simeon Taskaris, Dimitris Melas, Serafim Kontos, Dafni Parliari | Geospatial Enabling Technologies (GET Map); Aristotle University of Thessaloniki, Greece Development of an Operational Heat Health Warning System Using Advanced Modelling and ICT Tools
Page 11 of 269
SafeGreece 2021 – 8th International Conference on Civil Protection & New Technologies 24-26 November, on-line | www.safegreece.gr/safegreece2021 | [email protected]
4
15:00 – 15:15 Paraskevi Begou | University of Ioannina, Greece Preliminary Analysis of The 2021 Heat Wave In Greece. The Importance of Planning Preventive and Response Strategies
15:15 – 15:30 Marina Bresta, Vasileios Martzaklis | National & Kapodistrian University of Athens, Greece
Codification of the New Building Fire Protection Regulation (Presidential Decree 41/2018). Conclusions and Recommendations for an Effective Implementation
15:00 – 16:00 Poster Session
Session 1.3 24.11
Chair: Gerasimos Papadopoulos | EU and UNESCO Scientific Collaborator INVITED TALK 16:00 – 16:30 Ian Clark | European Commission Joint Research Centre
"Science for Disaster Risk Management 2020 - Acting Today, Protecting Tomorrow"
16:30 – 16:45 Miranda Dandoulaki, Ioannis Kapris | Region of Attica, Greece Emergency Service 112 for Alert and Information in Greece
16:45 – 17:00 Areti Plessa, Miranda Dandoulaki | Region of Attica, Greece International Approaches in Emergency Evacuation in Case of a Disaster, Focusing on Community Engagement
17:00 – 17:15 Lazaros Filippidis, P.J. Lawrence, L. Hulse, A. Veeraswamy, D. Blackshields | University of Greenwich, U.K. Large-Scale Evacuations: They Worked Last Time. Will they Work Again?
17:15 – 17:30 Ioannis Zikeloglou, Efthymios Lekkas, Stylianos Lozios, Maria Stavropoulou | National & Kapodistrian University of Athens, Greece Human Behaviour During Wildland Urban Interface Fire the Evacuation of North East Attica 03/08/2021
Page 12 of 269

SafeGreece 2021 – 8th International Conference on Civil Protection & New Technologies 24-26 November, on-line | www.safegreece.gr/safegreece2021 | [email protected]
5
17:30 – 19:00 Round Table:
Organised Preventive Evacuation of Citizens due to Forest Fire at the Level of Municipality – Community Οργανωμένη Απομάκρυνση Πολιτών Εξαιτίας Δασικής Πυρκαγιάς σε Επίπεδο Δήμων - Κοινοτήτων Panel Evaggelos Lempousis, Special Civil Protection Consultant, Municipality of Oropos Nikolaos Skoubris, Head of Environment & Civil Protection Department, Municipality of Mandoudi, Limni, Agia Anna Manolis Kokkalis, Deputy Mayor for Environment, Cyclical Economy & Civil Protection, Municipality of Dionysos Dimitrios Raftopoulos, General Secretary, Municipality of Mandra-Eidyllia Andreas Antonakos, General Secretary of Civil Protection, Natural Disasters Department, Head
Coordinator: Konstantinos Chouvardas, Region of Eastern Macedonia & Thrace, Civil Protection Directorate, Head
Video on youtube
Page 13 of 269

SafeGreece 2021 – 8th International Conference on Civil Protection & New Technologies 24-26 November, on-line | www.safegreece.gr/safegreece2021 | [email protected]
6
Session 2.1 25.11
Chair: Efthymios Karympalis | Harokopio University of Athens, Greece 09:30 – 09:45 Michael Foumelis, Jean-Philippe Malet, Philippe Bally, Floriane Provost, Elena
Papageoriou, Aline Deprez, Fabrizio Pacini |Aristotle University of Thessaloniki, Greece; CNRS/EOST, France; ESA; Université Laval, Canada; TerraDue, Italy Affordable Earth Observation Services on Cloud-Based and High-Performance Computing Environments in Support of Geohazard Risk Assessment
09:45– 10:00 Varvara Tsironi, Athanassios Ganas, Ioannis Karamitros, Eirini Efstathiou,
Ioannis Koukouvelas, Efthimios Sokos | National Observatory of Athens; University of Patras, Greece Detection of Active Landslides in Achaia (central Greece) through InSAR Time Series Analysis
10:00– 10:15 Georgia Kalousi, Manon Besset, Virginie Lafon, Aurelie Dehouck, Konstantinos
Mytakidis, Evagelos Fryganiotis |Terra Spatium SA, Athens, Greece; i-Sea, Bordeaux, France Watching out Large-Scale Waterline and Coastal Changes in Greece: the Space for Shore Project, under ESA’s Coastal Erosion Project
10:15– 10:30 Vana Giavi | Totalview, Greece
Direct Satellite Tasking and Very High Resolution Geospatial Data Management 10:30 – 10:45 Grigorios Tsinidis, Sotiria Stefanidou, Anna Karatzetzou, Olga Markogiannaki | Aristotle
University of Thessaloniki, Greece Towards Effective Risk Assessment of Greek Roadway Networks in a Multi-Hazard Environment
10:45 - 11:00 Konstantinos Papatheodorou | International Hellenic University
Improving Earthquake Emergency Response with Decision Supporting Systems – the Redact Example
Page 14 of 269

SafeGreece 2021 – 8th International Conference on Civil Protection & New Technologies 24-26 November, on-line | www.safegreece.gr/safegreece2021 | [email protected]
7
Session 2.2 25.11
Chair: Gerasimos Papadopoulos | EU and UNESCO Scientific Collaborator INVITED TALK 11:00 – 11:45 Fumihiko Imamura | Tohoku University, Japan
Lessons from the 2011 Tohoku Earthquake and Tsunami for Future Risk Reduction
11:45 – 12:00 Denis Istrati, Ian Buckle | University of Nevada, Reno, U.S.A. Deciphering the Tsunami-Induced Hydrodynamic Loads on Coastal Bridges Based on Large-Scale Physical Modeling
12:00 – 12:15 Ignacio Castro-Melgar, Janire Prudencio, Jesús Ibáñez, Theodoros Gatsios, Issaak Parcharidis | University of Granada, Spain; Harokopio University of Athens; National & Kapodistrian University of Athens, Greece; Operational Monitoring of a Volcano Before Entering in Unrest Phase Using Sentinel 1 DINSAR and MTINSAR: the Case of La Palma Volcanic Island
12:15 – 12:30 George Papathanassiou, Sotiris Valkaniotis, Athanassios Ganas, Riccardo Caputo | Aristotle University of Thessaloniki; Democritus University of Thrace; National Observatory of Athens, Greece; University of Ferrara, Italy A New Protocol for Post-Earthquake Reconnaissance Survey; Case Study of Thessaly, Greece March 2021 Liquefaction Phenomena
12:30 – 12:45 Manolis Tsogas | Satways, Greece ”Listening” to Survivors in Search and Rescue Operations – a Novel Method for Detecting Victims Under Debris with the Use of Geophones
12:45 – 13:00 Break
Page 15 of 269

SafeGreece 2021 – 8th International Conference on Civil Protection & New Technologies 24-26 November, on-line | www.safegreece.gr/safegreece2021 | [email protected]
8
Session 2.3 25.11 Chair: Maria Manousaki | Earthquake Planning and Protection Organisation, Greece 13:00 – 13:15 Ioanna Triantafyllou, Gerasimos A. Papadopoulos | National & Kapodistrian University of
Athens, Greece; International Society for the Prevention & Mitigation of Natural Hazards The Predictive Value of the Foreshock Activity Preceding the 27 September 2021 Strong Earthquake (Mw6.0) in Crete Isl., Greece
13:15 – 13:30 Nikolaos Theodoulidis, Basil Margaris, Christos karakostas, Vassilis Papanikolaou, Kiriaki Konstantinidou, Elena Zargli, Can Zulfikar, Dragos Toma-Danila | Institute of Engineering Seismology and Earthquake Engineerits (ITSAK), Greece; Aristotle University of Thessaloniki, Greece; Gebze Technical University,Turkey; Ovidius University of Constanta, Romania Rapid Earthquake Damage Assessment System: Harmonization of Ground Motion Parameters
13:30 – 13:45 Kyriazis Pitilakis, Evi Riga, Stefania Apostolaki, Anna Karatzetzou | Aristotle University of Thessaloniki, Greece The Role of Seismic Hazard In Seismic Risk Assessment of Industrial Facilities: Application to Industrial Areas in Greece
13:45 – 14:00 Dimitris Pitilakis, Chiara Amendola, Kyriazis Pitilakis | Aristotle University of Thessaloniki, Greece Risk Assessment of Cities: Should we Include Site-Effects and SSI in our Analyses?
14:00 – 14:15 Nikolaos Klimis, George Papathanassiou, Georgios Panagopoulos, Emmanouil Kirtas, Christos Karakostas, Konstantinos Papatheodorou | Democritus University of Thrace, Aristotle University of Thessaloniki, International Hellenic University, Institute of Engineering Seismology & Earthquake Engineering, Greece REDA System: Earthquake Triggered Geotechnical Hazard and Risk Assessment of Building Stock in Black Sea Basin Cross-Border Areas
14:30 – 14:30 Anna Fokaefs, Kalliopi Sapountzaki | Harokopio University of Athens, Greece Seismic Risk Perception of Emergency Managers and First Responders in Greece: a Public Survey.
14:30 – 14:45 Kyriaki Makri, Vassiliki Kotroni, Konstantinos Lagouvardos | National Observatory of Athens/ΙERSD, Greece The Content of Meteorology in Greek Geosciensces's Textbook: Preliminary Results
14:45 – 15:00 Break
Page 16 of 269

SafeGreece 2021 – 8th International Conference on Civil Protection & New Technologies 24-26 November, on-line | www.safegreece.gr/safegreece2021 | [email protected]
9
15:00 – 16:00 Round Table:
School Buildings: Risks & Readiness | Σχολικά Κτίρια: Κίνδυνοι & Ετοιμότητα Panel Asimina Kourou, Earthquake Planning and Protection Organisation, Greece Miranda Dandoulaki, Region of Attica, Greece Konstantinos Kokolakis, Decentralized Administration of Macedonia, Civil Protection Division, former Director
Video on youtube
Session 2.4 25.11 Chair: Kyriaki Makri | National Observatory of Athens/ΙERSD, Greece 16:00 – 16:15 Christos Stefanis, Elpida Giorgi, Konstantinos Kaletzis, Athanasios Tselemponis,
Evangelia Nena, Theodoros Konstantinidis, Eugenia Bezirtzoglou | Democritus University of Thrace, Greece Bibliometric Analysis as a Tool to Reveal Research Trends in Civil Protection: the Case of Greece
16:15 – 16:30 Ana María Aldea Reyes, Marta Burgos González, Susana Izquierdo Funcia | Escuela Española de Salvamento y Detección con Perros, Spain Ethics in Catastrophes, Extraordinary Decisions
16:30 – 16:45 Stavros Kalogiannidis, Ermelinda Toska, Fotios Chatzitheodoridis, Vaios Zygouris | University of Western Macedonia, Greece Investigating the Impact of Civil Protection on Economic Growth and Development. Case Study of Kozani City Greece
16:45 – 17:00 Ioanna Kyriopoulou | National & Kapodistrian University of Athens, Greece Implications of Major Natural Disasters on National Budget
Page 17 of 269
SafeGreece 2021 – 8th International Conference on Civil Protection & New Technologies 24-26 November, on-line | www.safegreece.gr/safegreece2021 | [email protected]
10
17:00 – 18:00 Book Presentation:
Στα Μονοπάτια του Εγκέλαδου (On the Paths of the Enceladus) Pannel: Dr Gerasimos Papadopoulos,
Scientific Collaborator EU and UNESCO Prof. Efthymios Lekkas,
Earthquake Planning and Protection Organisation of Greece, Chairman University of Athens, Professor
Mrs Christina Vidou, Journalist
Mrs Lena Pantopoulou, Publisher
Open live event on youtube
Session 2.5 25.11
Chair: Kyriaki Makri | National Observatory of Athens/ΙERSD, Greece 18:00 – 18:15 Asimina Kourou, Maria Panoutsopoulou, Maria Manousaki | Earthquake Planning and
Protection Organisation, Greece Telemachus Project: the Case of EPPO‘ s Εducation Action Plan
18:15 – 18:30 Stavros Kalogiannidis, Evgenia Marneri, Stavroula Savvidou, Olympia Papaevangelou | University of Western Macedonia; Ministry of Education, Greece Leveraging School’s Systems as a Locus for Risks and Disaster Management. A Case Study of Greece
18:30 – 18:45 Georgia Korakidi, Sotirios Giannopoulos, Evangelos C. Papakitsos, Anastasios Mavrakis | West Attica Secondary Education Directorate; University of West Attica; NGO Z–My Grand Road; Greek Ministry of Education Teaching ‘Road Safety’ – A Systemic Approach Used at West Attica Secondary Education Directorate
18:45 – 19:00 Georgia Korakidi, Evangelos C. Papakitsos, Sotirios Giannopoulos, Christina Papavasileiou, Anastasios Mavrakis | West Attica Secondary Education Directorate; University of West Attica; NGO Z–My Grand Road; National & Kapodistrian University of Athens; Greek Ministry of Education Teaching ‘Road Safety’ Using “Experiential Learning” at West Attica Secondary Education Directorate
Page 18 of 269

SafeGreece 2021 – 8th International Conference on Civil Protection & New Technologies 24-26 November, on-line | www.safegreece.gr/safegreece2021 | [email protected]
11
Session 3.1 26.11 Workshop
09:30 –10:30 “Risk Management Planning at Local and Regional Level Based on General Planning Requirements" “Σχεδιασμός Διαχείρισης Κινδύνων σε Τοπικό και Περιφερειακό Επίπεδο με Βάση τις Απαιτήσεις του Γενικού Σχεδιασμού”
09:30 – 09:50 Konstantinos Chouvardas, Region of Eastern Macedonia & Thrace, Civil Protection Directorate, Head 09:50 – 10:10 Ilias Argyris, Municipality of Rhodes, Civil Protection Office, Head 10:10 - 10:30 Questions & Answers, Discussion
10:30 – 10:45 Break
Page 19 of 269

SafeGreece 2021 – 8th International Conference on Civil Protection & New Technologies 24-26 November, on-line | www.safegreece.gr/safegreece2021 | [email protected]
12
Session 3.2 26.11
Chair: Issaak Parcharidis | Harokopio University of Athens, Greece 10:45 – 11:00 Antonis Kostaridis | Satways, Greece
Critical Infrastructure Risk Assessment Platform
11:00 – 11:15 Yorgos Vosinakis, Aristidis Dadoukis, Athanasios Douklias, Maria Krommyda, Dimitra Dionysiou, Spyros Athanasiadis, Lazaros Karagiannidis, Eleftherios Ouzounoglou, Angelos Amditis | Institute of Communication and Computer Systems, Greece Technologies for First Responders and Search and Rescue Operations: Focusing on Field Communications
11:15 – 11:30 Theodore D. Katsilieris | Federation of Telecommunication Engineers of the European Community - FITCE Radio Planning Investigation of DMR Trunked System for the PPDR Authorities in Attica Region
11:30 – 11:45 Filip Sever, Pauli Mikkonen, Veli-Pekka Anttonen, Jaakko Schroderus | Kajaani University of Applied Sciences; Kainuu Rescue Services, Finland Building Situation Tool: Indoor Disaster Scene Overview
11:45 – 12:00 Stavroula Charalampidou, Zeleskidis Apostolos, Dokas Ioannis, Psathas Anastasios Panagiotis, Dimitriou Vasileios, Pechtelidis Alexandros | Democritus University of Thrace, Greece Applying Preliminary Hazard Analysis in a Crisis Management Data Collection System: a Case Study
12:00 – 12:15 Gavriel Mavrelis | Geospatial Enabling Technologies (GET Map), Greece Geoinformatics Solutions Based on Free and Open-Source Software, Open Data and Standards, Contributing to Achieving a Common Operational Picture
12:15 – 12:30 Panagiotis Michalis | Disaster Risk Innovation Cluster (DRIC) Defkalion, Greece Disaster Risk Innovation Cluster (Dric) Defkalion – The First Interdisciplinary And Collaborative Action in Greece in the Field of Protection Against Natural Hazards and Climatic Risks
12:30 – 12:45 Break
Page 20 of 269

SafeGreece 2021 – 8th International Conference on Civil Protection & New Technologies 24-26 November, on-line | www.safegreece.gr/safegreece2021 | [email protected]
13
Session 3.3 26.11
Chair: Ilias Argyris | Municipality of Rhodes, Greece 12:45 – 13:00 Georgios Sotiriadis | International Hellenic University, Greece
Data Collection in Emergency Crises. The Case of Halkidiki’s Storm in 2019
13:00 – 13:15
Evangelos Skoubris, George Hloupis | University of West Attica, Greece Low-Cost Water Level Meter with Imaging Capability Aimed for Flood Early Warning Systems
13:15 – 13:30 Dimitris Vamvatsikos | National Technological University if Athens; Satways, Greece The PANOPTIS-INFRASTRESS Framework for Infrastructure Risk Assessment
13:30 – 13:45 Dimitra Angra, Kalliopi Sapountzaki | Harokopio University of Athens, Greece Climate Change Εffect on Forest Fire and Flood Risk - Theoretical Suggestions, Empirical Data and Public Perceptions in Central and South Greece
13:45 – 14:00 Christina Natalia Patsioti, Andreas Antonakos, Isaak Parcharidis | Harokopio University of Athens, Greece Flood Mapping of the Kalamas River Basin Using Satellite Earth Observation Data
14:00 – 14:15 Triantafyllos Falaras, Michalis Diakakis, Kostas Lagouvardos, Efthymios Lekkas, Issaak Parcharidis | Harokopio University of Athens; National & Kapodistrian University of Athens; National Observatory of Athens, Greece Confluence of Operational Tracking of Flood Events in Western Thessaly’s Basin (Greece) in September 2020 Based on Sequence of Optical and Radar of Copernicus Satellite Imagery
14:15 – 14:30 Sofia Lalikidou, Eirini Efraimidou, Apostolos Vasileiou, Michail Spiliotis, Panagiotis Angelidis, Christos Akratos | Democritus University of Thrace, Greece Determination of the Role of Vegetation in Flood Routing with the Usage of Geographical Information Systems and Hechms & Hecras Software Packages. The Case of the Kimmeria Watershed.
14:30 – 14:45 Nikolaos Ziagkos | National & Kapodistrian University of Athens, Greece Geomorphic Impact of the Flash Flood of Mandra (West Attica, Greece, November 15, 2017)
14:45 – 15:00 Emmanouela Ieronymidi | Planetek Hellas, Greece The European Coastal Flood Awareness System (ECFAS) in Support of Sustainable Urban Planning
14:30 – 14:45 Closure
Page 21 of 269

SafeGreece 2021 – 8th International Conference on Civil Protection & New Technologies 24-26 November, on-line | www.safegreece.gr/safegreece2021 | [email protected]
14
Poster Session 24.11 Chrysoula Chatzichristaki, Georgia Kalantzi, Vasileios Alexandridis OMIKRON SA Environmental Consultant, Greece An Integrated Approach for Wildfire Hazard Mapping and Vulnerability Assessment
Ioannis Logothetis, Christina Antonopoulou, Georgios Zisopoulos, Adamantios Mitsotakis, Panagiotis Grammelis Centre for Research and Technology Hellas, Chemical Process and Energy Resources, Greece The Impact of Wildfires of Southwestern Turkey and Rhodes Island on the Air Quality of Rhodes City in The Summer of 2021
Georgios Alatsakis, Asimina Kourou 2nd Vocational School of Rethymno, EPPO, Greece The Importance of Prevention and Preparedness in Risk Reduction. Case Study: The School Units of Heraklion and Rethymno Prefectures.
Tomasz Lachacz, Przemyslaw Wrzosek Police Academy in Szczytno, Poland FASTER Technologies to Ensure the Safety of First Responders
Aspasia Tzeletopoulou, Alexios Vlachopoulos, Harris Georgiou, Panagiotis Kasnesis, Christos Chatzigeorgiou, Dimitris Kogias, Charalampos Patrikakis Hellenic Rescue Team of Attica (HRTA) - University of West Attica, Greece Field trials of emergency alerting, ad-hoc networking and smart textiles at the Afidnes Training Center (ATC)
Georgia Gioltzidou, Thomai Baltzi, Sofia Karekla, Ioanna Kostarella, Antonios Skamnakis Department of Journalism and Mass Communication, Aristotle University of Thessaloniki, Greece #EUGreenDeal: SUSTAINABLE DEVELOPMENT IN GREECE THE CASE OF THE EUROPEAN GREEN DEAL PUBLIC CONSULTATION
Maria V. Mavrakis, Anastasios Mavrakis Department of Public and One Health, University of Thessaly, West Attica Secondary Education Directorate, Greece Health Units and Occupational Safety in Thriasio Plain Area, Greece
Ilias Argyris, Sofia Karma, Milt Statheropoulos, Spyros Georgiou, Ioannis Boukis, Dimitrios Menemenlis, Nektarios Floskakis Municipality of Rhodes, National Technical University of Athens, European Center for Forest Fires, Ministry for Climate Crisis and Civil Protection, Fire Brigade, Greece Wildfire Preparedness and Response Amidst COVID-19 Pandemic Crisis. Case study: the Evacuation of the Butterflies Valley in Rhodes during the Wildfires of August 2021
Page 22 of 269

oral presentations
24-26.11proceedings

SafeGreece 2021 on-line Proceedings | ISSN 2654-1823
SafeGreece 2021 – 8th International Conference on Civil Protection & New Technologies 24-26 November, on-line | www.safegreece.org/safegreece2021 | [email protected]
NNAATTUURRAALL HHAAZZAARRDDSS:: NNEEWW TTEECCHHNNOOLLOOGGIIEESS IINN CCIIVVIILL PPRROOTTEECCTTIIOONN && TTHHEE AACCTTIIVVEE RROOLLEE OOFF CCIITTIIZZEENNSS
Ermioni E. Gialiti Geologist – Environmental Geotechnologist MSc,
Special Consultant in Regional Governance of Crete, Greece
ABSTRACT Global conditions, from the climate crisis to the pandemic and humanitarian crises, make Civil Protection a social benefit, more and more relevant. Prevention, resilience, interoperability and good practices, now require urgent implementation. This is exactly the requirement that Crete Region meets, through the presented innovative technologies. The initial goal is to provide reliable data, to improve services provided to citizens, with the maximum possible efficiency and economy of resources. In addition, as civil protection technologies evolve, a new type of citizen is being created: fully informed, with increased awareness, environmentally sensible, ready to take action, and to have a rational reaction, whenever it’s needed.
Keywords: natural hazards, innovative technologies, geospatial data, interoperability, crisis management, acceptable risk, vulnerability.
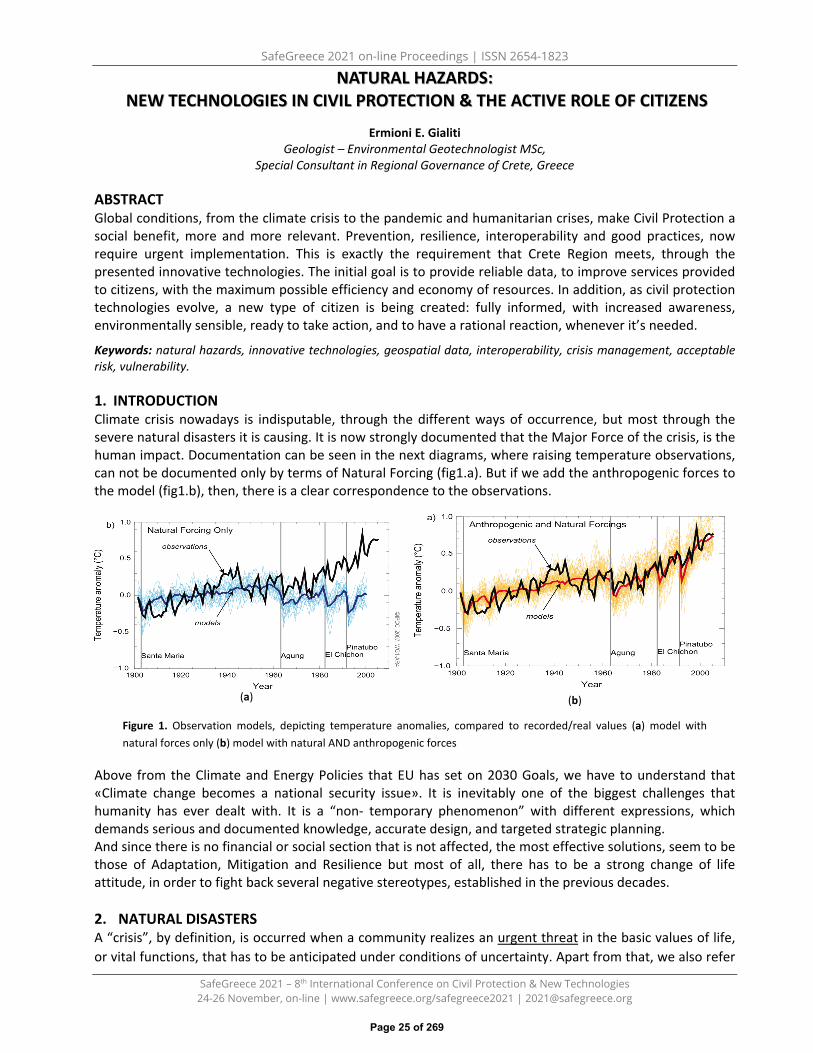
1. INTRODUCTIONClimate crisis nowadays is indisputable, through the different ways of occurrence, but most through thesevere natural disasters it is causing. It is now strongly documented that the Major Force of the crisis, is thehuman impact. Documentation can be seen in the next diagrams, where raising temperature observations,can not be documented only by terms of Natural Forcing (fig1.a). But if we add the anthropogenic forces tothe model (fig1.b), then, there is a clear correspondence to the observations.
(a) (b)
Figure 1. Observation models, depicting temperature anomalies, compared to recorded/real values (a) model with natural forces only (b) model with natural AND anthropogenic forces
Above from the Climate and Energy Policies that EU has set on 2030 Goals, we have to understand that «Climate change becomes a national security issue». It is inevitably one of the biggest challenges that humanity has ever dealt with. It is a “non- temporary phenomenon” with different expressions, which demands serious and documented knowledge, accurate design, and targeted strategic planning. And since there is no financial or social section that is not affected, the most effective solutions, seem to be those of Adaptation, Mitigation and Resilience but most of all, there has to be a strong change of life attitude, in order to fight back several negative stereotypes, established in the previous decades.
2. NATURAL DISASTERSA “crisis”, by definition, is occurred when a community realizes an urgent threat in the basic values of life,or vital functions, that has to be anticipated under conditions of uncertainty. Apart from that, we also refer
Page 25 of 269

SafeGreece 2021 on-line Proceedings | ISSN 2654-1823
SafeGreece 2021 – 8th International Conference on Civil Protection & New Technologies 24-26 November, on-line | www.safegreece.org/safegreece2021 | [email protected]
to it, as the main reason that causes a “Natural Disaster” (the term is used because of the impact over the human nature, and not due to the reason that causes it). Nevertheless, collected data from the international database EM-DAT [1], about the global evolution of disasters, indicate that the number of Disaster Events, has been multiplied by seven (7) within the last 40 years!
2.1. MAIN TYPES OF DISASTERS Globally referring statistic data [1], indicate the three main type of disasters affecting urban areas are:
2.1.1. Wildfires, mainly forest fires, that are directly connected to the Mediterranean ecosystems. It is indicative that Mediterranean territory, loses 0,6% of its forest areas. On the other hand, urban fires are also increased, in a rate of over 80%, within the last 10 years.
2.1.2. As wildfires, never come alone, they are caused by drought and are subsequently causing floods and landslides. In the vicious circle of these interconnected events, soil mass movements, result to great amounts of sediments being transferred and deposited. Through loss of the upper fertile stratigraphy layers, at the end of this long pathway, 9 billion tons of soil/year end up in the sea!
2.1.3. The next disastrous, most frequent phenomena are floods. As it is globally recorded, 1/3 of the total disaster events, have been caused by floods
Among the different existing categories, Flash Floods with rapid evolvement, are the main flood type in Greece, due to the intense geomorphology of the country. This happens in Crete as well, where flash floods cause runoffs, extended erosion and soil deposits, creating additional hazards such as mudflows and landslides (rotational landslide, toppling etc), caused by natural or artificial anthropogenic causes.
Something positive to focus on, is that during the last years, although the flood events are increasing, there is an elimination in the number of total deaths and casualties. This shows that through evolution of technology, we can be prevented, if well informed and trained to do so.
3. THE ROLE OF CIVIL PROTECTIONCivil Protection aims to the citizens’ protection, individually or in groups, or communities, from natural oranthropogenic disasters, that are slowly or fast accelerating. But regarding Civil Protection in a perspectiveof Climate Change, there is no “one best solution” in anticipating natural hazards, as the vulnerability ofeach region should be estimated separately. Also, a modern view in Civil Protection, does not focus on theconfrontation only. It takes the highest grade of prevention & preparedness, to implement the mostsuitable protection method. Above all, in this new aspect, in order to involve citizens in their ownprotection plan, we must encounter that there is a great discrimination between hazard evaluation andhazard perception. Evaluation (estimation) is a scientific method, analyzing the possibility of a disastrousevent to happen, and therefore, its impact. The aim is to produce results, suitable to be applied repeatedly,in groups of people, to increase awareness. While Perception, consists of all the individual perceptions of“what hazard means”. For a possible threat, every person will choose the reaction related to his own“danger-theory”. And of course, there is also the official, strategic plan for disasters management.
4. STRATEGIC PLANS FOR DISASTER MANAGEMENTEvery strategic plan is governed by the main mathematical type: RISK = HAZARD * VULNERABILITYThat means Risk is the possibility of a hazardous event to happen, depending on the social vulnerability ofthe particular region. Also Hazard represents the possibility of the event occurrence and not the eventitself. Thus: while the occurrence most of the natural hazards is inevitable, the Risk of natural disasters canbe avoided, if early and wisely anticipated. Another definition need to be made is that of Vulnerability: theinability of predicting, tolerating, resisting and recovery, from the impact of a disaster. All societies in theworld, are vulnerable to some extent, against most of the hazards. What we really need to focus on, is theestimation of vulnerability, which has a significant use for the harmed region’s recovery treatment.Through this, each disastrous event, highlights the geographical and cultural characteristics of the affectedarea. Every effective strategy for the reduction of natural disasters, has to be customized to the specificconditions of the particular region. That rule basically governs the administration of Crete.
Page 26 of 269

SafeGreece 2021 on-line Proceedings | ISSN 2654-1823
SafeGreece 2021 – 8th International Conference on Civil Protection & New Technologies 24-26 November, on-line | www.safegreece.org/safegreece2021 | [email protected]
5. ACTIVE ENVIRONMENTAL STRATEGIC PLAN, IMPLEMENTED BY REGIONAL GOVERNANCE OF CRETEThe main principles of the strategy that Regional Governance of Crete implements, are those of increasingenvironmental awareness, use of geospatial & open data , active civil protection.
5.1. “SAFE CRETE” - A SITE DEDICATED TO CLIMATE CRISIS In the crossroad where three continents meet, Crete is an island with a coastline of 1.046km, encountering a strong morphological relief, related to the intense tectonic history which created 400 canyons, 5.000 caves and 12 plateaus. So, protection becomes imperative, especially in the current period of climate crisis, something that highlights the importance of sustainable management for the environment, the economy and society. Thus, we are working on increasing awareness, knowledge, prevention & preparedness, through a website [2], dedicated to climate crisis impact on Crete island.
5.2. GIS CRETE – GEOSPATIAL DATA At the same time, and as “Copernicus” earth observation system provides real time open data, we combine them with the primary Crete Region’s data, with constant update. The end users through the GIS CRETE geoportal, are enabled to find and download the geo-data & the descriptive information. The revolutionary way of superimposing individual thematic maps, can produce a synthesis of Natural environment multi-thematic maps (rivers, protected areas, geology, land use, natural hazard areas, atmospheric parameters, habitats, marine areas) combined with Urban design – referring to citizens’ needs (administration units, transport networks, infrastructure, health & safety, public utilities). The final web-GIS product, covers the whole area of the island (8.336 km2), with over 1400 data layers, something that inducted us to the Innovation Unit of Ministry of internal affairs, as the first Regional Governance to do so. With complete interoperability between GIS and other public services, educational & research institutes, ministries, regions & municipalities, always aiming to the benefit of the end users.
5.2.2. How GIS Crete is linked to Civil Protection We log in and choose “Civil Protection Maps” [3] with a scope of 3 phases:
• Prevention: In the prefecture of Heraklion, an instruction is issued for prohibited district zones,during days with danger index 4 & 5 (fig 2a). Citizens can locate these areas through GIS CRETE, bydownloading the map given, identifying the restriction borders within the forest of Rouvas (Fig 2b).
(a) (b)
Figure 2. Designated prohibited district zones (a), Rouvas specific area map with prohibited purple dotted zone
• Enterprise use: In a situation of a crisis, with an urgent need for communication and coordination,GIS maps must be able to deliver answers to questions like: “where is each team? where should theylead to? how do they get access? which are the escape roads? Shelters etc”
• Using Earth Observation Browser, evaluation of damaged areas is provided. Through this agileapplication, the land burnt is depicted, before & after the wildfire event, by producing a framestimeline.
Page 27 of 269

SafeGreece 2021 on-line Proceedings | ISSN 2654-1823
SafeGreece 2021 – 8th International Conference on Civil Protection & New Technologies 24-26 November, on-line | www.safegreece.org/safegreece2021 | [email protected]
(a) (b)
Figure 3. Evaluation of harmed areas in acres of territory (a) and land use (b)
The first week of July, within a few hours, the information of the 5 main fire incidents was available (fig.3a). In addition, for Preveli palm forest (southern Crete) [4], was estimated with accuracy that 1859 acres of land had been burnt and according to the CORINE land cover legislation, the system estimated also the kind of land burnt (by percentage of forest and agricultural land, that had been destroyed, as shown in fig.3b).
Evaluation phase of GIS Crete, can also produce information of other natural hazard datasets, such as the floods in Malia Crete [5], during November 2020. After the polygons of flooded areas were designated, we were allowed to know the properties affected, the protection measures that had to be taken, and also the areas of high vulnerability, for the design and strategy decisions in the future. Apart from wildfires and floods, we intend to use the satellite capabilities for monitoring & management of landslide phenomena in Crete, which are quite often, because of the intense tectonic structure of the island, deriving from the tectonic plates subduction, producing high seismicity. In order to collect information of settlement, and other surface anomalies, we utilize synthetic aperture radar (SAR) Interferometry. Thus, we produce a vulnerability map depicting the instable areas in the island of Crete.
6. LINKING SOCIETY RESPONSE TO CLIMATE CHANGE – THE ROLE OF CITIZENSAs no action can be irrelevant to the climate crisis scenarios, a new type of civil protection is being formed,where the active participation of citizens, is of major importance. Three crucial principles to bare in mind:
1. Climate change reforms the way that natural disasters evolve, and creates particular anticipationdifficulties. That’s why extreme phenomena are now part of our daily lives.
2. Immediate and early warning of impending danger is decisive. Readiness and preparedness are thekey components of an effective response to natural disasters.
3. Our security is not possible without our active participation.
REFERENCES 1. http://www.emdat.be/ 2. https://www.safecrete.gr/3. http://gis.crete.gov.gr/sdi/?tab=viewport_maptab&loader=map6_loader_public&lon=2762663.5125719&lat=4201151.0570441&zoom=94. Sentinel Monitoring (crete.gov.gr)5. http://gis.crete.gov.gr/sdi/?tab=viewport_maptab&loader=map6_loader_public&lon=2831193.1620793&lat=4211636.12549&zoom=10
Page 28 of 269

SafeGreece 2021 on-line Proceedings | ISSN 2654-1823
SafeGreece 2021 – 8th International Conference on Civil Protection & New Technologies 24-26 November, on-line | www.safegreece.org/safegreece2021 | [email protected]
SOCIAL VULNERABILITY ASSESSMENT THROUGH CENSUS-BASED INDICATORS: THE CASE STUDY OF LEFKADA TOWN
Maria Gaspari Disaster Risk Consultant, World Bank (GFDRR)
ABSTRACT The objective of this article is to examine the local drivers of human and social vulnerability against earthquake hazard in the capital town of Lefkada island (western Greece) and develop a measure or an index that captures the spatial variations and underlying causes of social vulnerability. Place-specific determinants of social vulnerability derived from the 2011 national population and housing census (ELSTAT, 2011) and the income and living conditions survey (SILC, 2011) are analyzed and construct the Social Vulnerability Index (SoVI) and its dimensions by applying Principal Component Analysis (PCA). The Social Vulnerability Index is a comparative metric that ranks the 256 town blocks of Lefkada town based on their social vulnerability against earthquake hazard, prioritizing the resources needed in the affected areas in the aftermath of a disaster.
The development and integration of indices in social vulnerability assessment can advance risk reduction policies since they can inform a rapid response mechanism and stakeholders about where the vulnerable people are and why they are vulnerable, alleviating human casualties, injuries and financial losses concerning emergency and public health services.
Keywords: social vulnerability, SoVI index, PCA, census data, Lefkada town
1. INTRODUCTION
The concept of vulnerability and health vulnerability, in particular, might be more relevant today than ever before after the 2019 coronavirus disease (COVID-19) pandemic outbreak and its disruptive effects worldwide. Vulnerability has recently become ubiquitous in many aspects of personal and public life, a fact that makes the concept imperative to be revisited. In general terms, vulnerability is taken to mean the ‘susceptibility to be harmed’ [1] or the ’propensity to loss under the effect of a stressor’ [2], implying that vulnerability has an uncertain future evolution in nature. Vulnerability is most apparent in the immediate aftermath of a disaster, not only because unequal patterns of losses and recovery are observed, but also because disasters introduce new social vulnerabilities as people have to deal with response, recovery and reconstruction phases [3].
Vulnerability is a dynamic situation [4, 5, 6], that is, it varies across a geographic and social space over time. To reduce human vulnerability and enhance resilience, it is necessary to understand the triggering factors of vulnerability and their dynamics. In the last few decades, it seems widely accepted that human vulnerability is not produced only by the exposure to a hazard but mainly by a complex set of both local and cross-scale drivers related to, among others, poverty, livelihoods and income-generating opportunities, social inequalities, social and political networks, risk perception and governance [7, 8, 9, 10, 11]. The fact that vulnerability spans so many different contexts, sectors, scales and elements of society makes it necessary to introduce the scope of this research.
Page 29 of 269
SafeGreece 2021 on-line Proceedings | ISSN 2654-1823
SafeGreece 2021 – 8th International Conference on Civil Protection & New Technologies 24-26 November, on-line | www.safegreece.org/safegreece2021 | [email protected]
The objective of this article is to examine the local drivers of human and social vulnerability against earthquake hazard and develop a measure or an index that captures the spatial variations and the causal dimensions of social vulnerability in the capital town of Lefkada island (western Greece). In this regard, it takes into consideration place-specific and census-based indicators and delineates their contribution to social vulnerability in the 256 town blocks of the town of Lefkada.
2. METHDOLOGYFrom a social vulnerability estimation perspective, a great deal of effort has been devoted to census-based indicators describing the social vulnerability of a place [12, 13, 14, 15, 16, 17]. Although there is acommon consensus among scholars about the main factors influencing social vulnerability (e.g. shortageof resources, social and human capital, risk perception, demographics, built environment, etc.),disagreements ensue from the selection of variables which would represent these broad concepts. Here,the main focus is on human capital and particularly on social groups bearing the disproportionateburden of disaster impact while it would be even harder for them to recover if they survive, because oftheir gender, physical fragility, socioeconomic situation, employment status, household composition,and the quality of their dwellings. In this respect, 23 variables were collected from the 2011 nationalpopulation-household and building censuses (ELSTAT, 2011) and the income and living conditions survey(SILC, 2011) to capture these aspects (at town block level).
The SoVI is constructed as a spatial composite index by using the Principal Component Analysis, summarizing the census-based aspects of social vulnerability. The PCA is a reductionist method that reduces the number of original variables (23) to a few conceptual dimensions (4 principal components) while retaining as much as possible of the variation in the data set [18]. The overall SoVI index is resultant of the aggregation of the principal components and ranks the 256 town blocks based on their social vulnerability (comparative metric).
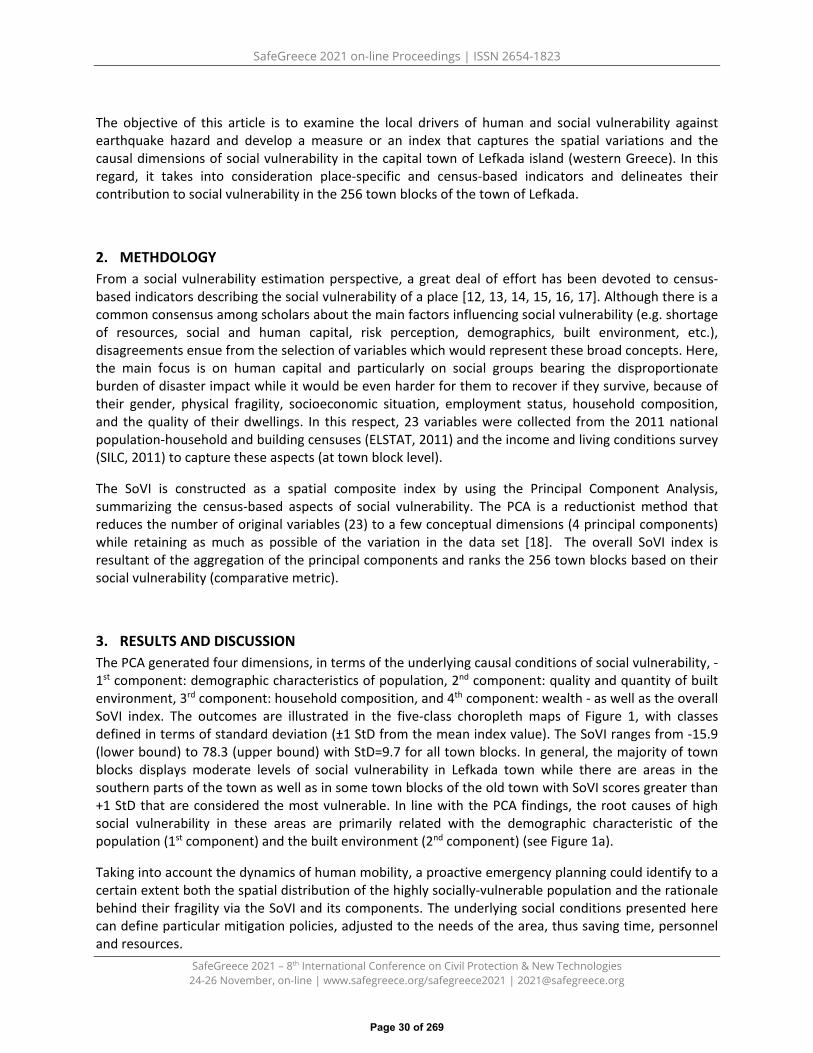
3. RESULTS AND DISCUSSIONThe PCA generated four dimensions, in terms of the underlying causal conditions of social vulnerability, -1st component: demographic characteristics of population, 2nd component: quality and quantity of builtenvironment, 3rd component: household composition, and 4th component: wealth - as well as the overallSoVI index. The outcomes are illustrated in the five-class choropleth maps of Figure 1, with classesdefined in terms of standard deviation (±1 StD from the mean index value). The SoVI ranges from -15.9(lower bound) to 78.3 (upper bound) with StD=9.7 for all town blocks. In general, the majority of townblocks displays moderate levels of social vulnerability in Lefkada town while there are areas in thesouthern parts of the town as well as in some town blocks of the old town with SoVI scores greater than+1 StD that are considered the most vulnerable. In line with the PCA findings, the root causes of highsocial vulnerability in these areas are primarily related with the demographic characteristic of thepopulation (1st component) and the built environment (2nd component) (see Figure 1a).
Taking into account the dynamics of human mobility, a proactive emergency planning could identify to a certain extent both the spatial distribution of the highly socially-vulnerable population and the rationale behind their fragility via the SoVI and its components. The underlying social conditions presented here can define particular mitigation policies, adjusted to the needs of the area, thus saving time, personnel and resources.
Page 30 of 269

SafeGreece 2021 on-line Proceedings | ISSN 2654-1823
SafeGreece 2021 – 8th International Conference on Civil Protection & New Technologies 24-26 November, on-line | www.safegreece.org/safegreece2021 | [email protected]
(a) (b)
Figure 1. (a) The spatial distribution of four components of the SoVI index (1st component: demographic characteristics of population, 2nd component: quality and quantity of built environment, 3rd component: household composition, and 4th component: wealth); (b) the overall SoVI index in the 256 town blocks of Lefkada town in 2011.
4. CONCLUSIONSSocial vulnerability is a dynamic process but it is viewed as a static phenomenon for practical reasons,i.e. to make it measurable. The use of census-based indicators in social vulnerability assessment studieshas emerged from the desire for ‘measuring the unmeasurable’, enabling though certain disaster riskreduction policies to gain ground or more relevance at various scales through models, metrics, andindices. The development and integration of indices in social vulnerability assessment can advance riskreduction policies since they can inform a rapid response mechanism and stakeholders about where themost vulnerable people are and why they are vulnerable, alleviating human casualties, injuries andfinancial losses concerning emergency and public health services.
However crucial they are, there also exist place-independent, supra-local or cross-scale agents (e.g. higher-level institutional deficiencies, political leadership/negligence, lack of coordination between competent organizations, etc.) that come to the fore at moments of crisis, aggravating by far the final outcome of disasters. Could a SoVI index include the macro-perspectives of social vulnerability in its consideration?
REFERENCES
1. N. Adger (2006). Vulnerability, Global Environmental Change, 16, 268-2812. K. Sapountzaki, Ch. Chalkias (2014). Urban geographies of vulnerability and resilience in the economic
crisis era – the case study of Athens, Journal of Faculty of Architecture, 11:1,59-753. K. Warner (2007). Perspectives on Social Vulnerability: Introduction, UNU-EHS No6/20074. S.K . Cutter (1996). Vulnerability to environmental hazards. Progress in Human Geography, 40:4, 529-5395. D. Hilhost, G.Bankoff (2004). Introduction: Mapping vulnerability. In EarthScan (ed.) Mapping
vulnerability. Disasters, Development and People. London, UK6. K. Sapountzaki, M. Dandoulaki (2016). Hazards and disasters. Concepts and tools for risk assessment,
protection and management (e-book in Greek)
Page 31 of 269
SafeGreece 2021 on-line Proceedings | ISSN 2654-1823
SafeGreece 2021 – 8th International Conference on Civil Protection & New Technologies 24-26 November, on-line | www.safegreece.org/safegreece2021 | [email protected]
7. P. O’Keefe, K. Westgate, B. Wisner (1976). Taking the naturalness out of natural disasters, Nature, 260,566-567
8. S. Cutter, B. Boruff, W. Shirley (2003). Social Vulnerability to Environmental Hazards, Social ScienceQuarterly, 84:2.242-261
9. P. Blaikie, T. Canon, I. Davis, B. Wisner (2003). At Risk. Natural Hazards, People's Vulnerability andDisasters
10. T. Cannon (2008). Reducing People’s vulnerability to natural hazards. Research Paper No. 2008/34, UNU-WIDER
11. O. D. Cardona, M.K. van Aalst, J. Birkmann, M. Fordham, G. McGregor, R. Perez, R.S. Pulwarty, E.L.F.Schipper, and B.T. Sinh (2012). Determinants of risk: exposure and vulnerability. In: Managing the Risks ofExtreme Events and Disasters to Advance Climate Change Adaptation [Field, C.B., V. Barros, T.F. Stocker,D. Qin, D.J. Dokken, K.L. Ebi, M.D. Mastrandrea, K.J. Mach, G.-K. Plattner, S.K. Allen, M. Tignor, and P.M.Midgley (eds.)]. A Special Report of Working Groups I and II of the Intergovernmental Panel on ClimateChange (IPCC). Cambridge University Press, Cambridge, UK, and New York, NY, USA, 65-108.
12. K.A. Borden, M.C. Schmidtlein, S.T. Emrish, W. W.Piegorsch, S.K. Cutter (2007). Vulnerability of U.S. Citiesto Environmental Hazards, Journal of Homeland Security and Emergency Management, 4:2
13. I. Armas, A. Gavris (2016). Census-based social vulnerability assessment for Bucharest, ProcediaEnvironmental Sciences, 32, 138-146
14. M. Gaspari (2017). Assessment of social vulnerability to seismic hazard based on 2011 census datafor Lefkas town (Greece), Master of Science Thesis, Department of Geography, University ofAegean,
15. C. Guillard-Concalves, S.L. Cutter, C.T Emrich, J.L. Zezere (2014). Application of Social Vulnerability Index(SoVI) and delineation of natural risk zones in Greater Lisbon, Portugal. Journal of Risk Research
16. 1. Armas, I., A. Gavris (2016). Census-based social vulnerability assessment for Bucharest, ProcediaEnvironmental Sciences, 32, 138-146
17. C. Burton, V. Silva (2019). Assessing Integrated Earthquake Risk in OpenQuake with an Application toMainland Portugal, Earthquake Spectra, 32:3, 1383-1413
18. I.T., Jolliffe (2002). Principal Component Analysis. Springer-Verlag
Page 32 of 269

SafeGreece 2021 on-line Proceedings | ISSN 2654-1823
SafeGreece 2021 – 8th International Conference on Civil Protection & New Technologies 24-26 November, on-line | www.safegreece.org/safegreece2021 | [email protected]
CLIMATE CHANGE AND THE ADAPTATION STRATEGY OF GREECE
Ermelinda Toska1, Stavros Kalogiannidis2, Fotios Chatzitheodoridis3, Efstratios Loizou4 1, 2, 3, 4 Department of Regional and Cross-Border Development, University of Western Macedonia, (Greece)
(E-mail: [email protected], [email protected], [email protected], [email protected])
ABSTRACT
Against the background of the scientific community’s warnings of the environmental degradation, the severe weather phenomena that occur on the planet are a tangible proof of the course of climate change. In particular, emphasis is placed on the need for comprehensive action in order to face the irreversible consequences of climate threat. This abstract portrays briefly the policies of adaptation to the climate crisis in Greece, focusing on climate vulnerability management and the resilience enhancement.
Keywords: climate change/crisis, adaptation strategies, civil protection, Greece.
1. INTRODUCTION
Undoubtedly, the appearance of the new SARS-CoV-2 coronavirus strain at the end of 2019 and the rapid spread of COVID-19 respiratory disease with so far about 5 million deaths worldwide [1], has emerged the public health crisis in major challenge of recent decades. Humanity's primary concern is managing the global COVID-19 pandemic crisis and its social and economic consequences. On the other hand, the appearance of extreme climate phenomena with catastrophic consequences around the world is an irrefutable evidence of climate change. The climate crisis is not an abstract concept of a future threat. It is evident and is affecting the entire planet, prompting a request for the urgent global mobilization in order to mitigate it and ensure the well-being of future generations [2, 3].
All living organisms are characterized by the ability to adapt in order to survive in any kind of difficulties, uncertainties and shocks. The international community, states and citizens must adapt to climate change, as an evolutionary process that is an important resource in managing the effects of natural phenomena. Given the severity of the weather phenomena and the uncertainty of their effects, the role of the state is considered necessary in ensuring the planning of strategies, as well as their implementation at national, regional and local level, shielding the vulnerable people [4]. The purpose of this paper is to demonstrate the adaptation policies in Greece implemented in order to address the effects of climate change. Also, the environmental problem of climate change and its effects on extreme weather phenomena are briefly recorded. Finally, there are conclusions about global management of the climate crisis and the adaptation strategy on the part of our country.
2. THE EXPLICIT CLIMATE CHANGE AND THE GLOBAL ACTIVITY AGAINST CLIMATE THREAT
Considering the finite space and energy [5], the ignorance of the ecological boundaries [6] of the planet in combination with the reckless use of fossil fuels (coal, oil and gas) foster the risk of causing irreversible environmental pollution and deepening climate change, exposing the humanity in uncharted conditions with undefined and uncontrollable consequences for the health and well-being of future generations [7, 8, 9, 10]. According to the definition of the United Nations Framework Convention (UNFCCC) “climate change means a change of climate which is attributed directly or indirectly to human activity that alters the composition of the global atmosphere and which is in addition to natural climate variability observed over comparable time periods.” [11].
Page 33 of 269

SafeGreece 2021 on-line Proceedings | ISSN 2654-1823
SafeGreece 2021 – 8th International Conference on Civil Protection & New Technologies 24-26 November, on-line | www.safegreece.org/safegreece2021 | [email protected]
The decisive role of human influence in the emission and accumulation of large amounts of greenhouse gas emissions into the atmosphere, mainly carbon dioxide, leads to additional global warming, which is estimated to increase its average temperature by 1◦C above pre-industrial levels, with 2/3 of the increase having been recorded mainly in the last 45 years [10], which is clearly reflected through the aggravation of weather phenomena. Extreme weather conditions are recorded all over the world [12], such as increased frequency, intensity and amount of heavy precipitation, flash floods, prolonged heat waves and periods of intense drought, uncontrollable catastrophic mega fires, melting ice, rising sea level, continuous erosion of lowland coastal areas as well as climate extremes, such as intense tropical cyclones, unusual snowfall and cold waves in desert areas, with severe and multidimensional consequences of a social, economic and environmental nature [3]. The year 2020 is characterized as one of the three warmest years, due to the increase in the global average temperature by 1.2±0.1°C compared to the period 1850-1900, with the increase in the annual global average temperature being between 1.15°C and 1.28°C above pre-industrial levels, dangerously approaching the 1.5°C limit of the Paris Agreement [13, 14, 15]. Also, in the last five decades, there has been a fivefold increase in the number of natural disasters in floods and heat waves, which has resulted in the loss of life of more than 2 million people and death in millions of animals as well as economic damage of over $ 3.64 trillion worldwide [16].
3. ADAPTATION POLICY AGAINST CLIMATE CHANGE IN EUROPE AND GREECE
The European Union (EU) has emerged as one of the key leaders in the arena of international negotiations of climate change containment, effectively encouraging other countries to take part in the global mobilization [17]. Its leadership role is reflected through the important initiatives in the design and implementation of a framework of innovative strategies and climate and energy policies in order to reduce emissions, based on the fulfilment of the Paris Agreement’s objectives and the "European Green Deal". The EU goal is to achieve that form of sustainable development that will be balanced between the triptych "environment-economy-society" based on a long-term vision of metamorphosis into a climate-resilient society. Sustainability presupposes the ability to adapt through preparing for and addressing the inevitable consequences of climate change. For this reason, through adaptation strategy, the EU focuses on anticipation of the adverse effects of climate change, finding of appropriate solutions and increasing the preparedness for their prevention or response at local, regional, national level, minimizing the possibility of damages occurrence or even when they have occurred taking advantage of any possible opportunities [18].
The Greek Government has stated its commitment to the implementation of the Paris Agreement, the United Nations Agenda for 2030 with the 17 Sustainable Development Goals as well as the achievement of the EU long-term goals through the implementation of the European Energy Strategy and the Environment by 2050 [19]. In the "business as usual" scenario, of the non-existent global reaction to the reduction of greenhouse gases, it is estimated that by 2100 the Greek economy could suffer a cumulative financial burden of 701 billion Euros, a cost which is equivalent to three times the annual gross domestic product of the country, with Greek GDP recording an annual decrease of 2% by 2050 [20].
Greece, like all EU Member States, has started the effort of adaptation policy to climate change, the implementation of which is divided into two adaptation policy cycles: the first cycle refers to the period 2016-2025 and will be followed by a second one (2026+) [21]. According to the "National Adaptation Strategy to Climate Change", the adaptation strategy in order to enhance climate resilience focuses on fifteen areas of interest: i) Agriculture and Livestock, ii) Forestry, iii) Biodiversity and Ecosystems, iv ) Aquaculture, vi) Water resources, vii) Coastal zones, viii) Tourism, ix) Energy, x) Infrastructure and Transport xi) Health, xii) Structured environment, xiii) Extractive industry, xiv) Cultural heritage and xv) Insurance. Furthermore, during the first adaptation policy cycle the thirteen regional authorities of the country are obliged to prepare "Regional Adaptation Action Plans” to climate change [22].
Page 34 of 269

SafeGreece 2021 on-line Proceedings | ISSN 2654-1823
SafeGreece 2021 – 8th International Conference on Civil Protection & New Technologies 24-26 November, on-line | www.safegreece.org/safegreece2021 | [email protected]
Furthermore, in the category of early warning and evacuation schemes, the European Emergency Call Number "112" was put into operation as a free emergency communications service. It allows the use of either incoming or outgoing communication form in the EU and in Greece. In the form of an incoming call, the person/persons who are in an emergency situation can call the number "112" free of charge.
Figure 1: “Climate change adaptation policies toolkit”. Source: International Monetary Fund (2017), [23].
4. RESULTS AND DISCUSSION
In recent decades, the most of governments around the world have been engaged in a marathon of important climate negotiations and agreements with conclusions and targets for managing the climate crisis. But so far, no absolute consensus seems to have been reached at the table of intensified international negotiations. The main point of contention in environmental diplomacy between the countries is the division of responsibilities and the corresponding costs, as these have been reflected in the quantitative targeting of the reduction of greenhouse gas emissions.
The development of the national adaptation strategy in Greece seems to be awakening and starting its implementation, notwithstanding it is at an early stage and there are important delays. However, the precautionary nature of the adaptation strategy makes imperative the necessity for immediate mobilization through policies forming before the onset of extreme climate phenomena. Furthermore, the implementation of adaptation actions in addition to the benefit of protection and management of the effects of climate change, at the same time creates both an economic benefit at the level of action (local, regional and national) through the implementation of investment actions.
Page 35 of 269

SafeGreece 2021 on-line Proceedings | ISSN 2654-1823
SafeGreece 2021 – 8th International Conference on Civil Protection & New Technologies 24-26 November, on-line | www.safegreece.org/safegreece2021 | [email protected]
Finally, the sudden pandemic of COVID-19 can be seen an opportunity to take a different approach to adapting to climate change by shifting to new sustainable investment opportunities.
REFERENCES 1. COVID-19 Map - Johns Hopkins Coronavirus Resource Center (jhu.edu) (accessed on 23/10/2021)2. UNFCCC, (2015). Adoption of the Paris Agreement. Proposal by the President. Paris Climate Change
Conference - November 2015, COP 21, 21932 (December), 32. DOI:FCCC/CP/2015/L.9/Rev.13. IPCC, 2021: Climate Change 2021: The Physical Science Basis. Contribution of Working Group I to the Sixth
Assessment Report of the Intergovernmental Panel on Climate Change [Masson-Delmotte, V., et al.(eds.)]. Cambridge University Press. In Press. (IPCC AR6 WGI: Sixth Assessment Report (AR6), ClimateChange 2021: The Physical Science Basis).
4. Υπουργείο Περιβάλλοντος & Ενέργειας, Γενική Διεύθυνση Περιβαλλοντικής Πολιτικής, ΔιεύθυνσηΚλιματικής Αλλαγής & Ποιότητας της Ατμόσφαιρας, (2016). «Εθνική Στρατηγική για την Προσαρμογή στηνΚλιματική Αλλαγή» Απρίλιος 2016, Αθήνα.
5. Baillie, J., Zhang, Y., (2018). Space for nature. Science 361 (6407), 1051. Space for nature (science.org)6. Site: https://www.wwf.gr/climate-crisis (accessed on 23/10/2021)7. 1992 “World Scientists’ Warning to Humanity”, Available on 1992 World Scientists’ Warning to Humanity |
Union of Concerned Scientists (ucsusa.org) (accessed on 23/10/2021)8. William J. Ripple, Christopher Wolf, Thomas M. Newsome, Mauro Galetti, Mohammed Alamgir, Eileen
Crist, Ahmoud I. Mahmoud, William F. Laurance, World Scientists’ Warning to Humanity: A Second Notice.BioScience, December 2017 / Vol. 67 No. 12.
9. William J Ripple, Christopher Wolf, Thomas M. Newsome, Phoebe Barnard, William R Moomaw, 2020,World Scientists’ Warning of a Climate Emergency, BioScience, Volume 70, Issue 1, January 2020, Pages 8–12, https://doi.org/10.1093/biosci/biz088
10. IPCC (2018). Global Warming of 1.5°C. An IPCC Special Report on the impacts of global warming of 1.5°Cabove pre-industrial levels and related global greenhouse gas emission pathways, in the context ofstrengthening the global response to the threat of climate change, sustainable development, and effortsto eradicate poverty. [Masson-Delmotte, V., et al. (eds.)]
11. United Nations (1992). United Nations Framework Convention on Climate Change (UNFCCC):http://unfccc.int/files/essential_background/background_publications_htmlpdf/application/pdf/conveng.pdf
12. Site: https://earthobservatory.nasa.gov (accessed on 23/10/2021)13. Site: Paris Agreement .:. Sustainable Development Knowledge Platform (un.org)14. World Meteorological Organization, (2021). State of the Global Climate 2020, WMO-No. 126415. United Nations, (2016). «Report of the Conference of the Parties on its twenty-first session, held in
Paris from 30 November to 13 December 2015».16. Site: WHO | World Health Organization (accessed on 23/10/2021)17. COMMUNICATION FROM THE COMMISSION TO THE EUROPEAN PARLIAMENT, THE EUROPEAN
COUNCIL, THE COUNCIL, THE EUROPEAN ECONOMIC AND SOCIAL COMMITTEE, THE COMMITTEE OFTHE REGIONS AND THE EUROPEAN INVESTMENT BANK, A Clean Planet for all. A European strategic long-term vision for a prosperous, modern, competitive and climate neutral economy, COM(2018)773,Brussels, 28 November 2018. https://eur-lex.europa.eu/legal-content/EN/ALL/?uri=COM%3A2018%3A773%3AFIN
18. REPORT FROM THE COMMISSION TO THE EUROPEAN PARLIAMENT AND THE COUNCIL on theimplementation of the EU Strategy on adaptation to climate change. COM(2018) 738 final.Brussels, 12.11.2018, EUR-Lex - 52018DC0738 - EN - EUR-Lex (europa.eu)
19. Site: Ομιλία του Πρωθυπουργού Kυριάκου Μητσοτάκη στη Σύνοδο Κορυφής για το Κλίμα | ΟΠρωθυπουργός της Ελληνικής Δημοκρατίας (primeminister.gr) (accessed on 23/10/2021)
20. Site: Speeches (bankofgreece.gr) “Keynote address by Bank of Greece Governor Yannis Stournaras at theSymposium on “Climate Change: Threats, Challenges, Solutions for Greece”, 03/04/2019. (accessedon 23/10/2021)
21. Site: https://www.adaptivegreece.gr/en-us/the-project/overview-objectives (accessed on 23/10/2021)22. Site: Greece — Climate-ADAPT (europa.eu) (accessed on 23/10/2021)23. International Monetary Fund (2017). Seeking Sustainable Growth: Short-Term Recovery, Long-Term
Challenges. Chapter 3: The Effects of Weather Shocks on Economic Activity: How Can Low-IncomeCountries Cope?
Page 36 of 269
SafeGreece 2021 on-line Proceedings | ISSN 2654-1823
SafeGreece 2021 – 8th International Conference on Civil Protection & New Technologies 24-26 November, on-line | www.safegreece.org/safegreece2021 | [email protected]
PM10 CONTRIBUTION TO DAILY AIR QUALITY STRESS INDEX IN THE SOCIO-ENVIRONMENTALLY STRESSED CITY OF ASPROPYRGOS (ATTICA – GREECE)
Eleni Verouti1, Dimitrios Gavathas2, Anastasios Mavrakis3 1 Bureau of Environment and Civil Protection, Municipality of Aspropyrgos, GR–19300, Aspropyrgos – Attica, Greece (E-mail: [email protected])
2 Department of Chemistry, University of Patras, GR–26504, University Campus, Rio Patras, Greece (E-mail: [email protected])
3 Environmental Education Coordinator, West Attica Secondary Education Directorate, Greek Ministry of Education, 24 I. Dragoumi str., GR–19200, Elefsis – Attica, Greece (E-mail: [email protected])
ABSTRACT In this study, the contribution of PM10 to the daily Air Quality Stress Index (AQSI) is examined, in the heavily stressed environmentally and socially industrial city of Aspropyrgos, Greece. For this purpose, hourly values of four pollutants measured in the area (namely SO2, NO2, O3, and PM10) were used, as recorded for the 2012 – 2020 time periods. The results indicate that the main contributor to AQSI levels is PM10. The contribution of PM10 to the daily AQSI is in the range between 17% and 90% of the calculated values, while without PM10, the AQSI remained below the thresholds.
Keywords: PM10, Air Quality Stress Index, Aspropyrgos.
1. INTRODUCTIONThriasio Plain, 20 km northwest of Athens, includes three municipalities, namely, Aspropyrgos, Elefsisand Mandra, along with the community of Magoula. The Thriasio Plain exhibits the higher: (a) industrialactivity concentration, (b) fuel consumption and (c) pollution, related to the production processes inGreece [1]. Apart from the industrial activities, the area is crossed by three freeways (two national roadsand, since 2003, a large part of the urban freeway “Attiki Odos”), as well as by two railroad lines (thenational railway line and, since 2005, the Athens’ suburban railway), (9) large quarries, while the 13docks of Elefsis harbour accommodate 5500 ships per year, with a total cargo load of 2.5 times largerthan that handled by the Piraeus harbour. The municipality of Aspropyrgos houses about 35000inhabitants and receives the largest number of all kinds of established activities (2700 in a total of 6500)[1–3]. This study aims to present the air quality over the city of Aspropyrgos, in terms of air qualityindex, as this index is calculated using the four pollutants measured in the area (namely SO2, NO2, O3,and PM10) The contribution of PM10 to the daily Air Quality Stress Index (AQSI) is examined.
2. DATA AND METHOD
The data used in this paper were provided by the air pollution monitoring station Alonistra (AL) operated by the Bureau of Environment, Municipality of Aspropyrgos (BEMA). Hourly values of concentrations (in μg/m3) of sulphur dioxide (SO2), nitrogen dioxide (ΝΟ2), ozone (Ο3) and particulate matter less than 10 μm in diameter (PM10), were recorded for the 2012 – 2020 time period. Daily Air Quality Stress Index (AQSI) is a measure of air quality and health risk from air pollution, derived from the average daily concentration of air pollutants according to the following formula [4]:
∑= −−
−−−=
n
i ivalueshMIvaluesdailyaverageCi
nAQSI
1 241 (1) ( ) ( ) ( ) ( )
+++=
5018020035041 10322 PMCOCNOCSOCAQSI (2) where, n is the
number of air pollutants, Ci is the time-specific concentration and MI-24h value indicates the threshold of air pollutant concentration, according to the European Community standards [5] (i.e., hourly SO2: 350
Page 37 of 269
SafeGreece 2021 on-line Proceedings | ISSN 2654-1823
SafeGreece 2021 – 8th International Conference on Civil Protection & New Technologies 24-26 November, on-line | www.safegreece.org/safegreece2021 | [email protected]
μg/m3; hourly NO2: 200 μg/m3; mean 8hourly O3: 180 μg/m3; daily PM10: 50 μg/m3). These values were calculated for hourly data and were averaged by day. Katsoulis and Kassomenos [4] give the following description of stress categories scale: for values of AQSI<0.2 “Very Low” – category I; for 0.2<AQSI<0.4 “Low” – category II; for 0.4<AQSI<0.6 “Moderate” – category III; for 0.6<AQSI<0.8 “Distinct” – category IV; for 0.8<AQSI<1 “Strong” – category V, while for AQSI>1 extreme – category VI.
3. RESULTS
For the calculation of the daily AQSI, all available air pollutants data per day were used. In Table 1, a descriptive statistics of data is given for each pollutant and the index. Sulphur dioxide (SO2) concentrations, both average and maximum daily or hourly values, have been greatly reduced since the 80’s over the entire area of Attica Prefecture and are now well below the thresholds, set by the EU Directive. There are very few and short terms exceeding of thresholds, so there is a little contribution of this air pollutant to daily AQSI values. Nitrogen dioxide (NO2) concentrations remain at almost the same levels throughout most of the examined period. The concentrations recorded did not exceed the threshold defined by CEC Directive 99/30 and the overall levels are much lower than those thresholds. Ozone (O3), due to its photochemical nature, shows a strong seasonal dependence, following the variations of solar irradiation. During summer months, exceedings of 8-hours moving average thresholds were recorded. PM10 corresponds to 80% of the Total Suspended Particulate (TSP) in the area. Only 43% of the recorded PM10 daily values are below the European threshold of 50 μg/m3. All other records exceed this threshold. Even though that and other studies report other cases from Eastern Mediterranean, in our case a persistence of the high values is always present. The contribution of PM10 to the daily AQSI range was calculated between 17% and 90%. In agreement and with other studies [2, 3, 6, 7], PM10 have a daily impact to air pollution/air quality of the area and also there are possible health effects. As it is noticed in Table 1 and Figure 1b and 1c, there are exceedings of the threshold of 0.8 (strong health risk). There are 47 exceedings identified of the specific threshold of 0.8, the 17 among them exceed the threshold of 1. Between all of them, the value of AQSI=3.90 looks emblematic. As World Meteorological Organization mention in his official report, dust transport episodes can characterized as a hazard, for which there is not official guidelines for preparation and mitigation of such events [8, 9]. Also, during last few years, very early heat waves events occur in Greece and they are accompanied with intense dust transport episodes, downgraded air quality [7] which alarmed authorities.
4. CONCLUSIONS
The results indicate that more than 55% of PM10 values were measured greater than EU thresholds. This made the PM10 concentrations the main contributor to AQSI levels. The contribution of PM10 to the daily AQSI range was calculated between 17% and 90%. The results from the present study could be used to inform the population about possible negative consequences of AQSI elevated levels and alert citizens into adopting personal prevention measures. Also the above results indicate that policy makers have to add additional prevention and mitigation plans to meet new health risks for general population regarding elevated PM10 concentrations. This could also be a planning and risk management tool for policy and decision making authorities to chart their long-term future actions with a better understanding of potentially unfolding scenarios and their impacts.
Page 38 of 269

SafeGreece 2021 on-line Proceedings | ISSN 2654-1823
SafeGreece 2021 – 8th International Conference on Civil Protection & New Technologies 24-26 November, on-line | www.safegreece.org/safegreece2021 | [email protected]
Table 1. Annual descriptive statistics of daily values of the air pollutants and Air Quality Stress Index (AQSI) and exceeding of the thresholds of 0.8 and 1 per year
2012 2013 2014 2015 2016 2017 2018 2019 2020
SO2
Average 8 6 6 8 7 7 6 6 10 StDev 10 5 6 8 8 5 5 4 6 Min 0 0 1 1 1 0 0 1 2 Max 62 28 55 57 57 30 28 21 52
NO2
Average 35 48 36 41 51 39 46 47 41 StDev 16 22 14 17 18 14 15 16 15 Min 3 8 5 5 16 8 13 14 10 Max 81 140 92 90 110 77 94 101 92
O3
Average 36 41 50 54 42 43 44 33 46 StDev 20 24 23 23 23 20 21 20 22 Min 3 1 4 11 8 5 2 2 2 Max 91 102 100 114 240 94 93 84 91
PM10
Average 58 54 52 41 47 42 49 49 42 StDev 20 21 51 16 23 17 25 20 18 Min 24 11 9 15 14 8 11 8 3 Max 113 154 726 124 283 112 310 123 115
AQSI
Average 0.32 0.44 0.42 0.42 0.45 0.41 0.44 0.48 0.41 StDev 0.14 0.16 0.25 0.12 0.15 0.12 0.15 0.17 0.13 Min 0.10 0.06 0.02 0.14 0.16 0.18 0.14 0.09 0.12 Max 0.81 1.19 3.90 0.84 1.70 0.89 1.78 1.25 0.94
AQSI>=0.8 1 8 6 1 5 1 5 16 4 AQSI>=1 0 2 3 0 2 0 2 2 0
1.19
1.66
3.90
1.61 1.70 1.78
1.25
0.90
0.00.20.40.60.81.01.21.41.61.82.02.22.42.62.83.03.23.43.63.84.0
1/12
4/12
7/12
10/1
21/
134/
137/
1310
/13
1/14
4/14
7/14
10/1
41/
154/
157/
1510
/15
1/16
4/16
7/16
10/1
61/
174/
177/
1710
/17
1/18
4/18
7/18
10/1
81/
194/
197/
1910
/19
1/20
4/20
7/20
10/2
0
Date
Dai
ly A
ir Q
ualit
y St
ress
Inde
x - A
QSI
AQSI
(a)
Page 39 of 269

SafeGreece 2021 on-line Proceedings | ISSN 2654-1823
SafeGreece 2021 – 8th International Conference on Civil Protection & New Technologies 24-26 November, on-line | www.safegreece.org/safegreece2021 | [email protected]
1
8
10
1
5
1
6
15
4
0
2
7
0
3
0
32
00
2
4
6
8
10
12
14
16
2012 2013 2014 2015 2016 2017 2018 2019 2020
Year
# of
cas
es
Episodes >0.8
Episodes >1
(b)
0
3
5
2
11
6
3
01
0
2
0 0
5
0
5
7
1
0 0 0 0 0
16
0
2
4
6
8
10
12
14
16
Jan Feb Mar Apr May Jun Jul Aug Sep Oct Nov Dec
Month
# of
cas
es
Episodes >0.8
Episodes >1
(c)
Figure 1. (a) Diurnal variation of daily Air Quality Stress Index values. Thresholds of the index are marked with green, yellow, orange and red lines; (b) Yearly distribution of AQSI>8 & 1; (C) Monthly distribution of AQSI>8 & 1.
REFERENCES
1. A. Mavrakis, C. Papavasileiou, L. Salvati (2015). Towards (Un)sustainable Urban Growth? Climate aridity,land-use changes and local communities in the industrial area of Thriasio plain. Journal of AridEnvironments, 121, 1–6, https://doi.org/10.1016/j.jaridenv.2015.05.003
2. G. Abatzoglou, A. Chaloulakou, D. Assimacopoulos, T. Lekkas (1996). Prediction of air pollution episodes:extreme value theory applied in Athens, Environmental Technology, 17, 349–359,https://doi.org/10.1080/09593331708616394
3. M. Toumpos, H. A. Flocas, A. Christides, A. Mavrakis (2017). Generating a “Typical Air Pollutant Day” inThriasio Plain, Greece. In: Karacostas T., Bais A., Nastos P. (eds) Perspectives on Atmospheric Sciences.Springer Atmospheric Sciences. Springer, Cham, https://doi.org/10.1007/978-3-319-35095-0_154
4. B. D. Katsoulis, P. A. Kassomenos (2004). Assessment of the air-quality over urban areas by means ofbiometeorological indices: The case of Athens, Greece. Environmental Technology, 25, 11, 1293–1304,https://doi.org/10.1080/09593332508618375
5. CEC (2001) Commission Directive of 17 October 2001 amending Annex V to Council Directive (1999/30/ECrelating to limit values for sulfur dioxide, nitrogen dioxide and oxides of nitrogen, particulate matter andlead in ambient air. Official Journal of the EC, L 278/35
6. P. G. Kanellopoulos, E. Verouti, E. Chrysochou, K. Koukoulakis, E. Bakeas (2021). Primary and secondaryorganic aerosol in an urban/industrial site: Sources, health implications and the role of plastic enrichedwaste burning. Journal of Environmental Sciences, 99, 222–238, https://doi.org/10.1016/j.jes.2020.06.012
7. A. Mavrakis, A. Kapsali, K. Pantavou, I. X. Tsiros (2021). Air quality and meteorological patterns of an earlyspring heatwave event in an industrialized area of Attica, Greece. Euro-Mediterranean Journal forEnvironmental Integration, 6, 25, 2–10, https://doi.org/10.1007/s41207-020-00237-0
8. L. Cori, G. Donzelli, F. Gorini, F. Bianchi, O. Curzio, (2020). Risk Perception of Air Pollution: A SystematicReview Focused on Particulate Matter Exposure., International Journal of Environmental Research andPublic Health., 17(17), 6424. https://doi.org/10.3390/ijerph17176424
9. D. Palmos, C. Papavasileiou, C. E. Papakitsos, X. Vamvakeros, A. Mavrakis (2021). Enhancing theenvironmental programmes of secondary education by using web-tools concerning precaution measuresin civil protection: The case of Western Attica (Greece). Safety Science, 135, 105117,https://doi.org/10.1016/j.ssci.2020.105117
Page 40 of 269

SafeGreece 2021 on-line Proceedings | ISSN 2654-1823
SafeGreece 2021 – 8th International Conference on Civil Protection & New Technologies 24-26 November, on-line | www.safegreece.org/safegreece2021 | [email protected]
MANAGEMENT OF COVID -19 IN THE WORKPLACE: A STUDY IN GREECE
Evi Georgiadou1, Dimitra Pinotsi1, Theoni Koukoulaki1, Konstantina Kapsali11 Research and Development Department, Hellenic Institute for Occupational Health and Safety, (Greece). (E-mail: [email protected], [email protected], [email protected], [email protected])
ABSTRACT
Previous experience from pandemic management in the workplace highlights the priorities for the future for the prevention of remaining pandemic risks, but also for the prevention of risks from other emergencies. The purpose of this paper is the presentation of the main results of the study carried out by the Hellenic Institute for Occupational Health and Safety and related to the implementation of protection measures against the new coronavirus in the workplace in Greece. The level of safety culture, workers' risk perception and awareness of COVID-19, and the impact of the COVID-19 pandemic on workers’ stress, were also investigated. The findings of the study highlight the need to intensify the efforts of all those involved in taking measures to protect workers in the workplace from risks such as the COVID-19 pandemic such as technical protection measures, informing and educating workers and the public about emergencies, the development of a safety culture and sector specific actions (research, information, training actions). Priority should be given to sectors with increased risks (e.g. Health Sector) and vulnerable groups of workers. The importance of an integrated approach to health and safety issues is highlighted and especially of preventing psychosocial risk factors. Particularly important is the role of health and safety institutions at work, such as the Safety Technician, the Occupational Physician, and workers’ participation in relevant matters through Workers’ Health and Safety Committees or Workers’ Health and Safety Representatives.
Keywords: COVID-19, Occupational Safety and Health (OSH), safety culture, stress, risk perception
1. INTRODUCTION
Protecting the population from risks such as an epidemic will continue to be a critical issue for the protection of public health in the coming years. Previous experience with pandemic management can help prevent the remaining COVID-19 pandemic risks. It can also contribute to the effective management of other related risks. In this context, a particularly important aspect is the management of epidemic risks in the workplace. The importance of implementing precautionary measures in the workplace to protect workers from the spread of COVID-19 is well recognized. The International Labour Organization (ILO) and the World Health Organization (WHO), the European Agency for Safety and Health at Work (EU-OSHA), as well as other organizations, such as the US Department of Labour (OSHA), have published relevant instructions and guidelines [1, 2, 3]. The Hellenic Ministry of Labour and Social Affairs and the Hellenic Institute for Occupational Health and Safety (ELINYAE) have also published a guide [4]. Some studies have been carried out on the protection measures (technical and organizational) for the new coronavirus in the workplace [5, 6], however, most of them focus on psychosocial risk factors. According to these studies, the effect of COVID-19 on stress and other psychosocial factors is significant [7, 8]. The purpose of this paper is the presentation of the main results of the study carried out by ELINYAE and related to the implementation of protection measures against the new coronavirus in the workplace in Greece. The results of the study are useful for promoting prevention policies in the workplace for
Page 41 of 269
SafeGreece 2021 on-line Proceedings | ISSN 2654-1823
SafeGreece 2021 – 8th International Conference on Civil Protection & New Technologies 24-26 November, on-line | www.safegreece.org/safegreece2021 | [email protected]
related risks. In addition, the level of safety culture, workers' risk perception and awareness of COVID-19, and the impact of the COVID-19 pandemic on workers’ stress, were investigated.
2. METHOD
A special research tool (electronic questionnaire) was created to conduct a field study [2, 4, 9, 10]. After its validation, the questionnaire was distributed to the public through an online platform. The study investigated the application of a series of measures and procedures for protection against the new coronavirus in the workplace. It should be noted that at the time of the study the vaccination process of the general population had not yet progressed. Three parameters with multiple questions were examined. The first concerned the implementation of technical measures and procedures, the second the implementation of measures against overcrowding and the third, the use of personal protective equipment (PPE). Factor analysis was applied to the first two parameters. The sample of the study consists of male and female adults of all ages and education levels. 1,288 questionnaires were collected. For the use of the research tool, all the terms related to the protection of personal data complied with the legislation of the country. The sample under study is considered a sample of the general population during the period of conducting the study period. Based on the above, statistical tests were performed on the "sample". The confidence level was a=0.05.
3. RESULTS AND DISCUSSION
The age of the sample ranges from 18 to 70 years with an average value of 45.4 (± 9.5) years. The majority of the respondents (80.3%) were workers of the private and public sector, 5.5% were business owners and 10.9% were self-employed. Regarding the technical measures and procedures, it is found that the measures most often taken in the workplace are those grouped as factor 3 measures, such as the provision of antiseptic solutions (93.8% of the respondents answered positively that this measure is taken), the ventilation of the premises (72.2%), the placement of informative posters (70.8%) etc. Measures related to health and safety procedures, measures for the protection of vulnerable groups and implementation of additional measures such as performing a coronavirus test on workers, have been taken less frequently. For example, only 36.5% of the respondents answered that the occupational risk assessment was updated in the workplace in order to take the pandemic into account. Additionally, only 29% of the respondents answered that the temperature of the workers was taken in their workplace. The statistical analysis revealed the effect of the industry sector in relation to the implementation of measures for the coronavirus. The effect of business size on all types of measures was also found. For example, it was found that there is a statistically significant difference between small and large enterprises in terms of measures grouped as factor 1 (i.e. measures related to health and safety procedures such as informing workers about the incident management process if they experience any symptoms, occupational risk assessment update, training of workers in the use of PPE etc.). The impact of presence of health and safety institutions in the workplace in relation to the implementation of protection measures against the new coronavirus was investigated. There is a statistically significant difference for all factors, if there is a Safety Technician, if there is an Occupational Physician and if there is a Workers Health and Safety Committee or a Workers Health and Safety Representative. Risk perception and subjective assessment of the degree of preparedness for emergencies was measured on a scale from 1 (not at all) to 5 (too much). The results demonstrate that the epidemic concerns the respondents more than other emergencies such as earthquake, fire, etc.
Page 42 of 269

SafeGreece 2021 on-line Proceedings | ISSN 2654-1823
SafeGreece 2021 – 8th International Conference on Civil Protection & New Technologies 24-26 November, on-line | www.safegreece.org/safegreece2021 | [email protected]
The presence of a Safety Technician, Occupational Physician and Workers Health and Safety Committee or Workers Health and Safety Representative, has a statistically significant positive effect, on the degree of workers perception of preparedness in relation to the epidemic. A special investigation was conducted to understand how the evolution of COVID-19 pandemic was perceived to have affected different parameters of life and health. On a scale from 1 (not at all) to 5 (too much), the negative impact of the COVID-19 pandemic was measured in 4 different parameters. The respondents were more concerned with the negative effect on social relations, followed by the effect on their financial situation, οn employment relations and on mental health, while less concerned with the negative effect on health in general. The implementation of measures such as updating the occupational risk assessment and providing instructions by the Safety Technician, seems to have a positive, statistically significant effect on how concerned the respondents are about the impact of the pandemic on their health (they are less worried). The study highlights the need to utilize institutional procedures for workers' health and safety (e.g. occupational risk assessment, training, provision of services by a Safety Technician and an Occupational Physician, consultation between employers and workers, participation of workers) to adapt occupational risk prevention procedures to the new needs that arise due to the evolution of the pandemic. The importance of these procedures is also highlighted by EU-OSHA [2], as well as by studies conducted in other countries [11, 12]. The results of our study on risk perception are similar with the ones of a study conducted in Italy [13]. The subjective assessment of the respondents in relation to the feeling of stress was also investigated, by evaluating the responses on a scale from 1 (not at all) to 5 (too much); Stress is defined "as a situation in which the person feels tension, anxiety, nervousness, anxiety or has nighttime insomnia due to the constant concentration of his/her mind on problems" [10]. It is observed that a significant percentage approaching 60%, reports that they feel from "enough" to "too much" stress in the last 6 months. It was also found that the greater the degree of adverse effects of the COVID-19 pandemic, the more frequent stress was reported in the last six months. The results of our study are similar with other studies investigating the psychosocial effects of the pandemic. Numerous studies conducted in many countries have highlighted the impact of pandemic evolution on psychosocial risk factors, including stress [7, 8, 14, 15].
4. CONCLUSIONS
Previous experience from pandemic management in the workplace highlights the priorities for the future for the prevention of remaining pandemic risks, but also for the prevention of risks from other emergencies. The findings of our study highlight the need to intensify the efforts of all those involved to take measures to protect workers in the workplace from risks such as the COVID-19 pandemic. Examples are technical protection measures, informing and educating workers and the public about emergencies, the development of a safety culture, sector specific actions (such as research, information, training actions). Priority should be given to sectors with increased risks (e.g. Health Sector) and vulnerable groups of workers. The importance of an integrated approach to health and safety issues is highlighted, and in particular the importance of the prevention of psychosocial risk factors. Particularly important is the role of health and safety institutions at work, such as the Safety Technician, the Occupational Physician, and workers’ participation in relevant matters through Workers’ Health and Safety Committees or Workers’ Health and Safety Representatives. In addition, the effect of telework on health and safety of workers is among the new challenges to be investigated.
Page 43 of 269
SafeGreece 2021 on-line Proceedings | ISSN 2654-1823
SafeGreece 2021 – 8th International Conference on Civil Protection & New Technologies 24-26 November, on-line | www.safegreece.org/safegreece2021 | [email protected]
REFERENCES 1. International Labour Organization (ILO), World Health Organization (WHO) (2021). COVID-19:
Occupational health and safety for health workers, Interim Guidance. Available at:https://hlh.who.int/docs/librariesprovider4/hlh-documents/covid-19---occupational-health-and-safety-for-health-workers.pdf?sfvrsn=581e60c6_5 [Accessed: 8/10/2021]
2. European Agency for Safety and Health at Work (EU-OSHA) (2020). COVID-19: guidance for the workplace.European Agency for Safety and Health at Work. Available at: https://oshwiki.eu/wiki/COVID-19:_guidance_for_the_workplace#See [Accessed: 8/10/2021]
3. Occupational Safety and Health Administration (OSHA), US Department of Labour (2021). ProtectingWorkers: Guidance on Mitigating and Preventing the Spread of COVID-19 in the Workplace. Available at:https://www.osha.gov/coronavirus/safework [Accessed: 8/10/2021]
4. Ministry of Labor and Social Affairs, Hellenic Institute of Occupational Health and Safety (2020).Guidelines: Coronavirus (SARS-CoV-2) - Instructions and measures for prevention in the workplace (inGreek). Available at: https://www.elinyae.gr/sites/default/files/2020-03/12313.pdf [Accessed: 8/10/2021]
5. E.M. Garzillo, M.G.L. Monaco, A. Spacone, E. Inglese, M. Lamberti, D. Pompei (2020). SARS-CoV-2emergency in the workplace: are companies ready to protect their workers? A cross-sectional survey.International Journal of Occupational Safety and Ergonomics.
6. E. Rind, K. Kimpel, C. Preiser, F. Papenfuss, A. Wagner, K. Alsyte, A. Siegel, A. Klink, B. Steinhilber, J.Kauderer, M.A. Rieger (2020). Adjusting working conditions and evaluating the risk of infection during theCOVID-19 pandemic in different workplace settings in Germany: a study protocol for an explorativemodular mixed methods approach. BMJ Open., 10:e043908.
7. N. Sasaki, R. Kuroda, K. Tsuno, N. Kawakami (2020). Workplace responses to COVID-19 associated withmental health and work performance of employees in Japan. J Occup Health, 62, e12134.
8. G. Giorgi, L.I. Lecca, F. Alessio, G.L. Finstad, G. Bondanini, L.G. Lulli, G. Arcangeli, N. Mucci (2020). COVID-19-Related Mental Health Effects in the Workplace: A Narrative Review. Int J Environ Res Public Health,27, 17(21), 7857.
9. Hellenic Institute for Occupational Health and Safety (2020). Research report: "Emergency situationsduring the COVID-19 pandemic" (in Greek).
10. K. Lindström, M. Dallner, A.-L. Elo, F. Gamberale, S. Knardahl, E. Ørhede, A. Skogstad, V. Hottinen (2000).Validation of the general nordic questionnaire (QPSNordic) for psychological and social factors at work.Nord 2000:12. Copenhagen: Nordic Council of Ministers.
11. E. Wong, K. Ho, W ong S., A. Cheung, P. Yau, D. Dong, E. Yeoh (2020). Views on Workplace Policies and itsImpact on Health-Related Quality of Life During Coronavirus Disease (COVID-19) Pandemic: Cross-Sectional Survey of Employees. International Journal of Health Policy and Management.
12. N. Salari, A. Hosseinian-Far, R. Jalali et al. (2020). Prevalence of stress, anxiety, depression among thegeneral population during the COVID-19 pandemic: a systematic review and meta-analysis. Global Health,16, 57.
13. T.Lanciano, G. Graziano, A. Curci, S. Costadura, A. Monaco (2020). Risk Perceptions and PsychologicalEffects During the Italian COVID-19 Emergency. Frontiers in Psychology, 11, 2434.
14. E. Finell, A. Vainio (2020). The Combined Effect of Perceived COVID-19 Infection Risk at Work andIdentification with Work Community on Psychosocial Wellbeing among Finnish Social Sector and HealthCare Workers. Int. J. Environ. Res. Public Health, 17, 7623.
15. R.P. Rajkumar (2020). COVID-19 and mental health: A review of the existing literature. Asian J. Psychiatry,52, 102066.
Page 44 of 269

SafeGreece 2021 on-line Proceedings | ISSN 2654-1823
SafeGreece 2021 – 8th International Conference on Civil Protection & New Technologies 24-26 November, on-line | www.safegreece.org/safegreece2021 | [email protected]
EARLY WARNING OF EXTREME PYROCONVECTIVE EVENTS: LESSONS LEARNED FROM THE EARLY AUGUST 2021 WILDFIRES IN GREECE
Theodore M. Giannaros1, Georgios Papavasileiou1, Konstantinos Lagouvardos1, Vassiliki Kotroni1, Stavros Dafis1, Athanassios Karagiannidis1
1 Institute for Environmental Research & Sustainable Development, National Observatory of Athens, Greece. (E-mail: [email protected], [email protected], [email protected], [email protected], [email protected],
ABSTRACT This study focuses on the extreme pyroconvective wildfires that affected southern Greece in early August 2021. Employing ground-based and spaceborne observations, we provide a preliminary analysis of these extreme events. Our findings indicate that the presence of large potential for the occurrence of extreme wildfires was evident since the beginning of the 2021 fire season and increased further since late June. Overall, we demonstrate that in the dawn of a globally new wildfire reality, it is urgent that we focus on enhancing our capability for early detection and warning of extreme wildfires.
Keywords: extreme wildfires, August 2021, Greece, pyroconvection, flammability, early warning
1. INTRODUCTION
The wildfires that burnt across southern Greece in early August 2021 were unprecedented in extent, intensity, and impacts. They broke out in Attica, Euboea, Elis, Messenia, and Laconia on August 03 and 04 and kept burning for several days. According to the European Forest Fire Information System (EFFIS), the five wildfires burnt a total surface of 93,996 ha, which corresponds to about 73 % of the national total burnt area of the 2021 fire season (up to October 8, 2021). Observational evidence indicates that all wildfires developed extreme fire behavior, characterized by very rapid fire spread, massive spotting, and the formation of pyroclouds (Figure 1).
Figure 1. Locations of the extreme wildfires of early August 2021 in Greece (flame icons) overlaid with observational evidence of extreme fire behavior (photos).
The factors that contributed to this outbreak of extreme wildfires shall be sought in the combination of (1) antecedent meteorological conditions that allowed for the accumulation and extreme dry-out of fuels,and (2) concurrent adverse fire weather that enabled wildfires to couple with the atmosphere and evolveinto extreme pyroconvective events. These topics serve as motivation of the present study, which
Page 45 of 269

SafeGreece 2021 on-line Proceedings | ISSN 2654-1823
SafeGreece 2021 – 8th International Conference on Civil Protection & New Technologies 24-26 November, on-line | www.safegreece.org/safegreece2021 | [email protected]
presents a preliminary analysis of the extreme early August 2021 wildfires in Greece. Our overarching goal is to consolidate the need for early detection and warning of elevated potential for extreme pyroconvective events, which are becoming a globally increasing concern due to inter alia climate change.
2. DATA AND METHODS
For this preliminary analysis we retrieved both ground-based and spaceborne observational data. Ground-based observational data were retrieved from the dense network of automatic weather stations (AWS) operated by the National Observatory of Athens (NOA) [1]. In particular, hourly measurements of air temperature (oC) and humidity (%), wind speed (m s-1), and accumulated precipitation (mm) for the period from January 1 to August 10, 2021 were extracted from the AWS nearest to the area affected by each of the examined wildfires (Table 1). The hourly observations were employed for (1) computing the components of the Canadian Forest Fire Weather Information System (CFFWIS) [2], and (2) estimating the daily fuel moisture content of fine dead fuels (DFMC) [3]. Spaceborne fire radiative power (FRP) data were retrieved from the Land Surface Analysis Satellite Applications Facility (LSA SAF). These data are produced by processing satellite imagery provided by the Spinning Enhanced Visible and Infrared Imager (SEVIRI) onboard the Meteosat Second Generation (MSG) series of geostationary EO satellites [4]. This dataset has a temporal resolution of 15 minutes and a spatial resolution of about 5 x 5 km. The retrieved FRP data were aggregated hourly for each wildfire and the total instantaneous FRP was divided by the number of available observations per hour in order to construct a consistent and representative time series.
Table 1. Summary of examined wildfires and corresponding AWS used in the analysis. Wildfire Ignition location1
(latitude, longitude) AWS name AWS location
(latitude, longitude) Attica 38.1317 oN, 23.8044 oE Tatoi 38.1212 oN, 23.7949 oE
Euboea 38.7940 oN, 23.3242 oE Vateri 38.7741 oN, 23.3133 oE Elis 37.7016 oN, 21.5747 oE Oleni 37.7250 oN, 21.5370 oE
Laconia 36.8472 oN, 22.3885 oE Krokees 36.8836 oN, 22.5606 oE
Messenia 37.3251 oN, 21.9410 oE Alagonia 37.1067 oN, 22.2442 oE 1 Ignition locations were provided by the Hellenic Fire Corps.
3. RESULTS AND DISCUSSION
The extreme wildfires of early August 2021 in Greece resulted from the evolution of landscape conditions that escalated wildfire danger in the affected regions. The evolution of landscape conditions was in turn driven by several climatic and meteorological processes that opened the four switches required for the development of extreme wildfires [5]. In the following sub-sections, we present and discuss how these switches were opened. For brevity, results are only presented for the Attica wildfire. However, the conclusions drawn are similar for all examined wildfires.
3.1 Fuel accumulation and dry-down (Switches 1 and 2)
Southern Greece’s temperate forests are mainly composed of pine trees that are among the most fire-prone in the world. The typically high fuel loads of coniferous forests in Greece were enhanced further in the beginning of the year (February 13-16, 2021) due to the ‘Medea’ snow storm that affected a large part of the southern country, resulting in the accumulation of large quantities of broken tree branches and logs. Subsequently, prolonged drought conditions resulted in the effective dry-out of the available fuels. This can be clearly seen in the DFMC time series for the Attica wildfire, shown in Figure 2. It is interesting
Page 46 of 269
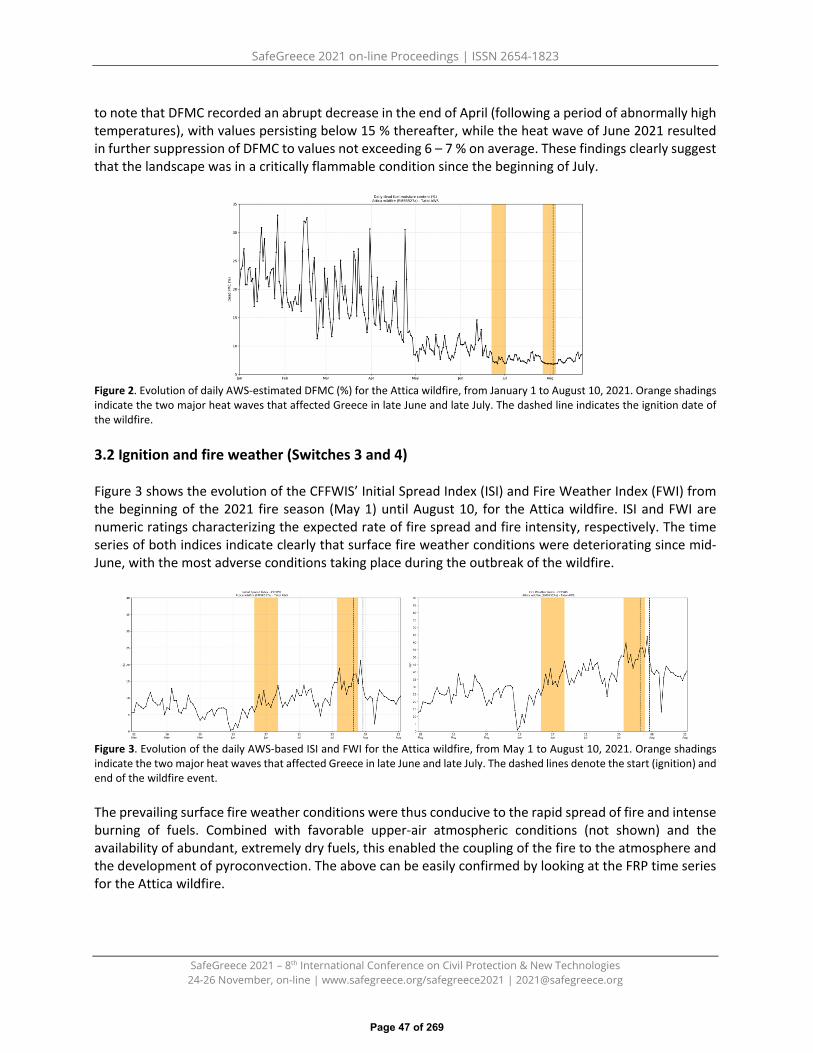
SafeGreece 2021 on-line Proceedings | ISSN 2654-1823
SafeGreece 2021 – 8th International Conference on Civil Protection & New Technologies 24-26 November, on-line | www.safegreece.org/safegreece2021 | [email protected]
to note that DFMC recorded an abrupt decrease in the end of April (following a period of abnormally high temperatures), with values persisting below 15 % thereafter, while the heat wave of June 2021 resulted in further suppression of DFMC to values not exceeding 6 – 7 % on average. These findings clearly suggest that the landscape was in a critically flammable condition since the beginning of July.
Figure 2. Evolution of daily AWS-estimated DFMC (%) for the Attica wildfire, from January 1 to August 10, 2021. Orange shadings indicate the two major heat waves that affected Greece in late June and late July. The dashed line indicates the ignition date of the wildfire.
3.2 Ignition and fire weather (Switches 3 and 4)
Figure 3 shows the evolution of the CFFWIS’ Initial Spread Index (ISI) and Fire Weather Index (FWI) from the beginning of the 2021 fire season (May 1) until August 10, for the Attica wildfire. ISI and FWI are numeric ratings characterizing the expected rate of fire spread and fire intensity, respectively. The time series of both indices indicate clearly that surface fire weather conditions were deteriorating since mid-June, with the most adverse conditions taking place during the outbreak of the wildfire.
Figure 3. Evolution of the daily AWS-based ISI and FWI for the Attica wildfire, from May 1 to August 10, 2021. Orange shadings indicate the two major heat waves that affected Greece in late June and late July. The dashed lines denote the start (ignition) and end of the wildfire event.
The prevailing surface fire weather conditions were thus conducive to the rapid spread of fire and intense burning of fuels. Combined with favorable upper-air atmospheric conditions (not shown) and the availability of abundant, extremely dry fuels, this enabled the coupling of the fire to the atmosphere and the development of pyroconvection. The above can be easily confirmed by looking at the FRP time series for the Attica wildfire.
Page 47 of 269

SafeGreece 2021 on-line Proceedings | ISSN 2654-1823
SafeGreece 2021 – 8th International Conference on Civil Protection & New Technologies 24-26 November, on-line | www.safegreece.org/safegreece2021 | [email protected]
Figure 4. Time series of SEVIRI-based FRP for the Attica wildfire, from August 03 to August 08, 2021, overlaid with observational evidence of pyroconvection. Note the coincidence between the largest FRP values (most intense fuel burning) and the development of the pyroclouds.
4. CONCLUSIONS
Robust indications of increased potential for the occurrence of extreme wildfires were evident since the beginning of the 2021 fire season, as suggested by the evolution of the DFMC (Figure 2). Throughout the fire season, especially after the late June heat wave, fire weather conditions kept deteriorating until the outbreak of the wildfires, which unsurprisingly coincided with the period of most adverse fire weather (Figure 3). The combination of abundant and extremely dry fuels with favorable surface and upper-air atmospheric conditions resulted in the coupling of the fire with the atmosphere, and the transformation of the ignited wildfires into extreme pyroconvective phenomena (Figure 4). Conclusively, it becomes understandable that it is urgent to focus on enhancing our capability for early detection and warning of such extreme wildfire events.
ACKNOWLEDGMENTS
This work has been supported financially by the Hellenic Foundation for Research and Innovation (H.F.R.I.) under the "2nd Call for H.F.R.I. Research Projects to support Post-Doctoral Researchers" (Project Number: 00559, Project Acronym: FLAME).
REFERENCES
1. K. Lagouvardos, V. Kotroni, A. Bezes, I. Koletis, D. Kopania, S. Lykoudis, N. Mazarakis, K. Papagiannaki, S.Vougioukas (2017) The automatic weather stations NOANN network of the National Observatory of Athens: operation and database. Geoscience Data Journal 4(1), 4-16.
2. C.E. Van Wagner (1987) Development and structure of the Canadian Forest Fire Weather Index System.Canadian Forestry Service, Forestry Technical Report number: 35, Ottawa, Canada.
3. R.H. Nolan, V. Resco de Dios, M.M. Boer, G. Caccamo, M.L. Goulden, R. Bradstock (2016) Predicting deadfine fuel moisture at regional scales using vapour pressure deficit from MODIS and gridded weather data.Remote Sensing of Environment 174, 100-108.
4. G. Roberts, M.J. Wooster, W. Xu, P.H. Freeborn, J.-J. Morcrette, L. Jones, A. Benedetti, H. Jiangping, D.Fisher, J.W. Kaiser (2015) LSA SAF Meteosat FRP products – Part 2: Evaluation and demonstration for use inthe Copernicus Atmosphere Monitoring System (CAMS). Atmospheric Chemistry and Physics 15, 13241-13267.
5. M.M. Boer, R.H. Nolan, V. Resco de Dios, H. Clarke, O.F. Price, R.A. Bradstock (2017) Changing weatherextremes call for early warning of potential for catastrophic wildfires. Earth’s Future 5, 1196-1202.
Page 48 of 269

SafeGreece 2021 on-line Proceedings | ISSN 2654-1823
SafeGreece 2021 – 8th International Conference on Civil Protection & New Technologies 24-26 November, on-line | www.safegreece.org/safegreece2021 | [email protected]
NEXT DAY FOREST FIRE RISK PREDICTION IN GREECE USING MACHINE LEARNING
Alexis Apostolakis1, Stella Girtsou1, Giorgos Giannopoulos1, Charalampos Kontoes1, 1 National Observatory of Athens (Greece).
(E-mail: [email protected], [email protected], [email protected], [email protected])
ABSTRACT Forest fires comprise natural disasters with a highly negative impact on ecosystems and human lives. Consequently, the ability to model the risk of forest fire occurrence on a day to day level is of great importance for implementing risk mitigation policies. In this paper, we briefly present our work and experiments on modeling forest fire risk via machine learning (ML) techniques. Our work focuses on the next day wildfire prediction task, utilizing state of the art machine learning algorithms trained on a rich set of fire driving factors, extracted from a large historical wildfire dataset. The target of our research is to maximize the fire prediction rate while maintaining at a reasonable extent the areas that are characterized at high risk by the models.
Keywords: Forest Fire, Machine Learning, Deep Learning, Fire Risk, Neural Networks
1. INTRODUCTIONForest fires severely affect the natural ecosystems, human lives, and critical infrastructures as it isunpleasantly proven by recent events in the world (Australia 2019-2020, California 2020 ) and in Greece(Evia, Olympia, Vilia 2021, Mati 2018 ). If we account for the climate change scenarios which suggestsubstantial warming and increase of heat waves and drought throughout the entire Mediterranean inthe future years, the situation will only get worse. In this regard, access to validated information on thespatiotemporal patterns of wildfire behavior is of great importance for the implementation of policiesfor disaster risk reduction.Considering the significance and practicality for potential mitigation measures, our work handles theproblem of next day wildfire prediction in a fine grained analysis grid, with 500m wide cells over theentire territory of Greece.Methods used in the past for predicting fire susceptibility can be classified into two main categories: thetheoretical (or physics-based) and the empirical models [1], including machine learning (ML) techniques.Supervised ML algorithms can learn directly from historical, labeled data and develop their own internal,adjustably expressive model. Thus, they have an important advantage over the physical models, whichare mostly based on trying to model fire risk as complex but limited in expressiveness mathematicalfunctions. As a result, lately, a substantial number of studies investigate wildfire related phenomena,including the risk of fire occurrence, using ML methods. A thorough review of the wildfire researchtopics handled with ML is presented in [2]. The first part of our work, presented in [3], contributed withthe creation of a large scale and rich labeled dataset of historical forest fires covering the territory ofGreece with daily information for a period of ten years and proposed a first cut modelling via RandomForests. The second part [4] focused on implementing a thorough model optimization procedure onseveral ML algorithms, as well as on handling some important methodological omissions andshortcomings of existing works. Some important aspects handled compared to the related work were a)the lack of extensive hyperparemeterization of the algorithms, b) data leakage that emerged fromstrong correlations between neighbouring instances in the dataset, and c) the extreme class imbalanceof the dataset.In the next parts of this paper we briefly present the dataset, the problem definition, the MachineLearning Methodology proposed explaining the contributions of our work, the Models performances,and the ongoing evaluation phase from the daily Fire Risk Maps production.
Page 49 of 269

SafeGreece 2021 on-line Proceedings | ISSN 2654-1823
SafeGreece 2021 – 8th International Conference on Civil Protection & New Technologies 24-26 November, on-line | www.safegreece.org/safegreece2021 | [email protected]
2. MATERIAL AND METHODS2.1. Dataset and problem definition
The dataset corresponds to a geographic grid of 500m wide cells covering the whole study area (the territory of Greece) and each instance is the daily snapshot of the characteristics (features) that are extracted for the specific cell at a specific day (utilizing information exclusively gathered up until the previous day). The historical dataset is annotated with the existence or absence of fire, for each grid cell, for each day, carrying a binary label denoting the existence (label: fire) or absence of fire (label:no-fire). The goal for the ML algorithm is to learn, using the historical data, a function that labels the fire occurrence in each cell for each day [4]. Forest Fire Inventory. A reliable forest fire inventory is vital for extracting the dependent/target variable that would be used to train the ML algorithm for the prediction of forest fires. For this task, the data were retrieved from the forest fire inventory of fire occurrences and burn scar maps of the FireHub system of BEYOND [5], [6], as well as from the NASA FIRMS and the European Forest Fire Information System (EFFIS/JRC). By processing those data we performed the annotation of fire and no-fire classes for the years starting from 2010, for each cell, for each day [3], [4]. Features. A set of variables related to meteorology, ground morphology, land cover, and vegetation status that are known to render an area at a specific time prone to fire are used as the features of the dataset. Specifically remote sensing vegetation indices (NDVI, EVI), the Digital Elevation Model parameters (elevation, slope, curvature, aspect), wind speed and direction, temperature, 7 days accumulated precipitation, and Land Cover comprise the feature set. An analytical description of the features, their data sources, and the preprocessing of the dataset are presented in [3] and [4].
2.2. Algorithms We considered state of the art algorithms with consistently high performance in similar classification tasks [2]. In particular, we adopted Tree Ensemble algorithms either based on bagging (Random Forest - RF) or on boosting (XGBoost - XGB, LogitBoost - LGB) and shallow Neural Networks – NN architectures of maximum 3 hidden layers. A large space of hyperparameters for each of these four algorithms was explored via the cross-validation process [4].
2.3. Machine Learning Methodology A shortcoming of several works ([7], [8]) is that they don’t take into account the spatio-temporal correlation of the neighbouring cells that correspond to the instances of the dataset. If left unconditional, the random shuffling of the instances for splitting the dataset will distribute some very similar instances to training and test sets, making it easier for the algorithms to achieve better results, but this would be based on data leakage, compromising generalization capacity. To overcome this issue we applied a strict rule that forbade instances for the same day to be shared on the training and on the test set. Another important omission generally observed in related works was the lack of methodical parametrization of the algorithms [7]–[10]. However, if the hyperparameter space of an algorithm is extensively searched, it can significantly improve the algorithm’s effectiveness. In our work, we apply an extensive hyperparameter search for each algorithm by applying a 10-fold cross-validation scheme. Implementing this method, in each iteration, k-1 folds are used for training, leaving the remaining fold for validation. The best performing models are selected based on the average performance on the validation set. Finally, a model that achieves high sensitivity and very low specificity may correctly predict almost all the fires but it would have characterized at the same time almost all the cells at high risk. Thus, for selecting the best models we took into account not only the recall of fire class (sensitivity) but also the
Page 50 of 269
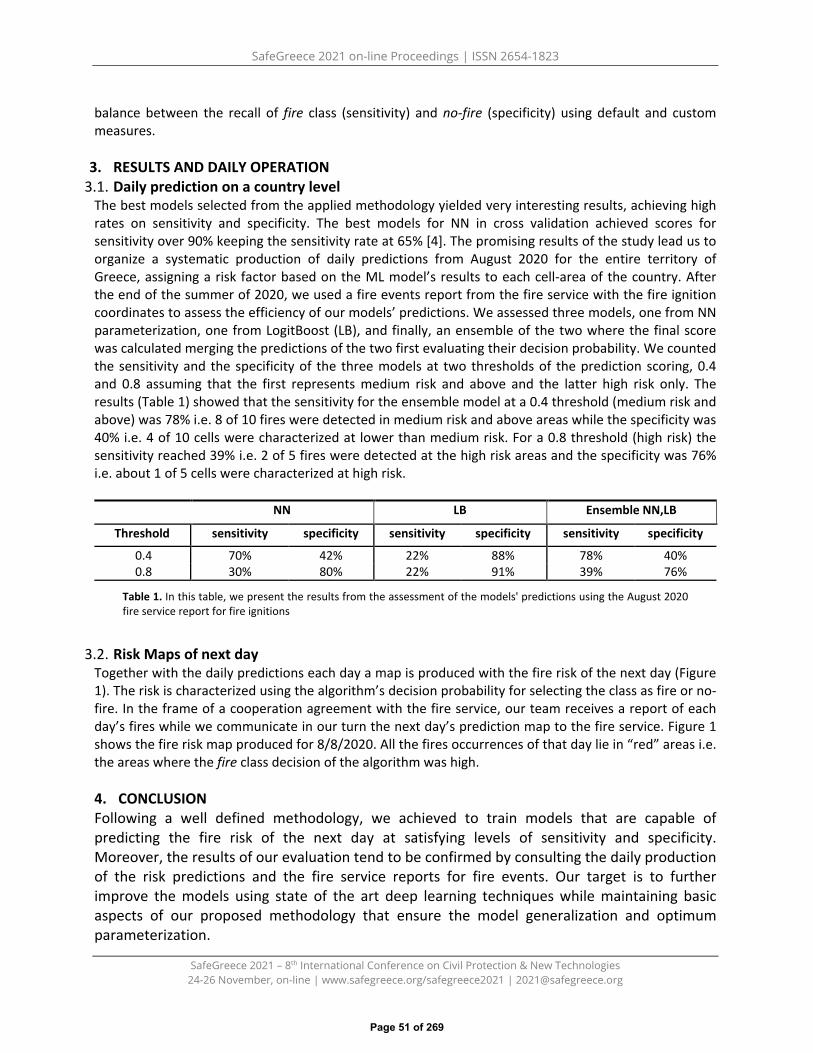
SafeGreece 2021 on-line Proceedings | ISSN 2654-1823
SafeGreece 2021 – 8th International Conference on Civil Protection & New Technologies 24-26 November, on-line | www.safegreece.org/safegreece2021 | [email protected]
balance between the recall of fire class (sensitivity) and no-fire (specificity) using default and custom measures.
3. RESULTS AND DAILY OPERATION3.1. Daily prediction on a country level
The best models selected from the applied methodology yielded very interesting results, achieving high rates on sensitivity and specificity. The best models for NN in cross validation achieved scores for sensitivity over 90% keeping the sensitivity rate at 65% [4]. The promising results of the study lead us to organize a systematic production of daily predictions from August 2020 for the entire territory of Greece, assigning a risk factor based on the ML model’s results to each cell-area of the country. After the end of the summer of 2020, we used a fire events report from the fire service with the fire ignition coordinates to assess the efficiency of our models’ predictions. We assessed three models, one from NN parameterization, one from LogitBoost (LB), and finally, an ensemble of the two where the final score was calculated merging the predictions of the two first evaluating their decision probability. We counted the sensitivity and the specificity of the three models at two thresholds of the prediction scoring, 0.4 and 0.8 assuming that the first represents medium risk and above and the latter high risk only. The results (Table 1) showed that the sensitivity for the ensemble model at a 0.4 threshold (medium risk and above) was 78% i.e. 8 of 10 fires were detected in medium risk and above areas while the specificity was 40% i.e. 4 of 10 cells were characterized at lower than medium risk. For a 0.8 threshold (high risk) the sensitivity reached 39% i.e. 2 of 5 fires were detected at the high risk areas and the specificity was 76% i.e. about 1 of 5 cells were characterized at high risk.
NN LB Ensemble NN,LB
Threshold sensitivity specificity sensitivity specificity sensitivity specificity
0.4 70% 42% 22% 88% 78% 40% 0.8 30% 80% 22% 91% 39% 76%
Table 1. In this table, we present the results from the assessment of the models' predictions using the August 2020 fire service report for fire ignitions
3.2. Risk Maps of next day Together with the daily predictions each day a map is produced with the fire risk of the next day (Figure 1). The risk is characterized using the algorithm’s decision probability for selecting the class as fire or no-fire. In the frame of a cooperation agreement with the fire service, our team receives a report of each day’s fires while we communicate in our turn the next day’s prediction map to the fire service. Figure 1 shows the fire risk map produced for 8/8/2020. All the fires occurrences of that day lie in “red” areas i.e. the areas where the fire class decision of the algorithm was high.
4. CONCLUSIONFollowing a well defined methodology, we achieved to train models that are capable ofpredicting the fire risk of the next day at satisfying levels of sensitivity and specificity.Moreover, the results of our evaluation tend to be confirmed by consulting the daily productionof the risk predictions and the fire service reports for fire events. Our target is to furtherimprove the models using state of the art deep learning techniques while maintaining basicaspects of our proposed methodology that ensure the model generalization and optimumparameterization.
Page 51 of 269
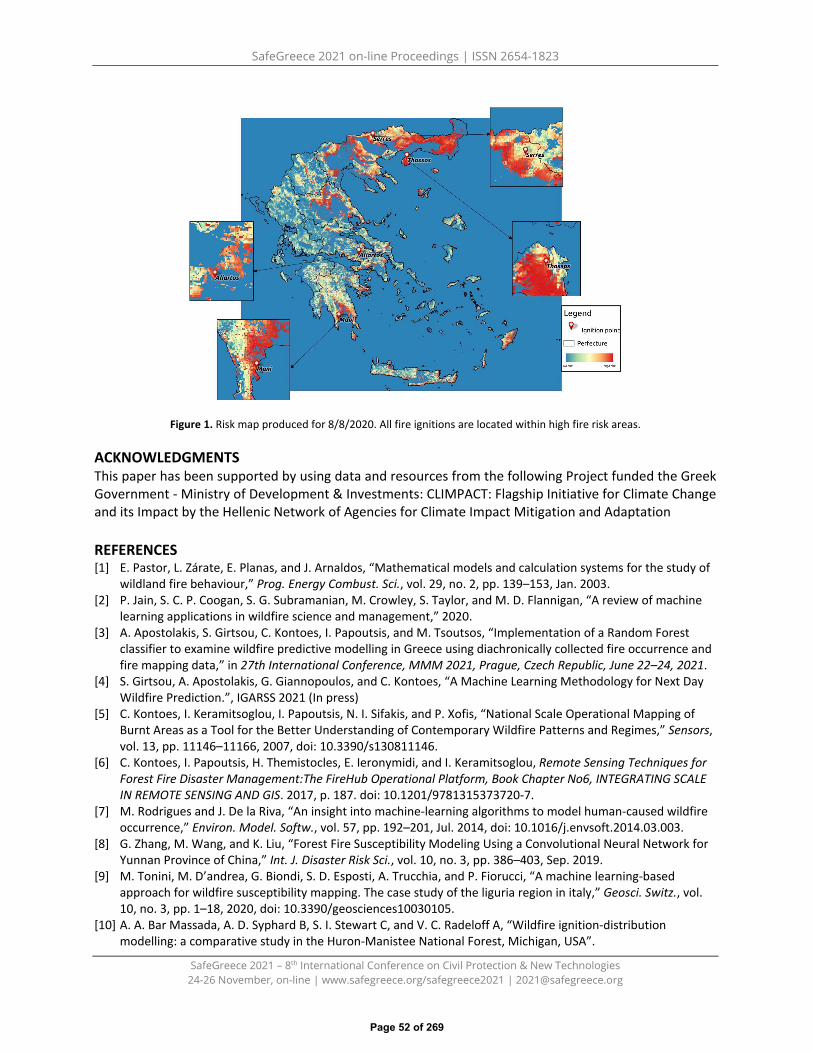
SafeGreece 2021 on-line Proceedings | ISSN 2654-1823
SafeGreece 2021 – 8th International Conference on Civil Protection & New Technologies 24-26 November, on-line | www.safegreece.org/safegreece2021 | [email protected]
Figure 1. Risk map produced for 8/8/2020. All fire ignitions are located within high fire risk areas.
ACKNOWLEDGMENTS This paper has been supported by using data and resources from the following Project funded the Greek Government - Ministry of Development & Investments: CLIMPACT: Flagship Initiative for Climate Change and its Impact by the Hellenic Network of Agencies for Climate Impact Mitigation and Adaptation
REFERENCES [1] E. Pastor, L. Zárate, E. Planas, and J. Arnaldos, “Mathematical models and calculation systems for the study of
wildland fire behaviour,” Prog. Energy Combust. Sci., vol. 29, no. 2, pp. 139–153, Jan. 2003.[2] P. Jain, S. C. P. Coogan, S. G. Subramanian, M. Crowley, S. Taylor, and M. D. Flannigan, “A review of machine
learning applications in wildfire science and management,” 2020.[3] A. Apostolakis, S. Girtsou, C. Kontoes, I. Papoutsis, and M. Tsoutsos, “Implementation of a Random Forest
classifier to examine wildfire predictive modelling in Greece using diachronically collected fire occurrence andfire mapping data,” in 27th International Conference, MMM 2021, Prague, Czech Republic, June 22–24, 2021.
[4] S. Girtsou, A. Apostolakis, G. Giannopoulos, and C. Kontoes, “A Machine Learning Methodology for Next DayWildfire Prediction.”, IGARSS 2021 (In press)
[5] C. Kontoes, I. Keramitsoglou, I. Papoutsis, N. I. Sifakis, and P. Xofis, “National Scale Operational Mapping ofBurnt Areas as a Tool for the Better Understanding of Contemporary Wildfire Patterns and Regimes,” Sensors,vol. 13, pp. 11146–11166, 2007, doi: 10.3390/s130811146.
[6] C. Kontoes, I. Papoutsis, H. Themistocles, E. Ieronymidi, and I. Keramitsoglou, Remote Sensing Techniques forForest Fire Disaster Management:The FireHub Operational Platform, Book Chapter No6, INTEGRATING SCALEIN REMOTE SENSING AND GIS. 2017, p. 187. doi: 10.1201/9781315373720-7.
[7] M. Rodrigues and J. De la Riva, “An insight into machine-learning algorithms to model human-caused wildfireoccurrence,” Environ. Model. Softw., vol. 57, pp. 192–201, Jul. 2014, doi: 10.1016/j.envsoft.2014.03.003.
[8] G. Zhang, M. Wang, and K. Liu, “Forest Fire Susceptibility Modeling Using a Convolutional Neural Network forYunnan Province of China,” Int. J. Disaster Risk Sci., vol. 10, no. 3, pp. 386–403, Sep. 2019.
[9] M. Tonini, M. D’andrea, G. Biondi, S. D. Esposti, A. Trucchia, and P. Fiorucci, “A machine learning-basedapproach for wildfire susceptibility mapping. The case study of the liguria region in italy,” Geosci. Switz., vol.10, no. 3, pp. 1–18, 2020, doi: 10.3390/geosciences10030105.
[10] A. A. Bar Massada, A. D. Syphard B, S. I. Stewart C, and V. C. Radeloff A, “Wildfire ignition-distributionmodelling: a comparative study in the Huron-Manistee National Forest, Michigan, USA”.
Page 52 of 269
SafeGreece 2021 on-line Proceedings | ISSN 2654-1823
SafeGreece 2021 – 8th International Conference on Civil Protection & New Technologies 24-26 November, on-line | www.safegreece.org/safegreece2021 | [email protected]
THE INCORPORATION OF ISO 31000:2018 ON RISK MANAGEMENT AND ISO 22301:2012 ON BUSINESS CONTINUITY INTO THE XENOCRAT CIVIL PROTECTION
PLAN FOR THE OPTIMAL RESPONSE TO NATURAL DISASTERS IN GREECE
Konstantina Efthymiou1, Vasileios Martzaklis1
1 Department of Geology and Geoenvironment, National and Kapodistrian University of Athens , Greece (E-mail: [email protected], [email protected] )
ABSTRACT This thesis analyzes the General Plan of Civil Protection under the name "XENOKRATIS", as well as the international standards ISO 31000: 2018 on Risk Management and ISO 22301: 2012 on Business Continuity. Are still being investigated the Civil Protection systems of various developed countries. In general, the work aims to promote tactics and methods of optimization of the "XENOKRATIS" plan.
Keywords: Business Continuity, BCMS, Risk Management, ISO 31000:2018, ISO 22301:2012
1. INTRODUCTION – OBJECTIVE - EXPERIMENTAL METHOD
This work is a comparative - qualitative study, which examines whether the General Plan of Civil Protection called "XENOKRATIS" complies with the two international standards, ISO 31000: 2018 (on Risk Management) and ISO 22301: 2012 (on Business Continuity). In addition, the Civil Protection systems of seven developed countries and the reasons that influenced their formation are examined. Conclusions are then drawn on the ways in which the action protocols of the "XENOCRATIS" Plan that could potentially be improved.
2. THE "XENOKRATIS" PLAN
The General Plan "XENOKRATİS" of the General Secretariat for Civil Protection is analyzed. Initially, reference is made to the feasibility of the specific plan. Continuing, the organizational chart of the General Secretariat for Civil Protection and the Ministries involved and other bodies are mentioned. Particular reference is made to those elements that contribute to the formulation and improvement of the individual plans that consist the General Plan "XENOKRATIS" and, in general, to the practices applied. Furthermore, the structure and purpose of the National Mechanism for Crisis Management and Risk Management and its operation during the phases of prevention - preparedness - response - rehabilitation are analyzed. Furthermore, the role and the administrative and operational structure of the National Coordination Center for Business and Crisis Management are extensively analyzed. Furthermore, special mention is made of the flow of information, the ways in which it is implemented, the means used and, clearly, the members involved in the transmission of information.
3. CORRESPONDING INTERNATIONAL STANDARDS USED FROM DEVELOPED COUNTRIES(JAPAN, USA, UNITED KINGDOM, GERMANY, FRANCE, SPAIN, ITALY)
A brief and comprehensive presentation of Civil Protection systems adopted by developed countries is examined and made. More specifically, Japan, the USA, the United Kingdom, Germany, France, Spain, as well as Italy were selected, exposing how each country has shaped its practices based on its
Page 53 of 269

SafeGreece 2021 on-line Proceedings | ISSN 2654-1823
SafeGreece 2021 – 8th International Conference on Civil Protection & New Technologies 24-26 November, on-line | www.safegreece.org/safegreece2021 | [email protected]
morphology, its population distribution, its political system, the means and materials available, and its budget.
Figure 1. (a) Risk Management Standard ISO 31000: 2018 [2,3,8] and International Business Continuity Standard ISO 22301: 2012 [1,4,6,7] (b) The co-examined objects :"XENOKRATIS" and the two International Standards
4. CONCLUSION - PROPOSALS FOR OPTIMIZATION OF THE GENERAL PLAN "XENOKRATIS",WITH INTEGRATION OF ISO 31000: 2018 AND ISO 22301: 2012
A comparison of the two international standards shows that there are two ways of looking at things. The first presents Business Continuity as something more specialized, as a subcategory of Risk Management, while the second treats the two standards distinctly and equally, stating that it is at the discretion of the organization / company whether it will apply both, or only the international standard on Risk Management. According to Figure 1.(b): (c) Similarities: These two international standards operate in a complementary and overlappingmanner. Both, using common terminology, are mentioned to the identification of risks that threaten theorganization / business, to the goals of the organization / company, to the views of stakeholders, to
(a) (b)
(d)
(c)
Page 54 of 269

SafeGreece 2021 on-line Proceedings | ISSN 2654-1823
SafeGreece 2021 – 8th International Conference on Civil Protection & New Technologies 24-26 November, on-line | www.safegreece.org/safegreece2021 | [email protected]
work interdependencies (partners, suppliers, shareholders, etc.), to the cost of triggering a risk, to the agreed commitments and requirements and to the available resources. Finally, both international standards emphasize in exercising continuous supervision, updating, controlling and improving procedures, as well as in the administration and its roles it is called upon to fulfill. What is certain is that organizations / companies that implement a Risk Management policy and a Business Continuity Management System (BCMS) at the same time increase the value of the organization / business, have reduced premiums (as they appear to be more stable) and enjoy the trust of associates and other stakeholders members.
Differences: ISO 22301: 2012, on Business Continuity in addition to searching for and identifying the risks that threaten the organization / business, it provides the analysis of the effects of triggering the risks and follows the design of procedures for prevention and / or response to these risks, according to the results of the analysis. Planning for the impact, rather than the risk itself, in a way that sets under consideration what it is preferable to do, so that recovery is feasible at minimal cost, offsetting minimal damage.
(d) Similarities: Those elements that are equally found in the General Plan "XENOKRATIS" andthe two international standards are mostly the following:
• Identification and evaluation of risks and their effects and defining a time frame for actions.• Planning and drafting plans and memoranda of action by type of danger / crisis / disaster.• Checking the plans, evaluating the procedures, updating - reviewing - improving.• Development of surveillance and warning procedures and systems.• Defining hierarchy, coordination of departments and actions and cooperation between
services.• Information and training of individual entities (citizens and volunteers, the staff etc.).• Checking and ensuring the adequacy of resources.• Determining the way of communication and the information flow diagram.
Differences: The points where the General Plan "XENOKRATIS" presents weaknesses compared to the application of ISO 31000: 2018 and ISO 22301: 2012 are mostly concern:
• the standardization of the coordination process between the involved parties (so far,coordination is something that adapts to the circumstances),
• the involvement and co-education of many services - institutions – organizationsparticipating with their personnel, equipment and means,
• informing the citizens that they can contribute with their attitude,• ensuring the business continuity of those involved.
CONCLUSION: It is highly proposed the integration of the two co-examined international standards in the General Plan "XENOKRATIS" by:
• updating the General Plan "XENOKRATIS"• informing and educating the citizens• separating the responsibilities among stakeholders• clarifying the obligations that managers need to be aware of, depending on the area of
responsibility or on the imminent risk.
More specifically, the proposing points of optimization are the following: • The review and updating of the Plan, taking into account Law 3852/2010 "New Architecture of
Self-Government and Decentralized Administration - Kallikratis Program."
Page 55 of 269

SafeGreece 2021 on-line Proceedings | ISSN 2654-1823
SafeGreece 2021 – 8th International Conference on Civil Protection & New Technologies 24-26 November, on-line | www.safegreece.org/safegreece2021 | [email protected]
• The cooperation and mutual assistance agreements with other countries. The support concernsinformation, know-how knowledge derived from experience, etc., as well as support withmaterials and means. Such agreements are the bilateral one between Greece-France and themultilateral so-called "FIRE 5" (Greece-Italy-France-Spain-Portugal).
• The creation of a real-time monitoring platform of the state of readiness per region, thecorrespondence of required and available resources (personnel, materials, equipment andmeans), the possibility of occurrence of a phenomenon and the plans that it would activate.
• The creation of a program of actions of information and awareness of the citizens, with posters,speeches, TV spots, radio advertisements, presentations etc. in order to adopt an auxiliaryattitude towards the actions of the projects while at the same time triggering the volunteering.
• The integration of courses related to Civil Protection in all levels of education.• The obligation of voluntary organizations to submit the annual report of their action. In this way,
the Register of Volunteers will be updated only with the active voluntary organizations.• The recording by the Municipalities of the risks that threaten them with serious disasters. Then,
carrying out procedures for the development and installation of warning systems, wherepossible, or the execution of protection and prevention projects.
• Assigning responsibilities to stakeholders regarding their business continuity.• The creation of memoranda of action per state of emergency in each organization and entity, in
order to achieve rapid action and missions within the organization, only waiting for orders forfurther action.
REFERENCES
1. BSI Standards Limited 2012, First edition (15-05-2012), «BS ISO 22301:2012, Societal security – Businesscontinuity management systems – Requirements» (online), Available from:https://www.smv.gob.pe/Biblioteca/catalogacion/ISO22301_2012.pdf
2. BSI Standards Limited 2018, Second edition (15-02-2018), «BS ISO 31000:2018, Risk management —Guidelines» (online), Available from:https://www.ashnasecure.com/uploads/standards/BS%20ISO%2031000-2018.pdf
3. Institute of Risk Management, A company limited by guarantee, Registered in England number 2009507,«A Risk Practitioners Guide to ISO 31000: 2018» (online), Available from:http://www.demarcheiso17025.com/31000%20%96%202018.pdf
4. Georgios Stefanopoulos, 2020, "Detailed analysis of business continuity (ISO 22301) and riskmanagement standards (ISO 31000) as well as a study of the correlation between businesscontinuity and risk management within an organization or a company." Geology andGeoenvironment, submitted to the School of Sciences of the National and Kapodistrian University ofAthens
5. Christos Th. Gallis, 2018, "Compulsory Civil Protection Education for our people at all levels ofeducation" (online), Article available at: https://www.kathimerini.gr/society/977507/arthro-toy-christoy-th -galli-sto-kathimerini-gr-ypochreotiki-ekpaideysi-politikis-prostasias-toy-laoy-mas-se-oles-tis-vathmides-ekpaideysis
6. BCP Builder, (Accessed 03 December 2020), https://www.bcpbuilder.com/2018/11/21/business-continuity-risk-management/
7.
8.
Continuity 2, (Accessed 10 December 2020), https://continuity2.com/relationships-between-risk-management-business-continuityRisk Management Studio, (Πρόσβαση 10 Δεκεμβρίου 2020), https://www.riskmanagementstudio.com/risk-management-business-continuity
Page 56 of 269

SafeGreece 2021 on-line Proceedings | ISSN 2654-1823
SafeGreece 2021 – 8th International Conference on Civil Protection & New Technologies 24-26 November, on-line | www.safegreece.org/safegreece2021 | [email protected]
ATMOSPHERIC CONDITIONS THAT CONTRIBUTED TO THE BLOWUP OF THE LARGE WILDFIRE IN KALAMONAS, RHODES ISLAND, ON AUGUST 1st 2021
Dimitrios Menemenlis1, Palaiologos Palaiologou2, Kostas Kalabokidis3
1. PhD student, Department of Geography, University of the Aegean, 81100 Mytilene, Greece(E-mail: [email protected])
2. Postdoc researcher, Department of Geography, University of the Aegean, 81100 Mytilene, Greece(E-mail: [email protected])
3. Professor, Department of Geography, University of the Aegean, 81100 Mytilene, Greece(E-mail: [email protected])
ABSTRACT The extensive wildfires of summer 2021 in southwestern Turkey, created large fire plumes that moved over Greece and dramatically increased the mean variation of PM 2.5 and CO emissions over the island of Rhodes. This situation, combined with the large decrease of atmospheric relative humidity, produced ideal conditions for the ignition and rapid spread of a large-scale wildfire in the region of Kalamonas, Rhodes, in August 1st. In this study, we analyzed the atmospheric quality above the southeastern Mediterranean region shortly before the ignition of the Kalamonas wildfire. We simulated the transfer of wildfire plume from Marmaris, Turkey to Rhodes Island to understand if its presences was connected with the extreme climatic conditions that prevailed over Rhodes island from July 27 to August 1st,2021, and in turn, contributed to the rapid spread and burn severity patterns of the Kalamonas wildfire.
Keywords: wildfire, plume trajectory, HYSPLIT model, air pollution, burn severity.
1. INTRODUCTIONOn August 1st2021, a wildfire ignited in the area of Kalamonas Rhodes and burned about 1,000 hectaresof coniferous forests and shrublands. During the previous days, multiple wildfires occurred in the westcoast of Turkey [1]. These fires produced a hot veil of toxic gases that were transferred within thewildfire plume, covering the island of Rhodes from July 27 to August 1st 2021 and leading to adramatically increased atmospheric PM 2.5 and CO content, which in turn, increased the averageatmospheric temperature with a parallel reduction of relative humidity [2,3]. The purpose of this work isthrough observation and analysis of satellite data and terrestrial measurements to show that thepreviously reported transfer of wildfire plume had an impact on air pollution in Greece. Additionally,through the simulation of the aerosol dispersion of these fires, an attempt is made to verify that thiswas the main cause of the dramatic change of meteorological conditions and the moisture content ofthe forest fuels on the island of Rhodes during this period. Finally, we detected the changes in thereflected energy of healthy vegetation, soil and soil moisture to correlate high combustion severitylevels with the above-mentioned meteorological factors.
2. MATERIAL AND METHODS2.1. Study area
Rhodes Island is characterized by a semi-mountainous terrain covered by dense conifer forest mostly in its central part. The island has all the characteristics of a Mediterranean ecosystem and in the last 43 years, more than 1,300 fires ignited that burned approximately 51,000 hectares.
2.2. Atmospheric conditions prior to the Kalamonas wildfire
Page 57 of 269
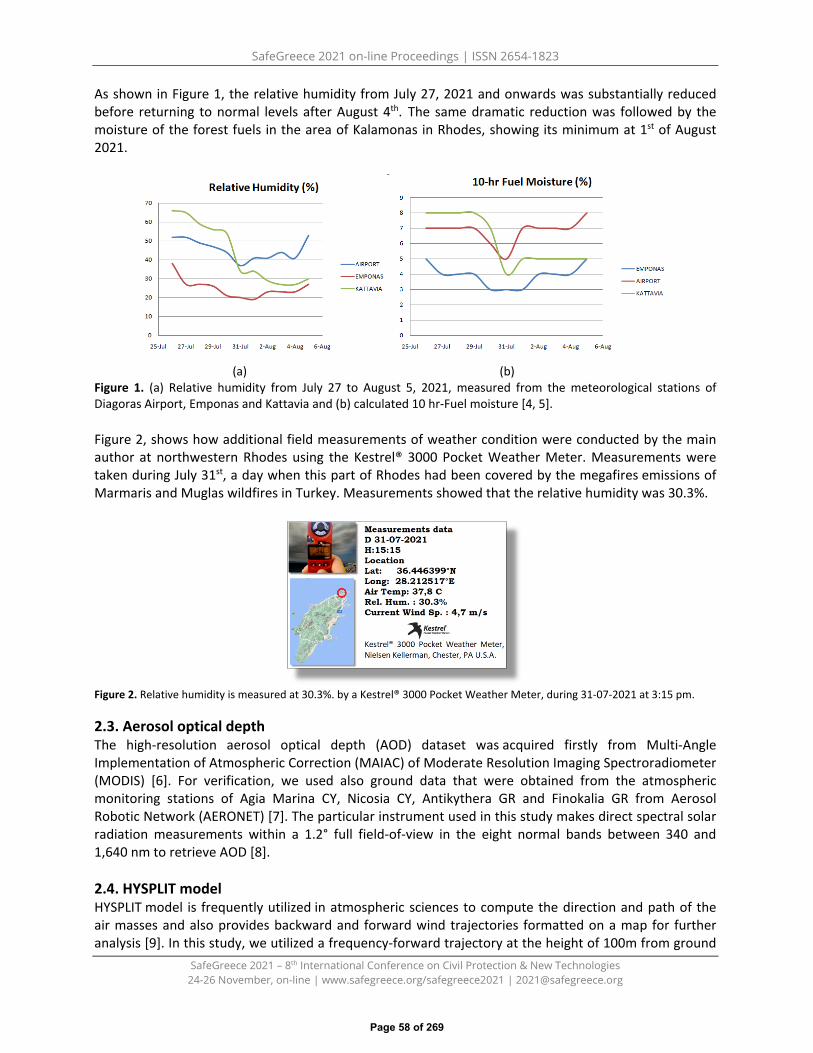
SafeGreece 2021 on-line Proceedings | ISSN 2654-1823
SafeGreece 2021 – 8th International Conference on Civil Protection & New Technologies 24-26 November, on-line | www.safegreece.org/safegreece2021 | [email protected]
As shown in Figure 1, the relative humidity from July 27, 2021 and onwards was substantially reduced before returning to normal levels after August 4th. The same dramatic reduction was followed by the moisture of the forest fuels in the area of Kalamonas in Rhodes, showing its minimum at 1st of August 2021.
(a) (b) Figure 1. (a) Relative humidity from July 27 to August 5, 2021, measured from the meteorological stations of Diagoras Airport, Emponas and Kattavia and (b) calculated 10 hr-Fuel moisture [4, 5].
Figure 2, shows how additional field measurements of weather condition were conducted by the main author at northwestern Rhodes using the Kestrel® 3000 Pocket Weather Meter. Measurements were taken during July 31st, a day when this part of Rhodes had been covered by the megafires emissions of Marmaris and Muglas wildfires in Turkey. Measurements showed that the relative humidity was 30.3%.
Figure 2. Relative humidity is measured at 30.3%. by a Kestrel® 3000 Pocket Weather Meter, during 31-07-2021 at 3:15 pm.
2.3. Aerosol optical depth The high-resolution aerosol optical depth (AOD) dataset was acquired firstly from Multi-Angle Implementation of Atmospheric Correction (MAIAC) of Moderate Resolution Imaging Spectroradiometer (MODIS) [6]. For verification, we used also ground data that were obtained from the atmospheric monitoring stations of Agia Marina CY, Nicosia CY, Antikythera GR and Finokalia GR from Aerosol Robotic Network (AERONET) [7]. The particular instrument used in this study makes direct spectral solar radiation measurements within a 1.2° full field-of-view in the eight normal bands between 340 and 1,640 nm to retrieve AOD [8].
2.4. HYSPLIT model HYSPLIT model is frequently utilized in atmospheric sciences to compute the direction and path of the air masses and also provides backward and forward wind trajectories formatted on a map for further analysis [9]. In this study, we utilized a frequency-forward trajectory at the height of 100m from ground
Page 58 of 269

SafeGreece 2021 on-line Proceedings | ISSN 2654-1823
SafeGreece 2021 – 8th International Conference on Civil Protection & New Technologies 24-26 November, on-line | www.safegreece.org/safegreece2021 | [email protected]
level to determine the direction of particle distribution and path of the wildfire plume and PM 2.5 emissions.
2.5.Sentinel 2 We obtained geometric, radiometric and atmospherically corrected Sentinel 2B images, using the Multispectral Instrument (MSI), for the days of July 28th (pre-fire) and August 2nd (post-fire). MSI measures reflected Earth radiation in 13 spectral bands, from VNIR to SWIR. The dNBR spectral index was calculated with the QGIS Semi-Automatic Classification Plugin and the usage of bands 8 (NIR) and 12 (SWIR) [10].
3. RESULTS AND DISCUSSION3.1 Air pollution and plume trajectory
It was shown that the large-scale wildfires of Turkey negatively affected the air quality above the wider area of Rhodes Island. During this period, the daily average value was 1.15 for aerosol optical depth (AOD500nm), while under normal conditions in the area the average value is about 0.40 (AOD500nm). Furthermore, the latitudinal and longitudinal transportation of wildfires plumes and their aerosols, during the period of 29-07 to 01-08 and between 33–38°N and 27-29°E, demonstrated high aerosol concentrations that caused air quality reduction over Rhodes Island. Figure 3 reveals the HYSPLIT model forward trajectories. These trajectories follow the south and southeastern direction from their source, i.e., the Marmaris wildfire. The same latitudinal and longitudinal transportation of wildfires plumes alsoapplied to the other megafires in Muglas and Antalya of the same period.
(a) (b) Figure 3. (a),(b) Latitudinal and longitudinal transportation of the Marmaris wildfire plume and its aerosol, during 29-07-2021 to 01-08-2021, as estimated by the HYSPLIT model.
3.2 The Kalamonas wildfire severity Behavior of wildfires depends, among other factors, on the forest fuel moisture content [11]. We found that the decrease of available forest fuel moisture came from rapid fuel evapotranspiration due to the congested atmosphere from the smoke plume that was transported and settled over the island. Therefore, all the above factors have contributed to the rapid spread of this wildfire and at the same time, to its severity due to the very low fuel moisture (Figure 4). We found that 60% of the burned area showed moderate to high severity, i.e., about 660 hectares of the total burned area.
Page 59 of 269
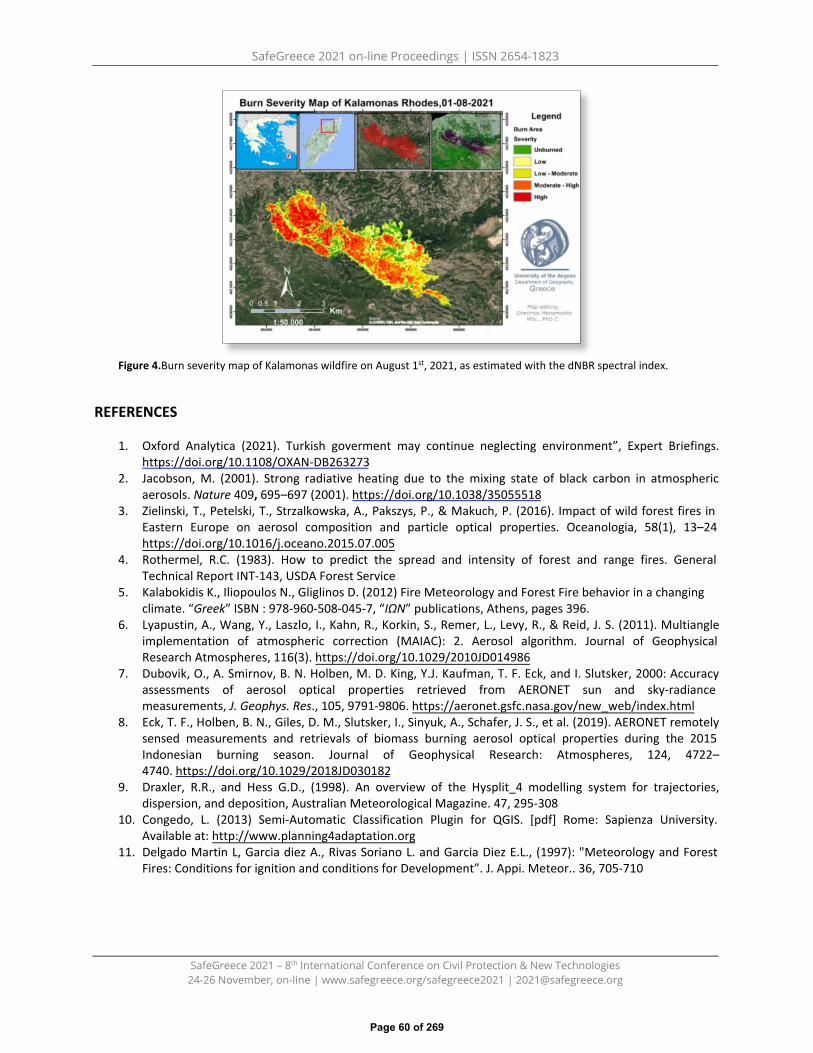
SafeGreece 2021 on-line Proceedings | ISSN 2654-1823
SafeGreece 2021 – 8th International Conference on Civil Protection & New Technologies 24-26 November, on-line | www.safegreece.org/safegreece2021 | [email protected]
Figure 4.Burn severity map of Kalamonas wildfire on August 1st, 2021, as estimated with the dNBR spectral index.
REFERENCES
1. Oxford Analytica (2021). Turkish goverment may continue neglecting environment”, Expert Briefings. https://doi.org/10.1108/OXAN-DB263273
2. Jacobson, M. (2001). Strong radiative heating due to the mixing state of black carbon in atmospheric aerosols. Nature 409, 695–697 (2001). https://doi.org/10.1038/35055518
3. Zielinski, T., Petelski, T., Strzalkowska, A., Pakszys, P., & Makuch, P. (2016). Impact of wild forest fires in Eastern Europe on aerosol composition and particle optical properties. Oceanologia, 58(1), 13–24 https://doi.org/10.1016/j.oceano.2015.07.005
4. Rothermel, R.C. (1983). How to predict the spread and intensity of forest and range fires. General Technical Report INT-143, USDA Forest Service
5. Kalabokidis K., Iliopoulos N., Gliglinos D. (2012) Fire Meteorology and Forest Fire behavior in a changing climate. “Greek” ISBN : 978-960-508-045-7, “ΙΩΝ” publications, Athens, pages 396.
6. Lyapustin, A., Wang, Y., Laszlo, I., Kahn, R., Korkin, S., Remer, L., Levy, R., & Reid, J. S. (2011). Multiangle implementation of atmospheric correction (MAIAC): 2. Aerosol algorithm. Journal of Geophysical Research Atmospheres, 116(3). https://doi.org/10.1029/2010JD014986
7. Dubovik, O., A. Smirnov, B. N. Holben, M. D. King, Y.J. Kaufman, T. F. Eck, and I. Slutsker, 2000: Accuracy assessments of aerosol optical properties retrieved from AERONET sun and sky-radiance measurements, J. Geophys. Res., 105, 9791-9806. https://aeronet.gsfc.nasa.gov/new_web/index.html
8. Eck, T. F., Holben, B. N., Giles, D. M., Slutsker, I., Sinyuk, A., Schafer, J. S., et al. (2019). AERONET remotely sensed measurements and retrievals of biomass burning aerosol optical properties during the 2015 Indonesian burning season. Journal of Geophysical Research: Atmospheres, 124, 4722–4740. https://doi.org/10.1029/2018JD030182
9. Draxler, R.R., and Hess G.D., (1998). An overview of the Hysplit_4 modelling system for trajectories, dispersion, and deposition, Australian Meteorological Magazine. 47, 295-308
10. Congedo, L. (2013) Semi-Automatic Classification Plugin for QGIS. [pdf] Rome: Sapienza University. Available at: http://www.planning4adaptation.org
11. Delgado Martin L, Garcia diez A., Rivas Soriano L. and Garcia Diez E.L., (1997): "Meteorology and Forest Fires: Conditions for ignition and conditions for Development”. J. Appi. Meteor.. 36, 705-710
Page 60 of 269
SafeGreece 2021 on-line Proceedings | ISSN 2654-1823
SafeGreece 2021 – 8th International Conference on Civil Protection & New Technologies 24-26 November, on-line | www.safegreece.org/safegreece2021 | [email protected]
GREECE 2021 WΙLDFΙRES: OPERATΙONAL MAPPΙNG USΙNG GEOSPATΙAL ΙNTELLΙGENCE AND RESTORATΙON-NEEDED KNOWLEDGE DΙSSEMΙNATΙON
THROUGH A CLOUD-BASED PLATFORM
Ioannis Papadopoulos1, Triantafyllos Falaras1, Aliki Petani1, Pavlos Krassakis1, Andreas Karavias1, Despoina Bafi1, Ioanna Tselka1, Ioannis Gkougkoustamos1, Maria Nikolidaki1, Issaak Parcharidis1
1Department of Geography, Harokopio University of Athens, (Greece). (E-mail: [email protected], [email protected], [email protected], [email protected], [email protected],
[email protected], [email protected], [email protected] [email protected], [email protected])
ABSTRACT In 2021, Greece has faced one of the worst ecological disasters of the past few decades due to wildfires as well as the most intense heatwave of the last 30 years. To this extent, the mapping of the spatial impact of these wildfires is crucial for operational purposes. Our research team worked on timely with the use of satellite-based earth observation data from the Copernicus program of the European Space Agency that has already made a significant contribution in wildfire mapping. Also, land cover data (Corine Land Cover 2018 (CLC 2018)) were utilized for the burned area identification. More precisely, knowledge of burned areas, their burn severity, and land cover was produced and then was used to compile a useful geospatial intelligence web app.
Keywords: wildfires, geospatial intelligence, platform, burned areas, burn severity
1. INTRODUCTIONNatural hazards affect both the natural and human environment more than ever. In the past few years,numerous natural disasters have destroyed communities around the world [1]. It is supported thatclimate change affects both the frequency and intensity of these phenomena [2]. The manifestations ofclimate change mainly concern prolonged periods of drought, frequent and severe thunderstorms,floods, increased heat days, and more mega-fires [3]. These events pose risks, so their propermanagement is beneficial [4].
The wildfires in Greece, broke out as the country was suffering from the most intense and protracted heatwave experienced since 1987 with the 3rd August of 2021 to be the hottest day since then. The majority of the events investigated occurred almost simultaneously. During the fire season, more than 7249 fires occurred in Greece, as a result, it was one of the greatest ecological catastrophes of the last few decades. During the first eight days of August, more than 180 evacuations took place in many settlements in a timely manner, according to the former Deputy Minister for Civil Protection and Crisis Management. However, the wildfires caused considerable damage in the aftermath. Furthermore, due to the smoke, air pollution reached dangerously high levels with a dense cloud of harmful fine particles blanketed a considerable extent of Greece’s atmosphere [5].
The integrated use of Earth Observation (EO) data has been used towards this direction and it is a proven useful tool due to their synoptic view capability and multispectral properties in the case of optical sensors [6]. The collection, analysis, and dissemination of images and geospatial information in order to describe, appraise and visually depict physical features and geographically referenced activities on the Earth are referred to as geospatial intelligence (GEOINT). The core premise of geospatial intelligence (GEOINT) is to collect and combine all accessible data surrounding a geographic area on
Page 61 of 269

SafeGreece 2021 on-line Proceedings | ISSN 2654-1823
SafeGreece 2021 – 8th International Conference on Civil Protection & New Technologies 24-26 November, on-line | www.safegreece.org/safegreece2021 | [email protected]
Earth and then exploit it to create products that planners, emergency responders, and decision-makers can use quickly also in the in-situ inspection [7].
The current study aims at mapping the spatial impact of wildfires in the 2021 fire season in Greece. The investigated wildfires were selected considering the severity, impact, and duration while the mapping was performed operationally at the time of each event. To that extent, with the use of optical Satellite-2 Level 2A Bottom-Of-Atmosphere (BOA), the burned severity of the wildfires is assessed with the use of the related spectral indices aiming at enhancing the analysis of the phenomenon's spatial consequences. In addition, land cover data were utilized regarding the programme Corine Land Cover 2018 (CLC 2018) due to the assessment of burned areas related to their land cover. Lastly, a web app was developed with the ESRI’s ArcGIS Online, a cloud-based mapping and analysis tool enabling the combination of this knowledge to a useful geospatial intelligence tool.
2. APPROACH-METHODOLOGY2.1. BackgroundThe processing was based on the application of spectral indices using the Normalized Burn Ratio (NBR).The NBR is a widely applied index that makes use of near-infrared and shortwave infrared spectralbands for the burned area mapping and burn severity assessment in remote sensing [8, 9, 10]. A highNBR value generally indicates healthy vegetation whereas a low value indicates low or no vegetation,such as a result of a fire. Also, the dNBR which is the difference between the pre-fire NBR and post-fireNBR is calculated not only to distinguish the burned areas but also the burn severity [11]. The last indexutilized is the RBR (Relativized Burn Ratio), which provides accurate burn severity assessment for regionsand ecosystems with a variety of characteristics [12]. It is a suitable index designed for changesdetection in low vegetation cover areas. Finally, regarding burn severity, is a term that expresses thedegree of effect that a wildfire has on an ecosystem and it is also useful for the management of naturaldisasters and the following restoration [8, 9, 13, 14].
2.2. Data and software For the operational purpose of the study, ESA Copernicus Sentinel-2 mission openly accessible satellite images available from the Copernicus Open Access Hub platform (URL: https://scihub.copernicus.eu/) were utilized. These images are available on the platform within a few hours after the acquisition thus consisting of an important tool in the operational mapping of the wildfires. Regarding the land cover information, the Corine Land Cover 2018 (CLC 2018) in vector geodatabase format was used freely available via Copernicus Land Monitoring Service (URL: https://land.copernicus.eu/paneuropean/corine-land-cover/clc2018?tab=download). The utilized software includes the open ESA’s STEP platform remote sensing software, SNAP v.8.0 for the satellite imagery processing, and the commercial GIS software ESRI’s ArcGIS desktop v.10, Pro 2.8, and Online.
2.3. Methodology The applied methodology for the purposes of this operational wildfire mapping was based on the application of the previously mentioned background, data, and tools. The framework was built on the already gained experience and established approaches through the literature [10]. At the final processing stage, an interactive web map was created with ArcGIS Online, ESRI's web-based mapping software. ArcGIS Online is a cloud-based mapping and analysis solution. Moreover, the data would be published and shared as a web layer on ArcGIS Online. Since it is a Software as a Service (SaaS), ArcGIS Online runs on any device with an internet connection. Its world-class infrastructure allows your maps to
Page 62 of 269
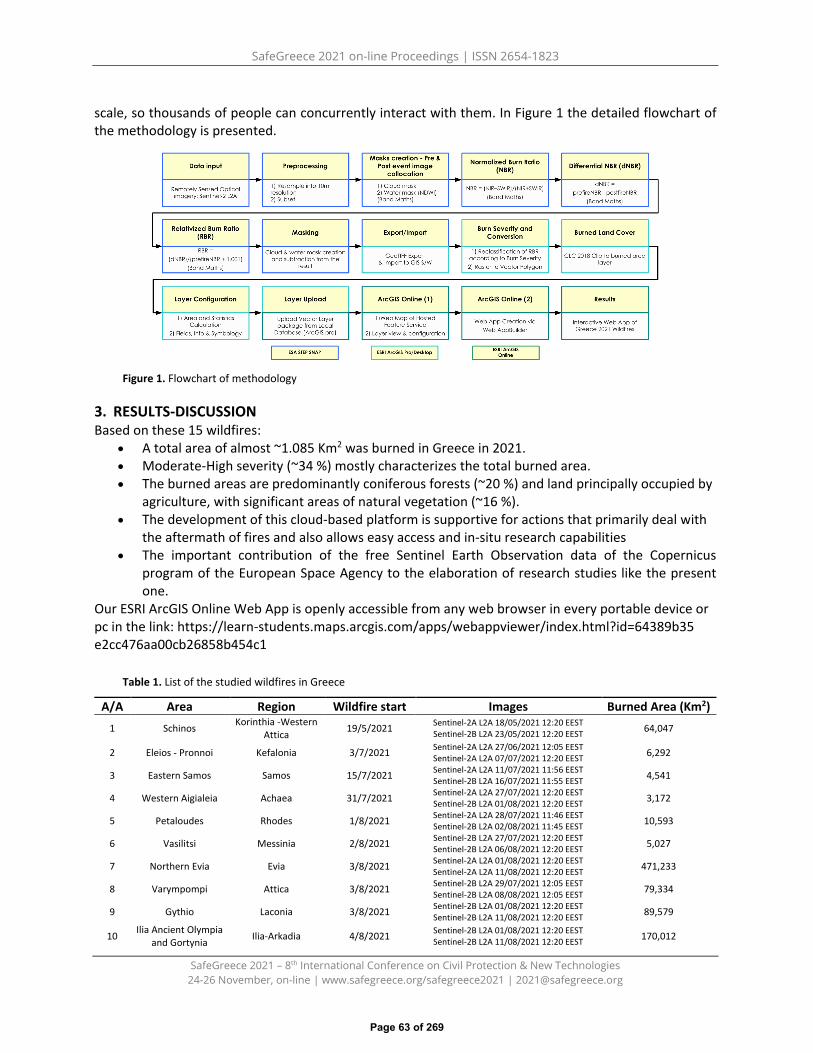
SafeGreece 2021 on-line Proceedings | ISSN 2654-1823
SafeGreece 2021 – 8th International Conference on Civil Protection & New Technologies 24-26 November, on-line | www.safegreece.org/safegreece2021 | [email protected]
scale, so thousands of people can concurrently interact with them. In Figure 1 the detailed flowchart of the methodology is presented.
Figure 1. Flowchart of methodology
3. RESULTS-DISCUSSIONBased on these 15 wildfires:
• A total area of almost ~1.085 Km2 was burned in Greece in 2021.• Moderate-High severity (~34 %) mostly characterizes the total burned area.• The burned areas are predominantly coniferous forests (~20 %) and land principally occupied by
agriculture, with significant areas of natural vegetation (~16 %).• The development of this cloud-based platform is supportive for actions that primarily deal with
the aftermath of fires and also allows easy access and in-situ research capabilities• The important contribution of the free Sentinel Earth Observation data of the Copernicus
program of the European Space Agency to the elaboration of research studies like the presentone.
Our ESRI ArcGIS Online Web App is openly accessible from any web browser in every portable device or pc in the link: https://learn-students.maps.arcgis.com/apps/webappviewer/index.html?id=64389b35 e2cc476aa00cb26858b454c1
Table 1. List of the studied wildfires in Greece
A/A Area Region Wildfire start Images Burned Area (Km2) 1 Schinos Korinthia -Western
Attica 19/5/2021 Sentinel-2A L2A 18/05/2021 12:20 EEST Sentinel-2B L2A 23/05/2021 12:20 EEST 64,047
2 Eleios - Pronnoi Kefalonia 3/7/2021 Sentinel-2A L2A 27/06/2021 12:05 EEST Sentinel-2A L2A 07/07/2021 12:20 EEST 6,292
3 Eastern Samos Samos 15/7/2021 Sentinel-2A L2A 11/07/2021 11:56 EEST Sentinel-2B L2A 16/07/2021 11:55 EEST 4,541
4 Western Aigialeia Achaea 31/7/2021 Sentinel-2A L2A 27/07/2021 12:20 EEST Sentinel-2B L2A 01/08/2021 12:20 EEST 3,172
5 Petaloudes Rhodes 1/8/2021 Sentinel-2A L2A 28/07/2021 11:46 EEST Sentinel-2B L2A 02/08/2021 11:45 EEST 10,593
6 Vasilitsi Messinia 2/8/2021 Sentinel-2B L2A 27/07/2021 12:20 EEST Sentinel-2B L2A 06/08/2021 12:20 EEST 5,027
7 Northern Evia Evia 3/8/2021 Sentinel-2A L2A 01/08/2021 12:20 EEST Sentinel-2A L2A 11/08/2021 12:20 EEST 471,233
8 Varympompi Attica 3/8/2021 Sentinel-2B L2A 29/07/2021 12:05 EEST Sentinel-2B L2A 08/08/2021 12:05 EEST 79,334
9 Gythio Laconia 3/8/2021 Sentinel-2B L2A 01/08/2021 12:20 EEST Sentinel-2B L2A 11/08/2021 12:20 EEST 89,579
10 Ilia Ancient Olympiaand Gortynia Ilia-Arkadia 4/8/2021 Sentinel-2B L2A 01/08/2021 12:20 EEST
Sentinel-2B L2A 11/08/2021 12:20 EEST 170,012
Page 63 of 269

SafeGreece 2021 on-line Proceedings | ISSN 2654-1823
SafeGreece 2021 – 8th International Conference on Civil Protection & New Technologies 24-26 November, on-line | www.safegreece.org/safegreece2021 | [email protected]
11 Melpeia Messinia 4/8/2021 Sentinel-2B L2A 01/08/2021 12:20 EEST Sentinel-2B L2A 16/08/2021 12:20 EEST 45,781
12 Chasia-Ventzio Grevena 5/8/2021 Sentinel-2B L2A 01/08/2021 12:20 EEST Sentinel-2A L2A 09/08/2021 12:30 EEST 9,238
13 Tolofon-Lidoriki Fokida 5/8/2021 Sentinel-2B L2A 01/08/2021 12:20 EEST Sentinel-2B L2A 11/08/2021 12:20 EEST 27,320
14 Lavreotiki South-Eastern Attica 16/8/2021 Sentinel-2B L2A 13/08/2021 12:06 EEST Sentinel-2B L2A 18/08/2021 12:05 EEST 5,009
15 Vilia Western Attica 16/8/2021 Sentinel-2A L2A 29/07/2021 12:05 EEST Sentinel-2A L1C 26/08/2021 12:20 EEST 95,986
ACKNOWLEDGMENTS We would like to express our gratitude to ESRI’s Learn ArcGIS Student Program for the access to ArcGIS Pro and ArcGIS Online for making this web application possible. Also, acknowledgments should be given to every one of our team who contributed to the operational mapping of the wildfires.
REFERENCES 1. B. E. Montz, G. A. Tobin, R. R. Hagelman (2017). Natural hazards: explanation and integration. Guilford
Publications.2. M.K. Van Aalst (2006). The impacts of climate change on the risk of natural disasters. Disasters,30(1), 5-
18.3. P. A. Smithson (2002). IPCC, 2001: climate change 2001: the scientific basis. Contribution of Working
Group 1 to the Third Assessment Report of the Intergovernmental Panel on Climate Change. Edited by JTHoughton, Y. Ding, DJ Griggs, M. Noguer, PJ van der Linden, X. Dai, K. Maskell and CA Johnson (eds).Cambridge University Press, Cambridge, UK, and New York, USA, 2001. No. of pages: 881.
4. T. A. Steelman, S. McCaffrey (2013). Best practices in risk and crisis communication: Implications fornatural hazards management. Natural hazards, 65(1), 683-705.
5. E. Lekkas, […] (2021). The July – August 2021 Wildfires in Greece. Newsletter of Environmental, Disasterand Crises Management Strategies, 25, ISSN 2653-9454.
6. C. J. Westen (2000). Remote sensing for natural disaster management. International archives ofphotogrammetry and remote sensing, 33(B7/4; PART 7), 1609-1617.
7. K. Richardson (2010). The next generation of digital mapping. GEO Connex 9(9):26–28.8. J. D. Miller, A. E. Thode (2007). Quantifying burn severity in a heterogeneous landscape with a relative
version of the delta Normalized Burn Ratio (dNBR). Remote Sensing of Environment, 109(1), 66-80.9. UN-SPYDER Knowledge Portal (2019). Normalized Burn Ratio. Retrieved from: http://un-
spider.org/advisory-support/recommended-practices/recommended-practice-burn-severity/in-detail/normalized-burn-ratio.
10. RUS-Copernicus (2017). Burned area mapping with Sentinel-2 using SNAP Training kit – HAZA02.11. G. M. Casady, W. J. Van Leeuwen, S. E. Marsh (2010). Evaluating post-wildfire vegetation regeneration as
a response to multiple environmental determinants. Environmental modeling & assessment, 15(5), 295-307.
12. S. Parks, G. Dillon, C. Miller (2014). A new metric for quantifying burn severity: the relativized burn ratio.Remote Sensing, 6(3), 1827 1844.
13. J. Eidenshink, B. Schwind, K. Brewer, Z. L. Zhu, B. Quayle, S. Howard (2007). A project for monitoringtrends in burn severity. Fire ecology, 3(1), 3-21.
14. J. E. Keeley (2009). Fire intensity, fire severity and burn severity: a brief review and suggested usage.International Journal of Wildland Fire, 18(1), 116-126.
Page 64 of 269

SafeGreece 2021 on-line Proceedings | ISSN 2654-1823
SafeGreece 2021 – 8th International Conference on Civil Protection & New Technologies 24-26 November, on-line | www.safegreece.org/safegreece2021 | [email protected]
DEVELOPMENT OF AN OPERATIONAL HEAT HEALTH WARNING SYSTEM USING ADVANCED MODELLING AND ICT TOOLS
Panagiotis Symeonidis1, Theodoros Vakkas2, Simeon Taskaris3, Dimitris Melas4, Serafim Kontos5, Dafni Parliari6 1,2,3 Geospatial Enabling Technologies (Greece).
(E-mail: [email protected] , [email protected], [email protected] ) 4,5,6 Laboratory of Atmospheric Physics, Department of Physics, Aristotle University of Thessaloniki (Greece).
(E-mail: [email protected] , [email protected] , [email protected] )
ABSTRACT The LIFE ASTI project focuses on the Urban Heat Island effect and human health by using a system of numerical models that lead to the short-term forecast and future projection of the UHI phenomenon in three Mediterranean cities: Thessaloniki, Rome, and Heraklion. The LIFE ASTI modelling system produces high-quality and high-resolution forecasting results, not limited to standard meteorological parameters but including also bioclimatic indicators and heating and cooling degree days. A geospatial management and visualisation platform was developed, based on a multi-tier architecture, that ensures the flexibility and the expandability of the system. The system is operational and thus the meteorological database is updated daily with new model results and heat health warning alerts. A web application provides an easy-to-use interface for the users (experts and non-experts) to exploit the outputs of the models. It utilizes interactive maps or charts for the visualization of the results. The information is provided aggregated, at city district level, but also at city block level. For easier access to information, a mobile app for both Android and iOS devices is also available.
Keywords: Urban Heat Island; climate change; geospatial analysis; enviromatics
1. INTRODUCTION
The combined effect of global climate change and rapid urbanisation is expected to make the residents of urban areas more vulnerable to several severe environmental problems. Among them are extreme heat waves and urban heat island (UHI) effect, which risk is expected in the near future to become even greater as heat waves become more frequent and longer lasting. To tackle with these problems, but also to support local communities adopt climate change adaptation measures and strategies, the LIFE ASTI (Implementation of a forecasting system for urban heat island effect for the development of urban adaptation strategies) project has developed a Heat Health Warning System applied and demonstrated in Thessaloniki, Heraklion, and Rome, based on state-of-the-art numerical models. It has also established an ICT platform to allow open access to UHI-related information to end-users and stakeholders. In this paper we will provide a brief description of the modelling system as well as an overview of the system platform, focusing on the provided functionalities of the web and the mobile applications that are available for the dissemination of the results.
2. THE MODELING SYSTEM
In LIFE ASTI an operational modelling system was setup based on the regional WRF-ARW numerical weather prediction model [1]. The WRF uses five nested domains. The first domain (d01; mesh size of 460x270) cover most of the Europe, the North Africa and the Middle East to simulate the synoptic
Page 65 of 269
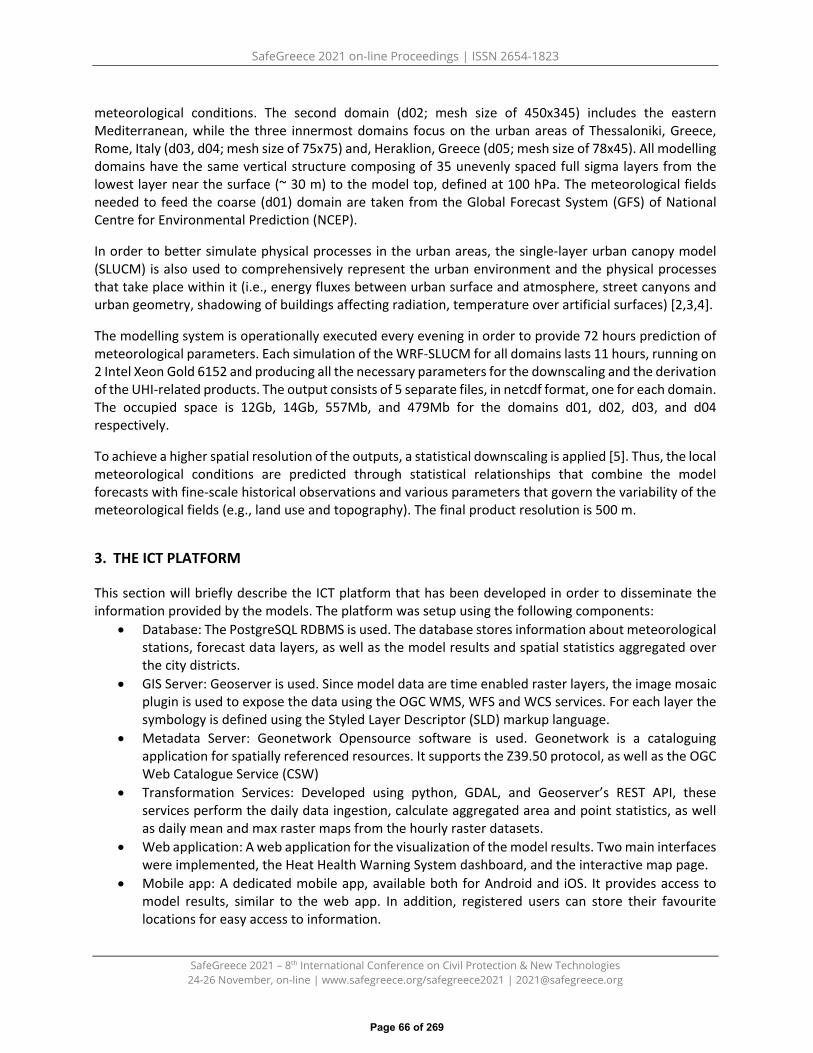
SafeGreece 2021 on-line Proceedings | ISSN 2654-1823
SafeGreece 2021 – 8th International Conference on Civil Protection & New Technologies 24-26 November, on-line | www.safegreece.org/safegreece2021 | [email protected]
meteorological conditions. The second domain (d02; mesh size of 450x345) includes the eastern Mediterranean, while the three innermost domains focus on the urban areas of Thessaloniki, Greece, Rome, Italy (d03, d04; mesh size of 75x75) and, Heraklion, Greece (d05; mesh size of 78x45). All modelling domains have the same vertical structure composing of 35 unevenly spaced full sigma layers from the lowest layer near the surface (~ 30 m) to the model top, defined at 100 hPa. The meteorological fields needed to feed the coarse (d01) domain are taken from the Global Forecast System (GFS) of National Centre for Environmental Prediction (NCEP).
In order to better simulate physical processes in the urban areas, the single-layer urban canopy model (SLUCM) is also used to comprehensively represent the urban environment and the physical processes that take place within it (i.e., energy fluxes between urban surface and atmosphere, street canyons and urban geometry, shadowing of buildings affecting radiation, temperature over artificial surfaces) [2,3,4].
The modelling system is operationally executed every evening in order to provide 72 hours prediction of meteorological parameters. Each simulation of the WRF-SLUCM for all domains lasts 11 hours, running on 2 Intel Xeon Gold 6152 and producing all the necessary parameters for the downscaling and the derivation of the UHI-related products. The output consists of 5 separate files, in netcdf format, one for each domain. The occupied space is 12Gb, 14Gb, 557Mb, and 479Mb for the domains d01, d02, d03, and d04 respectively.
To achieve a higher spatial resolution of the outputs, a statistical downscaling is applied [5]. Thus, the local meteorological conditions are predicted through statistical relationships that combine the model forecasts with fine-scale historical observations and various parameters that govern the variability of the meteorological fields (e.g., land use and topography). The final product resolution is 500 m.
3. THE ICT PLATFORM
This section will briefly describe the ICT platform that has been developed in order to disseminate the information provided by the models. The platform was setup using the following components:
• Database: The PostgreSQL RDBMS is used. The database stores information about meteorologicalstations, forecast data layers, as well as the model results and spatial statistics aggregated overthe city districts.
• GIS Server: Geoserver is used. Since model data are time enabled raster layers, the image mosaicplugin is used to expose the data using the OGC WMS, WFS and WCS services. For each layer thesymbology is defined using the Styled Layer Descriptor (SLD) markup language.
• Metadata Server: Geonetwork Opensource software is used. Geonetwork is a cataloguingapplication for spatially referenced resources. It supports the Z39.50 protocol, as well as the OGCWeb Catalogue Service (CSW)
• Transformation Services: Developed using python, GDAL, and Geoserver’s REST API, theseservices perform the daily data ingestion, calculate aggregated area and point statistics, as wellas daily mean and max raster maps from the hourly raster datasets.
• Web application: A web application for the visualization of the model results. Two main interfaceswere implemented, the Heat Health Warning System dashboard, and the interactive map page.
• Mobile app: A dedicated mobile app, available both for Android and iOS. It provides access tomodel results, similar to the web app. In addition, registered users can store their favouritelocations for easy access to information.
Page 66 of 269
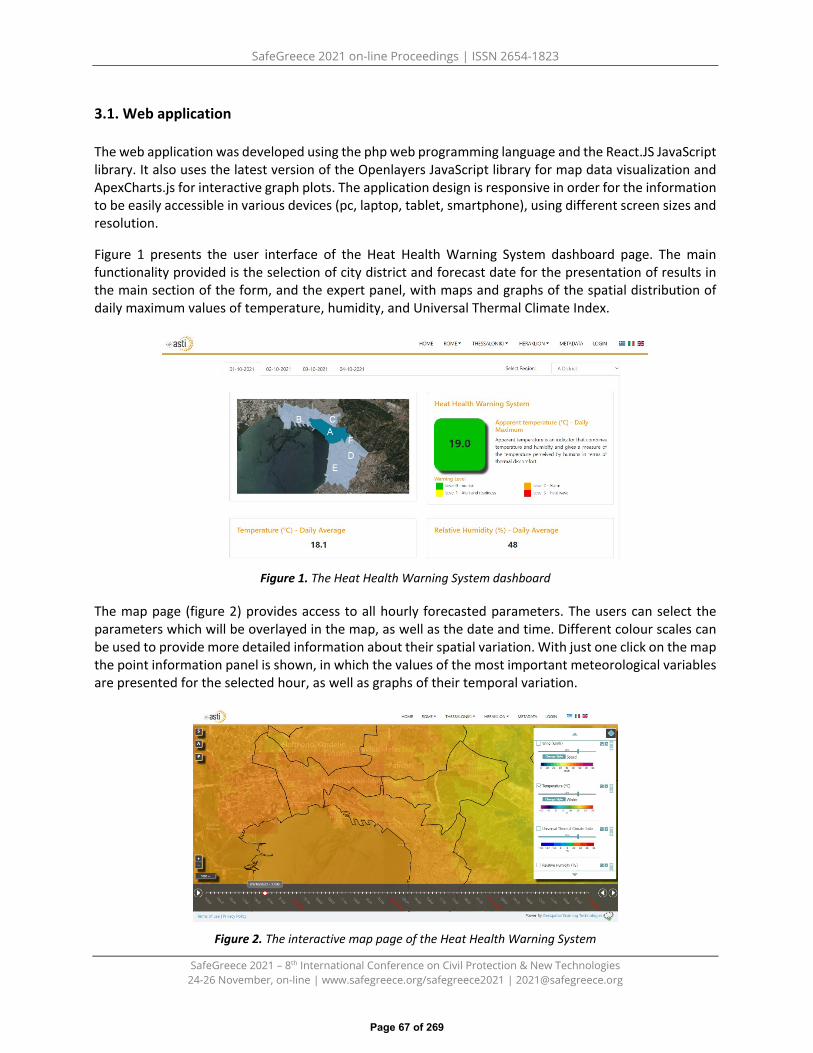
SafeGreece 2021 on-line Proceedings | ISSN 2654-1823
SafeGreece 2021 – 8th International Conference on Civil Protection & New Technologies 24-26 November, on-line | www.safegreece.org/safegreece2021 | [email protected]
3.1. Web application
The web application was developed using the php web programming language and the React.JS JavaScript library. It also uses the latest version of the Openlayers JavaScript library for map data visualization and ApexCharts.js for interactive graph plots. The application design is responsive in order for the information to be easily accessible in various devices (pc, laptop, tablet, smartphone), using different screen sizes and resolution.
Figure 1 presents the user interface of the Heat Health Warning System dashboard page. The main functionality provided is the selection of city district and forecast date for the presentation of results in the main section of the form, and the expert panel, with maps and graphs of the spatial distribution of daily maximum values of temperature, humidity, and Universal Thermal Climate Index.
Figure 1. The Heat Health Warning System dashboard
The map page (figure 2) provides access to all hourly forecasted parameters. The users can select the parameters which will be overlayed in the map, as well as the date and time. Different colour scales can be used to provide more detailed information about their spatial variation. With just one click on the map the point information panel is shown, in which the values of the most important meteorological variables are presented for the selected hour, as well as graphs of their temporal variation.
Figure 2. The interactive map page of the Heat Health Warning System
Page 67 of 269

SafeGreece 2021 on-line Proceedings | ISSN 2654-1823
SafeGreece 2021 – 8th International Conference on Civil Protection & New Technologies 24-26 November, on-line | www.safegreece.org/safegreece2021 | [email protected]
3.2. Mobile application
The mobile application provides easy access to the LIFE ASTI forecasting system using an Android or iOS mobile phone. The application was developed using React Native for cross platform compatibility, flexibility, and performance. The functionalities provided are heat waves alert / warning, access to forecast data, map visualization of hourly forecasted parameters, point info report, and favourite user locations (figure 3).
Figure 3. The Heat Health Warning System mobile app. (a) and (b) The dashboard with city District level information; (c) The favourite location functionality for information at specific point
4. CONCLUSIONS
ICT tools and services can be a valuable asset for stakeholders working towards sustainable climate change adaption. The LIFE ASTI platform is an example of such tools. It demonstrates the ability to visualize complex information, like the outputs of the meteorological models, in an easy-to-understand way, suitable both for expert and non-expert users, as well as to the public. In addition to the web application, which is designed to provide comprehensive information and advanced analysis tools, a mobile app can facilitate further the dissemination of the information, as well as the provision of personalized information and services.
REFERENCES
1. Skamarock, W.C., Klemp, J.B., Dudhia, J., Gill, D.O., Backer, D.M., Duda, M.G., Huang, X.Y., Wang, W.,Powers, J.G., 2008. A description of the advanced WRF version 3, NCAR Technical Note (NCAR/TN-475+STR),Boulder, Colorando, USA.
2. Kusaka, H.; Kondo, H.; Kikegawa, Y.; Kimura, F. A simple single-layer urban canopy model for atmosphericmodels: Comparison with multi-layer and slab models. Bound. Layer Meteorol. 2001, 101, 329–358.
3. Kusaka, H.; Kimura, F. Coupling a Single-Layer Urban Canopy Model with a Simple Atmospheric Model:Impact on Urban Heat Island Simulation for an Idealized Case. J. Meteorol. Soc. Jpn. 2004, 82, 67–80.
4. Giannaros, C., Nenes, A., Giannaros, T.M., Kourtidis, K., Melas, D., 2018. A comprehensive approach for thesimulation of the Urban Heat Island effect with the WRF/SLUCM modelling system: The case of Athens(Greece). Atmos. Res. 201, 86–101.
5. Giannaros, T.M., Melas, D., Daglis, I.A., Keramitsoglou, I., 2014. Development of an operational modelingsystem for urban heat islands: An application to Athens, Greece. Nat. Hazards Earth Syst. Sci. 14, 347–358.
Page 68 of 269

SafeGreece 2021 on-line Proceedings | ISSN 2654-1823
SafeGreece 2021 – 8th International Conference on Civil Protection & New Technologies 24-26 November, on-line | www.safegreece.org/safegreece2021 | [email protected]
PRELIMINARY ANALYSIS OF THE 2021 HEAT WAVE IN GREECE. THE IMPORTANCE OF PLANNING PREVENTIVE AND RESPONSE STRATEGIES
Paraskevi Begou1, Anastasia Paschalidou2, Pavlos Kassomenos1
1Laboratory of Meteorology and Climatology, Department of Physics, University of Ioannina, Ioannina, Greece 2Department of Forestry and Management of the Environment and Natural Resources, Democritus University of
Thrace, Orestiada, Greece ([email protected], [email protected], [email protected])
ABSTRACT Heat waves are among the most fatal meteorological hazards that jeopardize human health and well-being. During the last decades, the frequency, intensity and duration of extreme heat events have increased globally and are projected to increase further due to climate change. In the summer of 2021 (from the 28th of July to the 5th of August) a severe heat wave with high temperatures and prolonged duration afflicted Greece. In this study, we analyse the temperatures during this specific heat wave using the Climate Report of the Hellenic National Meteorological Service (HNMS) and the temperature data from the network of automatic weather stations of the National Observatory of Athens (NOA). On the whole, the study reveals the importance of planning heat wave response strategies and preventive measures for protecting public health.
Keywords: climate change, heat waves, extreme heat events
1. INTRODUCTIONAccording to the regional IPCC (Intergovernmental Panel on Climate Change) fact sheet for Europe,‘temperatures will rise in all European areas at a rate exceeding the global mean temperaturechanges, while the frequency and intensity of hot extremes are projected to increase regardless ofthe greenhouse gas emissions scenario’ [1]. Under these projections, heat waves will become morefrequent and intense over time, with extended duration as well as season length. Epidemiologicalstudies have shown that high temperatures contribute to the burden of morbidity and mortality [2].During heat waves a considerable number of hospital admissions and emergency department visitsare attributed to extreme heat exposure [3]. The most common heat-related symptoms are in thespectrum of heat-related illnesses, such as heat stroke and heat exhaustion [2]. In accordance withthe scientific literature, extreme heat is associated with circulatory, cerebrovascular, cardiovascularand respiratory diseases or even renal diseases [2,3]. Additionally, exposure to high temperaturesaffects mental health and emotional well-being [4]. In the summer of 2003, Europe experienced afatal heat wave with more than 70,000 additional deaths, based on data from 16 European countries[5]. In France, 15,000 additional deaths caused by the heat wave of August 2003 [5]. In the Parisarea, the maximum temperatures remained above 35°C for 14 consecutive days (1-14 August 2003),including 8 days with temperatures above 40°C and 9 days with minimum temperatures above 35°C[6]. Greece experienced an unprecedented heat wave in the country’s climatic history in July 1987when the maximum temperature recorded in Athens was 43.6°C (on the 27th of July) [7,8]. The deathtoll in the Greater Athens Area surpassed 1,000 cases during the period 20-31 July 1987 [7,8,9].Between the 28th of July and the 5th of August 2021, Greece experienced another severe heat wavewith extremely high temperatures in many areas of the country. In this study, we presentpreliminary results from the temperature recordings during this heat wave.
SafeGreece 2021 – 8th International Conference on Civil Protection & New Technologies 24-26 November, on-line | www.safegreece.org/safegreece2021 | [email protected]
Page 69 of 269

SafeGreece 2021 on-line Proceedings | ISSN 2654-1823
SafeGreece 2021 – 8th International Conference on Civil Protection & New Technologies 24-26 November, on-line | www.safegreece.org/safegreece2021 | [email protected]
2. METHODSIn this study, we present preliminary results from the temperature records during the 2021 heatwave in Greece. For this purpose, we use data from the HNMS Climate Report for the heat waveperiod, from 28/7/2021 to 5/8/2021 [10]. We compare these temperature records with the highestmonthly record-breaking temperatures (absolute monthly maximum temperature) in selectedmeteorological stations. Also, we present and analyze the temperature data from the NOA networkof automated weather stations which are available online at http://meteosearch.meteo.gr/.
3. RESULTS AND DISCUSSIONAlthough no formal, standardized and universally accepted definition of heat waves is available[11,12], in general terms, a heat wave is characterized by a period of consecutive days withexceptionally hot weather which deviates from the local climatic conditions [12]. During theseperiods of hot weather, both daytime and night-time temperatures reach high levels and may risebeyond their long-term mean [11]. In Greece, according to the HNMS, a heat wave is registeredwhen the following criteria are met [13]: (i)The maximum temperature in synoptic or aeronauticalweather stations is greater than or equal to 39°C, (ii)The minimum temperature is greater than 26°C,(iii) Calm or light winds prevail, (iv)The high temperatures are observed in a wide geographical areaand their duration exceeds 3 consecutive days.During the 2021 heat wave in Greece, the HNMS issued an orange-level warning on the 26th of Julyand a red-level warning on the 28th of July (Figure 1a).
Table 1. Maximum temperatures of July 2021 and absolute monthly maximum temperature of July
Meteorological Station (WMO station number)
Maximum temperature (°C)
of July 2021
Date of occurrence
Absolute monthly
maximum temperature (°C)
of July
Date of occurrence
Serres (16606) 43.7 30/07/2021 44.6 25/07/2007 Larisa (16648) 41.5 30/07/2021 45.4 05/07/2000 Kozani (16632) 39.4 30/07/2021 42.2 07/07/1988
Ioannina (16642) 40.4 29/07/2021 42.4 07/07/1988 Lamia (16675) 42.0 30/07/2021 46.5 19/07/1973
Tanagra (16699) 40.0 30-31/07/2021 46.0 19/07/1973 Elefsina (16718) 41.0 29/07/2021 48.0 10/07/1977
Tatoi (16715) 40.4 31/07/2021 48.0 10/07/1977
The temperatures exceeded 40°C from the 29th of July to the 31st of July in many meteorological stations in the country, including the stations in Serres where they reached 43.7 °C on the 30th of July (Table 1). Nevertheless, these values were not record-breaking temperatures. For example, in the stations in Elefsina and Tatoi the monthly absolute maximum temperatures for July (48°C) were recorded on the 10th of July 1977. On the other hand, the all-time highest temperatures of August (monthly absolute maximum temperature) were exceeded in many stations across Greece. On the 2nd and 3rd of August 2021, record-breaking temperatures were recorded in Nea Philadelphia (45.3°C) and Elefsina (44.8°C) in Attica Region (Table 2). These temperatures surpassed the absolute monthly maximum temperatures of August recorded on the 24th of August 1958.
In Table 3 we present the temperature records in the region of Eastern Macedonia and Thrace during the heat wave of July-August 2021. The temperature data were derived by the NOA network of automated weather stations.
Page 70 of 269
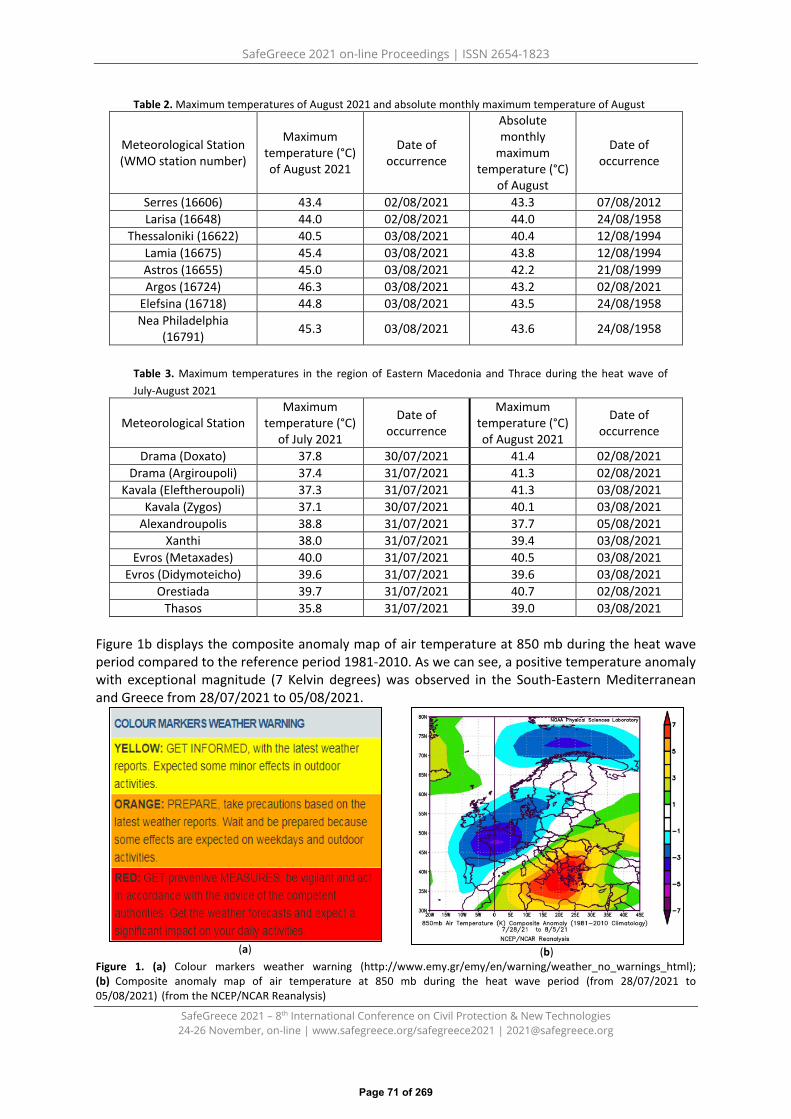
SafeGreece 2021 on-line Proceedings | ISSN 2654-1823
SafeGreece 2021 – 8th International Conference on Civil Protection & New Technologies 24-26 November, on-line | www.safegreece.org/safegreece2021 | [email protected]
Table 2. Maximum temperatures of August 2021 and absolute monthly maximum temperature of August
Meteorological Station (WMO station number)
Maximum temperature (°C) of August 2021
Date of occurrence
Absolute monthly
maximum temperature (°C)
of August
Date of occurrence
Serres (16606) 43.4 02/08/2021 43.3 07/08/2012 Larisa (16648) 44.0 02/08/2021 44.0 24/08/1958
Thessaloniki (16622) 40.5 03/08/2021 40.4 12/08/1994 Lamia (16675) 45.4 03/08/2021 43.8 12/08/1994 Astros (16655) 45.0 03/08/2021 42.2 21/08/1999 Argos (16724) 46.3 03/08/2021 43.2 02/08/2021
Elefsina (16718) 44.8 03/08/2021 43.5 24/08/1958 Nea Philadelphia
(16791) 45.3 03/08/2021 43.6 24/08/1958
Table 3. Maximum temperatures in the region of Eastern Macedonia and Thrace during the heat wave of July-August 2021
Meteorological Station Maximum
temperature (°C) of July 2021
Date of occurrence
Maximum temperature (°C) of August 2021
Date of occurrence
Drama (Doxato) 37.8 30/07/2021 41.4 02/08/2021 Drama (Argiroupoli) 37.4 31/07/2021 41.3 02/08/2021
Kavala (Eleftheroupoli) 37.3 31/07/2021 41.3 03/08/2021 Kavala (Zygos) 37.1 30/07/2021 40.1 03/08/2021
Alexandroupolis 38.8 31/07/2021 37.7 05/08/2021 Xanthi 38.0 31/07/2021 39.4 03/08/2021
Evros (Metaxades) 40.0 31/07/2021 40.5 03/08/2021 Evros (Didymoteicho) 39.6 31/07/2021 39.6 03/08/2021
Orestiada 39.7 31/07/2021 40.7 02/08/2021 Thasos 35.8 31/07/2021 39.0 03/08/2021
Figure 1b displays the composite anomaly map of air temperature at 850 mb during the heat wave period compared to the reference period 1981-2010. As we can see, a positive temperature anomaly with exceptional magnitude (7 Kelvin degrees) was observed in the South-Eastern Mediterranean and Greece from 28/07/2021 to 05/08/2021.
(a) (b) Figure 1. (a) Colour markers weather warning (http://www.emy.gr/emy/en/warning/weather_no_warnings_html); (b) Composite anomaly map of air temperature at 850 mb during the heat wave period (from 28/07/2021 to05/08/2021) (from the NCEP/NCAR Reanalysis)
Page 71 of 269

SafeGreece 2021 on-line Proceedings | ISSN 2654-1823
SafeGreece 2021 – 8th International Conference on Civil Protection & New Technologies 24-26 November, on-line | www.safegreece.org/safegreece2021 | [email protected]
4. CONCLUSIONThe heat wave of 2021 in Greece lasted for 9 consecutive days, from 28/7/2021 to 5/8/2021, withmaximum temperatures above 40°C in many stations of the country. The exceptional duration of thisheat wave and the extreme temperatures during day and night contributed to great thermaldiscomfort, especially in the urban centres of Greece. Therefore, the development andimplementation/operation of Heat-Health Warning Systems (HHWS) is of crucial importance. SuchHeat–Health Action Plans (HHAP) should include measures to prepare the health-care and socialservices for upcoming extreme heat events in coordination with the HNMS, Heat-Health WarningsSystems and the General Secretariat for Civil Protection.
ACKNOWLEDGMENTS We acknowledge support of this work by the project “Risk and Resilience Assessment Center –Prefecture of East Macedonia and Thrace -Greece.” (MIS 5047293) which is implemented under the Action “Reinforcement of the Research and Innovation Infrastructure”, funded by the Operational Programme "Competitiveness, Entrepreneurship and Innovation" (NSRF 2014-2020) and co-financed by Greece and the European Union (European Regional Development Fund).
REFERENCES
1. https://www.ipcc.ch/report/ar6/wg1/downloads/factsheets/IPCC_AR6_WGI_Regional_Fact_Sheet_Europe.pdf
2. Koppe C., Kovats R., Jendritzky G., Menne B. (2004). Heat-waves: risks and responses. Health and GlobalEnvironmental Change Series, No. 2, World Health Organization (2004)
3. Halaharvi H., Schramm J.P., Vaidyanathan A. (2020). Heat Exposure and Cardiovascular Health: ASummary for Health Departments Climate and Health Technical Report Series Climate and HealthProgram, Centers for Disease Control and Prevention, July 2020
4. Noelke C., McGovern M., Corsi D. J., Jimenez M. P., Stern A., Wing I. S., Berkman L. (2016). Increasingambient temperature reduces emotional well-being. Environmental research, 151, 124–129.https://doi.org/10.1016/j.envres.2016.06.045
5. Robine J. M., Cheung S. L., Le Roy S., Van Oyen H., Griffiths C., Michel J. P., Herrmann F. R. (2008). Deathtoll exceeded 70,000 in Europe during the summer of 2003. Comptes rendus biologies, 331(2), 171–178.https://doi.org/10.1016/j.crvi.2007.12.001
6. Claessens Y. E., Taupin P., Kierzek G., Pourriat J. L., Baud M., Ginsburg C., Jais J. P., Jougla E., Riou B.,Dhainaut J. F., Landais P. (2006). How emergency departments might alert for prehospital heat-relatedexcess mortality?. Critical care (London, England), 10(6), R156. https://doi.org/10.1186/cc5092
7. Giles B.D., Balafoutis C., Maheras P. (1990). Too hot for comfort: The heatwaves in Greece in 1987 and1988. Int J Biometeorol 34, 98–104 (1990). https://doi.org/10.1007/BF01093455
8. Matzarakis A., Mayer H. (1991). The extreme heat wave in Athens in July 1987 from the point of view ofhuman biometeorology (1991) Atmos Env, 25, 203-211 https://doi.org/10.1016/0957-1272(91)90055-J
9. Katsouyanni K., Trichopoulos D., Zavitsanos X., Touloumi G. (1988). The 1987 Athens heatwave. Lancet(London, England), 2(8610), 573. https://doi.org/10.1016/s0140-6736(88)92699-2
10. http://www.hnms.gr/emy/el/pdf/heatwave_2021.pdf11. McGregor G.R., Bessmoulin P., Ebi K., Menne B. (2015). Heatwaves and health: guidance on
warning-system development. World Meteorological Organisation and World HealthOrganisation (2015) https://library.wmo.int/index.php?lvl=notice_display&id=17215#.YVWVCVVBzIV
12. Katavoutas G., Founda D. (2019). Response of Urban Heat Stress to Heat Waves in Athens (1960–2017). Atmosphere. 2019; 10(9):483. https://doi.org/10.3390/atmos10090483
13. http://www.hnms.gr/emy/el/meteorology/meteorological_news?name=2106221136
Page 72 of 269
SafeGreece 2021 on-line Proceedings | ISSN 2654-1823
SafeGreece 2021 – 8th International Conference on Civil Protection & New Technologies 24-26 November, on-line | www.safegreece.org/safegreece2021 | [email protected]
CODIFICATION OF THE NEW BUILDING FIRE PROTECTION REGULATION (PRESIDENTIAL DECREE 41/2018). CONCLUSIONS AND RECOMMENDATIONS FOR
AN EFFECTIVE IMPLEMENTATION
Marina Bresta1, Vasileios Martzaklis1 1 Department of Geology and Geoenvironment, National and Kapodistrian University of Athens, Greece
(E-mail: [email protected], [email protected] ) ABSTRACT
The Disaster Management Cycle consists of the mitigation and preparedness stages, as improvements are sought to be achieved, when expecting an event. Developmental factors significantly contribute to mitigating losses and preparing a community for effectively responding to a disaster [1]. Risk reduction requires an ongoing attempt of social resilience in two primary fields of action: public commitment and regulatory frameworks (organisational, political, legislative and social action), as well as implementation measures (environmental management, use of land, urban planning, science and technology application, financial instruments, etc.) [2]. Fires are a severe threat for the functionality of the structured environment and may severely damage various infrastructures, disturbing the ability of urban structures to respond to its residents’ needs [3]. Urban fires have both a significant social (human losses and injuries) and economic impact (destruction of building structures and of various assets) [4]. In order to reduce the risks associated with urban fires, the existence of a sufficient legislative framework and regulations is of utmost importance, the implementation of which, in combination with other preventive measures, can ensure societies’ protection and cities’ safety. In 2018, the new Building Fire Protection Regulation was issued in Greece [5], after a 30-year application of the previous one. The circumstances were overly mature, as during this period large-scale changes had occurred in designing and constructing buildings and in terms of new technologies advancement. This paper wishes to contribute to better understanding this new Regulation and to facilitating its implementation. The method used for its codification is summarising and matching the requirements of the Regulation’s General and Special Provisions with each building usage, in order to draft a “manual” containing all necessary information for carrying out the control of the fire protection study (passive-active).
Keywords: Fire safety, building fire protection, Fire Protection Regulation, codification
1. INTRODUCTION
From the introduction/issuance of a legislative framework to its complete and effective practical implementation, a transitional period elapses, during which stakeholders, scientists and the society must familiarise themselves, get trained and adopt new practices that are in line with the new legislation. This paper aims to present the primary elements of the new national Fire Protection Regulation and its codification, in order to make use thereof in facilitating the work of competent audit bodies and, in particular, of the competent Fire Protection Offices of the Hellenic Fire Service, as well as of engineers who are competent according to law for carrying out the necessary studies and for properly implementing the Regulation.
Page 73 of 269

SafeGreece 2021 on-line Proceedings | ISSN 2654-1823
SafeGreece 2021 – 8th International Conference on Civil Protection & New Technologies 24-26 November, on-line | www.safegreece.org/safegreece2021 | [email protected]
2. METHODOLOGY
2.1. Stage I: drafting the codification • Determining the structure of the codification based on building usage and correspondingly
structure of the articles of the Special Provisions, Chapter B’ of the Regulation.• Structuring the codification’s each chapter-article following the structure of the applicable
Special Fire Fighting Provisions.• Recording and summarising all general requirements related to each building usage based on
the General Provisions and on both the passive and active fire protection.• Selecting and collecting all data and requirements of the Regulation’s General Provisions based
on building usage.• Combining general with building usage-specific requirements (Table 1).• Adding supplemental information, clarification and modifications to the Clarifying Circulars
issued with regard to the Regulation.• Summarising critical data, concepts, definitions and providing examples thereof as Annexes,
using schematic illustrations, tables and graphs of the Regulations and Clarifying Circulars.
Table 1. Calculation and requirements of vertical routings (training use)
Floor Minimum allowed width
Number of floors (above the
evacuation floor) Calculation Rounding
Above ground 0.70 m
5 floors P=0.60* TP/60 Round units
(P/0.60) + 0.30 6-10 floors P=0.60*(TP1+TP2)/60
Above 11 floors P=0.60*(TP1+TP2+TP3)/60
Underground 0.70 m Underground P=0.60* TP/30 Round units
(P/0.60) + 0.30
where TP: theoretical population of the most unfavourable floor
TP1 and TP2: sum of the theoretical population of the two most unfavourable floors
TP1, TP2, TP3: sum of the theoretical population of the three most unfavourable floors
2.2. Stage II: checking the correctness of the codification The codification was sent to the bodies that co-signed the new Fire Protection Regulation, i.e. to both the Legal Service of the Hellenic Fire Service Headquarters, and more specifically to Fire Major Christos Tsavalopoulos, and the Directorate of Architecture, Building Regulations and Permits of the Hellenic Ministry of Environment and Energy, and more specifically to Deputy Head of the Department of Regulations, Standards and Modern Architecture, Ms. Efrosini Tsartinoglou, in order to check the correctness of its content. Meetings took place, during which remarks and amendments were made to the content of the codification, which were then incorporated in the final text thereof.
Page 74 of 269

SafeGreece 2021 on-line Proceedings | ISSN 2654-1823
SafeGreece 2021 – 8th International Conference on Civil Protection & New Technologies 24-26 November, on-line | www.safegreece.org/safegreece2021 | [email protected]
3. CONCLUSIONS AND DISCUSSION
3.1. The benefits of the codification The codification may operate as a guide for critical data and requirements for the building under design or audit, given that by combining general and special requirements and collecting all information based on building usage the expert/auditor is successfully facilitated in their work (saving time and reducing complexity in order to avoid mistakes or omissions). For the needs of the codification, the Regulation’s data have been summarised and aren’t fully and in detail described therein. Therefore, looking closely into and continuously referring to the legislation are undoubtedly a condition for the proper implementation thereof.
3.2. Conclusions The new Regulation is particularly clear and comprehensive. Building classification and usage are completely and analytically matched with the Building Code. A clear framework for responding in terms of building fire protection with various uses and based on the completeness of use or not is determined. The role of the passive and structural fire protection in designing and architecturally calculating the building is upgraded and requirements and specifications are strengthened. European standards regarding the characteristics and quality of structural elements against fire are incorporated. Accordingly, requirements concerning active fire protection are also strengthened. It is further determined that an automatic fire detection and notification system must be installed in residence buildings. This requirement was introduced in order to cover the gap found in residence buildings, which are also the majority of the buildings where fire incidents occurred (Table 2). Specific requirements concerning the accessibility of People with Disabilities and ensuring safe evacuation in case of a fire are determined.
Table 2. Fire incidents in building in Greece during 2010-2020
USAGE - YEAR 2010 2011 2012 2013 2014 2015 2016 2017 2018 2019 2020 TOTAL %
RESIDENCE 5059 5670 4823 4251 3725 4023 3774 3963 3700 3992 3854 46834 67.13
TEMPORARY RESIDENCE 86 106 62 73 37 76 94 110 80 89 96 909 1.30 PUBLIC ASSEMBLY SPACES 548 585 488 402 327 377 424 394 345 367 285 4542 6.51
EDUCATIONAL FACILITIES 139 177 109 108 110 116 96 100 91 108 119 1273 1.82 HEALTH AND SOCIAL WELFARE BUILDINGS 38 40 34 19 28 37 26 26 33 25 18 324 0.46
PRISONS 14 12 3 4 4 14 13 7 6 7 7 91 0.13
COMMERCIAL SPACES 339 348 261 207 239 238 205 197 227 226 192 2679 3.84 OFFICE SPACES 156 142 112 84 49 72 80 88 59 63 58 963 1.38 CRAFTS-INDUSTRIES 468 459 380 384 288 313 323 327 333 321 347 3943 5.65
STORAGE FACILITIES 616 673 638 558 470 523 573 557 541 529 584 6262 8.98
PARKING-GAS STATIONS 64 57 67 53 42 58 45 46 47 49 41 569 0.82 BUILDINGS OF OTHER USAGE 192 254 199 196 7 143 10 8 8 17 14 1048 1.50
BUILDINGS’ INDEPEN. SPECIAL SPACES 41 34 30 29 26 34 33 29 17 19 32 324 0.46
Page 75 of 269

SafeGreece 2021 on-line Proceedings | ISSN 2654-1823
SafeGreece 2021 – 8th International Conference on Civil Protection & New Technologies 24-26 November, on-line | www.safegreece.org/safegreece2021 | [email protected]
3.3. Recommendations • Providing for an audit procedure carried out by competent services for the passive fire protection
and training of technical scientists working in such services.• Providing for an audit procedure also for the implementation of active fire protection for all building
usages.• Amending legislation for existing residence buildings with the obligation of placing at least portable
fire-fighting equipment.• Providing training engineers that are competent according to law through their chambers and
associations and enriching the study programmes of competent engineers’ university faculties, inorder to achieve training and developing research in fire protection issues.
• Organising seminars at school for pupils aiming at developing a prevention culture and preparednessexercises in case of a fire incident.
• Providing training at workplaces (in the private and public sector) and carrying out preparednessexercises (either for the safe evacuation of the building or for putting out a fire).
• Organising a campaign all over Greece for raising citizens’ awareness by the state with theparticipation of/support by the Hellenic Fire Service, the academic community and other scientificand professional bodies.
• Issuing the Fire Protection Regulation for mixed areas (forests-housing developments).
4. CONCLUSION
The new national Building Fire Protection Regulation is a modern reference framework harmonised with the applicable international standards, through which the enhancement and upgrade of fire safety is achieved and contributes significantly to designing, constructing and using contemporary, safe buildings. Citizens’ training, particularly in prevention matters, in combination with fire protection measures and equipment would critically affect the risk reduction in residence buildings, which are the majority of the buildings where fire incidents occur. The state’s preparedness and the development of a prevention knowledge and culture within the society are the two main pillars for enhancing the Greek community’s resilience and mitigating the urban fire risk.
REFERENCES
[1] H. KHAN, L. G. VASILESCU, and A. KHAN, “Disaster Management Cycle – a Theoretical Approach,” Manag.Mark., vol. 6, no. 1 November, pp. 43–50, 2008.
[2] E. Lekkas and Ε. Andreadakis, Lesson "Introduction to The Theory of Disaster and Crisis Management", PostGraduate Program Enviromental, Disaster and Crisis Management Strategies- Department of Geology andGeoenvironment, National and Kapodistrian University of Athens, p. 178, 2015.
[3] T. Gernay, S. Selamet, N. Tondini, and N. E. Khorasani, “Urban Infrastructure Resilience to Fire Disaster: AnOverview,” Procedia Eng., vol. 161, pp. 1801–1805, 2016, doi: 10.1016/j.proeng.2016.08.782.
[4] Martzaklis, V, Lesson "Technological and NATECH disasters" Section "Urban fires", Post Graduate ProgramEnviromental, Disaster and Crisis Management Strategies- Department of Geology and Geoenvironment,National and Kapodistrian University of Athens, 2020.
[5] Presidential Degree 41/2018, “Building Fire Protection Regulation,” Government Gazette 80/Α/07-05-2018
Page 76 of 269

SafeGreece 2021 on-line Proceedings | ISSN 2654-1823
SafeGreece 2021 – 8th International Conference on Civil Protection & New Technologies 24-26 November, on-line | www.safegreece.org/safegreece2021 | [email protected]
EMERGENCY SERVICE 112 FOR ALERT AND INFORMATION IN GREECE
Miranda Dandoulaki1, Ioannis Kapris1 1Independant Direction of Civil Protection, Region of Attica, (Greece).
(E-mail: [email protected], [email protected])
ABSTRACT 112 is planned to be an integrated emergency communications service, which includes an inbound and an outbound component. The outbound component allows for citizens receiving warnings via multiple technologies and communication channels in case of an imminent or occurring incident or situation that is considered to pose an immediate threat to their health and safety, so that they can timely take appropriate protective actions. The outbound service was initiated in Greece in 2019 and is being employed since for sending messages to the population for alert and emergency information. The paper presents a record of cases of use of 122 service for alert and dissemination of emergency information to the population in Greece and examines the efficacy of the service in terms of content of message, promptness of message and timeliness of outreach. Moreover, it discusses the harmonization of the use of the outbound component of 112 with the current civil protection plans.
Keywords: 112, emergency information, early warning, risk communication, Greece.
1. INTRODUCTIONEarly warning systems (EWS) are acquiring growing recognition as a valid disaster risk reduction andclimate change adaptation tool [1]. The Sendai Framework for Disaster Risk Reduction 2015-2030which guides the efforts worldwide to reduce disaster risk, sets as one of seven targets until 2030 to«Substantially increase the availability of and access to multi-hazard EWS and disaster riskinformation and assessments to the people by 2030” [2]. EU Directive on European ElectronicCommunications Code (EECC) requires all EU member states to set up a public warning system toprotect citizens by 2022 [3]. The key requirement of the directive is that all Member States must beable to send alerts to people’s mobile phones in an area of danger.Nonetheless, early warning is a complex process which consists of different elements. According toUNDRR online glossary an Early warning system is an integrated system of hazard monitoring,forecasting and prediction, disaster risk assessment, communication and preparedness activitiessystems and processes that enables individuals, communities, governments, businesses and othersto take timely action to reduce disaster risks in advance of hazardous events [4].This paper focuses on one of the four components of a EWS that of dissemination andcommunication by an official source, of authoritative, timely, accurate and actionable warnings andassociated information on likelihood and impact [4]. An early warning system can only protectpeople when the warning is received in a timely fashion, the meaning of the warning is understood,and the appropriate actions are taken [5].
In EU, 112 is an integrated emergency communications service, which includes an inbound and an outbound component. The outbound component allows for citizens receiving warnings via multiple technologies and communication channels in case of an imminent or occurring incident or situation that is considered to pose an immediate threat to their health and safety, so that they can timely take appropriate protective actions [6]. According to BuilDERS project [7], messaging which is one of the main solutions for location sensitive alerting can be implemented through location-based SMS and Cell Broadcast (CB) messages; in May 2020, there were four European countries (The
Page 77 of 269

SafeGreece 2021 on-line Proceedings | ISSN 2654-1823
SafeGreece 2021 – 8th International Conference on Civil Protection & New Technologies 24-26 November, on-line | www.safegreece.org/safegreece2021 | [email protected]
Netherlands, Lithuania, Romania and Greece) that use CB technology for alerting and three (Norway, Sweden and Belgium) location-based SMS alerting. In Greece, 112 Outbound - Citizen Alert System allows for services from 112 to the public (Reverse 112), such as alerts to citizens in a particular geographical area via Cell Broadcast messages, voice calls, SMS and emails, public alerts for an emergency situation via social media (Facebook, Twitter) and other alternative channels, as well as features facilitating the communication of authorities and organizations involved in the management of emergency situations. The paper presents a record of cases in which 122 was used for alert and dissemination of emergency information in Greece and examines the efficacy of the service in terms of content of message, promptness of the alert and timeliness of outreach. Moreover, it discusses the harmonization of the use of the outbound component of 112 with the current civil protection plans.
2. A RECORD OF CASES IN WHICH THE OUTBOUND COMPONENT OF 112 WAS EMPLOYEDThe Hellenic General Secretariat for Civil Protection (GSCP) launched the outbound component ofthe European emergency service 112 on Saturday August 10, 2019 at noon. Mobile phones in areasof extreme fire danger according to the Daily Fire Risk Map that is issued by GSCP between May 15th
and October 31st, received the SMS message “GR-ALERT Civil Protection Greece 10-08-2012 11:56.Avoid actions which may cause fire. Extreme fire danger. Protective action guidelines:https://www.civilprotection.gr/en/all-guidelines#!”, urging people to avoid actions that could sparkfires outdoors due to extreme risk of wild and forest fires and providing a link to guidelines forprotective actions in case of a fire. The messages both in Greek and English were sent using CellBroadcast (CB) which allows for messages to be sent to multiple mobile telephone users in a definedarea at the same time. However, not all mobile phones not all phones have CB capability.The outbound component of emergency service 112 has been since activated in many cases ofimminent or ongoing emergencies. Table 1 presents information concerning each case andspecifically: a) the type, time, code name of emergency if any, the affected or in danger areas, b) thecontent of the messages sent, and c. comments on timing and in general on the use of the tool.
3. DISCUSSIONThere is little doubt that the implementation of the outbound component of 112 emergency servicein Greece is a much needed improvement in emergency preparedness and response. The tool hasbeen used to send messages in about 24 emergencies due to different hazards (technologicalaccidents, forest and wild fires, earthquakes, tsunami, extreme weather, floods) and for differentpurposes. Messages were disseminated in order to inform people about extreme conditions in theirarea and to urge them to take up precautionary actions that were prescribed in existing guidelinesissued by GSCP or to avoid actions that will increase the danger; also, to prompt emergencyevacuation from areas deemed in immediate danger or to advice for shelter-in-place. Two modes ofalerts were issued: extremely urgent alert and urgent alert.Observed shortcomings concern the promptness of the message (for example in the case of Samosearthquake and tsunami, the message reached the population after the first wave of the tsunamihad reached the island). Moreover, there were many complains about people receiving an alertmessage although they were away from the area in danger or they not receiving the message at allalthough they were in the area in danger. In most cases, instructions on protective action that werefound through the suggested link were too generic to become actionable and not adjusted to thesituation at hand. Despite these shortfalls, people in general appreciated the novel effort to alertand inform them in emergencies. A wise use of the tool in the future would avert overloading peoplewith alerts therefore reducing the effectiveness of alert in the long term and would minimize whatpeople perceive as false alarm thus diminishing their trust to the responsible authorities.At any case, emergency alerting is not a merely technical issue, but presents important decisionmaking aspects such as deciding what emergencies require sending an alert, when to send the alert,to whom and how to achieve a seamless integration of alert dissemination with emergency
Page 78 of 269

SafeGreece 2021 on-line Proceedings | ISSN 2654-1823
SafeGreece 2021 – 8th International Conference on Civil Protection & New Technologies 24-26 November, on-line | www.safegreece.org/safegreece2021 | [email protected]
operations on the ground [8]. What seems to be missing at this stage is the incorporation of the whole procedure to the General Civil Protection Plans that at present do not mention at all the use of 112 for alerting and information. Moreover, the whole process leaves aside local and regional authorities who according to the existing Civil Protection Plans, are assigned with the responsibility to decide and implement emergency evacuation in their area of responsibility. In the end, disaster communication is not only about delivering an early warning about a specific disaster risk or emergency, but primarily about empowering people to take action and to initiate mitigation or precautionary measures before a catastrophic event occurs [1].
Table 1. Employment of the outbound component of emergency service 112 in Greece since 2020.
Situation at hand Content of the message Comments
Wildfires, 03/09/2020
Areas in Extreme Fire Risk
Avoid actions which may cause a fire. Very high fire danger tomorrow. Follow protective action guidelines. https://www.civilprotection.gr/el/all-guidelines#!
Message sent on 3/09 at around 17:30 to people in Attica, Evia, Boiotia, Kephalonia, Corfu, Zakynthos, Messinia, Achaia, Ilia, Magnesia, Sporades, Samos, Chios, Ikaria & Rhodes Thessaloniki, Halkidiki.
Extreme weather, floods, 17/09/2020
Name: “Ianos”
Zakynthos, Kephalonia, Ithaca Islands
Extreme Weather Warning on the Ionian Islands. Avoid basements and flood areas. Secure objects that may become windborne debris. Check local media. Proactive action guidelines: https://bit.ly/2ZLDsJ6
Message sent on 17/09 at around 14:50, to people in the areas mentioned in column 1.
Extreme Weather Warning on the Ionian Islands. Avoid basements and flood areas. Secure objects that may become windborne debris. Check local media. Proactive action guidelines: https://bit.ly/2ZLDsJ6
Message sent on 17/09 at around 19:50, to citizens located in areas of the Ionian islands.
Landfill Fire, 26/09/2020 West Attica
Close all windows and doors. Avoid going outdoors. Major fire at a landfill in your area. Smoke inhalation can be dangerous. 1
Message sent on 26/09 at around 23:30, to people in areas with extremely low air quality.
Earthquake, tsunami 30/10/2021
Samos Island
Stay away from the coast. Danger from high waves due to earthquake. 1 1st message sent on 30/10 at around 14:15 to people in Ikaria, Kos & Chios, islands urging them to move away from the coast. 2nd message sent on 30/10 at around 14:45 only of people in Samos. Avoid dangerous buildings. Remain in an open safe area. Don’t use the telephone
unless to seek help. Earthquake in Samos. 1
Wildfire, 19-24/05/2021
Geraneia Mountains
Wildfire in your area, winds are rapidly increasing. If you are located in the area between Chani Derveni, Ano and Kato Pefkeneas, evacuate now towards Megara as a precaution.
1st message sent on 20/05 at around 13:45. 2nd message sent on 20/05 at around 14:58 to people in a wider area, urging them to evacuate the area immediately. Wildfire in your area, winds are rapidly increasing. If you are located in the area
between AGEIROUSES and DOURAKOS, evacuate now towards Alepochori.
Fire in Industrial Facility, 18/06/2021
Aspropyrgos, Attica Region
Take shelter now. Close windows and stay away from glass windows. Fire at industrial facility, explosion hazard.1 1st message sent on 18/06 at around 12:00 to people in the wider
area of Aspropyrgos. 2nd message sent on 18/06 at around 13:00. This message was sent by mistake also to people in Pagkrati. Link
End of hazardous condition. Fire in propane storage facility at Aspropyrgos under partial control.
Wildfire, 03/07/2021 Cephalonia Island
If you are in Pastra, Kremmidi, Markopoulo, Katelios & Kato Katelios Kefallinias, remain on alert all night and follow official guidance. Wildfire in your area. 1 Message sent on 03/07 at around 22:40.
Wildland fire, 10/07/2021 Nimborio, Evia
If you are located in Nimborio, Evia, evacuate now towards Marmari-Karystos as a precaution. Wildland fire in your area. 1 Message sent on 10/07 at around 16:15.
Wildfire, 24/07/2021 Korinthia
If you are in Rito Korinthias evacuate immediately towards Kato Almiri via Ntrassa Galataki. Wildfire in the area. 1 Message sent on 24/07 at around 17:30.
Wildfire, 25/07/2021 Epidavros
If you are in Gatzia Epidavrou evacuate now towards Metohi. Wildfire in the Area. 1 Message sent on 25/07 at around 16:17.
Wildfire, 27/07/2021
Stamata & Ropoli area, Attica
If you are in Stamata and Rodopoli area, Attica, stay alert. Wildfire in your area. 11st message sent on 27/07 around 13:20. 2nd message sent on 27/07 at around 14:15.
If you are in Stamata, Rodopoli, Ekali, Drosia, Dionysos close chimneys, windows, doors to prevent sparks from entering the building. Remain on alert and follow the instructions of the authorities. Wildfire in your area.
Wildfire, 28/07/2021 Pteri, Achaia If you are in Pteri, evacuate now towards Staurodromi. Wildfire in your area. 1 Message sent on 28/07 at around 17:50.
Wildfire, 31/07/2021 Achaia
If you are in Ziria, Kamares, Lampiri Achaias, evacuate immediately towards Aigio. Wildfire in your area. 1 1st message sent on 31/07 at around 14:35.
2nd message sent on 31/07 at around 17:45. If you are near Longos Achaias, evacuate immediately towards Egio. Wildfire in your area. 1
Wildfire, 03/08/2021 Northern Attica
If you are in Varympompi or Kryoneri, close chimneys, windows, doors to prevent sparks from entering the building. Remain on alert and follow the instructions of the authorities. Wildfire in your area.
1st message sent on 03/08 at around 14:25. 2nd message sent on 03/08 at around 17:05.
3rd message sent on 03/08 at around 18:10. 4th message sent on 03.08 at around 20:00.
If you are in Mortero north of the Erythrea interchange, close chimneys, windows, doors to prevent sparks from entering the building. Remain on alert and follow the instructions of the authorities. Wildfire in your area. If you are in Thrakomakedones or Varympompi, evacuate now towards Acharnai. Wildfire in your area1
If you are in Thrakomakedones, Olympic Village or Varympompi, evacuate now towards Acharnai. Wildfire in your area. 1
Page 79 of 269
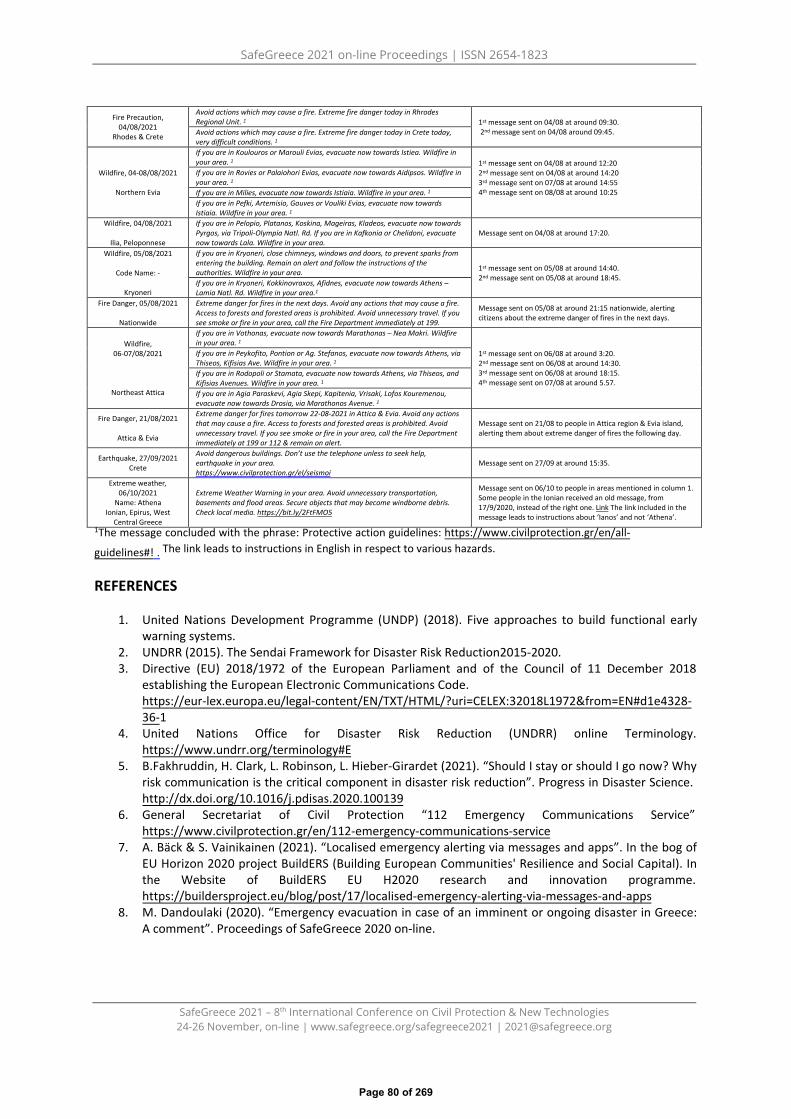
SafeGreece 2021 on-line Proceedings | ISSN 2654-1823
SafeGreece 2021 – 8th International Conference on Civil Protection & New Technologies 24-26 November, on-line | www.safegreece.org/safegreece2021 | [email protected]
Fire Precaution, 04/08/2021
Rhodes & Crete
Avoid actions which may cause a fire. Extreme fire danger today in Rhrodes Regional Unit. 1 1st message sent on 04/08 at around 09:30.
2nd message sent on 04/08 around 09:45. Avoid actions which may cause a fire. Extreme fire danger today in Crete today, very difficult conditions. 1
Wildfire, 04-08/08/2021
Northern Evia
If you are in Koulouros or Marouli Evias, evacuate now towards Istiea. Wildfire in your area. 1 1st message sent on 04/08 at around 12:20
2nd message sent on 04/08 at around 14:20 3rd message sent on 07/08 at around 14:55 4th message sent on 08/08 at around 10:25
If you are in Rovies or Palaiohori Evias, evacuate now towards Aidipsos. Wildfire in your area. 1 If you are in Milies, evacuate now towards Istiaia. Wildfire in your area. 1 If you are in Pefki, Artemisio, Gouves or Vouliki Evias, evacuate now towards Istiaia. Wildfire in your area. 1
Wildfire, 04/08/2021
Ilia, Peloponnese
If you are in Pelopio, Platanos, Koskina, Mageiras, Kladeos, evacuate now towards Pyrgos, via Tripoli-Olympia Natl. Rd. If you are in Kafkonia or Chelidoni, evacuate now towards Lala. Wildfire in your area.
Message sent on 04/08 at around 17:20.
Wildfire, 05/08/2021
Code Name: -
Kryoneri
If you are in Kryoneri, close chimneys, windows and doors, to prevent sparks from entering the building. Remain on alert and follow the instructions of the authorities. Wildfire in your area. 1st message sent on 05/08 at around 14:40.
2nd message sent on 05/08 at around 18:45. If you are in Kryoneri, Kokkinovraxos, Afidnes, evacuate now towards Athens – Lamia Natl. Rd. Wildfire in your area.1
Fire Danger, 05/08/2021
Nationwide
Extreme danger for fires in the next days. Avoid any actions that may cause a fire. Access to forests and forested areas is prohibited. Avoid unnecessary travel. If you see smoke or fire in your area, call the Fire Department immediately at 199.
Message sent on 05/08 at around 21:15 nationwide, alerting citizens about the extreme danger of fires in the next days.
Wildfire, 06-07/08/2021
Northeast Attica
If you are in Vothonas, evacuate now towards Marathonas – Nea Makri. Wildfire in your area. 1
1st message sent on 06/08 at around 3:20. 2nd message sent on 06/08 at around 14:30. 3rd message sent on 06/08 at around 18:15. 4th message sent on 07/08 at around 5.57.
If you are in Peykofito, Pontion or Ag. Stefanos, evacuate now towards Athens, via Thiseos, Kifisias Ave. Wildfire in your area. 1 If you are in Rodopoli or Stamata, evacuate now towards Athens, via Thiseos, and Kifisias Avenues. Wildfire in your area. 1 If you are in Agia Paraskevi, Agia Skepi, Kapitenia, Vrisaki, Lofos Kouremenou, evacuate now towards Drosia, via Marathonos Avenue. 1
Fire Danger, 21/08/2021
Attica & Evia
Extreme danger for fires tomorrow 22-08-2021 in Attica & Evia. Avoid any actions that may cause a fire. Access to forests and forested areas is prohibited. Avoid unnecessary travel. If you see smoke or fire in your area, call the Fire Department immediately at 199 or 112 & remain on alert.
Message sent on 21/08 to people in Attica region & Evia island, alerting them about extreme danger of fires the following day.
Earthquake, 27/09/2021 Crete
Avoid dangerous buildings. Don’t use the telephone unless to seek help, earthquake in your area. https://www.civilprotection.gr/el/seismoi
Message sent on 27/09 at around 15:35.
Extreme weather, 06/10/2021
Name: Athena Ionian, Epirus, West
Central Greece
Extreme Weather Warning in your area. Avoid unnecessary transportation, basements and flood areas. Secure objects that may become windborne debris. Check local media. https://bit.ly/2FtFMO5
Message sent on 06/10 to people in areas mentioned in column 1. Some people in the Ionian received an old message, from 17/9/2020, instead of the right one. Link The link included in the message leads to instructions about ‘Ianos’ and not ‘Athena’.
1The message concluded with the phrase: Protective action guidelines: https://www.civilprotection.gr/en/all-
guidelines#! . The link leads to instructions in English in respect to various hazards.
REFERENCES
1. United Nations Development Programme (UNDP) (2018). Five approaches to build functional earlywarning systems.
2. UNDRR (2015). The Sendai Framework for Disaster Risk Reduction2015-2020.3. Directive (EU) 2018/1972 of the European Parliament and of the Council of 11 December 2018
establishing the European Electronic Communications Code.https://eur-lex.europa.eu/legal-content/EN/TXT/HTML/?uri=CELEX:32018L1972&from=EN#d1e4328-36-1
4. United Nations Office for Disaster Risk Reduction (UNDRR) online Terminology.https://www.undrr.org/terminology#E
5. B.Fakhruddin, H. Clark, L. Robinson, L. Hieber-Girardet (2021). “Should I stay or should I go now? Whyrisk communication is the critical component in disaster risk reduction”. Progress in Disaster Science.http://dx.doi.org/10.1016/j.pdisas.2020.100139
6. General Secretariat of Civil Protection “112 Emergency Communications Service”https://www.civilprotection.gr/en/112-emergency-communications-service
7. A. Bäck & S. Vainikainen (2021). “Localised emergency alerting via messages and apps”. In the bog ofEU Horizon 2020 project BuildERS (Building European Communities' Resilience and Social Capital). Inthe Website of BuildERS EU H2020 research and innovation programme.https://buildersproject.eu/blog/post/17/localised-emergency-alerting-via-messages-and-apps
8. M. Dandoulaki (2020). “Emergency evacuation in case of an imminent or ongoing disaster in Greece:A comment”. Proceedings of SafeGreece 2020 on-line.
Page 80 of 269

SafeGreece 2021 on-line Proceedings | ISSN 2654-1823
SafeGreece 2021 – 8th International Conference on Civil Protection & New Technologies 24-26 November, on-line | www.safegreece.org/safegreece2021 | [email protected]
INTERNATIONAL APPROACHES IN EMERGENCY EVACUATION IN CASE OF A DISASTER, FOCUSING ON COMMUNITY ENGAGEMENT
Areti Plessa1 and Miranda Dandoulaki1 1 Region of Attica, Civil Protection Directorate, Dept of Emergency Planning (Greece).
(E-mail: [email protected], [email protected])
ABSTRACT Evacuation is a risk management strategy with the purpose to save lives and minimize the harm to the exposed population in the case of an imminent or ongoing disaster. Based on literature review, the paper discusses international approaches and practices of emergency evacuation, including self-evacuation and shelter in place options. While local, regional and national authorities are responsible for effective planning, community engagement is significant for a successful evacuation. To this end, public information and education activities increase risk perception and enhance disaster resilience. Providing reliable information on protection measures and on evacuation procedures, according to risk communication strategies are essential. Exercises and drills are important for the effectiveness of the plans and also, to foster public awareness.
Keywords:disaster evacuation, shelter-in-place,self-evacuation, public awareness
1. INTRODUCTIONEmergency evacuation is a risk management strategy that involves the timely and safemovement of people from a place that is in immediate danger due to a hazard or an impactof a disaster to a safer place. Depending on the type of the crisis, it is commonly characterizedby a short time frame within which emergency procedures need to be enacted. The crisis maybe associated either with natural hazards (earthquake, flood, wildfire, landslide, tsunami,volcano, hurricane, tornado), or technological accidents (releases of hazardous or nuclearmaterials) or even intentional (terrorist arracks, bombing). Some types of events, such asfluvial floods or volcanic eruptions allow for advance warning and preparations for evacuationand sheltering. Others, such as earthquakes and flash floods, arrive with little or no advancenotice. The development of early warning systems has a key role in evacuation proceduresand decision making, while delivering the warning to the public remains a challenge.Based on literature review, the paper discusses international strategies and practices onemergency evacuation and highlights the importance of community engagement inemergency evacuation strategies.
2. KEY CONCEPTS AND APPROACHES FROM THE INTERNATIONAL EXPERIENCEVarious approaches to evacuationstrategies have been taken in different countries around theworld. Evacuation can be either compulsory or directed, when a relevant government agencyhas exercised a legislated power that requires people to evacuate, or recommended, whenthe evacuation warning has been issued but people have the option to remain[1].Themovement of people may be either horizontal (e.g. away from coastal areas) or vertical (e.g.movement of people to higher storeys,in the case of a tsunami or a flash flood, provided thatthe building fullfils specific criteria. For example, reinforced concrete or structural steelmoment resisting frames, and reinforced concrete shear wall systems, designed to higherseismic requirements, may provide adequate tsunami resistance [2]. In some cases, themovement of people to safer places is self-initiated in the absence of official warnings (self-evacuation). Τhis type of spontanious evacuation must be also considered in the mass
Page 81 of 269

SafeGreece 2021 on-line Proceedings | ISSN 2654-1823
SafeGreece 2021 – 8th International Conference on Civil Protection & New Technologies 24-26 November, on-line | www.safegreece.org/safegreece2021 | [email protected]
evacuation plans [3]. ‘Shelter in place’ is an alternative to evacuation, where the affected population may take protective shelter inside structures [1],[4]. Evacuation becomes necessary when the benefits of moving away significantly outweigh the risk of ‘sheltering in place’. This strategy may be considered when: a)there is no time to undertake an evacuation before the hazard is manifested, b) when going outside would expose people to greater harm, and c) when the immediate risk is unclear [5]. The shelter-in-place option may be appropriate for people with disabilities and other vulnerable groups, depending on the circumstances. Countries such asthe Philippines and China have well-established procedures for mass evacuations from areas prone to natural disasters [3]. The USA has also experience in mass evacuations, employing a ‘whole community approach’ which emphasizes: a) understanding and meeting the actual needs of the whole community, b) engaging and empowering all parts of the community and c) strengthening what works well in communities on a daily basis[3]. Australia encourages those who are prepared to stay and defend their properties in case of bushfires (‘Prepare, stay and defend or leave early’ policy), which is not inherently the same as the shelter-in-place approach [6]. In any case, the Australian approach acknowledges that effective evacuation management relies on detailed planning and exercising and considers five stages of evacuation: 1.Decision, 2. Warning, 3. Withdrawal, 4. Shelter, 5.Return [1]. Theseare typically identified for action in an evacuation plan. Planning for evacuation is a key responsibility of government (national, regional and local), engaging all relevant stakeholders, including the community [1]. Evacuation plans should: a) set clear expectations for whole community partners by hosting education, training, and information sessions, b) establish and publish clear, accessible evacuation routes and zones for the community, c) identify evacuation shelters in the community, d) create pre-approved accessible messaging for rapid distribution regarding incident and shelter-in-place or evacuation instructions, e) have a continuity plan to help maintain response operations if interrupted, f) provide real-time mapping and navigation routing systems through Geographic Information System (GIS) [7]. Evacuation plans should be developped in advance and be quickly adapted to a specific situation, as there is no evacuation plan that can be applied to cover all situations [3].
3. EXAMPLES AND INITIATIVES FROM THE INTERNATIONAL EXPERIENCEInternational experience in emergency evacuation is ample and success stories have beenidentified, for instance:• In March 2011, a M=9.0 earthquake in Japan triggered a disastrous tsunami. In the city of
Kamaishi,the students of a school, who were already trained in tsunami evacuation, readilyleft the school to higher ground, encouraging other students and local residents to do thesame. Almost all of the nearly 3,000 studentsof the city were saved [3].
• In Chile, 1 million people left areas with high tsunami risk due to the timely alertmessagessent after the M=8.3 earthquake in 2015 [8]. Thetsunami spread across thePacific, with waves up to 4.75m hitting Coquimbo, Chile at 00:25 GMT. National authoritiesconfirmed 8 deaths, mainly due to buildings collapsing during the earthquake, and severalcoastal cities were flooded. However, major casualties were prevented1.
• During Thomas wild fire in 2017, Southern California (December 4–January 12)[9], morethan 90,000 residents were under evacuation orders (voluntary and mandatory) [10]. Lifelosses were limited to 2 although the impact of the fire was severe: 1,063 Buildings weredestroyed (777 Residences), 281 Buildings were damaged (210 residences), $171 millionloss to the agriculture industry, 281,893 Acres were burned.
1 https://en.unesco.org/news/earthquake-and-tsunami-chile-massive-evacuation-and-building-codes-reduce-loss-life
Page 82 of 269

SafeGreece 2021 on-line Proceedings | ISSN 2654-1823
SafeGreece 2021 – 8th International Conference on Civil Protection & New Technologies 24-26 November, on-line | www.safegreece.org/safegreece2021 | [email protected]
Based on experiences around the world, good practices that enhance evacuation preparedness have been identified, such as: • The California Department of Forestry and Fire Protection encourages wildfire
preparedness, engaging the whole Community2. The “Ready, Set, GO!” multi-mediacampaign has been developed by CAL FIRE to help educatingand preparingthe public forwildfire events. This toolkit provides an overview of graphics, public serviceannouncements, and collateral files for fire agencies and stakeholders across the state touse to help disseminate key messages. According to the given instructions, preparing for awildfire starts with three simple steps: 1) Ready (creating defensible space andstrengtheningcitizens homes against wildfire), 2) Set (developing a Wildfire Action Plan)and 3) Go! (a quick-referenceevacuation guide).
• An worthwhile best practice of risk preparedness including evacuation planning is theTsunami Ready community-based program, which aims at fostering the resilience of localcoastal communities to tsunamis, through better planning, education and awareness.Communities recognized as “Tsunami ready” should meet specific guidelines, whichinclude the development of designated and mapped tsunami hazard zones and evacuationmaps, public display of tsunami information, public education activities supported byeducational material, drills, emergency planning for tsunami and reliable means for a 24-hour warning point for receiving and disseminating the official alerts3.
4. CONCLUSIONS AND SUGGESTIONSBased on international experience and best practices, one could argue that key elements fora successful evacuation, that should be taken into account in an emergency plan are:• The role of the community is significant and the citizensshould be aware of the risks in their
community and of their expected behavior in case of an emergency. Understanding therisks, how the community would be warned, how to be prepared as a family, which are thepublic shelters in the area, what supplies to have always available, (e.g. emergency kit),are all important aspects of preparedness. Educational activities regarding protectiveactions and measuresshould take place in advance. For example, self evacuation is crucialwhen the time for evacuation is very shortand relevent knowlegde is pre-required torecognise the signs (e.g. to recognise the natural warning signs in the case of a tsunami).InGreece, Earthquake Planning and Protection Organisation (EPPO) since its establishmentin 1983, issues evacuation guidelines and relevant training material regarding earthquakepreparedness for schools and other target groups [11]. Such succesful programs need tobe developed for other hazards as well. School education and drills are important becausestudents could communicate the safety behavior rules to their families, increasingprotection to a wider community.
• Emphasis should be given to emergency risk communication as a functional "pillar" ofpreparedness and response [12].
• Identification and design of refugee areas and shelters are part of the emergency plan andthe population should know where these shelters are. Appropriate signage could helppeople find the shelters more easily and more significant, public awareness would beenhanced. Availability of appropriate public open space to be used as refugee space canbe crucial in some emergencies.
• Exercises and drills are important to ensure the effectivenness of the plan and thereadiness of all stakeholders,including the community.
• Mass media (e.g. newspapers, magazines, radio, television, and the Internet), and social
2 https://www.readyforwildfire.org/ 3 https://www.weather.gov/TsunamiReady/
Page 83 of 269

SafeGreece 2021 on-line Proceedings | ISSN 2654-1823
SafeGreece 2021 – 8th International Conference on Civil Protection & New Technologies 24-26 November, on-line | www.safegreece.org/safegreece2021 | [email protected]
media, (facebook, twitter, blogs etc.) can play an important role, as a source of reliable information prior to emergencies to raise awareness and provide effective guidance for evacuation procedures.
• Citizen alert systems and applications for disseminating emergency and disasterwarnings provide a useful tool for informing the public. However, the use of multiplechannels for disseminating the warning message (e.g. siren/megaphone notification onemergency vehicles, national/local TV and radio communications via VHF or FM radiostations) is necessary in order to ensure the delivery of the message to the public.Significant efforts have been made lately in Greece, such as the 112 outbound emergencycommunications service.
• Vulnerable groups such as people with disabilities, the elder, foreigners should be includedin emergency planning and involved in drills and exercieses.
International experience and best practices implemented worldwide provide useful input and tools for evacuation planning in Greece, however these should be tried and gradually adopted to the Greek context.
REFERENCES 1. ADHR (2017). Australian Disaster Resilience Handbook 4 “Evacuation Planning”.
Available at: https://knowledge.aidr.org.au/media/5617/aidr-evacuation-planning-handbook.pdf
2. FEMA (2019). Guidelines for Design of Structures for Vertical Evacuation from Tsunamis.National Earthquake Hazard Reduction Program . 3rd edition, P646A / August 2019.Available: https://www.fema.gov/sites/default/files/2020-08/fema_earthquakes_guidelines-for-design-of-structures-for-vertical-evacuation-from-tsunamis-fema-p-646.pdf
3. Global Camp Coordination and Camp Management (CCCM) Cluster, 2014. The MENDGuide: Comprehensive Guide for Planning Mass Evacuations in Natural Disasters (Pilotdocument).
4. Haynes, K., Coates, L., Leigh, R., Handmer, J., Whittaker, J., Gissing, A., ... Opper, S.(2009). 'Shelter-in-place' vs. evacuation in flash floods. Environmental Hazards, 8(4),291-303. https://doi.org/10.3763/ehaz.2009.0022
5. Civil Contingencies Secretariat (CCS), 2014, Evacuation and shelter guidance, CabinetOfice.Available:https://assets.publishing.service.gov.uk/government/uploads/system/uploads /attachment_data/file/274615/Evacuation_and_Shelter_Guidance_2014.pdf
6. McCaffrey, S.M, and Rhodes, A., 2009. Public Response to Wildfire: Is the Australian“Stay and Defend or Leave Early” Approach an Option for Wildfire Management in theUnited States. Journal of Forestry, 107, 1, 9-15
7. FEMA (2019), Planning Considerations: Evacuation and Shelter-in-Place. Available at:https://www.fema.gov/sites/default/files/2020-07/planning-considerations-evacuation-and-shelter-in-place.pdf
8. OCHA, 2015. Chile Earthquake Flash NoteNo1. Available at:https://reliefweb.int/sites/reliefweb.int/files/resources/Chile%20Earthquake%20Flash%20Note%20No%2001.pdf
9. FEMA, 2018a. National preparedness report. Available at:https://www.fema.gov/media-library-data/1541781185823
10. FEMA, 2018b.Thomas fire briefing Available at: https://www.fema.gov/media-library-data/1526574011770-6a3afb18c82beaf881650ae12cfe9891/ThomasFireBriefingNAC_508.pdf
11. EPPO & ECPFE (2015) Get ready for an earthquake: Guidelines for people with mobilityimpairments. Available at: https://www.oasp.gr/
12. [12] Kalendi, M. (2020). Risk Communication and Disaster Management in Greece: theProspect of an Adult Education Program. SafeGreece 2020 on-line Proceedings, 157-160.
Page 84 of 269

SafeGreece 2021 on-line Proceedings | ISSN 2654-1823
SafeGreece 2021 – 8th International Conference on Civil Protection & New Technologies 24-26 November, on-line | www.safegreece.org/safegreece2021 | [email protected]
LARGE-SCALE EVACUATIONS: THEY WORKED LAST TIME. WILL THEY WORK AGAIN?
L. Filippidis1, P.J. Lawrence1, L. Hulse1, A. Veeraswamy1, D. Blackshields1
1 Fire Safety Engineering Group*, University of Greenwich, UK ([email protected], [email protected], [email protected],
[email protected], [email protected])
ABSTRACT The 2021 wildfire season affected many countries around the Mediterranean basin. In most incidents, large-scale multi-modal evacuations were conducted to transfer the population at risk to safe locations. Overall, tens of thousands of people were evacuated with modes of transportation including pedestrian, private or public transport, and sea vessels. In Greece, full evacuations were conducted in almost all incidents. However, despite the maximum protection offered to life, questions arose regarding the universality of this measure. Evacuation modelling can be used to better plan evacuations, providing insights on safety margins and, through educational programs, strengthening community resilience.
Keywords: community resilience, preparedness, risk reduction, evacuation modelling, simulation
1. INTRODUCTIONFocusing on the 2021 wildfires in Greece [1] that mainly affected the regions of Attica, Euboea,Messenia and Olympia, early and full evacuations took place to transfer the population to safety [2].Compared to the past, a paradigm shift was observed with respect to emergency response andevacuation policies. The turning point for this change seems to be the devastating 2018 wildfire in Mati,Attica, that claimed the lives of at least 102 people. While large-scale evacuations did take place as aresponse to wildfires prior to 2018, no other event highlighted the importance of preparedness, theavailability of verified evacuation plans and their execution, to such an extent. The absence of theseaspects, amongst others, contributed to the high fatality rate. Since 2018, the rate at which evacuationsare ordered has increased significantly. The reasons behind the apparent reluctance to evacuate in thepast, needs to be investigated.
Clearly the paradigm shift reduced the risk of injuries or fatalities, and also follows established national guidelines in emergency response priorities, that dictate foremost protection of life, property, and environment [3,4,5]. This paradigm shift led to the extensive and successful evacuations [2] of thousands of residents in the regions mentioned previously, where no major injuries or loss of lives were reported due to the lack of evacuation actions. The reported loss of lives during the 2021 wildfires were linked to the direct effects of the wildfires or to accidents [6,7,8].
The question however arises that if the evacuations were mainly uneventful during the 2021 season, will this also be the case during the next fire season? Despite the non-adherence to pre-established evacuation plans and the extensive nature of the fires, the evacuations that were conducted were deemed successful. Several reasons contributed to this, including the forecasts that predicted extreme danger from wildfires in the days prior to the fires, the sufficient available time, and the fact that no major critical infrastructure was involved, all of which could have otherwise complicated the evacuation process significantly. A further issue to consider is that even though the topmost priority in emergency
* Director: Prof Ed Galea, [email protected]
Page 85 of 269

SafeGreece 2021 on-line Proceedings | ISSN 2654-1823
SafeGreece 2021 – 8th International Conference on Civil Protection & New Technologies 24-26 November, on-line | www.safegreece.org/safegreece2021 | [email protected]
response is, and should be, the protection of life, it has been argued that in the 2021 wildfires some evacuations were called too easily or too early [9,10]. In some circumstances, residents of mainly rural areas raised questions about the ease at which the evacuations were ordered while expressing their strong desire to stay and defend their properties [11,12,13]. In the cases where they did manage to stay and defend, it was reported that they had some success in saving their property [13].
An early and full evacuation may have, in some circumstances, an adverse effect on the task load that the Fire Service (FS) may face as it depletes the threatened area of potentially useful civilian resources. The local population has local knowledge, and in many cases equipment, which may become invaluable during wildfire mitigation activities. Residents can engage in activities such as fuel reduction, extinguishment of small spot fires, creation of cutlines and other protective actions. These actions enable the FS to concentrate and engage in other, higher risk, mitigation, and protective tasks. However, this assumes that the local population that stays behind can provide constructive help and implement protective measures and not become a hindrance to the FS efforts or cause their focus to redirect to attend to the local population’s increasing needs.
The engagement of the local population in emergency preparedness and, when possible, mitigation tasks is in line with the drive towards building community resilience promoted by disaster risk reduction organisations and agencies including, for example, the European Commission and civil protection agencies of member states, the Federal Management Agency [14], and the United Nations Office for Disaster Risk Reduction [15]. Moreover, community resilience applies to all stages of disaster pre-, peri- and post impact [16] and therefore needs to be supported.
While large-scale evacuation plans may exist, these plans are rarely verified and practically impossible to validate without appropriate tools. Also, it is an unfortunate fact that in many cases these plans are not followed or even consulted during actual wildfire incidents and are certainly not known to the public. The use of appropriate tools can aid both in increasing the authorities’ preparedness levels, strengthen community resilience and provide the means to disseminate the evacuation plans to the public.
2. METHODOLOGYIn light of the different conditions posed by each wildfire and the residents’ need to defend theirproperty and the drive to strengthen community resilience, it is suggested [9,11,17] that a moredynamic strategy, than a persistent and monolithic full evacuation, is adopted. This assumes that thosewho are willing to stay can engage in protective mitigation tasks. However, this should only take place ifthe population has received appropriate training and is in close collaboration with the FS. When anevacuation is deemed necessary, the order and decision to evacuate should be taken early. Lateevacuations are known to be unsafe and can prove fatal [17,18]. The necessity for early evacuation andproperly trained residents that are prepared to defend their homes, together with the consequence oflate evacuation, is highlighted by the report into the 2009 Black Saturday fires in Victoria, Australia [19].This report identified the significance of preparedness, acting decisively, leaving early, defending only ifthe conditions allow, and then only if the property is defendable [20].
Community educational programs [17] must be conducted to enhance risk awareness, risk perception, and preparedness for wildfire incidents and thus strengthening community resilience. Evacuation procedures and strategies must be established, verified, and communicated to the public in a clear, concise, and informative manner. To that effect, large-scale evacuation modelling tools [21] can be used to achieve these goals while catering for a variety of hazardous incidents and what-if scenarios [21,22].
Page 86 of 269

SafeGreece 2021 on-line Proceedings | ISSN 2654-1823
SafeGreece 2021 – 8th International Conference on Civil Protection & New Technologies 24-26 November, on-line | www.safegreece.org/safegreece2021 | [email protected]
One such model is the urbanEXODUS [23] microsimulation Agent-Based Model. This tool can represent pedestrian and vehicle evacuation scenarios coupled with wildfire data [21,22,24]. The coupled nature of the evacuation simulation allows decision-makers to go beyond the traditional RSET/ASET analysis [25,26] where the fire and evacuation components are examined separately. This unique coupled approach provides insights arising from the complexities and interactions between the evacuation process and the impact of the wildfire hazard that in turn influences the adopted evacuation strategy. The use of urbanEXODUS, which can provide insights regarding evacuation times, arrival times, assembly times, and safety margins, has been demonstrated as part of a study conducted for the Forestry Commission England [21] (Figure 1a). Its potential for use in evacuation planning has also been explored as part of the EU H2020 project IN-PREP [22]. So has its ability to represent a multi-modal evacuation strategy involving pedestrians and vehicles while coupled with wildfire data, as presented during the SafeGreece 2020 conference [27] (Figure 1b) and during the 4th Hellenic Disaster Risk Reduction Forum following a full-scale demonstration exercise for IN-PREP [28] (Figure 1c).
(a) (b) (c) Figure 1. Snapshots of urbanEXODUS wildfire evacuations depicting (a) pedestrian evacuation due to the Swinley wildfire, (b) multi-modal evacuation of Kallithea Springs, Rhodes, (c) multimodal evacuation of Marysville, Australia.
3. CONCLUSIONSWhile early evacuations offer the safest options for the community, contingency planning is still neededgiven that each incident may differ, and they could also leave residents’ properties vulnerable to aprogressing wildfire as the Fire Service’s (FS) limited resources cannot protect every property [20].Furthermore, the FS may not be privy to local knowledge that can prove valuable when navigatingunfamiliar areas or when engaging in wildfire mitigation tasks. People affected by wildfires, especially inrural areas, have a strong urge to stay behind and defend their property. The use of evacuation modelsis suggested to aid the formulation of evacuation procedures. The visual capabilities of these tools canhelp with disseminating plans and exhibiting the benefits of adhering to procedures during wildfires, forexample, through educational programs that also help in strengthening community resilience and riskperception. Evacuation tools allow incident managers to adapt plans and evaluate different strategies,therefore aiding the decisions around calling and managing large-scale evacuations.
REFERENCES 1. https://theguardian.com/environment/2021/aug/13/summer-of-fire-blazes-mediterranean-more-
extreme-weather-forecast, accessed 26 Sep. 20212. https://wildfiretoday.com/2021/08/09/wildfires-in-greece-force-thousands-to-evacuate-some-by-ferry,
accessed 26 Sep. 20213. D. Nuijten, M. Onida, R. Lelouvier, Land-based wildfire prevention, Directorate-General for Environment,
European commission, DOI 10.2779/695867, 20214. T. G. Veenema, Disaster nursing and emergency preparedness: for chemical, biological, and radiological
terrorism and other hazards, DOI: 10.1891/9780826144225, 2018
Page 87 of 269

SafeGreece 2021 on-line Proceedings | ISSN 2654-1823
SafeGreece 2021 – 8th International Conference on Civil Protection & New Technologies 24-26 November, on-line | www.safegreece.org/safegreece2021 | [email protected]
5. R.A. Usman, F.B. Olorunfemi, G.P. Awotayo, A.M. Tunde, B.A. Usman, Disaster Risk Management andSocial Impact Assessment: Understanding Preparedness, Response and Recovery in Community Projects,Environmental Change and Sustainability, DOI: 10.5772/55736, 2013
6. https://cnn.gr/ellada/story/277319/fotia-sti-fokida-mpoylntoza-epese-se-gkremo-nekros-o-xeiristis,accessed 26 Sep. 2021, in Greek
7. https://newsbeast.gr/greece/arthro/7791209/pethane-55chronos-pou-eiche-ypostei-egkavmata-sti-fotia-tis-varybobis, accessed 26 Sep. 2021, in Greek
8. https://euronews.com/2021/08/07/death-toll-from-greek-wildfires-rises-to-2-as-fight-against-blazes-enters-11th-day, accessed 26 Sep. 2021
9. https://ethnos.gr/ellada/169485_fotia-xanthopoylos-sto-ethnosgr-oi-tyfles-ekkenoseis-den-einai-horis-synepeies, accessed 30 Sep. 2021, in Greek
10. https://www.naftemporiki.gr/story/1773837/apo-tuxi-den-upirksan-thumata-fetos-stis-purkagies-oxi-apo-sxedio-ki-organosi [In Greek, accessed 30 Sep. 2021, in Greek
11. I. Zikeloglou, E. Lekkas, S. Loizos, M. Stavropoulou, Human behaviour during wildland urban interfacefires. The evacuation of northeast Attica 03/08/2021, SafeGreece 2021 (to be published)
12. https://euronews.com/green/2021/08/11/watch-as-people-in-greece-resist-evacuation-to-battle-widespread-wildfires, accessed 28 Sep. 2021
13. https://kathimerini.gr/society/561462163/foties-stin-eyvoia-pos-oi-25arides-esosan-ta-spitia-apo-tis-floges-perigrafoyn-sto-kathimerini-gr-tis-dramatikes-stigmes, accessed 30 Sep. 2021, in Greek
14. N. Nunes, K. Roberson, A. Zamudio, The MEND Guide, Camp Coordination and Camp ManagementCluster, 2014
15. United Nations Office for Disaster Risk Reduction, Sendai framework for disaster risk reduction 2015–2030, UN world conference on disaster risk reduction, 2015
16. R. Shaw, Community-Based Disaster Risk Reduction, DOI: 10.1093/acrefore/9780199389407.013.47, 201617. J. Mclennan, G. Wright, Bushfire survival preparations by householders in at-risk areas of south-eastern
Australia, Australian Journal of Emergency Management, 201418. S. Shahparvari, P. Chhetri, B. Abbasi, A. Abareshi, Enhancing emergency evacuation response of late
evacuees: Revisiting the case of Australian Black Saturday bushfire, Transportation Research Part E:Logistics and Transportation Review, DOI: 10.1016/j.tre.2016.05.010, 2016
19. B. Teague, Victorian Bushfires Royal Commission, 2009 Victorian Bushfires Royal Commission: final report20. Volume II: Fire Preparation, Response and Recovery https://
parliament.vic.gov.au/papers/govpub/VPARL2006-10No332Vol2Chap1-2.pdf, accessed 29 Sep. 2021 21. A. Veeraswamy, E.R. Galea, L. Filippidis, P.J. Lawrence, S. Haasanen, R.J. Gazzard, The simulation of urban-
scale evacuation scenarios with application to the Swinley Forest fire, Safety Science, DOI:10.1016/j.ssci.2017.07.015, 2017
22. S. Marsella, D. Pozzi, M. Marzoli, F. Ferrucci, L. Filippidis, P.J. Lawrence, A. Veeraswamy, C. Garibaldi,Evacuation Planning as a Key Factor in Disaster Management: the contribution of the H2020 IN-PREPAction, Conference: Complexity, Informatics and Cybernetics: IMCIC 2019
23. P.J. Lawrence, L. Filippidis, A. Veeraswamy, E.R. Galea, Utilising OpenStreetMap for Urban EvacuationAnalysis. Conference: The 24th GIS Research UK, GISRUK 2016
24. P.J. Lawrence, V. Pellacini E.R. Galea, The Modelling of Pedestrian Vehicle Interaction for Post-ExitingBehaviour, Collective Dynamics, DOI: 5. 10.17815/CD.2020.60, 2020
25. E.R. Galea, Z. Wang, A. Veeraswamy, F. Jia, P.J. Lawrence, J. Ewer, Coupled Fire/Evacuation Analysis of theStation Nightclub Fire, Fire Safety Science, DOI 10.3801/IAFSS.FSS.9-465, 2009
26. A.A. Siddiqui, J.A. Ewer, P.J. Lawrence, E.R. Galea, I.R. Frost, Building Information Modelling forperformance-based Fire Safety Engineering analysis – A strategy for data sharing, Journal of BuildingEngineering, DOI: 10.1016/j.jobe.2021.102794
27. L.Filippidis, P.J. Lawrence, V. Pellacini, A. Veeraswamy, D. Blackshields, E.R. Galea, Multimodal WildfireEvacuation At The Microscopic Level, Conference: SafeGreece 2020
28. L. Filippidis, P.J. Lawrence, A. Veeraswamy, D. Blackshields, Wildfire: trapped on the seashore andseaborne evacuation, 3rd Demonstration exercise of the H2020 IN-PREP Action, 4th Hellenic Disaster RiskReduction Forum, DOI: 10.13140/RG.2.2.20817.66402
Page 88 of 269

SafeGreece 2021 on-line Proceedings | ISSN 2654-1823
SafeGreece 2021 – 8th International Conference on Civil Protection & New Technologies 24-26 November, on-line | www.safegreece.org/safegreece2021 | [email protected]
HUMAN BEHAVIOUR DURING WILDLAND URBAN INTERFACE FIRE THE EVACUATION OF NORTH EAST ATTICA 03/08/2021
Ioannis Zikeloglou1, Efthimios Lekkas2, Stylianos Lozios3, Maria Stavropoulou4 1, 2, 3 ,4 Faculty of Geology and Geoenvironment, National and Kapodistrian University of Athens, Greece).
(E-mail: [email protected], [email protected], [email protected], [email protected] )
ABSTRACT The fire disaster on 23/07/2018 in East Attica (Mati) cost the lives of 102 people. In the aftermath, crisis managers decide early evacuation at almost every wildland fire that threatens residential areas. The present study, through the analysis of ordinary citizens’ personal experiences, aims to explore perceptions and attitudes which might have affected their choices during the NE Attica’s wildland fire expansion on 03/08/2021. Data were collected, via twelve narrative interviews of people who evacuated from the affected areas, and then analysed systematically according to the principles of thematic analysis. As a result of the survey, a variety of behaviours, some opposing the decision to evacuate, are challenging the horizontal implementation of the measure. The research results are assessed to find out how useful can be people’s view for crisis managers, in order to improve the existing evacuation practices to protect even the residents who refuse to abandon their properties. Finally, there are comments on the necessary fire protection preventive actions which ensure people’s preparedness independently of their final decision to evacuate early or shelter-in-place.
Keywords: Evacuation, Sheltering, Human Behaviour, Narrative, Community Resilience
1. INTRODUCTIONA qualitative research methodology is chosen because of the necessity to explore and understand in depth the subjective perceptions, beliefs and experiences of affected individuals in order to create a deeper,more complete and more elaborate knowledge of human behaviour during wildland fire [1] and not toremain in a distant, isolated, abstract approach [2]. The sampling strategy followed was snowball or chainsampling [3] and adjusted according to the findings [4], meaning that it was completed when the sampleprovided enough and qualitative information (saturation) for the phenomenon under investigation[1,5,6]. This study presents the results of twelve narrative interviews of people that experienced theevacuation following the 2021 North East Attica fire. These were followed by the thematic analysis andthe extraction of the results in six stages, that included transcripts of the text, coding, coding textcomparison from which the thematic units emerged and their connection with the wider literature [1,7].Two other surveys are currently being conducted and their results are currently being processed. The firstinvolves interviews from the Police officers who implemented the evacuation on the field during the NEAttica’s wildland fire on 03/08/2021 and the second involves a quantitative survey at a wildland urbaninterface area in East Attica (Rafina) about potential human behaviour under a future fire threat.
2. THEMATIC ANALYSISThe residents' narratives include five key themes: (1) The sense of risk before the wildfire, (2) residencefire protection and evacuation plans (3) the necessity for real time and reliable information (4) residents’behaviour during the evacuation (5) the people’s suggestions for optimizing the system of organizedevacuation. The following sections present these five key themes including sample excerpts from thenarratives (italics), once the thematic analysis was conducted.
Page 89 of 269

SafeGreece 2021 on-line Proceedings | ISSN 2654-1823
SafeGreece 2021 – 8th International Conference on Civil Protection & New Technologies 24-26 November, on-line | www.safegreece.org/safegreece2021 | [email protected]
2.1. The sense of risk before the wildfire By analysing the stories of people who live in or near wildland areas, it was evident that during the summer period they have a strong feeling that somehow a fire will break out. The potential consequences of such fire cultivate an additional and constant stress. The spread of the fire of NE Attica in areas without dense forest vegetation worried even those who felt well-protected. However, there is also an aspect which indicates that people who live in or near forests as "complacent" apparently not by conscious choice, but because they do not want to make negative thoughts.
Man does not want to make unhappy thoughts. I had thought that the mountain would catch fire for sure. I was always afraid of fires, I always wondered where the fire would come from, but I never expected this development. We chose to live here because we feel very safe, we know the roads, we have choices, if you are going to live in the forest you are exposed to high risk of being burned. I did not feel that I could be in danger, but that did not mean that I had confidence in the authorities.
2.2. Residence fire protection and evacuation plans Emphasis was placed on the importance of cleaning the ground around the residency and the need for more residents to comply with fire protection legislation. The effort of some citizens to install fire suppression equipment (water pumps, hoses, nozzles etc.) in their homes is significant, but it turned out to be inferior to the circumstances.
Concrete houses and open deforested areas were used as shelters in cases where firefighting efforts were unsuccessful and evacuation at the last minute would put residents at greater risk. I regularly clean the adjacent plot of land which is not mine and I prune it. I have a swimming pool with an external water pump, but as I realised in practice, I was in no circumstances prepared and I was scared. I have built a concrete panic room that seals, it was the only room in the house that ten days after the fire didn’t smell smoke contrastingly to the other rooms of the house.
Most interviewees considered the transfer of the vulnerable population and people with special needs as a priority, while taking their own stay for granted. Their experience of previous fires that had a less severe effect that did not force the residents to leave, acted as a deterrent to considering evacuation as an appropriate option. Furthermore, the interviewees’ familiarity with the area, knowledge of road network as well as the sheltering options enhanced their confidence that they could leave at the last moment.
I had sent the family away early, there was no evacuation plan for me, I would not leave because I had the basement, and the grounds were with no vegetation, the smoke and fire would be extremely difficult to get there. I had never thought I would give up; we had experienced a fire in the past and we had not gotten to the point of experiencing the fear of evacuation so intensely.
2.3. The necessity for real time and reliable information Television, radio, websites, and social media provided only generic information, forcing residents to request specific information from unofficial sources. Essentially there was an attempt to extract information from people who they trusted such as neighbours, friends, relatives, firefighters, etc. who may have not been privy to reliable information. A major problem also lies in the clarity of the message and the instructions that should be given at the time of the evacuation by the authorities, as well as information regarding the residents’ possible return to their homes.
We had a neighbour who knew the area very well, he used to drive to the fire and inform the neighbourhood every 2 hours. I personally drove my car and sought around to see how far the blaze was, to see how much time I have at my disposal and generally the fire’s condition. My 23- year-old son who
Page 90 of 269

SafeGreece 2021 on-line Proceedings | ISSN 2654-1823
SafeGreece 2021 – 8th International Conference on Civil Protection & New Technologies 24-26 November, on-line | www.safegreece.org/safegreece2021 | [email protected]
was on vacation told me what to do to survive and where to go, who was being informed by a friend of his who was a Fire Academy student.
2.4. Residents’ behaviour during the evacuation The attitudes and reactions of the residents to the call to evacuate varied considerably. The following summarise these reactions: (1) full compliance with the measure of preventive evacuation, (2) refusal to leave, (3) repeated departure and return at various intervals, (4) return and subsequent stay or departure (for those who were not at the property when informed of the fire in the area). Large number of people remained until the fire threatened their homes and fled at the last minute. Unlike those who remained and fought, those that evacuated had first ensured the safe evacuation of the vulnerable population. It is also worth mentioning that there were cases where people remained locked in their homes, ignoring the development of the fire.
Empty city, many people had left, and many were locked in their homes without giving signs of life and without a sense of danger. I wanted to make sure that my mother would not go through stress because she was old, and I came back to protect my property. I thought the fire would stop and we would not have to give up. I would only stay if I were prepared, if I knew the fire was here, I would rather the house burned than me.
2.5. The people’s suggestions for optimizing the system of organized evacuation There is a full agreement amongst the interviewees that the protection of life is the supreme goal. However, there is disagreement about the horizontal implementation of the measure, claiming that many homes were destroyed by small fires many hours after the main fire had passed. The prevailing suggestion is to transfer very early the vulnerable population while those who are prepared and have the ability (physically, mentally and emotionally ready) to assist the fire brigade personnel to fight the fire, must stay.
I believe that evacuations should not be done this way and so widespread. Let the children go, let the women go, let the elderly go, but for some people up to 40-50 years old who have experienced fires, have served voluntarily at civil protection, at least let them protect their home. Many houses were lost due to small fires, hours after the main fire. To tell the truth, even if you evacuate, some people will try to turn around, it is more dangerous to try to drive back through the fires than to let them stay at home.
3. CONCLUSIONForest fire experts assert that the safest option for the public under the threat of forest fire is evacuation[8]. However, there are studies that support an alternative option of staying and protecting property orsearching for an indoor or outdoor refuge [9,10]. During the summer of 2021, wildfires threatenedresidential areas almost all over Greece. Early evacuation was widely used but provoked many reactionsregarding the horizontal implementation of this tactic. The fire disaster illustrates that evacuation and theuse of a refuge to temporarily protect individuals from the hazard or threat (shelter in place) [14] iscommon and necessary for every fire. The challenge is to tailor the protective actions to best address avariety of factors, including a community’s demographics, location, infrastructure, resources, authorities,and decision-making processes [14]. Past events like Victoria’s Black Saturday which cost the lives of 173people [11], proved that emergency managers must conduct a range of outreach and engagementactivities to help everyone understand their respective roles and responsibilities for evacuation andshelter in place [14]. In the aftermath of the catastrophic Australian fires, there has been strong criticismabout the public's "stay or go" tactics, attributing the ineffectiveness of the policy to the failure toadequately clarify the risks as well as the terms and conditions for the safety of people in shelters. The
Page 91 of 269

SafeGreece 2021 on-line Proceedings | ISSN 2654-1823
SafeGreece 2021 – 8th International Conference on Civil Protection & New Technologies 24-26 November, on-line | www.safegreece.org/safegreece2021 | [email protected]
directive has been improved and transformed into "Prepare, stay and defend, or leave early " with a greater emphasis on early evacuation as being the safest option. People's choices in fire are an extremely complex process. The intensity of the fire, the public perception of the danger and the individual circumstances have an important effect [12]. There are cases in which the decision to stay or leave was clear initially, but the circumstances of the fire, the information received as well as other factors led to more dangerous behaviours [13]. Thus, it must be clear that individuals and families must fully understand the peculiarities and concepts of evacuation and shelter in place before a disaster strikes so that they can make informed decisions and take proactive actions [14]. The choice of stay to protect the property while the fire is in full development should be done only under strict conditions and provided there has been proper preparation. More specifically, the means, potential, knowledge and skills that are required to deal with the fire, while at the same time plan for instant shelter in a safe place if conditions demand need to be developed. A lower risk operational procedure which can compromise life and property safety in a more rational manner is the one that evacuates people early while identifies those who can support fire mitigation operations. People who can deal with the fire should be able to find shelter close to the burning area, so they can have the opportunity to return immediately after the main fire passes and protect their properties from spot fires under the guidance of fire service crews.
REFERENCES 1. Stefanos Mantzoukas (2007). Qualitative research in six easy steps. The epistemology, the methods and the
presentation. NOSILEFTIKI 2007, 46(1):88-98. Thames Valley University, London, UK2. Φιλία Ίσαρη, Μάριος Πουρκός (2015). Ποιοτική Μεθοδολογία Έρευνας, Εφαρμογές στην Ψυχολογία και στην
Εκπαίδευση. ΣΥΝΔΕΣΜΟΣ ΕΛΛΗΝΙΚΩΝ ΑΚΑΔΗΜΑΙΚΩΝ ΒΙΒΛΙΟΘΗΚΩΝ. Εθνικό Μετσόβειο Πολυτεχνείο. ΑθήναISBN:978-960-603-455-8
3. Patton, M.Q. (2002). Qualitative research and evaluation methods (3rd ed.). Thousand Oaks: Sage Publications4. Καλλινικάκη, Θ. (2010) Ποιοτικές μέθοδοι στην έρευνα της κοινωνικής εργασίας. Αθήνα: Τόπος5. Marshall, M. N. (1996). Sampling for qualitative research. Family Practise, 13 (6), 522-5256. Ιωσηφίδης, Θ. (2008) Ποιοτικές μέθοδοι έρευνας στις κοινωνικές επιστήμες. Αθήνα: Κριτική7. Braun, Virginia and Clarke, Victoria (2006) Using thematic analysis in psychology. Qualitative Research in
Psychology, 3 (2). pp. 77-101. ISSN 1478-08878. Edgeley, C. M., & Paveglio, T. B. (2019). Exploring influences on intended evacuation behaviors during wildfire:.
International Journal of Disaster Risk Reduction (37)9. McCaffrey, S., Rhodes, A., & Stidham, M. (2015). Wildfire evacuation and its alternatives:perspectives from four
United States' communities. Int. J. Wildland Fire(24), pp. 170-17810. Paveglio, T., Prato, T., Dalenberg, D., & Venn, T. (2014). Understanding evacuation preferences and wildfire
mitigations among Northwest Montana residents. Int. J. Wildland Fire(23), σσ. 435-44411. Final report for the Victorian Bushfires Royal Commission (2010). Review of fatalities in the February 7, 2009,
bushfires. Centre for Risk and Community Safety RMIT University & Bushfire CRC12. John Handmer & Amalie Tibbits (2005). Is staying at home the safest option during bushfires? Historical
evidence for an Australian approach, Global Environmental Change Part B: Environmental Hazards, 6:2, 81-91, DOI: 10.1016/j.hazards.2005.10.006
13. Whittaker, J., Haynes, K., Handmer, J., & McLennan, J. (2013). Community safety during the 2009 Australian'Black Saturday' bushfires: an analysis of household preparedness and response. International Journal ofWildland Fire 22(6), σσ. 841-849
14. U.S. DEPARTEMENT OF HOMELAND SECURITY (2019). Planning Considerations: Evacuation and Shelter-in-Place. Guidance for State, Local, Tribal, and Territorial Partners
Page 92 of 269
SafeGreece 2021 on-line Proceedings | ISSN 2654-1823
SafeGreece 2021 – 8th International Conference on Civil Protection & New Technologies 24-26 November, on-line | www.safegreece.org/safegreece2021 | [email protected]
AFFORDABLE EARTH OBSERVATION SERVICES ON CLOUD-BASED AND HIGH-PERFORMANCE COMPUTING ENVIRONMENTS IN SUPPORT OF GEOHAZARD RISK
ASSESSMENT
Michael Foumelis1, Jean-Philippe Malet2, Philippe Bally3, Floriane Provost4, Elena Papageoriou1, Aline Deprez2, Fabrizio Pacini5
1 Aristotle University of Thessaloniki (AUTh), Department of Physical and Environmental Geography, (Greece). (E-mail: [email protected], [email protected])
2 CNRS/Université de Strasbourg, Ecole et Observatoire des Sciences de la Terre /EOST, (France). (E-mail: [email protected], [email protected])
3 European Space Agency (ESA), (Italy). (E-mail: [email protected])
4 Université Laval, Département de génie civil et des eau, Québec, (Canada). (E-mail: [email protected])
5 Terradue s.r.l., (Italy). (E-mail: [email protected])
ABSTRACT The Geohazards Exploitation Platform (GEP) is a cloud-based environment providing a set of services for online processing of Earth Observation (EO) data, allowing the mapping of hazard prone land surfaces and monitoring terrain deformation. The platform is continuously expanding to include a broad range of on-demand and systematic products and services, currently available or under development on cloud processing resources, to support EO practitioners and other users to better understand geohazards and their impact. The present work is introducing several of these services, as well as other innovative concepts such as GEP's e-collaboration environment.
Keywords: Online processing services, high-performance computing, cost-effective solution, Earth Observation, Geohazards Exploitation Platform.
1. INTRODUCTIONThe rapid urbanization of the world´s landscape is inducing population to live in urban areas, for the firsttime in human history, 55% of the world´s population live in cities [1]. The growing concentration ofpeople and assets means that the impact of natural hazards is more likely to turn into disasters, whichcombined with the lack of adequate infrastructure[2], might results in having devastating consequencesfor both human lives and economic livelihoods [3].Copernicus is the most ambitious Earth observation program to date. The Sentinel missions perform asystematic data acquisition, which is based upon a pre-defined and conflict-free acquisition plan. TheSentinel missions provides routinely a large volume of EO data to the European Copernicus services andto the global scientific and operational user community. However, the ever increasing volume ofsatellite data, Sentinels being a very caracteristic case of large-volume data missions, might hamper theutilization of EO data by individual practitioners. The above fact has been well-underlined during theInternational Forum on Satellite EO for Geohazards [4], where the need for cloud-based processingsolutions to address difficulties for both storage and processing capacity was addressed.
Page 93 of 269

SafeGreece 2021 on-line Proceedings | ISSN 2654-1823
SafeGreece 2021 – 8th International Conference on Civil Protection & New Technologies 24-26 November, on-line | www.safegreece.org/safegreece2021 | [email protected]
Preparing cities for disaster and climate risks and strengthening urban resilience are critical if we are to achieve urban development goals. Within the Disaster Risk Reduction (DRR) portfolio, we present herein online processing services on the Geohazards Exploitation Platform (GEP, https://geohazards-tep.eu), to emphasize the advantages of platform-based solutions for systematic monitoring of geohazards.
2. THE GEOHAZARDS EXPLOITATION PLATFORMGEP is an initiative set up by ESA aiming to support further exploitation of satellite EO for geohazardsassessment (Figure 1). GEP is a cloud-based environment providing a set of processing tools and servicesthat allow mapping hazard prone land surfaces and monitoring terrain deformation. The platform iscontinuously expanding to address broader objectives of the geohazards community, by integrating abroad range of on-demand and systematic services [5]. Currently, GEP development has passed pre-operation phase supporting approximately 2403 registered users from 115 countries worldwide (usersuptake on August 2021). Combined with properly designed capacity building activities, it will allowbetter understanding of geohazards and their impact, as well as introducing innovative concepts for theassessment of hazard and associated risks.
Figure 1. The Thematic Exploitation Platforms concept, such as GEP, in linking EO practitioners and experts to data and processing resources for responding and monitoring of geohazards.
3. ONLINE PROCESSING SERVICESThe platform is meant to allow users to easily exploit EO data resources by combining fast data access,processing facilities and flexibility for the user’s own data analysis (Figure 2). The platform provides DataAccess services, Data Processing services and PaaS (Platform as a Service) capacities.Data Access includes the possibility to perform catalogue queries and download data of the free datacollections. Data Processing services enable users to process data available in remote or localrepositories using a number of well-known tools and on-demand services, and to exploit the results. Inaddition, the platform makes available value-added information layers, offered as collections within theThematic Applications and generated by a set of systematic processing services deployed and runningon Cloud Computing resources. The available on-demand processing services and information layersfrom the systematic processing services are detailed in [5].The DIAPASON DInSAR service is developed by the French Space Agency (CNES) to measure surfacedisplacements occurring between two dates. Copernicus Sentinel-1, ERS and Envisat missions aresupported. The SNAP InSAR service provides an interferometric processor for Copernicus Sentinel-1mission using ESA SNAP toolbox. Several processing parameters are made available to allow serviceoptimization depending on the case study. Other conventional InSAR services include GMTSAR
Page 94 of 269

SafeGreece 2021 on-line Proceedings | ISSN 2654-1823
SafeGreece 2021 – 8th International Conference on Civil Protection & New Technologies 24-26 November, on-line | www.safegreece.org/safegreece2021 | [email protected]
developed by the University of Miami Geodesy Group. In addition, several services involve advanced processing techniques for time series analysis using multiple optical and SAR acquisitions. The FASTVEL service is developed by TRE-Altamira for generating differential interferograms and PSI-based mean displacement velocity maps. Copernicus Sentinel-1, ERS and ENVISAT missions are supported. The P-SBAS processing chain developed by CNR-IREA as well as the SNAPPING (Surface motioN mAPPING) service by AUTH, MJaen and Terradue are both able to generate ground displacement time series and corresponding mean velocity maps based on Copernicus Sentinel-1 mission data (Figure 3).
Figure 2. The Geohazards Exploitation Platform (GEP) geobrowser with the user interface to access satellite data and process them through dedicated online services.
On-demand services based on times series of optical satellite EO data are complementing the geohazards assessment. Examples are CNRS EOST’s services MPIC-OPT to quantify horizontal displacement from image correlation techniques, DSM-OPT to generate high-resolution topographic surface models from satellite stereoscopy, and ALADIM to generate change detection maps using supervised techniques based on machine learning and applied on high (Sentinel-2, Landsat 7/8) and very-high spatial resolution (Pléiades, Spot6/7, Planets) bi-date images. These services are relevant for landslides, ice, volcano and fault rupture deformation analysis. The GEP further supports volcano monitoring by making available optical-based products generated by systematic services using Copernicus Sentinel-2 and Landsat-7/8 data through the STEMP (Surface Temperature Mapping) service developed by INGV for the generation of surface temperature maps over volcanic areas. Finally, VEGAN systematic service, developed by NOVELTIS and INGV, offers operational monitoring of volcanic eruptions by detecting impact on vegetation and active eruptions and burnt areas.
3.1. GEP e-Collaboration Environment The GEP also allows users to share and promote EO results. The e-collaboration concept is used to either share results publicly or in closed communities. In both cases, sharing results can lead to discussions and
Page 95 of 269

SafeGreece 2021 on-line Proceedings | ISSN 2654-1823
SafeGreece 2021 – 8th International Conference on Civil Protection & New Technologies 24-26 November, on-line | www.safegreece.org/safegreece2021 | [email protected]
exchanges that could help users to perform comparison among products that were generated using different inputs parameters, or different chains, work on the refinement of input parameters or outputs, and identify new features about the phenomena under analysis. Moreover, GEP is a collaborative platform, allowing any user to control their way to engage and interact with other users on the platform, for sharing and promoting their assets and/or results. There are communities that are publicly accessible, and there are others that are private and can be joined upon invitation only.
Figure 3. Terrain motion map of Jakarta (Indonesia) metropolitan area as derived using the P-SBAS service on GEP. Contains modified Copernicus Sentinel-1 data (2015-2020), processed by BRGM on GEP.
ACKNOWLEDGEMENTS GEP services rely on the efforts of scientists and EO practitioners implementing services and sharing processing results. The authors would like to acknowledge the support of AUTh, BRGM, CNES, CNR IREA, CNRS EOST, DLR, INGV, MJaen, TRE-Altamira (listed alphabetically), for they support to GEP.
REFERENCES
1. U. Desa (2018). Revision of World Urbanization Prospects. May, 16, 2018.2. G. Le Cozannet, M. Kervyn, S. Russo, C. Ifejika Speranza, P. Ferrier, M. Foumelis, T. Lopez, H. Modaressi
(2020). Space-based Earth Observations for disaster risk management. Surveys in Geophysics,https://doi.org/10.1007/s10712-020-09586-5.
3. V. Thomas (2017). Climate change and natural disasters: transforming economies and policies for asustainable future. Taylor & Francis, p.158.
4.
5.
Ph. Bally (ed.) (2012). The International Forum on Satellite EO and Geohazards. European Space Agency,Scientific and Technical Memorandum, Santorini, Greece, 21-23 May, 2012.Geohazards Exploitation Platform (GEP). Services Catalogue, https://geohazards-tep.eu/#!pages/serviceCatalogue.
Page 96 of 269
SafeGreece 2021 on-line Proceedings | ISSN 2654-1823
SafeGreece 2021 – 8th International Conference on Civil Protection & New Technologies 24-26 November, on-line | www.safegreece.org/safegreece2021 | [email protected]
DETECTION OF ACTIVE LANDSLIDES IN ACHAIA (CENTRAL GREECE) THROUGH INSAR TIME SERIES ANALYSIS
Varvara Tsironi1,2, Athanassios Ganas1, Ioannis Karamitros1, Eirini Efstathiou1, Ioannis Koukouvelas2 and Efthimios Sokos2
1National Observatory of Athens, Institute of Geodynamics, Lofos Nymfon, Thission, 11810 Athens, Greece;; ([email protected]; [email protected])
2Department of Geology, University of Patras, 26504 Rio, Greece
ABSTRACT Nowadays, among the most crucial and frequent occuring natural hazards are landslides. Active landslides can be efficiently captured by InSAR and especially through the time series analysis. The study area is located on the eastern hillslopes of Panachaiko mountain, in the western part of Gulf of Corinth. This area suffers from instability that is manifested in various degrees of ground displacement affecting greatly the morphological features of the inhabited areas. We performed timeseries analysis by Small Baseline Subset technique. The mean velocity of the main landslides, (Krini and Pititsa) was measured up to -75 mm/yr) in the direction of Line of Sight (LOS) for the ascending track and velocities up to 35 mm/yr in the LOS for the descending track. In addition, correlation between rainfall and movement of an active landslide was performed. We found a strong correlation between these timeseries, with an increase of displacement rate right after a period of intense rainfall.
Keywords: Active Landslides, InSAR, Time Series Analysis, Rainfall.
1. INTRODUCTIONThe movement of an active landslide could be captured by the InSAR measurements [1]. Through theInSAR time series analysis, the velocity of the movement could be measured with an accuracy of mm/yr[2]. Using this technique, the whole area which is affected by the active landslides can also easily beidentifiable. The InSAR time series method has been applied successfully in a range of landslide studies,not only to locate landslide bodies, but also to identify spatial-temporal patterns of movement [3]. Also,potential landslide prone areas could be detected by monitoring the hillslopes. The analysis of InSAR-generated displacement time series has the potential to identify periods of accelerated grounddeformation and to evaluate correlations with different triggers (rainfall, earthquakes). Large landslidesand debris flows form a frequently occurring geohazard posing significant risk to lives and livelihoods.The study area is in the Achaia municipality in Peloponnese and especially near the villages Krini, Pititsaand Sella (Fig. 1). These villages are located on the slopes of the mountain Panachaiko and they areaffected by active landslides. For this study, SBAS (small baseline subset) technique have been applied todetect ground deformation.
2. METHODS & RESULTS
2.1. DInSAR Time Series AnalysisThe processing of InSAR time series analysis was held by the LiCSBAS, an open-source python-based package that integrates with LiCSAR products [5]. We perfomed the processing of the time series analysis on the unwrapped interferograms and the coherence images For ascending and descending track, we used 96 and 289 available interferograms from the LiCSAR portal, respectively. Before the main processing, a tropospheric correction was applied using the GACOS data [8]. The STD of unwrapped phases for each entire interferogram is generally reduced, which indicates that the GACOS
Page 97 of 269

SafeGreece 2021 on-line Proceedings | ISSN 2654-1823
SafeGreece 2021 – 8th International Conference on Civil Protection & New Technologies 24-26 November, on-line | www.safegreece.org/safegreece2021 | [email protected]
correction significantly mitigated the tropospheric noise. In order to estimate the velocity of a surface pixel through time based upon a series of displacement data, we perform a Small Baseline inversion on the network of interferograms. To obtain the more realistic time series of the displacement even with a disconnected network, we follow the NSBAS method [4]. We present the annual displacements over the area of interest. In the broader area of Krini village, an active landslide is located. We also mapped active landslides in close proximity to the villages Graikas, Pititsa, Sella and to the Moni Agias Eleousas (Fig 1). Here, we measured velocities up to -75 mm/yr) in the direction of Line of Sight (LOS) for ascending track and velocities up to 35 mm/yr in the LOS for descending track. The values of displacements are referenced to a local reference point which is located south of the area of interest.
Figure 1 Up (left) and East-West (right) Component of the velocity after the decomposition of InSAR data for the broader areas of Krini and Pititsa villages
Through the decomposition of LOS vector, we produced maps of the E-W and Up Component. We found that all the landslides are moving to the east in addition to subsidence (Fig. 1). Also, we used rainfall data [3] in order to identify possible spatio-temporal patterns of ground movement which could be correlated with the rainfall. We used the daily rain data of three meteorological stations (Kalavrita, Panaxaiko and Kato Vlassia station). We used data for the same time span with the InSAR timeseries. We use the time span between 2015 and 2020 to cover the time period of InSAR and GNSS timeseries.
Page 98 of 269

SafeGreece 2021 on-line Proceedings | ISSN 2654-1823
SafeGreece 2021 – 8th International Conference on Civil Protection & New Technologies 24-26 November, on-line | www.safegreece.org/safegreece2021 | [email protected]
2.2. Cross Correlation between rainfall and annual displacement In order to reveal the correlation between the rainfall and the seasonal movement of the landslide we used a signal processing method, the cross correlation [7]. The main purpose to convert our data to signal and compared them, was to reveal the time delay (time lag) between the two maximum picks of the time series of rainfall and of InSAR, respectively.
Figure 2 InSAR Time Series Analysis and Monthly Rainfall for each time period and Cross-correlation technique for each time period We apply this technique to the daily rainfall dataset and to the InSAR time series. We used the InSAR time series of the descending track due to the completeness of its dataset. We selected the data from the meteorological station Kato Vlassia, and we performed the correlation for the landslide of Krini. Then, we applied the cross correlation to three sub-periods of time. These three time periods correspond to the periods where the maximum picks of displacements and the maximum picks of rainfall occurred. As we observed in figure 2, when we see changes in the displacement, previously, we had the maximum values of rainfall. In two instanses, the displacement rate increased after the maximum pick of rainfall. The mean time lag was 13,5 days between the maximum value of rainfall and the maximum value of displacement.
3. DISCUSSION & CONCLUSIONSThe Krini and Pititsa landslides are well-known active landslides which were measured by InSARtimeseries analysis. The maximum displacement rate of each landslide is located at the center of eachlandslide. Also, through InSAR analysis we identified more than these two landslides in the broader area.We identified the active landslides of Graikas village, Sella village and one near to the Moni AgiasEleousas.In this paper, the determination of the correlation between rainfall and movement of an active landslidewas performed. Through, the cross correlation method, the maximum correlation between the two dataseries were about 13 days. So, the correspondence time between the maximum value of rainfall and themaximum displacement for the Krini landslide is 13,5 days. We suggest a strong correlation betweenthese timeseries, with an increase of displacement rate right after a period of rainfall. Thespatiotemporal pattern of movement is revealed due to the seasonal rainfall which allow us to expect
Page 99 of 269

SafeGreece 2021 on-line Proceedings | ISSN 2654-1823
SafeGreece 2021 – 8th International Conference on Civil Protection & New Technologies 24-26 November, on-line | www.safegreece.org/safegreece2021 | [email protected]
increase of displacement rate of the landslide of Krini at the end of rainfall period and the beginning of the dry one. Also, a possible earthquake, or its combination with rainfall, in the area could increase the displacement rate of the landslides.
Acknowledgement: This research was funded by the ESPA project “PROION” https://proion-hellas.eu/index.php/en/home-2/
REFERENCES 1. Aslan, G., Foumelis, M., Raucoules, D., De Michele, M., Bernardie, S., Cakir, Z. (2020). Landslide Mapping
and Monitoring Using Persistent Scatterer Interferometry (PSI) Technique in the French Alps. RemoteSens., 12, 1305. https://doi.org/10.3390/rs12081305
2. Elias P., Valkaniotis, S., Ganas, A., Papathanassiou, G., Bilia, A., Kollia, E. (2020). Satellite SARinterferometry for monitoring dam deformations: the case of Evinos dam, central Greece. Proc. SPIE11524,(RSCy2020), 115241I, http://dx.doi.org/10.1117/12.2571954
3. Lagouvardos, K., Kotroni, V., Bezes, A., Koletsis, I., Kopania, T., Lykoudis, S., ... & Vougioukas, S. (2017). Theautomatic weather stations NOANN network of the National Observatory of Athens: operation anddatabase. Geoscience Data Journal, 4(1), 4-16.
4. López-Quiroz, P., Doin, M. P., Tupin, F., Briole, P., & Nicolas, J. M. (2009). Time series analysis of MexicoCity subsidence constrained by radar interferometry. Journal of Applied Geophysics, 69(1), 1-15.
5. Morishita, Y., Lazecky, M., Wright, T. J., Weiss, J. R., Elliott, J. R., & Hooper, A. (2020). LiCSBAS: An open-source InSAR time series analysis package integrated with the LiCSAR automated Sentinel-1 InSARprocessor. Remote Sensing, 12(3), 424.
6. Singleton, A., Li, Z., Hoey, T., & Muller, J. P. (2014). Evaluating sub-pixel offset techniques as an alternativeto D-InSAR for monitoring episodic landslide movements in vegetated terrain. Remote Sensing ofEnvironment, 147, 133-144
7. Tomás, R., Li, Z., Lopez-Sanchez, J. M., Liu, P., & Singleton, A. (2016). Using wavelet tools to analyseseasonal variations from InSAR time-series data: a case study of the Huangtupo landslide. Landslides,13(3), 437-450.
8. Wang, Q., Yu, W., Xu, B., & Wei, G. (2019). Assessing the use of GACOS products for SBAS-INSARdeformation monitoring: A case in Southern California. Sensors, 19(18), 3894.
Page 100 of 269

SafeGreece 2021 on-line Proceedings | ISSN 2654-1823
SafeGreece 2021 – 8th International Conference on Civil Protection & New Technologies 24-26 November, on-line | www.safegreece.org/safegreece2021 | [email protected]
WATCHING OUT LARGE-SCALE WATERLINE AND COASTAL CHANGES IN GREECE, THE SPACE FOR SHORE PROJECT, UNDER ESA’S COASTAL EROSION PROJECT
Georgia Kalousi1, Manon Besset2, Virginie Lafon2, Aurelie Dehouck2, Konstantinos Mytakidis1, Evagelos Fryganiotis1
1 Terra Spatium SA, Athens, Greece. 2 i-Sea, Bordeaux, France.
(E-mail: [email protected], [email protected], [email protected], [email protected], [email protected], [email protected])
ABSTRACT Coastal areas are subject to intense urbanization and population growth, but also strong dynamics and severe coastal hazards. In order to support coastal authorities to achieve sustainable shoreline management, coastal monitoring is undertaken by all possible means, following technological advances and specific contexts. We propose an alternative large-scale and affordable strategy based on satellite imagery to complete the local and episodic field surveys, which is what satellite remote sensing can offer. In the frame of the ESA Coastal Erosion Project, the Space for Shore consortium leaded by i-Sea, has prototyped coastal erosion monitoring tools and products. These tools and products extend over the entire coastal system, from nearshore to the inshore), exploiting the archives of the Copernicus European Programme and other satellite missions to cover 25 years of coastal dynamics. The project is highly end-user driven and the studied areas include all types of European coasts. The adopted temporal frequency matches the dynamics of each sector. Terra Spatium backed by i-Sea has processed hundreds of satellite images from 1995 to 2020 to perform the shoreline change monitoring over time in Greece, which has been then turned into a preliminary coastal erosion assessment at the scale of the Peloponnese, Eastern Macedonia, and Thrace regions. During the third and last year of project (mid-2021/2022), we are deploying our tools over other highly threatened coastal areas such as the island of Rhodes and the areas that were recently burned (August 2021) and afterwards flooded, located on the coast of Evia island. We propose to present the results of high-frequency coastal monitoring, of the Greek study areas, using satellite imagery over highly sensitive regions to show the potential for the scientific community but also and above all to help coastal managers in their fight against coastal erosion and hazards.
Keywords: Coastal Erosion, Satellite Earth-Observation, Remote Sensing.
1. INTRODUCTION
For decades now, coastal areas have been subject to intense urbanization and population growth [1]. Unfortunately, these attractive areas are the ones that are going through the most dynamic changes on Earth and suffer from severe coastal hazards due to storm activity and sea level rise. Coastal erosion is a natural process, a non-linear phenomenon [2] and show successive phases of erosion/accretion, which sometimes is shifting trends upon the decades. Nevertheless, the issue of coastal retreat appears everywhere around the world under the effect of those natural processes, which are aggravated by climate change and human activities. To help coastal authorities securing coastal city attractivity while facing the challenge of sustainable shoreline management, the need for coastal monitoring actions to be undertaken in order to upgrade the knowledge of coastal dynamics is present.
Page 101 of 269
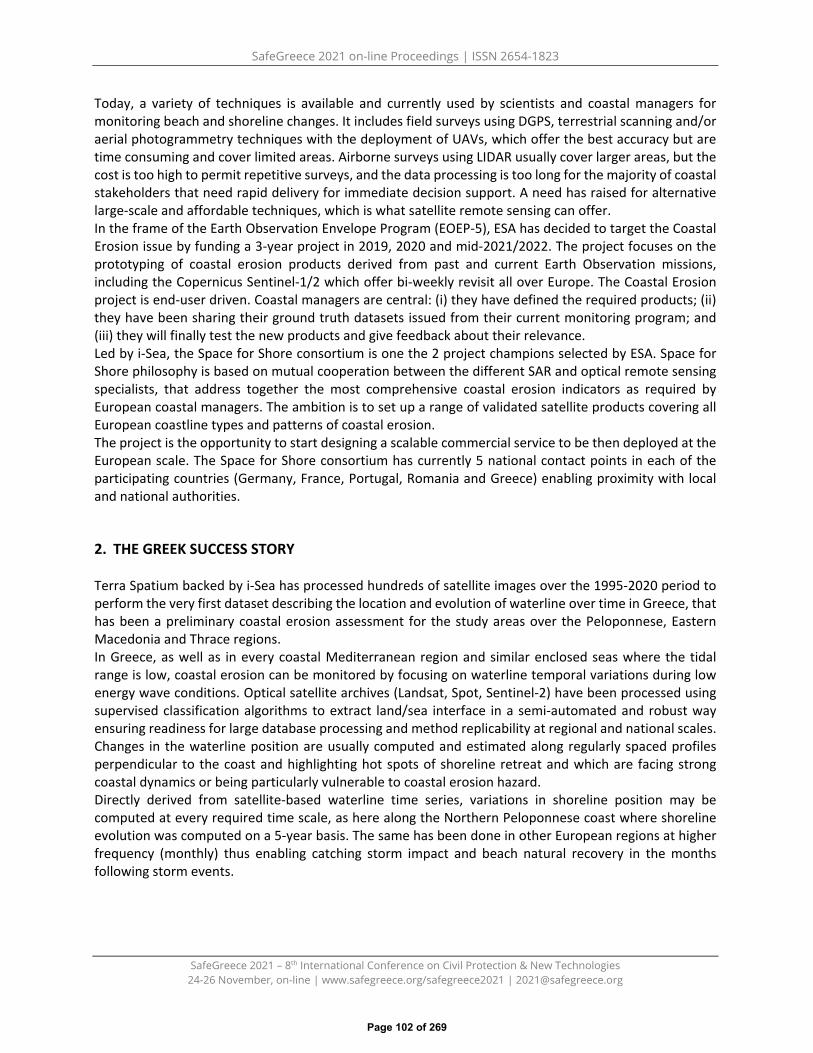
SafeGreece 2021 on-line Proceedings | ISSN 2654-1823
SafeGreece 2021 – 8th International Conference on Civil Protection & New Technologies 24-26 November, on-line | www.safegreece.org/safegreece2021 | [email protected]
Today, a variety of techniques is available and currently used by scientists and coastal managers for monitoring beach and shoreline changes. It includes field surveys using DGPS, terrestrial scanning and/or aerial photogrammetry techniques with the deployment of UAVs, which offer the best accuracy but are time consuming and cover limited areas. Airborne surveys using LIDAR usually cover larger areas, but the cost is too high to permit repetitive surveys, and the data processing is too long for the majority of coastal stakeholders that need rapid delivery for immediate decision support. A need has raised for alternative large-scale and affordable techniques, which is what satellite remote sensing can offer. In the frame of the Earth Observation Envelope Program (EOEP-5), ESA has decided to target the Coastal Erosion issue by funding a 3-year project in 2019, 2020 and mid-2021/2022. The project focuses on the prototyping of coastal erosion products derived from past and current Earth Observation missions, including the Copernicus Sentinel-1/2 which offer bi-weekly revisit all over Europe. The Coastal Erosion project is end-user driven. Coastal managers are central: (i) they have defined the required products; (ii) they have been sharing their ground truth datasets issued from their current monitoring program; and (iii) they will finally test the new products and give feedback about their relevance.Led by i-Sea, the Space for Shore consortium is one the 2 project champions selected by ESA. Space forShore philosophy is based on mutual cooperation between the different SAR and optical remote sensingspecialists, that address together the most comprehensive coastal erosion indicators as required byEuropean coastal managers. The ambition is to set up a range of validated satellite products covering allEuropean coastline types and patterns of coastal erosion.The project is the opportunity to start designing a scalable commercial service to be then deployed at theEuropean scale. The Space for Shore consortium has currently 5 national contact points in each of theparticipating countries (Germany, France, Portugal, Romania and Greece) enabling proximity with localand national authorities.
2. THE GREEK SUCCESS STORY
Terra Spatium backed by i-Sea has processed hundreds of satellite images over the 1995-2020 period to perform the very first dataset describing the location and evolution of waterline over time in Greece, that has been a preliminary coastal erosion assessment for the study areas over the Peloponnese, Eastern Macedonia and Thrace regions. In Greece, as well as in every coastal Mediterranean region and similar enclosed seas where the tidal range is low, coastal erosion can be monitored by focusing on waterline temporal variations during low energy wave conditions. Optical satellite archives (Landsat, Spot, Sentinel-2) have been processed using supervised classification algorithms to extract land/sea interface in a semi-automated and robust way ensuring readiness for large database processing and method replicability at regional and national scales. Changes in the waterline position are usually computed and estimated along regularly spaced profiles perpendicular to the coast and highlighting hot spots of shoreline retreat and which are facing strong coastal dynamics or being particularly vulnerable to coastal erosion hazard. Directly derived from satellite-based waterline time series, variations in shoreline position may be computed at every required time scale, as here along the Northern Peloponnese coast where shoreline evolution was computed on a 5-year basis. The same has been done in other European regions at higher frequency (monthly) thus enabling catching storm impact and beach natural recovery in the months following storm events.
Page 102 of 269

SafeGreece 2021 on-line Proceedings | ISSN 2654-1823
SafeGreece 2021 – 8th International Conference on Civil Protection & New Technologies 24-26 November, on-line | www.safegreece.org/safegreece2021 | [email protected]
Figure 1. Coastlines in Greece mapped by Space for Shore project.
(a) (b)
Figure 2. Highly dynamic coastal area near the Kalogera lagoon, located in Achaia in the Region of Peloponnese.
A first demonstration of satellite-derived bathymetry has been achieved over the study area of Laganas beach on Zakynthos Island, where the underwater topography has been retrieved up to depths of 30 m. This provided the opportunity to systematic monitoring of shallow water bathymetry changes over sandy areas suffering from coastal erosion and in complement to beach and shoreline monitoring with the overall objective of achieving a better understanding of coastal dynamics and sediment budgets. The results obtained in Greece, i.e. more than 900 kms of coastline produced for the period of 25-years, testify how mature is the Space for Shore coastal erosion service and ready to play an active role in the future coastal monitoring infrastructure in the service of the Greek authorities.
Page 103 of 269

SafeGreece 2021 on-line Proceedings | ISSN 2654-1823
SafeGreece 2021 – 8th International Conference on Civil Protection & New Technologies 24-26 November, on-line | www.safegreece.org/safegreece2021 | [email protected]
(a) (b)
Figure 3. Peloponnese site: (a) Waterlines from 1995 to 2020; (b) Coastal changes, erosion and accretion.
\
Figure 3. Tracking changes in the nearshore seabed and beach morphology using satellite-derived bathymetry. Focus on LAGANAS Embayment.
ACKNOWLEDGMENT Space for Shore project is funded under the ESA Coastal Erosion Project, ESA EOEP-5 program.
REFERENCES 1. The PLOS ONE Staff (2015) Correction: Future Coastal Population Growth and Exposure to Sea-Level Rise
and Coastal Flooding - A Global Assessment. PLoS ONE 10(6): e0131375.https://doi.org/10.1371/journal.pone.0131375
2. Phillips, J. D. 1993a: Chaotic evolution of some coastal plain soils. Physical Geography 14, 566-580.
Page 104 of 269

SafeGreece 2021 on-line Proceedings | ISSN 2654-1823
SafeGreece 2021 – 8th International Conference on Civil Protection & New Technologies 24-26 November, on-line | www.safegreece.org/safegreece2021 | [email protected]
TOWARDS EFFECTIVE RISK ASSESSMENT OF GREEK ROADWAY NETWORKS IN A MULTI-HAZARD ENVIRONMENT
Grigorios Tsinidis1, Sotiria Stefanidou1, Anna Karatzetzou1, Olga Markogiannaki1
1 Postdoctoral Researcher, Department of Civil Engineering, Aristlotle University of Thessaloniki, Greece (E-mail: [email protected] , [email protected], [email protected], [email protected])
ABSTRACT
Recent hazardous events in Greece, for instance, the 2021 Thessaly earthquake and floods, as well as the heavy 2019 rainfall in Crete, resulted in severe physical damage and important economic and societal losses, demonstrating the vulnerability of Greek roadway networks to natural hazards. Severe damage on bridges and tunnels of roadway networks is commonly related to the effects of multiple natural hazards that may act independently during their life. However, the literature on risk assessment of the above elements is commonly focused on the effects of one hazard, disregarding the potential interaction effects of diverse hazards in a multi-hazard environment. In this context, there is an increasing need for reasonable and effective evaluation of the multi-hazard risk of transportation infrastructure. Research project INFRARES (www.infrares.gr) aspires to bridge this gap by gaining further insight into the risk assessment of bridges and tunnels of roadway networks in Greece, when subjected to independent and subsequent hazards. Emphasis is placed on seismic hazard and flood hazard since these are identified as the more relevant ones for the assessment of roadway networks in Greece. The present study aims to highlight the main objectives of INFRARES research project.
Keywords: multi-hazard assessment, earthquake, flood, bridges, tunnels
1. INTRODUCTION
Bridges and tunnels constitute major components of roadway networks, playing a vital role in economic and societal regional development, as they influence the national integration to the world economic market. Transportation networks are also important for the support of international economic activities since they act as a crucial connection between different countries. However, hundreds or thousands of bridges require urgent upgrading or replacement, to increase the capacity and safety of transportation networks, which is vital for stimulating the local and national economy and enhancing societal resilience. This is actually, one of the top priorities for EU and USA [1]. The above observations highlight the importance of rigorous assessment methodologies of their risk and resilience against a variety of natural hazards. During the last 30 years, numerous methods have been developed for the assessment of seismic performance and vulnerability of bridges [2] and tunnels [3], [4]. Recognizing the crucial effects of climate change, as well as the effects of other natural hazards on the vulnerability of civil infrastructure, the research interest has been recently shifted upon the derivation of multi-hazard fragility curves [5]. The limited number of existing studies refers to bridges, while the knowledge gap for tunnels is more evident. Additionally, it well known that ageing and deterioration phenomena have a great impact on the fragility of critical structural components [6], while the effect of Soil-Structure Interaction (SSI) on both bridge and tunnel performance is also well recognized [7]. However, most of the available assessment methodologies in literature ignore the above crucial effects. The importance of resilience assessment of critical civil infrastructure, such roadway networks, in a multi-hazard environment, defined as the ability of a infrastructure system to maintain functionality and return to
Page 105 of 269
SafeGreece 2021 on-line Proceedings | ISSN 2654-1823
SafeGreece 2021 – 8th International Conference on Civil Protection & New Technologies 24-26 November, on-line | www.safegreece.org/safegreece2021 | [email protected]
previous condition, following an extreme event, has been heavily highlighted recently and relevant methodologies have been proposed (e.g. [8]), which in any case call for further improvements and relevant ‘adjustments’ so as to be applicable in different terrains. In this context, INFRARES project aims at proposing a systemic analytical methodology and developing a relevant software for the risk and resilience assessment of roadway networks in a multi-hazard environment. The proposed framework will account for the effects of single or multiple natural hazards in Greece, namely earthquakes, floods, scouring etc. This constitutes an important development beyond the current state-of-the-art since the majority of the studies on vulnerability assessment focus on either individual transportation assets or entire networks, typically considering only one hazard at a time. Moreover, the proposed methodology will be a great tool for operators or stakeholders towards hierarch of the most dangerous components and application of more appropriate, effective, and optimized mitigation measures to improve the resilience of their network.
2. EXAMINED TOPICS BY INFARES SO FAR
The present paper summarizes some preliminary outcomes of INFRARES project referring to the risk assessment of roadway networks against natural hazards. To meet the objectives of the project regarding this task, various methodological frameworks will be used, associated with the following components enclosed in the definition of risk: (i) Exposure: inventory of elements in a roadway networks, which may be affected by diverse hazards; (ii) Multi-Hazard assessment: consideration of diverse natural hazards and definition of appropriate measures to describe the intensity of hazards, i.e. intensity measures; (iii) Vulnerability assessment: degree of loss on a given element or set of elements at risk, subjected to a specific natural hazard or to a combination of diverse hazards, accounting for ageing of the elements and SSI effects. Some recent outcomes of INFRARES, referring to each of the above components are described in the next paragraphs.
2.1. Multihazard maps
An innovative unified methodology to homogenize the single seismic and flood hazard scenarios and develop appropriate single- and multi-hazard maps for Greece is developed within INFRARES, to be used for the risk assessment of Greek roadway networks. The methodology builds upon newly developed material from European databases and platforms to identify the seismic and flood hazard throughout Greece. In particular, the seismic hazard at rock site conditions, is initially selected based on the outcomes of the research project SHARE (www.share-eu.org). This data is properly amplified to account for site effects by employing a simplified Vs,30 model, originating from morphology and topography data of each region in Greece. The seismic hazard is estimated for various return periods (the 475y scenario is presented herein). With reference to the flood hazard, flood hazard zones are derived for whole Greece using data from the Joint Research Center of the European Commission (https://data.jrc.ec.europa.eu/dataset) for various return periods (the 100y scenario is presented herein). Using the above input, both single hazard and multiple hazard models are developed and provided in terms of maps in GIS format (for instance, Figure 1). The proposed methodology contributes towards the generation of a uniform multiple hazard model for the risk assessment of roadway networks in Greece, accounting for a multi-hazard environment.
Page 106 of 269

SafeGreece 2021 on-line Proceedings | ISSN 2654-1823
SafeGreece 2021 – 8th International Conference on Civil Protection & New Technologies 24-26 November, on-line | www.safegreece.org/safegreece2021 | [email protected]
Figure 1. Bivariate map depicting the combination of seismic (Tms=475 years) and flood (Tmf=100 years) hazard for Greece.
2.2. Fragility assessment of bridges in a mutli-hazard environment
Bridge damage may cause significant disruption to a transportation system, resulting in severe substantial direct and indirect losses; for instance, the Loma Prieta 1989 earthquake resulted in more than 40 deaths due to bridge damage and $1.8 billion monetary direct losses due to damage to the transportation infrastructure. Flood due to heavy rainfall may result in substantial losses, as well; for example, in 2007, heave rainfall in the UK affected the road network with estimated cost £60 million Extreme weather conditions, associated with recorded climate changes, e.g., floods and extreme temperatures, are expected to worsen the performance of many bridges in the near future. Damage to bridge infrastructure due to extreme weather conditions is more frequently reported in Greece during the last years (e.g., reported damage in Trikala 2016, Crete 2019). As depicted in Figure 2, bridge flood, scouring and ground failures, resulted in bridges collapse and therefore significant traffic disruption. It is worth noting that public investment for reconstruction is usually greater than the one required for pre-hazard retrofit and improvement of existing bridge stock.
Figure 2: Bridge collapse in Greece (2016-2017) due to flood (left-Kalampaka, Trikala, 2016) and ground movement/foundation slip (right – Iasmos, Rodopi,2017)
In this context, a holistic methodology for the fragility assessment of bridges subjected to multiple natural hazards (i.e., earthquake and floods), is developed within INFRARES. The methodology accounts for ageing and SSI effects. In the framework of the proposed methodology, component-specific limit state thresholds are proposed for critical bridge components, accounting for different failure modes and damage mechanisms. Cumulative damage effects for the case of subsequent hazards are also investigated. Uncertainty sources are discussed and quantified and fragility curves for single and multiple hazards are plotted applying a probabilistic framework.
Page 107 of 269

SafeGreece 2021 on-line Proceedings | ISSN 2654-1823
SafeGreece 2021 – 8th International Conference on Civil Protection & New Technologies 24-26 November, on-line | www.safegreece.org/safegreece2021 | [email protected]
2.3. Fragility assessment of tunnels in a mutli-hazard environment
Tunnels are also crucial elements of roadway networks, which require appropriate assessment of their performance against natural hazards. Indeed, the induced by natural hazards potential damage on tunnels might be difficult and costly to repair. Tunnels in Greece are relatively newly built structures; hence, no significant damage has been reported on them during recent hazard events. However, some exceptions may be found during recent events (e.g., the blockage of the south portal of the ‘Othrios’ railway tunnel due to debris flow, reported during the 2020 Ianos Medicare (Figure 3). Similar to bridges, a holistic methodology for the fragility assessment of tunnels subjected to natural hazards will be developed within INFRARES.
Figure 3. Blockage of the south portal of the ‘Othrios’ twin tunnel, caused by rainfall-induced landslides
3. CONCLUSIONS
This work presents the main objectives of INFRARES research project, which aims at proposing a methodology for the risk and resilience assessment of roadway networks in Greece against various single or multiple natural hazards. The presented topics, actually, contribute on the first main topic of the research related to the risk assessment in a multi-hazard environment.
REFERENCES 1. ASCE (2017) Infrastructure Report Card. https://www.infrastructurereportcard.org/cat-item/bridges/2. Stefanidou, S. P., & Kappos, A. J. (2017). Methodology for the development of bridge-specific fragility curves.
Earthquake Engineering & Structural Dynamics, 46, 73–93.3. Argyroudis, S., Tsinidis, G., Gatti, F., & Pitilakis, K. (2017). Effects of SSI and lining corrosion on the seismic
vulnerability of shallow circular tunnels. Soil Dynamics and Earthquake Engineering, 98(April), 244–256. 64. Tsinidis, G., De Silva, F., Anastasopoulos, I., Bilotta, E., Bobet, A., Hashash, Y.M.A., He, C. , Kampas, G. ,
Knappett, J., Madabhushi, G., Nikitas, N., Pitilakis, K., Silvestri, F., Viggiani, G., Fuentes, R (2029). Seismicbehavior of tunnels: From experiments to analysis. Tunnelling and Underground Space Technology, 99, 103334
5. Gehl, P., & D’Ayala, D. (2018). System loss assessment of bridge networks accounting for multi-hazardinteractions. Structure and Infrastructure Engineering, 2479, 1–17
6. Fotopoulou, S., Karapetrou, S., Argyroudis, S., & Tsinidis, G. (2014). Strategies and tools for RealTimeEarthquake Risk Reduction REAKT Towards real-time earthquake risk reduction
7. Karatzetzou A., Pitilakis D. (2018). Reduction factors to evaluate acceleration demand of soil-foundation-structure systems, Soil Dynamics and Earthquake Engineering. Volume 109, June 2018, Pages 199-208
8. Dong, Y., & Frangopol, D. M. (2016). Probabilistic Time-Dependent Multihazard Life-Cycle Assessment andResilience of Bridges Considering Climate Change. 1–12. https://doi.org/10.1061/(ASCE)CF.1943-5509
Page 108 of 269

SafeGreece 2021 on-line Proceedings | ISSN 2654-1823
SafeGreece 2021 – 8th International Conference on Civil Protection & New Technologies 24-26 November, on-line | www.safegreece.org/safegreece2021 | [email protected]
IMPROVING EARTHQUAKE EMERGENCY RESPONSE WITH DECISION SUPPORTING SYSTEMS – THE REDACt EXAMPLE
Konstantinos Papatheodorou1, Nikolaos Theodoulidis2, Nikolaos Klimis3, Can Zulfikar4, Dragos Vintila5, Dragos Toma-Danila5, Vladlen Cardanet6, Emmanuel Kirtas1
1, Surveying & Geoinformatics Dept, International Hellenic University (Hellas) ( [email protected])
2 Institute of Engineering Seismology & Earthquake Engineering, Earthquake Planning Protection Organization (Hellas)
([email protected]) 3 Civil Engineering Dept, Democritus University of Thrace (Hellas)
([email protected]) 4 Civil Engineering Dept, Gebze Technical University (Turkey)
([email protected]) 5 Civil Engineering Dept, Ovidius University of Constanta (Romania)
([email protected]) 6 Institute of Geology and Seismology, Moldova
ABSTRACT
An undergoing effort aiming at developing a Rapid Earthquake Damage Assessment System (REDAS) as a new ICT-based solution in the field of Earthquake Prevention and Early Damage Assessment & Response planning, is presented. It will include a Rapid Earthquake Damage Assessment platform, which will provide event-related real-time data as well as earthquake damage level per structure typology, in both the case of “what if” scenarios and real events, and it will help to substantially reduce response time in post-earthquake emergencies, a critical parameter for improving public safety. As earthquake imposed crises invoke the entire community including all of its components, REDAS will also include a smartphone app with information & data dissemination & communication capabilities as well as an “Educational Hub”, which will provide targeted education to help raise public awareness and improve response capacity during emergencies, always in line with existing emergency plans and regulations. By combining data and information from different monitoring networks, REDAS will be able to cover all areas inluding Cross Border (CBA) ones. The neccessary harmonization of data, information, protocols and methodologies combined with existing restrictions, have shaped the proposed REDAS structure. Six fully operational REDA platforms having the same functionality, sharing the same data, except the building inventories due to data sharing restrictions, will be built. Each REDA platform will provide both scenario based and near Real-Time solutions by using data from all available monitoring stations, so the strong ground motion parameters will be calculated by each REDAS for the entire area. Each REDAS will have access to the respective National building inventory data so, it will be able to calculate harmonized damage and losses within country borders. A higher accuracy of ground motion estimations will be achieved in selected areas by installing low-cost acccelerometers. The smartphone app will support crowd-sourcing, will be connected to other streams (EMSC Felt Reports, INFP), will provide advise and will provide the ability to share updates on emergency information, upon user choise.
Keywords: Rapid earthquake damage assessment, earthquake disaster mitigation, earthquake response, prevention, earthquake imposed geotechnical hazards.
Page 109 of 269

SafeGreece 2021 on-line Proceedings | ISSN 2654-1823
SafeGreece 2021 – 8th International Conference on Civil Protection & New Technologies 24-26 November, on-line | www.safegreece.org/safegreece2021 | [email protected]
1. INTRODUCTION
Earthquake damage assessment can provide valuable information leading to informed decisions towards disaster mitigation both at a pre-event stage, by supporting planning for Prevention and Preparedness and during an event, by providing situation awareness, thus helping decision makers to allocate resources tailored to case and intervene. A number of existing earthquake damage assessment platforms including AFAD_Red [1], ELER [2], Armagedom [3], PAGER [4, 5], OpenQuake [6], HAZUS [7], CARPA [8], SELENA [9] have been used worldwide, mainly on a “local” basis, partially due to harmonization issues and data sharing restrictions. At the same time, strong earthquakes occuring in Cross Border Areas (CBA) cause damage on both sides of the borders. Still, earthquake monitoring networks maintained by national authorities are deployed within national borders so there’s always a lack of sufficient real-time data covering the “foreign” side of the border does. This fact leads to less accurate near Real-Time damage estimations, limits planning and reduces the ability to make informed decisions regarding Emergency Response. The problem of incompatible and sometimes even uncomparable estimations on different sides of the same border is enhanced by the different approaches, methodologies and protocols used. A first important and absolutely necessary step to resolve this problem, is the establishment of a cross-border cooperation to promote common policies and strategies leading to sharing data, information and competencies in order to respond to major issues related to Earthquake Preparedness & Emergency Response. Based on that, an ongoing effort to develop an operational Rapid Earthquake Damage Assessment System (REDAS) which can respond successfully to those problems is presented in the following paragraphs. REDAS consists of a Rapid Earthquake Damage Assessment platform able to provide damage assessment in both the case of “what if” scenarios and real events by combining near Real-Time data and information from the entire affected area, thus covering Cross Border Areas as well. Considering that earthquake imposed crises invoke the entire community including all of its components, and that public response to earthquake emergencies is closely related to the level of communication, of comprehending the situation and of being trained to respond, the platform is coupled with a smartphone app focusing on improving public response to emergencies by providing real-time communication capabilities. Finally an Educational Hub offering principles and guidelines regarding best practices to reduce the risk at various levels and conditions (personal, family, work etc) in line with State emergency plans and regulations, is also included.
2. REDA System information
2.1. Harmonization
A first important step towards the joint development of a REDAS is related to overcoming existing harmonization issues. It is a demanding task since earthquake monitoring Institutions are well established and operate on their own protocols, adopting their specific data formats, methodologies and protocols. For that reason, the establishment of a cross-border cooperation to bring those Institutions into a consensus regarding their common targets and promote common policies and strategies leading to sharing data, information and competencies, is a demanding task. To that end, prior and continuous communication with the stakeholders can greatly help since they all share the same concerns and needs. At its first release, REDAS will be populated with high detail, high accuracy harmonized “input” parameters regarding Strong Motion Records from the National monitoring networks including ITSAK (Greece), AFAD (Turkey) and NIEP (Romania), combined with harmonized
Page 110 of 269

SafeGreece 2021 on-line Proceedings | ISSN 2654-1823
SafeGreece 2021 – 8th International Conference on Civil Protection & New Technologies 24-26 November, on-line | www.safegreece.org/safegreece2021 | [email protected]
structure response data, which have been developed for selected areas in partner countries for “assets at risk” (building types, gas pipelines, lifelines, geotechnical failures), most of which will be merged to form a common database except the National building inventory data due to data sharing restrictions. Ground motion prediction equations, damage models and geotechnical failure models have been jointly processed and adapted for implementation in the entire pilot implementation areawhich covers a large part of the Black Sea Basin area.
2.2. Operational mode
The REDA platform triggering point is an automatic alert of the earthquake magnitude and hypocenter, within a few minutes after the earthquake origin time, followed by an accurate calculation of magnitude and hypocenter parameters (Figure 2). A database including all possible active faults is used to identify the causative fault. Forward modeling based on selected ground motion predictive equations is then performed for the study area and shakemaps (PGA, PGV, Spectral Acceleration for selected natural periods) are generated within a few minutes after the earthquake automatic alert. At the same time, automatically selected acceleration time histories from regional free-field accelerometers are used to calibrate and improve the accuracy of calculated shakemaps at regional scale. In densely instrumented urban areas, a refined shakemap at large scale, based mainly on the observed data, is generated. In almost real time, convolution of the calculated strong motion parameters with the corresponding vulnerability curves of “assets at risk”, provide the expected damage distribution, followed by a final report including all necessary information regarding damage distribution in the area, which is directly communicated to members of the Target Group.
Figure 1 A schematic representation of REDACt operational mode
Ground motion sensors will be installed in schools to densen the monitoring network, to contribute to real-time information and at the same time, to help promote earthquake safety principles to an important part of the population. The REDA platform will be validated using geo-spatial damage inventories, available from past disastrous earthquakes.
Page 111 of 269

SafeGreece 2021 on-line Proceedings | ISSN 2654-1823
SafeGreece 2021 – 8th International Conference on Civil Protection & New Technologies 24-26 November, on-line | www.safegreece.org/safegreece2021 | [email protected]
REDAS includes a smartphone app which will support crowd-sourcing, will provide advise, will be connected to other streams (EMSC Felt Reports, INFP) and will provide the ability to share updates on emergency information, upon user choise (with friends, family etc). Finally and in order to improve the level of communication with the public, the level of comprehending the situation and of being trained to respond an Educational Hub, hosted at the project’s Website (https://www.redact-project.eu/) will present a list of short manuals and tutorials aiming at helping the public develop their own emergency response plans at various levels (personal, family etc) always in line with State emergency plans and regulations. An indicative list includes the documents: “REDAS Operational Guide”; “Smartphone user manual”; “Planning for Emergencies and for Safe Citizens”; “From Earthquake Focus to induced Damage”, Earthquake Damage to Structures and Infrastructure”, Earthquake induced Geotechnical Failures”. Most of these documents will be based on the wealth of existing, published by State authorities, respective material after is has been harmonized and popularized. All will be produced in English and translated into Greek, Turkish and Romanian.
3. CONCLUSIONSA Rapid Earthquake Damage Assessment System is proposed to be used as both a decision supportingsystem for planning Prevention, Preparedness and in case of disastrous events, for Emergency Responseand at the same time to promote public awareness and public response to emergencies, fully in linewith the Sendai Framework for Disaster Risk Reduction (2015-2030). REDAS outputs will be harmonizedand fully cover cross border areas.
REFERENCES 1. Murat Nurlu, Yasin Fahjan, Bengi Eravci, Mehmet Baykal, Güler Yenilmez, Derya Yalcin, Kenan Yanik, F.
İlknur Kara, Ferhat Pakdamar (2014): Rapid Estimation of Earthquake Losses in Turkey using AFAD-REDSystem. Second European Conference on Earthquake Engineering and Seismology, Istanbul Aug. 25-29,2014.
2. Hancilar U, Tuzun C, Yenidogan C, Erdik M. (2010): ELER Software - a New Tool for Urban Earthquake LossAssessment. Natural Hazards and Earth System Sciences 10 (12); 2010. p. 2677-2696. JRC59821
3. Olivier Sedan, Caterina Negulescu, Monique Terrier, Agathe Roulle, Thierry Winter, Didier Bertil (2013):Armagedom -- A Tool for Seismic Risk Assessment Illustrated with Applications. Journal of EarthquakeEngineering (ISSN : 1363-2469, ISSN électronique : 1363-2469).
4. Wald D J, Earle P S, Allen T I, Jaiswal K, Porter K, and Hearne M (2008): Development of the U.S. GeologicalSurvey’s Prompt Assessment of Global Earthquakes for Response (PAGER) System. 31st General Assemblyof the European Seismological Commission ESC 2008. Hersonissos, Crete, Greece, 7-12 September 2008
5. D. J. Wald, K. S. Jaiswal, K. D. Marano, D. Garcia, E. So & M. Hearne (2012): Impact-Based EarthquakeAlerts with the U.S. Geological Survey’s PAGER System: What's Next? Fifteenth (15th) World Conf. Earthq.Eng.At: Lisbon (Portugal) Volume: Paper No. 956.
6. M. Pagani, D. Monelli, G. Weatherill, L. Danciu, H. Crowley, V. Silva, P. Henshaw, L. Butler, M. Nastasi, L.Panzeri, M. Simionato, D. Vigano (2014): OpenQuake Engine: An Open Hazard (and Risk) Software for theGlobal Earthquake Model. Seismological Research Letters (2014) 85 (3): 692–702. DOI10.1785/0220130087
7. FEMA Natural Hazards Risk Assessment Program (NHRAP), Risk Management Directorate (2020): HazusEarthquake Model Technical Manual. FEMA, US Department of Homeland Security.
8. Omar Dario Cardona, Mario Ordaz, Eduardo Reinoso, Alex H. Barbat (2012): CAPRA - ComprehensiveApproach to Probabilistic Risk Assessment: International Initiative for Risk Management Effectiveness.Fifteenth (15th) World Conf. Earthq. Eng.At: Lisbon (Portugal).
9. S. Molina-Palacios, D. H. Lang, A. Meslem, C. D. Lindholm & N. Agea-Medina (2017): A Next-GenerationOpen-Source Tool for Earthquake Loss Estimation. Int. J. of Safety and Security Eng., Vol. 7, No. 4 (2017)585–596.
Page 112 of 269
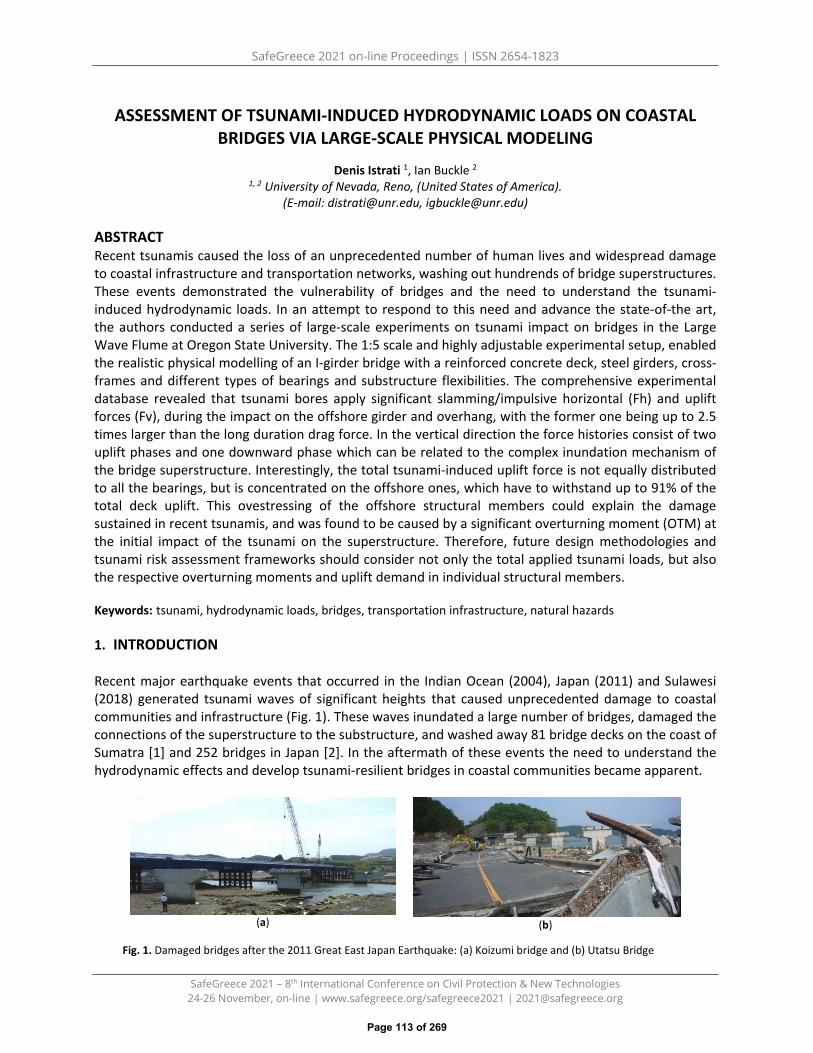
SafeGreece 2021 on-line Proceedings | ISSN 2654-1823
SafeGreece 2021 – 8th International Conference on Civil Protection & New Technologies 24-26 November, on-line | www.safegreece.org/safegreece2021 | [email protected]
ASSESSMENT OF TSUNAMI-INDUCED HYDRODYNAMIC LOADS ON COASTAL BRIDGES VIA LARGE-SCALE PHYSICAL MODELING
Denis Istrati 1, Ian Buckle 2 1, 2 University of Nevada, Reno, (United States of America).
(E-mail: [email protected], [email protected])
ABSTRACT Recent tsunamis caused the loss of an unprecedented number of human lives and widespread damage to coastal infrastructure and transportation networks, washing out hundrends of bridge superstructures. These events demonstrated the vulnerability of bridges and the need to understand the tsunami-induced hydrodynamic loads. In an attempt to respond to this need and advance the state-of-the art, the authors conducted a series of large-scale experiments on tsunami impact on bridges in the Large Wave Flume at Oregon State University. The 1:5 scale and highly adjustable experimental setup, enabled the realistic physical modelling of an I-girder bridge with a reinforced concrete deck, steel girders, cross-frames and different types of bearings and substructure flexibilities. The comprehensive experimental database revealed that tsunami bores apply significant slamming/impulsive horizontal (Fh) and uplift forces (Fv), during the impact on the offshore girder and overhang, with the former one being up to 2.5 times larger than the long duration drag force. In the vertical direction the force histories consist of two uplift phases and one downward phase which can be related to the complex inundation mechanism of the bridge superstructure. Interestingly, the total tsunami-induced uplift force is not equally distributed to all the bearings, but is concentrated on the offshore ones, which have to withstand up to 91% of the total deck uplift. This ovestressing of the offshore structural members could explain the damage sustained in recent tsunamis, and was found to be caused by a significant overturning moment (OTM) at the initial impact of the tsunami on the superstructure. Therefore, future design methodologies and tsunami risk assessment frameworks should consider not only the total applied tsunami loads, but also the respective overturning moments and uplift demand in individual structural members.
Keywords: tsunami, hydrodynamic loads, bridges, transportation infrastructure, natural hazards
1. INTRODUCTION
Recent major earthquake events that occurred in the Indian Ocean (2004), Japan (2011) and Sulawesi (2018) generated tsunami waves of significant heights that caused unprecedented damage to coastal communities and infrastructure (Fig. 1). These waves inundated a large number of bridges, damaged the connections of the superstructure to the substructure, and washed away 81 bridge decks on the coast of Sumatra [1] and 252 bridges in Japan [2]. In the aftermath of these events the need to understand the hydrodynamic effects and develop tsunami-resilient bridges in coastal communities became apparent.
(a) (b)
Fig. 1. Damaged bridges after the 2011 Great East Japan Earthquake: (a) Koizumi bridge and (b) Utatsu Bridge
Page 113 of 269
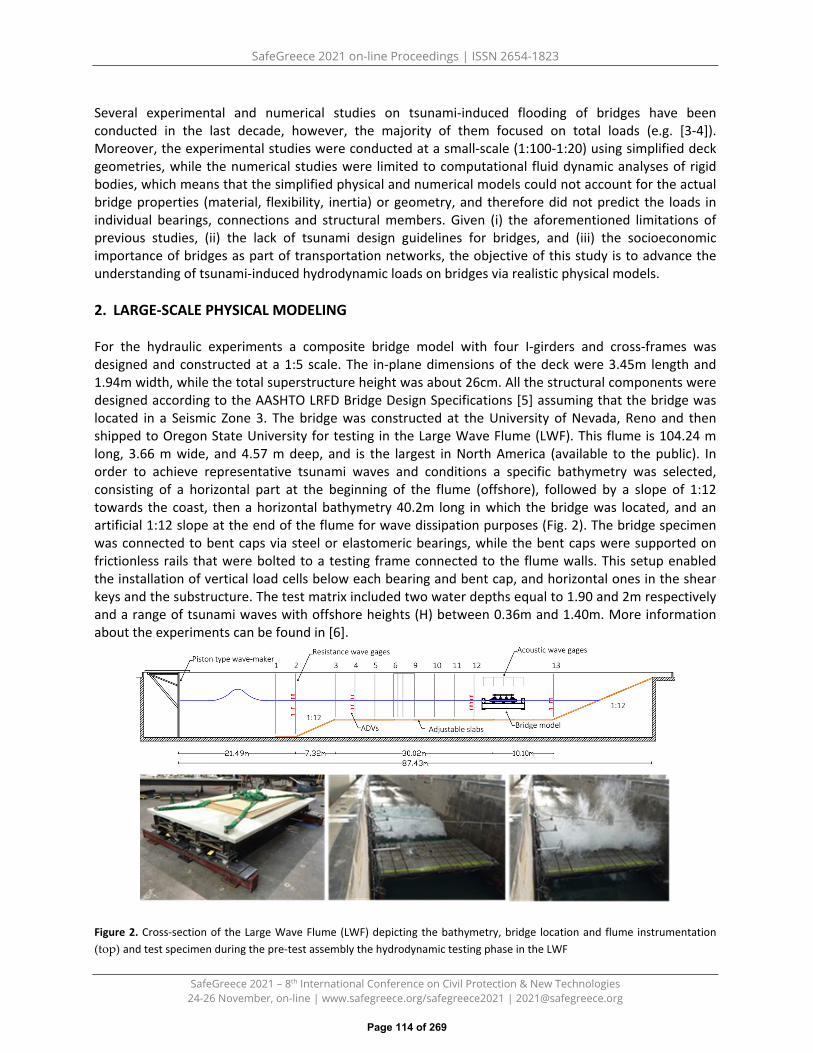
SafeGreece 2021 on-line Proceedings | ISSN 2654-1823
SafeGreece 2021 – 8th International Conference on Civil Protection & New Technologies 24-26 November, on-line | www.safegreece.org/safegreece2021 | [email protected]
Several experimental and numerical studies on tsunami-induced flooding of bridges have been conducted in the last decade, however, the majority of them focused on total loads (e.g. [3-4]). Moreover, the experimental studies were conducted at a small-scale (1:100-1:20) using simplified deck geometries, while the numerical studies were limited to computational fluid dynamic analyses of rigid bodies, which means that the simplified physical and numerical models could not account for the actual bridge properties (material, flexibility, inertia) or geometry, and therefore did not predict the loads in individual bearings, connections and structural members. Given (i) the aforementioned limitations of previous studies, (ii) the lack of tsunami design guidelines for bridges, and (iii) the socioeconomic importance of bridges as part of transportation networks, the objective of this study is to advance the understanding of tsunami-induced hydrodynamic loads on bridges via realistic physical models.
2. LARGE-SCALE PHYSICAL MODELING
For the hydraulic experiments a composite bridge model with four I-girders and cross-frames was designed and constructed at a 1:5 scale. The in-plane dimensions of the deck were 3.45m length and 1.94m width, while the total superstructure height was about 26cm. All the structural components were designed according to the AASHTO LRFD Bridge Design Specifications [5] assuming that the bridge was located in a Seismic Zone 3. The bridge was constructed at the University of Nevada, Reno and then shipped to Oregon State University for testing in the Large Wave Flume (LWF). This flume is 104.24 m long, 3.66 m wide, and 4.57 m deep, and is the largest in North America (available to the public). In order to achieve representative tsunami waves and conditions a specific bathymetry was selected, consisting of a horizontal part at the beginning of the flume (offshore), followed by a slope of 1:12 towards the coast, then a horizontal bathymetry 40.2m long in which the bridge was located, and an artificial 1:12 slope at the end of the flume for wave dissipation purposes (Fig. 2). The bridge specimen was connected to bent caps via steel or elastomeric bearings, while the bent caps were supported on frictionless rails that were bolted to a testing frame connected to the flume walls. This setup enabled the installation of vertical load cells below each bearing and bent cap, and horizontal ones in the shear keys and the substructure. The test matrix included two water depths equal to 1.90 and 2m respectively and a range of tsunami waves with offshore heights (H) between 0.36m and 1.40m. More information about the experiments can be found in [6].
Figure 2. Cross-section of the Large Wave Flume (LWF) depicting the bathymetry, bridge location and flume instrumentation (top) and test specimen during the pre-test assembly the hydrodynamic testing phase in the LWF
Page 114 of 269
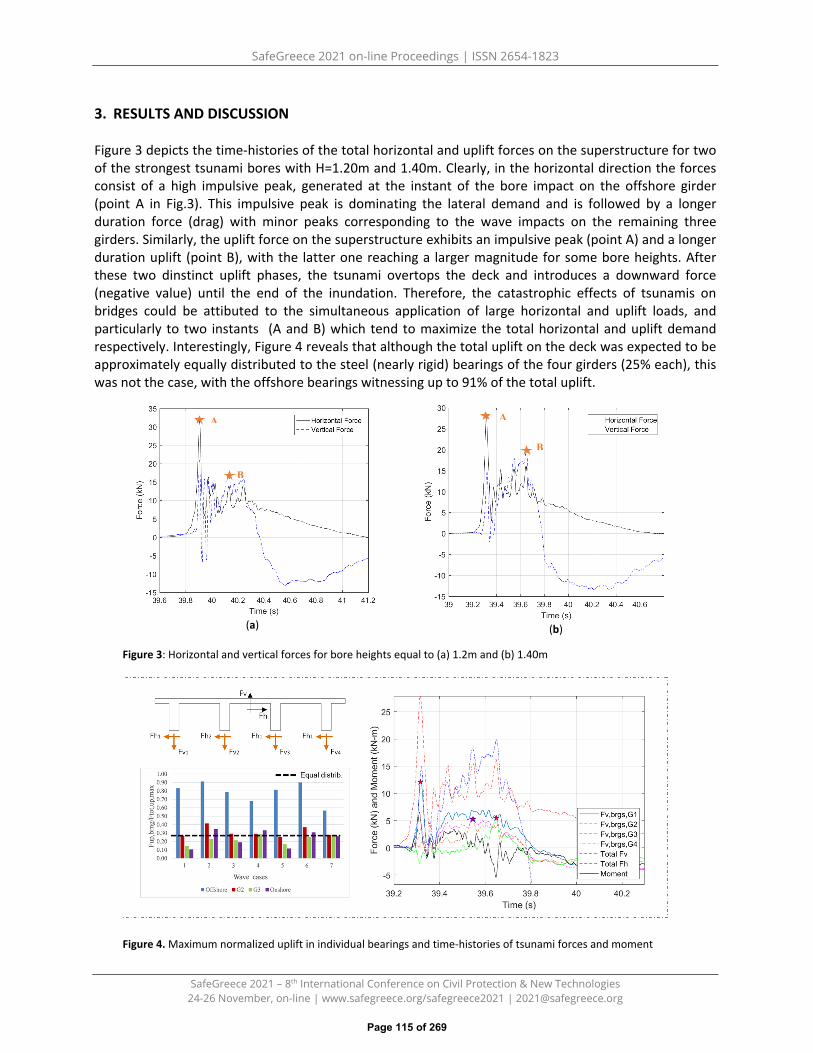
SafeGreece 2021 on-line Proceedings | ISSN 2654-1823
SafeGreece 2021 – 8th International Conference on Civil Protection & New Technologies 24-26 November, on-line | www.safegreece.org/safegreece2021 | [email protected]
3. RESULTS AND DISCUSSION
Figure 3 depicts the time-histories of the total horizontal and uplift forces on the superstructure for two of the strongest tsunami bores with H=1.20m and 1.40m. Clearly, in the horizontal direction the forces consist of a high impulsive peak, generated at the instant of the bore impact on the offshore girder (point A in Fig.3). This impulsive peak is dominating the lateral demand and is followed by a longer duration force (drag) with minor peaks corresponding to the wave impacts on the remaining three girders. Similarly, the uplift force on the superstructure exhibits an impulsive peak (point A) and a longer duration uplift (point B), with the latter one reaching a larger magnitude for some bore heights. After these two dinstinct uplift phases, the tsunami overtops the deck and introduces a downward force (negative value) until the end of the inundation. Therefore, the catastrophic effects of tsunamis on bridges could be attibuted to the simultaneous application of large horizontal and uplift loads, and particularly to two instants (A and B) which tend to maximize the total horizontal and uplift demand respectively. Interestingly, Figure 4 reveals that although the total uplift on the deck was expected to be approximately equally distributed to the steel (nearly rigid) bearings of the four girders (25% each), this was not the case, with the offshore bearings witnessing up to 91% of the total uplift.
(a) (b)
Figure 3: Horizontal and vertical forces for bore heights equal to (a) 1.2m and (b) 1.40m
Figure 4. Maximum normalized uplift in individual bearings and time-histories of tsunami forces and moment
A
B
A
B
Page 115 of 269

SafeGreece 2021 on-line Proceedings | ISSN 2654-1823
SafeGreece 2021 – 8th International Conference on Civil Protection & New Technologies 24-26 November, on-line | www.safegreece.org/safegreece2021 | [email protected]
The uplift load concentration in the offshore bearings seems to take place when the tsunami slams on the deck (point A), which means that if these bearings fail at this instant, then that could lead to a progressive collapse mechanism with the sequential failure of the remaining bearings as the tsunami propagates through the superstructure. Calculating the overturning moment (OMT) from the measured forces and the respective moment arms of the load cells, reveals that the tsunami bore generates a significant clockwise moment at instant A, which tends to introduce tension in the offshore bearings and compression in the onshore ones. The large OTM, which has not been considered in the literature, is responsible for the overstressing of the offshore bearings, since both of them are maximized at the same instant. This means that future tsunami design and retrofitting methodologies for bridges should consider multiple combinations of horizontal and uplift forces with corresponding moments, in order to capture accurately the maximum demand in structural members.
4. CONCLUSIONS
This study advances the understanding of tsunami-induced effects on bridge superstructures by revealing the generation of:
• Impulsive horizontal forces that can be 2.5 times larger than the respective long duration ones.• A complex force pattern in the vertical direction that consists of two uplift phases and a
downward one. Contrary to the total horizontal demand on the deck, the uplift demand can begoverned by either the impulsive or the long duration uplift force.
• An unexpectedly large uplift force in the offshore bearings and connections, which can reach91% of the total deck uplift. This was attributed to the signficant overturning moment (OTM)generated by the simultaneously large horizontal and uplift forces at the instant the tsunamislams on the offshore girder and overhang.
The above findings suggest the need for a paradigm shift in the assessment of tsunami risk to coastal bridges to include not just the estimation of total forces but also the OTM and the distribution of the loads to individual structural components that are necessary for the survival of the bridge.
ACKNOWLEDGEMENTS This research project was funded by the Federal Highway Administration under Contract No. DTFH61-07-C-0031. Authors wish to thank Patrick Laplace, Tao Xiang, Tim Maddux and the staff of HinsdaleWave Research Laboratory at Oregon State University for their assistance during the experiments.
REFERENCES
1. Unjoh S. Bridge damage caused by tsunami. B Japan Assoc Earthquake Eng 2007, 6: 6–282. Maruyama, K.; Tanaka, Y.; Kosa, K.; Hosoda, A.;Arikawa, T.; Mizutani, N.; Nakamura, T. Evaluation of
tsunami force acting on bridge girders. Proc Thirteenth East Asia-Pacific Conference on StructuralEngineering and Construction (EASEC-13) (pp. Keynote-Lecture), 2013
3. Hayashi H (2013): Study on tsunami wave force acting on a bridge superstructure. Proc 29th US-JapanBridge Engineering Workshop, Tsukuba, Japan.
4. Hoshikuma J, Zhang G, Nakao H, Sumimura T (2013): Tsunami-induced effects on girder bridges. Proc ofthe Intl Symp for Bridge Earthq Eng in Honor of Retirement of Prof. Kazuhiko Kawashima, Tokyo, Japan
5. AASHTO LRFD Bridge Design Specifications (2012). ISBN: 978-1-56051-523-4, Publication Code: LRFDUS-6.6. Istrati, D., Buckle, I.G., A., Lomonaco, P., Yim, S. (2018): “Deciphering the tsunami wave impact and
associated connection forces in open-girder coastal bridges”, Jl Marine Science & Eng, 2018, MDPI,6 (148).
Page 116 of 269

SafeGreece 2021 on-line Proceedings | ISSN 2654-1823
SafeGreece 2021 – 8th International Conference on Civil Protection & New Technologies 24-26 November, on-line | www.safegreece.org/safegreece2021 | [email protected]
OPERATIONAL MONITORING OF A VOLCANO BEFORE ENTERING IN UNREST PHASE USING SENTINEL 1 DINSAR AND MTINSAR: THE CASE OF LA PALMA
VOLCANIC ISLAND Ignacio Castro-Melgar1,2, Janire Prudencio1,3, Jesús Ibáñez1,3, Theodoros Gatsios2,4 and Issaak Parcharidis2
1Department of Theoretical Physics and Cosmos, University of Granada (Spain) (E-mail: [email protected], [email protected], [email protected])
2Department of Geography, Harokopio University of Athens (Greece) (E-mail: [email protected], [email protected])
3Andalusian Institute of Geophysics, University of Granada (Spain) 4Department of Geophysics and Geothermy, National and Kapodistrian University of Athens (Greece)
ABSTRACT The volcanic complex of Cumbre Vieja on the island of La Palma is in eruption (October 2021) with serious implications for the inhabits of the island. SAR interferometry has been used as an operational tool in order to monitoring active volcanoes. The current study concerns the application of DinSAR and MTInSAR-SBAS in the area using Sentinel 1 SLC images in order to detect potential precursor of uplift in the unrest area. The final task is to confirm that interferometric techniques could act as a warning system before the explosion of a volcano. Results show that starting from last week of August a pattern of uplift is detected which increased few days before the explosion.
Keywords: SAR Interferometry, DinSAR, SBAS, Volcanic hazard, La Palma
1. INTRODUCTION
The Canary archipelago is formed by a chain of seven volcanic islands and four islets located in the eastern Atlantic Ocean. There is an alignment of the islands, islets and seamounts showing age progression from NE to SW [1]. Its two western, youngest, and active islands in the archipelago (La Palma and El Hierro) are host of the highest potential risk due to their active volcanism. The origin of the volcanism in the Canary Archipelago started in Oligocene and continues active [2], the mechanism that originated its volcanism is still under debate by the scientific community. The most accepted models are the propagation fracture from the Atlas Mountains [3] or the existence of a hotspot or mantle plume [4, 5] among others models.
One of the youngest islands of the archipelago is La Palma, located in the NW area. It is the second island in height and the fifth in size, it has an area of 706 km2 and its aligned N-S. Volcanic activity in La Palma first originated with the formation of an underwater complex of seamounts and a plutonic complex between 3 and 4 Ma [6]. In terms of its historical eruption records, La Palma is the most active island, at least 7 eruptions have been reported, including 1585, 1646, 1677, 1712, 1949, 1971 volcanic eruptions and the last one that is currently in progress. The last eruption in the other islands of the archipelago happened in 2011, it was an underwater eruption off the coast El Hierro, the neighbouring island in the Southwest of Canarias.
Currently, the volcanic complex of Cumbre Vieja on the island of La Palma is in eruption (October 2021) with serious implications for the inhabits of the island. In the century XXI different volcanic manifestations have been observed in the Canary Islands such as the seismic series of Tenerife in 2004, the reactivations and eruptions of El Hierro between 2011 and 2014 and the seismic series on La Palma in 2017, 2018, 2020 and 2021.
The previous eruption on La Palma of 1971, it is called the Teneguia eruption, the eruption lasted 24 days and began through a 200m eruptive fissure producing pyroclasts and lavas. Later, the behaviour turned more explosive with strombolian activity. The precursor seismicity had the onset 6 days before
Page 117 of 269

SafeGreece 2021 on-line Proceedings | ISSN 2654-1823
SafeGreece 2021 – 8th International Conference on Civil Protection & New Technologies 24-26 November, on-line | www.safegreece.org/safegreece2021 | [email protected]
the eruption [7] This eruption was probably fed by an another magma plumbing/reservoir system with respect to the older Taburiente/Cumbre Nueva volcanic system [8].
2. METHODOLOGY
Synthetic Aperture Radar (SAR) is a powerful remote sensing satellite sensor used for Earth observation [9]. It emits electromagnetic radiation and then coherently records the amplitude and phase of the returned signal to produce images of the ground. It has cloud-penetrating capabilities, as well as day and night operational capabilities. Spaceborne SAR interferometry is a technique that produces 3D topographic data of Earth’s surface directly from two SAR images [10]. An extension of the basic technique, called differential SAR interferometry (DInSAR), allows measurements of land deformation very precisely with millimetre resolution. It has various applications in the fields of volcanology, cartography, crustal dynamics and land subsidence.
By using large stacks of SAR images acquired over the same area, long deformation time series can be analysed using multitemporal differential SAR interferometry techniques. These coherent methods exploit either permanently coherent Persistent Scatterers (PSs) or temporally coherent Distributed Scatterers (DSs). PSs are typically artificial objects that reflect radar energy well such as metal structures and buildings. The PS methods that have been developed include the Persistent Scatterer Interferometry (PSI). PSI provides a parametric estimation of the 3D location and velocity of each PS along the line of sight (LOS) connecting it to the satellite [11,12]. Many such measurements are combined using PSI to produce highly accurate terrain motion maps. In urban areas where there is a prevalence of PSs, PSI allows analysis of even individual structures on the ground. The DS methods include algorithms such as SBAS. A DS object reflects lower radar energy compared to PSs and it usually covers several pixels in high resolution SAR images. These pixels exhibit similar scattering properties and can be used together for deformation estimation. SBAS estimates the deformation time series even in rural areas where the density of PSs is low [13].
3. RESULTS AND DISCUSSION
The aim of the present work is to prove that in this case SAR interferometry is an important tool for detecting and mapping surface deformation, which is a precursor phenomenon which, in combination with other phenomena, can lead a volcano into unrest phase even to explosion. DInSAR and SBAS methods have been applied using Sentinel 1 A & B SLC. For SBAS method 24 SLC images in descending geometry of acquisition (169 relative orbit) covering the period 01/05/2021 - 16/09/2021 were processed with GAMMA/IPTA s/w. For DInSAR method have been used two interferometric pairs from Sentinel 1 SLC specifically (i) 05/08/2021 & 16/09/2021 in descending geometry (169) and (ii) 09/08/2021 & 14/09/2021 in ascending geometry of acquisition (60) both processed with ESA’s open SNAP s/w.
Page 118 of 269
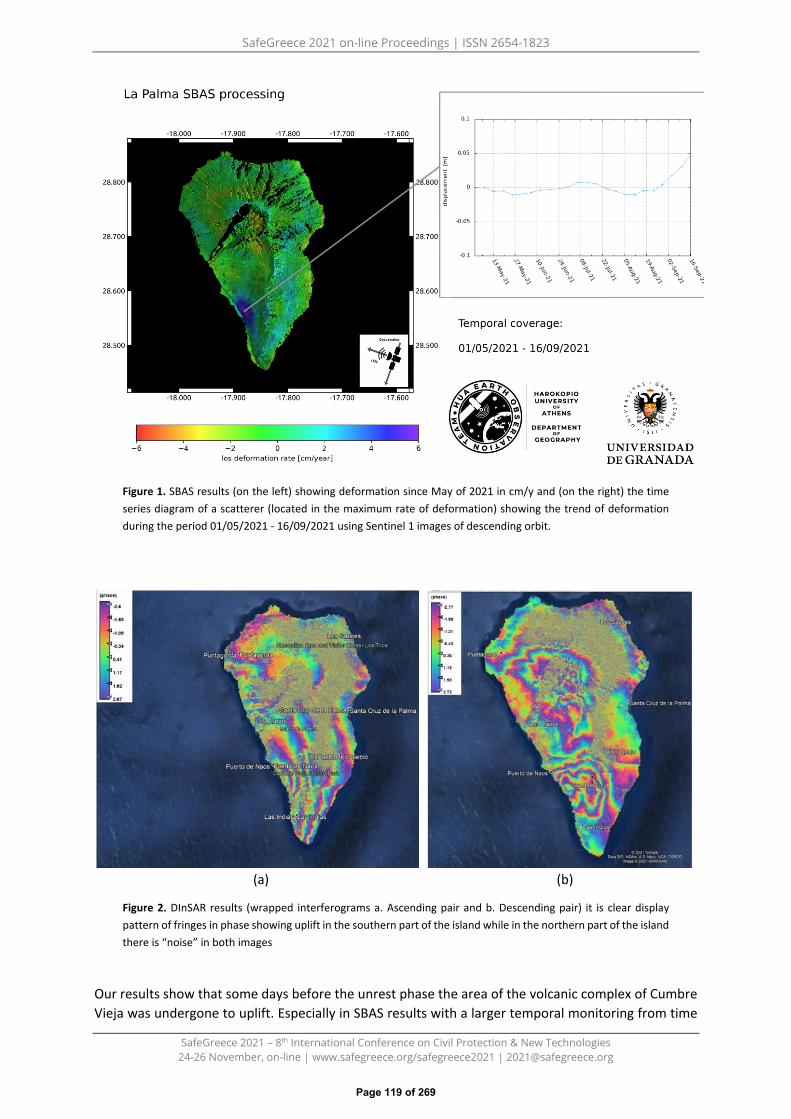
SafeGreece 2021 on-line Proceedings | ISSN 2654-1823
SafeGreece 2021 – 8th International Conference on Civil Protection & New Technologies 24-26 November, on-line | www.safegreece.org/safegreece2021 | [email protected]
Figure 1. SBAS results (on the left) showing deformation since May of 2021 in cm/y and (on the right) the time series diagram of a scatterer (located in the maximum rate of deformation) showing the trend of deformation during the period 01/05/2021 - 16/09/2021 using Sentinel 1 images of descending orbit.
(a) (b)
Figure 2. DInSAR results (wrapped interferograms a. Ascending pair and b. Descending pair) it is clear display pattern of fringes in phase showing uplift in the southern part of the island while in the northern part of the island there is “noise” in both images
Our results show that some days before the unrest phase the area of the volcanic complex of Cumbre Vieja was undergone to uplift. Especially in SBAS results with a larger temporal monitoring from time
Page 119 of 269

SafeGreece 2021 on-line Proceedings | ISSN 2654-1823
SafeGreece 2021 – 8th International Conference on Civil Protection & New Technologies 24-26 November, on-line | www.safegreece.org/safegreece2021 | [email protected]
series diagram it is clearly noticed that the after an up-down between May and last week of August there is an abrupt uplift in September until very few days before the explosion.
REFERENCES
1. J. Geldmacher, K. Hoernle, P. Bogaard, S. Duggen, R. Werner (2005). New 40Ar/39Ar age and geochemicaldata from seamounts in the Canary and Madeira volcanic provinces: support for the mantle plumehypothesis. Earth and Planetary Science Letters, 237(1-2), 85-101.https://doi.org/10.1016/j.epsl.2005.04.037
2. H. Staudigel, H. U. Schmincke (1984). The pliocene seamount series of la palma/canary islands. Journalof Geophysical Research: Solid Earth, 89(B13), 11195-11215. https://doi.org/10.1029/JB089iB13p11195
3. F. Anguita, F. Hernán (1975). A propagating fracture model versus a hot spot origin for the CanaryIslands. Earth and Planetary Science Letters, 27(1), 11-19. https://doi.org/10.1016/0012-821X(75)90155-7
4. W. J. Morgan (1983). Hotspot tracks and the early rifting of the Atlantic. In Developments inGeotectonics (Vol. 19, pp. 123-139). Elsevier. https://doi.org/10.1016/B978-0-444-42198-2.50015-8
5. J. C. Carracedo, S. Day, H. Guillou, E. R. Badiola, J. A. Canas, F. P. Torrado (1998). Hotspot volcanism close to a passive continental margin: the Canary Islands. Geological Magazine, 135(5), 591-604.https://doi.org/10.1017/S0016756898001447
6. H. Staudigel, G. Feraud, G. Giannerini (1986). The history of intrusive activity on the island of La Palma(Canary Islands). Journal of Volcanology and Geothermal Research, 27(3-4), 299-322.https://doi.org/10.1016/0377-0273(86)90018-1
7. H. Albert, F. Costa, J. Martí (2016). Years to weeks of seismic unrest and magmatic intrusions precedemonogenetic eruptions. Geology, 44(3), 211-214. https://doi.org/10.1130/G37239.1
8. K. Galipp, A. Klügel, T. H. Hansteen (2006). Changing depths of magma fractionation and stagnationduring the evolution of an oceanic island volcano: La Palma (Canary Islands). Journal of Volcanology andGeothermal Research, 155(3-4), 285-306. https://doi.org/10.1016/j.jvolgeores.2006.04.002
9. J. Curlander, R. McDonough (1991). Synthetic aperture radar: Systems and signal processing. John Wiley and Sons. ISBN: 978-0-471-85770-9
10. R. Bamler, P. Hartl (1998). Synthetic aperture radar interferometry. Inverse problems 14, R1-R54, IOPPublishing Limited. https://doi.org/10.1088/0266-5611/14/4/001
11. A. Ferretti, C. Prati, F. Rocca (2000). Nonlinear subsidence rate estimation using permanent scatterersin differential SAR interferometry. IEEE Transactions on Geoscience and Remote Sensing 38 (5), 2202–2212. https://doi.org/10.1109/36.868878
12. A. Ferretti, C. Prati, F. Rocca (2001). Permanent scatterers in SAR interferometry. IEEE Transactions onGeoscience and Remote Sensing 39 (1), 8-20. https://doi.org/10.1109/36.898661
13. P. Berardino, G. Fornaro, R. Lanari, E. Sansosti (2002). A new algorithm for surface deformationmonitoring based on small baseline differential SAR interferograms. IEEE Transactions on Geoscienceand Remote Sensing 40 (11), 2375-2383. https://doi.org/10.1109/TGRS.2002.803792
Page 120 of 269

SafeGreece 2021 on-line Proceedings | ISSN 2654-1823
SafeGreece 2021 – 8th International Conference on Civil Protection & New Technologies 24-26 November, on-line | www.safegreece.org/safegreece2021 | [email protected]
A NEW PROTOCOL FOR POST EARTHQUAKE RECONNAISSANCE SURVEY; CASE STUDY OF THESSALY, GREECE MARCH 2021 LIQUEFACTION PHENOMENA
George Papathanassiou1, Sotiris Valkaniotis2, Athanassios Ganas3, Riccardo Caputo4 1School of Geology, Aristotle University of Thessaloniki, Greece ([email protected])
2Department of Civil Engineering, Democritus University of Thrace, Greece ([email protected]) 3 Geodynamic Institute, National Observatory of Athens, Greece ([email protected])
4 Department of Physics and Earth Sciences, University of Ferrara, Italy ([email protected])
ABSTRACT A seismic sequence on March 2021 occurred in Thessaly triggering extensive liquefaction phenomena; the mainshock Mw=6.3 occurred on March 3rd, 2021, in the area between Tyrnavos and Elassona. Less than 48 hours from the mainshock, our team conducted a field survey aiming to document the earthquake-induced ground failures. In order to achieve this, a new approach was developed and proposed to be used as a protocol for relevant post earthquake surveys.
Keywords: liquefaction, remote sensing, lateral spreading
1. OBJECTIVEThe goal of this research was twofold; i) develop a methodogy that will be used for post earthquakerecons and ii) document the liquefaction phenomena that have been triggered by the March 2021Thessaly seismic sequence. In order to achieve this, a 10-days field survey was conducted in conjuctionwith the remote survey that was started immediately after the mainshock on March 3rd.
2. METHOD
For the purposes of this research, we developed a new methodology for conducting post earthqukae reconnaissance survey, which is proposed to be used and tested in future events. The developed protocol is separated in two phases; phase 1 is related to desktop studies (remote survey) by analyzing the satellite imageries for locating the ground failures, and the second phase is realized on the field and consisted of a set of drive-by, ground survey and UAV campaigns, performed to quantitatively document the earthquake-induced ground disruption. In particular, the drive-by recon aimed to rapidly reporting the low- and high-density liquefaction zones as they have been delineated in advance based on data provided by satellite imagery. The ground and UAV-based surveys focused on high density areas aiming to measure their dimensions e.g., length, diameter and orientation.
During the extensive field survey and mapping, accompanied by UAV aerial surveys, following the strong earthquakes, numerous (more than 400 cases) liquefaction-related features were identified, including sand blows and craters, fissures and lateral spreading cracks/ruptures along the Pinios and Titarisios river banks (Valkaniotis et al. 2021). A rapid documentation of these features was important, as most of these features were going to be erased or smoothed by the ploughing season that is ongoing in the area.
Page 121 of 269

SafeGreece 2021 on-line Proceedings | ISSN 2654-1823
SafeGreece 2021 – 8th International Conference on Civil Protection & New Technologies 24-26 November, on-line | www.safegreece.org/safegreece2021 | [email protected]
Figure 1. Density (number per square kilometer) of mapped liquefaction features along Pinios river (Valkaniotis et al. 2021).
3. CONCLUSIONSThe remote survey that took place before the field survey is considered as time-saving procedure sincethe clustering of liquefaction phenomena were identified in advance. It is important to highlight that thepreliminary map compiled based on data provided by remote sensing correctly delineated the clustersof liquefaction phenomena . Afterwards, the field survey (ground and UAV based) conducted in order toquantitavey defined the liquefaction phenomena. Regarding the characteristcs of liquefactionmanifestations, it was found that the orientation of the aligned features is not unique for the wholearea, but if follows the direction of the former channels and their associated ox-bow lakes inside thePiniada valley. In addition, lateral spreading phenomena were mapped both on inner and outer banks ofPinios and Titarissios rivers. Finally, as it was shown by comparing the spatial distribution of liquefactionphenomena with the historical geomorphological maps showing the evolution of the Piniada Valley, theliquefaction clusters are clearly related to the presence of recently abandoned channels andpalaeomeanders (ox-bow lakes) (Papathanssiou et al. 2021).
REFERENCES 1. Papathanassiou G., Valkaniotis S., Ganas Ath., Stampolidis Al., Rapti D., Caputo R. 2021 Floodplain evolution andits influence on liquefaction clustering: the case study of March 2021 Thessaly, Greece, seismic sequence,Engineering Geology (in review)2. Valkaniotis S., Papathanassiou G., Ganas Ath., Kremastas V., Caputo R. 2021. Preliminary report of liquefactionphenomena triggered by the March 2021 earthquakes in Central Thessaly, Greece. Zenodo.http://doi.org/10.5281/zenodo.4608365
Page 122 of 269

SafeGreece 2021 on-line Proceedings | ISSN 2654-1823
SafeGreece 2021 – 8th International Conference on Civil Protection & New Technologies 24-26 November, on-line | www.safegreece.org/safegreece2021 | [email protected]
THE PREDICTIVE VALUE OF THE FORESHOCK ACTIVITY PRECEDING THE 27 SEPTEMBER 2021 STRONG EARTHQUAKE (Mw6.0) IN CRETE ISL., GREECE
Ioanna Triantafyllou1, Gerassimos A. Papadopoulos2 1 Department of Geology & Geoenvironment, National & Kapodistrian University of Athens, 15784 Athens, Greece
[email protected] 2 International Society for the Prevention & Mitigation of Natural Hazards, 10681 Athens, Greece
ABSTRACT
The strong earthquake (Mw6.0) that caused extensive damage in the area of Arkalochori, central Crete Isl., on 27 September 2021, was preceded by an intense foreshock sequence that started by the beginning of June 2021. In this study we examine the features of the sequence, show that they are similar to features of other foreshock sequences studied worldwide and underline the potential value of foreshocks for the prediction of the mainshock. This is a stable conclusion reached after the main shock occurrence when a complete knoweledge of the sequence became available. However, the recognition of the foreshock sequence in real-time has been a quite challenging issue from both the scientific and operational points of view. This is due to that our knowledge about the foreshock sequence was highy incomplete even at its last stages. One reason is the relatively low number of events involved in the seismicity process, which is a feature of the Arkalochori foreshock sequence. An additional reason is the relatively high value of the completeness magnitude threshold, Mc, which characterizes the foreshock catalogue. For the Arkalochori case the Mc ranges from 2.3 up to 2.8, depending on the technique used to calculate it. This implies that mean value of Mc was about 2.5. Besides the Mc has not been constant during the entire sequence. The value of Mc strongly depends on the detection capabilities of the seismicity monitoring and analysis system. For Mc=1.5 the number of the earthquake events inserted in the complete part of the seismic catalogue is ten times more than the number of events inserted for Mc=2.5. It is evident that the higher the Mc the more uncertain the seismicity statistics. From this standpoint the Arkalochori is an important case for further study that may help to improve both our capabilities for the foreshocks recognition beforehand and the operational utilization towards preparing the area under threat from a forthcoming strong main shock.
Keywords: foreshocks, mainshock of 27 September 2021, Crete Isl.
Page 123 of 269

SafeGreece 2021 on-line Proceedings | ISSN 2654-1823
SafeGreece 2021 – 8th International Conference on Civil Protection & New Technologies 24-26 November, on-line | www.safegreece.org/safegreece2021 | [email protected]
RAPID EARTHQUAKE DAMAGE ASSESSMENT SYSTEM: HARMONIZATION OF GROUND MOTION PARAMETERS
Nikolaos Theodoulidis1, Basil Margaris1, Christos karakostas1, Vassilis K. Papanikolaou2, Kiriaki Konstantinidou1, Elena Zargli1, Can Zulfikar3, Dragos Toma-Danila4
1 Institute of Engineering Seismology & Earthquake Engineering, (Hellas) ([email protected], [email protected], [email protected], [email protected], [email protected])
2Civil Enrineering Dept. Aristotle University of Thessaloniki (Hellas) ([email protected])
3 Civil Engineering Dept, Gebze Technical University (Turkey) ([email protected])
4 Civil Engineering Dept, Ovidius University of Constanta (Romania) ([email protected])
ABSTRACT
Development of an effective Rapid Earthquake Damage Assessment System (REDAS) for Earthquake Prevention, Rapid Damage Assessment & Response Planning, is based on reliable input motion parameters. Especially in the case of Cross Border Areas (CBA) there is an imperative need for harmonization of all input parameters to be integrated into REDAS. Those parameters may include (a) seismic source properties and triggering alerts, (b) ground motion models, (c) geologic and topographic proxies as well as (d) vulnerability models of elements at risk and (e) geotechnical parameters. In this work the first three (a), (b), (c) are presented and discussed in a harmonization framework, especially in the CBA of the Black Sea Basin. In addition, the real time streaming to REDAS of accelerometric data from all involved national seismographic monitoring networks is discussed as a basic ingredient to reliable shakemaps generation. A proposition of dense arrays in urban environments is also presented based on low cost accelerometers to increase the spatial distribution of recorded ground motion and improve the reliability of REDAS output in metropolitan areas.
Keywords: Rapid Earthquake Damage Assessment System, Seismic source Harmonization, Ground Motion Model Harmonization, Geologic & Topographic proxies, Accelerometric networks, Low cost accelerometers.
1. INTRODUCTION
Rapid Earthquake Damage Assessment System (REDAS) can provide valuable information just after a disastrous event to support decision making for the timely and effective response of all involved stakeholders towards disaster mitigation. This may be achieved both at a pre-event stage by supporting prevention and preparedness planning as well as just after an event by providing situation awareness, helping thus decision makers to properly allocate resources for an effective intervention. Implementation of REDAS in Cross Border Areas (CBA) is more demanding since an extra effort is needed for the harmonization of all necessary input data and metadata, the proper deployment of monitoring accelerometric/seismographic networks at the different countries and the population of the system with real-time strong motion data from the different networks. A representative case of a recent Shakemap example in CBA, for the Samos Oct. 30, 2020 mainshock, is presented (Figure 1). In this work all aforementioned issues are presented and discussed in the light of improving input parameters to achieve as much as possible reliable estimates of expected losses and damage in the affected area.
Page 124 of 269

SafeGreece 2021 on-line Proceedings | ISSN 2654-1823
SafeGreece 2021 – 8th International Conference on Civil Protection & New Technologies 24-26 November, on-line | www.safegreece.org/safegreece2021 | [email protected]
Figure 1. Shakemap of the Samos Oct. 20, 2020 earthquake (M7.0) [http://shakemaps.itsak.gr/archive]
2. HARMONIZATION OF INPUT IN THE REDA SYSTEM
2.1. Seismic Sources and Triggering Alert
In the Black Sea Basin the seismotectonic setting is quite complex, including active shallow crustal, stable shallow crustal as well as subduction zone areas and deep focus zones. Harmonization of seismic sources and faults will be inspired by the European proposed model (SHARE prj., 2013) which will be updated where new data exists. In Figure 2 (left) the proposed SHARE model is shown. In addition, the REDA system will need a triggering alert to start the generation of a Shakemap after an earthquake with M>4.0. For that reason, polygon areas of event location responsibility and alerting shared among thepartners have been decided (see Figure 2right).
(a) (b)Figure 2. (a) Seismic sources in the Cross Border Area , (b) polygon zones for triggering alert in Black Sea Basin
Page 125 of 269
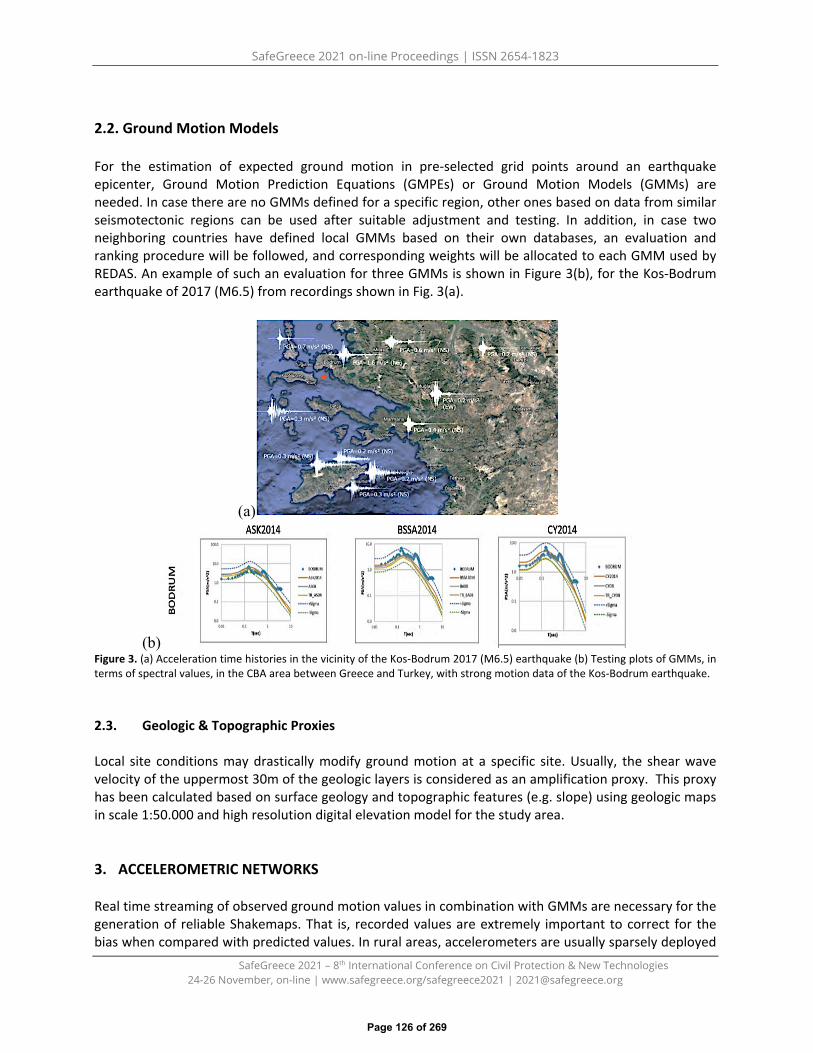
SafeGreece 2021 on-line Proceedings | ISSN 2654-1823
SafeGreece 2021 – 8th International Conference on Civil Protection & New Technologies 24-26 November, on-line | www.safegreece.org/safegreece2021 | [email protected]
2.2. Ground Motion Models
For the estimation of expected ground motion in pre-selected grid points around an earthquake epicenter, Ground Motion Prediction Equations (GMPEs) or Ground Motion Models (GMMs) are needed. In case there are no GMMs defined for a specific region, other ones based on data from similar seismotectonic regions can be used after suitable adjustment and testing. In addition, in case two neighboring countries have defined local GMMs based on their own databases, an evaluation and ranking procedure will be followed, and corresponding weights will be allocated to each GMM used by REDAS. An example of such an evaluation for three GMMs is shown in Figure 3(b), for the Kos-Bodrum earthquake of 2017 (M6.5) from recordings shown in Fig. 3(a).
(a)
(b)Figure 3. (a) Acceleration time histories in the vicinity of the Kos-Bodrum 2017 (M6.5) earthquake (b) Testing plots of GMMs, in terms of spectral values, in the CBA area between Greece and Turkey, with strong motion data of the Kos-Bodrum earthquake.
2.3. Geologic & Topographic Proxies
Local site conditions may drastically modify ground motion at a specific site. Usually, the shear wave velocity of the uppermost 30m of the geologic layers is considered as an amplification proxy. This proxy has been calculated based on surface geology and topographic features (e.g. slope) using geologic maps in scale 1:50.000 and high resolution digital elevation model for the study area.
3. ACCELEROMETRIC NETWORKS
Real time streaming of observed ground motion values in combination with GMMs are necessary for the generation of reliable Shakemaps. That is, recorded values are extremely important to correct for the bias when compared with predicted values. In rural areas, accelerometers are usually sparsely deployed
Page 126 of 269

SafeGreece 2021 on-line Proceedings | ISSN 2654-1823
SafeGreece 2021 – 8th International Conference on Civil Protection & New Technologies 24-26 November, on-line | www.safegreece.org/safegreece2021 | [email protected]
but within urban areas it is necessary to dense the monitoring network in order to provide a more detailed picture of ground motion distribution. Given that the cost of such a deployment is extremely high if high resolution broadband accelerometers are used, in house made low cost instruments capable of streaming real time data have been designed and manufactured (www.seismobug.com). A case study of such a configuration is under implementation in Thessaloniki (Greece) as shown in Figure 4.
(a) (b) (c)
Figure 4. (a) Accelerometric networks deployed in the western Black Sea Basin, (b) configuration of the REDA System data flowchart and (c) low-cost accelerometers dense array to be deployed in the city of Thessaloniki (green solid circles).
4. CONCLUSIONS
In this work harmonization of all necessary input motion data to the REDA System is presented and discussed in combination with a double fold monitoring network in the western Black Sea Basin (high resolution broadband accelerometers and low cost in house produced accelerometers. These efforts will substantially reduce uncertainties of Shakemaps output and consequently those of near-real time Rapid Earthquake Damage Assessment, strengthening its reliability, a few minutes after a disastrous event. However, validation of the proposed methodology and further research is required, to reduce epistemic uncertainties inherent in all data & metadata to be inserted into the REDA System.
ACKNOWLEDGEMENTS Rapid Earthquake Damage Assessment Consortium-REDACt [BSB 966]. Contract Nr: MLPDA 88712/26.06.2020.
REFERENCES
1. Boore D., Jonathan P. Stewart, Andreas A. Skarlatoudis, Emel Seyhan, Basil Margaris, Nikos Theodoulidis,Emmanuel Scordilis, Ioannis Kalogeras, Nikolaos Klimis, Nikolaos S. Melis; A Ground-Motion PredictionModel for Shallow Crustal Earthquakes in Greece. Bulletin of the Seismological Society of America 2020;111 (2): 857–874. doi: https://doi.org/10.1785/0120200270
2. Shakemaps ITSAK (2020). http://shakemaps.itsak.gr3. SHARE Project (2013). http://www.share-eu.org
Page 127 of 269

SafeGreece 2021 on-line Proceedings | ISSN 2654-1823
SafeGreece 2021 – 8th International Conference on Civil Protection & New Technologies 24-26 November, on-line | www.safegreece.org/safegreece2021 | [email protected]
THE ROLE OF SEISMIC HAZARD IN SEISMIC RISK ASSESSMENT OF INDUSTRIAL FACILITIES: APPLICATION TO INDUSTRIAL AREAS IN GREECE.
Kyriazis Pitilakis1, Evi Riga2, Stefania Apostolaki3, Anna Karatzetzou4 1 Emeritus Professor, Department of Civil Engineering, Aristotle University of Thessaloniki, Thessaloniki, Greece.
(E-mail: [email protected]) 2 Teaching Staff, Department of Civil Engineering, Aristotle University of Thessaloniki, Thessaloniki, Greece (E-
mail: [email protected]) 3 PhD Candidate, Department of Civil Engineering, Aristotle University of Thessaloniki, Thessaloniki, Greece (E-
mail: [email protected]) 4 Dr. Civil Engineer, Department of Civil Engineering, Aristotle University of Thessaloniki, Thessaloniki, Greece
(E-mail: [email protected])
ABSTRACT Reducing the risks related to seismic hazard in the industrial sector is of paramount importance. The severe damages observed at industrial facilities during past major seismic events, such as the 2011 Mw 9.0 Tohoku earthquake in Japan, have highlighted the need for the development of a comprehensive and updated seismic risk assessment for industrial facilities. Seismic risk assessment of industrial facilities is very challenging, as they typically consist of complex structural and non-structural elements with various interactions. Many of the existing facilitiies have been designed and constructed using outdated knowledge of the actual seismic hazard or/and old seismic codes. It is also important to emphasize that the release of hazardous materials during extreme earthquakes poses additional environmental and societal risk. Therefore, the development of a reliable seismic risk model is a significant challenge, and the first step fort this is the updated assessment of the seismic hazard which is the scope of this paper. We present the seismic hazard output obtained from the European Seismic Hazard Model (ESHM20) for 16 sites in Greece, where important industrial facilities are located. The ESHM20 hazard is compared with the seismic hazard calculated according to the current Eurocode 8 (CEN, 2004), the most updated draft revised version of Eurocode 8 and current national regulations. This comparison leads to significant conclusions and aims to contribute to the efforts towards increasing the safety of the industrial facilities using the most recent knowledge of the hazard modeling.
Keywords: industrial facilities, seismic risk assessment, seismic hazard, ESHM20
1. INTRODUCTION
The accuracy of a seismic risk model to predict future losses is a significant challenge as it depends on many parameters, each with uncertainties, that are present in all components of the model. The assessment of seismic hazard, i.e. the probability of an earthquake of a certain intensity, in a given area and time period, is the first and most critical step in the seismic risk assessment at urban, regional and national level (Riga et al., 2019). In this paper we present the seismic hazard output obtained from the latest version of the European Seismic Hazard Model (ESHM20, Danciu et al., 2020) for 16 industrial sites in Greece, where important industrial facilities are located, i.e. peak ground acceleration (PGA) values, hazard curves and uniform hazard spectra, as well the horizontal elastic response spectra using different seismic codes.
Page 128 of 269
SafeGreece 2021 on-line Proceedings | ISSN 2654-1823
SafeGreece 2021 – 8th International Conference on Civil Protection & New Technologies 24-26 November, on-line | www.safegreece.org/safegreece2021 | [email protected]
2. METHODOLOGY
For the soil conditions at the selected sites, which is an important element of the seismic hazard assessment, we used for simplicity the topography and geology data provided by the U.S. Geological Survey (USGS) (available in https://usgs.maps.arcgis.com/apps/webappviewer/index.html) to estimate the Vs,30 values necessary for the assessment.. The obtained Vs,30 values, i.e., the average shear wave velocity of the upper 30m of the soil profile, were obtained from the global mosaic Vs,30 model, which is based on topographic slope, with custom embedded maps (Heath et al., 2020).
The 2020 European Seismic Hazard Model (ESHM20, Danciu et al. 2020) is the result of a probabilistic seismic hazard assessment carried out for Europe. ESHM20 was developed within the SERA Project (JRA3 - WP25), funded by the European Union under the H2020 Programme for Research. ESHM20 results areprovided for a 10 km x 10 km grid. For each one of the selected industrial facilities, we evaluated theESHM20 outputs corresponding to the grid point located at the closest distance from the centroid of thepolygon representing the extent of the specific industrial facility. More specifically, we evaluated thefollowing: 1) Hazard curves: Mean and median hazard curves, representing the relationship between thePeak Ground Acceleration (PGA) on reference rock (Vs,30 = 800 m/s) and its return period. 2) UniformHazard Spectra (UHS): Mean and median UHS for all the available return periods (49, 101, 475, 975, 2500,5000 and 9999 years), as well as mean values and fractile levels of 5%, 16%, 50%, 84% and 95% of spectralacceleration for a return period of 475 years. 3) Horizontal elastic response spectra: Based on (a) theGreek seismic code EAK2000, (β) the current Eurocode 8 (CEN, 2004), (b) and (c) most updated draftrevised version of Eurocode 8 (EN1998-1-1 SC8 11-09-2020 Working draft) combined with the ESHM20seismic hazard.
In the following section, we present the selected sites and some indicative results for one selected site namely the Aspropyrgos Refinery.
2.1 Application in Greece Figure 1 shows the selected industrial sites and the respective Vs,30 values from the USGS mosaic model. Shear wave velocity Vs,30 takes values from 300m/s to 600 m/s. The softer soil profiles (with the lowest values for the Vs,30) are located in the area of Kozani, while the stiffer soils (with the higher values for the Vs,30) are located in the areas of Attica, Evia and Thessaly. Figure 2 shows the distribution of the median Peak Ground Accelerations (PGAs) according to the version 12e of the 2020 European Seismic Hazard Model for the return periods of 475 and 2500 years. The median PGAs range between 0.2g-0.5g and 0.37g-0.84g for return periods of 475 and 2500 years, respectively. Figure 3 shows the horizontal elastic response spectra based on the Greek seismic code EAK2000, the current Eurocode 8 (EC8) and the proposed review of Eurocode 8 (EN1998-1-1 SC8 11-09-2020 Working draft) calculated for the largest refinery in Greece, the Aspropyrgos Refinery. The horizontal elastic response spectrum based on the proposed review of the Eurocode 8 was calculated considering all the parameters that may affect its form such as the availability of the H800 and the Sα and Sβ values namely the spectral values at short (T=0.2sec) and high (T=1.0sec) spectral periods. The discrepancies between the spectra shown in Figure 3 are important, highlighting the importance of updating the seismic hazard assessment for checking the risk and safety of the industrial facilities.
3. CONCLUSIONSThe updated assessment of seismic hazard is the first and most critical step in the seismic risk assessmentat urban, regional and national level. The adopted seismic hazard level is of major importance and directly
Page 129 of 269
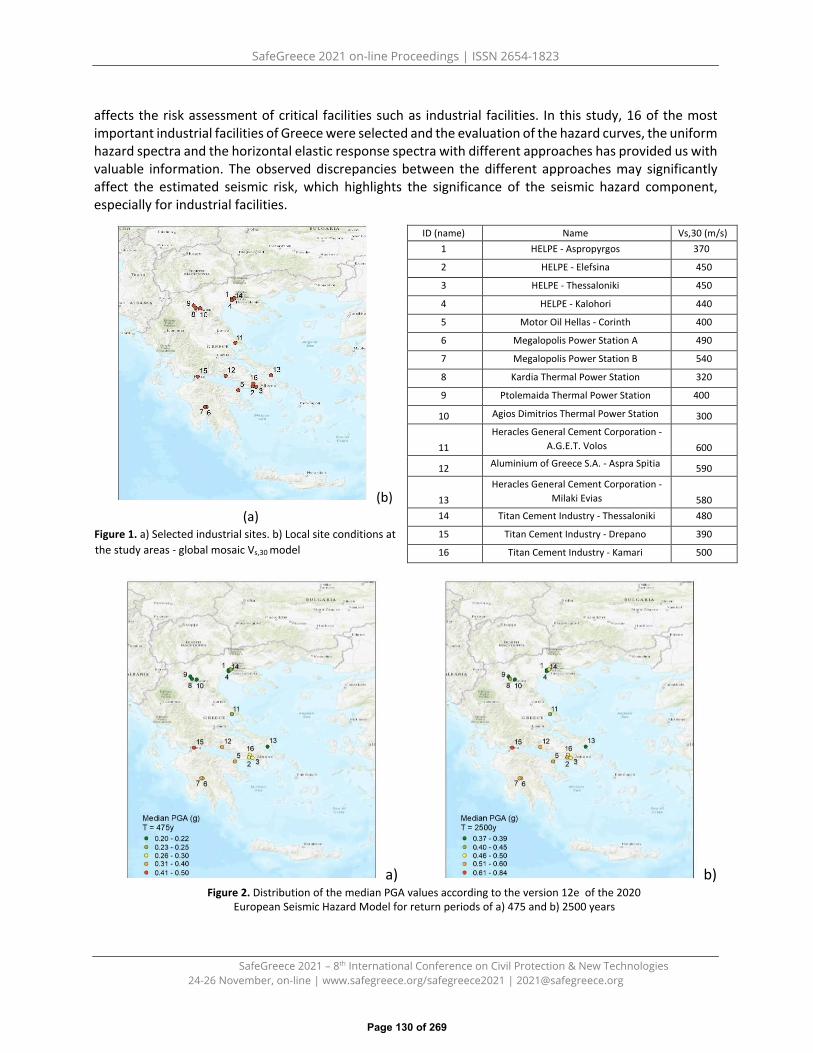
SafeGreece 2021 on-line Proceedings | ISSN 2654-1823
SafeGreece 2021 – 8th International Conference on Civil Protection & New Technologies 24-26 November, on-line | www.safegreece.org/safegreece2021 | [email protected]
affects the risk assessment of critical facilities such as industrial facilities. In this study, 16 of the most important industrial facilities of Greece were selected and the evaluation of the hazard curves, the uniform hazard spectra and the horizontal elastic response spectra with different approaches has provided us with valuable information. The observed discrepancies between the different approaches may significantly affect the estimated seismic risk, which highlights the significance of the seismic hazard component, especially for industrial facilities.
(b) (a)
Figure 1. a) Selected industrial sites. b) Local site conditions at the study areas - global mosaic Vs,30 model
a) b) Figure 2. Distribution of the median PGA values according to the version 12e of the 2020
European Seismic Hazard Model for return periods of a) 475 and b) 2500 years
ID (name) Name Vs,30 (m/s) 1 HELPE - Aspropyrgos 370
2 HELPE - Elefsina 450
3 HELPE - Thessaloniki 450
4 HELPE - Kalohori 440
5 Motor Oil Hellas - Corinth 400
6 Megalopolis Power Station A 490
7 Megalopolis Power Station B 540
8 Kardia Thermal Power Station 320
9 Ptolemaida Thermal Power Station 400
10 Agios Dimitrios Thermal Power Station 300
11 Heracles General Cement Corporation -
A.G.E.T. Volos 600
12 Aluminium of Greece S.A. - Aspra Spitia 590
13 Heracles General Cement Corporation -
Milaki Evias 580 14 Τitan Cement Industry - Thessaloniki 480
15 Τitan Cement Industry - Drepano 390
16 Τitan Cement Industry - Kamari 500
Page 130 of 269

SafeGreece 2021 on-line Proceedings | ISSN 2654-1823
SafeGreece 2021 – 8th International Conference on Civil Protection & New Technologies 24-26 November, on-line | www.safegreece.org/safegreece2021 | [email protected]
Figure 3. Horizontal elastic response spectra calculated for the Aspropyrgos Refinery site based on the Greek seismic code EAK2000, the current Eurocode 8 (EC8) and the proposed review of Eurocode 8 (EN1998-1-1 SC8 1109-
2020 Working draft)
REFERENCES
1. Danciu, L., Hiemer, S., Nandan, S., Weatherill, G., Lammers, S., Rovida, A. N., Antonucci, A., Basili, R., Carafa,M., Kastelic, V., Maesano, F. E., Tiberti, M. M., Sesetyan, K., Vilanova, S., Beauval, C., Bard, P.-Y., Cotton, F.,Wiemer, S., Giardini, D. (2019): Status, Milestones and Next Activities on the Development of the 2020European Seismic Hazard Model (ESHM20), (Geophysical Research Abstracts, Vol. 21, EGU2019-8317),European Geosciences Union General Assembly 2019 (Wien 2019).
2. CEN (2004) Eurocode 8: design of structures for earthquake resistance. European Standard, EuropeanCommittee for Standardiation, Brussels
3. EAK (2000). Greek Code for Seismic Resistant Structures. Ministry of Environment Planning and PublicWorks, Greece (OASP) Organization for Earthquake Resistant Planning and Protection, Greek code forSeismic Resistant
4. Heath, D., Wald, D. J., Worden, C. B., Thompson, E. M., and Scmocyk, G. (2020). A Global Hybrid VS30 Mapwith a Topographic-Slope-Based Default and Regional Map Insets”, Earthquake Spectra, vol. 36, 3: pp.15701584.
5. Riga E., Karatzetzou Α, Apostolaki S., Pitilakis Κ. (2019). Parametric assessment of seismic hazard in the
urban complex of Thessaloniki. 8th Panhellenic Conference of Geotechnical Engineering, Athens, Greece, 6-8 November 2019.
6. Wald, D. J., and Allen, T. I.,2007, Topographic slope as a proxy for seismic site conditions and amplification,Bulletin of the Seismological Society of America, 97, no. 5, 1379-1395.
Page 131 of 269
SafeGreece 2021 on-line Proceedings | ISSN 2654-1823
SafeGreece 2021 – 8th International Conference on Civil Protection & New Technologies 24-26 November, on-line | www.safegreece.org/safegreece2021 | [email protected]
RISK ASSESSMENT OF CITIES: SHOULD WE INCLUDE SITE-EFFECTS AND SSI IN OUR ANALYSES?
Dimitris Pitilakis, Chiara Amendola, Kyriazis Pitilakis Department of Civil Engineering, Aristotle University of Thessaloniki, Thessaloniki, Greece. (E-mail:
[email protected], [email protected], [email protected])
ABSTRACT Fragility curves for structures are typically calculated considering fixed-base structures, i.e., neglecting the soil-structure interaction (SSI), as well as the influence of site-effects. The state-of-the-art literature proves that considering foundation flexibility, especially for structures resting on soft soil, may lead to different fragility or loss estimates with respect to the fixed-base assumption. Including these effects on the city-scale vulnerability analysis is considered a challenging task due to the high exposure concentration and complexity of the whole interacting urban system. To this aim, a new simplified methodology is proposed in this study to perform an urban-scale vulnerability assessment of structures considering the influence of SFSI and local site-effects. The applicability of the proposed approach is based on globally available data regarding the soil parameters, the foundation, and the building taxonomy. The main findings demonstrate that, especially in soft soil formations, the conventional way of calculating fragility curves, i.e., fixed-base structures subjected to free-field motion, may lead to an incorrect evaluation of the seismic risk.
Keywords: soil-foundation-structure-interaction, site-effects, fragility curves, city-scale risk analysis.
1. INTRODUCTION
Seismic risk assessment requires the definition of fragility curves, ι.ε., the probability of exceedance of a predefined limit state. The complexity related to the characterization of the soil-foundation system and the common perception in the beneficial effects associated with SSI led over the years to develop fragility function considering fixed-base structures. The modification of the fragility functions of structures founded on soft soil with respect to the typical fixed-base assumption has been recognized by different authors (Sáez et al., 2011; Pitilakis et al., 2014; Karapetrou et al. 2015; de Silva, 2020; Petridis and Pitilakis 2020). These studies reveal that the shift of fragility functions from the fixed-base reference case is expected to be significant in deformable soil conditions, leading to either beneficial or unfavorable effects, depending on the dynamic properties of the soil, the foundation (Piro et al., 2020) and the structure and the characteristics (frequency content, amplitude, significant duration) of the input motion (Dutta et al., 2004). Even though the results of such studies provided the scientific community with valuable knowledge at site-specific vulnerability assessment, the reliability of risk analysis at the urban scale is assessed with certain limitations. Further research is necessary to develop generalized fragility functions applicable to different reinforced concrete and masonry building typologies that would take into account SFSI and site-effects for a great variety of soil-foundation systems. This aspect is particularly significant in city risk assessment to identify the most appropriate short- and long-term earthquake mitigation policies.
2. METHODOLOGY
This section aims to propose and quantify an analytical methodology to assess the fragility functions for different building classes founded on shallow foundations taking into account SSI and site-effects. Figure 1 summarizes the main steps of the methodological framework. All the analyses are conceived to be
Page 132 of 269

SafeGreece 2021 on-line Proceedings | ISSN 2654-1823
SafeGreece 2021 – 8th International Conference on Civil Protection & New Technologies 24-26 November, on-line | www.safegreece.org/safegreece2021 | [email protected]
implemented in the open-source OpenSees software (Mazzoni et al., 2006). To formally consider the aleatoric uncertainties related to the so-called record-to-record variability, a large set of input ground motions recorded on rock/firm soil was selected to perform all the dynamic cloud analyses (Jalayer et al. 2017). The modification of the selected records due to the local site effects was quantified by performing one dimensional (1D) numerical simulations of seismic site response performed on virtual stratigraphic profiles. The selected soil profiles were conceived considering different shear wave velocities VS,30 (i.e., ranging from 150 to 450 m/s), thus relating to the soil types B, C, and D according to EC8 (CEN, 2004).
Figure 1. Flow chart assessment of the proposed methodology for the fragility assessment of structures considering SSI and site-effects at an urban scale.
The so-modified input motions were then adopted to perform dynamic analyses following the equivalent single degree of freedom (ESDoF) systems approximation for the superstructure. Following this approach, the superstructure is modeled with a single degree of freedom system characterized by a specific nonlinear hysteretic behavior. The parameters taken to define the specific hysteretic low adopted are defined based on the nonlinear backbone curve (capacity curve) available in the literature for different building classes https://github.com/lmartins88/global_fragility_vulnerability (Martin and Silva, 2020). At the same time, the compliance of the foundation subsoil is considered using the Beamon-Nonlinear-Winkler-Foundation (BNWF) concept (NIST, 2012). The advantage of this model is the possibility to directly account for nonlinear soil-foundation behavior, which is expected to occur primarily at higher intensity measures levels. For the BNWF modeling, to cover different scenarios of foundation systems that can be encountered in an urban environment, the parameters mainly affecting the interaction problem (Wolf, 1985), such as the slenderness ratio, H/2B (where B is the characteristic foundation length), the soil to structure relative ratio, σ, and the structure to soil relative inertia, δ were parametrically investigated. The dynamic analysis results are processed to calculate the probability of exceeding four different limit states (ranging from slight to complete damage state) given the intensity measure (IM). In this study, the average spectral acceleration, AvgSa was adopted as intensity measure because it brings desired properties such as sufficiency (Bianchini et al., 2009), and it allows the comparison between fragility functions developed for compliant systems and the reference curves considering the fixed-base assumption that correspond to different fundamental periods of vibrations.
Page 133 of 269

SafeGreece 2021 on-line Proceedings | ISSN 2654-1823
SafeGreece 2021 – 8th International Conference on Civil Protection & New Technologies 24-26 November, on-line | www.safegreece.org/safegreece2021 | [email protected]
3. RESULTS
The proposed methodology results are fragility functions developed for building classes belonging to different SSI scenarios investigated by changing the dimensionless parameters most influencing the response of structures founded on soft soil profiles. Figure 2 reports the comparison of fragility functions developed for a mid-rise regularly infilled structure designed with low-code prescriptions (namely CR-LFINF-DUL-H4) by changing the H/2B, the δ ratio, and the Vs,30 for all the predefined limit states. All in all (see, for example, Figure 2a), the result of the analyses for the flexible foundations, i.e., considering SSI and site-effects (dashed lines), produce a shift to the left of the fragility curves compared to the fixed-base case (continuous lines), thus resulting into an increase of the structural fragility. When comparing the fragility functions developed for the selected building class resting on the same soft soil profile but by considering different BNWF system scenarios varying the slenderness and structure-soil relative inertia, it is possible to appreciate the variability associated with SSI phenomenon in the fragility computation (see Figure 2b).
(a) (b) Figure 2. Fragility functions developed for one reference building class, i.e. CR-LFINF-DUL-H4 considering: (a) the fixed-base common assumption subjected to input motions record on rock (continuous lines) and SSI and site-effects for one BNWF system characterized by Vs,30=180m/s H/2B=1 and δ=0.1 (dashed lines); (b) and SSI and site-effects for different hypotheses for the BNWF system, i.e. by Vs,30=180m/s H/2B=1 and δ=0.1 (continuous lines), Vs,30=180m/s H/2B=1.5 and δ=0.1 (dashed lines), Vs,30=180m/s H/2B=1 and δ=0.2 (dotted lines) and Vs,30=180m/s H/2B=1.5 and δ=0.2 (dashed-dot lines).
This variability is likely to be more pronounced for high damage states due to the nonlinear soilfoundation phenomenon occurring for high IM values. In particular, for the complete damage state (red curves) the modification of AvgSa corresponding to 50% probability of exceeding the limit state, P(LS), when considering the BNWF system defined by H/2B=1 and δ=0.1 (red continuous line in Figure 2b) is about 40% of the corresponding AvgSa for fixed-base structure (red continuous line in Figure 2a). This percentage increases to more than 50% when SSI effects are expected to be more pronounced, i.e., for the BNWF system defined by H/2B=1.5 and δ=0.2 (red dashed-dot line in Figure 2b).
4. CONCLUSIONS
A new methodology is proposed to perform an urban-scale vulnerability assessment of structures considering the influence of SFSI and SE. This study also provides the first attempt to show how SSI and
Page 134 of 269

SafeGreece 2021 on-line Proceedings | ISSN 2654-1823
SafeGreece 2021 – 8th International Conference on Civil Protection & New Technologies 24-26 November, on-line | www.safegreece.org/safegreece2021 | [email protected]
site-effects can modify the fragility analysis of structures founded on soft soil. The numerical simulation confirmed that, especially in soft soil formations, the conventional way of calculating fragility curves, i.e., fixed-base structures subjected to free-field motion, may lead to an incorrect evaluation of the seismic risk. Moreover, the uncertainties associated with the definition of the soil-foundation system can further affect the results, and including all these effects will provide researchers or stakeholders with a correct quantification of the potential fragility or loss estimates, which constitute essential elements in the risk assessment.
REFERENCES
1. Bianchini, M., Diotallevi, P. P. and Baker, J. W. (2009) ‘Prediction of Inelastic Structural Response Using anAverage of Spectral Accelerations’, p. 8. Available at:http://www.sc.kutc.kansaiu.ac.jp/icossar2009/index.html.
2. de Silva, F. (2020) ‘Influence of soil-structure interaction on the site-specific seismic demand to masonrytowers’, Soil Dynamics and Earthquake Engineering, 131(January), p. 106023. doi:10.1016/j.soildyn.2019.106023.
3. Dutta, S. C., Bhattacharya, K. and Roy, R. (2004) ‘Response of low-rise buildings under seismic groundexcitation incorporating soil-structure interaction’, Soil Dynamics and Earthquake Engineering, 24(12), pp.893–914. doi: 10.1016/j.soildyn.2004.07.001.
4. EN-1998 (2005) Eurocode 8: Design of structures for earthquake resistance. Technical report. EuropeanCommittee for Standardization.
5. Jalayer, F., Ebrahimian, H., Miano, A., Manfredi, G., & Sezen, H. (2017). Analytical fragility assessment usingunscaled ground motion records. Earthquake Engineering and Structural Dynamics, 46(15), 2639– 2663.https://doi.org/10.1002/eqe.2922
6. Karapetrou, S. T., Fotopoulou, S. D. and Pitilakis, K. D. (2015) ‘Seismic vulnerability assessment of high-risenon-ductile RC buildings considering soil-structure interaction effects’, Soil Dynamics and EarthquakeEngineering, 73, pp. 42–57. doi: 10.1016/j.soildyn.2015.02.016.
7. Martins L. and Silva V. ‘Development of a fragility and vulnerability model for global seismic risk analyses’(2020), Bulletin of Earthquake Engineering. https://doi.org/10.1007/s10518-020-00885-1
8. Mazzoni, S., Mckenna, F., Scott, M. H., & Fenves, G. L. (2006). The Open System for Earthquake EngineeringSimulation (OpenSEES) User Command-Language Manual. Retrieved fromhttp://citeseerx.ist.psu.edu/viewdoc/summary?doi=10.1.1.476.1843
9. NIST (2012) Soil-structure interaction for building structures. Technical report, US Department ofCommerce, Washington, DC.
10. Petridis, C. and Pitilakis, D. (2020) ‘Fragility curve modifiers for reinforced concrete dual buildings,including nonlinear site effects and soil–structure interaction’, Earthquake Spectra, (June 2019). doi:10.1177/8755293020919430.
11. Piro, A., de Silva, F., Parisi, F., Scotto di Santolo, A., & Silvestri, F. (2020). Effects of soil-foundationstructureinteraction on fundamental frequency and radiation damping ratio of historical masonry building sub-structures. Bulletin of Earthquake Engineering, 18(4), 1187–1212. https://doi.org/10.1007/s10518-019-00748-4
12. Pitilakis, K. D., Karapetrou, S. T. and Fotopoulou, S. D. (2014) ‘Consideration of aging and SSI effects onseismic vulnerability assessment of RC buildings’, Bulletin of Earthquake Engineering, 12(4), pp. 1755–1776. doi: 10.1007/s10518-013-9575-8.
13. Sáez, E., Lopez-Caballero, F. and Modaressi-Farahmand-Razavi, A. (2011) ‘Effect of the inelastic dynamicsoil-structure interaction on the seismic vulnerability assessment’, Structural Safety, 33(1), pp. 51–63. doi:10.1016/j.strusafe.2010.05.004.
14. Wolf, J. P. (1985) ‘Dynamic soil-structure interaction.’, Dynamic soil-structure interaction.
Page 135 of 269

SafeGreece 2021 on-line Proceedings | ISSN 2654-1823
SafeGreece 2021 – 8th International Conference on Civil Protection & New Technologies 24-26 November, on-line | www.safegreece.org/safegreece2021 | [email protected]
REDA SYSTEM: EARTHQUAKE TRIGGERED GEOTECHNICAL HAZARD AND RISK ASSESSMENT OF BUILDING STOCK IN BLACK SEA BASIN CROSS-BORDER AREAS
Nikolaos Klimis1, George Papathanassiou1,2, Georgios Panagopoulos3, Emmanouil Kirtas4, Christos Karakostas5
, Konstantinos Papatheodorou6
1Civil Engineering Department, Democritus University of Thrace, (Hellas). ([email protected])
2 Geology Department, Aristotle University of Thessaloniki (Hellas). ([email protected])
3,4 Civil Engineering Department, International Hellenic University, (Hellas). (E-mail: [email protected], [email protected])
5 Institute of Engineering Seismology & Earthquake Engineering, Earthquake Planning Protection Organization (Hellas)
([email protected]) 6 Surveying & Geoinformatics Engineering Department, International Hellenic University (Hellas)
ABSTRACT In the framework of the REDA (Rapid Earthquake Damage Assessment) system development, the earthquake triggered geotechnical hazard is one of the modules to be included. To this end, one method regarding liquefaction hazard assessment and two methods regarding landslide hazard assessment, a statistical one and a physically based one, have been chosen as the most appropriate to be implemented, given that harmonization of results in the near cross-border areas is one of the main targets of the project. As per the seismic risk assessment of the building stock in different countries several difficulties and challenges have also arisen in the effort to achieve a harmonized one. Variation in codes and regulations, local construction practices, current trends in seismic risk assessment procedures are some indicative factors of difference amongst the involved countries. Several options have been carefully considered and decisions have been made regarding a common building classification system and vulnerability model for the entire area.
Keywords: liquefaction, landslide hazard assessment, regional scale, seismic risk assessment, building stock, taxonomy, vulnerability model.
1. EARTHQUAKE TRIGGERED GEOTECHNICAL HAZARD ASSESSMENTIn the event of a strong earthquake, there is usually a noticeable part of damages related to groundfailures which can be covered under the generic term of “Earthquake triggered Geotechnical Hazards”.Namely, we refer to liquefaction and to landslide hazard assessment, both at a regional scale. The goal ofthis project is the development of maps showing the spatial distribution of liquefaction hazard on aregional scale, which can consequently be incorporated in relevant rapid response maps and lossestimates. The same stands for landslide hazard assessment, also included in the REDA system.
1.1. Evaluation of liquefaction potential Recently, geoscientists and engineers focused on the correlation of geological, geomorphological and climatic factors in order to assess the liquefaction hazard at a regional scale. Afterwards, these probabilistic liquefaction maps can be integrated with event-specific shaking intensity maps for rapid response and eventually loss estimation. Zhu et al., 2015 [1] developed the Global Geospatial Liquefaction (GGL) model based on a logistic regression model to predict the probability of liquefaction occurrence as
Page 136 of 269
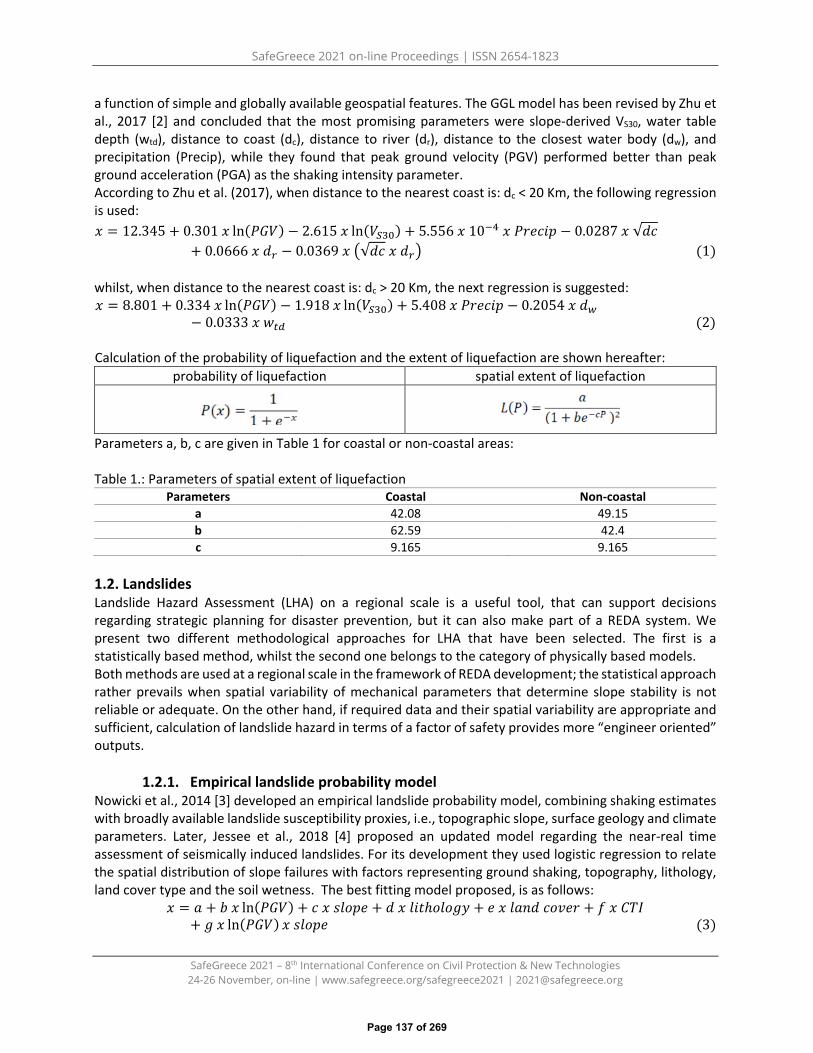
SafeGreece 2021 on-line Proceedings | ISSN 2654-1823
SafeGreece 2021 – 8th International Conference on Civil Protection & New Technologies 24-26 November, on-line | www.safegreece.org/safegreece2021 | [email protected]
a function of simple and globally available geospatial features. The GGL model has been revised by Zhu et al., 2017 [2] and concluded that the most promising parameters were slope-derived VS30, water table depth (wtd), distance to coast (dc), distance to river (dr), distance to the closest water body (dw), and precipitation (Precip), while they found that peak ground velocity (PGV) performed better than peak ground acceleration (PGA) as the shaking intensity parameter. According to Zhu et al. (2017), when distance to the nearest coast is: dc < 20 Km, the following regression is used: 𝑥𝑥 = 12.345 + 0.301 𝑥𝑥 ln(𝑃𝑃𝑃𝑃𝑃𝑃) − 2.615 𝑥𝑥 ln(𝑃𝑃𝑆𝑆30) + 5.556 𝑥𝑥 10−4 𝑥𝑥 𝑃𝑃𝑃𝑃𝑃𝑃𝑃𝑃𝑃𝑃𝑃𝑃 − 0.0287 𝑥𝑥 √𝑑𝑑𝑃𝑃
+ 0.0666 𝑥𝑥 𝑑𝑑𝑟𝑟 − 0.0369 𝑥𝑥 �√𝑑𝑑𝑃𝑃 𝑥𝑥 𝑑𝑑𝑟𝑟� (1)
whilst, when distance to the nearest coast is: dc > 20 Km, the next regression is suggested: 𝑥𝑥 = 8.801 + 0.334 𝑥𝑥 ln(𝑃𝑃𝑃𝑃𝑃𝑃) − 1.918 𝑥𝑥 ln(𝑃𝑃𝑆𝑆30) + 5.408 𝑥𝑥 𝑃𝑃𝑃𝑃𝑃𝑃𝑃𝑃𝑃𝑃𝑃𝑃 − 0.2054 𝑥𝑥 𝑑𝑑𝑤𝑤
− 0.0333 𝑥𝑥 𝑤𝑤𝑡𝑡𝑡𝑡 (2)
Calculation of the probability of liquefaction and the extent of liquefaction are shown hereafter: probability of liquefaction spatial extent of liquefaction
Parameters a, b, c are given in Table 1 for coastal or non-coastal areas:
Table 1.: Parameters of spatial extent of liquefaction Parameters Coastal Non-coastal
a 42.08 49.15 b 62.59 42.4 c 9.165 9.165
1.2. Landslides Landslide Hazard Assessment (LHA) on a regional scale is a useful tool, that can support decisions regarding strategic planning for disaster prevention, but it can also make part of a REDA system. We present two different methodological approaches for LHA that have been selected. The first is a statistically based method, whilst the second one belongs to the category of physically based models. Both methods are used at a regional scale in the framework of REDA development; the statistical approach rather prevails when spatial variability of mechanical parameters that determine slope stability is not reliable or adequate. On the other hand, if required data and their spatial variability are appropriate and sufficient, calculation of landslide hazard in terms of a factor of safety provides more “engineer oriented” outputs.
1.2.1. Empirical landslide probability model Nowicki et al., 2014 [3] developed an empirical landslide probability model, combining shaking estimates with broadly available landslide susceptibility proxies, i.e., topographic slope, surface geology and climate parameters. Later, Jessee et al., 2018 [4] proposed an updated model regarding the near-real time assessment of seismically induced landslides. For its development they used logistic regression to relate the spatial distribution of slope failures with factors representing ground shaking, topography, lithology, land cover type and the soil wetness. The best fitting model proposed, is as follows:
𝑥𝑥 = 𝑎𝑎 + 𝑏𝑏 𝑥𝑥 ln(𝑃𝑃𝑃𝑃𝑃𝑃) + 𝑃𝑃 𝑥𝑥 𝑠𝑠𝑠𝑠𝑠𝑠𝑃𝑃𝑃𝑃 + 𝑑𝑑 𝑥𝑥 𝑠𝑠𝑃𝑃𝑙𝑙ℎ𝑠𝑠𝑠𝑠𝑠𝑠𝑜𝑜𝑜𝑜 + 𝑃𝑃 𝑥𝑥 𝑠𝑠𝑎𝑎𝑙𝑙𝑑𝑑 𝑃𝑃𝑠𝑠𝑐𝑐𝑃𝑃𝑃𝑃 + 𝑓𝑓 𝑥𝑥 𝐶𝐶𝐶𝐶𝐶𝐶+ 𝑜𝑜 𝑥𝑥 ln(𝑃𝑃𝑃𝑃𝑃𝑃) 𝑥𝑥 𝑠𝑠𝑠𝑠𝑠𝑠𝑃𝑃𝑃𝑃 (3)
Page 137 of 269

SafeGreece 2021 on-line Proceedings | ISSN 2654-1823
SafeGreece 2021 – 8th International Conference on Civil Protection & New Technologies 24-26 November, on-line | www.safegreece.org/safegreece2021 | [email protected]
The predicted probability of landslide occurrence P(x) can be computed based on the following formula: P(x)=1/(1+exp(-x)), whilst the equation for estimating the frequency of landslide occurrence that can be interpreted as the areal coverage is expressed as:
𝐿𝐿𝑝𝑝(P) = 𝑃𝑃�𝑎𝑎+𝑏𝑏 𝑥𝑥 𝑃𝑃+𝑐𝑐 𝑥𝑥 𝑃𝑃2+𝑡𝑡 𝑥𝑥 𝑃𝑃3� (4) where a=-7.592, b=5.237, c=-3.042 and d=4.035.
1.2.2. Physically based methods – infinite slope model In physically based models, the probability of occurrence of a landslide is based on the respective triggering factor and are expressed throughout FS values. Physically based landslide hazard assessment methods are based on the modelling of slope failure processes. They can be applicable over large areas (regional scale), if geological and geomorphological conditions are fairly homogeneous and landslide types relatively simple. They also apply to areas with incomplete or inexistent landslide inventories; this is considered as a major advantage for countries with incomplete landslide inventories. In case of seismic conditions, the driving equation of the infinite slope model turns into:
𝐹𝐹𝑆𝑆 = 𝑃𝑃′ + (𝛾𝛾 ∗ 𝛨𝛨 ∗ 𝑃𝑃𝑠𝑠𝑠𝑠2𝑎𝑎 − 𝛾𝛾 ∗ 𝐻𝐻 ∗ 𝑘𝑘 ∗ 𝑃𝑃𝑠𝑠𝑠𝑠𝑎𝑎 ∗ 𝑠𝑠𝑃𝑃𝑙𝑙𝑎𝑎 − 𝛾𝛾𝑤𝑤 ∗ ℎ𝑤𝑤 ∗ 𝑃𝑃𝑠𝑠𝑠𝑠2𝑎𝑎) ∗ 𝑙𝑙𝑎𝑎𝑙𝑙𝜑𝜑′
𝛾𝛾 ∗ 𝐻𝐻 ∗ 𝑠𝑠𝑃𝑃𝑙𝑙𝑎𝑎 ∗ 𝑃𝑃𝑠𝑠𝑠𝑠𝑎𝑎 + 𝛾𝛾 ∗ 𝛨𝛨 ∗ 𝜅𝜅 ∗ 𝑃𝑃𝑠𝑠𝑠𝑠2𝑎𝑎 (5)
where: FS is factor of safety; φ’ is effective friction angle (o); c’ is effective cohesion (kPa); γ is unit weight of sliding mass (kN/m3); γw is unit weight of water (kN/m3); H is depth of failure surface below the ground surface (m); hw is height of water table above sliding surface (m); α is slope surface angle (o); k is seismic coefficient (PGA/g). The hw can be replaced by m*h, as m = hw/H; m can be considered as a groundwater saturation ratio.
2. SEICMIC RISK ASSESMENT OF BUILDING STOCKThe development of a platform that can achieve a harmonized seismic risk assessment of buildings indifferent countries presents certain difficulties that need to be addressed, such as: variation in codes andregulations, local construction practices, current trends in seismic risk assessment procedures in eachcountry (building taxonomy, seismic damage definition, etc), geographical unit determination (buildingblock, mahalla, etc), differences in available exposure datasets (level of detail, format, etc)In order to obtain a homogenized result especially near cross-border areas, it is mandatory to reachcertain decisions that will allow common procedures to be employed. The most important are the building taxonomy and the vulnerability models that will be employed in the REDA system.
2.1. Taxonomy of the building stock Clearly, the building stock characteristics in different countries is not common since there exist variations in local construction practices, different codes and regulations adopted in each country etc. In order to have a common base for all countries and produce harmonized outputs, the adoption of a common building typology scheme to serve a harmonized system provides a convenient solution to overcome compatibility problems. The building typology scheme proposed for the Global Earthquake Model-GEM [5] has been selected as the most appropriate for all countries of the Black Sea Basin area, as it is theoutcome of one of the most recent efforts carried out on global scale and includes all major buildingclasses that appear in the European building stock. Available alternative options are not so efficient, e.g.the HAZUS building taxonomy focuses mainly on the US building stock while former internationalEuropean projects such as “RiskUE” or “Syner-G” can be regarded as predecessors of the GEM scheme.
2.2. Vulnerability models
Page 138 of 269

SafeGreece 2021 on-line Proceedings | ISSN 2654-1823
SafeGreece 2021 – 8th International Conference on Civil Protection & New Technologies 24-26 November, on-line | www.safegreece.org/safegreece2021 | [email protected]
There is a number of different approaches for the vulnerability assessment of the building stock, based on intensely variegated procedures. Furthermore, even when the same type of procedures (e.g. analytical) are adopted, compatibility issues may still arise due to the different number and/or the definition of the damage states, the analysis procedure, as well as, the intensity measure that describes the seismic motion. The most efficient way to overcome this problem would be to adopt a common procedure/model to describe the vulnerability assessment. In this project compatible damage states (in number and qualitative definition) starting from minor/slight damage until collapse of buildings, have been adopted by all involved countries. Analytical and/or hybrid approaches are likely the best option, as they achieve to adequately describe the seismic performance of the building stock in European countries. Regarding the number of damage states (DS), a four DS scale, compatible with the HAZUS approach, was also adopted. Available fragility and vulnerability models will be tested in the process, in terms of compatibility; adoption of a common set is not excluded. In a very recent study, Martins and Silva [6] derived some series of fragility and vulnerability functions for a large number of the GEM taxonomy building classes which could serve as a common base for seismic loss estimation on an international scale. This study has been adopted by the European Seismic Risk Model 2020 (ESRM 2020) [7] and was used in recent case studies. Clearly, these fragility and vulnerability curves need to be further tested in the development of the REDA system. A first attempt was carried out by Panagopoulos et al. [8] for the building stock of the city of Serres (Greece).
ACKNOWLEDGMENTS Rapid Earthquake Damage Assessment Consortium-REDACt [BSB 966]. Contract Nr: MLPDA 88712/26.06.2020
REFERENCES
1. J. Zhu, D. Daley, L.G. Baise, E.M. Thompson, D.J. Wald, K.L. Knudsen (2015). A Geospatial Liquefaction Model for Rapid Response and Loss Estimation. Earthq. Spectra, 31(3), 1813–1837.
2. J. Zhu, L.G. Baise, E.M. Thompson (2017). An Updated Geospatial Liquefaction Model for Global Application. Bulletin of the Seismological Society of America, Vol. 107, No. 3, doi: 10.1785/0120160198.
3. M.A. Nowicki, D. Wald, M. Hamburger, M. Hearne, E. Thompson (2014): Development of a globallyapplicable model for near real-time prediction of seismically induced landslides. Engineering Geology, 173,pp. 54-65.
4. M.A. Jessee, M.W. Hamburger, K. Allstadt, D.J. Wald, S.M. Robeson, H. Tanyas, M. Hearne, E. Thompson(2018). A global empirical model for near-real-time assessment of seismically induced landslides. Journal ofGeophysical Research: Earth Surface, 123, 1835–1859. https://doi.org/10.1029/2017JF004494.
5. S. Brzev, C. Scawthorn, A.W. Charleson, L. Allen, M. Greene, K. Jaiswal, V. Silva (2013). GEM BuildingTaxonomy Version 2.0. Technical Report 2013-02 Exposure Modelling. GEM (Global Earthquake Model).
6. L. Martins, V. Silva (2020). Development of a fragility and vulnerability model for global seismic risk analyses.Bulletin of Earthquake Engineering. https://doi.org/10.1007/s10518-020-00885-1.
7. H. Crowley, D. Rodrigues, V. Silva, V. Despotaki, L. Martins, X. Romão, J.M. Castro, N. Pereira, A. Pomonis,A. Lemoine, A. Roullé, B. Tourlière, G. Weatherill, K. Pitilakis, L. Danciu, A.A. Correia, S. Akkar, U. Hancilar,P. Covi (2019). The European Seismic Risk Model 2020 (ESRM 2020).
8. G. Panagopoulos, A. Sismanidou, S. Stefanidou, E. Kirtas (2020). Seismic Risk Assessment of the City ofSerres Using the Openquake Platform, in: SafeGreece2020.
Page 139 of 269

SafeGreece 2021 on-line Proceedings | ISSN 2654-1823
SafeGreece 2021 – 8th International Conference on Civil Protection & New Technologies 24-26 November, on-line | www.safegreece.org/safegreece2021 | [email protected]
SEISMIC RISK PERCEPTION OF EMERGENCY MANAGERS AND FIRST RESPONDERS IN GREECE: A PUBLIC SURVEY
Anna Fokaefs1, Kalliopi Sapountzaki1 1Department of Geography, Harokopio University of Athens, (Greece).
(E-mail: [email protected], [email protected])
ABSTRACT Earthquakes have been recurrent phenomena in Greece, often with devastating impact. Previous studies have proved that compared to other natural hazards, earthquakes cause the highest level of worry among the greek population. Protective actions and policies aiming to risk mitigation are influenced by the way risk is perceived. The objective of this research is to examine the seismic risk perception of the emergency managers and seismic crisis information communicators (professionals or “experts”). An online questionnaire was developed to access the level of knowledge and worry of the participants about earthquakes and analyze their opinion regarding the quality of the emergency information released after an earthquake. A set of questions was also addressed to investigate the satisfaction from seismic crisis management and communication. The results show that while experts’ seismic risk perception is high, their Knowledge on earthquakes and seismic disaster needs to be improved. The findings also underline the need to reconsider practicies in crisis communication and management.
Keywords: seismic risk perecption, knowledge, crisis managers, communication, Greece.
1. INTRODUCTION
Risk perception is the intuitive subjective judgments that people make regarding the characteristics, the severity and the management of risk [1]. These judgements are reflected in people’s reactions, behavior and decision-making against the risk [1,2] as well as in willingness to undertake protective measures [3]. Despite the numerous studies on seismic risk perception worldwide [4-7], there is a limited number of relevant research in Greece [8-10]. Greece has a rich seismic history and understanding of seismic risk perception of emergency managers and the public in an earthquake prone country is fundumental for policy making and establishing emergency communication strategies. Several factors are identified to influence risk perception: cognitive bias, previous experience, hazard frequency, hazard/risk knowledge etc. Experts and the general public though perceive risk differently [11-13]. In the present study we focus on investigating the knowledge and level of worry of the scientific advisors, decision-makers and risk-crisis communicators, as well as the way they perceive public crisis management and crisis communication. Based on the results of the analysis, we attempt to identify the components of crisis management that call for improvement.
2. METHODOLOGY
For the purpose of our study, an online survey questionnaire of 24 closed-ended questions was carried out to evaluate experts’ knowledge, cognition and opinion regarding the response mechanism to earthquake disasters in Greece. The target group of the questionnaire include the members of authorities tangled to emergency management and disaster prevention, e.g. Civil Protection officials, scientific advisors, responding agents, staff of lifeline and support organizations, etc. Experts were invited to
Page 140 of 269
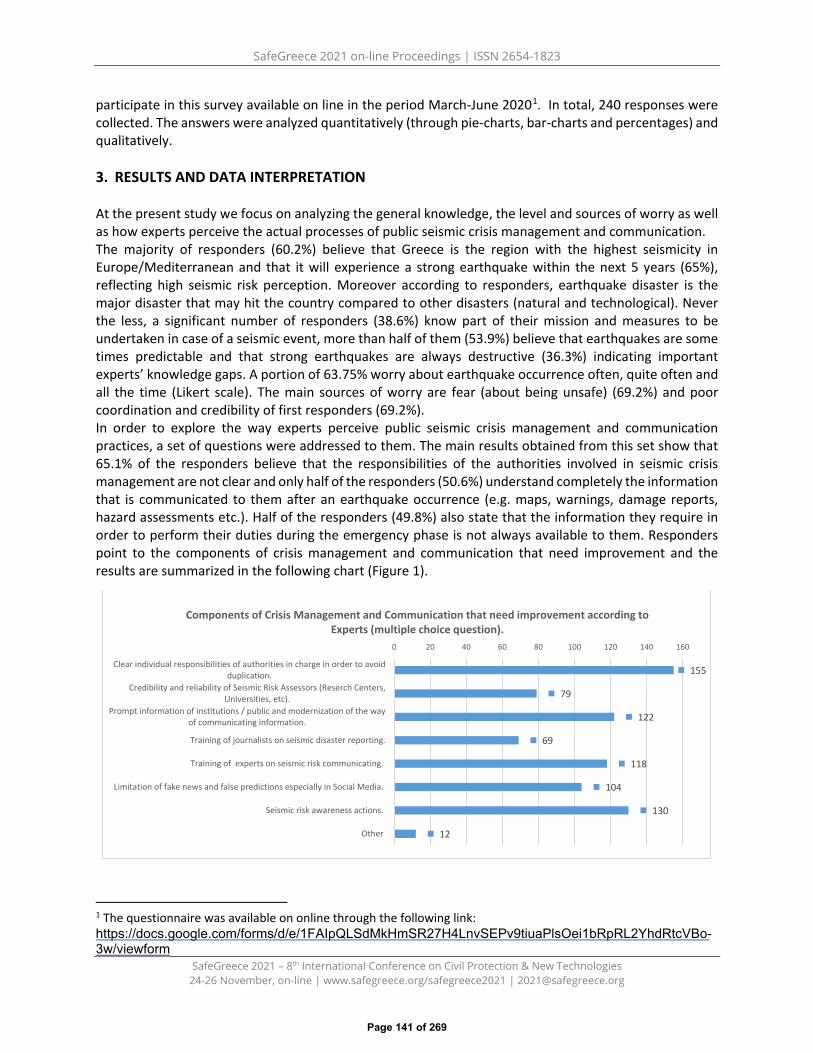
SafeGreece 2021 on-line Proceedings | ISSN 2654-1823
SafeGreece 2021 – 8th International Conference on Civil Protection & New Technologies 24-26 November, on-line | www.safegreece.org/safegreece2021 | [email protected]
participate in this survey available on line in the period March-June 20201. In total, 240 responses were collected. The answers were analyzed quantitatively (through pie-charts, bar-charts and percentages) and qualitatively.
3. RESULTS AND DATA INTERPRETATION
At the present study we focus on analyzing the general knowledge, the level and sources of worry as well as how experts perceive the actual processes of public seismic crisis management and communication. The majority of responders (60.2%) believe that Greece is the region with the highest seismicity in Europe/Mediterranean and that it will experience a strong earthquake within the next 5 years (65%), reflecting high seismic risk perception. Moreover according to responders, earthquake disaster is the major disaster that may hit the country compared to other disasters (natural and technological). Never the less, a significant number of responders (38.6%) know part of their mission and measures to be undertaken in case of a seismic event, more than half of them (53.9%) believe that earthquakes are some times predictable and that strong earthquakes are always destructive (36.3%) indicating important experts’ knowledge gaps. A portion of 63.75% worry about earthquake occurrence often, quite often and all the time (Likert scale). The main sources of worry are fear (about being unsafe) (69.2%) and poor coordination and credibility of first responders (69.2%). In order to explore the way experts perceive public seismic crisis management and communication practices, a set of questions were addressed to them. The main results obtained from this set show that 65.1% of the responders believe that the responsibilities of the authorities involved in seismic crisis management are not clear and only half of the responders (50.6%) understand completely the information that is communicated to them after an earthquake occurrence (e.g. maps, warnings, damage reports, hazard assessments etc.). Half of the responders (49.8%) also state that the information they require in order to perform their duties during the emergency phase is not always available to them. Responders point to the components of crisis management and communication that need improvement and the results are summarized in the following chart (Figure 1).
1 The questionnaire was available on online through the following link: https://docs.google.com/forms/d/e/1FAIpQLSdMkHmSR27H4LnvSEPv9tiuaPlsOei1bRpRL2YhdRtcVBo-3w/viewform
155
79
122
69
118
104
130
12
0 20 40 60 80 100 120 140 160
Clear individual responsibilities of authorities in charge in order to avoidduplication.
Credibility and reliability of Seismic Risk Assessors (Reserch Centers,Universities, etc).
Prompt information of institutions / public and modernization of the wayof communicating information.
Training of journalists on seismic disaster reporting.
Training of experts on seismic risk communicating.
Limitation of fake news and false predictions especially in Social Media.
Seismic risk awareness actions.
Other
Components of Crisis Management and Communication that need improvement according to Experts (multiple choice question).
Page 141 of 269
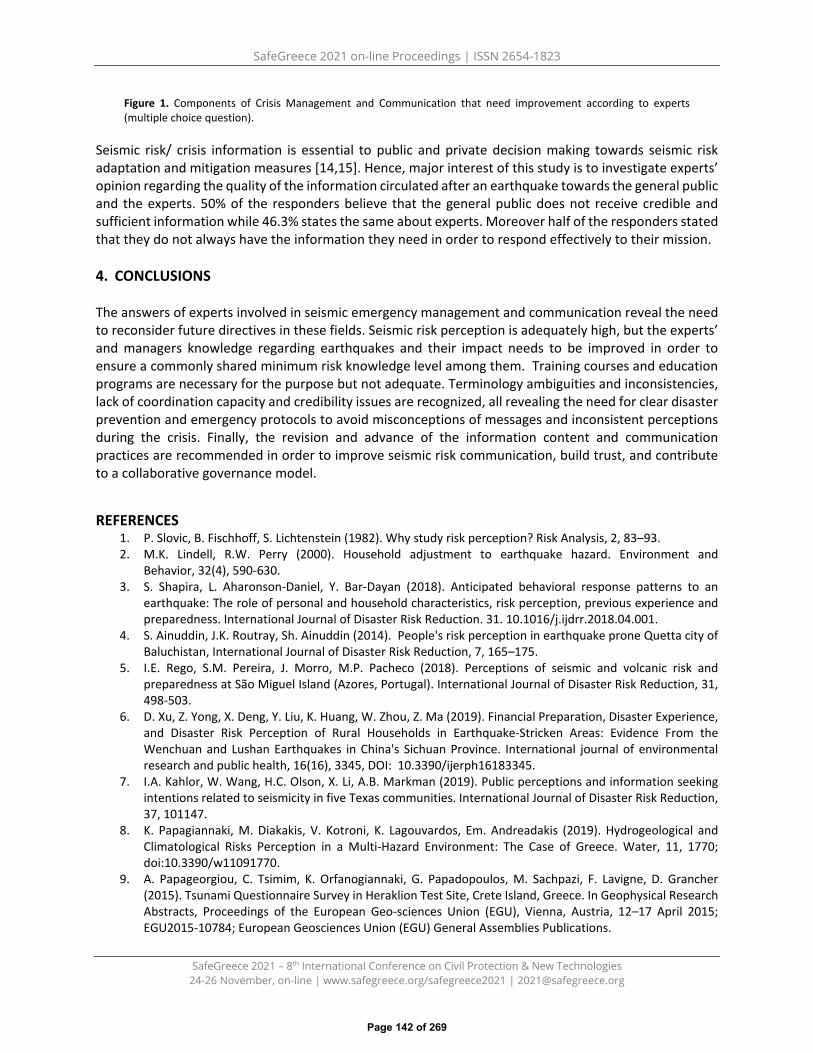
SafeGreece 2021 on-line Proceedings | ISSN 2654-1823
SafeGreece 2021 – 8th International Conference on Civil Protection & New Technologies 24-26 November, on-line | www.safegreece.org/safegreece2021 | [email protected]
Figure 1. Components of Crisis Management and Communication that need improvement according to experts (multiple choice question).
Seismic risk/ crisis information is essential to public and private decision making towards seismic risk adaptation and mitigation measures [14,15]. Hence, major interest of this study is to investigate experts’ opinion regarding the quality of the information circulated after an earthquake towards the general public and the experts. 50% of the responders believe that the general public does not receive credible and sufficient information while 46.3% states the same about experts. Moreover half of the responders stated that they do not always have the information they need in order to respond effectively to their mission.
4. CONCLUSIONS
The answers of experts involved in seismic emergency management and communication reveal the need to reconsider future directives in these fields. Seismic risk perception is adequately high, but the experts’ and managers knowledge regarding earthquakes and their impact needs to be improved in order to ensure a commonly shared minimum risk knowledge level among them. Training courses and education programs are necessary for the purpose but not adequate. Terminology ambiguities and inconsistencies, lack of coordination capacity and credibility issues are recognized, all revealing the need for clear disaster prevention and emergency protocols to avoid misconceptions of messages and inconsistent perceptions during the crisis. Finally, the revision and advance of the information content and communication practices are recommended in order to improve seismic risk communication, build trust, and contribute to a collaborative governance model.
REFERENCES 1. P. Slovic, B. Fischhoff, S. Lichtenstein (1982). Why study risk perception? Risk Analysis, 2, 83–93.2. M.K. Lindell, R.W. Perry (2000). Household adjustment to earthquake hazard. Environment and
Behavior, 32(4), 590-630.3. S. Shapira, L. Aharonson-Daniel, Y. Bar-Dayan (2018). Anticipated behavioral response patterns to an
earthquake: The role of personal and household characteristics, risk perception, previous experience andpreparedness. International Journal of Disaster Risk Reduction. 31. 10.1016/j.ijdrr.2018.04.001.
4. S. Ainuddin, J.K. Routray, Sh. Ainuddin (2014). People's risk perception in earthquake prone Quetta city ofBaluchistan, International Journal of Disaster Risk Reduction, 7, 165–175.
5. I.E. Rego, S.M. Pereira, J. Morro, M.P. Pacheco (2018). Perceptions of seismic and volcanic risk andpreparedness at São Miguel Island (Azores, Portugal). International Journal of Disaster Risk Reduction, 31,498-503.
6. D. Xu, Z. Yong, X. Deng, Y. Liu, K. Huang, W. Zhou, Z. Ma (2019). Financial Preparation, Disaster Experience,and Disaster Risk Perception of Rural Households in Earthquake-Stricken Areas: Evidence From theWenchuan and Lushan Earthquakes in China's Sichuan Province. International journal of environmentalresearch and public health, 16(16), 3345, DOI: 10.3390/ijerph16183345.
7. I.A. Kahlor, W. Wang, H.C. Olson, X. Li, A.B. Markman (2019). Public perceptions and information seekingintentions related to seismicity in five Texas communities. International Journal of Disaster Risk Reduction,37, 101147.
8. K. Papagiannaki, M. Diakakis, V. Kotroni, K. Lagouvardos, Em. Andreadakis (2019). Hydrogeological andClimatological Risks Perception in a Multi-Hazard Environment: The Case of Greece. Water, 11, 1770;doi:10.3390/w11091770.
9. A. Papageorgiou, C. Tsimim, K. Orfanogiannaki, G. Papadopoulos, M. Sachpazi, F. Lavigne, D. Grancher(2015). Tsunami Questionnaire Survey in Heraklion Test Site, Crete Island, Greece. In Geophysical ResearchAbstracts, Proceedings of the European Geo-sciences Union (EGU), Vienna, Austria, 12–17 April 2015;EGU2015-10784; European Geosciences Union (EGU) General Assemblies Publications.
Page 142 of 269

SafeGreece 2021 on-line Proceedings | ISSN 2654-1823
SafeGreece 2021 – 8th International Conference on Civil Protection & New Technologies 24-26 November, on-line | www.safegreece.org/safegreece2021 | [email protected]
10. A. Fokaefs, K. Sapountzaki (2021). Crisis Communication after Earthquakes in Greece and Japan: Effects onSeismic Disaster Management. Sustainability, 13(16):9257. https://doi.org/10.3390/su13169257
11. P. Slovic (1987). Perception of risk. Science, 236, 280–285.12. A. Dwyer, C. Zoppou, O. Nielsen, S. Day, S. Roberts (2004). Quantifying Social Vulnerability: A methodology
for identifying those at risk to natural hazards, Geoscience Australia Record 2004/14.13. M-C. Ho, D. Shaw, S. Lin, Y-C Chiu (2008). How Do Disaster Characteristics Influence Risk Perception? Risk
Analysis, 28, (3).14. D. Paton (2006). Promoting Household and Community Preparedness for Bushfires: A review of issues that
inform the development and delivery of risk communication stratigies. Bushfire Co-operative ResearchCenter.
15. K. Neuwirth, S. Dunwoody, R.J. Griffin (2000). Protection Motivation and Risk Communication. Risk Analysis,20 (5), 721-734.
Page 143 of 269

SafeGreece 2021 on-line Proceedings | ISSN 2654-1823
SafeGreece 2021 – 8th International Conference on Civil Protection & New Technologies 24-26 November, on-line | www.safegreece.org/safegreece2021 | [email protected]
THE CONTENT OF METEOROLOGY IN GREEK GEOSCIENSCES'S TEXTBOOK: PRELIMINARY RESULTS
Kyriaki Makri, Vassiliki Kotroni, Konstantinos Lagouvardos.
National Observatory of Athens/ΙERSD, Greece. E-mail: [email protected], [email protected], [email protected]
ABSTRACT
In the Greek primary and secondary education, weather phenomena and climate change are mainly approached through the courses of Physics, Geology, Geography and Chemistry. The main objective of teaching Science is to acquire knowledge about theories, laws and principles. The expected result is that the student will be able to interpret the physical, chemical, biological and geological phenomena, as well as their interactions. Furthermore, teaching Science aims to develop the personality of the student through the promotion of independent thinking and the ability to reasonably deal with difficult situations. In this context, this research seeks to investigate the adequacy of the knowledge provided in existing school textbooks on weather events (such as floods, lightning, thunderstorms, tornadoes, cyclones, fires related to weather events) and on their impact to the society. This study be based on the content analysis method [1], adopting the following four key steps: Specification of the objectives, identification of the analysis term, clustering of the data and data analysis.
Keywords: textbooks, education, Meteology.
1. INTRODUCTIONClimate change causes a global increase in the frequency and the severity of weather events such asdroughts, floods, hurricanes, tornadoes and wildfires [2]. In line with the United Nations InternationalDisaster Reduction Strategy (www.unisdr.org), the understanding of the risks associated with naturaldisasters and the increased awareness and preparedness of citizens can effectively contribute toreducing the impact on society [3]. The increasing of awareness and preparedness should begin with theunderstanding of the weather patterns at the school environment. As schools affects children'sperceptions, the main objective of this research proposal is the study of the cognitive content ofmeteorology in school textbooks that are included in Greek educational system. The proposed researchsearched in the school textbooks: a) the level of precision and detail of presentation of meteorologicalphenomena, b) the level of information provided on severe weather events, c) the information onprotection measures against weather related natural hazards and d) the knowledge provided on theimpacts of climate change.
2. METHODOLOGYTo implement the research, the method of Content Analysis of the Greek schoolbooks was used.Content analysis is a methodology that enables researchers to study human behavior through theanalysis of their communication. It is based on the analysis of all kinds of communication forms such astextbooks, essays, newspapers, novels, magazine articles, cookbooks, songs, political speeches,advertisements and pictures. The analysis of people’s communication could reveal conscious andunconscious beliefs, attitudes and values at a personal or at a group level. Content analysis is often used
Page 144 of 269

SafeGreece 2021 on-line Proceedings | ISSN 2654-1823
SafeGreece 2021 – 8th International Conference on Civil Protection & New Technologies 24-26 November, on-line | www.safegreece.org/safegreece2021 | [email protected]
in conjunction with other methodologies, in particular educational researches, where it can be used for the coding, categorizing and quantification of data. The method of content analysis decrypts messages contained in texts. It is a quantitative method for communication, which analyzes texts on the presence and frequency of specific terms, narratives or concepts. In the quantitative analysis there are three distinct phases: data collection, coding and analysis of the data and presentation of the analysis. The proposed survey will include a measurement procedure for counting the occurrence of meteorological terms in the school textbooks of the Greek modern educational system. The number of occurrence of meteorological terms, the number of pages for each topic, the type of descriptive or scientific formats, and the number of shapes per category will be the variables that will be analysed in our research [4[. After the measurement of the variables will be conducted, statistical processing will be performed to produce the final results of the study. The above methodology has been implemented in the study "The historical development of geological education in Greece" [4]. In this study, among other elements, the number of pages of scientific content of geology and mineralogy, scientific figures and descriptive figures are counted in a total of 73 school textbooks from 1977 to 1996. Also, Chiappetta & Fillman [5] analyzed five biology school textbooks from 2002 to 2004 in order to determine the magnitude of emphasis given to the knowledge and the interactions with technology and society. In addition, an attempt was made to ascertain whether the present books of Biology have a different distribution and proportion of their subjects than those written in previous years. Park Do-Yong [6] developed a methodology to investigate the differences between a standard school program in the USA (EarthComm) and curricula that follow traditional books. To substantiate his point of view, the author has chosen to compare the level of the laboratory activities which was contained in three textbooks. Equipment and method that have been used in the work must be stated clearly and sub-headings should be used when necessary. Results of the work and supporting figures, tables and images of the results should take part in the extended abstract. Not having appropriate content can cause disapproval of the sent declarations before judge’s assessment.
2.1. Data analysis Content analysis is often used in conjunction with other methodologies, particularly educational research, where it can be used to code, categorize, and quantify data. The methodology for capturing the context, which describes the content of Meteorology in school textbooks, is developed as follows. For the quantification of Meteorology content, the following criteria were used: I. Content of Meteorology i.e., % pages of content in the relevant section of the textbook, as it ispresented here: LS - shapes per page, LD - shapes per page, ZM- % pages of Meteorology content/II. Characterization of the scientific adequacy of the content graded I to III (poor -satisfactory -excellent). The analysis of textbooks was mean the 1rst period analysis, from 1977 to 1996,
3. RESULTS & DISCUSIONThe figures 1 and 2 show the results of time evolution of the ratio ZM , LS, LD. in Greek schools textbooksand in particular in science textbooks.As it is observed, there is a wide variation which does not follow a normal distribution (Figure 1). Allmaximum ZM values corresponds to Geosciences textbook, while all minimum ZM values corresponds totextbooks on Biology. Although Meteorology is a scientific field of Atmospheric Physics, there is not animportant content textbooks on Physics and lags behind the equivalent of Geosciences textbooks. Onepossible interpretation of this differentiation, is that Physics was mainly concerned with Engineering andElectricity in the Secondary Education curricula from 1977. The teaching of Physics, in particular, focused
Page 145 of 269
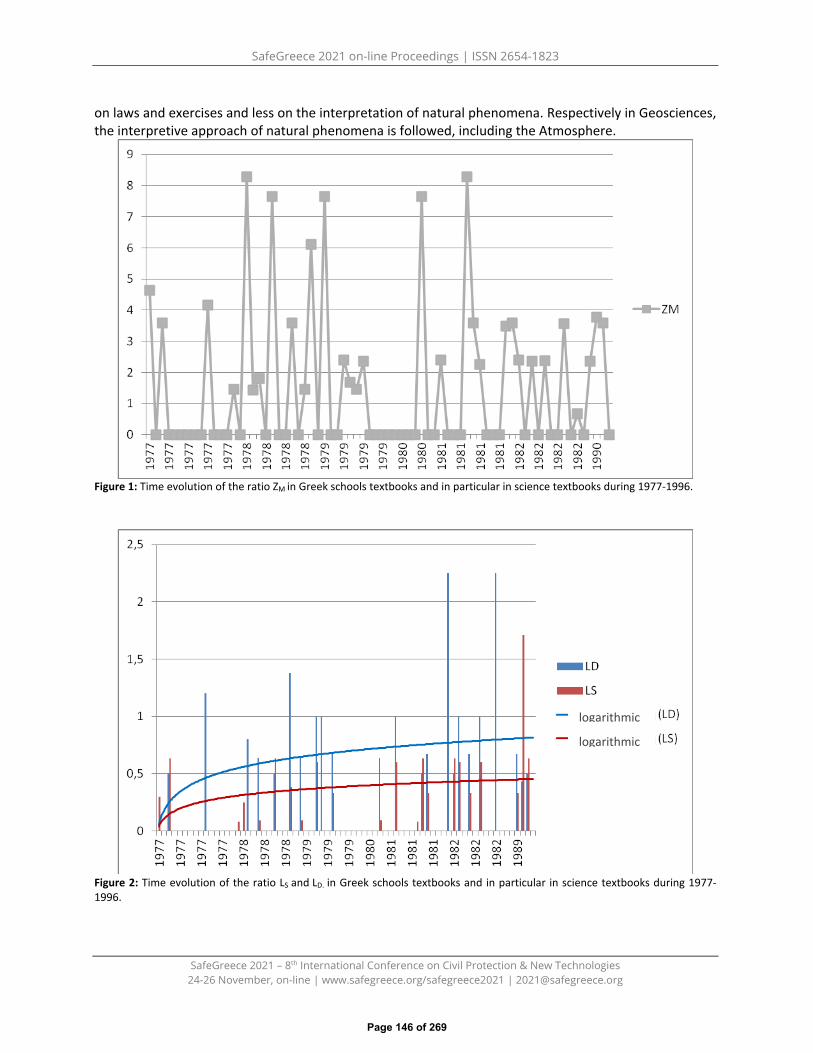
SafeGreece 2021 on-line Proceedings | ISSN 2654-1823
SafeGreece 2021 – 8th International Conference on Civil Protection & New Technologies 24-26 November, on-line | www.safegreece.org/safegreece2021 | [email protected]
on laws and exercises and less on the interpretation of natural phenomena. Respectively in Geosciences, the interpretive approach of natural phenomena is followed, including the Atmosphere.
Figure 1: Time evolution of the ratio ZM in Greek schools textbooks and in particular in science textbooks during 1977-1996.
Figure 2: Time evolution of the ratio LS and LD. in Greek schools textbooks and in particular in science textbooks during 1977-1996.
logarithmic logarithmic
Page 146 of 269

SafeGreece 2021 on-line Proceedings | ISSN 2654-1823
SafeGreece 2021 – 8th International Conference on Civil Protection & New Technologies 24-26 November, on-line | www.safegreece.org/safegreece2021 | [email protected]
The mapping of the LS, LD indicators is presented in Figure 2, i.e. the scientific and descriptive representation of Meteorology. Scientific figures or images are defined as those that contain measurable and scientific information. On the contrary, Descriptive schemes are defined as those that do not contain information that can be measured numerically or based on scientific law. It is obvious that the descriptive content is superior (LD), following a slight upward trend from 1977 to 1996. The scientific illustrations (LS) are quite a few, and a slight upward trend from 1977 to 1996 is respectively observed. It should be noted in two cases within the period after 1981, the maximum LD and LS values appear, since one of the most important educational reforms in Greek education took place in 1981 (Makri, 2015) with the modernization of textbooks and curricula. Summarizing, the characterization of the scientific adequacy of the content for the first period of analysis, from 1977 to 1996, is evaluated as I -poor, as derived from the analysis of textbooks. This proves the lack of cognitive education of the society in meteorological phenomena, with the result that the behavior of the citizens is not appropriate in case of risk from extreme weather phenomena [3]. The research is ongoing and results are evaluated for the period 1997 - 2020, as well as the correlation of the content with the type of textbook (Geosciences, Physics, Chemistry, Biology).
ACKNOWLEDGEMENTS This research is co-financed by Greece and the European Union (European Social Fund- ESF) through the Operational Programme «Human Resources Development, Education and Lifelong Learning» in the context of the project “Reinforcement of Postdoctoral Researchers - 2nd Cycle” (MIS-5033021), implemented by the State Scholarships Foundation (ΙΚΥ).
REFERENCES 1. Fraenkel R. Jack & Wallen E. Norman (2009). How to Design and Evaluate Research in
Education.McGraw-Hill, ISBN 978-0-07-352596-9.2. Mackay, A. 2008. Climate change 2007: Impacts, adaptation and vulnerability. Contribution of working
group II to the fourth assessment report of the intergovernmental panel on climate change. J. Environ.Qual. 37, 2407
3. CRED & UNISDR Report, 2018. Economic Losses, Poverty & Disasters 1998-2017.https://www.emdat.be/publications
4. Makri K. (2015). The historical development of geological education in Greece. PhD Thesis. Department ofGeology, Aristotle University of Thessaloniki
5. Chiappetta Ε. & Fillmanb D. A. (2007). Analysis of Five High School Biology Textbooks Used in the UnitedStates for Inclusion of the Nature of Science. International Journal of Science Education Volume 29, Issue 15
6. Park Do-Yong. (2005). Differences between a Standards-Based Curriculum and Traditional Textbooks inHigh School Earth Science. Journal of Geoscience Education Vol. 53, No.
Page 147 of 269
SafeGreece 2021 on-line Proceedings | ISSN 2654-1823
SafeGreece 2021 – 8th International Conference on Civil Protection & New Technologies 24-26 November, on-line | www.safegreece.org/safegreece2021 | [email protected]
BIBLIOMETRIC ANALYSIS AS A TOOL TO REVEAL RESEARCH TRENDS IN CIVIL PROTECTION: THE CASE OF GREECE
Christos Stefanis Laboratory of Hygiene and Environmental Protection, Department of Medicine, Democritus University of Thrace
E-mail: [email protected]
ABSTRACT What are the actual trends in civil protection in Greece, and in which direction is academic interest moving? Much progress has been achieved in setting up civil protection in Greece to eliminate natural disasters and hazards, provide on-demand support in emergencies, and contribute to and improve the coordination of assistance provided by the State. This study conducted a thorough bibliometric analysis on the scientific literature available on the Scopus database from 01/01/1950 to 31/21/2021. After a preliminary application of various combinations, the phrase "civil protection" was used with language selection "English" and country/territory "Greece". A collection of 113 articles published in scientific journals and conference proceedings was yielded, which allowed the visualization mapping of the research agenda in the field of civil protection. The most relevant topics are related to engineering, environmental and social science, and earth and planetary science. It has been found that a significant number of documents were published after 2010. The most productive institution was the National Technical University of Athens, followed by the Aristotle University of Thessaloniki and the National and Kapodistrian University of Athens. Moreover, the main funding sponsor of several research schemes was the European Commission and respective initiatives. It was possible to spot past trends and ongoing development, intending to introduce the civil protection topic in Greece and examine the issues expected to be pertinent in the future.
Keywords: civil protection, bibliometrics, Greece
1. INTRODUCTION
There has been an increase in bibliometric publications aimed at the quantitative and qualitative analysis of research trends in recent years. In addition, the given interdisciplinarity in many scientific themes that combine multiple mechanisms and cognitive tools and their diffusion into several experimental methods make bibliometric analysis a more helpful tool for interpreting and speculating research trends from the production of the scientific literature. Furthermore, bibliometric research can detect changes that occur in scientific areas and their progress encompassing new scientific fields, keeping pace with the evolution of technology and the integration of new research methods and protocols. The bibliometric analysis combines the use of statistical methods of quantitative analysis in books, research papers and bibliography in general, capturing the frequency of occurrence and the relationship between criteria for citation and content analysis such as authors between surveys, keywords used, keyword field, university affiliations, co-authorship criteria etc. [1, 2, 3]. With climate change dominating the political, economic, and social agenda, much research has been on climate change, natural disasters, and civil protection in recent years. The leading cause is an attempt to find the scientific literature trends that have proliferated in recent years. The above research has focused mainly on natural disasters, risk assessment, urban planning, economics, environment, tourism, environmental impact, sustainability, civil protection and public health [4, 5, 6]. Bibliographic trends and studies on various factors and research topics with a central focus on civil protection have been carried out; however, it does
Page 148 of 269

SafeGreece 2021 on-line Proceedings | ISSN 2654-1823
SafeGreece 2021 – 8th International Conference on Civil Protection & New Technologies 24-26 November, on-line | www.safegreece.org/safegreece2021 | [email protected]
not appear if there is similar bibliometric research on this topic. This study aims to analyze the scientific literature on civil protection in Greece in the Scopus database.
2. EXPERIMENTAL METHODS
A search was performed in the Scopus database, includes 1,7 billion cited references and covers nearly 2600 serial titles from approximately 7.000 publishers in top-level subject fields: life-social sciences, physical sciences and health sciences. Additionally, the Scopus database offers many advantages like diversification, flexibility of research fields and an advanced document analyzer mechanism [7, 8, 9, 10]. After a preliminary application of various combinations, the phrase “civil protection” was used with a time range from 01/01/1950 to 31/21/2021 and with language selection in English, country/territory Greece and search details: TITLE-ABS-KEY ( civil AND protection ) AND ( LIMIT-TO ( DOCTYPE , "ar" "cp" "re" ) AND ( LIMIT-TO ( SRCTYPE , "j" ) AND (LIMIT-TO(AFFILCOUNTRY, "Greece"). Only research documents, manuscripts from conference proceedings and reviews were included. Moreover, the obtained manuscripts were recorded in the Microsoft Excell program by year, subject area, document type, and institutional affiliation. VOS Viewer program was applied to visualize the results and create a bibliographic map.
3. RESULTS AND DISCUSSION
Articles and conference papers were the most common document type published for 'civil protection' of all the 113 manuscripts (Table 1). The number of publications published year-on-year provides a reasonable estimate of the research trend in a specific field of research. Publications were categorized annually, revealing that the first manuscript in the literature appeared in 1996; however, the exponential growth of produced articles is manifested after the year 2010 (Figure 1a). The Civil Protection Authority in Greece was established in 1995 as General Secretariat for Civil Protection (GSCP), and progressively, its significance was reinforced aiming at forecasting, formulating and coordinating actions regarding risk assessment, disaster management and public information. GSCP also provides on-demand support in emergencies and contributes to and improves the State's coordination of assistance. Figure 1b illustrates the number of documents combining the subjects area of the research theme of civil protection in Greece. Engineering, Environmental and Social Science, and Earth and Planetary Sciences are linked to the civil protection theme [11].
(a) (b)
Figure 1. (a) Number of publications per year; (b) Cumulative percentage of documents by subject area
Network visualization map of co-occurrence of keywords in the selected manuscripts is depicted in Fig 2. Setting the minimum number of occurrences of a keyword to 5, only 35 met the threshold. The map
Page 149 of 269

SafeGreece 2021 on-line Proceedings | ISSN 2654-1823
SafeGreece 2021 – 8th International Conference on Civil Protection & New Technologies 24-26 November, on-line | www.safegreece.org/safegreece2021 | [email protected]
categorized terms into five significant clusters with respective colours. The weight of each item determines the size of the label and the circle of an item. The higher the weight of an item, the larger the label and the circle of the item. The colour of an item is dictated by the cluster to which the item belongs. Lines between items represent links. In essence, the closer two keywords are spotted to each other, the stronger their relatedness [12]. The terms with the highest occurrences were Greece, civil protection, disasters, earthquakes, human, remote sensing and risk assessment. Since Greece is an earthquake-prone area, earthquakes, disasters, and risk management are considered in several publications. The aforementioned items describe the top 3 clusters: red, green, and blue (Figure 2). Fires, floods, deforestation and hazard assessment are included in the yellow and purple clusters.
Figure 2. Keyword analysis
Further, the top 10 institutions that published documents in the civil protection research area were identified (Table 1). The National Technical University of Athens, Aristotle University of Thessaloniki, and National and Kapodistrian University of Athens were the most productive in academic publications. Moreover, the dominant funding sponsor of several research schemes was the European Commission and respective initiatives (Table 1).
Table 1. Table 1. Descriptive characteristics of manuscripts indexed in the Scopus database.
Document by type N(%) Top 5 institutions (N documents) Top 5 funding sponsors
Article 66(58,4%)
Conference paper
41(36,3%) Review 6(5,3%)
National Technical University of Athens19
Aristotle University of Thessaloniki 15 National and Kapodistrian University of
Athens 14 Democritus University of Thrace 12
National Observatory of Athens 10
European Commission 15 Seventh Framework Programme 8
European Regional Development Fund4
Horizon 2020 Framework Programme4
Alexander S. Onassis Public Benefit Foundation 1
4. CONCLUSION
Page 150 of 269
SafeGreece 2021 on-line Proceedings | ISSN 2654-1823
SafeGreece 2021 – 8th International Conference on Civil Protection & New Technologies 24-26 November, on-line | www.safegreece.org/safegreece2021 | [email protected]
The current bibliometric study considered open access publications on civil protection subjects in Greece from the Scopus database. One hundred thirteen documents met the criteria; most of the articles were classified in Engineering, Environmental Science and multiple diversified subject areas, highlighting the interdisciplinarity of civil protection in Greece. Natural disasters, climate change, hazard management, risk management and civil engineering are among other topics highly related to civil protection agencies. Subsequently, this bibliometric study allowed visualization of the research trends in civil protection for the last 25 years in Greece.
ACKNOWLEDGEMENT
We acknowledge the support of this work by the project "Risk and Resilience Assessment Center –Prefecture of East Macedonia and Thrace -Greece." (MIS 5047293), which is implemented under the Action "Reinforcement of the Research and Innovation Infrastructure", funded by the Operational Programme "Competitiveness, Entrepreneurship and Innovation" (NSRF 2014-2020) and co-financed by Greece and the European Union (European Regional Development Fund).
Co-financed by Greece and the European Union
REFERENCES 1. R. Broadus (1987). Toward a Definition of "Bibliometrics". Scientometrics, 1, 373-379.2. F. Claveau, Y. Gingras (2016). Macrodynamics of Economics: A Bibliometric History. History of Political Economy,
48, 551-592.3. J.-M. Merigo, A. Rocafort, J.-P. Aznar-Alarcon (2016). Bibliometric Overview of Business and Economics
Research. Journal of Business and Economic Management, 17, 397-413.4. Bandh, S.A., Shafi, S., Peerzada, M. et al. Multidimensional analysis of global climate change: a review. Environ
Sci Pollut Res 28, 24872–24888 (2021). https://doi.org/10.1007/s11356-021-13139-75. Intergovernmental Panel on Climate Change (IPCC), Climate Change 2014: Impacts, Adaptation, and
Vulnerability. Part A: Global and Sectoral Aspects. Contribution of Working Group II to the Fifth AssessmentReport of the Intergovernmental Panel on Climate Change, (2014) (Retrieved from United Kingdom and NewYork, NY, USA). 2016, UNDP, New York, 2016
6. G. Zuccaro, M.F. Leone, C. Martucci. (2020). Future research and innovation priorities in the field of naturalhazards, disaster risk reduction, disaster risk management and climate change adaptation: a shared vision fromthe ESPREssO project, International Journal of Disaster Risk Reduction, Volume 51, 101783, ISSN 2212-4209https://doi.org/10.1016/j.ijdrr.2020.101783
7. https://www.elsevier.com/solutions/scopus (Last accessed 10/09/2021)8. A. Martín-Martín, E. Orduna-Malea, M. Thelwall, E. Delgado López-Cózar (2018). Google Scholar, Web of
Science, and Scopus: A systematic Comparison of Citations in 252 Subject Categories. Journal of Informetrics,12, 1160–1177.
9. A. Yataganbaba, I. Kurtbaş (2016). A Scientific Approach with Bibliometric Analysis Related to Brick and TileDrying: A Review. Renewable and Sustainable Energy Reviews, 59, 206–224.
10. S. Zyoud, D. Fuchs-Hanusch (2020). Mapping of Climate Change Research in the Arab World: A BibliometricAnalysis. Environmental Science and Pollution Research, 27, 3523–3540.
11. https://www.civilprotection.gr/en/civil-protection-operations-centre (Last accessed 10/09/2021).12. https://docs.google.com/viewer?url=https%3A%2F%2Fwww.vosviewer.com%2Fdocumentation%2FManual_VO
Sviewer_1.6.8.pdf&pdf=true.
Page 151 of 269

SafeGreece 2021 on-line Proceedings | ISSN 2654-1823
SafeGreece 2021 – 8th International Conference on Civil Protection & New Technologies 24-26 November, on-line | www.safegreece.org/safegreece2021 | [email protected]
1
ETHICS IN CATASTROPHES, EXTRAORDINARY DECISIONS
Ana María Aldea Reyes1, Marta Burgos González1, Susana Izquierdo Funcia1 1Spanish School of Rescue and Detection with Dogs (Spain).
([email protected]; [email protected]; [email protected])
ABSTRACT European research projects take ethical aspects into central consideration. In this extended abstract we have developed the methodology of the Search and Rescue (SnR) project and research made of the Spanish School of Rescue and Detection with Dogs (ESDP) in relation to the ethical aspects of animal welfare.
Keywords: Ethics, research, European projects, Ethics Board.
1. INTRODUCTIONThe Spanish School of Rescue and Detection with Dogs (ESDP) is a partner of Search and Rescue Project(SnR), a three-year project funded by H2020 under grant agreement number 882897, which aims todevelop new technologies to increase the efficiency and safety of first responders during search, rescueand health care of victims.The SnR consortium is comprised by twenty-eight (28) partners from twelve (12) European countries.The project’s involved stakeholders and end-users bring together high expertise and innovationcapabilities from various practitioner’s organisations, civil society, universities and research centers, aswell as industry organisations and SMEs.The SnR project [1] will design, implement and test through a series of largescale pilot scenarios a highlyinteroperable, modular open architecture platform for first responders’ capitalising on expertise andtechnological infrastructure from both COncORDE [2] and IMPRESS FP7 [3] projects. The governancemodel of S&R will be designed to operate more effectively and its architectural structure will allow toeasily incorporate next generation R&D and COTS solutions which will be possibly adopted in the futuredisaster management systems. The Model will also support a unified vision of the EU role and willprovide a common framework to assess needs and integrate responses.From the beginning of the SnR project, the needs of the first responders as end users have been takeninto consideration through different qualitative and quantitative research tools (workshops, interviewsand questionnaires). Experts in emergency, search and rescue together with technology developers areworking to create innovative technologies that increase responder safety and reduce the rescue timeassociated with acting in various types of emergencies in complex response environments.One of the most important phases of the project will be to implement and evaluate the overallapproach of the SnR platform and to define validation activities, in order to assure validity of resultsbased on the scientific and technical objectives. A series of tests will be designed and executed tomonitor progress and validate the methodologies and technologies developed by SnR. The tests will bebased on real life scenarios and case studies based on seven complex SnR domain-specific use caseswill be:
• UC1: Victims trapped under rubble (Italy)• UC2: Plane crash, mountain rescue, non-urban (Greece)• UC3: Earthquake / heavy storms between Vienna Rail Station & Kufstein railway station heavy
damages in the rail station (Cross-border pilot, Austria-Germany)• UC4: Forest fire expanded and threat to industrial zone (Attica Region, Greece)• UC5: Victims trapped under rubbles (France)
Page 152 of 269
SafeGreece 2021 on-line Proceedings | ISSN 2654-1823
SafeGreece 2021 – 8th International Conference on Civil Protection & New Technologies 24-26 November, on-line | www.safegreece.org/safegreece2021 | [email protected]
2
• UC6: Resilience Support for Critical Infrastructures through Standardised Training on CBRN(Romania)
• UC7: Chemical substances spill (Spain).The following course of action will be pursued:
• Implementation guidelines and pilots’ management.• Evaluation instruments to be adapted according to all actors’ profiles.• Value sensitive evaluations, including end-user ethnographic observations and interviewing.• Evaluation procedures: planning and coordination of the filling-in process, analysis methodology
according to planned objectives and outcomes. The following are specific WP8 objectives:• To setup the pilot environment considering all the special requirements / needs of the end users
and stakeholders• To fully operate and test the S&R solution on specific piloting experiments.• To validate the S&R Platform from a usability and end-user point of view.• To make the capabilities of the S&R Platform available to policy stakeholders willing to use
S&R’s technologies.SnR not only faces the challenge of making rescue systems more effective but must also meet ethical requirements for all EU-funded research activities. According to the EC, "ethical conduct of research involves the application of fundamental ethical principles and legislation to scientific research in all possible areas of study". Implicit in this, it is the compliance with the ethical principles included in the Charter of Fundamental Rights of the European Union and the European Convention on Human Rights and its Supplementary Protocol.
2. METHODOLOGYUnder SnR Project, an Ethics Board has been created. This Ethics Board will oversee all ethics-relatedaspects of the SnR project and consult with the project consortium on the potential ethical impacts ofthe activities undertaken."Ethics protocol" is to identify and describe the procedures and methodology to ensure that the SnRProject research activities will:
• Provide ethical guidelines to ensure that project partners comply with ethical requirementsimposed by the Grant Agreement.
• Ensure that the processing of all data, both personal and research data, complies with theGeneral Data Protection Regulation (GDPR) and its implementing national laws.
• Provide an informed consent to the project partners of each procedure carried out, not only fortheir knowledge, but also for third parties involved in events and/or simulations that take placeduring the development of the project.
• Establish an Ethics Board of experts, which will oversee all ethics-related aspects of the SnRproject.
The Ethics Board work will consist of: • Consulting the project consortium on the potential ethical impacts of the activities carried out
during the project life cycle.• Resolving various ethical considerations that arise during the project.• Ensuring good practice in terms of ethical values, responsibility and integrity.
The principles of proportionality, the right to privacy, the right to protection of personal data, non-discrimination, respect for the principle of justice and animal protection are considered mandatory.
3. RESULTS
Page 153 of 269
SafeGreece 2021 on-line Proceedings | ISSN 2654-1823
SafeGreece 2021 – 8th International Conference on Civil Protection & New Technologies 24-26 November, on-line | www.safegreece.org/safegreece2021 | [email protected]
3
The SnR Ethics Board aims to find solutions that go beyond disaster relief. - Adherence of all Consortium members to the ethical principles of H2020 projects.- Development of procedures to protect privacy and data protection.- Development of information sheets on procedures to be carried out and informed consent.- Establishment of an Ethics Committee to oversee all aspects of SnR technology development.Under this framework, the Spanish School of Rescue and Detection with Dogs (ESDP) has drawn up acode of ethics, which reflects the principles of our organisation, focusing on the animal welfare of oursearch and rescue dogs, as well as all the implications that have to do with the development and testingof technologies.The Ethical Code [4] aimed at volunteers and professionals working in the organization and developedby the ESDP takes as starting point the “five freedoms” [5] considered by the World Organization forAnimal Health. These freedoms are (1) freedom from hunger and thirst, (2) freedom from discomfort,(3) freedom from pain, injury and disease, (4) freedom to express normal behavior, (5) freedom fromfear and distressRegarding (1), freedom from hunger and thirst, the following considerations should be followed :
• Both the dog handler and the other members of the team are responsible for providing therescue dogs with adequate food (quantity and composition) for the work they do, their speciesand their size, thus ensuring their health and performance.
• They must have access to clean, drinkable water whenever they need it.• When, due to the needs of the mission to which we are assigned, the dog must remain in a
transport cage for a prolonged period of time, it shall be ensured that they have access to waterand, if necessary, sufficient food for the entire journey.
• Avoid fear and distress.Regarding (2), freedom from discomfort, the following considerations should be followed.
• The facilities in which the dog is kept must be clean, protected from inclement weather andhave dimensions in accordance with the size and periods of confinement of the dog.
• The transport cages must comply with safety regulations in terms of dimensions, ventilation,materials and structure to guarantee adequate protection for the animal.
• On long journeys, it shall be ensured that the animal is given sufficient time to walk and relieveitself before, during and after the journey.
• It is advisable to have a veterinarian on hand, especially in the case of real missions, where theremay be situations of risk for the animal.
• It is an added value the training of its dog handlers in basic veterinary knowledge of dog care, sothey can act in case of emergencies and accidents. Likewise, it will have revised and updatedsanitary material for use both in regular training and during missions.
• In the context of research projects it should be taken into account:o Whenever a technology designed for working dogs is tested, the potential risks to the
animal, direct or indirect, will be analyzed beforehand.o The dog shall not be exposed to any unnecessary risk, which could seriously endanger its
physical integrity or well-being.o If, for research purposes, a dog has to be trained to develop a specific function within
the project, the organization will guarantee that the dog will be brought back to usefullife and/or a home will be found for it at the end of the research project.
• It is essential to respect the working/rest times of the animal, not only to guarantee the goodperformance of its work, but also to respond to its physiological and psychological needs.
In relation to (3), freedom from pain, injury and disease, the following considerations should be followed:
Page 154 of 269

SafeGreece 2021 on-line Proceedings | ISSN 2654-1823
SafeGreece 2021 – 8th International Conference on Civil Protection & New Technologies 24-26 November, on-line | www.safegreece.org/safegreece2021 | [email protected]
4
• The dog's international vaccination record must be kept up to date, as well as any othernecessary legal documentation. This is a prerequisite for the dog to be considered as anoperational member of the group.
• Before, during and after each work, the dog shall be examined to ensure that it is in perfecthealth. If the dog suffers any injury or wound that significantly alters its state of well-being, itshall be declared as "non-operational", either temporarily or absolutely, according to thedecision of the vet.
• The sick animal shall be monitored (treatment, administration of medication, visits to the vetand any necessary treatment) until it recovers.
• Any dog that has suffered injuries that cause pain or suffering in the performance of its duties,shall be temporarily or permanently removed from the service, according to the medicaldiagnosis.
Regarding (4), freedom to express normal behavior, the following considerations should be followed: • Dogs are considered as cognitive animals, capable of basic conscious responses, and emotionally
empathetic.• Working dogs, undergoing training and employed in useful work, should not be deprived of the
opportunity to express those behaviours that are unique to them as a species.• One of our priorities is to ensure that training techniques and programmes include aspects of
animal welfare related to the time dedicated to recreation and social interaction, in order tomaintain and emotional balance.
Finally, regarding (5), freedom from fear and distress, the following consideration must be followed: • The nature of rescue dogs' work can subject them to highly stressful situations related to
transport and working scenarios. It will be a fundamental part of the work of dog handlers toprepare their dogs, through experience, to become accustomed to and normalize thosesituations in order to minimize the distress.
• Dog handlers should avoid subjecting dogs to unnecessary risk during training and intervention,always choosing alternative manoeuvres that are less physically and/or emotionally damaging tothe dog.
• Training techniques used will always be aimed at avoiding physical and/or emotional violence tothe dogs, limiting the pressure they receive during training.
4. CONCLUSIONSSnR project aims at providing technological solutions that suit the first responders´ needs. From thisperspective, challenges of the K9 units have been highlighted from the beginning of the project and willbe taken into consideration by developers, being the ethical aspects in the research a key point underthe project.The results will be validated in the pilots, also by the K9 teams. One of the most expected impacts is thedevelopment of technological tools that will allow the reduction of response times and save a greaternumber of lives, in an effective and efficient way considering ethical principles around all the process.
REFERENCES 1. https://search-and-rescue.eu/2. https://cordis.europa.eu/project/id/6078143. https://cordis.europa.eu/project/id/6080784. Aldea Reyes, A; Funcia Izquierdo, S. Código Ético dirigido a profesionales y voluntarios de la ESDP. (2021)
in https://escuelasalvamento.org/wp-content/uploads/2021/04/Codigo-Etico_vf.pdf5. OIE (Organización Mundial de Salud Animal) - Código Sanitario para los Animales Terrestres – Bienestar
animal, Cap. 7, 2019
Page 155 of 269

SafeGreece 2021 on-line Proceedings | ISSN 2654-1823
SafeGreece 2021 – 8th International Conference on Civil Protection & New Technologies 24-26 November, on-line | www.safegreece.org/safegreece2021 | [email protected]
IMPACT OF CIVIL PROTECTION ON ECONOMIC GROWTH. CASE STUDY OF KOZANI CITY GREECE.
Stavros Kalogiannidis1, Ermelinda Toska2, Fotios Chatzitheodoridis3, Vaios Zygouris4
1Department of Business Administration,University of Western Macedonia, Greece 2, 3 Department of Regional and Cross-Border Development, University of Western Macedonia
4Major of Hellenic Fire Corp, professor of Firefighters Academy, M.ed and natural hazards & disaster management: e-mail: [email protected], [email protected], [email protected], [email protected]
ABSTRACT
Civil protection includes disaster preparedness and management, where it is essential to alert the public to potential disasters and to take disaster recovery measures. However, there is little research on civil protection and its role in economic growth and development. This study therefore sought to investigate the impact of civil protection on economic growth and development using the city of Kozani in Greece as a case study. The study used data from 160 residents of Kozani. The results of the study confirm that important civil protection areas such as national early warning systems, economic preparedness measures and rescue operations significantly influence economic growth and development. . In addition, key strategies needed for better civilian protection, such as government support, positively affect economic growth.
Keywords: civil protection, economic recovery, economic growth and development, crisis management
1. INTRODUCTION & PROBLEM STATEMENTCivil protection is the first line of defense for a country's people after a disaster, and is an expression ofhumanitarian solidarity beyond that country's borders with other affected countries. In-kind support,deployment of specially equipped teams, or assessment and coordination by field experts can all be partof a national emergency response. Most of the partnerships include information sharing, consularassistance cooperation, and specialist capacity development cooperation, among others. Emergencyresponse agencies coordinate the deployment of knowledge and provision of resources, helping tomitigate long-term crises. Despite different studies on different mechanisms used in disaster oremergency management and economic recovery, little or no civil protection and its effect on economicgrowth . Therefore, this study assesses the impact of civil protection on economic growth anddevelopment.Research Questions
1. What is the role of civil protection in economic recovery?2. What are the key focus areas of civil protection?3. What are the different strategies essential for improved civil protection?
Research hypotheses H1: There is a strong t relationship between strategies for improved civil protection and Economic growth and development. H2: Key focus areas of civil protection positively affect economic growth and development Function of civil protection
Chinkin [1] points out that the sharing economy is a concept that aims to create, acquire and manage primary products and services by a group of people depends on international partnerships for research and innovation in certain fields [2]. For example, nuclear fusion reactors and space laboratories are
Page 156 of 269
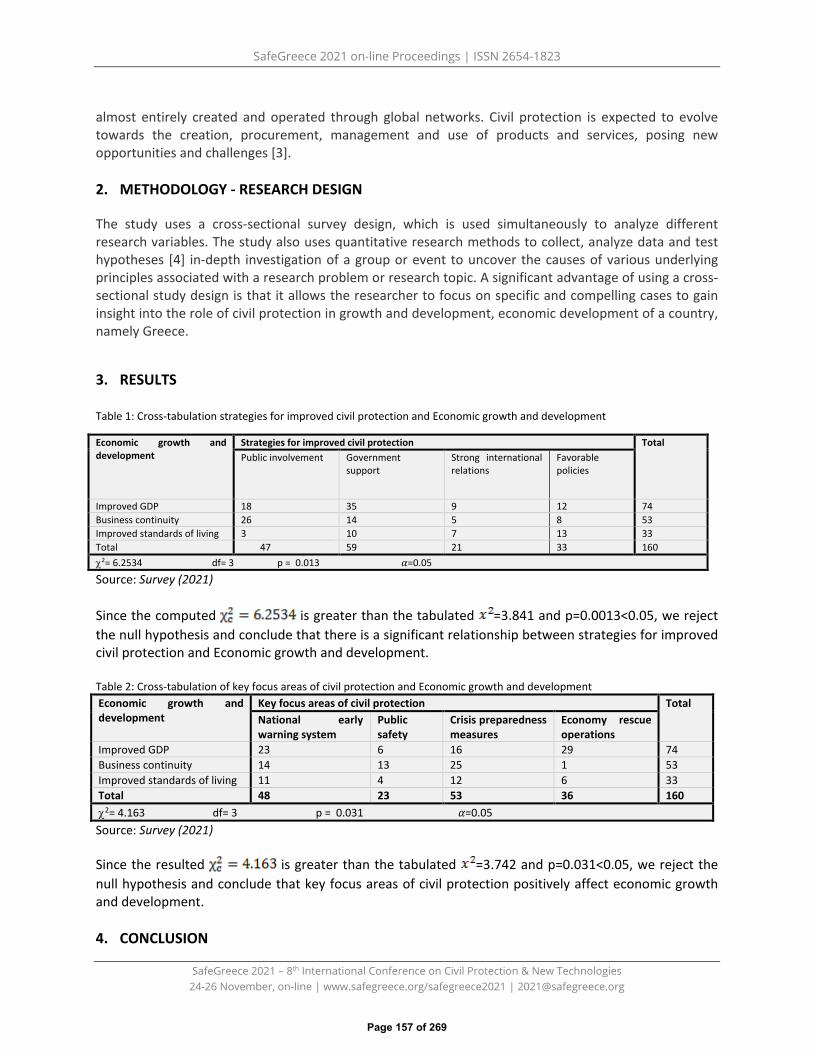
SafeGreece 2021 on-line Proceedings | ISSN 2654-1823
SafeGreece 2021 – 8th International Conference on Civil Protection & New Technologies 24-26 November, on-line | www.safegreece.org/safegreece2021 | [email protected]
almost entirely created and operated through global networks. Civil protection is expected to evolve towards the creation, procurement, management and use of products and services, posing new opportunities and challenges [3].
2. METHODOLOGY - RESEARCH DESIGN
The study uses a cross-sectional survey design, which is used simultaneously to analyze different research variables. The study also uses quantitative research methods to collect, analyze data and test hypotheses [4] in-depth investigation of a group or event to uncover the causes of various underlying principles associated with a research problem or research topic. A significant advantage of using a cross-sectional study design is that it allows the researcher to focus on specific and compelling cases to gain insight into the role of civil protection in growth and development, economic development of a country, namely Greece.
3. RESULTS
Table 1: Cross-tabulation strategies for improved civil protection and Economic growth and development
Economic growth and development
Strategies for improved civil protection Total Public involvement Government
support Strong international relations
Favorable policies
Improved GDP 18 35 9 12 74 Business continuity 26 14 5 8 53 Improved standards of living 3 10 7 13 33 Total 47 59 21 33 160 χ2= 6.2534 df= 3 p = 0.013 𝛼𝛼=0.05
Source: Survey (2021)
Since the computed is greater than the tabulated =3.841 and p=0.0013<0.05, we reject the null hypothesis and conclude that there is a significant relationship between strategies for improved civil protection and Economic growth and development.
Table 2: Cross-tabulation of key focus areas of civil protection and Economic growth and development Economic growth and development
Key focus areas of civil protection Total National early warning system
Public safety
Crisis preparedness measures
Economy rescue operations
Improved GDP 23 6 16 29 74 Business continuity 14 13 25 1 53 Improved standards of living 11 4 12 6 33 Total 48 23 53 36 160 χ2= 4.163 df= 3 p = 0.031 𝛼𝛼=0.05 Source: Survey (2021)
Since the resulted is greater than the tabulated =3.742 and p=0.031<0.05, we reject the null hypothesis and conclude that key focus areas of civil protection positively affect economic growth and development.
4. CONCLUSION
Page 157 of 269

SafeGreece 2021 on-line Proceedings | ISSN 2654-1823
SafeGreece 2021 – 8th International Conference on Civil Protection & New Technologies 24-26 November, on-line | www.safegreece.org/safegreece2021 | [email protected]
The study confirms the role of civil defense strategies in improving economic growth and development. Civil protection policies should also be a visible expression of international solidarity, by assisting other countries in disaster prevention, preparedness and response, in a global environment challenging without taking into account human rights at the border. Civil protection authorities in Greece should consider in detail disaster patterns for future resilience, ensuring that the necessary resilience is created to deal with possible consequences happened but not known. The government should use the capabilities provided by civil protection proactively and decisively. By employing civil defense strategies, governments can make a significant contribution to maintaining and strengthening the resilience of Greek society to obstacles to economic growth and development.
REFERENCES 1 Chinkin, C. (2007). The Protection of Economic, Social and Cultural Rights Post-Conflict. Commissioner for
Human Rights, 1–57. 2 Sotiropoulos, D. (2014). Civil society in Greece in the wake of the economic crisis. Report for Konrad
Adenauer Stiftung und ELIAMEP. 3 World Bank. (2021). Understanding the Needs of Civil Protection Agencies and Opportunities for Scaling up
Disaster Risk Management Investments. 4 Drummond, K., & Murphey-Reyes, A. (2017). Quantitative research designs: Experimental, quasi-
experimental, and descriptive. Jones & Bartlett Learning, 155–183.
Page 158 of 269
SafeGreece 2021 on-line Proceedings | ISSN 2654-1823
SafeGreece 2021 – 8th International Conference on Civil Protection & New Technologies 24-26 November, on-line | www.safegreece.org/safegreece2021 | [email protected]
IMPLICATIONS OF MAJOR NATURAL DISASTERS ON NATIONAL BUDGET
Ioanna Kyrıopoulou Ministry of Infrastructure and Transport, Greece
(E-mail: [email protected])
ABSTRACT Recent researches show that the catastrophic events, triggered by natural processes, are increasing. This is mainly due to the urbanization and the extension of human activities in areas of “high risk” from natural hazards. As a result, more people are affected by extreme phenomena and more infrastructures and properties are damaged. This is also due to the climate crisis which increases both frequency and intensity of extreme natural events. The current study aims to record and estimate the financial liabilities arising for the state, from the advent of a major natural disaster. It also aims to investigate its direct and indirect economic consequences on public finances and to examine macroeconomic impact on the national economy. To evaluate the financial consequences of a natural disaster in the national budget, an economic assessment of the fire that struck Eastern Attica on July 23rd, 2018, up to two years after its occurrence, is performed. Data has been collected from the Greek and international literature, articles and legislation, regarding government relevant decisions. In particular, data and information regarding the economic consequences of the deadly fire of July 23rd were provided by public services and agencies responsible for managing natural hazards and their impacts. They were also provided by the open public procurement platforms Diavgeia and Promitheus, private companies, press releases and the Greek press. Several models and methods have been proposed to evaluate the economic impacts of natural disasters. Most of them are based on the input-output model that represents the interdependencies between different sectors of a national economy or different regional economies. However none of them is widely accepted and official adopted [1]. Recording loss data and building a disaster database is highly recommended in order to identify, asses and monitor disaster risk and reduce disaster impacts [2].
Keywords: Natural disasters, economic impacts, national budget, disaster losses, fire.
1. INTRODUCTION
Disaster is: “A serious disruption of the functioning of a community or a society involving widespread human, material, economic or environmental losses and impacts, which exceeds the ability of the affected community or society to cope using its own resources” [3]. A natural disaster is an adverse situation triggered by natural processes such as earthquakes, volcanic eruptions, tsunamis, fires, floods, storms and other geologic processes. All of these processes have been operating throughout Earth history all over the world [4]. “A natural event only becomes a disaster when it impacts human life, property, or livelihood” [5]. Natural disasters can cause loss of life, property, infrastructure and enviromental damages. They also cause financial losses at the local, national or even international level. The financial effects usually distinguish between direct and indirect, short and long-term [6,7]. A major disaster may have negative effects on the national budget and on the GDP of a country.
Page 159 of 269

SafeGreece 2021 on-line Proceedings | ISSN 2654-1823
SafeGreece 2021 – 8th International Conference on Civil Protection & New Technologies 24-26 November, on-line | www.safegreece.org/safegreece2021 | [email protected]
2. IMPLICATIONS OF MAJOR NATURAL DISASTERS ON NATIONAL BUDGET
Governments, in an effort to deal with natural disasters, manage their consequences hence, to strengthen social resilience against potential risks, undertake the responsibility to support the affected population. In addition, within this framework, governments act to support and stimulate the economy. They also initiate the construction of required protection structures, training and educating, the emergency managers and other community members by competent authorities and experts and the implementation of effective integrated emergency preparedness and contingency plans, to respond in future emergencies [8]. To deal with issues arising by forthcoming major natural disasters, a significant part of national funds is provided, burdening the State budget in a short, medium and long-term period. The amount and the way of allocating financial aid are determined by the existing legislative Government framework and by special regulations approved and implemented. It has been found that all types of natural disasters cause the state reserves to shrink during the event and the period immediately afterwards. Their fiscal impact is reflected in the Revenue - Expenditure Report of the State Budget. The rate of decline in GDP and the long-term post-catastrophic development of the national growth and economy depend on the “Vulnerability”. Developmental, economic and societal factors affect the sensitivity of economies to natural hazards [9]. Developing countries and less advanced economies are more vulnerable to natural events. In absolute terms the cost of a natural disaster for the advanced economies is higher because they have more and expensive assets and constructions but they are also capable to undertake the appropriate measures to mitigate economic, financial and social effects. On the other hand, the developing countries can’t easily absorb shocks so recovering their economy is difficult if not impossible [10]. Some researchers (Skidmore & Toya, 2002, Okuyama - Hewings & Sonis 2004) suggest that a disaster can have positive affect on long-term economic growth, mainly thanks to the activity of the construction industry. Also modern technologies and equipment increase productivity. However, this could have happened in the absence of disaster and without suffering from the disaster-related human and welfare losses [11]. Policies and practices for disaster risk management should be based on an understanding of the disaster risk and its consequences. Evaluating the data and comparing them would be useful to better understand natural disasters and it would provide a source of information in order to minimize the impacts and adopt the appropriate preventive measures to decrease Vulnerability. Although there are several efforts and several global and national disaster databases exist, such as EM-DAT [12] and Swiss Re, the financial impacts of disasters are not systematically recorded and there is no standard or widely accepted methodology of reporting, analyze and utilize them.
2.1. Increase in public expenditures
Public spending is increased by the commitment and initiative of all government levels (local, regional and central) to relieve and support citizens, while also paying for the mitigation physical losses, damages and economic impacts. Indicatively, governments often undertake a large share of recovery and reconstruction costs, the responsibility of speeding up, via funding, affected populations relief, medical assistance and the expenditure for restoring essential services. In addition, central governments usually fund the economic enhancement and speeding up measures to protect impacts from future hazards.
2.2. Reduction of public revenues
Page 160 of 269
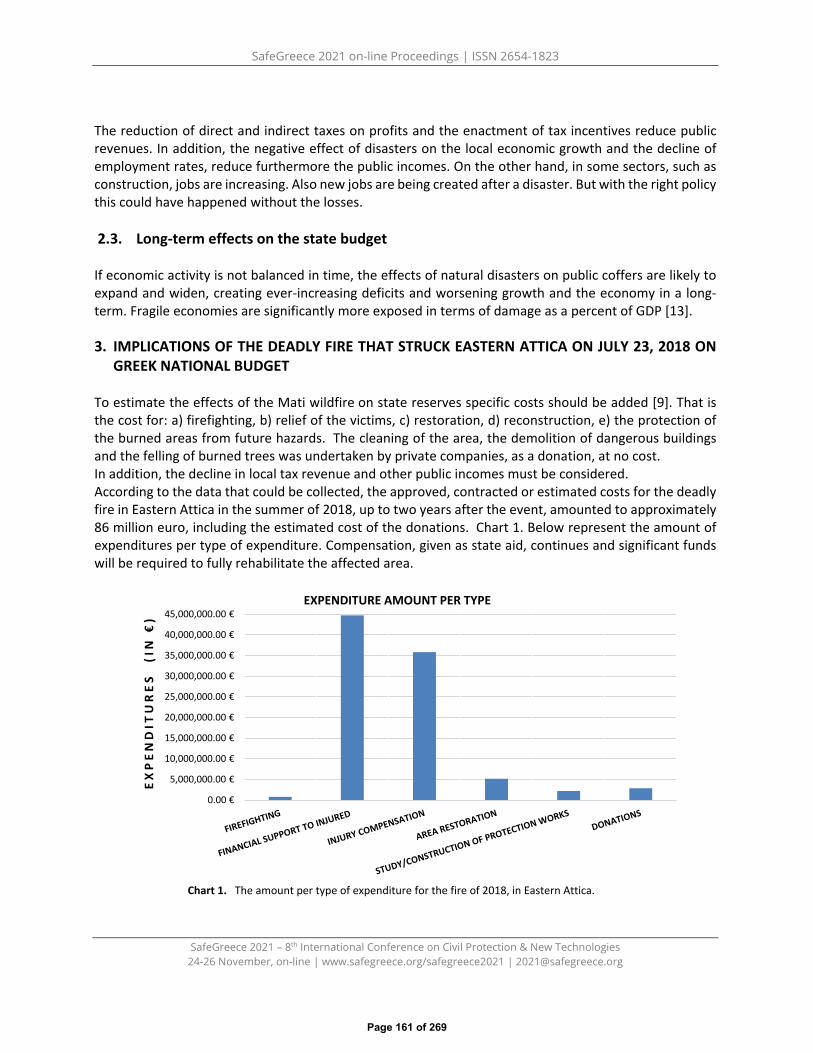
SafeGreece 2021 on-line Proceedings | ISSN 2654-1823
SafeGreece 2021 – 8th International Conference on Civil Protection & New Technologies 24-26 November, on-line | www.safegreece.org/safegreece2021 | [email protected]
The reduction of direct and indirect taxes on profits and the enactment of tax incentives reduce public revenues. In addition, the negative effect of disasters on the local economic growth and the decline of employment rates, reduce furthermore the public incomes. On the other hand, in some sectors, such as construction, jobs are increasing. Also new jobs are being created after a disaster. But with the right policy this could have happened without the losses.
2.3. Long-term effects on the state budget
If economic activity is not balanced in time, the effects of natural disasters on public coffers are likely to expand and widen, creating ever-increasing deficits and worsening growth and the economy in a long-term. Fragile economies are significantly more exposed in terms of damage as a percent of GDP [13].
3. IMPLICATIONS OF THE DEADLY FIRE THAT STRUCK EASTERN ATTICA ON JULY 23, 2018 ONGREEK NATIONAL BUDGET
To estimate the effects of the Mati wildfire on state reserves specific costs should be added [9]. That is the cost for: a) firefighting, b) relief of the victims, c) restoration, d) reconstruction, e) the protection of the burned areas from future hazards. Τhe cleaning of the area, the demolition of dangerous buildings and the felling of burned trees was undertaken by private companies, as a donation, at no cost. In addition, the decline in local tax revenue and other public incomes must be considered. According to the data that could be collected, the approved, contracted or estimated costs for the deadly fire in Eastern Attica in the summer of 2018, up to two years after the event, amounted to approximately 86 million euro, including the estimated cost of the donations. Chart 1. Below represent the amount of expenditures per type of expenditure. Compensation, given as state aid, continues and significant funds will be required to fully rehabilitate the affected area.
Chart 1. The amount per type of expenditure for the fire of 2018, in Eastern Attica.
0.00 €
5,000,000.00 €
10,000,000.00 €
15,000,000.00 €
20,000,000.00 €
25,000,000.00 €
30,000,000.00 €
35,000,000.00 €
40,000,000.00 €
45,000,000.00 €
EX
PE
ND
ITU
RE
S
(IN
€)
EXPENDITURE AMOUNT PER TYPE
Page 161 of 269
SafeGreece 2021 on-line Proceedings | ISSN 2654-1823
SafeGreece 2021 – 8th International Conference on Civil Protection & New Technologies 24-26 November, on-line | www.safegreece.org/safegreece2021 | [email protected]
4. CONCLUSIONS
• The economic losses of natural disasters are increasing worldwide and in Greece respectively [EM-DAT].
• Governments, in order to support the affected population and mitigate the impacts, spentsignificant amount of public funds.
• The accurate recording of previous disasters loss data and is useful.• For the implementation of disaster risk reduction strategies and to help understand disaster loss
trends at global and local level, it is essential to record data of previous disasters. It is alsorecommended to calculate the cost of preventive measures that have been taken and protectionprojects that have been constructed. Α cost-benefit analysis, based on this data, will provideinformation on the economic feasibility of investments in reducing natural disaster risk in advance.
• In order to better monitor hazards and their costs, it would be useful to build a uniformly database,to systematically entry data for every catastrophic event.
REFERENCES
1. Avelino A. F. T., G. J. D. Hewings, A. Fernandes, & T. Avelino. (2017). The Challenge of Estimating the Impactof Disasters: many approaches, many limitations and a compromise. www.real.illinois.edu
2. De Groeve T., K. Poljansek, & D. Ehrlich. (2013). Recording disaster losses - Recommendations for aEuropean approach. Luxembourg: European Commission Joint Research Centre Institute for the Protectionand the Security of the Citizen, EUR 26111 EN. https://doi.org/10.2788/98653.
3. UNDRR Terminology. https://www.undrr.org/terminology/disaster4. Nelson S. A. (2018). Natural Disasters & Assessing Hazards and Risk.
https://www.tulane.edu/~sanelson/Natural_Disasters/introduction.htm5. Melton G. (2012). When Natural Events become Natural Disasters. https://www.dewberry.com/insights-
news/post/blog/2012/05/04/When-Natural-Events-become-Natural-Disasters6. Benson C., & E. J. Clay. (2004). Disaster and Risk Management Series : Understanding the Economic and
Financial Impacts of Natural Disasters. THE WORLD BANK (Vol. 4). Washington, DC.7. Lazzaroni S., & P. Van Bergeijk. (2013). Natural disasters impact , factors of resilience and development : A
meta-analysis of the macroeconomic literature Working Paper Νο 554 Hague.https://www.sciencedirect.com/science/article/pii/S0921800914002705
8. European Civil Protection and Humanitarian Aid Operations. Greecehttps://ec.europa.eu/echo/what/civil-protection/disaster-management/ greece_en
9. Kyriopoulou I. (2021). Implications of major natural disasters on national budget CASE STUDY: MATIΑΤΤΙΚΗS. Pergamos - Library and Information Center of National and Kapodistrian University of Athens.https://pergamos.lib.uoa.gr/uoa/dl/frontend/en/browse/2940365
10. MOODY’S INVESTORS SERVICE. (2016). Understanding the Impact of Natural Disasters : Exposure to DirectDamages Across Countries, (November), (pages 1,5).
11. Hallegatte S. (2015). The Indirect Cost of Natural Disasters and an Economic Definition of MacroeconomicResilience. Policy Research Working Papers 7357-WORLD BANK GROUP.https://www.gfdrr.org/sites/gfdrr.org/files/documents/Public finance and macroeconomics, Paper 3.pdf
12. EM-DAT Public Data. https://public.emdat.be/data13. CRED - UNISDR. (2018). Economic Losses, Poverty & DISASTERS 1998-2017. www.unisdr.org
Page 162 of 269

SafeGreece 2021 on-line Proceedings | ISSN 2654-1823
SafeGreece 2021 – 8th International Conference on Civil Protection & New Technologies 24-26 November, on-line | www.safegreece.org/safegreece2021 | [email protected]
“TELEMACHUS” PROJECT: THE CASE OF EPPO’S EDUCATION ACTION PLAN
Dr Asimina Kourou1, Panoutsopoulou Maria2 MSc, Manousaki Maria3 MSc 1, 2,3 Earthquake Planning and Protection Organization (Greece).
(E-mail: [email protected], [email protected] , [email protected])
ABSTRACT Earthquake disasters are a result of the combination of parameters of natural phenomenon, the conditions of building and social environment vulnerability and of the insufficient measures to reduce the potentially negative impacts of the seismic events. Greece is one of the most earthquake prone countries of the world and Ionian Island Region is an area with high seismicity. Beacause of that this region has an holistic and strategic approach for implementing measures to reduce earthquake risk. Based on this request, “Telemachus” Project consists of a set of tools and actions that will strengthen the stakeholders and the local communities or individuals to prepare better, respond and cope in case of earthquake. In the abovementioned framework, EPPO earthquake training ativities are designed to help users obtain the knowledge, and support them to plan and implement effective earthquake mitigation actions. The aim of this survey is identify specific needs and gaps in knowledge, practices, or skills of personnel of Prefectures and Municipalities and involved with tourism industry personnel, in order to be designed and implemented the proper education activities by EPPO.
Keywords: awareness, preparedness, Ionian Islands, Telemachus Project, seismic risk reduction.
1. INTRODUCTION
Earthquakes affect millions of people each year on a personal, local community and national level. All areas of Greece have experienced earthquakes in the past and will do again in the future. Ionian islands Region is in extremely active seismic area of Greece, comprising of the prefectures of Corfu, Kefalonia - Ithaca, Lefkada and Zakynthos.
Earthquake Planning and Protection Organization (EPPO) is a national organization that implements actions, among others, such as training for civil protection staff and other personnel, community sensitisation and awareness-raising. Taking into consideration the needs of citizens in earthquake preparedness, EPPO is participating to “Telemachus - Innovative Operational System for Ionian Islands Region Seismic Risk Management” Project. The Telemachus Project connects science-based research, IT tools and education that empower local communities, agencies, involved with tourism industry and individuals to prepare for, protect against and respond to disaster. In this way, EPPO adopts a range of approaches and tools to educate, build and sustain public awareness on earthquake risk and vulnerabilities.
2. OBJECTIVE
“We must, above all, shift from a culture of reaction to a culture of prevention. Prevention is not only more humane than cure; it is also much cheaper.... Above all, let us not forget that disaster prevention is a moral imperative, no less than reducing the risks of war” {1]. It is well known that the goal of education efforts is to improve the knowledge and the skills of the population in case of earthquake, and to change people’s behavior.
Page 163 of 269

SafeGreece 2021 on-line Proceedings | ISSN 2654-1823
SafeGreece 2021 – 8th International Conference on Civil Protection & New Technologies 24-26 November, on-line | www.safegreece.org/safegreece2021 | [email protected]
Taking into account that the education to build up the culture for earthquake risk reduction should be permanent and cut across all formal and informal educational efforts, “Telemachus” project is in progress. This project is funded under the Priority Axis "Environmental Protection and Sustainable Development" of Operational Plan "Ionian Islands 2014-2020" (ESPA 2014-2020). It is an innovative operational project that is carefully planned to achieve coordination and promotion of seismic risk-reduction actions in local key sectors. The Region of Ionian Islands is the coordinator of “Telemachus” Project. This project is a collaborative process involving different partners, such as EPPO, Geodynamic Institute, National and Kapodistrian University of Athens and Ionian University.
To enhance knowledge and awareness on the concept of seismic protection of Ionian islands is one of the main EPPO’s objectives. More specifically, EPPO’s key preparedness activities, such as continuity of operations plans for agencies, information of the population, training of local authorities, development specific material aim to engage local authorities to take an active part in protecting the citizens and strength the community as a whole [2, 3]. In the framework of “Telemachus” project, EPPO implemented the following educational actions:
˗ Needs analysis through anonymous questionnaires. ˗ Nine in-person workshops addressed to local authorities and the civil protection personnel of
Region of Ionian Islands and Municipalities of Corfu, Lefkada, Zakynthos and Kefalonia. ˗ Three webinars addressed to the personnel of public agencies of the Ionian Islands. ˗ Hybrid seminar addressed to involved with tourism industry (e.g. hotel industry, the hospitality
industry and the transport industry). ˗ a leaflet on “Telemachus” Project issues. ˗ 15 presentations through which local authorities can reduce seismic risk and cope with
disasters.
3. RESULTS OF SURVEY
In the framework of Telemachus project, EPPO collected information in order to identify specific needs and gaps in knowledge, practices, or skills. Two closed-form questionnaires were developed for the research, which contained questions concerning protective earthquake measures at family and workplace level. The first one of questionnaires contains 24 questions and addressed to personnel of Prefectures and Municipalities. The second questionnaire contains 28 questions and addressed to involved with tourism industry personnel and businessmen. A total of 106 questionnaires were collected from September 2019 to May 2021, and analyzed by EPPO.
According to the results the 99% of the respoders have experienced an earthquake which is expected due to seismicity of the Ionian islands which are one of the most seismic prone areas of the country and a number of serious earthquakes have occurred and affected them in multiple ways. Kefalonia, Zakynthos and Ithaki are in the third seismic hazard zone with the highest seismicity in Greece and in Europe. Most of the responders have experienced the earthquake at home (Figure 1a), it is remarkable that only half of the responders reacted correctly (Figure 1b).
Page 164 of 269

SafeGreece 2021 on-line Proceedings | ISSN 2654-1823
SafeGreece 2021 – 8th International Conference on Civil Protection & New Technologies 24-26 November, on-line | www.safegreece.org/safegreece2021 | [email protected]
(a) (b) Figure 1. (a) Responses to the question: Have you ever experienced an earthquake, and if yes where? (b) Responses to the question: What was your reaction during an earthquake? (%)
Regarding to the existence of the Earthquake Emergency Plan at workplace, the 45% of the responders claimed that they “don’t know if there is a Plan in their workplace” and the 21% replied that “there is no any plan” (Figure 2a). These results are not satisfactory taking into consideration the high seismicity of the Ionian Islands Region and the mandatory implementation of workplace’s emergency planning (according to the Hellenic legal framework).
(a) (b) Figure 2. (a) Responses to the question: Is there an Earthquake Emergency Plan at your workplace? (%) (b) Do you consider that the earthquake drills are necessary? (%)
Almost all the responders (98%), that answered the question «Do you consider that the earthquake drills are necessary?», believe that the drills are necessary, enough up to very much (Figure 2b). However, unfortunately 69% of the responders claimed that they have never implemented an earthquake drill and only 5% have implemented a drill once a year (Figure 3a). It is well known that drills are an important part of workplace safety procedures because they ensure that all staff and visitors to the premises understand what they need to do in case of earthquake, but they also help the planners to test how effective the evacuation plan is and to improve the workplace preparedness. According to the results of the survey, the majority of the employers have not applied the main protective measures in their workplace, such as posting of the Emergency Plan in the building, information of personnel, supply of emergency items (Figure 3b). The basic measure that they take is to place the heavy items in lower shelves and keep the flammable, dangerous substances in closed, low closets.
Page 165 of 269

SafeGreece 2021 on-line Proceedings | ISSN 2654-1823
SafeGreece 2021 – 8th International Conference on Civil Protection & New Technologies 24-26 November, on-line | www.safegreece.org/safegreece2021 | [email protected]
(a) (b) Figure 3. (a) How often do you organize an earthquake drill at your workplace? (%) (b) Protective actions that the employers have applied in the workplace
Finally, a high percentage of responders (92,1%) answered that the «Telemechus» project will contribute to the Prefecture ’s preparedness in seismic risk management.
4. CONCLUSIONS
It is well known that reducing exposure to hazards, wise emergency management and improving earthquake preparedness contributes to disaster risk reduction. On the other hand, community preparedness mainly depends on population characteristics, building, physical and social environment. Earthquake risk reduction is a clear priority for EPPO and Ionian Island Region. According to the results of the needs analysis survey, a lot of earthquake preparedness measures have been taken at workplaces in Ionian Islands Region, but it is a continuous effort and there is always room for improvement. “Telemachus” project has the potential to play a critical role in managing earthquake disasters. In the framework of “Telemachus” project, EPPO through educational actions expand the knowledge about the best ways prevention and preparedness to individuals, communities and local authorities.
REFERENCES
1. K. Annan (1999). Strategy for a Safer World in the 21st Century: Disaster and Risk Reduction, Geneva, July9, 1999.
2. EPPO (2015). Earthquakes and Workplaces. https://www.oasp.gr/userfiles/Earthquakes%20and%20Workplaces_final.pdf
3. ΕLINYAE (2008). Guidelines for earthquake planning at workplaces, 240p (in Greek)4. Law 3850 (2010). Legal Framework of Health and Safety of Workers, FEK 84/2-6-2010 (in Greek)
Page 166 of 269

SafeGreece 2021 on-line Proceedings | ISSN 2654-1823
SafeGreece 2021 – 8th International Conference on Civil Protection & New Technologies 24-26 November, on-line | www.safegreece.org/safegreece2021 | [email protected]
LEVERAGING SCHOOL’S SYSTEMS AS A LOCUS FOR RISKS AND DISASTER MANAGEMENT. A CASE STUDY OF GREECE
Stavros Kalogiannidis1, Evgenia Marneri2, Stavroula Savvidou3, Olympia Papaevangelou4
1, Department of Business Administration,University of Western Macedonia, Greece 2, 3, 4, Ministry of Education, Kozani , Greece, Prefectue of Western Macedonia, Greece
(E-mail: [email protected], [email protected], [email protected],[email protected])
ABSTRACT The relationship between climate change and rising poverty rates increases the vulnerability of communities to disasters, weakening communities' resilience to the impacts of disasters. In such a situation, developers, planners, and academics must devise new approaches to increase the resilience of communities in the face of increasing risk. This study examined how school systems, as important social institutions, can best reduce disaster risk in their communities. Social institutions strongly influence people's norms, beliefs and actions. School, after home, is the second most important socialization facility, is responsible for developing people's attitudes, knowledge, behaviors, skills and values to ensure social compliance. This study explored the possibility of using the school system to improve disaster risk reduction in disadvantaged regions of Greece. According to the study, many benefits would be achieved if disaster risk reduction was integrated into Greece's school systems. Integrating disaster risk management into school curricula and learning concepts such as emergency preparedness are both considered essential for improving disaster risk management.
Keywords: Disaster Risk Reduction, School Systems, Civil Protection
1. PROBLEM STATEMENTLike many other regions of the world, Greece is beset by various dangers [1]. Various factors can createthese hazards and are classified into two categories: natural threats and man-made threats. However,we can argue about the root cause, threats of nature and concludes that man is responsible. However,this is a topic for a separate post. These risks can lead to disaster if not managed appropriately ifcontainment action is not taken and if no action is taken after a threat emerges [2]. It is thereforeessential to understand the best approach to address these dangers and, where possible, avoid orminimize disasters [3]. The gap between and local action at the cost of community resilience equates toremoving the key driver of community development from the disaster risk reduction equation.Education and the school system are at the heart of community socio-economic development [4].
Purpose of the study The major objective of the study is to assess leveraging schools systems as a locus for risks and disaster management using Greece as a case study. The study is also based on different specific objectives that include;
• To establish the effect of school curriculum on disaster risks management school.• To explore the effect of civil protection knowledge acquisition on disaster risks management
school.Research Questions
1. What is the effect of school curriculum on disaster risks management school?
Page 167 of 269
SafeGreece 2021 on-line Proceedings | ISSN 2654-1823
SafeGreece 2021 – 8th International Conference on Civil Protection & New Technologies 24-26 November, on-line | www.safegreece.org/safegreece2021 | [email protected]
2. What is the effect of civil protection knowledge acquisition on disaster risks managementschools?
Research hypothesis H1: School curriculum has a positive effect on disaster risks management school H2: Civil protection knowledge acquisition has a positive effect on disaster risks management schools.
Theoretical review The Hyogo Framework guides this research for Action 2005-2015 and the Sendai Framework for Disaster Risk Reduction 2015-2030. The Sendai Framework for Disasters was approved in March 2015 in Japan to replace the Hyogo Japan Framework for Action, spanning from 2005 to 2015 [5]. Its goal is to help countries and communities become more resilient to disasters. Sendai's Framework for Action ensures the continuation of efforts initiated under the Hyogo Framework for Action. In this study, the Sendai framework is important because it emphasizes the resilience of communities to disasters, and in Greece schools are the hubs of community development. Additionally, in any given community, students are the most important source of information about disasters.
2. METHODOLOGY - RESEARCH DESIGNThe study used a quantitative approach and a descriptive research design. Descriptive research is aninquiry in which quantitative data is gathered and evaluated to characterize a particular phenomenon interms of current trends, current occurrences, and current connections between various variables.ResultsThis section presents the interpretation of the different results obtained after analyzing data collectedfrom the selected teachers in Kozani, Greece.Regression analysisThe relationship between school systems (school curriculum and knowledge acquisition) and disasterrisk management was established using regression analysis as presented in the subsequent tables (Table1-4).
Table 1 Model Summary
Model Summary Model R R
Square Adjusted R Square Std. Error of the Estimate
1 0.831a 0.573 0.484 0.71437 a. Predictors: (Constant), School curriculum, Knowledge acquisitionThe dependent variable is disaster risk management. The independent variable is regressed against the dependent variable obtaining R2 value of 0.573. This indicates that the independent variables jointly explain 57.3 % of the variation in the dependent variable (disaster risk management). The regression results also confirm that the study's independent variables do not influence 42.7% of the changes.
Table 2 ANOVA
ANOVA S Sum of Squares Df Mean Square F Sig. 1 Regression 79.216 3 28.031 71.241 0.021
Residual 71.878 150 0.413 Total 143.082 159
a. Dependent Variable: Disaster risk management
Page 168 of 269

SafeGreece 2021 on-line Proceedings | ISSN 2654-1823
SafeGreece 2021 – 8th International Conference on Civil Protection & New Technologies 24-26 November, on-line | www.safegreece.org/safegreece2021 | [email protected]
b. Predictors: (Constant), School curriculum, Knowledge acquisition
The F-statistic of 71.241 at prob. (Sig) = 0.021 conducted at 5% level of significance is used to determine the significance of the regression model. This means a statistically significant linear relationship between the independent variables (School curriculum and Knowledge acquisition) and the dependent variable (Disaster risk management) as a whole.
Table 3 Coefficients
Coefficients Model Unstandardized Coefficients Standardized
Coefficients T Sig.
B Std. Error Beta 1 (Constant) 0.617 0.315 1.259 0.210
School curriculum 0.361 0.065 0.491 11.024 0.000 Knowledge acquisition 0.052 0.097 0.042 0.628 0.031
a. Dependent Variable: Disaster risk management
The results in the table above confirm a relationship between school systems (school curriculum and knowledge acquisition) and disaster risk management since p<0.05.
3. CONCLUSIONSResearch confirms the importance of school systems in improving disaster risk management. In thiscontext, it is necessary to continue to develop DRR education at all stages of the educational process,starting with primary schools. The school curriculum should include; Theoretical training and practicalexperience in health protection, first aid, fire prevention, emergency response, natural disaster andresidential protection functions. Educating students in Greece about disaster risk reduction plays animportant role in increasing the resilience of ordinary citizens to different types of disasters. However, ifwe want to have a proper education in terms of academic background and practical experience, weneed the right education of students in the faculties of education. These students are the bearers ofknowledge and mediators for the students. There are many opportunities to scale up disaster riskreduction through the school education system. The Greek education system offers opportunities tointegrate disaster risk reduction into educational institutions. Schools are social organizations capable ofreceiving and redirecting community money for community development.
References 1 Diakakis, M., Damigos, D. G., & Kallioras, A. (2020). Identification of patterns and influential factors on civil
protection personnel opinions and views on different aspects of flood risk management: The case of Greece. Sustainability (Switzerland), 12(14).
2 World Health Organization. (2019). Health Emergency and Disaster Risk Management: Overview. In Health Emergency and Disaster Risk Management Fact Sheets. https://www.who.int/hac/techguidance/preparedness/health-emergency-and-disaster-risk-management-framework-eng.pdf?ua=1
3 Department for International Development. (2017). Education in Emergencies Guidance Note. 4 Papaevangelou, O. (2021). A short communication of the role of media in disaster management Education
system. International Journal of Multidisciplinary Research and Growth Evaluation, 2(1), 390-392. 5 Gunawan, I., Sopaheluwakan, J., Sagala, S. A. H., Zawani, H., Amin, S., & Mangunsong, R. T. J. (2016).
Building Indonesia’s resilience to disaster : experiences from mainstreaming disaster risk reduction in Indonesia program. 1–348.
Page 169 of 269
SafeGreece 2021 on-line Proceedings | ISSN 2654-1823
SafeGreece 2021 – 8th International Conference on Civil Protection & New Technologies 24-26 November, on-line | www.safegreece.org/safegreece2021 | [email protected]
TEACHING ‘ROAD SAFETY’ – A SYSTEMIC APPROACH USED AT WEST ATTICA SECONDARY EDUCATION DIRECTORATE
Georgia Korakidi1, Evangelos C. Papakitsos2, Sotirios Giannopoulos3, Christina Papavasileiou4, Anastasios Mavrakis5
1 Health Education Coordinator, West Attica Secondary Education Directorate, Greek Ministry of Education, Greece; e-mail: [email protected]
2 Department of Industrial Design and Production Engineering, University of West Attica; 250 Thivon Av., GR–12244 Egaleo, Greece; e-mail: [email protected]
3 Project Manager, NGO Z–My Grand Road; Megara GR–19100, Attica, Greece; e-mail: [email protected]
4 MSc in Environmental Disaster and Crisis Management Strategies – Post Graduate Programme, National and Kapodistrian University of Athens; Greece. e-mail: [email protected]
5 Environmental Education Coordinator, West Attica Secondary Education Directorate, Greek Ministry of Education, Greece; e-mail: [email protected]
ABSTRACT
The issue of road safety is a social matter of ongoing concern for the educational authorities, especially in Greece where an increased number of fatal traffic accidents occur annually. In accordance to this concern, the Western Attica Secondary Education Directorate (WASED) has initiated a project consisting of a series of educational activities aiming at training the high-school pupils on the acute problem of road safety. These activities involve the formation of a local sustainability network of schools and the collaboration of other communities’ stakeholders (the local traffic-police department, private vehicle technical inspection centers and a few voluntary organizations).
Keywords: road safety; traffic education; Systemic Approach.
1. INTRODUCTIONRoad safety is an issue of ongoing concern internationally, due to the social and economic repercussionsof traffic accidents, especially the fatal ones among youths. The potential causes of traffic accidents [1,2] are extremely diverse, including:1. driving on the unfamiliar side of the road, which is globally the most common type of traffic
accidents involving tourists;2. consumption of alcohol;3. not using seat belt;4. risky or aggressive driving behaviours, especially among young drivers;5. overestimation or underestimation of driving skills;6. loss of focus and attention;7. even the locally lower socioeconomic conditions, especially the educational ones.Thus, the improvement of road safety and the prevention of dangerous driving are equally demandinggoals. The procedural tool for achieving these goals is the proper training of novice drivers that includesseveral aspects, such as:• how to acquire driving and vehicle management skills;• cognitive issues on how novice trainees learn;• the adequacy of formal training for acquiring a driving license, also regarding issues like the
knowledge of traffic legislation;
Page 170 of 269

SafeGreece 2021 on-line Proceedings | ISSN 2654-1823
SafeGreece 2021 – 8th International Conference on Civil Protection & New Technologies 24-26 November, on-line | www.safegreece.org/safegreece2021 | [email protected]
• the ability to pay attention when driving that can be distracted by listening to music, eating, usingphones and other activities parallel to driving;
• self-control in various traffic conditions and other individual personality considerations;• the limitations of training practices.
2. METHODOLOGY
In order to include all the important factors and to coordinate efficiently the various participants of the traffic education project in a holistic manner, the local authorities of WASED utilized Systems Science for planning the relevant intervention. In particular, the educational activities have been designed by using Systems Inquiry. Accordingly, Systems Inquiry includes three fields of study: Systems Philosophy, Systems Theory and Systems Methodology, the latter one consisting of conceptual tools that are utilized in the various applications. Such a conceptual tool is the Organizational Method for Analyzing Systems (OMAS-III), originally introduced in 2010 and finally revised in 2013 [3, 4]. OMAS-III is conceptually compatible to the Generic Systems Model (GSM) that consists of the looping quadruplet [input] > [process] > [output] + [feedback] and to the relevant analysis’ models of Information Systems. The aspects of a problem (perceived as a system) are classified in seven categories: 1) Causality aspects, regarding the purpose and motivation of the system (i.e., traffic education).2) Input aspects, regarding resources (both material and human) and raw data.3) Ruling aspects, regarding any kind of conditions (social or natural), like legislation, policies and other
regulations.4) Spatial aspects, regarding parts of the structure of the system concerning natural or virtual places.5) Temporal aspects, regarding relevant/absolute time and scheduling.6) Monitoring aspects, regarding institutions or persons (“stakeholders”) that operate in an influential
or managerial manner.7) Output aspects, regarding the required planning and results of the intervention (including feedback).
3. RESULTS
3.1 Causality Aspects The numbers of traffic accidents involving adolescents and children [5], defined the motives of WASED regarding traffic education, focused on road safety. 3.2 Input Aspects The input aspects of the traffic education project included the target-population and the target-topics. The former consisted of the high-school pupils of WASED, along with their associated cognitive features. The later consisted of all those topics that the pupils should primarily become aware of, regarding road safety. In addition and in relation to didactic goals that are cognitive, emotional and psychomotor, the pupils were informed on the following topics: • Regarding the dangers of traffic, to cross a road safely waiting for the traffic to stop first, not to cross
it by carelessly following others or by zigzagging, to use pedestrian crossings, to cross a pavement inthe middle of an avenue (if there is any, separating the opposite lanes) as if there were two separatestreets, to pay attention, to think for themselves and to be always careful, realizing that life isvaluable.
• Regarding their traffic awareness, to understand the potential dangers of each walking route(especially towards their school), to use the sidewalks (if they exist), to recognize risks and “saferpasses”, to properly estimate the speed and distance of cars on busy roads and to play in securedplaces.
Page 171 of 269

SafeGreece 2021 on-line Proceedings | ISSN 2654-1823
SafeGreece 2021 – 8th International Conference on Civil Protection & New Technologies 24-26 November, on-line | www.safegreece.org/safegreece2021 | [email protected]
• Regarding their knowledge on traffic formalities, to recognize and understand the meaning ofpedestrian traffic signs and to respond to visual signals.
• Regarding various functional subjects, the relationship between the conventional and the racingsafety belt, the role of tires in road safety (tire pressure control, when to replace them, suitability forevery vehicle, replace a flat tire), the importance of having a first-aid kit and a fire extinguisher in thevehicle (usage and inspection), the use of the Emergency Lane (LEA), the notion of Sustainable UrbanMobility, the proper use of the motorcycle (potential dangers, safe driving, the importance ofhelmet) etc.
3.3 Ruling Aspects Besides the cognitive issues on how novice trainees learn and the national traffic legislation to be learned, the ruling aspects included other innovative didactic practices and road safety policies [1] that are used as guidelines for planning traffic education efficiently. In the former case, experiential learning is the method that allows pupils to understand better the cognitive issues and to perceive the existing dangers in real conditions, both as future drivers and as passengers. In the latter case, the Sustainable Urban Mobility Plan (SUMP) [6] is a strategic plan that takes into account various principles such as the citizens’ participation in decision-making processes, the ongoing evaluation of interventions and the holistic approach for exerting related policies. In order to have the quality of life in urban centers improved, the satisfaction of existing and future travel needs is a key criterion for the planning of such projects. 3.4 Spatial Aspects The implementation of such a demanding educational project could not be conducted only in the premises of schools, thus requiring the participation of other related agencies and organizations. The most suitable outer premises for traffic education activities proved to be those of Vehicle Technical Inspection Centers – VTIC [7 – 10]. 3.5 Temporal Aspects The conducting of traffic education projects in secondary education level were mainly extracurricular, they were implemented either inside the school’s premises after the normal teaching schedule or outside the school’s premises during the normal teaching schedule; depending on the overall duration, there were a bit of both modes. The daily duration of the project did not exceed two hours’ time. Consequently, a one-day training activity had been designed, that included an introductory presentation of 30 minutes and 90 minutes of workshops (six). The workshops had a duration of 15 minutes each, for dealing effectively with the “lazy brain” phenomenon [11]. 3.6 Monitoring Aspects The diversity and nature of topics to be covered required the participation of teachers, parents and experts. Because the participation of teachers in extracurricular programmes was voluntary, the WASED occasionally conducted surveys for recording their opinions in matters of educational interest, in order to improve the planning of training activities. In a recently conducted survey, the participating teachers (N=110, almost 11% of the total in WASED) responded on a question about how concerned they feel in case of road accidents involving vehicles that carry hazardous load. A 32% of them declared “very”, 30% “enough”, 18% “average”, 12% “a little” and 8% “not at all”. This particular survey indicates that the majority of teachers take the issues of road safety seriously [12]. Parents should become the right example of traffic behaviour [1], both as pedestrians and as drivers/riders. Their contribution is crucial because it is direct and long-lasting. The rest of experts that contributed in traffic education are the engineers of VTICs, officers of the local traffic-police department, specialized members of the Automobile Association Clubs (car racing driver, safety technician, motorcycle rider) and members of a local voluntary organization [7]. 3.7 Output Aspects
Page 172 of 269

SafeGreece 2021 on-line Proceedings | ISSN 2654-1823
SafeGreece 2021 – 8th International Conference on Civil Protection & New Technologies 24-26 November, on-line | www.safegreece.org/safegreece2021 | [email protected]
This traffic education project for road safety had been designed with two main parts: a lecture and a set of six workshops, circularly executed in an experiential manner. All the topics were presented by experts, in the suitable premises of a VTIC.
4. CONCLUSIONS
This pilot project was carried out in open space premises of VTICs, where pupils and teachers attended it, with no participation cost . The participating pupils commented that this was their first participation in such action, considering that this approach was different and original. It has been requested to repeat such actions in the future, by widening the range of pupils and classes. The necessity of school population training on road safety has been covered It would be very useful to implement similar practices [13] to more pupils and to carry out a more extensive evaluation of such learning activities.
REFERENCES
1. European Commission – EC (2019). Mobility and transport: Road Safety. Retrieved fromhttps://ec.europa.eu/transport/road_safety/ .
2. European Transport Safety Council – ETSC (2019). Road deaths in the European Union – latest data.Brussels. Retrieved from https://etsc.eu/euroadsafetydata/
3. E. Papakitsos (2010). Organizational Method of Analysing Systems. Athens: Thessalou E. K. (in Greek).4.
5.
E. Papakitsos (2013). The Systemic Modelling via Military Practice at the Service of any OperationalPlanning. International Journal of Academic Research in Business and Social Science, 3(9), 176-190. European Road Safety Observatory (2018). Press released. Retrieved from https://ec.europa.eu/transport/road_safety/sites/default/files/pdf/ersosynthesis2018-children.pdf
I. I. Spadaro, F.Pirlone, (2021). Sustainable Urban Mobility Plan and Health Security. Sustainability 2021,13, 4403. https://doi.org/10.3390/su13084403
6. S. Giannopoulos (2018). European Commission Road Safety, Mobility and Transport, European Road SafetyCharter, Experiential workshops on road safety. Retrieved from http://www.erscharter.eu/charter-across-europe/member-events/βιωματικά-εργαστήρια-εxperiential-workshops-road-safety_en (in Greek/English).
7. G. Korakidi, A. Mavrakis (2018). Approaching the subject of “Road Safety” in an experiential manner. InProceedings of the 5th Conference “Neos Paidagogos” (pp. 3449-3455). Athens, Greece. Retrieved fromhttp://neospaidagogos.gr/ (in Greek).
8. KOUROS (2018). European Commission Road Safety, Mobility and Transport, European Road SafetyCharter, Volunteer group of Megara Attica, KOUROS. Retrieved from http://www.erscharter.eu/road-safety-in-action/good-practice/good-practice-submission-255 (in Greek/English).
9. E. C. Papakitsos, G. Korakidi, X. Vamvakeros, A. Mavrakis (2018). Planning Educational Activities forLearning “Road Safety”. Humanities and Social Science Research, 1(2), 43-51.https://doi.org/10.30560/hssr.v1n2p43
10. P. Haselager, J.V. Dijk, I.V. Rooij (2008). A lazy brain? Embodied embedded cognition and cognitiveneuroscience.
11. C. Papavasileiou, A. Mavrakis, A. Kourou, L. Salvati (2021). Perception of biohazards: a focus on schools inWestern Attica, Greece. Euro-Mediterranean Journal for Environmental Integration, 27, 2–6.https://doi.org/10.1007/s41207-020-00231-6
12. D. Palmos, C. Papavasileiou, C. E. Papakitsos, X. Vamvakeros, A. Mavrakis (2021). Enhancing theenvironmental programmes of secondary education by using web-tools concerning precaution measuresin civil protection: The case of Western Attica (Greece). Safety Science, 135, 105117,https://doi.org/10.1016/j.ssci.2020.105117
Page 173 of 269
SafeGreece 2021 on-line Proceedings | ISSN 2654-1823
SafeGreece 2021 – 8th International Conference on Civil Protection & New Technologies 24-26 November, on-line | www.safegreece.org/safegreece2021 | [email protected]
TEACHING ‘ROAD SAFETY’ USING “EXPERIENTIAL LEARNING” AT WEST ATTICA SECONDARY EDUCATION DIRECTORATE
Georgia Korakidi1, Sotirios Giannopoulos2, Evangelos C. Papakitsos3, Anastasios Mavrakis4
1 Health Education Coordinator, West Attica Secondary Education Directorate, Greek Ministry of Education, Greece; e-mail: [email protected]
2 Project Manager, NGO Z–My Grand Road; Megara GR–19100, Attica, Greece; e-mail: [email protected]
3 Department of Industrial Design and Production Engineering, University of West Attica; 250 Thivon Av., GR–12244 Egaleo, Greece; e-mail: [email protected]
4 Environmental Education Coordinator, West Attica Secondary Education Directorate, Greek Ministry of Education, Greece; e-mail: [email protected]
ABSTRACT Road safety is a social matter of ongoing concern for the educational authorities, especially in Greece where an increased number of fatal traffic accidents occur annually. In accordance to this concern, the West Attica Secondary Education Directorate (WASED) has initiated a project consisting of a series of educational activities that aim at training the high-school pupils on the acute problem of road safety. The subject of this project is “Road Safety”, and it was addressed to third grade pupils of junior high-schools. It has been planned as the result of collaboration between the West Attica Secondary Education Directorate, a few voluntary organizations, some private Vehicle Technical Inspection Centers and the local traffic-police department. This educational activity had been mainly implemented through the teaching and learning method of “experiential learning”. The pupils were divided into groups and attended six workshops that were designed accordingly. The entire process aims at establishing educational activities that in long-term will deal effectively with the acute problem of road safety.
Keywords: road safety; health education; experiential learning.
1. INTRODUCTION
Road safety is an issue of ongoing concern internationally, due to the social and economic repercussions of traffic accidents, especially the fatal ones among youths. The potential causes of traffic accidents [1, 2] are extremely diverse, including:1. driving on the unfamiliar side of the road, which is globally the most common type of traffic
accidents involving tourists;2. consumption of alcohol;3. not using seat belt;4. risky or aggressive driving behaviours, especially among young drivers;5. overestimation or underestimation of driving skills;6. loss of focus and attention;7. even the locally lower socioeconomic conditions, especially the educational ones.Thus, the improvement of road safety and the prevention of dangerous driving are equally demandinggoals. The procedural tool for achieving these goals is the proper training of novice drivers that includesseveral aspects, such as:• how to acquire driving and vehicle management skills;• cognitive issues on how novice trainees learn;
Page 174 of 269

SafeGreece 2021 on-line Proceedings | ISSN 2654-1823
SafeGreece 2021 – 8th International Conference on Civil Protection & New Technologies 24-26 November, on-line | www.safegreece.org/safegreece2021 | [email protected]
• the adequacy of formal training for acquiring a driving license, also regarding issues like theknowledge of traffic legislation;
• the ability to pay attention when driving that can be distracted by listening to music, eating, usingphones and other activities parallel to driving;
• self-control in various traffic conditions and other individual personality considerations;• the limitations of training practices.The present work is aligned with training innovations that extend the training period towards earlyadolescence, being focused on developing personal attitude and behaviour skills (according to therelevant priorities of the European Union’s policy) rather than driving ones, due to the minor age of thetarget group (14-15 years old). It has been implemented considering major topics of the national context(Greece), regarding road safety. In addition, intent social and economic problems and challenges exist,due to the presence of motley social groups of diverse origins and values-background, like foreignimmigrants and ethnic groups. In this particular context, the West Attica Secondary EducationDirectorate strive to cope with social exclusion, in-school violence and the underfunding of schools.Planning though in a systemic manner, the Secondary Education Directorate of Western Attica (WASED)initiated a major action of the local sustainability network of the schools in this area. Specifically, thereare 47 schools (24 Junior High-Schools, 14 General Senior High-Schools, 5 Vocational Senior High-Schools, 1 Special Vocational Education Training Center and 3 Laboratory Centers), located in fivemunicipalities, with a total educational population of about 1,000 teachers and 10,000 students. Thepilot project has been designed and implemented in 10 high-schools of two municipalities (Megara andAspropyrgos), titled “Road Safety”.
2. METHODOLOGY
This pilot project (“Road Safety”) was mainly addressed to third grade junior high-school pupils, but latter on it was also expanded for senior high-school students, because of their demand for such training. It was the result of collaboration between WASED, a local voluntary organization, some private Vehicle Technical Inspection Centers (VTIC) and the local traffic-police department. The project took place during 7 days (4 in May 2017 and 3 in March 2018) and addressed a total of about 850 pupils from 10 participating schools (6 Junior High-Schools, 2 General Senior High-Schools and 2 Vocational Senior High-Schools), accompanied by about 110 teachers. The topics of road safety had been approached experientially. The participating pupils (per school) were divided into six teams of about fifteen persons each. These teams attended circularly six workshops of 15 minutes each. This particular duration of each workshop copes well with the phenomenon of “lazy brain”, by keeping each topic less complex, boring and difficult, in order to ensure the cognitive attention of pupils. Based on the timetable within 90 minutes, all teams had passed through the workshops, in this one-day (per school) training activity that included also an additional introductory presentation, being similar to relevant educational activities that have been reported elsewhere. After its completion and the qualitative evaluation of the outcomes, this pilot project resulted in a standard educational proposal for learning road safety to junior teenagers, which is presented in the next section [3 – 6].
3. RESULTS
The educational project for learning road safety had two main parts. The first part was titled “The right transition from bicycles to motorized vehicles”. It was a half-hour lecture, conducted by specialized persons, namely: representatives of the local department of traffic police, representatives of VTICs, who
Page 175 of 269
SafeGreece 2021 on-line Proceedings | ISSN 2654-1823
SafeGreece 2021 – 8th International Conference on Civil Protection & New Technologies 24-26 November, on-line | www.safegreece.org/safegreece2021 | [email protected]
also gave the training-place, a representative of a driver’s school, a representative of motorway assistance, a racing car driver and representatives of a bicycle club. The second part is titled “After the bike, what?” and was composed of the six workshops. These workshops elaborated the following topics: 1. “What is the relationship between the conventional safety belt and the racing one?” An experienced
car racing driver analyzed to pupils what the difference between the two belts is and the differencebetween a family and a racing car (1st Workshop).
2. What do the tires have to do with road safety?” An experienced tire-engineer analyzed the need fortire pressure control, when and where to replace the tires, how to test whether a tire is suitable forour vehicle and how to replace a flat tire (2nd Workshop).
3. “Why should I always have a first-aid kit and a fire extinguisher in my vehicle?” Specialized staff of adrivers’ club analyzed the necessity to have a fire extinguisher and a first-aid kit, how to use themand how to inspect their functionality (3rd Workshop).
4. “What is the use of the Emergency Lane (LEA)?” Specialized staff analyzed the necessity of LEA, aswell as the problems that occur during its illegal/improper use, when we can use it, which vehiclescan do it (4th Workshop).
5. “Sustainable Urban Mobility” Qualified members (spokesman from a local traffic-police departmentand a member of a voluntary organization) analyzed what is sustainable urban mobility, how we canimplement it and what are its benefits, e.g., respect for our fellow human beings, practical respectfor the environment, less pollution, less wear and damage to the vehicle, use of environmentallyfriendly transport means (like subways or other public transportations) that reduce our ecologicalfootprint, etc. (5th Workshop).
6. “Motorcycle” Specialized members of a Motorcycle Club analyzed (through examples) the proper useof the motorcycle, the potential dangers, safe driving and the value of using a helmet (6thWorkshop).
All the workshops were experiential, because in this way the pupils understand better the cognitive issues and, at the same time, they can perceive in real conditions the existing dangers, either as future drivers or as passengers [3 – 6]. Snapshots from workshops can be viewed at reference [3]: http://www.erscharter.eu/charter-across-europe/member-events/βιωματικά-εργαστήρια-εxperiential-workshops-road-safety_en.
4. CONCLUSIONS
This pilot project was carried out in open space premises of VTICs, where pupils and teachers attended it, without any cost of participation for all. The participating pupils commented that this was their first participation in such action, taking the view that this approach was different and original. It has been requested to repeat such actions in the future, by widening the range of pupils and classes. Therefore, the necessity of prevention of road accidents by informing the school population on traffic education and road safety was achieved. It would be very useful to implement similar practices to more pupils and to carry out a more extensive evaluation of such learning activities [7].
REFERENCES
1. European Commission – EC (2019). Mobility and transport: Road Safety. Retrieved fromhttps://ec.europa.eu/transport/road_safety/ .
2. European Transport Safety Council – ETSC (2019). Road deaths in the European Union – latest data.Brussels. Retrieved from https://etsc.eu/euroadsafetydata/
Page 176 of 269

SafeGreece 2021 on-line Proceedings | ISSN 2654-1823
SafeGreece 2021 – 8th International Conference on Civil Protection & New Technologies 24-26 November, on-line | www.safegreece.org/safegreece2021 | [email protected]
[1] S. Giannopoulos (2018). European Commission Road Safety, Mobility and Transport, European Road SafetyCharter, Experiential workshops on road safety. Retrieved from http://www.erscharter.eu/charter-across-europe/member-events/βιωματικά-εργαστήρια-εxperiential-workshops-road-safety_en (in Greek/English).
[2] KOUROS (2018). European Commission Road Safety, Mobility and Transport, European Road SafetyCharter, Volunteer group of Megara Attica, KOUROS. Retrieved from http://www.erscharter.eu/road-safety-in-action/good-practice/good-practice-submission-255 (in Greek/English).
[3] G. Korakidi, A. Mavrakis (2018). Approaching the subject of “Road Safety” in an experiential manner. InProceedings of the 5th Conference “Neos Paidagogos” (pp. 3449-3455). Athens, Greece. Retrieved fromhttp://neospaidagogos.gr/ (in Greek).
[4] E. C. Papakitsos, G. Korakidi, X. Vamvakeros, A. Mavrakis (2018). Planning Educational Activities for Learning“Road Safety”. Humanities and Social Science Research, 1(2), 43-51. https://doi.org/10.30560/hssr.v1n2p43
[5] D. Palmos, C. Papavasileiou, C. E. Papakitsos, X. Vamvakeros, A. Mavrakis (2021). Enhancing the environmentalprogrammes of secondary education by using web-tools concerning precaution measures in civilprotection: The case of Western Attica (Greece). Safety Science, 135, 105117, https://doi.org/10.1016/j.ssci.2020.105117
Page 177 of 269
SafeGreece 2021 on-line Proceedings | ISSN 2654-1823
SafeGreece 2021 – 8th International Conference on Civil Protection & New Technologies 24-26 November, on-line | www.safegreece.org/safegreece2021 | [email protected]
TECHNOLOGIES FOR FIRST RESPONDERS AND SEARCH AND RESCUE OPERATIONS: FOCUSING ON FIELD COMMUNICATIONS
Yorgos Vosinakis, Aristidis Dadoukis, Athanasios Douklias, Maria Krommyda, Dimitra Dionysiou, Spyros Athanasiadis, , Lazaros Karagiannidis, Eleftherios Ouzounoglou, Angelos Amditis,
Institute of Communication and Computer Systems (E-mail: [email protected], [email protected], [email protected],
[email protected], [email protected], [email protected] [email protected], [email protected], [email protected])
ABSTRACT
First responders are operating on natural or human-made disasters under unknown environments. They have to work continuously, in hazardous situations, often with limited awareness of the operational situation. Aiming to support them in this task, technologies have been developed to ensure resilient communications at the field as well as timely transfer of the field collected data to the command and control centres. In this paper, we present the architecture of such communication systems as well as a use case, a K9 vest for the canine companion of the K9 unit that is using the communications to increase the situational awareness in the field and at the command centre.
Keywords: field communications, search and rescue, technologies for first responders, K9 vest.
1. INTRODUCTION
Search and rescue operations after natural or man-made disasters are time-critical events. Locating survivors within the “72 golden hours” time frame is a race against the clock, often within unsafe environments. Currently, First Responders (FRs) use mostly conventional technologies, with widely acknowledged limitations. One important area where several limitations and capability gaps have been identified, is field communications; robust and secure solutions supporting the communication and data transfer needs of FRs at the disaster sites, are actively being sought by the scientific and technological community [1]. In this context, the present paper focuses on two paradigms of field communication solutions developed within the framework of the European funded projects CURSOR and INGENIOUS as well as a use case for these solutions, the K9 unit and the smart vest for the canine companion. CURSOR is an ongoing European H2020 project with the ultimate objective to enhance the efficient of Urban Search and Rescue (USaR) operations. The project’s research and development are structured around an earthquake scenario. The project embraces an integrative approach, combines multiple mature and emerging technologies into a single platform so as to boost efficiency and reliability in USaR operations. INGENIOUS is an ongoing EU project which aims to assist First Responders act more effective during natural and man-made disasters by exploiting novel technologies. INGENIOUS is developing, integrating and validating a Next Generation Integrated Toolkit (NGIT) for Collaborative Response, which ensures high level of Protection and Augmented Operational Capacity to respond to the disaster scene.
Page 178 of 269
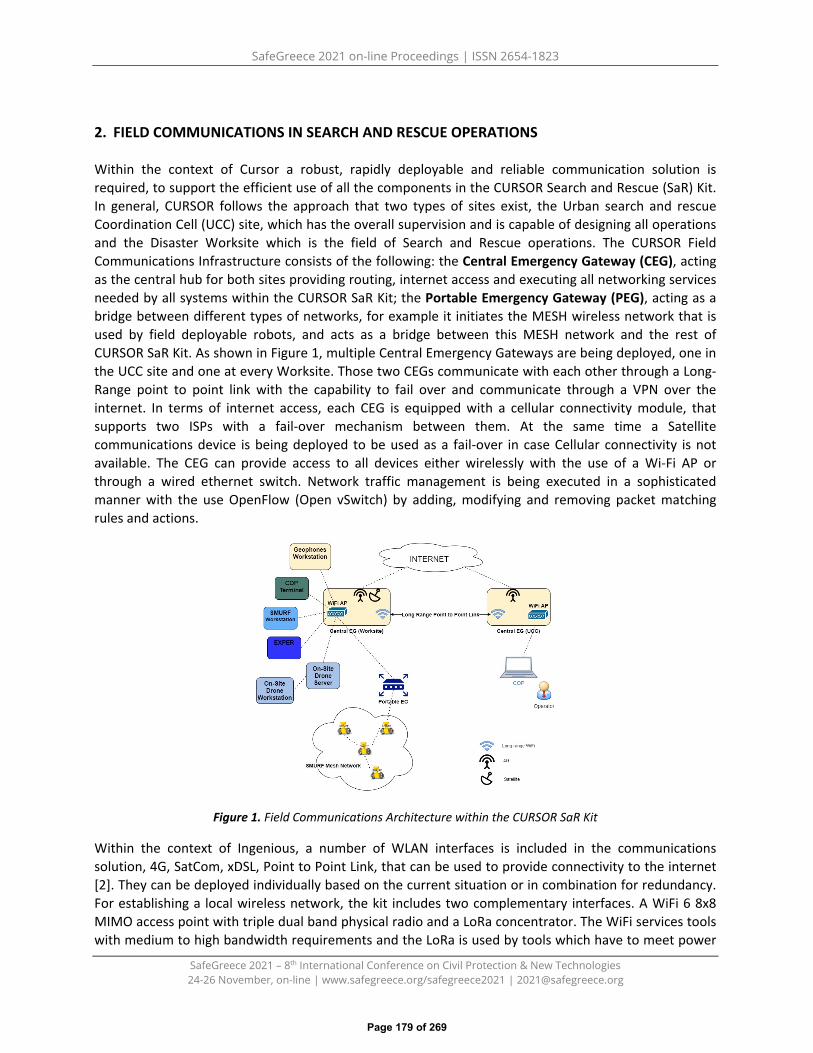
SafeGreece 2021 on-line Proceedings | ISSN 2654-1823
SafeGreece 2021 – 8th International Conference on Civil Protection & New Technologies 24-26 November, on-line | www.safegreece.org/safegreece2021 | [email protected]
2. FIELD COMMUNICATIONS IN SEARCH AND RESCUE OPERATIONS
Within the context of Cursor a robust, rapidly deployable and reliable communication solution is required, to support the efficient use of all the components in the CURSOR Search and Rescue (SaR) Kit. In general, CURSOR follows the approach that two types of sites exist, the Urban search and rescue Coordination Cell (UCC) site, which has the overall supervision and is capable of designing all operations and the Disaster Worksite which is the field of Search and Rescue operations. The CURSOR Field Communications Infrastructure consists of the following: the Central Emergency Gateway (CEG), acting as the central hub for both sites providing routing, internet access and executing all networking services needed by all systems within the CURSOR SaR Kit; the Portable Emergency Gateway (PEG), acting as a bridge between different types of networks, for example it initiates the MESH wireless network that is used by field deployable robots, and acts as a bridge between this MESH network and the rest of CURSOR SaR Kit. As shown in Figure 1, multiple Central Emergency Gateways are being deployed, one in the UCC site and one at every Worksite. Those two CEGs communicate with each other through a Long-Range point to point link with the capability to fail over and communicate through a VPN over the internet. In terms of internet access, each CEG is equipped with a cellular connectivity module, that supports two ISPs with a fail-over mechanism between them. At the same time a Satellite communications device is being deployed to be used as a fail-over in case Cellular connectivity is not available. The CEG can provide access to all devices either wirelessly with the use of a Wi-Fi AP or through a wired ethernet switch. Network traffic management is being executed in a sophisticated manner with the use OpenFlow (Open vSwitch) by adding, modifying and removing packet matching rules and actions.
Figure 1. Field Communications Architecture within the CURSOR SaR Kit
Within the context of Ingenious, a number of WLAN interfaces is included in the communications solution, 4G, SatCom, xDSL, Point to Point Link, that can be used to provide connectivity to the internet [2]. They can be deployed individually based on the current situation or in combination for redundancy. For establishing a local wireless network, the kit includes two complementary interfaces. A WiFi 6 8x8 MIMO access point with triple dual band physical radio and a LoRa concentrator. The WiFi services tools with medium to high bandwidth requirements and the LoRa is used by tools which have to meet power
Page 179 of 269

SafeGreece 2021 on-line Proceedings | ISSN 2654-1823
SafeGreece 2021 – 8th International Conference on Civil Protection & New Technologies 24-26 November, on-line | www.safegreece.org/safegreece2021 | [email protected]
consumption constrains or require connectivity in hard to reach areas. All these interfaces are brought together by a central node. The central node provides the necessary power for all the aforementioned devices ensuring a clean design. In addition, a network virtualization layer is deployed that enables the management and routing over the diverse devices. WLAN interfaces are prioritized using bandwidth/cost rules and outgoing traffic is filtered to meet the network restrictions. In case of insufficient bandwidth messages involving the status of the first responders are preserved while video streams are dropped. Finally, the solution is powered by a combination of a portable battery power station and a gas generator. The battery station is able to provide power for up to 6 hours facilitating the fuel change of the gas generator and a backup solution in case of a breakdown of the gas generator.
Figure 2. The field communication solution deployed during a Small Scale Field Test. The WiFi 6 access point, with the 4G antenna and the central node can be seen attached to a portable antenna mast.
The K9 vest use case
K9 vests are meant to be used by search and rescue units in K9 operations. Rescue trained dogs are used to locate victims that are lost in rubble following a collapse, or in open areas such as mountains and forests. The functionalities offered by the vest we have developed are two cameras (RGB and Thermal) on stabilization gimbals, two-way audio and GPS/Dead reckoning localization. The vest is capable of transmitting live data either to a portable device held by the handler or to a Command and Control centre overseeing the operation. The vest incorporates two distinct modules, the camera and the localisation/communication. They operate independently and each one can be attached or removed depending on the specific situation in the field. Each unit is controlled by a Raspberry Pi Zero W unit, powered by a common lightweight 5V power supply attached to the side of the vest. The power supply has been tested with both modules attached and can last for at least 3 hours when fully charged.
Page 180 of 269
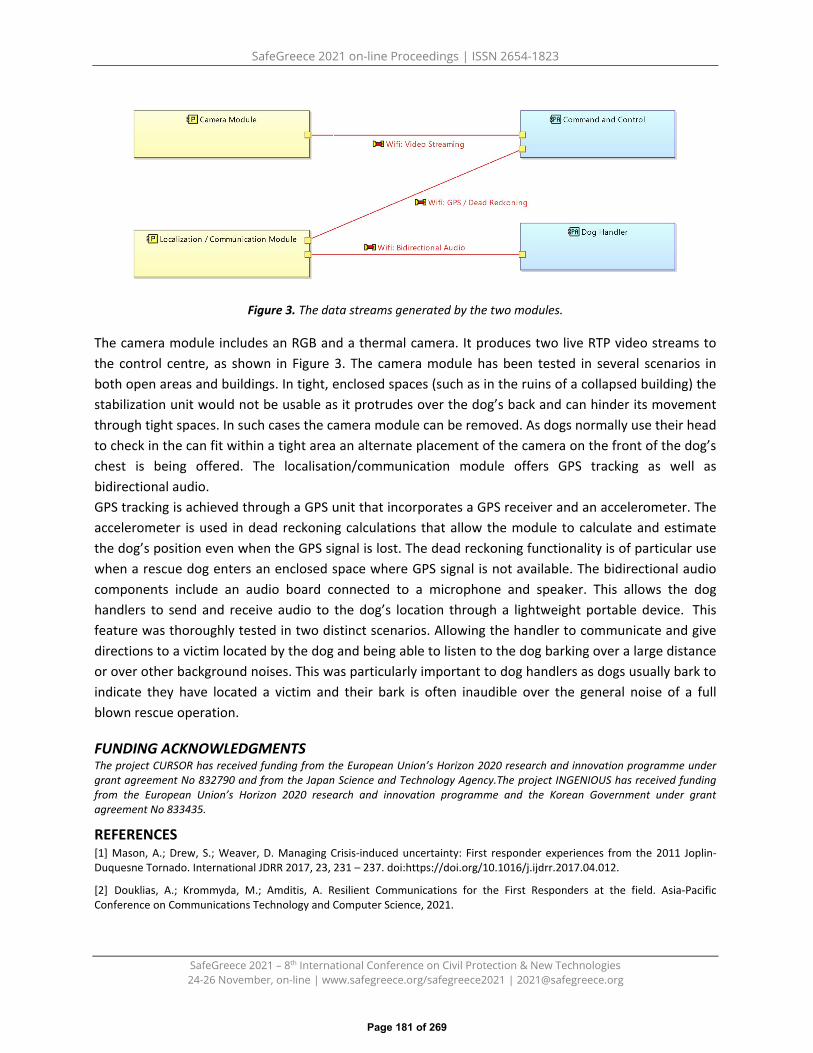
SafeGreece 2021 on-line Proceedings | ISSN 2654-1823
SafeGreece 2021 – 8th International Conference on Civil Protection & New Technologies 24-26 November, on-line | www.safegreece.org/safegreece2021 | [email protected]
Figure 3. The data streams generated by the two modules.
The camera module includes an RGB and a thermal camera. It produces two live RTP video streams to the control centre, as shown in Figure 3. The camera module has been tested in several scenarios in both open areas and buildings. In tight, enclosed spaces (such as in the ruins of a collapsed building) the stabilization unit would not be usable as it protrudes over the dog’s back and can hinder its movement through tight spaces. In such cases the camera module can be removed. As dogs normally use their head to check in the can fit within a tight area an alternate placement of the camera on the front of the dog’s chest is being offered. The localisation/communication module offers GPS tracking as well as bidirectional audio. GPS tracking is achieved through a GPS unit that incorporates a GPS receiver and an accelerometer. The accelerometer is used in dead reckoning calculations that allow the module to calculate and estimate the dog’s position even when the GPS signal is lost. The dead reckoning functionality is of particular use when a rescue dog enters an enclosed space where GPS signal is not available. The bidirectional audio components include an audio board connected to a microphone and speaker. This allows the dog handlers to send and receive audio to the dog’s location through a lightweight portable device. This feature was thoroughly tested in two distinct scenarios. Allowing the handler to communicate and give directions to a victim located by the dog and being able to listen to the dog barking over a large distance or over other background noises. This was particularly important to dog handlers as dogs usually bark to indicate they have located a victim and their bark is often inaudible over the general noise of a full blown rescue operation.
FUNDING ACKNOWLEDGMENTS The project CURSOR has received funding from the European Union’s Horizon 2020 research and innovation programme under grant agreement No 832790 and from the Japan Science and Technology Agency.The project INGENIOUS has received funding from the European Union’s Horizon 2020 research and innovation programme and the Korean Government under grant agreement No 833435.
REFERENCES [1] Mason, A.; Drew, S.; Weaver, D. Managing Crisis-induced uncertainty: First responder experiences from the 2011 Joplin-Duquesne Tornado. International JDRR 2017, 23, 231 – 237. doi:https://doi.org/10.1016/j.ijdrr.2017.04.012.
[2] Douklias, A.; Krommyda, M.; Amditis, A. Resilient Communications for the First Responders at the field. Asia-PacificConference on Communications Technology and Computer Science, 2021.
Page 181 of 269

SafeGreece 2021 on-line Proceedings | ISSN 2654-1823
SafeGreece 2021 – 8th International Conference on Civil Protection & New Technologies 24-26 November, on-line | www.safegreece.org/safegreece2021 | [email protected]
RADIO PLANNING INVESTIGATION OF DMR TRUNKED SYSTEM FOR THE PPDR AUTHORITIES IN ATTICA REGION
Theodore D. Katsilieris Telecommunication Engineer member of (F.I.T.C.E) Federation of Telecommunication Engineers in Europe,
Communications and e-Goverment Division, Hellenic Fire Corps (Greece) (e-mail: [email protected])
ABSTRACT Althought there is a great needs from PPDR Services to have robust and reliable critical communication systems while in addition to this, these communications also to have state of the art unique features . However the traditional PMR succesful systems fulfil the demads of the PPDR services except the crital video transmision that requires higher data throuput than these systems can support. Moreover, analog systems remain opperational and it is belived to be approximately the 40% of the total PMR radio systems globaly. The modern Broadcast-PPDR systems on the other hand are not fulfill the requirements of the PPDR Services and also these systems are operates on higher frequency band at 700MHz giving them disadvantages over the narrowband digital PMR systems. Among to the other PMR systems the DMR trunked standard is chosen on this study due to economical and technical balanced that this technology offers. In this study the radio electric coverage has been investigated by using the ITU-R P.1812 propagation model that predics the coverage for PPDR Services in Attica region. Concluding to wefind out that 36 Broadcast sites of DMR trunked standard it is needed to produce coverage 93.4% ofterrain land area for the region of interest.
Keywords: Public Safety, mission critical communications, DMR, radio planning , PPDR services
Notes: The views and the conclusions contained in this work express only the author research and should not be interpreted as representing the official positions of the Hellenic Fire Corps.
1. INTRODUCTIONPPDR critical communications are the communications that are used by Public Safety Services andgovernment agencies as the most robust, reliable and secure communications. Professional mobile radio(PMR) systems are used by PPDR services for decades that have unique features that stand out fromcommon modern broadband communication systems.For this reason for more than last 5 years the 3GPP try to find a reliable solution for PPDR Servicesevolving the LTE-PPDR for critical communication [1-2], offering the advantage for transferring criticaldata from the users to the dispatcher centers. However, modern broadband - PPDR systems are laggingbehind [5] compared to the mandatory digital PMR technologies such as TETRA, TETRAPOL, P-25, DMRand dPMR [1,2,6,7]. The operational frequency of PMR systems on lower frequency band such as UHF[410 – 430 MHz] offers a physical advantage of the propagation path over the modern broadbandtechnologies.According to market analysts, technology standards such as TETRA, P25 and DMR are believed to beexpanded and adopted by more PPDR authorities globally at least until 2027 [2]. Moreover to this tofulfill the gap from the PMR analog systems that is used worldwide and it is approximate the 40% of thePMR systems globally. Thus, we decided to choose for this investigation the DMR trunked standard dueto it offers a very good balance between PPDR technological requirements and economicalimplementation solution compared with the other technologies. Furthermore in our investigation thesemi-empirical propagation model ITU-R 1812 propagation model was used to predict the radio coverage
Page 182 of 269

SafeGreece 2021 on-line Proceedings | ISSN 2654-1823
SafeGreece 2021 – 8th International Conference on Civil Protection & New Technologies 24-26 November, on-line | www.safegreece.org/safegreece2021 | [email protected]
by the broadcast sites. Also for the radio planning design of the DMR standard we choose to use the UHF (410-430)MHz frequency band that has bound frequency spectrum for PPDR authorities. In adition, the uplink direction has been selected by a portable subscriber user as the worst case scenario with a 12.2 dB lower than the downlink direction in the Link Budget parameters are being investigated. All the broadcast centers were chosen to be located on high hills and are spread in the Attica region, in order to offer the maximum possible geografical coverage where it is nessesary with effective radius up to 45 km for each site. In the simulation results it is find out that the 36 sites that are selected offred 93.4 % perecentage of coverage in the desired geographical land terrain that is close to the required 95% , so further optimization in the design process is required until the predicted coverage rate is improved and fulfil the demands on the required area.
Concluding to this work due to the the handheld radios are more used by first responders we choose to study portable terminals that are more difficult on the radio planning proccedure, thus to be more reliable on every true scenario.
2. THE PROPAGATION MODELIn this paper work, we choose to use the ITU-1812 propagation model that is widely used for suchpurposes [3]. The ITU-R 1812 is a semi-empirical propagation model that predicts point-to-area radioelectric fields. This model uses frequencies from 30 MHz to 3000Mhz, for paths up to 3,000km and theantenna height between 0.5 m to 3000m for both vertical and horizontal polarization.The ITU-R 1812 is appropriate for realistic filed predictions that required for terrestrial mobile radiocommunications. Using multipath distribution estimates the radio signal levels for a given percentage oftime up to 99% and for locations up to 99% and also it takes into account tropospheric scatteringphenomena. The main parameters of this model are: frequency, antenna heights, polarization, effectiveradiated power, area type of mobile units (eg. urban, sub-urban and rural environments), time andlocation variability. All these parameters can be changed in radio coverage tool in order to have a moreaccurate prediction. The model is used to predict the attenuation of the radio signal as a function of thedistance and is also used to predict other losses due to refraction and terrain obstacles.In this research, the worst case scenario is investigated for this reason the uplink direction is taken intoaccount from a handheld portable device to the Base Station due to is 12.2 dB lower compared to thedownlink direction which can be easily calculated from the Link Budget parameters in Table 1. In additionto this we use realistic radio parameters for coverage prediction in UHF (410-430) MHz frequency band.
Table 1. Link budget parameters of the system DMR on UHF band.
System Parameters Downlink Uplink (portable terminal))
Power transmitted Tx 45 W 5 W Antenna height 10 m 1.5 m Antenna Gain Tx 5.2 dBi 0 dBi Additional Losses
(cables, connectors,..) 4.5 dB 6 dB
EiRP 47.5 dBm 41.8 dBm Link margin
(for DAQ 3.4) 3 dB 3 dB
Dynamic sensitivity Rx (faded) -104dBm -108dBm
In the Table 1, is taken into account for all portable subscribers to transmit from at 1.5 m height as an average head level. For a more realistic approach, the antennas used are omnidirectional where in some cases special antennas are used with the vertical plane offering negative tilt angle of radiation pattern.
Page 183 of 269
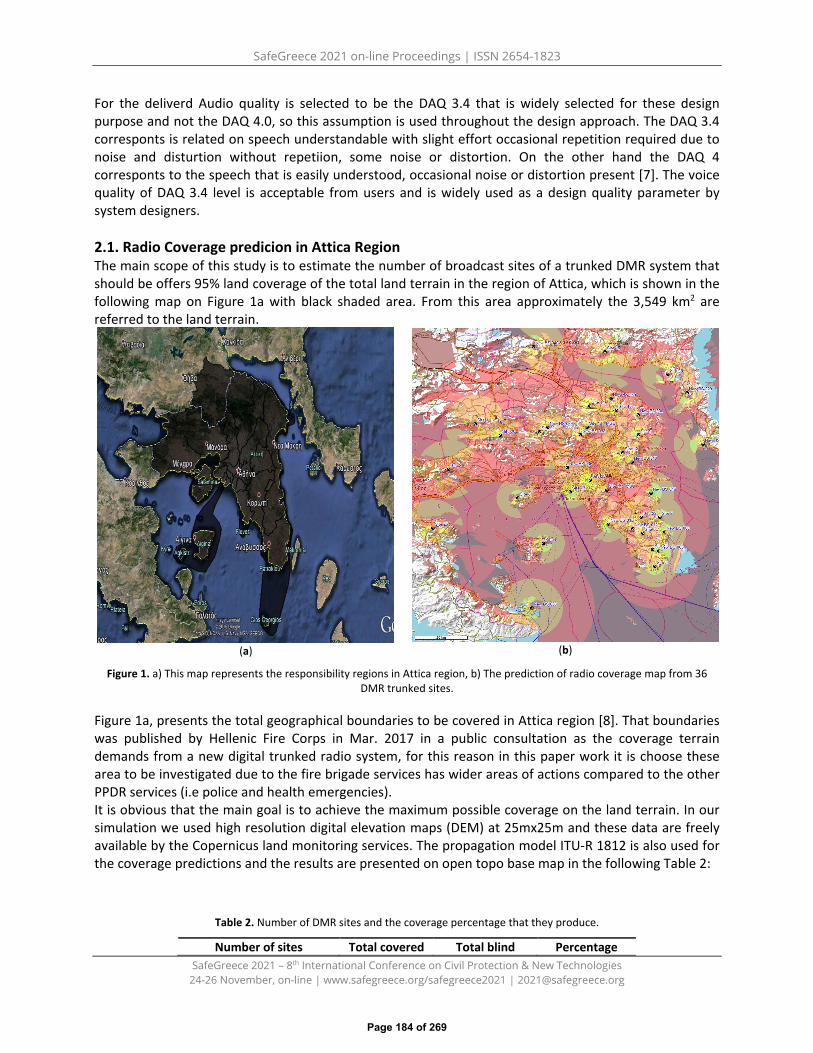
SafeGreece 2021 on-line Proceedings | ISSN 2654-1823
SafeGreece 2021 – 8th International Conference on Civil Protection & New Technologies 24-26 November, on-line | www.safegreece.org/safegreece2021 | [email protected]
For the deliverd Audio quality is selected to be the DAQ 3.4 that is widely selected for these design purpose and not the DAQ 4.0, so this assumption is used throughout the design approach. The DAQ 3.4 corresponts is related on speech understandable with slight effort occasional repetition required due to noise and disturtion without repetiion, some noise or distortion. On the other hand the DAQ 4 corresponts to the speech that is easily understood, occasional noise or distortion present [7]. The voice quality of DAQ 3.4 level is acceptable from users and is widely used as a design quality parameter by system designers.
2.1. Radio Coverage predicion in Attica Region The main scope of this study is to estimate the number of broadcast sites of a trunked DMR system that should be offers 95% land coverage of the total land terrain in the region of Attica, which is shown in the following map on Figure 1a with black shaded area. From this area approximately the 3,549 km2 are referred to the land terrain.
(a) (b)
Figure 1. a) This map represents the responsibility regions in Attica region, b) The prediction of radio coverage map from 36 DMR trunked sites.
Figure 1a, presents the total geographical boundaries to be covered in Attica region [8]. That boundaries was published by Hellenic Fire Corps in Mar. 2017 in a public consultation as the coverage terrain demands from a new digital trunked radio system, for this reason in this paper work it is choose these area to be investigated due to the fire brigade services has wider areas of actions compared to the other PPDR services (i.e police and health emergencies). It is obvious that the main goal is to achieve the maximum possible coverage on the land terrain. In our simulation we used high resolution digital elevation maps (DEM) at 25mx25m and these data are freely available by the Copernicus land monitoring services. The propagation model ITU-R 1812 is also used for the coverage predictions and the results are presented on open topo base map in the following Table 2:
Table 2. Number of DMR sites and the coverage percentage that they produce.
Number of sites Total covered Total blind Percentage
Page 184 of 269
SafeGreece 2021 on-line Proceedings | ISSN 2654-1823
SafeGreece 2021 – 8th International Conference on Civil Protection & New Technologies 24-26 November, on-line | www.safegreece.org/safegreece2021 | [email protected]
terrain area terrain area 12 2,858 km2 691 km2 87.1 % 36 3,324 km2 225 km2 93.4%
According to the Table 2 two scenarios are being investigated. The first one uses 12 broadcast sites that are conveniently selected to be located on very high hills and mountains in the desired area. This approach in our simulations provides up to 87.1% terrain coverage. While, in the second scenario the coverage is investigated as much as possible, as a result the remaining blind areas that still exist are less than 0.1km2 each blind area. The Figure 1b shows the simulation results for scenario 2 were 36 broadcast sites were used. The total coverage area achieved in this radio planning investigation was 93.4% that corresponts on the 224 km2. The optimization procedure is mandatory until the results satisfy the required coverage area.
3. CONCLUSIONRegarding on the coverage planning we found out that the radio coverage from 36 sites that is selectedin our investigation are quite close to achieve the 95 % of coverage of the land terrain in Attica region. Byusing the ITU-R 1812 propagation model that the worst-case scenario has been investigated for theuplink direction by handheld subscriber users. Nevertheless, the design optimization is necessary toachieve optimal results not only form the coverage requirements but also the project itself to beeconomically feasible at the same time.
ACKNOWLEDGMENTS: This work was suppored by Federation of Telecommunication Engineers of the European Community F.I.T.C.E. Hellenic branch.
REFERENCES
1. R. Ferrus and O. Sallent (2015). Mobile Broadband Communications for Public Safety: The Road AheadThought LTE Technology. Spain: John Wiley & Sons.
2. M. Ulema, “Fundamentals of Public Safety Networks and Critical M. Ulema, “Fundamentals of PublicSafety Networks and Critical Communications Systems; Technologies, Deployment, and Management,”USA: John Wiley & Sons, 2019
3. T.S Rappaport , “Wireless Communications: Principles and Practice, ” 2nd., USA: Prentice Hall RTP 2002.4. D. del Rey Carrion, L. Juan-Llacer, and J.-V. Rodriguez, “Radio Planning Considerations in TETRA to LTE
Migration for PPDR Systems: A Radioelectric Coverage Case Study,” MDPI, Applied Science, J. vol. 9 , no. 2,p. 250, 2019
5. A. Sanchoyerto, R. Solozabal, B. Blanco, and F. Liberal, “Analysis of the impact of the evolution towards 5Garchitectures on Mission Critical Push-to-talk services, ” IEEE Access, vol. 7, pp.115052 – 115061 , 24 July2019.
6. T.D Katsilieris and T.E Karafasoulis , “Capacity and Coverage Planning of DMR Trunking Radio Network forPPDR Services, ” 2020 24th International Conference on Circuits, Systems, Communications and Computers(CSCC), (IEEE Xplore), pp. 230-236, doi: 10.1109/CSCC49995.2020.00049.
7. Tait [Online] Available: https://blog.taitradio.com/2013/08/01/under-the-hood-specifying-voice-quality-for-your-digital-network/ [ Accessed: Oct. 2021].
8. Hellenic Fireservice (2017). ‘Public consultation on the draft technical requirements for Digital TrunkedRadio Network’. Athens: Hellenic Fireservice
Page 185 of 269
SafeGreece 2021 on-line Proceedings | ISSN 2654-1823
SafeGreece 2021 – 8th International Conference on Civil Protection & New Technologies 24-26 November, on-line | www.safegreece.org/safegreece2021 | [email protected]
BUILDING SITUATION TOOL: INDOOR DISASTER SCENE OVERVIEW
Filip Sever1, Veli-Pekka Anttonen2, Pauli Mikkonen3, Jaakko Schroderus4 1, 2 School of Business, Kajaani University of Applied Sciences, Finland.
(E-mail: [email protected], [email protected]) 3 School of Information Systems, Kajaani University of Applied Sciences, Finland.
(E-mail: [email protected]) 4Kainuu Rescue Services, Finland
(E-mail: [email protected])
ABSTRACT During emergency situations, rescue services dispatch a first response team to the emergency location. Once at the location, the first responders assess the situation, and call for support as needed. Emergency services rely on information received from witnesses on site when committing the initial resources for the emergency. Furthermore, the location and situation of the fire outbreak is unknown to the first responders, as is the extent of the threat, and number of persons inside the building. The progress of information technology and smart systems allows sensors to be installed into buildings, which automate building operations, monitor people flow, and identify potential risks. While the new technologies have entered buildings to streamline maintenance, first responders still rely on paper printed building plans located on site.
Keywords: first response, sensors, data visualization, interactive overview, first response planning
1. INTRODUCTIONEach emergency is different, and the information first responders have of the incident is limited. Theemergency site, status of victims, or the threat are not clear, making planning and organizing theresponse challenging [1]. For each case, and type of event, the first responders have drilled proceduresand actions to be performed in place [2]. This work [3] focuses on indoor emergencies, examining thecase of newer buildings equipped with sensors and building automation: utilizing building sensors tomonitor and maintain temperature, access control, security, lightning, and other related systems.However, integration to existing building sensors is challenging due to reasons such as data privacy anduse of proprietary systems. To avoid functional and operational issues while prototyping, a set of sametypes of sensors is purchased and will be tested in the project. In addition, first responders highlightedthat information on approximate number of persons within the building is of value in emergencyoperation. For that reason, person counting is tested as an addition.
The sensor installation guidelines [4] dictate that smoke sensors need to be installed every 60m2 and temperature sensors every 30m2, ensuring high coverage for fire outbreaks and early discovery. Building automation standards define values, such as room temperature, that the building sensors monitor for, and adjust to accordingly. The minimum required indoor temperature is 20°C during winter months, with a target value of 21,5°C [5].
2. MATERIALS AND METHODS
In collaboration with first responders, a list of critical information to be shown was developed, which is visualized in a 3D building model, along with sensor values and alerts. The sensors systems and visualization software are referred to as the Building Situation Tool (BUST).
2.1. Visualization software
The building visualization software operates on a Windows PC and is developed using Unreal Engine 4. An important requirement for first responders is that the software, while offering interactive 3D
Page 186 of 269

SafeGreece 2021 on-line Proceedings | ISSN 2654-1823
SafeGreece 2021 – 8th International Conference on Civil Protection & New Technologies 24-26 November, on-line | www.safegreece.org/safegreece2021 | [email protected]
elements and touch functionality, can run on laptop devices with lower hardware specifications. An Internet connection is required to receive and send data. Sensor data and alerts are received from KAMK’s data server. Visualization software can send user added points of interest and planned path data to the FASTER project Kafka broker, used for sharing and visualizing information at different levels of the command chain in emergency situations.
In addition to existing sensor types, first responders highlighted the need to know the number of persons within the building, as well as their movement within different section, such as main restaurant, ground floor, second floor and sport hall. The first responders can assess the number of persons in the vicinity of the fire outbreak, and how many persons are in the building at any given time.
The purpose of the software is to record data from building sensors and display it over a 3D model of the building. First responders use a mouse and keyboard, or touch input to navigate the building, inspect individual rooms’ sensors, review the timeline of events, or current events in real time (Figure 1). The sensor data includes temperature, movement, person count, CO2, smoke, and door state. In addition, first responders can plan different routes inside the building and place different point of interest markers for better situational awareness.
Figure 1 BUST displaying notifications and alerts in a side window. 2.2. Sensor system
Sensor demonstration system was developed from scratch in the FASTER project [3]. It can be used independently from existing building sensor infrastructure, and thus, easily adopted in any building for demonstration purposes. The system consists of the following hardware: sensors, measurement nodes, mobile network routers and a server.
Sensor models and their measurement variables are: AHT-10 for temperature, CCS811 for CO2, gas sensor MQ-2 for smoke level, a simple switch for door state, passive infrared (PIR) sensor HC-SR501 for movement detection and ultrasound sensor HC-SR04 for person count. Ultrasound sensors are used as a pair for detecting direction of movement. Environmental sensor values are typically measured and sent once every minute but can be adjusted according to needs. Other sensors measure and send data only when there is a change in sensor state. Sensors are connected to measurement node ESP32 through General Purpose Input/Output pins (GPIO). ESP32 nodes are development kits with Wi-Fi and Bluetooth
Page 187 of 269

SafeGreece 2021 on-line Proceedings | ISSN 2654-1823
SafeGreece 2021 – 8th International Conference on Civil Protection & New Technologies 24-26 November, on-line | www.safegreece.org/safegreece2021 | [email protected]
interfaces. For demonstration purposes up to 15 nodes have been deployed and each equipped with specific set of sensors. Nodes can be powered by power banks for short demonstration use, or by phone chargers for continuous use. Once a node is powered up it connects to predefined Wi-Fi network and starts sending data. Nodes send sensor data through Wi-Fi connection to routers, which pass it to server using 4G mobile network. Number of required routers depends on distribution of nodes. Data is encrypted using Transport Layer Security (TLS). Nodes provide web interface for status checks, latest sensor readings and person counter reset. The status and settings of individual nodes is checked with a mobile device or a computer. The interface is limited to the local Wi-Fi network.
The server is located at Kajaani University of Applied Sciences (KAMK) and is maintained by KAMK personnel. It is a virtual Linux machine running Influx database for time series applications. Sensor data gets timestamps automatically and is stored for authenticated data requests. A Python program runs on the server that will, first, calculate person count in predefined areas of the building based on person counter values collected near exits and in hallways, and second, use sensor data to create alerts using specific thresholds and rules. There is also an integration to Faster Kafka broker for data fusion and review.
2.3. Laboratory testing
The sensors were tested in office surrounding in multiple occasions and up to several days or even weeks at a time and later in a planned demonstration with Kainuu rescue services at Kajaani Lehtikangas school in March 2021.
The cheap environmental sensor was not expected to be highly accurate, and they were not controlled by known precise sensors. Temperature and PIR sensors were found to be working without any problems and were reacting to small temperature changes and movement as expected. Door switches were taped to door frames so that they would have contact to closed door. They needed some adjustment from time to time. Challenge was not to use anything that would leave a permanent mark on any surfaces. The CCS811 for CO2 was found to be precise enough for demonstration purposes but seems to have tendency to show higher values than expected occasionally. HC-SR04 ultrasound sensor had issues with range and some materials that did not reflect ultrasonic sound waves well enough.
Figure 2 Defining threshold level for alert for smoke sensor.
Page 188 of 269
SafeGreece 2021 on-line Proceedings | ISSN 2654-1823
SafeGreece 2021 – 8th International Conference on Civil Protection & New Technologies 24-26 November, on-line | www.safegreece.org/safegreece2021 | [email protected]
Each particle sensor MQ-2 were calibrated in clean air (office air) as per instructions by the sensor manufacturer. Precise absolute concentrations of smoke or other gases were not expected, but instead clear and repeatable reaction to smoke or similar substance. The sensors were tested using air humidifier, similar but in smaller scale that fire and rescue units use for practicing, and threshold value was defined for node when to send an alert. Rs/R0 ratio was measured every 10 seconds and after a while “smoke” was induced to the sensor for a short time. R0 means resistance of sensor in clean air and Rs value that is actively measured. Rs/R0 ratio should be 10 for clean air. In Figure 2 is an example of such test. The window size is 500 samples which indicates the reaction speed is a bit sluggish, on the other hand, measurement values have some averaging (old value*0.85+new value*0.15) to prevent unnecessary peak values.
3. RESULTS AND DISCUSSION
Most sensors were usable in demonstration setting. Person count using ultrasound sensor HC-SR04 was found to be unreliable. Operation range was limited, and it had trouble detecting less reflective clothing material. Next iteration will be implemented with ESP32-Cam module which has a compact camera module. Edge computing is used for image processing, and it is not necessary to send any GDPR material over the network. First responders reported that the visualization tool felt a bit hard to use, all fundamental parts worked but user interface and controls needed some clarification. For the next iteration user interface and controls will be updated.
4. CONCLUSION
Through the FASTER project, a set of sensors was tested matching the types of sensors installed in buildings. The aim is to trial the components together with a visualization software and allow first responders to examine emergency situations already before arriving at the scene. Initial laboratory and field testing showed that sensors are usable, except for the person counter. For person counting, the camera module will be tested. A second-round usability trial of the visualization software, as well as a field trial exercise with first responders are planned to test the BUST system. The BUST concept trailed through FASTER can be adopted for other buildings for future demonstration purposes.
ACKNOWLEDGEMENT
The FASTER project has received funding from the European Union's Horizon 2020 research and innovation programme under grant agreement No 833507.
REFERENCES 1. Nunavath, Vimala & Prinz, Andreas & Comes, T. (2016). Identifying First Responders Information Needs:
Supporting Search and Rescue Operations for Fire Emergency Response. International Journal ofInformation Systems for Crisis Response and Management. 8. 25-46. 10.4018/IJISCRAM.2016010102.
2. Hyvönen, E. (2019). The Basics of Remote Management in Rescue Operations, 10.3. “First responder Advanced technologies for Safe and efficienT Emergency Response.” FASTER Project (GA-
833507), EU Horizon H2020, CORDIS, E.C. https://cordis.europa.eu/project/id/833507 –http://www.faster-project.eu/
4. Ahola, M., Säteri, J., & Sariola, L. (2019). Revised Finnish classification of indoor climate 2018. E3S Web ofConferences, CLIMA 2019, 2.
5. Sähkötieto Ry (2019). Paloilmoittimen suunnittelu, asennus ja ylläpito 2019, ST-ohjeisto 1 (In English:Design, installation, and maintenance of fire alarms 2019,), section 4.1
Page 189 of 269
SafeGreece 2021 on-line Proceedings | ISSN 2654-1823
SafeGreece 2021 – 8th International Conference on Civil Protection & New Technologies 24-26 November, on-line | www.safegreece.org/safegreece2021 | [email protected]
APPLYING PRELIMINARY HAZARD ANALYSIS IN A CRISIS MANAGEMENT DATA COLLECTION SYSTEM: A CASE STUDY
Stavroula Charalampidou1, Apostolos Zeleskidis1, Ioannis Dokas1, Anastasios Panagiotis Psathas1, Vasileios Dimitriou1, Alexandros Pechtelidis1, Antonios Papaleonidas1, Lazaros Iliadis1
1 Civil Engineering Department, Democritus University of Thrace, (Greece). (E-mail: [email protected], [email protected], [email protected], [email protected],
[email protected], [email protected], [email protected], [email protected])
ABSTRACT
The paper presents a case study where a Preliminary Hazard Analysis was applied on the design phase of a mobile data collection unit, whose purpose is to collect and transmit field data in different geographical areas during ordinary and crisis situations. This unit is set to be created via the Democritus University of Thrace Risk and Resilience Assessment Center research project (RRAC). The objective of the mobile data collection unit is to collect and transmit various data via sensors to the Risk and Resilience Assessment Center, to be used by researchers in order to: a) Record the deviations of different variables that describe natural and technological hazards over time. b) Generate dynamic hazard maps for these phenomena. Preliminary Hazard Analysis (PHA) is a tool used by analysts to assess hazards early in the design process of systems. It requires the design criteria, the material and equipment specifications, and it works by identifying the causes of system level hazards and proposing measures in order to eliminate or mitigate them. By applying PHA to the mobile data collection unit system, it was possible to distinguish five states of operations, which are the storage state, the preparation for the movement to the designated area state, the transportation state of the mobile unit to the designated area, the installation state of the unit in order for it to be able to perform uninterruptedly the data collection and transmission operations and its operation state. The number of hazards identified is 100, which led to the identification of 180 causes and 229 proposed actions. The final result of the PHA are checklists that will be used by the personnel of the RRAC when the mobile unit will be commenced for operation.
Keywords: Preliminary Hazard Analysis, Hazard analysis, Mobile data collection unit, Case study
1. INTRODUCTION
The increased severity and occurrence of natural disasters in Greece [1], has highlighted the need of systems that can be used in order to collect and analyse data about the potential occurrence of hazards, the advancement of hazards with time and their risks, so that it will be possible to define potential scenarios about their development. This information is especially useful for national organisations such as the Civil Protection Agency, as well as industries and the general public to help them in figuring the best course of action toward reacting to the potential threat or mitigate its consequences. The Risk and Resilience Assessment Center (RRAC), is a research project in the Democritus University of Thrace, which is implemented under the Action “Reinforcement of the Research and Innovation Infrastructure”, funded by the Operational Programme "Competitiveness, Entrepreneurship and Innovation" (NSRF 2014-2020) and co-financed by Greece and the European Union (European Regional Development Fund). and began in November 2020. The duration of the project is 30 months. One major deliverable of RRAC is the mobile data collection unit in the form of a trailer, which will be equipped with a plethora of sensors, an efficient energy management system and other features, and it will be
Page 190 of 269
SafeGreece 2021 on-line Proceedings | ISSN 2654-1823
SafeGreece 2021 – 8th International Conference on Civil Protection & New Technologies 24-26 November, on-line | www.safegreece.org/safegreece2021 | [email protected]
placed in specific area in order to collect and transmit the necessary data for the calculation and the update of the dynamic models which are used for risk assessments. From the perspective of the RRAC such a system is viewed as critical. Thus, it is important to design it taking into consideration, as early as possible, potential hazardous scenarios that can jeopardise its mission and its integrity in order to be addressed effectively in a cost-effective manner. That view established the need to utilise safety science tools in its design process. The safety science tool that was used was in this case was the Preliminary Hazard Analysis (PHA). PHA is a qualitative hazard analysis method, which can be applied in the early developmental stage of a system, since it requires the design criteria, the specifications of the equipment and the materials used [2,3]. The PHA is being used mainly because of the ease of application as a first hazard analysis and it is usually followed by a more in-depth hazard analysis method [4]. Because the PHA is incorporated during the design phase of the system, major changes can be applied before the actualization of the system. This fact, while enhancing the reliability of the system in hazardous situations, also reduces the cost of incorporating the safety requirements than if the system was built. In overall the aim of this paper is to highlight the usefulness of adopting safety science tools early in the design phase of crisis management systems.
2. THE PRELIMINARY HAZARD ANALYSIS METHODOLOGY
Any PHA begins with a meeting with the developers, in which details about the system, its purpose, its components and technical specifications were discussed. Firstly, the operational states the system transitions between during its operations were identified. Secondly, the assumptions made about the system and its operational states were set. This led to the first step of the PHA, which is the identification of the hazards concerning the components of the system. The second step of the PHA is the identification of causes for the hazards identified on the previous step and the third step is the identification of actions that should be taken in order to eliminate the causes of the hazard or mitigate their consequences. The final step of PHA is the creation of checklists, after discussing with the developers, about which actions can be applied to the system.
3. CASE STUDY
3.1. The mobile data collection unit
The mobile unit system is an O1 category trailer, made of galvanized steel with dimensions (WxLxH): 1.50x2.50x1.80 m, together with the vehicle that will transport it by hauling it at the required position. The trailer will be equipped with a variety of sensors. Those will be an air quality station, that will be used to collect data about the air pollution levels, by measuring the levels of CO, CO2, NO₂, CH₄, O3, CH2O, SO₂, Cl, H₂S, CO and the levels of the UVA rays, a hydrological station that will measure the waterflow, the water speed and the water level of a specified water body, a water quality station that will be used to measure the water temperature, pH, ORP, conductivity, TDS, salinity, TSS, turbidity and the Dissolved oxygen percentage. Finally, it will be equipped with a meteorological station that will be used to measure the sun ray levels, the rainfall levels, the humidity and the air temperature, the wind speed, and its direction and also the barometric pressure. Those data will be used by the researchers in order to help with the management of a potential crisis, by creating and updating hazard maps, which can be used by the Civil Protection Unit in order to help with the planning of the evacuation paths that civilians might need to follow.
Page 191 of 269

SafeGreece 2021 on-line Proceedings | ISSN 2654-1823
SafeGreece 2021 – 8th International Conference on Civil Protection & New Technologies 24-26 November, on-line | www.safegreece.org/safegreece2021 | [email protected]
The sensors that the trailer will be equipped with, will either be mounted on poles that will be attached on the outside of the trailer, or they will be placed in the appropriate location, specified from the research team, outside of the trailer. Inside the trailer there will be all the equipment that is needed by each sensor in order to be fully operational. The power for the usage of the trailer systems will be provided by an li-ion battery and it will be also supplemented, when needed, by a backup power source. The trailer will be equipped with a solar panel, that is foldable and removable, which when needed can be mounted either on the panel, or on the ground near the trailer and with a fuel generator, that when used, will be placed in a sufficient distance away from the actual module, in order to not distort the results from the sensors.
3.2. The analysis
A sample of the assumptions that were made for the analysis of the system are stated as follows in Table 1.
Table 1. Assumptions made for the analysis of the mobile data collection unit
That all requirements mentioned in the technical report of the equipment are met. That the person in charge of installing and preparing the sensors is adequately trained in that task. The technical specifications of the trailer certify that it will be able to withstand the movement and
installation procedures and that is able to carry and protect all the necessary equipment.
The operational states for the trailer that were studied during the PHA are the following: storage, preparation for movement, the movement to the designated area and the proper installation of the trailer and its systems at the desired area. The purpose of the storage state is the safe storing of the trailer in a specified area, that it will remain in there in a standby mode and in where there will be no risk of damage or reduction of its efficiency, either from natural or man-made causes. The second operational state of the system is the preparation for the movement of the trailer. The purpose of this state is the preparation of the trailer and its equipment in order to ensure the proper operational functioning of the mobile unit and also to make sure that no damage is done to the system during the movement to the designated area. The purpose of the movement operational state is to maintain the operational condition of the trailer while on the move and for the trailer to be transported safely to the designated area. Finally, the purpose of the installation state is to set up and operate every sensor and procedure that are necessary in order to collect the data. After the definition of the operational states and the assumptions, the application of the PHA begun. In the present analysis, only the major system components of each operational mode were analysed. At the next table a part of the PHA results are depicted. Some of the hazards, causes and solutions for a component of the storage state and the installation state are presented.
Table 2. Indicative Preliminary Hazard Analysis
Component Hazard Cause Solution
Towing system
Distortion of the towbar arm and the trailer shaft.
Rust and wear and tear of the towbar.
Incorrect weight distribution during loading.
Overload of the trailer. No maintenance of the
towbar and its components.
Management of the weight distribution of the trailer.
Regular lubrication of towbar connection with carbon-based lubricant.
Cabin of Fire, Wear and The temperature inside of the Installation of the trailer in a safe area
Page 192 of 269

SafeGreece 2021 on-line Proceedings | ISSN 2654-1823
SafeGreece 2021 – 8th International Conference on Civil Protection & New Technologies 24-26 November, on-line | www.safegreece.org/safegreece2021 | [email protected]
the trailer tear trailer increases. Large heat source and fuel source (for example power
generator).
Managing of flammable external sources (cutting dry grass in an area around the
trailer) Installation of a fire suppressant system
inside the trailer.
4. RESULTS AND CONCLUSION
The Preliminary Hazard Analysis resulted in 100 hazards, 180 causes and 229 actions, with the majority of actions being in the preparation for the movement state (79), followed by the storage state (73), the installation state (49) and finally the movement state (28). This was expected, because of the higher number of hazards in those two states, due to the fact that there are more components that needed to be taken into consideration in the analysis. Also, some hazards correspond to multiple causes, therefore multiple actions must be taken in order to avoid them. The PHA analysis of the fifth and final mode of the system, the operational state, has not been concluded yet. It is expected to be completed in the following months, as a future work on this analysis. After the first meeting with the designers, in which they were presented with a first draft of the analysis, new hazards were introduced. A constructive discussion about which of those actions are practically applicable to improve the system, based on the financial and material planning, was done. Finally, it was observed that people without any background in safety sciences had no difficulty in understanding and applying the Preliminary Hazard Analysis.
ACKNOWLEDGEMENTS
We acknowledge support of this work by the project “Risk and Resilience Assessment Center –Prefecture of East Macedonia and Thrace -Greece.” (MIS 5047293) which is implemented under the Action “Reinforcement of the Research and Innovation Infrastructure”, funded by the Operational Program "Competitiveness, Entrepreneurship and Innovation" (NSRF 2014-2020) and co-financed by Greece and the European Union (European Regional Development Fund).
Co-financed by Greece and the European Union
REFERENCES
1. Greek Civil Protection Unit, ΣΤΑΤΙΣΤΙΚΑ ΣΤΟΙΧΕΙΑ ΔΙΑΧΕΙΡΙΣΗΣ ΠΕΡΙΣΤΑΤΙΚΩΝ. [Online]Available at: https://www.civilprotection.gr/sites/default/gscp_uploads/media/Apologismos2012.pdf[Accessed 7 10 2021].2. Lees, F., 2012. Lees' Loss prevention in the process industries: Hazard identification, assessment and control.Butterworth-Heinemann.3. Department of Defence (2012) MIL-STD-882e: Standard Practice for Systems Safety. U.S. Department ofDefence.4. Flaus, J.M., 2013. Preliminary Hazard Analysis. Risk Analysis: Socio-technical and Industrial Systems, pp.151-178.
Page 193 of 269

SafeGreece 2021 on-line Proceedings | ISSN 2654-1823
SafeGreece 2021 – 8th International Conference on Civil Protection & New Technologies 24-26 November, on-line | www.safegreece.org/safegreece2021 | [email protected]
DISASTER RISK INNOVATION CLUSTER (DRIC) DEFKALION – THE FIRST INTERDISCIPLINARY AND COLLABORATIVE ACTION IN GREECE IN THE FIELD OF
PROTECTION AGAINST NATURAL HAZARDS AND CLIMATIC RISKS
Panagiotis Michalis, Eleftherios Ouzounoglou, Nantia Skepetari, Niki Georgiou and Angelos Amditis Institute of Communication and Computer Systems (ICCS), National Technical University of Athens (Greece)
(E-mail: [email protected], [email protected], [email protected], [email protected], [email protected])
ABSTRACT
Recent climate change projections indicate that the frequency of extreme climatic events will substantially increase in the European continent. This is expected to put under significant stress ageing infrastructure, substantially increase disaster risk and bring significant implications to functions of our society. In an effort to address these challenges, DRIC Defkalion is the first collaborative and innovative cluster in Greece in the field of protection and resilience to natural hazards and climatic risks. The cluster aims to expand the innovation ecosystem by strengthening the competitiveness of its members and developing new partnerships to provide solutions that will facilitate and strengthen the critical area of managing and responding to disasters, environmental crises, and emergencies. DRIC Defkalion aims to bring together under the same umbrella businesses, research organisations, and technology companies, aiming to play a leading role offering a specialization hub in the field of disaster risk management and protection of climatic and environmental risks.
Keywords: Disaster, risk management, cluster, innovation, climatic crisis, hazards, environment, civil protection, safety, resilience.
1. INTRODUCTION
Climate-related and environmental risks are one of the major problems, and challenges humanity faces today on a global scale. These issues are expected to amplify as recent climate change projections [1] indicate that the frequency of shifting weather events will substantially increase, and severe flooding incidents are anticipated to double in Europe by 2050 [2], posing a significant threat to the resilience of critical assets over watercourses [3]. Therefore, modern climatic conditions are expected to significantly affect the integrity of ageing critical assets [4] and societal functions due to the high potential of extreme drought and flood events [5]. The increasing trend of extreme weather events and natural hazards emphasises the urgency of adapting to current and future climatic events and tackling its effects on multiple levels of our lives.
The resilience of infrastructure and societal systems to the changing climate is therefore considered of significant importance. Natural disaster management requires organisation and collaboration coupled with critical contributions from innovation and technology areas. Considering the scale of the disasters and the global nature of the problem, it is necessary to identify solutions that enhance cooperation between the main natural disaster management bodies, companies operating in the field, as well as specialised research and technology centres. Technically and economically feasible and acceptable results can be achieved, and the challenges of the international, highly competitive market can be met only by the joining of forces of the fundamental operators.
Page 194 of 269

SafeGreece 2021 on-line Proceedings | ISSN 2654-1823
SafeGreece 2021 – 8th International Conference on Civil Protection & New Technologies 24-26 November, on-line | www.safegreece.org/safegreece2021 | [email protected]
The Disaster Resilience Innovation Cluster (DRIC) Defkalion (https://www.dric-defkalion.org/) is the first coordinated, interdisciplinary and collaborative action in Greece in the critical field of protection against natural hazards and climatic risks. The cluster's primary goal is to effectively manage and deal with natural disasters, environmental crises, and civil protection emergencies for secure and climate resilient societies. DRIC Defkalion seeks to create a favourable environment for presenting and promoting private and public sector initiatives that promote such technological innovations in the market and solutions related to early warning of climatic hazards and disaster risk management.
2. DRIC DEFKALION OBJECTIVES
The primary objective of DRIC Defkalion is to bring together businesses, scientific research organisations, and technology companies focused on developing products, systems, and services for the management and response to natural disasters, climatic hazards, and emergencies in the field of civil protection. The cluster aims to join forces, enhance know-how, and put into practice experience to advance knowledge in the disaster risk management area, introduce new products & services to the market, and intermediate research results, such as product prototypes and patents. Mainly, DRIC Defkalion focuses on the following activities:
• Contributing to policymaking and funding of research and innovation.• Creating a network with other collaborative organisations and well-known entrepreneurship
and innovation programs and expand DRIC Defkalion.• Establishing education and training mechanisms to improve the experience of the companies
involved in the disaster risk management areas.• Creating knowledge through state-of-the-art practices and training with collaborative research
and scientific bodies.• Accessing to a network of partners and renowned entrepreneurs.• Assisting in research funding and promote entrepreneurship through business interconnection
and development of funding tools• Transferring of expertise between young entrepreneurs and high-profile companies in the
industry to develop and accelerate innovation.• Gathering of knowledge and technology innovation resources.• Developing new products or services in the market of disaster risk management.• Commercial development and enhanced collaboration between the members of the DRIC
Defkalion
3. DRIC DEFKALION MEMBER ACTIVITIES AND WORKING GROUPS
DRIC Defkalion currently consists of 36 members, including businesses, scientific research organisations, and technology companies. The cluster will provide a modern hub for knowledge exchange, strengthening research in the critical field of environmental risks and their effects, and the development of new innovative and competitive solutions in the market. At the same time, it aims to be a reliable partner for the companies, research centres, and institutions, offering both technical training and education as well as the possibility of commercial development, networking, and synergies between its members. More specifically, the central axes of support that DRIC Defkalion provides to its members are:
• Research and Networking• Education and training
Page 195 of 269

SafeGreece 2021 on-line Proceedings | ISSN 2654-1823
SafeGreece 2021 – 8th International Conference on Civil Protection & New Technologies 24-26 November, on-line | www.safegreece.org/safegreece2021 | [email protected]
• Commercial Development and Cooperation• Innovation and Technology
DRIC Defkalion aims to expand the innovation ecosystem by strengthening the competitiveness of its members and developing new partnerships to provide solutions that will facilitate and strengthen the critical area of managing and responding to disasters and emergencies. The members of the cluster have formed working groups that aim to contribute to knowledge exchange activities and contribute to the creation of a collaborative environment between cluster members focusing on the following thematic areas:
• Atmospheric Modelling, Meteorological and Ocean Forecasts and Climate Change Scenarios• Earth Observation, GIS Applications, and Spatial Analysis• Disasters' impact assessment and development of mitigation solutions• Information and Communication Technologies• Systems and Procedures for enhancing Operational Preparedness, Efficiency and Security• Risk, hazard and vulnerability assessment• Decision support and feasibility assessment• Training and Consultation• Interoperability Issues
AKNOWLEDGMENTS
DRIC Defkalion is funded by the General Secretariat for Research and Innovation (GSRI) in Greece, under programme EPAneK 2014-2020, Operational Programme Competitiveness Entrepreneurship Innovation (Programme no. ΓΓ1CL-0059188)
REFERENCES
1. G. Forzieri, G., A. Bianchi, F.B. e Silva, M.A.M. Herrera, A. Leblois, C. Lavalle, J.C.J.H. Aerts, L. Feyen (2018).Escalating impacts of climate extremes on critical infrastructures in Europe. Glob. Environ. Chang. 48, 97–107.
2. B. Jongman, S. Hochrainer-Stigler, L. Feyen, J.C.J.H. Aerts, R. Mechler, W.J.W. Botzen, L.M. Bouwer, G.Pflug, R. Rojas, P.J. Ward (2014). Increasing stress on disaster risk finance due to large floods. Nat. Clim.Chang. 2014, 4, 264–268.
3. P. Michalis, P. Cahill, I. Kerin, H. Solman, D. Bekic, V. Pakrashi and E. McKeogh (2017). WILD BIRD for Real-Time Assessment of Hydro-Hazards at Bridge Structure. Proceedings of the 1st International Symposiumand Exhibition on Hydro-Environment Sensors and Software - HydroSenSoft 2017, Madrid, Spain, 290-296.
4. S. Pytharouli, P. Michalis, S. Raftopoulos S (2019). From theory to field evidence: observations on theevolution of the settlements of an earthfill dam, over long time scales. Infrastructures 4(4):65.https://doi.org/10.3390/infrastructures4040065
5. P. Michalis, P. Sentenac (2021). Subsurface condition assessment of critical dam infrastructure with non-invasive geophysical sensing. Environmental Earth Sciences, 80, 556. https://doi.org/10.1007/s12665-021-09841-x
Page 196 of 269

SafeGreece 2021 on-line Proceedings | ISSN 2654-1823
SafeGreece 2021 – 8th International Conference on Civil Protection & New Technologies 24-26 November, on-line | www.safegreece.org/safegreece2021 | [email protected]
DATA COLLECTION IN EMERGENCY CRISES. THE CASE OF HALKIDIKI’S STORM IN 2019
Georgios Sotiriadis1,2 1MSc, International Hellenic University, Kavala, Greece,
2MSc, Aegean University, Lesvos, Greece, (E-mail: [email protected])
ABSTRACT
During and after a natural or manmade disaster, quickly gathering data in real-time is crucial. In a crisis, every information is pivotal to those making decisions. Sufficient data collection allows the maximum amount of information available at any given moment. Mobile data collection tools typically function without any need to be online. They will function normally while away from the internet and sync to the database when a connection becomes available. In disaster situations, internet connections and network towers are frequently knocked out. Consequently, having a tool that can be used in areas that are bereft of internet access greatly increases their versatility and operational efficiency. All the data in a mobile data collector is geolocated, linking the data and its location. Usually, a GPS is needed to provide location data. Delocalized tags automatically provide the user with a detailed map of the area and which areas are affected, efficiently aiding command in the best ways to organize response. Much like the geolocated tags, the various forms of media retrieved from the collection scene are automatically linked to the data. Photo, video, and audio are all linked and stored in the database. During the deadly storm of Halkidiki in 2019 responders used KoBo Toolbox to record gps points and narrative of their direct observations. Analysis and visualization of these data helped to understand the situation and to support the decision makers, fast and efficient.
Keywords: data collection, direct observation, kobo toolbox, spatial data, information management
1. INTRODUCTION
The explosion of increasingly sophisticated mobile phone technologies can usefully be harnessed by disaster risk reduction (DRR) as a means of enhancing inclusivity and local relevance of knowledge production and resilience building [1].
Currently many Red Cross / Red Crescent National Societies, ICRC and IFRC are widely using mobile devices to collect data on a global scale. Many projects have successfully reduced the costs of data collection by a factor of ten and the time to gather and analyze data from up to twelve months to less than two weeks [2].
According to the IFRC [3] the most common uses of mobile device applications for development and humanitarian action by NGOs and civil society are:
• Map information in disaster and conflict zones.• Monitoring.• Conduct community censuses.• Epidemiological surveillance.• Plan the response to crises, disasters or conflicts.
Page 197 of 269

SafeGreece 2021 on-line Proceedings | ISSN 2654-1823
SafeGreece 2021 – 8th International Conference on Civil Protection & New Technologies 24-26 November, on-line | www.safegreece.org/safegreece2021 | [email protected]
• Support humanitarian efforts following disasters such as earthquakes, floods and other adverseevents.
• Help find missing or separated people following disasters such as earthquakes, floods or armedconflicts.
• Collect health data.• Assist the follow-up of patients living in areas of difficult access.• Interviews with the target population.• Knowledge, Attitude and Practice Surveys (KAP).• Register the places visited and people surveyed.• Distribute humanitarian aid.• Planning, Monitoring, Evaluation and Reporting activities.
Data collection could be a damage assessment and needs analysis, a survey, an interview and a direct observation. The advantages that IFRC [3] mentions are:
• More economical: The collection of data and their entry in digital systems the traditional way isexpensive in terms of time and staff, as it needs data collection equipment, as well as acomputer for the digitization of the data. The use of mobile devices requires an initialinvestment in the devices, as well as in the training of the sampling team, but in the long run, itreduces costs and time as it does not need to enter the data in the digital system. Instead, onemust only send them or download them to the computer.
• Less aggressive: The presence of a sampling team with their charts and forms has the potentialto intimidate respondents. The presence of a mobile device reduces this effect and facilitatesinteraction with respondents.
• Ease of use: The popularization of mobile devices facilitates their use. The learning curve ismuch simpler and faster, as almost everyone is familiar with mobile devices.
• Time: The possibility of having information in real time saves the time necessary for itsdigitization, as once it is collected, it is ready to be processed and analyzed.
• Accuracy: Information can be synchronized to a remote storage system with Internet access ordownloaded directly to a personal computer, so information cannot be lost. The fact of beinggeotagged and with records of dates facilitates the use of the information to any user andassures its reliability.
• Storage: In addition to geotagging and date records, photos or videos can be added in a singlefile and stored in an SD memory. There are no mountains of paper and forms, and oncesynchronized, it is not susceptible to loss.
2. KOBO TOOLBOX
KoBo Toolbox is a free open-source tool for mobile data collection. It allows to collect data in the field using mobile devices such as mobile phones or tablets, as well as with paper or computers. The adaptation of KoBo Toolbox for humanitarian use was a joint initiative between OCHA, Harvard Humanitarian Initiative (HHI) and the International Rescue Committee (IRC). It is a ready-to-use all-in-one platform for developing, storing, managing and sharing forms, as well as managing and sharing
Page 198 of 269
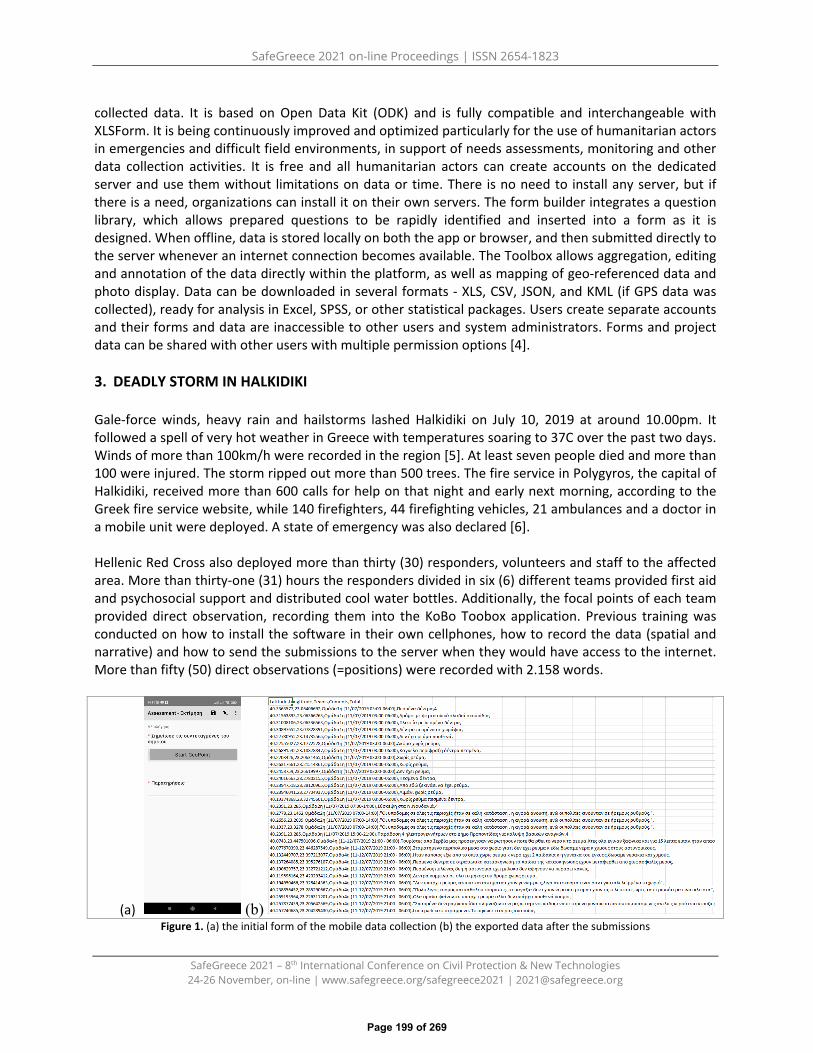
SafeGreece 2021 on-line Proceedings | ISSN 2654-1823
SafeGreece 2021 – 8th International Conference on Civil Protection & New Technologies 24-26 November, on-line | www.safegreece.org/safegreece2021 | [email protected]
collected data. It is based on Open Data Kit (ODK) and is fully compatible and interchangeable with XLSForm. It is being continuously improved and optimized particularly for the use of humanitarian actors in emergencies and difficult field environments, in support of needs assessments, monitoring and other data collection activities. It is free and all humanitarian actors can create accounts on the dedicated server and use them without limitations on data or time. There is no need to install any server, but if there is a need, organizations can install it on their own servers. The form builder integrates a question library, which allows prepared questions to be rapidly identified and inserted into a form as it is designed. When offline, data is stored locally on both the app or browser, and then submitted directly to the server whenever an internet connection becomes available. The Toolbox allows aggregation, editing and annotation of the data directly within the platform, as well as mapping of geo-referenced data and photo display. Data can be downloaded in several formats - XLS, CSV, JSON, and KML (if GPS data was collected), ready for analysis in Excel, SPSS, or other statistical packages. Users create separate accounts and their forms and data are inaccessible to other users and system administrators. Forms and project data can be shared with other users with multiple permission options [4].
3. DEADLY STORM IN HALKIDIKI
Gale-force winds, heavy rain and hailstorms lashed Halkidiki on July 10, 2019 at around 10.00pm. It followed a spell of very hot weather in Greece with temperatures soaring to 37C over the past two days. Winds of more than 100km/h were recorded in the region [5]. At least seven people died and more than 100 were injured. The storm ripped out more than 500 trees. The fire service in Polygyros, the capital of Halkidiki, received more than 600 calls for help on that night and early next morning, according to the Greek fire service website, while 140 firefighters, 44 firefighting vehicles, 21 ambulances and a doctor in a mobile unit were deployed. A state of emergency was also declared [6].
Hellenic Red Cross also deployed more than thirty (30) responders, volunteers and staff to the affected area. More than thirty-one (31) hours the responders divided in six (6) different teams provided first aid and psychosocial support and distributed cool water bottles. Additionally, the focal points of each team provided direct observation, recording them into the KoBo Toobox application. Previous training was conducted on how to install the software in their own cellphones, how to record the data (spatial and narrative) and how to send the submissions to the server when they would have access to the internet. More than fifty (50) direct observations (=positions) were recorded with 2.158 words.
(a) (b)Figure 1. (a) the initial form of the mobile data collection (b) the exported data after the submissions
Page 199 of 269

SafeGreece 2021 on-line Proceedings | ISSN 2654-1823
SafeGreece 2021 – 8th International Conference on Civil Protection & New Technologies 24-26 November, on-line | www.safegreece.org/safegreece2021 | [email protected]
Using GIS and visualization tools a dashboard was created showing the response. From the below figure someone can understand the route of the different teams that are identified with different colors and the narrative from the observations.
Figure 2. Data visualized after exported from KoBo Toolbox. On the left the GPS points, on the right the narrative of the observations.
4. CONCLUSIONS
Even though the mobile data collection was for the first time used in an emergency crisis, after the deadly storm of Halkidiki in July 2019, the outputs were impressive. The training on the use of the mobile data collection tool was fast and easy to understand. All the teams recorded observations using the android software on their cellphones. Due to lack of internet accessibility the submissions took place in the way back to Thessaloniki. A quick data analysis and a creation of an interactive dashboard helped the understanding of the situation. Field reports and visualizations were created easily and quickly.
Mobile data collection is a tool easy to use, economical, accurate and provides fast information management. The approach of this method could help the decision makers for better respondence and for better future planning based on the outcomes of the analysis.
REFERENCES
1.
2.
J.D. Paul, E. Bee, M.Budimir (2021). Mobile phone technologies for disaster risk reduction. Climate RiskManagement,Volume 32, 2021, https://doi.org/10.1016/j.crm.2021.100296.Global Disaster Preparedness Center (2021, Oct 1) retrieved fromhttps://preparecenter.org/topic/mobile-technology/
3. IFRC (2017). Reference Manual Open Data Kit. Mobile Data Collection4. IFRC (2018). KoBo Toolbox, Training Package v1.5. BBC (2021, Oct 1) retrieved from https://www.bbc.com/news/world-europe-489458216. The New York Times (2021, Oct 1) retrieved from
https://www.nytimes.com/2019/07/11/world/europe/greece-storms-halkidiki.html
Page 200 of 269

SafeGreece 2021 on-line Proceedings | ISSN 2654-1823
SafeGreece 2021 – 8th International Conference on Civil Protection & New Technologies 24-26 November, on-line | www.safegreece.org/safegreece2021 | [email protected]
LOW-COST WATER LEVEL METER WITH IMAGING CAPABILITY AIMED FOR FLOOD EARLY WARNING SYSTEMS
Evangelos Skoubris, George Hloupis Department of Surveying and Geoinformatics Engineering, University of West Attica, (Greece).
(E-mail: [email protected], [email protected])
ABSTRACT Natural disasters generally present great risk and damage, and have been extensively studied during the past decades. Among them, river floods are becoming increasingly frequent, and can be fairly destructive and of strong economic, health, and social importance. Key tools to avoid their catastrophic results are the Early Warning Systems (EWS). An EWS usually monitors various physical quantities through a specific hardware, and produces data which after certain processing can detect and estimate the level of the risk. The best practice to predict a river flood is to monitor certain parameters in multiple locations throughout the river basin, and most important the water level. Especially in areas where extensive wildfires have occurred, the need to install a relatively dense monitoring network is emerging. To aid this need, this study presents the design and application of an easy to install low cost Internet of Things (IoT) node. Apart from its water level measuring capability, this device also embeds a VGA resolution camera which periodically captures still images of a view of interest. The latter can be for example an implementation prone to defects in case of flood, such as a river basin level road crossing, or a bridge. The images can also provide constant monitoring of the river basin state, i.e. to detect the presence of any unwanted objects (waste or other natural & artificial bring materials). This design has been already pilot tested at several locations at river Evros, and preliminary data will be presented.
Keywords: Early Warning Systems, River Floods, IoT, Low-Cost nodes.
1. INTRODUCTION
Early Warning science and technology has been extensively and increasingly studied during the past two decades [1]. Mainly due to the increase of extreme climatic phenomena, natural disasters are becoming increasingly frequent [2]. The need for monitoring certain parameters and designing reliable EWSs is emerging. Floods occupy approximately 40% of the total number of disasters and the total number of people affected from natural disasters for the decade 2009-2019 [3]. At the EU region, there are already present lots of EWS related to water hazards [4]. Flood early warning systems may be solely supported by prediction models using radar meteorological data [5] or ensemble flood forecasting [6], or by combining prediction models and modern technology such as machine learning and neural networks alongside with in situ real or near-real time measurements [7]. River floods are mainly caused by long lasting rainfall events or massive snow and ice melt [4]. Other causes include poorly designed water discharges from water reservoir dams, or the damage of technical constructions such as a dam or an anti-flood embankment, like in the case of Ivanovo dam which resulted in severe flood at the villages Biser, Bulgaria, and Ormenio, Greece [8]. Soil saturation and wave propagation play key roles in the flood dynamic, contributing to the long time scales typically related to flood hazards [4]. EWSs for river floods are referred to be deployed around readily available commercial platforms of embedded systems [9], and around low-cost microcontroller development boards and sensors [10, 11,
Page 201 of 269

SafeGreece 2021 on-line Proceedings | ISSN 2654-1823
SafeGreece 2021 – 8th International Conference on Civil Protection & New Technologies 24-26 November, on-line | www.safegreece.org/safegreece2021 | [email protected]
12, and 13]. This study presents the design and development, testing and application of a low-cost, easy to build and install, imaging capable water level meter.
2. MATERIALS AND METHODS
The node consists of the main unit, from which the solar panel and the ultrasonic distance sensor are purposely separated (figure 1a). The main unit holds most of the electronics, together with the imaging sensor. Being separated from the main unit, the solar panel can be properly oriented for optimal power performance, and the ultrasonic sensor can also be remotely installed at suitable position, facing the targeting water surface without obstacles. Finally, this design gives the user the ability to freely mount the main unit and easily target the scenery of imaging interest. A sample QVGA greyscale image is shown in figure 1b.
(a) (b)
Figure 1. (a) An overview of a complete node; (b) A sample image of the node.
The hardware design of the node is based mainly on the integration of several low-cost and popular electronic modules, which makes it really easy to build and assemble (figure 2a). Only a minority of discrete components is present on our custom designed electronics board.
(a) (b)
Figure 2. (a) An overview of the electronics and hardware design; (b) User visualization frontend.
Camera lens
Page 202 of 269

SafeGreece 2021 on-line Proceedings | ISSN 2654-1823
SafeGreece 2021 – 8th International Conference on Civil Protection & New Technologies 24-26 November, on-line | www.safegreece.org/safegreece2021 | [email protected]
The node is fully power independent, utilizing a Li-Ion battery recharged with the aid of a small solar panel. Power autonomy extends to several months without recharging, even with a data upload rate of one measurement per hour, and one QVGA image per six hours. An ultrasonic distance sensor (MaxBotix MB7066-100) is used to aid the water level measuring capability with 1cm resolution. Imaging sensor is the Omnivision OV7670, and can produce color images with maximum analysis of 640x480 pixels (RGB-VGA). Data connectivity is twofold; GSM, and LoRaWAN. Data are uploaded to a server, which also hosts the user visualization frontend (figure 2b). Finally, since the microcontroller board (RobotDyn Mega2560PRO) is Arduino compatible, programming ease is provided. Data receptor is build on open source software allowing reception from multiple telecommunication gateways (2G/3G/4G, WiFi, LoRAWAN, Ethernet). Visualization dashbord is fully customizable, providing the ability not only to present the datasets in abstractive visual format, but in addition it has the ability to run early warning algorithms for the estimation of possible abnormal situations. The latter can be completed in multiple ways: using only the recorded data and the predefined models, as well as embedding information from other sources such as satellite images and crowdsensing responses (using the corresponding developed reporting Android app).
3. RESULTS AND DISCUSSION
Four nodes were installed at Evros region, Greece. Node 1 and 4 at Kastanies bridge and Therapeio dam, Ardas river, and node 2 and 3 at Didymoteicho bridge and Polia/Avdela bridge, Erythropotamos river, respectively. Installation points are depicted in figure 3a.
(a) (b)
Figure 3. (a) Location of the 4 water level meter nodes installed at Evros region; (b) Comparison of water level at the two monitoring points at Ardas River (node 1 Kastanies bridge – top, node 2 Therapio dam – bottom).
Comparing the data of water level at nodes 1 and 4 (Ardas river), it is observed that when major water volumes were discharged from Therapeio dam (figure 3b, bottom), the water level at Kastanies bridge showed a respective behavior (figure 3b, top). The signal footprints are absolutely related, 6 hours shifted, and differ in the exact water level. This is normal both due to water absorption, and due to differences at the riverbed widths (at Kastanies Bridge the riverbed is much wider than just after the Therapeio dam).
Page 203 of 269
SafeGreece 2021 on-line Proceedings | ISSN 2654-1823
SafeGreece 2021 – 8th International Conference on Civil Protection & New Technologies 24-26 November, on-line | www.safegreece.org/safegreece2021 | [email protected]
4. CONCLUSIONS
Conclusively, the nodes worked as intended, with the expected power, sensing, and imaging performance. Yet, we do not have the results of a direct comparison between our system and reference water level meter measurements. Thus, it is between our future objectives to compare and confirm the reliability of our system, although the preliminary results look very promissing. The cost of materials for each complete node was maintained well below the €200 margin. Throught the academic research of our institute it is within our scope to offer river water level and imaging monitoring services at several points of interest. More monitoring locations will also provide bigger datasets which are critical for the development and training of the alarm issuing algorithms. Finally, raw data will be provided to all parties involved, together with access to the user visualization frontend.
ACKOWLEDGEMENTS Authors would like to thank Konstantinos Chouvardas for the organization and installation support of the initial four nodes at Evros River.
REFERENCES
1. J. E. Quansah, B. Engel, G. L. Rochon (2010). Early Warning Systems: A Review. Journal of TerrestrialObservation, 2(2), 24-44.
2. R. E. Morss, O. V. Wilhelmi, G. A. Meehl, L. Dilling (2011). Improving Societal Outcomes of ExtremeWeather in a Changing Climate: An integrated Perspective. Annual Review of Environment and Resources,36, 1-25.
3. B. Arshad, R. Ogie, J. Barthelemy, B. Pradhan, N. Verstaevel, P. Perez (2019). Computer Vision and IoT-Based Sensors in Flood Monitoring and Mapping: A Systematic Review. Sensors, 19, 5012.
4. L. Alfieri, P. Salamon, F. Pappenberger, F. Wetterhall, J. Thielen (2012). Operational early warning systemsfor water-related hazards in Europe. Environmental Science & Policy, 21, 35-49.
5. C. Corral, M. Berenguer, D. Sempere-Torres, L. Poletti, F. Silvestro, N. Rebora (2019). Comparison of twoearly warning systems for regional flash flood hazard forecasting. Journal of Hydrology, 572, 603-619.
6. H. L. Cloke, F. Pappenberger (2009). Ensemble flood forecasting: A review. Journal of Hydrology, 375, 613-626.
7. G. Furquim, G. Pessin, B. S. Faiçal, E. M. Mendiondo, J. Ueyama (2015). Improving the accuracy of a floodforecasting model by means of machine learning and chaos theory. Neural Computing & Applications,27(5), 1129-1141.
8. K. Chouvardas, C. Papapostolou (2016). River Floods and Crossborder Cooperation: The case of EvrosRiver. Geographies, 27, 44-71.
9. D. Purkovic, L. Coates, M. Hönsch, D. Lumbeck, F. Schmidt (2019). Smart river monitoring and early flooddetection system in Japan developed with the EnOcean long range sensor technology. 2nd InternationalColloquium on Smart Grid Metrology, Split, Croatia.
10. G. S. Karun, B. Sudharshan, R. R. Rao, B. L. M. Reddy (2019). Development of Smart Flood MonitoringSystem Using Ultrasonic Sensor with Blynk Application. Journal of Engineering Sciences, 10(2), 41-45.
11. V. Balaji, A. Akshaya, N. Jayashree, T. Karthika (2017). Design of ZigBee based Wireless Sensor Network forearly Flood Monitoring and Warning system. Proceedings IEEE International Conference on TechnologicalInnovations in ICT For Agriculture and Rural Development, 236-240.
12. N. Kafli, K. Isa (2019). Internet of Things (IoT) for Measuring and Monitoring Sensors Data of WaterSurface Platform. IEEE 7th International Conference on Underwater System Technology: Theory andApplications.
13. E. Skoubris, G. Hloupis (2020). Low Cost Sensor Node for Monitoring River Floods. EGU 22nd GeneralAssembly, held online 4-8 May, id. EGU2020-20175.
Page 204 of 269

SafeGreece 2021 on-line Proceedings | ISSN 2654-1823
SafeGreece 2021 – 8th International Conference on Civil Protection & New Technologies 24-26 November, on-line | www.safegreece.org/safegreece2021 | [email protected]
CLIMATE CHANGE ΕFFECT ON FOREST FIRE AND FLOOD RISK-THEORETICAL SUGGESTIONS, EMPIRICAL DATA AND PUBLIC
PERCEPTIONS IN CENTRAL AND SOUTH GREECE
Dimitra Angra1, Kalliopi Sapountzaki2 1, 2 Harokopio University, (Greece).
(E-mail: [email protected],[email protected])
ABSTRACT
It has been suggested that as global climate changes, there is a parallel increase in the number and intensity of extreme weather events and the interrelated natural disasters like forest fires and floods. Greece, a country of the Eastern Mediterranean region, features a variety of microclimates both due to the effect of weather systems and its complex topography. Additionally, historical statistical data point to Central and South Greece as “hot areas”, i.e. more prone to forest fires and floods. Consequently, some key questions arise: To what extent has Climate Change (CC) affected forest fires and floods? How will CC affect these areas in the future? What are the perceptions of citizens and management authorities about CC's impact on the trends of floods and forest fires? By focusing on Central and South Greece as "Hot Areas", the authors attempt to: (a) present the forest fire risk and flooding trends of the last decades since the mid 90’s (on the basis of statistical analysis of empirical data, (b) address the recent and predicted regional climate changes that are expected to affect the forest fire and flood risk and (c) conduct a survey on the perceptions of citizens and management authorities of the two regions on the effect of CC in the present and the future.
Keywords: Climate Change, Forest fires, Floods, Public Perception
1. INTRODUCTION/OBJECTIVEIn recent decades CC has been one of the most frequently interdisciplinary research topics, as globalwarming, especially from the mid-20th century until today, is both due to natural and anthropogeniccauses [1][2]. The rise in air temperature seems to directly affect both the incidence of extreme weatherevents and their intensity [3]. In turn, changes in the extreme weather events such as heat waves,extreme rainfall, droughts are suggested to modify the profile and characteristics of forest fire andflooding risks and disasters [4,5]. The basic objective of this work is to confirm or dispute theinterrelations between CC and forest fire and flood risk through the lens of scientific estimations,historical empirical data and public perceptions in Central and South Greece.
2. EXPERIMENTAL METHODThis study includes the following methodological approaches: (a) a literature review on the decisiveclimatic and other parameters regarding the forest fire and flood risk in the Eastern Mediterraneanregion and relevant predictions for the future; (b) a statistical analysis of the flooding and forest fireevents in Central and South Greece for the period 1960-2020 and possible correlations with regionalclimatic changes in the same period and (c) a field survey on risk perceptions based on structuredquestionnaires addressed to lay public samples and key-informers in Central and South Greece. Withregard to the survey, an online questionnaire was distributed to the citizens and the managementauthorities through social media and e-mail. The sample of the study consisted of 317 residents ofCentral and South Greece, of whom 99 were residents of the Region of Sterea Ellada, 84 residents of the
Page 205 of 269

SafeGreece 2021 on-line Proceedings | ISSN 2654-1823
SafeGreece 2021 – 8th International Conference on Civil Protection & New Technologies 24-26 November, on-line | www.safegreece.org/safegreece2021 | [email protected]
Region of Attica, 51 residents of the Region of Dytiki Ellada and 83 residents of the Region of Peloponnese. The sample included female and male adults of all ages and educational levels. Additionally, the survey involved 42 employees of management authorities (Administrative Regions, Fire Brigade and Forest Authorities) of which 64.29% belong to the Region of Central Greece and 35.71% to the Region of South Greece. The parameters examined are related to the perception of CC and its influence on forest fires and floods. Cross examination of the results of these analyses illuminate convergences and divergences between theoretical suggestions, facts, predictions and perceptions.
3. RESULTS AND DISCUSSIONThe present work examines: (a) the objective/scientific risk of CC effect on forest fıres and floods, i.e. ifthere are indications that CC affecting forest fire and flood risk in Central and South Greece andpredictions/estimations that it will continue to affect them further in the future and (b) the subjectiverisk, i.e. public perceptions regarding CC effect on these risks, including the perceptions of theresponsible risk management authorities. Central and South Greece (Attica, Sterea Ellada, Dytiki Elladaand the Peloponnese administrative Regions –NUTS II) have been considered “hot regions” and theywere case study areas for testing theoretical assumptions and analyzing historical empirical data.
According to the literature the average temperature in Central and South Greece it is estimated that it will be higher by 2100, and the number of very hot and dry days is expected to increase. At the same time, it is estimated that there will be an increase in extreme rainfall, while a decrease in monthly rainfall is estimated to occur [6,7,8,9,10,11].
However, some changes have already appeared. More specifically, in the period 2011-2020 (compared to the period 1955-2010), the average temperature in Central Greece was higher, the average monthly rainfall was lower, while heavy rainfall events seem to make their appearance mainly during the months of December, November and January. In addition, since the beginning of the 21st century it seems that the frequency and intensity of extreme rainfall has increased [12,13]. On the contrary, in South Greece the temperature was lower in the period 2011-2020 (compared to the period 1955-2010) with the exception of September, the average monthly rainfall was higher and heavy rainfall occurred mainly during December, January and November. In terms of extreme rainfall, since the end of the 20th century it seems that there has been a significant increase, both in their frequency and intensity [12,13].
Forest fires are a fairly common phenomenon in Greece, constituting an important problem that is directly related to the prevailing meteorological conditions [14]. The burnt areas in Greece for the period 1991-2020 amount to 13,009,032 acres, of which 51.83% are located in Central and South Greece, hence their classification as “hot areas”. In the period 2004-2020 there was a dramatic increase in fires in Central and South Greece, compared to the period 1991-2004. However, as far as the burnt areas are concerned, a significant increase in the period 2004-2020 occurred only in Central Greece, where the burnt acres increased by 1,000,000, compared to the previous period. Besides, it seems that after 2005 the forest fire period tends to cover the whole year, as fire season has been extended to include even spring and winter seasons: January, February, March, April, November and December (with almost zero events in the preceding period) [15,16].
As far as floods are concerned, in the period 1991-2020 a total of 570 serious events were recorded in Central and South Greece. From 2003 onwards, it seems that the annual number of floods has increased in Central and South Greece, compared to previous years, excluding the year 1994. Besides, in the period 1991-2004 flood events in Central Greece tended to occur basically in three months November,
Page 206 of 269

SafeGreece 2021 on-line Proceedings | ISSN 2654-1823
SafeGreece 2021 – 8th International Conference on Civil Protection & New Technologies 24-26 November, on-line | www.safegreece.org/safegreece2021 | [email protected]
October and January. However, in the following period 2005-2020, flooding has increased significantly throughout the year and the hot period of flooding has been enlarged. As far as South Greece is concerned, in the period 1991-2004, most of the floods were recorded in January and November. On the contrary, in the period 2005-2020 it seems that flood events occur throughout the autumn and winter seasons, while they begin to make their appearance during the spring and summer seasons [17,18]. These conclusions are analogous to the findings referring to forest fires and indicate that the once seasonal meteorological and climatic disasters are increasing rapidly throughout the year and their occurrence should be expected at any time.
Perceptions of citizens and management authorities play a key role in addressing CC challenges, either through adaptation or mitigation. Appropriate training and continuous dissemination of information on CC-related issues can help individuals and societies understand the serious impacts of CC and obtainknowledge and practical skills for mitigation and adaptation measures. Important step to this end isaddressing current perceptions of people and responsible authorities on CC.
Based on the research conducted, it was found that the highest percentage of the respondents and the majority of the management authorities of Central Greece have observed in the region more extreme rainfall, changes in flowering times and plant growth and that the average temperature has risen throughout the year in the last fifteen years. The management authorities have additionally noticed more storms and stronger winds. These observations of the citizens and the management authorities seem to converge with the theoretical suggestions and the trends of meteorological and climate parameters in Central Greece. In South Greece, the majority of the respondents and the majority of the management authorities have noticed an increase in heat waves, warmer summers and winters, more droughts and more extreme rainfall. However, this view does not converge completely with the trends of meteorological and climate parameters in South Greece in the recent decades.
Finally, it seems that the increase of forest fires and floods in the regions of Central and South Greece over the last fifteen years has escaped the citizens’ and the management authorities’ attention.
4. CONCLUSIONOn the basis of theoretical arguments, the trends of meteorological and climatic parameters in Centraland South Greece and the trends of forest fires and floods in the same regions, it has been assumed bythe authors that CC is expected to have a significant impact on both forest fires and floods (especially inCentral Greece) in the future. Furthermore, the responses of the citizens and the managementauthorities of Central and South Greece indicate that they have noticed a number of changes in theirplace of residence such as the rise in temperature throughout the year, the increase in extreme rainfalland heat waves, the reduction of rain days etc. However, although they have observed significantclimate changes in their region over the last fifteen years, they do not consider that these changes havecaused an increase/intensification of forest fire and flood events. This view demonstrates the urgentneed for environmental information and education, both for the management authorities and for thecitizens of Central and South Greece, with regard to CC and its interconnection with extreme weatherevents and natural disasters. Information and education are necessary, as false views may adverselyaffect effective mitigation and adaptation measures.
REFERENCES
1. Environmental Science (2020). Climatology: The Science of Global Weather Systems over the Long Term,
Page 207 of 269

SafeGreece 2021 on-line Proceedings | ISSN 2654-1823
SafeGreece 2021 – 8th International Conference on Civil Protection & New Technologies 24-26 November, on-line | www.safegreece.org/safegreece2021 | [email protected]
URL: https://www.environmentalscience.org/climatology. Date of access: 07/2021. 2. NASA (2020). The Causes of Climate Change, Global Climate Change – Vital Sings of the Planet, URL:
https://climate.nasa.gov/causes/. Date of access: 07/2021.3. National Climate Assessment U.S. (2014). Extreme Weather, U.S. Global Change Research Program, URL:
https://nca2014.globalchange.gov/highlights/report-findings/extreme-weather. Date of access: 07/2021.4. T.A. Myers, E.W. Maibach, C. Roser-Renouf, K. Akerlof, A.A. Leiserowitz (2012). The relationship between
personal experience and belief in the reality of global warming, Natural Climate Change. Nature climatechange, URL: https://www.nature.com/nclimate/articles. Date of access: 07/2021.
5. L. Gilman (2020). Extreme Weather, Encyclopedia, URL:https://www.encyclopedia.com/environment/energy-government-and-defense-magazines/extreme-weather. Date of access: 07/2022.
6. Oikoskopio (2021). Climate Change and Forest Fires, WWF. URL: http://www.oikoskopio.gr/map/. Date ofaccess: 08/2021. (In Greek).
7. Region of Sterea Ellada (2018). Regional Plan for Adaptation to Climate Change, PSPKA of Central Greece,Envirometrics, With the co-financing of Greece and the European Union, Athens. (In Greek).
8. Region of Peloponnese and Academy of Athens (2020). Regional Plan for Adaptation to Climate Change,PESCA Peloponnese, With the co-financing of Greece and the European Union, Athens. (In Greek).
9. Region of Dytiki Ellada (2019). Regional Climate Change Adaptation Plan (PESPKA) of Dytiki Ellada,ΕΝVIROPLAN A.E. (In Greek).
10. Region of Attica - Directorate-General for Sustainable Development and Climate Change (2020).Preparation of the Regional Plan for Adaptation to Climate Change (PESPKA) Region of Attica, ContractorScholar: Adens, European Union, Regional Operational Programme of Attica. (In Greek).
11. Bank of Greece (2011). The environmental, economic and social impacts of climate change in Greece,Athens. (In Greek).
12. National Weather Service (2020). Climate data per month, URL:http://www.hnms.gr/emy/el/climatology/climatology_month?minas=01&fbclid=IwAR3SWvNuvGwmroESBx_8s0cOseB5HubolGuVsEUQRkCGqzWP3shndRNMd3I. Date of access: 08/2021.
13. National Oceanic and Atmospheric Administration -NOAA- (2021). Monthly Summaries Map,URL:https://gis.ncdc.noaa.gov/maps/ncei/summaries/monthly. Date of access: 08/2021.
14. G. Xanthopoulos (2009). Forest Protection and forest firefighting, WWF Hellas, Athens. (In Greek).15. Fire Brigade of Greece, n.d., Event Items, URL: https://www.nrdc.org/stories/flooding-and-climate-
change-everything-you-need-know#facts. Date of access: 08/2021. (In Greek).16. Kaoukis, K., 2009, Forest Fires in Greece in the period 1991-2004: Messages from the Evolution of the
Phenomenon, Athens. (In Greek).17. Μeteo, 2020, Map of high-impact weather events, URL: https://meteo.gr/weatherEvents.cfm. Date of
access: 08/2021. (In Greek).18. Ministry of Environment and Energy, 2012, Historical Flood Recording Base, URL:
https://floods.ypeka.gr/index.php?option=com_content&view=article&id=1035&Itemid=669. Date ofaccess: 08/2021. (In Greek).
ACKOWLEDGEMENTS This research is co-financed by Greece and the European Union (European Social Fund- ESF) through the Operational Programme «Human Resources Development, Education and Lifelong Learning» in the context of the project “Strengthening Human Resources Research Potential via Doctorate Research” (MIS-5000432), implemented by the State Scholarships Foundation (ΙΚΥ)
Page 208 of 269

SafeGreece 2021 on-line Proceedings | ISSN 2654-1823
SafeGreece 2021 – 8th International Conference on Civil Protection & New Technologies 24-26 November, on-line | www.safegreece.org/safegreece2021 | [email protected]
FLOOD MAPPING OF THE KALAMAS RIVER BASIN USING SATELLITE EARTH OBSERVATION DATA
Christina Natalia Patsioti1, Andreas Antonakos2, Isaak Parcharidis3 1,3 Geography Department, Harokopio University, (Greece).
(E-mail: [email protected], [email protected], [email protected])
ABSTRACT The present study concerns the flood risk of the catchment area of “Kalamas” or “Thyamis” river, which is located in the Water District of Epirus, originates from Mount Dousko within the Municipality of Pogoni, crosses the Municipality of Zitsa and a small part of the Municipality of Dodoni and outflows into Ionian Sea, north of Igoumenitsa, within the boundaries of the Municipality of Filiates. More specifically, three recorded flood phenomena that have occurred within the basin in the years 2015, 2018 and 2021 are mapped and monitored using remote sensing data and specifically SAR Sentinel 1 GRD images. The flooded areas are designated using the free SNAP software, analyzing the histograms of the images on a logarithmic scale and locating the thresholds that will separate the flooded pixels from the non-flooded (image binarization), ones considering that low values correspond to water presence while high values to water absence. Then the flooded areas, the flood duration as well as, their classification based on the frequency of recurrence are calculated. Furthermore, the Topographic Wetness Index (TWI) is applied and the results of the analysis are checked, considering the fact that for the specific watershed there are Potentially High Flood Risk Zones established by the Greek state. This study shows that the area where the floods occur is always the same, which is included in the High Flood Risk Zones established by the Greek state, as well as in the High Flood Risk Zones of the TWI index.
Keywords: Satellite Remote Sensing, Flood Mapping, Flood Risk, SAR
1. INTRODUCTIONFloods are one of the most common and serious hazards in Greece, causing damage to property andhuman lives. The most common floods in Greece are due to natural causes and are mainly land or river,either slow-evolving (plane floods) or fast-evolving (flash floods). Soil cover, land uses, geomorphology,hydrographic network density, soil permeability are all factors on which the susceptibility of an area toflood risk depends.The science of remote sensing, combined with the applications of geographic information systems, inrecent years has played a huge role in the prevention and management of natural disasters, which isbecoming increasingly important.The purpose of this study is to evaluate the flood risk of the Kalamas river basin, through these tools.More specifically, using satellite earth tracking data, specifically radar data from Sentinel 1 satellites, threeflood events recorded in the last six years in the region will be captured and studied (February 2015,February 2018 and January 2021).Finally, comparing the results of the above study with each other and with the data recorded for thespecific area in the literature, an overall evaluation of the flood risk will be made and relevant conclusionswill be drawn.
2. STUDY AREA2.1. General features
Kalamas river has a length of 115km while its basin has an area of 1880km2. Kalamas river is located in northwestern Greece in the geographical region of Epirus. 8. It originates from the Municipality of Pogoni,
Page 209 of 269
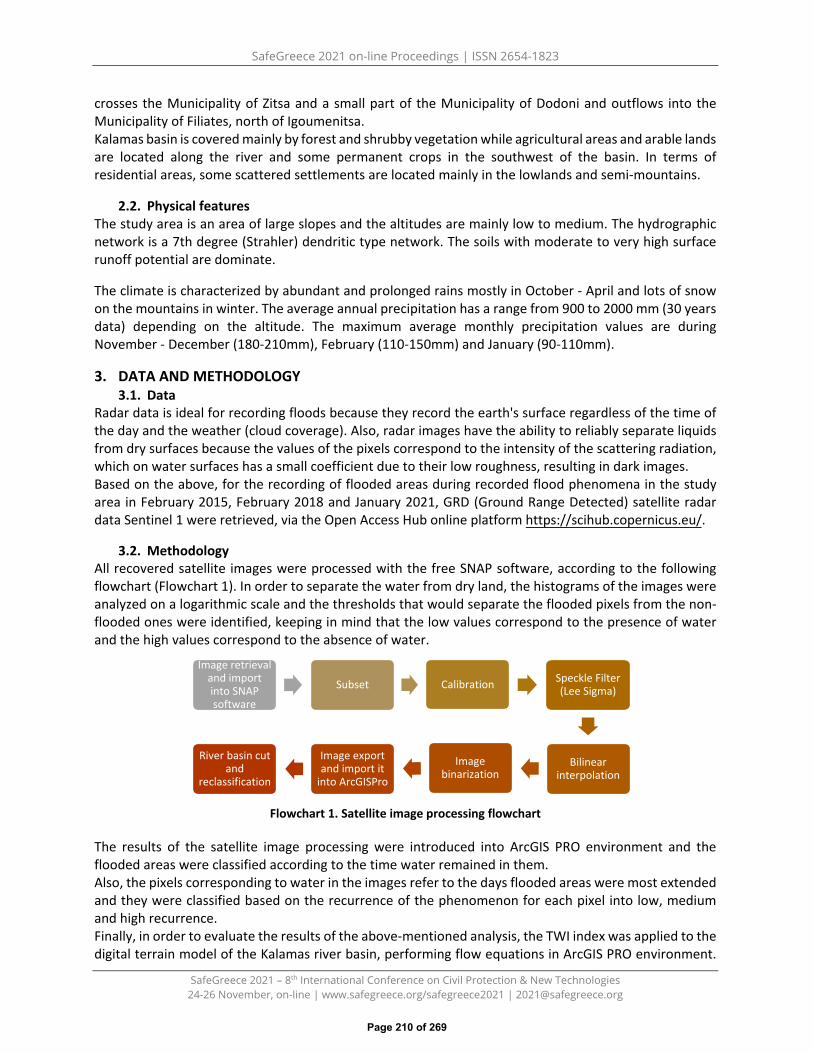
SafeGreece 2021 on-line Proceedings | ISSN 2654-1823
SafeGreece 2021 – 8th International Conference on Civil Protection & New Technologies 24-26 November, on-line | www.safegreece.org/safegreece2021 | [email protected]
crosses the Municipality of Zitsa and a small part of the Municipality of Dodoni and outflows into the Municipality of Filiates, north of Igoumenitsa. Kalamas basin is covered mainly by forest and shrubby vegetation while agricultural areas and arable lands are located along the river and some permanent crops in the southwest of the basin. In terms of residential areas, some scattered settlements are located mainly in the lowlands and semi-mountains.
2.2. Physical features The study area is an area of large slopes and the altitudes are mainly low to medium. The hydrographic network is a 7th degree (Strahler) dendritic type network. The soils with moderate to very high surface runoff potential are dominate.
The climate is characterized by abundant and prolonged rains mostly in October - April and lots of snow on the mountains in winter. The average annual precipitation has a range from 900 to 2000 mm (30 years data) depending on the altitude. The maximum average monthly precipitation values are during November - December (180-210mm), February (110-150mm) and January (90-110mm).
3. DATA AND METHODOLOGY3.1. Data
Radar data is ideal for recording floods because they record the earth's surface regardless of the time of the day and the weather (cloud coverage). Also, radar images have the ability to reliably separate liquids from dry surfaces because the values of the pixels correspond to the intensity of the scattering radiation, which on water surfaces has a small coefficient due to their low roughness, resulting in dark images. Based on the above, for the recording of flooded areas during recorded flood phenomena in the study area in February 2015, February 2018 and January 2021, GRD (Ground Range Detected) satellite radar data Sentinel 1 were retrieved, via the Open Access Hub online platform https://scihub.copernicus.eu/.
3.2. Methodology All recovered satellite images were processed with the free SNAP software, according to the following flowchart (Flowchart 1). In order to separate the water from dry land, the histograms of the images were analyzed on a logarithmic scale and the thresholds that would separate the flooded pixels from the non-flooded ones were identified, keeping in mind that the low values correspond to the presence of water and the high values correspond to the absence of water.
Flowchart 1. Satellite image processing flowchart
The results of the satellite image processing were introduced into ArcGIS PRO environment and the flooded areas were classified according to the time water remained in them. Also, the pixels corresponding to water in the images refer to the days flooded areas were most extended and they were classified based on the recurrence of the phenomenon for each pixel into low, medium and high recurrence. Finally, in order to evaluate the results of the above-mentioned analysis, the TWI index was applied to the digital terrain model of the Kalamas river basin, performing flow equations in ArcGIS PRO environment.
Image retrieval and import into SNAP software
Subset Calibration Speckle Filter (Lee Sigma)
Bilinear interpolation
Image binarization
Image export and import it
into ArcGISPro
River basin cut and
reclassification
Page 210 of 269

SafeGreece 2021 on-line Proceedings | ISSN 2654-1823
SafeGreece 2021 – 8th International Conference on Civil Protection & New Technologies 24-26 November, on-line | www.safegreece.org/safegreece2021 | [email protected]
The TWI (Topographic Wetness Index) is considered extremely important in predicting floods in a catchment area and is used to understand the effect of topography on the rate of water accumulation under the influence of gravity at any point in a catchment area.
4. RESULTSFlooded areas are located downstream of Kalama's river in the southwestern part of the basin, in areasof low altitude and small terrain slopes. The land cover is purely rural with some rural settlements in thewider area. The majority of the settlements are located on hills so they are not affected by thephenomenon.The areas at river’s estuary, on the borders of the deltaic plain with the coastline, have been excluded:they are swampy areas with altitude lower than sea level that are permanently cover by water,phenomenon which depend mainly on sea waves and not on river floods.The 2015’s phenomenon was the most serious, both based on the extend of the flood and its duration(Figure 1). Monthly precipitation (with the exception of 01.2018) was much higher than the averagemonthly values, a fact that justifies the phenomena.The recurrence of the phenomena was found medium in the east of the area, low and high in the west ofthe area (Figure 2). It seems that flood recurrence and flood persistence, is highly depended not only tothe proximity to the main channel of the river network but also on geomorphological parameters likeslope, soil type etc.
Figure 1. Flood phenomenon monitoring– February 2015 Figure 2. Flood recurrence
5. DISCUSSIONThe main objective of this study was to capture, measure and study specific floods that have occurred inrecent years in the area, with the help of Remote Sensing. Only radar images, specifically Sentinel-1 GRD,were selected to study the floods, as no optical satellite images without cloud cover were available. Themethod of image binarization for the separation of pixels into "water" and "not water" is consideredparticularly satisfactory for the capture of water-flooded areas.One issue to consider during analysis was if the deltaic river plain areas should be included in the analysisor not, because they are mostly swampy areas with altitudes many times lower than sea level, in whichthe presence of water may be due to sea tide and sea waves and not due to river flooding. Because mostof these areas were flooded even during the dry season, it was finally decided not to be included in theanalysis.In general, the results of the present study are considered satisfactory and accurate and the purpose ofthe study is considered to have been achieved. Based on the meteorological data used to make an
Page 211 of 269

SafeGreece 2021 on-line Proceedings | ISSN 2654-1823
SafeGreece 2021 – 8th International Conference on Civil Protection & New Technologies 24-26 November, on-line | www.safegreece.org/safegreece2021 | [email protected]
interpretation of the flood phenomena, it seems that the specific area does not create flash floods but plain floods which in fact depend to a large extent, not only on the amount of precipitation during or immediately prior to the flood event, but also to the soil saturation resulting from the seasonal amount of precipitation and the seasonal climatic conditions in general. For this reason, in some cases the drainage of water from flooded areas seems to be very slow.
6. CONCLUSIONSThree different flood phenomena were studied, all during the winter months, which were measured asfollows:
i. February 2015: 6,533 acres of flooded areas and maximum duration of the phenomenon 23-24 daysii. February 2018: 1082 acres of flooded areas and maximum duration of phenomenon 9-10 in verylimited areasiii. January 2021: 4080 acres of flooded areas and maximum duration of the phenomenon 11-12 daysin very limited areas
In all recorded flood phenomena the flooding area is the same and does not seem to affect urban fabric but agricultural land. This area is included in the high risk areas, in the application of the TWI index but also in the Potentially Significant Flood Risk Areas. There is a spatial identification of the results of the present study with the depiction of the area by the EMS Copernicus service for the phenomenon of 2015. It is found that the areas that have medium and high repeatability almost coincide with the areas in which the phenomena have a longer duration.
REFERENCES 1. Carreño Conde, F., De Mata Muñoz, M., (2019), Flood Monitoring Based on the Study of Sentinel-1 SAR
Images: The Ebro River Case Study, Water, 11, 12, 2454, διαθέσιμο στο:https://doi.org/10.3390/w11122454
2. European Space Agency (ESA), (2015), Sentinel 2- User Handbook, [ηλεκτρονικό αρχείο] διαθέσιμο στο:https://sentinel.esa.int/documents/247904/685211/Sentinel-2_User_Handbook
3. Huang M, Jin S., (2020), Rapid Flood Mapping and Evaluation with a Supervised Classifier and ChangeDetection in Shouguang Using Sentinel-1 SAR and Sentinel-2 Optical Data, Remote Sensing, 12(13), 2073,διαθέσιμο στο: https://doi.org/10.3390/rs12132073
4. Παρχαρίδης, Ι., (2015), Αρχές δορυφορικής τηλεπισκόπησης, Σύνδεσμος Ελληνικών ΑκαδημαϊκώνΒιβλιοθηκών: Αθήνα, [ηλεκτρονικό βιβλίο] διαθέσιμο στο: http://hdl.handle.net/11419/3960,ημερομηνία πρόσβασης [12-01-2021]
5. Perrou, T., Garioud, A. & Parcharidis, I., (2018) Sentinel-1 imagery for flood management in a reservoir-regulated river basin, Front. Earth Sci., 12, 506–520, διαθέσιμο στο: https://doi.org/10.1007/s11707-018-0711-2
6. Pourali, S.H., Arrowsmith, C., Chrisman, N.et al., (2016) Topography Wetness Index Application in Flood-Risk-Based Land Use Planning, Appl. Spatial Analysis 9, 39–54, διαθέσιμο στο https://doi.org/10.1007/s12061-014-9130-2
7. Sarkar, D., Mondal, P., (2020), Flood vulnerability mapping using frequency ratio (FR) model: a case studyon Kulik river basin, Indo‑Bangladesh Barind region, Applied Water Science. 10:17,doi.org/10.1007/s13201-019-1102-x
8. Tavus, B.; Kocaman, S.; Gokceoglu, C.; Nefeslioglu, H. A., (2018), Considerations on the use of Sentinel-1data in flood mapping in urban areas: Ankara (Turkey) 2018 Floods, International Archives of thePhotogrammetry, Remote Sensing & Spatial Information Sciences, Vol. XLII-5, p575-581
9. Χαλκιάς, Χ., (2006), Όροι & έννοιες επιστήμης γεωγραφικών πληροφοριών (GIS), Αθήνα: Εκδόσεις ΙΩΝ
Page 212 of 269
SafeGreece 2021 on-line Proceedings | ISSN 2654-1823
SafeGreece 2021 – 8th International Conference on Civil Protection & New Technologies 24-26 November, on-line | www.safegreece.org/safegreece2021 | [email protected]
CONFLUENCE OF OPERATIONAL TRACKING OF FLOOD EVENTS IN WESTERN THESSALY’S BASIN (GREECE) IN SEPTEMBER 2020 BASED ON SEQUENCE OF
OPTICAL AND RADAR OF COPERNICUS SATELLITE IMAGERY
Triantafyllos Falaras1, Michalis Diakakis 2, Kostas Lagouvardos3, Efthymios Lekkas2, Issaak Parcharidis1 1Department of Geography, Harokopio University of Athens, (Greece).
(E-mail: [email protected], [email protected]) 2Faculty of Geology and Geoenvironment, National and Kapodistrian University of Athens, (Greece).
(E-mail: [email protected], [email protected]) 3National Observatory of Athens, Institute for Environmental Research and Sustainable Development, (Greece).
(E-mail: [email protected])
ABSTRACT In September 2020, the medicane Ianos hit western Greece causing floods due to very high precipitation in the western Thessaly basin. This extreme phenomenon led to the flooding of a large area and extensive damages. In this case, the importance of operational tracking of the flood extent is very important. The flood area mapping was performed timely with the use of multiple European Space Agency’s (ESA) Sentinel-1 and Sentinel-2 imagery. In this way, the initial flood extent, as well as the area's drainage from the floodwater, was monitored, and knowledge about the impact of the flood on land cover and linear infrastructure was also retrieved.
Keywords: Floods, Operational Flood Mapping, Copernicus, Western Thessaly’s Basin, Medicane Ianos
1. INTRODUCTION
Natural disasters caused by extreme weather phenomena it is evident that they are more frequent and severe nowadays with the Climate Change constituting a key factor. Examples may include flood events caused by these phenomena leading to serious consequences. The satellite-based Earth Observation can be an important tool in tracking the effects of such events as floods helping in the managing of these situations. A powerful Mediterranean cyclone (medicane), named Ianos from the METEO unit of the National Observatory of Athens, was formed over the warm Mediterranean waters in mid-September 2020. Ianos lasted 7 days (from 15 to 21 September 2020), following a path of approximately 1900 km, affecting Greece with gale-force winds and extremely high precipitation amounts that in areas of Central Greece exceeded 320 mm within 48 hours. An in-depth analysis of the event of Lagouvardos et al. (2021) revealed that Ianos was the most intense medicane ever recorded in the Mediterranean. [1] It hit Greece on 18 September 2020 and more specifically its western part with the extreme rainfall amounts overflowed virtually all torrents and rivers that drain the southern mountainous part of Thessaly, including Enipeas R., Sofaditis R., Makryrema R., Kalentzis R., Farsaliotis R., Pamisos R., Mega Rema R., as well as Gavras R., and Karampalis R. that flows through the city of Karditsa. The floodwaters were rich in debris content as the extreme meteorological forcing triggered various mass movement and erosion phenomena (i.e., debris flows, landslides) at high-inclination areas and along riverbanks. The extensive flooding caused a very large part of the Southwestern Thessaly’s plain and a significant portion of Karditsa's urban fabric to be inundated inducing 4 fatalities and damages to numerous properties and infrastructure. [2]
Page 213 of 269
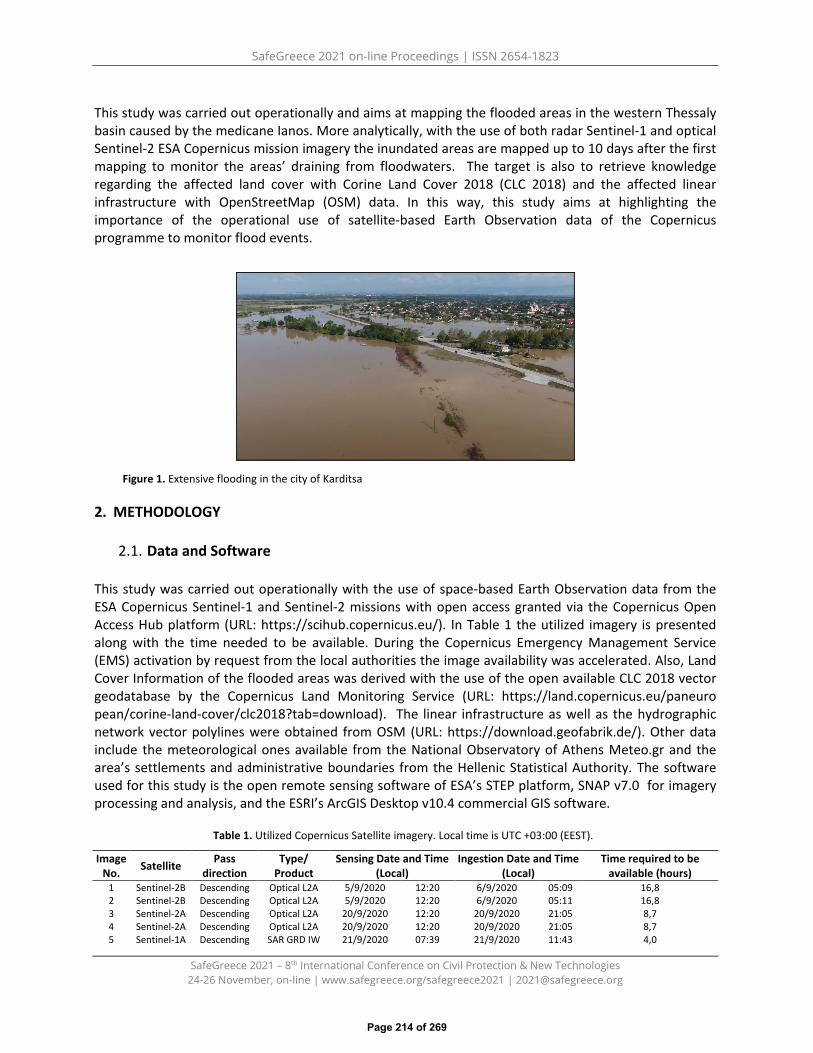
SafeGreece 2021 on-line Proceedings | ISSN 2654-1823
SafeGreece 2021 – 8th International Conference on Civil Protection & New Technologies 24-26 November, on-line | www.safegreece.org/safegreece2021 | [email protected]
This study was carried out operationally and aims at mapping the flooded areas in the western Thessaly basin caused by the medicane Ianos. More analytically, with the use of both radar Sentinel-1 and optical Sentinel-2 ESA Copernicus mission imagery the inundated areas are mapped up to 10 days after the first mapping to monitor the areas’ draining from floodwaters. The target is also to retrieve knowledge regarding the affected land cover with Corine Land Cover 2018 (CLC 2018) and the affected linear infrastructure with OpenStreetMap (OSM) data. In this way, this study aims at highlighting the importance of the operational use of satellite-based Earth Observation data of the Copernicus programme to monitor flood events.
Figure 1. Extensive flooding in the city of Karditsa
2. METHODOLOGY
2.1. Data and Software
This study was carried out operationally with the use of space-based Earth Observation data from the ESA Copernicus Sentinel-1 and Sentinel-2 missions with open access granted via the Copernicus Open Access Hub platform (URL: https://scihub.copernicus.eu/). In Table 1 the utilized imagery is presented along with the time needed to be available. During the Copernicus Emergency Management Service (EMS) activation by request from the local authorities the image availability was accelerated. Also, Land Cover Information of the flooded areas was derived with the use of the open available CLC 2018 vector geodatabase by the Copernicus Land Monitoring Service (URL: https://land.copernicus.eu/paneuro pean/corine-land-cover/clc2018?tab=download). The linear infrastructure as well as the hydrographic network vector polylines were obtained from OSM (URL: https://download.geofabrik.de/). Other data include the meteorological ones available from the National Observatory of Athens Meteo.gr and the area’s settlements and administrative boundaries from the Hellenic Statistical Authority. The software used for this study is the open remote sensing software of ESA’s STEP platform, SNAP v7.0 for imagery processing and analysis, and the ESRI’s ArcGIS Desktop v10.4 commercial GIS software.
Table 1. Utilized Copernicus Satellite imagery. Local time is UTC +03:00 (EEST).
Image No. Satellite Pass
direction Type/
Product Sensing Date and Time
(Local) Ingestion Date and Time
(Local) Time required to be
available (hours) 1 Sentinel-2B Descending Optical L2A 5/9/2020 12:20 6/9/2020 05:09 16,8 2 Sentinel-2B Descending Optical L2A 5/9/2020 12:20 6/9/2020 05:11 16,8 3 Sentinel-2A Descending Optical L2A 20/9/2020 12:20 20/9/2020 21:05 8,7 4 Sentinel-2A Descending Optical L2A 20/9/2020 12:20 20/9/2020 21:05 8,7 5 Sentinel-1A Descending SAR GRD IW 21/9/2020 07:39 21/9/2020 11:43 4,0
Page 214 of 269
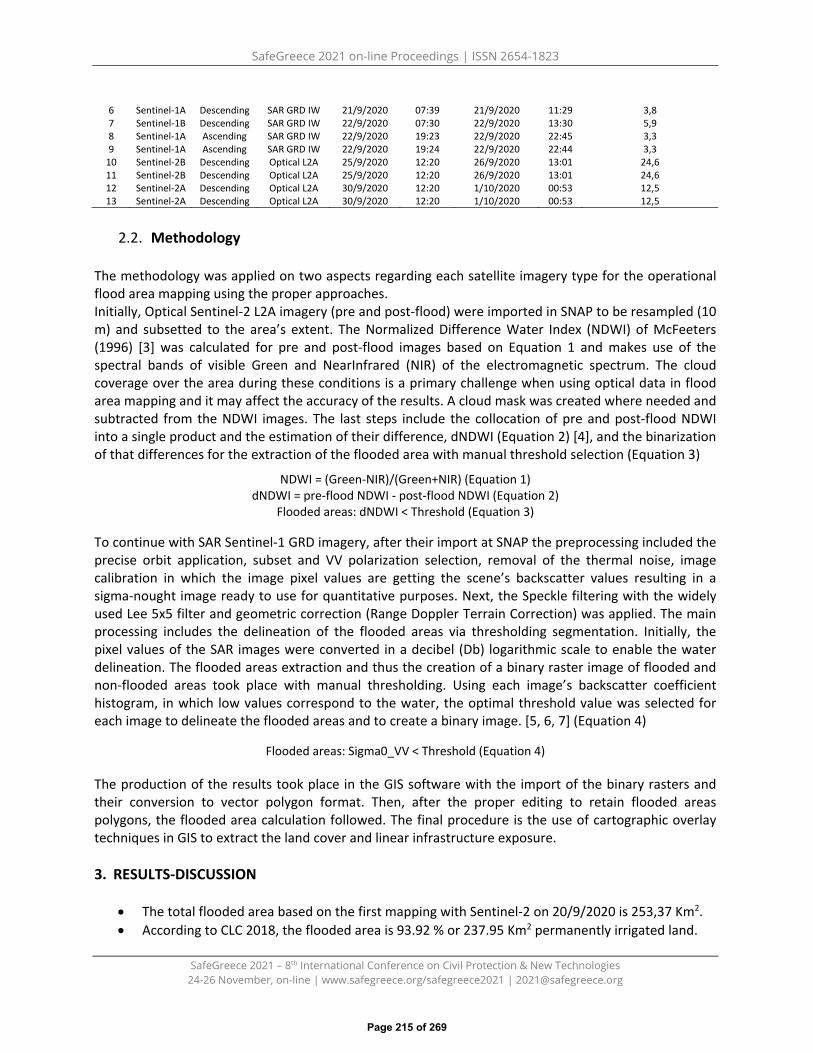
SafeGreece 2021 on-line Proceedings | ISSN 2654-1823
SafeGreece 2021 – 8th International Conference on Civil Protection & New Technologies 24-26 November, on-line | www.safegreece.org/safegreece2021 | [email protected]
6 Sentinel-1A Descending SAR GRD IW 21/9/2020 07:39 21/9/2020 11:29 3,8 7 Sentinel-1B Descending SAR GRD IW 22/9/2020 07:30 22/9/2020 13:30 5,9 8 Sentinel-1A Ascending SAR GRD IW 22/9/2020 19:23 22/9/2020 22:45 3,3 9 Sentinel-1A Ascending SAR GRD IW 22/9/2020 19:24 22/9/2020 22:44 3,3
10 Sentinel-2B Descending Optical L2A 25/9/2020 12:20 26/9/2020 13:01 24,6 11 Sentinel-2B Descending Optical L2A 25/9/2020 12:20 26/9/2020 13:01 24,6 12 Sentinel-2A Descending Optical L2A 30/9/2020 12:20 1/10/2020 00:53 12,5 13 Sentinel-2A Descending Optical L2A 30/9/2020 12:20 1/10/2020 00:53 12,5
2.2. Methodology
The methodology was applied on two aspects regarding each satellite imagery type for the operational flood area mapping using the proper approaches. Initially, Optical Sentinel-2 L2A imagery (pre and post-flood) were imported in SNAP to be resampled (10 m) and subsetted to the area’s extent. The Normalized Difference Water Index (NDWI) of McFeeters(1996) [3] was calculated for pre and post-flood images based on Equation 1 and makes use of thespectral bands of visible Green and NearInfrared (NIR) of the electromagnetic spectrum. The cloudcoverage over the area during these conditions is a primary challenge when using optical data in floodarea mapping and it may affect the accuracy of the results. A cloud mask was created where needed andsubtracted from the NDWI images. The last steps include the collocation of pre and post-flood NDWIinto a single product and the estimation of their difference, dNDWI (Equation 2) [4], and the binarizationof that differences for the extraction of the flooded area with manual threshold selection (Equation 3)
NDWI = (Green-NIR)/(Green+NIR) (Equation 1) dNDWI = pre-flood NDWI - post-flood NDWI (Equation 2)
Flooded areas: dNDWI < Threshold (Equation 3)
To continue with SAR Sentinel-1 GRD imagery, after their import at SNAP the preprocessing included the precise orbit application, subset and VV polarization selection, removal of the thermal noise, image calibration in which the image pixel values are getting the scene’s backscatter values resulting in a sigma-nought image ready to use for quantitative purposes. Next, the Speckle filtering with the widely used Lee 5x5 filter and geometric correction (Range Doppler Terrain Correction) was applied. The main processing includes the delineation of the flooded areas via thresholding segmentation. Initially, the pixel values of the SAR images were converted in a decibel (Db) logarithmic scale to enable the water delineation. The flooded areas extraction and thus the creation of a binary raster image of flooded and non-flooded areas took place with manual thresholding. Using each image’s backscatter coefficient histogram, in which low values correspond to the water, the optimal threshold value was selected for each image to delineate the flooded areas and to create a binary image. [5, 6, 7] (Equation 4)
Flooded areas: Sigma0_VV < Threshold (Equation 4)
The production of the results took place in the GIS software with the import of the binary rasters and their conversion to vector polygon format. Then, after the proper editing to retain flooded areas polygons, the flooded area calculation followed. The final procedure is the use of cartographic overlay techniques in GIS to extract the land cover and linear infrastructure exposure.
3. RESULTS-DISCUSSION
• The total flooded area based on the first mapping with Sentinel-2 on 20/9/2020 is 253,37 Km2.• According to CLC 2018, the flooded area is 93.92 % or 237.95 Km2 permanently irrigated land.
Page 215 of 269

SafeGreece 2021 on-line Proceedings | ISSN 2654-1823
SafeGreece 2021 – 8th International Conference on Civil Protection & New Technologies 24-26 November, on-line | www.safegreece.org/safegreece2021 | [email protected]
• A total of 95.10 Km of the road network and railway have been affected• Regarding the evolution of the flood event from the first mapping (20/9/2020) to the last
(30/9/2020) rapid drainage of the area is observed (Figure 2).• The conditions impacted the difficulty and the accuracy of the optical Sentinel-2 imagery use.• This study as well as others highlights the importance of satellite-based Earth Observation data
in operational flood mapping and especially the contribution of ESA’s Copernicus programme tothis extent.
Figure 2. Flooded area evolution from 20/9/2020 to 30/9/2020 derived from multiple Sentinel-1 and Sentinel-2 acquisitions.
REFERENCES
1. K. Lagouvardos, A. Karagiannidis, S. Dafis, A. Kalimeris, & V. Kotroni (2021). Ianos - A hurricane in theMediterranean. Bulletin of the American Meteorological Society, 1-31.
2. E. Lekkas, […] (2020). Impact of Medicane “IANOS” (September 2020). Newsletter of Environmental,Disaster and Crises Management Strategies, 20, ISSN 2653-9454.
3. S. K. McFeeters (1996). The use of the Normalized Difference Water Index (NDWI) in the delineation ofopen water features. International Journal of Remote Sensing, 17(7), 1425-1432.
4. I. Ogashawara, M. P. Curtarelli, & C. M. Ferreira (2013). The use of optical remote sensing for mappingflooded areas. International Journal of Engineering Research and Application, 3(5), 1-5.
5. T. Perrou, A. Garioud, & I. Parcharidis (2018). Use of Sentinel-1 imagery for flood management in areservoir-regulated river basin. Frontiers of Earth Science, 12(3), 506-520.
6. F. Filipponi (2019). Sentinel-1 GRD Preprocessing Workflow. In Multidisciplinary Digital Publishing InstituteProceedings 18(1), 11.
7. Serco Italia SPA (2018). Flood Monitoring with Sentinel-1 Using S-1 Toolbox - January 2015, Malawi(version 1.2).
Page 216 of 269
SafeGreece 2021 on-line Proceedings | ISSN 2654-1823
SafeGreece 2021 – 8th International Conference on Civil Protection & New Technologies 24-26 November, on-line | www.safegreece.org/safegreece2021 | [email protected]
DETERMINATION OF THE ROLE OF VEGETATION IN FLOOD ROUTING WITH THE USAGE OF GEOGRAPHICAL INFORMATION SYSTEMS AND HECHMS & HECRAS
SOFTWARE PACKAGES. THE CASE OF THE KIMMERIA WATERSHED
Sofia Lalikidou, Eirini Efraimidou, Apostolos Vasileiou, Michail Spiliotis ,Panagiotis Angelidis, Christos Akratos, Fotios Maris
Civil Engineering, Democritus University of Thrace, (Greece). (E-mail:[email protected], [email protected], [email protected], [email protected],
[email protected], [email protected], [email protected])
ABSTRACT The aim of this paper is to quantify the impact of forest fires on possible flood areas. The latter was achieved by hydrologic and hydraulic simulation using the HMS-HMS and HEC-RAS software packages. In addition, to specify the land uses as well as the burned areas, Object Based Image Analysis (OBIA) remote sensing method with the help of the Trimble eCognition software was used. The analysis of hydrographs shows that the maximum pre-fire discharge was 172.9 m3/sec, after the fire phenomenon reached 221.1 m3/sec for 50 years. For 100 year return period, the corresponding values are 216.4 m3/sec and 268.00 m3/sec. From the hydraulic simulation for return period of 50 years, the water height before the fire was 5.69 m and after the fire was 7.30 m. The corresponding values for 100 year return period were 7.15 m and 8.87 m respectively. Taking all above into account, the significance of the protective role of the forest is highlighted, thus, measures that should be applied after any possible disturbance in forest ecosystems are proposed.
Keywords: Flood, Forest Fire, Hec Hms, Hec ras
1. INTRODUCTION
Climate change has contributed to the increase of extreme weather events worldwide. The dominant scientific opinion on climate variability is that it will increase megafires and the frequency of heavy rainstorms, causing high devastation risk from floods for many communities (Karl, 2009; Domakinis et al., 2014). Initially, the forest offers significant amounts of rainwater retention in both the canopy and the forest floor (Robichaud, 2000). At the same time, it retains soil moisture (Smith, 1989), protects soil losses (Indar, 2007), affects the manning coefficient (Barnes, 1967), while simultaneously is the main factor of evapotranspiration (Diamantopoulou, 2010). Especially after a forest fire case, the effects are more harmful since initially the soil of the river basin is swept away due to its erosion by water, there is more surface runoff due to lack of vegetation, it is observed inability of soil resistance to drift due to vegetation reduction, there is also a reduced rate of infiltration of rain in the soil, due to the blockage of its pores from the burned area, while at the same time there is a sharp increase in water supply in the soil cavity (Rulli M.C. and Rosso R, 2007). Finally, in the burned areas, it is observed a division of the soil due to the existence of heavy rainfall and erosion of the bottom and a transfer of the scattered materials to the cavity (Imeson et all., 1992).
2. STUDY AREA
Page 217 of 269

SafeGreece 2021 on-line Proceedings | ISSN 2654-1823
SafeGreece 2021 – 8th International Conference on Civil Protection & New Technologies 24-26 November, on-line | www.safegreece.org/safegreece2021 | [email protected]
The selected study area is the watershed of Kimmeria. The stream of Kimmeria (Kydoneas) contributes to river of Kosinthos in the plain section while it originates from the mountainous region of Xanthi. Its basin has a total area of 35.5 km2 while the length of the stream is L = 16.5 km.
3. MATERIALS AND METHODS
The methodology followed in this paper concerns two basic sections, the hydrologic modelling and the hydraulic modelling. The Intensity-Duration-Frequency (IDF) curves were used for the hydrologic modelling, which resulted in the production of three different unit hydrographs. The unit hydrograph that estimates the highest discharge was used for the hydraulic modelling. The result is the flood hazard assessment by means of the flood zones delimitation. The flood hazard of the basin was examined for two different return periods (50 and 100 years) before and after fire. For the accentuation of the significance of vegetation, a hypothetical scenario was constructed including a a small fire case that burned various types of vegetation.
3.1. Rainfall analysis
Due to the lack of measurements, regarding rainfall and flood discharge data, the “Design Storm”method was used (VICAIRE, 2003). For the implementation of this method the IDF curves were constructed using the data from the rainfall station Oraio.
3.2. Hydrological modelling
The rainfall-runoff modelling was realised with the HEC-HMS 3.5 software, which has been developed by the US Army Corps of Engineers (USACE) Hydrologic Engineering Center (HEC).It aims to simulate the precipitation runoff processes of watershed systems and includes different components, such as runoff volume, baseflow, and channel flow (USACE, 2010). The hydrologic modelling of the basin regards the construction of the unit hydrographs. In order to achieve the latter, several hydrologic multi-analysis pre-processing and main processing operations upon the DEM were required, using the ARC Hydro 2.0 and the geospatial extension HEC- GeoHMS 10.2 in ArcGIS 10.2 environment. The chosen method for the watershed losses is a USDA Natural Resources Conservation Service development, the runoff Curve Number (CN). The CN is a dimensionless empirical parameter for predicting runoff or infiltration from rainfall excess (USDA, 1986). It ranges from 30 to 100, with large numbers indicating high runoff potential. The separation of the soil groups was achieved by data based on the geological maps of the area. The Corine Land cover classes, integrated with different CN tables (Ward et al., 2004), were used for the land cover modelling. The CN classifies the AMC (Antecedent Moisture Condition) in three different classes: dry (I), average (II) and moist (III). For the routing it was used the Muskingum – Cunge method (Cunge, 1969) for two reasons. First, the parameter that this method uses can be calculated based on flow and channel characteristics and second, because it makes possible the extensive channel routing in ungaged streams with a reasonable expectation of accuracy (Ponce, 1989).
3.3. Hydraulic modelling
The hydraulic modelling of the river was realised with the HEC-RAS 4.1 software. HEC-RAS is hydraulic modelling software developed by the US Army Corps of Engineers (USACE) Hydrologic Engineering Center (HEC). It performs one-dimensional steady flow/unsteady flow,sediment transport/mobile bed
Page 218 of 269
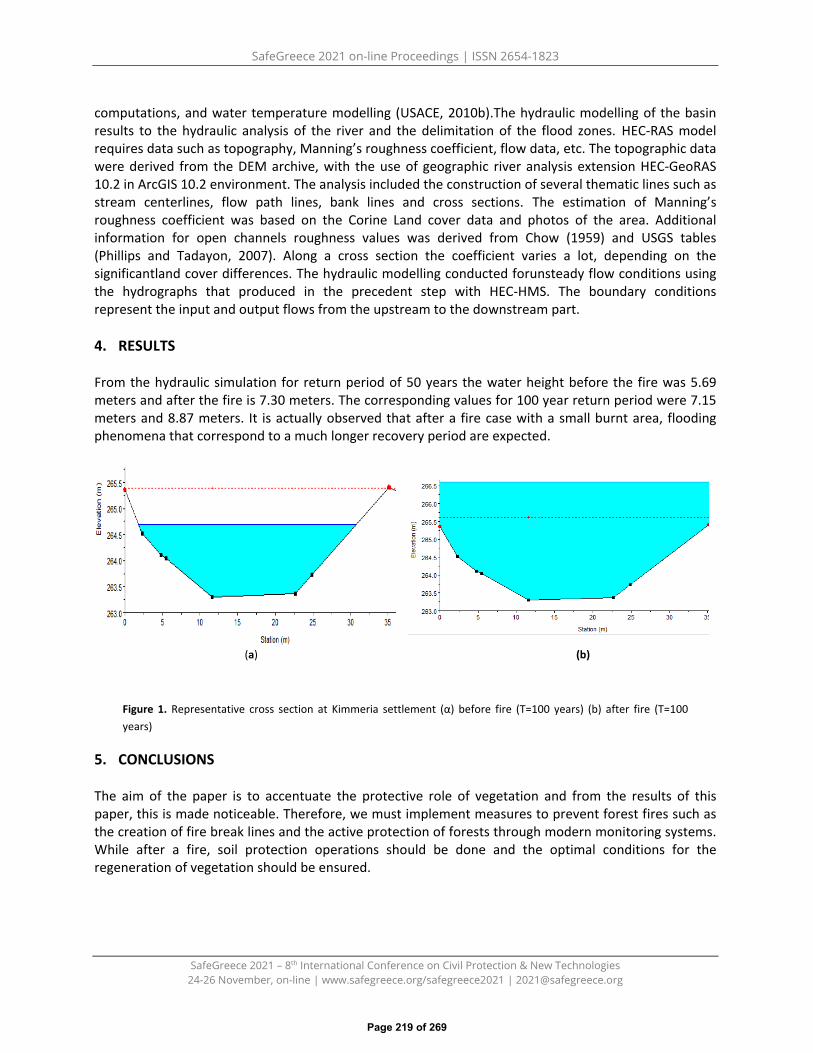
SafeGreece 2021 on-line Proceedings | ISSN 2654-1823
SafeGreece 2021 – 8th International Conference on Civil Protection & New Technologies 24-26 November, on-line | www.safegreece.org/safegreece2021 | [email protected]
computations, and water temperature modelling (USACE, 2010b).The hydraulic modelling of the basin results to the hydraulic analysis of the river and the delimitation of the flood zones. HEC-RAS model requires data such as topography, Manning’s roughness coefficient, flow data, etc. The topographic data were derived from the DEM archive, with the use of geographic river analysis extension HEC-GeoRAS 10.2 in ArcGIS 10.2 environment. The analysis included the construction of several thematic lines such as stream centerlines, flow path lines, bank lines and cross sections. The estimation of Manning’s roughness coefficient was based on the Corine Land cover data and photos of the area. Additional information for open channels roughness values was derived from Chow (1959) and USGS tables (Phillips and Tadayon, 2007). Along a cross section the coefficient varies a lot, depending on the significantland cover differences. The hydraulic modelling conducted forunsteady flow conditions using the hydrographs that produced in the precedent step with HEC-HMS. The boundary conditions represent the input and output flows from the upstream to the downstream part.
4. RESULTS
From the hydraulic simulation for return period of 50 years the water height before the fire was 5.69 meters and after the fire is 7.30 meters. The corresponding values for 100 year return period were 7.15 meters and 8.87 meters. It is actually observed that after a fire case with a small burnt area, flooding phenomena that correspond to a much longer recovery period are expected.
(a) (b)
Figure 1. Representative cross section at Kimmeria settlement (α) before fire (Τ=100 years) (b) after fire (Τ=100 years)
5. CONCLUSIONS
The aim of the paper is to accentuate the protective role of vegetation and from the results of this paper, this is made noticeable. Therefore, we must implement measures to prevent forest fires such as the creation of fire break lines and the active protection of forests through modern monitoring systems. While after a fire, soil protection operations should be done and the optimal conditions for the regeneration of vegetation should be ensured.
Page 219 of 269

SafeGreece 2021 on-line Proceedings | ISSN 2654-1823
SafeGreece 2021 – 8th International Conference on Civil Protection & New Technologies 24-26 November, on-line | www.safegreece.org/safegreece2021 | [email protected]
REFERENCES
1. Barnes, H.H., Jr. (1967), Roughness characteristics of natural channels: U.S. Geological Survey Water-Supply Paper 1849, 213 p
2. Chow, V.T., 1959. Open-channel Hydraulics. McGraw-Hill book Company, Inc, 109-125.3. Cunge, J.A., 1969. On the Subject of a Flood Propagation Computation Method (Muskingum
Method), Journal of Hydraulic Research, vol. 7, no. 2, p. 205-230.4. Diamantopoulou M., Milios E. (2010). Modeling total volume of dominant pine trees in reforestations via
multivariate analysis and artificial neural network models. Biosystems Engineering 105(3): 306-315.5. Domakinis, C., Oikonomdis, D., Voudouris, K., Astaras, T., 2014. Using geographic information
systems (GIS) and remote sensing to map flood extent and to assess flood hazard inErythropotamos riverbasin (Evros, Greece). Proc. of 10 th International Congress of the Hellenic Geographical Society,Thessaloniki (in press).
6. Imeson A.C., Verstraten J.M., van Mulligen E.J. and Sevink, J. (1992) The effects of fire and waterrepellency on infiltration and runoff under Mediterranean type forest, CATENA, 19, 345–361.
7. Indar M., Wittenberg L., and Tamir M. (1997). Soil erosion and Forestry management after wildfire in aMediterranean woodland, Mt. Carmel, Israel. Int. J. Wild land Fire, 7(4):285-294.
8. Karl, T.R., Melillo J.M., Peterson T.C. (Eds) 2009. Global climate change impacts in the United States. NewYork: Cambridge University Press.
9. Ponce, V.M., 1989. Engineering Hydrology, Principles and Practices. Prentice Hall, pp. 291-297, 311-313.10. Phillips, J.V. and Tadayon, S. (2007). Selection of Manning’s Roughness Coefficient for Natural and
Constructed Vegetated and Non-Vegetated Channels, and Vegetation Maintenance Plan Guidelines forVegetated Channels in Central Arizona. Scientific Investigations ReportVL, USGS PublicationsWarehouseUR
11. Robichaud, P.R. (2000). Fire effects on infiltration rates after prescribed fire in Northern Rocky MountainForest, MSA, Journal of Hydrology, 231-232: 220-229.
12. Rulli M.C. and Rosso R. (2007) Hydrologic response of upland catchments to wildfires, Advances inWater Resources, 30, 2072–2086
13. Smith M.E. and Wright K.A. (1989). Emergency watershed protection measures in highly unstable terrainon the Blake Fire, Six Rivers National Forest. USDA, Forest Service Gen. Tech. Rep, PSW-109, pp. 103-108.
14. USACE, 2010. U.S. Army Corps of Engineers, Hydrologic Engineering Center, HEC-RAS. Available online at:http://www.hec.usace.army.mil/software/hec-ras/
15. USDA (1986). United States Department of Agriculture. Urban Hydrology for Small Watersheds, TechnicalRelease 55 (TR-55) (Second Edition ed.). Natural Resources Conservation Service, ConservationEngineering Division.
16. USACE, 2010b. U.S. Army Corps of Engineers, Hydrologic Engineering Center, HEC-RAS.Available online at: http://www.hec.usace.army.mil/software/hec-ras/
17. VICAIRE, 2003. Virtual campus in hydrology and water resources. Module 1B Engineering hydrology,Chapter 2, Design storm.
18. Ward, Andy D.; Trimble, Stanley W. (2004). Environmental Hydrology. Boca Raton, Florida 33431: CRCPress LLC. ISBN 9781566706162.
ACKOWLEDGEMENTS We acknowledge support of this work by the project “Risk and Resilience Assessment Center –Prefecture of East Macedonia and Thrace -Greece.” (MIS 5047293) which is implemented under the Action “Reinforcement of the Research and Innovation Infrastructure”, funded by the Operational Programme "Competitiveness, Entrepreneurship and Innovation" (NSRF 2014-2020) and co-financed by Greece and the European Union (European Regional Development Fund).
Page 220 of 269
SafeGreece 2021 on-line Proceedings | ISSN 2654-1823
SafeGreece 2021 – 8th International Conference on Civil Protection & New Technologies 24-26 November, on-line | www.safegreece.org/safegreece2021 | [email protected]
GEOMORPHIC IMPACT OF THE FLASH FLOOD OF MANDRA (WEST ATTICA, GREECE, NOVEMBER 15, 2017)
Nikolaos Ziagkos Department of Geology and Geoenvironment, National and Kapodistrian University of Athens, (Greece).
(E-mail: [email protected])
ABSTRACT Large floods may produce remarkable channel changes, which determine damages and casualties in inhabited areas. However, our knowledge of such processes remains poor, as is our capability to predict them. This research attempts to capture the geomorphological effects of the meteorological disaster of November 15, 2017 that plagued Mandra in west Attica. The incident was considered an extreme flood phenomenon as evidenced by the high, for the area, value of the Peak Discharge (Qpeak=140 m3/s) for the stream of Agia Aikaterini [5]. The adopted approach encompassed: satellite images by Google Earth Pro (pixel size 15 m), National Cadastre’s orthophoto map (pixel size 0.5 m) and the Digital Elevation Model (DEM) of the area, as well as photos and videos aquired through the use of unmanned vehicle. The data was properly processed using ArcMap 10.5. Specifically, the initial and final riverbed boundaries of the hydrographic network of the area were mapped as well as the locations where the creation of a new riverbed as well as the areas of erosion and deposition. Finally, the changes observed in the geometry of the hydrographic network were calculated and categorized. The result of this elaboration was the creation of maps and charts for quantitative and qualitative assessment of the effects of the flash flood in the area. The accumulated data shows that most of the examined hydrographic network before the flood was covered by erosion products. Main riverbeds underwent widening and depening extending to multiple meters, while the effect on the tributaries reached in many cases the original width. It was also found that parts of the riverbed were converted to rural road, as well as the existence of houses near the later flooded area which in turn significantly increase the vulnerability in the study area.
Keywords: erosion, deposition, width ratio, change of geometry, outcrops
1. INTRODUCTIONFloods are among the most relevant natural events causing geomorphological channel changes andfluvial landscape development [11, 20]. Extreme floods induce physical impacts on the channels and thevalley bottoms, such as widening [13], changes in bed level, channel position and patterns, extensive barformation, erosion and construction of islands [1], meander migration, avulsions, bank erosion [7], andfloodplain accretion [9]. Numerous studies have tried to determine the main factors controlling channelresponse to extreme flood events. Most of these studies focused on the influence of hydraulic variables,e.g., flow duration, magnitude, frequency, flow-competence, flood power, duration of effective flows,sequence of events, unit stream power [2, 3, 12]. The variability of impacts on recorded flash floods re-veals that floods of similar magnitude can result in a variety of impacts at a location over time and on acase-by-case basis [11]. At this point it is worth noting that not all extreme floods cause radical changesin geomorphology [3, 10, 21], which proves that the dynamics of each region is common, very complex,non-linear and rarely predictable [14]. The occurrence of heavy rainfall during the winter months playsan important role, a phenomenon typical of the Mediterranean climate, which is mainly an importantpart of the mechanism of flash floods. In this paper, a major flash flood event which took place on 15November 2017 in the Agia Aikaterini and Soures River catchments, Mandra, West Attica is used as a
Page 221 of 269

SafeGreece 2021 on-line Proceedings | ISSN 2654-1823
SafeGreece 2021 – 8th International Conference on Civil Protection & New Technologies 24-26 November, on-line | www.safegreece.org/safegreece2021 | [email protected]
study case, aiming to: (i) calculate channel width before and after the event, (ii) indicate erosion and deposition sites, (iii) indicate bedrock revelation sites and (iv) categorize all of the above.
2. METHODSThe digitization of the hydrographic network was completed in two stages. The final riverbed bounda-ries as well as erosion and deposition areas were digitized using Google Earth Pro’s toolbar (Figure 1)using as guides the snapshots taken by the UAV to determine the exact location of the impacts and theoverall particle size of the materials transferred. The above data were extracted as kml files and con-verted through the use of conversion toolbox of ArcMap into vector files. In ArcMap the initial riverbedboundaries before the flood were digitized using as basemap the National Cadastre’s official orthophotomap of 2011 (Figure 1).
Figure 1. Digitization process of riverbed boundaries (a) Before the flood (b) After the flood accompanied by flood deposits and limestone outcrops. (c) UAV snapshot after the flood
Then, using the program digitization toolkit, straight sections were drawn at points of interest using the initial and final boundaries of the riverbed which were saved in two separate shapefiles (Wb and Wa) and with the Spatial Join command a new shapefile was created entitled Calculations that included data for the two parameters. For each pair of measurements, three additional parameters were calculated, Width Ratio (Wa/Wb), the difference (Wa-Wb) and their difference to the initial width [(Wa-Wb) / Wb]. The final table (Table 1) included all the results obtained from the operations between the two initial varia-bles (Wa, Wb) to the nearest three decimal digits. In the end, the new measurements were classified based on Width Ratio in four classes (1:1, <x2, x2-x5, x5-x10) and were depicted on a map using a chromatic scale.
Table 1. Calculation of riverbed changes
Wb (m) Wa (m) Wa-Wb (m) Wa/Wb (Wa-Wb)/Wb
14,94 34,02 19,08 2,28 1,28 15,09 28,53 13,44 1,89 0,89 12,97 23,78 10,81 1,83 0,83 13,63 23,72 10,09 1,74 0,74 13,85 23,78 9,94 1,72 0,72 15,96 24,84 8,88 1,56 0,56 17,20 25,00 7,80 1,45 0,45 16,32 24,22 7,90 1,48 0,48 15,15 16,40 1,25 1,08 0,08
Figure 2. Width Ratio Map
Page 222 of 269
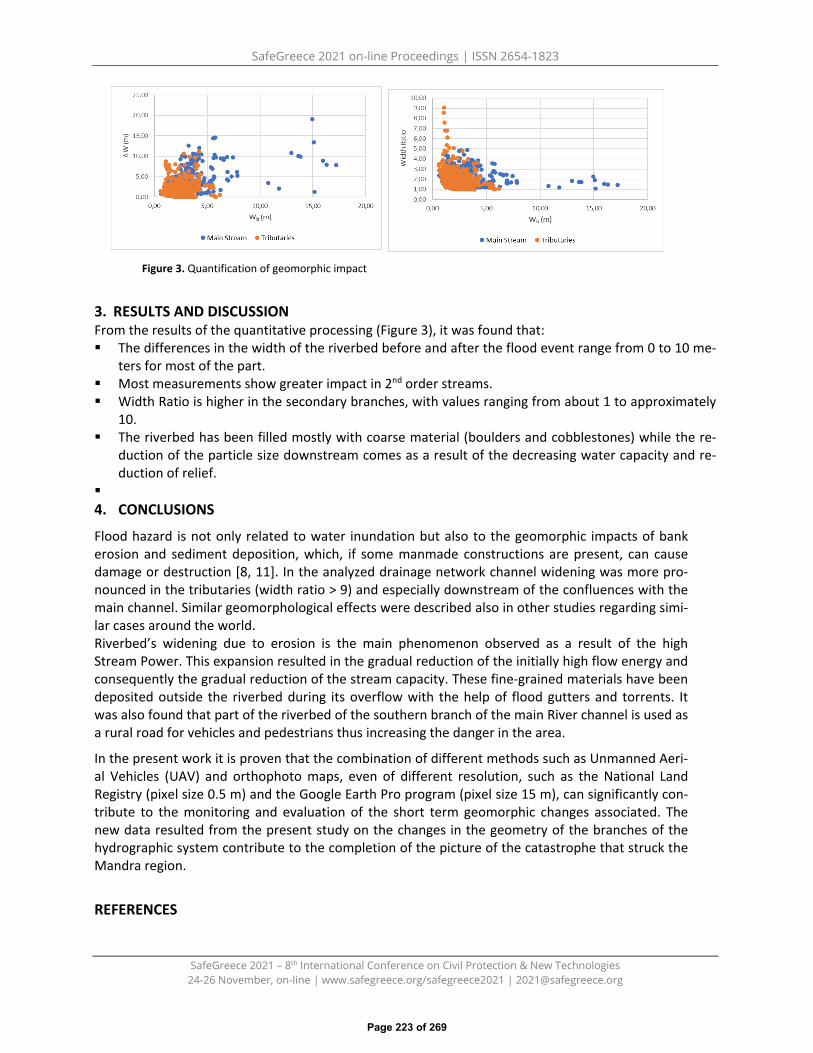
SafeGreece 2021 on-line Proceedings | ISSN 2654-1823
SafeGreece 2021 – 8th International Conference on Civil Protection & New Technologies 24-26 November, on-line | www.safegreece.org/safegreece2021 | [email protected]
3. RESULTS AND DISCUSSIONFrom the results of the quantitative processing (Figure 3), it was found that: The differences in the width of the riverbed before and after the flood event range from 0 to 10 me-
ters for most of the part. Most measurements show greater impact in 2nd order streams. Width Ratio is higher in the secondary branches, with values ranging from about 1 to approximately
10. The riverbed has been filled mostly with coarse material (boulders and cobblestones) while the re-
duction of the particle size downstream comes as a result of the decreasing water capacity and re-duction of relief.
4. CONCLUSIONS
Flood hazard is not only related to water inundation but also to the geomorphic impacts of bank erosion and sediment deposition, which, if some manmade constructions are present, can cause damage or destruction [8, 11]. In the analyzed drainage network channel widening was more pro-nounced in the tributaries (width ratio > 9) and especially downstream of the confluences with the main channel. Similar geomorphological effects were described also in other studies regarding simi-lar cases around the world. Riverbed’s widening due to erosion is the main phenomenon observed as a result of the high Stream Power. This expansion resulted in the gradual reduction of the initially high flow energy and consequently the gradual reduction of the stream capacity. These fine-grained materials have been deposited outside the riverbed during its overflow with the help of flood gutters and torrents. It was also found that part of the riverbed of the southern branch of the main River channel is used as a rural road for vehicles and pedestrians thus increasing the danger in the area.
In the present work it is proven that the combination of different methods such as Unmanned Aeri-al Vehicles (UAV) and orthophoto maps, even of different resolution, such as the National Land Registry (pixel size 0.5 m) and the Google Earth Pro program (pixel size 15 m), can significantly con-tribute to the monitoring and evaluation of the short term geomorphic changes associated. The new data resulted from the present study on the changes in the geometry of the branches of the hydrographic system contribute to the completion of the picture of the catastrophe that struck the Mandra region.
REFERENCES
Figure 3. Quantification of geomorphic impact
Page 223 of 269

SafeGreece 2021 on-line Proceedings | ISSN 2654-1823
SafeGreece 2021 – 8th International Conference on Civil Protection & New Technologies 24-26 November, on-line | www.safegreece.org/safegreece2021 | [email protected]
1. Belletti, B., Dufour, S., & Piégay, H. (2014). Regional assessment of the multi-decadal changes in braidedriverscapes following large floods (example of 12 reaches in South East of France). Advances in Geosciences,37, 57–71. https://doi.org/10.5194/adgeo-37-57-2014
2. Cenderelli, D. A., & Wohl, E. E. (2003). Flow hydraulics and geomorphic effects of glacial-lake outburst floods inthe Mount Everest region, Nepal. Earth Surface Processes and Landforms, 28(4), 385–407.https://doi.org/10.1002/esp.448
3. Costa, J. E., & O’Connor, J. E. (1995). Geomorphically effective floods. 45–56.https://doi.org/10.1029/gm089p0045
4. Dean, D.J., Schmidt, J.C., 2013. The geomorphic effectiveness of a large flood on the Rio Grande in the BigBend region: insights on geomorphic controls and post-flood geomorphic response. Geomorphology 201, 183–198.
5. Diakakis, M., Andreadakis, E., Nikolopoulos, E. I., Spyrou, N. I., Gogou, M. E., Deligiannakis, G., … Kalogiros, J.(2018). International Journal of Disaster Risk Reduction An inte-grated approach of ground and aerialobservations in flash flood disaster investigations. The case of the 2017 Mandra flash flood in Greece.International Journal of Disaster Risk Reduction, (March), 0–1. https://doi.org/10.1016/j.ijdrr.2018.10.015
6. Ferguson, R., Hoey, T., 2008. Effects of tributaries on main-channel geomorphology. In: Rice, S.P., Roy, A.G.,Rhoads, B.L. (Eds.), River Confluences, Tributaries and the Fluvial Network. Wiley, London, pp. 183–208.
7. Grove, J. R., Croke, J., Thompson, C., & Building, S. (2013). Quantifying different riverbank erosion processesduring an extreme flood event. 1406(February), 1393–1406. https://doi.org/10.1002/esp.3386
8. Guan, M., Carrivick, J.L., Wright, N.G., Sleigh, P.A., Staines, K., E., H., 2016. Quantifying the combined effectsof multiple extreme floods on river channel geometry and on flood hazards. J. Hydrol. 538, 256–268.
9. Hauer, C., & Habersack, H. (2009). Morphodynamics of a 1000-year flood in the Kamp River , Austria , andimpacts on floodplain. 682(February), 654–682. https://doi.org/10.1002/esp
10. Hooke, J. M. (2016). Geomorphology Morphological impacts of fl ow events of varying magnitude onephemeral channels in a semiarid region. Geomorphology, 252, 128–143.https://doi.org/10.1016/j.geomorph.2015.07.014
11. Hooke, J. M. (2015). Geomorphology Variations in flood magnitude – effect relations and the implications forflood risk assessment and river management. Geomorphology.https://doi.org/10.1016/j.geomorph.2015.05.014
12. Kale, V. S. (2007). Geomorphic effectiveness of extraordinary floods on three large rivers of the IndianPeninsula. Geomorphology, 85(3–4), 306–316. https://doi.org/10.1016/j.geomorph.2006.03.026
13. Krapesch, G., Hauer, C., & Habersack, H. (2011). Scale orientated analysis of river width changes due toextreme flood hazards. Natural Hazards and Earth System Sciences, 11(8), 2137–2147.https://doi.org/10.5194/nhess-11-2137-2011
14. Lisenby, P. E., Croke, J., & Fryirs, K. A. (2017). Geomorphic effectiveness: a linear concept in a non-linear world.Earth Surface Processes and Landforms, 43(1), 4–20. https://doi.org/10.1002/esp.4096
15. Magilligan, F. J. (1992). Thresholds and the spatial variability of flood power during extreme floods.Geomorphology, 5(3–5), 373–390. https://doi.org/10.1016/0169-555X(92)90014-F
16. Magilligan, F. J., Buraas, E. M., & Renshaw, C. E. (2015). The efficacy of stream power and flow duration ongeomorphic responses to catastrophic flooding. Geomorphology, 228, 175–188.https://doi.org/10.1016/j.geomorph.2014.08.016
17. Magilligan, F. J., Phillips, J. D., James, L. A., & Gomez, B. (1998). Geomorphic and Sedimentological Controls onthe Effectiveness of an. 106(1), 87–96.
18. Petts, G.E., Gurnell, A.M., 2005. Dams and geomorphology: research progress and future directions.Geomorphology 71 (1–2), 27–47.
19. Scorpio, V., Crema, S., Marra, F., Righini, M., Ciccarese, G., Borga, M., … Marchi, L. (2018). Science of the TotalEnvironment Basin-scale analysis of the geomorphic effectiveness of fl ash fl oods : A study in the northernApennines ( Italy ). Science of the Total Environment, 640–641, 337–351.https://doi.org/10.1016/j.scitotenv.2018.05.252
20. Stoffel, M., & Marston, R. A. (2016). NU SC. https://doi.org/10.1016/j.geomorph.2016.07.00821. Wolman, M. G., & Gerson, R. (1978). Relative scales of time and effectiveness of climate in watershed
geomorphology. Earth Surface Processes, 3(2), 189–208. https://doi.org/10.1002/esp.3290030207
Page 224 of 269

poster presentations
24-26.11proceedings


SafeGreece 2021 on-line Proceedings | ISSN 2654-1823
SafeGreece 2021 – 8th International Conference on Civil Protection & New Technologies 24-26 November, on-line | www.safegreece.org/safegreece2021 | [email protected]
AN INTEGRATED APPROACH FOR WILDFIRE HAZARD MAPPING AND VULNERABILITY ASSESSMENT
Chrysoula Chatzichristaki1, Georgia Kalantzi1, Vasileios Alexandridis1, Theodora Theodoridou1, Kostantinos Karystinakis1, Stefanos Stefanidis1
1, OMIKRON Environmental Consultants SA, 15th km of Thessaloniki-Moudania Nat. Rd, 57001, Thermi, Thessaloniki, Greece
(E-mail: [email protected], [email protected], [email protected], [email protected], [email protected], [email protected])
ABSTRACT Wildfires are considered a major threat for Mediterranean forests. This is also confirmed by the recent hazardous events in Greece during the 2021 summer, with the devastating environmental and socioeconomic impacts. Therefore, the assessment and mapping of wildfire hazard zones is fundamental for preparedness and efficient protection against these phenomena. In this study, a GIS-based multicriteria approach was applied for the identification of wildfire prone landscapes taking into account geomorphological, vegetation factors and the proximity to infrastructures. Additionally, the vulnerability was evaluated using socio-economic and environmental criteria focusing on infrastructure and land use exposure to wildfire. It is highlighted that the proposed methodology has a high degree of transferability as it is based on open-source data.
Keywords: wildfire, hazard, vulnerability GIS, open data.
1. INTRODUCTION
Wildfires have been an integral part of the Mediterranean ecosystem contributing to the vegetation composition and diversity [1]. Moreover, under the context of climate change the climate in the Mediterranean basin is expected to be drier by the end of the 21st century. Therefore, outbreaks of wildfires are expected to increase. To this end, reliable hazard maps are necessary for preparedness and efficient protection against these phenomena. During the last years, the multicriteria analysis tools have been extensively used for wildfire hazard assessment especially in wildland urban interface (WUI) areas [2]. The selection of the factors and their relative weight according to their importance on wildfire hazard is the most important task needs to be addressed. The aim of the present study is to assess the wildfire hazard based on a multi-criteria approach and open-source geospatial data. Additionally, vulnerability was evaluated using socio-economic and environmental criteria based on infrastructure and land use exposure to wildfire.
2. MATERIAL AND METHOD
2.1. Study area
The study area is located in the wider area of the Thessaloniki conurbation, in North Greece. It covers an area of 973.8 Km2 and the included Municipalities are: 1) Oreokastro, 2) Ampelokipoi - Menemeni, 3) Kordelio - Euosmos, 4) Pavlos Melas, 5) Neapoli - Sykies, 6) Thessaloniki, 7) Kalamaria, 8) Pylaia – Chortiati, 9) Thermi and 10) Thermaikos. Apart from the administrative bountaries of the included Munincipalites, also the watershed bountaries were taken into account for the delination of the study area.
Page 227 of 269

SafeGreece 2021 on-line Proceedings | ISSN 2654-1823
SafeGreece 2021 – 8th International Conference on Civil Protection & New Technologies 24-26 November, on-line | www.safegreece.org/safegreece2021 | [email protected]
2.2. Methodology and Datasets
Regarding the wildfire hazard, the data corresponding to the key driven factors were processed in a GIS environment. These factors are fueldbed, slope, aspect, distance to settlements and distance to road networks. Slope and aspect were extracted from the ΑLOS DEM. The fuelbed was derived from a global database (pangaea) as described in the literature [3] while multiple ring buffer analysis was performed to estimate the distance from roads and settlements obtained from OSM, Corine and Urban Atlas, respectively. The collection, processing and the selection of the relative weight of each dataset corresponding to each factor in accordance with wildfire likelihood, were performed as proposed in the relevant, recent literature [4].The integration of these data leads to the creation of the static wildfire hazard map. Furthermore, the Canandian Fire Weather Index (FWI) is taken into account in order to present different climatic scenarios as proposed in similar studies [5]. To this end, three scenarios are labeled as Low, Moderate and High, based on the FWI values. The combination of FWI and the static wildfire hazard map leads to the final hazard map. This map is categorized into five classes. Herein, only the moderate scenario is presented which is based on the FWI moderate danger class. The vulnerability assessment is based on the results of the wildfire hazard map. Initially the polygons that hazard has been characterized as high and very high were selected and extracted in a separate layer. Afterwards, the infrastructures and land use that exposure in the selected layer were identified. The vulnerable areas were grouped into seven categories as follow: 1) urban areas, 2) areas of increased human activities and concentration (eg. schools, hospitals, sport facilities etc.), 3) industrial zones, 4) transport infrastructure, 5) archeological and cultural heritage areas (archaeological sites and monuments), 6) areas of environmental importance (Natura2000, peri-urban forest etc.) and 7) agricultural and grazing lands. The type of infrastructure (eg. transport network, industrial areas, hospitals etc.) which are crucial for disaster management were extracted from the Open Street Map (OSM) database. Also, the settlement boundaries from Corine 2018 and Urban Atlas products were provided through the Copernicus land monitoring service. Additionally, the protected Natura2000 and environmentally important areas were collected from the European Environment Agency (https://ec.europa.eu/environment/nature/natura2000/data) and the National scale datasets (https://geodata.gov.gr/dataset), respectively. Regarding the archeological sites and historical monuments, these were also obtained from the OSM database. Finally, the Land Parcel Information System (LPIS) was used to identify agricultural areas and grazing lands.
3. RESULTS
The adopted methodology produced a wildfire hazard map for the wider area of Thessaloniki’s conurbation (Figure 1). The wildfire hazard was characterized as high or very high in the 15% of the study area. As illustrated in the map, the Municipalities of Neapoli – Sykies and Pylaia – Chortiatis depict the higher proportion of their respective area to the high or very high wildfire hazard class, followed by Municipalities of Pavlos Melas, Thermi and Oreokastro. Additionally, the categories of vulnerable areas per Municipality is presented in the next table (Table 1).
Page 228 of 269

SafeGreece 2021 on-line Proceedings | ISSN 2654-1823
SafeGreece 2021 – 8th International Conference on Civil Protection & New Technologies 24-26 November, on-line | www.safegreece.org/safegreece2021 | [email protected]
Figure 1. Spatial distribution of wildfire hazard in the study area.
Table 1. Vulnerable areas per Municipality of the study area.
Categories of Vulnerable Areas
Municipalities Urban(ha)
Human activities &
concentration (ha)
Industrial zone (ha)
Transport (Km)
Agricultural & grazing
land (ha)
Archeological & cultural heritage
(ha)
Environmental importance
(ha)
Oreokastro 400.5 14.9 48.8 49.0 3779.6 13.2 360.7 Ampelokipoi -
Menemeni 0.0 0.0 0.0 0.0 0.0 0.0 0.0
Kordelio - Evosmos 0.0 0.0 0.0 0.0 0.0 0.0 0.0
Pavlos Melas 86.3 15.3 133.7 25.3 639.8 0.0 0.7
Neapoli - Sykies 300.4 16.2 0.0 20.3 177.7 0.0 559.9
Thessaloniki 38.7 4.2 0.0 4.1 2.5 0.0 92.2 Kalamaria 0.0 0.0 0.0 0.0 0.0 0.0 0.0
Pylaia – Chortiatis 959.7 235.1 7.5 88.9 5997.6 0.0 6997.8
Thermi 366.3 42.6 12.6 11.2 8366.2 0.0 2025.6 Thermaikos 26.7 0.0 0.0 0.29 46.7 0.0 0.0
Page 229 of 269
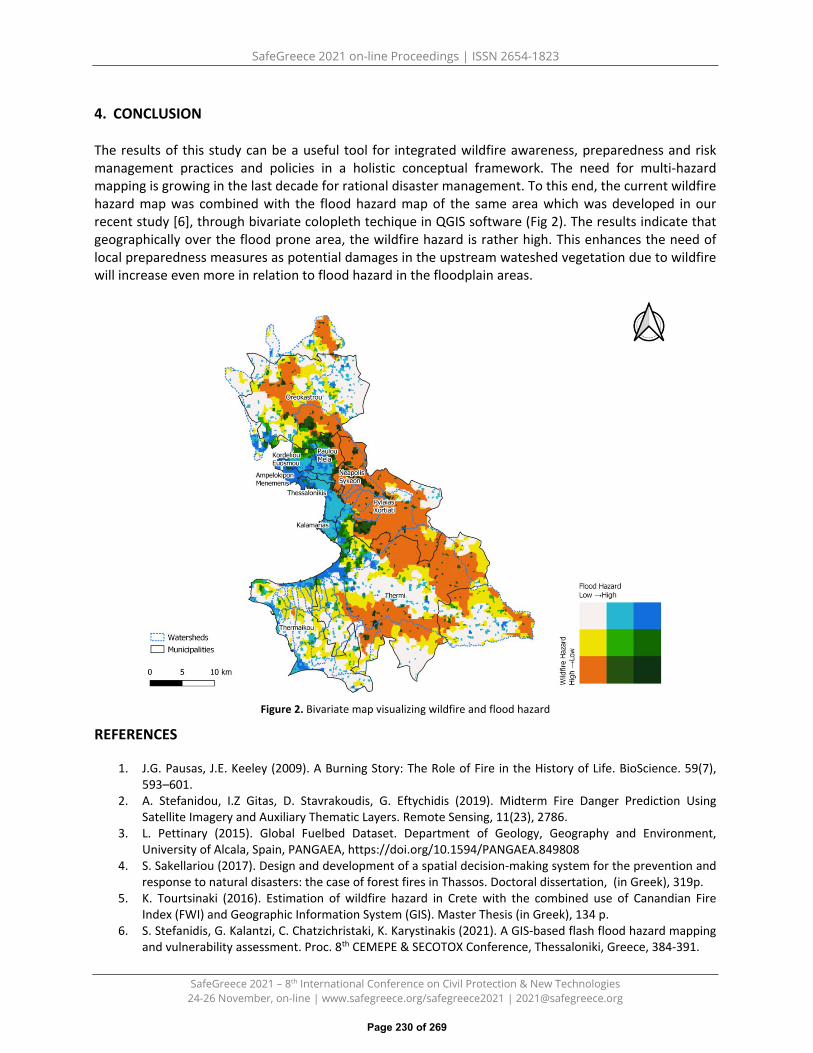
SafeGreece 2021 on-line Proceedings | ISSN 2654-1823
SafeGreece 2021 – 8th International Conference on Civil Protection & New Technologies 24-26 November, on-line | www.safegreece.org/safegreece2021 | [email protected]
4. CONCLUSION
The results of this study can be a useful tool for integrated wildfire awareness, preparedness and risk management practices and policies in a holistic conceptual framework. The need for multi-hazard mapping is growing in the last decade for rational disaster management. To this end, the current wildfire hazard map was combined with the flood hazard map of the same area which was developed in our recent study [6], through bivariate colopleth techique in QGIS software (Fig 2). The results indicate that geographically over the flood prone area, the wildfire hazard is rather high. This enhances the need of local preparedness measures as potential damages in the upstream wateshed vegetation due to wildfire will increase even more in relation to flood hazard in the floodplain areas.
Figure 2. Bivariate map visualizing wildfire and flood hazard
REFERENCES
1. J.G. Pausas, J.E. Keeley (2009). A Burning Story: The Role of Fire in the History of Life. BioScience. 59(7),593–601.
2. A. Stefanidou, I.Z Gitas, D. Stavrakoudis, G. Eftychidis (2019). Midterm Fire Danger Prediction UsingSatellite Imagery and Auxiliary Thematic Layers. Remote Sensing, 11(23), 2786.
3. L. Pettinary (2015). Global Fuelbed Dataset. Department of Geology, Geography and Environment,University of Alcala, Spain, PANGAEA, https://doi.org/10.1594/PANGAEA.849808
4. S. Sakellariou (2017). Design and development of a spatial decision-making system for the prevention andresponse to natural disasters: the case of forest fires in Thassos. Doctoral dissertation, (in Greek), 319p.
5. K. Tourtsinaki (2016). Estimation of wildfire hazard in Crete with the combined use of Canandian FireIndex (FWI) and Geographic Information System (GIS). Master Thesis (in Greek), 134 p.
6. S. Stefanidis, G. Kalantzi, C. Chatzichristaki, K. Karystinakis (2021). A GIS-based flash flood hazard mappingand vulnerability assessment. Proc. 8th CEMEPE & SECOTOX Conference, Thessaloniki, Greece, 384-391.
Page 230 of 269

SafeGreece 2021 on-line Proceedings | ISSN 2654-1823
SafeGreece 2021 – 8th International Conference on Civil Protection & New Technologies 24-26 November, on-line | www.safegreece.org/safegreece2021 | [email protected]
THE IMPACT OF WILDFIRES OF SOUTHWESTERN TURKEY AND RHODES ISLAND ON THE AIR QUALITY OF RHODES CITY IN THE SUMMER OF 2021
Ioannis Logothetis, Christina Antonopoulou, Georgios Zisopoulos, Adamantios Mitsotakis, Panagiotis Grammelis Centre for Research and Technology Hellas, Chemical Process and Energy Resources (Greece)
(E-mail: [email protected], [email protected], [email protected], [email protected], [email protected] )
ABSTRACT Climate change promotes warmer and drier conditions over the Mediterranean climate “hot-spot” increasing wildfire risk. Forest fires are associated with the air quality degradation affecting human health and activities. This study investigates the impact of fire events that occurred in south-western coastal Turkey and the island of Rhodes on the air quality of the city of Rhodes during the summer of 2021. Additionally, the impact of meteorological parameters on the fire danger as well as on the concentration of pollutants is examined. Hourly meteorological data and recordings of pollutants concentration have been collected from a monitoring station located in the center of Rhodes city. In addition, hourly reanalysis data (ERA5) available from European Centre for Medium-Range Weather Forecasts (ECMWF) have been used. The comparative analysis concerns the difference in the concentration of pollutants between a period during which wildfire occurs (from 28-7-2021 to 1-8-2021) and a period without wildfire events (from 19-7-2021 to 27-7-2021). A boxplot of meteorological data and the pollutants concentration is presented, in order to compare the air quality for each period. A linear fire danger index (Fuel Moisture Index; FMI) is implemented for the investigation of the relation between the wildfire occurrence and the air quality in Rhodes city. Furthermore, the relation of the wildfires on the concentration of pollutants is studied using the regression analysis. The results indicate that the wildfires of south-western Turkey and Rhodes island during the summer of 2021 have a significant impact on the degradation of air quality in the Rhodes city and on the ecosystem sustainability in the south-eastern Mediterranean.
Keywords: wildfires, fire danger, Rhodes island, south-eastern Mediterranean, south-eastern Aegean, air quality, Climate change, monitoring station, ERA5
1. INTRODUCTIONThe Mediterranean region is one of the most responsive areas regarding climate change over the world[1] showing high wildfire sensitivity and increased fire risk during the summer period. Future projectionsbased on ERA40-driven Regional Climate Models (RCMs) show that global warming promotes the numberof fires in the absence of a fire management strategy [2]. Previous studies have shown that PM2.5 fromwildfires is more toxic than PM2.5 from ambient sources and significantly affect human health [3].Moreover, the climate dynamics and meteorological parameters increase the likelihood of wildfires andtheir spread in an area [4]. In the summer of 2021, wildfire events started on 28-07-2021 and 1-08-2021over south-western Turkey and Rhodes island respectively, resulting in affecting the air quality in thesouth-eastern Mediterranean. Rhodes island is located over the south-eastern Aegean Sea, in theMediterranean region. The city center of Rhodes presents high traffic activity especially during thesummer months (peak tourist season). In general, transport, high traffic and port activities worsen urbanair quality [5]. This study investigates the effect of wildfire events, which occurred mainly in the secondhalf of July 2021, on the air quality of the city of Rhodes. Furthermore, the potential impact ofmeteorology on fire events as well as on the concentration of pollutants is investigated.
Page 231 of 269

SafeGreece 2021 on-line Proceedings | ISSN 2654-1823
SafeGreece 2021 – 8th International Conference on Civil Protection & New Technologies 24-26 November, on-line | www.safegreece.org/safegreece2021 | [email protected]
2. DATA AND METHODOLOGYIn the current study, recordings from a mobile air quality monitoring system (Haz-Scanner™ modelHIM-6000; https://environmentaldevices.com/him-6000-2/) - that was located in the center of Rhodescity (36°26ʹ55ʹʹN, 28°13ʹ 2ʹʹE) - for the period 19-7-2021 to 1-8-2021, have been analysed. In particular,hourly data for meteorological parameters (wind direction; Wdir, wind speed; WS, temperature; T,relative humidity; RH) and pollutants (noise/ sound; Sd, particle matter 2.5; PM2.5, particle matter 10;PM10, carbon monoxide; CO, carbon dioxide; CO2, nitrogen monoxide; NO, nitrogen dioxide; NO2, ozone;O3 and sulphur dioxide; SO2) are employed for the analysis. In addition, hourly data of zonal andmeridional wind speed (WS-m/s), relative humidity (RH-%) and 10m temperature (T-°C) were derivedfrom the 5th generation of atmospheric reanalysis (ERA5) for the common aforementioned period. ERA5data are available in the frame of the European Centre for Medium-Range Forecasts (ERA5) on spatialresolution 0.25°x0.25° and provide improved fit of T, RH and WS as compared with observations prior tothe assimilation [6].To study the effect of wildfires (over south-western Turkey and Rhodes island) in the Rhodes city, themeteorological factors, the concentration of pollutants and their relation are investigated. The box-plotof meteorological factors and the concentration of pollutants for the days with fires (from 28-7 to 1-8,2021) and days without fires (from 19-7 to 27-7, 2021) is calculated to study the impact of wildfires on theair quality degradation. Moreover, the fire danger (spread and occurrence) is investigated using a simpledimensionless linear index (fuel moisture index; FMI) [7]. FMI is defined by the equation
FMI = 10 – 0.25*(T-HR),
where T (°C) is the temperature and HR is the relative humidity (%). The lower the FMI the higher the fire danger (warmer and drier conditions are related to lower FMI). Finally, FMI field (ERA5 hourly data) regressed on the hourly concentration anomalies normalized with the standard deviation of each pollutant (monitoring system recordings) is calculated to investigate the impact of fire danger on air quality.
3. RESULTSIn Figure 1, the box-plots of meteorological parameters (Fig. 1a-d) and the concentration of pollutants(Fig. 1 e-m) from 19-7-2021 to 27-7-2021 (period without wildfires; No_FD) and from 28-7-2021 to 1-8-2021 (period with wildfires; FD) are presented. The analysis shows that in Rhodes city, T (°C) and HR (%)are increased about 3.2°C and decreased about 19% respectively in the FD period in comparison to theNo_FD one (Fig. 3c,d). In addition, the concentration of pollutants is increased. In particular, theconcentration of PM2.5 and PM10 is increased by about 5.2 and 9.0 μg/m³, respectively (Fig. 3f,g). A raisein CO2 and CO concentrations by about 19.3 and 0.1 ppm respectively can be also observed (Fig. 3h,i).The concentration of NO and NO2 show a statistically insignificant increase of about 1.8 ppb and limitednegative change, respectively (Fig. 3j,k). Finally, the concentration of O3 and SO2 shows a slight reductionof about 1.7 ppb (statistically insignificant) and an increase of about 36.0 ppb, respectively (Fig. 3l,m). Theinsignificant change of the concentration of NO, NO2 and O3 possibly is explained by the photochemicalreactions (during the studied period the sunlight activity is high).
Page 232 of 269

SafeGreece 2021 on-line Proceedings | ISSN 2654-1823
SafeGreece 2021 – 8th International Conference on Civil Protection & New Technologies 24-26 November, on-line | www.safegreece.org/safegreece2021 | [email protected]
Figure 1. Box-plots showing a comparison of meteorological parameters and the concentration of each pollutant for days with fire (FD) and days without fire (No-FD) in the city center of Rhodes.
In Figure 2 the mean FMI (Fuel Moisture Index) for the two examined periods (FD and No_FD) is presented. It should be noted that the lower the FMI value the higher the danger for fire. The FMI calculation is based on data available from ERA5. During the FD period, the fire danger is higher over the coast of south-western Turkey and the south-eastern Aegean region (Fig. 2b).
Figure 2. The mean FMI on the days (a) without Fire (No_FD) and (b) with Fire (FD) calculated using ERA5 meteorological data.
In order to investigate the impact of wildfires on the air quality of Rhodes city, the regression of the hourly FMI anomalies (calculated from ERA5 data) on the hourly anomalies of concentration, normalized with a standard deviation of each pollutant (recordings from monitoring station), are calculated (Figure 3). The analysis shows that the regression values are negative mainly over the south-western Turkey for the majority of pollutants (Fig. 3 a-e,g,h).This result indicates the association between the climatic conditions (in terms of FMI index) and the wildfire events as well as an effect on the air quality over the city.
Page 233 of 269

SafeGreece 2021 on-line Proceedings | ISSN 2654-1823
SafeGreece 2021 – 8th International Conference on Civil Protection & New Technologies 24-26 November, on-line | www.safegreece.org/safegreece2021 | [email protected]
Figure 3. FMI fields regressed on the hourly concentration anomalies normalized with the standard deviation of each pollutant. The colored area denotes the statistical significance at the 99%.
4. CONCLUSIONThis study investigates the impact of wildfires in south-western Turkey and Rhodes island, as well as therole of meteorology in the air quality of Rhodes city during the days from 19-7-2021 to 1-8-2021. Findingsindicate that during the days with fire events the concentration of pollutants is higher compared to thedays without fires. The climatic conditions affect the air quality and fire danger. In particular, on days withfire events, the FMI is lower than on days without fire events, indicating a higher fire danger. The relationbetween FMI anomalies (ERA5 data) and the anomalies of concentration (monitoring station) normalizedwith a standard deviation of each pollutant shows that the variability of the concentration of pollutants isassociated with climatic conditions and wildfire events. Finally, this analysis emphasizes the importanceof further investigating the impact of climate conditions on fire danger in the frame of an improved firemanagement context regarding climate change.
ACKOWLEDGEMENTS The research is carried out in the frame of project “ELECTRON" with operation code (MIS) 5047136 that it is co-financed by ERDF and national funds.
REFERENCES 1. F., Giorgi (2006). Climate change hot-spots. Geophysical Research Letters. 33. L08707.
doi:10.1029/2006GL025734.2. Μ., Turco,·M.-C., Llasat , J., von Hardenberg, A., Provenzale (2014). Climate change impacts on wildfires in
a Mediterranean Environment, Climatic Change, ISSN 0165-0009, doi: 10.1007/s10584-014-1183-3.3. R., Aguilera, T., Corringham, A., Gershunov, T., Benmarhnia. (2021) Wildfire smoke impacts respiratory
health more than fine particles from other sources: observational evidence from Southern California,nature communication, 12:1493, doi: org/10.1038/s41467-021-21708-0.
4. I., Tošić, D., al. (2019). "Potential influence of meteorological variables on forest fire risk in Serbia duringthe period 2000-2017. Open Geosciences, vol. 11, no. 1, pp. 414-425. doi: org/10.1515/geo-2019-0033.
5. I., Logothetis, C., Antonopoulou, K., Sfetsioris, A., Mitsotakis, P., Grammelis (2021) Comparison Analysis ofthe Effect of High and Low Port Activity Seasons on Air Quality in the Port of Heraklion. Environ. Sci. Proc.2021, 8, 3. https://doi.org/10.3390/ecas2021-10329.
6. H., Hersbach, (2020). The ERA5 global reanalysis. Q J R Meteorol Soc.; 146: 1999– 2049.https://doi.org/10.1002/qj.3803
7. J.J, Sharples, R.H.D. McRae, R.O. Weber, A.M. Gill. (2009) A simple index for assessing fire danger rating,Environmental Modelling & Software, Volume 24, Issue 6, Pages 764-774, ISSN 1364-8152, doi:org/10.1016/j.envsoft.2008.11.004.
Page 234 of 269

SafeGreece 2021 on-line Proceedings | ISSN 2654-1823
SafeGreece 2021 – 8th International Conference on Civil Protection & New Technologies 24-26 November, on-line | www.safegreece.org/safegreece2021 | [email protected]
THE IMPORTANCE OF PREVENTION AND PREPAREDNESS IN RISK REDUCTION. CASE STUDY THE SCHOOL UNITS OF HERAKLION AND RETHYMNO
PREFECTURES
Georgios Alatsakis1, Asimina Kourou2 1 MSc, MA, Secondary Education Teacher, 2nd Vocational School of Rethymnon (Greece).
(Email: [email protected])2 Dr. Geologist, Head of Social Earthquake Defense Division of EPPO.
(Email: [email protected])
ABSTRACT
Schools can be significantly affected by the impact of natural and technological disasters for a long time. Proper and certified teacher training as well as preventive and preparedness measures in each school unit can play a key role in disaster risk reduction at school environment. School emergency plans, drills and other preparedness efforts empower students and staff to respond effectively to emergencies that occur when class is in session. The aim of this research is to investigate the level of disaster awareness and preparedness of Primary and Secondary Schools of Heraklion and Rethymnon Prefectures in Crete, Greece. The survey was implemented among 161 primary and secondary education teachers from 121 different schools of the Regional Units of Heraklion and Rethymnon. The survey instrument used was an anonymous questionnaire with 74 closed-ended questions.
According to the results of the survey, a lot of disaster prevention and preparedness actions have been conducted till now, but there is still room for improvement (e.g., firefighting and first aid teachers training). The majority of teachers claimed that their school had an Earthquake Emergency Plan and carry out drills every year. The involvement of parents and local authorities in the implementation and assessment of school preparedness drills is very low. It is worth mentioning that as far as the level of emergency preparedness of schools is concerned, no significant differences were noticed either among Heraklion and Rethymnon Education Directorates or among the areas where the schools are located (urban, suburban and rural areas).
Keywords: emergency plan, drill, teachers training, primary and secondary education, safe school.
1. INTRODUCTION
Schools, as subsystems of society, and indeed a very sensitive one since they host one of the most vulnerable target groups, children, can be significantly affected by the impact of natural and technological disasters for a long time. Globally, there are around 1.2 billion students in primary and secondary schools. About 875 million of them live in high seismic risk zones and hundreds of millions are exposed to flood and landslide risks (Ersoy & Koçak, 2016; Pazzi et al., 2016). Schools that are neither built nor maintained to be disaster resilient can lead to injury and death for millions of children and adults (Pazzi et al., 2016).
The educational community has an important role in raising awareness among the population, disseminating the right knowledge and promoting the mentality of prevention and preparedness to deal with natural or technological disasters (Kourou & Panoutsopoulou, 2017). In order to design a safe school, all possible natural and technological hazards of the wider area that threaten or may threaten the school should be identified.
Page 235 of 269

SafeGreece 2021 on-line Proceedings | ISSN 2654-1823
SafeGreece 2021 – 8th International Conference on Civil Protection & New Technologies 24-26 November, on-line | www.safegreece.org/safegreece2021 | [email protected]
A school is classified as safe when it ensures the daily safety of pupils by minimizing the chances of accidents within its premises. This can be achieved through appropriate architectural design, the functional use of the school premises, the adoption of all safety standards and equipment and the school's preparedness for emergencies. According to the current legislation (Law 4559/2018, Article 57), each school unit of Primary and Secondary Education should develop an Emergency Plan for earthquake, fire and extreme weather events, while it should organize at least two drills every year for each hazard.
The present study aims to investigate the degree of preparedness of Primary & Secondary schools of Heraklion and Rethymnon Prefectures in Crete, for dealing with emergencies.
2. EXPERIMENTAL METHOD
2.1. Sample
161 teachers of primary and secondary education from a total of 121 different schools of Heraklion and Rethymnon Prefectures participated in the survey. The distribution of the schools is shown in Table 1.
Table 1: Distribution of schools participating in the survey
Primary schools in Heraklion (Total 367)
Primary schools in Rethymnon
(Total 122)
Secondary schools in Heraklion
(Total 94)
Secondary Schools in Rethymnon
(Total 31)
Ν 59 19 Ν 24 19
% 16,1% 15,6% % 25,5% 61,3%
2.2 Survey methodology
The survey began on 10 January 2018 and completed in May 2018. It should be mentioned that the researcher made a relevant request to the Ministry of Education and Religious Affair (MERA) and granted permission to conduct the survey. In the framework of the survey an anonymous questionnaire with 74 closed-ended questions was developed. Completion of the questionnaire was voluntary.
3. RESULTS AND DISCUSSION
According to the results of the survey, 36% of the teachers considered their school as a safe place, 24.8% did not, while 39.1% considered it a partially safe place. 44.1% stated that prevention and preparedness activities have been carried out in their school, 39.1% partially, while 5.6% stated that no prevention and preparedness activities have been carried out.
School emergency plan is a fundamental tool building capacity in preparedness. It is important for each school unit to create its own customized plan. When the responders were asked if their school has an Emergency Plan, 77.6% of them responded positively, 6.2% responded that it does not have one, while 16.1% responded that they did not know (Fig. 1). This probably means that no one informed them about the development of the School Emergency Plan. According to data at the national level data for the period 2014-2019, 93.36% of teachers stated that Earthquake Emergency Plan has been developed to their school (Kourou et al., 2019).
Page 236 of 269
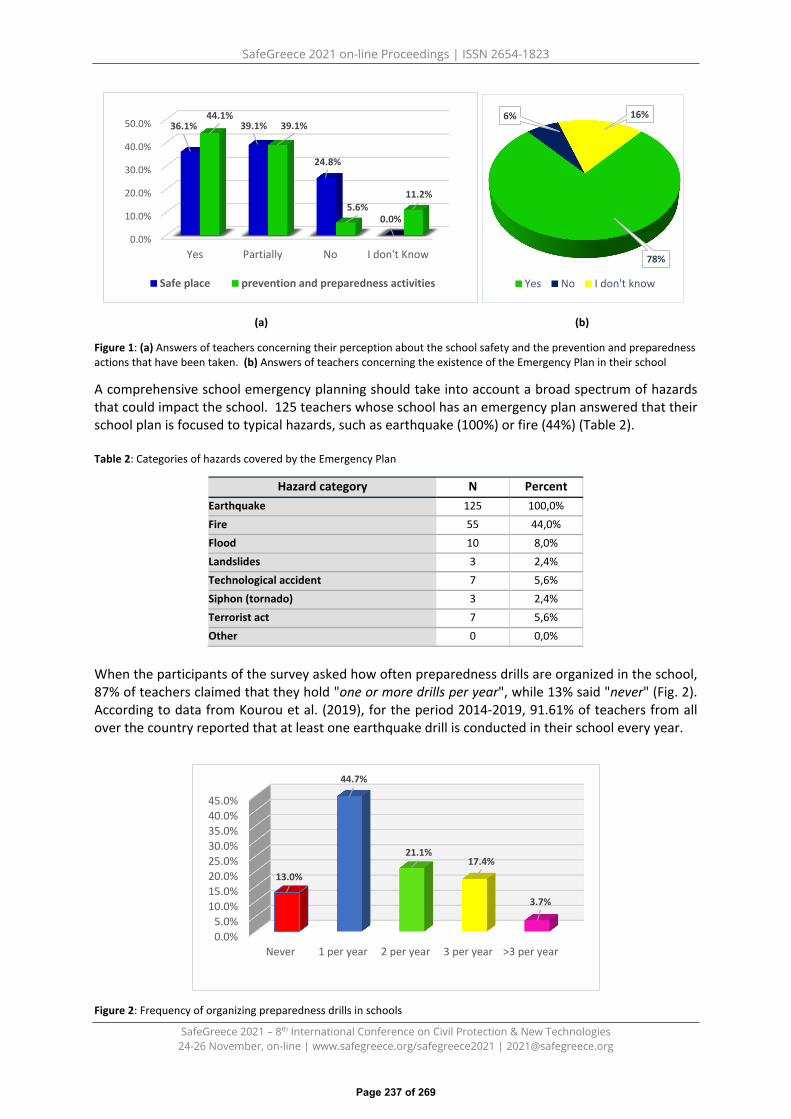
SafeGreece 2021 on-line Proceedings | ISSN 2654-1823
SafeGreece 2021 – 8th International Conference on Civil Protection & New Technologies 24-26 November, on-line | www.safegreece.org/safegreece2021 | [email protected]
(a) (b)
Figure 1: (a) Answers of teachers concerning their perception about the school safety and the prevention and preparedness actions that have been taken. (b) Answers of teachers concerning the existence of the Emergency Plan in their school
A comprehensive school emergency planning should take into account a broad spectrum of hazards that could impact the school. 125 teachers whose school has an emergency plan answered that their school plan is focused to typical hazards, such as earthquake (100%) or fire (44%) (Table 2).
Table 2: Categories of hazards covered by the Emergency Plan
Hazard category N Percent Earthquake 125 100,0% Fire 55 44,0% Flood 10 8,0% Landslides 3 2,4% Technological accident 7 5,6% Siphon (tornado) 3 2,4% Terrorist act 7 5,6% Other 0 0,0%
When the participants of the survey asked how often preparedness drills are organized in the school, 87% of teachers claimed that they hold "one or more drills per year", while 13% said "never" (Fig. 2). According to data from Kourou et al. (2019), for the period 2014-2019, 91.61% of teachers from all over the country reported that at least one earthquake drill is conducted in their school every year.
Figure 2: Frequency of organizing preparedness drills in schools
0.0%
10.0%
20.0%
30.0%
40.0%
50.0%
Yes Partially No I don't Know
36.1% 39.1%
24.8%
0.0%
44.1%39.1%
5.6%11.2%
Safe place prevention and preparedness activities
78%
6% 16%
Yes No I don't know
0.0%5.0%
10.0%15.0%20.0%25.0%30.0%35.0%40.0%45.0%
Never 1 per year 2 per year 3 per year >3 per year
13.0%
44.7%
21.1%17.4%
3.7%
Page 237 of 269

SafeGreece 2021 on-line Proceedings | ISSN 2654-1823
SafeGreece 2021 – 8th International Conference on Civil Protection & New Technologies 24-26 November, on-line | www.safegreece.org/safegreece2021 | [email protected]
Finally, 96.4% of teachers stated that parents were never involved in the scenarios of school’s drills, while 95.7% of them stated that they were never involved in planning a drill, suggesting scenarios, etc. Meanwhile, 89.3% of the teachers said that Emergency Services were not involved in the planning of any school preparedness drill. Also, 23.6% of teachers indicated that the competent authorities such as Fire brigade, Civil Protection etc. were aware of the school's Emergency Plan, 40.4% said that they were not aware, while 36% said that they did not know.
4. CONCLUSION
International experience has shown that there are vulnerabilities regarding school preparedness, such as poor testing of Emergency Plans through preparedness drills, poor evaluation of drills and lack of cooperation between schools and other stakeholders (Tipler et al., 2017). As a result of these weaknesses, it is possible that some schools may not be able to respond effectively in an emergency. It is also generally accepted that identifying hazards, having an Emergency Plan in place and testing its implementation through preparedness drills, is not only a school's obligation to the law, but ensures that the impact of a catastrophic event on the school community is reduced. In this regard, collaboration between teachers, students, parents, the local community and other stakeholders is deemed imperative for the successful implementation of the school's Emergency Plan in case of emergency and the rapid reunification of students with their parents.
According to the current national legislation, each school unit should have an Emergency Plan for earthquake, fire and extreme weather events and should organize at least two preparedness drills each year for each of the abovementioned hazards. The preparedness drills are a low-risk, fully controlled process that enables the school community to improve its knowledge, gain skills and evaluate the whole process to make necessary corrections and adjustments to the Emergency Plan where required. At the same time, as part of the acquisition of a culture of prevention and improvement of the preparedness of school units, seminars should be organized periodically for teachers by hazard, in collaboration with the relevant competent bodies, as well as experiential workshops for the Directors and the teachers in charge of development the School Emergency Plan.
In conclusion, concerning the seismic risk reduction actions, the school units of Heraklion and Rethymnon Prefectures are at high level, but for the other hazards there is still a lot of room for improvement. The EPPO seminars for teachers in cooperation with the MERA, the preparation and promotion of the Handbook on School Earthquake Planning by EPPO, as well as the creation of appropriate educational material for students and teachers have contributed decisively to taking prevention and preparedness actions to reduce the seismic risk in the school environment.
REFERENCES
1. Ersoy, Ş., & Koçak, A. (2016). Disasters and earthquake preparedness of children and schools in Istanbul, Turkey. Geomatics, Natural Hazards and Risk, 7 (4).
2. Kourou A., Allagianni N., Vella A., Gkountinakou E. (2019). Greek School Community is Coping withEarthquakes. 6th International Civil Protection Conference "Safe Corfu 2019", Corfu, 6-9 November2019.
3. Kourou, A., & Panoutsopoulou, M. (2017). Lesson A18 - Emergency planning in the school environment.MSc Strategies for Environmental, Disaster and Crisis Management, National and KapodistrianUniversity of Athens, Athens, Greece.
4. Law 4559/2018 (Government Gazette A'142/03.08.2018).5. Pazzi, V., Morelli, S., Pratesi, F., Sodi, T., Valori, L., Gambacciani, L., & Casagli, N. (2016). Assessing the
safety of schools affected by geo-hydrologic hazards: the geohazard safety classification (GSC).International Journal of Disaster Risk Reduction, 15, 80-93.
6. Tipler, K., Tarrant, R., Johnston, D., & Tuffin, K. (2017). Are you ready? Emergency preparedness in NewZealand schools. International Journal of Disaster Risk Reduction, 25.
Page 238 of 269

SafeGreece 2021 on-line Proceedings | ISSN 2654-1823
SafeGreece 2021 – 8th International Conference on Civil Protection & New Technologies 24-26 November, on-line | www.safegreece.org/safegreece2021 | [email protected]
FASTER TECHNOLOGIES TO ENSURE THE SAFETY OF FIRST RESPONDERS
Tomasz Lachacz, Przemyslaw Wrzosek Police Academy in Szczytno, Poland
(E-mail: [email protected], [email protected] )
ABSTRACT
The aim of the paper is to present a set of modern technologies and tools developed by an international consortium within the FASTER project - First responders Advanced Technologies for Safe and EfficienT Emergency Response. Solutions, which are being developed, are addressed to first responders who undertake high-risk rescue operations in hazardous environments. The use of FASTER technologies and tools (e.g. smart textiles, AR tools, drones) in emergency situations is expected to provide greater safety for responders and increase the effectiveness of actions taken. First responders from different countries have been involved in the development of the technology from the beginning, sharing their experience and practical tips.
Keywords: FASTER project, first responders, technology, safety
1. INTRODUCTION
FASTER- First responders Advanced Technologies for Safe and EfficienT Emergency Response is an international project implemented under Horizon 2020 by a consortium of 23 partners [1]. The team members include scientific, technical, social partners and rescue entities. The main objective of the conducted research is to create a set of innovative technologies that will benefit first responders in emergency actions undertaken in dangerous and difficult conditions (e.g. earthquake, flood, terrorist attack) [2]. First responders from different countries have been invited to collaborate in order to develop tools whose use will help keep rescuers safe and make their actions more effective. From the beginning, they have participated in identifying the needs of first responders, designing the tools and evaluating their usability and efficiency. In addition, a group of stakeholders has been created who also share their experiences and participate in the different stages of the project. The solutions developed in the research are currently being tested in pilot field trials based on different emergency scenarios.
2. THE FASTER TECHNOLOGIES AND TOOLS SYSTEM
The paper illustrates a system consisting of technologies and tools developed for those involved in emergency operations. Complex emergency operations require the use of data, communications, unit positioning, mapping and scene imaging technologies. These functions are for more effective management of the forces and technical resources at the scene. They also improve commanding and direct actions of emergency services (see Figure 1). The system includes tools dedicated to first responders directly rescuing victims. The structure of the system is schematically presented in Figure 2. It is worth to underline that the tools presented in the graphics can be used in different configurations depending on the needs and nature of the disaster, also independently from other components of the system. This is their versatility, however, they are the most effective in a system combination, cooperating with supporting technologies.
Page 239 of 269

SafeGreece 2021 on-line Proceedings | ISSN 2654-1823
SafeGreece 2021 – 8th International Conference on Civil Protection & New Technologies 24-26 November, on-line | www.safegreece.org/safegreece2021 | [email protected]
Figure 1. Illustration of the FASTER technologies for crisis management Source: The FASTER project consortium materials
3. SELECTED COMPONENTS OF THE FASTER SYSTEM
A key component of the FASTER technology system is the Control Centre (see Figure 2), which provides a Common Operational Picture. In real time, various data are transmitted to the command centre from other FASTER components, which are processed and visualised using a special application developed as part of the research. This creates a Common Operational Picture, which is made available to first responders taking action in the field. This allows the responders to be updated with various important information about the operation. It is worth mentioning that they are provided in a visual form and easier to perceive (e.g. map view, alerts, location of units and deployment of resources).
An important tool of the FASTER are smart textiles designed to be worn by rescuers (see Figure 2). These are equipped with sensors designed to collect data on the rescuers' physical condition as well as detectors for collecting data on environmental conditions. Sensors monitoring the first responder's basic vital functions (e.g. body temperature, heart rate, saturation). They are placed in the rescuer's underwear, while detectors are placed in his jacket [3]. The purpose of detectors is to measure, among other things air temperature, air humidity, oxygen content, carbon monoxide content or to detect the presence of poisonous substances. The collected data are automatically transmitted to the command centre using a smartphone to be available in both visual and digital form for the commanders and other first responders via the Common Operational Picture module.
Page 240 of 269

SafeGreece 2021 on-line Proceedings | ISSN 2654-1823
SafeGreece 2021 – 8th International Conference on Civil Protection & New Technologies 24-26 November, on-line | www.safegreece.org/safegreece2021 | [email protected]
Figure 2. Structure of the FASTER technologies and tools Source: The FASTER project consortium materials
It is worth mentioning other wearable devices wristbands, bracelets, smartwatches and mobile devices - smartphones (see Figure 2). Their application in emergency operations can be very broad. They can be used to provide efficient communication and transfer of data between first responders and commanders using COP. For example in the MORSE system developed for communication in conditions when the use of other communication channels are not available due to failure. The system uses a specially designed smartwatch application that records and identifies a rescuer's arm movements. These are transformed into messages and send to other partners devices present in the in the area of the incident [4]. MORSE warning messages are transmitted using IoT communication protocols (e.g. Bluetooth Low Energy; BLE).
A further solution is to equip first responders with augmented reality technology which is provided to them via appropriate glasses (see Figure 2). This allows first responders to access important information in real time (e.g. geolocation of units on a 2D map, safe evacuation routes, marking of danger zones with holograms), which is sent to the device and displayed in its field of vision using the glasses. Importantly, the glasses enable hands-free viewing of the transmitted information, as they interact with the rescuer through gestures and voice commands. In addition, augmented reality technology has also been used in conjunction with small drones equipped with cameras, which can be deployed in places inaccessible to humans. The use of advanced algorithm of analysis with 3D scene modelling enables visualisation of rooms located behind obstacles [5]. This will allow, for example, a more appropriate choice of tactics for anti-terrorist units before entering and taking action against criminals.
Unmanned aerial vehicles are a very important component of the FASTER technology and tools system. In the course of consultations with representatives of the security services, many creative applications were found. Drones are to be used to take photos and videos of the scene of an incident also as network relays or to provide light the rescuer's workplace. They can deliver equipment: first aid supplies, batteries, communication means, or to remove small obstacles (see Figure 2). Drone swarms have been adapted for more complex operations mapping terrain (2D, 3D), finding people, places or objects, using temperature sensors, gas and hazardous substance detectors, LIDAR technology.
Page 241 of 269

SafeGreece 2021 on-line Proceedings | ISSN 2654-1823
SafeGreece 2021 – 8th International Conference on Civil Protection & New Technologies 24-26 November, on-line | www.safegreece.org/safegreece2021 | [email protected]
The project has also developed robotic vehicles both autonomous and remotely controlled. They can perform various tasks thanks to their equipment: carrying rescuers, transporting injured people, carrying heavier equipment, removing obstacles and setting up network relays. The vehicle platform, for example, can be equipped with a robotic arm with grippers, or adapted as a landing platform for drones.
4. CONCLUSIONS
The FASTER project technologies and tools applied systems-wide way in emergency situations will provide a different kind of perspective on crisis management operations. They will allow both commanders and first responders real-time access to information that was previously unavailable to them. The FASTER tool and technologies will speed up communication and allow important information to be automatically transmitted during operations, such as the location and physical condition of the responder or victim, environmental conditions, hazards, or the location of equipment and vehicles. Fast mapping will give real and actual image of the scene. It will increase the commanders situational awareness. This will optimise decision-making in dangerous conditions and thus enhance the safety of rescuers and the efficiency of rescuing. FASTER technologies create new opportunities for communication between first responders and the command centre. Ongoing recording and transmission of various data and messages will be easy and also possible hands-free. For example, the aforementioned MORSE system in situations where verbal communication is difficult enables the easy and fast transmission of a warning of danger. The multi-purpose use of unmanned aerial vehicles and autonomous vehicles will enable, for example, very fast search for victims, effective and efficient mapping of terrain, reaching dangerous and inaccessible places for rescuers, or will allow for very fast transport of first aid supplies and equipment. The FASTER technologies and tools create new opportunities in effective commanding of the operation and will improve coordination of the actions of first responders. In conclusion, it should be emphasised that application of the FASTER technologies and tools will directly result in safety and efficiency of first responders, and through their improved performance will contribute to saving human lives.
ACKNOWLEDGEMENTS
This work is supported by the project FASTER, which has received funding from the European Union's Horizon 2020 (H2020) programme under grant agreement No: 833507.
REFERENCES 1. First responder Advanced technologies for Safe and efficienT Emergency Response, FASTER Project,
EU Horizon H2020 , CORDIS, https://cordis.europa.eu/project/id/833507/pl, accessed: 13 October 2021.2. FASTER technologies for first responders, https://www.faster-project.eu/tech/,
accessed: 14 October 2021.3. A. Dimou, D. G. Kogias, P. Trakadas, F. Perossini, M. Weller, O. Balet, Cz. Z. Patrikakis, T. Zahariadis,
P. Daras, FASTER: First Responder Advanced Technologies for Safe and Efficient Emergency Response(Online), https://www.faster-project.eu/wp-content/uploads/2020/03/MSE2019-3.pdf,accessed: 15 October 2021.
4. A. Vlachopoulos, H. Georgiou, A. Tzeletopoulou, P. Kasnesis, Ch. Chatzigeorgiou, D. G. Kogias, Ch. Z.Patrikakis, G. Albanis, K. Konstantoudakis, A. Dimou, P. Daras, Enabling gesture-based controls for firstresponders and K9 units,SafeGreece 2020 on-line Proceedings (Online),https://safegreece.org/safegreece2020/images/docs/safegreece2020_proceedings.pdf,accessed: 15 October 2021.
5. G. Albanis, N. Zioulis, A. Dimou, D. Zarpalas, P. Daras, DronePose: Photorealistic UAV-Assistant DatasetSynthesis for 3D Pose Estimation via a Smooth Silhouette Loss(Online), https://www.faster-project.eu/wp-content/uploads/2020/11/2008.08823.pdf, accessed: 15 October 2021.
Page 242 of 269

SafeGreece 2021 on-line Proceedings | ISSN 2654-1823
SafeGreece 2021 – 8th International Conference on Civil Protection & New Technologies 24-26 November, on-line | www.safegreece.org/safegreece2021 | [email protected]
FIELD TRIALS OF EMERGENCY ALERTING, AD-HOC NETWORKING AND SMART TEXTILES AT THE AFIDNES TRAINING CENTER (ATC) – FASTER (EU HORIZON 2020)
Aspasia Tzeletopoulou1, Alexios Vlachopoulos2, Harris Georgiou3, Panagiotis Kasnesis4, Christos Chatzigeorgiou5, Dimitris Kogias6, Charalampos Patrikakis7
1,2,3 Hellenic Rescue Team of Attica (HRTA), Greece (E-mails: [email protected], [email protected], [email protected])
4,5,6,7University of West Attica (UniWA), Greece (E-mail: [email protected], [email protected], [email protected], [email protected])
ABSTRACT On October 21st and 22nd a piloting field activity for FASTER project (EU H2020)1 took place at HRTA’s training facilities in Afidnes (ATC), Attica region. FASTER is about enhancing safety and effectiveness of First Responders during emergency situations and large-scale disasters. Several technical partners from the consortium participated as developers of these technologies, as well as first responders from other countries as observers. Three scenarios were executed regarding team deployment in the disaster area and search & rescue of victims after a large earthquake. Results showed that Technologies are easy to integrate within existing USAR procedures; the project’s components (MORSE, RESCUE, STF) are small and durable enough to be incorporated in existing First-Responder field gear. Future USAR operations will integrate and use Next-gen technologies in order to ensure safety of FRs and citizens, as well as to provide faster and more efficient results for assessment and decision making.
Keywords: Search and Rescue, field tests, crisis managment, security and safety, First responders
1. INTRODUCTION
First Responders (FR) around the globe share a common mission to ensure the safety and security of the people they serve and protect. Due to the nature of their work, FR are often operating in high-risk and hazardous conditions, disaster areas, fire fronts, flooded districts, or exposed to non-visible threats such as very high temperatures and toxic gases. Furthermore, FR may experience incidents (e.g. sudden illness, dizziness or exhaustion) during operations, which can prevent them from completing their mission, but, more importantly, put their own health at risk.
The FASTER project has a clear vision of going well beyond the current state-of-the-art, providing cross-discipline tools to assist FR in all aspects of their work. In order to create tools that match FR needs, FASTER is establishing new ways of involving them very intensely in the development, as well as the evaluation phases of these novel technologies. The consortium’s FR organizations participate in a continuous usability and performance assessment program of the toolkit, with the goal of monitoring the progress of key technologies and components. All solutions are designed for specific scenarios and use cases that simulate actual operational scenarios. As a result, FASTER delivers specific, validated solutions that address current and future FR operational needs.
1 This work is supported by the project FASTER, which has received funding from the European Union's Horizon 2020 (H2020) programme under Grant Agreement No:833507.
Page 243 of 269

SafeGreece 2021 on-line Proceedings | ISSN 2654-1823
SafeGreece 2021 – 8th International Conference on Civil Protection & New Technologies 24-26 November, on-line | www.safegreece.org/safegreece2021 | [email protected]
2. BACKGROUND INFORMATION – MORSE, STF, ResCuE
The FASTER integrated toolkit involves designing and developing innovations regarding the use of sensors in wearable textiles, equipped inside the FR uniform, capable of collecting biometric data (i.e., body temperature, heart rate). Additionally, sensors are deployed externally attached on the FR uniform for measuring the external environment (i.e., temperature, humidity).
As part of the integrated FASTER toolkit, the FR use wearables in order to communicate with gestures in the field of action [3]. An Artificial Intelligence (AI) smart wearable framework named MORSE (MOvement Recognition for firSt rEsponders) is implemented for using hand gestures to generate alert messages for immediate danger or when environmental noise is too high for voice communications. The Smart Textile Framework (STF) solution, together with a mobile application, enables the collection data from a smart textile prototype, providing continuous monitoring of the FR biometrics, as well as environmental data from many sensors embedded on the FR undergarment and outside of their uniform. The ResCuE (Resilient Communication Equipment) is also developed as part of the FASTER toolkit, providing an additional communication asset for supporting the first few hours or days of FR operations inside the “hot zone”, before any other power or networking infrastructure is available, i.e., without depending on any other technology.
3. METHODOLOGY – DESCRIPTION OF THE FIELD TRIALS
On October 21-22 2021 the second iteration of the Greek piloting activities took place at the Afidnes Training Center (ATC) of HRTA in Athens, Greece. The purpose of this field activity was to present the project’s technology demonstrations and conduct field tests in realistic operational conditions (simulated) during Urban Search and Rescue (USAR) deployments of FR teams, according to the INSARAG guidelines and procedures [2]. The location of the ATC site is about 20 km to the north from Athens Centre (Omonia square) near the Afidnes village.
3.1. Scenario A: Wide area search Upon arrival, the team leader gathered information from locals, while the USAR Coordination Cell (UCC) was set up at some distance from the worksite. Power grid and the local mobile network were unavailable or highly volatile, due to damages and saturation. A few minutes later, the FASTER toolkit infrastructure was fully operational and received information given by the field operation leader. First information reported two missing people in the surrounding area, one female and one child (small body shape), as well as others inside the damaged building after the earthquake. The chief of operations ordered the drone pilot to fly a camera-equipped UAV over the area of interest, in order to subsequently perform SAR level 2 (ASR2) actions for locating possible victims.
Subsequently, drones located the two victims, one at the hill (child) and the other one (female) trapped inside a water pipe near the gorge. Two teams of four FRs wearing STF each were assigned to operate in the specific areas with the corresponding equipment, using FASTER tools in addition (MORSE, RESCUE). During the operation one FR fell down in the gorge and asked for help using the MORSE. Assistance was provided to the FR by team members, there was no major injury and the mission continues. One RESCUE device was set up in the location near the gorge in order to provide texts regarding the danger of falling down the gorge slopes (loose ground and gaps after the earthquake). The FR team located the victim, performed preliminary medical assessment and assisted the person moving out of the gorge. For fast and safe extrication, the victim was secured and moved uphill and out of the gorge using rope lines that were set up for this purpose by another specialized FR team. The second team wearing STF was directed
Page 244 of 269
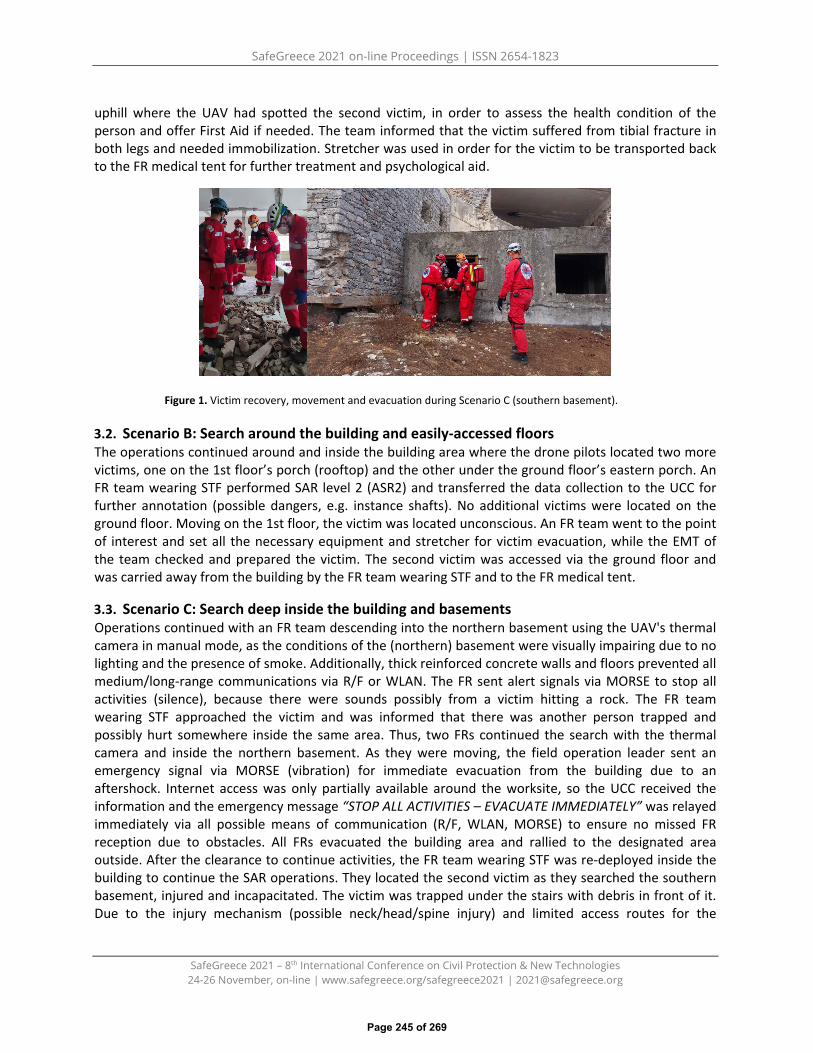
SafeGreece 2021 on-line Proceedings | ISSN 2654-1823
SafeGreece 2021 – 8th International Conference on Civil Protection & New Technologies 24-26 November, on-line | www.safegreece.org/safegreece2021 | [email protected]
uphill where the UAV had spotted the second victim, in order to assess the health condition of the person and offer First Aid if needed. The team informed that the victim suffered from tibial fracture in both legs and needed immobilization. Stretcher was used in order for the victim to be transported back to the FR medical tent for further treatment and psychological aid.
Figure 1. Victim recovery, movement and evacuation during Scenario C (southern basement).
3.2. Scenario B: Search around the building and easily-accessed floors The operations continued around and inside the building area where the drone pilots located two more victims, one on the 1st floor’s porch (rooftop) and the other under the ground floor’s eastern porch. An FR team wearing STF performed SAR level 2 (ASR2) and transferred the data collection to the UCC for further annotation (possible dangers, e.g. instance shafts). No additional victims were located on the ground floor. Moving on the 1st floor, the victim was located unconscious. An FR team went to the point of interest and set all the necessary equipment and stretcher for victim evacuation, while the EMT of the team checked and prepared the victim. The second victim was accessed via the ground floor and was carried away from the building by the FR team wearing STF and to the FR medical tent.
3.3. Scenario C: Search deep inside the building and basements Operations continued with an FR team descending into the northern basement using the UAV's thermal camera in manual mode, as the conditions of the (northern) basement were visually impairing due to no lighting and the presence of smoke. Additionally, thick reinforced concrete walls and floors prevented all medium/long-range communications via R/F or WLAN. The FR sent alert signals via MORSE to stop all activities (silence), because there were sounds possibly from a victim hitting a rock. The FR team wearing STF approached the victim and was informed that there was another person trapped and possibly hurt somewhere inside the same area. Thus, two FRs continued the search with the thermal camera and inside the northern basement. As they were moving, the field operation leader sent an emergency signal via MORSE (vibration) for immediate evacuation from the building due to an aftershock. Internet access was only partially available around the worksite, so the UCC received the information and the emergency message “STOP ALL ACTIVITIES – EVACUATE IMMEDIATELY” was relayed immediately via all possible means of communication (R/F, WLAN, MORSE) to ensure no missed FR reception due to obstacles. All FRs evacuated the building area and rallied to the designated area outside. After the clearance to continue activities, the FR team wearing STF was re-deployed inside the building to continue the SAR operations. They located the second victim as they searched the southern basement, injured and incapacitated. The victim was trapped under the stairs with debris in front of it. Due to the injury mechanism (possible neck/head/spine injury) and limited access routes for the
Page 245 of 269

SafeGreece 2021 on-line Proceedings | ISSN 2654-1823
SafeGreece 2021 – 8th International Conference on Civil Protection & New Technologies 24-26 November, on-line | www.safegreece.org/safegreece2021 | [email protected]
stretcher, the victim was secured and evacuated horizontally via one of the windows at the south side of the building, moving it to the FR medical tent for further treatment and psychological aid.
Figure 2. Victim recovery, movement and evacuation during Scenario C (northern basement).
4. CONCLUSIONS
Given the nature and challenges of the work of FR teams in the field, it is clear than modern autonomous technologies like wearable devices, ad-hoc portable networking and sensor integration in the suits can provide extremely valuable modalities in their existing capabilities. During the recent field testing activities at HRTA’s ATC site these FASTER tools were successfully deployed and evaluated in realistic operational conditions. It was a great opportunity for FR teams to provide actionable feedback to the technical partners, who in turn could see how their developed tools are functioning in practice.
Figure 3. Overview of victim movement and recovery during Scenarios A and B (open field and building area).
REFERENCES
1. “First responder Advanced technologies for Safe and efficienT Emergency Response”. FASTER Project (GA-833507), EU Horizon H2020, CORDIS, E.C. – http://www.faster-project.eu
2. INSARAG, “USAR Coordination Manual”, Aug. 2017.3. P. Kasnesis, C. Chatzigeorgiou, L. Toumanidis, C. Z. Patrikakis (2019). Gesture-based incident reporting
through smart watches. IEEE Intl. Conf. on Perv. Comp. and Comm. Workshops.
Page 246 of 269

SafeGreece 2021 on-line Proceedings | ISSN 2654-1823
SafeGreece 2021 – 8th International Conference on Civil Protection & New Technologies 24-26 November, on-line | www.safegreece.org/safegreece2021 | [email protected]
#EUGreenDeal: SUSTAINABLE DEVELOPMENT IN GREECE THE CASE OF THE EUROPEAN GREEN DEAL PUBLIC CONSULTATION
Georgia Gioltzidou1, Thomai Baltzi2 , Sofia Karekla3, Ioanna Kostarella4, Antonis Skamnakis5 1, Department of Journalism and Mass Communication, Aristotle University of Thessaloniki, (Greece) and Adjunct Faculty member, Hellenic Open University and 2, Department of Journalism and Mass Communication, Aristotle
University of Thessaloniki, (Greece) (E-mail: [email protected] , [email protected])
3 Department of Journalism and Mass Communication, Aristotle University of Thessaloniki, (Greece) (E-mail: [email protected])
4 Faculty member, Department of Journalism and Mass Communication, Aristotle University of Thessaloniki, (Greece) , 5 Faculty member, Department of Journalism and Mass Communication, Aristotle University of
Thessaloniki, (Greece) (E-mail: [email protected], [email protected])
ABSTRACT This paper investigates how sustainable development issues are communicated in Greece. Specifically, the study focuses on the way in which Social Media users communicate with each other at times sustainable development issues are being put to public consultation. The reasoning of the research is part of the scientific discussion on the use of Social Media as communication tools for sustainable development. The main research question of the study was posed as follows: What are the main issues that appear in the public issues related to sustainable development and who are their main communicators?
The conclusions showed that Twitter users in Greece show low participation in discussions related to sustainable development, while the public debate is led more by government agencies than by citizens or politicians.
Keywords: Sustainable Development, Public Consultation, European Union, European Green Deal, Social Media, Twitter
1. INTRODUCTION
In the last years, the European Commission has made climate change a top priority, stated repeatedly its aim to be at the forefront of global action against climate change (Claeys, 2019). In this direction, in December 2019, the European Commission announced a new European growth strategy, the European Green Deal, which focus on making Europe climate neutral by 2050. More specifically, the new European Green Deal has the ambition to make the European Union the first climate-neutral continent by 2050 (Montanarella, 2021) and aspires to “protect the health and well-being of citizens from environment-related risks and impacts” (European Commission, 2019). The key to this transition is an increase in the emissions reductions target for 2030 to 50% (Elkerbout, 2020). The European Commission has recently launched a public consultation inviting citizens and organisations to express their opinions on how to increase the EU 2030 emission reduction ambition in a responsible way. The enhancement of public participation on environment and development decision-making is generally understood as an essential characteristic of governance sustainable development (Meadowcroft, 2004:162). In 1987, the World Commission on Environment and Development used the term “sustainable development” extensively and defined it as “Development that meets the needs of the present without compromising the ability of future generations to meet their own needs” (WCED, 1987:43). Despite the research and progress that have been made in “green” public consultations, there is no systematic study
Page 247 of 269

SafeGreece 2021 on-line Proceedings | ISSN 2654-1823
SafeGreece 2021 – 8th International Conference on Civil Protection & New Technologies 24-26 November, on-line | www.safegreece.org/safegreece2021 | [email protected]
for the case of Greece. Nevertheless, there is enough systematic investigation of Twitter as a communications platform (Bruns, 2014). As a news medium (Kwak, 2010), Twitter provides new insight into the divergence or systematicity of communicative patterns in a community (Bruns, 2014). Considering the above, the present study attempts to map the Social Media users’ involvement in the public sphere of sustainable development in Greece.
2. OBJECTIVE
In this research, we seak to identify how Social Media (especially Twitter) users communicate on issues related to sustainable development in Greece. We also seak to find who tweets about sustainable development and how they can be categorized. Greece was chosen as the geographical area for the study of the subject. The choice was made as, unlike other countries, there is no systematic study on the use of Social Media in discussions on sustainable development in Greece. The case study of the present research is the European Green Deal public consultation (4 March 2020 until 17 June 2020).
3. EXPERIMENTAL METHOD
In order to map the dimensions of who, when and what publishes, the study collected user activity data (tweets, relevant information, etc.) during the public consultation. With the use of Twitter for Developers we extracted all twitter posts in Greek, containing the official EU hashtag #EUGreenDeal. The profiles of the users who posted the tweets were searched and categorised one by one based on the Lotan (2011) study, aimed at finding the main actors in the discussions. Thereafter we proceeded with the textual analysis, in order to reveal the relationships between ideas embedded in text, based on the grounded theory.
4. RESULTS AND DISCUSSION
The topics that are examined in order to investigate the extent to which Social Media users are interested and discuss publicly on issues related to sustainable development are: the categories of users who post the messages, the content of the messages that are published, the frequency of the submission of hyperlinks by the media (links) and the number of hashtags used during the communication. Each section begins with a presentation of tables and graphs resulting from the analysis of Twitter data. The protagonists of the communication during the periods of public consultation are the Governmental organizations / bodies, in a percentage that exceeds 53% (Figure 1). Citizens' accounts follow, however their participation rate in public debates is very low (15%). As a group, journalists and media-owned accounts (traditional and non-traditional) rank third after citizens, but their overall share is only 9%. It is worth noting that, although they are the "timeless" protagonists of public consultations, politicians are the least active group, with 8%. In terms of content (Figure 2), we notice that news about developments in Europe are high in the preferences of Twitter users. Discussions regarding the developments in Greece are at a low level (6%), while the news that contains a comment (negative or positive) comes in second place, with a remarkable, however, percentage (36%). Rarely do messages appear in support of policies, demonstrating the general frustration of users with the country's political leaders.
Page 248 of 269
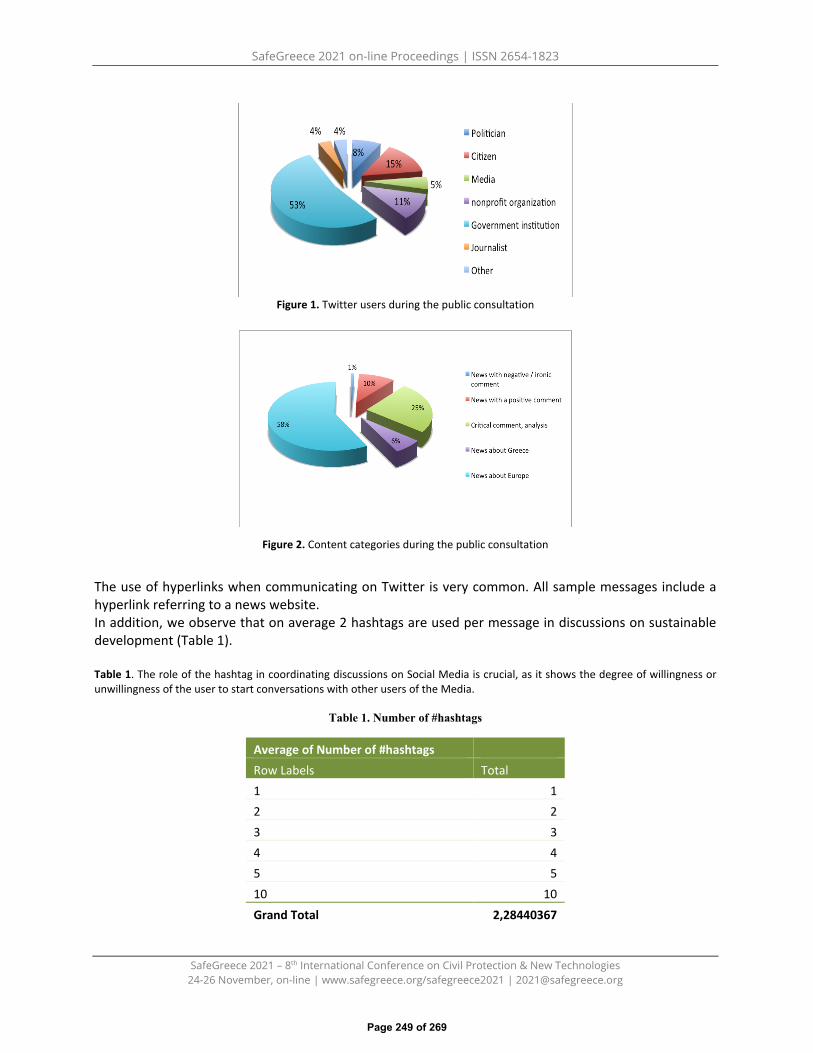
SafeGreece 2021 on-line Proceedings | ISSN 2654-1823
SafeGreece 2021 – 8th International Conference on Civil Protection & New Technologies 24-26 November, on-line | www.safegreece.org/safegreece2021 | [email protected]
Figure 1. Twitter users during the public consultation
Figure 2. Content categories during the public consultation
The use of hyperlinks when communicating on Twitter is very common. All sample messages include a hyperlink referring to a news website. In addition, we observe that on average 2 hashtags are used per message in discussions on sustainable development (Table 1).
Table 1. The role of the hashtag in coordinating discussions on Social Media is crucial, as it shows the degree of willingness or unwillingness of the user to start conversations with other users of the Media.
Table 1. Number of #hashtags
Average of Number of #hashtags Row Labels Total 1 1 2 2 3 3 4 4 5 5 10 10 Grand Total 2,28440367
Page 249 of 269

SafeGreece 2021 on-line Proceedings | ISSN 2654-1823
SafeGreece 2021 – 8th International Conference on Civil Protection & New Technologies 24-26 November, on-line | www.safegreece.org/safegreece2021 | [email protected]
5. CONCLUSION
The systematic observation of communication on Twitter during the selected period leads us to the conclusion that Twitter users in Greece are less interested in issues related to sustainable development. In particular, the main hashtag used by the EU for the public consultation of the European Green Agreement has collected a limited number of messages, only 109. Data analysis has emerged as the dominant news content type over time. In particular, during the public consultation period more than half of the messages (58%) were related to events in Europe. The priority of the users is therefore the information, free from comments. At the same time, however, we observe strong characteristics of commentary speech, which reach the limits of criticism and irony. In addition, it seems that the public debate in the Greek crisis is driven more by government agencies than by citizens (who are the largest users of the Social Media and were expected to be more involved) and journalists (who would be expected to have a dominant position at the beginning of discussions). Finally, through the number of hashtags they use (2 on average / message), we notice that users do not seek much diffusion of their messages and therefore more discussion with other users of the Media.
ACKOWLEDGEMENTS Funding: The project "Communication and Journalism for Sustainable Development. Greece as a case study is funded by the Hellenic Foundation for Research and Innovation (ELIDEK) and by the General Secretariat for Research and Technology (GSRT), with no. Project Contract 2839.
REFERENCES
1. Bruns, A., Woodford, D., & Sadkowsky, T. (2014). Towards a methodology for examining Twitter followeraccession. First Monday, 19(4). https://doi.org/10.5210/fm.v19i4.5211
2. Claeys, Gregory., Tagliapietra, Simone., Zachmann, Georg. 2019. How to make the European Green Dealwork. Policy Contribution Bruegel Institute, November 13. Accessedat: https://www.bruegel.org/2019/11/how-to-make-the-european-green-deal-work/
3. Elkerbout, Milan & Egenhofer, Christian & Nuñez, Jorge & Catuti, Mihnea & Kustova, Irina & Rizos, Vasileios. (2020). The European Green Deal after Corona: Implications for EU climate policy.
4. Kwak, Haewoon & Lee, Changhyun & Park, Hosung & Moon, Sue. (2010). What Is Twitter, a Social Networkor a News Media?. Proceedings of the 19th International Conference on World Wide Web, WWW '10. 19.10.1145/1772690.1772751.
5. Meadowcroft, James. (2007). Who is in Charge here? Governance for Sustainable Development in aComplex World. Journal of Environmental Policy & Planning - J ENVIRON POL PLAN. 9. 299-314.10.1080/15239080701631544.
6. Montanarella, Luca & Panagos, Panos. (2020). The relevance of sustainable soil management within theEuropean Green Deal. Land Use Policy. 100. 10.1016/j.landusepol.2020.104950.
7. S. Park, G. Pitner, G. Giri, J. H. Koo, J. Park, K. Kim, H. Wang, R. Sinclair, H.-S. Philip Wong, Z. Bao (2015).Large-Area Assembly of Densely Aligned Single-Walled Carbon Nanotubes Using Solution Shearing and TheirApplication to Field-Effect Transistors. Advance Materials, 27, 2656-2662.
8. World Commission on Environment and Development (WCED). (1987). Our common future. Oxford: Oxford University Press.
Page 250 of 269

SafeGreece 2021 on-line Proceedings | ISSN 2654-1823
SafeGreece 2021 – 8th International Conference on Civil Protection & New Technologies 24-26 November, on-line | www.safegreece.org/safegreece2021 | [email protected]
HEALTH UNITS AND OCCUPATIONAL SAFETY IN THRIASIO PLAIN AREA, GREECE Maria V. Mavrakis1, Anastasios Mavrakis2
1 Department of Public and One Health, University of Thessaly, Karditsa, Greece (E-mail: [email protected])
2 Environmental Education Coordinator, West Attica Secondary Education Directorate, Greek Ministry of Education, 24 I. Dragoumi str., GR–19200, Elefsis – Attica, Greece
(E-mail: [email protected])
ABSTRACT Occupational health is a vital component of the industrial development and economic growth. The reduce of such loses in the industrial sector has two components: a) safety procedures of each industry and b) health units for first aid. In this study we refer to some major “occupational or work-related disease” and the distribution of public health units in the industrial and socio-environmental stressed area of Thriasio Plain Greece. Results indicates that there is a need for a different model of management for such “occupational or work-related disease”.
Keywords: occupational disease, public health units, Thriasio Plain.
1. INTRODUCTION
A ‘work-related disease’ is any illness caused or made worse by workplace factors.This includes many diseases that have more complex causes, involving a combination of occupational and non-work-related factors. An ‘occupational disease’ is any disease caused primarily by exposure at work to a physical, organisational, chemical or biological risk factor or to a combination of these factors. Occupational diseases are mostly those listed in national legislation as resulting from exposure to risk factors at work. The recognition of an occupational disease may be linked to compensation if it is clear that there is a causal relationship between an occupational exposure and the disease [1, 2]. The European schedule of occupational diseases provides recommendations on which occupational diseases should be included in Member States’ national lists. It also makes recommendations on introducing rules for compensation, prevention and statistical data collection. Guidance documents at the EU level and at national level define the diagnostic and exposure criteria for recognising a work-related disease as a listed occupational disease. Additional criteria apply for compensation, mostly linked to minimum degrees of injury or of work incapacity. Many Member States publish data on recognised occupational diseases in annual reports, for example on the state of occupational safety and health [2 – 6]. Many types of disease, including cancer, respiratory disorders, cardiovascular disease, skin diseases, musculoskeletal disorders and mental health problems, can be caused or made worse by work. Although the underlying causes of such diseases may be complex, certain workplace exposures are known to contribute to the development or progression of a disease, including: • dangerous substances, such as chemical and biological agents, including carcinogens (for example
“work-related cancer”; “work-related diseases from biological agents”; etc)• physical factors, including vibration, noise, manual lifting and sedentary work (for example
“musculoskeletal disorders”; “fals”; “sedentary behavior”; etc)• work organisational and psychosocial risk factors, such as shift work and stress (for example “stress
and mental health disorders”; “skin diseases”;)• radiation, including ionising radiation and ultraviolet radiation from the sun (for example
‘Discomfort”, “Heat Illness”; “burns”; etc)
Page 251 of 269
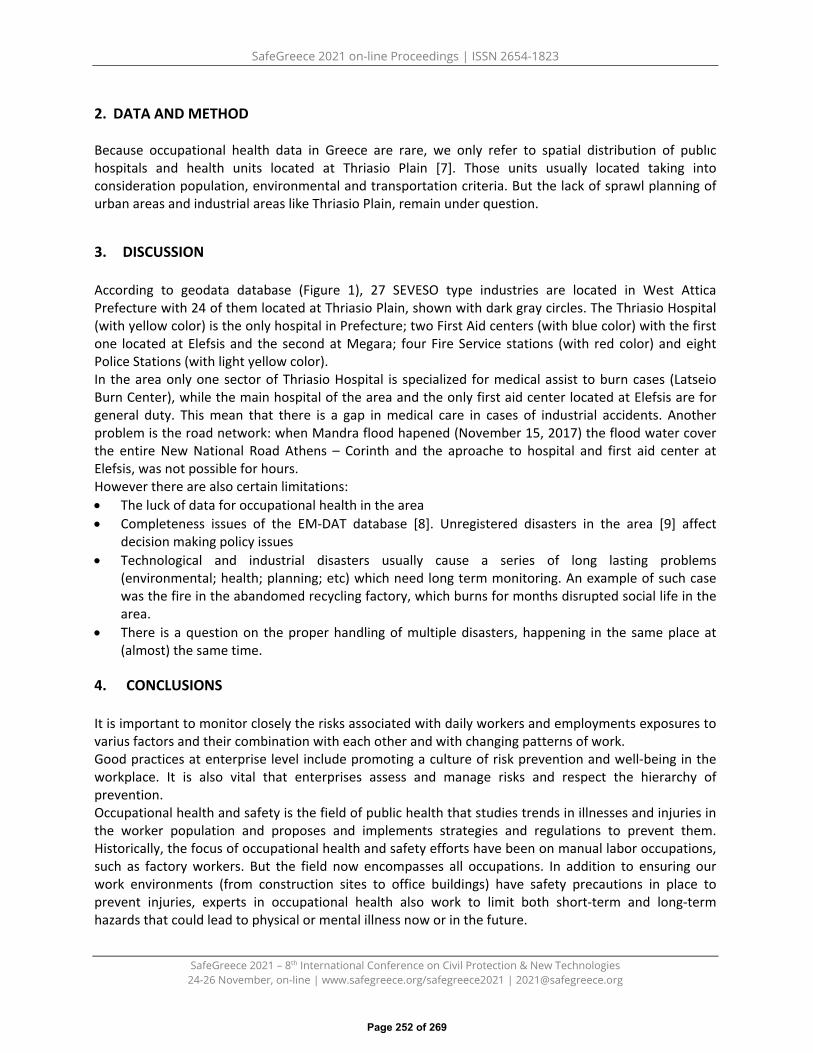
SafeGreece 2021 on-line Proceedings | ISSN 2654-1823
SafeGreece 2021 – 8th International Conference on Civil Protection & New Technologies 24-26 November, on-line | www.safegreece.org/safegreece2021 | [email protected]
2. DATA AND METHOD
Because occupational health data in Greece are rare, we only refer to spatial distribution of publıc hospitals and health units located at Thriasio Plain [7]. Those units usually located taking into consideration population, environmental and transportation criteria. But the lack of sprawl planning of urban areas and industrial areas like Thriasio Plain, remain under question.
3. DISCUSSION
According to geodata database (Figure 1), 27 SEVESO type industries are located in West Attica Prefecture with 24 of them located at Thriasio Plain, shown with dark gray circles. The Thriasio Hospital (with yellow color) is the only hospital in Prefecture; two First Aid centers (with blue color) with the first one located at Elefsis and the second at Megara; four Fire Service stations (with red color) and eight Police Stations (with light yellow color). In the area only one sector of Thriasio Hospital is specialized for medical assist to burn cases (Latseio Burn Center), while the main hospital of the area and the only first aid center located at Elefsis are for general duty. This mean that there is a gap in medical care in cases of industrial accidents. Another problem is the road network: when Mandra flood hapened (November 15, 2017) the flood water cover the entire New National Road Athens – Corinth and the aproache to hospital and first aid center at Elefsis, was not possible for hours. However there are also certain limitations: • The luck of data for occupational health in the area• Completeness issues of the EM-DAT database [8]. Unregistered disasters in the area [9] affect
decision making policy issues• Technological and industrial disasters usually cause a series of long lasting problems
(environmental; health; planning; etc) which need long term monitoring. An example of such casewas the fire in the abandomed recycling factory, which burns for months disrupted social life in thearea.
• There is a question on the proper handling of multiple disasters, happening in the same place at(almost) the same time.
4. CONCLUSIONS
It is important to monitor closely the risks associated with daily workers and employments exposures to varius factors and their combination with each other and with changing patterns of work. Good practices at enterprise level include promoting a culture of risk prevention and well-being in the workplace. It is also vital that enterprises assess and manage risks and respect the hierarchy of prevention. Occupational health and safety is the field of public health that studies trends in illnesses and injuries in the worker population and proposes and implements strategies and regulations to prevent them. Historically, the focus of occupational health and safety efforts have been on manual labor occupations, such as factory workers. But the field now encompasses all occupations. In addition to ensuring our work environments (from construction sites to office buildings) have safety precautions in place to prevent injuries, experts in occupational health also work to limit both short-term and long-term hazards that could lead to physical or mental illness now or in the future.
Page 252 of 269
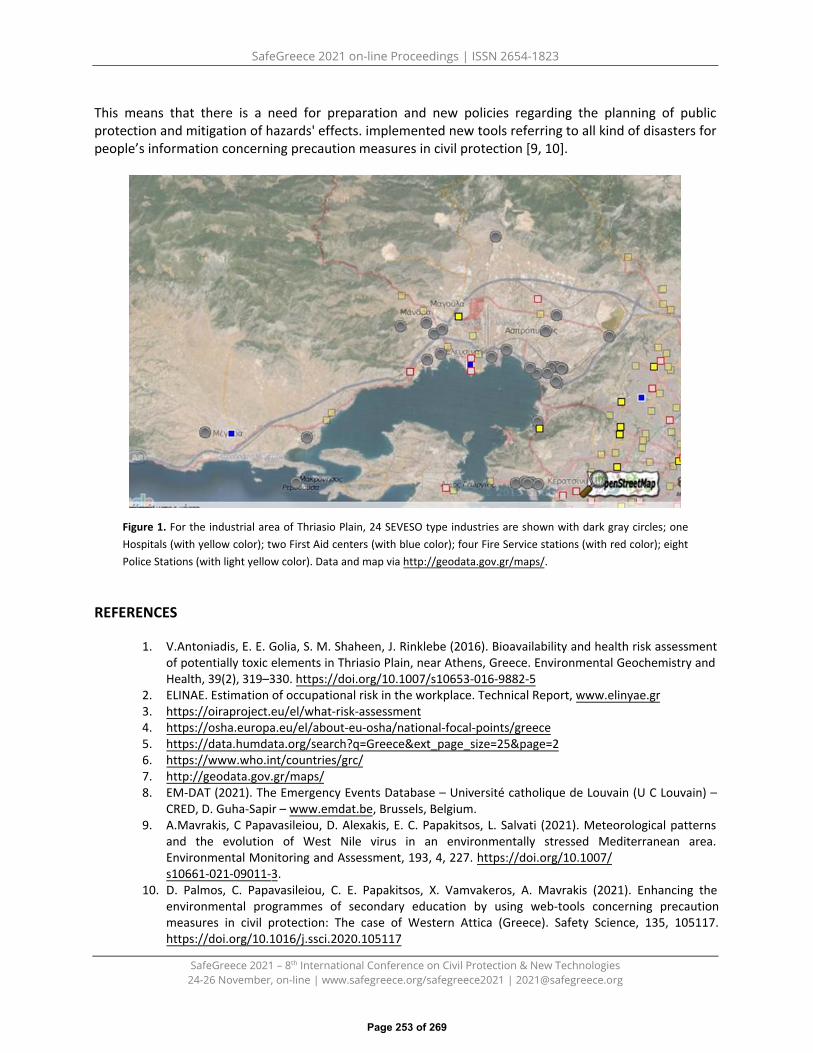
SafeGreece 2021 on-line Proceedings | ISSN 2654-1823
SafeGreece 2021 – 8th International Conference on Civil Protection & New Technologies 24-26 November, on-line | www.safegreece.org/safegreece2021 | [email protected]
This means that there is a need for preparation and new policies regarding the planning of public protection and mitigation of hazards' effects. implemented new tools referring to all kind of disasters for people’s information concerning precaution measures in civil protection [9, 10].
Figure 1. For the industrial area of Thriasio Plain, 24 SEVESO type industries are shown with dark gray circles; one Hospitals (with yellow color); two First Aid centers (with blue color); four Fire Service stations (with red color); eight Police Stations (with light yellow color). Data and map via http://geodata.gov.gr/maps/.
REFERENCES
1. V.Antoniadis, E. E. Golia, S. M. Shaheen, J. Rinklebe (2016). Bioavailability and health risk assessmentof potentially toxic elements in Thriasio Plain, near Athens, Greece. Environmental Geochemistry andHealth, 39(2), 319–330. https://doi.org/10.1007/s10653-016-9882-5
2. ELINAE. Estimation of occupational risk in the workplace. Technical Report, www.elinyae.gr3. https://oiraproject.eu/el/what-risk-assessment4. https://osha.europa.eu/el/about-eu-osha/national-focal-points/greece5. https://data.humdata.org/search?q=Greece&ext_page_size=25&page=26. https://www.who.int/countries/grc/7. http://geodata.gov.gr/maps/8. EM-DAT (2021). The Emergency Events Database – Université catholique de Louvain (U C Louvain) –
CRED, D. Guha-Sapir – www.emdat.be, Brussels, Belgium.9. A.Mavrakis, C Papavasileiou, D. Alexakis, E. C. Papakitsos, L. Salvati (2021). Meteorological patterns
and the evolution of West Nile virus in an environmentally stressed Mediterranean area.Environmental Monitoring and Assessment, 193, 4, 227. https://doi.org/10.1007/s10661-021-09011-3.
10. D. Palmos, C. Papavasileiou, C. E. Papakitsos, X. Vamvakeros, A. Mavrakis (2021). Enhancing theenvironmental programmes of secondary education by using web-tools concerning precautionmeasures in civil protection: The case of Western Attica (Greece). Safety Science, 135, 105117.https://doi.org/10.1016/j.ssci.2020.105117
Page 253 of 269
SafeGreece 2021 on-line Proceedings | ISSN 2654-1823
SafeGreece 2021 – 8th International Conference on Civil Protection & New Technologies 24-26 November, on-line | www.safegreece.org/safegreece2021 | [email protected]
WILDFIRE PREPAREDNESS AND RESPONSE AMIDST COVID-19 PANDEMIC CRISIS. CASE STUDY: THE EVACUATION OF THE BUTTERFLIES VALLEY IN RHODES
DURING THE WILDFIRES OF AUGUST 2021
Ilias Argyris1, Sofia Karma2,3, Milt Statheropoulos2,3, Spyros Georgiou4, Ioannis Boukis4, Dimitrios Menemenlis5, Nektarios Floskakis6
1Head of Civil Protection Office at Municipality of Rhodes, MSc, PhDc. Surveyor Engineer (Greece) (Email: [email protected])
2National Technical University of Athens, School of Chemical Engineering, Athens (Greece) (Email: [email protected])
3 European Center for Forest Fires, Council of Europe 4 Ministry for Climate Crisis and Civil Protection, General Secretariat for Civil Protection (Greece)
(Email: [email protected] , Email: [email protected]) 5 MSc, PhDc. Fire Major, Fire Department of Rhodes
(Email: [email protected]) 6 Deputy Mayor of Civil Protection at Municipality of Rhodes (Greece)
(Email: [email protected])
ABSTRACT The extreme weather events that have been recorded the recent years at international level are mostly correlated with the so called “climate crisis” that we currently experience. As a result, prolonged droughts, intense heat waves, destructive wildfires, exceptional rainfall and flash-floods etc. are observed in a global basis. Especially for the wildfires, due to the fact that increased number of population has been moved to urban and suburban areas in the Wildland Urban Interface (WUI), it seems that a wildfire at those areas may result to major impacts in terms of human and property losses. Nowadays, the COVID-19 pandemic crisis has intensified the challenges and difficulties for effective disaster risk management. It appears that complex emergencies will be the case for the future and therefore a multi-hazard risk approach might be necessary for copying with the relevant impacts. In that perspective, this work strives to provide with the experiences and lessons learned by a recent complex emergency, namely the management of a wildfire event and evacuation of Butterflies Valley in the Rhodes Island on the 1st of August 2021 under the COVID-19 pandemic conditions; a data file has been prepared including geographical data, vegetation – land use data, meteorological data, the resources used for suppressing the fire and other relevant data.
Keywords: wildfires, multi-hazard risks, COVID-19, Batterflies Valley, data file
1. INTRODUCTIONExtreme weather events that have been recorded the recent years at European and International level,such as prolonged droughts, heat waves in terms of increasing trends in frequency, duration andcumulative heat, as well as intensive rainfalls and flooding have been correlated with global warmingand climate change, the so called “climate crisis”. According to the IPCC, for 1.5°C of global warming,there will be increasing heat waves, longer warm seasons and shorter cold seasons [1]. Humanity hasrecently faced another hazard, this of Covid-19 pandemic that caused one of the greatest sanitary crisisof all years. The Covid-19 dispersion created “a new normal” for the human kind, in terms of health andsafety protocols application in their every-day life. Additionally, the social and economic impact wasglobally extraordinary [2-4]. In that perspective, it seems a real challenge if a need of emergency
Page 254 of 269
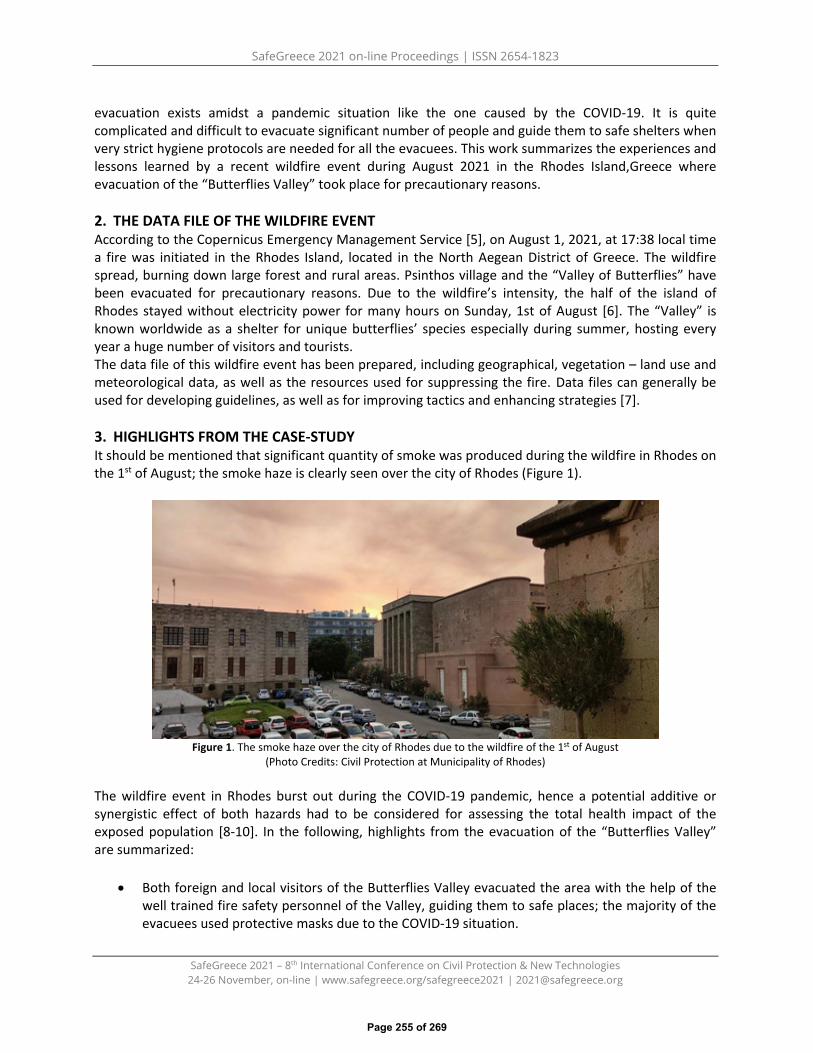
SafeGreece 2021 on-line Proceedings | ISSN 2654-1823
SafeGreece 2021 – 8th International Conference on Civil Protection & New Technologies 24-26 November, on-line | www.safegreece.org/safegreece2021 | [email protected]
evacuation exists amidst a pandemic situation like the one caused by the COVID-19. It is quite complicated and difficult to evacuate significant number of people and guide them to safe shelters when very strict hygiene protocols are needed for all the evacuees. This work summarizes the experiences and lessons learned by a recent wildfire event during August 2021 in the Rhodes Island,Greece where evacuation of the “Butterflies Valley” took place for precautionary reasons.
2. THE DATA FILE OF THE WILDFIRE EVENTAccording to the Copernicus Emergency Management Service [5], on August 1, 2021, at 17:38 local timea fire was initiated in the Rhodes Island, located in the North Aegean District of Greece. The wildfirespread, burning down large forest and rural areas. Psinthos village and the “Valley of Butterflies” havebeen evacuated for precautionary reasons. Due to the wildfire’s intensity, the half of the island ofRhodes stayed without electricity power for many hours on Sunday, 1st of August [6]. The “Valley” isknown worldwide as a shelter for unique butterflies’ species especially during summer, hosting everyyear a huge number of visitors and tourists.The data file of this wildfire event has been prepared, including geographical, vegetation – land use andmeteorological data, as well as the resources used for suppressing the fire. Data files can generally beused for developing guidelines, as well as for improving tactics and enhancing strategies [7].
3. HIGHLIGHTS FROM THE CASE-STUDYIt should be mentioned that significant quantity of smoke was produced during the wildfire in Rhodes onthe 1st of August; the smoke haze is clearly seen over the city of Rhodes (Figure 1).
Figure 1. The smoke haze over the city of Rhodes due to the wildfire of the 1st of August (Photo Credits: Civil Protection at Municipality of Rhodes)
The wildfire event in Rhodes burst out during the COVID-19 pandemic, hence a potential additive or synergistic effect of both hazards had to be considered for assessing the total health impact of the exposed population [8-10]. In the following, highlights from the evacuation of the “Butterflies Valley” are summarized:
• Both foreign and local visitors of the Butterflies Valley evacuated the area with the help of thewell trained fire safety personnel of the Valley, guiding them to safe places; the majority of theevacuees used protective masks due to the COVID-19 situation.
Page 255 of 269
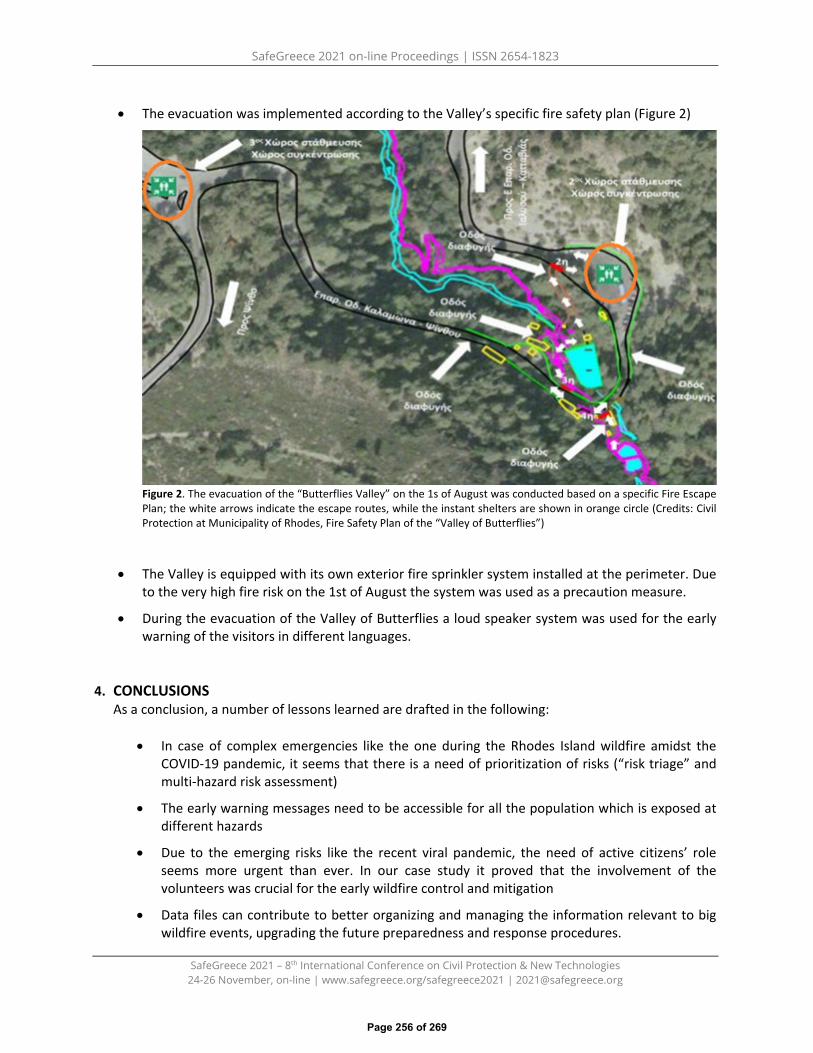
SafeGreece 2021 on-line Proceedings | ISSN 2654-1823
SafeGreece 2021 – 8th International Conference on Civil Protection & New Technologies 24-26 November, on-line | www.safegreece.org/safegreece2021 | [email protected]
• The evacuation was implemented according to the Valley’s specific fire safety plan (Figure 2)
Figure 2. The evacuation of the “Butterflies Valley” on the 1s of August was conducted based on a specific Fire Escape Plan; the white arrows indicate the escape routes, while the instant shelters are shown in orange circle (Credits: Civil Protection at Municipality of Rhodes, Fire Safety Plan of the “Valley of Butterflies”)
• The Valley is equipped with its own exterior fire sprinkler system installed at the perimeter. Dueto the very high fire risk on the 1st of August the system was used as a precaution measure.
• During the evacuation of the Valley of Butterflies a loud speaker system was used for the earlywarning of the visitors in different languages.
4. CONCLUSIONSAs a conclusion, a number of lessons learned are drafted in the following:
• In case of complex emergencies like the one during the Rhodes Island wildfire amidst theCOVID-19 pandemic, it seems that there is a need of prioritization of risks (“risk triage” andmulti-hazard risk assessment)
• The early warning messages need to be accessible for all the population which is exposed atdifferent hazards
• Due to the emerging risks like the recent viral pandemic, the need of active citizens’ roleseems more urgent than ever. In our case study it proved that the involvement of thevolunteers was crucial for the early wildfire control and mitigation
• Data files can contribute to better organizing and managing the information relevant to bigwildfire events, upgrading the future preparedness and response procedures.
Page 256 of 269

SafeGreece 2021 on-line Proceedings | ISSN 2654-1823
SafeGreece 2021 – 8th International Conference on Civil Protection & New Technologies 24-26 November, on-line | www.safegreece.org/safegreece2021 | [email protected]
REFERENCES
1. Climate change widespread, rapid, and intensifying – IPCC, Available at:https://www.ipcc.ch/2021/08/09/ar6-wg1-20210809-pr/, Accessed November 2021
2. Peeri, N. C., Shrestha, N., Rahman, M. S., Zaki, R., Tan, Z., Bibi, S., Baghbanzadeh, M., Aghamohammadi,N., Zhang, W., & Haque, U, 2020. The SARS, MERS and novel coronavirus (COVID-19) epidemics, thenewest and biggest global health threats: What lessons have we learned? International Journal ofEpidemiology. Advance online publication. doi: 10.1093/ije/dyaa033
3. Shenker, J. (2020, March 26). Cities after coronavirus: How Covid-19 could radically alter urban life. TheGuardian. Available at: https://www.theguardian.com/world/2020/mar/26/life-after-coronavirus-pandemic-change-world, Accessed November 2021
4. World Health Organization (WHO). (2020). Coronavirus disease (COVID-19) advice for the public. Availableat: https://www.who.int/emergencies/diseases/novel-coronavirus-2019/advice-for-public, AccessedNovember 2021
5. EMSR526: Fire in Rhodes island, North Aegean District, Greece, Copernicus Emergency ManagementService, Available at: https://emergency.copernicus.eu/mapping/list-of-components/EMSR526, Accessedon November 2021
6. Rhodes is on fire - Most of the island is without electricity, Available at:https://www.typosthes.gr/koinonia/256600_flegetai-anexelegkta-i-rodos-horis-reyma-megalo-meros-toy-nisioy-foto-video, Accessed on November 2021
7. FFNet, Forest Fire Net Volume 5. Forest fires in Greece during summer 2007: The data file of a case study.European Center for Forest Fires, Council of Europe. Available at:https://www.civilprotection.gr/sites/default/gscp_uploads/ffnet_5.pdf, Accessed November 2021
8. S. Karma et.al, 2019. Challenges and Lessons Learned from past major Environmental. Disasters due toTechnological or Wildland Urban Interface Fire Incidents. Contributing paper to the Global AssessmentReport on Disaster Risk Reduction (GAR 2019), UNDRR, Available at:(https://www.preventionweb.net/publications/view/66718), Accessed November 2021
9. M. Statheropoulos, S.Karma, Complexity and origin of the smoke components as measured near theflame-front of a real forest fire incident: A case study, Journal of Analytical and Applied Pyrolysis, 2007,78, 430-437
10. I. Dokas, M. Statheropoulos, S. Karma,Integration of field chemical data in initial risk assessment of forestfire smoke, Science of The Total Environment, 376,Issues 1–3,2007, Pages 72-85
Page 257 of 269


thanks to:
Copyright © 2022 FDOKUMEN