Attenuation of skeletal muscle and strength in the elderly: The Health ABC Study
Upload
independentCategory
view
3download
0
STUDY DESIGN ARTICLE
Rural–urban differences in health and health behaviour: A baselinedescription of a community health-promotion programme for theelderly
MIKAEL FOGELHOLM1,2, RAISA VALVE3, PILVIKKI ABSETZ4, HEIKKI HEINONEN4,
ANTTI UUTELA4, KRISTIINA PATJA4, ANTTI KARISTO5, RIIKKA KONTTINEN3,
TIINA MAKELA3, AULIKKI NISSINEN4, PIIA JALLINOJA4, OLLI NUMMELA4 &
MARTTI TALJA6
1The UKK Institute for Health Promotion Research, Tampere, Finland, 2Research Unit, Pirkanmaa Hospital District,
Tampere, Finland, 3Palmenia Centre for Continuing Education, University of Helsinki, Lahti, Finland, 4National Public
Health Institute, Helsinki, Finland, 5Department of Social Policy, University of Helsinki, Finland, and 6Paijat-Hame
Hospital District, Lahti, Finland
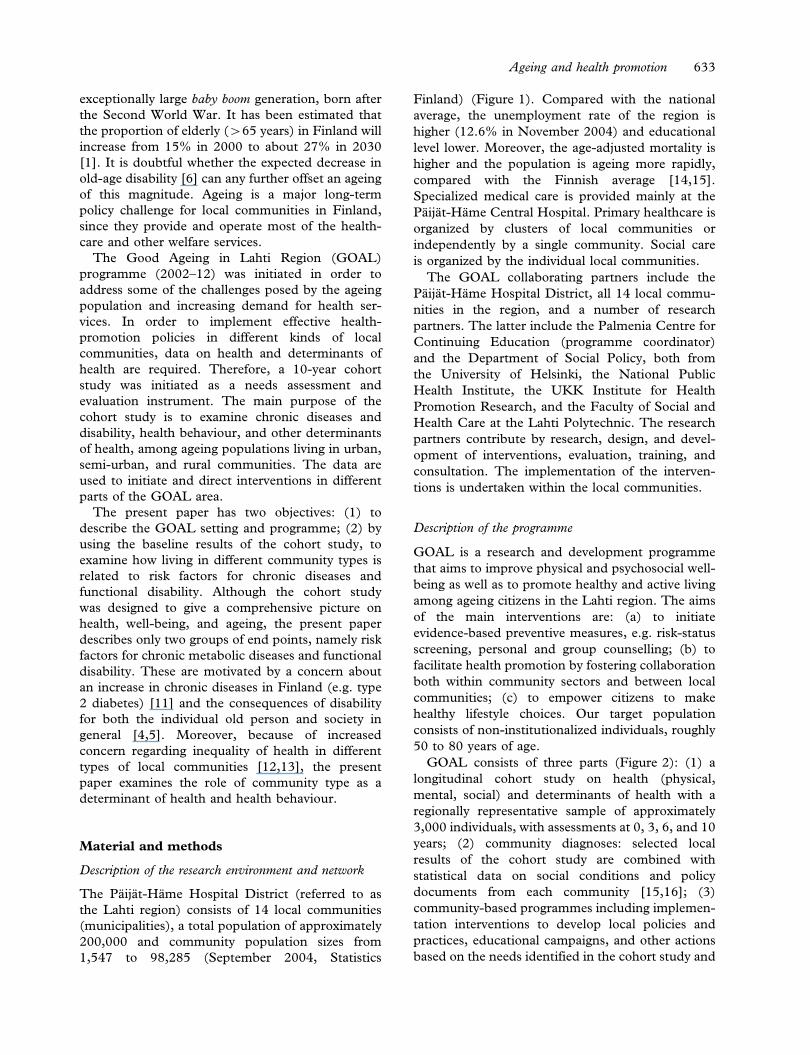
AbstractStudy objective: To (1) describe the setting and design of the Good Ageing in Lahti Region (GOAL) programme; (2) byusing the baseline results of the GOAL cohort study, to examine whether living in urban, semi-urban, or rural communitiesis related to risk factors for chronic diseases and functional disability in ageing individuals. Design: The baseline data of acohort study of ageing individuals living in three community types (urban, semi-urban, rural). Data were collected by twoquestionnaires and laboratory assessments. Setting: Fourteen municipalities in the Lahti region (Paijat-Hame County) inFinland. Participants: A regionally and locally stratified random sample of men and women born in 1946–50, 1936–40, and1926–30. A total of 4,272 were invited and 2,815 (66%) participated. Main results: Elevated serum cholesterol, obesity,disability, sedentary lifestyle (v2 times/week walking), and high fat intake were more prevalent in rural vs. urban and semi-urban communities. After adjustment for sex, age, education, obesity, diet, physical activity, smoking, and alcohol use, ruralcommunities remained the only community type with increased (pv0.05) probability for high BMI (OR 1.33) and highwaist circumference (OR 1.43). Conclusions: The unfavourable health and lifestyle profile, together with an old population,makes health promotion for elderly citizens a special challenge for rural communities such as those in Paijat-Hame County,Finland. Most, if not all, of the differences in health between the three community types were explained by educationalbackground, physical activity, and smoking.
Key Words: Chronic diseases, disability, elderly, rural, urban, urbanization
Introduction
The demographic shift with a growing proportion of
elderly individuals (w65 years) is expected to
continue for the next 30–50 years [1]. Ageing per
se is associated with an increased prevalence of non-
communicable diseases (e.g. cardiovascular diseases,
type 2 diabetes, hypertension, etc.) and cognitive
and functional disability [2,3], and dependency on
external help [4,5]. The age-related morbidity and
disability may be shifted to a later age and their
impact on quality of life can be reduced [6].
Modification of risk factors (e.g. physical activity
and diet), increased social support, environmental
changes, and more effective medical care have been
potential explanations for improved functioning
during the last two decades [6–8]. Studies from the
US suggest that the positive trend in disability may
even offset the effects of population ageing [9,10].
Among OECD countries, the process of ageing is
the most rapid in Finland [1]. This is due to the
Correspondence: Mikael Fogelholm, The UKK Institute for Health Promotion Research, POB 30, 33501 Tampere, Finland. Tel: +358 3 282 9201. Fax: +358
3 282 9559. E-mail: [email protected]
(Accepted 6 February 2006)
Scandinavian Journal of Public Health, 2006; 34: 632–640
ISSN 1403-4948 print/ISSN 1651-1905 online/06/060632-9 # 2006 Taylor & Francis
DOI: 10.1080/14034940600616039
exceptionally large baby boom generation, born after
the Second World War. It has been estimated that
the proportion of elderly (w65 years) in Finland will
increase from 15% in 2000 to about 27% in 2030
[1]. It is doubtful whether the expected decrease in
old-age disability [6] can any further offset an ageing
of this magnitude. Ageing is a major long-term
policy challenge for local communities in Finland,
since they provide and operate most of the health-
care and other welfare services.
The Good Ageing in Lahti Region (GOAL)
programme (2002–12) was initiated in order to
address some of the challenges posed by the ageing
population and increasing demand for health ser-
vices. In order to implement effective health-
promotion policies in different kinds of local
communities, data on health and determinants of
health are required. Therefore, a 10-year cohort
study was initiated as a needs assessment and
evaluation instrument. The main purpose of the
cohort study is to examine chronic diseases and
disability, health behaviour, and other determinants
of health, among ageing populations living in urban,
semi-urban, and rural communities. The data are
used to initiate and direct interventions in different
parts of the GOAL area.
The present paper has two objectives: (1) to
describe the GOAL setting and programme; (2) by
using the baseline results of the cohort study, to
examine how living in different community types is
related to risk factors for chronic diseases and
functional disability. Although the cohort study
was designed to give a comprehensive picture on
health, well-being, and ageing, the present paper
describes only two groups of end points, namely risk
factors for chronic metabolic diseases and functional
disability. These are motivated by a concern about
an increase in chronic diseases in Finland (e.g. type
2 diabetes) [11] and the consequences of disability
for both the individual old person and society in
general [4,5]. Moreover, because of increased
concern regarding inequality of health in different
types of local communities [12,13], the present
paper examines the role of community type as a
determinant of health and health behaviour.
Material and methods
Description of the research environment and network
The Paijat-Hame Hospital District (referred to as
the Lahti region) consists of 14 local communities
(municipalities), a total population of approximately
200,000 and community population sizes from
1,547 to 98,285 (September 2004, Statistics
Finland) (Figure 1). Compared with the national
average, the unemployment rate of the region is
higher (12.6% in November 2004) and educational
level lower. Moreover, the age-adjusted mortality is
higher and the population is ageing more rapidly,
compared with the Finnish average [14,15].
Specialized medical care is provided mainly at the
Paijat-Hame Central Hospital. Primary healthcare is
organized by clusters of local communities or
independently by a single community. Social care
is organized by the individual local communities.
The GOAL collaborating partners include the
Paijat-Hame Hospital District, all 14 local commu-
nities in the region, and a number of research
partners. The latter include the Palmenia Centre for
Continuing Education (programme coordinator)
and the Department of Social Policy, both from
the University of Helsinki, the National Public
Health Institute, the UKK Institute for Health
Promotion Research, and the Faculty of Social and
Health Care at the Lahti Polytechnic. The research
partners contribute by research, design, and devel-
opment of interventions, evaluation, training, and
consultation. The implementation of the interven-
tions is undertaken within the local communities.
Description of the programme
GOAL is a research and development programme
that aims to improve physical and psychosocial well-
being as well as to promote healthy and active living
among ageing citizens in the Lahti region. The aims
of the main interventions are: (a) to initiate
evidence-based preventive measures, e.g. risk-status
screening, personal and group counselling; (b) to
facilitate health promotion by fostering collaboration
both within community sectors and between local
communities; (c) to empower citizens to make
healthy lifestyle choices. Our target population
consists of non-institutionalized individuals, roughly
50 to 80 years of age.
GOAL consists of three parts (Figure 2): (1) a
longitudinal cohort study on health (physical,
mental, social) and determinants of health with a
regionally representative sample of approximately
3,000 individuals, with assessments at 0, 3, 6, and 10
years; (2) community diagnoses: selected local
results of the cohort study are combined with
statistical data on social conditions and policy
documents from each community [15,16]; (3)
community-based programmes including implemen-
tation interventions to develop local policies and
practices, educational campaigns, and other actions
based on the needs identified in the cohort study and
Ageing and health promotion 633
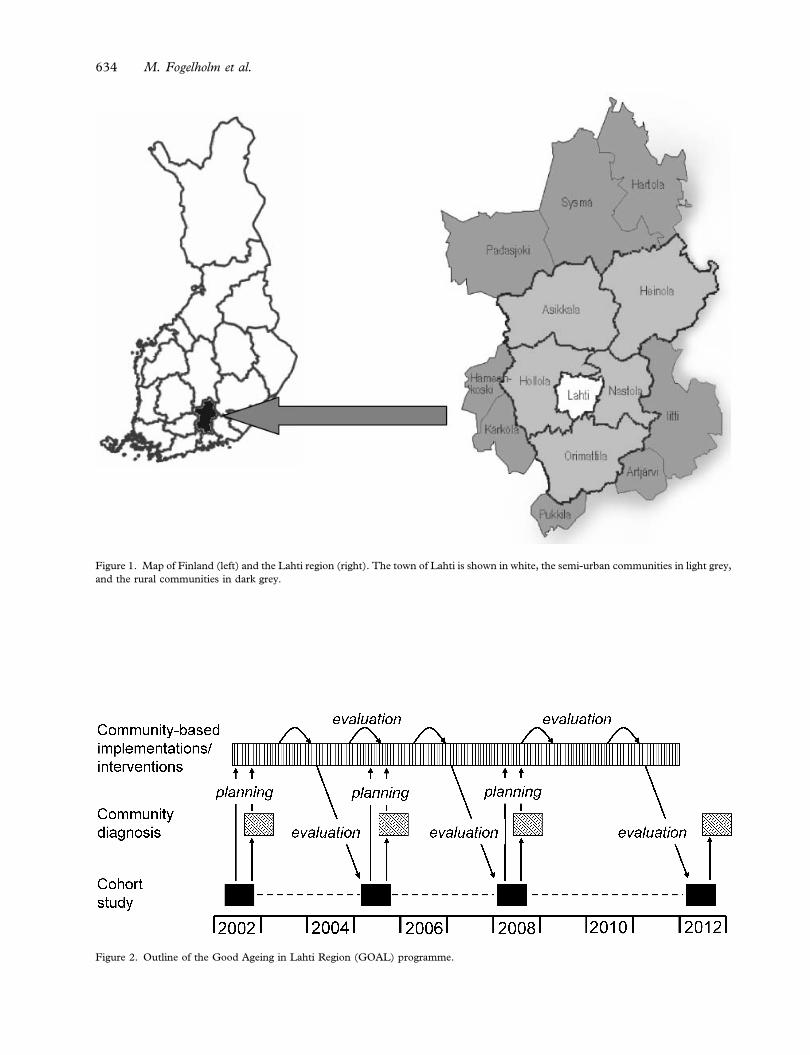
Figure 1. Map of Finland (left) and the Lahti region (right). The town of Lahti is shown in white, the semi-urban communities in light grey,
and the rural communities in dark grey.
Figure 2. Outline of the Good Ageing in Lahti Region (GOAL) programme.
634 M. Fogelholm et al.
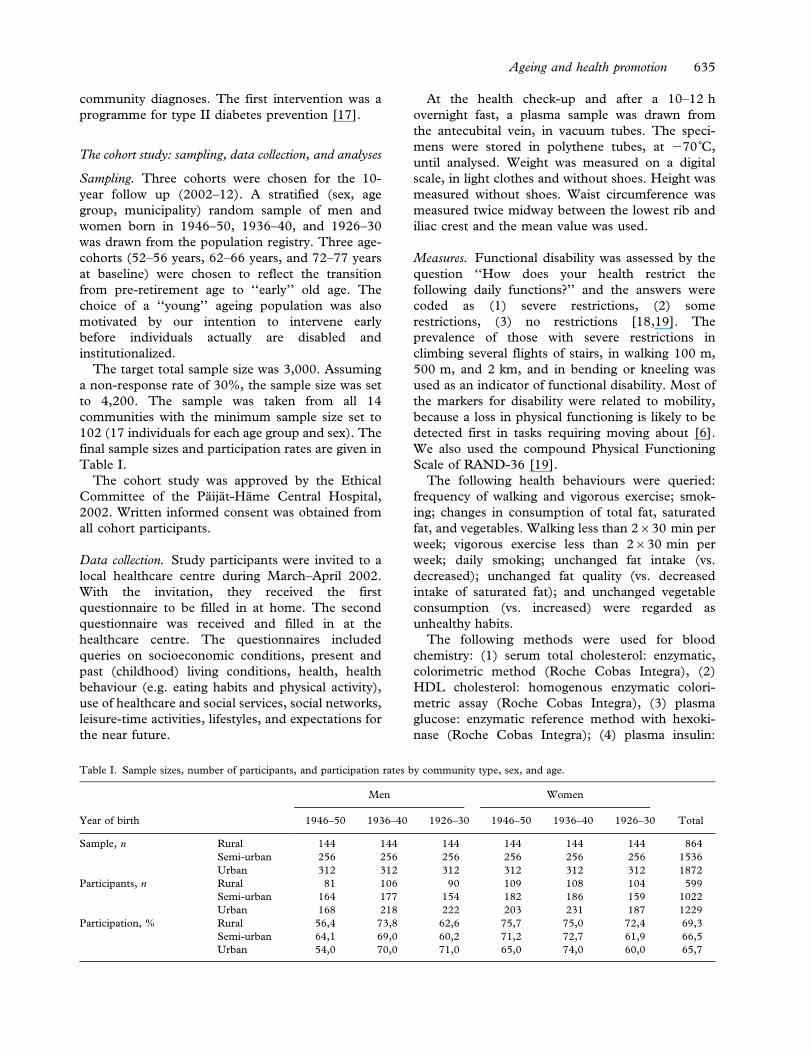
community diagnoses. The first intervention was a
programme for type II diabetes prevention [17].
The cohort study: sampling, data collection, and analyses
Sampling. Three cohorts were chosen for the 10-
year follow up (2002–12). A stratified (sex, age
group, municipality) random sample of men and
women born in 1946–50, 1936–40, and 1926–30
was drawn from the population registry. Three age-
cohorts (52–56 years, 62–66 years, and 72–77 years
at baseline) were chosen to reflect the transition
from pre-retirement age to ‘‘early’’ old age. The
choice of a ‘‘young’’ ageing population was also
motivated by our intention to intervene early
before individuals actually are disabled and
institutionalized.
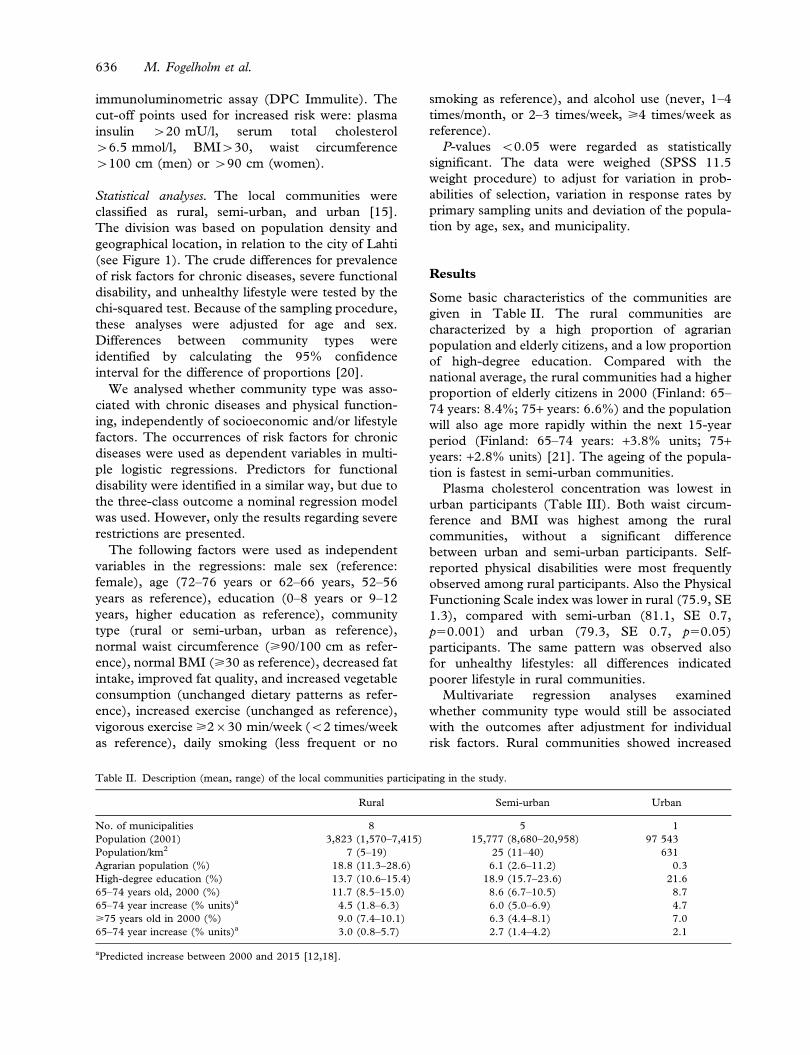
The target total sample size was 3,000. Assuming
a non-response rate of 30%, the sample size was set
to 4,200. The sample was taken from all 14
communities with the minimum sample size set to
102 (17 individuals for each age group and sex). The
final sample sizes and participation rates are given in
Table I.
The cohort study was approved by the Ethical
Committee of the Paijat-Hame Central Hospital,
2002. Written informed consent was obtained from
all cohort participants.
Data collection. Study participants were invited to a
local healthcare centre during March–April 2002.
With the invitation, they received the first
questionnaire to be filled in at home. The second
questionnaire was received and filled in at the
healthcare centre. The questionnaires included
queries on socioeconomic conditions, present and
past (childhood) living conditions, health, health
behaviour (e.g. eating habits and physical activity),
use of healthcare and social services, social networks,
leisure-time activities, lifestyles, and expectations for
the near future.
At the health check-up and after a 10–12 h
overnight fast, a plasma sample was drawn from
the antecubital vein, in vacuum tubes. The speci-
mens were stored in polythene tubes, at 270˚C,
until analysed. Weight was measured on a digital
scale, in light clothes and without shoes. Height was
measured without shoes. Waist circumference was
measured twice midway between the lowest rib and
iliac crest and the mean value was used.
Measures. Functional disability was assessed by the
question ‘‘How does your health restrict the
following daily functions?’’ and the answers were
coded as (1) severe restrictions, (2) some
restrictions, (3) no restrictions [18,19]. The
prevalence of those with severe restrictions in
climbing several flights of stairs, in walking 100 m,
500 m, and 2 km, and in bending or kneeling was
used as an indicator of functional disability. Most of
the markers for disability were related to mobility,
because a loss in physical functioning is likely to be
detected first in tasks requiring moving about [6].
We also used the compound Physical Functioning
Scale of RAND-36 [19].
The following health behaviours were queried:
frequency of walking and vigorous exercise; smok-
ing; changes in consumption of total fat, saturated
fat, and vegetables. Walking less than 2630 min per
week; vigorous exercise less than 2630 min per
week; daily smoking; unchanged fat intake (vs.
decreased); unchanged fat quality (vs. decreased
intake of saturated fat); and unchanged vegetable
consumption (vs. increased) were regarded as
unhealthy habits.
The following methods were used for blood
chemistry: (1) serum total cholesterol: enzymatic,
colorimetric method (Roche Cobas Integra), (2)
HDL cholesterol: homogenous enzymatic colori-
metric assay (Roche Cobas Integra), (3) plasma
glucose: enzymatic reference method with hexoki-
nase (Roche Cobas Integra); (4) plasma insulin:
Table I. Sample sizes, number of participants, and participation rates by community type, sex, and age.
Year of birth
Men Women
Total1946–50 1936–40 1926–30 1946–50 1936–40 1926–30
Sample, n Rural 144 144 144 144 144 144 864
Semi-urban 256 256 256 256 256 256 1536
Urban 312 312 312 312 312 312 1872
Participants, n Rural 81 106 90 109 108 104 599
Semi-urban 164 177 154 182 186 159 1022
Urban 168 218 222 203 231 187 1229
Participation, % Rural 56,4 73,8 62,6 75,7 75,0 72,4 69,3
Semi-urban 64,1 69,0 60,2 71,2 72,7 61,9 66,5
Urban 54,0 70,0 71,0 65,0 74,0 60,0 65,7
Ageing and health promotion 635
immunoluminometric assay (DPC Immulite). The
cut-off points used for increased risk were: plasma
insulin w20 mU/l, serum total cholesterol
w6.5 mmol/l, BMIw30, waist circumference
w100 cm (men) or w90 cm (women).
Statistical analyses. The local communities were
classified as rural, semi-urban, and urban [15].
The division was based on population density and
geographical location, in relation to the city of Lahti
(see Figure 1). The crude differences for prevalence
of risk factors for chronic diseases, severe functional
disability, and unhealthy lifestyle were tested by the
chi-squared test. Because of the sampling procedure,
these analyses were adjusted for age and sex.
Differences between community types were
identified by calculating the 95% confidence
interval for the difference of proportions [20].
We analysed whether community type was asso-
ciated with chronic diseases and physical function-
ing, independently of socioeconomic and/or lifestyle
factors. The occurrences of risk factors for chronic
diseases were used as dependent variables in multi-
ple logistic regressions. Predictors for functional
disability were identified in a similar way, but due to
the three-class outcome a nominal regression model
was used. However, only the results regarding severe
restrictions are presented.
The following factors were used as independent
variables in the regressions: male sex (reference:
female), age (72–76 years or 62–66 years, 52–56
years as reference), education (0–8 years or 9–12
years, higher education as reference), community
type (rural or semi-urban, urban as reference),
normal waist circumference (>90/100 cm as refer-
ence), normal BMI (>30 as reference), decreased fat
intake, improved fat quality, and increased vegetable
consumption (unchanged dietary patterns as refer-
ence), increased exercise (unchanged as reference),
vigorous exercise >2630 min/week (v2 times/week
as reference), daily smoking (less frequent or no
smoking as reference), and alcohol use (never, 1–4
times/month, or 2–3 times/week, >4 times/week as
reference).
P-values v0.05 were regarded as statistically
significant. The data were weighed (SPSS 11.5
weight procedure) to adjust for variation in prob-
abilities of selection, variation in response rates by
primary sampling units and deviation of the popula-
tion by age, sex, and municipality.
Results
Some basic characteristics of the communities are
given in Table II. The rural communities are
characterized by a high proportion of agrarian
population and elderly citizens, and a low proportion
of high-degree education. Compared with the
national average, the rural communities had a higher
proportion of elderly citizens in 2000 (Finland: 65–
74 years: 8.4%; 75+ years: 6.6%) and the population
will also age more rapidly within the next 15-year
period (Finland: 65–74 years: +3.8% units; 75+years: +2.8% units) [21]. The ageing of the popula-
tion is fastest in semi-urban communities.
Plasma cholesterol concentration was lowest in
urban participants (Table III). Both waist circum-
ference and BMI was highest among the rural
communities, without a significant difference
between urban and semi-urban participants. Self-
reported physical disabilities were most frequently
observed among rural participants. Also the Physical
Functioning Scale index was lower in rural (75.9, SE
1.3), compared with semi-urban (81.1, SE 0.7,
p50.001) and urban (79.3, SE 0.7, p50.05)
participants. The same pattern was observed also
for unhealthy lifestyles: all differences indicated
poorer lifestyle in rural communities.
Multivariate regression analyses examined
whether community type would still be associated
with the outcomes after adjustment for individual
risk factors. Rural communities showed increased
Table II. Description (mean, range) of the local communities participating in the study.
Rural Semi-urban Urban
No. of municipalities 8 5 1
Population (2001) 3,823 (1,570–7,415) 15,777 (8,680–20,958) 97 543
Population/km2 7 (5–19) 25 (11–40) 631
Agrarian population (%) 18.8 (11.3–28.6) 6.1 (2.6–11.2) 0.3
High-degree education (%) 13.7 (10.6–15.4) 18.9 (15.7–23.6) 21.6
65–74 years old, 2000 (%) 11.7 (8.5–15.0) 8.6 (6.7–10.5) 8.7
65–74 year increase (% units)a 4.5 (1.8–6.3) 6.0 (5.0–6.9) 4.7
>75 years old in 2000 (%) 9.0 (7.4–10.1) 6.3 (4.4–8.1) 7.0
65–74 year increase (% units)a 3.0 (0.8–5.7) 2.7 (1.4–4.2) 2.1
aPredicted increase between 2000 and 2015 [12,18].
636 M. Fogelholm et al.
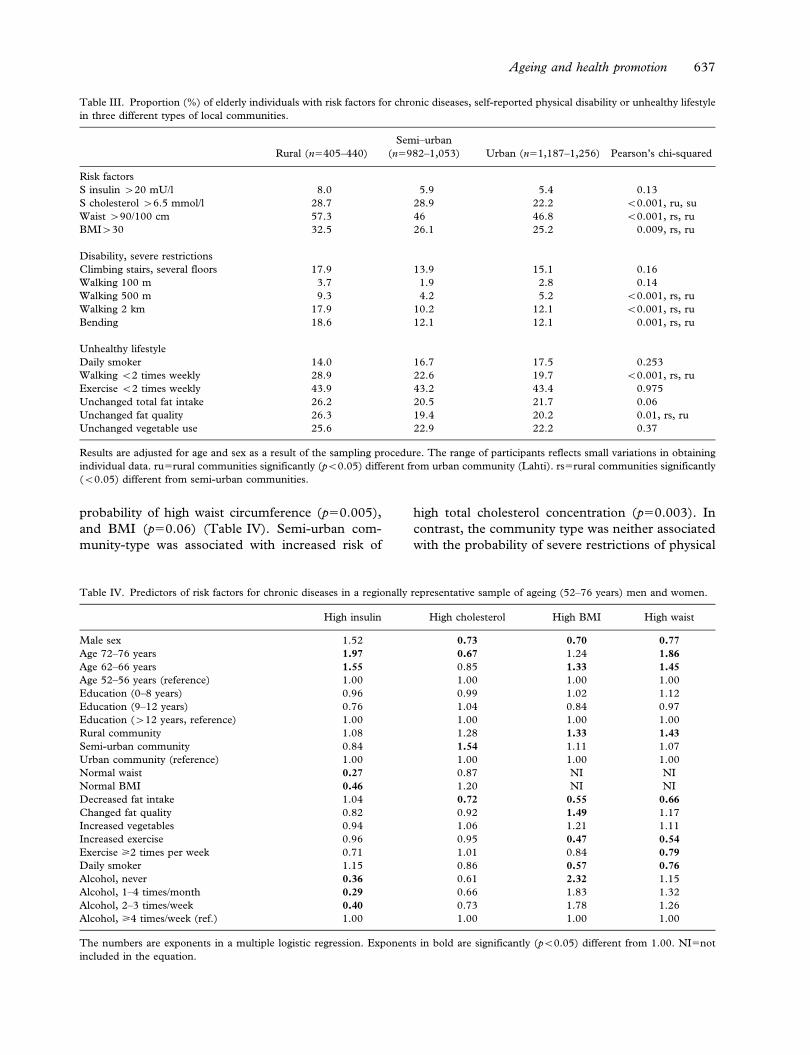
probability of high waist circumference (p50.005),
and BMI (p50.06) (Table IV). Semi-urban com-
munity-type was associated with increased risk of
high total cholesterol concentration (p50.003). In
contrast, the community type was neither associated
with the probability of severe restrictions of physical
Table III. Proportion (%) of elderly individuals with risk factors for chronic diseases, self-reported physical disability or unhealthy lifestyle
in three different types of local communities.
Rural (n5405–440)
Semi–urban
(n5982–1,053) Urban (n51,187–1,256) Pearson’s chi-squared
Risk factors
S insulin w20 mU/l 8.0 5.9 5.4 0.13
S cholesterol w6.5 mmol/l 28.7 28.9 22.2 v0.001, ru, su
Waist w90/100 cm 57.3 46 46.8 v0.001, rs, ru
BMIw30 32.5 26.1 25.2 0.009, rs, ru
Disability, severe restrictions
Climbing stairs, several floors 17.9 13.9 15.1 0.16
Walking 100 m 3.7 1.9 2.8 0.14
Walking 500 m 9.3 4.2 5.2 v0.001, rs, ru
Walking 2 km 17.9 10.2 12.1 v0.001, rs, ru
Bending 18.6 12.1 12.1 0.001, rs, ru
Unhealthy lifestyle
Daily smoker 14.0 16.7 17.5 0.253
Walking v2 times weekly 28.9 22.6 19.7 v0.001, rs, ru
Exercise v2 times weekly 43.9 43.2 43.4 0.975
Unchanged total fat intake 26.2 20.5 21.7 0.06
Unchanged fat quality 26.3 19.4 20.2 0.01, rs, ru
Unchanged vegetable use 25.6 22.9 22.2 0.37
Results are adjusted for age and sex as a result of the sampling procedure. The range of participants reflects small variations in obtaining
individual data. ru5rural communities significantly (pv0.05) different from urban community (Lahti). rs5rural communities significantly
(v0.05) different from semi-urban communities.
Table IV. Predictors of risk factors for chronic diseases in a regionally representative sample of ageing (52–76 years) men and women.
High insulin High cholesterol High BMI High waist
Male sex 1.52 0.73 0.70 0.77
Age 72–76 years 1.97 0.67 1.24 1.86
Age 62–66 years 1.55 0.85 1.33 1.45
Age 52–56 years (reference) 1.00 1.00 1.00 1.00
Education (0–8 years) 0.96 0.99 1.02 1.12
Education (9–12 years) 0.76 1.04 0.84 0.97
Education (w12 years, reference) 1.00 1.00 1.00 1.00
Rural community 1.08 1.28 1.33 1.43
Semi-urban community 0.84 1.54 1.11 1.07
Urban community (reference) 1.00 1.00 1.00 1.00
Normal waist 0.27 0.87 NI NI
Normal BMI 0.46 1.20 NI NI
Decreased fat intake 1.04 0.72 0.55 0.66
Changed fat quality 0.82 0.92 1.49 1.17
Increased vegetables 0.94 1.06 1.21 1.11
Increased exercise 0.96 0.95 0.47 0.54
Exercise >2 times per week 0.71 1.01 0.84 0.79
Daily smoker 1.15 0.86 0.57 0.76
Alcohol, never 0.36 0.61 2.32 1.15
Alcohol, 1–4 times/month 0.29 0.66 1.83 1.32
Alcohol, 2–3 times/week 0.40 0.73 1.78 1.26
Alcohol, >4 times/week (ref.) 1.00 1.00 1.00 1.00
The numbers are exponents in a multiple logistic regression. Exponents in bold are significantly (pv0.05) different from 1.00. NI5not
included in the equation.
Ageing and health promotion 637
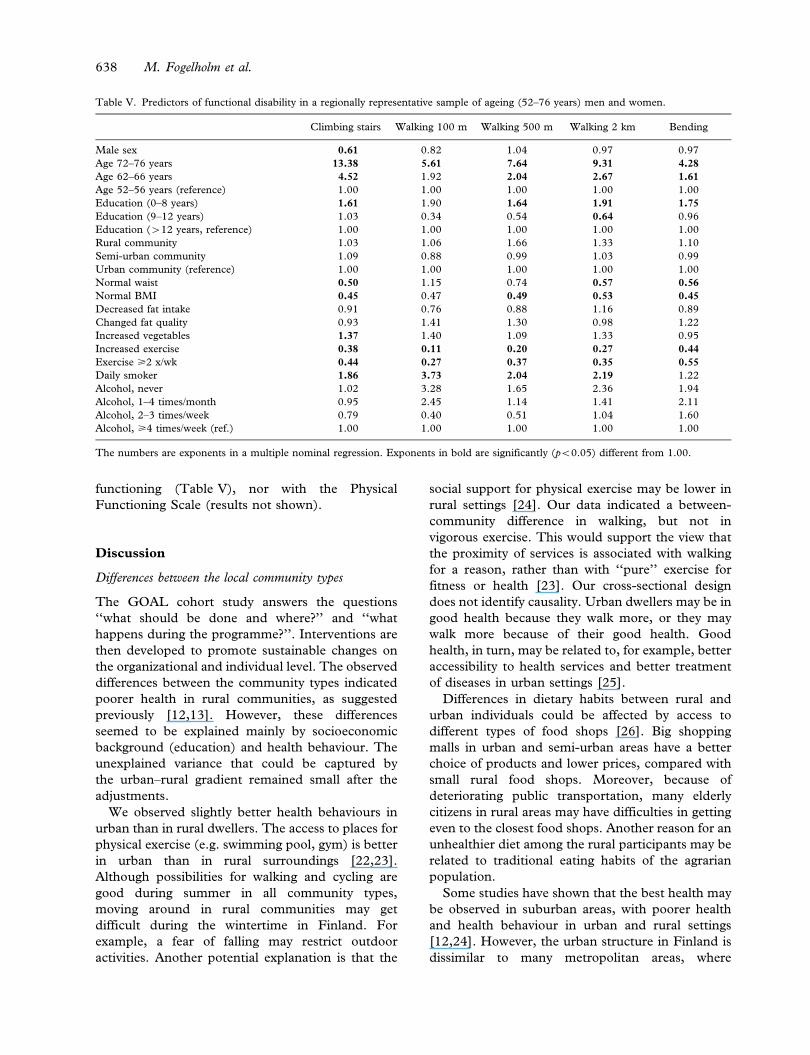
functioning (Table V), nor with the Physical
Functioning Scale (results not shown).
Discussion
Differences between the local community types
The GOAL cohort study answers the questions
‘‘what should be done and where?’’ and ‘‘what
happens during the programme?’’. Interventions are
then developed to promote sustainable changes on
the organizational and individual level. The observed
differences between the community types indicated
poorer health in rural communities, as suggested
previously [12,13]. However, these differences
seemed to be explained mainly by socioeconomic
background (education) and health behaviour. The
unexplained variance that could be captured by
the urban–rural gradient remained small after the
adjustments.
We observed slightly better health behaviours in
urban than in rural dwellers. The access to places for
physical exercise (e.g. swimming pool, gym) is better
in urban than in rural surroundings [22,23].
Although possibilities for walking and cycling are
good during summer in all community types,
moving around in rural communities may get
difficult during the wintertime in Finland. For
example, a fear of falling may restrict outdoor
activities. Another potential explanation is that the
social support for physical exercise may be lower in
rural settings [24]. Our data indicated a between-
community difference in walking, but not in
vigorous exercise. This would support the view that
the proximity of services is associated with walking
for a reason, rather than with ‘‘pure’’ exercise for
fitness or health [23]. Our cross-sectional design
does not identify causality. Urban dwellers may be in
good health because they walk more, or they may
walk more because of their good health. Good
health, in turn, may be related to, for example, better
accessibility to health services and better treatment
of diseases in urban settings [25].
Differences in dietary habits between rural and
urban individuals could be affected by access to
different types of food shops [26]. Big shopping
malls in urban and semi-urban areas have a better
choice of products and lower prices, compared with
small rural food shops. Moreover, because of
deteriorating public transportation, many elderly
citizens in rural areas may have difficulties in getting
even to the closest food shops. Another reason for an
unhealthier diet among the rural participants may be
related to traditional eating habits of the agrarian
population.
Some studies have shown that the best health may
be observed in suburban areas, with poorer health
and health behaviour in urban and rural settings
[12,24]. However, the urban structure in Finland is
dissimilar to many metropolitan areas, where
Table V. Predictors of functional disability in a regionally representative sample of ageing (52–76 years) men and women.
Climbing stairs Walking 100 m Walking 500 m Walking 2 km Bending
Male sex 0.61 0.82 1.04 0.97 0.97
Age 72–76 years 13.38 5.61 7.64 9.31 4.28
Age 62–66 years 4.52 1.92 2.04 2.67 1.61
Age 52–56 years (reference) 1.00 1.00 1.00 1.00 1.00
Education (0–8 years) 1.61 1.90 1.64 1.91 1.75
Education (9–12 years) 1.03 0.34 0.54 0.64 0.96
Education (w12 years, reference) 1.00 1.00 1.00 1.00 1.00
Rural community 1.03 1.06 1.66 1.33 1.10
Semi-urban community 1.09 0.88 0.99 1.03 0.99
Urban community (reference) 1.00 1.00 1.00 1.00 1.00
Normal waist 0.50 1.15 0.74 0.57 0.56
Normal BMI 0.45 0.47 0.49 0.53 0.45
Decreased fat intake 0.91 0.76 0.88 1.16 0.89
Changed fat quality 0.93 1.41 1.30 0.98 1.22
Increased vegetables 1.37 1.40 1.09 1.33 0.95
Increased exercise 0.38 0.11 0.20 0.27 0.44
Exercise >2 x/wk 0.44 0.27 0.37 0.35 0.55
Daily smoker 1.86 3.73 2.04 2.19 1.22
Alcohol, never 1.02 3.28 1.65 2.36 1.94
Alcohol, 1–4 times/month 0.95 2.45 1.14 1.41 2.11
Alcohol, 2–3 times/week 0.79 0.40 0.51 1.04 1.60
Alcohol, >4 times/week (ref.) 1.00 1.00 1.00 1.00 1.00
The numbers are exponents in a multiple nominal regression. Exponents in bold are significantly (pv0.05) different from 1.00.
638 M. Fogelholm et al.
crowded inner cities may be surrounded by wealthy
suburbs. Since the urban clutter in Lahti is low by
international standards, the finding of apparently the
best health status and health behaviour in Lahti is
not in conflict with the above results [12].
Individual determinants of risk factors and disability
Obesity remains a significant risk factor for cardio-
vascular morbidity and functional disability even
among elderly individuals [27,28]. Because of
potential loss of muscle mass, body mass index
(BMI) may not always be the best indicator of body
fatness [29]. The prevalence of obesity in our sample
was higher when judged from waist circumference
than from BMI. However, it should be kept in mind
that the general cut-off points for both BMI and
waist circumference may not apply equally well to
elderly individuals [30].
The determinants of risk factors for chronic
diseases and functional disability (e.g. older age,
low education, obesity, physical inactivity, and
smoking) were consistent with earlier data [28,31].
Smoking was negatively associated with functions
that are related to increased oxygen consumption
(cardio-respiratory fitness). It is noteworthy that
both obesity and a healthy lifestyle predicted health,
independently of each other. This has important
implications, since it shows the benefits of a healthy
lifestyle, even if body weight cannot be changed.
Conclusions and potentials
The theoretical framework of GOAL stems from the
social ecological model, integrating multiple levels
and multiple theories [32,33]. Based on a review of
major community interventions, Sorensen et al.
suggested ‘‘new directions for the second generation
of community health promotion programmes’’ [32].
Of the five key directions recommended, the GOAL
programme explicitly addresses four of these: (a)
targeting multiple levels of influence; (b) involving
communities in programme planning and imple-
mentation; (c) incorporating approaches for ‘‘tailor-
ing’’; and (d) utilizing rigorous process tracking and
evaluation. The fifth direction, addressing social
inequalities in disease risk, is also tackled: as the
GOAL cooperates closely with the social and
healthcare system of local communities, it will most
probably reach a major part of the population, also
including those with a lower socioeconomic status.
Compared with the more urban communities
in the Lahti region, the health status and health
behaviours among elderly individuals in rural
communities were poorer. Moreover, since the
proportion of elderly individuals at present is also
already greater, the rural communities face an
evident and immediate challenge. Semi-urban com-
munities, with a rapidly increasing proportion of
elderly individuals, but with presently more favour-
able health and health behaviour profile, have more
time to prepare for the demographic shift. The
distinct between-community differences in health
and health behaviour within a rather small area, such
as the Lahti region, were noteworthy. This has also
practical implications, since all interventions of
GOAL are to be planned, focused, and tailored
according to the local community needs and context.
In terms of research potential, the GOAL pro-
gramme provides excellent opportunities for both
epidemiological analysis of ageing and for evidence-
based interventions tackling questions related espe-
cially to implementation and sustainability.
Comparison of trends in health and health behaviour
in the different community types will be a central
research question. Too high a dropout and potential
intervention effect of the follow-up (individuals in
the cohort change their habits more than the general
population) are the main limitations of the cohort
study.
Acknowledgements
The study was financially supported by the Paijat-
Hame Hospital District, and the European Social
Fund. The authors are grateful to all students and
teachers at the Lahti Polytechnic who assisted with
the data collection. They would also like thank Prof.
Brian Oldenburg, who read the draft and made
incisive and valuable comments.
References
[1] Antolin P, Oxley H, Suyker W. How will ageing affect
Finland? OECD Economics Department Working Papers
295, OECD Economics Department, ECO/WKP(2001)21;
2001:1–43, Available at: http://www.oecd.org/dataoecd/33/
35/1863374.pdf (accessed 5 August 2005).
[2] Allaire SH, LaValley MP, Evans SR, et al. Evidence for
decline in disability and improved health among persons
aged 55 to 70 years: The Framingham Heart Study.
Am J Public Health 1999;89:1678–83.
[3] Ostchega Y, Harris TB, Hirsch R, et al. The prevalence of
functional limitations and disability in older persons in the
US: Data from the National Health and Nutrition
Examination Survey III. J Am Geriatr Soc 2000;48:1132–5.
[4] Laukkanen P, Leskinen E, Kauppinen M, Sakari-Rantala R,
Heikkinen E. Health and functional capacity as predictors of
community dwelling among elderly people. J Clin Epidemiol
2000;53:257–65.
[5] Van Schoor NM, Smit JH, Twisk JWR, Lips P. Impact of
vertebral deformities, osteoarthritis, and other chronic
Ageing and health promotion 639

diseases on quality of life: A population-based study.
Osteoporosis Int 2005;16:749–56.
[6] Freedman VA, Martin LG, Schoeni RF. Recent trends in
disability and functioning among older adults in the United
States: A systematic review. JAMA 2002;288:3137–46.
[7] Burden of Disease Network Project. Disability in old age
(BURDIS). Finnish Centre for Interdisciplinary
Gerontology University of Jyvaskyla Finland, 2004:1–47.
[8] Nelson ME, Layne JE, Bernstein MJ, et al. The effects of
multidimensional home-based exercise on functional perfor-
mance in elderly people. J Gerontol A Biol Sci Med Sci
2004;59:154–60.
[9] Singer BH, Manton KG. The effects of health changes on
projections on health services needs for the elderly popula-
tion in the United States. Proc Natl Acad Sci USA 1998;95:
15618–22.
[10] Waidmann T, Liu K. Disability trends among the elderly
and implications for the future. J Gerontol B Psychol Sci Soc
Sci 2000;55:S298–307.
[11] Aromaa A, Koskinen S, editors, Health and functional
capacity in Finland. Baseline results of the Health 2000
Health Examination Survey. Publications of the National
Public Health Institute B12/2004. Helsinki: National Public
Health Institute; 2004. p. 1–148.
[12] Takano T, Nakamura K. An analysis of health levels and
various indicators of urban environments for Healthy Cities
projects. J Epidemiol Community Health 2001;55:263–70.
[13] Robert SA, Strombom I, Trentham-Dietz A, et al.
Socioeconomic risk factors for breast cancer:
Distinguishing individual- and community-level effects.
Epidemiology 2004;15:442–50.
[14] Blom-Lange M. [Mortality, morbidity and socio-economic
factors in municipalities of Paijat-Hame hospital district, in
the Paijat-Hame hospital district and in large cities (in
Finnish)]. Publications of the Paijat-Hame hospital district
A4/1999. Lahti: Paijat-Hame hospital district; 1999. p.
1–74.
[15] Karisto A, Nummela O, Konttinen R, et al. [The ageing
Paijat-Hame. Report of community well-being (in Finnish)].
University of Helsinki, Palmenia Centre for Research and
Continuing Education, reports and surveys 41/2003.
Helsinki: University of Helsinki, Palmenia Centre for
Research and Continuing Education; 2003. p. 1–149.
[16] Webster P. Review of the ‘‘City Health Profiles’’ produced
by WHO-Healthy Cities – do they present information on
health and its determinants and what are their perceived
benefits? J Epidemiol Community Health 1999;53:125–7.
[17] Uutela A, Absetz P, Nissinen A, et al. Health psychological
theory in promoting population health in Paijat-Hame,
Finland: First steps toward a type 2 diabetes prevention
study. J Health Psychol 2004;9:73–84.
[18] Aalto A-M, Aro AR, Teperi J. RAND-36 terveyteen liittyvan
elamanlaadun mittarina. Mittarin luotettavus ja suomalaiset
vaestoarvot [RAND-36 as an indicator of health-related
quality of life. The validity of the method and Finnish
reference values (in Finnish)]. STAKES tutkimuksia/
Research by the National Research Centre for Welfare and
Health, nr. 101. Helsinki, 1999. p. 1–78.
[19] Hays RD, Sherbourne CD, Mazel RM. The RAND 36-Item
health Survey 1.0. Health Econ 1993;2:213–15.
[20] Gardner MJ, Altman DG. Calculating confidence intervals
for proportions and their differences. In: Gardner MJ,
Altman DG, editors. Statistics with confidence – confidence
intervals and statistical guidelines. London: British Medical
Journal; 1989. p. 28–33.
[21] Statistics Finland. Vaestoennuste kunnittain 2001–2030
[Population projection by municipalities 2001–2030 (in
Finnish with English summary and titles)]. Helsinki:
Statistics Finland; 2001. p. 31, 45.
[22] Troped PJ, Saunders RP, Pate RR, et al. Correlates of
recreational and transportation physical activity among
adults in a New England community. Prev Med 2003;37:
304–10.
[23] Patterson PK, Chapman NJ. Urban form and older
residents’ service use, walking, driving, quality of life, and
neighborhood satisfaction. Am J Health Promotion
2004;19:45–52.
[24] Parks SE, Housemann RA, Brownson RC. Differential
correlates of physical activity in urban and rural adults of
various socioeconomic backgrounds in the United States.
J Epidemiol Community Health 2003;57:29–35.
[25] Shipton D, Glazier RH, Guan J, et al. Effects of use of
specialty services on disease-modifying antirheumatic drug
use in the treatment of rheumatoid arthritis in an insured
elderly population. Med Care 2004;42:907–13.
[26] Turrell G, Blakely T, Patterson C, et al. A multilevel analysis
of socioeconomic (small area) differences in household food
purchasing behaviour. J Epidemiol Community Health
2004;58:208–15.
[27] Visser M, Langlois J, Guralnik JM, et al. High body fatness,
but not low fat-free mass, predicts disability in older men
and women. The Cardiovascular Health Study. Am J Clin
Nutr 1998;68:584–90.
[28] Wannamethee SG, Shaper AG, Whincup PH, et al.
Overweight and obesity and the burden of disease and
disability in elderly men. Int J Obes 2004;28:1374–82.
[29] Turcato E, Bosello O, Di Francesco V, et al. Waist
circumference and abdominal sagittal diameter as surrogates
of body fat distribution in the elderly: Their relation with
cardiovascular risk factors. Int J Obes 2000;24:1005–10.
[30] WHO. Obesity: Preventing and managing the global
epidemic. Report of a WHO consultation on obesity.
WHO Technical Report Series 2000;894:1–253.
[31] Fogelholm M, Kujala U, Kaprio J, Sarna S. Predictors of
weight change in middle-aged and old men. Obes Res
2000;8:367–73.
[32] Sorensen G, Emmons K, Hunt MK, Johnston D.
Implications of the results of community intervention trials.
Ann Rev Public Health 1998;19:379–416.
[33] McLeroy K, Bibeau D, Steckler D, Glanz K. An ecological
perspective on health promotion programs. Health Educ Q
1988;15:351–77.
640 M. Fogelholm et al.

Copyright © 2022 FDOKUMEN