Rotation Forest: A New Classifier Ensemble Method
12
Rotation Forest: A New Classifier Ensemble Method Juan J. Rodrı ´guez, Member, IEEE Computer Society, Ludmila I. Kuncheva, Member, IEEE, and Carlos J. Alonso Abstract—We propose a method for generating classifier ensembles based on feature extraction. To create the training data for a base classifier, the feature set is randomly split into K subsets (K is a parameter of the algorithm) and Principal Component Analysis (PCA) is applied to each subset. All principal components are retained in order to preserve the variability information in the data. Thus, K axis rotations take place to form the new features for a base classifier. The idea of the rotation approach is to encourage simultaneously individual accuracy and diversity within the ensemble. Diversity is promoted through the feature extraction for each base classifier. Decision trees were chosen here because they are sensitive to rotation of the feature axes, hence the name “forest.” Accuracy is sought by keeping all principal components and also using the whole data set to train each base classifier. Using WEKA, we examined the Rotation Forest ensemble on a random selection of 33 benchmark data sets from the UCI repository and compared it with Bagging, AdaBoost, and Random Forest. The results were favorable to Rotation Forest and prompted an investigation into diversity-accuracy landscape of the ensemble models. Diversity-error diagrams revealed that Rotation Forest ensembles construct individual classifiers which are more accurate than these in AdaBoost and Random Forest, and more diverse than these in Bagging, sometimes more accurate as well. Index Terms—Classifier ensembles, AdaBoost, bagging, random forest, feature extraction, PCA, kappa-error diagrams. Ç 1 INTRODUCTION C LASSIFIER combination is now an active area of research in Machine Learning and Pattern Recognition [31], [33], [34], [35], [36], [46]. Many studies have been published, both theoretical and empirical, which demonstrate the advan- tages of the combination paradigm over the individual classifier models [21]. A great deal of research has gone into designing multiple classifier systems based on the same classifier model trained on different data subsets or feature subsets. Such multiple classifier systems are commonly called classifier ensembles. 1 Two approaches for constructing classifier ensembles seem to be perceived as “classic” at present. They have been found to be accurate, computationally feasible across various data domains, and with no clear dominance between them. . Bagging [5] takes bootstrap samples of objects 2 and trains a classifier on each sample. The classifier votes are combined by majority voting. In some implementations, classifiers produce estimates of the posterior probabilities for the classes. These probabilities are averaged across the classifiers and the most probable class is assigned, called “aver- age” or “mean” aggregation of the outputs. Bagging with average aggregation is implemented in WEKA and used in the experiments in this paper. Since each individual classifier is trained on a bootstrap sample, the data distribution seen during training is similar to the original distribution. Thus, the individual classifiers in a bagging ensemble have relatively high classification accuracy. The only factor encouraging diversity between these classi- fiers is the proportion of different objects in the training samples. Although the classifier models used in Bagging are sensitive to small changes in data, the bootstrap sampling appears to lead to ensembles of low diversity compared to other ensemble creating methods. As a result, Bagging requires larger ensemble sizes to perform well. To enforce diversity, a version of Bagging called Random Forest was proposed by Breiman [7]. The ensemble consists of decision trees built again on bootstrap samples. The difference lies in the construction of the decision tree. The feature to split a node is selected as the best feature among a set of M randomly chosen features, where M is a parameter of the algorithm. This small alteration appeared to be a winning heuristic in that diversity was introduced without much compromising the accuracy of the individual classifiers. The Random Subspaces method [17] builds each ensemble mem- ber on a different subset of features randomly selected form the original feature set. A common feature of all methods in this class is that the IEEE TRANSACTIONS ON PATTERN ANALYSIS AND MACHINE INTELLIGENCE, VOL. 28, NO. 10, OCTOBER 2006 1619 . J.J. Rodrı´guez is with the Escuela Polite´cnica Superior, Edificio C, Universidad de Burgos, c/ Francisco de Vitoria s/n, 09006 Burgos, Spain. E-mail: [email protected]. . L.I. Kuncheva is with the School of Informatics, University of Wales, Bangor, Gwynedd, LL57 1UT, UK. E-mail: [email protected]. . C.J. Alonso is with the Departamento de Informa´tica, Escuela Te´cnica Superior de Ingenierı´a Informa´tica (E.T.S.I.I.), Campus Miguel Delibes s/n, Universidad de Valladolid, 47011 Valladolid, Spain. E-mail: [email protected]. Manuscript received 21 Sept. 2005; revised 3 Feb. 2006; accepted 22 Feb. 2006; published online 11 Aug. 2006. Recommended for acceptance by M. Figueiredo. For information on obtaining reprints of this article, please send e-mail to: [email protected], and reference IEEECS Log Number TPAMI-0513-0905. 1. While still unifying terminology across the field, in a wider sense, any system of more than one classifier can be called a classifier ensemble. 2. We use “objects” as synonym of instances, examples, and data points. 0162-8828/06/$20.00 ß 2006 IEEE Published by the IEEE Computer Society
-
Upload
independent -
Category
Documents
-
view
1 -
download
0
Transcript of Rotation Forest: A New Classifier Ensemble Method
Rotation Forest:A New Classifier Ensemble Method
Juan J. Rodrıguez, Member, IEEE Computer Society,
Ludmila I. Kuncheva, Member, IEEE, and Carlos J. Alonso
Abstract—We propose a method for generating classifier ensembles based on feature extraction. To create the training data for a base
classifier, the feature set is randomly split intoK subsets (K is a parameter of the algorithm) and Principal Component Analysis (PCA) is
applied to each subset. All principal components are retained in order to preserve the variability information in the data. Thus, K axis
rotations take place to form the new features for a base classifier. The idea of the rotation approach is to encourage simultaneously
individual accuracy and diversity within the ensemble. Diversity is promoted through the feature extraction for each base classifier.
Decision trees were chosen here because they are sensitive to rotation of the feature axes, hence the name “forest.” Accuracy is sought
by keeping all principal components and also using the whole data set to train each base classifier. Using WEKA, we examined the
Rotation Forest ensemble on a random selection of 33 benchmark data sets from the UCI repository and compared it with Bagging,
AdaBoost, and Random Forest. The results were favorable to Rotation Forest and prompted an investigation into diversity-accuracy
landscape of the ensemble models. Diversity-error diagrams revealed that Rotation Forest ensembles construct individual classifiers
which are more accurate than these in AdaBoost and Random Forest, and more diverse than these in Bagging, sometimes more
accurate as well.
Index Terms—Classifier ensembles, AdaBoost, bagging, random forest, feature extraction, PCA, kappa-error diagrams.
Ç
1 INTRODUCTION
CLASSIFIER combination is now an active area of researchin Machine Learning and Pattern Recognition [31], [33],
[34], [35], [36], [46]. Many studies have been published, boththeoretical and empirical, which demonstrate the advan-tages of the combination paradigm over the individualclassifier models [21]. A great deal of research has gone intodesigning multiple classifier systems based on the sameclassifier model trained on different data subsets or featuresubsets. Such multiple classifier systems are commonlycalled classifier ensembles.1
Two approaches for constructing classifier ensembles
seem to be perceived as “classic” at present. They have been
found to be accurate, computationally feasible across various
data domains, and with no clear dominance between them.
. Bagging [5] takes bootstrap samples of objects2 andtrains a classifier on each sample. The classifiervotes are combined by majority voting. In some
implementations, classifiers produce estimates ofthe posterior probabilities for the classes. Theseprobabilities are averaged across the classifiers andthe most probable class is assigned, called “aver-age” or “mean” aggregation of the outputs. Baggingwith average aggregation is implemented in WEKAand used in the experiments in this paper. Sinceeach individual classifier is trained on a bootstrapsample, the data distribution seen during training issimilar to the original distribution. Thus, theindividual classifiers in a bagging ensemble haverelatively high classification accuracy. The onlyfactor encouraging diversity between these classi-fiers is the proportion of different objects in thetraining samples. Although the classifier modelsused in Bagging are sensitive to small changes indata, the bootstrap sampling appears to lead toensembles of low diversity compared to otherensemble creating methods. As a result, Baggingrequires larger ensemble sizes to perform well. Toenforce diversity, a version of Bagging calledRandom Forest was proposed by Breiman [7]. Theensemble consists of decision trees built again onbootstrap samples. The difference lies in theconstruction of the decision tree. The feature tosplit a node is selected as the best feature among aset of M randomly chosen features, where M is aparameter of the algorithm. This small alterationappeared to be a winning heuristic in that diversitywas introduced without much compromising theaccuracy of the individual classifiers. The RandomSubspaces method [17] builds each ensemble mem-ber on a different subset of features randomlyselected form the original feature set. A commonfeature of all methods in this class is that the
IEEE TRANSACTIONS ON PATTERN ANALYSIS AND MACHINE INTELLIGENCE, VOL. 28, NO. 10, OCTOBER 2006 1619
. J.J. Rodrıguez is with the Escuela Politecnica Superior, Edificio C,Universidad de Burgos, c/ Francisco de Vitoria s/n, 09006 Burgos, Spain.E-mail: [email protected].
. L.I. Kuncheva is with the School of Informatics, University of Wales,Bangor, Gwynedd, LL57 1UT, UK. E-mail: [email protected].
. C.J. Alonso is with the Departamento de Informatica, Escuela TecnicaSuperior de Ingenierıa Informatica (E.T.S.I.I.), Campus Miguel Delibes s/n,Universidad de Valladolid, 47011 Valladolid, Spain.E-mail: [email protected].
Manuscript received 21 Sept. 2005; revised 3 Feb. 2006; accepted 22 Feb. 2006;published online 11 Aug. 2006.Recommended for acceptance by M. Figueiredo.For information on obtaining reprints of this article, please send e-mail to:[email protected], and reference IEEECS Log Number TPAMI-0513-0905.
1. While still unifying terminology across the field, in a wider sense, anysystem of more than one classifier can be called a classifier ensemble.
2. We use “objects” as synonym of instances, examples, and data points.
0162-8828/06/$20.00 � 2006 IEEE Published by the IEEE Computer Society
individual classifiers can be built in parallel,independently of one another. This does not meanthat their outputs will be independent though [16].
. Boosting [12] is a family of methods, the mostprominent member of which is AdaBoost. The idea isto boost the performance of a “weak” classifier byusing it within an ensemble structure. The classifiersin the ensemble are added one at a time so that eachsubsequent classifier is trained on data which havebeen “hard” for the previous ensemble members. Aset of weights is maintained across the objects in thedata set so that objects that have been difficult toclassify acquire more weight, forcing subsequentclassifiers to focus on them. The ensemble construc-tion through AdaBoost comes from theory and is, infact, equivalent to fitting an additive logistic regres-sion model by a stage-wise estimation procedure [13],[37], [38]. The function being optimized is closelyrelated to the classification error. Bounds on thetraining and generalisation errors of AdaBoost havebeen proven [12], [37], [39], thereby inspiring furtherdevelopments of theory and practice of boosting [1],[6], [12], [25], [27], [28], [30], [40], [45].
Comparative studies can be found in [2], [3], [8], [18]. Itappears that, on average, AdaBoost is the best methodalthough Random Subspaces and Bagging have theirapplication niches as well. Interestingly, for large ensemblesizes (in the order of thousand classifiers) the significantdifferences between the ensemble models almost disappear[2]. This raises a quest for a consistently good ensemblestrategy for small ensemble sizes. Regardless of thecomputational effort required for training, small ensembleswill have the advantage of fast and, in many cases, near-optimal performance [26].
Diversity is an important property of a classifier ensemble[23]. The success of AdaBoost has been explained, amongothers, with its diversity creating ability. Margineantu andDietterich [26] devise the so-called “kappa-error” diagramsto show the effect of making the classifiers diverse at theexpense of reduced individual accuracy. Plotted in thesediagrams areLðL� 1Þ=2 points, whereL is the ensemble size.Each point corresponds to a pair of classifiers. On the x-axis isa measure of diversity between the pair; kappa was chosen in[26]. On the y-axis is the averaged individual error of theclassifiers in the pair. Plotting a diagram for an ensembledesigned by Bagging and another designed by AdaBoostmade the differences between the two approaches very clear.AdaBoost was creating inaccurate classifiers by forcing themto concentrate on difficult objects and ignore the rest of thedata. This however, led to large diversity which boosted theensemble performance, often beyond that of Bagging. Thisleads us to the famous accuracy-diversity dilemma. It seemsthat classifiers cannot be both very accurate and have verydiverse outputs.
In this study, we propose an ensemble constructionmethod, called Rotation Forests which aims at buildingaccurate and diverse classifiers. The main heuristic consistsin applying feature extraction to subsets of features andreconstructing a full feature set for each classifier in theensemble. We have chosen Principal Component Analysis(PCA) in this study for reasons explained in Section 2. Therest of the paper is organized as follows: Section 2 explainsthe Rotation Forests. Section 3 presents our experimental
study comparing Rotation Forest with Bagging, AdaBoostand Random Forest. In Section 4, kappa-error diagrams areplotted to illustrate the pattern of relationship betweendiversity and individual accuracy for all ensemble methodsstudied here. Section 5 offers our conclusions and outlinesdirections of future work.
2 ROTATION FORESTS
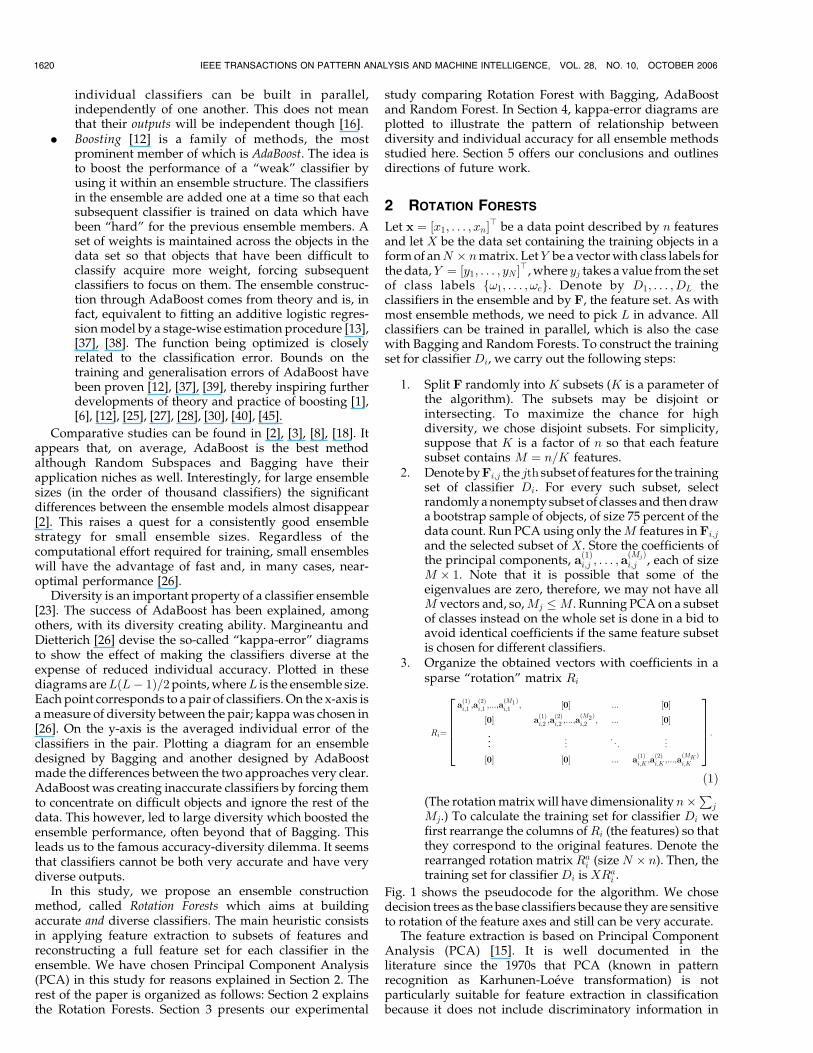
Let x ¼ ½x1; . . . ; xn�> be a data point described by n featuresand let X be the data set containing the training objects in aform of anN � nmatrix. LetY be a vector with class labels forthe data,Y ¼ ½y1; . . . ; yN �>, where yj takes a value from the setof class labels f!1; . . . ; !cg. Denote by D1; . . . ; DL theclassifiers in the ensemble and by F, the feature set. As withmost ensemble methods, we need to pick L in advance. Allclassifiers can be trained in parallel, which is also the casewith Bagging and Random Forests. To construct the trainingset for classifier Di, we carry out the following steps:
1. Split F randomly into K subsets (K is a parameter ofthe algorithm). The subsets may be disjoint orintersecting. To maximize the chance for highdiversity, we chose disjoint subsets. For simplicity,suppose that K is a factor of n so that each featuresubset contains M ¼ n=K features.
2. Denote by Fi;j the jth subset of features for the trainingset of classifier Di. For every such subset, selectrandomly a nonempty subset of classes and then drawa bootstrap sample of objects, of size 75 percent of thedata count. Run PCA using only theM features in Fi;j
and the selected subset of X. Store the coefficients ofthe principal components, a
ð1Þi;j ; . . . ; a
ðMjÞi;j , each of size
M � 1. Note that it is possible that some of theeigenvalues are zero, therefore, we may not have allM vectors and, so,Mj �M. Running PCA on a subsetof classes instead on the whole set is done in a bid toavoid identical coefficients if the same feature subsetis chosen for different classifiers.
3. Organize the obtained vectors with coefficients in asparse “rotation” matrix Ri
Ri¼
að1Þi;1;að2Þi;1;...;a
ðM1Þi;1
; ½0� ... ½0�½0� a
ð1Þi;2;að2Þi;2;...;a
ðM2Þi;2
; ... ½0�
..
.... . .
. ...
½0� ½0� ... að1Þi;K;að2Þi;K;...;a
ðMK Þi;K
26664
37775:ð1Þ
(The rotation matrix will have dimensionality n�P
j
Mj.) To calculate the training set for classifier Di wefirst rearrange the columns ofRi (the features) so thatthey correspond to the original features. Denote therearranged rotation matrix Ra
i (size N � n). Then, thetraining set for classifier Di is XRa
i .
Fig. 1 shows the pseudocode for the algorithm. We chosedecision trees as the base classifiers because they are sensitiveto rotation of the feature axes and still can be very accurate.
The feature extraction is based on Principal ComponentAnalysis (PCA) [15]. It is well documented in theliterature since the 1970s that PCA (known in patternrecognition as Karhunen-Loeve transformation) is notparticularly suitable for feature extraction in classificationbecause it does not include discriminatory information in
1620 IEEE TRANSACTIONS ON PATTERN ANALYSIS AND MACHINE INTELLIGENCE, VOL. 28, NO. 10, OCTOBER 2006
calculating the optimal rotation of the axes. Manyalternative linear transformations have been suggestedbased on discrimination criteria [11], [14], [19], [43], [44].Sometimes a simple random choice of the transformationmatrix leads to classification accuracy superior to thatwhen PCA is used. Fern and Brodley [9] advocaterandom projections rather than PCA for cluster ensem-bles. On the other hand, Skurichina and Duin [41] findthat an ensemble based on PCA performs better thanensembles based on random feature selection. Theensemble proposed in their study is built using theprincipal components calculated on the whole data set.The first classifier uses the first M components, the nextclassifier uses the next M components, etc.
Tumer and Oza [42] also use PCA as a tool for ensemblegeneration, but in their study it is applied to reducedimensionality. They propose an ensemble consisting ofL ¼ c classifiers, where c is the number of classes. Toproduce diverse classifiers, they use different sets ofextracted features. To train classifier Di, they first singleout class !i and run PCA on this data only. (The number ofcomponents to keep is a parameter of the algorithm.) Theobtained transformation is applied on the whole data setand Di is trained on these new extracted features todiscriminate among all the original classes. This limits theensemble size L to the number of classes.
We used PCA to determine its feasibility and find out
whether it does contribute to increased accuracy and
diversity. The examples in the literature exposing PCA as
an inadequate method for feature extraction in classification
problems are related to dimensionality reduction. As only
few components are retained, there is a chance that the most
relevant discriminatory components correspond to small
variance and will be discarded. Here, we keep all the
components, so the discriminatory information will be
preserved even if it lies with the component responsible for
the least variance. Keeping all the components does not mean
that the classification will be easier in the new space of
extracted features. However, even if the rotation does not
contribute much to finding good discriminatory directions, it
is valuable here as a diversifying heuristic. Pilot experiments
with our Rotation Forest ensemble and random projections
using all n features showed that although the results were
competitive, they were not as good as the results with PCA.The intended diversity in this model will come from
the difference in the possible feature subsets. Using onlythe rotation heuristic, there are in total T ¼ n!
K!ðM!ÞKdifferent partitions of the feature set into K subsets ofsize M, each giving raise to a classifier (recall thatn ¼ KM). If the ensemble consists of L classifiers,assuming that each partition of the feature set is equallyprobable, the probability that all classifiers will bedifferent is P ðdifferent classifiersÞ ¼ T !
ðT�LÞ!TL . For example,the chance to have all different classifiers in an ensembleof L ¼ 50 classifiers for K ¼ 3 and n ¼ 9 is less than0.01. Therefore, there is a need for an extra randomiza-tion of the ensemble. This can be done by applying PCAto a bootstrap sample from X, a random subset of X ora random selection of classes. In this study, we appliedboth these heuristics. A nonempty random subset ofclasses was chosen for each feature subset, and then abootstrap sample of objects was drawn. PCA wasapplied on this new data set using only the features in
RODR�IGUEZ ET AL.: ROTATION FOREST: A NEW CLASSIFIER ENSEMBLE METHOD 1621
Fig. 1. Pseudocode of the Rotation Forest ensemble method.
the subset. Note, however, that after obtaining theprojection matrix from all feature subsets, the whole dataset was transformed and subsequently used for traininga base classifier.
3 EXPERIMENTAL VALIDATION
An experiment was set up to compare Rotation Forests withBagging, AdaBoost, and Random Forests. In all ensemblemethods, decision trees were used as the base classifier. Thedecision tree construction method was J48 from the WEKAlibrary [47], a reimplementation of C4.5 [32], except for theRandom Forest method. Random Forest constructs the tree inadifferentwaysoas to allowfor arandomchoiceof afeatureateach node. The implementations of Bagging, AdaBoost.M1(the version proposed in [12] for multiple classes) andRandom Forests are also from that library. As PCA is definedfor numeric features, discrete features were converted tonumeric ones for Rotation Forests. Each categorical featurewas replaced by s binary features encoded numerically as 0and 1, where s is the number of possible categories of thefeature.3
This encoding unifies all the inputs so that PCA can becarried out on any subsets of features. Kolenikov and Angeles[20] advise against using dummy variables to replace ordinalvariables and subsequently apply PCA on these dummyvariables. Their main argument is that the evaluation of theexplained variance by the principal components in this case islargely imprecise. Their study is primarily looking at dataanalysis for devising scoring indices in economics. In our case,however, the estimate of the explained variance is irrelevant,as we keep all the principal components rather than discardthe ones with smaller contribution to the variance. On theother hand, while the explained variance and the coefficientsfor the first few principal components are very important for ascoring index, they act merely as a rotation heuristic in ourensemble model. Finally, in the presence of mixed contin-uous-valued and categorical variables of nominal type (noordering of the categories), binary encoding is the mostnatural way to unify the data for further processing. Asneither interpretation of the extracted features, nor the totalexplained variance is a concern in Rotation Forest, we apply
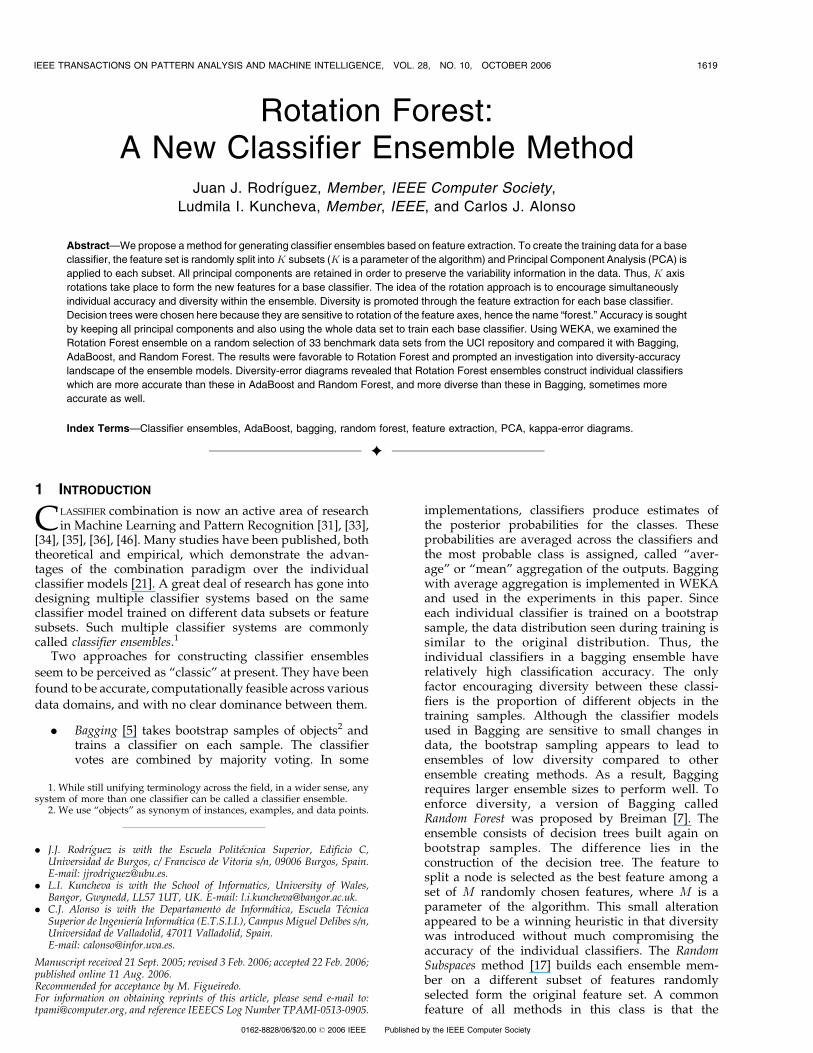
standard PCA. Each category is encoded by one bit. Clearly,this code contains redundancy as the sufficient number of bitswould be log2ðnumber of categoriesÞ. Also, the binary featuresin the one-bit-per-category representation are dependentbecause only one of them can be 1 at a time. There are no strongarguments either way, so we adopted this encoding—it iseasy, intuitive, and is the standard one implemented inWEKA [47]. An example of how PCA works on nominalvariables is shown in Fig. 2. PCA has been applied to the“mushroom” data from the UCI repository [4], containing22 nominal variables encoded as explained above into a totalof 121 binary variables. The new feature set was splitrandomly into three subsets. Thus, some of the originalvariables were “split” themselves, so that the bits correspond-ing to the categories fell into different feature subsets. On eachof the three feature subsets, a PCA was run. The threescatterplots show the data in the space of the first twoprincipal components. All plots reveal a cluster structureindicating that a decision tree classifier would be a suitablechoice in each of the new spaces.
Table 1 shows the characteristics of the 33 data sets usedin this study. All of them are from the UCI repository [4].We consider two versions of the “vowel” data, “vowel-c,”and “vowel-n.” In “vowel-c,” the sex of the speaker and aspeaker identifier were used and in “vowel-n” they werenot. Because results with both versions have been reportedin the literature, we used both versions too.
The experimental settings were as follows: The parametersof Bagging, AdaBoost, and Random Forests were kept at theirdefault values in WEKA. For Random Forest, the number offeatures fo select from at each node is set at log2ðnÞ þ 1. ForRotation Forest, we did not fix K but fixed the number offeatures in each subset to beM ¼ 3. Ifndid not divide by 3, the“remainder” subset was completed with 1 or 2 features, asnecessary, randomly selected from the rest of the feature set.
The decision tree classifier, J48, implemented in WEKAuses an error-based pruning algorithm. The user can choosea confidence value to be used when pruning the tree. Thedefault of 25 percent was found to work reasonably well, inmost cases, so we left it unchanged in our experiments. Thisstandard implementation was not suitable for RandomForests, so Rotation Forest was compared with Bagging andAdaBoost only.
The ensemble size L can be regarded as a hyperparameter of the ensemble method. It can be tuned throughcross-validation or by using a separate validation set. L can
1622 IEEE TRANSACTIONS ON PATTERN ANALYSIS AND MACHINE INTELLIGENCE, VOL. 28, NO. 10, OCTOBER 2006
Fig. 2. Scatterplot of the “mushroom” data (22 nominal features). The binary representation of the features (121 in total) was randomly split into three
subsets and PCA was applied on each subset. The scatterplots show the two classes in the space defined by the first two principal components.
3. In the current implementation, this conversion is done as apreprocessing step, before the algorithm of Fig. 1. Hence, when the featureset is splitted in subsets, the binary features from a categorical feature canbe assigned to different subsets. It could also be possible to do theconversion after the splitting.
also be thought of as an indicator of the operatingcomplexity of the ensemble. Then, we can choose the mostaccurate ensemble of a fixed complexity. As we areinterested in ensembles of a small (fixed) size, we decidedto train all ensemble methods with the same L. Hence, theresults of the experiments will apply with this restriction inmind. If we let L be tuned, we could get a different rankingof the ensemble methods with respect to their accuracy aswell as operational complexity.
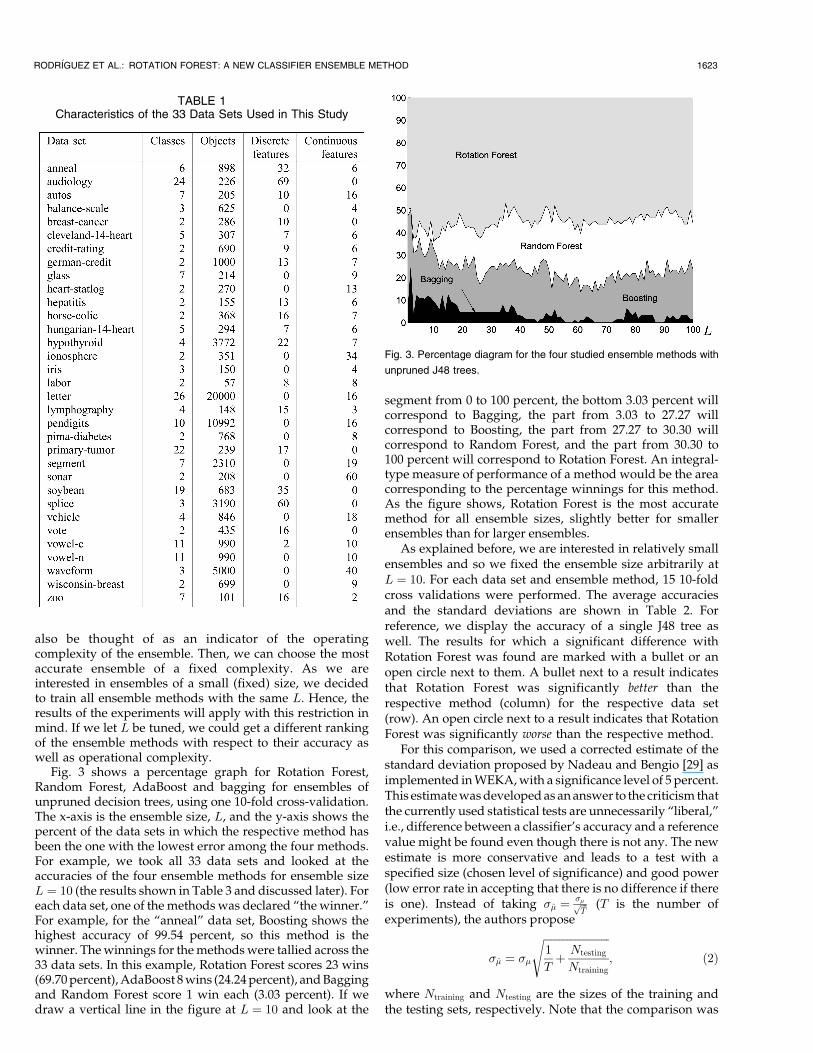
Fig. 3 shows a percentage graph for Rotation Forest,Random Forest, AdaBoost and bagging for ensembles ofunpruned decision trees, using one 10-fold cross-validation.The x-axis is the ensemble size, L, and the y-axis shows thepercent of the data sets in which the respective method hasbeen the one with the lowest error among the four methods.For example, we took all 33 data sets and looked at theaccuracies of the four ensemble methods for ensemble sizeL ¼ 10 (the results shown in Table 3 and discussed later). Foreach data set, one of the methods was declared “the winner.”For example, for the “anneal” data set, Boosting shows thehighest accuracy of 99.54 percent, so this method is thewinner. The winnings for the methods were tallied across the33 data sets. In this example, Rotation Forest scores 23 wins(69.70 percent), AdaBoost 8 wins (24.24 percent), and Baggingand Random Forest score 1 win each (3.03 percent). If wedraw a vertical line in the figure at L ¼ 10 and look at the
segment from 0 to 100 percent, the bottom 3.03 percent willcorrespond to Bagging, the part from 3.03 to 27.27 willcorrespond to Boosting, the part from 27.27 to 30.30 willcorrespond to Random Forest, and the part from 30.30 to100 percent will correspond to Rotation Forest. An integral-type measure of performance of a method would be the areacorresponding to the percentage winnings for this method.As the figure shows, Rotation Forest is the most accuratemethod for all ensemble sizes, slightly better for smallerensembles than for larger ensembles.
As explained before, we are interested in relatively smallensembles and so we fixed the ensemble size arbitrarily atL ¼ 10. For each data set and ensemble method, 15 10-foldcross validations were performed. The average accuraciesand the standard deviations are shown in Table 2. Forreference, we display the accuracy of a single J48 tree aswell. The results for which a significant difference withRotation Forest was found are marked with a bullet or anopen circle next to them. A bullet next to a result indicatesthat Rotation Forest was significantly better than therespective method (column) for the respective data set(row). An open circle next to a result indicates that RotationForest was significantly worse than the respective method.
For this comparison, we used a corrected estimate of thestandard deviation proposed by Nadeau and Bengio [29] asimplemented in WEKA, with a significance level of 5 percent.This estimate was developed as an answer to the criticism thatthe currently used statistical tests are unnecessarily “liberal,”i.e., difference between a classifier’s accuracy and a referencevalue might be found even though there is not any. The newestimate is more conservative and leads to a test with aspecified size (chosen level of significance) and good power(low error rate in accepting that there is no difference if thereis one). Instead of taking �� ¼ ��ffiffiffi
Tp (T is the number of
experiments), the authors propose
�� ¼ ��
ffiffiffiffiffiffiffiffiffiffiffiffiffiffiffiffiffiffiffiffiffiffiffiffiffi1
Tþ Ntesting
Ntraining
s; ð2Þ
where Ntraining and Ntesting are the sizes of the training andthe testing sets, respectively. Note that the comparison was
RODR�IGUEZ ET AL.: ROTATION FOREST: A NEW CLASSIFIER ENSEMBLE METHOD 1623
TABLE 1Characteristics of the 33 Data Sets Used in This Study
Fig. 3. Percentage diagram for the four studied ensemble methods with
unpruned J48 trees.
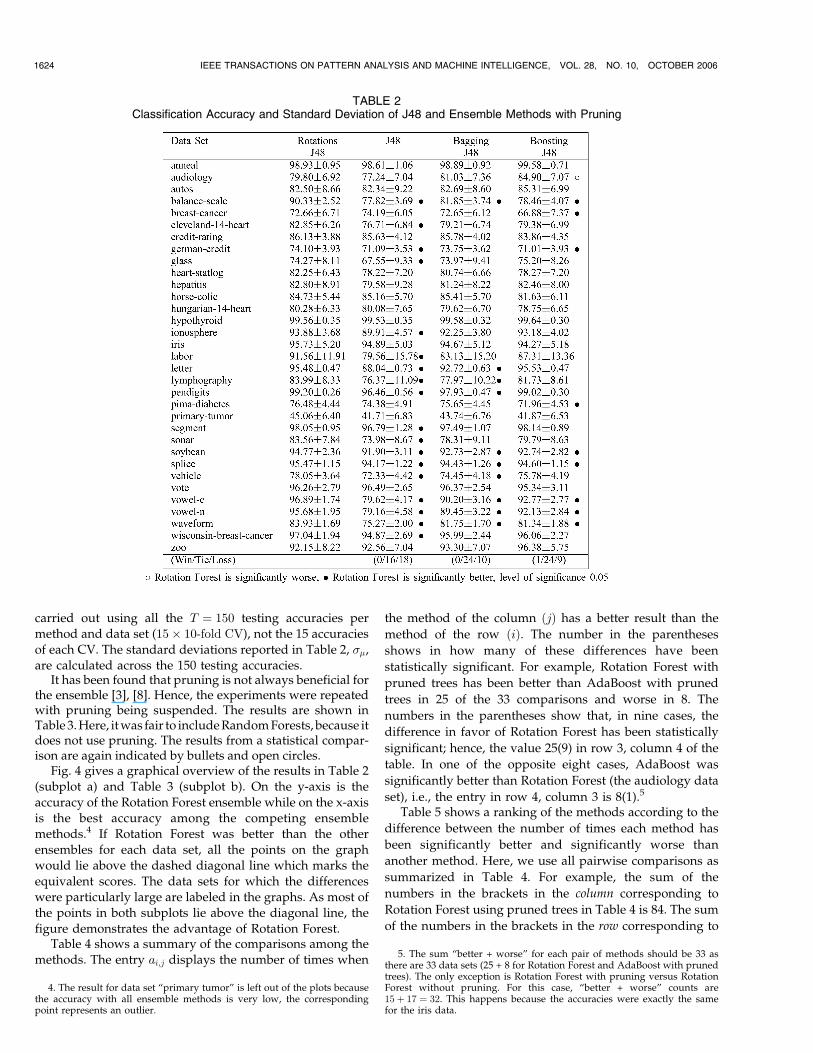
carried out using all the T ¼ 150 testing accuracies permethod and data set (15� 10-fold CV), not the 15 accuraciesof each CV. The standard deviations reported in Table 2, ��,are calculated across the 150 testing accuracies.
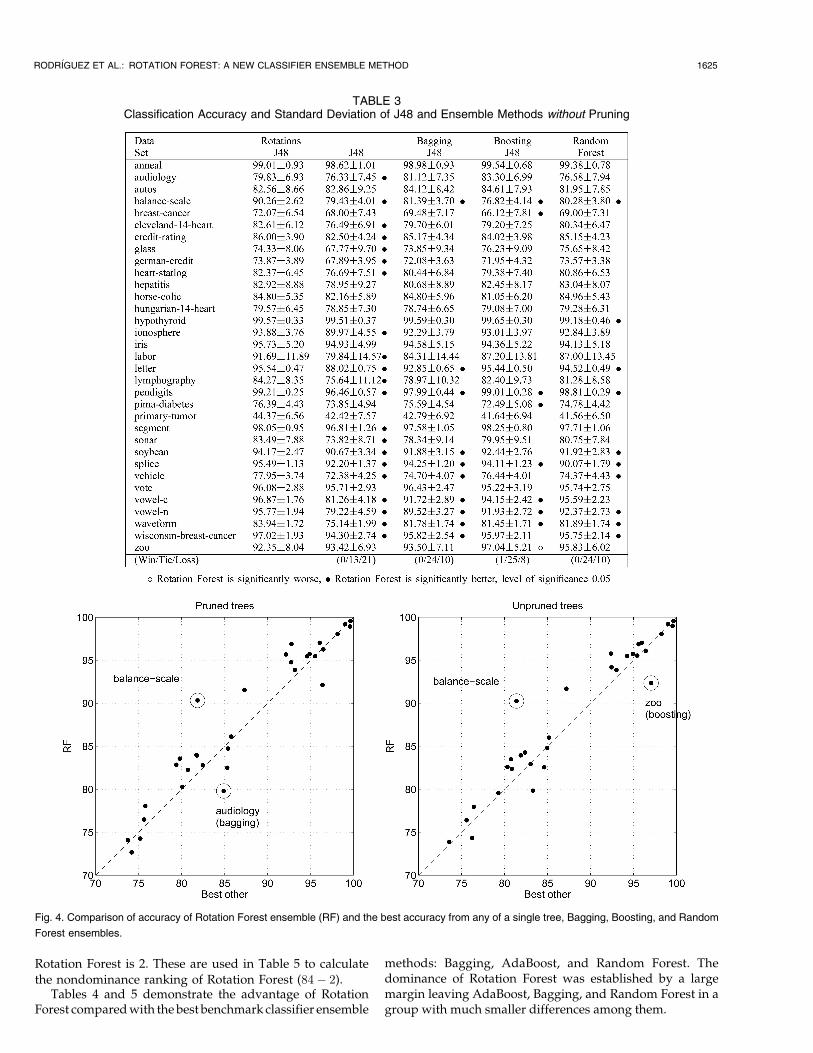
It has been found that pruning is not always beneficial forthe ensemble [3], [8]. Hence, the experiments were repeatedwith pruning being suspended. The results are shown inTable 3. Here, it was fair to include Random Forests, because itdoes not use pruning. The results from a statistical compar-ison are again indicated by bullets and open circles.
Fig. 4 gives a graphical overview of the results in Table 2(subplot a) and Table 3 (subplot b). On the y-axis is theaccuracy of the Rotation Forest ensemble while on the x-axisis the best accuracy among the competing ensemblemethods.4 If Rotation Forest was better than the otherensembles for each data set, all the points on the graphwould lie above the dashed diagonal line which marks theequivalent scores. The data sets for which the differenceswere particularly large are labeled in the graphs. As most ofthe points in both subplots lie above the diagonal line, thefigure demonstrates the advantage of Rotation Forest.
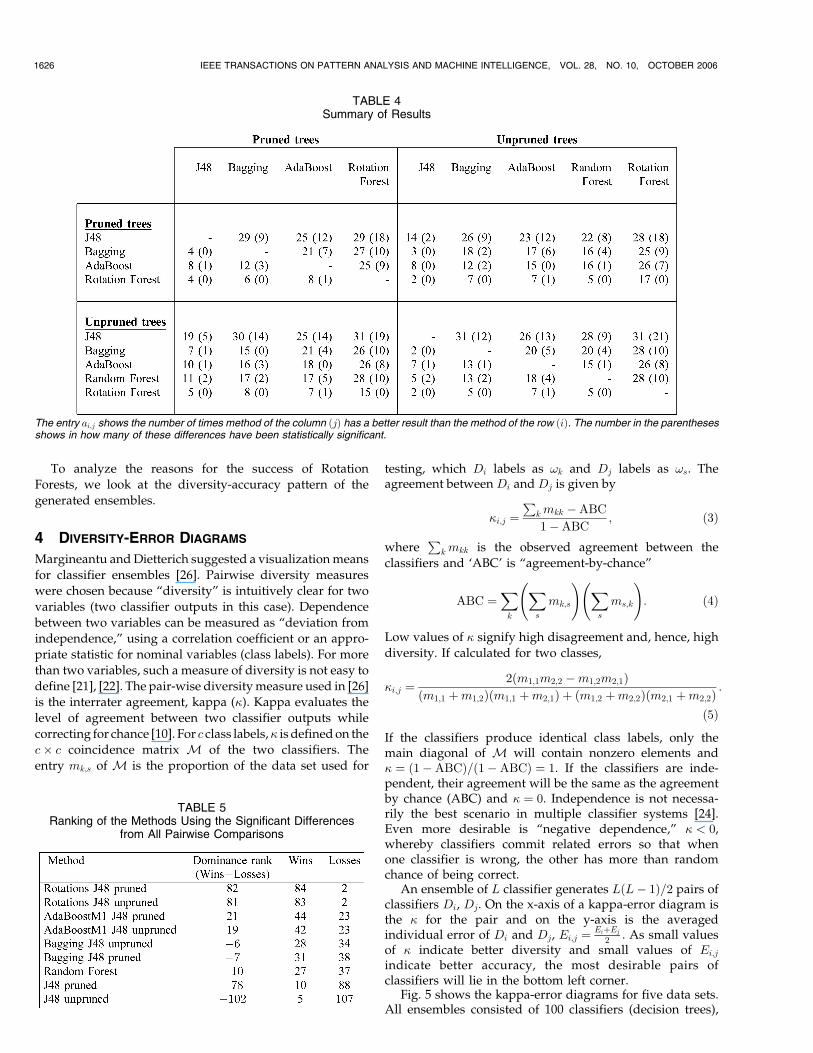
Table 4 shows a summary of the comparisons among themethods. The entry ai;j displays the number of times when
the method of the column ðjÞ has a better result than the
method of the row ðiÞ. The number in the parentheses
shows in how many of these differences have been
statistically significant. For example, Rotation Forest with
pruned trees has been better than AdaBoost with pruned
trees in 25 of the 33 comparisons and worse in 8. The
numbers in the parentheses show that, in nine cases, the
difference in favor of Rotation Forest has been statistically
significant; hence, the value 25(9) in row 3, column 4 of the
table. In one of the opposite eight cases, AdaBoost was
significantly better than Rotation Forest (the audiology data
set), i.e., the entry in row 4, column 3 is 8(1).5
Table 5 shows a ranking of the methods according to the
difference between the number of times each method has
been significantly better and significantly worse than
another method. Here, we use all pairwise comparisons as
summarized in Table 4. For example, the sum of the
numbers in the brackets in the column corresponding to
Rotation Forest using pruned trees in Table 4 is 84. The sum
of the numbers in the brackets in the row corresponding to
1624 IEEE TRANSACTIONS ON PATTERN ANALYSIS AND MACHINE INTELLIGENCE, VOL. 28, NO. 10, OCTOBER 2006
TABLE 2Classification Accuracy and Standard Deviation of J48 and Ensemble Methods with Pruning
4. The result for data set “primary tumor” is left out of the plots becausethe accuracy with all ensemble methods is very low, the correspondingpoint represents an outlier.
5. The sum “better + worse” for each pair of methods should be 33 asthere are 33 data sets (25 + 8 for Rotation Forest and AdaBoost with prunedtrees). The only exception is Rotation Forest with pruning versus RotationForest without pruning. For this case, “better + worse” counts are15þ 17 ¼ 32. This happens because the accuracies were exactly the samefor the iris data.
Rotation Forest is 2. These are used in Table 5 to calculatethe nondominance ranking of Rotation Forest (84� 2).
Tables 4 and 5 demonstrate the advantage of RotationForest compared with the best benchmark classifier ensemble
methods: Bagging, AdaBoost, and Random Forest. Thedominance of Rotation Forest was established by a largemargin leaving AdaBoost, Bagging, and Random Forest in agroup with much smaller differences among them.
RODR�IGUEZ ET AL.: ROTATION FOREST: A NEW CLASSIFIER ENSEMBLE METHOD 1625
TABLE 3Classification Accuracy and Standard Deviation of J48 and Ensemble Methods without Pruning
Fig. 4. Comparison of accuracy of Rotation Forest ensemble (RF) and the best accuracy from any of a single tree, Bagging, Boosting, and Random
Forest ensembles.
To analyze the reasons for the success of RotationForests, we look at the diversity-accuracy pattern of the
generated ensembles.
4 DIVERSITY-ERROR DIAGRAMS
Margineantu and Dietterich suggested a visualization means
for classifier ensembles [26]. Pairwise diversity measureswere chosen because “diversity” is intuitively clear for two
variables (two classifier outputs in this case). Dependence
between two variables can be measured as “deviation fromindependence,” using a correlation coefficient or an appro-
priate statistic for nominal variables (class labels). For more
than two variables, such a measure of diversity is not easy to
define [21], [22]. The pair-wise diversity measure used in [26]is the interrater agreement, kappa (�). Kappa evaluates the
level of agreement between two classifier outputs while
correcting for chance [10]. For c class labels,� is defined on thec� c coincidence matrix M of the two classifiers. The
entry mk;s of M is the proportion of the data set used for
testing, which Di labels as !k and Dj labels as !s. Theagreement between Di and Dj is given by
�i;j ¼P
k mkk �ABC
1�ABC; ð3Þ
whereP
k mkk is the observed agreement between the
classifiers and ‘ABC’ is “agreement-by-chance”
ABC ¼Xk
Xs
mk;s
! Xs
ms;k
!: ð4Þ
Low values of � signify high disagreement and, hence, high
diversity. If calculated for two classes,
�i;j ¼2ðm1;1m2;2 �m1;2m2;1Þ
ðm1;1 þm1;2Þðm1;1 þm2;1Þ þ ðm1;2 þm2;2Þðm2;1 þm2;2Þ:
ð5Þ
If the classifiers produce identical class labels, only themain diagonal of M will contain nonzero elements and� ¼ ð1�ABCÞ=ð1�ABCÞ ¼ 1. If the classifiers are inde-pendent, their agreement will be the same as the agreementby chance (ABC) and � ¼ 0. Independence is not necessa-rily the best scenario in multiple classifier systems [24].Even more desirable is “negative dependence,” � < 0,whereby classifiers commit related errors so that whenone classifier is wrong, the other has more than randomchance of being correct.
An ensemble of L classifier generates LðL� 1Þ=2 pairs ofclassifiers Di, Dj. On the x-axis of a kappa-error diagram isthe � for the pair and on the y-axis is the averagedindividual error of Di and Dj, Ei;j ¼ EiþEj
2 . As small valuesof � indicate better diversity and small values of Ei;j
indicate better accuracy, the most desirable pairs ofclassifiers will lie in the bottom left corner.
Fig. 5 shows the kappa-error diagrams for five data sets.All ensembles consisted of 100 classifiers (decision trees),
1626 IEEE TRANSACTIONS ON PATTERN ANALYSIS AND MACHINE INTELLIGENCE, VOL. 28, NO. 10, OCTOBER 2006
TABLE 4Summary of Results
The entry ai;j shows the number of times method of the column ðjÞ has a better result than the method of the row ðiÞ. The number in the parenthesesshows in how many of these differences have been statistically significant.
TABLE 5Ranking of the Methods Using the Significant Differences
from All Pairwise Comparisons
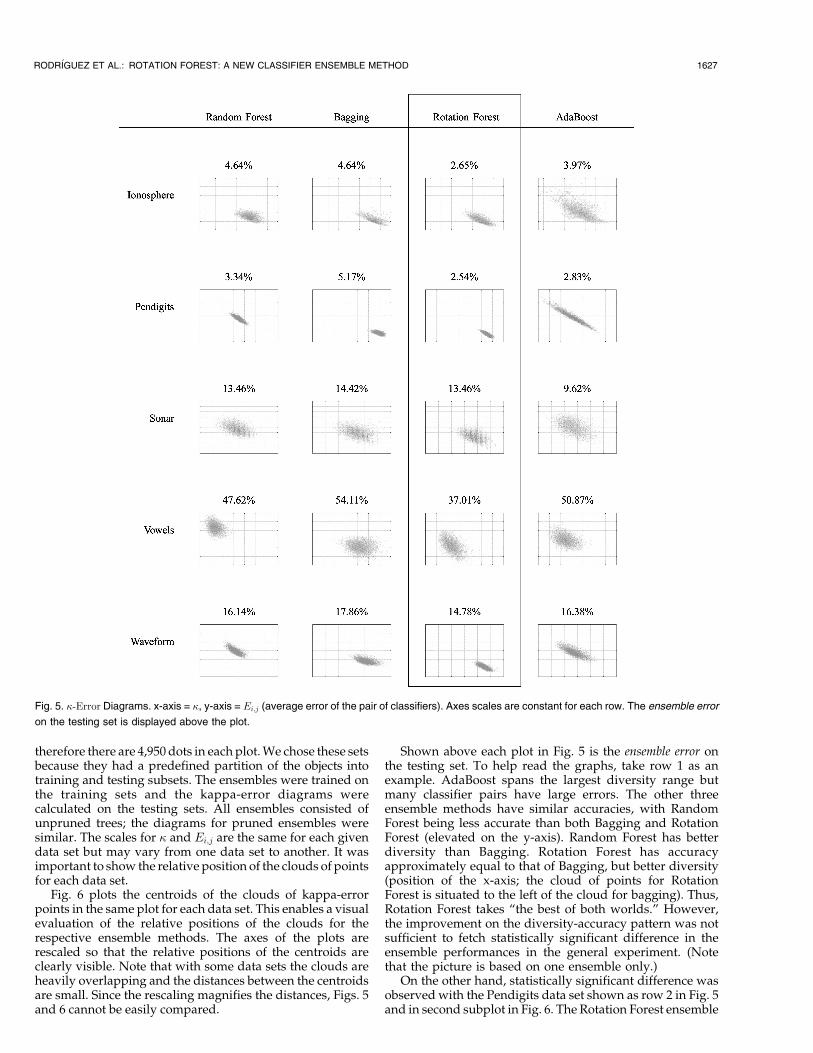
therefore there are 4,950 dots in each plot. We chose these setsbecause they had a predefined partition of the objects intotraining and testing subsets. The ensembles were trained onthe training sets and the kappa-error diagrams werecalculated on the testing sets. All ensembles consisted ofunpruned trees; the diagrams for pruned ensembles weresimilar. The scales for � and Ei;j are the same for each givendata set but may vary from one data set to another. It wasimportant to show the relative position of the clouds of pointsfor each data set.
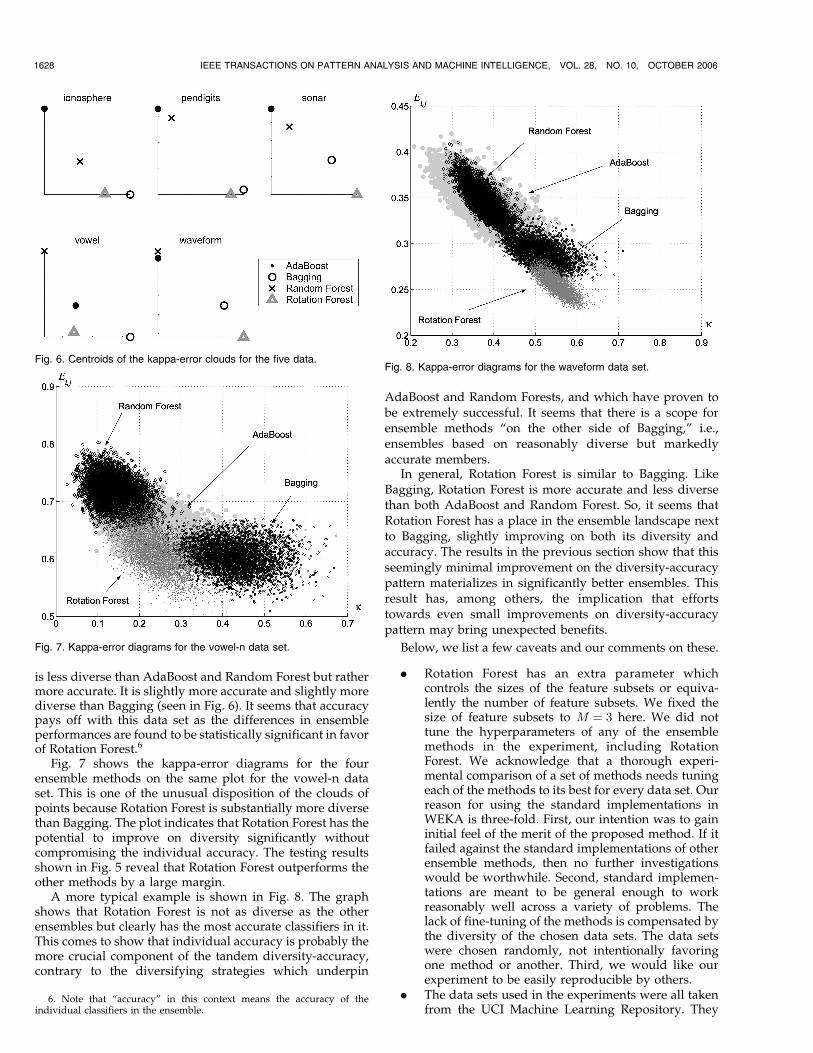
Fig. 6 plots the centroids of the clouds of kappa-errorpoints in the same plot for each data set. This enables a visualevaluation of the relative positions of the clouds for therespective ensemble methods. The axes of the plots arerescaled so that the relative positions of the centroids areclearly visible. Note that with some data sets the clouds areheavily overlapping and the distances between the centroidsare small. Since the rescaling magnifies the distances, Figs. 5and 6 cannot be easily compared.
Shown above each plot in Fig. 5 is the ensemble error onthe testing set. To help read the graphs, take row 1 as anexample. AdaBoost spans the largest diversity range butmany classifier pairs have large errors. The other threeensemble methods have similar accuracies, with RandomForest being less accurate than both Bagging and RotationForest (elevated on the y-axis). Random Forest has betterdiversity than Bagging. Rotation Forest has accuracyapproximately equal to that of Bagging, but better diversity(position of the x-axis; the cloud of points for RotationForest is situated to the left of the cloud for bagging). Thus,Rotation Forest takes “the best of both worlds.” However,the improvement on the diversity-accuracy pattern was notsufficient to fetch statistically significant difference in theensemble performances in the general experiment. (Notethat the picture is based on one ensemble only.)
On the other hand, statistically significant difference wasobserved with the Pendigits data set shown as row 2 in Fig. 5and in second subplot in Fig. 6. The Rotation Forest ensemble
RODR�IGUEZ ET AL.: ROTATION FOREST: A NEW CLASSIFIER ENSEMBLE METHOD 1627
Fig. 5. �-Error Diagrams. x-axis = �, y-axis = Ei;j (average error of the pair of classifiers). Axes scales are constant for each row. The ensemble error
on the testing set is displayed above the plot.
is less diverse than AdaBoost and Random Forest but rathermore accurate. It is slightly more accurate and slightly morediverse than Bagging (seen in Fig. 6). It seems that accuracypays off with this data set as the differences in ensembleperformances are found to be statistically significant in favorof Rotation Forest.6
Fig. 7 shows the kappa-error diagrams for the fourensemble methods on the same plot for the vowel-n dataset. This is one of the unusual disposition of the clouds ofpoints because Rotation Forest is substantially more diversethan Bagging. The plot indicates that Rotation Forest has thepotential to improve on diversity significantly withoutcompromising the individual accuracy. The testing resultsshown in Fig. 5 reveal that Rotation Forest outperforms theother methods by a large margin.
A more typical example is shown in Fig. 8. The graphshows that Rotation Forest is not as diverse as the otherensembles but clearly has the most accurate classifiers in it.This comes to show that individual accuracy is probably themore crucial component of the tandem diversity-accuracy,contrary to the diversifying strategies which underpin
AdaBoost and Random Forests, and which have proven tobe extremely successful. It seems that there is a scope forensemble methods “on the other side of Bagging,” i.e.,ensembles based on reasonably diverse but markedlyaccurate members.
In general, Rotation Forest is similar to Bagging. LikeBagging, Rotation Forest is more accurate and less diversethan both AdaBoost and Random Forest. So, it seems thatRotation Forest has a place in the ensemble landscape nextto Bagging, slightly improving on both its diversity andaccuracy. The results in the previous section show that thisseemingly minimal improvement on the diversity-accuracypattern materializes in significantly better ensembles. Thisresult has, among others, the implication that effortstowards even small improvements on diversity-accuracypattern may bring unexpected benefits.
Below, we list a few caveats and our comments on these.
. Rotation Forest has an extra parameter whichcontrols the sizes of the feature subsets or equiva-lently the number of feature subsets. We fixed thesize of feature subsets to M ¼ 3 here. We did nottune the hyperparameters of any of the ensemblemethods in the experiment, including RotationForest. We acknowledge that a thorough experi-mental comparison of a set of methods needs tuningeach of the methods to its best for every data set. Ourreason for using the standard implementations inWEKA is three-fold. First, our intention was to gaininitial feel of the merit of the proposed method. If itfailed against the standard implementations of otherensemble methods, then no further investigationswould be worthwhile. Second, standard implemen-tations are meant to be general enough to workreasonably well across a variety of problems. Thelack of fine-tuning of the methods is compensated bythe diversity of the chosen data sets. The data setswere chosen randomly, not intentionally favoringone method or another. Third, we would like ourexperiment to be easily reproducible by others.
. The data sets used in the experiments were all takenfrom the UCI Machine Learning Repository. They
1628 IEEE TRANSACTIONS ON PATTERN ANALYSIS AND MACHINE INTELLIGENCE, VOL. 28, NO. 10, OCTOBER 2006
Fig. 7. Kappa-error diagrams for the vowel-n data set.
Fig. 8. Kappa-error diagrams for the waveform data set.
6. Note that “accuracy” in this context means the accuracy of theindividual classifiers in the ensemble.
Fig. 6. Centroids of the kappa-error clouds for the five data.
represent a variety of problems but do not includevery large-scale data sets with the number offeatures or objects in a scale of millions. Examplesof such data sets are DNA microarray data, searchesof the Web and image databases, time series data,data from financial transactions, etc. Modificationsof the standard classification methods and algo-rithms are needed in order to account for thespecifics of such large data sets. This applies toensemble methods as well including the rotationforest method. Thus, the results reported here arevalid for data sets of small to moderate sizes.
. Random Forest offers as a by-product a way to orderthe features by their importance. Rotation Forestdoes not share this capability.
. Here, we used the same ensemble size L for allmethods. It is known that bagging fares better for largeL. On the other hand, AdaBoost would benefit fromtuning L. Our results apply to ensembles of fixed L(L ¼ 10 for the statistical comparisons), which, ad-mittedly, is quite small by the ensemble standards. Forlarger L, we expect the differences to fade away, asindicated by Fig. 3. It is not clear what the outcomewould be if L was treated as hyperparameter andtuned for all ensemble methods compared here.
5 CONCLUSIONS AND FUTURE WORK
A novel method for generating ensembles of classifiers hasbeen proposed. It consists in splitting the feature set intoK subsets, running principal component analysis (PCA)separately on each subset and then reassembling a newextracted feature set while keeping all the components. Thedata is transformed linearly into the new features. A decisiontree classifier is trained with this data set. Different splits ofthe feature set will lead to different rotations. Thus diverseclassifiers are obtained. On the other hand, the informationabout the scatter of the data is completely preserved in thenew space of extracted features. In this way, accurateindividual classifiers are built. Thus, we target diversityand accuracy together.
Since PCA is a simple rotation of the coordinate axes andthe base classifier model is a decision tree we call theproposed ensemble method Rotation Forest. Decision treeswere used here because this classifier model is sensitive torotation of the axes, yet sufficiently accurate.
Rotation Forest was compared with the standard imple-mentations of Bagging, AdaBoost, and Random Forestavailable in WEKA. The experimental results with 33 datasets from UCI Machine Learning Repository showed thatRotation Forest outperformed all three methods by a largemargin. We looked for an explanation of this improvement byusing kappa-error diagrams. It transpired that RotationForest has similar diversity-accuracy pattern to Bagging,but is slightly more accurate and slightly more diverse than it.This seemingly marginal improvement fetched statisticallysignificant differences in favor of Rotation Forest. Futurestudies and developments of Rotation Forest include, but arenot limited to:
1. Evaluation of the sensitivity of the algorithm to thechoice of M (or alternatively the number of featuresubsets K) and to the choice of the ensemble size, L.
2. Application of Rotation Forest together with otherensemble approaches.
3. Trying a different base classifier model, e.g., NaıveBayes and neural networks, to see whether the“forest” component is a necessity for the ensemblesuccess.
4. Examining the effect of randomly pruning classes andtaking a bootstrap sample for each feature subset,prior to applying PCA. Removing these two heuristicsmight lead to more similar PCA projections beingobtained. It is interesting to find out whether or notthis will have an adverse effect on the performance ofRotation Forest.
5. A different feature extraction algorithm can be usedin the place of the PCA.
While we view the proposed ensemble model as a general
framework, variants thereof will have to be tailored to
address the application specifics.
ACKNOWLEDGMENTS
The authors would like to thank the reviewers for their
comments. This work was partially supported by Spanish
Ministry of Education and Culture, through grant DPI2005-
08498, Junta Castilla y Leon VA088A05 and a Mobility
Grant from the University of Burgos.
REFERENCES
[1] E.L. Allwein, R.E. Schapire, and Y. Singer, “Reducing Multiclassto Binary: A Unifying Approach for Margin Classifiers,”J. Machine Learning Research, vol. 1, pp. 113-141, 2000.
[2] R.E. Banfield, L.O. Hall, K.W. Bowyer, D. Bhadoria, W.P.Kegelmeyer, and S. Eschrich, “A Comparison of EnsembleCreation Techniques,” Proc Fifth Int’l Workshop Multiple ClassifierSystems (MCS ’04), 2004.
[3] E. Bauer and R. Kohavi, “An Empirical Comparison of VotingClassification Algorithms: Bagging, Boosting, and Variants,”Machine Learning, vol. 36, nos. 1-2, pp. 105-139, 1999.
[4] C.L. Blake and C.J. Merz, “UCI Repository of MachineLearning Databases,” 1998, http://www.ics.uci.edu/mlearn/MLRepository.html.
[5] L. Breiman, “Bagging Predictors,” Machine Learning, vol. 24, no. 2,pp. 123-140, 1996.
[6] L. Breiman, “Arcing Classifiers,” Annals of Statistics, vol. 26, no. 3,pp. 801-849, 1998.
[7] L. Breiman, “Random Forests,” Machine Learning, vol. 45, no. 1,pp. 5-32, 2001.
[8] T.G. Dietterich, “Ensemble Methods in Machine Learning,” Proc.Conf. Multiple Classifier Systems, pp. 1-15, 2000.
[9] X.Z. Fern and C.E. Brodley, “Random Projection for HighDimensional Data Clustering: A Cluster Ensemble Approach,”Proc. 20th Int’l Conf. Machine Learning (ICML), pp. 186-193, 2003.
[10] J.L. Fleiss, Statistical Methods for Rates and Proportions. John Wileyand Sons, 1981.
[11] F.H. Foley and J.W. Sammon, “An Optimal Set of DiscriminantVectors,” IEEE Trans. Computers, vol. 24, no. 3, pp. 281-289, Mar.1975.
[12] Y. Freund and R.E. Schapire, “A Decision-Theoretic General-ization of On-Line Learning and an Application to Boosting,”J. Computer and System Sciences, vol. 55, no. 1, pp. 119-139, 1997.
[13] J. Friedman, T. Hastie, and R. Tibshirani, “Additive LogisticRegression: A Statistical View of Boosting,” Annals of Statistics,vol. 28, no. 2, pp. 337-374, 2000.
[14] K. Fukunaga and W.L.G. Koontz, “Application of the Karhunen-Loeve Expansion to Feature Selection and Ordering,” IEEE Trans.Computers, vol. 19, no. 4, pp. 311-318, Apr. 1970.
[15] J. Han and M. Kamber, Data Mining: Concepts and Techniques.Morgan Kaufmann, 2001.
RODR�IGUEZ ET AL.: ROTATION FOREST: A NEW CLASSIFIER ENSEMBLE METHOD 1629
[16] L.K. Hansen and P. Salamon, “Neural Network Ensembles,” IEEETrans. Pattern Analysis and Machine Intelligence, vol. 12, no. 10,pp. 993-1001, Oct. 1990.
[17] T.K. Ho, “The Random Subspace Method for ConstructingDecision Forests,” IEEE Trans. Pattern Analysis and MachineIntelligence, vol. 20, no. 8, pp. 832-844, Aug. 1998.
[18] T.K. Ho, “A Data Complexity Analysis of Comparative Advan-tages of Decision Forest Constructors,” Pattern Analysis andApplications, vol. 5, pp. 102-112, 2002.
[19] J. Kittler and P.C. Young, “A New Approach to Feature SelectionBased on the Karhunen-Loeve Expansion,” Pattern Recognition,vol. 5, no. 4, pp. 335-352, Dec. 1973.
[20] S. Kolenikov and G. Angeles, “The Use of Discrete Data in PCA:Theory, Simulations, and Applications to Socioeconomic Indices,”Proc. 2004 Joint Statistical Meeting, 2004.
[21] L.I. Kuncheva, Combining Pattern Classifiers. Methods and Algo-rithms. John Wiley and Sons, 2004.
[22] L.I. Kuncheva and C.J. Whitaker, “Measures of Diversity inClassifier Ensembles,” Machine Learning, vol. 51, pp. 181-207, 2003.
[23] L.I. Kuncheva, “Diversity in Multiple Classifier Systems (editor-ial),” Information Fusion, vol. 6, no. 1, pp. 3-4, 2004.
[24] L.I. Kuncheva, C.J. Whitaker, C.A. Shipp, and R.P.W. Duin, “IsIndependence Good for Combining Classifiers?” Proc. 15th Int’lConf. Pattern Recognition, vol. 2, pp. 169-171, 2000.
[25] P.M. Long and V.B. Vega, “Boosting and Microarray Data,”Machine Learning, vol. 52, pp. 31-44, 2003.
[26] D.D. Margineantu and T.G. Dietterich, “Pruning Adaptive Boost-ing,” Proc. 14th Int’l Conf. Machine Learning, pp. 211-218, 1997.
[27] L. Mason, P.L. Bartlet, and J. Baxter, “Improved Generalizationthrough Explicit Optimization of Margins,” Machine Learning,vol. 38, no. 3, pp. 243-255, 2000.
[28] P. Melville, N. Shah, L. Mihalkova, and R.J. Mooney, “Experi-ments with Ensembles with Missing and Noisy Data,” Proc FifthInt’l Workshop Multiple Classifier Systems, pp. 293-302, 2004.
[29] C. Nadeau and Y. Bengio, “Inference for the GeneralizationError,” Machine Learning, vol. 62, pp. 239-281, 2003.
[30] N.C. Oza, “Boosting with Averaged Weight Vectors,” Proc FourthInt’l Workshop Multiple Classifier Systems (MCS 2003), 2003.
[31] Multiple Classifier Systems, Proc. Sixth Int’l Workshop, MCS 2005,N.C. Oza et al., eds., 2005.
[32] J.R. Quinlan, C4.5: Programs for Machine Learning. MorganKaufmann, 1993.
[33] Proc. First Int’l Workshop Multiple Classifier Systems (MCS 2000),F. Roli and J. Kittler, eds., 2001.
[34] Proc. Second Int’l Workshop Multiple Classifier Systems (MCS 2001),F. Roli and J. Kittler, eds., 2001.
[35] Proc. Third Int’l Workshop Multiple Classifier Systems (MCS 2002),F. Roli and J. Kittler, eds., 2002.
[36] Proc. Fifth Int’l Workshop Multiple Classifier Systems (MCS 2004),F. Roli et al., eds., 2004.
[37] R.E. Schapire, “Theoretical Views of Boosting,” Proc. FourthEuropean Conf. Computational Learning Theory, pp. 1-10, 1999.
[38] R.E. Schapire, “The Boosting Approach to Machine Learning: AnOverview,” Proc. MSRI Workshop Nonlinear Estimation and Classi-fication, 2002.
[39] R.E. Schapire, Y. Freund, P. Bartlett, and W.S. Lee, “Boosting theMargin: A New Explanation for the Effectiveness of VotingMethods,” Annals of Statistics, vol. 26, no. 5, pp. 1651-1686, 1998.
[40] R.E. Schapire and Y. Singer, “Improved Boosting AlgorithmsUsing Confidence-Rated Predictions,” Machine Learning, vol. 37,no. 3, pp. 397-336, 1999.
[41] M. Skurichina and R.P.W. Duin, “Combining Feature Subsets inFeature Selection,” Proc. Sixth Int’l Workshop Multiple ClassifierSystems, (MCS ’05), pp. 165-175, 2005.
[42] K. Tumer and N.C. Oza, “Input Decimated Ensembles,” PatternAnalysis Applications, vol. 6, pp. 65-77, 2003.
[43] F. van der Heijden, R.P.W. Duin, D. de Ridder, and D.M.J. Tax,Classification, Parameter Estimation and State Estimation. Wiley,2004.
[44] A. Webb, Statistical Pattern Recognition. London: Arnold, 1999.[45] G.I. Webb, “MultiBoosting: A Technique for Combining Boosting
and Wagging,” Machine Learning, vol. 40, no. 2, pp. 159-196, 2000.[46] Proc. Fourth Int’l Workshop Multiple Classifier Systems (MCS 2003),
T. Windeatt and F. Roli, eds., 2003.[47] I.H. Witten and E. Frank, Data Mining: Practical Machine Learning
Tools and Techniques, second ed. Morgan Kaufmann, 2005.
Juan J. Rodrıguez received the BS, MS, andPhD degrees in computer science from theUniversity of Valladolid, Spain, in 1994, 1998,and 2004, respectively. He worked with theDepartment of Computer Science, University ofValladolid from 1995 to 2000. Currently, he isworking with the Department of Civil Engineer-ing, University of Burgos, Spain, where he is anassociate professor. His main interests aremachine learning, data mining, and pattern
recognition. He is a member of the IEEE Computer Society.
Ludmila I. Kuncheva received the MSc degreefrom the Technical University, Sofia, in 1982 andthe PhD degree from the Bulgarian Academy ofSciences in 1987. Until 1997, she worked at theCentral Laboratory of Biomedical Engineering,Bulgarian Academy of Sciences, as a seniorresearch associate. She is currently a reader atthe School of Informatics, University of Wales,Bangor, United Kingdom. Her interests includepattern recognition, classifier combination, diver-
sity measures, and nearest neighbor classifiers. She has publishedmore than 100 research papers and two books. She won of the bestpaper award for 2006 in IEEE Transactions on Fuzzy Systems and theSage best transaction paper award for 2003 across IEEE Transactionson Systems, Man, and Cybernetics, A, B, and C. She has served as anassociate editor for the IEEE Transactions on Fuzzy Systems and iscurrently an associate editor for IEEE Transactions on Pattern Analysisand Machine Intelligence. She is a member of the IEEE.
Carlos J. Alonso received the BS degree inscience and the PhD degree in physics, from theUniversity of Valladolid, Valladolid, Spain, in1985 and 1990, respectively. Currently, he is anassociate professor in the Departamento deInformatica, University of Valladolid. He hasbeen working in different nationally fundedprojects related to supervision and diagnosis ofcontinuous industrial environments. His mainresearch interests are knowledge-based sys-
tems for supervision and diagnosis of dynamic systems, model-baseddiagnosis, knowledge engineering, and machine learning.
. For more information on this or any other computing topic,please visit our Digital Library at www.computer.org/publications/dlib.
1630 IEEE TRANSACTIONS ON PATTERN ANALYSIS AND MACHINE INTELLIGENCE, VOL. 28, NO. 10, OCTOBER 2006