Application and Interpretation of Ensemble Methods for ...
11
Application and Interpretation of Ensemble Methods for Darknet Traffic Classification The paper has been submitted for peer review at IEEE S&P 2021. This anonymous preprint is published with the consent of the PC Chair. The authors declare no conflict of interest.
-
Upload
khangminh22 -
Category
Documents
-
view
3 -
download
0
Transcript of Application and Interpretation of Ensemble Methods for ...

Application and Interpretation of EnsembleMethods for Darknet Traffic Classification
The paper has been submitted for peer review at IEEE S&P 2021. This anonymous preprint is published with the consentof the PC Chair. The authors declare no conflict of interest.

Application and Interpretation of EnsembleMethods for Darknet Traffic Classification
Abstract—Darknet, a part of the deep web, has been latelyexperiencing increased illegal activities like drug trafficking,terrorism, extremism, child pornography, etc. Hence, properidentification and classification of the Darknet traffic areof due importance. In this paper, we successfully appliedensemble machine learning methods on the recently publishedCIC-Darknet2020 dataset to distinguish Darknet traffic apartfrom the Benign ones (with 98% accuracy) and further identifythe type of application running beneath the Darknet traffic(with 97% accuracy). Besides, we adopted a game-theoreticapproach to show the impact of the features and interpret theoutput of the machine learning models to better understand thebehavior of the Darknet traffic. To the best of our knowledge,following the dataset publishers, ours is the first work on thisdataset.
Keywords: Darknet, Tor, VPN, Ensemble Method, SHAP
I. INTRODUCTION
Darknet is an overlay network within the internet that canbe accessed only through a particular set of specific softwarerequirements and configuration [1]. It is also referred as theunused address space of the internet, which cannot be foundby typical search engines. Biddle et al. [2] defined Darknetas a distribution network where any widely shared contentwill be injected to be available to a portion of users in acopy-able form, and contents will be shared or copied, whenit is interesting and possible to do so. Since the Darknet is notregulated by any legal entity, it is, along with many researchand military purposes, often used for carrying out criminalactivities. Hence detecting Darknet traffic, along with thebackground application, might be useful for cyber-forensicinvestigation.
One of the most widely used Darknet instance, Tor, thesecond-generation Onion Router, is a decentralized open-source software introduced by Dingledine et al. [3]. In OnionRouting, initiating applications connect to the respondingserver through a sequence of machines called Onion Routers(OR) [4]. Each OR maintains a TLS connection to all otherORs and no OR gets any special privilege. By passing datathrough multiple relays, and decrypting and re-encryptingin each stage, Tor protects the identity of the sender butfaithfully transmits the message to the final server in itsaccessible form [1].
It is of note that the designers of Tor themselves identifiedseveral plausible passive attacks. Observing a connection willnot reveal the destination or underlying content; nonetheless,traffic patterns can be observed and timing and packet size
correlations can be obtained [3]. An attempt to distinguishand characterize Tor traffic across various applications waspresented in [5]. They gathered their observation in the publicISCXTor2016 dataset1.
Another popular approach to access the Darknet is throughVirtual Private Networks (VPN). VPN can formally be definedas “a communication environment constructed by controlledsegmentation of a shared communications infrastructure toemulate the characteristics of a private network” [6]. Similarto the ISCXTor2016 dataset, Habibi Lashkari et al. [7]presented ISCXVPN20162 dataset containing time-relatedflow features across various applications. Both Tor over VPNand VPN over Tor are common in use to ensure furtheranonymity [8].
Tor and VPN technologies (collectively mentioned asDarknet within the scope of this paper) have many legitimateand illegitimate usage. Moore and Rid [9] categorizeda sample of 5000 Darknet sites and the most frequenttypes were “Drugs”, “Finance”, “Extremism”, “IllegitimatePornography”, “Nexus”, “Hacking”, “Social”, “Arms”,“Violence”, etc. Thus the necessity of proper identificationof Darknet traffic cannot be ignored. Traffic classification, ingeneral, has enormous applications in fields like providingQuality of Service (QoS), anomaly detection, billing byservice providers, etc. The emergence of new applications aswell as increased interaction between them and wide-scaleencryption in network protocols make the task of trafficclassification quite hard [10]. There are a lot of recent worksin the field, specially based on the two aforementioneddatasets. To create a real representation of Darknet traffic,these two datasets have been amalgamated into the publicCIC-Darknet2020 dataset3, which has been studied in thiswork.
To the best of our knowledge, after the original authors,ours is the first work on the CIC-Darknet2020 dataset.We applied several machine learning algorithms to classifyDarknet traffic. We also tried to infer the type of applicationrunning behind the Darknet traffic in the same way. We alsoapplied SHAP, a game-theoretic approach for interpretablemachine learning introduced in [11], to analyze the important
1https://www.unb.ca/cic/datasets/tor.html2https://www.unb.ca/cic/datasets/vpn.html3https://www.unb.ca/cic/datasets/Darknet2020.html

features for our task.
Our contribution in this work is two-fold. Firstly, we extendthe scope of previous works to build a model to classifyDarknet traffic (both Tor and VPN) from Benign ones andpredict the application-type running beneath Darknet trafficusing time and packet related features. In our studies, wecould detect Darknet traffic with 98% accuracy and categorizethem with 97% accuracy. Secondly, we also studied therelative importance of time and packet related features usinginterpretive ML techniques.
The rest of the paper is organized as follows. Section IIdiscusses the related previous works in the domain of trafficclassification. Section III describes the dataset, the machinelearning models, the evaluation metrics we used and the tunedhyperparameters along with an overview of SHAP. We presentour results and visulizations in Section IV followed by a shortdiscussion in Section V. We provide some concluding remarksin Section VI.
II. RELATED WORKS
Traffic classification methods can be divided into fivecategories based on granularity, timeliness and computationalcost: port-based, deep packet inspection (DPI), stochasticpacket inspection (SPI), statistical and behavioural [12]. Port-based approaches like Bro [13] relies on extracting valuesfrom packet headers and then matching them with knownport-application connections. Due to the increasing amount ofapplications, and innovative strategies of peer-to-peer (P2P)applications like usage of random initial ports, port-basedapproaches cannot be deemed trustworthy for a generalpurpose classification task. Deep packet inspection matches adeterministic set of signatures against packet payload, whereasstochastic packet inspection looks for statistical properties ofthe packet. DPI has been successfully applied in Linux kernelfirewall implementation. However, DPI is computationallytoo expensive [7] and fails for encrypted data [14]. SPI addssome statistical measures to the above approach like PearsonChi-square test in [15]. SPI still requires huge computationalresources. Current research now focuses on the remainingtwo classes (statistical and behavioural) of methods. Bothare machine learning approaches dependent on extractingfeatures from raw traffic and then performing clustering andclassification operations on them [14]. Behavioral methodslike [16] differ from statistical ones by the usage of higherlevel of social, functional and application-oriented detail.
The authors of [7] observed that the classificationfor encapsulated protocols like VPN has not beencomprehensively discussed in the literature. The time-related features of their ISCXVPN2016 dataset has widelybeen used for both VPN identification and applicationclassification. The authors themselves applied C4,5 decisiontrees and k-Nearest Neighbour (KNN) algorithms to thedataset. Yamansavascilar et al. [17] selected 111 features
and applied a Random Forest classifier to a combination ofISCXVPN2016 and their own internal dataset. Wang et al.[14] implemented an end-to-end model using one-dimensionalconvolutional neural networks (1D-CNN) and reported 99.9%precision and 100% recall for protocol encapsulated trafficidentification. However, their methodology was severelycriticized in a parallel work [10], because of the inclusion ofnetwork layer headers containing source and destination IPaddresses, which are unique for each application, supposedlymake their model learn from those features only. Lotfollahiet al. [10] used 1D-CNN and Stacked Autoencoder (SAE)for both traffic characterization and application identification.It is of note that neural networks have been used for trafficclassification before as in [18].
Unlike the previous case, there have been some works todetect Tor traffic before the publication of the ISCXTor2016dataset. AlSabah et al. [19] tried to classify Tor traffic intothree categories: streaming, interactive and bulk transfer.They picked four features to work with: circuit lifetime,amount of data transferred, cell inter-arrival time, and numberof cells sent recently. The machine learning models theyused were Bayesian networks, functional trees and logisticmodel tree. Bai et al. [20] used fingerprinting methods forthe detection of Tor and Web-mix traffic, but they did notattempt to identify the underlying application. He et al. [21]utilized Hidden Markov Models within a private Tor networkto identify four categories of applications: P2P, FTP, IM,and otherwise. The ISCXTor2016 dataset was introduced in[5], where the author used C4,5 Decision Trees, k-NearestNeighbors and Random Forest for both traffic characterizationand application identification. Support vector machine (SVM)and artificial neural network (ANN) were applied to thedataset for the same purposes in [22]. However, they alsomade the same methodological error as [14] by includingsource and destination IPs in the classifier model.
We have not noticed any attempt to interpret the classifiermodels in this field. Several works preselected features fortraining the classifier. Hodo et al. [22] used Categorical FeatureSelection (CFS). Habibi Lashkari et al. [5] used CfsSubsetE-val+BestFirst and InfoGain+Ranker to select features to traintheir models. Yamansavascilar et al. [17] used CFSSubsetEvalfor ISCXTor2016 dataset and ChiSquaredAttributeEval fortheir internal dataset. We also observed a trend to explain theimportance of feature subsets based on the performance of thetrained model [14].
III. METHODOLOGY
A. Dataset
The CIC-Darknet2020 dataset has been used throughout ourstudy. As mentioned before, it is an amalgamation of two pre-vious datasets: ISCXTor2016 and ISCXVPN2016. The datasettraffic was generated over eight different traffic categories.

Traffic Category Applications Used Benign Tor VPN TotalAudio-Stream Vimeo and Youtube 4780 121 13060 17961
Browsing Firefox and Chrome 32451 263 0 32714Chat ICQ, AIM, Skype, Facebook and Hangouts 6937 65 4476 11478Email SMTPS, POP3S and IMAPS 5563 13 569 6145
File Transfer Skype, FTP over SSH (SFTP) and FTP overSSL (FTPS) using Filezilla and an externalservice
8572 107 2503 11182
P2P uTorrent and Transmission (BitTorrent) 24150 110 0 24260Video-Stream Vimeo and Youtube 8421 202 1144 9767
VOIP Facebook, Skype and Hangouts voice calls 2101 298 1167 3566Total 92975 1179 22919 117073
Table I: Number of samples per traffic category after removing erroneous samples. Traffics were categorized based on theunderlying application.
Feature Name DescriptionFwd IAT Forward Inter Arrival Time, the timespan between two packets
sent in the forward direction (mean, max, min, std)Bwd IAT Backward Inter Arrival Time, the timespan between two
packets sent in the backward direction (mean, max, min, std)Flow IAT Flow Inter Arrival Time, the timespan between two packets
sent in any direction (mean, max, min, std)Active The amount of time time a flow was active before going idle
(mean, max, min, std)Idle The amount of time time a flow was idle before going active
(mean, max, min, std)Fwd Packet Length The length of a packet sent in the forward direction (mean,
max, min, std)Bwd Packet Length The length of a packet sent in the backward direction (mean,
max, min, std)Packet Length The length of a packet sent in any direction (mean, max, min,
std, variance)Header Length The length of the header (Fwd, Bwd)
Flag Counts Counts of various network flags (FIN, SYN, RST, PSH, ACK,URG, CWE, ECE)
Existence of Flag Boolean values for the presence of PSH and URG flags inforward and backward directions respectively
Subflow Amount of packets and bytes in subflows in either directionRates Flow bytes/s, Flow packets/s, Fwd packets/s, Bwd packets/s
Average Bulk Statistics Bytes/bulk, Packets/bulk and bulk rate in each directionTotal Packets In each directionSegment Size In forward (avg, min) and backward (avg) directionInit Win Bytes In each direction
Total Length of Packets In each directionFlow Duration -
Average Packet Size -Down/Up Ratio -
Fwd Active Data Packets -Timestamp -
Table II: A descriptions of the features in the dataset. Most features are either time-related or packet-related.

The dataset was downloaded from CIC website4. Few rowscontained erroneous input and were discarded. Duplicaterows were also removed from calculations. The statistics ofthe remnant rows is presented in Table I.
Researchers at CIC developed ISCXFlowMeter [7], aJava-based application to measure properties of networkflows. They define flow as a sequence of packets having thesame values for the tuple (Source IP, Destination IP, SourcePort, Destination Port and Protocol). The flow meter generatesforward and backward flows and separately calculate therelevant statistics. A summary of the features is presented inTable II.
Preprocessing: We did not consider (Source IP, DestinationIP, Source Port, Destination Port and Protocol) fields as rele-vant features for classification, and attempted to perform theclassification based on the measured features only. Lotfollahiet al. [10] categorically stated, with a reference to their contactwith the ISCXVPN2016 dataset providers in the CIC that thesource and destination IP addresses, appearing in the header ofnetwork layer, are unique for each application and hence arenot suitable for usage in classification. An argument about theinclusion of ‘Protocol’ can be made. However, Tor is supposedto work with TCP networks [3]. Here we find 35 Tor datapoints with protocol code 0 (HOPOFT) and 65 with code17 (UDP). Because of these degenerate cases, we droppedthe protocol column. We also noticed that the feature ‘PacketLength Variance’ can be dropped as it just contained thesquared values of the column ‘Packet Length Std’. Including‘Timestamp’ in the ML models is also not appropriate as itdoes not represent any information inherent to the flow. Wealso cleansed the 15 singleton columns, each with a singlevalue.
B. Machine Learning Models
We used several models which are popular among otherresearchers for traffic classification tasks.
Ensemble methods [23] have been highly successful inclassification tasks where data is presented in tabular formatlike ours. We used three ensemble methods in our work,Random Forest (RF) [24], AdaBoost (AB) [25] and Gra-dient Boosted Trees (GBT) [26]. RF consists of multipletrees constructed systematically by pseudorandomly selectingsubsets of components of the feature vector, that is, treesconstructed in randomly chosen subspaces. Boosting is theidea of merging weak learners to constitute a strong learner.AdaBoost starts with same weights for all data points. It thenlearns a classifier (most often decision trees) and based onthe performances, tunes the weights of the points and fixesthe coefficient of the classifiers. The process continues untilthe training error is negligible or the number of classifiersreaches a provided max value. Gradient boosting constructsadditive models by sequentially fitting a simple parameterized
4https://www.unb.ca/cic/datasets/Darknet2020.html
function (base learner) to current “pseudo”-residuals (gradientof the loss function being minimized) by least squares at eachiteration.
Artificial Neural Networks (ANN) [27] have been success-fully applied in a variety of fields like speech recognition,image classification, natural language processing, etc. How-ever, like [28], we believe the type and size of the datasetwe are working with are not suitable for any ANN modelto outperform ensemble methods. In our experiments, neuralnetwork based models (autoencoder, multilayer perceptron,tabnet) did perform poorly with respect to the ensemble meth-ods discussed above. Those results have not been reported.
C. Experimental Environment
We used Google Colaboratory to perform our experimentsin Python programming language. The libraries we used werescikit-learn (for training and testing the models) [29], pandas(for storing the data) [30], numpy (for numerical calculations)[31], shap (for analyzing feature importances) [11], xgboost(for efficient implementation of gradient boosting) [32], mat-plotlib [33] and yellowbrick [34] (for visualization), and keras[35] on tensorflow [36] backend (for neural network models).
D. Metrics and Visualizers
The metrics we used include: accuracy, precision, recall,F1-score, area under the ROC curve (AUROC).
accuracy =TP + TN
TP + TN + FP + FN
precision =TP
TP + FP
recall =TP
TP + FN
F1− score =2× precision× recall
precision+ recall
where, for Benign-Darknet classification, TP is the numberof instances appropriately classified as ‘Darknet’, TN is thenumber of instances appropriately classified as ‘Benign’,FP is the number of instances inappropriately classified as‘Darknet’, and FN is the number of instances inappropriatelyclassified as ‘Benign’. For categorizing Darknet traffic, theabove definitions were extended by treating the target categoryas the positive class and all other categories as negative class.
A receiver operating characteristic curve, or ROC curve is agraphical representation of how a classifier’s true positive rate(TPR) (which is basically recall) varies with false positive rate(FPR) per class.
TPR =TP
TP + FN
FPR =FP
FP + TN

AUROC is the area the TPR-FPR curve makes with theFPR axis.
A great way to visualize classifiers (especially multiclassones) is the “confusion matrix”. It is a square matrix repre-sentation of true labels in one dimension and predicted labelsin another.
E. Hyperparameters
The ensemble methods being used are quite robust tooverfitting [37]. Yet the number of estimators and themaximum depth of a tree are the two most importanthyperparameters to tune. After studying some characteristicsof the data, we performed a grid search over suitablehyperparameters. Due to resource limitations, we onlysearched over a limited space of hyperparameters. Only thebest performing hyperparameter values that we changed fromtheir default values in scikit-learn (or xgboost for GBT) arementioned in the following subsection.
1) Benign-Darknet Classification: For RF, we usedn estimators = 180 and criterion = “entropy”. ForAdaBoost, we chose n estimators = 150 and the underlyingestimator to be a decision tree classifier of max depth = 3.For GBT, we set n estimators = 300 and max depth = 8.To improve the recall of GBT (since we believe labellingDarknet traffic as Darknet is more important than labellingBenign traffic as Benign), we also set scale pos weight = 3.
2) Darknet Traffic Characterization: For RF, we usedn estimators = 200 and criterion = “gini”. For AdaBoost,we chose n estimators = 1500 and the underlying estimatorto be a decision tree classifier of max depth = 8. For GBT,we set n estimators to 100 and max depth to 8. To focuson minority classes, we also set scale pos weight to 99.
It is of note here that our dataset was first split in a stratifiedmanner between 85% train-validation set and 15% test set. Thehyperparameters were tuned using 5-fold cross-validation onthe train-validation set. The classifier was trained using theselected model parameters on the entire train-validation setand the evaluation metrics are reported on the hold-out testset.
F. Interpretation
SHAP (SHapley Additive exPlanations) is a model-agnostictool for interpretive machine learning. The goal of SHAP isto explain the prediction of an instance x by computing thecontribution of each feature to the prediction by computingShapley values from coalitional game theory [38]. Treatingthe features (or a group of them) as players in a game,SHAP identifies the significance of each feature in anyparticular prediction. Also summing up SHAP values fromthe entire dataset, we can rank the features by their importance.
Shapely values have a strong theoretical basis in gametheory and it is measured over all possible ways an elementcan be added to a group. However, for ensemble methods,Lundberg et al. [39] reduced the computational complexityfrom exponential time to polynomial time, allowing us toproduce the values within the computational resources.
IV. RESULTS AND ANALYSIS
A. Benign-Darknet Classification
We considered ‘VPN’ and ‘Tor’ labeled traffics as ‘Darknet’traffic and ‘Non-VPN’ and ‘Non-Tor’ traffics as ‘Benign’traffic. The classification results are being presented in TableIII.
Model Preci-sion
Recall Accu-racy
F1-Score
AUROC
RF 0.95365 0.94227 0.97876 0.94793 0.99236GBT 0.93761 0.95948 0.97859 0.94842 0.97150AB 0.96680 0.93755 0.98058 0.95195 0.99597
Table III: Comparison of RF, GBT and AB models based ondifferent performances matrices for Benign-Darknet classifi-cation. The highest values are highlighted with bold texts.
The metrics from Table III suggests that AdaBoost per-formed better than other models in terms of all the metricsexcept recall. However, since detecting Darknet traffic is ourprimary objective, the classifier with the best recall, XGBoost,is recommended.
To evaluate the classifiers performance across variousthresholds, we plot the precision-recall curve and ROC curvefor each classifier, presented in Appendix A.
For each of the classifiers, we use SHAP summary plots inFigure 1, which use the sum of SHAP values for each instancefor each feature to rank the features.
Upon analyzing the feature ranking results of SHAP inFigure 1 we observe that maximum idle time (Idle Max) hasbeen ranked as the most important feature across all threeclassifiers. The blue color indicates that Darknet traffics tendsto have lower value of Idle Max. Other high ranked featuresare Fwd Seg Size Min, Bwd Packet Length Min and FlowIAT Min. Among the top 10 important features presented inFigure 1, it is noticeable that the features representing theminimum values of traffic flow and packet length have positivecorrelation with Darknet traffic. This might be explained bythe encryption and packet relay related overheads associatedwith Darknet traffic.
We utilized another useful feature of SHAP, which can trackhow each model treats each feature of an instance. Since thethree ensemble methods proceed in different ways, they mayimpose positive or negative weight on a particular featurewhich is illustrated in Figure 2.

RF
GBT
AB
Figure 1: SHAP feature ranking for binary classification ofBenign and Darknet traffic. Features are listed in decreasingorder of importance. Red color denotes that higher value ofthat feature contributes more to the prediction of positive classand blue color denotes the opposite.
RF
GBT
ABFigure 2: Comparison of the models for a particular instance
B. Darknet Traffic Categorization
We filtered out the Tor’ and ’VPN’ labelled data fromour original dataset. Then we intend to categorize the trafficinto one of the eight categories in Table I. We present theaccuracies in Table IV, and ROC curves and the confusionmatrices per classifier in Appendix B.
Model AccuracyRF 0.96127GBT 0.96791AB 0.96515
Table IV: Comparison of RF, GBT and AB models based ondifferent performances matrices for Darknet traffic character-ization. The highest values are highlighted with bold texts.
Just like the binary case, we present SHAP summary plotsto rank feature importances in Figure 3. In this case, weobserve that the most contributing features are Flow IAT Min,Flow IAT Max, Flow Bytes/Sec, and Idle Max.

RF
GBT
ABFigure 3: Darknet Traffic Characterization: SHAP featureranking. The trend of similar features getting importance isalso noted here.
V. DISCUSSION
Although the mechanisms of Tor and VPN are quitedifferent, and one of them can be overlayed on the other, wecould still distinguish a mixture Tor and VPN traffic fromthe dataset with fairly good performance. For a similar task,classifying VPN vs non-VPN on the ISCXVPN2016 dataset,Lotfollahi et al. [10] notes 93% accuracy, while stating thethen state-of-the-art accuracy to be 90%. We achieved 98%accuracy using AdaBoost. Since no performance result on
the CIC-Darknet2020 dataset has reached us yet, we cannotcomment on the state-of-the-art performance here.
Previous works like [28] made an effort to separatelyclassify VPN vs non-VPN over each traffic class. Ourapproach was obviously different: we are first interestedwhether a traffic may be related to Darknet or not. If weidentify a Darknet traffic, then we are interested to know theapplication type underneath.
The usage of SHAP in the field of traffic classification,in our opinion, can be very significant. In both our tasks,some features turn out to contribute more to the classifiers. InSubsection IV-A we tried to provide an intuitive explanation ofthe significance of top ranked features for binary classification.For the application category classification, the interaction offeatures is more complex and hence we did not make anysuch comments. Further analysis of the reported top rankedfeatures in our study is required to establish the behaviouralpattern of Darknet traffic. Proper investigation with domainexpertise can reveal why and how the top ranked featuresare influencing the classification results. Poor performance ofANN and DNN in our study indicate that more data fromdiverse source might improve the performance of neuralnetworks for this purpose.
Although SHAP has been successful and deployed in manyapplications, it should not be treated as “know-it-all” methodto explain any classifier. There has been recent works onconstructing adversarial techniques so that the underlyingclassifier can be fooled [40]. Further studies can be doneon whether Tor and VPN users can use these techniques tocombat the available inspection models.
The experiments were performed in a curated dataset gen-erated by a specific set of computers. It is necessary thatthe future research works and experiments are carried out onreal life traffic. For example, data can be mined from publiccomputers, under attack by malware connecting with Darknet.
VI. CONCLUSION
The extensive use of Tor and VPN, and specially theiruse in notorious activities, has been a growing concern overthe last decade [1]. In this paper, we successfully appliedensemble methods to the recent CIC-Darknet2020 dataset toclassify Darknet traffic from Benign ones. We were also ableto track the underlying application type with good accuracy.We also demonstrated the relative importance of some featuresusing SHAP, which can unravel new directions for the domainexperts to carry out more research on the inspection of Darknettraffic.
REFERENCES
[1] L. Gayard, Darknet: Geopolitics and Uses. ISTE Ltd, 2018.[2] P. Biddle, P. England, M. Peinado, and B. Willman, “The darknet
and the future of content protection,” in Digital Rights Management,J. Feigenbaum, Ed. Berlin, Heidelberg: Springer Berlin Heidelberg,2003, pp. 155–176.

[3] R. Dingledine, N. Mathewson, and P. Syverson, “Tor: The second-generation onion router,” in Proceedings of the 13th Conference onUSENIX Security Symposium - Volume 13, ser. SSYM’04. USA:USENIX Association, 2004, p. 21.
[4] M. G. Reed, P. F. Syverson, and D. M. Goldschlag, “Anonymousconnections and onion routing,” IEEE Journal on Selected Areas inCommunications, vol. 16, no. 4, pp. 482–494, 1998.
[5] A. H. Lashkari., G. D. Gil., M. S. I. Mamun., and A. A. Ghorbani.,“Characterization of tor traffic using time based features,” in Proceedingsof the 3rd International Conference on Information Systems Security andPrivacy - Volume 1: ICISSP,, INSTICC. SciTePress, 2017, pp. 253–262.
[6] R. Venkateswaran, “Virtual private networks,” Potentials, IEEE, vol. 20,pp. 11 – 15, 03 2001.
[7] G. Draper-Gil., A. H. Lashkari., M. S. I. Mamun., and A. A. Ghor-bani., “Characterization of encrypted and vpn traffic using time-relatedfeatures,” in Proceedings of the 2nd International Conference on Infor-mation Systems Security and Privacy - Volume 1: ICISSP,, INSTICC.SciTePress, 2016, pp. 407–414.
[8] J. Smith, Tor and the Darknet. Fayetteville, New York: PinnaclePublishers, 2016.
[9] D. Moore and T. Rid, “Cryptopolitik and the darknet,” Survival,vol. 58, no. 1, pp. 7–38, 2016. [Online]. Available: https://doi.org/10.1080/00396338.2016.1142085
[10] M. Lotfollahi, R. Shirali hossein zade, M. Jafari Siavoshani, andM. Saberian, “Deep packet: A novel approach for encrypted trafficclassification using deep learning,” Soft Computing, 09 2017.
[11] S. M. Lundberg and S.-I. Lee, “A unified approach to interpreting modelpredictions,” in Proceedings of the 31st International Conference onNeural Information Processing Systems, ser. NIPS’17. Red Hook, NY,USA: Curran Associates Inc., 2017, p. 4768–4777.
[12] S. Valenti, D. Rossi, A. Dainotti, A. Pescape, A. Finamore, andM. Mellia, Reviewing Traffic Classification. Berlin, Heidelberg:Springer Berlin Heidelberg, 2013, pp. 123–147. [Online]. Available:https://doi.org/10.1007/978-3-642-36784-7 6
[13] V. Paxson, “Bro: A system for detecting network intruders in real-time,”Comput. Netw., vol. 31, no. 23–24, p. 2435–2463, Dec. 1999. [Online].Available: https://doi.org/10.1016/S1389-1286(99)00112-7
[14] W. Wang, M. Zhu, J. Wang, X. Zeng, and Z. Yang, “End-to-endencrypted traffic classification with one-dimensional convolution neuralnetworks,” in 2017 IEEE International Conference on Intelligence andSecurity Informatics (ISI), 2017, pp. 43–48.
[15] A. Finamore, M. Mellia, M. Meo, and D. Rossi, “Kiss: Stochasticpacket inspection classifier for udp traffic,” IEEE/ACM Transactions onNetworking, vol. 18, no. 5, pp. 1505–1515, 2010.
[16] K. Xu, Z.-L. Zhang, and S. Bhattacharyya, “Profiling internet backbonetraffic: Behavior models and applications,” in Proceedings of the 2005Conference on Applications, Technologies, Architectures, and Protocolsfor Computer Communications, ser. SIGCOMM ’05. New York,NY, USA: Association for Computing Machinery, 2005, p. 169–180.[Online]. Available: https://doi.org/10.1145/1080091.1080112
[17] B. Yamansavascilar, M. A. Guvensan, A. G. Yavuz, and M. E. Karsligil,“Application identification via network traffic classification,” in 2017 In-ternational Conference on Computing, Networking and Communications(ICNC), 2017, pp. 843–848.
[18] R. Sun, Bo Yang, L. Peng, Z. Chen, L. Zhang, and S. Jing, “Trafficclassification using probabilistic neural networks,” in 2010 Sixth Inter-national Conference on Natural Computation, vol. 4, 2010, pp. 1914–1919.
[19] M. AlSabah, K. Bauer, and I. Goldberg, “Enhancing tor’s performanceusing real-time traffic classification,” in Proceedings of the 2012 ACMConference on Computer and Communications Security, ser. CCS ’12.New York, NY, USA: Association for Computing Machinery, 2012, p.73–84. [Online]. Available: https://doi.org/10.1145/2382196.2382208
[20] X. Bai, Y. Zhang, and X. Niu, “Traffic identification of tor and web-mix,” in 2008 Eighth International Conference on Intelligent SystemsDesign and Applications, vol. 1, 2008, pp. 548–551.
[21] G. He, M. Yang, J. Luo, and X. Gu, “Inferring application typeinformation from tor encrypted traffic,” in 2014 Second InternationalConference on Advanced Cloud and Big Data, 2014, pp. 220–227.
[22] E. Hodo, X. Bellekens, E. Iorkyase, A. Hamilton, C. Tachtatzis, andR. Atkinson, “Machine learning approach for detection of nontortraffic,” in Proceedings of the 12th International Conference onAvailability, Reliability and Security, ser. ARES ’17. New York, NY,
USA: Association for Computing Machinery, 2017. [Online]. Available:https://doi.org/10.1145/3098954.3106068
[23] R. Polikar, “Ensemble based systems in decision making,” IEEE Circuitsand systems magazine, vol. 6, no. 3, pp. 21–45, 2006.
[24] Tin Kam Ho, “The random subspace method for constructing decisionforests,” IEEE Transactions on Pattern Analysis and Machine Intelli-gence, vol. 20, no. 8, pp. 832–844, 1998.
[25] R. E. Schapire, “A brief introduction to boosting,” in Proceedings of the16th International Joint Conference on Artificial Intelligence - Volume 2,ser. IJCAI’99. San Francisco, CA, USA: Morgan Kaufmann PublishersInc., 1999, p. 1401–1406.
[26] J. Friedman, “Stochastic gradient boosting,” Computational Statisticsand Data Analysis, vol. 38, pp. 367–378, 02 2002.
[27] D. W. Patterson, Artificial neural networks: theory and applications.Prentice Hall PTR, 1998.
[28] S. Bagui, X. Fang, E. Kalaimannan, S. Bagui, and J. Sheehan, “Com-parison of machine-learning algorithms for classification of vpn networktraffic flow using time-related features,” Journal of Cyber SecurityTechnology, pp. 1–19, 06 2017.
[29] F. Pedregosa, G. Varoquaux, A. Gramfort, V. Michel, B. Thirion,O. Grisel, M. Blondel, P. Prettenhofer, R. Weiss, V. Dubourg, J. Vander-plas, A. Passos, D. Cournapeau, M. Brucher, M. Perrot, and E. Duch-esnay, “Scikit-learn: Machine Learning in Python,” Journal of MachineLearning Research, vol. 12, pp. 2825–2830, 2011.
[30] W. McKinney, “Data structures for statistical computing in python,” inProceedings of the 9th Python in Science Conference, S. van der Waltand J. Millman, Eds., 2010, pp. 51 – 56.
[31] C. R. Harris, K. J. Millman, S. J. van der Walt, R. Gommers, P. Virtanen,D. Cournapeau, E. Wieser, J. Taylor, S. Berg, N. J. Smith, R. Kern,M. Picus, S. Hoyer, M. H. van Kerkwijk, M. Brett, A. Haldane, J. F. delRıo, M. Wiebe, P. Peterson, P. Gerard-Marchant, K. Sheppard, T. Reddy,W. Weckesser, H. Abbasi, C. Gohlke, and T. E. Oliphant, “Arrayprogramming with NumPy,” Nature, vol. 585, no. 7825, pp. 357–362,2020. [Online]. Available: https://doi.org/10.1038/s41586-020-2649-2
[32] T. Chen and C. Guestrin, “XGBoost: A scalable tree boosting system,”in Proceedings of the 22nd ACM SIGKDD International Conferenceon Knowledge Discovery and Data Mining, ser. KDD ’16. NewYork, NY, USA: ACM, 2016, pp. 785–794. [Online]. Available:http://doi.acm.org/10.1145/2939672.2939785
[33] J. D. Hunter, “Matplotlib: A 2d graphics environment,” Computing inScience & Engineering, vol. 9, no. 3, pp. 90–95, 2007.
[34] B. Bengfort and R. Bilbro, “Yellowbrick: Visualizing the Scikit-LearnModel Selection Process,” The Journal of Open Source Software, vol. 4,no. 35, 2019. [Online]. Available: http://joss.theoj.org/papers/10.21105/joss.01075
[35] F. Chollet et al., “Keras,” https://keras.io, 2015.[36] M. Abadi, A. Agarwal, P. Barham, E. Brevdo, Z. Chen, C. Citro, G. S.
Corrado, A. Davis, J. Dean, M. Devin, S. Ghemawat, I. Goodfellow,A. Harp, G. Irving, M. Isard, Y. Jia, R. Jozefowicz, L. Kaiser,M. Kudlur, J. Levenberg, D. Mane, R. Monga, S. Moore, D. Murray,C. Olah, M. Schuster, J. Shlens, B. Steiner, I. Sutskever, K. Talwar,P. Tucker, V. Vanhoucke, V. Vasudevan, F. Viegas, O. Vinyals,P. Warden, M. Wattenberg, M. Wicke, Y. Yu, and X. Zheng,“TensorFlow: Large-scale machine learning on heterogeneous systems,”2015, software available from tensorflow.org. [Online]. Available:https://www.tensorflow.org/
[37] R. E. Schapire, Y. Freund, P. Barlett, and W. S. Lee, “Boosting themargin: A new explanation for the effectiveness of voting methods,”in Proceedings of the Fourteenth International Conference on MachineLearning, ser. ICML ’97. San Francisco, CA, USA: Morgan KaufmannPublishers Inc., 1997, p. 322–330.
[38] C. Molnar, Interpretable Machine Learning, 2019, https://christophm.github.io/interpretable-ml-book/.
[39] S. M. Lundberg, G. G. Erion, and S.-I. Lee, “Consistent individualizedfeature attribution for tree ensembles,” arXiv preprint arXiv:1802.03888,2018.
[40] D. Slack, S. Hilgard, E. Jia, S. Singh, and H. Lakkaraju, “Foolinglime and shap: Adversarial attacks on post hoc explanation methods,”in Proceedings of the AAAI/ACM Conference on AI, Ethics,and Society, ser. AIES ’20. New York, NY, USA: Associationfor Computing Machinery, 2020, p. 180–186. [Online]. Available:https://doi.org/10.1145/3375627.3375830

APPENDIX ABENIGN DARKNET CLASSIFICATION: CURVES
RF
GBT
AB
Fig. : Benign-Darknet Classification: Precision-Recall Curves and ROC Curves
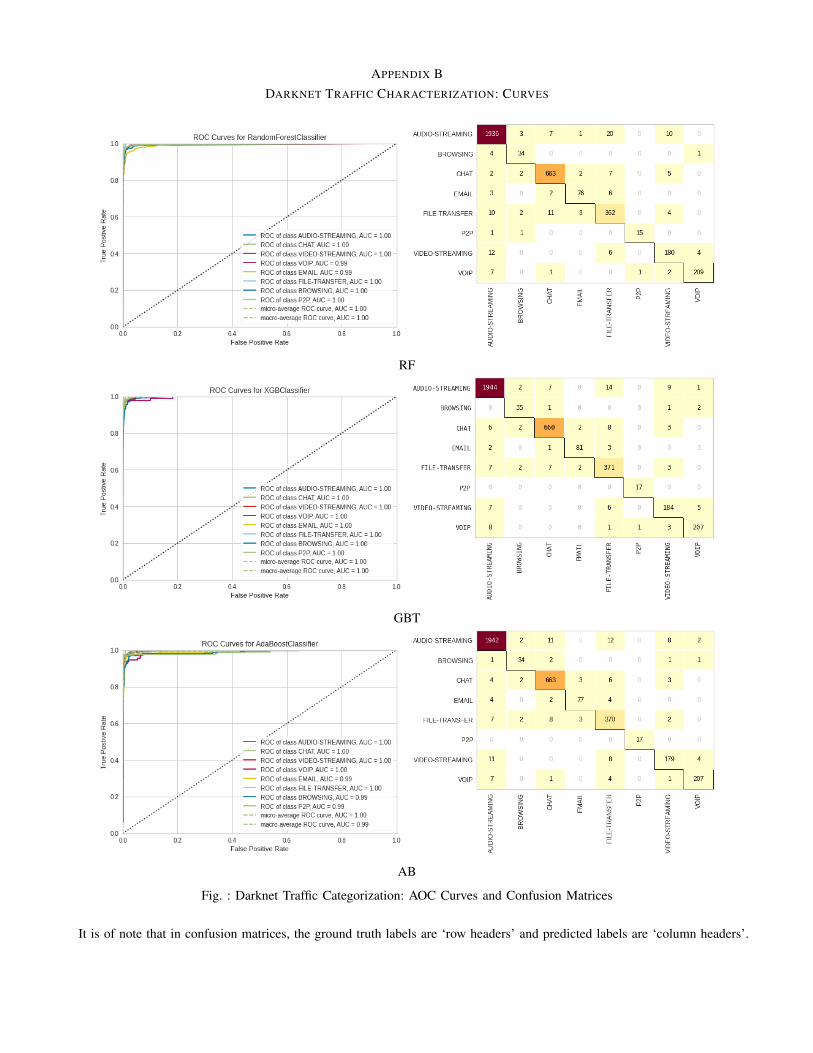
APPENDIX BDARKNET TRAFFIC CHARACTERIZATION: CURVES
RF
GBT
AB
Fig. : Darknet Traffic Categorization: AOC Curves and Confusion Matrices
It is of note that in confusion matrices, the ground truth labels are ‘row headers’ and predicted labels are ‘column headers’.