Comparative analysis of missing value imputation methods to improve clustering and interpretation of...
16
RESEARCH ARTICLE Open Access Comparative analysis of missing value imputation methods to improve clustering and interpretation of microarray experiments Magalie Celton 1,2 , Alain Malpertuy 3 , Gaëlle Lelandais 1,4 , Alexandre G de Brevern 1,4* Abstract Background: Microarray technologies produced large amount of data. In a previous study, we have shown the interest of k-Nearest Neighbour approach for restoring the missing gene expression values, and its positive impact of the gene clustering by hierarchical algorithm. Since, numerous replacement methods have been proposed to impute missing values (MVs) for microarray data. In this study, we have evaluated twelve different usable methods, and their influence on the quality of gene clustering. Interestingly we have used several datasets, both kinetic and non kinetic experiments from yeast and human. Results: We underline the excellent efficiency of approaches proposed and implemented by Bo and co-workers and especially one based on expected maximization (EM_array). These improvements have been observed also on the imputation of extreme values, the most difficult predictable values. We showed that the imputed MVs have still important effects on the stability of the gene clusters. The improvement on the clustering obtained by hierarchical clustering remains limited and, not sufficient to restore completely the correct gene associations. However, a common tendency can be found between the quality of the imputation method and the gene cluster stability. Even if the comparison between clustering algorithms is a complex task, we observed that k-means approach is more efficient to conserve gene associations. Conclusions: More than 6.000.000 independent simulations have assessed the quality of 12 imputation methods on five very different biological datasets. Important improvements have so been done since our last study. The EM_array approach constitutes one efficient method for restoring the missing expression gene values, with a lower estimation error level. Nonetheless, the presence of MVs even at a low rate is a major factor of gene cluster instability. Our study highlights the need for a systematic assessment of imputation methods and so of dedicated benchmarks. A noticeable point is the specific influence of some biological dataset. Background Numerous genomes from species of the three kingdoms are now available [1,2]. A major current aim of biologi- cal research is to characterize the function of genes, for instance their cellular regulation pathways and implica- tions in pathology [3-7]. High-throughput analyses (e.g., Microarrays) combined with statistical and bioinfor- matics data analyses are necessary to decipher such complex biological process [8,9]. Microarrays technolo- gies allow the characterization of a whole-genome expression by measuring the relative transcript levels of thousand of genes in one experiment [10,11]. For instance, their relevancies were proved for the classifica- tion/identification of cancer subtype or diseases [12-17]. However, technical limitations or hazards (dust, scratches) lead to corrupted spots on microarray [18]. During the image analysis phase, corrupted or suspi- cious spots are filtered [11], generating missing data [18]. These missing values (MVs) disturb the gene clus- tering obtained by classical clustering methods, e.g ., hierarchical clustering [19], k-means clustering [20], Kohonen Maps [21,22] or projection methods, e.g., Prin- cipal Component Analysis [23]. In practice, three differ- ent options can be considered. The first method leads * Correspondence: [email protected] 1 INSERM UMR-S 726, Equipe de Bioinformatique Génomique et Moléculaire (EBGM), DSIMB, Université Paris Diderot - Paris 7, 2, place Jussieu, 75005, France Celton et al. BMC Genomics 2010, 11:15 http://www.biomedcentral.com/1471-2164/11/15 © 2010 Celton et al; licensee BioMed Central Ltd. This is an Open Access article distributed under the terms of the Creative Commons Attribution License (http://creativecommons.org/licenses/by/2.0), which permits unrestricted use, distribution, and reproduction in any medium, provided the original work is properly cited.
-
Upload
univ-paris-diderot -
Category
Documents
-
view
4 -
download
0
Transcript of Comparative analysis of missing value imputation methods to improve clustering and interpretation of...

RESEARCH ARTICLE Open Access
Comparative analysis of missing value imputationmethods to improve clustering and interpretationof microarray experimentsMagalie Celton1,2, Alain Malpertuy3, Gaëlle Lelandais1,4, Alexandre G de Brevern1,4*
Abstract
Background: Microarray technologies produced large amount of data. In a previous study, we have shown theinterest of k-Nearest Neighbour approach for restoring the missing gene expression values, and its positive impactof the gene clustering by hierarchical algorithm. Since, numerous replacement methods have been proposed toimpute missing values (MVs) for microarray data. In this study, we have evaluated twelve different usable methods,and their influence on the quality of gene clustering. Interestingly we have used several datasets, both kinetic andnon kinetic experiments from yeast and human.
Results: We underline the excellent efficiency of approaches proposed and implemented by Bo and co-workersand especially one based on expected maximization (EM_array). These improvements have been observed also onthe imputation of extreme values, the most difficult predictable values. We showed that the imputed MVs have stillimportant effects on the stability of the gene clusters. The improvement on the clustering obtained by hierarchicalclustering remains limited and, not sufficient to restore completely the correct gene associations. However, acommon tendency can be found between the quality of the imputation method and the gene cluster stability.Even if the comparison between clustering algorithms is a complex task, we observed that k-means approach ismore efficient to conserve gene associations.
Conclusions: More than 6.000.000 independent simulations have assessed the quality of 12 imputation methodson five very different biological datasets. Important improvements have so been done since our last study. TheEM_array approach constitutes one efficient method for restoring the missing expression gene values, with a lowerestimation error level. Nonetheless, the presence of MVs even at a low rate is a major factor of gene clusterinstability. Our study highlights the need for a systematic assessment of imputation methods and so of dedicatedbenchmarks. A noticeable point is the specific influence of some biological dataset.
BackgroundNumerous genomes from species of the three kingdomsare now available [1,2]. A major current aim of biologi-cal research is to characterize the function of genes, forinstance their cellular regulation pathways and implica-tions in pathology [3-7]. High-throughput analyses (e.g.,Microarrays) combined with statistical and bioinfor-matics data analyses are necessary to decipher suchcomplex biological process [8,9]. Microarrays technolo-gies allow the characterization of a whole-genome
expression by measuring the relative transcript levels ofthousand of genes in one experiment [10,11]. Forinstance, their relevancies were proved for the classifica-tion/identification of cancer subtype or diseases [12-17].However, technical limitations or hazards (dust,
scratches) lead to corrupted spots on microarray [18].During the image analysis phase, corrupted or suspi-cious spots are filtered [11], generating missing data[18]. These missing values (MVs) disturb the gene clus-tering obtained by classical clustering methods, e.g.,hierarchical clustering [19], k-means clustering [20],Kohonen Maps [21,22] or projection methods, e.g., Prin-cipal Component Analysis [23]. In practice, three differ-ent options can be considered. The first method leads
* Correspondence: [email protected] UMR-S 726, Equipe de Bioinformatique Génomique et Moléculaire(EBGM), DSIMB, Université Paris Diderot - Paris 7, 2, place Jussieu, 75005,France
Celton et al. BMC Genomics 2010, 11:15http://www.biomedcentral.com/1471-2164/11/15
© 2010 Celton et al; licensee BioMed Central Ltd. This is an Open Access article distributed under the terms of the Creative CommonsAttribution License (http://creativecommons.org/licenses/by/2.0), which permits unrestricted use, distribution, and reproduction inany medium, provided the original work is properly cited.

to the elimination of genes, i.e., information loss [5].The eliminated genes may be numerous and amongthem some may be essential for the analysis of the stu-died mechanism [24]. The second method correspondsto the replacement by zero [13]; it brings up a differentproblem in the analysis. Indeed, real data close to 0 willbe confused with the MVs. Thus to limit skews relatedto the MVs, several methodologies using the values pre-sent in the data file to replace the MVs by estimatedvalues have been developed [25].The most classical method to estimate these values is
the k-nearest neighbours approach (kNN), which com-putes the estimated value from the k closest expressionprofiles among the dataset [26]. This approach wasapplied to DNA chips by Troyanskaya and collaborators[27] and rapidly became one of the most popular meth-ods. Since this pioneer study, more sophisticatedapproaches have been proposed, like Sequential kNN(SkNN) [28].Simple statistical methods have been also proposed as
the Row Mean [29]/Row Average method [28], orapproaches based on the Expectation Maximisationalgorithm (EM), e.g., EM_gene and EM_array [29]. Prin-ciple of least square (LS) has been also widely used, e.g.,LSI_gene, LSI_array, LSI_combined and LSI_adaptative[29]. Kim and co-workers have extended the LeastSquare Imputation to Local Least Square Imputation(LLSI) [28]. However this method is only based on thesimilarity of genes for estimating the missing data.Others more sophisticated methods like the BayesianPrincipal Component Analysis (BPCA) [30] combines aprincipal component regression, a Bayesian estimationand a variational Bayes (VB) algorithm.The MVs replacement in microarrays data is a recent
research field and numerous new and innovative meth-odologies are developed. We can noticed the work ofBar-Joseph et al. who described a model-based splinefitting method for time-series data [31] and Schliep etal. who used hidden Markov models for imputation[32]. Tuikkala and co-workers have investigated theinterest to use GO annotation to increase the imputa-tion accuracy of missing values [33] as Kim et al. [34].Hu et al. and Jörnsten et al. have incorporated informa-tion from multiple reference microarray dataset toimprove the estimation [35,36], while Gan co-workerstakes into consideration the biological characteristics ofthe data [37]. Hua and Lai did not propose a newmethod, but assess the quality of imputation on the con-cordance of gene prioritization and estimation of true/false positives [38].In addition we can list the following relevant meth-
odologies applied in MVs replacement for microarrayanalysis: Support Vector Regression [39], Factor AnalysisRegression [40], Ordinary Least Square Impute [41],
Gaussian Mixture Clustering [42], LinCmb [43], Collat-eral Missing Value Estimation [44], Linear based modelimputation [45], Dynamic Time Warping [46] or itera-tive kNN [47,48].In a previous study, we estimated the influence of
MVs on hierarchical clustering results and evaluated theeffectiveness of kNN approach [49]. We observed thateven a low rate of missing data can have importanteffects on the clusters obtain by hierarchical clusteringmethods. Recently, this phenomenon was confirmed byWong and co-workers for other particular clusteringmethods [50].Since our work, numerous replacement methods (see
Table 1 and previous paragraphs) have been developedto estimate MVs for microarray data. Most of the time,the new approaches are only compared to kNN. In thisstudy, we decided to evaluate the quality of MV imputa-tions with all usable methods, and their influence on thequality of gene clustering. The present paper undertakesa large benchmark of MVs replacement methods to ana-lyze the quality of the MVs evaluation according toexperimental type (kinetic or not), percentage of MVs,gene expression levels and data source (Saccharomycescerevisiae and human).
ResultsGeneral principleFigure 1 shows the general principle of the analysis.From the initial gene expression datasets, the series ofobservations with missing values are eliminated to createa Reference matrix. Then simulated missing values aregenerated for a fixed τ percentage and are included inthe Reference matrix. In a second step, these simulatedmissing values are imputed using the different availablemethods. Difference between the replaced values andthe original true values is finally evaluated using theroot mean square error (RMSE) (see Methods). In thiswork, we chose 5 microarray datasets, very different onefrom the other, i.e., coming from yeasts and humancells, and with or without kinetics (see Table 2). Theidea was to have the broadest possible vision types ofexpression data [see Additional file 1 for more details[49,51-54]].Our goals were also (i) to evaluate methods that
experimental scientists could use without intervention,(ii) to select only published methods, and (iii) to analyseinfluence of the gene clusters. Indeed, some studies havebeen done to compare numerous methods, e.g., [55], butdoes not go through the clustering; while less frequentresearches goes through the clustering, but test only alimited number of imputation methods as [56]. We sohave searched all kinds of published imputation meth-ods with available dedicated softwares or codes, when-ever the Operating System, language or software. From
Celton et al. BMC Genomics 2010, 11:15http://www.biomedcentral.com/1471-2164/11/15
Page 2 of 16

this search, we selected 12 available replacement meth-ods, which were compatible with high-throughput com-putation. Others methods had not been used due to theunavailability of the program despite the indication inthe corresponding papers or to impossibility to modifythe source code to used our microarrays data.Error rate for each replacement methodFigure 2 shows the dispersion of expected and truevalues, for three given imputation methods. On onehand, kNN and EM_gene approaches exhibit a high dis-persion between expected and true values; the correla-tions R equal respectively 0.33 and 0.32 (see Figures 2aand 2b). On the other hand EM_array approach pre-sents a highly better agreement with a R value of 0.97(see Figure 2c). Figure 3 shows the evolution of RMSEvalues for τ ranging between 0.5 and 50% using the twodatasets GHeat and OS. These two examples are goodillustrations of the different behaviours observed withthe different replacement methods. Some have initialhigh RMSE values and remains quite consistent, whileothers have lower initial RMSE values but are very sen-sitive to an increased rate of MVs. Moreover,
performances for the different methods appeared to bedependant of the used dataset.• EM_gene[29]: This method is always associated to
very high RMSE values, which range in an interval from0.6 to 0.7 for a rate τ ranging from 0.5 to 3.0% (see Fig-ure 3b) and decrease for values from 0.30 to 0.40. Sucha curved profile is observed for the datasets OS andGH2O2 (see Figure 3a). For the other dataset, RMSEincreases as expected (see Figure 3a), but is always asso-ciated to high RMSE values.• kNN[27]: Its RMSE values for all six data files always
range between 0.3 and 0.4. The increase of τ only affectsslightly the kNN approximation, at most 0.05 for thedatasets B and OS. This constancy of RMSE valuesimplies that for high rates of missing data (more than20% of missing data) the RMSE values remainacceptable.• SkNN[28]: Despite the fact that SkNN is an improve-
ment of kNN, their RMSE values are surprisingly alwayshigher than the one of kNN (from 0.01 to 0.08). Onlywith the dataset B, SkNN performs slightly better thankNN (RMSE difference of 0.076).
Table 1 Different missing values replacement methods.
Methods Author Availability Language Used Year
K-Nearest Neighbors (kNN) Troyanskaya O. Y C Y 2001
Bayesian Pricipal Component Analysis(BPCA)
Oba S. Y JAVA Y 2003
Row Mean1 Bø T.H. Y JAVA Y 2004
EM_gene1 Bø T.H. Y JAVA Y 2004
EM_array1 Bø T.H. Y JAVA Y 2004
LSI_gene1 Bø T.H. Y JAVA Y 2004
LSI_array1 Bø T.H. Y JAVA Y 2004
LSI_combined1 Bø T.H. Y JAVA Y 2004
LSI_adaptative1 Bø T.H. Y JAVA Y 2004
Sequential KNN (SkNN) Kim K. Y R Y 2004
Local Least Square Impute2 (LLSI) Kim H. Y MATLAB Y 2005
Row Average2 Kim H. Y MATLAB Y 2005
Linear model based Imputation (LinImp) Scheel I Y R N 2005
FAR, Factor Analysis Regression (FAR) Feten. N - N 2005
Ordinary Least Square Impute (OLSI) Nguyen D.V. N - N 2004
Support Vector Regression (SVR) Wang X. Y C++ N 2006
Gaussian Mixture Clustering (GMC) Ouyang M. On demand MATLAB N 2004
Singular Value Decomposition (SVD) Troyanskaya O. N C N 2001
ghmm Schielp, A Y N 2003
Collateral Missing Value Estimation (CMVE) Sehgal M. On demand MATLAB N 2005
GO-based imputation Tuikkala N - N 2005
LinCmb Jörnsten, R On demand MATLAB N 2005
Integrative Missing value Estimation (iMISS) Hu, J Y C++ N 2006
Projection Onto convex sets (POCS) Gan, X N - N 2006
Iterative kNN Bras N - N 2007
Is given the name of the methods, the authors, its availability, if we have used it (Y) or not (N) and the publication year.1 Package Bø T.H.2 Package Kim H.
Celton et al. BMC Genomics 2010, 11:15http://www.biomedcentral.com/1471-2164/11/15
Page 3 of 16

Figure 1 Principle of the method. The initial data matrix is analyzed. Each gene associated to at least one missing value (in pink) is excludedgiven a Reference matrix without any missing value. Then missing values are simulated (in red) with a fixed rate τ. This rate τ goes from 0.5% to50% of missing values by step of 0.5%. 100 independent simulations are done each time. Missing values are then imputed (in blue) for eachsimulations by the selected methods. RMSE is computed between the estimated values of missing values and their true values.
Celton et al. BMC Genomics 2010, 11:15http://www.biomedcentral.com/1471-2164/11/15
Page 4 of 16

Table 2 The different datasets used
Ogawa et al., 2000 Gasch et al., 2000 Bohen S.P etal., 2002
Lelandais etal., 2005
Organism Saccharomyces cerevisiae Saccharomyces cerevisiae human Saccharomy-ces cerevisiae
Initial gene number 6013 6153 16523 5261
Initial number of conditions 8 178 16 6
Missing values (%) 0.8 3 7.6 11.4
Genes with missingvalues (%)
3,8 87,7 63,6 88.29
Genes erased fromthe study
230 NA NA 616
Conditions erased fromthe study
0 136 0 0
Ogawa_Complet(OC)
Ogawa_subset(OS)
Gasch HEAT(GHeat)
Gasch H2O2(GH2O2)
Bohen (B) Lelandais (L)
Kinetics N N Y N N Y
Final gene numbers 5783 827 523 717 861 4645
Final condition number 8 8 8 10 16 6
Figure 2 Example of three methods. Distribution of predicted values (y-axis) in regards to true values (x-axis). Estimation of the missing valueshas been done (a) by kNN approach, (b) EM_gene and (c) EM_array. The dataset used is the Bohen set with τ values ranging from 0.5% to 50%of missing values with a step of 0.5. 10 independent simulations have been done for each τ value.
Celton et al. BMC Genomics 2010, 11:15http://www.biomedcentral.com/1471-2164/11/15
Page 5 of 16

• LLSI[57]: The average RMSE values of LLSI rangesmainly from 0.34 to 0.41 for most of the dataset. Its per-formance could be considered as median and its effec-tiveness is close to the LSI_gene method. Its RMSEvalues increase gradually with the increase of τ, i.e., 0.1from 0.5 to 50% of missing data. It is the less efficientmethod based on least square regressions. However forthe dataset L, this method is the most powerful after theLSIs methods (see below).• LSI_gene[29]: The effectiveness of LSI_gene is slightly
affected by the increase in the percentage of missingdata. For each data file, the values of RMSE range
between 0.3 and 0.4. These results are close to thoseobserved for methods LLSI and kNN, i.e., methods giv-ing of the medium results ranging between the best(LSI_array) and the less efficient methods (EM_gene).• Row Mean[29] and Row Average [57]: Low RMSE
values are observed for L (0.23) and B (0.28) datasets.Only for dataset GHeat, the RMSE value is high (0.54).Strikingly this method shows equivalent and or betterresults than more elaborated approaches.• BPCA[30]: For the OC, OS and GH2O2 datasets, and
for τ comprises in the range 0.5 to 10-15% of missingdata, BPCA appears to have one of the lowest RMSE
Figure 3 Missing value imputation. RMSE value for (a) GHeat subset and (b) for OS for rate of missing value going from 0.5% to 50% by step of0.5%. (b) 100 independent simulations are done at each level.
Celton et al. BMC Genomics 2010, 11:15http://www.biomedcentral.com/1471-2164/11/15
Page 6 of 16

values [see Additional file 2], only bypass by two otherapproaches. This method is powerful for low rates ofmissing values. However it should be noted that the effi-ciency of BPCA is strongly reduced when the rate ofmissing data increases. This is particularly notable inthe case of the GHeat dataset. The values of the RMSEincreases from 0.2 to 1.1 (see Figure 3a). For a τ valuehigher than 30%, BPCA performs worst than most ofthe imputation methods. This observation is less strikingfor the other datasets. For B and OS datasets, RMSEvalues increase by a maximum of 0.1 for τ increasingfrom 0.5 to 50%. It is a good illustration of the datasetspecificity related to the quality of the imputationmethods.• LSI_array, LSI_combined, LSI_adaptative and
EM_array[29]: Their RMSE values are always lowerthan 0.1. Remarkably, it is true even for a rate of miss-ing data that equals 50%. The average RMSE values ofEM_array are slightly lower than the ones of the threeother methods. It is striking when the rate of missingdata exceeds 20%. A pair-wise comparison shows thatEM_array is better than the three other methods; itsapproximation is better in 2/3 of the case. If τ is higherthan of 33%, this method remains the best one in 80%of the cases (see Table 3 for two examples).
The different datasets influence the qualityof the imputationTable 4 shows the average RMSE values for each impu-tation methods. They are given as the average of all thesimulations ranging from τ = 0.5 to 50% (50,000 inde-pendent simulations per imputation method). This tablehighlights the differences that were observed betweenthe datasets. Nonetheless, it allowed us to rank themethods in term of efficiency. Roughly, we could iden-tify three groups: The first one comprise four methods(EM_array, LSI_array, LSI_combined and LSI_adapta-tive) for which small RMSE values were always observed(EM_array always exhibited the best performances); (2)the second group comprised 4 methods, i.e., BPCA, RowMean, LSI_gene and LLSI; (3) and finally the thirdgroup, which can be considered as the last group, com-prised three methods, i.e., kNN, SkNN and EM_gene.Notably, this order depends on the dataset, but still the
changes are often limited. For instance, EM_gene per-forms better than kNN and SkNN for B dataset, but doesnot perform better than the others. Strong changes couldbe noted for OS that allows SkNN to be better than LLSIand LSI_gene. Nonetheless, it is mainly due to the poorquality of the estimation of these two methods with thisdataset. For the L dataset, we observed that LLSI method
Table 3 Pairwise comparison of imputation method.
(a)kNN BPCA Row Mean EM_gene EM_array LSI_gene LSI_array LSI_combined LSI_adaptative SkNN
kNN ——— 23.47 47.65 60.82 4.59 38.06 5.00 5.41 7.25 47.14
BPCA ——— ——— 75.41 81.33 11.12 67.04 12.76 14.49 16.63 75.51
Row Mean ——— ——— ——— 64.69 4.49 40.82 5.10 5.71 6.12 52.45
EM_gene ——— ——— ——— ——— 3.67 29.49 4.08 4.39 5.31 37.04
EM_array ——— ——— ——— ——— ——— 92.45 60.04 63.89 63.36 95.00
LSI_gene ——— ——— ——— ——— ——— ——— 7.86 7.65 7.45 61.53
LSI_array ——— ——— ——— ——— ——— ——— ——— 37.24 38.27 94.79
LSI_combined ——— ——— ——— ——— ——— ——— ——— ——— 44.39 93.78
LSI_adaptative ——— ——— ——— ——— ——— ——— ——— ——— ——— 92.96
SkNN ——— ——— ——— ——— ——— ——— ——— ——— ——— ———
(b)
kNN BPCA RowMean EM_gene EM_array LSI_gene LSI_array LSI_combined LSI_adaptative SkNN
kNN ——— 42.59 44.02 55.90 6.32 45.45 18.74 18.74 18.74 50.09
BPCA ——— ——— 52.02 63.49 7.84 53.04 23.37 23.37 23.37 58.03
Row Mean ——— ——— ——— 62.18 6.69 24.88 14.01 14.01 14.01 56.58
EM_gene ——— ——— ——— ——— 5.06 39.27 15.67 15.67 15.67 44.54
EM_array ——— ——— ——— ——— ——— 92.97 79.65 79.65 79.65 93.61
LSI_gene ——— ——— ——— ——— ——— ——— 14.85 14.85 14.85 55.52
LSI_array ——— ——— ——— ——— ——— ——— ——— 39.24 43.29 81.67
LSI_combined ——— ——— ——— ——— ——— ——— ——— ——— 46.49 81.67
LSI_adaptative ——— ——— ——— ——— ——— ——— ——— ——— ——— 81.67
SkNN ——— ——— ——— ——— ——— ——— ——— ——— ——— ———
Is given the percentage of better approximation of one method versus another for a rate of missing value t equal to (a) 32% and (b) 48.5% with the OS dataset.The percentage is given in regards to the method given at the left.
Celton et al. BMC Genomics 2010, 11:15http://www.biomedcentral.com/1471-2164/11/15
Page 7 of 16

performs well and remains better than other LSIs andEM_array methods. GHeat dataset that is associated tothe highest average RMSE values has strong particulari-ties as (i) kNN performs better than BPCA, Row Mean,LSI_gene and LLSI, and (ii) BPCA and Row Mean per-forms poorly compared to other methods, being onlyslightly better than EM_gene. Hence, it appears thatGHeat is a more difficult dataset to impute.
Extreme valuesThe same methodology was followed to analyze theextreme values, i.e., 1% of the microarray measurementswith the highest absolute values. They have major biolo-gical key role as they represent the highest variations inregards to the expression reference [see Additional file3]. Figure 4 presents similar examples to these of Figure3, but this time, only extreme values were used in the
Table 4 Mean RMSE value for the different datasets
methods meanEM_gene SkNN kNN LLSI LSI_gene Row
MeanBPCA LSI_array EM_array
datasets B 0.334 0.390 0.455 0.344 0.320 0.283 0.194 0.098 0.053 0.275
GH2O2 0.586 0.445 0.431 0.452 0.358 0.319 0.334 0.068 0.028 0.336
OS 0.444 0.369 0.383 0.379 0.377 0.263 0.257 0.077 0.036 0.287
L 0.388 0.292 0.300 0.078 0.261 0.215 0.250 0.028 0.020 0.204
GHeat 0.703 0.426 0.350 0.412 0.403 0.541 0.690 0.091 0.054 0.408
mean 0.491 0.384 0.384 0.333 0.344 0.324 0.345 0.072 0.038 0.302
Figure 4 Extreme values (representing 1% of the missing values). Evolution of RMSE according to τ ranging (a) from 0.5% to 30% of theextreme values for the Bohen dataset and (b) from 0.5% to 50% of the extreme values) for the Ogawa dataset.
Celton et al. BMC Genomics 2010, 11:15http://www.biomedcentral.com/1471-2164/11/15
Page 8 of 16

analysis. Thus, the percentage of missing values τ can bedifferently apprehend, i.e., τ = 10% corresponds to 10%of the extreme missing values, so 0.1% of the values ofthe dataset. At one exception, all the replacement meth-ods decrease in effectiveness for the estimate of theextreme values. Performance of the methods also greatlydepends on the used dataset and especially -in agree-ment with previous observation - in the case of theGHeat dataset. A description of the behaviour of eachmethod is presented in Additional file 3. kNN [27] is theless powerful method in most of the case (see Figures 4aand 4b). Its average RMSE value is often 0.5 higher thanthe second poorest imputation method. Interestingly, inthe case of the extreme values, SkNN improved greatly.EM_gene [29] remains one of the less powerful methodsfor the imputation of missing values. LLSI [57] methodeffectiveness remains similar compared to the othermethods of its group. Row Mean [29] and Row Average
[57] have RMSE values increased by 0.2 to 0.4 for theyeast dataset, which is correct in regards to other meth-ods (see Figures 6). Their efficiencies are median com-pared to the other methods. BPCA [30] has a correctbehaviour. But contrary to most of them, it is very sensi-tive to the datasets. LSI_gene [29] has the lowest RMSEvalues observed after EM_array, LSI_array, LSI_com-bined and LSI_adaptative. This result shows that LSIs,whatever the specificity of their implementations, areeffective to impute the values missing.EM_array method is again the most performing
method (see previous section). Its RMSE values arealmost identical to the ones previously computed.LSI_array, LSI_combined and LSI_adaptative are slightlyless efficient than previously seen. Thus, the clusteringwe have proposed remains pertinent when only theextreme values are implicated. LSI_array, LSI_combined,LSI_adaptative and EM_array are always good, and the
Figure 5 CPP of hierarchical clustering approach algorithm. (a) with complete, average, ward and McQuitty algorithm for OS with kNN and(b) with Ward algorithm for Ogawa dataset for the different imputation methods.
Celton et al. BMC Genomics 2010, 11:15http://www.biomedcentral.com/1471-2164/11/15
Page 9 of 16
less efficient methods can be associated now to consid-erable RMSE values. Noticeably, kNN efficiency col-lapses and the influence of datasets on the imputationquality is sharpened.Clustering in questionA critical point in the analysis of DNA data is the clus-tering of genes according to their expression values.Missing values have an important influence on the stabi-lity of the gene clusters [49,58]. Imputations of missingvalues have been used both to do hierarchical clustering(with seven different algorithms) and k-means [20] (seeMethods).Figure 5a shows the Cluster Pair Proportions (CPP,
[49] see Methods section) of OS using hierarchical clus-tering with complete linkage, average linkage, McQuittyand Ward algorithm. CPP values of average linkageranges between 78 and 68%, those of McQuitty between58 and 45%, those of Ward between 57 and 35% andfinally those of complete linkage between 50 and 41%.We obtain for the 7 hierarchical clustering algorithmsthe same behaviours than previously observed [49]: ran-ging from high CPP values for single linkage to low CPPvalues for Ward. This observation can be explained bythe topology given by each algorithm, e.g., Ward giveswell equilibrated clusters whereas single linkage createsfew major clusters and numerous adjacent singletons.For every hierarchical clustering methods the CPP
values are different, but the general tendencies remainthe same: (i) imputation of small rate τ of MVs hasalways a strong impact on the CPP values, and (ii) theCPP values slowly decreased with the increased of τ.Between 0.5 and 3% of MVs and the CPP valuesdecrease by 1 to 3% per step of 0.5% of MVs. From τequals 3.5 to 20% of MVs, the values of CPP decreaseoverall by 10%. For higher rate of MVs the decreasingof CPP is slower. This loss of stability is present in thecase of the k-means method and for each type of hier-archical classification (except for the methods singlelinkage and centroid linkage, due to the building of theclusters).Individual evaluation of the methods highlights the
lack of efficiency of the EM_gene imputation method; itobtains always the lowest CPP values, i.e., 1.37 to 5.34%less than other approaches. At the opposite, EM_array,LSI_array, LSI_combined and LSI_adaptative are
associated to the highest CPP values. In the case of themethods with a median efficiency, e.g., Row_Mean, theirCPP values could be assigned as median compared tothe values of the other methods. Figure 5b shows theparticular example of OS dataset. CPP values of BPCA(average value equals 42.6%) are close to the mostpowerful methods (42.8% for the four methods). More-over, in the classical range of τ less than 20%, it is thebest. As seen in Table 4, BPCA is one of the bestapproaches for this dataset. Hence, common trends canbe found between the quality of the imputation methodand the gene cluster stability.In addition, evaluation of imputation methods shows
that the cluster quality depends on the dataset. Forinstance, with the dataset OS, imputation of missingvalues with kNN method gives an average CPP value(for the Ward algorithm) that equals 42.9%, while theaverage CPP values for all the other methods onlyequals 40.6% whereas its RMSE value is one of highest(see Table 4). The CPP differences are mainly bellow5%. These results show that an improvement has beenobtained since last study. Nonetheless, no newapproaches had drastically improved the quality of theclustering. Interestingly, k-means approach had similartendencies, underlining that this low improvement isnot due to hierarchical clustering.Another question is the comparison between hierarch-
ical clustering algorithms and k-means. Nonetheless,comparison only between hierarchical clustering algo-rithms is already a difficult task. Comparison with k-means is so more difficult. Indeed, the use of the samenumber of clusters to compare the hierarchical cluster-ing algorithms with k-means can leads to a wrong con-clusion. Indeed, for an equivalent number of clusters,most of the CPP values of k-means are lower than CPPvalues obtained with hierarchical clustering algorithms.However, it is only due to the dispersion of observationswithin the clusters obtained by k-means approach. Thus,to have an unbiased comparison, the dispersion of geneswithin cluster between k-means and hierarchical cluster-ing algorithms must be computed. It had been done, aspreviously described [49]. Following this approach,Ward and complete linkages were defined as the bestapproaches to assess an unbiased comparison. Theyhave both CPP values lower than k-means CPP values.The differences were often higher than 5% underliningthe interest of k-means approach to cluster gene expres-sion profiles.Distribution of the observationsWhen index CPP is calculated, only one group is takeninto account. To go further, we used another index,named CPPf that allows to take into account the fivecloser groups, and to check the pairs of genes remainingjoint partners. The values of CPPf are higher than those
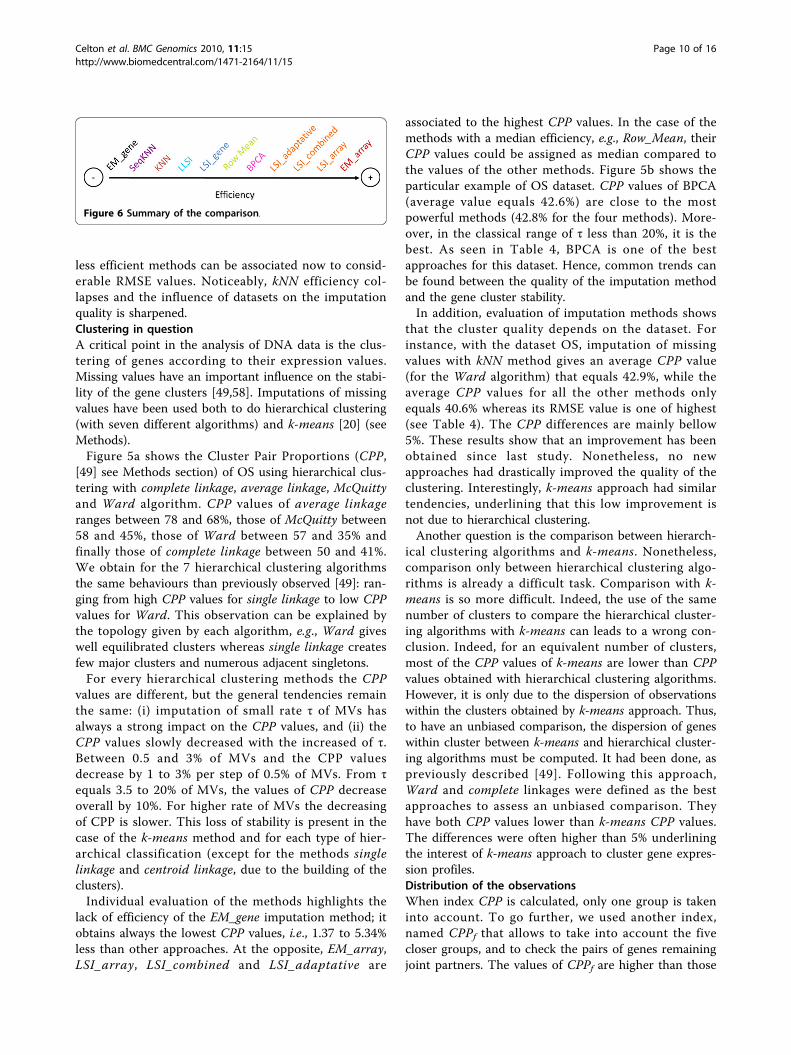
Figure 6 Summary of the comparison.
Celton et al. BMC Genomics 2010, 11:15http://www.biomedcentral.com/1471-2164/11/15
Page 10 of 16

of the CPP, e.g., 20% for the Ward. Methods associatedto high CPP values have also high CPPf values, whilemethods with low CPP values have also a lower CPPfvalues. These weak variations shows that often a part ofthe observations, not associated to the original clustercould be find in its vicinity. These results are entirely inagreement with our previous results [49]. It shows herethat the novel imputation methods have not permit toget closer related genes with better improvement.The analysis of associations could also take into
account the non-associations. For this purpose, Cluster-ing Agreement Ratio (CAR, see Methods section) hasbeen used which considers both associated and non-associated genes. CAR values are higher than the one ofthe CPP due to the calculation of the pairs of genesremaining dissociated. Indeed, it is more probable thanthe genes are dissociated than associated according tothe number of treated genes and the number of gener-ated groups. For the OS dataset, the highest values ofthe index CAR concerns Ward classification and areranging between 88.2 and 91.2%. For the GHeat dataset,it ranges between 91.0 and 94.1%. Complete linkage,average linkage and McQuitty have lower CAR values(80%). For k-means classification, the values are higher 1to 2% compared to Ward classification, 10% better thanMcQuitty and Complete linkage and 13% to averagelinkage. This results underlines that K-means allows soa better stability of gene clusters.
DiscussionImputationSince our previous analysis [49], numerous new MVsimputation methods have been proposed. Someappeared to be true improvements in regards to thecomputation of RMSE. In particular, EM_array is clearlythe most efficient methods we tested. For τ < 35%, it isthe best imputation method for 60% of the values, andfor τ > 35%, in 80%. This feature was confirmed by theanalysis of extreme values. LSI_array, LSI_combined andLSI_adaptative follow closely the efficiency of EM_ar-ray. We have unsuccessfully tried to combine these fourdifferent methods to improve the RMSE values. Nocombination performs better than EM_array.We can underline four interesting points:i. As expected, the imputation quality is greatly affectedby the rate of missing data, but surprisingly it is alsorelated to the kind of data. BPCA is a perfect illustra-tion. For non-kinetic human dataset, MVs estima-tions were correct, whereas for the GHeat dataset theerror rate appeared to be more important.
ii. The efficiency of Row_Mean (and Row_Average)is surprisingly good in regards to the simplicity ofthe methodology used (with the exception of GHeatdataset).
iii. Even if kNN is the most popular imputation method;it is one of the less efficient, compared to other meth-ods tested in this study. It is particularly strikingwhen analyzing the extreme values. SkNN is animprovement of kNN method, but we observed thatRMSE values of SkNN were not better than ones ofkNN. It could be due to the use of non-optimal num-ber of neighbours (k), as for kNN. It must be noticedwe used kopt defined by [27], this choice has a directimpact on the imputation values.
Extreme values are the ones that are the most valuablefor the experiments. The imputation of extreme valuemissing data shows that -except for EM_array- theeffectiveness of all the methods is affected.Our results are so in good accordance with the results
of Brock and co-workers [55] who found that methodsfrom Bo and co-workers [29], Kim and co-workers [57]and Oba and co-workers [30] are highly competitive.However, they consider “that no method is uniformlysuperior in all datasets” [29]. Our results are simpler tosummarize as we observe -thanks to our distance cri-teria- a grading between the effectiveness of the meth-ods. LLSI of Kim and co-workers [57] has a correctbehavior for all datasets while BPCA of Oba and co-workers [30] is strongly dependant of the dataset. At theopposite, the methods implemented by Bo and co-work-ers [29] remain the most efficient in all cases. Moreover,some implemented methods of Bo and co-workers [29]have not been tested by [55], but are the most efficient.All these results are reinforced by the analyses ofextreme value imputations.An important point must be not forgotten, we have, as
the other authors, e.g., [24,55,56], used the entire data-set, i.e., no specific selection of interesting profile genehad been done. It could have importance in terms ofquality of the imputation values and consequence onthe clustering.ClusteringA strong assumption of the microarray data analysis isthat genes with similar expression profiles are likely tobe co-regulated and thus involved in the same or similarbiological processes. Different types of clustering andclassification methods have been applied to microarraydata, e. g., some classical as k-means clustering [20],self-organizing maps [21,22,59], hierarchical clustering[19,60], Self Organizing Tree Algorithm [61-63], andsome dedicated approaches as DSF_Clust [64], re-sam-pling based tight clustering [65], cluster affinity searchtechnique [66], multivariate Gaussian mixtures [67],model-based clustering algorithms [68,69], clustering ofchange patterns using Fourier coefficients [70], NearestNeighbor Networks [71], Fuzzy clustering by localApproximation of membership [72] or Multi-Dimen-sional Scaling [73].
Celton et al. BMC Genomics 2010, 11:15http://www.biomedcentral.com/1471-2164/11/15
Page 11 of 16

Given one particular dataset, different clustering algo-rithms are very likely to generate different clusters [74].This is true when large-scale gene expression data frommicroarrays are analyzed [58,75,76]. Comparison of dif-ferent clusters even obtained with the same classificationapproach is still a difficult task [see Additional file 4[69,77-79]]. Thus, to assess the relevance of missingvalue imputation methods, we observed the behavioursof different hierarchical clustering methods and k-meansclustering using CPP, CPPf [49] and newly introduceCAR index. Results follow exactly the observations doneon RMSE values (see previous section). Only onemethod seems ambiguous: kNN. Indeed, its CPP andCPPf are higher than expected. It is mainly due to theselection of the genes in the different datasets. We havedecided at the beginning to not discard any genes, i. e.,we have absolute no a priori. Thus very flat profileshave been conserved and empower kNN that prefers topredict values closer to zero than the other methods(see Figure 4 of [49]). It generates clusters with lot ofzero, these clusters are so stable. For the majority of themethods, the order of effectiveness of the methods forthe maintenance of stability within the groups betweenvarious classifications is identical. Combination of CPP,CPPf and CAR index underlines the interest of k-meansclustering in regards to hierarchical clustering methods.For comparable clusters, k-means gives better values.Wang and co-workers does not found a strong differ-
ence between the three imputation methods they used, i.e.,kNN, BPCA and LLS, in the classification performance[24]. The only comparable extensive study has been doneby Tuikkala and co-workers [56], they have focussed inter-estingly on the GO term class and use k-means. They havetested six different methods with less simulation per miss-ing value rates and less missing value rates. But, theimportant point is they have not tested the methods foundthe most efficient by our approach. We also slightly dis-agree with their conclusion about the quality of BPCA[56]. It can be easily understand as only a very limitednumber of clusters has been tested (5 clusters); in ourcase, we have supervised the choice of cluster numbers(see Method section), leading to a higher number of clus-ters. This higher number is so more sensitive to the qualityof clustering. It must be noticed we have used Euclideandistance and not Pearson correlation, it was mainly to (i)stay consistent with our previous research, and (ii) as wehave not filtered the data, Pearson correlation could haveaggregated very different profiles. As the time computationwas very important, it was not possible to test the twopossibilities.
ConclusionsThe DNA microarrays generate high volume of data.However they have some technical skews. Microarrays
studies must take into account the important problemof missing values for the validity of biological results.Numerous methods exist to replace them, but no sys-tematic and drastic comparisons have been performedbefore our present work. In this study, we have donemore than 6.000.000 independent simulations, to assessthe quality of these imputation methods. Figure 6 sum-marizes the results of our assessment. The methodEM_array, LSI_array, LSI_combined and LSI_adaptativeare the most performing methods. BPCA is very effec-tive when the rate of missing values is lower than 15%,i.e., for classical experiments. The values estimated bythe Row_Mean are quite correct in regards to the sim-plicity of the approach. kNN (and SkNN) does not giveimpressive results, it is an important conclusion for amethod used by numerous scientists. The methods LSI_-gene and EM_gene are not effective but they are to betested with data files made up of little of genes and agreat number of experiments. These conclusions are tobe taken carefully because the quality of the imputationsdepends on the used datasets.A major disadvantage of numerous methods is their
accessibilities. We have tested here only a part of themethods as some are unavailable and others had notworked properly. Some methods used here could not beused easily by a non-specialist. It could be interesting soto have implementation of all the different methods in auseful manner with the standardized input and outputfile format. In the second time, graphic interfaces forthe methods could be helpful. These remarks are parti-cularly relevant in regards to recent papers that pro-posed novel approaches as SLLSimpute [80] orinteresting comparison [55,56] that do not comparewith the methods that had been considered as the mostefficient in this study.
MethodsDatasetsWe used 5 data sets for the analysis [see Additional file1]; they were mainly coming from the SMD database[81]. The first one, named Ogawa set, was initially com-posed of N = 6013 genes and n = 8 experimental condi-tions about the phosphate accumulation and thepolyphosphate metabolism of the yeast Saccharomycescerevisiae [51]. The second one corresponds to variousenvironmental stress responses in S. cerevisiae [52]. Thisset, named Gasch set, contains N = 6153 genes and n =178 experimental conditions. Due to the diversity ofconditions in this set, we focused on two experimentalsubsets corresponding to heat shock and H2O2 osmoticshock respectively. Bohen and co-workers have analyzedthe patterns of gene expression in human follicular lym-phomas and the interest of treatment by rituximab [53].This dataset is composed of N = 16.523 genes and n =
Celton et al. BMC Genomics 2010, 11:15http://www.biomedcentral.com/1471-2164/11/15
Page 12 of 16

16 experimental conditions. The last dataset has beenobtained by Lucau-Danila, Lelandais and co-workers[54]. To precisely describe the very early genomicresponse developed by yeast to accommodate a chemicalstress, they performed a time course analyses of theyeast gene expression which follows the addition of theantimitotic drug benomyl. The dataset is a kinetic thatcomprised N = 5.621 genes for n = 6 kinetic time (30seconds, 2, 4, 10, 20 and 40 minutes).Datasets refinement: missing values enumerationFrom the original datasets, we built complete datasetswithout MVs. All the genes containing at least onemissing value were eliminated from the Ogawa set(noted OS). The resulting OS set contains N = 5783genes and n = 8 experimental conditions. The secondset without MVs was taken from Gasch et al. andcalled GS. The experimental conditions (column) con-taining more than 80 MVs were removed. The result-ing GS matrix contains N = 5843 genes and n = 42experimental conditions. Two subsets were generatedfrom GS and have been noted GHeat and GH2O2.They correspond to specific stress conditions asdescribed previously. GHeat and GH2O2 containrespectively N = 3643 genes with n = 8 experimentalconditions and N = 5007 genes with n = 10 experi-mental conditions.To test the influence of the matrix size, i.e., the num-
ber of genes, we built smaller sets corresponding to 1/7of OS, GS, GHeat and GH2O2. Principles are describedin [49]. For the dataset of Bohen et al. (noted B), wehave done the same protocol and used a subset repre-senting 1/7 of B, i.e., N = 861 genes. For the dataset ofLucau-Danila et al.: [54], 11.4% of the genes have atleast one missing values. The dataset with no missingvalues (noted L) was so composed of N = 4645 genes.Missing values generationFrom the sets without MVs, we introduced a rate τ ofgenes containing MVs (τ = 1 to 50.0%), these MVs arerandomly drawn. Each random simulation is generatedat least 100 times per experiment to ensure a correctsampling. It must be notices that contrary to ourprevious work, each gene could contain more than oneMV [49].Replacement methodsThe different packages have been downloaded from theauthors’ websites (see Table 1). kNN has been computedusing the well-known KNNimpute developed byTroyanskaya and co-workers [27]. The determined koptvalue is associated with a minimal global error rate asdefined by Troyanskaya and co-workers [27]. BPCA wasused without its graphical interface [30] as for the Bo etal. package (Java) [29]. For LLSI and Row_Average, wehave modified the original Matlab code to use our own
microarray datasets [57]. SkNN was performed with Rsoftware [28].Hierarchical ClusteringThe hierarchical clustering (HC) algorithm allows theconstruction of a dendogram of nested clusters basedon proximity information [19]. The HC have been per-formed using the “hclust” package in R software [82].Seven hierarchical clustering algorithms have beentested: average linkage, complete linkage, median link-age, McQuitty, centroid linkage, single linkage and Wardminimum variance [83].The distance matrix between all the vectors (i.e.,
genes) is calculated by using an external module writtenin C language. We used the normalized Euclidean dis-tance d* to take account of the MVs:
dn m
v wi i
i
n
* ,v w( ) =−
−( )=∑1 2
1
(1)
v and w are two distinct vectors and m is the numberof MVs between the two vectors. Thus, (vi - wi) is notcomputed if vi and/or wi is a missing valueAn index for clustering results comparison: ConservedPairs Proportion (CPP)To assess the influence of missing data rates and differ-ent replacement methods into clustering results (seeFigure 1), we have analysed the co-associated genes ofan original dataset (without MVs) compared to thesegenes location in a set with MVs. A similar approachhas been used by Meunier et al. on proteomic data [84].Hence, we realized in a first step the clustering with
the data sets without MV by each aggregative clusteringalgorithm. The results obtained by these first analysesare denoted reference clustering (RC). In a second step,we generated MVs in data. The MVs are replaced byusing the different replacement methods. Then we per-formed the hierarchical clustering for each new set. Theresults obtained by these second analyses are denotedgenerated clustering (GC).We compared the resultingclusters defined in RC and GC and assessed the diver-gence by using an index named Conserved Pair Propor-tions (CPP). The CPP is the maximal proportion ofgenes belonging to two clusters, one from the RC andthe other one from the GC (cf. Figure 1 of [49] andAdditional file 5 for more details).Clustering Agreement Ratio (CAR)The Clustering Agreement Ration (CAR) is the concor-dance index measuring the proportion of genes pairs,either belonging to a same cluster (resp. different clus-ters) in the reference clustering (RC) and found again ina same cluster (resp. different clusters) in the clustering(GC) obtained without or after replacing the MVs.
Celton et al. BMC Genomics 2010, 11:15http://www.biomedcentral.com/1471-2164/11/15
Page 13 of 16

The index CAR is defined by the following equation:
CARijref
ijnew
ijref
ijnew
j iiG
a olg
( ) ( )
(=
⋅ + − ⋅ −⎢⎣⎢
⎥⎦⎥<
∑∑
⋅
1 1
GG−1 2)/
(2)
where ijref and ij
new specify the co-presence of twogenes in a same cluster, i.e., they take the value 1 whenthe genes i and j belong to a same cluster in the cluster-ing RC and GC respectively. The numbers of pairs in Ggenes is G.(G - 1)/2. The first term of the numeratorcorresponds to the co-presence of the pair (i, j) in asame cluster for RC and GC, and, the second term theco-absence of this pair in a same cluster.
Additional file 1: Dataset details.Click here for file[ http://www.biomedcentral.com/content/supplementary/1471-2164-11-15-S1.DOC ]
Additional file 2: RMSE of OS with BPCA imputing method. RMSEvalue for OS for rate of missing value going from 0.5% to 20% by step of0.5% with the L dataset.Click here for file[ http://www.biomedcentral.com/content/supplementary/1471-2164-11-15-S2.DOC ]
Additional file 3: Extreme values. Distribution of the values observedin OS dataset. The extreme values are highlighted on each size of thehistogram.Click here for file[ http://www.biomedcentral.com/content/supplementary/1471-2164-11-15-S3.DOC ]
Additional file 4: Comparing clustering algorithms.Click here for file[ http://www.biomedcentral.com/content/supplementary/1471-2164-11-15-S4.DOC ]
Additional file 5: Details of CPP and CPPf.Click here for file[ http://www.biomedcentral.com/content/supplementary/1471-2164-11-15-S5.DOC ]
AcknowledgementsWe would like to thanks all the scientists who have deposited theirexperiments and make them freely available to the scientific community. Inthe same way, we would like to thanks all the scientists who havedeveloped and distributed missing value replacement methods. This workwas supported by grants from the Ministère de la Recherche, from FrenchInstitute for Health and Medical Research (INSERM), Université Paris Diderot -Paris 7, Institut National de Transfusion Sanguine (INTS) and Genopole®.Clustering Agreement Ration (CAR) was proposed by late Pr. Serge Hazout.
Author details1INSERM UMR-S 726, Equipe de Bioinformatique Génomique et Moléculaire(EBGM), DSIMB, Université Paris Diderot - Paris 7, 2, place Jussieu, 75005,France. 2UMR 1083 Sciences pour l’Œnologie INRA, 2 place Viala, 34060Montpellier cedex 1, France. 3Atragene Informatics, 33-35, Rue Ledru-Rollin94200 Ivry-sur-Seine, France. 4INSERM UMR-S 665, DSIMB, Université ParisDiderot - Paris 7, Institut National de Transfusion Sanguine (INTS), 6, rueAlexandre Cabanel, 75739 Paris cedex 15, France.
Authors’ contributionsMC done all the computational and analysis works. AdB wrote the paper,conceived of the study and carried out the MVs generation. AM and GLparticipated in the design of the study and coordination. All authors readand approved the final manuscript.
Competing interestsThe authors declare that they have no competing interests.
Received: 2 September 2009Accepted: 7 January 2010 Published: 7 January 2010
References1. Liolios K, Tavernarakis N, Hugenholtz P, Kyrpides NC: The Genomes On
Line Database (GOLD) v.2: a monitor of genome projects worldwide.Nucleic Acids Res 2006, , 34 Database: D332-334.
2. Bernal A, Ear U, Kyrpides N: Genomes OnLine Database (GOLD): a monitor ofgenome projects world-wide. Nucleic Acids Res 2001, 29(1):126-127.
3. Muro S, Takemasa I, Oba S, Matoba R, Ueno N, Maruyama C, Yamashita R,Sekimoto M, Yamamoto H, Nakamori S, et al: Identification of expressedgenes linked to malignancy of human colorectal carcinoma by parametricclustering of quantitative expression data. Genome Biol 2003, 4(3):R21.
4. Perou CM, Sorlie T, Eisen MB, Rijn van de M, Jeffrey SS, Rees CA, Pollack JR,Ross DT, Johnsen H, Akslen LA, et al: Molecular portraits of human breasttumours. Nature 2000, 406(6797):747-752.
5. Statnikov A, Aliferis CF, Tsamardinos I, Hardin D, Levy S: A comprehensiveevaluation of multicategory classification methods for microarray geneexpression cancer diagnosis. Bioinformatics 2005, 21(5):631-643.
6. Imai K, Kawai M, Tada M, Nagase T, Ohara O, Koga H: Temporal change inmKIAA gene expression during the early stage of retinoic acid-inducedneurite outgrowth. Gene 2005, 364:114-122.
7. Raab RM: Incorporating genome-scale tools for studying energyhomeostasis. Nutr Metab (Lond) 2006, 3:40.
8. Fellenberg K, Busold CH, Witt O, Bauer A, Beckmann B, Hauser NC, Frohme M,Winter S, Dippon J, Hoheisel JD: Systematic interpretation of microarraydata using experiment annotations. BMC Genomics 2006, 7:319.
9. Hoheisel JD: Microarray technology: beyond transcript profiling andgenotype analysis. Nat Rev Genet 2006, 7(3):200-210.
10. DeRisi JL, Iyer VR, Brown PO: Exploring the metabolic and genetic controlof gene expression on a genomic scale. Science 1997, 278(5338):680-686.
11. Clarke JD, Zhu T: Microarray analysis of the transcriptome as a steppingstone towards understanding biological systems: practicalconsiderations and perspectives. Plant J 2006, 45(4):630-650.
12. Zhang W, Rekaya R, Bertrand K: A method for predicting disease subtypesin presence of misclassification among training samples using geneexpression: application to human breast cancer. Bioinformatics 2006,22(3):317-325.
13. Alizadeh AA, Eisen MB, Davis RE, Ma C, Lossos IS, Rosenwald A, Boldrick JC,Sabet H, Tran T, Yu X, et al: Distinct types of diffuse large B-celllymphoma identified by gene expression profiling. Nature 2000,403(6769):503-511.
14. Pham T, Wells C, Crane D: Analysis of microarray gene expression data.Current Bioinformatics 2006, 1(1):37-53.
15. Asyali MH, Colak D, Demirkaya O, Inan MS: Gene expression profileclassification: A review. Current Bioinformatics 2006, 1(1):55-73.
16. Wei JS, Greer BT, Westermann F, Steinberg SM, Son CG, Chen QR, WhitefordCC, Bilke S, Krasnoselsky AL, Cenacchi N, et al: Prediction of clinicaloutcome using gene expression profiling and artificial neural networksfor patients with neuroblastoma. Cancer Res 2004, 64(19):6883-6891.
17. Gruzdz A, Ihnatowicz A, Slezak D: Interactive gene clustering - a casestudy of breast cancer microarray data. Inf Syst Front 2006, 8:21-27.
18. Schuchhardt J, Beule D, Malik A, Wolski E, Eickhoff H, Lehrach H, Herzel H:Normalization strategies for cDNA microarrays. Nucleic Acids Res 2000,28(10):E47.
19. Everitt B: Cluster Analysis. Heinemann Educ 1974.20. Hartigan JA, Wong MA: k-means. Applied Statistics 1979, 28:100-115.21. Kohonen T: Self-organized formation of topologically correct feature
maps. Biol Cybern 1982, 43:59-69.22. Kohonen T: Self-Organizing Maps. Springer, 3 2001.23. Mardia K, Kent J, Bibby J: Multivariate Analysis. Academic Press 1979.24. Wang D, Lv Y, Guo Z, Li X, Li Y, Zhu J, Yang D, Xu J, Wang C, Rao S, et al:
Effects of replacing the unreliable cDNA microarray measurements onthe disease classification based on gene expression profiles andfunctional modules. Bioinformatics 2006, 22(23):2883-2889.
25. Grużdź A, Ihnatowicz A, Ślęzak D: Gene Expression Clustering: Dealingwith the Missing Values. Intelligent Information Processing and Web Mining2005, 521.
Celton et al. BMC Genomics 2010, 11:15http://www.biomedcentral.com/1471-2164/11/15
Page 14 of 16

26. Fix E, Hodges J: Discriminatory analysis, nonparametric discrimination:Consistency properties. Technical Report 4, USAF School of AviationMedicine Randolph Field, Texas 1951.
27. Troyanskaya O, Cantor M, Sherlock G, Brown P, Hastie T, Tibshirani R,Botstein D, Altman RB: Missing value estimation methods for DNAmicroarrays. Bioinformatics 2001, 17(6):520-525.
28. Kim KY, Kim BJ, Yi GS: Reuse of imputed data in microarray analysisincreases imputation efficiency. BMC Bioinformatics 2004, 5:160.
29. Bo TH, Dysvik B, Jonassen I: LSimpute: accurate estimation of missingvalues in microarray data with least squares methods. Nucleic Acids Res2004, 32(3):e34.
30. Oba S, Sato MA, Takemasa I, Monden M, Matsubara K, Ishii S: A Bayesianmissing value estimation method for gene expression profile data.Bioinformatics 2003, 19(16):2088-2096.
31. Bar-Joseph Z, Gerber GK, Gifford DK, Jaakkola TS, Simon I: Continuousrepresentations of time-series gene expression data. J Comput Biol 2003,10(3-4):341-356.
32. Schliep A, Schonhuth A, Steinhoff C: Using hidden Markov models toanalyze gene expression time course data. Bioinformatics 2003, 19(Suppl1):i255-263.
33. Tuikkala J, Elo L, Nevalainen OS, Aittokallio T: Improving missing valueestimation in microarray data with gene ontology. Bioinformatics 2006,22(5):566-572.
34. Kim DW, Lee KY, Lee KH, Lee D: Towards clustering of incompletemicroarray data without the use of imputation. Bioinformatics 2007,23(1):107-113.
35. Hu J, Li H, Waterman MS, Zhou XJ: Integrative missing value estimationfor microarray data. BMC Bioinformatics 2006, 7:449.
36. Jornsten R, Ouyang M, Wang HY: A meta-data based method for DNAmicroarray imputation. BMC Bioinformatics 2007, 8:109.
37. Gan X, Liew AW, Yan H: Microarray missing data imputation based on aset theoretic framework and biological knowledge. Nucleic Acids Res2006, 34(5):1608-1619.
38. Hua D, Lai Y: An ensemble approach to microarray data-based geneprioritization after missing value imputation. Bioinformatics 2007,23(6):747-754.
39. Wang X, Li A, Jiang Z, Feng H: Missing value estimation for DNAmicroarray gene expression data by Support Vector Regressionimputation and orthogonal coding scheme. BMC Bioinformatics 2006, 7:32.
40. Feten G, Almoy T, Aastveit AH: Prediction of missing values in microarrayand use of mixed models to evaluate the predictors. Stat Appl Genet MolBiol 2005, 4:Article10.
41. Nguyen DV, Wang N, Carroll RJ: Evaluation of Missing Value Estimationfor Microarray Data. Journal of Data Science 2004, 2:347-370.
42. Ouyang M, Welsh WJ, Georgopoulos P: Gaussian mixture clustering andimputation of microarray data. Bioinformatics 2004, 20(6):917-923.
43. Jornsten R, Wang HY, Welsh WJ, Ouyang M: DNA microarray dataimputation and significance analysis of differential expression.Bioinformatics 2005, 21(22):4155-4161.
44. Sehgal MS, Gondal I, Dooley LS: Collateral missing value imputation: anew robust missing value estimation algorithm for microarray data.Bioinformatics 2005, 21(10):2417-2423.
45. Scheel I, Aldrin M, Glad IK, Sorum R, Lyng H, Frigessi A: The influence ofmissing value imputation on detection of differentially expressed genesfrom microarray data. Bioinformatics 2005, 21(23):4272-4279.
46. Tsiporkova E, Boeva V: Two-pass imputation algorithm for missing valueestimation in gene expression time series. J Bioinform Comput Biol 2007,5(5):1005-1022.
47. Bras LP, Menezes JC: Dealing with gene expression missing data. Syst Biol(Stevenage) 2006, 153(3):105-119.
48. Bras LP, Menezes JC: Improving cluster-based missing value estimation ofDNA microarray data. Biomol Eng 2007, 24(2):273-282.
49. de Brevern AG, Hazout S, Malpertuy A: Influence of microarraysexperiments missing values on the stability of gene groups byhierarchical clustering. BMC Bioinformatics 2004, 5:114.
50. Wong DS, Wong FK, Wood GR: A multi-stage approach to clustering andimputation of gene expression profiles. Bioinformatics 2007, 23(8):998-1005.
51. Ogawa N, DeRisi J, Brown PO: New components of a system forphosphate accumulation and polyphosphate metabolism inSaccharomyces cerevisiae revealed by genomic expression analysis. MolBiol Cell 2000, 11(12):4309-4321.
52. Gasch AP, Spellman PT, Kao CM, Carmel-Harel O, Eisen MB, Storz G, BotsteinD, Brown PO: Genomic expression programs in the response of yeastcells to environmental changes. Mol Biol Cell 2000, 11(12):4241-4257.
53. Bohen SP, Troyanskaya OG, Alter O, Warnke R, Botstein D, Brown PO, LevyR: Variation in gene expression patterns in follicular lymphoma and theresponse to rituximab. Proc Natl Acad Sci USA 2003, 100(4):1926-1930.
54. Lucau-Danila A, Lelandais G, Kozovska Z, Tanty V, Delaveau T, Devaux F,Jacq C: Early expression of yeast genes affected by chemical stress. MolCell Biol 2005, 25(5):1860-1868.
55. Brock GN, Shaffer JR, Blakesley RE, Lotz MJ, Tseng GC: Which missing valueimputation method to use in expression profiles: a comparative studyand two selection schemes. BMC Bioinformatics 2008, 9:12.
56. Tuikkala J, Elo LL, Nevalainen OS, Aittokallio T: Missing value imputationimproves clustering and interpretation of gene expression microarraydata. BMC Bioinformatics 2008, 9:202.
57. Kim H, Golub GH, Park H: Missing value estimation for DNA microarraygene expression data: local least squares imputation. Bioinformatics 2005,21(2):187-198.
58. Cox B, Kislinger T, Emili A: Integrating gene and protein expression data:pattern analysis and profile mining. Methods 2005, 35(3):303-314.
59. Tamayo P, Slonim D, Mesirov J, Zhu Q, Kitareewan S, Dmitrovsky E, LanderES, Golub TR: Interpreting patterns of gene expression with self-organizing maps: methods and application to hematopoieticdifferentiation. Proc Natl Acad Sci USA 1999, 96(6):2907-2912.
60. Eisen MB, Spellman PT, Brown PO, Botstein D: Cluster analysis and displayof genome-wide expression patterns. Proc Natl Acad Sci USA 1998,95(25):14863-14868.
61. Herrero J, Valencia A, Dopazo J: A hierarchical unsupervised growingneural network for clustering gene expression patterns. Bioinformatics2001, 17(2):126-136.
62. Dopazo J, Carazo JM: Phylogenetic reconstruction using an unsupervisedgrowing neural network that adopts the topology of a phylogenetictree. J Mol Evol 1997, 44(2):226-233.
63. Yin L, Huang CH, Ni J: Clustering of gene expression data: performanceand similarity analysis. BMC Bioinformatics 2006, 7(Suppl 4):S19.
64. Fu X, Teng L, Li Y, Chen W, Mao Y, Shen IF, Xie Y: Finding dominant setsin microarray data. Front Biosci 2005, 10:3068-3077.
65. Tseng GC, Wong WH: Tight clustering: a resampling-based approach foridentifying stable and tight patterns in data. Biometrics 2005, 61(1):10-16.
66. Ben-Dor A, Shamir R, Yakhini Z: Clustering gene expression patterns. JComput Biol 1999, 6(3-4):281-297.
67. Qu Y, Xu S: Supervised cluster analysis for microarray data based onmultivariate Gaussian mixture. Bioinformatics 2004, 20(12):1905-1913.
68. Yeung KY, Fraley C, Murua A, Raftery AE, Ruzzo WL: Model-basedclustering and data transformations for gene expression data.Bioinformatics 2001, 17(10):977-987.
69. Yeung KY, Haynor DR, Ruzzo WL: Validating clustering for geneexpression data. Bioinformatics 2001, 17(4):309-318.
70. Kim J, Kim H: Clustering of Change Patterns Using Fourier Coefficients.Bioinformatics 2007.
71. Huttenhower C, Flamholz AI, Landis JN, Sahi S, Myers CL, Olszewski KL,Hibbs MA, Siemers NO, Troyanskaya OG, Coller HA: Nearest NeighborNetworks: clustering expression data based on gene neighborhoods.BMC Bioinformatics 2007, 8:250.
72. Fu L, Medico E: FLAME, a novel fuzzy clustering method for the analysisof DNA microarray data. BMC Bioinformatics 2007, 8:3.
73. Lelandais G, Vincens P, Badel-Chagnon A, Vialette S, Jacq C, Hazout S:Comparing gene expression networks in a multi-dimensional space toextract similarities and differences between organisms. Bioinformatics2006, 22(11):1359-1366.
74. Datta S, Datta S: Evaluation of clustering algorithms for gene expressiondata. BMC Bioinformatics 2006, 7(Suppl 4):S17.
75. Allison DB, Cui X, Page GP, Sabripour M: Microarray data analysis: fromdisarray to consolidation and consensus. Nat Rev Genet 2006, 7(1):55-65.
76. Handl J, Knowles J, Kell DB: Computational cluster validation in post-genomic data analysis. Bioinformatics 2005, 21(15):3201-3212.
77. Wu LF, Hughes TR, Davierwala AP, Robinson MD, Stoughton R, AltschulerSJ: Large-scale prediction of Saccharomyces cerevisiae gene functionusing overlapping transcriptional clusters. Nat Genet 2002, 31(3):255-265.
78. Thalamuthu A, Mukhopadhyay I, Zheng X, Tseng GC: Evaluation andcomparison of gene clustering methods in microarray analysis.Bioinformatics 2006, 22(19):2405-2412.
Celton et al. BMC Genomics 2010, 11:15http://www.biomedcentral.com/1471-2164/11/15
Page 15 of 16

79. Swift S, Tucker A, Vinciotti V, Martin N, Orengo C, Liu X, Kellam P:Consensus clustering and functional interpretation of gene-expressiondata. Genome Biol 2004, 5(11):R94.
80. Zhang X, Song X, Wang H, Zhang H: Sequential local least squaresimputation estimating missing value of microarray data. Comput Biol Med2008, 38:1112-1120.
81. Gollub J, Ball CA, Binkley G, Demeter J, Finkelstein DB, Hebert JM,Hernandez-Boussard T, Jin H, Kaloper M, Matese JC, et al: The StanfordMicroarray Database: data access and quality assessment tools. NucleicAcids Res 2003, 31(1):94-96.
82. Ihaka R, Gentleman R: R: a language for data analysis and graphics. JComput Graph Stat 1996, 5:299-314.
83. Quackenbush J: Computational analysis of microarray data. Nat Rev Genet2001, 2(6):418-427.
84. Meunier B, Dumas E, Piec I, Bechet D, Hebraud M, Hocquette JF:Assessment of hierarchical clustering methodologies for proteomic datamining. J Proteome Res 2007, 6(1):358-366.
doi:10.1186/1471-2164-11-15Cite this article as: Celton et al.: Comparative analysis of missing valueimputation methods to improve clustering and interpretation ofmicroarray experiments. BMC Genomics 2010 11:15.
Submit your next manuscript to BioMed Centraland take full advantage of:
• Convenient online submission
• Thorough peer review
• No space constraints or color figure charges
• Immediate publication on acceptance
• Inclusion in PubMed, CAS, Scopus and Google Scholar
• Research which is freely available for redistribution
Submit your manuscript at www.biomedcentral.com/submit
Celton et al. BMC Genomics 2010, 11:15http://www.biomedcentral.com/1471-2164/11/15
Page 16 of 16