A General Audio Classifier based on human perception motivated model 1
Upload
independentCategory
view
1download
0
A New Meta-Classifier
Massimo Buscema Stefano Terzi
Semeion Research Center Rome, Italy
{m.buscema;s.terzi}@semeion.it
William Tastle Department of Management
Ithaca College, Ithaca, New York 14850 USA [email protected]
Abstract – A taxonomy for classifying classifiers is presented. A new meta-classifier, Meta-Consensus, with a foundation in both consensus theory and the theory of independent judges, is introduced.
Introduction It is the intention of a classification system to
perform the task of classifying some object and to do so with a reasonable degree of accuracy. There exists today a rather extensive listing of meta-classifiers developed around specialized algorithms to satisfy certain classification schemes. This has led to the creation of a vast library of available instruments from which an investigator must make a choice, with each classifier possessing a particular typology. While one type of classifier might yield excellent results in one situation, it might also yield dismal results when applied to another.
Proposed algorithm: Meta-Net Meta-Classifiers
General Properties The fundamental characteristic of the Meta-Net [5]
consists of considering not only the “positive credibility” of its composing classifiers (i.e., “this pattern is white”), but also their “negative credibility” (i.e., “this pattern is not white”). So, the characterizing connection of the Meta-Net is to connect each output node of each composing classifier with each output class. “Complete grid” connections are planned between Meta-Net inputs and outputs, and each connection can be either excitatory (positive numbers), or inhibitory (negative numbers).
Between 1994 and 2008 Semeion researchers conceived and developed a series of Meta-Classifiers [3] based on some common traits and called them “Meta-Nets.” All Meta-Nets have typically similar neural network architecture [1, 5]: certain input nodes are the whole outputs of all composing classifiers, and certain output nodes are the output classes of the classification problem.
The connections between Meta-Net inputs and outputs always possess a complete grid structure and are defined by specific algorithms characterizing the Meta-Net peculiarities.
The Meta-Net output vector is calculated from the probabilistic equation Soft Max [4]:
,
P Nk k
j i i jk i
Net Out w= ⋅∑∑
j
i
Net
j NNet
i
eMetaOute
=∑
where k is an index of P classifiers, j is the index of the
output unit, kiOut is the output node of each single
classifier k, and jMetaOut is the jth output node of the
Meta-Net.
All Meta-Nets are unsupervised. Each one evaluates its own output without knowing its composing classifiers errors; it only knows the statistic of their responses. So, Meta-Nets are strongly sensitive to the quality of classifiers to be optimized. This means that each Meta-Net, to be considered excellent, should be composed of classifiers in which the confusion matrix, in blind testing, clearly respects the following equation:
1
, ,, : 0;N
k ki i i j
j i
k k P a a−
≠
∀ ∈ − >∑
where ,ki ja is a generic cell of the confusion matrix.
However, in the tests that follow we shall verify that this condition, if not properly respected, will produce a “very smooth” fall of Meta-Net capacities in accordance with the typical characteristics of artificial neural networks (ANNs).
Each connection value represents the plausibility trough in which every component classifier supports every classification node of the Meta-Net. The numerical value of each Meta-Net connection can belong to the interval between –• (implausibility) and +• (plausibility). The plausibility and the implausibility of each connection is a function of the probability of each Meta-Net component during the testing phase.
The Nomenclature of Topology
,ki ja is the row i, column j element from the confusion
matrix of the kth classifier
N is the dimension of the confusion matrix
M is the number of classifiers
978-1-4244-7858-6/10/$26.00 ©2010 IEEE

,ki jw is the value of the weight connecting output
node i of the kth base classifier to output node j of metanet
kjI is the output node j of the kth base classifier
Label is the winner class (output of meta-classifier)
Weight definition Weights are estimations based on the performance
of base classifiers evaluated on an independent testing set. The results are summarized and used in the confusion matrix.
From a mathematical perspective, the common feature of the all Meta-Net algorithms is the specific procedure through which the plausibility of each output of any classifier is connected to each output of the global Meta-Classifier.
To explain this procedure we need to start from the analysis of the confusion matrix of one classifier [5]:
11 1
1
k Output...
Target ... ... ......
N
N NN
Classifiera a
a a
⎛ ⎞⎜ ⎟⎜ ⎟⎜ ⎟⎝ ⎠
In this matrix we need to distinguish four criteria for
each cell, ,ki ja . The first criterion represents the
“Rights,” that is, the plausibility by which the kth classifier considers correct the records classified in the
cell ,ki jv with respect to the summation of Targets:
,,
,
ki jk
i j Nki j
j
aR
a=∑
The second criteria represents the “Corrects,” that is, the plausibility by which the kth classifier considers
“correct” the records classified in the cell ,ki jv with
respect to the (column) summation of outputs:
,,
,
=ki jk
i j Nki j
i
aC
a∑
The third criteria is a correlation of the “Rights” to the probability that any specific output depends on a
specific Target: , ( | )k k kj i j ip p O T= .
The fourth criteria is a correlation of the “Corrects” to the probability that any specific Target comes from a
specific Output: , ( | )k k ki j i jp p T O= .
Every weight connecting the output of each basic classifier (that is, the Meta Net input) and the output of
the Meta Net depends not only by the sensitivity of the considered classifier, but also by its precision. In other words, each weight of Meta Net is the result of a function composed by the sensitivity and by the precision of each cell of the confusion matrix generated in test phase for each basic classifier.
( )
,
,
,
, , , .
Legenda:
sensitivity of the cell i,j in the k-th basic classifier;
precision of the cell i,j in the k-th basic classifier;
() typically a fuzzy function;
value of
,
k
i j
k
i j
k
i j
k k ki j i j i j
R
C
f
w
w f R C
=
=
=
=
=
the weight between the j-th output of the k-th
classifier and the i-th output of Meta Net.
The function composing the sensitivity and the precision of each weight of Meta Net can be a simple fuzzy rule, like the following:
{ }, , , .min ,ki j
k ki j i jw R C=
Or a more complex fuzzy rule like this one:
( ) ( ) ( )( ), , , , ,1 1 .k k ki j i j i j
k ki j i jw R C R C= + − ⋅− −
Meta Consensus, presented in this paper (see equations 1-5), is a particularly suitable and effective new fuzzy function composing sensitivity and precision. The Meta Consensus function was explicitly inspired by Consensus Theory [6-7].
Both the R and C matrices give additional information to the Meta-Classifier for the purpose of the weighting of each base classifier. The intention is to provide increased accuracy to the Meta-Classifier. Traditionally, the combination of the outputs from the base classifiers has been done with weighted averages and these weights have been determined by the main diagonal of R and C. By limiting the weight calculations to the diagonal omits potentially important additional information and hence, the precision of a value does not necessarily indicate conciseness of accuracy, and here is where the Meta-Classifier gains it value. It utilizes all the information available in the entire matrix to determine the weights of the Meta-Classifier.
Referring to Kuncheva’s [2] work, given L number of classifiers and c number of classes, we can have three types of weighted averages depending on the number of weights. First, we can have L weights in which each classifier has exactly one weight; second, we can have L * c weights in which there is one weight per class, and third we can have L * c * c weights which represent a complete connection between the outputs of the base classifiers and the outputs of the Meta-Classifier. The Meta-Net algorithm uses this third method to take into account the possibility of how much a single base classifier might render a wrong decision.
It is important to understand the meaning of the R and C values that are off the main diagonal. For the R matrix the values represent the number of times the base classifier answered i when the answer should have been j, and the C

matrix is the “precision” of the confusion between i and j; simply stated, C informs us that from among all the times the classifier answered class i (correct and incorrect decisions) the percentage of correct decisions was actually class j.
In other words, Meta Consensus (and all the Meta Net algorithms) additionally considers the inhibitory credibility of each basic classifier. This is the case when the weight pushes Meta Consensus to change opinion in relation to the classification suggested by the basic classifier. An example: suppose the basic classifier confuses the correct class A with the incorrect class B 30 times out of 100, but let us also suppose that the basic classifier makes a systematic mistake confusing class A with class B. At this point, the weight connecting class B of the basic classifier with class A (the correct one) of Meta Consensus will be strong, while the weight connecting class B of the basic classifier with class B of Meta Consensus will be weak. And, consequently, Meta Consensus is also able to correct many systematic errors of classification generated by its basic classifiers.
Armed with this theory we can now proceed to a description of the equations.
Specific weight equation on the Confusion Matrix
Meta-Consensus For each output cell in the base classifiers a weight
as calculated on a Meta-Classifier input node. Given k input nodes in which i and j are subscripts that identify the column (precision) and row (sensitivity) values, equation 1 gives the weight provided by the row calculation.
( ),,
, 2log2 1
k kki j ii jk k
i j iki
a R Nar R
R N
⎛ ⎞−⎜ ⎟= ⋅ −⎜ ⎟⋅ −⎝ ⎠
(1)
A similar weight calculation (equation 2) is made based on column values:
( ),,
, 2c log2 1
k kki j ii jk k
i j iki
a C NaC
C N
⎛ ⎞−⎜ ⎟= ⋅ −⎜ ⎟⋅ −⎝ ⎠
(2)
The data that are missing from these calculations of weight are addressed in an additional weight equation that captures this missing information. Note that from the sum of the rows is subtracted the individual value from the confusion matrix classifier (equation 3) to yield the remaining information that is also used to calculate the weight:
( )
,,
, 2log2 1
kk k i
k k i i ji i jk k
i j ik
i
RR a
R a Nm R
R N
− −−
= ⋅ −⋅ −
⎛ ⎞⎜ ⎟⎜ ⎟⎜ ⎟⎜ ⎟⎝ ⎠
(3)
In the same manner that the missing information is calculated for the rows, equation 4 captures the missing information from the column:
( )
,,
, 2log2 1
kk k i
k k i i ji i jk k
i j ik
i
CC a
C a Nf C
C N
− −−
= ⋅ −⋅ −
⎛ ⎞⎜ ⎟⎜ ⎟⎜ ⎟⎜ ⎟⎝ ⎠
(4)
which is combined to yield the overall weight (equation 5) acting on the Meta-Classifier:
, ,,
, ,
lnk ki j i jk
i j k ki j i j
m fw
r c⎛ ⎞⋅
= − ⎜ ⎟⎜ ⎟⋅⎝ ⎠ (5)
These are now the weights used to modify the Meta-Classifier nodes.
, N M
k kj i j
i j kLabel Arg Max I w
⎧ ⎫= ⋅⎨ ⎬
⎩ ⎭∑∑ (6)
Experimentation
Experimental setup As base classifiers we chose to utilize different
typologies and in this way we can reasonably expect to have high variability. The set includes CART, a decisional tree (TREE) [8], a K Nearest Neighbor (KNN), a BackPropagation (BP) [9] neural network, a Sine Network (SN) [10], a Support Vector Machine (SVM) [11], a Bayesian linear classifier (LDC), the Bayesian “naive” classifier (NAIVEBC), and a quadratic Bayesian classifier (QDC).
With respect to meta-classifiers we propose, for comparison purposes, to compare our model with the other models: Wernecke [12], Dempster Shafer Combination [13], Behavior Knowledge Space Method (BKS) [14], Majority Vote (MajVote), Clustering and Selection [15], Direct Knn Decision Dependent (DynDdDirectKnn) [16], Fuzzy Integral [17] and some simple methods of output fusion, i.e., Naïve Bayesan Combiner (BayesComb), Simple Mean, Median, Minimum and Product. We have also used two classifiers that do not use the base classifier trained, rather create by themselves the classifier ensemble: ArcX4 [18] and AdaBoostM1 [19].
For the experiment we use five datasets, two of these are Semeion Research Centre property and come from experimental activities on real problems: Digits and Faults [20]. The other three come from the UCI Repository [21] and are used in machine learning area to evaluate the different algorithms performances (DNA, Letters and Segment).

Experimental Results
DIGITS Dataset Recognition of handwritten numeric characters. The
dataset is composed of 1594 digits handwritten by different subjects in different situations and codified in a 256 bit streak corresponding to a 16 x 16 grid. The objective is to classify each grid into the corresponding digit, 0 of 9. In this dataset the presence of a clear advantage in using meta-classifiers in not clear because the result of the best classifier (PARZENC) is quite similar to the best meta-classifiers [Table I].
FAULTS dataset Every dataset record represents a superficial fault of
a stainless steel leaf. There are 6 different typologies of faults. The fault description is constituted by 27 indicators representing the geometric shape of the fault and its contour. We have 1941 records in total.
The Faults’ dataset underlines, in a well-marked way, the efficacy in using meta-classifiers and is further illustrative of the evidence that serves to establish the quality of Meta-Consensus as a classifier. While it occupies the third position in terms of weighted average, it is the first of the set that does not create a base classifier (Arcing, Boosting) but rather, uses the available base classifiers [Table II].
DNA dataset From UCI Repository: Molecular Biology (Splice-
junction Gene Sequences) Data Set.
Splice junctions are points on a DNA sequence at which `superfluous' DNA is removed during the process of protein creation in higher organisms. The problem posed in this dataset is to recognize, given a sequence of DNA, the boundaries between exons (the parts of the DNA sequence retained after splicing) and introns (the parts of the DNA sequence that are spliced out). This problem consists of two subtasks: recognizing exon/intron boundaries (referred to as EI sites), and recognizing intron/exon boundaries (IE sites). (In the biological community, IE borders are referred to a ``acceptors'' while EI borders are referred to as ``donors''). Details on the dataset can be found at http://archive.ics.uci.edu/ml/machine-learning-databases/molecular-biology/splice-junction-gene-sequences/splice.names [Table III].
LETTERS dataset UCI: Letter Recognition Data Set
The objective is the identification of a great number of boxes containing white and black pixels representing one of the 26 letters of the English alphabet. The characters are extracted by 20 different fonts and distorted in random way producing 20,000 different characters. Each character has been codified with 16 numeric attributes, scaled on 16 integer values from 0 to 15 [Table IV].
SEGMENT dataset UCI: Statlog (Image Segmentation) Data Set
The records have been randomly extracted from a database of seven outdoor pictures. These images have been manually sectioned to create a classification for each pixel. Each record represents a 3 x 3 region. There are seven classes (1 = brick face, 2 = sky, 3 = foliage, 4 = cement, 5 = window, 6 = path, 7 = grass). Every region is characterized by 19 measures on the color image. There are 2310 records.
Even in this dataset the good performances of Meta-Consensus are evident [Table V].
SATIMAGE dataset UCI: Statlog (Image Segmentation) Data Set
The database consists of the multi-spectral values of pixels in 3 x 3 neighborhoods in a satellite image, and the classification associated with the central pixel in each neighborhood. The aim is to predict this classification, given the multi-spectral values.
Results are reported on Table VI.
AGGREGATE RESULTS To synthesize the results on the single datasets and
globally evaluate the classifiers’ performances we calculate the positions (ranking) of each classifier compared to the five datasets and calculate the average ranking. The results of this calculation are reported in table VII (see below). The results make clearly evident the quality of the meta-classifier proposed in this paper, and the fact that it has the first position and is the only one ensemble able to overcome SVM suggests that the criteria that inspired this algorithm is particularly useful for the fusion of the results of a set of classifiers.
Conclusion and Future works Meta-Consensus is a meta classifier conceived in the
framework of the Meta Nets algorithms [5]. The main features of this algorithm are two:
• Every weight connecting the output of each basic classifier (that is, the Meta Net input) and the output of the Meta Net depends not only on the sensitivity of the considered classifier, but also by its precision.
• Each cell of the confusion matrix of every basic classifier will generate a specific weight connecting all the outputs of the basic classifiers to all the outputs of the Meta Net. The weights matrix of Meta Consensus is a full matrix, where the “residuals” (the cells outside the main diagonal) also play a role in the final classification. In other words, Meta Consensus (and all the Meta Net algorithms) additionally considers the inhibitory credibility of each basic classifier.
These features make Meta Consensus more effective than the other Meta Classifiers as this benchmark study has clearly shown.
With these observations it may now be necessary to also take into account a possible change of philosophy in the Meta Classifiers literature: local sensitivity, local precision and small residuals can dramatically increase the

amount of information available upon which complex decisions can be made. To paraphrase an often used phrase: The devil is in the detail.
TABLE I. RANKING OF RESULTS ON DIGITS BY WEIGHTED MEANS.
Mean Predict AMean WMean Errors Rank
QDC 95.79% 95.79% 13.4 1
SVM 95.73% 95.73% 13.6 2
MajVote 95.27% 95.29% 15.0 3
BayesComb 94.81% 94.79% 16.6 4
DempsterShafer 94.78% 94.79% 16.6 4
Meta-Consensus 94.78% 94.79% 16.6 4
Wernecke 94.76% 94.79% 16.6 4
DecisionTemplate 94.41% 94.41% 17.8 8
DynDdDirectKnn 94.40% 94.41% 17.8 8
ClusteringAndSelection 93.38% 93.41% 21.0 10
Parzen 92.17% 92.22% 24.8 11
DBD 90.76% 90.77% 29.4 12
KNN 90.50% 90.59% 30.0 13
LDC 90.26% 90.27% 31.0 14
BP 89.56% 89.58% 33.2 15
SN 88.88% 88.89% 35.4 16
NaiveBayes 85.01% 84.99% 47.8 17
FuzzyIntegral 83.36% 83.49% 52.6 18
TREE 73.23% 73.32% 85.0 19 WeightedAverage 61.09% 61.2% 123.4 20
TABLE II. RANKING OF RESULTS ON FAULTS BY WEIGHTED MEANS.
Mean Predict A.Mean W.Mean Errors Rank
ArcX4 80.35% 79.50% 79.6 1
AdaBoostM1 79.31% 78.93% 81.8 2
Meta-Consensus 77.00% 76.47% 94.8 3
MajVote 80.44% 74.76% 98.0 4
SVM 73.62% 74.04% 100.8 5
BayesComb 71.95% 73.83% 101.6 6
DecisionTemplate 79.98% 73.73% 102.0 7
DempsterShafer 80.58% 73.68% 102.2 8
Wernecke 78.11% 73.37% 103.4 9
TREE 76.22% 73.11% 104.4 10
DynDdDirectKnn 77.40% 72.59% 106.4 11
ClusteringAndSelection 74.24% 70.99% 112.6 12
Parzen 74.15% 70.94% 112.8 13
KNN 73.62% 70.94% 112.8 13
FuzzyIntegral 77.82% 70.74% 113.6 15
SN 74.16% 70.68% 113.8 16
BP 74.54% 70.53% 114.4 17
DBD 75.73% 70.37% 115.0 18
NaiveBayes 73.60% 68.63% 121.8 19
LDC 74.25% 64.97% 136.0 20
QDC 77.20% 63.37% 142.2 21
WeightedAverage 75.75% 59.92% 155.6 22
TABLE III. RANKING OF RESULTS ON DNA BY WEIGHTED MEANS.
Mean Predict A.Mean W.Mean Errors Rank
DecisionTemplate 96.69% 96.70% 21.0 1
WeightedAverage 96.63% 96.64% 21.4 2
BayesComb 96.42% 96.61% 21.6 3
DempsterShafer 96.63% 96.61% 21.6 3
QDC 96.51% 96.45% 22.6 5
Meta-Consensus 96.19% 96.39% 23.0 6
SVM 95.94% 96.23% 24.0 7
MajVote 96.17% 96.04% 25.2 8
DynDdDirectKnn 95.2% 95.32% 29.8 9
ClusteringAndSelection 94.92% 94.82% 33.0 10
AdaBoostM1 94.3% 94.73% 33.6 11
DBD 94.34% 94.51% 35.0 12
ArcX4 94.19% 94.48% 35.2 13
NaiveBayes 93.55% 94.04% 38.0 14
FuzzyIntegral 93.95% 94.01% 38.2 15
BP 93.35% 93.69% 40.2 16
LDC 94.41% 93.41% 42.0 17
SN 92.77% 93.19% 43.4 18
TREE 92.21% 93.03% 44.4 19
Wernecke 88.92% 89.83% 64.8 20
KNN 87.12% 88.04% 76.2 21
Parzen 78.45% 73.63% 168.0 22
TABLE IV. RANKING OF RESULTS ON LETTERS BY WEIGHTED MEANS.
Mean Predict A.Mean W.Mean Error Ranking
SVM Mean 97.87% 97.89% 84.60 1
Meta-Consensus 97.60% 97.62% 95.4 2
mcWeightedAverage 97.48% 97.49% 100.20 3
mcClusteringAndSelection 96.98% 96.98% 120.80 4
mcDempsterShafer 96.65% 96.66% 133.40 5
mcDecisionTemplate 96.62% 96.63% 134.80 6
mcMajVote 96.45% 96.46% 141.60 7
C Parzen Mean 96.20% 96.22% 151.40 8
mcDynDdDirectKnn 96.05% 96.07% 157.20 9
DBD Mean 95.76% 95.78% 168.80 10
mcBayesComb 95.35% 95.36% 185.40 11
KNN Mean 94.86% 94.88% 205.00 12
SN Mean 94.71% 94.74% 210.60 13
BP Mean 94.19% 94.22% 231.40 14
LVQ Mean 94.06% 94.08% 236.80 15
mcArcX4 92.94% 92.97% 281.40 16
mcAdaBoostM1 92.62% 92.64% 294.20 17
mcFuzzyIntegral 88.65% 88.68% 452.80 18
QDC Mean 88.49% 88.54% 458.60 19
Tree Mean 87.87% 87.89% 484.40 20
NaiveBayes Mean 73.22% 73.27% 1069.40 21
LDC Mean 70.07% 70.17% 1193.40 22
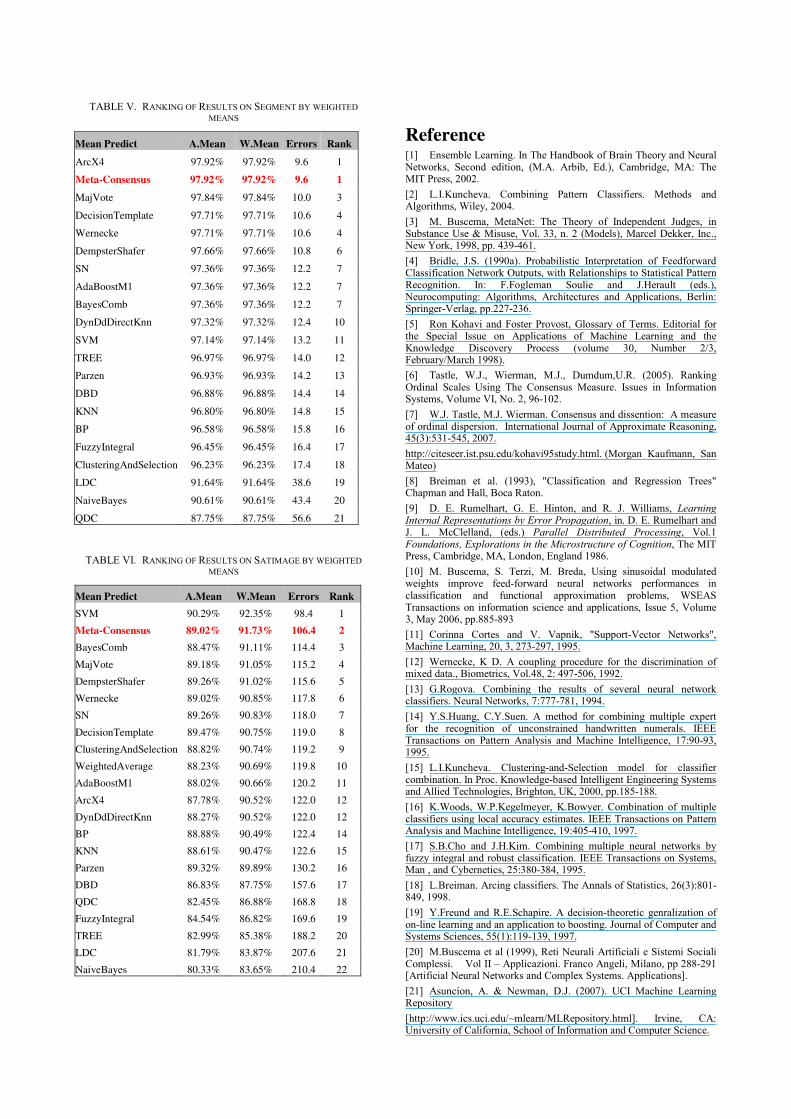
TABLE V. RANKING OF RESULTS ON SEGMENT BY WEIGHTED MEANS
Mean Predict A.Mean W.Mean Errors Rank
ArcX4 97.92% 97.92% 9.6 1
Meta-Consensus 97.92% 97.92% 9.6 1
MajVote 97.84% 97.84% 10.0 3
DecisionTemplate 97.71% 97.71% 10.6 4
Wernecke 97.71% 97.71% 10.6 4
DempsterShafer 97.66% 97.66% 10.8 6
SN 97.36% 97.36% 12.2 7
AdaBoostM1 97.36% 97.36% 12.2 7
BayesComb 97.36% 97.36% 12.2 7
DynDdDirectKnn 97.32% 97.32% 12.4 10
SVM 97.14% 97.14% 13.2 11
TREE 96.97% 96.97% 14.0 12
Parzen 96.93% 96.93% 14.2 13
DBD 96.88% 96.88% 14.4 14
KNN 96.80% 96.80% 14.8 15
BP 96.58% 96.58% 15.8 16
FuzzyIntegral 96.45% 96.45% 16.4 17
ClusteringAndSelection 96.23% 96.23% 17.4 18
LDC 91.64% 91.64% 38.6 19
NaiveBayes 90.61% 90.61% 43.4 20
QDC 87.75% 87.75% 56.6 21
TABLE VI. RANKING OF RESULTS ON SATIMAGE BY WEIGHTED MEANS
Mean Predict A.Mean W.Mean Errors Rank
SVM 90.29% 92.35% 98.4 1
Meta-Consensus 89.02% 91.73% 106.4 2
BayesComb 88.47% 91.11% 114.4 3
MajVote 89.18% 91.05% 115.2 4
DempsterShafer 89.26% 91.02% 115.6 5
Wernecke 89.02% 90.85% 117.8 6
SN 89.26% 90.83% 118.0 7
DecisionTemplate 89.47% 90.75% 119.0 8
ClusteringAndSelection 88.82% 90.74% 119.2 9
WeightedAverage 88.23% 90.69% 119.8 10
AdaBoostM1 88.02% 90.66% 120.2 11
ArcX4 87.78% 90.52% 122.0 12
DynDdDirectKnn 88.27% 90.52% 122.0 12
BP 88.88% 90.49% 122.4 14
KNN 88.61% 90.47% 122.6 15
Parzen 89.32% 89.89% 130.2 16
DBD 86.83% 87.75% 157.6 17
QDC 82.45% 86.88% 168.8 18
FuzzyIntegral 84.54% 86.82% 169.6 19
TREE 82.99% 85.38% 188.2 20
LDC 81.79% 83.87% 207.6 21
NaiveBayes 80.33% 83.65% 210.4 22
Reference [1] Ensemble Learning. In The Handbook of Brain Theory and Neural Networks, Second edition, (M.A. Arbib, Ed.), Cambridge, MA: The MIT Press, 2002. [2] L.I.Kuncheva. Combining Pattern Classifiers. Methods and Algorithms, Wiley, 2004. [3] M. Buscema, MetaNet: The Theory of Independent Judges, in Substance Use & Misuse, Vol. 33, n. 2 (Models), Marcel Dekker, Inc., New York, 1998, pp. 439-461. [4] Bridle, J.S. (1990a). Probabilistic Interpretation of Feedforward Classification Network Outputs, with Relationships to Statistical Pattern Recognition. In: F.Fogleman Soulie and J.Herault (eds.), Neurocomputing: Algorithms, Architectures and Applications, Berlin: Springer-Verlag, pp.227-236. [5] Ron Kohavi and Foster Provost, Glossary of Terms. Editorial for the Special Issue on Applications of Machine Learning and the Knowledge Discovery Process (volume 30, Number 2/3, February/March 1998). [6] Tastle, W.J., Wierman, M.J., Dumdum,U.R. (2005). Ranking Ordinal Scales Using The Consensus Measure. Issues in Information Systems, Volume VI, No. 2, 96-102. [7] W.J. Tastle, M.J. Wierman. Consensus and dissention: A measure of ordinal dispersion. International Journal of Approximate Reasoning, 45(3):531-545, 2007. http://citeseer.ist.psu.edu/kohavi95study.html. (Morgan Kaufmann, San Mateo) [8] Breiman et al. (1993), "Classification and Regression Trees" Chapman and Hall, Boca Raton. [9] D. E. Rumelhart, G. E. Hinton, and R. J. Williams, Learning Internal Representations by Error Propagation, in. D. E. Rumelhart and J. L. McClelland, (eds.) Parallel Distributed Processing, Vol.1 Foundations, Explorations in the Microstructure of Cognition, The MIT Press, Cambridge, MA, London, England 1986. [10] M. Buscema, S. Terzi, M. Breda, Using sinusoidal modulated weights improve feed-forward neural networks performances in classification and functional approximation problems, WSEAS Transactions on information science and applications, Issue 5, Volume 3, May 2006, pp.885-893 [11] Corinna Cortes and V. Vapnik, "Support-Vector Networks", Machine Learning, 20, 3, 273-297, 1995. [12] Wernecke, K D. A coupling procedure for the discrimination of mixed data., Biometrics, Vol.48, 2: 497-506, 1992. [13] G.Rogova. Combining the results of several neural network classifiers. Neural Networks, 7:777-781, 1994. [14] Y.S.Huang, C.Y.Suen. A method for combining multiple expert for the recognition of unconstrained handwritten numerals. IEEE Transactions on Pattern Analysis and Machine Intelligence, 17:90-93, 1995. [15] L.I.Kuncheva. Clustering-and-Selection model for classifier combination. In Proc. Knowledge-based Intelligent Engineering Systems and Allied Technologies, Brighton, UK, 2000, pp.185-188. [16] K.Woods, W.P.Kegelmeyer, K.Bowyer. Combination of multiple classifiers using local accuracy estimates. IEEE Transactions on Pattern Analysis and Machine Intelligence, 19:405-410, 1997. [17] S.B.Cho and J.H.Kim. Combining multiple neural networks by fuzzy integral and robust classification. IEEE Transactions on Systems, Man , and Cybernetics, 25:380-384, 1995. [18] L.Breiman. Arcing classifiers. The Annals of Statistics, 26(3):801-849, 1998. [19] Y.Freund and R.E.Schapire. A decision-theoretic genralization of on-line learning and an application to boosting. Journal of Computer and Systems Sciences, 55(1):119-139, 1997. [20] M.Buscema et al (1999), Reti Neurali Artificiali e Sistemi Sociali Complessi. Vol II – Applicazioni. Franco Angeli, Milano, pp 288-291 [Artificial Neural Networks and Complex Systems. Applications]. [21] Asuncion, A. & Newman, D.J. (2007). UCI Machine Learning Repository [http://www.ics.uci.edu/~mlearn/MLRepository.html]. Irvine, CA: University of California, School of Information and Computer Science.

TABLE VII. RANKING RESULTS ON 6 DATASETS
Segm
ent
Dig
its
Fau
lts
DN
A
Let
ter
Sati
m
Mea
n R
ank
Meta-Consensus 1 4 3 6 1 2 2.83 SVM 11 2 5 7 4 1 5.00
MajVote 3 3 4 8 13 4 5.83
DempsterShafer 6 4 8 3 10 5 6.00
BayesComb 7 4 6 3 15 3 6.33
DecisionTemplate 4 8 7 1 11 8 6.50
ArcX4 1 1 13 16 12 8.60
AdaBoostM1 7 2 11 17 11 9.60
ClusteringAndSelection 18 10 12 10 5 9 10.67
DynDdDirectKnn 10 8 11 9 14 12 10.67
SN 7 16 16 18 3 7 11.17
DBD 14 12 18 12 8 17 13.50
Parzen 13 11 13 22 7 16 13.67
KNN 15 13 13 21 9 15 14.33
TREE 12 19 10 19 6 20 14.33
QDC 21 1 21 5 21 18 14.50
BP 16 15 17 16 12 14 15.00
FuzzyIntegral 17 18 15 15 20 19 17.33
LDC 19 14 20 17 18 21 18.17
NaiveBayes 20 17 19 14 19 22 18.50
Copyright © 2022 FDOKUMEN