
Robustness and Variability of Neuronal Coding by Amplitude Sensitive Afferents in the Weakly...
16
Robustness and Variability of Neuronal Coding by Amplitude- Sensitive Afferents in the Weakly Electric Fish Eigenmannia GABRIEL KREIMAN, 1 R ¨ UDIGER KRAHE, 2 WALTER METZNER, 2 CHRISTOF KOCH, 1 AND FABRIZIO GABBIANI 1 1 Computation and Neural Systems Program, Division of Biology, 139-74 California Institute of Technology, Pasadena 91125; and 2 Department of Biology, University of California at Riverside, Riverside, California 92521-0427 Received 10 November 1999; accepted in final form 21 March 2000 Kreiman, Gabriel, Ru ¨ diger Krahe, Walter Metzner, Christof Koch, and Fabrizio Gabbiani. Robustness and variability of neuro- nal coding by amplitude-sensitive afferents in the weakly electric fish Eigenmannia. J Neurophysiol 84: 189 –204, 2000. We investigated the variability of P-receptor afferent spike trains in the weakly electric fish, Eigenmannia, to repeated presentations of random electric field AMs (RAMs) and quantified its impact on the encoding of time- varying stimuli. A new measure of spike timing jitter was developed using the notion of spike train distances recently introduced by Victor and Purpura. This measure of variability is widely applicable to neuronal responses, irrespective of the type of stimuli used (determin- istic vs. random) or the reliability of the recorded spike trains. In our data, the mean spike count and its variance measured in short time windows were poorly correlated with the reliability of P-receptor afferent spike trains, implying that such measures provide unreliable indices of trial-to-trial variability. P-receptor afferent spike trains were considerably less variable than those of Poisson model neurons. The average timing jitter of spikes lay within 1–2 cycles of the electric organ discharge (EOD). At low, but not at high firing rates, the timing jitter was dependent on the cutoff frequency of the stimulus and, to a lesser extent, on its contrast. When spikes were artificially manipu- lated to increase jitter, information conveyed by P-receptor afferents was degraded only for average jitters considerably larger than those observed experimentally. This suggests that the intrinsic variability of single spike trains lies outside of the range where it might degrade the information conveyed, yet still allows for improvement in coding by averaging across multiple afferent fibers. Our results were summa- rized in a phenomenological model of P-receptor afferents, incorpo- rating both their linear transfer properties and the variability of their spike trains. This model complements an earlier one proposed by Nelson et al. for P-receptor afferents of Apteronotus. Because of their relatively high precision with respect to the EOD cycle frequency, P-receptor afferent spike trains possess the temporal resolution nec- essary to support coincidence detection operations at the next stage in the amplitude-coding pathway. INTRODUCTION Variability has long attracted neurophysiologists as a tool to investigate the biophysical mechanisms of sensory processing, the integrative properties of nerve cells, and the encoding schemes used in various parts of the nervous system (Baylor et al. 1979; Hecht et al. 1942; Shadlen et al. 1996; Softky and Koch 1993). Until recently, most work has focused on char- acterizing the response variability of nerve cells to static stim- uli, in part because simple measures such as the variance of the number of spikes recorded in long time windows provide universal and effective ways to quantify variability under such conditions (Parker and Newsome 1998). Most biologically relevant stimuli, however, are not static. Therefore, more recently, investigators have started to charac- terize the trial-to-trial variability of responses to time-varying, dynamic stimuli in vivo and in vitro (Bair and Koch 1996; Berry et al. 1997; de Ruyter van Steveninck et al. 1997; Mainen and Sejnowski 1995; Mechler et al. 1998; Reich et al. 1997; Stevens and Zador 1998; Warzecha et al. 1998). When temporal variations are sufficiently strong to induce locking of spikes to stimulus transients, measures such as the standard deviation in the spike occurrence times following those tran- sients or the probability of spike occurrence within a given time window from trial to trial may be used to provide a characterization of variability (Bair and Koch 1996; Mainen and Sejnowski 1995). However, these measures are not likely to carry over to more general stimulation conditions, when locking to stimulus transients is absent or less pronounced. An alternative approach consists of extrapolating from the study of static stimuli and to use the variance in the number of spikes observed in short time windows as a measure of variability (referred to as the spike count variance) (Berry et al. 1997; de Ruyter van Steveninck et al. 1997; Warzecha and Egelhaaf 1999). Two goals of the present work are to clarify the limits of the spike count variance as a measure of short term vari- ability, and to introduce a new measure of spike time jitter based on recent work by Victor and Purpura (1996, 1997) that should be applicable to a wide range of stimuli, independent of the integrative properties of the investigated neurons. Eigenmannia is a weakly electric gymnotiform fish of wave type that discharges its electric organ at regular intervals 200 – 600 times per second. Two types of tuberous sensory afferent nerve fibers convey information about the resulting electrical environment to the brain (Scheich et al. 1973). T-type afferent fibers provide the first stage of a pathway specialized to process phase information, called the timing pathway (Heiligenberg 1991). They fire one spike per electric organ discharge (EOD) cycle, each tightly phase locked to the zero crossings of the EOD and thus signal phase modulations of the electric field. Address reprint requests to F. Gabbiani (E-mail: [email protected]. edu). The costs of publication of this article were defrayed in part by the payment of page charges. The article must therefore be hereby marked “advertisement” in accordance with 18 U.S.C. Section 1734 solely to indicate this fact. 189 0022-3077/00 $5.00 Copyright © 2000 The American Physiological Society www.jn.physiology.org
-
Upload
hms-harvard -
Category
Documents
-
view
5 -
download
0
Transcript of Robustness and Variability of Neuronal Coding by Amplitude Sensitive Afferents in the Weakly...
Robustness and Variability of Neuronal Coding by Amplitude-Sensitive Afferents in the Weakly Electric FishEigenmannia
GABRIEL KREIMAN,1 RUDIGER KRAHE,2 WALTER METZNER,2 CHRISTOF KOCH,1 ANDFABRIZIO GABBIANI 1
1Computation and Neural Systems Program, Division of Biology, 139-74 California Institute of Technology, Pasadena91125; and2Department of Biology, University of California at Riverside, Riverside, California 92521-0427
Received 10 November 1999; accepted in final form 21 March 2000
Kreiman, Gabriel, Rudiger Krahe, Walter Metzner, ChristofKoch, and Fabrizio Gabbiani. Robustness and variability of neuro-nal coding by amplitude-sensitive afferents in the weakly electric fishEigenmannia. J Neurophysiol84: 189–204, 2000. We investigatedthe variability of P-receptor afferent spike trains in the weakly electricfish, Eigenmannia,to repeated presentations of random electric fieldAMs (RAMs) and quantified its impact on the encoding of time-varying stimuli. A new measure of spike timing jitter was developedusing the notion of spike train distances recently introduced by Victorand Purpura. This measure of variability is widely applicable toneuronal responses, irrespective of the type of stimuli used (determin-istic vs. random) or the reliability of the recorded spike trains. In ourdata, the mean spike count and its variance measured in short timewindows were poorly correlated with the reliability of P-receptorafferent spike trains, implying that such measures provide unreliableindices of trial-to-trial variability. P-receptor afferent spike trains wereconsiderably less variable than those of Poisson model neurons. Theaverage timing jitter of spikes lay within 1–2 cycles of the electricorgan discharge (EOD). At low, but not at high firing rates, the timingjitter was dependent on the cutoff frequency of the stimulus and, to alesser extent, on its contrast. When spikes were artificially manipu-lated to increase jitter, information conveyed by P-receptor afferentswas degraded only for average jitters considerably larger than thoseobserved experimentally. This suggests that the intrinsic variability ofsingle spike trains lies outside of the range where it might degrade theinformation conveyed, yet still allows for improvement in coding byaveraging across multiple afferent fibers. Our results were summa-rized in a phenomenological model of P-receptor afferents, incorpo-rating both their linear transfer properties and the variability of theirspike trains. This model complements an earlier one proposed byNelson et al. for P-receptor afferents ofApteronotus.Because of theirrelatively high precision with respect to the EOD cycle frequency,P-receptor afferent spike trains possess the temporal resolution nec-essary to support coincidence detection operations at the next stage inthe amplitude-coding pathway.
I N T R O D U C T I O N
Variability has long attracted neurophysiologists as a tool toinvestigate the biophysical mechanisms of sensory processing,the integrative properties of nerve cells, and the encodingschemes used in various parts of the nervous system (Baylor etal. 1979; Hecht et al. 1942; Shadlen et al. 1996; Softky andKoch 1993). Until recently, most work has focused on char-acterizing the response variability of nerve cells to static stim-
uli, in part because simple measures such as the variance of thenumber of spikes recorded in long time windows provideuniversal and effective ways to quantify variability under suchconditions (Parker and Newsome 1998).
Most biologically relevant stimuli, however, are not static.Therefore, more recently, investigators have started to charac-terize the trial-to-trial variability of responses to time-varying,dynamic stimuli in vivo and in vitro (Bair and Koch 1996;Berry et al. 1997; de Ruyter van Steveninck et al. 1997;Mainen and Sejnowski 1995; Mechler et al. 1998; Reich et al.1997; Stevens and Zador 1998; Warzecha et al. 1998). Whentemporal variations are sufficiently strong to induce locking ofspikes to stimulus transients, measures such as the standarddeviation in the spike occurrence times following those tran-sients or the probability of spike occurrence within a giventime window from trial to trial may be used to provide acharacterization of variability (Bair and Koch 1996; Mainenand Sejnowski 1995). However, these measures are not likelyto carry over to more general stimulation conditions, whenlocking to stimulus transients is absent or less pronounced. Analternative approach consists of extrapolating from the study ofstatic stimuli and to use the variance in the number of spikesobserved in short time windows as a measure of variability(referred to as thespike count variance) (Berry et al. 1997; deRuyter van Steveninck et al. 1997; Warzecha and Egelhaaf1999). Two goals of the present work are to clarify the limitsof the spike count variance as a measure of short term vari-ability, and to introduce a new measure of spike time jitterbased on recent work by Victor and Purpura (1996, 1997) thatshould be applicable to a wide range of stimuli, independent ofthe integrative properties of the investigated neurons.
Eigenmanniais a weakly electric gymnotiform fish of wavetype that discharges its electric organ at regular intervals 200–600 times per second. Two types of tuberous sensory afferentnerve fibers convey information about the resulting electricalenvironment to the brain (Scheich et al. 1973). T-type afferentfibers provide the first stage of a pathway specialized to processphase information, called the timing pathway (Heiligenberg1991). They fire one spike per electric organ discharge (EOD)cycle, each tightly phase locked to the zero crossings of theEOD and thus signal phase modulations of the electric field.
Address reprint requests to F. Gabbiani (E-mail: [email protected]).
The costs of publication of this article were defrayed in part by the paymentof page charges. The article must therefore be hereby marked “advertisement”in accordance with 18 U.S.C. Section 1734 solely to indicate this fact.
1890022-3077/00 $5.00 Copyright © 2000 The American Physiological Societywww.jn.physiology.org

P-type afferents, on the other hand, fire at most one spike perEOD cycle with loose phase locking to the EOD and a prob-ability that increases in direct proportion to the mean amplitudeof the field. They thus convey information about amplitudechanges of the electric field to higher order neurons in thebrain.
While it is well-known that the timing jitter of P-receptorafferent spikes is greater than that of T-type afferents (Scheichet al. 1973), variability in the amplitude pathway has receivedlittle quantitative attention. In contrast, variability in the timingpathway has been characterized in considerable detail, reveal-ing the high precision of neurons in encoding phase shifts ofthe EOD. T-type fibers are able to fire spikes with a precisionof approximately 30ms (Carr et al. 1986). This precisionincreases at higher stages of electrosensory processing becauseof the pooling and averaging of T-type activity across the bodysurface (Rose and Heiligenberg 1985). Here we focus on thevariability of P-type afferents and show that their firing isapproximately 100 times less precise. Nevertheless, our resultsdemonstrate that the jitter in P-receptor afferent spike trainslies within the appropriate range to efficiently convey ampli-tude information to the electrosensory lateral line lobe, thehindbrain nucleus that forms the first central stage of theamplitude coding pathway.
Part of our results has been presented in abstract form(Kreiman et al. 1998).
M E T H O D S
Preparation and electrophysiology
Eigenmanniaspecimens of 12–20 cm body length were preparedfor electrophysiological recordings as described by Wessel et al.(1996) and Metzner et al. (1998). Briefly, the EOD frequency wasmeasured, and subsequently the animal was immobilized and its EODamplitude attenuated by an intramuscular injection of Flaxedil (gal-lamine triethiodide, Sigma, St. Louis, MO;,5 mg/g body wt). Underlocal anesthesia (2% lidocaine, Western Medical Supply, Arcadia,CA), the posterior branch of the anterior lateral line nerve wasexposed just rostral to the operculum. Signals from P-receptor affer-ents were recorded extracellularly from this nerve with glass micropi-pettes filled with 3 M KCl (resistance: 40–60 MV), amplified with anextra/intracellular electrometer (World Precision Instruments 767,Sarasota, FL), and stored on video tape using a PCM recordingadapter (Vetter 3000A, Rebersburg, PA; sampling rate: 40 kHz). Theywere subsequently digitized using a commercial data analysis system(Datawave, Denver, CO; sampling rate: 10 kHz/channel). A fewrecordings were acquired and digitized using LabView (NationalInstruments, Austin, TX). Data corresponding to one point in Fig. 13(for the cutoff frequencyfc 5 88 Hz, seeStimulationbelow for acomplete description) were obtained in a previous study (Wessel et al.1996).
Stimulation
P-receptor afferents were stimulated as described previously(Metzner et al. 1998; Wessel et al. 1996). A sinusoidal carrier signal(Exact 519, Hillsboro, OR) with a frequency matched to the EODfrequency (fEOD) of the fish was modulated in amplitude. The maindifference with earlier work was that electric field AMs were synthe-sized and stored digitally for playback using commercial software(Signal Engineering Design, Belmont, MA; sampling rate: 2 kHz),allowing for repeated presentations of identical stimuli. The AM andthe carrier signal were gated by the same trigger signal and weretherefore phase locked to each other. The stimuli were delivered via
two carbon rod electrodes, one positioned either in front of the animalor in its mouth, the other behind its tail. No differences in the neuronalresponses were observed between these two configurations. The meanstimulus amplitude, measured at the side fin perpendicular to the bodyaxis, ranged from 1 to 5 mV/cm. To avoid under-driving the afferents,it was adjusted individually for each P-receptor afferent to stimulate itat 10–15 dB above threshold.
One set of stimuli consisted of random AMs (RAMs) with a flatpower spectrum (white noise) up to a fixed cutoff frequency (fc 5 5,10, 20, 40, and 60 Hz). These AMs were obtained using a modulationsignals(t) that caused a doubling of the carrier signal amplitude fors(t) 5 1 V and a reduction to zero fors(t) 5 21 V (seeEq. 1 ofWessel et al. 1996). The standard deviation,s, of the stimuluss(t)(which can be thought of as the stimulus contrast) was varied between10 and 30% of the mean electric field amplitude (s 5 100, 150, 200,250, 275, and 300 mV;s 5 1 V corresponded to a 100% variation ofthe stimulus amplitude). Consequently, amplitudes varied over arange of220 to 210 dB of the mean stimulus amplitude. A single15-s-long stimulus was synthesized for each parameter pair (fc, s) andwas presented 10 times, drawn in pseudo-random order from a subsetof all possible (fc, s) combinations. We usually started by presentingall fc values at a fixed contrast (s 5 250 mV) or all contrasts at twocutoff frequencies (fc 5 5, 60 Hz). Further (fc, s) combinations weretested as time permitted.
The second set of stimuli consisted of sinusoidal AMs (SAMs) at afixed contrast (s 5 250 mV) and at various temporal frequenciesfs.The values used werefs 5 0.1, 0.5, 1, 5, 7, 10, 20, 50, 100, and 125Hz. Each stimulus was 15 s long and was presented six times inpseudo-random order. These stimuli were presented interleaved withthe RAMs protocol described above.
Characterization of spike train variability
Two methods were used to quantify inter-trial spike train vari-ability in response to repeated presentations of the same RAMstimulus. We first computed the spike count variance as a functionof the mean spike count in fixed time windows of lengthT(seeRESULTS and Fig. 5). The same RAM stimulus was presentedR 5 10 times and the number of spikes,ni, occurring in a fixed timewindow,T, was determined for each triali 5 1, . . .R.The averagenumber of spikes occurring in that window,^n& (mean spike count),and its variance,s^n&
2 (spike count variance), were estimatedfrom
^n& 51
ROi51
R
ni s^n&2 5
1
R 2 1 Oi51
R
~ni 2 ^n&!2
Three window sizes were used (T 5 10, 50, and 100 ms), and eachtime window was successively shifted by 5 ms to cover the entirestimulus presentation interval. For highly variable spike trains,such as those corresponding to independent Poisson-distributedspike occurrence times, the spike count variance equals the meanindependent of the windowT. Conversely, if theR 5 10 spiketrains are exactly identical,s^n&
2 5 0 in each windowT. If, how-ever, the spike trains are not exactly identical, the minimumnonzero variance may be computed by considering the discretenature of spiking. Withf lying in the interval [0;1), we assume thata fraction (12 f ) of spike counts in a fixed interval of lengthTequals the integernT (wherenT is usually small) and the remainingfraction, f, contains one additional spike, so that the spike countsequal nT 1 1. It then follows that the mean spike count,^n& (apositive real number), is given by
^n& 5 ~1 2 f !nT 1 f~nT 1 1!
5 nT 1 f
190 KREIMAN, KRAHE, METZNER, KOCH, AND GABBIANI

and the minimal variance is
s^n&2 5 ~1 2 f !~nT 2 ^n&!2 1 f~nT 1 1 2 ^n&!2
5 f~1 2 f !
This last equation states thats^n&2 is a quadratic function of the
fraction, f, of spike counts equalingnT 1 1 in the intervalT. As afunction of f, the minimal variance spans a parabola between succes-sive integer values of the mean spike count, taking its maximal value(51/4) atf 5 1⁄2 and its minimal value (50) for integer spike counts( f 5 0; seeRESULTSand Fig. 5). Similarly, if all spike counts inT forall R repetitions are equal tonT or nT 1 1 except for one spike countequal tonT 2 1 (or nT 1 2), then the variance still follows a parabola,but translated by a factor 2/R along the vertical axis:f(1 2 f ) 1 2/R.Successive parabolas translated vertically are generated by an analo-gous procedure (seeRESULTS and Fig. 5).
A second measure of inter-trial variability that proved more sensi-tive to changes in stimulus parameters (seeRESULTS) was obtained bycomputing an average distance between spike trains obtained inresponse to the same RAM. The distance measure employed wasintroduced by Victor and Purpura (1996) based on an earlier one usedto quantify the similarity of DNA sequences (Li and Graur 1991,chap. 3; Sellers 1974). Operationally, the distance between two spiketrains is defined by the following procedure: the first spike train istransformed into the second one by a series of elementary steps. Eachstep is assigned a “cost” and the distance is obtained by adding up thecost of all elementary steps and finding the transformation sequenceyielding the minimal cost. This procedure is illustrated in Fig. 1: thetwo spike trains to be compared are labeled 1 and 8, while spike trains2–7 represent the sequence of elementary steps in the transformationyielding the minimal cost. Only three elementary steps are allowed:adding a spike (as in step 6 to 7), deleting a spike (as in step 1 to 2)or moving a spike to a new position (as in step 2 to 3). The first twoelementary steps are assigned an arbitrary cost of 1, whereas movinga spike byDt ms is assigned a cost ofq z uDtu for q positive. Victor andPurpura (1996, 1997) describe an algorithm for determining the min-imum cost transformation sequence and derive the mathematicalproperties of the ensuing distance measure,dij(q), between two spiketrains xi and xj. The parameterq (measured in units of 1/time)characterizes the time interval for which the occurrence of a spike inxi is considered to be significantly different from the occurrence of aspike inxj: if the interval separating the spikes is larger than2/q it is
less “expensive” to transformxi into xj by first deleting the spike inxi
and then adding it inxj (at a cost of 2) than by translating it to its newposition (at a cost ofq z uDtu; Fig. 1B). It is therefore straightforwardto computedij(q) whenq is large: letni andnj be the number of spikesin xi and xj, respectively, and the integercij denote the number ofcoincident spikes inxi andxj (coincident within some discretizationinterval). For largeq’s it is always less expensive to delete and addspikes than to move them so that the distance betweenxi and xj isobtained by first deleting (ni 2 cij) spikes inxi and then adding (nj 2cij) spikes inxj. Thus
dij~q 3 `! 5 ni 1 nj 2 2cij (1)
On the other hand, if the cost of moving a spike vanishes,q 5 0, eachspike in xi may be moved at zero cost to match the position of anarbitrary spike inxj, and a cost of 1 is only endured for each additionalspike to be added or deleted inxj. Therefore
dij~0! 5 uni 2 nju (2)
measures the difference in the number of spikes between the two spiketrains. Asq $ 0 increases,dij(q) increases monotonically and reachesits maximum value (given byEq. 1) when 2/q is smaller than theminimal time interval between two noncoincident spikes inxi andxj.Note that if the two spike trains are perfectly coincidentdij(q) 5 0,independent ofq. The distancedij(q) was normalized by the totalnumber of spikes in the two spike trains
dijn~q! 5 dij~q!/~ni 1 nj! with 0 # dij
n~q! # 1 (3)
so thatdijn(0) measures the difference in spike count normalized by the
total spike count anddijn(q 3 `) is the fraction of noncoincident
spikes relative to the total number of spikes.The effective temporal jitter, tjitter, of the spike occurrence times
was defined astjitter 5 1/q1/2 whereq1/2 is the value ofq such thatdij
n(q1/2) 5 1/2. This definition is motivated by the following argu-ments showing thattjitter equals the average time interval,#tinter, bywhich spikes are moved to transform one spike train into the other oneif no spikes have to be added or deleted (seeEq. 6). Thus the effectivetemporal jitter tjitter is a generalization of#tinter to situations wherespikes might also need to be added or deleted, as we now explain. Fora fixed value ofq, let na, nb, and ng denote the number of spikesmoved, deleted, and added when computing the distance betweenxi
andxj. If we pool together all noncoincident spikes inxi andxj, ni 1
FIG. 1. Computation of spike train distances. The distance between 2 spike trains was obtained as the minimum cost to convertone spike train into the 2nd one using 3 elementary steps.A: the minimum cost path transforming spike train 1 into spike train 8is illustrated (for a fixed value ofq). Each intermediate spike train 2–7 corresponds to one elementary step: moving (from 2 to 3),adding (from 6 to 7) or deleting (from 1 to 2) a single spike. The cost of each elementary step is indicated on theright. Note thatthe cost of moving a spike is proportional to the distance that it is moved along the time axis.B: there are 2 alternatives to go fromspike train 2 to spike train 3 inA: i) delete the last spike and add a new one orii ) move the last spike to its new desired position.The latter alternative is less expensive for the particular value ofq illustrated here sinceq z uDt1u , 2 (the dashed time interval oflength 2/q corresponds to the maximum displacement for which it is less expensive to move a spike).
191SPIKE TRAIN VARIABILITY IN P-RECEPTOR AFFERENTS

nj 2 2cij , then each one of these spikes is either moved, deleted, orcreated when transformingxi into xj so that the following equationholds
2na 1 nb 1 ng 5 ni 1 nj 2 2cij (4)
Using Eqs. 3and4 to expressdijn(q) directly in terms ofna, nb, and
ng we obtain
dijn~q! 5
Oi51
na
q z uDtiu 1 nb 1 ng
2na 1 nb 1 ng 1 2cij
where uDtiu is the time interval by which theith spike (out ofna) ismoved. Therefore whenq 5 q1/2, rearranging this last equation showsthat the average time interval by which a spike is moved is given by
1
naOi51
na
uDtiu 51
q1/2S1 2
nb 1 ng 2 2cij
2naD (5)
Let us assume from now on that the number of coincident spikes isnegligible,cij 5 0 (seeRESULTS). If all spikes are moved to transformone spike train into the other one (nb 5 ng 5 0), Eq. 5 implies that
1
naOi51
na
uDtiu 51
q1/2
~if nb 5 ng 5 0! (6)
and 1/q1/2 is the average time interval,#tinter, by which spikes aremoved. If nb Þ 0 and/orng Þ 0, then the distance by which theremainingna spikes are moved is on average smaller to compensatefor the extra cost imposed by spike additions and deletions (seeEqs.4 and5; the expression within the parentheses inEq. 5will be ,1).Note, however, that the total number of displaced spikes cannot beless than half the average total number of spikes
na $1
2zni 1 nj
2
since the right hand side ofEq. 5 has to be positive. Thustjitter
provides an appropriate measure of spike time jitter, which automat-ically takes into account possible spike additions or deletions.
From the responses of a P-receptor afferent to 10 repetitions of aRAM stimulus, we computed an estimate of the average normalizeddistance between two spike trains as a function ofq,
Dn~q! 51
npairsOi51
10 Oj51jÞi
10
dijn~q! with 0 # Dn~q! # 1
wherenpairs 5 90 (npairs is obtained by considering all possible pairsof trains among 10). Normalized distances were typically computedfor q 5 0, 0.05, 0.1, 0.25, 0.5, and 20 ms21 (the last value correspondsto the temporal resolution, 2/q 5 0.1 ms, at which spike occurrencetimes were digitized). According toEqs. 1and2, Dn(20) measures theaverage fraction of noncoincident spikes, whileDn(0) measures theaverage difference in spike counts (normalized by the total spikecount). The average effective temporal jitter,#tjitter 5 1/q#1/2,Dn(q#1/2) 5 1/2 measures the average jitter of the spike occurrencetimes under repeated presentation of the same stimulus. The value ofq#1/2 was estimated to60.02 accuracy [i.e.,q#1/2 satisfied the require-ment: 0.48, Dn(q#1/2) , 0.52] by the bisection method (Press et al.1992, chapt. 9). The percentage of spikes moved,na/(2na 1 nb 1 ng),and the percentage of spikes added or deleted, (nb 1 ng)/(2na 1 nb 1ng), were computed over 3 s of data and six stimulus repetitions(instead of the 15 s and 10 repetitions used to compute the distances)because this task was computationally very intensive. We verified ina few cases that the results were not altered significantly by thisprocedure. For this latter task, a total of 15 units and 140 stimulusconditions were analyzed. We checked that the distancesDn(q#1/2)
computed over these reduced data sets lay between 0.45 and 0.55.This was the case for 125 stimulus conditions; the other 15 conditionswere not considered further.
Stimulus estimation
The accuracy of single P-receptor afferent spike trains in encodingRAMs was assessed by linearly estimating the stimulus from therecorded spike trains. This technique essentially replaces each spike ina spike train by a continuous waveform,h(t), thus yielding an esti-mate, sest(t), of the stimulus,s(t) (Fig. 2A). The waveformh(t) ischosen to optimize the match betweensest(t) ands(t) and, at low firingrates, it closely resembles the mean stimulus waveform preceding aspike (Gabbiani and Koch 1996; Wessel et al. 1996). The theoreticalaspects of this signal processing technique and its application toP-receptor afferent spike trains have been discussed in detail else-where (Gabbiani and Koch 1998; Wessel et al. 1996; see also Gab-biani and Metzner 1999 for an introduction). For each spike trainxi(t)(i 5 1, . . . , 10)obtained on presentation of a RAMs(t), we subtractedthe mean firing rate and estimated the filter,hi(t), that minimizes themean square error between the stimulus and the estimated stimulusobtained by convolvinghi(t) with xi(t) (see Fig. 2A). This filter iscalled a Wiener-Kolmogorov (WK) filter in the signal processingliterature (e.g., Poor 1994) and plays a role analogous to the impulseresponse used to estimate the instantaneous firing rate of a neuron (see
FIG. 2. Quantification of stimulus encoding and of its robustness to spiketime jittering.A: an estimate,sest(t), of the stimuluss(t) was obtained from thespike train by convolving it with a Wiener-Kolmogorov (WK) filter (see maintext for details). The accuracy of stimulus encoding by the spike train wasassessed by computing the mean square error (e2) between the stimulus and theestimate. The brackets,^z&, denote averaging over time.B: temporal jitter wasintroduced by adding to each spike time a random variable taken from azero-mean gaussian distribution with standard deviationsjitter. The modifiedspike trains are shown for increasing values ofsjitter (from top to bottom) onthe left. From each distorted spike train, a new WK-filter and a new estimate,sest(t), of the stimulus were computed (right). Robustness was quantified bycomputing the rate at which the fraction of the stimulus encoded decreasedwith sjitter (seeinset to Fig. 13). A similar procedure was used when spikeswere randomly added or deleted from the spike trains.
192 KREIMAN, KRAHE, METZNER, KOCH, AND GABBIANI

Fig. 1 of Gabbiani and Metzner 1999). Each estimate of the WK filterdepends on the recorded spike trainxi(t) from which it is computedand is therefore indexed accordingly ashi(t). The WK filter wascomputed using MATLAB M-files (The MathWorks, Natick, MA)available at the following web address: http://www.klab.caltech.edu/;gabbiani/signproc.html. We then estimated the mean square estima-tion error, e2, by cross-validation (Fukunaga 1990): each filterhi(t)was convolved with a spike trainxj(t) different from the one used tocomputehi(t) to avoid over fitting. This yielded an estimateeij
2
e ij2 5 ^@s~t! 2 ~hi p xj!~t!#
2& i 5 1, . . . , 10,j 5 1, . . . , 10,i Þ j
where the brackets,^z&, denote time-averaging and * denotes the timeconvolution operation (Gabbiani and Koch 1998). An improved esti-mate was obtained by averaging over all possible pairs
e2 51
npairsOi51
10 Oj51jÞi
10
e ij2
wherenpairs 5 90. The fraction of the stimulus encoded, or codingfraction, was evaluated as
g 5 1 2e
s
wheres is the standard deviation of the stimulus. In the worst possiblecase, when the spike train is completely uncorrelated with the stim-ulus, the linear estimation algorithm predicts the stimulus mean valueand the root mean square error equals the stimulus standard deviation.The root mean square error is therefore always smaller than thestimulus standard deviation (e # s) so that the coding fraction,g, liesbetween 0 and 1. The coding fraction represents the fraction of thestimulus, expressed in units ofs, that can be reconstructed by linearfiltering of the spike train.
Robustness of RAM encoding to spike time jitter, andrandom spike additions or deletions
To investigate the effect of spike time jitter, spike failures and theoccurrence of spikes unrelated to the stimulus on the encoding ofRAMs by P-receptor afferents, we created synthetic spike trains fromthe experimental ones by randomly adding, deleting or jittering spikes(Bialek et al. 1991). The stimulus was then estimated from these
synthetic spike trains, and the coding fraction was monitored as afunction of the parameters determining the amount of jitter and thenumber of spikes added or deleted. Each one of these three types ofmodifications was introduced separately. In all cases, a minimumseparation of 2 ms was imposed between two spikes of the modifiedspike trains to take into account the refractory period of the afferentfibers.
Let paddindicate the percentage of spikes added to the experimentalspike train andpdel the percentage of spikes randomly deleted. Forspike time jittering, the spikes were moved from their actual occur-rence times by a random distance taken from a zero-mean gaussiandistribution with various standard deviationssjitter (Fig. 2B). We usedsjitter 5 0, 1, 3, 5, 7, 10, 15, and 30 ms;padd 5 0, 1, 5, 10, 20, and30%; pdel 5 0, 1, 5, 10, 20, and 30%.
Let g(padd), g(pdel), andg(sjitter) denote the coding fractions for agiven value ofpadd, pdel, andsjitter, respectively. The robustness ofRAM encoding by P-receptor afferent spike trains was evaluated byplotting the normalized coding fractiongn(x) 5 g(x)/g(0) wherex 5padd, pdel, or sjitter as a function ofx (Fig. 13,inset). In most cases, thenormalized coding fraction was linearly related to the distortionparameterx (seeRESULTS). We therefore performed linear fits ofgn asa function ofx 5 padd, pdel, or sjitter
gn~padd! 5 1 1 aadd z padd
gn~pdel! 5 1 1 adel z pdel
gn~s jitter! 5 1 1 a jitter z s jitter
whereaadd, adel, andajitter are the slopes of the regression lines. Therobustness was defined as the amount of distortion required to causea 50% drop in coding fraction
padd50 5
21
2 z aadd
pdel50 5
21
2 z adel
s jitter50 5
21
2 z a jitter
The values ofpadd50 , pdel
50, ands jitter50 were obtained by linear interpola-
tion between adjacent values of the normalized coding fraction plottedas a function of the perturbation or by extrapolation at low stimuluscutoff frequencies (see the pointfc 5 5 Hz in Fig. 13).
Modeling of P-receptor afferent spike trains
Modeling of P-receptor afferent spike trains was performed in threesteps. In the first step, the variability of P-receptor afferent spike trains
FIG. 3. Comparison of P-receptor afferentspike trains to integrate-and-fire models.A: thevariability of experimental spike trains wascompared with the variability of perfect inte-grate-and-fire (I&F) neurons with a randomthreshold. In this model, the sum of the stim-ulus and a constant bias term (corresponding tothe spontaneous activity) is integrated, and aspike is emitted each time that the threshold(Vthresh) is reached. After each spike, a refrac-tory period of 2 ms is imposed and a newthreshold value is chosen from a gamma prob-ability distribution. B: to model the lineartransfer properties of P-receptor afferent spiketrains, the AM was first linearly filtered, with ahigh-pass filter fitted from the responses ofP-receptor afferent to sinusoidal AMs (SAMs;see Fig. 14) and then delayed. The outputz(t)was clipped and injected into a perfect I&Fneuron with random threshold and refractoryperiod equal to 2 ms.
193SPIKE TRAIN VARIABILITY IN P-RECEPTOR AFFERENTS

during RAM stimulation was compared with that of standard non-leaky integrate-and-fire models with a random voltage threshold (Fig.3A) (Gabbiani and Koch 1998; Reich et al. 1997). The properties ofthe model random threshold determine the variability of the resultingspike trains. The random threshold was taken from a gamma distri-bution with parametersn andVth
pn~V! 5 cn
e2nV/VthVn21
Vthn21
where
cn 5nn
~n 2 1!!
1
Vth
Larger values ofn correspond to more reliable spike trains (seeRESULTSand Fig. 7) (see also Gabbiani and Koch 1998, Fig. 9.3), andthe mean voltage thresholdVth determines the mean firing rate of themodel. An absolute refractory period of 2 ms was inserted after eachspike occurrence. The order of the gamma distribution was variedbetween 1 (corresponding to an exponential distribution leading toPoisson distributed spike times), 3, 5, 10, and 100 (effectively imple-menting the limitn3 `, which corresponds to a perfect integrator).The mean voltage threshold value,Vth, was fixed so as to match themean firing rate of the model to the one of each P-receptor afferent.Ten repetitions of the same RAM used to stimulate P-receptor affer-ents were fed to each model, and the distances between spike trainswere computed as explained above.
In the second step, the linear transfer properties of P-receptorafferents were characterized using a model based on an earlier oneproposed by Nelson et al. (1997) for P-receptor afferents ofApter-onotus leptorhynchus(see Fig. 3B). An alternative biophysical modelproposed by Kashimori et al. (1996) was not considered here, as ourgoal was to obtain the simplest possible description of P-receptorafferent spike trains taking into account their linear transfer functionand the variability of their spike trains. The stimulus was passedthrough a first-order high-pass filter with transfer functionH(s)
H~s! 5Gas
s 1 1/ta
1 Gc (7)
simulating the linear transfer properties of P-receptor afferents. In thisequation,Ga andGc are gain and offset terms, respectively,ta is thetime constant of the filter ands 5 iv 5 2pif is the complex circularfrequency of the input signal. The parametersGa, Gc, and ta wereobtained by fitting the gainG( f ) 5 uH(2pif )u and the phasef( f ) 5tan21[ImH(2pif )/ReH(2pif )] of the model to experimentally mea-sured gains and phases obtained from responses to SAMs. For eachSAM stimulus, the mean instantaneous firing rate was computed overthe full stimulus cycle and fitted to the function
mfr~t! 5 Gfs sin ~2pfst 1 ffs! 1 c (8)
(see RESULTS and Fig. 14). The fit parametersGfsand ffs
are theexperimental gain and phase at the frequenciesfs used in the SAMsprotocols, respectively (seeStimulationabove). The constantc repre-sents an offset between stimulus and response.
In the third and last step, the variability characterized in the firststep and the linear filtering properties obtained in the second step werecombined to obtain a complete model reproducing both the variabilityof P-receptor afferents and their linear filtering properties. The high-pass filtered signal was delayed by 2.5 ms (corresponding to thesynaptic delay between tuberous receptors and afferent fibers), and amean spontaneous activity was added (Nelson et al. 1997) (see Fig.3B). The resulting signal,z(t), was then passed through a clippingnonlinearity, effectively half-wave rectifying it, and imposing a max-imal firing rate of 1 spike per EOD cycle
r ~t! 5 H 0 if z~t! , 0z~t! if 0 # z~t! # fEOD
fEOD if z~t! $ fEOD
The output,r(t) (see Fig. 3B), was fed as input to a perfect integratorwith gamma-distributed threshold, as described above, to determinewhen a spike was fired. The ordern of the gamma distribution for thethreshold was selected to match the spike train variability in responseto SAMs, as assessed by computing interspike interval distributionsand distances between spike trains (see above and Gabbiani and Koch1998). The responses to RAM stimuli, when available, were thencompared with the model predictions (seeRESULTS). In some cases themean firing rate of the model was adjusted to take into accountchanges in the experimental firing rate during a recording session.
R E S U L T S
This study is based on recordings and analysis from 69P-receptor afferent fibers obtained in 34 different animals.
Responses of P-receptor afferents to repeated presentationsof identical RAMs
To investigate the variability of P-receptor afferent spiketrains and its relation to the encoding of electric field AMs, werecorded their responses to repeated presentations of identicalRAMs of a sinusoidal electric field. The mean firing rates ofafferent fibers were widely distributed, ranging from 25 spike/sto 374 spike/s (1176 69 spike/s, mean6 SD). The coefficientof variation of the interspike interval (ISI) distribution (CV5mean/SD) ranged from 0.16 to 1.7 (0.596 0.36, mean6 SD).These values were similar to those observed in spontaneouslyactive units (range: 0.12–1.12) (Wessel et al. 1996, Fig. 2B2),although several units analyzed here had higher CVs underRAM stimulation than those observed spontaneously.
Figure 4 illustrates the range of responses to repeated RAMsrecorded under a variety of stimulus conditions and mean firingrates. In a few cases, the responses of P-receptor afferents werehighly reproducible from trial to trial (see in particular Fig. 4Cand, to a lesser extent, Fig. 4D) as has sometimes been ob-served in other preparations (Bair and Koch 1996; Berry andMeister 1998; Mainen and Sejnowski 1995). A clear locking ofthe responses to the stimulus was usually observed at highcontrasts (s . 200 mV) and cutoff frequencies (fc . 40 Hz;see Fig. 4,C andD). Furthermore, the mean firing rate of theafferent fibers had to be low (,125 spike/s; compare Fig. 4,CandG). Decreasing the cutoff frequency or the stimulus con-trast tended to decrease the reproducibility of the spike occur-rence times (Fig. 4,A and B). At high firing rates (.125spike/s), P-receptor afferent responses did not show cleartrends of changes in reproducibility with stimulus parameters(Fig. 4, E–H). These preliminary observations suggested thatthe variability across trials of P-receptor afferent spike trainsdepended on stimulus parameters as well as on the mean firingrate of the units.
Quantification of response variability
The spike count variance over short time windows has oftenbeen considered as an indicator of spike train variability acrossrepeated trials of the same stimulus (Berry et al. 1997; deRuyter van Steveninck et al. 1997). As a first step in quanti-fying P-receptor afferent spike train variability, we therefore
194 KREIMAN, KRAHE, METZNER, KOCH, AND GABBIANI

plotted the spike count variance versus mean spike countacross trials in windows of various sizes (10, 50, and 100 ms)as illustrated in Fig. 5. At low firing rates (Fig. 5,top row) theobserved mean spike count in a given window was typically
low (,10 spikes per window), and the variance across trials asa function of the mean had a scalloped appearance, reproduc-ing almost perfectly a series of parabolas stacked onto eachother along the vertical axis. Similar observations have been
FIG. 4. P-receptor afferent responses to RAMs exhibit abroad range of variability. A portion of the stimulus presented toeach P-receptor afferent is shown ontop. Each raster of spikes(9 per panel, 500 ms long) illustrates the response of the sameP-receptor afferent to a single presentation of the stimulus. Theleft column (A, C, E, and G) illustrates responses for fixedstimulus contrast (s 5 250 mV) of a neuron with low meanfiring rate (A and C: mfr 5 65 6 2 spikes/s) and a differentneuron with high firing rate (E andG: mfr 5 1376 1 spikes/s)to stimuli with low and high cutoff frequencies (A andE: fc 55 Hz; C andG: fc 5 60 Hz). Theright column(B, D, F,andH)illustrates the responses for a fixed cutoff frequency (fc 5 60Hz) of a neuron with low firing rate (B andD: mfr 5 62 6 1spikes/s) and a different neuron with high firing rate (F andH:mfr 5 1516 1 spikes/s) to stimuli with low and high contrasts(B andF: s 5 100 mV; D andH: s 5 275 mV).
FIG. 5. Scalloping of the variance vs. mean spike countrelation is not a predictor of spike timing variability. Plots ofspike count variance vs. mean spike count in windowsT of 10,50, and 100 ms.A–Dwere obtained in a neuron firing at low rate(mfr 5 65 6 2 spikes/s) for fixed contrast (s 5 250 mV) andvarious cutoff frequenciesfc (as indicated on thetop of eachpanel; A is the same experiment as in Fig. 4A). E–H wereobtained in a different neuron with high firing rate (mfr5151 6 1 spikes/s) for the same contrast and cutoff frequencyvalues. Note that the variance vs. mean spike count curvesfollow the theoretical minimum curves inA–D in spite of thefact that reliable spike timing was only observed at highfcs (seeFig. 4, A–D). At higher firing rates (E–H), scalloping is stillobserved in some cases but is masked by a general increase inspike count variability. The 3 clusters evident inG andH, andto a lesser extent inF, correspond to the 3 window sizes (ifTvaries continuously between 10 and 100 ms, no clusters areobserved). In all panels, mean equal to variance is indicated bya straight dashed line.
195SPIKE TRAIN VARIABILITY IN P-RECEPTOR AFFERENTS

made in other preparations [in ganglion cells of the salamanderretina (Berry and Meister 1998); in a wide-field visual tangen-tial neuron of the fly lobula plate (de Ruyter van Steveninck etal. 1997)]. The lowest series of parabolas corresponded to theminimal possible variance that is achieved when the spikecount is either equal ton or n 1 1 (wheren is an integer) in agiven window (seeMETHODS). Higher parabolas correspondedsuccessively to all spike counts equal ton or n 1 1, except forone equal ton 2 1 (or n 1 2), etc. . . . per window. This resultindicated that the number of spikes per window was reliable(eithern, n 1 1, or n 2 1) and well below that expected for aPoisson process (mean equals variance; dashed line in Fig. 5).However, since the scalloping was observed independently ofthe stimulus cutoff frequency, it did not correlate with thereliability of spike occurrence times, as observed in spikerasters (see Fig. 4,A–D). At higher firing rates, the mean spikecount reached up to 25 spikes or more per window (Fig. 5,bottom row), and the variance increased considerably, rangingfrom the theoretical minimum up to the mean equals varianceline. On average, the variance was still below that of a Poissonprocess.
Thus according to the experimental results plotted in Fig. 5,scalloping did not appear to be directly related to the precisionof spike timing across trials. To confirm this point, we artifi-cially modified the spike trains obtained in response to repeatedpresentations of identical RAMs to alter the precision in spiketiming without changing the statistical properties of the spiketrains. We took the 10 rasters of units exhibiting scalloping ofthe spike count variance versus mean spike count relation andfiring with varying degrees of reliability in response to RAMs(such as the rasters for the unit illustrated in Figs. 4,A andC,and 5,A–D) and successively shifted the spikes with a fixeddelay tshift. In other words, ifx1(t), . . . , x10(t) represent theoriginal spike trains, new spike trains were defined asx1(t) 5x1(t), x2(t) 5 x2(t 1 tshift), . . . , x10(t) 5 x10(t 1 9 z tshift). Theparametertshift took three values: 1, 5, and 10 ms. We thencomputed the variance versus mean relations exactly as in Fig.5. In all cases (5 units, 14 conditions) and irrespective ofwhether the timing of spikes was reliable or not, the scallopingremained present, independently of the value oftshift. In somecases the number of vertical rows of parabolas increased withtshift. These points are illustrated in Fig. 6, A and B. Similarresults were obtained in integrate-and-fire neuron models asillustrated in Fig. 6,C andD. Thus in the worst case,tshift 5 10ms, the timing of spikes drifted by 90 ms between the firstspike trainx1(t) and the last spike trainx10(t) without affectingthe scalloping in windows of 10, 50, and 100 ms. Since it waspossible to largely eliminate any precision in the spike occur-rence times from trial to trial without altering the scalloping ofthe spike count variance, this analysis confirmed that scallop-ing in these time windows was not related to the reliability ofspike occurrence times.
Because the spike count variance as a function of mean spikecount did not offer a reliable indication of spike train variabil-ity under our experimental conditions, we turned to a secondmeasure based on the calculation of distances between spiketrains obtained under repeated RAM stimulation. This mea-sure, Dn(q), depends on a parameterq (in units of 1/time),which determines the temporal precision at which the distancebetween two spike trains is computed (higher values ofqcorrespond to higher temporal precisions, seeMETHODS). For
two identical spike trainsDn(q) 5 0 independent ofq. Themaximum,Dn(q) 5 1, is obtained for largeq’s only if no spikesin the two spike trains occurred exactly at the same time. Thevalue at whichDn(q) 5 1/2, called q#1/2, may be used tosummarize spike train variability: if we set#tjitter 5 1/q#1/2, then#tjitter measures the average time by which spikes have to bemoved to transform one spike train into the second one, orequivalently, the average jitter in spike timing. By definition,this jitter also takes into account differences in spike numbersbetween the two spike trains (i.e., the need to create or deletespikes to transform one spike train into the other; seeMETHODS
and Fig. 1).We computed the average distance between all pairs of spike
trains obtained in response to the same RAM stimulus for oursample of 69 P-receptor afferents. The spike train distancesDn(q) were compared with those obtained from a family ofgamma neuron models indexed by a parametern controllingspike train variability (seeMETHODS). A value of n 5 1(gamma-1 neuron) corresponds to Poisson-distributed spikeoccurrence times in response to the stimulus while for largen(n . 100) the gamma model is identical to an integrate-and-fireneuron. Figure 7A illustrates in one example how the variabil-ity observed in P-receptor afferents compared with the modelvariability. The top 10 rasters labeled “P-unit” correspond tothe response of a P-receptor afferent, while the next 10 rasters
FIG. 6. Scalloping of the variance vs. mean spike count relation measuredacross trials is preserved even after large shifts in the timing of individual spiketrains. A: the top 10 rasters represent the response of a P-receptor afferent(mfr 5 65 6 2 spikes/s; same experiment as in Figs. 4A and 5A) to repeatedpresentations of a random electric field AM (RAM) stimulus (s 5 250 mV,fc 5 10 Hz). The corresponding spike count variance vs. mean spike count plotis scalloped as illustrated below.B: the spike trains were successively shiftedby 10 ms as illustrated ontop (see main text), and the variance vs. mean spikecount relations was recomputed. Note that the scalloping remained present,although the variance increased as compared withA. C andD: same stimula-tion and analysis procedure as inA and B for an I&F neuron model withgamma order 10 (mfr5 81 spikes/s; see main text and Fig. 7A for a moredetailed description of the model).
196 KREIMAN, KRAHE, METZNER, KOCH, AND GABBIANI

were obtained by simulating a Poisson (gamma-1) model. TheP-receptor afferent spike trains are considerably more regularthan those of a Poisson neuron and match quite well those ofthe gamma-10 model illustrated at thebottom of Fig. 7A.Accordingly, the average distance between two spike trains ofthis P-receptor afferent followed closely those of the gam-ma-10 neuron (see Fig. 7B,Œ and■) and were always smallerthan those of a Poisson model (Fig. 7B,F). The valueDn(0) inFig. 7B yields the average difference in spike number betweentwo spike trains normalized by the total spike count. The smalldistance value,Dn(0) 5 0.02, indicates that the number ofspikes was very reproducible from one trial to the next with anaverage variability of 2%. On the other hand,Dn(20) is thefraction of noncoincident spikes in two spike trains at 0.1-msresolution. The valueDn(20) 5 0.98 in this experiment indi-cates that,2% of spikes occurred at the same time (60.05 ms)and thus the spike trains were clearly not reproducible at a0.1-ms resolution. The average temporal jitter in spike occur-rence times,#tjitter, was in this case equal to 2.9 ms (with 86%of spikes moved and 14% of spikes added or deleted), corre-
sponding to 1.3 EOD cycles (fEOD 5 438 Hz). Furthermore,the largest deviation betweenDn(q) in the gamma-10 model (orthe P-receptor afferent) and the Poisson model was observedfor q values lying in the interval (0.05–0.25 ms21; Fig. 7C). Avalue of q 5 0.25 ms21 was used to illustrate our results insubsequent figures.
Similar results were obtained in all 69 P-receptor afferentsanalyzed. The relative difference in spike count,Dn(0), rangedfrom 0.01 to 0.1 (0.036 0.04, mean6 SD), while the fractionof noncoincident spikes,Dn(20), ranged from 0.87 to 1.0(0.97 6 0.04). The distribution of average temporal jitters isplotted in Fig. 8A for 69 P-receptor afferents. The range ofvalues was between 0.6 and 23.2 ms (3.56 3.9) with 776 7%of spikes moved (range: 62–87%) and 236 7% of spikesadded or deleted (range: 13–38%). Figure 8B replots the aver-age temporal jitter in units of the EOD cycle (1/fEOD) asmeasured for each fish prior to the experiment. The temporaljitter ranged from a fraction of the EOD cycle (0.29) up toseveral cycles (8.7; 1.46 1.5). The temporal jitter was depen-dent on the firing rate of the afferent fibers. High firing rateafferents (arbitrarily defined as those with mean firing rateabove.125 spike/s) had a mean jitter,#tjitter, of 1.7 6 0.3 ms(range: 0.6–2.45 ms) corresponding to 0.86 0.3 EOD cycles(range: 0.3–1.2). The mean jitter of low firing rate afferents(,125 spike/s) was typically higher, 6.36 6.0 ms (range:1.7–23.2 ms) corresponding to 2.46 2.3 EOD cycles (range:0.7–8.7).
Dependence of temporal jitter on stimulus cutoff frequency
Next, we investigated the dependence of spike timing jitteron stimulus parameters and P-receptor afferent firing rates.
FIG. 8. Distribution of mean spike time jitter on 69 P-receptor afferents(corresponding to 508 different RAM stimulations).A: distribution of theaverage temporal jitter (bin size: 0.4 ms). For display purposes, the probabilitydistribution is shown only up to 10 ms; 8.2% of the cumulative distribution wasbetween 10 ms and the maximal value observed (23.2 ms).B: same distributionof t#jitter in units of electric organ discharge (EOD) cycles (2 bins per EODcycle). In each panel, the arrows indicate the means of the distributions.
FIG. 7. Spike train distances of P-receptor afferents match those of gammaintegrate-and-fire neurons with ordern in the 3–10 range.A: the spike trains ofa P-receptor afferent (top 10 rasters, labeled P-unit; same experiment as in Fig.5B) recorded in response to a RAM stimulus [s(t), shown ontop] are illustratedtogether with those elicited by the same stimulus in 2 I&F models with randomthreshold (labeledn 5 1 and 10; see Fig. 3A). Then 5 1 model correspondsto Poisson spike occurrence times and matches poorly the observed variability,while the n 5 10 model matches it quite well.B: plot of the mean distanceDn(q) between 2 spike trains in response tos(t) for the P-receptor afferent andI&F models shown inA. The close match between P-unit andn 5 10 I&Fdistances confirms quantitatively the visual observation inA (standard errorsare too small to be visible,npairs 5 90). C: plot of the difference in meandistances betweenn 5 1 andn 5 10 models (mean6 SE, npairs 5 90) as afunction ofq. DDn(q) 5 Dn(q)Poisson2 Dn(q)gamma order 10, whereDn(q)Poisson
corresponds to the filled circles inB andDn(q)gamma order 10to the squares. Notethat the largest difference in distances is observed in the range ofq valuesbetween 0.05 and 0.25 ms21. In B andC the valueq 5 20 ms21 was not plottedbecause it would lie off-scale (see main text).
197SPIKE TRAIN VARIABILITY IN P-RECEPTOR AFFERENTS

Figure 9A illustrates the change in temporal jitter as a functionof cutoff frequency for a low firing rate unit (mfr5 65 spike/s).When the stimulus cutoff frequency was increased from 5 to 40Hz, the timing jitter decreased 1.4-fold from 4.8 to 3.5 ms. Thisincrease in spike timing precision was quantified by the slopeof linear regression lines fitted to the data (see Fig. 9A, – – –).As illustrated in Fig. 9B, an increase in temporal precision wasobserved mainly for units firing at low rates. Theleft panelshows the distribution of slopes for units with a mean firingrate below 125 spike/s, and theright panel shows the distri-bution of slopes for units with mean firing rates above 125spike/s. The slopes calculated for low firing rate units werenegative on average (20.0526 0.066 ms/Hz, mean6 SD) andsignificantly different from 0 (P , 0.05, 2-tailedt-test) whilethey were not significantly different from zero at high firingrates (0.016 0.02 ms/Hz;P . 0.4). Correspondingly, corre-lation coefficients betweenfc and #tjitter were negative at lowrates (20.596 0.35) but not at high firing rates (0.296 0.62).
Similar results were obtained for the distance measureDn(q)over a broad range of the spike distance parameterq, asillustrated in Fig. 10. At fixed, intermediate values ofq, theaverage distance decreased as a function of stimulus cutofffrequency for low-firing rate units (Fig. 10,A–C). At lowtemporal resolution [i.e., whenq 5 0 ms21 andDn(q) measuresdifferences in spike counts] the slopes and correlation coeffi-cients ofDn(q) versusfc regression lines were not significantlydifferent from 0 (P . 0.2 atq 5 0 ms21, 2-tailedt-test). That
is, no trend in spike count variability versus stimulus band-width could be observed. The same result was true at very hightemporal resolution (P . 0.2 atq 5 20 ms21). At intermediatetemporal resolutions, units firing at high rates did not showslopes or regression coefficients significantly different fromzero (q in the range of 0.05–0.75 ms21; P . 0.05) while lowfiring rate units yielded a significant decrease in variabilitywith stimulus bandwidth (P , 0.01 over the same range ofvalues). The strongest tendencies were observed for values ofq between 0.25 and 0.5 ms21 (Fig. 10,B andC).
Variability and stimulus contrast
The dependence of spike time jitter on stimulus contrast wasvery similar to the one found for stimulus cutoff frequency.
FIG. 10. Increase in timing precision with stimulus cutoff frequency at lowbut not at high firing rate is observed across a broad range of spike movingcosts.A: mean distance between 2 spike trains as a function of cutoff frequencyfor a value ofq 5 0.25 ms21 (1/q 5 4 ms) in a low firing rate neuron (mfr565 spike/s;s 5 250 mV). This represents a particularly clear example.B:average slopes (mean6 SE) of distance [Dn(q)] vs. cutoff frequency (fc)relations (computed as inA) at low (F, average ofn 5 21 neurons) and high(■, average overn 5 12 neurons) firing rates plotted as a function ofq. C:average correlation coefficient (mean6 SE) of distance vs. cutoff frequency asa function ofq (computed as inA).
FIG. 9. The timing jitter decreases with stimulus cutoff frequency at lowbut not at high firing rates.A: plot of the mean jitter in spike occurrence timesas a function of stimulus frequency for a neuron firing at low rate (mfr5 65spikes/s,s 5250 mV,fEOD 5 438 Hz; percentage of spikes moved: 856 3%).B: the slope of timing jitter vs. cutoff frequency plots (seeA) is negative at lowfiring rates but not at high firing rates. The 2 distributions are significantlydifferent (Wilcoxon rank-sum test,P , 0.0001).
198 KREIMAN, KRAHE, METZNER, KOCH, AND GABBIANI

Figure 11A illustrates an example of a low firing rate P-receptor afferent for which spike timing jitter decreased two-fold as the stimulus contrast was changed from 10 to 30%. Theeffect of stimulus contrast on spike timing jitter is summarizedin Fig. 11B, which reports the slopes of linear regression linesfor #tjitter versuss in P-units firing at low and high rates (left andright panels,respectively). Increasing stimulus contrast wasgenerally less effective than increasing cutoff frequency atreducing spike time jitter as may be seen from the largerfraction of units with slopes close to zero, even at low firingrates.
Figure 12 reports the same results directly in terms of spiketrain distances at all values ofq used. At low firing rates and forintermediate values of the temporal resolution parameter, theaverage distance between two spike trains decreased as a functionof stimulus contrast (Fig. 12A). Accordingly, the slopes of linearregression lines and their correlation coefficients were signifi-cantly different from zero for low firing rate units (P , 0.01,2-tailedt-test) but not for high firing rate units (P . 0.05) at thosevalues ofq (Fig. 12,B andC). At very low or very high temporalresolution (q 5 0 or 20 ms21) changes with stimulus contrastwere not statistically significant (P . 0.05).
In summary, the study of spike train distances demonstratedthat the timing precision of P-receptor afferents increased withstimulus cutoff frequency and, to a lesser extent, with stimuluscontrast. Low firing rate units appear to be less variable thanhigh firing rate units.
Robustness of stimulus encoding
To assess the impact of alterations in spike timing on theaccuracy of RAMs encoding, we modified experimental spiketrains by randomly adding, deleting, or moving spikes. Thestimuli were then estimated from the modified spike trains (seeFig. 2B and METHODS), and the change in coding fraction wasmonitored. Theinset of Fig. 13 reports in one example thefraction of the stimulus encoded as a function of spike timejitter, normalized by its baseline value, the coding fraction ofthe original spike train. In most cases the addition and thedeletion of spikes or the addition of spike time jitter resulted ina linear decrease of the normalized coding fraction as the
FIG. 12. Increase in timing precision as a function of stimulus contrast isobserved at low but not at high firing rates across a broad range of spikemoving costs.A: mean distance between 2 spike trains as a function of stimuluscontrast for a value ofq 5 0.25 ms21 in a low firing rate neuron (mfr5 52spikes/s,fc 5 5 Hz, fEOD 5 438 Hz). This represents a particularly clearexample.B: average slopes (mean6 SE) of distance [Dn(q)] vs. stimuluscontrast (s) relations (computed as inA) at low (F, average overn 5 23neurons) and high (■, average overn 5 8 neurons) firing rates as a function ofq. C: average correlation coefficient (mean6 SE) of distance vs. cutofffrequency as a function ofq (computed as inA).
FIG. 11. The timing jitter decreases with increasing stimulus contrast at lowbut not at high firing rates.A: plot of the mean jitter as a function of stimuluscontrast for a neuron at low firing rate (mfr5 52 spikes/s,fc 5 5 Hz, fEOD 5438 Hz; percentage of spikes moved: 796 4%).B: the slope of the timing jittervs. stimulus contrast relation (seeA) is negative at low firing rates (left,20.0306 0.041) but not at high firing rates (right, 0). The 2 distributions aresignificantly different (Wilcoxon rank-sum test,P , 0.001).
199SPIKE TRAIN VARIABILITY IN P-RECEPTOR AFFERENTS
perturbation parameter was increased. Correlation coefficientsranged from 0.80 to 0.97 for 96% of the data. In those cases,the robustness of encoding was characterized by the perturba-tion value required to cause a 50% drop in coding fraction (seeFig. 13, inset for the definition ofs jitter
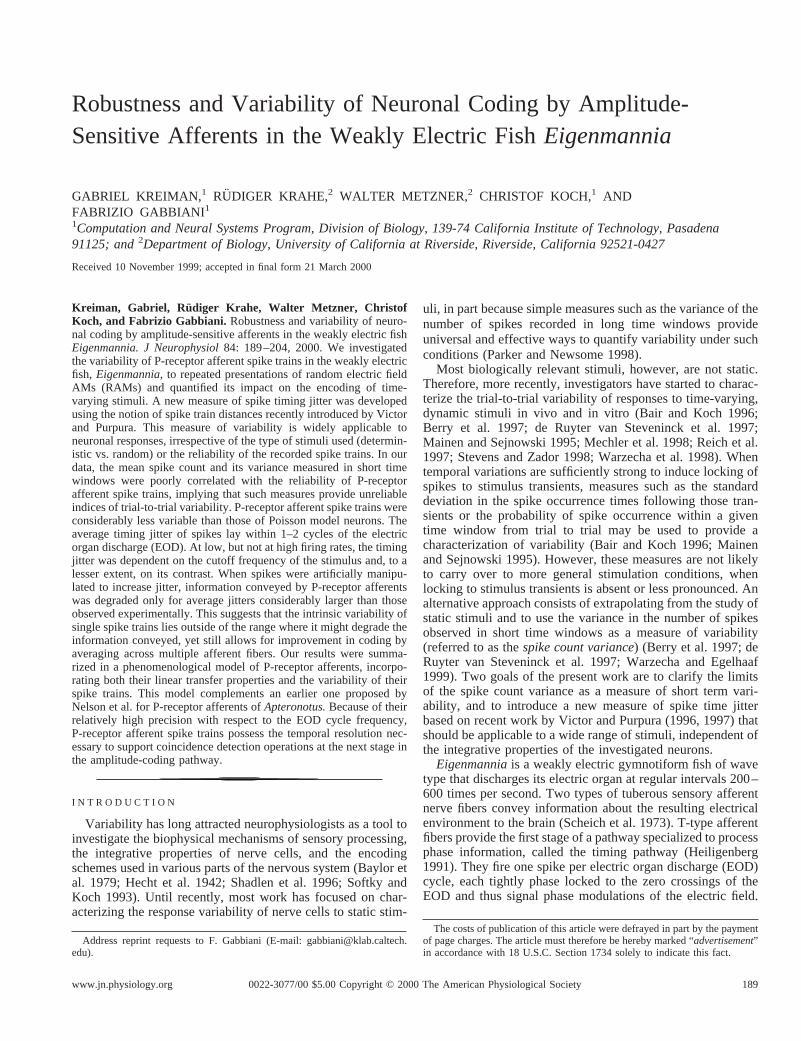
50 ). P-receptor afferentspike trains were in general quite robust to such perturbations.As illustrated in Fig. 13, at low cutoff frequencies, spike timejittering as high as 125 ms was required to cause a 50% dropin g. The robustness to spike time jitter decreased as thestimulus cutoff frequency increased, reaching a value of 6 msfor fast changing stimuli (fc 5 88 Hz). The robustness to spikeadditions or deletions did not show a dependency on stimulusbandwidth forfc . 5 Hz (see Table 1). For those stimuli, a dropof 50% in the coding fraction was obtained after 36% randomspike deletions and 41% additions. Robustness was not signif-icantly dependent on stimulus contrast (data not shown).
Modeling of P-receptor afferent variability and lineartransfer properties
The results reported above were summarized by building amodel of P-receptor afferent spike trains able to account for theencoding of RAMs and the spike train variability observed
experimentally across trials (see Fig. 3 andMETHODS). We usedan approach similar to the one adopted by Nelson et al. (1997)in modeling P-receptor afferents ofApteronotus leptorhynchus.The transfer functions of P-receptor afferents have been de-scribed as high pass in the species of weakly electric fishinvestigated so far (Bastian 1981; Nelson et al. 1997). Weconfirmed this and characterized quantitatively the transferfunction in Eigenmanniaby recording responses to SAMs.Gains and phases were extracted from linear fits to sinusoids(Fig. 14A andEq. 8 in METHODS) at various frequenciesfs. Theexperimental gains and phases were then fitted by maximumlikelihood to a first-order high-pass filter (Fig. 14B andEq. 7).The resulting fits hadx2-values divided by the number ofdegrees of freedoms (x2/DOF) (Press et al. 1992, chapt. 15) forthe fits between 0.7 and 8.0 (for 15 afferent fibers), except fortwo outliers (x2/DOF 5 22.8 and 24.2, respectively). Themean values of the filter parameters wereGa 5 120 6 82spikes/s (range: 16–300 spikes/s),Gc 5 40 6 26 spikes/s(range: 7–99 spikes/s), andta 5 4 6 5 ms (range:0.2–17.5 ms).In contrast to the results of Nelson et al. (1997) inApteronotus,fitting the data with a second-order filter improved only slightlythe x2/DOF-values of the fits (range: 0.4–6.2). Since theadditional parameters were not well constrained, this approachwas not pursued further. The static nonlinearity illustrated inFig. 3B was needed in the model to preventz(t) from becomingnegative, leading to firing rates lower than those observedexperimentally. The variability of P-receptor afferent spiketrains was estimated from repeated presentations of SAM stim-uli and was in the same range as the one observed for RAMs.
The ability of the model to predict responses to RAMs wastested in 10 P-receptor afferents by computing coding fractionsand spike train distances as a function of stimulus contrast andcutoff frequency. Figure 15 illustrates two examples for aP-receptor afferent firing at low rate (A–D) and a secondP-receptor afferent at high firing rate (E–H). The model suc-cessfully reproduced both the dependence of coding fractionand spike train distances observed experimentally onfc ands.
D I S C U S S I O N
We characterized the variability of P-receptor afferent re-sponses to RAMs under a variety of stimulus conditions usinga new measure of distance between spike trains. Our resultsprovide insight into the relationship between the variance in thenumber of spikes and the mean spike count as a measure ofvariability across repeated trials. They also shed light on theimpact of variability on the processing of electric field AMs bythe electrosensory system in weakly electric fish.
FIG. 13. Robustness of RAM encoding decreases with stimulus bandwidth.Plot of the timing jitter (mean6 SE) causing a 50% reduction in the codingfraction as a function of stimulus bandwidth. Averages were computed onn 558, 38, 21, 22, 38, and 9 stimulus conditions from low to highfc, respectively(the large error atfc 5 5 Hz is due to extrapolation from shallow slopes, seeMETHODS and inset for the computation ofs jitter
50 ).
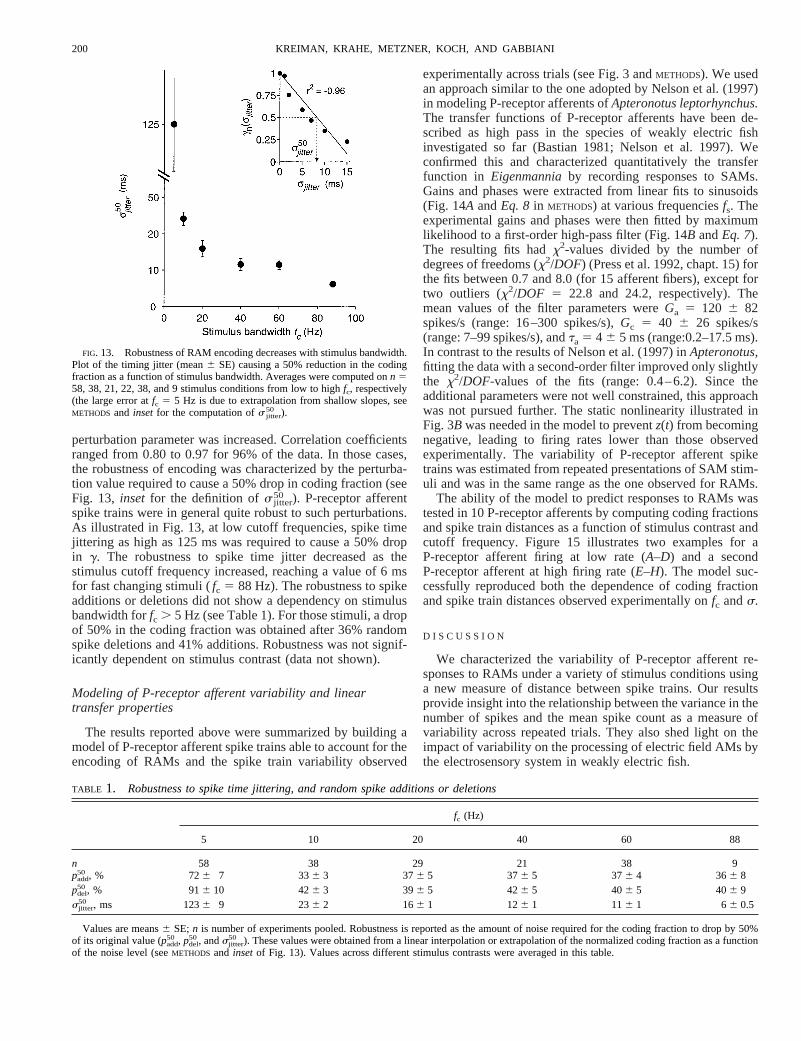
TABLE 1. Robustness to spike time jittering, and random spike additions or deletions
fc (Hz)
5 10 20 40 60 88
n 58 38 29 21 38 9padd
50 , % 726 7 336 3 376 5 376 5 376 4 366 8pdel
50, % 916 10 426 3 396 5 426 5 406 5 406 9sjitter
50 , ms 1236 9 236 2 166 1 126 1 116 1 66 0.5
Values are means6 SE;n is number of experiments pooled. Robustness is reported as the amount of noise required for the coding fraction to drop by 50%of its original value (padd
50 , pdel50, andsjitter
50 ). These values were obtained from a linear interpolation or extrapolation of the normalized coding fraction as a functionof the noise level (seeMETHODS and insetof Fig. 13). Values across different stimulus contrasts were averaged in this table.
200 KREIMAN, KRAHE, METZNER, KOCH, AND GABBIANI

Quantification of spike train variability
Spike train variability has often been quantified by comput-ing the spike count variance as a function of the mean spikecount in fixed windows of lengthT (for a review, see Teich etal. 1996). The benchmark stochastic process to which thesevalues are compared is the Poisson process for which thegeneration of independent spikes yields a variance equal to themean. The spike count variance provides an appropriate mea-sure of neural noise in tasks where the mean spike count(averaged overT) is used to assess a neuron’s ability todiscriminate between two alternatives (for reviews, see Gab-biani and Koch 1998; Parker and Newsome 1998). For longtime intervals (T $ 1 s) variances larger than mean spikecounts are often observed, indicative of positive long-termcorrelations in the spike trains (Teich et al. 1996). Such timewindows are, however, inadequate to assess the ability ofneurons to convey information about time-varying stimuli byrapid changes in instantaneous firing rate.
Recently, the spike count variance has also been used as ameasure of variability at short time scales (T # 300 ms) (Berryet al. 1997; de Ruyter van Steveninck et al. 1997; Warzechaand Egelhaaf 1999). In our data, minimal nonzero values for
the spike count variance were observed in windows smallerthan 100 ms, as has been reported in these studies. However,they were not correlated with the reliability of spike occurrencetimes assessed from raster plots (such as stimulus-dependentphase locking to the sinusoidal carrier signal) or with objectivemeasures of the information encoded in the time-varying firingrate like the coding fraction (Figs. 4–6). Therefore reliablespike timing is not a necessary prerequisite for minimumnonzero variance curves: they may be observed independentlyof whether spike timing is reproducible at the millisecond levelfrom trial to trial or not. Such curves should therefore beinterpreted with caution (see also Barberini et al. 2000; War-zecha and Egelhaaf 1999, footnote 21). One effect leading tovariances smaller than the mean over short time windows is thepresence of a refractory period that introduces negative corre-lations between spike occurrence times. The addition of arefractory period to a Poisson stochastic process has recentlybeen shown to be sufficient to account for the variabilityobserved in retinal ganglion cells under dynamic stimulation(Berry and Meister 1998). Similar observations were made inother preparations (for a review, see Johnson 1996). Figure 7Bshows that a simple Poisson process with a 2-ms refractory
FIG. 14. Fit of linear transfer function properties of a P-recep-tor afferent by a 1st-order high-pass filter.A: plot of the meaninstantaneous firing rate as a function of the normalized periodfractionpn (pn 5 t fs/2p, bin size: 1/20 of the period cycle) for 3different sinusoidal AMs (fs 5 1, 20, and 100 Hz, respectively).The solid line represents the fit withEq. 8(seeMETHODS; r2 is thecorrelation coefficient between the data and fit).B: fits of the meangain and phase (6SD) obtained fromA (see Eq. 7) with a1st-order high-pass filter (same neuron as inA; fit parameters:Ga 5 1476 9 spikes/s,Gc 5 20 6 2 spikes/s,ta 5 1.26 0.8 ms,x2/degress of freedom5 3.2).
FIG. 15. Comparison of spike train distances and stimulusencoding properties of P-receptor afferents and model.A andE: coding fraction (mean6 SE) as a function of stimuluscutoff frequency for 2 different neurons with low and highfiring rates, respectively (F) and models (■; s 5 250 mV).CandG: coding fraction as a function of stimulus contrast forthe same 2 neurons (fc 5 5 Hz).B andF: average spike traindistances for the same stimuli as inA andE, respectively.DandH: average spike train distances for the same stimuli as inC andG, respectively. Model parameters were set as follows.A–D: Ga 5 17 spikes/s,Gc 5 7 spikes/s,ta 5 6 ms,fEOD 5375 Hz,rbase5 5 spike/s,n 5 3, Vth 5 80 mV. E–H: Ga 5165 Hz,Gc 5 34 Hz,ta 5 2 ms,fEOD 5 575 Hz,rbase5 65spikes/s,n 5 3, Vth 5 130 mV.
201SPIKE TRAIN VARIABILITY IN P-RECEPTOR AFFERENTS

period driven by the stimulus did not reproduce the spike trainvariability of P-receptor afferents. A comparison of varianceversus mean spike count with theoretical results (Vannucci andTeich 1981) suggests that the regularizing effect of the refrac-tory period is not sufficient to account entirely for the lowvariability observed in our data. In addition to the refractoryperiod, the generation of spikes in P-receptor afferents appearsto be governed by biophysical mechanisms that exhibit inter-mediate levels of variability lying between those of Poissonand perfect integrate-and-fire models and corresponding to thefactorsn 5 3–10 of our gamma models.
Because of their mathematical definition and properties,the distancesDn(q) and the average timing jitter#tjitter arewell suited to characterize the reproducibility of spike oc-currence times from one trial to the next. These measuresare equally effective with deterministic or random stimuliand are applicable in cases, such as here, where simplermeasures like the timing precision or reliability cannot beused (see Fig. 4) (Bair and Koch 1996; Berry et al. 1997).By definition, the average jitter#tjitter is a measure thatautomatically incorporates possible differences in spikenumber between two spike trains. For example, since onaverage 23% of the spikes had to be added or deleted totransform one spike train to a second one in our data set (seeRESULTS, Quantification of response variability,last para-graph), the average time interval by which the remainingspikes were moved was actually smaller by 15% than thatreported in Fig. 8. This may be seen fromEqs. 3and4: if na
and/or nb are different from zero, the parenthesis on theright hand side ofEq. 4will be smaller than one (0.85 in thepresent case), implying that#tjitter 5 1/q#1/2 is larger than theaverage time interval given by the left hand side ofEq. 4.The additional 15% increase in#tjitter converts the added ordeleted spikes into an effective time jitter equivalent.
Our use of spike train distances is different from the oneoriginally introduced by Victor and Purpura (1996, 1997).These authors employed spike train distances to assess theinformation conveyed by stimulus-dependent clustering ofspike trains from neurons of the monkey visual cortex. In thepresent study, spike distances were used only to assess thevariability across identical trials; the performance at conveyingstimulus-dependent information was monitored with a second,independent measure, the coding fraction.
Variability under various stimulus conditions
The results illustrated in Figs. 9 –12 show that the timingprecision of P-receptor afferent spikes increases with thecutoff frequency of the stimulus and, to a lesser extent, withthe contrast of the RAMs. These results are consistent withobservations made in other preparations reporting that fasttransients are likely to increase the precision of spike oc-currence times (Berry et al. 1997; Mechler et al. 1998;Warzecha et al. 1998). Similarly, our findings that spiketrains can be more reproducible at low than at high firingrates (see Fig. 4) is consistent with earlier observations(Berry et al. 1997; de Ruyter van Steveninck et al. 1997;Warzecha and Egelhaaf 1999). In contrast, no significantdifferences in reliability were observed for RAM or SAMstimuli. Under the assumption that the RAMs employed hereare closer to natural stimuli than SAMs (de Ruyter van
Steveninck et al. 1997), our results do not support the ideathat spike timing is more reliable under natural stimulation(Warzecha and Egelhaaf 1999). Behavioral experimentsshow thatEigenmanniais able to perform remarkably pre-cise jamming avoidance behaviors under artificial stimula-tion (for a review, see Kawasaki 1997). Accordingly, thereliability of spike timing recorded in the time-coding path-way is very precise under such conditions. In contrast to theamplitude-coding pathway, high reliability in the time-cod-ing pathway is necessary for the jamming avoidance re-sponse.
Variability and robustness of encoding
Our results show that the average jitter in the timing ofP-receptor afferent spikes#tjitter, is in most cases below 4 ms.On the other hand, the robustness of encoding to spike timejitter yields values ofs jitter
50 well above 4 ms for most of thebehaviorally relevant range of stimulus cutoff frequencies (seeTable 1). Even at high stimulus cutoff frequencies (e.g.,fc 5 60Hz), a jitter of 4 ms leads to a relative decrease in codingfraction of at most 18% (see Table 1;s jitter
50 5 11 ms impliesthatgn (4 ms)5 0.82). A similar observation is valid for spikeadditions and deletions. Therefore the jitter observed in P-receptor afferents is in a temporal range that does not signifi-cantly affect the information transmitted by single spike trainsfor most units and stimulus conditions. On the other hand, asmall amount of spike time jitter is beneficial to improve thestimulus estimate obtained from several independent spiketrains by averaging. We verified this by computing estimates ofthe stimulus fromn 5 2–10 spike trains (recorded successivelyfrom one neuron) simultaneously (Kreiman et al. 1998). Thecoding fraction increased when additional spike trains wereincluded and started to saturate forn 5 6–7 spike trains. Thusour results suggest that the spike timing jitter of P-receptorafferents lies in a range for which the information transmittedby single units (when assessed by linear estimation) is notdegraded (for the range of behaviorally relevant stimulus cutofffrequencies considered here) but which still allows for im-provement by averaging over a small number of afferents.Additional experiments recording simultaneously from severalP-receptor afferents under repeated presentations of the sameRAMs are needed to confirm this result.
Variability and the processing of AM in the electrosensorylateral line lobe (ELL)
At the next stage of the amplitude coding pathway, theinformation carried by P-receptor afferent spike trains is pro-cessed by pyramidal cells of the ELL. These neurons representthe output elements of the amplitude pathway and project tovarious higher order brain structures specialized in the process-ing of electrosensory information. There are two types ofpyramidal cells, E- and I-type, which receive direct excitatoryinput and indirect input via inhibitory interneurons, respec-tively. At least two transformations have been identified in therepresentation of AMs between the afferent input and thepyramidal cell output to the ELL:1) the detection threshold ofpyramidal cells for AMs appears considerably lower than theone of P-receptor afferents (Bastian 1981) and2) E- and I-typepyramidal cells appear less sensitive to the detailed time course
202 KREIMAN, KRAHE, METZNER, KOCH, AND GABBIANI

of AMs than P-receptor afferrents and seem to extract theoccurrence of upstrokes and downstrokes in AMs, respectively(Metzner et al. 1998). Both these transformations are likely toplay a role in the generation of electrolocation and electrocom-munication behaviors. In particular, understanding how theincreased sensitivity of pyramidal cells arises might contributeto explain jamming avoidance responses to extremely weakAMs and the detection of small preys using the electric sense(Kawasaki 1997; Nelson and MacIver 1999).
Some sort of averaging operation across several afferentfibers converging onto a pyramidal cell is likely to contributeto this increased sensitivity (Bastian 1981), as discussed in theprevious section. One biophysical mechanism specifically pro-posed to enhance the sensitivity of E-type pyramidal cells toupstrokes in the AM waveform is coincidence detection (Ber-man and Maler 1999): in slices of the ELL ofApteronotus,thestimulation of afferents in the deep fiber layer produces com-pound postsynaptic potentials consisting of an initial, fast-rising excitatory postsynaptic potential followed by an inhibi-tory postsynaptic potential that limits the time window ofintegration to,10 ms and could therefore act as a high-passfilter for coincident spikes occurring within 1–2 EOD cycles ofeach other (Berman and Maler 1998; see Softky 1995 for asimilar theoretical result). Our experimental results show thatunder repeated RAM stimulation, more than 77% of P-receptorafferent spikes will on average occur within 1–2 EOD cycles ofeach other in response to the same AM (Fig. 8B). Thus withinthe range of stimulus parameters investigated in this study,spike trains of P-receptor afferents appear indeed able to pro-vide the information necessary for such coincidence detectionoperations.
The authors thank Dr. M. Stopfer for carefully reading the manuscript andsuggesting many improvements. Experiments were carried out by R. Kraheand W. Metzner. Data analysis was carried out by G. Kreiman and F. Gabbiani.F. Gabbiani and G. Kreiman co-wrote the paper. The original experimentswere designed by F. Gabbiani, C. Koch, and W. Metzner.
This work was supported by a National Science Foundation grant to C. Kochand W. Metzner, by a National Institute of Mental Health grant to C. Koch, andby the Sloan Center for Theoretical Neuroscience.
REFERENCES
BAIR W AND KOCH C. Temporal precision of spike trains in extrastriate cortexof the behaving macaque monkey.Neural Comp8: 1185–1202, 1996.
BARBERINI CL, HORWITZ GD, AND NEWSOME WT. A comparison of spikingstatistics in motion sensing neurons of flies and monkeys. In:Computa-tional, Neural and Ecological Constraints of Visual Motion Processing,edited by Zeil J and Zanker JM. Springer Verlag, In press.
BASTIAN J. Electrolocation. II. The effects of moving objects and other elec-trical stimuli on the activities of two categories of posterior lateral line lobecells in Apteronotus albifrons. J Comp Physiol144: 481–494, 1981.
BAYLOR DA, LAMB TD, AND YAU K-W. Responses of retinal rods to singlephotons.J Physiol (Lond)288: 613–634, 1979.
BERMAN NJ AND MALER L. Inhibition evoked from primary afferents in theelectrosensory lateral line lobe of weakly electric fish (Apteronotus lepto-rhynchus). J Neurophysiol80: 3173–3213, 1998.
BERMAN NJAND MALER L. Neural architecture of the electrosensory lateral linelobe: adaptations for coincidence detection, a sensory searchlight and fre-quency-dependent adaptive filtering.J Exp Biol202: 1243–1253, 1999.
BERRY MJ AND MEISTER M. Refractoriness and neural precision.J Neurosci18: 2200–2211, 1998.
BERRY MJ, WARLAND DK, AND MEISTER M. The structure and precision ofretinal spike trains.Proc Natl Acad Sci USA94: 5411–5416, 1997.
BIALEK W, DE RUYTER VAN STEVENINCK R, AND WARLAND D. Reading aneural code.Science252: 1854–1857, 1991.
CARR C, HEILIGENBERGW, AND ROSEG. A time comparison circuit in the electricfish midbrain. I. Behavior and physiology.J Neurosci6: 107–110, 1986.
DE RUYTER VAN STEVENINCK R, LEWEN GD, STRONG SP, KOBERLE R, AND
BIALEK W. Reproducibility and variability in neural spike trains.Science275: 1805–1808, 1997.
FUKUNAGA K. Introduction to Statistical Pattern Recognition(2nd ed.). SanDiego, CA: Academic, 1990.
GABBIANI F AND KOCH C. Coding of time-varying signals in spike trains ofintegrate-and-fire neurons with random threshold.Neural Comput8: 44–66,1996.
GABBIANI F AND KOCH C. Principles of spike train analysis. In:Methods inNeuronal Modeling(2nd ed.), edited by Segev I and Koch C. Cambridge,MA: MIT Press, 1998, p. 313–360.
GABBIANI F AND METZNER, W. Encoding and processing of sensory informa-tion in neuronal spike trains.J Exp Biol202: 1267–1279, 1999.
HECHT S, SHLAER S, AND PIRENNE MH. Energy, quanta, and vision.J GenPhysiol25: 819–840, 1942.
HEILIGENBERG W. Neural Nets in Electric Fish.Cambridge, MA: MIT Press,1991.
JOHNSON DH. Point process models of single-neuron discharges.J ComputNeurosci3: 275–299, 1996.
KASHIMORI Y, GOTO M, AND KAMBARA T. Model of P- and T-electroreceptorsof weakly electric fish.Biophys J70: 2513–2526, 1996.
KAWASAKI M. Sensory hyperacuity in the jamming avoidance response ofweakly electric fish.Curr Opin Neurobiol7: 473–479, 1997.
KREIMAN G, GABBIANI F, METZNER W, AND KOCH C. Robustness of amplitudemodulation encoding by P-receptor afferent spike trains of weakly electricfish. Soc Neurosci Abstr24: 186, 1998.
LI W-H AND GRAUR D. Fundamentals of Molecular Evolution.Sunderland,MA: Sinauer Associates, 1991.
MAINEN ZF AND SEJNOWSKI TJ. Reliability of spike timing in neocorticalneurons.Science268: 1503–1506, 1995.
MECHLER F, VICTOR JD, PURPURA KP, AND SHAPLEY R. Robust temporalcoding of contrast by V1 neurons for transient but not for steady-statestimuli. J Neurosci18: 6583–6598, 1998.
METZNER W, KOCH C, WESSEL R, AND GABBIANI F. Feature extraction byburst-like spike patterns in multiple sensory maps.J Neurosci18: 2283–2300, 1998.
NELSON ME AND MACIVER MA. Prey capture in the weakly electric fishApteronotus albifrons. J Exp Biol202: 1205–1215, 1999.
NELSON ME, XU Z, AND PAYNE JR. Characterization and modeling of P-typeelectrosensory afferent responses to amplitude modulations in a wave-typeelectric fish.J Comp Physiol181: 532–544, 1997.
PARKER AJ AND NEWSOME WT. Sense and the single neuron: probing thephysiology of perception.Annu Rev Neurosci21: 227–277, 1998.
POOR HV. An Introduction to Signal Detection and Estimation(2nd ed.). NewYork: Springer, 1994.
PRESSWH, TEUKOLSKY SA, VETTERLING WT, AND FLANNERY BP. NumericalRecipes in C, The Art of Scientific Computing(2nd ed.). Cambridge, UK:Cambridge Univ. Press, 1992.
REICH DS, VICTOR JD, KNIGHT BW, OZAKI T, AND KAPLAN E. Responsevariability and timing precision of neuronal spike trains in vivo.J Neuro-physiol77: 2836–2841, 1997.
ROSE G AND HEILIGENBERG W. Temporal hyperacuity in the electric sense offish. Nature318: 178–180, 1985.
SCHEICH H, BULLOCK TH, AND HAMSTRA RH. Coding properties of two classesof afferent nerve fibers: high-frequency electroreceptors in the electric fishEigenmannia. J Neurophysiol36: 39–60, 1973.
SELLERS PH. On the theory and computation of evolutionary distances.SIAMJ Appl Math26: 787–793, 1974.
SHADLEN MN, BRITTEN KH, NEWSOME WT, AND MOVSHON JA. A computa-tional analysis of the relationship between neuronal and behavioral re-sponses to visual motion.J Neurosci16: 1486–1510, 1996.
SOFTKY WR. Simple codes versus efficient codes.Curr Biol 5: 239–247, 1995.SOFTKY WR AND KOCH C. The highly irregular firing of cortical cells is
inconsistent with temporal integration of EPSPs.J Neurosci13: 334–350,1993.
STEVENS CF AND ZADOR AM. Input synchrony and the irregular firing ofcortical neurons.Nature Neurosci1: 210–217, 1998.
TEICH MC, TURCOTT RG, AND SIEGEL RM. Temporal correlation in cat striate-cortex neural spike trains.IEEE Eng Med BiolSept/Oct: 79–87, 1996.
VANNUCCI G AND TEICH MC. Dead-time-modified photocount mean and vari-ance for chaotic radiation.J Opt Soc Am71: 164–170, 1981.
203SPIKE TRAIN VARIABILITY IN P-RECEPTOR AFFERENTS

VICTOR JD AND PURPURA KP. Nature and precision of temporal coding invisual cortex: a metric-space analysis.J Neurophysiol76: 1310–1326, 1996.
VICTOR JD AND PURPURA KP. Metric-space analysis of spike trains, algorithmsand application.Network:Comput Neural Systems8: 127–164, 1997.
WARZECHA AK AND EGELHAAF M. Variability in spike trains during constantand dynamic stimulation.Science283: 1927–1930, 1999.
WARZECHA AK, K RETZBERG J, AND EGELHAAF M. Temporal precision of theencoding of motion information by visual interneurons.Curr Opin Neuro-biol 8: 359–368, 1998.
WESSEL R, KOCH C, AND GABBIANI F. Coding of time-varying electric fieldamplitude modulations in a wave-type electric fish.J Neurophysiol75:2280–2293, 1996.
204 KREIMAN, KRAHE, METZNER, KOCH, AND GABBIANI