Robustness in biological neural networks
10
Available online at www.sciencedirect.com Physica A 317 (2003) 581 – 590 www.elsevier.com/locate/physa Robustness in biological neural networks Alkiviadis Kalampokis a , Christos Kotsavasiloglou b , Panos Argyrakis a ; ∗ , Stavros Baloyannis b a Department of Physics, University of Thessaloniki, GR-54124 Thessaloniki, Greece b Department of Neurology I, School of Medicine, University of Thessaloniki, GR-54124 Thessaloniki, Greece Received 19 January 2002; received in revised form 22 April 2002 Abstract We present a computational model to study the robustness and degradation of dynamics on a network that includes a large number of units and connections between them. Each unit has an internal structure and it is connected to other units through contact points. These contact points correspond to the synapses of the biological neural networks. We monitor the network activity as a function of time, after we initiate an input signal at random in the network. We vary the number of connections (as a function of several properties of each connection), and observe that there exists a critical crossover value regarding the loss of connections below which all network activity decreases at a much faster rate than the expected normal loss. This crossover value is in the range of 70 –80% loss. A similar critical value observed in biological neural networks may dene the limit between the healthy state and the disease. Correlations between the computational and the biological model are discussed. c 2003 Elsevier Science B.V. All rights reserved. PACS: 87.10.+e; 84.35.+i Keywords: Neural network; Synapse degradation 1. Introduction There has been considerable interest [1–4] recently in the properties of networks, mainly due to the emergence of scaling laws that have been discovered in a very large number of dierent types of networks examined, such as the World Wide Web, the Internet, the citation patterns in publications, the chemical network of a cell, and ∗ Corresponding author. E-mail address: [email protected] (P. Argyrakis). 0378-4371/03/$ - see front matter c 2003 Elsevier Science B.V. All rights reserved. PII: S0378-4371(02)01340-7
Transcript of Robustness in biological neural networks

Available online at www.sciencedirect.com
Physica A 317 (2003) 581–590www.elsevier.com/locate/physa
Robustness in biological neural networksAlkiviadis Kalampokisa, Christos Kotsavasilogloub,
Panos Argyrakisa ;∗, Stavros BaloyannisbaDepartment of Physics, University of Thessaloniki, GR-54124 Thessaloniki, Greece
bDepartment of Neurology I, School of Medicine, University of Thessaloniki,GR-54124 Thessaloniki, Greece
Received 19 January 2002; received in revised form 22 April 2002
Abstract
We present a computational model to study the robustness and degradation of dynamics on anetwork that includes a large number of units and connections between them. Each unit has aninternal structure and it is connected to other units through contact points. These contact pointscorrespond to the synapses of the biological neural networks. We monitor the network activityas a function of time, after we initiate an input signal at random in the network. We vary thenumber of connections (as a function of several properties of each connection), and observethat there exists a critical crossover value regarding the loss of connections below which allnetwork activity decreases at a much faster rate than the expected normal loss. This crossovervalue is in the range of 70–80% loss. A similar critical value observed in biological neuralnetworks may de3ne the limit between the healthy state and the disease. Correlations betweenthe computational and the biological model are discussed.c© 2003 Elsevier Science B.V. All rights reserved.
PACS: 87.10.+e; 84.35.+i
Keywords: Neural network; Synapse degradation
1. Introduction
There has been considerable interest [1–4] recently in the properties of networks,mainly due to the emergence of scaling laws that have been discovered in a verylarge number of di:erent types of networks examined, such as the World Wide Web,the Internet, the citation patterns in publications, the chemical network of a cell, and
∗ Corresponding author.E-mail address: [email protected] (P. Argyrakis).
0378-4371/03/$ - see front matter c© 2003 Elsevier Science B.V. All rights reserved.PII: S0378 -4371(02)01340 -7

582 A. Kalampokis et al. / Physica A 317 (2003) 581–590
numerous other cases which range from the natural sciences, to social sciences, tomedicine, or other complex systems that are encountered in daily life. The noveltybrought by these studies is that many network characteristics, which seemed to berandom, are now found to obey deterministic equations by which one can predict suchimportant properties as the growth of the network, its robustness to external attacks,and other properties of interest. Nevertheless, all previous work has been limited tothe geometrical (static) properties only, several of which are now well understood.However, one would like to extend this knowledge to dynamic properties, such as, e.g.,signal propagation on a network. This task is considerably more complicated, becauseit involves the superposition of two stochastic but independent processes, namely, therandom connectivity of the network nodes (static property) and the random signaldi:usion (dynamic property). A model that addresses both of these characteristics,namely, the internal structure and signal transfer between the elementary units couldpossibly pertain to the biological neural networks.Neural networks are made of elementary units (cells), the neurons, which are inter-
connected together in a complex pattern with a de3nite structure, resulting in a picturethat involves very rich dynamics, as it depends on a multitude of parameters. Theyform the basis of the central nervous system (CNS). The points of physical contactbetween the neurons are the so-called synapses. These are the equivalent of a connec-tion between two nodes in a generalized network. It is through the synapses that theelectrical signals propagate through the networks. It is now well understood that it isthe collective character of the neural units together with their connectivities that makeall functions of the living organism possible. Isolated neurons or collections of neu-rons without interconnecting synapses can perform no function at all. There are severalphysical and chemical processes occurring at the synapses which determine indirectlythe functions of the network as a whole. Naturally, any degradation of the synapses, ortotal destruction of them, will immediately reCect on the signal processing through theneural network, and its robustness. But it is well known that such degradation and lossroutinely occur with advancing age in the CNS and the human brain. This loss occurswithout any manifestation of a disease. It is strongly believed that the rate of loss ofcells in this case is linear. However, in the presence of a disease there is a neuronalloss with a much faster rate of cell destruction, e.g. exponential. In this regard thereexists experimental evidence [5], that normal aging is accompanied by a gradual lossof neurons, whereas a very severe decrease appears in patients with a neural disease,regardless of age.Until now there is no clear relationship between the loss of neurons and the occur-
rence of the 3rst disease symptoms. In the case of the substantia nigra there are noclinical signs until at least 50% of the nigral neurons are lost [6]. Similar 3ndings existfor other cerebral regions. In order to improve our understanding of the early stages ofnervous system diseases, we believe that it is imperative to investigate the details ofsuch relationship, between the neuronal loss and the impairment of the nervous systemfunctions. In particular, a crucial question is, whether this relationship is linear in theentire range or if there is some critical threshold, beyond which there is a characteristicdi:erence and a very fast degradation. This is important both from the theoretical pointregarding the function of neural networks, but additionally it will help to answer the

A. Kalampokis et al. / Physica A 317 (2003) 581–590 583
question of what part (percentage) of the brain neural networks can be incapacitatedbefore total loss of functions will occur? Apparently, if we know this answer we willbe able to predict the details of how and when does the human brain degrade, di:er-entiate the degradation in normal age from that in a disease, and will ultimately helpin the search for a cure.There are many citations in the literature about such relationships, for di:erent parts
of the brain, with a variety of di:erent answers. However, they are all either qualitativeor the data have a very large dispersion. There is a total lack of a theoretical basisfor such relationship. The present paper attempts to shed some light in this directionby utilizing a complex computational model recently developed [7]. We map the brainfunction to a quantity called network activity, a (see below), and investigate this activityas a function of the neural loss and other net parameters.Since we know that the connectivity pattern between the neurons is very complicated,
it is reasonable to assume that this relationship is not simply linear. Two neurons canbe connected at several di:erent points via di:erent synapses. Thus, when a singlesynapse is removed this does not necessarily preclude any connectivity between thesetwo neurons. Assuming that this is true we see that it is very important to treat theindividual neurons not as simple binary entities, but one is forced to take into accounttheir internal structure. This is exactly what we do in the present study. Each neuron(cell) is made of a very large number of parts, as a real one is. We believe that if weconsider the neuron as one single unit, as practically all theoretical models until nowhave done, that it is diGcult to address our basic question.
2. The model
We recently [7] introduced a computer simulation model of a neural network that isbased on a collection of dendritic structures, the so-called di:usion-limited aggregates(DLA). These entities originated and are derived from solid-state physics [8], but nev-ertheless, resemble very much the picture of the backbone of an actual brain neuron,and this is why we adopt them. Fig. 1 contains one DLA simulated structure, and acamera lucida [9] drawing of a Purkinje neuron. We can see that each unit possessesa dendritic nature. The only related study until now utilizing similar structure is thatof Caserta et al. [10]. A collection of these units placed randomly in space at highdensities make up an entire neural network. Such a network is shown in Fig. 2. Thus,each neuron is made of several thousands of building blocks placed according to theDLA model on a lattice. At this stage no di:erentiation is made for the soma, axon,etc., but all building blocks are treated equally. Because they are closely packed thereis a large overlap between them, especially on the branched dendrites. These overlapscan be thought of being the synapses. In the model a synapse can be declared activeor inactive at will, and this is one of the external parameters that we control. Eachsynapse is a one-way channel, meaning that the signal can be propagated only alongone of the two directions. In order for this to happen the value of the signal must begreater than the synapse threshold, �. Thus, each synapse is assigned a � value. Theprocedure of the signal transfer from one unit to the next is not instantaneous, but the

584 A. Kalampokis et al. / Physica A 317 (2003) 581–590
Fig. 1. (a) A simple isolated DLA cluster, and (b) a camera lucida drawing of a typical Purkinje neuron.
Fig. 2. A collection of eight DLA clusters built on a 350× 350 lattice. The cluster mean size is 2200 sites.
transmission is delayed for a certain time, called the synaptic delay, SD, as it is wellknown that the signal transfer in the synapse is of the order of 1000 times slowerthan the transfer inside a neuron. After 3ring the synapse goes into a refractory period,RP, during which the synapse cannot be active any more, but must necessarily remainpassive. All synapses are characterized as either excitatory or inhibitory. The fractionof each (out of the total number of synapses) is fe and fi, respectively. The identity

A. Kalampokis et al. / Physica A 317 (2003) 581–590 585
of each synapse is determined at random with a probability according to that fraction.Generally, the excitatory (inhibitory) characterization describes the property that bringscloser (further away) the synapse signal value to the synapse threshold.Our interest is focused on the details of signal transport throughout the network.
This process is dynamic in nature, and thus we de3ne the smallest increment of timeto be the actual time that it takes for the signal to transfer from one lattice point toits nearest neighbor inside the same neuron. This time unit is arbitrary, typically incomputer simulations it is called one (1) Monte-Carlo Step (MCS). While it could berelated to actual time (e.g. ms) in a real system, at this stage we will not attempt to doso. At any rate, this timing is the smallest time increment required for these processes,and as such it is probably much smaller than the time it takes for a neuron to remodelits structure. Originally, at time t = 0 some initial signal is randomly given to a smallsubset of the neural network. This signal is allowed to travel throughout the system,i.e. both inside the neurons and also, when reaching a synapse, to transfer to adjacentneurons. This is done by “transferring” the signal to all of its nearest-neighbor sites,and incrementing time by one time unit. Next, this step is repeated again and thusagain and time advances up to a certain limit.
3. Results
Initially, we investigate the connectivity properties of the generated structures. Wedo this by using the parameter fs, which is the fraction of active synapses out of thetotal number of sysnapses. Thus, here 0¡fs¡ 1:0, and it is treated as a parameter.An fs = 1 value means that all synapses are active (allowed), while at the other limitan fs = 0 value means that neurons are not connected at all, as no synapses exist.Following Ref. [3], we de3ne as S the fraction of neurons that are contained in thelargest cluster formed. Thus, S = 1 when fs = 1. Additionally, when a large numberof the connections is cut-o:, then we see that we have the formation of small isolatedclusters (islands). We also de3ne here as 〈s〉 the average size of these isolated clusters.We calculate these quantities for the entire fs range, and the results are shown inFig. 3. We see that S initially starts at 0, and pretty fast reaches a constant valueof 1, meaning that practically all units quite fast are part of the largest cluster. Nosmall clusters exist, but only in the very beginning. Complementary to this is thebehavior of 〈s〉 in the same 3gure. The peak observed in the mean size of the isolatedclusters indicates a critical point at about fs = 0:01 implying the existence of a pointbelow which the network loses its connectivity, while it is quite stable at fs valuesgreater than that of the critical point. We note here that this analysis is based onlyon the spatial properties of the model and thus, this critical point reCects only staticcharacteristics of the network. No comparison can be made at this point between thebehavior of the model system and actual biological neural networks. These results arein excellent (qualitative) agreement with the model of (Ref. [3], Fig. 3), even thoughthe networks are quite di:erent. Nevertheless, their connectivity properties are quitethe same. This point implies that the connectivity patterns are quite general for allnetworks, regardless of their detailed structure.

586 A. Kalampokis et al. / Physica A 317 (2003) 581–590
0.20 0.15 0.10 0.05 0.00
0.0
0.5
1.0
1.5
2.0
2.5
3.0
S
<s>
S
<s>
fs
Fig. 3. Network fragmentation under random failures of neuron synapses. The relative size of the largestcluster (S) and the mean size of the isolated clusters (〈s〉) are plotted as a function of the percentage of thenetwork synapses used (fs). Note that the 0 of the x-axis is on the right of the plot.
We next monitor the activity, a, of the entire network, which is de3ned as theratio of (active neurons/total number of neurons). An active neuron is one that carriessignal in any part of it. Thus, 0¡a¡ 1 at all times. We examine in detail the networkactivity as a function of the fraction of active synapses, fs. We saw above the twolimiting cases of fs=0 and 1. Our interest now is in the intermediate range. We coverthe entire fs range in detail. The results are given in Figs. 4–6. In all three 3gureswe plot the network activity vs. fs, but varying di:erent parameters in each case. InFig. 4 we vary the refractory period, in Fig. 5 we vary the synaptic delay, while inFig. 6 we vary the fraction of excitatory synapses. In all these 3gures the behavioris quite similar. Starting at the right of each diagram we see that initially there is alinear decrease of a, up to a certain value which is around the value fs = 0:2–0.3.Then, at this point starts a much sharper decrease of a, eventually leading down tozero. This intersection point of the two linear segments constitutes a crossover, whosevalue must be a critical value or critical threshold for such networks. Above and belowthis crossover value the decrease is linear, but with very di:erent slopes in the tworegions. The crossover between the two regions is around the value fs = 0:2 or 0.3.This result implies that a neural network could sustain destruction of its synapses up to70% or 80% maximum, and still operate normally. After this point there is a crossoverleading to a degradation, and subsequently to zero activity. Note that this crossoverbehavior characterizes the dynamics of the signal transfer and it is qualitatively andquantitatively di:erent than the crossover behavior of S and 〈s〉 of Fig. 3, which wascharacteristic of the geometry (static) of the clusters formed.

A. Kalampokis et al. / Physica A 317 (2003) 581–590 587
0.0 0.2 0.4 0.6 0.8 1.00.00
0.05
0.10
0.15
0.20
0.25
0.30
RP 300 700 1200
a
fs
Fig. 4. System activity a vs. the fraction of the synapses used, fs, for various values for the refractoryperiod RP = 300; 700; 1200. SD = 800, fe = 0:8. Mean neuron size 2200, lattice 800× 800.
0.0 0.2 0.4 0.6 0.8 1.00.0
0.1
0.2
0.3
0.4
0.5 SD
200 800 1500
a
fs
Fig. 5. System activity a vs. the fraction of the synapses used, fs, for various values for the synaptic delay.SD = 200; 800; 1500. RP = 200, fe = 0:8.
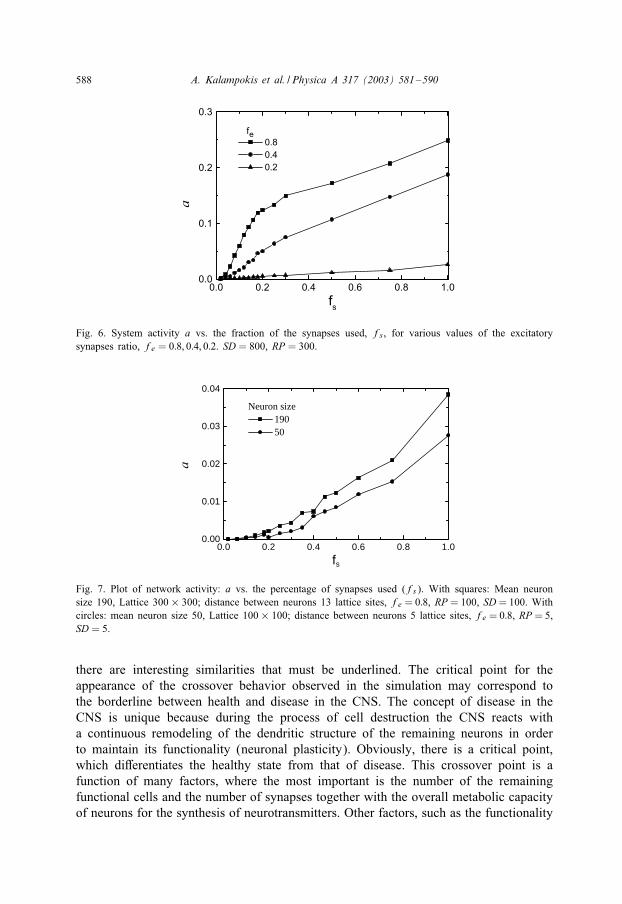
In Fig. 7, we employ neurons of size 50 and 190 units, which are 10 and 40 timessmaller than the size (2200 units) used in the previous 3gures. We immediately observethat we do not have the crossover breakdown at the critical value, as we did earlier,but instead we have a rather smooth behavior. Thus, this is clear evidence that theinternal neuron structure plays a dominant role in the appearance of a breakdown ofthe entire network, as it has been hypothesized before. Systems that use neurons assingle point elements cannot exhibit this behavior.A direct comparison between this (or other) computational model and a biological
one it is not possible at this stage. This is because of the di:erences in the complexity ofeach system and our limited knowledge about the functions of the synapse. However,
588 A. Kalampokis et al. / Physica A 317 (2003) 581–590
0.0 0.2 0.4 0.6 0.8 1.00.0
0.1
0.2
0.3
fe
0.8
0.4
0.2
a
fs
Fig. 6. System activity a vs. the fraction of the synapses used, fs, for various values of the excitatorysynapses ratio, fe = 0:8; 0:4; 0:2. SD = 800, RP = 300.
0.0 0.2 0.4 0.6 0.8 1.00.00
0.01
0.02
0.03
0.04
Neuron size19050
a
fs
Fig. 7. Plot of network activity: a vs. the percentage of synapses used (fs). With squares: Mean neuronsize 190, Lattice 300× 300; distance between neurons 13 lattice sites, fe = 0:8, RP = 100, SD= 100. Withcircles: mean neuron size 50, Lattice 100× 100; distance between neurons 5 lattice sites, fe = 0:8, RP = 5,SD = 5.
there are interesting similarities that must be underlined. The critical point for theappearance of the crossover behavior observed in the simulation may correspond tothe borderline between health and disease in the CNS. The concept of disease in theCNS is unique because during the process of cell destruction the CNS reacts witha continuous remodeling of the dendritic structure of the remaining neurons in orderto maintain its functionality (neuronal plasticity). Obviously, there is a critical point,which di:erentiates the healthy state from that of disease. This crossover point is afunction of many factors, where the most important is the number of the remainingfunctional cells and the number of synapses together with the overall metabolic capacityof neurons for the synthesis of neurotransmitters. Other factors, such as the functionality

A. Kalampokis et al. / Physica A 317 (2003) 581–590 589
of the blood supply system (arteriols and capillaries), etc., are very important, but thesealmost always manifest themselves initially as a decrease of the metabolic functionality,and then as neuronal loss.A disease that has been extensively studied in the last decades is Alzheimer’s disease,
which is well known that results in a tremendous loss of neurons. Microscopically thisneuronal depletion is observed in the cerebral cortex, in the nucleus basalis of Meynertand Locus Coeruleus [11]. It is found that the same loss occurs in the substantia nigraof patients with Alzheimer disease, where the number of neurons was reduced inthe range 97–78% of the control values from the medial to the lateral substantianigra [12].A typical example of neuronal depletion and the manifestation of a disease is the
substantia nigra and the Parkinson’s disease. It has been found that there is a lossof 91% in the lateral ventral tier of the substantia nigra and 71% and 56% in themedial ventral tier and dorsal tier, respectively [13]. The same authors suggest thatthe onset of symptoms starts at around 68% of cells in the lateral ventral tier and48% in the caudal nigra as a whole [13]. Other authors have reported a 76% decreaseof pigmented neurons in the entire substantia nigra in respect to control values [14].All these studies point to the same conclusion: patients with neural diseases have wellabove 1
2 of the constituent neurons destroyed. They are all experimental, over a widetime period, referring to several di:erent brain sections, a wide variety of patients,pointing to the same conclusion, as in the present study.The model presented here has attempted to include most of the principal character-
istics of the CNS. This includes the geometrical structure of the elementary unit andsubsequently the geometrical distribution of the synapses, the presence of excitatoryand inhibitory synapses, the propagation time in the synapse, etc. One drawback of themodel at this stage is that it maintains its structure intact during the simulation time,whereas we know well that there is a continuous remodeling of the dendritic neuralstructure. But as mentioned earlier, our time domain is too short for such remodel-ing to take place. Additionally, the synapses in this model were randomly created andnot as a consequence of dynamic interactions between neurons in response to partic-ular stimuli, which is what happens in reality. Our main hypothesis is that the brainexhibits a similar crossover behavior in its functions as the model, all depending uponthe structure of the neurons and their synapses. In other words, the brain has an inherentresistance to the manifestation of diseases due to its geometrical structure.
4. Conclusions
Summarizing, we have presented a theoretical neural net model, and studied itsrobustness as a function of the synapses present. The model itself is made of DLAclusters that resemble neural cells, and as such it is only a zeroth-order approximation.We 3nd that such systems undergo through two di:erent regimes when the numberof their synapses is decreased. First, there is a linear decrease of their functions. Thisdecrease goes up to a certain point, at which time starts a second regime, in whichthere is sharp change in the rate of this decrease, the rate (slope) becoming much

590 A. Kalampokis et al. / Physica A 317 (2003) 581–590
faster. The crossover point where this occurs is around 20–30% of active neurons(80–70% loss). In order for this model to become of functional importance, it isnecessary to accept that neurons have a complicated internal structure approaching innature the real one. The model agrees with several experimental observations in theliterature. It gives a 3rst handle at distinguishing the degradation of synapses due toage vs. one of the well-known diseases, such as Parkinson’s or Alzheimer’s. In theaging process one expects a linear loss of neurons/synapses throughout the entire range.This loss occurs gradually, it a:ects the CNS very little, which continues to functionsatisfactorily until late in one’s life. Therefore, if no disease has appeared the criticaldamage will occur, but it will occur quite late. On the other hand, if a disease hasappeared, then, relatively early in one’s life the symptoms of the damage will becomeevident, as the organism goes through the crossover change in the rate of loss.
References
[1] A.L. Barabasi, R. Albert, Science 286 (1999) 509.[2] A.L. Barabasi, R. Albert, H. Jeong, G. Bianconi, Science 287 (2000) 2115a.[3] R. Albert, H. Jeong, A.L. Barabasi, Nature 406 (2000) 378.[4] A.L. Barabasi, R. Albert, H. Jeong, Physica A 281 (2000) 2115.[5] M.J. Ball, Acta Neuropathol. (Berlin) 28 (1977) 111.[6] C.D. Marsden, Lancet 335 (1990) 948–952.[7] C. Kotsavasiloglou, A. Kalampokis, P. Argyrakis, S. Baloyannis, Phys. Rev. E 56 (1997) 4489.[8] D. Stau:er, H.E. Stanley, From Newton to Mandelbrot, a Primer in Theoretical Physics, Springer, Berlin,
1990.[9] T. Takeda, A. Ishikawa, K. Ohtomoto, Y. Kobayashi, T. Matsuoka, Neurosci. Res. 13 (1992) 19.[10] F. Caserta, H.E. Stanley, W.D. Eldred, R.E. Hausman, J. Nittman, Phys. Rev. Lett. 64 (1990) 95.[11] R.D. Adams, M. Victor, Principles of Neurology, 5th Edition, McGraw-Hill, New York, 1993.[12] J.O. Rinne, J. Rummukainen, L. Paljarvi, U.K. Rinne, Ann. Neurol. 26 (1989) 47.[13] J.M. Fearnley, A.J. Lees, Brain 114 (1991) 2283.[14] S.Y. Ma, J.O. Rinne, Y. Collan, M. Royotta, U.K. Rinne, J. Neurol. Sci. 140 (1996) 40.