
Enhancing Project Robustness: A Risk Management Perspective
192
Enhancing Project Robustness: A Risk Management Perspective vorgelegt von Diplom-Ingenieur Kilian Gericke aus Potsdam Von der Fakultät V – Verkehrs- und Maschinensysteme der Technischen Universität Berlin zur Erlangung des akademischen Grades Doktor der Ingenieurwissenschaften Dr.-Ing. genehmigte Dissertation Promotionsausschuss: Vorsitzender: Prof. Dr. rer. nat. Volker Schindler Berichterin: Prof. Dr.-Ing. Luciënne Blessing Berichter: Prof. Dr.-Ing. Henning Meyer Tag der wissenschaftlichen Aussprache: 25.03.2011 Berlin 2011 D 83
-
Upload
uni-rostock -
Category
Documents
-
view
1 -
download
0
Transcript of Enhancing Project Robustness: A Risk Management Perspective

Enhancing Project Robustness: A Risk Management
Perspective
vorgelegt von
Diplom-Ingenieur
Kilian Gericke
aus Potsdam
Von der Fakultät V – Verkehrs- und Maschinensysteme
der Technischen Universität Berlin
zur Erlangung des akademischen Grades
Doktor der Ingenieurwissenschaften
Dr.-Ing.
genehmigte Dissertation
Promotionsausschuss:
Vorsitzender: Prof. Dr. rer. nat. Volker Schindler
Berichterin: Prof. Dr.-Ing. Luciënne Blessing
Berichter: Prof. Dr.-Ing. Henning Meyer
Tag der wissenschaftlichen Aussprache: 25.03.2011
Berlin 2011
D 83


I
ACKNOWLEDGEMENTS
This work is the result of my research as a member of the Engineering Design and Methodology
group at the Technische Universität Berlin. Here I would like to thank my colleagues for an always
pleasant time and an inspiring working environment. My special thanks go to Dr. Bruno Gries, Patrick
Müller, and Andreas Bischof; they supported my reflections by giving me always honest feedback.
Prof. Dr. Michael Schmidt-Kretschmer contributed to this work by giving me insights into aspects of
design practice you will never find in any textbook and who always reminded me to stick to my own
schedule.
Prof. Dr. Mogens Myrup Andreasen influenced this work from the very first time I met him. I really
liked all the “nasty” questions he asked during the summer school on engineering design research.
His sharp-wittedness and constructiveness impressed me.
This work would not be possible without the willingness of the industrial experts, who participated in
the empirical studies, the sponsors of the P3I study, who enabled an outstanding study of industrial
practice, and my students Lars Klimentew and Dana Paul, who contributed with their theses in a
meaningful way.
Furthermore I would like to thank my supervisors Prof. Dr. Henning Meyer and Prof. Dr. Lucienne
Blessing. Prof. Meyer did not hesitate to supervise this work despite of uncommon circumstances.
Prof. Blessing was more than just a supervisor of my work. She enabled me to explore different
areas of design research and to get access to an inspiring research community. Her cordial, accurate
behaviour and her expertise influenced this work and my personal development.
My warmest thanks go to my family, my wife Susanne and my little son Tillmann for their loving
support throughout the whole time. My wife and my son often had to wait longer than they
expected because I had some interesting ideas …
Thank you all very much!

II

III
SUMMARY
Product development projects are challenging management tasks. The complexity and dynamics of
requirements and goals, the novelty of design tasks, and polytely (striving for multiple goals) can all
affect the course of a project. Frequent consequences of these boundary conditions are unwanted
events which inhibit a successful project.
This work shall provide a better understanding of project robustness, its barriers and enablers. To
achieve this goal, the work was conducted following a research approach based on the Design
Research Methodology proposed by Blessing and Chakrabarti. The work is based on a
comprehensive literature study which resulted in a model describing the causality of project failures.
The underlying assumption of the project failure causality model, that companies which treat risks
preventively and proactively are more likely to successfully finish their product development projects
than other companies, is examined by an analysis of data from 141 small and medium sized
enterprises (SMEs).
Design methodologies, project management, risk management and maturity models such as the
Capability Maturity Model Integration (CMMI) are proposed in order to support product
development. The study validates the importance of the use of these systematic approaches to
support product development projects, but none of the considered approaches on its own will secure
project success. This suggests that the expected benefit (a robust project) can only be achieved using
different approaches conjointly.
While design methodologies and project management offer a rich support for development
activities, risk management supports the project specific selection of appropriate risk treatment
measures.
A result of this work is a support for the pre-selection of risk treatment strategies based on the
project failure causality model and its link to the proposed categorisation of risk treatment
strategies.
In this dissertation it is shown that the proposed categorisation of risk treatment strategies, the
categorisation of the risk impact evolvement, and the question based support were easily
understood by industrial experts. Their feedback validates the applicability and acceptance of the
question based support as helpful for risk treatment strategy pre-selection, but also lead to a revision
of the proposed support. The result is a matrix based support, intended to contribute to an
enhancement of project robustness by supporting the process of risk treatment strategy selection
which is currently only insufficiently supported. The matrix based support considers, in addition to
traditional risk characteristics (likelihood of occurrence and severity of impact) the time-dependent
evolvement of risk impacts.

IV
V
ZUSAMMENFASSUNG
Produktentwicklungsprojekte sind anspruchsvolle Aufgaben. Die Komplexität und Dynamik von
Anforderungen und Zielen, der Neuheitsgrad der Aufgaben und Polytelie (mehrere Ziele zugleich zu
verfolgen) können den Kurs eines Projektes beeinflussen. Häufige Konsequenzen dieser
Randbedingungen sind ungewollte Ereignisse, welche ein erfolgreiches Projekt verhindern.
Diese Arbeit soll ein besseres Verständnis robuster Projekte schaffen sowie von Aspekten, welche
diese verhindern und ermöglichen. Um dieses Ziel zu erreichen, wurde die Arbeit gemäß eines
Forschungsansatzes nach Blessing und Chakrabarti durchgeführt. Die Arbeit basiert auf einer
umfangreichen Literaturstudie, die zur Erstellung eines Models führte, welches die Kausalität
gescheiterter Projekte beschreibt.
Die zugrundeliegende Annahme des project failure causality model, dass Unternehmen, die Risiken
präventiv oder proaktiv behandeln, mit größerer Wahrscheinlichkeit ihre Projekte erfolgreich
beenden, wurde untersucht, indem Daten einer Studie von 141 kleinen und mittelständischen
Unternehmen (KMU) ausgewertet wurden.
Entwicklungsmethodiken, Projektmanagement, Risikomanagement und Reifegradmodelle wie zum
Beispiel das Capability Maturity Model Integration (CMMI) wurden vorgeschlagen, um die
Produktentwicklung zu unterstützen. Die Studie bestätigt die Bedeutung der Anwendung dieser
Ansätze in Produktentwicklungsprojekten, zeigt aber auch, dass keiner der Ansätze allein den Erfolg
eines Projektes sicherstellen kann. Dies legt nahe, dass der erwartete Nutzen (ein robustes Projekt)
nur erreicht werden kann, wenn die Ansätze gemeinsam genutzt werden.
Während Entwicklungmethodiken und Projektmanagement eine umfangreiche Unterstützung für
Produktentwicklungsaktivitäten anbieten, unterstützt Risikomanagement die Projekt-spezifische
Auswahl geeigneter Risikobehandlungsmaßnahmen.
Ein Ergebnis dieser Arbeit ist eine methodische Unterstützung für die Vorauswahl von
Risikobehandlungsstrategien, die auf dem project failure causality model und dessen Verknüpfung
mit den vorgeschlagenen Kategorien von Risikobehandlungsstrategien basiert.
In dieser Dissertation wird gezeigt, dass die vorgeschlagene Kategorisierung von
Risikobehandlungsstrategien, die Kategorisierung der Entwicklung der Risikoauswirkung und die
Fragebogen-basierte methodische Unterstützung von Produktentwicklern aus der Industrie einfach
verstanden wurden. Deren Kommentare belegen die Anwendbarkeit und Akzeptanz der
Fragebogen-basierten Unterstützung als hilfreich für die Auswahl von Risikobehandlungsstrategien,
sie führten aber auch zu einer weiteren Überarbeitung des vorgeschlagenen Lösungsansatzes. Das
Ergebnis dieser Überarbeitung ist eine Matrix-basierte Unterstützung, die dazu gedacht ist, die
Robustheit von Produktentwicklungsprojekten zu steigern, indem die Auswahl von

VI
Risikobehandlungsstrategien unterstützt wird, was durch bisherige Ansätze nur unzureichend erfolgt.
Die Matrix-basierte Unterstützung berücksichtigt neben den üblichen Risikomerkmalen
(Wahrscheinlichkeit des Auftretens und Schwere der Auswirkung) die Zeitabhängigkeit der
Entwicklung der Risikoauswirkung.

VII
CONTENTS
ACKNOWLEDGEMENTS ..................................................................................................................................... I
SUMMARY ...................................................................................................................................................... III
ZUSAMMENFASSUNG ...................................................................................................................................... V
LIST OF FIGURES .............................................................................................................................................. XI
LIST OF TABLES ............................................................................................................................................. XVII
1 MOTIVATION ........................................................................................................................................... 1
1.1 PROJECT FAILURE ........................................................................................................................................ 1
1.2 UNCERTAINTY AS A CHARACTERISTIC OF PRODUCT DEVELOPMENT PROJECTS ........................................................... 2
1.3 EXAMPLES OF FAILED PRODUCT DEVELOPMENT PROJECTS.................................................................................... 3
1.4 ROBUSTNESS ............................................................................................................................................. 6
1.5 GOAL AND RESEARCH QUESTIONS................................................................................................................... 7
1.6 RESEARCH APPROACH AND METHODS ............................................................................................................. 8
1.7 CHAPTER OVERVIEW .................................................................................................................................... 9
2 PROJECT SUCCESS AND FAILURE ............................................................................................................ 11
2.1 UNDERSTANDING PROJECT SUCCESS ............................................................................................................. 11
2.1.1 Iron triangle ..................................................................................................................................... 11
2.1.2 Aspects of rating project success ..................................................................................................... 12
2.1.3 Extended list of success criteria ....................................................................................................... 15
2.2 UNDERSTANDING PROJECT FAILURE .............................................................................................................. 19
2.2.1 Causes related to project management .......................................................................................... 19
2.2.2 Causes related to stakeholders........................................................................................................ 25
2.2.3 Forensic analyses of design processes ............................................................................................. 33
2.3 DISCUSSION ............................................................................................................................................. 36
3 APPROACHES TO AVOID PROJECT FAILURE AND ENHANCE PROJECT ROBUSTNESS ............................... 37
3.1 DESIGN METHODOLOGIES ........................................................................................................................... 37
3.2 PROJECT MANAGEMENT ............................................................................................................................. 42
3.2.1 Project planning .............................................................................................................................. 43
3.2.2 Project simulation............................................................................................................................ 43
3.2.3 Project controlling ........................................................................................................................... 44
3.3 CMMI – MATURITY MODELS ...................................................................................................................... 45
3.4 PROJECT RISK MANAGEMENT ...................................................................................................................... 48
3.4.1 Risk models ...................................................................................................................................... 48
3.4.2 Time dependency of risk impacts .................................................................................................... 50
3.4.3 Models of project risk management................................................................................................ 51
3.4.4 Methods of project risk management ............................................................................................. 52
3.4.5 Project risk management application ............................................................................................. 61

VIII
3.5 DISCUSSION ............................................................................................................................................. 62
4 MODELLING PROJECT FAILURE AND LINKING RISK TREATMENT STRATEGIES ......................................... 63
4.1 MODELLING CAUSES OF PROJECT FAILURES..................................................................................................... 63
4.2 LINKING RISK TREATMENT STRATEGIES AND CAUSAL CHAIN OF PROJECT FAILURE .................................................... 66
4.3 LINKING RISK TREATMENT STRATEGIES AND STATE OF THE ART APPROACHES ......................................................... 68
4.4 DISCUSSION AND HYPOTHESES ..................................................................................................................... 70
5 PROJECT ROBUSTNESS: AN EMPIRICAL STUDY ....................................................................................... 73
5.1 STUDYING PRODUCT DEVELOPMENT ............................................................................................................. 73
5.2 THE P3I PROJECT ...................................................................................................................................... 75
5.2.1 Original study design ....................................................................................................................... 75
5.2.2 The self help package ...................................................................................................................... 75
5.3 THE DATA SET .......................................................................................................................................... 76
5.4 METHODS ............................................................................................................................................... 76
5.5 SUCCESS CRITERIA ..................................................................................................................................... 78
5.6 SAMPLE PROFILE ....................................................................................................................................... 79
5.6.1 Company data ................................................................................................................................. 79
5.6.2 Product development ...................................................................................................................... 80
5.6.3 Capabilities profile ........................................................................................................................... 81
5.6.4 Self assessment of core competencies............................................................................................. 83
5.7 FINDINGS ................................................................................................................................................ 85
5.7.1 H1 – systematic project execution ................................................................................................... 85
5.7.2 H2 – project risk management ........................................................................................................ 89
5.7.3 H3 – capabilities .............................................................................................................................. 92
5.7.4 H4 – maturity .................................................................................................................................. 98
5.7.5 Explorative analysis of selected factors ......................................................................................... 103
5.8 DISCUSSION ........................................................................................................................................... 106
6 SUPPORT OF RISK TREATMENT PRE-SELECTION ................................................................................... 109
6.1 FOCUS OF THE PROPOSED APPROACH .......................................................................................................... 109
6.2 RISK IMPACT EVOLVEMENT CATEGORIES ...................................................................................................... 110
6.3 EPISODES OF RISK IMPACT EVOLVEMENT ...................................................................................................... 112
6.4 COMPARISON OF RISK TREATMENT EFFECTS DEPENDENT ON RISK IMPACT EVOLVEMENT ........................................ 113
6.4.1 Sudden burst .................................................................................................................................. 114
6.4.2 Rising ............................................................................................................................................. 114
6.4.3 Snowballing ................................................................................................................................... 116
6.5 PRE-SELECTION OF SUITABLE RISK TREATMENT STRATEGIES .............................................................................. 118
6.5.1 Question based pre-selection of risk treatment strategies ........................................................... 118
6.5.2 Matrix based pre-selection of risk treatment strategies ............................................................... 119
6.6 REMARKS ON FINAL STRATEGY SELECTION .................................................................................................... 121
7 RISK TREATMENT STRATEGY PRE-SELECTION – APPLICATION EVALUATION......................................... 123
7.1 STUDY DESIGN........................................................................................................................................ 123
7.1.1 Intention of the study and research questions .............................................................................. 123
7.1.2 Selection of the research method .................................................................................................. 123
7.1.3 Execution of the study ................................................................................................................... 124
7.2 SAMPLE PROFILE ..................................................................................................................................... 126
7.3 FINDINGS .............................................................................................................................................. 131
7.3.1 Risk treatment strategy selection: current practice ...................................................................... 131
7.3.2 Application of the question based support .................................................................................... 136

IX
7.4 REFLECTIONS OF THE INTERVIEWER............................................................................................................. 140
7.5 DISCUSSION ........................................................................................................................................... 141
8 CONCLUSIONS ...................................................................................................................................... 143
8.1 SUMMARY ............................................................................................................................................. 143
8.2 CONCLUSIONS ........................................................................................................................................ 146
8.3 SUGGESTIONS FOR FURTHER RESEARCH ....................................................................................................... 147
REFERENCES ................................................................................................................................................. 151
APPENDIX – APPLICATION EVALUATION QUESTIONS ................................................................................... 161

X
XI
LIST OF FIGURES
Figure 1-1: Assessment of project performance n=82 (Engel and Holm 2004) ..................................... 1
Figure 1-2: Characteristics of projects according to (Litke 1993) ............................................................ 2
Figure 1-3: Bugatti Veyron (Autoclub 2005) ............................................................................................ 4
Figure 1-4: Airbus A380 (Airbus 2007) .................................................................................................... 4
Figure 1-5: Volkswagen Eos (Volkswagen 2009) ..................................................................................... 5
Figure 1-6: Taguchi’s concept of robustness, according to (Kamiske and Brauer 1995) ........................ 6
Figure 1-7: Research approach based on the Design Research Methodology, adapted from (Blessing
and Chakrabarti 2009) ............................................................................................................................. 8
Figure 2-1: Link between project objectives and project success (Baccarini 1999) .............................. 17
Figure 2-2: Most important causes for deviations from project goals, n=100 (Bullinger, Kiss-
Preußinger et al. 2003) .......................................................................................................................... 19
Figure 2-3: Barriers for successful project management, multiple answers were possible, n=230
(Akademie 1997) ................................................................................................................................... 20
Figure 2-4: Causes for project failures, multiple answers were possible, n=98 (Engel and Holm 2004)
............................................................................................................................................................... 20
Figure 2-5: Prioritized problem areas in product development that need addressing (Grabowski and
Geiger 1997), multiple answers were possible ..................................................................................... 22
Figure 2-6: Steps in the organisation of complex action (Dörner 1996) ............................................... 28
Figure 2-7: Failures during problem solving (Ehrlenspiel 2002) ............................................................ 29
Figure 2-8: Division of critical situations according to the general problem solving process
(Frankenberger and Badke-Schaub 1998) ............................................................................................. 30
Figure 2-9: Examples of factors that influence critical situation within the design process
(Frankenberger and Badke-Schaub 1998) ............................................................................................. 31
Figure 2-10: The C-QuARK method (Ahmed and Wallace 2001) ........................................................... 33
Figure 2-11: Checklist for the project level (Hales and Gooch 2004) .................................................... 35

XII
Figure 3-1: Application of methods in German industry (Grabowski and Geiger 1997); n=415 ........... 39
Figure 3-2: General approach to design (Pahl, Beitz et al. 2007) .......................................................... 40
Figure 3-3: Project planning process and outcomes (Wallmüller 2004) ............................................... 43
Figure 3-4: Project controlling process (Litke 2007).............................................................................. 44
Figure 3-5: History of CMMs (Carnegie 2006) ....................................................................................... 45
Figure 3-6: CMMI model components (Carnegie 2006) ........................................................................ 46
Figure 3-7: Example of an achievement and a target profile (Carnegie 2006) ..................................... 47
Figure 3-8 Simple risk model (Smith and Merritt 2002) ........................................................................ 48
Figure 3-9: Cascade risk model (Smith and Merritt 2002) .................................................................... 49
Figure 3-10: Ishikawa risk model (Smith and Merritt 2002).................................................................. 49
Figure 3-11: Standard risk model (Smith and Merritt 2002) ................................................................. 50
Figure 3-12: Time dependency of impact caused by an event (Seibold 2006) ..................................... 51
Figure 3-13: General risk management process (McMahon and Busby 2005) ..................................... 51
Figure 3-14: FMEA chart example (Pahl, Beitz et al. 2007) ................................................................... 54
Figure 3-15: RFMEA scatter plot, RPN vs. Risk score (Carbone and Tippett 2004) ............................... 57
Figure 3-16: Risk grid (Patzak and Rattay 2004) .................................................................................... 58
Figure 3-17: Risk treatment options (Smith and Merritt 2002) ............................................................ 59
Figure 3-18: Decision elements for risk contingencies (Kerzner 2006) ................................................. 60
Figure 3-19: Constraints of risk treatment strategy selection (Kerzner 2006) ...................................... 61
Figure 4-1: Representation of project failure as causal chain ............................................................... 63
Figure 4-2: Representation of project failure as causal network .......................................................... 64
Figure 4-3: Project failure causality model – a project risk management perspective ......................... 65
Figure 4-4: Multi-project dependencies of effects and consequences ................................................. 65
Figure 4-5: Relations between risk treatment strategies and causal chain of project failure .............. 67
Figure 5-1: Units of analysis and methods of empirical research in social sciences (Bender, Reinicke et
al. 2002) ................................................................................................................................................. 73
Figure 5-2: Selection of analysable data ............................................................................................... 76
Figure 5-3: Categorisation of company success (n=141) ....................................................................... 79

XIII
Figure 5-4: Number of employees (a) and designers (b), n=141 ........................................................... 79
Figure 5-5: Annual sales in m £, n=141 ................................................................................................. 80
Figure 5-6: Market sector ...................................................................................................................... 80
Figure 5-7: Type of production .............................................................................................................. 80
Figure 5-8: Capabilities profile .............................................................................................................. 81
Figure 5-9: Detailed capabilities profile – part 1 ................................................................................... 82
Figure 5-10: Detailed capabilities profile – part 2 ................................................................................. 82
Figure 5-11: Self assessment of maturity of core competencies .......................................................... 84
Figure 5-12: Dependency between product creation strategy and company success (p=0.031;
X2=6.95; n=116) ..................................................................................................................................... 86
Figure 5-13: Formation of cluster describing systematic project execution (two-step cluster analysis)
............................................................................................................................................................... 87
Figure 5-14: Dependency between systematic product development approach and company success
(p=0.019; X2=5.473; n=110; two-sided test) ......................................................................................... 88
Figure 5-15: Formation of cluster describing systematic project risk management (two-step cluster
analysis) ................................................................................................................................................. 91
Figure 5-16: Dependency between clusters representing application of project risk management and
company success (p=0.011; X2=6.542; n=58; two-sided test) .............................................................. 91
Figure 5-17: Dependency between capability rating and company success (n=141) ........................... 94
Figure 5-18: Formation of cluster describing range of capabilities (two-step cluster analysis) ........... 96
Figure 5-19: Dependency between clusters describing holism of capabilities and company success
(p=0.084; X2=2.979; n=141; two-sided test) ......................................................................................... 97
Figure 5-20: Dependencies between successful and less successful companies regarding self
assessments of maturity levels of core competencies .......................................................................... 99
Figure 5-21: Formation of cluster describing holism of maturity of core competencies (two-step
cluster analysis, n=128) ....................................................................................................................... 101
Figure 5-22: Dependency between clusters describing maturity in core competencies and company
success (p=0.005; X2=7.735; n=128; two-sided test) .......................................................................... 102
Figure 5-23: Have you clearly defined your goals in relation to the 'products' you are providing and
the markets and customers you are able to access? (n=117; answers encoded)............................... 103
Figure 5-24: Have you, as a result of regular reviews, a clear vision of how you wish the company
move forward? (n=116; answers encoded) ........................................................................................ 104

XIV
Figure 5-25: Do you interrogate and observe what your potential customers want of your products
and match their needs to the detail features and parameters of your products? (n=114; answers
encoded) .............................................................................................................................................. 104
Figure 5-26: Do you liaise regularly with your customers in order to provide education and training
for your company staff in researching your customers’ requirements? (n=103; answers encoded) . 105
Figure 5-27: Are you using a frozen specification so that you don't have continual interruptions and
delays to accommodate changes? (n=131; answers encoded)........................................................... 105
Figure 6-1: Focus of the proposed approach referring to the general risk management process
adapted from McMahon and Busby (McMahon and Busby 2005) ..................................................... 109
Figure 6-2: Sudden burst ..................................................................................................................... 110
Figure 6-3: Rising ................................................................................................................................. 111
Figure 6-4: Snowballing ....................................................................................................................... 111
Figure 6-5: Episodes of impact rise and corrective risk management activities ................................. 112
Figure 6-6: Effect of proactive risk treatment aiming at a limitation of the impact compared to
reactive risk treatment ........................................................................................................................ 114
Figure 6-7: Effect of proactive risk treatment aiming at a limitation of the impact compared to
reactive risk treatment ........................................................................................................................ 114
Figure 6-8: Effect of proactive risk treatment aiming at a halt of impact evolvement compared to
reactive risk treatment ........................................................................................................................ 115
Figure 6-9: Effect of proactive risk treatment aiming at an enhancement of impact detection in
combination with proactive risk treatment aiming at a halt of impact evolvement compared to
reactive risk treatment ........................................................................................................................ 115
Figure 6-10: Effect of proactive risk treatment aiming at a limitation of the impact compared to
reactive risk treatment ........................................................................................................................ 116
Figure 6-11: Effect of proactive risk treatment aiming at a halt of impact evolvement compared to
reactive risk treatment ........................................................................................................................ 117
Figure 6-12: Effect of proactive risk treatment aiming at an enhancement of impact detection in
combination with proactive risk treatment aiming at a halt of impact evolvement compared to
reactive risk treatment ........................................................................................................................ 117
Figure 6-13: Question based support of strategy pre-selection ......................................................... 119
Figure 6-14: Optimum level of risk prevention adapted from Ahrendts and Marton (2008) ............. 121
Figure 7-1: (a) Number of employees; (b) number of designers ......................................................... 126
Figure 7-2: Annual sales in € ................................................................................................................ 126

XV
Figure 7-3: Company growth rate compared to branch average ........................................................ 127
Figure 7-4: Capabilities profile (n=10) ................................................................................................. 127
Figure 7-5: a) Type of product; b) Novelty of the design .................................................................... 128
Figure 7-6: Type of production ............................................................................................................ 128
Figure 7-7: Duration of the analysed projects in months ................................................................... 129
Figure 7-8: Number of designers involved in the analysed projects ................................................... 129
Figure 7-9: Years working in the company .......................................................................................... 129
Figure 7-10: Number of projects completed as (a) a designer; (b) project leader.............................. 130
Figure 7-11: Self assessment of risk management maturity (n=10).................................................... 130
Figure 7-12: Severity of impacts of analysed risks .............................................................................. 131
Figure 7-13: Categorisation of real risk impact evolvement ............................................................... 132
Figure 7-14: severity of risk impacts dependent on risk impact evolvement category ...................... 132
Figure 7-15: Overview of real risk treatment (n=45, multiple answers were possible) ...................... 133
Figure 7-16: Real risk treatment strategies and their combinations used for the identified risk impact
evolvement categories ........................................................................................................................ 133
Figure 7-17: Risk treatment strategy selection process (n=10, multiple answers were possible) ...... 134
Figure 7-18: Criteria used for risk treatment strategy selection (n=10, multiple answers were possible)
............................................................................................................................................................. 134
Figure 7-19: Responsibility for risk treatment strategy selection (n=10, multiple answers were
possible because responsibility can vary for different risks) .............................................................. 135
Figure 7-20: Frequency of combinations of answers (n=45) ............................................................... 136
Figure 7-21: Risk treatment strategies selected using the question based support (n=45) ............... 137
Figure 7-22: Accordance of real strategy with pre-selection using the question based support (n=45)
............................................................................................................................................................. 137
Figure 7-23: Suitability of suggestions of the question based support, assessed by the participants 139
Figure 8-1: Project failure causality model .......................................................................................... 144
Figure 8-2: Relations between risk treatment strategies and causal chain of project failure ............ 145

XVI

XVII
LIST OF TABLES
Table 2-1: Relation between project types and overriding objectives - according to (Wit 1988) ........ 12
Table 2-2: Criteria used for judging project success, n=236 (White and Fortune 2002) ...................... 13
Table 2-3: The three major criteria for success, n=132 (Wateridge 1998) ........................................... 14
Table 2-4: Kerzner’s classification of success criteria (Kerzner 2006) ................................................... 15
Table 2-5: Success dimensions and success criteria proposed by (Lipovetsky, Tishler et al. 1997)...... 16
Table 2-6: Factors believed to be most critical to the project’s outcome, n=236 (White and Fortune
2002) ...................................................................................................................................................... 21
Table 2-7: Problems and weaknesses – examples (Grabowski and Geiger 1997) ................................ 23
Table 2-8: Success factors for the handling of critical situations, according to (Badke-Schaub and
Frankenberger 2004) ............................................................................................................................. 32
Table 3-1: Methods supporting the early phases of the design process and embodiment design phase
according to (Pahl, Beitz et al. 2007) ..................................................................................................... 38
Table 3-2: Project risk management methods – examples proposed in standard literature ............... 52
Table 3-3: RFMEA terminology compared to FMEA terminology (Carbone and Tippett 2004) ........... 55
Table 3-4: Impact and detection value guidelines (Carbone and Tippett 2004) ................................... 56
Table 5-1: Description of maturity levels - examples ............................................................................ 83
Table 5-2: Answers to questions related to systematic project execution ........................................... 85
Table 5-3: Test of dependencies between Q1_H1, Q2_H1, Q3_H1 and company success .................. 86
Table 5-4: Importance of variables representing systematic project execution .................................. 86
Table 5-5: Answers to questions related to systematic project execution ........................................... 89
Table 5-6: Test of dependencies between Q1_H2, Q2_H2, Q3_H2 and company success .................. 90
Table 5-7: Importance of variables representing systematic project risk management ...................... 90
Table 5-8: Capability areas covered by hypothesis 3 ............................................................................ 92

XVIII
Table 5-9: Test of dependencies between questions indicating capability areas and company success
............................................................................................................................................................... 95
Table 5-10: Importance of variables representing wide-ranging capabilities ....................................... 95
Table 5-11: Test of dependencies between questions indicating capability areas and company success
............................................................................................................................................................. 100
Table 5-12: Importance of variables representing holism of maturity in core competencies ............ 100
Table 6-1: Matrix based support of strategy pre-selection ................................................................. 120
Table 7-1: Course of the study ............................................................................................................ 124
Table 7-2: Examples of analysed risks ................................................................................................. 131
Table 7-3: Comparison of real risk treatment and suggestions of the question based support......... 138

XIX

XX
1
1 MOTIVATION
1.1 Project failure
Product development is usually conducted as a project (Pahl, Beitz et al. 2007). Despite the use of
project management methods, a large number of projects do not meet the stakeholder’s
expectations. Overrunning schedules and budgets is more the rule than the exception (Wheelwright
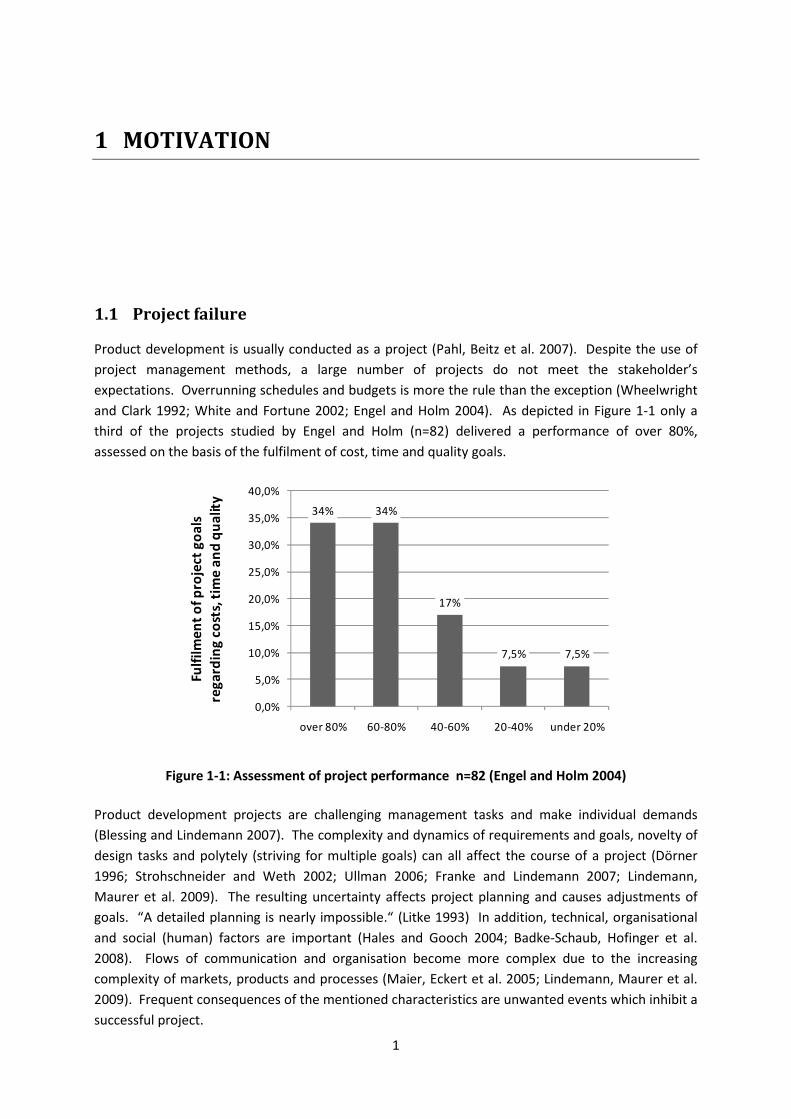
and Clark 1992; White and Fortune 2002; Engel and Holm 2004). As depicted in Figure 1-1 only a
third of the projects studied by Engel and Holm (n=82) delivered a performance of over 80%,
assessed on the basis of the fulfilment of cost, time and quality goals.
Figure 1-1: Assessment of project performance n=82 (Engel and Holm 2004)
Product development projects are challenging management tasks and make individual demands
(Blessing and Lindemann 2007). The complexity and dynamics of requirements and goals, novelty of
design tasks and polytely (striving for multiple goals) can all affect the course of a project (Dörner
1996; Strohschneider and Weth 2002; Ullman 2006; Franke and Lindemann 2007; Lindemann,
Maurer et al. 2009). The resulting uncertainty affects project planning and causes adjustments of
goals. “A detailed planning is nearly impossible.“ (Litke 1993) In addition, technical, organisational
and social (human) factors are important (Hales and Gooch 2004; Badke-Schaub, Hofinger et al.
2008). Flows of communication and organisation become more complex due to the increasing
complexity of markets, products and processes (Maier, Eckert et al. 2005; Lindemann, Maurer et al.
2009). Frequent consequences of the mentioned characteristics are unwanted events which inhibit a
successful project.
34% 34%
17%
7,5% 7,5%
0,0%
5,0%
10,0%
15,0%
20,0%
25,0%
30,0%
35,0%
40,0%
over 80% 60-80% 40-60% 20-40% under 20%
Fulf
ilm
en
t o
f p
roje
ct g
oa
ls
reg
ard
ing
co
sts,
tim
e a
nd
qu
ality

2
1.2 Uncertainty as a characteristic of product development projects
Budgets and delivery dates of product development projects are usually tight and the tolerance of
project sponsors (clients and corporate management) with respect to deviations is usually limited.
Hence, it is important to make precise forecasts about the execution of the project. However,
characteristics of projects, complexity, dynamics, novelty of tasks, imprecise goal definitions and
uncertainty (see Figure 1-2) make precise forecasts a challenge (Litke 1993; Dörner 1996).
Figure 1-2: Characteristics of projects according to (Litke 1993)
Attempts to forecast the course of dynamic and interdependent actions which lie far ahead (such as
product development projects) can only ever be best guesses that describe one of several possible
alternatives and are based on various explicit and implicit assumptions. Such forecasts are riddled
with uncertainty.
Browning (1998) defines six categories of uncertainties which can affect project plans:
• Performance
Uncertainty in the ability of a design to meet desired quality criteria (along any one or
more dimensions of merit, including price and timing)
• Schedule
Uncertainty in the ability of a project to develop an acceptable design (i.e., to sufficiently
reduce performance risk) within a span of time
• Development cost
Uncertainty in the ability of a project to develop an acceptable design (i.e., to sufficiently
reduce performance risk) within a given budget
• Technology
A subset of performance risk: uncertainty in the capability of technology to provide
performance benefits (within cost and/or schedule expectations)
Project
Imprecise goal
def inition
Complexity
Novelty of task
High uncertainty
High risk
Dynamics
Interdiscipli-narity
Temporal limitation
Uniqueness of task
Limited ressources

3
• Market
Uncertainty in the anticipated utility or value to the market of the chosen “design to”
specifications (including price and timing)
• Business
Uncertainty in political, economic, labour, societal, or other factors in the business
environment
Creativity and courage are preconditions for product development and innovations which secure the
growth of the company (Yates 1998; Kelley and Littmann 2006; Blessing and Lindemann 2007).
Excluding every uncertainty – if at all possible - can limit creativity and discourage from trying
something new. Thus, it is of vital importance that some uncertainties in the domain of product
development are accepted.
1.3 Examples of failed product development projects
In the following, some well-known examples of failed projects will be discussed.
Bugatti Veyron
The Bugatti 16.4 (see Figure 1-3) is a sports car developed by Volkswagen. Having acquired the
trademark rights for Bugatti, Volkswagen presented a concept car with the aim to relaunch the
brand. The project team which was responsible for the development of the car was faced with some
severe problems (Bugatti 2009; Manager-Magazin 2009).
Aerodynamic
The design of the concept car caused problems regarding its aerodynamic properties. The requested
maximum speed of 407 km/h (259 mph) required a wedge-shaped car body, which differed from the
proposed design. A hydraulic spoiler which unfolds at a pre-defined speed was developed, adding to
budget and schedule.
Engine
The 16-cylinder engine and the four turbochargers which offer 1001 HP (736 kW) required new
solutions for the cooling system, which were not foreseen in the budget.
Gearbox
The first prototypes of the new seven-gear clutch transmission collapsed under the load of 1250 Nm.
This required the development of a new gearbox, which was not planned.
Safety-standards
The safety and quality standards required a revision of the front body. The redesign and the required
tools for the carbon fibre construction strained the schedule and budget.

Figure
Consequences
The mentioned problems caused a delay
costs. As a consequence, the costs of the Bugatti will never break even
Volkswagen approved the deviations from the project goals
increase the prestige of both Bugatti and Volkswagen.
Airbus A380
In the year 2000 the EADS subsidiary company Airbus decided to develop a new wide
the Airbus A380 (see Figure 1-4). The project had a budget of 12 billion Euros
In spring 2005 Airbus admitted a slippage of the schedule.
revealed little by little. One reason was a static load test of the wings which resulted in a
revision of the design (Spiegel 2006a)
Figure
A further reason was the inconsistent CAD data.
the CAD software at the different development sites.
design of the cableforms of the board entertainment system
Further delays were caused by massive problems
the different development sites
4
Figure 1-3: Bugatti Veyron (Autoclub 2005)
The mentioned problems caused a delay in product launch of two years and considerable additiona
he costs of the Bugatti will never break even (Manager
the deviations from the project goals, as the new solutions
Bugatti and Volkswagen.
subsidiary company Airbus decided to develop a new wide
). The project had a budget of 12 billion Euros (BBC 2004)
In spring 2005 Airbus admitted a slippage of the schedule. The reasons for
reason was a static load test of the wings which resulted in a
(Spiegel 2006a).
Figure 1-4: Airbus A380 (Airbus 2007)
inconsistent CAD data. The development team used different releases of
the CAD software at the different development sites. One of the consequences was the incorrect
the board entertainment system (Spiegel 2006b).
delays were caused by massive problems in the coordination and communication between
the different development sites (Manager 2006). The mentioned problems led to a
of two years and considerable additional
(Manager-Magazin 2004).
new solutions were considered to
subsidiary company Airbus decided to develop a new wide-bodied aircraft,
(BBC 2004).
reasons for the problem were
reason was a static load test of the wings which resulted in a major
The development team used different releases of
One of the consequences was the incorrect
and communication between
The mentioned problems led to a total delay of

more than two years and 2.5 billion Euros
of the management structure
(Manager 2008).
Volkswagen Eos
Volkswagen decided to develop an innovative folding roof made from glass and steel for their new
cabriolet (see Figure 1-5). The integration of a sliding roof into the folding roof posed a challenge to
the development team (Handelsblatt 2006)
with a buckling resistant car body
These challenges required rework and caused a delayed market entry. Volkswagen and its suppliers
decided to introduce a training program to all designers
2006).
Figure
Discussion
These examples make clear that product development projects carry
and for the people dependent on the project
covered different issues: technology, communication, professional skills and of course the project
planning itself.
By analysing such examples, it is usually easy to formulate recommendations
problem (e.g. to use only one software version)
root causes, but only symptoms of deeper causes.
solve the problems appropriately
improvement of the situation should be based on a detailed causal analysis.
5
more than two years and 2.5 billion Euros (BBC 2004; Spiegel 2006c) and resulted in a radical revision
and cost cutting measures and caused uncertainty of many jobs
Volkswagen decided to develop an innovative folding roof made from glass and steel for their new
The integration of a sliding roof into the folding roof posed a challenge to
(Handelsblatt 2006). The design required accurate clearances in combination
body (FAZ 2006).
These challenges required rework and caused a delayed market entry. Volkswagen and its suppliers
decided to introduce a training program to all designers to avoid similar failures in the future
Figure 1-5: Volkswagen Eos (Volkswagen 2009)
examples make clear that product development projects carry severe risks for the company
people dependent on the project outcome. The examples also showed that the problems
covered different issues: technology, communication, professional skills and of course the project
it is usually easy to formulate recommendations to
(e.g. to use only one software version). However, the identified problems may not be the
root causes, but only symptoms of deeper causes. Hence, addressing these reduces the chance to
solve the problems appropriately. Recommendations and measures which aim to
the situation should be based on a detailed causal analysis.
resulted in a radical revision
and caused uncertainty of many jobs
Volkswagen decided to develop an innovative folding roof made from glass and steel for their new
The integration of a sliding roof into the folding roof posed a challenge to
The design required accurate clearances in combination
These challenges required rework and caused a delayed market entry. Volkswagen and its suppliers
to avoid similar failures in the future (FAZ
risks for the company
The examples also showed that the problems
covered different issues: technology, communication, professional skills and of course the project
to solve the identified
he identified problems may not be the
se reduces the chance to
ecommendations and measures which aim to provide a lasting
6
1.4 Robustness
The word robustness is colloquially used to mean “The property of strong in constitution” (Websters
2009). In the domain of mechanical engineering it is associated with the concept of robust design.
Taguchi’s robust design
Robust design focuses on manufacturing processes and addresses issues of quality management
(Phadke 1989; Taguchi, Chowdhury et al. 2005). According to Taguchi robust processes are defined
as:
“Processes are robust, if the result of the process depends as little as possible from inevitable
variations of parameters, material properties, environmental conditions etc.” (Kamiske and Brauer
1995)
The concept of robust design was developed by Taguchi to reduce the consequences of disturbances
during the manufacturing process (Kerzner 2006). A disturbance is defined as an event that
hampers, disrupts or affects an action in a way contrary to the actual intention of the initiator
(Badke-Schaub and Frankenberger 2004).
Taguchi’s quality philosophy is based on the comparison of a target value with the observed values of
a chosen quality characteristic of a manufacturing process. He uses a quality loss function, rather
than the traditional tolerance range for the target value. Accordingly, every deviation of a realised
value from the target value is a loss. The traditional approach accepts deviations that stay between
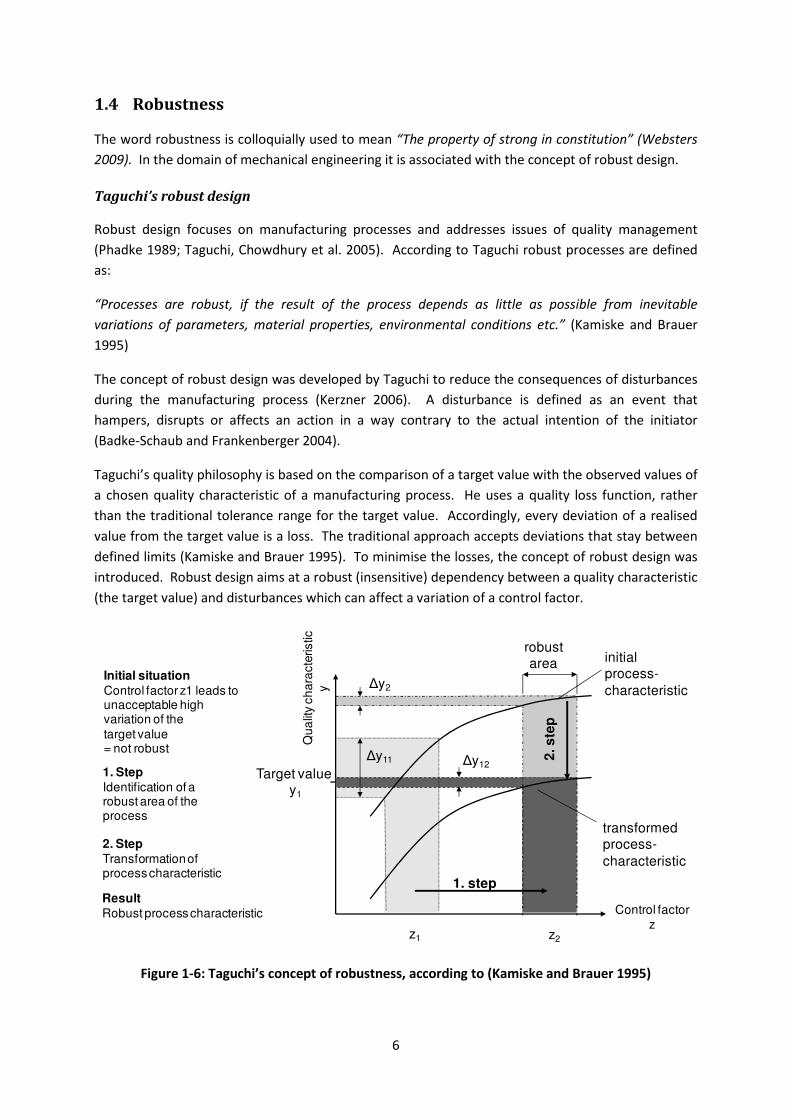
defined limits (Kamiske and Brauer 1995). To minimise the losses, the concept of robust design was
introduced. Robust design aims at a robust (insensitive) dependency between a quality characteristic
(the target value) and disturbances which can affect a variation of a control factor.
Figure 1-6: Taguchi’s concept of robustness, according to (Kamiske and Brauer 1995)
Control factor
z
Qu
alit
y c
ha
racte
ristic
y
Target value y1
initialprocess-
characteristic
transformedprocess-
characteristic
z1 z2
robustarea
∆y11
∆y2
∆y12
1. step
2. s
tep
Initial situation
Control factor z1 leads tounacceptable highvariation of the
target value= not robust
1. Step
Identification of arobust area of theprocess
2. Step
Transformation ofprocess characteristic
Result
Robust process characteristic

7
To affect the robustness, the dependency between a control factor and a quality characteristic can
be changed in two steps (see Figure 1-6). Assuming there is a non-linear relation between the
control factor and the quality characteristic, a new control factor is chosen which has a less sensitive
dependency between a variation of the control factor and the dependent variation of the quality
characteristic. In a second step, the characteristic of the manufacturing process is transformed in a
way that the target value can be attained using the less sensitive (more robust) dependency between
the control factor and the quality characteristic (Kamiske and Brauer 1995).
Project Robustness
Taguchi’s concept of process robustness is capable to enhance processes; therefore its application to
product development projects seems promising. As mentioned before, product development
projects are affected by uncertainty, which causes variations of performance, costs and schedules of
a project. A less sensitive (more robust) relation between control factors and quality characteristics
(project success criteria) would be a desirable characteristic of product development projects.
As the methods of robust design focus on production systems and processes which are mainly
repetitive, they cannot be transferred directly to product development projects. First, Taguchi’s
definition of robustness is adapted to the domain of project management. In this dissertation the
term robust project is defined as follows:
Projects are robust, if the achievement of the project goals depends as little as possible on unwanted
and unexpected disturbances of the planned project course.
The concept of project robustness aims for smart and tailored solutions, based on a holistic
understanding of the causality of project failures and project success in order to reduce the risk of
failure in projects which are characterised by uncertainty, such as product development projects.
1.5 Goal and research questions
The overall goal of the research described in this dissertation is the enhancement of project
robustness. The focus is on product development projects in the domain of mechanical engineering
and mechatronics.
The overall research questions are:
RQ I. What are the characteristics and properties of a robust project?
RQ II. What influences project robustness?
RQ III. How to enhance project robustness?
The answers to these questions should provide a better understanding of project robustness, its
barriers and enablers. A precondition is the consolidation of existing risk models and the
development of a consistent terminology. Based on this, a support is proposed which aims to
facilitate practitioners in planning of product development projects, in order to deal with uncertainty
and to cope with the resulting risks. The support facilitates a systematic selection of suitable risk
treatment strategies.
8
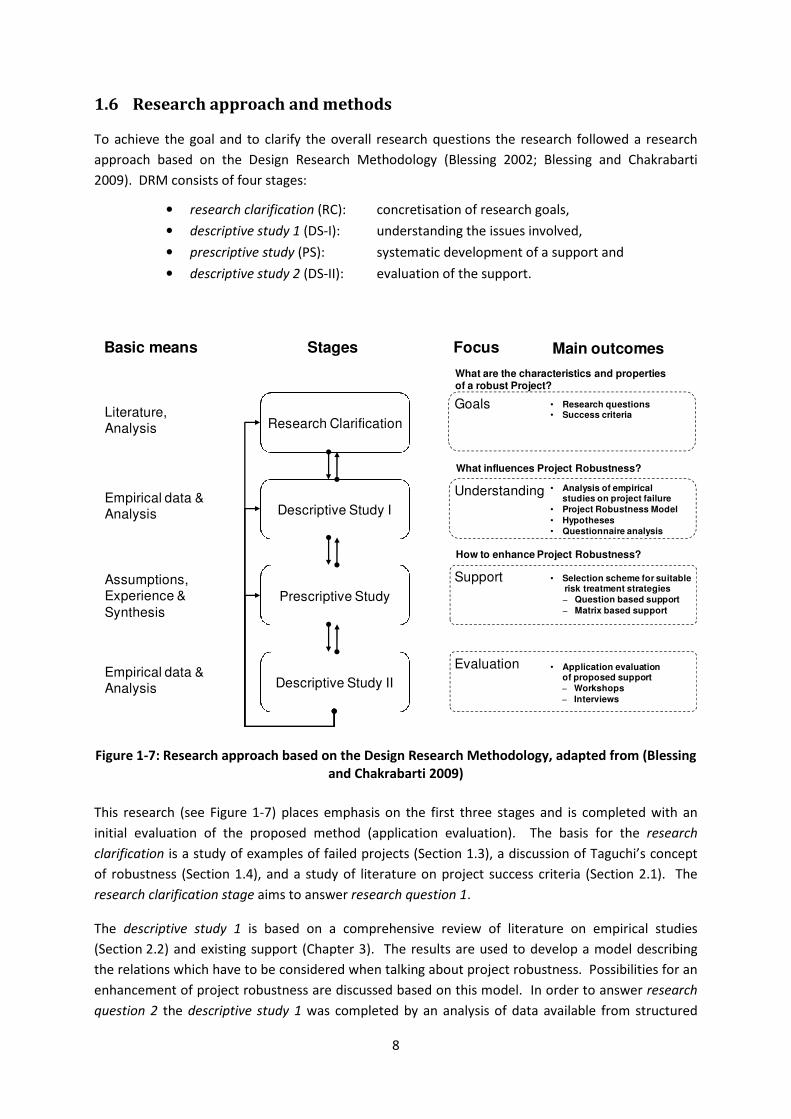
1.6 Research approach and methods
To achieve the goal and to clarify the overall research questions the research followed a research
approach based on the Design Research Methodology (Blessing 2002; Blessing and Chakrabarti
2009). DRM consists of four stages:
• research clarification (RC): concretisation of research goals,
• descriptive study 1 (DS-I): understanding the issues involved,
• prescriptive study (PS): systematic development of a support and
• descriptive study 2 (DS-II): evaluation of the support.
Figure 1-7: Research approach based on the Design Research Methodology, adapted from (Blessing
and Chakrabarti 2009)
This research (see Figure 1-7) places emphasis on the first three stages and is completed with an
initial evaluation of the proposed method (application evaluation). The basis for the research
clarification is a study of examples of failed projects (Section 1.3), a discussion of Taguchi’s concept
of robustness (Section 1.4), and a study of literature on project success criteria (Section 2.1). The
research clarification stage aims to answer research question 1.
The descriptive study 1 is based on a comprehensive review of literature on empirical studies
(Section 2.2) and existing support (Chapter 3). The results are used to develop a model describing
the relations which have to be considered when talking about project robustness. Possibilities for an
enhancement of project robustness are discussed based on this model. In order to answer research
question 2 the descriptive study 1 was completed by an analysis of data available from structured
• Application evaluationof proposed support
− Workshops
− Interviews
Research Clarification
Descriptive Study I
Prescriptive Study
Descriptive Study II
Basic means Stages Focus
Literature,Analysis
Empirical data &Analysis
Assumptions,Experience &
Synthesis
Empirical data &Analysis
Goals
Understanding
Support
Evaluation
• Research questions• Success criteria
• Analysis of empiricalstudies on project failure
• Project Robustness Model
• Hypotheses
• Questionnaire analysis
• Selection scheme for suitablerisk treatment strategies
− Question based support
− Matrix based support
Main outcomes
What are the characteristics and propertiesof a robust Project?
What influences Project Robustness?
How to enhance Project Robustness?

9
questionnaire-based interviews which were conducted as part of a study in the UK (Foxley, Blessing
et al. 2000).
The prescriptive study resulted in a support for the selection of risk treatment strategies. The
proposed support is partially evaluated through a study involving structured interviews and a
workshop during descriptive study 2. Together, the prescriptive study and the descriptive study 2
answer research question 3.
1.7 Chapter overview
Chapters 2 and 3 present the results of the descriptive study 1. In Chapter 4, these results are
consolidated in the project failure causality model and its link with approaches intended to enhance
project robustness. In Chapter 5 hypotheses about the efficacy of activities, capabilities, and
competencies as suggested by the supporting approaches are verified.
In Chapters 6 and 7 a support for the pre-selection of risk treatment strategies and an evaluation of
the proposed support are described. The dissertation is completed by a discussion of the results and
an outlook (Chapter 8).

10

11
2 PROJECT SUCCESS AND FAILURE
The literature study presented in this chapter is intended to provide answers to research questions I
and II.
Projects are defined as robust if the achievement of the project goals depends as little as possible on
unwanted and unexpected disturbances of the planned project course. To achieve a goal – to achieve
a desired result equates to the definition of ‘success’ (Cambridge 2005). Hence, robustness is
strongly related to project success.
Considering the context of this research (product development projects in the domain of mechanical
engineering and mechatronics) and the definition of project robustness, the first research question is
specified by formulating two corresponding questions.
RQ I. What are the characteristics and properties of a robust project?
• How can the concept of robustness be interpreted in the domain of project
management?
• What are relevant criteria for rating project success?
In order to understand influences on project robustness the second research question is specified as
follows:
RQ II. What influences project robustness?
• What are causes for project failure?
• What are relevant success factors?
• What is recommended in literature?
In the following sections different perspectives on project success and project failure and related
research results will be presented guided by these questions.
2.1 Understanding project success
“Project success is a core concept of project management but its definition remains elusive.”
(Baccarini 1999)
2.1.1 Iron triangle
Turner (Turner 1993) defines project success criteria as “The dependent variables by which we will
judge the successful outcome of the project.”.

12
In the past, many authors have suggested time (meeting the schedule), cost (meeting the budget)
and user specification (quality) as the key criteria for the assessment of project success. These
criteria are often called the ‘iron triangle’. This compilation of criteria is under criticism (Wit 1988;
Wateridge 1995; Wateridge 1998; Atkinson 1999; Dvir, Raz et al. 2003; Westerveld 2003; Judgev and
Müller 2005; Westhuizen and Fitzgerald 2006). “This approach is too simplistic, as determining the
project objectives is somewhat more complicated than that.” (Wit 1988) Projects that are completed
on time, on budget and deliver a satisfactory product have been rated as not successful and vice
versa (Wit 1988; Judgev and Müller 2005). Criteria that represent the basis for an assessment of
project success are discussed in the following.
2.1.2 Aspects of rating project success
Project motive
Projects can be classified dependent on the main motive (see Table 2-1). A project has usually
several objectives, which may differ in their prioritisation for different stakeholders. Designers will
probably prioritise the objective ‘It should work’. The management will probably emphasise ‘It
should pay’ or ‘It should exist’. Therefore, it is of importance to clarify the overriding objective
before the project starts as this will influence the way the project will be assessed during and after its
execution because dependent on the motive and the overriding objective the prioritisation of the
success criteria will differ (Wit 1988).
Table 2-1: Relation between project types and overriding objectives - according to (Wit 1988)
Motive Project (example) Overriding objective Primary discipline
Necessity Thames barrier It should work Engineering
Opportunity Nuclear power plant It should pay Economics
Prestige Eifel tower It should exist Politics
Research CERN project Reaching a solution Science
Subjectivity
De Wit gives following definition for ‘project success’: “The project is considered an overall success if
the project meets the technical performance specification and/or mission to be performed, and if
there is a high level of satisfaction concerning the project outcome among key people in the parent
organization, key people in the project team, and key users or clientele of the project effort.” (Wit
1988) The fulfilment of technical performance specifications and the satisfaction of stakeholders’
expectations are not necessarily the same. The definition of de Wit accentuates the subjectivity and
possibly differing perception of success among the stakeholders.

13
Table 2-2: Criteria used for judging project success, n=236 (White and Fortune 2002)
Criteria Sum of re-coded
ranking
Sums ranked
Meets client’s requirements 970 1
Completed within schedule 850 2 Completed within budget 766 3
Meets organisational objectives 188 4
Yields business and other benefits 86 5
Causes minimal business disruption 71 6
Meets quality/safety standards 48 7
Other criteria 20 8
White and Fortune (2002) analysed the criteria used for the assessment of project success of 236
projects (see Table 2-2).
The participants of the study had to indicate and rank (from 1 to 5) the criteria they used for
assessing project success. The ranks were re-coded (1=5 points, 2=4 points, 3=3 points, 4=2 points,
5=1 point). The criteria ranked as most important are ‘meets client’s requirements’, ‘completed
within schedule’ and ‘completed within budget’. The large difference between the sums of the re-
coded ranking of the three most important ranks and the lower ranks indicates conformity between
the participants, which were in majority part of the company management (director 5%, senior
manager 9%, project manager 47%, manager 19%).
Wateridge (1998) compared 132 projects based on the major success criteria used for their
assessment. He involved project managers and users in the study in order to analyse differences
between these groups in the prioritisation of the used success criteria. He also analysed differences
between successful and less successful projects as assessed by the participants).
The comparison of successful and failed projects showed differences regarding the prioritisation of
the three major success criteria used (see Table 2-3). Projects that are perceived by project
managers as having failed were assessed by focussing on ‘meets budget’, ‘meets timescales’ and
‘meets user requirements’, whereas successful projects were assessed using ‘meets user
requirements’, ‘commercial success’ and ‘meets quality’. Wateridge (1998) also found that the
criteria used by the project managers differed from those used by the users for both successful and
failed projects. The criteria ‘meets user requirements’ stands out in this study; in all projects it was
mentioned as one of the three major criteria.

14
Table 2-3: The three major criteria for success, n=132 (Wateridge 1998)
Users % Project managers %
Successful projects:
Meets user requirements 96 Meets user requirements 86
Happy users 71 Commercial success 71
Meets budget 71 Meets quality 67
Failed projects:
Meets user requirements 100 Meets budget 83
Achieves purpose 100 Meets timescales 78
Happy users 67 Meets user requirements 78
The studies of White and Fortune (2002) and Wateridge (1998) disclose two aspects of the current
understanding of project success in practice. Firstly, the ‘iron triangle’ is used by most of the project
managers for the assessment of project success. However, that does not prove that these are the
right criteria. The mentioned criteria may be those project managers look into, as these are the ones
they were taught to consider when determining project success. Secondly, the perception of project
success differs strongly (even within the same project) between project managers and users.
Therefore, the studies show that it is important to consider subjectivity of the person who is judging
project success.
Time-dependency
A further aspect which has to be considered when analysing project success is the time-dependency
of project success judgements. The main criteria on which a judgement about project success is
based changes over time. “During the early phase of the project, schedule is of primary importance,
while cost takes second place and quality third. Later in the project, cost becomes the controlling
interest, with schedule taking a secondary role. After the project has been completed, schedule and
cost problems are easily forgotten and quality becomes the key.” (Avots 1984)
Discussion
As shown, people use different criteria for judging project success. The chosen criteria depend on
the group the people belong to, the project motive (which is often related to the group) and the
point of time they make their judgement. Focussing on the ‘iron triangle’ might bias the judgement
of project success. Therefore, time, cost and quality are not sufficient to judge project success.
“After 50 years it appears that the definitions for project management continue to include a limited
set of success criteria, namely the Iron Triangle, cost, time and quality. These criteria, it is suggested,
are no more than two best guesses and a phenomenon. A finite time resource is possibly the feature
which differentiates project management from most other types of management. However to focus
the success criteria exclusively upon the delivery criteria to the exclusion of others, it is suggested,
may have produced an inaccurate picture of so called failed project management.” (Atkinson 1999)
15
2.1.3 Extended list of success criteria
Research has continued to investigate success criteria and various authors propose extensions to the
‘iron triangle’.
Kerzner
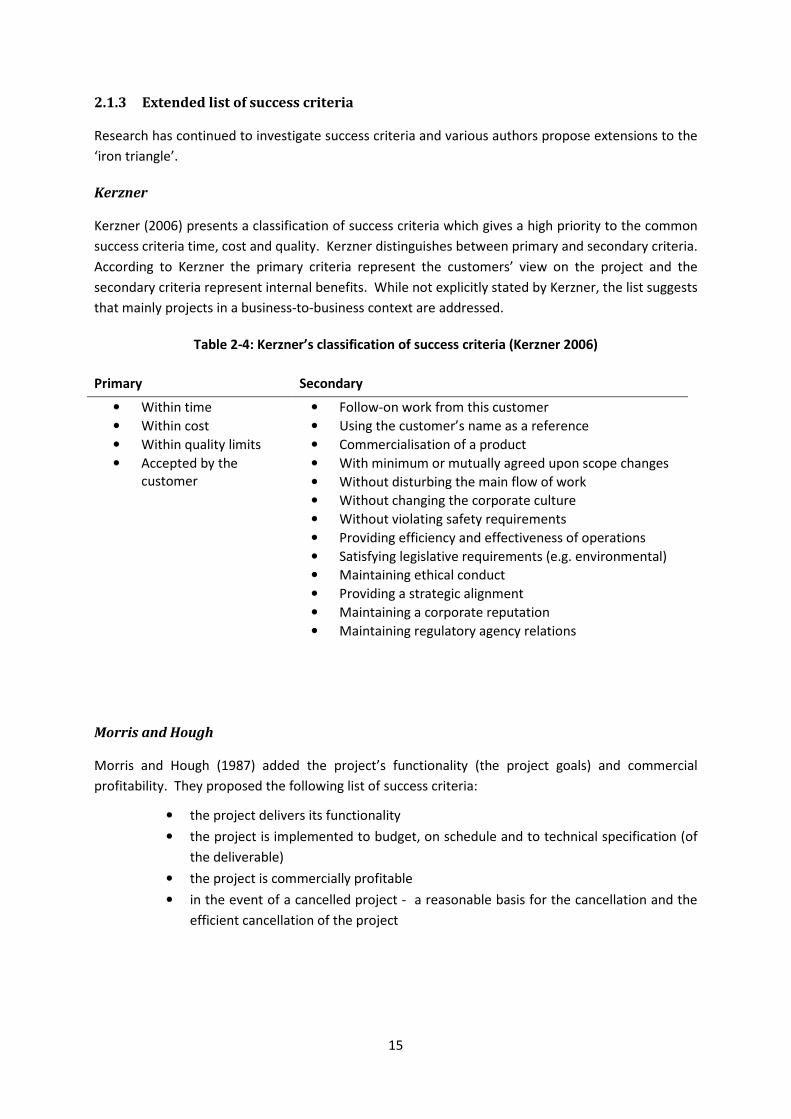
Kerzner (2006) presents a classification of success criteria which gives a high priority to the common
success criteria time, cost and quality. Kerzner distinguishes between primary and secondary criteria.
According to Kerzner the primary criteria represent the customers’ view on the project and the
secondary criteria represent internal benefits. While not explicitly stated by Kerzner, the list suggests
that mainly projects in a business-to-business context are addressed.
Table 2-4: Kerzner’s classification of success criteria (Kerzner 2006)
Primary Secondary
• Within time
• Within cost
• Within quality limits
• Accepted by the
customer
• Follow-on work from this customer
• Using the customer’s name as a reference
• Commercialisation of a product
• With minimum or mutually agreed upon scope changes
• Without disturbing the main flow of work
• Without changing the corporate culture
• Without violating safety requirements
• Providing efficiency and effectiveness of operations
• Satisfying legislative requirements (e.g. environmental)
• Maintaining ethical conduct
• Providing a strategic alignment
• Maintaining a corporate reputation
• Maintaining regulatory agency relations
Morris and Hough
Morris and Hough (1987) added the project’s functionality (the project goals) and commercial
profitability. They proposed the following list of success criteria:
• the project delivers its functionality
• the project is implemented to budget, on schedule and to technical specification (of
the deliverable)
• the project is commercially profitable
• in the event of a cancelled project - a reasonable basis for the cancellation and the
efficient cancellation of the project

16
Turner
Turner (1993) puts more emphasis on the interests of the different stakeholders. The schedule, the
budget and the specifications are no longer the dominant criteria. The success criteria proposed by
(Turner 1993) are that:
• the project achieves its stated business purpose
• the project provides satisfactory benefit to the owner
• the project satisfies the needs of the owner, user and stakeholders
• the project meets its pre-stated objectives
• the outcome is realised to specification, within budget and on time
• the project satisfies the needs of the project team and supporters.
Lipovetsky, Tishler et al.
Lipovetsky, Tishler et al. (1997) analysed the success criteria used in 110 defence projects performed
by Israeli industry. The criteria (respectively the measures to control their achievement) are grouped
into four so-called success dimensions (see Table 2-5). Although the list is influenced by the context
in which the study was conducted, the priority of the context specific criterion ‘benefits to the
defence and national infrastructure’ was rated low. More importantly, the list shows the complexity
of success criteria.
Table 2-5: Success dimensions and success criteria proposed by (Lipovetsky, Tishler et al. 1997)
Success dimension Success measures
Meeting design goals Functional specifications
Technical specifications
Schedule goals
Budget goals
Benefits to the customer Meeting acquisition goals
Meeting the operational need
Product entered service
Reached the end-user on time
Product had a substantial time for use
Product yields substantial improvement in user’s
effectiveness and/or capability User is satisfied with product
Benefits to the developing organisation Project yielded relatively high profit Project opened new markets
Project created a new product line
Project developed a new technological capability
Project improved reputation
Benefits to the defence and Project developed a new technological capability
national infrastructure Project contributed to critical fields
Project maintains a flow of updated generations
Project decreases dependence on outside sources
Contribution to other projects

17
Baccarini
Baccarini (1999) proposes a model of project success which covers a wider range of criteria,
structured in a logical manner. The criteria are linked to four hierarchically arranged classes of
objectives:
• Project goal
the overall strategic orientation to which the project contributes; documented in the
strategic plans of the organisation; provides the rationale behind the project
• Project purpose
intended near-term effects on the users of the project’s output; the achievement of the
project purpose depends on the user’s satisfaction
• Project outputs
the immediate, specific and tangible results or deliverables; what the project will
produce
• Project inputs
required resource inputs and activities for project execution; documented in the project
breakdown structure, schedule and budget
“The project goal and the project’s purpose together explain why the project is undertaken.”
(Baccarini 1999) The four classes are interrelated in two directions. The bottom-up relation explains
how the higher level goal will be achieved: the project inputs are necessary to realise the project
outputs and the project outputs are necessary to achieve the project purpose. The top-down
relation delivers the motivation for the lower level goal. Goal and purpose are the strategic
objectives of the project while outputs and inputs are operational objectives. This distinction
between the different kinds of objectives corresponds to a division of project success (Figure 2-1).
According to Baccarini (1999) project success is the combination of product success and project
management success; whereby product success is superior to project management success because
product success is directly related to the strategic organisational objectives of the company.
Figure 2-1: Link between project objectives and project success (Baccarini 1999)
Product Success Project Management Success
Project Success
Goal Purpose Outputs Inputs
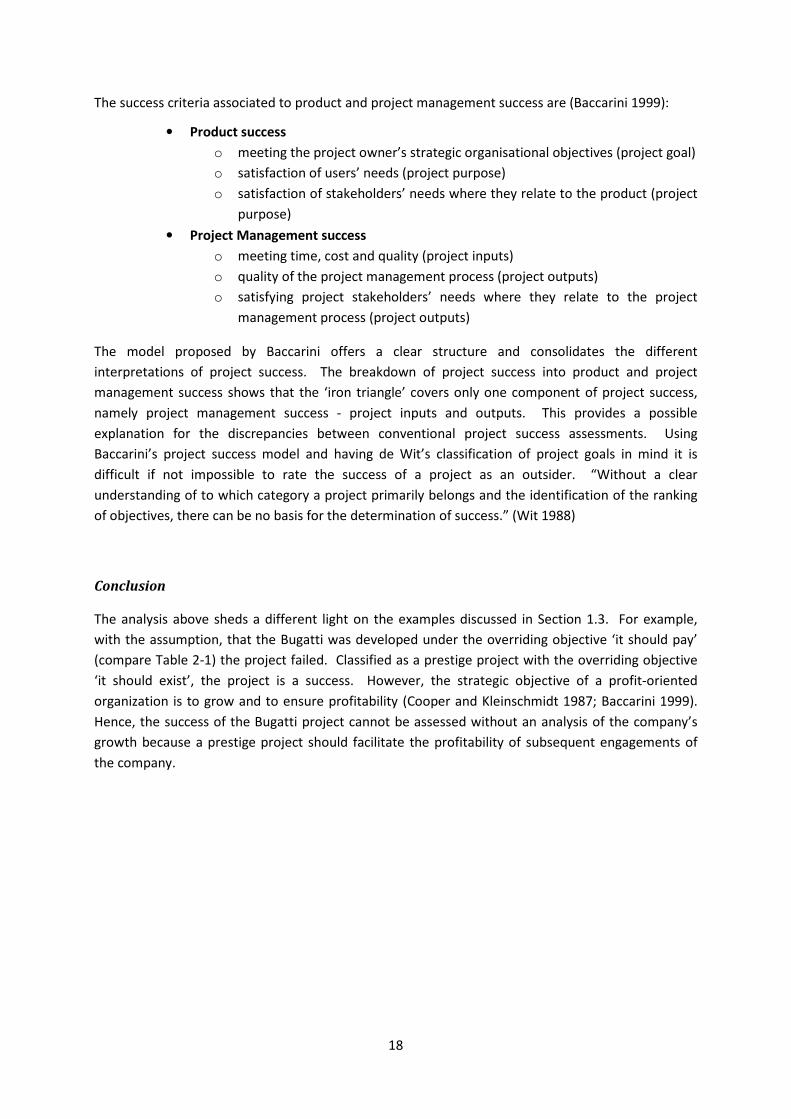
18
The success criteria associated to product and project management success are (Baccarini 1999):
• Product success
o meeting the project owner’s strategic organisational objectives (project goal)
o satisfaction of users’ needs (project purpose)
o satisfaction of stakeholders’ needs where they relate to the product (project
purpose)
• Project Management success
o meeting time, cost and quality (project inputs)
o quality of the project management process (project outputs)
o satisfying project stakeholders’ needs where they relate to the project
management process (project outputs)
The model proposed by Baccarini offers a clear structure and consolidates the different
interpretations of project success. The breakdown of project success into product and project
management success shows that the ‘iron triangle’ covers only one component of project success,
namely project management success - project inputs and outputs. This provides a possible
explanation for the discrepancies between conventional project success assessments. Using
Baccarini’s project success model and having de Wit’s classification of project goals in mind it is
difficult if not impossible to rate the success of a project as an outsider. “Without a clear
understanding of to which category a project primarily belongs and the identification of the ranking
of objectives, there can be no basis for the determination of success.” (Wit 1988)
Conclusion
The analysis above sheds a different light on the examples discussed in Section 1.3. For example,
with the assumption, that the Bugatti was developed under the overriding objective ‘it should pay’
(compare Table 2-1) the project failed. Classified as a prestige project with the overriding objective
‘it should exist’, the project is a success. However, the strategic objective of a profit-oriented
organization is to grow and to ensure profitability (Cooper and Kleinschmidt 1987; Baccarini 1999).
Hence, the success of the Bugatti project cannot be assessed without an analysis of the company’s
growth because a prestige project should facilitate the profitability of subsequent engagements of
the company.

19
2.2 Understanding project failure
Based on his discussion of success criteria de Wit (1988) concludes: “It is evident that measuring
success is complex and a project is hardly ever a disaster or failure for all stakeholders during all
phases in the project life-cycle. Therefore, a project can be a success for one party and a disaster for
another. Success is also time dependent. A project may be perceived a success one day and a failure
the next. Therefore, to think that one can objectively measure the success of a project is an illusion.”
Nevertheless a multitude of projects clearly do fail and, in doing so, provide helpful hints for
preventing a repetition of the same mistakes. The following section presents five studies on the
causes of project failures.
2.2.1 Causes related to project management
Bullinger
Bullinger et. al (2003) conducted a study under the title ‘automotive development in Germany – how
safe is the future?’. The aim of the study was to identify the potential for optimisation in the
automotive industry. Participants of the study were managers from OEMs (Original Equipment
Manufacturers) as well as 1st tier and 2nd tier suppliers. The study involved interviews (n=40) and a
questionnaire (n=100). One of the questions in the questionnaire was “What are the most important
causes for deviations from project goals?” The answers are summarised in Figure 2-2.
The result clearly shows a general criticism of the feasibility of the project plan.
Figure 2-2: Most important causes for deviations from project goals, n=100 (Bullinger, Kiss-
Preußinger et al. 2003)
Akademie
The Akademie für Führungskräfte der Wirtschaft conducted an interbranch study in 1997. The study
analysed the data from 230 managers of German and Austrian companies (Akademie 1997) using
questionnaires. One of the questions was: „What are barriers for successful project management?“.
Many of the identified barriers (e.g. fire-fighting, ambiguous goals, wrong manning of the project
team) relate to the remit of project management (see Figure 2-3). All of the reported barriers were
mentioned by 70% to 91% of the participants and are therefore of importance.
technical requirements too challenging
permitted product costs unrealistic
schedule unrealistic
permitted development costs unrealistic
insufficient project organisation
insufficient qualification of project partners
others
0% 10% 20% 30% 40% 50% 60% 70% 80% 90% 100%

20
Figure 2-3: Barriers for successful project management, multiple answers were possible, n=230
(Akademie 1997)
The study is a management perspective on the issue of barriers for successful project management.
The next study also involved project leaders.
GPM
The Deutsche Gesellschaft für Projektmanagement (GPM) in collaboration with PA Consulting
conducted an interbranch study on successful project execution. The study involved project leaders
and managers. One of the questions asked for causes of project failures (Engel and Holm 2004). The
percentages indicate the number of participants mentioning the particular cause.
Figure 2-4: Causes for project failures, multiple answers were possible, n=98 (Engel and Holm 2004)
Despite the wider range of stakeholders involved in this study compared to the Akademie study, the
results also emphasise causes related to improper project management. The most frequently
mentioned cause is ’ambiguous requirements and goals’ (see Figure 2-4). Further important causes
are lacking resources, politics, lacking PM-experience, insufficient project planning and poor
91%
88%
87%
84%
84%
83%
83%
83%
80%
77%
70%
0% 20% 40% 60% 80% 100%
fire-fighting
time pressure
ambiguous goals of the project sponsor
focus on individual solutions
resistance in project environment
wrong manning of the project team
insufficient support by management
insufficient resources
results, beeing out of proportion to efforts
lacking user orientation
insufficient personel dedication of project team
0% 10% 20% 30% 40% 50% 60% 70% 80% 90% 100%
ambiguous requirements and goals
lacking resources at project kick-off
politics, egoism, competence disputes
lacking PM-experience of the management
insufficient project planning
poor communication
lack of trained employees
lacking PM-methodology (e.g. no risk mgmt.)
insufficient stakeholder management
insufficient support by top management / lacking commitment
technical requirements too challenging

21
communication. Only eight percent of the participants mentioned ‘challenging technical
requirements’ as a cause.
White and Fortune
The survey conducted by White and Fortune (2002) addressed companies in the United Kingdom.
236 project managers of companies from different domains participated.
One question aimed to identify the factors that are most critical to a project’s outcome. The most
frequently mentioned factors are (‘clear goals/objectives’, ‘realistic schedule’, ‘support from senior
management’, ‘adequate funds/resources’ and ‘end user commitment’ (see Table 2-6).
Further factors that are considered critical to the project’s outcome are covering management skills
(‘clear communication channels’, ‘conflict resolution’, ‘monitoring and feedback’, ‘team building’)
and factors related to designers (‘past experience’), product (‘complexity’), business environment
(‘external influences’) and risk management (‘effective management of risks’).
Table 2-6: Factors believed to be most critical to the project’s outcome, n=236
(White and Fortune 2002)
Factors Count
Clear goals/objectives 206
Realistic schedule 185
Support from senior management 176
Adequate funds/resources 164
End user commitment 159
Clear communication channels 144
Effective leadership/conflict resolution 138
Effective monitoring and feedback 135
Flexible approach to change 133
Taking account of past experience 121
Recognising complexity 121
Taking account of external influences 120
Effective team building/motivation 117
Effective management of risk 117
Training provision 98
Contextual awareness 94
Provision of planning and control systems 88
Appreciating the effect of human error 53
Considering multiple views of project 47
Having access to innovative/talented people 8
Other factor(s) 7
Having relevant past experience 3
Support from stakeholder(s)/champion(s) 3
Having a clear project boundary 2

22
BMBF - Berliner Kreis
The research project “Neue Wege zur Produktentwicklung” funded by the BMBF (German Federal
Ministry of Education and Research) and initiated by the Berliner Kreis e.V. addressed problems
which were observed in a decade of structural change in German industry. Goals of this project were
to identify strengths and weaknesses of German industry and to provide recommendations to enable
German industry to overcome the problems related to the structural changes that took place
(Grabowski and Geiger 1997).
The study comprehended interviews, workshops and questionnaires involving more than 40
participants (management and designer) from different branches closely related to mechanical
engineering (Grabowski and Geiger 1997).
The results of the study were analysed by an expert group (VDI-Arbeitskreis). The experts identified
11 interdependent problem areas. The problem areas were prioritised by the experts during a
workshop, based on areas to be addressed most urgently, because of their importance or because
they cause other problem areas. The six most important areas are listed in Figure 2-5. A selection of
examples describing the six prioritised areas is given in Table 2-7.
The authors of the study aimed to identify root causes rather than effects. The prioritisation of the
problem areas depicted in Figure 2-5 is based on the dependencies between these problem areas
which result in a higher priority for measures which aim to overcome problems than for the
problems which have to be solved. For example, communication issues might cause problems
related to goal determination. Therefore, communication is of a higher priority.
Figure 2-5: Prioritized problem areas in product development that need addressing (Grabowski and
Geiger 1997), multiple answers were possible
0 2 4 6 8 10 12 14 16
goal determination
organisation/management
people
application of methods
market/customer
communication
frequency

23
Table 2-7: Problems and weaknesses – examples (Grabowski and Geiger 1997)
area examples
coo
pe
rati
on
and
com
mu
nic
atio
n
• lacking communication between engineers and business people
• missing problem-solving and social competences
• missing support of interdisciplinary collaboration
• insufficient team-work
mar
ket
and
cust
om
er
• lacking ideas, how to find new product ideas in a systematical manner
• saturated markets
• lacking marketing strategy
• no real survey of user needs
• lacking coordination between sales department and engineering department
• lacking interaction between customer and sales/engineering department
app
licat
ion
of
me
tho
ds • inacceptable efforts caused by some methods
• methods too theoretical
• lacking preparation and support of application of methods
• missing computational support
• slowly introduction of new methods and approaches
• underestimation of the importance of QFD and FMEA
• missing of holistic methodologies with integrated methods
• missing methods for requirements change management
pe
op
le a
nd
risk
tak
ing • human failure
• lacking self-confidence regarding presentation of results and work performed
• insufficient budget and human resources for R&D
• missing will to continuing education
org
anis
atio
n a
nd
man
age
me
nt
• unconfident management
• lack of suitable organisational structures for design and production
• lack of systematical design processes
• lacking flexibility of operations
• redtapism (having too much bureaucracy) caused by standards like ISO 9000
goal
de
term
inat
ion
• lacking R&D-strategy in Small and Medium Sized Enterprises (SMEs)
• imprecise goals
• stakeholder goals not shared
• technical and financial goals out of reach
• corporate goals and requirements often change

24
Discussion
The presented studies aimed to identify typical problems which cause project failure. The studies
were selected because they give an overview on project management practice with an emphasis on
engineering branches. The Berliner Kreis study was included because of its different (more holistic)
perspective.
Bringing the results together, a clear trend is observable, despite of the slightly different foci of the
studies. Problems related to project planning (including scheduling, resource and cost planning, and
goal definition) were reported to be important causes for project failures. This result is not surprising
because scheduling, cost planning and goal definition (insofar product quality is affected) provide
forecasts of those performance indicators which are covered by the ‘iron triangle’. As shown in
Section 2.1, cost, time and quality (the ‘iron triangle’) are still the dominant criteria when judging
project success, thus problems related to these criteria are perceived as more important than others.
Further important problems are related to general management activities (support of
communication, conflict resolution/politics, and make commitments). Although not reported by all
studies it is worth mentioning that also problems related to the project team (insufficient training
and dedication), and the insufficient use of specific techniques such as risk management cause
project failures.
Problems related to design activities such as too challenging requirements and technical goals that
are out of reach were reported only by some studies, which might be explained by their slightly
different foci. All studies focussing exclusively on engineering branches (Bullinger and BMBF –
Berliner Kreis) and one of the interbranch studies (GPM) state this as a possible cause. However, too
challenging requirements were not rated with a high priority by any of these studies.
The Berliner Kreis study prioritises communication and insufficient marketing and customer
integration, which were not identified as the most critical factors in the others studies, but were also
mentioned as important factors. An explanation might be the rationale behind the prioritisation of
the Berliner Kreis study, namely, the search for the root causes of identified problems.
The studies provide information about the most frequently occurring problems causing project
failures in project management practice. A limitation of these studies is the limited granularity of the
identified problems (except the Berliner Kreis study) and the loss of context information. The
abstract labelling of problem areas might divert from the real problems. Often non-technical
problems are labelled as communication problems, and factors which cause an insufficient
communication are not identified (Maier, Eckert et al. 2009). This requires an interpretation of what
communication problems means.
The abstraction and loss of context information restricts the applicability of recommendations. Even
if the definition of communication problem is clear, the advice to ‘improve communication’ is
unfeasible without an explanation of how to do so and in which context. This depends on the cause
of the poor communication. Nevertheless, the studies show a pattern of frequently occurring
problems which can be used as guidance for further investigation.

25
2.2.2 Causes related to stakeholders
As identified by the studies presented in Section 2.2.1, problems related to project planning
(including the definition of goals) is often reported to hinder successful project execution. In the
following, these and related aspects will be analysed with a focus on the people executing product
development projects. Furthermore, implications for project work will be discussed.
The project plan is a result of planning activities. Hence, to understand problems which are related
to project plans the planning activity and the person which performs this activity should be analysed.
Planning
The term planning is used to mean “an act of formulating a program for a definite course of action”
and “the cognitive process of thinking about what you will do in the event of something happening”
(WordNet 2009). These definitions indicate two important aspects of the planning activity. A plan,
as the result of the planning activity, is a program for a course of action and is based on assumptions
about the future (in the event of something happening). This means that a project plan is a
description of a possible course of action which is affected by uncertainty.
Important characteristics of planning are (Wall 1999):
• Future orientation
plans describe a future state/a course of action
• Evolution
planning is usually conducted in multiple steps and iteratively
• Organisation
intention is to manage the future of a limited field of activity
• Information
planning provides information for management, operators and others
Planning supports the coordination of actions of all participating persons by providing a shared basis
for decision making. The documentation and visualisation of interrelations between activities and of
the outcome of these activities facilitates cooperation.
Planning as problem solving
“A problem occurs, if a human being has a goal and does not know how to reach the goal. Whenever
the given situation cannot be transformed into the desired situation by mere execution of routine
operations, thinking will occur in order to conceptualise the interventional action.” (Duncker 1935)
A plan documents a possible course of action, which is intended to transform a current state into a
desired state, involving a conceptualised action of one or more persons. Nontrivial planning is
characterised by the impossibility of a direct transformation of the current into the desired state.
Hence, it can be treated as a problem (Klix 1971; Funke 2003).
One way of categorising planning activities is according to the problem types they address. McCarthy
(1956) distinguish only two problem types: well-defined and ill-defined. Well-defined problems are
characterised by clarity of the solution strategy. Ill-defined problems are characterised by unknown
solution strategies and ambiguous goals.

26
According to Dörner (1976) problems can be described by the main barrier which hinders
transformation of states:
• Interpolation barrier
− current state is known
− desired state is known
− optimal sequence of known operators to transform the current state into the desired
state is not known
• Synthesis barrier
− current state is known
− desired state is known
− appropriate operators to transform the current state into the desired state are not
known
• Dialectical barrier
− current state is known
− desired state is not known
• Synthesis and dialectical barrier
− current state is known
− desired state is not known
− appropriate operators to transform the current state into the desired state are not
known
Dörner’s classification can be seen as a refinement of McCarty’s category of ill-defined problems.
Both authors point at the subjectivity of problems. Whether someone is confronted with a problem
or not depends on the persons’ experience and knowledge. However, typical planning activities in
product development projects are ill-defined problems including synthesis and dialectical barriers for
most people due to the complexity of the task.
Failures during problem solving
Dörner (1996) analysed the success of human planning and decision making processes. He validated
his hypotheses using several computer based experiments. The simulations required the controlling
of complex social systems. The test persons controlled the actions of fictitious people either in a
country or a small town over time. The software controlled the events that took place, such as
amount of rain, closure of factories, etc.
From these studies, Dörner (1996) identified the following causes for failures during problem solving,
which mainly affect the problem structuring and decision making processes:
• to act without previous analysis of the situation
• to ignore side-effects and long term effects of decisions
• to ignore the behaviour/evolvement of processes
• methodism – to believe to have the right measures because no negative effects
occur
• vertical escape – to search for other challenges which are easier to solve
• to react cynically
• to dose measures incorrectly

27
• to anticipate time effects inaccurately
• to incorrectly anticipate non-linear processes (inappropriate linearization)
• to react inappropriately on further problems occurring during problem solving
Another observation of Dörner (1996) is the use of multiple measures by successful problem solvers.
They consider several aspects of each problem, take interrelations of subsystems into account, and
choose the most suitable measure or measures.
Furthermore Dörner (1996) observed that successful problem solvers validated their assumptions
about a situation before making decisions which were based on these. They reviewed the effects of
actions and revised their strategy (see Figure 2-6). Successful problem solvers stayed focused on the
core problems, whereas less successful problem solvers tended to be easily distracted by complex
problems.
The behaviour of validating before making decisions was also observed by Ahmed, Wallace et al.
(2003) during a study comparing novice and expert designers in an industrial setting. The expert
designers performed a preliminary evaluation of decisions before implementing these and
performing a final evaluation. The novice designers tended to use a trial and error approach. They
evaluated their decision not until these were already implemented (Ahmed, Wallace et al. 2003).
Dörner and Schaub characterise complex problems using the following criteria (Dörner 1996; Schaub
2006):
• complexity
• interdependence
• lack of transparency
• dynamics
• novelty of the task
• polytely (to strive for multiple goals) – which is a human characteristic, intensifying
the other criteria
Complexity, as “the existence of multiple, interdependent characteristics” (Dörner 1996) requires the
ability to collect and interpret information and to deduce actions from this interpretation. The ability
to use information in an appropriate accuracy and amount (called operative intelligence) is
paramount for solving complex problems (Dörner 1996).
As guidance, Dörner (1996) sub-divides the problem solving process, which should be executed when
planning complex actions (see Figure 2-6). Thereby, the initial formulation of goals requires an
analysis of the complex action. The collection of information and modelling of the action enables a
better prediction and extrapolation of its execution. Based on this, actions can be planned and
executed. A review of the effects of the planned actions ends the process. Each step of the process
should be combined with a review of assumptions and observations. If necessary, further
information has to be collected or predictions of the action have to be revised (Dörner 1996).
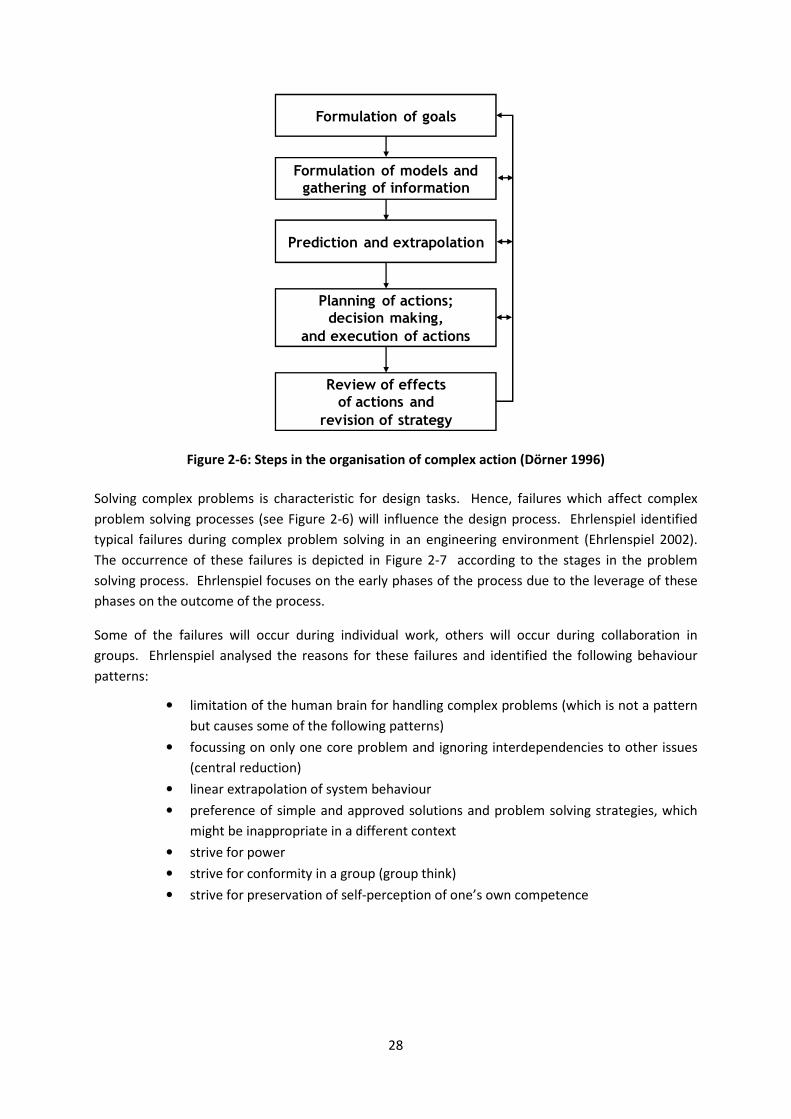
28
Figure 2-6: Steps in the organisation of complex action (Dörner 1996)
Solving complex problems is characteristic for design tasks. Hence, failures which affect complex
problem solving processes (see Figure 2-6) will influence the design process. Ehrlenspiel identified
typical failures during complex problem solving in an engineering environment (Ehrlenspiel 2002).
The occurrence of these failures is depicted in Figure 2-7 according to the stages in the problem
solving process. Ehrlenspiel focuses on the early phases of the process due to the leverage of these
phases on the outcome of the process.
Some of the failures will occur during individual work, others will occur during collaboration in
groups. Ehrlenspiel analysed the reasons for these failures and identified the following behaviour
patterns:
• limitation of the human brain for handling complex problems (which is not a pattern
but causes some of the following patterns)
• focussing on only one core problem and ignoring interdependencies to other issues
(central reduction)
• linear extrapolation of system behaviour
• preference of simple and approved solutions and problem solving strategies, which
might be inappropriate in a different context
• strive for power
• strive for conformity in a group (group think)
• strive for preservation of self-perception of one’s own competence
Formulation of goals
Formulation of models andgathering of information
Prediction and extrapolation
Planning of actions;decision making,
and execution of actions
Review of effectsof actions and
revision of strategy

29
Figure 2-7: Failures during problem solving (Ehrlenspiel 2002)
Critical situations
To understand the causes for problems, which might lead to a failed product development project, it
is important to understand the interactions of the people coping with these problems.
Frankenberger and Badke-Schaub (1998) studied the factors influencing teamwork in engineering
design practice, the situation in which these factors are of importance, and how these factors
interact. They focused on so called critical situations i.e. unexpected situations during product
development projects, which might affect the project in a negative way (for example failed collection
of information) (Frankenberger and Badke-Schaub 1998). Critical situations are of importance
because they affect the direction of the design process depending on the interplay of influencing
factors.
Five different types of critical situations are distinguished according to the general problem solving
process: goal analysis, solution search, solution analysis, disturbing and conflict management (see
Figure 2-8).
approach failure
1.1 Analysis of the problem
• collection information
• modelling and structuring
• weak-point analysis
• Forecast
1.2 Def inition of problem and goal
2 – Search for solutions
2.1 Alternative plans and processes
2.2 Alternative technical solutions
4 – Execution of the plan
Production and use of the product
5 – Control and feedback
5.1 Control of ef fects
5.2 Revision of methods and strategies
F1 - Failures during clarification of problemsF1.1 Insuff icient analysis of the problem
• encapsulation
• thematic vagrancy
• isolation and reduction of problems
• mandalism
• insuff icient forecasting
• conformity of the group
F1.2 Insuff icient def inition of goals
• faulty decomposition of goals
• oversimplif ied goals
• insuff icient decomposition of goals
• contradictions between goals not identif ied
F2 - Failures during search for solution• insuf f icient abstraction and search for alternatives
• linear planning, insuf f icient validation of constraints and risks
• ballistic action (lacking iteration, routine)
• group-specif ic risk behaviour
F3 - Failures during analysis and selectionof solutions
• insuff icient analysis of plans and technical solutions
• lacking and faulty weighted criteria
F4 - Failures during project execution
F5 - Failures caused by insufficient controllingand feedback
1 – Clarification of problem
3.1 Preselection of alternatives
3.2 Assessment and selection of remaining
alternatives
3 – Analysis and selection of solutions
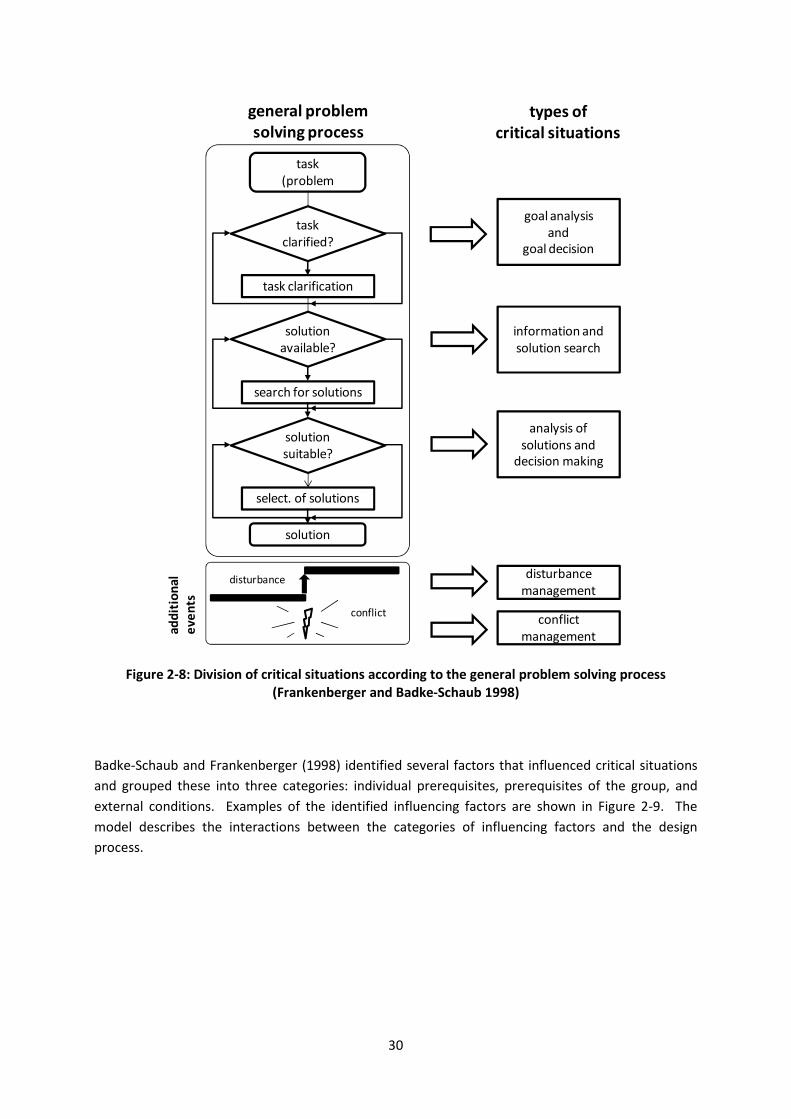
30
Figure 2-8: Division of critical situations according to the general problem solving process
(Frankenberger and Badke-Schaub 1998)
Badke-Schaub and Frankenberger (1998) identified several factors that influenced critical situations
and grouped these into three categories: individual prerequisites, prerequisites of the group, and
external conditions. Examples of the identified influencing factors are shown in Figure 2-9. The
model describes the interactions between the categories of influencing factors and the design
process.
task
(problem
general problem
solving process
types of
critical situations
task
clarified?
solution available?
solution suitable?
solution
task clarification
search for solutions
select. of solutions
conflict
disturbance
ad
dit
ion
al
ev
en
ts
goal analysisand
goal decision
information and
solution search
analysis of
solutions and decision making
conflict
management
disturbance
management

31
Figure 2-9: Examples of factors that influence critical situation within the design process
(Frankenberger and Badke-Schaub 1998)
Frankenberger and Badke-Schaub identified critical situations by observing four development
projects in two different companies with a total duration of 28 weeks. Of the 256 observed critical
situations, 88% occurred during team work, even though the observed designers worked individually
for 85% of the working time; this emphasizes the influence of cooperation and communication on
the whole process (Frankenberger and Badke-Schaub 1998).
Based on their study, they then identified success factors and target effects that contribute to a
successful handling of critical situations. Target effects are enablers for a successful handling of
critical situations. They can be fostered by improving the success factors. The success factors and
the related target effects address the individual prerequisites, prerequisites of the group and
external conditions (see Table 2-8).
task- complexity
- novelty
result-quality
- cost, time, …
design process- clarif ication of requirements,
goal analysis
- search for solutions,
occurrence of ideas
- solution variants- analysis, evaluation and control
of solutions
- decision-making
- disturbances
- conflicts …
individual prerequisites- domain specific knowledge
- experience
- style of problem-solving
- open-mindedness
(e.g. for new measures) …
prerequisites of the group- hierarchy (formal/informal)
- conflict-solving abilities
- cohesiveness (‘groupthink’)
- style of communication
- group climate …
external conditions- working environment
- company situation
- management style
- restrictions …
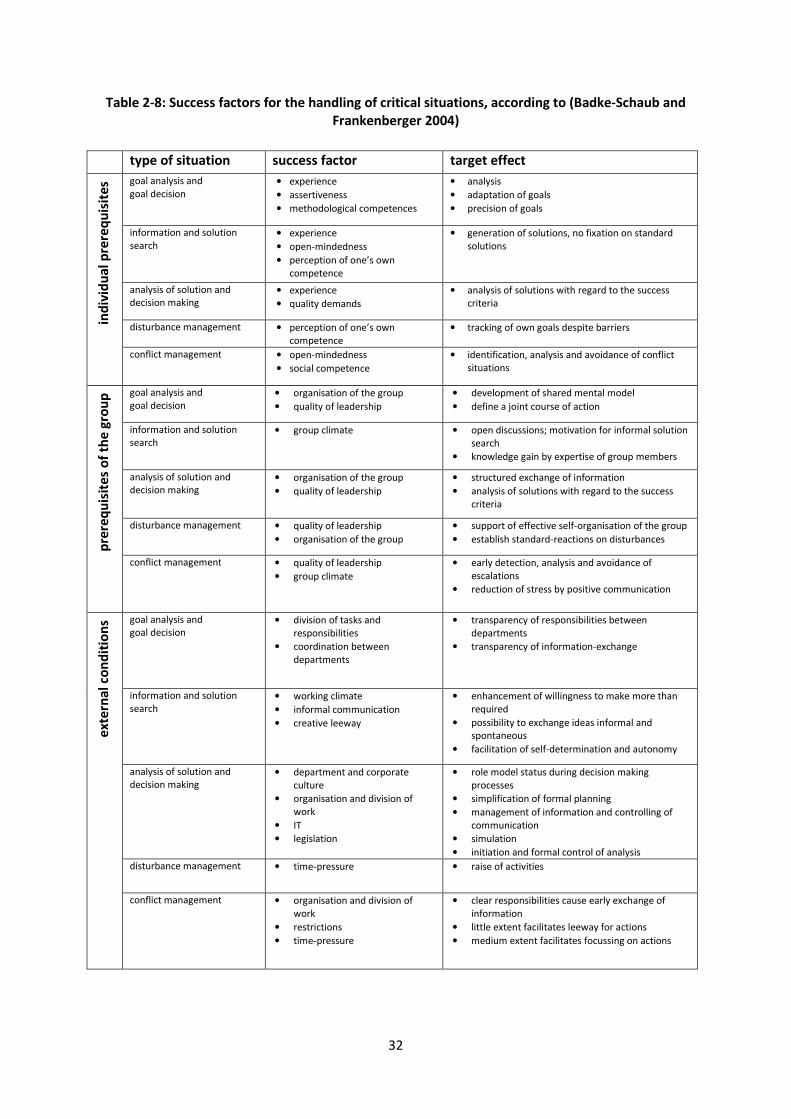
32
Table 2-8: Success factors for the handling of critical situations, according to (Badke-Schaub and
Frankenberger 2004)
type of situation success factor target effect
ind
ivid
ua
l p
rere
qu
isit
es goal analysis and
goal decision • experience
• assertiveness
• methodological competences
• analysis
• adaptation of goals
• precision of goals
information and solution
search • experience
• open-mindedness
• perception of one’s own
competence
• generation of solutions, no fixation on standard
solutions
analysis of solution and decision making
• experience
• quality demands
• analysis of solutions with regard to the success
criteria
disturbance management • perception of one’s own
competence
• tracking of own goals despite barriers
conflict management • open-mindedness
• social competence
• identification, analysis and avoidance of conflict
situations
pre
req
uis
ite
s o
f th
e g
rou
p goal analysis and
goal decision • organisation of the group
• quality of leadership
• development of shared mental model
• define a joint course of action
information and solution search
• group climate • open discussions; motivation for informal solution
search
• knowledge gain by expertise of group members
analysis of solution and decision making
• organisation of the group
• quality of leadership
• structured exchange of information
• analysis of solutions with regard to the success
criteria
disturbance management • quality of leadership
• organisation of the group
• support of effective self-organisation of the group
• establish standard-reactions on disturbances
conflict management • quality of leadership
• group climate
• early detection, analysis and avoidance of
escalations
• reduction of stress by positive communication
ex
tern
al
con
dit
ion
s goal analysis and goal decision
• division of tasks and
responsibilities
• coordination between
departments
• transparency of responsibilities between
departments
• transparency of information-exchange
information and solution
search • working climate
• informal communication
• creative leeway
• enhancement of willingness to make more than
required
• possibility to exchange ideas informal and spontaneous
• facilitation of self-determination and autonomy
analysis of solution and decision making
• department and corporate
culture
• organisation and division of
work
• IT
• legislation
• role model status during decision making
processes
• simplification of formal planning
• management of information and controlling of
communication
• simulation
• initiation and formal control of analysis
disturbance management • time-pressure • raise of activities
conflict management • organisation and division of
work
• restrictions
• time-pressure
• clear responsibilities cause early exchange of
information
• little extent facilitates leeway for actions
• medium extent facilitates focussing on actions

33
Frankenberger and Badke-Schaub propose two ways to facilitate the target effects related to these
success factors: training and self-reflection.
Self-reflection was already referred to by Schön (1983).Self-reflection can be improved by the use of
methods like C-QuARK (Ahmed and Wallace 2001; Ahmed, Wallace et al. 2003; Wallace and Ahmed
2003). C-QuARK aims: to enable novice designers to use question-patterns of expert designers; to
inform novice designers of what they need to know; and to provide expert strategies for designing.
C-QuARK uses generic questions, which were derived from observation of expert designers in an
industrial setting (see p. 27). Examples of these questions are shown in Figure 2-10. The questions
are grouped in eight categories and linked by arrows which indicate how the observed expert
designers moved between these categories (Ahmed and Wallace 2001).
Figure 2-10: The C-QuARK method (Ahmed and Wallace 2001)
2.2.3 Forensic analyses of design processes
When the outcome of a product development project, the product, is flawed, it may pose severe
consequences for the users as well as for the developing company. Injured product users or
stakeholders who suffer a loss will probably go to court. In order to clarify liability, authorised
AWARE OF LIMITATIONS
To accept/reject the option and move to
implementation, either move to a new task or issue
• What should the current task expect to
achieve? (versus further tasks)
• What should I be satisfied with?
• How complete is the task, will further
information be required? (e.g. will changes be
made, has the component been tested?)
REFER TO PAST DESIGNS
To compare past with present designs
• Which designs are similar?
• Which designs were subjected to similar
conditions (environmental and functional)?
• In which projects did similar issues arise and
how were they resolved?
QUESTION DATA/SPECIFICATION
To avoid spending time on design based on unsuitable
data and to obtain better data
• How accurate is this value?
• How much does accuracy matter?- carrying
out a sensitivity analysis -how much flexibility
do I have?
• How was this modelled/tested?
• What conditions are the standards/tolerances
for?
KEEP OPTIONS OPEN
To avoid putting too many constraints on the design
• What should be considered further down the
design process (task y and z)?
• Does this option limit later options in the
design process?
CONSIDER ISSUES
To prevent foreseeable problems with the design
Lifecycle- Functional -Product issues - Component
Interfaces
• What issues are relevant?
• Which are the most important?
• When shouldn't I consider?
AWARE OF REASON
Why is this feature modelled? How does it work?
Geometric-Component-Features-Functional-
Manufacturing Process
• What is the reason why this component or
manufacturing process is used?
• How does this component function?
AWARE OF TRADE OFF
To achieve an optimum compromise
• What other issues does this effect?
• What other systems does this effect?
IS IT WORTH PURSUING?
To only change the design for a worthwhile
improvement to the design
• How much can I expect to achieve if I
continue this approach?
• Is it worthwhile pursuing?

34
experts, forensic engineers, will analyse the product and if necessary the design process of the
particular product.
Hales, a forensic engineer and design researcher, investigated during the last two decades several
flawed products and their design processes covering different branches like plant construction,
furniture development and consumer goods (Hales 1998; Hales and Gooch 2004; Mniszewski, Lyson
et al. 2004). Legal issues do not allow publishing all details of forensic analyses which may provide an
opportunity to learn from mistakes of others (Hales 2005), but based on their analyses of flawed
products and failed product development processes Hales and Gooch (2004) provide some
recommendations for successfully managing engineering design projects:
• Treat engineering design as an important management issue
• Learn from excellence in design, as well as from disasters
• Consider new innovations that demonstrate the current state of the art
• Try introducing a systematic approach to design as a framework for product
development
• Perceive the “big picture” through the concepts of resolution level and view-point
• Develop the art of “windowing in” on tiny details and critically assess their
significance
• Encourage disciplined ways of thinking and ways of working in design
• Investigate what working tools are available and select the most appropriate
• Be flexible in approach, take advantage of opportunities, and negotiate with
persistence
Hales and Gooch (2004) provide a set of checklists. The intention of checklists is to avoid overseeing
or forgetting something important and in doing so reduce the risk of project failure. Hales and Gooch
structure the design process according to the approach of Pahl and Beitz (2007) and propose five
levels of resolution (macroeconomic, microeconomic, corporate, project and personal) for each
process stage. For each of these levels, checklists are provided with factors that are known to
influence the process (see Figure 2-11). The checklists can be used to assess the current status of the
project and identify areas which should be improved.

35
Figure 2-11: Checklist for the project level (Hales and Gooch 2004)

36
2.3 Discussion
As pointed out in Section 1.4, projects are robust, if the achievement of the project goals depends as
little as possible on unwanted and unexpected disturbances of the planned project course. This
definition accentuates the close relation of project robustness to project success and to causes which
might disturb the successful completion of projects. This chapter focused on project success and the
causes that might disturb the successful execution of projects. The analyses of project failures,
failures during problem solving, and critical situations show the multitude of possible causes. While
specific examples of failed projects (Section 1.3) are often linked to technological problems (e.g.
incorrect design of A380 cableforms causing a delay of the project), the studies presented in
Section 2.2.1 mainly highlight internal issues related to project management practices, such as the
influence of insufficient goal definition, lacking project management experience, poor planning, lack
of resources, lack of top-management commitment and poor communication. The results of the
observational studies of the people working in a project supports the understanding of reasons for
failures which occur during problem solving and other activities on the basis of individual
prerequisites and prerequisites of the group (Section 2.2.2).
The presented studies represent different perspectives on project failures: the manifestation of the
failure, the design process and its management, and the project stakeholders. Dependent on the
perspective different categorisations of factors causing project failures and project success are
possible. In this dissertation, the factors are categorised into:
• product related,
• project related and
• stakeholder related.
In order to enhance project robustness all categories of factors contributing to project success and
failure, and – as Dörner and Ehrlenspiel pointed out – the interplay between the factors have to be
considered.
37
3 APPROACHES TO AVOID PROJECT FAILURE AND
ENHANCE PROJECT ROBUSTNESS
“Success in design is also more likely if designers and design managers are aware of: models of design
that can be used to describe the design process; perspectives on design from which to view the
design process; good design practice to improve product and process performance; and a range of
approaches to ensure effective and efficient design management.” (Eckert and Clarkson 2005)
Based on the understanding of project success and failure discussed in Chapter 2, this chapter
focuses on approaches which are intended to support product development projects to increase
project robustness. The literature review covers the following approaches: design methodologies
(Section 3.1), project management (Section 3.2), maturity models (Section 3.3), and project risk
management (Section 3.4).
3.1 Design methodologies
Purpose
Design methodologies are presumed to represent effective and efficient design processes (Blessing
1996). A design methodology is “a concrete plan of action for the design of technical systems (…). It
includes plans of action that link working steps and design phases according to content and
organisation.” (Pahl, Beitz et al. 2007). The action plans are supported by methods (see Table 3-1).
Many methodologies are based on the experience of the authors and examples of good practice
(Blessing 1996), rather than on empirical studies.
They were developed in order to support designing by rationalising creative work, reducing the
likelihood of forgetting something important, permitting design to be taught and transferred,
facilitating planning, and improving communication between disciplines involved in design (Pahl,
Beitz et al. 2007).
Structure
Design methodologies “… include the breakdown of the design process into conceptually distinct
stages or activities, leading to certain intermediate results (specification, functional structure,
preliminary layout, detailed documentation, etc.), the subdivision of the overall problem into
subproblems, and varying emphases on iteration and interaction within and between these as the
overall direction of progression through the design process is maintained.” (Maffin 1998)

38
Some of the early work on design methodologies took place in architecture (Archer 1965; Rittel and
Webber 1973) but these were never established in practice. In mechanical engineering a
considerable amount of work took place in the 60s and 70s (Asimov 1962; Rodenacker 1970; French
1971; Altschuller 1973; Koller 1976; Pahl and Beitz 1977; Andreasen 1980; Hubka 1982). Some of this
work was developed further (VDI 1993; Andreasen and Hein 2000; Orloff 2006; Pahl, Beitz et al.
2007) and new work appeared only recently, albeit strongly based on the earlier work (Ehrlenspiel
2003; Ulrich and Eppinger 2007; Cross 2008). For an overview of the historic development of these
methodologies, see (Heymann 2005). A comparison can be found in (Blessing 1996).
Table 3-1: Methods supporting the early phases of the design process and embodiment design
phase according to (Pahl, Beitz et al. 2007)
generally applicable
methods
product planning and
task clarification
conceptual design embodiment design
• analysis
• abstraction
• synthesis
• method of persistent
questions
• method of negotiation
• method of forward steps
• method of backward steps
• method of factorisation
• method of systematic
variation
• product-market matrix
• portfolio matrix
• need-strength matrix
• solution finding methods
(compare conceptual
design)
• requirements list
• abstraction of the design
task
• function structures
• working structures
• solution finding methods
o conventional
o intuitive
o discursive
• morphological analysis
(classification scheme)
• selection chart
• evaluation methods
• checklists
• basic rules
• design principles
• design guidelines
Implementation issues
Although design methodologies are often taught, at least in the US and Northern Europe, their
industrial uptake has been limited and many remain unknown (Franke 1985; Jorden, Havenstein et
al. 1985; Franke, Rückert et al. 2002; Jänsch 2007). However, some of the underlying concepts did
find their way into practice and had a profound impact on design processes in industry (Eckert and
Clarkson 2005) and many companies introduced their own systematic approaches (Maffin 1998).
The results of a study on the use of methods in German industry (Grabowski and Geiger 1997) are
shown in Figure 3-1. The questionnaire based survey involved 415 participants (managers and
designers) from branches closely related to mechanical engineering.
The study (Grabowski and Geiger 1997) shows that methods supporting the early phases of product
development – market analysis, target costing, value analysis, benchmarking, creativity methods,
assessment methods, portfolio analysis – are known and applied by nearly all of the participants.
Quality methods – failure mode and effects analysis (FMEA) and quality function deployment (QFD) –
were reported to be applied (always or occasionally) by three-fourths (FMEA) or more than half
(QFD) of the participants.

39
Figure 3-1: Application of methods in German industry (Grabowski and Geiger 1997); n=415
Even if underlying concepts of design methodologies have an impact on design practice (Eckert and
Clarkson 2005) and companies develop own systematic approaches (Maffin 1998), the study of
Grabowski and Geiger (1997) shows that only a selection of those methods covered by design
methodologies is commonly used.
Araujo (1996) conducted a survey of UK industry focussing on the utilization of product development
methods. The survey comprehends a questionnaire study (n=27) and interviews (n=13). His findings
are in line with those of Grabowski and Geiger (1997). According to Araujo (1996) the limited uptake
of many methods can be explained by the limited awareness of methods and their benefits in
industry. Some methods are only applicable in a specific context, thus they cannot be used in all
companies. Araujo further states that in many companies a dedicated conceptual design phase is not
performed (concepts are generated during market research) which affects the use of methods aiming
to support this phase.
Benefits of systematic product development
“[…] even though it has seldom been established ‘scientifically’ that design methods work, it is
certainly sensible to use these tools sensibly, especially in situations in which the firm’s own
experience falls short, and the design process threatens to come to a standstill.” (Roozenburg
and Eekels 1995)
Design methodologies, for example the approach of Pahl and Beitz (Pahl, Beitz et al. 2007) (see
Figure 3-2), aim to structure the design process, to ease planning and scheduling of the project and
thereby to avoid project failure. The use of a design methodology as a way of thinking is said to
enhance the probability of a successful product development project (Hales and Gooch 2004).
0% 10% 20% 30% 40% 50% 60% 70% 80% 90% 100%
market analysis
target costing
value analysis
benchmarking
creativity methods
assessment methods
systems technology
failure mode and effects analysis
Portfolio-analysis
morphological analysis
simulations
variant-management
QFD
early warning systems
technology scenarios
value-chain analysis
analysis of potential for success
stakeholder-analyses
branche-analyses
conjoint-analyses
method is allways applied method is occasional applied method is never applied

40
Figure 3-2: General approach to design (Pahl, Beitz et al. 2007)

41
Several design researchers analysed whether the postulated benefits of design methodologies can be
observed when applied to design tasks.
Fricke’s (1993; 1996) observations of designers showed that designers who worked in a flexible
methodical way generated superior results compared to designers working non-systematically or
strictly according to a design methodology. Important tactics which were observed during search for
solution were: generation of varying alternatives in a balanced manner and frequent evaluation of
solutions according to their level of abstraction (Fricke 1993; Fricke 1996).
The generation of alternative solutions, enhances the opportunity of developing outstanding
solutions contributing to project success, which would not have been found if only few or only one
solution would have been considered. The subsequent evaluation is important to focus design
activities on superior solutions and limiting design effort.
Rückert (1997) states, based on an experiment with engineering design students, that the acceptance
of design methodologies and the design results corresponded with the way the design methodology
was taught and applied. He too found a self-determined and flexible (opportunistic) application of
design methodology to be superior to a strict hierarchical application by Rückert (1997). This was
also confirmed by Bender (2004).
Frankenberger (1997) analysed critical situations during the design process and factors contributing
to a successful accomplishment of these situations. He emphasises the importance of experience as
an enabler to successfully cope with critical situations. Furthermore, the use of design methodologies
was observed as a contributing factor, but only if applied in a flexible manner (Frankenberger 1997).
Günther and Ehrlenspiel (1999) analysed the individual design processes of experienced designers
without training in design methodologies (p-designers) and novice designers with training in design
methodologies (m-designers). They characterise the design processes of p-designers as optimised
with reference to working time and documentation of sub-results. Furthermore, “p-designers are
not aiming at optimal solutions, but at simple solutions that fulfil the needed function adequately.”
P-designers developed fewer variants during the conceptual design phase. Thus, the duration of the
design processes of p-designers was on average 30 percent shorter compared to those of the m-
designers (the processes did not include the detail design phase). The design processes of p-
designers differed in many ways from what is proposed by design methodologies, and had some
important disadvantages. The p-designers did not recognise requirements (or too late) and did not
recognise sub-functions or assessed these wrongly, which caused extensive changes, even in the
embodiment design phase. This was not observed for m-designers (Günther and Ehrlenspiel 1999).
Late change requests - which require design iteration - do affect the whole project in different ways.
For example: additional work load and costs, knock-on effects such as delayed market entry and
reduced team spirit. Thus, design methodologies contribute to an enhancement of project
robustness by reducing the likelihood of such (late) design iterations.
In his role as forensic engineer and design researcher, Crispin Hales analysed many flawed products
and the design processes that lead to these products (Hales 2001; Hales 2003; Hales and Gooch
2004). He concludes the following: „There is mounting evidence to show that if a systematic
approach is not used, then the probability of a major disaster is high.” (Hales and Gooch 2004)

42
Discussion
The studies presented in the previous section suggest that design methodologies enhance the
probability of project success by reducing the likelihood of forgetting something important (e.g.
important requirements), and enhance the likelihood of developing outstanding and innovative
products by considering different solution variants. In this way, design methodologies offer support
(such as design process models and design methods) that particularly contributes to the
enhancement of project robustness by reducing the likelihood of product failure.
Unfortunately, many of the methods proposed by the authors of design methodologies and the
benefit they offer are not known by designers in many companies, and hence not utilised.
A disadvantage of current design methodologies is the effort caused by additional working steps. A
common recommendation aiming to enhance the efficiency is to use methodologies in a flexible
(opportunistic) manner and to adapt the approach to the individual context (Bender 2004; Bender
and Blessing 2004; Pahl, Beitz et al. 2007; Smith 2007). The adaptation of the proposed approaches
is currently not sufficiently supported (Blessing 1994; Maffin 1998; Meißner, Gericke et al. 2005).
This important step is left to the project manager.
3.2 Project management
Project management is an approach supporting the planning, execution and controlling of projects.
A project is defined as “intention, characterised by the uniqueness of its constraints as a whole, e.g.
the goal, temporal, financial, personal and other limitations, its separation to other intentions and a
project specific organization” (DIN 1987) Project management covers the operational structure and
organisational structure of design activities (PMI 2004; Kerzner 2006; Litke 2007).
Literature proposes different organisational forms to execute project work: product organisation,
matrix organisation, project office, line-staff organisation and modifications of these basis forms
(Kerzner 2006). A detailed discussion of advantages and disadvantages of different forms of project
organisation is provided by Kerzner (2006). He concludes that the selection of the appropriate
project organisational form depends on: project size, project duration, experience with project
management organisation, philosophy and visibility of top management, project location, available
resources, and unique aspects of the project.
Project management is supported by a multitude of established methods, for example the work
breakdown structure, network scheduling technique, Gantt-chart, milestone trend analysis, methods
for cost calculation and for resource control. These methods support the project manager in
handling the necessary information and complexity of the project and to prepare and document all
decisions in a comprehensible way. Overviews, especially of methods for planning time, cost and
resources, and for monitoring are given in (Madauss 1994; Patzak and Rattay 2004; PMI 2004;
Dinsmore and Cabanis-Brewin 2006; Kerzner 2006; Litke 2007).
Product development processes have to be planned, executed and controlled. Therefore, project
management as a concept is an integral element of the product development process.

43
3.2.1 Project planning
Project planning comprises the planning of the project structure (represented for example in a work
breakdown structure), the definition of the project organisation, selection of personnel and
resources, calculation of efforts, planning of appointments and activities, and the assessment of
risks. A model of the project planning process is given in Figure 3-3. The complexity of many projects
makes project planning a very difficult task.
Figure 3-3: Project planning process and outcomes (Wallmüller 2004)
3.2.2 Project simulation
Project simulation is an advanced method which supports the decision making in planning of
complex and dynamic projects (Voigtsberger 2005; Chalupnik 2006; Chalupnik, Wynn et al. 2007).
Using simulations, alternative plans can be compared and the use of measures assessed (Kerley,
Wynn et al. 2008). To deal with uncertainty of real process behaviour, simulations are based on
techniques such as Monte-Carlo-simulation (Chalupnik, Wynn et al. 2008), which runs large numbers
of simulations while modifying variables such as task duration and iteration necessity. The
interpretation of the result of these simulations is based on frequency distributions of possible
courses of the project, e.g. in terms of resource consumption and duration.
The modelling approach proposed by Chalupnik and Wynn (2007) aims to address the slippage rate
of product development projects. Using the P3 Signposting software (Wynn, Eckert et al. 2006),
different process configurations were simulated in terms of probability of rework, and expected
minimum and maximum duration of a task (Chalupnik, Wynn et al. 2008). In doing so, they were able
to identify process elements and patterns that strongly affect the process outcome. However, in-
depth knowledge about the process is necessary to run the simulations, which for new product
development can be difficult. Furthermore, the simulation of complex projects using Monte-Carlo-
Analysis is labour intensive and exceeds normal computer capacities; therefore, it is currently limited
Planning of
project structure
Definition of
project organization
Selection of
personnel & resources
Calculation of
effort
Planning of
appointments & activities
Risk assessment
Work breakdown structure
Resource plan
Costs projection
Risk management plan
Steps Outcome

44
to small details of a project. Nevertheless, this approach allows new insights into product
development process behaviour.
3.2.3 Project controlling
The dynamics of typical product development projects often invalidate the plans that were
generated before the start of the project. Changes of available resources and goals require new or
revised versions during project execution (Dörner 1996; Reinertsen 1998; Strohschneider and Weth
2002; Litke 2007). To cope with the dynamics of executed projects the project should be continually
controlled. Project controlling means that if new and more precise information becomes available or
disturbances of the project execution are monitored, project planning will be revisited and corrective
measures will be implemented (see Figure 3-4). The continuous controlling of the project execution
aims to initiate corrective measures as soon as possible to avoid further deviations from the project
plan.
Figure 3-4: Project controlling process (Litke 2007)
In contrast to controlling which is reactive, a risk assessment of the project plan which should be an
integral part of project planning (see Figure 3-3) is proactive. Risk assessment respectively risk
management aims to reduce the likelihood of occurrence and impact of disturbances during project
execution. Risk assessment is executed before the start of the project as part of project planning and
has to be redone if the plan is changed and new information relevant for the risk assessment
becomes available.
The project controlling loop shown in Figure 3-4 exemplifies the potential of risk assessments as an
integral element of project planning. Systematic analyses of risks and related consequences enable
the project manager to take measures, which might lead to fewer corrective actions during the
project planning
monitoring execution
project steering
„to be“
according to project charter
disturbances
„to be“ decisions decisions „as is“measures
„to be“
„as is“

45
project resulting in a more robust project. An introduction into project risk management follows in
Section 3.4.
3.3 CMMI – maturity models
Maturity models assess the application of methods and best practice recommendations in a variety
of competence areas. Originally developed for the assessment of companies which act as sub-
contractors in a business-to-business context, they are currently also used as a tool for business
transformation. An established maturity model is the Capability Maturity Model Integration (CMMI)
which consolidates several models from different disciplines (see Figure 3-5) (Carnegie 2006).
Figure 3-5: History of CMMs (Carnegie 2006)
Maturity level is defined as: “Degree of process improvement across a predefined set of process areas
in which all goals in the set are attained.” (Carnegie 2006)
CMMI is comprehensive; it covers 22 process areas which might not all be relevant in every company
as CMMI is applicable in different contexts:
• Causal Analysis and Resolution (CAR)
• Configuration Management (CM)
• Decision Analysis and Resolution (DAR)
• Integrated Project Management +IPPD (IPM+IPPD)
• Measurement and Analysis (MA)
• Organizational Innovation and Deployment (OID)
• Organizational Process Definition +IPPD (OPD+IPPD)
• Organizational Process Focus (OPF)
• Organizational Process Performance (OPP)
• Organizational Training (OT)
• Product Integration (PI)
• Project Monitoring and Control (PMC)
CMM for Software
v1.1 (1993)
Software CMM
v2, draft C (1997)
INCOSE SECAM
(1996)
EIA 731 SECM
(1998)
Systems Engineering
CMM v1.1 (1995)
Integrated Product
Development CMM
(1997)
v1.02 (2000)
v1.1 (2002)
CMMI for Development
v1.2 (2006)CMMI for Acquisition
v1.2 (2007)
CMMI for Services
v1.2 (2007)

46
• Project Planning (PP)
• Process and Product Quality Assurance (PPQA)
• Quantitative Project Management (QPM)
• Requirements Development (RD)
• Requirements Management (REQM)
• Risk Management (RSKM)
• Supplier Agreement Management (SAM)
• Technical Solution (TS)
• Validation (VAL)
• Verification (VER)
A CCMI assessment is company-oriented, not project-oriented. Therefore the application of CMMI
has a strategical character. The maturity is assessed on a five-point scale (initial, managed, defined,
quantitatively managed and optimising).
Different generic and specific goals are defined by CMMI for each process area (see Figure 3-6).
CMMI gives an overview of practices and sub-practices which are intended to support the successful
execution of projects. These have to be implemented in a company in order to achieve these goals
and thus to reach the related maturity level.
Figure 3-6: CMMI model components (Carnegie 2006)
The definition of a target profile of the required maturity level in the different process areas (see
Figure 3-7) is the precondition for the planning of an implementation strategy for the necessary
practices and sub-practices. The definition of the target profile is challenging as the target profile has
PurposeStatement
IntroductoryNotes
RelatedProcess Areas
Specific Goals Generic Goals
SpecificPractices
GenericPractices
Typical Work Products
Subpractices SubpracticesGeneric Practice
Elaborations
KEY ExpectedRequired Informative
Process area

47
to balance the use of each practice and the required effort for its companywide implementation and
application.
Figure 3-7: Example of an achievement and a target profile (Carnegie 2006)
A critique of maturity models is the underlying assumption on which these models are based: the
application of methods describes the maturity of a product development process in a sufficient
manner (Judgev and Müller 2005). Judgev and Müller (2005) argue that maturity models are based
on codified (tangible) knowledge whereas project management knowledge is in large part intangible.
Hence, important aspects relevant for the successful execution of product development projects
cannot be assessed by CMMI.
Applied on a corporate level CMMI might contribute to project robustness. For the management of
individual projects, however, CMMI is of limited use: the assessment process and subsequent
formulation of measures are labour intensive and focus at company level.
Requirements
Management
Project Planning
Project Monitoring
and Control
Supplier Agreement
Management
Measurementand
Analysis
Process and Product
Quality Assurance
Configuration
Management
Capability
Level 2
Capability
Level 1
Capability
Level 3
Capability
Level 4
Capability
Level 5
targeted level
current level

48
3.4 Project risk management
Risk management is the systematic application of management principles, procedures and practices
with the intention of defining the context, identification, analysis, assessment, controlling and
communication of risks and enabling companies to reduce losses and optimise opportunities (DIN
2002). A risk is defined as „a measure of the probability and consequence of not achieving a defined
project goal.“ (Kerzner 2006) This definition implies two components:
• Likelihood of occurrence of an event
• Impact of the event
In this context, an event is an occurred risk (Kloss and Moss 2008). Smith and Merrit give the
following definition: “The happening or state that ‘triggers’ a loss.” (Smith and Merritt 2002)
“The internal risk is the probability that the project group does not reach the target, multiplied by the
consequences of this.” (Andreasen and Hein 2000) “The external risk is the probability of the
product not reaching the expected sales figures, multiplied by the consequences of this.” (Andreasen
and Hein 2000) Project risk management aims to avoid or reduce the consequences (e.g. the loss)
caused by internal and external risks.
3.4.1 Risk models
Smith and Merrit (2002) present and discuss different models (see Figures 3-8 to 3-11) which can be
used to describe risks. A short overview of strengths and weaknesses of the models is given in the
following paragraphs.
Simple risk model
The simple risk model (see Figure 3-8) is the most elementary model. It reduces the impact of an
occurring risk to the total loss. The simple risk model equates to the understanding of risk by people
who are not familiar with risk management (Smith and Merritt 2002). While the simplicity enables its
use without a detailed analysis of risks, the model does not provide an insight into the interrelation
between causes, events and their impacts. This insight is a precondition for effective risk
management.
Figure 3-8 Simple risk model (Smith and Merritt 2002)
Total loss
Drivers
Probability of risk event
and impact (Pe and Pi)
Risk
event
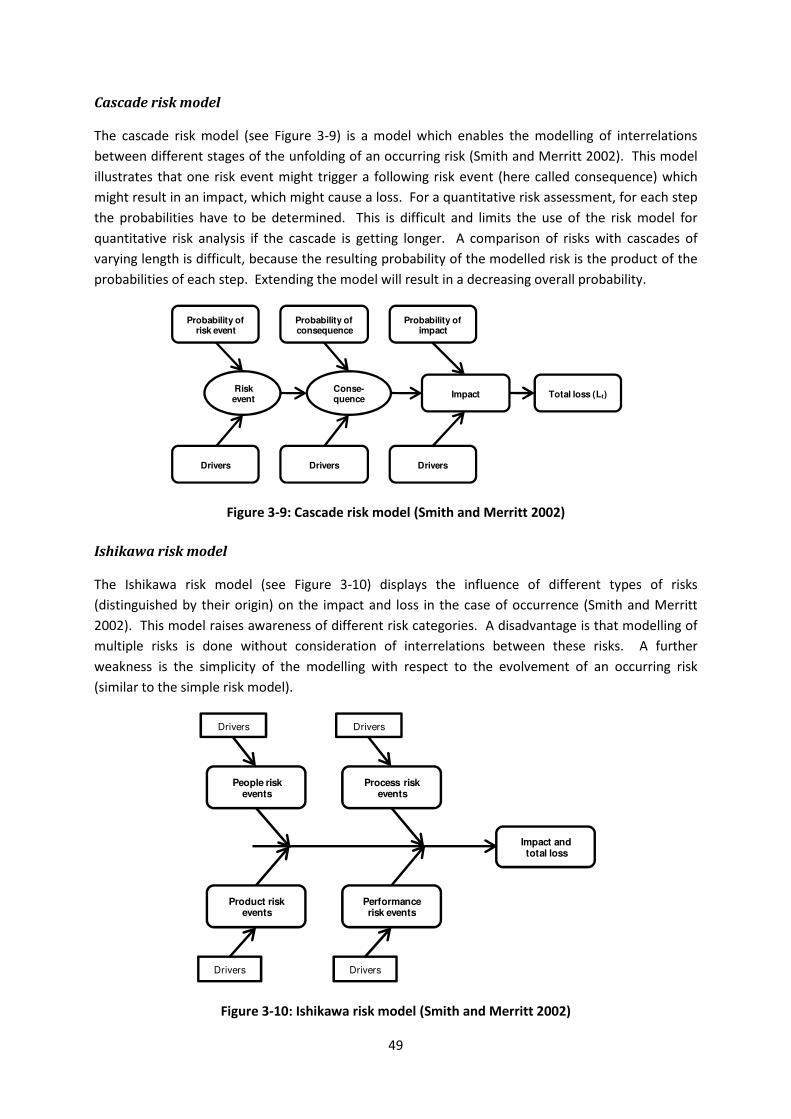
49
Cascade risk model
The cascade risk model (see Figure 3-9) is a model which enables the modelling of interrelations
between different stages of the unfolding of an occurring risk (Smith and Merritt 2002). This model
illustrates that one risk event might trigger a following risk event (here called consequence) which
might result in an impact, which might cause a loss. For a quantitative risk assessment, for each step
the probabilities have to be determined. This is difficult and limits the use of the risk model for
quantitative risk analysis if the cascade is getting longer. A comparison of risks with cascades of
varying length is difficult, because the resulting probability of the modelled risk is the product of the
probabilities of each step. Extending the model will result in a decreasing overall probability.
Figure 3-9: Cascade risk model (Smith and Merritt 2002)
Ishikawa risk model
The Ishikawa risk model (see Figure 3-10) displays the influence of different types of risks
(distinguished by their origin) on the impact and loss in the case of occurrence (Smith and Merritt
2002). This model raises awareness of different risk categories. A disadvantage is that modelling of
multiple risks is done without consideration of interrelations between these risks. A further
weakness is the simplicity of the modelling with respect to the evolvement of an occurring risk
(similar to the simple risk model).
Figure 3-10: Ishikawa risk model (Smith and Merritt 2002)
Impact Total loss (Lt)
Probability ofimpact
DriversDrivers
Probability ofconsequence
Conse-quence
Drivers
Probability ofrisk event
Riskevent
Impact andtotal loss
Process riskevents
Performance risk events
Product riskevents
People riskevents
DriversDrivers
DriversDrivers

50
Standard risk model
Smith and Merrit propose the use of the “Standard Risk Model” (see Figure 3-11). They emphasise
the balance of the model between precision and the necessary effort. The evolvement of a risk is
represented by the risk event, the impact and the total loss (the magnitude of the impact) as a
consequence of the event (Smith and Merritt 2002).
Figure 3-11: Standard risk model (Smith and Merritt 2002)
The definitions used by Smith and Merrit (2002) (which are identical for all of these models) are
slightly confusing. A risk-event driver is defined as: „Something existing in the project environment
that leads one to believe that a particular risk event could occur.“ The probability of risk event is
defined as: “The likelihood that a risk event will occur.” These definitions and the added explanation:
“For instance, by referring to the left side of the model, notice that changing the risk event drivers
can reduce the probability of the risk event occurring” imply that the driver affects the probability (as
different drivers can have different probabilities). This seems logical but this dependency is neither
displayed in the simple risk model, the cascade risk model, nor in the standard risk model.
The modelling of risks, their interrelations, their evolvement and drivers (causes) is not sufficiently
solved. The proposed models are inspiration for further development and illustrate the importance
of clear definitions.
3.4.2 Time dependency of risk impacts
An aspect which has received little attention in literature on project risk management is the time
dependent evolvement of the risk impact. Seibold (2006) describes two different courses of the
evolvement of an impact (see Figure 3-12). The first is an impact which increases steadily; the
second is a quickly escalating impact. These two different courses describe possible extremes.
Seibold hints at the importance of this characteristic, as time-dependency influences which measures
address the risk appropriately. Risks where a steady rise of the impact is expected, offer the
opportunity to react after the risk event, which is not appropriate in the case of a quick escalation of
the impact (Seibold 2006).
Impact Total loss (Lt)
Probability ofimpact (Pi)
Impact driversRisk event
drivers
Probability ofrisk event (Pe)
Riskevent

51
Figure 3-12: Time dependency of impact caused by an event (Seibold 2006)
3.4.3 Models of project risk management
Project risk management aims at ensuring the successful execution of projects (Chapman and Ward
2003). Various process models for risk management are proposed in standards (IEC 2001; DIN 2002;
ISO 2009) and standard literature on project risk management (Kendrick 2003; PMI 2004; Dinsmore
and Cabanis-Brewin 2006; Kerzner 2006; Litke 2007). The models differ in the number of phases and
level of detail. Irrespective of differences in their terminology and detailing, these models follow a
common approach (see Figure 3-13).
Figure 3-13: General risk management process (McMahon and Busby 2005)
This general risk management process, which is preceded by a risk management planning phase in
order to structure the risk management process, is iterative and consist of four key phases
(McMahon and Busby 2005):
• Risk identification
The phase of identifying, collecting and specifying risks.
• Risk assessment
The phase of risk analysis and estimation.
• Risk treatment
The phase of risk-strategy selection and implementation of measures to avoid deviations
from project goals.
• Risk monitoring, review and communication
A continual process of re-examining assumptions, reviewing developing risk and
communicating likely impacts to stakeholders.
time
Accumulated
impact
low
hig
h
Escalation of the impact
Stealthy rise of the impact
Risk identification Risk assessment Risk treatmentRisk
monitoring, review &communication
RM-Planning

52
Authors of literature on risk management differ in the allocation of the prioritisation of risks. Most
allocate this step to the phase of risk treatment because it is necessary to select risk treatment
strategies, but some allocate this step to the phase of risk assessment, because it concludes the
assessment of risks. In this dissertation risk prioritisation is allocated to the risk treatment phase.
3.4.4 Methods of project risk management
Several methods are proposed to support the four phases of project risk management (see
Table 3-2). Many of these methods are generally applicable methods and not specifically developed
for project risk management (IEC 2001; Kendrick 2003; PMI 2004; Dinsmore and Cabanis-Brewin
2006; Kerzner 2006).
Risk identification is a challenging task and determines the quality of the whole risk management
process and therefore the course of the project. It is a precondition for the subsequent assessment
and treatment of risks.
Risk identification and assessment are topics of numerous research projects and considerable
methodical support. In contrast, risk treatment is usually left to the experience of the risk manager
(Raz and Michael 2001; Oehmen, Dick et al. 2006; Hatefi, Seyedhoseini et al. 2007), despite the fact
that decisions about measures and strategies for coping with identified risks are crucial and
determine the success of the risk management process. Methods supporting the planning of risk
treatment will be discussed in the following. These can be divided into methods to prioritise risks
and methods to select a risk treatment strategy.
Table 3-2: Project risk management methods – examples proposed in standard literature
Risk identification Risk assessment Risk treatment Risk monitoring,
review and
communication
• Brainstorming
• Checklists
• Delphi method
• Expert interviews
• Lessons learned files
• Causal analysis
• Failure tree analysis
• SWOT-analysis
• Ishikawa diagrams
• Influence diagrams
• Assumption analysis
• Document analysis
• Life-cycle cost analysis
• Schedule analysis
• Risk scenarios
• 5-Whys
• Risk breakdown
structure
• Failure mode and effect
analysis (FMEA)
• Risk scales
• Delphi method
• Network analysis
• Sensitivity analysis
• Expected monetary value
analysis
• Failure mode and effect
analysis (FMEA)
• Surveys
• Expert interviews
• Expert judgement
• Probability distribution
• Modelling and simulation
(Monte-Carlo)
Prioritisation
• Pareto analysis
• Top 10 risk ranking
• Failure mode and
effect analysis
(FMEA)
Strategy selection
• Risk grids
• Flowcharts
• Scenario-based
tracking of risks (Risk
related)
• Schedule performance
monitoring
• Technical performance
measurement
• Program metrics
• Risk contingencies
• Risk grids

53
Methods supporting risk prioritisation
Pareto analysis and Top 10 risk ranking
Pareto analysis supports the prioritisation of risks. The prioritisation is based on the rationale that 80
percent of risk related losses are caused by only 20 percent of the risks (Dinsmore and Cabanis-
Brewin 2006). The analysis is based on risks assessments. Only the most critical risks will be selected
for treatment in order to find a compromise between cost of risk treatment and cost caused by
occurred risks.
The Top 10 risk ranking is based on the same rational as the Pareto analysis. Because treating all
risks would usually cause inacceptable effort, the risk treatment is focussed on the ten risks assessed
as most critical.
Pareto analysis and top 10 risk ranking can be supported by using for example the Failure Mode and
Effect Analysis.
Failure Mode and Effect Analysis
The Failure Mode and Effect Analysis (FMEA) is different in nature from the other mentioned
methods. FMEA supports risk identification, assessment and risk prioritisation. FMEA is a
methodology rather than a method, because other methods are involved to support steps which are
required in FMEA (e.g. brainstorming and checklists for risk identification). FMEA is usually
conducted in a workshop format involving different experts, with the intention to enhance the
reliability of the FMEA results.
Different types of FMEA exist: design (development)-, process (production)- and system FMEA
(Kamiske and Brauer 1995; Pahl, Beitz et al. 2007). “The design FMEA is used to verify whether the
functions set out in the requirements list are fulfilled. The process FMEA is used to verify whether the
planned production process can produce the required product characteristics.” (Pahl, Beitz et al.
2007) These foci cover only a subset of those risks which may affect a product development project.
However, several authors (for example (NetLibary 2005; Flouris and Lock 2008; Kerzner 2010))
propose to use FMEA also in order to manage project risks in general.
Each FMEA basically follows the same approach (Pahl, Beitz et al. 2007):
1. Risk analysis of each component (or process step) regarding:
− potential failure (failure types)
− failure consequences
− failure causes
− planned measures to avoid failures
− planned measures to detect failures
2. Risk assessment
− estimation of probability of occurrence
− estimation of the effects of the failure on the customer
− estimation of the probability that the failure can be detected before delivery
3. Risk number calculation
4. Risk minimisation
− Development of measures to improve the design of the product (or the process)
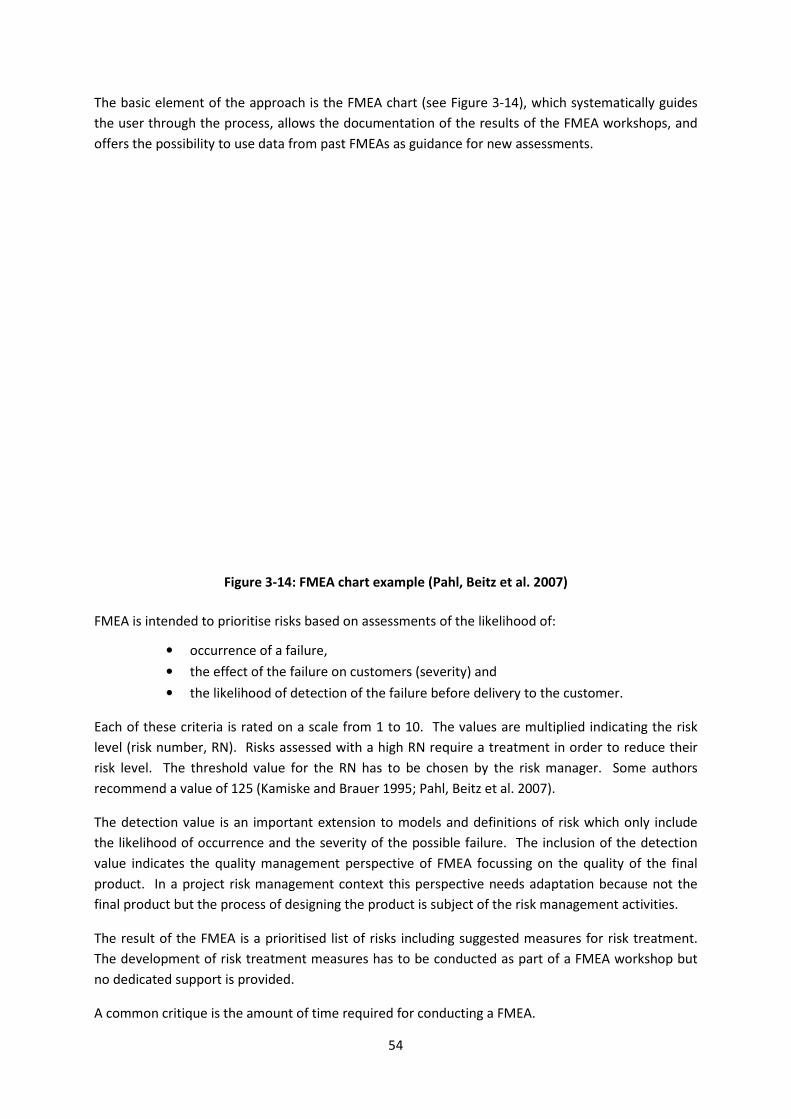
The basic element of the approach is the FMEA chart (see
the user through the process, allows the documentation of the results of the FMEA workshops, and
offers the possibility to use data from past FMEAs as
Figure 3-14
FMEA is intended to prioritise risks based on assessments of the likelihood
• occurrence of a failure,
• the effect of the failure on customers (severity) and
• the likelihood of
Each of these criteria is rated on a scale from 1 to 10. The values are multiplied indicating the risk
level (risk number, RN). Risks assessed
risk level. The threshold value for the RN has to be chosen by the risk manager. Some authors
recommend a value of 125 (Kamiske and Brauer 1995; Pahl, Beitz et al. 2007)
The detection value is an important extension
the likelihood of occurrence and the severity of the possible failure.
value indicates the quality management perspective
product. In a project risk management context this perspective needs adaptation because not the
final product but the process of designing the product is subject of the risk management activities.
The result of the FMEA is a prioritised list of risks includ
The development of risk treatment m
no dedicated support is provided
A common critique is the amount of time required
54
The basic element of the approach is the FMEA chart (see Figure 3-14), which systematically guides
the user through the process, allows the documentation of the results of the FMEA workshops, and
offers the possibility to use data from past FMEAs as guidance for new assessments.
14: FMEA chart example (Pahl, Beitz et al. 2007)
FMEA is intended to prioritise risks based on assessments of the likelihood of:
nce of a failure,
the effect of the failure on customers (severity) and
likelihood of detection of the failure before delivery to the customer.
Each of these criteria is rated on a scale from 1 to 10. The values are multiplied indicating the risk
assessed with a high RN require a treatment in order to reduce their
The threshold value for the RN has to be chosen by the risk manager. Some authors
(Kamiske and Brauer 1995; Pahl, Beitz et al. 2007).
The detection value is an important extension to models and definitions of risk
the likelihood of occurrence and the severity of the possible failure. The inclusion of the detection
quality management perspective of FMEA focussing on the quality of the final
oduct. In a project risk management context this perspective needs adaptation because not the
final product but the process of designing the product is subject of the risk management activities.
The result of the FMEA is a prioritised list of risks including suggested measures for risk treatment.
of risk treatment measures has to be conducted as part of a
o dedicated support is provided.
A common critique is the amount of time required for conducting a FMEA.
), which systematically guides
the user through the process, allows the documentation of the results of the FMEA workshops, and
guidance for new assessments.
efore delivery to the customer.
Each of these criteria is rated on a scale from 1 to 10. The values are multiplied indicating the risk
RN require a treatment in order to reduce their
The threshold value for the RN has to be chosen by the risk manager. Some authors
to models and definitions of risk which only include
The inclusion of the detection
focussing on the quality of the final
oduct. In a project risk management context this perspective needs adaptation because not the
final product but the process of designing the product is subject of the risk management activities.
ing suggested measures for risk treatment.
FMEA workshop but

55
Project Risk FMEA
Carbone and Tippett (2004) propose an adaptation of FMEA. Motivation for this adaptation is the
insufficient applicability of existing FMEA-approaches in a project risk management context. Carbone
and Tippett argue that the terminology of existing approaches is inconsistent and the fundamental
differences between products and projects require a conceptual rethinking.
Their Project Risk FMEA (RFMEA) uses a slightly different terminology from FMEA and adds a “Risk
Score”, to take into account the project context. The differences between FMEA and RFMEA
terminology as outlined by Carbone and Tippett (2004) are shown in Table 3-3. A further difference
is that Carbone and Tippett do not include the columns failure cause and failure consequence as
included in the FMEA chart as provided by Pahl and Beitz (see Figure 3-14). A chart similar to that of
Pahl and Beitz is not proposed by Carbone and Tippett.
Table 3-3: RFMEA terminology compared to FMEA terminology (Carbone and Tippett 2004)
FMEA
columns
Failure type
(mode)
Probability of
occurrence
Effect on
customers
(severity)
Probability of
detection
RPN
RFMEA
columns
Risk event Likelihood Impact Risk Score Detection RPN
Carbon and Tippett use the term likelihood to describe the likelihood of occurrence which is
synonymous to probability of occurrence (compare FMEA chart, Figure 3-14). The description of
likelihood value is identical to conventional FMEAs.
The impact value is assigned by analysing possible impacts regarding schedule, cost and technical
aspects. The impact on schedule is assessed by an analysis of timeliness of milestones. The impact
on costs is assessed by an analysis of project cost. The impact on technical aspects is assessed from a
user perspective, analysing the usability and functionality of the product.
The detection value is assigned by an assessment of the remaining time after the detection of an
event. If the remaining time is sufficient for the planning of contingencies and acting upon the
occurred risk, the detection value is low. If the remaining time is insufficient, the value is high. While
Carbone and Tippett refer to detection methods as a means to detect risk events and base their
assignment of detection values on the effectiveness of such methods (see Table 3-4) they do not
mention examples of such methods.
The Risk Score represents the multiplication of the likelihood value and the impact value as usually
done in risk management to describe the risk level.
The Risk Priority Number (RPN) is the result of a multiplication of the likelihood value, the impact
value and the detection value as is the case with FMEA.
Carbone and Tippett propose guidelines for the assignment of the impact and detection values (see
Table 3-4). The descriptions of these values differ from conventional design- and process-FMEAs, by
referring to the project context but follow the same concept.

56
The result of the RFMEA is a scatter-plot (see Figure 3-15) which supports the prioritisation of risks
based on the Risk Score and RPN. In doing so, the scatter-plot organises the analysed risks according
to importance (Risk Score) and risk level (RPN). Separate pareto analyses for RPN and Risk Score
prioritise the analysed risks on each scale. The threshold values (as a result of the pareto analyses)
are indicated by bold lines in the scatter plot (see see Figure 3-15). The combined analysis of Risk
Score and RPN support an identification of severe risks (circle in the right upper corner of Figure
3-15) which need prioritised risk treatment (Carbone and Tippett 2004).
Table 3-4: Impact and detection value guidelines (Carbone and Tippett 2004)
Impact value Description
9 -10 Schedule Major milestone impact > 20% impact to critical path
Cost Total project cost increase > 20%
Technical
The effect on the scope renders end item unusable.
7-8 Schedule Major milestone impact and 10% - 20% impact to critical path Cost Total project cost increase of 10% - 20%
Technical
The effect on the scope changes the output of the project and it may not be
usable to client.
5-6 Schedule Impact of 5% - 10% to critical path
Cost Total project cost increase of 5% - 10%
Technical
The effect on the scope changes the output of the project and it will require
client approval.
3-4 Schedule Impact of <5% impact to critical path
Cost Total project cost increase of <5%
Technical
The effect on the scope is minor but requires an approved scope change
internally and maybe with the client.
1-2 Schedule Impact insignificant
Cost Project cost increase insignificant
Technical Changes are not noticeable.
Detection value Description Definition: Detection is “the ability of detection technique or method(s) to detect the risk event with enough time to plan for a contingency planning and act upon the risk.” 9-10
There is no detection method available or known that will provide an alert with enough time
to plan for a contingency
7-8 Detection method is unproven or unreliable; or effectiveness of detection method is
unknown to detect in time.
5-6 Detection method has medium effectiveness.
3-4 Detection method has moderately high effectiveness.
1-2 Detection method is highly effective and it is almost certain that the risk will be detected
with adequate time
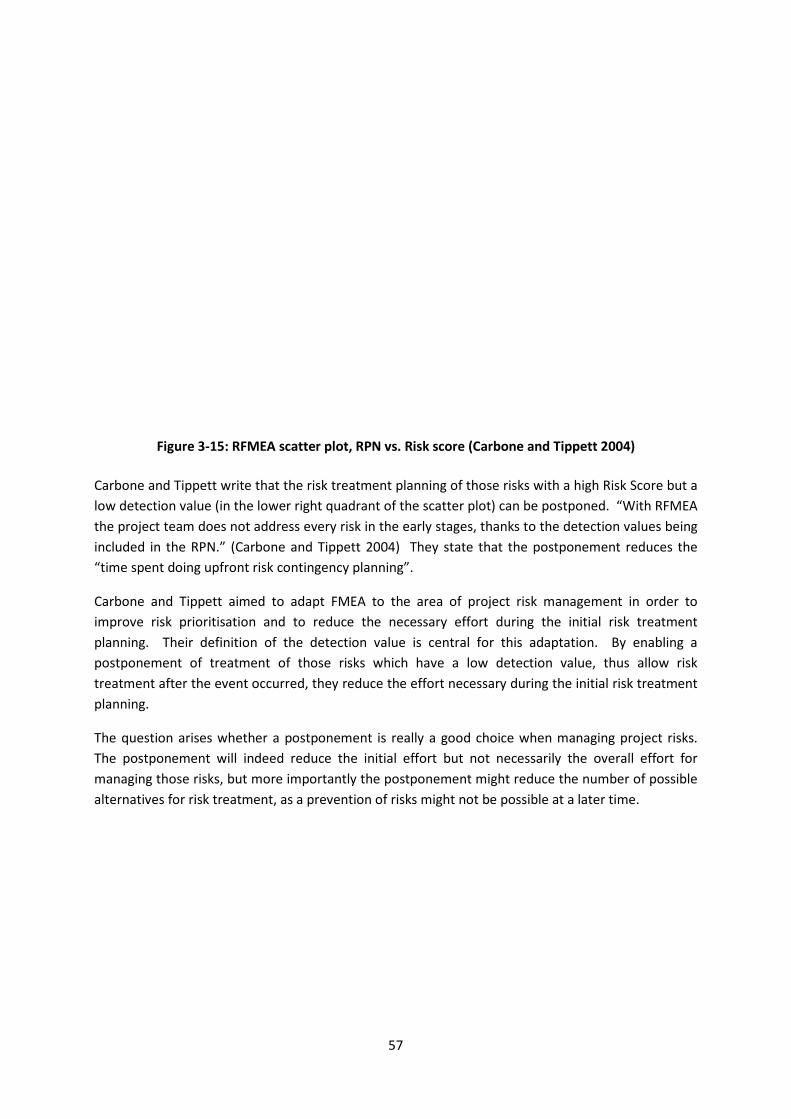
Figure 3-15: RFMEA scatter
Carbone and Tippett write that the risk treatment planning of t
low detection value (in the lower right quadrant of the scatter plot) can be postponed.
the project team does not address every risk in the early stages, thanks to the detection values being
included in the RPN.” (Carbone and Tippett 2004)
“time spent doing upfront risk co
Carbone and Tippett aimed to adapt FMEA to the area of project risk management
improve risk prioritisation and
planning. Their definition of the detection va
postponement of treatment of
treatment after the event occurred, they reduce the effort necessary during the initial risk
planning.
The question arises whether a postponement is really a good choice when managing project risks.
The postponement will indeed reduce the initial effort but not necessarily the overall effort for
managing those risks, but more importantly the postponement mi
alternatives for risk treatment, as a prevention of risks
57
: RFMEA scatter plot, RPN vs. Risk score (Carbone and Tippett 2004)
the risk treatment planning of those risks with a high Risk Score but a
low detection value (in the lower right quadrant of the scatter plot) can be postponed.
the project team does not address every risk in the early stages, thanks to the detection values being
(Carbone and Tippett 2004) They state that the postponement reduces
“time spent doing upfront risk contingency planning”.
aimed to adapt FMEA to the area of project risk management
risk prioritisation and to reduce the necessary effort during the initial risk
definition of the detection value is central for this adaptation
treatment of those risks which have a low detection value, thus allow risk
after the event occurred, they reduce the effort necessary during the initial risk
he question arises whether a postponement is really a good choice when managing project risks.
The postponement will indeed reduce the initial effort but not necessarily the overall effort for
more importantly the postponement might reduce the
alternatives for risk treatment, as a prevention of risks might not be possible at a later time
d Tippett 2004)
th a high Risk Score but a
low detection value (in the lower right quadrant of the scatter plot) can be postponed. “With RFMEA
the project team does not address every risk in the early stages, thanks to the detection values being
They state that the postponement reduces the
aimed to adapt FMEA to the area of project risk management in order to
the necessary effort during the initial risk treatment
adaptation. By enabling a
those risks which have a low detection value, thus allow risk
after the event occurred, they reduce the effort necessary during the initial risk treatment
he question arises whether a postponement is really a good choice when managing project risks.
The postponement will indeed reduce the initial effort but not necessarily the overall effort for
ght reduce the number of possible
might not be possible at a later time.

58
Methods supporting risk treatment strategy selection
Treatment of risk involves addressing the causes and/or impacts of an event. Addressing causes
implies taking preventive measures which eliminate or reduce the likelihood of a risk event occurring.
Measures which address the impact of an event are called corrective. Based on this, four risk
strategies are usually distinguished (Kendrick 2003; Patzak and Rattay 2004):
• Avoidance
Avoiding risks e.g. by reorganizing the project or modifying the assignment
• Transfer
Sharing risk with other stakeholders or transferring it to insurances
• Reduction (i.e. mitigation)
Initiating measures to control the risk and to continuously evaluate its current status;
development of fall-back positions
• Acceptance
Risks and possible consequences are known, no measures are initiated
The selection of appropriate risk strategies is influenced by the corporate risk culture, the willingness
of the risk manager to take risks, the risk tolerance of the team, and the companies’ project
management and product development capabilities (Kerzner 2006). A common threat is to overrate
one’s own capabilities and to take (accept) risks which overstrain the development team. This
triggers the phenomenon of fire-fighting which is self-reinforcing (Repenning 2001).
Only a few rather elementary methods are available supporting the selection of the risk treatment
strategy.
Risk grid
A very simple approach to support the selection of a risk treatment strategy is shown in Figure 3-16.
The risk grid analyses the risk using two criteria: the probability of occurrence and the amount of loss
(impact of the event), in order to select one of the above mentioned risk strategies (Patzak and
Rattay 2004).
Figure 3-16: Risk grid (Patzak and Rattay 2004)
Risk impact
Pro
ba
bilit
yo
fo
cc
ure
nc
e
Risk-Acceptance
Risk-Avoidance
Risk-Transfer
Risk-Reduction
low
low
high
hig
h

59
Allocation of strategies and measures using this method cannot be recommended. It implies that
these two dimensions describe a risk in a sufficient manner (Williams 1996). Important
characteristics of the addressed risks, like the time dependent evolvement of the impact and the
detection, are not addressed. The characteristic of occurring risks to feature a rising impact is an
important aspect to consider for the selection of an optimal risk strategy and related measure.
Risk treatment options
Smith and Merrit propose a model (see Figure 3-17) showing possible options for risk treatment
(Smith and Merritt 2002), but provide no support for their selection. Their claim of providing a
process model for the risk resolution planning is unfounded.
Figure 3-17: Risk treatment options (Smith and Merritt 2002)
Question-based flow chart
A more sophisticated approach for the selection of risk treatment strategies is proposed by Kerzner
(Kerzner 2006). It is based on a question-based flowchart that supports the decision making process
by guiding through the different options (see Figure 3-18). Important aspects covered by Kerzner are
the influence of interdependencies between risks, which might influence risk prioritisation and risk
treatment. Another important element considered by Kerzner is the feedback of people having
experience with similar risk, which might provide advice on appropriate risk treatment. However,
this approach does neither take the time dependent evolvement of impacts into account, nor does it
consider the likelihood of detection of risk events and resulting impacts.
Risk treatment
Defer action
for more info
Take no action
(accept the risk)
Develop action
plans
Provide redundancy
(alternatives)
Transfer risk to
a third party
Prevention of the
risk event
Reserves of
budget/schedule
Contingency if
risk event occurs
Mitigate the riskAvoid the risk

60
Figure 3-18: Decision elements for risk contingencies (Kerzner 2006)
Interdependency
of risksProbability
Will happen
• high• medium• low
• remote
Seriousness
(quantified)
Catastrophe
• high• medium• low
Impacton
cost and schedule
Risks
Identified
QuantifiedProbabilityInterdependency
Get advice
from people whohave been through it
Eliminate
Makeappropriate
arrangements
Develop plans to
minimisecost and control
No
action
Avoidable?
Probability
and/or seriousnessreducible?
Make
adjustmens
Transferable
by insurance oragreement with
client?
Controllable?
What is/are
the residual risk(s)?
Fundsrisk contingencies
Seriousness
low?
YES
NO
YESNO
YES
NO
YES
NO
NO
YES

61
Constraints of risk treatment strategy selection
The selection of risk treatment strategies is strongly influenced by the project management
philosophy (represented by rigidness of the procedures) and the risk willingness of a team/company
(see Figure 3-19). Rigid procedures and less tolerance facilitate the selection of avoidance or transfer
strategies. More flexible project management procedures and project leaders use a wider spectrum
of strategies (Kerzner 2006).
Figure 3-19: Constraints of risk treatment strategy selection (Kerzner 2006)
Existing methods do not sufficiently support the selection of a risk treatment strategy. Barriers for a
better support of risk treatment strategy selection are the existing risk models (Section 3.4.1) and the
commonly used risk treatment strategy categories (Section 3.4.4) which do neither consider the time
dependent evolvement of risk impacts (Section 3.4.2) nor the likelihood of detection as proposed for
FMEA.
3.4.5 Project risk management application
While the principles of risk management are known by many companies, they are hardly ever used
(Raz, Shenhar et al. 2002; White and Fortune 2002). A reason for the sparse application of risk
management principles are the over-optimistic project managers and a lacking awareness of possible
risks which reduces the motivation to execute risk management activities systematically (Raz,
Shenhar et al. 2002).
The impossibility to identify all risks, as well as the resources needed for the risk management
process and necessary measures are arguments of those who decline the application of project risk
management (Carbone and Tippett 2004). Even though, risk treatment is limited to those risks which
were identified beforehand, project risk management offers the chance to reduce the likelihood of
project failure.
Project risk management is still in its infancy (Raz, Shenhar et al. 2002). Some of the issues which
should be considered in further development of project risk management approaches are: coping
with unidentified risks and enhancing risk management efficiency for example by a better support for
the selection of risk treatment strategies.
Acceptance
Reduction
Transfer
Avoidance
Risk willingness lowhigh
Guidelines
Rigid
Policies/Procedures
Pro
jec
t P
roc
ed
ura
lD
oc
um
en
tati
on

62
3.5 Discussion
The approaches described in this chapter claim to support the successful execution of product
development processes by offering an understanding of and a systematic support for the manifold of
management and engineering activities. On a corporate level, an analysis of a company’s
capabilities, which are a prerequisite for successful product development, can be supported by
maturity models such as CMMI (Section 3.3). On a project level, approaches such as design
methodologies (Section 3.1) and project risk management (Section 3.4) contribute to successful
product development. Design methodologies (Section 3.1) and project management (Section 3.2)
can be seen as a preparation for development activities, project risk management (Section 3.4)
supports the application of these approaches. This relation makes it necessary to apply these
approaches in combination to unfold their full potential.
Studies of current practice (Grabowski and Geiger 1997; White and Fortune 2002; Oehmen, Dick et
al. 2006) show that most of the available support is seldom or only superficially used. Barriers for the
application are the difficult selection of appropriate support and the effort caused by their
application. Due to limited resources, project managers aim to avoid activities which are resource
intensive and do not seem required, independent of whether these are recommended or listed in
checklists. As a consequence, experience with many of the available support is not gained, which
hinders an efficient application. The need for a way of selecting a tailored set of methods that
supports the successful execution of a design project and requires minimum additional resources is
evident.
With the intention to ease application and improve efficiency, enhancement of support such as
design methodologies, project management, risk management and other approaches presented in
this chapter is necessary. Design methodologies need further improvement to enhance their
acceptance and thus to facilitate their application. Project management has to consider all aspects
contributing to project success, which is more than just project planning and controlling. It also
includes systematic management of project risks, no matter whether these are related to project
management, to the product being developed, or to the stakeholders involved.
This dissertation will address risk management as this approach offers direct support to project
managers for identifying and assessing project specific risks which might hinder the accomplishment
of project goals which is a precondition for selecting measures in order to cope with those risks, thus
enabling an enhancement of project robustness. The measures selected during a risk management
process might include methods covered by design methodologies and project management. As
argued in Section 3.4, the application of project risk management, especially the selection of
appropriate risk treatment strategies, is hindered by inconsistent and ambiguous risk models and
related terminology (Ullman 2006).
Risk modelling and risk treatment strategy selection are the focus of the research described in this
dissertation. They are addressed in the following chapter. Based on an alternative model of project
related risks a support of risk treatment strategy selection will be proposed in Chapter 6.

63
4 MODELLING PROJECT FAILURE AND LINKING RISK
TREATMENT STRATEGIES
The following chapter provides a model describing project failure which enables risk treatment
strategies to be linked.
4.1 Modelling causes of project failures
A project failure is always unique. From a risk management perspective a project failure is the
consequence of one or more occurred risks. An opportunity to prevent the consequence of a risk,
i.e. project failure, is to manage the risk based on analyses of its cause and the possible effect of the
risk which leads to the consequence, i.e. analysing the causal chain of a possible project failure (see
Figure 4-1.).
Figure 4-1: Representation of project failure as causal chain
The causal chain represents the relation between cause, effect and the resulting consequence for
one occurred risk. Cause and effect represent the project risk, which may lead to a project failure
(consequence). An effect is an occurred risk (event) and the caused time-dependent impact,
impact (t).
As stated before, project failure can be the consequence of individual risks or the consequence of
multiple risks which can be interrelated. Modelling project failure based on multiple risks will result
in a causal network (see Figure 4-2). The network shows that:
• A risk event can have multiple causes, which individually or jointly might trigger an
event.
• An effect can be the cause of another effect, i.e. an effect can trigger another risk.
ConsequenceCause Event Impact (t)
Effect
Project risk Project failure

64
• A project failure can be the joint consequence of multiple risks, but also the
consequence of one (or a subset) out of several risks.
Figure 4-2: Representation of project failure as causal network
As shown in Section 2.2, causes of project failures in the context of product development may be:
• Project-related
• Product-related
• Stakeholder-related
Causes are highly interrelated, across categories as well as within categories.
Figure 4-3 integrates the different causal chains depicted in Figure 4-2, by introducing bi-directional
arrows and using the plural of “cause” and “effect”, and adds the different cause categories and their
interrelationships.
Consequence
Project risks Project failure
CausesCause Event Impact (t)
Effect
Event Impact (t)
Effect
Cause
Cause
Cause
Event Impact (t)
EffectCause

65
Figure 4-3: Project failure causality model – a project risk management perspective
From a project management perspective a risk event affects the course of the project in an
unwanted way and can be interpreted as a critical situation (compare Section 2.2.2). From a multi-
project perspective further dependencies have to be considered. A project failure can be triggered
by another project, whether a previous or a parallel running project. The effects and consequences
of such projects can be interpreted as risk events for the project under consideration. In the same
way, effects and consequences of the latter can influence parallel and follow-up projects (see
Figure 4-4).
Figure 4-4: Multi-project dependencies of effects and consequences
Effects
Causes
Project failureConsequence
Impact (t)
Projectrelated
Productrelated
Stakeholderrelated
Event
Project risks
previous and
follow-up projects
parallel projects

66
The manifold of causes, their interrelations, and the dependencies between causes and effects of
project risks (Figure 4-2) as well as multi-project dependencies (Figure 4-4) show the complexity of
project failure causality. A holistic analysis of project failure causality, involving the analysis of root-
causes as well as analyses of risk impacts and the mentioned interrelations and dependencies, is
necessary in order to enhance project robustness.
Such analyses are only possible for specific projects - not on a generic level. A good support for root-
cause analysis is the 5-Whys method, developed by Ohno (1988) and discussed/elaborated in
(Hinckley 2001; Smith and Merritt 2002; Oehmen, Dick et al. 2006). The method supports root-cause
analysis by asking ‘why?’ five times, starting with the initial description of a risk, focusing then on
causes of the expected effect and afterwards on underlying causes, i.e. the cascade of causes that
might be related to the initial risk. Asking why five times is usually sufficient to identify a root-cause,
but, if necessary, it is possible to continue. In order not to reduce a risk to a single cause or to
identify wrong causes it is important to consider different answers and verify these answers before
proceeding asking why.
4.2 Linking risk treatment strategies and causal chain of project failure
An analysis of project failure causality should be conducted during the initial phase of a structured
project risk management process, the risk identification phase (see Section 3.4.3). This has to be
done the first time during the project planning and iterated as part of project controlling (see
Section 3.2).
As described in Section 3.4.3 risk identification is followed by risk assessment and the planning of risk
treatment, consisting of the selection of risks which require treatment (prioritisation) and the
selection of a suitable risk treatment strategy.
In Section 3.4.4 risk treatment was distinguished into corrective and preventive. Corrective can be
further divided into reactive and proactive.
These strategies either address the causes or the effect of a project risk, thus the consequence will
be affected indirectly. If advantageous, a risk can be treated using different strategies together.
The three risk treatment strategies are described in the following. The relations between the
strategies, their targets, and the causal chain model of project failure are shown in Figure 4-5.
Reactive risk treatment
Reactive risk treatment addresses the risk impact. Risk treatment measures are selected and
implemented after the occurrence of a risk event, which triggered the risk impact. They aim at a
reduction of the risk impact, i.e. the halt of evolvement of the impact. The time-dependent
evolvement of the impact determines the urgency of the introduction of the treatment.
Proactive risk treatment
Proactive risk treatment addresses the effect of a risk (similar to reactive risk treatment). Related
measures might aim at an enhancement of the likelihood of detection of the risk event and at a

67
reduction of the impact. Reducing the impact proactively can mean to halt the evolvement of the
risk impact, as well as to limit the impact. A limitation of the risk impact can be done for example by
risk transfer, i.e. sharing risk with other stakeholders or transferring to insurances (Section 3.4.4).
The difference between proactive and reactive risk treatment is the point of time at which risk
treatment is selected. In proactive risk treatment measures are selected before a risk occurs.
Implementation of measures is done either before or after occurrence of the event (dependent on
the individual aim). For example measures aiming at a limitation of the risk impact can be
implemented before a risk occurs, in contrast to a measure aiming at a halt of the risk impact
evolvement, which is implemented after the risk event. Measures aiming at an enhancement of the
likelihood of detection have to be implemented before a risk occurs.
Preventive risk treatment
Preventive risk treatment addresses the causes of risks. Preventive measures are necessarily
selected and implemented before a risk event occurs. They aim for a reduction of the likelihood of
occurrence of an event by removing the cause(s). Hence, if the measure works, the risk event does
not occur and the impact is prevented.
Figure 4-5: Relations between risk treatment strategies and causal chain of project failure
reactive
proactive
preventive
Selection ofmeasures after
occurrence of risks
Reduction ofthe impact
Reduction ofthe likelihood of
occurrence
Selection ofmeasures before
occurrence of risks
Enhancementof likelihoodof detection
Consequence
Causes
Event
Impact (t)
Effects
Risk treatment strategies Target of risk
treatment strategies

68
4.3 Linking risk treatment strategies and state of the art approaches
The approaches discussed in Chapter 3 contribute to an enhancement of project robustness in
different ways. The approaches support the prevention of project failures by offering:
• a systematic support of design activities - Section 3.1 Design methodologies
• a systematic support of management activities - Section 3.2 Project management
• a systematic support to identify a company’s competencies, capabilities and
weaknesses - Section 3.3 CMMI – maturity models
• a systematic support for failure prevention - Section 3.4 Project risk management
The overall aim of the described support is to improve the process and reduce the likelihood to fail.
The approaches comprise bundles of methods and measures which can be selected depending on
project and risk. The decision whether to use these approaches or not has to be made prior to the
start of a product development project. Hence, they affect the project in a preventive or proactive,
not reactive manner.
A detailed linking to risk treatment strategies is only possible for specific measures and methods
suggested by these approaches. An exemplarily linking is provided in the following.
Design methodologies
Design methodologies contribute to the avoidance of project failure for example by providing:
• prescriptive models of the design process, which facilitate planning of the design
projects, and reduce the likelihood of forgetting something important (e.g.
requirements),
• methods and guidelines for designing high quality products, reducing the likelihood
of major design iterations.
These examples indicate the preventive character of design methodologies. Other examples can be
classified as proactive, for example:
• methods supporting evaluation and selection of solutions in order to avoid
developing solutions which do not fulfil requirements and user needs thus do not
attract customers.
Evaluation methods do not prevent the development of deficient concepts but they avoid developing
these further, hence they enhance the likelihood of detection of this risk and halt the further
propagation of the risk effect which would be the cause of other risks.
Project Management
Project management contributes to the avoidance of project failure in a preventive way by providing:
• methods for project planning in order to avoid imprecise and unrealistic schedules
and budgets,

69
• modelling approaches representing dependencies between working packages in
order to avoid planning failures,
• best practice recommendations and checklists help to avoid known failures
But also in a proactive way by providing:
• controlling methods in order to detect a deviation (risk impact) from the project plan
Capability maturity model integration (CMMI)
The assessment of a company’s capabilities (the companies’ qualification in performing specific
activities) and competencies (the companies’ maturity-levels in specific areas) enables the
identification of areas which need improvement in order to prevent failures caused by inappropriate
capabilities and competencies. Thus, CMMI can be interpreted as a preventive approach.
Project risk management
While project risk management might result in the selection of a preventive, proactive or reactive
strategy, the application of project risk management itself takes effect only in a preventive or
proactive way. Even though project risk management might result in the selection of a reactive
strategy, reactive measures are not subject of project risk management; because a reactive risk
treatment strategy means that the identification of suitable measures and their implementation will
happen after the risk event occurred. This way of risk treatment is usually called fire-fighting or crisis
management.

70
4.4 Discussion and hypotheses
Content of the project causality model
The basis of the project failure causality model (see Figure 4-3) is the causal chain of project failure
(see Figure 4-1) or rather the causal network of project failure (see Figure 4-2). The project failure
causality model (see Figure 4-3) considers aspects which are illustrated only partially in existing risk
models (Section 3.4.1) such as risk causality (standard-risk model), multi-risk dependencies (cascade
risk model), different categories of risk causes (Ishikawa risk model), and additionally the time-
dependency of risk impact evolvement (as highlighted by Seibold (2006), Section 3.4.2). The model
enables a better understanding of project failure and the linking of risk treatment strategies (see
Figure 4-5).
Expected benefits of using the model
Support of systematic risk analysis
The project failure causality model and the categorisation of approaches according to their
underlying strategy (reactive, proactive and preventive) offer a logic and consistent basis for a
support of risk treatment planning. A systematic support of risk treatment strategy selection based
on this model will be presented in Section 6.5.
Communication
The modelling allows combining the management perspective (which includes a multi-project
perspective) and the project leader perspective focussing on a specific project and specific risks.
When applied it offers a clear description of a specific risk and its relation to a possible project
failure. Improved communication between stakeholders is expected to support the whole project
risk management process by improving its efficiency and efficacy.
Insights derived from linking approaches intended to avoid project failure with the project
causality model
The approaches presented in Chapter 3 claim to support product development projects. As shown in
the last section, the approaches presented in Chapter 3 can be linked to proactive and preventive risk
treatment. None of the approaches addresses effects reactively.
Proactive and preventive strategies offer more opportunities to avoid project failure than reactive
approaches. A disadvantage is the fact, that related measures afford an allocation of resources,
regardless of whether a risk occurs or not.
Hypotheses
The project failure causality model represents a risk management perspective on project failure
considering the insights about causes for project failure found in literature and enables a linking of
approaches supporting the product development process.

71
Projects are in this dissertation defined as robust, if the achievement of the project goals depends as
little as possible on unwanted and unexpected disturbances of the planned project course.
Preventive and proactive risk treatment offers the opportunity to reduce the number and impact of
occurred risks. The approaches which were linked in Section 4.3 to preventive and proactive risk
treatment strategies offer support for the treatment of specific risks, thus might contribute to a
reduction of the number and impact of unwanted disturbances.
As most of the support, offered by these approaches, is based on studies of design practice
identifying strategies, practices, principles and methods supporting successful product development,
designers have the opportunity to benefit from this knowledge, by avoiding known problems, thus
these approaches might contribute to a reduction of the number of risks in general - irrespective of
whether these were identified as such or not (unexpected disturbances).
Therefore, it is expected that project robustness can be enhanced by:
• performing activities,
• possessing capabilities and
• possessing competencies
in process areas, such as project planning, product planning, requirements management, design,
quality management, and risk management as suggested and supported by the approaches
addressed in Section 4.3.
These expectations lead to the formulation of the following hypotheses:
H 1. Projects which are managed systematically are more likely to be successful.
H 2. Projects which are supported by a systematic risk management are more likely to be
successful.
H 3. Companies possessing wide-ranging capabilities are more likely to execute their projects
successfully.
H 4. Companies possessing wide-ranging competencies are more likely to execute their projects
successfully.

72

5 PROJECT ROBUSTNESS: AN
The project failure causality model
treatment strategies and approaches
hypotheses about the efficacy of activities, capabilities, and competencies, suggested and supported
by the approaches, were formulated (Section
The hypotheses are verified by using data of
companies conducting product development projects
5.1 Studying product developm
Studies of social reality in product development projects can be
human activity and studies of human behaviour (see
Human behaviour can be analysed in natural and synthetic
real product development projects belongs to the category of studies analysing human behaviour in
natural situations (Atteslander 1995; Bender, Reinicke et al. 2002)
divided into observations and surveys.
Figure 5-1: Units of analysis and methods of empirical research in social sciences
Content analysis is a retrospective data collection method which can include the analysis of formal
project and product documents, informal documen
data (functional data, service and maintenance data)
73
OBUSTNESS: AN EMPIRICAL STUDY
project failure causality model, presented in the last chapter (see Figure 4-3)
treatment strategies and approaches to enhance project robustness (Section
hypotheses about the efficacy of activities, capabilities, and competencies, suggested and supported
were formulated (Section 4.4).
by using data of a study of small and medium sized
companies conducting product development projects.
Studying product development
f social reality in product development projects can be divided into studies of products of
human activity and studies of human behaviour (see Figure 5-1) (Bender, Reinicke et al. 2002)
Human behaviour can be analysed in natural and synthetic situations. Studying factors influencing
real product development projects belongs to the category of studies analysing human behaviour in
(Atteslander 1995; Bender, Reinicke et al. 2002). This kind of studies is f
observations and surveys.
: Units of analysis and methods of empirical research in social sciences
et al. 2002)
is a retrospective data collection method which can include the analysis of formal
project and product documents, informal documentations (notes of team members), and product
data (functional data, service and maintenance data) (Blessing and Chakrabarti 2009)
TUDY
) was used to link risk
(Section 4.3). Based on this,
hypotheses about the efficacy of activities, capabilities, and competencies, suggested and supported
small and medium sized manufacturing
into studies of products of
(Bender, Reinicke et al. 2002).
tudying factors influencing
real product development projects belongs to the category of studies analysing human behaviour in
. This kind of studies is further
: Units of analysis and methods of empirical research in social sciences (Bender, Reinicke
is a retrospective data collection method which can include the analysis of formal
tations (notes of team members), and product
(Blessing and Chakrabarti 2009).

74
Observations are connected to time and place of the project, and can be used for analysing a part or
a whole project. It allows a deep insight into real design activities, but is usually limited to a small
number of cases due to the time required for its execution (Blessing and Chakrabarti 2009).
Surveys are not necessarily connected to time and place of the studied projects. Possible research
methods which belong to this category are interviews and questionnaires. These research methods
can only be used to study human behaviour on a retrospective basis (Atteslander 1995; Mehrmann
1995). Advantages of surveys are the possibility of analysing large samples and a generally lower
effort for conducting such a study (Gries and Blessing 2005).
Experiments are studies of human behaviour in synthetic situations, often focussing on real time data
capture, but not necessarily limited to these. The analysis can include content analysis, observation
and survey.
“Any of the methods can be used to study a variety of factors, but not all factors can be studied using
a particular method.” (Blessing and Chakrabarti 2009)
The aim of this research is to raise new insights into influences on project robustness. The
assumptions about superiority of proactive and preventive risk treatment, represented by
expectations regarding the efficacy of activities, capabilities, and competencies suggested by
supporting approaches, have to be validated on a large empirical basis.
Project success, which is the key success criteria for the mentioned research hypotheses (see
Section 4.4), consists of two main components – project management success and product success
(see Section 2.1). Project management success focuses on the process, and indicates in particular
the successful accomplishment of cost, time and quality objectives. Product success indicates the
achievement of the desired effects of the final product (Baccarini 1999). Project management
success can be assessed at the end of the project by a comparison of planned cost, time and quality
of the product. An assessment of product success is related to the realised market share of the
product, customer satisfaction, etc., thus not possible during or directly at the end of a project.
The assessment of project success presupposes the completion of a project. The analysis of the
efficacy of activities which are covered by the hypotheses can be done by content analysis,
observation and survey. Individual analyses of the efficacy of the addressed activities, capabilities
and competencies might be possible performing experiments; but the execution of whole projects
involving practitioners in a laboratory, covering the addressed factors jointly, seems not feasible. The
analysis of effects of capabilities (the companies’ qualification in performing specific activities) and
competencies (the companies’ maturity-levels in specific areas) can be done by observation and
survey; a content analysis seems not appropriate.
The survey, which is described in the following Section, was conducted as a part of a study into the
product development performance of small and medium sized manufacturing companies (SMEs), in
which the supervisor of this dissertation was involved. The study was conducted prior to the
research project. The very extensive dataset was available and considered suitable to validate the
hypotheses formulated in the previous chapter.

75
5.2 The P3I project
Between October 1997 and October 1999 the Project “Partnership for Profitable Product
Improvement” (P3I), initialised by the UK Royal Academy of Engineering and largely funded by the
Department of Trade and Industry, was carried out to improve SME performance in product design
and innovation (Blessing and Yates 1999; Foxley, Blessing et al. 2000).
The overall project aim was to improve the growth and profitability of SMEs by increasing added
value, raising the awareness amongst SMEs of the need to modify or to develop new products to suit
changing markets, and to engender a “product development culture” (Blessing and Yates 1999).
5.2.1 Original study design
To reach the goals of the P3I project three strategies were formulated (Foxley, Blessing et al. 2000):
• Developing self-help methods assisting companies to identify their own objectives,
strengths, shortcomings and opportunities,
• Enabling companies to benchmark and improve their performance in product
development as a result of self-analysis and feedback and
• Providing additional information and sources of help.
The project involved the development of a self-help package including a self-assessment
questionnaire and information relating to the topics in the questionnaire. The package was to be
used by top-management or management teams to reflect upon their situation. To obtain feedback
about the process and adjust the package, additional questionnaires were used. To help the SMEs
benchmark their own situation, they obtained feedback about their answers to 8 key-assessment
questions in relation to that of all the other participating companies and to those of a similar size in
similar domains (Blessing and Yates 1999).
5.2.2 The self help package
The three part questionnaire comprises 270 questions consisting of around 80 closed questions
(quantitative data – part A), more than 180 open-ended questions (qualitative data – part B) and 8
key-assessment, multiple-choice questions (part C) (Blessing and Yates 1999).
a) The closed questions in Part A provided data about the company, such as company size,
nature of the business and growth rate.
b) The open-ended questions in Part B covered issues such as product and market strategy,
management of cost and time of product development, manufacturing and personnel.
c) The key-assessment, multiple-choice questions at the end of the questionnaire were
intended to summarise the situation regarding overall competencies of the companies.
Experienced senior industrialists interested in improving the situation in SMEs were trained as
facilitators. They spent at least one day with the company and together with the participants (mainly
at management level) filled out the questionnaire (each participating company spent an average of
18.1 hours with the facilitator and on their own). They also helped identifying issues the company
should address in their improvement process based on the answers in the questionnaire. Through an
additional questionnaire for the facilitators, information was obtained as to whether the companies

76
correctly assessed their situation and which improvements were suggested (Blessing and Yates
1999).
Of the 650 companies that were contacted, 343 companies participated (with 338 cases suitable for
analysis). More details about the study and earlier analysis can be found in (Blessing and Yates 1999;
Seidel 1999; Foxley, Blessing et al. 2000; Schmidt-Kretschmer, Gericke et al. 2007). The focus of
these publications was on the questions in Parts A and C, on the overall product development
process questions in Part B, and on the P3I project’s success in achieving its aims.
5.3 The data set
The analysis of the P3I dataset was used to verify the formulated hypotheses (Section 4.4) focuses on
the questions related to product development, project management, risk management, customer
relations management, and the companies’ capabilities and competencies. These questions covered
all three parts of the original questionnaire.
The initial 338 participating companies were reduced by excluding companies which did not develop
the products they produce and which lacked information regarding the selected success criteria (see
Section 5.5), i.e. did not answer the relevant questions. An overview of the stepwise selection is
given in Figure 5-2. After the completion of the selection of analysable data 141 data sets remain.
Figure 5-2: Selection of analysable data
5.4 Methods
Preparation
The analysis of the P3I data started with the operationalisation of the parameters which are
addressed by the hypotheses. Due to the fact, that the questionnaire was not formulated as a part

77
of this research project, the operationalisation differs slightly from standard procedures (Atteslander
1995; Bortz 2005). The operationalisation was data-driven, based on an analysis of the answers of
questions of the P3I questionnaire that were selected. More details can be found in the Section 5.5
(success criteria) and Section 5.7 (findings).
After the operationalisation, answers to open-ended questions were grouped into categories of
similar answers and coded as nominal or ordinal variables, depending on the type of answer. An
inter-encoder reliability test was conducted for samples of the data and showed sufficient results of
κ>0.8.
Data analysis
Frequency distributions and dependencies between coded answers and project success were
analysed using standard statistics software (PASW 18). Because a normal-distribution of the data
cannot be assumed, non-parametric tests were used. The X2 method (two-sided) was used to
identify dependencies. The confidence level was set to α= 0.05.
The operationalisation of the parameters addressed by the hypotheses involved multiple questions.
Answers to multiple questions were merged by a two-step cluster analysis. The two-step clustering
algorithm identifies clusters (groups of companies) which show a maximum difference in the pattern
of the answers between the clusters and a minimum difference within each cluster. The two-step
cluster analysis was performed using the Log-likelihood distance measure and Schwarz’s Bayesian
information criterion. The number of clusters was predefined based on assumptions on observable
clusters (SPSS 2009).
The results of the two-step cluster analysis were assessed based on the average silhouette
coefficient, which combines concepts of cluster cohesion (models containing tightly cohesive
clusters) and cluster separation (models containing highly separated clusters). The scale of the
average silhouette coefficient ranges from -1 to 1. The maximum value 1 indicates an excellent
clustering. The minimum value -1 indicates a very poor clustering. An average silhouette value of 0.5
indicates a good clustering. Values of less than 0.2 indicate a weak clustering (Rousseeuw 1987; SPSS
2009).
In addition to the average silhouette coefficient, the two-step clustering algorithm calculates an
importance value for each variable involved in the clustering. The importance value indicates how
well each variable differentiates the identified clusters. The higher the value (0 to 1) the less likely
variations in the clustering are due to chance. The importance value is a relative measure (SPSS
2009). The interpretation of the importance values is graded in this dissertation as follows: 0 to 0.33
(weak), 0.34 to 0.66 (good), 0.67 to 1 (excellent).
A detailed description of the applied methods is given in (Bortz 2005; Brosius 2006; SPSS 2009).

78
5.5 Success criteria
As a precondition to distinguish between successful and less successful cases, an operationalisation
of project success is necessary. As mentioned earlier, according to Baccarini (1999) project success
includes project management success and product success. Project success was operationalised
using the answers to two questions, an open-ended question and a multiple-choice question:
1. “Have your previous new product developments failed to realise the success that you
had expected?“ (answers are coded into: were not successful, mixed, were
successful)
2. “What do you think your growth rate is relative to other companies in your industry
sector?” (multiple choice: below sector average, equal to sector average,
comfortably above the average, one of the leaders)
The first question provides the opinion of the interviewed person regarding the product
development success. The questionnaire did not specify which criteria had to be used for this
assessment. However, answers given by the participants indicate that the typical criteria (cost, time
and quality) were used. Thus, the question represents an assessment of what is described as project
management success according to Baccarini (1999).
The second question provides the growth rate of a company relative to other companies in the
specific industry sector, i.e. the overall economic success of a company. This was a multiple-choice
question. Considering that the overall success of companies which develop, produce and sell
products as their core business, as indicated by the companies’ growth rate, depends on product
success, the growth rate of the companies is used to assess product success.
Considering both questions, companies can be identified which usually finish their product
development projects successfully and companies which do usually not. Therefore, in this study the
distinction between successful and less successful companies is used in order to identify the
influence on project success of those factors which are covered by the hypotheses formulated in
Section 4.4.
The companies are categorised as successful and less successful using the scheme depicted in Figure
5-3. The successful cases represent companies whose past product development projects
successfully fulfilled expectations regarding time, cost and quality (question 1) and whose growth
rate was above average and better relative to competitors (question 2).
In addition, those companies with an mixed success of previous projects (question 1) and with an
above average growth rate (question 2), were classified as “successful” based on the consideration
that despite the mixed success the company remained one of the leader or above average compared
to other companies in the industry sector.
According to this scheme 21.4% (n=40) of the 141 analysed companies can be rated as successful and
71.6% (n=101) can be rated as less successful (see Figure 5-3).

79
Figure 5-3: Categorisation of company success (n=141)
5.6 Sample profile
5.6.1 Company data
The description of the characteristics of the analysed companies presented in this section is the
result of an analysis of questions from part A of the questionnaire. The sample size n for each
question varies, because not all companies answered all questions.
• 88% of the companies (n=141) can be classified as SMEs (less than 250 employees),
12% of the participating companies have more than 250 employees of which 4%
have more than 500 employees (see Figure 5-4 a).
• 6% of the companies (n=141) employ only one designer, 43% employ 2 to 5
designers, 22% employ 6 to 10 designers, only 10% employ more than 25 designers
(see Figure 5-4 b).
• 32% of the companies have more than 10 m £ annual sales, only 7% have less than 1
m £ (see Figure 5-5).
Figure 5-4: Number of employees (a) and designers (b), n=141
success ofprevious
projects
companygrowth rate
relative to othercompanies
Were
successful22% (n=31)
Mixed36.2% (n=51)
Were not
successful41.8% (n=59)
One of the leader24.1% (n=34)
Above the average19.9% (n=28)
Equal to average45.4% (n=64)
Below average10.6% (n=15)
Successful28.4% (n=40)
Less successful71.6% (n=101)
answer percentage frequency
3%
14%
24%26%
22%
8%
4%
0%
10%
20%
30%
40%
50%
<11 12-25 26-50 51-100 101-250 251-500 >500
(a)
6%
43%
22%20%
10%
0%
10%
20%
30%
40%
50%
1 2-5 6-10 11-25 >25
(b)

80
Figure 5-5: Annual sales in m £, n=141
5.6.2 Product development
The companies involved in the study develop mechanical and mechatronical products for several
branches (see Figure 5-6). The participants were asked to indicate two market sectors which are
most important for their company. The largest share of the sample (n=141) is from companies
developing their products for the following market sectors: mechanical equipment (26%), industrial
electronics (16%), electrical equipment (16%) or mechanical components (16%). 34% of the
participants chose the answer option ‘other’. Some of them explained their choice by developing
products for a couple of market sectors, thus not being able to prioritize the both most important
sectors.
Figure 5-6: Market sector
Figure 5-7: Type of production
3%4%
19%
24%
18%
32%
0%
10%
20%
30%
40%
<0.5 0.5-1 1-2.5 2.5-5 5-10 <10
16%n=23
6%n=8
4%n=6
16%n=23
4%n=6
16%n=22
6%n=8
26%n=37
6%n=9 3%
n=4
15%n=21
15%n=21
8%n=11
34%n=48
0%
5%
10%
15%
20%
25%
30%
35%
40%
ind
ust
rial
ele
ctro
nic
s
ele
ctri
cal
com
po
ne
nts
con
sum
er e
lect
ron
ics
ele
ctri
cal e
qu
ipm
en
t m
ach
ine
s
do
me
stic
ap
plia
nce
s
me
chan
ical
co
mp
on
en
ts
IT h
ard
war
e
me
chan
ical
e
qu
ipm
en
t mac
hin
es
IT s
oft
war
e
civi
l en
gin
ee
rin
g
inst
rum
en
tati
on
me
chan
ical
e
ngi
ne
eri
ng
me
dic
al e
qu
ipm
en
t
oth
er
24%
64%
3%9%
0%
10%
20%
30%
40%
50%
60%
70%
one-off batch continuous cell

81
The majority of the companies (64%, n=137) classified their type of production as batch production
(see Figure 5-7).
5.6.3 Capabilities profile
The classification of the companies’ capabilities (the companies’ qualification in performing specific
activities) is based on the answers to the following question: “Please indicate your company's product
development capability“. Companies were asked to rate their capabilities according to: full
capability, partial capability, do not do. It was possible to indicate additionally whether a company
buys in external assistance. The set of capabilities comprehend the following:
• market analysis and forecasting,
• requirements specifications,
• design,
• development testing,
• components manufacture fabrication,
• production systems and equipment development,
• assembly,
• sales and distribution,
• installation, and
• customer support
The majority of analysed companies indicated full capability regarding requirements specification
(71%), design (72%) assembly (74%), sales & distribution (81%), customer support (82%) (see
Figure 5-8). Interestingly only a third of the companies possess full capabilities in market analysis
(30%).
Figure 5-8: Capabilities profile
Considering the possibility to answer that a company buys in external assistance, four combinations
arise: full capability, partial capability, buy in external assistance, and do not do (see Figure 5-9 and
Figure 5-10).
In those areas in which most of the companies possess full capabilities on their own, buying in
external assistance is only seldom reported. Even though, 43% of the companies state that they do
not possess own capabilities in installation only 5% state that they buy in external assistance in this
area. Only 15% of the companies stated to buy in external assistance for development testing.
Market analysis and forecasting
Requirements specifications
DesignDevelopment
testing
Components manufacture
fabrication
Production systems and equipment
develop
AssemblySales and
distributionInstallation
Customer support
full capability 43 100 102 68 46 43 105 114 52 116
partial capability 78 36 39 56 53 78 24 21 25 20
do not do 20 5 0 17 42 20 12 6 64 5
0
20
40
60
80
100
120
140
Market analysis and forecasting
Requirements specifications
DesignDevelopment
testing
Components manufacture
fabrication
Production systems and equipment
develop
AssemblySales and
distributionInstallation
Customer support
30%
71% 72%
48%
33%30%
74%81%
37%
82%
55%
26% 28%
40% 38%
55%
17% 15% 18% 14%14%4% 0%
12%
30%
14%9% 4%
45%
4%
0%
20%
40%
60%
80%
100%

82
Capabilities for which companies buy in external assistance more often are market analysis (32%),
components manufacture and fabrication (32%), production systems, and equipment development
(20%).
A possible explanation for this might be that it is more economical for small and medium sized
manufacturing companies to buy in external assistance in these areas. Especially if companies do not
often start new product development projects, and if manufacturing requires special machinery and
tools, buying in external assistance might be a good alternative compared to possessing these
capabilities on their own.
Figure 5-9: Detailed capabilities profile – part 1
Figure 5-10: Detailed capabilities profile – part 2
Market analysis
and forecasting
Requirements
specificationsDesign
Development
testing
Components
manufacture
fabrication
full capability 43 100 102 68 46
partial capability 78 36 39 56 53
do not do 10 4 0 12 15
buy in external capability 10 1 0 5 27
0
20
40
60
80
100
120
140
Market analysis
and forecasting
Requirements
specificationsDesign
Development
testing
Components
manufacture
fabrication
30%
71% 72%
48%
33%
55%
26% 28%
40% 38%
7%3% 0%
9% 11%7%
1% 0% 4%
19%
0%
10%
20%
30%
40%
50%
60%
70%
80%
90%
100%
full capability
partial capability
do not do
buy in external capability
0
20
40
60
80
100
120
140
Market analysis
0%
10%
20%
30%
40%
50%
60%
70%
80%
90%
100%
Production
systems and
equipment
develop
AssemblySales and
distributionInstallation
Customer
support
43 105 114 52 116
78 24 21 25 20
16 6 6 61 5
4 6 0 3 0
Production
systems and
equipment
develop
AssemblySales and
distributionInstallation
Customer
support
30%
74%81%
37%
82%
55%
17% 15% 18%14%11%
4% 4%
43%
4%3% 4% 0% 2% 0%

83
5.6.4 Self assessment of core competencies
The companies were asked to assess their own competencies (their maturity-levels) in the following
areas by answering key assessment, multiple choice questions in part C of the questionnaire
(compare Section 5.2.2):
• company strategy,
• product champion,
• product development process,
• design & development,
• project management,
• manufacturing strategy,
• supply & manufacture, and
• people & quality
The self assessment of the competencies is based on a verbal description of different maturity levels
in the specific area (see Table 5-1). The possible answers cover the range between less mature
(level 1) and mature (level 5).
Table 5-1: Description of maturity levels - examples
Maturity level Description
Product development process
less mature - 1 We do what is necessary when it is necessary.
2 We have some processes in some departments.
3 We have a documented product development procedure, but it is not always used.
4 We have procedures and regularly undertake market analysis and business
planning.
mature - 5 We have integrated the development of products across most company functions
with documented instructions, active competitive market analysis and business
case evaluation.
Project management
less mature - 1 We work to our customers’ delivery dates. 2 We develop products as we can generate the resources to do so and launch them
when ready.
3 We develop products as speedily as we can within the constraints of our
development budget and try to achieve our forward launch date, provided that
does not exceed the budget.
4 We set a timing plan and budget to guide our development programme; we may
hold review meetings at milestones; achieving budget is more important than exact
timing.
mature - 5 We pre-plan the development tasks and resources needed in detail, fix targets for
project cost and timing for each project phase, continuously monitor time and cost and take corrective action to ensure that both are met, and hold review meetings
at milestone dates to approve continuation to the next phase.
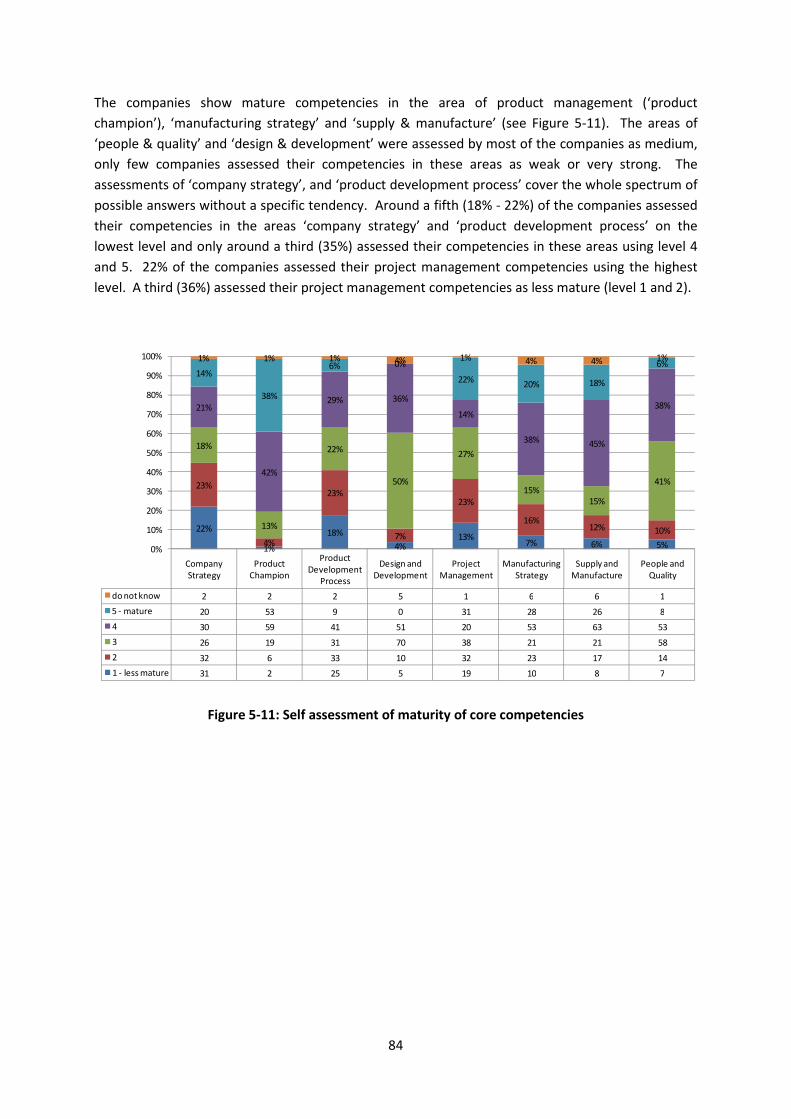
84
The companies show mature competencies in the area of product management (‘product
champion’), ‘manufacturing strategy’ and ‘supply & manufacture’ (see Figure 5-11). The areas of
‘people & quality’ and ‘design & development’ were assessed by most of the companies as medium,
only few companies assessed their competencies in these areas as weak or very strong. The
assessments of ‘company strategy’, and ‘product development process’ cover the whole spectrum of
possible answers without a specific tendency. Around a fifth (18% - 22%) of the companies assessed
their competencies in the areas ‘company strategy’ and ‘product development process’ on the
lowest level and only around a third (35%) assessed their competencies in these areas using level 4
and 5. 22% of the companies assessed their project management competencies using the highest
level. A third (36%) assessed their project management competencies as less mature (level 1 and 2).
Figure 5-11: Self assessment of maturity of core competencies
do not know 2 2 2 5 1 6 6 1
5 - mature 20 53 9 0 31 28 26 8
4 30 59 41 51 20 53 63 53
3 26 19 31 70 38 21 21 58
2 32 6 33 10 32 23 17 14
1 - less mature 31 2 25 5 19 10 8 7
Company Strategy
Product Champion
Product Development
Process
Design and Development
Project Management
Manufacturing Strategy
Supply and Manufacture
People and Quality
22%
1%
18%
4%13%
7% 6% 5%
23%
4%
23%
7%
23%
16%12% 10%
18%
13%
22%
50%
27%
15%15%
41%
21%
42%
29% 36%
14%
38% 45%
38%
14%
38%
6% 0%
22%20% 18%
6%1% 1% 1% 4% 1% 4% 4% 1%
0%
10%
20%
30%
40%
50%
60%
70%
80%
90%
100%

85
5.7 Findings
5.7.1 H1 – systematic project execution
Hypothesis H1 states that ‘Projects which are managed systematically are more likely to be
successful.’. The categorisation of companies using a systematic/non-systematic approach to
manage their projects is based on a clustering of the coded answers to the following three open-
ended questions (all from part B of the questionnaire).
Formal product creation strategy (Q1_H1)
Do you have a formal or even an informal product creation strategy?
Detailed project plan (Q2_H1)
Do you try to map out the time needed for each step before you start?; Do you have a detailed
project plan which you continuously monitor and update?; Do you identify the longest steps and
see where you can reduce time by starting work on them perhaps before all the necessary
information is available from previous steps?
Awareness of tools and techniques (Q3_H1)
Are you aware of the many tools and techniques that could help you speed time to market and
reduce project and product cost?
Analysis of individual variables
The majority of the companies state that they do have a formal product creation strategy (41%,
n=116, Q1_H1) and do have a detailed project plan (44%, n=135, Q2_H1). Interestingly, 40% of the
companies (n=136) state that they are not aware of tools and techniques that help to reduce
development time and cost (see Table 5-2).
Table 5-2: Answers to questions related to systematic project execution
Coded answers Frequency
Q1_H1
(formal product
creation strategy)
n=116
Yes
Yes, informally
No
41%
31%
28%
Q2_H1
(detailed project
plan)
n=135
Yes, we have a detailed project plan which we monitor
Yes, we have a project plan
We plan only informally
No, we do not
44%
19%
16%
21%
Q3_H1
(awareness of tools
and techniques)
n=136
Yes
Yes, but we use only conventional tools
No
29%
31%
40%

86
Table 5-3: Test of dependencies between Q1_H1, Q2_H1, Q3_H1 and company success
Variable (question) p-value X2
Q1_H1 (formal product creation strategy) 0.031 6.95
Q2_H1 (detailed project plan) 0.288 3.766
Q3_H1 (awareness of tools and techniques) 0.052 5.926
An analysis of the dependencies between the three questions representing systematic project
execution and the classification of the company as successful or not successful (see Section 5.5)
shows a significant dependency between the existence of a formal product creation strategy (Q1-H1)
and company success (p=0.031; X2=6.95; n=116).
Companies which have only an informal product creation strategy or do not have a product creation
strategy at all are more likely to be less successful than companies which do have a formal product
creation strategy (see Figure 5-12).
The answers to the other questions do not show significant dependencies (see Table 5-3).
Figure 5-12: Dependency between product creation strategy and company success (p=0.031;
X2=6.95; n=116)
Analysis of clusters
The cluster analysis of the answers to the questions (Q1_H1, Q2_H1, Q3_H1) resulted in two clusters
(see Figure 5-13). The average silhouette coefficient of the clustering is 0.3 which indicates a
reasonable clustering. The individual importance of each question was at least good, which indicates
that these contribute to the clustering (see Table 5-4).
Table 5-4: Importance of variables representing systematic project execution
Variable (question) Importance (interpretation)
Q1_H1 (formal product creation strategy) 1 (excellent)
Q2_H1 (detailed project plan) 0.41 (good)
Q3_H1 (awareness of tools and techniques) 0.47 (good)
0%
10%
20%
30%
40%
50%
60%
70%
80%
90%
100%
yes (n=47) yes, informally
(n=36)
no (n=33)
less successful
successful
40%n=19
60%n=28
14%n=5
86%n=31
30%n=10
70%n=23

87
The first cluster (C11) comprises those companies which follow a rather systematic approach (n=28).
The second cluster (C12) comprises those companies which conduct the management of their project
in an informal manner or do not use a systematical approach at all (n=82). The majority of the 110
companies (74.5%; n=82) do not manage their projects using a systematic approach.
All companies labelled as using a systematic approach (cluster C11) do have a formal product
creation strategy and a project plan. The majority (71%) has a detailed project plan, which is
monitored during project execution, and 54% are aware of tools and techniques supporting design
management (see Figure 5-13).
Figure 5-13: Formation of cluster describing systematic project execution (two-step cluster
analysis)
100%
0%
0%
71%
29%
0%
0%
54%
46%
0%
15%
26%
26%
23%
9%
13%
22%
15%
17%
35%
0% 20% 40% 60% 80% 100%
yes
yes, informally
no
Yes, we have a detailed project plan which we monitor
Yes, we have a projcet plan
We plan only informally
No, we do not
Yes
Yes, but we use only conventional tools
No
Do
yo
u h
ave
a f
orm
al p
rod
uct
de
velo
pm
en
t str
ate
gy (
n=
11
0)
Do
yo
u p
lan
an
d m
on
ito
r yo
ur
pro
ject
s
(n=
11
0)
Are
aw
are
of
man
age
me
nt
too
ls a
nd
te
chn
iqu
es
(n=
11
0)
C11 - systematic approach (n=28) C12 - non-systematic approach (n=82)

88
Figure 5-14: Dependency between systematic product development approach and company
success (p=0.019; X2=5.473; n=110; two-sided test)
The relative share of successful companies is bigger for those companies applying a systematic
approach (Cluster C11, 46.6%) compared to the share in cluster C12 (23.2%). However, this does not
imply that using systematic approach makes projects automatically more successful. As shown in
Figure 5-14 less of the successful companies belong to Cluster C11 (systematic approach, n=15) than
to the Cluster C12 (non-systematic approach, n=19) and the relative share of less successful
companies is bigger in both clusters. Therefore, the positive formulation of H1 is not accepted based
on the answers to the selected questions. However, a negative formulation of the relation which is
covered by H1 is accepted. That is: Companies which do not manage their product development
projects using a systematic approach are significantly (p=0.019; X2=5.473; two-sided test) less likely
to be successful than companies which use a systematic approach (see Figure 5-14).
46.4%
n=1523.2%
n=19
53.6%
n=1376.8%
n=63
0%
10%
20%
30%
40%
50%
60%
70%
80%
90%
100%
C11 - systematic approach
n=28
C12 - non-systematic
approach
n=82
less successful
successful
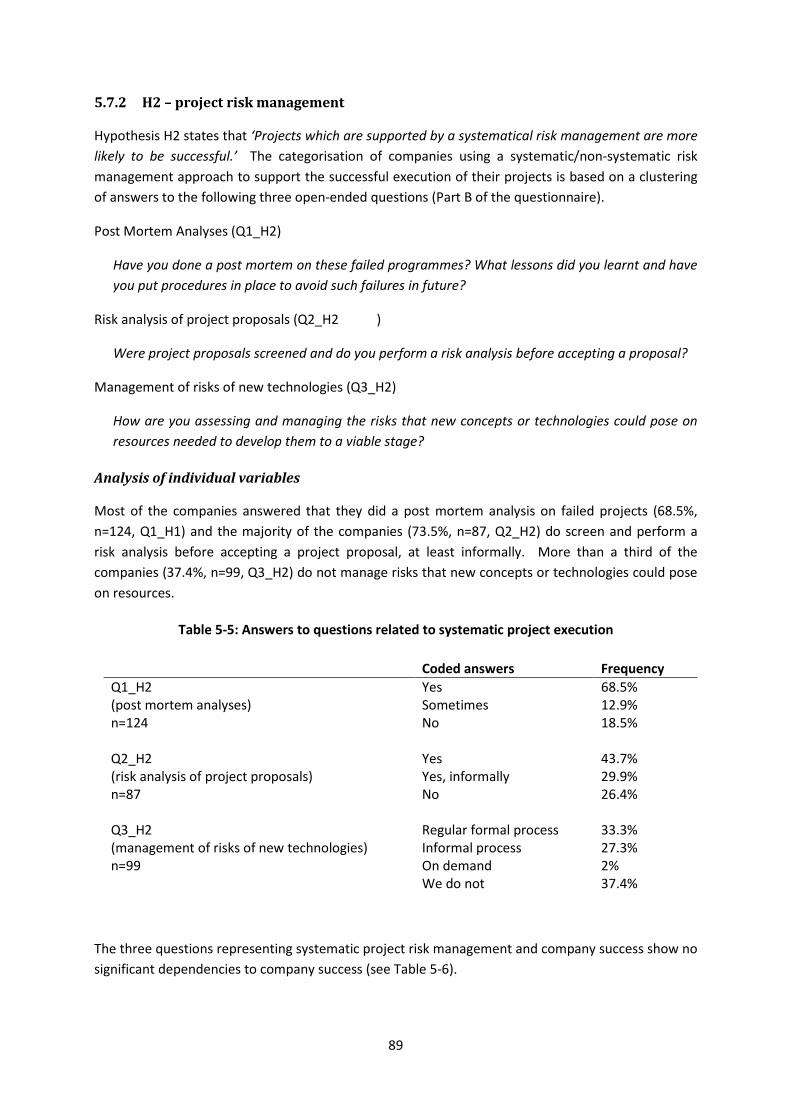
89
5.7.2 H2 – project risk management
Hypothesis H2 states that ‘Projects which are supported by a systematical risk management are more
likely to be successful.’ The categorisation of companies using a systematic/non-systematic risk
management approach to support the successful execution of their projects is based on a clustering
of answers to the following three open-ended questions (Part B of the questionnaire).
Post Mortem Analyses (Q1_H2)
Have you done a post mortem on these failed programmes? What lessons did you learnt and have
you put procedures in place to avoid such failures in future?
Risk analysis of project proposals (Q2_H2 )
Were project proposals screened and do you perform a risk analysis before accepting a proposal?
Management of risks of new technologies (Q3_H2)
How are you assessing and managing the risks that new concepts or technologies could pose on
resources needed to develop them to a viable stage?
Analysis of individual variables
Most of the companies answered that they did a post mortem analysis on failed projects (68.5%,
n=124, Q1_H1) and the majority of the companies (73.5%, n=87, Q2_H2) do screen and perform a
risk analysis before accepting a project proposal, at least informally. More than a third of the
companies (37.4%, n=99, Q3_H2) do not manage risks that new concepts or technologies could pose
on resources.
Table 5-5: Answers to questions related to systematic project execution
Coded answers Frequency
Q1_H2
(post mortem analyses)
n=124
Yes
Sometimes
No
68.5%
12.9%
18.5%
Q2_H2
(risk analysis of project proposals)
n=87
Yes
Yes, informally
No
43.7%
29.9%
26.4%
Q3_H2
(management of risks of new technologies)
n=99
Regular formal process
Informal process
On demand
We do not
33.3%
27.3%
2%
37.4%
The three questions representing systematic project risk management and company success show no
significant dependencies to company success (see Table 5-6).
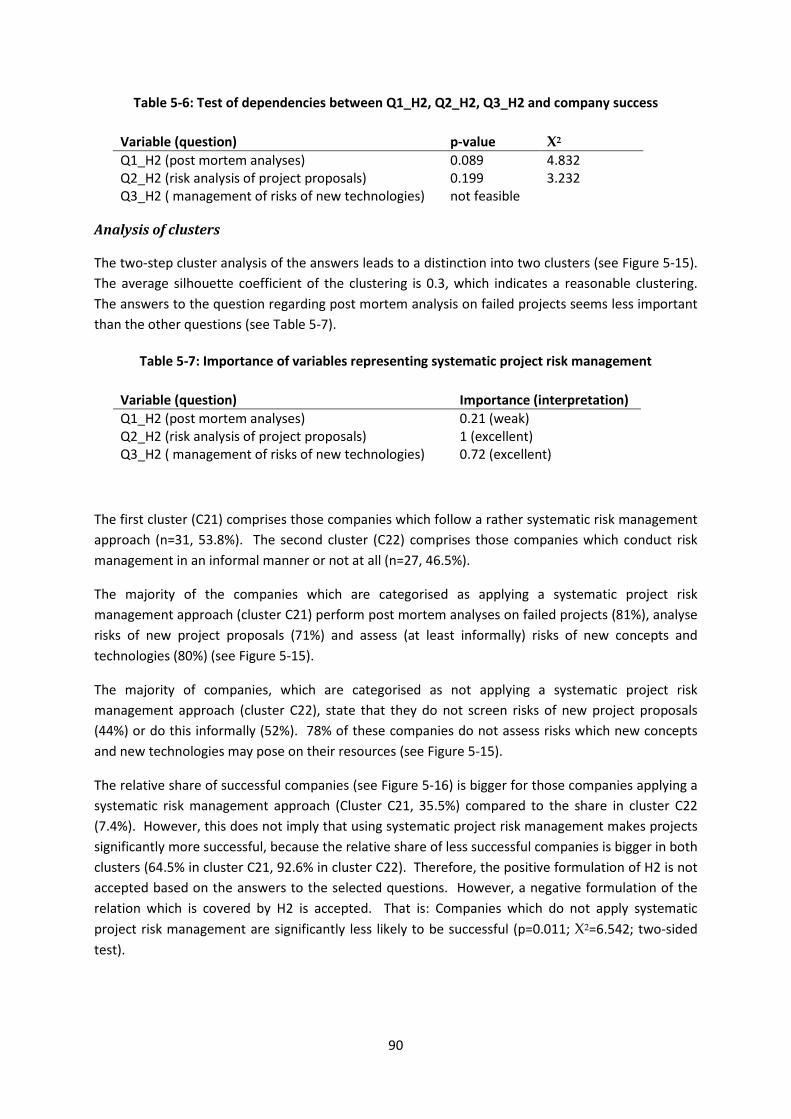
90
Table 5-6: Test of dependencies between Q1_H2, Q2_H2, Q3_H2 and company success
Variable (question) p-value X2
Q1_H2 (post mortem analyses) 0.089 4.832
Q2_H2 (risk analysis of project proposals) 0.199 3.232
Q3_H2 ( management of risks of new technologies) not feasible
Analysis of clusters
The two-step cluster analysis of the answers leads to a distinction into two clusters (see Figure 5-15).
The average silhouette coefficient of the clustering is 0.3, which indicates a reasonable clustering.
The answers to the question regarding post mortem analysis on failed projects seems less important
than the other questions (see Table 5-7).
Table 5-7: Importance of variables representing systematic project risk management
Variable (question) Importance (interpretation)
Q1_H2 (post mortem analyses) 0.21 (weak)
Q2_H2 (risk analysis of project proposals) 1 (excellent)
Q3_H2 ( management of risks of new technologies) 0.72 (excellent)
The first cluster (C21) comprises those companies which follow a rather systematic risk management
approach (n=31, 53.8%). The second cluster (C22) comprises those companies which conduct risk
management in an informal manner or not at all (n=27, 46.5%).
The majority of the companies which are categorised as applying a systematic project risk
management approach (cluster C21) perform post mortem analyses on failed projects (81%), analyse
risks of new project proposals (71%) and assess (at least informally) risks of new concepts and
technologies (80%) (see Figure 5-15).
The majority of companies, which are categorised as not applying a systematic project risk
management approach (cluster C22), state that they do not screen risks of new project proposals
(44%) or do this informally (52%). 78% of these companies do not assess risks which new concepts
and new technologies may pose on their resources (see Figure 5-15).
The relative share of successful companies (see Figure 5-16) is bigger for those companies applying a
systematic risk management approach (Cluster C21, 35.5%) compared to the share in cluster C22
(7.4%). However, this does not imply that using systematic project risk management makes projects
significantly more successful, because the relative share of less successful companies is bigger in both
clusters (64.5% in cluster C21, 92.6% in cluster C22). Therefore, the positive formulation of H2 is not
accepted based on the answers to the selected questions. However, a negative formulation of the
relation which is covered by H2 is accepted. That is: Companies which do not apply systematic
project risk management are significantly less likely to be successful (p=0.011; X2=6.542; two-sided
test).

91
Figure 5-15: Formation of cluster describing systematic project risk management (two-step cluster
analysis)
Figure 5-16: Dependency between clusters representing application of project risk management
and company success (p=0.011; X2=6.542; n=58; two-sided test)
81%
6%
13%
71%
0%
29%
45%
35%
6%
13%
48%
26%
26%
4%
52%
44%
4%
19%
0%
78%
0% 20% 40% 60% 80% 100%
yes
sometimes
no
yes
yes, informally
no
regular formal process
informal process
on demand
we do not
Po
st m
ort
em
an
alys
is (
n=
58
)
Scre
en
ing
and
ris
k an
alys
is o
f
pro
po
sals
(n
=5
8)
Ass
ess
ing
of
risk
s fr
om
ne
w t
ech
no
logi
es
(n=
58
)
C21 - systematic RM (n=31) C22 - non-systematic RM (n=27)
35.5%
n=11
7.4%, n=2
64.5%
n=2092.6%
n=25
0%
10%
20%
30%
40%
50%
60%
70%
80%
90%
100%
C21 - systematic RM
n=31
C22 - non-systematic RM
n=27
less successful
successful
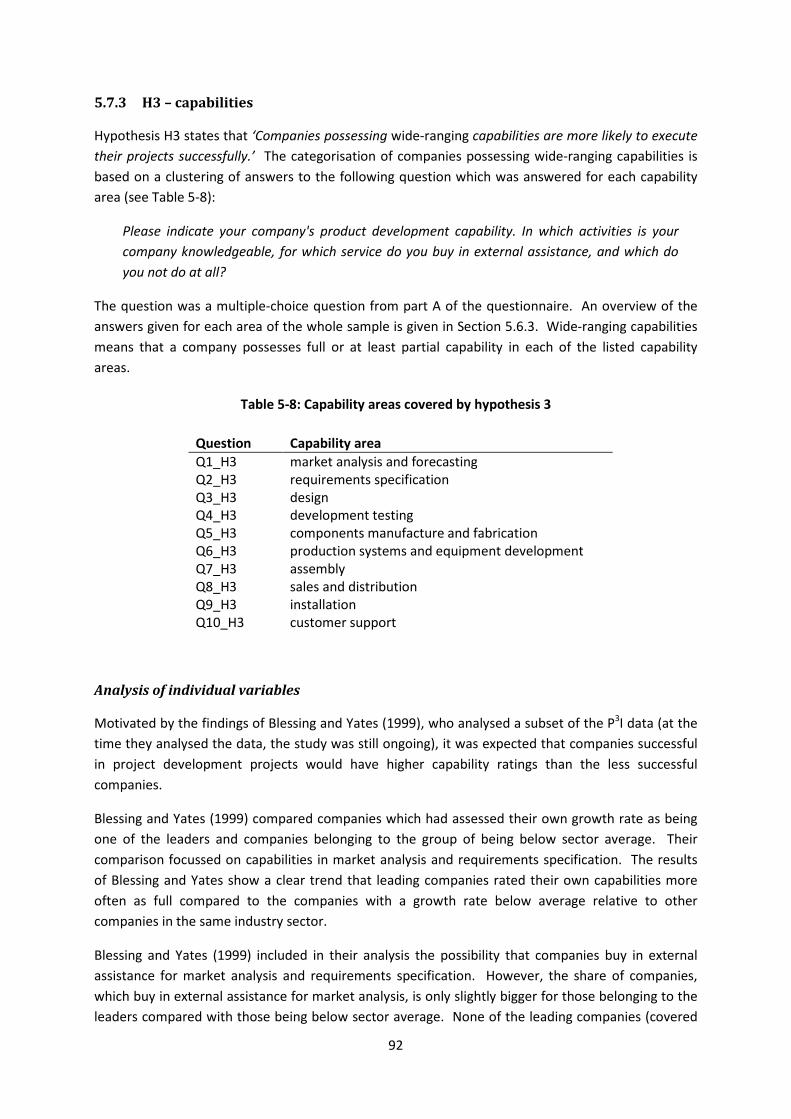
92
5.7.3 H3 – capabilities
Hypothesis H3 states that ‘Companies possessing wide-ranging capabilities are more likely to execute
their projects successfully.’ The categorisation of companies possessing wide-ranging capabilities is
based on a clustering of answers to the following question which was answered for each capability
area (see Table 5-8):
Please indicate your company's product development capability. In which activities is your
company knowledgeable, for which service do you buy in external assistance, and which do
you not do at all?
The question was a multiple-choice question from part A of the questionnaire. An overview of the
answers given for each area of the whole sample is given in Section 5.6.3. Wide-ranging capabilities
means that a company possesses full or at least partial capability in each of the listed capability
areas.
Table 5-8: Capability areas covered by hypothesis 3
Question Capability area
Q1_H3 market analysis and forecasting
Q2_H3 requirements specification
Q3_H3 design Q4_H3 development testing
Q5_H3 components manufacture and fabrication
Q6_H3 production systems and equipment development
Q7_H3 assembly
Q8_H3 sales and distribution
Q9_H3 installation
Q10_H3 customer support
Analysis of individual variables
Motivated by the findings of Blessing and Yates (1999), who analysed a subset of the P3I data (at the
time they analysed the data, the study was still ongoing), it was expected that companies successful
in project development projects would have higher capability ratings than the less successful
companies.
Blessing and Yates (1999) compared companies which had assessed their own growth rate as being
one of the leaders and companies belonging to the group of being below sector average. Their
comparison focussed on capabilities in market analysis and requirements specification. The results
of Blessing and Yates show a clear trend that leading companies rated their own capabilities more
often as full compared to the companies with a growth rate below average relative to other
companies in the same industry sector.
Blessing and Yates (1999) included in their analysis the possibility that companies buy in external
assistance for market analysis and requirements specification. However, the share of companies,
which buy in external assistance for market analysis, is only slightly bigger for those belonging to the
leaders compared with those being below sector average. None of the leading companies (covered

93
by the subset analysed by Blessing and Yates) is buying in external assistance for requirements
specification and only few of the companies below sector average are doing this. Blessing and Yates
made no statements regarding the significance of their findings.
In this analysis of the P3I data the option of buying in capabilities (as included in the detailed
capabilities profile, see Figure 5-9 and Figure 5-10) is not considered, due to requirements of the
used statistical methods on the minimum expected frequency of combinations of answers (Bortz
2005; SPSS 2009). Therefore, only own capabilities of the participating companies (as shown in
Figure 5-8) are considered.
In this analysis little difference was found (see Figure 5-17). In addition some variations to the
expectation were found: successful companies did do less requirements specifications (do not do),
production systems and equipment development (full capability) sales and distribution (do not do),
and customer support (do not do). However, these are, except from the rating of production
systems and equipment development, based on only few answers (n=5 or 6), thus less meaningful.
No significant individual dependencies were observed (see Table 5-9) not even for the rating in
production systems and equipment development capability or customer support which showed
results similar to what was expected.
The result of the analysis of dependencies between capability ratings and company success are
somewhat surprising. A possible explanation for the deviation of the results of this study from the
expected results might be that focussing on the capabilities of the companies without considering
the influence of external assistance biases the result too much, even though this was not expected
based on the results of Blessing and Yates (1999).
A possible explanation for the differences between the findings of Blessing and Yates (1999) and the
results of this analysis might be the fact that Blessing and Yates used a partially different success
criterion. They compared only the companies with the highest and the lowest rating regarding
growth rate. As described in Section 5.5, in this analysis, the companies are distinguished into
successful and less successful by using a more complex success criterion (including the companies’
success in previous projects and all answer options for growth rate).
A further explanation might be that Blessing and Yates (1999) analysed (to some extent) a different
subset of the final data set. As mentioned earlier, they analysed a subset of the final P3I study
because the study was still ongoing when they made their analysis. The analysis described in this
dissertation focuses also on a subset of the final P3I data set. The selection of the data is described in
Section 5.3. Information which companies were analysed by Blessing and Yates is not available, thus
a comparison of both subsets is not possible.

94
Figure 5-17: Dependency between capability rating and company success (n=141)
67%
77%
60%
70%
78%
60%
74%
67%
71%
71%
76%
70%
74%
71%
58%
77%
80%
73%
67%
67%
72%
76%
50%
69%
76%
72%
70%
75%
100%
33%
23%
40%
30%
22%
40%
26%
33%
29%
29%
24%
30%
26%
29%
42%
23%
20%
27%
33%
33%
28%
24%
50%
31%
24%
28%
30%
25%
0%
0% 20% 40% 60% 80% 100%
Full capability (n=43)
partial capability (n=78)
do not do (n=20)
Full capability (n=100)
partial capability (n=36)
do not do (n=5)
full capability (n=102)
partial capability (n=39)
do not do (n=0)
full capability (n=68)
partial capability (n=56)
do not do (n=17)
full capability (n=46)
partial capability (n=53)
do not do (n=42)
full capability (n=43)
partial capability (n=78)
do not do (n=20)
full capability (n=105)
partial capability (n=24)
do not do (n=12)
full capability (n=114)
partial capability (n=21)
do not do (n=6)
full capability (n=52)
partial capability (n=25)
do not do (n=64)
full capability (n=116)
partial capability (n=20)
do not do (n=5)
Ma
rke
t a
na
lysi
ng
an
d f
ore
cast
ing
Re
qu
ire
me
nts
spe
cifi
cati
on
sD
esi
gn
De
velo
pm
en
t
test
ing
Co
mp
on
en
ts
ma
nu
fact
ure
fab
rica
tio
n
Pro
du
ctio
n
syst
em
sa
nd
eq
uip
me
nt
de
velo
pm
en
tA
sse
mb
ly
Sale
s
an
dd
istr
ibu
tio
nIn
sta
lla
tio
n
Cu
sto
me
r
sup
po
rt
less successful successful
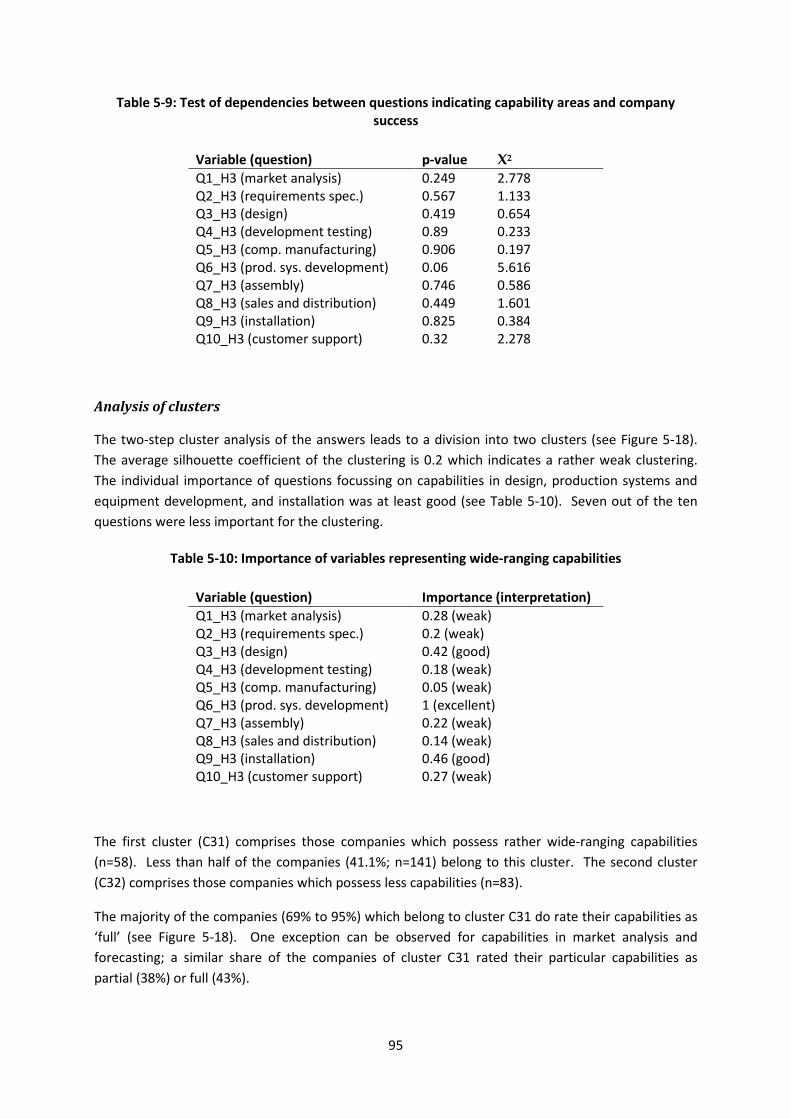
95
Table 5-9: Test of dependencies between questions indicating capability areas and company
success
Variable (question) p-value X2
Q1_H3 (market analysis) 0.249 2.778
Q2_H3 (requirements spec.) 0.567 1.133 Q3_H3 (design) 0.419 0.654
Q4_H3 (development testing) 0.89 0.233
Q5_H3 (comp. manufacturing) 0.906 0.197
Q6_H3 (prod. sys. development) 0.06 5.616
Q7_H3 (assembly) 0.746 0.586
Q8_H3 (sales and distribution) 0.449 1.601
Q9_H3 (installation) 0.825 0.384
Q10_H3 (customer support) 0.32 2.278
Analysis of clusters
The two-step cluster analysis of the answers leads to a division into two clusters (see Figure 5-18).
The average silhouette coefficient of the clustering is 0.2 which indicates a rather weak clustering.
The individual importance of questions focussing on capabilities in design, production systems and
equipment development, and installation was at least good (see Table 5-10). Seven out of the ten
questions were less important for the clustering.
Table 5-10: Importance of variables representing wide-ranging capabilities
Variable (question) Importance (interpretation)
Q1_H3 (market analysis) 0.28 (weak)
Q2_H3 (requirements spec.) 0.2 (weak)
Q3_H3 (design) 0.42 (good)
Q4_H3 (development testing) 0.18 (weak)
Q5_H3 (comp. manufacturing) 0.05 (weak)
Q6_H3 (prod. sys. development) 1 (excellent)
Q7_H3 (assembly) 0.22 (weak)
Q8_H3 (sales and distribution) 0.14 (weak) Q9_H3 (installation) 0.46 (good)
Q10_H3 (customer support) 0.27 (weak)
The first cluster (C31) comprises those companies which possess rather wide-ranging capabilities
(n=58). Less than half of the companies (41.1%; n=141) belong to this cluster. The second cluster
(C32) comprises those companies which possess less capabilities (n=83).
The majority of the companies (69% to 95%) which belong to cluster C31 do rate their capabilities as
‘full’ (see Figure 5-18). One exception can be observed for capabilities in market analysis and
forecasting; a similar share of the companies of cluster C31 rated their particular capabilities as
partial (38%) or full (43%).

96
Companies belonging to cluster C32 rated their capabilities more often as ‘partial’. The capability
areas assembly, sales and distribution, and customer support show similar distributions of the ratings
for both clusters. Both questions were less important for the clustering.
Figure 5-18: Formation of cluster describing range of capabilities (two-step cluster analysis)
43%
38%
19%
88%
10%
2%
95%
5%
0%
66%
29%
5%
40%
38%
22%
69%
26%
5%
91%
7%
2%
93%
5%
2%
64%
7%
29%
93%
0%
7%
22%
67%
11%
59%
36%
5%
57%
43%
0%
36%
47%
17%
28%
37%
35%
4%
76%
20%
63%
24%
13%
72%
22%
6%
18%
25%
57%
75%
24%
1%
0% 20% 40% 60% 80% 100%
Full capability
partial capability
do not do
Full capability
partial capability
do not do
Full capability
partial capability
do not do
Full capability
partial capability
do not do
Full capability
partial capability
do not do
Full capability
partial capability
do not do
Full capability
partial capability
do not do
Full capability
partial capability
do not do
Full capability
partial capability
do not do
Full capability
partial capability
do not do
Ma
rke
t a
na
lysi
ng
an
d f
ore
cast
ing
Re
qu
ire
me
nts
spe
cifi
cati
on
sD
esi
gn
De
velo
pm
en
t
test
ing
Co
mp
on
en
ts
ma
nu
fact
ure
fab
rica
tio
n
Pro
du
ctio
n
syst
em
s
an
d e
qu
ipm
en
t
de
velo
pm
en
tA
sse
mb
ly
Sale
s
an
d
dis
trib
uti
on
Inst
alla
tio
n
Cu
sto
me
r
sup
po
rt
C31 - wide-ranging capabilities (n=58) C32 - less capabilities (n=83)

97
Hypothesis 3 ‘Companies possessing wide-ranging capabilities are more likely to execute their
projects successfully.’ cannot be accepted (see Figure 5-19). The X2 test showed no significant
dependency between both variables (p=0.084; X2=2.979; two-sided). Therefore, the null hypothesis
must be accepted: Companies possessing wide-ranging capabilities are not more likely to be
successful than companies possessing less capabilities.
Figure 5-19: Dependency between clusters describing holism of capabilities and company success
(p=0.084; X2=2.979; n=141; two-sided test)
This result is counterintuitive. A possible reason is that missing dependencies between the individual
capability areas and company success caused the weak clustering. Therefore, the same reasons
which might explain the missing individual dependencies might explain the result of the dependency
analysis. Excluding the answer option of buying in external assistance might have biased the analysis
of the dependency between wide-ranging capabilities and company success. As stated before,
considering this answer option was not possible due to requirements of the statistical test method.
36.2%
n=21 22.9%
n=19
63.8%
n=37 77.1%
n=64
0%
10%
20%
30%
40%
50%
60%
70%
80%
90%
100%
C31 - wide-ranging
capabilities
n=58
C32 - less capabilities
n=83
less successful
successful

98
5.7.4 H4 – maturity
Hypothesis H4 states that ‘Companies possessing wide-ranging competencies are more likely to
execute their projects successfully.’ The categorisation of companies possessing wide-ranging
competencies (competencies in all covered areas) is based on a clustering of answers to the following
eight self-assessment questions (part C of the questionnaire).
Company strategy (Q1_H4)
Do you have a fully detailed, coherent, consistent and disseminated company strategy?
Product champion (Q2_H4)
Who acts as mentor of your product development, to ensure its success?
Product development process (Q3_H4)
Do you have a documented product development process that covers market analysis,
development and test, customer support and feedback?
Design and development (Q4_H4)
What level of design capability do you utilise?
Project management (Q5_H4)
At what level do you manage your product development programmes?
Manufacturing strategy (Q6_H4)
What is your manufacturing strategy and how does it relate to what your customers want?
Manufacture plan, suppliers (Q7_H4)
Do you have a sound manufacturing plan which links into your suppliers’ and ensures innovation,
quality, timely delivery and acceptable cost?
People and quality (Q8_H4)
How do you regard your employees?
The self assessment is based on a description of five different maturity levels in each area (compare
Table 5-1).
Individual analysis of variables
An overview of the answers given for each maturity area of the whole sample is given in
Section 5.6.4. It can be observed that successful companies assessed their competencies using
higher maturity levels compared to less successful companies (see Figure 5-20), apart from the
overall company strategy. Successful companies seldom used low maturity levels to assess their
maturity level regarding product development mentoring (product champion), design and
development capabilities, manufacturing strategy, supplier involvement in manufacturing, and
regard to employees process and quality attitude (people and quality).
An analysis of dependencies between the maturity level rating and company success showed some
significant individual dependencies (see Table 5-11). A dependency analysis of question Q2_H4 and
Q8_H4 using the Χ2 method was not feasible because the required minimum frequency of variable
combinations was not satisfied.

99
The significant dependency (p=0.026, Χ2=11.085) between company success and maturity of the
product development process shows that companies possessing a high level of maturity (level 4 and
5) are more likely to be successful. A similar relation can be found for self-assessments of project
management maturity, but this dependency is not significant (p=0.062).
None of the companies assessed their design and development capabilities using the highest
maturity level but a larger share of successful companies (8%) used the lowest level compared to less
successful companies (2%). Considering the second lowest maturity level, which was not used by
successful companies but by 10% of the less successful companies, this relation alternates. It is
important to mention that, a larger share of the successful companies (46%) used second best
maturity level compared to the less successful companies (34%). Therefore this significant
dependency (p=0.05, Χ2=7.811) is interpreted as follows: Companies possessing a high level of
maturity in design and development are more likely to be successful.
Figure 5-20: Dependencies between successful and less successful companies regarding self
assessments of maturity levels of core competencies
15%
25%
0%
2%
15%
19%
8%
2%
10%
15%
0%
10%
3%
7%
3%
6%
20%
24%
0%
6%
15%
27%
0%
10%
13%
27%
11%
19%
5%
16%
3%
13%
23%
17%
15%
13%
15%
25%
46%
54%
23%
29%
14%
16%
10%
18%
35%
44%
30%
18%
45%
41%
38%
26%
46%
34%
23%
11%
43%
38%
51%
45%
48%
34%
13%
15%
40%
37%
15%
3%
0%
0%
33%
18%
32%
16%
31%
15%
13%
3%
0% 10% 20% 30% 40% 50% 60% 70% 80% 90% 100%
successful n=40
less successful n=99
successful n=40
less successful n=99
successful n=39
less successful n=100
successful n=39
less successful n=97
successful n=40
less successful n=100
successful n=37
less successful n=98
successful n=39
less successful n=96
successful n=40
less successful n=100
Co
mp
any
stra
tegy
Pro
du
ct
cham
pio
n
Pro
du
ctd
evel
op
men
tp
roce
ssD
esig
n a
nd
dev
elo
pm
ent
Pro
ject
man
agem
ent
Man
ufa
ctu
rin
g
stra
tegy
Sup
ply
an
d
man
ufa
ctu
re
Peo
ple
and
qu
alit
y
1 - less mature 2 3 4 5 - mature

100
Table 5-11: Test of dependencies between questions indicating capability areas and company
success
Variable (question) p-value X2
Q1_H4 (company strategy) 0.409 3.981
Q2_H4 (product champion) not feasible Q3_H4 (product development process) 0.026 11.085
Q4_H4 (design and development) 0.05 7.811
Q5_H4 (project management) 0.062 8.957
Q6_H4 (manufacturing strategy) 0.071 8.637
Q7_H4 (manufacture plan, suppliers) 0.075 8.486
Q8_H4 (people and quality) not feasible
Analysis of clusters
The two-step cluster analysis of the answers leads to a division into two clusters (see Figure 5-21).
The average silhouette coefficient of the clustering is 0.5575 which indicates a good clustering. The
individual importance of questions focussing on maturity of product development process, project
management, and manufacturing strategy was excellent. Importance of questions on maturity of
company strategy, design and development strategy, supplier involvement in manufacturing, and
regard of employees and quality attitude (people and quality) was good (see Table 5-12). Only the
question addressing maturity of product development mentoring (product champion) is of low
importance for the clustering.
Table 5-12: Importance of variables representing holism of maturity in core competencies
Variable (question) Importance (interpretation)
Q1_H4 (company strategy) 0.34 (good)
Q2_H4 (product champion) 0.1 (weak)
Q3_H4 (product development process) 1 (excellent)
Q4_H4 (design and development) 0.47 (good)
Q5_H4 (project management) 0.89 (excellent)
Q6_H4 (manufacturing strategy) 0.77 (excellent)
Q7_H4 (manufacture plan, suppliers) 0.55 (good)
Q8_H4 (people and quality) 0.34 (good)
The majority of the companies (53% to 88%) which belong to cluster C41 assess their maturity using
the two highest levels (see Figure 5-21). Companies belonging to cluster C42 assessed their maturity
more often using lower levels. One exception can be observed for the maturity assessments of the
companies regarding product development mentoring (product champion). Companies of both
clusters often used the two highest maturity levels to assess their competencies, but none of the
companies belonging to cluster C41 assessed their competencies using the two lowest maturity
levels.
The first cluster (C41 – wide ranging competencies) comprises companies which possess a rather high
level of maturity regarding the considered competencies (n=71). The second cluster (C42) comprises
companies which possess a low level of maturity (n=57). 55.5% of the companies (n=128) possess a
high level of maturity in the considered competence areas.
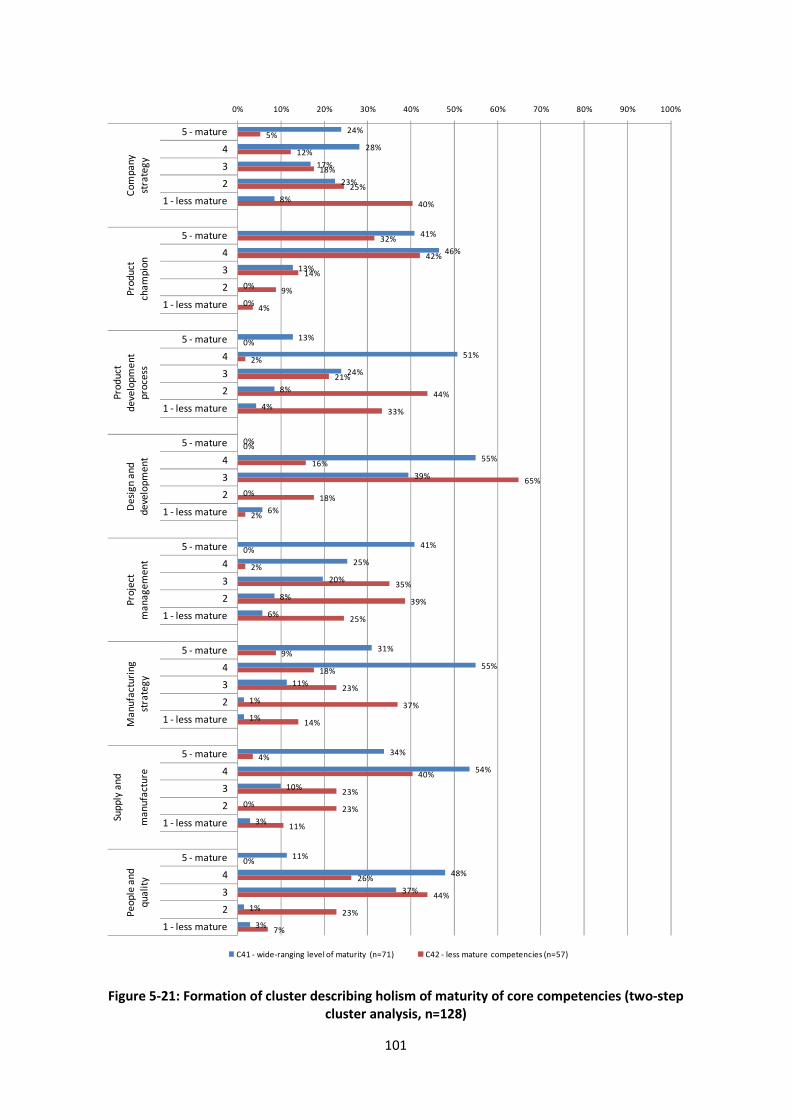
101
Figure 5-21: Formation of cluster describing holism of maturity of core competencies (two-step
cluster analysis, n=128)
24%
28%
17%
23%
8%
41%
46%
13%
0%
0%
13%
51%
24%
8%
4%
0%
55%
39%
0%
6%
41%
25%
20%
8%
6%
31%
55%
11%
1%
1%
34%
54%
10%
0%
3%
11%
48%
37%
1%
3%
5%
12%
18%
25%
40%
32%
42%
14%
9%
4%
0%
2%
21%
44%
33%
0%
16%
65%
18%
2%
0%
2%
35%
39%
25%
9%
18%
23%
37%
14%
4%
40%
23%
23%
11%
0%
26%
44%
23%
7%
0% 10% 20% 30% 40% 50% 60% 70% 80% 90% 100%
5 - mature
4
3
2
1 - less mature
5 - mature
4
3
2
1 - less mature
5 - mature
4
3
2
1 - less mature
5 - mature
4
3
2
1 - less mature
5 - mature
4
3
2
1 - less mature
5 - mature
4
3
2
1 - less mature
5 - mature
4
3
2
1 - less mature
5 - mature
4
3
2
1 - less mature
Co
mp
an
y
stra
teg
y
Pro
du
ct
cha
mp
ion
Pro
du
ct
de
velo
pm
en
tp
roce
ss
De
sig
n a
nd
de
velo
pm
en
t
Pro
ject
ma
na
ge
me
nt
Ma
nu
fact
uri
ng
stra
teg
y
Sup
ply
an
d
ma
nu
fact
ure
Pe
op
le a
nd
qu
ali
ty
C41 - wide-ranging level of maturity (n=71) C42 - less mature competencies (n=57)

102
Even though, more of the successful companies rated themselves using higher maturity levels (n=27)
than using lower maturity levels (n=9), this does not imply that possessing wide-ranging
competencies makes companies more successful because the majority (62%) of those companies
with high maturity ratings (cluster C41) belongs to the group of less successful companies (see
Figure 5-22). Therefore, the positive formulation of hypothesis H4 (‘Companies possessing wide-
ranging competencies are more likely to execute their projects successfully.’) is not accepted.
However, a negative formulation of the dependency covered by H4 is accepted: Companies not
possessing wide-ranging competencies are significantly (p=0.005; X2=7.735; two-sided test) less likely
to execute their projects successfully.
Figure 5-22: Dependency between clusters describing maturity in core competencies and company
success (p=0.005; X2=7.735; n=128; two-sided test)
38.0%
n=2715.8%
n=9
62.0%
n=4484.2%
n=48
0%
10%
20%
30%
40%
50%
60%
70%
80%
90%
100%
C41 - wide-ranging
competencies (n=71)
C42 - less mature
competencies (n=57)
less successful (n=92)
successful (n=36)

103
5.7.5 Explorative analysis of selected factors
The analyses described in this section aim at identifying additional factors influencing company
success beyond those pre-defined in the hypotheses. The successful and less successful companies
were compared regarding their answers to the following open-ended questions (part B of the
questionnaire):
Q 1. Have you clearly defined your goals in relation to the 'products' you are providing and the
markets and customers you are able to access?
Q 2. Have you, as a result of regular reviews, a clear vision of how you wish the company move
forward?
Q 3. Do you interrogate and observe what your potential customers want of your products and
match their needs to the detail features and parameters of your products?
Q 4. Do you liaise regularly with your customers in order to provide education and training for
your company staff in researching your customers’ requirements?
Q 5. Are you using a frozen specification so that you don't have continual interruptions and
delays to accommodate changes?
These questions were selected from the questionnaire because they address aspects considered to
be important for company success, namely the definition of the companies’ goals and vision,
customer relationship management and requirements management (compare Table 2-7,
Section 2.2.1). The answers were coded to support analysis.
Q1 – definition of goals
The answers of the majority of the companies (65%) suggest that they have clearly defined their
goals in relation to their products and the markets and customers they access (see left side of
Figure 5-23). 31% of the companies stated that they define their goals informally. Only 5 companies
(4%) stated that they did not define their goals.
Figure 5-23: Have you clearly defined your goals in relation to the 'products' you are providing and
the markets and customers you are able to access? (n=117; answers encoded)
The dependency between the different ways of defining a company’s goals and company success is
significant (p=0.027; n=117; X2=4.904) (see right side of Figure 5-23). All companies which do not
define their goals are rated as less successful.
33%
28%
0%
67%72%
100%
0%
10%
20%
30%
40%
50%
60%
70%
80%
90%
100%
yes (n=76) yes, informally /
some of these
factors (n=36)
no (n=5)
successful
less successful
65%
31%
4%
yes (n=76)
yes, informally / some of
these factors (n=36)
no (n=5)
23 38 10 26 5

104
Q2 – vision of the company’s future
The answers suggest that only half of the companies (53%, n=116) have a clear vision about how they
wish the company to move forward, 25% stated that they have it informally, incomplete or only on
top level. 22% (n=26) do not have a clear vision at all (see left side of Figure 5-24).
Figure 5-24: Have you, as a result of regular reviews, a clear vision of how you wish the company
move forward? (n=116; answers encoded)
The dependency between company success and the completeness of a company’s vision about how
the company will move forward is significant (n=116; p=0.048; X2=6.08). Companies which do not
have a clearly defined vision are more likely to be less successful (see right side of Figure 5-24).
Q3 – analysis of customer needs
70% of the companies (n=114) do interrogate and observe their potential customers and match their
needs to the detail features and parameters of their products. The answers of 25% of the companies
suggest that they analyse their customers’ needs informally or only to some extent. Only 5
companies (5%) are not doing this (see left side of Figure 5-25).
Figure 5-25: Do you interrogate and observe what your potential customers want of your products
and match their needs to the detail features and parameters of your products?
(n=114; answers encoded)
The observed dependency between company success and interrogation and observation of potential
customers is significant (n=114; p=0.049; X2=6.044). Companies which do not interrogate and
observe their customers and do it informally are more likely less successful (see right side of
Figure 5-25).
38%
28%
12%
62%
72%
88%
0%
10%
20%
30%
40%
50%
60%
70%
80%
90%
100%
yes (n=61) yes, but
informally or only
on top level /
short term or
incomplete (n=29)
no (n=26)
successful
less successful53%
25%
22%yes (n=61)
yes, but informally or only
on top level / short term
or incomplete (n=29)
no (n=26)
23 38 8 21 3 23
36%
18%
0%
64%
82%
100%
0%
10%
20%
30%
40%
50%
60%
70%
80%
90%
100%
Yes (n=80) Yes, informally /
to some extent
(n=28)
No (n=6)
successful
less successful
29 51 5 23 670%
25%
5%
Yes (n=80)
Yes, informally / to some
extent (n=28)
No (n=6)
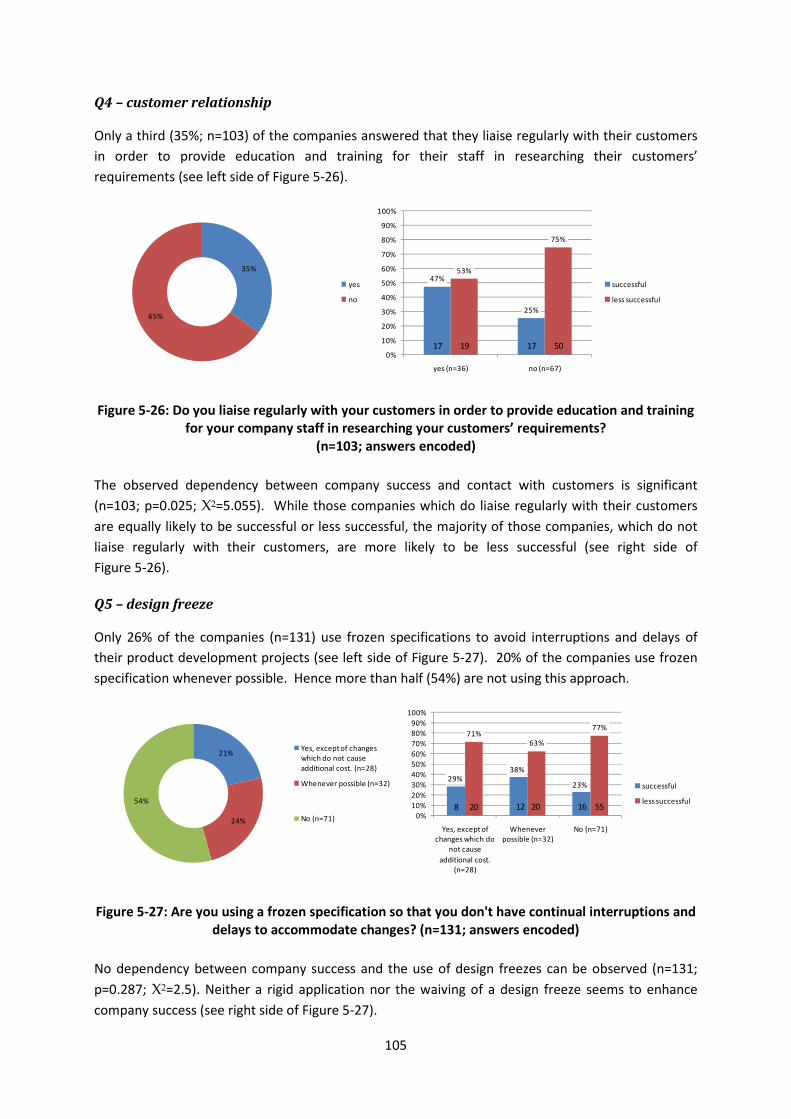
105
Q4 – customer relationship
Only a third (35%; n=103) of the companies answered that they liaise regularly with their customers
in order to provide education and training for their staff in researching their customers’
requirements (see left side of Figure 5-26).
Figure 5-26: Do you liaise regularly with your customers in order to provide education and training
for your company staff in researching your customers’ requirements?
(n=103; answers encoded)
The observed dependency between company success and contact with customers is significant
(n=103; p=0.025; X2=5.055). While those companies which do liaise regularly with their customers
are equally likely to be successful or less successful, the majority of those companies, which do not
liaise regularly with their customers, are more likely to be less successful (see right side of
Figure 5-26).
Q5 – design freeze
Only 26% of the companies (n=131) use frozen specifications to avoid interruptions and delays of
their product development projects (see left side of Figure 5-27). 20% of the companies use frozen
specification whenever possible. Hence more than half (54%) are not using this approach.
Figure 5-27: Are you using a frozen specification so that you don't have continual interruptions and
delays to accommodate changes? (n=131; answers encoded)
No dependency between company success and the use of design freezes can be observed (n=131;
p=0.287; X2=2.5). Neither a rigid application nor the waiving of a design freeze seems to enhance
company success (see right side of Figure 5-27).
35%
65%
yes
no
47%
25%
53%
75%
0%
10%
20%
30%
40%
50%
60%
70%
80%
90%
100%
yes (n=36) no (n=67)
successful
less successful
17 19 17 50
29%38%
23%
71%63%
77%
0%
10%
20%
30%
40%
50%
60%
70%
80%
90%
100%
Yes, except of
changes which do
not cause
additional cost.
(n=28)
Whenever
possible (n=32)
No (n=71)
successful
less successful
21%
24%
54%
Yes, except of changes
which do not cause
additional cost. (n=28)
Whenever possible (n=32)
No (n=71)
8 20 12 20 16 55

106
5.8 Discussion
Summary of the findings
The study provides important findings on systematic approaches which aim to support product
development projects. 71.6% of the participating companies, the majority of which are small and
medium sized (SMEs), are rated as less successful based on self-assessments of the companies’
growth rate in relation to competing companies, and of the successful realisation of previous product
development projects (see Section 5.5).
Interestingly the majority of the companies do not manage their product development projects using
a systematic approach (covering the existence of a formal product creation strategy, planning and
monitoring of projects, and awareness of further techniques and tools offered for design process
improvement - see Section 5.7.1). A significant dependency was found between company success
and the existence of a formal product creation strategy (p=0.31; X2=6.95; two-sided): Companies
which have only an informal product creation strategy or do not have a product creation strategy at
all are more likely to be less successful than companies which do have a formal product creation
strategy. The importance of formal process descriptions is supported by the significant dependency
(p=0.026, Χ2=11.085; two-sided) between company success and maturity of the product
development process (one of the competency areas covered by hypothesis 4; see Section 5.7.4):
Companies possessing a high level of maturity (level 4 and 5) in the area of product development
process are more likely to be successful. A high level of maturity in this area means that a company
has integrated the development of products across most company functions with documented
instructions, active competitive market analysis and business case evaluation.
Although none of the approaches which are covered by the hypotheses guarantees an enhancement
of the likelihood of being successful, significant dependencies were identified for systematic product
development, project risk management and the level of maturity in different areas.
The analysis supports the following finding. Executing the activities suggested and supported by the
addressed approaches (systematic project execution, managing risks) and possessing wide-ranging
capabilities and wide-ranging competencies in the analysed areas does not guarantee success, but
not doing so reduces the chances of success. The observed dependencies are the followings:
H1 Companies which do not manage their product development projects using a
systematic approach are significantly (p=0.019; X2=5.473; two-sided) less likely to be
successful than companies which use a systematic approach.
H2 Companies which do not apply systematic project risk management are significantly
less likely to be successful (p=0.011; X2=6.542; two-sided).
H3 Companies possessing wide-ranging capabilities are not more likely to be successful
than companies possessing less capabilities (p=0.084; X2=2.979; two-sided).
H4 Companies which assessed themselves as less mature in the considered areas are
significantly less likely to be successful (p=0.005; X2=7.735; two-sided).

107
Besides the analyses of the relations covered by the hypotheses, further significant dependencies
were identified:
• Companies which do not define their goals are more likely to be less successful
(p=0.027; X2=4.904; two-sided).
• Companies which do not have a clearly defined vision of how their company should
move forward are more likely to be less successful (p=0.048; X2=6.08; two-sided).
• Companies which do not interrogate and observe their customers or do it informally
are more likely to be less successful (p=0.049; X2=6.044; two-sided).
• Companies which do not liaise regularly with their customers are more likely to be
less successful (p=0.025; X2=5.055; two-sided).
Limitations of the study
The major concern about the validity of the results of the P3I study is the age of the data. Current
practice of product development may vary from the picture drawn in this study but there is no
reason why factors which did influence the outcome of product development activities ten years ago
should not be valid nowadays anymore. New developments are expected to affect product
development practice as formulated by the hypotheses, thus not being in conflict with the findings of
this study.
The study which was designed as a self-assessment questionnaire, completed with the assistance of
industrial experts, differs slightly from conventional research questionnaires. The main difference is
the way the questions were formulated. Many of the questions from part B of the questionnaire are
leading questions in order to provide hints for further improvement to the participants as well as
collecting data about the current situation (Section 5.2.1). A biasing of the answers was effectively
avoided by two measures (Section 5.2.2) – the industrial experts who worked as facilitators and the
motivation of the companies to gain an honest feedback about their own product development
practice, which is a precondition to move forward in a successful manner.
A further limitation of the study is the context dependency of the findings. The study focussed on
small and medium sized (SME’s) manufacturing companies in the UK that develop their own
products. Whether the same findings can be in found in different context is not sure, but it is
expected that similar dependencies can be found in other SME’s conducting product development
projects as the questions used for the verification of the hypotheses 1, 2, and 4 are not related to
specific branches or specific for the UK.
It is also expected that the findings can be transferred to larger companies, as more complex
dependencies between collaborating departments and interdependent projects might pose more
risks for projects and thus the importance of systematic approaches and high mature competencies
as described in this study will become more important rather than less.
Conclusions
The goal of this analysis of the P3I data was to verify the hypotheses described in Section 4.3. The
formulated hypotheses are based on the linking of the project failure causality model (see Figure 4-3)
with risk treatment strategies (Section 4.2) and the linking with various approaches (Section 4.3).

108
In this analysis a company is categorised as successful if the company usually finishes their product
development projects successfully, that includes the successful accomplishment of goals regarding
time, cost and quality, and the achievement of product success (Section 5.5). The distinction
between successful and less successful companies is used in order to identify influences on project
success as addressed by the hypotheses.
The study validates the importance of the use of systematic approaches to support product
development projects. The presented analysis of the P3I data supports the following conclusion:
Companies which do not implement preventive and proactive approaches (project management,
project risk management, goal definition and communication, customer involvement and
stakeholder management) and do not have wide-ranging competencies (i.e. high level of maturity in
different areas) are less prepared to cope with situations which may cause project failure.
It was also shown that none of the considered approaches will on their own secure project success.
The expected benefit (a robust project) may only be achieved using the different approaches
together. These conclusions are drawn based upon the findings related to hypothesis 1, 2 and 4 (see
Sections 5.7.1, 5.7.2, 5.7.4) and the analysis of the additionally selected factors described in
Section 5.7.5.

109
6 SUPPORT OF RISK TREATMENT PRE-SELECTION
This chapter is intended to provide an answer to research question III ‘How to enhance project
robustness?’. As this dissertation takes a risk management perspective and risk treatment strategy
selection was found to be an important step during the risk management process which is not
sufficiently supported, this research question is further specified as follows:
• How to manage the selection of suitable risk treatment strategies?
• Which issues have to be taken into account?
6.1 Focus of the proposed approach
The decision of which risk treatment strategy to select is a challenging task, which is not sufficiently
supported by existing approaches. The time dependent evolvement of risk impacts is not considered
and the categorisation of risk treatment strategies is not suitable as basis for systematic support.
In the following section, a support is described which facilitates the analysis of risk impact
evolvement and selection of a risk treatment strategy. The support can be applied after risk
assessment and prioritisation (see Figure 6-1), which can be done by performing FMEA or RFMEA
(Section 3.4.4). The selection of a risk treatment strategy is a precondition for the selection and
implementation of associated risk treatment measures.
Figure 6-1: Focus of the proposed approach referring to the general risk management process
adapted from McMahon and Busby (McMahon and Busby 2005)
The support proposed in this chapter is based on the categorisation of risk treatment strategies
which was introduced in Section 4.2: reactive, proactive and preventive.
1 2 3 4
Risk identification RiskAssessment Risk TreatmentRisk
monitoring, review &communication
Ma
in p
ha
se
s
Selection of
strategy
Selection
of measure
b c
focus
Risk prioritisation
a
Implementation
of measure
d

110
Dependent on the course, in which a risk impact would evolve if no risk treatment would be initiated,
a comparison of the suitability of the different risk treatment strategies is possible. A categorisation
scheme which covers different courses is described in Section 6.2. The risk impact evolvement is
further detailed by a distinction into three episodes (Section 6.3). Based on the categorisation and
the detailing of the risk impact evolvement, recommendations on the suitability of the three risk
treatment strategies are given (Section 6.4).
Because different risk treatment strategies might be suitable, the selection of a risk treatment
strategy should be done in two steps. The first step is a pre-selection of suitable risk treatment
strategies for a specific risk. The pre-selection will be addressed in more detail in Section 6.5. The
second step is the final selection of the risk treatment strategy which is done together with the
selection of an associated risk treatment measure. The final selection is not supported by the
proposed support. Some remarks on the final strategy selection are given in Section 6.6.
6.2 Risk impact evolvement categories
The estimation of the impact of an event is dependent on its course. As depicted in Figure 3-12 two
different courses are discussed in literature (Seibold 2006): a stealthy rise of the impact (called
‘snowballing’ in this dissertation) and a quickly escalating impact (called ‘sudden burst’ in this
dissertation). In the following, these courses are supplemented by a third course called ‘rising’. The
discussed courses are strong simplifications of real courses. It is important to consider that the
impact of a risk is not necessarily limited. The interplay of multiple risks which may reinforce the
resulting impact can be described in the same way as the impact evolvement of a single risk.
Escalation of the impact - Sudden burst
The mentioned ‘escalation of the impact’ (compare Figure 3-12) describes an event which causes the
impact suddenly after occurrence of the risk. The subsequent rise is negligible. This course is called
‘sudden burst’ (see Figure 6-2). An example is the loss of data (impact) caused by a destruction of a
data server (event). A possible cause might be an overheating of the server. If no preventive
measures were taken, for example to save the data on a redundant system, the impact occurs
immediately.
Figure 6-2: Sudden burst
imp
act
time

111
Constant rise of the impact – Rising
The impact can rise at a constant pace (see Figure 6-3). An example is the delay of a work package
(impact) due to the loss of manpower (event) because a designer is falling ill (cause). If this loss of
manpower is not compensated the impact rises constantly.
Risk impact evolvement which is expected to rise in a linear manner should be analysed with care.
The assumption of a linear behaviour of a system (or a process) is a common failure and might cause
hazardous decisions because many processes do not evolve in a linear manner (Dörner 1996).
Figure 6-3: Rising
Non-linear rise of the impact – Snowballing
This course describes an event which causes in first instance no or only little impact, but rises sharply
after a certain period of time. This course is called ‘snowballing’ (see Figure 6-4).
A non-linear rise of the impact is critical. The non existing impact or slow rise of the impact directly
after the event may hinder an early detection of the impact or an early realisation of the severity of
the impact.
An example is a failure in the requirements list. The event (the wrong requirement) occurs early in
the project. This may go unnoticed for some time. Once identified, however, all results of work
packages which are based on the wrong requirement have to be reworked, hence the impact rises
suddenly. The later in the process, the larger the impact will be.
Figure 6-4: Snowballing
imp
act
time
imp
act
time

112
6.3 Episodes of risk impact evolvement
A division of the course of risk impact evolvement for risks which are treated by implementing
measures after the event (proactive and reactive) can be done by considering the following situations
(see Figure 6-5):
• event,
• detection of the impact,
• implementation of a measure and
• measure takes effect
Hence, the course is divided into three episodes. This division is suitable to describe risks which are
categorised as ‘rising’ or ‘snowballing’. Risks which show a sudden rise of the risk impact (‘sudden
burst’) cannot be described using this division of the course because implementation of risk
treatment measures after the event cannot halt or prevent the impact. Preventive risk treatment
does not require such a division, because preventive risk treatment aims at avoiding the occurrence
of the event; hence, risks which were successfully treated using this strategy have no impact.
The chosen risk treatment strategy (proactive or reactive) and related risk treatment measures,
affect the course of the risk impact evolvement. The effects are described in Section 6.4.
Figure 6-5: Episodes of impact rise and corrective risk management activities
Episode 1
Episode 1 is characterized by the occurrence of an event and the rise of the resulting impact, which
are not yet detected. The undetected existence of an event and its resulting impact is an enormous
hazard for a project. The duration of this episode depends on the controlling mechanisms and the
communication culture in the concerned project.
Episode 1 ends with the detection of the impact. In the best case, the event itself is detected. This
would reduce the duration of episode 1 to near zero.
time
imp
ac
t
eventdetectionof impact
implementationof measure
measure takeseffect
1 32

113
Using the example of a designer who is falling ill, its absence due to illness will be detected the first
day.
Episode 2
Episode 2 starts with the detection of the event or the detection of the resulting impact. The
detection triggers the implementation of a risk treatment measure which is already defined in the
case of proactive risk treatment or has to be defined in the case of reactive risk treatment. Due to
the delay from the decision to the implementation of a measure, the impact still rises. The duration
of this episode is the longest in the case of a reactive risk treatment strategy because appropriate
measures have to be selected and available resources must be assigned and approved.
In the case of the ill designer, the implementation of a measure, for example of sickness cover, will
depend on the expected duration of the absence. If the absence legitimates sickness cover,
appropriate designers have to be assigned. If proactive risk treatment was chosen, a qualified
designer who is able to carry the extra work load was selected before and must only be informed. In
the case of reactive risk treatment qualified designers, who are available have to be found.
Episode 3
The measure is implemented but the impact rises as it may take some time for the measure to have
an effect. In the case of the ill designer, this may be the time which is needed until the replacement
is completely familiar with the new tasks.
The impact stops rising after full evolvement of the measure’s effect. The duration of this episode is
not dependent on the chosen strategy; it depends on the chosen measure.
6.4 Comparison of risk treatment effects dependent on risk impact
evolvement
The impact of an event is time dependent; hence, the course of the evolvement of the impact
determinates the appropriateness of a risk treatment strategy and related measures. In the
following, implications for risk treatment strategy selection are outlined based on the categorisation
scheme of risk impact evolvement (sudden burst, rising and snowballing) presented in Section 6.2
and the description of risk treatment strategies (reactive, proactive and preventive) given in
Section 4.2.
It is evident, that the applicability of a risk treatment strategy is dependent on the specific risk or,
more precisely, on the possibility of finding a measure related to a potentially suitable strategy.
As shown in Figure 4-5, preventive risk treatment aims at avoiding the occurrence of the event,
hence risks successfully treated using this strategy have no impact. This implies that preventive risk
treatment is potentially applicable independently of the risk impact evolvement category. Reactive
and proactive risk treatment do depend on the risk impact evolvement category: both aim at a
reduction of the impact, and proactive risk treatment in addition aims to enhance the likelihood of
detection.

114
6.4.1 Sudden burst
Risks which are expected to show a risk impact evolvement which is categorised as ‘sudden burst’
cannot be treated in a corrective manner, i.e. be neither treated using a reactive strategy nor be
treated using a proactive strategy aiming at a halt of the risk impact rise. A proactive risk treatment
aiming at an enhancement of the likelihood of detection will also not affect the impact.
Figure 6-6: Effect of proactive risk treatment aiming at a limitation of the impact compared to
reactive risk treatment
Such risks can be treated using a proactive strategy aiming at a limitation of the impact (for example
by risk transfer, i.e. sharing risk with other stakeholders or transferring to insurances) as well as a
preventive risk treatment strategy. A comparison of reactive and proactive risk treatment is given in
Figure 6-6.
6.4.2 Rising
Risks which are expected to show a risk impact evolvement which is categorised as ‘rising’ can be
treated using a preventive strategy and a proactive strategy aiming at a limitation of the impact (see
Figure 6-7).
Figure 6-7: Effect of proactive risk treatment aiming at a limitation of the impact compared to
reactive risk treatment
imp
act
impact of reactive strategy
impact of proactive strategy
eventtime
imp
ac
t
detectionof impact
implementationof measure
measure takeseffect
1 32
impact of reactive strategy
impact of proactive strategy
eventtime

115
If the likelihood of detection of the risk impact is high, such risks can also be treated using a reactive
strategy and a proactive strategy aiming at a halt of the further rise of the impact (see Figure 6-8). In
this case proactive risk treatment would cause a shorter duration of episode 2 which will cause a
lower impact.
Figure 6-8: Effect of proactive risk treatment aiming at a halt of impact evolvement compared to
reactive risk treatment
If the likelihood of detection is low, reactive and proactive risk treatment (aiming at a halt of the
further rise of the risk impact) additionally require proactive risk treatment aiming at an
enhancement of the likelihood of detection. An enhancement of the likelihood of detection of the
risk impact will reduce the duration of episode 1 so that the risk impact can be reduced even further
(see Figure 6-9).
Figure 6-9: Effect of proactive risk treatment aiming at an enhancement of impact detection in
combination with proactive risk treatment aiming at a halt of impact evolvement compared to
reactive risk treatment
imp
ac
t
detectionof impact
implementationof measure
measure takeseffect
1 32
impact of reactive strategy1 2
impact of proactive strategy
eventtime
3
imp
ac
t
detectionof impact
measure takeseffect
1 32
impact of reactive strategy1 2
impact of proactive strategy
implementationof measure
eventtime
3

116
6.4.3 Snowballing
Risks which are expected to show a risk impact evolvement which is categorised as ‘snowballing’ can
be treated using a preventive strategy or a proactive strategy aiming at a limitation of the impact
(see Figure 6-10).
Figure 6-10: Effect of proactive risk treatment aiming at a limitation of the impact compared to
reactive risk treatment
The selection of an appropriate risk treatment strategy is dependent on the possibility to detect the
event or the risk impact. If the detection of the event itself is possible, all strategies are suitable. If
the event cannot be detected, the suitability depends on the likelihood of detection of the impact. It
is necessary that the risk impact can be detected while the impact is still low enough to implement
corrective measures. Otherwise the situation must be treated similar to a ‘sudden burst’ because
measures might not take effect early enough.
If the likelihood of detection of the risk impact is high, such risks can be treated using a reactive
strategy or a proactive strategy aiming at a halt of the further rise of the impact (see Figure 6-11).
Again, proactive risk treatment reduces the duration of episode 2 which will cause a lower impact
compared to reactive risk treatment.
imp
ac
t
detectionof impact
implementationof measure
measure takeseffect
1 32
impact of reactive strategy
impact of proactive strategy
eventtime

117
Figure 6-11: Effect of proactive risk treatment aiming at a halt of impact evolvement compared to
reactive risk treatment
If the likelihood of detection is low, additional proactive risk treatment aiming at an enhancement of
the likelihood of detection has to be planned (see Figure 6-12).
Figure 6-12: Effect of proactive risk treatment aiming at an enhancement of impact detection in
combination with proactive risk treatment aiming at a halt of impact evolvement compared to
reactive risk treatment
imp
ac
t
detectionof impact
implementationof measure
measure takeseffect
1 32
impact of reactive strategy1 2
impact of proactive strategy
eventtime
3
imp
ac
t
detectionof impact
1 32
impact of reactive strategy1 2
impact of proactive strategy
eventtime
3
implementationof measure
measure takeseffect

118
6.5 Pre-selection of suitable risk treatment strategies
In this section two alternative methods which aim to support the pre-selection of a suitable risk
treatment strategy are presented. Both methods presuppose that identification, assessment, and
prioritisation of risks have already been done (see Section 6.1).
The first is a simple question based scheme which guides the finding of suitable risk treatment
strategies (see Section 6.5.1). The scheme was developed under the assumption that practitioners
will have difficulties in directly categorising (forecasting) the risk impact evolvement and thus avoids
this categorisation. The result of the evaluation of the question based scheme (see Chapter 7) lead
to the development of the second method, a more detailed matrix based support (see Section 6.5.2).
The matrix based support considers the likelihood of detection, which has to be assessed separately
for example by performing a FMEA or RFMEA.
6.5.1 Question based pre-selection of risk treatment strategies
As argued in Sections 6.2 and 6.3, a precondition for the selection of an appropriate risk treatment
strategy is the availability of information about the course of the risk impact evolvement. Obtaining
reliable information is difficult, because the risk impact evolvement of a specific project risk implies a
forecast of the project. The proposed categories of the risk impact evolvement (sudden burst, rising
and snowballing) simplifies the process, because only a limited set of information is required to
categorise (forecast) the course of the risk impact evolvement:
• Information about the detectability of the event,
• Information about immediate/early detectability of the risk impact, and
• Information about expected further rise of the risk impact.
These aspects are covered by four questions, which have to be answered by the risk manager for
each risk according to the scheme depicted in Figure 6-13.
The possibility to detect an impact early as considered in the question based support means that the
risk impact can be detected while the impact is still low enough to implement corrective measures.
The scheme guides to a recommendation about the strategy or strategies that are suitable for coping
with the specific risk. As mentioned before, some categories of risk impact evolvement can be
treated using more than one strategy. In that case, the scheme offers a pre-selection of suitable
strategies.

119
Figure 6-13: Question based support of strategy pre-selection
6.5.2 Matrix based pre-selection of risk treatment strategies
The matrix based support of the risk treatment strategy pre-selection (see Table 6-1) requires a risk
analysis which includes an assessment of the likelihood of detection (as proposed by FMEA, see
Section 3.4.4). Contrary to the question based support (presented in the previous section) the matrix
based support explicitly includes the categorisation of the risk impact evolvement according to the
introduced categories (sudden burst, rising and snowballing). No support for the categorisation is
provided, as the evaluation of the question-based support (see Chapter 7) showed that designers
seem to be able to categorise the risk impact evolvement without additional support.
The matrix represents the results of the analysis of the suitability of the different risk treatment
strategies dependent on the risk impact evolvement category (see Section 6.4) and the likelihood of
detection of the effect. The likelihood of detection of the effect is implemented using only two
categories: high and low. A high likelihood of detection means that the risk effect can be detected
during the period in which an implementation of corrective measures is still feasible.
Can the event bedetected?
Can the impactbedetected early?
Is an impactexpectedshortly after the
event?
Can the impact risesuddenly?
preventive,proactive,reactive
preventive,proactive
preventive
yes no
yes yes
yes
nono
no

120
Each line shows the suitability of the different risk treatment strategies for the risk characteristics
specified in the first two columns: risk impact evolvement and likelihood of detection of the effect. A
risk treatment strategy can be: suitable, suitable to a limited extend, and unsuitable. When a risk
treatment strategy is suitable to a limited extend, additional risk treatment is required in the form of
a proactive risk treatment strategy aimed at enhancing the likelihood of detection.
Table 6-1: Matrix based support of strategy pre-selection
The inclusion of the likelihood of detection of the effect enables a more detailed assessment of the
suitability of risk treatment strategies. As a consequence, further suitable combinations of risk
impact evolvement and risk treatment strategies are included compared to the question based
support. Furthermore, the matrix based support considers the possibility to treat a ‘sudden burst’
preventive reactive
reduction of the
likelihood of
occurence
enhancement of
likelihood of
detection
reduction of the
impact
limitation of
maximum impact
halt of time
dependent
evolvement
only in
combination with
reduction of the
impact (proactive
or reactive)
halt of time
dependent
evolvement
lowsuitable suitable unsuitable unsuitable unsuitable
highsuitable suitable unsuitable unsuitable unsuitable
lowsuitable suitable
suitable to a
limited extent,
additonally
enhancement of
likelihood of
detection is
necessary
suitable
suitable to a
limited extent,
additonally
enhancement of
likelihood of
detection is
necessary
highsuitable suitable suitable suitable suitable
lowsuitable suitable
suitable to a
limited extent,
additonally
enhancement of
likelihood of
detection is
necessary
suitable
suitable to a
limited extent,
additonally
enhancement of
likelihood of
detection is
necessary
highsuitable suitable suitable suitable suitable
Risk characteristics Risk treatment strategies
time dependent evolvement
of risk impact
likelihood of
detection of
effect
proactive
reduction of the impact
sud
de
n b
urs
tri
sin
gsn
ow
ba
llin
g

121
risk by proactive risk treatment aiming at a limitation of the impact, which is not considered by the
question based support.
6.6 Remarks on final strategy selection
After the completion of the pre-selection, different strategies might still be suitable. The final
strategy selection is linked to the decision about the corresponding measure.
Independent from the strategy, costs of risk treatment is a major criterion for the selection of the
final risk treatment strategy and the related risk treatment measure (Ahrendts and Marton 2008). A
strategy might lead to an unnecessary investment. The decision making process is a trade-off
between possible costs of an occurring risk and costs caused by risk treatment measures (see
Figure 6-14).
Figure 6-14: Optimum level of risk prevention adapted from Ahrendts and Marton (2008)
A further criterion is the ability of the project team to define and implement suitable risk treatment
measures for the pre-selected strategies. This might not only be a question of the budget, but of the
risk itself, the experience of the team, and the enforceability of the measure. If major changes of the
project are necessary, which could affect the field of responsibility of other people and other
projects, a measure might be not enforceable.
Level ofrisk prevention
Costs
too muchrisk management
insufficientrisk management
Costs of risk managementmeasures
Costs ofoccurred risks
Totalizedcosts

122
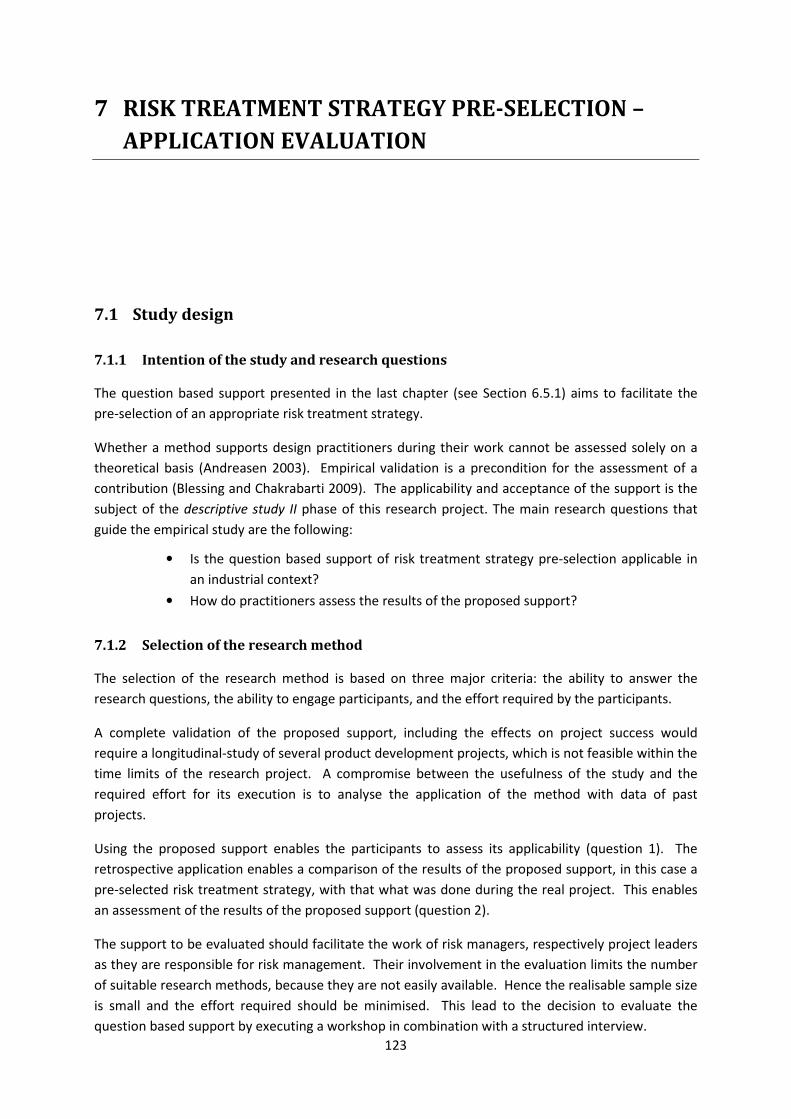
123
7 RISK TREATMENT STRATEGY PRE-SELECTION –
APPLICATION EVALUATION
7.1 Study design
7.1.1 Intention of the study and research questions
The question based support presented in the last chapter (see Section 6.5.1) aims to facilitate the
pre-selection of an appropriate risk treatment strategy.
Whether a method supports design practitioners during their work cannot be assessed solely on a
theoretical basis (Andreasen 2003). Empirical validation is a precondition for the assessment of a
contribution (Blessing and Chakrabarti 2009). The applicability and acceptance of the support is the
subject of the descriptive study II phase of this research project. The main research questions that
guide the empirical study are the following:
• Is the question based support of risk treatment strategy pre-selection applicable in
an industrial context?
• How do practitioners assess the results of the proposed support?
7.1.2 Selection of the research method
The selection of the research method is based on three major criteria: the ability to answer the
research questions, the ability to engage participants, and the effort required by the participants.
A complete validation of the proposed support, including the effects on project success would
require a longitudinal-study of several product development projects, which is not feasible within the
time limits of the research project. A compromise between the usefulness of the study and the
required effort for its execution is to analyse the application of the method with data of past
projects.
Using the proposed support enables the participants to assess its applicability (question 1). The
retrospective application enables a comparison of the results of the proposed support, in this case a
pre-selected risk treatment strategy, with that what was done during the real project. This enables
an assessment of the results of the proposed support (question 2).
The support to be evaluated should facilitate the work of risk managers, respectively project leaders
as they are responsible for risk management. Their involvement in the evaluation limits the number
of suitable research methods, because they are not easily available. Hence the realisable sample size
is small and the effort required should be minimised. This lead to the decision to evaluate the
question based support by executing a workshop in combination with a structured interview.

124
In the workshop, each participant applied the question based support in using data from a past
project, with which the participant was familiar. Structured interviews, rather than questionnaires,
were used to ask participants for their assessments of the applicability and the results of the
proposed approach. Interviews offer the opportunity to clarify questions and answers, which is not
possible when using questionnaires.
7.1.3 Execution of the study
The study and its preparation were executed in five phases:
• preparation of the workshop and the interview,
• pilot study,
• acquisition of participants,
• execution of workshops and interviews,
• data analysis.
The preparation included the design of the workshop and the formulation of questions for the
interview (see Appendix – application evaluation questions). As part of the preparation the student,
who conducted the study, was trained in the use of the question based support. The set-up of the
study is outlined in Table 7-1.
Table 7-1: Course of the study
phase questions about the
1. clarification of terminology
(different strategies and categories of risk impact evolvement)
2. introduction company
product
project selected for the workshop
participants background
3. transition companies’ capabilities
4. workshop
application of the question based support on the basis of risks from a past project
5. results risk impact evolvement
real strategy selection (what did the company do during the project?)
6. current practice risk treatment strategy selection (process, criteria and responsibility)
7. assessment and feedback assessment of the use and applicability of the question based support

125
The pilot study with one project leader, who was not included in the study, was used to test the
research method and the terminology used. The feedback led to minor changes in the sequence of
the questions.
The acquisition of the participants and the execution of the interviews were done by a student, who
worked in a product certification agency, which assured the support of the agency in acquiring
participants. To ensure that the participants had the competence to assess the applicability of a risk
management method, the acquisition focused on companies which usually perform project risk
analyses as a part of their product development activities. This was verified during the acquisition
phase. Ten participants were found.
The question based support was used during the workshop, which was executed after the
introductory phase of the interview (see Table 7-1). The support was used to pre-select suitable risk
treatment strategies for five risks selected by the participants from the last project the participant
was involved in. The selection of the risks was done during the workshop. Two participants could
only mention less than five project risks for the particular project. In total, 45 risks from 10 projects
were analysed using the question based support. At the end of the interview the participants had
the possibility to give feedback and provide additional remarks during the second part of the
interview. Each workshop including the interview lasted around one hour and was conducted in the
office of the participant.
The interview data were analysed using standard statistics software (PASW 18). Due to the fact that
only ten experts were interviewed, methods of inferential statistics were not used. This implies that
the findings are based on descriptive statistics and do not contain statements about statistical
significances.

126
7.2 Sample profile
The companies
The questions used to collect data for the description of the company profile were adapted from the
P3I questionnaire described in Section 5.2. The characteristics of the companies involved in this study
are similar to those observed in the P3I study. A detailed comparison, however, is not possible due to
the limited number of participants.
The participating companies develop electronic (n=5), mechanical (n=4) and medical devices (n=1).
Three companies employ 1 to 50 people and only one company employs more than 500 people (see
Figure 7-1 a/b). Seven of the companies have more than 10 designers of which one company
employs more than 50.
Figure 7-1: (a) Number of employees; (b) number of designers
Only two companies have sales of less than € 5 million per year and only one company exceeds the
level of € 100 million per year (see Figure 7-2). One participant did not know the annual sales of his
company.
Figure 7-2: Annual sales in €
The companies can be categorised as small and medium sized. Although the company sizes are
similar to those in the P3I study, the range of the annual sales, however, is higher in this study.
The participants assessed the growth rate of their company compared to the branch average as
depicted in Figure 7-3 (multiple-choice question). Only one of the participants assed the company he
0%
5%
10%
15%
20%
25%
30%
35%
1-50
(n=3)
51-100
(n=2)
101-200
(n=2)
201-500
(n=2)
>500
(n=1)
(a)
0%
5%
10%
15%
20%
25%
30%
35%
1-10
(n=3)
11-20
(n=3)
21-50
(n=3)
51-100
(n=1)
(b)
0%
5%
10%
15%
20%
25%
30%
35%
€ 1m - € 5m
(n=2)
€ 5m - €
10m(n=1)
€ 10m - €
50m(n=3)
€ 50m - €
100m(n=2)
> € 100m
(n=1)

127
is working for as one of the market leaders. No one assessed the company’s growth rate as below
sector average.
Figure 7-3: Company growth rate compared to branch average
The participants were asked to assess the capabilities within their company in several areas. The
question could be answered by using the following options ‘full capabilities’, ‘partial capability’,
‘external’ and ‘do not do’. ‘Partial capabilities’ means that the company is doing the particular
activity in cooperation with external partners, external means that the company completely
outsourced the activity.
Most of the interviewed companies possess only partial capabilities in market analysis. One
company is not doing it at all (see Figure 7-4). Requirements specification is an area in which most of
the companies possess full capabilities. One company has completely outsourced this activity. All
companies possess full or partial capabilities in the area of design. The manufacturing related
activities: components fabrication, production systems as well as equipment manufacturing,
assembly and installation, show a more intensive involvement of external partners. Two companies
do not possess own capabilities in sales and distribution. Customer support is an area (like design) in
which the majority of the companies possess full capabilities.
Figure 7-4: Capabilities profile (n=10)
0%
10%
20%
30%
40%
50%
60%
70%
below average
(n=0)
equal to
average(n=3)
comfortably
above the average
(n=6)
one of the
leaders(n=1)
Market analysis
and forecasting
Requirements
specificationsDesign
Components
manufacture
fabrication
Production
systems and
equipment
develop
AssemblySales and
distributionInstallation
Customer
support
full capability 3 6 6 2 2 5 4 2 6
partial capability 6 3 4 4 4 3 4 2 4
do not do 1 0 0 0 0 0 1 2 0
external 0 1 0 4 4 2 1 4 0
0
30%
60% 60%
20% 20%
50%
40%
20%
60%60%
30%
40% 40% 40%
30%
40%
20%
40%
10% 10%
20%
10%
40% 40%
20%
10%
40%
0%
10%
20%
30%
40%
50%
60%
70%

128
The products
The products which are developed by the companies belong in equal parts to the categories
consumer good, capital good and vendor parts (see Figure 7-5 a). Only a minority of the companies
primarily develops products which they categorise as original design. The majority (7 out of 10)
develops adaptive designs (see Figure 7-5 b). Only one of the participating companies develops one-
off products. The majority develops their products for batch or continuous production (see
Figure 7-6).
Figure 7-5: a) Type of product; b) Novelty of the design
Figure 7-6: Type of production
The analysed projects
Five of the ten projects which were analysed during the workshop lasted 19 to 24 months (see
Figure 7-7). All of the participants stated that these projects were executed using a matrix
organisation. Half of the project teams involved less than six designers. Only two project teams
involved 10 or more designers (see Figure 7-8).
0%
10%
20%
30%
40%
50%
consumer good
(n=3)
capital good
(n=3)
vendor
part/OEM(n=4)
other
(n=0)
(a)
0%
10%
20%
30%
40%
50%
60%
70%
80%
original design
(n=3)
adaptive design
(n=7)
variant design
(n=0)
(b)
0%
10%
20%
30%
40%
50%
60%
one-off
(n=1)
batch
(n=5)
continuous
(n=4)

129
Figure 7-7: Duration of the analysed projects in months
Figure 7-8: Number of designers involved in the analysed projects
The participants
The participants who were interviewed had been working in their company on average 9.6 years.
Only three participants had been working 5 years or less in the particular company (see Figure 7-9).
Figure 7-9: Years working in the company
The experience of the participants with project management was analysed in terms of completed
design projects as a designer and as a project leader. Most (nine out of ten) of the participants have
experience in the role of a designer (see Figure 7-10a). The participant without experience as
0
1
2
3
4
5
6
4 6 7 18 24 30fr
eq
ue
ncy
duration of projects in months
0
1
2
3
2 3 4 7 10 15
fre
qu
en
cy
number of people involved in the project team
0
1
2
3
3 4 5 6 8 11 17 18
fre
qu
en
cy
years working in the company

130
designer was project leader in three projects. Those participants who had no experience as project
leader (see Figure 7-10b) are designers which have been involved in the management of project risks
(in 3 respectively 8 projects).
Figure 7-10: Number of projects completed as (a) a designer; (b) project leader
Risk management maturity level
To determine the maturity level of the risk management in the company the participants were asked
to assess project risk management practices used in the analysed project on a five-point scale. The
majority of the participants used the top-level ratings (see Figure 7-11). Only two participants
described their risk management as primarily reactive. The positive assessments reflect the way the
companies were selected: those, which do not perform project risk management, were excluded.
Figure 7-11: Self assessment of risk management maturity (n=10)
0
1
2
3
0 1 3 7 8 10 40
fre
qu
en
cy
number of projects as designer
(a)
0
1
2
3
0 2 3 4 7 10 20
fre
qu
en
cy
number of projects as leader
(b)
0
1
1
4
4
0 1 2 3 4 5
We react on occured risks.
We identify risks informally.
We identify risks and plan reactive measures.
We identify risks and treat the most severe/important risks.
We identify risks and treat the most severe/important risks and
control them continually.
frequency

131
7.3 Findings
7.3.1 Risk treatment strategy selection: current practice
As described earlier, the ten participants were asked to select risks from the last project they were
involved in. The 45 selected risks had been identified during a risk management process. The
participants were asked about the risk treatment and the risk impacts of these risks.
The first question aimed at the severity of the real risk impacts. The risk impact of 38 percent (n=17)
of the analysed risks exceeded an acceptable level (see Figure 7-12). This indicates a demand for an
improvement of the risk management practices in these companies. However, the dependency
between risk maturity of the company and the severity of the risk impacts did not show relevant
differences.
Figure 7-12: Severity of impacts of analysed risks
The causes of the analysed risks enclose all areas (project, product and stakeholder related) covered
by the project failure causality model (see Figure 4-3). Some examples are given in Table 7-2.
Table 7-2: Examples of analysed risks
risk cause is mainly examples
project related - Wrong estimates of the demanded resources caused a delay
- Rising prices for vendor parts, caused deviations from estimated
product cost
product related - Demanding requirements caused a delay
- Insufficient performance of the product (identified during a test)
caused design iteration
- Deficient vendor part required own development activities - Requirements changes by customer caused design iteration
stakeholder related - Delayed invoicing caused a delay of dependent activities
- Insolvency of subcontractor caused a delay
62%
38%
0%
10%
20%
30%
40%
50%
60%
70%
risk impacts were acceptable
(n=28)
risk impacts were not
acceptable(n=17)

132
After an explanation of the three risk evolvement categories (sudden burst, rising and snowballing),
the participants were asked to classify the real risk impact evolvement using these categories. They
had only a verbal description and a graphical representation of the risk impact evolvement
categories, which were given at the beginning of the interview. The participants were able to
categorise the risk impact evolvement without additional support.
All categories of risk impact evolvement occurred. Rising risks were observed less frequently than
sudden burst and snowballing risks (see Figure 7-13).
Figure 7-13: Categorisation of real risk impact evolvement
Risks with sudden burst and snowballing risk impact evolvement equally often resulted in
unacceptable risk impacts (see Figure 7-14). Only risks with a rising risk impact evolvement had
slightly less often an unacceptable risk impact.
Figure 7-14: severity of risk impacts dependent on risk impact evolvement category
The occurred risks were often treated using a combination of risk treatment strategies (see
Figure 7-15). Most of the risk treatments (83 percent) involved a reactive strategy, either on its own
(49 percent) or in combination with preventive and/or proactive strategies. 40 percent of the risk
treatments included preventive risk treatment.
38%
24%
38%
0%
5%
10%
15%
20%
25%
30%
35%
40%
sudden burst
(n=17)
rising
(n=11)
snowballing
(n=17)
59%
n=10
73%
n=8 59%
n=10
41%
n=7
27%
n=3
41%
n=7
0%
20%
40%
60%
80%
sudden
burst(n=17)
rising
(n=11)
snowballing
(n=17)
risk impacts were
acceptable
risk impacts were not
acceptable
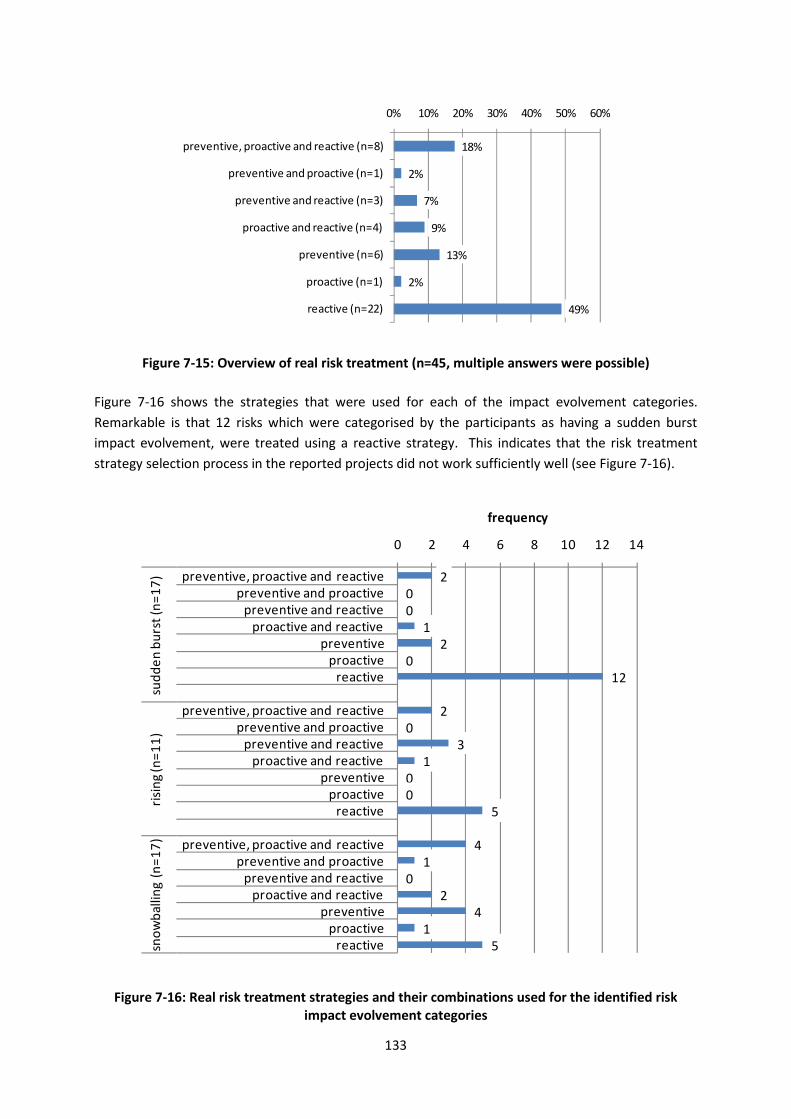
133
Figure 7-15: Overview of real risk treatment (n=45, multiple answers were possible)
Figure 7-16 shows the strategies that were used for each of the impact evolvement categories.
Remarkable is that 12 risks which were categorised by the participants as having a sudden burst
impact evolvement, were treated using a reactive strategy. This indicates that the risk treatment
strategy selection process in the reported projects did not work sufficiently well (see Figure 7-16).
Figure 7-16: Real risk treatment strategies and their combinations used for the identified risk
impact evolvement categories
18%
2%
7%
9%
13%
2%
49%
0% 10% 20% 30% 40% 50% 60%
preventive, proactive and reactive (n=8)
preventive and proactive (n=1)
preventive and reactive (n=3)
proactive and reactive (n=4)
preventive (n=6)
proactive (n=1)
reactive (n=22)
200
12
012
20
31
00
5
41
02
41
5
0 2 4 6 8 10 12 14
preventive, proactive and reactivepreventive and proactive
preventive and reactiveproactive and reactive
preventiveproactive
reactive
preventive, proactive and reactivepreventive and proactive
preventive and reactiveproactive and reactive
preventiveproactive
reactive
preventive, proactive and reactivepreventive and proactive
preventive and reactiveproactive and reactive
preventiveproactive
reactive
sud
de
n b
urs
t (n
=1
7)
risi
ng
(n=
11
)sn
ow
bal
ling
(n=
17
)
frequency

134
Asked for the risk treatment strategy selection process, eight out of the ten participants answered
that they used a structured strategy selection process (see Figure 7-17), but that the selection of risk
treatment strategy is mostly based on personal experience and influenced by analyses of past
projects (nine out of ten). Only in one case, a team meeting was involved.
Figure 7-17: Risk treatment strategy selection process (n=10, multiple answers were possible)
The dominant criteria for the selection of the risk treatment strategies were cost and existing
experience with a strategy and a corresponding measure (see Figure 7-18). Delivery dates, quality
management guidelines and technical possibilities influenced the selection of the chosen risk
treatment strategy only in specific projects.
Figure 7-18: Criteria used for risk treatment strategy selection (n=10, multiple answers were
possible)
In most of the projects (nine out of ten) the project leader took the responsibility for the decision
about the strategy to be used (see Figure 7-19). Alternatively, chief executive officers (six out of ten)
and the company management (four out of ten) were responsible. Quality managers, designers and
the head of the department were seldom responsible.
0 2 4 6 8 10
structured strategy selection process
based on personal experience
based on analysis of past projects
external recommendations
team meetings
0 1 2 3 4 5 6
costs
experience with the strategy/measure
management proposal
standard (automotive)
delivery date
qualtiy management guidelines
technical possibilites
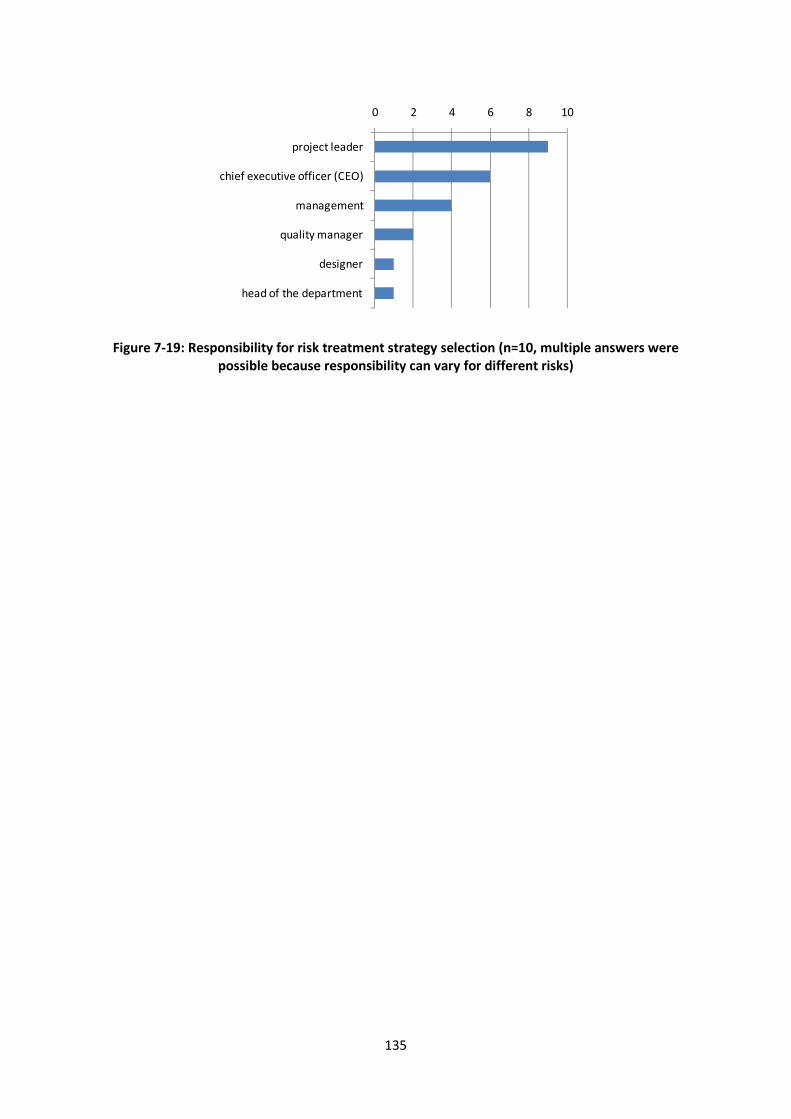
135
Figure 7-19: Responsibility for risk treatment strategy selection (n=10, multiple answers were
possible because responsibility can vary for different risks)
0 2 4 6 8 10
project leader
chief executive officer (CEO)
management
quality manager
designer
head of the department

136
7.3.2 Application of the question based support
Pre-selected strategies
The application of the question based support offers six different paths leading to three different
results (see Figure 7-20). The result of the application of the question based support is a pre-
selection of the most suitable risk treatment strategies to cope with a particular risk. The pre-
selection is based on an analysis of the expected risk impact evolvement.
An overview of the paths used during the analysis of the 45 risks is given in Figure 7-20. Only 18
percent (n=8) of the risks, offer a choice of all strategies (see Figure 7-21). In 47 percent of the cases,
the scheme recommended a preventive risk treatment strategy (n=21).
Figure 7-20: Frequency of combinations of answers (n=45)
Can the event bedetected?
(n=45)
Can the impactbedetected early?
(n=15)
Is an impactobservable shortlyafter the the event?
(n=30)
Can the impact risesuddenly?
(n=31)
preventive,proactive,reactive
preventive, proactive
preventive
(n=8)
(n=11) (n=5)
(n=11)
(n=4)
(n=6)
yes no
yes yes
yes
nono
no

137
Figure 7-21: Risk treatment strategies selected using the question based support (n=45)
Suitability of the recommendations – a user perspective
A comparison of the results of the application of the question based support with those strategies
which were chosen in reality during the execution of the projects showed that in 42 percent (n=19)
(see Figure 7-22) one of the suggested strategies was used. The other risks (n=26, 58 percent) were
treated using a different strategy than the one suggested by the question based support.
Figure 7-22: Accordance of real strategy with pre-selection using the question based support (n=45)
A detailed comparison of the real strategies with those which are suggested by the question based
support is shown in Table 7-3. A white cell of the table indicates accordance between the real risk
treatment and the suggestion of the question based support.
In total, 26 of the 45 risks were not treated in accordance with the suggestions of the question based
support. Of these, 17 (12 sudden burst risks and 5 rising risks) were treated reactively. The other 9
risks were treated using a combination of risk treatment strategies including reactive risk treatment.
Of the 17 risks with a risk impact evolvement categorised as sudden burst, only two were treated
according to the suggestion of the support. None of the eleven risks with a rising risk impact
evolvement were treated as suggested by the question based support.
10 of the 17 risks which had an inacceptable impact were treated using a strategy that was not in
accordance with those suggested by the question based support.
18%
36%
47%
0%
10%
20%
30%
40%
50%
preventive,
proactive, reactive(n=8)
preventive,
proactive(n=16)
preventive
(n=21)
42%
58%
0%
10%
20%
30%
40%
50%
60%
accordance
(n=19)
no accordance
(n=26)

138
The participants were asked to assess for each risk the suitability of the strategies suggested by the
question based support. For six risks out of 45 (13 percent) the suggested strategies were assessed
as not suitable (see Figure 7-23). All six risks (three were ‘sudden bursts’, two were ‘rising’, and one
risk was categorised as ‘snowballing’) had been treated reactively. For four of these risks a
preventive strategy was suggested by the question based support and for two risks preventive or
proactive strategies. That is, the suggestions were to address the risk in an earlier stage.
The suggested risk treatment strategies were assessed as not suitable for three risks out of the 17
which had an inacceptable impact.
Asked for the reason of the rejection of the suggested strategies the participants argued that the
suggested preventive risk treatment would be too expensive or its implementation not feasible. In
the cases where preventive or proactive risk treatment was suggested, the participants argued, that
they were not responsible for the risk treatment. They relied, for example, on the quality control of
their subcontractors, which failed.
Table 7-3: Comparison of real risk treatment and suggestions of the question based support
white cell - accordance between real risk treatment and suggestion of the question based support
grey cell - real risk treatment differs from suggestion
preventive,
proactive or
reactive
preventive or
proactivepreventive
8 16 21
preventive, proactive and reactive 2 2
preventive and proactive 0
preventive and reactive 0
proactive and reactive 1 1
preventive 2 2
proactive 0
reactive 12 1 11
preventive, proactive and reactive 2 1 1
preventive and proactive 0
preventive and reactive 3 2 1
proactive and reactive 1 1
preventive 0
proactive 0
reactive 5 4 1
preventive, proactive and reactive 4 1 2 1
preventive and proactive 1 1
preventive and reactive 0
proactive and reactive 2 2
preventive 4 2 2
proactive 1 1
reactive 5 2 3
sud
de
n b
urs
t
(n=
17
)
risi
ng
(n=
11
)
combinations
risk impact
evolvement
categories
What was done in reality? What is suggested by the question
based support?
sno
wb
all
ing
(n=
17
)

139
Figure 7-23: Suitability of suggestions of the question based support, assessed by the participants
Participant feedback
At the end of the interviews the participants were asked to reflect on the application of the question
based support and to give a feedback about the aspects, which might be improved, and which
aspects contribute to their work. In the following, representative statements are listed. The
feedback of the participants is grouped into aspects of the support, the graphical representation of
the risk impact evolvement, and general remarks.
Remarks regarding the question based support (decision tree in citations):
• “The decision tree clarifies precisely what has to be done preventively.”
• “Good visualisation – the combination of the (graphical representations of the) risk
impact evolvement and the decision tree is better.” (remark of the author: better
than using the question based support solely)
• “helpful”
• “Yes, valuable as a first support for decision making but should not be applied
solely.”
• “The decision tree is expandable, difficult to answer prior to the project.”
• “Can be used like a filter, is a basis for decisions regarding the treatment of risks.”
Remarks regarding the use of the graphical representations of the risk impact evolvement as a
support for the application of the question based support:
• “Visualisation is sufficient.”
• “A direct classification rather not”
• “The combination makes the approach traceable.”
• “You immediately have an idea how a risk evolves.”
• “The gain of knowledge is not yet sufficient but you already see a lot.”
General remarks:
• “Saves time compared to an FMEA” – (remark of the author: the question based
support is not intended to substitute an FMEA)
• “The approach is helpful for the selection of a strategy, but could be refined.”
• “In the area of medical engineering the strategy is predetermined – it is not helpful.”
• “The approach shows how a failure takes effect, an FMEA shows its relevance.”
• “Prevents unnecessary discussions.”
87%
13%
0%
20%
40%
60%
80%
100%
Yes, recommended strategy is
suitable(n=39)
No, recommended strategy is
not suitable(n=6)
100%88% 81%
0%
13% 19%
0%
20%
40%
60%
80%
100%
preventive,
proactive, reactive
(n=8)
prevenive,
proactive (n=16)
preventive
(n=21)
Yes, recommended
strategy is suitable
No, recommended
strategy is not suitable

140
7.4 Reflections of the interviewer
After the completion of the study, the student, who conducted the workshops and interviews, was
interviewed in order to obtain further insights in the application of the support. This interview
revealed some important aspects to be considered when applying the proposed support, as well as
when selecting risk treatment strategies in general.
The main challenge during the workshops was the initial description and analysis of the risks. In
order to ensure that the participants used the terms risk, event and impact in the same ways as the
interviewer, the participants were asked to describe for each risk the event and the resulting impact.
The participants had difficulties in distinguishing these terms. The interviewer reported that it was
often necessary to ask for further descriptions of the risk and the context of the risk in order to trace
the risk impact back to an event.
During the workshop the participants recognised that the reported events were usually the result of
a cascade of dependent events, which was not identified before. The participants stopped the causal
analysis often too early. A possible explanation is that the participants did not recognise the
importance of a causal analysis as a precondition or successful risk treatment especially for proactive
and preventive risk treatment. Another explanation is that the many dependencies between causes,
which can be described as a causal network (compare Section 4.1), were too complex to keep in
mind.
Insufficient causal analyses prior to the execution of the analysed projects might be an explanation
for the high number of risks which were not treated appropriately, because, especially when using a
preventive risk treatment strategy, knowing the causes of a risk is crucial for successful risk
treatment. The dialogue between participants and interviewer, which was guided by the clarifying
questions of the interviewer, supported the analysis of the risk event and the impact, even though
the interviewer was not familiar with the project. During these dialogues the participants realised
that a more detailed analysis, aiming at the identification of root causes and dependencies between
risks, would have help to avoid the partly unacceptable risk impacts, because the initial risk and its
causes offered easier options for treatment.
Another observation of the interviewer was that the participants had no problems in understanding
and using the three risk impact evolvement categories. Most of the participants were able to
categorise the risk evolvement directly by using the graphical representations.

141
7.5 Discussion
Summary of the findings
The main goal of the evaluation was to gain first feedback on the applicability and acceptance of the
proposed support by its potential users.
The question based support was applied by participants from ten companies to analyse 45 project
risks which had occurred in real product development projects. The participating companies
represent small and medium sized enterprises (SMEs).
Asked for the risk treatment strategy selection process, eight of ten participants answered that they
are using a structured strategy selection process. Asked for the rational of their decision making nine
participants stated that decisions are mostly based on personal experience. The dominant criteria
for the selection of risk treatment strategies are cost and existing experience with a strategy and a
corresponding measure.
The feedback of the participants on the applicability and the results of the question based support
were mainly positive. Besides the supporting statements some of the remarks pointed to aspects of
the method which have to be refined or studied in the future. Some participants wished a more
detailed support, which involves/shows the rationale of the pre-selection and using the graphical
representation in order to categorise the risk impact evolvement.
Limitations of the study
This study has two limitations. The first is the limited number of participating experts, which
precludes a generalisation of the findings. Nevertheless the participants provided valuable feedback
for further development of the support.
The second limitation is that the retrospective perspective might influence the ability of the
participants to apply the proposed support, as some remarks suggested. This aspect of the
application of the support requires further evaluation and a different study design, which is not
solely based on a retrospective application.
Conclusions
The analysis of current practice of risk treatment strategy selection and the success of the risk
treatment indicate a demand for a better support of this risk management activity. The majority of
risks were treated reactively, although in many cases, the risk impact evolved suddenly after the
event, which prevents an effective application of reactive risk treatment. The strategies were usually
selected using a structured strategy selection process, but based on personal experience of the
project leaders.
38 percent of the risks which were analysed during the evaluation had caused an inacceptable
impact. This finding is contradictory to the findings of Kloss and Moss (2008), who observed that
once a risk was identified the risk management process works well. A reason for the difference is
possibly caused by the particular company (a large company) and the specific product (jet-engine)
involved in their study. The design of a jet-engine has a long history and is strongly predefined,
giving the team more knowledge about risks and appropriate measures.

142
Against expectation, the application evaluation workshops showed that analysing the causality of
risks was challenging for the participants. The question based support does not support causal
analysis, although this is important for the correct categorisation of the risk impact evolvement. It is
not included, as this should be done already in the risk identification phase, for example by using
existing methods like 5-Whys (Ohno 1988) and Ishikawa-diagrams (Ishikawa 1991).
It is important to consider that a risk may have more than only one cause (Section 4.1), that means a
network of causes and effects might be identified (see Figure 4-2) instead of a single root cause.
Focussing on only one cause which is assumed to be ‘the’ root cause might lead to the selection of
inappropriate measures. As Dörner (1996) pointed out central reduction (focussing on only one core
problem and ignoring interdependencies to other issues) is an often observed behaviour of less
successful problem solvers (see Section 2.2.2).
The joint analysis of the risk causalities by the interviewer and the participants often resulted in a
cascade of interrelated risks. Clearly, focussing risk treatment on the initial risk would enhance the
leverage of the risk treatment activities. For this reason, root cause analysis is a key factor to success
of risk management activities. Obviously the participants need to be supported in this activity.
Although in the participating companies, team meetings were hardly involved in risk treatment
strategy selection the workshops showed that executing this task in collaboration with other people
(perhaps people who are not involved in the project) might be beneficial.
Regarding applicability, the study showed that the categorisation of the risk impact evolvement and
the question based support were easily understood by industrial experts. Furthermore, the feedback
confirms the applicability and acceptance of the question based support for risk treatment strategy
pre-selection. Nevertheless, some participants stated that a further detailing would probably be
useful in order to use the support as a basis for decision making and argumentation in meetings with
other stakeholders. The application evaluation also showed that the participants had no problems in
directly categorising the risk impact evolvement by using the graphical representations (see
Figures 6-2, 6-3, 6-4). The feedback motivated the development of the more detailed matrix-based
support described in Section 6.5.2.

143
8 CONCLUSIONS
8.1 Summary
What was the question?
The research described in this dissertation addressed the problem of product development projects
which fail to deliver the expected outcome, focusing on a lacking robustness of projects as an
important contributing factor. The main goal was to identify opportunities for an enhancement of
the robustness of product development projects. This goal raised some fundamental questions:
RQ I. What are the characteristics and properties of a robust project?
• How can the concept of robustness be interpreted in the domain of project
management?
• What are relevant criteria for rating project success?
RQ II. What influences project robustness?
• What are causes for project failure?
• What are relevant success factors?
• What is recommended in literature?
RQ III. How to enhance project robustness?
• How to manage the selection of suitable risk treatment strategies?
• Which issues have to be taken into account?
What has been done?
Research questions I and II were answered based on a comprehensive literature analysis (see
Chapters 2 and 3) which resulted in a model (Chapter 4) describing the causality of project failures
(see Figure 8-1) and the linking with selected approaches for supporting product development
projects (see Figure 8-2).
The term robustness, originally proposed by Taguchi for production systems and processes has been
adapted to the domain of project management as follows:
Projects are robust, if the achievement of the project goals depends as little as possible on unwanted
and unexpected disturbances of the planned project course.

144
Using cost, time and quality as criteria is insufficient for assessing the successful achievement of
project goals (see Section 2.1). Project success can be subdivided into project management success
and product success. Cost, time and quality describe only some aspects of project management
success. Product success is represented e.g. by the market share of the product and user
satisfaction, and contributes directly to the success of a company represented, for example, by the
company’s growth rate.
Unwanted and unexpected disturbances of the planned project course can lead to project failure.
Analysis of the causes of project failure creates a complex network of interrelated factors influencing
the outcome of a product development project (Section 4.1). These factors can be categorised into
product related, project related and stakeholder related issues (Section 2.3). Whether these factors
are considered during product development and handled appropriately will influence project
robustness (see Figure 8-1).
Figure 8-1: Project failure causality model
The project failure causality model describes project risks as consisting of causes and effects (the
possible event and impact). The consequence of an occurring project risk is project failure. From a
risk management perspective, project failure can be prevented by following a preventive, proactive
or reactive risk treatment strategy (see Figure 8-2).
Effects
Causes
Project failure
Consequence
Impact (t)
Project
related
Product
related
Stakeholderrelated
Event
Project risks

145
Figure 8-2: Relations between risk treatment strategies and causal chain of project failure
The assumption underlying the project failure causality model was verified using an extensive data
set, which was collected some years ago and made available to the author (see Chapter 5). The data
analysis provided insights into the benefit of utilizing specific elements of design methodologies,
project management and risk management approaches, as well as other approaches, such as
requirements and stakeholder management.
The project failure causality model (see Figure 8-1) and the linking with risk treatment strategies (see
Figure 8-2) were the basis for the development of a question based support facilitating the pre-
selection of risk treatment strategies (see Section 6.5.1). The application evaluation of the question
based support (see Chapter 7) lead to a revision of the proposed support. The result of this revision
is the matrix based support (see Section 6.5.2), which is intended to be a contribution to the
enhancement of project robustness and is a response to research question III.
The matrix based support aims to support the process of risk treatment pre-selection which is
currently only insufficiently supported. First, the relevant risk characteristics have to be determined
based on the proposed categorisation of the time dependent risk impact evolvement. Second, the
likelihood of the detection of the risk impact has to be assessed, for example by using a FMEA or
RFMEA (see Section 3.4.4). Based on the risk impact evolvement category and the likelihood of
detection of the effect, the support proposes one or more suitable risk treatment strategies:
reactive, proactive and preventive (see Table 6-1).
reactive
proactive
preventive
Selection ofmeasures after
occurrence of risks
Reduction ofthe impact
Reduction ofthe likelihood of
occurrence
Selection ofmeasures before
occurrence of risks
Enhancementof likelihoodof detection
Consequence
Causes
Event
Impact (t)
Effects
Risk treatment strategies Target of risk
treatment strategies
146
8.2 Conclusions
Regarding existing support
Several approaches, for example design methodologies, project management, risk management and
maturity models, such as the Capability Maturity Model Integration (CMMI), are proposed in order to
support product development (see Chapter 3).
Design methodologies and project management approaches deliver the necessary framework to
execute a structured and beneficial risk management process and therefore to reduce the risk of
failing the project’s goals. CMMI can be used to assess a company’s capabilities in applying these
approaches. The implementation of these approaches can be seen as a strategic component of
enhancing project robustness.
The interplay between the product being developed, project management, and the stakeholders is
highly sensitive and dynamic. As a consequence, project management has to be flexible to cope with
unwanted and unexpected changes and disturbances. While flexibility is important, the smarter way
to cope with this challenge is to anticipate changes and disturbances and to adapt the project
accordingly, preferably by introducing preventive measures, otherwise by proactive measures, or – if
everything else fails – by reactive measures.
The identification of a project specific demand for supporting measures can be facilitated by applying
project risk management. The selection and implementation of risk-specific measures can be seen as
an operational component of enhancing project robustness.
Regarding the effect of existing support on project success
The implementation of the above mentioned approaches is intended to affect project success
preventively and proactively.
The analysis of data of 141 small and medium sized enterprises (SMEs) confirms the importance of
the use of systematic approaches as a means to support product development projects. The
presented analysis of the P3I data supports the following conclusion: Companies which do not
implement preventive and proactive approaches and do not have wide-ranging competencies (i.e.
high level of maturity in different areas) are less prepared to cope with situations which may cause
project failure.
The assumption that possessing wide-ranging capabilities (the companies’ qualification in performing
specific activities) also contributes could not be confirmed.
Although the use of these approaches to support product development projects was found to be
important, the study also suggested that the expected benefit (a robust project) can only be achieved
using the different approaches conjointly.
Regarding the current practice of risk treatment selection
The analysis of current practices of risk treatment strategy selection in the participating companies
suggested that the selection of suitable risk treatment strategies was not always executed
appropriately (see Chapter 7). The majority of the analysed risks was treated reactively, although the

147
risk involved a sudden impact after the event. Such risks cannot be treated effectively using reactive
risk treatment. The strategies were usually selected based on a structured strategy selection
process, but based on the personal experience of the project-leaders. Team meetings were hardly
involved.
For a successful application of project risk management it is important to identify possible risks, but it
is problematic to believe that as soon as a risk has been identified the treatment measure can be
selected. It is of vital importance to perform a comprehensive causal analysis before decisions about
risk treatment are made. This activity can be supported by involving a team of people, perhaps even
involving outsiders to the project.
Regarding the proposed support
Practitioners need support for decision making about appropriate risk treatment strategies.
For that reason, a question-based support was developed, which supports the pre-selection of risk
treatment strategies, based on the project failure causality model and its link with the proposed
categorisation of treatment strategies (see Chapter 6). Apart from the traditional characteristics of
risk (likelihood of occurrence and severity of impact), the time-dependent evolvement of risk impact
was considered.
An evaluation showed that the categorisation of the risk impact evolvement and the question based
support were easily understood by the practitioners involved, and that they considered the support
acceptable and applicable to support the pre-selection of strategies (see Chapter 7). The risk
treatment strategies suggested by the support were assessed as suitable in 39 out of 45 analysed risk
cases. The results were used to develop a matrix based support, which includes the likelihood of
detection and allows a more refined selection of strategies.
The proposed categorisation of risk treatment strategies, the categorisation of risk impact
evolvement, and the matrix based support are expected to facilitate the communication between
stakeholders involved in decision making about risk treatment strategies, thus contributing to a
successful execution of product development projects.
8.3 Suggestions for further research
The matrix-based support needs evaluation of its applicability in an industrial context and the effect
of its application. The support should be evaluated during the project planning phase. This would
enable an observation of whether the matrix based support can be used prior to the execution of the
project. Specific issues to be addressed are the possibility, at this point in time, to correctly assess
the time dependent evolvement of the impact and to analyse causal relations with sufficient
accuracy.
The assessment of the quality of these analyses would require additional data collection stages
during or after the completion of the projects. The quality of the risk assessments (including the
forecast of the time dependent risk impact evolvement) is likely to be influenced by several factors
(such as experience, risk attitude of the participants, and time pressure). These factors should be

148
part of the evaluation to guide the further improvement of not only the matrix based support but
also the whole project risk management approach.
An issue which arose during the application evaluation is the analysis of root causes of project risks
(see Section 7.4). Most of the participants of the study had problems in analysing the causality of
risks which occurred during their projects. Further research should be undertaken to understand the
reasons and to verify the suitability of existing methods to address this issue.
Another issue which needs further research is the final step in risk treatment planning - the selection
of the final risk strategy and the appropriate risk treatment measures. As outlined in Section 6.6 the
final selection is dependent on several criteria, which usually require a trade-off. This requires a
careful data collection and analysis, based on which support can be developed to complete the risk
treatment planning phase.

149

150

151
REFERENCES
Ahmed, S. and K. M. Wallace (2001). Developing a support system for novice designers in industry. 13th International Conference on Engineering Design. S. Culley, A. Duffy, C. McMahon and K. M. Wallace. Glasgow, Wiley: 75-82.
Ahmed, S., K. M. Wallace, et al. (2003). "Understanding the differences between how novice and experienced designers approach design tasks." Research in Engineering Design 14(1): 1-11.
Ahrendts, F. and A. Marton (2008). IT-Risikomanagement leben. Berlin, Springer.
Airbus. (2007). "Airbus A380." Retrieved 16.04.2009, 2009, from http://www.airbus.com/store/photolibrary/EVENTS/att00009340/media_object_image_lowres_DSC_7132_md.jpg.
Akademie, D. (1997). Schlechte Noten für Projektmanager. Überlingen, Akademie für Führungskräfte der Wirtschaft GmbH.
Altschuller, G. S. (1973). Erfinden - (k)ein Problem, Tribüne Verlag.
Andreasen, M. M. (1980). Machine design methods based on a systematic approach - contribution to a design theory. Department of Machine Design. Lund, Lund Institute of Technology.
Andreasen, M. M. (2003). Improving Design Methods' Usability by a Mindset Approach. Human Behaviour in Design. U. Lindemann. Berlin, Springer: 209-218.
Andreasen, M. M. and L. Hein (2000). Integrated Product Development. Lyngby, Institute for Product Development, Technical University of Denmark.
Archer, L. B. (1965). Systematic Method for Designers. London, The Design Council.
Asimov, M. (1962). Introduction to design. Englewood Cliffs, Prentice-Hall.
Atkinson, R. (1999). "Project management: cost, time and quality, two best guesses and a phenomenon, its time to accept other success criteria." International Journal of Project Management 17(6): 337-342.
Atteslander, P. (1995). Methoden der empirischen Sozialforschung. Berlin, de Gruyter.
Aurajo, C. S., H. Benedetto, et al. (1996). "The Utilization of Product Development Methods: A Survey of UK Industry." Journal of Engineering Design 7(3): 265-277.
Autoclub. (2005). "Bugatti Veyron." Retrieved 27.11.2005, 2005, from http://www.autoclub.com.au/2005/11/bugatti-veyron-w16-engine.html.

152
Avots, I. (1984). Information systems for matrix organisations. Matrix management systems handbook. D. I. Cleveland, Prentice Hall: 635-537.
Baccarini, D. (1999). "The Logical Framework Method for Defining Project Success." Project Management Journal 30(4): 25-32.
Badke-Schaub, P. and E. Frankenberger (2004). Management kritischer Situationen. Berlin Heidelberg, Springer-Verlag.
Badke-Schaub, P., G. Hofinger, et al., Eds. (2008). Human Factors. Heidelberg, Springer Medizin Verlag.
BBC. (2004). "Airbus 380 budget." Retrieved 24.04., 2009, from http://news.bbc.co.uk/2/hi/business/4097885.stm.
Bender, B. (2004). Erfolgreiche individuelle Vorgehensstrategien in frühen Phasen der Produktentwicklung - Fortschrittsbericht VDI-Reihe 1 Nr. 377. Düsseldorf, VDI-Verlag.
Bender, B. and L. Blessing (2004). On The Superiority Of Opportunistic Design Strategies During Early Embodiment Design. 8th International Design Conference. D. Marjanovic. Dubrovnik, University of Zagreb.
Bender, B., T. Reinicke, et al. (2002). Application of the methods from social sciences in design research. 7th International Design Conference. D. Marjovanic. Dubrovnic, The Design Society.
Blessing, L. (1996). Comparison of design models proposed in prescriptive literature. COST A3 / COST A4 International research workshop. J. Perrin and D. Vinck. Lyon, European Committee. Social Sciences Series Vol. 5.
Blessing, L. (2002). What is this thing calles 'design research'? Annals of the 2002 International CIRP Design Seminar, Hong Kong.
Blessing, L. and A. Chakrabarti (2009). DRM, a Design Research Methodology. London, Springer.
Blessing, L. and U. Lindemann (2007). Gestaltung von Produktentwicklungsprozessen. Innovationspotenziale in der Produktentwicklung. F.-L. Krause, H.-J. Franke and J. Gausemeier. München, Hanser Verlag: 89-95.
Blessing, L. and I. Yates (1999). Design and development capabilites of small and medium sized enterprises in the UK. International Conference on Engineering Design 99, Technical University of Munich.
Blessing, L. T. M. (1994). A Process-Based Approach to Computer-Supported Engineering Design. Enschede, the Netherlands, University of Twente.
Bortz, J. (2005). Statistik: für Human- und Sozialwissenschaftler. Berlin, Springer.
Brosius, F. (2006). SPSS 14. Heidelberg, mitp.
Browning, T. R. (1998). Modeling and Analyzing Cost, Schedule and Performance in Complex System Product Development. Cambridge, Massachusetts Institute of Technology. PhD.
Bugatti. (2009). "History of development." Retrieved 23.04.2009, 2009, from http://www.bugatti.com/en/veyron-16.4/history-of-development.html.
Bullinger, H.-J., E. Kiss-Preußinger, et al. (2003). Automobilentwicklung in Deutschland - wie sicher in die Zukunft? Stuttgart, Fraunhofer-Institut - Arbeitswissenschaft und Organisation.

153
Cambridge (2005). Cambridge Advanced Learner's Dictionary, Cambridge University Press.
Carbone, T. A. and D. D. Tippett (2004). "Project Risk Management Using the Project Risk FMEA." Engineering Management Journal 16(4): 28-35.
Carnegie (2006). CMMI for Development V1.2, Carnegie Mellon Software Engineering Institute.
Chalupnik, M. J. (2006). Modelling Design Processes to Improve Robustness. 6th Integrated Product Development Workshop. Salzelmen bei Magdeburg.
Chalupnik, M. J., D. Wynn, et al. (2007). Understanding Design Process Robustness: A Modelling Approach. International Conference on Engineering Design. J.-C. Bocquet. Paris, Ecole Centrale Paris.
Chalupnik, M. J., D. C. Wynn, et al. (2008). Analysing the relationship between design process composition and robustness to task delays. International Design Conference - DESIGN 2008. D. Marjanovic, M. Storga, N. Pavkovic and N. Bojcetic. Dubrovnik, Faculty of Mechanical Engineering and Naval Architecture, University of Zagreb, the Design Society.
Chapman, C. and S. Ward (2003). Project Risk Management. Hoboken, John Wiley & Sons.
Cooper, R. G. and E. J. Kleinschmidt (1987). "New products: What separates Winners from Loosers?" Journal of Production Innovation Management 4(3): 169-184.
Cross, N. (2008). Engineering Design Methods. Chichester, John Wiley & Sons. Litd.
DIN (1987). DIN 69901 Projektmanagement, Beuth Verlag. DIN 69901.
DIN (2002). Risikomanagement für Projekte Anwendungsleitfaden, Beuth Verlag. DIN IEC
62198.
Dinsmore, P. C. and J. Cabanis-Brewin, Eds. (2006). The AMA Handbook of Project Management. New York, AMACOM American Management Association.
Dörner, D. (1976). Problemlösen als Informationsverarbeitung. Stuttgart, Kohlhammer.
Dörner, D. (1996). The Logic of Failure. New York, Metropolitan Books.
Duncker, K. (1935). Zur Psychologie des produktiven Denkens. Berlin, Julius Springer.
Dvir, D., T. Raz, et al. (2003). "An empirical analysis of the relationship between project planning and project success." International Journal of Project Management 21(2): 89-95.
Eckert, C. and J. Clarkson (2005). The reality of design. Design Process Improvement A review of current practice. J. Clarkson and C. Eckert. London, Springer: 1-29.
Ehrlenspiel, K. (2002). Denkfehler bei der Maschinenkonstruktion: Beispiele, Gründe und Hintergründe. Ja, mach nur einen Plan. S. Strohschneider and R. v. d. Weeth. Bern, Huber:
196-207.
Ehrlenspiel, K. (2003). Integrierte Produktentwicklung. München, Hanser Verlag.
Engel, C. and C. Holm (2004). Erfolgreich Projekte durchführen, GPM Deutsche Gesellschaft für Projektmanagement, PA Consulting Group.
FAZ. (2006). "VW Eos." Retrieved 17.01.2006, 2006, from http://www.faz.net/s/Rub1DABC609A05048D997A5F315BF55A001/Doc~EFDE9AD045FF4436FBF8234816CAA9C45~ATpl~Ecommon~Scontent.html.

154
Flouris, T. G. and D. Lock (2008). Aviation Project Management. Aldersgate, Ashgate.
Foxley, D. M., L. Blessing, et al. (2000). Closing Report - Partnership for Profitable Product Improvement, The Royal Academy of Engineering.
Franke, H.-J. (1985). Konstruktionsmethodik und Konstruktionspraxis - Eine kritische Betrachtung. International Conference on Engineering Design. V. Hubka. Hamburg, Edition HEURSITA. 2: 910-924.
Franke, H.-J. and U. Lindemann (2007). Komplexitätsmanagement. Innovationspotenziale in der Produktentwicklung. F.-L. Krause, H.-J. Franke and J. Gausemeier. München, Car-Hanser Verlag: 3-34.
Franke, J., C. Rückert, et al. (2002). Konstruieren methodisch lernen - Führt die konstruktionsmethodische Ausbildung schon im Studium zu besseren Lösungen? Denken in der Produktentwicklung. Psychologische Unterstützung der frühen Phasen. W. Hacker, Vdf hochschulverlag: 155-167.
Frankenberger, E. (1997). Arbeitsteilige Produktentwicklung - Empirische Untersuchung und Empfehlungen zur Guppenarbeit in der Konstruktion. Düsseldorf, VDI Verlag.
Frankenberger, E. and P. Badke-Schaub (1998). Integration of Group, Individual and External Influences in the Design Process. Designers The Key to Successful Product Development. E. Frankenberger, P. Badke-Schaub and H. Birkhofer. Berlin, Springer: 149-164.
French, M. J. (1971). Engineering Design: the conceptual stage. London, Heinemann Educational.
Fricke, G. (1993). Konstruieren als flexibler Problemlöseprozeß - Empirische Untersuchung über erfolgreiche Strategien und methodische Vorgehensweisen beim Konstruieren. Darmstadt, Technische Hochschule Darmstadt.
Fricke, G. (1996). "Succesful Individual Apporaches in Engineering Design." Research in Engineering Design 8: 151-165.
Funke, J. (2003). Problemlösendes Denken. Stuttgart, Kohlhammer.
Grabowski, H. and K. Geiger, Eds. (1997). Neue Wege zur Produktentwicklung. Berlin, Raabe.
Gries, B. and L. Blessing (2005). Use and usefulness of mail surveys as method of design research. International Conference on Engineering Design ICED05. Melbourne, Design Society.
Günther, J. and K. Ehrlenspiel (1999). "Comparing designers from practice and designers with systematic design education." Design Studies 20(5): 439-451.
Hales, C. (1998). Forensic Analysis of the Engineering Design Process. Designers - The Key to Successful Product Development. E. Frankenberger, P. Badke-Schaub and H. Birkhofer. London, Springer: 137-148.
Hales, C. (2001). "Critical Factors in Design." Mechanical Engineering Design 123(3): 36-38.
Hales, C. (2003). Respect Design or expect disaster! International Conference on Engineering Design ICED03. A. Folkeson, K. Gralen, M. Norell and U. Sellgren. Stockholm, Design Society.
Hales, C. (2005). Ten Tips for better design from forensic experience. International Conference on Engineering Design ICED05. A. Samuel and W. Lewis. Melbourne, Design Society.
Hales, C. and S. Gooch (2004). Managing Engineering Design. London, Springer-Verlag.

155
Handelsblatt. (2006). "VW Eos." Retrieved 23.03.2006, 2006, from http://www.handelsblatt.com/technologie/news/eos-soll-im-mai-in-den-showrooms-stehen%3B1054150.
Hatefi, M. a., S. M. Seyedhoseini, et al. (2007). "Risk Response Actions Selection." The Internaional Journal of Applied Management and Technology: 385-408.
Heymann, M. (2005). Kunst und Wissenschaft in der Technik des 20. Jahrhunderts: zur Geschichte der Konstruktionswissenschaft. Zürich, Chronos Verlag.
Hinckley, C. M. (2001). Make No Mistake! an Outcome-Based Approach to Mistake-Proofing, Productivity Press.
Hubka, V. (1982). Principles of Engineering Design. London, Butterworth Scientific.
IEC (2001). Project Risk Management - Application Guidelines, British Standards Institute. IEC
62198.
Ishikawa, K. (1991). Introducion to Quality Control, Chapman and Hall.
ISO (2009). Risk management - principles and guidelines, International Organisation for Standardization. ISO 31000.
Jänsch, J. (2007). Akzeptanz und Anwendung von Konstruktionsmethoden im industriellen Einsatz - Analyse und Empfehlungen aus kognitionswissenschaftlicher Sicht. Produktentwicklung und Maschinenelemente. Darmstadt, TU Darmstadt.
Jorden, W., G. Havenstein, et al. (1985). Vergleich von Konstruktionswissenschaft und Praxis Teilergebnisse eines Forschungsvorhabens. International Conference on Engineering Design. V. Hubka. Hamburg, Edition HEURISTA. 2: 957-966.
Judgev, K. and R. Müller (2005). "A retrospective look at our evolving understanding of project success." Project Management Journal 36(4): 19-31.
Kamiske, F. G. and J.-P. Brauer (1995). Qualitätsmanagement von A-Z. München, Carl-Hanser Verlag.
Kelley, T. and J. Littmann (2006). The ten faces of innovation. London, Profile Books.
Kendrick, T. (2003). Identifying and managing project risk: essential tools for failure-proofing your project. New York, AMACOM.
Kerley, W. P., D. C. Wynn, et al. (2008). Using simulation to support integration of life-cycle engineering activities into existing design processes: a case study. Proceeding of the DESIGN 2008. D. Marjanovic, M. Storga, N. Pavkovic and N. Bojcetic. Dubrobnik, Faculty of Mechanical Engineering and Naval Architecture, University of Zagreb, the Design Society.
Kerzner, H. (2006). Project management - a systems approach to planning, scheduling and controlling. Hoboken, New Jersey, John Wiley & Sons, Inc.
Kerzner, H. (2010). Project Management: Best Practices: Achieving Global Excellence, John Wiley & Sons.
Klix, F. (1971). Information und Verhalten, Kybernetische Aspekte der organismischen Informationsverarbeitung. Bern, Huber.

156
Kloss, B. and M. A. Moss (2008). "How effective is Risk Management in Engineering Design Projects? A New Approach for Analysing Risk Management Performance." Research in Engineering Design 19: 71-100.
Koller, R. (1976). Konstruktionslehre für den Maschinenbau. Berlin, Springer Verlag.
Lindemann, U., M. Maurer, et al. (2009). Structural Complexity Management. Berlin, Springer-Verlag.
Lipovetsky, S., A. Tishler, et al. (1997). "The relative importance of project success dimensions." R&D Management 27(2): 97-106.
Litke, H.-D. (1993). Projektmanagement - Methoden, Techniken, Verhaltensweisen. München, Carl Hanser Verlag.
Litke, H.-D. (2007). Projektmanagement - Methoden, Techniken, Verhaltensweisen. Evolutionäres Projektmanagement. München, Carl Hanser Verlag.
Madauss, B. J. (1994). Handbuch Projektmanagement. Stuttgart, Schäffer Poeschel.
Maffin, D. (1998). "Engineering Design Models: context, theory and practice." Journal of Engineering Design 9(4): 315-327.
Maier, A. M., C. M. Eckert, et al. (2005). "A meta-model for communication in engineering design." CoDesign 1(4): 243-254.
Maier, A. M., C. M. Eckert, et al. (2009). Towards managing team interfaces: An elicitation of factors influencing communication. International Conference on Engineering Design ICED09, Stanford, CA, Design Society.
Manager-Magazin. (2004). "Bugatti Veyron." Retrieved 23.04.2009, 2009, from http://www.manager-magazin.de/life/auto/0,2828,327122,00.html.
Manager-Magazin. (2009). "Bugatti Veyron." Retrieved 23.04.2009, 2009, from http://www.manager-magazin.de/life/auto/0,2828,327122,00.html.
Manager. (2006). "Airbus communication." Retrieved 19.10.2006, 2006, from http://www.manager-magazin.de/unternehmen/artikel/0,2828,443281-4,00.html.
Manager. (2008). "Airbus Power 8." Retrieved 04.08.2008, 2008, from http://www.manager-magazin.de/unternehmen/artikel/0,2828,569960,00.html.
McCarthy, J. (1956). The Inversion of Functions Defined by Turing Machines. Automata studies. annuals of Mathematical Studies. C. E. Shannon and J. McCarthy, Princeton University Press. 34: 177-181.
McMahon, C. and J. Busby (2005). Risk in the design process. Design Process Improvement A review of current practice. J. Clarkson and C. M. Eckert. London, Springer: 286-305.
Mehrmann, E. (1995). vom Konzept zum Interview. Düsseldorf, ECON Taschenbuch Verlag.
Meißner, M., K. Gericke, et al. (2005). Eine adaptive Produktentwicklungsmethodik als Beitrag zur Prozessgestaltung in der Produktentwicklung. Design for X. H. Meerkamm. Neukirchen, The Design Society, Friedrich-Alexander-Universität Erlangen-Nürnberg:
67-77.
Mniszewski, K., H. Lyson, et al. (2004). "The 1999 Ford power plant explosion: A study of problems encountered during large-loss fire investigations." nfpa Journal(July/August 2004).

157
Morris, P. W. and G. H. Hough (1987). The Anatomy of Mayor Projects, John Wiley.
NetLibary (2005). The owner's role in project risk management /Committee for Oversight and Assessment of U.S. Department of Energy Project Management, National Research Council of the National Academies. Washington DC, national Academies Press.
Oehmen, J., B. Dick, et al. (2006). Risk management in product development - current methods. 9th International Design Conference. D. Marjanovic. Dubrovnik, Croatia, Design Society.
Ohno, T. (1988). Toyota Production System: Beyond Large-Scale Prodcution. Cambridge Massachusetts, Productivity Press.
Orloff, M. A. (2006). Inventive Thinking through TRIZ, Springer.
Pahl, G. and W. Beitz (1977). Konstruktionslehre. Handbuch für Studium und Praxis. Berlin, Springer.
Pahl, G., W. Beitz, et al. (2007). Engineering Design - A Systematic Approach. Berlin, Springer-Verlag.
Patzak, G. and G. Rattay (2004). Projekt Management: Leitfaden zum Management von Projekten, Projektportfolios und projektorientierten Unternehmen. Wien, Linde.
Phadke, M. S. (1989). Quality Engineering using Robust Design, Prentice Hall.
PMI (2004). A Guide to the Project Management Body of Knowledge - PMBOK Guide. Newton Square, Pennsylvania, Project Management Institute Inc.
Raz, T. and E. Michael (2001). "Use and benefits of tools for project risk management." International Journal of Project Management 19: 9-17.
Raz, T., A. J. Shenhar, et al. (2002). "Risk management, project success, and technological uncertainty." R&D Management 32(2): 101-109.
Reinertsen, D. G. (1998). Die neuen Werkzeuge der Produktentwicklung. München, Hanser Verlag.
Repenning, N. P. (2001). "Understanding fire fighting in new product development." The Journal of Product Innovation Management 18: 285-300.
Rittel, H. W. J. and M. M. Webber (1973). "Dilemmas in a General Theory of Planning." Policy Sciences 4: 155-169.
Rodenacker, W. G. (1970). Methodisches Konstruieren. Berlin, Springer Verlag.
Roozenburg, N. and J. Eekels (1995). Product Design: Fundamentals and Methods. Chichester, John Wiley & Sons.
Rousseeuw, P. J. (1987). "Silhouettes: a graphical aid to the representation and validation of cluster analysis." Journal of Computational and Applied Mathematics 20: 53-65.
Rückert, C. (1997). Untersuchungen zur Konstruktionsmethodik - Ausbildung und Anwendung. Düsseldorf, VDI Verlag.
Schaub, H. (2006). Störungen und Fehler beim Denken und Problemlösen. Denken und Problemlösen. Kognition C/II/ Bd. 8: C/II/5. J. Funke, Hogrefe Verlag.

158
Schmidt-Kretschmer, M., K. Gericke, et al. (2007). Managing requirements or be managed by requirements - results of an empirical study. International Conference on Engineering Design. J.-C. Bocquet. Paris, Ecole Centrale Paris.
Schön, D. A. (1983). The Reflective Practitioner - How Professionals Think in Action, Basic Books.
Seibold, H. (2006). IT-Risikomanagement. München, Oldenbourgh.
Seidel, M. S. F. (1999). An Investigation into Product Development Process of SMEs - Diploma Thesis. Engineering Design Centre, Department of Engineering Cambridge University.
Smith, P. G. (2007). Flexible Product Development. San Francisco, Jossey-Bass.
Smith, P. G. and G. M. Merritt (2002). Proactive Risk Management - Controlling Uncertainty in Product Development. New York, Productivity Press.
Spiegel. (2006a). "A380-Erstkunde stellt sich hinter Airbus." Retrieved 17.2., 2006, from http://www.spiegel.de/wirtschaft/0,1518,401474,00.html.
Spiegel. (2006b). "Airbus drohen Millionenzahlungen wegen A380-Verzögerungen." Retrieved 6.10., 2006, from http://www.spiegel.de/wirtschaft/0,1518,441097,00.html.
Spiegel. (2006c). "Bei A380 drohen weitere sechs Monate Lieferverzögerung." Retrieved 20.9., 2006, from http://www.spiegel.de/wirtschaft/0,1518,438013,00.html.
SPSS (2009). PASW Statistics Base 18, SPSS Inc.
Strohschneider, S. and R. v. d. Weth, Eds. (2002). Ja, mach nur einen Plan. Bern, Huber.
Taguchi, G., S. Chowdhury, et al. (2005). Taguchi's Quality Engineering Handbook. Hoboken, John Wiley & Sons.
Turner, J. R. (1993). The Handbook of Project-based Management, McGraw Hill.
Ullman, D. G. (2006). Making Robust Decisions, Trafford Publishing.
Ulrich, K. T. and S. D. Eppinger (2007). Product Design and Development, McGraw-Hill Higher Education.
VDI (1993). VDI 2221 - Systematic approach to the development and design of technical systems and products, VDI-Verlag GmbH. VDI 2221.
Voigtsberger, J. (2005). Adaptive Modellierung und Simulation von Produktentwicklungsprozessen. Berlin, Technische Universität Berlin.
Volkswagen. (2009). "VW Eos." Retrieved 16.04.2009, 2009, from http://www.volkswagen.de/vwcms/master_public/virtualmaster/de3/modelle/eos/galerie/filme.html.
Wall, F. (1999). Planungs- und Kontrollsysteme, Gabler.
Wallace, K. and S. Ahmed (2003). How engineering Designers Obtain Information. Human Behaviour in Design. U. Lindemann. Berlin, Springer: 184-194.
Wallmüller, E. (2004). Risikomanagement für IT- und Software-Projekte. München Wien, Carl-Hanser Verlag.
Wateridge, J. (1995). "IT projects: a basis for success." International Journal of Project Management 13(3): 169-172.

159
Wateridge, J. (1998). "How can IS/IT projects be measured for success?" International Journal of Project Management 16(1): 59-63.
Websters. (2009). "Definition Robustness." Retrieved 27.04.2009, 2009, from http://www.websters-online-dictionary.org/definition/robustness.
Westerveld, E. (2003). "The Project Excellence Model: linking success criteria and critical success factors." International Journal of Project Management 21: 411-418.
Westhuizen, D. v. d. and E. P. Fitzgerald (2006). Defining and measuring project success. European Conference on IS Management, Leadership and Governance. D. Remenyi. Dublin, Academic Conferences.
Wheelwright, S. C. and K. B. Clark (1992). Revolutionizing Product Development. New York, The Free Press.
White, D. and J. Fortune (2002). "Current practice in project management - an empirical study." International Journal of Project Management 20: 1-11.
Williams, T. M. (1996). "The two-dimensionality of project risk." International Journal of Project Management 14(3): 185-186.
Wit, A. d. (1988). "Measurement of project success." International Journal of Project Management 6(3): 164-170.
WordNet. (2009). "planning." Retrieved 15.05.2009, 2009, from http://wordnetweb.princeton.edu/perl/webwn?s=planning.
Wynn, D., C. M. Eckert, et al. (2006). Applied Signposting: A Modeling Fremawork to Support Design Process Improvement. IDETC/CIE 2006. Philadelphia, ASME.
Yates, I. (1998). Yes, Prime Minister, but it is also investment, investment, investment. 14th Lord Nelson of Stafford Lecture. London, IEE.

160

161
APPENDIX – APPLICATION EVALUATION QUESTIONS
1. Questions about the company
1.1 Main market areas? _______ ______________________________
1.2 Number of employees ______________________________________
1.3 Number of designers _____________________________________
1.4 Annual sales (in m €) ______________________________________
1.5 Product development capability
Please indicate your company’s product development capability?
full partial/
extern
extern none
1.5.1 Market analysis � � � �
1.5.2 Requirements management � � � �
1.5.3 Design � � � �
1.5.4 Manufacturing of components � � � �
1.5.5 Tooling � � � �
1.5.6 Assembly � � � �
1.5.7 Sales and marketing � � � �
1.5.8 Installation � � � �
1.5.9 Customer support � � � �

162
1.6 What do you think your growth rate is relative to other companies in your industry sector?
� Below sector average
� Equal to sector average
� Comfortably above the average
� One f the leaders
2. Questions about the product
Please refer all following questions to the same project.
2.1 What type of product describes your product best?
� Consumer good
� Capital good
� Vendor part
� Other
2.2 Which of the following options describes your development activities best?
� Development of new solution principles for a new problem/task; entering technical
unknown territory
� Adaptation of an existing solution to changed boundary conditions by using approved
solution principles; task not entirely new
� Adaptation to changed boundary condition by varying existing parts/subsystems
� Do not know
2.3 What type of production is your product?
� One-off
� Batch
� Continuous
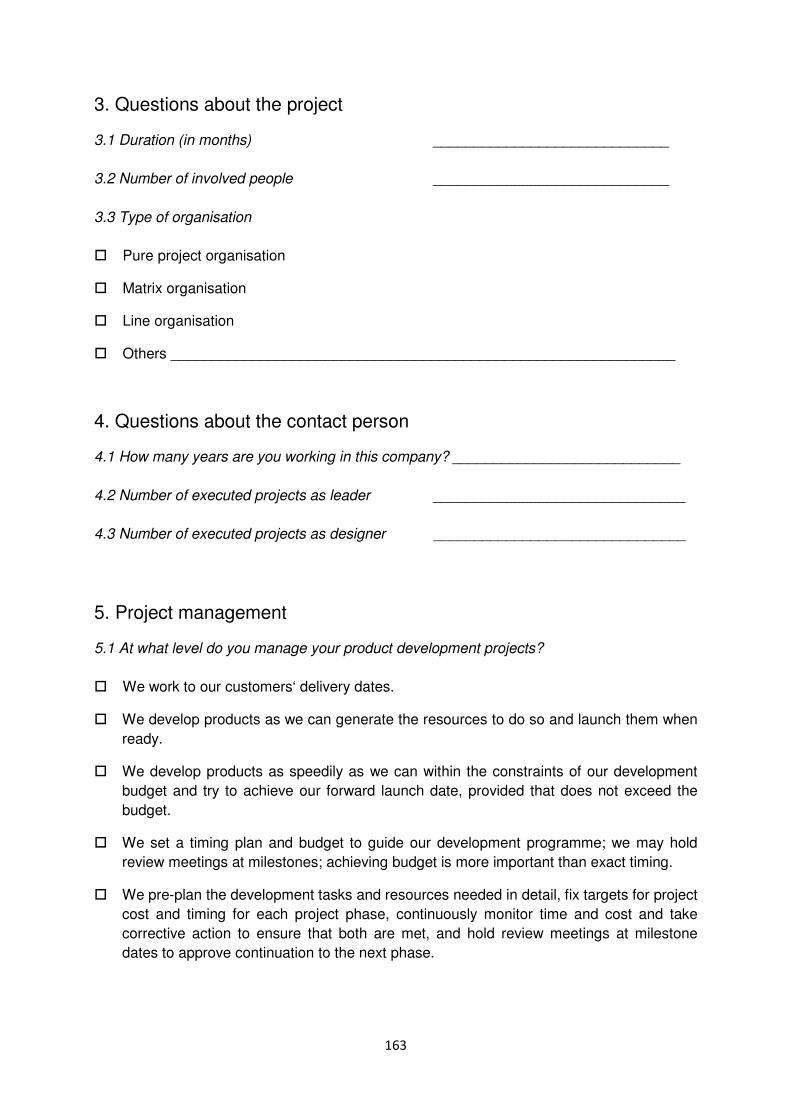
163
3. Questions about the project
3.1 Duration (in months) _____________________________
3.2 Number of involved people _____________________________
3.3 Type of organisation
� Pure project organisation
� Matrix organisation
� Line organisation
� Others ______________________________________________________________
4. Questions about the contact person
4.1 How many years are you working in this company? ____________________________
4.2 Number of executed projects as leader _______________________________
4.3 Number of executed projects as designer _______________________________
5. Project management
5.1 At what level do you manage your product development projects?
� We work to our customers‘ delivery dates.
� We develop products as we can generate the resources to do so and launch them when
ready.
� We develop products as speedily as we can within the constraints of our development
budget and try to achieve our forward launch date, provided that does not exceed the
budget.
� We set a timing plan and budget to guide our development programme; we may hold
review meetings at milestones; achieving budget is more important than exact timing.
� We pre-plan the development tasks and resources needed in detail, fix targets for project
cost and timing for each project phase, continuously monitor time and cost and take
corrective action to ensure that both are met, and hold review meetings at milestone
dates to approve continuation to the next phase.

164
5.2 A which level do you manage your project risks?
� We react to risk events.
� We identify risks informally.
� We identify risks and plan possible reactions.
� We identify risks and implement risk treatment measures for the most severe risks.
� We identify risks and plan risk treatment measures for the most severe risks, assess
their efficacy and control them continuously.

165
Can the event bedetected?
Can the impactbeobserved early?
Is an impactobservable shortlyafter the the event?
Can the impact risesuddenly?
preventive,proactive,reactive
preventive,proactive
preventive
yes no
yes yes
yes
nono
no
Company: Date: Risk- no.:
Risk:
Event:
Impact:

6. Questions about the result
Which risk impact evolvement category describes the risk
� A
7. Risk treatment strategy
7.1 When did you plan the risk treatment measures?
� Before the event
� After the event
Applied risk treatment strategy
_____________________________
Suggested strategy (question based support):
_____________________________
7.3 Is the suggested risk treatment strategy suitable to cope with the risk?
� yes
� no
� do not know
Reason:
7.4 Were the costs and the delay caused by the risks acceptable for the company?
166
Questions about the result
Which risk impact evolvement category describes the risk best?
� B
Risk treatment strategy
When did you plan the risk treatment measures? 7.2 What was the goal of the measure
� Reduction of likelihood of
� Enhancement of likelihood of detection
� Reduction of risk impact severity
risk treatment strategy:
_____________________________
Suggested strategy (question based support):
_____________________________
the suggested risk treatment strategy suitable to cope with the risk?
Were the costs and the delay caused by the risks acceptable for the company?
� C
What was the goal of the measure?
Reduction of likelihood of occurrence
Enhancement of likelihood of detection
tion of risk impact severity
Were the costs and the delay caused by the risks acceptable for the company?

167
8. Risk treatment strategy practice
8.1 Do you have a structured risk treatment selection process?
� yes
� no
� do not know
8.2 How do you select an appropriate risk treatment strategy?
� based on the experience of the responsible person
� based on analyses of past projects
� external recommendations
� __________________
8.3 Who selects the strategy? 8.4 Who is responsible?
� Project leader � Project leader
� Person in charge for the specific work package � Person in charge for the specific work package
� Project manager � Project manager
� Head of department � Head of department
� CEO � CEO
� ____________ � ____________
8.5 What are the main selection criteria?
� Cost
� Experience with strategy
� Proposal of the management
� _______________________

168
9. Assessment of the support
9.1 Would you use the question based support in order to select a suitable risk treatment
strategy?
9.2 Would you prefer a direct linking of risk treatment strategies and risk impact evolvement
categories?
9.3 Did the question based support offer you a benefit?