road transport year book (2017 - 2018 & 2018 - 2019)
144
-
Upload
khangminh22 -
Category
Documents
-
view
1 -
download
0
Transcript of road transport year book (2017 - 2018 & 2018 - 2019)


ROAD TRANSPORT YEAR BOOK (2017 - 2018 & 2018 - 2019)
lR;eso t;rs

FOREWORD
Road is the dominant mode of transportation in India, both in terms of share in goods and passenger traffic and in terms of contribution to national economy. Proper developed transport road network not only reduces the cost of transportation, both in terms of money and time, but also helps in the integration of various regions within the country and better motor transport connectivity with neighbouring countries at the international level. Transportation by road has remained a preferred mode of transport primarily because of easy access, flexibility of operations, door-to-door services and reliability.
Continuous and ambitious policy interventions of Ministry of Road Transport and Highways (MoRTH) has contributed towards development of a comprehensive road transport network in the country. Sustained economic growth, improved road infrastructure and increased disposable income of households have led to the rising demand for road transport. The number of registered vehicles has recorded annual growth at the rate of 9.9 percent during the last ten years (2009-2019) with 296 million
stregistered vehicles in India as on 31 March, 2019. Personalised modes of transport (Cars and two- wheelers) constitute about 88 percent of total vehicular population.
The present issue of 'Road Transport Year Book 2017-18 and 2018-19' provide comprehensive information pertaining to registered motor vehicles overtime across States/UTs. Publication contains details on production, sales, export of motor vehicles, motor vehicles taxation, composition of registered motor vehicles, drivers and conductors licences issued, revenue realised from road transport by Centre and States etc.
I hope that the data on different facets of road transport sector analysed in this publication will be useful to administrators, policy makers and the academicians, especially those interested in infrastructure development.
I gratefully acknowledge the cooperation extended to the Transport Research Wing (TRW) by different agencies involved in motor vehicles and road transport regulation and administration. Contribution of the officers and staff of the Transport Research Wing involved in bringing out this publication is recognized and well appreciated.
(Giridhar Aramane)New DelhiJune 28, 2021
fxfj/kj vjeus] fxfj/kj vjeus] vkbZ-,-,l-vkbZ-,-,l-fxfj/kj vjeus] vkbZ-,-,l-lfpolfpolfpo
GIRIDHAR ARAMANE, GIRIDHAR ARAMANE, I.A.S.I.A.S.GIRIDHAR ARAMANE, I.A.S.SecretarySecretarySecretary
lM+d ifjogu vkSj jktekxZ ea=ky;Ministry of Road Transport & Highways
Hkkjr ljdkj @ Government of India
Room No. 509, Transport Bhawan, 1 Parliament Street, New Delhi-110 001, India Tel.: 91-11-23714104, Fax : 91-11-23356669E-mail: [email protected] Web : http://www.morth.nic.in

MESSAGE
Road transport is the only extensive system that gives transportation to the final destination. It offers a vital link between production and consumption. Over the years, the road transport in India has recorded a considerable growth both in terms of distance as well as in terms of the output of the system. Ministry of Road Transport and Highways (MoRTH) is not only concerned about better accessibility and safer road network in the country but also about enhanced transparency and efficiency. The Sector specific policies of the Ministry has contributed significantly in increasing road network and improving the quality of public transportation system in India.
The road transport sector in India has expanded manifold after independence in terms of spread and capacity. The Number of registered vehicles on road and the volume of passenger and freight traffic handled by road transport has significantly increased over the years. The number of registered motor vehicles per thousand persons increased from 53 in 2001 to 225 in 2019 indicating improvement in accessibility of means of transport for the public. The automobile industry is rapidly growing with an annual production of over 26.4 million vehicles in 2019. Road transport sector contributes significantly to Gross Value Added, export and employment generation.
The present issue of 'Road Transport Year Book 2017-18 and 2018-19' provide wide range of information in respect of registered motor vehicles segments along with additional information in respect of production, sales, export of motor vehicles, motor vehicles taxation structure and revenue realised from road transport by Centre and States.
I hope the publication will be useful to administrators, policy makers and the academicians. I gratefully acknowledge the cooperation extended to TRW by the State/UTs, RBI, CSO, DGCI&S and SIAM who have contributed a lot to bring out this publication. I also wish to express my appreciation for the support and coordination provided by my colleagues in Transport Research Wing in bringing out the publication. We look forward to any suggestions you may have in improving this document further.
(Kailash Chand Gupta)New DelhiJune 28, 2021

dy�flagdy�flagdy�flagmi�egkfuns'kdmi�egkfuns'kdmi�egkfuns'kdKAL SINGHKAL SINGHKAL SINGHDy. Director GeneralDy. Director GeneralDy. Director General
lM+d� ifjogu� vkSj �jktekxZ� ea=ky;lM+d� ifjogu� vkSj �jktekxZ� ea=ky;lM+d� ifjogu� vkSj �jktekxZ� ea=ky;Ministry of Road Transport & HighwaysMinistry of Road Transport & HighwaysMinistry of Road Transport & Highways
Government of IndiaGovernment of IndiaGovernment of IndiaHkkjr�ljdkjHkkjr�ljdkjHkkjr�ljdkj
Room No. 102, Transport Research Wing, IDA Building, Jamnagar House, New Delhi - 110011.Room No. 102, Transport Research Wing, IDA Building, Jamnagar House, New Delhi - 110011.Email- [email protected], Tel. 011-23072936, 23072938Email- [email protected], Tel. 011-23072936, 23072938
Room No. 102, Transport Research Wing, IDA Building, Jamnagar House, New Delhi - 110011.Email- [email protected], Tel. 011-23072936, 23072938
PREFACE
The Road Transport Year Book is an Annual Publication of Transport Research Wing of the Ministry of Road Transport & Highways. The present issue collates data on registered motor vehicles furnished by the States and UTs for the Financial year's 2017-18 and 2018-19 for different categories of vehicles.
The present Publication provides the State / UT wise and Million Plus city wise spread of motor vehicles in India. This issue examined India's position internationally in terms of vehicle penetration ratios analysed based on the data provided by World Road Statistics, 2018 of International Road Federation, Geneva. The whole document has revamped substantially over previous versions. Besides registered Motor Vehicles, this Publication touched issues relating to road transport such as road network, production, Sale and Export of Motor Vehicles, Employment generation in transport sector and Trade performance of Motor Vehicles and parts in last five years.
The data given in the Publication sourced from States / UTs transport departments, Budget Documents, DGCI & S, NSSO, SIAM and State Finance-study of State Budget, RBI. I am grateful to the concerned authorities for furnishing the requisite data / information to TRW. The contribution of officers and staff of the Transport Research Wing deserve a special mention and has been most noteworthy. I hope this document will be a good reference for academicians, Planners, automobile manufactures, and other devout readers.
We look forward to receive comments / suggestions from the users for improving this document further.
(Kal Singh)
New Delhi, th28 June, 2021

(i)
S. No. Sections Page No.
1 Section - 1 Road Transport Sector 1-13
2 Section - 2 Registered Motor Vehicles in India 14-24
3 Section - 3 Registered Motor Vehicles Population in India-State Wise Distribution
25-29
4 Section - 4 Registered Motor Vehicles in Million-Plus Cities 30-36
5 Section - 5 International Comparison of Vehicular Penetration 37-40
6 Section - 6 Road Transport and Motor Vehicles Taxation in India 41-47
(ii)
S. No. CHARTS Page No.
1.1 Percentage Share of Different Modes of Transport Services in Total Transport Services share to GVA [base year 2011-12] from 2014-15 to 2018-19 2
1.2 Percentage of Professional and Non-Professional Valid Driver’s Licenses issued 3
1.3 Share of Employment of Various Categories (in percent) 41.4 Total Production of Motor Vehicles ( in million) 51.5 Category wise Production of Motor Vehicles (in million) 6
1.6 Category wise trends in the Growth rate of Productionof Motor Vehicles (in percent) 6
1.7 Category wise trends in Production of Motor Vehicles (in million) 7
1.9 Category wise Saleof Motor Vehicles (in Million) 8
1.10 The share of each category of Vehicles in Total Sales including Exports (in percent) 8
1.11 Production and Sale (including export) of Motor Vehicles (in Million) 91.12 Total Export of Motor Vehicles and Trends in Growth Rate (in Percent) 91.13 Category wise Export of Motor Vehicles (in Million) 101.14 Category wise share of Vehicles in Total Automobile Export (in percent) 10
1.15 Freight Traffic Movement by Roads Transport (in Billion Tonnes Km) and Y-on-Y Growth Rate (in percent) 12
1.16 Passenger Traffic Movement by Roads Transport (in Billion Tonnes Km) and Y-on-Y Growth Rate (in percent) 13
1.17 Share of Freight and Passenger movement in Total Traffic Movement by Road Transport (in percent) 13
2.1 Number of Registered Vehicles (in Million) in India 142.2 Total Number of Registered Motor Vehicles (in 000’) –Category wise 152.3 Trends in Category wise Growth rate of Registration of Vehicles (in percent) 15
2.4 Category wise share of Newly Registered Transport Vehicles in 2018-19 (in percent) 18
2.5 Category share of Newly Registered Non-Transport Vehicles in 2018-19 (in percent) 19
2.6 Category wise share of commercial vehicles in use (in percent) 20
1.8 Total Sale of Motor Vehicles including Export ( in million) and Growth Rate (in percent) 7
Contd...

(iii)
Contd...List of Charts Contd...List of Charts
(iv)
Contd...
S. No. CHARTS Page No.
2.7 Number of Buses owned by the Public and the Private Sector (in 000’) 212.8 Share of Public and Private owned buses in Total Buses (in percent) 212.9 The number of registered Motor Vehicles per 1000 Persons 232.10 Number of Registered Motor Vehicles per 100 Km of National Highways 232.11 The number of Registered Motor Vehicles per 100 Km of Total Road Length 24
3.1 State/UT wise distribution of Registered Motor Vehicle (in 000’) as on 31st March, 2019 25
3.2 State/UT wise CAGR of Registered Motor Vehicles during 2009-19 26
3.3 State/UT wise distribution of Registered Transport Vehicles as on 31st March 2019
27
3.4 State/UT wise distribution of Registered Non-Transport Vehicles as on 31st
March 2019 27
3.5The share of transport and non-transport vehicles in total vehicles registered across State/UTs as on 31 st March 2019 (in percent)
28
3.6 Total Bus Fleet and Buses in Public Sector (SRTUs) 29
4.1 Total Number of Registered Motor Vehicles in Million Plus Cities and All India (in Million) 30
4.2 The trend in the growth rate of Registered Vehicles in Million Plus Cities and Percent share of Million Plus Cities in Total Vehicles Registered in India 30
4.3 Total Registered Motor Vehicles in Million Plus Cities as on 31st March, 2019 (in Million) 31
4.4 Share of Transport and Non-transport Vehicles in total Registered Vehicles in Million Plus Cities in 2018-19 (in percent) 31
4.5Total Number of Registered Transport Vehicles in Million Plus Cities as on 31st March 2019
32
4.6Share of various Categories of Transport vehicles in Total Registered Transport Vehicles as on 31 st March, 2019 (in percent)
33
4.7Total Number of Registered Non-Transport Vehicles in Million Plus Cities as on 31st March 2019
34
4.8Share of various Categories of Non-Transport vehicles in Total Registered Non-Transport Vehicles as on 31 st March, 2019 (in percent)
34
4.9Share of Registered Transport and Non-Transport Vehicles of Million Plus Cities in Total Registered Transport and Non-Transport Vehicles in India (in percent)
35
S. No. CHARTS Page No.
4.10 Share of Registered Transport and Non-Transport Vehicles in Million Plus Cities in Total Registered Vehicles in India (in percent) 36
5.1 Country wise distribution of Total Vehicles in Use and World Ranking 38
5.2 Country wise total Vehicle penetration per 1000’ People 38
5.3 Country wise distribution of Number of Passenger Cars in Use and Ranking 39
5.4 Country- wise total number of passenger cars penetration per 1000’ People 39
5.5 Country wise distribution of Number of Buses and Motor Coaches 40
5.6 Country wise distribution of Number of Motor Cycles and Mopeds 40
6.1 Revenue realized by Centre from Road Transport and YoY Growth (in percent) 42
6.2 The trend in growth of various source of revenue realized by the Centre from Road Transport 43
6.3 Share of various sources of revenues in Total Revenue realized by the Centre from Road Transport (in Percent) 43
6.4 Composition of tax revenue (percentage of total) collected from Road Transport by the Centre in 2018-19 44
6.5 Revenue collected by State Government from Road Transport Sector (in 000’ crore) 44
6.6 The composition of revenue realized from Road Transport by State and YoY growth. 45
6.7 State wise distribution of revenue from Road Transport in 2018-19 46

(v) (vi)
List of Tables
Contd...
Annexure No. Annexure Page No.
1.1 Vehicular Population per 1,000 Population and per 100 kms of National Highway’s & Road Length : 2001-2019 48
1.2 Production of Motor Vehicles in India: 2009-10 to 2019-20 49
1.3 Sales of Motor Vehicles in India (Including Exports): 2009-10 to 2019-20 50
1.4 Automobile Exports : 2009-10 to 2019-20 51
1.5 Number of Buses Owned by the Public and Private Sectors in India: 1961-2019 52
1.6 Freight and Passenger Movement by Road Transport:1999-2000 to 2018-19 53
1.7 Number of Valid Drivers' Licences Issued as on 31.03.2018 (Cumulative) 54
1.8 Number of Drivers' Licences Issued during the Year 2017-18 55
1.9 Number of Valid Drivers' Licences Issued as on 31.03.2019 (Cumulative) 56
1.1 Number of Drivers' Licences Issued during the Year 2018-19 57
1.11 Number of Conductors' Licenses Issued as on 31.03.2018 and during 2017-18 58
1.12 Number of Conductors' Licenses Issued as on 31.03.2019 and during 2018-19 59
2.1 Total Number of Registered Motor Vehicles in India: 1951-2019 60-61
2.2 Number of Newly Registered and Total Registered Motor Vehicles (Category-wise) 62
2.3 Number of Commercial Vehicles in Use (detailed category-wise) 63
2.3 (a) Number of Commercial Vehicles in Use (detailed category-wise) 64
3.1 State/UT-wise total registered vehicles and their Percentage Share during 2017-18 & 2018-19 65
3.2 Total Registered Motor Vehicles in India 2007-2019 (State-Wise) 66
3.3 (a) State/UT wise and category wise number of Newly Registered Transport Motor Vehicles during 2017-18 & till 31.03.2018 67
3.3 (b) State/UT wise and category wise number of Newly Registered Transport Motor Vehicles during 2018-19 & till 31.03.2019 68
3.3 (c) State/UT wise and category wise number of Newly Registered Transport Motor Vehicles during 2017-18 69
S.No. Tables Page No.
1.1 Road Network in India as on 31stMarch, 2019 1
1.2 Percentage Share of Different Modes of Transport Services in Gross Value Added (GVA) [base year 2011-12] from 2014-15 to 2018-19 2
1.3 Total Number of Valid Driver’s Licenses Issued (in Million) 3
1.4 Employment in the Transport Sector through Manufacture of Motor Vehicles and other Transport Equipment (NIC Group 29 & 30) 4
1.5 Trade of Vehicles other than railway or tramway rolling stock and parts and accessories thereof-HS 87 (Automobile). 11
1.6 Top 5 Products Exported under Chapter 87 11
1.7 Top 5 Products Imported under Chapter 87 12
2.1 The trend of category wise percentage share of vehicles in total registered vehicles over the period from 1951 to 2019 16
2.2 Newly Registered Vehicles and Total Registered Vehicles (in Million) 17
2.3 Compound Annual Growth Rates (in %) in Vehicles and Road Length 22
5.1 The details of total vehicles in use, category wise with respective penetration levels in respect of top 15 countries 37
6.1 Revenue Realised from Road Transport (Centre) during 2009-10 to 2018-19 41

Contd...List of Annexures
Section - 1
(iiv)
Appendix Glossary of Important Terms 122-124
Annexure No. Annexure Page No.
3.3 (d) State/UT wise and category wise number of Newly Registered Non-Transport Motor Vehicles during 2017-18 70
3.3 (e) State/UT wise and category wise number of Total Registered Transport(Transport) Motor Vehicles (Category-wise) as on 31.03.2018 71
3.3 (f) State/UT wise and category wise number of Total Registered Non-Transport Motor Vehicles (Category-wise) as on 31.03.2018 72
3.4 (b) State/UT wise and category wise number of Newly Registered Transport Motor Vehicles during 2018-19 73
3.4 (c) State/UT wise and category wise number of Newly Registered Non-Transport Motor Vehicles during 2018-19 74
3.4 (d) State/UT wise and category wise number of Total Registered Transport(Transport) Motor Vehicles (Category-wise) as on 31.03.2019 75
3.4 (e) State/UT wise and category wise number of Total Registered Non-Transport Motor Vehicles (Category-wise) as on 31.03.2019 76
3.5 Total Bus Fleet and Buses in Public Sector (SRTUs) (State-wise) 77
3.6 Number of Commercial Vehicles in Use (State-wise) 78
3.6 (a) Number of Commercial Vehicles in Use (State-wise) 79
3.7 Number of Commercial Vehicles in Use (detailed category-wise/ State-wise) as per Primary Permit Valid as on 31.03.2018 80-81
3.8 Number of Commercial Vehicles in Use (detailed category-wise/ State-wise) as per Primary Permit Valid as on 31.03.2019 82-83
4.1 Total Registered Motor Vehicles (Transport and Non-Transport) in Million Plus Cities of India (as on 31.03.2018 & 31.03.2019) 84
4.2 Total Registered Motor Vehicles In Million Plus Cities of India (2008-2019) 85
4.3 Total Registered Motor Vehicles (Non-Transport) in Million Plus Cities of India 86-87
4.4 Total Registered Motor Vehicles (Transport ) in Million Plus Cities of India 88-89
5.1 Revenue Realised from Road Transport (Centre): 2009-10 to 2018-19 90
5.2 Revenue Realised from Road Transport (States): 1950-51 to 2018-19 91
5.3 Revenue from Taxes on Motor Vehicle and Passenger & Goods and Percentage Share of States/UTs 92
5.4 State/UT-wise Rates of Motor Vehicle Taxes 93-121

1.1 Roads are a primary method of transportation, used daily all around the world to transport people and cargo. Roads make a huge contribution to economic development, and bring important social benefits too. India's transport sector is large and diverse; it caters
to the needs of 1.3 billion people. India has the second largest road network in the world of about 63.86 lakh Km. This comprises National Highways, Expressways, State Highways, District Roads, Rural Roads, Urban Roads and Project Roads (Table 1.1).
Section – 1
1
Road Transport Sector
Table 1.1: Road Network in India as on 31st March, 2019
Data Source: Planning Division, MoRTH
1.2 In India, amongst the major modes of transport the road transport remains the dominant mode both in terms of its contribution to gross value added and in terms of its share in passenger and freight transported. As per the National Transport Development Policy Committee, road transport carries about 90 percent of the total passenger traffic and 67 percent freight traffic. It contributes about 3.10 percent of Gross Value Addition (GVA) as against the
total transport sector contribution of 4.63 percent to GVA at national level for the year 2018-19, where the share of Railways was at 0.73 per cent, Air Transport at 0.1 per cent and Water Transport at 0.07 percent (Table 1.2). Road transport alone accounted for about more than 64 per cent share in total transport sector contribution to GVA followed by Railways during the period 2014-15 to 2018-19 (Chart 1.1).
Category of Road Length in Km % Share of Total RoadsNational Highways (NHs) 1,32,500 2.13State Highways 1,86,528 3District Roads 6,32,154 10.17Rural Roads (including JRY Roads) 45,35,511 72.97Urban Roads 5,44,683 8.76Project Roads 3,54,921 5.71
Total 63,86,297

2014-15
Road Transport Water Transport Air Transport Services Incidental to TransportRailways
Perc
ent
100.0
80.0
60.0
40.0
20.0
0.02015-16 2016-17 2017-18 2018-19
Table 1.2: Percentage Share of Different Modes of Transport Services in Gross Value Added (GVA) [base year 2011-12] from 2014-15 to 2018-19
Source: National Accounts Division, CSO
Source: National Accounts Division, CSO
Composition of Road Transport1.3 Road Transport comprises motor vehicles
and Road Transport services. The share of Road Transport in the national accounts in Table 1.2 pertains only to the output or gross value addition in services component and does not include the manufacture of Motor Vehicle components of Road Transport. Road Transport is also a significant employer.
Employment Generation –Service Component1.4 The “services” component of Road
Transport sector provide direct employment in the form of drivers and conductors / cleaners and also generate other direct and indirect employments such as accounts and administrative staff, brokers, booking agents, loading and unloading operations, wayside facilities, dhaba & hotels, petrol pump etc. In Table 1.3, the cumulative number of valid driver licenses issued has increased from 198.11 million as on 31st March 2018 to 205.84 million as on March 2019, with an increase in growth rate of
2
Chart 1.1: Percentage Share of Different Modes of Transport Services in Total Transport Services share to GVA [base year 2011-12] from 2014-15 to 2018-19
1.5 The total cumulative number of valid conductor licenses issued as on 31.3.2018 were 4.4 million and the number of valid incremental conductor licenses issued during 2017-18 were 0.21 million (Annexure 1.11). The total cumulative number of valid conductor licenses issued as on 31.3.2019 were 2.9 million and the number of valid incremental conductor licenses issued during 2018-19 were 0.12 million (Annexure 1.12).
Employment Generation – Manufacture of Motor Vehicles1.6 Further, the manufacture of Motor vehicles,
trailers and semi-trailers and other transport equipment also generate employment. The details of employment provided through manufacture of Motor vehicles, trailers and semi-trailers and other transport equipment i.e. under National Industrial Classification Codes 29 and 30 during the period 2012-13 to 2017-18 shown in Table 1.4.
3
about 3.9 percent over the corresponding previous period (details at Annexure 1.7 & 1.9). There has been a decline in total number of valid driver's licenses issued to 10.55 million in 2018-19 from 12.10 million in 2017-18, registered a decrease in growth rate of about 12.8 percent over corresponding
previous period (Table 1.3 refer to) and details given at Annexure 1.8 and 1.10. The percent share of professional and non-professional valid driver's licenses in total Valid Driver's Licenses issued displayed in the Chart 1.2.
Table 1.3 Total Number of Valid Driver's Licenses Issued (in Million)
Data Source : Office of State Transport Commissioners/UT Administration
Chart 1.2: Percentage of Professional and Non-Professional Valid Driver's Licenses issued
Data Source : Office of State Transport Commissioners/UT Administration
Sector/Year 2014-15 2015-16 2016-17 2017-18 2018-19Road Transport 3.28 3.26 3.12 3.05 3.1
Railways 0.81 0.82 0.77 0.75 0.73
Water Transport 0.08 0.08 0.07 0.07 0.07
Air Transport 0.05 0.06 0.16 0.15 0.1
Services Incidental to Transport 0.77 0.77 0.74 0.69 0.63
Transport Sector 4.99 4.99 4.86 4.71 4.63
Category Licences Issued in 2017-18
Licences Issued in 2018-19
Licences Issued up to 31st Mar, 2018
Licences Issued up to 31st Mar, 2019
% Change in 2018-19 over 2017-18
% Change up to 31st Mar,2019 over 2018
Professional 1.53 1.15 35.3 35.29 -24.86 -0.05
Non-Professional 10.57 9.4 162.81 170.55 -11.06 4.76
Total 12.1 10.55 198.11 205.84 -12.8 3.9

Table 1.4: Employment in the Transport Sector through Manufacture of Motor Vehicles and other Transport Equipment (NIC Group 29 & 30)
4
Data Source: ASI data, NSSO
1.7 Employment in the Motor Vehicles & other Transport Equipment has grown from 10.58 lakhs in 2012-13 to 13.65 lakhs in 17-18 (Table 1.2) at the CAGR of 4.34%, which is more than employment growth of 3.17% in total Industry. The share of automobile sector in industry employment is about 8.74% (Chart 1.3), out of which 6.52% contributed by manufacture of Motor
vehicles, trailers and semi-trailers and the remaining 2.23% contributed by the other transport equipment sector.
1.8 In total transport sector employment, more than 70 percent of employment has been generated through manufacture of Motor vehicles, trailers and semi-trailers during the period 2012-13 to 2017-18 (Chart 1.4 refer to).
Chart 1.3: Employment Generation by Various Categories (in percent)
Data Source: ASI data, NSSO
Data source: SIAM
5
Production, Sale and Export of Motor Vehicles1.9 The production, sale and exports of motor
vehicles during the period 2009-10 to 2018-19 has been analyzed based on the data of Society of Indian Automobile Manufactures (SIAM), New Delhi and displayed in Annexure 1.2, 1.3 and 1.4 respectively.
Production of Motor Vehicles1.10 Production of motor vehicles consists mainly
of production of passenger vehicles, commercial vehicles, three wheelers and two wheelers. The total production has increased from 14.1 million units in 2009-10 to 26.4 million units in 2019-20 (Chart 1.3), with a CAGR of 6.49 per cent. The YoY growth rate presented in Chart 1.4 depicts a declining trend and has turned to about -14.7 in 2019-20.
Chart 1.4: Total Production of Motor Vehicles (in million)
1.11 The category wise production of motor vehicles displayed in the Chart 1.5 show that production of two wheelers constitute the highest share in total production followed by passenger vehicles. Details on production of motor vehicles are at Annexure 1.2. The total production of two wheelers has increased from 10.5 million in 2009-10 to 21.0 million in 2019-20. Total production of passenger vehicles has increased from 2.4 million in 2009-10 to 3.4 million in 2019-20, with a slight decline in production in 2019-20.
Production of three wheelers and commercial vehicles depicts more or less constant trend over the period from 2009-10 to 2019-20 (Chart 1.5 refer to). Amongst all motor vehicles, two wheelers has the highest share (79.82 %) in total production followed by passenger vehicles (13.03%) in 2019-20. Category wise trend in the growth rate of production of vehicles displayed in Chart 1.6 show mixed trend, declining from 2018-19 onwards for all categories. The category wise breakup presented in Annexure 1.2.
NIC-08 Description 2012-13 2013-14 2014-15 2015-16 2016-17 2017-18
% share in total industry employment in 2017-18
CAGR (%)
29
Motor vehicles, trailers and semi- trailers
7,64,515 7,92,885 8,92,955 9,32,968 9,87,191 10,17,614 6.52 4.88
30Other transport equipment
2,93,983 2,83,498 3,02,363 3,08,549 3,16,391 3,47,825 2.23 2.84
Total Transport Sector
10,58,498 10,76,383 11,95,318 12,41,517 13,03,582 13,65,439 8.74 4.34
Total all Industries 129,50,025 135,38,114 138,81,386 142,99,710 149,11,189 156,14,619 100 3.17

Chart 1.5: Category wise Production of Motor Vehicles (in million)
Data source: SIAM
Chart 1.6: Category wise trends in the Growth rate of Production of Motor Vehicles (in percent)
6
Data source: SIAM
Chart 1.7: Category wise trends in Production of Motor Vehicles (in million)
Sale of Motor Vehicles1.12 Sale of motor vehicles (including export)
has been increasing over the years from 2009-10 to 2019-20, accept for a decline in 2019-20. The total sales has increased from 14.1 million in 2009-10 to 21.5 million in 2019-20, with a CAGR of 4.33 percent. The
growth rate in production of vehicles presented in the Chart 1.8 show declining trends and details is at Annexure 1.3. Two wheelers has the highest share in total sales 17.4 million (80.8%) followed by passenger vehicles 2.8 million (12.98%) in 2019-20. (Refer to Chart 1.9 and 1.10).
Chart 1.8: Total Sale of Motor Vehicles including Export (in million) and Growth Rate (in percent)
Data source: SIAM
7
Data source: SIAM

Chart 1.9: Category wise Sale of Motor Vehicles (in Million)
Chart 1.10: The share of each category of Vehicles in Total Sales including Exports (in percent)
Data source: SIAM
Data source: SIAM
1.13 Production and Sale of motor vehicles (in million) has been increasing at almost constant rate until 2016-17, afterwards total production has exceeded total sales (Chart
1.11 refer to). In 2019-20, total production was 26. Million whereas total sales including export was at 26.4 million show reduction in demand for motor vehicles.
Chart 1.11: Production and Sale (including export) of Motor Vehicles (in Million)
Chart 1.12: Total Export of Motor Vehicles and Trends in Growth Rate (in Percent)
98
Data source: SIAM
Data source: SIAM
Exports of Motor Vehicles1.14 Exports of Motor Vehicles have been
displaying an increasing trend since 2009-10. It has increased from 1.8 million in quantity terms in 2009-10 to 4.8 million in 2019-20,
accounted for a CAGR of 10.20 % ( refer to Annexure 1.4). Trend in growth rate show mixed trend, which has declined from 14.5 percent in 2018-19 to 3.0 percent in 2019-20 (refer to chart 1.12).

Chart 1.13: Category wise Export of Motor Vehicles (in Million)
Chart 1.14: Category wise share of Vehicles in Total Automobile Export (in percent)
1.15 It may be noted that certain categories of motor vehicles like Passengers cars, Light Commercial Vehicles, Vans and Mopeds have shown a decline in Exports in 2019-20 as compared to 2018-19 (Annexure 1.4 refer to). Amongst the categories of automobile export,
two wheelers has shown increase in export from 3.28 million in 2018-19 to 3.52 million in 2019-20 (Chart 1.13). Two wheelers shares about 73.9 percent of total automobile export followed by passenger vehicles 14.2 percent in 2019-20 (Chart 1.14 refer to).
Data source: SIAM
Data source: SIAM
Trade Performance of Motor Vehicle & Parts in last Five Years1.16 The data in Table 1.5 show that India has a
positive trade balance in the automobile export sector and has been growing at a CAGR of 5.21%. The Trade Competitiveness
1Index (TCI) for automobiles ranges between 0.23 and 0.28 reflecting that the sector is trade competitive. Automobile exports of US$ 17.25 billion account for 5.69 % of India's total exports implies that automobiles are a significant foreign exchange earner.
Table 1.5: Trade of Vehicles other than railway or tramway rolling stock and parts and accessories thereof-HS 87 (Automobile).
Value in US$ Million
1110
Source: DGCIS1 The formula of Trade competitiveness index (TCI) is calculated as TCI = (Ej-Ij) / (Ej + Ij) where Ej is on behalf of one kind of industry exports of a country and Ij is the imports.The value of TCI varies between 1 and (-) 1 and the interpretation is that if TCI > 0, it means this industry is in a dominant position. Contrarily, if TCI < 0, it implies that the respective industry has a negative trade balance and is not competitive.
Source: DGCIS
1.17 India's major items of exports in the automobile category is that of Motor cars,
parts and accessories and motor cycles are presented in Table 1.6.
Table 1.6 Top 5 Products Exported under Chapter 87
Year 2013-14 2014-15 2015-16 2016-17 2017-18 2018-19 2019-20 CAGR
Import 4,475.71 4,861.67 4,988.89 4,719.25 5,844.93 6,159.43 5,243.02 2.67
Share in Total Imports 0.99 1.09 1.31 1.23 1.26 1.2 1.1
Export 12,933.04 14,473.85 14,356.04 14,950.09 17,255.39 18,096.30 16,711.78 4.36
Share in Total Exports 4.11 4.66 5.47 5.42 5.68 5.48 5.33
Trade Balance 8,457.33 9,612.18 9,367.15 10,230.84 11,410.46 11,936.87 11,468.76 5.21
TCI1 0.49 0.5 0.48 0.52 0.49 0.49 0.52
S. No HS Code Commodity 2016-17 2017-18 2018-19
1 87032291 MOTOR CAR WTH CYLNDR CPCTY >= 1000CC BUT < 1500CC WTH SPRK -IGNTN 3,548.55 3,553.95 3,017.53
2 87089900 OTR PRTS AND ACCSSRS OF VHCLS OF HDG 8701 -8705 2,333.11 2,611.58 2,817.84
3 87032391 MOTOR CAR WTH CYLNDR CPCTY >= 1500CC BUT <3000CC WTH SPRK -IGNTN 1,197.49 1,732.12 1,909.98
4 87112029 MOTR CYCLWTH CYLNDR CPCTY>75 BT<=250 CC 1,329.85 1,555.02 1,657.36
5 87032191 MOTOR CAR WTH CYLNDR CPCTY<=1000 WTH SPRK -IGNTN 850.19 769.19 848.68

Chart 1.15 Freight Traffic Movement by Roads Transport (in Billion Tonnes Km) and Y-on-Y Growth Rate (in percent)
Table 1.7 Top 5 Products Imported under Chapter 87
1.18 India's major items of imports comprises of parts and accessories, gear parts and accessories of bodies and parts and
accessories of motor cycles etc. is given in Table 1.7.
Source: DGCIS
Passenger and Freight traffic movement by Roads1.19 The availability date on passenger traffic and
freight traffic movement by roads presents a serious challenge, as there is no data available for this segment unlike the Airways and Railways, which are better organized. However, TRW has been making projections of passenger traffic and freight traffic based on the GDP growth rate and the elasticity of freight traffic of 1.4 and passenger elasticity
of 1.9 as provided by the National Transport Development Committee in 2014 (Annexure 1.6 refers to). The estimated volumes of freight and passenger movement by road transport is at Annexure 1.6. Both freight and passenger movement by road has been increasing since 1999-2000, whereas trend in the growth rate show mixed trend and declining since 2016-17 (Chart 1.15 and 1.16).
Chart 1.16: Passenger Traffic Movement by Roads Transport (in Billion Tonnes Km) and Y-on-Y Growth Rate (in percent)
Chart 1.17: Share of Freight and Passenger movement in Total Traffic Movement by Road Transport (in percent)
1312
1.20 Percentage share of passenger movement by road has been increasing since 1999-2000, which shares about 89.3 percent in 2018-19. Share of Freight movement to
total traffic movement by road has declined drastically from 20.3 percent in 1999-2000 to 10.7 percent in 2018-19 (Chart 1.17 refer to).
S. No. HS Code Commodity 2016-17 2017-18 2018-19 2019-20
1 87089900 OTR PRTS AND ACCSSRS OF VHCLS OF HDG 8701-8705
1,457.41 1,792.10 1,718.35 1,462.82
2 87084000 GEAR BOXES 742.88 1,004.36 1,076.50 1,019.81
3 87141090 PARTS AND ACCESSORIES OF MOTOR CYCLE EXCL. SADDLE 318.01 358.66 512.39 386.89
4 87082900 OTHR PRTS AND ACCSSRS OF BODIES(INCL CABS)
328.17 401.57 418.41 436.11
5 87089400 STERNG WHEELS, STERNG COLUMNS AND STERNG BOXS 213.88 273.79 262.09 196.68

Section - 2

Section – 2
2.1 Registered vehicles consists of Transport and Non Transport vehicles. In 2019-20, about 92 percent of registered vehicles are non-transport vehicles in India. There has been a continuous increase in the number of registered motor vehicles in India since
1951 (refer to Annexure 2.1). The total number of registered vehicles has increased from 0.3 million in 1951 to 295.8 million in 2019 (Chart 2.1). The total registered vehicles in the country grew at a CAGR of 9.91 percent during 2009-2019.
14
Registered Motor vehicle in India
Chart 2.1: Total Number of Registered Vehicles (in Million) in India
Data Source : Office of State Transport Commissioners/UT Administration
2.2 Category wise growth of registered motor vehicles depicts, amongst all categories of vehicles, two-wheelers account for highest number of registration 221.3 million in 2019 (75%) followed by Cars, Jeeps and Taxis 38.4 million (13%), seen in Chart 2.2. Buses including omnibuses, which are the main mass transport vehicles on the roads, have
shown a growth rate of 5.5 % in 2019 over 2018. However, they account for only 1% (2 million) of the registered traffic on the roads (Chart 2.2). All categories of vehicles have displayed a mixed trend in the growth rate over the period 1960 to 2019 (Chart 2.3 refer to). Details are at Annexure 2.1.

Chart 2.2: Total Number of Registered Motor Vehicles (in 000') – Category wise
Chart 2.3: Trends in Category wise Growth rate of Registration of Vehicles (in percent)
Two Wheelers Cars, Jeeps and Taxis @Buses Goods Vehicles Others**
@ incluedes Omni buses since 2001**Includes Tractors, trailers,three wheelers (Passenger vehicles)/LMV and other miscellaneous vehicles which are not classified seperatly.Data Source : Offices of State Transport Commissioners/UT Administration
Data Source : Office of State Transport Commissioners/UT Administration
Table 2.1: The trends in the category wise share of vehicles in total registered vehicles (in percent)
Source: Offices of State Transport Commissioners/UT Administrations.Note: 'Other vehicles' include tractors, trailers, three wheelers (passenger vehicles)/LMV and other miscellaneous vehicles which are not classified separately @ includes Omni buses since 2001
1615
2.3 The share of two wheelers in total registered motor vehicles in India stood at 74.4% in 2018 and 74.8% in 2019 as compared to 8.8% in 1951 (Table 2.1). The combined share of cars, jeeps and taxis in the total number of registered vehicles was 13.37% in March 2018 and 12.99% in 2019, marking a steep decline from 52% in 1951. The share of buses in total registered vehicles has declined from 11.1% as on 31st March 1951, to 0.71% as on 31st March 2018 and 0.69% as on 31st March 2019. Omni buses have
also been included in the fleet of buses from 2001. The share of registered goods vehicles in the country, which had accounted for 26.8% in 1951 declined to 4.69% in March 2018 and 4.65% in March 2019 of the total vehicles in 2017. The share of 'Other vehicles', which include tractors, trailers, three wheelers (passenger)/ Light Motor Vehicles (LMVs) and other miscellaneous vehicles, increased from 1.3% in 1951 to 6.85% during 2017-18 and 2018-19.
(Million)1951 8.80 52.00 11.10 26.80 1.30 0.301961 13.20 46.60 8.60 25.30 6.30 0.701971 30.90 36.60 5.00 18.40 9.10 1.901981 48.60 21.50 3.00 10.30 16.60 5.401991 66.40 13.80 1.50 6.30 11.90 21.402001 70.10 12.80 1.20 5.40 10.50 55.002002 70.60 12.90 1.10 5.00 10.40 58.902003 70.90 12.80 1.10 5.20 10.00 67.002004 71.40 13.00 1.10 5.20 9.40 72.702005 72.10 12.70 1.10 4.90 9.10 81.502006 72.20 12.90 1.10 4.90 8.80 89.602007 71.50 13.10 1.40 5.30 8.70 96.702008 71.50 13.20 1.40 5.30 8.60 105.302009 71.70 13.30 1.30 5.30 8.40 115.002010 71.70 13.50 1.20 5.00 8.60 127.702011 71.80 13.60 1.10 5.00 8.50 141.802012 72.40 13.50 1.00 4.80 8.30 159.502013 72.70 13.60 1.00 4.70 8.00 176.002014 73.10 13.60 1.00 4.60 7.70 190.702015 73.50 13.60 1.00 4.40 7.50 210.002016 73.50 13.10 0.80 4.60 8.10 230.002017 73.90 13.30 0.74 4.84 7.27 253.002018 74.40 13.37 0.71 4.69 6.85 272.602019 74.8 12.99 0.69 4.65 6.85 295.8
As on 31st March
TotalCars, Jeeps & Taxis Buses @ Goods Vehicles Other Vehicles
(as % age of total vehicle population)
Two Wheelers

2.4 Apart from the sheer dominance of the total vehicular population in India by two- wheelers, this category of vehicle has seen steady growth, though at a lower rate in recent years, whereas the share of buses has declined over the years (Table 2.1 refer to). This preference of road users for personalised means of transport over public transport appears to have been dictated by reasons such as personal convenience, economic conditions as also by the failure of public transportation system to keep up with the demand.
Composition of Registered Vehicles Population in India2.5 Registered vehicles consists of Transport
and Non Transport vehicles. Out of total 295.77 million vehicles registered in 2018-19, about 269.88 million vehicles are in the non-transport category and the remaining 25.89 are in the transport category (Table 2.2). That is, more than 91 percent of vehicles registered are non-transport vehicles.
Table 2.2: Newly Registered Vehicles and Total Registered Vehicles (in Million)
Source: Offices of State Transport Commissioners/UT Administrations.
Chart 2.4: Category wise share of Newly Registered Transport Vehicles in 2018-19 (in percent)
Source: Offices of State Transport Commissioners/UT Administrations.
1817
Transport Vehicles 2.6 Transport vehicles include Multiaxled/
Articulated vehicles, Trucks and Lorries, Light Motor Vehicles (Goods & Passenger), Buses, Taxis, Motor Cycles on hire etc. Total number of transport vehicles has increased from 23.97 million in 2017-18 to 25.89 million in 2018-19 (Table 2.2), accounted for a growth rate of about 8.03 percent over previous period. Total number of newly registered transport vehicles increased from 1.92 million in 2017-18 to 2.14 million in 2018-19, registered a growth of rate of about 11.9 percent over the previous period. The details of category wise newly registered vehicles during 2017-18
and 2018-19 and total registered vehicles as on 31st March 2018 and 2019 are at Annexure 2.2.
2.7 In 2017-18, out of 24.42 million newly registered vehicles, 1.9 million (7.84%) vehicles registered are in the Transport vehicles category. Similarly, out of 24.56 million newly registered vehicles in 2018-19, 2.14 million constitutes transport vehicles (91.16%), seen in the Table 2.2. Light Motor Vehicles (Passenger) has the highest share i.e. 30 % (0.64 Million) in newly registered transport vehicles in 2018-19 (Chart 2.4) followed by Light Motor Vehicles (goods) with share of 24% (0.52 million) and Trucks and Lorries with share of 18 % (0.4 million).2017-18 2018-19 2018 2019
Multiaxled / Articulated Vehicles 0.15 0.19 1.57 1.76 30.62 12.17
Trucks & Lorries 0.34 0.40 4.96 5.33 18.04 7.39
Light Motor Vehicles (Goods) 0.47 0.52 6.24 6.68 9.47 6.97
Buses 0.08 0.08 1.40 1.47 -1.01 5.41
Taxi 0.23 0.24 2.88 3.11 3.46 8.19
Light Motor Vehicles (Passengers) 0.57 0.64 6.24 6.79 10.62 8.82
Motor cycles on hire 0.01 0.02 0.15 0.17 83.20 9.55
Other vehicles 0.06 0.06 0.53 0.58 -2.42 10.79
Total Transport 1.91 2.14 23.97 25.89 11.90 8.03
Two Wheelers 18.73 18.64 202.75 221.27 -0.46 9.13
Cars 2.80 2.62 30.86 32.42 -6.32 5.08
Jeeps 0.17 0.19 2.72 2.90 12.96 6.47
Omni buses 0.02 0.02 0.55 0.58 0.86 5.63
Tractors 0.57 0.63 8.18 8.82 9.87 7.79
Trailers 0.09 0.09 2.13 2.23 0.87 4.98
Other vehicles 0.12 0.23 1.43 1.66 80.89 15.77
Total Non-Transport 22.50 22.42 248.62 269.88 -0.37 8.55Grand Total 24.42 24.56 272.59 295.77 0.58 8.51
Non-Transport
Transport
CategoryNewly Registered Total Registered
as on 31st MarchNewly
Registered % change
Total Registered % change

Non-Transport Vehicles2.8 Non-Transport vehicles include Two
Wheelers, Cars, Jeeps, Omni Buses, Tractors, Trailers etc. Total number of non-transport vehicles has increased from 248.62 million in 2017-18 to 269.88 million in 2018-19 (Table 2.2), accounted for a growth rate of about 8.55 percent over previous period. Non-transport vehicles constitute more than 91 percent of total vehicles registered in the country. Newly registered non-transport vehicles constitute about 22.5 million in 2017-18, which has marginally decreased to 22.42 million in 2018-19. In 2017-18 and 2018-19, more than 91% of newly registered vehicles are in non-transport category, thereby the real culprits for increase in
road congestion. Out of the non-transport vehicles, two wheelers alone account for about 74% share in total registered motor vehicles in the country.
2.9 In 2017-18, out of 24.42 million newly registered vehicles, 22.5 million (92.1%) vehicles registered are in the Non-Transport vehicles category. Similarly, out of 24.56 million newly vehicles registered in 2018-19, 22.42 million constitutes non-transport vehicles (91.2%), refer to Table 2.2. In 2019, within the category of newly registered non-transport vehicles, two wheelers has the highest share i.e. 83.2 % (18.64 Million) followed by Cars with share of 11.7% (2.62 million) and Tractors with share of 2.8% (0.63million), refer to Chart 2.5.
Chart 2.5: Category share of Newly Registered Non-Transport Vehicles in 2018-19 (in percent)
Source: Offices of State Transport Commissioners/UT Administrations.
Chart 2.6: Category wise share of commercial vehicles in use (in percent)
2019
Source: Offices of State Transport Commissioners/UT Administrations.
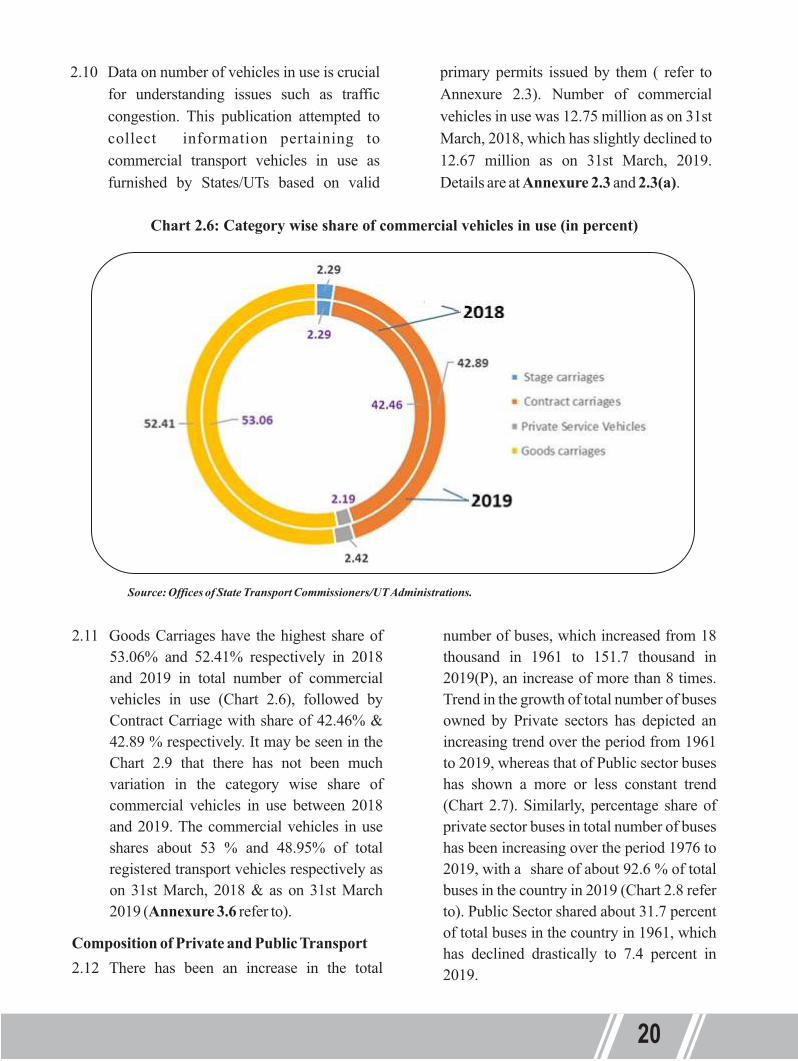
2.10 Data on number of vehicles in use is crucial for understanding issues such as traffic congestion. This publication attempted to collect information pertaining to commercial transport vehicles in use as furnished by States/UTs based on valid
primary permits issued by them ( refer to Annexure 2.3). Number of commercial vehicles in use was 12.75 million as on 31st March, 2018, which has slightly declined to 12.67 million as on 31st March, 2019. Details are at Annexure 2.3 and 2.3(a).
2.11 Goods Carriages have the highest share of 53.06% and 52.41% respectively in 2018 and 2019 in total number of commercial vehicles in use (Chart 2.6), followed by Contract Carriage with share of 42.46% & 42.89 % respectively. It may be seen in the Chart 2.9 that there has not been much variation in the category wise share of commercial vehicles in use between 2018 and 2019. The commercial vehicles in use shares about 53 % and 48.95% of total registered transport vehicles respectively as on 31st March, 2018 & as on 31st March 2019 (Annexure 3.6 refer to).
Composition of Private and Public Transport2.12 There has been an increase in the total
number of buses, which increased from 18 thousand in 1961 to 151.7 thousand in 2019(P), an increase of more than 8 times. Trend in the growth of total number of buses owned by Private sectors has depicted an increasing trend over the period from 1961 to 2019, whereas that of Public sector buses has shown a more or less constant trend (Chart 2.7). Similarly, percentage share of private sector buses in total number of buses has been increasing over the period 1976 to 2019, with a share of about 92.6 % of total buses in the country in 2019 (Chart 2.8 refer to). Public Sector shared about 31.7 percent of total buses in the country in 1961, which has declined drastically to 7.4 percent in 2019.
Non-Transport Vehicles2.8 Non-Transport vehicles include Two
Wheelers, Cars, Jeeps, Omni Buses, Tractors, Trailers etc. Total number of non-transport vehicles has increased from 248.62 million in 2017-18 to 269.88 million in 2018-19 (Table 2.2), accounted for a growth rate of about 8.55 percent over previous period. Non-transport vehicles constitute more than 91 percent of total vehicles registered in the country. Newly registered non-transport vehicles constitute about 22.5 million in 2017-18, which has marginally decreased to 22.42 million in 2018-19. In 2017-18 and 2018-19, more than 91% of newly registered vehicles are in non-transport category, thereby the real culprits for increase in
road congestion. Out of the non-transport vehicles, two wheelers alone account for about 74% share in total registered motor vehicles in the country.
2.9 In 2017-18, out of 24.42 million newly registered vehicles, 22.5 million (92.1%) vehicles registered are in the Non-Transport vehicles category. Similarly, out of 24.56 million newly vehicles registered in 2018-19, 22.42 million constitutes non-transport vehicles (91.2%), refer to Table 2.2. In 2019, within the category of newly registered non-transport vehicles, two wheelers has the highest share i.e. 83.2 % (18.64 Million) followed by Cars with share of 11.7% (2.62 million) and Tractors with share of 2.8% (0.63million), refer to Chart 2.5.
Chart 2.5: Category share of Newly Registered Non-Transport Vehicles in 2018-19 (in percent)
Source: Offices of State Transport Commissioners/UT Administrations.
Chart 2.6: Category wise share of commercial vehicles in use (in percent)
2019
Source: Offices of State Transport Commissioners/UT Administrations.
2.10 Data on number of vehicles in use is crucial for understanding issues such as traffic congestion. This publication attempted to collect information pertaining to commercial transport vehicles in use as furnished by States/UTs based on valid
primary permits issued by them ( refer to Annexure 2.3). Number of commercial vehicles in use was 12.75 million as on 31st March, 2018, which has slightly declined to 12.67 million as on 31st March, 2019. Details are at Annexure 2.3 and 2.3(a).
2.11 Goods Carriages have the highest share of 53.06% and 52.41% respectively in 2018 and 2019 in total number of commercial vehicles in use (Chart 2.6), followed by Contract Carriage with share of 42.46% & 42.89 % respectively. It may be seen in the Chart 2.9 that there has not been much variation in the category wise share of commercial vehicles in use between 2018 and 2019. The commercial vehicles in use shares about 53 % and 48.95% of total registered transport vehicles respectively as on 31st March, 2018 & as on 31st March 2019 (Annexure 3.6 refer to).
Composition of Private and Public Transport2.12 There has been an increase in the total
number of buses, which increased from 18 thousand in 1961 to 151.7 thousand in 2019(P), an increase of more than 8 times. Trend in the growth of total number of buses owned by Private sectors has depicted an increasing trend over the period from 1961 to 2019, whereas that of Public sector buses has shown a more or less constant trend (Chart 2.7). Similarly, percentage share of private sector buses in total number of buses has been increasing over the period 1976 to 2019, with a share of about 92.6 % of total buses in the country in 2019 (Chart 2.8 refer to). Public Sector shared about 31.7 percent of total buses in the country in 1961, which has declined drastically to 7.4 percent in 2019.

Chart 2.7: Number of Buses owned by the Public and the Private Sector (in 000')
Chat 2.8: Share of Public and Private owned buses in Total Buses (in percent)
Sources: 1. Offices of State Transport Commissioners/UT Administrations. 2. State Road Transport UndertakingsOmni buses are included since 2001P- Provisional
Sources: . Offices of State Transport Commissioners/UT Administrations.
Table 2.3: Compound Annual Growth Rates (in percent) in Vehicles and Road Length
Note: NHs: National Highways; SHs: State Highways; PWD: Other Public Works Department roads Others include tractors, trailers, three-wheelers (passenger vehicles/LMVs) and other miscellaneous vehicles, which are not
classified separately. During the year 2015-16, Other PWD Road category has been discontinued and PWD road, other SHs, are categorized under
Districts Roads and Rural roads under PWD. Because of this change, the figures in respect of OPWD, District Road & Rural Roads are not comparable with figures of previous years.
Sources: 1. Offices of State Transport Commissioners/UT Administrations 2. 'Basic Road Statistics of India 2017-18.
2.14 The CAGR of total registered Motor vehicles grew @ 9.97% during the period 2008 to 2018 and during the period 2009 to 2019 CAGR of total registered Motor vehicles grew @ 9.91% in Table 2.3. Among the various categories of vehicles, the highest CAGR registered during the period 2008 to 2018 was by two-wheelers (10. 41%) and cars, jeeps & taxis (10.08%), followed by goods vehicles (8.59%), other vehicles (7.52%) and buses (3.13%).
During the period 2009 to 2019 the highest CAGR registered was by two-wheelers (10.38%) and cars, jeeps & taxis (9.64%), followed by goods vehicles (8.58%), other vehicles (7.63%) and buses (3.27%).
2.15 The number of registered motor vehicles per 1000 persons has increased from 53 in 2001 to 225 in 2019, indicating an improvement in the accessibility of means of transportation for the public (Chart 2.9 refer to). Details are at Annexure 1.1
2221
Growth of Vehicles versus Roads2.13 The CAGR of the registered motor vehicles,
category wise and different categories of Roads presented in Table 2.3
*
**
Two - Wheelers
Cars, Jeeps &
TaxisBuses Goods
Vehicles Others* Total NHs SHs & OP WD Rural Urban Project Total
1961/1951 12.50 6.90 5.30 7.40 26.50 8.10 1.90 4.00 -0.50 NA NA 2.70
1971/1961 20.70 8.20 5.10 7.40 15.00 10.90 0.00 2.60 6.00 4.50 NA 5.70
1981/1971 16.30 5.40 5.60 4.90 18.10 11.20 2.90 4.50 5.90 5.50 3.50 5.00
1991/1981 18.40 9.80 7.40 9.40 10.90 14.80 0.60 2.10 7.20 4.30 1.20 4.60
2001/1991 10.50 9.10 6.70 8.10 8.60 9.90 5.50 3.10 4.60 3.00 0.60 3.80
2011/2001 10.20 10.50 9.70 9.10 7.60 9.90 2.10 3.00 3.40 5.00 2.30 3.30
2014/2004 10.40 10.60 9.40 8.80 8.00 10.10 3.40 3.90 4.40 4.30 1.30 4.10
2015/2005 10.10 10.70 8.20 8.80 7.80 9.80 4.10 3.10 3.80 5.00 1.50 3.70
2016/2006 10.10 10.10 5.90 9.00 8.90 9.90 4.30 -2.50 5.50 5.70 2.00 3.70
2017/2007 10.47 10.29 3.28 9.12 8.09 10.11 5.54 -2.60 5.70 5.80 2.00 3.90
2018/2008 10.41 10.08 3.13 8.59 7.52 9.97 6.60 -2.40 6.10 5.80 2.50 4.20
2019/2009 10.38 9.64 3.27 8.58 7.63 9.91
Period
Vehicles Roads

Chart 2.9: The number of registered Motor Vehicles per 1000 Persons
Chart 2.10: Number of Registered Motor Vehicles per 100 Km of National Highways
Sources: 1. Offices of State Transport Commissioners/UT Administrations 2. Population- Report of the Technical Group on Population Projections constituted by National Commission on
Population, Office of Registrar General & Census Commissioner, India
Sources: 1. Offices of State Transport Commissioners/UT Administrations 2. Road Length, Basic Road Statistics, MoRTH
2.16 The number of registered motor vehicles per 100 Km of National Highways increased from 95,244 in 2001 to 2,23,224 in 2019, increase of more than two times,
indicating improvement in accessibility and quality of means of transport for the public (Chart 2.10 refer to). Details are at Annexure 1.1
2.17 The number of registered motor vehicles per 100 Km of total road length has increased from 1630 Km in 2001 to 4361 Km in 2019, increase of more than two times, indicating
improvement in accessibility and quality of means of transport for the people (Chart 2.11 refer to). Details are at Annexure 1.1
Chart 2.11: The number of Registered Motor Vehicles per 100 Km of Total Road Length
2423
Sources: 1. Offices of State Transport Commissioners/UT Administrations 2. Road Length, Basic Road Statistics, MoRTH

Section - 3

25
Section – 3
3.1 Total number of registered Motor vehicles has increased from 272.6 million in 2017-18 to 295.8 million in 2018-19, has grown at 8.51% over previous period. The absolute number of vehicles registered across States and UTs varies widely and depend inter-alia on the size of the States/UTs in terms of population, road length, road transport, economic activity, etc.
3.2 Amongst the States, Maharashtra has the highest number of registered vehicles i.e. 35.39 million (12%) followed by Uttar Pradesh with 32.71 million (11.1%), Tamil Nadu with 30.18 million (10.2%), Gujarat with 25.2 million (8.5%) and Karnataka with 21.07 million (7.1%) in the Chart 3.1. These top five States share about more 49% of total
stregistered vehicles in the country as of 31 March, 2019, whereas 14 small States/UTs of Goa, Puducherry, Chandigarh, Nagaland, Tripura, Meghalaya, Manipur, Arunachal Pradesh, Mizoram, A & N Islands, D & N Haveli, Sikkim, Lakshadweep, Daman & Diu together accounted for less than 1 per cent. The UT of Lakshadweep with 0.18 lakh-registered vehicles has the smallest share of less than 0.01% in the total registered motor vehicles in the country. Among the States, Sikkim reported the lowest number of the total registered vehicles (0.54 lakh) with a share of 0.02% in the total registered motor vehicles in the country (Annexure 3.1). State/UT-wise number of registered motor vehicles as on 31st March, 2019 in the Chart 3.1.
Registered Motor Vehicle Population in India- State Wise Distribution
Chart 3.1: State/UT wise distribution of Registered Motor Vehicle (in 000') as on 31st March, 2019
Source: Offices of State Transport Commissioners/UT Administrations.
States/UTs
Mah
aras
htra UP
Tam
il N
adu
Guj
arat
Kar
nata
kaR
ajas
than
Mad
hya
Prad
esh
Ker
ala
Tela
ngan
aA
ndhr
a Pr
ades
hD
elhi
Punj
abH
arya
naB
ihar
Odi
sha
Wes
t Ben
gal
Chh
attis
garh
Ass
amJh
arkh
and
Utta
rakh
and
J &
KH
imac
hal P
rG
oaPu
duch
erry
Cha
ndig
arh
Trip
ura
Nag
alan
dM
egha
laya
Man
ipur
Miz
oram
Aru
nach
al P
rA
& N
Isla
nds
Dam
an &
Diu
Sikk
imLa
ksha
dwee
p

Chart 3.2: State/UT wise CAGR of Registered Motor Vehicles during 2009-19
26
3.3 State/UT-wise number of registered motor vehicles for the period 2009 to 2019 is at Annexure 3.2 and the compound annual
growth rate of the respective States/UTs is given in Chart 3.2.
Sources: 1. Offices of State Transport Commissioners/UT Administrations Daman Diu include Dadra Nagar Haveli
3.4 The States/UTs wise CAGR during 2009-2019 (Chart 3.2), reveals that Arunachal Pradesh has the highest annual growth rate of 26.40% followed by Bihar (15.88%) and Ut ta rakhand (13 .33%) . Whereas , Chandigarh (3.07%) recorded the lowest CAGR followed by Andhra Pradesh (4.06%) and Jharkhand (5.21%).
3.5 Total Registered vehicles consisted of Transport and Non Transport Vehicles. The summary of State wise and category wise number of registered vehicles during the year 2017-18 and 2018-19 displayed in
Annexure 3.3(a) and 3.3 (b). The State/UT wise distribution of total registered transport vehicles (Chart 3.3) depicts that Maharashtra has the highest number of registered transport vehicles i.e. 3.18 million (12.3%) followed by Gujarat with 2.27 million (8.8%), Tamil Nadu with 2.17 million (8.4%), Karnataka with 1.96 million (7.6%) and Haryana with 1.9 million (7.2%). These top five States together accounted for about more than 44% of total registered transport vehicles in the country as on 31st March, 2019.
Chart 3.3 State/UT wise distribution of Registered Transport Vehicles as on 31st March 2019
Chart 3.4 State/UT wise distribution of Registered Non-Transport Vehicles as on 31st March 2019
27
Sources: 1. Offices of State Transport Commissioners/UT Administrations Daman Diu include Dadra Nagar Haveli
Sources: 1. Offices of State Transport Commissioners/UT Administrations Daman Diu include Dadra Nagar Haveli
3.6 The State/UT wise distribution of total registered Non-Transport vehicles (Chart 3.4) depicts that Maharashtra has the highest number of registered Non-Transport vehicles i.e. 32.2 million (11.93%) followed by Uttar Pradesh with 31.24 million (11.57%), Tamil
Nadu with 28 million (10.38%), Gujarat with 22.92 million (8.49%) and Karnataka with 19.1million (7.08%). These top five States shares about more than 49% of total registered
sttransport vehicles in the country as on 31 March, 2019.
States/UTs
Mah
aras
htra
Guj
arat
Tam
il N
adu
Kar
nata
kaH
arya
naTe
lang
ana
Ker
ala
And
hra
Pr UP
Raj
asth
anO
rissa
Bih
arW
est B
enga
lM
adhy
a Pr
Del
hiPu
njab
Jhar
khan
dA
ssam
Chh
attis
garh
J &
KH
imac
hal P
rN
agal
and
Utta
rakh
and
Goa
Meg
hala
yaTr
ipur
aPu
duch
erry
Man
ipur
Aru
nach
al P
rM
izor
amC
hand
igar
hSi
kkim
A &
N Is
land
sD
aman
& D
iuLa
ksha
dwee
p
State/UTs
(Num
ber i
n 00
0’)
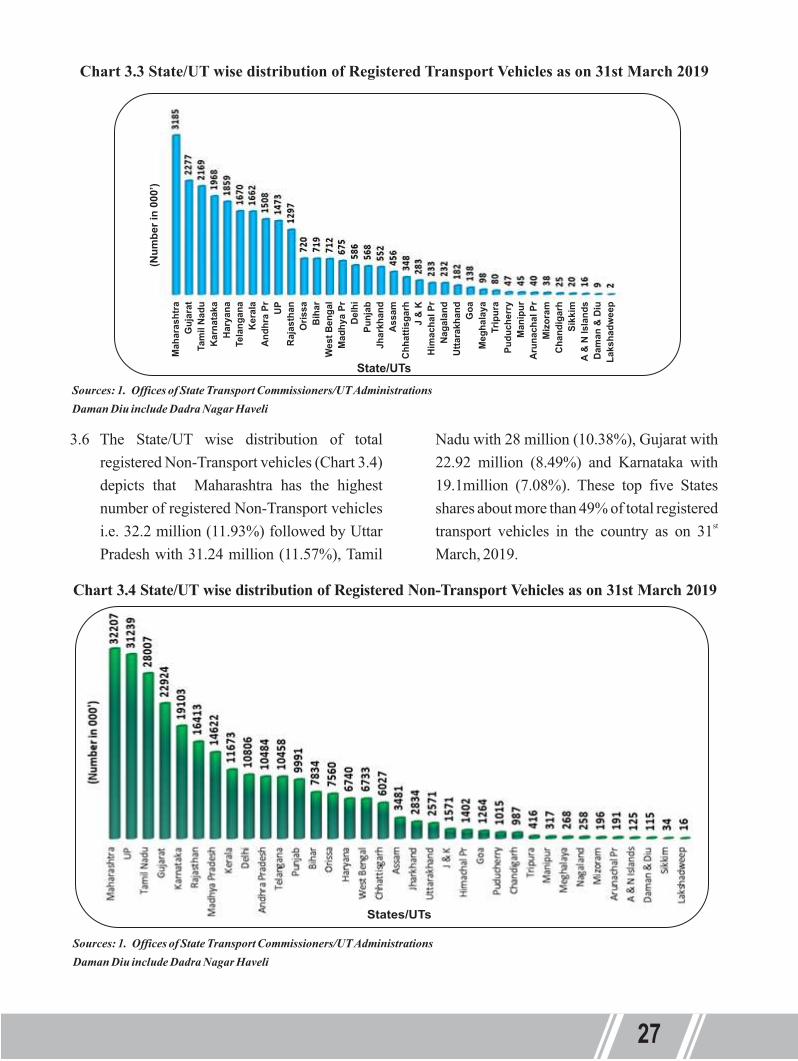

Chart 3.5: The share of transport and non-transport vehicles in total vehicles registered across State/UTs as on 31st March 2019 (in percent)
3.7 The State/UT wise breakup of percent of transport and non-transport vehicles to total
stvehicles registered as of 31 March, 2019 is shown in Chart 3.3. In all the States/UTs, registration of non-transport vehicles dominate and Maharashtra top the States with 32.2 million non-transport vehicles followed by Uttar Pradesh (31.2 million) and Tamil Nadu (28 million). With respect
to transport vehicles, Maharashtra has largest number (3.2 million) followed by Gujarat (2.3 million) and Tamil Nadu (2.2 million). State/UT wise distribution of percentage share of registered Transport and Non-Transport vehicles is given in Chart 3.5, non-transport vehicles accounted for major share in registration.
28
Source: Offices of State Transport Commissioners/UT Administrations.
3.8 The State-wise and category wise details of newly registered transport and non-transport vehicles during 2017-18 are at Annexure 3.3(b) & 3.3(c) and during 2018-19 are at Annexure 3.4(b) & 3.4(c) respectively, while the State-wise and category wise cumulative total of 2017-18 number of vehicles (Transport and Non-transport) can be seen at Annexure 3.3(d) and 3.3(e) and cumulative total of 2018-19 number of vehicles (Transport and Non-transport) can
be seen at Annexure 3.4(d) and 3.4(e).
3.9 The total number of buses has increased from 18.14 lakh in 2013 to 20.49 in 2019 (Chart 3.6), with a growth rate of about 5.5 percent over previous period. The share of public transport i.e. public sector buses in total public transport is marginal i.e. 7.8% and 7.4% respectively during 2017-18 & 2018-19. State/UT wise details are at Annexure 3.5.
Chart 3.6: Total Bus Fleet and Buses in Public Sector (SRTUs)
29
Include Omni busesData Source: 1.Total Buses- Offices of State Transport Commissioners/UT Administrations 2. Public Buses: State Road Transport Undertakings
3.10 State-wise number of commercial vehicles in stuse as on 31 March 2018 is presented in
stAnnexure 3.6 and as on 31 March, 2019 is at 3.6 (a). Maharashtra has the highest number of commercial vehicles in use i.e. 3.8 million (30%) followed by Kerala with 1.4 million (11.1%), Tamil Nadu with 1.3 million (10%), Andhra Pradesh with 0.8 million (6.3%) and
Uttar Pradesh with 0.7 million (5.8%). These top five States share about more 63% of total commercial vehicles in use in the country as
stof 31 March, 2019. Details of State wise and category wise commercial vehicles in use in respect of reporting States are at Annexure 3.6, 3.6(a), 3.7 and 3.7(a).

Section - 4

Section – 4
4.1 The Urban centers are associated with high vehicular density and road traffic congestion. The information collected from 51 Million Plus Cities (MPCs) on various indicators of transportation has been analysed in the Section. The total number of registered motor vehicles (Transport and
Non Transport) in the 51 reporting Million-Plus Cities has increased from 87.6 million in 2017-18 to 92.3 million in 2018-19, with a growth of about 5.3 percent over previous period. Million Plus Cities share about 31.2 percent of total vehicles registered in the country in 2019 (Chart 4.2).
Registered Motor Vehicles in Million-Plus Cities
Chart 4.1: Total Number of Registered Motor Vehicles in Million Plus Cities and All India (in Million)
Chart 4.2: The trend in growth rate of Registered Vehicles in Million Plus Cities and Percent share of Million Plus Cities in Total Vehicles Registered in India
Source: Offices of State Transport Commissioners/UT Administrations.
Source: Offices of State Transport Commissioners/UT Administrations.
30

31
4.2 Amongst the Cities, Delhi has the highest number of registered motor vehicles (11.4 million), followed by Faridabad (8.6 million), Bengaluru (8.1 million), Chennai (6 million) and Ahmedabad (4.3 million), are seen in Chart 4.3. These five cities accounted for about 40.61% and 41.49%
respectively of the total registered vehicles in respect of the reported Million Plus Cities in 2018 & 2019. Details are at Annexure 4.3. Non-transport vehicles share about 91 percent of total registered vehicles in Million Plus Cities in 2019 and the city wise breakup is given in Chart 4.4.
Source: Offices of State Transport Commissioners/UT Administrations.
Source: Offices of State Transport Commissioners/UT Administrations.
Chart 4.3: Total Registered Motor Vehicles in Million Plus Cities as on 31st March, 2019 (in Million)
Chart 4.4: Share of Transport and Non-transport Vehicles in total Registered Vehicles in Million Plus Cities in 2018-19 (in percent)
Transport Non - Transport
100%90%80%70%60%50%40%30%20%10%
0%
32
Source: Offices of State Transport Commissioners/UT Administrations.
Chart 4.5: Total Number of Registered Transport Vehicles in Million Plus Cities as on 31st March 2019
Composition of Registered Motor Vehicles in Million Plus Cities4.3 Registered vehicles consist of Transport and
Non Transport vehicles. Transport vehicles include Multiaxled/Articulated vehicles, Trucks and Lorries, Light Motor Vehicles (Goods & Passenger), Buses, Taxis, Motor Cycles on hire etc. Total number of transport vehicles has increased from 7.78 million in 2017-18 to 8.34 million in 2018-19, accounted for a growth about 7.12 percent
over previous period (details are at Annexure 4.1). In Chart 4.5, Faridabad has the highest number of registered transport vehicles (1.86 million), followed by Bengaluru (0.8 million), Delhi (0.59 million), Chennai (0.54) and Ahmedabad (0.41 million). These top five Cities accounted for about more than 50 percent of total transport vehicles registered in the Million Plus Cities. Jamshedpur has the lowest number of registered transport vehicles (0.02 million).
4.4 Transport vehicles share about 9 percent (8.3 Million) of total vehicles registered in the Million Plus Cities in 2019. The Category wise share of registered transport vehicles in the Million Plus Cities (Chart 4.6 refer to)
indicate, Light Motor Vehicles (Passengers) share about 29 percent (2.4 Million) of total transport vehicles registered followed by Light Motor Vehicles (Goods) with 20 percent (1.7 Million). Details are at Annexure 4.4.
DEL
HI
FAR
IDA
BA
DB
ENG
ALU
RU
CH
ENN
AI
AH
MED
AB
AD
SUR
AT
GR
EATE
R M
UM
BA
IJA
IPU
RPU
NE
HYD
ERA
BA
DLU
CK
NO
WVA
DO
DA
RA
CO
IMB
ATO
RE
RA
JKO
TIN
DO
RE
KA
NPU
RPA
TNA
RA
IPU
RN
AG
PUR
ALL
AH
AB
AD
BH
OPA
LJO
DH
PUR
MA
DU
RA
IA
GR
AG
HA
ZIA
BA
DVA
RA
NA
SI
CH
AN
DIG
AR
HVI
SAK
HA
PATN
AM
D
UR
G B
HIL
AI
KO
CH
I TR
ICH
YVI
JAYA
WA
DA
TH
IRU
VAN
AN
THA
PUK
OLK
ATA
MEE
RU
TR
AN
CH
IN
ASH
IKD
HA
NB
AD
A
UR
AN
GA
BA
D
KO
ZHIK
OD
A
MA
LAPP
UR
AM
KO
LLA
M
SRIN
AG
AR
KA
NN
UR
PALA
KK
AD
JAM
SHED
PUR
ALL
APP
PUZH
AK
OTA
MILLION PLUS CITIES
(NU
MB
ER IN
MIL
LIO
N)
AGRA
AHM
EDAB
ADAL
LAHA
BAD
AL
LAPP
PUZH
AAU
RANG
ABAD
BE
NGAL
URU
BHO
PAL
CHAN
DIG
ARH
CH
ENNA
ICO
IMBA
TORE
DELH
IDH
ANBA
DDU
RG B
HILA
IFA
RIDA
BAD
GHA
ZIAB
AD
GRE
ATER
MUM
BAI
HYDE
RABA
DIN
DORE
JAIP
URJA
MSH
EDPU
RJO
DHPU
RKA
NNUR
KANP
URKO
CHI
KOLK
ATA
KOLL
AM
KOTA
KOZH
IKO
DA
LUCK
NOW
M
ADUR
AIM
ALAP
PURA
MM
EERU
T NA
GPU
RNA
SHIK
PALA
KKAD
PATN
APU
NERA
IPUR
RAJK
OT
RANC
HISR
INAG
ARSU
RAT
TRIC
HYTH
IRUV
ANAN
THA
VARA
NASI
VI
JAYA
WAD
A VA
DODA
RAVI
SAKH
APAT
NAM
FAR
IDA
BA
DB
ENG
ALU
RU
DEL
HI
CH
ENN
AI
AH
MED
AB
AD
GR
EATE
R M
UM
BA
IJA
IPU
RSU
RAT
HYD
ERA
BA
DVA
DO
DA
RA
PUN
EPA
TNA
RA
JKO
TIN
DO
RE
RA
IPU
RJO
DH
PUR
VIJA
YAW
AD
A K
OLK
ATA
CO
IMB
ATO
RE
KO
CH
I R
AN
CH
IVI
SAK
HA
PATN
AM
TH
IRU
VAN
AN
THA
PUR
AM
VAR
AN
ASI
LU
CK
NO
W
MA
DU
RA
IN
AG
PUR
ALL
AH
AB
AD
K
OZH
IKO
DA
KA
NPU
RG
HA
ZIA
BA
D
DH
AN
BA
DB
HO
PAL
MA
LAPP
UR
AM
TRIC
HY
SRIN
AG
AR
AU
RA
NG
AB
AD
A
GR
AD
UR
G B
HIL
AI
MEE
RU
T K
OTA
NA
SHIK
KO
LLA
M
KA
NN
UR
PALA
KK
AD
ALL
APP
PUZH
AC
HA
ND
IGA
RH
JA
MSH
EDPU
R
MILLION PLUS CITIES
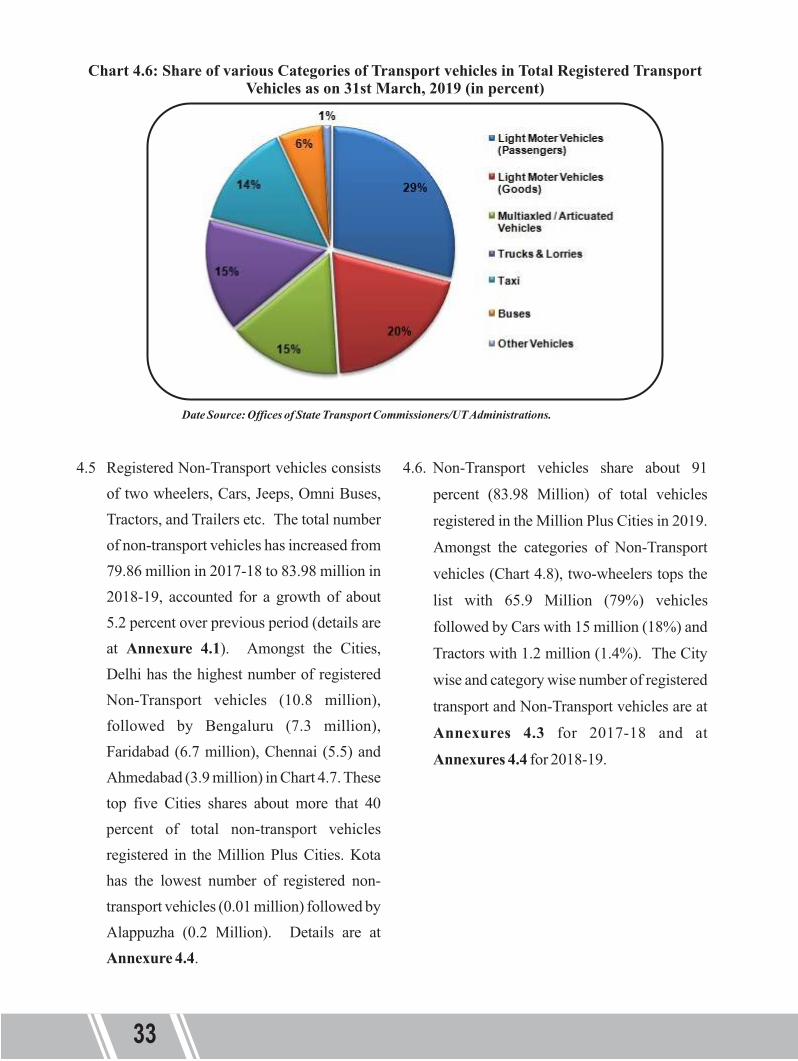
Date Source: Offices of State Transport Commissioners/UT Administrations.
Chart 4.6: Share of various Categories of Transport vehicles in Total Registered Transport Vehicles as on 31st March, 2019 (in percent)
4.5 Registered Non-Transport vehicles consists of two wheelers, Cars, Jeeps, Omni Buses, Tractors, and Trailers etc. The total number of non-transport vehicles has increased from 79.86 million in 2017-18 to 83.98 million in 2018-19, accounted for a growth of about 5.2 percent over previous period (details are at Annexure 4.1). Amongst the Cities, Delhi has the highest number of registered Non-Transport vehicles (10.8 million), followed by Bengaluru (7.3 million), Faridabad (6.7 million), Chennai (5.5) and Ahmedabad (3.9 million) in Chart 4.7. These top five Cities shares about more that 40 percent of total non-transport vehicles registered in the Million Plus Cities. Kota has the lowest number of registered non-transport vehicles (0.01 million) followed by Alappuzha (0.2 Million). Details are at Annexure 4.4.
4.6. Non-Transport vehicles share about 91
percent (83.98 Million) of total vehicles
registered in the Million Plus Cities in 2019.
Amongst the categories of Non-Transport
vehicles (Chart 4.8), two-wheelers tops the
list with 65.9 Million (79%) vehicles
followed by Cars with 15 million (18%) and
Tractors with 1.2 million (1.4%). The City
wise and category wise number of registered
transport and Non-Transport vehicles are at
Annexures 4.3 for 2017-18 and at
Annexures 4.4 for 2018-19.
3433
Date Source: Offices of State Transport Commissioners/UT Administrations.
Date Source: Offices of State Transport Commissioners/UT Administrations.
Chart 4.7: Total Number of Registered Non-Transport Vehicles in Million Plus Cities as on 31st March 2019
Chart 4.8: Share of various Categories of Non-Transport vehicles in Total Registered Non-Transport Vehicles as on 31st March, 2019 (in percent)
Two wheelers
Cars
Jeeps
Omni Buses
Tractors
Trailers
Others
DEL
HI
BEN
GA
LUR
UFA
RID
AB
AD
CH
ENN
AI
AH
MED
AB
AD
SUR
ATJA
IPU
RG
REA
TER
MU
MB
AI
PUN
EH
YDER
AB
AD
LUC
KN
OW
CO
IMB
ATO
RE
VAD
OD
AR
AR
AJK
OT
IND
OR
EK
AN
PUR
NA
GPU
RPA
TNA
RA
IPU
RB
HO
PAL
ALL
AH
AB
AD
M
AD
UR
AI
AG
RA
JOD
HPU
RG
HA
ZIA
BA
D
CH
AN
DIG
AR
H
VAR
AN
ASI
D
UR
G B
HIL
AI
VISA
KH
APA
TNA
M
KO
CH
I TR
ICH
YM
EER
UT
VIJA
YAW
AD
A TH
IRUV
ANAN
THAP
URAM
KO
LKAT
AN
ASH
IKR
AN
CH
ID
HA
NB
AD
A
UR
AN
GA
BA
D
KO
ZHIK
OD
A M
ALA
PPU
RA
MK
OLL
AM
SR
INA
GA
RK
AN
NU
RJA
MSH
EDPU
RPA
LAK
KA
DA
LLA
PPPU
ZHA
KO
TA
MILLION PLUS CITIES
(IN M
ILLI
ON
)
10.8
7.3
6.7
5.5
3.9
3.1
2.7
2.7
2.6
2.5
2.3
2.2
2.1
2.0
1.8
1.8
1.4
1.4
1.4
1.2
1.2
1.1
1.1
1.1
1.0
1.0
1.0
0.9
0.9
0.8
0.8
0.8
0.7
0.7
0.7
0.7
0.7
0.6
0.5
0.4
0.4
0.3
0.3
0.3
0.2
0.2
0.2
0.1

Date Source: Offices of State Transport Commissioners/UT Administrations.
Chart 4.6: Share of various Categories of Transport vehicles in Total Registered Transport Vehicles as on 31st March, 2019 (in percent)
4.5 Registered Non-Transport vehicles consists of two wheelers, Cars, Jeeps, Omni Buses, Tractors, and Trailers etc. The total number of non-transport vehicles has increased from 79.86 million in 2017-18 to 83.98 million in 2018-19, accounted for a growth of about 5.2 percent over previous period (details are at Annexure 4.1). Amongst the Cities, Delhi has the highest number of registered Non-Transport vehicles (10.8 million), followed by Bengaluru (7.3 million), Faridabad (6.7 million), Chennai (5.5) and Ahmedabad (3.9 million) in Chart 4.7. These top five Cities shares about more that 40 percent of total non-transport vehicles registered in the Million Plus Cities. Kota has the lowest number of registered non-transport vehicles (0.01 million) followed by Alappuzha (0.2 Million). Details are at Annexure 4.4.
4.6. Non-Transport vehicles share about 91
percent (83.98 Million) of total vehicles
registered in the Million Plus Cities in 2019.
Amongst the categories of Non-Transport
vehicles (Chart 4.8), two-wheelers tops the
list with 65.9 Million (79%) vehicles
followed by Cars with 15 million (18%) and
Tractors with 1.2 million (1.4%). The City
wise and category wise number of registered
transport and Non-Transport vehicles are at
Annexures 4.3 for 2017-18 and at
Annexures 4.4 for 2018-19.
3433
Date Source: Offices of State Transport Commissioners/UT Administrations.
Date Source: Offices of State Transport Commissioners/UT Administrations.
Chart 4.7: Total Number of Registered Non-Transport Vehicles in Million Plus Cities as on 31st March 2019
Chart 4.8: Share of various Categories of Non-Transport vehicles in Total Registered Non-Transport Vehicles as on 31st March, 2019 (in percent)
Two wheelers
Cars
Jeeps
Omni Buses
Tractors
Trailers
Others
DEL
HI
BEN
GA
LUR
UFA
RID
AB
AD
CH
ENN
AI
AH
MED
AB
AD
SUR
ATJA
IPU
RG
REA
TER
MU
MB
AI
PUN
EH
YDER
AB
AD
LUC
KN
OW
CO
IMB
ATO
RE
VAD
OD
AR
AR
AJK
OT
IND
OR
EK
AN
PUR
NA
GPU
RPA
TNA
RA
IPU
RB
HO
PAL
ALL
AH
AB
AD
M
AD
UR
AI
AG
RA
JOD
HPU
RG
HA
ZIA
BA
D
CH
AN
DIG
AR
H
VAR
AN
ASI
D
UR
G B
HIL
AI
VISA
KH
APA
TNA
M
KO
CH
I TR
ICH
YM
EER
UT
VIJA
YAW
AD
A TH
IRUV
ANAN
THAP
URAM
KO
LKAT
AN
ASH
IKR
AN
CH
ID
HA
NB
AD
A
UR
AN
GA
BA
D
KO
ZHIK
OD
A M
ALA
PPU
RA
MK
OLL
AM
SR
INA
GA
RK
AN
NU
RJA
MSH
EDPU
RPA
LAK
KA
DA
LLA
PPPU
ZHA
KO
TA
MILLION PLUS CITIES
(IN M
ILLI
ON
)
10.8
7.3
6.7
5.5
3.9
3.1
2.7
2.7
2.6
2.5
2.3
2.2
2.1
2.0
1.8
1.8
1.4
1.4
1.4
1.2
1.2
1.1
1.1
1.1
1.0
1.0
1.0
0.9
0.9
0.8
0.8
0.8
0.7
0.7
0.7
0.7
0.7
0.6
0.5
0.4
0.4
0.3
0.3
0.3
0.2
0.2
0.2
0.1

4.7 The total number of registered transport vehicles in the Million Plus Cities constitute about 32.5 percent of total of registered transport vehicles in India in 2017-18, which has marginally declined to 32.2 percent in
2018-19 (Chart 4.9). Similarly, Million Plus Cities share about 32.1 percent of registered non-transport vehicles in the country in 2017-18, which has declined to 31.1 percent in 2018-19 (Chart 4.9).
Date Source: Offices of State Transport Commissioners/UT Administrations.
Chart 4.9: Share of Registered Transport and Non-Transport Vehicles of Million Plus Cities in Total Registered Transport and Non-Transport Vehicles in India (in percent)
4.8 Total number of registered transport vehicles in Million Plus Cities constitute about 2.9 percent of total registered vehicles in India in 2017-18, which slightly declined to about 2.8 percent in 2018-19. The non-transport vehicles in the Million Plus Cities constitute about 29.3 percent of total vehicles registered in India in 2017-18, which has declined to about 28.4 percent in 2018-19 (Chart 4.10 refer to).
4.9 Even though, there has been a marginal decline in percentage share of transport and non-transport vehicles registered in Million Plus Cities, in absolute terms, total number of transport vehicles registered has increased from 7.8 million in 2017-18 to 8.3 million in 2018-19 and non- transport vehicles from 79.9 million to 84.0 million for the same period.
3635
Date Source: Offices of State Transport Commissioners/UT Administrations.
Chart 4.10: Share of Registered Transport and Non-Transport Vehicles in Million Plus Cities in Total Registered Vehicles in India (in percent)

Section - 5

37
Section – 5
5.1 International comparison is based on the data provided by World Road Statistics, 2018 of International Road Federation and analyses the positioning of India viz-a-viz
other countries in terms of total vehicles in use, category wise composition and penetration levels per 1000 for different type of vehicles.
International Comparison of Vehicular penetration
Table 5.1: The details of total vehicles in use, category wise with respective penetration levels in respect of top 15 countries
Source : World road statistics, 2018 published by International Road Federation Geneva
*Note:
Total motor vehicles – include passenger cars, buses and motor coaches, vans and lorries, but exclude motor cycles and mopeds
Passenger cars – motor vehicle, other than motor cycle, intended for carriage of passengers and designed to seat not more than 9 persons (including driver)
Buses and Motor coaches: - passenger road motor vehicle designed to seat more than nine persons (including the driver). Included are mini-buses and mini-coaches designed to seat more than nine persons (including the driver).
Motor cycles– Two or three -wheeled road motor vehicle not exceeding 400kg (900lb) of unladen weight. All such vehicles with a cylinder capacity of 50cc or over are included, as are those under 50cc which do not meet the definition of moped.
Moped:- Two or three wheeled road motor vehicle which is fitted with an engine having a cylinder capacity of less than 50cc (3.05cu.in) and a maximum authorised design speed in accordance with national regulations.
# - This publication only brings out commercial transport vehicles in use in India
United States
26,01,19,703 1 804 11,29,61,266 2 349 9,76,161 5 3 86,79,380 7 27
China 18,45,01,356 2 134 16,04,83,935 1 116 22,98,484 2 2 6,82,61,220 3 50
Japan 7,73,01,798 3 609 6,08,31,892 3 479 2,30,603 9 2 1,12,15,300 5 88Brazil 6,85,11,508 4 330 5,20,04,134 4 250 9,84,847 4 5 2,53,11,251 4 122Russia 5,23,37,486 5 363 4,51,63,201 6 313 8,74,382 7 6 22,66,183 12 16Germany 5,09,64,751 6 619 4,58,03,560 5 556 78,949 14 1 43,14,493 8 52Italy 4,33,23,517 7 715 3,85,15,701 7 635 98,623 12 2 97,40,471 6 161India 4,25,15,000# 8 32 3,02,42,000 10 23 17,57,000 3 1 16,89,75,000 1 128Mexico 3,99,45,510 9 313 2,91,64,157 11 229 3,65,419 8 3 29,87,057 10 23France 3,91,18,000 10 585 3,23,90,000 8 484 91,000 13 1 NA NAUnited Kingdom
3,52,87,562 11 538 3,08,50,440 9 470 1,61,500 10 2 12,48,074 14 19
Spain 2,88,95,046 12 622 2,28,76,830 12 492 61,838 15 1 32,11,474 9 69Poland 2,53,29,863 13 667 2,16,75,388 13 571 1,13,139 11 3 26,47,825 11 70Indonesia 2,41,30,997 14 92 1,45,80,666 15 56 24,86,898 1 10 10,51,50,082 2 403Korea 2,17,22,872 15 424 1,73,38,160 14 338 8,92,539 6 17 21,80,688 13 43
Country Penetration per '000 people
Penetration per '000 people
RankTotal
Passenger cars Buses and Motor coaches
Penetration per '000
peopleTotal Rank Total Rank
Total Vehicles in use
World Rank
Total Vehicle
penetration per '000 people
Motorcycles & Mopeds
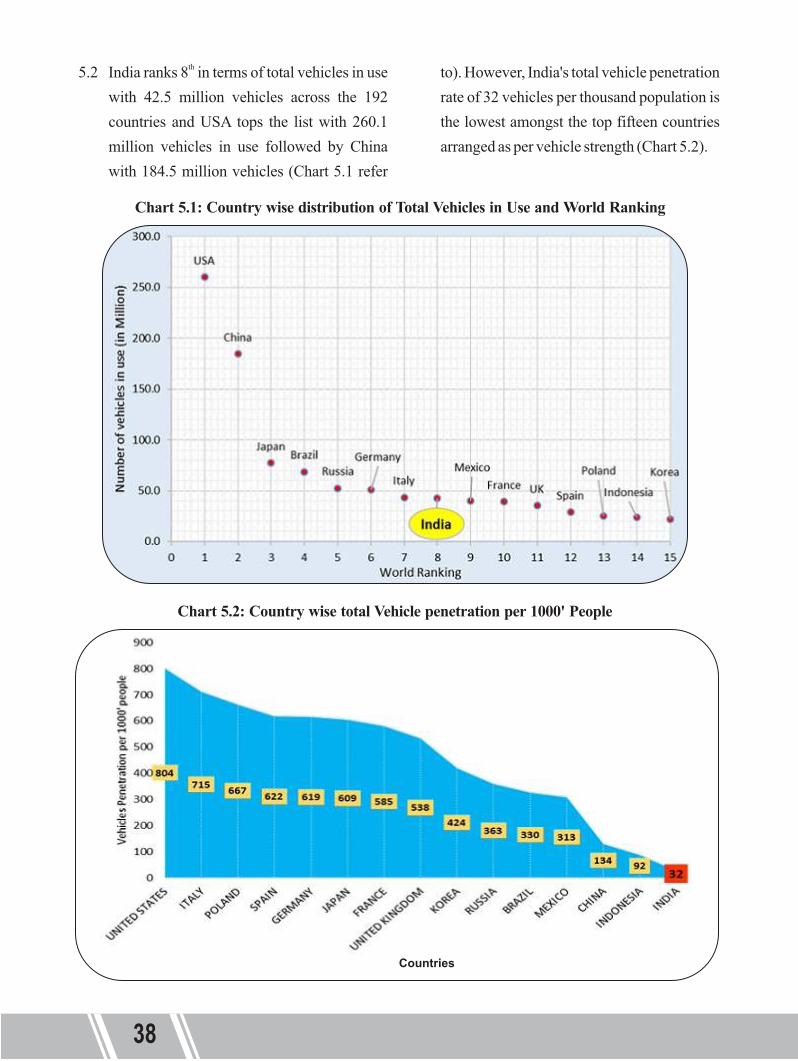
38
Chart 5.2: Country wise total Vehicle penetration per 1000' People
Chart 5.1: Country wise distribution of Total Vehicles in Use and World Ranking
th5.2 India ranks 8 in terms of total vehicles in use with 42.5 million vehicles across the 192 countries and USA tops the list with 260.1 million vehicles in use followed by China with 184.5 million vehicles (Chart 5.1 refer
to). However, India's total vehicle penetration rate of 32 vehicles per thousand population is the lowest amongst the top fifteen countries arranged as per vehicle strength (Chart 5.2).
39
th5.3 India ranks 10 in terms of total strength of passenger cars in use across the 192 countries reported in the World Road Statistics, 2018 (Chart 5.3). However, with
a penetration rate of 23 passengers' car per thousand people India is far behind Italy (635), Poland (571), Germany (556), Spain (492) and Japan (479) refer Chart 5.4.
Chart 5.3: Country wise distribution of Number of Passenger Cars in Use and Ranking
Chart 5.4: Country- wise total number of passenger cars penetration per 1000' People
rd5.4 India ranks 3 in terms of strength of buses and motor coaches after Indonesia and China across the 192 countries reported in the World Road Statistics, 2018 (Chart 5.5). The
buses and Motor coaches penetration rate of India is only 1 per thousand people is much less than that of Korea (17), Indonesia (10) and Russia (6), refer to Table 5.1.Countries

40
Chart 5.5: Country wise distribution of Number of Buses and Motor Coaches
Chart 5.6: Country wise distribution of Number of Motor Cycles and Mopeds
st5.5 India ranks 1 in terms of strength of Motorcycles & mopeds across the 192 countries reported in the World Road Statistics, 2018 followed by Indonesia and China (Chart 5.6). In terms of penetration of
motorcycles & Mopeds per thousand of population, India with a penetration rate of
rd128, ranks 3 behind Indonesia (403) and Italy (161), refer to Table 5.1. Section - 6

41
Section – 6
6.1 In the road transport sector, regulation and taxation of motor vehicles are treated as two distinct powers. The regulation of Motor vehicles falls within the Concurrent List (List III, Entry 35 refer to), which is jointly exercised by both the Central and State Governments with residuary powers with the Centre, whereas the taxation of motor vehicles essentially falls within the ambit of State List (List II, entry 56 & 57 refer to).
6.2 The Central Government thus regulates motor vehicles under the Indian Motor Vehicles Act, 1988, and Central Motor Vehicles Rules, 1989. The levies charged under the Act including fees for registering motor vehicles; obtaining driving licenses; transfer of ownership of motor vehicles;
issue of permits and certificate of fitness of transport vehicles are levied by State Transport Departments. Besides the levy of above-mentioned fees, States also levy taxes like the Motor Vehicle Tax (also referred to registration fees in some States), the passenger and goods tax, etc.
6.3 Under the pre-GST regime, the Union Government levied excise duty & import duties on Motor vehicles and Accessories, tyres and tubes, High Speed Diesel and Motor spirit and service tax on certain road transport services like the rent a cab scheme, tour operator services etc.The Revenue realized from Road Transport by the Centre for the period 2009-10 to 2018-19 is presented in the Table 6.1.
Road Transport and Motor Vehicle Taxation in India
Table 6.1 Revenue Realised from Road Transport (Centre) during 2009-10 to 2018-19
# Included in Import Duty of Motor Vehicles and Accessories, ##: Included in Import Duty of High Speed Diesel Oil Includes petroleum oils, oils obtained from bituminous minerals, crude, other mineral fuels, oils, waxes and bituminous
substances Source: Directorate of Data Management, Central Excise & Customs, New Delhi
*
Import Duty Excise Duty Total Import Duty Excise Duty Total Import Duty* Excise Duty Total Import Duty Excise Duty Total
1 2 3 4 5 6 7 8 9 10 11 12 13 14
2009-10 4,121.70 6,294.20 10,415.90 1,470.90 596.8 2,067.70 4,376.60 3,339.10 7,715.70 3,378.20 24,809.50 28,187.70 48,386.90
2010-11 6,508.70 8,667.60 15,176.30 2,552.50 939.8 3,492.30 17,546.20 3,731.90 21,278.10 8,735.60 26,770.90 35,506.50 75,453.20
2011-12 8,126.70 9,331.20 17,457.80 2,961.20 1,115.40 4,076.60 15,280.10 4,723.00 20,003.10 5,239.50 28,795.50 34,034.90 75,572.50
2012-13 9,096.40 12,309.90 21,406.30 3,513.70 1,358.70 4,872.40 9,949.60 27,237.90 37,187.50 3,754.90 23,710.10 27,465.00 90,931.20
2013-14 11,762.80 10,013.30 21,776.10 # 1,985.90 1,985.90 15,563.00 27,335.10 42,898.10 ## 22,424.00 22,424.00 89,084.10
2014-15 12,412.50 9,264.20 21,676.70 # 2,113.10 2,113.10 12,571.80 42,753.50 55,325.30 ## 30,825.90 30,825.90 109,941.00
2015-16 13,945.00 14,220.00 28,165.00 # 2,441.30 2,441.30 15,202.00 101,438.10 116,640.00 ## 52,413.40 52,413.40 199,659.70
2016-17 14,421.20 19,591.00 34,012.30 # 2,109.40 2,109.40 21,290.40 151,523.90 172,814.30 ## 71,196.20 71,196.20 280,132.10
2017-18 15060.2 21766.3 36826.4 1068.2 1343.4 2411.6 2227.7 139798.9 142026.7 - - - 181264.8
2018-19 19211.9 - 19211.9 1090.6 - 1090.6 1103.6 99877.2 100980.8 - - - 121283.3
% share 15.8 - 15.8 0.8 - 0.9 0.9 82.4 83.3 - - 100
CAGR 16.6 - 16.6 -3.94 - -7.19 -13.87 40.47 29.33 - - - 5.87
Grand Total (4+7+10+13)
(Rs. Crores)
YearMotor Vehicles & Accessories Tyres & Tubes High Speed Diesel Oil Motor Spirit Total

42
Char 6.1: Revenue realized by Centre from Road Transport and YoY Growth (in percent)
6.4 Revenue realized from road transport by Centre has increased from Rs. 0.48 lakh crore in 2009-10 to Rs. 1.21 lakh crore in 2018-19. However, since 2016-17, there has been a decline in revenue i.e. from Rs 2.8 lakh crore in 2016-17 to Rs.1.21 lakh
crore in 2018-19. Year on year growth depicts a mixed trend, but declining since 2015-16 and registered a decline in growth of about 33.1 percent in 2018-19 over the previous period (Chart 6.1 refer to).
Data Source: Directorate of Data Management, Central Excise & Customs, New Delhi
6.5 The trend of growth of various source of revenue (Chart 6.2) indicates that the revenue from High Speed Motor Vehicles has the largest share Rs 101 thousand crore followed by Motor Vehicles & Accessories with Rs 19.2 thousand crore and Tyres and Tubes with Rs 1.1 thousand crore. Motor Sprit had the largest share until 2011-12,
however declined to zero due to GST. In the post GST period, revenue from all source depicts a declining trend. Percent share of High Speed Motor Vehicles in total revenue from road transport depicts increasing trend over the years from 2009-10 to 2018-19, for others it is either more or less constant or declining (Chart 6.3).
Chart 6.2: The trend in growth of various source of revenue realized by the Centre from Road Transport
Chart 6.3: Share of various sources of revenues in Total Revenue realized by the Centre from Road Transport (in Percent)
43
Data Source: Directorate of Data Management, Central Excise & Customs, New Delhi
Data Source: Directorate of Data Management, Central Excise & Customs, New Delhi
6.6 Thus, may be noted that High speed diesel oil is the single most important source of revenue for the Government with a share of 83.3%
followed by Motor Vehicle & Accessories of 15.8% and tyres & tubes of 0.9% in 2018-19 (Chart 6.4).

44
Chart 6.4: Composition of tax revenue (percentage of total) collected from Road Transport by the Centre in 2018-19.
Chart 6.5: Revenue collected by State Government from Road Transport Sector (in 000' crore)
6.7 Revenue collected by the State Government from various subsectors of road transport sector (Chart 6.5) has increased from Rs 12,901.7 crore in 2000-01 to Rs 72,115.6 crore in 2018-19 (Annexure 5.2), an
increase of more than 5 times. However, year on year growth for the period 2000-01 to 2018-19 depicts a mixed trend, which declined from about 1.7 percent in 2017-18 to about 8.3 percent in 2018-19 (Chart 6.5).
Data Source: Directorate of Data Management, Central Excise & Customs, New Delhi
Data source: State Finance-A Study of State Budgets of 2018-19 and 2019-20, RBI
45
6.8 In terms of composition, revenue from tax on motor vehicle constitute about two-thirds of the combined revenue of States and UTs from road transport whereas taxes on passenger and goods constitute the balance one-third (Chart 6.6 refer to). Motor Vehicles Tax and Fees has increased from Rs 64,914.8 crore in 2017-18 to Rs 68,575.3
crore in 2018-19, with a growth of about 5.6 percent over previous period. The Tax on Passengers and Goods has decreased from Rs 13,719.2 crore in 2017-18 to Rs 3,504.3 crore in 2018-19. Details attached in Annexure 5.2. The YoY growth shows mixed trend and declining since 2017-18.
Chart 6.6: The composition of revenue realized from Road Transport by State and YoY growth.
Source: State Finances- A Study of Budgets 2012-13 to 2019-20 by Reserve Bank of India
6.9 State wise distribution of revenue from Road Transport (Chart 6.7) indicates that Maharashtra (13. 1 %) has the largest share followed by Uttar Pradesh (9.6%), Karnataka (9.1%), Tamil Nadu (7.7%) and
Rajasthan (6.4%). These top five States account for about 46 percent of total revenues of road transport. Details are at Annexure 5.3.

46
Chart 6.7: State wise distribution of revenue from Road Transport during 2018-19
6.10 The revenue generated by States and UTs with legislatures from tax on Motor Vehicles and taxes on Goods and Passengers constitutes, on an average, 6.96% and 5.95% of their combined own tax revenue in 2017-18 and 2018-19 respectively (Annexure 5.3). The magnitude of the revenue significance of these taxes differs widely across States; from as low as 2.97 percent of its own tax revenue in case of Arunachal Pradesh to 15.89 percent of own tax revenue for Nagaland. Among major States, the revenue from motor vehicle and goods & passenger taxes constitute from 5.24 per cent of own tax revenue for Andhra Pradesh to 28.17 percent for Bihar.
6.11 The new National Permit System introduced in May 2010 to provide a framework for uninterrupted movement of goods vehicles across the country authorizing the permit holder to operate throughout the country. Under the system, national permit can be granted by the home
State on payment of requisite authorisation fee and annual fee. The consolidated fee so collected is distributed among the States and UTs based on a formula based upon the average composite fee received by the States/UTs during previous three years. A Statement of the comparison of fee received in National Permit Account by States/UTs is at Annexure 5.4.
6.12 Different States use different basis for computation of registration fees, goods tax and passenger tax such as cost of vehicle, engine capacity, unladen weight, seating capacity etc. and use different rates, different periodicity rendering inter State comparisons of the above taxes incomparable. There is a complex matrix, which emerges once we try to put together the tax structure for different segments of Transport (Stage Carriage/ Contract carriage) and Non-transport Vehicles for different States together (Annexure 5.5).
Mah
aras
htra
Utta
r Pra
desh
Kar
nata
ka
Tam
il N
adu
Raj
asth
an
Guj
arat
Tela
ngan
a
Ker
ala
And
hra
Prad
esh
Mad
hya
Prad
esh
Wes
t Ben
gal
Har
yana
Bih
ar
NC
T of
Del
hi
Odi
sha
Punj
ab
Chh
attis
garh
Jam
mu
& K
ashm
ir
Utta
rakh
and
Jhar
khan
d
Ass
am
Him
acha
l Pra
desh
Goa
Nag
alan
d
Pudu
cher
ry
Meg
hala
ya
Miz
oram
Man
ipur
Aru
nach
al P
rdes
h
Sikk
im
Trip
ura
(Rs.
in 0
00’ C
rore
)10.0
9.08.0
7.0
6.0
5.0
4.0
3.0
2.0
1.0
0.0
47
6.13 It may be noted from Annexure 5.5 that most States have switched over to one time tax /lifetime tax (LTT) in respect of the Motor Vehicle Tax for two-wheelers, cars and Taxis belonging to the Non Transport category. In the case of Transport Vehicles for passengers, the passenger tax rates are differentiated based on whether the vehicle is for stage or contract carriage, with the seating capacity generally forming the basis for levying tax. Many States differentiate in
t axes based on type o f se rv ice (Ordinary/Luxury/Express etc.) as also based on the area where the vehicle is plying as. In some States, routes are divided into different categories as in mofussil versus town, city versus rural areas etc. Goods vehicles are usually taxed based on the registered laden weight (RLW) or gross vehicle weight (GVW) or unladen weight (ULW) and they are based on one time tax, quarterly and annually respectively.

46
Chart 6.7: State wise distribution of revenue from Road Transport during 2018-19
6.10 The revenue generated by States and UTs with legislatures from tax on Motor Vehicles and taxes on Goods and Passengers constitutes, on an average, 6.96% and 5.95% of their combined own tax revenue in 2017-18 and 2018-19 respectively (Annexure 5.3). The magnitude of the revenue significance of these taxes differs widely across States; from as low as 2.97 percent of its own tax revenue in case of Arunachal Pradesh to 15.89 percent of own tax revenue for Nagaland. Among major States, the revenue from motor vehicle and goods & passenger taxes constitute from 5.24 per cent of own tax revenue for Andhra Pradesh to 28.17 percent for Bihar.
6.11 The new National Permit System introduced in May 2010 to provide a framework for uninterrupted movement of goods vehicles across the country authorizing the permit holder to operate throughout the country. Under the system, national permit can be granted by the home
State on payment of requisite authorisation fee and annual fee. The consolidated fee so collected is distributed among the States and UTs based on a formula based upon the average composite fee received by the States/UTs during previous three years. A Statement of the comparison of fee received in National Permit Account by States/UTs is at Annexure 5.4.
6.12 Different States use different basis for computation of registration fees, goods tax and passenger tax such as cost of vehicle, engine capacity, unladen weight, seating capacity etc. and use different rates, different periodicity rendering inter State comparisons of the above taxes incomparable. There is a complex matrix, which emerges once we try to put together the tax structure for different segments of Transport (Stage Carriage/ Contract carriage) and Non-transport Vehicles for different States together (Annexure 5.5).
Mah
aras
htra
Utta
r Pra
desh
Kar
nata
ka
Tam
il N
adu
Raj
asth
an
Guj
arat
Tela
ngan
a
Ker
ala
And
hra
Prad
esh
Mad
hya
Prad
esh
Wes
t Ben
gal
Har
yana
Bih
ar
NC
T of
Del
hi
Odi
sha
Punj
ab
Chh
attis
garh
Jam
mu
& K
ashm
ir
Utta
rakh
and
Jhar
khan
d
Ass
am
Him
acha
l Pra
desh
Goa
Nag
alan
d
Pudu
cher
ry
Meg
hala
ya
Miz
oram
Man
ipur
Aru
nach
al P
rdes
h
Sikk
im
Trip
ura
(Rs.
in 0
00’ C
rore
)
10.0
9.08.0
7.0
6.0
5.0
4.0
3.0
2.0
1.0
0.0
47
6.13 It may be noted from Annexure 5.5 that most States have switched over to one time tax /lifetime tax (LTT) in respect of the Motor Vehicle Tax for two-wheelers, cars and Taxis belonging to the Non Transport category. In the case of Transport Vehicles for passengers, the passenger tax rates are differentiated based on whether the vehicle is for stage or contract carriage, with the seating capacity generally forming the basis for levying tax. Many States differentiate in
t axes based on type o f se rv ice (Ordinary/Luxury/Express etc.) as also based on the area where the vehicle is plying as. In some States, routes are divided into different categories as in mofussil versus town, city versus rural areas etc. Goods vehicles are usually taxed based on the registered laden weight (RLW) or gross vehicle weight (GVW) or unladen weight (ULW) and they are based on one time tax, quarterly and annually respectively.

ANNEXURES

Vehicular Population per 1,000 Population and per 100 kms of National Highway & Road Length: 2001-2019
48
Sources: 1. Registered Motor Vehicles - Offices of State Transport Commissioners/UT Administrations.
2. Road Length fom the publication Basic Road Statistics 2016-17, Ministry of Road Transport & Highways
3. Population - Report of the Technical Group on population projections constituted by the National Commission on Population, Office of registrar General & Census Commissioner, India
Annexure 1.1
Total Cars Buses Total Cars Buses
1 2 3 4 5 6 7 8 9 10 11 12
2001 1,028,610 54,991 5,297 533 57,737 3,373,520 53.46 5.15 0.52 95,244 1630
2002 1,045,547 58,924 5,748 519 58,112 3,426,600 56.36 5.50 0.50 101,397 1720
2003 1,062,388 67,007 6,594 565 58,112 3,528,654 63.07 6.21 0.53 115,307 1899
2004 1,079,117 72,718 7,267 594 65,569 3,621,507 67.39 6.73 0.55 110,903 2008
2005 1,095,722 81,499 8,073 678 65,569 3,809,156 74.38 7.37 0.62 124,295 2140
2006 1,112,186 89,618 9,110 762 66,590 3,880,651 80.58 8.19 0.69 134,582 2309
2007 1,128,521 96,707 10,146 1,098 66,590 4,016,401 85.69 8.99 0.97 145,228 2408
2008 1,144,734 105,353 11,200 1,157 66,754 4,109,592 92.03 9.78 1.01 157,823 2564
2009 1,160,813 114,951 12,366 1,206 70,548 4,471,510 99.03 10.65 1.04 162,940 2571
2010 1,176,742 127,746 13,749 1,177 70,934 4,582,439 108.56 11.68 1.00 180,091 2788
2011 1,192,506 141,866 15,467 1,238 70,934 4,676,838 118.96 12.97 1.04 199,997 3033
2012 1,208,116 159,491 17,570 1,297 76,818 4,865,394 132.02 14.54 1.07 207,621 3278
2013 1,223,581 181,508 20,503 1,419 79,116 5,231,922 148.34 16.76 1.16 229,420 3469
2014 1,238,887 190,704 21,672 1,468 91,287 5,402,486 153.93 17.49 1.18 208,906 3530
2015 1,254,019 210,023 23,808 1,527 97,991 5,472,144 167.48 18.99 1.22 214,329 3838
2016 1,268,961 230,031 25,635 1,385 101,011 5,603,293 181.27 20.20 1.09 227,728 4105
2017 1,283,600 253,311 28,694 1,340 114,158 5,909,561 197.34 22.35 1.04 221,895 4286
2018 1,298,041 272,587 30,857 1,396 126,350 6,215,797 210.00 23.77 1.08 215,740 4385
2019 1,312,240 295,772 32,425 1,472 132,500 6,386,297 225.39 24.71 1.12 223,224 4631
Population of India
(in thousands)
Year
Number of Registered Motor Vehicles (in thousands)
Registered Motor Vehicles per 1,000 Population
Total Registered
Motor Vehicle per 100Km of National Highways
Total Registered
Motor Vehicle per 100Km of
Road Length
Length of National
Highways (in km)
Length of all Roads (in km)

Annexure 1.2
Prod
uctio
n of
Mot
or V
ehic
les i
n In
dia:
200
9-10
to 2
019-
20(in
num
bers
)
M &
HCV
s : M
ediu
m an
d Hea
vy C
omm
erci
al V
ehic
les
LCVs
: Li
ght C
omm
erci
al V
ehic
les.
- : N
ot A
valia
ble
Sour
ce : S
ocie
ty of
Indi
an A
utom
obile
Man
ufac
ture
rs, N
ew D
elhi
.
49
Sale
s of M
otor
Veh
icle
s in
Indi
a (I
nclu
ding
Exp
orts
): 2
009-
10 to
201
9-20
(in n
umbe
rs)
M &
HCV
s : M
ediu
m an
d Hea
vy C
omm
erci
al V
ehic
les
LCVs
: Li
ght C
omm
erci
al V
ehic
les.
- : N
ot A
valia
ble
Sour
ce : S
ocie
ty of
Indi
an A
utom
obile
Man
ufac
ture
rs, N
ew D
elhi
.
Annexure 1.3
50
Cat
egor
y20
09-1
020
10-1
120
11-1
220
12-1
320
13-1
420
14-1
520
15-1
620
16-1
720
17-1
820
18-1
920
19-2
0C
AG
R
(200
9-10
to
2019
-20)
12
34
56
78
910
1112
13
Pass
enge
r Car
s1,
932,
620
2,45
3,11
32,
537,
170
2,42
9,19
92,
322,
578
2,41
6,86
22,
565,
970
2,71
1,91
12,
746,
658
2,71
1,16
02,
175,
242
1.19
Util
ity V
ehic
les
272,
883
318,
576
370,
945
564,
928
568,
692
629,
255
717,
809
909,
555
1,09
3,34
61,
099,
780
1,12
4,97
315
.22
Vans
151,
908
215,
607
237,
954
239,
434
196,
703
174,
055
181,
266
180,
204
180,
263
217,
531
133,
798
-1.2
6
Tota
l Pas
seng
er
Vehi
cles
2,35
7,41
12,
987,
296
3,14
6,06
93,
233,
561
3,08
7,97
33,
220,
172
3,46
5,04
53,
801,
670
4,02
0,26
74,
028,
471
3,43
4,01
33.
83
M&
HC
Vs
250,
133
344,
542
384,
801
278,
560
221,
556
268,
553
341,
287
342,
761
344,
592
444,
356
233,
979
-0.6
7
LCV
s31
7,42
340
8,19
354
4,33
555
3,18
447
7,47
942
8,53
044
5,40
546
7,49
255
0,85
666
8,04
951
8,04
35.
02
Tota
l CV
s56
7,55
675
2,73
592
9,13
683
1,74
469
9,03
569
7,08
378
6,69
281
0,25
389
5,44
81,
112,
405
752,
022
2.85
Thre
e W
heel
ers
619,
194
799,
553
879,
289
839,
742
830,
108
949,
021
934,
104
783,
721
1,02
2,18
11,
268,
833
1,13
3,85
86.
24
Scoo
ters
1,49
4,40
92,
144,
765
2,65
9,34
03,
025,
014
3,67
6,21
34,
721,
415
5,27
6,13
85,
926,
499
7,11
7,79
57,
095,
164
6,02
7,19
814
.96
Mot
orcy
cles
8,44
4,85
710
,527
,111
11,9
82,6
6911
,904
,212
12,4
74,6
2613
,023
,210
12,8
16,2
0313
,088
,208
15,1
67,4
8116
,499
,424
14,3
59,4
185.
45
Mop
eds
571,
070
704,
575
785,
523
791,
954
732,
210
755,
345
737,
886
919,
032
869,
562
905,
189
649,
678
1.30
Tota
l Tw
o W
heel
ers
10,5
12,9
0313
,376
,451
15,4
27,5
3215
,721
,180
16,8
83,0
4918
,499
,970
18,8
30,2
2719
,933
,739
23,1
54,8
3824
,499
,777
21,0
36,2
947.
18
Qua
dric
ycle
--
--
--
-1,
584
1,71
35,
388
6,09
5-
Gra
nd T
otal
14,0
57,0
6417
,916
,035
20,3
82,0
2620
,626
,227
21,5
00,1
6523
,366
,246
24,0
16,0
6825
,330
,967
29,0
94,4
4730
,914
,874
26,3
62,2
826.
49
Cat
egor
y20
09-1
020
10-1
120
11-1
220
12-1
320
13-1
420
14-1
520
15-1
620
16-1
720
17-1
820
18-1
920
19-2
0
CA
GR
(2
009-
10
to 2
019-
20)
12
34
56
78
910
1112
13
Pass
enge
r C
ars
1,97
0,04
6
2,43
0,10
5
2,53
2,85
2
2,44
0,12
7
2,33
8,04
4
2,41
8,09
9
2,55
7,72
7
2,70
5,98
1
2,17
4,02
4
2,21
8,48
9
1,69
5,44
1
-1.4
9
Util
ity
Vehi
cles
275,
563
328,
001
368,
993
561,
921
569,
272
630,
723
705,
317
916,
255
922,
322
941,
474
946,
010
13.1
3
Vans
151,
869
215,
794
236,
777
239,
067
192,
335
174,
759
179,
217
184,
073
192,
235
217,
426
132,
124
-1.3
8
Tota
l Pa
ssen
ger
Vehi
cles
2,39
7,47
8
2,97
3,90
0
3,13
8,62
2
3,24
1,11
5
3,09
9,65
1
3,22
3,58
1
3,44
2,26
1
3,80
6,30
9
3,28
8,58
1
3,37
7,38
9
2,77
3,57
5
1.47
M&
HC
Vs
265,
369
352,
060
377,
711
287,
282
224,
431
263,
407
337,
594
346,
286
340,
781
390,
732
224,
806
-1.6
5
LCV
s31
2,36
1
400,
645
524,
046
585,
812
485,
470
437,
336
451,
234
476,
067
516,
135
616,
579
492,
882
4.67
Tota
l CV
s
577
,730
752
,705
901
,757
873
,094
709
,901
700
,743
788
,828
822
,353
856
,916
1
,007
,311
717
,688
2.
19
Thre
e W
heel
ers
613,
606
795,
989
875,
034
841,
379
833,
477
939,
884
942,
649
783,
773
635,
698
701,
005
636,
569
0.37
Scoo
ters
1,49
2,65
9
2,12
6,10
9
2,65
3,42
1
3,01
4,48
5
3,69
6,67
4
4,70
1,65
6
5,28
9,15
9
5,89
7,50
1
6,71
9,90
9
6,70
1,43
0
5,56
6,03
6
14.0
7
Mot
orcy
cles
8,44
4,10
0
10,5
00,0
73
11,9
44,8
98
11,9
52,1
35
12,4
63,9
32
12,9
95,3
40
12,9
11,0
21
13,1
21,8
44
12,6
20,6
90
13,5
98,1
90
11,2
14,6
40
2.88
Mop
eds
571,
489
703,
713
785,
942
792,
069
730,
172
765,
182
738,
547
910,
670
859,
518
880,
227
636,
940
1.09
Elec
tric
Two
Whe
eler
s2,
761
-
-
-
-
-
-
-
Tota
l Tw
o W
heel
ers
10,
511,
009
13,
329,
895
15,
384,
261
15,
758,
689
16,
890,
778
18,
462,
178
18,
938,
727
19,
930,
015
20,
200,
117
21,
179,
847
17,
417,
616
5.18
Qua
dric
ycle
-
-
-
-
-
-
-
1,55
6
-
627
942
Gra
nd T
otal
14,
099,
823
17,
852,
489
20,
299,
674
20,
714,
277
21,
533,
807
23,
326,
386
24,
112,
465
25,
344,
006
24,
981,
312
26,
266,
179
21,
546,
390
4.33
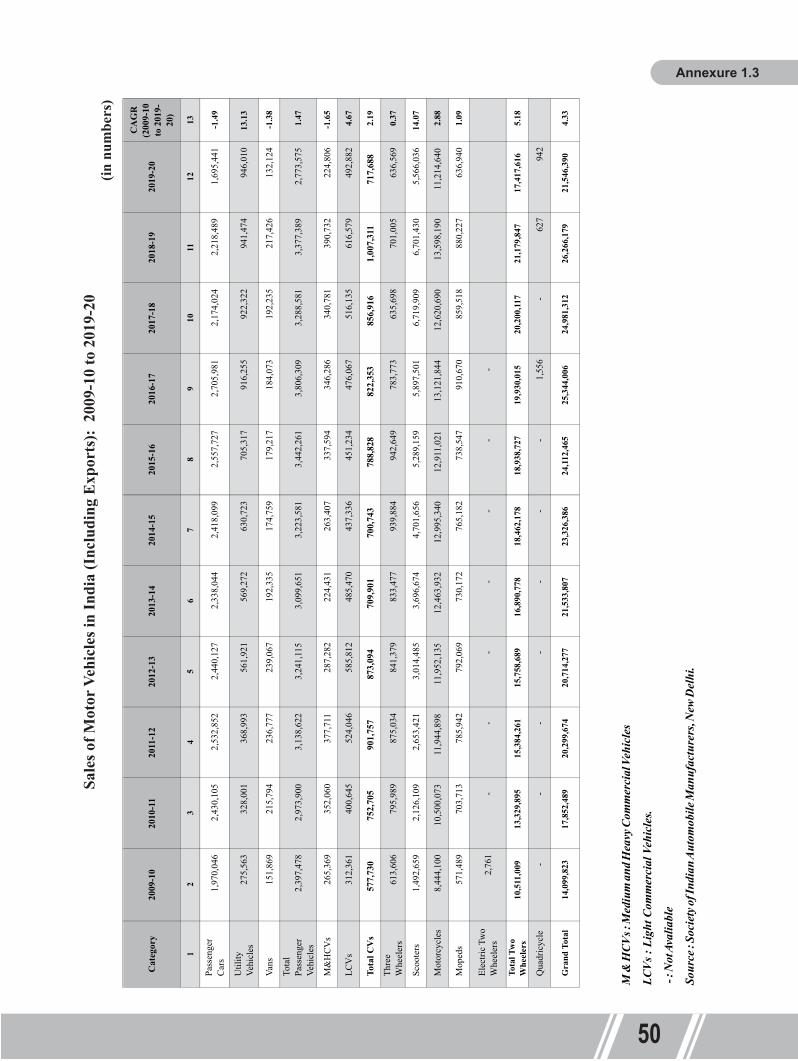

51
M &
HCV
s : M
ediu
m an
d Hea
vy C
omm
erci
al V
ehic
les
LCVs
: Li
ght C
omm
erci
al V
ehic
les.
- : N
ot A
valia
ble
Sour
ce : S
ocie
ty of
Indi
an A
utom
obile
Man
ufac
ture
rs, N
ew D
elhi
.
Aut
omob
ile E
xpor
ts :
2009
-10
to 2
019-
20(in
num
bers
)
Annexure 1.4
Number of Buses Owned by the Public and Private Sectors in India: 1961-2019 (in thousands)
: Includes omni - buses. - : Not reported.Note: i. Public sector buses are owned and operated by SRTUs. The total number of buses of the private sector
are derived from the total number of buses net of those in public sector (SRTU buses). ii. Public Sector / SRTU bus fleet based on information furnished by reporting (31) SRTUs.Sources: 1. Offices of State Transport Commissioners/UT Administrations. 2. State Road Transport Undertakings.Omni Bus: Omnibus means any motor vehicle constructed or adapted to carry more than six persons excluding the driver.
52
*
Annexure 1.5
Cat
egor
y20
09-1
020
10-1
120
11-1
220
12-1
320
13-1
420
14-1
520
15-1
620
16-1
720
17-1
820
18-1
920
19-2
0
CA
GR
(2
009-
10
to 2
019-
20)
12
34
56
78
910
1112
13
Pass
enge
r Car
s44
1,70
9
447,
403
50
1,54
6
544,
656
551,
218
542,
082
532,
630
602,
134
580,
153
513,
912
490,
748
1.06
Util
ity V
ehic
les
2,82
3
3,
789
5,22
1
8,
261
43,4
3377
,024
118,
741
154,
257
166,
317
158,
251
183,
671
51.8
2
Vans
1,61
3
2,
287
2,01
6
1,
769
1,49
13,
364
1,68
22,
336
1,89
64,
029
2,89
26.
01
Tota
l Pas
seng
er
Vehi
cles
446,
145
45
3,47
9
508,
783
55
4,68
659
6,14
262
2,47
065
3,05
375
8,72
774
8,36
667
6,19
267
7,31
14.
26
M&
HC
Vs
20,4
25
29,2
72
28,4
95
19,0
1923
,813
30,6
5235
,197
43,7
1944
,093
48,6
7624
,162
1.69
LCV
s24
,584
47
,025
63
,763
60
,925
53,2
3755
,130
67,9
2764
,552
52,7
7251
,257
36,5
514.
05
Tota
l CV
s
45,
009
76
,297
92,2
58
79,
944
77,
050
85,
782
1
03,1
24
1
08,2
71
96,
865
99,
933
60,
713
3.04
Thre
e W
heel
ers
173,
214
26
9,96
7
36
1,75
3
30
3,08
835
3,39
240
7,95
740
4,44
127
1,89
438
1,00
256
7,68
350
2,16
911
.23
Scoo
ters
30,1
25
52,3
12
94,4
40
91,0
8493
,931
196,
127
257,
481
292,
828
314,
284
398,
316
369,
998
28.5
1
Mot
orcy
cles
1,10
2,97
8
1,48
0,98
3
1,87
1,59
5
1,86
6,54
91,
982,
817
2,25
1,79
12,
210,
615
2,02
7,29
72,
483,
307
2,86
5,85
13,
136,
519
11.0
2
Mop
eds
6,90
5
6,29
5
9,07
6
3,30
87,
252
9,67
914
,780
20,1
5217
,412
16,6
7413
,859
7.22
Tota
l Tw
o W
heel
ers
1,14
0,05
8
1,53
9,59
0
1,97
5,11
1
1,96
0,94
12,
084,
000
2,45
7,59
72,
482,
876
2,34
0,27
72,
815,
003
3,28
0,84
13,
520,
376
11.9
4
Qua
dric
ycle
-
-
-
-
-
-
-
1,
556
1,
605
4,
400
5,
185
Gra
nd T
otal
1,80
4,42
6
2,33
9,33
3
2,93
7,90
5
2,89
8,65
93,
110,
584
3,57
3,80
63,
643,
494
3,48
0,72
54,
042,
841
4,62
9,04
94,
765,
754
10.2
0
1 2 3 4 5 61961 18.0 31.7 38.8 68.3 56.8
1966 26.5 36.1 47.0 63.9 73.5
1971 - - - - 94.0
1976 52.2 45.4 62.8 54.6 115.0
1981 69.6 43.0 92.3 57.0 161.9
1986 84.0 37.0 143.3 63.0 227.3
1991 106.1 32.0 225.0 68.0 331.1
1996 111.1 24.7 338.7 75.3 449.8
2001 115.0 18.1 518.9 81.9 633.9
2002 114.7 18.1 520.3 81.9 635.0
2003 114.9 15.9 605.9 84.1 720.8
2004 111.4 14.5 656.2 85.5 767.6
2005 113.3 12.7 779.4 87.3 892.7
2006 112.1 11.3 879.9 88.7 992.0
2007 107.8 8.0 1,242.5 92.0 1,350.3
2008 113.6 8.0 1,313.6 92.0 1,427.2
2009 117.6 7.9 1,368.0 92.1 1,485.6
2010 118.8 7.8 1,408.3 92.2 1,527.1
2011 130.6 8.1 1,473.2 91.9 1,603.8
2012 131.8 7.9 1,544.7 92.1 1,676.5
2013 137.9 7.6 1,676.1 92.4 1,814.0
2014 140.2 7.4 1,746.7 92.6 1,886.9
2015 140.5 7.1 1,830.3 92.9 1,970.8
2016 142.9 8.1 1,613.8 91.9 1,756.7
2017 149.1 8.0 1,715.1 92.0 1,864.2
2018(P) 149.7 7.7 1,792.8 92.3 1,942.5
2019(P) 149.5 7.3 1,899.4 92.7 2,048.9
Year (As on 31st March) Public Sector Private Sector%age share to
total buses%age share to
total buses Total
*
*
*
*
*
*
*
*
*
*
*
*
*
*
*
*
*
*
*

Freight and Passenger Movement by Road Transport:1999-2000 to 2018-19
53
Note:
1. In respect of freight movement, the figure from 1999-2000 to 2005-06 are from earlier publication of RTYBs, figure for the year 2006-07 is from report of National Transport Development Policy Committee, 2014 and figure from 2007-08 to 2018-19 have been estimated by Transport Research Wing, Ministry of Road Transport & Highways, Government of India on the basis of actual GDP growth rate and elasticity of freight traffic (1.4) estimated by the National Transport Development Policy Committee, 2014.
Formula : (previous year freight movement figure) X (1+(GDP growth rate X elasticity of Freight movement)2. In respect of Passenger movement, the figure from 1999-2000 to 2005-06 are from earlier publication of RTYBs,
figure for the year 2006-07 is from report of National Transport Development Policy Committee, 2014 and figure from 2007-08 to 2018-19 are estimated by Transport Research Wing, Ministry of Road Transport & Highways, Government of India on the basis of actual GDP growth rate and elasticity of Passenger movement (1.9) estimated by the National Transport Development Policy Committee, 2014.
Formula : (previous year passenger movement figure) X (1+(GDP growth rate X elasticity of passenger movement)
3. GDP growth rate ( at constant prices) have been adopted from the press note on " FIRST REVISED ESTIMATES OF NATIONAL INCOME, CONSUMPTION EXPENDITURE, SAVING AND CAPITAL FORMATION FOR 2017-18" and the figures for the the years 2012-13 onwards have been revised.
Annexure 1.6
Number of Valid Drivers' Licences Issued as on 31.03.2018 (Cummulative)
( )= data not furnishedSource: Offices of State Transport Commissioners/UT Administrations.
54
*
Annexure 1.7
Year Freight (Billion Tonnes km) Passenger (Billion Passengers km) GDP Growth Rate used
(1) (2) (3) (4)
1999-2000 467.0 1,832 0.080
2000-01 494.0 2,076 0.041
2001-02 515.0 2,413 0.054
2002-03 545.0 2,815 0.039
2003-04 595.0 3,070 0.080
2004-05 643.0 3,469 0.071
2005-06 728.3 4,252 0.095
2006-07 825.9 4,657 0.096
2007-08 933.7 5,482 0.093
2008-09 1,021.6 6,182 0.067
2009-10 1,144.5 7,192 0.086
2010-11 1,287.3 8,409 0.089
2011-12 1,407.8 9,478 0.067
2012-13 1,516.2 10,469 0.055
2013-14 1,652.1 11,742 0.064
2014-15 1,823.2 13,393 0.074
2015-16 2,027.4 15,428 0.080
2016-17 2,260.2 17,832 0.082
2017-18 2,484.8 20,237 0.070
2018-19 2,697.0 22,582 0.061
Male Female Total (2+3) Male Female Total (5+6) Male Female Total (8+9) Male (2+5+8) Female (3+6+9) Total (4+7+10)
1 2 3 4 5 6 7 8 9 10 11 12 13 14 15
STATES
Andhra Pradesh 556,091 809 556,900 100,833 394 101,227 5,419,092 208,618 5,627,710 6,076,016 209,821 6,285,837 96.66 3.34
Arunachal Pradesh 5,055 -
5,055 6,457 -
6,457 55,118 11,708 66,826 66,630 11,708 78,338 85.05 14.95
Assam 95,873 12 95,885 156,652 730 157,382 1,018,626 65,192 1,083,818 1,271,151 65,934 1,337,085 95.07 4.93
Bihar 135,703 70 135,773 25,486 64 25,550 2,868,680 85,696 2,954,376 3,029,869 85,830 3,115,699 97.25 2.75
Chhattisgarh 87,912 154 88,066 38,490 1,202 39,692 1,658,059 239,178 1,897,237 1,784,461 240,534 2,024,995 88.12 11.88
Goa 49,795 95 49,890 53,367 210 53,577 505,683 186,183 691,866 608,845 186,488 795,333 76.55 23.45
Gujarat 1,097,121 3,174,836 19,942,389 0 0 24,214,346 0.00 0.00
Haryana 316,050 455 316,505 0 0 0 3,609,730 286,500 3,896,230 3,925,780 286,955 4,212,735 93.19 6.81
Himachal Pradesh 205,802 1,514 207,316 40,725 210 40,935 1,170,148 73,102 1,243,250 1,416,675 74,826 1,491,501 94.98 5.02
Jammu & Kashmir 62,276 0 62,276 112,339 0 112,339 835,959 114,944 950,903 1,010,574 114,944 1,125,518 89.79 10.21
Jharkhand 170,390 0 170,390 54,710 348 55,058 765,605 46,451 812,056 990,705 46,799 1,037,504 95.49 4.51
Karnataka 1,687,814 17,571 1,705,385 653,634 57,754 711,388 11,093,380 2,288,573 13,381,953 13,429,278 2,363,933 15,798,726 85.00 14.96
Kerala 746,218 876 747,094 759,660 877 760,537 5,485,242 1,544,062 7,029,304 6,991,120 1,545,815 8,536,935 81.89 18.11
Madhya Pradesh 1,081,273 8,845 1,090,118 -
-
-
4,410,261 462,877 4,873,138 5,491,534 471,722 5,963,256 92.09 7.91
Maharashtra 2,296,112 5,848 2,301,960 9,770,508 7,870 9,778,378 21,755,935 249,441 22,005,376 33,822,555 263,159 34,085,714 99.23 0.77
Manipur 26,749 26,749 21,174 21,174 350,000 150,000 500,000 397,923 150,000 547,923 72.62 27.38
Meghalaya 100,248 84 100,332 0 376,602 30,559 407,161 476,850 30,643 507,493 93.96 6.04
Mizoram (*) -
-
-
-
-
-
-
-
-
- - - - -
Nagaland 13,594 0 13,594 95,975 3 95,978 147,849 27,793 175,642 257,418 27,796 285,214 90.25 9.75
Odisha 90,127 19 90,146 257,967 55 258,022 3,254,324 151,580 3,405,904 3,602,418 151,654 3,754,072 95.96 4.04
Punjab 458,628 1,016 459,644 926,178 1,997 928,175 9,568,670 698,794 10,267,464 10,953,476 701,807 11,655,283 93.98 6.02
Rajasthan - - - - - 1,067,769 - - 11,598,910 - - 12,666,679 0.00 0.00
Sikkim 51,224 42 51,266 4,127 580 4,707 78,421 4,989 83,410 133,772 5,611 139,383 95.97 4.03
Tamil Nadu 3,825,997 75,064 3,901,061 1,563,451 54,250 1,617,701 15,784,402 2,312,264 18,096,666 21,173,850 2,441,578 23,615,428 89.66 10.34
Telangana 262,211 835 263,046 185,303 501 185,804 2,981,629 243,190 3,224,819 3,429,143 244,526 3,673,669 93.34 6.66
Tripura 78,784 15 78,799 0 0 0 533,755 12,207 545,962 612,539 12,222 624,761 98.04 1.96
Uttarakhand 81,913 12 81,925 52,904 16 52,920 663,921 87,315 751,236 798,738 87,343 886,081 90.14 9.86
Uttar Pradesh 1,932,767 83 1,932,850 84,116 364 84,480 18,140,151 1,190,150 19,330,301 20,157,034 1,190,597 21,347,631 94.42 5.58
West Bengal 0 0 0 0 0 0 0 0 0 0 0 0 0.00 0.00
UTs 0
A & N Islands 13,915 23 13,938 19,225 33 19,258 104,184 6,375 110,559 137,324 6,431 143,755 95.53 4.47
Chandigarh 0 0 0 35,835 53 35,888 564,906 142,171 707,077 600,741 142,224 742,965 80.86 19.14
D & N Haveli 0
Daman & Diu 0
Delhi 114,468 654 115,122 155,802 135 155,937 6,415,644 715,460 7,131,104 6,685,914 716,249 7,402,163 90.32 9.68
Lakshadweep 0 0 0 937 0 937 11,990 595 12,585 12,927 595 13,522 95.60 4.40
Puducherry (*) 0 0 0 0 0 0 0 0 0 0 0 0 0.00 0.00
Total 14,546,989 114,096 15,758,206 15,175,855 127,646 19,546,106 119,627,966 11,635,967 162,805,232 149,345,260 11,877,744 198,109,544 75.39 6.00
STATES / UTs
ProfessionalNon professional Total %age Share
of total Male Driver
Licences
%age Share of total Female Driver
Licences
Authorised to drive public Service Vehicles Others

55
Num
ber o
f Dri
vers
' Lic
ence
s Iss
ued
duri
ng th
e Yea
r 201
7-18
(*)=
dat
a no
t fur
nish
ed -
: Not
repo
rted.
Sour
ce: O
ffice
s of S
tate
Tra
nspo
rt Co
mm
issio
ners
/UT
Adm
inist
ratio
ns.
Annexure 1.8
56
Annexure 1.9
Num
ber o
f Val
id D
rive
rs' L
icen
ces I
ssue
d as
on
31.0
3.20
19 (C
umm
ulat
ive)
(*)=
dat
a no
t fur
nish
edSo
urce
: Offi
ces o
f Sta
te T
rans
port
Com
miss
ione
rs/U
T Ad
min
istra
tions
.
Mal
eFe
mal
eTo
tal (
2+3)
Mal
eFe
mal
eTo
tal (
5+6)
Mal
eFe
mal
eTo
tal (
8+9)
Mal
e (2
+5+8
)Fe
mal
e (3
+6+9
)To
tal (
4+7+
10)
12
34
56
78
910
1112
1314
15
And
hra
Prad
esh
34,1
0211
634
,218
11,5
2095
11,6
1538
1,23
633
,908
415,
144
426,
858
34,1
1946
0,97
792
.60
7.40
Aru
nach
al P
rade
sh
1,97
9-
1,97
93,
162
153,
177
19,6
694,
466
24,1
3524
,810
4,48
129
,291
84.7
015
.30
Ass
am3,
535
3,53
51,
253
621,
315
110,
154
17,3
6712
7,52
111
4,94
217
,429
132,
371
86.8
313
.17
Bih
ar9,
742
199,
761
4,75
52
4,75
733
9,84
88,
496
348,
344
354,
345
8,51
736
2,86
297
.65
2.35
Chh
attis
garh
8,72
513
98,
864
8,82
61,
201
10,0
2717
6,63
223
,223
199,
855
194,
183
24,5
6321
8,74
688
.77
11.2
3G
oa13
70
137
1,48
510
1,49
518
,598
8,32
826
,926
20,2
208,
338
28,5
5870
.80
29.2
0G
ujar
at46
,234
7546
,309
32,5
2747
32,5
7453
5,53
579
,903
615,
438
614,
296
80,0
2569
4,32
188
.47
11.5
3H
arya
na
3,97
315
3,98
80
00
264,
997
43,1
0830
8,10
526
8,97
043
,123
312,
093
86.1
813
.82
Him
acha
l Pra
desh
9,
364
209,
384
5,49
06
5,49
610
1,91
29,
047
110,
959
116,
766
9,07
312
5,83
992
.79
7.21
Jam
mu
& K
ashm
ir7,
905
07,
905
4,97
60
4,97
656
,564
11,9
2168
,485
69,4
4511
,921
81,3
6685
.35
14.6
5Jh
arkh
and
193
019
347
83
481
161,
786
32,4
9719
4,28
316
2,45
732
,500
194,
957
83.3
316
.67
Kar
nata
ka
105,
672
177
105,
849
54,8
356,
146
60,9
8173
1,79
017
8,97
091
0,76
089
2,29
718
5,29
31,
077,
590
82.8
017
.20
Ker
ala
29,5
6876
29,6
4429
,751
7729
,828
512,
765
216,
969
729,
734
572,
084
217,
122
789,
206
72.4
927
.51
Mad
hya
Prad
esh
216,
430
1,96
821
8,39
8-
-
-
587,
821
84,0
1867
1,83
980
4,25
185
,986
890,
237
90.3
49.
66M
ahar
asht
ra79
,918
5,84
985
,767
170,
692
7,87
517
8,56
779
5,48
224
9,44
61,
044,
928
1,04
6,09
226
3,17
01,
309,
262
79.9
020
.10
Man
ipur
263
263
1,09
30
1,09
362
,268
8,18
370
,451
63,6
248,
183
71,8
0788
.60
11.4
0M
egha
laya
4,67
92
4,68
10
28,5
424,
910
33,4
5233
,221
4,91
238
,133
87.1
212
.88
Miz
oram
(*)
-
-
-
-
-
-
-
-
-
-
-
-
0.00
0.00
Nag
alan
d50
00
500
4,47
33
4,47
610
,774
1,42
712
,201
15,7
471,
430
17,1
7791
.67
8.33
Odi
sha
44,0
690
44,0
692,
098
02,
098
213,
934
32,7
7524
6,70
926
0,10
132
,775
292,
876
88.8
111
.19
Punj
ab
25,5
3884
25,6
2230
,912
3730
,949
302,
535
34,2
3733
6,77
235
8,98
534
,358
393,
343
91.2
78.
73R
ajas
than
-
-
-
-
-
46,3
2551
6,22
263
,346
579,
568
-
-
625,
893
0.00
0.00
Sikk
im
1,46
36
1,46
919
019
4,64
392
25,
565
6,11
992
87,
053
86.7
613
.16
Tam
il N
adu
92,4
582,
019
94,4
7792
,365
5,42
497
,789
762,
954
280,
632
1,04
3,58
694
7,77
728
8,07
51,
235,
852
76.6
923
.31
Tela
ngan
a44
,066
284
44,3
509,
911
379,
948
339,
884
34,7
9437
4,67
839
3,86
135
,115
428,
976
91.8
18.
19Tr
ipur
a2,
823
12,
824
00
046
,376
1,95
148
,327
49,1
991,
952
51,1
5196
.18
3.82
Utta
rakh
and
8,78
44
8,78
81,
795
31,
798
100,
864
22,5
3212
3,39
611
1,44
322
,539
133,
982
83.1
816
.82
Utta
r Pra
desh
160,
326
1916
0,34
51,
765
101,
775
1,40
5,15
884
,217
1,48
9,37
51,
567,
249
84,2
461,
651,
495
94.9
05.
10W
est B
enga
l (*)
00
00
00
00
00
00
0.00
0.00
A &
N Is
land
s1,
384
41,
388
848
885
67,
129
799
7,92
89,
361
811
10,1
7292
.03
7.97
Cha
ndig
arh
00
01,
320
41,
324
9,86
73,
915
13,7
8211
,187
3,91
915
,106
74.0
625
.94
D &
N H
avel
iD
aman
& D
iuD
elhi
16,0
2240
616
,428
12,9
1762
12,9
7933
0,22
256
,901
387,
123
359,
161
57,3
6941
6,53
086
.23
13.7
7La
ksha
dwee
p0
00
312
031
21,
367
137
1,50
41,
679
137
1,81
692
.46
7.54
Pudu
cher
ry (*
)0
00
00
00
00
00
00.
000.
00To
tal
959,
852
11,2
8397
1,13
548
9,57
821
,127
557,
030
8,93
7,52
81,
633,
345
10,5
70,8
739,
870,
730
1,60
2,40
912
,099
,038
81.5
813
.24
STAT
ES /
UTs
Prof
essio
nal
Non
pro
fess
iona
lTo
tal
%ag
e Sh
are
of to
tal
Mal
e D
rive
r Li
cenc
es
%ag
e Sh
are
of T
otal
Fe
mal
e D
rive
r Li
cenc
es
Aut
hori
sed
to d
rive
pub
lic S
ervi
ce V
ehic
les
Oth
ers
UTs
STAT
ES
Mal
eFe
mal
eTo
tal (
2+3)
Mal
eFe
mal
eTo
tal (
5+6)
Mal
eFe
mal
eTo
tal (
8+9)
Mal
e (2
+5+8
)Fe
mal
e (3
+6+9
)To
tal (
4+7+
10)
12
34
56
78
910
1112
1314
15
And
hra
Prad
esh
597,
689
965
598,
654
111,
324
526
111,
850
6,02
2,89
425
2,91
96,
275,
813
6,73
1,90
725
4,41
06,
986,
317
96.3
63.
64A
runa
chal
Pra
desh
6,
729
-
6,72
910
,108
010
,108
90,7
2418
,565
109,
289
107,
561
18,5
6512
6,12
685
.28
14.7
2A
ssam
97,9
1612
97,9
2815
9,37
476
616
0,14
01,
164,
731
97,8
781,
262,
609
1,42
2,02
198
,656
1,52
0,67
793
.51
6.49
Bih
ar
143,
094
7514
3,16
938
,132
124
38,2
563,
125,
016
97,5
153,
222,
531
3,30
6,24
297
,714
3,40
3,95
697
.13
2.87
Chh
attis
garh
90
,909
124
91,0
3340
,807
1,17
441
,981
1,70
5,90
224
2,31
41,
948,
216
1,83
7,61
824
3,61
22,
081,
230
88.2
911
.71
Goa
49,9
3098
50,0
2854
,564
223
54,7
8752
9,87
820
1,60
073
1,47
863
4,37
220
1,92
183
6,29
375
.86
24.1
4G
ujar
at
00
1,13
7,34
30
03,
207,
410
00
20,6
96,8
140
025
,041
,567
0.00
0.00
Har
yana
31
6,51
945
831
6,97
70
00
3,89
1,72
133
8,01
94,
229,
740
4,20
8,24
033
8,47
74,
546,
717
92.5
67.
44H
imac
hal P
rade
sh
210,
847
1,52
921
2,37
646
,669
218
46,8
871,
301,
748
86,1
821,
387,
930
1,55
9,26
487
,929
1,64
7,19
394
.66
5.34
Jam
mu
& K
ashm
ir70
,022
070
,022
118,
114
111
8,11
589
5,26
912
9,84
81,
025,
117
1,08
3,40
512
9,84
91,
213,
254
89.3
010
.70
Jhar
khan
d17
0,39
00
170,
390
54,7
1034
855
,058
765,
605
46,4
5181
2,05
699
0,70
546
,799
1,03
7,50
495
.49
4.51
Kar
nata
ka1,
768,
558
17,8
431,
786,
401
719,
456
67,0
5578
6,51
111
,750
,682
2,43
6,10
214
,186
,784
14,2
38,6
962,
521,
000
16,7
59,6
9684
.96
15.0
4K
eral
a77
0,03
196
277
0,99
378
,675
963
79,6
385,
866,
428
1,74
0,51
67,
606,
944
6,71
5,13
41,
742,
441
8,45
7,57
579
.40
20.6
0M
adhy
a Pr
ades
h1,
081,
273
8,84
51,
090,
118
-
-
-
4,41
0,26
146
2,87
74,
873,
138
5,49
1,53
447
1,72
25,
963,
256
92.0
97.
91M
ahar
asht
ra2,
214,
854
1,43
42,
216,
288
9,58
5,03
914
,820
9,59
9,85
920
,462
,350
498,
149
20,9
60,4
9932
,262
,243
514,
403
32,7
76,6
4698
.43
1.57
Man
ipur
26
,963
26,9
6322
,164
22,1
6438
0,37
815
2,66
153
3,03
942
9,50
515
2,66
158
2,16
673
.78
26.2
2M
egha
laya
163,
554
8516
3,63
90
412,
217
36,2
4744
8,46
457
5,77
136
,332
612,
103
94.0
65.
94M
izor
am (*
)-
-
-
-
-
-
-
-
-
-
-
-
0.00
0.00
Nag
alan
d13
,819
113
,820
97,9
085
97,9
1316
0,29
629
,494
189,
790
272,
023
29,5
0030
1,52
390
.22
9.78
Odi
sha
99,6
1922
99,6
4127
1,22
362
271,
285
3,56
3,96
317
9,78
93,
743,
752
3,93
4,80
517
9,87
34,
114,
678
95.2
04.
80Pu
njab
49
0,43
11,
090
491,
521
963,
790
2,05
196
5,84
19,
912,
003
748,
369
10,6
60,3
7211
,366
,224
751,
510
12,1
17,7
340.
000.
00R
ajas
than
-
-
-
-
-
1,11
9,12
70
012
,152
,474
-
-
13,2
71,6
010.
000.
00Si
kkim
51
,224
4251
,266
4,12
758
04,
707
78,4
214,
989
83,4
1013
3,77
25,
611
139,
383
95.9
74.
03Ta
mil
Nad
u3,
903,
708
75,8
743,
979,
582
1,65
6,30
455
,639
1,71
1,94
316
,619
,593
2,61
2,88
319
,232
,476
22,1
79,6
052,
744,
396
24,9
24,0
0188
.99
11.0
1Te
lang
ana
289,
882
979
290,
861
188,
490
516
189,
006
3,37
0,08
828
1,11
53,
651,
203
3,84
8,46
028
2,61
04,
131,
070
93.1
66.
84Tr
ipur
a 80
,552
1580
,567
00
058
7,94
114
,481
602,
422
668,
493
14,4
9668
2,98
997
.88
2.12
Utta
rakh
and
87,4
6812
87,4
8055
,062
1955
,081
702,
875
91,1
4979
4,02
484
5,40
591
,180
936,
585
90.2
69.
74U
ttar P
rade
sh2,
055,
456
842,
055,
540
90,5
9842
591
,023
19,3
48,7
421,
274,
131
20,6
22,8
7321
,494
,796
1,27
4,64
022
,769
,436
94.4
05.
60W
est B
enga
l (*)
00
00
00
00
00
00
0.00
0.00
A &
N Is
land
s14
,129
2714
,156
19,8
2533
19,8
5810
9,51
96,
902
116,
421
143,
473
6,96
215
0,43
595
.37
4.63
Cha
ndig
arh
00
036
,058
6036
,118
840,
070
212,
083
1,05
2,15
387
6,12
884
0,13
01,
088,
271
80.5
177
.20
D &
N H
avel
iD
aman
& D
iuD
elhi
120,
383
991
121,
374
155,
981
135
156,
116
6,58
2,32
874
3,03
47,
325,
362
6,85
8,69
274
4,16
07,
602,
852
90.2
19.
79La
ksha
dwee
p0
00
937
093
711
,990
595
12,5
8512
,927
595
13,5
2295
.60
4.40
Pudu
cher
ry (*
)0
00
00
00
00
00
00.
000.
00To
tal
14,9
85,9
4911
1,56
716
,234
,859
14,5
79,4
3914
5,74
319
,051
,719
124,
663,
633
13,0
36,8
5717
0,54
9,77
815
4,22
9,02
113
,922
,154
205,
836,
356
74.9
36.
76
STAT
ES /
UTs
Prof
essio
nal
Non
pro
fess
iona
lTo
tal
%ag
e Sh
are
of to
tal
Mal
e D
rive
r Li
cenc
es
%ag
e Sh
are
of to
tal
Fem
ale
Dri
ver
Lice
nces
Aut
hori
sed
to d
rive
pub
lic S
ervi
ce V
ehic
les
Oth
ers
STAT
ES
UTs

55
Num
ber o
f Dri
vers
' Lic
ence
s Iss
ued
duri
ng th
e Yea
r 201
7-18
(*)=
dat
a no
t fur
nish
ed -
: Not
repo
rted.
Sour
ce: O
ffice
s of S
tate
Tra
nspo
rt Co
mm
issio
ners
/UT
Adm
inist
ratio
ns.
Annexure 1.8
56
Annexure 1.9N
umbe
r of V
alid
Dri
vers
' Lic
ence
s Iss
ued
as o
n 31
.03.
2019
(Cum
mul
ativ
e)
(*)=
dat
a no
t fur
nish
edSo
urce
: Offi
ces o
f Sta
te T
rans
port
Com
miss
ione
rs/U
T Ad
min
istra
tions
.
Mal
eFe
mal
eTo
tal (
2+3)
Mal
eFe
mal
eTo
tal (
5+6)
Mal
eFe
mal
eTo
tal (
8+9)
Mal
e (2
+5+8
)Fe
mal
e (3
+6+9
)To
tal (
4+7+
10)
12
34
56
78
910
1112
1314
15
And
hra
Prad
esh
34,1
0211
634
,218
11,5
2095
11,6
1538
1,23
633
,908
415,
144
426,
858
34,1
1946
0,97
792
.60
7.40
Aru
nach
al P
rade
sh
1,97
9-
1,97
93,
162
153,
177
19,6
694,
466
24,1
3524
,810
4,48
129
,291
84.7
015
.30
Ass
am3,
535
3,53
51,
253
621,
315
110,
154
17,3
6712
7,52
111
4,94
217
,429
132,
371
86.8
313
.17
Bih
ar9,
742
199,
761
4,75
52
4,75
733
9,84
88,
496
348,
344
354,
345
8,51
736
2,86
297
.65
2.35
Chh
attis
garh
8,72
513
98,
864
8,82
61,
201
10,0
2717
6,63
223
,223
199,
855
194,
183
24,5
6321
8,74
688
.77
11.2
3G
oa13
70
137
1,48
510
1,49
518
,598
8,32
826
,926
20,2
208,
338
28,5
5870
.80
29.2
0G
ujar
at46
,234
7546
,309
32,5
2747
32,5
7453
5,53
579
,903
615,
438
614,
296
80,0
2569
4,32
188
.47
11.5
3H
arya
na
3,97
315
3,98
80
00
264,
997
43,1
0830
8,10
526
8,97
043
,123
312,
093
86.1
813
.82
Him
acha
l Pra
desh
9,
364
209,
384
5,49
06
5,49
610
1,91
29,
047
110,
959
116,
766
9,07
312
5,83
992
.79
7.21
Jam
mu
& K
ashm
ir7,
905
07,
905
4,97
60
4,97
656
,564
11,9
2168
,485
69,4
4511
,921
81,3
6685
.35
14.6
5Jh
arkh
and
193
019
347
83
481
161,
786
32,4
9719
4,28
316
2,45
732
,500
194,
957
83.3
316
.67
Kar
nata
ka
105,
672
177
105,
849
54,8
356,
146
60,9
8173
1,79
017
8,97
091
0,76
089
2,29
718
5,29
31,
077,
590
82.8
017
.20
Ker
ala
29,5
6876
29,6
4429
,751
7729
,828
512,
765
216,
969
729,
734
572,
084
217,
122
789,
206
72.4
927
.51
Mad
hya
Prad
esh
216,
430
1,96
821
8,39
8-
-
-
587,
821
84,0
1867
1,83
980
4,25
185
,986
890,
237
90.3
49.
66M
ahar
asht
ra79
,918
5,84
985
,767
170,
692
7,87
517
8,56
779
5,48
224
9,44
61,
044,
928
1,04
6,09
226
3,17
01,
309,
262
79.9
020
.10
Man
ipur
263
263
1,09
30
1,09
362
,268
8,18
370
,451
63,6
248,
183
71,8
0788
.60
11.4
0M
egha
laya
4,67
92
4,68
10
28,5
424,
910
33,4
5233
,221
4,91
238
,133
87.1
212
.88
Miz
oram
(*)
-
-
-
-
-
-
-
-
-
-
-
-
0.00
0.00
Nag
alan
d50
00
500
4,47
33
4,47
610
,774
1,42
712
,201
15,7
471,
430
17,1
7791
.67
8.33
Odi
sha
44,0
690
44,0
692,
098
02,
098
213,
934
32,7
7524
6,70
926
0,10
132
,775
292,
876
88.8
111
.19
Punj
ab
25,5
3884
25,6
2230
,912
3730
,949
302,
535
34,2
3733
6,77
235
8,98
534
,358
393,
343
91.2
78.
73R
ajas
than
-
-
-
-
-
46,3
2551
6,22
263
,346
579,
568
-
-
625,
893
0.00
0.00
Sikk
im
1,46
36
1,46
919
019
4,64
392
25,
565
6,11
992
87,
053
86.7
613
.16
Tam
il N
adu
92,4
582,
019
94,4
7792
,365
5,42
497
,789
762,
954
280,
632
1,04
3,58
694
7,77
728
8,07
51,
235,
852
76.6
923
.31
Tela
ngan
a44
,066
284
44,3
509,
911
379,
948
339,
884
34,7
9437
4,67
839
3,86
135
,115
428,
976
91.8
18.
19Tr
ipur
a2,
823
12,
824
00
046
,376
1,95
148
,327
49,1
991,
952
51,1
5196
.18
3.82
Utta
rakh
and
8,78
44
8,78
81,
795
31,
798
100,
864
22,5
3212
3,39
611
1,44
322
,539
133,
982
83.1
816
.82
Utta
r Pra
desh
160,
326
1916
0,34
51,
765
101,
775
1,40
5,15
884
,217
1,48
9,37
51,
567,
249
84,2
461,
651,
495
94.9
05.
10W
est B
enga
l (*)
00
00
00
00
00
00
0.00
0.00
A &
N Is
land
s1,
384
41,
388
848
885
67,
129
799
7,92
89,
361
811
10,1
7292
.03
7.97
Cha
ndig
arh
00
01,
320
41,
324
9,86
73,
915
13,7
8211
,187
3,91
915
,106
74.0
625
.94
D &
N H
avel
iD
aman
& D
iuD
elhi
16,0
2240
616
,428
12,9
1762
12,9
7933
0,22
256
,901
387,
123
359,
161
57,3
6941
6,53
086
.23
13.7
7La
ksha
dwee
p0
00
312
031
21,
367
137
1,50
41,
679
137
1,81
692
.46
7.54
Pudu
cher
ry (*
)0
00
00
00
00
00
00.
000.
00To
tal
959,
852
11,2
8397
1,13
548
9,57
821
,127
557,
030
8,93
7,52
81,
633,
345
10,5
70,8
739,
870,
730
1,60
2,40
912
,099
,038
81.5
813
.24
STAT
ES /
UTs
Prof
essio
nal
Non
pro
fess
iona
lTo
tal
%ag
e Sh
are
of to
tal
Mal
e D
rive
r Li
cenc
es
%ag
e Sh
are
of T
otal
Fe
mal
e D
rive
r Li
cenc
es
Aut
hori
sed
to d
rive
pub
lic S
ervi
ce V
ehic
les
Oth
ers
UTs
STAT
ES
Mal
eFe
mal
eTo
tal (
2+3)
Mal
eFe
mal
eTo
tal (
5+6)
Mal
eFe
mal
eTo
tal (
8+9)
Mal
e (2
+5+8
)Fe
mal
e (3
+6+9
)To
tal (
4+7+
10)
12
34
56
78
910
1112
1314
15
And
hra
Prad
esh
597,
689
965
598,
654
111,
324
526
111,
850
6,02
2,89
425
2,91
96,
275,
813
6,73
1,90
725
4,41
06,
986,
317
96.3
63.
64A
runa
chal
Pra
desh
6,
729
-
6,72
910
,108
010
,108
90,7
2418
,565
109,
289
107,
561
18,5
6512
6,12
685
.28
14.7
2A
ssam
97,9
1612
97,9
2815
9,37
476
616
0,14
01,
164,
731
97,8
781,
262,
609
1,42
2,02
198
,656
1,52
0,67
793
.51
6.49
Bih
ar
143,
094
7514
3,16
938
,132
124
38,2
563,
125,
016
97,5
153,
222,
531
3,30
6,24
297
,714
3,40
3,95
697
.13
2.87
Chh
attis
garh
90
,909
124
91,0
3340
,807
1,17
441
,981
1,70
5,90
224
2,31
41,
948,
216
1,83
7,61
824
3,61
22,
081,
230
88.2
911
.71
Goa
49,9
3098
50,0
2854
,564
223
54,7
8752
9,87
820
1,60
073
1,47
863
4,37
220
1,92
183
6,29
375
.86
24.1
4G
ujar
at
00
1,13
7,34
30
03,
207,
410
00
20,6
96,8
140
025
,041
,567
0.00
0.00
Har
yana
31
6,51
945
831
6,97
70
00
3,89
1,72
133
8,01
94,
229,
740
4,20
8,24
033
8,47
74,
546,
717
92.5
67.
44H
imac
hal P
rade
sh
210,
847
1,52
921
2,37
646
,669
218
46,8
871,
301,
748
86,1
821,
387,
930
1,55
9,26
487
,929
1,64
7,19
394
.66
5.34
Jam
mu
& K
ashm
ir70
,022
070
,022
118,
114
111
8,11
589
5,26
912
9,84
81,
025,
117
1,08
3,40
512
9,84
91,
213,
254
89.3
010
.70
Jhar
khan
d17
0,39
00
170,
390
54,7
1034
855
,058
765,
605
46,4
5181
2,05
699
0,70
546
,799
1,03
7,50
495
.49
4.51
Kar
nata
ka1,
768,
558
17,8
431,
786,
401
719,
456
67,0
5578
6,51
111
,750
,682
2,43
6,10
214
,186
,784
14,2
38,6
962,
521,
000
16,7
59,6
9684
.96
15.0
4K
eral
a77
0,03
196
277
0,99
378
,675
963
79,6
385,
866,
428
1,74
0,51
67,
606,
944
6,71
5,13
41,
742,
441
8,45
7,57
579
.40
20.6
0M
adhy
a Pr
ades
h1,
081,
273
8,84
51,
090,
118
-
-
-
4,41
0,26
146
2,87
74,
873,
138
5,49
1,53
447
1,72
25,
963,
256
92.0
97.
91M
ahar
asht
ra2,
214,
854
1,43
42,
216,
288
9,58
5,03
914
,820
9,59
9,85
920
,462
,350
498,
149
20,9
60,4
9932
,262
,243
514,
403
32,7
76,6
4698
.43
1.57
Man
ipur
26
,963
26,9
6322
,164
22,1
6438
0,37
815
2,66
153
3,03
942
9,50
515
2,66
158
2,16
673
.78
26.2
2M
egha
laya
163,
554
8516
3,63
90
412,
217
36,2
4744
8,46
457
5,77
136
,332
612,
103
94.0
65.
94M
izor
am (*
)-
-
-
-
-
-
-
-
-
-
-
-
0.00
0.00
Nag
alan
d13
,819
113
,820
97,9
085
97,9
1316
0,29
629
,494
189,
790
272,
023
29,5
0030
1,52
390
.22
9.78
Odi
sha
99,6
1922
99,6
4127
1,22
362
271,
285
3,56
3,96
317
9,78
93,
743,
752
3,93
4,80
517
9,87
34,
114,
678
95.2
04.
80Pu
njab
49
0,43
11,
090
491,
521
963,
790
2,05
196
5,84
19,
912,
003
748,
369
10,6
60,3
7211
,366
,224
751,
510
12,1
17,7
340.
000.
00R
ajas
than
-
-
-
-
-
1,11
9,12
70
012
,152
,474
-
-
13,2
71,6
010.
000.
00Si
kkim
51
,224
4251
,266
4,12
758
04,
707
78,4
214,
989
83,4
1013
3,77
25,
611
139,
383
95.9
74.
03Ta
mil
Nad
u3,
903,
708
75,8
743,
979,
582
1,65
6,30
455
,639
1,71
1,94
316
,619
,593
2,61
2,88
319
,232
,476
22,1
79,6
052,
744,
396
24,9
24,0
0188
.99
11.0
1Te
lang
ana
289,
882
979
290,
861
188,
490
516
189,
006
3,37
0,08
828
1,11
53,
651,
203
3,84
8,46
028
2,61
04,
131,
070
93.1
66.
84Tr
ipur
a 80
,552
1580
,567
00
058
7,94
114
,481
602,
422
668,
493
14,4
9668
2,98
997
.88
2.12
Utta
rakh
and
87,4
6812
87,4
8055
,062
1955
,081
702,
875
91,1
4979
4,02
484
5,40
591
,180
936,
585
90.2
69.
74U
ttar P
rade
sh2,
055,
456
842,
055,
540
90,5
9842
591
,023
19,3
48,7
421,
274,
131
20,6
22,8
7321
,494
,796
1,27
4,64
022
,769
,436
94.4
05.
60W
est B
enga
l (*)
00
00
00
00
00
00
0.00
0.00
A &
N Is
land
s14
,129
2714
,156
19,8
2533
19,8
5810
9,51
96,
902
116,
421
143,
473
6,96
215
0,43
595
.37
4.63
Cha
ndig
arh
00
036
,058
6036
,118
840,
070
212,
083
1,05
2,15
387
6,12
884
0,13
01,
088,
271
80.5
177
.20
D &
N H
avel
iD
aman
& D
iuD
elhi
120,
383
991
121,
374
155,
981
135
156,
116
6,58
2,32
874
3,03
47,
325,
362
6,85
8,69
274
4,16
07,
602,
852
90.2
19.
79La
ksha
dwee
p0
00
937
093
711
,990
595
12,5
8512
,927
595
13,5
2295
.60
4.40
Pudu
cher
ry (*
)0
00
00
00
00
00
00.
000.
00To
tal
14,9
85,9
4911
1,56
716
,234
,859
14,5
79,4
3914
5,74
319
,051
,719
124,
663,
633
13,0
36,8
5717
0,54
9,77
815
4,22
9,02
113
,922
,154
205,
836,
356
74.9
36.
76
STAT
ES /
UTs
Prof
essio
nal
Non
pro
fess
iona
lTo
tal
%ag
e Sh
are
of to
tal
Mal
e D
rive
r Li
cenc
es
%ag
e Sh
are
of to
tal
Fem
ale
Dri
ver
Lice
nces
Aut
hori
sed
to d
rive
pub
lic S
ervi
ce V
ehic
les
Oth
ers
STAT
ES
UTs

Annexure 1.10
5857
Annexure 1.11N
umbe
r of D
rive
rs' L
icen
ces I
ssue
d du
ring
the Y
ear 2
018-
19
(*)=
dat
a no
t fur
nish
ed -
: Not
repo
rted.
Sour
ce: O
ffice
s of S
tate
Tra
nspo
rt Co
mm
issio
ners
/UT
Adm
inist
ratio
ns.
(*)= data not furnishedSource: Offices of State Transport Commissioners/UT Administrations.
Number of Conductors' Licences Issued as on 31.03.2018 and during 2017-18
Mal
eFe
mal
eTo
tal (
2+3)
Mal
eFe
mal
eTo
tal (
5+6)
Mal
eFe
mal
eTo
tal (
8+9)
Mal
e (2
+5+8
)Fe
mal
e (3
+6+9
)To
tal (
4+7+
10)
12
34
56
78
910
1112
1314
15
And
hra
Prad
esh
41,5
9815
641
,754
10,4
9113
210
,623
603,
802
44,3
0164
8,10
365
5,89
144
,589
700,
480
93.6
36.
37A
runa
chal
Pra
desh
3,
091
-
3,09
14,
272
224,
294
22,6
796,
022
28,7
0130
,042
6,04
436
,086
83.2
516
.75
Ass
am2,
043
2,04
32,
722
362,
758
146,
105
14,6
8616
0,79
115
0,87
014
,722
165,
592
91.1
18.
89B
ihar
7,39
15
7,39
612
,646
6012
,706
256,
336
11,8
1926
8,15
527
6,37
311
,884
288,
257
95.8
84.
12C
hhat
tisga
rh7,
739
152
7,89
17,
093
1,12
88,
221
126,
292
16,2
3414
2,52
614
1,12
417
,514
158,
638
88.9
611
.04
Goa
135
313
81,
197
131,
210
24,1
9515
,417
39,6
1225
,527
15,4
3340
,960
62.3
237
.68
Guj
arat
40,1
5567
40,2
2232
,527
4732
,574
655,
437
98,9
8875
4,42
572
8,11
999
,102
827,
221
88.0
211
.98
Har
yana
46
93
472
00
028
2,42
251
,522
333,
944
282,
891
51,5
2533
4,41
684
.59
15.4
1H
imac
hal P
rade
sh
5,04
515
5,06
05,
944
85,
952
131,
600
13,0
8014
4,68
014
2,58
913
,103
155,
692
91.5
88.
42Ja
mm
u &
Kas
hmir
7,74
60
7,74
65,
776
15,
777
59,3
1014
,905
74,2
1572
,832
14,9
0687
,738
83.0
116
.99
Jhar
khan
d19
30
193
478
348
116
1,78
632
,497
194,
283
162,
457
32,5
0019
4,95
783
.33
16.6
7K
arna
taka
80
,744
272
81,0
1665
,822
9,30
175
,123
657,
302
147,
529
804,
831
803,
868
157,
102
960,
970
83.6
516
.35
Ker
ala
26,0
7090
26,1
6026
,283
9026
,373
144,
273
428,
834
573,
107
196,
626
429,
014
625,
640
31.4
368
.57
Mad
hya
Prad
esh
216,
430
1,96
821
8,39
8-
-
-
587,
821
84,0
1867
1,83
980
4,25
185
,986
890,
237
90.3
49.
66M
ahar
asht
raM
anip
ur21
421
499
00
990
30,3
782,
661
33,0
3931
,582
2,66
134
,243
92.2
37.
77M
egha
laya
3,30
53,
305
035
,293
5,62
740
,920
38,5
985,
627
44,2
2587
.28
12.7
2M
izor
am (*
)-
-
-
-
-
-
-
-
-
-
-
-
0.00
0.00
Nag
alan
d22
51
226
1,93
32
1,93
512
,447
1,70
114
,148
14,6
051,
704
16,3
0989
.55
10.4
5O
dish
a9,
492
39,
495
13,2
567
13,2
6330
9,63
928
,209
337,
848
332,
387
28,2
1936
0,60
692
.17
7.83
Punj
ab
31,8
0374
31,8
7737
,612
5437
,666
343,
324
49,5
7539
2,89
941
2,73
949
,703
462,
442
89.2
510
.75
Raj
asth
an-
-
-
-
-
51,3
5848
1,91
171
,653
553,
564
-
-
604,
922
0.00
0.00
Sikk
im
1,46
36
1,46
919
019
4,64
392
25,
565
6,11
992
87,
053
86.7
613
.16
Tam
il N
adu
77,7
1181
078
,521
92,8
531,
389
94,2
4283
5,19
130
0,61
91,
135,
810
1,00
5,75
530
2,81
81,
308,
573
76.8
623
.14
Tela
ngan
a27
,671
144
27,8
154,
082
194,
101
408,
199
38,0
0244
6,20
143
9,95
238
,165
478,
117
92.0
27.
98Tr
ipur
a1,
768
01,
768
00
054
,186
2,27
456
,460
55,9
542,
274
58,2
2896
.09
3.91
Utta
rakh
and
8,14
52
8,14
72,
245
32,
248
115,
820
26,0
8914
1,90
912
6,21
026
,094
152,
304
82.8
717
.13
Utta
r Pra
desh
134,
784
1713
4,80
11,
729
381,
767
1,06
7,83
086
,395
1,15
4,22
51,
204,
343
86,4
501,
290,
793
93.3
06.
70W
est B
enga
l (*)
00
00
00
00
00
00
0.00
0.00
A &
N Is
land
s21
44
218
600
060
05,
335
527
5,86
26,
149
531
6,68
092
.05
7.95
Cha
ndig
arh
00
072
54
729
8,62
82,
974
11,6
029,
353
2,97
812
,331
75.8
524
.15
D &
N H
avel
iD
aman
& D
iuD
elhi
9,31
634
49,
660
3,79
37
3,80
020
2,88
727
,963
230,
850
215,
996
28,3
1424
4,31
088
.41
11.5
9La
ksha
dwee
p0
00
312
031
21,
367
137
1,50
41,
679
137
1,81
692
.46
7.54
Pudu
cher
ry (*
)0
00
00
00
00
00
00.
000.
00To
tal
744,
960
4,13
674
9,09
633
5,40
012
,364
399,
122
7,77
6,43
81,
625,
180
9,40
1,61
88,
374,
881
1,57
0,02
710
,549
,836
79.3
814
.88
STAT
ES /
UTs
Prof
essio
nal
Non
pro
fess
iona
lTo
tal
%ag
e Sh
are
of to
tal
Mal
e D
rive
r Li
cenc
es
%ag
e Sh
are
of T
otal
Fe
mal
e D
rive
r Li
cenc
es
Aut
hori
sed
to d
rive
pub
lic S
ervi
ce
Vehi
cles
Oth
ers
UTs
STAT
ES
Male Female Total (2+3) Male Female Total (5+6)
1 2 3 4 5 6 7
Andhra Pradesh 58,309 16,781 75,090 566 91 657
Arunachal Pradesh 576 146 722 367 191 558
Assam (*) 42,998 0 42,998 760 0 760
Bihar 583 583 21 21
Chhattisgarh 4,385 0 4,385 74 0 74
Goa 6,374 2,130 8,504 125 2 127
Gujarat 0 0 71,777 20,515 4,809 25,324
Haryana 71,651 0 71,651 69,455 0 69,455
Himachal Pradesh 29,867 340 30,207 9,652 225 9,877
Jammu & Kashmir 644 0 644 82 0 82
Jharkhand 66,900 2,463 69,363 9,837 686 10,523
Karnataka 936,839 109,620 1,046,459 10,136 981 11,117
Kerala 106,886 7,645 114,531 3,471 409 3,880
Madhya Pradesh 0 0 0 - - -
Maharashtra 1,335,201 230,608 1,565,809 17,509 4,533 22,042
Manipur (*)
Meghalaya 0 0 0 0 0 0
Mizoram (*) - - - - - -
Nagaland 754 0 754 0 0 0
Odisha 0 0 0 0 0 0
Punjab 8 0 8 425 23 448
Rajasthan - - 230,902 - - 13,400
Sikkim 2,928 632 3,560 2,894 630 3,524
Tamil Nadu 766,836 18,742 785,578 14,810 91 14,901
Telangana 6,002 818 6,820 485 93 578
Tripura 626 3 629 90 1 91
Uttarakhand 7,676 85 7,761 2,304 79 2,383
Uttar Pradesh 220,976 238 221,214 13,092 62 13,154
West Bengal (*) 0 0 0 0 0 0
A & N Islands 0 0 0 0 0 0Chandigarh 6,777 3,048 9,825 840 236 1,076D & N Haveli
Daman & Diu
Delhi 17,159 653 17,812 2,545 134 2,679Lakshadweep 0 0 0 0 0 0Puducherry (*) 0 0 0 0 0 0
Total 3,690,955 393,952 4,387,586 180,055 13,276 206,731
STATES/UTsLicences valid at the end of the year i.e upto
31.3.2018 (Cummulative)New licences issued during the year i.e during
2017-18 (Incremental)
UTs
STATES

Annexure 1.10
5857
Annexure 1.11
Num
ber o
f Dri
vers
' Lic
ence
s Iss
ued
duri
ng th
e Yea
r 201
8-19
(*)=
dat
a no
t fur
nish
ed -
: Not
repo
rted.
Sour
ce: O
ffice
s of S
tate
Tra
nspo
rt Co
mm
issio
ners
/UT
Adm
inist
ratio
ns.
(*)= data not furnishedSource: Offices of State Transport Commissioners/UT Administrations.
Number of Conductors' Licences Issued as on 31.03.2018 and during 2017-18
Mal
eFe
mal
eTo
tal (
2+3)
Mal
eFe
mal
eTo
tal (
5+6)
Mal
eFe
mal
eTo
tal (
8+9)
Mal
e (2
+5+8
)Fe
mal
e (3
+6+9
)To
tal (
4+7+
10)
12
34
56
78
910
1112
1314
15
And
hra
Prad
esh
41,5
9815
641
,754
10,4
9113
210
,623
603,
802
44,3
0164
8,10
365
5,89
144
,589
700,
480
93.6
36.
37A
runa
chal
Pra
desh
3,
091
-
3,09
14,
272
224,
294
22,6
796,
022
28,7
0130
,042
6,04
436
,086
83.2
516
.75
Ass
am2,
043
2,04
32,
722
362,
758
146,
105
14,6
8616
0,79
115
0,87
014
,722
165,
592
91.1
18.
89B
ihar
7,39
15
7,39
612
,646
6012
,706
256,
336
11,8
1926
8,15
527
6,37
311
,884
288,
257
95.8
84.
12C
hhat
tisga
rh7,
739
152
7,89
17,
093
1,12
88,
221
126,
292
16,2
3414
2,52
614
1,12
417
,514
158,
638
88.9
611
.04
Goa
135
313
81,
197
131,
210
24,1
9515
,417
39,6
1225
,527
15,4
3340
,960
62.3
237
.68
Guj
arat
40,1
5567
40,2
2232
,527
4732
,574
655,
437
98,9
8875
4,42
572
8,11
999
,102
827,
221
88.0
211
.98
Har
yana
46
93
472
00
028
2,42
251
,522
333,
944
282,
891
51,5
2533
4,41
684
.59
15.4
1H
imac
hal P
rade
sh
5,04
515
5,06
05,
944
85,
952
131,
600
13,0
8014
4,68
014
2,58
913
,103
155,
692
91.5
88.
42Ja
mm
u &
Kas
hmir
7,74
60
7,74
65,
776
15,
777
59,3
1014
,905
74,2
1572
,832
14,9
0687
,738
83.0
116
.99
Jhar
khan
d19
30
193
478
348
116
1,78
632
,497
194,
283
162,
457
32,5
0019
4,95
783
.33
16.6
7K
arna
taka
80
,744
272
81,0
1665
,822
9,30
175
,123
657,
302
147,
529
804,
831
803,
868
157,
102
960,
970
83.6
516
.35
Ker
ala
26,0
7090
26,1
6026
,283
9026
,373
144,
273
428,
834
573,
107
196,
626
429,
014
625,
640
31.4
368
.57
Mad
hya
Prad
esh
216,
430
1,96
821
8,39
8-
-
-
587,
821
84,0
1867
1,83
980
4,25
185
,986
890,
237
90.3
49.
66M
ahar
asht
raM
anip
ur21
421
499
00
990
30,3
782,
661
33,0
3931
,582
2,66
134
,243
92.2
37.
77M
egha
laya
3,30
53,
305
035
,293
5,62
740
,920
38,5
985,
627
44,2
2587
.28
12.7
2M
izor
am (*
)-
-
-
-
-
-
-
-
-
-
-
-
0.00
0.00
Nag
alan
d22
51
226
1,93
32
1,93
512
,447
1,70
114
,148
14,6
051,
704
16,3
0989
.55
10.4
5O
dish
a9,
492
39,
495
13,2
567
13,2
6330
9,63
928
,209
337,
848
332,
387
28,2
1936
0,60
692
.17
7.83
Punj
ab
31,8
0374
31,8
7737
,612
5437
,666
343,
324
49,5
7539
2,89
941
2,73
949
,703
462,
442
89.2
510
.75
Raj
asth
an-
-
-
-
-
51,3
5848
1,91
171
,653
553,
564
-
-
604,
922
0.00
0.00
Sikk
im
1,46
36
1,46
919
019
4,64
392
25,
565
6,11
992
87,
053
86.7
613
.16
Tam
il N
adu
77,7
1181
078
,521
92,8
531,
389
94,2
4283
5,19
130
0,61
91,
135,
810
1,00
5,75
530
2,81
81,
308,
573
76.8
623
.14
Tela
ngan
a27
,671
144
27,8
154,
082
194,
101
408,
199
38,0
0244
6,20
143
9,95
238
,165
478,
117
92.0
27.
98Tr
ipur
a1,
768
01,
768
00
054
,186
2,27
456
,460
55,9
542,
274
58,2
2896
.09
3.91
Utta
rakh
and
8,14
52
8,14
72,
245
32,
248
115,
820
26,0
8914
1,90
912
6,21
026
,094
152,
304
82.8
717
.13
Utta
r Pra
desh
134,
784
1713
4,80
11,
729
381,
767
1,06
7,83
086
,395
1,15
4,22
51,
204,
343
86,4
501,
290,
793
93.3
06.
70W
est B
enga
l (*)
00
00
00
00
00
00
0.00
0.00
A &
N Is
land
s21
44
218
600
060
05,
335
527
5,86
26,
149
531
6,68
092
.05
7.95
Cha
ndig
arh
00
072
54
729
8,62
82,
974
11,6
029,
353
2,97
812
,331
75.8
524
.15
D &
N H
avel
iD
aman
& D
iuD
elhi
9,31
634
49,
660
3,79
37
3,80
020
2,88
727
,963
230,
850
215,
996
28,3
1424
4,31
088
.41
11.5
9La
ksha
dwee
p0
00
312
031
21,
367
137
1,50
41,
679
137
1,81
692
.46
7.54
Pudu
cher
ry (*
)0
00
00
00
00
00
00.
000.
00To
tal
744,
960
4,13
674
9,09
633
5,40
012
,364
399,
122
7,77
6,43
81,
625,
180
9,40
1,61
88,
374,
881
1,57
0,02
710
,549
,836
79.3
814
.88
STAT
ES /
UTs
Prof
essio
nal
Non
pro
fess
iona
lTo
tal
%ag
e Sh
are
of to
tal
Mal
e D
rive
r Li
cenc
es
%ag
e Sh
are
of T
otal
Fe
mal
e D
rive
r Li
cenc
es
Aut
hori
sed
to d
rive
pub
lic S
ervi
ce
Vehi
cles
Oth
ers
UTs
STAT
ES
Male Female Total (2+3) Male Female Total (5+6)
1 2 3 4 5 6 7
Andhra Pradesh 58,309 16,781 75,090 566 91 657
Arunachal Pradesh 576 146 722 367 191 558
Assam (*) 42,998 0 42,998 760 0 760
Bihar 583 583 21 21
Chhattisgarh 4,385 0 4,385 74 0 74
Goa 6,374 2,130 8,504 125 2 127
Gujarat 0 0 71,777 20,515 4,809 25,324
Haryana 71,651 0 71,651 69,455 0 69,455
Himachal Pradesh 29,867 340 30,207 9,652 225 9,877
Jammu & Kashmir 644 0 644 82 0 82
Jharkhand 66,900 2,463 69,363 9,837 686 10,523
Karnataka 936,839 109,620 1,046,459 10,136 981 11,117
Kerala 106,886 7,645 114,531 3,471 409 3,880
Madhya Pradesh 0 0 0 - - -
Maharashtra 1,335,201 230,608 1,565,809 17,509 4,533 22,042
Manipur (*)
Meghalaya 0 0 0 0 0 0
Mizoram (*) - - - - - -
Nagaland 754 0 754 0 0 0
Odisha 0 0 0 0 0 0
Punjab 8 0 8 425 23 448
Rajasthan - - 230,902 - - 13,400
Sikkim 2,928 632 3,560 2,894 630 3,524
Tamil Nadu 766,836 18,742 785,578 14,810 91 14,901
Telangana 6,002 818 6,820 485 93 578
Tripura 626 3 629 90 1 91
Uttarakhand 7,676 85 7,761 2,304 79 2,383
Uttar Pradesh 220,976 238 221,214 13,092 62 13,154
West Bengal (*) 0 0 0 0 0 0
A & N Islands 0 0 0 0 0 0Chandigarh 6,777 3,048 9,825 840 236 1,076D & N Haveli
Daman & Diu
Delhi 17,159 653 17,812 2,545 134 2,679Lakshadweep 0 0 0 0 0 0Puducherry (*) 0 0 0 0 0 0
Total 3,690,955 393,952 4,387,586 180,055 13,276 206,731
STATES/UTsLicences valid at the end of the year i.e upto
31.3.2018 (Cummulative)New licences issued during the year i.e during
2017-18 (Incremental)
UTs
STATES

Number of Conductors' Licences Issued as on 31.03.2019 and during 2018-19 Total Number of Registered Motor Vehicles in India: 1951-2019(in thousands)
Annexure 1.12
6059
Annexure 2.1
(*)= data not furnishedSource: Offices of State Transport Commissioners/UT Administrations. Contd...
Male Female Total (2+3) Male Female Total (5+6)
1 2 3 4 5 6 7
Andhra Pradesh 58,720 16,853 75,573 411 72 483
Arunachal Pradesh 926 221.00 1,147 509 269 778
Assam (*) 43,758 0 43,758 785 0 785
Bihar (*) 0 0 0 0 0 0
Chhattisgarh 4,402 0 4,402 32 0 32
Goa 6,617 2,137 8,754 170 7 177
Gujarat 0 0 75,437 2,614 954 3,568
Haryana 99,144 0 99,144 25,055 0 25,055
Himachal Pradesh 41,748 565 42,313 11,881 225 12,106
Jammu & Kashmir 406 0 406 80 0 80
Jharkhand 66,900 2,463 69,363 9,837 686 10,523
Karnataka 944,914 110,572 1,055,486 8,075 952 9,027
Kerala 106,886 7,645 114,531 3,471 409 3,880
Madhya Pradesh 0 0 0 - - -
Maharashtra
Manipur (*)
Meghalaya 0 0 0 0 0 0
Mizoram (*) - - - - - -
Nagaland 754 0 754 0 0 0
Odisha 0 0 0 0 0 0
Punjab 12 0 12 4,839 118 4,957
Rajasthan - - 241,419 8,149.00 2,368.00 10,517
Sikkim 2,928 632 3,560 2,894 630 3,524
Tamil Nadu 780,506 19,142 799,648 13,670 400 14,070
Telangana 6,690 921 7,611 688 103 791
Tripura 546 3 549 80 0 80
Uttarakhand 6,094 33 6,127 421 9 430
Uttar Pradesh 227,841 268 228,109 7,267 59 7,326
West Bengal (*) 0 0 0 0 0 0
A & N Islands 0 0 0 0 0 0
Chandigarh 7,542 3,253 10,795 765 205 970
D & N Haveli
Daman & Diu
Delhi 24,398 1,148 25,546 7,239 495 7,734
Lakshadweep 0 0 0 0 0 0
Puducherry (*) 0 0 0 0 0 0
Total 2,431,732 165,856 2,914,444 108,932 7,961 116,893
STATES/UTsLicences valid at the end of the year i.e upto
31.3.2019 (Cummulative)New licences issued during the year i.e during 2018-
19 (Incremental)
STATES
UTs
Year (As on 31st March) All Vehicles Two Wheelers* Cars, Jeeps and
Taxis Buses Goods Vehicles Others**
1 2 3 4 5 6 7
1951 306 27 159 34 82 4
1956 426 41 203 47 119 16
1959 562 67 267 48 148 32
1960 605 76 282 54 157 36
1961 665 88 310 57 168 42
1962 749 116 340 60 189 44
1963 847 140 375 63 215 54
1964 906 168 388 67 224 59
1965 1,006 202 428 70 242 64
1966 1,099 226 456 73 259 85
1967 1,191 286 482 76 266 81
1968 1,332 347 522 83 285 95
1969 1,474 417 574 86 298 99
1970 1,658 503 628 92 322 113
1971 1,865 576 682 94 343 170
1972 2,045 656 740 100 364 185
1973 2,109 734 709 95 308 263
1974 2,327 838 768 105 323 293
1975 2,472 946 766 114 335 311
1976 2,700 1,057 779 115 351 398
1977 3,260 1,415 878 119 383 465
1978 3,614 1,618 919 124 403 550
1979 4,059 1,888 996 133 444 598
1980 4,521 2,117 1,059 140 473 732
1981 5,391 2,618 1,160 162 554 897
1982 6,055 3,065 1,243 173 613 961
1983 6,973 3,654 1,385 185 675 1,074
1984 7,949 4,351 1,455 199 742 1,202
1985 9,170 5,179 1,607 223 822 1,339
1986 10,577 6,245 1,780 227 863 1,462
1987 12,618 7,739 2,007 245 984 1,643
1988 14,818 9,300 2,295 269 1,114 1,840
1989 16,920 10,965 2,486 278 1,179 2,012
1990 19,152 12,611 2,694 298 1,238 2,311
1991 21,374 14,200 2,954 331 1,356 2,533
@

Total Number of Registered Motor Vehicles in India: 1951-2019(in thousands)
: 'Two-wheelers' include auto-rickshaws for the years 1959 to 1969. For the remaining years, auto-rickshaws are included in 'Others'.Goods Vehicles include Multiaxled /articulated vehicles, trucks & lorries and Light Motor Vehicle(LMV Goods) : Others include tractors, trailers, three wheelers (passenger vehicles)/LMV and other miscellaneous vehicles for which
category-wise break up is not reported by State/UT.@ : Includes omni buses since 2001.Source: Offices of State Transport Commissioners/UT Administrations.
Annexure 2.1 (Contd...)
Note: Horizontal summation may not add up to total as some State/UTs did not furnish break up.
Source: Offices of State Transport Commissioners/UT Administrations.
Number of Newly Registered and Total Registered Motor Vehicles (Category-wise) All States & UTs
6261
Annexure 2.2
*
**
(in numbers)Year (As on 31st March) All Vehicles Two Wheelers* Cars, Jeeps and
Taxis Buses Goods Vehicles Others**
1 2 3 4 5 6 7
1992 23,507 15,661 3,205 358 1,514 2,769
1993 25,346 17,060 3,344 380 1,592 2,970
1994 27,660 18,899 3,569 392 1,691 3,109
1995 30,295 20,831 3,841 423 1,794 3,406
1996 33,786 23,252 4,204 449 2,031 3,850
1997 37,332 25,729 4,672 484 2,343 4,104
1998 41,368 28,642 5,138 538 2,536 4,514
1999 44,875 31,328 5,556 540 2,554 4,897
2000 48,857 34,118 6,143 562 2,715 5,319
2001 54,991 38,556 7,058 634 2,948 5,795
2002 58,924 41,581 7,613 635 2,974 6,121
2003 67,007 47,519 8,599 721 3,492 6,676
2004 72,718 51,922 9,451 768 3,749 6,828
2005 81,499 58,799 10,320 892 4,031 7,457
2006 89,618 64,743 11,526 992 4,436 7,921
2007 96,707 69,129 12,649 1,350 5,119 8,460
2008 105,353 75,336 13,950 1,427 5,601 9,039
2009 114,951 82,402 15,313 1,486 6,041 9,710
2010 127,746 91,598 17,109 1,527 6,432 11,080
2011 141,866 101,865 19,231 1,604 7,064 12,102
2012 159,491 115,419 21,568 1,677 7,658 13,169
2013 176,044 127,830 24,056 1,814 8,307 14,037
2014 190,704 139,410 25,998 1,887 8,698 14,712
2015 210,023 154,298 28,611 1,971 9,344 15,799
2016 230,031 168,975 30,242 1,757 10,516 18,541
2017 253,311 187,091 33,688 1,864 12,256 18,411
2018 272,587 202,755 36,453 1,943 12,773 18,663
2019 295,772 221,270 38,433 2,049 13,766 20,254
CAGR 2008/2018 9.97 10.41 10.08 3.13 8.59 7.52
CAGR 2009/2019 9.91 10.38 9.64 3.27 8.58 7.63
@
Newly registered
Total registered as on 31st March
Newly registered
Total registered as on 31st March
2017-18 2018 2018-19 20191 2 3 2 3
I.Multiaxled / Articulated Vehicles 145,987 1,569,203 190,691 1,760,130II.Trucks & Lorries 339,372 4,963,578 396,556 5,330,182III. Light Motor Vehicles (Goods) a) Four Wheelers 320,660 3,696,657 350,741 3,985,573 b) Three Wheelers 152,656 2,543,855 167,308 2,689,711Total III 473,316 6,240,512 518,049 6,675,284
a) Stage carriages 26,777 634,952 25,668 665,002 b) Contract carriages 19,964 322,748 17,660 341,958 c) Private service vehicles 10,800 127,496 12,473 137,848 d) Other buses 25,551 310,845 26,383 326,815Total IV 83,092 1,396,042 82,184 1,471,624
a) Motor cabs 151,784 1,731,820 166,071 1,940,083 b) Maxi cabs 55,893 853,758 54,060 865,029 c) Other taxis 23,232 290,463 18,777 306,407Total V 230,909 2,876,040 238,908 3,111,518
a) Three seaters 408,618 4,148,076 454,536 4,526,563 b) Four to six seaters 165,542 2,092,698 180,578 2,264,698Total VI 574,160 6,240,774 635,114 6,791,261VII. Motor cycles on hire 13,086 154,942 24,193 169,739VIII. Other vehicles not included in (I-VII) 58,042 525,030 56,636 581,666Total Transport (I to VII) * 1,917,964 23,966,121 2,142,331 25,891,404
I. Two wheelers a) Scooters 5,964,199 63,866,386 5,835,807 72,362,289 b) Mopeds 568,368 13,656,406 584,645 14,144,601 c) Motor cycles 12,196,064 125,231,897 12,222,313 134,763,165 Total I 18,728,631 202,754,689 18,642,765 221,270,055 II. Cars 2,797,170 30,856,869 2,620,250 32,424,868 III. Jeeps 165,487 2,720,342 186,930 2,896,339 IV. Omni buses 23,538 546,476 23,740 577,239 V. Tractors 572,986 8,184,453 629,559 8,822,014 VI. Trailers 91,174 2,128,104 91,964 2,234,061 VII. Other vehicles not covered 124,462 1,430,116 225,141 1655708Total Non-Transport (I to VII) 22,503,448 248,621,049 22,420,349 269,880,284Grand Total (Transport + Non-Transport) 24,421,412 272,587,170 24,562,680 295,771,688
Type of Vehicles
NON TRANSPORT
TRANSPORT
IV. Buses
V. Taxis
VI. Light Motor Vehicles (Passengers)

Number of Commercial Vehicles in Use (detailed category-wise)(As per Primary Permit Valid As on 31.03.2018)
STU : State Transport UndertakingSP : State Permit; NP : National Permit; AIP : All India PermitNote: Vertical summation may not tally with total as some states/UTs did not provide the breakup.Source: Offices of State Transport Commissioners/UT Administrations.
STU : State Transport UndertakingSP : State Permit; NP : National Permit; AIP : All India PermitNote: Vertical summation may not tally with total as some states/UTs did not provide the breakup.Source: Offices of State Transport Commissioners/UT Administrations.
Annexure 2.3
Number of Commercial Vehicles in Use (detailed category-wise)(As per Primary Permit Valid As on 31.03.2019)
6463
Annexure 2.3 (a)
All States & UTs
31.3.20181 2
A. Stage carriages Public (STU) 145,943
Private 145,373
Total 291,316 B. Contract carriages Auto rickshaw 3,470,519
E-rickshaw 4,782
Ordinary taxi 241,197
Motor Cab (SP) 573,007
Motor Cab (AIP) 441,796
Maxi Cab (SP) 398,161
Maxi Cab (AIP) 67,965
Omni Bus (SP) 59,569
Omni Bus (AIP) 11,858
Any other 133,502
Total 5,402,356 C. Private Service Vehicles Educational Institution Bus 184,488
Ambulance 51,435
Fire Fighter 3,108
Any other 39,978
Total 279,009 D. Goods carriages Lorry (SP) 1,742,639
Lorry (NP) 742,333
Tankers (SP) 175,073
Tankers (NP) 142,288
Tractor & Trailer 1,548,166
Light Motor Vehicles 1,723,904
Multiaxled/Articulated (SP) 339,988
Multiaxled/Articulated (NP) 218,663
Any other 119,087
Total 6,752,141
Grand Total (A+B+C+D) 12,724,822
CategoryAll States & UTs
31.3.20191 2
Public (STU) 129,332
Private 160,383
Total 289,715
Auto rickshaw 3,477,813
E-rickshaw 4,982
Ordinary taxi 244,647
Motor Cab (SP) 607,751
Motor Cab (AIP) 483,877
Maxi Cab (SP) 327,140
Maxi Cab (AIP) 79,291
Omni Bus (SP) 57,212
Omni Bus (AIP) 13,417
Any other 139,456
Total 5,435,586
Educational Institution Bus 205,847
Ambulance 52,740
Fire Fighter 3,284
Any other 44,996
Total 306,867
Lorry (SP) 1,412,678
Lorry (NP) 839,634
Tankers (SP) 348,958
Tankers (NP) 172,887
Tractor & Trailer 1,484,516
Light Motor Vehicles 1,671,363
Multiaxled/Articulated (SP) 382,622
Multiaxled/Articulated (NP) 211,015
Any other 118,434
Total 6,642,107
Grand Total (A+B+C+D) 12,674,275
Category
A. Stage carriages
B. Contract carriages
C. Private Service Vehicles
D. Goods carriages
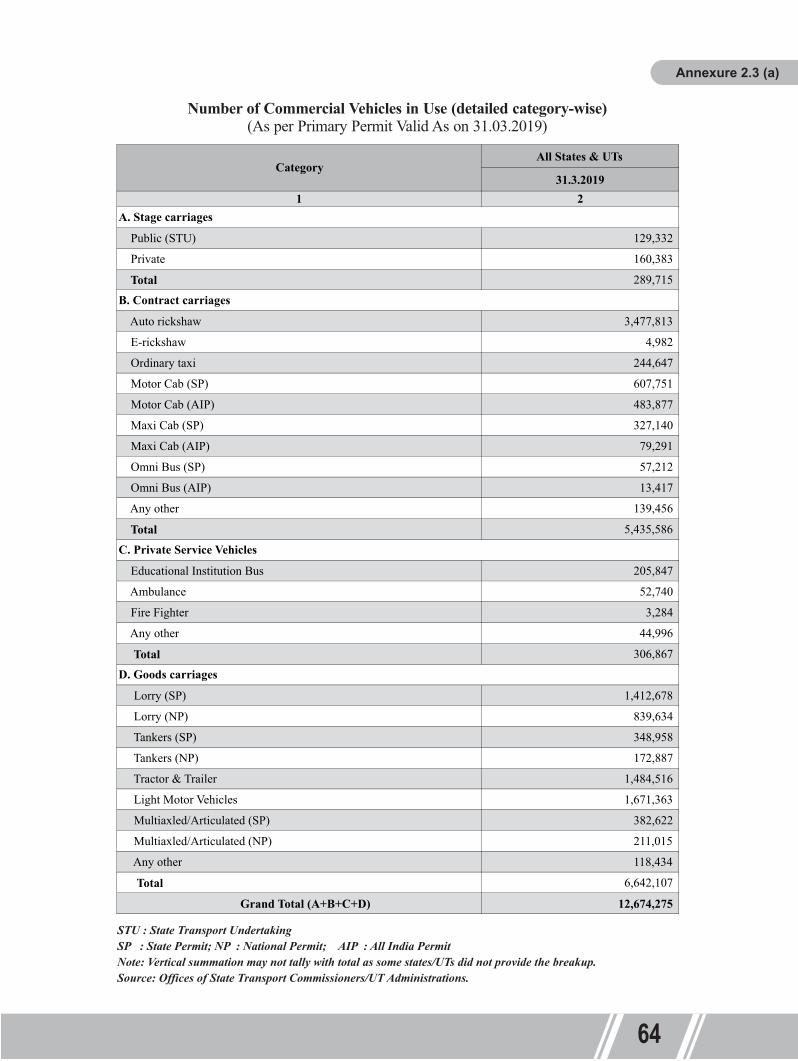

State/UT-wise total registered vehicles and their Percentage Share during 2017-18 & 2018-19
Tota
l Reg
ister
ed M
otor
Veh
icle
s in
Indi
a 20
09-2
019
(Sta
te-W
ise)
(Fig
ures
as o
n as
on
31st
Mar
ch o
f res
pect
ive
year
s)(I
n th
ousa
nds)
* : Data relates to 2016-17 as data for the years 2017-18 & 2018-19 has not been furnished by the State Govt.** : Merged in D & N HaveliSource: Offices of State Transport Commissioners/UT Administrations. *
: D
ata
rela
tes t
o 19
97.
@: F
igur
es a
re a
s per
Sta
tistic
al H
andb
ook
of th
e St
ate/
UT.
&:
Dat
a re
late
s to
2010
**
Mer
ged
in D
& N
Hav
eli
# : D
ata
rela
tes t
o 20
12
Sour
ce: O
ffice
s of S
tate
Tra
nspo
rt Co
mm
issio
ners
/UT
Adm
inist
ratio
ns.
Annexure 3.1
6665
Annexure 3.2
1 2 3 4 5Andhra Pradesh 10,796,015 3.96 11,992,806 4.05Arunachal Pradesh 209,873 0.08 230,156 0.08Assam 3,441,997 1.26 3,936,517 1.33Bihar 7,364,022 2.70 8,553,183 2.89Chhattisgarh 5,793,363 2.13 6,375,266 2.16Goa 1,325,442 0.49 1,402,051 0.47Gujarat 23,820,816 8.74 25,201,085 8.52Haryana 7,733,002 2.84 8,599,668 2.91Himachal Pradesh 1,494,857 0.55 1,634,827 0.55Jammu & Kashmir 1,674,168 0.61 1,853,639 0.63Jharkhand* 3,385,347 1.24 3,385,347 1.14Karnataka 19,381,753 7.11 21,070,551 7.12Kerala 12,341,326 4.53 13,334,984 4.51Madhya Pradesh 14,569,877 5.35 15,296,374 5.17Maharashtra 32,853,334 12.05 35,392,167 11.97Manipur 307,917 0.11 361,970 0.12Meghalaya 332,626 0.12 365,804 0.12Mizoram 207,879 0.08 233,567 0.08Nagaland 449,202 0.16 489,688 0.17Odisha 7,423,927 2.72 8,280,877 2.80Punjab 9,680,976 3.55 10,559,435 3.57Rajasthan 16,280,006 5.97 17,709,949 5.99Sikkim* 54,106 0.02 54,106 0.02Tamil Nadu 28,042,398 10.29 30,175,178 10.20Telangana 10,965,202 4.02 12,128,272 4.10Tripura 435,130 0.16 495,859 0.17Uttarakhand 2,480,440 0.91 2,752,685 0.93Uttar Pradesh 29,394,816 10.78 32,712,054 11.06West Bengal* 7,445,573 2.73 7,445,573 2.52A & N Islands 131,139 0.05 141,051 0.05Chandigarh 950,788 0.35 1,011,280 0.34D & N Haveli 117,526 0.04 123,522 0.04Daman & Diu**Delhi 10,686,379 3.92 11,391,551 3.85Lakshadweep* 18,087 0.01 18,087 0.01Puducherry 997,861 0.37 1,062,559 0.36Total All India 272,587,170 100 295,771,688 100
States/UTsTotal registered
motor vehicles (2017-18)
%age share (2017-18)
Total registered motor vehicles
(2018-19)
%age share (2018-19)
STAT
ES /
UTs
2009
2010
2011
2012
2017
2018
2019
CA
GR
20
09/2
019
12
34
510
1112
13A
ndhr
a Pr
ades
h8,
059
8,92
310
,189
12,4
24
6,
286
7002
7882
8728
9,62
610
,796
11,9
934.
06A
runa
chal
Pra
desh
2222
*14
515
1
15
1##
#15
115
126
518
021
023
026
.40
Ass
am1,
235
1,38
41,
582
1,80
7
1,87
822
1725
1028
173,
029
3,44
23,
937
12.2
9B
ihar
1,96
02,
357
2,67
33,
113
3,
617
4163
4778
5482
6,24
67,
364
8,55
315
.88
Chh
attis
garh
2,11
52,
436
2,76
63,
104
3,
437
3871
4314
4810
5,24
25,
793
6,37
511
.67
Goa
674
727
790
866
938
1009
1084
1158
1,23
91,
325
1,40
27.
60G
ujar
at10
,999
11,8
7312
,993
14,4
14
15,7
7217
092
1872
120
361
22,0
3723
,821
25,2
018.
64H
arya
na
4,42
54,
792
5,37
75,
978
6,60
072
3979
2886
339,
370
7,73
38,
600
6.87
Him
acha
l Pra
desh
49
453
862
273
7
876
974
1077
1176
1,35
61,
495
1,63
512
.70
Jam
mu
& K
ashm
ir66
873
992
791
7
1,02
111
3312
4413
661,
511
1,67
41,
854
10.7
4Jh
arkh
and
2,03
82,
767
3,11
33,
158
3,41
717
1920
6624
773,
385
3,38
53,
385
5.21
Kar
nata
ka6,
953
9,04
49,
930
10,9
10
12,0
6413
335
1478
516
292
17,8
7119
,382
21,0
7111
.73
Ker
ala
4,86
05,
398
6,07
26,
893
7,85
887
7596
4810
172
11,3
0312
,341
13,3
3510
.62
Mad
hya
Prad
esh
6,01
16,
591
7,35
68,
144
8,76
097
2211
141
1114
113
,199
14,5
7015
,296
9.79
Mah
aras
htra
14,4
5115
,768
17,4
3419
,432
21,4
8823
394
2556
227
870
30,2
1732
,853
35,3
929.
37M
anip
ur
147
194
207
215
296
395
307
306
340
308
362
9.40
Meg
hala
ya14
215
817
619
8
220
248
267
558
583
333
366
9.93
Miz
oram
7080
9310
2
121
137
151
171
187
208
234
12.8
2N
agal
and
240
254
273
291
311
318
334
380
410
449
490
7.40
Odi
sha
2,60
72,
932
3,33
83,
759
4,21
647
0252
1958
336,
558
7,42
48,
281
12.2
5Pu
njab
4,
832
5,27
45,
274
6,26
3
6,26
3#62
63#
6263
#90
64@
9,84
3@9,
681
10,5
598.
13R
ajas
than
6,49
07,
166
7,98
68,
985
10,0
7211
133
1237
913
632
14,9
0116
,280
17,7
1010
.56
Sikk
im29
3439
43
3640
4349
5454
546.
60Ta
mil
Nad
u12
,891
14,0
6215
,638
17,4
12
19,2
3220
864
2251
924
203
26,1
0928
,042
30,1
758.
88Te
lang
ana
......
......
6,37
670
7378
4587
099,
844
10,9
6512
,128
Trip
ura
144
160
188
204
245
256
282
319
383
435
496
13.1
8U
ttara
khan
d78
783
199
71,
244
1,46
016
4018
2718
882,
137
2,48
02,
753
13.3
3U
ttar P
rade
sh10
,779
11,9
8813
,287
15,4
45
17,0
4819
115
2163
623
936
26,2
6529
,395
32,7
1211
.74
Wes
t Ben
gal
3,04
42,
747
3,26
13,
861
6,11
167
4574
0364
887,
446
7,44
67,
446
9.36
A &
N Is
land
s60
6269
77
8594
102
111
122
131
141
8.97
Cha
ndig
arh
747
949
1,00
81,
058
1,10
663
167
683
788
395
110
11.2
83.
07D
& N
Hav
eli
6369
7685
9310
311
210
511
611
812
46.
90D
aman
& D
iu70
7278
85
9295
100
106
111
****
Del
hi6,
302
6,74
77,
228
7,35
0
7,78
582
9388
5197
05@
10,2
6010
,686
11,3
926.
10La
ksha
dwee
p7
89
10
1113
1416
1818
189.
60Pu
duch
erry
538
599
673
755
700
751
803
863
930
998
1,06
37.
04G
RA
ND
TO
TAL
114,
951
127,
746
141,
866
159,
490
176,
044
190,
704
210,
023
230,
031
253,
311
272,
587
295,
772
9.91
67
89
2013
2014
2015
2016

State/UT-wise total registered vehicles and their Percentage Share during 2017-18 & 2018-19 To
tal R
egist
ered
Mot
or V
ehic
les i
n In
dia
2009
-201
9 (S
tate
-Wise
) (F
igur
es a
s on
as o
n 31
st M
arch
of r
espe
ctiv
e ye
ars)
(In
thou
sand
s)
* : Data relates to 2016-17 as data for the years 2017-18 & 2018-19 has not been furnished by the State Govt.** : Merged in D & N HaveliSource: Offices of State Transport Commissioners/UT Administrations. *
: D
ata
rela
tes t
o 19
97.
@: F
igur
es a
re a
s per
Sta
tistic
al H
andb
ook
of th
e St
ate/
UT.
&:
Dat
a re
late
s to
2010
**
Mer
ged
in D
& N
Hav
eli
# : D
ata
rela
tes t
o 20
12
Sour
ce: O
ffice
s of S
tate
Tra
nspo
rt Co
mm
issio
ners
/UT
Adm
inist
ratio
ns.
Annexure 3.1
6665
Annexure 3.2
1 2 3 4 5Andhra Pradesh 10,796,015 3.96 11,992,806 4.05Arunachal Pradesh 209,873 0.08 230,156 0.08Assam 3,441,997 1.26 3,936,517 1.33Bihar 7,364,022 2.70 8,553,183 2.89Chhattisgarh 5,793,363 2.13 6,375,266 2.16Goa 1,325,442 0.49 1,402,051 0.47Gujarat 23,820,816 8.74 25,201,085 8.52Haryana 7,733,002 2.84 8,599,668 2.91Himachal Pradesh 1,494,857 0.55 1,634,827 0.55Jammu & Kashmir 1,674,168 0.61 1,853,639 0.63Jharkhand* 3,385,347 1.24 3,385,347 1.14Karnataka 19,381,753 7.11 21,070,551 7.12Kerala 12,341,326 4.53 13,334,984 4.51Madhya Pradesh 14,569,877 5.35 15,296,374 5.17Maharashtra 32,853,334 12.05 35,392,167 11.97Manipur 307,917 0.11 361,970 0.12Meghalaya 332,626 0.12 365,804 0.12Mizoram 207,879 0.08 233,567 0.08Nagaland 449,202 0.16 489,688 0.17Odisha 7,423,927 2.72 8,280,877 2.80Punjab 9,680,976 3.55 10,559,435 3.57Rajasthan 16,280,006 5.97 17,709,949 5.99Sikkim* 54,106 0.02 54,106 0.02Tamil Nadu 28,042,398 10.29 30,175,178 10.20Telangana 10,965,202 4.02 12,128,272 4.10Tripura 435,130 0.16 495,859 0.17Uttarakhand 2,480,440 0.91 2,752,685 0.93Uttar Pradesh 29,394,816 10.78 32,712,054 11.06West Bengal* 7,445,573 2.73 7,445,573 2.52A & N Islands 131,139 0.05 141,051 0.05Chandigarh 950,788 0.35 1,011,280 0.34D & N Haveli 117,526 0.04 123,522 0.04Daman & Diu**Delhi 10,686,379 3.92 11,391,551 3.85Lakshadweep* 18,087 0.01 18,087 0.01Puducherry 997,861 0.37 1,062,559 0.36Total All India 272,587,170 100 295,771,688 100
States/UTsTotal registered
motor vehicles (2017-18)
%age share (2017-18)
Total registered motor vehicles
(2018-19)
%age share (2018-19)
STAT
ES /
UTs
2009
2010
2011
2012
2017
2018
2019
CA
GR
20
09/2
019
12
34
510
1112
13A
ndhr
a Pr
ades
h8,
059
8,92
310
,189
12,4
24
6,
286
7002
7882
8728
9,62
610
,796
11,9
934.
06A
runa
chal
Pra
desh
2222
*14
515
1
15
1##
#15
115
126
518
021
023
026
.40
Ass
am1,
235
1,38
41,
582
1,80
7
1,87
822
1725
1028
173,
029
3,44
23,
937
12.2
9B
ihar
1,96
02,
357
2,67
33,
113
3,
617
4163
4778
5482
6,24
67,
364
8,55
315
.88
Chh
attis
garh
2,11
52,
436
2,76
63,
104
3,
437
3871
4314
4810
5,24
25,
793
6,37
511
.67
Goa
674
727
790
866
938
1009
1084
1158
1,23
91,
325
1,40
27.
60G
ujar
at10
,999
11,8
7312
,993
14,4
14
15,7
7217
092
1872
120
361
22,0
3723
,821
25,2
018.
64H
arya
na
4,42
54,
792
5,37
75,
978
6,60
072
3979
2886
339,
370
7,73
38,
600
6.87
Him
acha
l Pra
desh
49
453
862
273
7
876
974
1077
1176
1,35
61,
495
1,63
512
.70
Jam
mu
& K
ashm
ir66
873
992
791
7
1,02
111
3312
4413
661,
511
1,67
41,
854
10.7
4Jh
arkh
and
2,03
82,
767
3,11
33,
158
3,41
717
1920
6624
773,
385
3,38
53,
385
5.21
Kar
nata
ka6,
953
9,04
49,
930
10,9
10
12,0
6413
335
1478
516
292
17,8
7119
,382
21,0
7111
.73
Ker
ala
4,86
05,
398
6,07
26,
893
7,85
887
7596
4810
172
11,3
0312
,341
13,3
3510
.62
Mad
hya
Prad
esh
6,01
16,
591
7,35
68,
144
8,76
097
2211
141
1114
113
,199
14,5
7015
,296
9.79
Mah
aras
htra
14,4
5115
,768
17,4
3419
,432
21,4
8823
394
2556
227
870
30,2
1732
,853
35,3
929.
37M
anip
ur
147
194
207
215
296
395
307
306
340
308
362
9.40
Meg
hala
ya14
215
817
619
8
220
248
267
558
583
333
366
9.93
Miz
oram
7080
9310
2
121
137
151
171
187
208
234
12.8
2N
agal
and
240
254
273
291
311
318
334
380
410
449
490
7.40
Odi
sha
2,60
72,
932
3,33
83,
759
4,21
647
0252
1958
336,
558
7,42
48,
281
12.2
5Pu
njab
4,
832
5,27
45,
274
6,26
3
6,26
3#62
63#
6263
#90
64@
9,84
3@9,
681
10,5
598.
13R
ajas
than
6,49
07,
166
7,98
68,
985
10,0
7211
133
1237
913
632
14,9
0116
,280
17,7
1010
.56
Sikk
im29
3439
43
3640
4349
5454
546.
60Ta
mil
Nad
u12
,891
14,0
6215
,638
17,4
12
19,2
3220
864
2251
924
203
26,1
0928
,042
30,1
758.
88Te
lang
ana
......
......
6,37
670
7378
4587
099,
844
10,9
6512
,128
Trip
ura
144
160
188
204
245
256
282
319
383
435
496
13.1
8U
ttara
khan
d78
783
199
71,
244
1,46
016
4018
2718
882,
137
2,48
02,
753
13.3
3U
ttar P
rade
sh10
,779
11,9
8813
,287
15,4
45
17,0
4819
115
2163
623
936
26,2
6529
,395
32,7
1211
.74
Wes
t Ben
gal
3,04
42,
747
3,26
13,
861
6,11
167
4574
0364
887,
446
7,44
67,
446
9.36
A &
N Is
land
s60
6269
77
8594
102
111
122
131
141
8.97
Cha
ndig
arh
747
949
1,00
81,
058
1,10
663
167
683
788
395
110
11.2
83.
07D
& N
Hav
eli
6369
7685
9310
311
210
511
611
812
46.
90D
aman
& D
iu70
7278
85
9295
100
106
111
****
Del
hi6,
302
6,74
77,
228
7,35
0
7,78
582
9388
5197
05@
10,2
6010
,686
11,3
926.
10La
ksha
dwee
p7
89
10
1113
1416
1818
189.
60Pu
duch
erry
538
599
673
755
700
751
803
863
930
998
1,06
37.
04G
RA
ND
TO
TAL
114,
951
127,
746
141,
866
159,
490
176,
044
190,
704
210,
023
230,
031
253,
311
272,
587
295,
772
9.91
67
89
2013
2014
2015
2016
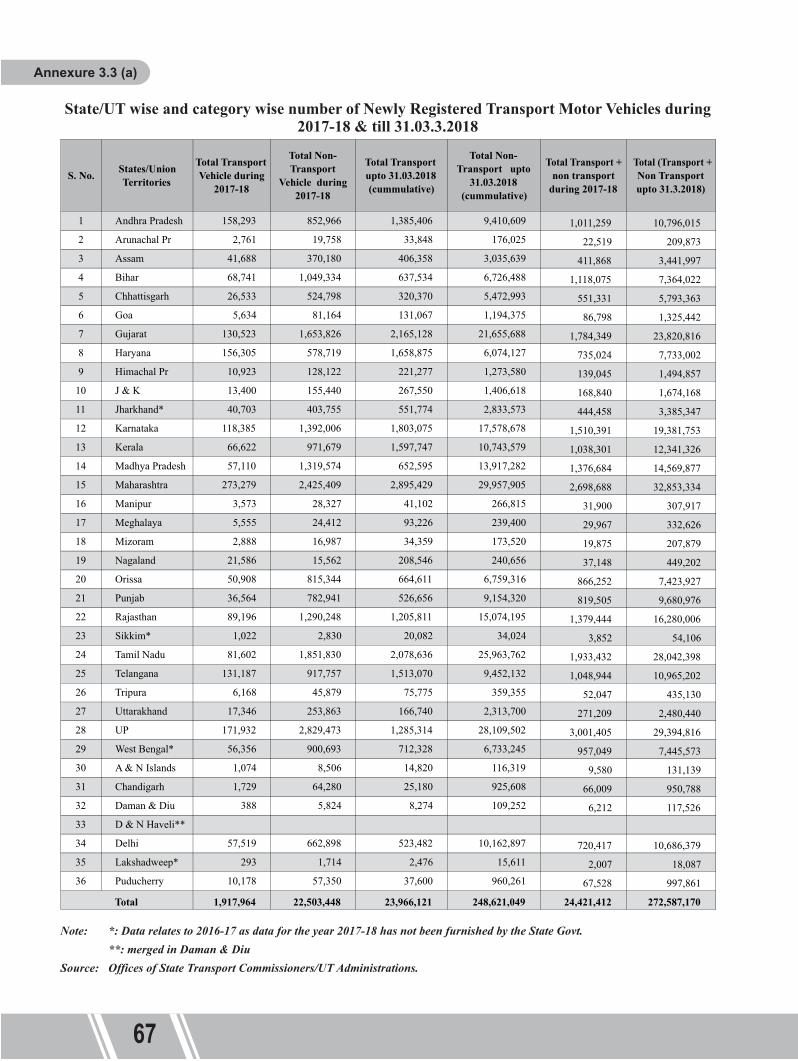
State/UT wise and category wise number of Newly Registered Transport Motor Vehicles during 2017-18 & till 31.03.3.2018
Note: *: Data relates to 2016-17 as data for the year 2017-18 has not been furnished by the State Govt. **: merged in Daman & DiuSource: Offices of State Transport Commissioners/UT Administrations.
Annexure 3.3 (a)
: Data relates to 2016-17 as data for the year 2017-18 has not been furnished by the State Govt. : merged in Daman & DiuSource: Offices of State Transport Commissioners/UT Administrations.
State/UT wise and category wise number of Newly Registered Transport Motor Vehicles during 2018-19 & till 31.03.2019
6867
Annexure 3.3(b)
***
S. No. States/Union Territories
Total Transport Vehicle during
2018-19 (incremental)
Total Non-Transport Vehicle
during 2018-19 (incremental)
Total Transport upto 31.03.2019 (cummulative)
Total Non-Transport upto
31.03.2019 (cummulative)
Total Transport + non transport during
2018-19 (incremental)
Total (Transport + Non Transport upto
31.3.2019) (cummulative)
1 Andhra Pr 122,613 1,073,880 1,508,319 10,484,487 1,196,493 11,992,8062 Arunachal Pr 3,778 25,191 39,526 190,630 28,969 230,1563 Assam 49,186 445,334 455,544 3,480,973 494,520 3,936,5174 Bihar 81,521 1,107,640 719,055 7,834,128 1,189,161 8,553,1835 Chhattisgarh 28,029 553,874 348,399 6,026,867 581,903 6,375,2666 Goa 7,430 69,179 138,497 1,263,554 76,609 1,402,0517 Gujarat 144,598 1,598,003 2,276,952 22,924,133 1,742,601 25,201,0858 Haryana 199,864 672,051 1,859,240 6,740,428 871,915 8,599,6689 Himachal Pr 11,925 128,045 233,202 1,401,625 139,970 1,634,82710 J & K 15,067 164,404 282,617 1,571,022 179,471 1,853,63911 Jharkhand* 40,703 403,755 551,774 2,833,573 444,458 3,385,34712 Karnataka 164,514 1,524,284 1,967,589 19,102,962 1,688,798 21,070,55113 Kerala 63,982 929,676 1,661,729 11,673,255 993,658 13,334,98414 Madhya Pr 73,068 274,852 674,772 14,621,602 347,920 15,296,37415 Maharashtra 289,239 2,249,594 3,184,668 32,207,499 2,538,833 35,392,16716 Manipur 4,310 49,743 45,412 316,558 54,053 361,97017 Meghalaya 4,979 28,199 98,205 267,599 33,178 365,80418 Mizoram 3,472 22,216 37,831 195,736 25,688 233,56719 Nagaland 23,579 16,907 232,125 257,563 40,486 489,68820 Orissa 55,859 801,091 720,470 7,560,407 856,950 8,280,87721 Punjab 41,740 836,719 568,396 9,991,039 878,459 10,559,43522 Rajasthan 90,845 1,339,098 1,296,656 16,413,293 1,429,943 17,709,94923 Sikkim* 1,022 2,830 20,082 34,024 3,852 54,10624 Tamil Nadu 89,986 2,042,794 2,168,622 28,006,556 2,132,780 30,175,17825 Telangana 157,188 1,006,064 1,670,076 10,458,196 1,163,252 12,128,27226 Tripura 4,107 56,592 79,897 415,962 60,699 495,85927 Uttarakhand 16,770 252,236 181,515 2,571,170 269,006 2,752,68528 UP 221,708 3,069,990 1,473,481 31,238,573 3,291,698 32,712,05429 West Bengal* 56,356 900,693 712,328 6,733,245 957,049 7,445,57330 A & N Islands 771 9,141 15,591 125,460 9,912 141,05131 Chandigarh 1,488 61,012 24,660 986,620 62,500 1,011,28032 Daman & Diu 518 5,478 8,792 114,730 5,996 123,52233 D & N Haveli**
34 Delhi 62,090 643,105 585,573 10,805,978 705,195 11,391,55135 Lakshadweep* 293 1,714 2,476 15,611 2,007 18,08736 Puducherry 9,733 54,965 47,333 1,015,226 64,698 1,062,559
2,142,331 22,420,349 25,891,404 269,880,284 24,562,680 295,771,688Total
S. No. States/Union Territories
Total Transport Vehicle during
2017-18
Total Non-Transport
Vehicle during 2017-18
Total Transport upto 31.03.2018 (cummulative)
Total Non-Transport upto
31.03.2018 (cummulative)
Total Transport + non transport
during 2017-18
Total (Transport + Non Transport upto 31.3.2018)
1 Andhra Pradesh 158,293 852,966 1,385,406 9,410,609 1,011,259 10,796,0152 Arunachal Pr 2,761 19,758 33,848 176,025 22,519 209,8733 Assam 41,688 370,180 406,358 3,035,639 411,868 3,441,9974 Bihar 68,741 1,049,334 637,534 6,726,488 1,118,075 7,364,0225 Chhattisgarh 26,533 524,798 320,370 5,472,993 551,331 5,793,3636 Goa 5,634 81,164 131,067 1,194,375 86,798 1,325,4427 Gujarat 130,523 1,653,826 2,165,128 21,655,688 1,784,349 23,820,8168 Haryana 156,305 578,719 1,658,875 6,074,127 735,024 7,733,0029 Himachal Pr 10,923 128,122 221,277 1,273,580 139,045 1,494,857
10 J & K 13,400 155,440 267,550 1,406,618 168,840 1,674,16811 Jharkhand* 40,703 403,755 551,774 2,833,573 444,458 3,385,34712 Karnataka 118,385 1,392,006 1,803,075 17,578,678 1,510,391 19,381,75313 Kerala 66,622 971,679 1,597,747 10,743,579 1,038,301 12,341,32614 Madhya Pradesh 57,110 1,319,574 652,595 13,917,282 1,376,684 14,569,87715 Maharashtra 273,279 2,425,409 2,895,429 29,957,905 2,698,688 32,853,33416 Manipur 3,573 28,327 41,102 266,815 31,900 307,91717 Meghalaya 5,555 24,412 93,226 239,400 29,967 332,62618 Mizoram 2,888 16,987 34,359 173,520 19,875 207,87919 Nagaland 21,586 15,562 208,546 240,656 37,148 449,20220 Orissa 50,908 815,344 664,611 6,759,316 866,252 7,423,92721 Punjab 36,564 782,941 526,656 9,154,320 819,505 9,680,97622 Rajasthan 89,196 1,290,248 1,205,811 15,074,195 1,379,444 16,280,00623 Sikkim* 1,022 2,830 20,082 34,024 3,852 54,10624 Tamil Nadu 81,602 1,851,830 2,078,636 25,963,762 1,933,432 28,042,39825 Telangana 131,187 917,757 1,513,070 9,452,132 1,048,944 10,965,20226 Tripura 6,168 45,879 75,775 359,355 52,047 435,13027 Uttarakhand 17,346 253,863 166,740 2,313,700 271,209 2,480,44028 UP 171,932 2,829,473 1,285,314 28,109,502 3,001,405 29,394,81629 West Bengal* 56,356 900,693 712,328 6,733,245 957,049 7,445,57330 A & N Islands 1,074 8,506 14,820 116,319 9,580 131,13931 Chandigarh 1,729 64,280 25,180 925,608 66,009 950,78832 Daman & Diu 388 5,824 8,274 109,252 6,212 117,52633 D & N Haveli**
34 Delhi 57,519 662,898 523,482 10,162,897 720,417 10,686,37935 Lakshadweep* 293 1,714 2,476 15,611 2,007 18,08736 Puducherry 10,178 57,350 37,600 960,261 67,528 997,861
1,917,964 22,503,448 23,966,121 248,621,049 24,421,412 272,587,170Total
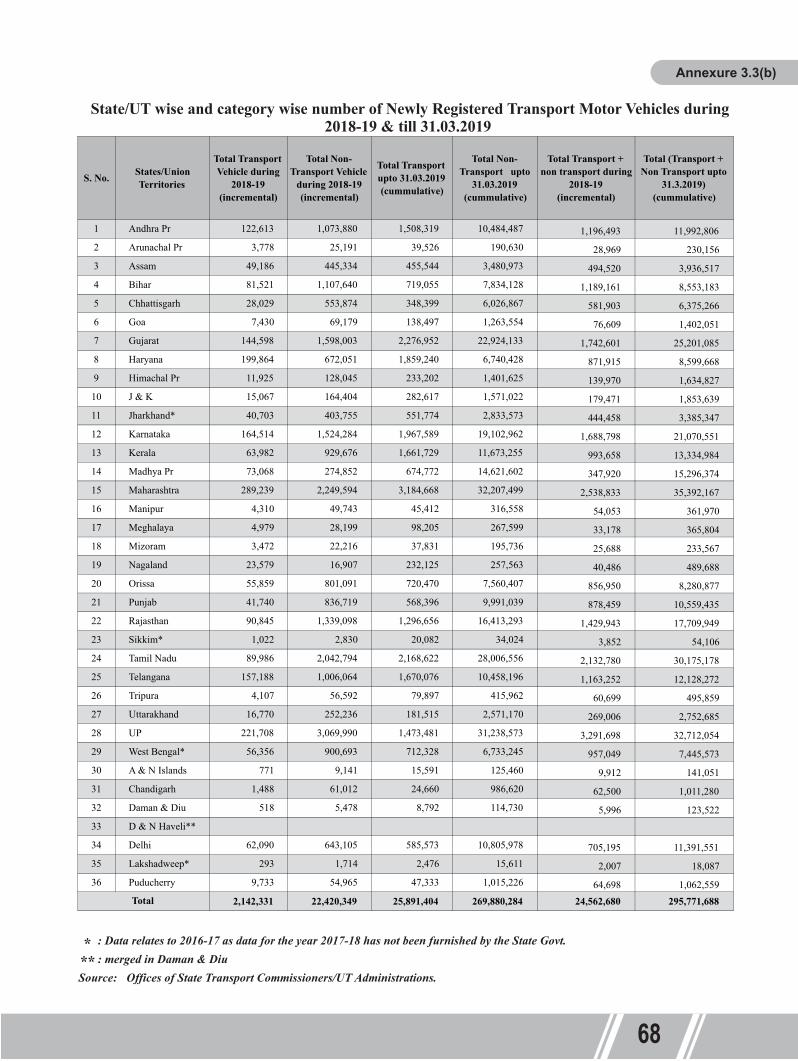

Stat
e/U
T w
ise a
nd ca
tego
ry w
ise n
umbe
r of N
ewly
Reg
ister
ed T
rans
port
Mot
or V
ehic
les d
urin
g 2
017-
18
Stat
e/U
T w
ise a
nd ca
tego
ry w
ise n
umbe
r of N
ewly
Reg
ister
ed N
on-T
rans
port
Mot
or V
ehic
les d
urin
g 20
17-1
8
Annexure 3.3(c)
7069
Annexure 3.3(d)
Not
e:
*: D
ata
rela
tes t
o 20
16-1
7 as
dat
a fo
r the
yea
r 201
7-18
has
not
bee
n fu
rnish
ed b
y th
e St
ate
Gov
t.
**: m
erge
d in
Dam
an &
Diu
Sour
ce:
Offi
ces o
f Sta
te T
rans
port
Com
miss
ione
rs/U
T Ad
min
istra
tions
.
Not
e:
*: D
ata
rela
tes t
o 20
16-1
7 as
dat
a fo
r the
yea
r 201
7-18
has
not
bee
n fu
rnish
ed b
y th
e St
ate
Gov
t.
**: m
erge
d in
Dam
an &
Diu
Sour
ce:
Offi
ces o
f Sta
te T
rans
port
Com
miss
ione
rs/U
T Ad
min
istra
tions
.
Four
W
heel
ers
Thre
e W
heel
ers
Stag
e ca
rria
ges
Con
trac
t ca
rria
ges
Priv
ate
serv
ice
vehi
cles
Oth
er b
uses
Mot
or c
abs
Max
i cab
sO
ther
ta
xis
Thre
e se
ater
sFo
ur to
six
seat
ers
1A
ndhr
a Pr
ades
h75
825
,783
16,0
1611
,411
2,39
276
215
02,
114
2,41
51,
523
592
044
,471
110
49,7
9615
8,29
32
Aru
nach
al P
r26
451
562
119
186
198
501
2142
8741
261
266
00
2,76
13
Ass
am1,
052
7,29
814
,886
3,39
374
901
012
63,
003
678
1,65
78,
620
00
041
,688
4B
ihar
1,00
57,
722
14,0
467,
297
2,83
30
00
6,04
00
029
,798
00
068
,741
5C
hhat
tisga
rh3,
819
6,96
57,
687
874
571
337
288
458
1,45
010
90
3,73
823
70
026
,533
6G
oa0
20
755
421
227
1,65
089
072
01,
648
1,85
95,
634
7G
ujar
at89
331
,965
18,7
5515
,534
00
05,
084
7,29
72,
722
048
,273
00
013
0,52
38
Har
yana
68,1
7219
,075
11,6
191,
402
100
276
928
518
13,2
3282
80
26,2
9113
,232
632
015
6,30
59
Him
acha
l Pr
03,
408
3,96
898
528
876
6172
1,42
736
50
120
00
010
,923
10J &
K76
4,50
33,
829
2,76
626
117
4020
546
50
726
960
013
,400
11Jh
arkh
and*
207
4,22
611
,506
5,44
222
630
117
247
705
790
250
6,60
51,
249
9,10
30
40,7
0312
Kar
nata
ka7,
045
7,43
526
,715
8,81
53,
203
228
688
3,63
620
,697
4,08
41,
356
28,3
011,
541
04,
641
118,
385
13K
eral
a14
71,
555
18,9
976,
582
543
4,51
418
00
9,20
10
900
23,2
0240
1,57
166
,622
14M
adhy
a Pr
ades
h4,
851
9,80
418
,409
060
71,
057
2,29
60
1,52
03,
352
15,2
140
00
57,1
1015
Mah
aras
htra
3,87
741
,971
46,9
0316
,802
733
6,44
434
43,
605
869
27,5
360
124,
195
00
027
3,27
916
Man
ipur
158
491
643
285
500
79
601
128
951
767
50
03,
573
17M
egha
laya
3023
02,
717
4928
100
1556
499
180
926
700
250
05,
555
18M
izor
am0
418
1,22
40
81
30
592
124
029
055
173
02,
888
19N
agal
and
6,21
512
,611
1,65
355
918
015
019
314
33
536
00
021
,586
20O
rissa
16,0
591,
458
6,76
15,
541
643
320
253
449
3,45
468
50
15,2
850
00
50,9
0821
Punj
ab26
21,9
7725
80
3,22
910
00
3,19
92,
473
05,
308
1173
036
,564
22R
ajas
than
051
,897
5,05
24,
978
5,28
39,
354
8,59
04,
042
00
89,1
9623
Sikk
im*
016
111
20
160
110
404
128
185
00
50
1,02
224
Tam
il N
adu
3,19
315
,791
5,38
21,
991
770
130
1,46
84,
004
17,3
764,
211
025
,403
1,88
30
081
,602
25Te
lang
ana
259
26,2
8716
,876
40,0
031,
204
389
125
1,48
310
,235
2,17
817
031
,405
726
013
1,18
726
Trip
ura
01,
265
891
259
3622
00
2611
50
3,50
450
00
6,16
827
Utta
rakh
and
6,33
40
00
942
00
04,
475
00
5,50
00
950
17,3
4628
UP
21,7
5918
,639
37,4
606,
509
870
2,51
92,
489
2,24
414
,190
3,29
411
,255
30,2
1720
,036
451
017
1,93
229
Wes
t Ben
gal*
00
25,8
1510
,922
313
627
313
940
5,36
094
63,
469
5,66
11,
960
300
56,3
5630
A &
N Is
land
s0
105
195
3813
00
00
00
261
462
00
1,07
431
Cha
ndig
arh
098
651
243
400
121
022
76
028
360
00
1,72
932
Dam
an &
Diu
631
90
100
00
167
20
280
00
388
33D
& N
Hav
eli *
*34
Del
hi0
15,4
5355
31,
125
938
00
78,
161
100
114
,147
16,8
590
175
57,5
1935
Laks
hadw
eep
*0
029
990
00
041
90
115
00
029
336
Pudu
cher
ry20
949
07
7318
45
455,
157
375
2959
3,72
50
010
,178
145,
987
339,
372
320,
660
152,
656
26,7
7719
,964
10,8
0025
,551
151,
784
55,8
9323
,232
408,
618
165,
542
13,0
8658
,042
1,91
7,96
4To
tal
S. N
o.St
ates
/Uni
on
Terr
itori
es
Mul
tiaxl
ed /
Art
icul
ated
Ve
hicl
es (I
)
Truc
ks &
Lo
rrie
s (II
)
Ligh
t Mot
or V
ehic
les
(Goo
ds)
(II)
Buse
s (I
V)
Taxi
s (V
)Li
ght M
otor
Veh
icle
s (P
asse
nger
s) (
VI)
Mot
or
cycl
es o
n hi
re (
VII
)
Oth
er
vehi
cles
no
t in
clud
ed
in (I
- V
II)
Tota
l Tr
ansp
ort
(I t
o V
II)
Scoo
ters
Mop
eds
Mot
or c
ycle
s1
And
hra
Prad
esh
060
270
6,95
789
,613
01,
614
22,9
3313
,695
17,5
5285
2,96
61,
011,
259
2A
runa
chal
Pr
4,98
319
18,
130
5,95
896
726
810
619
19,7
5822
,519
3A
ssam
298,
899
063
,936
015
6,30
41,
026
037
0,18
041
1,86
84
Bih
ar0
9,52
391
9,26
249
,865
12,6
680
32,6
8313
,900
11,4
331,
049,
334
1,11
8,07
55
Chh
attis
garh
119,
937
29,4
3830
6,04
034
,922
1,93
73,
616
18,5
186,
932
3,45
852
4,79
855
1,33
16
Goa
53,2
896,
664
021
,022
00
390
150
81,1
6486
,798
7G
ujar
at1,
182,
499
99,1
950
304,
135
5,30
90
52,7
013,
711
6,27
61,
653,
826
1,78
4,34
98
Har
yana
03,
186
509,
658
24,8
5111
,619
2027
,699
01,
686
578,
719
735,
024
9H
imac
hal P
r77
,427
2,23
10
46,9
550
1926
81
1,22
112
8,12
213
9,04
510
J & K
4,84
341
,132
51,7
8754
,065
101
19
751
155,
440
168,
840
11Jh
arkh
and*
62,9
4819
,892
265,
187
38,7
985,
085
66,
262
5,27
630
140
3,75
544
4,45
812
Kar
nata
ka0
01,
150,
231
190,
345
852
3,25
526
,909
12,3
508,
064
1,39
2,00
61,
510,
391
13K
eral
a32
8,01
13
400,
900
236,
984
3,48
547
590
01,
659
971,
679
1,03
8,30
114
Mad
hya
Prad
esh
024
,173
1,09
3,16
411
2,35
70
9,08
478
,032
02,
764
1,31
9,57
41,
376,
684
15M
ahar
asht
ra21
8,15
144
,314
1,72
7,13
834
4,60
517
,891
2461
,615
4,22
07,
451
2,42
5,40
92,
698,
688
16M
anip
ur17
,760
937
105
8,18
41,
134
2252
1811
528
,327
31,9
0017
Meg
hala
ya7,
197
47,
641
9,28
038
031
1720
424
,412
29,9
6718
Miz
oram
017
714
,233
2,57
60
10
00
16,9
8719
,875
19N
agal
and
2,80
994
2,89
34,
765
2,10
60
886
2,80
115
,562
37,1
4820
Oris
sa14
5,19
245
,009
535,
759
50,2
0980
00
18,5
1712
,523
7,33
581
5,34
486
6,25
221
Punj
ab63
7,55
84,
229
3911
8,50
30
320
,564
811,
964
782,
941
819,
505
22R
ajas
than
1,06
3,80
210
7,13
552
,000
062
,711
4,60
00
1,29
0,24
81,
379,
444
23Si
kkim
*28
60
389
1,15
397
90
014
92,
830
3,85
224
Tam
il N
adu
451,
530
111,
753
1,03
5,62
519
9,06
518
223
17,4
2368
835
,541
1,85
1,83
01,
933,
432
25Te
lang
ana
01,
133
763,
839
118,
020
156
2,32
018
,888
8,49
34,
908
917,
757
1,04
8,94
426
Trip
ura
700
540
,031
4,99
70
011
013
545
,879
52,0
4727
Utta
rakh
and
201,
069
00
46,7
370
853,
113
2,58
027
925
3,86
327
1,20
928
UP
289,
256
83,8
692,
102,
071
220,
169
46,6
893,
274
78,0
0788
95,
249
2,82
9,47
33,
001,
405
29W
est B
enga
l*26
6,77
934
,057
497,
798
83,0
420
015
,933
03,
084
900,
693
957,
049
30A
& N
Isla
nds
6,13
00
00
2,34
60
030
08,
506
9,58
031
Cha
ndig
arh
28,2
0512
517
,967
17,9
698
06
00
64,2
8066
,009
32D
aman
& D
iu3,
997
210
1,77
00
05
328
5,82
46,
212
33D
& N
Hav
eli
34D
elhi
476,
713
4,74
70
181,
431
00
60
166
2,89
872
0,41
735
Laks
hadw
eep
218
31,
392
654
032
00
1,71
42,
007
36Pu
duch
erry
14,0
111,
661
37,8
283,
689
210
227
624
57,3
5067
,528
5,96
4,19
956
8,36
812
,196
,064
2,79
7,17
016
5,48
723
,538
572,
986
91,1
7412
4,46
222
,503
,448
24,4
21,4
12To
tal
S N
o.St
ates
/Uni
on
Terr
itori
esTw
o w
heel
ers
(I)
Car
s (I
I)Je
eps (
III)
Om
ni b
uses
(I
V)
Trac
tors
(V
)Tr
aile
rs
(VI)
Oth
er v
ehic
les
not c
over
ed
(VII
)
Tota
l Non
-Tr
ansp
ort
(
I TO
VII
)
Gra
nd T
otal
(T
rans
port
+
Non
Tr
ansp
ort)

Stat
e/U
T w
ise a
nd ca
tego
ry w
ise n
umbe
r of N
ewly
Reg
ister
ed T
rans
port
Mot
or V
ehic
les d
urin
g 2
017-
18
Stat
e/U
T w
ise a
nd ca
tego
ry w
ise n
umbe
r of N
ewly
Reg
ister
ed N
on-T
rans
port
Mot
or V
ehic
les d
urin
g 20
17-1
8Annexure 3.3(c)
7069
Annexure 3.3(d)
Not
e:
*: D
ata
rela
tes t
o 20
16-1
7 as
dat
a fo
r the
yea
r 201
7-18
has
not
bee
n fu
rnish
ed b
y th
e St
ate
Gov
t.
**: m
erge
d in
Dam
an &
Diu
Sour
ce:
Offi
ces o
f Sta
te T
rans
port
Com
miss
ione
rs/U
T Ad
min
istra
tions
.
Not
e:
*: D
ata
rela
tes t
o 20
16-1
7 as
dat
a fo
r the
yea
r 201
7-18
has
not
bee
n fu
rnish
ed b
y th
e St
ate
Gov
t.
**: m
erge
d in
Dam
an &
Diu
Sour
ce:
Offi
ces o
f Sta
te T
rans
port
Com
miss
ione
rs/U
T Ad
min
istra
tions
.
Four
W
heel
ers
Thre
e W
heel
ers
Stag
e ca
rria
ges
Con
trac
t ca
rria
ges
Priv
ate
serv
ice
vehi
cles
Oth
er b
uses
Mot
or c
abs
Max
i cab
sO
ther
ta
xis
Thre
e se
ater
sFo
ur to
six
seat
ers
1A
ndhr
a Pr
ades
h75
825
,783
16,0
1611
,411
2,39
276
215
02,
114
2,41
51,
523
592
044
,471
110
49,7
9615
8,29
32
Aru
nach
al P
r26
451
562
119
186
198
501
2142
8741
261
266
00
2,76
13
Ass
am1,
052
7,29
814
,886
3,39
374
901
012
63,
003
678
1,65
78,
620
00
041
,688
4B
ihar
1,00
57,
722
14,0
467,
297
2,83
30
00
6,04
00
029
,798
00
068
,741
5C
hhat
tisga
rh3,
819
6,96
57,
687
874
571
337
288
458
1,45
010
90
3,73
823
70
026
,533
6G
oa0
20
755
421
227
1,65
089
072
01,
648
1,85
95,
634
7G
ujar
at89
331
,965
18,7
5515
,534
00
05,
084
7,29
72,
722
048
,273
00
013
0,52
38
Har
yana
68,1
7219
,075
11,6
191,
402
100
276
928
518
13,2
3282
80
26,2
9113
,232
632
015
6,30
59
Him
acha
l Pr
03,
408
3,96
898
528
876
6172
1,42
736
50
120
00
010
,923
10J &
K76
4,50
33,
829
2,76
626
117
4020
546
50
726
960
013
,400
11Jh
arkh
and*
207
4,22
611
,506
5,44
222
630
117
247
705
790
250
6,60
51,
249
9,10
30
40,7
0312
Kar
nata
ka7,
045
7,43
526
,715
8,81
53,
203
228
688
3,63
620
,697
4,08
41,
356
28,3
011,
541
04,
641
118,
385
13K
eral
a14
71,
555
18,9
976,
582
543
4,51
418
00
9,20
10
900
23,2
0240
1,57
166
,622
14M
adhy
a Pr
ades
h4,
851
9,80
418
,409
060
71,
057
2,29
60
1,52
03,
352
15,2
140
00
57,1
1015
Mah
aras
htra
3,87
741
,971
46,9
0316
,802
733
6,44
434
43,
605
869
27,5
360
124,
195
00
027
3,27
916
Man
ipur
158
491
643
285
500
79
601
128
951
767
50
03,
573
17M
egha
laya
3023
02,
717
4928
100
1556
499
180
926
700
250
05,
555
18M
izor
am0
418
1,22
40
81
30
592
124
029
055
173
02,
888
19N
agal
and
6,21
512
,611
1,65
355
918
015
019
314
33
536
00
021
,586
20O
rissa
16,0
591,
458
6,76
15,
541
643
320
253
449
3,45
468
50
15,2
850
00
50,9
0821
Punj
ab26
21,9
7725
80
3,22
910
00
3,19
92,
473
05,
308
1173
036
,564
22R
ajas
than
051
,897
5,05
24,
978
5,28
39,
354
8,59
04,
042
00
89,1
9623
Sikk
im*
016
111
20
160
110
404
128
185
00
50
1,02
224
Tam
il N
adu
3,19
315
,791
5,38
21,
991
770
130
1,46
84,
004
17,3
764,
211
025
,403
1,88
30
081
,602
25Te
lang
ana
259
26,2
8716
,876
40,0
031,
204
389
125
1,48
310
,235
2,17
817
031
,405
726
013
1,18
726
Trip
ura
01,
265
891
259
3622
00
2611
50
3,50
450
00
6,16
827
Utta
rakh
and
6,33
40
00
942
00
04,
475
00
5,50
00
950
17,3
4628
UP
21,7
5918
,639
37,4
606,
509
870
2,51
92,
489
2,24
414
,190
3,29
411
,255
30,2
1720
,036
451
017
1,93
229
Wes
t Ben
gal*
00
25,8
1510
,922
313
627
313
940
5,36
094
63,
469
5,66
11,
960
300
56,3
5630
A &
N Is
land
s0
105
195
3813
00
00
00
261
462
00
1,07
431
Cha
ndig
arh
098
651
243
400
121
022
76
028
360
00
1,72
932
Dam
an &
Diu
631
90
100
00
167
20
280
00
388
33D
& N
Hav
eli *
*34
Del
hi0
15,4
5355
31,
125
938
00
78,
161
100
114
,147
16,8
590
175
57,5
1935
Laks
hadw
eep
*0
029
990
00
041
90
115
00
029
336
Pudu
cher
ry20
949
07
7318
45
455,
157
375
2959
3,72
50
010
,178
145,
987
339,
372
320,
660
152,
656
26,7
7719
,964
10,8
0025
,551
151,
784
55,8
9323
,232
408,
618
165,
542
13,0
8658
,042
1,91
7,96
4To
tal
S. N
o.St
ates
/Uni
on
Terr
itori
es
Mul
tiaxl
ed /
Art
icul
ated
Ve
hicl
es (I
)
Truc
ks &
Lo
rrie
s (II
)
Ligh
t Mot
or V
ehic
les
(Goo
ds)
(II)
Buse
s (I
V)
Taxi
s (V
)Li
ght M
otor
Veh
icle
s (P
asse
nger
s) (
VI)
Mot
or
cycl
es o
n hi
re (
VII
)
Oth
er
vehi
cles
no
t in
clud
ed
in (I
- V
II)
Tota
l Tr
ansp
ort
(I t
o V
II)
Scoo
ters
Mop
eds
Mot
or c
ycle
s1
And
hra
Prad
esh
060
270
6,95
789
,613
01,
614
22,9
3313
,695
17,5
5285
2,96
61,
011,
259
2A
runa
chal
Pr
4,98
319
18,
130
5,95
896
726
810
619
19,7
5822
,519
3A
ssam
298,
899
063
,936
015
6,30
41,
026
037
0,18
041
1,86
84
Bih
ar0
9,52
391
9,26
249
,865
12,6
680
32,6
8313
,900
11,4
331,
049,
334
1,11
8,07
55
Chh
attis
garh
119,
937
29,4
3830
6,04
034
,922
1,93
73,
616
18,5
186,
932
3,45
852
4,79
855
1,33
16
Goa
53,2
896,
664
021
,022
00
390
150
81,1
6486
,798
7G
ujar
at1,
182,
499
99,1
950
304,
135
5,30
90
52,7
013,
711
6,27
61,
653,
826
1,78
4,34
98
Har
yana
03,
186
509,
658
24,8
5111
,619
2027
,699
01,
686
578,
719
735,
024
9H
imac
hal P
r77
,427
2,23
10
46,9
550
1926
81
1,22
112
8,12
213
9,04
510
J & K
4,84
341
,132
51,7
8754
,065
101
19
751
155,
440
168,
840
11Jh
arkh
and*
62,9
4819
,892
265,
187
38,7
985,
085
66,
262
5,27
630
140
3,75
544
4,45
812
Kar
nata
ka0
01,
150,
231
190,
345
852
3,25
526
,909
12,3
508,
064
1,39
2,00
61,
510,
391
13K
eral
a32
8,01
13
400,
900
236,
984
3,48
547
590
01,
659
971,
679
1,03
8,30
114
Mad
hya
Prad
esh
024
,173
1,09
3,16
411
2,35
70
9,08
478
,032
02,
764
1,31
9,57
41,
376,
684
15M
ahar
asht
ra21
8,15
144
,314
1,72
7,13
834
4,60
517
,891
2461
,615
4,22
07,
451
2,42
5,40
92,
698,
688
16M
anip
ur17
,760
937
105
8,18
41,
134
2252
1811
528
,327
31,9
0017
Meg
hala
ya7,
197
47,
641
9,28
038
031
1720
424
,412
29,9
6718
Miz
oram
017
714
,233
2,57
60
10
00
16,9
8719
,875
19N
agal
and
2,80
994
2,89
34,
765
2,10
60
886
2,80
115
,562
37,1
4820
Oris
sa14
5,19
245
,009
535,
759
50,2
0980
00
18,5
1712
,523
7,33
581
5,34
486
6,25
221
Punj
ab63
7,55
84,
229
3911
8,50
30
320
,564
811,
964
782,
941
819,
505
22R
ajas
than
1,06
3,80
210
7,13
552
,000
062
,711
4,60
00
1,29
0,24
81,
379,
444
23Si
kkim
*28
60
389
1,15
397
90
014
92,
830
3,85
224
Tam
il N
adu
451,
530
111,
753
1,03
5,62
519
9,06
518
223
17,4
2368
835
,541
1,85
1,83
01,
933,
432
25Te
lang
ana
01,
133
763,
839
118,
020
156
2,32
018
,888
8,49
34,
908
917,
757
1,04
8,94
426
Trip
ura
700
540
,031
4,99
70
011
013
545
,879
52,0
4727
Utta
rakh
and
201,
069
00
46,7
370
853,
113
2,58
027
925
3,86
327
1,20
928
UP
289,
256
83,8
692,
102,
071
220,
169
46,6
893,
274
78,0
0788
95,
249
2,82
9,47
33,
001,
405
29W
est B
enga
l*26
6,77
934
,057
497,
798
83,0
420
015
,933
03,
084
900,
693
957,
049
30A
& N
Isla
nds
6,13
00
00
2,34
60
030
08,
506
9,58
031
Cha
ndig
arh
28,2
0512
517
,967
17,9
698
06
00
64,2
8066
,009
32D
aman
& D
iu3,
997
210
1,77
00
05
328
5,82
46,
212
33D
& N
Hav
eli
34D
elhi
476,
713
4,74
70
181,
431
00
60
166
2,89
872
0,41
735
Laks
hadw
eep
218
31,
392
654
032
00
1,71
42,
007
36Pu
duch
erry
14,0
111,
661
37,8
283,
689
210
227
624
57,3
5067
,528
5,96
4,19
956
8,36
812
,196
,064
2,79
7,17
016
5,48
723
,538
572,
986
91,1
7412
4,46
222
,503
,448
24,4
21,4
12To
tal
S N
o.St
ates
/Uni
on
Terr
itori
esTw
o w
heel
ers
(I)
Car
s (I
I)Je
eps (
III)
Om
ni b
uses
(I
V)
Trac
tors
(V
)Tr
aile
rs
(VI)
Oth
er v
ehic
les
not c
over
ed
(VII
)
Tota
l Non
-Tr
ansp
ort
(
I TO
VII
)
Gra
nd T
otal
(T
rans
port
+
Non
Tr
ansp
ort)
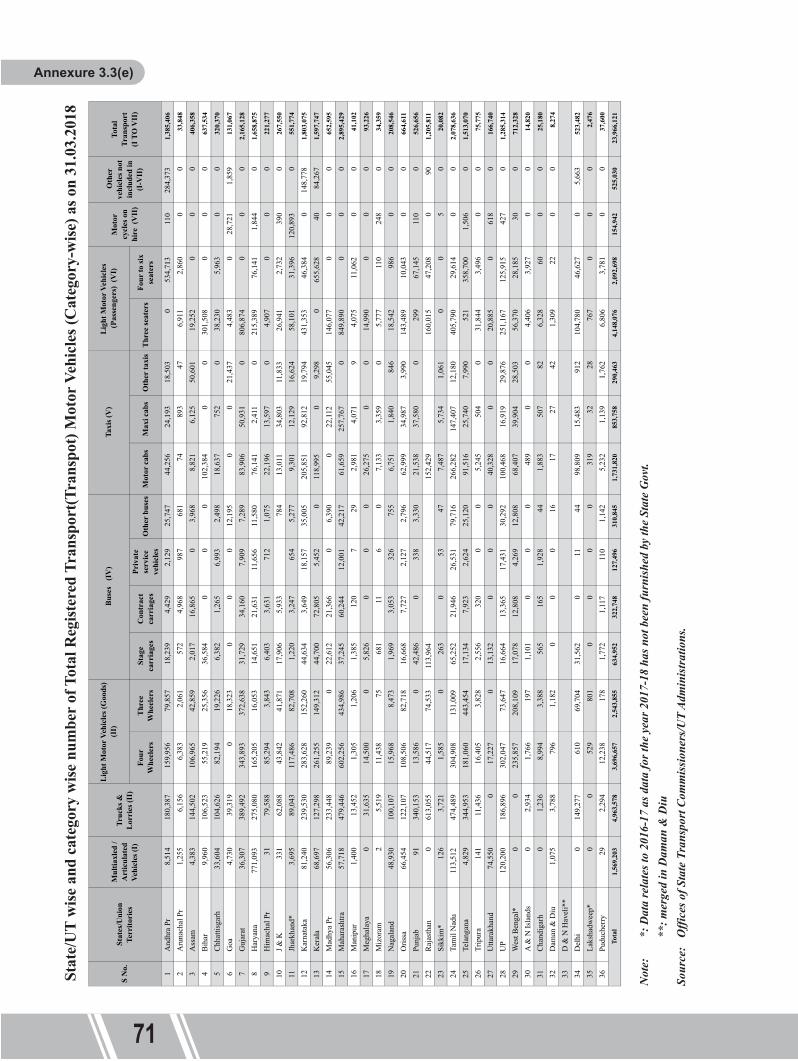
Annexure 3.3(e)
7271
Annexure 3.3(f)St
ate/
UT
wise
and
cate
gory
wise
num
ber o
f Tot
al R
egist
ered
Tra
nspo
rt(T
rans
pot)
Mot
or V
ehic
les (
Cat
egor
y-w
ise) a
s on
31.0
3.20
18
Sta
te/U
T w
ise a
nd ca
tego
ry w
ise n
umbe
r of T
otal
Reg
ister
ed N
on-T
rans
port
Mot
or V
ehic
les (
Cat
egor
y-w
ise) a
s on
31.0
3.20
18
Not
e:
*: D
ata
rela
tes t
o 20
16-1
7 as
dat
a fo
r the
yea
r 201
7-18
has
not
bee
n fu
rnish
ed b
y th
e St
ate
Gov
t.
**: m
erge
d in
Dam
an &
Diu
Sour
ce:
Offi
ces o
f Sta
te T
rans
port
Com
miss
ione
rs/U
T Ad
min
istra
tions
.
Not
e:
*: D
ata
rela
tes t
o 20
16-1
7 as
dat
a fo
r the
yea
r 201
7-18
has
not
bee
n fu
rnish
ed b
y th
e St
ate
Gov
t.
**: m
erge
d in
Dam
an &
Diu
Sour
ce:
Offi
ces o
f Sta
te T
rans
port
Com
miss
ione
rs/U
T Ad
min
istra
tions
.
Four
W
heel
ers
Thre
e W
heel
ers
Stag
e ca
rria
ges
Con
trac
t ca
rria
ges
Priv
ate
serv
ice
vehi
cles
Oth
er b
uses
Mot
or c
abs
Max
i cab
sO
ther
taxi
sTh
ree
seat
ers
Four
to si
x se
ater
s
1A
ndhr
a Pr
8,51
418
0,38
715
9,95
679
,857
18,2
394,
429
2,12
925
,747
44,2
5624
,193
18,5
030
534,
713
110
284,
373
1,38
5,40
6
2A
runa
chal
Pr
1,25
56,
156
6,38
32,
061
572
4,96
898
768
174
893
476,
911
2,86
00
033
,848
3A
ssam
4,38
314
4,50
210
6,96
542
,859
2,01
716
,865
03,
968
8,82
16,
125
50,6
0119
,252
00
040
6,35
8
4B
ihar
9,96
010
6,52
355
,219
25,3
5636
,584
00
010
2,38
40
030
1,50
80
00
637,
534
5C
hhat
tisga
rh33
,604
104,
626
82,1
9419
,226
6,38
21,
265
6,99
32,
498
18,6
3775
20
38,2
305,
963
00
320,
370
6G
oa4,
730
39,3
190
18,3
230
00
12,1
950
021
,437
4,48
30
28,7
211,
859
131,
067
7G
ujar
at36
,307
389,
492
343,
893
372,
638
31,7
2934
,160
7,90
97,
289
83,9
0650
,931
080
6,87
40
00
2,16
5,12
8
8H
arya
na77
1,09
327
5,08
016
5,20
516
,053
14,6
5121
,631
11,6
5611
,580
76,1
412,
411
021
5,38
976
,141
1,84
40
1,65
8,87
5
9H
imac
hal P
r31
79,5
8885
,294
3,84
36,
403
3,63
171
21,
075
22,1
9613
,597
04,
907
00
022
1,27
7
10J &
K33
162
,088
43,8
4241
,871
17,9
065,
933
784
13,0
1134
,803
11,8
3326
,941
2,73
239
00
267,
550
11Jh
arkh
and*
3,69
589
,043
117,
486
82,7
081,
220
3,24
765
45,
277
9,30
112
,129
16,6
2458
,101
31,3
9612
0,89
30
551,
774
12K
arna
taka
81,2
4023
9,53
028
3,62
815
2,26
044
,634
3,64
918
,157
35,0
0520
5,85
192
,812
19,7
9443
1,35
346
,384
014
8,77
81,
803,
075
13K
eral
a68
,697
127,
298
261,
255
149,
312
44,7
0072
,805
5,45
20
118,
995
09,
298
065
5,62
840
84,2
671,
597,
747
14M
adhy
a Pr
56,3
0623
3,44
889
,239
022
,612
21,3
660
6,39
00
22,1
1255
,045
146,
077
00
065
2,59
5
15M
ahar
asht
ra57
,718
479,
446
602,
256
434,
986
37,2
4560
,244
12,0
0142
,217
61,6
5925
7,76
70
849,
890
00
02,
895,
429
16M
anip
ur1,
400
13,4
521,
305
1,20
61,
385
120
729
2,98
14,
071
94,
075
11,0
620
041
,102
17M
egha
laya
031
,635
14,5
000
5,82
60
00
26,2
750
014
,990
00
093
,226
18M
izor
am2
5,51
911
,438
7568
111
60
7,13
33,
359
05,
777
110
248
034
,359
19N
agal
and
48,9
3010
0,10
715
,968
8,47
31,
969
3,05
332
675
56,
751
1,84
084
618
,542
986
00
208,
546
20O
rissa
66,4
5412
2,10
710
8,50
682
,718
16,6
687,
727
2,12
72,
796
62,9
9934
,987
3,99
014
3,48
910
,043
00
664,
611
21Pu
njab
9134
0,15
313
,586
042
,486
033
83,
330
21,5
3837
,580
029
967
,145
110
052
6,65
6
22R
ajas
than
061
3,05
544
,517
74,5
3311
3,96
415
2,42
916
0,01
547
,208
090
1,20
5,81
1
23Si
kkim
*12
63,
721
1,58
50
263
053
477,
487
5,73
41,
061
00
50
20,0
82
24Ta
mil
Nad
u11
3,51
247
4,48
930
4,90
813
1,00
965
,252
21,9
4626
,531
79,7
1626
6,28
214
7,40
712
,180
405,
790
29,6
140
02,
078,
636
25Te
lang
ana
4,82
934
4,95
318
1,06
044
3,45
417
,134
7,92
32,
624
25,1
2091
,516
25,7
407,
990
521
358,
700
1,50
60
1,51
3,07
0
26Tr
ipur
a14
111
,436
16,4
053,
828
2,55
632
00
05,
245
504
031
,844
3,49
60
075
,775
27U
ttara
khan
d74
,550
017
,227
013
,132
00
040
,328
00
20,8
850
618
016
6,74
0
28U
P12
0,20
018
6,89
630
2,04
773
,647
16,6
6413
,365
17,4
3130
,292
100,
468
16,9
1929
,876
251,
167
125,
915
427
01,
285,
314
29W
est B
enga
l*0
023
5,85
720
8,10
917
,078
12,8
084,
269
12,8
0868
,407
39,9
0428
,503
56,3
7028
,185
300
712,
328
30A
& N
Isla
nds
02,
934
1,76
619
71,
101
00
048
90
04,
406
3,92
70
014
,820
31C
hand
igar
h0
1,23
68,
994
3,38
856
516
51,
928
441,
883
507
826,
328
600
025
,180
32D
aman
& D
iu1,
075
3,78
879
61,
182
00
016
1727
421,
309
220
08,
274
33D
& N
Hav
eli*
*34
Del
hi0
149,
277
610
69,7
0431
,562
011
4498
,809
15,4
8391
210
4,78
046
,627
05,
663
523,
482
35La
ksha
dwee
p*0
052
980
10
00
031
932
2876
70
00
2,47
6
36Pu
duch
erry
292,
294
12,2
3817
81,
772
1,11
711
01,
142
5,23
21,
139
1,76
26,
806
3,78
10
037
,600
1,56
9,20
34,
963,
578
3,69
6,65
72,
543,
855
634,
952
322,
748
127,
496
310,
845
1,73
1,82
085
3,75
829
0,46
34,
148,
076
2,09
2,69
815
4,94
252
5,03
023
,966
,121
Ligh
t Mot
or V
ehic
les (
Goo
ds)
(II)
Buse
s (I
V)
Taxi
s (V
)Li
ght M
otor
Veh
icle
s (P
asse
nger
s) (
VI)
Tota
l
S N
o.St
ates
/Uni
on
Terr
itori
es
Mul
tiaxl
ed /
Art
icul
ated
Ve
hicl
es (I
)
Truc
ks &
Lo
rrie
s (II
)
Mot
or
cycl
es o
n hi
re (
VII
)
Oth
er
vehi
cles
not
in
clud
ed in
(I
-VII
)
Tota
l Tr
ansp
ort
(I T
O V
II)
Scoo
ters
Mop
eds
Mot
or c
ycle
s1
And
hra
Prad
esh
027
8,38
38,
100,
389
654,
214
10,5
1827
,303
177,
150
124,
388
38,2
649,
410,
609
2A
runa
chal
Pra
desh
32,1
522,
532
63,0
1566
,352
3,91
134
1,30
172
36,
005
176,
025
3A
ssam
00
2,27
3,68
968
4,13
30
1,47
953
,626
22,7
120
3,03
5,63
94
Bih
ar0
26,8
995,
533,
470
349,
947
146,
557
042
0,57
721
0,00
639
,032
6,72
6,48
85
Chh
attis
garh
2,81
9,41
052
6,01
61,
351,
758
316,
983
23,9
6058
,057
224,
258
128,
779
23,7
725,
472,
993
6G
oa0
091
3,37
427
2,05
60
03,
927
05,
018
1,19
4,37
57
Guj
arat
14,8
80,4
282,
564,
078
02,
794,
957
192,
789
074
1,63
339
0,27
691
,527
21,6
55,6
888
Har
yana
051
,216
5,13
0,04
424
1,34
616
5,20
530
841
4,78
50
71,2
236,
074,
127
9H
imac
hal P
r75
0,97
67,
600
036
5,19
922
,411
2,01
86,
465
110
118,
801
1,27
3,58
010
J & K
221,
346
56,7
6356
1,58
347
4,61
315
,246
35,9
7288
615
,177
1,40
6,61
811
Jhar
khan
d*24
8,82
912
8,59
51,
887,
527
352,
510
64,6
1434
80,8
1664
,659
5,98
92,
833,
573
12K
arna
taka
00
14,1
05,3
442,
300,
838
47,1
7113
4,14
552
5,88
634
8,09
511
7,19
917
,578
,678
13K
eral
a3,
567,
224
814,
355,
844
2,47
7,97
414
5,86
42,
673
13,7
400
180,
179
10,7
43,5
7914
Mad
hya
Prad
esh
081
7,76
710
,779
,188
982,
124
014
4,73
41,
152,
821
040
,648
13,9
17,2
8215
Mah
aras
htra
4,10
1,78
51,
692,
531
18,3
14,2
564,
050,
681
552,
982
18,7
7671
6,63
340
1,11
810
9,14
329
,957
,905
16M
anip
ur19
0,59
610
,588
7,17
239
,256
14,6
191,
148
1,56
926
71,
600
266,
815
17M
egha
laya
115,
239
00
91,2
4123
,114
091
52,
894
5,99
723
9,40
018
Miz
oram
01,
193
127,
710
44,5
100
180
260
173,
520
19N
agal
and
40,0
8516
,911
35,6
3579
,328
36,4
9649
82,
956
1,07
427
,673
240,
656
20O
rissa
258,
633
100,
536
5,59
2,45
740
0,43
549
,469
3,66
816
2,39
113
7,10
754
,620
6,75
9,31
621
Punj
ab6,
859,
338
188,
434
01,
628,
985
09
423,
879
10,7
2442
,951
9,15
4,32
022
Raj
asth
an12
,314
,229
1,09
5,52
648
7,36
60
1,09
2,43
284
,642
015
,074
,195
23Si
kkim
*1,
717
03,
345
18,6
629,
928
00
217
155
34,0
2424
Tam
il N
adu
3,49
6,54
95,
378,
585
13,8
17,5
242,
514,
834
60,8
4420
,377
268,
054
80,7
7032
6,22
525
,963
,762
25Te
lang
ana
022
5,79
47,
669,
923
1,20
7,53
216
,042
55,6
4415
3,27
392
,935
30,9
899,
452,
132
26Tr
ipur
a1,
910
400
299,
019
54,8
790
5629
673
92,
056
359,
355
27U
ttara
khan
d1,
825,
226
00
438,
622
021
640
,283
5,32
54,
028
2,31
3,70
028
UP
2,77
7,07
783
2,69
420
,302
,020
2,19
5,78
358
1,77
035
,014
1,33
9,98
017
,785
27,3
7928
,109
,502
29W
est B
enga
l*1,
921,
492
428,
198
3,24
5,66
796
1,36
90
013
6,11
20
40,4
076,
733,
245
30A
& N
Isla
nds
92,5
320
00
22,9
180
086
90
116,
319
31C
hand
igar
h20
3,68
31,
400
208,
052
487,
641
24,5
510
281
00
925,
608
32D
aman
& D
iu28
,580
5,49
941
,524
32,1
0661
051
434
227
221
109,
252
33D
& N
Hav
eli*
*34
Del
hi6,
955,
464
119,
852
03,
087,
309
04
215
053
10,1
62,8
9735
Laks
hadw
eep*
2,66
453
011
,514
155
3639
171
050
215
,611
36Pu
duch
erry
159,
222
193,
331
500,
854
94,7
691,
351
4,21
82,
482
751
3,28
396
0,26
1
63,8
66,3
8613
,656
,406
125,
231,
897
30,8
56,8
692,
720,
342
546,
476
8,18
4,45
32,
128,
104
1,43
0,11
624
8,62
1,04
9
Tota
l Non
-Tr
ansp
ort
(I to
VII
)
Tota
l
S N
o.St
ates
/Uni
on T
erri
tori
esTw
o w
heel
ers
(I)
Car
s (I
I)Je
eps (
III)
Om
ni b
uses
(I
V)
Trac
tors
(V
)Tr
aile
rs (
VI)
Oth
er v
ehic
les n
ot
cove
red
(VII
)

Annexure 3.3(e)
7271
Annexure 3.3(f)
Stat
e/U
T w
ise a
nd ca
tego
ry w
ise n
umbe
r of T
otal
Reg
ister
ed T
rans
port
(Tra
nspo
t) M
otor
Veh
icle
s (C
ateg
ory-
wise
) as o
n 31
.03.
2018
Sta
te/U
T w
ise a
nd ca
tego
ry w
ise n
umbe
r of T
otal
Reg
ister
ed N
on-T
rans
port
Mot
or V
ehic
les (
Cat
egor
y-w
ise) a
s on
31.0
3.20
18
Not
e:
*: D
ata
rela
tes t
o 20
16-1
7 as
dat
a fo
r the
yea
r 201
7-18
has
not
bee
n fu
rnish
ed b
y th
e St
ate
Gov
t.
**: m
erge
d in
Dam
an &
Diu
Sour
ce:
Offi
ces o
f Sta
te T
rans
port
Com
miss
ione
rs/U
T Ad
min
istra
tions
.
Not
e:
*: D
ata
rela
tes t
o 20
16-1
7 as
dat
a fo
r the
yea
r 201
7-18
has
not
bee
n fu
rnish
ed b
y th
e St
ate
Gov
t.
**: m
erge
d in
Dam
an &
Diu
Sour
ce:
Offi
ces o
f Sta
te T
rans
port
Com
miss
ione
rs/U
T Ad
min
istra
tions
.
Four
W
heel
ers
Thre
e W
heel
ers
Stag
e ca
rria
ges
Con
trac
t ca
rria
ges
Priv
ate
serv
ice
vehi
cles
Oth
er b
uses
Mot
or c
abs
Max
i cab
sO
ther
taxi
sTh
ree
seat
ers
Four
to si
x se
ater
s
1A
ndhr
a Pr
8,51
418
0,38
715
9,95
679
,857
18,2
394,
429
2,12
925
,747
44,2
5624
,193
18,5
030
534,
713
110
284,
373
1,38
5,40
6
2A
runa
chal
Pr
1,25
56,
156
6,38
32,
061
572
4,96
898
768
174
893
476,
911
2,86
00
033
,848
3A
ssam
4,38
314
4,50
210
6,96
542
,859
2,01
716
,865
03,
968
8,82
16,
125
50,6
0119
,252
00
040
6,35
8
4B
ihar
9,96
010
6,52
355
,219
25,3
5636
,584
00
010
2,38
40
030
1,50
80
00
637,
534
5C
hhat
tisga
rh33
,604
104,
626
82,1
9419
,226
6,38
21,
265
6,99
32,
498
18,6
3775
20
38,2
305,
963
00
320,
370
6G
oa4,
730
39,3
190
18,3
230
00
12,1
950
021
,437
4,48
30
28,7
211,
859
131,
067
7G
ujar
at36
,307
389,
492
343,
893
372,
638
31,7
2934
,160
7,90
97,
289
83,9
0650
,931
080
6,87
40
00
2,16
5,12
8
8H
arya
na77
1,09
327
5,08
016
5,20
516
,053
14,6
5121
,631
11,6
5611
,580
76,1
412,
411
021
5,38
976
,141
1,84
40
1,65
8,87
5
9H
imac
hal P
r31
79,5
8885
,294
3,84
36,
403
3,63
171
21,
075
22,1
9613
,597
04,
907
00
022
1,27
7
10J &
K33
162
,088
43,8
4241
,871
17,9
065,
933
784
13,0
1134
,803
11,8
3326
,941
2,73
239
00
267,
550
11Jh
arkh
and*
3,69
589
,043
117,
486
82,7
081,
220
3,24
765
45,
277
9,30
112
,129
16,6
2458
,101
31,3
9612
0,89
30
551,
774
12K
arna
taka
81,2
4023
9,53
028
3,62
815
2,26
044
,634
3,64
918
,157
35,0
0520
5,85
192
,812
19,7
9443
1,35
346
,384
014
8,77
81,
803,
075
13K
eral
a68
,697
127,
298
261,
255
149,
312
44,7
0072
,805
5,45
20
118,
995
09,
298
065
5,62
840
84,2
671,
597,
747
14M
adhy
a Pr
56,3
0623
3,44
889
,239
022
,612
21,3
660
6,39
00
22,1
1255
,045
146,
077
00
065
2,59
5
15M
ahar
asht
ra57
,718
479,
446
602,
256
434,
986
37,2
4560
,244
12,0
0142
,217
61,6
5925
7,76
70
849,
890
00
02,
895,
429
16M
anip
ur1,
400
13,4
521,
305
1,20
61,
385
120
729
2,98
14,
071
94,
075
11,0
620
041
,102
17M
egha
laya
031
,635
14,5
000
5,82
60
00
26,2
750
014
,990
00
093
,226
18M
izor
am2
5,51
911
,438
7568
111
60
7,13
33,
359
05,
777
110
248
034
,359
19N
agal
and
48,9
3010
0,10
715
,968
8,47
31,
969
3,05
332
675
56,
751
1,84
084
618
,542
986
00
208,
546
20O
rissa
66,4
5412
2,10
710
8,50
682
,718
16,6
687,
727
2,12
72,
796
62,9
9934
,987
3,99
014
3,48
910
,043
00
664,
611
21Pu
njab
9134
0,15
313
,586
042
,486
033
83,
330
21,5
3837
,580
029
967
,145
110
052
6,65
6
22R
ajas
than
061
3,05
544
,517
74,5
3311
3,96
415
2,42
916
0,01
547
,208
090
1,20
5,81
1
23Si
kkim
*12
63,
721
1,58
50
263
053
477,
487
5,73
41,
061
00
50
20,0
82
24Ta
mil
Nad
u11
3,51
247
4,48
930
4,90
813
1,00
965
,252
21,9
4626
,531
79,7
1626
6,28
214
7,40
712
,180
405,
790
29,6
140
02,
078,
636
25Te
lang
ana
4,82
934
4,95
318
1,06
044
3,45
417
,134
7,92
32,
624
25,1
2091
,516
25,7
407,
990
521
358,
700
1,50
60
1,51
3,07
0
26Tr
ipur
a14
111
,436
16,4
053,
828
2,55
632
00
05,
245
504
031
,844
3,49
60
075
,775
27U
ttara
khan
d74
,550
017
,227
013
,132
00
040
,328
00
20,8
850
618
016
6,74
0
28U
P12
0,20
018
6,89
630
2,04
773
,647
16,6
6413
,365
17,4
3130
,292
100,
468
16,9
1929
,876
251,
167
125,
915
427
01,
285,
314
29W
est B
enga
l*0
023
5,85
720
8,10
917
,078
12,8
084,
269
12,8
0868
,407
39,9
0428
,503
56,3
7028
,185
300
712,
328
30A
& N
Isla
nds
02,
934
1,76
619
71,
101
00
048
90
04,
406
3,92
70
014
,820
31C
hand
igar
h0
1,23
68,
994
3,38
856
516
51,
928
441,
883
507
826,
328
600
025
,180
32D
aman
& D
iu1,
075
3,78
879
61,
182
00
016
1727
421,
309
220
08,
274
33D
& N
Hav
eli*
*34
Del
hi0
149,
277
610
69,7
0431
,562
011
4498
,809
15,4
8391
210
4,78
046
,627
05,
663
523,
482
35La
ksha
dwee
p*0
052
980
10
00
031
932
2876
70
00
2,47
6
36Pu
duch
erry
292,
294
12,2
3817
81,
772
1,11
711
01,
142
5,23
21,
139
1,76
26,
806
3,78
10
037
,600
1,56
9,20
34,
963,
578
3,69
6,65
72,
543,
855
634,
952
322,
748
127,
496
310,
845
1,73
1,82
085
3,75
829
0,46
34,
148,
076
2,09
2,69
815
4,94
252
5,03
023
,966
,121
Ligh
t Mot
or V
ehic
les (
Goo
ds)
(II)
Buse
s (I
V)
Taxi
s (V
)Li
ght M
otor
Veh
icle
s (P
asse
nger
s) (
VI)
Tota
l
S N
o.St
ates
/Uni
on
Terr
itori
es
Mul
tiaxl
ed /
Art
icul
ated
Ve
hicl
es (I
)
Truc
ks &
Lo
rrie
s (II
)
Mot
or
cycl
es o
n hi
re (
VII
)
Oth
er
vehi
cles
not
in
clud
ed in
(I
-VII
)
Tota
l Tr
ansp
ort
(I T
O V
II)
Scoo
ters
Mop
eds
Mot
or c
ycle
s1
And
hra
Prad
esh
027
8,38
38,
100,
389
654,
214
10,5
1827
,303
177,
150
124,
388
38,2
649,
410,
609
2A
runa
chal
Pra
desh
32,1
522,
532
63,0
1566
,352
3,91
134
1,30
172
36,
005
176,
025
3A
ssam
00
2,27
3,68
968
4,13
30
1,47
953
,626
22,7
120
3,03
5,63
94
Bih
ar0
26,8
995,
533,
470
349,
947
146,
557
042
0,57
721
0,00
639
,032
6,72
6,48
85
Chh
attis
garh
2,81
9,41
052
6,01
61,
351,
758
316,
983
23,9
6058
,057
224,
258
128,
779
23,7
725,
472,
993
6G
oa0
091
3,37
427
2,05
60
03,
927
05,
018
1,19
4,37
57
Guj
arat
14,8
80,4
282,
564,
078
02,
794,
957
192,
789
074
1,63
339
0,27
691
,527
21,6
55,6
888
Har
yana
051
,216
5,13
0,04
424
1,34
616
5,20
530
841
4,78
50
71,2
236,
074,
127
9H
imac
hal P
r75
0,97
67,
600
036
5,19
922
,411
2,01
86,
465
110
118,
801
1,27
3,58
010
J & K
221,
346
56,7
6356
1,58
347
4,61
315
,246
35,9
7288
615
,177
1,40
6,61
811
Jhar
khan
d*24
8,82
912
8,59
51,
887,
527
352,
510
64,6
1434
80,8
1664
,659
5,98
92,
833,
573
12K
arna
taka
00
14,1
05,3
442,
300,
838
47,1
7113
4,14
552
5,88
634
8,09
511
7,19
917
,578
,678
13K
eral
a3,
567,
224
814,
355,
844
2,47
7,97
414
5,86
42,
673
13,7
400
180,
179
10,7
43,5
7914
Mad
hya
Prad
esh
081
7,76
710
,779
,188
982,
124
014
4,73
41,
152,
821
040
,648
13,9
17,2
8215
Mah
aras
htra
4,10
1,78
51,
692,
531
18,3
14,2
564,
050,
681
552,
982
18,7
7671
6,63
340
1,11
810
9,14
329
,957
,905
16M
anip
ur19
0,59
610
,588
7,17
239
,256
14,6
191,
148
1,56
926
71,
600
266,
815
17M
egha
laya
115,
239
00
91,2
4123
,114
091
52,
894
5,99
723
9,40
018
Miz
oram
01,
193
127,
710
44,5
100
180
260
173,
520
19N
agal
and
40,0
8516
,911
35,6
3579
,328
36,4
9649
82,
956
1,07
427
,673
240,
656
20O
rissa
258,
633
100,
536
5,59
2,45
740
0,43
549
,469
3,66
816
2,39
113
7,10
754
,620
6,75
9,31
621
Punj
ab6,
859,
338
188,
434
01,
628,
985
09
423,
879
10,7
2442
,951
9,15
4,32
022
Raj
asth
an12
,314
,229
1,09
5,52
648
7,36
60
1,09
2,43
284
,642
015
,074
,195
23Si
kkim
*1,
717
03,
345
18,6
629,
928
00
217
155
34,0
2424
Tam
il N
adu
3,49
6,54
95,
378,
585
13,8
17,5
242,
514,
834
60,8
4420
,377
268,
054
80,7
7032
6,22
525
,963
,762
25Te
lang
ana
022
5,79
47,
669,
923
1,20
7,53
216
,042
55,6
4415
3,27
392
,935
30,9
899,
452,
132
26Tr
ipur
a1,
910
400
299,
019
54,8
790
5629
673
92,
056
359,
355
27U
ttara
khan
d1,
825,
226
00
438,
622
021
640
,283
5,32
54,
028
2,31
3,70
028
UP
2,77
7,07
783
2,69
420
,302
,020
2,19
5,78
358
1,77
035
,014
1,33
9,98
017
,785
27,3
7928
,109
,502
29W
est B
enga
l*1,
921,
492
428,
198
3,24
5,66
796
1,36
90
013
6,11
20
40,4
076,
733,
245
30A
& N
Isla
nds
92,5
320
00
22,9
180
086
90
116,
319
31C
hand
igar
h20
3,68
31,
400
208,
052
487,
641
24,5
510
281
00
925,
608
32D
aman
& D
iu28
,580
5,49
941
,524
32,1
0661
051
434
227
221
109,
252
33D
& N
Hav
eli*
*34
Del
hi6,
955,
464
119,
852
03,
087,
309
04
215
053
10,1
62,8
9735
Laks
hadw
eep*
2,66
453
011
,514
155
3639
171
050
215
,611
36Pu
duch
erry
159,
222
193,
331
500,
854
94,7
691,
351
4,21
82,
482
751
3,28
396
0,26
1
63,8
66,3
8613
,656
,406
125,
231,
897
30,8
56,8
692,
720,
342
546,
476
8,18
4,45
32,
128,
104
1,43
0,11
624
8,62
1,04
9
Tota
l Non
-Tr
ansp
ort
(I to
VII
)
Tota
l
S N
o.St
ates
/Uni
on T
erri
tori
esTw
o w
heel
ers
(I)
Car
s (I
I)Je
eps (
III)
Om
ni b
uses
(I
V)
Trac
tors
(V
)Tr
aile
rs (
VI)
Oth
er v
ehic
les n
ot
cove
red
(VII
)

Annexure 3.4(b)
7473
Annexure 3.4(c)St
ate/
UT
wise
and
cate
gory
wise
num
ber o
f New
ly R
egist
ered
Tra
nspo
rt M
otor
Veh
icle
s dur
ing
201
8-19
Stat
e/U
T w
ise a
nd ca
tego
ry w
ise n
umbe
r of N
ewly
Reg
ister
ed N
on-T
rans
port
Mot
or V
ehic
les d
urin
g 20
18-1
9
Not
e:
*: D
ata
rela
tes t
o 20
16-1
7 as
dat
a fo
r the
yea
r 201
7-18
has
not
bee
n fu
rnish
ed b
y th
e St
ate
Gov
t.
**: m
erge
d in
Dam
an &
Diu
Sour
ce:
Offi
ces o
f Sta
te T
rans
port
Com
miss
ione
rs/U
T Ad
min
istra
tions
.
Not
e:
*: D
ata
rela
tes t
o 20
16-1
7 as
dat
a fo
r the
yea
r 201
7-18
has
not
bee
n fu
rnish
ed b
y th
e St
ate
Gov
t.
**: m
erge
d in
Dam
an &
Diu
Sour
ce:
Offi
ces o
f Sta
te T
rans
port
Com
miss
ione
rs/U
T Ad
min
istra
tions
.
Four
W
heel
ers
Thre
e W
heel
ers
Stag
e ca
rria
ges
Con
trac
t ca
rria
ges
Priv
ate
serv
ice
vehi
cles
Oth
er
buse
sM
otor
cab
sM
axi c
abs
Oth
er ta
xis
Thre
e se
ater
sFo
ur to
six
seat
ers
1A
ndhr
a Pr
1,14
216
,475
17,6
0810
,167
1,00
01,
085
129
1,64
02,
923
1,29
668
40
33,2
7713
535
,052
122,
613
2A
runa
chal
Pr
3160
376
017
227
236
860
336
4899
5636
336
70
03,
778
3A
ssam
1,06
65,
442
18,9
615,
777
078
20
466
3,42
21,
017
2,54
39,
710
00
049
,186
4B
ihar
1,54
910
,635
14,8
637,
377
3,03
40
00
4,92
70
039
,136
00
081
,521
5C
hhat
tisga
rh2,
631
9,86
08,
369
664
526
9435
253
61,
107
101
03,
706
830
028
,029
6G
oa0
00
450
220
144
2,98
693
076
02,
014
2,04
17,
430
7G
ujar
at1,
385
54,8
678,
064
18,7
910
00
5,13
898
51,
723
053
,645
00
014
4,59
88
Har
yana
84,9
4720
,523
17,1
031,
722
175
538
2,62
11,
191
16,9
1971
30
35,1
5416
,919
1,33
90
199,
864
9H
imac
hal P
r0
2,23
66,
219
7182
473
135
641,
977
474
019
40
00
11,9
2510
J & K
105
4,52
84,
443
3,55
738
421
117
121
464
060
520
80
015
,067
11Jh
arkh
and*
207
4,22
611
,506
5,44
222
630
117
247
705
790
250
6,60
51,
249
9,10
30
40,7
0312
Kar
nata
ka9,
807
12,8
0436
,872
10,4
801,
340
353
890
3,33
521
,705
4,58
21,
173
37,8
385,
499
017
,836
164,
514
13K
eral
a89
2,05
317
,635
6,39
350
64,
328
181
08,
816
072
022
,294
841,
531
63,9
8214
Mad
hya
Pr8,
133
28,1
577,
476
01,
633
729
050
50
2,09
93,
340
20,9
960
00
73,0
6815
Mah
aras
htra
5,24
341
,432
63,3
2715
,309
341
4,88
665
83,
315
3,93
226
,401
012
4,39
50
00
289,
239
16M
anip
ur25
11,
985
332
9018
30
14
184
218
3540
662
10
04,
310
17M
egha
laya
1,07
691
511
1575
50
1,72
220
90
900
510
04,
979
18M
izor
am0
368
1,68
90
252
00
537
246
032
145
239
03,
472
19N
agal
and
6,69
813
,216
1,50
856
277
4575
8348
320
427
904
30
023
,579
20O
rissa
25,4
132,
706
04,
974
1,36
928
521
827
35,
956
00
14,6
650
…0
55,8
5921
Punj
ab37
23,7
660
1,17
13,
103
00
04,
343
1,62
50
7,52
658
111
041
,740
22R
ajas
than
052
,871
5,96
33,
378
4,33
78,
565
7,76
43,
654
4,31
30
90,8
4523
Sikk
im0
161
112
016
011
040
412
818
50
05
01,
022
24Ta
mil
Nad
u4,
570
9,07
57,
169
2,65
22,
382
103
1,54
43,
795
16,4
333,
834
035
,777
2,65
20
089
,986
25Te
lang
ana
357
35,5
5323
,571
43,5
9932
446
213
82,
071
11,9
341,
979
21
33,4
893,
708
015
7,18
826
Trip
ura
088
31,
325
381
8514
00
125
167
01,
102
250
04,
107
27U
ttara
khan
d7,
504
00
098
70
00
4,57
80
03,
544
015
70
16,7
7028
UP
28,3
8521
,250
46,5
5811
,558
1,85
32,
235
3,90
42,
441
16,1
674,
296
6,94
134
,687
38,4
782,
955
022
1,70
829
Wes
t Ben
gal*
00
25,8
1510
,922
313
627
313
940
5,36
094
63,
469
5,66
11,
960
300
56,3
5630
A &
N Is
land
s0
114
185
3318
00
00
00
102
319
00
771
31C
hand
igar
h0
139
642
251
50
180
220
100
7213
10
01,
488
32D
aman
& D
iu46
369
09
00
622
2111
034
00
051
833
D &
N H
avel
i **
34D
elhi
020
,259
1,06
22,
152
611
00
110
,057
118
08,
460
19,1
940
176
62,0
9035
Laks
hadw
eep*
00
2999
00
00
419
011
50
00
293
36Pu
duch
erry
190
660
4619
612
320
198,
368
208
072
20
09,
733
190,
691
396,
556
350,
741
167,
308
25,6
6817
,660
12,4
7326
,383
166,
071
54,0
6018
,777
454,
536
180,
578
24,1
9356
,636
2,14
2,33
1To
tal
S.
No.
Stat
es/U
nion
Te
rrito
ries
Mul
tiaxl
ed /
Art
icul
ated
Ve
hicl
es (I
)
Truc
ks &
Lo
rrie
s (II
)
Ligh
t Mot
or V
ehic
les
(Goo
ds)
(II)
Buse
s (I
V)
Taxi
s (V
)Li
ght M
otor
Veh
icle
s (P
asse
nger
s) (
VI)
Mot
or
cycl
es o
n hi
re (
VII
)
Oth
er
vehi
cles
no
t in
clud
ed in
(I
-VII
)
Tota
l Tr
ansp
ort
(I to
VII
)
Scoo
ters
Mop
eds
Mot
or c
ycle
s1
And
hra
Prad
esh
01,
467
946,
649
76,6
536
1,79
632
,249
10,0
415,
019
1,07
3,88
01,
196,
493
2A
runa
chal
Pr
6,98
342
110
,151
6,80
917
611
419
193
2825
,191
28,9
693
Ass
am36
0,29
50
66,0
950
137
12,6
596,
148
044
5,33
449
4,52
04
Bih
ar0
8,48
496
9,32
454
,534
6,08
60
37,5
3715
,867
15,8
081,
107,
640
1,18
9,16
15
Chh
attis
garh
114,
328
17,0
3335
6,24
036
,871
1,22
72,
511
18,6
813,
188
3,79
555
3,87
458
1,90
36
Goa
44,3
116,
209
018
,484
00
361
138
69,1
7976
,609
7G
ujar
at1,
153,
715
112,
105
027
2,12
11,
460
046
,765
4,52
77,
310
1,59
8,00
31,
742,
601
8H
arya
na0
2,26
457
8,00
734
,022
17,1
0359
37,6
570
2,93
967
2,05
187
1,91
59
Him
acha
l Pr
73,3
262,
836
048
,912
029
1,34
50
1,59
712
8,04
513
9,97
010
J & K
4,71
039
,771
52,3
7063
,941
109
210
815
164,
404
179,
471
11Jh
arkh
and*
62,9
4819
,892
265,
187
38,7
985,
085
66,
262
5,27
630
140
3,75
544
4,45
812
Kar
nata
ka0
01,
271,
433
194,
890
1,00
23,
356
31,8
9312
,987
8,72
31,
524,
284
1,68
8,79
813
Ker
ala
327,
840
436
9,68
822
6,86
73,
156
4255
60
1,52
392
9,67
699
3,65
814
Mad
hya
Prad
esh
039
,838
117,
428
13,5
640
9,28
382
,591
012
,148
274,
852
347,
920
15M
ahar
asht
ra16
1,40
136
,398
1,66
0,41
629
6,40
815
,759
111
54,6
6413
,055
11,3
822,
249,
594
2,53
8,83
316
Man
ipur
33,8
7733
315
013
,770
1,41
42
6041
9649
,743
54,0
5317
Meg
hala
ya9,
300
07,
782
9,68
10
021
151,
400
28,1
9933
,178
18M
izor
am0
3218
,448
3,72
90
07
00
22,2
1625
,688
19N
agal
and
6,61
333
07,
401
00
3118
2,81
116
,907
40,4
8620
Oris
sa12
6,76
753
,480
480,
001
50,2
130
014
,741
8,45
167
,438
801,
091
856,
950
21Pu
njab
690,
927
716
454
120,
472
05
22,4
7583
1,58
783
6,71
987
8,45
922
Raj
asth
an1,
113,
012
108,
479
55,8
150
61,0
7871
40
1,33
9,09
81,
429,
943
23Si
kkim
286
038
91,
153
979
00
149
2,83
03,
852
24Ta
mil
Nad
u25
2,88
011
4,84
11,
392,
285
196,
501
6759
22,8
3210
163
,228
2,04
2,79
42,
132,
780
25Te
lang
ana
039
183
6,13
212
4,70
182
4,88
123
,165
9,82
66,
886
1,00
6,06
41,
163,
252
26Tr
ipur
a40
21
51,0
934,
933
00
31
159
56,5
9260
,699
27U
ttara
khan
d20
3,64
40
043
,802
039
3,14
298
262
725
2,23
626
9,00
628
UP
300,
253
90,2
292,
273,
999
222,
551
75,2
301,
218
99,9
1639
56,
199
3,06
9,99
03,
291,
698
29W
est B
enga
l*26
6,77
934
,057
497,
798
83,0
420
015
,933
03,
084
900,
693
957,
049
30A
& N
Isla
nds
6,96
20
00
2,16
20
017
09,
141
9,91
231
Cha
ndig
arh
27,3
6410
016
,763
16,7
608
017
00
61,0
1262
,500
32D
aman
& D
iu3,
758
110
1,66
40
019
323
5,47
85,
996
33D
& N
Hav
eli
34D
elhi
477,
131
3,57
60
162,
364
00
320
264
3,10
570
5,19
535
Laks
hadw
eep*
218
31,
392
654
032
00
1,71
42,
007
36Pu
duch
erry
5,77
712
048
,734
00
193
6510
6654
,965
64,6
985,
835,
807
584,
645
12,2
22,3
132,
620,
250
186,
930
23,7
4062
9,55
991
,964
225,
141
22,4
20,3
4924
,562
,680
Tota
l
S. N
o.St
ates
/Uni
on T
erri
tori
esTw
o w
heel
ers
(I)
Car
s (I
I)Je
eps (
III)
Om
ni b
uses
(I
V)
Trac
tors
(V
)Tr
aile
rs
(VI)
Oth
er
vehi
cles
not
co
vere
d
(VII
)
Tota
l Non
-Tr
ansp
ort
(I to
VII
)
Gra
nd T
otal
(T
rans
port
+ N
on
Tran
spor
t)

Annexure 3.4(b)
7473
Annexure 3.4(c)
Stat
e/U
T w
ise a
nd ca
tego
ry w
ise n
umbe
r of N
ewly
Reg
ister
ed T
rans
port
Mot
or V
ehic
les d
urin
g 2
018-
19
Stat
e/U
T w
ise a
nd ca
tego
ry w
ise n
umbe
r of N
ewly
Reg
ister
ed N
on-T
rans
port
Mot
or V
ehic
les d
urin
g 20
18-1
9
Not
e:
*: D
ata
rela
tes t
o 20
16-1
7 as
dat
a fo
r the
yea
r 201
7-18
has
not
bee
n fu
rnish
ed b
y th
e St
ate
Gov
t.
**: m
erge
d in
Dam
an &
Diu
Sour
ce:
Offi
ces o
f Sta
te T
rans
port
Com
miss
ione
rs/U
T Ad
min
istra
tions
.
Not
e:
*: D
ata
rela
tes t
o 20
16-1
7 as
dat
a fo
r the
yea
r 201
7-18
has
not
bee
n fu
rnish
ed b
y th
e St
ate
Gov
t.
**: m
erge
d in
Dam
an &
Diu
Sour
ce:
Offi
ces o
f Sta
te T
rans
port
Com
miss
ione
rs/U
T Ad
min
istra
tions
.
Four
W
heel
ers
Thre
e W
heel
ers
Stag
e ca
rria
ges
Con
trac
t ca
rria
ges
Priv
ate
serv
ice
vehi
cles
Oth
er
buse
sM
otor
cab
sM
axi c
abs
Oth
er ta
xis
Thre
e se
ater
sFo
ur to
six
seat
ers
1A
ndhr
a Pr
1,14
216
,475
17,6
0810
,167
1,00
01,
085
129
1,64
02,
923
1,29
668
40
33,2
7713
535
,052
122,
613
2A
runa
chal
Pr
3160
376
017
227
236
860
336
4899
5636
336
70
03,
778
3A
ssam
1,06
65,
442
18,9
615,
777
078
20
466
3,42
21,
017
2,54
39,
710
00
049
,186
4B
ihar
1,54
910
,635
14,8
637,
377
3,03
40
00
4,92
70
039
,136
00
081
,521
5C
hhat
tisga
rh2,
631
9,86
08,
369
664
526
9435
253
61,
107
101
03,
706
830
028
,029
6G
oa0
00
450
220
144
2,98
693
076
02,
014
2,04
17,
430
7G
ujar
at1,
385
54,8
678,
064
18,7
910
00
5,13
898
51,
723
053
,645
00
014
4,59
88
Har
yana
84,9
4720
,523
17,1
031,
722
175
538
2,62
11,
191
16,9
1971
30
35,1
5416
,919
1,33
90
199,
864
9H
imac
hal P
r0
2,23
66,
219
7182
473
135
641,
977
474
019
40
00
11,9
2510
J & K
105
4,52
84,
443
3,55
738
421
117
121
464
060
520
80
015
,067
11Jh
arkh
and*
207
4,22
611
,506
5,44
222
630
117
247
705
790
250
6,60
51,
249
9,10
30
40,7
0312
Kar
nata
ka9,
807
12,8
0436
,872
10,4
801,
340
353
890
3,33
521
,705
4,58
21,
173
37,8
385,
499
017
,836
164,
514
13K
eral
a89
2,05
317
,635
6,39
350
64,
328
181
08,
816
072
022
,294
841,
531
63,9
8214
Mad
hya
Pr8,
133
28,1
577,
476
01,
633
729
050
50
2,09
93,
340
20,9
960
00
73,0
6815
Mah
aras
htra
5,24
341
,432
63,3
2715
,309
341
4,88
665
83,
315
3,93
226
,401
012
4,39
50
00
289,
239
16M
anip
ur25
11,
985
332
9018
30
14
184
218
3540
662
10
04,
310
17M
egha
laya
1,07
691
511
1575
50
1,72
220
90
900
510
04,
979
18M
izor
am0
368
1,68
90
252
00
537
246
032
145
239
03,
472
19N
agal
and
6,69
813
,216
1,50
856
277
4575
8348
320
427
904
30
023
,579
20O
rissa
25,4
132,
706
04,
974
1,36
928
521
827
35,
956
00
14,6
650
…0
55,8
5921
Punj
ab37
23,7
660
1,17
13,
103
00
04,
343
1,62
50
7,52
658
111
041
,740
22R
ajas
than
052
,871
5,96
33,
378
4,33
78,
565
7,76
43,
654
4,31
30
90,8
4523
Sikk
im0
161
112
016
011
040
412
818
50
05
01,
022
24Ta
mil
Nad
u4,
570
9,07
57,
169
2,65
22,
382
103
1,54
43,
795
16,4
333,
834
035
,777
2,65
20
089
,986
25Te
lang
ana
357
35,5
5323
,571
43,5
9932
446
213
82,
071
11,9
341,
979
21
33,4
893,
708
015
7,18
826
Trip
ura
088
31,
325
381
8514
00
125
167
01,
102
250
04,
107
27U
ttara
khan
d7,
504
00
098
70
00
4,57
80
03,
544
015
70
16,7
7028
UP
28,3
8521
,250
46,5
5811
,558
1,85
32,
235
3,90
42,
441
16,1
674,
296
6,94
134
,687
38,4
782,
955
022
1,70
829
Wes
t Ben
gal*
00
25,8
1510
,922
313
627
313
940
5,36
094
63,
469
5,66
11,
960
300
56,3
5630
A &
N Is
land
s0
114
185
3318
00
00
00
102
319
00
771
31C
hand
igar
h0
139
642
251
50
180
220
100
7213
10
01,
488
32D
aman
& D
iu46
369
09
00
622
2111
034
00
051
833
D &
N H
avel
i **
34D
elhi
020
,259
1,06
22,
152
611
00
110
,057
118
08,
460
19,1
940
176
62,0
9035
Laks
hadw
eep*
00
2999
00
00
419
011
50
00
293
36Pu
duch
erry
190
660
4619
612
320
198,
368
208
072
20
09,
733
190,
691
396,
556
350,
741
167,
308
25,6
6817
,660
12,4
7326
,383
166,
071
54,0
6018
,777
454,
536
180,
578
24,1
9356
,636
2,14
2,33
1To
tal
S.
No.
Stat
es/U
nion
Te
rrito
ries
Mul
tiaxl
ed /
Art
icul
ated
Ve
hicl
es (I
)
Truc
ks &
Lo
rrie
s (II
)
Ligh
t Mot
or V
ehic
les
(Goo
ds)
(II)
Buse
s (I
V)
Taxi
s (V
)Li
ght M
otor
Veh
icle
s (P
asse
nger
s) (
VI)
Mot
or
cycl
es o
n hi
re (
VII
)
Oth
er
vehi
cles
no
t in
clud
ed in
(I
-VII
)
Tota
l Tr
ansp
ort
(I to
VII
)
Scoo
ters
Mop
eds
Mot
or c
ycle
s1
And
hra
Prad
esh
01,
467
946,
649
76,6
536
1,79
632
,249
10,0
415,
019
1,07
3,88
01,
196,
493
2A
runa
chal
Pr
6,98
342
110
,151
6,80
917
611
419
193
2825
,191
28,9
693
Ass
am36
0,29
50
66,0
950
137
12,6
596,
148
044
5,33
449
4,52
04
Bih
ar0
8,48
496
9,32
454
,534
6,08
60
37,5
3715
,867
15,8
081,
107,
640
1,18
9,16
15
Chh
attis
garh
114,
328
17,0
3335
6,24
036
,871
1,22
72,
511
18,6
813,
188
3,79
555
3,87
458
1,90
36
Goa
44,3
116,
209
018
,484
00
361
138
69,1
7976
,609
7G
ujar
at1,
153,
715
112,
105
027
2,12
11,
460
046
,765
4,52
77,
310
1,59
8,00
31,
742,
601
8H
arya
na0
2,26
457
8,00
734
,022
17,1
0359
37,6
570
2,93
967
2,05
187
1,91
59
Him
acha
l Pr
73,3
262,
836
048
,912
029
1,34
50
1,59
712
8,04
513
9,97
010
J & K
4,71
039
,771
52,3
7063
,941
109
210
815
164,
404
179,
471
11Jh
arkh
and*
62,9
4819
,892
265,
187
38,7
985,
085
66,
262
5,27
630
140
3,75
544
4,45
812
Kar
nata
ka0
01,
271,
433
194,
890
1,00
23,
356
31,8
9312
,987
8,72
31,
524,
284
1,68
8,79
813
Ker
ala
327,
840
436
9,68
822
6,86
73,
156
4255
60
1,52
392
9,67
699
3,65
814
Mad
hya
Prad
esh
039
,838
117,
428
13,5
640
9,28
382
,591
012
,148
274,
852
347,
920
15M
ahar
asht
ra16
1,40
136
,398
1,66
0,41
629
6,40
815
,759
111
54,6
6413
,055
11,3
822,
249,
594
2,53
8,83
316
Man
ipur
33,8
7733
315
013
,770
1,41
42
6041
9649
,743
54,0
5317
Meg
hala
ya9,
300
07,
782
9,68
10
021
151,
400
28,1
9933
,178
18M
izor
am0
3218
,448
3,72
90
07
00
22,2
1625
,688
19N
agal
and
6,61
333
07,
401
00
3118
2,81
116
,907
40,4
8620
Oris
sa12
6,76
753
,480
480,
001
50,2
130
014
,741
8,45
167
,438
801,
091
856,
950
21Pu
njab
690,
927
716
454
120,
472
05
22,4
7583
1,58
783
6,71
987
8,45
922
Raj
asth
an1,
113,
012
108,
479
55,8
150
61,0
7871
40
1,33
9,09
81,
429,
943
23Si
kkim
286
038
91,
153
979
00
149
2,83
03,
852
24Ta
mil
Nad
u25
2,88
011
4,84
11,
392,
285
196,
501
6759
22,8
3210
163
,228
2,04
2,79
42,
132,
780
25Te
lang
ana
039
183
6,13
212
4,70
182
4,88
123
,165
9,82
66,
886
1,00
6,06
41,
163,
252
26Tr
ipur
a40
21
51,0
934,
933
00
31
159
56,5
9260
,699
27U
ttara
khan
d20
3,64
40
043
,802
039
3,14
298
262
725
2,23
626
9,00
628
UP
300,
253
90,2
292,
273,
999
222,
551
75,2
301,
218
99,9
1639
56,
199
3,06
9,99
03,
291,
698
29W
est B
enga
l*26
6,77
934
,057
497,
798
83,0
420
015
,933
03,
084
900,
693
957,
049
30A
& N
Isla
nds
6,96
20
00
2,16
20
017
09,
141
9,91
231
Cha
ndig
arh
27,3
6410
016
,763
16,7
608
017
00
61,0
1262
,500
32D
aman
& D
iu3,
758
110
1,66
40
019
323
5,47
85,
996
33D
& N
Hav
eli
34D
elhi
477,
131
3,57
60
162,
364
00
320
264
3,10
570
5,19
535
Laks
hadw
eep*
218
31,
392
654
032
00
1,71
42,
007
36Pu
duch
erry
5,77
712
048
,734
00
193
6510
6654
,965
64,6
985,
835,
807
584,
645
12,2
22,3
132,
620,
250
186,
930
23,7
4062
9,55
991
,964
225,
141
22,4
20,3
4924
,562
,680
Tota
l
S. N
o.St
ates
/Uni
on T
erri
tori
esTw
o w
heel
ers
(I)
Car
s (I
I)Je
eps (
III)
Om
ni b
uses
(I
V)
Trac
tors
(V
)Tr
aile
rs
(VI)
Oth
er
vehi
cles
not
co
vere
d
(VII
)
Tota
l Non
-Tr
ansp
ort
(I to
VII
)
Gra
nd T
otal
(T
rans
port
+ N
on
Tran
spor
t)

Annexure 3.4(d)
7675
Annexure 3.4(e)
Four
W
heel
ers
Thre
e W
heel
ers
Stag
e ca
rria
ges
Con
trac
t ca
rria
ges
Priv
ate
serv
ice
vehi
cles
Oth
er b
uses
Mot
or c
abs
Max
i cab
sO
ther
taxi
sTh
ree
seat
ers
Four
to si
x se
ater
s
1A
ndhr
a Pr
9,95
619
6,86
217
7,56
490
,024
19,2
395,
514
2,25
827
,387
47,1
7925
,489
19,1
870
567,
990
245
319,
425
1,50
8,31
92
Aru
nach
al P
r1,
544
6,36
77,
292
2,56
668
16,
677
1,18
976
385
1,01
565
7,01
04,
272
00
39,5
263
Ass
am5,
449
149,
944
125,
926
48,6
362,
017
17,6
470
4,43
412
,243
7,14
253
,144
28,9
620
00
455,
544
4B
ihar
11,5
0911
7,15
870
,082
32,7
3339
,618
00
010
7,31
10
034
0,64
40
00
719,
055
5C
hhat
tisga
rh36
,235
114,
486
90,5
6319
,890
6,90
81,
359
7,34
53,
034
19,7
4485
30
41,9
366,
046
00
348,
399
6G
oa4,
730
39,3
190
18,3
270
00
12,4
110
024
,516
4,55
90
30,7
353,
900
138,
497
7G
ujar
at37
,519
419,
780
356,
005
386,
594
32,2
3535
,930
8,80
49,
187
89,3
5853
,117
084
8,42
30
00
2,27
6,95
28
Har
yana
857,
033
294,
031
183,
115
18,0
9914
,726
21,8
9313
,349
12,2
5393
,349
3,08
10
251,
886
93,3
493,
076
01,
859,
240
9H
imac
hal P
r31
81,8
2491
,513
3,91
46,
485
4,10
484
71,
139
24,1
7314
,071
05,
101
00
023
3,20
210
J & K
436
66,6
1648
,285
45,4
2818
,290
5,95
490
113
,132
35,2
6711
,833
27,5
462,
940
390
028
2,61
711
Jhar
khan
d*3,
695
89,0
4311
7,48
682
,708
1,22
03,
247
654
5,27
79,
301
12,1
2916
,624
58,1
0131
,396
120,
893
055
1,77
412
Kar
nata
ka91
,047
252,
334
320,
500
162,
740
45,9
744,
002
19,0
4738
,340
227,
556
97,3
9420
,967
469,
191
51,8
830
166,
614
1,96
7,58
913
Ker
ala
68,7
8612
9,35
127
8,89
015
5,70
545
,206
77,1
335,
633
012
7,81
10
9,37
00
677,
922
124
85,7
981,
661,
729
14M
adhy
a Pr
*64
,509
261,
782
96,7
000
24,3
0422
,014
06,
814
022
,225
58,7
0111
7,72
30
00
674,
772
15M
ahar
asht
ra62
,961
520,
878
665,
583
450,
295
37,5
8665
,130
12,6
5945
,532
65,5
9128
4,16
80
974,
285
00
03,
184,
668
16M
anip
ur1,
651
15,4
371,
637
1,29
61,
568
120
833
3,16
54,
289
444,
481
11,6
830
045
,412
17M
egha
laya
032
,711
15,4
260
5,92
10
00
28,2
060
015
,941
00
098
,205
18M
izor
am2
5,88
713
,127
7570
613
60
7,67
03,
605
06,
098
155
487
037
,831
19N
agal
and
55,6
2811
3,32
317
,476
8,52
92,
246
3,09
840
183
87,
234
2,04
487
319
,446
989
00
232,
125
20O
rissa
91,8
6712
4,81
310
8,50
687
,692
18,0
378,
012
2,34
53,
069
68,9
5534
,987
3,99
015
8,15
410
,043
00
720,
470
21Pu
njab
128
363,
919
14,7
570
49,2
570
00
65,0
860
07,
825
67,2
0322
10
568,
396
22R
ajas
than
066
5,92
650
,480
77,9
1111
8,30
116
0,99
416
7,77
950
,862
4,31
390
1,29
6,65
623
Sikk
im*
126
3,72
11,
585
026
30
5347
7,48
75,
734
1,06
10
05
020
,082
24Ta
mil
Nad
u11
8,08
248
3,56
431
2,07
713
3,66
167
,634
22,0
4928
,075
83,5
1128
2,71
515
1,24
112
,180
441,
567
32,2
660
02,
168,
622
25Te
lang
ana
5,18
638
0,50
620
4,63
148
7,05
317
,458
8,38
52,
762
27,1
9110
3,45
027
,537
7,99
252
239
2,18
95,
214
01,
670,
076
26Tr
ipur
a14
112
,019
18,0
304,
209
2,90
075
00
8,63
067
10
32,9
6126
10
079
,897
27U
ttara
khan
d82
,054
00
015
,108
00
050
,594
00
33,0
540
705
018
1,51
528
UP
148,
656
208,
172
334,
998
85,5
7618
,206
15,3
8922
,378
30,5
5811
5,24
021
,531
34,6
1327
3,86
216
1,00
13,
301
01,
473,
481
29W
est B
enga
l*0
023
5,85
720
8,10
917
,078
12,8
084,
269
12,8
0868
,407
39,9
0428
,503
56,3
7028
,185
300
712,
328
30A
& N
Isla
nds
03,
048
1,95
123
01,
119
00
048
90
04,
508
4,24
60
015
,591
31C
hand
igar
h0
1,37
59,
636
3,63
957
016
520
442,
103
517
06,
400
191
00
24,6
6032
Dam
an &
Diu
1,12
14,
157
796
1,19
10
06
3838
3842
1,34
322
00
8,79
233
D &
N H
avel
i**
34D
elhi
016
9,53
51,
672
71,8
5632
,173
011
4510
8,86
815
,601
912
113,
240
65,8
210
5,83
958
5,57
335
Laks
hadw
eep*
00
529
801
00
00
319
3228
767
00
02,
476
36Pu
duch
erry
482,
294
12,8
9822
41,
968
1,24
013
01,
161
13,6
001,
347
1,76
26,
878
3,78
30
047
,333
1,76
0,13
05,
330,
182
3,98
5,57
32,
689,
711
665,
002
341,
958
137,
848
326,
815
1,94
0,08
386
5,02
930
6,40
74,
526,
563
2,26
4,69
816
9,73
958
1,66
625
,891
,404
Ligh
t Mot
or V
ehic
les (
Goo
ds)
(II)
Buse
s (I
V)
Taxi
s (V
)Li
ght M
otor
Veh
icle
s (P
asse
nger
s) (
VI)
Tota
l
S N
o.St
ates
/Uni
on
Terr
itori
es
Mul
tiaxl
ed /
Art
icul
ated
Ve
hicl
es (I
)
Truc
ks &
Lo
rrie
s (II
)M
otor
cyc
les
on h
ire
(VII
)
Oth
er
vehi
cles
not
in
clud
ed in
(I-V
II)
Tota
l Tra
nspo
rt
(I T
O V
II)
Stat
e/U
T w
ise a
nd ca
tego
ry w
ise n
umbe
r of T
otal
Reg
ister
ed T
rans
port
(Tra
nspo
t) M
otor
Veh
icle
s (C
ateg
ory-
wise
) as o
n 31
.03.
2019
Stat
e/U
T w
ise a
nd ca
tego
ry w
ise n
umbe
r of T
otal
Reg
ister
ed N
on-T
rans
port
Mot
or V
ehic
les (
Cat
egor
y-w
ise) a
s on
31.0
3.20
19
Not
e:
*: D
ata
rela
tes t
o 20
16-1
7 as
dat
a fo
r the
yea
r 201
7-18
has
not
bee
n fu
rnish
ed b
y th
e St
ate
Gov
t.
**: m
erge
d in
Dam
an &
Diu
Sour
ce:
Offi
ces o
f Sta
te T
rans
port
Com
miss
ione
rs/U
T Ad
min
istra
tions
.
Not
e:
*: D
ata
rela
tes t
o 20
16-1
7 as
dat
a fo
r the
yea
r 201
7-18
has
not
bee
n fu
rnish
ed b
y th
e St
ate
Gov
t.
**: m
erge
d in
Dam
an &
Diu
Sour
ce:
Offi
ces o
f Sta
te T
rans
port
Com
miss
ione
rs/U
T Ad
min
istra
tions
.
Scoo
ters
Mop
eds
Mot
or c
ycle
s1
And
hra
Prad
esh
027
9,85
09,
047,
038
730,
865
10,5
2429
,099
209,
399
134,
429
43,2
8310
,484
,487
2A
runa
chal
Pra
desh
39,4
053,
684
65,1
7067
,553
5,22
839
1,49
092
77,
134
190,
630
3A
ssam
2,63
3,98
40
750,
228
01,
616
66,2
8528
,860
03,
480,
973
4B
ihar
035
,383
6,50
2,79
440
4,48
115
2,64
30
458,
114
225,
873
54,8
407,
834,
128
5C
hhat
tisga
rh2,
933,
738
543,
049
1,70
7,99
835
3,85
425
,187
60,5
6824
2,93
913
1,96
727
,567
6,02
6,86
76
Goa
963,
894
00
290,
540
00
3,96
31
5,15
61,
263,
554
7G
ujar
at15
,801
,542
2,64
6,82
90
3,01
1,65
619
5,03
10
773,
221
393,
045
102,
809
22,9
24,1
338
Har
yana
053
,440
5,69
9,85
727
6,46
418
3,11
537
345
3,01
70
74,1
626,
740,
428
9H
imac
hal P
r82
4,30
210
,436
041
4,11
122
,411
2,04
77,
810
110
120,
398
1,40
1,62
510
J & K
226,
056
96,5
3461
3,95
353
8,55
415
,355
35,9
7489
615
,992
1,57
1,02
211
Jhar
khan
d*24
8,82
912
8,59
51,
887,
527
352,
510
64,6
1434
80,8
1664
,659
5,98
92,
833,
573
12K
arna
taka
00
15,3
76,7
772,
495,
728
48,1
7313
7,50
155
7,77
936
1,08
212
5,92
219
,102
,962
13K
eral
a3,
895,
064
854,
725,
532
2,70
4,84
114
9,02
02,
715
14,2
960
181,
702
11,6
73,2
5514
Mad
hya
Prad
esh
085
6,70
312
,192
,002
115,
973
016
0,51
11,
243,
358
053
,055
14,6
21,6
0215
Mah
aras
htra
4,26
3,18
61,
728,
929
19,9
74,6
724,
347,
089
568,
741
18,8
8777
1,29
741
4,17
312
0,52
532
,207
,499
16M
anip
ur22
4,47
310
,921
7,32
253
,026
16,0
331,
150
1,62
930
81,
696
316,
558
17M
egha
laya
132,
321
00
100,
922
23,1
140
936
2,90
97,
397
267,
599
18M
izor
am0
1,22
514
6,15
848
,239
01
8726
019
5,73
619
Nag
alan
d82
,333
16,9
440
86,7
2936
,496
498
2,98
71,
092
30,4
8425
7,56
320
Oris
sa38
5,40
015
4,01
66,
072,
458
450,
648
49,4
693,
668
177,
132
145,
558
122,
058
7,56
0,40
721
Punj
ab7,
550,
265
189,
150
454
1,74
9,45
70
1444
6,35
410
,807
44,5
389,
991,
039
22R
ajas
than
13,4
27,2
411,
204,
005
543,
181
01,
153,
510
85,3
560
16,4
13,2
9323
Sikk
im*
1,71
70
3,34
518
,662
9,92
80
021
715
534
,024
24Ta
mil
Nad
u3,
749,
429
5,49
3,42
615
,209
,809
2,71
1,33
560
,911
20,4
3629
0,88
680
,871
389,
453
28,0
06,5
5625
Tela
ngan
a0
226,
185
8,50
6,05
51,
332,
233
16,1
2460
,525
176,
438
102,
761
37,8
7510
,458
,196
26Tr
ipur
a40
1,87
235
0,91
259
,812
099
299
644
2,28
441
5,96
227
Utta
rakh
and
2,01
2,41
40
047
1,37
40
1,53
572
,832
9,49
53,
520
2,57
1,17
028
UP
3,08
2,04
891
4,72
822
,600
,224
2,43
9,84
564
9,40
535
,444
1,44
7,60
436
,118
33,1
5731
,238
,573
29W
est B
enga
l*1,
921,
492
428,
198
3,24
5,66
796
1,36
90
013
6,11
20
40,4
076,
733,
245
30A
& N
Isla
nds
99,4
940
00
25,0
800
088
60
125,
460
31C
hand
igar
h23
1,04
71,
500
224,
815
504,
401
24,5
590
298
00
986,
620
32D
aman
& D
iu32
,338
5,51
041
,524
33,7
7061
051
453
230
244
114,
730
33D
& N
Hav
eli*
*34
Del
hi7,
432,
574
123,
428
03,
249,
670
04
247
055
10,8
05,9
7835
Laks
hadw
eep*
2,66
453
011
,514
155
3639
171
050
215
,611
36Pu
duch
erry
164,
999
193,
451
549,
588
94,7
691,
351
4,41
12,
547
761
3,34
91,
015,
226
72,3
62,2
8914
,144
,601
134,
763,
165
32,4
24,8
682,
896,
339
577,
239
8,82
2,01
42,
234,
061
1,65
5,70
826
9,88
0,28
4To
tal
S. N
o.St
ates
/Uni
on T
erri
tori
esTw
o w
heel
ers
(I)
Car
s (I
I)Je
eps (
III)
Om
ni b
uses
(I
V)
Trac
tors
(V
)Tr
aile
rs (
VI)
Oth
er v
ehic
les
not c
over
ed
(VII
)
Tota
l Non
-Tr
ansp
ort
(I T
O V
II)

Tota
l Bus
Fle
et a
nd B
uses
in P
ublic
Sec
tor (
SRTU
s) (S
tate
-wise
) (A
s on
31st
Mar
ch, 2
013-
2019
)Annexure 3.5
Number of Commercial Vehicles in Use (State-wise)(As per Primary Permit Valid As on 31.03.2018)
- : Not reported.Source: Offices of State Transport Commissioners/UT Administrations.
7877
Annexure 3.6
* :
Incl
udes
om
ni b
uses
.
**: m
erge
d in
Dam
an &
Diu
- : N
ot re
porte
d.So
urce
: 1. T
otal
Bus
es: O
ffice
s of S
tate
Tra
nspo
rt Co
mm
issio
ners
/UT
Adm
inist
ratio
ns.
2. P
ublic
Sec
tor B
uses
: St
ate R
oad T
rans
port
Und
erta
king
s (SR
TUs)
. States/UTs 2017-18
1 2
Andhra Pradesh 747,453
Arunachal Pradesh 3,807
Assam 469,466
Bihar 180,746
Chhattisgarh 72,670
Goa 31,346
Gujarat -
Haryana 49,172
Himachal Pradesh 211,070
Jammu & Kashmir 195,238
Jharkhand 47,287
Karnataka 569,652
Kerala 1,314,124
Madhya Pradesh 261,059
Maharashtra 4,129,093
Manipur 14,305
Meghalaya 84,300
Mizoram 32,601
Nagaland 182,547
Odisha 486,371
Punjab -
Rajasthan 645,804
Sikkim 20,014
Tamil Nadu 1,228,550
Telangana 718,291
Tripura 57,478
Uttarakhand 125,042
Uttar Pradesh 693,512
West Bengal -
Andaman & Nicobar Islands 14,820
Chandigarh 13,183
Dadra & Nagar Haveli 11,608
Daman & Diu
Delhi 114,213
Lakshadweep -
Puducherry -
Total 12,724,822
UTs
(in n
umbe
rs)
Publ
ic
Sect
orTo
tal *
Publ
ic
Sect
orTo
tal *
Publ
ic
Sect
orTo
tal *
Publ
ic
Sect
orTo
tal *
Publ
ic
Sect
orTo
tal *
Publ
ic
Sect
orTo
tal *
Publ
ic
Sect
orTo
tal *
12
34
56
78
910
1112
1314
15A
ndhr
a Pr
ades
h22
,477
52,3
2311
,857
56,1
2512
,079
60
,144
12,0
12
64,4
44
12
,072
66
,472
11,6
8777
,847
11,8
3783
,497
A
runa
chal
Pra
desh
20
7-
21
9-
21
8
-
164
8,
670
19
2
5,
221
219
7,24
223
79,
349
Ass
am-
20,2
11-
19,9
12-
21
,401
1,09
0
23
,863
1,06
7
21,7
49
1,
327
24,3
291,
284
25,7
14
Bih
ar41
425
,992
414
27,6
3822
3
29
,384
223
31
,075
223
33,7
51
57
936
,584
579
39,6
18
Chh
attis
garh
-
49
,684
-
54
,366
-
58,8
95-
64
,541
-
69
,925
NIL
75,1
95N
IL79
,214
G
oa42
59,
956
547
10,9
2554
0
11
,224
569
11
,503
530
11,8
88
52
012
,195
548
12,4
11
Guj
arat
8,83
970
,615
8,88
872
,998
8,71
1
76,4
358,
845
82,7
34
8,
773
74
,855
8,46
581
,087
9,04
986
,156
H
arya
na
3,75
543
,456
3,81
646
,558
4,07
9
52,6
404,
170
55,7
81
4,
145
60
,129
4,06
359
,826
3,95
162
,594
H
imac
hal P
rade
sh
2,07
615
,937
2,05
916
,139
2,16
2
17,1
642,
645
21,0
30
3,
105
11
,632
3,17
213
,839
3,21
614
,622
Ja
mm
u &
Kas
hmir
704
29,5
7569
430
,634
610
32,3
8261
0
33,4
13
52
9
65
,045
525
65,6
8051
266
,718
Jh
arkh
and
-
30
,721
-
12
,451
-
13,0
90-
74
,112
-
10
,432
NIL
10,4
32N
IL10
,432
K
arna
taka
22,7
4018
6,70
523
,708
195,
913
24,0
28
204,
803
23,8
03
213,
699
23
,668
22
4,58
0
24,4
5723
5,59
025
,232
244,
864
K
eral
a 5,
847
407,
983
5,83
041
3,83
05,
691
41
8,62
05,
636
111,
835
5,
869
11
7,72
0
5,73
812
5,63
05,
679
130,
687
M
adhy
a Pr
ades
h0
40,6
330
42,6
36-
45
,976
-
167,
467
-
18
9,11
8
NIL
195,
102
NIL
213,
643
M
ahar
asht
ra24
,462
129,
535
24,9
6114
0,08
725
,162
14
0,10
225
,613
15
0,42
7
25,7
09
160,
042
25
,562
170,
483
25,4
3517
9,79
4
Man
ipur
05,
356
05,
500
-
5,57
7-
7,
314
-
2,
583
NIL
2,68
9N
IL2,
879
Meg
hala
ya52
4,94
864
4,94
863
4,
948
59
5,46
6
52
5,59
0
61
5,82
662
5,92
1
M
izor
am
341,
187
341,
208
33
1,23
149
1,
268
49
1,
268
4269
937
726
N
agal
and
233
6,28
921
35,
890
193
5,93
318
5
6,
282
22
3
6,42
4
249
6,60
125
07,
081
Oris
sa37
626
,672
422
27,7
7544
6
28,6
6945
9
29
,818
455
31,2
89
443
32,9
8644
135
,131
Pu
njab
2,
908
30,1
602,
640
30,1
602,
593
30,1
602,
748
41,9
08
2,88
1
45,3
78
3,00
246
,163
3,00
949
,271
R
ajas
than
4,48
088
,616
4,67
493
,892
4,70
4
97,6
504,
529
102,
818
4,63
5
108,
681
5,95
211
3,96
45,
700
118,
301
Si
kkim
9568
197
236
85
272
126
336
122
363
122
363
120
363
Ta
mil
Nad
u19
,350
176,
427
19,9
6618
5,21
620
,132
191,
827
20,5
09
199,
330
20,5
40
207,
427
1421
3,82
210
221,
705
Te
lang
ana
-
77,9
0310
,288
82,7
8510
,329
88,4
2410
,391
47,4
70
10,4
15
104,
323
21,7
8710
8,44
520
,863
116,
321
Tr
ipur
a63
2,29
147
1,92
047
2,48
448
2,74
9
47
2,96
7
10,5
582,
932
10,4
813,
074
Utta
rakh
and
8,89
310
,731
1,22
511
,639
1,24
6
12,3
571,
246
7,90
2
10,7
80
12,0
31
12,6
4313
,348
12,3
8016
,643
U
ttar P
rade
sh1,
215
64,1
479,
600
74,3
899,
415
80,4
609,
577
89,1
27
1,24
2
112,
020
1,29
711
2,76
61,
338
121,
975
W
est B
enga
l 1,
976
173,
710
1,83
018
8,96
82,
033
205,
480
2,22
3
44,7
71
2,29
9
46,9
64
796
46,9
6489
846
,964
A
& N
Isla
nds
227
958
258
1,00
726
6
1,03
926
8
1,07
4
268
1,08
8
284
1,10
128
41,
119
Cha
ndig
arh
472
2,29
546
82,
326
432
2,56
149
4
2,72
9
533
2,93
2
550
2,70
253
479
9
D
& N
Hav
eli
035
90
690
-
735
-
554
-
599
NIL
67N
IL95
Dam
an &
Diu
**-
594
-
602
-
617
-
51
-
51
NIL
NIL
NIL
Del
hi5,
602
19,9
175,
341
19,5
954,
977
19,7
004,
564
43,7
23
4,16
8
41,6
86
5,61
831
,621
5,57
332
,233
La
ksha
dwee
p-
-
-
37-
37-
37
-
39
NIL
39N
IL39
Pudu
cher
ry0
7,67
80
7,83
8-
8,12
8-
7,34
6
-
7,95
0
08,
359
08,
910
Gra
nd T
otal
13
7,92
2
1,81
4,24
514
0,16
01,
886,
833
140,
497
1,97
0,54
9
142,
855
1,75
6,66
7
144,
591
1,86
4,21
2
149,
732
1,94
2,51
8
149,
539
2,04
8,86
3
2018
2019
STAT
ES /
UTs
2013
2014
2015
2016
2017

Tota
l Bus
Fle
et a
nd B
uses
in P
ublic
Sec
tor (
SRTU
s) (S
tate
-wise
) (A
s on
31st
Mar
ch, 2
013-
2019
)
Annexure 3.5
Number of Commercial Vehicles in Use (State-wise)(As per Primary Permit Valid As on 31.03.2018)
- : Not reported.Source: Offices of State Transport Commissioners/UT Administrations.
7877
Annexure 3.6
* :
Incl
udes
om
ni b
uses
.
**: m
erge
d in
Dam
an &
Diu
- : N
ot re
porte
d.So
urce
: 1. T
otal
Bus
es: O
ffice
s of S
tate
Tra
nspo
rt Co
mm
issio
ners
/UT
Adm
inist
ratio
ns.
2. P
ublic
Sec
tor B
uses
: St
ate R
oad T
rans
port
Und
erta
king
s (SR
TUs)
. States/UTs 2017-18
1 2
Andhra Pradesh 747,453
Arunachal Pradesh 3,807
Assam 469,466
Bihar 180,746
Chhattisgarh 72,670
Goa 31,346
Gujarat -
Haryana 49,172
Himachal Pradesh 211,070
Jammu & Kashmir 195,238
Jharkhand 47,287
Karnataka 569,652
Kerala 1,314,124
Madhya Pradesh 261,059
Maharashtra 4,129,093
Manipur 14,305
Meghalaya 84,300
Mizoram 32,601
Nagaland 182,547
Odisha 486,371
Punjab -
Rajasthan 645,804
Sikkim 20,014
Tamil Nadu 1,228,550
Telangana 718,291
Tripura 57,478
Uttarakhand 125,042
Uttar Pradesh 693,512
West Bengal -
Andaman & Nicobar Islands 14,820
Chandigarh 13,183
Dadra & Nagar Haveli 11,608
Daman & Diu
Delhi 114,213
Lakshadweep -
Puducherry -
Total 12,724,822
UTs
(in n
umbe
rs)
Publ
ic
Sect
orTo
tal *
Publ
ic
Sect
orTo
tal *
Publ
ic
Sect
orTo
tal *
Publ
ic
Sect
orTo
tal *
Publ
ic
Sect
orTo
tal *
Publ
ic
Sect
orTo
tal *
Publ
ic
Sect
orTo
tal *
12
34
56
78
910
1112
1314
15A
ndhr
a Pr
ades
h22
,477
52,3
2311
,857
56,1
2512
,079
60
,144
12,0
12
64,4
44
12
,072
66
,472
11,6
8777
,847
11,8
3783
,497
A
runa
chal
Pra
desh
20
7-
21
9-
21
8
-
164
8,
670
19
2
5,
221
219
7,24
223
79,
349
Ass
am-
20,2
11-
19,9
12-
21
,401
1,09
0
23
,863
1,06
7
21,7
49
1,
327
24,3
291,
284
25,7
14
Bih
ar41
425
,992
414
27,6
3822
3
29
,384
223
31
,075
223
33,7
51
57
936
,584
579
39,6
18
Chh
attis
garh
-
49
,684
-
54
,366
-
58,8
95-
64
,541
-
69
,925
NIL
75,1
95N
IL79
,214
G
oa42
59,
956
547
10,9
2554
0
11
,224
569
11
,503
530
11,8
88
52
012
,195
548
12,4
11
Guj
arat
8,83
970
,615
8,88
872
,998
8,71
1
76,4
358,
845
82,7
34
8,
773
74
,855
8,46
581
,087
9,04
986
,156
H
arya
na
3,75
543
,456
3,81
646
,558
4,07
9
52,6
404,
170
55,7
81
4,
145
60
,129
4,06
359
,826
3,95
162
,594
H
imac
hal P
rade
sh
2,07
615
,937
2,05
916
,139
2,16
2
17,1
642,
645
21,0
30
3,
105
11
,632
3,17
213
,839
3,21
614
,622
Ja
mm
u &
Kas
hmir
704
29,5
7569
430
,634
610
32,3
8261
0
33,4
13
52
9
65
,045
525
65,6
8051
266
,718
Jh
arkh
and
-
30
,721
-
12
,451
-
13,0
90-
74
,112
-
10
,432
NIL
10,4
32N
IL10
,432
K
arna
taka
22,7
4018
6,70
523
,708
195,
913
24,0
28
204,
803
23,8
03
213,
699
23
,668
22
4,58
0
24,4
5723
5,59
025
,232
244,
864
K
eral
a 5,
847
407,
983
5,83
041
3,83
05,
691
41
8,62
05,
636
111,
835
5,
869
11
7,72
0
5,73
812
5,63
05,
679
130,
687
M
adhy
a Pr
ades
h0
40,6
330
42,6
36-
45
,976
-
167,
467
-
18
9,11
8
NIL
195,
102
NIL
213,
643
M
ahar
asht
ra24
,462
129,
535
24,9
6114
0,08
725
,162
14
0,10
225
,613
15
0,42
7
25,7
09
160,
042
25
,562
170,
483
25,4
3517
9,79
4
Man
ipur
05,
356
05,
500
-
5,57
7-
7,
314
-
2,
583
NIL
2,68
9N
IL2,
879
Meg
hala
ya52
4,94
864
4,94
863
4,
948
59
5,46
6
52
5,59
0
61
5,82
662
5,92
1
M
izor
am
341,
187
341,
208
33
1,23
149
1,
268
49
1,
268
4269
937
726
N
agal
and
233
6,28
921
35,
890
193
5,93
318
5
6,
282
22
3
6,42
4
249
6,60
125
07,
081
Oris
sa37
626
,672
422
27,7
7544
6
28,6
6945
9
29
,818
455
31,2
89
443
32,9
8644
135
,131
Pu
njab
2,
908
30,1
602,
640
30,1
602,
593
30,1
602,
748
41,9
08
2,88
1
45,3
78
3,00
246
,163
3,00
949
,271
R
ajas
than
4,48
088
,616
4,67
493
,892
4,70
4
97,6
504,
529
102,
818
4,63
5
108,
681
5,95
211
3,96
45,
700
118,
301
Si
kkim
9568
197
236
85
272
126
336
122
363
122
363
120
363
Ta
mil
Nad
u19
,350
176,
427
19,9
6618
5,21
620
,132
191,
827
20,5
09
199,
330
20,5
40
207,
427
1421
3,82
210
221,
705
Te
lang
ana
-
77,9
0310
,288
82,7
8510
,329
88,4
2410
,391
47,4
70
10,4
15
104,
323
21,7
8710
8,44
520
,863
116,
321
Tr
ipur
a63
2,29
147
1,92
047
2,48
448
2,74
9
47
2,96
7
10,5
582,
932
10,4
813,
074
Utta
rakh
and
8,89
310
,731
1,22
511
,639
1,24
6
12,3
571,
246
7,90
2
10,7
80
12,0
31
12,6
4313
,348
12,3
8016
,643
U
ttar P
rade
sh1,
215
64,1
479,
600
74,3
899,
415
80,4
609,
577
89,1
27
1,24
2
112,
020
1,29
711
2,76
61,
338
121,
975
W
est B
enga
l 1,
976
173,
710
1,83
018
8,96
82,
033
205,
480
2,22
3
44,7
71
2,29
9
46,9
64
796
46,9
6489
846
,964
A
& N
Isla
nds
227
958
258
1,00
726
6
1,03
926
8
1,07
4
268
1,08
8
284
1,10
128
41,
119
Cha
ndig
arh
472
2,29
546
82,
326
432
2,56
149
4
2,72
9
533
2,93
2
550
2,70
253
479
9
D
& N
Hav
eli
035
90
690
-
735
-
554
-
599
NIL
67N
IL95
Dam
an &
Diu
**-
594
-
602
-
617
-
51
-
51
NIL
NIL
NIL
Del
hi5,
602
19,9
175,
341
19,5
954,
977
19,7
004,
564
43,7
23
4,16
8
41,6
86
5,61
831
,621
5,57
332
,233
La
ksha
dwee
p-
-
-
37-
37-
37
-
39
NIL
39N
IL39
Pudu
cher
ry0
7,67
80
7,83
8-
8,12
8-
7,34
6
-
7,95
0
08,
359
08,
910
Gra
nd T
otal
13
7,92
2
1,81
4,24
514
0,16
01,
886,
833
140,
497
1,97
0,54
9
142,
855
1,75
6,66
7
144,
591
1,86
4,21
2
149,
732
1,94
2,51
8
149,
539
2,04
8,86
3
2018
2019
STAT
ES /
UTs
2013
2014
2015
2016
2017
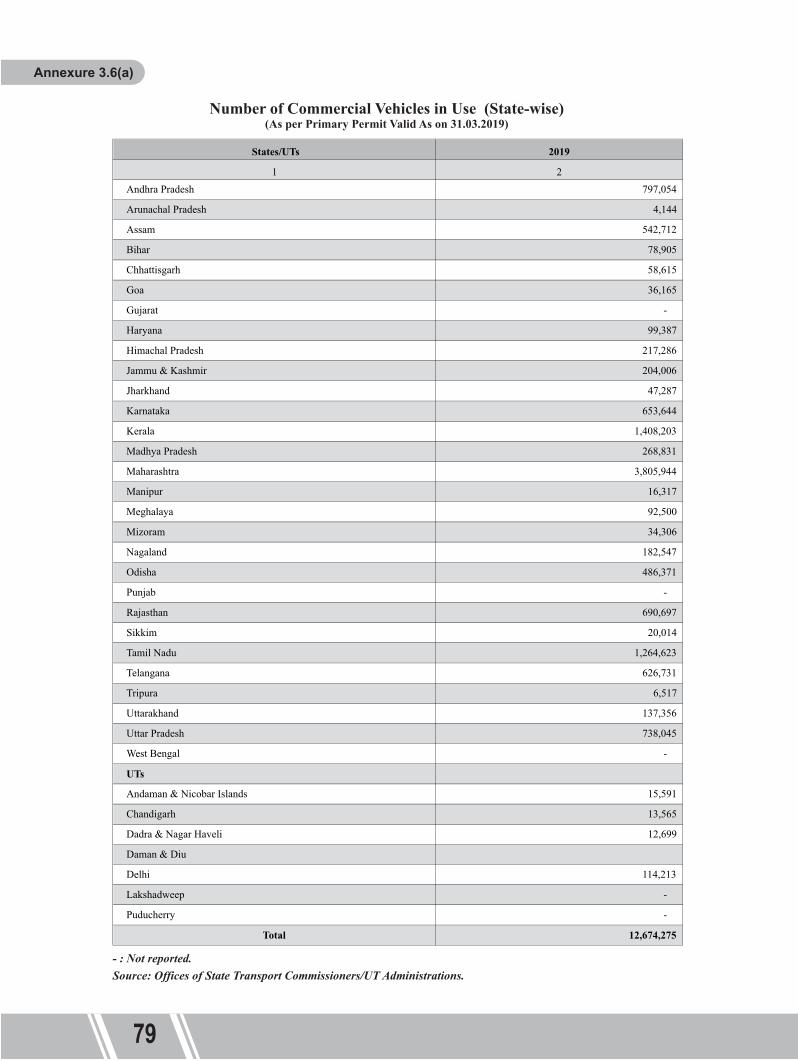
Annexure 3.6(a)
States/UTs 2019
1 2Andhra Pradesh 797,054
Arunachal Pradesh 4,144
Assam 542,712
Bihar 78,905
Chhattisgarh 58,615
Goa 36,165
Gujarat -
Haryana 99,387
Himachal Pradesh 217,286
Jammu & Kashmir 204,006
Jharkhand 47,287
Karnataka 653,644
Kerala 1,408,203
Madhya Pradesh 268,831
Maharashtra 3,805,944
Manipur 16,317
Meghalaya 92,500
Mizoram 34,306
Nagaland 182,547
Odisha 486,371
Punjab -
Rajasthan 690,697
Sikkim 20,014
Tamil Nadu 1,264,623
Telangana 626,731
Tripura 6,517
Uttarakhand 137,356
Uttar Pradesh 738,045
West Bengal -
UTs
Andaman & Nicobar Islands 15,591
Chandigarh 13,565
Dadra & Nagar Haveli 12,699
Daman & Diu
Delhi 114,213
Lakshadweep -
Puducherry -
Total 12,674,275
- : Not reported.Source: Offices of State Transport Commissioners/UT Administrations.
Number of Commercial Vehicles in Use (State-wise)(As per Primary Permit Valid As on 31.03.2019)
79

80
Annexure 3.7N
umbe
r of C
omm
erci
al V
ehic
les i
n U
se (d
etai
led
cate
gory
-wise
/ Sta
te-w
ise) a
s per
Pri
mar
y Pe
rmit
Valid
as o
n 31
.03.
2018
Cont
d...
Publ
ic
(STU
)Pr
ivat
e A
uto
Ric
ksha
wE-
Ric
ksha
wO
rdin
ary
Taxi
Mot
or C
ab
(SP)
Mot
or C
ab
(AIP
)M
axi C
ab
(SP)
Max
i Cab
(A
IP)
Om
ni B
us
(SP)
Om
ni B
us
(AIP
)A
ny O
ther
12
34
56
78
910
1112
1314
1A
ndhr
a Pr
17,0
3097
537
6,90
20
7,50
229
,104
1,47
218
,752
198
00
02
Aru
nach
al P
r0
311,
819
089
220
119
1128
013
73
Ass
am1,
292
010
2,85
90
00
11,6
740
6,25
40
1,18
434
,462
4B
ihar
7,11
32,
004
33,6
840
9,29
592
00
1,29
50
00
907
5C
hhat
tisga
rh1,
410
1,34
620
,417
091
716
43,
067
179
511
937
01,
367
6G
oa58
689
21,
288
071
517
687
019
657
207
171,
122
7G
ujar
at0
00
00
00
00
00
08
Har
yana
971,
173
8,91
70
028
110
,090
3832
40
1077
89
Him
acha
l Pr
3,07
83,
300
4,97
20
08,
652
17,6
455,
254
10,7
593,
976
1,38
50
10J &
K1,
849
13,4
5826
,470
09,
193
8,96
30
38,0
0271
710
030
11Jh
arkh
and
01,
488
6,51
20
1,43
825
20
283
018
00
12K
arna
taka
4,01
41,
431
208,
862
06,
512
20,5
3239
,084
32,1
2016
,293
3,56
01,
643
4,96
313
Ker
ala
5,71
924
,120
646,
914
022
,416
150,
075
18,3
7673
,107
014
,848
223
3,11
114
Mad
hya
Pr0
15,7
150
00
2428
15,7
8021
66,
904
454
315
Mah
aras
htra
37,1
2113
885
1,81
20
61,9
040
256,
353
00
00
59,2
4016
Man
ipur
015
01,
443
016
3,74
20
2,32
876
104
640
17M
egha
laya
228
2,56
513
,272
011
,275
1,25
77,
707
5,13
74,
175
1,09
612
011
818
Miz
oram
4785
95,
480
00
6,35
10
03,
146
00
355
19N
agal
and
1,96
00
18,9
920
843
04,
767
1,61
20
498
060
520
Oris
sa16
,025
013
8,24
70
34,3
0259
,545
034
,302
011
,075
02,
315
21Pu
njab
022
Raj
asth
an6,
696
46,0
6012
8,52
80
065
,371
043
,700
08,
535
00
23Si
kkim
245
550
00
7,34
20
5,55
30
00
1,06
124
Tam
il N
adu
21,8
3511
,892
260,
696
04,
494
107,
184
14,4
9680
,818
6,10
171
316
80
25Te
lang
ana
13,4
590
328,
493
06,
479
92,7
326,
001
27,4
6114
05,
509
191
026
Trip
ura
425
2,84
821
,612
015
695
661
2,04
90
105
00
27U
ttara
khan
d50
91,
858
10,6
700
2,78
92,
755
8,23
06,
875
3,27
00
635
1,64
228
UP
3,35
811
,320
211,
565
053
,610
6,51
035
,629
2,54
22,
860
749
3,77
55,
908
29W
est B
enga
l0
00
00
00
00
00
030
A &
N Is
land
s0
1,10
15,
693
4,60
348
90
00
00
00
31C
hand
igar
h56
50
6,08
20
082
1,88
30
507
165
440
32D
& N
Hav
eli
072
00
00
90
110
364
567
33D
aman
& D
iu34
Del
hi1,
282
522
28,3
1817
96,
763
154,
354
659
12,3
3953
22,
031
14,2
7135
Laks
hadw
eep
00
00
00
00
00
00
36Pu
duch
erry
145,
943
145,
373
3,47
0,51
94,
782
241,
197
573,
007
441,
796
398,
161
67,9
6559
,569
11,8
5813
3,50
2
S N
o.St
ates
/ Uni
on
Terr
itori
es
Stag
e C
arri
age
Con
trac
t Car
riag
es
Tota
l

Annexure 3.7 (Contd..)
8281
Annexure 3.8
Edu
Inst
. Bu
ses
Am
bula
nce
Fire
Fi
ghte
rA
ny
Oth
erLo
rry
(SP)
Lorr
y (N
P)Ta
nker
s (S
P)Ta
nker
s (N
P)Tr
acto
rs &
Tr
ailo
rLM
VM
ultia
xled
/ A
rtic
ulat
ed
Vehi
cles
(I)
Mul
tiaxl
ed /
Art
icul
ated
Ve
hicl
es (I
)A
ny O
ther
115
1617
1819
2021
2223
2425
2627
2829
1 A
ndhr
a Pr
23
,201
115
461,
521
89,4
0759
,029
8,00
43,
331
102,
450
04,
045
4,36
90
747,
453
2 A
runa
chal
Pr
361
1612
459
80
510
045
356
00
3,80
73
Ass
am
1,43
32,
230
730
137,
990
00
066
,085
100,
202
3,72
80
046
9,46
64
Bih
ar
2,08
92
06
85,5
605,
403
119
210
2,49
65,
257
1,15
919
,478
3,74
918
0,74
65
Chh
attis
garh
1,
855
161
913,
940
404
1,12
075
10,2
276,
835
14,4
543,
334
372
,670
6 G
oa
434
00
130
15,9
8444
648
047
498
6,03
60
741,
064
31,3
467
Guj
arat
0
00
00
00
00
00
08
Har
yana
1,
078
00
705
2,48
723
,185
00
70
00
249
,172
9 H
imac
hal P
r 3,
193
1,15
793
00
79,5
880
025
,711
42,2
940
130
211,
070
10 J
& K
0
2,96
842
422
70
6,28
26,
023
227
8,44
445
,992
22,9
690
2,99
019
5,23
811
Jhar
khan
d 65
611
068
3,93
34,
616
231
386
147
2,80
712
,849
11,5
7715
47,2
8712
Kar
nata
ka
15,4
6210
,240
281,
938
20,4
8034
,103
26,1
8389
032
,119
40,6
9214
,242
5,80
328
,458
569,
652
13 K
eral
a 33
,827
6,98
266
54,
216
168,
980
8,06
32,
678
801
13,7
1239
,437
47,9
7120
,558
7,32
51,
314,
124
14 M
adhy
a Pr
6,
413
00
243
41,4
8410
,031
289
56,2
421,
722
23,0
1737
,855
44,5
490
261,
059
15 M
ahar
asht
ra
26,7
0415
,348
011
,988
320,
985
156,
521
39,7
186,
899
1,11
8,30
61,
045,
402
19,5
3338
,930
62,1
914,
129,
093
16 M
anip
ur
273
00
2,50
910
558
631
55
1,80
721
799
714
,305
17 M
egha
laya
14
221
428
456
18,5
447,
034
454
161
3,35
05,
892
540
1,02
184
,300
18 M
izor
am
1838
05
00
00
271
15,9
862
043
32,6
0119
Nag
alan
d 32
60
00
87,4
960
00
022
,733
42,7
150
018
2,54
720
Oris
sa
1,87
40
00
120,
469
00
00
17,8
2250
,395
00
486,
371
21 P
unja
b 22
Raj
asth
an
00
01,
373
174,
808
170,
733
00
00
00
064
5,80
423
Sik
kim
49
155
420
3,56
50
350
217
1,56
912
60
020
,014
24 T
amil
Nad
u 31
,812
11,1
331,
655
12,4
7619
3,11
635
,745
54,6
0345
,757
77,7
7423
1,62
514
,853
9,60
40
1,22
8,55
025
Tel
anga
na
528
01,
720
105,
664
32,0
6911
,205
2,50
368
,498
10,8
092,
877
2,44
80
718,
291
26 T
ripur
a 14
327
839
03,
312
8,71
98
372
1,84
614
,546
30
057
,478
27 U
ttara
khan
d 2,
304
501
20
45,0
6820
,285
1,08
727
010
,192
3,42
561
32,
062
012
5,04
228
UP
28,8
180
02,
066
91,4
8669
,578
11,1
479,
893
3,21
734
,393
49,4
6855
,616
469
3,51
229
Wes
t Ben
gal
00
00
00
00
00
00
030
A &
N Is
land
s 0
00
00
00
00
00
02,
934
14,8
2031
Cha
ndig
arh
1,18
30
074
570
91,
127
085
60
00
013
,183
32 D
& N
Hav
eli
163
00
00
5,70
40
00
4,47
70
241
011
,608
33 D
aman
& D
iu
034
Del
hi
918
00
04,
065
3,56
311
,052
13,3
971,
266
396
00
8,29
111
4,21
335
Laks
hadw
eep
00
00
00
00
00
00
036
Pud
uche
rry
00
Tot
al
184,
488
51,4
353,
108
39,9
781,
742,
639
742,
333
175,
073
142,
288
1,54
8,16
61,
723,
904
339,
988
218,
663
119,
087
12,7
24,8
22
S N
o.St
ates
/ Uni
on
Terr
itori
es
Priv
ate
Serv
ice V
ehic
le
Goo
ds C
arri
ages
Tota
l C
omm
erci
al
Vehi
cles
in U
se
Num
ber o
f Com
mer
cial
Veh
icle
s in
Use
(det
aile
d ca
tego
ry-w
ise/ S
tate
-wise
) as p
er P
rim
ary
Perm
it Va
lid a
s on
31.0
3.20
18
Num
ber o
f Com
mer
cial
Veh
icle
s in
Use
(det
aile
d ca
tego
ry-w
ise/ S
tate
-wise
) as p
er P
rim
ary
Perm
it Va
lid a
s on
31.0
3.20
19
Publ
ic
(STU
)Pr
ivat
e A
uto
Ric
ksha
wE-
Ric
ksha
wO
rdin
ary
Taxi
Mot
or C
ab
(SP)
Mot
or C
ab
(AIP
)M
axi C
ab
(SP)
Max
i Cab
(A
IP)
Om
ni B
us
(SP)
Om
ni B
us
(AIP
)A
ny
Oth
er1
23
45
67
89
1011
1213
141
And
hra
Prad
esh
1801
097
640
6492
010
282
2979
817
3519
548
305
00
02
Aru
nach
al P
r0
2720
350
9126
012
68
310
142
3A
ssam
1372
013
8841
00
014
075
093
450
1015
4167
64
Bih
ar11
9523
2017
200
029
8848
80
1307
00
069
95
Chh
attis
garh
1284
1561
1931
50
809
114
3142
277
349
309
015
346
Goa
407
643
922
064
312
662
176
211
691
631
1124
7G
ujar
at0
00
00
00
00
00
08
Har
yana
237
2677
1898
50
021
923
260
3581
80
6217
389
Him
acha
l Pr
3108
3377
4983
00
8514
1778
354
6010
553
4113
1553
010
J & K
1892
1379
726
763
091
9390
840
3846
673
610
030
11Jh
arkh
and
014
8865
120
1438
252
028
30
180
012
Kar
nata
ka40
2111
9823
6242
084
1326
548
4697
742
151
1755
440
1117
8758
4113
Ker
ala
5719
2456
072
5812
023
127
1800
8920
899
7648
019
039
261
3223
14M
adhy
a Pr
ades
h0
2669
70
016
2013
398
162
5654
30
964
15M
ahar
asht
ra27
494
186
7406
090
7509
60
2318
880
00
054
195
16M
anip
ur0
018
9245
1646
760
2910
130
173
940
17M
egha
laya
254
4832
1422
30
1158
213
8988
5953
6543
7911
0612
228
218
Miz
oram
4291
858
010
00
6889
033
830
00
19N
agal
and
1960
018
992
084
30
4767
1612
049
80
605
20O
rissa
1602
50
1382
470
3430
259
545
034
302
011
075
023
1521
Punj
ab0
00
00
00
00
00
022
Raj
asth
an66
9647
661
1338
850
069
044
045
285
088
860
023
Sikk
im24
555
00
073
420
5553
00
010
6124
Tam
il N
adu
2154
211
646
2809
640
4300
1116
5814
946
8261
262
0478
311
00
25Te
lang
ana
1177
30
2693
450
4639
9213
272
7722
426
161
5128
187
026
Trip
ura
640
4915
00
110
062
018
00
27U
ttara
khan
d52
918
2611
506
027
8933
7310
460
7967
3726
083
116
5028
UP
3580
1229
721
2333
046
799
3139
5040
317
1630
1439
852
8980
6729
Wes
t Ben
gal
00
00
00
00
00
00
30A
& N
Isla
nds
011
1961
9747
3848
90
00
00
00
31C
hand
igar
h57
00
6154
00
021
030
517
165
440
32D
& N
Hav
eli
310
330
2029
5041
446
00
039
33D
aman
& D
iu34
Del
hi12
8252
228
318
179
6763
1543
5465
912
339
532
2031
1427
135
Laks
hadw
eep
00
00
00
00
00
00
36Pu
duch
erry
00
00
00
00
00
00
1293
3216
0383
3477
813
4982
2446
4760
7751
4838
7732
7140
7929
157
212
1341
713
9456
S N
o.St
ates
/ Uni
on T
erri
tori
esSt
age
Car
riag
eC
ontr
act C
arri
ages
Tota
lCo
ntd.
..

83
Annexure 3.8 (Contd...)
Annexure 4.1
Edu
Inst
. Bu
ses
Am
bula
nce
Fire
Fi
ghte
rA
ny O
ther
Lorr
y (S
P)Lo
rry
(NP)
Tank
ers
(SP)
Tank
ers (
NP)
Trac
tors
&
Trai
lor
LMV
Mul
tiaxl
ed /
Art
icul
ated
Ve
hicl
es (I
)
Mul
tiaxl
ed /
Art
icul
ated
Ve
hicl
es (I
)
Any
O
ther
1516
1718
1920
2122
2324
2526
2728
29A
ndhr
a Pr
ades
h24
792
243
8316
3792
725
6241
287
6040
2110
6473
041
7845
840
7970
54A
runa
chal
Pr
376
2118
763
10
680
044
691
00
4144
Ass
am22
4726
1511
30
8561
841
815
00
7912
011
8255
6605
00
5427
12B
ihar
433
10
1724
073
1024
114
224
616
3635
9916
4365
9540
8278
905
Chh
attis
garh
1084
20
179
1835
1118
505
455
1837
6394
1189
846
095
5861
5G
oa29
20
013
714
368
359
526
488
102
1219
40
7013
1836
165
Guj
arat
00
00
00
00
00
00
00
Har
yana
2288
00
1387
6430
4119
00
03
4216
00
9938
7H
imac
hal P
r33
3811
0493
00
8182
40
024
062
4741
00
110
2172
86J &
K0
3476
456
257
062
8262
0322
796
3548
469
2580
00
3230
2040
06Jh
arkh
and
656
110
6839
3346
1623
138
614
728
0712
849
1157
715
4728
7K
arna
taka
1845
210
960
3924
9324
074
4015
630
429
940
3469
346
526
1390
353
0430
932
6536
44K
eral
a35
828
7245
675
4512
1912
8010
108
2916
862
1426
853
898
4803
220
586
7616
1408
203
Mad
hya
Prad
esh
1431
51
060
421
595
6697
298
5291
719
3515
009
6351
545
031
026
8831
Mah
aras
htra
2416
714
533
011
721
2709
1417
0888
1191
633
982
1052
833
9745
2728
015
2662
256
358
3805
944
Man
ipur
2330
00
1606
8947
927
05
2473
314
1371
1631
7M
egha
laya
148
312
2867
918
738
7262
463
172
4218
5912
560
2119
9250
0M
izor
am24
430
60
00
028
916
866
20
4334
306
Nag
alan
d32
60
00
8749
60
00
022
733
4271
50
018
2547
Oris
sa18
740
00
1204
690
00
017
822
5039
50
048
6371
Punj
ab0
00
00
00
00
00
00
0R
ajas
than
00
030
910
1818
6219
4287
00
00
00
6906
97Si
kkim
4915
542
035
650
350
217
1569
126
00
2001
4Ta
mil
Nad
u32
648
1134
716
8012
620
2041
0836
561
5788
548
899
7799
522
0613
1542
210
080
012
6462
3Te
lang
ana
545
014
6995
507
3041
798
3026
6758
483
1056
723
8522
880
6267
31Tr
ipur
a0
00
022
994
00
010
230
02
6517
Utta
rakh
and
2841
529
500
4831
322
034
1134
326
1102
630
0969
127
460
1373
56U
P37
510
00
3030
8801
173
964
1172
112
476
3613
3683
654
230
6961
54
7380
45W
est B
enga
l0
00
00
00
00
00
00
0A
& N
Isla
nds
00
00
00
00
00
00
3048
1559
1C
hand
igar
h12
070
079
273
511
810
916
00
00
1356
5D
& N
Hav
eli
667
729
023
6049
0178
6565
419
6824
1293
012
699
Dam
an &
Diu
Del
hi91
80
00
4065
3563
1105
213
397
1266
396
00
8291
1142
13La
ksha
dwee
p0
00
00
00
00
00
00
0Pu
duch
erry
00
00
00
00
00
00
00
Tota
l20
5847
5274
032
8444
996
1412
678
8396
3434
8958
1728
8714
8451
616
7136
338
2622
2110
1511
8434
1267
4275
Stat
es/U
nion
Te
rrito
ries
Priv
ate
Serv
ice V
ehic
le
Goo
ds C
arri
ages
Tota
l C
omm
erci
al
Vehi
cles
in U
se
Num
ber o
f Com
mer
cial
Veh
icle
s in
Use
(det
aile
d ca
tego
ry-w
ise/ S
tate
-wise
) as p
er P
rim
ary
Perm
it Va
lid a
s on
31.0
3.20
19
Total Registered Motor Vehicles (Transport and Non-Transport) in Million Plus Cities of India (as on 31.03.2018 & 31.03.2019)
(in number)
1 2 3 4 5 6 7 81 Agra 40,717 971,214 1,011,931 47,092 1,070,975 1,118,0672 Ahmedabad 398,711 3,733,014 4,131,725 411,783 3,853,490 4,265,2733 Allahabad 66,705 1,079,387 1,146,092 77,712 1,186,180 1,263,8924 Allapppuzha 27,042 183,200 210,242 27,042 183,200 210,2425 Aurangabad 50,827 509,282 560,109 47,383 468,098 515,4816 Bengaluru 721,981 6,684,221 7,406,202 801,021 7,253,009 8,054,0307 Bhopal 66,411 1,189,373 1,255,784 66,411 1,189,373 1,255,7848 Chandigarh 25,118 925,608 950,726 26,428 986,620 1,013,0489 Chennai 518,602 5,122,917 5,641,519 544,453 5,452,171 5,996,624
10 Coimbatore 97,562 2,066,384 2,163,946 102,642 2,175,172 2,277,81411 Delhi 523,482 10,162,897 10,686,379 585,573 10,805,978 11,391,55112 Dhanbad 66,456 584,602 651,058 66,456 584,602 651,05813 Durg Bhilai 43,865 866,192 910,057 46,626 911,032 957,65814 Faridabad 1,658,875 6,074,127 7,733,002 1,859,240 6,740,428 8,599,66815 Ghaziabad 59,218 947,975 1,007,193 67,782 1,040,499 1,108,28116 Greater Mumbai 364,294 2,953,590 3,317,884 321,050 2,731,851 3,052,90117 Gwalior 0 0 0 0 0 018 Hyderabad 225,413 2,489,097 2,714,510 225,413 2,489,097 2,714,51019 Indore 140,099 1,794,489 1,934,588 140,099 1,794,489 1,934,58820 Jabalpur 0 0 0 0 0 021 Jaipur 224,498 2,548,575 2,773,073 241,120 2,733,795 2,974,91522 Jamshedpur 19,431 246,302 265,733 19,431 246,302 265,73323 Jodhpur 116,074 998,909 1,114,983 123,112 1,067,515 1,190,62724 Kannur 34,189 248,664 282,853 36,100 277,676 313,77625 Kanpur 55,939 1,690,070 1,746,009 69,449 1,788,272 1,857,72126 Kochi 95,665 792,844 888,509 96,621 837,420 934,04127 Kolkata 103,205 696,987 800,192 103,205 696,987 800,19228 Kollam 35,202 274,910 310,112 36,430 319,835 356,26529 Kota 48,779 763,469 812,248 42,201 134,811 177,01230 Kozhikoda 69,518 342,515 412,033 72,729 393,471 466,20031 Lucknow 66,536 2,106,420 2,172,956 80,316 2,260,585 2,340,90132 Madurai 77,594 1,017,231 1,094,825 80,125 1,080,524 1,160,64933 Malappuram 65,467 308,221 373,688 66,239 379,052 445,29134 Meerut 40,790 676,795 717,585 46,110 753,255 799,36535 Nagpur 85,627 1,533,385 1,619,012 79,568 1,447,209 1,526,77736 Nashik 36,733 700,252 736,985 37,022 670,896 707,91837 Palakkad 33,925 233,289 267,214 33,925 233,289 267,21438 Patna 147,468 1,290,094 1,437,562 159,415 1,418,751 1,578,16639 Pune 184,062 2,770,365 2,954,427 164,560 2,552,762 2,717,32240 Raipur 118,173 1,315,806 1,433,979 125,271 1,406,367 1,531,63841 Rajkot 136,374 1,930,470 2,066,844 142,396 2,021,465 2,163,86142 Ranchi 95,107 670,069 765,176 95,107 670,069 765,17643 Srinagar 57,005 258,742 315,747 58,634 278,766 337,40044 Surat 220,214 2,948,795 3,169,009 230,071 3,148,122 3,378,19345 Trichy 59,052 796,577 855,629 60,869 818,272 879,14146 Thiruvananthapuram 88,743 724,169 812,912 88,743 724,169 812,91247 Thrissur 0 0 0 0 0 048 Varanasi 74,876 910,309 985,185 81,149 976,914 1,058,06349 Vijayawada 100,146 680,729 780,875 111,862 739,096 850,95850 Vadodara 190,722 1,988,669 2,179,391 201,534 2,113,159 2,314,69351 Visakhapatnam 6,014 57,917 63,931 88,831 876,005 964,836
7,782,506 79,859,118 87,641,624 8,336,351 83,981,075 92,317,426
Year 2017-18 2018-19Total
Transport Vehicles
Total Non-Transport Vehicles
Total Registered Motor Vehicle (col.6+col.7)
TOTAL
S.No. Million Plus CitiesTotal
Transport Vehicles
Total Non-Transport Vehicles
Total Registered Motor Vehicle (col.
3+col.4)
Source: Offices of State Transport Commissioners/UT Administrations.
84

Annexure 4.2
Annexure 4.3
S. No. Million Plus Cities 2008 2009 2010 2011 2012 2013 2014 2015 2016 2017 2018 2019 CAGR
1 2 3 4 5 6 7 8 9 10 11 12 13 14 151 Agra - - 580 640 704 752 825 905 923 962 1,012 1,118 (*)2 Ahmedabad 1,586 1,691 - - 1,682 1,796 3,196 3,420 3656 3,905 4,132 4,265 9.693 Allahabad - - - - 738 747 817 897 1060 1,023 1,146 1,264 (*)4 Allappuzha - - - - - - - - 198 210 210 210 (*)5 Aurangabad - - - 253 281 310 362 426 755 515 560 515 (*)6 Bengaluru 2,640 3,016 3,491 3,791 4,156 4,591 5,050 5,560 6113 6,833 7,406 8,054 10.327 Bhopal 571 617 674 755 829 877 933 1,080 1061 1,256 1,256 1,256 7.378 Chandigarh - - - - 1,058 1,106 631 746 837 883 951 1,013 (*)9 Chennai 2,701 2,919 3,149 3,456 3,767 4,072 4,354 4,934 4938 5,299 5,642 5,997 7.4710 Coimbatore 910 1,002 1,110 1,241 1,386 1,528 1,649 1,901 1904 2,059 2,164 2,278 8.5611 Delhi 5,899 6,302 6,747 7,228 7,350 7,785 8,293 8,851 8851 10,260 10,686 11,392 6.1012 Dhanbad -
-
31 41 462 490 521 563 604 651 651 651 (*)
13 Durg Bhilai -
-
-
-
445 490 721 769 817 815 910 958 (*)14 Faridabad 7,733 8,600 (*)15 Ghaziabad -
-
409 470 525 628 685 752 840 918 1,007 1,108 (*)
16 Greater Mumbai 1,605 1,674 1,768 1,870 2,029 2,187 2,333 2,571 2820 3,053 3,318
3,053
6.1917 Gwalior -
-
412 449 490 530 573 618 634 -
0 0 (*)
18 Hyderabad 2,444 2,682 2,728 3,033 3,387 2,040 2,203 2,369 2369 2,715 2,715 2,715 (*)19 Indore 929 1,007 1,098 1,213 1,338 1,491 1,568 1,713 1811 1,935 1,935
1,935
6.75
20 Jabalpur -
-
516 559 605 646 585 638 663 -
0 0 (*)21 Jaipur 1,289 1,387 1,549 1,694 1,871 1,962 2,121 2,249 2424 2,583 2,773 2,975 (*)22 Jamshedpur -
-
56 67 682 682 421 472 59 266 266 266 (*)
23 Jodhpur -
-
577 636 868 793 854 916 977 1,052 1,115 1,191 (*)24 Kannur -
-
-
-
-
-
167 188 213 232 283 314 (*)25 Kanpur 598 642 940 1,002 1,067 1,143 1,227 1,462 1542 1,633 1,746
1,858
11.21
26 Kochi 247 303 322 409 480 547 576 606 501 889 934 11.9227 Kolkata 573 581 411 445 496 1,278 1,339 1,402 741 800 800
800
3.2528 Kollam -
-
-
-
-
-
245 274 304 310 356 (*)29 Kota -
-
440 473 953 554 597 654 711 764 812
177
(*)30 Kozhikode -
-
-
-
-
-
373 412 445 412 466 (*)31 Lucknow 962 1,025 1,107 1,211 1,315 1,424 1,553 1,710 1818 1,978 2,173 2,341 8.6132 Madurai 440 478 530 603 680 768 833 955 957 1,037 1,095 1,161 9.2833 Malappuram -
-
-
-
-
-
257 277 304 324 374 445 (*)34 Meerut -
-
387 423 420 412 459 525 567 624 718 799 (*)
35 Nagpur 946 1,009 1,079 1,157 1,237 1,270 1,274 1,276 1475 1,527 1,619 1,527 4.2336 Nashik -
-
358 398 444 490 541 622 677 708 737 708 (*)37 Palakkad -
-
-
-
-
-
-
-
252 267 267 267 (*)38 Patna 471 516 581 658 743 829 941 1,019 1136 1,258 1,438 1,578 11.8339 Pune 1,141 1,153 1,908 2,094 2,267 2,347 2,185 2,337 2519 2,717 2,954 2,717 8.9540 Raipur -
-
469 527 579 639 980 1,112 1213 1,324 1,434 1,532 (*)41 Rajkot -
-
-
-
760 827 888 979 1804 1,926 2,067 2,164 (*)42 Ranchi -
-
-
-
729 684 74 547 613 765 765 765 (*)43 Srinagar -
-
172 184 201 218 218 236 272 291 316 337 (*)44 Surat 982 1,036 … … 1,145 1,241 2,244 2,459 2666 2,887 3,169 3,378 12.5545 Trichy -
-
400 457 521 593 649 763 764 831 856 879 (*)46 Thiruvananthapuram -
-
-
-
-
-
535 572 616 813 813
813
(*)47 Thrissur -
-
-
-
-
-
329 355 390 -
-
-
(*)48 Varanasi 482 522 497 538 588 633 695 769 777 907 985
1,058
(*)49 Vijayawada -
-
523 466 553 517 568 610 663 781 851 (*)50 Vadodara 934 1,009 -
-
839 914 980 1,042 1895 2,022 2,179
2,315
8.6651 Visakhapatnam 515 559 586 617 683 643 690 731 783 64 965 5.61
28,865 31,130 35,605 39,058 51,353 53,473 60,112 66,244 70,929 72,827 87,642 92,317 11.48Total
Total Registered Motor Vehicles In Million Plus Cities of India (2008-2019)st(as on 31 March)
(in thousands)
Tota
l Reg
ister
ed M
otor
Veh
icle
s (Tr
ansp
ort )
in M
illio
n Pl
us C
ities
of I
ndia
st(A
s on
31 M
arch
, 201
8)(*) : CAGR not calculated because initial year data not available - : Not reported.Source: Offices of State Transport Commissioners/UT Administrations.
Four
W
heel
ers
Thre
e W
heel
ers
Stag
e ca
rria
geC
ontr
act
carr
iage
Priv
ate
Serv
ice
Oth
er
Buse
sM
otor
cab
Max
i cab
Oth
er ta
xis
Thre
e Se
ater
sFo
ur to
Six
Se
ater
s
12
34
56
78
910
1112
1314
1516
1718
1A
gra
2,60
61,
882
4,64
511
,806
136
364
366
1,01
14,
002
814
148
12,1
5877
90
040
,717
2A
hmed
abad
3,49
043
,578
43,1
8866
,028
21,0
287,
227
1,14
797
40
6,42
919
,693
185,
929
00
039
8,71
13
Alla
haba
d 10
,120
9,49
815
,997
656
718
334
231
1,48
42,
810
356
213
7,54
416
,744
00
66,7
054
Alla
pppu
zha
674
2,52
14,
799
2,00
448
31,
530
800
2,82
80
108
010
,517
01,
498
27,0
425
Aur
anga
bad
26,
405
12,0
6312
,773
2,53
682
481
671
229
01,
298
13,3
690
00
50,8
276
Ben
galu
ru47
,566
65,1
5187
,852
46,3
0316
,121
2,23
611
,350
16,8
8010
5,06
237
,762
14,4
2618
5,34
433
,589
052
,339
721,
981
7B
hopa
l3,
590
5,51
19,
574
11,6
632,
724
2,03
625
848
711
,305
01,
832
17,4
310
00
66,4
118
Cha
ndig
arh
01,
236
8,99
43,
386
565
165
1,92
844
1,88
350
782
6,32
80
00
25,1
189
Che
nnai
44,1
4364
,995
70,3
8422
,583
9,73
114
,525
4,18
414
,424
96,9
1038
,802
2,25
612
5,26
510
,400
00
518,
602
10C
oim
bato
re2,
988
14,4
6713
,811
7,91
73,
089
603
1,46
94,
047
21,5
026,
501
483
19,6
8799
80
097
,562
11D
elhi
149,
277
061
069
,704
31,5
620
1144
98,8
0915
,483
912
104,
780
46,6
272,
022
3,64
152
3,48
212
Dha
nbad
027
,676
9,34
82,
740
906
00
610
269
8,46
016
,681
00
066
,456
13D
urg
Bhi
lai
1,26
117
,936
10,0
324,
093
1,11
945
11,
140
293
1,09
816
50
2,76
53,
512
00
43,8
6514
Farid
abad
771,
093
275,
080
165,
205
16,0
5314
,651
21,6
3111
,656
11,5
8076
,141
2,41
10
132,
197
159,
333
1,84
40
1,65
8,87
515
Gha
ziab
ad
2,02
66,
499
11,7
591,
390
226
719
1,13
72,
290
9,67
034
538
919
,590
2,97
320
50
59,2
1816
Gre
ater
Mum
bai
256,
120
30,3
2423
,629
5,16
75,
751
1,03
74,
000
44,0
640
68,0
8317
6,09
40
00
364,
294
17G
wal
ior
-
-
-
-
-
-
-
-
-
-
-
-
-
-
-
-
18
Hyd
erab
ad1,
113
26,0
8044
,332
18,9
684,
265
1,05
790
52,
321
24,6
265,
050
4,57
20
87,0
745,
050
022
5,41
319
Indo
re19
,193
36,9
1422
,682
19,7
412,
434
4,42
883
91,
526
6,07
80
2,53
223
,732
00
014
0,09
920
Jaba
lpur
**
-
-
-
-
-
-
-
-
-
-
-
-
-
-
-
-
21
Jaip
ur0
95,0
986,
754
15,1
9825
,746
00
041
,087
00
32,2
528,
363
00
224,
498
22Ja
msh
edpu
r35
3,23
64,
145
2,43
121
432
00
293,
006
05,
151
1,15
20
019
,431
23Jo
dhpu
r0
63,2
113,
687
11,1
058,
618
00
012
,444
00
14,1
052,
904
00
116,
074
24K
annu
r1,
495
2,19
65,
638
3,54
71,
503
1,34
710
30
1,68
30
1,69
40
13,3
820
1,60
134
,189
25K
anpu
r57
828
,759
6,27
14,
335
154
176
1688
61,
789
733
03,
421
8,74
081
055
,939
26K
ochi
1,
721
5,81
5
10
,811
2,
648
6,
376
2,
712
2,69
4
-
5,67
9
-
4,68
4
-
45
,383
-
7,14
2
95
,665
27K
olka
ta*
*12
,683
11,1
902,
250
1,68
856
31,
688
27,3
1513
,658
11,3
8113
,840
6,92
030
010
3,20
528
Kol
lam
1,
723
2,96
2
4,
878
3,66
4
935
1,59
4
12
4
-
1,
624
-
16
5
-
15,9
66
-
1,
567
35,2
02
29
Kot
a0
21,9
541,
816
2,45
43,
974
00
04,
435
00
10,4
513,
695
00
48,7
7930
Koz
hiko
da
2,28
9
5,
126
9,81
1
4,
714
2,
094
2,
177
658
-
3,45
6
-
419
-
34
,743
-
4,03
1
69
,518
31Lu
ckno
w
4,37
98,
894
20,5
603,
601
310
5411
43,
060
10,0
811,
033
6,44
04,
584
3,34
581
066
,536
32M
adur
ai93
314
,245
9,58
43,
574
3,28
019
457
53,
105
13,0
835,
806
479
21,7
8894
80
077
,594
33M
alap
pura
m6,
008
5,01
910
,719
6,57
61,
918
1,74
963
02,
046
013
90
28,5
930
2,63
765
,467
34M
eeru
t 1,
291
10,8
868,
090
953
586
514
02,
519
1,62
821
04,
648
5,53
43,
931
00
40,7
9035
Nag
pur
1,56
115
,956
22,1
7311
,963
1,83
11,
224
1,33
62,
955
130
7,45
019
,165
00
085
,627
36N
ashi
k52
5743
513
,593
494
720
107
930
1,09
20
1,83
917
,414
0…
036
,733
37Pa
lakk
ad1,
720
2,89
14,
535
3,49
792
01,
526
117
01,
472
015
60
15,5
860
1,50
533
,925
38Pa
tna
5,14
635
,669
9,35
67,
375
8,63
70
00
18,4
600
062
,825
00
014
7,46
839
Pune
5,84
129
,343
37,7
5227
,314
2,14
98,
893
1,06
13,
162
221
022
,688
45,6
380
00
184,
062
40R
aipu
r7,
270
56,5
2324
,157
5,92
61,
238
304
1,96
052
05,
909
409
012
,759
1,19
80
011
8,17
341
Raj
kot
1,89
031
,316
25,7
2932
,099
390
4,01
951
979
80
2,53
05,
166
31,9
18...
00
136,
374
42R
anch
i1,
923
34,0
1210
,742
29,7
980
00
5,12
76,
860
6,54
80
961
00
95,1
0743
Srin
agar
013
,497
5,57
68,
174
4,97
40
2,15
445
80
7,29
42,
213
12,6
650
…0
57,0
0544
Sura
t1,
027
32,4
5631
,473
41,4
5055
32,
185
543
1,28
30
1,35
53,
478
104,
411
00
022
0,21
445
Tric
hy2,
749
11,9
006,
051
8,99
83,
032
166
233
1,72
18,
207
3,48
214
111
,736
636
00
59,0
5246
Thiru
vana
ntha
pura
m1,
671
5,60
810
,350
2,08
06,
354
2,41
42,
668
04,
796
04,
501
040
,756
07,
545
88,7
4347
Thris
sur
-
-
-
-
-
-
-
-
-
-
-
-
-
-
-
-
48
Vara
nasi
4,
898
8,58
915
,631
7,23
21,
825
1,08
52,
108
1,92
15,
907
365
2,70
919
,934
2,66
84
074
,876
49V
ijaya
wad
a 2,
206
26,6
20
11
,628
10
,024
2,00
8
567
18
7
2,11
7
6,
249
1,42
4
84
2
-
34,2
98
36
1,
940
100,
146
50
Vado
dara
9,97
930
,485
30,9
6222
,503
203
3,67
61,
785
302
05,
357
10,2
2475
,246
00
019
0,72
251
Vis
akha
patn
am
114
81
2
1,12
0
30
9
68
19
1
26
872
165
86
-
1,
912
10
5
405
6,
014
1,12
7,66
61,
214,
684
928,
716
649,
762
210,
095
102,
916
58,2
4395
,305
693,
280
168,
009
217,
029
1,57
3,82
764
7,66
69,
458
85,8
517,
782,
506
Mot
or
Cyc
les o
n H
ire
Oth
er
vehi
cles
no
t co
vere
d
Tota
l Tr
ansp
ort
TOTA
L
Mul
ti-ax
led/
A
rtic
ulat
ed
Vehi
cles
Truc
ks &
Lo
rrie
s
Ligh
t Mot
or V
ehic
les
(Goo
ds)
Buse
sTa
xies
Ligh
t Mot
or V
ehic
les
(Pas
seng
ers-
Aut
o)S.
No.
Mill
ion
Plus
Citi
es
TRA
NSP
ORT
Cont
d...
85 86

Annexure 4.2
Annexure 4.3
S. No. Million Plus Cities 2008 2009 2010 2011 2012 2013 2014 2015 2016 2017 2018 2019 CAGR
1 2 3 4 5 6 7 8 9 10 11 12 13 14 151 Agra - - 580 640 704 752 825 905 923 962 1,012 1,118 (*)2 Ahmedabad 1,586 1,691 - - 1,682 1,796 3,196 3,420 3656 3,905 4,132 4,265 9.693 Allahabad - - - - 738 747 817 897 1060 1,023 1,146 1,264 (*)4 Allappuzha - - - - - - - - 198 210 210 210 (*)5 Aurangabad - - - 253 281 310 362 426 755 515 560 515 (*)6 Bengaluru 2,640 3,016 3,491 3,791 4,156 4,591 5,050 5,560 6113 6,833 7,406 8,054 10.327 Bhopal 571 617 674 755 829 877 933 1,080 1061 1,256 1,256 1,256 7.378 Chandigarh - - - - 1,058 1,106 631 746 837 883 951 1,013 (*)9 Chennai 2,701 2,919 3,149 3,456 3,767 4,072 4,354 4,934 4938 5,299 5,642 5,997 7.4710 Coimbatore 910 1,002 1,110 1,241 1,386 1,528 1,649 1,901 1904 2,059 2,164 2,278 8.5611 Delhi 5,899 6,302 6,747 7,228 7,350 7,785 8,293 8,851 8851 10,260 10,686 11,392 6.1012 Dhanbad -
-
31 41 462 490 521 563 604 651 651 651 (*)
13 Durg Bhilai -
-
-
-
445 490 721 769 817 815 910 958 (*)14 Faridabad 7,733 8,600 (*)15 Ghaziabad -
-
409 470 525 628 685 752 840 918 1,007 1,108 (*)
16 Greater Mumbai 1,605 1,674 1,768 1,870 2,029 2,187 2,333 2,571 2820 3,053 3,318
3,053
6.1917 Gwalior -
-
412 449 490 530 573 618 634 -
0 0 (*)
18 Hyderabad 2,444 2,682 2,728 3,033 3,387 2,040 2,203 2,369 2369 2,715 2,715 2,715 (*)19 Indore 929 1,007 1,098 1,213 1,338 1,491 1,568 1,713 1811 1,935 1,935
1,935
6.75
20 Jabalpur -
-
516 559 605 646 585 638 663 -
0 0 (*)21 Jaipur 1,289 1,387 1,549 1,694 1,871 1,962 2,121 2,249 2424 2,583 2,773 2,975 (*)22 Jamshedpur -
-
56 67 682 682 421 472 59 266 266 266 (*)
23 Jodhpur -
-
577 636 868 793 854 916 977 1,052 1,115 1,191 (*)24 Kannur -
-
-
-
-
-
167 188 213 232 283 314 (*)25 Kanpur 598 642 940 1,002 1,067 1,143 1,227 1,462 1542 1,633 1,746
1,858
11.21
26 Kochi 247 303 322 409 480 547 576 606 501 889 934 11.9227 Kolkata 573 581 411 445 496 1,278 1,339 1,402 741 800 800
800
3.2528 Kollam -
-
-
-
-
-
245 274 304 310 356 (*)29 Kota -
-
440 473 953 554 597 654 711 764 812
177
(*)30 Kozhikode -
-
-
-
-
-
373 412 445 412 466 (*)31 Lucknow 962 1,025 1,107 1,211 1,315 1,424 1,553 1,710 1818 1,978 2,173 2,341 8.6132 Madurai 440 478 530 603 680 768 833 955 957 1,037 1,095 1,161 9.2833 Malappuram -
-
-
-
-
-
257 277 304 324 374 445 (*)34 Meerut -
-
387 423 420 412 459 525 567 624 718 799 (*)
35 Nagpur 946 1,009 1,079 1,157 1,237 1,270 1,274 1,276 1475 1,527 1,619 1,527 4.2336 Nashik -
-
358 398 444 490 541 622 677 708 737 708 (*)37 Palakkad -
-
-
-
-
-
-
-
252 267 267 267 (*)38 Patna 471 516 581 658 743 829 941 1,019 1136 1,258 1,438 1,578 11.8339 Pune 1,141 1,153 1,908 2,094 2,267 2,347 2,185 2,337 2519 2,717 2,954 2,717 8.9540 Raipur -
-
469 527 579 639 980 1,112 1213 1,324 1,434 1,532 (*)41 Rajkot -
-
-
-
760 827 888 979 1804 1,926 2,067 2,164 (*)42 Ranchi -
-
-
-
729 684 74 547 613 765 765 765 (*)43 Srinagar -
-
172 184 201 218 218 236 272 291 316 337 (*)44 Surat 982 1,036 … … 1,145 1,241 2,244 2,459 2666 2,887 3,169 3,378 12.5545 Trichy -
-
400 457 521 593 649 763 764 831 856 879 (*)46 Thiruvananthapuram -
-
-
-
-
-
535 572 616 813 813
813
(*)47 Thrissur -
-
-
-
-
-
329 355 390 -
-
-
(*)48 Varanasi 482 522 497 538 588 633 695 769 777 907 985
1,058
(*)49 Vijayawada -
-
523 466 553 517 568 610 663 781 851 (*)50 Vadodara 934 1,009 -
-
839 914 980 1,042 1895 2,022 2,179
2,315
8.6651 Visakhapatnam 515 559 586 617 683 643 690 731 783 64 965 5.61
28,865 31,130 35,605 39,058 51,353 53,473 60,112 66,244 70,929 72,827 87,642 92,317 11.48Total
Total Registered Motor Vehicles In Million Plus Cities of India (2008-2019)st(as on 31 March)
(in thousands)
Tota
l Reg
ister
ed M
otor
Veh
icle
s (Tr
ansp
ort )
in M
illio
n Pl
us C
ities
of I
ndia
st(A
s on
31 M
arch
, 201
8)
(*) : CAGR not calculated because initial year data not available - : Not reported.Source: Offices of State Transport Commissioners/UT Administrations.
Four
W
heel
ers
Thre
e W
heel
ers
Stag
e ca
rria
geC
ontr
act
carr
iage
Priv
ate
Serv
ice
Oth
er
Buse
sM
otor
cab
Max
i cab
Oth
er ta
xis
Thre
e Se
ater
sFo
ur to
Six
Se
ater
s
12
34
56
78
910
1112
1314
1516
1718
1A
gra
2,60
61,
882
4,64
511
,806
136
364
366
1,01
14,
002
814
148
12,1
5877
90
040
,717
2A
hmed
abad
3,49
043
,578
43,1
8866
,028
21,0
287,
227
1,14
797
40
6,42
919
,693
185,
929
00
039
8,71
13
Alla
haba
d 10
,120
9,49
815
,997
656
718
334
231
1,48
42,
810
356
213
7,54
416
,744
00
66,7
054
Alla
pppu
zha
674
2,52
14,
799
2,00
448
31,
530
800
2,82
80
108
010
,517
01,
498
27,0
425
Aur
anga
bad
26,
405
12,0
6312
,773
2,53
682
481
671
229
01,
298
13,3
690
00
50,8
276
Ben
galu
ru47
,566
65,1
5187
,852
46,3
0316
,121
2,23
611
,350
16,8
8010
5,06
237
,762
14,4
2618
5,34
433
,589
052
,339
721,
981
7B
hopa
l3,
590
5,51
19,
574
11,6
632,
724
2,03
625
848
711
,305
01,
832
17,4
310
00
66,4
118
Cha
ndig
arh
01,
236
8,99
43,
386
565
165
1,92
844
1,88
350
782
6,32
80
00
25,1
189
Che
nnai
44,1
4364
,995
70,3
8422
,583
9,73
114
,525
4,18
414
,424
96,9
1038
,802
2,25
612
5,26
510
,400
00
518,
602
10C
oim
bato
re2,
988
14,4
6713
,811
7,91
73,
089
603
1,46
94,
047
21,5
026,
501
483
19,6
8799
80
097
,562
11D
elhi
149,
277
061
069
,704
31,5
620
1144
98,8
0915
,483
912
104,
780
46,6
272,
022
3,64
152
3,48
212
Dha
nbad
027
,676
9,34
82,
740
906
00
610
269
8,46
016
,681
00
066
,456
13D
urg
Bhi
lai
1,26
117
,936
10,0
324,
093
1,11
945
11,
140
293
1,09
816
50
2,76
53,
512
00
43,8
6514
Farid
abad
771,
093
275,
080
165,
205
16,0
5314
,651
21,6
3111
,656
11,5
8076
,141
2,41
10
132,
197
159,
333
1,84
40
1,65
8,87
515
Gha
ziab
ad
2,02
66,
499
11,7
591,
390
226
719
1,13
72,
290
9,67
034
538
919
,590
2,97
320
50
59,2
1816
Gre
ater
Mum
bai
256,
120
30,3
2423
,629
5,16
75,
751
1,03
74,
000
44,0
640
68,0
8317
6,09
40
00
364,
294
17G
wal
ior
-
-
-
-
-
-
-
-
-
-
-
-
-
-
-
-
18
Hyd
erab
ad1,
113
26,0
8044
,332
18,9
684,
265
1,05
790
52,
321
24,6
265,
050
4,57
20
87,0
745,
050
022
5,41
319
Indo
re19
,193
36,9
1422
,682
19,7
412,
434
4,42
883
91,
526
6,07
80
2,53
223
,732
00
014
0,09
920
Jaba
lpur
**
-
-
-
-
-
-
-
-
-
-
-
-
-
-
-
-
21
Jaip
ur0
95,0
986,
754
15,1
9825
,746
00
041
,087
00
32,2
528,
363
00
224,
498
22Ja
msh
edpu
r35
3,23
64,
145
2,43
121
432
00
293,
006
05,
151
1,15
20
019
,431
23Jo
dhpu
r0
63,2
113,
687
11,1
058,
618
00
012
,444
00
14,1
052,
904
00
116,
074
24K
annu
r1,
495
2,19
65,
638
3,54
71,
503
1,34
710
30
1,68
30
1,69
40
13,3
820
1,60
134
,189
25K
anpu
r57
828
,759
6,27
14,
335
154
176
1688
61,
789
733
03,
421
8,74
081
055
,939
26K
ochi
1,
721
5,81
5
10
,811
2,
648
6,
376
2,
712
2,69
4
-
5,67
9
-
4,68
4
-
45
,383
-
7,14
2
95
,665
27K
olka
ta*
*12
,683
11,1
902,
250
1,68
856
31,
688
27,3
1513
,658
11,3
8113
,840
6,92
030
010
3,20
528
Kol
lam
1,
723
2,96
2
4,
878
3,66
4
935
1,59
4
12
4
-
1,
624
-
16
5
-
15,9
66
-
1,
567
35,2
02
29
Kot
a0
21,9
541,
816
2,45
43,
974
00
04,
435
00
10,4
513,
695
00
48,7
7930
Koz
hiko
da
2,28
9
5,
126
9,81
1
4,
714
2,
094
2,
177
658
-
3,45
6
-
419
-
34
,743
-
4,03
1
69
,518
31Lu
ckno
w
4,37
98,
894
20,5
603,
601
310
5411
43,
060
10,0
811,
033
6,44
04,
584
3,34
581
066
,536
32M
adur
ai93
314
,245
9,58
43,
574
3,28
019
457
53,
105
13,0
835,
806
479
21,7
8894
80
077
,594
33M
alap
pura
m6,
008
5,01
910
,719
6,57
61,
918
1,74
963
02,
046
013
90
28,5
930
2,63
765
,467
34M
eeru
t 1,
291
10,8
868,
090
953
586
514
02,
519
1,62
821
04,
648
5,53
43,
931
00
40,7
9035
Nag
pur
1,56
115
,956
22,1
7311
,963
1,83
11,
224
1,33
62,
955
130
7,45
019
,165
00
085
,627
36N
ashi
k52
5743
513
,593
494
720
107
930
1,09
20
1,83
917
,414
0…
036
,733
37Pa
lakk
ad1,
720
2,89
14,
535
3,49
792
01,
526
117
01,
472
015
60
15,5
860
1,50
533
,925
38Pa
tna
5,14
635
,669
9,35
67,
375
8,63
70
00
18,4
600
062
,825
00
014
7,46
839
Pune
5,84
129
,343
37,7
5227
,314
2,14
98,
893
1,06
13,
162
221
022
,688
45,6
380
00
184,
062
40R
aipu
r7,
270
56,5
2324
,157
5,92
61,
238
304
1,96
052
05,
909
409
012
,759
1,19
80
011
8,17
341
Raj
kot
1,89
031
,316
25,7
2932
,099
390
4,01
951
979
80
2,53
05,
166
31,9
18...
00
136,
374
42R
anch
i1,
923
34,0
1210
,742
29,7
980
00
5,12
76,
860
6,54
80
961
00
95,1
0743
Srin
agar
013
,497
5,57
68,
174
4,97
40
2,15
445
80
7,29
42,
213
12,6
650
…0
57,0
0544
Sura
t1,
027
32,4
5631
,473
41,4
5055
32,
185
543
1,28
30
1,35
53,
478
104,
411
00
022
0,21
445
Tric
hy2,
749
11,9
006,
051
8,99
83,
032
166
233
1,72
18,
207
3,48
214
111
,736
636
00
59,0
5246
Thiru
vana
ntha
pura
m1,
671
5,60
810
,350
2,08
06,
354
2,41
42,
668
04,
796
04,
501
040
,756
07,
545
88,7
4347
Thris
sur
-
-
-
-
-
-
-
-
-
-
-
-
-
-
-
-
48
Vara
nasi
4,
898
8,58
915
,631
7,23
21,
825
1,08
52,
108
1,92
15,
907
365
2,70
919
,934
2,66
84
074
,876
49V
ijaya
wad
a 2,
206
26,6
20
11
,628
10
,024
2,00
8
567
18
7
2,11
7
6,
249
1,42
4
84
2
-
34,2
98
36
1,
940
100,
146
50
Vado
dara
9,97
930
,485
30,9
6222
,503
203
3,67
61,
785
302
05,
357
10,2
2475
,246
00
019
0,72
251
Vis
akha
patn
am
114
81
2
1,12
0
30
9
68
19
1
26
872
165
86
-
1,
912
10
5
405
6,
014
1,12
7,66
61,
214,
684
928,
716
649,
762
210,
095
102,
916
58,2
4395
,305
693,
280
168,
009
217,
029
1,57
3,82
764
7,66
69,
458
85,8
517,
782,
506
Mot
or
Cyc
les o
n H
ire
Oth
er
vehi
cles
no
t co
vere
d
Tota
l Tr
ansp
ort
TOTA
L
Mul
ti-ax
led/
A
rtic
ulat
ed
Vehi
cles
Truc
ks &
Lo
rrie
s
Ligh
t Mot
or V
ehic
les
(Goo
ds)
Buse
sTa
xies
Ligh
t Mot
or V
ehic
les
(Pas
seng
ers-
Aut
o)S.
No.
Mill
ion
Plus
Citi
es
TRA
NSP
ORT
Cont
d...
85 86
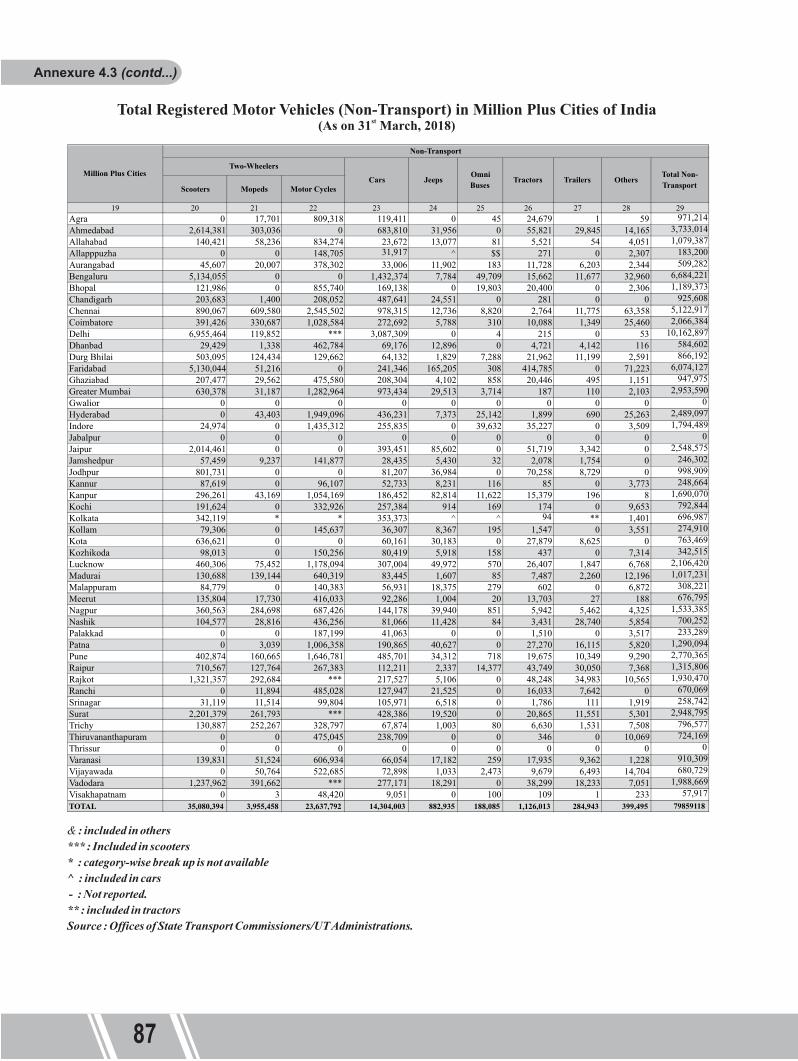
Annexure 4.3 (contd...)
Annexure 4.4
Total Registered Motor Vehicles (Non-Transport) in Million Plus Cities of Indiast(As on 31 March, 2018)
& : included in others *** : Included in scooters* : category-wise break up is not available^ : included in cars - : Not reported.** : included in tractorsSource : Offices of State Transport Commissioners/UT Administrations.
Scooters Mopeds Motor Cycles
19 20 21 22 23 24 25 26 27 28 29Agra 0 17,701 809,318 119,411 0 45 24,679 1 59 971,214Ahmedabad 2,614,381 303,036 0 683,810 31,956 0 55,821 29,845 14,165 3,733,014Allahabad 140,421 58,236 834,274 23,672 13,077 81 5,521 54 4,051 1,079,387Allapppuzha 0 0 148,705 31,917 ^ $$ 271 0 2,307 183,200Aurangabad 45,607 20,007 378,302 33,006 11,902 183 11,728 6,203 2,344 509,282Bengaluru 5,134,055 0 0 1,432,374 7,784 49,709 15,662 11,677 32,960 6,684,221Bhopal 121,986 0 855,740 169,138 0 19,803 20,400 0 2,306 1,189,373Chandigarh 203,683 1,400 208,052 487,641 24,551 0 281 0 0 925,608Chennai 890,067 609,580 2,545,502 978,315 12,736 8,820 2,764 11,775 63,358 5,122,917Coimbatore 391,426 330,687 1,028,584 272,692 5,788 310 10,088 1,349 25,460 2,066,384Delhi 6,955,464 119,852 *** 3,087,309 0 4 215 0 53 10,162,897Dhanbad 29,429 1,338 462,784 69,176 12,896 0 4,721 4,142 116 584,602Durg Bhilai 503,095 124,434 129,662 64,132 1,829 7,288 21,962 11,199 2,591 866,192Faridabad 5,130,044 51,216 0 241,346 165,205 308 414,785 0 71,223 6,074,127Ghaziabad 207,477 29,562 475,580 208,304 4,102 858 20,446 495 1,151 947,975Greater Mumbai 630,378 31,187 1,282,964 973,434 29,513 3,714 187 110 2,103 2,953,590Gwalior 0 0 0 0 0 0 0 0 0 0Hyderabad 0 43,403 1,949,096 436,231 7,373 25,142 1,899 690 25,263 2,489,097Indore 24,974 0 1,435,312 255,835 0 39,632 35,227 0 3,509 1,794,489Jabalpur 0 0 0 0 0 0 0 0 0 0Jaipur 2,014,461 0 0 393,451 85,602 0 51,719 3,342 0 2,548,575Jamshedpur 57,459 9,237 141,877 28,435 5,430 32 2,078 1,754 0 246,302Jodhpur 801,731 0 0 81,207 36,984 0 70,258 8,729 0 998,909Kannur 87,619 0 96,107 52,733 8,231 116 85 0 3,773 248,664Kanpur 296,261 43,169 1,054,169 186,452 82,814 11,622 15,379 196 8 1,690,070Kochi 191,624 0 332,926 257,384 914 169 174 0 9,653 792,844Kolkata 342,119 * * 353,373 ^ ^ 94 ** 1,401 696,987Kollam 79,306 0 145,637 36,307 8,367 195 1,547 0 3,551 274,910Kota 636,621 0 0 60,161 30,183 0 27,879 8,625 0 763,469Kozhikoda 98,013 0 150,256 80,419 5,918 158 437 0 7,314 342,515Lucknow 460,306 75,452 1,178,094 307,004 49,972 570 26,407 1,847 6,768 2,106,420Madurai 130,688 139,144 640,319 83,445 1,607 85 7,487 2,260 12,196 1,017,231Malappuram 84,779 0 140,383 56,931 18,375 279 602 0 6,872 308,221Meerut 135,804 17,730 416,033 92,286 1,004 20 13,703 27 188 676,795Nagpur 360,563 284,698 687,426 144,178 39,940 851 5,942 5,462 4,325 1,533,385Nashik 104,577 28,816 436,256 81,066 11,428 84 3,431 28,740 5,854 700,252Palakkad 0 0 187,199 41,063 0 0 1,510 0 3,517 233,289Patna 0 3,039 1,006,358 190,865 40,627 0 27,270 16,115 5,820 1,290,094Pune 402,874 160,665 1,646,781 485,701 34,312 718 19,675 10,349 9,290 2,770,365Raipur 710,567 127,764 267,383 112,211 2,337 14,377 43,749 30,050 7,368 1,315,806Rajkot 1,321,357 292,684 *** 217,527 5,106 0 48,248 34,983 10,565 1,930,470Ranchi 0 11,894 485,028 127,947 21,525 0 16,033 7,642 0 670,069Srinagar 31,119 11,514 99,804 105,971 6,518 0 1,786 111 1,919 258,742Surat 2,201,379 261,793 *** 428,386 19,520 0 20,865 11,551 5,301 2,948,795Trichy 130,887 252,267 328,797 67,874 1,003 80 6,630 1,531 7,508 796,577Thiruvananthapuram 0 0 475,045 238,709 0 0 346 0 10,069 724,169Thrissur 0 0 0 0 0 0 0 0 0 0Varanasi 139,831 51,524 606,934 66,054 17,182 259 17,935 9,362 1,228 910,309Vijayawada 0 50,764 522,685 72,898 1,033 2,473 9,679 6,493 14,704 680,729Vadodara 1,237,962 391,662 *** 277,171 18,291 0 38,299 18,233 7,051 1,988,669Visakhapatnam 0 3 48,420 9,051 0 100 109 1 233 57,917TOTAL 35,080,394 3,955,458 23,637,792 14,304,003 882,935 188,085 1,126,013 284,943 399,495 79859118
Two-WheelersCars Jeeps
Million Plus Cities
Non-Transport
Tractors Trailers Others Total Non-Transport
Omni Buses
Four
W
heel
ers
Thre
e W
heel
ers
Stag
e ca
rria
geC
ontr
act
carr
iage
Priv
ate
Serv
ice
Oth
er B
uses
Mot
or c
abM
axi c
abO
ther
taxi
sTh
ree
Seat
ers
Four
to S
ix
Seat
ers
12
34
56
78
910
1112
1314
1516
1718
1A
gra
3,19
92,
275
4,94
013
,410
136
482
467
1,01
54,
886
867
148
13,5
261,
722
190
47,0
922
Ahm
edab
ad3,
498
46,0
9743
,200
67,7
4521
,028
7,77
31,
148
981
06,
656
21,5
6219
2,09
50
00
411,
783
3A
llaha
bad
11,1
0310
,677
18,4
891,
863
746
516
232
1,61
33,
296
484
224
7,97
320
,483
130
77,7
124
Alla
pppu
zha
674
2,52
14,
799
2,00
448
31,
530
800
2,82
80
108
010
,517
01,
498
27,0
425
Aur
anga
bad
06,
025
11,2
2912
,483
2,53
668
481
369
929
01,
162
11,7
230
00
47,3
836
Ben
galu
ru51
,951
69,6
6798
,989
49,8
7416
,536
2,48
511
,936
18,3
5111
7,94
040
,184
15,4
0020
2,03
338
,703
066
,972
801,
021
7B
hopa
l3,
590
5,51
19,
574
11,6
632,
724
2,03
625
848
711
,305
01,
832
17,4
310
00
66,4
118
Cha
ndig
arh
01,
375
9,63
63,
619
570
165
1,99
944
2,10
351
70
6,40
00
00
26,4
289
Che
nnai
44,8
9265
,540
71,4
0222
,960
9,92
914
,539
4,32
214
,821
102,
645
39,8
112,
256
139,
855
11,4
810
054
4,45
310
Coi
mba
tore
3,10
114
,774
14,1
738,
050
3,20
361
11,
537
4,23
123
,165
6,65
148
321
,537
1,12
60
010
2,64
211
Del
hi16
9,53
50
1,67
271
,856
32,1
730
1145
108,
868
15,6
0191
211
3,24
065
,821
2,02
23,
817
585,
573
12D
hanb
ad0
27,6
769,
348
2,74
090
60
061
026
98,
460
16,6
810
00
66,4
5613
Dur
g B
hila
i1,
547
19,6
5310
,112
4,29
01,
127
451
1,21
335
21,
146
223
02,
990
3,52
20
046
,626
14Fa
ridab
ad85
7,03
329
4,03
118
3,11
518
,099
14,7
2621
,893
13,3
4912
,253
93,3
493,
081
014
8,07
619
7,15
93,
076
01,
859,
240
15G
hazi
abad
2,
509
8,61
213
,249
1,54
729
085
51,
137
2,46
112
,137
406
389
19,7
403,
846
604
067
,782
16G
reat
er M
umba
i11
4,32
126
,456
20,3
734,
951
3,92
41,
021
3,78
157
,810
060
,752
137,
650
00
032
1,05
017
Gw
alio
r -
-
-
-
-
-
-
-
-
-
-
-
-
-
-
-
18
Hyd
erab
ad1,
113
26,0
8044
,332
18,9
684,
265
1,05
790
52,
321
24,6
265,
050
4,57
20
87,0
745,
050
022
5,41
319
Indo
re19
,193
36,9
1422
,682
19,7
412,
434
4,42
883
91,
526
6,07
80
2,53
223
,732
00
014
0,09
920
Jaba
lpur
**
-
-
-
-
-
-
-
-
-
-
-
-
-
-
-
-
21Ja
ipur
010
2,59
17,
321
15,4
7526
,288
00
044
,110
00
33,2
898,
851
3,19
50
241,
120
22Ja
msh
edpu
r35
3,23
64,
145
2,43
121
432
00
293,
006
05,
151
1,15
20
019
,431
23Jo
dhpu
r0
67,0
364,
507
11,5
588,
847
00
013
,015
00
14,8
303,
245
740
123,
112
24K
annu
r1,
496
2,29
96,
337
3,90
21,
521
1,38
810
50
1,91
70
1,69
60
13,8
120
1,62
736
,100
25K
anpu
r3,
149
29,6
936,
848
6,76
870
622
528
932
2,47
01,
301
254,
218
12,7
7531
10
69,4
4926
Koc
hi
1,73
4
5,91
7
10
,874
2,
821
6,41
6
2,
729
2,73
3
-
5,79
4
-
4,
791
-
45,5
14
-
7,29
8
96
,621
27K
olka
ta*
*12
,683
11,1
902,
250
1,68
856
31,
688
27,3
1513
,658
11,3
8113
,840
6,92
030
010
3,20
528
Kol
lam
1,
725
3,
054
5,16
5
3,
852
946
1,65
1
13
0
-
1,
767
-
172
-
16
,332
-
1,
636
36,4
30
29
Kot
a0
23,2
011,
966
2,61
90
00
00
00
10,5
993,
766
500
42,2
0130
Koz
hiko
da
2,30
7
5,21
9
9,
965
4,83
6
2,
188
2,33
6
82
9
-
3,
818
-
508
-
36
,527
-
4,
196
72,7
29
31
Luck
now
5,
777
9,27
024
,040
3,91
664
755
114
3,06
012
,654
1,41
810
,819
4,79
63,
373
377
080
,316
32M
adur
ai1,
002
14,4
089,
899
3,69
13,
332
194
590
3,19
013
,777
5,90
147
922
,654
1,00
80
080
,125
33M
alap
pura
m6,
014
5,03
210
,988
6,67
31,
931
1,76
478
02,
077
015
20
28,8
580
2,67
266
,239
34M
eeru
t 2,
167
12,1
258,
751
1,10
364
361
921
2,65
21,
896
269
4,65
55,
885
4,98
533
90
46,1
1035
Nag
pur
1,54
516
,028
21,2
9811
,060
1,77
91,
187
1,32
82,
537
130
6,15
016
,643
00
079
,568
36N
ashi
k0
3943
514
,948
494
719
105
717
1,09
20
1,71
316
,760
0…
037
,022
37Pa
lakk
ad1,
720
2,89
14,
535
3,49
792
01,
526
117
01,
472
015
60
15,5
860
1,50
533
,925
38Pa
tna
6,06
336
,852
11,7
028,
442
9,02
40
00
19,4
560
067
,876
00
015
9,41
539
Pune
5,09
926
,872
34,2
0326
,129
2,08
28,
161
1,05
12,
855
221
018
,036
39,8
510
00
164,
560
40R
aipu
r7,
682
59,9
0426
,156
6,11
31,
336
318
2,15
263
46,
239
409
013
,130
1,19
80
012
5,27
141
Raj
kot
1,87
034
,649
25,7
0832
,157
391
4,14
152
185
80
2,54
15,
192
34,3
68...
00
142,
396
42R
anch
i1,
923
34,0
1210
,742
29,7
980
00
5,12
76,
860
6,54
80
961
00
95,1
0743
Srin
agar
013
,712
6,04
58,
679
4,97
40
2,23
245
80
7,34
52,
213
12,9
760
…0
58,6
3444
Sura
t1,
040
33,1
7434
,193
44,0
3377
92,
270
526
1,42
10
1,40
63,
823
107,
406
00
023
0,07
145
Tric
hy2,
779
11,9
966,
145
9,03
33,
216
168
269
1,75
08,
483
3,54
014
112
,645
704
00
60,8
6946
Thiru
vana
ntha
pura
m1,
671
5,60
810
,350
2,08
06,
354
2,41
42,
668
04,
796
04,
501
040
,756
07,
545
88,7
4347
Thris
sur
-
-
-
-
-
-
-
-
-
-
-
-
-
-
-
-
48
Vara
nasi
5,
124
8,59
816
,348
7,71
61,
860
1,13
22,
289
1,93
46,
372
558
2,72
023
,436
2,98
775
081
,149
49V
ijaya
wad
a 2,
273
28,7
79
13,0
71
10,9
03
2,10
3
611
187
2,13
4
6,99
3
1,51
7
845
-
37,1
48
66
5,23
2
111,
862
50
Vado
dara
10,4
2833
,778
30,9
6423
,939
203
3,86
11,
880
305
05,
584
10,6
1379
,979
00
020
1,53
451
Vis
akha
patn
am
2,08
8
13,3
72
11,0
88
4,30
7
1,35
1
726
287
1,38
3
5,04
3
2,47
0
3,92
4
-
42,0
22
151
619
88,8
31
1,24
9,66
01,
285,
094
983,
869
674,
954
211,
558
103,
344
62,0
7099
,226
769,
916
177,
011
215,
497
1,61
5,11
076
8,97
415
,452
104,
617
8,33
6,35
1
Mot
or
Cyc
les o
n H
ire
Oth
er
vehi
cles
not
co
vere
d
Tota
l Tr
ansp
ort
TOTA
L
Mul
ti-ax
led/
A
rtic
ulat
ed
Vehi
cles
Truc
ks &
Lo
rrie
s
Ligh
t Mot
or V
ehic
les
(Goo
ds)
Buse
sTa
xies
Ligh
t Mot
or V
ehic
les
(Pas
seng
ers-
Aut
o)S.
No
Mill
ion
Plus
Citi
es
TRA
NSP
ORT
Tota
l Reg
ister
ed M
otor
Veh
icle
s (Tr
ansp
ort )
in M
illio
n Pl
us C
ities
of I
ndia
st(A
s on
31 M
arch
, 201
9)
Cont
d...
87 88

Annexure 4.4 (contd...)
Annexure 5.1
Total Registered Motor Vehicles (Non-Transport) in Million Plus Cities of Indiast(As on 31 March, 2019)
Rev
enue
Rea
lised
from
Roa
d Tr
ansp
ort (
Cen
tre)
: 20
09-1
0 to
201
8-19
& : included in others *** : Included in scooters* : category-wise break up is not available^ : included in cars - : Not reported.** : included in tractorsSource : Offices of State Transport Commissioners/UT Administrations.
#: In
clud
ed in
Im
port
Dut
y of M
otor
Veh
icle
s and
Acc
esso
ries
## : I
nclu
ded i
n Im
port
Dut
y of H
igh
Spee
d Die
sel O
il* I
nclu
des p
etro
leum
oils,
oils
obta
ined
from
bitu
min
ous m
iner
als,
crud
e, ot
her m
iner
al fu
els,
oils,
wax
es an
d bitu
min
ous s
ubsta
nces
Sour
ce: D
irect
orat
e of D
ata M
anag
emen
t, Ce
ntra
l Exc
ise &
Cus
tom
s, N
ew D
elhi
.
Scooters Mopeds Motor Cycles
19 20 21 22 23 24 25 26 27 28 29Agra 0 19,805 891,677 132,460 0 70 26,850 1 112 1,070,975Ahmedabad 2,702,517 303,903 0 714,526 32,337 0 55,996 29,856 14,355 3,853,490Allahabad 156,006 59,263 911,773 31,784 15,803 96 7,281 58 4,116 1,186,180Allapppuzha 0 0 148,705 31,917 ^ $$ 271 0 2,307 183,200Aurangabad 45,597 19,398 343,551 28,576 11,902 183 10,620 6,119 2,152 468,098Bengaluru 5,588,029 0 0 1,541,017 8,276 50,628 17,230 12,846 34,983 7,253,009Bhopal 121,986 0 855,740 169,138 0 19,803 20,400 0 2,306 1,189,373Chandigarh 231,047 1,500 224,815 504,401 24,559 0 298 0 0 986,620Chennai 955,850 616,940 2,738,268 1,032,894 12,746 8,825 2,856 11,775 72,017 5,452,171Coimbatore 413,436 333,490 1,091,065 290,923 5,788 310 10,249 1,349 28,562 2,175,172Delhi 7,432,574 123,428 *** 3,249,670 0 4 247 0 55 10,805,978Dhanbad 29,429 1,338 462,784 69,176 12,896 0 4,721 4,142 116 584,602Durg Bhilai 529,821 125,797 140,174 69,066 1,853 7,419 22,889 11,388 2,625 911,032Faridabad 5,699,857 53,440 0 276,464 183,115 373 453,017 0 74,162 6,740,428Ghaziabad 230,625 29,715 521,530 229,621 5,569 859 20,632 591 1,357 1,040,499Greater Mumbai 613,580 31,063 1,140,014 911,856 29,513 3,714 191 102 1,818 2,731,851Gwalior - - - - - - - - - - Hyderabad 0 43,403 1,949,096 436,231 7,373 25,142 1,899 690 25,263 2,489,097Indore 24,974 0 1,435,312 255,835 0 39,632 35,227 0 3,509 1,794,489Jabalpur - - - - - - - - - - Jaipur 2,155,505 0 0 424,975 96,213 0 53,742 3,360 0 2,733,795Jamshedpur 57,459 9,237 141,877 28,435 5,430 32 2,078 1,754 0 246,302Jodhpur 857,975 0 0 86,852 41,247 0 72,712 8,729 0 1,067,515Kannur 96,507 0 109,312 59,102 8,624 119 98 0 3,914 277,676Kanpur 320,131 44,754 1,107,681 198,095 88,641 11,685 16,794 270 221 1,788,272Kochi 207,036 2 353,017 266,191 982 182 195 - 9,815 837,420 Kolkata 342,119 * * 353,373 ^ ^ 94 ** 1,401 696,987Kollam 98,896 - 166,988 40,026 8,568 199 1,578 - 3,580 319,835 Kota 0 0 0 61,402 36,020 0 28,704 8,685 0 134,811Kozhikoda 112,241 - 174,358 91,526 7,033 187 494 - 7,632 393,471 Lucknow 500,097 77,280 1,245,458 325,840 74,467 571 28,010 1,942 6,920 2,260,585Madurai 131,364 139,217 694,325 90,129 1,607 85 7,607 2,261 13,929 1,080,524Malappuram 105,862 0 185,412 61,297 18,659 308 611 0 6,903 379,052Meerut 156,524 19,538 459,363 102,850 1,004 22 13,707 27 220 753,255Nagpur 494,224 23,422 742,860 131,529 39,224 842 5,716 5,459 3,933 1,447,209Nashik 103,507 27,854 396,145 73,231 11,428 82 3,199 44,164 11,286 670,896Palakkad 0 0 187,199 41,063 0 0 1,510 0 3,517 233,289Patna 0 4,560 1,110,066 208,264 42,337 0 27,270 16,115 10,139 1,418,751Pune 402,816 160,467 1,476,514 439,922 34,312 718 19,020 10,324 8,669 2,552,762Raipur 731,961 131,122 319,738 122,134 2,547 14,970 45,756 30,614 7,525 1,406,367Rajkot 1,391,334 294,279 *** 235,228 5,106 0 49,880 35,003 10,635 2,021,465Ranchi 0 11,894 485,028 127,947 21,525 0 16,033 7,642 0 670,069Srinagar 32,712 14,031 107,066 114,385 6,518 2 1,788 112 2,152 278,766Surat 2,339,097 286,269 *** 463,214 20,778 0 21,449 11,743 5,572 3,148,122Trichy 132,557 252,291 344,983 70,841 1,003 81 6,656 1,531 8,329 818,272Thiruvananthapuram 0 0 475,045 238,709 0 0 346 0 10,069 724,169Thrissur - - - - - - - - - - Varanasi 141,355 56,955 659,439 70,116 18,647 413 18,435 9,362 2,192 976,914Vijayawada - 50,774 571,689 80,898 1,033 2,652 10,096 6,636 15,318 739,096 Vadodara 1,324,729 401,208 *** 303,345 18,277 0 39,826 18,253 7,521 2,113,159Visakhapatnam - 1,907 747,031 113,748 1,401 2,587 1,386 114 7,831 876,005
TOTAL 37,011,336 3,769,544 25,115,098 15,000,222 964,361 192,795 1,185,664 303,017 439,038 83,981,075
Two-WheelersCars Jeeps
Million Plus Cities
Non-Transport
Tractors Trailers Others Total Non-TransportOmni Buses
Tota
lTo
tal
Tota
lTo
tal
(2+3
)(5
+6)
(8+9
)(1
1+12
)
12
34
56
78
910
1112
1314
2009
-10
4121
.762
94.2
1041
5.9
1470
.959
6.8
2067
.743
76.6
3339
.177
15.7
3378
.224
809.
528
187.
768
586.
2
2010
-11
6508
.786
67.6
1517
6.3
2552
.593
9.8
3492
.317
546.
237
31.9
2127
8.1
8735
.626
770.
935
506.
511
5400
.0
2011
-12
8126
.793
31.2
1745
7.8
2961
.211
15.4
4076
.615
280.
147
23.0
2000
3.1
5239
.528
795.
534
034.
911
7110
.1
2012
-13
9096
.412
309.
921
406.
335
13.7
1358
.748
72.4
9949
.627
237.
937
187.
537
54.9
2371
0.1
2746
5.0
1543
97.4
2013
-14
1176
2.8
1001
3.3
2177
6.1
#19
85.9
1985
.915
563.
027
335.
142
898.
1##
2242
4.0
2242
4.0
1557
44.2
2014
-15
1241
2.5
9264
.221
676.
7#
2113
.121
13.1
1257
1.8
4275
3.5
5532
5.3
##30
825.
930
825.
918
9056
.1
2015
-16
1394
5.0
1422
0.0
2816
5.0
#24
41.3
2441
.315
202.
010
1438
.111
6640
.0##
5241
3.4
5241
3.4
3469
05.9
2016
-17
1442
1.2
1959
1.0
3401
2.3
#21
09.4
2109
.421
290.
415
1523
.917
2814
.3##
7119
6.2
7119
6.2
4890
68.0
2017
-18
1506
0.2
2176
6.3
3682
6.4
1068
.213
43.4
2411
.622
27.7
1397
98.9
1420
26.7
0.0
0.0
0.0
1812
64.8
2018
-19
1921
1.9
0.0
1921
1.9
1090
.60.
010
90.6
1103
.699
877.
210
0980
.80.
00.
00.
012
1283
.3
%sh
are
15.8
0.0
15.8
0.9
0.0
0.9
0.9
82.4
83.3
0.0
0.0
0.0
100.
0
Year
Tota
lIm
port
Dut
y
Mot
or V
ehic
les &
Acc
esso
ries
Tyre
s & T
ubes
Hig
h Sp
eed
Die
sel O
ilM
otor
Spi
rit
Exci
se D
uty
Impo
rt D
uty
Exci
se D
uty
Impo
rt
Dut
y*Ex
cise
Dut
yIm
port
Dut
yEx
cise
Dut
y
89 90

Annexure 5.1
Revenue Realised from Road Transport (Centre): 2009-10 to 2018-19 (Rs. Crores)Year Tyres & Tubes High Speed Diesel Oil Motor Spirit Total
Import Duty Excise Duty Total Import Duty Excise Duty Total Import Duty* Excise Duty Total Import Duty Excise Duty Total
(2+3) (5+6) (8+9) (11+12)
1 2 3 4 5 6 7 8 9 10 11 12 13 14
2009-10 4,121.7 6,294.2 10,415.9 1,470.9 596.8 2,067.7 4,376.6 3,339.1 7,715.7 3,378.2 24,809.5 28,187.7 48,386.9
2010-11 6,508.7 8,667.6 15,176.3 2,552.5 939.8 3,492.3 17,546.2 3,731.9 21,278.1 8,735.6 26,770.9 35,506.5 75,453.2
2011-12 8,126.7 9,331.2 17,457.8 2,961.2 1,115.4 4,076.6 15,280.1 4,723.0 20,003.1 5,239.5 28,795.5 34,034.9 75,572.5
2012-13 9,096.4 12,309.9 21,406.3 3,513.7 1,358.7 4,872.4 9,949.6 27,237.9 37,187.5 3,754.9 23,710.1 27,465.0 90,931.2
2013-14 11,762.8 10,013.3 21,776.1 # 1,985.9 1,985.9 15,563.0 27,335.1 42,898.1 ## 22,424.0 22,424.0 89,084.1
2014-15 12,412.5 9,264.2 21,676.7 # 2,113.1 2,113.1 12,571.8 42,753.5 55,325.3 ## 30,825.9 30,825.9 1,09,941.0
2015-16 13,945.0 14,220.0 28,165.0 # 2,441.3 2,441.3 15,202.0 1,01,438.1 1,16,640.0 ## 52,413.4 52,413.4 1,99,659.7
2016-17 14,421.2 19,591.0 34,012.3 # 2,109.4 2,109.4 21,290.4 1,51,523.9 1,72,814.3 ## 71,196.2 71,196.2 2,80,132.1
2017-18 15,060.2 21,766.3 36,826.4 1,068.2 1,343.4 2,411.6 2,227.7 1,39,798.9 1,42,026.7 0.0 - 0.0 1,81,264.8
2018-19 19,211.9 - 19,211.9 1,090.6 - 1,090.6 1,103.6 99,877.2 1,00,980.8 0.0 - 0.0 1,21,283.3
%share 15.8 - 15.8 0.9 - 0.9 0.9 82.4 83.3 0.0 - 0.0 100.0
#: Included in Import Duty of Motor Vehicles and Accessories
## : Included in Import Duty of High Speed Diesel Oil
* Includes petroleum oils, oils obtained from bituminous minerals, crude, other mineral fuels, oils, waxes and bituminous substances
Source: Directorate of Data Management, Central Excise & Customs, New Delhi.
90
Motor Vehicles & Accessories

Annexure 5.2
Annexure 5.3
1 2 3 4 5
1950-51 - 12.5 0.1 12.6
1955-56 13.9 8.9 3.0 25.8
1960-61 29.9 16.9 8.4 55.2
1965-66 61.8 31.5 33.4 126.7
1970-71 107.7 63.2 60.5 231.4
1975-76 209.7 92.0 160.5 462.2
1980-81 356.3 154.5 239.6 750.4
1985-86 835.5 322.0 395.7 1,553.2
1990-91 1,566.3 631.5 1,061.8 3,259.6
1995-96 3,726.3 1,703.8 1,507.7 6,937.8
1996-97 4,117.3 2,755.9 1,662.6 8,535.8
1997-98 4,853.9 3,502.4 2,003.9 10,360.2
1998-99 5,024.0 3,862.2 1,979.2 10,865.4
1999-00 6,153.1 4,728.8 2,098.7 12,980.6
2000-01 6,665.6 4,161.4 2,074.7 12,901.7
2001-02 7,644.4 5,645.0 3,671.4 16,960.8
2002-03 8,441.0 5,106.0 3,569.3 17,116.3
2003-04 10,138.2 4,967.5 4,189.9 19,295.6
2004-05 10,811.0 6,657.0 5,206.0 22,674.0
2005-06 11,964.0 2,951.0 6,450.0 21,365.0
2006-07 13,630.1 1,331.6 6,808.3 21,770.0
2007-08 15,594.9 1,623.2 6,807.7 24,025.8
2008-09 17,340.3 8,438.1 8,462.6 34,241.0
2009-10 19,637.8 10,017.8 9,857.0 39,512.6
2010-11 23,497.7 11,198.3 11,296.4 45,992.4
2011-12 28,679.7 13,815.7 12,665.7 55,161.1
2012-13 35,296.3 - 15,306.4 50,602.7
2013-14 37,304.9 - 19,444.9 56,749.8
2014-15 43,024.3 - 19,606.4 62,630.7
2015-16 46,642.7 - 23,360.6 70,003.3
2016-17 53,388.1 - 26,574.1 79,962.2
2017-18 64,914.8 - 13,719.2 78,633.9
2018-19 68,575.3 - 3,540.3 72,115.6
Year Motor Vehicles Taxes and Fees SalesTax/ VAT on Motor Spirit and Lubricants Tax on Passengers and Goods Total
Revenue Realised from Road Transport (States): 1950-51 to 2018-19(Rs. crore)
Rev
enue
from
Tax
es o
n M
otor
Veh
icle
and
Pas
seng
er &
Goo
ds a
nd P
erce
ntag
e Sh
are
of S
tate
s/UTs
(R
s. cr
ore)
… : not available Source : State Finances - A Study of Budgets of 2018-19 & 2019-20, by Reserve Bank of India
Sour
ce: S
tate
Fin
ance
s - A
Stu
dy of
Bud
gets
of 20
18-1
9 & 20
19-2
0, R
eser
ve B
ank o
f Ind
ia.
2017
-18
(Acc
ount
s)20
18-1
9 (A
ccou
nts)
Tax
on
Vehi
cles
Tax
on G
oods
&
Pass
.To
tal (
col.3
+4)
Tax
on
Vehi
cles
Tax
on G
oods
&
Pass
.To
tal (
col.6
+7)
Perc
enta
ge o
f St
ates
/UTs
Ow
n Ta
x R
even
ue
Perc
enta
ge o
f St
ates
/UTs
Ow
n Ta
x R
even
ue
12
34
56
78
910
1A
ndhr
a Pr
ades
h30
39.0
5.0
3044
.033
40.8
26.2
3367
.05.
815.
742
Aru
nach
al P
rdes
h31
.412
9.0
160.
432
.45.
437
.89.
182.
973
Ass
am64
7.0
262.
690
9.6
765.
0-3
.676
1.4
5.88
4.64
4B
ihar
1599
.516
44.9
3244
.420
85.9
398.
724
84.7
10.9
28.
055
Chh
attis
garh
1180
.047
7.7
1657
.712
04.9
54.5
1259
.47.
545.
756
Goa
314.
720
9.7
524.
529
8.7
30.5
329.
110
.51
6.76
7G
ujar
at38
85.4
131.
340
16.7
4118
.611
6.7
4235
.35.
455.
268
Har
yana
2777
.623
17.5
5095
.029
08.3
20.7
2929
.012
.18
6.85
9H
imac
hal P
rade
sh36
7.2
111.
747
8.9
408.
010
4.4
512.
46.
316.
6710
Jam
mu
& K
ashm
ir22
8.1
852.
610
80.7
238.
990
9.2
1148
.210
.01
11.3
611
Jhar
khan
d77
8.4
0.0
778.
486
3.9
0.0
863.
95.
375.
8612
Kar
nata
ka62
08.6
1279
.174
87.7
6567
.727
.965
95.6
8.29
6.76
13K
eral
a36
62.9
0.0
3662
.937
08.6
0.0
3708
.67.
617.
2714
Mad
hya
Prad
esh
2691
.611
59.3
3850
.930
08.3
117.
531
25.8
7.71
6.00
15M
ahar
asht
ra86
65.4
984.
096
49.4
8613
.283
7.1
9450
.35.
625.
0216
Man
ipur
36.1
1.1
37.3
39.8
1.2
41.0
3.08
3.57
17M
egha
laya
67.0
7.8
74.8
87.0
8.4
95.4
3.97
5.05
18M
izor
am31
.67.
839
.438
.44.
743
.14.
595.
4119
Nag
alan
d10
1.5
17.6
119.
112
6.2
20.2
146.
412
.19
15.8
920
Odi
sha
1534
.912
60.5
2795
.417
45.6
182.
319
27.9
9.00
6.22
21Pu
njab
1911
.20.
019
11.2
1861
.40.
018
61.4
6.07
5.85
22R
ajas
than
4363
.034
0.8
4703
.745
76.4
50.8
4627
.28.
667.
9523
Sikk
im29
.40.
029
.433
.10.
033
.13.
133.
4924
Tam
il N
adu
5362
.689
9.5
6262
.155
72.8
2.8
5575
.76.
495.
2525
Tela
ngan
a35
89.5
87.6
3677
.137
61.9
188.
539
50.5
6.32
6.07
26Tr
ipur
a54
.40.
054
.40.
00.
00.
02.
9327
Utta
rakh
and
816.
00.
081
6.0
908.
60.
090
8.6
7.50
7.36
28U
ttar P
rade
sh64
03.6
0.0
6403
.769
29.3
0.7
6930
.05.
845.
6429
Wes
t Ben
gal
2317
.215
32.0
3849
.225
62.6
435.
429
97.9
6.67
4.85
30N
CT
of D
elhi
2115
.80.
021
15.8
2054
.80.
020
54.8
5.92
5.61
31Pu
duch
erry
104.
30.
010
4.3
114.
20.
011
4.2
4.22
4.40
Tota
l64
914.
813
719.
278
633.
968
575.
335
40.3
7211
5.6
6.96
5.95
2017
-18
(Acc
ount
s)20
18-1
9 (A
ccou
nts)
S. N
o.N
ame
of S
tate
/UT
91 92

Annexure 5.4
Stat
e/U
T-w
ise R
ates
of M
otor
Veh
icle
Tax
es
Co
ntd.
..
Cont
d...
St
ates
/Uni
on
Terr
itori
es
Buse
s
Truc
ks/G
oods
Veh
icle
s, Tr
aile
rs a
nd
Trac
tors
Tw
o W
heel
ers
C
ars/
Je
eps
Ta
xi/
C
ab
Aut
o ri
cksh
aws/
3Whe
eler
sA
ndhr
a Pr
ades
h (A
s on
31st
Mar
ch 2
019)
Tow
n Se
rvic
e :
K
ms
Ta
x (R
s.)
Upt
o 10
0
346.
50
100-
160
51
6.60
16
0-24
0
648.
90
240-
693
69
3.0
Oth
er th
an T
own
Serv
ice
K
ms
Ta
x (R
s.)
Upt
o 32
0
1146
.00
32
0-75
0
1514
.10
>7
50
1800
.00
Con
trac
t Car
riag
e
A
ll In
dia
Tour
ist P
erm
its –
Rs.
3,75
0 PS
PQ
St
ate
Wid
e Pe
rmits
–
Rs.
3,75
0
PS
PQ
D
istri
ct W
ide
Perm
its –
Rs.
1,00
0
PS
PQ
Id
le C
ontra
ct C
arria
ge –
Rs.
397
PSPQ
Truc
ks: B
asis
: LW
LW
(kg)
Ta
x PS
PQ(R
s.)
Upt
o 10
00
530.
00
1000
-300
0
794.
85
> 3,
000
1080
.00
Tr
aile
rs:
R
s.760
PQ
(T
ax e
xem
pted
fr
om G
.O. N
o. 1
6 dt
: 6.2
.201
9
Trac
tors
:
Rs.4
40
PQ
(Tax
exe
mpt
ed
from
G.O
. No.
16
dt: 6
.2.2
019
OTT
9% o
f VC
;
14%
in c
ase
of 2
nd
ve
hicl
e. O
TT
9%
to
14 %
on
the
cost
of
ve
hicl
e
OTT
9%
to
14 %
on
the
cost
of
ve
hicl
e
Aut
os
Pass
enge
r:4
seat
er:R
s. 11
0 PS
PQ
6 se
ater
:Rs.
330
PSPQ
Goo
ds:
Ve
hicl
es w
ith
GV
W =
300
Kg
Rs.
430
PQTo
G
VW
150
00 K
g
Rs.
2970
PQ
And
th
erea
fter e
ach
250
Kg
Rs.
69.3
0
Annexure 5.4 (contd...)
Stat
es/ U
nion
Te
rrito
ries
Bu
ses
Tr
ucks
/Goo
ds V
ehic
les,
Trai
lers
an
d Tr
acto
rs
Two
Whe
eler
s
Car
s/Jee
ps Ta
xi/ C
ab
Aut
o ri
cksh
aws/
3Whe
eler
sA
runa
chal
Pr
ades
h
(As o
n 31
stM
arch
20
19)
Pass
enge
r Tax
Se
atin
g C
apac
ity
13 to
30
30
and
mor
e
Goo
ds T
ax
Truc
ks:
C
arry
ing
capa
city
(MT)
Goo
ds ta
x PA
0-1
15
00
Abo
ve 1
to 3
30
00
Abo
ve 3
to 9
30
00+
Rs.
500
for e
ach
addi
tiona
l MT
A
bove
9 to
12
7000
+ R
s. 10
0 fo
r eac
h ad
ditio
nal M
T
12 a
nd a
bove
8000
+ R
s. 35
0 fo
r eac
h ad
ditio
nal M
T
Trai
lers
:
Ligh
t : R
s. 50
0
M
ediu
m :
Rs.
1200
H
eavy
: R
s. 20
00
OTT
( fo
r 10
year
s)
U
LW (k
g)
Upt
o 90
90
-135
>1
35
Car
s/Je
eps
O
TT (
for 1
0 ye
ars)
VC
(Rs.
Lakh
)
Upt
o 5
5-
15
15-2
0
>20
MV
T
Upt
o 6
pass
enge
rs
Rs.
2,40
0 PA
7-12
pa
ssen
gers
R
s. 50
00
PA Pa
ssen
ger
Tax
Thre
e w
heel
ers
(Pas
seng
er):
Upt
o 3
pass
enge
rs
Rs.8
00 P
A
4
to 6
pa
ssen
gers
R
s.160
0 PA
93 94

Stat
es/ U
nion
Te
rrito
ries
Bu
ses
Tr
ucks
/Goo
ds V
ehic
les,
Trai
lers
an
d Tr
acto
rs
Two
Whe
eler
s
Car
s/Jee
ps
Taxi
/ Cab
A
uto
rick
shaw
s/ 3W
heel
ers
B
ihar
(A
s on
31st M
arch
201
9)
B
asis
Se
atin
g ca
paci
ty 1
3 to
26:
Ty
pe o
f Se
rvic
e
Ord
inar
y
Sem
i Del
uxe
D
elux
e
Se
atin
g ca
paci
ty 2
7 to
32:
Ty
pe o
f Se
rvic
e
O
rdin
ary
Se
mi D
elux
e
D
elux
e
Seat
ing
capa
city
33
and
abov
e:
Type
of
Serv
ice
Ord
inar
y
Sem
i Del
uxe
Del
uxe
Volv
o,
Mer
cidi
ze a
nd
equi
vale
nt
buse
s
Tr
ucks
:
G
VW
30
01 -
16
000
1600
1-24
000
2400
1 an
d ab
ove
Trac
tors
&
Trai
lers
: 4.5
% o
f VC
, ex
clud
ing
VAT
Plus
1%
of c
ost o
f veh
icle
(exc
l. VA
T)
M
VT:
O
TT-
Ex-
show
room
pr
ice
of
vehi
cle
(Rs.
lakh
)
U
pto
1
2-
8
9-
15
>1
6
+ R
oad
Safe
ty C
ess 1
% o
f co
st o
f veh
icle
(exc
l. VA
T)
M
VT:
O
TT-
Ex-
show
room
pr
ice
of
vehi
cle
(Rs.
lakh
)
Upto
1
2-
8
9-
15
>1
6
M
VT:
OTT
-
Ex
-sh
owro
om
pric
e of
ve
hicl
e (R
s. la
kh)
% o
f Ex
-sh
owro
om
pric
e
of
ve
hicl
e
U
pto
1
8
2-
8
9
9-
15
10
>1
6
12
M
VT:
OTT
-
Pass
enge
r:
Seat
ing
Cap
acity
Upt
o 4
Rs.
1000
0/-
Upt
o 7
Rs.
1500
0/-
+ 1%
of a
nnua
l tax
G
oods
:
GV
W
upto
100
0 K
gs:
For 1
st
10 y
ears
Rs.8
000/
- Fo
r nex
t 5 Y
ears
Rs.
8000
/-
+ 1%
of a
nnua
l tax
G
VW
upto
100
1 to
300
0 K
gs:
For 1
st
10 y
ears
Rs.
6500
/-
per
tone
an
d pa
rt th
ereo
f. Fo
r nex
t 5 Y
ears
Rs.
6500
/-per to
ne
and
part
ther
eof.
+ 1%
of a
nnua
l tax
paid
as R
oad
Safe
ty C
ess
95 96
Annexure 5.4 (contd...)
Annexure 5.4 (contd...)
Stat
es/
Uni
on
Terr
itori
es
Buse
s
Truc
ks/G
oods
Veh
icle
s, Tr
aile
rs a
nd T
ract
ors
Tw
o W
heel
ers
C
ars/J
eeps
Taxi
/ Cab
Aut
o ri
cksh
aws/
3Whe
eler
s A
ssam
(As o
n 31
stM
arch
20
19)
Bas
is: S
eatin
g C
apac
ity:
M
VT
N
o. o
f Pe
r-so
ns
14 to
30
> 30
O
mni
Tou
rist B
us: R
s. 1
8,00
0 PA
or
Rs.
4500
PQ
Del
uxe/
Supe
r-de
luxe
Exp
ress
B
uses
: Rs.
14,4
00 P
A
R
s. 3,
600
PQ
+ R
s. 37
for e
very
se
at a
bove
31
All
Ass
am S
uper
Del
uxe
cont
ract
ca
rria
ge: R
s. 55
,000
PA
or R
s.
13,7
50
PQ
Truc
ks:
B
asis
: Aut
horiz
ed
capa
city
Capacity (MT)
Ta
x (R
s.)
Upt
o1
Rs.2
,400
PA
or
R
s.600
PQ
1-
3
Rs.4
,600
PA
or
Rs.1
,150
PQ
3-9
R
s.4,6
00 P
A +
Rs.
950f
or e
very
ad
dl 1
MT
mor
e th
an 3
MT
PA
or
Qua
rterly
Rs.
1,19
0 +
Rs.
235
fo
r ev
ery
addl
1M
T
mor
e th
an 3
MT.
>9
Rs.
10,8
00
PA +
Rs.
350
for
ever
y ad
dl.
1MT
mor
e th
an
9MTo
r
R
s.2,2
50 P
Q +
Rs.8
0 fo
r eve
ry
addl
.
1MT,
mor
e th
an 9
MT.
>12
Rs.
13,5
00 P
A +
Rs.4
70 fo
r
ever
y ad
dl 1
MT,
abo
ve 1
2 M
T
or
R
s.3,3
75
PQ +
Rs.1
15
for e
very
ad
dl
1MT
abov
e 12
MT
Trac
tors
/Tra
ilers
:
Cap
acity
(M
T)
Tax
(Rs.)
U
pto
2
Rs.1
,000
PA
or
Rs.2
50 P
Q
2-
5
Rs.2
,000
PA
or
Rs.5
00 P
Q
5-9
Rs.4
,000
PA
or
Rs.1
,000
PQ
> 9
Rs.6
,000
PA
orR
s.1,5
00 P
Q
MV
T
(OTT
)
Bas
is: U
LW
ULW
(kg)
Ta
x
(Rs.)
U
pto
65
2,60
0
65 –
90
3,
600
90
–
135
5,
000
13
5-16
5
5,50
0
> 16
5
6,50
0
MV
T (O
TT)
B
asis
: VC
V
C (R
s la
kh)
Upt
o 4
4-6
6-12
12-1
5 15
-20
20-3
0 >3
0
Pass
enge
r Tax
U
pto
6 pe
rson
s (p
erm
itted
to
oper
ate
in on
e ci
ty o
r reg
ion)
: R
s. 4,
000
PA or
Rs.
1,00
0 PQ U
pto9
pers
ons:
(p
erm
itted
to
oper
ate
in a
ll ov
er st
ate)
: Rs
6,50
0 PA
or
Rs.
1,65
0 PQ
U
pto
10
pers
ons:
All
over
stat
e : R
s 7,
500
PA o
r R
s. 1,
900
PQ
Upt
o 13
pe
rson
s: A
ll ov
er st
ate
: Rs
11,0
00 P
A o
r R
s. 2,
800
PQ
OTT
Rs.
6,00
0
Bas
is: p
asse
nger
car
ryin
g ca
paci
ty:
Per-
sons
Upt
o 3
4-7
Cont
d...
Cont
d...
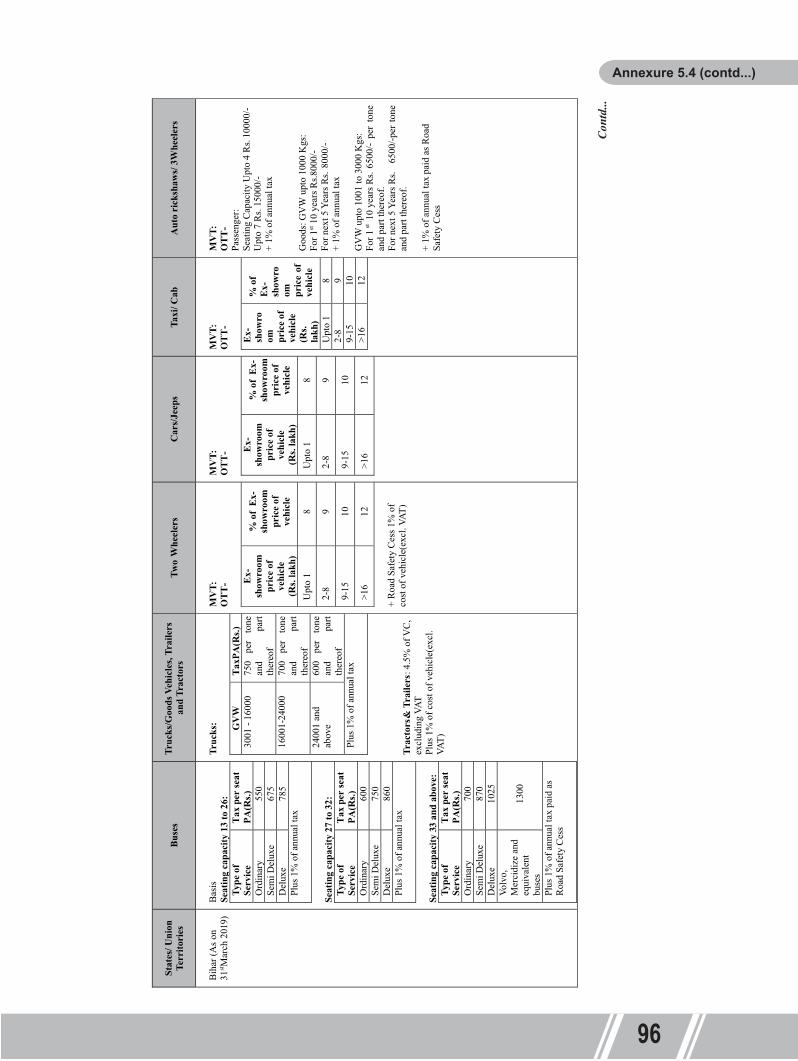
Stat
es/ U
nion
Te
rrito
ries
Bu
ses
Tr
ucks
/Goo
ds V
ehic
les,
Trai
lers
an
d Tr
acto
rs
Two
Whe
eler
s
Car
s/Jee
ps
Taxi
/ Cab
A
uto
rick
shaw
s/ 3W
heel
ers
B
ihar
(A
s on
31st M
arch
201
9)
B
asis
Se
atin
g ca
paci
ty 1
3 to
26:
Ty
pe o
f Se
rvic
e
Ord
inar
y
Sem
i Del
uxe
D
elux
e
Se
atin
g ca
paci
ty 2
7 to
32:
Ty
pe o
f Se
rvic
e
O
rdin
ary
Se
mi D
elux
e
D
elux
e
Seat
ing
capa
city
33
and
abov
e:
Type
of
Serv
ice
Ord
inar
y
Sem
i Del
uxe
Del
uxe
Volv
o,
Mer
cidi
ze a
nd
equi
vale
nt
buse
s
Tr
ucks
:
G
VW
30
01 -
16
000
1600
1-24
000
2400
1 an
d ab
ove
Trac
tors
&
Trai
lers
: 4.5
% o
f VC
, ex
clud
ing
VAT
Plus
1%
of c
ost o
f veh
icle
(exc
l. VA
T)
M
VT:
O
TT-
Ex-
show
room
pr
ice
of
vehi
cle
(Rs.
lakh
)
U
pto
1
2-
8
9-
15
>1
6
+ R
oad
Safe
ty C
ess 1
% o
f co
st o
f veh
icle
(exc
l. VA
T)
M
VT:
O
TT-
Ex-
show
room
pr
ice
of
vehi
cle
(Rs.
lakh
)
Upto
1
2-
8
9-
15
>1
6
M
VT:
OTT
-
Ex
-sh
owro
om
pric
e of
ve
hicl
e (R
s. la
kh)
% o
f Ex
-sh
owro
om
pric
e
of
ve
hicl
e
U
pto
1
8
2-
8
9
9-
15
10
>1
6
12
M
VT:
OTT
-
Pass
enge
r:
Seat
ing
Cap
acity
Upt
o 4
Rs.
1000
0/-
Upt
o 7
Rs.
1500
0/-
+ 1%
of a
nnua
l tax
G
oods
:
GV
W
upto
100
0 K
gs:
For 1
st
10 y
ears
Rs.8
000/
- Fo
r nex
t 5 Y
ears
Rs.
8000
/-
+ 1%
of a
nnua
l tax
G
VW
upto
100
1 to
300
0 K
gs:
For 1
st
10 y
ears
Rs.
6500
/-
per
tone
an
d pa
rt th
ereo
f. Fo
r nex
t 5 Y
ears
Rs.
6500
/-per to
ne
and
part
ther
eof.
+ 1%
of a
nnua
l tax
paid
as R
oad
Safe
ty C
ess
95 96
Annexure 5.4 (contd...)
Annexure 5.4 (contd...)
Stat
es/
Uni
on
Terr
itori
es
Buse
s
Truc
ks/G
oods
Veh
icle
s, Tr
aile
rs a
nd T
ract
ors
Tw
o W
heel
ers
C
ars/J
eeps
Taxi
/ Cab
Aut
o ri
cksh
aws/
3Whe
eler
s A
ssam
(As o
n 31
stM
arch
20
19)
Bas
is: S
eatin
g C
apac
ity:
M
VT
N
o. o
f Pe
r-so
ns
14 to
30
> 30
O
mni
Tou
rist B
us: R
s. 1
8,00
0 PA
or
Rs.
4500
PQ
Del
uxe/
Supe
r-de
luxe
Exp
ress
B
uses
: Rs.
14,4
00 P
A
R
s. 3,
600
PQ
+ R
s. 37
for e
very
se
at a
bove
31
All
Ass
am S
uper
Del
uxe
cont
ract
ca
rria
ge: R
s. 55
,000
PA
or R
s.
13,7
50
PQ
Truc
ks:
B
asis
: Aut
horiz
ed
capa
city
Capacity (MT)
Ta
x (R
s.)
Upt
o1
Rs.2
,400
PA
or
R
s.600
PQ
1-
3
Rs.4
,600
PA
or
Rs.1
,150
PQ
3-9
R
s.4,6
00 P
A +
Rs.
950f
or e
very
ad
dl 1
MT
mor
e th
an 3
MT
PA
or
Qua
rterly
Rs.
1,19
0 +
Rs.
235
fo
r ev
ery
addl
1M
T
mor
e th
an 3
MT.
>9
Rs.
10,8
00
PA +
Rs.
350
for
ever
y ad
dl.
1MT
mor
e th
an
9MTo
r
R
s.2,2
50 P
Q +
Rs.8
0 fo
r eve
ry
addl
.
1MT,
mor
e th
an 9
MT.
>12
Rs.
13,5
00 P
A +
Rs.4
70 fo
r
ever
y ad
dl 1
MT,
abo
ve 1
2 M
T
or
R
s.3,3
75
PQ +
Rs.1
15
for e
very
ad
dl
1MT
abov
e 12
MT
Trac
tors
/Tra
ilers
:
Cap
acity
(M
T)
Tax
(Rs.)
U
pto
2
Rs.1
,000
PA
or
Rs.2
50 P
Q
2-
5
Rs.2
,000
PA
or
Rs.5
00 P
Q
5-9
Rs.4
,000
PA
or
Rs.1
,000
PQ
> 9
Rs.6
,000
PA
orR
s.1,5
00 P
Q
MV
T
(OTT
)
Bas
is: U
LW
ULW
(kg)
Ta
x
(Rs.)
U
pto
65
2,60
0
65 –
90
3,
600
90
–
135
5,
000
13
5-16
5
5,50
0
> 16
5
6,50
0
MV
T (O
TT)
B
asis
: VC
V
C (R
s la
kh)
Upt
o 4
4-6
6-12
12-1
5 15
-20
20-3
0 >3
0
Pass
enge
r Tax
U
pto
6 pe
rson
s (p
erm
itted
to
oper
ate
in on
e ci
ty o
r reg
ion)
: R
s. 4,
000
PA or
Rs.
1,00
0 PQ U
pto9
pers
ons:
(p
erm
itted
to
oper
ate
in a
ll ov
er st
ate)
: Rs
6,50
0 PA
or
Rs.
1,65
0 PQ
U
pto
10
pers
ons:
All
over
stat
e : R
s 7,
500
PA o
r R
s. 1,
900
PQ
Upt
o 13
pe
rson
s: A
ll ov
er st
ate
: Rs
11,0
00 P
A o
r R
s. 2,
800
PQ
OTT
Rs.
6,00
0
Bas
is: p
asse
nger
car
ryin
g ca
paci
ty:
Per-
sons
Upt
o 3
4-7
Cont
d...
Cont
d...
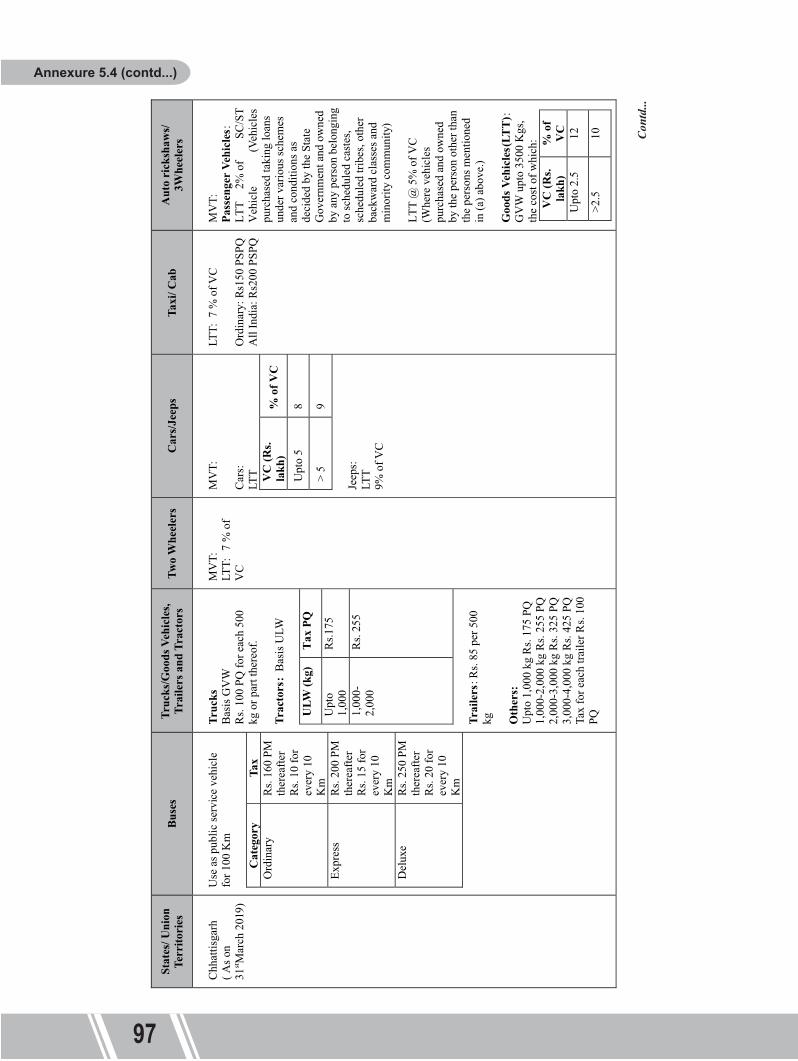
St
ates
/ Uni
on
Terr
itori
es
Buse
s
Truc
ks/G
oods
Veh
icle
s, Tr
aile
rs a
nd T
ract
ors
Tw
o W
heel
ers
C
ars/J
eeps
Taxi
/ Cab
Aut
o ri
cksh
aws/
3Whe
eler
s
C
hhat
tisga
rh
(
As o
n 31
st Mar
ch 2
019)
U
se a
s pub
lic se
rvic
e ve
hicl
e fo
r 100
Km
C
ateg
ory
Ta
x
Ord
inar
y
Rs.
160
PM
ther
eafte
r R
s. 10
for
ever
y 10
K
m
Ex
pres
s
Rs.
200
PM
ther
eafte
r R
s. 15
for
ever
y 10
K
m
Del
uxe
R
s. 25
0 PM
th
erea
fter
Rs.
20 fo
r ev
ery
10
Km
Tr
ucks
Bas
is G
VW
Rs.
100
PQ
for
ea
ch 5
00
kg o
r par
t the
reof
.
Tr
acto
rs:
B
asis
ULW
ULW
(kg)
U
pto
1,00
0
1,00
0-2,
000
Tr
aile
rs: R
s. 85
per
500
kg
Oth
ers:
Upt
o 1,
000
kg R
s. 17
5 PQ
1,
000-
2,00
0 kg
Rs.
255
PQ
2,
000-
3,00
0 kg
Rs.
325
PQ
3,
000-
4,00
0 kg
Rs.
425
PQ
Ta
x fo
r eac
h tra
iler R
s. 10
0 PQ
M
VT:
LTT:
7
% o
f V
C
M
VT:
Car
s: LT
T
VC
(Rs.
lakh
) Upt
o 5
>
5
Je
eps:
LTT
9% o
f VC
LT
T: 7
% o
f VC
O
rdin
ary:
Rs1
50 P
SPQ
A
ll In
dia:
Rs2
00 P
SPQ
M
VT:
Pass
enge
r Vehi
cles
: LT
T 2%
of
SC/S
T V
ehic
le
(Veh
icle
s pu
rcha
sed
taki
ng lo
ans
unde
r var
ious
sche
mes
an
d co
nditi
ons a
s de
cide
d by
the
Stat
e G
over
nmen
t and
ow
ned
by a
ny p
erso
n be
long
ing
to sc
hedu
led
cast
es,
sche
dule
d tri
bes,
othe
r ba
ckw
ard
clas
ses a
nd
min
ority
com
mun
ity)
LT
T @
5%
of V
C (W
here
veh
icle
s pu
rcha
sed
and
owne
d by
the
pers
on othe
r tha
n th
e pe
rson
s men
tione
d in
(a) a
bove
.)
Goo
ds
Vehi
cles
(LTT
): G
VW
upt
o 35
00 K
gs,
the
cost
of w
hich
: V
C (R
s. la
kh)
% o
f V
C U
pto
2.5
12
>2
.5
10
St
ates
/ U
nion
Te
rrito
ries
Bu
ses
Tr
ucks
/Goo
ds V
ehic
les,
Trai
lers
an
d Tr
acto
rs
Two
Whe
eler
s
Car
s/Jee
ps Ta
xi/ C
ab A
uto
rick
shaw
s/ 3W
heel
ers
Goa
( A
s on
31st M
arch
20
19)
MV
T
Upt
o 18
seat
s MV
T R
s180
0 PA
Fo
r eve
ry a
dditi
onal
seat
ove
r 18
seat
s Rs.
100,
for e
very
ad
ditio
nal p
asse
nger
(oth
er th
an se
ated
pas
seng
er w
hich
the
vehi
cle
os p
erm
itted
to c
arry
) Rs.
150.
pl
us
Pa
ssen
ger T
ax
(veh
icle
s reg
iste
red
in G
oa):
C
ateg
ory
Pa
ssen
ger
Tax
Rs.
PS
Stat
e C
arria
ge
40(P
SPM
)
Con
tract
C
arria
ge
75(P
SPM
)
Slee
per C
oach
200
(PPP
M)
Vehi
cles
regi
ster
ed in
a S
tate
oth
er th
an G
oa: R
s. 30
0/-
pe
r sea
t fo
r one
roun
d tri
p fo
r con
tract
car
riage
veh
icle
s.
Bus
es re
gist
ered
in S
tate
oth
er th
an G
oa a
nd p
lyin
g in
the
Sate
of
Goa
Rs.6
00 P
SPM
.
B
uses
regi
ster
ed in
Sta
te o
ther
than
Goa
/spe
cial
per
mit
(sle
eper
co
ach)
Rs.
300
per p
asse
nger
for s
ingl
e re
turn
trip
Truc
ks:
Basis
:GV
W
A.
G
oods
veh
icle
s bel
ongi
ng
to in
divi
dual
s:
GV
W 1
5000
Kg
to 1
6000
Kg
Goo
ds T
ax R
s. 75
00 P
A o
r Rs.
5250
0/-a
s OTT
.
GV
W e
xcee
ds 1
6000
Kg
for 1
000
kgs o
r par
t the
reof
in
exce
ss o
f 16
000
kgs R
s 400
/-
PA o
r Rs.
2800
/-
OTT
.
B.
G
oods
veh
icle
s not
cov
ered
un
der c
laus
e (A
) of w
hich
GV
W 1
5000
Kg
to 1
6000
Kg
Goo
ds T
ax R
s. 93
75 P
A o
r R
s. 65
625/
-as O
TT.
G
VW
exc
eeds
160
00 K
g fo
r 100
0 kg
s or p
art t
here
of i
n ex
cess
of
1600
0 kg
s Rs 8
00/-
PA
or R
s. 56
00/-
OTT
.
Tr
acto
rs:
Ba
sis:R
LW
R
s. 30
00
MV
T O
TT a
t the
tim
e of
re
gist
ratio
n
V
C
(Rs.
Lakh
) Up
to
1.50
1.5
0-3
>3
M
otor
Cyc
le
used
for h
ire:
Rs.
150/
-
PA
Car
s & J
eeps
:
O
TT: v
ehic
le c
ost a
t the
tim
e of
regi
stra
tion.
Indi
vidu
als:
V
C (R
s. La
kh)
Tax
(%)
U
pto
6
9
6-15
11
16-3
5
13 >3
5
14
Partn
ersh
ip fi
rms &
Ltd
co
mpa
nies
with
shar
e ca
pita
l of l
ess t
han
Rs.
50 L
akhs
VC
(Rs.
Lakh
)
Tax
(%)
U
pto
6
10 6-
15
12 16
-35
14
Se
atin
g ca
paci
ty U
pto
3 4 5 Fo
r eve
ry
addl
.seat
up
to 7
se
ats
All
Indi
a To
uris
t Ta
xi
(A/C
)
per s
eat
A
ll In
dia
Tour
ist
Taxi
(N
on
A/C
)per
se
at
MV
T: O
TT a
t the
tim
e of
regi
stra
tion:
Pass
enge
rs
Vehi
cles
: Rs
160/
- at th
e tim
e of
regi
stra
tion.
Goo
ds V
ehic
les:
R
s 566
0/- at
the
time
of
regi
stra
tion.
Guj
arat
(A
s on
31st M
arch
20
19)
Bas
is: S
eatin
g C
apac
ity
O
rdin
ary
Om
ni B
us:
Se
atin
g C
apac
ity
Tax
Per S
eat/a
nnum
7
to12
Rs.
1,20
0
12
-20
Rs.
3,00
0
>2
0
Rs.
3600
Luxu
ry O
mni
Bus
:
Se
atin
g C
apac
ity
Tax
Per S
eat/a
nnum
U
pto
20
Rs.
4500
>2
0
Rs.
7800
Slee
per O
mni
Bus
:
Seat
ing
Cap
acity
Tax
Per S
eat/a
nnum
B
erth
/Sle
eper
ca
paci
ty u
pto
20
Rs.
7800
B
erth
/Sle
eper
ca
paci
ty >
20
Rs.
1320
0
C
ombi
natio
n of
seat
an
d be
rth u
pto
20
Each
seat
Rs.4
620
&ea
ch b
erth
R
s. 90
00
Com
bina
tion
of se
at
and
berth
abo
ve 2
0
Each
seat
Rs.6
000
& e
ach
berth
Rs.
1200
0
Truc
ks: B
asis
GV
W
GV
W (k
g)
Upt
o 7,
500
7,
501-
1200
0
>1
2001
Trai
lers
:
6% o
f VC
Trac
tors
(Agr
icul
ture
use
):
3.
5% o
f VC
OTT
6% o
f VC
(L
ump
sum
)
OTT
6% o
f VC
(Lum
p su
m)
OTT
6%
of V
C(L
ump
sum
)
Lum
p su
m ta
x Pa
ssen
gers
: 2.5
%
of V
C
Goo
ds: 6
% o
f V
C
97 98
Annexure 5.4 (contd...)
Annexure 5.4 (contd...)
Cont
d...
Cont
d...

St
ates
/ Uni
on
Terr
itori
es
Buse
s
Truc
ks/G
oods
Veh
icle
s, Tr
aile
rs a
nd T
ract
ors
Tw
o W
heel
ers
C
ars/J
eeps
Taxi
/ Cab
Aut
o ri
cksh
aws/
3Whe
eler
s
Har
yana
(As o
n 31
st Mar
ch
2017
)
V
V (R
s. la
kh)
Tax
(%
of V
V)
U
pto6
5 6-20
8
> 20
10
V
V (R
s. la
kh)
Tax
(%
of V
V)
U
pto6
5
6-
20
8
> 20
10
Mop
eds:
ULW
upt
o 90
.72
Kg
Rs.
150
VV
(Rs.
lakh
)
Tax
Rat
e (%
of
VV
)
Upt
o 0.
75
4
0.75
-2
6
>2
8
(F
or 1
5 ye
ars)
V
V (R
s. la
kh)
Tax
(%
of
VV
)
Upt
o6
5
6-20
8
>
20
10
V
V (R
s. la
kh)
Tax
(%
of V
V)
Upt
o6 5
6-20
8 >
20 10
V
V (R
s. la
kh)
Upt
o6
6-20
> 20
Him
acha
l Pra
desh
(A
s on
31st M
arch
20
19)
Stag
e ca
rria
ge:
R
s. 50
0 PS
PA
C
ontra
ct c
arria
ge:
R
s.
1,00
0 PS
PA
Truc
ks:
LG
V: R
s. 1,
500
PA
M
GV
:
Rs.
2,00
0
PA
H
GV
:Rs.
2,50
0 PA
Tr
acto
rs
and
Trai
lers
:
Rs.
1,50
0 PA
Life
Tim
e Ta
x
for a
per
iod
of
15 y
ears
B
asis
: Eng
ine
capa
city
En
gine
ca
paci
ty
Tax
U
p to
50
cc
3 %
of
pric
e
>
50 c
c
4 %
of
pric
e
LTT
for 1
5 ye
ars
B
asis
: Eng
ine
capa
city
Car
s and
Jeep
s: En
gine
C
apac
ity (c
c)
% o
f V
C
Upt
o 1,
000
2.5
A
bove
1,0
00
3
C
omm
erci
al p
ick
-up
jeep
s Rs.
1,50
0 PA
Rs.
350
PSPA
Pass
enge
rs: R
s. 20
0 PS
PA
Goo
ds: R
s. 1,
500
PA
Jam
mu
& K
ashm
ir (A
s on
31st M
arch
20
19)
R
s. 11
00 Q
uarte
rly
Truc
ks
:Rs.
1100
Q
uarte
rly
Trai
lors
:
Rs.
1100
Qua
rterly
Trac
tors
: Exe
mpt
ed
OTT
M
otor
cyc
le: R
s. 4,
000
Sc
oote
r: R
s. 2,
400
OTT Car
: R
s. 60
00/-
Je
ep:
Rs.
2000
0/-
R
s. 37
5
Qua
rterly
Pa
ssen
gers
: Rs.
250
Qua
rterly
G
oods
: Rs.
400
Qua
rterly
99 100
Annexure 5.4 (contd...)
Annexure 5.4 (contd...)
Cont
d...
Cont
d...
Jhar
khan
d
(
As o
n 31
stM
arch
20
17)
Bas
is: S
eatin
g ca
paci
ty
R
s. 61
6+R
s. 10
5.50
PA
for
each
add
ition
al se
at b
eyon
d 5
seat
s.
A
dditi
onal
Mot
or v
ehic
le
Tax
Se
ats
Ta
x R
s. PA
6 to
15
240
PSPA
16 to
32
320
PSPA
Abo
ve 3
2
416
PSPA
Truc
ksB
asis
: R
LW
RLW
(k
g)
Tax
PA
(R
s.)
< 50
0
Rs.
296.
50
PA P
lus
Add
ition
al M
V T
ax
Rs.
310
PA
500-
2000
Rs.
298.
50
PA +
Rs.
34 fo
r ev
ery
ad
dl.
25
0 K
gs o
r par
t th
ere
of
abov
e 2,
000
kgs
2,
000-
4,00
0
Rs.
502.
50
PA +
Rs.
34
PA
for e
very
addl
.
250
Kgs
or p
art t
here
of
40
00-
8000
Rs.
836.
50 P
A +
Rs.
51.5
0 PA
for e
very
addl
. 250
K
gs
>800
0
Rs.
1662
.60
PA +
Rs.
136.
50 P
A fo
r eve
ry
addl
. 25
0 K
gs
Trac
tors
: Rs.
100
PA
Trai
lers
:
RLW
(k
g)
Tax
PA (R
s.)
< 50
0
Rs.
253
PA +
Goo
ds
tax
Rs.1
440
PA
500-
2000
Rs.
253
+ 29
PA
for
ever
y
addl
. 250
Kgs
+ G
oods
tax
Rs.1
440
PA
2,00
0-4,
000
Rs.
432
PA +
Rs.
40 P
A
for e
very
addl
. 250
Kgs
+ G
oods
tax
Rs.1
440
PA
4000
-80
00
Rs.
760
PA +
Rs.
49.5
0 PA
for e
very
addl
. 250
K
gs+
Goo
ds
tax
Rs.1
440
PA +
Rs 1
60 P
A fo
r eac
h
addi
tiona
l per
100
0 kg
OTT
U
LW
(Kg)
Ta
x R
s.
Upt
o 90
16
00 >9
0
1800
and
3%
of
vehi
cle
pric
e
ULW
upt
o 90
Kg
MV
T R
s. 16
00
ab
ove
3%
of c
ost p
rice
of v
ehic
le
Bas
is: S
eatin
g ca
paci
ty
C
ars:
O
TT Se
atin
g ca
paci
ty
5 pe
rson
s
Rs.
9000
or
3% o
f cos
t pric
e of
veh
icle
Jeep
s: O
TT
6
to 8
seat
s: 4
%
of c
ost p
rice
of
vehi
cle
9
to 1
0 se
ats:
5%
of
cos
t pric
e of
ve
hicl
e
Bas
is: S
eatin
g ca
paci
ty
U
pto5
seat
s(in
clud
ing
driv
er) R
s. 62
6 PA
pl
us
Add
ition
al M
. V.
Tax
Rs 1
600
PA
Abo
ve5
se
ats R
s. 61
6 PA
plu
s Rs
105.
50 fo
r eac
h ad
dl.
Seat
A
dditi
onal
M. V
. Ta
x R
s 240
PA fo
r ea
ch a
ddl s
eat.
Pass
enge
rs: u
pto
4 pe
rson
s R
s. 88
PQ +
Pass
enge
r tax
Rs.
160
PQ
Goo
ds:
RLW
(Kg)
Tax
(Rs)
Upt
o 10
00
MV
T R
S.
92
PQ+G
oods
ta
x R
s. 13
6 PQ

Stat
es/
Uni
on
Terr
itori
es Bu
ses
Truc
ks/G
oods
Veh
icle
s, Tr
aile
rs a
nd T
ract
ors
Tw
o W
heel
ers
C
ars/J
eeps
Ta
xi/ C
ab
Aut
o ri
cksh
aws/
3Whe
eler
sK
arna
taka
(As o
n 31
st Mar
ch
2019
)
cate
gory
Tax
(Rs.
PQ)
Cam
pirv
ans
4700
/eve
ry
sq. m
tr.
Con
tract
ca
rria
ge
1000
PS
PQ
Stag
e ca
rria
ge 60
0 PS
PQ
Luxu
ry B
uses
2750
PSPQ
+1
1% c
ess
Truc
ks :
Bas
is : RLW
R
LW (k
g)
Rs.
5,50
0-1
2,00
0
1,80
0 PQ
12,0
00-1
5,00
0
2,20
0 PQ
> 15
,000
2,
200
PQ
plus
75
for
ever
y 25
0 kg
or p
art
ther
eof i
n ex
cess
of
15,0
00 k
g
+1
1% c
ess
Trac
tors
: Rs.
1,50
0
Tr
aile
rs
: Rs.
500
LTT
VC
Tax
(%)
Upt
o
Rs.
50,0
00
10
Abo
ve
R
s. 50
,000
12
>1,0
0, 0
00
18
Plus
11%
ces
s
Mot
or c
ycle
s run
on
elec
trici
ty:
ex
empt
ed fr
om p
aym
ent o
f tax
w
.e.f.
01.
04.2
016.
LTT
V
C (R
s. La
khs)
Tax
(%
)
Upt
o 5
13
5-
10
14
10-1
5
15
15-2
0
17
>20
18
+1
1% c
ess
Car
s, va
ns
run
on
elec
trici
ty:
exem
pted
fr
om p
aym
ent o
f tax
w
.e.f.
01.
04.2
016.
V
C
(Rs.
Lakh
s)
Rs.
U
pto
15
10
0
PSPQ
>1
5
LTT
of
15%
+1
1% c
ess
Pass
enge
rs/ G
oods
: R
s 2,5
00
(LTT
)
+ 11
% c
ess
Stat
es/
Uni
on
Terr
itori
es
Buse
s
Truc
ks/G
oods
Veh
icle
s, Tr
aile
rs a
nd
Trac
tors
Tw
o W
heel
ers
C
ars/J
eeps
Taxi
/ Cab
A
uto
rick
shaw
s/ 3W
heel
ers
Ker
ala
( A
s on
31st M
arch
20
19)
Vehi
cle
to p
ly so
lely
as
Sta
ge
Car
riage
(bas
ed o
n
floor
are
a):
a)
Ord
inar
y se
rvic
e ot
her t
han
city
/tow
n se
rvic
es-
R
s. 13
00 p
er sq
uare
m
eter
or p
art
ther
eof.
b)
Ord
inar
y ci
ty/to
wn
serv
ices
-
Rs.
1360
per
squa
re
met
er o
r par
t th
ereo
f.
c)
Fast
pas
seng
er
and
othe
r hig
her
clas
s ser
vice
-
Rs.
1400
per
sq
uare
met
er o
r pa
rt th
ereo
f.
Vehi
cles
regi
ster
ed in
K
eral
a an
d
oper
atin
g on
Inte
r Sta
te ro
utes
i.
Con
tract
ca
rria
ge p
erm
itted
to
car
ry
mor
e th
an
6 pa
ssen
gers
-
for
ever
y pa
ssen
ger
-R
s.22
50
ii.
Con
tract
ca
rria
ge w
ith p
ush
back
seat
s and
pe
rmitt
ed to
car
ry
mor
e th
an 6
pa
ssen
ger
s -
for
ever
y pa
ssen
ger
-R
s.300
0
iii.
Con
tract
ca
rria
ge w
ith
slee
per b
erth
s and
pe
rmitt
ed to
car
ry
mor
e th
an 6
pa
ssen
gers
-
for
ever
y pa
ssen
ger
-R
s.400
0
Bas
is:
GV
W/L
W
Goo
ds c
arria
ges o
ther
than
thos
e fit
ted
with
tip
ping
mec
hani
sm
GV
W (k
g)
Tax
(Rs.
PQ)
U
pto
300
15
0
Upt
o 1,
000
25
0
1,00
0-1
,500
47
0
1,
500
-2,0
00
610
2,
000
-3,0
00
780
3,
000
-4,0
00
930
4,
000
-5,5
00
1340
5,
500-
7,00
0
1580
7,
000
-9,0
00
1,94
0
9,
000
-9,5
00
2060
9,
500
-10,
500
2300
10
,500
-11
,000
2,55
0
11
,000
-12
,000
2790
12
,000
-13
,000
3030
13
,000
-14
,000
3270
14
,000
-15
,000
3390
15,0
00-
20,0
00
3390
+ R
s.13
0 fo
r eve
ry
250
kg o
r par
t the
reof
in
exce
ss o
f 15,
000
kg
>20,
000
5990
+ R
s.25
0 fo
r eve
ry
250
kg o
r par
t the
reo
f in
exce
ss o
f 20
,000
kg
Goo
ds c
arria
ges f
itted
with
tipp
ing
mec
hani
sm
GV
W (k
g)
Tax
(Rs.
PQ)
Upt
o 30
0
190
Upt
o 1,
000
310
1,00
0-1
,500
590
1,50
0-2
,000
760
2,00
0-3
,000
970
3,00
0-4
,000
1160
4,00
0-5
,500
1670
5,50
0-7,
000
1970
7,00
0-9
,000
2420
9,00
0-9
,500
2590
9,50
0-1
0,50
0
2880
10,5
00 -
11,0
0031
90
Mot
or C
ycle
s (in
clud
ing
Mot
or C
ycle
and
cyc
les w
ith
atta
chm
ent f
or p
rope
lling
the
sam
e by
mec
hani
cal p
ower
):
Rs.
45PQ
OTT
Pu
rcha
se
valu
e (la
khs)
Tax
(%)
Upt
o
1
8% o
f pu
rcha
se
valu
e (P
V)
A
bove
1
upto
2
10%
of P
V
>2
20%
of P
V
8% o
f VV
B
asis
: Pu
rcha
se v
alue
Purc
hase
va
lue
(R
s. La
kh)
Tax
(%
of
purc
hase
va
lue)
U
pto
5
6
5-
10
8
10
-15
10
>1
5
15
Mot
or c
abs a
nd T
ouris
t M
otor
cab
s hav
ing
cubi
c ca
paci
ty o
f 150
0 C
C:
Purchase value(Rs.
Lakh)
Tax (% of purchase
value)
Upt
o 15
10
>15
15
Mot
or c
abs a
nd T
ouris
t M
otor
cab
s hav
ing
cubi
c ca
paci
ty o
f 150
0 C
C
&
abov
e an
d ha
ving
Pu
rcha
se v
alue
of >
20
lakh
:
20 %
of P
urch
ase
valu
e.
OTT
6% o
f VV
Pass
enge
rs: C
arry
ing
Cap
acity
:U
pto
3 Pa
ssen
gers
:R
s.125
PQ
101 102
Annexure 5.4 (contd...)
Annexure 5.4 (contd...)
Cont
d...
Cont
d...

Stat
es/
Uni
on
Terr
itori
es Bu
ses
Truc
ks/G
oods
Veh
icle
s, Tr
aile
rs a
nd T
ract
ors
Tw
o W
heel
ers
C
ars/J
eeps
Ta
xi/ C
ab
Aut
o ri
cksh
aws/
3Whe
eler
sK
arna
taka
(As o
n 31
st Mar
ch
2019
)
cate
gory
Tax
(Rs.
PQ)
Cam
pirv
ans
4700
/eve
ry
sq. m
tr.
Con
tract
ca
rria
ge
1000
PS
PQ
Stag
e ca
rria
ge 60
0 PS
PQ
Luxu
ry B
uses
2750
PSPQ
+1
1% c
ess
Truc
ks :
Bas
is : RLW
R
LW (k
g)
Rs.
5,50
0-1
2,00
0
1,80
0 PQ
12,0
00-1
5,00
0
2,20
0 PQ
> 15
,000
2,
200
PQ
plus
75
for
ever
y 25
0 kg
or p
art
ther
eof i
n ex
cess
of
15,0
00 k
g
+1
1% c
ess
Trac
tors
: Rs.
1,50
0
Tr
aile
rs
: Rs.
500
LTT
VC
Tax
(%)
Upt
o
Rs.
50,0
00
10
Abo
ve
R
s. 50
,000
12
>1,0
0, 0
00
18
Plus
11%
ces
s
Mot
or c
ycle
s run
on
elec
trici
ty:
ex
empt
ed fr
om p
aym
ent o
f tax
w
.e.f.
01.
04.2
016.
LTT
V
C (R
s. La
khs)
Tax
(%
)
Upt
o 5
13
5-
10
14
10-1
5
15
15-2
0
17
>20
18
+1
1% c
ess
Car
s, va
ns
run
on
elec
trici
ty:
exem
pted
fr
om p
aym
ent o
f tax
w
.e.f.
01.
04.2
016.
V
C
(Rs.
Lakh
s)
Rs.
U
pto
15
10
0
PSPQ
>1
5
LTT
of
15%
+1
1% c
ess
Pass
enge
rs/ G
oods
: R
s 2,5
00
(LTT
)
+ 11
% c
ess
Stat
es/
Uni
on
Terr
itori
es
Buse
s
Truc
ks/G
oods
Veh
icle
s, Tr
aile
rs a
nd
Trac
tors
Tw
o W
heel
ers
C
ars/J
eeps
Taxi
/ Cab
A
uto
rick
shaw
s/ 3W
heel
ers
Ker
ala
( A
s on
31st M
arch
20
19)
Vehi
cle
to p
ly so
lely
as
Sta
ge
Car
riage
(bas
ed o
n
floor
are
a):
a)
Ord
inar
y se
rvic
e ot
her t
han
city
/tow
n se
rvic
es-
R
s. 13
00 p
er sq
uare
m
eter
or p
art
ther
eof.
b)
Ord
inar
y ci
ty/to
wn
serv
ices
-
Rs.
1360
per
squa
re
met
er o
r par
t th
ereo
f.
c)
Fast
pas
seng
er
and
othe
r hig
her
clas
s ser
vice
-
Rs.
1400
per
sq
uare
met
er o
r pa
rt th
ereo
f.
Vehi
cles
regi
ster
ed in
K
eral
a an
d
oper
atin
g on
Inte
r Sta
te ro
utes
i.
Con
tract
ca
rria
ge p
erm
itted
to
car
ry
mor
e th
an
6 pa
ssen
gers
-
for
ever
y pa
ssen
ger
-R
s.22
50
ii.
Con
tract
ca
rria
ge w
ith p
ush
back
seat
s and
pe
rmitt
ed to
car
ry
mor
e th
an 6
pa
ssen
ger
s -
for
ever
y pa
ssen
ger
-R
s.300
0
iii.
Con
tract
ca
rria
ge w
ith
slee
per b
erth
s and
pe
rmitt
ed to
car
ry
mor
e th
an 6
pa
ssen
gers
-
for
ever
y pa
ssen
ger
-R
s.400
0
Bas
is:
GV
W/L
W
Goo
ds c
arria
ges o
ther
than
thos
e fit
ted
with
tip
ping
mec
hani
sm
GV
W (k
g)
Tax
(Rs.
PQ)
U
pto
300
15
0
Upt
o 1,
000
25
0
1,00
0-1
,500
47
0
1,
500
-2,0
00
610
2,
000
-3,0
00
780
3,
000
-4,0
00
930
4,
000
-5,5
00
1340
5,
500-
7,00
0
1580
7,
000
-9,0
00
1,94
0
9,
000
-9,5
00
2060
9,
500
-10,
500
2300
10
,500
-11
,000
2,55
0
11
,000
-12
,000
2790
12
,000
-13
,000
3030
13
,000
-14
,000
3270
14
,000
-15
,000
3390
15,0
00-
20,0
00
3390
+ R
s.13
0 fo
r eve
ry
250
kg o
r par
t the
reof
in
exce
ss o
f 15,
000
kg
>20,
000
5990
+ R
s.25
0 fo
r eve
ry
250
kg o
r par
t the
reo
f in
exce
ss o
f 20
,000
kg
Goo
ds c
arria
ges f
itted
with
tipp
ing
mec
hani
sm
GV
W (k
g)
Tax
(Rs.
PQ)
Upt
o 30
0
190
Upt
o 1,
000
310
1,00
0-1
,500
590
1,50
0-2
,000
760
2,00
0-3
,000
970
3,00
0-4
,000
1160
4,00
0-5
,500
1670
5,50
0-7,
000
1970
7,00
0-9
,000
2420
9,00
0-9
,500
2590
9,50
0-1
0,50
0
2880
10,5
00 -
11,0
0031
90
Mot
or C
ycle
s (in
clud
ing
Mot
or C
ycle
and
cyc
les w
ith
atta
chm
ent f
or p
rope
lling
the
sam
e by
mec
hani
cal p
ower
):
Rs.
45PQ
OTT
Pu
rcha
se
valu
e (la
khs)
Tax
(%)
Upt
o
1
8% o
f pu
rcha
se
valu
e (P
V)
A
bove
1
upto
2
10%
of P
V
>2
20%
of P
V
8% o
f VV
B
asis
: Pu
rcha
se v
alue
Purc
hase
va
lue
(R
s. La
kh)
Tax
(%
of
purc
hase
va
lue)
U
pto
5
6
5-
10
8
10
-15
10
>1
5
15
Mot
or c
abs a
nd T
ouris
t M
otor
cab
s hav
ing
cubi
c ca
paci
ty o
f 150
0 C
C:
Purchase value(Rs.
Lakh)
Tax (% of purchase
value)
Upt
o 15
10
>15
15
Mot
or c
abs a
nd T
ouris
t M
otor
cab
s hav
ing
cubi
c ca
paci
ty o
f 150
0 C
C
&
abov
e an
d ha
ving
Pu
rcha
se v
alue
of >
20
lakh
:
20 %
of P
urch
ase
valu
e.
OTT
6% o
f VV
Pass
enge
rs: C
arry
ing
Cap
acity
:U
pto
3 Pa
ssen
gers
:R
s.125
PQ
101 102
Annexure 5.4 (contd...)
Annexure 5.4 (contd...)
Cont
d...
Cont
d...

Stat
es/ U
nion
Te
rrito
ries
Bu
ses
Tr
ucks
/Goo
ds V
ehic
les,
Trai
lers
and
Tra
ctor
s
Two
Whe
eler
s
Car
s/
Jeep
s Ta
xi/ C
ab
Aut
o ri
cksh
aws/
3Whe
eler
s
GV
W (k
g)
Tax
(Rs.
PQ)
11
,000
-12,
000
34
80
12,0
00-1
3,00
0
3790
13
,000
-14,
000
40
90
14,0
00-1
5,00
0
4240
>1
5,00
0
4240
+
Rs.1
60
for e
very
25
0 kg
or p
art t
here
of in
ex
cess
of 1
5,00
0 kg
Tr
acto
rs
: Rs.
880
PA
Trai
lers
:
G
VW
(k
g)
Tax
(Rs.
PQ)
U
pto
1000
18
0
1,
000-
1,50
0
360
1,50
0-2,
000
480
2,
000-
3,00
0
650
3,
000-
4,00
0
870
4,
000-
5,50
0
1100
5,
500-
7,00
0
1460
7,
000-
9,00
0
1700
9,
000-
9,50
0
1820
9,
500-
10,5
00
1940
10
,500
-12,
000
2180
12
,000
-13,
000
2300
13,0
00-1
4,00
0
2420
14,0
00-1
5,00
0
2550
15,0
00-2
0,00
0
2550
+ R
s. 13
0 fo
r eve
ry
250
kg o
r par
t the
reof
in
exce
ss
of 1
5,00
0 kg
>20,
000
5150
+ R
s.250
for e
very
25
0 kg
or p
art t
here
of in
ex
cess
of 2
0,00
0 kg
Stat
es/ U
nion
Te
rrito
ries
Bu
ses
Tr
ucks
/Goo
ds V
ehic
les,
Trai
lers
and
Tr
acto
rs
Two
Whe
eler
s
Car
s/Jee
ps Ta
xi/ C
ab
Aut
o ri
cksh
aws/
3Whe
eler
sM
adhy
a Pr
ades
h
( As o
n 31
st Mar
ch
20
15)
Cat
egor
y of
Bu
s
Spar
e Tax
(R
s. PS
PM)
A
.C.
23
0
Del
uxe
23
0
Expr
ess
18
0
Ord
inar
y
120
St
age
Car
riage
(Prim
e R
oute
)
Cat
egor
y of
Bu
s
Tax
(Rs.
PSPM
)
A
.C.
250
for f
irst 1
00 k
m +
R
s. 20
for e
very
10
km
D
elux
e
250
for f
irst 1
00 k
m +
R
s. 15
for e
very
10
km
Expr
ess
O
rdin
ary
240
for f
irst 1
00 k
m +
R
s. 10
for e
very
10
km
Stag
e C
arria
ge (O
rdin
ary
Rou
te)
C
ateg
ory
of
Bus
Tax
(Rs.
PSPM
)
A
.C.
200
for f
irst 1
00 k
m +
R
s. 15
for e
very
10
km
Del
uxe
180
for f
irst 1
00 k
m +
R
s. 10
for e
very
10
km
Expr
ess
Ord
inar
y
160
for f
irst 1
00 k
m +
R
s. 10
for e
very
10
km
Stag
e C
arria
ge (D
oora
sth
Rou
te)
Cat
egor
y of
Bu
s
Tax
(Rs.
PSPM
)
A.C
.
160
for f
irst 1
00 k
m +
R
s. 10
for e
very
10
km
Del
uxe
140
for f
irst 1
00 k
m +
R
s. 5
for e
very
10
km
Expr
ess
Ord
inar
y
120
for f
irst 1
00 k
m +
R
s. 5
for e
very
10
km
Con
tract
Car
riage
Seat
ing
Cap
acity
Tax
(Rs.
PSPM
)
Upt
o 3
90
4 to
7
300
7-13
450
> 12
+ 1
800
Goo
ds
vehi
cles
with
out
pn
eum
atic
ty
res:
Bas
is R
LW
RLW
(MT)
R
s PQ
U
pto
2
600
2-
4
900
4-
6
1,30
0
6-8
1,
700
8-
10
2,10
0
10
-12
2,50
0
12
-14
2,90
0
14
-16
3,30
0
16
-18
3,70
0
>1
8
3,70
0 +
Rs
500/
PQ
All
good
s veh
icle
s with
pne
umat
ic
tyre
s: 1
.5 ti
mes
the
orig
inal
slab
Goo
ds v
ehic
les (
Oth
er S
tate
s with
out
pneu
mat
ic ty
res)
: 85%
of t
he o
rigin
al
slab
Trai
lers
: Bas
is U
LW
ULW
(kg)
Rs.
PQ
Upt
o 1,
000
28
>1,0
00
66
Mot
or C
ycle
:
LT
T-
7%
of V
C
M
otor
Cyc
le
batte
ry/C
NG
/LP
G d
riven
: 5%
of
VC
C
ars/
cabs
:
LTT
VC
upt
oRs.
15 L
akh:
Fuel
use
d
Tax
(% o
f V
C)
Pe
trol/d
iese
l dr
iven
7
H
ybrid
ve
hicl
e
6
B
atte
ry/C
NG
/LPG
5
V
C a
bove
Rs.
15
Lakh
:
Fu
el u
sed
Tax
(% o
f V
C)
Petro
l/die
sel
driv
en
8
H
ybrid
ve
hicl
e
6
Bat
tery
/CN
G/L
PG
5
Qua
rterly
tax:
Kg(
ULW
)
Tax
Rs.
PQ)
800
64
801-
1600
94
1601
-240
0
112
2401
-320
0
132
>320
0
150
Bas
is
: sea
ting
ca
paci
ty
Se
atin
gca
paci
ty
>6
+1
and
upto
12
+1
Life
Ti
me
Tax
(%
of V
C)
Pe
trol/d
iese
l dr
iven
8
H
ybrid
ve
hicl
e
6
B
atte
ry/
CN
G/L
PG
5
Pass
enge
rs
Seat
ing
capa
city
Rs.
PSPQ
Upt
o 3
+ 1
90
4-6
30
0
Se
atin
gca
paci
ty3+
1
Life
Tim
e Ta
x (%
of
VC
)
Petro
l/di
esel
dr
iven
7
Hyb
rid
vehi
cle
6
Bat
tery
/CN
G/L
PG5
103 104
Annexure 5.4 (contd...)
Annexure 5.4 (contd...)
Cont
d...
Cont
d...

Stat
es/ U
nion
Te
rrito
ries
Bu
ses
Tr
ucks
/Goo
ds V
ehic
les,
Trai
lers
and
Tra
ctor
s
Two
Whe
eler
s
Car
s/
Jeep
s Ta
xi/ C
ab
Aut
o ri
cksh
aws/
3Whe
eler
s
GV
W (k
g)
Tax
(Rs.
PQ)
11
,000
-12,
000
34
80
12,0
00-1
3,00
0
3790
13
,000
-14,
000
40
90
14,0
00-1
5,00
0
4240
>1
5,00
0
4240
+
Rs.1
60
for e
very
25
0 kg
or p
art t
here
of in
ex
cess
of 1
5,00
0 kg
Tr
acto
rs
: Rs.
880
PA
Trai
lers
:
G
VW
(k
g)
Tax
(Rs.
PQ)
U
pto
1000
18
0
1,
000-
1,50
0
360
1,50
0-2,
000
480
2,
000-
3,00
0
650
3,
000-
4,00
0
870
4,
000-
5,50
0
1100
5,
500-
7,00
0
1460
7,
000-
9,00
0
1700
9,
000-
9,50
0
1820
9,
500-
10,5
00
1940
10
,500
-12,
000
2180
12
,000
-13,
000
2300
13,0
00-1
4,00
0
2420
14,0
00-1
5,00
0
2550
15,0
00-2
0,00
0
2550
+ R
s. 13
0 fo
r eve
ry
250
kg o
r par
t the
reof
in
exce
ss
of 1
5,00
0 kg
>20,
000
5150
+ R
s.250
for e
very
25
0 kg
or p
art t
here
of in
ex
cess
of 2
0,00
0 kg
Stat
es/ U
nion
Te
rrito
ries
Bu
ses
Tr
ucks
/Goo
ds V
ehic
les,
Trai
lers
and
Tr
acto
rs
Two
Whe
eler
s
Car
s/Jee
ps Ta
xi/ C
ab
Aut
o ri
cksh
aws/
3Whe
eler
sM
adhy
a Pr
ades
h
( As o
n 31
st Mar
ch
20
15)
Cat
egor
y of
Bu
s
Spar
e Tax
(R
s. PS
PM)
A
.C.
23
0
Del
uxe
23
0
Expr
ess
18
0
Ord
inar
y
120
St
age
Car
riage
(Prim
e R
oute
)
Cat
egor
y of
Bu
s
Tax
(Rs.
PSPM
)
A
.C.
250
for f
irst 1
00 k
m +
R
s. 20
for e
very
10
km
D
elux
e
250
for f
irst 1
00 k
m +
R
s. 15
for e
very
10
km
Expr
ess
O
rdin
ary
240
for f
irst 1
00 k
m +
R
s. 10
for e
very
10
km
Stag
e C
arria
ge (O
rdin
ary
Rou
te)
C
ateg
ory
of
Bus
Tax
(Rs.
PSPM
)
A
.C.
200
for f
irst 1
00 k
m +
R
s. 15
for e
very
10
km
Del
uxe
180
for f
irst 1
00 k
m +
R
s. 10
for e
very
10
km
Expr
ess
Ord
inar
y
160
for f
irst 1
00 k
m +
R
s. 10
for e
very
10
km
Stag
e C
arria
ge (D
oora
sth
Rou
te)
Cat
egor
y of
Bu
s
Tax
(Rs.
PSPM
)
A.C
.
160
for f
irst 1
00 k
m +
R
s. 10
for e
very
10
km
Del
uxe
140
for f
irst 1
00 k
m +
R
s. 5
for e
very
10
km
Expr
ess
Ord
inar
y
120
for f
irst 1
00 k
m +
R
s. 5
for e
very
10
km
Con
tract
Car
riage
Seat
ing
Cap
acity
Tax
(Rs.
PSPM
)
Upt
o 3
90
4 to
7
300
7-13
450
> 12
+ 1
800
Goo
ds
vehi
cles
with
out
pn
eum
atic
ty
res:
Bas
is R
LW
RLW
(MT)
R
s PQ
U
pto
2
600
2-
4
900
4-
6
1,30
0
6-8
1,
700
8-
10
2,10
0
10
-12
2,50
0
12
-14
2,90
0
14
-16
3,30
0
16
-18
3,70
0
>1
8
3,70
0 +
Rs
500/
PQ
All
good
s veh
icle
s with
pne
umat
ic
tyre
s: 1
.5 ti
mes
the
orig
inal
slab
Goo
ds v
ehic
les (
Oth
er S
tate
s with
out
pneu
mat
ic ty
res)
: 85%
of t
he o
rigin
al
slab
Trai
lers
: Bas
is U
LW
ULW
(kg)
Rs.
PQ
Upt
o 1,
000
28
>1,0
00
66
Mot
or C
ycle
:
LT
T-
7%
of V
C
M
otor
Cyc
le
batte
ry/C
NG
/LP
G d
riven
: 5%
of
VC
C
ars/
cabs
:
LTT
VC
upt
oRs.
15 L
akh:
Fuel
use
d
Tax
(% o
f V
C)
Pe
trol/d
iese
l dr
iven
7
H
ybrid
ve
hicl
e
6
B
atte
ry/C
NG
/LPG
5
V
C a
bove
Rs.
15
Lakh
:
Fu
el u
sed
Tax
(% o
f V
C)
Petro
l/die
sel
driv
en
8
H
ybrid
ve
hicl
e
6
Bat
tery
/CN
G/L
PG
5
Qua
rterly
tax:
Kg(
ULW
)
Tax
Rs.
PQ)
800
64
801-
1600
94
1601
-240
0
112
2401
-320
0
132
>320
0
150
Bas
is
: sea
ting
ca
paci
ty
Se
atin
gca
paci
ty
>6
+1
and
upto
12
+1
Life
Ti
me
Tax
(%
of V
C)
Pe
trol/d
iese
l dr
iven
8
H
ybrid
ve
hicl
e
6
B
atte
ry/
CN
G/L
PG
5
Pass
enge
rs
Seat
ing
capa
city
Rs.
PSPQ
Upt
o 3
+ 1
90
4-6
30
0
Se
atin
gca
paci
ty3+
1
Life
Tim
e Ta
x (%
of
VC
)
Petro
l/di
esel
dr
iven
7
Hyb
rid
vehi
cle
6
Bat
tery
/CN
G/L
PG5
103 104
Annexure 5.4 (contd...)
Annexure 5.4 (contd...)
Cont
d...
Cont
d...

St
ates
/ Uni
on
Terr
itori
es
Buse
s
Truc
ks/G
oods
Veh
icle
s, Tr
aile
rs a
nd T
ract
ors
Tw
o W
heel
ers
C
ars/J
eeps
Ta
xi/ C
ab
Aut
o ri
cksh
aws/
3Whe
eler
s
Mah
aras
htra
(as o
n 31
st M
arch
201
9)
Bas
is :
Car
ryin
g C
apac
ity
Stag
e ca
rria
ge
Pers
ons
Ta
x (R
s.)PS
PA
City
M
VT
71 +
PT
3.5%
of f
are
colle
cted
R
ural
M
VT
71 +
PT
17.5
% o
f far
e co
llect
ed
A.C
.
MV
T 71
+PT
5.
5% o
f far
e co
llect
ed
Con
trac
t Car
riag
e:
Pe
rson
s
Tax
(R
s.)
13+1
to 2
4+1
1,
700P
SPA
>2
5+1
1,
900
PSPA
Tour
ist:
Rs.
5,50
0
PSPA
A
C T
ouris
t Bus
es:R
s. 6,
500
PSPA
Slee
per C
oach
: Rs.
7,00
0
per b
erth
PA
Truc
ks: B
asis
: GV
W
GV
W (k
g)
OTT
(R
s.)
LMV
s
Upt
o 75
0
8,40
0
750-
1500
13
650
15
01-3
000
18
900
30
00-4
500
25
200
45
01-6
000
31
500
60
01-7
500
37
800
M
ediu
m a
nd
HG
Vs(
Ann
ual)
75
01-9
000
64
50
9001
-105
00
75
00
10
501-
1200
0
8550
12
001-
1350
0
9750
13
501-
1500
0
1095
0
15
001-
1550
0
1135
0
15
501-
1600
0
1175
0
16
0001
-165
00
1215
0
R
s. 45
0 fo
r eve
ry 5
00 K
gs o
r its
par
t exc
eedi
ng 1
6500
Kgs
.
OTT
Ow
ners
hip
Ta
x
(%
on
VC
)
Indi
vidu
al
U
pto
99 c
c
10
99.1
to
299
cc
11
>229
cc
12
Oth
er
than
in
divi
dual
U
pto
99 c
c
20
99.1
to
299
cc
20
>2
29
cc
20
Pe
trol
Dri
ven:
V
C (R
s. La
kh)
O
TT
(Rs.)
Indi
vidu
al
Up
to 1
0
11%
of V
C
10-2
0 12
% o
f VC
>2
0
13%
of V
C
Oth
er th
an
indi
vidu
al/Im
porte
d
Up
to 1
0
20%
of V
C
10-2
0 20
% o
f VC
>2
0
20%
of
V
C
Die
sel D
rive
n:
VC
(Rs.
Lakh
)
OTT
(R
s.)
Indi
vidu
al
U
p to
10
13%
of V
C
10
-20
14%
of V
C
>2
0
15%
of V
C
O
ther
than
in
divi
dual
/Impo
rted
U
p to
10
20%
of V
C
10
-20
20%
of V
C
>2
0
20%
of V
C
C
NG
/LPG
Dri
ven:
V
C (R
s. La
kh)
OTT
(Rs.)
U
p to
10
7% o
f
VC
10
-20
8% o
f VC
>2 0
9% o
f VC
O
ther
than
in
divi
dual
/Impo
rted
Up
to 1
0
14%
of V
C
10
-20
16%
of V
C
>2
0
18%
of V
C
M
otor
C
ab
Seat
ing
Cap
acity
O
TT
(Rs.)
3+
1
3850
4+
1
4950
5+
1
6050
6+
1
7150
7+
1
4494
8+
1
4496
9+
1
4500
10
+1
4500
11
+1
4500
12
+1
45
00
To
uris
t Tax
i
Se
atin
g C
apac
ity
Ann
ual T
ax
(Rs.)
N
on A
C
4+
1
4000
5+
1
5000
6+
1
6000
A
.C.
4+
1
8000
5+
1
1000
0
6+
1
1200
0
Im
porte
d
4+
1
1200
0
5+
1
1500
0
6+
1
1800
0
Pr
ivat
e Se
rvic
e Veh
icle
:
Non
-AC
: Rs.
1,00
0 PS
PA;
AC
: Rs.
2,00
0 P
PPA
G
oods
C
arria
ges f
or
each
veh
icle
R
s. 75
0 PA
Fu
el u
sed
in v
ehic
le
Age
of v
ehic
le
(in y
ears
)
Peri
odic
ity o
f Ta
x(in
Yr
s)
Rat
e of
Tax
(Rs.)
Tran
spor
t V
ehic
les
A
uto
ricks
haw
Pe
tro /
Die
sel
A
bove
8
5
750
M
otor
cab
Pe
tro /
Die
sel
A
bove
8
5
1250
M
otor
cab
(Jee
p ty
pe)
Pe
tro /
Die
sel
A
bove
8
5
1250
To
uris
t Tax
i
Petro
/ D
iese
l
Abo
ve 8
5
25
00
Ligh
t Goo
ds V
ehic
les
Pe
tro /
Die
sel
A
bove
8
5
2500
M
ediu
m &
Hea
vy G
oods
Veh
icle
s
Petro
/ D
iese
l
Abo
ve 8
1
10
% o
f ann
ual t
ax
Con
tract
Car
riag
e
Petro
/ D
iese
l
Abo
ve 8
1
2.
5% o
f ann
ual t
ax
Priv
ate
Serv
ice
Vehi
cle
Pe
tro /
Die
sel
A
bove
8
1
2.5%
of a
nnua
l tax
To
uris
t Bus
es
Petro
/ D
iese
l
Abo
ve 8
1
2.
5% o
f ann
ual t
ax
Oth
ers
Pe
tro /
Die
sel
A
bove
8
1
2.5%
of a
nnua
l tax
A
uto
ricks
haw
C
NG
/ LP
G
Abo
ve 1
5
5
750
M
otor
cab
C
NG
/ LP
G
Abo
ve 1
5
5
1250
M
otor
cab
(Jee
p ty
pe)
C
NG
/ LP
G
Abo
ve 1
5
5
1250
To
uris
t Tax
i
CN
G /
LPG
A
bove
15
5
25
00
Ligh
t Go
ods V
ehic
les
C
NG
/ LP
G
Abo
ve 1
5
5
2500
N
on-T
rans
port
Veh
icle
s
Two
Whe
eler
Pe
trol
A
bove
15
5
20
00
O
ther
than
two
whe
eler
(Pet
rol)
Pe
trol
A
bove
15
5
30
00
Oth
er th
an tw
o w
heel
er (D
iese
l)
Die
sel
A
bove
15
5
35
00
Prof
essio
n Ta
x R
ates
Cat
egor
y
Ann
ual T
ax
(in R
s)
All
type
of T
axie
s for
veh
icle
10
00
Pass
enge
r Bus
es &
goo
ds C
arria
ge v
ehic
le fo
r eac
h ve
hicl
e
1500
In a
dditi
on to
the
MV
T, E
nvir
onm
ent T
ax a
nd P
rofe
ssio
n Ta
x ra
tes i
n M
ahar
asht
ra S
tate
are
as b
elow
: En
viro
nmen
t Tax
Rat
es
Not
e: T
ax sh
all n
ot e
xcee
d R
s. 25
00/-
P.A
.
105 106
Annexure 5.4 (contd...)
Annexure 5.4 (contd...)
Cont
d...
Cont
d...
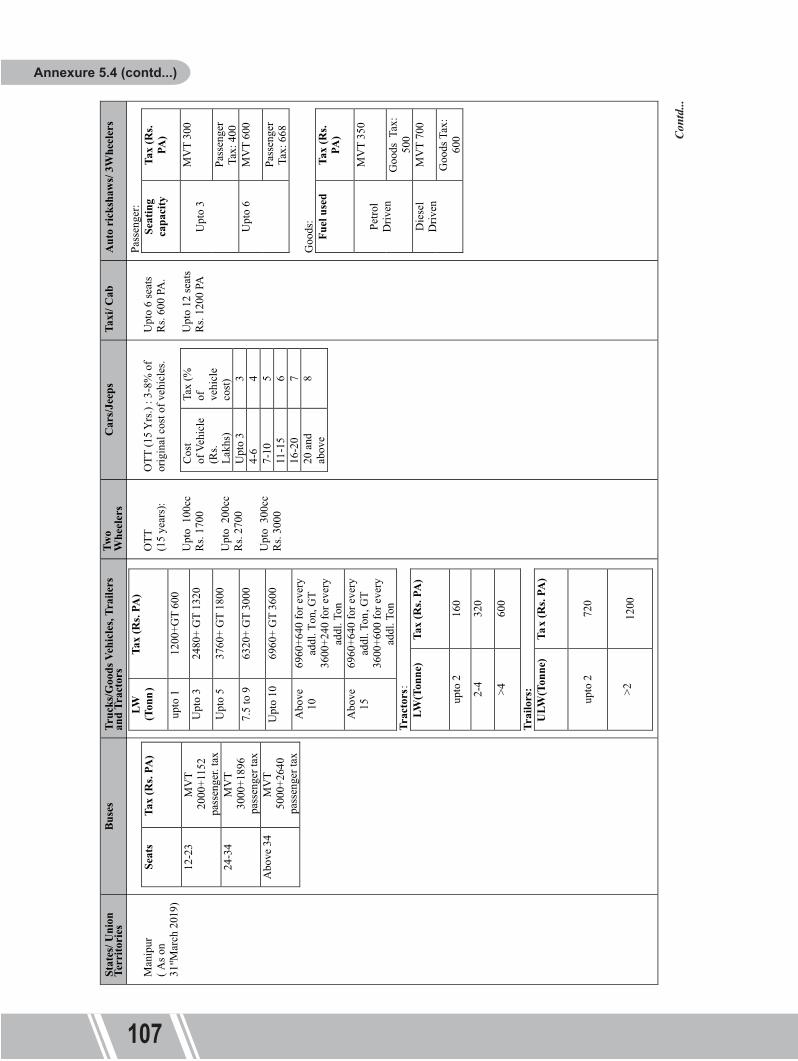
St
ates
/ Uni
on
Terr
itori
es M
anip
ur
(A
s on
31st M
arch
201
9)
Buse
s
Seat
s
Tax
(Rs.
PA)
12-2
3
MV
T 20
00+1
152
pass
enge
r. ta
x
24-3
4
MV
T 30
00+1
896
pass
enge
r tax
A
bove
34
M
VT
5000
+264
0 pa
ssen
ger t
ax
Truc
ks/G
oods
Veh
icle
s, Tr
aile
rs
and
Trac
tors
LW
(Ton
n)
Tax
(Rs.
PA)
upto
1
12
00+G
T 60
0
Upt
o 3
24
80+
GT
1320
U
pto
5
3760
+ G
T 18
00
7.5
to 9
63
20+
GT
3000
U
pto
10
6960
+ G
T 36
00
Abo
ve
10
6960
+640
for e
very
ad
dl. T
on, G
T 36
00+2
40 fo
r eve
ry
addl
. Ton
A
bove
15
6960
+640
for e
very
ad
dl. T
on, G
T 36
00+6
00 fo
r eve
ry
addl
. Ton
Tr
acto
rs:
LW(T
onne
)
Tax
(Rs.
PA)
up
to
2
160
2-
4
320
>4
600
Tr
ailo
rs:
ULW
(Ton
ne)
Tax
(Rs.
PA)
up
to 2
720
>2
1200
Two
Whe
eler
s
O
TT (1
5 ye
ars)
:
U
pto
100
cc
Rs.
1700
Upt
o 2
00cc
R
s. 27
00
U
pto
300
cc
Rs.
3000
Car
s/Jee
ps
O
TT (1
5 Y
rs.)
: 3-8
% o
f or
igin
al c
ost o
f veh
icle
s.
C
ost
of V
ehic
le
(Rs.
Lakh
s)
Tax
(% of
ve
hicl
e co
st)
U
pto
3
3
4-6
4
7-
10
5
11-1
5
6
16-2
0
7
20 a
nd
abov
e
8
Taxi
/ Cab
U
pto
6 se
ats
Rs.
600
PA.
Upt
o 12
seat
s R
s. 12
00 PA
Aut
o ri
cksh
aws/
3Whe
eler
s
Pass
enge
r: Se
atin
g ca
paci
ty Ta
x (R
s. PA
)
Upt
o 3
MV
T 30
0
Pass
enge
r Ta
x: 4
00
Upt
o 6
MV
T 60
0 Pa
ssen
ger
Tax:
668
Goo
ds:
Fuel
use
d Ta
x (R
s. PA
)
Petro
l D
riven
MV
T 35
0 G
oods
Tax:
50
0 D
iese
l D
riven
MV
T 70
0 G
oods Ta
x:
600
Stat
es/
Uni
on
Terr
itori
es
Meg
hala
ya
( A
s on
31st M
arch
20
19)
Bu
ses
Rs.
5,25
0 PA
+ R
s 60
for
ever
y se
at
Car
ryin
g ca
paci
ty 1
3-30
Rs.
7350
and
Rs.
7350
+Rs.
80 fo
r eve
ry
seat
abo
ve 3
0 pa
ssen
gers
.
Om
ni T
ouris
t Bus
Rs.
1260
0.
Del
uxe
Expr
ess B
uses
w
ith c
arry
ing
capa
city
of
>30:
R
s. 10
500
+ R
S 10
5 fo
r ev
ery
addi
tiona
l sea
t ab
ove
30.
Rs.
4200
0 fo
r all
Meg
hala
ya S
uper
D
elux
e C
ontra
ct
Car
riage
.
Tr
ucks
/Goo
ds V
ehic
les,
Trai
lers
and
Tr
acto
rs
Tr
ucks
:
Met
ric T
onne
R
s. PA
U
pto
1
1575
1-
3
3150
3-
7
3150
+735
for e
very
ad
ditio
nal 1
MT
7-
12
6300
+ 21
0 fo
r eve
ry
addi
tiona
l 1 M
T
>1
2
8400
+ 3
15 fo
r eve
ry
addi
tiona
l 1 M
T
Tr
acto
rs:
M
etri
c Ton
ne
Rs.
PA
Upt
o 2
63
0
2-5
12
60
>5
2100
Trai
lers
:
Trai
lers
R
s. PA
Li
ght
630
M
ediu
m
1675
H
eavy
2625
Tw
o W
heel
ers
OTT
for
10
Yea
rs
K
g Ta
x (R
s.)
Upt
o 65
1100
65
-90
18
00
90-
135
2500
>1
35 2990
C
ars/J
eeps
Car
s:
10 Y
ears
Cos
t
of
Ve
hicl
e (R
s. La
khs)
Tax
(% o
f ve
hicl
e co
st)
U
pto3
4
4-15
6
16
-20
8
Je
eps:
C
ost
of
Vehi
cle
(Rs.
Lakh
s)
Tax
(% o
f ve
hicl
e co
st)
U
pto3
6
15-2
0 8
>2
0
10
Ta
xi/ C
ab
M
VT
Car
ryin
g ca
paci
ty
Upt
o 6
tax
Rs.
2730
PA
(o
pera
ted
in o
ne
city
/regi
on).
Car
ryin
g ca
paci
ty
Upt
o 6
tax
Rs.
5640
PA
(o
pera
ted
in a
ll ov
er th
e St
ate)
Car
ryin
g ca
paci
ty
7
-12
tax
Rs.
5985
PA
.
A
uto
rick
shaw
s/ 3W
heel
ers
MV
T: R
s. 24
00Pa
ssen
gers
Ve
hicl
es: C
arry
ing
capa
city
upt
o 3
Rs.
1,03
0
PA
Car
ryin
g ca
paci
ty 4
to
6 R
s. 18
90 P
A
G
oods
Ve
hicl
es: R
s. 25
00
PA @
of 1
m
etric
tonn
e
Miz
oram
( A
s on
31st M
arch
20
19)
Ann
ual T
ax
M
VT
6% +
Rs.
2000
pa
ssen
ger t
ax
Tran
spor
t Veh
icle
s
U
nlad
en W
eigh
t (R
LW)
U
LW.
Kgs
PA
U
pto5
00
Rs.
500
50
0-20
00
Rs.
2000
20
00-
4000
Rs.
3500
40
00-
8000
Rs.
5000
>8
000
Rs.
7500
+ 4
00 fo
r ev
ery
addi
tiona
l 500
kg
s or p
art t
here
of
abov
e 80
00 k
gs
OTT
(for
15
year
s)
6%
of sa
le a
mou
nt
Car
s:
O
TT (f
or 1
5 ye
ars)
6%
of sa
le a
mou
nt
Jeep
s:
O
TT (f
or 1
5 ye
ars)
6%
of sa
le a
mou
nt
OTT
(for
15
year
s)
6% (o
f sal
e am
ount
) pl
us
Rs.
650
Pass
enge
r tax
Pass
enge
rs:
OTT
(for
15
year
s)
6% o
f sal
e am
ount
+
Rs.
450 p
asse
nger
tax.
3
whe
eler
s for
pe
rson
al u
se
Rs.1
500
G
oods
:
O
TT (f
or 1
5 ye
ars)
6%
+
Rs.
1400
G
oods
tax
107 108
Annexure 5.4 (contd...)
Annexure 5.4 (contd...)
Cont
d...
Cont
d...

Stat
es/
Uni
on
Terr
itori
es
Nag
alan
d
( As o
n 31
st
Mar
ch
2019
)
Buse
s
All
Indi
a
Tour
ist:
Rs.
300
PSPA
plus
Rs.
2,50
0 pa
ssen
ger
tax
per v
ehic
le.
Rur
al a
nd c
ity
buse
s: R
s. 12
0
PSPA
pl
us R
s.
2,00
0 pa
ssen
ger
tax
Truc
ks/G
oods
Veh
icle
s, Tr
aile
rs a
nd T
ract
ors
Tr
ucks
: R
s. 55
0 fo
r 1st
to
ne a
nd
Rs.1
75 fo
r eve
ry a
dditi
onal
500
Kg
G
oods
Tax
:
Car
ryin
g C
apac
ity(M
T)
Rs
< 2
50
0
2-5
1,
000
5
-10
1,
500
10
-20
2,
000
20
-30
2,
500
>3
1
3,00
0
Tr
acto
rs: R
s. 58
0 PA
Tr
aile
r:
Rs.
600
PA
Two
Whe
eler
s
O
TT
15 y
ears
5% o
f bas
ic c
ost
Car
s/Jee
ps
O
TT 1
5
year
s
5% o
f bas
ic
cost
Taxi
/ Cab
Lo
cal:
Rs.
600
PA
plus
Rs.
1,00
0
pass
enge
r tax
pe
r
vehi
cle
Zo
nal:
Rs.
800
PA
plus
Rs.
1,00
0
pass
enge
r tax
Lo
cal M
axi C
ab: R
s.
4,00
0 PA
plu
s Rs.
1,25
0 pa
ssen
ger t
ax
A
ITT
Max
i Cab
: Rs.
6,00
0 PA
plu
s Rs,
1,50
0 pa
ssen
ger t
ax
Aut
o ri
cksh
aws/
3Whe
eler
s Pa
ssen
gers
: R
s. 30
0
PA
plus
Rs
.
750
pass
enge
r
tax
pe
r
vehi
cle.
St
ates
/ Uni
on
Terr
itori
es
Odi
sha
( A
s on
31st
Mar
ch
2019
)
Buse
s
Bas
is :
Cap
acity
, dis
tanc
e co
vere
d pe
r day
and
na
ture
of s
ervi
ce m
onth
ly
Stag
e C
arri
age:
D
istan
ce
(km
)
Tax
U
pto
160
R
s. 17
2 PA
Add
ition
al R
s. 57
6 (o
rdin
ary)
Rs.
895
(exp
ress
)
160-
240
R
s. 19
6 PA
Add
ition
al R
s. 72
0 (o
rdin
ary)
Rs.
1,12
0 (e
xpre
ss)
24
0-32
0
Rs.
245
PA A
dditi
onal
Rs.
955
(ord
inar
y) R
s. 1,
550
(exp
ress
)
>320
R
s. 29
4 PA
Add
ition
al R
s. 1,
146
(ord
inar
y) R
s. 1,
746
(exp
ress
)
Pl
us fo
r eve
ry st
andi
ng p
asse
nger
: Rs.
152
PA
C
ontr
act c
arri
age:
Pe
rson
s (N
o.)
Tax
U
pto
25
Rs.
307
PA A
dditi
onal
R
s. 41
3
>
25
Rs.
768
PA A
dditi
onal
R
s. 1,
032
Truc
ks/G
oods
Veh
icle
s, Tr
aile
rs a
nd
Trac
tors
Reg
iste
red
Lade
n W
eigh
t
(RLW
)
Rat
es fo
r Tru
cks
R
LW.
MT
PA
(R
s.)
Upt
o 1
R
s. 54
0
1-2
R
s. 2,
356
2-
5
Rs.
2,44
6+R
s. 44
4 ad
dl ta
x
5-10
R
s. 3,
773+
Rs.
1,18
2 ad
dl ta
x
10-1
3 R
s. 5,
363+
Rs.
1,81
6 ad
dl ta
x
13-1
6.2
Rs.
78,0
0+R
s. 2,
640
addl
tax
>1
6.2
R
s. 7,
800
+ R
s. 2,
640
addl
tax
+ R
s.120
/add
l 500
Kgs
Tr
acto
rs
Upt
o 1
MT
Rs.
375
PA
45
73-
7621
Rs.
2700
PA
76
21-
9500
Rs.
3675
PA
>9
500
Rs.
3675
PA+R
s 120
pe
r eve
ry 5
00 k
g or
pa
rt th
eir o
f.
Tr
ailo
rs
U
pto
1 M
T
Rs.
196
PA A
ddl.
Rs.
96
1-
3 M
T
Rs.
750
PA A
ddl.
Rs.
370
>
3 M
T
Rs.
1,50
0
PA A
ddl.
Rs.
738
Two
Whe
eler
s
<
91 k
gs
ULW
: Rs 1
50
PA
> 91
kgs
U
LW: R
s 200
PA
or
OTT
5
% o
f cos
t or
10 ti
mes
of
annu
al ta
x as
ab
ove
whi
chev
er is
hi
gher
.
Car
s/Jee
ps
R
LW
(Kg)
Ta
x PA
(R
s)
Upt
o 76
2
1100
763-
1524
1600
15
25-
2286
2100
22
87-
3048
2500
30
48-
6000
3000
5
% o
f cos
t or 1
0 tim
es o
f ann
ual t
ax
as a
bove
whi
chev
er
is h
ighe
r.
Taxi
/ Cab
Rs.
307
PSPA
+
Rs.4
13
addi
tiona
l tax
PS
PA
or
5 %
of c
ost o
r 10
tim
es o
f an
nual
tax
as
abov
e w
hich
ever
is
high
er.
Aut
o ic
ksha
ws
/ 3
Whe
eler
s
Pa
ssen
ger:
R
s. 12
3 PS
PA
or
5 %
of c
ost o
r 10
tim
es o
f an
nual
tax
as
abov
e w
hich
ever
is
high
er.
Goo
ds:
R
s. 54
0 PA
or
5
% o
f cos
t or
10 ti
mes
of
annu
al ta
x as
ab
ove
whi
chev
er is
hi
gher
.
109 110
Annexure 5.4 (contd...)
Annexure 5.4 (contd...)
Cont
d...
Cont
d...

Stat
es/
Uni
on
Terr
itori
es
Buse
s
Truc
ks/G
oods
Ve
hicl
es,
Trai
lers
and
Tra
ctor
s
Two
Whe
eler
s Car
s/
Jeep
s Ta
xi/ C
ab
Aut
o ri
cksh
aws/
3Whe
eler
s
Punj
ab
( As o
n 31
stM
arch
20
07)
Stag
e C
arria
ge
Ord
inar
y B
uses
-
Rs.2
.25
Per K
m
per d
ay
Ord
inar
y H
V A
C B
uses
(3x2
Sea
ts)-
R
s.1.0
0 Pe
r Km
pe
r day
In
tegr
al C
oach
(2x2
seat
s bus
es) –
R
s.0.5
0 Pe
r Km
pe
r day
Stag
e C
arria
ge B
uses
com
ing
from
Oth
er S
tate
s:-
Bus
es c
ount
ersi
gned
und
er re
cipr
ocal
agr
eem
ents-
R
s. 3.
70 P
er K
m p
er d
ay
Bus
es n
ot c
ount
ersi
gned
und
er re
cipr
ocal
ag
reem
ents-
Rs.
5.00
Per
Km
pe
r day
Min
i Bus
es R
s.30,
000
PA.
C
ity B
us S
ervi
ce R
s. 60
PS
PQ
City
Bus
es p
lyin
g o
utsi
de M
unic
ipal
lim
its
Ord
inar
y B
us: R
s. 4.
50-
pe
r Km
per
bus
per
day
.
HV
AC
Bus
es: R
s. 2.
00 p
er K
m p
er b
us p
er d
ay.
In
tegr
al C
oach
Bus
: Re.
1.0
0 pe
r Km
per
bus
per
day
.
Con
tract
Car
riage
To
uris
t
Bus
es:-
O
rdin
ary
and
Del
uxe-
Rs.6
,000
PSPA
A
ir C
ondi
tione
d-
Rs.5
,000
PSPA
In
tegr
al C
oach
-
Rs.
4,00
0
PSPA
A
ll In
dia
Tour
ist P
erm
its O
rdin
ary
Bus
es-
Rs.2
,000
Pe
r Day
Per
Veh
icle
Del
uxe
Bus
es-
Rs.
3,00
0 Pe
r Day
Pe
r Veh
icle
A
ir C
ondi
tione
d B
uses
-
Rs.4
,000
Per
Day
Per
Ve
hicl
e
3.
Om
ni B
us R
s.150
Per
day
Bas
is: G
VW
G
VW
(9
1one
s) Ta
x (R
s. Pa
)
Upt
o 1.
2
3,00
0
1.2
–
6
4,00
0
6 –
16
.2
5,00
0
16.2
–
25
8,00
0
>25
15
,000
Pe
rmit
Hol
ders
of T
ract
ors w
ith
trolle
ys u
sed
for c
omm
erci
al
purp
oses
w
ithin
the
radi
us o
f 25
Km
from
the
plac
e of
per
mit
hold
ers r
esid
ence
–
Rs.2
,000
PA
.
Va
lue
of
Mot
or
Cyc
le
(Rs.)
Lum
p su
m
tax
Upt
o 15
,000
3% o
f va
lue
>
15,0
00
4% o
f va
lue
2% o
f va
lue
of
mot
or
vehi
cle
Con
tract
Car
riage
:
Max
i and
Mot
or
Cab
s: R
s. 75
0 PS
PA
A
ll In
dia
Tour
ist
Perm
its:
M
axi C
ab: R
s. 60
0 pe
r day
M
otor
Cab
: Rs.
300
per d
ay
To
uris
t per
mit
vehi
cles
:
Max
i an
d M
otor
C
abs:
A
C/ N
on-
AC
N
on-A
c
AC
Pass
enge
rs: R
s. 40
0 PS
PA
Stat
es/ U
nion
Te
rrito
ries
Bu
ses
Tr
ucks
/Goo
ds V
ehic
les,
Trai
lers
and
Tra
ctor
s
Two
Whe
eler
s
Car
s/Jee
ps
Taxi
/ Cab
A
uto
rick
shaw
s/ 3W
heel
ers
Raj
asth
an
(As o
n 31
stM
arch
20
19)
Stag
e C
arria
ges:
R
s. 15
000
per y
ear+
pas
seng
er ta
x of
0.
49%
of t
he c
ost o
f cha
ssis
pl
us
Surc
harg
e 6.
25%
of o
rigin
al ta
x.
Con
tract
Car
riage
:
Rs.
3200
0 pe
r yea
r+ p
asse
nger
tax
of
12-2
4% o
f the
cos
t of c
hass
is
plus
su
rcha
rge
6.25
% o
f orig
inal
tax.
Bas
is: C
ost o
f Veh
icle
Rs 8
300
to 2
5000
PA
+Rs.
4000
pa
ssen
ger t
ax+
surc
harg
e 6.
25%
of o
rigin
al ta
x.
R
LW u
pto
1650
0 LT
T 11
% o
f th
e co
st o
f veh
icle
s + 1
2.5%
of
the
orig
inal
tax
paya
ble.
Engi
ne C
apac
ity-L
TT
4-10
% o
f Cos
t of v
ehic
le
Plus
12.
5% o
f orig
inal
tax
paya
ble
as su
rcha
rge
pa
yabl
e.
Bas
is: L
TT
Car
s & Je
eps:
4-
10%
of c
ost o
f veh
icle
.
Plus
12.
5% o
f orig
inal
tax
paya
ble
as su
rcha
rge
pa
yabl
e.
Mot
or/m
axi c
ab
LT
T: 1
1% o
f cos
t of
vehi
cle
Pl
us su
rcha
rge.
12.5
% o
f or
igin
al ta
x
paya
ble.
Pass
enge
r:
Rs.
300
to
800
year
lyPl
us
surc
harg
e 6.
25%
of
orig
inal
tax
paya
ble.
G
oods
:LTT
Bas
is:
VC
9% o
f VC
Plus
surc
harg
e 12
.5%
of
orig
inal
tax
paya
ble.
Sikk
im
(As o
n 31
.3.2
017)
Se
atin
g ca
paci
ty
Tax
(Rs.)
PA
32
+1
6400
+ R
s. 50
0 ot
her t
axes
Tr
ucks
,
Trai
lers
and
Tra
ctor
s:
Bas
is:
G
VW
W
eigh
t (in
kgs
)
TaxR
s. PA
U
pto
1470
96
5
18
05
11
26
77
40
6558
12
100
1210
8
Pl
us R
s. 50
0 O
ther
Tax
es
B
asis
: Eng
ine
Cap
acity
En
gine
C
apac
ity (c
c)
Tax
R
s. PA
U
pto
80
150
81
-170
300
17
1-25
0
450
>2
50
600
B
asis
: Eng
ine
Cap
acity
En
gine
C
apac
ity (c
c)
Tax
R
s. PA
U
pto
900
1,
500
90
1-1,
490
1,80
0
1,
491-
2,00
0
3,00
0
>2
000
4,50
0
B
asis
: Sea
ting
Cap
acity
Pe
rson
s
TaxR
s. PA
4+
1
1200
6+
1
1700
10
+1
2700
12
+1
3200
Pl
us R
s. 30
0 O
ther
Ta
xes
N
ot re
porte
d
111 112
Annexure 5.4 (contd...)
Annexure 5.4 (contd...)
Cont
d...
Cont
d...

Stat
es/
Uni
on
Terr
itori
es
Buse
s
Truc
ks/G
oods
Ve
hicl
es,
Trai
lers
and
Tra
ctor
s
Two
Whe
eler
s Car
s/
Jeep
s Ta
xi/ C
ab
Aut
o ri
cksh
aws/
3Whe
eler
s
Punj
ab
( As o
n 31
stM
arch
20
07)
Stag
e C
arria
ge
Ord
inar
y B
uses
-
Rs.2
.25
Per K
m
per d
ay
Ord
inar
y H
V A
C B
uses
(3x2
Sea
ts)-
R
s.1.0
0 Pe
r Km
pe
r day
In
tegr
al C
oach
(2x2
seat
s bus
es) –
R
s.0.5
0 Pe
r Km
pe
r day
Stag
e C
arria
ge B
uses
com
ing
from
Oth
er S
tate
s:-
Bus
es c
ount
ersi
gned
und
er re
cipr
ocal
agr
eem
ents-
R
s. 3.
70 P
er K
m p
er d
ay
Bus
es n
ot c
ount
ersi
gned
und
er re
cipr
ocal
ag
reem
ents-
Rs.
5.00
Per
Km
pe
r day
Min
i Bus
es R
s.30,
000
PA.
C
ity B
us S
ervi
ce R
s. 60
PS
PQ
City
Bus
es p
lyin
g o
utsi
de M
unic
ipal
lim
its
Ord
inar
y B
us: R
s. 4.
50-
pe
r Km
per
bus
per
day
.
HV
AC
Bus
es: R
s. 2.
00 p
er K
m p
er b
us p
er d
ay.
In
tegr
al C
oach
Bus
: Re.
1.0
0 pe
r Km
per
bus
per
day
.
Con
tract
Car
riage
To
uris
t
Bus
es:-
O
rdin
ary
and
Del
uxe-
Rs.6
,000
PSPA
A
ir C
ondi
tione
d-
Rs.5
,000
PSPA
In
tegr
al C
oach
-
Rs.
4,00
0
PSPA
A
ll In
dia
Tour
ist P
erm
its O
rdin
ary
Bus
es-
Rs.2
,000
Pe
r Day
Per
Veh
icle
Del
uxe
Bus
es-
Rs.
3,00
0 Pe
r Day
Pe
r Veh
icle
A
ir C
ondi
tione
d B
uses
-
Rs.4
,000
Per
Day
Per
Ve
hicl
e
3.
Om
ni B
us R
s.150
Per
day
Bas
is: G
VW
G
VW
(9
1one
s) Ta
x (R
s. Pa
)
Upt
o 1.
2
3,00
0
1.2
–
6
4,00
0
6 –
16
.2
5,00
0
16.2
–
25
8,00
0
>25
15
,000
Pe
rmit
Hol
ders
of T
ract
ors w
ith
trolle
ys u
sed
for c
omm
erci
al
purp
oses
w
ithin
the
radi
us o
f 25
Km
from
the
plac
e of
per
mit
hold
ers r
esid
ence
–
Rs.2
,000
PA
.
Va
lue
of
Mot
or
Cyc
le
(Rs.)
Lum
p su
m
tax
Upt
o 15
,000
3% o
f va
lue
>
15,0
00
4% o
f va
lue
2% o
f va
lue
of
mot
or
vehi
cle
Con
tract
Car
riage
:
Max
i and
Mot
or
Cab
s: R
s. 75
0 PS
PA
A
ll In
dia
Tour
ist
Perm
its:
M
axi C
ab: R
s. 60
0 pe
r day
M
otor
Cab
: Rs.
300
per d
ay
To
uris
t per
mit
vehi
cles
:
Max
i an
d M
otor
C
abs:
A
C/ N
on-
AC
N
on-A
c
AC
Pass
enge
rs: R
s. 40
0 PS
PA
Stat
es/ U
nion
Te
rrito
ries
Bu
ses
Tr
ucks
/Goo
ds V
ehic
les,
Trai
lers
and
Tra
ctor
s
Two
Whe
eler
s
Car
s/Jee
ps
Taxi
/ Cab
A
uto
rick
shaw
s/ 3W
heel
ers
Raj
asth
an
(As o
n 31
stM
arch
20
19)
Stag
e C
arria
ges:
R
s. 15
000
per y
ear+
pas
seng
er ta
x of
0.
49%
of t
he c
ost o
f cha
ssis
pl
us
Surc
harg
e 6.
25%
of o
rigin
al ta
x.
Con
tract
Car
riage
:
Rs.
3200
0 pe
r yea
r+ p
asse
nger
tax
of
12-2
4% o
f the
cos
t of c
hass
is
plus
su
rcha
rge
6.25
% o
f orig
inal
tax.
Bas
is: C
ost o
f Veh
icle
Rs 8
300
to 2
5000
PA
+Rs.
4000
pa
ssen
ger t
ax+
surc
harg
e 6.
25%
of o
rigin
al ta
x.
R
LW u
pto
1650
0 LT
T 11
% o
f th
e co
st o
f veh
icle
s + 1
2.5%
of
the
orig
inal
tax
paya
ble.
Engi
ne C
apac
ity-L
TT
4-10
% o
f Cos
t of v
ehic
le
Plus
12.
5% o
f orig
inal
tax
paya
ble
as su
rcha
rge
pa
yabl
e.
Bas
is: L
TT
Car
s & Je
eps:
4-
10%
of c
ost o
f veh
icle
.
Plus
12.
5% o
f orig
inal
tax
paya
ble
as su
rcha
rge
pa
yabl
e.
Mot
or/m
axi c
ab
LT
T: 1
1% o
f cos
t of
vehi
cle
Pl
us su
rcha
rge.
12.5
% o
f or
igin
al ta
x
paya
ble.
Pass
enge
r:
Rs.
300
to
800
year
lyPl
us
surc
harg
e 6.
25%
of
orig
inal
tax
paya
ble.
G
oods
:LTT
Bas
is:
VC
9% o
f VC
Plus
surc
harg
e 12
.5%
of
orig
inal
tax
paya
ble.
Sikk
im
(As o
n 31
.3.2
017)
Se
atin
g ca
paci
ty
Tax
(Rs.)
PA
32
+1
6400
+ R
s. 50
0 ot
her t
axes
Tr
ucks
,
Trai
lers
and
Tra
ctor
s:
Bas
is:
G
VW
W
eigh
t (in
kgs
)
TaxR
s. PA
U
pto
1470
96
5
18
05
11
26
77
40
6558
12
100
1210
8
Pl
us R
s. 50
0 O
ther
Tax
es
B
asis
: Eng
ine
Cap
acity
En
gine
C
apac
ity (c
c)
Tax
R
s. PA
U
pto
80
150
81
-170
300
17
1-25
0
450
>2
50
600
B
asis
: Eng
ine
Cap
acity
En
gine
C
apac
ity (c
c)
Tax
R
s. PA
U
pto
900
1,
500
90
1-1,
490
1,80
0
1,
491-
2,00
0
3,00
0
>2
000
4,50
0
B
asis
: Sea
ting
Cap
acity
Pe
rson
s
TaxR
s. PA
4+
1
1200
6+
1
1700
10
+1
2700
12
+1
3200
Pl
us R
s. 30
0 O
ther
Ta
xes
N
ot re
porte
d
111 112
Annexure 5.4 (contd...)
Annexure 5.4 (contd...)
Cont
d...
Cont
d...

St
ates
/ Uni
on
Terr
itori
es
Buse
s
Truc
ks/G
oods
Veh
icle
s, Tr
aile
rs a
nd T
ract
ors
Two
Whe
eler
s
Car
s/Jee
ps
Taxi
/ Cab
A
uto
rick
shaw
s/ 3W
heel
ers
Tam
il N
adu
( A
s on
31st M
arch
20
19)
Stag
e ca
rria
ge:
Rs.
400
PSPQ
Su
rcha
rge
25%
of
tax
To
uris
t om
ni
buse
s: s
eatin
g ca
paci
ty:
<
35 +
1: R
s. 4,
900
for e
very
sq
uare
met
er of
floor
are
a of
the
vehi
cle
>3
5 +
1: R
s. 3,
000
PS P
Q
B
asis
: RLW
R
LW (i
n kg
s)
Tax
(Rs.)
U
pto
3,00
0
19,2
00 L
TT
3,
001
–
5,50
0
950
PQ
5,50
1-
9,00
0
1,50
0 PQ
9,
001-
12
,000
1,
900
PQ
12,0
01-1
3,00
0
2,10
0 PQ
13
,001
-15,
000
2,
500
PQ
> 15
,000
25
00 P
Q +
Rs 7
5 fo
r ev
ery
addi
tiona
l 250
K
gs a
nd p
art t
here
of.
Tr
acto
rs:U
LW
ULW
(in
kgs)
Ta
x (R
s.)
Upt
o 2,
500
11
0 PQ
>2
,500
16
0 PQ
Tr
aile
rs
R
LW (i
n kg
s)
Tax
(Rs.)
U
pto
3,00
0
340
LT
3,
001
–
5,50
0
400
PQ
5,
501-
9,00
0
700
PQ
90
01-1
2000
810
PQ
12
001-
1300
0
1010
PQ
13
001-
1500
0
1220
PQ
>1
5000
1220
+Rs.
50 fo
r eve
ry 2
50
Kg
and
part
ther
eof i
n ex
cess
of 1
5000
Kgs
.
LT
T 8%
on
valu
e
C
ars
&
jeep
s: L
TT
Va
lue
(Rs.
Lakh
)
upto
10
>
10
To
uris
t Tax
i
Valu
e (R
s. La
kh)
Tax
New
Veh
icle
s
upto
10
10
% o
f va
lue
>
10 15
% o
f va
lue
O
ld V
ehic
les
up
to 1
0
8.5%
of
valu
e
> 10
14.5
% o
f va
lue
Met
er T
axi:
PPT
R
s. 40
00 fo
r 5 y
ears
Pa
ssen
ger:
LT
T: 1
0% o
n va
lue
PP
T R
s. 1,
400
G
oods
:
RLW
(in
kgs)
Ta
x (R
s.)
Upt
o
3,00
0
19,2
00 L
T
3,00
1 –
5,
500
950
PQ
5,50
1-
9,00
0
1,50
0 PQ
9,
001-
12
,000
1,90
0 PQ
12
,001
-13
,000
2,10
0 PQ
13
,001
-15
,000
2,50
0 PQ
>1
5,00
0
2,
500+
Rs.7
5 fo
r eve
ry
250K
gs a
nd
part
ther
eof
in e
xces
s of
15,0
00 K
gs
in w
eigh
t la
den
Stat
es/ U
nion
Te
rrito
ries
Bu
ses
Tr
ucks
/Goo
ds V
ehic
les,
Trai
lers
and
Tr
acto
rs
Two
Whe
eler
s
Car
s/Jee
ps
Taxi
/ Cab
A
uto
rick
shaw
s/ 3W
heel
ers
Te
lang
ana
(As o
n 31
st
Mar
ch 2
017)
Stag
e C
arri
age
(SRT
C
buse
s)
APS
RTC
Mof
fusi
l se
rvic
es: 7
% o
f Gro
ss
Traf
fic E
arni
ngs.
U
rban
serv
ices
: 5%
on
Gro
ss T
raffi
c Ea
rnin
gs.
Pr
ivat
e –
:
Tow
n Se
rvic
e :
O
rdin
ary
serv
ices
: R
s. 33
0 to
Rs.
660
(on
daily
kilo
met
erag
e)
Expr
ess s
ervi
ces:
Rs.
822.
M
offu
sil S
ervi
ces:
O
rdin
ary
serv
ices
:
Rs.
441
to R
s.948
(on
daily
kilo
met
erag
e)
Expr
ess s
ervi
ces:
R
s 1,0
92 to
Rs.
3,50
0 (o
n da
ily ki
lom
eter
age)
.Con
trac
t Car
riag
e
All
Indi
a To
uris
t Per
mits
–
Rs.
3,67
5 PS
PQ
Stat
e W
ide
Perm
its –
R
s. 2,
625
PSPQ
D
istri
ct W
ide
Perm
its –
R
s. 1,
207
PSPQ
Id
le C
ontra
ct C
arria
ge –
R
s. 85
0 PS
PQ
Truc
ks: B
asis
: LW
LW
(kg)
Ta
x (R
s.)
Upt
o 30
0
404
12
,000
-15
,000
2,
967
> 15
,000
R
s. 2,
967
+ R
s. 66
for e
very
250
kg
s in
exce
ss o
f 15
,000
kgs
Tr
aile
rs:
LW
(kg)
Ta
x (R
s.)
Upt
o 76
2
230
3,
048
to 4
,000
69
0
> 4,
000
R
s. 34
5 +
Rs.
40
for e
very
250
kgs
PQ
Tr
acto
rs:
LW
(kg)
Ta
x (R
s.)
Upt
o 76
2
230
3,
048
to
4,00
0
690
>
4,00
0
Rs.
690
+ R
s. 80
for
ever
y 25
0 kg
s
O
TT
9%
of V
C;
14
% in
cas
e of
2nd
ve
hicl
e.
O
TT
9% o
f VC
;
14%
in c
ase
of 2
nd
vehi
cle.
.
O
TT
VC
(Rs.)
Ta
x
Bel
ow 1
0 la
kh
12%
of
VC
>
10 la
kh 1
4% o
f V
C
A
utos
Pa
ssen
ger:
4
seat
er:
Rs.
110
Per
vehi
cle
PQ
6 se
ater
: R
s. 20
0 PS
PQ
G
oods
:
< 10
00
Kgs
Rs.
510
10
00-1
500
K
gs
Rs.
750
15
00 to
30
00 K
gs
Rs.
850
PQ
113 114
Annexure 5.4 (contd...)
Annexure 5.4 (contd...)
Cont
d...
Cont
d...
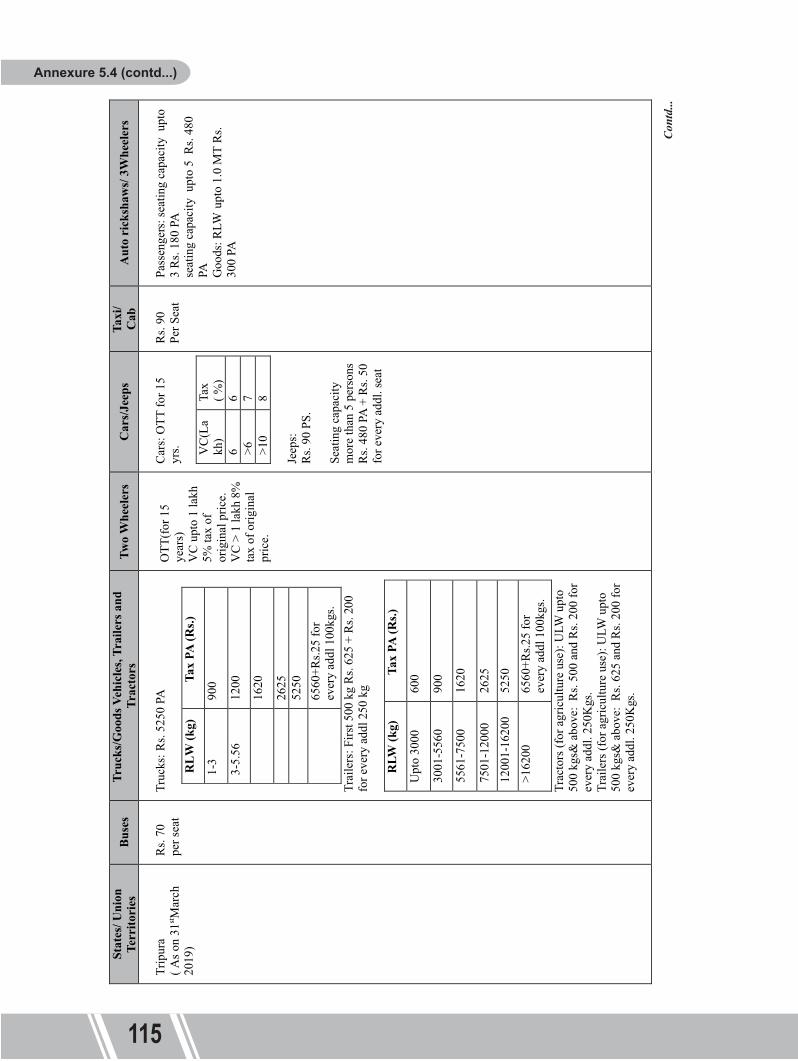
St
ates
/ Uni
on
Terr
itori
es
Buse
s
Truc
ks/G
oods
Veh
icle
s, Tr
aile
rs a
nd
Trac
tors
Tw
o W
heel
ers
C
ars/J
eeps
Ta
xi/
Cab
Aut
o ri
cksh
aws/
3Whe
eler
s
Trip
ura
( A
s on
31st M
arch
20
19)
Rs.
70
per s
eat
Tr
ucks
: Rs.
5250
PA
R
LW (k
g)
Tax
PA (R
s.)
1-3
90
0
3-5.
56
1200
16
20
26
25
52
50
65
60+R
s.25
for
ever
y ad
dl 1
00kg
s.
Trai
lers
: Firs
t 500
kg
Rs.
625
+
Rs.
200
for e
very
add
l 250
kg
R
LW (k
g)
Tax
PA (R
s.)
Upt
o 30
00
600
30
01-5
560
90
0
55
61-7
500
1620
75
01-1
2000
2625
12
001-
1620
0
5250
>1
6200
6560
+Rs.2
5 fo
r ev
ery
addl
100
kgs.
Tr
acto
rs (f
or a
gric
ultu
re u
se):
ULW
upt
o 50
0 kg
s& a
bove
: R
s. 50
0 an
d R
s. 20
0 fo
r ev
ery
addl
. 250
Kgs
.
Tr
aile
rs (f
or a
gric
ultu
re u
se):
ULW
upt
o 50
0 kg
s& a
bove
: R
s. 62
5 an
d R
s. 20
0 fo
r ev
ery
addl
. 250
Kgs
.
OTT
(for
15
year
s)
VC
up
to 1
lakh
5%
tax
of
orig
inal
pric
e.
VC
> 1
lakh
8%
ta
x of
orig
inal
pr
ice.
C
ars:
OTT
for 1
5 yr
s.
V
C(L
akh
) Ta
x
(
%)
6
6
>6
7
>10
8
Je
eps:
R
s. 90
PS
.
Se
atin
g ca
paci
ty
mor
e th
an 5
per
sons
R
s. 48
0 PA
+ R
s. 50
fo
r eve
ry a
ddl.
seat
R
s. 90
Pe
r Sea
t
Pa
ssen
gers
: sea
ting
capa
city
upt
o 3
Rs.
180
PA
se
atin
g ca
paci
ty u
pto
5 R
s. 48
0 PA
G
oods
:
RLW
up
to 1
.0 M
T R
s. 30
0 PA
St
ates
/ Uni
on
Terr
itori
es
Bu
ses
Truc
ks/G
oods
Veh
icle
s, Tr
aile
rs a
nd T
ract
ors
Tw
o W
heel
ers
Car
s/Jee
ps
Ta
xi/ C
ab
Aut
o ri
cksh
aws/
3Whe
eler
s
Utta
rakh
and
( A
s on
31st M
arch
20
17)
C
ontra
ct C
arria
ge: w
ith se
atin
g ca
paci
ty >
12 R
s. 10
0 pe
r mon
th
Stag
e C
arria
ge:
D
ista
nce
upto
150
0 K
m c
over
ed
in 1
mon
th
Tax
R
s/Sea
t
Plai
n R
oute
s
85
H
illy
Rou
tes
95
A
bove
150
0 K
m
for e
ach
extra
Km
add
ition
al R
s.
0.
04 p
er se
at/K
m
Truc
ks:
R
s. 23
0 pe
r ton
PQ
R
s. 85
0 pe
r Ton
PA
Tr
ailo
rs:
R
s.230
pe
r met
ric to
n
PQ
Rs.1
800
per m
etric
ton
PA
Tr
acto
rs:
R
s.500
per
met
ric to
n PQ
R
s.180
0 pe
r met
ric to
n PA
Agr
icul
tura
l Tra
ctor
s are
ex
empt
ed fo
r Tax
.
OTT
V
C
(Rs L
akhs
)
Tax
(%
of V
c)
Upt
o
10
6
>10
8
Pl
us R
s. 40
0 G
reen
Ta
x
OTT
VC
(R
s La
khs
)
Upt
o 10
>1
0
Bas
is: S
eatin
g ca
paci
ty
Se
ats
Ta
x R
s. PQ
U
pto
5
43
0
Upt
o 12
510
Pass
enge
rs :
Se
ats
Tax
Rs.
PA3+
1
730
6+1
84
57+
1
1700
G
oods
:
R
s. 10
00/M
TPA
R
s. 10
000
/ Ton
(OTT
)
Utta
r Pra
desh
( A
s on
31st M
arch
20
19)
Up
to 5
yea
rs o
ld:
Rs.
127
PSPM
Rs.
380
PSPQ
Rs.1
,380
PSPA
>5-1
0 ye
ars o
ld:
Rs.
132
PSPM
Rs.
397
PSPQ
Rs.1
,438
PSPA
>10
year
s old
:
Rs.
138
PSPM
Rs.
414
PSPQ
Rs.1
,495
PSPA
U.P
.S.R
.T.C
. Bus
es
Age
(yea
rs)
MV
T &
PT
(Rs.)
0-2
MV
T
Rs.
58
PSPQ
or R
s. 23
0 PS
PA p
lus P
T R
s. 60
0 PS
PM o
r Rs.1
800P
SPQ
or
Rs.6
500P
SPA
2-4
MV
T R
s. 58
PSP
Q o
r Rs.
230
PSPA
pl
us P
T R
s. 50
0 PS
PM o
r R
s.150
0PSP
Q o
r Rs.5
400P
SPA
4-6
MV
T R
s. 58
PSP
Q o
r Rs.
230
PSPA
pl
us P
T R
s. 40
0 PS
PM o
r R
s.120
0PSP
Q o
r Rs.4
800P
SPA
>6
MV
T R
s. 58
PSP
Q o
r Rs.
230
PSPA
pl
us P
T R
s. 15
0 PS
PM o
r R
s.450
PSPQ
or R
s.160
0PSP
A
Und
er C
ontr
act t
o U
.P.S
.R.T
.C. B
uses
MV
T R
s. 58
PSP
Q o
r Rs.
230
PSPA
plu
s PT
Rs.
450
PSPM
or R
s.135
0PSP
Q o
r Rs.5
000P
SPA
Truc
ks/T
railo
rs: B
asis
: G
VW
Rs.
242
PQ p
er
tonn
e or
pa
rt th
ereo
f
Rs.
893
PA p
er to
nne
or
part
ther
eof.
Agr
icul
ture
Tra
ilors
are
exem
pted
from
tax
Trac
tors
: Bas
is: U
LW
Rs.
525
PQ p
er to
nne
or
part
ther
eof
Rs.
1,89
0
PA p
er to
nne
or p
art t
here
of.
Agr
icul
ture
Tra
ctor
s are
ex
empt
ed fr
om ta
x
OTT
7% o
f
vehi
cle
cost
[cos
t no
t mor
e th
an R
s. 40
000/
-/
OTT
10%
of v
ehic
le c
ost
[cos
t mor
e th
an R
s. 40
000/
-/
OTT
Non
AC
: 7%
of
VC
AC
veh
icle
cos
t up
to 1
0 La
cs: 8
% o
f V
C
AC
veh
icle
cos
t mor
e th
an
10 L
acs:
10%
of
VC
Rs.
660
PSPQ
or R
s. 23
50PS
PA
Pass
enge
rs:
Rs.
600
PSPA
OTT
Rs.
5400
PS(
optio
nal)
Goo
ds ta
x: R
s. 85
0 pe
r ton
PA
or p
art t
here
of.
OTT
Rs.
7,60
0 pe
r ton
or
part
ther
eof.
115 116
Annexure 5.4 (contd...)
Annexure 5.4 (contd...)
Cont
d...
Cont
d...

St
ates
/ Uni
on
Terr
itori
es
Buse
s
Truc
ks/G
oods
Veh
icle
s, Tr
aile
rs a
nd T
ract
ors
Tw
o W
heel
ers
C
ars/J
eeps
Ta
xi/
Cab
Aut
o ri
cksh
aws/
3Whe
eler
s
Wes
t Ben
gal
( A
s on
31st M
arch
20
17)
B
asis
: Sea
ting
Cap
acity
PQ
Stag
e C
arria
ge(o
rdin
ary)
R
s125
for e
ach
seat
+10%
of q
uarte
rly
tota
l tax
as a
dditi
onal
ta
x.
Tr
ucks
:
Bas
is:
G
VW
(Ann
ual)
G
VW
(Kg)
A
nnua
l Rat
e of
Ta
x(R
s.)
Upt
o 2,
000
60
0
2,00
0-
3,50
0
1050
3,
500-
5,
500
21
00
5,50
0-7,
000
28
50
7,00
0-
9,00
0
3450
9,
000-
12,0
00
5550
12
,000
-14,
000
75
00
14,0
00-1
5,00
0
8250
15
,000
-16,
250
93
00
>16,
250
R
s. 93
00/-
pl
us R
s. 15
0 fo
r eve
ry a
ddl.
250
kgs.
+ 50
% o
f ann
ual
ta
x
Trai
lers
G
VW
(kg)
A
nnua
l Rat
e of
Tax
(Rs.)
U
pto
2,00
0
Rs.
1750
2,
000-
4,00
0
Rs.
2350
4,
000-
6,00
0
Rs.
3025
60
00-8
,000
Rs.
3925
80
00-1
0000
Rs.
5350
10
000-
1200
0
Rs.
7450
12
000-
1300
0
Rs.
8875
13
000-
1400
0
Rs.
9925
14
000-
1500
0
Rs.
1092
5
>1
5000
Rs.1
0975
+ R
s.
200/
-
for
ever
y ad
dl. 2
50 K
gs.
Tr
acto
rs:
U
LW (K
g)
Ann
ual R
ate
of
Tax(
Rs.)
50
0-20
00
1600
+70
for e
very
ad
ditio
nal 2
50 k
g.
2000
-400
0
2200
+100
for e
very
ad
ditio
nal 2
50 k
g.
4000
-800
0
3430
+ 3
50 fo
r eve
ry
addi
tiona
l 250
kg.
>800
0
1183
0 +
400
for e
very
ad
ditio
nal 2
50 k
g.
LT
T
Engi
ne
Cap
acity
(c
c) Ta
x (R
s.)
80
1800
or
6%
of
va
lue(
whi
che
ver i
s hi
gher
)
80-1
60
3600
or 9
%
of v
alue
(w
hich
ever
is
hig
her)
>6
0
5800
or
10%
of
valu
e (w
hich
ever
is
hig
her)
M
VT
(LTT
):
Upt
o 90
0 cc
: 10%
of
VV
or R
s. 40
,000
whi
chev
er
is h
ighe
r. N
ote:
A
reba
te o
f Rs.
1000
0/-
on
LTT
sh
all b
e al
low
ed
to N
on-A
C
vehi
cle
havi
ng
engi
ne c
apac
ity
upto
800
CC
.
90
0
cc to
149
0 cc
: 10%
of V
V o
r R
s. 55
,000
w
hich
ever
is
high
er.
14
90
cc to
20
00
cc: 1
0% o
f VV
or
Rs.
80,0
00
whi
chev
er is
hi
gher
.
>
2000
cc:
10%
of
VV
or R
s. 1,
00
,000
whi
chev
er
is h
ighe
r.
U
pto
5 se
ats
R
s.160
0 PA
Sp
ecia
l ta
x fo
r A
C R
s. 30
00/-
Pa
ssen
ger:
U
pto
4 se
ats
Rs.
660
PA
e-ric
ksha
w:
U
pto
4 se
ats
Rs.
660
PA
G
oods
:
GV
W u
pto
2000
Kg
R
s. 60
0 PA
St
ates
/ Uni
on
Terr
itori
es
Buse
s
Truc
ks/G
oods
Veh
icle
s, Tr
aile
rs a
nd T
ract
ors
Tw
o W
heel
ers
C
ars/J
eeps
Taxi
/ Cab
A
uto
rick
shaw
s/ 3W
heel
ers
A
ndam
an &
N
icob
ar Is
land
s (a
s on
1.3.
2019
)
R
s. 10
0 PA
Truc
ks a
nd T
ract
ors:
Rs.
150
PA
Rs.
25 P
A
R
s. 60
PA
R
s. 75
PA
Pass
enge
r &
Goo
ds:
Rs.6
0
C
hand
igar
h
(
as o
n 31
.3.2
019)
Bas
is: S
eatin
g ca
paci
ty U
pto
12+1
OTT
6%
of c
ost o
f va
lue
13
+1 a
nd a
bove
se
ats R
s. 20
0
PSPA
(M
axim
um R
s. 42
00)
GV
W
Upt
o 3
to
n
OTT
6%
of c
ost o
f val
ue.
GV
W>6
tons
Rs.
3000
PA
GV
W>
6
Tonn
es to
16.
2 to
nnes
Rs.
5000
PA
GV
W>
16.2
tonn
es
to 2
5 to
nnes
Rs.
7000
PA
GV
W >
25 to
nnes
Rs.
1000
0 PA
.
(OTT
)
Valu
e
of
Mot
or
Vehi
cle
Tax
Up
to R
s. 1
lakh
3% o
f VC
Rs.
1 la
kh
up to
Rs.
4 La
kh
4% o
f VC
>Rs.
4 La
kh
5% o
f VC
Va
lue
of
Mot
or
Vehi
cle
(Rs)
Tax
(15
year
s) up
to 20
lakh
6% o
f cos
t of
mot
or
vehi
cle
> 20
lakh
8% o
f cos
t of
mot
or
vehi
cle
O
TT
6% o
f cos
t of
vehi
cle
Pass
enge
r &
Goo
ds:
6% o
f cos
t
Dad
ar
& N
agar
H
avel
i
(a
s on
31.3
.201
7)
Bas
is: S
eatin
g ca
paci
ty
Ann
ual t
ax:
Ve
hicl
es c
arry
m
ore
than
9
pass
enge
rs: R
s. 85
0 +
Rs.
80 p
er
addi
tiona
l sea
t
in
addi
tion
to 9
pa
ssen
gers
.
Truc
ks: B
asis
RLW
Rs.
25
PA fo
r eve
ry
100
kg
of
RLW
Bas
is: V
ehic
le v
alue
.
LT
T
Indi
an
vehi
cles
:
2.5%
Impo
rted
vehi
cles
:
5%
Oth
er th
an d
iese
l veh
icle
s:
2.5
% o
f VC
.
5% fo
r im
porte
d ve
hicl
es.
Die
sel v
ehic
les:
LTT
VC
(Rs.
Lakh
)
Tax
Rat
e
Tax
Rat
e fo
r Im
port
ed
Vehi
cles
upto
10
2.5%
of
VC
5% >
10
3% o
f V
C
6%
Bas
is: S
eatin
g ca
paci
ty U
pto
4 pa
ssen
ger:
R
s. 40
0 PA
4
to 9
pa
ssen
gers
: R
s. 40
0 PA
+ R
s. 90
per
addi
tiona
l se
at
Pass
enge
r:
B
asis
: Sea
ting
capa
city
- U
pto 4 se
ats
Rs.
400
PA
117 118
Annexure 5.4 (contd...)
Annexure 5.4 (contd...)
Cont
d...
Cont
d...

St
ates
/ Uni
on
Terr
itori
es
Buse
s
Truc
ks/G
oods
Veh
icle
s, Tr
aile
rs a
nd T
ract
ors
Tw
o W
heel
ers
C
ars/J
eeps
Ta
xi/
Cab
Aut
o ri
cksh
aws/
3Whe
eler
s
Wes
t Ben
gal
( A
s on
31st M
arch
20
17)
B
asis
: Sea
ting
Cap
acity
PQ
Stag
e C
arria
ge(o
rdin
ary)
R
s125
for e
ach
seat
+10%
of q
uarte
rly
tota
l tax
as a
dditi
onal
ta
x.
Tr
ucks
:
Bas
is:
G
VW
(Ann
ual)
G
VW
(Kg)
A
nnua
l Rat
e of
Ta
x(R
s.)
Upt
o 2,
000
60
0
2,00
0-
3,50
0
1050
3,
500-
5,
500
21
00
5,50
0-7,
000
28
50
7,00
0-
9,00
0
3450
9,
000-
12,0
00
5550
12
,000
-14,
000
75
00
14,0
00-1
5,00
0
8250
15
,000
-16,
250
93
00
>16,
250
R
s. 93
00/-
pl
us R
s. 15
0 fo
r eve
ry a
ddl.
250
kgs.
+ 50
% o
f ann
ual
ta
x
Trai
lers
G
VW
(kg)
A
nnua
l Rat
e of
Tax
(Rs.)
U
pto
2,00
0
Rs.
1750
2,
000-
4,00
0
Rs.
2350
4,
000-
6,00
0
Rs.
3025
60
00-8
,000
Rs.
3925
80
00-1
0000
Rs.
5350
10
000-
1200
0
Rs.
7450
12
000-
1300
0
Rs.
8875
13
000-
1400
0
Rs.
9925
14
000-
1500
0
Rs.
1092
5
>1
5000
Rs.1
0975
+ R
s.
200/
-
for
ever
y ad
dl. 2
50 K
gs.
Tr
acto
rs:
U
LW (K
g)
Ann
ual R
ate
of
Tax(
Rs.)
50
0-20
00
1600
+70
for e
very
ad
ditio
nal 2
50 k
g.
2000
-400
0
2200
+100
for e
very
ad
ditio
nal 2
50 k
g.
4000
-800
0
3430
+ 3
50 fo
r eve
ry
addi
tiona
l 250
kg.
>800
0
1183
0 +
400
for e
very
ad
ditio
nal 2
50 k
g.
LT
T
Engi
ne
Cap
acity
(c
c) Ta
x (R
s.)
80
1800
or
6%
of
va
lue(
whi
che
ver i
s hi
gher
)
80-1
60
3600
or 9
%
of v
alue
(w
hich
ever
is
hig
her)
>6
0
5800
or
10%
of
valu
e (w
hich
ever
is
hig
her)
M
VT
(LTT
):
Upt
o 90
0 cc
: 10%
of
VV
or R
s. 40
,000
whi
chev
er
is h
ighe
r. N
ote:
A
reba
te o
f Rs.
1000
0/-
on
LTT
sh
all b
e al
low
ed
to N
on-A
C
vehi
cle
havi
ng
engi
ne c
apac
ity
upto
800
CC
.
90
0
cc to
149
0 cc
: 10%
of V
V o
r R
s. 55
,000
w
hich
ever
is
high
er.
14
90
cc to
20
00
cc: 1
0% o
f VV
or
Rs.
80,0
00
whi
chev
er is
hi
gher
.
>
2000
cc:
10%
of
VV
or R
s. 1,
00
,000
whi
chev
er
is h
ighe
r.
U
pto
5 se
ats
R
s.160
0 PA
Sp
ecia
l ta
x fo
r A
C R
s. 30
00/-
Pa
ssen
ger:
U
pto
4 se
ats
Rs.
660
PA
e-ric
ksha
w:
U
pto
4 se
ats
Rs.
660
PA
G
oods
:
GV
W u
pto
2000
Kg
R
s. 60
0 PA
St
ates
/ Uni
on
Terr
itori
es
Buse
s
Truc
ks/G
oods
Veh
icle
s, Tr
aile
rs a
nd T
ract
ors
Tw
o W
heel
ers
C
ars/J
eeps
Taxi
/ Cab
A
uto
rick
shaw
s/ 3W
heel
ers
A
ndam
an &
N
icob
ar Is
land
s (a
s on
1.3.
2019
)
R
s. 10
0 PA
Truc
ks a
nd T
ract
ors:
Rs.
150
PA
Rs.
25 P
A
R
s. 60
PA
R
s. 75
PA
Pass
enge
r &
Goo
ds:
Rs.6
0
C
hand
igar
h
(
as o
n 31
.3.2
019)
Bas
is: S
eatin
g ca
paci
ty U
pto
12+1
OTT
6%
of c
ost o
f va
lue
13
+1 a
nd a
bove
se
ats R
s. 20
0
PSPA
(M
axim
um R
s. 42
00)
GV
W
Upt
o 3
to
n
OTT
6%
of c
ost o
f val
ue.
GV
W>6
tons
Rs.
3000
PA
GV
W>
6
Tonn
es to
16.
2 to
nnes
Rs.
5000
PA
GV
W>
16.2
tonn
es
to 2
5 to
nnes
Rs.
7000
PA
GV
W >
25 to
nnes
Rs.
1000
0 PA
.
(OTT
)
Valu
e
of
Mot
or
Vehi
cle
Tax
Up
to R
s. 1
lakh
3% o
f VC
Rs.
1 la
kh
up to
Rs.
4 La
kh
4% o
f VC
>Rs.
4 La
kh
5% o
f VC
Va
lue
of
Mot
or
Vehi
cle
(Rs)
Tax
(15
year
s) up
to 20
lakh
6% o
f cos
t of
mot
or
vehi
cle
> 20
lakh
8% o
f cos
t of
mot
or
vehi
cle
O
TT
6% o
f cos
t of
vehi
cle
Pass
enge
r &
Goo
ds:
6% o
f cos
t
Dad
ar
& N
agar
H
avel
i
(a
s on
31.3
.201
7)
Bas
is: S
eatin
g ca
paci
ty
Ann
ual t
ax:
Ve
hicl
es c
arry
m
ore
than
9
pass
enge
rs: R
s. 85
0 +
Rs.
80 p
er
addi
tiona
l sea
t
in
addi
tion
to 9
pa
ssen
gers
.
Truc
ks: B
asis
RLW
Rs.
25
PA fo
r eve
ry
100
kg
of
RLW
Bas
is: V
ehic
le v
alue
.
LT
T
Indi
an
vehi
cles
:
2.5%
Impo
rted
vehi
cles
:
5%
Oth
er th
an d
iese
l veh
icle
s:
2.5
% o
f VC
.
5% fo
r im
porte
d ve
hicl
es.
Die
sel v
ehic
les:
LTT
VC
(Rs.
Lakh
)
Tax
Rat
e
Tax
Rat
e fo
r Im
port
ed
Vehi
cles
upto
10
2.5%
of
VC
5% >
10
3% o
f V
C
6%
Bas
is: S
eatin
g ca
paci
ty U
pto
4 pa
ssen
ger:
R
s. 40
0 PA
4
to 9
pa
ssen
gers
: R
s. 40
0 PA
+ R
s. 90
per
addi
tiona
l se
at
Pass
enge
r:
B
asis
: Sea
ting
capa
city
- U
pto 4 se
ats
Rs.
400
PA
117 118
Annexure 5.4 (contd...)
Annexure 5.4 (contd...)
Cont
d...
Cont
d...

St
ates
/ U
nion
Te
rrito
ries
Bu
ses
Tr
ucks
/Goo
ds V
ehic
les,
Trai
lers
and
Tra
ctor
s
Two
Whe
eler
s
Car
s/Jee
ps
Taxi
/ Cab
A
uto
rick
shaw
s/ 3W
heel
ers
Dam
an &
Diu
(a
s on
31.3
.201
9)
Pass
enge
r Tax
:
Rs.
1.50
PSP
A
per K
m o
f the
to
tal d
aily
Km
s pe
rmitt
ed o
r
Rs.
24 P
SPM
.
Tr
ucks
: Bas
is:
W
eigh
t
unla
den
W
eigh
t un
lade
n (K
gs)
Tax
PA
(Rs)
<7
50
350
75
0-12
00
450
12
00-2
500
600
25
00-5
000
800
Ove
r 100
0 K
gs o
r par
t th
ereo
f in
exce
ss o
f 50
00 K
gs
150
B
asis
:
Rs.
150
per
annu
m
O
TT:
2.
5% o
f the
V
C.
Fuel
Use
d
Driv
en o
n ot
her
than
die
sel
D
riven
on
dies
el
VC
upt
o 10
Lak
h
Driv
en o
n di
esel
V
C a
bove
10
lakh
Pa
ssen
gers
Veh
icle
: Bas
is:
Se
atin
g ca
paci
ty
Upt
o 4
pass
enge
r Rs.
400
PA; f
or
addi
tiona
l sea
t ove
r fou
r pa
ssen
gers
upt
o ni
ne R
s. 50
; for
ev
ery
addi
tiona
l sea
t ove
r nin
e R
s. 40
PA
.
G
oods
Veh
icle
:
Fu
el o
ther
than
die
sel:
R
s. 20
PA
per
100
kgs
of R
LW
D
iese
l: R
s. 25
PA
per
100
kgs
of
RLW
Goo
ds ta
x:
R
s.37.
50 u
p to
1,0
00 k
gs o
f RLW
Rs.
60 fo
r mor
e th
an 1
,000
kgs
of
RLW
Stat
es/
Uni
on
Terr
itori
es
Buse
s
Truc
ks/G
oods
Veh
icle
s, Tr
aile
rs a
nd
Trac
tors
Tw
o W
heel
ers
C
ars/J
eeps
Ta
xi/
Cab
A
uto
rick
shaw
s/ 3W
heel
ers
NC
T, D
elhi
( a
s on
31.3
.201
9)
Bas
is: S
eatin
g C
apac
ity
Se
atin
g C
apac
ity
excl
udin
g dr
iver
and
C
ondu
ctor
Tax
Rs.
PA
Not
mor
e th
an
4
605
5-
6
1,13
0
7-18
1,
915
M
ore
than
18
R
s. 1,
915
+ R
s. 28
0 pe
r pa
ssen
ger P
A
.
Tr
ucks
:
Petr
ol/C
NG
dri
ven
To
nne
Ta
x R
s. PA
U
pto
1
665
1-
2
940
2-
4
1,43
0
4-6
1,
915
6-
8
2,37
5
8-9
2,
865
9-
10
3,32
0
>10
3,32
0 PA
+ R
s.470
pe
r add
l
to
nne
D
iese
l dri
ven
To
nne
Tax
Rs.
PA
U
pto
1
832
1-
2
1175
2-
4
1,78
8
4-
6
2394
6-
8
2,96
9
8-
9
3,58
2
9-
10
4,15
0
>1
0
4,15
0 PA
+
Rs.5
88 p
er a
ddl
tonn
e
Pe
trol
/CN
G d
rive
n
Trac
tors
:
Add
ition
al ta
x pa
yabl
e in
resp
ect o
f ve
hicl
es, i
f suc
h ve
hicl
es a
re u
sed
for
draw
ing
traile
rs:
For e
ach
Trai
ler
Reg
ister
ed U
LW
Tax
Rs.
PA
U
pto2
ton
465
>2
ton
925
Die
sel d
rive
n
For e
ach
Trai
ler
Reg
ister
ed U
LW
Tax
Rs.
PA
Upt
o2 to
n
582
>2 to
n
1157
O
TT
Bas
is: V
C
Petr
ol/C
NG
dri
ven
V
C (R
s.) Ta
x
Upt
o 25
,000
2.
5% o
f VC
25
,000
-40
,000
5.0%
of V
C
40,0
00-
60,0
00 7.5%
of V
C
> 60
,000
10
% o
f VC
D
iese
l dri
ven
V
C (R
s.) Ta
x
Upt
o 25
,000
2.
5% o
f VC
25
,000
-40,
000
5 %
of V
C
40
,000
-60,
000
7.5%
of V
C
>
60,0
00
10%
of V
C
C
ompa
ny O
wne
d Ve
hicl
es
Pe
trol
/CN
G d
rive
n
V
C (R
s.)
Tax
U
pto
25,0
00
2.5%
of V
C
25
,000
-40,
000
5 %
of V
C
40
,000
-60,
000
7.5%
of V
C
>
60,0
00
10%
of V
C
C
ompa
ny O
wne
d Ve
hicl
es
D
iese
l dri
ven
V
C (R
s.)
Tax
U
pto
25,0
00
3.1%
of V
C
25,0
00-4
0,00
0
6.3
% o
f V
C
40,0
00-6
0,00
0
9.4%
of V
C
> 60
,000
12.5
% o
f V
C
O
TT B
asis
: VC
Petr
ol/C
NG
dri
ven
V
C (R
s. la
kh)
Tax
U
pto
6
4% o
f VC
6-
10
7% o
f VC
>1
0
10%
of V
C
Die
sel d
rive
n
VC
(Rs.
lakh
) Ta
x
Upt
o 6
5%
of V
C
6-
10
8.8%
of V
C
>1
0
12.5
% o
f VC
C
ompa
ny O
wne
d Ve
hicl
es
Pe
trol
/CN
G d
rive
n
V
C (R
s. la
kh)
Tax
U
pto
6
5% o
f VC
6-
10
8.8%
of V
C
>1
0
12.5
% o
f V
C
Com
pany
Ow
ned
Vehi
cles
Die
sel d
rive
n
VC
(Rs.
lakh
)
Tax
U
pto
6
6.3%
of V
C
6-
10
10.9
% o
f VC
>10
15.6
% o
f VC
Bas
is: S
eatin
g C
apac
ity
Pe
trol
/CN
G d
rive
n
Se
atin
g C
apac
ity
(exc
ludi
ng
driv
er a
nd
Con
duct
or)
Tax
Rs.
PA
Not
mor
e th
an 2
305
3-
4
60
5
5-
6
1,13
0
7-
18
1,91
5
M
ore
than
18
Rs.
1,91
5 +
Rs.
280
per
pass
enge
r
Die
sel d
rive
n
Seat
ing
Cap
acity
(e
xclu
ding
dr
iver
and
C
ondu
ctor
)
Tax
Rs.
PA
Not
mor
e th
an 2
305
3-
4
757
5-6
1413
7-18
2394
Mor
e th
an
18
Rs.
2394
+
Rs.
350
per
pass
enge
r
Not
e: T
here
is a
n ad
ditio
nal i
ncre
ase
of 2
5% o
f exi
sting
ann
ual r
ates
of t
axes
levi
ed o
n M
otor
Veh
icle
s pro
pelle
d by
the
Die
sel f
uel w
.e.f.
29.
9.20
11
119 120
Annexure 5.4 (contd...)
Annexure 5.4 (contd...)
Cont
d...
Cont
d...

Stat
es/
U
nion
Te
rrito
ries
Bu
ses
Tr
ucks
/Goo
ds V
ehic
les,
Trai
lers
an
d Tr
acto
rs
Two
Whe
eler
s
Car
s/Jee
ps T
axi/
Cab
A
uto
rick
shaw
s/ 3W
heel
ers
Pu
duch
erry
(a
s on3
1.3.
2019
)
St
age
Car
riag
e:
Urb
an: R
s. 15
0 PS
PQ
Intra
-Sta
te: R
s. 26
0 PS
PQ
Inte
r-Sta
te O
rdin
ary:
Rs.
360
PSPQ
In
ter-S
tate
Exp
ress
: Rs.
370
PSPQ
Con
tract
car
riage
:
Pers
ons
R
s.
14-2
7
325
PSPQ
<5
4
375
PS
PQ
O
rdin
ary
cont
ract
car
riage
(Upt
o 54
pe
rson
s): R
s. 45
0 PS
PQ
Del
uxe
cont
ract
car
riage
(Upt
o 54
pe
rson
s):
Rs.
1200
PSP
Q
Rs.
1500
per
ber
th/P
Q
B
asis
RLW
RLW
(kg)
R
s.
up to
3,0
00 2,
000P
A
5,50
0
800
PQ
9,00
0
1,20
0 PQ
12
,000
1,
700
PQ
13,0
00
2,00
0 PQ
15
,000
2,
200
PQ
> 15
,000
R
s.220
0+
Rs.2
00
for e
very
100
0 kg
Tr
acto
rs:
<
2,50
0 kg
ULW
: Rs.
120
PQ
>
2,50
0 kg
ULW
: Rs.
150
PQ
Tr
aile
rs:
LW
(kg)
Rs.
up
to 3
,000
150P
Q
30
01-5
500
300
PQ
55
01-9
000
550
PQ
90
00-1
2000
650
PQ
12
001-
1300
0
800
PQ
13
001-
1500
0
1000
PQ
>
15,0
00
Rs.1
000
PQ+
Rs.
50 fo
r eve
ry
250
kg
B
asis
: Eng
ine
Cap
acity
Engi
ne
Cap
acity
(cc)
Tax
Upt
o 55
N
il
56-7
5
Rs.
60 P
A R
s. 45
0 LT
T
76
-
170
Rs.
110
PA R
s. 85
0 LT
T
>170
Rs.
160
PA R
s. 1,
200
LTT
B
asis
: ULW
ULW
(kg)
Ta
x (R
s.)
Upt
o 70
0
Rs.
550
PA
/
Rs.
4,80
0 LT
T
700-
1,50
0
Rs.
710
PA
/
Rs.
6,00
0 LT
T
1,50
0-2,
000
Rs.
910
PA
/ R
s. 8,
000
LTT
2,
000-
3,00
0
Rs.
940
PA
/
Rs.
8,00
0 LT
T
>3
,000
Rs.
960
PA
/
R
s. 8,
000
LTT
M
ore
than
4
upto
6
pers
ons
incl
udin
g dr
iver
:
Rs.
900
PA /
R
s. 45
00 fo
r fiv
e ye
ars
Mor
e th
an 6
up
to 1
0 pe
rson
s in
clud
ing
driv
er: R
s. 45
00 P
A
Mor
e th
an
10 u
pto
13
pers
ons
incl
udin
g dr
iver
: Rs.
6500
PA
Pa
ssen
gers
Ta
x :
U
pto
3 pa
ssen
gers
:Rs.
200P
A/R
s. 10
00 fo
r 5
year
s
Upt
o 4
pass
enge
rs
:Rs 2
60
PA/ R
s 13
00 fo
r 5
year
s.
Add
l: A
dditi
onal
CO
C: C
ost o
f Cha
ssis
GV
W: G
ross
Veh
icle
Wei
ght
HG
V: H
eavy
Goo
ds V
ehic
les
LGV:
Lig
ht G
oods
Veh
icle
s LT
T: L
ife T
ime
Tax
LW: L
aden
Wei
ght
M
GV:
Med
ium
Goo
ds V
ehic
les
OTT
: One
Tim
e Ta
x PA
: Per
Ann
um
PM: P
er M
onth
PQ: P
er Q
uarte
r PP
: Per
Pas
seng
er PS
: Per
Sea
t
RLW
: Reg
iste
red
Lade
n W
eigh
t RT
: Roa
d Ta
x SR
T: S
peci
al R
oad
Tax
ULW
: Unl
aden
Wei
ght
VC
: Veh
icle
Cos
t V
V: V
ehic
le V
alue
PP
T: P
erm
it Pe
riod
Tax
MV
T: M
otor
Veh
icle
Tax
PT
: Pas
seng
er T
ax
Abb
revi
atio
ns u
sed
in A
nnex
ure
5.8:
121 122
Appendix
GLOSSARY OF IMPORTANT TERMS
Annexure 5.4 (contd...)
Contd...
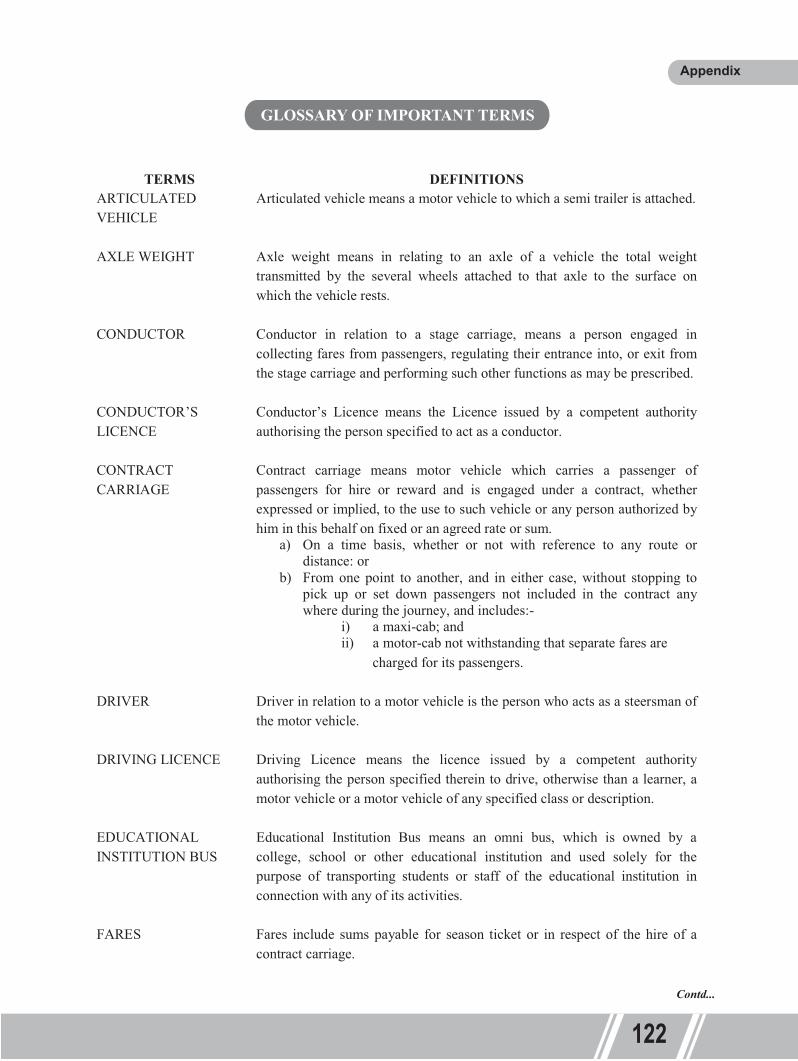
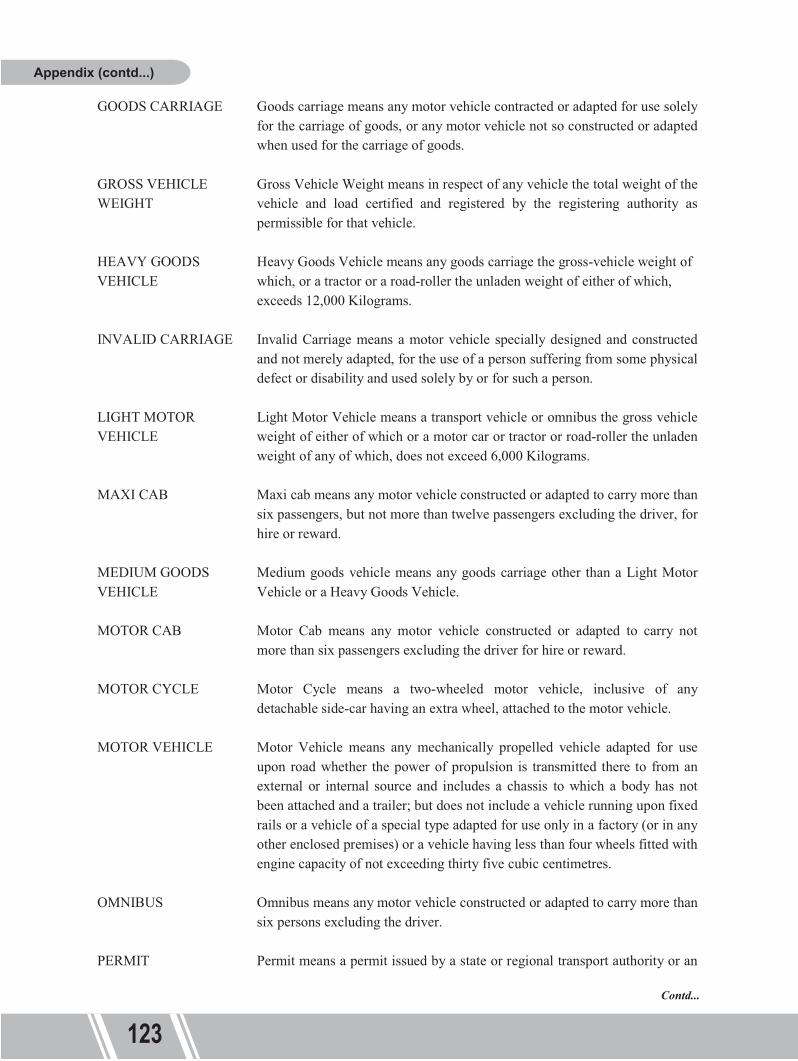
123 124
Appendix (contd...)
Appendix (contd...)
Contd...

123 124
Appendix (contd...)
Appendix (contd...)
Contd...