Rail Station Fact Sheet – Parker Road Station - North Central ...
Upload
khangminh22Category
view
3download
0
Sustainable High Volum
e Road and Rail Transport in Low Incom
e Countries M
ichael Burrow, Gurm
el Ghataora, Bruce Thompson and Bernard O
bika
Sustainable High Volume Road and Rail Transport in Low Income Countries
Printed Edition of the Special Issue Published in Sustainability
www.mdpi.com/journal/sustainability
Michael Burrow, Gurmel Ghataora, Bruce Thompson and Bernard Obika
Edited by
Sustainable High Volume Road and Rail Transport in Low Income Countries


Sustainable High Volume Road and Rail Transport in Low Income Countries
Editors
Michael Burrow
Gurmel Ghataora
Bruce Thompson
Bernard Obika
MDPI • Basel • Beijing • Wuhan • Barcelona • Belgrade • Manchester • Tokyo • Cluj • Tianjin
Editors
Michael Burrow
University of Birmingham
UK
Gurmel Ghataora University of Birmingham UK
Bruce Thompson IMC Worldwide UK
Bernard Obika
IMC Worldwide
UK
Editorial Office
MDPI
St. Alban-Anlage 66
4052 Basel, Switzerland
This is a reprint of articles from the Special Issue published online in the open access journal
Sustainability (ISSN 2071-1050) (available at: https://www.mdpi.com/journal/sustainability/
special issues/High Road Rail Transport Low Income).
For citation purposes, cite each article independently as indicated on the article page online and as
indicated below:
LastName, A.A.; LastName, B.B.; LastName, C.C. Article Title. Journal Name Year, Article Number,
Page Range.
ISBN 978-3-03943-088-8 (Hbk)
ISBN 978-3-03943-089-5 (PDF)
Cover image courtesy of Ben Walker.
c© 2020 by the authors. Articles in this book are Open Access and distributed under the Creative
Commons Attribution (CC BY) license, which allows users to download, copy and build upon
published articles, as long as the author and publisher are properly credited, which ensures maximum
dissemination and a wider impact of our publications.
The book as a whole is distributed by MDPI under the terms and conditions of the Creative Commons
license CC BY-NC-ND.

Contents
About the Editors . . . . . . . . . . . . . . . . . . . . . . . . . . . . . . . . . . . . . . . . . . . . . . vii
Bruce Thompson and Bernard Obika
Advancing Applied Research in High Volume Transport in Low-Income Countries in Africaand South AsiaReprinted from: Sustainability 2020, 12, 4088, doi:10.3390/su12104088 . . . . . . . . . . . . . . . . 1
Nicholas Thom and Andrew Dawson
Sustainable Road Design: Promoting Recycling and Non-Conventional MaterialsReprinted from: Sustainability 2019, 11, 6106, doi:10.3390/su11216106 . . . . . . . . . . . . . . . . 7
Marcelo Blumenfeld, Wendy Wemakor, Labib Azzouz and Clive Roberts
Developing a New Technical Strategy for Rail Infrastructure in Low-Income Countries inSub-Saharan Africa and South AsiaReprinted from: Sustainability 2019, 11, 4319, doi:10.3390/su11164319 . . . . . . . . . . . . . . . . 19
Phill Wheat, Alexander D. Stead, Yue Huang and Andrew Smith
Lowering Transport Costs and Prices by Competition: Regulatory and Institutional Reforms inLow Income CountriesReprinted from: Sustainability 2019, 11, 5940, doi:10.3390/su11215940 . . . . . . . . . . . . . . . . 43
A S M Abdul Quium
Transport Corridors for Wider Socio–Economic DevelopmentReprinted from: Sustainability 2019, 11, 5248, doi:10.3390/su11195248 . . . . . . . . . . . . . . . . 63
Stefan Bakker, Gary Haq, Karl Peet, Sudhir Gota, Nikola Medimorec, Alice Yiu, Gail Jennings and John Rogers
Low-Carbon Quick Wins: Integrating Short-Term Sustainable Transport Options in Climate Policy in Low-Income CountriesReprinted from: Sustainability 2019, 11, 4369, doi:10.3390/su11164369 . . . . . . . . . . . . . . . . 87
Tanu Priya Uteng and Jeff Turner
Addressing the Linkages between Gender and Transport in Low- and Middle-Income CountriesReprinted from: Sustainability 2019, 11, 4555, doi:10.3390/su11174555 . . . . . . . . . . . . . . . . 105
Maria Kett, Ellie Cole and Jeff Turner
Disability, Mobility and Transport in Low- and Middle-Income Countries: A Thematic ReviewReprinted from: Sustainability 2020, 12, 589, doi:10.3390/su12020589 . . . . . . . . . . . . . . . . . 139
Mark Gorman, Sion Jones and Jeffrey Turner
Older People, Mobility and Transport in Low- and Middle-Income Countries: A Review ofthe ResearchReprinted from: Sustainability 2019, 11, 6157, doi:10.3390/su11216157 . . . . . . . . . . . . . . . . 157
Gina Porter and Jeff Turner
Meeting Young People’s Mobility and Transport Needs: Review and ProspectReprinted from: Sustainability 2019, 11, 6193, doi:10.3390/su11226193 . . . . . . . . . . . . . . . . 173
Shahram Heydari, Adrian Hickford, Rich McIlroy, Jeff Turner and Abdulgafoor M. Bachani
Road Safety in Low-Income Countries: State of Knowledge and Future DirectionsReprinted from: Sustainability 2019, 11, 6249, doi:10.3390/su11226249 . . . . . . . . . . . . . . . . 197
v

About the Editors
Michael Burrow is senior lecturer in the School of Engineering at the University of Birmingham,
and specialises in pro-poor infrastructure asset management. He has 20 years’ experience in
multi-disciplinary applied road research and capacity building with partners in Africa and South
Asia and has published more than 100 peer-reviewed papers and professional reports on this work.
Projects are on-going in Ethiopia, The Gambia, Ghana, India, Kenya, Liberia, Sierra Leone and
Uganda. As director of the MSc Road Management and Engineering programme, Michael lectures in
road asset management, risk management and rural roads for development. He currently supervises
some 40 PhD research students in these and related topics. His excellence in teaching and mentoring
was recognised with the 2018 Teaching Innovation Award by the Higher Education Futures institute;
and the award for Excellence in Doctoral Research Supervision (College of EPS; 2018-19).
Gurmel Ghataora has a PhD in geotechnical engineering and some 50 years’ experience in
academic and industrial research on the geotechnics of transport infrastructure. His international
experience includes materials’ testing (laboratory and field), ground improvement, use of
out-of-specification materials in construction, improvement of roads and railways, and laboratory
research. His international experience includes on-going projects in Ethiopia, The Gambia, Ghana,
India, Liberia, Sierra Leone and Uganda. He lecturers in geotechnical engineering, rural roads
and soil mechanics, and sustainable transport. He has published two books on materials and
transportation geotechnics, several book chapters, and over 150 peer-reviewed journal and
conference papers. Dr Ghataora has supervised over 60 research students.
Bruce Thompson is an independent transport policy adviser to international development
clients. Currently, he is working for the DFID Applied Research Programme in High Volume
Transport in Low-Income Countries in Africa and South Asia. While Head of Infrastructure Policy
at DG Development at the European Commission in Brussels, he wrote the Commission’s transport
sector guidelines and EU policy communications on transport in EU development cooperation. He
was a founding Board Member of the Africa Transport Policy Program (SSATP) and has also worked
in close coordination with the African Development Bank, the African Union Commission, UN
Economic Commission for Africa, and the World Bank. His in-depth knowledge in the transport
sector reflects his work in the private and public sectors and insights gained from living in
developing countries, mainly Africa. He is a Chartered Civil Engineer with over 30 years’ experience
in developing transport policy, strategy, sectoral reform programmes, and in managing investment
programmes.
vii
Bernard Obika is leading the DFID funded Applied Research Programme in High Volume
Transport in Low-Income countries in Africa and South Asia. The research programme aims to
deliver an evidence base for transport that is affordable, efficient, green and safe. Dr Obika has a
PhD from the University of Birmingham and has published some 40 technical papers and research
reports on infrastructure and institutional development issues. Topics range from local contractor
capacity development, and labour-based works, to soluble salt damage to bituminous surfacing of
roads and runways in tropical environments. Committed to international development, Dr Obika
has more than 30 years’ experience in transport engineering, working for multilateral organisations,
national governments and the private sector. During this time, he has been responsible for over
200 major infrastructure and institutional development projects in Africa, Asia, South America, the
Caribbean, Europe and United Kingdom. In 2017, Powerlist nominated Dr Obika as one of the top
100 most influential black persons in the UK. In 2015, he was a finalist in European CEO of the Year
in recognition of his contribution to transport and infrastructure development for governments in
Africa and Asia.
viii


sustainability
Editorial
Advancing Applied Research in High VolumeTransport in Low-Income Countries in Africa andSouth Asia
Bruce Thompson * and Bernard Obika
IMC Worldwide Ltd., 64–68 London Road, Redhill, Surrey RH1 1LG, UK; [email protected]* Correspondence: [email protected]
Received: 7 May 2020; Accepted: 13 May 2020; Published: 16 May 2020
Abstract: The Department for International Development (DFID) is funding the High VolumeTransport (HVT) Applied Research Programme. This programme is an integral component of theUK response to delivering transport and mobility that is accessible, efficient, safe, and green in thelow-income countries (LICs) in Africa and South Asia. The first part of the HVT programme producedan up-to-date and comprehensive state of knowledge on high volume transport in these countries.This Special Issue presents a selection of papers to cover key research priorities identified in road andrail transport, low carbon transport, and gender and inclusive transport. The state of knowledge hasproduced a sound basis for setting priorities for applied research in the second part of the programme.Applied research is directed to delivering high volume transport that contributes to economic growthand social development, and that is more resilient to the impact of climate change in LICs in Africaand South Asia.
Keywords: accessible road and rail infrastructure; efficient transport services; transport corridors;green transport; low carbon transport; road safety; disability and mobility; gender disparity;vulnerable groups
1. Background
Research on transport in low-income countries (LICs) is a strategic priority for the UK Departmentfor International Development (DFID) because accessible, efficient, safe, and green transport isimperative to economic growth, social development, and the environment. Since the transport sectoris one of the largest recipients of aid in almost every LIC and DFID focus countries, DFID is committedto ensuring that spending on transport is effective. Every one percent gain on the cost effectiveness oftransport infrastructure is worth potentially US $1 billion each year in Africa. Thus, there is an ongoingand urgent need for research that will contribute to meeting the emerging and changing conditions inmany LICs, and to ensuring the transport sector works better in these countries to achieve the UNSustainable Development Goals (SDGs).
2. Research Objectives
DFID development priorities are aligned with the UN SDGs and to this end, DFID is a leadingpartner in the Sustainable Mobility for All (Sum4All) Consortium. Sum4All partners are committed toensuring transport plays its critical role in supporting LICs to reach their SDGs by seeking innovativeways to make transport accessible, efficient, safe, and green.
2.1. Universal Access
One billion people in LICs have no access to an all-weather road [1]. This means about 70% ofAfrica’s rural population—some 450 million people—are isolated from economic activity, employment,
Sustainability 2020, 12, 4088; doi:10.3390/su12104088 www.mdpi.com/journal/sustainability1

Sustainability 2020, 12, 4088
and basic provisions of health and education [2]. Meanwhile, the urban population in developingcountries, which is expected to rise by two billion people by 2045, has rapidly outstripped the capacitygrowth of public transport [2]. Thus, transport infrastructure and services urgently need adaptingand extending to meet these pressing mobility and access needs of people in LICs in Africa andSouth Asia. Adequate access includes safe mobility for women, people with disabilities, and othervulnerable groups.
2.2. Efficiency
Missing links in strategic transport networks connecting LICs in Africa and South Asia maketransport more costly, render trade uncompetitive, and stifle economic growth. LICs in Africa,particularly the landlocked countries, are the hardest hit, with intra-African trade only 15% comparedto 61% in South Asia [3]. This means African consumers pay more for goods because 40% of the price ofgoods is transport costs. Although vehicle and mainly fuel efficiency improved in the period between2005 and 2015, progress has stalled recently, reducing the potential benefits to goods and passengertransport particularly in urban areas. Thus, better transport connectivity and lower transport priceswill benefit manufacturers, commerce, farmers, consumers, and passengers alike.
2.3. Road Safety
Low and middle-income countries account for 90% of global road fatalities, yet own only 50% ofthe world’s road vehicles [1]. The fatality risk is 20 times higher for motorcyclists than for car occupants,and 7 and 9 times higher for cyclists and pedestrians, respectively. By far the highest number of globaltraffic fatalities (40% to 50%) occur in urban areas, and is rising faster in LICs [2]. These high fatalityand injury rates cost 3% of GDP in most LICs and place a heavy demand on hospital and healthbudgets. They also damage the livelihoods of countless families in LICs in Africa and South Asia.
2.4. Green Transport
Between 2000 and 2016, greenhouse gas (GHG) emissions from all transport modes increasedby 86% in Africa and 92% in Asia, primarily driven by increases in motorised passenger and freighttransport; whereas transport emissions decreased by 2% in OECD countries [4]. Consequently, air andnoise pollution is a health hazard in many LIC cities. Traffic congestion, low quality fuel, and poorlymaintained trucks and motorcycles contribute to pollutant levels in excess of levels set by the WorldHealth Organisation. Thus, LICs need to adapt transport policies, to adopt new technologies, and toboost urban transport efficiency in ways that will reduce GHG emissions and improve health in urbancities and urban areas.
3. Methodology
In November 2017, DFID launched the High Volume Transport (HVT) Applied ResearchProgramme as part of the UK response to deliver transport and mobility that is accessible, efficient,safe, and green. HVT is a five-year research programme backed by UK Aid funding of £14 million.The first part of the programme assessed the State of Knowledge in four thematic areas: (1) longdistance strategic road and rail transport; (2) urban transport; (3) low carbon transport; and (4) gender,inclusion, vulnerable groups, and road safety.
Following a competitive call, HVT commissioned research suppliers to review current researchin order to establish future directions for research that will contribute to meeting the developmentgoals for transport in LICs. The findings of the literature reviews were examined and tested with LICstakeholders in Africa and South Asia using qualitative and quantitative questionnaires, as well asphysical and virtual interviews. Participatory workshops were held in Bangladesh, Kenya, Tanzania,and Malaysia. This comprehensive testing and analysis resulted in the identification of priority researchareas and key topics for applied research to be carried out in the second part of the HVT programmethat started in January 2020.
2

Sustainability 2020, 12, 4088
4. Future Research Directions
The first part of the HVT programme revealed a wide range of research topics, as shown in therepresentative papers presented in this Special Issue. The selected papers cover key research prioritiesin road and rail transport, low carbon transport, and gender and inclusive transport with regard touniversal access, efficiency, safe, and green transport in LICs in Africa and South Asia.
4.1. Road Infrastructure
A technical and contractual review of the use of recycled road pavement materials and inexpensive,non-conventional materials identified a range of road designs based on these materials in temperateand tropical climates [5]. However, little agreement was found on the use of non-conventional materialsand on appropriate contractual arrangements to mainstream their use in road pavement construction.The contractual methods assessed were mainly public-private partnerships (PPPs) and “alliancing”,a new form of PPP. However, to gain cost and environmental benefits of using recycling road pavementand non-conventional materials, two research areas were identified that would contribute to greentransport. One is to gain more insight into the design and specifications of these materials forwater-resilient roads, and the other is to establish guidelines for financial, institutional, and contractualarrangements for sustainable PPPs.
4.2. Railway Infrastructure
LICs in Africa and South Asia are investing, mainly with Chinese funding, in new railway linesto replace deteriorating infrastructure built in the 19th and 20th centuries [6]. However, many railinfrastructure projects are driven by international supplier preference to create continent-wide networks,rather than effective interoperable regional networks. A new technical strategy that focuses on nationaland regional networks would contribute to more efficient and greener alternatives to road transport.To this end, technology and standards need to be adapted to increase railway interoperability and thusto improve access to more competitive railway services. To support this strategy, the research prioritieshave been identified as comprehensive data collection on rail network conditions and performance;development of affordable technologies for LICs; and harmonisation of technical standards to facilitatecross-border operations.
4.3. Road and Rail Transport Services
A comprehensive review identified multiple barriers to the efficiency and safety of road andrail services in LICs in Africa and South Asia. These barriers range from unregulated driver hours,inadequate road safety standards, vehicle overloading, inappropriate railway concessioning; theyalso include low skills and capacity in the public sector, and poor cross-border road and rail services.Overcoming these barriers will improve efficiency, widen public access to road and rail services,and contribute to better road safety. Based on best practice worldwide, research priorities havebeen identified as systematic study in LIC transport services, development of new technology ande-border systems at border crossings, improvement of management of rail infrastructure and servicesin concessions, and assessment of railway regulatory frameworks and railway authorities [7].
4.4. Transport Corridors
The review of transport corridors in LICs in Africa and South Asia focused on corridor developmentin the light of trade investment, governance, and management of cross border and corridor operations [8].The review also covered the impact of transport corridor development on the rural economy andinclusive employment, trafficking of women, and the spread of HIV/AIDS and other sexually transmitteddiseases. Research in these priority areas would contribute to improving efficiency, increasing access,and providing safer mobility for women and vulnerable groups. As few studies have been conductedon the socio-economic impacts of transport corridors, the research priorities identified focus on
3
Sustainability 2020, 12, 4088
the uneven corridor investment outcomes across geographical locations and population groups.The research priorities include modelling distributional impacts of regional transport investment,regulatory corridor governance and management, and gaining better insight into the negative socialexternalities of transport corridors.
4.5. Low Carbon Transport
In an assessment of the current status, feasibility, and potential of low-carbon transport measures,ten “quick-wins” for sustainable development and green transport were identified [9]. These quickwins range from better fuel economy and pricing incentives as well as the introduction of electric two-and three-wheelers to making urban mobility more sustainable and the promotion of non-motorisedtransport. Directed to integrating national transport and climate change policies, the applied researchpriorities identified are to assess the design and implementation of cost effective quick wins. In addition,greater coordination between transport agencies, vehicle manufacturers, and energy suppliers wouldbuild a cohesive low carbon strategy in LICs.
4.6. Mobility of Vulnerable Groups
4.6.1. Gender Disparity
The review of gender inequality in mobility and transport focused on spatial and transportplanning, and mobility in newly emerging smart cities [10]. Gender disparities in transport were foundto have impacts on young girls’ and women’s access to education, employment, health services, andwell-being and consequently affect income levels and livelihood outcomes. Transport disparities werefound to be higher in cities where more women pedestrians were involved in road traffic accidents, andinnovations in smart mobility tended to benefit men more than women. Furthermore, women werefound to be under-represented in transport and urban planning, thus further compounding transportgender disparities. Thus, delivering accessible transport and safe mobility that would ensure betteraccess to health and education services and jobs, creating better livelihoods for women, is important.The review identified 11 priority research areas to tackle this gender disparity in transport, highlightingthe need to integrate quantitative and qualitative data in knowledge generation and decision making.
4.6.2. Disability and Mobility
Equitable and inclusive transport for people with disabilities were identified as key issues in urban,rural, and long distance journeys, as well as affordability of transport services and availability of specialtransport services for people with mobility difficulties. The findings of the literature review showedknowledge gaps on the barriers to accessible and inclusive transport and an urgent need for extensiveresearch on inclusive transport in LICs and on effective ways to monitor it [11]. The research prioritiesinclude ensuring the needs of adults and children with disabilities are better understood, as well ashow to involve them in planning and setting standards for transport services. In addition, training indisability awareness needs to be developed for public and private sector transport providers, as wellas adapting technology to better facilitate access and safe mobility for all people with disabilities.
4.6.3. Older People
Little is known about the mobility needs of older people in LICs [12]. The literature reviewhas shown how health, gender, and social well-being are influenced by their mobility and transport.Transport can be a barrier to access to health services and may involve multiple journeys to differenthealth centres. Furthermore, socially isolated old people without inadequate support in urban andrural areas call for innovative transport services. Consequently, research priorities that would benefitthe access and mobility of older people include collection of gender and age-disaggregated data,gaining insight into transport’s role in affordable access to health services and job opportunities, new
4
Sustainability 2020, 12, 4088
approaches to involve older people actively in research, and the use of new technology to explorespatial barriers to urban services.
4.6.4. Children and Youth
Limited access to transport was found to restrict the mobility of children and youth from poorerhouseholds in LICs and thus impact on their livelihood potential and life chances [13]. The literaturereview covered journey patterns of schoolchildren in rural and urban areas, transport access andaffordability for young workers, and the safe mobility of vulnerable children, cyclists, and motorcyclists.Research priorities for better access to safe and affordable mobility include engaging the young inresearch and the outcomes, assessing transport infrastructure and services interventions; developingapproaches to transport subsidies; assessing job opportunities for young people, particularly the poorand women; and the use of mobile technology to change travel patterns.
4.7. Road Safety
The review of road safety focused on data collection and management, traffic engineering, andsafety policy aspects in 10 key areas of safety, thus providing a holistic approach to road safety [14].Key research focuses identified are to gain more insight into underreported road crashes; traffic injuriesand resulting disabilities; the cost of road crashes; vehicle safety and risks in the different compositionof vehicle fleets; social and behavioural approaches to road safety in LICs; and capacity building in allaspects of safety. Four initial steps for better road safety were identified: improving the quality of datacollection and analysis; raising public awareness of road crash reporting, as well as examining dataanalysis techniques; and using proactive measures to prioritise investments.
5. Conclusions
The literature reviews have produced up-to-date and comprehensive state of knowledge on highvolume transport in LICs in Africa and South Asia. The review findings focus on the DFID priorities ofuniversal access to transport, efficient transport networks and services, and safe and green transport forall. Thus, the first part of the programme provides a sound basis for setting applied research priorities.These priorities are directed to delivering high volume transport that is more accessible, more efficient,more inclusive, and more resilient to the impact of climate change in LICs across Africa and South Asia.
Author Contributions: Writing, B.T.; review, B.O. All authors have read and agreed to the published version ofthe manuscript.
Funding: This research was funded by UK AID through the UK Department for International Development underthe High Volume Transport Applied Research Programme, managed by IMC Worldwide.
Conflicts of Interest: The authors declare no conflict of interest.
References
1. World Bank. Available online: https://www.worldbank.org/en/topic/transport/overview (accessed on28 March 2020).
2. Sustainability Mobility for All (Sum4All). Available online: https://sum4all.org/priorities/universal-access(accessed on 28 March 2020).
3. Africa Transport Policy Program (SSATP). Available online: https://www.ssatp.org/topics/regional-integration(accessed on 28 March 2020).
4. SLoCaT (2018). Transport and Climate Change Global Status Report 2018. Available online: http://slocat.net/tcc-gsr (accessed on 11 May 2020).
5. Thom, N.; Dawson, A. Sustainable Road Design: Promoting Recycling and Non-Conventional Materials.Sustainability 2019, 11, 6106. [CrossRef]
5

Sustainability 2020, 12, 4088
6. Blumenfeld, M.; Wemakor, W.; Azzouz, L.; Roberts, C. Developing a New Technical Strategy for RailInfrastructure in Low-Income Countries in Sub-Saharan Africa and South Asia. Sustainability 2019, 11, 4319.[CrossRef]
7. Wheat, P.; Stead, A.; Huang, Y.; Smith, A. Lowering Transport Costs and Prices by Competition: Regulatoryand Institutional Reforms in Low-Income Countries. Sustainability 2019, 11, 5940. [CrossRef]
8. Quium, A. Transport Corridors for Wider Socio–Economic Development. Sustainability 2019, 11, 5248.[CrossRef]
9. Bakker, S.; Haq, G.; Peet, K.; Gota, S.; Medimorec, N.; Yiu, A.; Jennings, G.; Rogers, J. Low-Carbon QuickWins: Integrating Short-Term Sustainable Transport Options in Climate Policy in Low-Income Countries.Sustainability 2019, 11, 4369. [CrossRef]
10. Uteng, T.; Turner, J. Addressing the Linkages between Gender and Transport in Low- and Middle-IncomeCountries. Sustainability 2019, 11, 4555. [CrossRef]
11. Kett, M.; Cole, E.; Turner, J. Disability, Mobility and Transport in Low- and Middle-Income Countries:A Thematic Review. Sustainability 2020, 12, 589. [CrossRef]
12. Gorman, N.; Jones, S.; Turner, J. Older People, Mobility and Transport in Low- and Middle-Income Countries:A Review of the Research. Sustainability 2019, 11, 6157. [CrossRef]
13. Porter, G.; Turner, J. Meeting Young People’s Mobility and Transport Needs: Review and Prospect.Sustainability 2019, 11, 6193. [CrossRef]
14. Heydari, S.; Hickford, A.; McIlroy, R.; Turner, J.; Bachani, A. Road Safety in Low-Income Countries: State ofKnowledge and Future Directions. Sustainability 2019, 11, 6249. [CrossRef]
© 2020 by the authors. Licensee MDPI, Basel, Switzerland. This article is an open accessarticle distributed under the terms and conditions of the Creative Commons Attribution(CC BY) license (http://creativecommons.org/licenses/by/4.0/).
6
sustainability
Review
Sustainable Road Design: Promoting Recycling andNon-Conventional Materials
Nicholas Thom * and Andrew Dawson
Department of Civil Engineering, University of Nottingham, Nottingham NG7 2RD, UK;[email protected]* Correspondence: [email protected]; Tel.: +44-115-9513901
Received: 20 September 2019; Accepted: 28 October 2019; Published: 2 November 2019
Abstract: Many factors impact on the sustainability of road maintenance, including the organizationof road authorities, contract forms used, financing structure and, unfortunately, political interferenceand corruption. However, this paper reviews the opportunities to increase sustainability by utilizingless environmentally damaging material sources, and also the associated challenges. It is a fieldthat has seen advances in recent decades, for example in the effectiveness of cold-mix asphaltbinders. Nevertheless, the opportunities are not being taken up in many countries, and this reflectsuncertainty in predicting performance. This paper reviews the different design methods available,developed in both temperate and tropical climates, and highlights the lack of agreement with regard tonon-conventional materials. The different sources of uncertainty and risk are then discussed, togetherwith ways of limiting them. It is found that, while advances in performance prediction are highlydesirable, the key to encouraging recycling and the use of inexpensive but non-conventional materialslies in development of the right contractual arrangements, specifically partnering and risk/rewardsharing. The paper concludes with a discussion on approaches to partnering in the constructionindustry and the prerequisite climate of trust without which innovation is almost inevitably stifled.
Keywords: road; materials; recycling; non-conventional; risk; design; partnering
1. Introduction
The need to minimize use of scarce primary resources is becoming ever more urgent in mostindustries as humanity relentlessly exhausts this planet’s ability to satisfy its demands and carelesslydiscards waste to the detriment of the environment. The roads industry is no exception to this.In the UK, for example, roads consume some 25% of all materials extracted from the ground [1]and, while most of these sources are not in immediate danger of becoming exhausted, the impact onthe environment is substantial. Furthermore, even if exhaustion of resources has not yet occurred,the costs are real. For example, in relation to Malawi, Kamanga and Steyn [2] list material costand/or shortage as a key reason for project delays. They suggest this is often because designs andspecifications do not allow for the use of a possibly inferior but more readily available material, whichwould include recycled materials. And if, as reported by Oke et al. [3] in the case of Nigeria, failedasphalt is routinely discarded rather than being recycled, this in itself represents a direct and negativeenvironmental impact.
Furthermore, the cost of road materials delivered to a construction site comprises two parts:The cost of the raw material at the quarry or gravel pit; and transport costs, both financial andenvironmental, which are frequently the higher of the two. Locally-available materials are obviouslyto be preferred. To this must be added the fact that if in situ recycling can be achieved, there aresubstantial time savings, beneficial for both the road authority and the user. Thus, the drivers are strong,both economic and environmental, in support of recycling and/or the use of locally-available materials.
Sustainability 2019, 11, 6106; doi:10.3390/su11216106 www.mdpi.com/journal/sustainability7

Sustainability 2019, 11, 6106
The first objective of this paper is, therefore, to explore the reasons why many road authorities find itdifficult to move from primary to secondary (e.g., industrial by-products), recycled or locally-availablebut possibly inferior sources. A further objective is to suggest the changes that have to be put in placeif this move is to be made.
The paper identifies two areas where change is necessary. The first is technical and relates to thedevelopments needed in design methodology in order to incorporate materials with non-standardproperties. The second, and certainly more significant, is organizational and relates to the typeof contractual arrangement that best enables such materials to be used. It will be suggested thatmanagement of the risk accompanying the use of non-conventional materials requires effectivepartnership between public and private sectors in a transparent and no-blame environment.
2. Barriers to Non-Conventional Technologies
It cannot be denied that road authorities are grappling with extremely difficult engineeringissues. The passage of time and the seemingly ever-increasing numbers of commercial vehiclesthat use our road networks cause accumulated damage to road materials, damage which cannot bereversed. Road renewal/reconstruction will therefore continue to be required. One technology that isbecoming increasingly conventional, and where the only barrier to uptake is investment in adaptedplant, is so-called hot in-plant asphalt recycling [4]. Just as waste steel can be taken back to a foundryand incorporated into a new product, so waste asphalt can be taken back to an asphalt plant andincorporated into a new mixture. Researchers have established [5] that, so long as the percentage ofrecycled material is kept to a reasonable limit (30% in the case of the Federal Highway Administrationin US) there should be no measurable loss of performance compared to a 100% virgin (i.e., primaryaggregate) mix. However, the gain in terms of sustainability is modest. Resources are saved, and thereis some reduction in energy demand but, depending on asphalt plant location, transport costs arestill present.
Another conventional process is to hot-recycle an asphalt surface course in situ. Machines existthat have the capability to re-heat the surface to a depth of several centimeters to sufficient temperaturefor the asphalt to become pliant. This allows cracks to heal and the material to be re-compacted intoa dense intact mat, usually with additional material added. This is proven technology and is usedextensively. For example, Finlayson et al. [6] report on 25 years of successful experience in Canada.In terms of sustainability, this process is partially successful in that it cuts out transport costs. However,the energy cost is very high, and it has technical limitations in that it cannot treat problems deeperthan a few centimeters.
The real ‘game-changer’ is cold in situ recycling. It has been done very successfully all overthe world, e.g., in South Africa [7], India [8], Poland [9], with established design guidance available(e.g., [10]). Troeger and Widyatmoko [11] illustrated cost savings of 35–40% for different in-situ recycledsolutions compared to conventional reconstruction, while a parallel estimate from Canada [12] wasa 42% saving. One London borough [13] quoted a cost-saving ratio of over three between the twoprocesses, and alongside financial savings reductions in environmental and disruption costs have alsobeen documented [11].
But the problem with a game-changer is that new rules have to be formulated to govern the ‘game’.Companies such as Wirtgen [14] have been producing the necessary plant for decades, and there isa long-associated history of production of high-quality in situ recycled pavements. However, theresulting materials, though often subjectively ‘high-quality’, are distinctly different in terms of theirengineering properties from conventional new materials [15], which means they do not fit easily intotraditional pavement design methods.
The same difficulties arise with other non-conventional materials, notably those using industrialby-products such as fly ash or blast-furnace slag as partial binder replacements. Different materialswith different properties require different designs. The following sections will review the range ofnon-conventional material types and the technical issues that currently present barriers to use.
8

Sustainability 2019, 11, 6106
2.1. In Situ and Ex Situ Recycling
Cold in situ recycling [16] is conceptually simple. A large rotary milling device breaks up thepavement to a specified depth and at the same time mixes in a binding or stabilizing agent, which maybe cementitious or bituminous. At the back of the machine, a paving screed gives a reasonably smoothfinish to the newly-created recycled layer, and this is followed by conventional roller-compaction.Depths up to about 250 mm can be treated in this way.
The term ‘ex situ’ is commonly used to describe an alternative, better controlled but more costlyprocess in which the milled products are transported to a mobile mixing plant located on, or adjacentto, the site. Conventional mixing then takes place and the mixed material is transported, placed backonto the road, and compacted.
The key problem that recycling introduces is variability [17]. With both in situ and ex situ recycling,variability in the source material, i.e., the existing road, is unavoidable. In the case of in situ, there islikely to be additional variability due to differences in binder application rate and mixing efficiency.Increased variability relative to a virgin mix means that the performance of a cold recycled materialwill never exactly match that of conventional materials, thus requiring adjustment to design standards.
2.2. Cementitious Binders
Cementitious binders include conventional Portland cement, and if this is used to stabilize amaterial, then the resulting layer is in effect a weak concrete. This is a well understood class of materialand is covered by standard specifications and design methods (e.g., [18]). However, in the context ofrenewal or rehabilitation of a road it comes with restrictions, and these limit its use.
If the new cement bound layer is designed to remain substantially intact under traffic, then itneeds to be handled carefully. Typically, it must be left for seven days before it is strong enough toallow paving of another layer on top, and another layer is certainly needed in order to achieve therequired surface level tolerances for anything other than the lowest of speeds. Furthermore, shrinkagedue to hydration reactions combined with diurnal thermal cycles will eventually cause the new layerto crack into discrete lengths [19], and there is then the likelihood that these cracks will ‘reflect’ throughoverlying asphalt and require maintenance. Thus, this solution, though used, risks the need forsignificant future maintenance expenditure.
An alternative is to opt for a weaker material and accept that it will crack under construction traffic.No delay is then necessary before paving an overlying surface, and the danger of reflective crackingis diminished since cracks in the cement stabilized base, though numerous, will be individually lesssevere. On the other hand, the value of the recycled material is also diminished, relegating its propertiesto little more than those of an excellent granular base. This means that an increased thickness of newmaterial has to be imported to site for overlying layer construction.
A more radical and much less conventional solution is to opt for a slow-setting binder, often ablend of hydrated lime with industrial by-products such as fly ash or ground granulated blast furnaceslag [20,21]. Again, there is no need to delay construction, but the advantage here is that immediatelyafter construction, the material is still in the relatively early stages of strength gain, and so long asearly traffic loading is not too severe, there is every prospect that it will achieve a good final strength.The obvious problem is that this is difficult to tie down in terms of a conventional specification. If amaterial is not expected to reach its potential until several weeks after construction, how is it possibleto control quality? In the UK, Highways England [22] have opted to test in situ and to assume afuture strength gain, but any such approach inevitably carries risk. Yet the possibilities offered bythis technique are highly attractive both technically and in terms of reduced environmental footprint.This difficulty represents another key point where design standards need to differ from those ofconventional solutions.
9

Sustainability 2019, 11, 6106
2.3. Bituminous Binders
Since cold in situ recycling is carried out at ambient temperature, there is no opportunity to heat andform conventional hot-mix asphalt (HMA). The bitumen has to be delivered cold, and two widely-usedproducts have been developed to do this: Bitumen emulsion and foamed bitumen. The binder arrivesinto the mixing zone in the form of tiny droplets (emulsion) or fine flakes (foamed bitumen) carried bywater. The material is still effectively unbound during compaction. The compaction process itself thencompresses the droplets or flakes of bitumen between aggregate particles, forcing them to adhere andthereby beginning the process by which a cold-mix asphalt is formed [23]. The process is a gradualone, and it is only as the water evaporates that the bitumen becomes ever more effective at binding theparticles together, especially fragments of old asphalt surfacing that already contain bitumen.
The problem here is similar to that with slow-setting cementitious binders. If the construction iscarried out well, the final state of the recycled layer will be that of an intact material with reasonablyhigh strength, but this is not possible to verify during construction. Furthermore ‘reasonably highstrength’ is still unlikely to be truly equivalent to a conventional HMA; for instance, a specific problemis that it is likely to have a reduced resistance to water attack [24]. Once again, conventional standardscannot be applied.
3. The Design/Specification Challenge
Both cold recycling and stabilization of locally-available, often secondary, materials are processesthat can produce a cheap new pavement base with minimized environmental impact. The problem isthat the materials with the potential to deliver the greatest economic and sustainability benefits alsopresent the greatest challenge to engineers.
In essence, there are four significant technical barriers to implementation:
1. Recycled materials are inherently more variable than virgin mixes.2. Material behavior, e.g., crack resistance, differs from conventional mixtures.3. Water-susceptibility is often higher for recycled or stabilized mixtures.4. Full strength can take many weeks or months to develop.
Undeniably each of these issues contribute to there being an appreciably higher risk attached tomany non-conventional materials than is usually considered acceptable, and this risk has to be takeninto account in design. For example, the widely used AASHTO (1993) method [25] requires the use ofa coefficient to quantify the effectiveness of each material, and it has been suggested [26–28] that coldrecycled materials should be assigned coefficients somewhere between 0.2 and 0.36. This compares toaround 0.44 for conventional HMA, and means they would have to be 1.2–2.2 times as thick. Similarly,one of the highway authorities in the UK [29] recommends a thickness 1.33 times that of HMA.Others have taken a still more cautious approach and consider cold recycled materials as high qualitygranular layers, with equivalence factors of 1.4 or 1.5 (e.g., [30]—relating to Californian practice) timesa conventional granular base.
In a given country or region, with materials and climate specific to that region, such anexperience-based approach may be satisfactory. But it is not automatically transferable elsewhere.A more flexible, but potentially riskier, approach to design is given by so-called analytical methods, inwhich materials are typically defined by a stiffness modulus and a fatigue cracking law.
Valentin et al. [31] have made a thorough review of the way these methods have been applied toin situ recycled materials, revealing a large variety of approaches. In the UK, the design advice mostcommonly followed was developed by the Transport Research Laboratory [10], and three grades ofmaterial are specified in terms of their differing characteristic stiffness moduli. However, thicknessis then determined from a chart, which is itself largely based on experience. In France [32], differentstiffness modulus values are suggested depending on the proportion of Recycled Asphalt Pavement(RAP) included in the cold recycled asphalt layer. However, the calculations that follow do not includefatigue cracking of the recycled layer; i.e., it is treated as an already-cracked material. Similarly, in New
10

Sustainability 2019, 11, 6106
Zealand [33], in situ recycled materials are treated as superior unbound bases rather than having anyintrinsic fatigue strength. In contrast, in Australia they are generally treated as slightly inferior asphaltlayers, and a fatigue life is computed [33].
Thus, it is fair to say that many road authorities have found ways around the four barriers listedabove. However, there is a lack of consistency, partially explicable by different typical road structuresbeing used in different parts of the world. It is also fair to say that over the years there have beenadvances in prediction of the performance of roads incorporating non-conventional materials such ascold-mix asphalt [34–37] or in situ recycled layers [38].
Nevertheless, the four barriers listed above still significantly inhibit the take-up of recycled andother non-conventional materials. The following subsections consider each barrier in more detail.
3.1. Material Variability
Material variability is undeniably a negative feature of any in situ recycled material. Traditionallymaterial variability has been dealt with in the same way as any other source of uncertainty, i.e.,it contributes to the overall reliability of a design, and a client has to select a certain level of reliabilityappropriate to each class of road. In some methods, e.g., AASHTO (1993) [25], the client has freedomto choose; in others, e.g., Highways England [18], a certain probability of achieving the design life isbuilt in, 85% in that case. But these methods were all developed based on experience of variability inconventional materials.
However, variability in recycled materials is different. The nature of the mixing process combinedwith variations in material type/quality along the road mean that there can be very large differencesbetween small elements of material. These differences then tend to even out over larger areas, e.g.,the >1 m diameter area stressed by a heavy goods vehicle tire. In a South African context, Lynch andJenkins [39] report an increased variability between closely spaced test points in in situ recycled material.This is supported by the authors’ own experience of a comparative trial on a newly-reconstructedpavement, in situ recycled against plant-mixed. Table 1 shows the results obtained.
Table 1. Comparison of tests on in situ recycled and plant-mixed base pavements.
Description
Test Method Plant-Mixed In-Situ Recycled
MeanCoefficientof Variation
MeanCoefficient of
Variation
Modulus fromtests on cores
Indirect tensile;BS-EN 12697-26 [40] 4960 MPa 17% 3930 MPa 58%
Modulus over alarger area
Falling weightdeflectometer 3890 MPa 24% 2460 MPa 28%
The implication is that defects that are the result of combined effects from a relatively wide area,e.g., rutting, will show similar variation to that expected with plant-mixed materials; on the other hand,localized defects, e.g., cracks, will be much more varied in terms of when they first appear. Thus, in thecommon case of an in situ recycled layer overlaid by a relatively thin asphalt surface, localized surfacecracking may appear over localized weak spots in the recycled base. For in situ recycled material, thisnegative feature has to be understood and either a reduced reliability has to be accepted or else thedesign needs to be modified to give the same reliability as for plant-mixed materials. In either case,there will be increased uncertainty and this has to be managed, both technically and contractually.
3.2. Unconventional Material Behavior
Unconventional material behavior is another difficult problem and is the subject of ongoing research,e.g., [41]. In essence, the materials under discussion can be classed into one of three material types:
• Strong, cementitious binder;• Strong, bituminous binder;
11

Sustainability 2019, 11, 6106
• Weak, either binder.
The first of these is effectively equivalent to a normal cement-bound base and so can be consideredas conventional.
The second however, if cold-mix binder (emulsion or foamed bitumen) is used, is not equivalentto conventional asphalt. Cold-mix asphalts are a class of material that can be described as partiallybound [28], which means they start life with ready-formed and well distributed micro-cracks. In onesense, this is a disadvantage since the initiation phase of fatigue cracking is effectively bypassed.But in another sense, it is an advantage because the cracking that eventually occurs tends to be welldistributed. This avoids occurrence of discrete large cracks [37], and reduces the stresses and strainsfelt by an overlying surfacing. Unfortunately, this is a level of complexity which the art of pavementperformance modelling is not yet capable of addressing confidently, and this introduces additionaluncertainty in performance prediction.
The third type will display unbound material behavior, but with a higher strength and stiffnessthan conventional unbound layers. In many design approaches, e.g., AASHTO (1993) [25] or analyticalmethods, this presents no problem so long as a realistic long-term modulus can be assigned, althoughthis is something that currently relies more on experience than pavement science. However, in morerestrictive design methods that rely on non-numeric descriptors for materials, recycled materials oftendo not fit easily into any conventional category. In such a case, it has to be accepted that the methodcannot be directly applied.
The problem of unconventional behavior is one which is still being researched, bringing inherentrisk, additional to that already identified due to material variability. Whilst the fruits of research mayreduce these risks in the future, there is nevertheless a clear need for effective risk management.
3.3. Water Susceptibility
The problem of water susceptibility applies chiefly to cold asphalt mixes, whether recycled ornot [24]. Many asphalts have a degree of susceptibility to water since aggregates are often hydrophilic.This means that if water can reach the bond between aggregate and bitumen it will gradually destroyit [42], although adhesion promoters incorporated into the asphalt can be effective at combatingthis problem.
Water ingress is a serious design challenge for all pavement types. Trapped water when pressurizedby traffic loads softens soil, reduces the stiffness and shear strength of unbound materials, and alsoleads to breakage of cement and bitumen-bound materials [43]. In a conventional hot-mix asphalt,each particle of aggregate is fully coated by bitumen and it is difficult for water to gain access; in acold-mix, the particles are not fully coated and water has a ready route in. It is therefore particularlydesirable to keep water out of cold-mix asphalts, and the potential benefits will not be fully realized ifwater is allowed to gain access in large quantities. Preventative measures could include:
• Increasing the camber on the road;• Installing/repairing functioning sub-surface drainage prior to recycling/re-construction;• Re-sealing the road surface as necessary.
These are all practical steps that should lead to the water content within the pavement beingcontrolled. However, the key point is that yet another source of risk is introduced, one that is difficult todesign out completely and which therefore has to be managed contractually. And in a world in whichthe climate is changing rapidly in many locations, the magnitude of this risk is only likely to increase.
3.4. Delayed Strength Gain
In several of the materials under discussion strength may continue to develop for upwards of ayear [44–46]. The long-term gain in properties therefore needs to be estimated as part of pavementdesign [47]. This is probably the hardest problem of all to deal with and it brings the issue of risk
12

Sustainability 2019, 11, 6106
into sharp focus. This sub-section will therefore begin to introduce non-engineering aspects of riskmanagement. The options appear to be:
• Specify tests on accelerated-cured laboratory specimens in order to predict in-road properties.However, material curing in the road depends heavily on ambient temperature, moistureavailability, exposure to air, and level of compaction achieved. This means that the laboratoryvalue can only give an indication of what would be possible under ideal conditions [48].
• Ask for contractor guarantees. However, there are many factors outside the contractor’s control,which means that the guarantee will be expensive to the client. Furthermore, there may oftenbe arguments the contractor can make to cast doubt on his responsibility for any perceived lackof performance.
• Partnering and shared risk/reward. This approach [49] acknowledges the inherent unknownsinvolved and is designed to avoid the confrontations and disagreements that are almost inevitablewith either of the first two options. It removes the risk of punitive claims or penalties and allowsengineers to make relatively unimpeded judgments.
• All risk is taken by the client. If both design and construction are carried out in-house by the client,then in theory this gives even more flexibility since there are no externally imposed requirementsto satisfy.
It would seem unavoidable that simple reliance on a specification based on tests on laboratory-curedspecimens—even accepting that the engineering community knows which tests to apply—is a recipefor uncertainty, early failure, and contractual dispute. And while contractor guarantees are logical andworkable if restricted to defects that become apparent within a year or so of completion, this does noteasily apply to road base materials. Thus, in the opinion of the authors, this technical difficulty, on topof the others introduced previously, simply cannot be overcome without first setting in place a meansof taking and managing risk.
Figure 1 summarizes the above discussion relating to the four barriers identified. The next sectionwill discuss further the critical issue of risk management.
Figure 1. Summary of problems and solutions related to use of non-conventional materials.
4. Managing the Risk
Foregoing sections have made the point that improved engineering alone cannot overcome therisks associated with in situ recycling or the use of various types of non-conventional material. Thus,it is necessary to explore the means of providing an appropriate contractual climate to allow therisk-benefit balance to be managed properly.
Turning to the broad types of contractual arrangement possible, there is some evidence [50] thatinternal corruption is often less in the private sector than in the public sector, which suggests that
13

Sustainability 2019, 11, 6106
keeping all activities within the public sector will not usually deliver an optimum result. It has alsobeen noted that the use of sub-contractors often increases efficiency [51], which further suggests thebenefits of private sector involvement. Furthermore, internal constraints from a risk-averse hierarchicalclient organizational structure may be hard to overcome and, it has to be conceded, many also lacktechnical expertise. Experience also suggests [52] that a performance-related incentive of some sort toan external organization (the contractor) leads to considerable benefit, and many would argue, e.g., [53]that partnering and the sharing of risk and reward is the optimum way to achieve this. Many studieshave also come to the conclusion that public–private partnering in one form or another is the best wayto stimulate innovation as well as handling project risk [54–56].
Public–private partnerships (PPPs) are widespread, but they vary enormously. In many cases,the motivation is finance, tying in banks as well as construction companies themselves, and these canbe a means of procuring infrastructure developments that would have otherwise been unaffordable.For example, in an African context, Ajacaiye and Ncube [57] evaluate the potential of PPPs to contributeto development, and they are strongly supportive, based largely on the lack of available public financein many African countries.
However, that has nothing to do with encouraging innovation; a bank may be even morerisk-averse than a road administration. Leiringer [58] discusses the concept of ‘design freedom’commonly promoted as a benefit of PPPs, and finds that in practice this freedom is easily stifled. Thereare pressures to control uncertainty at the bid stage; restrictions are often written into the contract,for example, to follow an established standard; and the more that risk is placed on the contractor’sshoulders, the greater is the incentive to fall back on standard solutions. Compared to other aspectsof PPP, design innovation is easily forgotten [59] despite it featuring prominently in perceived riskfactors [60].
Thus, if innovation such as the use of non-conventional materials is to be encouraged, then the PPPhas to be deliberately set up to achieve this. Issues such as speedy delivery and meeting environmentalor safety targets can of course still feature, but it is also necessary to build in measures that rewarddesign whose benefits can only be seen in the long term. To achieve this, the nature of the partnershiphas to be deep and long-lasting.
‘Alliancing’ is a form of PPP [61] that has risen to prominence over the last decade, leadingfor example to the UK Institution of Civil Engineers’ NEC4 Alliance Contract, brought out in 2018.Highways England have declared their intention to use alliancing on all future ‘smart motorway’projects. Alliancing brings in the concept of zero blame, zero claims, and a pre-agreed cash flow, as wellas risk/reward sharing. The concept is that a partnership (the alliance) is set up very early, with anintegrated team from all the main parties involved [62]. This requires considerable up-front work bythe client organization and self-evidently can only function effectively in a very transparent culture interms of bidding and contract award.
Love et al. [63], reporting on Australian experience, suggest that the normal way that alliancingcontracts work is that contractors are rewarded in three ways: (a) All direct project costs are fullyreimbursed, whatever the outcome of the project; (b) an agreed percentage overhead is also paid;(c) performance incentive payments are paid (or penalties levied) according to success against a numberof Key Result Areas (KRAs). These can often be primarily concerned with speed of delivery [62],but this is also the area where long-term performance-related measures can be written in, potentiallywith reward or penalty being deferred for several years. In the context of recycling or using localmaterials, KRAs related to environmental damage/preservation would also appear to be appropriate.
However, Love et al. [63] also evaluated by means of interviews the actual factors that droveinnovation by individual members of staff. Their conclusion was that the details of the alliancingcontract itself were important only in allowing a collaborative and transparent culture to develop.The real drivers for innovation by individuals were accountability, credibility, pride, and reputation.The implication appears to be that engineers will come up with innovative solutions, but only if they
14
Sustainability 2019, 11, 6106
are given the right no-blame environment to work in. This is the real challenge that procurementagencies face.
They also face the continuing battle against corruption if such an environment is to be created,a subject for which there is a large body of literature related to the roads sector, e.g., [64]. Links topolitical patronage have been documented [65] as has endemism within the procurement sector [66].As an example, Ntayi et al. [67] note that an estimated $107 M is lost to procurement-related corruptioneach year in Uganda, and they provide a detailed and thoughtful study reflecting on the causes,for example poor public sector pay. Snaith and Khan [68] even found that effective unit rates for roadworks varied as a function of the source of funding and they developed a model to quantify the effectsof this corruption on national wealth.
However, a wide body of literature suggests that transparency makes corruption more difficultand therefore almost inevitably increases cost-effectiveness. For example, e-procurement systems canbe used to avoid the danger of deals being done in secret. Its introduction in India and Indonesia hasbeen analyzed [69], leading to the conclusion that either quality goes up (India) or delays are reduced(Indonesia). Neupane et al. [70] also report positive experience in Nepal, particularly an increase inthe level of trust in the procurement process. They concluded that e-procurement cuts down on theopportunities for secret meetings between bidders and public sector officials.
Thus, the types of partnering suggested as being the logical means of encouraging use ofnon-conventional materials depend greatly on there being an appropriate level of transparency.The very real benefits of PPPs, particularly the alliancing model, have to be offset against the dangers ofcollusion and cartels [71] in the letting of PPP contracts, implying that achieving the desired outcomedemands a transparent environment and suitable public scrutiny, supported by meaningful penalties.
5. Conclusions
This paper has set out the key issues that currently hold back the use of recycled and othernon-conventional materials in road construction, concentrating particularly on the economically andenvironmentally attractive in situ recycling options. Several of these options have been shown tohave real long-term benefits and to be highly cost-effective. It is therefore essential that the industryfinds ways of making these benefits a reality, even if this means taking a rather different approach toprocurement and design than has historically been the case. Research should target the following areasif in situ recycling and the use of secondary and other non-conventional materials is to develop asit should:
• Research that delivers guidelines covering the financial, institutional, procurement, and contractualarrangements necessary to facilitate sustainable forms of public-private partnerships.
• Research that delivers design and specifications for using recycled and non-conventional materialsfor building and maintaining water-resilient road pavements.
Of these, the first is considered to be the real key. Once risk and reward sharing are establishedwithin working partnership arrangements, then engineers and researchers will find ways to improvetheir predictive capabilities and therefore their designs, leading to greatly improved sustainability inroad construction and maintenance.
Author Contributions: Investigation, N.T. and A.D.; writing—original draft, N.T.; writing—review & editing, A.D.
Funding: This research was funded by UK AID through the UK Department for International Development underthe High Volume Transport (HVT) Applied Research Programme, managed by IMC Worldwide.
Acknowledgments: The authors are particularly grateful for the advice of Bruce Thompson, the leader of Theme 1,Long Distance Strategic Road and Rail Transport, of the HVT Programme. The authors also acknowledge theassistance of representatives of Cardno.
Conflicts of Interest: The study upon which this paper is based followed the requirements of the funder andsubmission of this paper was also their requirement. However, the content of the paper and its conclusions arethose of the authors. The authors themselves declare no personal conflict of interest.
15

Sustainability 2019, 11, 6106
References
1. BGS. Construction Aggregates. Mineral Planning Factsheet; British Geological Survey: Nottingham, UK, 2011.2. Kamanga, M.J.; Steyn, W.J.V.D.M. Causes of delay in road construction projects in Malawi. J. S. Afr. Inst.
Civ. Eng. 2013, 553, 79–85.3. Oke, O.L.; Aribisala, J.O.; Ogundipe, O.M.; Akinkurolere, O.O. Recycling of asphalt pavement for accelerated
and sustainable road development in Nigeria. Int. J. Sci. Technol. Res. 2013, 2, 92–98.4. Sivilevicius, H.; Bražiunas, J.; Prentkovskis, O. Technologies and principles of hot recycling and investigation
of preheated reclaimed asphalt pavement batching process in an asphalt mixing plant. Appl. Sci. 2017,7, 1104. [CrossRef]
5. Stephanos, P.; Pagán-Ortiz, J.E. Reclaimed Asphalt Pavement in Asphalt Mixtures: State of the Practice; ReportFHWA-HRT-11-021; Federal Highway Administration: Washington, DC, USA, 2011.
6. Finlayson, D.; Nicoletti, C.; Pilkington, I.; Sharma, V.; Teufele, B. British Columbia’s success with hot-in-placerecycling—A 25 year history. Proc. Can. Tech. Asph. Assoc. 2011, 56, 185–201.
7. Jenkins, K.J.; Collings, D.C. Mix design of bitumen-stabilised materials–South Africa and abroad. Road Mater.Pavement Des. 2017, 182, 331–349. [CrossRef]
8. Bhavsar, H.; Dubey, R.; Kelkar, V. Rehabilitation by in-situ cold recycling technique using reclaimedasphalt pavement material and foam bitumen at vadodara halol road project (SH87)—A case study.Transp. Res. Procedia 2016, 17, 359–368. [CrossRef]
9. Dolzicki, B. Polish experience with cold in-place recycling. Mater. Sci. Eng. 2017, 236, 012089.10. Merrill, D.; Nunn, M.; Carswell, I. A Guide to the Use and Specification of Cold Recycled Materials for the
Maintenance of Road Pavements; TRL611; Transport Research Laboratory: Crowthorne, Berks, UK, 2004.11. Troeger, J.; Widyatmoko, I. Development in road recycling. In Proceedings of the 11th International
Conference on Pavement Engineering and Infrastructure, Liverpool, UK, 15–16 February 2012.12. Alkins, A.E.; Lane, B.; Kazmierowski, T. Sustainable pavements: Environmental, economic and social benefits
of in situ pavement recycling. Transp. Res. Rec. 2008, 2084, 100–103. [CrossRef]13. Construction News. Enfield Saves Big with Insitu Road Recycling. Construction News, June 2012.14. Wirtgen. Wirtgen Cold Recycling Technology; Wirtgen GmbH: Windhagen, Germany, 2011.15. Karlsson, R.; Isacsson, U. Material-related aspects of asphalt recycling—State-of-the-art. J. Mater. Civ. Eng.
2006, 18, 81–92. [CrossRef]16. Milton, L.J.; Earland, M. Design Guide and Specification for Structural Maintenance of Highway Pavements by Cold
in-Situ Recycling; Transport Research Laboratory Report TRL386: Crowthorne, Berks, UK, 1999.17. Zaumanis, M.; Oga, J.; Haritonovs, V. How to reduce reclaimed asphalt variability: A full-scale study.
Constr. Build. Mater. 2018, 188, 546–554. [CrossRef]18. Highways England. Pavement Design. HD26/06 Design Manual for Roads and Bridges 7(2) Part 3; Highways
England: London, UK, 2006.19. Pittman, D.W.; McCullough, B.F. Development of a roller-compacted concrete pavement crack and joint
spacing model. Transp. Res. Rec. 1997, 1568, 52–64. [CrossRef]20. Juenger, M.C.G.; Winnefeld, F.; Provis, J.L.; Ideker, J.H. Advances in alternative cementitious binders.
Cem. Concr. Res. 2011, 41, 1232–1243. [CrossRef]21. Hicks, J.K.; Caldarone, M.A.; Bescher, E. Opportunities from alternative cementitious materials. Concr. Int.
2015, 37, 47–51.22. Highways England. Design Guidance for Road Pavement Foundations (Draft HD25); Interim Advice Note 73/06
revision 1; Highways England: London, UK, 2009.23. Miljkovic, M.; Radenberg, M. Effect of compaction energy on physical and mechanical performance of
bitumen emulsion mortar. Mater. Struct. 2016, 49, 193–205. [CrossRef]24. Valentin, J.; Montschein, P.; Fiedler, J.; Mollenhauer, K.; Batista, F.; Freira, A.C. Report on Durability of
Cold-Recycled Mixes: Moisture Susceptibility; Conference of European Directors of Roads (CEDR): Brussels,Belgium, 2015.
25. AASHTO. Design of Pavement Structures; American Association of State Highway and Transportation Officials:Washington, DC, USA, 1993.
26. Davis, K.; Timm, D. Recalibration of the Asphalt Layer Coefficient; Report 09-03; National Centre for AsphaltTechnology: Auburn, AL, USA, 2013.
16
Sustainability 2019, 11, 6106
27. Labuz, J.; Tang, S.; Cao, Y. Structural Evaluation of Asphalt Pavements with Full-Depth Reclaimed Base; ReportMN/RC 2012-36; University of Minnesota: Minneapolis, MN, USA, 2012.
28. Khosravifar, S.; Schwartz, C.H.; Goulias, D. Mechanistic structural properties of foamed asphalt stabilisedbase materials. Int. J. Pavement Eng. 2015, 16, 27–38.
29. Babtie. Road Pavement Design Guide; Kent County Council: Maidstone, Kent, UK, 2000.30. Jones, D.; Fu, P.; Harvey, J.; Halles, F. Full-Depth Pavement Reclamation with Foamed Asphalt: Final Report;
Research Report UCPRC-RR-2008-07; University of California: Berkeley, CA, USA, 2008.31. Valentin, J.; Montschein, P.; Fiedler, J.; Mollenhauer, K.; Batista, F.; Freira, A.C. Report on Incorporation of
Cold-Recycled Pavement Layers in Empirical and Mechanistic Design Procedures; Conference of European Directorsof Roads (CEDR): Brussels, Belgium, 2014.
32. LCPC. Retraitement en Place à froid des Anciennes Chausées; Guide Technique; Laboratoire Centrale des Ponts etChaussées: Paris, France, 2003.
33. Browne, A. Foamed bitumen stabilization in New Zealand—A performance review and comparison withAustralian and South African design philosophy. In Proceedings of the 25th ARRB Conference, Perth,Australia, 28–30 August 2012.
34. Liebenberg, J.J.E.; Visser, A.T. Towards a mechanistic structural design procedure for emulsion-treated baselayers. J. S. Afr. Inst. Civ. Eng. 2004, 463, 2–8.
35. Kuna, K.; Thom, N.; Airey, G. Structural design of pavements incorporating foamed bitumen mixtures.Proc. Inst. Civ. Eng. Constr. Mater. 2018, 171, 22–35. [CrossRef]
36. Perez, I.; Medina, L.; Del Val, M.A. Mechanical properties and behaviour of in situ materials which arestabilised with bitumen emulsion. Road Mater. Pavement Des. 2013, 14, 221–238. [CrossRef]
37. Lacalle-Jiménez, H.I.; Edwards, J.P.; Thom, N.H. Analysis of stiffness and fatigue resistance of cold recycledasphalt mixtures manufactured with foamed bitumen for their application to airfield pavement design.Mater. De Construcción 2017, 67, 127. [CrossRef]
38. Paige-Green, P.; Ware, C. Some material and construction aspects regarding in situ recycling of roadpavements in South Africa. Road Mater. Pavement Des. 2006, 73, 273–287. [CrossRef]
39. Lynch, A.; Jenkins, K. Materials recycled using foamed bitumen stabilisation: What is their long-termload-spreading capacity? In Proceedings of the 15th AAPA International Flexible Pavements Conference,Brisbane, Australia, 22–25 September 2013.
40. British Standards Institution. Bituminous Mixtures-Test Methods for Hot Mix Asphalt; BS EN 12697: Part 26;British Standards Institution: London, UK, 2012.
41. Nasser, A.I.; Mohammed, M.K.; Thom, N.; Parry, T. Characterisation of high-performance cold bitumenemulsion mixtures for surface courses. Int. J. Pavement Eng. 2018, 19, 509–518. [CrossRef]
42. Canestrari, F.; Cardone, F.; Graziani, A.; Santagata, F.A.; Bahia, H.U. Adhesive and cohesive properties ofasphalt-aggregate systems subjected to moisture damage. Road Mater. Pavement Design 2010, 11, 11–32.[CrossRef]
43. Wang, W.; Wang, L.; Xiong, H.; Luo, R. A review and perspective for research on moisture damage in asphaltpavement induced by dynamic pore water pressure. Constr. Build. Mater. 2019, 204, 631–642. [CrossRef]
44. Avirneni, D.; Peddinti, P.R.; Saride, S. Durability and long term performance of geopolymer stabilizedreclaimed asphalt pavement base courses. Constr. Build. Mater. 2016, 121, 198–209. [CrossRef]
45. Beeghly, J.H. Recent experiences with lime-fly ash stabilization of pavement subgrade soils, base and recycledasphalt. In Proceedings of the International Ash Utilization Symposium, University of Kentucky, Lexingston,KY, USA, 19 October 2003; pp. 20–22.
46. Kazmierowski, T.; Marks, P.; Lee, S. Ten-year performance review of in situ hot-mix recycling in Ontario.Transp. Res. Rec. 1999, 1684, 194–202. [CrossRef]
47. Tabakovic, A.; McNally, C.; Fallon, E. Specification development for cold in-situ recycling of asphalt.Constr. Build. Mater. 2016, 102, 318–328. [CrossRef]
48. Serfass, J.-P.; Poirier, J.-E.; Henrat, J.-P.; Carbonneau, X. Influence of curing on cold mix mechanicalperformance. Mater. Struct. 2004, 37, 365–368. [CrossRef]
49. Dewulf, G.; Kadefors, A. Collaboration in public construction—Contractual incentives, partnering schemesand trust. Eng. Proj. Organ. J. 2012, 2, 240–250. [CrossRef]
50. Kenny, C. Transport construction, corruption and developing countries. Transp. Rev. 2009, 29, 21–41.[CrossRef]
17

Sustainability 2019, 11, 6106
51. Wales, J.; Wild, L. The Political Economy of Roads: An Overview and Analysis of Existing Literature; OverseasDevelopment Institute: London, UK, 2012.
52. ADB. Guide to Performance-Based Road Maintenance Contracts; Asian Development Bank: Manila, Philippines, 2018.53. Osipova, E.; Eriksson, P.E. How procurement options influence risk management in construction projects.
Constr. Manag. Econ. 2011, 29, 1149–1158. [CrossRef]54. Lu, W.; Liu, A.M.M.; Wang, H.; Wu, Z. Procurement innovation for public construction projects: A study of
agent-construction system and public-private partnership in China. Eng. Constr. Archit. Manag. 2013, 20,543–562.
55. Nawaz, A.; Waqar, A.; Shah, S.A.R.; Sajid, M.; Khalid, M.I. An innovative framework for risk management inconstruction projects in developing countries: Evidence from Pakistan. Risks 2019, 7, 24. [CrossRef]
56. Tang, W.; Duffield, C.F.; Young, D.M. Partnering mechanism in construction: An empirical study on theChinese construction industry. J. Constr. Eng. Manag. 2006, 132, 217–229. [CrossRef]
57. Ajakaiye, O.; Ncube, M. Infrastructure and economic development in Africa: An overview. J. Afr. Econ. 2010,19, 3–12. [CrossRef]
58. Leiringer, R. Technological innovation in the context of PPPs: Incentives, opportunities and actions.Constr. Manag. Econ. 2006, 24, 301–308. [CrossRef]
59. Raisbeck, P. Considering design and PPP innovation: A review of design factors in PPP research.In Proceedings of the 25th Annual ARCOM Conference, Nottingham, UK, 7–9 September 2009; pp. 239–247.
60. Chan, D.W.M.; Chan, A.P.C.; Lam, P.T.I.; Yeung, J.F.Y.; Chan, J.H.L. Risk ranking and analysis in targetcost contracts: Empirical evidence from the construction industry. Int. J. Constr. Manag. 2011, 29, 751–763.[CrossRef]
61. Clifton, C.; Duffield, C.F. Improved PFI/PPP service outcomes through the integration of alliance principles.Int. J. Proj. Manag. 2006, 24, 573–586. [CrossRef]
62. Ibrahim, C.K.I.C.; Costello, S.B.; Wilkinson, S.; Walker, D. Innovation in alliancing for improved delivery ofroad infrastructure projects. Int. J. Manag. Proj. Bus. 2017, 10, 700–720. [CrossRef]
63. Love, P.E.D.; Davis, P.R.; Chevis, R.; Edwards, D.J. Risk/reward compensation model for civil engineeringinfrastructure alliance projects. J. Constr. Eng. Manag. 2011, 137, 127–136. [CrossRef]
64. Zedillo, E.; Cattaneo, O.; Wheeler, H. Africa at A Fork in the Road: Taking off or Disappointment Once Again; YaleCenter for the Study of Globalization: New Haven, CT, USA, 2013.
65. Lehne, J.; Shapiro, J.N.; Eynde, O.V. Building connections: Political corruption and road construction in India.J. Dev. Econ. 2018, 131, 62–78. [CrossRef]
66. Mahmoud, S.A.I. Public procurement and corruption in Bangladesh: Confronting the challenges andopportunities. J. Public Adm. Policy Res. 2010, 26, 103–111.
67. Ntayi, J.M.; Ngoboka, P.; Kakooza, C.S. Moral schemas and corruption in Ugandan public procurement.J. Bus. Ethics 2013, 112, 417–436. [CrossRef]
68. Snaith, M.S.; Khan, M.U. Deleterious effects of corruption in the roads sector. Proc. Inst. Civ. Eng. Transp.2008, 161, 231–235. [CrossRef]
69. Lewis-Faupel, S.; Neggers, Y.; Olken, B.K.; Pande, R. Can electronic procurement improve infrastructureprovision? Evidence from public works in India and Indonesia. Am. Econ. J. Econ. Policy 2016, 83, 258–283.[CrossRef]
70. Neupane, A.; Soar, J.; Vaidya, K. Evaluating the anti-corruption capabilities of public e-procurement in adeveloping country. Electron. J. Inf. Syst. Dev. Ctries 2012, 552, 1–17. [CrossRef]
71. World Bank. Curbing Fraud, Corruption and Collusion in the Roads Sector; World Bank: Washington, DC, USA, 2011.
© 2019 by the authors. Licensee MDPI, Basel, Switzerland. This article is an open accessarticle distributed under the terms and conditions of the Creative Commons Attribution(CC BY) license (http://creativecommons.org/licenses/by/4.0/).
18
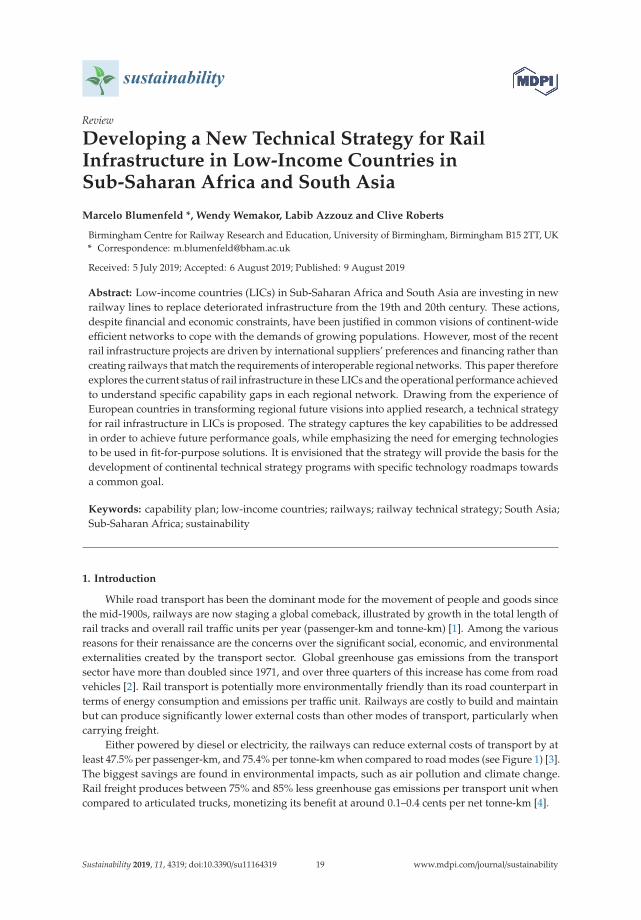
sustainability
Review
Developing a New Technical Strategy for RailInfrastructure in Low-Income Countries inSub-Saharan Africa and South Asia
Marcelo Blumenfeld *, Wendy Wemakor, Labib Azzouz and Clive Roberts
Birmingham Centre for Railway Research and Education, University of Birmingham, Birmingham B15 2TT, UK* Correspondence: [email protected]
Received: 5 July 2019; Accepted: 6 August 2019; Published: 9 August 2019
Abstract: Low-income countries (LICs) in Sub-Saharan Africa and South Asia are investing in newrailway lines to replace deteriorated infrastructure from the 19th and 20th century. These actions,despite financial and economic constraints, have been justified in common visions of continent-wideefficient networks to cope with the demands of growing populations. However, most of the recentrail infrastructure projects are driven by international suppliers’ preferences and financing rather thancreating railways that match the requirements of interoperable regional networks. This paper thereforeexplores the current status of rail infrastructure in these LICs and the operational performance achievedto understand specific capability gaps in each regional network. Drawing from the experience ofEuropean countries in transforming regional future visions into applied research, a technical strategyfor rail infrastructure in LICs is proposed. The strategy captures the key capabilities to be addressedin order to achieve future performance goals, while emphasizing the need for emerging technologiesto be used in fit-for-purpose solutions. It is envisioned that the strategy will provide the basis for thedevelopment of continental technical strategy programs with specific technology roadmaps towardsa common goal.
Keywords: capability plan; low-income countries; railways; railway technical strategy; South Asia;Sub-Saharan Africa; sustainability
1. Introduction
While road transport has been the dominant mode for the movement of people and goods sincethe mid-1900s, railways are now staging a global comeback, illustrated by growth in the total length ofrail tracks and overall rail traffic units per year (passenger-km and tonne-km) [1]. Among the variousreasons for their renaissance are the concerns over the significant social, economic, and environmentalexternalities created by the transport sector. Global greenhouse gas emissions from the transportsector have more than doubled since 1971, and over three quarters of this increase has come from roadvehicles [2]. Rail transport is potentially more environmentally friendly than its road counterpart interms of energy consumption and emissions per traffic unit. Railways are costly to build and maintainbut can produce significantly lower external costs than other modes of transport, particularly whencarrying freight.
Either powered by diesel or electricity, the railways can reduce external costs of transport by atleast 47.5% per passenger-km, and 75.4% per tonne-km when compared to road modes (see Figure 1) [3].The biggest savings are found in environmental impacts, such as air pollution and climate change.Rail freight produces between 75% and 85% less greenhouse gas emissions per transport unit whencompared to articulated trucks, monetizing its benefit at around 0.1–0.4 cents per net tonne-km [4].
Sustainability 2019, 11, 4319; doi:10.3390/su11164319 www.mdpi.com/journal/sustainability19
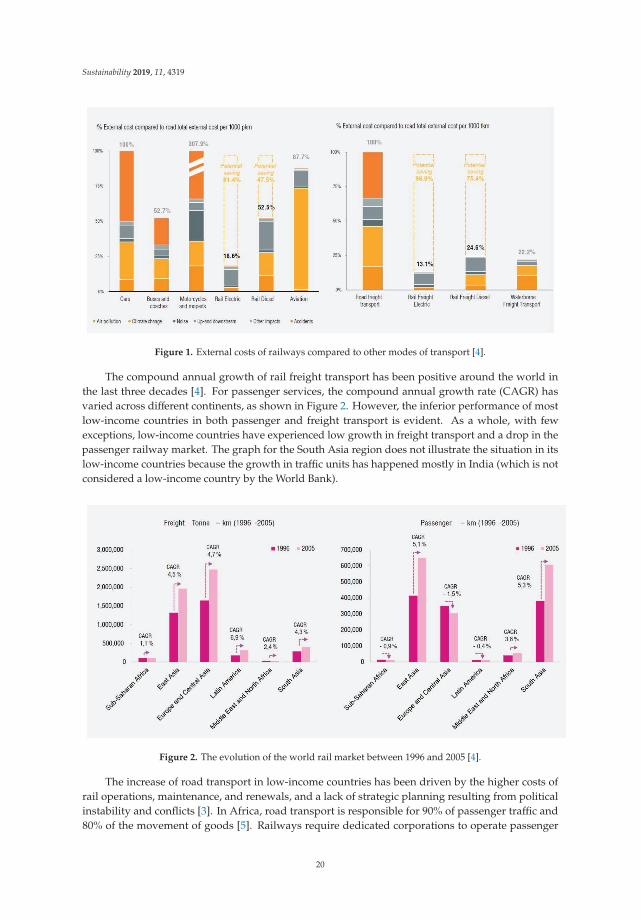
Sustainability 2019, 11, 4319
Figure 1. External costs of railways compared to other modes of transport [4].
The compound annual growth of rail freight transport has been positive around the world inthe last three decades [4]. For passenger services, the compound annual growth rate (CAGR) hasvaried across different continents, as shown in Figure 2. However, the inferior performance of mostlow-income countries in both passenger and freight transport is evident. As a whole, with fewexceptions, low-income countries have experienced low growth in freight transport and a drop in thepassenger railway market. The graph for the South Asia region does not illustrate the situation in itslow-income countries because the growth in traffic units has happened mostly in India (which is notconsidered a low-income country by the World Bank).
Figure 2. The evolution of the world rail market between 1996 and 2005 [4].
The increase of road transport in low-income countries has been driven by the higher costs ofrail operations, maintenance, and renewals, and a lack of strategic planning resulting from politicalinstability and conflicts [3]. In Africa, road transport is responsible for 90% of passenger traffic and80% of the movement of goods [5]. Railways require dedicated corporations to operate passenger
20

Sustainability 2019, 11, 4319
and freight services. The centralised costs for maintaining and upgrading capital assets create theimpression that the railways are too costly to compete with road transport, but rail is considerablycheaper when economies of scale are possible [4].
Despite the financial constraints, many low-income countries in Sub-Saharan Africa and South Asiahave followed through and started prioritizing railway infrastructure in their plans for the upcomingdecades. The current moment seems appropriate, as most low-income countries are experiencinghigher economic growth than the global average, leading to promising prospects [6]. When this growthis combined with an emerging middle class and untapped resources, it is clear that the potential forrailway development is timely [6]. In line with this, the African Union has published a vision of acontinent-wide rail network to facilitate inter- and intra-regional trade and meet the travel needs ofits growing population [7]. In South Asian countries, future goals for railway development are of asimilar scale.
Therefore, there seems to exist important gaps between the current status of rail infrastructure, thecommon vision of regional development, and short-term projects in implementation. While investmentin rail infrastructure is seen as an essential feature for the achievement of Sustainable DevelopmentGoals, projects need to be chosen carefully, especially in financially constrained countries [5].
2. Aims, Objectives, Scope, and Limitations
2.1. Aims and Objectives
This paper builds upon the research conducted for the U.K. Department for InternationalDevelopment (DFID), as part of the High-Volume Transport (HVT) project. The project was establishedto identify key areas for capacity building in order to improve access to more affordable, safer, andlower carbon transport services in low income countries. More specifically, the objectives of the railsub-theme were to determine the current state of the infrastructure in low-income countries to identifypathways towards regional interoperability goals. Subsequently, the research targeted the gaps inthe continental visions with present-day capabilities in order to develop key guidelines for technicaldevelopment in each region.
2.2. Scope
As a starting point, the HVT project focused on low-income countries in Sub-Saharan Africa andSouth Asia. According to the World Bank [8], low-income countries (LICs) are those where the GrossNational Income (GNI) per capita is less than US$1005. Lower middle-income economies are thosewith a GNI per capita between $1005 and $3895. Besides these countries, the project also includedDFID priority projects [9]. Some of these countries are in fact in the lower middle-income bracket, butpresent similar levels of Human Development Indices (HDI) to their low-income counterparts.
Not all countries that passed the criteria contain rail infrastructure or operate railway services.With these criteria, the initial list of 41 countries was then reduced to the 27 countries, which are listedin Table 1. The rail infrastructure sub-theme then adopted these as the scope of the research project.
Table 1. List of countries contemplated in the project.
Afghanistan Ethiopia Mali SudanBangladesh Ghana Mozambique Tanzania
Benin Guinea Myanmar TogoBurkina Faso Kenya Nigeria UgandaCote d’Ivoire Liberia Pakistan Zambia
Democratic Republic of the Congo (DRC) Madagascar Senegal ZimbabweEritrea Malawi Sierra Leone
Of the 27 countries contemplated, 23 are in Africa and 4 are in South Asia, as illustrated in Figure 3.
21

Sustainability 2019, 11, 4319
Sub Saharan Africa South Asia
Figure 3. Low-income countries in Sub-Saharan Africa and South Asia contemplated in the project.
3. Methodology
This research reviewed the literature on the current state of rail infrastructure to identifydevelopment areas that have the greatest potential for increasing future affordability and sustainabilityof railways in low-income countries (LICs) in Sub-Saharan Africa and South Asia. Findings were alsoderived from a workshop conducted in Nairobi, Kenya, in November 2018, with key stakeholdersfrom Sub-Saharan African countries.
The review looked at data available from primary and secondary sources. Extensive databasesheld by organisations such as the World Bank and the International Union of Railways (UIC) were usedas the main sources. Secondary sources were reports that provided supporting information [10,11].The availability, age, and robustness of databases found posed a challenge to the systematic process.In South Asia, more up-to-date information was available through reports from governments andinternational agencies [11–15].
Due to the significant differences in use of rail infrastructure between Sub-Saharan Africa andSouth Asia, the process of data collection adopted two separate fronts. Breadth of scope was prioritisedin this review in order to provide a comprehensive understanding of key areas needing development.Under each front, themes were defined where data was available for both regions. Subsequently,each sub-theme and the list indicators for infrastructure condition and operational performance weredefined according to the information available. The process is illustrated in Figure 4.
Information on rail infrastructure and performance in low-income countries was found to begenerally fractured and outdated, in accordance with previous works [3,4]. Large discrepancies werefound among sources. It was found that the most comprehensive database where indicators areavailable for most countries analysed stopped being updated between 2005 and 2008 [1,10]. Morerecent information, where available, was used to calibrate the reliability of sources [11]. Some countrieslisted infrastructure indicators until 2011, with one listing indicators until 2017 (Democratic Republicof the Congo). In the twelve years separating the data for DRC, no significant changes in indicatorswere found.
22
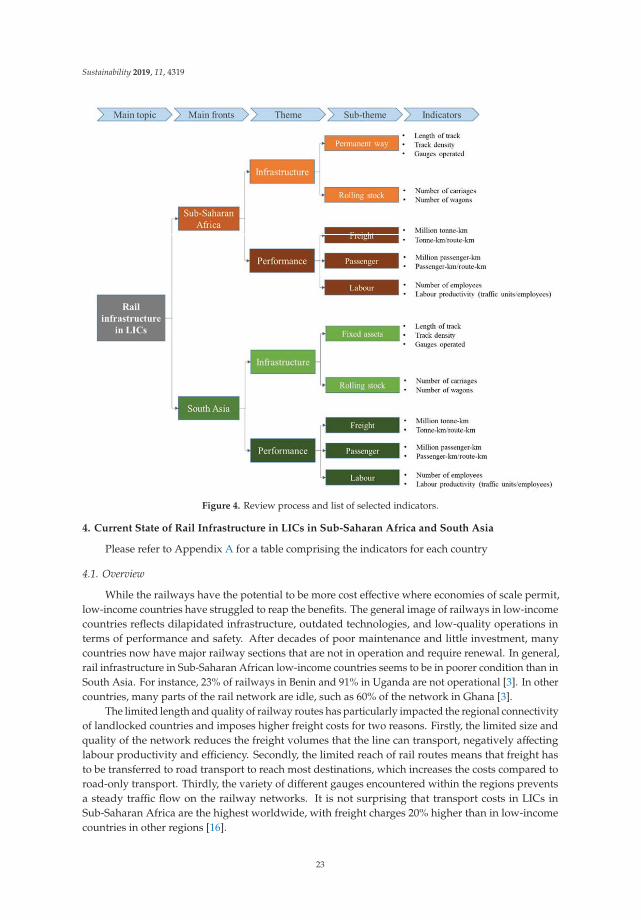
Sustainability 2019, 11, 4319
Figure 4. Review process and list of selected indicators.
4. Current State of Rail Infrastructure in LICs in Sub-Saharan Africa and South Asia
Please refer to Appendix A for a table comprising the indicators for each country
4.1. Overview
While the railways have the potential to be more cost effective where economies of scale permit,low-income countries have struggled to reap the benefits. The general image of railways in low-incomecountries reflects dilapidated infrastructure, outdated technologies, and low-quality operations interms of performance and safety. After decades of poor maintenance and little investment, manycountries now have major railway sections that are not in operation and require renewal. In general,rail infrastructure in Sub-Saharan African low-income countries seems to be in poorer condition than inSouth Asia. For instance, 23% of railways in Benin and 91% in Uganda are not operational [3]. In othercountries, many parts of the rail network are idle, such as 60% of the network in Ghana [3].
The limited length and quality of railway routes has particularly impacted the regional connectivityof landlocked countries and imposes higher freight costs for two reasons. Firstly, the limited size andquality of the network reduces the freight volumes that the line can transport, negatively affectinglabour productivity and efficiency. Secondly, the limited reach of rail routes means that freight hasto be transferred to road transport to reach most destinations, which increases the costs compared toroad-only transport. Thirdly, the variety of different gauges encountered within the regions preventsa steady traffic flow on the railway networks. It is not surprising that transport costs in LICs inSub-Saharan Africa are the highest worldwide, with freight charges 20% higher than in low-incomecountries in other regions [16].
23

Sustainability 2019, 11, 4319
For many of these countries, the length of railway infrastructure has an impact on the potentialto exploit their substantial deposits of natural resources. Furthermore, rail infrastructure in manyLICs dates back to colonial times and much of the network has not been upgraded since. Each nationpost-independence retained the track gauges that had been selected by their colonisers [6,10].
Track densities in LICs are generally lower than the global average. The exceptions are smallcountries, such as Bangladesh, and countries with very small networks, such as Afghanistan. In LICsin Sub-Saharan Africa (SSA), average track density is even lower at 2.76 km per 1000 km2, while LICsin South Asia (SA) are served by a relatively higher density of 7.8 km of track per 1000 km2 [10]. Thereare expected variations where either area or population is significantly high, yet LICs in both regionsfare poorly when compared to countries with robust rail traffic. For instance, Germany has 121 km oftrack per 1000 km2, which possibly explains why its railways carry 43% of the country’s freight [17].
4.2. Sub-Saharan Africa
4.2.1. Infrastructure
In Sub-Saharan Africa (SSA), rail infrastructure is predominantly used to transport freight(Figure 5). This can be partly explained by the vast reserves of minerals and bulk commodities in manycountries in the region. Most railways connect major ports to large cities and mining areas because 90%of African imports and exports are transported by sea [4,18]. However, the movement of people andgoods through the continent is limited because there is little connectivity between railway networks.Only a few lines cross borders, such as the Tanzania–Zambia Railway Authority (TAZARA) connectingTanzania and Zambia, and Sitarail between Burkina Faso and Cote d’Ivoire. Interoperability is alsoconstrained. Several countries operate different track gauges that range from 600 mm to standard(1435 mm). Cape gauge lines of 1067 mm predominate, especially in the south, followed by metregauge (1000 mm) lines and standard gauge (1435 mm), which are more recently built [10]. Efforts inbuilding new standard gauge tracks seem to overshadow interest in existing infrastructure.
0100200300400500600700800900
0
20
40
60
80
100
120
140
Germany UK USA India SouthAfrica
China SSA LIC SA LIC Km
oftrackpe
rmillioninha
bitants
Km
oftrackpe
r1000Km²o
farea
Track density (km/1000 km²) Km of track per million inhabitants
Figure 5. Track density in Sub-Saharan African (SSA) and South Asian (SA) low-income countries (LIC)compared to middle and high income countries [1,8].
Although the commonly used narrow gauge tracks are said to marginally limit the loading gaugeof trains, greater loads are carried on South African Cape gauge tracks than on standard gauges inthe United Kingdom [10]. However, smaller gauges tend to be associated with smaller curve radii,so rolling stock design and performance are crucial. The main concern with narrow gauges is thelateral oscillation (hunting) because of short-wheelbase bogies. The greater lateral oscillation of narrowgauges impacts passenger comfort, yet there are measures to address this issue, such as improving
24

Sustainability 2019, 11, 4319
suspension systems, lowering the centre of gravity of the wagon, or adjusting the lateral forces on thetracks [19].
Figure 6 illustrates the greater connectivity found in the southern region of the continent, wherecountries connect to the more developed network in South Africa. A metre gauge line from Mombasain Kenya to Dar es Salaam in Tanzania connects the East Africa region. Until recently, little has beendone to improve the connectivity and interoperability of rail infrastructure in LICs in Sub-SaharanAfrica. Early attempts with concessionary frameworks transferred the responsibility of infrastructuremaintenance and renewal to operators. Following that, the lines were not extended and connectivityremained very limited [6].
Figure 6. Track gauges operated in Sub-Saharan Africa (adapted from creative commons mediaAttribution-ShareAlike 4.0 International Public License).
Literature shows that not only track density but also track quality is below international standardsin Sub-Saharan Africa. Many railway assets in LICs are more than 100 years old, and thus the qualityof track materials is considerably outdated [6]. In much of Sub-Saharan Africa, the original rail tracksare ballasted but have not been appropriately or regularly maintained. The combination of asset ageand inadequate track maintenance and tamping has severely affected the operational performance ofrailways in the region. Firstly, the maximum axle load that the railway track structure can withstand inSub-Saharan Africa is approximately 15 tonnes [3]. In comparison, European standards for axle loadsare greater than 25 tonnes [20]. The poor track quality affects the maximum speed achievable. In 2009,freight trains in Sub-Saharan Africa reached only an average speed of 18 km/h [3].
Almost all lines are single track. Data on double track sections or passing loops were not availablefor a more detailed investigation. Sidings and platforms are outdated and date back to the originallines first built. In many cases, signaling on networks still relies mostly on manual systems, whetherwith mechanical signals or manual train orders [3]. Manual systems are adequate for the very lowtraffic currently achieved on most lines, but human error often creates safety problems. For traffic to beincreased in a safely manner, signaling systems may prove to be a barrier that needs to be overcome.
25

Sustainability 2019, 11, 4319
None of the original lines are electrified [6]. Electrified lines are only available on a few routes builtin recent projects, but these present challenges. The electrical grid in many low-income countries inSub-Saharan Africa is not robust enough to accommodate an electrified railway network. In Ethiopia,for example, a separate grid was built to cater for the large amount of power required to run electrictrains [21]. Where electrically powered signaling is installed, often it cannot be used because of shortcircuits, no electrical power, and degraded cable networks that are susceptible to cable theft. Telephoneexchanges in many railways are obsolete, with limited capacity and with spare parts being virtuallyimpossible to obtain [3].
4.2.2. Operational Performance
Railway traffic consists mainly of freight services in low-income countries in Sub-Saharan Africa.The movement of goods accounts for almost 90% of the traffic in the region. This can be explained bythe fact that it is more difficult to recover the costs of passenger operations without subsidies, and withlimited track availability, more cost-effective choices have to be made.
The combination of low maximum axle loads and speed limits within limited routes has asignificant impact on traffic volumes achievable in LICs in Sub-Saharan Africa. Traffic volumes arean important measure of the sustainability and affordability of rail operations because they highlightinfrastructure usage. Higher volumes generate economies of scale in the costs of infrastructuremaintenance and improvements, which in turn increase the competitiveness of rail transport againstother modes.
With the exception of Guinea, where private mining companies extensively use their own railwaylines, all LICs show traffic densities below or around 1 million traffic units (tonne-km plus passenger-km)per route-km (Figure 7). Data for Eritrea, Liberia, and Sierra Leone were not available. In contrast,railway networks in the United Kingdom, France, and Germany operate around 4.5 million units perroute-km. Global leaders in traffic volumes such as Russia, the United States, and China reach densitiesup to 40 million units per route-km (Figure 8) [1,17,22].
0.0
1000.0
2000.0
3000.0
4000.0
5000.0
6000.0
1000
tran
sportu
nitspe
rrou
tekm
Freight services Passenger services
Figure 7. Rail traffic density in SSA LICs [10].
26

Sustainability 2019, 11, 4319
05,00010,00015,00020,00025,00030,00035,00040,00045,000
LIC UK France Germany Russia USA China1000
tran
sportu
nitspe
rrou
tekm
Freight Passengers
Figure 8. Rail traffic density in SSA LICs compared with high income countries and global leaders [1,10].
Due to the low volumes achieved, labour productivity is significantly lower in most LICs inSub-Saharan Africa than in developed nations. On average, employees in the United Kingdom producefour-times more traffic units per employee than SSA LICs. In a more extreme comparison, while anaverage employee in LICs in Sub-Saharan Africa produces 150,000 traffic units per year, a U.S. employeeproduces 14.2 million (Figure 9) [8,22]. Under these circumstances, fixed costs are spread over fewertraffic units, which in turn become expensive in comparison to other transport modes. In exchange,that leads to a vicious cycle where higher unit costs lead to lower demand, which affects the unitcosts and return. The exceptions in the region are Burkina Faso, Senegal, and Zambia, which reachapproximately 500,000 units per employee and are close to the productivity of German railways [10].No data was found for Guinea.
0 2,000 4,000 6,000 8,000 10,000 12,000 14,000 16,000
SSA LICs
Great Britain
France
Germany
Russia
USA
China
Labour productivity (1000 transport units per employee)
Figure 9. Comparison of labour productivity between SSA LICs and selected countries [10,22].
Safety on railways in low-income countries has been a matter of significant concern. There is verylittle data on safety records, as well as unclear standards and compliance, and the issue has been raisedin the literature [3–5]. In addition, safety was the most mentioned aspect during the workshop withkey stakeholders in Nairobi. Respondents listed trespassing, derailments, and theft of infrastructure asthe main problems faced in the region. From the data available, safety records in LICs in Sub-SaharanAfrica are significantly worse when compared to other countries [11].
Sample safety records were found for DR Congo (2015), Cote d’Ivoire (2002), Kenya (2002),and Nigeria (2003), and used to infer a comparison against more developed economies [11]. With
27

Sustainability 2019, 11, 4319
0.545 accidents for every million traffic units, DR Congo had an accident rate 545-times higher thanGermany or Great Britain (0.001 accidents per million traffic units), and 32-times the average in thedeveloping world [11,13]. Other LICs performed better but still experienced over 100 more accidentsthan the two European counterparts, as shown in Table 2.
Table 2. Safety record of sample SSA LICs compared to Germany and the United Kingdom [11,22].
Country Traffic Units (million) Accidents Accidents per Million Traffic Units
DR Congo (2015) 697 380 0.545Cote d’Ivoire (2002) 436 91 0.209
Nigeria (2003) 268 108 0.403Kenya (2002) 2191 249 0.114
Germany 208,262 346 0.0016Great Britain 68,912 71 0.0010
4.3. South Asia
4.3.1. Infrastructure
There are significant differences between railway usage in South Asian LICs and those inSub-Saharan Africa. Railway systems in South Asia’s LICs are mostly used for passenger transport.Since the railways are owned and operated by the government in all countries analysed, services areheavily subsidised for social reasons. Railway lines connect major cities in commuting networks acrossregions and sometimes between countries.
Possibly due to closer geographical proximity and a more common colonial influence, trackgauges in South Asia are more homogenous than in Sub-Saharan Africa (see Figure 10). Countriesbordering India have adopted mainly the same broad gauge (1676 mm), which assists with connectivityand interoperability. Nepal has broad gauge track infrastructure but has not operated railway servicessince 2008. East of India, trains in Myanmar and east Bangladesh run on meter gauge tracks (1000 mm).In Pakistan and west Bangladesh, broad gauge tracks are the standards [23]. Further west, a shortline in Afghanistan runs on Soviet gauge (1520 mm). Bangladesh also has 365 km of dual gauge track(metre gauge and broad gauge) connecting the broad gauge network in the west to the meter gaugenetwork in the east [12,24]. Pakistan runs a short 312 km metre gauge line [15].
Figure 10. Illustration of track gauges in use in South Asia (based on previous work [10–13]).
28

Sustainability 2019, 11, 4319
With a total of 7.8 km per 1000 km2, LICs in South Asia are almost three times more denselycrossed by railway lines than low-income countries in Sub-Saharan Africa [10,22]. Bangladesh has morerailway tracks per area than Pakistan and Myanmar but a lower track density per head of population.Despite the higher track density, age of assets and infrastructure quality in South Asian LICs are asimilar issue to those found in Sub-Saharan Africa. In all four countries studied, most lines are singletrack. In Pakistan, only approximately 10% of the track is double track.
Track quality varies according to country, and has an important impact on operational performance.Poor condition of the track infrastructure, which includes aspects such as track alignment, ballastcondition, and the presence of cracks on the rail surface, not only limits the maximum load and speedthat can be safely achieved but also increases the risk of derailment. For instance, railway infrastructurein Myanmar has an axle load limit of only 12.5 tonnes [14]. Moreover, the infrastructure condition inthe country limits the maximum speeds of freight trains to 48 km/h and passenger trains to 60 km/h.Pakistan and Bangladesh have upgraded rail tracks to support 22.5 tonnes per axle in certain sections.In other sections, axle load is limited to 17.87 tonnes [23]. The variance in track quality is problematicin two ways. The lower threshold limits rolling stock loads and wastes the investments in the sectionswith better track quality, while there is a risk that rolling stock loads match the improved sections andpresent a risk of overloading the track. Available traffic speeds have not improved. As an example, theaverage speed of freight trains in Bangladesh is only 18.5 km/h [12].
In the region, none of the lines are electrified and signaling is still mainly manual. Ahmed et al. [24]have listed the outdated systems as a threat to safe and efficient train operations in Bangladesh.In Myanmar, contracts to upgrade signaling to electronic systems have been signed recently but arestill not available [25].
4.3.2. Operational Performance
Traffic densities in South Asia are considerably higher than in LICs in Sub-Saharan Africa.Crowded passenger volumes make traffic densities (1000 traffic units per route-km) in Pakistanand Bangladesh comparable to high-income European countries, such as Great Britain, France, andGermany, but still far from world leaders, such as Russia and China (Figure 11). According to recentdata, Bangladesh and Pakistan operated approximately 3.0 and 3.6 million traffic units per route-km,respectively [12,15]. Myanmar has a traffic density below 1 million units per route-km, and therefore isconsidered a low volume network similar to most low-income countries in Sub-Saharan Africa [14].Contrary to the African continent, only a small proportion of total rail traffic in South Asian LICs isdedicated to freight. Passenger services account for 80% of the total traffic in the region [10]. No trafficdata was available for the Afghan line, which operates only freight services to Uzbekistan.
05,00010,00015,00020,00025,00030,00035,00040,00045,000
1000
tran
sportu
nitspe
rrou
tekm
Freight Passengers
Figure 11. Traffic density of South Asian LDCs compared with high income countries and worldleaders [9–13,15].
29
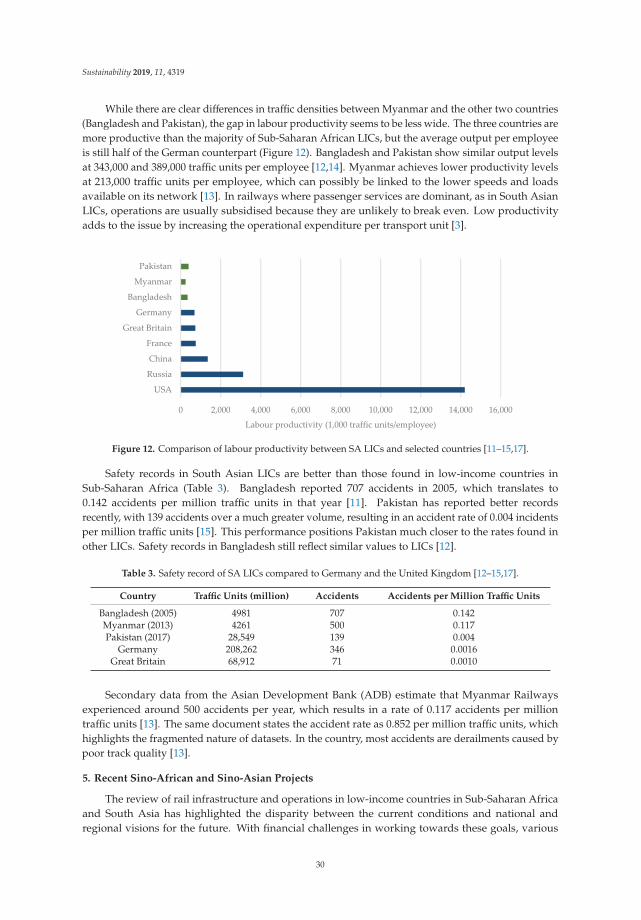
Sustainability 2019, 11, 4319
While there are clear differences in traffic densities between Myanmar and the other two countries(Bangladesh and Pakistan), the gap in labour productivity seems to be less wide. The three countries aremore productive than the majority of Sub-Saharan African LICs, but the average output per employeeis still half of the German counterpart (Figure 12). Bangladesh and Pakistan show similar output levelsat 343,000 and 389,000 traffic units per employee [12,14]. Myanmar achieves lower productivity levelsat 213,000 traffic units per employee, which can possibly be linked to the lower speeds and loadsavailable on its network [13]. In railways where passenger services are dominant, as in South AsianLICs, operations are usually subsidised because they are unlikely to break even. Low productivityadds to the issue by increasing the operational expenditure per transport unit [3].
0 2,000 4,000 6,000 8,000 10,000 12,000 14,000 16,000
USA
Russia
China
France
Great Britain
Germany
Bangladesh
Myanmar
Pakistan
Labour productivity (1,000 traffic units/employee)
Figure 12. Comparison of labour productivity between SA LICs and selected countries [11–15,17].
Safety records in South Asian LICs are better than those found in low-income countries inSub-Saharan Africa (Table 3). Bangladesh reported 707 accidents in 2005, which translates to0.142 accidents per million traffic units in that year [11]. Pakistan has reported better recordsrecently, with 139 accidents over a much greater volume, resulting in an accident rate of 0.004 incidentsper million traffic units [15]. This performance positions Pakistan much closer to the rates found inother LICs. Safety records in Bangladesh still reflect similar values to LICs [12].
Table 3. Safety record of SA LICs compared to Germany and the United Kingdom [12–15,17].
Country Traffic Units (million) Accidents Accidents per Million Traffic Units
Bangladesh (2005) 4981 707 0.142Myanmar (2013) 4261 500 0.117Pakistan (2017) 28,549 139 0.004
Germany 208,262 346 0.0016Great Britain 68,912 71 0.0010
Secondary data from the Asian Development Bank (ADB) estimate that Myanmar Railwaysexperienced around 500 accidents per year, which results in a rate of 0.117 accidents per milliontraffic units [13]. The same document states the accident rate as 0.852 per million traffic units, whichhighlights the fragmented nature of datasets. In the country, most accidents are derailments caused bypoor track quality [13].
5. Recent Sino-African and Sino-Asian Projects
The review of rail infrastructure and operations in low-income countries in Sub-Saharan Africaand South Asia has highlighted the disparity between the current conditions and national andregional visions for the future. With financial challenges in working towards these goals, various
30

Sustainability 2019, 11, 4319
low-income countries have recently signed resource-for-infrastructure agreements, mostly with China,to replace dilapidated infrastructure with new lines using modern technologies [16]. From the literature,Sino-African projects exceed those found in South Asia. This may be explained by the large investmentsfrom the ADB in the region to develop a Trans-Asian Railway network [26]. Conversely, projects inSub-Saharan Africa seem to be conducted on an ad hoc basis.
Since its beginning in 2006, Sino-African trade volumes grew rapidly to reach more than US$200billion in 2013 [16]. These resource-for-infrastructure investments include several railway projectsacross the continent, with some examples listed in Table 4. Most projects consist of single track,non-electrified, standard gauge lines [18,21,27–29]. Lines are built with freight and passenger servicesin mind and permit an average maximum speed between 100 km/h and 120 km/h [18,21,27–29]. Thereare exceptions to these standards: (1) the Addis Ababa–Djibouti line, which is electrified and includes151 km of double tracks; (2) the Mali–Senegal line, which is a renovation of the existing infrastructure;and (3) the Abuja–Kaduna section of the Lagos–Kano line, which is double-track and will permitspeeds of up to 250 km/h [30].
Table 4. Sino-African railway development projects [18,21,27–30].
Country Project Length Cost (in US$)
Chad Chad Railways [27] 1364 km 5.6 billionEthiopia-Djibouti Addis Ababa–Djibouti line [21] 751 km 4 billion
Mali Mali–Guinea Railway line [28]Mali–Senegal Railway [18]
900 km1286 km 11 billion
Nigeria Lagos–Calabar line [29]Lagos–Kano line [30]
1400 km1124 km
11.1 billion8.3 billion
Kenya Mombasa–Nairobi line [18] 485 km 4 billion
In South Asia, such projects are not as numerous. In Bangladesh, work has started on the PadmaBridge Rail Link, a 225 km project connecting regions to the port of Payra, at a total cost of the projectexpected to be US$3.14 billion with a loan of 80% of the amount [31]. Pakistan signed with Chinaa US$8.2 billion overall investment in railways in Pakistan, including the renewal of broad-gaugetracks and the acquisition of rolling stock. It has since, however, been reduced by US$2 billion due toconcerns over the costs of the loans [32].
At a first glimpse, these projects are reshaping the capacity of existing routes. For instance, the lineconnecting Addis Ababa to Djibouti has reduced the journey time between Djibouti and the dry port ofMojo in Ethiopia from 84 h to 10–15 h [21]. Similarly, the Standard Gauge Railway has reduced journeytimes between the port of Mombasa and the capital Nairobi to less than 5 h. In Nigeria, these projectsare expected to provide a long-awaited expansion to reduce congestion on the country’s damagedroads [33].
However, there is significant concern over the sustainability of these projects. From an economicperspective, concern is increasing that these large loans will tie low-income countries to a long-termdependency on China rather than promoting internal development [16]. These concerns have somesupport in the case of Sri Lanka, which handed over control of one of its deep-sea ports to ease itsdebt with China [34]. Moreover, the cost-effectiveness of such large-scale projects has been questioned.For instance, the Mombasa-Nairobi line in Kenya is reported to have cost close to three times theinternational standard and four times the original estimate [35].
From a technical standpoint, systems have been developed only within the national context,with little attention to compatibility and standardisation [6,36]. Rahmatullah [36] adds that regionalrail use is likely to be constrained by differences in track gauge, track structure, signaling systems,and incompatible rolling stock. Delelegn [21] highlighted that lines within Ethiopia run on differentsignaling systems because they were built by different companies. Stakeholders at the Nairobi workshopshared similar concerns about the link between new rail infrastructure and wider development regionalplans, where projects are not standardised with regard to maximum axle loads and speeds, and control
31

Sustainability 2019, 11, 4319
and communication systems to be used in different sections. It was also highlighted that nationalmasterplans were not available and very few documents were digitalised for common access.
Moreover, it seems that recent investments are not entirely aligned with the current gapsin capability. Technical decisions on new projects are being driven by external forces, includinginternational suppliers and foreign governments, rather than following regional plans with a holisticperspective. This has resulted in investments in solutions that do not match the requirements of thespecific context and development trajectory of low-income countries. For example, electrification isstill not possible in many countries, as the national electricity grids are insufficient to support railwayoperations. When electrified lines were built in Ethiopia, a new grid had to be added to the project [21].Furthermore, expensive and highly sophisticated complex systems have been specified where they arenot required, as in the example of the deployment of advanced ERTMS Level 3 (European Rail TrafficManagement System Level 3) technologies in Zambia, where traffic volumes are less than 1.5 milliontraffic units per year [37].
There are clear discrepancies in future goals and current actions. Since there is no establishedtechnology roadmap to lead national development towards a common goal, countries are buyingoff-the-shelf technologies that are too expensive for the near future traffic projected. In doing so, theirpathway to development is likely to only follow the steps of developed countries decades ago andremain outdated in the long-term. Little attention has been given to the specific context of the regionsand their needs for fit-for-purpose solutions that can leapfrog previous development curves and createfit-for-purpose solutions.
If these problems are left unaddressed, there is significant potential for scarcely available moneyto be wasted, and for new railway systems to underperform and lose money. Such an outcome is likelyto slow the rate of development of railways in low-income countries and lead to less efficient and moreenvironmentally damaging solutions being deployed in the future.
Therefore, it is imperative that scarcely available investments are made consistently and coherentlyin order to follow a pathway towards continental future goals. Experience in developed regions showsthat technical strategies are important studies that can identify common capabilities and producecontext-specific and fit-for-purpose technology roadmaps that connect future visions to current levelsof development.
6. Technical Strategies in Europe
In 1995, the European Union had a similar vision to restructure the rail transport market andstrengthen the position of the rail industry in relation to other transport modes [38]. Infrastructure atthat point was in a much better condition than currently found in LICs in Sub-Saharan Africa and SouthAsia, yet there was a need for harmonised development to fulfil the goals of a continent-wide network.This implied opening-up of the rail transport market to competition, improving interoperabilityand safety of national networks, as well as developing better rail infrastructure [36]. These threemain areas—crucial to the development of a strong and competitive rail transport industry—are nodifferent from what is required to enable low-income countries to provide an efficient, reliable, andsafe alternative mode of transport for its citizens.
To achieve these goals, the European Union started developing technical strategies to connectfuture visions to tangible development programs. The first edition was published in 2008 with thepurpose of “foreseeing the kind of railway that the rail industry is capable of supplying in response toEuropean and national needs and affordability criteria, to assess whether this railway can be deliveredthrough ‘natural’ incremental change mechanisms, or whether some planned strategic changes arerequired” [39].
Technical strategies are roadmaps to connect the present state to the future goals of systemsbecause the gaps between both are usually of considerable magnitude. In this, the complex contextand the uncertainty that surrounds development require coordinated actions to achieve a common
32
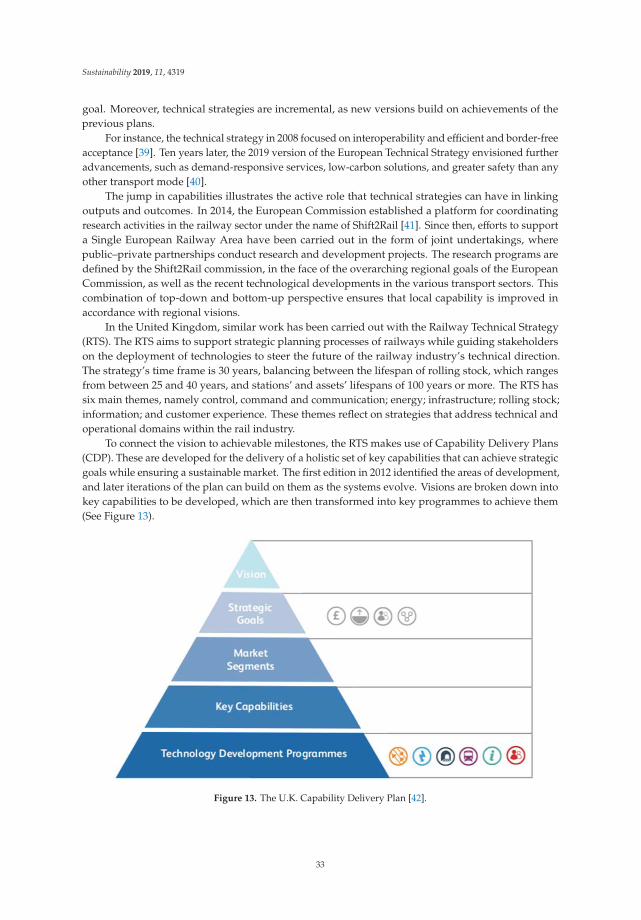
Sustainability 2019, 11, 4319
goal. Moreover, technical strategies are incremental, as new versions build on achievements of theprevious plans.
For instance, the technical strategy in 2008 focused on interoperability and efficient and border-freeacceptance [39]. Ten years later, the 2019 version of the European Technical Strategy envisioned furtheradvancements, such as demand-responsive services, low-carbon solutions, and greater safety than anyother transport mode [40].
The jump in capabilities illustrates the active role that technical strategies can have in linkingoutputs and outcomes. In 2014, the European Commission established a platform for coordinatingresearch activities in the railway sector under the name of Shift2Rail [41]. Since then, efforts to supporta Single European Railway Area have been carried out in the form of joint undertakings, wherepublic–private partnerships conduct research and development projects. The research programs aredefined by the Shift2Rail commission, in the face of the overarching regional goals of the EuropeanCommission, as well as the recent technological developments in the various transport sectors. Thiscombination of top-down and bottom-up perspective ensures that local capability is improved inaccordance with regional visions.
In the United Kingdom, similar work has been carried out with the Railway Technical Strategy(RTS). The RTS aims to support strategic planning processes of railways while guiding stakeholderson the deployment of technologies to steer the future of the railway industry’s technical direction.The strategy’s time frame is 30 years, balancing between the lifespan of rolling stock, which rangesfrom between 25 and 40 years, and stations’ and assets’ lifespans of 100 years or more. The RTS hassix main themes, namely control, command and communication; energy; infrastructure; rolling stock;information; and customer experience. These themes reflect on strategies that address technical andoperational domains within the rail industry.
To connect the vision to achievable milestones, the RTS makes use of Capability Delivery Plans(CDP). These are developed for the delivery of a holistic set of key capabilities that can achieve strategicgoals while ensuring a sustainable market. The first edition in 2012 identified the areas of development,and later iterations of the plan can build on them as the systems evolve. Visions are broken down intokey capabilities to be developed, which are then transformed into key programmes to achieve them(See Figure 13).
Figure 13. The U.K. Capability Delivery Plan [42].
33

Sustainability 2019, 11, 4319
7. Developing a Technical Strategy for Low-Income Countries
7.1. Overview
As previously mentioned, there are visions of a continent-wide railway network, specificallyhigh-speed rail, in Sub-Saharan Africa and South Asia to facilitate trade as well as to sustainably meetthe travel needs of the growing populations. A more specific vision for the African railway sector in2040 was published in 2013 [5]. Its main focus is on the regeneration of railway networks, highlightingthe need to consider transport networks at regional and continental levels.
This paper suggests a framework for a technical strategy to be used in the development of railinfrastructure in LICs in Sub-Saharan Africa and South Asia (Figure 14). Assuming a future goal ofinteroperable and efficient rail networks, eight main capabilities were identified considering the currentstate of rail infrastructure found in the literature. These are infrastructure, signaling, interoperability,planning, standards, costs, data, and safety.
Figure 14. A technical strategy for developing rail infrastructure in low-income countries.
Currently, rail infrastructure in these LICs is mostly what is left from the legacy of the originalnetworks of the 19th and 20th century, with little planning and almost no interoperability betweencountries. Most countries struggle with severely dilapidated infrastructure from years of negligenceand poor maintenance. Traffic volumes are affected and so are the costs. Various track gauges have beenfound in bordering countries, challenging cross-border operations and limiting the competitiveness of
34

Sustainability 2019, 11, 4319
railway transport with road-based modes. Some countries even operate different gauges within theirown borders, creating operational difficulties that consume precious time and result in greater costs.
More important in the diagram are the intermediate milestones, which provide a systematicbridge between the current state and future goals of railway networks. It is crucial to acknowledge theincremental level of sophistication of the systems where appropriate cost-effective technologies canbe implemented. Large scale projects such as railways take several years to be completed, meaningthat the evolution of capabilities must be taken as a long-term process. Otherwise, localised initiativessuch as those seen in Sino-African projects may become the norm, adopting unsustainable projects andunaffordable solutions for quick wins.
Based on regional documents outlining the vision for interoperable railway networks, we haveestablished a maturity pathway for each of the capabilities. Similarly to processes conducted inEurope, they focus on outcomes and are kept “solution agnostic” in order to maintain the pool ofpotential technologies available. The framework also acknowledges previous and current projects ofmodernisation that have adopted international standards, but not in a cohesive manner.
There is a considerable gap between the desired state of rail infrastructure in 2040 and the currentsituation where countries are beginning to move away from legacy systems. However, there is alsoan advantage in the greater technological prowess available nowadays, which can help leapfrog thedevelopment path taken by high income countries. As an example, digitalisation and recent advancesin traction and materials can reduce the costs of renovation, as well as achieve levels of interoperabilityand standardisation that have taken other countries much longer in the past.
The key outcomes of the strategy are found at the bottom of Figure 14 in the form of appliedresearch programmes. Similarly to the European case, the role of a technical strategy for LICs is to bridgethe desired capability development with applied and appropriate research programmes. The threemain drivers identified in this research are: (i) data collection and capacity building; (ii) emergingrailway technologies; and (iii) fit-for-purpose regional standards.
7.2. Data Collection and Capacity Building
Data was found to be a crucial capability, not only for the development of more efficient networksbut also for the technical strategy itself. Many indicators of the current state of infrastructure andoperational performance in low-income countries are not available. When they are, they are atleast 10 years old, which renders them unreliable, especially in the context of accelerated economicgrowth seen in these countries. Little technical information has been found on the new projects fromSino-African and Sino-Asian agreements.
In this, data collection and capacity building become short-term priorities for the pathways of thetechnical strategy. However, the process must be systematic in identifying key performance indicatorsthat can assess whether capability developments align with the future vision. Therefore, all countriesin the region must agree on a list of indicators to be measured, the metrics to be used, and standardcollection processes to ensure reliability in the results.
Building such capacity in data collection and benchmarking, LIC regions will become able toidentify the different levels of each country and act accordingly. In addition, indicators can indicategaps between current performance and each milestone, highlighting priority areas for researchand development.
The advantage of using a technical strategy to guide data collection activities is that the type andamount of data is decided not on the current availability of the system but on the future vision of thenetworks. With this, when capabilities start to evolve, measures of effectiveness of past programs canbe assessed, and new iterations of research and development (R&D) initiatives decided accordingly.On the other hand, this paradigm requires a high level of transparency between all countries that takepart in the technical strategy. This means that efforts need to be leveled and a baseline amount ofinformation shared.
35
Sustainability 2019, 11, 4319
7.3. Emerging Railway Technologies
Improved databases can then be used as a basis for the technical strategy to achieve the othertwo medium- and long-term outcomes. The technical strategy should use performance indicatorsto identify differentiated technologies that can provide technological shortcuts to achieve similaroutcomes without having to follow the same path of high-income countries. It is important that thecapabilities defined are solution agnostic because one of the key elements of technical strategies is thedifferentiation approach to rail infrastructure. This perspective suggests that a more cost-effective planfor the development of railway networks is based on differentiation at an infrastructure level as partof a wider multi-purpose strategy, where different types of operations can share some routes, whileothers will be largely used by a single sector.
Track renovation and renewal seem to be an early milestone to restore traffic efficiency in areaswhere the network has suffered most. Specific geometries, track density, and gauge must follow carefulconsideration of demand forecasts to differentiate international corridors from local lines. By doing so,improvements towards interoperability can start with more cost-effective routes and use appropriatetechnologies for each section. In the meantime, research programs can be started on solutions formoving assets and control and communication.
For instance, emerging digital signaling technologies can offer a more cost-effective transitionbetween the current state of the infrastructure (2018) and the next milestone (2025), leapfroggingtrack-side equipment. One important advantage of digital technologies is the easier and morecost-effective upgrading when traffic increases in the network.
Similarly, a deeper and broader knowledge of track conditions and geometry can give way tobespoke wagon design and materials to achieve a certain performance at appropriate costs. The role ofemerging railway technologies can prove crucial to accelerate and integrate the regional developmentof rail infrastructure in LICs in Sub-Saharan Africa and South Asia. Nonetheless, the situationencountered in those countries is one of fragmented capabilities and distinct standards. It logicallyfollows that off-the-shelf solutions may not suffice, and that research initiatives should also look atsolutions at the technology level.
7.4. Fit-for-Purpose Regional Standards
In the medium to long term, the adoption of emerging technologies in differentiated solutionscan lead to agreements on regional standards. Fit-for-purpose standards can be elicited to cater forthe specific operational paradigms encountered in low-development countries so that differentiatedtechnologies can be used in a safe and reliable manner. Differentiated technologies comprise disruptivesolutions that have the potential to save money (both in terms of initial cost and whole life cycle costs),while also providing greater capability, improved environmental impacts, and a better solution forcustomers. Adopting fit-for-purpose regional standards has the potential to create leading expertiseregionally, and companies that are able to export products and expertise internationally.
In addition, having a coordinated approach to technology development creates markets for newfit-for-purpose technological solutions that consider the differentiated operating parameters in eachregion. Within this scenario, technical strategies such as the ones practiced in Europe help small andmedium enterprises (SMEs) to access those specific regional markets.
There are challenges to be overcome. Regional standards that can foster local economies dependon collective and cohesive action between countries, and facilitated movement of products and peoplebetween borders. In addition, technical strategies usually channel funding streams centrally, requiringcoordinated decisions from a central commission. These mechanisms are essential interfaces betweenthe building blocks of the technical strategy that ensure its efficacy.
36

Sustainability 2019, 11, 4319
8. Conclusions and Discussion
Railways are staging a comeback around the world as governments are changing policies andstrategies to address sustainable development goals. Railway transport has the potential to be moresustainable and more affordable than road transport when economies of scale are made possible. Theycan reduce emissions and energy consumption per traffic unit, both in passenger-km and tonne-km.However, low-income countries have been struggling to achieve this because of the current conditionof their rail infrastructure. In most cases, tracks have been poorly maintained for decades, and littleinvestment has been made to improve signaling systems and rolling stock technologies. As a result,most low-income countries analysed in this research produce low traffic densities as a measure oftraffic units per kilometer of rail lines. With that, the operational costs per traffic unit becomes higherthan in other parts of the world and reduces the competitiveness of rail against road transport.
This paper conducted a review on the current condition of infrastructure and operationalperformance of railways in low-income countries in Sub-Saharan Africa and South Asia. A total of23 countries in Sub-Saharan Africa and 4 countries in South Asia were included in the study. Reliabledatasets were found to be mostly outdated, and recent available data is fragmented. The review of thecurrent state of the infrastructure confirms the general perception of the regions—assets dating back tocolonial periods with little improvement since, and single-track routes with manual signaling systemslimit the capacity of lines.
Despite the financial constraints, low-income countries in Sub-Saharan Africa and South Asiaare following through and agreeing to various resource-for-infrastructure loans to build new lines toreplace severely dilapidated existing networks. These plans seem to go in an opposite direction toa shared vision of continent-wide efficient rail networks that can provide a competitive alternativeto road transport. Firstly, most of the lines planned have been driven by international suppliers’preferences and the financing available rather than as part of a coherent and coordinated developmentplan. As a result, some of the new lines suffer from the same interoperability issues as the originalinfrastructure from the beginning of the last century. Secondly, there have been concerns over thefinancial sustainability of these projects. They have been deployed with little consideration of specificrequirements of the lines, resulting in technologies used in high-capacity networks being applied tothe low traffic volumes currently found in the regions.
Further research is necessary to put such a technical strategy into practice:
1. As a starting point, data is a crucial aspect for a successful development of a technical strategy.There is very little data concerning the current state of railway infrastructure and the operationalperformance achieved. It is important that the current condition of assets and current performancelevels are known so that specific technology roadmaps can be traced.
2. Specific research on emerging technologies that can provide cost-effective and more sustainablesolutions for the specific operational context of low-income countries. Off-the-shelf technologiesin use in countries with high volumes of traffic can be too costly and unsustainable in the longrun. These include new traction solutions (e.g., hydrogen) that can bypass the need for expensiveelectrified networks, cost-effective materials for tracks and rolling stock, digitalised train-basedsignaling systems, etc.
3. A final part of the technical strategy relates to standards. In order to achieve efficient, interoperable,continent-wide rail networks, low-income regions need to ensure that the technologies adoptedare standardised. If not, that they are at least compatible with cross-border operations. Withthe research on the use of emerging technologies for context-specific solutions, research shouldalso develop fit-for-purpose regional standards in accordance with future visions. In addition,the creation of standards that are lacking in many LICs can promote improved operationalperformance, especially concerning safety.
37
Sustainability 2019, 11, 4319
Therefore, this paper suggests that low-income countries in Sub-Saharan Africa and South Asianeed to develop a technical strategy to coordinate localised development towards a common goal inorder to achieve their visions. Technical strategies used in high-income countries are used as a baselineto define key processes in developing a counterpart for low-development countries so that they canfind technological shortcuts rather than just follow the previous development paths of high-incomeregions. A framework for a technical strategy for LICs in Sub-Saharan Africa and South Asia waspresented, in which eight capabilities were identified for priority. In addition, the framework proposesa structured mechanism to transform the three main areas of further research into practice and achievethe milestones elicited.
Future work should initially scan the current condition and performance of rail infrastructure inLICs in Sub-Saharan Africa and South Asia to update and equalise databases. Subsequently, once thelocal and regional gaps are identified, research programs can be devised in order to address the buildingblocks suggested. Using emerging technologies and adopting fit-for-purpose standards will facilitatethese regions to achieve their capability milestones and achieve their future visions more efficiently.
Author Contributions: Data collection, M.B., W.W., and L.A.; workshop organisation, M.B. and C.R.; authorship,M.B., W.W., L.A., and C.R.
Funding: This project is part of the High Volume Transport (HVT) applied research programme funded by theUK Department for International Development (DFID)
Acknowledgments: This research was funded by UK AID through the UK Department for InternationalDevelopment under the High Volume Transport (HVT) Applied Research Programme, managed by IMCWorldwide. The authors are particularly grateful for the advice of Bruce Thompson the leader of Theme 1, LongDistance Strategic Road and Rail Transport, of the HVT Programme.
Conflicts of Interest: The authors declare no conflict of interest.
38

Sustainability 2019, 11, 4319
Ap
pe
nd
ixA
To
tal
Tra
ck(k
m)
Tra
ckD
en
sity
(km/1
000
km
2)
Km
of
Tra
ckp
er
Mil
lio
nIn
hab
itan
ts
Nu
mb
er
of
Carr
iag
es
Nu
mb
er
of
Wag
on
s
Lab
ou
rP
rod
uct
ivit
y(1
000
Traffi
cU
nit
sp
er
Em
plo
yee)
Fre
igh
tT
raffi
cV
olu
me
(Mil
lio
nN
et
To
nn
e-k
m)
Pass
en
ger
Traffi
cV
olu
me
(Mil
lio
nP
ass
en
ger-
km
)
Traffi
cD
en
sity
(1000
Tra
nsp
ort
Un
its
per
Ro
ute
-km
)
Beni
n57
95.
054
2032
640
.411
752
291.
9Bu
rkin
aFa
so62
22.
334
2965
748
1.0
360
5867
2.0
Cot
ed’
Ivoi
re63
92.
028
--
-37
660
682.
3D
RC
ongo
3641
1.6
4723
331
9927
.868
116
191.
4Er
itre
a11
71.
217
--
-0
00.
0Et
hiop
ia68
10.
77
2749
370
.918
911
144
0.5
Gha
na94
74.
235
154
489
84.1
298
6938
7.5
Gui
nea
1045
4.3
96-
--
5760
3855
48.3
Ken
ya20
653.
645
328
7140
203.
518
5833
310
61.0
Libe
ria
428
4.4
123
--
-0
00.
0M
adag
asca
r88
61.
539
-18
7-
370
41.8
Mal
awi
797
8.5
4717
478
131.
091
2714
8.1
Mal
i64
10.
544
4450
933
9.0
240
5445
8.7
Moz
ambi
que
3128
4.0
112
2883
414
3.8
913
127
332.
5N
iger
ia35
573.
921
236
1299
37.2
160
108
75.3
Sene
gal
1053
5.5
7310
875
547
9.2
754
5977
2.1
Sier
raLe
one
841.
213
--
-0
0.0
0.0
Suda
n46
802.
511
616
739
4976
.794
658
214.
5Ta
nzan
ia36
914.
272
216
3600
305.
523
8958
680
6.0
Togo
522
9.6
84-
--
195
2041
1.9
Uga
nda
1244
6.3
3621
1289
155.
921
10
169.
6Z
ambi
a21
642.
914
021
1150
502.
011
7624
865
8.0
Zim
babw
e32
278.
324
731
410
713
389.
931
7045
711
24.0
Afg
hani
stan
277
0.4
8-
--
--
-Ba
ngla
desh
2874
22.1
1714
76-
343.
667
781
3530
66.1
Mya
nmar
6207
9.5
116
1375
3384
241.
588
753
0799
7.9
Paki
stan
7791
8.8
4016
3616
085
389.
660
7322
476
3664
.4
39

Sustainability 2019, 11, 4319
References
1. World Bank. Data Bank: Railways. Available online: https://data.worldbank.org (accessed on 18 April 2019).2. Borin, E.; Guivarch, C. Transport infrastructure costs in low-carbon pathways. Transp. Res. Part D 2017, 55,
389–403. [CrossRef]3. Bullock, R. Off-Track: SSA Railways; The World Bank: Washington, DC, USA, 2009.4. AfDB. Rail Infrastructure in Africa: Financing Policy Options; African Development Bank: Abidjan,
Cote d’Ivoire, 2015.5. UIC. Railway Revitalization in Africa—Destination; International Union of Railways: Paris, France, 2013.6. Olievschi, V.N. Railway Transport: Framework for Improving Railway Sector Performance in SSA; The World Bank:
Washington, DC, USA, 2013.7. African Union Commission. Agenda 2063: The Africa We Want; African Union Commission: Addis Ababa,
Ethiopia, 2014.8. The World Bank. World Bank Country and Lending Groups. Available online: https://datahelpdesk.
worldbank.org/knowledgebase/articles/906519-world-bank-country-and-lending-groups (accessed on2 April 2019).
9. DFID. Where We Work. Available online: https://www.gov.uk/guidance/where-we-work (accessed on2 April 2019).
10. The World Bank. African Infrastructure: Railways. Available online: https://databank.worldbank.org/data/source/africa-infrastructure:-railways (accessed on 23 March 2019).
11. UIC. RAILISA Statistics. Available online: https://uic-stats.uic.org (accessed on 29 April 2019).12. Bangladesh Railway. Rail Master Plan; Government of Bangladesh: Dhaka, Bangladesh, 2013.13. Asian Development Bank. Myanmar Transport Sector Policy Note: Railways; Asian Development Bank:
Mandaluyong, Philippines, 2016.14. Ministry of Rail Transportation. Developing a Myanmar’s Rail Network that Meet Demands; Government of
Myanmar: Naympyitaw, Myanmar, 2015.15. Pakistan Railways. Yearbook 2016; Ministry of Railways of the Government of Pakistan: Lahore, Pakistan, 2017.16. Habiyareme, A. Is Sino-African trade exacerbating resource dependence in Africa? Struct. Chang. Econ. Dyn.
2016, 37, 1–12. [CrossRef]17. Eurostat. Railway Transport Database. Available online: https://ec.europa.eu/eurostat/data/database
(accessed on 15 April 2019).18. Morlin-Yron, S. All Aboard! The Chinese-Funded Railways Linking East Africa. Available online: https:
//edition.cnn.com/2016/11/21/africa/chinese-funded-railways-in-africa/index.html (accessed on 15 April 2019).19. Gopalakrishnan, S. In Search of a Smoother Ride on Narrow Gauge Track. Available
online: https://www.railwaygazette.com/news/single-view/view/in-search-of-a-smoother-ride-on-narrow-gauge-track.html (accessed on 15 April 2019).
20. European Union. Commission Decision 2004/446/EC of 29 April; European Union: Brussels, Belgium, 2004.21. Delelegn, M. The hottest projects in Ethiopia and what is being done to open for investments. In Proceedings
of the East Africa Rail Conference, Nairobi, Kenya, 21–22 November 2018.22. UIC. Railway Statistics: 2015 Synopsis; International Union of Railways: Paris, France, 2015.23. JICA. Pakistan Transport Plan Study in the Islamic Republic of Pakistan; Japan International Cooperation Agency:
Tokyo, Japan, 2008.24. Ahmed, B.N.; van der Windt, N.; van Rijsbergen, B. Railway Signalling and Interlocking in Bangladesh; Erasmus
University of Rotterdam: Rotterdam, The Netherlands, 2015.25. Railway Gazette. Myanmar Signalling Contract Signed. Available online: https://www.railwaygazette.com/
news/news/asia/single-view/view/myanmar-signalling-contract-signed.html (accessed on 10 December 2018).26. Asian Development Bank. $1.5 Billion ADB Rail Project will Develop Southeast Bangladesh. Available
online: https://www.adb.org/news/15-billion-adb-rail-project-will-develop-southeast-bangladesh (accessedon 29 April 2019).
27. Railway Gazette. Work to Begin on Chad Rail Network. Available online: https://www.railwaygazette.com/news/infrastructure/single-view/view/work-to-begin-on-chad-rail-network.html (accessed on 29 April 2019).
40

Sustainability 2019, 11, 4319
28. Samseer, M. Mali Signs $11bn Agreements with China for New Rail Projects. Availableonline: https://www.railway-technology.com/uncategorised/newsmali-signs-agreements-with-china-for-new-rail-projects-4375202/ (accessed on 29 April 2019).
29. Odditah, C. FG, CCECC Sign $11.117 Billion Lagos-Calabar Rail Contract. Available online: https://guardian.ng/news/fg-ccecc-sign-11-117-billion-lagos-calabar-rail-contract (accessed on 29 April 2019).
30. Railway Technology. Abuja-Kaduna Rail Line. Available online: https://www.railway-technology.com/projects/abuja-kaduna-rail-line (accessed on 29 April 2019).
31. Railway Gazette. Padma Bridge Rail Link Contract Awarded. Available online: https://www.railwaygazette.com/news/infrastructure/single-view/view/padma-bridge-rail-link-contract-awarded.html (accessed on10 March 2019).
32. Bukhari, M. Pakistan Cuts Chinese ‘Silk Road’ Rail Project by $2 Billion due to Debt Concerns. Availableonline: https://www.reuters.com/article/us-pakistan-silkroad-railways/pakistan-cuts-chinese-silk-road-rail-project-by-2-billion-due-to-debt-concerns-idUSKCN1MB2V8 (accessed on 29 April 2019).
33. Ndukwe, L. Getting Nigeria’s Railways Back on Track with China’s Help. Available online: https://www.bbc.co.uk/news/world-africa-42172955 (accessed on 29 April 2019).
34. Mourdoukoutas, P. China is Doing the Same Things to Sri Lanka that Great Britain did to China after the OpiumWars. Available online: https://www.forbes.com/sites/panosmourdoukoutas/2018/06/28/china-is-doing-the-same-things-to-sri-lanka-great-britain-did-to-china-after-the-opium-wars/#298adeba7446 (accessed on7 April 2019).
35. Kacungira, N. Will Kenya Get Value for Money from Its New Railway? Available online: https://www.bbc.co.uk/news/world-africa-40171095 (accessed on 7 April 2019).
36. Rahmatullah, M. Transport issues and integration in South Asia. In Promoting Economic Cooperation in SouthAsia: Beyond SAFTA; Ahmed, S., Kelegama, S., Ghani, E., Eds.; The World Bank: Washington, DC, USA, 2010;pp. 174–194.
37. Railway Gazette. ERTMS Regional Contract in Zambia. Available online: https://www.railwaygazette.com/news/infrastructure/single-view/view/ertms-regional-contract-in-zambia.html (accessed on 29 April 2019).
38. European Commission. Mobility and Transport. Available online: https://ec.europa.eu/transport/modes/rail_en (accessed on 3 April 2019).
39. EIM. European Railway Technical Strategy: Technical Vision to Guide the Development of TSIs; European RailInfrastructure Managers: Brussels, Belgium, 2008.
40. UIC. Railway Technical Strategy Europe; International Union of Railways: Paris, France, 2019.41. European Commission. Rail Research and Shift2Rail. Available online: https://ec.europa.eu/transport/modes/
rail/shift2rail_en (accessed on 25 July 2019).42. RSSB. Rail Technical Strategy: Capability Delivery Plan; Rail Safety and Standards Board: London, UK, 2017.
© 2019 by the authors. Licensee MDPI, Basel, Switzerland. This article is an open accessarticle distributed under the terms and conditions of the Creative Commons Attribution(CC BY) license (http://creativecommons.org/licenses/by/4.0/).
41

sustainability
Review
Lowering Transport Costs and Prices by Competition:Regulatory and Institutional Reforms in LowIncome Countries
Phill Wheat *, Alexander D. Stead, Yue Huang and Andrew Smith
Institute for Transport Studies, University of Leeds, Leeds LS2 9JT, UK; [email protected] (A.D.S.);[email protected] (Y.H.); [email protected] (A.S.)* Correspondence: [email protected]
Received: 26 July 2019; Accepted: 7 October 2019; Published: 25 October 2019
Abstract: High passenger and freight transport costs are a barrier to economic growth and socialmobility, particularly in Low Income Countries (LICs). This paper considers the current state ofknowledge regarding the barriers to achieving lower generalised transport costs. It considers both theroad and railway modes across passenger and freight transport. These issues include a reform on theregulations for driver hours (preventing the road infrastructure from overloading), structuring railconcessions, increasing competition, and tackling corruption. Such reforms aim to deliver efficiencygains and service quality improvements at lower costs for users. This paper identifies the knowledgegap in previous research and concludes by setting out a research agenda that builds the evidence basefor how the best practices from around the world can best be applied to the specific circumstances inLow Income Countries, with a particular focus on Sub-Saharan Africa and South Asia.
Keywords: transport costs; passenger and freight; road and railway; Low Income Countries
1. Introduction
Transport is an important enabler of economic growth and society’s development [1–3]. Strategictransport along road and rail corridors presents several challenges from a cost, subsidy, and pricingperspective. This is particularly important in low-income countries (LICs), where limited studies haveyet to explore economic and mobility needs. Efficient transport services require appropriate funding tomeet user needs. These services must be offered at prices that are affordable to facilitate the free flowof goods and services and to increase the mobility of people. Furthermore, a strong oversight of roadtraffic transit regulations and rail concessions by public authorities is vital for regulatory compliance,including road safety.
This paper addresses a broad set of mode-specific issues, such as road versus rail, and issuescommon to both road and rail in LICs, specifically aimed at LICs in Sub-Sharan Africa and SouthAsia. The aim of the paper is to identify both outstanding issues not fully addressed by existingresearch and such issues that future research, in turn, can help address. Thus, our paper focuses onidentifying opportunities for new research. This paper covers issues related to lowering transportcosts in terms of the generalised cost of transport. This includes not only financial costs but also themonetary equivalent values of intangible aspects of transport services. Examples include the traveltime for shipments and passenger journeys, the associated reliability of that transit time, and servicequality aspects, such as the perceived comfort of passenger travel and wider safety considerationsimpacting users and the broader society (such as other road users in the case of road safety issues).
The role of road transport and rail transport differs both between LICs and high-income countries(HICs) and across different LICs. In HICs, both modes cover freight and passenger movements. Overall,road transport is dominant, but rail still has a non-trivial mode share in both the passenger and freight
Sustainability 2019, 11, 5940; doi:10.3390/su11215940 www.mdpi.com/journal/sustainability43
Sustainability 2019, 11, 5940
market. In LICs, experience varies. In Sub-Sharan Africa, the lack of railway infrastructure means that,for passenger flows outside of the long distance segment (which is small in any case), the road mode isdominant. As such, the rail transport that exists is biased towards freight. In South Asia, however,LICs can have substantive railway transport focused on passenger flows (for example in Bangladeshand Myanmar).
More broadly, road and rail services are different because roads are open to private users whilst railshave much stronger access restrictions. Studies on the regulation, concession design, and institutionalskills requirements for planning, designing, and monitoring transport services have been reviewed.Given the access restrictions in rail, these issues are more applicable to the rail sector. The situationfor roads is different, where the state usually provides the infrastructure either directly or indirectlyvia letting tenders, but private users are also free to use the infrastructure. The issues with respectroads are more focused on regulations on driver hours, road safety, and preventing the over loadingof vehicles and tackling corruption. Such reforms aim to deliver efficiency gains and service qualityimprovements at lower costs for users.
Common to both road and rail are the long and costly clearance times at border crossings. Arvis [4]shows that the cost in the bottom three quintile LICs is three times higher, and its paperwork twiceas high as that for the top two quintiles LICs. The literature also indicates that transit time and thereliability of transit impact freight choices and that cross-border delays significantly increase freighttariffs. Existing evidence on alternative technologies that can help improve cross border crossing isalso considered. In many LICs, it is clear that the opportunities presented by strategic roads and railsare not being fully realised for a variety of reasons.
Specific experiences in LICs are considered (both in Sub-Sharan Africa and South Asian but alsooutside of this area), with conclusions identifying opportunities to enhance transport service delivery,costs, and pricing. Our literature search also reflected the experiences and lessons learned from HICsand MICs that can be applied to LICs, especially where the evidence from LICs is sparse on solutionsto specific issues (an example being the regulation of driver hours in Section 3.1). The paper concludesby setting out a research agenda that builds the evidence base for how best practices from around theworld can best be applied to specific circumstances in LICs. This research agenda will contribute torealising economic growth and social benefits by improving transport services and transit flows.
The structure of this paper is as follows. Section 2 provides an overview of our approach toreviewing the literature. Section 3 reviews road specific issues. Section 4 reviews rail specific issues.Section 5 reviews common issues across the road and rail sectors. Finally, Section 6 synthesises thestate of knowledge review into a set of research issues.
2. Review Methodology
This paper is a synthesis of the literature. As part of this research project, we undertook a timelimited review of literature pertaining to key issues in transport services in LICs and the best practicesin responding to these issues across high income countries (HICs), medium income countries (MICs),and LICs. We supplemented our review of databases (described below) with literature on transportservices by the project team. Social issues, such as the gender barriers associated with access totransport, were not reviewed as part of this project.
The literature on some of these topics is limited, so the criteria for inclusion were widened inseveral different ways, so that the review would encompass less specific, but still relevant, studies.Rather than look for literature pertaining specifically to individual countries, or to low-income countries,we searched for any literature on a given topic that was likely to be relevant. For example, severalheadings relate to rail franchising and regulation. In order to capture a wide range of studies, weentered a few relatively general search terms, such as “railway franchising”, and selected publicationsthat seemed relevant to one or more of the headings. These were studies involving low-incomecountries or studies of high-income countries that were felt to be particularly relevant.
44

Sustainability 2019, 11, 5940
During the search, we noticed that there is something of a trade-off (though not in all cases)between the relevance of publications and their quality. For example, there are a large number ofrelatively high-quality publications on the topic of franchising in high-income countries, but not all ofthese studies are of direct interest here. On the other hand, there tend to be a much smaller number ofpublications related to low-income countries, and some of these tend to be of lower quality or are notpeer-reviewed (e.g., World Bank reports and articles in trade journals). A degree of judgement wasmade to determine which articles should be included in the review. Indeed, this selection is one ofthe conclusions of this review, namely the need for high quality, peer reviewed studies on LICs formany of these issues. A second issue was that much evidence from LIC countries was centred aroundspecific case studies. The generalisability of the findings across LICs was unclear, and this result is,again, a conclusion of this review.
We used four databases to search the literature: The Transport Research Information Database(TRID), Web of Science, EconLit, and Google Scholar. TRID integrates the database owned by TRB’sTransportation Research Information Services (TRIS) and the OECD’s International Transport ResearchDocumentation (ITRD) database. Web of Science is a general, multidisciplinary, citation indexingservice, and should yield a comprehensive list of results for a given search term. EconLit is aneconomics-specific database which we expect will yield sets of results that are more limited, but alsomore specific and with less irrelevant material. Google Scholar is a freely accessible search engine thatcovers scholarly literature, including peer-reviewed papers, books, and technical reports across anarray of disciplines.
In Table 1 below, we give examples of our approach to the literature search for two of the areascovered in this review: the value of time and the value of reliability for freight transport, and railwayconcessioning, franchising, and regulation, for two of the databases used (Web of Science and GoogleScholar). In addition to deciding on the search terms used, it was necessary to decide which of theresults to include in the review. In the case of Web of Science, which returned fewer but more relevantresults, we used all relevant results, while for Google Scholar, which typically turns up a much greaternumber of results, including some which are less relevant, we decided on appropriate cut-off pointsbased on the numbers of relevant results as we moved down the list of results.
Table 1. Example search terms.
Topic Web of Science Search Google Scholar Search
Value of Time and Reliability forFreight
TS = (“value of time” freighttransport)All relevant results
“value of time” freight transportRelevant material from first 15 pages of searchresults, ordered by relevance
TS = (“value of travel timesavings” freight transport)All relevant results
“value of travel time savings” freight transportRelevant material from first 15 pages of searchresults, ordered by relevance
TS = (“value of reliability” freighttransport)All relevant results
“value of reliability” freight transportRelevant material from first 15 pages of searchresults, ordered by relevance
Railway Franchising,Concessioning, and Regulation
TS = (railway concessions)All relevant results
railway concessionsRelevant material from first 10 pages of searchresults, ordered by relevance
TS = (railway franchising)All relevant results
railway franchisingRelevant material from first 10 pages of searchresults, ordered by relevance
TS = (railway concession failure)All relevant results
railway concession failureRelevant material from first 10 pages of searchresults, ordered by relevance
TS = (railway infrastructure priceregulation)All relevant results
railway infrastructure price regulationRelevant material from first 10 pages of searchresults, ordered by relevance
In addition, the following sources were found to contain useful reports:
• World Bank and United Nations sponsored project reports.
45

Sustainability 2019, 11, 5940
• Articles in speciality magazines and media, such as engineering news and tollinfrastructure Services.
• Reports by transport consultancies, which are made publicly available.• Web articles, such as news articles. These are not peer reviewed but may contain insider views,
case studies, and recent data.
The following are typical reasons for literature being excluded from the review:
• Only general information pertinent to the subject, e.g., overloading, was found.• Reference to the data was not provided.• The full text was not available (only the abstract).• Information was only found second-hand; we were unable to retrieve the original file.• A substantive amount of the research that we initially found was done in a European context and
there were few implications for elsewhere.
The culmination of our review was to identify a set of issues, which are grouped in Table 2. Wewill, in turn, discuss in the remainder of this paper the issues that are specific to road transport, railtransport, and issues that are common across the two modes. Within this, approximately 100 paperswere found to provide relevant unique contributions to this review.
Table 2. Summary of the issues in road and rail freight transport with references.
Issues References Issues References Issues References Issues References
Road SpecificIssues (Section 3)
3.1 Driverhours [5–10] 3.2 Safety
regulation [11–17] 3.3 Corruption [11,12,18–20] 3.4 Overloading [21–30]
Rail SpecificIssues (Section 4)
4.1. Railwayconcessioning [31–61] 4.2. Economic
regulation [37,39,62–67]
Road and RailCommon Issues(Section 5)
5.1. Publicauthority andskills capacity
[58,68–74]
5.2. Cross borderroad and railfreight—Theimpact of delays
[4,75–96]
5.3 Cross borderroad and rail freightsolutions - e-bordertechnology andstandardiseddocumentation
[97–103]
While we consider our review to be extensive, it is not a systematic review. Instead, it was atime limited review with the scope and approach discussed above. As such we may have missedsome relevant literature. However, we note that our review has been subject to review by academicexperts selected by the Department for International Development in the United Kingdom. Theyhave helped supplement the material in this review to be evaluated by the academic author team,thereby providing a secondary check, alongside our primary review methodology, to ensure we havenot missed key literature.
3. Road Specific Transport Services Issues
In the road sector, the primary issues relate to regulation, governance, and the enforcement ofregulations. This includes driver hour regulations, road safety regulations, efforts to combat corruption,and vehicle overloading.
3.1. Regulation of Driver Hours
The link between working hours and rest time for drivers and the risk of collisions is wellestablished. This suggests the need for regulating drivers’ hours of service. Enforcing these hours ofservice and similar regulations rely upon authorities’ ability to inspect company and vehicle records.Technology has progressed from log books, to analogue tachographs, to digital tachographs, whichhave become progressively more difficult to tamper with and easier to process. Increasingly, as inthe UK, it is a requirement that new vehicles be fitted with digital tachographs. The use of digitaltachographs suggests the possibility that the authorities may eventually be able to collect data and,therefore, detect infractions in real time.
46

Sustainability 2019, 11, 5940
McDonald [5] argued that regulating drivers’ hours reduced the risk of collisions and highlightedthe need for the enforcement of, and adherence to, these regulations. Baas [6] surveyed truck drivers inNew Zealand and found high levels of fatigue and sleepiness and also that many drivers exceeded theallowed driving hours. In a review of the literature, Amundsen [7] emphasised the high proportion ofprofessional drivers reporting incidents of fatigue and falling asleep while driving, as well as the linkbetween the length and quality of sleep and accident risk. The authors attributed the low levels ofcompliance to the complexity of regulations and suggested that harmonisation across countries mayimprove compliance and safety. Based on a survey of UK truck drivers, Poulter [8] found that perceivedbehavioural control had the largest effect on compliance with regulations than other ‘soft’ factors.
Hall [9], using data from the Fatality Analysis Reporting System of the US National HighwaysTraffic Safety Administration, estimated that a 3–5% reduction in crashes could be achieved withperfect enforcement of hours of service regulations. Jones [10] compared the working hour regulationsin several countries and suggested a ‘hybrid’ approach to regulation, combining prescriptive measures(e.g., hours of service) and a less prescriptive ‘outcomes based’ approach. However, overall, there is alack of evidence related to LICs in this area, which could be studied in future research. The experiencesand lessons learned from previous practices in developed economies can be applied to an LIC basedon its prevailing conditions.
3.2. Road Safety Regulation
Road safety is a particular problem in developing countries, and there has been much discussionof the issue with regard to Africa specifically, where accident and fatality rates have increased alongwith vehicle ownership [11,12].
Driver licensing and vehicle licensing are generally the responsibility of government agencies.The enforcement of traffic laws and regulations is generally the responsibility of traffic police andcourts, while some government agencies have a role in the roadside inspection of freight vehicles.
Assum [13] appraised the road safety initiatives in five African countries: Benin, Côte d’Ivoire,Kenya, Tanzania, and Zimbabwe. The author concluded that each country has the legal framework,organisation, technology, and institutions required for road safety and is aware of effective road safetymeasures, as well as the scope of the problem. However, a number of weaknesses were identified, suchas their lack of political concern and funding, their lower value placed on human life, the weak politicalpositions of their road safety boards, their overreliance on education and information approaches, andtheir corruption.
Khayesi [14] discussed the growth in road traffic injuries in Africa and the need for governments toimprove data collection and analysis, share between agencies, and tackle the problem of under-reporting.Chen [15] noted an ongoing upward trend in road traffic injuries, and identified the lack of leadingagencies with regulatory powers and public support as one of the key obstacles to reducing injury rates.
Sumaila [16] discussed the limitations of the Federal Road Safety Corps in Nigeria andrecommended restructuring the agency and strengthening the strategic ties with other governmentdepartments and agencies to increase their effectiveness. The need for driver education in road safetywas also emphasised.
Abegaz [17] analysed the effectiveness of new road safety regulations in Ethiopia. These regulationsinclude bans on the use of mobile phones while driving, driving without a seatbelt, and riding amotorcycle without a helmet, as well as strengthening existing laws on drunk driving, speeding, andunsafe loading. Using data from the period of 2002–2011, the authors found considerable reductions infatalities and accident rates following the first year after the introduction of these new regulations.
3.3. Corruption and the Effectiveness of Road Safety Regulation
Nantulya [11] discussed road traffic injury rates and the reasons for the differing rates and trendsacross countries, citing corruption as one of the main factors behind high injury rates in developingcountries. Kopits [12] found a non-monotonic relationship between GDP per capita and traffic fatality
47
Sustainability 2019, 11, 5940
rates, that traffic fatality rates increase initially with income, but begin to fall after a threshold incomelevel. The authors noted that, since vehicle ownership rates increase monotonically with income,this turning point reflects reductions in fatalities per vehicle. This inverted-U shaped relationshipwas also found by Anbarci [18]. Importantly, Anbarci [18] also found that public sector corruption isassociated with increased traffic fatalities. Various ways that corruption can affect traffic fatality rateswere outlined: corrupt license examiners may allow drivers to bypass training and testing for a fee;corrupt vehicle inspectors may sell safety certificates for unsafe vehicles; and corrupt traffic police mayaccept bribes to overlook infringements and undermine faith in traffic regulations by extorting moneyfrom innocent drivers.
Tackling corruption by public officials is, therefore, important for road safety. Measures couldinclude increased monitoring and detection and the punishment of offenders via some combinationof dismissal, fines, and imprisonment. An alternative, or complementary, concept suggested byBecker [19] is to pay efficiency wages above the market-clearing rate, with mark-ups reflecting thepotential benefits of corruption and the risk of being caught. This increases the costs of engagingin corruption and may be less costly than increased monitoring. Empirical support for an inverserelationship between wages and corruption was provided by Van Rijckeghem [20].
3.4. Road Freight Overloading
Vehicle overloading, where vehicle axle loads exceed pavement design limits, is a specific issueon African roads. This occurs because freight operators overload cargo to maximise their payload andoperational efficiency and reduce fuel costs (per tonne-km output). However, overloading significantlyaffects the life of the highway pavement’s asset. Rys [21] studied the effect and concluded that if 20%of trucks are overloaded, the life of the road pavement reduces by about 50%.
The reason that vehicle overloading is important for examining barriers to lower transport costsis three fold. Firstly, there is a cost impact on the whole system when overloading the road networkbecause the infrastructure deteriorates faster. This ultimately results in a poor use of resources ifsufficient resources do exist. At some point, the operators or society will have to pay for this increasein costs. Secondly, in an LIC environment, funds for maintenance and renewal of infrastructures arescarce. Thus, the impact of overloading tends to be that infrastructure quickly degrades into a statethat leads to poor quality, resulting in the slowing down and unreliability of road transport. Thirdly, alack of compliance with overloading regulations can result in the lack of a level playing field betweentransport providers, which skews competition and enhances corruption in the sector.
To provide insight into the extent of the problem, we highlight three case studies. The World Bank(2005) found that 30% to 40% of trucks in India are overloaded by 25% to 50%. This report containeddata on truck operations in India, such as vehicle operating costs, toll rates, and journey times, thatcan be used in the economic appraisal of overloading and enforcement measures. A case study byKolo [22] found that 53% of trucks using a rural road in Nigeria were overloaded. They took a similarapproach to Bagui [23] and analysed the percentage and magnitude of overloading separately basedon the number of axles and positions (e.g., front and rear) of the axles. Chan [24] showed that theweight limit was exceeded by as much as 100%, and some 50–70% of heavy trucks were overloaded ina central province of China, compared to 0.5–2% overloaded in the USA.
Turning to road safety, an overloaded vehicle is difficult to control because it is operated outsidethe vehicle’s design parameters for steering and braking and thus becomes a serious threat to roadsafety. Overloading leads to increased congestion caused by damaged roads and accidents that increaselogistics costs in the region. According to Toll Infrastructure Services [25], transport operators largelywelcome overloading control as they value a level playing field that fosters fair competition betweenmodes and operators.
For these reasons, overloading control is a priority, and static weighbridges are used to controloverloading. Toll Infrastructure Services [25] have estimated there to be 260 weighbridges in Africa,with plans for another 40. This quantity of bridges has undoubtedly had a strong beneficial effect.
48

Sustainability 2019, 11, 5940
Pinard [26,27] has documented the steady reduction in overloading due to weighbridge use in SouthAfrica, Namibia, Zimbabwe, and Zambia. In addition to the technical solution of weighbridges, thedecriminalisation of related offences has also produced benefits, according to Pinard [27].
However, static weighbridges have their limitations. They are inflexible and control a load ata specified point but do not cover the whole network. An alternative that has been available forimplementation for several years is portable weigh-in-motion (WIM) devices. These devices allowa road authority to set up temporary checks. Though less accurate than static installations, theseportable devices are recommended by, for example, Bagui [23]. According to Cottineau [28], overloadcontrol using WIM was tried in Taiwan, with a 30% tolerance margin due to potential measurementerrors. This tolerance margin is higher than is desirable. Current research in France [28,29] is aimingto achieve a 10% tolerance. This, then, is an area where progress can be made, potentially leading tobetter overloading control.
Alternative technologies are available to monitor and enforce overloading. For example, aframework and field studies have recently been developed for truck overloading and novel control andmonitoring methods in China and South Africa. The measures proposed by Hu [30] include weightsensors installed in vehicles, wireless device sending data to a GPS installed in the driver’s cab, and aremote control terminal to receive and process the information sent by the GPS.
Overall, vehicle overloading can be combated by monitoring technology, and there has beeninstances of success, such as in South Africa, Namibia, Zimbabwe, and Zambia. As we will discussin Section 5.1, there is also the need for the public authority to have sufficient skills and processes tosupport technology.
4. Railway Transport Service Specific Issues
Unlike access to roads, access to railways must be heavily regulated to ensure the safe andequitable scheduling of services. Railways feature a high fixed cost and low marginal cost and aresuited to high volume passenger and freight flows. These high flows present a set of challenges toensuring viable services. These include concessioning passenger services to achieve better financialvalue, reducing state subsidy requirements, and stimulating passenger demand. This also raises issuessurrounding the extent to which it is optimal to separate transport services from the management ofthe infrastructure (track and signals) and the regulatory needs around such a separation.
4.1. Railway Concessioning
Rail concessioning (also known as rail franchising) has been adopted in Great Britain (GB),Germany, Sweden, and (to a lesser extent) in the Netherlands and Norway. The EU’s fourth RailwayPackage requires competitive tendering of public service railway contracts. A major study waspublished by the Centre on Regulation in Europe (CERRE) in 2016, drawing on the lessons from GB,Germany, Sweden, and offering suggestions for countries, such as France, who are about to start thetendering process. For the summary report, see Nash [31]. Individual country reports for GB, Sweden,Germany, and France are also available (see Smith [32], Nilsson [33], Crozet [34], and Link [35]).
Typically, rail franchising in Europe has produced cost reductions on the order of 20–30%. However,Britain has instead seen sharp cost increases (see Smith [32]). In Great Britain, an incoming operatortakes over an existing company, rather than bringing his or her own rolling stock and staff. Combinedwith short franchises that are also net cost contracts, this incentivises a focus on revenue growth ratherthan cost reduction (see Smith [32]). In addition, British rail franchises may be too large, such that theyface diseconomies of scale (see Wheat [36]). Costs and subsidies have risen substantially in France,where there has been no tendering Nash [31]. Affuso [38] used UK data to investigate the relationshipbetween contract length and investment and found that short franchise lengths reduce incentives toinvest in some assets.
49

Sustainability 2019, 11, 5940
Generally, demand has risen strongly in countries that have implemented tendering. However,part of this growth may be related to the “regionalisation” of responsibility for tendering, becauseFrance has also seen growth. Nash [31] lists key considerations to be made in future tendering:
• Who should be responsible for franchising (a regional or national body)?• The size and length of franchises. Evidence suggests that longer franchises may reduce costs [35]
and also that large franchises may increase unit costs [35,36].• Risk Sharing: Evidence from Germany and Sweden suggests that gross cost contracts perform
best, although some incentive mechanisms are needed to ensure service quality.
A recurring problem in Great Britain has been franchise failure. This has been less of a problemin other European countries, partly because of their greater use of gross-cost contracts, and possiblybecause their franchises are much smaller (see Nash [31]). Smith [39] discussed policy responses tofranchise failures and their impacts on the performance of Train Operating Companies (TOCs) in GB.These have included placing TOCs on management contracts (these are essentially cost-plus regimeswith extra subsidies and, hence, weak incentive properties), short term franchise renegotiations, andplacing TOCs temporarily under public ownership. The authors found that the efficiency of TOCs onmanagement contracts deteriorated markedly, but this was not the case with franchise renegotiation.Outside Europe, franchise failure has also been a problem (for example, in Melbourne during the earlyyears of their reforms and in Latin America [40]).
Cruz [41] analysed renegotiations of road and rail concessions in Portugal, where renegotiationshave been common, particularly in the very early years of the contract. The authors noted thatrenegotiation itself is a very costly process, and should be avoided where possible. The authorsindicated that the main reasons for contract renegotiation were the inadequate monitoring andenforcement of contract terms and over-optimistic bids.
Outside of Europe, Carbajo [42] pointed to lower public subsidies and increased passengernumbers following rail concessioning in Argentina. They also defined early problems, such asdifficulties in enforcing investment plans and imposing fines. Crampes [43] discussed issues inconcession contract design, with reference to the Argentine experience, and recommended a formof menu regulation. Under menu regulation, companies choose from a menu of contracts offeringdifferent trade-offs between the rate of return, risk, and profit sharing. In choosing their optimalbundle, a company is forced to reveal information about itself to the regulator, which helps to mitigateinformation asymmetry (the fact that the company knows more about its activities than the regulator).This could potentially lessen the likelihood of regular and costly renegotiations or failures.
Campos [44] found that performance indicators generally improved rail privatisation in Mexicoand that concessions may have contributed to reversing railway declines in developing countries. Theauthor concluded that concessions can be a viable approach in developing countries, although careshould be taken in concession design.
The analysis of around 1000 concessions in different industries (including the road, rail, energy,water, and telecommunications industries) in Latin America and the Caribbean concluded thatconcessions can work well [45]. However, the author found that the implementation of the contractswas flawed in many cases, and opportunistic renegotiations should have been dissuaded. Further, hefound that most implementation mistakes could have been avoided by improved design and a greaterintention to develop incentives.
Guasch [46] emphasised the importance of regulators in reducing the probability of renegotiations.Likewise, Guasch [47] found that regulators and arbitration processes both reduced the probability ofgovernment-led renegotiation, while price capping, longer contracts, elections, and growth shocks allincreased the probability of renegotiation. Using data on road and rail concessions in Latin America,Estache [48] found that multi-criteria auctions (considering social goals, such as employment) increasedthe risk of renegotiation but that this problem could be mitigated by high-quality regulations andanti-corruption policies.
50

Sustainability 2019, 11, 5940
Rodríguez [49] concluded that rail (and road) concessions are more likely to fail if large-scalecapital investments are involved, if they are in developing countries, if they involve urban transport, orif they demand uncertainty. Stern [50] emphasised the complementarity of contracting and regulationand the role of an independent regulatory agency in building trust between stakeholders, resolvingconflicts, and enabling ordered renegotiations.
Tam [51] discussed three successful and three failed transport infrastructure BOT(build–operate–transfer) concessions in Asia. These were road concessions but are included here, as thefindings can transfer to the design of rail concessions, and this study features specific comparisons ofLICs and HICs. The authors identified reasonable rates of return, sound mechanisms for the adjustmentof terms, strong and technically competent franchisees, and equitable and experienced governmentsand legal systems as the factors needed for success. Frequent changes in government, corruption, andpolitical interference are identified as factors explaining failure. All three of Tam’s (1999) success storiesare from an HIC, such as the Hong Kong Special Administrative Region of the People’s Republic ofChina, while all three failures are taken from Thailand, an LIC.
In Kazakhstan, rail reforms from 2005 separated train operation and infrastructure maintenanceand encouraged competition in the passenger and freight markets via franchising and open accessarrangements, respectively. Sharipov [52] finds that usage and safety both improved, while subsidylevels increased.
Gwilliam [53] stated that 14 of the 30 African countries with state-owned railways use concessionarrangements, that four had begun the concession progress, and that only one was operating under amanagement contract. The rest were subject to political influence. Roy [54] noted that infrastructureinvestments have tended to remain the preserve of governments and aid agencies.
The introduction of railway concessions in Africa has been accompanied by significant investmentsin assets, including rolling stocks [54,55], and improvements in productivity [53–55] and allocativeefficiency [55]. Budin [56] noted an impressive increase in freight traffic and a substantial improvementin quality of service during the first year of the Abidjan-Ouagadougou railway concession. Roy [54]concluded that there was no indication of an increase in freight rates or that travel for the poor has beenmade more expensive. Pozzo [57], reviewing railway concessions in Sub-Saharan Africa, found that,due to competition from road transport and clauses against excessive pricing in concession contracts,there was no clear evidence for an abuse of market power. Ndonye [58] evaluated the impact ofdifferent public–private partnership (PPP) strategies on the performance of concessions, focusing onthe Rift Valley Railways concession in Kenya. A survey of managers indicated a perception that themost important strategic considerations for the performance of concessions are having a strong privateconsortium as a concession-holder, a sound financial strategy, having a sustainable risk allocationstrategy, and investment in technology.
Railway concessions in Africa face significant risks, however. Roy [54] noted the disruptionscaused by the civil war in the Ivory Coast and the collapse of a bridge in Malawi. Jones [59] citedpolitical unrest in Kenya in 2008 as affecting the Rift Valley Railways concession, along with politicalpressure from governments. Pozzo [57] notes the generally weak financial performance of Sub-SaharanAfrican railway concessions and the private sector reluctance to invest in transport in the region or totake on any risk.
Related to the design of rail transport services concessions is its ability to integrate into themanagement of rail infrastructures (the extent of vertical integration). In Europe, EU legislation hasrequired some form of vertical separation. Countries such as Britain and Sweden have followedfull legal separation, whereas others, such as Germany, have used a holding company structure.Mizutani [60] and van de Velde [61] reviewed the literature and provided both quantitative andqualitative assessments of different approaches to separation. A key finding is that, in congestednetworks, capacity constraints may magnify the misalignment of incentives, such that vertical separationincreases costs. This suggests that a holding company or even full vertical integration are preferable.Partly as a result of these studies, European legislation permits both approaches.
51

Sustainability 2019, 11, 5940
Fair infrastructure access is important, especially when the incumbent operator also managesthe infrastructure. This necessitates the independent oversight of track, station, and terminal accesscharges and capacity allocation in order to ensure that new operators can freely access the infrastructurewhile adequately compensating the infrastructure manager. This is crucial to enabling the emergenceof new operators while ensuring the financial stability of the infrastructure manager.
4.2. Economic Regulation of Infrastructure and Services
Transport services tend to operate as (i) directly provided state services, (ii) competitionin-the-market (open access), or (iii) competition-for-the market (tendered services). These deliverymechanisms need to be investigated as to the level of protection they provide to final (passenger andfreight) users from exploitation.
The ‘natural monopoly’ property of infrastructure management, i.e., the falling average up to aminimum efficient scale, implies that:
• For a given geographical area, a single firm can achieve lower unit costs than multiple firms.• Average costs exceed marginal costs, so revenues under marginal usage cost pricing costs are not
sufficient for full cost recovery.• Average cost pricing, however, would make socially desirable services unviable.• The key trade-off is between the financial viability of the infrastructure manager and the pricing
of access for train operators.
A key study in the EU funded project, NETIRAIL-INFRA, examined how cross-industry innovationand cost reduction can be stimulated through a range of regulatory, contractual, and structuralapproaches (see Nash [37]). Benedetto [62] surveyed regulatory reforms across European railwaysbased on a review of the literature on ideal regulatory characteristics. They found that while Europeanrail regulators generally exhibit many of the features of ideal regulation, there is room for a moreproactive approach to shaping the role of track access charges and in regulating the efficiency andquality of infrastructure managers.
Britain has had the most extensive powers of any economic regulator in Europe for manyyears. This regulator has conducted or commissioned many studies using econometric techniques todetermine cost efficiency savings [39,63,64]. These have highlighted inefficiencies in Network Rail (therailway infrastructure manager) and have been used for setting cost efficiency targets. This form ofbenchmarking and price cap regulation (which refers to the setting of limits on the prices or revenuethat a firm will receive) is considered to be successful for utilities but is arguably less successful forrail [65,66]. Smith [67] showed how the increased powers of economic regulators have contributed toefficiency savings and how these powers interact with other reforms.
5. Road and Rail Transport Service Issues
In addition to the issues specific to road and rail freight transport described in the previous twosections, there are issues common to both modes, which are described in this section.
5.1. Public Authority Capacity and Skills
There are many instances where transport infrastructure in developing countries has beenof low quality, and investment is biased towards ‘prestige projects’ that may not reflect the mostefficient approach for investment [68]. Lee [69] noticed a tendency to focus on investment rather thaninstitutional and regulatory setups and to identify poor financial and environmental sustainability butno comprehensive approaches to poverty, safety, and environmental issues.
Sohail [70] undertook case studies for transport regulation in Sri Lanka, Pakistan, and Tanzania,and highlighted the need for appropriate regulatory frameworks and more effective enforcement.
Mexico provides a useful case study for how public agency skills develop over time. The Agencyfor Rail Transport (ARTF) was recently established in response to complaints by freight shippers
52

Sustainability 2019, 11, 5940
about tariffs and service levels. The International Transport Forum [71] compared the capabilities andfunctions of the ARTF to those of its US and Canadian counterparts, discussed issues in Mexican railregulation, and outlined priorities for the new regulator. This report highlighted the considerable timeneeded for ARTF to develop an information base and capabilities comparable to more establishedregulators and report the recommended discussions with Mexican concession holders and the US andCanadian regulators to determine the financial and operating data that ARTF will need.
Until ARTF’s capabilities are fully developed, the ITF recommends a low cost, less prescriptiveapproach to regulation based on negotiation and arbitration and the continuity of existing safetyregulations in the short run. The development of safety regulations based on performance criteria,rather than prescribing certain behaviour and design requirements, was identified as a long-run priority.ITF identified the need for a “critical mass of human skills and management resources spread acrosslaw, economics, accounting, and engineering” comparable to that of US and Canadian regulators.
In discussing the regulation of railway concessions in Africa, Gwilliam [53] identified inadequateprovisions for regulators as an impediment to effective regulation. The author stated that “manyrailway concessions in Africa lack formal regulatory structures with real power and are thus susceptibleto abuse”. In addition, the author listed factors impacting concession performance, includingconflicts and delays with the governments over compensation, concession fees, time frames, staffing,administratively imposed salary increases, restrictions on access to container facilities, and unfundedpublic service requirements.
In the road transport sector, overloading of trucks provides an example of the challengesfacing public authorities in LICs. Different institutions are responsible for overload control indifferent countries, and there are differences in institutional capacities and responsibilities for overloadcontrol. Strathman [72] highlights that authorities can influence compliance through changes in bothenforcement intensity and the severity of penalties and finds that the marginal effects of these elementsin deterring overloading are similar.
The role out of enforcement measures also creates challenges for public authority resources. Inparticular, alternative routes without weighbridges and the shortfalls in weighbridges necessitateadequate policing of the road network. Overload control strategies should focus on regions and notone stretch of road. Further, Chen [73] suggests that mobile weighbridges could be used to identifyseverely overloaded trucks before being escorted to weighbridges. However, this “first best” solutionwould create massive demands for a skilled work force.
Therefore, checking truck weight compliance places high demands on resources, and its efficiencyis generally low. In 2014, 20% of the two million vehicles weighed in South Africa exceeded the weightlimit. Only 2.6% of the 20% were prosecuted, according to Council for Scientific and Industrial Researchreported in Engineering News [74]. Officers accepted bribes and operators paid their way throughthe weighbridges. Corruption is a major hindrance to compliance. Low fines are imposed, and thepractice is seen as ’unimportant’ by the Department of Justice [74].
Overall, there is no one solution to combat overloading. However, any solution requires bothan investment in technology (weighbridges, etc.) and a strong institutional structure with clear andaccountable roles of public authorities and the individuals working within them. This translatesto other public authority enforcement activities (such as the road safety enforcement discussed inSection 3.2).
5.2. Cross Border Road and Rail Freight—The Impact of Delays
The time to clear goods through customs rises sharply if the goods are physically inspected.Physical inspection is far more prevalent in lower-performing countries, as defined by Arvis [4], becauseof the quality of their logistics services, and the same shipment may be subject to repeated inspectionsby multiple agencies. Clearance times for the bottom three quintile (20%) performing countries arethree times as much, and the paperwork twice as much, as those for the top two quintiles [4].
53

Sustainability 2019, 11, 5940
The key business and trade implication of such barriers is that export lead times are nearly fourtimes as long for LICs than for HICs. Thus, the benefits of reducing the time and time uncertainty atborders include increased international trade and investment, new commercial opportunities, access tonew materials, reduced input costs, and improved competitiveness.
Using data on landlocked Sub-Saharan African countries, Christ [75] conducted an analysis onthe relative size of time costs versus money costs. Christ concluded that time costs (barriers to tradedue to time taken to clear customs, for example) generally exceed the monetary costs of trucking. Thestudy suggested that this helps explain why such countries have a comparative advantage in primarycommodities, such as metals and agricultural products, while hindering the export of time-sensitivegoods. Thus, border and transit delays reduce both the overall volume of trade and the impact of themix of products traded, which may hinder development.
The extent to which benefits can be realised depends largely on the response of freight operators,and thus the extent to which such improvements reduce freight costs. It is, therefore, important toknow the value of time (VOT) and value of reliability (VOR) from the perspective of freight operators.
While there is a large quantity of literature on the estimation of road users’ VOT/VOR, muchless research has been undertaken regarding the VOT/VOR for freight, particularly in the context oflow-income countries. An overview of the methods by de Jong [76] distinguished between the factorcost methods that sum the monetary costs of the factors used (e.g., labour and fuel costs) and modellingapproaches, including the revealed preference (RP) (based on an analysis of the impact of variouscharacteristics on modal choices) or the stated preference (SP), which uses survey methods.
Summaries of VOT and VOR findings for rail and road, and overviews of the methods used, areprovided by Feo-Valero [77], de Jong [76], and Zamparini [78–80]. A recurring narrative from thisliterature is that the reliability of journey times is very important to freight shippers [81] and is possiblymore important than the journey time itself [82–85].
Shinghal [86] analysed a survey of firms sending freight via the Delhi–Bombay (now known asMumbai) corridor and found that the reliability of transit times was particularly important for exporters.Larranaga [87] found that reliability and cost were the most important attributes in explaining freightmode choice in Rio Grande do Sul, Brazil. Norojono [88] concluded that safety and reliability weremore important factors than travel time in explaining the choice between rail and road freight byIndonesian freight shippers. Similar findings are presented by Arunotayanun [89], who used the samedata. These findings complement the HIC studies in suggesting that reliability is paramount.
However, Zamparini [90] found, from an SP survey of the logisitics managers of 24 Tanzanianfirms, that reliability was one of the least important service attributes and that transit time and themonetary value of damage and losses is more important. The authors pointed out that this may reflectthe challenges facing freight transport in Tanzania, where transport infrastructure is of low-qualitycompared to other Sub-Saharan African countries and LICs, leading to slow freight and high rates ofdamage and losses.
Ogwude [91] found that VOT and VOR vary significantly between the shippers of consumergoods and shippers of capital goods in Nigeria. Cundill [92] derived RP VOT estimates for road, rail,and pipeline freight traffic in Kenya and found that modal choice was sensitive to the cost and speedof delivery. In Malaysia, Thomas [93] found that journey time savings due to road improvementsresulted in relatively small increases in vehicle utilisation because of other constraints.
Border issues with freight transport are of particular concern in landlocked developing countries(LLDCs), for whom the direct maritime transportation of international freight is not an option. This hasbeen a major impediment to development for LLDCs, which face bottlenecks not only at the seaportbut also at each transit country [94].
Zhang [95] analysed VOT in the context of rail freight from Tianjin Port in China to Ulan Bator,the capital of Mongolia. Compared to an average passenger journey time of 32 hours, the average railfreight journey time was 13.1 days: 4.3 days waiting at Tianjin Port, 3.8 days travelling from Tianjin tothe Mongolian border, 1.2 days waiting at the border, and 3.8 days from the border to Ulan Bator. The
54
Sustainability 2019, 11, 5940
authors described the route as being of great importance to landlocked Mongolia, as it is the shortestand most commonly used route to Mongolia’s nearest seaport. Border issues derive from the need forthe transhipment of freight from road to rail and from the standard gauge railways in China to thebroad-gauge railways in Mongolia.
Banomyong [96] compared the various routes available to garment exporters from Laos, anotherlandlocked country. The authors found that their preferred route (i.e., on the grounds of the estimatedcost and time) via Malaysia was not the same as that of the most frequently used route via Thailand.
5.3. Cross Border Road and Rail Freight Solutions: E-Border Technology and Standardised Documentation
Given the discussion in Section 5.2, measures to improve the flow of goods across borders andthrough corridors are essential to enable low transport prices and stimulate trade. Customs proceduresare becoming increasingly similar worldwide. However, customs is not the only agency in bordermanagement. Streamlining border procedures to facilitate trade and simplifying documentation forimports and exports have long been high on the trade development agenda, prompting initiatives tobring border agencies together and create a single window for trade. We have collated findings fromresearch done for countries in Asia and Africa with regard to their barriers and recommended measures.
In Asia, a roadmap for the integration of logistics services was endorsed in 2007 by ASEAN(Association of Southeast Asian Nations) members. The promotion of IT both within and amongthe parties in the logistics chain are considered conductive to the processing of documents and othertrade-related matters. The ultimate goal is to establish an ASEAN single window, adopt a 24 × 7customs operation, and offer provisions in the World Trade Organization (WTO) agreement for customsvaluation. Inefficient customs procedures and inspections are considered by De Souza [97] to be thebiggest barriers to logistics services in ASEAN. Gupta [98] found that unwieldy customs procedures andinspections, a lack of coordination, and arbitrary rulings are barriers to freer cross-border trade withinASEAN. Tongzon [99] found that the implementation of measures to improve the competitiveness ofASEAN logistics industries has been limited and characterised by a significant perception gap betweenlogistics firms and governments.
In Africa, Adaba [100] examined the effect of an e-government initiative to modernise customsprocedures and facilitate trade in Ghana. Hinson [101] found that a 1% increase in internet use by acountry’s population is associated with a 2.2% increase in exports through a reduction in the entry andsearch costs associated with exporting from Africa. Hoffman [102] suggested that cross-border delayscould be reduced by more than 80% through the interchange of information to facilitate the dynamicscheduling of customs processing capacities and operational changes.
Arvis [103] highlighted issues associated with border crossing in landlocked developing countries(LLDCs). These issues apply to both the Asian and African continent. In response to thesechallenges, several technologies/systems have been developed in LLDCs to facilitate trade via e-bordertechnology [103]. These include:
• Automated Customs documentation. For instance, UN Conference on Trade and Development(UNCTAD) have developed transit add-ons to Automated System for Customs Data (ASYCUDA).
• The regional integration of national customs, such as the NCTS (New Computerised TransitSystem) in Europe, allowing the seamless exchange of information, thereby managing bothdocumentation and guarantees.
• The carnet (passport for goods) barcode in e-TIR helps to validate the carnet at border crossings,using a central database accessible by each participating country. RFID technology may alsofacilitate the tracing of cargo on a corridor and speed up the controls at entry and exit checkpoints.
• Several groups of countries (such as those in Africa) have been experimenting with transit datainterfaces facilitating the passing of advance information from country to country, yieldingimmediate benefits in terms of transit facilitation.
55
Sustainability 2019, 11, 5940
• The GPS tracking of merchandise. Benefits include helping to build confidence between customsand transit operators and leading to the disuse of inefficient control solutions, such as convoys.
Specifically, on rail transit, the new Annex 9 of the UNECE (United Nations Economic Commissionfor Europe) International Convention on the Harmonization of Frontier Controls of Goods (the UNECEHarmonization Convention), is expected to streamline railway border crossing procedures through:
• Introducing minimum requirements for border (interchange) stations;• Co-operating at these stations;• Moving the controls from borders to the departure or destination stations;• Reducing the time required for controls;• Eliminating paper documents;• Using the CIM (Uniform Rules concerning the Contract of International Carriage of Goods by
Rail) / SMGS (Agreement on International Freight Traffic by Rail) common consignment note as acustoms document.
It can be seen from the above review that the measures recommended by UNECE will apply to,and improve on, current practices in Asia and Africa.
6. Discussion and Conclusions: Opportunities for Future Research
This paper has reviewed the broad state of knowledge for road and rail transport services inLICs. The aim of the paper was to identify outstanding issues not fully addressed by existing researchthat future research can help address. We have focused on the issues most prevalent to LICs inSub-Sharan Africa and South Asia. This review has covered a wide range of topics, from franchisingand concessioning, to various aspects of safety and economic regulation, to waiting times for bordertransit. This discussion makes it clear that LICs face considerable challenges in these areas and thatresolving these issues will be important to their development. Based on this review, we have identifiedthe following three areas for further academic research. This is not an exhaustive list but a prioritisationof what specific issues academic research can address.
Firstly, we note that this literature review has attempted to draw on the best practices that mightbe applicable to LICs. In doing so, evidence from LICs (both specifically in Sub-Sharan Africa andSouth Asia, as well as elsewhere in the world), MICs, and HICs has been considered. However, itis clear, overall, that there is a limited set of systematic evidence specifically for LICs. There arecase study examples for LICs (with many examples focusing on the failures rather than successes oftheir applications, e.g., in concessioning). However, a general finding from the reviewed literature isthat in the area of Transport Services for LICs, there is limited research that synthesizes experienceacross a range of countries. This type of systematic analysis is essential to yield best practice andgeneralizable findings for LICs. Thus, a key recommendation is the need for a greater quantity of, andmore systematic, research in the area of Transport Services in LICs.
Secondly, transporting goods in Africa often takes three times longer and is three to five timesmore expensive than in Europe, Asia, and Latin America. This literature review has indicated thattransit time and reliability affect freight transport choices. This is the case for both LICs and HICs, withevidence of border waiting times for cross-border freight having negative economic impacts on LICs.
Cross-border freight is a major concern for LICs and is stifling trade and economic development,particularly in landlocked countries. Research is needed to establish how new technologies and borderprocess alignments can speed up and improve reliability at border crossings. The economic and socialbenefits arising from improved transit times would be assessed and, where possible, quantified. Thisresearch would need to provide a holistic appraisal of the benefits to improving freight transit acrossnational borders.
Technological solutions at borders, such as developing an ICT infrastructure and smart bordercontrol measures, such as non-intrusive inspection and fully paperless systems (e-border) systems,
56
Sustainability 2019, 11, 5940
will need to be considered. A further key research objective is to enhance freight movements betweenports and hinterlands, particularly for Small and Medium Enterprises (SMEs) and others requiringeffective freight consolidation services, by formulating a coherent and integrated intermodal strategy.This strategy will involve coordination between transport modes and strategies for the developmentof ‘dry ports’ (inland freight depots), free industrial zones, inland customs clearance arrangements,and bonded facilities. Consideration around how to harmonise regulations (such as restrictions oncontainer transport by road) is needed, as are requirements for the employment of competent, trainedpersonnel, which will reduce skill shortages and unofficial payments.
Thirdly, the failure of railway concessions will lead to escalating costs, low-quality serviceprovisions, and, in extreme cases, the termination of services, with substantial societal and economicdisruptions. An essential requirement for sustainable rail services in LICs is the design of concessionsand establishing optimal regulatory and contracting models and solutions, as well as improving themode share of passenger transport support and many UN Strategic Development Goals. Railways areinherently safer and, therefore, lead to fewer fatalities and accidents (SDG Target 3.6) and cause lessenvironmental damage (SDG Target 3.9). Providing a viable passenger service as an alternative to roadtransport will increase the reliability and reduce the environmental impacts of the transport system(SDG Target 9.1).
Research should determine when it is appropriate to separate the management of railway servicesand infrastructure in LICs and to determine the most appropriate separation models. This wouldinclude considering the impact of different institutional and organisational structures for railways and,specifically, vertical separation versus vertical integration and intermediate structures. It should alsoconsider which forms of competition (concessions, open access, or franchising) can best improve theefficiency and societal welfare of railways.
Author Contributions: Conceptualisation and methodology, P.W.; writing—original draft preparation, A.D.S.and Y.H.; writing—review and editing, A.S.
Funding: This research was funded by the UK Department for International Development, grant number HVT/005.
Acknowledgments: This research was funded via UK AID through the UK Department for InternationalDevelopment under the High Volume Transport (HVT) Applied Research Programme, managed by IMCWorldwide. The authors are particularly grateful for the advice of, Bruce Thompson the leader of Theme 1, LongDistance Strategic Road and Rail Transport, of the HVT Programme.
Conflicts of Interest: The authors declare no conflict of interest. The funders had no role in the design of thestudy; in the collection, analyses, or interpretation of data; in the writing of the manuscript, or in the decision topublish the results.
References
1. Banister, D.; Berechman, Y. Transport investment and the promotion of economic growth. J. Trans. Geogr.2001, 9, 209–218. [CrossRef]
2. Venables, A.; Laird, J.J.; Overman, H.G. Transport Investment and Economic Performance: Implications for ProjectAppraisal; Department for Transport: London, UK, 2014.
3. Farhadi, M. Transport infrastructure and long-run economic growth in OECD countries. Trans. Res. Part APolicy Pract. 2015, 74, 73–90. [CrossRef]
4. Arvis, J.-F.; Ojala, L.; Wiederer, C.; Shepherd, B.; Raj, A.; Dairabayeva, K.; Kiiski, T. Connecting to Compete2018; World Bank: Washington, DC, USA, 2018.
5. McDonald, N. Safety and regulations restricting the hours of driving of goods vehicle drivers. Ergonomics1981, 24, 475–485. [CrossRef]
6. Baas, P.H.; Charlton, S.G.; Bastin, G.T. Survey of New Zealand truck driver fatigue and fitness for duty. Trans.Res. Part F Traffic Psychol. Behav. 2000, 3, 185–193. [CrossRef]
7. Amundsen, A.H.; Sagberg, F. Hours of Service Regulations and the Risk of Fatigue- and Sleep-Related RoadAccidents; Transportøkonomisk Institutt (Institute of Transport Economics) Report 659/2003; Institute ofTransport Economics: Oslo, Norway, 2003.
57

Sustainability 2019, 11, 5940
8. Poulter, D.R.; Poulter, D.R.; Chapman, P.; Bibby, P.A.; Clarke, D.D.; Crundall, D. An application of the theoryof planned behaviour to truck driving behaviour and compliance with regulations. Accid. Anal. Prev. 2008,40, 2058–2064. [CrossRef]
9. Hall, R.W.; Mukherjee, A. Bounds on effectiveness of driver hours-of-service regulations for freight motorcarriers. Trans. Res. Part E Logist. Trans. Rev. 2008, 44, 298–312. [CrossRef]
10. Jones, C.B.; Dorrian, J.; Rajaratnam, S.M.W.; Dawson, D. Working hours regulations and fatigue intransportation: A comparative analysis. Saf. Sci. 2005, 43, 225–252. [CrossRef]
11. Nantulya, V.M.; Reich, M.R. The neglected epidemic: Road traffic injuries in developing countries. BMJ 2002,324, 1139. [CrossRef]
12. Kopits, E.; Cropper, M. Traffic fatalities and economic growth. Accid. Anal. Prev. 2005, 37, 169–178. [CrossRef]13. Assum, T. Road Safety in Africa: Appraisal of Road Safety Initiatives in Five African Countries; Sub-Saharn Africa
Transport Policy Program Working Paper No. 33; The World Bank: Washington, DC, USA, 1998.14. Khayesi, M.; Peden, M. road safety in Africa. BMJ 2005, 331, 710. [CrossRef]15. Chen, G. Road traffic safety in African countries–status, trend, contributing factors, countermeasures and
challenges. Int. J. Inj. Control Saf. Promot. 2010, 17, 247–255. [CrossRef] [PubMed]16. Sumaila, A.F. Road crashes trends and safety management in Nigeria. J. Geogr. Reg. Plan. 2013, 6, 43–62.17. Abegaz, T.; Berhane, Y.; Worku, A.; Assrat, A. Effectiveness of an improved road safety policy in Ethiopia:
An interrupted time series study. BMC Public Health 2014, 14, 539. [CrossRef]18. Anbarci, N.; Escaleras, M.; Register, C. Traffic fatalities and public sector corruption. Kyklos 2006, 59, 327–344.
[CrossRef]19. Becker, G.S.; Stigler, G.J. Law enforcement, malfeasance, and compensation of enforcers. J. Leg. Stud. 1974, 3,
1–18. [CrossRef]20. Van Rijckeghem, C.; Weder, B. Bureaucratic corruption and the rate of temptation: Do wages in the civil
service affect corruption, and by how much? J. Dev. Econ. 2001, 65, 307–331. [CrossRef]21. Rys, D.; Judycki, J.; Jaskula, P. Analysis of effect of overloaded vehicles on fatigue life of flexible pavements
based on weigh in motion (WIM) data. Int. J. Pavement Eng. 2016, 17, 716–726. [CrossRef]22. Kolo, S.S.; Jimoh, Y.A.; Ndoke, P.N.; James, O.; Amada, A.Y.; Bala, A. Analysis of Axle Loadings on a Rural
Road in Nigeria. Publ. Int. J. Eng. Sci. Invent. 2014, 3, 8–14.23. Bagui, S.; Das, A.; Bapanapalli, C. Controlling Vehicle Overloading in BOT Projects. Procedia Soc. Behav. Sci.
2013, 104, 962–971. [CrossRef]24. Chan, Y.C.M. Truck Overloading Study in Developing Countries and Strategies to Minimize its Impact.
Master’s Thesis, Queensland University of Technology, Brisbane, Australia, 2008.25. Toll Infrastructure Services. Overloading Control Strategies in Africa; Toll Infrastructure Services: Pretoria,
South Africa, 2017.26. Pinard, M.I. Guidelines on Vehicle Overload Control in Eastern and Southern Africa; Sub-Saharan Africa Transport
Policy Programme; The World Bank: Washington, DC, USA, 2010.27. Pinard, M.I. Emerging Good Practice in Overload Control in Eastern and Southern Africa; Discussion Paper 12,
Sub-Saharan Africa Transport Policy Program; The World Bank: Washington, DC, USA, 2011.28. Cottineau, L.M.; Hornych, P.; Jacob, B.; Schmidt, F.; Dronneau, R.; Klein, E. Automated overload enforcement
by WIM. In Proceedings of the 25th World Road Congress, Seoul, Korea, 2–6 November 2015.29. Jacob, B.; Cottineau, L.-M. Weigh-in-motion for Direct Enforcement of Overloaded Commercial Vehicles.
Trans. Res. Procedia 2016, 14, 1413–1422. [CrossRef]30. Hu, T. A framework of truck overload intelligent monitoring system. In Proceedings of the 2011 Fourth
International Symposium on Computational Intelligence and Design, Hangzhou, China, 28–30 October 2011.31. Nash, C.A.; Crozet, Y.; Link, H.; Nilsson, J.; Smith, A. Liberalisation of Passenger Rail Services: Project Report;
Centre on Regulation in Europe: Brussels, Belgium, 2016.32. Smith, A.S.J. Liberalisation of Passenger Rail Services—Case Study—Britain; Centre on Regulation in Europe:
Brussels, Belgium, 2016.33. Nilsson, J.-E. Liberalisation of Passenger Rail Services: Case Study—Sweden; Centre on Regulation in Europe:
Brussels, Belgium, 2016.34. Crozet, Y. Liberalisation of Passenger Rail Services: Case Study—France; Centre on Regulation in Europe: Brussels,
Belgium, 2016.
58

Sustainability 2019, 11, 5940
35. Link, H. Liberalisation of Passenger Rail Services: Case Study—Germany; Centre on Regulation in Europe:Brussels, Belgium, 2016.
36. Wheat, P.; Smith, A.S.J. Do the usual results of railway returns to scale and density hold in the case ofheterogeneity in outputs? a hedonic cost function approach. J. Trans. Econ. Policy 2015, 49, 35–57.
37. Nash, C.; Matthews, B.; Smith, A.S.J. The impact of rail industry restructuring on incentives to adoptinnovation: A case study of Britain. Proc. Inst. Mech. Eng. Part F J. Rail Rapid Transit 2018. [CrossRef]
38. Affuso, L.; Newbery, D.M.G. Investment, Reprocurement and Franchise Contract Length in the British RailwayIndustry; C.E.P.R. Discussion Papers; University of Cambridge: Cambridge, UK, 2000.
39. Smith, A.S.J.; Wheat, P. Evaluating alternative policy responses to franchise failure: Evidence from thepassenger rail sector in Britain. J. Trans. Econ. Policy (JTEP) 2012, 46, 25–49.
40. Smith, A.S.J.; Wheat, P.E.; Nash, C.A. Exploring the effects of passenger rail franchising in Britain: Evidencefrom the first two rounds of franchising (1997–2008). Res. Trans. Econ. 2010, 29, 72–79. [CrossRef]
41. Cruz Carlos, O.; Marques Rui, C. Exogenous determinants for renegotiating public infrastructure concessions:Evidence from Portugal. J. Constr. Eng. Manag. 2013, 139, 1082–1090. [CrossRef]
42. Carbajo, J.; Estache, A. Railway concessions: Heading down the right track in Argentina; World Bank OtherOperational Studies; The World Bank: Washington, DC, USA, 1996.
43. Crampes, C.; Estache, A. Regulatory trade-offs in the design of concession contracts. Util. Policy 1998, 7,1–13. [CrossRef]
44. Campos, J. Lessons from railway reforms in Brazil and Mexico. Trans. Policy 2001, 8, 85–95. [CrossRef]45. Guasch, J.L. Granting and Renegotiating Infrastructure Concessions; The World Bank: Washington, DC, USA,
2004.46. Guasch, J.L.; Straub, S. Renegotiation of infrastructure concessions: An overview. Ann. Public Coop. Econ.
2006, 77, 479–493. [CrossRef]47. Guasch, J.L.; Laffont, J.J.; Straub, S. Concessions of infrastructure in Latin America: Government-led
renegotiation. J. Appl. Econ. 2007, 22, 1267–1294. [CrossRef]48. Estache, A.; Guasch, J.L.; Iimi, A.; Trujillo, L. Multidimensionality and renegotiation: Evidence from
transport-sector public-private-partnership transactions in Latin America. Rev. Ind. Organ. 2009, 35, 41.[CrossRef]
49. Rodríguez, D. Expanding the urban transportation infrastructure through concession agreements: Lessonsfrom Latin America. Trans Res Rec. J. Trans. Res. Board 1999, 1659, 3–10. [CrossRef]
50. Stern, J. The relationship between regulation and contracts in infrastructure industries: Regulation as orderedrenegotiation. Regul. Gov. 2012, 6, 474–498. [CrossRef]
51. Tam, C.M. Build-operate-transfer model for infrastructure developments in Asia: Reasons for successes andfailures. Int. J. Proj. Manag. 1999, 17, 377–382. [CrossRef]
52. Sharipov, T. Results so far and prospects of Kazakhstan passenger rail franchising. Res. Trans. Econ. 2010, 29,19–35. [CrossRef]
53. Gwilliam, K.M. Africa’s Transport Infrastructure; The World Bank: Washington, DC, USA, 2011.54. Roy, M.-A.; Kieran, P. Rail privatisation rolls across the continent. Int. Railw. J. 2006, 46, 38–41.55. Bullock, R. Results of Railway Privatization in Africa; Transport Papers, No. TP-8; The World Bank: Washington,
DC, USA, 2005.56. Budin, K.-J.; Mitchell, B. The Abidjan-Ouagadougou Railway Concession; Infrastructure Notes, No. RW-14; The
World Bank: Washington, DC, USA, 1997.57. Pozzo di Borgo, P.; Labeau, A.; Eskinazi, R.; Dehornoy, J.; Parte, A.; Ameziane, M. Sub-Saharan Africa: Review
of Selected Railway Concessions; Africa Transport Sector, Report No. 36491; The World Bank: Washington, DC,USA, 2006.
58. Ndonye, H.N.; Anyika, E.; Gongera, G. Evaluation of public private partnership strategies on concessionperformance: Case of rift valley railways concession, Kenya. Eur. J. Bus Manag. 2014, 6, 145–166.
59. Jones, J.; Murphy, J. The risks are rising for Africa’s private operators. Int. Railw. J. 2008, 48, 104–108.60. Mizutani, F.; Smith, A.; Nash, C.; Uranishi, S. Comparing the costs of vertical separation, integration, and
intermediate organisational structures in European and East Asian railways. J. Trans. Econ. Policy (JTEP)2015, 49, 496–515.
61. Van de Velde, D.; Nash, C.; Smith, A.; Mizutani, F.; Uranishi, S.; Lijesen, M.; Zschoche, F. EVESRail—EconomicEffects of Vertical Separation in the Railway Sector; inno-V: Amsterdam, The Netherlands, 2012.
59
Sustainability 2019, 11, 5940
62. Benedetto, V.; Smith, A.S.J.; Nash, C.A. Evaluating the roles and powers of rail regulatory bodies in Europe:A survey-based approach. Trans. Policy 2017, 59, 116–123. [CrossRef]
63. Smith, A.S.J. The application of stochastic frontier panel models in economic regulation: Experience from theEuropean rail sector. Trans. Res. Part E Logist. Trans. Rev. 2012, 48, 503–515. [CrossRef]
64. Office of Rail and Road. PR18 Econometric Top-Down Benchmarking of Network Rail: A Report; Office of Railand Road: London, UK, 2018.
65. Smith, A.S.J. Use of Benchmarking by British Regulators: Presentation to a Seminar on Yardstick Competition inTransport; The Italian Regulatory Authority: Turin, Italy, 2017.
66. Smith, A.S.J. Benchmarking Methodologies: With Examples from Rail. In Presentation to a Seminar: The artof ART: Measuring Efficiency for Growth, Development, and Better Quality Transport; The Italian RegulatoryAuthority: Turin, Italy, 2018.
67. Smith, A.S.J.; Benedetto, V.; Nash, C. The impact of economic regulation on the efficiency of european railwaysystems. J. Trans. Econ. Policy (JTEP) 2018, 52, 113–136.
68. Button, K. Transport regulation and the environment in low income countries. Util. Policy 1992, 2, 248–257.[CrossRef]
69. Lee, J.; Hine, J.L. Preparing a National Transport Strategy: Suggestions for Government Agencies in DevelopingCountries; Transport Papers No. TP-19; The World Bank: Washington, DC, USA, 2008.
70. Sohail, M.; Maunder, D.A.C.; Cavill, S. Effective regulation for sustainable public transport in developingcountries. Trans. Policy 2006, 13, 177–190. [CrossRef]
71. International Transport Forum. Establishing Mexico’s Regulatory Agency for Rail Transport: Peer Reviewof Regulatory Capacity. Case-Specific Policy Analysis 2016; Organisation for Economic Co-Operation andDevelopment: Paris, France, 2016.
72. Strathman, J.G. Economics of Overloading and the Effect of Weight Enforcement; Center for Urban Studies Collegeof Urban and Public Affairs Portland State University: Portland, OR, USA, 2001.
73. Chen, Q.; Guo, L. Development of truck overloading automatic detection system based on TPMS. InProceedings of the 2010 International Conference on Measuring Technology and Mechatronics Automation(ICMTMA 2010), Piscataway, NJ, USA, 13–14 March 2010; pp. 19–21.
74. Engineering News. Available online: http://www.engineeringnews.co.za/print-version/road-transport-2015-07-24 (accessed on 7 August 2015).
75. Christ, N.; Ferrantino, M.J. Land transport for export: The effects of cost, time, and uncertainty in sub-saharanAfrica. World Dev. 2011, 39, 1749–1759. [CrossRef]
76. de Jong, G. Value of Freight Travel-Time Savings. Handbook of Transport Modelling; Hensher, D.A., Button, K.J.,Eds.; Elsevier: Amsterdam, The Netherlands, 2007; pp. 649–663.
77. Feo-Valero, M.; Garcia-Menendez, L.; Garrido-Hidalgo, R. Valuing freight transport time using transportdemand modelling: A bibliographical review. Trans. Rev. 2011, 31, 625–651. [CrossRef]
78. Zamparini, L.; Reggiani, A. Freight transport and the value of travel time savings: A meta-analysis ofempirical studies. Trans. Rev. 2007, 27, 621–636. [CrossRef]
79. Zamparini, L.; Reggiani, A. The value of reliability and its relevance in transport networks: A systemsperspective. In Integrated Transport: From Policy to Practice; Givoni, M., Banister, D., Eds.; Routledge:Abingdon, UK, 2010; pp. 97–116.
80. Zamparini, L.; Reggiani, A. The value of travel time savings in passenger a freight transport: An overview.In Policy Analysis of Transport Networks; Van Geenhuizen, M., Rietveld, P., Eds.; Routledge: London, UK, 2016;pp. 161–178.
81. Beuthe, M.; Bouffioux, C. Analysing qualitative attributes of freight transport from stated orders of preferenceexperiment. J. Trans. Econ. Policy (JTEP) 2008, 42, 105–128.
82. Kurri, J.; Sirkiä, A.; Mikola, J. Value of time in freight transport in Finland. Trans. Res. Rec J. Trans. Res. Board2000, 1725, 26–30. [CrossRef]
83. Bergantino, A.S.; Bolis, S. An analysis of maritime ro-ro freight transport service attributes through adaptivestated preference: An application to a sample of freight forwarders. Eur. Trans. 2004, 25–26, 33–51.
84. Fowkes, A.S.; Firmin, P.E.; Tweddle, G.; Whiteing, A.E. How highly does the freight transport industry valuejourney time reliability—And for what reasons? Int. J. Logistics Res. Appl. 2004, 7, 33–43. [CrossRef]
85. Hillestad, R.; Van Roo, B.D.; Yoho, K.D. Fast-Forward: Key Issues in Modernizing the US Freight-TransportationSystem for Future Economic Growth; RAND Corporation: Santa Monica, CA, USA, 2009.
60

Sustainability 2019, 11, 5940
86. Shinghal, N.; Fowkes, T. Freight mode choice and adaptive stated preferences. Trans. Res. Part E LogisticsTrans. Rev. 2002, 38, 367–378. [CrossRef]
87. Larranaga, A.M.; Arellana, J.; Senna, L.A. Encouraging intermodality: A stated preference analysis of freightmode choice in Rio Grande do Sul. Trans. Res. Part A Policy Prac. 2017, 102, 202–211. [CrossRef]
88. Norojono, O.; Young, W. A stated preference freight mode choice model. Trans. Plan. Technol. 2003, 26, 1.[CrossRef]
89. Arunotayanun, K.; Polak, J.W. Taste heterogeneity and market segmentation in freight shippers’ mode choicebehaviour. Trans. Res. Part E Logistics Trans. Rev. 2011, 47, 138–148. [CrossRef]
90. Zamparini, L.; Layaa, J.; Dullaert, W. Monetary values of freight transport quality attributes: A sample ofTanzanian firms. J. Trans. Geogr. 2011, 19, 1222–1234. [CrossRef]
91. Ogwude, I.C. The value of transit time in industrial freight transportation in Nigeria. Int. J. Trans. Econ./Rivistainternazionale di economia dei trasporti 1993, 20, 325–337.
92. Cundill, M.A. Road-Rail Competition for Freight Traffic in Kenya; Transport and Road Research LaboratoryResearch Report, No. RR 41; Transport Research Laboratory: Wokingham, UK, 1986.
93. Thomas, S. The Value of Time Savings in West Malaysia: Commercial Vehicles; Transport and Road ResearchLaboratory Research Report, No. HS-036 881; Transport Research Laboratory: Berkshire, UK, 1983.
94. Faye, M.L.; McArthur, J.W.; Sachs, J.D.; Snow, T. The challenges facing landlocked developing countries.J. Hum. Dev. 2004, 5, 31–68. [CrossRef]
95. Zhang, J.; Kawasaki, T.; Hanaoka, S. Freight transport value of time estimation for border crossing route:Case study of Tianjin Port-Ulan Bator route. In Proceedings of the 3rd International Conference on Transportand Logisitics, Malé, Republic of Maldives, 15–17 December 2011.
96. Banomyong, R.; Beresford, A.K.C. Multimodal transport: The case of Laotian garment exporters. Int. J. Phys.Distrib. Logistics Manag. 2001, 31, 663–685. [CrossRef]
97. De Souza, R.; Goh, M.; Gupta, S.; Lei, L. An Investigation into the Measures Affecting the Integration of ASEAN’sPriority Sectors (Phase 2): The Case of Logistics; ASEAN: Jakarta, Indonesia, 2018.
98. Gupta, S.; Desouza, M.G.R.; Garg, M. Assessing trade friendliness of logistics services in ASEAN. Asia Pac. J.Mark. Logistics 2011, 23, 773–792. [CrossRef]
99. Tongzon, J.; Cheong, I. The challenges of developing a competitive logistics industry in ASEAN countries.Int. J. Logistics Res. Appl. 2014, 17, 323–338. [CrossRef]
100. Adaba, G.B.; Rusu, L. E-trade facilitation in Ghana: A capability approach perspective. Electron. J. Inf. Syst.Dev. Ctries. 2014, 63, 1–13. [CrossRef]
101. Hinson, R.E.; Adjasi, C.K.D. The Internet and export: Some cross-country evidence from selected Africancountries. J. Int. Commer. 2009, 8, 309–324. [CrossRef]
102. Hoffman, A.; Bhero, E. A simulation approach to the optimized design of cross-border operations.In Proceedings of the 2015 IEEE 18th International Conference on Intelligent Transportation Systems,Las Palmas, Spain, 15–18 September 2015.
103. Arvis, J.-F.; Carruthers, R.C.; Smith, G.; Willoughby, C. Connecting Landlocked Developing Countries to Markets;The World Bank: Washington, DC, USA, 2011.
© 2019 by the authors. Licensee MDPI, Basel, Switzerland. This article is an open accessarticle distributed under the terms and conditions of the Creative Commons Attribution(CC BY) license (http://creativecommons.org/licenses/by/4.0/).
61


sustainability
Article
Transport Corridors for Wider Socio–EconomicDevelopment
A S M Abdul Quium
Former member of staff, United Nations Economic and Social Commission for Asia and the Pacific Secretariat,Bangkok 10200, Thailand; [email protected]
Received: 31 July 2019; Accepted: 19 September 2019; Published: 25 September 2019
Abstract: There can be two broad objectives of transport corridor development: to improve efficiencyin the transport and logistics processes in the corridor, and to generate economic development inthe corridor region, capitalizing on improved connectivity and transport networks. This paperfocuses on the second objective of corridor development. A transport corridor can become a toolfor spatially balanced and more sustainable economic development and human well-being in thecorridor region. Considering the promise of this approach, this paper undertakes a critical review oftransport infrastructure development studies undertaken in Sub-Saharan and South Asian countriesto find evidence of infrastructure development impacts. Evidence gathered from the review suggeststhat transport infrastructure development can have significant positive impacts on economic growth,income, poverty, employment, equity, and inclusion. However, there can be important trade-offsbetween economy and welfare and environmental quality, and the distribution of impacts can beuneven. The paper also considers how some of the transport corridor development issues areaddressed and complementary interventions that may be required, and, finally, discusses lessonslearned from the review and their policy implications which can be useful for future corridor designs,and provides suggestions of research studies to fill the current knowledge gaps.
Keywords: transport corridor; transport infrastructure; transport development impacts; widereconomic benefits; corridor management; South Asia; Sub-Saharan Africa
1. Introduction
High Volume Transport (HVT) corridors and networks comprise arterial and main roads andrailways to form the national transport backbone, which connects the smaller feeder road and rail links.HVT corridors and networks carry the major share of passenger and freight traffic and play a key rolein the economic and social development of a country. For example, one transport corridor region inBangladesh (Dhaka–Chittagong corridor) generates almost 50% of Gross Domestic Product (GDP) andhandles about 85% of international maritime trade [1] (pp. 345–357).
The impacts of investments in transport corridors and networks can be substantial. At the macrolevel, the transport network is linked to national output, employment, and income. At the microlevel, well-connected transport networks link producers and consumers and affect people’s wellbeing,including poverty alleviation through higher production and wages, new jobs, and lower input andhigher output prices. Transport networks also facilitate access to education, employment, health,and other social and cultural facilities.
A well-managed HVT corridor can help to improve the quality of transport and logisticsservices in the corridor, reduce the cost of transport, increase efficiency in the overall supply anddistribution chain, and reduce the carbon footprint of freight transport. In addition, an HVT corridorcan bring together infrastructure facilities, policies, institutions, and investments to spur widersocio–economic development.
Sustainability 2019, 11, 5248; doi:10.3390/su11195248 www.mdpi.com/journal/sustainability63

Sustainability 2019, 11, 5248
Transport development is linked to many Sustainable Development Goals (SDGs) and can be usedas an intervention tool to achieve some of them (see United Nations (UN) [2] for SDGs). For example,HVT corridors and networks can be a tool to support achieving SDG 9 (sustainable infrastructure:Targets 9.1 and 9.a), and SDG 10 (reduced inequalities: Targets 10.2, 10.3, 10.7, and 10.8).
There are many theoretical works linking the contribution of transport infrastructure to growthand welfare. Aschauer [3] presented an econometric model of the relationship between productionand public investments. Krugman [4] examined the forces that concentrate and disperse economicactivity across economic space (geography). The new economic geography theories advanced byKrugman [4], Duranton and Puga [5], and other researchers have sought to explain the agglomerationof economic activity and its implications. Venables and Gasiorek [6], Department for Transport [7],Graham and Gibbons [8], Venables [9], and Vickerman [10] have considered the welfare implicationsof transport improvements in case of market failures and imperfect competition. They argue thatconventional cost–benefit analysis (CBA) must be extended to include wider economic benefits (WEBs).WEBs are considered to be additional benefits, as they derive from sources of market failure andimperfect competition.
Discussions on some of the important theoretical works can be found in References [11,12]and elsewhere. It is generally agreed by academics, development practitioners, and policymakersthat transport infrastructure is vital for economic development and human wellbeing. Transportdevelopment works through several mechanisms and various intermediate outcomes, such as decreasein trade costs, and increase in trade, investment, land value, and assets to induce WEBs in the long run.
An AECOM [13] study explains these effects of transport development in three stages.The first-order benefits (or direct benefits) are related to improvements in travel time, reductionsin transport costs, increased reliability, and the introduction of new services, which result in costreductions to transport users and transport service providers.
The second-order benefits arise as transport improvements enable access to larger markets andto wider facilities and services. The availability of better services and reduced cost of transportinfluence the location/relocation of firms, volume of trade, and higher agricultural production.An important characteristic of this stage is the visible signs of development: more traffic, shops,buildings, factories, etc.
The third-order effects arise in the long run from structural changes due to economy-wide dynamicprocesses activated by the second order effects. These changes ultimately lead to positive impactson people’s wellbeing, including poverty alleviation through an increase in employment, higheragricultural production and wages, and higher output prices. These changes, however, may also leadto externalities, such as negative impacts on the environment and some social aspects.
A recent study by Asian Development Bank (ADB) et al. [14] also describes a similartransformational process which leads to a set of final outcomes or wider economic benefits andcosts. The chain of effects of transport development can be summarized in Figure 1.
It is important to mention here that the magnitude of such changes in different stages depends onresponses of firms and households to effects in the first round, pre-existing conditions, institutionalenvironment, and policy interventions of the government [15,16].
Considering the promise of transport corridors to be an important policy intervention tool,this paper aims to review the current knowledge on wider economic benefits and costs of transportcorridor development. The specific objectives include:
• to review and analyze the literature on wider economic benefits and costs of major transportnetwork/corridor development;
• to examine how some of the corridor development issues are addressed;• to identify the current knowledge gaps related to transport corridor development and potential
research studies that can be considered to fill these gaps.
64

Sustainability 2019, 11, 5248
Figure 1. Effects of transport improvement/intervention. Source: Adapted from Asian DevelopmentBank et al. [14] and based on preceding discussion.
To fulfil these objectives, the paper focusses on evidence from low- and middle-income countriesfrom Sub-Saharan Africa (SSA) and South Asia, but relevant evidence from other developing countriesare also considered.
Section 2 provides methodology and data sources. In Section 3, the paper provides a review ofthe development impacts of transport corridors and networks gathered from both peer-reviewed andgrey literature.
The discussion in Section 4 is based on the main findings and lessons learned from the literaturereview. This section also considers issues related to corridor development and management and theirpolicy implications, and future research to fill some current knowledge gaps.
2. Methodology
The findings and discussion in this paper are based on desktop literature review.For this study, both peer-reviewed and grey literature have been used. Using search engines
(Google Scholar, Google), an extensive search of online databases, namely, CrossRef, JStor, ResearchGate, and Science Direct was undertaken, from which the cited papers were accessed.
The grey literature came from development banks and their institutes (World Bank, AsianDevelopment Bank, African Development Bank, Asian Development Bank Institute, etc.),UN organisations, and research organisations, such as the Economic Research Institute for ASEANand East Asia (ERIA), and Asian Institute of Transport Development (AITD). The grey literature wasaccessed mostly from the respective organization’s official websites or e-Library.
3. Findings from Literature Review
3.1. Transport Infrastructure Investment and Economy
This sub-section first reviews the literature for Sub-Saharan and South Asian countries, followedby a review of some important studies in developed countries. This has been done to find differencesof the research in developed and developing countries.
Many studies have found positive effects of transport infrastructure investment on the economy.Although the measured growth effects vary among studies, the positive correlation between transportinfrastructure investment and economic development is commonly accepted [17].
A number of studies have provided evidence of the substantial economic and social benefits oftransport projects [14,18]. Estimates from multiple studies have suggested cumulative gains rangingfrom less than 1% to more than 10% of GDP [19–22]. The variation in estimates and other findings isthought to be due mainly to differences in characteristics of individual studies and the difference incontext, and related to different phenomena (economic sectors, transport infrastructure, etc.) beingmeasured [23].
65

Sustainability 2019, 11, 5248
A review of 78 studies, including 18 studies in Africa (from six countries, namely, Cameroon,Democratic Republic of Congo (DRC), Egypt, Ethiopia, Nigeria, Tanzania, and Uganda, and six regionalstudies) provides evidence of the substantial economic and social benefits of transport projects [16].A meta-analysis of the results has revealed statistically significant benefits of transport networks forreal and nominal income, consumption, gender, education, and job creation.
A major study, covering 16 countries in North Africa and 24 countries in SSA, found thatinfrastructure (transport and other infrastructure) accounts for more than half of Africa’s recenteconomic growth and has the potential to contribute even more in the future [24].
Simulation-based estimates have demonstrated that transport infrastructure and services makesubstantial contributions to GDP in the long run [21,25–29]. Hahm and Raihan [25] used a ComputableGeneral Equilibrium (CGE) model to estimate the total economic gains from the six Belt and RoadInitiative (BRI) economic corridors. The estimated gains in terms of percentage of GDP for three BRIcountries in South Asia were 7% in Bangladesh, 4% in Pakistan, about 3% in India, and about 6% inMyanmar. For landlocked countries (Kazakhstan, Kyrgyzstan, Lao People’s Democratic Republic,Mongolia, Tajikistan, Turkmenistan, and Uzbekistan), estimates vary between 5 and 10% of GDP.However, some other low-income countries, such as Cambodia, may also experience growth in GDP ofmore than 10%.
Zhai [26] investigated the real income gains from investment in expanded regional transportinfrastructure in developing countries in Asia. The analysis has suggested that developing countriesin Asia as a whole would gain about USD967.7 billion in 2020, which is equivalent to 6.0% of theirbaseline income in 2008.
Gilbert and Banik [21] estimated the impacts of South Asia Sub-regional Economic Cooperation(SASEC) transport infrastructure to connect Bangladesh, Bhutan, northeastern India, and Nepal.The simulation study indicated that the cumulative impacts as a percentage of GDP would varybetween 0.7% and 14.8% (India 0.7%, Pakistan 2.7%, Bangladesh 4.1%, Sri Lanka 4.6%, and Nepal14.8%). In absolute value, the gain was the highest for India (USD4330.3 million) followed by Pakistan(USD2600.8 million), Bangladesh (USD2295.1 million), Sri Lanka (USD933.8 million), and Nepal(USD2057.1 million).
Similar potential gains from increased sub-regional infrastructure investments were found inother studies. Stone and Strutt [27] valued social impacts at USD8.1 billion, resulting from moderateimprovements to road infrastructure and trade facilitation in the Greater Mekong Sub-region (GMS).A major transport infrastructure project can have similar impacts on regional GDP. Anas et al. [20]used an Input–Output (IO) model to examine the impacts of a major toll way in West Java, Indonesia.Freight costs were found to decrease by 17%, and GDP in Bandung District to increase by 1.2%.
Hlotywa and Ndaguba [30] assessed the impact of road infrastructure investment on economicdevelopment in South Africa. The results of the study demonstrate that road transport investmentvariables account for approximately 86.7% of the variation in economic development in South Africa.Another study in South Africa examined the macroeconomic impact of labor-based road constructionin undeveloped rural areas. Input–output analysis of 11 projects found that the GDP multiplier rangesbetween 1.34 and 1.53 (average 1.45) [31].
Using a cross-country analysis of 60 countries for the period 1980–2010, Ng et al. [32] comparedimprovement in mobility (by investment in access-controlled highways, such as motorways andfreeways), accessibility (investment in local roads providing more direct links to destination),and economic growth. Their study found that improvement in mobility facilitated export-ledgrowth in countries of medium and high-level development. On the other hand, it was more importantto facilitate local business and trade activities investment in local roads to improve accessibility incountries of low-level development.
Pradhan and Bagchi [33] examined the effect of road and rail infrastructure on economic growthin India over the period 1970–2010. Using a Vector Error Correction Model (VECM), they foundbidirectional causality between road transport investment and economic growth, and unidirectional
66
Sustainability 2019, 11, 5248
causality between rail transport investment and economic growth. They also found bidirectionalcausality between road transport and gross capital formation and unidirectional causality from railtransport to gross capital formation. Considering the findings, they suggested that expansion oftransport infrastructure, along with gross capital formation, can lead to substantial economic growth.
Hong et al. [34] examined the linkage between transport infrastructure and regional economicgrowth in China using a panel data model of 31 provinces from 1998 to 2007. Transport infrastructurewas shown to play an important role in economic growth, and road infrastructure contributed moreto economic growth in locations with poor roads. A retrospective analysis showed that the unevendistribution of transport infrastructure is an important reason for disparities between regions.
The major highway networks can significantly contribute to the manufacturing output growth ofa country. Ghani et al. [18] found that the Golden Quadrilateral (GQ) highway network upgrades ledto a substantial increase in Indian manufacturing activity. They found that the largest growth camefrom the non-nodal districts within 0–10 km of the network, which accounted for 34% of the initiallevels. Their estimates credit about 43% of the observed increase to GQ upgrades and the rest to otherfactors. The N–5 highway in Vietnam had similar high output growth effects [14].
Evidence from the reviewed empirical studies suggests that transport infrastructure investmentgenerally has strong positive growth effects. However, a common limitation of the reviewed studies isthat they are restricted in scope, do not analyze how the growth effects of transport investment mayhave affected other aspects of economy, and, except for one study, do not show how growth effectsmay vary in different situations and for different groups. Some of the above studies indicate that otherpolicies may have also contributed to the impacts of transport infrastructure. However, the reviewdid not find any study that analyzed how the other policies may have influenced the impacts oftransport infrastructure.
Numerous studies were undertaken in developed countries to find empirical evidence thattransport infrastructure investment boosts overall economic growth. The Standing Advisory Committeeon Trunk Road Appraisal (SACTRA) in the United Kingdom (U.K.) examined the linkages betweentransport and economy [35]. They observed that empirical evidence of the scale and significance ofsuch linkages was weak and disputed, and concluded “ . . . that the theoretical effects can exist inreality, but that none of them is guaranteed” [35] (p. 8). A review of evidence on the transport sector’scontribution to GDP in the developed countries can be found in Reference [36]. The earlier studiesindicate that for a 10% increase in capital stock, GDP increases by about 2%. However, later studiesbased on more complex modelling indicate a much lower value.
More recently, government agencies and researchers in the developed countries have undertakenstudies focusing on estimation of WEBs for inclusion in CBA of transport projects. The Department forTransport (DfT) in the U.K. has been a pioneer in including WEBs in the CBA of transport projects [37,38].The Department recommends three categories of WEBs, namely, agglomeration, increased or decreasedoutput in imperfectly competitive markets, and labor market impacts, and provides detailed guidelinesto estimate them.
Following the DfT, other countries such as Australia and New Zealand have considered theinclusion of WEBs in CBA of transport projects. However, the number and category of WEBs and theirtreatment in evaluation vary. In New Zealand, five categories of WEBs (agglomeration, imperfectcompetition, increased competition, labor supply and job relocation) are considered in the evaluationframework, whereas, Australia’s framework requires the exclusion of WEBs in CBA. WEBs are reportedseparately and considered for sensitivity tests, but not as an element of evaluation [39].
An inter-agency Workstream report [40] provides a comparison of WEB estimates for nineurban rail projects in Australia, New Zealand, and the U.K. The estimates for each category of WEB,in proportion to direct benefits in CBAs, varied considerably by project. The highest estimate of WEBswas for the Crossrail project in the U.K. (56%) and the lowest for the Brisbane cross-river project inAustralia (19%). A similar comparison of seven rail and road projects can be found in Douglas andO’Keeffe [41]. These estimates show that for many projects, estimated WEBs can be substantial.
67

Sustainability 2019, 11, 5248
A study by Wangsness et. al. [42] investigated how 22 developed countries (Nordic countries,15 countries in the EU, the USA, Canada, Switzerland, Australia, New Zealand, and Japan) treatWEBs in transport project appraisals. They found that 15 countries recognized at least one category ofWEB, and only 10 of them recommended methods for their assessment. The recommended methodsgenerally differed across the countries. Agglomeration benefits, which were most widely recognized,and by far the largest component of WEBs in many studies, were recognized by 14 out of 22 countries.However, only five of them recommended their monetization for CBAs, while the others were in favorof their inclusion in other types of analysis.
The criticisms of WEBs are largely due to questionable assumptions used in estimation methodsand application in specific evaluations. Researchers [41,43,44] observed that there were several factorswhich might lead to biased estimates. These valid criticisms suggest that although the theoretical linksare strong, empirical evidence is weak, and estimated values for WEBs are disputed.
The above discussion shows that WEBs are not universally accepted, and researchers andgovernment agencies have divergent views on them. It also suggests that the quantification of WEBs isa new field of research in which more work is required.
Generally, the estimated contribution of transport infrastructure to GDP in developing countriesis much higher than in developed countries. This is plausible, as transport networks in developingcountries are not well-connected and generally not in good condition. Further infrastructure investmentto improve network connectivity or infrastructure quality can produce substantial economic growth.Some of the reviewed studies identified different types of impacts, but did not explicitly consider theirunderlying causes or separately estimate different categories of WEBs. The review also did not findany study in developing countries that considered estimation methods for WEBs or their considerationin an evaluation framework.
3.2. Trade and Investments
An empirical study by Buys et al. [12] found that isolation from regional and international marketscontributed significantly to poverty in Sub-Saharan Africa. Poor transport infrastructure and borderrestrictions were identified as significant deterrents to trade expansion. In another study, Hummels [45]found that the volume of trade between countries that share a land border varied widely by regions.It was only between 1 and 5% of trade for Africa, the Middle East, and Asia, compared to 10–20% forLatin America, and 25–35% for Europe and North America.
The land-locked developing countries (LLDCs) in Asia and SSA suffer more than coastal countriesbecause of their higher transport costs. In a study of transport costs and trade, Limao and Venables [46]found that poor infrastructure accounts for 60% of transport costs for landlocked countries, comparedto 40% for coastal countries. The estimated elasticity of trade flows with respect to trade cost wasaround −3. The analysis of trade flows showed that the relatively low level of trade in African countrieswas due mainly to poor infrastructure.
The decrease in transport cost has been the major driver of the increase in international trade [45].Freund and Rocha [47] investigated the effects of different components of trade time on export in SSA.They found that a one-day increase in overland travel time implies a nearly 7% decline in exports.Buys et al. [12] investigated the economics of upgrading a primary road network that connects themajor urban areas in Sub-Saharan Africa. Simulation results of the study indicated that upgrading hasthe potential to increase overland trade between countries in Sub-Saharan Africa by about USD250billion over 15 years. The upgrading programme would require an estimated USD20 billion for initialupgrading and USD1 billion annually for maintenance.
Another empirical study by Bosker and Garretsen [48] also suggested that market access mattersfor economic development. The study showed that improvement of market access for Sub-SaharanAfrica by investing in intra-continent infrastructure or through increased continental integration canhave substantial positive effects on future economic development.
68

Sustainability 2019, 11, 5248
Simulation results of a study by Hahm and Raihan [25] showed that all countries under theBRI initiative would experience a rise in exports of goods and services. For example, the increasefor Bangladesh, India, and Myanmar would be 3–7%, and 14% for Pakistan. Several other countrieswould also experience a high increase in exports. Exports of agricultural commodities would increasemore than manufactured products. The export increase of agricultural commodities from Bangladesh,Cambodia, Lao People’s Democratic Republic, and Myanmar could contribute to poverty reduction inthose countries.
Hahm and Raihan [25] also suggested that the increase in imports would be higher than exports.For example, the import increase in Bangladesh, India, and Myanmar would be about 8–14% (comparedto 3–7% export increase) and for Pakistan 14% (same as imports), and, for some countries, well above15%. The researchers noted that this would lead to deterioration in the trade balance in most countriesand would pose a risk for the overall balance of payments, which in turn could adversely affecteconomic growth.
Papriev and Sodikov [49] used a gravity model to evaluate overland trade expansion in 28 countries,resulting from improvements to the Asian highway network. The study has indicated that the highwaynetwork offers major potential for overland trade expansion through upgrading and improvementof the surface condition of selected roads, costing an estimated USD6.5 billion. One scenario ofimproving road quality indices up to 50 suggests that total intra–regional trade would increase byabout 20%, or USD48.7 billion annually. In the second scenario of improving road quality indices up to75, the predicted increase would be about 35%, or USD89.5 billion annually.
A gravity model-based study for the GMS by Fujimura and Edmonds [50] suggested that thedevelopment of cross-border road infrastructure has had a positive effect on intraregional trade inmajor commodities, with its elasticity in the range of 0.6–1.4. Similar effects on growth in trade werealso observed in a study in Eastern Europe [51]. The gravity model simulations suggested that roadupgrade could increase trade in the region by 50% above baseline, which exceeded the expected gainsfrom tariff reductions or trade facilitation programmes of comparable scope. In nominal terms, this wasabout USD45 billion of trade benefits, and the estimated cost for road upgrade was USD8 billion.
The reviewed studies show that improvement of cross-border transport infrastructure cansubstantially increase transnational trade. However, they do not provide insight into how the growth oftrade may affect other aspects of the economy. Only one study refers to the risk for the overall balanceof payments due to the deterioration of trade balance. Neither do some studies provide any indicationof the transport investment that would be needed. Further studies with a more comprehensive scopewould be required to understand the trade-offs among increase in trade, fiscal risks, economic welfare,and other aspects of the economy, including negative effects.
3.3. Rural Economy, Poverty Reduction, and Social Impacts
People living in rural areas may also gain from major transport networks, especially roads andstrategic transport infrastructure, such as a major bridge. Several studies provide evidence of transportnetworks having positive social impacts on rural people through poverty reduction and increasedemployment in non-farm activities [14,52–54]. Two studies [14,54] found a structural shift in the ruraleconomy in terms of increase in non-farm activities and more employment.
The NH–5 Highway corridor in Vietnam made substantial positive impacts in the corridor region.The number of households living in poverty dropped by 35% between 1995 and 2000. Cities closerto and further away from NH–5 both experienced higher income growth per capita, as well as fasterreduction in poverty than the rest of the country. The poverty rate in Vietnam as a whole reduced by27% during this period as a result of broader spill overs from NH–5 to other regions [14].
An empirical study by Blankespoor et al. [52] investigated the impact of the Jamuna bridgeon Bangladesh. They found that cropping intensity increased by 3% and the area using chemicalfertilizer by 7%. The large reduction in transport costs (about 50%) due to the bridge led to agriculturaldevelopment in the newly connected hinterland as a result of technology adoption and a better match
69
Sustainability 2019, 11, 5248
of land to crops. The long-term estimate (2005–2013) was positive and statistically significant, with anincrease in rice yield of 5.2%.
Neupane and Calkins [53] examined the status of poverty and income inequality in SouthernThailand along the Asian Highway network route (AH18) in Songkhla province. They used descriptivestatistics and Analysis of Variance (ANOVA) method that included poverty and income inequalityindices to analyze the household survey data. They found that the average household income variedwith location, and poverty was lower along the Asian Highway route.
The impacts of a major National Highway (NH2) in three states in India were analyzed in a studyby AITD [54]. Compared with a baseline survey, literacy increased by 6%, female literacy by 12%,school enrolment by 7%, female school children by 12%, and population gaining access to medicalfacilities by 7%. The study observed improvements in women’s participation in the labor force (9%increase), employment in non-agricultural activities (7% increase), and an increase in annual (deflated)per capita income by Rs 243.
Another study found that the welfare impacts on rural people along the GQ highway in Indiawas not similar in all areas [14] (p. 247). The highway reduced poverty significantly in districts with alarge agro-processing base, but poverty did not drop in the average district near the highway.
In their study, Fan and Chan-Kang [55] found a trade-off between growth and poverty reductionfrom road investments in different parts of China. Road investments gave the highest economic returnsin the eastern and central regions of China, while contributions to poverty reduction were greatest inwestern China.
An empirical study in Ethiopia by Minten et al. [56] found that an increase in transaction andtransport costs over a 35 km distance led to a 50% increase of the prices of fertilizer and a 75% reductionin its use. The cost to bring fertilizer over a distance of 10 km from the distribution centre was as highas the costs to bring fertilizer to the distribution centre from the port about 1000 km away. The studyconcluded that tackling the “last mile(s)” costs should thus be a priority.
A study by Omamo [57] in Kenya showed that improved rural road networks that reduce transportcosts could reduce the motivation of small farmers to meet food needs through domestic productionand promote specialization that raises farm incomes.
Dorosh et al. [58] examined the effects of increases in road investments on travel times andagricultural production. They found that improvements in road infrastructure can facilitate asubstantial increase in agricultural production in Sub-Saharan Africa.
The findings of some of the above studies show that transport development leading toimprovements in access in rural areas can have direct welfare impacts for the rural people. However,the impacts may vary in different situations and for different groups. On the other hand, transportdevelopments involving HVT corridors and networks are of strategic significance to a national economy,but their direct benefits to the rural people may remain limited unless they are linked with a system offeeder roads providing access to remote areas.
3.4. Equity/Inclusive Development, Employment
Roberts et al. [16] found that transport networks had a beneficial effect on social inclusion in termsof education and gender in most of the studies reviewed. About 75% of studies showed benefits ofequality in terms of spatial distribution, though all studies showed substantial negative effects in termsof overall income distribution.
A major study by Donaldson [59] investigated the impact of India’s vast colonial railway networkusing archival data. Donaldson [41] (p. 931) found that “Railroads reduced the cost of trading andinterregional price gaps, and increased trade volumes”. He (p. 931) also found that when the networkwas extended to a typical district, real agricultural income in that district rose by approximately 16%.
The findings of Zhenhua and Haynes [60] confirmed that the high-speed railway network in Chinacontributed to decreasing regional economic disparity and promoted regional economic convergence.
70

Sustainability 2019, 11, 5248
The review by Roberts et al. [16] found that roads have a beneficial effect on social inclusion interms of job creation. More jobs, especially in non-farm activities, and greater participation of womenin the labor force were also observed in the AITD study [54].
The rehabilitation and improvement of the Maputo corridor successfully boosted transit tradeflows and bilateral trade between South Africa and Mozambique. The Maputo corridor led to morethan USD5 billion worth of investments, and 15,000 direct jobs in the construction and operation oftransport, logistics, energy, and industrial ventures along the corridor [14].
The NH–5 highway corridor in Vietnam has attracted investment and created jobs. In 2006,83,453 and 134,846 jobs were generated along the corridor in Hung Yen and Hai Duong provinces,respectively [14].
An International Labor Organization (ILO) study in two states of India (Gujarat and West Bengal)found that investment in infrastructure created a substantial number of jobs [61]. The study found thata 10% increase in the investment in highways and urban road construction sectors (INR2345 million inGujarat and INR1831 million in West Bengal) led to 83,401 more workers being hired in Gujarat and178,181 more workers hired in West Bengal. This also led to INR13.52 billion growth in Gujarat andINR14.05 billion growth in West Bengal.
Two studies on the Jamuna bridge in Bangladesh have provided evidence of its impacts on ruralemployment and job transition patterns, even though they followed different methodologies [44,45].Blankespoor et al. [62] found that besides increasing employment, the bridge construction facilitated afarm to non-farm shift in employment. About 40% of the employment increase in services came fromthe reduction of employment in the manufacturing sector, and the rest from agriculture. The resultssuggest a long-term structural change in the employment pattern.
Mahmud and Sawada [63] also found that the bridge led to an increase in local employment andfacilitated a shift from farm to non-farm in both districts. The share of non-farm employment increasedfrom 6.7 to 14% in one district and from 8.6 to 16% in the other district.
A shift in production and labor from agriculture was also found in a study done in Cameroon [64].The study found that better road access led to a diversification of the economic activities within thosehouseholds that were most isolated.
The findings of the above studies suggest that transport investment can be an important policyinstrument to create jobs and may contribute to decreasing regional economic disparity. However,substantial negative effects on overall income distribution can be expected. The studies do not provideany analysis of how the negative effects on overall income distribution may affect different groups,either in relative or absolute terms. The results of some studies suggest that transport development inconjunction with appropriate complementary interventions, such as in Vietnam, can make substantialpositive changes in the economy.
3.5. Location and Spatial Effects
While the estimated overall impacts of transport networks are generally beneficial, there are oftennegative impacts in some country regions and for some groups in society. Dzumbira et al. [65] founddifferences in the development impacts of the Maputo Development Corridor. Economic impacts,access to services, employment opportunities, income levels, and access to formal housing in nodesalong and near the N4 spine were better than those away from the corridor.
In an empirical study on the impacts of railways in colonial India, Donaldson [66] found thatthe network extended to a typical district increased its real agricultural income, but reduced the realincome of its neighboring district without rail access.
A study by the United Nations Economic and Social Commission for Asia and the Pacific (UNESCAP) [22] used a CGE model to assess the development impacts of three Asian Highway routesfrom Kunming, China through Southeast Asia to South Asia. The results showed that, although mostcountry regions would remain unaffected, some regions would have substantial gains in GDP of about2.2–2.8%. For other regions, the average losses would be small, about 0.3–0.4% in GDP.
71
Sustainability 2019, 11, 5248
Other simulation-based studies have also found an uneven distribution of economic benefits alongtransport corridors, such as the Dhaka–Kolkata corridor in Bangladesh [14], and the Delhi MumbaiIndustrial Corridor (DMIC) in India [67].
In China, the National Express Network (NEN) has increased real incomes in nearby prefecturesby nearly 4% on average, but decreased real wages in many prefectures in the urban and ruralsector [68]. Other studies also provide evidence of uneven distribution of the impacts of transportnetworks [14,18,60,69]. This finding from many studies has implications for the planning and designof transport projects.
The major transport networks can motivate businesses to relocate in areas better served by thenetwork. An empirical study in Uganda found that businesses gain more from being located inareas that offer agglomeration economies, availability of skilled workforce, and better infrastructureconditions [70]. Public infrastructure investments in other locations are likely to attract fewerprivate investors.
To ensure more inclusive development, it is important to understand the distribution of impactsacross population groups as well as across geographical areas. The studies discussed above clearlyshow that the distribution of impacts can be uneven across geographical areas. However, this reviewdid not find any major study that explored the distribution of impacts across different segments of thepopulation. More research would be required to examine the distribution of impacts across differentsegments of the population for each development outcome and in different situations.
3.6. Cross-Border Facilitation
De [71] analyzed the effects of inefficient facilitation of trade flow and concluded that transactioncosts and delays at borders affect trade flows in the same way as tariffs do. The higher the transactioncosts, the less is trade between partners in neighboring countries. A 10% drop in transaction costs atborders increases exports by about 2%.
Intercountry trade in goods and services can be greatly improved with efficient facilitation atborder points and improved transit procedures [47,71]. These improvements would boost tradebetween landlocked countries [72]. However, the gains to countries may not be equal in either relativeor absolute terms [21,22].
Stone and Strutt [27] have suggested that welfare gains of USD8.1 billion could be attainedfrom moderate improvements in road infrastructure and trade facilitation in the Greater MekongSubregion (GMS).
UN ESCAP has developed a corridor performance method that provides information on therelative importance and variability of time and cost at each interface point in a corridor [73]. This methodwas used to analyze the performance of trade corridors in East and Central Asia, and showed costdetails for transport modes and transit time at each border post in the corridors.
Arvis et al. [72] did case studies on cost, time, and reliability of exports on some corridors inLLDCs, focusing on transit traffic for landlocked countries. The researchers concluded that the transitprocedures regulating goods were poorly designed and implemented, which discouraged competitionand high-quality logistics services.
In recent years, some countries have taken initiatives to streamline their border control andclearance procedures. These include Integrated Check Posts (ICP) by India and a single window systemfor southeast Asian countries which allows synchronized submission and processing of data, as wellas faster clearance and release of shipments. The clearance process at border posts in the MaputoCorridor in southern Africa has also been streamlined. However, the literature does not provideany major studies on these initiatives or their impacts on trade flows and other aspects. Studies onthese initiatives can provide important insights into how cross-border facilitation arrangements can beimproved and adapted for other situations.
72

Sustainability 2019, 11, 5248
3.7. Corridor Governance
Transnational corridor development and operation is complex because of their wide reach andscope, and involvement of a large variety of stakeholders. Corridor management can be unique forvarious reasons, including the historical development of the corridor, initial conditions, and politicalobjectives and institutions in countries along the corridor [72]. As a result, several managementstructures have emerged, see for example, References [72,74–76]. These structures include:
• Public–private partnership management structures, such as Maputo Corridor Logistics Initiative(MCLI) for Maputo Development Corridor (MDC) [75,77,78];
• Consensus-building structure, such as the Dar-es-Salaam Corridor Committee for Dar-es-salaamcorridor [75,77];
• Project coordination structure, such as the Central Asia Regional Economic Corridor (CAREC)corridors in Central Asia [74];
• Legislative management structure based on treaties between countries, such as the NorthernCorridor Transit and Transport Coordination Authority (NCTTCA) [75,77].
Many national corridors also have a formal management structure for coordination betweengovernment authorities, especially if they are large, multi-sectoral, or multi-modal. Several managementstructures for national corridors have emerged in India, Malaysia, and other countries [79,80].These management structures were established under respective national laws; however, their legalstatus and governance structures are different.
This review finds that most transnational corridor managements have a multi-layer structure,including an apex/umbrella body, an executive/coordination committee, and a secretariat.However, the details of their structures and institutional arrangements vary. National corridorsin India, and Malaysia also have multi-layer management structures [79,80].
Legal instruments such as treaties, conventions, agreements, protocols, covenants, compacts,exchange of notes, memoranda of understanding, etc., govern corridor management and operations [77].Legal instruments can be bilateral, covering two countries, or multilateral, covering many countriesalong a particular corridor, a subregion, region, or global.
As mentioned above, corridor management ranges from a private sector-led entity operating as alobby group (such as MCLI) to an intergovernmental body or state-run authority (such as NCTTCA).Each management structure has its strengths and weaknesses, but this review did not find any studythat assessed the current management structures. Neither did the review find any study on designingof corridor governance structure, which is important for efficient corridor operation.
Inefficient facilitation arrangements at border crossings is a major deterrent to trade expansion.Corridors in Africa and Asia operate mainly under bi-lateral or sub-regional agreements [77,81].Some 42 sub-reginal agreements have been signed in Asia alone. However, only some of these are inforce. Non-uniformity of these agreements is a major challenge for region-wide trade and movementof traffic. In Africa, for example, multiple corridors cross Tanzania and DRC; these corridors operateunder different management structures and their governance instruments are also different, which canlead to inconsistent corridor outcomes and administrative complications. However, studies on theseissues are yet to appear in the academic literature.
3.8. Financing and the Private Sector’s Involvement
The public sector has been the main source of financing new transport infrastructure, followedby official development assistance (ODA). For example, in Africa, more than half of transportinfrastructure investments were from the public sector; the remaining were through ODA (from theOrganization for Economic Co-operation and Development (OECD) and non-OECD countries) and theprivate sector [24]. Low-income countries (LICs) have not been very successful in attracting privateinvestment in infrastructure development. Only 4% of private-financed projects took place in LICs,
73

Sustainability 2019, 11, 5248
while the majority of projects have taken place in developing countries with relatively higher incomescountries [82].
Large gaps between required and available funds are a major challenge for developing transportinfrastructure in LICs. Some recent studies have identified substantial investment gaps in infrastructuredevelopment. For example, the estimated investment need in South Asia is about 8.8% of GDP, but thecurrent level of investment of about 3.2% of GDP [83,84]. The estimated financing gap for Africa’sinfrastructure is in the range of USD67.6–USD107.5 billion [85].
More recent data on private investment in infrastructure shows that globally private investmenthas declined [86]. The same trend has been observed in Asian countries [83]. It is necessary tounderstand the reasons for the decline in private investment and what can be done to reverse this trend.Given the limited success in implementing private-financed projects, LICs may explore alternativefinancing options, such as commercial borrowing by the government, issuing of bonds, and otherfinancing modalities that may be available.
3.9. Environment
There are direct costs of transport development to the environment, such as deforestation, loss ofbiodiversity, and general degradation of ecosystems [87]. Roberts et al. [16] found that transportnetworks and corridors have a harmful impact on the environment in terms of deforestation andcarbon dioxide (CO2) emission. A study by Laurance et al. [88] provided evidence of road clearings ontropical forests in Central Africa and other regions. A highway across the northwestern Congo Basinhas promoted massive logging, poaching, and forest loss.
The transport sector is a major consumer of energy resources and also one of the major emitters ofcarbon dioxide. Globally, the road sector accounts for most of the energy consumption in the transportsector. In 2010, the transport sector in the UN ESCAP region consumed 27.4% (648 million tons of oilequivalent, or Mtoe) of the sector’s total global energy consumption (2362 Mtoe). In the UN ESCAPregion, the road sector accounted for more than 80% of the total energy consumption in the transportsector [89]. Compared with the global increase, energy consumption by the road sector in the region isrising more steeply.
In a report by the United States (U.S.) Energy Information Administration [90], it is projected thatduring the period 2012–2040, the annual growth of the transport sector’s energy consumption in Africa(3.1%) and Asia (2.9%) (excluding China and India) will be higher than in other regions.
Globally, transport accounted for one-quarter of total emissions in 2016 (about 8 GtCO2) whichwas 71% higher than in 1990 [91]. Of this, the share of road transport emissions was 74%. In linewith the global increase, CO2 emissions from the transport sector in Asia and Africa also show anupward trend. CO2 emissions in the transport sector in Asia increased from 0.78 GtCO2 in 1990 to 2.44GtCO2 in 2016, and in the same period, Africa’s emission increased from 0.11 GtCO2 to 0.46 GtCO2 [91].Compared with the global share (24.21%), the share of emission from the transport sector in Asia wasmuch lower (about 14%) but its share in African countries was much higher (39.65%).
The steep rise in CO2 emissions from the sector is expected to continue with further economicdevelopment in African and Asian countries. As CO2 emissions is a major source of negative impactson welfare, greater efforts will be required to reduce the current trend of emission increase from thetransport sector.
It may be generally assumed that transport projects will have negative effects on environmentalquality outcomes. However, there is a knowledge gap in that the current studies do not provide insightinto the trade-offs between economic and social impact outcomes and environmental quality. It mayalso be pragmatic to consider the environmental impacts of some transport projects from a differentperspective, for example, the Delhi–Mumbai dedicated rail freight corridor (DFC). The alternativeto DFC would have far more detrimental impacts in terms of CO2 emissions [92]. The authors ofReference [58] estimate that annual CO2 emissions under the low-carbon scenario with DFC (0.28 milliontons) are less than one-fortieth under the business-as-usual scenario without DFC (12.32 million tons).
74

Sustainability 2019, 11, 5248
3.10. Congestion and Road Safety
Traffic congestion is an important source of welfare loss in almost all major developing countries.An Asian Development Bank report suggests that road congestion costs countries in the region about2–5% of GDP every year, due to lost time and higher transport costs [93]. Congestion also has othernegative impacts on the welfare of people. The major cities in Asia suffer from the highest air pollutionlevels in the world, about 80% of which is from transport. Kuala Lumpur, the capital city of Malaysia,has serious traffic congestion. According to a World Bank report [94], the city wastes 1.2 billion L of fuelon traffic congestion, which is about 2% of GDP. The results of a study show that the traffic congestioncost in Beijing was about RMB 58 billion (4.22% of GDP) in 2010 [95]. The estimated annual congestioncost in Dhaka in Bangladesh was USD3868 million, which included an environmental externality costof USD375 million [96]. Similar congestion cost estimates for some African cities are also available.
The TomTom traffic index, a measure of traffic congestion, shows that in 2018, some of the mostcongested cities in the world were in Asia (Mumbai, Delhi, Jakarta, and Kuala Lumpur, for example).In Africa, except Cairo and Lagos, the other most congested cities were in South Africa [97]. Measuresto reduce the congestion level can greatly help to reduce its adverse impacts on the environment andpeople’s welfare.
The road traffic death rate is highest in Africa (26.6/million people) followed by south andsoutheast Asian countries (20.7/million people). In both regions, the death rate has increased comparedwith 2013. The burden of road traffic injuries and deaths is disproportionately borne by vulnerable roadusers and those living in low- and middle-income countries [98]. In addition to a public health problem,road traffic injuries are a development issue. Low- and middle-income countries lose approximately3% of GDP as a result of road traffic crashes [99].
The LICs have about 9% of the world population and their vehicle population accounts for only1% of the total vehicles but they share 13% of total road deaths in the world. The LICs in Africa has thehighest rate of road traffic deaths in the world of 29.3 per 100,000 population [98]. The low standardand poor condition of most roads and inadequate/lack of road infrastructure facilities in most low- andmiddle-income countries in Africa and Asia are among the causes of high road traffic fatalities.
An analysis of the 2010 road safety data covering 34,370 km of highways in 23 countries, availablein the Asian Highway database, clearly shows that the higher class of roads are generally muchsafer than the lower class of roads [89]. A number of safe road demonstration corridor projects arebeing implemented in many states of India and other countries. A preliminary analysis of some ofthese safety improvement projects finds similar results. For example, the Kadapa to Renigunta safetydemonstration corridor project implemented under the Andhra Pradesh & Telangana Road SectorProject (APTRSP) in India shows impressive results. The locations where curves and junctions wereimproved saw a 53% reduction in road crashes and 42% reduction in fatalities [100]. These resultsshow that significant improvement in road safety can be achieved through the upgrading of highwaysand safer road infrastructure design.
3.11. Trafficking, Spread of Disease, and Socio–Political Issues
Cross-border transport infrastructure is accompanied by a wide range of negative externalities,such as the spread of HIV/AIDS, trafficking of vulnerable groups, particularly women and girls, illegaltrading of narcotics and other items, effects on local farmers and businesses, and erosion of socialvalues and cultural identities. As a result, the perceptions of local people in border areas may notalways be favorable to cross-border infrastructure [101–103].
Trafficking of women and girls is a serious problem in border areas of countries in South andSouth-East Asia. Deane [104] examined cross-border trafficking of women and girls from Nepal toIndia. This study cited different sources to estimate that 7000 to 10,000 girls between the ages of 9 to 16years are trafficked each month from Nepal to India. The trafficking problem between other countrieshas been examined in other studies [105,106].
75

Sustainability 2019, 11, 5248
Cross-border transport infrastructure can also have other adverse social impacts on the localpeople. Günther Slesak et al. [107] reported alarming vulnerability rates in ethnic minorities to sexuallytransmitted diseases (STDs) and HIV/AIDS along a new major intercountry road in south-east Asia.A review by Regondi et al. [108] found evidence of the spread of HIV/AIDS along the road networkin Southern Africa. The number of HIV-positive persons and AIDS patients increased sharply inSavannakhet in Lao People’s Democratic Republic during the construction of the Second MekongBridge [103].
Some of the above externalities are deeply rooted in the problem of widespread poverty, especiallyin remote border areas. Along with direct intervention measures, other measures to reduce poverty inthe border regions would also be necessary. However, apart from trafficking and the spread of diseases,the literature does not provide insights into other social issues. Displacement and marginalization oflocal communities, including indigenous people, are possible due to land appropriation and grabbing,and changing social structure along the corridors, especially in border areas. However, the reviewdid not find any study on these social issues. The review also did not find any study on mitigationpractices to counter the negative impacts of cross-border transport.
4. Discussion
For the convenience of discussion, a summary of the main impacts of transport infrastructureinvestment, discussed in Section 3, is presented in Table 1.
The outcomes or impacts of transport infrastructure development are generally positive oneconomy, income, poverty, employment, equity, and inclusion. However, there can be importanttrade-offs between economy and welfare and impacts on environmental quality. In some situations,there can even be trade-offs between economic growth and poverty [55]. In addition, the distributionof impacts can be uneven. To ensure more sustainable and inclusive development, the potential gainsto economy and welfare must be balanced against the potential adverse impacts, and the gains shouldbe more equitably distributed.
An important limitation of the current studies is that they are not comprehensive in scope,generally focused on some specific outcome, for example, economic growth, trade, etc. Comprehensivestudies which consider the impacts of specific transport projects on all aspects of outcomes, includingnegative externalities, simultaneously would be useful to gain insight into the nature of trade-offsbetween different outcomes. Further research is also required to understand the uneven impacts acrossgeographical locations and population groups for different types of infrastructure, and complementarypolicies, interventions, and institutions that can be considered to alleviate the adverse effects ofuneven impacts. Findings of these studies can help when considering the choice of appropriateinterventions and institutions which may then become part of the planning and design of HVTcorridors and networks.
Transport development is necessary but may not be sufficient to generate wider economic benefits.Additional complementary interventions may also be required. For example, in the case of GQHighways in India, non-availability of land for non-farm uses and low education and skills of the locallabor force were found to be the main constraints for wider sharing of socio–economic benefits of thehighways in some districts [16]. It also shows that transport investments and complementary policiesshould be based on a better understanding of the underlying mechanisms and the initial conditionsthat may affect the development outcomes. Otherwise, there is a risk that transport investments maynot always produce the expected outcomes.
76
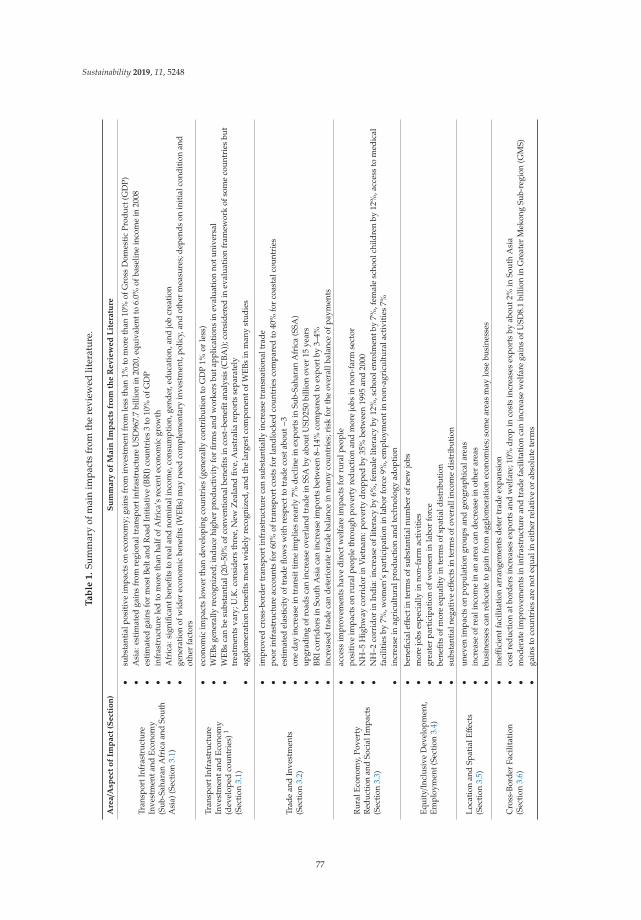
Sustainability 2019, 11, 5248
Ta
ble
1.
Sum
mar
yof
mai
nim
pact
sfr
omth
ere
view
edlit
erat
ure.
Are
a/A
spe
cto
fIm
pa
ct(S
ect
ion
)S
um
ma
ryo
fM
ain
Imp
act
sfr
om
the
Re
vie
we
dL
ite
ratu
re
Tran
spor
tInf
rast
ruct
ure
Inve
stm
enta
ndEc
onom
y(S
ub-S
ahar
anA
fric
aan
dSo
uth
Asi
a)(S
ecti
on3.
1)
•su
bsta
ntia
lpos
itiv
eim
pact
son
econ
omy;
gain
sfr
omin
vest
men
tfro
mle
ssth
an1%
tom
ore
than
10%
ofG
ross
Dom
esti
cPr
oduc
t(G
DP)
•A
sia:
esti
mat
edga
ins
from
regi
onal
tran
spor
tinf
rast
ruct
ure
USD
967.
7bi
llion
in20
20,e
quiv
alen
tto
6.0%
ofba
selin
ein
com
ein
2008
•es
tim
ated
gain
sfo
rm
ostB
elta
ndR
oad
Init
iati
ve(B
RI)
coun
trie
s3
to10
%of
GD
P•
infr
astr
uctu
rele
dto
mor
eth
anha
lfof
Afr
ica’
sre
cent
econ
omic
grow
th•
Afr
ica:
sign
ifica
ntbe
nefit
sto
real
and
nom
inal
inco
me,
cons
umpt
ion,
gend
er,e
duca
tion
,and
job
crea
tion
•ge
nera
tion
ofw
ider
econ
omic
bene
fits
(WEB
s)m
ayne
edco
mpl
emen
tary
inve
stm
ent,
polic
y,an
dot
her
mea
sure
s;de
pend
son
init
ialc
ondi
tion
and
othe
rfa
ctor
s
Tran
spor
tInf
rast
ruct
ure
Inve
stm
enta
ndEc
onom
y(d
evel
oped
coun
trie
s)1
(Sec
tion
3.1)
•ec
onom
icim
pact
slo
wer
than
deve
lopi
ngco
untr
ies
(gen
eral
lyco
ntri
buti
onto
GD
P1%
orle
ss)
•W
EBs
gene
rally
reco
gniz
ed;i
nduc
ehi
gher
prod
ucti
vity
for
firm
san
dw
orke
rsbu
tapp
licat
ions
inev
alua
tion
notu
nive
rsal
•W
EBs
can
besu
bsta
ntia
l(20
–50%
ofco
nven
tion
albe
nefit
sin
cost
–ben
efita
naly
sis
(CBA
));c
onsi
dere
din
eval
uati
onfr
amew
ork
ofso
me
coun
trie
sbu
ttr
eatm
ents
vary
;U.K
.con
side
rsth
ree,
New
Zea
land
five,
Aus
tral
iare
port
sse
para
tely
•ag
glom
erat
ion
bene
fits
mos
twid
ely
reco
gniz
ed,a
ndth
ela
rges
tcom
pone
ntof
WEB
sin
man
yst
udie
s
Trad
ean
dIn
vest
men
ts(S
ecti
on3.
2)
•im
prov
edcr
oss-
bord
ertr
ansp
orti
nfra
stru
ctur
eca
nsu
bsta
ntia
llyin
crea
setr
ansn
atio
nalt
rade
•po
orin
fras
truc
ture
acco
unts
for
60%
oftr
ansp
ortc
osts
for
land
lock
edco
untr
ies
com
pare
dto
40%
for
coas
talc
ount
ries
•es
tim
ated
elas
tici
tyof
trad
eflo
ws
wit
hre
spec
tto
trad
eco
stab
out−
3•
one
day
incr
ease
intr
ansi
ttim
eim
plie
sne
arly
7%de
clin
ein
expo
rts
inSu
b-Sa
hara
nA
fric
a(S
SA)
•up
grad
ing
ofro
ads
can
incr
ease
over
land
trad
ein
SSA
byab
outU
SD25
0bi
llion
over
15ye
ars
•BR
Icor
rido
rsin
Sout
hA
sia
can
incr
ease
impo
rts
betw
een
8–14
%co
mpa
red
toex
port
by3–
4%•
incr
ease
dtr
ade
can
dete
rior
ate
trad
eba
lanc
ein
man
yco
untr
ies;
risk
for
the
over
allb
alan
ceof
paym
ents
Rur
alEc
onom
y,Po
vert
yR
educ
tion
and
Soci
alIm
pact
s(S
ecti
on3.
3)
•ac
cess
impr
ovem
ents
have
dire
ctw
elfa
reim
pact
sfo
rru
ralp
eopl
e•
posi
tive
impa
cts
onru
ralp
eopl
eth
roug
hpo
vert
yre
duct
ion
and
mor
ejo
bsin
non-
farm
sect
or•
NH
–5H
ighw
ayco
rrid
orin
Vie
tnam
:pov
erty
drop
ped
by35
%be
twee
n19
95an
d20
00•
NH
–2co
rrid
orin
Indi
a:in
crea
seof
liter
acy
by6%
,fem
ale
liter
acy
by12
%,s
choo
lenr
olm
entb
y7%
,fem
ale
scho
olch
ildre
nby
12%
,acc
ess
tom
edic
alfa
cilit
ies
by7%
,wom
en’s
part
icip
atio
nin
labo
rfo
rce
9%,e
mpl
oym
enti
nno
n-ag
ricu
ltur
alac
tivi
ties
7%•
incr
ease
inag
ricu
ltur
alpr
oduc
tion
and
tech
nolo
gyad
opti
on
Equi
ty/I
nclu
sive
Dev
elop
men
t,Em
ploy
men
t(Se
ctio
n3.
4)
•be
nefic
ialeff
ecti
nte
rms
ofsu
bsta
ntia
lnum
ber
ofne
wjo
bs•
mor
ejo
bses
peci
ally
inno
n-fa
rmac
tivi
ties
•gr
eate
rpa
rtic
ipat
ion
ofw
omen
inla
bor
forc
e•
bene
fits
ofm
ore
equa
lity
inte
rms
ofsp
atia
ldis
trib
utio
n•
subs
tant
ialn
egat
ive
effec
tsin
term
sof
over
alli
ncom
edi
stri
buti
on
Loca
tion
and
Spat
ialEff
ects
(Sec
tion
3.5)
•un
even
impa
cts
onpo
pula
tion
grou
psan
dge
ogra
phic
alar
eas
•in
crea
seof
real
inco
me
inan
area
can
decr
ease
inot
her
area
s•
busi
ness
esca
nre
loca
teto
gain
from
aggl
omer
atio
nec
onom
ies;
som
ear
eas
may
lose
busi
ness
es
Cro
ss-B
orde
rFa
cilit
atio
n(S
ecti
on3.
6)
•in
effici
entf
acili
tati
onar
rang
emen
tsde
ter
trad
eex
pans
ion
•co
stre
duct
ion
atbo
rder
sin
crea
ses
expo
rts
and
wel
fare
;10%
drop
inco
sts
incr
ease
sex
port
sby
abou
t2%
inSo
uth
Asi
a•
mod
erat
eim
prov
emen
tsin
infr
astr
uctu
rean
dtr
ade
faci
litat
ion
can
incr
ease
wel
fare
gain
sof
USD
8.1
billi
onin
Gre
ater
Mek
ong
Sub-
regi
on(G
MS)
•ga
ins
toco
untr
ies
are
note
qual
inei
ther
rela
tive
orab
solu
tete
rms
77

Sustainability 2019, 11, 5248
Ta
ble
1.
Con
t.
Are
a/A
spe
cto
fIm
pa
ct(S
ect
ion
)S
um
ma
ryo
fM
ain
Imp
act
sfr
om
the
Re
vie
we
dL
ite
ratu
re
Cor
rido
rG
over
nanc
e(S
ecti
on3.
7)
•tr
ansn
atio
nalc
orri
dor
man
agem
entc
anbe
uniq
ue•
seve
ralm
anag
emen
tstr
uctu
res
have
emer
ged
•m
ostc
orri
dor
man
agem
ents
have
am
ulti
-lay
erst
ruct
ure
•a
wid
ear
ray
ofle
gali
nstr
umen
tsgo
vern
sco
rrid
orm
anag
emen
tand
oper
atio
ns;m
osta
gree
men
tsar
ebi
-lat
eral
and
sub-
regi
onal
•no
n-un
ifor
mit
yof
agre
emen
tsis
ach
alle
nge
for
regi
on-w
ide
trad
eex
pans
ion
inA
fric
aan
dA
sia
•so
me
dom
esti
cco
rrid
ors
have
form
alm
anag
emen
tstr
uctu
res
Fina
ncin
gan
dPr
ivat
eSe
ctor
’sIn
volv
emen
t(Se
ctio
n3.
8)
•pu
blic
sect
oris
the
mai
nso
urce
ofin
fras
truc
ture
finan
cing
•on
ly4%
priv
ate-
finan
ced
proj
ects
took
plac
ein
low
-inc
ome
coun
trie
s(L
ICs)
•la
rge
fund
ing
gaps
inLI
Cs
for
infr
astr
uctu
rede
velo
pmen
t•
glob
ally
priv
ate
inve
stm
enth
asde
clin
edin
rece
ntye
ars
Envi
ronm
ent(
Sect
ion
3.9)
•ha
rmfu
lim
pact
onth
een
viro
nmen
tin
term
sof
defo
rest
atio
nan
dlo
ssof
biod
iver
sity
•tr
ansp
orts
ecto
ris
am
ajor
cons
umer
ofen
ergy
reso
urce
san
dem
itte
rof
CO
2•
glob
ally
tran
spor
tsec
tor
emit
ted
one-
quar
ter
ofto
tale
mis
sion
sin
2016
;sha
reof
road
tran
spor
twas
74%
•ro
adse
ctor
acco
unts
for
83.3
%of
CO
2em
issi
ons
inES
CA
Pre
gion
•C
O2
emis
sion
sin
Asi
ain
crea
sed
from
0.78
GtC
O2
in19
90to
2.44
GtC
O2
in20
16(3
12%
incr
ease
)and
inA
fric
afr
om0.
11G
tCO
2to
0.35
GtC
O2
(318
%in
crea
se)
Roa
dco
nges
tion
and
road
safe
ty(S
ecti
on3.
10)
•co
nges
tion
cost
sA
sian
coun
trie
s2
to5%
ofG
DP
ever
yye
ar;K
uala
Lum
pur
was
tes
1.2
billi
onL
offu
el,a
bout
2%of
GD
P•
abou
t80%
ofai
rpo
lluti
onin
Asi
anm
ajor
citi
esis
from
tran
spor
t•
road
cong
esti
onis
anim
port
ants
ourc
eof
wel
fare
loss
inA
fric
anan
dA
sian
deve
lopi
ngco
untr
ies
•ro
adtr
affic
deat
hra
tes
are
amon
gth
ehi
ghes
tin
Afr
ica
(26.
6/m
illio
npe
ople
)and
sout
han
dso
uthe
astA
sia
(20.
7/m
illio
npe
ople
)•
low
-and
mid
dle-
inco
me
coun
trie
slo
seab
out3
%of
GD
Pfr
omro
adtr
affic
cras
hes
•ev
iden
cesh
ows
that
safe
tyim
prov
emen
tmea
sure
san
dbe
tter
infr
astr
uctu
reca
nre
duce
road
traffi
cde
aths
and
inju
ries
Traffi
ckin
g,Sp
read
ofD
isea
sean
dSo
cio–
Polit
ical
Issu
es(S
ecti
on3.
11)
•tr
affick
ing
ofw
omen
isa
seri
ous
prob
lem
inm
any
bord
erar
eas
•ad
vers
eim
pact
son
loca
lpeo
ple,
incl
udin
gdi
spla
cem
enta
ndm
argi
naliz
atio
n,eff
ects
onlo
calfi
rms
and
busi
ness
es•
tran
spor
tdev
elop
men
tcan
help
spre
adof
HIV/A
IDS
and
othe
rdi
seas
es•
illeg
altr
adin
gof
narc
otic
san
dot
her
item
sin
bord
erar
eas
Sour
ce:B
ased
ondi
scus
sion
pres
ente
din
Sect
ion
3.1
Com
pari
son
wit
hde
velo
ped
coun
trie
sha
sbe
enm
ade
for
this
aspe
cton
ly.
78

Sustainability 2019, 11, 5248
The NH–5 highway corridor in Vietnam is a good example of complementary interventions.The highway development was implemented in conjunction with complementary policies, includinghuman resource development. The availability of an educated labor force allowed quick transfer oflabor from agriculture to manufacturing and helped a major transformational shift in the economy [14].The Maputo Corridor in Southern Africa is another good example where infrastructure rehabilitationand upgrading of transport infrastructure, along with improved facilitation measures at border posts,made the corridor successful in boosting transnational trade.
The review showed that HVT corridors and networks can create agglomeration effects in somelocations. Businesses gain more from being in areas that offer agglomeration economies. Publicinfrastructure investments in other locations are likely to attract fewer private investors. Because ofagglomeration benefits in established main centres, investment only in transport infrastructurehas limitations to attract businesses to secondary centres outside the established main centres.Other intervention measures, such as public investment and policies, may be needed to inducegrowth in less attractive secondary centres or regions.
The burden of environmental and social costs of transport can be substantially reduced throughvarious measures. For example, road safety is an important development issue in both SSA andSouth Asian countries, and should not be left as an “afterthought” in road infrastructure developmentprojects. Although road safety is a cross-sectoral issue, evidence from the review suggests that theincidence of road crashes can be substantially reduced through road development with proper roadsafety audits at the road design stage.
Even though Environmental Impact Assessment (EIA) is now customary, further research maybe necessary to guide the planning of transport infrastructure projects in environmentally sensitiveareas. Other measures, such as the development of multi-modal transport systems, where possible,can substantially reduce the negative effects (see, for example, References [92,109]). Price instruments(congestion and pollution charges, for example) and regulations (such as emission and fuel standards)are useful tools to change the behavior of individuals and firms and address environmental externalities.However, the use of these tools is not common in LICs. They should be considered to reduce theburden of negative externalities, where feasible.
To improve transport project evaluation in developing countries, it would be worthwhile findingout if the same categories of WEBs, as in developed countries, are also important for developingcountries. Further studies with such a focus, as well as developing suitable estimation methods forWEBs, would be needed.
Researchers have used a variety of models and methodologies to study the impacts of transportdevelopment, including CGE-based simulation studies, multi-regional input–output (IO) model,and difference-in-difference and other statistical and econometric models. Models based on CGEand IO methodologies are promising for estimating transport infrastructure investments and theirdistributional effects. Theoretically, the CGE and structural models are superior to other models.However, the structure and application of such models are still in the developmental stage. They aremore complex, data-intensive, and require considerable expertise. Further efforts would be required todevelop operational models for practical applications.
Research studies may also be considered to assess the effectiveness and suitability of the currentlyavailable analytical tools/models to understand the distributional impacts of regional and nationaltransport projects/networks at the subnational level. Research is also needed to examine how suchtools/models may be adapted for policy analysis and policy formulation, including designing ofcomplementary intervention measures. A related issue in developing practical models for impactassessment is the availability of required data. The suggested research may also examine how thisproblem can be overcome.
Several corridor management structures have emerged. The review did not find any study on theassessment of the current management structures. An assessment study can provide valuable insights
79
Sustainability 2019, 11, 5248
into the current structures and contribute to designing new and improving the current managementstructures. Therefore, a study on this matter is recommended.
There is another issue linked to management structures: the governance of transport corridors.Currently, there is no general framework for designing governance structures for transport corridors.Research may be considered on how a transport corridor governance structure can be organized,structurally and procedurally, so that multiple stakeholders in corridor development, management,and operation can play their roles and interact effectively. Allied to this, the research may also considerhow governments can promote institutions to build partnerships, collaboration with such actors,and facilitate their action.
The establishment of functional linkages between local and rural communities and theurban/national economy by using major highways and railways is a major challenge. In addition torural feeder road networks, some countries have considered rural logistics and market centres alongthe major transport networks and other intervention measures to improve efficiency in rural supplyand distribution chains, serve as a direct market outlet for local produce, and generate non-farm localemployment [110]. However, these initiatives are not widespread and do not follow a coordinatedapproach to establish effective rural–urban linkages. A study can be considered to develop case studieson such measures, and assessment for their adaptation in other countries.
The negative externalities of cross-border transport need closer attention. Human trafficking,illegal trade in narcotics and other items, and the spread of diseases are some of the major challengesthat need to be tackled through appropriate interventions. Other social issues related to corridordevelopment, such as displacement and marginalization of local communities, changing socialstructure, etc. need the attention of researchers. Research may be undertaken to study these problemsin operational corridors. The study may also consider the effectiveness of the current mitigationmeasures, develop a general framework to formulate action plans for remedial measures, and examinehow these measures may be incorporated in corridor project design, as well as in legal and regulatoryinstruments for border-crossing procedures.
Railways are expected to have a greater role in the future to meet the growing demand for transportinfrastructure services. In recent years, many countries in South Asia and SSA have been buildingnew railway lines. In addition, freight movement by railway is expected to be a key design feature ofmultimodal transport corridor projects in the future. However, evidence of the impacts of rail transportin the literature is not rich. A better understanding would be needed for designing economicallyand environmentally efficient and socially inclusive railway projects. Studies are suggested onimpact evaluation of recent railway projects, including both passenger and railway freight corridors,which some countries are currently constructing.
Funding: This research was funded by UK AID through the UK Department for International Development underthe High Volume Transport (HVT) Applied Research Programme, managed by IMC Worldwide.
Acknowledgments: This research was funded by UK AID through the UK Department for InternationalDevelopment under the High Volume Transport (HVT) Applied Research Programme, managed by IMCWorldwide. The author is particularly grateful for the helpful comments and advice of Bruce Thompson, the leaderof Theme 1, Long Distance Strategic Road and Rail Transport, of the HVT Programme.
Conflicts of Interest: The author declares no conflict of interest.
References
1. Planning Commission. 7th Five Year Plan-FY2016-FY2020; Government of Bangladesh: Dhaka, Bangladesh,2015; pp. 345–357.
2. United Nations. Transforming Our World: The 2030 Agenda for Sustainable Development; United Nations:New York, NY, USA, 2017; ISBN 978-0-8261-9011-6.
3. Aschauer, D. Is Public Expenditure Productive? J. Monet. Econ. 1989, 23, 177–200. [CrossRef]4. Krugman, P. Increasing Returns and Economic Geography. J. Polit. Econ. 1991, 99, 483–499. [CrossRef]
80
Sustainability 2019, 11, 5248
5. Duranton, G.; Puga, D. Micro-foundations of Urban Agglomeration Economies. In Handbook of Regional andUrban Economics; Henderson, J.V., Thisse, J.-F., Eds.; Elsevier: Amsterdam, The Netherlands, 2004; Volume 4,pp. 2063–2117.
6. Venables, A.J.; Gasiorek, M. The Welfare Implications of Transport Improvements in the Presence of MarketFailure—Part 1 Report to Standing Advisory Committee on Trunk Road Assessment; DETR: London, UK, 1999.
7. Department for Transport. Transport, Wider Economic Benefits, and Impacts on GDP; Department for Transport:London, UK, 2005.
8. Graham, D.J.; Gibbons, S. Quantifying Wider Economic Impacts of Agglomeration for Transport Appraisal:Existing evidence and future directions. Econ. Transp. 2019, 19, 100121. [CrossRef]
9. Venables, A.J. Evaluating Urban Transport Improvements: Cost-Benefit Analysis in the presence ofagglomeration and income taxation. J. Transp. Econ. Policy 2007, 41, 173–188.
10. Vickerman, R. The Boundaries of Welfare Economics: Transport Appraisal in the UK. In TransportProject Evaluation; Haezendonck, E., Ed.; Edward Elgar Publishing: Cheltenham, UK, 2007; p. 12787.ISBN 978-1-84720-868-2.
11. Calderón, C.; Servén, L. Infrastructure and Economic Development in Sub-Saharan Africa. J. Afr. Econ. 2010,19, i13–i87. [CrossRef]
12. Buys, P.; Deichmann, U.; Wheeler, D. Road Network Upgrading and Overland Trade Expansion in Sub-SaharanAfrica. J. Afr. Econ. 2010, 19, 399–432. [CrossRef]
13. AECOM. Freight Benefit/Cost Study: Capturing the Full Benefits of Freight Transportation Improvements:A Non-Technical Review of Linkages of the Benefit-Cost Analysis Framework; Federal Highway Administration:Washington, DC, USA, 2001.
14. Asian Development Bank; Department for International Development; Japan International CooperationAgency; World Bank. The WEB of Transport Corridors in South Asia; World Bank: Washington, DC, USA, 2018;ISBN 978-1-4648-1216-3.
15. Berg, C.N.; Deichmann, U.; Liu, Y.; Selod, H. Transport Policies and Development. J. Dev. Stud. 2017, 53,465–480. [CrossRef]
16. Roberts, M.; Melecky, M.; Bougna, T.; Xu, Y. Transport Corridors and Their Wider Economic Benefits: A CriticalReview of the Literature; Policy Research Working Paper; The World Bank: Washington, DC, USA, 2018.
17. Berechman, J.; Ozmen, D.; Ozbay, K. Empirical Analysis of Transportation Investment and EconomicDevelopment at State, County and Municipality Levels. Transportation 2006, 33, 537–551. [CrossRef]
18. Ghani, E.; Goswami, A.G.; Kerr, W.R. Highway to Success: The Impact of the Golden Quadrilateral Projectfor the Location and Performance of Indian Manufacturing. Econ. J. 2016, 126, 317–357. [CrossRef]
19. Asian Development Bank. Bangladesh Quarterly Economic Update (December 2007) 2007; Asian DevelopmentBank Bangladesh Resident Mission: Dhaka, Bangladesh, 2007.
20. Anas, R.; Tamin, O.Z.; Wibowo, S.S. Applying Input-Output Model to Estimate the Broader EconomicBenefits of Cipularang Tollroad Investment to Bandung District. Procedia Eng. 2015, 125, 489–497. [CrossRef]
21. Gilbert, J.; Banik, N. Socioeconomic Impacts of Cross-Border Transport Infrastructure Development inSouth Asia. SSRN Electron. J. 2010. Available online: http://dx.doi.org/10.2139/ssrn.1586747 (accessed on31 January 2019). [CrossRef]
22. UN ESCAP. Growing Together: Economic Integration for an Inclusive and Sustainable Asia-Pacific Century;United Nations Economic and Social Commission for Asia and the Pacific: Bangkok, Thailand, 2012;ISBN 978-974-680-332-8.
23. Deng, T. Impacts of Transport Infrastructure on Productivity and Economic Growth: Recent Advances andResearch Challenges. Transp. Rev. 2013, 33, 686–699. [CrossRef]
24. Foster, V.; Briceño-Garmendia, C.M. Africa’s Infrastructure: A Time for Transformation; The World Bank:Washington, DC, USA, 2009; ISBN 978-0-8213-8041-3.
25. Hahm, H.; Raihan, S. The Belt and Road Initiative: Maximizing Benefits, Managing Risks—A ComputableGeneral Equilibrium Approach. J. Infrastruct. Policy Dev. 2018, 2, 97–115. [CrossRef]
26. Zhai, F. Benefits of Infrastructure Investment: An Empirical Analysis. In Infrastructure for Asian Connectivity;Bhattacharya, B.N., Kawai, M., Nag, R., Eds.; ADBI, ADB with Edward Elgar Publishing: Cheltenham, UK,2012; ISBN 978-1-78100-312-1.
27. Stone, S.; Strutt, A. Transport Infrastructure and Trade Facilitation in the Greater Mekong Subregion; ADBI WorkingPaper No. 130; Asian Development Bank Institute: Tokyo, Japan, 2009.
81

Sustainability 2019, 11, 5248
28. Francois, J.; Wignaraja, G. Economic Implications of Deeper Asian Integration; Johannes Kepler University: Linz,Austria, 2008.
29. Esfahani, H.S.; Ramírez, M.T. Institutions, Infrastructure, and Economic Growth. J. Dev. Econ. 2003, 70,443–477. [CrossRef]
30. Hlotywa, A.; Ndaguba, E.A. Assessing the Impact of Road Transport Infrastructure Investment on EconomicDevelopment in South Africa. J. Transp. Supply Chain Manag. 2017, 11, 12. [CrossRef]
31. Standish, B.; Boting, A. The Macroeconomic Impact of Road Construction in Rural Areas of South Africa.J. S. Afr. Inst. Civ. Eng. Johannesbg. 2004, 46, 14–19.
32. Ng, C.P.; Law, T.H.; Wong, S.V.; Kulanthayan, S. Relative Improvements in Road Mobility as Compared toImprovements in Road Accessibility and Economic Growth: A Cross-Country Analysis. Transp. Policy 2017,60, 24–33. [CrossRef]
33. Pradhan, R.P.; Bagchi, T. Effect of Transportation Infrastructure on Economic Growth in India: The VECMApproach. Res. Transp. Econ. 2013, 38, 139–148. [CrossRef]
34. Hong, J.; Chu, Z.; Wang, Q. Transport Infrastructure and Regional Economic Growth: Evidence from China.Transportation 2011, 38, 737–752. [CrossRef]
35. Standing Advisory Committee on Trunk Road Assessment (SACTRA). Transport and the Economy; DETR:London, UK, 1999.
36. Ministry of Transport. Contribution of Transport to Economic Development; Ministry of Transport: Wellington,New Zealand, 2014.
37. Department for Transport. The Wider Impacts Sub-Objective, TAG Unit 3.5.14; Department for Transport:London, UK, 2012.
38. Department for Transport. Wider Economic Impacts Appraisal, TAG Unit A2.1; Department for Transport:London, UK, 2018.
39. Commonwealth Department of Infrastructure. Australian Transport Assessment and Planning Guidelines: T3Wider economic benefits; Transport and Infrastructure Council: Canberra, Australia, 2016.
40. Inter-agency Working Group. Auckland CBD Rail Tunnel Assessment: Assessing Wider Economic Benefits;Workstream Report Draft; 2011. Available online: https://www.transport.govt.nz/assets/Import/Documents/067cb8b7a6/Auckland-CBD-Rail-Workstream-report-Review-of-Construction-Costs.pdf (accessed on23 August 2019).
41. Douglas, N.; O’Keeffe, B. Wider Economic Benefits—When and if they should be used in evaluationof transport projects. In Proceedings of the Australasian Transport Research Forum 2016 Proceedings,Melbourne, Australia, 16–18 November 2016.
42. Wangsness, P.B.; Rødseth, K.L.; Hansen, W. A review of guidelines for including wider economic impacts intransport appraisal. Transp. Rev. 2017, 37, 94–115. [CrossRef]
43. Kanemoto, Y. Pitfalls in Estimating “Wider Economic Benefits” of Transportation Projects; National GraduateInstitute for Policy Studies: Tokyo, Japan, 2013.
44. Rye, T. Transport and economic growth. Presented at SCOTS Annual Conference, Pitlochry, Scotland,19 May 2017.
45. Hummels, D. Transportation Costs and International Trade in the Second Era of Globalization. J. Econ.Perspect. 2007, 21, 131–154. [CrossRef]
46. Limão, N.; Venables, A.J. Infrastructure, Geographical Disadvantage, Transport Costs, and Trade. World BankEcon. Rev. 2001, 15, 451–479. [CrossRef]
47. Freund, C.; Rocha, N. What Constrains Africa’s Exports? World Bank Econ. Rev. 2011, 25, 361–386. [CrossRef]48. Bosker, M.; Garretsen, H. Economic Geography and Economic Development in Sub-Saharan Africa. World
Bank Econ. Rev. 2012, 26, 443–485. [CrossRef]49. Papriev, Z.; Sodikov, J. The Effect of Road Upgrading to Overland Trade in Asian Highway Network. Eurasian
J. Bus. Econ. 2008, 12, 85–101.50. Fujimura, M.; Edmonds, C. Impact of Cross-Border Road Infrastructure on Trade and Investment in the Greater
Mekong Subregion; ADBI Discussion Paper No.48; Asian Development Bank Institute: Tokyo, Japan, 2006.51. Shepherd, B.; Wilson, J.S. Trade, Infrastructure, and Roadways in Europe and Central Asia: New Empirical
Evidence. J. Econ. Integr. 2007, 22, 723–747. [CrossRef]
82

Sustainability 2019, 11, 5248
52. Blankespoor, B.; Emran, M.S.; Shilpi, F.; Xu, L. Transport Costs, Comparative Advantage, and AgriculturalDevelopment: Evidence from Jamuna Bridge in Bangladesh; Policy Research Working Paper 8509; DevelopmentResearch Group, World Bank: Washington, DC, USA, 2018.
53. Neupane, H.S.; Calkins, P. Poverty, Income Inequality and Livelihood Diversification: A Case of AsiaHighway in Songkhla Province of Thailand. In Asian Economic Reconstruction and Development under NewChallenges; Huang, W., Leeahtam, P., Eds.; CMSE Press: Chiang Mai, Thailand, 2012.
54. Asian Institute of Transport Development. Socio-Economic Impact of National Highway on Rural Population;Asian Institute of Transport Development: New Delhi, India, 2011.
55. Fan, S.; Chan-Kang, C. Regional Road Development, Rural and Urban Poverty: Evidence from China. Transp.Policy 2008, 15, 305–314. [CrossRef]
56. Minten, B.; Koro, B.; Stifel, D. The Last Mile(s) in Modern Input Distribution: Evidence from Northwestern Ethiopia;ESSP Working Paper 51; International Food Policy Research Institute: Washington, DC, USA, 2013.
57. Omamo, S.W. Transport Costs and Smallholder Cropping Choices: An Application to Siaya District, Kenya.Am. J. Agric. Econ. 1998, 80, 116–123. [CrossRef]
58. Dorosh, P.; Wang, H.G.; You, L.; Schmidt, E. Road connectivity, population, and crop production inSub-Saharan Africa. Agric. Econ. 2012, 43, 89–103. [CrossRef]
59. Donaldson, D. Railroads of the Raj: Estimating the Impact of Transportation Infrastructure. Am. Econ. Rev.2018, 108, 899–934. [CrossRef]
60. Zhenhua, C.; Haynes, K.E. Impact of High-Speed Rail on Regional Economic Disparity in China. J. Transp.Geogr. 2017, 65, 80–91.
61. Sinha, A.; Prabhakar, A.; Jaiswal, R. Employment Dimension of Infrastructure Investment: State Level Input-OutputAnalysis; Employment Working Paper; ILO: Geneva, Switzerland, 2015; Volume 168.
62. Blankespoor, B.; Emran, M.S.; Shilpi, F.; Xu, L. Bridge to Bigpush or Backwash? Market Integration,Reallocation, and Productivity Effects of Jamuna Bridge in Bangladesh. SSRN Electron. J. 2018.Available online: http://dx.doi.org/10.2139/ssrn.3162451 (accessed on 30 January 2019). [CrossRef]
63. Mahmud, M.; Sawada, Y. Infrastructure and Well-Being: Employment Effects of Jamuna Bridge in Bangladesh.J. Dev. Eff. 2018, 10, 327–340. [CrossRef]
64. Gachassin, M.C.; Najman, B.; Raballand, G. Roads and Diversification of Activities in Rural Areas:A Cameroon Case Study. Dev. Policy Rev. 2015, 33, 355–372. [CrossRef]
65. Dzumbira, W.; Geyer, H.S., Jr.; Geyer, H.S. Measuring the Spatial Economic Impact of the Maputo DevelopmentCorridor. Dev. South. Afr. 2017, 34, 635–651. [CrossRef]
66. Donaldson, D. Railroads of the Raj: Estimating the Impact of Transportation Infrastructure; Asia Research CentreWorking Paper; London School of Economics: London, UK, 2010.
67. Kumagai, S.; Hayakawa, K.; Isono, I.; Keola, S.; Tsubota, K. Geographical Simulation Analysis for LogisticsEnhancement in Asia. Econ. Model. 2013, 34, 145–153. [CrossRef]
68. Roberts, M.; Deichmann, U.; Fingleton, B.; Shi, T. Evaluating Road to Prosperity: A New Economic GeographicApproach. Reg. Sci. Urban Econ. 2012, 42, 580–594. [CrossRef]
69. Sun, F.; Mansury, Y.S. Economic Impact of High-Speed Rail on Household Income in China. Transp. Res. Rec.J. Transp. Res. Board 2016, 2581, 71–78. [CrossRef]
70. Lall, S.V.; Schroeder, E.; Schmidt, E. Identifying Spatial Efficiency–Equity Trade-offs in Territorial DevelopmentPolicies: Evidence from Uganda. J. Dev. Stud. 2014, 50, 1717–1733. [CrossRef]
71. De, P. Why Is Trade at Borders a Costly Affair in South Asia? An Empirical Investigation. Contemp. SouthAsia 2011, 19, 441–464. [CrossRef]
72. Arvis, J.-F.; Carruthers, R.; Smith, G.; Willoughby, C. Connecting Landlocked Developing Countriesto Markets—Trade Corridors in the 21st Century; The World Bank: Washington, DC, USA, 2011;ISBN 978-0-8213-8416-9.
73. UN ESCAP; KOTI. Integrated International Transport and Logistics System for North-East Asia; United Nations:New York, NY, USA, 2006.
74. Asian Development Bank. Central Asia Regional Economic Cooperation Corridor Performance Measurementand Monitoring: A Forward-Looking Retrospective; Asian Development Bank: Manila, Philippines, 2014;ISBN 978-92-9254-689-2.
83

Sustainability 2019, 11, 5248
75. Adzigbey, Y.; Kunaka, C.; Mitku, T.N. Institutional Arrangements for Transport Corridor Managementin Sub-Saharan Africa. SSATP Working Paper No.86. SSRN Electron. J. 2007. Available online: http://www.ssrn.com/abstract=1393864 (accessed on 1 January 2019).
76. Arnold, J. Best Practices in Management of International Trade Corridors; World Bank Transport Paper; WorldBank: Washington, DC, USA, 2006.
77. Grosdidier de Matons, J. A Review of International Legal Instruments, 2nd ed.; SSATP, World Bank: Washington,DC, USA, 2014.
78. Sequeira, S.; Hartmann, O.; Kunaka, C. Reviving Trade Routes Evidence from Maputo Corridor; SSATP DiscussionPaper No. 14; SSATP, World Bank: Washington, DC, USA, 2014.
79. Bhalaki, V. The Delhi Mumbai Industrial Corridor: Salient Features and Recent Developments; National Universityof Singapore: Singapore, 2013.
80. Athukorala, P.; Narayanan, S. Economic Corridors and Regional Development: The Malaysian Experience.World Dev. 2018, 106, 1–14. [CrossRef]
81. UN ESCAP. Review of Developments in Transport in Asia and the Pacific 2013; United Nations: Bangkok, Thailand,2013; ISBN 978-92-1-054206-7.
82. Trebilcock, M.; Rosenstock, M. Infrastructure Public–Private Partnerships in the Developing World: Lessonsfrom Recent Experience. J. Dev. Stud. 2015, 51, 335–354. [CrossRef]
83. UN ESCAP. Financing for Development in Asia and the Pacific—Highlights in the Context of the Adis Ababa ActionAgenda; United Nations Economic and Social Commission for Asia and the Pacific: Bangkok, Thailand, 2018.
84. Asian Development Bank. Meeting Asia’s Infrastructure Needs; Asian Development Bank: Manila, Philippines,2017; ISBN 978-92-9257-753-7.
85. African Development Bank. African Development Outlook 2018; African Development Bank: Abidjan, IvoryCoast, 2018; ISBN 978-9938-882-43-8.
86. Harris, C.; Chao, J. Declining Private Investment in Infrastructure—A Trend or an Outlier? Available online:https://blogs.worldbank.org/ppps/declining-private-investment-infrastructure-trend-or-outlier (accessed on7 April 2019).
87. Damania, R.; Russ, J.; Wheeler, D.; Barra, A.F. The Road to Growth: Measuring the Tradeoffs BetweenEconomic Growth and Ecological Destruction. World Dev. 2018, 101, 351–376. [CrossRef]
88. Laurance, W.F.; Goosem, M.; Laurance, S.G.W. Impacts of Roads and Linear Clearings on Tropical Forests.Trends Ecol. Evol. 2009, 24, 659–669. [CrossRef] [PubMed]
89. UN ESCAP. Statistical Yearbook for Asia and the Pacific 2013; United Nations: Bangkok, Thailand, 2014;ISBN 978-92-1-120659-3.
90. US Energy Information Administration. International Energy Outlook 2016; US Energy InformationAdministration: Washington, DC, USA, 2016.
91. IEA. CO2 Emissions. Available online: https://www.iea.org/statistics/co2emissions/ (accessed on29 August 2019).
92. Pangotra, P.; Shukla, P.R. Infrastructure for Low-Carbon Transport in India: A Case Study of the Delhi-MumbaiDedicated Freight Corridor; Indian Institute of Management: Ahmedabad, India, 2012.
93. Asian Development Bank. Urban Transport. Available online: https://www.adb.org/sectors/transport/key-priorities/urban-transport (accessed on 1 September 2019).
94. Sanders, G.; Mendivil, B.; Luis, C.; Reindert, W. Malaysia Economic Monitor—Transforming Urban Transport;World Bank: Washington, DC, USA, 2015.
95. Mao, L.-Z.; Zhu, H.-G.; Duan, L.-R. The Social Cost of Traffic Congestion and Countermeasures in Beijing.In Proceedings of the Ninth Asia Pacific Transportation Development Conference, Chongqing, China,29 June–1 July 2012; pp. 68–76.
96. Khan, T.; Islam, R.I. Estimating Costs of Traffic Congestion in Dhaka City. Int. J. Eng. Sci. Innov. Technol.2013, 2, 9.
97. TomTom—International BV. Traffic Index 2018. Available online: https://tomtom.com/en_gb/traffic-index/ranking/ (accessed on 5 September 2019).
98. World Health Organization. Global Status Report on Road Safety 2018; World Health Organization: Geneva,Switzerland, 2019; ISBN 978-92-4-156568-4.
99. World Health Organization. Global Status Report on Road Safety 2015; World Health Organisation: Geneva,Switzerland, 2015; ISBN 978-92-4-156506-6.
84

Sustainability 2019, 11, 5248
100. Gupta, N. Road Safety Action Pays off, and “Demonstration Corridors” Are here to Proveit. Available online: https://blogs.worldbank.org/transport/road-safety-action-pays-and-demonstration-corridors-are-here-prove-it (accessed on 1 September 2019).
101. Lin, S.; Grundy-Warr, C. One Bridge, Two Towns and Three Countries: Anticipatory Geopolitics in theGreater Mekong Subregion. Geopolitics 2012, 17, 952–979. [CrossRef]
102. Warr, P.; Menon, J.; Yusuf, A.A. Regional Economic Impacts of Large Projects: A General EquilibriumApplication to Cross-Border Infrastructure. Asian Dev. Rev. 2010, 271, 104–134.
103. Japan International Cooperation Agency; ALMEC Corporation. Cross-Border Transportation Infrastructure;Japan International Cooperation Agency: Tokyo, Japan, 2007.
104. Deane, T. Cross-Border Trafficking in Nepal and India—Violating Women’s Rights. Hum. Rights Rev. 2010,11, 491–513. [CrossRef]
105. Molland, S. “The Perfect Business”: Human Trafficking and Lao-Tai Cross-Border Migration. Dev. Change2010, 41, 831–855. [CrossRef]
106. Data and Research on Human Trafficking: A Global Survey. Int. Migr. 2005, 43, 99–128.107. Slesak, G.; Inthalad, S.; Kim, J.; Manhapadit, S.; Somsavad, S.; Sisouphanh, B.; Bouttavong, S.; Phengsavanh, A.;
Barennes, H. High HIV Vulnerability of Ethnic Minorities After a Trans-Asian Highway Construction inRemote Northern Laos. Int. J. STD AIDS 2012, 238, 570–575. [CrossRef] [PubMed]
108. Regondi, I.; George, G.; Pillay, N. Hiv/Aids in the Transport Sector of Southern Africa: Operational Challenges,Research Gaps and Policy Recommendations. Dev. South. Afr. 2013, 30, 616–628. [CrossRef]
109. Hanaoka, S.; Regmi, M.B. Promoting Intermodal Freight Transport Through the Development of Dry Portsin Asia: An Environmental Perspective. IATSS Res. 2011, 35, 16–23. [CrossRef]
110. Yokota, T. Guideliness for Road Side Stations “Michinoeki”; World Bank: Washington, DC, USA, Undated.
© 2019 by the author. Licensee MDPI, Basel, Switzerland. This article is an open accessarticle distributed under the terms and conditions of the Creative Commons Attribution(CC BY) license (http://creativecommons.org/licenses/by/4.0/).
85


sustainability
Article
Low-Carbon Quick Wins: Integrating Short-TermSustainable Transport Options in Climate Policy inLow-Income Countries
Stefan Bakker 1,*, Gary Haq 2, Karl Peet 1, Sudhir Gota 1, Nikola Medimorec 1, Alice Yiu 1,
Gail Jennings 1 and John Rogers 1
1 Partnership on Sustainable, Low-Carbon Transport, Rijnlaan 66, 3522 BO Utrecht, The Netherlands2 Stockholm Environment Institute, Department of Environment and Geography, Environment Building,
Wentworth Way, University of York, York YO10 5NG, UK* Correspondence: [email protected]
Received: 5 June 2019; Accepted: 8 August 2019; Published: 12 August 2019
Abstract: In low income countries (LICs) in Africa and Asia per capita transport greenhouse gasemissions are relatively low but are expected to grow. Therefore, a substantial reduction in projectedincreases is required to bring emissions in line with long-term global climate objectives. Literature onhow LICs are integrating climate change mitigation and sustainable transport strategies is limited.Key drivers of transport policy include improving accessibility, congestion, air quality, energy security,with reducing greenhouse gas emissions being of lower priority. This paper assesses the currentstatus, feasibility and potential of selected low-carbon transport measures with high sustainabledevelopment benefits that can be implemented in the short to medium term, so- called ‘quick wins’.It examines to what extent ten such quick wins are integrated in climate change strategies in ninelow- and middle-income countries in Africa and South Asia. The research method comprises expertinterviews, an online questionnaire survey of experts and policymakers in the focus countries, and areview of literature and government plans. Results indicate that sustainable urban transport policiesand measures are considered high priority, with vehicle-related measures such as fuel quality andfuel economy standards and electric two- and three-wheelers being of key relevance. In existingnational climate change strategies, these quick wins are integrated to a certain extent; however,with better coordination between transport and energy and environment agencies such strategies canbe improved. A general conclusion of this paper is that for LICs, quick wins can connect a ‘top-down’climate perspective with a ‘bottom-up’ transport sector perspective. A knowledge gap exists as to themitigation potential and sustainable development benefits of these quick wins in the local contextof LICs.
Keywords: low-income countries; low-carbon transport; sustainable mobility; climate changestrategies; transport policy; Paris Agreement
1. Introduction
Greenhouse gas (GHG) emissions from transport are rising faster than any other economicsector [1]. Under a business-as-usual (BAU) scenario, global transport GHG emissions are expectedto increase from 8 to 16 billion tonnes (t) by 2050. This poses a significant challenge to achievinglong-term objectives outlined in the United Nations Paris Agreement, which set out a global actionplan to avoid dangerous climate change [2]. Limiting global warming to below 1.5 ◦C will requireGHG emissions being reduced to 2 to 3 gigatonnes (Gt) by 2050 and to up to 6 Gt for a 2 ◦C scenario [3].
Per capita transport GHG emissions in low-income countries (LICs) are approximately 0.1 to 0.5 tcompared to high-income countries (HICs) at 2 to 5 t. The contribution of LICs to total global transport
Sustainability 2019, 11, 4369; doi:10.3390/su11164369 www.mdpi.com/journal/sustainability87
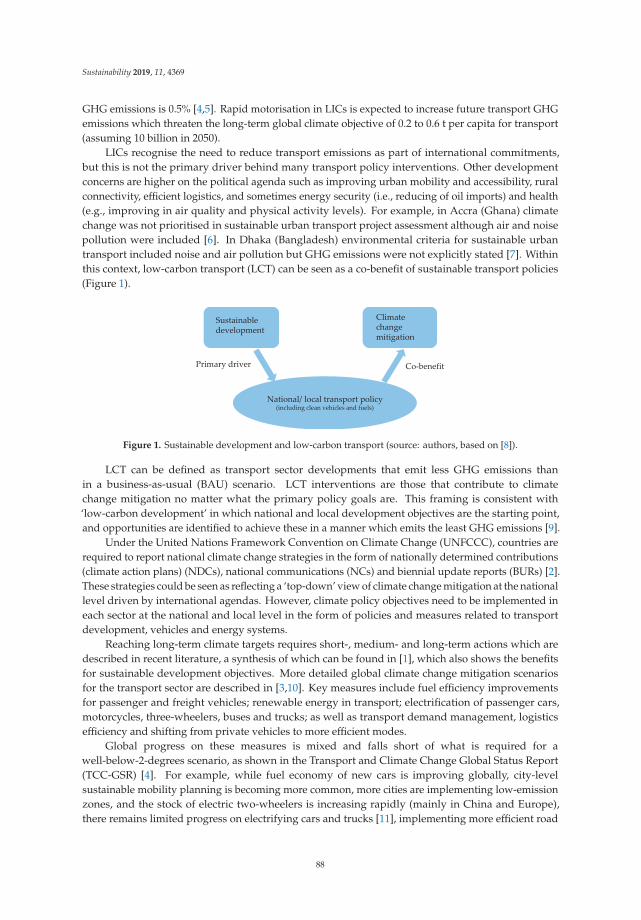
Sustainability 2019, 11, 4369
GHG emissions is 0.5% [4,5]. Rapid motorisation in LICs is expected to increase future transport GHGemissions which threaten the long-term global climate objective of 0.2 to 0.6 t per capita for transport(assuming 10 billion in 2050).
LICs recognise the need to reduce transport emissions as part of international commitments,but this is not the primary driver behind many transport policy interventions. Other developmentconcerns are higher on the political agenda such as improving urban mobility and accessibility, ruralconnectivity, efficient logistics, and sometimes energy security (i.e., reducing of oil imports) and health(e.g., improving in air quality and physical activity levels). For example, in Accra (Ghana) climatechange was not prioritised in sustainable urban transport project assessment although air and noisepollution were included [6]. In Dhaka (Bangladesh) environmental criteria for sustainable urbantransport included noise and air pollution but GHG emissions were not explicitly stated [7]. Withinthis context, low-carbon transport (LCT) can be seen as a co-benefit of sustainable transport policies(Figure 1).
National/ local transport policy (including clean vehicles and fuels)
Sustainable development
Climate change mitigation
Primary driver Co-benefit
Figure 1. Sustainable development and low-carbon transport (source: authors, based on [8]).
LCT can be defined as transport sector developments that emit less GHG emissions thanin a business-as-usual (BAU) scenario. LCT interventions are those that contribute to climatechange mitigation no matter what the primary policy goals are. This framing is consistent with‘low-carbon development’ in which national and local development objectives are the starting point,and opportunities are identified to achieve these in a manner which emits the least GHG emissions [9].
Under the United Nations Framework Convention on Climate Change (UNFCCC), countries arerequired to report national climate change strategies in the form of nationally determined contributions(climate action plans) (NDCs), national communications (NCs) and biennial update reports (BURs) [2].These strategies could be seen as reflecting a ‘top-down’ view of climate change mitigation at the nationallevel driven by international agendas. However, climate policy objectives need to be implemented ineach sector at the national and local level in the form of policies and measures related to transportdevelopment, vehicles and energy systems.
Reaching long-term climate targets requires short-, medium- and long-term actions which aredescribed in recent literature, a synthesis of which can be found in [1], which also shows the benefitsfor sustainable development objectives. More detailed global climate change mitigation scenariosfor the transport sector are described in [3,10]. Key measures include fuel efficiency improvementsfor passenger and freight vehicles; renewable energy in transport; electrification of passenger cars,motorcycles, three-wheelers, buses and trucks; as well as transport demand management, logisticsefficiency and shifting from private vehicles to more efficient modes.
Global progress on these measures is mixed and falls short of what is required for awell-below-2-degrees scenario, as shown in the Transport and Climate Change Global Status Report(TCC-GSR) [4]. For example, while fuel economy of new cars is improving globally, city-levelsustainable mobility planning is becoming more common, more cities are implementing low-emissionzones, and the stock of electric two-wheelers is increasing rapidly (mainly in China and Europe),there remains limited progress on electrifying cars and trucks [11], implementing more efficient road
88

Sustainability 2019, 11, 4369
freight and logistics measures [12], realising envisioned shifts to more efficient transport modes, andincreasing the share of renewables in the transport sector [4].
While there is a substantial body of literature on LCT at the global level and for developedcountries, existing research on developing country mitigation pathways for transport is more limitedand general. Figueroa et al. [13], for example, highlight the key role of informal transport and land-useplanning, and Dhar et al. [14] link transport policies in India to the NDC. However, a research gapexists as to which solutions exist for LICs that can be implemented quickly, have GHG mitigationpotential, and can contribute to climate strategies. Quick wins (QWs) are low-carbon transport policiesand measures that can be implemented in the short to medium term, are relatively low-cost, and havehigh sustainable development benefits. This paper therefore aims to address the following researchquestions:
• What are the most suitable low-carbon transport QWs for LICs?• Which QWs are priorities for stakeholders in LICs?• What is the current status of implementation of QWs?• To what extent are QWs integrated in national climate change strategies?
The research method and data sources used in the study are outlined in Section 2. This is followedby a discussion of the climate mitigation potential of QWs and how they are integrated in climatestrategies (Section 3), i.e., the top-down perspective. A bottom-up analysis is undertaken of QWs innine focus countries: six in Africa and three in Asia (Section 4), followed by a discussion of the results,main conclusions and recommendations.
2. Materials and Methods
The research method and data sources are summarised in the flow diagram in Figure 2 anddescribed below. The corresponding sections are indicated in brackets.
- QWs mitigation potential (3.2)- QWs in climate change strategies (3.3)- Prioritisation of QWs (4.1)- Implementation status of QWs (4.2)
Quick Win Selection (2.3)
- Stakeholder survey- Key informant interviews- Literature review
Focus Country Selection (2.1)
- DFID priority countries- Historic growth + emissions projections- Nine focus countries
- Long list of measures- Stakeholder consultation- Selection criteria- 10 quick wins (QWs)
Top-down perspective
Bottom-up perspective
Research Method (2.4) Results and analysis
Figure 2. Study method (with section numbers).
2.1. Country Selection Criteria
The study focused on the UK Department of International Development’s (DFID) priority countriesin Africa and Asia: Bangladesh, Ghana, India, Indonesia, Kenya, Nigeria, Rwanda, South Africa,and Uganda. These nine countries were selected through a robust, quantitative process based ontheir need for low-carbon transport interventions. This was assessed using the following criteria:motorisation rates, transport emissions currently, and projected BAU transport emissions growth inthe future.
89

Sustainability 2019, 11, 4369
2.2. Low-Carbon Transport Quick Wins Definition
Transport QWs are defined here as actions which can be taken in the short to medium termand contribute to the low carbon transformation of transport (i.e., a well below 2 degrees or even1.5-degree scenario). They provide different benefits (e.g., access, efficiency, safety and environmentbenefits) to local and national stakeholders and are main policy drivers with climate change mitigationas a co-benefit. QWs have been tested at scale and are replicable with the possibility for large-scaleimpact. They are technically and economically feasible in both developed and developing countriesusing available technologies. Finally, QWs address both passenger and freight transport and shouldbe relevant to the Avoid-Shift-Improve (ASI) concept [15]. This is a sustainable transport policyframework that emphasises avoiding and reducing trips (A), shifting to environmentally-friendlymodes of transport (S), and improving (I) vehicle energy and carbon efficiency of each mode [16].
2.3. Selection of Transport Quick Wins for LICs
From March to July 2016, a six-step process (see [15]) was undertaken to develop a list ofQWs. An email invitation was sent to more than 100 international organisations working onsustainable transport and resulted in the compilation of a long list of over 100 measures. Throughgrouping and balancing measures across themes, modes and world regions, the list was reduced toapproximately 40 options. These measures were further evaluated against sustainable developmentbenefits, implementation barriers and coverage of ‘Avoid-Shift-Improve’ measures, and both passengerand freight transport. Expert feedback was received on the remaining 23 measures while an on-linesurvey of more than 100 stakeholders provided feedback on the definition and feasibility of the QWs.Finally, a more detailed assessment against the following criteria provided a final list of 10 QWsspecifically for the purpose and context of the analysis:
• Sustainable development benefits, such as air quality and improved accessibility;• Applicability in DFID priority countries that reflect policy needs of the local transport
system context;• Climate change mitigation potential; and• Passenger and freight including avoid-shift-improve options.
The final 10 QWs for this analysis are:
1. Accelerate phase-out of fossil fuel subsidies;2. Formulate Sustainable Urban Mobility Plans (SUMPs) in primary and secondary cities, supported
by a National Urban Mobility Policy or programme;3. Promote electric two- and three wheelers, including e-vehicle sharing systems in primary and
secondary cities as well as rural areas, for both passenger mobility as well as last-mile urban freight;4. Limit import of inefficient and polluting secondhand trucks;5. Implement (ultra-) low emission zones, including car-free zones in city centres;6. Introduce and scale up pricing for car-related travel options (e.g., congestion/road charging,
parking pricing, workplace parking levy) in primary and secondary cities;7. Tighten fuel economy standards for passenger cars, coupled with labelling schemes and fiscal
incentives such as carbon dioxide (CO2) based vehicle taxation;8. Provide and improve walking and cycling infrastructure (e.g., connected walking paths, protected
cycle lanes, safe intersections), reallocating road space where necessary;9. Improve freight efficiency (e.g., reduce empty load running by freight trucks) through
route optimisation, asset sharing between companies, and increased use of information andcommunication technology (ICT) solutions;
10. Accelerate deployment of tighter diesel fuel quality standards to reduce emissions of black carbon(BC) and other short-lived climate pollutants.
90
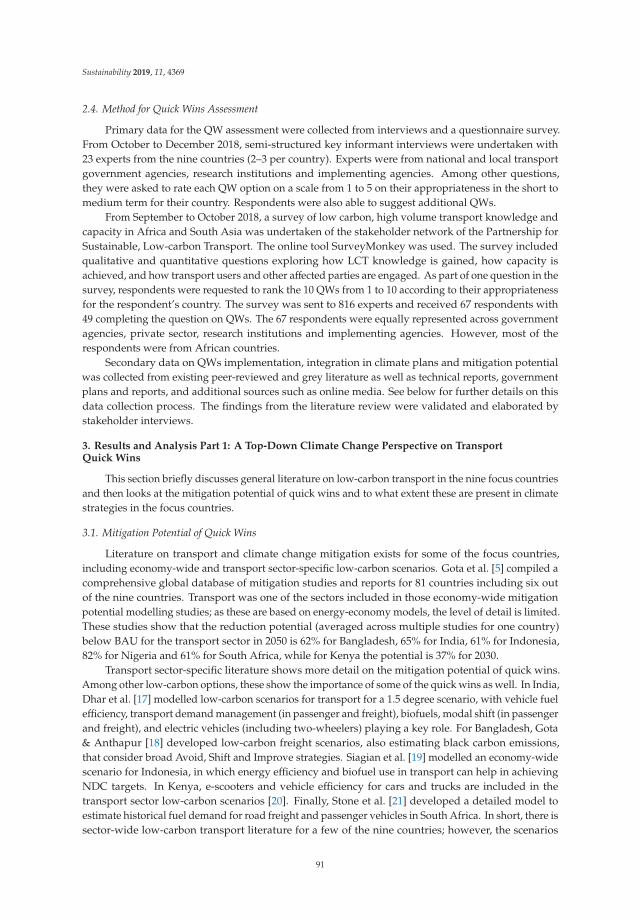
Sustainability 2019, 11, 4369
2.4. Method for Quick Wins Assessment
Primary data for the QW assessment were collected from interviews and a questionnaire survey.From October to December 2018, semi-structured key informant interviews were undertaken with23 experts from the nine countries (2–3 per country). Experts were from national and local transportgovernment agencies, research institutions and implementing agencies. Among other questions,they were asked to rate each QW option on a scale from 1 to 5 on their appropriateness in the short tomedium term for their country. Respondents were also able to suggest additional QWs.
From September to October 2018, a survey of low carbon, high volume transport knowledge andcapacity in Africa and South Asia was undertaken of the stakeholder network of the Partnership forSustainable, Low-carbon Transport. The online tool SurveyMonkey was used. The survey includedqualitative and quantitative questions exploring how LCT knowledge is gained, how capacity isachieved, and how transport users and other affected parties are engaged. As part of one question in thesurvey, respondents were requested to rank the 10 QWs from 1 to 10 according to their appropriatenessfor the respondent’s country. The survey was sent to 816 experts and received 67 respondents with49 completing the question on QWs. The 67 respondents were equally represented across governmentagencies, private sector, research institutions and implementing agencies. However, most of therespondents were from African countries.
Secondary data on QWs implementation, integration in climate plans and mitigation potentialwas collected from existing peer-reviewed and grey literature as well as technical reports, governmentplans and reports, and additional sources such as online media. See below for further details on thisdata collection process. The findings from the literature review were validated and elaborated bystakeholder interviews.
3. Results and Analysis Part 1: A Top-Down Climate Change Perspective on TransportQuick Wins
This section briefly discusses general literature on low-carbon transport in the nine focus countriesand then looks at the mitigation potential of quick wins and to what extent these are present in climatestrategies in the focus countries.
3.1. Mitigation Potential of Quick Wins
Literature on transport and climate change mitigation exists for some of the focus countries,including economy-wide and transport sector-specific low-carbon scenarios. Gota et al. [5] compiled acomprehensive global database of mitigation studies and reports for 81 countries including six outof the nine countries. Transport was one of the sectors included in those economy-wide mitigationpotential modelling studies; as these are based on energy-economy models, the level of detail is limited.These studies show that the reduction potential (averaged across multiple studies for one country)below BAU for the transport sector in 2050 is 62% for Bangladesh, 65% for India, 61% for Indonesia,82% for Nigeria and 61% for South Africa, while for Kenya the potential is 37% for 2030.
Transport sector-specific literature shows more detail on the mitigation potential of quick wins.Among other low-carbon options, these show the importance of some of the quick wins as well. In India,Dhar et al. [17] modelled low-carbon scenarios for transport for a 1.5 degree scenario, with vehicle fuelefficiency, transport demand management (in passenger and freight), biofuels, modal shift (in passengerand freight), and electric vehicles (including two-wheelers) playing a key role. For Bangladesh, Gota& Anthapur [18] developed low-carbon freight scenarios, also estimating black carbon emissions,that consider broad Avoid, Shift and Improve strategies. Siagian et al. [19] modelled an economy-widescenario for Indonesia, in which energy efficiency and biofuel use in transport can help in achievingNDC targets. In Kenya, e-scooters and vehicle efficiency for cars and trucks are included in thetransport sector low-carbon scenarios [20]. Finally, Stone et al. [21] developed a detailed model toestimate historical fuel demand for road freight and passenger vehicles in South Africa. In short, there issector-wide low-carbon transport literature for a few of the nine countries; however, the scenarios
91

Sustainability 2019, 11, 4369
include few short-term policy options and limited detail on these options, and the freight sector inparticular is covered only to a limited extent.
3.2. Mitigation Potential of Quick Wins
A literature review was undertaken on the climate mitigation potential of the 10 QWs includingglobal studies as well as research on the nine focus countries. The main methodology was a keywordsearch in Scopus and Google Scholar. Keywords included the 10 QWs, as well as “low-carbontransport”, in combination with the names of the nine countries. In addition, relevant references fromthese articles were used. This resulted in 24 peer-reviewed articles, of which 14 cover climate changepotential and 10 are indirectly relevant. In addition, 17 grey literature sources such as technical reportsfrom international organisations were found by searching in Google using similar keywords. Literaturewas from the past five years (2013–2018) with a few sources from before this period if more recentsources were unavailable.
Table 1 summarises literature on transport sector GHG mitigation and shows the importance andpotential of all 10 QWs in the nine selected countries.
For India, most mitigation options are included in low-carbon scenarios or studies for specificmeasures. For Indonesia, several studies are available as well. For Bangladesh and the six Africancountries, literature is limited, except for options related to fuel efficiency and fuel standards,where international organisations have done extensive analysis (even if not specifically on GHGmitigation potential). For some specific options (e.g., limiting imports of used trucks and introducinglow emission zones) more analysis would be beneficial.
Table 1. Mitigation potential literature for 10 LCT (low-carbon transport) quick wins.
Quick Win Key Points from MitigationPotential Literature (Global)
Mitigation Literature Country-Specific
1. Fossil fuel subsidyphase out
Removal of fossil fuel consumption subsidies couldlead to global GHG emission reductions of 2–4% by2020, rising to 8–12% by 2050 [22]. Removal of fossilfuel subsidies is a prerequisite to carbon taxation,which is required to achieve a beyond 2-degreescenario [3].
For India and Indonesia, fuel subsidy reform couldlead to between 1 and 9% GHG savings in 2030 [23].For Ghana, removal of subsidies could result innegative impact on household welfare [24]. Phasingout energy subsidies could reduce Indonesian CO2emissions from fuel combustion by 11–13%in 2020 [25]
2. Sustainable UrbanMobility Plans,National UrbanMobility Programme
Urban passenger transport emits about 25% of totaltransport sector emissions. SUMPs mainly focus onnon-technology options, i.e., ‘avoid’ and ‘shift’,which contribute 2–40% of emission reductions in the2050 low-carbon scenario [10]. Implementation of aSUMP in Burgos (Spain) resulted in 17% lower CO2emissions [26]. Pisoni et al. model impact of SUMPson air quality [27].
For the 1.5-degree scenario in India, demand-sideurban transport measures are essential [17], and CO2emissions is one of the key indicators incomprehensive mobility plans in India [28]. Urbantransport measures in 7 Indonesian cities, supportedby a national urban transport framework, can save0.1–0.2 tCO2 per capita in 2030 [29]
3. Electric two-and three-wheelers
Over 80% of the 29 Mt CO2 savings in 2017 by alltypes of EVs globally are due to e-bikes in China [11].Full decarbonisation of two- and three-wheelers isnecessary for the beyond 2 degrees scenario [3]. ForVietnam, e-bikes are the mitigation option with thesecond-largest potential in the transport sector [30].In Thailand, deploying electric motorcycles couldreduce two-wheeler life cycle CO2-eq emissions by42–46% [31].
For a 2-degree scenario in India, over 90% oftwo-wheelers should be electric [14]; however,energy-use of two- and three-wheelers variesdepending on driving conditions [32]. There are costand CO2 emission savings for electric tricycles inNigeria [33]. A study shows benefits of electrictwo-wheelers for Africa (no CO2 estimates) [34]Benefits are shown for ojek (motorcycle taxi) driversby switching to electric vehicles in Indonesia [35].There is a rapidly expanding market in Africa formotorcycles and boda boda (motorcycle taxis) inparticular [36].
4. Limit import ofinefficient andpollutingsecondhand trucks
Import restrictions for secondhand vehicles as a keypart of the policy package in a global low-sulphurscenario [37]. Fuel efficiency of vehicles declinesrapidly after 15 years of use, up to 50% by25 years [38].
Import policies are considered in the fuel efficiencyscenario in a green freight study for Bangladesh [18].A low-carbon scenario for Kigali (Rwanda) considersvehicle age restrictions [39].
92

Sustainability 2019, 11, 4369
Table 1. Cont.
Quick Win Key Points from MitigationPotential Literature (Global)
Mitigation Literature Country-Specific
5. Low-emission zonesImpact assessments show some impact ofenvironmental zones in EU cities on the impact onPM/soot emissions [40]. Further climate benefitswould accrue from more EV deployment; however,no study has been found estimating the GHG impact.
No sources found.
6. Pricing of car useThere is a relatively strong knowledge base of ex-postand ex-ante studies on road pricing and parkingmanagement [41,42]. In Singapore, a package ofmeasures including congestion charging andCO2-based vehicle taxation results in low transportemissions per capita [1].
Study on congestion pricing in Delhi showssignificant shift from private vehicles to publictransport [43].
7. Fuel economystandardsand incentives
Regulation on the energy-use and lifecycle GHGemissions of vehicles is necessary for a beyond 2degrees scenario [3] and progress is seen in manycountries [44]. The IPCC presents emission intensityreduction potentials for different types of diesel andpetrol vehicles [45].
Progress in fuel economy policies in major markets,including India, Indonesia and South Africa isreviewed [44]. Fuel efficiency strategies are includedin low-carbon transport scenario for India [14].
8. Non-motorisedtransport(NMT) infrastructure
Globally, it is estimated that in 2050, 22% of urbanpassenger travel can be by (e)bike, compared to 6% inthe base case. This results in 300 MtCO2 reductionsin 2050 and USD 1 trillion in savings from vehiclepurchase and operation and construction andmaintenance of infrastructure [46]. For walking, nospecific mitigation potential estimates have beenfound; however, it is acknowledged for its key role inmitigation [45] and reaching public transport modalshift targets.
Sustainable urban transport scenario for Bangaloreincludes NMT and transit-oriented development(TOD) and CO2 estimates [47]. Low-carbon scenariofor Kigali (Rwanda) quantifies CO2 savings frombike lane investments [39]. In Ghana, three out offour would not cycle to social events for publicimage; health is driver [48]. Research on walking andcycling in African cities, including in Kenya andSouth-Africa [49].
9. Logisticsoptimization/freight efficiency
The IEA [12] analyses 15 measures, e.g., urbanconsolidation centres, platooning, co-modality,backhauling, retiming of deliveries, etc. Most ofthese could have a best-case impact of up to about 5%emission reductions, while some measures may havea reduction potential over 10%. Implementation ofthese measures, including in developed countries, isstill in an early stage.
A study CO2 scenario with freight efficiency forBangladesh [18]. A report highlights many measures(no mitigation potential calculation) and note thatlogistics is 7% of India’s total CO2 emissions and 67%of transport PM [50]. Green freight programme forNorthern Corridor (including Rwanda, Kenya) withmeasures, in context of mitigation and air pollution(objective of 10% reduction in CO2 per ton-km) [51].
10. Dieselquality standards
A mitigation scenario for black carbon (BC) reducessuch emissions by about half, corresponding to about4 GtCO2-eq (GWP100) in 2050 [52]. Diesel roadvehicles and ships are one of the main sources of BCemissions with 19% of global BC emissions [53].Research shows that a global sulphur scenarioreduces BC emission from diesel road transport byabout 90% from the baseline in 2040 [37]. Suchstrategies will result substantial health benefits fromreduced exposure to air pollution.
Report includes country level market analysis forlow-sulphur diesel for Bangladesh, Ghana, India,Indonesia, Kenya, Nigeria, Rwanda, South Africa,and Uganda [54]. Diesel vehicles contribute 20–55%of total BC in South Asian cities [55].
3.3. Integration of Quick Wins in Climate Change Strategies
To assess how QWs are integrated in climate change strategies of the nine countries, an analysisof the Paris Agreement reporting mechanisms (NDCs, BURs and NCs) (a methodology used by forexample Stead [56]) and other strategies, such as climate change strategies (CCSs), climate changeaction plan (CCAP), low-carbon development strategy (LCDS) and National Climate Change Policy(NCCP) was undertaken. In Table 2, ‘Y’ means the QW is in at least one of the plans/reports. In mostcases a QW is not included in all of these. One reason for this is that NDCs are often short whereasBURs and NCs present measures in more detail. In addition, it should be noted that all countries havesubmitted an NDC and at least one NC, whereas five have submitted one or multiple BURs, and fivehave additional national strategies.
93

Sustainability 2019, 11, 4369
Table 2. Quick wins in climate change strategies and reports.
Country Bangladesh Ghana India Indonesia Kenya Nigeria RwandaSouthAfrica
Uganda
Reports AnalysedNDC, NC2
(2012)
NDC, BUR2,NC3, CC
policy
NDC, NC2,BUR1, LCS
NDC,NC3,BUR
NDC, NC,CCAP 2013
NDC,NC2,BUR1
NDC, NC2,LDCS 2011
NDC,NC3,BUR2
NDC, NC2,NCCP 2015
1. Phase-out fossilfuel subsidies Y Y Y
2. SUMPsand NUMP
3. Promote electrictwo- andthree-wheelers
Y
4. Limit import of2nd hand trucks Y Y Y
5. Low emissionzone (LEZ)
6. Pricing forcar-related travel Y Y Y
7. Fueleconomy policies Y Y Y Y Y Y Y
8. NMTinfrastructure Y Y Y Y Y Y
9. Freightefficiency/logistics
10. Dieselquality standards Y Y Y Y
NDC: nationally determined contribution; NC: national communication; BUR: biennial update report; LC(D)S:low-carbon (development) strategy; CC: climate change; NCCP: national climate change policy.
Fuel economy policies and non-motorised transport (NMT) infrastructure are the QWs that areincluded most often: six or more countries do so. Fossil fuel subsidy reduction, import restrictions,pricing measures, and diesel quality standards are included by 3–5 countries. SUMP, electric two- andthree-wheelers, low emission zone (LEZ) and freight efficiency by zero or one country.
4. Results and Analysis Part 2: A Bottom-Up Transport Perspective on Quick Wins forFocus Countries
4.1. Perceived Feasibility of Quick Wins for Focus Countries
Figure 3 shows perceived feasibility of transport QWs according to the survey responses.Respondents regarded the following QWs as most feasible in their countries (noting that dataare not sufficient to suggest a proposed ranking of these QWs on a country or regional basis):
• QW 2 Formulate Sustainable Urban Mobility Plans (SUMPs) in primary and secondary cities,supported by a National Urban Mobility Policy or programme.
• QW 8 Provide and improve walking and cycling infrastructure (e.g., connected walking paths,protected bicycle lanes), reallocating road space where necessary.
• QW 3 Limit imports of inefficient and polluting secondhand trucks, complemented by agelimitations for the existing fleet.
• QW 4 Promote electric two- and three-wheelers (including shared e-vehicles) in primary andsecondary cities.
• QW 1 Accelerate phase-out of fossil fuel subsidies.
94
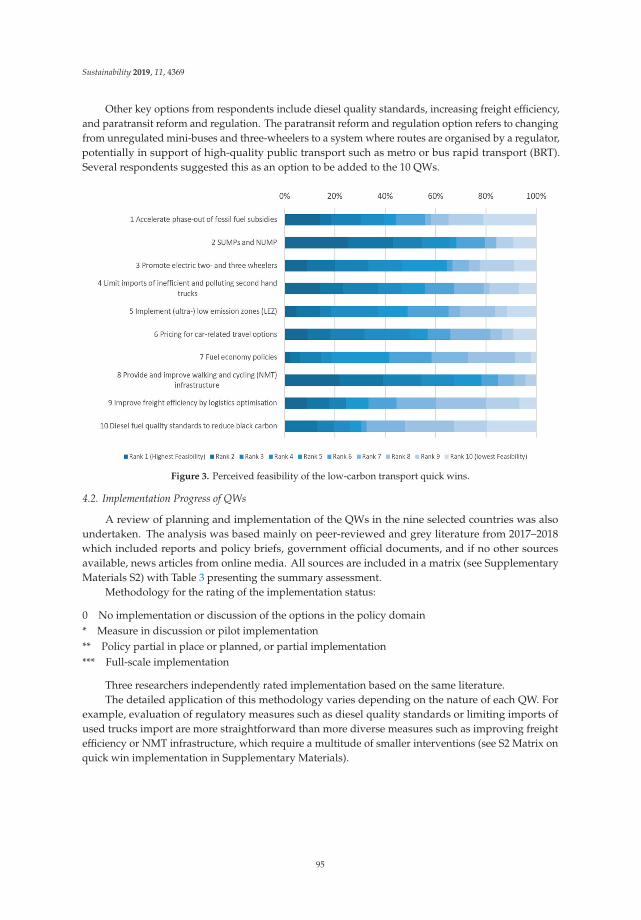
Sustainability 2019, 11, 4369
Other key options from respondents include diesel quality standards, increasing freight efficiency,and paratransit reform and regulation. The paratransit reform and regulation option refers to changingfrom unregulated mini-buses and three-wheelers to a system where routes are organised by a regulator,potentially in support of high-quality public transport such as metro or bus rapid transport (BRT).Several respondents suggested this as an option to be added to the 10 QWs.
Figure 3. Perceived feasibility of the low-carbon transport quick wins.
4.2. Implementation Progress of QWs
A review of planning and implementation of the QWs in the nine selected countries was alsoundertaken. The analysis was based mainly on peer-reviewed and grey literature from 2017–2018which included reports and policy briefs, government official documents, and if no other sourcesavailable, news articles from online media. All sources are included in a matrix (see SupplementaryMaterials S2) with Table 3 presenting the summary assessment.
Methodology for the rating of the implementation status:
0 No implementation or discussion of the options in the policy domain* Measure in discussion or pilot implementation** Policy partial in place or planned, or partial implementation*** Full-scale implementation
Three researchers independently rated implementation based on the same literature.The detailed application of this methodology varies depending on the nature of each QW. For
example, evaluation of regulatory measures such as diesel quality standards or limiting imports ofused trucks import are more straightforward than more diverse measures such as improving freightefficiency or NMT infrastructure, which require a multitude of smaller interventions (see S2 Matrix onquick win implementation in Supplementary Materials).
95

Sustainability 2019, 11, 4369
Table 3. Assessment of quick win implementation status in focus countries.
Country Bangladesh Ghana India Indonesia Kenya Nigeria RwandaSouthAfrica
Uganda
1. Phase-out fossilfuel subsidies ** ** *** ** *** * ** * *
2. SUMPsand NUMP ** * ** ** ** 0 * ** *
3. Promote electrictwo- andthree-wheelers
** * *** * ** * ** ** **
4. Limit import of2nd hand trucks * * *** *** ** ** ** *** *
5. Low-emissionzones 0 0 0 0 0 0 0 0 0
6. Pricing forcar-related travel * 0 ** ** * ** * ** *
7. Fueleconomy policies * * *** ** * * * ** *
8. NMTinfrastructure * ** ** ** ** ** ** ** **
9. Freightefficiency/logistics * * ** ** * * * ** *
10. Dieselquality standards ** ** *** ** *** ** *** ** ***
There is progress across most or all nine countries for QW 4 (Limiting imports of used trucks) andQW 10 (Diesel quality standards). This could indicate an increased awareness of air pollution issueswith both these options playing a key role in addressing diesel emissions. In addition, a number ofinternational organisations are also promoting these actions (e.g., the International Council on CleanTransportation and UN Environment).
Options where progress varies among the nine countries are the following:
• QW 1 (Fossil fuel subsidy reduction): this is a politically challenging option, where publicopposition to policy changes can be expected [22];
• QW 2 (SUMPs and NUMP): India and South Africa have a nationally-guided programme forcities, while in other countries only a few cities develop SUMP-like mobility plans. Awareness ofSUMPs and NUMPs as a key policy tool is picking up in recent years. NUMPs are challengingespecially because the national government is often reluctant to allocate financial resources tocities, with the local governments in turn not seeing the benefit of planning guidelines from ahigher-level authority;
• QW 3 (Promoting electric two and three wheelers): two-wheelers are not popular withpolicymakers [57], who see motorcycle drivers as reckless and often involved in traffic crashes,rather than a flexible, fast and space and energy-efficient mode of transport. However,electrification is increasingly acknowledged as part of air quality and energy security strategies;
• QW7 (Fuel economy policies) with for example India adopting relatively ambitious standards.Although fuel economy policies are beneficial to the national economy, implementing these couldbe politically challenging due to potential impacts on the car market and manufacturers;
96
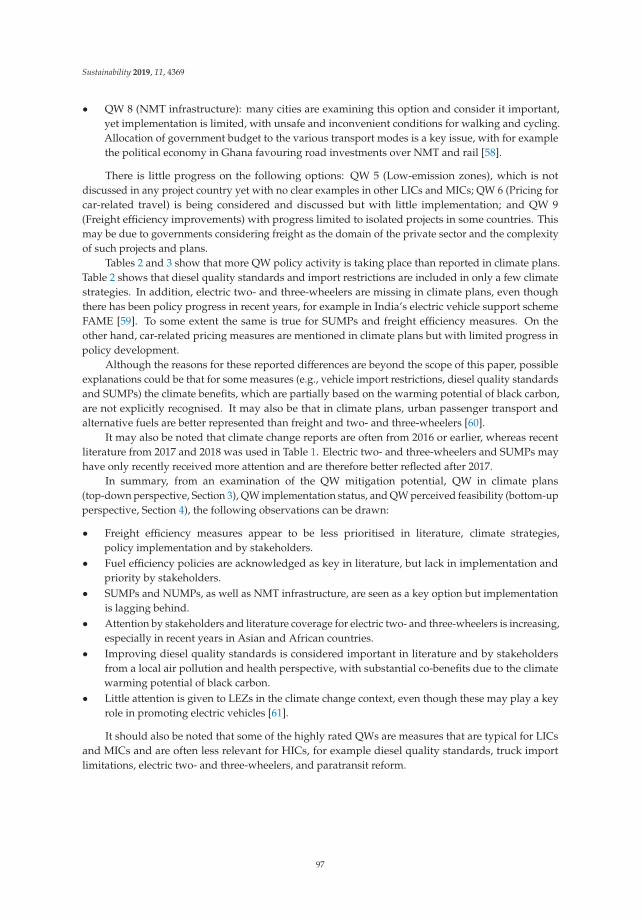
Sustainability 2019, 11, 4369
• QW 8 (NMT infrastructure): many cities are examining this option and consider it important,yet implementation is limited, with unsafe and inconvenient conditions for walking and cycling.Allocation of government budget to the various transport modes is a key issue, with for examplethe political economy in Ghana favouring road investments over NMT and rail [58].
There is little progress on the following options: QW 5 (Low-emission zones), which is notdiscussed in any project country yet with no clear examples in other LICs and MICs; QW 6 (Pricing forcar-related travel) is being considered and discussed but with little implementation; and QW 9(Freight efficiency improvements) with progress limited to isolated projects in some countries. Thismay be due to governments considering freight as the domain of the private sector and the complexityof such projects and plans.
Tables 2 and 3 show that more QW policy activity is taking place than reported in climate plans.Table 2 shows that diesel quality standards and import restrictions are included in only a few climatestrategies. In addition, electric two- and three-wheelers are missing in climate plans, even thoughthere has been policy progress in recent years, for example in India’s electric vehicle support schemeFAME [59]. To some extent the same is true for SUMPs and freight efficiency measures. On theother hand, car-related pricing measures are mentioned in climate plans but with limited progress inpolicy development.
Although the reasons for these reported differences are beyond the scope of this paper, possibleexplanations could be that for some measures (e.g., vehicle import restrictions, diesel quality standardsand SUMPs) the climate benefits, which are partially based on the warming potential of black carbon,are not explicitly recognised. It may also be that in climate plans, urban passenger transport andalternative fuels are better represented than freight and two- and three-wheelers [60].
It may also be noted that climate change reports are often from 2016 or earlier, whereas recentliterature from 2017 and 2018 was used in Table 1. Electric two- and three-wheelers and SUMPs mayhave only recently received more attention and are therefore better reflected after 2017.
In summary, from an examination of the QW mitigation potential, QW in climate plans(top-down perspective, Section 3), QW implementation status, and QW perceived feasibility (bottom-upperspective, Section 4), the following observations can be drawn:
• Freight efficiency measures appear to be less prioritised in literature, climate strategies,policy implementation and by stakeholders.
• Fuel efficiency policies are acknowledged as key in literature, but lack in implementation andpriority by stakeholders.
• SUMPs and NUMPs, as well as NMT infrastructure, are seen as a key option but implementationis lagging behind.
• Attention by stakeholders and literature coverage for electric two- and three-wheelers is increasing,especially in recent years in Asian and African countries.
• Improving diesel quality standards is considered important in literature and by stakeholdersfrom a local air pollution and health perspective, with substantial co-benefits due to the climatewarming potential of black carbon.
• Little attention is given to LEZs in the climate change context, even though these may play a keyrole in promoting electric vehicles [61].
It should also be noted that some of the highly rated QWs are measures that are typical for LICsand MICs and are often less relevant for HICs, for example diesel quality standards, truck importlimitations, electric two- and three-wheelers, and paratransit reform.
97
Sustainability 2019, 11, 4369
5. Discussion
5.1. Interpretation of Results and Limitations of Data and Method
The results presented here can be considered fairly robust. Nevertheless, the following caveatsare noted. In the primary data collection (online questionnaire survey and interviews), nearly all of therespondents are from the transport sector. They may have knowledge about energy and environmentalissues, yet their perspective and priorities may differ from experts that are primarily from the energy,industry and environmental sectors. This may impact the QW prioritisation outcome to some extent.In addition, most of the survey and interview respondents are from Africa.
The literature review covered a range of sources from peer-reviewed literature, grey literature,government reports and media articles, mostly from the last two years and nearly all more recentthan 2012. It covered all focus countries and QWs. Although non-exhaustive, it provides anup-to-date picture of the literature on QW implementation and mitigation potential in the ninecountries. The scoring of the implementation status involved a certain degree of subjectivity, both froma methodological perspective in assessing level of policy development and scope. For example, a largecountry such as India is not comparable to a small country like Ghana when it comes to implementationof NMT at the local level. Finally, the mentioning of a policy measure in climate plans does notnecessarily mean it will be implemented and in what way (i.e., scope and level of ambition).
5.2. Climate Change Strategy Development Process and Quick Wins
Climate policy is still a relatively new phenomenon. Since the adoption of the Paris Agreementin 2015 it is higher on the political agenda, and developing countries realise that the climate changepolicy framework is here to stay. The Paris Agreement climate reporting mechanisms (NDC/BUR/NC)have resulted in developing countries thinking about aspects of low-carbon transport, as shown in [8]for Southeast-Asian countries.
LCT strategies require actions from a variety of government agencies. Transport-related agenciessuch as national or local transport or planning bodies develop and implement Avoid and Shiftinterventions while Improve measures related to vehicles are often in the mandate of other agenciessuch as national ministries of environment, energy, finance and industry [62]. Some options mayinvolve all these stakeholders. Therefore, to develop a comprehensive climate strategy for the transportsector, collaboration and coordination between these various agencies is required. The NDC process hasbeen shown to help inter-ministerial coordination for LCT in some Southeast-Asian countries, includingin Indonesia [8]. However, various agencies may have different and sometimes conflicting objectives,for example, producing cars and reducing congestion, as was raised by an Indonesian respondent.
QWs may be an opportunity to improve integration of transport in climate change plans.However, more actions are being developed and taken than currently included in climate change plans.These can be discussed in future inter-ministerial processes for LCT strategies. In this way, QWs canact as an important bridge between the top-down and bottom-up perspectives on LCT, as described inSections 3 and 4 above (Figure 4).
To further promote development of QWs as well as their integration with climate strategies,more information and analysis about how to implement these is required. This also requires moreinformation about the mitigation potential of QWs for each local context, as well as distributionaleffects on various social groups and sustainable development benefits. International organisationssuch as the International Energy Agency, UN Environment and multilateral development banks alsohave a role to play as various global or regional initiatives are supporting QWs, in particular dieselquality standards, fuel economy policy, SUMPs/NUMP, NMT, electric vehicles (though not focusingspecifically on two- and three-wheelers) and green freight [15]. Examples of such initiatives includethe Global Fuel Economy Initiative, Mobilise Your City, Global Green Freight Action Plan and theElectric Vehicles Initiative.
98

Sustainability 2019, 11, 4369
Top – Down Perspectives
Ambition in national climatechange plans and strategies(NDC, BUR, NC, LCDS etc.)
Bottom– Up Perspectives
National and local transport policies
Based on local policy drivers
Low-carbon as co-benefit (low-carbon development)
Low-carbon transport
quick wins
Figure 4. Quick wins can connect top-down climate and bottom-up transport perspectives onlow-carbon transport. (Source: authors).
5.3. Broader Context of Long-Term Decarbonisation
QWs have a key role to play in climate change mitigation; however, they are only part of thepackage of measures that is required to bring the transport sector onto a 1.5-degree pathway. Moreover,QWs do not substitute large-scale investments in low-carbon infrastructure (e.g., rail, waterways, andelectric vehicle charging) infrastructure and vehicles that have to be taken in the short to medium termin order to avoid a long-term lock-in into high-carbon transport systems. Given the long lead time ofplanning required for such infrastructure to be operational, decision-making processes require a focuson low-carbon infrastructure investment.
6. Conclusions
For transport policy makers in LICs, climate change mitigation is generally not a high priority.Therefore, GHG reduction can be seen as a co-benefit of sustainable mobility. LCT interventions arethose that are implemented to improve access, reduce congestion, increase equity, improve air qualityand energy security, yet that also contribute to climate change mitigation. In this way, the transportsector can contribute to achieving climate objectives stipulated in the NDCs.
LCT QWs are interventions with high sustainable development benefits and can be implementedin the short-term. They can be seen as a bottom-up approach to integrate sustainable mobility optionsin climate change strategies, or in other words, can operationalise low-carbon development in thetransport sector. This paper presents 10 such QWs. As the climate change mitigation potential of theseis significant, they can play an important role in short-term decarbonisation of the transport sector andhelp to achieve long-term targets required under the Paris Agreement.
Analysis of nine LICs in Africa and Asia shows that fuel economy policies and NMT infrastructureare the QWs that are included most often in climate change strategies: six or more countries do so.Fossil fuel subsidy reduction, secondhand vehicle import restrictions, pricing measures, and dieselquality standards are included by 3–5 countries. SUMPs, electric two and three-wheelers, LEZand freight efficiency by zero or one country. However, when investigating policy developmentin the nine countries, it appears more is happening than the climate change reports are showing.For example, most countries are pursuing diesel quality standards, import restriction, and, to a lesserextent, promotion of electric two- and three-wheelers, even though the climate reports do not showthis. It should also be noted that these three options together with, for example, paratransit reform,are measures that are typical for LICs and MICs and are less relevant for high-income countries.In addition to these options, stakeholders in the nine countries prioritised SUMPs, NMT infrastructure,and fossil fuel subsidy reduction. However, low-carbon freight options are emphasised less by
99

Sustainability 2019, 11, 4369
stakeholders, literature, and current policy development, yet freight is responsible for 36% of carbondioxide emissions from the land transport [12].
Based on the analysis of LCT QWs for LICs, the following recommendations can be made.Firstly, more country-level analysis on the various costs and benefits, including distributional impacts,mitigation potential and sustainable development impacts of QWs, would be beneficial in enhancingthe knowledge base and awareness. Secondly, each QW requires a detailed analysis of design optionsto implement the measure, specific for each local or national context. Finally, improved coordinationand collaboration between transport authorities (mainly Avoid and Shift measures) and agenciesfocusing on energy, industrial and environmental aspects of vehicles (mainly Improve measures) iskey in bridging the top-down and bottom-up gap and achieving low carbon transport in LICs in Asiaand Africa.
This paper contributes to a growing body of literature that connects transport and climate policy.It particularly increases the understanding of how transport-related policies and measures can supportclimate strategies in LICs while also contributing to sustainable development.
Supplementary Materials: The following materials are available online at http://www.mdpi.com/2071-1050/11/16/4369/s1, Matrix on low-carbon transport measures in climate plans, and http://www.mdpi.com/2071-1050/11/16/4369/s2, Quick wins implementation status matrix.
Author Contributions: Conceptualization, S.B., K.P.; methodology, S.B., K.P., S.G., N.M., G.J., G.H.; investigation,S.B., J.R., G.J., N.M., S.G.; formal analysis, S.B., N.M.; writing—original draft preparation, S.B.; visualization, S.B.,N.M.; supervision, K.P., G.H.; writing—review and editing, G.H., K.P., G.J.; project administration, A.Y.; fundingacquisition, A.Y., K.P. All authors have reviewed the entire manuscript.
Funding: This research was funded by the UK Department for International Development’s (DFID) AppliedResearch Programme in High Volume Transport, Theme 3—Low Carbon Transport by DFID.
Acknowledgments: Feedback on a draft version by DFID and the comments by the anonymous reviewers aregreatly appreciated.
Conflicts of Interest: The authors declare no conflicts of interest.
References
1. IPCC. Global Warming of 1.5 ◦C. An IPCC Special Report on the Impacts of Global Warming of 1.5 ◦C AbovePre-Industrial Levels and Related Global Greenhouse Gas Emission Pathways, in the Context of Strengtheningthe Global Response to the Threat of Climate Change, Sustainable Development and Efforts to Eradicate Poverty;Masson-Delmotte, P., Zhai, H.O., Pörtner, D., Roberts, J., Skea, P.R., Shukla, A., Pirani, W., Moufouma-Okia, C.,Péan, R., Pidcock, S., et al., Eds.; World Meteorological Organization: Geneva, Switzerland, 2018.
2. United Nations 2015 Paris Agreement. Available online: http://unfccc.int/files/essential_background/convention/application/pdf/english_paris_agreement.pdf (accessed on 20 May 2019).
3. International Energy Agency. Energy Technology Perspectives 2017, Catalysing Energy Technology Transformations;OECD/IEA: Paris, France, 2017.
4. Peet, K.; Gota, S.; Huizenga, C.; Medimorec, N.; Enriquez, A.; Yiu, A. Transport and Climate Change 2018Global Status Repor; Partnership on Asutainable Low Carbon Transport, 2018; 184p. Available online:http://slocat.net/tcc-gsr (accessed on 20 May 2019).
5. Gota, S.; Huizenga, C.; Peet, K.; Medimorec, N.; Bakker, S. Decarbonising transport to achieve ParisAgreement targets. Energy Effic. 2019, 12, 363–386. [CrossRef]
6. Jones, S.; Tefe, M.; Appiah-Opuku, S. Proposed framework for sustainability screening of urban transportprojects in developing countries: A case study of Accra, Ghana. Trans. Res. Part A 2013, 49, 21–34. [CrossRef]
7. Munira, S.; San Santoso, D. Examining public perception over outcome indicators of sustainable urbantransport in Dhaka city. Case Stud. Trans. Policy 2017, 5, 169–178. [CrossRef]
8. Bakker, S. Shifting to Low-Carbon Transport in ASEAN: Policy Development in a Rapidly MotorisingRegion. Ph.D. Thesis, University of Twente, Enschede, The Netherlands, 29 March 2018. Available online:https://ris.utwente.nl/ws/portalfiles/portal/104186485/bakker_2.pdf (accessed on 20 May 2019).
100

Sustainability 2019, 11, 4369
9. Van Tilburg, X.; Würtenberger, L.; de Coninck, H.; Bakker, S. Paving the Way for Low-CarbonDevelopment Strategies. Report ECN-E-11059. Petten: Energy Research Centre of The Netherlands, 2011.Available online: https://www.researchgate.net/publication/236594280_Paving_the_way_for_Lowcarbon_development_strategies (accessed on 20 May 2019).
10. International Transport Forum. ITF Transport Outlook 2017; OECD Publishing: Paris, France, 2017. Availableonline: https://doi.org/10.1787/9789282108000-en (accessed on 20 May 2019).
11. International Energy Agency. Global EV Outlook 2018. Towards Cross-Modal Electrification; OECD Publishing:Paris, France, 2018.
12. International Energy Agency. The Future of Trucks. Implications for Energy and the Environment; OECDPublishing: Paris, France, 2017; 164p. Available online: https://webstore.iea.org/the-future-of-trucks(accessed on 20 May 2019).
13. Figueroa, M.; Fulton, L.; Tiwari, G. Avoiding, transforming, transitioning: pathways to sustainable lowcarbon passenger transport in developing countries. Curr. Opin. Environ. Sustain. 2014, 5, 184–190.[CrossRef]
14. Dhar, S.; Shukla, P.; Pathak, M. India’s INDC for Transport and 2 ◦C Stabilization Target. Chem. Eng. Trans.2017, 56, 31–36. [CrossRef]
15. Quick Wins on Transport, Sustainable Development and Climate Change. Kick-Starting the Transformationof the Transport Sector. Available online: http://www.ppmc-transport.org/wp-content/uploads/2016/11/SLoCaT-Quick-Wins-Report-1.pdf (accessed on 20 May 2019).
16. Bakker, S.; Zuidgeest, M.; de Coninck, H.; Huizenga, C. Transport, development and climate changemitigation: Towards and integrated approach. Trans. Rev. A Trans. Transdiscipl. J. 2014, 34, 335–355.[CrossRef]
17. Dhar, S.; Pathak, M.; Shukla, P. Transformation of India’s transport sector under global warming of 2 ◦C and1.5 ◦C scenario. J. Clean. Prod. 2018, 172, 417–427. [CrossRef]
18. Gota, S.; Anthapur, S. Advancing Green Freight in Bangladesh: A Background Paper; Clean Air Asia: Manila,Philippines, 2016. Available online: http://www.ccacoalition.org/es/node/1315 (accessed on 20 May 2019).
19. Siagian, U.; Yuwono, B.; Fujimori, S.; Masui, T. Low-Carbon Energy Development in Indonesia in Alignmentwith Intended Nationally Determined Contribution (INDC) by 2030. Energies 2017, 10, 52. [CrossRef]
20. Notter, B.; Weber, F.; Füssler, J. Greenhouse Gas Emissions from the Transport Sector: Mitigation Options for Kenya,Methodology and Results; Federal for The Environment, Nature Conversation and Nuclear Safety: Zurich,Swizterland, 2018; 25p. Available online: https://www.changing-transport.org/wp-content/uploads/2018_GIZ_INFRAS_Transport_Mitigation_Options_Kenya.pdf (accessed on 20 May 2019).
21. Stone, A.; Merven, B.; Maseela, T.; Moonsamy, R. Providing a foundation for road transport energy demandanalysis: A vehicle parc model for South Africa. J. Energy South. Afr. 2018, 29, 29–42. [CrossRef]
22. Burniaux, J.M.; Chateau, J. Greenhouse gases mitigation potential and economic efficiency of phasing-outfossil fuel subsidies. Int. Econ. 2014, 140, 71–88. [CrossRef]
23. Asian Development Bank. Fossil Fuel Subsidies in Asia: Trends, Impacts and Reforms—Integrative Report; AsianDevelopment Bank: Mandaluyong City, Philippines, 2016.
24. Cooke, E.; Hague, S.; Tiberti, L.; Cockburn, J.; El Lahga, A.R. Estimating the impact on poverty of Ghana’sfuel subsidy reform and a mitigating response. J. Dev. Eff. 2016, 8, 105–128. [CrossRef]
25. Durand-Lasserve, O.; Campagnolo, L.; Chateau, J.; Dellink, R. Modelling of Distributional Impacts of EnergySubsidy Reforms: An Illustration with Indonesia; OECD Publishing: Paris, France, 2015. Available online:https://www.oecd-ilibrary.org/docserver/5js4k0scrqq5-en.pdf (accessed on 20 May 2019).
26. Diez, J.; Lopez-Lambas, M.; Gonzalo, H.; Rojo, M.; Garcia-Martinez, A. Methodology for assessing the costeffectiveness of Sustainable Urban Mobility Plans (SUMPs). The case of the city of Burgos. J. Trans. Geo.2018, 68, 22–30. [CrossRef]
27. Pisoni, E.; Christidis, P.; Thunis, P.; Trombetti, M. Evaluating the impact of “Sustainable Urban MobilityPlans” on urban background air quality. J. Environ. Man. 2019, 231, 249–255. [CrossRef]
28. Preparing a Comprehensive Mobility Plan (CMP)—A Toolkit. Institute of Urban Transport. Available online:http://www.iutindia.org/downloads/Documents.aspx (accessed on 20 May 2019).
29. Sustainable Urban Transport Programme Indonesia (NAMA SUTRI) Pilot Phase. Available online:http://transferproject.org/wp-content/uploads/2015/02/Indonesia_NAMA-SUTRI_Full-NAMA-Concept-Document.pdf (accessed on 20 May 2019).
101

Sustainability 2019, 11, 4369
30. Asian Development Bank. Pathways to Low-Carbon Development for Viet Nam. Asian Development Bank; AsianDevelopment Bank: Mandaluong City, Philippines, 2017. Available online: https://www.adb.org/sites/default/files/publication/389826/pathways-low-carbon-devt-viet-nam.pdf (accessed on 20 May 2019).
31. Kerdlap, P.; Gheewala, S.H. Electric Motorcycles in Thailand: A Life Cycle Perspective. J. Ind. Ecol. 2016, 20,1399–1411. [CrossRef]
32. Saxena, S.; Gopal, A.; Phadke, A. Electrical consumption of two-, three- and four-wheel light-duty electricvehicles in India. Appl. Energy 2014, 115, 582–590. [CrossRef]
33. David, A.; Adelakun, A.; Etukudor, C.; Femi, A. Electric tricycle for commercial transportation. In Proceedingsof the 3rd International Conference on Africa Development Issues, Ota, Nigeria, 9–11 May 2016; CovenantUniversity Press: Ota, Nigeria, 2016. Available online: https://www.researchgate.net/publication/316470835_Electric_Tricycle_for_Commercial_Transportation (accessed on 20 May 2019).
34. Black, A.; Barnes, J.; Makundi, B.; Ritter, T. Electric Two-Wheelers in Africa? Markets, Production and Policy.2018. Available online: https://www.die-gdi.de/fileadmin/user_upload/pdfs/veranstaltungen/2018/20180618_green_transformation/Electric_two-wheelers_in_Africa.pdf (accessed on 20 May 2019).
35. Nugroho, S.; Zusman, E. Low carbon paratransit in Jakarta, Indonesia: Using econometric models to Timprove the enabling environment. Case Stud. Trans. Policy 2018, 6, 342–347. [CrossRef]
36. Sietchiping, R.; Permezel, M.; Ngomsi, C. Transport and mobility in sub-Saharan African cities: An overviewof practices, lessons and options for improvements. Cities 2012, 29, 183–189. [CrossRef]
37. Miller, J.; Jin, L. Global Progress Toward Soot-Free Diesel Vehicles in 2018; ICCT: Washington, DC, USA, 2018; 52p.Available online: https://www.theicct.org/publications/global-progress-toward-soot-free-diesel-vehicles-2018 (accessed on 20 May 2019).
38. Macias, J.; Aguilar, A.; Schmid, G.; Francke, E. Policy Handbook for the Regulation of Imported Second-HandVehicles; Report No.: 7; Global Fuel Economy Initiative: Mexico City, Mexico; 86p. Available online:https://www.globalfueleconomy.org/media/45362/wp7_regulation_for_2nd-hand_vehicles-lr.pdf (accessedon 20 May 2019).
39. Sudmant, A.; Colenbrander, S.; Gouldson, A.; Chilundika, N. Private opportunities, public benefits? Thescope for private finance to deliver low-carbon transport systems in Kigali, Rwanda. Urban Clim. 2017, 20,59–74. [CrossRef]
40. Calvert, T. The EVIDENCE project: Measure no.6-Environmental zones. World Trans. Policy Pract. 2016, 22,56–65.
41. Nash, C.; Whitelegg, J. Key research themes on regulation, pricing and sustainable urban mobility. Int. J.Sustain. Trans. 2016, 10, 33–39. [CrossRef]
42. Cavallaro, F.; Giaretta, F.; Nocera, S. The potential of road pricing schemes to reduce carbon emissions.Trans. Policy 2018, 67, 85–92. [CrossRef]
43. Swamy, S. Congestion pricing: A case of Delhi. In Proceedings of the Urban Mobility India 2016 conference,Gandhinagar, India, 8–11 November 2016. Available online: http://www.urbanmobilityindia.in/Upload/Conference/4ef8e29d-4c90-448a-a5d5-37b2c1cac9e3.pdf (accessed on 20 May 2019).
44. Global Fuel Economy Initiative. International Comparison of Light-Duty Vehicle Fuel Economy 2005–2015:Ten Years of Fuel Economy Benchmarking, Report No.: 15; GFEI: Mexico City, Mexico, 2017. Available online:https://www.globalfueleconomy.org/media/418761/wp15-ldv-comparison.pdf (accessed on 20 May 2019).
45. Sims, R.; Schaeffer, F.; Creutzig, X.; Cruz-Núñez, M.; D’Agosto, D.; Dimitriu, M.J.; Figueroa Meza, L.;Fulton, S.; Kobayashi, O.; Lah, A.; et al. 2014: Transport. In Proceedings of the Climate Change 2014: Mitigationof Climate Change. Contribution of Working Group III to the Fifth Assessment Report of the Intergovern-MentalPanel on Climate Change; Edenhofer, O., Pichs-Madruga, Y., Sokona, E., Farahani, S., Kadner, K., Seyboth, A.,Adler, I., Baum, S., Brunner, P., Eickemeier, B., et al., Eds.; Cambridge University Press: Cambridge, UK;New York, NY, USA, 2014.
46. Mason, J.; Fulton, L.; McDonald, Z. A Global High Shift Cycling Scenario: The Potential for Dramatically IncreasingBicycle and E-bike Use in Cities Around the World with Estimated Energy, CO2 and Cost Impacts; Institute forTransport and Development Policy, 2015; 42p. Available online: https://www.itdp.org/wp-content/uploads/2015/11/A-Global-High-Shift-Cycling-Scenario-_-Nov-12-2015.pdf (accessed on 20 May 2019).
102

Sustainability 2019, 11, 4369
47. Shastry, S.; Madhav, P. The Role of Transportation in the Future of Urban Developing Asia: A Case Studyof India. Pacific Energy Summit Working Paper. 2016. Available online: https://www.nbr.org/publication/the-role-of-transportation-in-the-future-of-urban-developing-asia-a-case-study-of-india/ (accessed on 20May 2019).
48. Acheampong, R. Cycling for Sustainable Transportation in Urban Ghana: Exploring Attitudes and Perceptionsamong Adults with Different Cycling Experience. J. Sustain. Dev. 2016, 9, 110–124. [CrossRef]
49. Mitullah, W.; Verschuren, M.; Khayesi, M. Non-Motorized Transport Integration into Urban Transport Planning inAfrica, 1st ed.; Routledge: New York, NY, USA, 2017; 240p.
50. NITI Aayog and Rocky Mountain Institute. Goods on the Move: Efficiency and Sustainability in Indian Logistic;NITI Aayog and Rocky Mountain Institute, 2018; 44p. Available online: https://niti.gov.in/writereaddata/files/document_publication/Freight_report.pdf (accessed on 20 May 2019).
51. Northern Corridor Transit and Transport Co-ordination Authority. Northern Corridor Green Freight Programme.For a Competitive and Sustainable Economic Corrido; Northern Corridor Transit and Transport Co-ordinationAuthority: Mombasa, Kenya; 44p. Available online: http://www.ccacoalition.org/sites/default/files/resources/2017_northern-corridor-green-freight_NCTTCA.pdf (accessed on 20 May 2019).
52. Klimont, Z.; Shindell, D. Bridging the gap – The role of short-lived climate pollutants. In The Emissions GapReport 2017—Bridging the Gap—Phasing out Coa; United Nations Environment Programme: Nairobi, Kenya,2017. Available online: https://www.unenvironment.org/resources/emissions-gap-report-2017 (accessed on20 May 2019).
53. Sims, R.; Gorsevski, V.; Anenberg, S. Black Carbon Mitigation and the Role of the Global Environment Facility:A STAP Advisory Document; Global Environment Facility: Washington, DC, USA, 2015; 113p. Availableonline: https://www.thegef.org/sites/default/files/publications/Black-Carbon-Web-Single_1.pdf (accessed on20 May 2019).
54. Malins, C.; Kodjak, D.; Galarza, S.; Chambliss, S.; Minjares, R. Clean up the on-Road Diesel Fleet. A GlobalStrategy to Introduce Low-Sulfur Fuels and Cleaner Diesel Vehicles; Climate and Clean Air Coalition: Paris,France, 2016; 77p. Available online: https://wedocs.unep.org/bitstream/handle/20.500.11822/21552/Cleaning_up_Global_diesel_fleet.pdf (accessed on 20 May 2019).
55. U.S. Environmental Protection Agency. Reducing Black Carbon Emissions in South Asia: Low Cost Opportunities;U.S. Environmental Protection Agency, 2012; 83p. Available online: http://ccacoalition.org/en/resources/reducing-black-carbon-emissions-south-asia-low-cost-opportunities (accessed on 20 May 2019).
56. Stead, D. Policy preferences and the diversity of instrument choice for mitigating climate change impacts inthe transport sector. J. Environ. Plan. Manag. 2017, 61, 2445–2467. [CrossRef]
57. Bakker, S. Electric two-wheelers, sustainable mobility and the city. In Sustainable Cities—Authenticity,Ambition and Dream; Almusaed, A., Almssad, A., Eds.; IntechOpen: London, UK. Availableonline: https://www.intechopen.com/books/sustainable-cities-authenticity-ambition-and-dream/electric-two-wheelers-sustainable-mobility-and-the-city (accessed on 20 May 2019). [CrossRef]
58. Obeng-Odoom, F. Drive left, look right: The political economy of urban transport in Ghana. Int. J. UrbanSustain. Dev. 2010, 1, 33–48. [CrossRef]
59. Dhar, S.; Pathak, M.; Shukla, P.R. Electric vehicles and India’s low carbon passenger transport: A long-termco-benefits assessment. J. Clean Prod. 2017, 146, 139–148. [CrossRef]
60. Gota, S.; Huizenga, C.; Peet, K.; Kaar, G. Nationally-Determined Contributions (NDCs) OfferOpportunities for Ambitious Action on Transport and Climate Change; PPMC/SLoCaT, 2016; 58p. Availableonline: http://www.ppmc-transport.org/wp-content/uploads/2015/06/NDCs-Offer-Opportunities-for-Ambitious-Action-Updated-October-2016.pdf (accessed on 20 May 2019).
61. Hall, D.; Cui, H.; Lutsey, N. Electric Vehicle Capitals: Accelerating the Global Transition to Electric Drive; ICCTBriefing: Washington, DC, USA, 2018; 15p. Available online: https://www.theicct.org/publications/ev-capitals-of-the-world-2018 (accessed on 20 May 2019).
62. Purwanto, J.; Karmini, K.; Kappiantari, M.; Sehlleier, F. Indonesia Stocktaking Report on Sustainable Transportand Climate Change. Data, Policy, and Monitoring; GIZ Indonesia: Jakarta, Indonesia, 2018; 93p.
© 2019 by the authors. Licensee MDPI, Basel, Switzerland. This article is an open accessarticle distributed under the terms and conditions of the Creative Commons Attribution(CC BY) license (http://creativecommons.org/licenses/by/4.0/).
103


sustainability
Article
Addressing the Linkages between Gender andTransport in Low- and Middle-Income Countries
Tanu Priya Uteng 1,* and Jeff Turner 2
1 Institute of Transport Economics (TOI), Gaustadalléen 21, NO 0349 Oslo, Norway2 Gender, Inclusion & Vulnerable Groups, High Volume Transport Research Programme, IMC Worldwide
Consultants, London RH1 1LG, UK* Correspondence: [email protected]
Received: 1 July 2019; Accepted: 8 August 2019; Published: 22 August 2019
Abstract: The Millennium Development Goals (MDGs) specifies gender equality and sustainabledevelopment as their two central priorities. An area of critical importance for sustainable andgender-fair development is mobility and transport, which has so far been neglected and downplayedin research and policy making both at the national and global levels. Rooted in the history of thetopic and the emerging ideas on smart, green and integrated transport, this paper presents a literaturereview of on gender and transport in the low- and middle-income countries. The paper presents ahost of cross-cutting topics with a concentrated focus on spatial and transport planning. The paperfurther identifies existing research gaps and comments on the new conceptualizations on smart citiesand smart mobilities in the Global South. Due attention is paid to intersections and synergies that canbe created between different development sectors, emerging transport modes, data and modelingexercises, gender equality and sustainability.
Keywords: gender; transport; accessibility; smart city; smart mobility; low- and middle-incomecountries
1. Women, Development and Transport
There is a growing recognition, both among the research and the practice communities, thatsocieties across the world are undergoing rapid mutation processes due to convergence of variousforms of mobilities. The physical and virtual mobilities are intersecting at an ever-increasing pacein sync with what was originally discussed under the ‘sociology beyond societies’ [1] and the ‘newmobilities paradigm’ [2]. Yet, access to mobilities remains fractured and is unevenly distributed. Here,we would like to clarify the basic position of this paper—transport is distinct from mobilities. Mobilitiesencompass dimensions like access to opportunities, quality of life and wellbeing of people. The factthat the transport sector is among the top three contributors to GHG emissions, the biggest consumerof non-renewable energy and has most negatively contributed towards climate change, makes it asuitable candidate for further analysis in light of the mobilities agenda, particularly for the low- andmiddle-income countries (LMICs; the paper uses the terms developing economies, Global South andlow- and middle-income countries (LMICs) in an interchangeable manner).
Unabated urbanization and a voluminous growth in personal motorization (driven solely onnon-renewable energies) remains one of the key challenges in developing economies. Motorizationis expected to continue to increase at an unprecedented rate in the developing parts of the world [3].Urban areas in these parts are experiencing a dramatic increase in air pollution, roadway congestion,noise, health issues and traffic accidents as a result of increased car ownership. This is occurring inconjunction with substantial shifts from active modes to motorized modes, and a categorical lack offocus on public transport. Thus, issues concerning the environment, climate and renewable energygains paramount importance here. Increasing public transport usage and a behavioral shift towards
Sustainability 2019, 11, 4555; doi:10.3390/su11174555 www.mdpi.com/journal/sustainability105
Sustainability 2019, 11, 4555
reduced consumption seems to be the only realistic way to curb the negative effects on environment,climate and energy usage. For example, the urban population in India shot from 17% in 1951 to32% in 2011 and is expected to rise to 35% in 2021 [4]. In absolute numbers, it is estimated that 91million joined the ranks of urban dwellers in the 2000s. Regarding vehicular growth, 35% of the totalvehicles in the country are concentrated in the metropolitan cities alone, which constitute just 11% ofthe population. Though public transport usage is high, the share of buses is negligible—two-wheelersand cars constitute 90% of the total vehicles on the road in contrast to buses, which constitute lessthan 1% of the motorized vehicles [4]. In the transport arena, the associated risk, uncertainty andirreversibility (RUI) issues gets exacerbated by the fact that decisions like constructing a highway ormajor road projects are both resource consuming, practically irreversible and generally operate onlonger time horizons [5,6]. The dominance of road building exercises in the Global South, despite themajority of people walking or cycling, highlights that firstly, policies and investment decisions arebased on imperfect and incomplete knowledge of the relationship between increased motorization andenergy issues, climate change, etc. and secondly, there is a strong lack of a context-based planningmethodologies/approach.
Simultaneously, for the first time in the history of policy-making and implementation, both GlobalNorth and South are immersed in resolving ways to restructure urban governance in light of Agenda2030 as many of the areas targeted by the Agenda 2030′s 17 objectives are linked to social sustainabilityand yet ways and means to achieve these objectives remain diffuse. This is particularly the case forgender-based analyses and policy-making. As Razavi [7] notes “In the end, while six of the 17 goalsinclude gender-specific indicators, the indicator framework under five of the goals can be described as‘gender-sparse’ (Goals 2, 10, 11, 13 and 17) and for the remaining six critical areas it is depressingly‘gender-blind’ (Goals 6, 7, 9, 12, 14 and 15) [8].” The reasons for this apparent gender neglect aremany and diverse but one of the simplest explanations is that gender as a category of analysis isdifficult to constrain in simple indicator-based systems, more so for systemic issues like climate changeurban planning and transport. In the field of urban development and transport, the issue gets furthercomplicated in the Global South, which does not have a strong quantitative data collection and analysistradition, and thus social sustainable perspectives on thematic issues like accessibility, universal design,gender and diversity mainstreaming, equity, power and influence on planning and decision making,seldom finds its way in discussions and analyses influencing policy making. The primacy of forecasts(based on existing travel patterns) and technical models rule the roost and even when certain trends like‘women exhibiting more sustainable travel behavior than men’ [9,10] are established, the prevailingnorms of the sector simply do not allow for alternate ways of planning to emerge [11]. Even in societieswith a firm agenda on gender equality like Sweden, research suggests that decisions on infrastructureinvestments and processes followed to reach these decisions are rarely in sync with the broad goalsspecified in the official documents [12].
This paper builds on the preceding arguments and is positioned in the domain of developmentplanning with particular reference to spatial and transport planning. The paper explores the topic ofgender, transport and mobilities in low- and middle-income countries and reflects on critical researchgaps emerging from this review. A further layering to the discussion on mobilities/accessibility isprovided by the ‘smart’ city agendas and smart mobilities, which currently pervades discussionsundertaken in urban and transport planning domains across the world. The paper structures itsarguments with due regards to the digitalization and smart agendas being currently discussed.
Our aim has not been to discuss one particular agenda in detail and given the multiplicity of topicscovered in this literature review, we have borrowed from a number of theories. Section 2 highlightssome relevant theories while Section 3 presents an overview of the current research findings and gapsidentified under a host of topics including access to various opportunities and the issue of safety.Section 3 also highlights the spatial issues of the urban, peri-urban and rural areas of the Global South.The elements of cross-border trading and its importance for women are also discussed in this section.Section 4 initiates a discussion on the methodologies and data needs for addressing the topic of gender,
106

Sustainability 2019, 11, 4555
transport and mobilities, while Section 5 presents the identified research gaps to be addressed in futurestudies. Section 6 concludes the study.
2. Theoretical and Methodological Underpinnings
In this paper, we reviewed the current status of research knowledge available in the Global Southand the research gaps to be addressed in future studies. Our aim was not to discuss one particularagenda in detail and given the multiplicity of topics covered in this literature review, we borrowedfrom a number of theories.
The complexity of the transport domain calls for a multi-theoretical approach, which considersmacro level perspectives as well as the micro determinants for individual attitudes and behavior. Suchtheoretical foundations are not readily available and need to be constructed through bringing a host oftheoretical standpoints to reflect on the theme of gender and transport in the Global South.
We present some relevant perspectives that hold the potential for taking the inclusivity agendaforward. Though the theories, we briefly touch upon here, have been discussed in the domain oftravel behavior, they have not been processed to reflect on gendering of travel behavior. This lackgets further pronounced when the current mores of planning smart cities and smart mobilities are putunder scrutiny. We propose that these theories merit further deliberation and have the potential toinsert a thematic focus on gendered mobilities into discussions related to governance and innovations.
2.1. Social Psychological and Feminist Theories
Taking the element of perceptions forward, social psychological theories related to norms, emotions,attitudes and behavior could be further employed to illuminate peoples’ opinions and sensitivitytoward socio-technical conditions in the context of everyday travel and likely social and cultural trends.A key issue is also to map various ‘cultures’ and the gendered variations within different cultures forcoping with changing mobility conditions. Relevant theories in this context are the theory of plannedbehavior [13], norm activation model [14] and theories including habits (e.g., [15]). Dijst et al. [16]provide a good discussion of different attitudinal models for understanding both the gendered natureof travel behavior and the kind of smart interventions, which promises most sustainable solutions.
Taking the agenda of prevalent norms, social and cultural practices, relations and organizationof roles of institutions and the subsequent phenomenon of gendering [17,18], the feminist theoryinsists on studying gender both at the individual level but also at the organizational or institutionallevels [11]. Feminist theory can be specifically employed in two particular ways to examine the field oftransport [19,20]:
i. The separation of men and women in transport decision making—Hirdman [20] points out tothe mechanisms of separation, which keep men and women restricted to separate domainseven when women enter the transport sector. Men are mostly involved in transport both as aneconomic and policy sector, while women get relegated to the service functions.
ii. The dominant masculine norms of the transport sector—transport institutions, across the world,have historically been dominated by male bodies and thus the prevalent masculine norms exertnormative powers over its agenda [19]. Economic and policy sectors have evolved to operatein the purview of masculine norms and thus its activities coded as masculine, while the servicefunctions tend to be feminine coded.
2.2. Socio-Technical Transition Theory
Socio-technical transition theory [21–25] builds on the premise that environmental problemsrepresent major societal challenges, whose solution requires structural changes in key areas of society.A socio-technical transition is defined as “ . . . a major shift or step change, in which an existingsocio-technical system—a cluster of aligned elements including technology, regulations, consumerpractices, cultural meanings, markets, infrastructure, scientific knowledge, supply and maintenance
107

Sustainability 2019, 11, 4555
networks—is durably reconfigured” [26] (p. 1003). A key idea is that large-scale transformations areinitiated by ongoing activities in small-scale networks (niches), which over time change prevailingpractices, competences and knowledge that constitute the existing (transport) system.
The basic ethos of the socio-technical perspective is that transitions are non-linear processes thatresult from the interplay of multiple developments at three analytical levels: “Niches” (the locus forradical innovations), “socio-technical regimes” (the locus of established practices and associated rules)and an exogenous socio-technical “landscape” [24]. Within the transport system, various “green niches”have emerged like new mobility systems based on mobile ICT technology and electrical vehicles.
In discussing the gender component of mobilities, socio-technical transition theory is relevantsince (i) it draws attention to a broad range of elements and actors and their interactions, (ii) analysesof past transitions tells about factors conductive to change and (iii) it shows the social interpretation oftechnology [26]. This conceptual framework can be applied in understanding both the social trendsand driving forces, along with perceptions and access to solutions.
2.3. Mobility Biographies Theory
The biological markers of a woman’s life have traditionally underpinned her freedom to negotiatethe inside-outside boundaries. This is particularly true for adolescent girls and young mothers inthe GS (Global South) affecting decisions to continue education, employment and seeking healthinterventions as accessing all the three domains remains interlinked with accessing spaces beyond theconfines of home. In light of the importance of life-events, a useful theoretical departure is offered bythe life course approaches or ‘mobility biographies’. This strand of research in travel behavior studiesunderpins that both travel demand and needs change over the life course of individuals. Mobilitybiographies emerged as a reaction to the aggregate results emerging from analyses of travel surveyswhere travel demand on an individual level appeared to be relatively stable in the medium term. Oncedisaggregated by key turning points in life like changes in the places of residence, childbirth, educationand employment [27], daily travel behavior underwent marked changes as the spatial distribution ofactivities and associated activity spaces altered.
The concept is further unpacked by Scheiner [28] as being embedded in other ‘partial biographies’,namely residential biography, employment biography and household biography. Studying ‘mobilitybiographies’ includes studying the tools, practices and context affecting daily travel behavior, andtopics like ownership of mobility tools (such as cars, and access to public transport), factors influencingpeople to start, stop or significantly change their mobility behavior [29] become important sub-headingsto be studied. Most of the studies employing this theory are from the Global North—for example,Chatterjee [30,31] confirm the effect of life course and turning events on the uptake of cycling, Clark [32]expands on the case of car-ownership while Priya Uteng et. al. [33] broach on the topic of carsharing. Thus topics like contextual change, intrinsic motivations, facilitating conditions and theinteractions between structural factors and human agency take center stage in discussing travelbehavior. The policy implications of studying when and how mobility behavior changes can open up a‘window of opportunity’ to plan for and maintain (desired) behavioral changes [34].
From a methodological perspective, this approach urges us to go beyond the purview ofquantitative studies and engage with the narrative-interpretative inquiries into the meaning andcomplexity of mobility biographies. This typology of engagement in the transport sector, even in thedeveloped economies with a relatively matured transport research arena, remains scarce [35].
2.4. Social Practice Theory (SPT)
Social practice theory (SPT) attempts to bridge the gap between two primary approaches oftreating human behavior—the homo economicus approach emphasizing that social order is a combinationof individual purposes, intentions and interests and the homo sociologicus approach, which relies on thecollective norms and values [36] (pp. 245–246).
108

Sustainability 2019, 11, 4555
Rather than treating these two entities of individual vs. collective as mutually exclusive domains,SPT urges us to conceptualize the body, mind, things, knowledge, discourse, structure/process andagent to localize the social within the practice as the main unit of analysis [36]. This essentially meansthat we focus on both the local or micro phenomena and large social phenomena [37].
SPT defines a practice as a routinized behavior consisting of a set of interconnected elements ofmaterials, skills and meanings associated with a practice [36,38]. SPT provides a framework for analyzingthe recruitment and retention mechanisms through seeking answers—how practices emerge, how theypersist and how they are abandoned—and through analyzing both the product/service providers aswell as their users and adopters.
Merging these different theories allowed us to combine results on in-depth analyses of day-to-daybehavior with the broader perspectives of policy-making to comment on the fundamental question of“How do practices envisioned in policy-making and those who carry them actually intersect?”.
3. Current Research Findings and Gaps
In the following points, we present some consistent findings emerging from studies focusing ongendered mobilities in the developing countries [9,10,39]:
1. Women’s travels are multi-purpose, complex and resource-constrained (vs. the male norm).Accessibility to health, education and employment opportunities remains constrained for womendue to a number of social, physical and economical reasons;
2. Walking, public transport (both formal and informal) and intermediate means of transport(IMTs) are the most used transport modes. Yet, public transport and IMTs inevitably get alower focus than road/highways/bridge building projects, thus putting women’s needs to afurther disadvantage;
3. Safety issues are critical and fear of sexual harassment on public transport and public spacesremain widespread. Fear of sexual harassment and personal security remain great concerns innegotiating daily mobilities;
4. Women on low-income suffer a disproportionately high loss of employment opportunities in theface of slum eviction and relocation. The same holds true for rural women when avenues ofemployment like cross-border trading does not get enough focus in trade agreements;
5. Cultural restrictions placed on the mobility of girls and women in accessing public spacesinfluences the time, space and duration of women’s movements. Extreme cultural restrictionsnecessitate a context-specific and inclusive approach to women’s mobility and transport;
6. The issue of affordability restricts women to a great extent. Constraints on women’s mobilitykeep them away from income sources and from services, with negative implications for botheconomic and social objectives of development;
7. Smart mobilities and smart cities do not necessarily help the agenda of creating inclusive cities(findings from the Global North so far indicate smart solutions have exclusively facilitated aparticular group—young, educated, high-income, white male).
We looked up the following terms in literature search covering both published works and greyliterature (from UN and other development organizations and consultancy reports) to consolidatethe findings emerging from across the Global South: Gender and transport ; Women and transport;Gendered moblities; Women and safety; Urban Women and safety, Transport; Women and cross-bordertrade; Women, development schemes in low-income countries/LMICs; Access to education, healthand employment in LMICs; Urban and rural accessibility, women; Transport and post-disasterrehabilitation; Gender and space; Transport, capacity building; Women, informal transport; Women,informal employment; Transport in developing countries—methodologies; Transport in developingcountries—data needs.
In the following sections, we briefly present both the established and emerging issues to framethe problematic of gendered mobilities.
109

Sustainability 2019, 11, 4555
3.1. Access to Education
Linkages between transport, (im)mobility, spatial/social stagnation and resultant poverty in Asiaand sub-Saharan Africa have been well established. Instead of being an isolated issue of culturalrestraints imposed on girls or a lack of physical access to schools, these two often intersect towards girls’low educational achievement. A study from Morocco highlights that in girls attending primary schooltripled to 54% in the area of influence of major paved rural roads, while similar jumps were evidentlyabsent in areas where physical accessibility was still an impediment [40]. Porter [41] presents researchfindings from a three-country study (Ghana, Malawi and South Africa) where it was consistentlyfound that girls living in remote rural areas with poor roads and poor or expensive transport serviceswere unable to access schools due to an interplay of a variety of cultural, economic and social factors.One of the cross-cutting factors, especially for young girls, is their contribution in the householdchores. In the highland village in Malawi, it was found that a significant majority of the students wereabsent from school on the market days, held twice a week in the nearby towns. Girls were expected toheadload local products for sale to the town, which becomes a time-consuming weekly routine sincethe villages were approximately 8 km from the paved road, with an irregular and erratic supply ofpublic transport. There are myriad examples available from across the developing world, which willconfirm the same (refer Box 1). In such circumstances, the inevitable outcome is that girls in remoterural areas often do not obtain even a basic education and further opportunities to develop a livelihoodare severely curtailed.
Box 1. Cycling to school: Increasing secondary school enrollment for rural girls.
An innovative program was launched in one of the poorest states of India, Bihar, with an aim to reduce thegender gap in secondary school enrollment by providing girls who continued to secondary school with a bicyclethat would improve their physical access to school. Using data from a large representative household survey,Muralidharan and Prakash [42] find that being in a cohort that was exposed to the Cycle program increasedgirls’ age-appropriate enrollment in secondary school by 30% and simultaneously reduced the gender gap inage-appropriate secondary school enrollment by 40%. Distance to the nearest secondary school was a crucialelement, and increases in enrollment mostly took place in villages where the nearest secondary school wasfurther away. This suggests that the program was most effective in reducing the time and safety costs of schoolattendance by providing a bicycle. The Cycle program was deemed as being more cost effective at increasinggirls’ enrolment than comparable conditional cash transfer programs in South Asia.
Coordinated provision of bicycles or other accessible modes (school bus for a cluster of villages etc.) to girlshas the potential to generate externalities beyond the cash value of the program. The cycle program went beyondthe mere provisioning of a transport mode, and included positive externalities like improved safety from girlscycling to school in groups, and changes in patriarchal social norms that typically discourages and condemnsfemale mobility outside the village, inhibiting female education and employment at large.
An extensive review of the data across 24 rural, peri-urban and urban sites is now available [43]pointing to major issues around mobility for education, even in urban areas, associated with cost andavailability of transport as well as the constraints imposed by demands for children’s work withinthe household.
3.2. Access to Employment Opportunities
Employment in the informal sector dominates the livelihood landscape in the developing countries.Even though the official numbers are typically conservative estimates, they remain staggeringlyhigh—48 percent in northern Africa; 51 percent in Latin America; 65 percent in Asia and 72 percent insub-Saharan Africa [44]. In the transport domain as well, informal sector dominates both in terms ofabsolute numbers of vehicles on roads and in the number of people, mostly men, employed in thissector. The informal modes—para-transit and non-motorized transport modes (NMTs)—are primarilythe main public transport modes available in a number of developing countries. They form the maincarriers of both the vast majority of population and of informal economies. Despite their pivotal rolein connecting people to different opportunities, para-transits and NMTs are either unrecognized in
110

Sustainability 2019, 11, 4555
the transport plans or in some instances, rules and regulations insist on either removing them fromcirculation or barring their access on the main arterial roads.
Non-motorized modes like bicycles and rickshaws and para-transit play a significant role in thelives of women who are dependent on these modes to access employment and other opportunities [39,45].In urban areas, where often zoning legislation separates commercial from residential areas, womenremain the hardest hit if transport accessibility is affected in negative ways. The same is true forwomen in rural areas as well since they remain dependent on others to sell their products in theregional markets thereby minimizing their control over the profits. Further, availability, affordabilityand acceptability of transport remains contested. Most formal public transport supply caters to peakhours facilitating the formal sector workers. Additionally, the issue of pricing, and the physical safetyof women on public transport also impact their freedom of movement.
The case of Bangladeshi garment workers invokes how a lack of focus on physical accessibility,particularly in the form of safe and reliable public transport, is counterproductive to the issue of makingwomen financially independent and active participants of the society. The ready-made garments(RMG) industry of Bangladesh is a booming industry, which exports to over 30 countries in the world,employing about 1.8 million workers of which 1.5 million were women [46]. On one hand, this casecan be celebrated as a major breakthrough of female employment in established sectors and yet amere scratching of the surface of this success story reveals how both living conditions and capacityto save is severely affected by a categorical lack of affordable transportation facilities for workers onlimited wages [47]. For example, planning decisions in Dhaka prohibits cycle rickshaws to drive oncertain major roads where several garment factories are located thus putting a ban on the most viabletransport mode for the female garment workers. Sharp differences in living conditions and savingpotentials were further found among female workers who worked in factories proving bus transport ascompared to workers who did not have access to such provisions (for detail discussion, refer to [10]).
Female employment in the Global South is also often within the premises of the household ina format popularly known as home-based manufacturing, which typically ranges from garments,consumable products to providing ancillary product creation for various industries. The savingspotential of women employed in the home-based sectors vary greatly depending on physical accessibilityto markets as illustrated through the case of home-based garment producers in Ahmedabad, India [48].She concludes that development decisions need to include a focus on spatial mobility to improvelivelihood outcomes of female producers and depending on the sector’s market characteristics, animportant intervention facilitating women producers could be improving access to the range andquality of markets available to them [48].
Microenterprise credit programs have received innumerable support in the past decades anda Nobel prize simply bolsters the effectiveness of this solution in addressing female empowerment.However, these mechanisms to support women’s income generating opportunities and economicempowerment have been contested [49–56] and Omorodion [53] points to the inconclusive nature of themicro-credit programs in improving the economic situation of women. A reading on the topic of dailymobilities highlights that economic empowerment and mobilities remain interlocked. The first issuehas already been raised in the previous point and concerns direct access to market. Women’s inabilityto access markets and directly sell their products and make networks to access information greatlyinhibits their saving potentials. The ability of this section of women to virtually access informationand networks through mobile phones remains contested. Further, lending institutions need to takethe accessibility criterion in consideration and locate their outlets for repayments close to markets,training centers and in communities involved in the program, enabling the women to make repaymentswithout social and physical obstructions. The case of Esan women in Nigeria [53] highlight “The lackof financial institutions in rural areas meant traveling long distances to make loan repayments alsocontributed to the failure of the micro-credit schemes in Esan communities”. Nigam [57] reinstates thispoint through assessing microcredit schemes in five countries—Nepal, Viet Nam, Egypt, India andKenya. He states that the credit schemes can be truly effective in reducing the worst manifestations of
111

Sustainability 2019, 11, 4555
poverty only when credit dole outs operate in combination with basic social services. Access to market,repayment nodes, basic education and training are among the most vital elements of such services(refer Box 2).
Box 2. Spatial mismatch.
The comparative analysis of working and non-working women’s mobility in Navi Mumbai, India [58] revealsthat economic empowerment coupled with improvement in literacy levels could result in three to four-foldincrease in an average women’s mobility. The time and activity pattern study of the working women reflectsgreater obligatory time requirements, which results in lesser time for travel in comparison to those observed inmore developed societies. It was also observed that there are spatial mismatches between the distribution of lowpaid female jobs and locations where low-income women live resulting in longer commuting by low incomewomen compared to high income women. The working women also are greatly dependent on the safe, reliableand affordable mass transport systems for their long work trips journeys.
Resettlement/subsidized/affordable housing schemes.One of the most prominent responses of city governments, across the developing world, to the issue of slums
and squatter settlements has been resettlement schemes, variants of which can be found under the name ofsubsidized and affordable housing schemes. These resettlement colonies are typically located in the peripheraledges of the city with poor or no public transport connection. The most immediate response to these resettlementprograms has been the loss of livelihood for women, which were originally anchored in walking distance ofthe slums. The mesh created by distant relocation, inadequate transport services with respect to frequency,connectivity and affordability, unsafe public space designs (primarily bus tops, access pathways) invariablyand continuously hits low-income women the hardest. Acknowledgement of these issues, and planning ofresidential housing areas, which are either mixed land uses or zoned with adequate provision for accessibleservices and employment opportunities continues to elude development authorities, donor organizations anddevelopment sector at large [10,59]).
3.3. Access to Health Services and Well-Being
Figures state that between 50%–60% of people in poor countries live more than 8 km from ahealthcare facility [60]. Mortality rates for women in time-critical medical emergencies related tochildbirth and infant illnesses continue to be high in a large part of the developing world simply dueto a lack of availability of access to these health centers [61]. This is typically manifested in form ofeither lack of transport options, unaffordability or a combination of both (Mlay et. al. [62] illustratesthis point through the case of Tanzania and similar case findings from Ethiopia are brought forth byHamlin [63]). Similarly, to illustrate the prevalence of this incidence in all parts of the developingworld, a study from Cebu in the Philippines quantified the (strong) association between infant, childand maternal mortality rates and distance to healthcare services [64] by calculating that a 10% increasein distance from a hospital was associated with a 2% increase in all three mortality rates.
The issue of head-loading continues to plague health deficits of women and is directly linkedto their mobility burdens. For example, figures derived from 276 women fuel carriers sampled inAddis Ababa highlighted an average load of 36.2 kg (i.e., 75% of body weight) being carried for anaverage trip length of 11.7 km, and close to 17% of the women were carrying loads heavier than theirbody-weight [65]. With reference to the maximum carrying weight of 20 kg recommended by theILO (International Labor Organization), it is not surprising that these women suffer from eye, chestand back pains coupled with high rates of miscarriage. Porter et al. [66] presents an analysis of loadcarrying impacts on children from 24 urban and rural research sites in Ghana, Malawi and SouthAfrica, emphasizing substantial detriments to both children’s health and their education. A full reviewof likely health impacts of head loading in sub-Saharan Africa highlights the need to build scientificallyvalidated evidence base with health professionals.
The incidence of HIV has also been linked to transport availability and spatial concentration ofmedical services. Several cases from Africa highlight that comprehensive HIV services, primarilyprovided through hospitals, remain inaccessible to rural population. The cost of transport to thesefacilities is often high, and Amnesty International calls for a meaningful consideration to the transport
112

Sustainability 2019, 11, 4555
needs of economically and socially marginalized people, especially rural women at risk of or livingwith HIV.
One of the research gaps identified so far is that there is little recorded evidence in the form ofresearch studies to highlight the constrained access of urban low-income women to health services. Mostof the studies in urban areas have focused on the quality, patient–provider relationships, accountabilityand affordability of the health services [67]. However, referral services like assisted or non-assistedtransport services have been rarely studied in the urban areas of the developing economies, except forstudies such as that by Murray et al. [68] that focused on Lusaka, Zambia and there is need for muchmore rigorous research work.
Essentially, even in the urban areas, women and girls experience maternal death and a myriad ofhealth-related problems for reasons similar to what has been consistently found in the rural areas—lackof affordable and reliable transportation to clinics and hospitals. A combination of lack of ambulanceservices to the urban slums and unaffordable public transport often leave women in extremelydangerous conditions [69,70]. During a focus group conducted with female residents of Bwaise slumin Kampala, Uganda, it was revealed that women were restricted by financial resources and distance.“It took at least one hour to walk from Bwaise to the nearest health centre, and there are reports ofwomen giving birth en route. The only vehicular access to health centres is by boda-boda (motorcycletaxis) because of the poor conditions on the surrounding roads” [71]. One of the concrete suggestionsput forth by the female slum residents was provision of an ambulance station (or a designated pickuppoint) in close vicinity of the slum.
3.4. Humanitarian Efforts, Post-Disaster and Post-Conflict Rehabilitation
Massive humanitarian efforts and resources are put in the post-disaster/post-conflict rehabilitationprocesses. These processes of transitioning from relief to development offer unique opportunities tocorrect spatial development-related imbalances and reduce vulnerabilities to hazards [72]. However,decisions under these stressful circumstances are taken more as a response to establish immediate controlrather than pre-mediated rehabilitation decisions with long-term consequences [73]. For example, theprimary focus of post disaster investments in Honduras after Hurricane Mitch was on major arterial orsecondary roads and not rural roads. Often, implementation of the transport sector’s modern rhetoricof sustainability, gender and the environment are strangely absent. Post disaster reconstruction stagesneed to be streamlined to reconstruct with change thereby avoiding the creation of new vulnerabilitiesor exacerbating the existing ones. The International Forum for Rural Transport and Development [74]notes that ‘prioritizing the rehabilitation of rural road networks to enable small farmers to accessmarkets could potentially discourage post-disaster migration to vulnerable rural areas and urbanslums. By continuing to listen to the needs of the poor in the post-disaster context, the transportsector has the potential to avoid creating new societies with even greater vulnerability.’. In light ofthe unprecedented urbanization taking place in the developing economies and issues like, which weexpand on in the later sections of the paper, feminization of slums in the urban areas, cross-bordertrading in which women are heavily involved, inserting evaluation and implementation of accessibilitymodules in the rehabilitation processes becomes a necessity.
3.5. Traffic Injuries and Women
The World Health Organization [75] reports that 90% of the world’s road fatalities occur inlow- and middle-income countries, even though these countries have approximately only half ofthe world’s vehicles. Majority share of fatal injuries consist of ‘vulnerable road users’ comprisingpedestrians, cyclists and motorcyclists. It is also reported that globally, three out of four road deathsare among men [76,77]. However, when we start analyzing disaggregated data in the low- andmiddle-income countries, a different picture emerges but is often under discussed as both access toand analyses of disaggregated data remains problematic in the low- and middle-income countries.
113

Sustainability 2019, 11, 4555
For example, Ghanaian accident data highlights that over 40% of fatal road traffic accidents (RTA)involved pedestrians, and the majority of these were women [78].
As previous sections have highlighted, women constitute a major share of pedestrians in theLMICs owning to their livelihood options like street vending, hawking and unaffordability to use othermodes of option than walking. Street vending across the LMICs operates through the modality ofsharing road space with the motorized and non-motorized vehicles thus putting women in precarioussituations. Further, Williams et al. [79] highlight the age dimension specific to the case of LMICs wherethe incidence of falls among elderly women remains much higher than men.
The intersectionality of traffic injuries remains an understudied topic, particularly in the LMICs.Reasons and the particular ways in which women are or become victims of road accidents needsfurther probing [80].
3.6. Safety, Smart Cities and Smart Mobilities
It is not new knowledge that women across the world are more fearful of crime than men. This feargets accentuated by a combination of limitations to defend themselves in face of physical attackand a greater propensity to transfer past experiences and memories of victimization to present [81].For example, in Chennai, India, 66 percent of female respondents stated that they have been harassedwhile commuting [82]. A series of studies document the prevalence of fears and concerns aboutsafety in the developing world. They plot how such fears influence travel decisions taken by womenand can have a substantial impact on both the volume and timing of ridership. In tandem with themain findings from a U.S. based study [83], studies from the developing economies come to similarconclusions—there is a significant mismatch between the safety and security needs and desires offemale passengers and the types and locations of strategies public transport agencies use [59,84–89].Studies focusing exclusively on safety concerns of women on their daily travels are scarce in thedeveloping world. However, the ones that have studied this topic unanimously assert that safetyconcerns have strong contextual determinants—public lighting, characteristics of sidewalks, isolationand neighborhood characteristics [90]. Perceptions of insecurity in a variety of urban environments—atthe bus and rail stations, on their way to and from the bus and rail stations, etc.—are a primal forcerestricting women from achieving their maximum potential not only in education, employment andhealth, but in their general well-being.
A major criticism of the smart cities approach is the gap between the technical/digital approachand quality-of-life approaches. Lauwers and Papa [91] claim the shift from conventional mobilityplanning towards smart mobility is primarily applying new technology to existing infrastructuresinstead of creating better solutions. For example, buses are being retrofitted with tracking devicesrather than increasing public transport supply and checking outcome measures such as access to work,education, etc. In this sense, smart mobility concerns itself primarily with innovative technological orconsumer-centric solutions rather than adopting a social sustainability lens to the entire mobility agenda.
Studies exploring the under-delivery of smart solutions for women are restricted to the GlobalNorth, but they have conclusively established the fact that smart solutions can be highly exclusive.Shaheen et al. [92] studied 23 bike-sharing programs in North America and found that the main obstaclesidentified for low-income groups were the need for smart devices, debit/credit cards, minimum bankbalance or deposit to cover for vandalism or theft. Although there has been a considerable increase insmartphone users in most developing countries, and this continues to grow, the actual penetrationlevel by population remains less than 50%. Further, there are examples of significant disparities inaccess to smart phones between men and women in some Asian and African countries. For example,women in India between the ages of 15–65 are 46% less likely than men to own a mobile phone, whilein Bangladesh and Rwanda women of the same age group are 62% less likely than men to use theInternet (for details, refer to Box 3).
114

Sustainability 2019, 11, 4555
Box 3. AfterAccess: Uncovering the gender gap.
AfterAccess is a large-scale data collection initiative aimed at compiling comparable information andcommunication technology indicators for countries in the Global South. The survey has focused on creatingcomprehensive mobile and Internet use database for the Global South. Funded by IDRC and conducted jointlyby DIRSI, LIRNEasia, and Research ICT Africa, AfterAccess surveys collect data on ICT access and use throughhousehold and individual surveys across 22 countries, covering a sample of 38,000 and counting. The samplingmethod allows for representation with a plus or minus 3% margin of error, and the sample sizes are large enoughto allow for gender-disaggregation of the indicators collected. Among other factors, the surveys measure thegender gaps in mobile and Internet usage. The disparities reveal a sobering picture in some Asian and Africancountries. For example, women in India between the ages of 15–65 are 46% less likely than men to own a mobilephone, while in Bangladesh and Rwanda women of the same age group are 62% less likely than men to usethe Internet.
Such analyses assist us in reflecting on the relevance of Smart Cities approach in current times. Beforeimplementing smart solutions, which are primarily based on digital interface, we need to address thegender gap of women’s (versus men’s) access to and use of ICTs and gendered barriers of use to enableevidence-based policymaking.
Source: AfterAccess: Uncovring the gender gap (https://www.idrc.ca/en/research-in-action/afteraccess-uncovering-gender-gap)
Another issue concerns the lack of digital literacy, knowledge, comfort and confidence to usesmartphones. In many emerging economies, disparities in digital literacy compound disparities inbasic literacy and reduce people’s access to smart solutions and services.
Ride-sourcing (also known as ‘on-demand-rides’ or ‘ride-hailing’) is one of the most popularforms of smart mobility. However, there have been some considerable safety setbacks because cases ofdrivers sexually assaulting female passengers have emerged from across the globe. Given the emergingdemand for safe transport services for women, women-only ride-hailing services (exclusively womendrivers and passengers) have been launched in many countries, such as Riding Pink in Malaysia,LadyDriver and FemiTaxi in Brazil, See-Jane-Go in the USA and almost a dozen similar services inIndia. In Indonesia, where people often hitch rides, two women-only, motorcycle ride-hailing services,LadyJek and Sister Jek, were launched. Ways to factor in safety in the smart solutions need immediateand urgent attention [89,93].
On the positive side, apps like Safetipin facilitate mapping exercises that can greatly enhanceweeding out unsafe spaces, corridors and routes (refer Figure 1). In 2014, Safetipin was launchedin India to help women safely navigate the city by identifying its safe and unsafe zones [94]. It is alocation-based mobile app that collects safety-related information and conduct safety audits of differentplaces by calculating a safety score. Users of the app can identify how safe certain areas are and canplan their travel routes and timings accordingly. The safety audit is based on nine parameters—lighting,openness, visibility, security, crowd, public transport (connectivity), presence of women and children, feelingsof safety and presence of footpaths or walkways. Safety scores for Nairobi are illustrated in Figure 1 (forfurther discussion, check [93]).
Each of the parameters, except for feelings (of safety), is measured objectively using a rubric andscored on a scale of 1 to 4 (from ‘poor’ to ‘good’ conditions). The safety data is available in multipleforms, including maps, reports and csv files, which can support urban stakeholders in making judiciousurban planning and monitoring decisions, such as identifying areas that need more lighting, security,CCTVs and/or public transport at night. Safetipin has now extended to more than 20 cities, includingsome outside India, such as Bogota, Manila-Quezon, Jakarta and Nairobi.
115

Sustainability 2019, 11, 4555
Figure 1. Safety score for Nairobi (source: Safetipin [95]).
Such exercises have become relatively easy, cheap and accessible to planning authorities across theworld. We urge a replication and continuous mapping of safety as part of the smart cities/mobilitiesagenda (for further discussion, check [93,96]).
The safety scores that Safetipin has generated in the case cities have driven city leaders to takeaction to improve women’s safety. In Bogotá, Safetipin has assisted policymakers in helping to createa data-driven approach to women’s safety in public space. City officials have been able to combinedata based on the safety audits with other data sources in order to better understand urban problems.For instance, the city was able to overlay maps indicating Safetipin’s security parameter rating withmaps of police station locations and incidences of crime. Based on Safetipin data, the city identifiedfive priority locations for interventions to generate a broader dialogue about women’s safety at nightthat included local operative councils for women and gender, local women’s organizations and citizens.These public engagement activities are key to educating people and changing people’s perceptionsand attitudes about women, gender and gender-based violence.
Data-driven approaches to women’s safety are increasingly being adopted in other cities as well(for example, web-based interactive map campaign ‘Free to Be’ [97]).
3.7. Feminization of Slums
This section builds on the increasing feminization of slums and spatial development rationales.It establishes links between transport and housing policies and the need for these two sectors to worktogether to facilitate women’s mobility.
Across a sample of 51 developing countries from Southern Asia, Latin America and sub-SaharanAfrica, women are more likely to live in slums than men [98]. For a majority of the countries, there are108 women living in slums for every 100 men in the same category. Living in slum conditions meansthat residents lack access to access to safe water, adequate sanitation, durable housing, sufficient livingspace and/or security of tenure.
For Kenya, housing the world’s fifth largest slum by population size, there are 13 more womenfor every 100 men living in slum conditions. The figure is 15 or more women aged 15–49 for every100 men of the same age group in other countries, including Swaziland, Gabon, Ghana, Cameroon and
116

Sustainability 2019, 11, 4555
Senegal. In Colombia about 11 and in Dominican Republic, Bolivia and India, about five more womenaged 15–49 respectively live in slum conditions than their male counterparts.
There is a further spatial layering of center vs. periphery. Lima et al. [99] underline that land usein Recife’s Metropolitan Area does not obey the center-periphery occupation pattern (European) orthe periphery-center occupation pattern (US). This observation, however, is applicable to a host ofdeveloping countries. A common denominator to urban development in the developing countries is thefact that slums and poor communities are scattered throughout the municipalities, in conurbation withthe richest neighborhoods. There are trends in some developing countries towards in-situ establishmentand legalization of the slums. For example, in the case of Recife [100], through establishing specialzones of social interests (known as ZEIS) in 1980s, legal right to the urban land of previously informallow-income settlements was recognized. This paved way for a spate of formal services being providedto the area to improve urbanization standards, provide basic infrastructure (e.g., sewage, drainage,pavement and water supply) and legal tenure of these settlements [100]. Contrary to this case, there aremyriad cases of slum relocation and allotment of low-income housing in the peripheries of urban areaswith little or no public transport available to these areas. Women remain the hardest hit group in thesereallocation schemes with loss of employment and further isolation from income-generating avenues.Majority of slum dwellers in Kolkata predominantly walk (56%) for their travel needs followed bybus travel (26%) [101]. In terms of travel distance, nearly 50% of slum dwellers commute within0.8 km, while 75% travel within 1 km. The percentage share of income on transport expendituretends to increase for slum dwellers residing away from city centre, which exhibits that slum dwellerstend to limit their travel distance in order to optimize their travel expenditure. It was observedthat with improved accessibility, per capita income of slum dwellers tends to increase due to betteraccess to work opportunities. The per capita average monthly savings of slum dwellers is moresensitive with transport accessibility than accessibility to employment opportunity highlighting theimportance of transport in improving standards of living of urban poor. In light of ‘feminizationof slums’ (refer Figure 2), which is a rapidly increasing phenomenon, there is a need to understandthe gender differences in this experience and report gender disaggregated travel patterns [102] (referBox 4).
Figure 2. Urban females aged 15–49 living in slums for every 100 males aged 15–49 living in slums,2007 or later (Source: UN Women calculations based on USAID 2018 [98]).
117

Sustainability 2019, 11, 4555
Box 4. Mobility, poverty and gender: Travel ‘choices’ of slum residents in Nairobi, Kenya.
Salon and Gulyani [103] present the gendered variations and the empowering potential of daily travels offemale slum residents. Their findings are based on one of the most comprehensive travel data collected for slumpopulation in the developing countries—survey of 4375 slum residents in Nairobi, Kenya. Analyses revealedthat though majority of the slum population could not afford any of the motorized transport options in the cityand coped by limiting their travel outside their settlement by often ‘choosing’ to walk, the burden of reducedmobility is borne disproportionately by women. Women faced distinct barriers to access, and though policiesaiming to improve mobility and transport access for the slum population first and foremost need to address theissue affordability, but specific constraints faced by women needs additional support.
The story that emerges from our analysis is that both poverty and gender matter in explaining differences inthe travel choices of working adults in Nairobi’s slums. It is expected that poverty level would affect travelchoices, but the gender effect that we find is surprisingly strong among adults. Characteristics of women’s travelare systematically distinct from those of men in this population, even when controlling for poverty level.
Policy implications—four divergent policy implications emerge from their study, and other studies confirmthat these are widely applicable in the developing contexts across the world:
i. Affordable and reliable public transport—if affordability increases—either through reduction in povertyor lower fares—women’s use of public transport will rise sharply.
ii. Child care facility—for women, children in the household greatly reduces their chances of being employed,while men become more mobile. Gainful employment takes place either by working closer to home orthrough running a household microenterprise (HME). Provision of (affordable) childcare facility canenhance employment opportunities for women.
iii. Education and employment—women reap larger mobility gains from education than do men. The increasein the likelihood of using matatu (local informal public transport) is accompanied by a large decrease inthe likelihood of being unemployed.
For rural areas, the location of market and health centers, and access to vocational trainingand higher education gains paramount importance in ascertaining how much of the benefits finallypercolate down to women. Specific and targeted interventions like providing cycles to girls in highschool (Cycle program in the state of Bihar, India) greatly reduce the ‘distance cost’ of attendingschools and related opportunities. “Comparisons with conditional cash transfer programs in otherSouth Asian contexts suggest that the Cycle program was much more cost effective at increasinggirls’ secondary school enrollment than an equivalent-valued cash transfer. Given the importance ofincreasing women’s education attainment in developing countries like India (especially in its mostunder-developed regions) and the fiscally-constrained policy environment, these results are importantand suggest that the Cycle program was not just politically popular but also much more cost-effectivethan the most frequently considered and implemented policy alternative to increase girls’ secondaryschool enrollment in developing countries in the past couple of decades (CCT’s).” [42] p. 26).
3.8. Space, Access and the Informal Economy
“Engagement with informality is in many ways quite difficult for planners. Informal spaces seemto be the exception to planning, lying outside its realm of control” [104] (p. 155). What Roy furtherargues and builds in the same paper is that though informality is the exception, it is an outcomeand product of the state. What is important to note that in the developing countries, informalityencompasses all modes of production and access to these modes of production.
At the same time, informality continues to facilitate women. Women are either equal participantsor, in some cases, dominate the informal markets, trades and usage of the informal transport modes.In urban areas, these three facets get typically expressed by:
i. Creation and adherence to land use plans without giving recognition or space to the informaluse of land, thus treating land use, social development, women empowerment and distributivejustice as separate blocks;
ii. Prioritizing car-based mobility or an imposed public transport system, which fails to bothrecognize the already existing informal modes and to cater to the majority of the population;
118
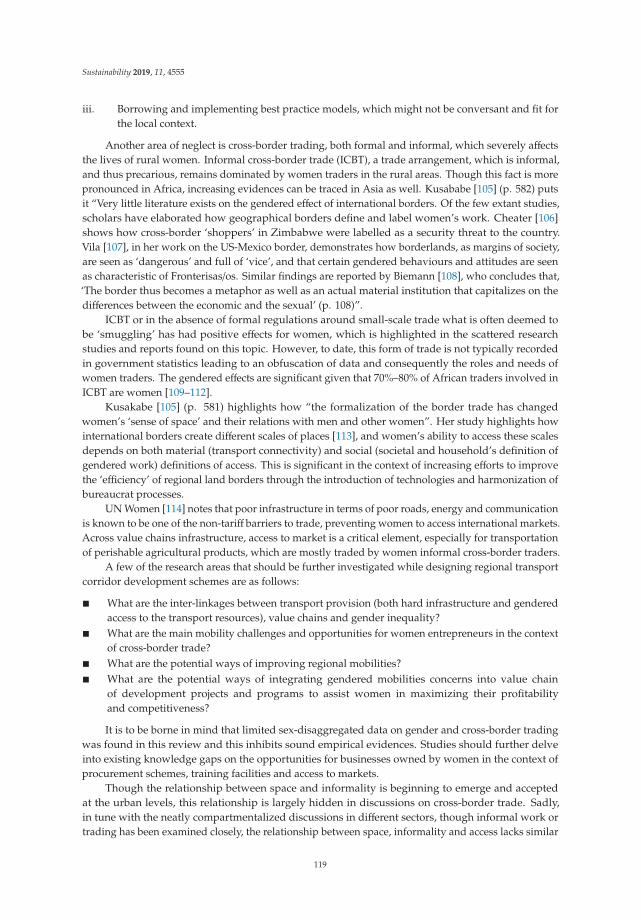
Sustainability 2019, 11, 4555
iii. Borrowing and implementing best practice models, which might not be conversant and fit forthe local context.
Another area of neglect is cross-border trading, both formal and informal, which severely affectsthe lives of rural women. Informal cross-border trade (ICBT), a trade arrangement, which is informal,and thus precarious, remains dominated by women traders in the rural areas. Though this fact is morepronounced in Africa, increasing evidences can be traced in Asia as well. Kusababe [105] (p. 582) putsit “Very little literature exists on the gendered effect of international borders. Of the few extant studies,scholars have elaborated how geographical borders define and label women’s work. Cheater [106]shows how cross-border ‘shoppers’ in Zimbabwe were labelled as a security threat to the country.Vila [107], in her work on the US-Mexico border, demonstrates how borderlands, as margins of society,are seen as ‘dangerous’ and full of ‘vice’, and that certain gendered behaviours and attitudes are seenas characteristic of Fronterisas/os. Similar findings are reported by Biemann [108], who concludes that,‘The border thus becomes a metaphor as well as an actual material institution that capitalizes on thedifferences between the economic and the sexual’ (p. 108)”.
ICBT or in the absence of formal regulations around small-scale trade what is often deemed tobe ‘smuggling’ has had positive effects for women, which is highlighted in the scattered researchstudies and reports found on this topic. However, to date, this form of trade is not typically recordedin government statistics leading to an obfuscation of data and consequently the roles and needs ofwomen traders. The gendered effects are significant given that 70%–80% of African traders involved inICBT are women [109–112].
Kusakabe [105] (p. 581) highlights how “the formalization of the border trade has changedwomen’s ‘sense of space’ and their relations with men and other women”. Her study highlights howinternational borders create different scales of places [113], and women’s ability to access these scalesdepends on both material (transport connectivity) and social (societal and household’s definition ofgendered work) definitions of access. This is significant in the context of increasing efforts to improvethe ‘efficiency’ of regional land borders through the introduction of technologies and harmonization ofbureaucrat processes.
UN Women [114] notes that poor infrastructure in terms of poor roads, energy and communicationis known to be one of the non-tariff barriers to trade, preventing women to access international markets.Across value chains infrastructure, access to market is a critical element, especially for transportationof perishable agricultural products, which are mostly traded by women informal cross-border traders.
A few of the research areas that should be further investigated while designing regional transportcorridor development schemes are as follows:
� What are the inter-linkages between transport provision (both hard infrastructure and genderedaccess to the transport resources), value chains and gender inequality?
� What are the main mobility challenges and opportunities for women entrepreneurs in the contextof cross-border trade?
� What are the potential ways of improving regional mobilities?� What are the potential ways of integrating gendered mobilities concerns into value chain
of development projects and programs to assist women in maximizing their profitabilityand competitiveness?
It is to be borne in mind that limited sex-disaggregated data on gender and cross-border tradingwas found in this review and this inhibits sound empirical evidences. Studies should further delveinto existing knowledge gaps on the opportunities for businesses owned by women in the context ofprocurement schemes, training facilities and access to markets.
Though the relationship between space and informality is beginning to emerge and acceptedat the urban levels, this relationship is largely hidden in discussions on cross-border trade. Sadly,in tune with the neatly compartmentalized discussions in different sectors, though informal work ortrading has been examined closely, the relationship between space, informality and access lacks similar
119

Sustainability 2019, 11, 4555
engagement. Studies documenting the incidence of cross-border trading highlight that internationalborders often create a space where income earning activities are being practiced, assigning both statusand new roles to women [115–117] but due to the lack of public transportation and high transportationcosts, women, in particular, faced hardships in directly accessing the market and claiming the revenues.Kusakabe [105] highlights this case through two examples drawn from Lao PDR—(i) cotton-weavingactivities in Sayaboury province, and (ii) sticky rice box production in Kammoune province.
3.9. Development Planning and Transport
Lack of gender balance in decision-making, ranging from the macro level in parliaments tocommunity and household levels have been routinely noted. Consequently, women’s perspectives andpriorities are not reflected in budget allocations and development related decisions. Seminal works likeMale Bias in the Development Process [118] highlight that male bias is easy to understand, empiricallytestable and in principle can be rectified [119].
Given that a large share of low-income women is employed in the informal market, governanceissues built on employment and related schemes need to strengthen their focus on accessibility. The factthat a large share of daily travel needs in the developing economies are met by informal public transportmodes like tuk-tuk and jitneys, such bottom-up initiatives need to be both recognized and bolstered inthe government action plans for transport, urban/rural planning and development at large. Even mostbasic infrastructure like mapping of these informal intra-city routes are largely amiss (most transportplans lean towards the case plotted in Box 5).
Women are typically less likely to find employment in the transport sector at large, but this isespecially pronounced for the developing economies. This inadvertently results in rendering women’sneeds invisible, even in the provision of informal transport, which is largely market responsive andhighly adaptable.
Box 5. National urban transport policy (NUTP) of India.
Realizing the importance of public transport and cycling and walking in the cities and equity concerns, thenational urban transport policy (NUTP) spelt out the following objectives: (i) To bring about a more equitableallocation of road space to various users through building a people-centric rather than vehicle-centric focus. (ii)To encourage greater use of public transport and non-motorized transport (NMT) modes by offering centralfinancial assistance for this purpose and (iii) to enable the establishment of multi-modal public transport systemsthat are well-integrated, providing seamless travel across modes [120]. Under the Jawaharlal Nehru NationalUrban Renewal Mission’s (JNNURM) Urban Infrastructure and Governance (UIG) component, 24.2 per cent ofthe total allocations were for transport related projects. However, 13.3 percent of the transport related projectwas road widening and flyover building and only 8.66 percent was for mass transit development and the rest forparking and other small transport projects [121]. Despite a positive shift in policy objectives and priorities, thelargest portion of the transport related funds in JNNURM were spent on road-building instead of allocatingthem to public transport projects.
The case of Dantewada, India, establishes how women can themselves tackle the deep-rootedinadequacies of the transport system, culminating from the inaction of both ‘state’ and ‘private’ actors.In the lack of any form of public transport connectivity, the tribal women of this remote rural areaorganized themselves through self-help groups. Through government-sponsored subsidy schemes,they have been successfully running E-rickshaws connecting rural markets, schools, etc (Figure 3).
The Kenyan case is also worth mentioning here (Figure 4). Though the Kenyan transport sectorremains largely male dominated, women are increasingly participating in the (informal) transportsector as owners, drivers, touts, stage clerks and fleet managers [122]. The female workers employedin the informal transport sector in Kenya comment that they have no contact with the formal socialprotection schemes as they are categorized as being ‘informal’. There are two sets of facts to beconsidered here for Global South at large. Firstly, there is a predominance of informal transport systemsin the developing countries, which might provide employment opportunities to females. Secondly,
120
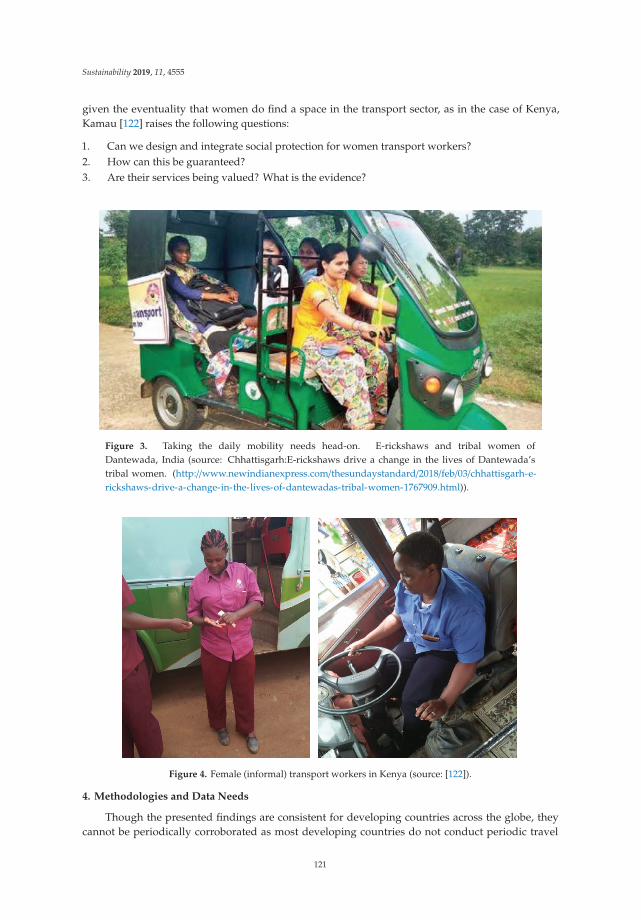
Sustainability 2019, 11, 4555
given the eventuality that women do find a space in the transport sector, as in the case of Kenya,Kamau [122] raises the following questions:
1. Can we design and integrate social protection for women transport workers?2. How can this be guaranteed?3. Are their services being valued? What is the evidence?
Figure 3. Taking the daily mobility needs head-on. E-rickshaws and tribal women ofDantewada, India (source: Chhattisgarh:E-rickshaws drive a change in the lives of Dantewada’stribal women. (http://www.newindianexpress.com/thesundaystandard/2018/feb/03/chhattisgarh-e-rickshaws-drive-a-change-in-the-lives-of-dantewadas-tribal-women-1767909.html)).
Figure 4. Female (informal) transport workers in Kenya (source: [122]).
4. Methodologies and Data Needs
Though the presented findings are consistent for developing countries across the globe, theycannot be periodically corroborated as most developing countries do not conduct periodic travel
121

Sustainability 2019, 11, 4555
surveys or qualitative evaluation of the situation. This means that the gendered patterns of differentand differentiated mobilities do not get highlighted and consequently are not acknowledged in theplanning and design processes. The increasing penetration of mobile phones, even in the remoteand poverty-stricken areas, in developing countries has to some extent changed the landscape ofhow women negotiate their daily mobilities. Developing routines and systems for data collectionon revealed, preferred and digital mobilities, thus, holds the potential of assisting policy-making.The analyses emerging from these surveys can help the research and policy-making field to commenton:
i. Given the current system, roles, jobs and gendered divisions—what are the current mobilityneeds of women (both urban and rural)?
ii. Assuming a world, where women have an increasing degree of freedom, what kind of arenaswill be available to them? For example, more female related growth of economy. We can lookat the case of advanced (and equitable) economies like Norway for the division of labor indifferent sectors. What are future mobility needs?
iii. What kind of transportation policies and investment will ensure an increased accessibilityto women?
iv. Are there systemic and systematic flaws responsible for gender-bias transport policies?v. How do land use regulations or the lack of it affect the mobilities in urban and peri-urban areas?vi. Which kinds of mobilities (both urban and rural) are being supplemented/complimented or
substituted by mobile phones?vii. How can women’s priorities and needs be included in planning and monitoring
transport systems?viii. How can transport be made affordable for women, particularly the poorest women?
Rather than advocating simple data collection, it is imperative that data collected in surveys issegregated at the level of gender, activities (land use) and time-use, which can essentially informthe transport planning authorities to take a more needs-oriented approach. Mobility-gap analysesshould form an inevitable part of routinized data collection (travel behavior surveys) and analyses.An explanation of the gap figures, for example in terms of average daily trips and time used bydifferent types of households, sheds light on the distribution of mobility opportunities among therespective genders.
Further, given the high incidence of no travel to work [123] and limited trips on a daily basis(a recent one-day trip diary from the city of Bengaluru, India revealed that only 20% of femalerespondents had taken a trip on the interview day (source: Personal correspondence, Tanu PriyaUteng), it is crucial that the popular methodology of the Global North focusing on a one-day traveldiary is not adopted in the developing economies. Instead, at least a one-week trip diary approachshould be adopted to filter out the trips that women are making over an expanded period of time(Box 6 illustrates a case from Indonesia).
Box 6. Time use allocation, transport poverty and social exclusion.
Through exploring the time use allocation and immobile behavior using a three-week time use diary collectedin Bandung metropolitan area (BMA), Indonesia (one of the first multi-day time use studies within developingcountries context), Susilo and Liu [124] establish clear differences of weekday and weekend patterns of time useallocations and mobility behaviors across different socio-demographic groups and gender. There exists a strongtendency of social exclusion due to transport poverty. As a typical patriarchal society in developing country,women are still responsible for housework and thus have a shorter contract time, free time and travel time butlonger committed time than men on both weekday and weekend. Housewives also have a particularly lowtravel time, indicating that either due to unaffordable public transport services or lack of time, they may nottravel a far distance.
122

Sustainability 2019, 11, 4555
Integrating data collection across sectors also holds the potential for addressing the needs ofwomen in a more robust and target-oriented fashion. For example, maternal mortality indicatorshave received a lot of attention and are a good indicator for demonstrating the efficiency of an entirehealth system. However, unpacking this indicator, availability of transport, availability of medicalsupplies, presence of trained health staff and access to health facility are major factors affecting maternalmortality rates. Thus, programs aiming at decreasing maternal mortality should have a detail analysisof mobility component as well. In areas where this access is problematic, complementary programsto address this issue specifically should be introduced, either through training the nurses to ridebicycles/motorbikes, providing support for owning a community cart, etc. The broad aim of buildingcapacity of the public health authorities to promote equitable access to primary health care servicesneeds to be broken down into workable components, based strictly on the contextual realities. Givensuch benchmarking, it will become easy to assess the specific kinds of alterations needed in the mobilitysystems to adapt towards gendered needs (for example, usage of mobile phones to substitute themissed trips and access information). This applies at both rural and urban levels. Community healthworkers in rural Bangladesh and Indian’s ASHA workers are both response to inaccessible hospitals inthe rural parts of developing world.
Further, there exists a need to link the ‘soft’ or qualitative information to the ‘hard’ data information.This can aid in developing a model that corresponds much more to ‘everyday transport functioning’than the much-used classical, techno-economical approach to transport model designing.
Projects can employ both traditional methods like focus groups/questionnaire surveys/measuringactual behavioral response to different measures (for example, concessionary bus cards, channelizingfeeder services, a change in the bus frequency, assistance in getting mobile phones as part of thedevelopment schemes like self-help groups, etc.), and new methods like mobile app-based datacollection, to understand the existing travel behavior and adaptive preferences of different groups.Studies conducted on these lines (e.g., [125–127]) have found that discretionary trips have a greaternumber of adaptation alternatives available from which to choose than non-discretionary work trips.This is applicable to the case of gendered mobilities in developing countries where a major shareof women’s trips caters to discretionary purposes of combining various household/social/shoppingrelated purposes.
Analyses of travel behavior, constraints and accessibility need to be triangulated and complementquantitative and qualitative data collection techniques.
4.1. Roadmap to Applied Research
4.1.1. Travel Survey
Travel survey data contains relevant information on all personal daily mobility, includinginformation on multimodal trips, transport modes, distances and times. Such datasets additionallycontain an extensive list of respondent and trip background variables, including socio-demographics,occupational status, home and work locations (possibly multiple), weekly working hours, occupationalstatus, education, income, etc. Such datasets are generally not collected in the developing countries orcollected as an adhoc exercise rather than being part of a regular data collection regime. We suggestusing both the traditional and wherever applicable, the mobile interface to collect this dataset in thedeveloping countries. Given the high penetration of mobile phones in the developing countries, anapp-based method can be a viable option for data collection in the urban areas.
A one-day trip diary will invariably fail to capture the nuances of women’s movement as there isa strong prevalence of a no-trip phenomenon on single days. Thus, the least time period assigned fortrip data collection should be a one-week period to capture the clustered travel phenomenon.
Existing studies demonstrate that the use of location-based technologies reduces missing dataon travel days and trips and improves the accuracy of departure/arrival locations and times overtraditional travel survey data [128]. Modules are already available to extract the entire travel diary by
123
Sustainability 2019, 11, 4555
accessing the smartphone data provided by the telephone operators. This data can be further enrichedwith local and regional spatial data from external sources, such as Open Street Maps, census, registerand cadastral data.
4.1.2. Attitudinal and Preference Survey
Attitudinal and preference travel survey distributed over different types of residentialenvironments (inner-city, outer-urban, suburban, peri-urban and rural) and population categorieswithin these regions will assist in capturing habits, attitudes, subjective well-being, perceived barriersand motivations with regard to the access to health, education, and employment opportunities [129].Background information on personal and household attributes, preferences and lifestyles should alsobe collected as part of this exercise.
4.1.3. Multi-Sited Ethnography Combined with In-Depth Traveller Interviews
Quantitative data inquiries should ideally be preceded and paralleled by collection and analysisof qualitative data. This is necessary not only to provide a full understanding of mobility experiences,barriers and motivations underlying the decision-making process of multimodal route, access,egress and transfer practices, but also to ensure that key questions are adequately identified forthe quantitative surveys.
4.1.4. Document Analysis and Informant Interviews
Document analysis and informant interviews form an important research tool in mobility mappingthrough (i) examining documents and records relevant to regional and urban policy-packaging, andsectoral development decisions having spatial dimension and (ii) key-informant interviews. Use ofdocumentary analysis has become quite popular in transport research, especially when we are tryingto evaluate the impact of an initiative. For example, a national government led approach to increaseaccess to health facilities. Key informants, including politicians, international funders, policy makers,humanitarian organizations, the local and regional authorities, ministry officials directly involved indecision making on sustainable transport, etc., should be engaged to shed light on the topic of mobilityand its inter-sectoral development dimensions. These experts can provide valuable insights whenmaking recommendations for solutions.
4.1.5. Exploring the Links Between Activity Participation and Subjective Well-Being
Concepts, terminologies and the will to explore linkages between the quality-of-life (QOL),subjective wellbeing (SWB) and daily travel have taken roots in the western research world in the pastdecade. This strand of research is primarily absent in the Global South. This could be partly due to lackof data for conducting robust studies to explore the relationship between QOL, SWB and daily travel.We propose that statistical methods like choice modeling, structural equation models, factor/cluster,etc. should be employed to identify and estimate the links between gender, daily travel times, timeuse, subjective well-being (SWB) and the extent to which the overall quality of life is affected by lackof access.
Studies based on similar approaches suggest important gender differences in activity participation,travel time, time use outcomes and resultant SWB [130]. They further find that travel times wereunassociated with SWB for both genders. Instead, results were consistent with travel times serving asinputs in activity participation and therefore—at least for women—indirectly contributing to higherlevels of SWB. These findings suggest that focusing on activity participation as a chief policy objectivecould yield higher quality of life benefits than a policy focus on travel time savings [130] (p. 10).
Transport planning in the Global South has been dominated by the logic of travel time savings,underpinning decisions on building highways, flyovers and road expansion programs. The field hassimultaneously and consistently failed to serve a majority of the population. We therefore propose a
124

Sustainability 2019, 11, 4555
shift in the transport planning approach—shifting the focus from travel time reductions as the chiefpolicy objective to a focus on activity participation, enhanced SWB and QOL.
Activity participation should ideally be analyzed at the macro, meso and micro levels and policiesdesigned for these three levels should be interlinked and complement each other (refer Table 1).
Table 1. Typology levels.
Spatial Level Methodology Output
Macro-regional/city level
Mapping of interaction betweenland use and accessibility;app-based survey plotting thetravel behavior, travel impedances,public transport route mapping,time use studies, mapping activityparticipation, personal interviews,ethnographic studies, documentanalysis and popular mediadiscourse and history of planningto unearth biases.
Accessibility mapping; routemapping; time use mapping andmobility potential of women (andspecifically low-income women)
Meso-zonal level
Questionnaire surveys, mappingactivity participation,ethnographic studies and focusgroups.
Accessibility levels to i. Work; ii.Education; iii. Socialopportunities; iv. Health amenitiesand v. Training facilities.
Micro-ward level
Safety audits, walkability andbikeability audits; assessment ofwalking and bicyclinginfrastructure and mapping unsafeareas, routes, hotspots.
Micro-level information, whichcan be collated and scaled up. Forex. design interventions based onlocal conditions.
4.1.6. Accessibility Mapping
Continuing the above discussion, there is a dominance of the transport modeling approach basedon the logics of travel-time savings underpinning the major transport infrastructure projects. Rarely iscomprehensive land use and transport interaction (LUTI) models employed in the Global South to seethe linkages between land use/activity participation and transport infrastructure provision.
We proposed that mapping of the interactions between accessibility with different transportmodes to different land uses, and facilities like schools, employment and health centers, be undertakenfor informing the design and implementation of transport infrastructure like public transport routes,bicycle network, etc.
In the following example, we presented a similar exercise for Bergen, Norway based on InMap (asimplified LUTI model), which links job accessibility by bicycle (and E-bike) and the land use plans(refer Figures 5 and 6). In this case, the supply of land was determined by the local municipalitiesthrough land use plans, while the demand for the land was estimated as a function of the accessibilityto jobs, trade, general services and health services in the areas (from comparing E-bike accessibilitywith the land use growth potential, the authors found that it was possible to develop land use strategiesto enhance the use of E-bikes. High job-accessibility with E-bikes close to the city centers supportsthe current general strategy of pursuing high density developments/transformation projects in theseareas. The findings that the green field development areas were, in general, not found to provide anysubstantial accessibility with E-bikes).
125

Sustainability 2019, 11, 4555
Figure 5. Accessibility with bicycle and growth potential, Bergen, Norway. (Source: [131]).
Figure 6. Accessibility with E-bike and growth potential, Bergen, Norway. (Source: [131]).
5. Research Gaps and Recommended Research Directions
The research gaps identified in this study deal with the following three components and theinterface between these components: (i) Organization/governance, (ii) infrastructure provision andplanning and (iii) travel (spatial) behavior culture/education. These three components can be furtherbroken down to address the specificities of rural, urban and peri-urban areas. The relationship betweengender and transport should underline all developmental policies—social protection programs, welfarepolicies, rural development, slum resettlement programs and urban planning policies. We commentspecifically on the identified research gaps and research directions in the following points.
126

Sustainability 2019, 11, 4555
5.1. RESEARCH GAP 1: Inclusion of Gender from the Costs–Benefits Analyses, Which are Typically Used toJustify Investments Promoting Male-Biased Car-Based Urban Mobility
Research direction: How can we insert gender in the equation of costs–benefits assessments andother routinized protocols that are used for decision making?
Accessibility to employment, health and education opportunities have tangible, economic benefits.These numbers can be calculated, and easy to convert into economic indicators. If these indicatorsare taken into the cost–benefit assessments, then the chances of prioritizing transport infrastructurefacilitating public transport, walking and cycling will be substantially increased.
It is of utmost importance that research findings are linked to policy making and programformulation. Currently, we have active research engagement on the topic of gender, transport andspatial planning in the Global South and yet the research findings are almost routinely ignored inpolicy making and seldom taken forward at the program formulation stage.
5.2. RESEARCH GAP 2: Acceptance of the Importance of (Affordable and Connected) Public TransportProvision for Facilitating Women in Transport Policy and Program Formulations
Research direction: What kind of capacity, knowledge and cooperation modalities need to bebuilt to include both formal and informal public transport systems in the different hierarchies oftransport plans?
How should we design specific programs on the tax structure for public transport and fundallocation to prioritize PT (Public transport)?
A most basic and simple message is to prioritize public transport over providing for cars. Informalpublic transport options like shuttle bus, jitneys, boda-boda, etc. should be included in the differenthierarchies of transport planning from national, regional to local transport plans. Provide adequate taxbenefit and subsidies to promote public transport. Address issues of unsafe running and operation ofthe informal public transport modes. Design policies to respond to the ‘special needs’ of women interms of trip duration, access-egress, length, trip-chaining and trip purposes (with special reference toaccompanying trips—traveling with children, elderly, etc.).
Research direction: How can we insert economic support systems in the welfare domain toaddress transport affordability issues for low-income women of the developing economies?
Affordability (and thereby accessing public transport) is a major impediment for low-incomewomen. This is further compounded if the employment spaces of women living in slum and squattersettlements are hit by resettlement programs. Programs to address affordability issues needs to besewed in with other welfare programs. Free public transport tickets, bicycles and other innovativesolutions can have positive impacts on low-income women’s access to education, employment andhealth opportunities.
5.3. RESEARCH GAP 3: Focus on Efficiency of Formal Sector Mobility and Transport System PerformanceTakes Precedence over Provision for Accessibility to Services and Opportunities for the Informal Economy andCommunities
Research direction: How to incorporate the transport needs for informal economy engaged inregional trade into formal regional transport corridor developments?
Research direction: How to fuse spatial development and relocation policies to cater to women’sopportunities with respect to education, health and employment?
Conduct accessibility mapping for different transport modes and prioritize areas for future growththat support walking and bicycling. In areas that are already built, create infrastructure that ensuressafe walking and bicycling.
Further, it is vital that land use planning and development programs recognize and make spacefor informality, as informal markets provide the lion share of working space available to low-incomewomen in both rural and urban parts of the developing world.
127
Sustainability 2019, 11, 4555
Route mapping and route planning of both the formal and informal public transport supply canaid in linking low-income areas to the employment and education hubs.
Develop toolkits for the incorporation of informal economy engaged in cross-border flows intoregional transport corridor planning
5.4. RESEARCH GAP 4: Integration with Other Sectors is Missing—Transport is Operated as a SeparateSector without Recognizing its Deep Connections to the Health, Employment and Education Domains
Research direction: How to frame a multi-sectoral approach—ensure the mobility for women(both urban and rural) to ensure their access to employment/markets, education and health centers?
Link policies of other social development sectors with the transport sector. Welfare and socialprotection programs can be built around the issue of access to promote access to education, health andemployment (refer to the cycling program of Bihar, India).
5.5. RESEARCH GAP 5: Lack of Clear and Visible Efforts to Map and Address Safety Concerns and Incidencesof Women on the Move
Research direction: What are the exact policies, programs and tools needed to enhance women’spersonal safety? How to design more gender-sensitive public transport, walking and cycling space?
Safety is a major concern for women. Spatial and transport projects need to prioritize creatingsafe spaces at both macro and micro levels. At the macro level, smart solutions like Safetipin apps andsafety auditing routines can be employed to map unsafe areas. Mapping without following up will bea wasted endeavor. Protocols need to be established on how to transform these unsafe areas, routes,etc. into safe, accessible areas [132].
At the micro level, for example, for spaces within the public transport, bus drivers and busconductors need to be trained to deal with situations of sexual harassment. When the driver orconductor themselves are found to be culprits, punitive measures need to be in place for dealing withsuch actions [133].
Further, there exists a strong need for putting more emphasis on non-work related travel issuesconcerning trips made for care, household and household-based industry works.
5.6. RESEARCH GAP 6: Labour Issues—Social Protection Programmes are not Linked with Employment in the(Informal) Transport Sector and Lack of Efforts to Address Male-Dominance in the Transport Sector Workforce
Research direction: How can we encourage more female participation in the spatial planning andtransportation sector?
How can the stigma and discrimination associated with women in the transport industry—especially in roles like driver, conductors, etc.—be tackled? How can laws that restrict women’sparticipation in the transportation sector be removed?
Women face high levels of discrimination to both enter and work in the transport sector, which isoften supported by restrictive laws in some developing countries (refer Figure 7).
Typically, women are either absent or marginally present on the different levels of transportdomain. Actively encouraging and engaging women in the transport field, through targeted programs,can have major impact on the future of this field. The current transport field has blatantly ignoredthe needs and preferences of women, which may be corrected through inserting women in this sector.A first step could be to collect data on female employment both in the formal and informal transportsector and chart out ways to protect these workers through social protection programs.
128

Sustainability 2019, 11, 4555
Figure 7. Legal restrictions on women’s employment in the transport sector (Source: [134]) Note:Ukraine removed restrictions after the data collection period ended.
5.7. RESEARCH GAP 7: Lack of Smart City, Smart Solutions Research from an Inclusive Perspective
Research direction: How can we design smart mobility and smart-city solutions to createinclusive settlements?
Smart cities and smart mobility solutions have changed the ways in which urban areas are beingplanned, utilized and consumed. It is vital that the element of inclusive settlements is inserted in thisdevelopment on an immediate and urgent basis to avoid further pitfalls. Questions like who has accessto these solutions? Who are the current users? How can we facilitate access to the other groups? Whatkind of solutions are needed? Are solutions based on bottom-up feedbacks? etc. needs to be routinelyasked, monitored and fed into design solutions.
5.8. RESEARCH GAP 8: Lack of Simple, Standard Indicators
Research direction: How can the findings emerging on gender and transport be supported bysimple (and non-complex) indicators for the benefit of policy makers?
How can programs like the results-based budgeting technical assistance (TA), which the WorldBank has adopted in the field of Health Planning, be designed and developed in the field of transportplanning in the developing economies?
The knowledge generated through periodic assessments and estimations of the macroeconomicand welfare effects of creating accessible (education, health and employment) opportunities, couldpotentially benefit two important groups of policy makers and government stakeholders—(i) officialsresponsible for infrastructure evaluating road construction programs as economic investments and(ii) welfare sector officials focused on promoting gender equality, social development and povertyreduction. For the first set of officials, core area of interest revolves around the relationship betweenthe provision of road infrastructure and national income growth as measured by GDP metrics whilethe second group is interested in social development outcomes. These two analytical perspectives areseldom brought together to complement each other. Through creating the simple, standardized andcontext-informed methodology for the measurement of economic and social impact of road buildingand other transport intervention programs, both sets of policy concerns can be monitored.
Simple indicators, however, run the risk of oversimplifying situation, yet they hold the potentialfor providing an overview to the policy-makers. Indicators should be developed and routinely used,
129

Sustainability 2019, 11, 4555
but subjected to periodical assessment and upgrading, based on both quantitative and qualitativeassessments and contextualization.
5.9. RESEARCH GAP 9: Traffic Accident Data is Under-Reported and not Sex Disaggregated
Research direction: Collect sex-disaggregated data on traffic accidents, which should include allforms of mobility—walking, cycling, public transport and car-based accidents.
Pedestrians form the biggest group who get either seriously injured or die in traffic accidents.If we analyze the predominance of walking among women in the developing countries, it will be nosurprise that a greater number of (pedestrian) women might be dying in traffic accidents and yet a sexdisaggregated analysis of traffic deaths remains unavailable. Disaggregated data analyses can assist inanswering questions on the spatiality and temporality dimensions of the accidents—where (locations)and when (time) are male and female respectively meeting accidents?
5.10. RESEARCH GAP 10: Unpacking the Linkages Between Feminization of Informal Settlements, Relocationand Livelihood Opportunities
Research direction: Collect sex-disaggregated data on livelihood issues in light of relocation.Informal settlements are increasingly becoming feminized with a relatively higher concentration of
females than males living in slums in the developing world. Relocation decisions impact livelihoods ofwomen to a much greater extent than men. Access to employment opportunities that suits the livelihoodprofile of slum women is hardly ever brought forth in relocation decisions. The interconnection betweenlivelihood and spatiality needs to be out in focus.
5.11. RESEARCH GAP 11: Knowledge on Mobility Options and Cross-Border Trading
Research direction: A few of the research areas that should be further investigated while designingregional transport corridor schemes are as follows:
� What are the inter-linkages between transport provision (both hard infrastructure and genderedaccess to the transport resources), value chains and gender inequality?
� What are the main mobility challenges and opportunities for women entrepreneurs in the contextof cross-border trade?
� What are the potential ways of improving regional mobilities?� What are the potential ways of integrating gendered mobilities concerns into value chain
of development projects and programs to assist women in maximizing their profitabilityand competitiveness?
6. Conclusions
We have looked at the specificities of women’s mobility and its implications for transport planningalong with urban, regional, rural and social planning. We posit that the multiplicity of the issuesinvolved in understanding a complex topic like gendered mobilities with both its traditional andemerging ‘smart’ variant necessitates that we borrow and build on a host of theories and analyses. To thatend, we have used a combination of socio-psychological and feminist theories, socio-technical transitiontheory, mobility biographies and social practice theory framework to frame a discussion around thedifferentiated patterns of women’s transport needs, usage and implications for future planning.
Currently, the transport sector in the Global South is becoming aware of the environmentalconsequences but is grappling with how to balance the development and the environmental agenda.Given this scenario, government agencies would do well to understand how the environmentalmeaning operates. If environmental meaning is a better retention mechanism than a recruitmentmechanism, then appeals to environmental sustainability or reduced carbon footprint are not likely tochange user behavior. Determining effective mechanisms for recruitment to sustainable mobility isan important agenda and our analysis reveals that women could be champions here. They exhibit
130

Sustainability 2019, 11, 4555
sustainable travel behavior and yet continue to be ignored. Transport systems will benefit greatlyby becoming gender-responsive as the sector can then simultaneously cater to the three pillars ofsustainable development—environment, social and economic pillars. As an initial step, it would beuseful to have a simple and overarching framework that underlines the relevance of transport towomen’s employment/livelihoods/income security and unpaid domestic care work (i.e., ‘production’and ‘reproduction’). In other words, mobility/transport are needed to facilitate women’s access tomarkets and jobs and to facilitate their access to services (e.g., health centers, schools, childcare centers,shops, etc.). Additionally, the transport sector itself can be a source of employment for women,contributing to becoming a source of livelihood but more essentially, influencing the norms dictatingthe field of transport at large to be more mindful of women’s needs and preferences. Traditionally, thenorms governing the transport sector remains heavily male dominated in terms of both employmentand a technical orientation. Issues regarding safety, affordability, accessibility, availability, acceptabilityand accommodation are vital and need to be taken into transport design and planning.
The transport field is undergoing huge transitions both from a policy perspective with addedimpetus of Agenda 2030, and practice perspective with insertions of smart solutions. In light ofthese developments, the policy focus is actively promoting a shift from car-based daily mobility toa more sustainable one. However, given the prevalent ‘norms’ in the transport field, focus on ‘hard’infrastructure persists and social-psychological elements benefitting women’s daily mobilities areroutinely ignored. Practice theory, for example, could be employed here to highlight and explain useradoption of innovations and provide for a richer understanding of the micro-phenomena that takesplace on different life stages by which these stages can be targeted in the right manner. In light of thesocial (sustainable) practices adopted by women at large, the process of recruitment/defection andretention/reproduction needs to be better understood. In the parlance of practice theory, how a practicesuch as walking, bicycling and public transport usage can undergo formation and reformation in amanner that it can sustain itself needs to be studied.
The ways in which different groups of women engage with different forms of mobilities varyaccording to the life-stage, conditions and contextual circumstances. This set of knowledge, on uservariations, offers tools for promoters with which the sustainable practices of majority of women can beupscaled to a mainstream or dominant practice of daily mobility. The relationship between user andpromoter circumstances and conditions is not static, but co-evolutionary. Promoters respond to howusers actually use their products and services, and, in this regard, every transport decision needs to beunpacked and scrutinized as a product delivery with an open discussion on who constitutes the targetcustomers. These analyses, for example, can be used to bolster the agenda of creating the walking- andbiking-friendly cities.
Further, the authorities need to seriously engage with the foremost issue of ‘How to make datacollection and analyses routinized processes?’. Links between transport and housing policies shouldbe inserted in land use, housing and relocation decisions. The research gaps identified so far highlightthat very few studies have looked at the interactions between urban housing policies and accessibilitywrt subsidized housing, establishment of resettlement colonies and loss of livelihoods of women.
Studies on governance and cross-border trade should discuss ways in which firstly, informality isrecognized and secondly, the transport sector is restructured to facilitate women’s employment bothwithin and outside the transport sector.
Additionally, how can the transport sector engage with women’s organizations to hear their needsand demands? Such analyses should be carried at micro, meso and macro levels to ensure that local,regional and international (wrt cross-border trading) markets are available to women for expandingtheir capabilities.
From a methodological perspective, a multi-method approach (e.g., [135]) should be adoptedto integrate both qualitative and quantitative data in knowledge generation and decision making.Plotting of existing data on travel behavior and survey data on individuals’ subjective and self-reportedpreferences, acceptance of different mobility options, and attitudes related to the adoption of the
131
Sustainability 2019, 11, 4555
proposed solutions can be a suitable starting point. An easily accessible way to move forward wouldbe through creating predictive scenarios of travel behavior by interlinking demographics data withtravel behavior. Such interlinking should be augmented through identification of major trends anddriving forces in the past and projections for future. Along with mapping out the gender effects, thesescenarios could be used to discuss and assess the environmental, social and economic impacts of theprojected travel behavior and future mobility. For the regulating and implementing agencies, suchscenario assessments will map out the opportunities and challenges involved in formulating policiesand programs to reach sustainability goals and assess the scale of the required changes. Ways tosew this knowledge into the specifics of designing social protection programs or niches for transitiondemands further exploration. The case of the Cycle program for rural students in the state of Bihar,India is an excellent example of such a niche.
Author Contributions: Both authors were involved in drawing the conceptual plan of this article. T.P.U. framedand wrote the first draft of the article, while J.T. provided valuable inputs on the content, structure and framing ofthe final draft.
Funding: This research was funded by UK AID through the UK Department for International Developmentunder the High-Volume Transport Applied Research Program, managed by IMC Worldwide. Discussions onthe ‘smart’ elements are inspired from a similar study conducted in the Global North by Dr. Priya Utengfor a Nordic Flagship Project SHIFT, funded by The Nordic Energy Research (grant number 77892) http://www.nordicenergy.org/flagship/project-shift/.
Acknowledgments: We remain deeply grateful for the constructive comments received by theanonymous reviewers.
Conflicts of Interest: The authors declare no conflict of interest.
References
1. Urry, J. Sociology beyond Societies. Mobilities for the Twenty-First Century; Routledge: London, UK, 2000.2. Sheller, M.; Urry, J. The new mobilities paradigm. Environ. Plan. A 2006, 38, 207–226. [CrossRef]3. Schipper, L.; Fabian, H.; Leather, J. Transport and Carbon Dioxide Emissions: Forecasts, Options Analysis, and
Evaluation; ADB Sustainable Development Working Paper Series; ADB: Mandaluyong, Philippines, 2009.4. Singh, S.K. Urban transport in India: Issues, challenges, and the way forward. Eur. Transp. 2012, 52,
1825–3997.5. Richardson, B.C. Sustainable transport: Analysis frameworks. J. Transp. Geogr. 2005, 13, 29–39. [CrossRef]6. Kaijser, A. How to describe large technical systems and their changes over time. In Urban Transport
Development: A Complex Issue; Jönson, G., Tengström, E., Eds.; Springer: Berlin/Heidelberg, Germany, 2005.7. Razavi, S. Indicators as Substitute for Policy Contestation and Accountability? Some Reflections on the
2030 Agenda from the Perspective of Gender Equality and Women’s Rights. Glob. Policy 2019, 10, 149–152.[CrossRef]
8. UN Women. Turning Promises into Action: Gender Equality in the 2030 Agenda for Sustainable Development; UNWomen: New York, NY, USA, 2018.
9. Turner, J.; Fouracre, P. Women and Transport in developing countries. Transp. Rev. 1995, 15, 77–96. [CrossRef]10. Priya Uteng, T. Gender and Mobility in the Developing World; The World Bank: Washington, DC, USA, 2012.11. Kronsell, A.; Rosqvist, L.S.; Hiselius, L.W. Achieving climate objectives in transport policy by including
women and challenging gender norms—The Swedish case. Int. J. Sustain. Transp. 2015. [CrossRef]12. Levin, L.; Faith-Ell, C. How to apply Gender Equality Goals in Transport and Infrastructure Planning.
In Workshop 3: Smart Mobilities, Planning and Policy Processes—Gender and Diversity Mainstreaming; Nos-Shworkshop series; VTI: Stockholm, Sweden, 17–18 September 2018.
13. Ajzen, I. The theory of planned behaviour. Organ. Behav. Hum. Decis. Process. 1991, 50, 170–211. [CrossRef]14. Schwartz, S.H. Normative influence on altruism. In Advances in Experimental Social Psychology; Berkowitz, L.,
Ed.; Academic Press: New York, NY, USA, 1977; Volume 10, pp. 221–279.15. Verplanken, B.; Aarts, H.; Van Knippenberg, A. Habit, information, acquisition, and the process of making
travel mode choices. Eur. J. Soc. Psychol. 1997, 27, 539–560. [CrossRef]16. Dijst, M.; Farag, S.; Schwanen, T. A comparative study of attitude theory and other theoretical models for
understanding travel behaviour. Environ. Plan. A 2008, 40, 831–847. [CrossRef]
132

Sustainability 2019, 11, 4555
17. Connell, R.W. Gender; Polity Press: Cambridge, UK, 2002.18. Acker, J. Inequality regimes: Gender, class and race in organizations. Gend. Soc. 2006, 20, 441–464. [CrossRef]19. Kronsell, A. Gendered practices in institutions of hegemonic masculinity: Reflections from feminist standpoint
theory. Int. Fem. J. Politics 2005, 7, 280–298. [CrossRef]20. Hirdman, Y. Genus—Om det Stabilas Föränderliga Former; Liber: Malmö, Sweden, 2001.21. Geels, F. Technological transitions as evolutionary reconfiguration processes: A multi-level perspective and
a case-study. Res. Policy 2002, 33, 897–920. [CrossRef]22. Grin, J.; Rotmans, J.; Schot, J. Transitions to Sustainable Development. New Directions in the Study of Long-Term
Transformative Change; Routledge: New York, NY, USA, 2010.23. Kemp, R.; Avelino, F.; Bressers, N. Transition management as a model for sustainable mobility. Eur. Transp.
2011, 47, 25–46.24. Rip, A.; Kemp, R. Technological change. In Human Choice: An Climate Change; Rayner, S., Malone, E.L., Eds.;
Battelle Press: Columbus, OH, USA, 1998; pp. 327–399.25. Rotmans, J.; Loorbach, D. Towards a Better Understanding of Transitions and Their Governance. In Transitions
to Sustainable Development. New Directions in the Study of Long Term Transformative Change. Part II; Grin, J.,Rotmans, J., Schot, J., Eds.; Routledge: New York, NY, USA, 2010; pp. 105–220.
26. Schwanen, T.; Banister, D.; Anable, J. Scientific research about climate change mitigation in transport: Acritical review. Transp. Res. Part A 2011, 45, 993–1006. [CrossRef]
27. Beige, S.; Axhausen, K.W. Interdependencies between turning points in life and long-term mobility decisions.Transportation 2009, 39, 857–872. [CrossRef]
28. Scheiner, J. Mobility biographies: Elements of a biographical theory of travel demand. Erdkunde 2007, 61,161–171. [CrossRef]
29. Schoenduwe, R.; Mueller, M.G.; Peters, A.; Lanzendorf, M. Analysing mobility biographies with the lifecourse calendar: A retrospective survey methodology for longitudinal data collection. J. Transp. Geogr. 2015,42, 99–109. [CrossRef]
30. Chatterjee, K.; Scheiner, J. Understanding changing travel behaviour over the life course: Contributions frombiographical research. In Proceedings of the 14th International Conference on Travel Behaviour Research,Windsor, UK, 19–23 July 2015.
31. Chatterjee, K.; Sherwin, H.; Jain, J. Triggers for changes in cycling: The role of life events and modificationsto the external environment. J. Transp. Geogr. 2013, 30, 183–193. [CrossRef]
32. Clark, B.; Lyons, G.; Chatterjee, K. Understanding the process that gives rise to household car ownershiplevel changes. J. Transp. Geogr. 2016, 55, 110–120. [CrossRef]
33. Priya Uteng, T.; Julsrud, T.E.; George, C. The role of life events and context in type of car share uptake:Comparing users of peer-to-peer and cooperative programs in Oslo, Norway. Transp. Res. Part D Transp.Environ. 2019, 71, 186–206. [CrossRef]
34. Müggenburg, H.; Busch-Geertsema, A.; Lanzendorf, M. Mobility biographies: A review of achievementsand challenges of the mobility biographies approach and a framework for further research. J. Transp. Geogr.2015, 46, 151–163. [CrossRef]
35. Sattlegger, L.; Rau, H. Carlessness in a car-centric world: A reconstructive approach to qualitative mobilitybiographies research. J. Transp. Geogr. 2016, 53, 22–31. [CrossRef]
36. Reckwitz, A. Toward a Theory of Social Practices: A Development in Culturalist Theorizing. Eur. J. Soc.Theory 2002, 5, 243–263. [CrossRef]
37. Schatzki, T. Where the Action Is (On Large Social Phenomena Such as Sociotechnical Regimes). SPRG WorkingPaper 1. 2011. Available online: http://www.sprg.ac.uk/uploads/schatzki-wp1.pdf (accessed on 29 April2018).
38. Pantzar, M.; Shove, E. Understanding innovation in practice: A discussion of the production and re-productionof Nordic Walking. Technol. Anal. Strateg. Manag. 2010, 22, 447–461. [CrossRef]
39. Priya Uteng, T.; Lucas, K. The Trajectories of Urban Mobilities in the Global South: An introduction. In UrbanMobilities in the Global South; Priya Uteng, T., Lucas, K., Eds.; Taylor & Francis: Abingdon, UK; Routledge:New York, NY, USA, 2017.
40. Levy, H.; Voyadzis, C. Morocco—Socio-Economic Impact of Rural Roads; Operations Evaluation Department,World Bank: Washington, DC, USA, 1996.
133
Sustainability 2019, 11, 4555
41. Porter, G. Transport planning in sub-Saharan Africa. Progress report 1. Improving access to markets andservices. Prog. Dev. Stud. 2007, 7, 251–257. [CrossRef]
42. Muralidharan, K.; Prakash, N. Cycling to School: Increasing Secondary School Enrollment for Girls in India;Working Paper 19305; National Bureau of Economic Research: Cambridge, UK, 2013; Available online:https://www.nber.org/papers/w19305 (accessed on 29 April 2018).
43. Porter, G.; Hampshire, K.; Abane, A.; Munthali, A.; Robson, E.; Mashiri, M.; Tanle, A.; Maponya, G.; Dube, S.Child Porterage and Africa’s Transport Gap: Evidence from Ghana, Malawi and South Africa. World Dev.2012, 40, 2136–2154. [CrossRef]
44. Carr, M.; Chen, M. Globalization, Social Exclusion and Work: With Special Reference to Informal Employment andGender; Working Paper No. 20; Policy Integration Department World Commission on the Social Dimensionof Globalization, ILO: Geneva, Switherland, 2004.
45. Houpin, S. Urban mobility in the Mediterranean CMI. In Proceedings of the Session C: Structuring TransitSystem and Urban Integration, Urban Mobility Program Damascus Regional Conference, Damascus, Syria,13 April 2009.
46. Kabeer, N. Globalization, labor standards, and women’s rights: Dilemmas of collective (in) action in aninterdependent world. Fem. Econ. 2004, 10, 3–35. [CrossRef]
47. Absar, S.S. Conditions, concerns and needs of garment workers in Bangladesh. Dev. Bull. 2000, 51, 82–84.48. Kantor, P. A Sectoral Approach to the Study of Gender Constraints on Economic Opportunities in the
Informal Sector in India. Gend. Soc. 2002, 16, 285–302. [CrossRef]49. Schuler, S.R.; Hashemi, S.M.; Riley, A.P. The Influence of Women’s Changing Roles and Status in Bangladesh’s
Fertility Transition: Evidence from a Study of Credit Programs and Contraceptive Use. World Dev. 1997, 25,563–578. [CrossRef]
50. Mayoux, L. Questioning Virtuous Spirals: Micro-Finance and Women’s Empowerment in Africa. J. Int. Dev.1999, 11, 957–984. [CrossRef]
51. Ahmed, S.M.; Chowdhury, M.; Bhuiya, A. Micro-Credit and Emotional Well-Being:Experience of Poor RuralWomen from Matlab, Bangladesh. World Dev. 2001, 29, 1957–1966. [CrossRef]
52. Amin, R.; Pierre, M.; Ahmed, H.; Haq, R. Integration of an Essential Services Package (ESP) in ChildReproductive Health and Family Planning with a Micro-Credit Program for Poor Women: Experiences froma Pilot Project in Rural Bangladesh. World Dev. 2001, 19, 1611–1629. [CrossRef]
53. Omorodion, F.I. Rural Women’s Experiences of Micro-Credit Schemes in Nigeria, Case Study of Esan Women.J. Asian Afr. Stud. 2007, 42, 479–494. [CrossRef]
54. Perry, D. Micro Credit and Women Money-lenders: The Shifting Terrain of Credit in Rural Senegal. Hum.Organ. 2002, 61, 30–35. [CrossRef]
55. Pitt, M.; Shahidur, R.K.; Cartwright, J. Does Micro-Credit Empower Women? Evidence from Bangladesh; The WorldBank, Policy Research Working Paper Series, 2998; The World Bank: Washington, DC, USA, 2003.
56. Izugbara, C.O. Gendered Micro-Lending Schemes and Sustainable Women’s Empowerment in Nigeria.Community Dev. J. 2004, 39, 72–84. [CrossRef]
57. Nigam, A. Give Us Credit: How Access to Loans and Basic Social Services Can Enrich and Empower People; UNICEF:New York, NY, USA, 2000.
58. Gupta, S.; Sharma, A.K. A Causal analysis of Public Sector Working Women’s Mobility in Navi Mumbai:Lessons for Policy Formulation. In Proceedings of the CODATU IX Conference, Mexico City, Mexico, 11–14April 2000.
59. Desai, R.; Parmar, V.; Mahadevia, D. Resettlement, mobility and women’s safety in cities. IIC Q. 2017, 43,65–76.
60. World Bank. Safe, Clean, and Affordable. Transport for Development; Transport Sector Board, World Bank:Washington, DC, USA, 2008.
61. Thaddeus, S.; Maine, D. Too far to walk: Maternal mortality in context. Soc. Sci. Med. 1994, 38, 1091–1110.[CrossRef]
62. Mlay, R.; Chuwa, M.; Smith, H. Emergency referral transport needs of pregnant women in rural Tanzania.Afr. J. Midwifery Womens Health 2010, 4. [CrossRef]
63. Hamlin, C. Preventing Fistula: Transport’s Role in Empowering Communities for Health in Ethiopia; The WorldBank: Washington, DC, USA, 2004.
134
Sustainability 2019, 11, 4555
64. Wagstaff, A. Unpacking the Causes of Child Survival: The Case of Cebu the Philippines; World Bank Report;The World Bank: Washington, DC, USA, 2000.
65. Peters, D. Gender and Transport in Less Developed Countries: A Background Paper in Preparation for CSD-9;Background Paper for the Expert Workshop “Gender Perspectives for Earth Summit 2002: Energy, Transport,Information for Decision-Making”; UNED Forum: London, UK, 2001.
66. Porter, G.; Hampshire, K.; Dunn, C.; Hall, R.; Levesley, M.; Burton, K.; Robson, S.; Abane, A.; Blell, M.;Panther, J. Health impacts of pedestrian head-loading: A review of the evidence with particular reference towomen and children in sub-Saharan Africa. Soc. Sci. Med. 2013, 88, 90–97. [CrossRef] [PubMed]
67. Mahumud, R.A.; Alamgir, N.I.; Hossain, M.T.; Baruwa, E.; Sultana, M.; Gow, J.; Alam, K.; Ahmed, S.M.;Khan, J.A.M. Women’s Preferences for Maternal Healthcare Services in Bangladesh: Evidence from a DiscreteChoice Experiment. J. Clin. Med. 2019, 8, 132. [CrossRef] [PubMed]
68. Murray, S.F.; Davies, S.; Phiri, R.K.; Ahmed, Y. Tools for monitoring the effectiveness of district maternityreferral systems. Health Policy Plan. 2001, 16, 353–361. [CrossRef]
69. Agarwal, S.; Sethi, V.; Srivastava, K.; Jha, P.K.; Baqui, A.H. Birth Preparedness and Complication Readinessamong Slum Women in Indore City, India. J. Health Popul. Nutr. 2010, 28, 383–391. [CrossRef] [PubMed]
70. Mberu, B.; Muindi, K. Ensuring Safer Pregnancies for Kenyan Women in Urban Slums. 2017. Availableonline: http://aphrc.org/post/7979 (accessed on 29 April 2018).
71. INTALInC. Transport and Mobilities: Pathways to Transformation. 2018. Available online: https://intalinc.leeds.ac.uk/wp-content/uploads/sites/28/2018/06/INTALInC-Uganda-report.pdf (accessed on 29 April 2018).
72. Graham, A. Gender Mainstreaming Guidelines for Disaster Management Programmes, A PrincipledSocio-Economic and Gender Analysis (SEAGA) Approach. In Proceedings of the Expert Group Meeting onEnvironmental Management and the Mitigation of Natural Disasters: A Gender Perspective, Ankara, Turkey,6–9 November 2001.
73. Priya, T. Urban Disaster Management Practises of India: How Sustainable? Case Study: Bhuj, India. Master’sThesis, Norwegian University of Science and Technology, Trondheim, Norway, 2003.
74. International Forum for Rural Transport and Development (IFRTD). Reconstructing Vulnerability orReconstruction with Change? Forum News 2005, 1, 1–4.
75. WHO (World Health Organization). Global Status Report on Road Safety; WHO: Geneva, Switherland, 2015.76. GBD 2015 Mortality and Causes of Death Collaborators. Global, regional, and national life expectancy,
all-cause mortality, and cause-specific mortality for 249 causes of death, 1980–2015: A systematic analysis forthe Global Burden of Disease Study 2015. Lancet 2016, 388, 1459–1544. [CrossRef]
77. Marquez, P.V.; Banjo, G.A.; Chesheva, E.Y. Confronting Death on Wheels: Making Roads Safe in Europe andCentral Asia—Establishing Multisectoral Partnerships to Address a Silent Epidemic; World Bank: Washington, DC,USA, 2010.
78. Damsere-Derry, J.; Palk, G.; King, M. Road accident fatality risks for “vulnerable” versus “protected” roadusers in northern Ghana. Traffic Inj. Prev. 2017, 18, 736–743. [CrossRef]
79. Williams, S.J.; Kowal, P.; Hestekin, H.; O’Driscoll, T.; Peltzer, K.; Yawson, A.; Biritwum, R.; Maximova, T.;Salinas Rodríguez, A.; Manrique Espinoza, B.; et al. Prevalence, risk factors and disability associated withfall-related injury in older adults in low- and middle-incomecountries: Results from the WHO Study onGlobal Ageing and Adult Health (SAGE). BMC Med. 2015, 13. [CrossRef]
80. Moshi, H.I. Physical Trauma and Its Consequences in Rural and Semi-Urban Regions of Low-and Middle-Income Countries. Curr. Issues Glob. Health IntechOpen 2018. Availableonline: https://www.intechopen.com/books/current-issues-in-global-health/physical-trauma-and-its-consequences-in-rural-and-semi-urban-regions-of-low-and-middle-income-countr (accessed on 29 April2019).
81. Warr, M. Fear of victimization: Why are women and the elderly more afraid? Soc. Sci. Q. 1984, 65, 681–702.82. Mitra-Sarkar Sand Partheeban, P. Abandon All Hope, Ye Who Enter Here: Understanding the Problem of
Eve Teasing in Chennai, India. In Women’s Issues in Transportation: Summary of the 4th International Conference,Volume 2: Technical Papers; The National Academies Press: Washington, DC, USA, 2009; Available online:https://www.nap.edu/read/22887/chapter/9 (accessed on 29 April 2018).
83. Loukaitou-Sideris, A.; Fink, C. Addressing Women’s Fear of Victimization in Transportation Settings: ASurvey of U.S. Transit Agencies. Urban Aff. Rev. 2009, 44, 554–587. [CrossRef]
135

Sustainability 2019, 11, 4555
84. Borker, G. Safety First: Perceived Risk of Street Harassment and Educational Choices of Women. 2018.Available online: https://girijaborker.files.wordpress.com/2017/11/borker_jmp.pdf (accessed on 29 April2018).
85. Verma, M.; Manoj, M.; Rodeja, N.; Verma, A. Service gap analysis of public buses in Bangalore with respectto women safety. Transp. Res. Procedia 2017, 25, 4326–4333. [CrossRef]
86. Verma, M.; Rodeja, N.; Manoj, M.; Verma, A. Young Women’s Perception of Safety in Public Buses: A Studyof Two Indian Cities (Ahmedabad and Bangalore). In Proceedings of the WCTR Conference, Mumbai, India,26–31 May 2019.
87. Meshram, A.; Choudhary, P.; Velaga, N.R. Assessing and Modelling Perceived Safety and Comfort of Womenduring Ridesharing. In Proceedings of the WCTR Conference, Mumbai, India, 26–31 May 2019.
88. Campbell, M.; Jain, T. Usage Patterns of Public Transport as a Starting Point for Thinking through GenderedConceptualizations of Delhi. In Proceedings of the WCTR Conference, Mumbai, India, 26–31 May 2019.
89. Abenoza, R.F.; Romero-Torres, J.; Cats, O.; Susilo, Y.O. User experiences and perceptions of women-onlytransport services in Mexico. In Gendering Smart Mobilities; Uteng, T.P., Levin, L., Christensen, H.R., Eds.;Routledge: Abingdon, UK; New York, NY, USA, 2019.
90. Olvera, L.D.; Plat, D.; Pochet, P. Not really a quiet stroll. The perception of insecurity during pedestrian tripsin Dakar (Senegal). In Proceedings of the WCTR Conference, Mumbai, India, 26–31 May 2019.
91. Lauwers, D.; Papa, E. Towards a Smarter Urban Mobility; Colloquium Vervoersplanologisch Speurwerk:Antwerp, Belgium, 2015.
92. Shaheen, S.A.; Martin, E.W.; Chan, N.D.; Cohen, A.P.; Pogodzinski, M. Public Bikesharing in North Americaduring a Period of Rapid Expansion: Understanding Business Models, Industry Trends and User Impacts; MinetaTransportation Institute: San Jose, CA, USA, 2014.
93. Priya Uteng, T.; Singh, Y.J.; Lam, T. Safety and daily mobilities of urban women—Methodologies toconfront the policy of “invisibility”. In Measuring Transport Equity; Lucas, K., Martens, K., Di Ciommo, F.,Dupont-Kieffer, A., Eds.; Elsevier: Amsterdam, The Netherlands, 2019.
94. Viswanath, K. Using Data to Improve Women’s Safety in Cities, Transport. 2016. Available online:https://blogs.adb.org/blog/using-data-improve-womens-safety-cities-transport (accessed on 29 April 2018).
95. Priya Uteng, T.; Singh, Y.J.; Hagen, O.H. Social Sustainability and Transport. Making ‘smart mobility’socially sustainable. In Urban Social Sustainability: Theory, Practice and Policy; Shirazi, M.R., Keivani, R., Eds.;Routledge: Abingdon, UK; New York, NY, USA, 2019.
96. Safetipin. Using Data to Build Safer Cities: Delhi, Bogota, Nairobi. 2017. Available online: http://safetipin.com/resources/files/Report%20Cities%20Alliance.pdf (accessed on 29 April 2018).
97. Kalms, N.; Matthewson, G.; Salen, P. Safe in the City? Girls Tell It Like It Is. 2017. Available online:https://theconversation.com/global (accessed on 29 April 2018).
98. Azcona, G.; Bhatt, A.; Duerto Valero, S.; Priya Uteng, T. Feminization of Slums: The Effects of Rapid Urbanizationin a Gender Unequal World; UN Women: New York, NY, USA, 2019; Forthcoming.
99. Lima, J.H.D.; Andrade, M.O.D.; Maia, M.L.A. Measuring accessibility: Effects of implementing multiple tripgenerating developments. J. Transp. Lit. 2016, 10, 25–29. [CrossRef]
100. Maia, M.L.A. Land use policy and rights to the city. Land Use Policy 1995, 12, 177–180. [CrossRef]101. Nayak, S.; Gupta, S. Travel Probability Fields of Urban Poor: Case Study of Slum Dwellers in Kolkata.
In Proceedings of the CTRG Conference, Mumbai, India, 17–20 December 2017.102. Carlin, J. Buenos Aires Urban Planning Wants Transport to Transform Slums. 2017. Available online:
https://www.ft.com/content/de3eed42-0e3e-11e7-a88c-50ba212dce4d (accessed on 29 April 2018).103. Salon, D.; Gulyani, S. Mobility, poverty, and gender: Travel ‘choices’ of slum residents in Nairobi, Kenya.
Transp. Rev. 2010, 30, 641–657. [CrossRef]104. Roy, A. Urban Informality—Toward an Epistemology of Planning. J. Am. Plann. Assoc. 2005, 71, 147–158.
[CrossRef]105. Kusakabe, K. Women’s Work and Market Hierarchies Along the Border of Lao PDR. Gender, Place & Culture
2004, 11, 581–594.106. Cheater, A.P. Transcending the state? Gender and borderline constructions of citizenship in Zimbabwe.
In Border Identities: nation and state at international frontiers; Cambridge University Press: Cambridge, UK,1998; pp. 191–214.
136
Sustainability 2019, 11, 4555
107. Vila, P. Gender and the overlapping of region, nation, and ethnicity on the U.S.-Mexico border. In Ethnographyat the Border; University of Minnesota Press: Minneapolis, MN, USA, 2003; pp. 73–104.
108. Biemann, U. Performing the border: On gender, transnational bodies, and technology. In Globalisation on theLine: Culture, Capital, and Citizenship at U.S. Borders; Sadowski-Smith, C., Ed.; Palgrave: New York, NY, USA,2002; pp. 99–118.
109. Soprano, C. Africa Opens the Gates to Cross-Border Trade. World Economic Forum. 22 August 2014. Availableonline: https://www.weforum.org/agenda/2014/08/africa-cross-border-traders/ (accessed on 29 April 2018).
110. Ibrahim, B.S. Cross Border Trade in West Africa: An Assessment of Nigeria and Niger Republic. Afr. Rev.2015, 42, 126–150.
111. Blumberg, R.L.; Malaba, J.; Meyers, L. Women Cross-Border Traders in Southern Africa. Contributions, Constraints,and Opportunities in Malawi and Botswana; USAID: Washington, DC, USA, 2016.
112. Koroma, S.; Nimarkoh, J.; You, N.; Ogalo, V.; Owino, B.; FAO Regional Office for Africa. Formalizationof Informal Trade in Africa. Trends, Experiences and Socio-Economic Impacts. 2017. Available online:http://www.fao.org/3/a-i7101e.pdf (accessed on 29 April 2018).
113. Smith, N. Homeless/global: Scaling places. In Mapping the Futures: Local Cultures, Global Change; Bird, J.,Curtis, B., Eds.; Routledge: London, UK, 1998; pp. 87–119.
114. UN Women. Opportunities for women entrepreneurs in the context of African Continental Free Trade Area.In Proceedings of the Eastern Africa Women in Transportation Conference, Nairobi, Kenya, 22–23 November2018; Available online: https://eastafricawitconference.com/ (accessed on 29 April 2019).
115. Staudt, K. Free Trade? Informal economies at the U.S.-Mexico border; Temple University Press: Philadelphia, PA,USA, 1998.
116. Marchand, M.H. Engendering globalisation in an era of transnational capital: New crossborder alliances andstrategies of resistance in a post Nafta Mexico. In Feminist Post-Development Thought: Thinking Modernity,Post-colonialism and Representation; Saunders, K., Ed.; Zed books: New York, NY, USA, 2002; pp. 105–119.
117. Moss, P. Taking on, thinking about, and doing feminist research in geography. In Feminist Geography inPractice: Research and methods; Moss, P., Ed.; Blackwell Publishers: Oxford, UK, 2002; pp. 1–17.
118. Elson, D. Male Bias in the Development Process; Manchester University Press: Manchester, UK, 1991.119. White, S.C. Male Bias in the Development Process. Public Admin. Dev. 1993, 13, 84–85. [CrossRef]120. Government of India. National Urban Transport Policy, Ministry of Urban Development; GOI: New Delhi, India,
2006.121. Mahadevia, D. Ahmedabad’s BRT System; Centre for Urban Equity (CUE): Ahmedabad, India, 2011.122. Kamau, A. Women Transport Workers: Social Protection and Labour Issues. In Proceedings of the Eastern
Africa Women in Transportation Conference, Nairobi, Kenya, 22–23 November 2018.123. Ghate, A.T.; Tiwari, G. A gendered perspective of the phenomenon of ‘no travel to work’ in Indian cities: A
case study of Jaipur city. In Proceedings of the WCTR Conference, Mumbai, India, 26–31 May 2019.124. Susilo, Y.O.; Liu, C. Exploring patterns of time-use allocation and immobility behaviors in the Bandung
Metropolitan Area, Indonesia. In Urban Mobilities in the Global South; Routledge: Abingdon, UK, 2017;pp. 111–133.
125. Gärling, T.; Gärling, A.; Johansson, A. Household choices of car-use reduction measures. Transp. Res. A 2000,34, 309–320. [CrossRef]
126. Loukopoulos, P.; Scholz, R.W. Sustainable future urban mobility: Using ‘area development negotiations’ forscenario assessment and participatory strategic planning. Environ. Plan. A 2004, 36, 2203–2226. [CrossRef]
127. Loukopoulos, P.; Jakobsson, C.; Gärling, T.; Meland, S.; Fujii, S. Choices of activity- and travel- change optionsfor reduced car use. In Progress in Activity-Based Analysis; Timmermans, H., Ed.; Elsevier: Amsterdam,The Netherlands, 2005; pp. 481–501.
128. Cottrill, C.; Pereira, F.; Zhao, F.; Dias, I.; Lim, H.; Ben-Akiva, M.; Zegras, P. Future mobility survey: Experiencein developing a smartphone-based travel survey in Singapore. Transp. Res. Rec. 2013, 2354, 59–67. [CrossRef]
129. Ettema, D.; Gärling, T.; Olsson, L.E.; Friman, M. Out-of-home activities, daily travel, and subjective well-being.Transp. Res. Part A Policy Pract. 2010, 44, 723–732. [CrossRef]
130. Sweet, M.; Kanaroglou, P. Gender differences: The role of travel and time use in subjective well-being. Transp.Res. Part F 2016, 40, 23–34. [CrossRef]
131. Priya Uteng, T.; Uteng, A.; Kittilsen, O.J. Land Use Development Potential and E-bike Analysis; Institute ofTransport Economics: Oslo, Norway, 2019.
137

Sustainability 2019, 11, 4555
132. UNEP Driving Gender in India’s Public Transport Policy. 2017. Available online: https://www.unenvironment.org/news-and-stories/story/driving-gender-indias-public-transport-policy (accessed on 29 April 2018).
133. UN Habitat. Improving Public Transport Services for Women: A Story from Cairo. 2018. Available online:https://unhabitat.org/improving-public-transport-services-for-women-a-story-from-cairo/ (accessed on 29April 2019).
134. Iqbal, S. Women, Business and the Law; The World Bank: Washington, DC, USA, 2018.135. Jeppesen, S.L.; Leleur, S. Sustainable Transport Planning—A Multi-Methodology Approach to Decision
Making. Ph.D. Thesis, Technical University of Denmark, Lyngby, Denmark, 2009.
© 2019 by the authors. Licensee MDPI, Basel, Switzerland. This article is an open accessarticle distributed under the terms and conditions of the Creative Commons Attribution(CC BY) license (http://creativecommons.org/licenses/by/4.0/).
138

sustainability
Article
Disability, Mobility and Transport in Low- andMiddle-Income Countries: A Thematic Review
Maria Kett 1, Ellie Cole 2 and Jeff Turner 3,*
1 Honorary Reader in Disability and International Development, UCL Institute of Epidemiology andHealthcare, London WC1E 6BT, UK; [email protected]
2 Honorary Research Associate, UCL Institute of Epidemiology and Healthcare, London WC1E 6BT, UK;[email protected]
3 Gender & Inclusion Theme Leader, High Volume Transport Research Programme, IMC WorldwideConsultants, 64–68 London Rd, Redhill RH1 1LG, UK
* Correspondence: [email protected]
Received: 3 October 2019; Accepted: 2 January 2020; Published: 13 January 2020
Abstract: This paper discusses issues affecting the transport and mobility needs of people withdisabilities in middle- and low-income countries and how disability intersects with a range of otherfactors to impact on transport needs, use and engagement. The paper is intended to stimulatediscussion and identify areas for further research, and identifies a number of key issues that aresalient to discussions around equitable and inclusive transport provision, including patterns oftransport use, behaviour and experiences, solutions and policy directions, measuring access andinclusion, policies and intersectionality. The paper also identifies gaps in knowledge and provision,barriers to addressing these gaps, and some possible solutions to overcoming these barriers. Theseinclude shifting the focus from access to inclusion, reconceptualising how ‘special’ transport might beprovided, and most importantly listening to the voices and experiences of adults and children withdisabilities. Despite lack of transport often being cited as a reason for lack of inclusion of people withdisabilities, there is surprisingly little evidence which either quantifies this or translates what this lackof access means to people with disabilities in their daily lives in low- and middle-income countries.
Keywords: people with disabilities; inclusive transport; high volume transport; accessible transport;low- and middle-income countries
1. Introduction
This paper aims to capture the current state of knowledge about the transport needs of peoplewith disabilities in low- and middle- income countries (as defined by the Organisation for EconomicCooperation and Development’s Development Assistance Committee list); and how disability intersectswith a range of other factors to impact on transport needs, use and engagement. It complements otherpapers in this special issue, which focus on the mobility needs of young people and older adults;and highlights how these identities intersect and impact on choices. In line with the overarching aimsof the special issue in focusing on sustainable High-Volume Road and Rail Transport in low-incomecountries, we have included the experiences of people with disabilities undertaking both urban andlong-distance journeys.
While there has been some research that links a lack of transport to barriers to other services foradults and children with disabilities, such as education [1] or healthcare [2], there has been much lessfocus on the actual mode of transport used, or the journey itself. So, despite a lack of transport oftenbeing cited as a reason for lack of inclusion of adults and children with disabilities, there is surprisinglylittle evidence which either quantifies this lack or translates what this lack of access means to peoplewith disabilities in their daily lives. Without this information, it remains challenging for planners and
Sustainability 2020, 12, 589; doi:10.3390/su12020589 www.mdpi.com/journal/sustainability139
Sustainability 2020, 12, 589
policymakers to understand where, what and how they should best invest in making transport moreinclusive of people with disabilities.
It is worth reiterating at the outset that while there is some literature on patterns of travel behaviour,types of travel and journey experiences in higher income countries, there is surprising little fromlow-income countries. Previous work has tended to focus on transport exclusion, rather than inclusion,and in turn how transport exclusion can create and perpetuate social exclusion [3]. As the authors note,social exclusion as a term is often poorly defined and measured, with the result that it is operationallyand theoretically difficult to assess [3] (p. 2).
The paper starts by placing inclusive transport in the context of existing international agreementsand global frameworks relating to disability rights. We then move on to discuss patterns of travelbehaviours and journey experiences identified in the literature. These have tended to be fromhigher-income countries, but it is possible to identify some possible ‘solutions’ to current transportchallenges that could be, or are already being, explored in low- and middle-income countries. Theseinclude adaptations of physical transport infrastructure, development of holistic/door-to-door journeyapproaches, specialised transport services, fare subsidies and technological innovations. The knowledgegaps about evidence of ‘what works’ in terms of disability inclusion align with existing gaps morebroadly. Most reviews, for example around inclusive education or health, tend to argue for a ‘twintrack’ approach [4]—both mainstreaming disability into services, as well as providing specialisttargeted services for those that need them. From the limited evidence there is in the transport sector,the indications are that this is also the required approach to inclusive transport. Finally, we also explorethe role of national policies and other institutional factors. The paper ends by identifying the gaps inthe literature, highlighting the lack of research around transport issues for people with disabilities inlow-income countries, and makes a series of recommendations for future research.
Transport Issues Affecting People with Disabilities in Middle- and Low-Income Countries
Transportation issues rate highly as a challenge for people with disabilities globally [5–7]. However,measuring access to transport, or indeed understanding who is the most severely affected, remainschallenging [8]. However, the United Nations (UN) Convention on the Rights of Persons with Disabilities(CRPD) [9], has had an impact on both national and international policy and focus around transport.While the CRPD does not have a specific Article on transport, it does acknowledge the centrality oftransport for people with disabilities to access a range of services including homes, schools, healthcarefacilities, workplace and leisure [CRPD Article 9]. The CRPD enshrines the right of people withdisabilities to access transportation on an equal basis with others. However, barriers to the enjoymentof these rights can be broadly divided into three main areas: institutional (legislation, political will,policy, etc.); environmental (infrastructure, vehicles, information); and attitudinal (transport staff, otherpassengers, lack of accessible information, etc). In reality, these often overlap.
Globally, there have been increasing efforts to address inclusion and ensure ‘no one is left behind’,culminating in the Sustainable Development Goals (SDGs) [10], with the aim of equity for all by2030. While all 17 goals are relevant for people with disabilities, SDG 11 ‘Making cities and humansettlements inclusive, safe, resilient and sustainable’ has a specific target (11.2) that ‘By 2030, provideaccess to safe, affordable, accessible and sustainable transport systems for all, improving road safety,notably by expanding public transport, with special attention to the needs of those in vulnerablesituations, women, children, persons with disabilities and older persons’; as well as an indicator(11.2.1): ‘Proportion of population that has convenient access to public transport, by sex, age andpersons with disabilities’. However, SDG targets and indicators are adapted to the country context,and it is left to individual countries to set country-specific goals, indicators and targets to monitortheir progress. Moreover, in the most recent SDG progress report, there is no mention of progresstowards this target. The recent UN Flagship Report on Disability and Development [11] also reviewedprogress toward SDG 11 as it relates to people with disabilities, though again, there is very little data orinformation on specific progress with regards to accessible transport at global level. This omission may
140

Sustainability 2020, 12, 589
be due to a lack of agreed definitions on what accessible transport is, and/or a lack of standardisedtargets and indicators. It could also mean that few countries have set targets, monitored their progress,or indeed actually focused in making any improvements.
In the Asia Pacific region, the Incheon Strategy (2012) is the benchmark for progress on ‘makingthe rights real’ for people with disabilities in the region [12]. Goal 3 of the strategy is to: ‘Enhance accessto the physical environment, public transportation, knowledge, information and communication’,although it is interesting to note that while the overall target is: (3.B) Enhance the accessibility andusability of public transportation, the overall core indicator is (3.2) Proportion of accessible internationalairports. While this is a laudable target, it could be argued that it does not address the most likelyday-to-day transport barriers faced by the majority of people living in the region.
Similarly, in 2013, a global online survey carried out by the Global Alliance on AccessibleTechnologies and Environments (GAATES) Transport Committee with its members (completedby 257 people from 39 countries) aimed to better understand what mobility issues people withdisabilities faced around the world [13] (p. 1). According to the data presented, the two biggestchallenges were inaccessible public transport vehicles and attitudes of drivers/staff. In terms of possiblesolutions, respondents were fairly evenly divided on four main areas: technical guidance on inclusivedesign solutions aimed at civil engineers, planners, etc.; guidance/information aimed at transportproviders/senior management in transport companies; guidance/information aimed at people withdisabilities to empower them; and guidance/information aimed at politicians about the UN Convention,etc. [13] (p. 7).
What these initiatives highlight is that even with a range of measures in place to facilitate inclusion,there may still be a gap between availability and use—demonstrating how these barriers often intersect.A second, related challenge is to measure the size of this gap. Estimating how many adults and childrenwith disabilities have access to, and more importantly use transport systems, as well as their safety,affordability and reliability is challenging. Some countries collect transport data as part of a nationalcensus or other largescale surveys. However, even if they highlight a lack of access and availability,it is still challenging to attribute this as a sole cause to a lack of access to healthcare, education oremployment, though it is certainly a contributing factor [c.f. 14]. However, regardless of the cause,it is unequivocal that barriers to accessing inclusive transport are found across most countries, in arange of contexts and for a spectrum of impairments, and result in a loss of education, employmentand overall wellbeing (see for example, on reduced access to education [1,14]; for employment [15,16];wellbeing more broadly [17]).
The knowledge gaps about evidence of ‘what works’ in terms of disability inclusion align withexisting gaps more broadly. Most reviews, for example around inclusive education or health, tend toargue for a ‘twin track’ approach–both mainstreaming disability into services, as well as providingspecialist targeted services for those that need them [4]. From the limited evidence there is in thetransport sector, the indications are that this is also the required approach to inclusive transport. Thereare some innovative and potentially paradigm-shifting ways to deliver this, including ‘Mobility as aService’ (MaaS), which use locally available and adapted structures with technology to provide thenecessary ‘total journey’. More work needs to be done to test these for a range of adults and childrenwith disabilities in a range of contexts.
2. Materials and Methods
Whilst this was not intended to be a systematic review, a search of the literature was done toidentify the key themes. There is a large volume of literature on the broad theme of ‘accessibletransport’, and an initial search was done on the Web of Science database in January 2019, in linewith the other articles in this series. The search operator was developed, based on similar operatorsused in other thematic areas of this study [18], to ensure consistency and include as wide a range oftypes of impairment as possible in selected geographical regions, and return results based on varioustransport-identifying expressions.
141

Sustainability 2020, 12, 589
Results that were written in English from the year 2008 to present were chosen for review. This yearwas chosen as it represented both an approximate 10-year timespan but also marks papers that werewritten following the coming into force of the CRPD in 2008. Inclusion criteria were reports that focusedon people with disabilities’ experience and issues with using various forms of transport. Papers thatwere not primarily focused on transport were excluded; so, for example, the large volume of literaturethat exists around active transportation or that of road safety. These are of course relevant to widerdiscussions about policy, given the prevalence of road traffic-related injuries and disabilities [4] (p. 60),but were not the main focus of this review. Road safety—and the relation between road traffic accidentsand disabilities in low- and middle-income countries—is one of the other themes of the overall review.It is worth noting that data on the number of people who survive crashes but live with disabilities arealmost non-existent [19].
The search of the Web of Science databased returned 295 results. These results were screenedby title and abstract, and a total of 23 results were selected for inclusion. A number of articles wereexcluded on the basis that they conceptualised ‘mobility’ as it relates to impairment, rather thantransport mobility, so were screened and excluded on this basis. During the full-text review a further12 articles were excluded due to inappropriate content or unavailability. Following the review ofthe returned results of the literature review, a further manual review was undertaken using GoogleScholar using the same inclusion criteria. This review returned an additional 38 articles from both‘grey’ and scientific literature. This literature was included to capture national guidelines on transportand disability inclusion, and reports from civil society and other actors which were not included in thedatabase review. This is important as it provides a context as well as potentially identifies policies andpractices not yet featured in the published literature. A total of 49 articles were included in this review.We manually coded and grouped together the main themes that emerged from this body of literature,as well as from existing literature and knowledge in the field using theme content analysis.
Limitations
This review included results from one database search—Web of Science—in line with other articlesfrom this series. This limited the number of results included in the review, and some may have beenomitted. This literature review is not intended to be systematic but rather thematic and comprehensive;the results included here give a helpful set of themes that emerge from the literature.
The search terms and inclusion criteria excluded returns from high-income countries, althoughsome were used in the manual search to allow for comparisons to be made and to highlight importantpoints in the absence of comparable low-income country returns. Transport issues in higher-incomecountries were not a focus of the review and these may have overwhelmed the search returns andskewed the emergent results. A further limitation to the operator was that if an article was about aspecific country (for example, Kenya but it did not mention Africa), it may not have been picked up.
3. Results
In this section, we present the set of themes emerging from the literature and aim to highlightthe persistent gaps, and some of the measures being developed to close them, in other low- andmiddle-income countries. These may also enable low-income countries to target this issue, and reachthe global goals, more effectively
3.1. Patterns of Travel Behaviour and Experiences
Given the paucity of data on transport disadvantage, identifying ‘what works’ to overcome thedisadvantage can be even more challenging, given the array of factors involved. Moreover, there is verylittle research on the types of journeys adults and children with disabilities make, the modes of transportthey use, and their overall experiences of the journey, in particular from a participatory perspective.
To deliver an inclusive transport system requires a joined-up approach that focuses not onlyon the what, but also on the how. The type of transport provided, and how it is provided, varies
142

Sustainability 2020, 12, 589
according to country and priorities. Many countries—particularly the higher-income ones—link theissue of accessible transport to broader legislation and commitments, including the CRPD (e.g., [20]).Higher-income countries can obviously provide more comprehensive transport options, though asrecent analysis of the in the UK demonstrates, even with these in place, people with disabilities stillface a number of challenges in using public transport. [21].
3.2. Transport Infrastructure
Many of the efforts to reduce car use and improve high volume (often public) transport havebeen in urban areas, in particular, cities. However, these initiatives have not always been accessibleor inclusive for adults or children with disabilities, as for some, cars and/or taxis offer freedom,independence and mobility, which public transport may not. Research in a number of higher-incomecountries has shown that people with disabilities tend to favour cars—their own or others (such as taxiservices) [22]—rather than, for example, waiting for a ramp to enable them to get on or off trains [23],or where there is limited provision of services (more so the case in rural areas). Cars can confer a levelof independence, autonomy and safety that users do not always feel on public transport. Fear—of howto use the services as well as other passengers’ attitudes—is often a key factor, and many users reportfeeling unsafe on any form of public transport; and parents of children with disabilities cited fear fortheir child’s safety as one of the key barriers in their journeys to school [1,14].
3.3. Long Distance Journeys
People living in rural areas who need to make long-distance journeys are generally lesswell-serviced by public transport almost everywhere. This is partly due to limited demand, whichin turn leads to reduced services [24]. A complex set of factors need to be taken into account whenplanning long-distance travel services. In countries with limited or no formal public transport system,cars or taxis provide one of the few means of getting around, particularly in rural or semi-urban areasand especially in emergencies. Use of hired vehicles raises the issue of additional costs for people withdisabilities—the ‘hidden costs’ of disabilities [25,26]. However, there is limited data which quantifiesthe amount of these additional costs, or costs of lost opportunities, for example, for adults and childrenwith disabilities who cannot afford transport to make (often long-distance) journeys for educational orincome-generation purposes, or access other services and activities.
3.4. Affordability and Subsidies for Individual Journeys
Included in debates around the ‘inclusiveness’ of sustainable accessible transport are issues of costand affordability. In part due to inequalities and exclusionary practices, in many countries around theworld, people with disabilities experience poverty. One form of poverty is transport poverty, whichcan be related to cost, affordability as well as accessibility [27,28]. However, transport poverty is hardto measure, and there are no universally agreed definitions. Moreover, some question whether it evenexists as a stand-alone phenomenon or whether it is simply an extension of being poor. Put differently,the question remains as to whether transport poverty a ‘real’ problem for individuals, or is it a systemicproblem that has a systemic solution, and if so, what are these solutions? Given this, is it a problemthat has a transport solution, or rather is it a broader issue of social welfare? [28] (p. 353).
In many (usually higher-income) countries, a range of measures have been put in place withintransport policies, including concessionary fares, subsidised public transport services and free specialtransport services (STS) for eligible groups such as older people, children, and/or people with disabilities.As such, they are only viable where there are (public) transport systems in place.
South Africa provides a heavily subsidised public transport system for older adults and peoplewith disabilities [22,25]. However, in his study reviewing provision of services, Venter found that itwas access, rather than affordability, that was the largest barrier to use, and the solution was thereforeto increase access more broadly, rather than to provide targeted subsidies:
143

Sustainability 2020, 12, 589
“The overall implication is that the limited funds that are available for improving publictransport in cities should go towards improving accessibility for all, rather than towardslowering fares for all disabled persons as a group. This is not to say that subsidisation isnot needed: the evidence shows that both disabled and non-disabled commuters benefitsubstantially from having access to subsidised bus and rail services. But the benefit stemsfrom the subsidies being available to all low-income workers.” [25] (p. 138)
Such universal coverage may also help overcome the predictable eligibility challenges,as assessment of disability is already a complex and much debated issue, particularly in low-incomecountries which have limited mechanisms for assessment [29]. In addition, most of the debates inthe literature tend to focus on the delivery structures and mechanisms, rather than eligibility criteria,so there is limited evidence on what are the most effective mechanism for assessment or identificationof eligibility.
3.5. Measuring Access to Services
In addition to limited evidence about assessment and eligibility criteria, there are also significantgaps in the literature about what specific impact transport restrictions have on people with disabilities’lives (e.g., opportunities lost), or the additional costs that may be associated with this lack of access(e.g., hiring taxis to get to work, or not getting to work at all) [25,26]. This gap exists across high- [20]and low-income countries and is largely due to a lack of agreed measures to estimate access andinclusion. Of the limited literature available that does address this, intersecting issues of age, gender,poverty, ethnicity, disability, etc., come to the fore (e.g., [2,30–32]). These make it difficult to attributetransport—or lack of—as a singular cause for exclusion. In recent research undertaken by authors inLiberia [33], when asking matched household heads about barriers to accessing healthcare services,distance to health facilities was weighted similarly between disabled (11.0%) and non-disabledhouseholds (12.8%). Unfortunately, the study did not ask what the most commonly used mechanismof transport was, nor whether this resulted in additional costs, for example if persons with disabilitieshad to use more expensive means of transport (e.g., taxi cars instead of taxi motorbikes), or spendmore on transport overall. Therefore, while the issue of transport—or lack of—is a barrier to accessand inclusion in all aspects of life and is highlighted in many papers (e.g., [1,34]), there are few papersthat identify mechanisms to quantify this.
One of the few pieces of research available that does attempt to do this is Venter [25] discussingthe situation in South Africa. Here the research found that geographic location was a key determinantof the affordability of transport, with transport in urban areas being unaffordable for poor peoplegenerally, but not specifically people with disabilities or older people, whereas in rural areas limitedtravel options constrain everybody as much as affordability, thus the solutions again point to improvingthe affordability, availability and quality for all users, not just specific groups, as all users would thenbenefit [25] (p. 129).
3.6. Transport Services Available
One area of transport provision that aims to address a lack of mobility are special transportservices (STS). These are designed to address services gap and are usually (though not exclusively) forpeople with mobility difficulties, such as older adults or people with disabilities. There have been somewell-reported models in South Africa, Brazil and Russia [4] (pp. 178–184), all high middle-incomecounties and we found none from low-income countries. STS (also known by a variety of other names,including ‘paratransit, or ‘dial-a-ride’ in other countries) vary not only in name, but also in deliveryand funding structures, as well as types of vehicles used. Some supplement existing services, or link tofeeder routes (such as mass rapid transport (MRT) services in Cape Town and Brazil), while othersoffer specific door-to-door services in adapted accessible vehicles (such as Dial-a-Ride in South Africa,which offers users a heavily subsidised service).
144

Sustainability 2020, 12, 589
There are a number of debates about the provision of STS, particularly around equity, as they tendto offer a segregated service (see for example [16] p. 4), as well as cost. In some countries, provision ofSTS (e.g., to schools, hospitals, etc.) is a mandatory requirement by law, though provision can be costly,and demand likely to increase with an ageing population. They are often publicly funded, or at leastsubsidised. Some high-income countries are exploring different models of payment for these services(see for example [35]). Though their findings are from a wealthy country with high levels of serviceprovision (Sweden), they do have some implications for decentralised budgets elsewhere—not theleast of which is the need to coordinate service provision (e.g., school buses) and that overall improvedpublic transport services can have a positive impact on access and inclusion more generally. Accordingto one study from eThekwini Municipality (South Africa), the Dial-a-Ride service provided faces anarray of challenges, including high costs, difficulty in managing high demand, scheduling of servicesand lack of flexibility in adapting route planning. In fact, demand was such that it had to be restrictedto people going to study or work. Complaints about the tendering process were also made [30] (p. 35).
An excellent practical guidance for setting up STS in low-income countries but drawing onexperience from high-income countries, suggests using a variety of state and non-state fundingmechanisms [36]. The guide suggests utilising existing locally available transport mechanisms,including motorised auto-rickshaws, cycle-rickshaws, and similar vehicles operated exclusivelyor partly for mobility-impaired people. The one thing they all have in common is that they are“demand-responsive”, which can be interpreted in one of several ways—pre-booked, scheduled orinstant access. This approach strengthens the idea that public transport provision needs to move awayfrom traditional delivery approaches, as well as addresses the challenge that the provision of STS doesnot address equity, inclusion or attitudinal and other barriers to transport access, nor does it conferindependence or autonomy on users, as there is still a reliance on others to provide a service. On theother hand, if there is no way to get to a station or bus stop—no matter how accessible the route is,then it could be argued that the provision of special transport enables people with transport restrictionsto make necessary journeys. To be genuinely effective, special transport needs to be included as partof a wider package of measures to address barriers to access and inclusion, such as increased andaccessible information and financial aids, such as concessionary travel passes [37] (p. 54).
However, if users require a high degree of assistance, there are still limitations in most currenttransport provisions around driver capacity, attitudes and willingness to provide such services. Anothercriticism of STS is the extent to which such systems include alternative (as well as sustainable andhealthy) modes of transport such as cycling or walking.
3.7. Holistic Approaches
People with disabilities in South Africa seem to enjoy more accessible transport opportunitiesthan those in neighbouring countries, including subsidies to address any additional costs they incur.However, even there, when progressive legislation is in place to enhance the rights of people withdisabilities, they still face a range of challenges. These include boarding the ostensibly accessiblemass rapid transport (MRT) services in Cape Town—anecdotally, not all the MRT buses are fullyaccessible, so users who need them have to wait for the next accessible vehicles to come along, causingdelays to their journey. By far, the most popular method of public transport for most people in SouthAfrica are taxi minibuses. These pose a number of challenges for people with disabilities, rangingfrom inaccessible vehicles to other passengers and the drivers themselves. Research with peoplewith disabilities and taxi drivers in the Durban area highlights that the actual operational structuresof taxis or other private minibus services function, often unintentionally, to actively disincentivisedrivers to pick up passengers with disabilities [30]. Given that taxi drivers often lease their cars fromowners, time is money and drivers are less keen to stop and spend time trying to get a wheelchairinto, or on top of, a vehicle, or wait for somebody with mobility difficulties to board. In their research,Lister and Dhunpath found little understanding of either side’s perspective, which they suggestcould be ameliorated by incentives, such as cash and/or training to encourage taxi drivers to pick up
145
Sustainability 2020, 12, 589
passengers with disabilities, along with disability awareness training, and subsidised fares for peoplewith disabilities [30].
3.8. Mobility as a Service
Taking the idea of shared, often private, services a step further is the idea of ‘mobility as a service’.In some respects, such an approach may well be undertaken informally in a range of settings. Whilethe idea of a barrier-free, door-to-door journey is not new, new ways to conceptualise what a ‘total’journey, or ‘continuity of travel chain’ or even ‘integrated mobility’ might look like are in development.These factor in age, health, mobility status as well as a range of other intersectional aspects andmove away from the more traditional ‘special transport’ models discussed above to more integratedapproaches that acknowledge that what works in one location or for one group may not be effective orutilised in another.
One of the most innovative and exciting area that links up discussions about autonomy, choice,continuity of journey, as well as bringing in new technology is that of ‘Mobility as a Service’ (MaaS).Not specifically designed for people with disabilities, MaaS is a way:
“ . . . to see transport or mobility not as a physical asset to purchase (e.g., a car) but as a singleservice available on demand and incorporating all transport services from cars to buses torail and on-demand services.” [38] (p. 583)
Originating in Sweden, it offers users the opportunity for door-to-door integrated services, payingfor a package of services ‘as they go’ via one (often online) payment system. Though most of theresearch around MaaS has been in higher-income countries, the concept has relevance to low-incomecountries, making it worth raising in this paper, and some very preliminary research about transposingit to such contexts has begun [39].
MaaS has the potential to cover a range of transport options, from self-drive cars (still underresearch), through to taxis (similar to Uber, which already operates via an app-based service), bicyclesand even walking. However, despite the ideology, such tailored services can be expensive, and inefficientto deliver, so researchers have begun to conceptualise how journeys can be ‘bundled’, so users can andbuy specifically tailored transport packages, in much the same way as they can buy satellite or cableTV packages to suit their specific viewing requirements [38].
The research focused on developing and delivering a broad range of options for both type ofjourney (work, socialising, etc.) and mode of transport (buses, taxis, etc.), which could be standardisedto some extent to reduce costs. These ‘service packages’ could also be customised, perhaps includingadd-ons such as household travel-planning, availability of car space in localities, travel training, ICTtraining, providing a driver for own car and learning to drive [38] (p. 590). These were offered asalternatives to car ownership, increasing car-sharing to reduce individual ownership, and thereforeincrease sustainability, but at the same time maintaining independence and freedom of movement.As the researchers note, whilst MaaS was not specifically set up for use by people with disabilities,the system could offer opportunities for flexibility and autonomy. Viewing transport as part of a servicepackage has the potential to move discussions away from seeing transport provision for older adultsand people with disabilities as a welfare issue, as, they argue, it currently is. Although they cautionabout the need to take the social benefits of mobility into account when thinking about MaaS too [38].
While MaaS offers an exciting potential for people with disabilities, it was not (necessarily)designed specifically for people with disabilities, but rather it is a transport system that can be used bypeople with disabilities. In this, it is similar to existing ‘community’ or ‘flexible’ transport’ systems,usually privately-funded or run cooperatively. Community transport can be funded and providedthrough a variety of mechanisms, including shared transport (such as cars or taxis), and may be aviable option in low-income countries, as they may lessen costs for passengers, as well as reduce thenumber of vehicles on the road. However, there are debates about the extent to which they are likely tobe viable as a long-term solution to reduced mobility in rural or semi-urban areas, in particular for
146
Sustainability 2020, 12, 589
people with disabilities, as they do not solve broader issues around mobility, including social aspects,such as independency and autonomy.
3.9. Technology
Technology has enabled significant improvements across a range of domains, includingtransport-specific services such as Uber and MaaS, as discussed above, as well as facilitate mapping ofjourneys to better understand patterns and usage and adapt services accordingly. There is alreadya significant body of literature exploring the benefits (as well as some of the more negative aspects)that technology can bring to the lives of people with disabilities, in particular how it can supportand maintain independence [40]. This is reflected in the array of transport-focused literature ontechnological advances in the transport sector, some of which may have been specifically designed andintended for use by people with disabilities, though not all. However, all have had a major impact onthe ability to travel. These fall largely into two categories: technology which provides information;and technology which provides a service. Some, but not all, of these are mainly used in higher-incomecountries, but all have the potential for transfer and adaptation.
Information-providing technologies include apps which give live updates about planes, trains,buses and other (usually public) transport, as well as live trackers, digital maps, etc. These oftenuse location-tracking devices, such as GPS. Use of these tracking devices has extended to supportindependent travel for people with disabilities [15,41,42]. Whilst all these examples have been tested inhigher-income countries with existing infrastructure and services, what the results demonstrate is thatwhilst accessible infrastructure is a necessary condition, it is not enough. Many of the challenges facedare related to, but not inherent within, the transport system, such as uncertainly about scheduling orroutes. This indicates that not just the transport mode, station or service need to be inclusive, but thewhole journey, requiring a joined-up approach to inclusive transport.
Technologies which support service provision include online ticketing systems, as well asautomated and integrated payment systems. However, whilst convenient, for some users withdisabilities it has been argued that these integrated payment systems can also present challenges.In their work in Durban, Lister and Dhunpath talk about these in relation to the Muvo Card, a singlesmartcard that can be used across all three of Durban’s transport systems. Users in Durban reportdifficulties with locating the machines, drivers being in a hurry, no signalling facilities for blind orvisually impaired users and numerous other problems with the machinery [30] (p. 40).
Similarly, in their findings from the Philippines, Cendana et al. [43] argue that such a single-usesmart card could be a mechanism for more equitable urban transport, though their main concern wasabout implementation and eligibility. To overcome this, they argued for a provider that would enablethe implementation of the use of the smart card across multiple transport platforms (hence multipleproviders) to enable discounts to be systematic to eligible travellers.
However, in the end, while technology is an enabler, a facilitator for accessible and inclusivetransport for people with disabilities, it is not in itself enough. Much more research is needed onthe systems within which it is embedded—including the costs (demand and supply) and user needs(especially the voices of adults and children with disabilities who will use the services—see [1]).Moreover, focusing solely on access tends to lead researchers to create solutions to overcome physicaland environmental barriers, rather than attitudinal or social barriers [44].
3.10. Intersectionalities, Inequalities and the Lifespan
Disability, like gender and age, is a factor that cuts across mobility, access to transport servicesfrom operational and employment perspectives [45]. However, much of the existing research aroundaccessible transport has tended to compare transport use between disabled and non-disabledpopulations, rather than between different groups of people with disabilities. As a result, thereis limited evidence of what works for specific groups, but as noted above, it is clear there is not aone-size-fits-all solution to these challenges. Perhaps as a consequence, increasingly in both high- and
147

Sustainability 2020, 12, 589
low-income countries, researchers and advocates have drawn attention to the need for a broader focuson inclusion, making it accessible and inclusive to all, not just people with disabilities, but also thosewith temporary mobility difficulties, older adults, people using pushchairs or prams, small children,cyclists and many other groups as well. However, while these design-led solutions tend to address theaccess issues, there are fewer indicators of measures of success around inclusion, or the socio-politicalchanges required more broadly (see [46] for discussion around the application of these principles inSouth Africa). Moreover, such universal approaches may unintentionally benefit most those who needit the least if underlying issues such as poverty or fear are not addressed.
These issues have been discussed more widely in the fields of gender and to some extent ageing(see for example [47,48]). Ahmad (2015) highlights how in Pakistan, in order to make public transportaccessible for women, including women with disabilities, planners and politicians need to considerreligious and social issues as much as financial and logistical ones, as it is these that have the mostimpact on women. He draws on work which focuses on the gendered aspects of public transport accessand provision (e.g., [31,47]) to show how dialogue between disability scholars, feminist critiques, andtransport planners is needed to address continuing gaps [49].
Overall, less is known about the complex interactions of disability with a range of other factorsincluding age, sex, location, class, caste, etc. One aspect highlighted in the literature is the unavoidablefact that as people age, their ability to drive safely is compromised, so there is also a safety aspectto reducing the number of older drivers on the road—for example, through mandatory visionscreening [50]. This raises challenges when much of the research highlights how cars confer a sense ofindependence and autonomy, but which can be taken away at the very point when it is most needed,often leaving older adults with disabilities without alternatives.
There is a significant body of research that highlights the changing patterns of transport useacross the lifespan, as well as according to location (e.g., [31,51]). However, the majority tends to focuson older adults in higher-income countries, with much less focus on children or young adults (forsome exceptions, see [52,53]). Other researchers have highlighted the social aspects of public transportfor older adults [54]. Older people have also become a focus for advances in travel technology (seefor example, [55,56]). However, there is much less evidence on these complex intersections in low-and middle-income countries. One study, from Mexico, highlights the range of factors that mediateaccess to transport, with subjective ‘transport deficiency’ being strongly associated with being female,illiterate, having a mobility disability and using assistive walking devices [31]. The researchers alsonoted the most commonly used mode of transport for older adults in Mexico City is private car,followed by walking, with a range of factors given for this, including fear, geographical location andlimited accessibility of transport options for older adults in Mexico City [31]. Similarly, data in SouthAfrica also suggests that travel options are limited by factors other than affordability [25].
Venter suggests that it is spatiality, rather than affordability or even accessibility, that determinesuse, a finding also found in other higher-income countries [21]. Venter further suggests that initiativessuch as road and footpath upgrading in rural areas would improve access and use [25] (p. 138).Moreover, he suggests that current subsidies in South Africa actively disincentivise older adultsfrom using public transport. Sammer et al. [37] go even further in highlighting the intersecting,and accumulating nature of transport inequalities, referring to ‘mobility impairment’ more broadly:
“In the past, mobility problems of physically disabled or sensory-disabled people were thefocus of attention, whereas, more recently, problems of the elderly have been recognized aswell. However, if such problems concern other groups, such as immigrants and people withlearning disabilities, they have been more or less neglected” [37] (p.46)
These findings highlight not only how disability can lead to exclusion, which comes about from acomplex intersecting of factors, but also the inequalities this exclusion can create. It is clear from theliterature that disability can lead to inequalities more broadly within the transport sector, particularlywith regards to access and inclusion, but also health inequalities more specifically. As noted above,
148

Sustainability 2020, 12, 589
this paper has not included the vast literature around road traffic accidents, the impact of which can bemost severely felt by people in low-income countries, where there is often less regulated transportsystems, poor infrastructure and limited availability and access to emergency services.
It is also clear that beyond these negative aspects, adults and children with disabilities may missout on the mental and physical benefits of travel (see for example Vancampfort et al. [57] for a discussionabout the associations between active travel and physical multi-morbidity). As Mindell [58] notes,disability and illness, along with age, is associated with ‘non-travel’; and recent research has shownthat urban residents in the USA with health conditions that limit travel, particularly driving, are morelikely to limit their travel than their rural counterparts (Henning-Smith et al., 2018, cited in [58]).This is problematic from a number of angles, not least of which is social isolation and loneliness, all ofwhich impact on mental and physical health. Transport policies that are good for health and reduceinequalities are low carbon, sustainable approaches, promoting active travel and public transportuse, and reducing private car use [58]. Moreover, Mindell notes that in the majority of countries,motor vehicles are owned and used more by the rich while the adverse health effects, such as injuries,air and noise pollution, and community severance are experienced primarily by those with fewerresources [58] (p. 1). This implies that not only are people with disabilities less likely to travel, but theyare at higher risk of the consequences of the overall health effects of non-travel.
There is also a cautionary note to this, in that much of the discussions around inclusion in thetransport sector have not focused on sustainable alternative modes of transport, such as cycling orwalking. It is worth noting that there is almost no literature that focuses on redressing these inequalities,from legislative or other perspectives, for people with disabilities, and there remains a gap in theliterature addressing the inequities of the health benefits of active travel and transport for adults andchildren with disabilities.
4. Solutions and Policy Directions
From the evidence above, there remains a gap between global goals toward accessible, sustainableand inclusive transport provision and addressing the specific transport needs of children and adultswith disabilities. Nevertheless, there have been attempts to address this gap, starting with policy.What lessons can be learnt from these, and are they transferrable to other contexts?
This growing shift is evident in much of the literature in the transport sector and reflects moves awayfrom a more straightforward focus on accessible transport ‘solutions’ (e.g., infrastructure, connectivity,adapting environments and policies) to that of ‘inclusive transport’—a broader understanding of thewider impact of transport exclusion (see for example [1,14]). Nevertheless, many guidelines still focuson physical access. In the UK, both public companies such as Transport for London, as well as privatecompanies such as Uber promote themselves as accessible and inclusive. Inclusive transport is notonly for people with disabilities but reflects a desire for a truly encompassing and integrated system.However, this is the central challenge—creating a system that works for everyone, whilst ensuring thatthe specific needs of individuals are catered for. Nevertheless, whilst some of these mechanisms havebeen aimed primarily at people with disabilities, including legislation and access standards, negativeattitudinal and other barriers persist [21].
Having political backing may at least enable these issues to be raised in the first place.Many countries have developed context-specific access standards, including the Government ofIndia, which supports a largescale national campaign on accessible public transport and buildings [59],though recent newspaper reports question how successful these have been [60]. However, whilst theseaccess standards and audits can be contextually relevant, another barrier is the absence of agreed (anduniversally comparable) definitions over what constitutes ‘accessible travel’ or its opposite, ‘transportimpaired’ travel. How are these measured if, as argued above, there has been a more general shift awayfrom ‘access’ to ‘inclusion’? In the wider development context, there are few tools or indeed markers,of what inclusion, participation or empowerment actually are, let alone how they are measured.
149

Sustainability 2020, 12, 589
To address this gap, a team of researchers from Australia have developed and tested a set of toolswhich combined access audits and road safety audits with inputs from people with disabilities inCambodia to create a ‘Journey Access Tool’ (JAT). The JAT is used to measure personal and interpersonalexperiences on a regular journey taken by a person with a disability, for example when they utilisehealth, employment or education services, or wider community access. The authors caution thatwhile the tools were overall a success in the trial, the interventions and interpersonal dynamics (e.g.,the personal assistants, interpreters and relations of the people with disabilities) were more difficult toaddress, as there was a tendency for care givers and assistants to speak on behalf of the person with adisability or interpret their views, risking skewing the data. Key messages may also be overlaid ormisinterpreted through the interventions of (often well-meaning) others [61]. Though the tool is onlyat the trial stage, these findings illustrate the crux of the debates about accessible transport provision:the extent to which it is the transport system itself, or wider systemic issues, that create the biggestbarriers for people with disabilities. The examples provided here demonstrate that while overallthere is an awareness of the need to shift from focusing solely on access—which can be measuredand audited by sets of standards and other tools—to broader discussions on inclusion, what actuallyconstitutes meaningful inclusion, as well as what disabled and other ‘transport impaired’ people wantthemselves, is still largely missing from the discourse.
Whilst it is clear from the literature that a conducive policy environment is necessary for accessibleand inclusive transport, it is also clear that policies alone are not enough. As the examples from SouthAfrica and other countries illustrate, without engaging with local political and other contexts, the bestintentions can go awry. Integrating and upgrading locally available transport systems requires morethan just accessible vehicles and paved roads. It also requires political will, budgets, monitoringof the process, and recourse if legislation or policy is not upheld. There also needs to be regularengagement with, and training of, public and private transport workers, unions and, crucially, peoplewith disabilities with a range of transport and access needs themselves. Even then, the picture can bemixed. For example, another paper from South Africa highlights the positive changes that, they argue,have come about through constitutional and legislative changes in the country [62]. The paper explorestaxi drivers’ experiences of, attitudes towards, and beliefs about passengers with communicationdifficulties in Gauteng Province. In addition to again demonstrating user preference for taxis becauseof the level of independence that they conferred on people with disabilities, the paper also found thatthe drivers included in the study viewed people with communication disabilities:
“ . . . as equals, with no negative stigma to a communication disorder . . . Participants regardedindividuals with communication disorders as ‘good’, normal people. This finding, arguably,indicates a positive and embracing culture rather than a negative and discriminatory one,facilitating participation and inclusion.” [62] (p. 6)
However, while the researchers credit the positive and enabling policy environment in SouthAfrica for these findings, they acknowledge it is a small study, and the results are not necessarilygeneralisable to other contexts. They also note that many of the people with communication difficultiesdid not travel alone, which reduces their autonomy, as well as the strength of the research findings.Another recent piece, again in South Africa, draws attention to the very positive policy context in thecountry, in particular South Africa’s Bus Rapid Transport (BRT) services, and linked upgrading andintegration of existing services to promoted accessibility. However, this has provided challenges torealise, due to the limited implementation of the BRT system and the majority of passengers that relyupon a combination of conventional buses, trains and minibus taxis. The authors note that:
“While we need to continue to improve the access offered in the formal system, the slow rolloutmeans that the number of disabled people benefiting from these changes (i.e., ‘horizontalequity’) are likely to remain proportionately very small for the foreseeable future.” [22](p. 184)
150

Sustainability 2020, 12, 589
Behrens and Görgens argue that there are two key reasons for this failure: over-expectation aboutthe role of the state in delivering transport services on the one hand, while on the other, an underplayingof the role—and power—of the private sector (in this case, taxi-minibuses) in South Africa. They arguethis has led to a lack of an understanding of the complexity of delivering the promised accessibleand integrated transport system in a context where the formal (state) and informal sectors intersect,compete with and occasionally complement each other [22] (p. 185). They conclude that a key focus forthe promotion of universal access in South Africa should be the minibus-taxi operations and provide arange of options to encourage this in line with existing policy. These include universally accessibleinfrastructure and wayfinding information provided at minibus-taxi ranks and at public transportinterchanges; state-supported incremental fleet renewal of existing taxis to more accessible vehicles;a (partial) shift to user subsidies, for example, cashless fare collection technologies for designatedpassengers (eligible for concessions/subsidies) and financial incentives to the minibus-taxi operatorsto carry passengers who would otherwise not be served [22] (p. 194). It could be argued that theauthors could have also included something around disability awareness raising and training—thoughperhaps, just the use of accessible buses, wayfinding information, etc. would raise awareness of driversand other users anyway.
Finally, it is worth noting that there is a striking absence of literature from low- and middle-incomecountries on the extent to which the voices of any people with disabilities are included in arenas wheretransport policies are decided, monitored, evaluated or governed.
5. Discussion
Whilst throughout this paper we have been keen to demonstrate that there is no ‘one size fits all’solution to the provision of inclusive transport, it is interesting to note that despite the diverse range ofliterature included here, the income levels of the countries and types of impairments written about,there are a number of common threads the emerge across the literature. These can offer some guidanceabout creating sustainable, accessible and inclusive high-volume transport systems in low-incomecountries that avoid some of the pitfalls outlined above. Addressing legislative, environmental andattitudinal barriers by improving access, delivering specific targeted services and policies and practices,as highlighted in the World Report on Disability [4] remain key. However, whilst transport is widelyacknowledged to be a barrier to equity and inclusion, the size of the exclusion gap remains difficult tomeasure, and what works to close it remains difficult to know, particularly in low-income countries.This may be because of an overall lack of understanding about transport needs, in particular from theperspective of those who need it most and are most affected by these gaps. The voices of adults andchildren with disabilities themselves are rarely heard in the literature. We found very little evidence ofdiscussions around costs or user satisfaction, particularly around new technologies. It is also apparentthat transport is not seen as a right—yet without it, rights will not be attained. Understanding andappreciating the “full social benefit of mobility services” [38] (p. 590) is yet to be realised in manycountries. There is then an urgent need for more research in this area.
It is also clear that more work needs to be done to support adults and children with disabilitiesto use transport services, but this should and could be done by integrating it more fully with otherinterventions, including education and livelihoods, shifting away from seeing it as a ‘transport’ issueper se. Overall, the research highlighted the possibility that improving general public transport(including door-to-door access) would enable more people with disabilities to use these services.
A supportive policy environment is necessary, as is a Universal Design framework, but it seems itis not actually the mode of transport that makes the biggest difference to use, rather convenience andautonomy. Even in countries with relatively good, regular public transport systems, and subsidisedservices (including paratransit services), many people with disabilities prefer to use cars (or taxis,and motorbike taxis—though there is very little on the use of motorbike taxis and people withdisabilities). If high volume transport networks are extended, it is worth considering how adultsand children with disabilities can and will be included for the whole journey. To do this, there first
151

Sustainability 2020, 12, 589
needs to be a shift by providers about transport access as a right, based on freedom of choice, ratherthan as a welfare provision (whilst still acknowledging that some people may benefit from additionalassistance). Viewing transport provision for people with disabilities as a welfare issue is tied to howcurrent funding mechanisms and delivery structures target and work for people with disabilities(in particular, concessions and STS). Universal concessions remove some of this stigma but can bepolitically motivated; moreover, the evidence about their usefulness was mixed, with several reviewsarguing the money would be better spent on general subsidies [25]. Nor was there much evidencein the literature on the commercial benefits of including adults and children with disabilities intomainstream (existing) transport structures, rather the focus has been on the costs of providing specialtransport services. Again, this is a lost opportunity.
In the examples from higher-income countries such as South Africa and elsewhere, one commontheme that emerged was the need to ‘twin track’ [63] accessible and inclusive transport—bothupgrading and ensuring new buses and mini-buses, etc. are accessible, but also actively incentivisebus and taxi drivers to pick up passengers with disabilities. This could be via a range of methods,including providing additional cash incentives (e.g., subsidising fares), but also providing trainingand education for drivers and vehicle owners. There should also be public awareness campaigns topromote transport as a safe space for all users, and recourse mechanisms for those who do experiencediscrimination whilst using public (or where possible private) transport. Such information could becollected through complaints mechanisms, even text-message numbers to report instantly, as wellas from passenger surveys. All this information will lead to a rethinking of how to target resourcesmore equitably—and effectively—based on evidence from the users themselves, and in turn help focusdelivery of these resources.
However, none of this can be done without listening to the voices of children and adults withdisabilities themselves. To date, there is very little research from low-income countries that genuinelyincludes these perspectives—what the absence of transport means to people with disabilities, why theydo not use it, what would enable their access and increase their inclusion. Not only are their voicesabsent, but there is an almost total absence of any literature from low-income countries on the extent towhich people with disabilities are included in governance and decision-making around transportation.Moreover, people with disabilities are not a homogenous group and their identities intersect across age,sex, social class, ethnicity, etc. Listening to these multiple voices and perspectives help us understandthe transport and mobility needs (and rights) of other marginalised and excluded groups, includingwomen, older adults and young people. This would seem to be key to moving the inclusive transportagenda forward.
Overall, the focus on inclusion still needs work to shift from a focus on solely access—which canbe measured and audited by sets of standards and other tools—to broader discussions on inclusion.However, solutions need to be mindful of ensuring that the onus is put on adapting the environment,not the person, to ensure they are in line with the human rights principles of the CRPD. One issuethat has yet to be resolved is how to measure and monitor transport access and inclusion for adultsand children with disabilities across a variety of settings, with a range of impairments, incorporatingissues of safety and security, independence and autonomy. Crucial to this discussion is what ‘inclusivetransport’ actually means for people with disabilities, and not what other (often well-meaning) peoplethink it means. It is clear from the literature that despite the lack of transport provision to ruralareas both within low-income countries and globally, merely providing accessible transport to theseareas will not be enough to increase inclusion. Evidence from urban areas shows that provision hasnot in itself universally increased public transport access in these areas in higher-income countries,and people continue to rely on cars for autonomy and convenience.
There is also a lack of evidence on what inclusion looks like—as noted above, though countries aretasked with developing their own indicators for the SDGs, it is unclear that these are being meaningfullytranslated regionally or nationally, nor are there any agreed universal targets or indicators for inclusivetransport. In order to deliver global commitments, as well as local ones, transport solutions need to
152
Sustainability 2020, 12, 589
move away from putting the onus on adapting the person and focus on adapting the environmentand behaviour change. While there are some interesting examples of accessible transport solutions,including from low- and middle-income countries, there are almost no examples from low-incomecountries of systemic adaptations or accommodations, such as universal travel concessions for eligiblepassengers, or indeed any examples of prosecutions of companies or people who break the lawregarding discrimination in access to transport in low- or middle-income countries. It is clear thatsignificant knowledge gaps remain.
6. Conclusions
In order to move this agenda forward, a number of recommendations emerge from this review.The first is the need for much more research on what inclusive transport is—or should be—from theperspective of users in low- and middle-income countries, as noted, there is an overall paucity ofresearch from low-income contexts to review. Secondly, there is a particular need for the voices ofadults and children with a range of disabilities to be heard in order to better understand their transportneeds. Thirdly, while the review has highlighted some positive examples of favourable policies andjoined-up services facilitating access, as the example of STS demonstrates, this has not necessarily ledto inclusion. In order to enable a shift to inclusion, planners not only need to consider access from aholistic perspective (Universal Design, whole journey approach, subsidies and adapted/specialisedservices), but also as a right (for example the right to health, education, etc.). In order to do this,planners should consider a ‘twin track’ approach to inclusive transport—making improvements toservices, training staff, etc., whilst at the same time ensuring that the specific needs of adults andchildren with disabilities are met. The review has also highlighted how travel and access needs changeover time and vary according to a range of factors, including age and location—one size will notfit all. This does not mean accessible approaches cannot be implemented, but planners will need tolisten carefully to a range of voices to understand who may be left out, and what alternatives can bedeveloped for them.
In order to facilitate this shift, incentives for existing structures should be developed, takingpassengers, transport providers, drivers, unions and other key players into consideration., It is vitalthat people with a range of impairments are included in planning discussions, on access panels, and inaudits of existing services and structures. Linked to this, governments need to develop a locally andcontextually appropriate sets of standards, targets and indicators, in collaboration with local disabilityorganisations (e.g., disabled people’s organisations) to measure availability, accessibility, affordability,acceptability and quality, as well as safety and security, independence, and autonomy. Complaintmechanisms for users must be developed and adhered to, with appropriate recourse mechanisms,and disciplinary measures for those that do not adhere to them.
Finally, the review has only been able to touch on the range of technologies available to facilitateaccess and inclusion—much more research on existing and new enabling technologies appropriate forlow- and middle-income country use is needed.
Author Contributions: Article conceptualisation, M.K. and J.T., methodology, M.K. and E.C.; validation, M.K.and E.C.; formal analysis, M.K. and E.C.; investigation, M.K. and E.C.; resources, J.T.; data curation, M.K.;writing—original draft preparation, M.K.; writing—review and editing, M.K., E.C., and J.T.; visualization, M.K.and J.T.; supervision, M.K and J.T.; project administration, M.K. All authors have read and agreed to the publishedversion of the manuscript.
Funding: This research was funded by UK AID through the UK Department for International Development underthe High Volume Transport Applied Research Programme, managed by IMC Worldwide.
Acknowledgments: The authors would like to thank Gina Porter for her comments on an earlier draft of this paper.
Conflicts of Interest: The authors declare no conflict of interest.
153

Sustainability 2020, 12, 589
References
1. Kett, M.; Deluca, M. Transport and Access to Inclusive Education in Mashonaland West Province, Zimbabwe.Soc. Incl. 2016, 4, 61–71. [CrossRef]
2. Mutwali, R.; Ross, E. Disparities in physical access and healthcare utilization among adults with and withoutdisabilities in South Africa. Disabil. Health 2019, 12, 35–42. [CrossRef] [PubMed]
3. Kamruzzaman, M.; Yigitcanlar, T.; Yang, J.; Mohamed, M.A. Measures of transport-related social exclusion:A critical review of the literature. Sustainability 2016, 8, 696. [CrossRef]
4. WHO/World Bank. World Report on Disability Report; WHO: Geneva, Switzerland, 2011.5. UNDP. A Review of International Best Practice in Accessible Public Transportation for Persons with Disabilities;
UNDP: New York, NY, USA, 2010.6. Frye, A. Disabled and Older Persons and Sustainable Urban Mobility; UN-HABITAT: New York, NY, USA, 2013.7. Frye, A. Inclusive Public Transport: Meeting the Mobility Needs of Disabled Citizens; Policy Brief prepared for
High Volume Transport Applied Research Programme; IMC: Redhill, UK, 2019.8. Kuneida, M.; Roberts, P. Inclusive Access and Mobility in Developing Countries; World Bank: Washington, DC,
USA, 2006.9. United Nations. Convention on the Rights of Persons with Disabilities; UN: New York, NY, USA, 2007.10. United Nations Development Programme. Sustainable Development Goals; UN: New York, NY, USA, 2015.11. United Nations. UN Flagship Report on Disability and Development; UN: New York, NY, USA, 2018.12. United Nations Economic and Social Commission for Asia and the Pacific. Incheon Strategy to “Make the Right
Real” for Persons with Disabilities in Asia and the Pacific; UNESCAP: Bangkok, Thailand, 2012.13. GAATES Survey of Local Transport Needs and Priorities. Analysis of Results. Available online: https:
//drive.google.com/file/d/1mDzAdxDhKPnqd0tlty4GtqbUvMlUV8da/view (accessed on 13 May 2019).14. Access Exchange International. Bridging the Gap: Your Role in Transporting Children with Disabilities to School in
Developing Countries; Access Exchange International: San Francisco, CA, USA, 2017.15. Davies, D.K.; Stock, S.E.; Holloway, S.; Wehmeyer, M. Evaluating a GPS-Based Transportation Device to
Support Independent Bus Travel by People with Intellectual Disability. J. Intellect. Dev. Disabil. 2010, 48,454–463. [CrossRef] [PubMed]
16. Grisé, E.; Boisjoly, G.; Maguire, M.; El-Geneidy, A. Elevating access: Comparing accessibility to jobs by publictransport for individuals with and without a physical disability. Transport. Res. A Pol. 2018, 125, 280–293.
17. Porter, G.; Tewodros, A.; Gorman, M. Mobility, transport and older people’s well being in sub-SaharanAfrica: Review and prospect. In Geographies of Transport and Ageing; Curl, A., Musselwhite, C., Eds.; PalgraveMacmillan: Heidelberg, Germany, 2018; pp. 75–100.
18. Sustainability Special Issue “Sustainable High Volume Road and Rail Transport in Low Income Countries”.Available online: https://www.mdpi.com/journal/sustainability/special_issues/High_Road_Rail_Transport_Low_Income (accessed on 8 January 2020).
19. Heydari, S.; Hickford1, A.; McIlroy, R.; Turner, J.; Bachani, A.M. Road Safety in Low Income Countries: Stateof Knowledge and Future Directions. Sustainability 2019, 11, 6249. [CrossRef]
20. European Disability Forum. EDF Report on the Situation of Passengers with Disabilities; EDF: Brussels,Belgium, 2015.
21. Butcher, L. Access to transport for disabled people. UK Parliament Briefing Paper Number CBP 601. 30 October.Available online: https://researchbriefings.parliament.uk/ResearchBriefing/Summary/SN00601 (accessed on13 May 2019).
22. Behrens, R.; Görgens, T. Challenges in Achieving Universal Access to Transport Services in South AfricanCities. In The Palgrave Handbook of Disability and Citizenship in the Global South; Watermeyer, B., McKenzie, J.,Swartz, L., Eds.; Palgrave Macmillan: Heidelberg, Germany, 2019.
23. Dejeammes, M. Boarding Aid Devices for Disabled Passengers on Heavy Rail: Evaluation of Accessibility.TRR J. 2000, 1713, 48–55. [CrossRef]
24. Mattson, J.; Hough, J.; Varma, A. Estimating demand for rural intercity bus services. Res. Transp. Econ. 2018,71, 68–75. [CrossRef]
25. Venter, C. Transport expenditure and affordability: The cost of being mobile. Dev. South. Afr. 2011, 28,121–140. [CrossRef]
154

Sustainability 2020, 12, 589
26. Mitra, S.; Palmer, M.; Kim, H.; Mont, D.; Groce, N. Extra Costs of Living with a Disability: A Review andAgenda for Research. Dis. Health 2017, 10, 475–4828. [CrossRef]
27. Sustrans. Locked Out: Transport Poverty in England. Available online: https://www.sustrans.org.uk/lockedout (accessed on 13 May 2019).
28. Lucas, K.; Mattioli, G.; Verlinghieri, E.; Guzman, A. Transport and Its Adverse Social Consequences. Proc. Inst.Civ. Eng. -Transp. 2016, 169, 353–365, ISSN 0965-092X. [CrossRef]
29. Mont, D.; Palmer, M.; Mitra, S.; Groce, N. Disability Identification Cards: Issues in Effective Design. LeonardChes. Res. Cent. Work. Pap. Ser. 2016, 29, 1–13.
30. Lister, H.; Dhunpath, R. The taxi industry and transportation for people with disabilities: Implications foruniversal access in a metropolitan municipality. Transformation 2016, 90, 28–48. [CrossRef]
31. Navarrete-Reyes, A.P.; Medina-Rimoldi, C.T.; Avila-Funes, J.A. Correlates of subjective transportationdeficiency among older adults attending outpatient clinics in a tertiary care hospital in Mexico City. Geriatr.Gerontol. Int. 2017, 17, 1893–1898. [CrossRef]
32. Deka, D.; Lubin, A. Exploration of Poverty, Employment, Earnings, Job Search, and Commuting Behavior ofPersons with Disabilities and African-Americans in New Jersey. Transp. Res. Rec. J. Transp. Res. Board 2012,2320, 37–45. [CrossRef]
33. Carew, M.T.; Colbourn, T.; Cole, E.; Ngufuan, R.; Groce, N.; Kett, M. Inter- and Intra-Household RelativeInequality among Disabled and Non-Disabled People in Liberia. PLoS ONE 2019, 14, e0217873. [CrossRef]
34. Eide, A.H.; Mannan, H.; Khogali, M.; van Rooy, G.; Swartz, L.; Munthali, A.; Hem, K.; MacLachlan, M.;Dyrstad, K. Perceived barriers for accessing health services among individuals with disability in four Africancountries. PLoS ONE 2015, 10, e0125915. [CrossRef]
35. Hansson, L.; Holmgren, J. Cost effect of reorganising—A study of special transport services. Res. Transp.Econ. 2018, 69, 453–459. [CrossRef]
36. Rickert, T. Paratransit for Mobility-Impaired Persons in Developing Regions: Starting Up and Scaling Up; AccessExchange International: San Francisco, CA, USA, 2012.
37. Sammer, G.; Uhlmann, T.; Unbehaun, W.; Millonig, A.; Mandl, B.; Dangschat, J.; Mayr, R. Identification ofMobility-Impaired Persons and Analysis of Their Travel Behavior and Needs. Transp. Res. Rec. J. Transp.Res. Board 2012, 2320, 46–54. [CrossRef]
38. Mulley, C.; Nelson, J.D.; Wright, S. Community transport meets mobility as a service: On the road to a new aflexible future. Res. Transp. Econ. 2018, 69, 583–591. [CrossRef]
39. Mobility as a Service (MaaS) in Developing Countries. Available online: https://citta.fe.up.pt/projects/3-59-mobility-as-a-service-maas-in-developing-countries (accessed on 8 January 2020).
40. Technology and Disability Journal. Available online: https://www.iospress.nl/journal/technology-and-disability/ (accessed on 8 January 2020).
41. Neven, A.; Vanrompay, Y.; Declercq, K.; Janssens, D.; Wets, G.; Dekelver, J.; Daems, J.; Bellemans, T. ViamigoMonitoring Tool to Support Independent Travel by Persons with Intellectual Disabilities. Transp. Res. Rec. J.Transp. Res. Board 2017, 2650, 25–32. [CrossRef]
42. Schlingensiepen, J.; Naroska, E.; Bolten, T.; Christen, O.; Schmitz, S.; Ressel, C. Empowering People withDisabilities Using Urban Public Transport. Procedia Manuf. 2015, 3, 2349–2356. [CrossRef]
43. Bustillo, N.V.; Cendana, D.I.; Palaoagm, T.D. E-Purse Transit Pass: The Potential of Public Transport SmartCard System in the Philippines. In Proceedings of the 3rd IEEE International Conference on Computer andCommunications, Chengdu, China, 13–16 December 2017.
44. Øksenholt, H.V.; Aarhaug, J. Public transport and people with impairments—Exploring non-use of publictransport through the case of Oslo, Norway. Disabil. Soc. 2018, 33, 1280–1302. [CrossRef]
45. HELPAGE International. Learning with Older People about their Transport and Mobility Problems in Rural Tanzania;HAI: Thame, UK, 2015.
46. Thompson, P. Challenges and Successes in the Application of Universal Access Principles in the Developmentof Bus Rapid Transport Systems in South Africa. Stud. Health Technol. Inform. 2016, 229, 629–638.
47. Porter, G. Mobilities in Rural Africa: New Connections, New Challenges. Ann. Assoc. Am. Geogr. 2016, 106,434–441. [CrossRef]
48. Rama, S. Gendered mobilities: The methodology, theory and practice disjuncture. Agenda 2018, 32, 113–122.[CrossRef]
155

Sustainability 2020, 12, 589
49. Ahmad, M. Independent-Mobility Rights and the State of Public Transport Accessibility for Disabled People:Evidence from Southern Punjab in Pakistan. Adm. Soc. 2013, 47, 197–213. [CrossRef]
50. Desapriya, E.; Harjee, R.; Brubacher, J.; Chan, H.; Hewapathirane, D.S.; Subzwari, S.; Pike, I. Vision screeningof older drivers for preventing road traffic injuries and fatalities. Cochrane Database Syst. Rev. 2014, 2, 1–18.[CrossRef]
51. Li, H.; Raeside, R.; Chen, T.; McQuaid, R.W. Population ageing, gender and the transportation system.Res. Transp. Econ. 2012, 34, 39–47. [CrossRef]
52. Wheeler, K.; Yang, Y.; Xiang, H. Transport use patterns of US children and teenagers with disabilities.Dis. Health 2009, 2, 158–164. [CrossRef]
53. Ross, T.; Buliung, R. A systematic review of disability’s treatment in the active school travel and children’sindependent mobility literatures. Transp. Rev. 2018, 38, 349–371. [CrossRef]
54. Lubin, A.; Alexander, K.; Voorhees, A.M. Achieving Mobility Access for Older Adults Through Group TravelInstruction. Transp. Res. Rec. J. Transp. Res. Board 2017, 2650, 18–24. [CrossRef]
55. Macagnano, E.V. Intelligent urban environments: Towards e-inclusion of the disabled and the aged in thedesign of a sustainable city of the future. A South African example. WIT Trans. Ecol. Environ. 2008, 117,537–547.
56. Macagnano, E.V. Wireless Portable Computer Systems and Technologies for the Disabled and the Agedtowards an Accessible, Inclusive and Intelligent Metropolis of the Future: The South African Context.In Proceedings of the Inclusion Between Past and Future AT from Adapted Equipment to InclusiveEnvironment Conference, Florence, Italy, 31 August–2 September 2009.
57. Vancampfort, D.; Smith, L.; Stubbs, B.; Swinnen, N.; Firth, J.; Schuch, F.B.; Koyanagi, A. Associationsbetween active travel and physical multi-morbidity in six LMICs among community-dwelling older adults:A cross-sectional study. PLoS ONE 2018, 13, e0203277. [CrossRef] [PubMed]
58. Mindell, J. Transport and inequalities (editorial). J. Transp. Health 2018, 8, 1–3. [CrossRef]59. Accessible India Campaign: Transport Systems. Available online: http://accessibleindia.gov.in/content/
makeaccessible/transport-systems.php (accessed on 8 January 2020).60. Hindustan Times. With just 3% of India’s buildings accessible, our disabled are at a huge disadvantage.
Available online: https://www.hindustantimes.com/editorials/with-just-3-of-india-s-buildings-accessible-our-disabled-are-at-a-huge-disadvantage/story-Rh2rd4QzNzw9kHpmaTPV1H.html (accessed on 8 January2020).
61. King, J.A.; King, M.J.; Edwards, N.; Hair, S.A.; Cheang, S.; Pearson, A.; Coelho, S. Addressing transportsafety and accessibility for people with a disability in developing countries: A formative evaluation of theJourney Access Tool in Cambodia. Glob. Health Action 2018, 11, 1. [CrossRef] [PubMed]
62. Green, S.; Mophosho, M.; Khoza-Shangase, K. Commuting and communication: An investigation of taxidrivers’ experiences, attitudes and beliefs about passengers with communication disorders. Afr. J. Disabil.2015, 4, 1–8. [CrossRef] [PubMed]
63. DFID. Disability, Poverty and Development; DFID: London, UK, 2000.
© 2020 by the authors. Licensee MDPI, Basel, Switzerland. This article is an open accessarticle distributed under the terms and conditions of the Creative Commons Attribution(CC BY) license (http://creativecommons.org/licenses/by/4.0/).
156

sustainability
Article
Older People, Mobility and Transport in Low- andMiddle-Income Countries: A Review of the Research
Mark Gorman 1,*, Sion Jones 1 and Jeffrey Turner 2
1 HelpAge International, London WC1H 9NA, UK; [email protected] Gender, Inclusion & Vulnerable Groups, High Volume Transport Research Programme, IMC Worldwide
Consultants, Redhill RH1 1LG, UK; [email protected]* Correspondence: [email protected]
Received: 16 July 2019; Accepted: 22 October 2019; Published: 4 November 2019
Abstract: Older populations are rising globally, which in high-income countries has helped to generatea growing literature on the impact of ageing on travel requirements and transport policy. This articleaims to provide an initial assessment of the state of knowledge on the impact on transportationpolicy and usage of the increasing numbers of older people in low- and middle-income countries(LAMICs), through a review of the literature relating to older people and transportation. As boththe academic and policy/practice-related literature specifically addressing ageing and transport inLAMICs is limited, the study looks beyond transportation to assess the state of knowledge regardingthe ways in which older people’s mobility is affected by issues, such as health, well-being, social(dis)engagement and gender. We find significant knowledge gaps, resulting in an evidence base tosupport the implementation of policy is lacking. Most research in low-income countries (LICs) iseither broad quantitative analysis based on national survey data or small-scale qualitative studies.We conclude that, although study of the differing contexts of ageing in LAMICs as they relate to olderpeople’s mobilities and transport use has barely begun, institutions which both make and influencepolicymaking recognise the existence of significant knowledge gaps. This should provide the contextin which research agendas can be established.
Keywords: ageing; disability; gender; mobility; older people; poverty; transport; urban
1. Introduction
There is by now a substantial body of literature discussing the impact of an ageing populationin developed countries on travel needs and required changes to transport policy. An age-friendlybuilt environment, including safe, affordable, and convenient transportation, has been identifiedas a critical factor in enhancing the quality of life for increasingly large numbers of older people.Studies across high-income countries have recognised that “Access to transport is regarded as a majordeterminant to achieving a good quality of life in older age” [1]. A number of reasons have beenproposed to explain this growth of interest in ageing and mobility, the most immediate being the globalincrease in the absolute number and share of older people. This interest has also been facilitated by asubstantial growth in the evidence available for high-income countries since 2000. However, very littleis known about older people outside high-income countries [2]. This article aims to provide an initialassessment of the state of knowledge on the impact on transportation policy and usage of the increasingnumbers of older people in low- and middle-income countries (LAMICs), through a review of theliterature relating to older people and transportation. As both the academic and policy/practice-relatedliterature specifically addressing ageing and transport in LAMICs is limited, the study looks beyondtransportation to assess the state of knowledge regarding the ways in which older people’s mobility isaffected by issues such as health, well-being, social (dis)engagement and gender.
Sustainability 2019, 11, 6157; doi:10.3390/su11216157 www.mdpi.com/journal/sustainability157
Sustainability 2019, 11, 6157
While there are many similarities between the experiences of mobility and transport use betweenhigh-income countries and LAMICs, there are also important differences. For example, transportinfrastructure in many low-income settings is significantly poorer than for the “developed” worldand some middle-income countries, and transport choices for older people who have to rely on publicor shared transport services are extremely limited in many situations. It has thus been pointed outthat context is significant, including, but not limited to, geographical settings: “Mobility is not justabout the individual . . . but about the individual as embedded in, and interacting with, the household,family, community and larger society” [3].
This consideration of context also highlights the need for a review of research into age-related issuesof mobility and transportation to move beyond a narrow biomedical model of ageing. For Schwanen andPaez context comprises four domains: the social relations of household, family, friends, acquaintancesand community; the built environment, including transport, communication and other infrastructures;the institutions responsible for the built environment, policies and other forms of regulation; andthe cultural norms and expectations that underpin travel practices and the regulation of mobility. Inaddition to these domains, life-course trajectories provide a history of past events and experiences forindividuals, households, families, communities and societies, which impact significantly on issuesto mobility in later life. So too do gender and ethnicity. Finally, old age, itself, is often treated as afixed and stable category in transport studies [2]. This is notwithstanding that as long ago as the1990s social gerontologists were pointing to the importance of understanding “the causal linkagesbetween aging and social and political structures” rather than seeking inherent cultural meaning in thebiological process of ageing [4]. Mobility and utilisation of transport is simply another example of howthe meaning and definition of “old age” and “ageing” are culturally and geographically variable andsocially constructed.
The article is structured as follows. After a review of the research materials and methods used weaddress global policy responses to ageing, mobility and transport, and this leads to a consideration ofsome of the evidence and policy gaps identified. This is followed by sections which address specificdimensions of ageing and its impact on mobility and transport. These are gender, social isolation andsocial support. Finally, consideration is given to ageing impacts and responses relating to mobilityand transport requirements in humanitarian emergencies before a discussion of research gaps andemerging issues.
2. Materials and Methods
While this paper is not intended to be a systematic review, a literature search was undertakenutilising the Web of Science database, Google Scholar and other sources (including online materialavailable from major international agencies). The search was undertaken between December 2018and March 2019, and included material in English from 2000 onwards, just prior to the UN’s firstmajor plan of action on ageing relevant to the developing world in 2002. Criteria for inclusion wasmaterial focussed both on the experience of older people in utilising transport, and on the barriersdue to age related to disability, gender and poverty. Search terms used were Older people ANDmobility AND [Africa, Asia, Latin America]; Older people AND transport AND [Africa, Asia, LatinAmerica]; Older people AND travel AND [Africa, Asia, Latin America]; Elderly AND mobility AND[Africa, Asia, Latin America]; Elderly AND transport AND [Africa, Asia, Latin America]; Elderly ANDtravel AND [Africa, Asia, Latin America]. The search on Web of Science database returned 82 results.After screening by title and abstract, 22 were selected for inclusion. In addition, a manual review wasundertaken through Google Scholar and other sources which returned 69 relevant items from scientificand grey literature. Eighty-two items were identified through database searches and 22 items wereincluded; 69 items were included from manual search out of a total of 81 items.
In addition to the Web of Science database, a manual search was also undertaken. The searchterms selected here were chosen to extend the inquiry beyond a focus on ageing and older people(which would produce limited results) to include related issues such as gender, disability and poverty.
158
Sustainability 2019, 11, 6157
Countries selected aimed to achieve a representative geographical spread of LAMICs in Africa, Asiaand Latin America. As articles and other publications were identified, citations they contained wereused to identify other research of potential relevance on the World Bank’s Open Knowledge Repositorywas searched, and the online resources of UN agencies (the World Health Organization, the UNDepartment of Economic and Social Affairs (which houses the UN’s Ageing Programme), the UNDevelopment Programme and UN Habitat. Other “grey” literature, included are the materials of HelpAge International, and the publications of other non-governmental organisations working in relatedfields. (It should be noted that some of this material was developed for advocacy rather than objectiveresearch purposes and their conclusions should, thus, be treated with more caution). Our reviewalso draws on the authors’ extensive practitioner experience of work with older people, in a majorinternational organisation dedicated to this field, including engagement with international and nationalpolicy makers, NGOs and communities in diverse LAMIC contexts. We are confident that we havebeen able to adequately identify eligibility and quality of the material we present in this paper.
3. Results
3.1. Ageing, Transport and Global Policy
The broadest context for population ageing is at the global level. Demographic change andpopulation ageing are now global trends, not ones confined to high-income countries. The growingnumbers and proportions of people living into later life in all societies pose new questions about theirtransport and mobility requirements and the extent to which transportation policy and practice will beresponsive to the mobility needs of older people. The policy response at the global level is an indicatorof the extent to which demographic ageing has elicited a policy response, and the degree to which anevidence base to inform policy has been developed.
At a global level, policy parameters are now set by the Sustainable Development Goals (SDGs),whose call to leave no one behind requires that the SDGs are met for all of society, at all ages, with aparticular focus on the most vulnerable, including older women and men [5]. Even before the adventof the SDGs various UN agencies addressed the impact of transportation issues on ageing populationsin the context of wider agenda-setting debates. Prior to the United Nations’ second global assemblyon ageing in 2002, Kalache and Keller noted the importance of adequate public transport to enablemore independent life well into very old age, noting that “one of the major challenges is to ensureaccess...to all older persons—including the poor and those who live in remote areas” [6]. The UN’sinternational plan of action on ageing which emerged from the 2002 World Assembly included as apriority “Ensuring enabling and supportive environments—Transportation is problematic in ruralareas because older persons rely more on public transport as they age and it is often inadequate inrural areas” and called for investment in local infrastructure, such as transportation [7].
The UN’s New Urban Agenda (which lays claim to being “a paradigm shift based on the scienceof cities; it lays out standards and principles for the planning, construction, development, management,and improvement of urban areas”) also makes broad commitments to be age-inclusive, from datacollection through consultation to policy-making. Specifically in relation to urban transportation,commitments are made to enable access to safe, efficient and sustainable transport systems for all [8].
In its Global Ageing and Health Report (2015) the World Health Organization addresses theinteractions of the different dimensions of an older person’s context (social relations, the builtenvironment, policy and regulation, and cultural norms). “Mobility is influenced not only by anolder person’s intrinsic capacity and the environments they inhabit but also by the choices they make.Decisions about mobility are, in turn, shaped by the built environment, the attitudes of the older personand of others, and having both a motivation and the means to be mobile (such as by using assistivedevices or transportation)”. The Report goes on, stating: “Specific consideration will need to be givento the needs of older people to ensure that environments are accessible, including homes, public spacesand buildings, workplaces and transportation” [9].
159
Sustainability 2019, 11, 6157
The World Bank has also recognised that “Vulnerable and special-need groups (including women,children, persons with disabilities, and older persons) are underserved by public and private transportsystems...because users and providers do not carry the full societal costs of excluding vulnerablegroups”. The World Bank argues for “equity and inclusivity [to be] at the heart of Universal Access.This objective...places a minimum value on everyone’s travel needs, providing all, including thevulnerable, women, young, old, and disabled, in both urban and rural areas, with at least some basiclevel of access through transport services and leaving ‘no one behind’” [10]. Both the SustainableDevelopment Goals and the New Urban Agenda call for expended, age- and gender-responsive publictransportation that responded to the challenges faced by all.
More broadly, the NUA calls for age-and gender-responsive approaches to policy and planningprocesses, design, budgeting, implementation, evaluation and review, and this indicates the importantpotential of focussing on universal access, rather than transport-related solutions aimed at older peoplealone. The World Bank has addressed ways to ensure universal access, but again the research basis islacking, at least as far as the participation of older people is concerned. The World Bank itself notesthat “While there is no widely agreed upon method of measuring universal access, there is a generalagreement that sustainable transport should leave no one behind. Data that measure access to transportinfrastructure and services for urban areas are not readily available on a global scale. The data that doexist suggest that the accessibility gap is huge, and potentially growing . . . ” [11].
3.2. Evidence and Policy Gaps
Notwithstanding the concern of the UN and other global bodies to establish these broad declaratoryframeworks, evidence-building and analysis have not been prioritised. For example, while the WorldBank makes significant reference to the evolving requirement for sustainable and accessible transportarising in part from the changing requirements of older populations, no supporting evidence is citedfor statements such as “The ageing of the population is likely to have significant effects on mobility...”The evidence base for a research agenda to support the implementation of global policy is thereforelacking [11]. Moreover, these global policy concerns are very rarely reflected at regional and nationallevels. National policymakers cite resource constraints and the absence of evidence for these policygaps [12]. Thus, while a number of studies conclude with proposals for policy interventions, thesehave not been translated into practice [13,14].
More recently greater attention has been paid to the global implications of population ageingfor transportation and transport policy [15]. A number of studies in LAMICs have been undertaken,often with the stated intention of influencing transport policies. A study of Hong Kong, for example,took as a starting point the rapid growth of the older population, which was expected to significantlyaffect the public transport systems, and “to provide suitable policy recommendations that cater tothe travel needs of an ageing society” [16]. Other work has relied on the WHO SAGE data for China,India, Mexico, Ghana, Russia and South Africa, which are, thus, studies of small samples of olderpopulations in middle- rather than low-income countries [17]. Datasets comparable to the SAGE datado not exist for low-income countries [18].
Other countrywide studies are rare and those that exist use broad national datasets, such asUSAID’s Demographic and Health Survey. Although the DHS is conducted in around 90 LAMICsand provides data for approximately 30 indicators in the Sustainable Development Goals, its data onolder people are of limited value. While interviewees are women aged 15-49 and men aged 15–49,15–54, or 15—59, data on older people are collected only through a whole-household questionnaire.Only two countries (South Africa DHS 2016, Haiti DHS 2016) have extended or lifted the upper age capin individual questionnaires. Thus, in sub-Saharan Africa for example, only one significant nationaltransport study has been undertaken with older people [19]. As we have seen, urban studies areconfined to West Africa, particularly Nigeria. For rural areas the literature is very meagre [20]. As wehave noted, studies in both south Asia and Latin America also concentrate heavily on urban settings.
160
Sustainability 2019, 11, 6157
These significant research gaps should be seen in the context of the overall lack of both empiricaldata and theoretical development on ageing and older people in LAMICs [14]. This in turn impactson planning and policy formation. Commenting on the lack of data sources for an inquiry on activeageing in the Philippines, for example, Pettersson and Schmöcker note that better datasets are a basicrequirement for urban planning in developing and newly developed countries [21]. Constraints suchas these apply particularly in Sub-Saharan Africa where, despite an intensification of debate on ageingand formal expressions of commitment on the part of national governments, comprehensive policyaction is still lacking. “The impasse reflects a lack of political will and an uncertainty about requiredpolicy approaches, engendered by wide gaps in understanding...in the region” [21]. A review ofresearch relating to care-seeking behaviours among older people finds that apart from a number ofsmall-scale, qualitative studies, no systematic, country-level evidence exists. Their findings, whichpoint to the negative impacts of physical and logistical access difficulties and financial barriers relatedto service fees and/or transport costs, thus have no means of translation into policy-making [22].
This highlights a particular problem in relation to population ageing and older people. Parker et al.point out that “Aging in the west is often viewed from a biomedical perspective where the emphasis is onmedical treatment and health and social care arrangements. Biomedicine also dominates internationalhealth strategies, organizations, and the funding streams for aid...” [12]. From this perspective, thewider implications of ageing as another stage in the life course receive much more scant consideration,and the familial, social and economic relations which structure older people’s lives tend to disappearfrom view. Furthermore, older people are often excluded from data collection mechanisms; for example,much of the data available for LAMICs comes from household surveys, which set age restrictionsand, therefore, do not routinely include older respondents. They often provide data and analysis atthe household rather than the individual level, and data, where collected, is not disaggregated andanalysed by age [23]. Exceptions to this, such as the World Health Organization’s “Study on globalAgeing and adult health” (a longitudinal study collecting data on adults aged 50 years and older),have very small sample sizes and tend to focus on middle-income countries where datasets may bemore reliable than in the least-resourced settings [24].
The inattention to the needs of older populations in transport policy may also reflect the relativelack of political participation by economically and socially disadvantaged older people, and theirconsequent inability to influence decision-making on mobility services and investment. A low levelof political participation has been noted as a key measure of the social exclusion of older people inmiddle- and low-income countries [25]. While the participation of older people in decision-makingprocesses is restricted, the relative weight given to perceived economic value, social participation andreducing inequalities is likely to remain limited. Porter et al. point out that “Transforming evidenceinto policy and practice is particularly challenging in the transport sector which is dominated bymale, middle-aged, middle-class engineers whose principal focus is road construction rather thantransport services and where there is still a common reluctance to engage with users or with qualitativedata” [20].
The lack of evidence that the perspectives of older people, amongst others, are considered whenplanning public transportation has been noted by, for example, the Institute for Transportation andDevelopment Policy (ITDP), which recognises the democratic deficit created as result of local andnational government transportation investment and planning decisions which fail to consult withand include urban residents, particularly those who are often the most marginalised [26]. In terms ofinvestment and impact assessment, even in high income contexts, there is little existing guidance forcomprehensive transport equity analysis that includes all groups of people [27].
3.3. Ageing, Health and Mobility
The relationship between ageing and health is complex; it is now well recognised that a globalepidemiological transition from diseases, which mainly impact children, to non-communicablediseases (NCDs), which are more common in adults, has accompanied the demographic transition
161

Sustainability 2019, 11, 6157
with population ageing at its core. The combination of disability and ageing potentially provides asignificant limitation on the mobility of older people in LAMICs, though again the evidence baseis relatively sparse, since very little research has been conducted on moderate to severe disabilitiesaffecting mobility, communication and mental function in later life [28–30]. For example, a comparativestudy across urban settings in Latin America and the Caribbean, while addressing gender differencesin later life health and functional status, similarly did not establish a connection between limitedfunctional capacity and transport utilisation [31], this notwithstanding that the research utilised datafrom the SABE study (“Survey on Health, Well-Being, and Aging in Latin America and the Caribbean”),the first health study of the old people in Latin America and the Caribbean to include transportationamong the physical environment determinants which it assessed [32].
What does seem to be clear from the evidence is that the outcomes of disease and injuries areincreasingly undermining the ability of the world’s population to live in full health. A recent review ofdata from the WHO “Global Burden of Diseases, Injuries, and Risk Factors Study” noted that (afteranaemia) the leading cause of impairments (by number of individuals affected) were hearing loss andvision loss. These sensory organ disorders were also the leading causes of impairments in 22 countriesin Asia and Africa and one in Central Latin America, while lower back and neck pain was the maincause of disability in most countries [33]. There is some recognition that these disabling conditionscan be critical for the wider social participation of older people. There is little published data on thepotential health benefits of active travel in low and middle-income countries, although some evidenceexists. For example, studies (which again drew on WHO’s widely-used SAGE data for six MICs,or the related INDEPTH datasets) found a correlation between increasing age and reduced activetravel (walking or cycling), translating into a higher risk of being overweight and raised BMI [34,35].A smaller-scale study in peri-urban areas of Nepal elicited similar results [36].
Problems over access to health care facilities is the most frequently cited transport-related issue forolder people in LAMICs, with physically remote clinics and hospitals necessitating costly and difficulttravel a key barrier. A common finding was that poverty and mobility constraints combined to reducedolder people’s access to healthcare [37]. Data from the WHO’s World Health Survey (2002–2004)indicated that, in total, more than 60% of older people in LAMICs did not access health care eitherbecause of the cost of the visit, or because they did not have transportation, or they could not payfor transportation. Transportation may be a particularly important issue for older people who livein rural areas because services are often concentrated in large cities far from people’s homes andcommunities [38]. A study in rural Kyrgyzstan, for example, found that one in five older people livedmore than a 30-minute travel away from a health facility, with access particularly problematic for thosewith a limiting longstanding illness or disability [39]. The structure of health care provision is alsoproblematic, noted by a study in South Africa of care and treatment for older people (50+) living withboth HIV and other chronic conditions, which found that services were typically provided at differenthealth facilities or by different health providers, necessitating multiple patient journeys [40].
Psychological factors, such as depression, may also play a role in limiting mobility. A study toidentify the most burdensome functioning domains in depression and their differential impact on thequality of life using SAGE data from countries in Asia, Africa and Latin America found that affect,domestic life and work and interpersonal activities were the domains most affected by depression, withgender also playing an important differentiating role [41]. A lack of self-confidence in physical capacity,leading for example to a consideration of the risk of falling, as well as concerns regarding traffic, havealso been identified as limiting factors. The risk of falls is a prevalent factor in activity restriction byolder people in a variety of settings. Even among a physically active older population in the ColombianAndes the risk of falling decreased physical activity with negative effects for self-perceived health anddepressive symptoms [42–44].
Again, however, and notwithstanding the high and rising level of death and injuries from roadtraffic accidents in LAMICs [45], and the significant proportion of older victims in some contexts,research on the impact of traffic accidents on older people remains undeveloped [46]. This may reflect
162

Sustainability 2019, 11, 6157
a context in many low- and middle-income countries, where poor quality transport infrastructure(including poorly maintained roads, pavements, crossings, shelters, as well as poorly maintained andinaccessible vehicles) affect people throughout the life course. Accident rates are high, affecting wholepopulations. In these circumstances it is perhaps unsurprising that the specific impacts on older peoplereceive relatively little attention.
The evidence that does exist indicates that older people, whether walking or using publictransport, have a significant exposure to accidents and injury [47]. Even crossing roads in busy urbanenvironments in LAMICs may (rightly) induce feelings of anxiety and fear, with a consequent impacton quality of life [48]. Although data limitations mean that studies have tended to be small-scale, theynevertheless raise important issues. For example, a study of the constraints on the travel of olderpeople in a Nigerian city found that issues such as vehicle design, long access and waiting time as wellas poor facilities at bus terminals were serious constraints to the effective mobility of older people [49].Similar conclusions were drawn from a study in Pakistan, which pointed to safety and security issues,as well as attitudinal behaviours on the part of service providers, as key factors in the mobility andtransport utilisation of older people [14]. These are issues to which we return below.
3.4. Ageing, Transport and Gender
As noted above, a key cross-cutting issue affecting the mobility of older people is that of gender,which has now become a well-recognised issue in transport research, and one that intersects with otherfactors to increase disadvantage. A study in Bogota, for example, which summarized recent research onunequal access to transport systems, focused on the ways that gender and socioeconomic inequalitiesmay be exacerbated by differences in transport accessibility [50]. Nevertheless, again the intersectionof gender with age has attracted far less attention, despite this being a feature that research has shownto be clearly recognised by older people themselves [51]. Moreover, there are no systematic genderand age inclusion procedures for transport, either in terms of training of professionals, participationof users or the design and planning of systems, services and equipment. Again, as internationalinstitutions such as the World Bank have pointed out, a lack of evidence limits progress in policymaking,particularly regarding gender issues in transport relating to older people in the developing world [52].
While other international institutions have drawn attention to the intersections of age and gender,again, a clear evidence base substantiating their assertions is lacking. The UN Economic and SocialCouncil (ECOSOC) for example, has pointed out the economic impacts of differential access to transportfor women. They noted in 2009 that women in low-income countries were seriously constrained intheir access to transport, limiting access to labour markets, increasing production costs and reducingthe amount of goods which could be taken to market. The ECOSOC report focussed on issues such aspoor access to transport, affecting girls’ school attendance, women’s use of health and other publicservices and maternal mortality. While older women were not specifically mentioned, evidence wasnoted regarding the lack of access to transport services affecting women who spend long hours haulingwater and fuel and walking to and from farm plots. Head-loading was cited as a major health hazardto women, as was the potential to suffer higher accident rates through walking on crowded roadswith heavy burdens [53]. Other evidence indicates that these are impacts which fall on women whocontinue to work into later life [20].
A small number of studies do address age and gender as features affecting access to transport andimpacting on mobility. Research in urban settings in Pakistan, Iran and Malaysia all found that ageand gender, together with other factors, such as car ownership, travel time, travel cost, household sizeand income, were significant factors in influencing individual choices in transportation. These studiesall included higher-income households, and demonstrated the importance of car ownership in travelfrequency, though even here gender played an important role, with older men making significantlymore journeys than older women [14,54,55]. Other evidence points to the limitations in “choice” thatolder women in particular may have; a study of a urban setting in Nigeria found that gender, along
163
Sustainability 2019, 11, 6157
with increasing age, education and monthly income, were significant in determining walking as themode choice, in a situation where over 70% of older people lacked access to motorised transport [56].
The impact of gender on transport access in Africa is also examined in a recent field studywhich assessed whether gender mainstreaming in rural transport programmes in Tanzania has had atransformative effect on women. The study found that despite the attention given to gender issues,women’s participation in designing and implementing rural travel and transport programmes waslimited by negative views of women’s potential to contribute effectively to such programmes. On theother hand, road construction did lead to improvements in transport services and expanded traveloptions for all women, including those in later life, who had more time both for family and to pursuemultiple projects [57].
3.5. Mobility, Transport and Social Isolation
Gender thus has clear impacts on mobility and helps to bring into question the role that mobilityplays in enhancing or mitigating loneliness and social isolation. The World Health Organizationhas recognised the importance of attitudinal factors for older people, commenting that “Mobility isinfluenced not only by an older person’s intrinsic capacity and the environments they inhabit but alsoby the choices they make. Decisions about mobility are, in turn, shaped by the built environment, theattitudes of the older person and of others” [9]. Characteristics of the built environment can function torestrict older people’s mobility and participation in urban life [58,59]. Nevertheless, research evidencefor the role that transport access plays in influencing older people’s social isolation is sparse forlow-income countries.
In recent years a significant number of studies have made a direct causal link between transportaccessibility and social exclusion [60]. Again, the great majority of these studies have been undertakenin high-income countries where both income poverty and lack of transport are relative rather thanabsolute states. There are few studies on the relationship between transport and social disadvantage inLAMICs, where income poverty is absolute and where access to transportation is very limited [61].Studies addressing the social exclusion of older people in relation to transport in low-income countriesare still rare [62–64]. While some studies discuss the part played by physical mobility in older people’ssocial isolation, the role that transport access plays in this is not examined [65].
For those living in LICs, social isolation is a significant risk with increasing age, again mediatedby factors such as gender and poverty. A primary issue for older people in these situations is theimpact of psychological factors. WHO notes the importance of the attitudes of older individuals and ofothers in decisions about mobility, and the motivation (and the means) to be mobile [9], p.180. A smallnumber of studies has addressed the links between confidence and behaviour, to assess the influenceson older people’s decision-making relating to mobility. Fear of crime and concerns over the safety ofpublic transport have been identified as a limiting factor in older people’s mobility in a number ofdifferent settings, albeit with wide national and regional variations [66].
WHO studies highlight a number of issues that influence decision making related to olderpeople’s use of transportation. These include availability of services, affordability, reliability andfrequency, appropriateness of service destinations and the availability of specialised and priorityservices. Comfort is also highlighted as a key concern, with respondents to focus groups in studies inRio de Janeiro and Mexico City citing hard, uncomfortable and bumpy journeys exacerbating existinghealth concerns and discomfort. Similar concerns were raised by focus groups undertaken in five citiesin Argentina, with issues such as struggling to board buses because of the height of the initial step.Multiple elements are necessary to make public transport an attractive alternative for older people,including physical accessibility, the availability of information and ease of way finding [67].
Social exclusion has a number of features which may be identified with the experience of olderpeople in relation to transport in the developing world, and which have been the subject of studieswhich address older people’s mobility and transport needs only obliquely. These features of socialexclusion are broader than income poverty alone, and include a lack of participation in social, economic
164

Sustainability 2019, 11, 6157
and political life. They are also multidimensional and cumulative: for example, limited financialresources and security are often reciprocally linked to low education and skills, ill-health, and, asnoted above, limited or no access to political influence. Social exclusion is also dynamic, and subject tochanges over time, as well as directly affecting individuals and households as well as neighbourhoodsand local communities [68]. Curl and Musselwhite have pointed out that, despite policy and discourse(at least in high income countries) placing strong emphasis on the maintenance and extension ofindependence and “ageing in place” as vital requirements for a dignified healthy later life, changes inlater life income, lifestyle and ability to use transport present significant challenges for the provision ofappropriate transport services [15]. Where and how people live impacts day-to-day life, particularly inthe urban built environment. Spatial barriers interact in complex and specific ways with the intersectingidentities that individuals carry, creating unique patterns of disadvantage. For example, lower incomepeople (in which older people, together with other disadvantaged groups such as women, children, arealso disproportionately represented) are increasingly pushed to the periphery of cities in their searchfor affordable housing [26].
In some cases, this is as a result of deliberate government policy and this has an impact on accessto affordable transport. This was noted by a study of peri-urban areas in South Africa, which foundthat location along the urban-rural continuum significantly affects both transport expenditure levelsand the perceived severity of transport affordability problems for marginalised people, notably thosewith disabilities and older people [19].
3.6. Mobility, Transport and Social Support
One important motivation for mobility and travel for older people is to access social support,particularly from family members, and a factor mitigating against the need for mobility in manylow-income settings in Asia remains the fact that normative support for filial obligations to ageingparents is widespread. A recent study of older people in Myanmar for example, found that themajority of rural-dwelling older people had an adult child co-residing or living nearby, facilitatingintergenerational exchanges of material support and personal services, and reducing the need fortravel [69]. In the same vein, a review of studies on long-term care systems in sub-Saharan Africanoted that “the provision of long-term care rests overwhelmingly with family members, in line withcustomary sub-Saharan African norms of family solidarity and obligation”. However, the reviewconcluded that the evidence also revealed that “a substantial group of older people received no familycare whatsoever” [70]. Again, studies which address the implications the care received by older peoplein terms of their mobility and transport requirements are almost non-existent for low-income countries.This is equally the case for evidence of older people as caregivers, despite the recognition of theimportant role that they play in many contexts. A study in Kenya, which found that older womenAIDS-caregivers reported high disability scores for mobility and low scores in self-care and life activitiesdomains, indicates that this comes at a high cost to older individuals [71]. Similarly, a Ugandan studyshowed how older women caregivers faced drastic disruptions of living arrangements, includinglengthy travel times and absences from their homes to care for PLWAs [72]. Nor should it be assumedthat care-giving is ensured simply by the traditional norms of extended family relationships, whenfamilies are spatially separated. For example, a recent study of the mobility constraints experienced bymarried and externally-resident daughters providing end of life care to parents in northern Ghanashows how these younger women had to negotiate conflicting responsibilities to provide parentalcare [73]. Similar issues are identified for settings in a recent comparative study on Manila andLondon [74].
Urban locations are by no means the only settings where security issues play a part in olderpeople’s travel choices. For example, both the lack of paved main roads in rural Myanmar and securityissues in some regions have been found to be a significant barrier to older people’s access to healthservices [69]. A study in Papua New Guinea examining the impact of road development on peoplewith disabilities found that while road development improved service access, inaccessible road and
165

Sustainability 2019, 11, 6157
transport infrastructure remained insurmountable barriers to easy and safe travel. Roads were plannedfor the needs of vehicle users, and planning around road infrastructure did not involve consultationwith people with disabilities [75].
3.7. Mobility and Transport in Crises and Humanitarian Emergencies
The particular vulnerabilities of older people in times of systems breakdown is an area whichhas had some attention in relation to humanitarian response. Clearly mobility plays a decisive rolein periods of crisis and humanitarian emergency, and is a major potential issue for older people, (asit is for people with disabilities and children). This has elicited some response from humanitarianagencies which have developed guidance on making services accessible to older people with mobilityconstraints [76]. However, in comparison to the attention paid to people with disabilities, older peoplehave received less attention from the international agencies, and their transport needs have been largelyignored. The United Nations High Commission for Refugees (UNHCR) has produced guidelines on“Working with Older Persons in Forced Displacement”, but while the companion guidance on workingwith people with disabilities in forced displacement has recommendations for accessible transport,that for older persons does not, confining itself to a broad recommendation to “Help older persons toaccess services by providing transport” [77].
More recently, a consortium of humanitarian agencies and academic institutions working in thefields of disability and ageing have recognised the overlapping and often coterminous vulnerabilitiesof older people and those with disabilities in emergencies in establishing key standards for achievingthe inclusion of both groups in humanitarian action, by, for example, addressing barriers that affectparticipation and access to services [78]. However, a more specific focus on transport requirementsremains lacking, reflecting a lack of studies on the specific mobility and transport requirements ofolder people in emergency situations.
The work that has been done reveals some familiar issues. For example, a recent study, based onfocus group interviews with older displaced persons in Sudan, found that many older people withdisabilities faced a number of physical barriers such as having to travel long distances to distributionpoints, a lack of accessible transport, as well as inaccessible housing, toilets and public buildings.Family and friends were identified as key providers of both physical and financial assistance, including,notably, paying transport costs, but the cost of transport to key points, such as health facilities, was aconstant source of stress [79].
4. Discussion
This review indicates that, notwithstanding growing recognition (at least at a global institutionallevel) of the implications of population ageing for transport policymaking, this has yet to be translatedinto significant investment in research in LAMICs. Such research as has been done in LICs is small-scaleand based on qualitative evidence, which may be dismissed by policymakers as “anecdotal”. This lackof systematic national-level evidence makes translation of any research findings into policy highlyproblematic. We have noted the predominant role that transport infrastructure planning plays in manyLAMICs, to the detriment of consideration of social value. Such policy biases reflect the fact thatpolicymaking is not a rational, evidence-based process, but is the outcome of numerous interactionsbetween policymakers and other actors (including researchers, but also politicians, lobby groupsand advocacy organisations). While evidence plays a role in illuminating policymaking, so too doother factors, such as political voice. As we have seen, the relative lack of political participation bydisadvantaged older people limits their ability to influence policy and, by extension, research decisions.This may be both a cause and effect of the exclusion which we have noted of older people from manydata collection mechanisms.
There is equally limited consideration of the ways in which age intersects with other factors,particularly gender, differential physical and mental capacity, and poverty. Here we have seen that thelack of age-disaggregated data is problematic. The imposition of upper age limits in data collection
166

Sustainability 2019, 11, 6157
is a significant barrier to understanding the characteristics of ageing, whether at the individualor the population level. Furthermore, despite the diversity to be found within older populations,disaggregation by age has been analysed very little. The lack of gender disaggregated data and analysisis also noticeable, notwithstanding the frequent references in policy documents to the particularchallenges of public transport for older women.
Access to services is often a strong focus of current work regarding older people’s mobility.The difficulty of accessing health services is, as we have seen, frequently cited, but there is a limitedperspective on the wider needs of older people beyond basic health. Issues of mental health, socialisolation and loneliness are rarely discussed. The roles played by older people as care-givers orrecipients, and their mobility implications has become an increasingly significant area of research inWestern contexts, and is also an important issue in LICs. This is an area that clearly needs greaterattention. Research on mobilities across generations is also a major gap, with little attention paid torelational mobilities, despite the clear importance of intergenerational connections, notably (but notexclusively) related to care-giving.
However, we have also noted an emphasis in research related to population ageing which focussesattention on medical and social care arrangements, to the detriment of considering the social andeconomic contexts in which people live the later stages of their life course. We have noted that somework has been done in this regard. For example, a number of studies have emphasised the importantplace that the continuing need to earn a livelihood has for many who enter later life in poverty.Older people’s mobilities and the role of transport in relation to livelihoods is, thus, another importantarea of inquiry but, again, is a significant research gap in LICs (where income earning must continueinto old age in the absence of adequate pension provision). In this regard, the affordability of transport,economic needs, subsidy issues and income categories are all areas for research which require furtherattention [19].
Research undertaken on psychological effects which act to limit the mobility of older people, andthe impacts of social isolation, has been reviewed. Issues ranging from concerns over road safety toharassment, personal security, stigma, shame, discrimination and the impact of crime have all beenshown to pose significant barriers to older people’s mobility. Many transport services, whether publicor private, provide physical hazards for older people, as does poorly maintained physical infrastructure.Again, with limited exceptions, these problems are inadequately addressed in the research literature.While the potential value of virtual connectivity (through mobile phones for example) to replace orcomplement physical mobilities has been examined, both the benefits and costs of virtual connectivityremain to be researched further [20].
In the absence of access to relevant national-level quantitative data, it may be useful to considerother innovative research approaches. For example, action research, involving interventions followedby in-depth monitoring of impacts over a period of time, which involve older people as active researchparticipants, has potential. However, while there is a growing rhetoric around the involvement ofolder people in research process, and some action has been taken, older people tend to remainrespondents. The value of using co-investigation approaches has been demonstrated by work inTanzania and in Papua New Guinea [19,20]. New methodologies, such as the use of geo-mappingalongside participatory inquiry methodologies to explore the social and spatial barriers to access ofurban services, also need further review and analysis [20]. To develop the necessary expertise, inacademic institutions, governments and NGOs, to conduct mobility studies with older people there isalso a need to build research capacity, both in-country and external expertise.
This review has indicated the importance of taking account of great diversity in the ageingexperience, across widely varying contexts. Influences on ageing range from societal and politicalattitudes to older people to the built environment, population density, climate, topography and landuse. As we have aimed to show, study of these differing contexts of ageing in LAMICs, particularly asthey relate to older people’s mobilities and use of transport, has barely begun. At the same time, as wehave seen, policymaking institutions recognise these issues, and assert the importance of prioritising
167
Sustainability 2019, 11, 6157
the widest possible inclusion in policies promoting transport and mobilities of people at all ages, sothat, in the words of the Sustainable Development Goals, “no one will be left behind” [80]. We haveseen that those institutions which both make and influence policymaking recognise the existence ofsignificant knowledge gaps, some of which have been discussed in this article. This should provide thepositive context in which research agendas to answer some of these key questions can be established.
Author Contributions: The article was conceptualized by M.G., S.J. and J.T.; the methodology was developed byM.G., who also undertook the validation, and formal analysis.; the investigation was undertaken by M.G. and S.J.;the original draft preparation was by M.G.; the review and editing was by M.G., S.J. and J.T.; project supervisionwas by M.G and J.T. and project administration was undertaken by M.G.
Funding: This research was funded by the UK Department for International Development.
Acknowledgments: This research was funded by UK AID through the UK Department for InternationalDevelopment under the High Volume Transport Applied Research Programme, managed by IMC Worldwide.Special thanks to Gina Porter for her support in developing the literature search and reviewing the output.
Conflicts of Interest: The authors declare no conflict of interest.
References
1. Manchester Institute for Collaborative Research on Ageing. Ageing, Transport and Mobility: New Approachesfrom Researchers and Providers, MICRA Seminar. 2013. Available online: https://www.micra.manchester.ac.uk/connect/events/events-archive/2013/ageing-transport-and-mobility (accessed on 3 March 2019).
2. Schwanen, T.; Paez, B. The mobility of older people—An introduction. J. Transp. Geogr. 2010, 8, 591–595.[CrossRef]
3. Hanson, S. Gender and mobility: New approaches for informing sustainability. Gend. Place Cult. 2010, 17,5–23. [CrossRef]
4. Phillipson, C. The social construction of old age: Perspectives from political economy. Rev. Clin. Gerontol.1991, 1, 403–441. [CrossRef]
5. United Nations Development Programme. Ageing, Older Persons and the 2030 Agenda for SustainableDevelopment; UNDP: New York, NY, USA, 2017; p. 7.
6. Kalache, A.; Keller, I. The greying world: A challenge for the twenty-first century. Sci. Prog. 2000, 83, 33–54.[PubMed]
7. United Nations, Madrid Political Declaration and International Plan of Action on Ageing, Madrid.2002. Available online: https://www.un.org/development/desa/ageing/madridplan-of-action-and-its-implementation.html (accessed on 1 March 2019).
8. United Nations. New Urban Agenda. In Proceedings of the United Nations Habitat 3 Conference, Quito,Ecuador, 17–20 October 2017; Paragraphs 113, 157. Available online: http://habitat3.org/the-new-urban-agenda/ (accessed on 25 February 2019).
9. Beard, J.; Officer, A.; Cassels, A. World Report on Ageing and Health; World Health Organization:Geneva, Switzerland, 2015; p. 180.
10. World Bank. Sustainable Mobility for All, Global Mobility Report 2017: Tracking Sector Performance; World Bank:Washington, DC, USA, 2017; p. 25.
11. Mason, J.; Turner, P.; Steriu, M. Universal Access in Urban Areas: Why Universal Access in Urban Areas Matters forSustainable Mobility Transport and ICT Connections; World Bank Group: Washington, DC, USA, 2017; Availableonline: http://documents.worldbank.org/curated/en/221451537381407483/Universal-Access-in-Urban-Areas-Why-Universal-Access-in-Urban-Areas-Matters-for-Sustainable-Mobility (accessed on 10 March 2019).
12. Parker, S.; Khatri, R.; Cook, I.G.; Pant, B. Theorizing Aging in Nepal: Beyond the Bio-Medical Model.Can. J. Sociol. 2014, 39, 231–253.
13. Olawole, M.O.; Aloba, O. Mobility characteristics of the elderly and their associated level of satisfaction withtransport services in Osogbo, southwestern Nigeria. Transp. Policy 2014, 35, 105–116. [CrossRef]
14. Ahmad, Z.; Batool, Z.; Starkey, P. Understanding mobility characteristics and needs of older persons inurban Pakistan with respect to use of public transport and self-driving. J. Transp. Geogr. 2019, 74, 181–190.[CrossRef]
168
Sustainability 2019, 11, 6157
15. Curl, A.; Musselwhite, C. Geographical perspectives on transport and ageing. In Geographies of Transport andAgeing; Curl, A., Musselwhite, C., Eds.; Palgrave Macmillan: Basingstoke, UK, 2018; pp. 3–24.
16. Szeto, W.Y. Spatio-temporal travel characteristics of the elderly in an ageing Society. Travel Behav. Soc. 2017,9, 10–20. [CrossRef]
17. Wilunda, B.; Ng, N.; Williams, J.S. Health and ageing in Nairobi’s informal settlements-evidence from theInternational Network for the Demographic Evaluation of Populations and Their Health. BMC Public Health2015, 15, 1231. [CrossRef]
18. HelpAge International. Global AgeWatch Insights: The Right to Health for Older People, the Right to be Counted;HelpAge International: London, UK, 2018; p. 37.
19. Venter, C. Transport expenditure and affordability: The cost of being mobile. Dev. South. Afr. 2011, 28,121–140. [CrossRef]
20. Porter, G.; Tewodros, A.; Gorman, M. Mobility, transport and older people’s well-being in sub-SaharanAfrica: Review and prospect. In Geographies of Transport and Ageing; Curl, A., Musselwhite, C., Eds.;Palgrave Macmillan: Basingstoke, UK, 2018; pp. 75–100.
21. Pettersson, P.; Schmöcker, J.-D. Active ageing in developing countries?—Trip generation and tour complexityof older people in Metro Manila. J. Transp. Geogr. 2010, 18, 613–623. [CrossRef]
22. Aboderin, L. Understanding and Advancing the Health of Older Populations in sub-Saharan Africa:Policy Perspectives and Evidence Needs. Public Health Rev. 2010, 32, 357–376. [CrossRef]
23. HelpAge International. Global AgeWatch Insights Report; HelpAge International: London, UK, 2018; p. 33.24. World Health Organization. Study on Global Ageing and Adult Health. Available online: https://www.who.
int/healthinfo/sage/en/ (accessed on 3 March 2019).25. United Nations Population Fund (UNFPA); HelpAge International. Ageing in the Twenty-First Century:
A Celebration and a Challenge; UNFPA: New York, NY, USA, 2012; p. 42.26. Institute for Transportation and Development Policy. Is Your City Really Made for You? ITDP. Available online:
https://www.itdp.org/2017/02/14/mag-city-made-for-you/ (accessed on 15 March 2019).27. Litman, T. Evaluating Transportation Equity: Guidance for Incorporating Distributional Impacts in Transportation
Planning; Victoria Transport Policy Institute: Victoria, BC, Canada, 2014; p. 20.28. Berthe, A.; Berthe-Sanou, L.; Konate, B.; Hien, H. Functional disabilities in elderly people living at home in
Bobo-Dioulasso, Burkina Faso. Santé Publique 2012, 24, 439–451.29. Lima-Costa, M.F.; Facchini, L.; Matos, D.; Macinko, J. Changes in ten years of social inequalities in health
among elderly Brazilians (1998–2008). Rev. De Saúde Pública 2012, 46, 100–107.30. Capistrant, B.D.; Glymour, M.M.; Berkman, L.F. Assessing Mobility Difficulties for Cross-National
Comparisons: Results from the World Health Organization Study on Global Ageing and Adult Health. J. Am.Geriatr. Soc. 2014, 62, 329–335. [CrossRef] [PubMed]
31. Zunzunegui, M.-V.; Alvarado, B.-V.; Beland, F.; Vissandjee, V. Explaining health differences between menand women in later life: A cross-city comparison in Latin America and the Caribbean. Soc. Sci. Med. 2009,68, 235–242. [CrossRef] [PubMed]
32. Gómez, J.; Corchuelo-Ojeda, J.; Curcio, C.-L.; Calzada, M.-T.; Mendez, F. SABE Colombia: Survey on Health,Well-Being, and Aging in Colombia—Study Design and Protocol. Curr. Gerontol. Geriatr. Res. 2016, 24, 1–7.[CrossRef] [PubMed]
33. Vos, T.; Global Burden of Disease 2015 Disease and Injury Incidence and Prevalence Collaborators. Global,regional, and national incidence, prevalence, and years lived with disability for 310 diseases and injuries,1990–2015: A systematic analysis for the Global Burden of Disease Study 2015. Lancet 2016, 388, 1545–1602.
34. Laverty, A.A.; Palladino, R.; Lee, J.T.; Millett, C. Associations between active travel and weight, bloodpressure and diabetes in six middle-income countries: A cross-sectional study in older adults. Int. J. Behav.Nutr. Phys. Act. 2015, 12, 65. [CrossRef]
35. Ng, N.; Hakimi, M.; van Minh, H.; Juvekar, S.; Razzaque, A.; Ashraf, A.; Masud, A.S.; Kanungsukkasem, U.;Soonthornthada, K.; HuuBich, T. Prevalence of physical inactivity in nine rural INDEPTH Health andDemographic Surveillance Systems in five Asian countries. Glob. Health Action 2009, 2, 44–53. [CrossRef]
36. Vaidya, A.; Krettek, A. Physical activity level and its socio-demographic correlates in a peri-urban Nepalesepopulation: A cross-sectional study from the Jhaukhel-Duwakot health demographic surveillance site. Int. J.Behav. Nutr. Phys. Act. 2014, 11, 39. [CrossRef]
169
Sustainability 2019, 11, 6157
37. Wandera, S.O.; Kwagala, B.; Ntozi, J. Determinants of access to healthcare by older persons in Uganda:Across-sectional study. Int. J. Equity Health 2015, 14, 26. [CrossRef] [PubMed]
38. World Health Organization. WHO World Health Survey: 2002–2004; World Health Organization:Geneva, Switzerland, 2015.
39. Sleap, B. The Rights of Older People in Kyrgyzstan; HelpAge International: London, UK, 2013; p. 5.40. Knight, L.; Schatz, E.; Mukumbang, C. “I attend at Vanguard and I attend here as well”: Barriers to
accessing healthcare services among older South Africans with HIV and non-communicable diseases. Int. J.Equity Health 2019, 17, 147. [CrossRef] [PubMed]
41. Kamenov, K.; Caballero, F.F.; Miret, M.; Leonardi, M.; Sainio, P.; Tobiasz-Adamczyk, B.; Chatterji, S.;Ayuso-Mateos, J.L.; Cabello, M. Which Are the Most Burdensome Functioning Areas in Depression?A Cross-National Study. Front. Psychol. 2016, 7, 1342. [CrossRef] [PubMed]
42. Curcio, C.L.; Gomez, F.; Reyes-Ortiz, C.A. Activity Restriction Related to Fear of Falling Among OlderPeople in the Colombian Andes Mountains Are Functional or Psychosocial Risk Factors More Important?J. Aging Health 2009, 21, 460–479. [CrossRef]
43. Kalula, S.Z.; Ferreira, M.; Swingler, G.H.; Badri, M. Risk factors for falls in older adults in a South AfricanUrban Community. BMC Geriatr. 2016, 16, 51. [CrossRef]
44. Romli, A.S.; Tan, M.P.; Mackenzie, L.; Lovarini, M.; Suttanon, P.; Clemson, L. Falls amongst older people inSoutheast Asia: A scoping review. Public Health 2017, 145, 96–112. [CrossRef]
45. Wismans, J.; Skogsmo, I.; Nilsson-Ehle, A.; Lie, A.; Thynell, M.; Lindberg, G. Commentary: Status of roadsafety in Asia. Traffic Inj. Prev. 2016, 17, 217–225. [CrossRef]
46. Mabunda, M.M. Magnitude and categories of pedestrian fatalities in South Africa. Accid. Anal. Prev. 2008,40, 586–593. [CrossRef]
47. Odofuwa, O. Enhancing mobility of the elderly in Sub-Saharan African cities through improved publictransportation. IATSS Res. 2006, 30, 60–66. [CrossRef]
48. Amosun, S.L.; Burgess, T.; Groeneveldt, L.; Hodgson, T. Are elderly pedestrians allowed enough time atpedestrian crossings in Cape Town, South Africa? Physiother. Theory Pract. 2007, 23, 325–332. [CrossRef]
49. Ipingbemi, O. Travel characteristics and mobility constraints of the elderly in Ibadan, Nigeria. J. Transp. Geogr.2010, 18, 285–291. [CrossRef]
50. Lecompte, M.C.; Bocarejo, J.P. Transport systems and their impact on gender equity. Transp. Res. Procedia2017, 25, 424–425. [CrossRef]
51. HelpAge International. Gender and Transport for Older People; HelpAge International: London, UK, 2002; p. 1.52. World Bank. Making Transport Work for Women and Men: Challenges and Opportunities in the Middle East
and North Africa, Lessons from Case Studies; World Bank: Washington, DC, USA, 2017; Available online:https://openknowledge.worldbank.org/handle/10986/17648 (accessed on 2 March 2019).
53. UN Economic Commission for Europe. Inland Transport Committee and Gender Issues in Transport; UN ECE:Geneva, Switzerland, 2009; Available online: https://www.unece.org/trans/theme_gender.html (accessed on10 March 2019).
54. Soltani, A.; Pojani, D.; Askari, S.; Masoumi, H.E. Socio-demographic and built environment determinants ofcar use among older adults in Iran. J. Transp. Geogr. 2018, 68, 109–117. [CrossRef]
55. Nurdden, A.; Rahmat, R.A.; Ismail, A.B. Effect of Transportation Policies on Modal Shift from Private Car toPublic Transport in Malaysia. J. Appl. Sci. 2017, 7, 1013–1018.
56. Olawole, M.O. Analysis of Intra-Urban Mobility of the Elderly in a Medium-Size City in SouthwesternNigeria. Mediterr. J. Soc. Sci. 2015, 6, 90–104. [CrossRef]
57. Mulongo, G.; Tewodros, A.; Porter, G. Impacts and Implications of Gender Mainstreaming in the RuralTransport Sector in Tanzania with Particular Reference to Women with Multi-Dimensional Vulnerabilities; HelpAgeInternational: London, UK, 2017; pp. 43–47.
58. Madani, M.; Sibai, M.A. Assisted Living Facilities’ Accessibility Challenge in the Beirut Area. Int. J.Architecton. Spat. Environ. Des. 2017, 11, 1–14. [CrossRef]
59. Munshi, T. Out-of-Home Mobility of Senior Citizens in Kochi, India. In Geographies of Transport and Ageing;Curl, A., Musselwhite, C., Eds.; Palgrave Macmillan: Basingstoke, UK, 2018; pp. 153–170.
60. Schwanen, T.; Lucas, K.; Akyelken, N.; Solsona, D.C.; Carrasco, J.-A.; Neutens, T. Rethinking the linksbetween social exclusion and transport disadvantage through the lens of social capital. Transp. Res. Part APolicy Plan. 2015, 74, 123–135. [CrossRef]
170

Sustainability 2019, 11, 6157
61. Lucas, K. Making the connections between transport disadvantage and the social exclusion of low incomepopulations in the Tshwane Region of South Africa. J. Transp. Geogr. 2011, 19, 320–1334. [CrossRef]
62. Porter, G. Living in a walking world: Rural mobility and social equity issues in sub-Saharan Africa. World Dev.2002, 30, 285–300. [CrossRef]
63. Porter, G. Transport planning in sub-Saharan Africa. Progress report 2, Putting gender into mobility andtransport planning in Africa. Prog. Dev. Stud. 2008, 8, 281–289. [CrossRef]
64. Porter, G. Mobilities in rural Africa: New connections, new challenges. Ann. Am. Assoc. Geogr. 2016, 106,434–441. [CrossRef]
65. Mudege, N.N.; Eze, A.C. Gender, aging, poverty and health: Survival strategies of older men and women inNairobi slums. J. Aging Stud. 2009, 23, 245–257. [CrossRef] [PubMed]
66. Lloyd-Sherlock, P.; Agrawal, S.; Minicuci, N. Fear of crime and older people in low-and middle-incomecountries. Ageing Soc. 2016, 36, 1083–1106. [CrossRef]
67. Jones, S.E. Ageing and the City: Making Urban Spaces Work for Older People; HelpAge International: London, UK,2016; p. 9.
68. Harriss-White, B.; Olsen, W.; Vera-Sanso, P.; Suresh, V. Multiple shocks and slum household economies inSouth India. Econ. Soc. 2013, 42, 398–429. [CrossRef]
69. Knodel, J.; Teerawichitchainan, B.P. Aging in Myanmar. Gerontologist 2017, 57, 599–605. [CrossRef] [PubMed]70. Aboderin, I.; Epping-Jordan, J. Towards Long-Term Care Systems in Sub-Saharan Africa; World Health
Organization: Geneva, Switzerland, 2017; p. 15.71. Chepngeno-Langlat, G.; Madise, N.; Evandrou, M.; Falkingham, J. Gender differentials on the health
consequences of care-giving to people with AIDS-related illness among older informal carers in two slums inNairobi, Kenya. Aids Care 2011, 23, 1586–1594. [CrossRef]
72. Ssengonzi, R. The impact of HIV/AIDS on the living arrangements and well-being of elderly caregivers inrural Uganda. Aids Care 2009, 21, 309–314. [CrossRef] [PubMed]
73. Hanrahan, K.B. Caregiving as mobility constraint and opportunity: Married daughters providing end of lifecare in northern Ghana. Soc. Cult. Geogr. 2018, 19, 59–80. [CrossRef]
74. Plyushteva, A.; Schwanen, T. Care-related journeys over the life course: Thinking mobility biographies withgender, care and the household. Geoforum 2018, 97, 131–141. [CrossRef]
75. Whitzman, C.; James, K.; Powaseu, I. Travelling Together: Disability Inclusive Road Development in Papua NewGuinea; University of Melbourne/Ausaid: Melbourne, Australia, 2013; Available online: https://msd.unimelb.edu.au/research/projects/completed/travelling-together (accessed on 21 March 2019).
76. Hartog, J. Disaster Resilience in an Ageing World: How to Make Policies and Programmes Inclusive of Older People;HelpAge International: London, UK, 2014; pp. 9–11.
77. World Health Organization. Older Persons in Emergencies: An Active Ageing Perspective; World HealthOrganization: Geneva, Switzerland, 2008; pp. 1–41.
78. Age and Disability Capacity Programme. Humanitarian Inclusion Standards for Older People and People withDisabilities; ADCAP: London, UK, 2018; pp. 9–13.
79. Sheppard, P.; Polack, S.; McGivern, M. Missing Millions: How Older People with Disabilities are Excluded fromHumanitarian Response; HelpAge International: London, UK, 2018; pp. 4, 32.
80. United Nations. 2030 Agenda for Sustainable Development; United Nations: New York, NY, USA, 2015; Availableonline: https://www.un.org/sustainabledevelopment/development-agenda/ (accessed on 3 march 2019).
© 2019 by the authors. Licensee MDPI, Basel, Switzerland. This article is an open accessarticle distributed under the terms and conditions of the Creative Commons Attribution(CC BY) license (http://creativecommons.org/licenses/by/4.0/).
171


sustainability
Article
Meeting Young People’s Mobility and TransportNeeds: Review and Prospect
Gina Porter 1,* and Jeff Turner 2
1 Department of Anthropology, Durham University, Durham DH13LE, UK2 Gender, Inclusion & Vulnerable Groups, High Volume Transport Research Programme, IMC Worldwide
Consultants, London RH1 1LG, UK; [email protected]* Correspondence: [email protected]
Received: 18 August 2019; Accepted: 25 October 2019; Published: 6 November 2019
Abstract: This paper reviews published and grey literature on young people’s daily transport andmobility experiences and potential, with the aim of identifying major research gaps. It draws onliterature across a range of disciplines where interest in mobilities has expanded significantly overthe last decade (transport studies; social sciences, notably geography and anthropology; healthsciences). We focus particularly on young people from poorer households, since poverty and mobilityintersect and interact in complex ways and this needs closer attention. Although youth transportissues are set in their global context, the focus on poverty encourages particular attention to low-and middle-income countries (LMICs), especially countries in Africa and Asia. Key themes includeeducation, employment, travel safety and the role of mobile technology. This review demonstrateshow young people’s travel experiences, needs and risks are embedded in power relations and varywith gender, age and location. It also points to the scale and range of uncertainties that so many youngpeople now face globally as they negotiate daily mobility (or immobility). Significant research gaps areidentified, including the need for more in-depth action research involving young people themselves(especially in Asia), and greater attention to the impact of mobile technologies on travel practices.
Keywords: children; mobility; transport; Africa; Asia; youth voice; school; work; road safety
1. Introduction: Young People’s Mobility and Transport in a Rapidly Changing World
Young people remain a remarkably neglected constituency in the world of transport planningglobally (with the exception of road safety), despite the vital importance of their access to education,health and other services for our future progress and for sustainable development. This omission is ofparticular concern in the many low- and middle-income countries (LMICs) where well over half thepopulation is under 30 years old and, in some, over half the population is under 18 years old. Twoparticularly pertinent trends for the discussion that follows are expanding urbanisation and expandingyouth populations. It is estimated that by 2030, 60 percent of the world’s population will live in citiesand that 37 percent of the world’s population will be under the age of 20 [1]. There will be 1.3 billionyoung people aged 15–24 years by 2030 globally [2]. Given the size and importance of the youthconstituency, and growing concerns around the potential political risk implied, especially by largeconcentrations of un/underemployed youth living in cities, young people’s transport and mobilityneeds require urgent attention from policy makers.
Access to services and facilities has massive implications for young people, not only in termsof their current wellbeing but also for their livelihood potential and life chances. The importance oftransport for urban young people is specifically recognised in Sustainable Development Goal (SDG)11.2: provide access to safe, affordable, accessible and sustainable transport systems...with specialattention to the needs of those in vulnerable situations (specifically including children). However,better access to mobility/transport will be crucial to achieving almost all the Sustainable Development
Sustainability 2019, 11, 6193; doi:10.3390/su11226193 www.mdpi.com/journal/sustainability173

Sustainability 2019, 11, 6193
Goals: in particular, SDGs 3, Good health and wellbeing, 4 Quality education, 5 Achieve equality andempower women and girls, 8.5, Full and productive employment and decent work for all...including foryoung people, and 8.6, Substantially reduce the proportion of youth not in employment, education ortraining. It is unlikely that current inter-generational cycles of poverty can be effectively broken withoutsignificant, sustained attention to the mobility of young people and their access to transport worldwide.
This paper reviews the available published and grey literature on young people’s daily transportand mobility experiences and potential in order to identify major research gaps. The review drawson the authors’ extensive personal knowledge of published and grey literature in this field (in whichboth have been active participants since the 1990s), searches in the international transport/mobilityjournals (for instance the Journal of Transport Geography, Transport Policy, Transport Reviews),child and youth-focused journals (for instance Children’s Geographies and Children, Youth andEnvironments) and Google Scholar, plus Web-of-Science searches undertaken for the period 2000–2019using the following search terms: Young people/Children/Youth AND Transport/Mobility ANDAfrica/Asia/Latin America. Overall, references in Web-of-Science are far fewer for Asia than for Africaand even fewer still for Latin America: for instance, a search on Young people AND mobility ANDAfrica produces 63 references, but only 19 for Young people AND mobility AND Asia (and just 8 forLatin America); Children AND mobility produces 176 references for Africa, 62 for Asia and 28 for LatinAmerica. Literature specifically focused on young people with disabilities was reviewed separately ina companion paper by Maria Kett.
There is insufficient space to review wider mobilities associated with migration in this paper: thefocus is specifically around the daily mobilities that shape young people’s access to education, workand general well-being. Similarly, space precludes consideration of the substantial evidence regardingthe importance of transport services for the health of children and young people beyond the trafficaccident issues noted in this paper. Consequently, the impacts of transport and mobility on vaccination,maternal health, access to TB, malaria and eye treatment, ARVs and sexual and reproductive health arenot included here. Similarly, the effects transport and road infrastructure have on health professionals’decisions regarding work place selection are also omitted. These latter (health-related) topics havebeen covered in other publications of the first author, who has undertaken field research and publishedwidely in the field of daily mobility, transport and access to services for vulnerable populations inAfrica since the late 1970s and with specific reference to children and young people since 2000.
The paper draws on literature from a diversity of disciplines, extending from transport studiesand health sciences through to the social sciences (notably geography and anthropology) where interestin mobilities research has expanded significantly over the last decade. Where possible, the spotlightthroughout is on young people from poorer households, since poverty and mobility intersect andinteract in complex ways and this needs far closer attention. Youth transport issues are set in theirglobal context but with particular reference to LMICs, especially countries in Africa and Asia. Africais the focus of particular attention in this paper because it is demographically the world’s youngestcontinent: by 2050, the estimated number of young people entering the labour force in Africa willexceed that of the rest of the world combined [3]. This fact may help explain why there is a moreextensive published and grey literature pertaining to Africa than to Asia.
The paper addresses seven topics, the first of which briefly explains the specific age focus ofinterest, while the following six topics represent key aspects of recent research/debate that can bedrawn from the literature reviewed here:
• Age categories/definitions: Age groups commonly considered under the ‘young people’ heading,with particular reference to those age groups commonly incorporated into policy discussions onyoung people and transport.
• Youth voice: Young people in governance and decision-making and their roles as actors in thewider development arena, with particular reference to the transport sector and the potential topromote their voices in transport planning and policy.
174

Sustainability 2019, 11, 6193
• Education: Transport and the education sector (including affordability, student discounts on urbaninformal public transport, harassment).
• Employment: Transport as youth employment and associated space for entrepreneurial andinnovative practices; transport as employment and entrepreneurial constraint.
• Safety: Road safety and other aspects of young people’s personal mobility safety.• Mobile technology: The interaction between mobile technology and travel among young
people (with particular reference to its potential to aid delivery of youth-equitable urbantransport services).
• Gender: Mobility is relational—it is embedded in power relations—and gender, like age, is acritical shaper in this respect. Attention is paid throughout to gender as a critical cross-cuttingfactor shaping the transport and mobility experiences of the focus age groups in this review.
2. Age Categories/Definitions: Who Is Included in the Category ‘Youth’ and ‘Young People’?
Various terms are used when identifying young people—‘child’, ‘young person’, ‘youth’.Formal definition of these terms may vary according to a country’s legal code or to a particularinstitution/agency’s decision, but it is also often informally shaped by cultural context: all thesecategories are, in essence, social constructs. The papers reviewed below adopt varying age definitionswhen talking about children and youth so it is not possible to work with any one specific definition.We note, however, that childhood is commonly associated with the period prior to puberty, while‘youth’—particularly in papers with an African focus—now often includes reference to people wellinto their 30s. This accords with the fact that growing levels of unemployment in Africa and the cost ofsetting up an independent household are putting many young people into an increasingly prolongedperiod of dependency [4,5].
3. Youth Voice
Young people’s role in governance and decision-making globally is small but it is beginning toexpand rapidly, associated with a growing recognition of the potential political risks associated withtheir unmet needs. An increasingly vocal mass of youth is drawing on its expanding expertise in socialmedia to help build extensive communities of interest and promote its growing demands for betterrepresentation in governance, whether in local, national or international contexts, and this is wellcharacterised by youth usage of social media in the ‘Arab spring’. Youth parliaments, mushroomingacross the world (for instance, in India from 2002; African Youth Parliament of 50 countries from2003 onwards, etc.), are a good example of the efforts currently being made to support and enhanceyouth voice.
In the transport planning sector, across the globe, young voices have played only a very small partto date (perhaps in part because transport planning has been seen largely in terms of motor-mobilityand young people are usually not legally allowed to drive until their mid/late teens) [6]. However,demands for social inclusion and mobility justice are growing [7,8]. Even in those rare cases wheretransport has been planned with attention to youth needs (mostly in developed country contexts), it hasvery rarely been planned with youth. Participatory planning has mostly been viewed by officialdomas a process of engagement with adults. However, given increasing recognition of the need for policychange towards low-carbon sustainable transport (more emphasis on public transport, cycling andwalking), youth transport strategies that directly engage with the youth of today will be of vitalimportance: new travel behaviours are more likely to be learned and adopted by young people [9].
The (albeit very limited) literature available shows how young people can provide vitalunderstanding of their transport challenges (which may be inaccessible to adults) and have valuableinsights into how these can be best addressed [10]. In LMICs, what appears to have been the firstparticipatory research with children and young people (aged 9–18 years) on transport issues started in2004 with pilots in India, Ghana and South Africa, followed by a major study across 24 sites in Ghana,South Africa and Malawi. This incorporated in-depth qualitative research taking an ethnographic
175
Sustainability 2019, 11, 6193
approach plus an extensive survey (N = 3000) [11–16]. The research went beyond adults simply askingyoung people for their views on transport issues. In the first place, it involved training 70 schoolchildren (aged 11–19 years) as co-researchers to identify key issues and questions, mostly throughin-depth interviews, photo-diaries and small surveys with their peers. This study, which was followedup by a further phase of academic-led qualitative and quantitative research in each site, drawing on thekey issues and questions raised by the young co-investigators, has arguably enabled a much strongerunderstanding of significant daily mobility issues affecting young lives than might have been achievedthrough a conventional academic research study alone.
Subsequently, there has been a slow turn towards promoting young people’s voices in thetransport sector in LMICs through the adoption of participatory approaches, including Simpson andCollard 2019 [17]. However, the constraints which tend to minimise poorer women’s voices (not leastsupposed lack of competence to contribute to what is perceived as the domain of middle-class maleengineer experts) continue to play an even stronger role globally in the case of children and youngpeople [14,18,19].
4. Education: Making the Journey to School
There is substantial literature around the journey to school in the Global North but much less workin the Global South. In the Global North, focus has moved from road safety to expanded attention tothe decline in children’s independent mobility associated with increasing car use and growing concernwith child obesity and the need to expand young people’s active travel (walking and cycling) [20–22].A similar trend can now be observed in the Global South [23]: among middle-class urban children,obesity issues are also emerging, with clear linkages to the expansion of motor transport usage forschool journeys [24–27]. In China, in particular, the one-child policy encouraged many parents to adjusttheir life patterns to provide better education for their children, including chauffeuring their children toand from school if they could afford to do so [28]. In a Nairobi context, parental perception of positiveneighbourhood social cohesion, positive environs and connectivity, all of which reduced their childsafety concerns, encouraged positive child physical activity outcomes [29]: these factors are likely tobe pertinent in many LMIC urban contexts [30]. While programmes in many developed country citiesnow promote the idea of ‘walking school buses’ and ‘bicycle trains’, in order to encourage more activetravel [1,31], in LMICs, these are much rarer, although there have been experiments, notably in SouthAfrica and Dar es Salaam [32].
Travel to school experiences in LMICs, especially among children from lower-income families,tend to differ substantially from the norm prevailing in many countries of the Global North (whereparental escorting of younger children to school is common and private motorised transport oftendominates) [33]. In many LMICs, escorting is mostly a task assigned to older siblings and the journeyis far less likely to involve private transport. For children from poorer households, in particular,challenges around physical access to school are closely aligned with issues of journey time anddistance—in Africa, mostly entirely conducted through pedestrian travel, in Asia by either walkingor cycling—and its associated dangers [14] (chapter 3) [34]. Information per se—and particularlyqualitative information—on school travel experiences is far more extensive for African than Asiancontexts where, in recent years, the focus has been principally on analysing large-scale survey data.Consequently, Africa dominates the following discussion.
4.1. Travel from Rural Homes to Schools and Training Opportunities in Urban Centres
Globally, secondary schools, further, and tertiary education are likely to be located in urban centres,restricting opportunities for skills development and the take-up of learning and training opportunitiesin more remote rural areas [35]. Transport and travel are likely to play a crucial ‘cause and effect’ rolein exacerbating poor skills and low productivity, especially in contexts where transport density is lowand subsidised transport is unavailable. In rural Africa, where transport availability is much sparserand more costly than in Asia, the impacts are particularly significant [36]. Thus, in Ghana, it has been
176

Sustainability 2019, 11, 6193
observed that the closer the secondary school, the more likely that children are sent to primary school,as continuity of the child’s education is feasible [37].
Across sub-Saharan Africa, children will be seen trudging each early morning and mid-afternoonalong major highways as traffic hurtles past. Such long daily walks to and from school due to lack ofor high cost of transport bring attendant problems of lateness and encourage late ‘over-age’ enrolment(especially of girls), truancy and early drop-out. The common alternative of ‘home boarding’ in town(renting a room alone in the absence of sufficient cheap school boarding places) is particularly fraughtwith dangers for young girls, who are often targeted for sex by predatory older men [14]. Data fromthe 2003 South Africa National Household Travel Survey indicates that just over three-quarters of‘learners’ walked to school and just under one fifth of the 16 million total spent over one hour each daywalking to and from their schools, which are commonly located in smaller or larger urban centres [38].
In remoter locations of rural Asia, poverty similarly forces many pupils to walk to school, despitethe greater availability of regular transport than in most of sub-Saharan Africa. In such circumstances,in Bangladesh, Matin et al. [39] described how it is the norm for such children to walk in groupsto school for safety reasons, just as they do in Africa. Unsurprisingly, parents in India, Thailandand China are reportedly more likely to allow girls to carry on with their education where transportservices are reliable and safe [40]. In Delhi, India, where sexual harassment on public transport is nowa notorious issue for women, a correlation has been found between young women’s college choiceand their perceptions of route safety, despite the higher transport fares thus involved (though withoutevidence of direct causal connection between the two [41].
It is also important to note that the performance of children and young people at school orin training programmes may be shaped by transport constraints at home. Such transport failures,particularly (but not only) in rural environments, may require young people to undertake a series oftasks before they leave for school or after they return home: these commonly include carrying waterand (less regularly) firewood, together with other domestic work such as cleaning, sweeping, washingclothes and caring for younger siblings [42].
4.1.1. School Travel within LMIC Urban Areas
Within LMIC urban areas, motorised transport is available, but fare costs limit its use by schoolpupils. This is a major factor shaping the very heavy dependence on pedestrian travel (together withbicycle travel in Asia). In urban Africa, generally well over 90% of pupils travel to school on foot:96% in a Nairobi slum according to Salon and Gulyani [43], 98% across eight diverse Ghana sitesand 99% across eight diverse Malawi sites studied by Porter et al. [14] (chapter 3). Journey timescan be far more substantial than in Asia given such high levels of dependence on pedestrian traveland the low availability of cycles to school pupils [14] (chapter 3). In peri-urban neighbourhoods inGhana, Malawi, South Africa and Kenya, pupils report walking considerable distances, especiallywhere there is a preference for a (usually better) school, or where the nearest schools are full [14,43]. InSoweto-Johannesburg, for instance, over a third of primary-school-aged children were found to travelmore than 3 km one way to school, nearly two-thirds attended schools outside of the suburb where theyresided, and only 18% attended the school closest to home [44]. School quality considerations are oftena significant factor shaping school selection, even among relatively poor households. See also Hunter’sresearch in Durban [45]; he makes the point that this applies to poor—but not the poorest—households.
In urban Asia, the sparse published material available suggests that school pupils make moresubstantial use of informal public transport and of bicycles. However, as cities expand in Asia, theschool commuting distance is inevitably growing, as Li and Xhao and Zhang et al. showed using datafrom Third and Fifth Travel Surveys of Beijing Inhabitants, respectively (with some children travellingover 5 km) [28,46].
177

Sustainability 2019, 11, 6193
4.1.2. Hazards of School Travel
Walk-along interviews with pupils are particularly powerful in demonstrating the fear ofharassment and attack for both boys and girls that are widespread in low income urban and ruralneighbourhoods, as Porter et al. showed for Ghana, Malawi and South Africa [47]. See also Phillipsand Tossa 2017 [48] for child-led walks in Thailand. Overall, children from particularly deprivedneighbourhoods tend to face the most constraints on their movement, as Adams et al. observed ina study across urban and rural neighbourhoods in Western Cape [49]. But even in somewhat lessdeprived neighbourhoods, children’s mobility can be restricted by diverse factors, as Benwell pointedout with reference to baboon troops, domestic ’guard’ dogs, traffic and the impact of family compositionin suburban Cape Town [50].
Across LMICs, the wider hazards of school travel by motor transport are numerous, whetherdedicated school transport or informal public transport is utilised: overcrowded poorly maintainedvehicles without seatbelts are driven by poorly trained drivers over poorly maintained roads. Thesituation is no different today across most of Africa and South Asia than was observed in rural Braziltwo decades ago [51]. However, in South Africa, where the Safe Travel to School Programme wasrecently implemented by a national child safety agency, there have been some indications of improvedpractice [52]. This has stemmed from a focus on driver road safety awareness, defensive driver training,eye-testing, vehicle roadworthy inspections with selected upgrades, incentives for safe performance,and implementation of a vehicle telematics tracking system with regular, individual driving behaviourinformation updates.
4.1.3. Subsidised Pupil Travel
Subsidised transport for pupils, as an effective policy measure to increase access to education,is far less widespread in LMICs than in the Global North and seems unlikely to advantage themsignificantly in practice in many locations. Pupil reports in Cape Coast, Ghana, of being forced offthe bus when seats are needed for full-fare passengers are unlikely to be unique. In Dar es Salaam,where, under a government scheme, children pay 33% of the adult fare (but without compensationarrangements to operators), children are often unable to even board the bus in the first place, beingbarred by the conductors [53]. Similarly, they face exclusion from buses in Karachi because of therequirement there to charge only half-fare [54]. However, across the globe, pupil transport subsidyremains a sensitive, complex issue [55].
4.1.4. Gender Issues in School Travel
Girl pupils face even higher transport constraints and hazards than boys in LMICs and thiscontributes to girls’ lower school enrolment rates. A review in Niger utilizing DHS surveys notedthat only 41 girls per 100 boys were at school in rural areas (as opposed to 80:100 in urban areas), andpointed to distance to school as a key factor behind this difference [56]. Improved road access andassociated availability of transport appear to have the potential to improve girls’ school attendancesignificantly in some contexts. In Morocco, assessment of a major road programme (National RuralRoads Program (NRRP-1)) entrusted to the National Highways Authority showed that the probabilityof girls’ attendance at primary school increased by 40% with the opening of a paved road [57–59].Road improvements in Asia appear to have similarly improved girls’ access to education, even morethan boys, as Mohsin et al. showed for Bangladesh, and Pilgrim and Chanrith for Cambodia, in thelatter case with benefits seemingly accruing principally following improvements to a provincial roadand a national road as opposed to purely local rural roads [60,61].
The negative impacts of distance, coupled with poor transport, on rural girls’ education in Africaand South Asia can be related to a number of factors: girls’ heavy household duties (typically heavierthan boys’ duties); negative cultural perceptions concerning female mobility and girls’ education; alsoperceived dangers for girls who travel a long way to school or alternatively must board far from home
178
Sustainability 2019, 11, 6193
in the school neighbourhood (as noted above) [14,62]. The safest travel procedure in African ruraland urban contexts, especially for girls, tends to be to walk together, as a group. However, whenthere is heavy traffic on urban streets and no separation of pedestrians from motorised transport,such group walks have the potential to cause traffic accidents [14] (Chapter 7). The first cause ofdeath among children aged 5–14 years and young adults 16–29 years is road traffic injury [63] (a pointfurther discussed in the Road Safety section below). Data for low income countries are inadequate butthe limited data available indicate that the vast majority of young people in such environments arepedestrians rather than passengers in motor vehicles when they are injured [14].
Even where regular transport is available (mostly in urban contexts), its cost and the potential forharassment tends to impact more strongly on (usually less well resourced) girls [14]. To date, there isless research on gendered patterns of school travel in Asian contexts but survey data from Kanpur City,India, suggests that girls are less likely to travel independently than in sub-Saharan Africa: they areeither dropped off from personal vehicles by richer families or accompanied by mothers in familieswithout such transport [64].
Cycles play a relatively small role in school travel scenarios across much of Africa, in particular,and there is much evidence across Africa and Asia to show that critical mass is essential to theirwidespread use, especially among girls [65,66]. Increasing emphasis on low-carbon transport may helpfuture efforts to promote cycling to school (crucially, if accompanied by training on cycle riding andrepair). However, if girls are unable to attend school because of the demand for domestic porterage,as is often the case in Africa, broader Intermediate Means of Transport (IMT) interventions such aspush carts aimed at the family may be of greater significance. In Pakistan, a World Bank pilot offered astipend to girls living a long way from the nearest school [67]. Another initiative which could helpprotect children against harassment and rape is the development of a ‘walking bus’ (whereby adultschaperone children along a set route, acting as driver and conductors), if this is adapted to localcontext [32].
5. Youth Employment: Transport to Work and Transport as Work
On average, unemployment is likely to be three times higher for youth than for adults globally,but five times as likely among youth as among adults in South Asia and South-East Asia [68]. Even insituations where open unemployment among youth is relatively low, as in most low income countriesin sub-Saharan Africa, there is much ‘working poverty’: temporary, low-paid work in the informalsector with poor working conditions [69,70]. Transport’s relationship with youth employment has twosignificant components which are explored in this section: firstly, its role in getting young people towork places (whether places of employment or places where they are building their own enterprise),secondly, with regard to employment within the transport sector.
5.1. Transport to Work
Firstly, with regard to accessing employment opportunities (whether provided by others, or oftheir own making, as, for instance, in the case of much petty trade), young people in both rural andurban locations face considerable challenges. Transport availability, reliability and cost are key factorsshaping young people’s access to employment. In LMIC rural areas, where employment outsideagriculture is often seen as key to improved incomes, accessing non-agricultural employment tends torequire long daily journeys to the nearest urban centre. In Western Kenya, this has led to the depressingpicture of rural youth ‘tarmaccing’, as young men trudge along pot-holed (tarmac) roads from ruralareas to the city in search of work and back again home when they cannot find employment [71].
Even in urban areas where transport availability is much higher, the distance from affordablesuburban dwellings to central employment areas (including potentially more lucrative trading locationsin the case of young entrepreneurs) can be a particular challenge for young people in poor households.This is a factor that affects poorer young people’s access to work opportunities in cities across theglobe [72], but in LMIC cities, transport constraints are often particularly limiting. There, the urban poor
179

Sustainability 2019, 11, 6193
often live in unplanned settlements and slums on the periphery of cities while employment densitiesare commonly greatest within the central area. Transport systems (including road infrastructure,formal or informal motorized transport, and non-motorized transport) linking to these opportunitiesare often extremely congested, unreliable and unsafe [1]. In cities such as Lagos and Manila, journeysfrom periphery to the city centre can take hours, especially in wet weather when transport demandeverywhere increases and potholed roads become impassable. Moreover, the informal para-transit thatdominates motorised travel in such contexts is simply unaffordable for the very poor. Unsurprisingly,many young women run small businesses from their own home, at least in part so that they do nothave to travel out of the home to work.
In South Africa, poor access to transport is one of a complex mix of factors that results in youngpeople actually stopping actively searching for work. When they leave school, they may have highhopes of finding good employment, but such dreams tend to be quickly dispelled as job applicationsfail. ‘Actively discouraged’ youth not seeking work is estimated at 61 per cent in the 20–24 yearscohort: a response to feelings of hopelessness and despair [73]. Elsewhere in sub-Saharan Africa,where the informal sector is much larger and there are no social grants, most young people tend tocontinue to search for work and to take on whatever tasks they can find because, as is so accuratelyobserved by Filmer et al., ‘most Africans simply cannot afford to be idle’ [69] (p. 3). This commentalso applies to many Asian contexts. However, Jeffrey’s observations in a north Indian city, whereneoliberal economic change had cut back employment opportunities for educated (lower-) middleclass young men, suggest conditions somewhat reminiscent of South Africa [74].
In studies of urban transport provision in 1990s Accra, which included specific considerationof its impact on young people, Grieco et al. and Turner and Kwakye, showed how the falling off intransport provision associated with the economic reform measures in place at that time (increasedcost of vehicles and spare parts due to devaluation raising the cost of imports, etc.) actually increaseddependence on the work of young women and children [75–77]. Children had become increasinglycentral to the economic organisation of households and would be taken in as foster-children to reducethe transport stress of middle-aged adults faced with transport under-provision: they acted as domesticanchors, compensating for the absence of adult household members delayed in distant markets bytransport problems. Additionally, children experienced high levels of local mobility due to domestictasks required of them, such as refuse removal, water and fuelwood collection and other activitiesincluding petty trade. Such conditions still prevail in Accra and probably also in many other Africanand Asian cities where traffic congestion is high and transport provision poor. Sibling care, especiallyin AIDS-affected households, adds to the pressures faced by many girls across LMICs [78].
5.2. Transport to Work for Young Women
For young women living in the poorer households of LMICs, conditions are often particularlydifficult in the absence of appropriate inexpensive and timely transport, as Venter et al. demonstratedfor rural South Africa and Esson et al. for Accra, urban Ghana [70,79]. Cultural barriers to mobilityvary (see Kjeldsberg et al. regarding variations in rural Nepal [80]) but for some young marriedwomen, these barriers can be insurmountable, especially if they cannot find reliable transport fortheir return journey home. This tends to be particularly important because of consequent delays toevening meal preparations, possibly coupled with male suspicions of the reason behind their delay.The unreliability of transport is a common but under-reported factor constraining young women’strade and entrepreneurial aspirations in both rural and urban sub-Saharan Africa [81,82]. Thisuncertainty/unpredictability may encompass not only concerns about how long the journey may take,but whether the journey can be done at all. Moreover, it can as significantly affect the young urbanwoman trying to establish a regional trading business in farm produce or fish as the rural womanhoping to sell her perishable plantain or cassava at a city market. Uncertainty with regards to thetransport of the perishable foods that so often underpin young women’s early efforts to build a tradingbusiness can have a particularly stultifying impact on emergent entrepreneurship.
180

Sustainability 2019, 11, 6193
In urban areas, women often must forego potential travel to find and engage in work becausemales in their households have first priority on sparse funds for transport fares. Young women aremore likely to be unemployed and, if they manage to find work (whether working for someone else orin their own enterprise), walk to their place of employment or undertake this work from their ownhome. The work tends to be predominantly in very low-paid service-related informal sector jobs.Globally, there is a tendency for women to focus on more local (often less well paid) employmentopportunities in their neighbourhood because of the financial costs (and also often the time costs,given family caring demands) [83]. This is particularly evident in LMIC cities such as Nairobi [43],Accra [70], Delhi [84] and Tunis (author fieldwork, 2019). As Langevang and Gough emphasisedwith reference to Accra, it is important to reflect on young people’s movements as tactics of socialnavigation, recognising the importance of spatial mobility to young people’s everyday well-being andtheir processes of social becoming [85].
In some better-provisioned cities in China, both women’s and men’s journeys for employment areseemingly less arduous. In Shanghai, for instance, only a small percentage of work journeys (13.0%) arelonger than 60 min [86]. However, there, the dominantly residential zones are associated with servicejobs and it is likely that women’s work will predominate in such contexts. Poor access to educationamong girls and women in many low-income contexts meanwhile limits their ability to read maps andbus information so they unsurprisingly feel safer working close to home, as has been described in bothsouthern Ghana and Buenos Aires [87,88].
5.3. Young People’s Employment in the Transport Sector
In LMICs, the transport sector often provides an employment niche for the poorest, includingyoung people. In both rural and urban areas, inadequate or costly transport can encourage adults tolook to children to fill the ‘transport gap’. This dependence on youth porterage, which can contributesubstantially to children’s time poverty and deficiencies in schooling, is still regularly overlooked inboth transport and education research. There is still insufficient detailed information about children’swork as load carriers apart from studies of the ‘kayayoo’ girl porters in Accra, Ghana [76,89] and theresearch referenced earlier conducted with young people 9–18 years across 24 urban and rural sitesin sub-Saharan Africa, which incorporated research on load-carrying and its (negative) impacts oneducation and well-being [14] (chapter 4) [42].
Employment in the transport sector is highly gendered across LMICs. Beyond their mid-teens,boys rarely carry (nor are they expected to carry) loads in domestic contexts (e.g., water carryingfor the household): this is considered work for women, girls and young boys [14,90]. Porterage ofgoods for commercial purposes is a different matter and many young men also work as push truckoperators, as, for instance, in Ghana’s urban market centres, usually for very low returns [75]. Otherwork in the transport sector involving motor vehicles, by contrast, is widely perceived across theLMICs as belonging firmly within the masculine domain. There is occasional publicity around womentaxi drivers such as Ghana’s MissTaxi [91] and India’s motorbike taxi service Bikxie [92] but theseare extremely rare, not least due to perceived safety and security issues where women operatorsare concerned.
For many young men in Africa and Asia, it is the motorcycle or tricycle taxi which has becomethe most important employment opportunity in the transport sector. Operating a motorcycle-taxi(known as boda-boda in much of East Africa, okada in much of West Africa) can offer them a relativelylucrative livelihood, whether as independent riders or, more commonly, through a renting arrangementwith the motorcycle owner (usually an older, better resourced man or woman). Young men are, insome cases, demonstrating significant entrepreneurship as they move out of less lucrative activities(for instance, charcoal production in Kibaha district, Tanzania) and into motorcycle taxi operations.However, negative impacts are widely reported in some regions: these may include not only recklessdriving and increased accident rates, but also violent crime and expanded sexually transmitted diseases(STDs). The latter is, in part, a product of relatively high incomes and consequent high bargaining
181
Sustainability 2019, 11, 6193
power for sex, as noted early in their expansion by Nyanzi et al. for south-west Uganda [93] and Waagefor Ngaoundere, Cameroon [94]. In rural areas of Lao PDR, Doussantousse et al. similarly found thatmotorbikes and mobile phones had expanded the sexual territory of indigenous youth at a time wheninternational commerce and a cash economy along improved highways were bringing new peopleinto the region [95]. Among the concerns for their health and safety are at-risk behaviours involvingalcohol and sexual practices, especially HIV and sexually transmitted infections. Such issues have ledto much government concern, such that, in Ghana, motorcycle-taxis are still banned nation-wide andmany countries have city-centre bans in place. However, such bans do not take into account the cruciallevel of access that motorcycle taxis deliver for people in informal and peripheral urban areas, such asthe satellite towns around Abuja in Nigeria. There, the personal mobility they deliver to young peoplewanting to be independent is widely appreciated not only by young men but also by the many youngwomen passengers who use them extensively (author fieldwork 2019; see also Adamu regarding theimpact on northern Nigerian women of shari’a-related campaigns to stop them riding commercialmotorcycle-taxis [96]).
There is a rapidly growing literature on motorcycle taxi operations by young men (rarely arewomen involved, except as passengers), for example Burge on young male entrepreneurs in SierraLeone, Olvera et al. on west and central African cities, and Jenkins and Peters on post-conflictLiberia [97–99]. An extensive review of the recent literature on this theme is now available [100]. It isimportant to note that motorcycle maintenance and repair is a growing support industry too, both forprivate and commercial motorcycles, but again mostly employs men.
6. Road Safety and Other Aspects of Young People’s Personal Mobility Safety
6.1. Road Safety
The bare bones of the global road safety issue are clearly presented in a recent World HealthOrganisation (WHO) road traffic injuries factsheet [101]. This demonstrates that, while globally, peoplefrom lower socioeconomic backgrounds are more likely to be involved in road traffic crashes, more than90% of road traffic deaths occur in LMICs and road traffic injury death rates are highest in the Africanregion (at 26.6/100,000 people), followed by South-East Asia (20.7/100,000 people). Africa has thehighest proportion of pedestrian and cyclist mortalities at 44% of deaths: unsurprisingly, pedestrians,cyclists and riders of two- and three-wheeler motorcycles are especially vulnerable as a result of beingless protected than car occupants. However, vulnerable road users are still largely ignored in theplanning, design and operation of roads. Across Africa and Asia, most roads still lack separate lanesfor cyclists or adequate crossings for pedestrians, while motor vehicle speeds are too high [102].
So far as children and young people are concerned, the statistics are particularly sobering: roadtraffic injuries are the leading cause of death globally for the 5–29 years cohort. The vulnerabilityof younger children to road traffic relates to their physical, cognitive and social development stagecompared to that of adults. Given their small stature, they may find it difficult to see surroundingtraffic and for drivers, in particular, to see them. They are likely to have more difficulty judging theproximity, speed and direction of moving vehicles. Impulsivity and a shorter attention span couldaffect their ability to cope with simultaneous events. In a road traffic crash, their softer heads will makethem more susceptible to serious head injury than an adult. Adolescents, meanwhile, are found to beespecially prone to take risks that compromise their road safety [63].
In urban areas, most of those injured in public transport accidents are either paratransit passengersor pedestrians (commonly including young people trying to hawk goods between slow moving traffic).In Ilesa, south-west Nigeria, a small study of child accident victims found that the majority (89%)were pedestrians and most were over 5 years old; 60% of them were injured either while hawking bythe roadside or when undertaking an errand [103]. Twenty per cent of cases involved motorcycles.This excludes potentially wider damage to young people’s health in urban areas associated withvehicle-generated air pollution.
182

Sustainability 2019, 11, 6193
During interviews in the 24-site child-mobility study across Ghana, Malawi and South Africa,teachers were questioned about road safety education. Whatever national programmes exist, theirevidence seems to suggest that many children in school obtain little quality road safety training [14](chapter 8). This mirrors conditions across many LMICs, despite the level of traffic injuries sustainedby children. However, efforts have been in progress in a number of countries to promote road safety,funded, for instance, by the UK Department for International Development (DFID) and the DanishInternational Development Agency (DANIDA) and, since 2012, through the International AutomobileFederation (FIA) Road Safety Grants Programme. The FIA projects aim to meet the objectives of the UNDecade of Action for Road Safety (2011) of halving the number of deaths and injuries from road trafficaccidents by 2020, with active programmes in diverse LMIC countries including Tanzania, Nigeria,Brazil, Morocco and China [104].
Recent research in the Global North has drawn attention to the value of training parents aboutroad safety [105] but in LMICs, where many children travel to school and other locations withoutparental accompaniment (see above), this is unlikely to have a significant impact. There, early trainingof children on pedestrian road safety is crucial. Salmon and Eckersley proposed that to become skilledpedestrians, children need to move ‘beyond a view of traffic as rule-bound and develop dynamicadaptable strategies for crossing roads’ [106] (p. 729). The reportedly successful local programme theydeveloped in Ethiopia, based on the UK Kerbkraft concept, entailed practical exercises on local streets,enabling children to develop techniques for identifying safe crossing-places. FIA foundation projectssuch as South Africa’s Safe Schools project take a similar approach [107]. A recent project by theNon-Governmental Organisation (NGO) Amend in a Lusaka school that includes addition of a raisedplatform pedestrian crossing, footpaths, fencing and a school zone warning, removal of vehicle parkingwhich blocked sight lines, and reduced operating speeds of passing vehicles, has reportedly hadsignificant impact [108]. Other examples show how high the returns from such investment can be: inKorea a school zoning scheme, together with improved school bus regulation and road safety trainingschemes, reportedly reduced traffic accidents among children under 14 years of age by 95% between1998 and 2012 [101]. However, finding means to bring road safety training to the many children whoeither never attend school or leave before the year in which road safety training is introduced, is alsovital [109]. Here, road safety NGO interventions that support short courses for groups such as youngtraders (at particular risk as they rush to vehicles to sell, darting across roads and within the path ofother vehicles) would be extremely valuable [14] (chapter 8).
Motorised traffic is also a growing danger for those who operate it or travel in it. In Cambodia,Kitamura et al. argued that speeding by young people is promoted by road improvements thatoccur alongside underdeveloped traffic legislation and limited public awareness and knowledgeof road safety [110]. They emphasise the importance of implementing the “three Es”, namelyEngineering, Enforcement and Education in low income countries such as Cambodia but note thatthe role of education to increase people’s road safety awareness is neglected compared to the othertwo dimensions. Across LMICs in Africa and Asia, there are widespread issues associated withpoorly regulated (privately operated) public transport, limited vehicle maintenance, deficiencies in lawenforcement, high traffic mix and little separation of vulnerable road users from high speed motorizedtraffic. When coupled with the lack of seat belts, overcrowding/standing passengers, poor roadinfrastructure and, overall, very hazardous road environments, it is clear that the conditions in whichyoung people navigate the city are often potentially lethal. The dangerous practice of transportingpassengers in the cargo area of light delivery vehicles (LDVs) also occurs in many countries: one smallstudy in South Africa found that 35% of passengers treated for injury following ejection from thevehicle were children under the age of 18 (and 11% sustained a permanent disability) [111].
Much recent attention has been paid to the high level of traffic injury associated with motorcycles(mostly driven by young men). Problems associated with a lack of adequate body and head protection(given that helmets are uncomfortable in high temperatures and often of sub-standard manufacture),poorly regulated vehicle and driver safety and the preponderance of young male drivers with a taste
183

Sustainability 2019, 11, 6193
for speed, are exacerbated when two, three or more passengers are riding pillion. Phone use whenoperating a vehicle adds to these hazards [112]. Air pollution from motorcycles is also a growing issuein densely populated urban areas, especially in Asia.
Finally, it is important to note that where gender-disaggregated data are available, road injurypatterns show a significant gender dimension, with nearly three quarters (73%) of all road traffic deathsoccurring among males under the age of 25 years: they are almost three times as likely to be killedin a road traffic crash as young females [101,113,114]. Unfortunately, in LMICs in Asia and Africa,adequate gender-disaggregated data are still regularly missing from road safety studies. This is likelyto be partly a factor of overall poor reportage of road injury by accident victims, their families andcarers, the police and hospitals [102]. One review of published and grey literature on road traffic injuryin urban sub-Saharan Africa among young people (≤19 years) suggested that boys and young menwere twice as likely to be involved as girls and young women [115]. A recent study of primary schoolpupils in low-income neighbourhoods in Cape Town found that older boys (10–15 years) were most atrisk of experiencing a severe pedestrian injury [116]. In India, data for 2014–2016 show that femalesrepresented only around 15% of road accident victims [117]. Gender imbalance in RTIs in LMICs, asglobally, appears to be associated not only with higher male access to and use of road transport andhigher male mobility overall, but also to gender variations in attitude to risk.
6.2. Travel Safety and Security
Beyond road traffic accidents, travel safety and security is often regarded as primarily an issueaffecting females. There is certainly substantial evidence regarding high perceptions of travel danger(from verbal harassment to rape and murder) among girls and young women across the globe. There isalso ample evidence of actual harassment of women globally and on a daily basis, with recent statisticssuggesting, for instance, that over 70% of women in Karachi had experienced harassment on publictransport and 90% in Sri Lanka, while 89% of women in Santiago had either seen or experienced itthemselves [83] (pp. 15–16). Participants in a Chennai research study reported 14 years as the meanage at which they first encountered harassment in travel contexts; harassment was worst at night [118].Jeffrey similarly reported so-called ‘eve-teasing’ in India [74]. This is rarely reported to the police and,as Anand and Tiwari noted for a Delhi slum [84] and Salon and Gulyani for a Nairobi slum [43], resultsin women travelling far less than they might otherwise do, thus contributing to their economic andsocial exclusion.
Lack of reportage means that it is difficult to assess the age-distributed incidence (or impact) ofsexual harassment. Women worldwide have reported street harassment even in their 80s [119], sothis is not purely an issue for youth. The statistics cited above are for women per se, but young girlsmay well be at particularly high risk of harassment and are even less likely to report such actions sotheir situation is often particularly dire. Young girls interviewed in the 24-site study in Ghana, Malawiand South Africa confided (especially to the peer researchers) a range of problems from catcalling andjeering by men to being groped when on public transport and actual rape [14] (pp. 184–186), [120].Especially in locations with high HIV/AIDS prevalence, rape is clearly life-threatening. Girls’ fear oftravelling alone often leads them to postpone travel until others can accompany them (travel in groupsis usually preferred by them and their parents), to take longer journeys to avoid particular troublespots or to simply not travel, especially during hours of darkness [14,121] (for urban South Africa).However, it is important to note that boys can also face significant harassment, intimidation and, albeitvery rarely, rape as they travel [14,122] (pp. 186–187).
7. Mobile Technology: Interactions between Mobile Technology and Travel among Young People
Young people tend to be at the forefront in uptake and use of digital technology acrossthe world. Consequently, there is already substantial evidence of their engagement with mobiletechnology—mobile phones, the internet and other information and communication technologies(ICTs)—in transport contexts, not least as an aid to help address transport poverty. E-learning and
184

Sustainability 2019, 11, 6193
mHealth are expanding rapidly, while smart mobility and smart city solutions are now becomingcentral foci of urban planning research globally. In remote rural areas, the potential for e-connectivityto reduce transport poverty can be particularly powerful [123,124]. In LMICs, where low cost mobilephone handsets and mobile phone networks have expanded dramatically over the last two decades, theimplications for travel practices are extremely significant, as a growing literature attests (for example,Porter on the implications for poorer people’s mobility [125], Williams et al. 2015 on the Nairobidigital matatu project [126]). When emergencies arise—not least obstetric emergencies among firsttime and very young mothers (who are at particularly high risk)—mobile-enabled mobility (wherebya phone-call to the nearest health centre brings in an ambulance) can be life-saving [127]. One issueworthy of note, however, is the varying cost of airtime and data. In countries with a highly competitiveICT sector, such as Kenya, airtime and data are relatively cheap, but in others, including South Africa,running a mobile phone, especially a smart phone, is costly. For young people with limited resources,this is an issue of considerable significance, although two studies conducted with African youthindicated that many young people see these costs as a priority over other consumables and often makeconsiderable sacrifices in order to maintain their access [128–130].
The published literature specifically concerned with youth use of phones in daily travel contexts(as opposed to migration contexts) is, to date, relatively sparse globally, although there is a largeamount of literature on phone practices based around youth culture and social media, adult orpartner surveillance, etc. Nonetheless, there is growing evidence in the Global North of young peopleembedding technology in their everyday lives to better accommodate the uncertainty in activityand travel scheduling, such that it ‘lubricates’ modern life without fundamentally changing travelbehaviours [131]. In the Global South, technology may have more impact on travel behaviour. Theextent to which mobile phones can reduce travel is a particularly important question with regardto resource-poor people and environments and to carbon reduction, especially in urban contexts.Qualitative and survey data regarding young people’s perception of the extent to which their use ofphones had substituted for travel in the previous year, conducted in 24 sites in Africa, suggests thatsome reductions in travel are occurring, although the precise patterning varies with location [132–134].
In urban South Africa, many short daily journeys conducted by both males and females, especiallywalking journeys, seem to be being substituted by phone calls with safety as the main reason behindthis. There is also evidence of a perceived reduction in longer (more expensive) journeys by motorvehicle as a result of greater mobile phone usage: in this case, the change is probably mostly attributableto the potential for saving money (although safety considerations could come into play too, given thehazards of long distance travel in the continent) [121]. Among urban residents, perceived reductionsin long distance, irregular, and short everyday journeys look substantial, but it is important to notethat these are only assessments based on respondent reflections about their travel activities over thepast year. Whether this a real change, and if so, whether it is one that has reduced pedestrian andmotorised traffic flows in the neighbourhoods where the surveys were conducted—and, if so, withwhat consequences for health and security—would be worthy of further research.
ICT/transport connectivities can be particularly important for women. As noted earlier, manywomen and girls in LMICs are restricted in their physical travel by male family members who maynot only express concern for the vulnerability of womenfolk travelling alone but also distrust thepotential that independent female mobility offers for promiscuity. In such contexts, women’s accessto mobile phones can be seen as a potential (virtual) mobility aid. However, keeping control of apartner’s mobile phone communication is now a regular male endeavour in many households (asBurrell observed for rural Uganda [135]). As handset prices drop and phone ownership increasesamong young women, this is becoming more difficult to maintain, but surveillance of wives’ andgirlfriends’ phone contact lists and calls and use of the phone as a ‘digital leash’ to check their physicallocation and travel movements appear to be growing features of many relationships [136,137]. In thiscontext, it is noteworthy that young men in the motor-cycle taxi business and older ‘sugar daddy’ male
185

Sustainability 2019, 11, 6193
taxi drivers have become notorious in some locations for using their relative wealth built throughtransport operations to buy phones for their girlfriends [121].
For (mostly male) transport operators, owning a working phone is widely considered essential torunning a successful business; this is even the case for bicycle-taxi operators in Malawi [133]. AcrossAfrica, people of all ages keep the numbers of local motorcycle-taxi and taxi drivers on their phones(ibid). For young women in particular, this is often seen not merely as a convenience but as a vitalinformal safety mechanism [121].
Beyond the transport sector per se, informal use of mobile devices appears to be having someimpact on youth entrepreneurship through leapfrogging physical distance and promoting socialnetworking. Qualitative and survey data on phone use for business among young people in 24 Africanresearch sites indicate that the phone is used extensively and intensively in small informal businesses.In trade, it is used not only to build relationships with customers and suppliers but also to help withpre-arranging meetings, organising travel, finding staff and for mobile money transfers and ensuringthat payments have been made [121]. However, it could be unwise to overrate the phone’s potentialto promote youth entrepreneurship [138]. In Kibera, one of Nairobi’s slum areas, although phonesare utilised by young people to ease communication and strengthen existent social ties, this does notnecessarily allow them to bypass Kenya’s hierarchical class-based society [139].
New Forms of ICT-Enabled Mobility Service
While mobile phone usage will continue to be interwoven in diverse ways with human corporealmobility and with physical transport technologies in LMICs, these patterns of interweaving areconstantly being re-shaped. A burgeoning array of inventive phone apps, closely tied to growingsmartphone use and the development of wireless infrastructure, appears to have particularly significantpotential. In Asia, where the ride-hailing app boom is currently massive, smartphones are now availablecheaply; advanced fourth-generation services can be accessed for just a few dollars. In Phnom Penh,for instance, at least four services, including one named CamGo, have been launched recently. Thisis for tuk-tuks, which are cheap but whose popularity was somewhat marred by drivers chargingunreasonably high fares or intentionally taking round-about routes to increase the fare. CamGo isreportedly popular with young people because it offers a fixed rate per km and the route takes theshortest distance to the destination, measured by GPS, confirmed before boarding. Other recentexamples include Chiang Mai, northern Thailand, where the Indonesian company Grab has launcheda ride-hailing service for microbuses, now with 300 registered drivers. Ride-hailing services arealso being used to book home deliveries. In India, Jugnoo, a ride-hailing service specializing inmotorized tricycles, has partnered with fast-food restaurants such as Kentucky Fried Chicken andBurger King to deliver meals: it reportedly has 15,000 vehicles operating in 35 cities. We can anticipatethat young people—both as customers and operators—will lead in the usage of these apps, althoughthe returns from ownership of the vehicles involved may well go mostly to older, more establishedentrepreneurs [140].
In Africa, Uber and Uber-style apps are now playing a similar role. In South Africa, for instance,Uber has operated in major cities since 2013, although not without considerable hostility from meteredtaxi companies [141]. Subsequently, in 2017, the South Africa Meter Taxi Association set up their ownapp, “Yookoo Rider”. This benefits customers through the registration of cab drivers, comprehensivedriver vetting and criminal checks with fingerprint technology [141].
Uber-style companies now operate in many Africa cities (including for motorcycle taxis in citieslike Kampala). With Little Cab, a Kenyan ride-hailing app backed by telecoms operator Safaricom,customers can pay for their ride through Safaricom’s mobile money service, M-Pesa, buy discountedairtime during the trip and access free Wi-Fi. It also lets women exclusively request female driversfrom 18:00 to 6:00 for safety reasons [142]. Many smaller operations are now attracting youngentrepreneurs—for instance, the mobile application, Tag Your Ride, was launched by a young SouthAfrican university graduate [142]. Young women customers appear to derive very considerable benefits
186

Sustainability 2019, 11, 6193
from these apps, as can women drivers, especially if they are able to build a women-only service.Finally, however, it is necessary to refer back to the potential of phones as a causal factor in transportaccidents with potential for impact on all sectors of the population.
8. Concluding Summary and Reflections
This paper covered diverse aspects of mobility while taking a specific child and youth perspectiveand drawing on the voices and evidence of young people themselves. It has emphasised how travelexperiences, needs and risks are embedded in power relations and vary with gender, age and location(urban versus rural, rich country versus poor country, Asia versus Africa). It has also pointed to thescale and range of uncertainties that so many young people now face as they negotiate daily mobility(or immobility). Neoliberal economic and social changes have been radically transforming youngpeople’s experiences of youth and early adulthood across much of the world over the last decade [143],while climate change and growing environmental fragility are beginning to bring further uncertaintiesto the fore. In this context, it is important to note that while the majority of emphasis in the literaturereviewed has been on daily mobility or immobility and travel experiences, the implication of suchdaily mobility experiences (physical and virtual) for migration decisions (short and long distance,short and long term) needs far stronger attention, particularly in this era of climate change. Thelinkages between daily mobility experiences and migration decisions will need far closer investigationglobally, but especially in the context of conflict, climate change and growing environmental fragilityin many LMICs.
The review pointed to other clear research gaps too: in particular, the need for a realignment ofresearch methods and associated practices. Of prime importance is the need for more in-depth research,particularly in Asia. There is a growing body of detailed evidence regarding children and youngpeople’s specific transport and mobility needs and experiences in sub-Saharan Africa, often takingan ethnographic approach, but as this review has demonstrated, data remain sparse (and primarilyquantitative) in Asian and Middle East and North Africa (MENA) contexts. But whatever the placecontext, it is important that mixed methods studies and an interdisciplinary approach are adopted inorder to capture a fuller understanding of young people’s complex transport needs and constraints. Todate, there has been a particular sparsity of research using mixed-methods approaches: the 24-sitestudy of daily mobilities among young people 9–18 years in sub-Saharan Africa [14] seems, to date, tobe the only extensive study in LMICs that utilised a range of qualitative and quantitative methods. InAsia, mixed methods studies are rare and a majority of research takes a quantitative survey approachthat commonly fails to provide adequate understanding of the patterns that emerge. A triangulationof in-depth ethnographic and survey research drawing on a range of disciplinary skills (possiblycoupled with action research where interventions are made, and their impact then studied in depth),can be particularly powerful in understanding mobility experiences, behaviours and opportunities forpositive change.
Linked to this point, greater engagement with young people themselves in research and planningprocesses is essential. Community peer-research with young people as a route to more fullyunderstanding their needs and aspirations in the transport field is gaining growing attention. Themixed-method study cited above, which brought together 70 young researchers (11–19 years) inAfrica to help build an extensive academic study, demonstrated the value of this approach. Smallstudies in Asia and Africa further support the importance of directly engaging young people in theresearch process [12,17]. At the same time, however, there is also need to build stronger recognitionamong transport professionals of the value of inputs from more vulnerable groups. There is no pointin conducting research with young people if the evidence collected is subsequently ignored. Thus,greater effort is required to draw transport professionals more centrally into the research process withvulnerable groups.
Action research incorporating and assessing both transport service and infrastructure interventionscould considerably aid exploration of a diversity of issues in both LMIC cities and rural areas. In LMIC
187

Sustainability 2019, 11, 6193
cities, this could include working with young people to pilot and monitor interventions associatedwith road safety and improving potential for active travel: for instance, walking buses and otherinterventions such as street lighting and dedicated pedestrian and cycle lanes, as well as safe travelskills training for young women. Given the growing obesity problems among middle-class children inLMICs, particular attention also needs to be paid to improving their active travel to school. Meanwhile,for young people who may have never attended school and thus never had access to any roadsafety curriculum, piloting of non-school based road safety training interventions could bring greatbenefit—notably for the many involved in dangerous roadside hawking on busy city streets. In LMICrural areas, there would be similar value in exploring the potential of walking buses, cycling and cyclemaintenance/repair training, especially for girls, dedicated contract transport, and other interventionsto improve girls’ journey to school and to work. In both urban and rural contexts, new approachesto transport subsidy need exploring (and piloting) that do not result in excluding young peoplefrom transport (as has occurred when operators on busy routes have to choose between paying andnon-paying customers). Subsidy is contentious in the transport services arena but could significantlyimprove the mobility opportunities and life chances of pupils, unemployed youth and young workersin urban and rural contexts.
Moving more centrally into the employment sphere, the transport/mobility elements that helpshape youth employment, job search, entrepreneurship and unemployment experiences have, as yet,been insufficiently researched. This needs urgent attention across LMIC peri-urban sites, in particularwhere so many poorer households are located—and not least with specific reference to young women.More research is also needed around mobility aspects of out-of-school activities associated withrecreation and social network building, which will be important for overall well-being but also mayaid youth employment opportunities. Linked to this, more attention will be required to relationalityacross age groups (especially the linkages between expanded older people and youth cohorts) and themobility implications that may extend well beyond work and employment.
Another area for further attention is how mobile technology is reshaping travel practices inlow income contexts in the Global South (but also with likely relevance to some poor Global Northcommunities). This includes the potential of mobile technology to reduce motorised transport usageand the extent to which young people may experience negative elements of exploitation or surveillancethrough digital technology. Mobile technology now helps young people to extend their networksacross the world and has potential to support distance management in both emergency and everydaytravel contexts and in rural and urban places. The potential for apps (including those developed byyoung people themselves) to reshape the transport arena globally is very exciting and opens up apotentially dramatic new phase of development. However, the extent to which less powerful groupsin society, especially young people, are able to benefit in the longer term while evading potentialthreats of exploitation (for instance in the gig economy) or the wider surveillance and control alsoposed by increasingly smart technological innovation is uncertain; the evolving scene will meritcareful observation.
Finally, it is important to look beyond the transport sector if we are to make significantimprovements in young people’s travel experiences and opportunities. Regarding LMICs, far greaterattention is needed to youth transport issues from development practitioners working in other sectorsoutside transport, particularly education, youth employment, ICT and energy (although recent movesin the health sector to incorporate both transport and ICT considerations in their analyses are veryencouraging). This will require more sustained efforts among transport practitioners and researchersto reach cross-sectorally and engage productively with those sectors if youth opportunities that are socentral to achieving progress across the SDGs are to be fully realised.
Author Contributions: Writing—original draft, G.P.; writing—review and editing, J.T.
Funding: This research was funded by the UK Department for International Development.
188
Sustainability 2019, 11, 6193
Acknowledgments: This research was funded by UK AID through the UK Department for InternationalDevelopment under the High Volume Transport Applied Research Programme, managed by IMC Worldwide.However, some of the material referenced in the paper was drawn from a series of original field research studieson youth mobility (and associated publications) led by the first author and funded in whole or in part by theDepartment of International Development from 2000 in sub-Saharan Africa. (Studies 2006–2010 and 2012–2015,were jointly funded by UK DFID and the UK Economic and Social Research Council).
Conflicts of Interest: The authors declare no conflict of interest.
References
1. McMillan, T. Children and Youth and Sustainable Urban Mobility. Thematic Study Prepared for GlobalReport on Human Settlements 2013. Available online: https://unhabitat.org/wp-content/uploads/2013/06/GRHS.2013.Thematic.Children.and_.Youth_.pdf (accessed on 28 October 2019).
2. UNDESA (United Nations Department of Economic and Social Affairs). The World Youth Report: Youth andthe 2030 Agenda for Sustainable Development; UNDESA: New York, NY, USA, 2018. Available online: https://www.un.org/development/desa/youth/world-youth-report/wyr2018.html (accessed on 28 October 2019).
3. Brookings Institution 2018. Harnessing Africa’s Youth Dividend. In Foresight Africa: Top Priorities for theContinent in 2019; Chapter 3; Brookings Institution: Washington, DC, USA.
4. By youth, with youth, for youth. Available online: https://en.unesco.org/youth#strategy (accessed on28 October 2019).
5. Honwana, A. The Time of Youth–Work, Social Change and Politics in Africa; Kumarian Press: Boulder, CO,USA, 2012.
6. Barker, J. Passengers or political actors? Children’s participation in transport policy and the micro-politicalgeographies of the family. Space Polity 2003, 7, 135–151.
7. Sheller, M. Mobility Justice: The Politics of Movement in an Age of Extremes; Verso: London, UK; Verso: New York,NY, USA, 2018.
8. Martens, K.; Lucas, K. Perspectives on transport and social justice. In Handbook on Global Social Justice;Craig, G., Ed.; Edward Elgar Publishing: Cheltenham, UK, 2018; pp. 351–370.
9. Grieco, M. Youth and Transport: The Emergence of Youth Transport Strategies. 2007. Available online:https://www.ssatp.org/sites/ssatp/files/publications/HTML/Gender-RG/Source%20%20documents/Issue%20and%20Strategy%20Papers/G&T%20Rationale/ISGT14%20Youth%20and%20transport%20Grieco.pdf(accessed on 28 October 2019).
10. Developing a School Travel Plan That Caters for the Needs of Pupils with SEN. Availableonline: http://www.brake.org.uk/facts-resources/21-resources/566-developing-a-school-travel-plan-that-caters-for-the-needs-of-pupils-with-senforoneexample (accessed on 28 October 2019).
11. Children’s Transport and Mobility: Towards a Child-Centred Methodology/toolkit. Availableonline: https://assets.publishing.service.gov.uk/media/57a08c6ee5274a27b20011d1/R8373a.pdf (accessedon 28 October 2019).
12. Lolichen, P. Children in the drivers’ seat: Children conducting a study of their transport and mobilityproblems. Child. Youth Environ. 2007, 17, 238–256.
13. Porter, G.; Abane, A. Increasing children’s participation in African transport planning: Reflections onmethodological issues in a child-centred research project. Child. Geogr. 2008, 6, 151–167. [CrossRef]
14. Porter, G.; Hampshire, K.; Abane, A.; Munthali, A.; Robson, E.; Mashiri, M. Young People’s Daily Mobilities inSub-Saharan Africa. Moving Young Lives; Palgrave Macmillan: London, UK, 2017.
15. Porter, G.; Hampshire KBourdillon, M.; Robson, E.; Munthali, A.; Abane, A.; Mashiri, M. Children as researchcollaborators: Issues and reflections from a mobility study in sub-Saharan Africa. Am. J. Commun. Psychol.2010, 46, 215–227. [CrossRef] [PubMed]
16. Porter, G. Reflections on co-investigation through peer research with young people and older people insub-Saharan Africa. Qual. Res. 2016, 16, 293–304. [CrossRef]
17. Simpson, E.; Collard, N. Thinking with young people: Transport experiences and aspirations in sub-SaharanAfrica and South Asia. Unpublished paper. January 2019.
18. Barker, J. A free for all? Scale and young people’s participation in UK transport planning. In CriticalGeographies of Childhood and Youth: Contemporary Policy and Practice; Kraftl, P., Horton, J., Tucker, F., Eds.;Policy Press: Bristol, UK, 2012; pp. 169–184.
189
Sustainability 2019, 11, 6193
19. Mulongo, G.; Porter, G.; Tewodros, A. Gendered politics in rural roads: Gender mainstreaming in Tanzania’stransport sector. In Proceedings of the Institution of Civil Engineers–Transport; Thomas Telford Ltd.: London,UK, 2019. [CrossRef]
20. Barker, J.; Kraftl, P.; Horton, J.; Tucker, F. The Road Less Travelled? New Directions in Children’s Mobility.Mobilities 2009, 4, 1–10. [CrossRef]
21. Southward, E.; Page, A.; Wheeler, B.; Cooper, A. Contribution of the School Journey to Daily Physical Activityin Children Aged 11–12 Years. Am. J. Prev. Med. 2012, 43, 201–204. [CrossRef]
22. Chaufan, C.; Yeh, J.; Ross, L.; Fox, P. You can’t walk or bike yourself out of the health effects of poverty:Active school transport, child obesity, and blind spots in the public health literature. Crit. Public Health 2015,25, 32–47. [CrossRef]
23. Loo, B.P.Y.; Siiba, A. Active transport in Africa and beyond: Towards a strategic framework. Transp. Rev.2019, 39, 181–203. [CrossRef]
24. Malone, K.; Rudner, J. Global Perspectives on Children’s Independent Mobility: A socio-cultural comparisonand theoretical discussion of children’s lives in four countries in Asia and Africa. Glob. Stud. Childhood 2011,1, 243–259. [CrossRef]
25. Roya, S.; Hanif, N.R.; Dali, M. Influence of the socio-economic factors on children’s school travel. Soc. Behav.Sci. 2012, 50, 135–147.
26. Andegiorgish, A.K.; Wang, J.; Zhang, X.; Liu, X.; Zhu, H. Prevalence of overweight, obesity, and associatedrisk factors among school children and adolescents in Tianjin, China. Eur. J. Pediatr. 2012, 171, 697–703.[CrossRef] [PubMed]
27. Yusoff, Z.M.; Shamin, F.; Arif, H.; Adnan, N.A.; Nordin, N.A. School Location and Mobility Effects to ObesityCases Among Primary School Children. In Proceedings of the International Conference on Architecture andBuilt Environment (ICABE), Kuala Lumpur, Malaysia, 5–6 October 2016.
28. Li, S.; Zhao, P. The determinants of commuting mode choice among school children in Beijing. J. Transp.Geogr. 2015, 46, 112–121. [CrossRef]
29. Muthuri, S.K.; Wachira, L.J.M.; Onywera, V.O.; Tremblay, M.S. Associations Between Parental Perceptions ofthe Neighborhood Environment and Childhood Physical Activity: Results from ISCOLE-Kenya. J. Phys.Act. Health 2016, 13, 333–343. [CrossRef] [PubMed]
30. Onywera, V.O.; Larouche, R.; Oyeyemi, A.L.; Prista, A.; Akinroye, K.K.; Heyker, S.; Owino, G.E.; Tremblay, M.S.Development and convergent validity of new self-administered questionnaires of active transportation inthree African countries: Kenya, Mozambique and Nigeria. BMC Public Health 2018, 18. [CrossRef]
31. Kingham, S.; Ussher, S. An assessment of the benefits of the walking school bus in Christchurch, New Zealand.Transp. Res. Part A 2007, 41, 502–510. [CrossRef]
32. Bwire, H.; Muchaka, P.; Behrens, R.; Chacha, P. Implementation and evaluation of walking buses and cycletrains in Cape Town and Dar es Salaam. In Non-Motorized Transport Integration into Urban Transport Planningin Africa; Mitullah, W., Vanderschuren, M., Khayesi, M., Eds.; Routledge: Abingdon, UK, 2017; pp. 150–169.Available online: https://www.researchgate.net/publication/321680296_Implementation_and_evaluation_of_walking_buses_and_cycle_trains_in_Cape_Town_and_Dar_es_Salaam (accessed on 28 October 2019).
33. Barker, J. ’Manic Mums’ and ’Distant Dads’? Gendered geographies of care and the journey to school.Health Place 2011, 17, 413–421. [CrossRef]
34. Porter, G.; Hampshire, K.; Abane, A.; Munthali, A.; Robson, E.; Mashiri, M.; Tanle, A. Youth transport,mobility and security in sub-Saharan Africa: The gendered journey to school. World Transp. Policy Pract.2010, 16, 51–71.
35. Owen, D.; Hogarth, T.; Green, A.E. Skills, transport and economic development: Evidence from a rural areain England. J. Transp. Geogr. 2012, 21, 80–92. [CrossRef]
36. Hine, J. Good Policies and Practices on Rural Transport in Africa Planning Infrastructure & Services; SSATP WorkingPaper 100; World Bank: Washington, DC, USA, 2014.
37. Avotri, R.; Owusu-Darko, L.; Eghan, H.; Ocansey, S. Gender and Primary Schooling in Ghana; Institute ofDevelopment Studies: Sussex, UK, 1999.
38. Department of Transport (Republic of South Africa). The first South African National Household Travel Survey2003: Technical Report; Republic of South Africa: Pretoria, South Africa, 2005.
190

Sustainability 2019, 11, 6193
39. Matin, N.; Mukib, M.; Begum, H.; Khanam, D. Women’s empowerment and physical mobility: Implicationsfor developing rural transport, Bangladesh. In Balancing the Load: Women, Gender and Transport; Fernando, P.,Porter, G., Eds.; Zed: London, UK, 2002.
40. Cook, C.; Duncan, T.; Jitsuchon, S.; Sharma, A.; Guobau, W. Assessing the Impact of Transport and EnergyInfrastructure on Poverty Reduction; Asian Development Bank: Metro Manila, Philippines, 2005.
41. India’s Women Are Choosing to Go to Worse Colleges Than Men. Available online: https://www.weforum.org/agenda/2017/12/indias-women-are-choosing-to-go-to-worse-colleges-than-men (accessed on28 October 2019).
42. Porter, G.; Hampshire, K.; Abane, A.; Munthali, A.; Robson, E.; Mashiri, M.; Tanle, A.; Maponya, G.; Dube, S.Child porterage and Africa’s transport gap: Evidence from Ghana, Malawi and South Africa. World Dev.2012, 40, 2136–2154. [CrossRef]
43. Salon, D.; Gulyani, S. Mobility, poverty, and gender: Travel ‘choices’ of slum residents in Nairobi, Kenya.Transp. Rev. 2011, 30, 641–657. [CrossRef]
44. De Kadt, J.; Norris, S.A.; Fleisch, B.; Richter, L.; Alvanides, S. Children’s daily travel to school inJohannesburg-Soweto, South Africa: Geography and school choice in the Birth to Twenty cohort study.Child. Geogr. 2014, 12, 170–188. [CrossRef]
45. Hunter, M. Racial desegregation and schooling in South Africa: Contested geographies of class formation.Environ. Plan. A 2010, 42, 2640–2657. [CrossRef]
46. Zhang, R.; Yao, E.; Liu, Z. School travel mode choice in Beijing, China. J. Transp. Geogr. 2017, 62, 98–110.[CrossRef]
47. Porter, G.; Hampshire, K.; Abane, A.; Munthali, A.; Robson, E.; Mashiri, M.; Maponya, G. Where dogs, ghostsand lions roam: Learning from mobile ethnographies on the journey from school. Child. Geogr. 2010, 8,91–105. [CrossRef]
48. Phillips, L.G.; Tossa, W. Intergenerational and intercultural civic learning through storied child-led walks ofChiang Mai. Geogr. Res. 2017, 55, 18–28. [CrossRef]
49. Adams, S.; Savahl, S.; Fattore, T. Children’s representations of nature using photovoice and communitymapping: Perspectives from South Africa. Int. J. Qual. Stud. Health Well-Being 2017, 12, 1333900. [CrossRef]
50. Benwell, M. Challenging Minority World Privilege: Children’s Outdoor Mobilities in Post-apartheid SouthAfrica. Mobilities 2009, 4, 77–101. [CrossRef]
51. Vasconcellos, E.A. Rural transport and access to education in developing countries: Policy issues. J. Transp.Geogr. 1997, 5, 127–136. [CrossRef]
52. Van Niekerk, A.; Govender, R.; Jacobs, R.; Van As, A.B. Schoolbus driver performance can be improvedwith driver training, safety incentivisation, and vehicle roadworthy modifications. S. Afr. Med. J. 2017, 107,188–191. [CrossRef]
53. Sohail, M.; Mitlin, D.; Maunder, D.A.C. Partnerships to Improve Access and Quality of Public Transport; WEDC:Loughborough, UK, 2003.
54. Sohail, M. Urban Public Transport and Sustainable Livelihoods for the Poor: A Case Study, Karachi, Pakistan; WEDC:Loughborough, UK, 2000.
55. Van Ristell, J.; Quddus, M.A.; Enoch, M.P.; Wang, C.; Hardy, P. Quantifying the impacts of subsidy policieson home-to-school pupil travel by bus in England. Transportation 2015, 42, 45–69. [CrossRef]
56. DFID. UK Department for International Development. In Children Out of School; DFID: London, UK, 2001.57. Khandker, S.R.; Lavy, V.; Filmer, D. Schooling and Cognitive Achievements of Children in Morocco; Discussion
Paper no. 264; World Bank: Washington, DC, USA, 1994.58. Levy, H.; Voyadzis, C. Morocco Impact Evaluation Report: Socio-Economic Influence of Rural Roads; Operations
Evaluation Department, Report no. 15808-MOR; World Bank: Washington, DC, USA, 1996.59. Levy, H. Rural Roads and Poverty Alleviation in Morocco; World Bank: Washington, DC, USA, 2004. Available
online: http://web.worldbank.org/archive/website00819C/WEB/PDF/ (accessed on 29 May 2019).60. Mohsin, S.M.; Mallorie, E.; Roy, M.A. Construction of village roads by villagers: Creating jobs for women
and men in Sunamganj, Bangladesh. In Gender, Roads and Mobility in Asia; Kusakabe, K., Ed.; Practical Action:Rugby, UK, 2012; pp. 182–191.
61. Pilgrim, J.; Chanrith, N. Road improvement in Cambodia: Livelihood, education, health, and empowerment.In Gender, Roads and Mobility in Asia; Kusakabe, K., Ed.; Practical Action: Rugby, UK, 2012; pp. 192–204.
191
Sustainability 2019, 11, 6193
62. Government of Nepal. Gender Policy and Operational Guidelines for Local Transportation Sector; Department ofLocal Infrastructure Development and Agricultural Roads: Khatmandu, Nepal, 2010.
63. WHO 2015: World Health Organization, Global Health Estimates. Available online: https://www.who.int/healthinfo/global_burden_disease/en/ (accessed on 28 October 2019).
64. Singh, N.; Vasudevan, V. Understanding school trip mode choice—The case of Kanpur (India). J. Transp.Geogr. 2018, 66, 283–290. [CrossRef]
65. Starkey, P. Promoting the Use of Intermediate Means of Transport—Vehicle Choice, PotentialBarriers and Criteria for Success. 2001. Available online: https://pdfs.semanticscholar.org/2969/9a6cfc3fbf3c234fe7fcf2a3966c2dad6caf.pdf (accessed on 28 October 2019).
66. Rao, N. Cycling into the future: The Pudukkotttai experience, Tamil Nadu, India. In Balancing the Load:Women, Gender and Transport; Fernando, P., Porter, G., Eds.; Zed: London, UK, 2002.
67. Gatnet Communication. Unpublished work. 21 June 2006.68. ILO. The Youth Employment Crisis: Time for Action; International Labour Organisation: Geneva,
Switzerland, 2012.69. Filmer, D.; Fox, L.; Brooks, K.; Goyal, A.; Mengistae, T.; Premand, P.; Ringold, D.; Sharma, S.; Zorya, S. Youth
Employment in Sub-Saharan Africa; The World Bank: Washington, DC, USA, 2014.70. Prince, R. Popular music and Luo youth in western Kenya. In Navigating Youth, Generating Adulthood;
Christiansen, C., Ed.; Nordiska Afrikainstitutet: Uppsala, Switzerland, 2006; pp. 117–152.71. Garcia-Palomares, J.C. Urban sprawl and travel to work: The case of the metropolitan area of Madrid.
J. Transp. Geogr. 2010, 18, 197–213. [CrossRef]72. Graham, L.; Mlatsheni, C. Youth unemployment in South Africa: understanding the challenge and working
on solutions. In South African Child Gauge; De Lannoy, A., Ed.; Children’s Institute, University of Cape Town:Cape Town, South Africa, 2015; pp. 51–59.
73. Jeffrey, C. Youth, class and time among unemployed young men in India. Am. Ethnol. 2010, 37, 465–481.[CrossRef]
74. Grieco, M.; Turner, J.; Kwakye, E. A Tale of Two Cultures: Ethnicity and Cycling Behaviour in Urban Ghana.Transport Research Record 1441; Transportation Research Board: Washington, DC, USA, 1995.
75. Grieco, M.; Apt, N.; Turner, J. At Christmas and on Rainy Days: Transport, Travel and the Female Traders of Accra;Avebury: Aldershot, UK, 1996.
76. Turner, G.; Kwakye, E. Transport and survival strategies in a developing economy: Case evidence fromAccra, Ghana. J. Transp. Geogr. 1996, 4, 161–168. [CrossRef]
77. Evans, R. Sibling caringscapes: Time-space practices of caring within youth-headed households in Tanzaniaand Uganda. Geoforum 2012, 43, 824–835. [CrossRef]
78. Venter, C.; Molomo, M.; Mashiri, M. Supply and pricing strategies of informal rural transport providers.J. Transp. Geogr. 2014, 41, 239–248. [CrossRef]
79. Esson, J.; Gough, K.V.; Si, D. Livelihoods in motion: Linking transport, mobility and income-generatingactivities. J. Transp. Geogr. 2016, 55, 182–188. [CrossRef]
80. Kjeldsberg, C.; Shrestha NPatel, M.; Davis, D.; Mundy, G.; Cunningham, K. Nutrition-sensitive agriculturalinterventions and gender dynamics: A qualitative study in Nepal. Matern. Child Nutr. 2018, 14, 3. [CrossRef]
81. Porter, G. ‘I think a woman who travels a lot is befriending other men and that’s why she travels’: Mobilityconstraints and their implications for rural women and girl children in sub-Saharan Africa. Gend. Place Cult.2011, 18, 65–81. [CrossRef]
82. Seedhouse, A.; Johnson, R.; Newbery, R. Potholes and pitfalls: The impact of rural transport on femaleentrepreneurs in Nigeria. J. Trans. Geogr. 2016, 54, 140–147. [CrossRef]
83. Allen, H. Approaches for Gender Responsive Urban Mobility; GiZ-SUTP: Bonn, Germany, 2018.84. Anand, A.; Tiwari, G. A gendered perspective of the shelter-transport-livelihood link. the case of poor
women in Delhi. Transp. Rev. 2006, 26, 63–80. [CrossRef]85. Langevang, T.; Gough, K.V. Surviving through movement: The mobility of urban youth in Ghana. Soc. Cult.
Geogr. 2009, 10, 741–756. [CrossRef]86. Li, M.; Kwan, M.-P.; Wang, F.; Wang, J. Using points-of-interest data to estimate commuting patterns in
central Shanghai, China. J. Transp. Geogr. 2018, 72, 201–210. [CrossRef]
192

Sustainability 2019, 11, 6193
87. Porter, G.; Blaufuss, K. Children, Transport and Traffic in Southern Ghana. Paper Presented at the Workshop onChildren and Traffic, Copenhagen, Denmark, 2–3 May 2002. Available online: www.dur.ac.uk/child.mobility/(accessed on 28 October 2019).
88. Mark, L. Daily (Im)Mobility in Slums. A Female Perspective from the Villa 20 in Buenos Aires. Master’s Thesis,Technisches Universitat, Berlin/ Universidade de Buenos Aires, Berlin, Germany, 2017.
89. Agarwal, S.; Attah, M.; Apt, N.; Grieco, M.; Kwakye, E.A.; Turner, J. Bearing the weight: The kayayoo,Ghana’s working girl child. Int. Soc. Work 1997, 40, 245–256. [CrossRef]
90. Malmberg-Calvo, C. Case Studies on the Role of Women in Rural Transport: Access of Women to Domestic Facilities;SSATP Working Paper 11; World Bank: Washington, DC, USA, 1994.
91. Driving Change: The Story of Miss Taxi—One of Ghana’s First Female Taxi Drivers. Availableonline: https://medium.com/beam-blog/driving-change-the-story-of-miss-taxi-one-of-ghana-s-first-female-taxi-drivers-42e98deeff81 (accessed on 28 October 2019).
92. India’s Two-Wheel Taxi Service by Women, for Women. Available online: https://www.bbc.co.uk/news/av/world-asia-india-38326781/india-s-two-wheel-taxi-service-by-women-for-women (accessed on28 October 2019).
93. Nyanzi, S.; Nyanzi, A.; Kalina, B.; Pool, R. Mobility, sexual networks and exchange among bodaboda men insouthwest Uganda. Cult. Health Sex. 2004, 6, 239–254. [CrossRef]
94. Waage, T. Coping with unpredictability: “Preparing for life” in Ngaoundere, Cameroon. In NavigatingYouth, Generating Adulthood; Christiansen, C., Utas, M., Vigh, H., Eds.; Nordiska Afrikainstitutet: Uppsala,Switzerland, 2006; pp. 61–87.
95. Doussantousse, S.; Sakounnavong, B.; Patterson, I. An expanding sexual economy along National Route 3 inLuang Namtha Province, Lao PDR. Cult. Health Sex. 2011, 13, 279–291. [CrossRef]
96. Adamu, F. Gender, Hisbah and enforcement of morality in northern Nigeria. Africa 2008, 78, 136–152.[CrossRef]
97. Burge, M. Riding the Narrow Tracks of Moral Life: Commercial Motorbike Riders in Makeni, Sierra Leone.Afr. Today 2011, 58, 58–95. [CrossRef]
98. Motorbike taxis in the “transport crisis” of West and Central African cities. Available online: https://journals.openedition.org/echogeo/13080#quotation (accessed on 28 October 2019).
99. Jenkins, J.T.; Peters, K. Rural connectivity in Africa: Motorcycle track construction. Proc. Instit. CivilEng. Transp. 2016, 169, 378–386. [CrossRef]
100. Enhancing Understanding on Safe Motorcycle and Three-Wheeler Use for Rural Transport. Availableonline: http://www.transaid.org/wp-content/uploads/2019/07/RAF2114A_Final-Report_190909_FINAL_Revised.pdf (accessed on 28 October 2019).
101. WHO 2018. Road Traffic Injuries Factsheet. December 2018. Available online: https://www.who.int/news-room/fact-sheets/detail/road-traffic-injuries (accessed on 28 October 2019).
102. Wismans, J.; Skogsmo, I.; Nilsson-Ehle, A.; Lie, A.; Thynell, M.; Lindberg, G. Commentary: Status of roadsafety in Asia. Traffic Inj. Prev. 2016, 17, 217–225. [CrossRef] [PubMed]
103. Adesunkanmi, A.R.K.; Oginni, L.M.; Oyelami, O.A.; Badru, O.S. Road traffic accidents to African children.Injury 2000, 31, 225–228. [CrossRef]
104. ABOUT THE FIA ROAD SAFETY GRANTS PROGRAMME. Available online: https://www.roadsafety.fia-grants.com/about-us.php (accessed on 28 October 2019).
105. O’Toole, S.; Christie, N. Educating parents to support children’s road safety: A review of the literature.Transp. Rev. 2019, 39, 392–406. [CrossRef]
106. Salmon, R.; Eckersley, W. Where there’s no green man: Child road-safety education in Ethiopia. Dev. Pract.2010, 20, 726–733. [CrossRef]
107. Safe Journeys to School Are a Child’s Right. Available online: http://www.fiafoundation.org/media/45780/safe-to-learn-report.pdf (accessed on 28 October 2109).
108. A World Free of High Risk Roads: Cases Studies of Success. Available online: https://www.irap.org/media-centre/case-studies/ (accessed on 28 October 2019).
109. Bradbury, A.; Quimby, A. Community road safety education: An international perspective. Proc. Instit. CivilEng.-Munic. Eng. 2008, 161, 137–143. [CrossRef]
110. Kitamura, Y.; Hayashi, M.; Yagi, E. Traffic problems in Southeast Asia featuring the case of Cambodia’s trafficaccidents involving motorcycles. IATSS Res. 2018, 42, 163–170. [CrossRef]
193

Sustainability 2019, 11, 6193
111. Howlett, J.B.; Aldous, C.; Clarke, D.L.; Howlett, J.B.; Aldous, C.; Clarke, D.L. Injuries sustained by passengerstravelling in the cargo area of light delivery vehicles. S. Afr. J. Surg. 2014, 52, 49–52. [CrossRef]
112. Oyedemi, T.; Kgasago, T.J. Always-available communication and technological distractions: Technology use,texting and driving. Commun.-S. Afr. J. Commun. Theory Res. 2018, 43, 36–53. [CrossRef]
113. Cordellieri, P.; Baralla, F.; Ferlazzo, F.; Sgalla, R.; Piccardi, L.; Giannini, A.M. Gender Effects in Young RoadUsers on Road Safety Attitudes, Behaviors and Risk Perception. Front. Psychol. 2016, 7, 1412. [CrossRef]
114. Al-Aamri, A.K.; Padmadas, S.S.; Zhang, L.C.; Al-Maniri, A.A. Disentangling age–gender interactionsassociated with risks of fatal and non-fatal road traffic injuries in the Sultanate of Oman. BMJ Glob. Health2017, 2, e000394. [CrossRef]
115. Hyder, A.A.; Labinjo, M.; Muzaffar, S. A new challenge to child and adolescent survival in urban Africa: Anincreasing burden of road traffic injuries. Traffic Inj. Prev. 2006, 7, 381–388. [CrossRef] [PubMed]
116. Koekemoer, K.; Van Gesselleen, M.; Van Niekerk, A.; Govender, R.; Van As, A.B. Child pedestrian safetyknowledge, behaviour and road injury in Cape Town, South Africa. Accid. Anal. Prev. 2017, 99, 202–209.[CrossRef] [PubMed]
117. Elango, S.; Ramya, A.B.; Renita, A.; Ramana, M.; Revathy, S.; Manivel, M. An Analysis of Road Traffic Injuriesin India from 2013 to 2016: A Review Article. J. Commun. Med. Health Educ. 2018, 8, 601. [CrossRef]
118. Mitra-Sarkar, S.; Partheeban, P. Abandon all hope, you who enter here: Understanding the problem of‘Eve Teasing’ in Chennai, India. In Proceedings of the Women’s Issues in Transportation, Summary of the 4thInternational Conference; Technical Papers; Transportation Research Board: Washington, DC, USA, 2011;Volume 2, pp. 74–84.
119. Logan, L.S. Street Harassment: Current and Promising Avenues for Researchers and Activists. Sociol. Compass2015, 9, 196–2011. [CrossRef]
120. Hampshire, K.; Porter, G.; Mashiri, M.; Maponya, M.; Dube, S. Proposing love on the way to school: Mobility,sexuality and youth transitions in South Africa. Cult. Health Sex. 2011, 13, 217–231. [CrossRef]
121. Porter, G.; Hampshire, K.; De Lannoy, A.; Gunguluza, N.; Mashiri, M.; Bango, A. Exploring the intersectionbetween physical and virtual mobilities in urban South Africa: Reflections from two youth-centred studies.In Urban Mobilities in the Global South; Uteng, T.P., Lucas, K., Eds.; Routledge: London, UK, 2018; pp. 59–75.
122. Banks, N. Youth poverty, employment and livelihoods: Social and economic implications of living withinsecurity in Arusha, Tanzania. Environ. Urban. 2016, 28, 437–454. [CrossRef]
123. Velaga, N.R.; Beecroft, M.; Nelson, J.D.; Corsar, D.; Edwards, P. Transport poverty meets the digital divide:Accessibility and connectivity in rural communities. J. Transp. Geogr. 2012, 21, 102–112. [CrossRef]
124. Aguilera, A.; Guillot, C.; Rallet, A. Mobile ICTs and physical mobility: Review and research agenda.Transp. Res. Part A 2012, 46, 664–672. [CrossRef]
125. Porter, G. Mobile phones, livelihoods and the poor in sub-Saharan: Review and prospect. Geogr. Compass2012, 6, 241–259. [CrossRef]
126. Williams, S.; White, A.; Waiganjo, P.; Orwa, D.; Klopp, J. The digital matatu project: Using cell phones tocreate an open source data for Nairobi’s semi-formal bus system. J. Transp. Geogr. 2015, 49, 39–51. [CrossRef]
127. Green, C.; Adamu, F.; Rahman, I.A. The Role of a Transport Union in Increasing Rural Women’s Access toEmergency Maternal Care in Northern Nigeria. World Transp. Policy Pract. 2013, 19, 29–45.
128. Porter, G.; Hampshire, K.; Abane, A.; Robson, E.; Mashiri, M.; Tanle, A. Youth, mobility and mobile phonesin Africa: Findings from a three-country study. J. Inf. Technol. Dev. 2012, 18, 145–162. [CrossRef]
129. Porter, G.; Hampshire, K.; Milner, J.; Munthali, A.; Robson, E.; De Lannoy, A.; Bango, A.; Gunguluza, N.;Mashiri, M.; Tanle, A.; et al. Mobile phones and education in sub-Saharan Africa: From youth practice topublic policy. J. Int. Dev. 2015, 28, 22–39. [CrossRef]
130. Porter, G.; Hampshire, K.; Abane, A.; Munthali, A.; Robson, E.; Bango, A.; De Lannoy, A.; Gunguluza, N.;Tanle, A.; Owusu, S.; et al. Intergenerational relations and the power of the cell phone: Perspectives onyoung people’s phone usage in sub-Saharan Africa. Geoforum 2015, 64, 37–46. [CrossRef]
131. Line, T.; Jain, J.; Lyons, G. The Role of ICTs in Everyday Mobile Lives. J. Transp. Geogr. 2011, 19, 1490–1499.[CrossRef]
132. Porter, G. Mobile phones, mobility practices and transport organisation in sub-Saharan Africa. Mobil. Hist.2015, 6, 81–88.
133. Porter, G. Mobilities in rural Africa: New connections, new challenges. Ann. Am. Assoc. Geogr. 2016, 106,434–441. [CrossRef]
194
Sustainability 2019, 11, 6193
134. Rural Transport News December 2015. Available online: http://www.ifrtd.org/index.php/component/k2/item/23-rural-transport-news-december-2015 (accessed on 28 October 2019).
135. Burrell, J. Evaluating shared access: Social equality and the circulation of mobile phones in rural Uganda.J. Comput.-Mediat. Commun. 2010, 15, 230–250. [CrossRef]
136. Archambault, J.S. ‘Travelling while sitting down’: Mobile phones, mobility and the communication landscapein Inhambane, Mozambique. Africa 2012, 82, 393–412. [CrossRef]
137. Stark, L. Transactional sex and cellphones in a Tanzanian slum. Suom. Antropol. 2013, 38, 12–36.138. Duncombe, R.A. Understanding the impact of mobile phones on livelihoods in developing countries.
Dev. Policy Rev. 2014, 32, 567–588. [CrossRef]139. Kibere, F.N. The paradox of mobility in the Kenyan ICT ecosystem: An ethnographic case of how the youth
in Kibera slum use and appropriate the mobile phone and the mobile internet. Inf. Technol. Dev. 2016, 22,47–67. [CrossRef]
140. Ride-Hailing Apps a Boon for Asia’s Motorcycle Taxis. Available online: https://asia.nikkei.com/Business/Ride-hailing-apps-a-boon-for-Asia-s-motorcycle-taxis (accessed on 28 October 2019).
141. Uber: A Game-Changer in Passenger Transport in South Africa? Available online: https://static1.squarespace.com/static/52246331e4b0a46e5f1b8ce5/t/56521e01e4b0e332af41071b/1448222209348/CCRED+Review7.4-6.pdf (accessed on 28 October 2019).
142. Top 7 African Taxi-Hailing Apps Giving Uber a Run for Its Money. Available online: https://www.itnewsafrica.com/2018/06/top-7-african-taxi-hailing-apps-giving-uber-a-run-for-its-money/ (accessed on28 October 2019).
143. Porter, G.; Hampshire, K.; Abane, A.; Robson, E.; Munthali, A.; Mashiri, M. Moving young lives: Mobility,immobility and inter-generational tensions in urban Africa. Geoforum 2010, 41, 796–804. [CrossRef]
© 2019 by the authors. Licensee MDPI, Basel, Switzerland. This article is an open accessarticle distributed under the terms and conditions of the Creative Commons Attribution(CC BY) license (http://creativecommons.org/licenses/by/4.0/).
195

sustainability
Review
Road Safety in Low-Income Countries: State ofKnowledge and Future Directions
Shahram Heydari 1,*, Adrian Hickford 1, Rich McIlroy 1, Jeff Turner 2 and
Abdulgafoor M. Bachani 3
1 Department of Civil, Maritime and Environmental Engineering, University of Southampton,Southampton SO16 7QF, UK; [email protected] (A.H.); [email protected] (R.M.)
2 High Volume Transport Applied Research Programme, IMC Worldwide Consultants, London RH1 1LG, UK;[email protected]
3 Johns Hopkins International Injury Research Unit, Health Systems Program, Department of InternationalHealth, Johns Hopkins Bloomberg School of Public Health, 615 N. Wolfe Street, Baltimore, MD 21205, USA;[email protected]
* Correspondence: [email protected]
Received: 26 September 2019; Accepted: 4 November 2019; Published: 7 November 2019
Abstract: Road safety in low-income countries (LICs) remains a major concern. Given the expectedincrease in traffic exposure due to the relatively rapid motorisation of transport in LICs, it is imperativeto better understand the underlying mechanisms of road safety. This in turn will allow for planningcost-effective road safety improvement programs in a timely manner. With the general aim ofimproving road safety in LICs, this paper discusses the state of knowledge and proposes a number offuture research directions developed from literature reviews and expert elicitation. Our study takesa holistic approach based on the Safe Systems framework and the framework for the UN Decadeof Action for Road Safety. We focused mostly on examining the problem from traffic engineeringand safety policy standpoints, but also touched upon other sectors, including public health andsocial sciences. We identified ten focus areas relating to (i) under-reporting; (ii) global best practices;(iii) vulnerable groups; (iv) disabilities; (v) road crash costing; (vi) vehicle safety; (vii) proactiveapproaches; (viii) data challenges; (ix) social/behavioural aspects; and (x) capacity building. Basedon our findings, future research ought to focus on improvement of data systems, understandingthe impact of and addressing non-fatal injuries, improving estimates on the economic burden,implementation research to scale up programs and transfer learnings, as well as capacity development.Our recommendations, which relate to both empirical and methodological frontiers, would lead tonoteworthy improvements in the way road safety data collection and research is conducted in thecontext of LICs.
Keywords: road safety; low-income countries; under-reporting; best practices; vulnerable groups;injury severity; road crash costing; crash data; capacity building
1. Introduction
Road safety is a major global health issue since large proportions of unintentional injuries arecaused by traffic-related crashes. According to the Global Health Observatory, 1.35 million fatalitiesoccur on the world’s roads each year [1]. In general, although traffic-related injuries and fatalitieshave seen a decreasing trend during the past two decades, this reduction has not been as significant asexpected [2]. This is despite several improvements in motor vehicle safety standards and features,road safety policies, and road design [2]. In fact, road transport still poses a substantial risk to humanhealth in many regions around the world.
Sustainability 2019, 11, 6249; doi:10.3390/su11226249 www.mdpi.com/journal/sustainability197

Sustainability 2019, 11, 6249
The problem is especially critical in low-income countries (LICs), due to several persistingshortcomings in road safety standards, vehicle safety and maintenance, and in the design andimplementation of policies and safe transportation infrastructure. Figure 1 displays national wealthversus road death rate based on data provided by the WHO [1]. Research is thus needed to betterunderstand the underlying mechanisms of road safety in LICs. This will help guide road safety policiesand strategies, with the aim of reducing traffic-related injuries and fatalities. Note that we refer toLMICs to indicate low- and lower-middle income countries, while LICs refer specifically to low-incomecountries, as shown in Figure 1.
Figure 1. Comparing road traffic death rates with national wealth [1].
There are global initiatives that have sought to address such issues, many of which are coordinatedthrough the Global Plan for the Decade of Action for Road Safety 2011–2020 [3], developed by the UnitedNations Road Safety Collaboration (UNRSC). Examples include the Global Road Safety Partnership(GRSP) [4], the World Bank’s Global Road Safety Facility [5], the Bloomberg Philanthropies Initiativefor Global Road Safety [6], and the Road Safety in 10 Countries Project [7]. These global efforts havegenerally focused on the practical implementation of policies and standards to improve road safety inthe developing world [8].
Given these developments in the field, and the fact that we are nearing the end of the UN Decadeof Action for Road Safety [3], it is important to take stock of where we are, what the state of the field is,and determine what research will be important in the future to make further progress. In line with thisapproach, our study aims to take a holistic approach investigating different lines of research under thebroad topic of road safety in LICs with the aim of (i) analysing and summarising the current state ofknowledge; and (ii) proposing a number of future research directions. We have used the Safe Systemsframework and the framework for the UN Decade of Action on Road Safety to identify the domainsof focus for this work [9,10]. There is a focus on the understanding of road safety engineering issueswhile also reaching out to other sectors.
The paper is structured as follows: Section 2 discusses our methodology. Section 3 discussesour findings and is centred on an overview of current (available) research focusing on the main roadsafety issues in LICs. In Section 4, we report on the results of a survey of experts in road safety in
198

Sustainability 2019, 11, 6249
LICs. Section 5 discusses implications and our proposed future directions, where there are severalopportunities for improvements, both empirically and methodologically. We conclude with a summaryin Section 6.
2. Materials and Methods
2.1. Review Framework
This article explores the state of knowledge of road safety in LICs based on a review of literature andconsultation with experts in the field. The review panel was formed by an international collaborationof the Transportation Research Group at the University of Southampton (United Kingdom) andJohns Hopkins International Injury Research Unit at Johns Hopkins University (USA). With respectto quantitative results, the literature search was carried out according to the PRISMA (PreferredReporting Items for Systematic Reviews and Meta-Analyses) guidelines [11] as explained in Section 2.3.Non-quantitative results were identified through online searches as described in Section 2.3. Expertconsultation is described in Section 2.4.
2.2. Research Questions
Our research questions were as follows:
i “what are some of the most important topics relating to road safety issues in LICs?”ii “what is known about these topics?”iii “what would be some of the most critical future research directions to be considered
by researchers?”
2.3. Search Strategy, Selection of Studies, and Eligibility Criteria
We extracted the search terms from published studies (journal/conference articles and reportspublished by international organisations) in a preliminary search. For the review, while there wasno search restriction on the publication date, articles published before 1990 were only considered forinclusion if the number of relevant results was particularly low. The search strategy aimed to limit thesearch to LICs by combining search results from a list of names of LICs with other relevant keywordsapplicable to other search topics such as vehicles and crashes, road safety measures, vehicle safetymeasures or vulnerable road user groups. Articles had to be peer-reviewed and published in English.Articles were screened by title and abstract for relevance, and appropriate bibliographies were alsoscanned for further relevant articles or reports. The search resulted in over 7000 potential articles to bescreened across all the topics under consideration.
Quantitative results were specifically sought for under-reporting, and the literature search forthat topic was carried out according to PRISMA guidelines, using electronic databases such as Web ofScience, Scopus, PUBMED, TRID, BMC, and EMBASE. Search strings were generated by combiningthe list of LIC named countries and other relevant search terms such as underreport, under-report, andcapture-recapture (a methodology used to address under-reporting). To be included, articles had tobe related to a formal assessment of under-reporting. As the number of eligible papers in LICs wasrelatively few, there was no restriction on whether the assessment was for injury/fatality counts, norany restriction on date. This in-depth search yielded many papers related to under-reporting as wellas the other topics of road safety, both as part of the search results, and from bibliographies withinrelevant articles and reports. In this regard, further details are discussed in Section 3.1.
With respect to other topics, further relevant articles or reports, published by internationalorganisations, were identified through online searches using appropriate keywords for each of thetopics, and from discussions with experts and stakeholders. Search strings were generated by combiningthe list of LIC named countries, and other relevant search terms; e.g., low-income OR road accident ORtraffic accident OR road crash OR traffic crash). Table 1 gives examples of the search strategy developedfor this study (the example displayed having been used for searching Scopus). The strategy aims to
199

Sustainability 2019, 11, 6249
limit the search to LICs (see Scopus #1), and then limit the search according to the desired topics ofvehicles and crashes (see Scopus #2), road safety measures (see Scopus #3), vehicle safety measures(see Scopus #4), or vulnerable road user groups (see Scopus #5). For example, from a total of 69,448studies relating to LICs, 454 studies were found to be relevant to road crashes in LICs (see Table 1).
Table 1. Example Scopus search strategy.
Set # Search String Results
#1 Low-income countries
TITLE-ABS-KEY(“developing country” OR “developingcountries” OR Afghanistan OR Benin OR “Burkina Faso” OR
Burundi OR “Central African Republic” OR Chad ORComoros OR Congo OR Eritrea OR Ethiopia OR Gambia ORGuinea OR “Guinea-Bissau” OR Haiti OR “North Korea” ORLiberia Madagascar OR Malawi OR Mali OR Mozambique ORNepal OR Niger OR Rwanda OR Senegal OR “Sierra Leone”
OR Somalia OR Sudan OR Tanzania OR Togo OR Uganda ORZimbabwe OR “low resource” OR “under-resourced” OR
“resource poor” OR “under-developed” OR “underdeveloped”OR “developing world” OR “third world” OR LIC OR (low
AND income))
69,448
#2 Vehicles and accidentsor crashes
TITLE-ABS-KEY(((“Motor Vehicles” OR Automobiles ORMotorcycles OR traffic OR vehicle OR vehicular OR car OR
cars OR automobile OR motorcycle OR taxi OR cab OR roadOR pedestrian OR pedestrians) AND (accident OR accidents
OR crash OR crashes OR injury OR injuries)))
151,221
#3 Road safety measures
TITLE-ABS-KEY(“road safety” OR “road safety interventions”OR speeding OR “drink driving” OR helmet OR “motorcyclehelmet” OR “seat belt” OR “seatbelt” OR “child restraint” OR“distracted driving” OR “drug driving” OR “traffic calming”)
49,812
#4 Vehicle safety measuresTITLE-ABS-KEY(“vehicle safety” OR “vehicle safety
standards” OR “advanced braking” OR “anti-lock braking”OR “electronic stability control” OR NCAP)
6,559
#5 Vulnerable road user(VRU) groups
TITLE-ABS-KEY(“vulnerable road user” OR “disability” OR“disabled” OR “gender disaggregation” OR “gender”) 956,942
#6 Crashes in LICs #1 AND #2 454#7 Road safety measures in
LICs #1 AND #3 147
#8 Vehicle safety measuresin LICs #1 AND #4 5
#9 VRU crashes in LICs #1 AND #2 AND #5 103
2.4. Expert and Stakeholder Consultations
In the process of synthesizing findings from the literature review and identifying areas for furtherinquiry, we informally consulted with ten road safety experts from academia and international roadsafety organizations, including local experts from Bangladesh, Nepal, Uganda, Ghana, and Kenya.We asked a smaller number of experts (n = 6), who have had extensive experience working on roadsafety in LICs and are well versed with the global road safety landscape, to respond to a survey toprovide further input on findings from the literature review. These consultations and surveys aidedin the synthesis and prioritization of important areas of focus for future road safety in LICs. Thisquestionnaire was based on three main themes regarding road safety in LICs: (i) main topics of concern;(ii) policy-making and implementation; and (iii) capacity development for road safety. Basically, withrespect to each theme, respondents were asked to answer “what needs to be done, and how it can beachieved?” Before undertaking this part of our research, we obtained an approval from the Universityof Southampton Faculty of Engineering and Physical Sciences Ethics Committee on 03/05/2019 (ERGOII 48744). The outcomes from the survey and other discussions also provided context for topics forwhich there was a gap in the literature. These consultations contributed to the future research agendaset out in Section 5. Our consultation results are discussed in Section 4.
200
Sustainability 2019, 11, 6249
3. State of Knowledge
This section discusses our findings with respect to pertinent previous studies.
3.1. Under-Reporting of Road Crashes in LICs
Accurate knowledge of road crashes and their causes can help provide robust motives for theinvestment of appropriate and effective road safety interventions, and is especially important wheresuch funds are limited [12]. Police road traffic crash data has been the traditional source of suchinformation, although the accuracy of such data is questionable since all countries suffer from somelevel of under-reporting. The WHO provide estimates of the numbers of fatalities in each country,using negative binomial modelling based on the actual number of reported fatalities [1]. According totheir estimates, the average number of road fatalities correctly reported to official sources is likely tobe higher for higher income countries, with an average of 88% of road fatalities correctly reported inhigh-income countries (HICs) and 77% in middle-income countries (MICs). However, this reportingaccuracy is significantly lower in LMICs (52%) and LICs (17%).
There are several underlying reasons why under-reporting may occur. A poor understandingregarding the benefits of complete and accurate road crash records means those involved mayavoid contacting the police [13], preferring to negotiate with the driver [14,15]. A poorly resourced,capacity-limited police force is likely to focus on those crashes that involve more injuries, fatalitiesor property damage [13,16,17]. Also, the legal requirement to report road crashes to the police variesfrom country to country [18]. In built-up areas, victims are likely to be taken to a nearby hospital byrelatives or bystanders before any police officers can attend the crash scene [13,14,17]. In rural areas,relatives and neighbours of crash victims may be deterred from travelling to hospitals due to costimplications [14]. There are further limitations due to the reliance on paper records, rather than onthe types of electronic recording systems in place in higher income countries [18], especially if suchoriginal paperwork is required for subsequent judicial hearings [19].
Numerous studies have investigated how to improve the quality and accuracy of road crashdata, particularly through combining police records with hospital records of patients admittedas a result of road crashes. These studies have mainly taken place in the developed world, forexample in France [20–23], elsewhere in Europe [24–30], the United States [31,32], Australia and NewZealand [33–38], and China and Japan [39,40].
With respect to quantitative results relating to under-reporting, we found only four studies inLICs (from an initial list of 983 potential articles) that provide a quantitative assessment of the level ofunder-reporting, comparing police data with those of hospital records (see the PRISMA flow diagram inFigure 2). The four studies were all from LICs in Africa (Ethiopia, Uganda, Malawi, and Mali). Table 2shows the location, study period, methodologies and metrics used, highlighting the inconsistencies instudy designs. The study in Ethiopia [14] focuses on a 264 km stretch of two-way, two-lane road, onwhich traffic volumes vary from an average of 17,000–20,000 vehicles per day on the 64 km stretch nearAddis Ababa, to around 3000–3500 vehicles per day on the remaining 200 km as the road approachesHawassa. The other studies focus on regional areas (adopting a zone- or macro-level approach),considering the records at police offices and hospitals within a certain region.
201
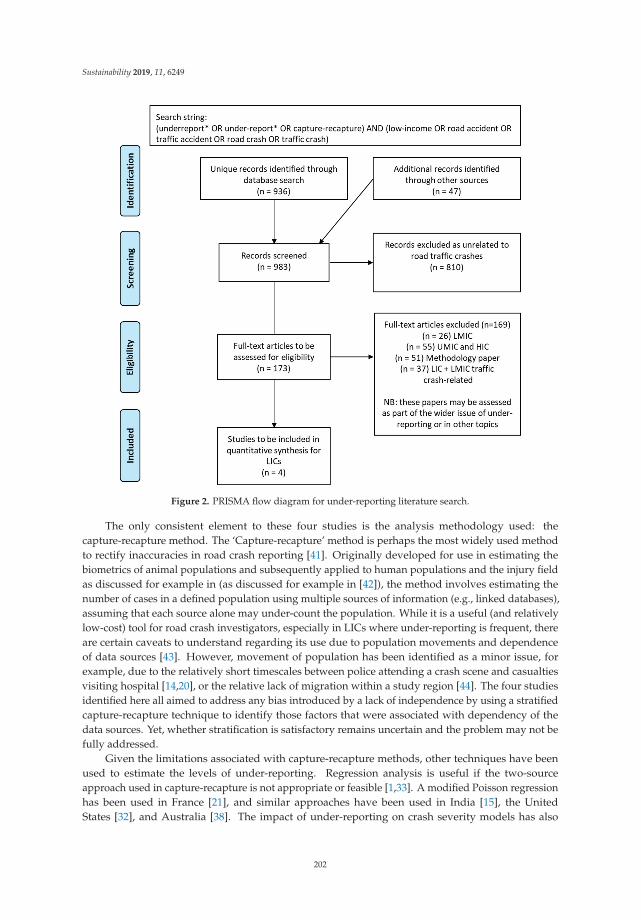
Sustainability 2019, 11, 6249
Figure 2. PRISMA flow diagram for under-reporting literature search.
The only consistent element to these four studies is the analysis methodology used: thecapture-recapture method. The ‘Capture-recapture’ method is perhaps the most widely used methodto rectify inaccuracies in road crash reporting [41]. Originally developed for use in estimating thebiometrics of animal populations and subsequently applied to human populations and the injury fieldas discussed for example in (as discussed for example in [42]), the method involves estimating thenumber of cases in a defined population using multiple sources of information (e.g., linked databases),assuming that each source alone may under-count the population. While it is a useful (and relativelylow-cost) tool for road crash investigators, especially in LICs where under-reporting is frequent, thereare certain caveats to understand regarding its use due to population movements and dependenceof data sources [43]. However, movement of population has been identified as a minor issue, forexample, due to the relatively short timescales between police attending a crash scene and casualtiesvisiting hospital [14,20], or the relative lack of migration within a study region [44]. The four studiesidentified here all aimed to address any bias introduced by a lack of independence by using a stratifiedcapture-recapture technique to identify those factors that were associated with dependency of thedata sources. Yet, whether stratification is satisfactory remains uncertain and the problem may not befully addressed.
Given the limitations associated with capture-recapture methods, other techniques have beenused to estimate the levels of under-reporting. Regression analysis is useful if the two-sourceapproach used in capture-recapture is not appropriate or feasible [1,33]. A modified Poisson regressionhas been used in France [21], and similar approaches have been used in India [15], the UnitedStates [32], and Australia [38]. The impact of under-reporting on crash severity models has also
202
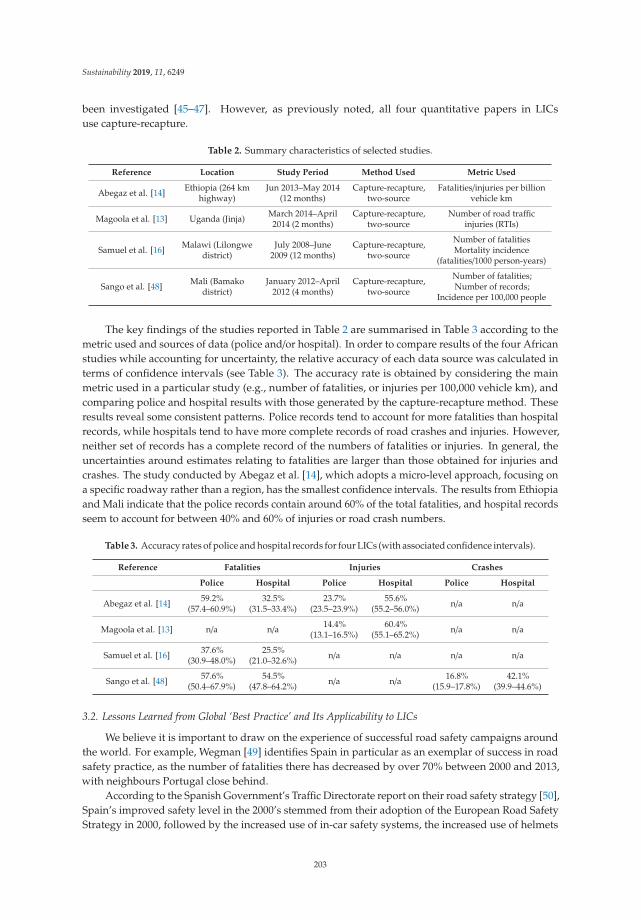
Sustainability 2019, 11, 6249
been investigated [45–47]. However, as previously noted, all four quantitative papers in LICsuse capture-recapture.
Table 2. Summary characteristics of selected studies.
Reference Location Study Period Method Used Metric Used
Abegaz et al. [14] Ethiopia (264 kmhighway)
Jun 2013–May 2014(12 months)
Capture-recapture,two-source
Fatalities/injuries per billionvehicle km
Magoola et al. [13] Uganda (Jinja) March 2014–April2014 (2 months)
Capture-recapture,two-source
Number of road trafficinjuries (RTIs)
Samuel et al. [16] Malawi (Lilongwedistrict)
July 2008–June2009 (12 months)
Capture-recapture,two-source
Number of fatalitiesMortality incidence
(fatalities/1000 person-years)
Sango et al. [48] Mali (Bamakodistrict)
January 2012–April2012 (4 months)
Capture-recapture,two-source
Number of fatalities;Number of records;
Incidence per 100,000 people
The key findings of the studies reported in Table 2 are summarised in Table 3 according to themetric used and sources of data (police and/or hospital). In order to compare results of the four Africanstudies while accounting for uncertainty, the relative accuracy of each data source was calculated interms of confidence intervals (see Table 3). The accuracy rate is obtained by considering the mainmetric used in a particular study (e.g., number of fatalities, or injuries per 100,000 vehicle km), andcomparing police and hospital results with those generated by the capture-recapture method. Theseresults reveal some consistent patterns. Police records tend to account for more fatalities than hospitalrecords, while hospitals tend to have more complete records of road crashes and injuries. However,neither set of records has a complete record of the numbers of fatalities or injuries. In general, theuncertainties around estimates relating to fatalities are larger than those obtained for injuries andcrashes. The study conducted by Abegaz et al. [14], which adopts a micro-level approach, focusing ona specific roadway rather than a region, has the smallest confidence intervals. The results from Ethiopiaand Mali indicate that the police records contain around 60% of the total fatalities, and hospital recordsseem to account for between 40% and 60% of injuries or road crash numbers.
Table 3. Accuracy rates of police and hospital records for four LICs (with associated confidence intervals).
Reference Fatalities Injuries Crashes
Police Hospital Police Hospital Police Hospital
Abegaz et al. [14] 59.2%(57.4–60.9%)
32.5%(31.5–33.4%)
23.7%(23.5–23.9%)
55.6%(55.2–56.0%) n/a n/a
Magoola et al. [13] n/a n/a 14.4%(13.1–16.5%)
60.4%(55.1–65.2%) n/a n/a
Samuel et al. [16] 37.6%(30.9–48.0%)
25.5%(21.0–32.6%) n/a n/a n/a n/a
Sango et al. [48] 57.6%(50.4–67.9%)
54.5%(47.8–64.2%) n/a n/a 16.8%
(15.9–17.8%)42.1%
(39.9–44.6%)
3.2. Lessons Learned from Global ‘Best Practice’ and Its Applicability to LICs
We believe it is important to draw on the experience of successful road safety campaigns aroundthe world. For example, Wegman [49] identifies Spain in particular as an exemplar of success in roadsafety practice, as the number of fatalities there has decreased by over 70% between 2000 and 2013,with neighbours Portugal close behind.
According to the Spanish Government’s Traffic Directorate report on their road safety strategy [50],Spain’s improved safety level in the 2000’s stemmed from their adoption of the European Road SafetyStrategy in 2000, followed by the increased use of in-car safety systems, the increased use of helmets
203
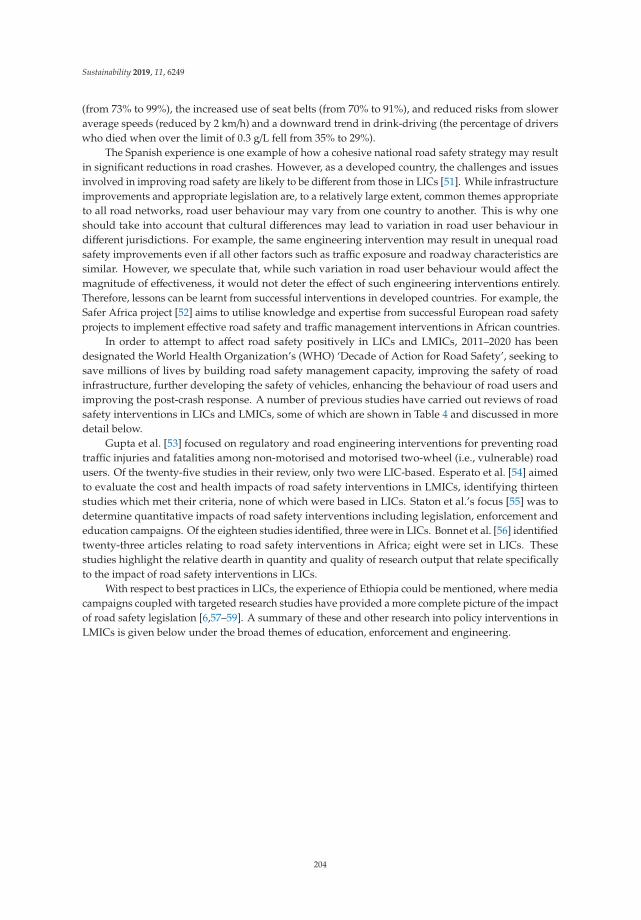
Sustainability 2019, 11, 6249
(from 73% to 99%), the increased use of seat belts (from 70% to 91%), and reduced risks from sloweraverage speeds (reduced by 2 km/h) and a downward trend in drink-driving (the percentage of driverswho died when over the limit of 0.3 g/L fell from 35% to 29%).
The Spanish experience is one example of how a cohesive national road safety strategy may resultin significant reductions in road crashes. However, as a developed country, the challenges and issuesinvolved in improving road safety are likely to be different from those in LICs [51]. While infrastructureimprovements and appropriate legislation are, to a relatively large extent, common themes appropriateto all road networks, road user behaviour may vary from one country to another. This is why oneshould take into account that cultural differences may lead to variation in road user behaviour indifferent jurisdictions. For example, the same engineering intervention may result in unequal roadsafety improvements even if all other factors such as traffic exposure and roadway characteristics aresimilar. However, we speculate that, while such variation in road user behaviour would affect themagnitude of effectiveness, it would not deter the effect of such engineering interventions entirely.Therefore, lessons can be learnt from successful interventions in developed countries. For example, theSafer Africa project [52] aims to utilise knowledge and expertise from successful European road safetyprojects to implement effective road safety and traffic management interventions in African countries.
In order to attempt to affect road safety positively in LICs and LMICs, 2011–2020 has beendesignated the World Health Organization’s (WHO) ‘Decade of Action for Road Safety’, seeking tosave millions of lives by building road safety management capacity, improving the safety of roadinfrastructure, further developing the safety of vehicles, enhancing the behaviour of road users andimproving the post-crash response. A number of previous studies have carried out reviews of roadsafety interventions in LICs and LMICs, some of which are shown in Table 4 and discussed in moredetail below.
Gupta et al. [53] focused on regulatory and road engineering interventions for preventing roadtraffic injuries and fatalities among non-motorised and motorised two-wheel (i.e., vulnerable) roadusers. Of the twenty-five studies in their review, only two were LIC-based. Esperato et al. [54] aimedto evaluate the cost and health impacts of road safety interventions in LMICs, identifying thirteenstudies which met their criteria, none of which were based in LICs. Staton et al.’s focus [55] was todetermine quantitative impacts of road safety interventions including legislation, enforcement andeducation campaigns. Of the eighteen studies identified, three were in LICs. Bonnet et al. [56] identifiedtwenty-three articles relating to road safety interventions in Africa; eight were set in LICs. Thesestudies highlight the relative dearth in quantity and quality of research output that relate specificallyto the impact of road safety interventions in LICs.
With respect to best practices in LICs, the experience of Ethiopia could be mentioned, where mediacampaigns coupled with targeted research studies have provided a more complete picture of the impactof road safety legislation [6,57–59]. A summary of these and other research into policy interventions inLMICs is given below under the broad themes of education, enforcement and engineering.
204

Sustainability 2019, 11, 6249
Ta
ble
4.
Asa
mpl
eof
pape
rsre
late
dto
road
safe
tyin
itia
tive
san
din
terv
enti
ons
inLI
Cs
and
LMIC
s.
Ma
inT
he
me
sL
oca
tio
nK
ey
Fin
din
g
Gen
eral
revi
ewof
inte
rven
tion
s
12co
untr
ies
inEa
ster
nan
dSo
uthe
rnA
fric
a
Bonn
etet
al.[
56]W
hati
nter
vent
ions
are
requ
ired
tore
duce
road
traffi
cin
juri
esin
Afr
ica?
Asc
opin
gre
view
ofth
elit
erat
ure
Ther
eis
ala
ckof
road
safe
tyin
terv
enti
ons
and
som
esh
ortc
omin
gsin
the
asso
ciat
edas
sess
men
ts.
LIC
s&
LMIC
s
Gup
taet
al.[
53]R
egul
ator
yan
dro
aden
gine
erin
gin
terv
enti
ons
for
prev
entin
gro
adtr
affic
inju
ries
and
fata
litie
sam
ong
vuln
erab
le(n
on-m
otor
ised
and
mot
oris
edtw
o-w
heel
)roa
dus
ers
inlo
w-a
ndm
iddl
e-in
com
eco
untr
ies
Ther
eis
ala
ckof
stud
ies
spec
ifica
llyas
sess
ing
the
impa
ctof
engi
neer
ing
inte
rven
tion
sin
LMIC
s.W
here
stud
ies
exis
t,th
ere
are
mix
edre
sult
s(e
.g.,
whi
lefa
talit
ies
decl
ined
,the
num
ber
ofca
sual
ties
mor
eth
ando
uble
d)
LIC
s&
LMIC
sSt
aton
etal
.[55
]Roa
dtr
affic
inju
rypr
even
tion
init
iati
ves:
asy
stem
atic
revi
ewan
dm
eta-
sum
mar
yof
effec
tive
ness
inlo
wan
dm
iddl
ein
com
eco
untr
ies
Am
ulti
-fac
eted
appr
oach
(inv
olvi
nged
ucat
ion,
legi
slat
ive
and
enfo
rcem
entm
easu
res)
ism
ore
effec
tive
LMIC
sEs
pera
toet
al.[
54]P
roje
ctin
gth
ehe
alth
and
econ
omic
impa
ctof
road
safe
tyin
itia
tive
s:A
case
stud
yof
am
ulti
-cou
ntry
proj
ect
Roa
dsa
fety
inte
rven
tion
sin
the
Roa
dSa
fety
in10
Cou
ntri
espr
ojec
tare
likel
yto
beco
st-eff
ecti
ve,b
utth
ere
isa
relia
nce
onpo
tent
ially
inac
cura
tegl
obal
data
sets
for
evid
ence
ofim
pact
s
Legi
slat
ion
chan
geEt
hiop
iaA
bega
zet
al.[
59]Eff
ectiv
enes
sof
anim
prov
edro
adsa
fety
polic
yin
Ethi
opia
:an
inte
rrup
ted
tim
ese
ries
stud
yR
evis
edro
adsa
fety
polic
yhe
lped
redu
cem
otor
vehi
cle
cras
hes
and
asso
ciat
edfa
talit
ies.
How
ever
,the
over
alli
ncid
ence
rate
isst
illve
ryhi
gh
Roa
dsa
fety
educ
atio
n
Paki
stan
Ahm
adet
al.[
60]T
each
ing
child
ren
road
safe
tyth
roug
hst
oryb
ooks
:An
appr
oach
toch
ildhe
alth
liter
acy
inPa
kist
anD
iscu
ssio
nsus
ing
bilin
gual
pict
oria
lsto
rybo
oks
help
edpr
imar
ysc
hool
child
ren
bett
erun
ders
tand
cras
hpr
even
tion
LIC
s&
LMIC
sLi
etal
.[61
]Chi
ldre
nan
dro
adtr
affic
inju
ries
:Can
’tth
ew
orld
dobe
tter
?V
alid
atio
nan
dim
plem
enta
tion
ofro
adsa
fety
inte
rven
tions
are
lack
ing
and
urge
ntly
need
edin
LMIC
Tanz
ania
Zim
mer
man
etal
.[62
]Roa
dtr
affic
inju
ryon
rura
lroa
dsin
Tanz
ania
:Mea
suri
ngth
eeff
ecti
vene
ssof
aro
adsa
fety
prog
ram
The
inci
denc
eof
road
cras
hes
inlo
w-v
olum
eru
rals
ettin
gsis
unac
cept
ably
high
and
mos
tcom
mon
lyas
soci
ated
wit
hm
otor
cycl
es.M
ore
rese
arch
isne
eded
toqu
anti
fyth
eim
pact
ofva
riou
spr
even
tion
stra
tegi
es
Ethi
opia
Salm
onan
dEc
kers
ley
[63]
Whe
reth
ere’
sno
gree
nm
an:c
hild
road
-saf
ety
educ
atio
nin
Ethi
opia
Roa
d-sa
fety
educ
atio
nin
Ethi
opia
isof
ten
loca
llyin
appr
opri
ate
and
impr
acti
cal,
freq
uent
lyba
sed
ondo
min
antb
utin
effec
tive
educ
atio
nal
mod
els
impo
rted
from
othe
rco
ntex
ts
LIC
s&
LMIC
sBr
adbu
ryan
dQ
uim
by[6
4]C
omm
unity
road
safe
tyed
ucat
ion:
anin
tern
atio
nalp
ersp
ecti
ve
Tran
sfer
ring
road
safe
tyed
ucat
ion
prac
tices
from
deve
lope
dto
deve
lopi
ngco
untr
ies
isar
guab
lyun
feas
ible
beca
use
ofva
riat
ions
ined
ucat
ion
syst
ems,
teac
hing
met
hods
,traffi
cre
gula
tion
san
dex
posu
reto
risk
.Roa
dsa
fety
prac
titi
oner
ssh
ould
rese
arch
and
deve
lop
besp
oke
teac
hing
met
hods
and
mat
eria
lsin
the
coun
try
inw
hich
they
will
beus
ed
Gha
naBl
anta
riet
al.[
65]A
nev
alua
tion
ofth
eeff
ecti
vene
ssof
tele
vise
dro
adsa
fety
mes
sage
sin
Gha
na
Tele
vise
dad
vert
isem
ents
conc
erni
ngsp
eedi
ngan
dal
coho
l-im
pair
eddr
ivin
g,ta
rget
edto
war
dsco
mm
erci
aldr
iver
s,w
ere
larg
ely
unde
rsto
od,
butr
oad
safe
tyac
tivi
ties
wou
ldbe
stre
ngth
ened
byin
crea
sing
acco
mpa
nyin
gla
wen
forc
emen
tact
ivit
ies
205

Sustainability 2019, 11, 6249
Ta
ble
4.
Con
t.
Ma
inT
he
me
sL
oca
tio
nK
ey
Fin
din
g
Enfo
rcem
ent
Ken
yaBa
chan
ieta
l.[6
6]H
elm
etw
eari
ngin
Ken
ya:p
reva
lenc
e,kn
owle
dge,
atti
tude
,pra
ctic
ean
dim
plic
atio
ns
Atr
affic
amen
dmen
tbill
resu
lted
inne
glig
ible
impa
cton
helm
etus
e,hi
ghlig
htin
gth
ene
edfo
ra
mul
ti-f
acet
edst
rate
gyth
atin
clud
esm
edia
cam
paig
nsan
dw
ides
prea
den
forc
emen
tin
addi
tion
tole
gisl
ativ
ech
ange
for
impr
ovin
ghe
lmet
use
Cam
bodi
aBa
chan
ieta
l.[6
7]K
now
ledg
e,at
titu
des,
and
prac
tice
sar
ound
drin
king
and
driv
ing
inC
ambo
dia:
2010
–201
2
Am
ulti
-pro
nged
,coo
rdin
ated
appr
oach
isne
eded
toeff
ecti
vely
addr
ess
drin
k-dr
ivin
g,in
clud
ing
soci
alm
arke
ting
and
publ
iced
ucat
ion
cam
paig
ns,
and
enha
nced
enfo
rcem
ent
Nig
eria
&V
ietn
amSt
ewar
teta
l.[6
8]D
rink
driv
ing
prev
entio
nin
itiat
ives
inlo
w-a
ndm
iddl
e-in
com
eco
untr
ies:
chal
leng
esan
dpr
ogre
ssin
Nig
eria
and
Vie
tnam
Inte
rven
tion
sta
ilore
dto
loca
lcon
diti
ons
and
need
sca
nhe
lpre
duci
ngdr
inki
ngan
ddr
ivin
gin
LMIC
s.Eff
ecti
vepa
rtne
rshi
psw
ith
loca
lgo
vern
men
tala
ndno
ngov
ernm
enta
lorg
aniz
atio
nsis
anim
port
anta
spec
tof
futu
repr
ogre
ss
Ken
yaBa
chan
ieta
l.[6
9]Pr
eval
ence
,kno
wle
dge,
attit
ude
and
prac
tice
ofsp
eedi
ngin
two
dist
rict
sin
Ken
ya:T
hika
and
Nai
vash
a
Whi
leth
isst
udy
dem
onst
rate
san
impr
ovem
enti
nth
epr
eval
ence
ofsp
eedi
ngin
two
Ken
yan
dist
rict
sov
er20
10-2
012,
ital
sohi
ghlig
hts
the
need
for
furt
her
acti
onto
beta
ken
toad
dres
sth
epr
oble
m
Mal
awi
Kra
emer
etal
.[70
]Cyc
lists
’hel
met
usag
ean
dch
arac
teri
stic
sin
cent
rala
ndso
uthe
rnM
alaw
i:a
cros
s-se
ctio
nals
tudy
Cyc
lehe
lmet
usag
ein
Mal
awii
svi
rtua
llyno
n-ex
iste
nt.F
utur
ein
terv
entio
nssh
ould
beta
rget
edto
adul
tand
youn
gad
ultm
ales
who
mad
eup
95%
ofob
serv
edcy
clis
ts
LIC
s&
LMIC
sJo
hnso
n[7
1]A
sses
sing
aco
untr
y’s
drin
kdr
ivin
gsi
tuat
ion:
An
over
view
ofth
em
etho
dus
edin
6lo
w-a
ndm
iddl
e-in
com
eco
untr
ies
Situ
atio
nas
sess
men
tsof
drin
k-dr
ivin
gin
six
coun
trie
sar
eno
wbe
ing
used
tode
velo
pap
prop
riat
ean
dre
leva
ntpi
lotp
roje
cts,
taki
ngin
toco
nsid
erat
ion
the
coun
try’
scu
ltur
ew
ith
resp
ectt
otr
ansp
orta
tion
,en
forc
emen
t,he
alth
care
,and
alco
holc
onsu
mpt
ion
Rou
ndab
out
desi
gnEt
hiop
iaTu
luet
al.[
58]I
nves
tigat
ing
pede
stri
anin
jury
cras
hes
onm
oder
nro
unda
bout
sin
Add
isA
baba
,Eth
iopi
a
The
pres
ence
ofa
publ
ictr
ansp
ortt
erm
inal
besi
dea
roun
dabo
utis
asso
ciat
edw
ithin
crea
sed
pede
stri
ancr
ashe
s.W
hile
the
max
imum
grad
ient
ofan
appr
oach
road
isne
gati
vely
asso
ciat
edw
ith
pede
stri
ansa
fety
,the
prov
isio
nof
ara
ised
med
ian
alon
gan
appr
oach
appe
ars
toin
crea
sepe
dest
rian
safe
tyat
roun
dabo
uts
206
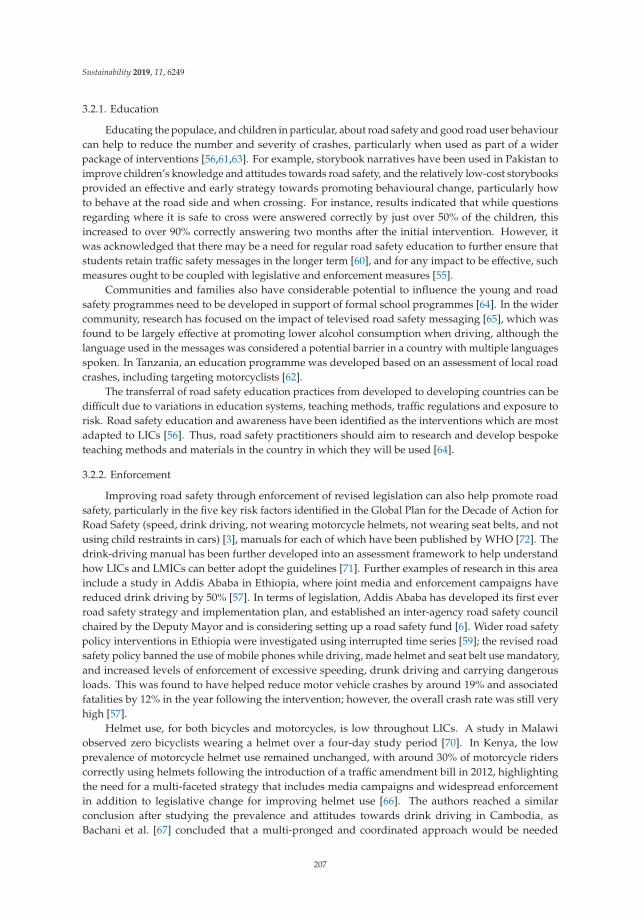
Sustainability 2019, 11, 6249
3.2.1. Education
Educating the populace, and children in particular, about road safety and good road user behaviourcan help to reduce the number and severity of crashes, particularly when used as part of a widerpackage of interventions [56,61,63]. For example, storybook narratives have been used in Pakistan toimprove children’s knowledge and attitudes towards road safety, and the relatively low-cost storybooksprovided an effective and early strategy towards promoting behavioural change, particularly howto behave at the road side and when crossing. For instance, results indicated that while questionsregarding where it is safe to cross were answered correctly by just over 50% of the children, thisincreased to over 90% correctly answering two months after the initial intervention. However, itwas acknowledged that there may be a need for regular road safety education to further ensure thatstudents retain traffic safety messages in the longer term [60], and for any impact to be effective, suchmeasures ought to be coupled with legislative and enforcement measures [55].
Communities and families also have considerable potential to influence the young and roadsafety programmes need to be developed in support of formal school programmes [64]. In the widercommunity, research has focused on the impact of televised road safety messaging [65], which wasfound to be largely effective at promoting lower alcohol consumption when driving, although thelanguage used in the messages was considered a potential barrier in a country with multiple languagesspoken. In Tanzania, an education programme was developed based on an assessment of local roadcrashes, including targeting motorcyclists [62].
The transferral of road safety education practices from developed to developing countries can bedifficult due to variations in education systems, teaching methods, traffic regulations and exposure torisk. Road safety education and awareness have been identified as the interventions which are mostadapted to LICs [56]. Thus, road safety practitioners should aim to research and develop bespoketeaching methods and materials in the country in which they will be used [64].
3.2.2. Enforcement
Improving road safety through enforcement of revised legislation can also help promote roadsafety, particularly in the five key risk factors identified in the Global Plan for the Decade of Action forRoad Safety (speed, drink driving, not wearing motorcycle helmets, not wearing seat belts, and notusing child restraints in cars) [3], manuals for each of which have been published by WHO [72]. Thedrink-driving manual has been further developed into an assessment framework to help understandhow LICs and LMICs can better adopt the guidelines [71]. Further examples of research in this areainclude a study in Addis Ababa in Ethiopia, where joint media and enforcement campaigns havereduced drink driving by 50% [57]. In terms of legislation, Addis Ababa has developed its first everroad safety strategy and implementation plan, and established an inter-agency road safety councilchaired by the Deputy Mayor and is considering setting up a road safety fund [6]. Wider road safetypolicy interventions in Ethiopia were investigated using interrupted time series [59]; the revised roadsafety policy banned the use of mobile phones while driving, made helmet and seat belt use mandatory,and increased levels of enforcement of excessive speeding, drunk driving and carrying dangerousloads. This was found to have helped reduce motor vehicle crashes by around 19% and associatedfatalities by 12% in the year following the intervention; however, the overall crash rate was still veryhigh [57].
Helmet use, for both bicycles and motorcycles, is low throughout LICs. A study in Malawiobserved zero bicyclists wearing a helmet over a four-day study period [70]. In Kenya, the lowprevalence of motorcycle helmet use remained unchanged, with around 30% of motorcycle riderscorrectly using helmets following the introduction of a traffic amendment bill in 2012, highlightingthe need for a multi-faceted strategy that includes media campaigns and widespread enforcementin addition to legislative change for improving helmet use [66]. The authors reached a similarconclusion after studying the prevalence and attitudes towards drink driving in Cambodia, asBachani et al. [67] concluded that a multi-pronged and coordinated approach would be needed
207

Sustainability 2019, 11, 6249
to effectively address this issue, including social marketing and public education campaigns, andenhanced enforcement measures.
Wismans et al. [73] provide a summary of the WHO report [74] focusing on Asian countries,highlighting that while the interventions suggested have been adopted in many countries, LICs (notablyAfghanistan and Nepal) tend to be lacking in such interventions.
3.2.3. Engineering
There is a lack of studies specifically assessing the impact of engineering interventions inLMICs [53], and those that are available have mixed results. Gupta et al. [53] report that the results ofthe three before-and-after engineering-based studies included in their review show that while fatalitiesdeclined, the number of casualties more than doubled. Other more recent research in Ethiopia hasfocused on reducing traffic-related pedestrian injuries at roundabouts by modelling the effects ofdifferent features of the approaches, such as the presence of guard railing and location of pedestriancrossings. The results which emerged from a crash prediction model and development of safetyperformance functions suggested that the number of crashes involving pedestrians was 50% highernear public transport terminals, where the spatial intensity of pedestrian-vehicle conflicts is high. Achange in gradient of the approach of 1% could result in 12% increase in pedestrian crashes, as visibilityis reduced and speeds are affected. However, there is less risk of pedestrian crashes where appropriatecrossing facilities are provided. For instance, roundabout approaches with central refuges had 44%fewer pedestrian crashes than those without such facilities [58]. However, provision of pedestrianfacilities does not imply compliant use. In Ghana, 65% of pedestrians using a zebra crossing displayedsome aspect of risky behaviour such as talking, eating or drinking, using telephones, and wearingheadphones [75].
The WHO’s annual ‘Global Status Report on Road Safety’ provides an overview of progress thathas been achieved in important areas such as legislation, vehicle standards and access to post-crashcare. The 2018 report [1] notes that progress has not, however, occurred at a pace fast enough tocompensate for the rising population and the rapid motorisation of transport taking place in manyparts of the world. At this rate, they note, the Sustainable Development Goals (SDG) target 3.6 to halveroad traffic deaths by 2020 will not be met.
3.3. Vulnerable Groups and Gender Disaggregation
The travel behaviour of vulnerable groups, such as the disabled, women and children, can beadversely affected by road safety issues, particularly in LICs. The injury profile of road traffic crashesin LICs differs in important ways from the profile seen in developed countries. Pedestrians, cyclistsand passengers on multi-passenger transport (buses, trucks and minibuses) are at particular risk ofinjury. For instance, Nantulya and Reich [76,77] note that pedestrians, cyclists and passengers inbuses and trucks account for around 90% of the casualties in countries in low- and middle-incomeregions, as opposed to high-income regions where drivers constitute the majority of victims. This largeproportion of vulnerable road users in road crash statistics in LICs may be explained by a traffic mix ofincompatible users, where pedestrians, cyclists and motorcyclist are forced to share road space withcars and trucks, especially where communities live within the vicinity of roads, where there is a lack ofpavement along large urban streets [78], and where children are particularly vulnerable to increasinglevels of motorisation [79].
Despite the prominence of vulnerable road users in LICs, they are still largely ignored in theplanning, design and operation of roads [1]. Around three-quarters of the casualties and fatalities inLICs are men [80,81], and this may reflect gender disparities in access to economic opportunities andin exposure to road traffic injury risks as drivers and passengers [77]. Unfortunately, the publishedsummary data of injury numbers is seldom disaggregated to look at patterns in factors such asgender [82]. However, as more countries are conducting household surveys, in addition to regularpopulation censuses, more countries can now produce data disaggregated by sex for basic indicators
208
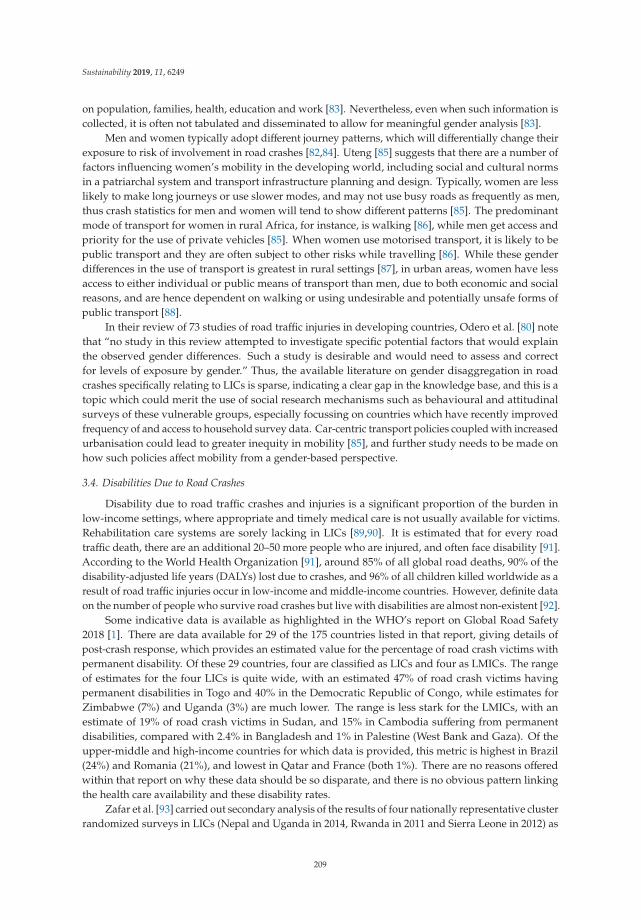
Sustainability 2019, 11, 6249
on population, families, health, education and work [83]. Nevertheless, even when such information iscollected, it is often not tabulated and disseminated to allow for meaningful gender analysis [83].
Men and women typically adopt different journey patterns, which will differentially change theirexposure to risk of involvement in road crashes [82,84]. Uteng [85] suggests that there are a number offactors influencing women’s mobility in the developing world, including social and cultural normsin a patriarchal system and transport infrastructure planning and design. Typically, women are lesslikely to make long journeys or use slower modes, and may not use busy roads as frequently as men,thus crash statistics for men and women will tend to show different patterns [85]. The predominantmode of transport for women in rural Africa, for instance, is walking [86], while men get access andpriority for the use of private vehicles [85]. When women use motorised transport, it is likely to bepublic transport and they are often subject to other risks while travelling [86]. While these genderdifferences in the use of transport is greatest in rural settings [87], in urban areas, women have lessaccess to either individual or public means of transport than men, due to both economic and socialreasons, and are hence dependent on walking or using undesirable and potentially unsafe forms ofpublic transport [88].
In their review of 73 studies of road traffic injuries in developing countries, Odero et al. [80] notethat “no study in this review attempted to investigate specific potential factors that would explainthe observed gender differences. Such a study is desirable and would need to assess and correctfor levels of exposure by gender.” Thus, the available literature on gender disaggregation in roadcrashes specifically relating to LICs is sparse, indicating a clear gap in the knowledge base, and this is atopic which could merit the use of social research mechanisms such as behavioural and attitudinalsurveys of these vulnerable groups, especially focussing on countries which have recently improvedfrequency of and access to household survey data. Car-centric transport policies coupled with increasedurbanisation could lead to greater inequity in mobility [85], and further study needs to be made onhow such policies affect mobility from a gender-based perspective.
3.4. Disabilities Due to Road Crashes
Disability due to road traffic crashes and injuries is a significant proportion of the burden inlow-income settings, where appropriate and timely medical care is not usually available for victims.Rehabilitation care systems are sorely lacking in LICs [89,90]. It is estimated that for every roadtraffic death, there are an additional 20–50 more people who are injured, and often face disability [91].According to the World Health Organization [91], around 85% of all global road deaths, 90% of thedisability-adjusted life years (DALYs) lost due to crashes, and 96% of all children killed worldwide as aresult of road traffic injuries occur in low-income and middle-income countries. However, definite dataon the number of people who survive road crashes but live with disabilities are almost non-existent [92].
Some indicative data is available as highlighted in the WHO’s report on Global Road Safety2018 [1]. There are data available for 29 of the 175 countries listed in that report, giving details ofpost-crash response, which provides an estimated value for the percentage of road crash victims withpermanent disability. Of these 29 countries, four are classified as LICs and four as LMICs. The rangeof estimates for the four LICs is quite wide, with an estimated 47% of road crash victims havingpermanent disabilities in Togo and 40% in the Democratic Republic of Congo, while estimates forZimbabwe (7%) and Uganda (3%) are much lower. The range is less stark for the LMICs, with anestimate of 19% of road crash victims in Sudan, and 15% in Cambodia suffering from permanentdisabilities, compared with 2.4% in Bangladesh and 1% in Palestine (West Bank and Gaza). Of theupper-middle and high-income countries for which data is provided, this metric is highest in Brazil(24%) and Romania (21%), and lowest in Qatar and France (both 1%). There are no reasons offeredwithin that report on why these data should be so disparate, and there is no obvious pattern linkingthe health care availability and these disability rates.
Zafar et al. [93] carried out secondary analysis of the results of four nationally representative clusterrandomized surveys in LICs (Nepal and Uganda in 2014, Rwanda in 2011 and Sierra Leone in 2012) as
209

Sustainability 2019, 11, 6249
part of the Surgeons Overseas Assessment of Surgical Needs, which collected information regardingdemographics, injury characteristics, anatomic location of injury, healthcare seeking behaviour, anddisability from injury. The authors found that among the four LICs, involvement in a road crash wasreported by 1.8%–2.6% of the population. These accounted for about 12.9% of all injuries. ‘Majordisability’ was reported by an average of 38.5% of those suffering an injury as a result of a road crash.Respondents from Sierra Leone (49.3%) and Uganda (46%) were most likely to report a disability,whereas those from Rwanda (32.8%) and Nepal (21.1%) were less likely. Patterns of injury variedbetween countries; however, head and extremity injuries remained the most common.
One potential problem comparing the studies above is that of inconsistent definitions. For instance,the international road safety community has not yet settled on a precise definition of ‘serious’ injuryresulting from a road traffic crash [94]. Injury severity in some developed countries has been assessedby means of the maximum abbreviated injury scale (MAIS), i.e., the maximum score of a six-pointscale ranging from 1 (minor injury) to 6 (fatal injury) [95]. However, there is no agreement on whichof the central MAIS levels should be used to define serious road injuries as a policy indicator. In theNetherlands, for instance, MAIS 2+ is used to indicate a serious road crash [94], while the InternationalRoad Traffic and Accident Database (IRTAD), proposes an injury score of MAIS 3+ to define a seriouslyinjured road casualty [12].
A number of studies (see for example [96–101]) provide means to monitor the prevalence ofdisabilities among populations, but it should be noted that improved health care and vehicle safetydoes not necessarily imply that there will be fewer disabled people as a result of road traffic crashes. Ifhealthcare and acute care services improve in LICs and in-vehicle protection devices (e.g., airbags)become more prevalent, there are likely to be fewer fatalities resulting from crashes. However, theimplication is that more people will survive with non-fatal but extensive injuries, resulting in highernumbers of disabled people [102], implying a greater need in the future for long-term care andrehabilitation facilities for those who survive road crashes, but are permanently disabled. There areobvious cost implications associated with this [96].
3.5. Economic Burden of Road Crashes
Since road crash cost estimates are difficult to obtain, there are few studies that specifically focuson road crash costing or cost-effectiveness of interventions in LICs [103]. A recent summary of theeconomic costs of RTIs included in the Disease Control Priorities project suggests that these costscould range between 1%–2% of a country’s GNP [92]. Delays in implementing road safety measurescould also impact severely on a nation’s wealth and its population’s wellbeing [104]. While estimateson the total costs of RTIs vary based on the methodological approaches used, one large 21-countrystudy estimated the global cost of RTIs at US$518 billion [92,105]. Another recent analysis of theeconomic impact of road traffic injuries led by the World Bank’s Global Road Safety Facility found thatif countries were able to halve mortality and morbidity due to road traffic injuries and sustain thatover 24 years, they could realize significant increases in their GDP—between 7% and 22% [106].
In addition to the above costs, it is important to note that RTIs result in a significant societalburden as well, information about which is important for evidence-based policy making. However,there is a paucity in information in the global literature about the societal costs of RTIs, especially inLMICs, and more studies are needed. This information would provide insight into the consequencesof crashes for the economy and social welfare. In fact, road crash costs can be used as a comparatorwith other policy areas, to help decision-makers prioritise investments. While epidemiologicaldata for crash-related disability from LICs is scarce, the costs of prolonged care, loss of incomeand consequences for injured parents and their dependents impose financial pressures on families,threatening sustainable livelihoods [107]. Also, the burden of care for long-term illness and disabilitymay fall disproportionately on women and girls [108]. That said, the tangible costs such as lostproductivity (indirect cost) and medical costs (direct costs) can be estimated in economic terms moreeasily compared to the intangible costs such as pain and suffering [109]. However, regardless of
210
Sustainability 2019, 11, 6249
difficulties in estimating road crash costs, accounting for economic costs of crashes is necessary toinform policy makers in prioritising and choosing the most effective countermeasures. Three mainapproaches used in estimating the cost of road crashes [109] are (i) the human capital approach, inwhich mainly tangible injury costs to individuals are aggregated at societal, regional and nationallevels; (ii) the willingness-to-pay approach, which derives a value of pain and suffering based on thepreferred amounts that people would be prepared to pay to live in a world where risks are reduced;and (iii) the general equilibrium approach, which uses simulation models to estimate costs from abroader macroeconomic perspective, although this is, as yet, untested for injury cost modelling [92].The human capital approach has been the most common approach used in LMICs, due to the relativesimplicity and structured nature of the approach [109].
3.6. Vehicle Safety Standards and Dumping of Old Vehicles
An emerging problem for road safety in LICs is the issue of vehicle safety and technologies. Whilethere is a dearth of literature focusing on this issue in LICs, as part of this project, we have beenworking to liaise with stakeholders in considering lessons learnt from the developed world in thisarea to understand this issue further. These stakeholders include experts from the Global New CarAssessment Programme (NCAP), and regional car assessment programs.
With respect to emerging vehicle safety features in LICs (e.g., air bags, crash avoidance systems,etc.), one should take into account risk compensation issues. A number of studies have investigated riskcompensation issues mostly in the developed world [110–113]. As discussed by Winston et al. [110],road users may become less vigilant about road safety due to innovations that are designed to improvesafety. For example, drivers may trade off improved safety for speedier trips [110]. With the expectedchange in vehicle fleet (and their safety features) in LICs, it is important to understand how theexperience of developed countries in this regard could lend itself to LICs. This also highlights theimportance of publicity campaigns to raise awareness among road users in LICs with respect to vehiclesafety features. This is particularly necessary to educate and train drivers at the very beginning stepsof moving towards advanced vehicle safety features in LICs.
With respect to dumping old vehicles in LICs, the issue has been raised by a number of organisationsand research studies, which mostly focus on the environmental impact [114]. The mainly old vehiclefleet in LICs does not meet some of the basic safety standards set in developed countries, increasing thepropensity of crashes. This may be exacerbated by vehicle modification, poor maintenance standards,inappropriate use (e.g., overloading) and lack of safety enforcement. In addition, when a crash occurs,drivers and passengers would sustain more severe injuries, for example, due to lack of airbags. Toour knowledge, scientific studies that investigate safety implications of exporting old vehicles to LICsare non-existent. Policies may be needed to prevent developed countries from dumping vehicles of acertain age or category in LICs and to encourage scrappage in LICs (e.g., cash for clunkers).
3.7. Proactive Approaches to Road Safety
Traditional methods that help detect, prioritise and treat high crash-risk sites have been basedsolely on prior crash history [115]. However, crash data quality in LICs tends to be poor, at limitednumbers of sites, and with high rates of under-reporting. Studies of observed unsafe road userbehaviour in LMICs do exist, e.g., [116,117], but manual data collection is time consuming and costly.To overcome these constraints, it may be possible to use new forms of data collection techniques suchas video data or remote sensors, and storage and manipulation techniques involving ‘big data’ to allowfor a proactive road safety approach that can address safety deficiencies before crashes occur [118].For instance, assessing global databases could help identify country-specific determinants of roadsafety [119]. More locally, it is possible to monitor and analyse road users’ trajectories and identifyconflicts and near misses [120]. A proactive approach to road safety should ideally complementtraditional, reactive methods [121], allowing us to design improvement programs (publicity campaigns,
211
Sustainability 2019, 11, 6249
engineering interventions, etc.) before crashes happen. However, applying such approaches in LICsmay not be straightforward, due to cost and resource constraints.
3.8. Limited Data Conditions, Omitted Variables Problem, and Unobserved Heterogeneity
A series of well-known issues often encountered in road safety analysis are related to datalimitations of various types. Crash data may be limited in terms of sample size or the number of risk(contributing) factors available in the data resulting in limited data conditions, the omitted variablesproblem, and unobserved heterogeneity [122–124]. Note that risk factors are needed to explain thesafety of a site (highway segment, jurisdiction, etc.).
When a crash data set is not large enough, the maximum likelihood estimation is prone to bias;therefore, the model estimates are biased. This problem can be addressed by employing Bayesianmethods in which prior knowledge can be included in the analysis in the form of the prior distribution,leading to enhanced statistical inferences. In this regard, for instance, Heydari et al. [124] showedhow it is possible to obtain reliable statistical models for crash data characterised by a small samplesize. With respect to the omission of risk factors, road safety literature discusses that, when importantvariables that have significant explanatory power are missing from the data, road safety inferencescould be misleading [122].
Unobserved heterogeneity is related to the omitted variables problem and leads to spurious roadsafety inferences as indicated in the crash literature [2]. Several risk factors that affect road safety at a site(intersection, road segment, neighbourhood, etc.) are often missing (being unknown or unmeasured)in crash databases, causing the unobserved heterogeneity problem. A large body of literature discusseshow to overcome this problem in order to obtain reliable estimates [2,125]. However, most studiesthat address the abovementioned issues are conducted in the developed world. Advanced statisticalmethods can mitigate unobserved heterogeneity and omitted variables problems [123], and suchmethods should be applicable to data sets in LICs, but their use in such contexts has so far been limited.
3.9. Reaching out to Other Sectors—Social and Behavioural Aspects
Road safety education and awareness campaigns in high-income settings are often based onchanging people’s attitudes. Change someone’s attitudes, and they will change their behaviour. Thismay not, however, work across all cultural contexts. For example, previous research has suggestedthe link between attitudes and behaviours (in a road safety context) to be weaker in Sub-SaharanAfrican countries than in high-income European countries [126,127]. In a study across six countries,McIlroy et al. [128] found that in Kenya, road safety attitudes predicted self-reported pedestrianbehaviours to a significantly lesser extent than in the UK. This cannot, however, be explained bynational income or road safety statistics. Across the six countries included in their investigation,McIlroy et al. found no patterns in this respect. This strongly points to the need to conduct preliminaryresearch in the country of interest before applying road safety interventions. Every setting has uniquecharacteristics, and interventions should be designed with this in mind.
Culture is a significant factor in this regard. This has been explored by a variety of researchers,with mixed results. In a study of West African taxi drivers, Kouabenan [129] examined religious,mystical, and fatalistic beliefs. Road crashes were attributed more to external factors (such as poorroad maintenance and the absence of pedestrian infrastructure) than to driver behaviours (such asthe breaking of road laws or carelessness). Additionally, such beliefs were linked with a disregardfor safety measures. A strong belief in luck, fate, or destiny, was linked with a perceived lack of needfor things such as helmets or seatbelts. Similar findings have since been reported by Dixey [130],Peltzer [131], Omari and Baron-Epel [132], and Maghsoudi et al. [133]. Additionally, not only arestronger beliefs in fate or destiny related to lower engagement in self-protective behaviours, but alsowith active engagement in risky behaviours. Results to this effect have been found in a variety ofsettings, including South Africa [134], Turkey and Iran [135,136], and Cameroon [137].
212
Sustainability 2019, 11, 6249
Results are not, however, clear-cut. In a study in Turkey, Yıldırım [138] found religiosity to havea positive effect on self-reported traffic behaviours. Those reporting stronger religious beliefs alsoreported making fewer risk-taking behaviours. Similarly, McIlroy et al. [139], found stronger beliefs inthe influence of God over one’s life to be related to safer attitudes and pedestrian behaviours in Kenyaand Bangladesh. Note that the opposite pattern was found in China, Thailand, the UK, and Vietnam.Once again, research conducted in the setting of interest is crucial for successful intervention designand implementation.
Road transport is a highly complex sociotechnical system, with influence from a wide varietyof individuals and organisations at varying levels of system abstraction [140]. Although it is the enduser that carries the weight of the road traffic injury and fatality burden, it is generally not the enduser that makes safety intervention decisions [141]. Yet it is this group that generally shoulders theblame [142]. This is not unique to low- and middle-income countries; however, change is beginning tobe seen in some high-income countries with acceptance of the ‘safe system’ or ‘vision zero’ philosophy.The approach’s primary central tenet is the idea that the end user is fallible, and that the system shouldbe designed in a way to reduce the likelihood of crashes and reduce the consequences of crashesthat happen. Crucially, blame is not placed solely on the end user, rather it is shared among systemactors [143]. Although this way of thinking is gaining traction in the Europe, North America, andAustralia, there is as yet a complete lack of systems-level research in low-income settings [144]. Toreiterate the sociotechnical perspective, road safety is not the domain of one actor or group of actorsalone, but it is the concern of many entities, at many levels of the system, from the end user to thepolicy maker [140].
3.10. Current Capacity for Research and Practice
Capacity for research and practice in the field of road safety is one of the key issues impedingprogress in this area in the context of LICs. This is a recurrent theme in all global and regional reportspublished to date on road safety [1,8,91,92]. Capacity is needed for research as well as planning andimplementation of appropriate safety improvement programmes, and any work being done in suchsettings ought to embed capacity development into it [145,146], as well as consider how to overcomeinstitutional barriers [147].
Initiatives such as the Road Traffic Injuries Research Network [148] and the UNECE programmesin developing countries, in partnership with ECLAC (Latin America and Caribbean region) and ESCAP(Asia and the Pacific region) [149] have aimed to reduce the burden of road crashes in developingcountries by identifying and promoting effective, evidenced-based interventions and supportingresearch capacity building in road safety research in LMICs. Building on the experience gained fromsuch initiatives, there is a need to develop formal training programs that are readily accessible byindividuals residing in LMICs. Based on the literature review and through liaising with experts andstakeholders, we have identified two main areas where improving capacity is most needed.
I Limited trained human resources: Many LICs around the world lack adequate human resourcesin the various areas necessary for effective action on road safety—research, program planningand implementation, as well as monitoring and evaluation [92,149]. One main reason for this isthe lack of formal training programs in these settings that are specifically targeted towards theskills necessary for effective and appropriate action on an issue as complex and multi-sectoral asroad safety [150]. This limits the amount and type of research conducted locally. For example,road safety studies that focus on data derived from LICs are extremely under-represented inpeer-reviewed publications [145], and when they exist, they are often far away from advancedmethodological techniques adopted in studies conducted in the developed world. To this end, itis important to train practitioners and researchers residing in LICs in the different areas necessaryto effect programmatic change, such as road safety management, research on risk factors for roadsafety, evaluation of interventions, etc. Incorporating some of these capacity building activities
213

Sustainability 2019, 11, 6249
in ongoing engagements and initiatives in LMICs will also have the added benefit of enhancingcollaboration between HIC and LMIC researchers and practitioners.
II Lack of data: As set out in Sections 3.1, 3.3, and 3.4, another gap identified in LICs is the limitedamount of disaggregated data available for understanding the safety condition and monitoringsafety improvement programs when implemented. Capacity development efforts for road safetyin LMICs ought to focus on improving data systems such that there is valid, reliable, and timelydata available to not only assess the safety condition, but also serve as a basis for assessing theeffectiveness of programs or interventions implemented.
4. Expert Consultation Results
As described in Section 2.4, six road safety experts, with extensive experience in road safety inLICs, participated in our survey. They provided insight into those topics that were most important toconsider for future research in LICs. Two main topics emerged as the most important issues: (i) datacollection and management techniques and (ii) governance and legislation. The range of sub-topicsand proposed solutions are reported in Table 5. The outcomes from the survey and other discussionsalso provided context for topics for which literature is unlikely to be available, but which helps providethe background to the future research agenda set out in Section 5.
Table 5. Expert elicitation results showing important topics for future road safety.
Topic Potential Solutions
Data:
Inconsistent data collection andmanagement techniques (includingunder-reporting)
- Improved training and resources for police and hospital staff- Dedicated specialists in crash data reporting- Use of modern technology to ensure accuracy of reporting and
efficiency of data storage- Use of multiple data sources- Public awareness raising of importance of accurate data
Under-use of road crash costestimates
- Establish specialised team to promote road safety, and ensure costimplications are explicitly considered in road safety interventions
- Disseminate cost evaluation results to reveal shortcomings incurrent approaches
Governance:
Lack of integrated approach toroad safety issues
- Develop and apply an integrated multi-sectoral, multi-governanceframework, possibly using a systems-based approach, includingfeedback mechanisms and knowledge exchange
- Consider how to integrate research into vulnerable road users,policy, and education
Lack of accountability ofleadership
- Review and re-evaluate current governance mechanisms toimprove transparency and avoid redundancy and overlappingof responsibilities
- Vision Zero approach- Implement Lead Road Safety Agency to coordinate and champion
road safety activities at national, municipal and local levels
Poor legislation - Apply best practice techniques from the developed world
Poorly resourced sector
- Increased levels of trained personnel, equipment andknowledge base
- Consider use of outsourcing to private sector for certain aspects ofroad traffic management
Respondents agreed that the complexities of road safety implementation meant that there areunlikely to be any ‘quick wins’, although investigating how governance could be improved and held
214

Sustainability 2019, 11, 6249
more accountable could initiate action to improve the impact of road safety interventions in the shortterm. Further responses suggested that the effective use of increased resources and awareness of globalbest practice could help provide rapid insight into the priority issues, particularly with respect to thesafety of vulnerable road users and the expected growth of traffic in developing countries. Additionally,reviewing current practices could help inform government and other stakeholders of the key issues intheir specific location, and highlight where current governance mechanisms can be improved, with theaim of achieving greater political and funding commitments from decision-makers, resulting in betterlegislation and enforcement.
5. Discussion: Implications and Future Directions
This section provides a discussion of our findings and their implications grouped in seven majorareas. A number of topics emerged from our analysis of the State of Knowledge review above combinedwith discussions with experts and stakeholders, which can help form a future research agenda. Thesetopics relate to both empirical and methodological frontiers; therefore, they will lead to noteworthyimprovements in the way road safety research will be conducted in the context of LICs. Note thattopics discussed below are inter-related; nevertheless, their theoretical and empirical weights varyfrom one topic to another.
5.1. Under-Reporting of Crashes
This is a major issue in LICs; research is needed not only to understand causes of under-reportingbut also to develop methodological approaches that can better address the issue. The use ofcapture-recapture techniques has been shown to be a useful tool to estimate the levels of under-reportingin low-income countries, and as such could be used when authorities wish to understand the true natureof road traffic crash rates in their country. To better address the under-reporting problem, alternativestatistical methods that overcome the limitations of the capture-recapture approach (discussed inSection 3.1) should be examined and/or developed. It is also advisable to carry out a review of policeand hospital data availability in LICs and LMICs, in order to understand better the nature of the typesof data generally available. Following such a review, a general ‘toolkit’ could be developed offeringguidance and methodologies for the analysis of under-reporting in LICs and LMICs. Such guidancecould incorporate minimum data requirements, software tools and reporting templates in order tostandardise such reporting in all LICs and LMICs in the future.
5.2. Traffic Injuries Sustained in the Crash
Understanding the causes, severities, long-term implications, and costs to society of disabilitiesresulting from road crashes could help refine road safety policies in LICs and improve impact analysisof road safety interventions. There are inconsistencies in the metrics and methods used to assess injuryseverities (as discussed in Section 3.4), and further work could seek to build on any review of roadsafety and healthcare data recording systems suggested in Section 5.1 (under-reporting), and aim toassess the most appropriate metrics for LICs to use in analyses of disabilities. Further research couldhelp to develop methodologies for road safety and healthcare practitioners in LICs to understand notonly the trends associated with disabilities resulting from road crashes but also their impact on societyand the economy. It may be appropriate to focus such future research on vulnerable groups. Also, asurprising gap in previous road safety research conducted in LICs relates to the lack of studies thataim at analysing and understanding differing injury-severity levels properly. That is, how differentfactors increase or decrease the likelihood of injury-severity sustained by road users. Such analysesare common in the developed world and help draw a complete picture, allowing decision makers todesign cost-effective countermeasures to reduce injuries once a crash occurs. In this regard, furtherresearch is thus needed in LICs.
215

Sustainability 2019, 11, 6249
5.3. Road Crash Costing
There are limitations in the methods used to apply cost estimates to road crashes in LMICs [151]and in LICs in particular. Wesson et al. [152] carried out a review of economic evaluations in LMICs,finding only three studies that assessed the costs of road safety interventions, and six studies thatwere cost-effectiveness analyses. Only one of these papers referred specifically to LICs [153]. Similarly,Banstola and Mytton [103] only found five studies assessing cost-effectiveness in LMICs, with only twointerventions showing moderate evidence of being cost-effective. More recently, Mukama et al. [154]assessed the costs of unintentional injuries to children in a Ugandan slum, noting that costs associatedwith road traffic crashes are higher than those for incidents occurring at a school, due to the severenature of most road traffic injuries requiring specialised care and hence higher treatment costs. Thislack of LIC-based research indicates that further research is needed to identify relevant methods of roadcrash cost estimations or cost-benefit analyses of road safety interventions applicable in those settings.
5.4. Characterisations of the Vehicle Fleet
With respect to the vehicle safety features and risk compensation concerns discussed in Section 3.6,further research is needed to better understand risk compensation issues in LICs to be able to takeadvantage of emerging safety innovations more fully. In addition, it is important to explore issuessurrounding the second hand vehicle market and how countries that are heavily reliant on importedsecond-hand vehicles can regulate more appropriately, as well as vehicle technologies. In this regard,scientific research is needed to quantify road safety implications of dumping old vehicles in LICs.
5.5. Challenges of Data Collection and Analysis
As set out in Section 3, and identified by the expert survey, many of the issues pertinent to thisstudy relate to the challenges of data collection, management and analysis. While it may be possibleto draw on experiences of global good practice, it may also be relevant to develop specific methodsand analysis techniques that apply in the LIC-context. The following sections discuss these issues ingreater detail.
5.5.1. Expected Increase in Traffic Volume and Its Implications
Previous research indicates that as a country’s economy grows and traffic volume (and consequentlyexposure) increases, road safety deteriorates. However, the relationship is not linear and varies fromone jurisdiction to another [155,156]. It is important to quantify the rate of deterioration in road safetyas traffic exposure increases; and consequently, investigate how we can reduce this rate. For example,using advanced statistical methods, a study conducted by Heydari et al. [157] shows how with thesame set of variables available in the data one can understand variation in crash frequency as trafficexposure increases. This is important since an increase in traffic volume in LICs seems inevitable in thenear future. Further research is thus needed to understand the relationship between road safety andtraffic exposure in LICs. To this end, a series of safety performance functions should be developedfor different road infrastructures in LICs, similar to those developed in the Highway Safety Manual2010 [158]. Note that safety performance functions are the main ingredient for the six-step safetymanagement process described in the Highway Safety Manual [158]. They are used to quantify roadsafety, to understand factors affecting safety, and to identify hazardous locations that should then beprioritised for safety improvement programs.
5.5.2. Accounting for Data-Related Limitations and Unobserved Heterogeneity
As previously discussed, in LICs, crash data tends to be lacking or when it exists, it is often limited,in terms of sample size limitations and/or the lack of risk factors available in the data. Therefore, issuesdiscussed in Section 3.8 are often more prevalent and frequent in LICs compared to the developedworld. The number of road safety studies conducted in LICs is limited, and rarely do those studies
216

Sustainability 2019, 11, 6249
employ rigorous road safety and statistical techniques to address the aforementioned issues properly.One aspect of future research should be to continue work in this area by developing statistical methods,especially those applicable to LIC-contexts, and help provide robust analyses of road safety data.
5.5.3. Feasibility of Proactive Approaches to Road Safety in LICs
Although we recognise challenges for implementing proactive road safety approaches in LICs, itis important to investigate how this could help mitigate crash risk propensities in LICs. Building onthe successful experience of developed countries in implementing such approaches, while consideringresource and cost constraints applicable to LIC-contexts, it would be possible to adapt proactivemethods in LICs to optimise their benefits with a minimum cost. Initially, this could be treated as arange of feasibility studies to extend the knowledge base to LICs. Perhaps, it would be possible tofocus on monitoring a limited number of road infrastructures and based on that provide valuableinsights, which in turn allow for designing tailored safety improvements transferable to other similarlocations within each jurisdiction. To summarise, proactive safety approaches should be considered inthe future if a major improvement in road safety in LICs is expected to be achieved.
5.5.4. Alternative Approaches to Obtain Data
With respect to data issues and limitations encountered by LICs, which also relates to limitedcapacity in these countries, a valuable and cost-effective approach could be based on using streetimagery, for example, available in Google street view or shared on social networks. Previous researchhas successfully taken advantage of street imagery, for example, to identify travel patterns [159].Estimating travel patterns and/or traffic exposure by different modes of transport and/or road usertypes could be promising when such information is not available (e.g., when data are not collectedthrough traditional data collection techniques). Also, automatic data collection, for example, usingtraffic analyser sensors has been shown to provide valuable data that allows the analyst to conduct roadsafety studies [160,161]. This is particularly important given the expected increase in traffic exposurein LICs since traffic exposure is known as a major determinant of road safety. Therefore, it wouldbe interesting to investigate how this could be employed to collect relevant data and improve safetyin LICs.
5.6. Social and Behavioural Approaches to Road Safety
As described in Section 3.2, the majority of road safety research is performed in high-incomecountries; hence, the majority of methods are biased towards these settings. As such, there is a strongrequirement for research methods developed in low-income settings. This can also be said for roadsafety interventions. Given differences in cultures, attitudes, and behaviour constraints, it may not bethe case that what has worked in Europe or America will also work in LICs. As such, interventionsshould be designed preferably based on research conducted in the country in which the interventionis to be implemented. Therefore, there is a clear need for more in-depth research on the social andbehavioural factors that influence road safety in low-income settings. There is also a strong needto embed sociotechnical systems thinking in crash analyses, and in road transport policy, planning,and construction. This is beginning to happen in high-income countries; however, LICs are beingleft behind in this respect. As such, a concerted effort to apply contemporary sociotechnical systemsmethods to the analysis of road transport in LICs is needed. The design of road safety interventionsshould be based on a good understanding of the context of application and a consideration of all thefactors that influence outcomes. Neither of these points are typically addressed in LICs; as such, theyrepresent important topics for research.
5.7. How to Build Sustainable Capacity Effectively and in a Timely Manner?
Two of the future road safety challenges identified by the WHO [10] are ‘Building Capacity’ and‘Strengthening Data Collection’, and effective training programmes could help improve both of these
217

Sustainability 2019, 11, 6249
aspects of road safety. As discussed in Section 3.10, limited trained human resources and a lack ofdata are two areas where capacity building is most warranted. Although some previous studieshave investigated related issues in LICs, there is a need to continue work in this area in order tosystematically identify and/or define the most cost-effective and sustainable strategies that can be inplace in a timely fashion.
6. Summary
The general objective of our research was to help improve road safety in LICs, identifying andtargeting the most important problems encountered by these countries and defining critical futureresearch directions that help enhance safety effectively given the expected increase in traffic exposurein LICs. Following recent developments in the field, including the UN Decade of Action for RoadSafety (2010–2020), this article contributes to the literature by reviewing the state of knowledge andrecommending a future research agenda for further improvements. Our study reveals where some ofthe major knowledge gaps exist for those topics that have been part of the research arena for sometime. To this end, not only have we conducted a literature review, but we have also liaised withinternational organisations, local authorities, experts and professionals, particularly where the bodyof literature does not exist. Thus, we have identified some of the most critical road safety concernsin LICs; consequently, we have suggested some areas of future research that could be considered toinform an agenda for future action.
Specifically, we identified ten focus areas: (i) under-reporting of road crashes in LICs; (ii) lessonslearned from global best practices; (iii) vulnerable groups and gender disaggregation; (iv) disabilitiesdue to road crashes; (v) economic burden of road crashes; (vi) vehicle safety standards and thedumping of old vehicles; (vii) proactive approaches to road safety; (viii) limited data conditions,omitted variables and unobserved heterogeneity; (ix) reaching out to other sectors, considering socialand behavioural aspects; and (x) capacity limitations of road safety research. Based on our analyses,we conclude that road safety is inherently a multi-sectoral issue, where interventions will need toinvolve multiple strategies and stakeholders. The most successful programmes globally have beenthose that have integrated systems of legislation, regulation and enforcement, combining robust datacollection and management systems, economic evaluation systems to inform investment decisions,significant technical and enforcement capacity, and a substantial knowledge base of the social, medicaland behavioural implications of road safety interventions.
Seven major research directions were identified based on the above-mentioned focus areas. Insummary, in terms of policy recommendations, given the poor resources and lack of capacity for datamanagement available in LICs, improving the quality of data in these countries would be one of theinitial steps to make any improvements, either through investing in capacity for analysis and research,or through the development of modern techniques of data collection. Raising public awareness of theimportance of accurate data and the reporting of road crashes is another central issue that should beconsidered by governments. We also suggest investigations into data analysis techniques consideringboth the statistical foundations upon which such analyses are built, and the use of proactive measuresto prioritise investments, all carried out with a focus on existing cost and resource limitations in LICs,and using evidence-based techniques to promote effective changes. Combining expert insights andexperiences with research from LICs, LMICs, and developed countries should provide the basis for arobust approach and a future research agenda that will help improve road safety in LICs.
Author Contributions: S.H., A.H., J.T., and A.M.B. were involved in drawing the conceptual plan of the paper.S.H. and A.H. wrote the first draft of the manuscript. R.M. wrote the sections relating to social and behaviouralaspects. A.M.B. and J.T. provided valuable inputs on the content of the article.
Funding: This research was funded by the UK Department for International Development.
218
Sustainability 2019, 11, 6249
Acknowledgments: This research was funded by UK AID through the UK Department for InternationalDevelopment under the High Volume Transport Applied Research Programme, managed by IMC Worldwide.The authors are grateful to the panel of experts, who participated in the survey, and anonymous reviewers fortheir valuable comments.
Conflicts of Interest: The authors declare no conflict of interest.
References
1. World Health Organization. Global Status Report on Road Safety 2018; World Health Organization: Geneva,Switzerland, 2018.
2. Mannering, F.L.; Shankar, V.; Bhat, C.R. Unobserved heterogeneity and the statistical analysis of highwayaccident data. Anal. Methods Accid. Res. 2016, 11, 1–16. [CrossRef]
3. World Health Organization. Global Plan. for the Decade of Action for Road Safety 2011–2020; World HealthOrganization: Geneva, Switzerland, 2011.
4. Global Road Safety Partnership. Road Map: Strategic Plan 2015–2020; Global Road Safety Partnership: Geneva,Switzerland, 2016.
5. World Bank. Global Road Safety Facility Annual Report 2018; World Bank: Washington, DC, USA, 2018.6. Bloomberg Philanthropies Road Safety. Available online: https://www.bloomberg.org/program/public-
health/road-safety/ (accessed on 24 April 2019).7. Hyder, A.A.; Allen, K.A.; Peters, D.H.; Chandran, A.; Bishai, D. Large-scale road safety programmes in
low-and middle-income countries: An opportunity to generate evidence. Glob. Public Health 2013, 8, 504–518.[CrossRef] [PubMed]
8. Hyder, A.A.; Paichadze, N.; Toroyan, T.; Peden, M.M. Monitoring the Decade of Action for Global RoadSafety 2011–2020: An update. Glob. Public Health 2017, 12, 1492–1505. [CrossRef] [PubMed]
9. World Road Association Safe System Principles. Road Safety Manual. Available online: https://roadsafety.piarc.org/en/road-safety-management-safe-system-approach/safe-system-principles (accessedon 28 October 2019).
10. World Health Organization. Decade of Action for Road Safety 2011–2020. Available online: https://www.who.int/roadsafety/decade_of_action/en/ (accessed on 28 October 2019).
11. Moher, D.; Shamseer, L.; Clarke, M.; Ghersi, D.; Liberati, A.; Petticrew, M.; Shekelle, P.; Stewart, L.A.;Group, P.-P. Preferred reporting items for systematic review and meta-analysis protocols (PRISMA-P) 2015statement. Syst. Rev. 2015, 4, 1. [CrossRef] [PubMed]
12. IRTAD. Reporting on Serious Road Traffic Casualties; International Traffic Safety Data and Analysis Group:Paris, France, 2011.
13. Magoola, J.; Kobusingye, O.; Bachani, A.M.; Tumwesigye, N.M.; Kimuli, D.; Paichadze, N. Estimating roadtraffic injuries in Jinja district, Uganda, using the capture-recapture method. Int. J. Inj. Contr. Saf. Promot.2018, 25, 341–346. [CrossRef] [PubMed]
14. Abegaz, T.; Berhane, Y.; Worku, A.; Assrat, A.; Assefa, A. Road traffic deaths and injuries are under-reportedin Ethiopia: A capture-recapture method. PLoS ONE 2014, 9, e103001. [CrossRef] [PubMed]
15. Dandona, R.; Kumar, G.A.; Ameer, M.A.; Reddy, G.B.; Dandona, L. Under-reporting of road traffic injuries tothe police: Results from two data sources in urban India. Inj. Prev. 2008, 14, 360–365. [CrossRef]
16. Samuel, J.C.; Sankhulani, E.; Qureshi, J.S.; Baloyi, P.; Thupi, C.; Lee, C.N.; Miller, W.C.; Cairns, B.A.;Charles, A.G. Under-reporting of road traffic mortality in developing countries: Application of acapture-recapture statistical model to refine mortality estimates. PLoS ONE 2012, 7, e31091. [CrossRef]
17. Bhatti, J.A.; Razzak, J.A.; Lagarde, E.; Salmi, L.R. Differences in police, ambulance, and emergency departmentreporting of traffic injuries on Karachi-Hala road, Pakistan. BMC Res. Notes 2011, 4, 75. [CrossRef]
18. Bonnet, E.; Nikiéma, A.; Traoré, Z.; Sidbega, S.; Ridde, V. Technological solutions for an effective healthsurveillance system for road traffic crashes in Burkina Faso. Glob. Health Action 2017, 10, 1295698. [CrossRef]
19. Patel, A.; Krebs, E.; Andrade, L.; Rulisa, S.; Vissoci, J.R.N.; Staton, C.A. The epidemiology of road trafficinjury hotspots in Kigali, Rwanda from police data. BMC Public Health 2016, 16, 697. [CrossRef] [PubMed]
20. Amoros, E.; Martin, J.-L.; Laumon, B. Estimating non-fatal road casualties in a large French county, using thecapture–recapture method. Accid. Anal. Prev. 2007, 39, 483–490. [CrossRef] [PubMed]
219
Sustainability 2019, 11, 6249
21. Amoros, E.; Martin, J.-L.; Laumon, B. Under-reporting of road crash casualties in France. Accid. Anal. Prev.2006, 38, 627–635. [CrossRef] [PubMed]
22. Amoros, E.; Martin, J.-L.; Lafont, S.; Laumon, B. Actual incidences of road casualties, and their injury severity,modelled from police and hospital data, France. Eur. J. Public Health 2008, 18, 360–365. [CrossRef] [PubMed]
23. Amoros, E.; Soler, G.; Pascal, L.; Ndaiye, A.; Gadegbeku, B.; Martin, J.-L. Estimation of the number ofseriously injured road users in France, 2006–2015. Rev. Epidemiol. Sante Publique 2018, 66, S334. [CrossRef]
24. Broughton, J.; Keigan, M.; Yannis, G.; Evgenikos, P.; Chaziris, A.; Papadimitriou, E.; Bos, N.M.; Hoeglinger, S.;Pérez, K.; Amoros, E.; et al. Estimation of the real number of road casualties in Europe. Saf. Sci. 2010, 48,365–371. [CrossRef]
25. Bauer, R.; Steiner, M.; Khnelt-Leddihn, A.; Rogmans, W.; Kisser, R. Under-reporting of vulnerable road usersin official EU road accident statistics—Implications for road safety and added value of EU IDB hospital data.Inj. Prev. 2018, 24, A266.
26. Chini, F.; Farchi, S.; Camilloni, L.; Borgia, P.; Antoniozzi, T.; Ciaramella, I.; Valenti, M.; Rossi, P. Road trafficinjuries in one local health unit in the Lazio region: Results of a surveillance system integrating police andhealth data. Int. J. Health Geogr. 2009, 8, 21. [CrossRef]
27. Ferrando, J.; Plasencia, A.; Ricart, I.; Oros, M.; Borrell, C. The contribution of independent health and policesources of information to the ascertainment of traffic deaths in a European urban setting. In Proceedings ofthe 43rd Annual Conference of the Association for the Advancement of Automotive Medicine, Barcelona,Spain, 20–21 September 1999.
28. Reurings, M.C.B.; Stipdonk, H.L. Estimating the number of serious road injuries in The Netherlands.Ann. Epidemiol. 2011, 21, 648–653. [CrossRef]
29. Ward, H.; Lyons, R.; Thoreau, R. Road Safety Research Report No. 69. Under-Reporting of Road Casualties—Phase1; Department for Transport: London, UK, 2006.
30. Yannis, G.; Papadimitriou, E.; Chaziris, A.; Broughton, J. Modeling road accident injury under-reporting inEurope. Eur. Transp. Res. Rev. 2014, 6, 425–438. [CrossRef]
31. Conderino, S.; Fung, L.; Sedlar, S.; Norton, J.M. Linkage of traffic crash and hospitalization records withlimited identifiers for enhanced public health surveillance. Accid. Anal. Prev. 2017, 101, 117–123. [CrossRef][PubMed]
32. Sciortino, S.; Vassar, M.; Radetsky, M.; Knudson, M.M. San Francisco pedestrian injury surveillance: Mapping,under-reporting, and injury severity in police and hospital records. Accid. Anal. Prev. 2005, 37, 1102–1113.[CrossRef] [PubMed]
33. Alsop, J.; Langley, J. Under-reporting of motor vehicle traffic crash victims in New Zealand. Accid. Anal.Prev. 2001, 33, 353–359. [CrossRef]
34. Meuleners, L.B.; Lee, A.H.; Cercarelli, L.R.; Legge, M. Estimating crashes involving heavy vehicles in WesternAustralia, 1999–2000: A capture–recapture method. Accid. Anal. Prev. 2006, 38, 170–174. [CrossRef][PubMed]
35. Cercarelli, L.R.; Rosman, D.L.; Ryan, G.A. Comparison of accident and emergency with police road injurydata. J. Trauma 1996, 40, 805–809. [CrossRef]
36. Lujic, S.; Finch, C.; Boufous, S.; Hayen, A.; Dunsmuir, W. How comparable are road traffic crash cases inhospital admissions data and police records? An examination of data linkage rates. Aust. N. Z. J. Public Health2008, 32, 28–33. [CrossRef]
37. Rosman, D.L. The Western Australian Road Injury Database (1987–1996): Ten years of linked police, hospitaland death records of road crashes and injuries. Accid. Anal. Prev. 2001, 33, 81–88. [CrossRef]
38. Watson, A.; Watson, B.; Vallmuur, K. Estimating under-reporting of road crash injuries to police usingmultiple linked data collections. Accid. Anal. Prev. 2015, 83, 18–25. [CrossRef]
39. Ma, S.; Li, Q.; Zhou, M.; Duan, L.; Bishai, D. Road traffic injury in China: A review of national data sources.Traffic Inj. Prev. 2012, 13, 57–63. [CrossRef]
40. Nakahara, S.; Wakai, S. Underreporting of traffic injuries involving children in Japan. Inj. Prev. 2001, 7,242–244. [CrossRef]
41. Ahmed, A.; Sadullah, A.F.M.; Yahya, A.S. Errors in accident data, its types, causes and methods ofrectification-analysis of the literature. Accid. Anal. Prev. 2017, 130, 3–21. [CrossRef] [PubMed]
42. Morrison, A.; Stone, D.H. Capture-recapture: A useful methodological tool for counting traffic relatedinjuries? Inj. Prev. 2000, 6, 299–304. [CrossRef] [PubMed]
220
Sustainability 2019, 11, 6249
43. Van Hest, R.; Grant, A.; Abubakar, I. Quality assessment of capture–recapture studies in resource-limitedcountries. Trop. Med. Int. Health 2011, 16, 1019–1041. [CrossRef] [PubMed]
44. Carter, K.L.; Williams, G.; Tallo, V.; Sanvictores, D.; Madera, H.; Riley, I. Capture-recapture analysis ofall-cause mortality data in Bohol, Philippines. Popul. Health Metr. 2011, 9, 9. [CrossRef]
45. Yamamoto, T.; Hashiji, J.; Shankar, V.N. Underreporting in traffic accident data, bias in parameters and thestructure of injury severity models. Accid. Anal. Prev. 2008, 40, 1320–1329. [CrossRef]
46. Ye, F.; Lord, D. Investigation of effects of underreporting crash data on three commonly used traffic crashseverity models. Transp. Res. Rec. J. Transp. Res. Board 2011, 2241, 51–58. [CrossRef]
47. Patil, S.; Geedipally, S.R.; Lord, D. Analysis of crash severities using nested logit model—Accounting for theunderreporting of crashes. Accid. Anal. Prev. 2012, 45, 646–653. [CrossRef]
48. Sango, H.A.; Testa, J.; Meda, N.; Contrand, B.; Traore, M.S.; Staccini, P.; Lagarde, E. Mortality and morbidityof urban road traffic crashes in Africa: Capture-recapture estimates in Bamako, Mali, 2012. PLoS ONE 2016,11, e0149070. [CrossRef]
49. Wegman, F. The future of road safety: A worldwide perspective. IATSS Res. 2017, 40, 66–71. [CrossRef]50. Traffic General Directorate. Spanish Road Safety Strategy 2011–2020; Traffic General Directorate: Madrid,
Spain, 2010.51. Wang, C.; Quddus, M.A.; Ison, S.G. The effect of traffic and road characteristics on road safety: A review and
future research direction. Saf. Sci. 2013, 57, 264–275. [CrossRef]52. Safer Africa SaferAfrica Project. Available online: http://www.saferafrica.eu/ (accessed on 7 June 2019).53. Bonnet, E.; Lechat, L.; Ridde, V. What interventions are required to reduce road traffic injuries in Africa? A
scoping review of the literature. PLoS ONE 2018, 13, e0208195. [CrossRef] [PubMed]54. Gupta, M.; Menon, G.R.; Devkar, G.; Thomson, H. Regulatory and Road Engineering Interventions for Preventing
Road Traffic Injuries and Fatalities among Vulnerable (NON-Motorised and Motorised Two-Wheel) Road Users inLow-and Middle-Income Countries; EPPI-Centre, Social Science Research Unit, Institute of Education, Universityof London: London, UK, 2016.
55. Staton, C.; Vissoci, J.; Gong, E.Y.; Toomey, N.; Wafula, R.; Abdelgadir, J.; Zhou, Y.; Liu, C.; Pei, F.D.; Zick, B.;et al. Road traffic injury prevention initiatives: A systematic review and metasummary of effectiveness inlow and middle income countries. PLoS ONE 2016, 11, e0144971.
56. Esperato, A.; Bishai, D.; Hyder, A.A. Projecting the health and economic impact of road safety initiatives: Acase study of a multi-country project. Traffic Inj. Prev. 2012, 13, 82–89. [CrossRef] [PubMed]
57. Abegaz, T.; Berhane, Y.; Worku, A.; Assrat, A. Effectiveness of an improved road safety policy in Ethiopia:An interrupted time series study. BMC Public Health 2014, 14, 539. [CrossRef] [PubMed]
58. Ahmad, H.; Naeem, R.; Feroze, A.; Zia, N.; Shakoor, A.; Khan, U.R.; Mian, A.I. Teaching children road safetythrough storybooks: An approach to child health literacy in Pakistan. BMC Pediatr. 2018, 18, 1–8. [CrossRef][PubMed]
59. Li, Q.; Alonge, O.; Hyder, A.A. Children and road traffic injuries: Can’t the world do better? Arch. Dis. Child.2016, 101, 1063–1070. [CrossRef]
60. Zimmerman, K.; Jinadasa, D.; Maegga, B.; Guerrero, A. Road traffic injury on rural roads in Tanzania:Measuring the effectiveness of a road safety program. Traffic Inj. Prev. 2015, 16, 456–460. [CrossRef]
61. Salmon, R.; Eckersley, W. Where there’s no green man: Child road-safety education in Ethiopia. Dev. Pract.2010, 20, 726–733. [CrossRef]
62. Bradbury, A.; Quimby, A. Community road safety education: An international perspective. Munic. Eng.2008, 161, 137–143. [CrossRef]
63. Blantari, J.; Asiamah, G.; Appiah, N.; Mock, C. An evaluation of the effectiveness of televised road safetymessages in Ghana. Int. J. Inj. Control Saf. Promot. 2005, 12, 23–29. [CrossRef]
64. Bachani, A.M.; Mogere, S.; Hyder, A.A.; Hung, Y.W.; Nyamari, J.; Akunga, D. Helmet wearing in Kenya:Prevalence, knowledge, attitude, practice and implications. Public Health 2017, 144, S23–S31. [CrossRef][PubMed]
65. Bachani, A.M.; Risko, C.B.; Gnim, C.; Coelho, S.; Hyder, A.A. Knowledge, attitudes, and practices arounddrinking and driving in Cambodia: 2010–2012. Public Health 2017, 144, S32–S38. [CrossRef] [PubMed]
66. Stewart, K.; Bivans, B.; Nguyen, L.H.; Onigbogi, L. Drink driving prevention initiatives in low-andmiddle-income countries: Challenges and progress in Nigeria and Vietnam. In Proceedings of the 20thInternational Conference on Alcohol, Drugs and Traffic Safety, Brisbane, Australia, 25–28 August 2013.
221

Sustainability 2019, 11, 6249
67. Bachani, A.M.; Hung, Y.W.; Mogere, S.; Akungah, D.; Nyamari, J.; Stevens, K.A.; Hyder, A.A. Prevalence,knowledge, attitude and practice of speeding in two districts in Kenya: Thika and Naivasha. Injury 2013, 44,S24–S30. [CrossRef]
68. Kraemer, J.D.; Honermann, B.J.; Roffenbender, J.S. Cyclists’ helmet usage and characteristics in central andsouthern Malawi: A cross-sectional study. Int. J. Inj. Control Saf. Promot. 2012, 19, 373–377. [CrossRef][PubMed]
69. Johnson, M. Assessing a country’s drink driving situation: An overview of the method used in 6 low-andmiddle-income countries. Traffic Inj. Prev. 2012, 13, 96–100. [CrossRef] [PubMed]
70. Tulu, G.S.; Haque, M.M.; Washington, S.; King, M.J. Investigating pedestrian injury crashes on modernroundabouts in Addis Ababa, Ethiopia. Transp. Res. Rec. J. Transp. Res. Board 2015, 2512, 1–10. [CrossRef]
71. John Hopkins International Injury Research Unit. Risky Road Behaviors in Addis Ababa; John HopkinsInternational Injury Research Unit: Baltimore, MD, USA, 2019.
72. UNRSC—United Nations Road Safety Collaboration Publications. Available online: https://www.who.int/roadsafety/publications/en/ (accessed on 6 June 2019).
73. Wismans, J.; Skogsmo, I.; Nilsson-Ehle, A.; Lie, A.; Thynell, M.; Lindberg, G. Commentary: Status of roadsafety in Asia. Traffic Inj. Prev. 2016, 17, 217–225. [CrossRef]
74. World Health Organization. Global Status Report on Road Safety 2013; World Health Organization: Geneva,Switzerland, 2013.
75. Ojo, T.; Adetona, C.O.; Agyemang, W.; Afukaar, F.K. Pedestrian risky behavior and safety at zebra crossingsin a Ghanaian metropolitan area. Traffic Inj. Prev. 2019, 20, 216–219. [CrossRef]
76. Nantulya, V.M.; Reich, M.R. The neglected epidemic: Road traffic injuries in developing countries. BMJ 2002,324, 1139–1141. [CrossRef]
77. Nantulya, V.M.; Reich, M.R. Equity dimensions of road traffic injuries in low-and middle-income countries.Inj. Control Saf. Promot. 2003, 10, 13–20. [CrossRef]
78. Lagarde, E. Road traffic injury is an escalating burden in Africa and deserves proportionate research efforts.PLoS Med. 2007, 4, 170. [CrossRef] [PubMed]
79. Towner, E.; Towner, J. Child injury in a changing world. Glob. Public Health 2009, 4, 402–413. [CrossRef][PubMed]
80. Odero, W.; Garner, P.; Zwi, A. Road traffic injuries in developing countries: A comprehensive review ofepidemiological studies. Trop. Med. Int. Health 1997, 2, 445–460. [CrossRef] [PubMed]
81. Peden, M.; Kobusingye, O.; Monono, M.E. Africa’s roads—The deadliest in the world. SAMJ S. Afr. Med. J.2013, 103, 228–229. [CrossRef] [PubMed]
82. Turner, J.; Fletcher, J. TI-UP Enquiry: Gender and Road Safety; TI-UP Resource Centre: London, UK, 2007.83. UN DESA. The World’s Women 2015: Trends and Statistics; UN Department of Economic and Social Affairs,
Ed.; UN DESA: New York, NY, USA, 2015.84. Damsere-Derry, J.; Palk, G.; King, M. Road accident fatality risks for “vulnerable” versus “protected” road
users in northern Ghana. Traffic Inj. Prev. 2017, 18, 736–743. [CrossRef] [PubMed]85. Uteng, T.P. Gender and Mobility in the Developing World; World Bank: Washington, DC, USA, 2012.86. Remacle, E.; Sanon, C.; Aketch, S. Safer Africa: Thematic Fact Sheet on Gender; European Commission: Brussels,
Belgium, 2018.87. Venter, C.; Vokolkova, V.; Michalek, J. Gender, residential location, and household travel: Empirical findings
from low-income urban settlements in Durban, South Africa. Transp. Rev. 2007, 27, 653–677. [CrossRef]88. Peters, D. Gender and Sustainable Urban Mobility; UN Habitat: Kenya, Nairobi, 2013.89. Hyder, A.A.; Razzak, J.A. The challenges of injuries and trauma in Pakistan: An opportunity for concerted
action. Public Health 2013, 127, 699–703. [CrossRef]90. Üzümcüoglu, Y.; Özkan, T.; Lajunen, T.; Morandi, A.; Orsi, C.; Papadakaki, M.; Chliaoutakis, J. Life quality
and rehabilitation after a road traffic crash: A literature review. Transp. Res. Part. F Traffic Psychol. Behav.2016, 40, 1–13. [CrossRef]
91. Peden, M. World Report on Road Traffic Injury Prevention; World Health Organization: Geneva,Switzerland, 2004.
92. Bachani, A.M.; Peden, M.; Gururaj, G.; Norton, R.; Hyder, A.A. Road traffic injuries. In Injury Prevention andEnvironmental Health. Disease Control Priorities Volume 7; Mock, C.N., Nugent, R., Kobusingye, O., Smith, K.R.,Eds.; World Bank Publications: Washington, DC, USA, 2017.
222
Sustainability 2019, 11, 6249
93. Zafar, S.N.; Canner, J.K.; Nagarajan, N.; Kushner, A.L.; Gupta, S.; Canner, J.K.; Tran, T.M.; Nagarajan, N.;Stewart, B.T.; Kamara, T.B.; et al. Road traffic injuries: Cross-sectional cluster randomized countrywidepopulation data from 4 low-income countries. Int. J. Surg. 2018, 52, 237–242. [CrossRef]
94. Polinder, S.; Haagsma, J.; Bos, N.; Panneman, M.; Wolt, K.K.; Brugmans, M.; Weijermars, W.; van Beeck, E.Burden of road traffic injuries: Disability-adjusted life years in relation to hospitalization and the maximumabbreviated injury scale. Accid. Anal. Prev. 2015, 80, 193–200. [CrossRef]
95. Petrucelli, E.; States, J.D.; Hames, L.N. The abbreviated injury scale: Evolution, usage and future adaptability.Accid. Anal. Prev. 1981, 13, 29–35. [CrossRef]
96. Alemany, R.; Ayuso, M.; Guillén, M. Impact of road traffic injuries on disability rates and long-term carecosts in Spain. Accid. Anal. Prev. 2013, 60, 95–102. [CrossRef] [PubMed]
97. Rissanen, R.; Berg, H.-Y.; Hasselberg, M. Quality of life following road traffic injury: A systematic literaturereview. Accid. Anal. Prev. 2017, 108, 308–320. [CrossRef] [PubMed]
98. Bachani, A.M.; Galiwango, E.; Kadobera, D.; Bentley, J.A.; Bishai, D.; Wegener, S.; Hyder, A.A. A new screeninginstrument for disability in low-income and middle-income settings: Application at the Iganga-MayugeDemographic Surveillance System (IM-DSS), Uganda. BMJ Open 2014, 4, e005795. [CrossRef] [PubMed]
99. Bachani, A.M.; Galiwango, E.; Kadobera, D.; Bentley, J.A.; Bishai, D.; Wegener, S.; Zia, N.; Hyder, A.A.Characterizing disability at the Iganga-Mayuge Demographic Surveillance System (IM-DSS), Uganda.Disabil. Rehabil. 2016, 38, 1291–1299. [CrossRef] [PubMed]
100. Palmera-Suárez, R.; López-Cuadrado, T.; Brockhaus, S.; Fernández-Cuenca, R.; Alcalde-Cabero, E.; Galán, I.Severity of disability related to road traffic crashes in the Spanish adult population. Accid. Anal. Prev. 2016,91, 36–42. [CrossRef] [PubMed]
101. Palmera-Suárez, R.; López-Cuadrado, T.; Fernández-Cuenca, R.; Alcalde-Cabero, E.; Galán, I. Inequalitiesin the risk of disability due to traffic injuries in the Spanish adult population, 2009–2010. Injury 2018, 49,549–555. [CrossRef]
102. Lund, J.; Bjerkedal, T. Permanent impairments, disabilities and disability pensions related to accidents inNorway. Accid. Anal. Prev. 2001, 33, 19–30. [CrossRef]
103. Banstola, A.; Mytton, J. Cost-effectiveness of interventions to prevent road traffic injuries in low- andmiddle-income countries: A literature review. Traffic Inj. Prev. 2017, 18, 357–362. [CrossRef]
104. Martin, A.; Lagarde, E.; Salmi, L.R. Burden of road traffic injuries related to delays in implementing safetybelt laws in low-and lower-middle-income countries. Traffic Inj. Prev. 2018, 19, S1–S6. [CrossRef]
105. Jacobs, G.; Aeron-Thomas, A.; Astrop, A. Estimating Global Road Fatalities; Transport Research Laboratory:Crowthorne, UK, 2000.
106. The World Bank. The High Toll of Traffic Injuries: Unacceptable and Preventable; The World Bank: Washington,DC, USA, 2017.
107. Ameratunga, S.; Hijar, M.; Norton, R. Road-traffic injuries: Confronting disparities to address a global-healthproblem. Lancet 2006, 367, 1533–1540. [CrossRef]
108. Aeron-Thomas, A.; Jacobs, G.D.; Sexton, B.F.; Gururaj, G.; Rahman, F. The Involvement and Impact of RoadCrashes on the Poor: Bangladesh and India Case Studies; TRL Limited: Wokingham, UK, 2004.
109. Bishai, D.; Bachani, A.M. Injury costing frameworks. In Injury Research: Theories, Methods and Approaches;Li, G., Baker, S.P., Eds.; Springer: New York, NY, USA, 2012.
110. Winston, C.; Maheshri, V.; Mannering, F. An exploration of the offset hypothesis using disaggregate data:The case of airbags and antilock brakes. J. Risk Uncertain. 2006, 32, 83–99. [CrossRef]
111. Lv, J.; Lord, D.; Zhang, Y.; Chen, Z. Investigating Peltzman effects in adopting mandatory seat belt laws inthe US: Evidence from non-occupant fatalities. Transp. Policy 2015, 44, 58–64. [CrossRef]
112. Nicita, A.; Benedettini, S. The costs of avoiding accidents: Selective compliance and the “Peltzman Effect” inItaly. Int. Rev. Law Econom. 2012, 32, 256–270.
113. Garbacz, C. Impact of the New Zealand seat belt law. Econ. Inq. 1991, 29, 310–316. [CrossRef]114. Health Effects Institute. State of Global Air 2018. A Special Report on Global Exposure to Air Pollution and Its
Disease Burden; Health Effects Institute: Boston, MA, USA, 2018.115. Sayed, T.; Saunier, N.; Lovegrove, G.; de Leur, P. Advances in proactive road safety planning. In Proceedings
of the 20th Canadian Multidisciplinary Road Safety Conference, Niagara Falls, ON, Canada, 6–9 June 2010.116. Uzondu, C.; Jamson, S.; Lai, F. Investigating unsafe behaviours in traffic conflict situations: An observational
study in Nigeria. J. Traffic Transp. Eng. 2019, 6, 482–492. [CrossRef]
223
Sustainability 2019, 11, 6249
117. Uzondu, C.; Jamson, S.; Lai, F. Exploratory study involving observation of traffic behaviour and conflicts inNigeria using the Traffic Conflict Technique. Saf. Sci. 2018, 110, 273–284. [CrossRef]
118. Chang, A.; Saunier, N.; Laureshyn, A. Proactive Methods for Road Safety Analysis; SAE Technical Paper WP-0005;SAE International: Troy, MI, USA, 2017.
119. Dhibi, M. Road safety determinants in low and middle income countries. Int. J. Inj. Control Saf. Promot. 2019,26, 99–107. [CrossRef] [PubMed]
120. St-Aubin, P.; Saunier, N.; Miranda-Moreno, L. Large-scale automated proactive road safety analysis usingvideo data. Transp. Res. Part. C Emerg. Technol. 2015, 58, 363–379. [CrossRef]
121. De Leur, P.; Sayed, T. A framework to proactively consider road safety within the road planning process.Can. J. Civ. Eng. 2003, 30, 711–719. [CrossRef]
122. Mitra, S.; Washington, S. On the significance of omitted variables in intersection crash modeling. Accid. Anal.Prev. 2012, 49, 439–448. [CrossRef] [PubMed]
123. Mannering, F.L.; Bhat, C.R. Analytic methods in accident research: Methodological frontier and futuredirections. Anal. Methods Accid. Res. 2014, 1, 1–22. [CrossRef]
124. Heydari, S.; Miranda-Moreno, L.F.; Lord, D.; Fu, L. Bayesian methodology to estimate and update safetyperformance functions under limited data conditions: A sensitivity analysis. Accid. Anal. Prev. 2014, 64,41–51. [CrossRef] [PubMed]
125. Heydari, S. A flexible discrete density random parameters model for count data: Embracing unobservedheterogeneity in highway safety analysis. Anal. Methods Accid. Res. 2018, 20, 68–80. [CrossRef]
126. Nordfjærn, T.; Simsekoglu, Ö.; Rundmo, T. Culture related to road traffic safety: A comparison of eightcountries using two conceptualizations of culture. Accid. Anal. Prev. 2014, 62, 319–328. [CrossRef] [PubMed]
127. Nordfjærn, T.; Jrgensen, S.; Rundmo, T. A cross-cultural comparison of road traffic risk perceptions, attitudestowards traffic safety and driver behaviour. J. Risk Res. 2011, 14, 657–684. [CrossRef]
128. McIlroy, R.C.; Nam, V.H.; Bunyasi, B.; Jikyong, U.; Kokwaro, G.O.; Wu, J.; Hoque, M.S.; Plant, K.A.;Preston, J.M.; Stanton, N.A. Vulnerable road users in low-, middle-, and high-income countries: Examiningthe relationships between pedestrian behaviours and attitudes towards traffic safety. Accid. Anal. Prev. 2019,131, 80–94. [CrossRef] [PubMed]
129. Kouabenan, D.R. Beliefs and the perception of risks and accidents. Risk Anal. 1998, 18, 243–252. [CrossRef]130. Dixey, R.A. “Fatalism”, accident causation and prevention: Issues for health promotion from an exploratory
study in a Yoruba town, Nigeria. Health Educ. Res. 1999, 14, 197–208. [CrossRef]131. Peltzer, K. Seatbelt use and belief in destiny in a sample of South African black and white drivers. Psychol. Rep.
2003, 93, 732–734. [CrossRef]132. Omari, K.; Baron-Epel, O. Low rates of child restraint system use in cars may be due to fatalistic beliefs and
other factors. Transp. Res. Part. F Traffic Psychol. Behav. 2013, 16, 53–59. [CrossRef]133. Maghsoudi, A.; Boostani, D.; Rafeiee, M. Investigation of the reasons for not using helmet among motorcyclists
in Kerman, Iran. Int. J. Inj. Control Saf. Promot. 2018, 25, 58–64. [CrossRef] [PubMed]134. Peltzer, K.; Renner, W. Superstition, risk-taking and risk perception of accidents among South African taxi
drivers. Accid. Anal. Prev. 2003, 35, 619–623. [CrossRef]135. Nordfjærn, T.; Jørgensen, S.; Rundmo, T. Cultural and socio-demographic predictors of car accident
involvement in Norway, Ghana, Tanzania and Uganda. Saf. Sci. 2012, 50, 1862–1872. [CrossRef]136. Simsekoglu, Ö.; Nordfjærn, T.; Zavareh, M.F.; Hezaveh, A.M.; Mamdoohi, A.R.; Rundmo, T. Risk perceptions,
fatalism and driver behaviors in Turkey and Iran. Saf. Sci. 2013, 59, 187–192. [CrossRef]137. Ngueutsa, R.; Kouabenan, D.R. Fatalistic beliefs, risk perception and traffic safe behaviors. Rev. Eur.
Psychol. Appliquée 2017, 67, 307–316. [CrossRef]138. Yildirim, Z. Religiousness, Conservatism and Their Relationship with Traffic Behaviour; Middle East Technical
University: Ankara, Turkey, 2007.139. McIlroy, R.C.; Kokwaro, G.O.; Nam, V.H.; Jikyong, U.; Wu, J.; Hoque, M.S.; Preston, J.P.; Plant, K.A.;
Stanton, N.A. How do fatalistic beliefs affect the attitudes and behaviours of vulnerable road users in differentcountries? A cross-cultural pedestrian study. Unpublished work.
140. McIlroy, R.C.; Plant, K.A.; Hoque, M.S.; Wu, J.; Kokwaro, G.O.; Vũ, N.H.; Stanton, N.A.; Jianping, W.;Kokwaro, G.O.; Vũ, N.H.; et al. Who is responsible for global road safety? A cross-cultural comparison ofActor Maps. Accid. Anal. Prev. 2019, 122, 8–18. [CrossRef]
224

Sustainability 2019, 11, 6249
141. Salmon, P.M.; Read, G.J.M.; Stevens, N.J. Who is in control of road safety? A STAMP control structure analysisof the road transport system in Queensland, Australia. Accid. Anal. Prev. 2016, 96, 140–151. [CrossRef]
142. Fahlquist, J.N. Responsibility ascriptions and Vision Zero. Accid. Anal. Prev. 2006, 38, 1113–1118. [CrossRef]143. Kristianssen, A.-C.; Andersson, R.; Belin, M.-Å.; Nilsen, P. Swedish Vision Zero policies for safety—A
comparative policy content analysis. Saf. Sci. 2018, 103, 260–269. [CrossRef]144. Jadaan, K.; Al-Braizat, E.; Al-Rafayah, S.; Gammoh, H.; Abukahlil, Y. Traffic safety in developed and
developing countries: A comparative analysis. J. Traffic Logist. Eng. 2018, 6, 1–5. [CrossRef]145. Perel, P.; Ker, K.; Ivers, R.; Blackhall, K. Road safety in low-and middle-income countries: A neglected
research area. Inj. Prev. 2007, 13, 227. [CrossRef] [PubMed]146. Bhalla, K.; Shotten, M. Building road safety institutions in low-and middle-income countries: The case of
Argentina. Health Syst. Reform 2019, 1–13, 121–133. [CrossRef] [PubMed]147. Khademi, N.; Choupani, A.-A. Investigating the road safety management capacity: Toward a lead agency
reform. IATSS Res. 2018, 42, 105–120. [CrossRef]148. Hyder, A.A.; Norton, R.; Pérez-Núñez, R.; Mojarro-Iñiguez, F.R.; Peden, M.; Kobusingye, O.; Road Traffic
Injuries Research Network’s Group. The Road Traffic Injuries Research Network: A decade of researchcapacity strengthening in low-and middle-income countries. Health Res. Policy Syst. 2016, 14, 14. [CrossRef]
149. UNECE. Strengthening the National Road Safety Management Capacities of Selected Developing Countries andCountries with Economies in Transition; UNECE: Geneva, Switzerland, 2014.
150. World Health Organization. Capacity Building for Preventing Injuries and Violence: Strategic Plan 2009–2013;World Health Organization: Geneva, Switzerland, 2008.
151. Wijnen, W.; Stipdonk, H. Social costs of road crashes: An international analysis. Accid. Anal. Prev. 2016, 94,97–106. [CrossRef]
152. Wesson, H.K.H.; Boikhutso, N.; Bachani, A.M.; Hofman, K.J.; Hyder, A.A. The cost of injury and trauma carein low-and middle-income countries: A review of economic evidence. Health Policy Plan. 2013, 29, 795–808.[CrossRef]
153. Bishai, D.; Hyder, A.A.; Ghaffar, A.; Morrow, R.H.; Kobusingye, O. Rates of public investment for roadsafety in developing countries: Case studies of Uganda and Pakistan. Health Policy Plan. 2003, 18, 232–235.[CrossRef]
154. Mukama, T.; Ssemugabo, C.; Ali Halage, A.; Gibson, D.G.; Paichadze, N.; Ndejjo, R.; Sempebwa, J.;Kobusingye, O. Costs of unintentional injuries among children in an urban slum community in Kampalacity, Uganda. Int. J. Inj. Control Saf. Promot. 2019, 26, 129–136. [CrossRef]
155. Hauer, E. Observational before/after Studies in Road Safety. Estimating the Effect of Highway and Traffic EngineeringMeasures on Road Safety; Emerald Group Publishing: Bingley, UK, 1997.
156. Wiebe, D.J.; Ray, S.; Maswabi, T.; Kgathi, C.; Branas, C.C. Economic development and road traffic fatalities intwo neighbouring African nations. Afr. J. Emerg. Med. 2016, 6, 80–86. [CrossRef]
157. Heydari, S.; Fu, L.; Thakali, L.; Joseph, L. Benchmarking regions using a heteroskedastic grouped randomparameters model with heterogeneity in mean and variance: Applications to grade crossing safety analysis.Anal. Methods Accid. Res. 2018, 19, 33–48. [CrossRef]
158. AASHTO. Highway Safety Manual; American Association of State Highway and Transportation Officials:Washington, DC, USA, 2010.
159. Goel, R.; Garcia, L.M.T.; Goodman, A.; Johnson, R.; Aldred, R.; Murugesan, M.; Brage, S.; Bhalla, K.;Woodcock, J. Estimating city-level travel patterns using street imagery: A case study of using Google StreetView in Britain. PLoS ONE 2018, 13, e0196521. [CrossRef] [PubMed]
160. Eluru, N.; Chakour, V.; Chamberlain, M.; Miranda-Moreno, L.F. Modeling vehicle operating speed on urbanroads in Montreal: A panel mixed ordered probit fractional split model. Accid. Anal. Prev. 2013, 59, 125–134.[CrossRef] [PubMed]
161. Heydari, S.; Miranda-Moreno, L.; Fu, L. Is speeding more likely during weekend night hours? Evidencefrom sensor-collected data in Montreal. Can. J. Civ. Eng. 2019. [CrossRef]
© 2019 by the authors. Licensee MDPI, Basel, Switzerland. This article is an open accessarticle distributed under the terms and conditions of the Creative Commons Attribution(CC BY) license (http://creativecommons.org/licenses/by/4.0/).
225


MDPISt. Alban-Anlage 66
4052 BaselSwitzerland
Tel. +41 61 683 77 34Fax +41 61 302 89 18
www.mdpi.com
Sustainability Editorial OfficeE-mail: [email protected]
www.mdpi.com/journal/sustainability


MDPI St. Alban-Anlage 66 4052 Basel Switzerland
Tel: +41 61 683 77 34 Fax: +41 61 302 89 18
www.mdpi.com ISBN 978-3-03943-089-5
Copyright © 2022 FDOKUMEN