FR-future-road-transport-ONLINE_new ID.indd
148
45.803716, 8.629654 52.790104, 4.684665 50.838720, 4.365634 49.011144, 8.404195 51.196851, 5.037699 37.394925, -6.010132 THE FUTURE OF ROAD TRANSPORT IMPLICATIONS OF AUTOMATED, CONNECTED, LOW-CARBON AND SHARED MOBILITY EUR 29748 EN
-
Upload
khangminh22 -
Category
Documents
-
view
2 -
download
0
Transcript of FR-future-road-transport-ONLINE_new ID.indd

45.803716, 8.629654
52.790104, 4.684665
50.838720, 4.365634
49.011144, 8.404195
51.196851, 5.037699
37.394925, -6.010132
THE FUTURE OF ROAD TRANSPORT
IMPLICATIONS OF AUTOMATED, CONNECTED, LOW-CARBON AND SHARED MOBILITY
EUR 29748 EN

This publication is a Science for Policy report by the Joint Research Centre (JRC), the European Commission’s science and knowledge service. It aims to provide evidence-based scientific support to the European policymaking process. The scientific output expressed does not imply a policy position of the European Commission. Neither the European Commission nor any person acting on behalf of the Commission is responsible for the use that might be made of this publication.
Manuscript completed in April 2019
Contact informationBiagio Ciuffo, Maria Alonso RaposoEuropean Commission, Joint Research Centre, Via E. Fermi 2749, I-21027, Ispra (VA), [email protected], [email protected] Tel.: +39 0332 78 9732 - +39 0332 78 9264
EU Science Hub https://ec.europa.eu/jrc
JRC116644EUR 29748 EN
PDF ISBN 978-92-76-14318-5 ISSN 1831-9424 doi:10.2760/668964 Print ISBN 978-92-76-14319-2 ISSN 1018-5593 doi:10.2760/524662
Luxembourg: Publications Office of the European Union, 2019
© European Union, 2019
Reuse is authorised provided the source is acknowledged. The reuse policy of European Commission documents is regulated by Decision 2011/833/EU (OJ L 330, 14.12.2011, p. 39). For any use or reproduction of photos or other material that is not under the EU copyright, permission must be sought directly from the copyright holders. The designations employed and the presentation of material on the maps do not imply the expression of any opinion whatsoever on the part of the European Union concerning the legal status of any country, territory, city or area or of its authorities, or concerning the delimitation of its frontiers or boundaries.
How to cite this report: Alonso Raposo, M. (Ed.), Ciuffo, B. (Ed.), Alves Dies, P., Ardente, F., Aurambout, J-P., Baldini, G., Baranzelli, C., Blagoeva, D., Bobba, S., Braun, R., Cassio, L., Chawdhry, P., Christidis, P., Christodoulou, A., Corrado, S., Duboz, A., Duch Brown, N., Felici, S., Fernández Macías, E., Ferragut, J., Fulli, G., Galassi, M-C., Georgakaki, A., Gkoumas , K., Grosso, M., Gómez Vilchez, J., Hajdu, M., Iglesias, M., Julea, A., Krause, J., Kriston, A., Lavalle, C., Lonza, L., Lucas, A., Makridis, M., Marinopoulos, A., Marmier, A., Marques dos Santos, F., Martens, B., Mattas, K., Mathieux, F., Menzel, G., Minarini, F., Mondello, S., Moretto, P., Mortara, B., Navajas Cawood, E., Paffumi, E., Pasimeni, F., Pavel, C., Pekár, F., Pisoni, E., Raileanu, I-C., Sala, S., Saveyn, B., Scholz, H., Serra, N., Tamba, M., Thiel, C., Trentadue, G., Tecchio, P., Tsakalidis, A., Uihlein, A., van Balen, M., Vandecasteele, I., The future of road transport - Implications of automated, connected, low-carbon and shared mobility, EUR 29748 EN, Publications Office of the European Union, Luxembourg, 2019, ISBN 978-92-76-14318-5, doi: 10.2760/668964, JRC116644.
All content ©European Union, 2019 except: p. 10 sittinan ©AdobeStock, 2019; p. 15 ©alexey soucho – unsplash, 2019; p. 22 ©Schmidt et al., 2017; p. 29 ©xavierlee – unsplash, 2019; p. 30 weedezign ©AdobeStock, 2019; p. 34 ©Silberg et al., 2015; p. 35 chesky ©AdobeStock, 2019; p. 37 phonlamaiphoto ©AdobeStock, 2019; p. 38 ©mike kononov – unsplash, 2019; p. 41 ©yolanda sun – unsplash, 2019; p. 44 leowolfert ©AdobeStock, 2019; p. 50 kasto ©AdobeStock, 2019; p. 58 zapp2photo ©AdobeStock, 2019; p. 68 ©KPMG International (2019); p. 69 ©Fleming et al., 2017; p. 70 ©European Union, 2019 – graphic elaboration based on vectorfusionart and kamonrat ©AdobeStock, 2019; p. 78 tong2530 ©AdobeStock, 2019; p. 85 Val Thoermer ©AdobeStock, 2019; p. 86 Iakov Kalinin and Семен Саливанчук ©AdobeStock, 2019; p. 94 from top-left to bottom-right: farbled_01, Björn Wylezich, farbled_01, Björn Wylezich, bambambu, Tina Rich, Henri Koskinen, david hughes and marcel ©AdobeStock, 2019; p. 100 THANANIT ©AdobeStock, 2019; p. 108 hin255 ©AdobeStock, 2019.
This is a re-edition of: Alonso Raposo, M. (Ed.), Ciuffo, B. (Ed.), Ardente, F., Aurambout, J-P., Baldini, G., Braun, R., Christidis, P., Christodoulou, A., Duboz, A., Felici, S., Ferragut, J., Georgakaki, A., Gkoumas , K., Grosso, M., Iglesias, M., Julea, A., Krause, J., Martens, B., Mathieux, F., Menzel, G., Mondello, S., Navajas Cawood, E., Pekár, F., Raileanu, I-C., Scholz, H., Tamba, M., Tsakalidis, A., van Balen, M., Vandecasteele, I., The future of road transport - Implications of automated, connected, low-carbon and shared mobility, EUR 29748 EN, Publications Office of the European Union, Luxembourg, 2019, ISBN 978-92-76-03409-4, doi:10.2760/9247, JRC116644.

THE FUTURE OF ROAD TRANSPORT
IMPLICATIONS OF AUTOMATED, CONNECTED, LOW-CARBON AND SHARED MOBILITY

2Table of contents
TABLEOF CONTENTS
Executive summary 4 1 Motivation and objective 8
2 A new era for road transport 11 2.1 Present and future challenges for mobility 122.2 Technology outlook 182.3 Overview of user uptake 252.4 The complexity of the transport system 26
3 New mobility paradigms 31
4 Transport supply system and new governance options 39
5 Transport platforms and data governance 45
6 Infrastructure requirements 51 6.1 Recharging and refuelling infrastructure 51 6.2 Infrastructure public safety 546.3 Digital infrastructure 56
7 Communication technologies and cybersecurity 59 7.1 Communication technologies 597.2 Cybersecurity 61

3 Table of contents
8 Legislation and standardisation 65
9 Economy 71
10 Employment and skills 79
11 Energy use and emissions 87
12 Sustainability of material supply 95
13 Privacy, democracy and social fairness 101 13.1 Privacy 10213.2 Democracy 10313.3 Social fairness 105
14 The urban road context 109
15 The way forward 116
Endnotes 118 List of abbreviations 122 References 126 List of boxes and tables 141 List of figures 142 Acknowledgements 144

4Executive summary
EXECUTIVE SUMMARY
We are witnessing nothing less than a revolution in transport. Technological drivers such as automation, connectivity and low-carbon technologies, coupled with new sharing trends are completely redefining the business of getting around. However, without the right policies in place, this may make things worse for most people in most cities.
Developments in road transport are the focus of this report, which is based on independent research and analysis by the European Commission’s Joint Research Centre aiming to inform policy debate at the European level.
A perfect storm of new technologies and new business models With its EUR 7 trillion annual revenue stream, transport attracts disruptive technology companies that are not interested in preserving the current model in the same way as conventional players may be tempted to. A perfect storm of new technologies and new business models is transforming not only our vehicles, but everything about how we get around and how we live our lives (Chapter 1).
Flexible options like electric bikes, scooters and modular automated shuttles may make public transport more accessible by shrinking the 'last mile' to and from our homes or workplaces. Innovation can slash costs and spur demand: full automation cuts out drivers, electrification simplifies production and lowers running costs, while sharing can increase profits by making vehicles work 24/7 and use the road more efficiently (Chapter 2).
However, new technologies alone will not spontaneously make our lives better without upgrading our transport systems and policies.Early evidence suggests that transport efficiency is not necessarily improving. New mobility solutions such as car sharing, ride sharing and ride-hailing services are making cars even more appealing, thereby luring passengers from public transport
which is often perceived as old, dangerous and uncomfortable. As a result, several cities, especially in the USA, are experiencing a significant increase in road congestion (Chapter 3). If the introduction of automated vehicles makes car-based transport cheaper and even more comfortable, the situation will deteriorate further. At the same time, flexible options may remain out of the reach of the more price-sensitive segments of the population unless they are well integrated into the public transport system.
The way forward
Privacy, democracy and social fairness
Energy use and emissions
The urban road context
Sustainability of material
supply
Employment and skills
Economy
Legislation and standardisation
Communication technologies
and cybersecurity
Infrastructure requirements
Transport platforms and data
governance
New mobility
paradigms
Transport supply system and new
governance options
Motivation and
objective
A new era for road transport2 4 6 8 10 12 14
1 3 5 7 9 11 13 15p. 8 p. 30 p. 44 p. 58 p. 70 p. 86 p. 100 p. 116
p. 10 p. 38 p. 50 p. 64 p. 78 p. 94 p. 108

5 Executive summary
Policymakers must act to ensure that new technologies will make future transport cleaner and more equitable than its car-centred present. The technological upheaval represents a unique opportunity to turn the transport sector upside down and make it more efficient and rational. For example, greater automation and connectivity may allow for regulated access to the road which, in turn, could bring substantial benefits for traffic flow, transport efficiency and energy consumption (Chapter 4). And this is no simple task. Policies, in particular, must take into account the fact that transport systems are extremely complex and their elements can often influence one another in unexpected ways. Today, uncoordinated competition among service providers and a lack of leadership by transport authorities are leading to more traffic problems
and unbalanced capacity provision. In addition, the lack of a predictable long-term framework, including standardisation, data governance, interoperability and digital security, may lead to suboptimal investments and create a glut of options in one place and a lack of them in others (Chapters 5-8). To make the picture even more complex for policymakers, rapid changes in the transport system can have negative effects far beyond transport itself. For example, such changes influence the demand for and supply of workers and skills, the demand for critical raw materials, how data is treated and who can access different modes of transport.
Left unmanaged, such changes may widen the gaps in our societies (Chapters 9-14).
Developing efficient and equitable governance systems by engaging citizensTo deal with the challenges facing the transport sector, policymakers will have to address road transport, which is putting increasingly unbearable burdens on society, be it through lives lost, economic losses, pollution or greenhouse gas emissions. To harness the promise of new technologies, public authorities must define and coordinate all actors in the public interest and establish efficient and equitable governance for complex, multimodal transport systems.
Given the many interconnected issues to be considered in shaping future transport and mobility,
research and experimentation with the engagement of citizens must be promoted. Establishing a network of ‘European living labs’ is one way to create the right environment in which innovative mobility solutions are tested and rolled out with the direct involvement of people. If framed in the right way, upcoming trends in road transport have the potential to significantly improve our lives, although decision-making must take account of the complexity of intertwined dimensions that are related to road transport and should be based on a debate with citizens to assess visions and needs (Chapter 15).
The way forward
Privacy, democracy and social fairness
Energy use and emissions
The urban road context
Sustainability of material
supply
Employment and skills
Economy
Legislation and standardisation
Communication technologies
and cybersecurity
Infrastructure requirements
Transport platforms and data
governance
New mobility
paradigms
Transport supply system and new
governance options
Motivation and
objective
A new era for road transport2 4 6 8 10 12 14
1 3 5 7 9 11 13 15p. 8 p. 30 p. 44 p. 58 p. 70 p. 86 p. 100 p. 116
p. 10 p. 38 p. 50 p. 64 p. 78 p. 94 p. 108

A STORM OF NEW TECHNOLOGIES AND BUSINESS MODELS IS TRANSFORMING EVERYTHING ABOUT HOW WE GET AROUND AND HOW WE LIVE OUR LIVES
BUT THE TRANSPORT SYSTEM AND POLICIES NEED TO BE UPGRADEDBECAUSE NEW TRANSPORT TECHNOLOGIES ALONE WON’T SPONTANEOUSLY MAKE OUR LIVES BETTER
...OFFERING OPPORTUNITIES FOR A BETTER TRANSPORT SYSTEM
AND LIVING LABS CAN SHOW THE WAY TOWARDS INNOVATIVE MOBILITY SOLUTIONS
accidents and fatalities
productivity losses
air pollution
AUTOMATION
CONNECTIVITY
DECARBONISATION
SHARING
economy
employment and skills
energy use and emissions
sustainabilityof material supply
social fairness
urban development
regulating road access
routingcoordination
upgrading public transport
more sustainable transport modes
promoting
POLICYMAKING
THE FUTURE OF ROAD TRANSPORT
IMPROVE GOVERNANCE
Under current trends,road transport and private carsremain dominant
If no action is taken, the challenges faced in road transport will get even harder
PEOPLE-CENTRICtransport system
coordinated and more efficient
safer
flexible
multimodal
shared
less polluting
more accessible
car-centred
policy
facilitating transition
new technologies interoperability
industry
local authorities network
CITIZENS INVOLVEMENT
uncoordinated competition
demand
lack of leadership
what education or career?
will there be enough of it?
where to live?
how to get around?
inclusive enough?
unbalanced serviceprovision
traffic
energy use
emissions
invest in what?
THE FUTURE OF ROAD TRANSPORT IMPLICATIONS OF AUTOMATED, CONNECTED, LOW-CARBON AND SHARED MOBILITY KEY MESSAGES
8
MOTIVATION AND OBJECTIVE
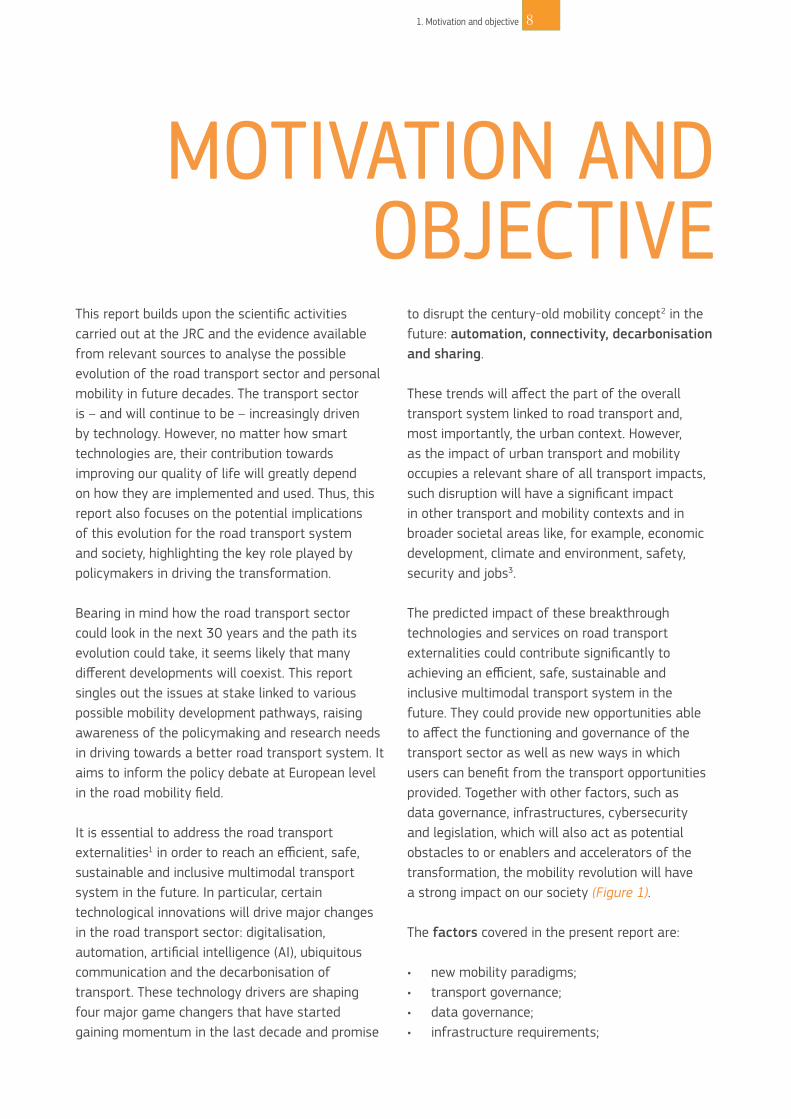
This report builds upon the scientific activities carried out at the JRC and the evidence available from relevant sources to analyse the possible evolution of the road transport sector and personal mobility in future decades. The transport sector is – and will continue to be – increasingly driven by technology. However, no matter how smart technologies are, their contribution towards improving our quality of life will greatly depend on how they are implemented and used. Thus, this report also focuses on the potential implications of this evolution for the road transport system and society, highlighting the key role played by policymakers in driving the transformation.
Bearing in mind how the road transport sector could look in the next 30 years and the path its evolution could take, it seems likely that many different developments will coexist. This report singles out the issues at stake linked to various possible mobility development pathways, raising awareness of the policymaking and research needs in driving towards a better road transport system. It aims to inform the policy debate at European level in the road mobility field.
It is essential to address the road transport externalities1 in order to reach an efficient, safe, sustainable and inclusive multimodal transport system in the future. In particular, certain technological innovations will drive major changes in the road transport sector: digitalisation, automation, artificial intelligence (AI), ubiquitous communication and the decarbonisation of transport. These technology drivers are shaping four major game changers that have started gaining momentum in the last decade and promise
to disrupt the century-old mobility concept2 in the future: automation, connectivity, decarbonisation and sharing.
These trends will affect the part of the overall transport system linked to road transport and, most importantly, the urban context. However, as the impact of urban transport and mobility occupies a relevant share of all transport impacts, such disruption will have a significant impact in other transport and mobility contexts and in broader societal areas like, for example, economic development, climate and environment, safety, security and jobs3.
The predicted impact of these breakthrough technologies and services on road transport externalities could contribute significantly to achieving an efficient, safe, sustainable and inclusive multimodal transport system in the future. They could provide new opportunities able to affect the functioning and governance of the transport sector as well as new ways in which users can benefit from the transport opportunities provided. Together with other factors, such as data governance, infrastructures, cybersecurity and legislation, which will also act as potential obstacles to or enablers and accelerators of the transformation, the mobility revolution will have a strong impact on our society (Figure 1).
The factors covered in the present report are:
• new mobility paradigms;• transport governance;• data governance;• infrastructure requirements;
1. Motivation and objective 8

9 1. Motivation and objective
• communication technologies and cybersecurity;
• legislation and standardisation. The report then analyses the following societal implications:
• economy;• employment and skills;• energy use and emissions;• sustainability of material supply;• privacy, democracy and social fairness;• urban development.
Policymakers, public authorities and the other actors in the decision-making process will have the important role of preparing society for these changes, protecting consumers and enabling the uptake of these new technologies and systems by means of the market creating wealth and sustainability.
The report is structured into 14 chapters. Chapter 2 introduces the technological and social drivers of the future and presents the challenges affecting mobility. The potential impacts of these drivers on travel behaviour are analysed in Chapter 3, while new transport governance approaches enabled by the new technologies are presented in Chapter 4. A set of external factors that can either contribute to or hinder the transition (data governance, infrastructure, communication technologies, cybersecurity, legislation and standardisation) are introduced in Chapters 5 to 8, while Chapters 9 to 14 address the future issues at stake for our society (namely economy, employment and skills, energy use and emissions, sustainability of material supply, democracy, privacy and social fairness, and the urban context). Finally, Chapter 15 summarises the main messages provided throughout the report.
Figure 1: Enabling factors and societal implications of automated, connected, low-carbon and shared mobility
sustainability of material supply
energy use and emissions
economy employmentand skills
urban contextprivacy, democracyand social fairness
infrastructurerequirements
legislation and standardisation
data governance
transportgovernance
new mobilityparadigms
chapter 3
chapter 2
chapter 9 chapter 10 chapter 11 chapter 12 chapter 13 chapter 14
chapter 5
chapter 7
chapter 4
chapter 6
chapter 8
communication technologies and cybersecurity

2. A new era for road transport
SUMMARY
Four key game changers are shaping the future of road transport: automation, connectivity, decarbonisation and sharing. These future technologies and services promise to contribute to fewer negative impacts from road transport while also generating new mobility paradigms and transport governance opportunities. Users’ acceptance of these trends is an important factor that will drive their adoption. Understanding how new technology options will affect transport systems requires an analysis of the dynamic interactions between the demand for transporting people and goods and the new opportunities offered by these systems. This chapter introduces these trends from the technological and user’ uptake perspectives in the context of present and future road mobility challenges and the complexity of the road transport demand-supply relationship.
10

A NEW ERA FOR ROAD
TRANSPORTAUTOMATION, CONNECTIVITY, DECARBONISATION AND SHARING
Four fast-moving trends are currently shaping road mobility and have a disruptive potential to transform road transport as we know it:
Automation is defined as systems able to “perform part or all of the Dynamic Driving Task (DDT) – i.e. all of the real-time operational and tactical functions required to
operate a vehicle in on-road traffic, excluding the strategic functions such as trip scheduling and selection of destinations and waypoints – on a sustained basis” (SAE International, 2016). There are different levels of automation, as further explained in Section 2.2, referred to overall as ‘automated vehicles’ (AVs).
Connectivity refers to the use of technologies enabling road vehicles to communicate with each other and with roadside infrastructure (e.g. traffic signals). Connectivity
enables the concept of Cooperative Intelligent Transport Systems (C-ITS) and is closely interlinked with automation, especially for the efficient management of AVs in traffic. “Connectivity, Cooperation and Automation are complementary technologies that reinforce each other and will over time merge completely” (European Commission, 2016a). The term ‘connected and
automated vehicle’ (CAV) encompasses connectivity and automation.
Decarbonisation addresses the use of alternative fuels like electricity, hydrogen, biofuels and natural gas, which are crucial to break the European transport sector’s
dependence on fossil fuels and to reduce greenhouse gas (GHG) emissions. Among these, electrification is widely considered as a viable strategy for reducing oil dependency and the environmental impacts of road transport.
11 2. A new era for road transport
Four fast-moving trends promise to disrupt road transport as we know it: automation, connectivity, decarbonisation and sharing.
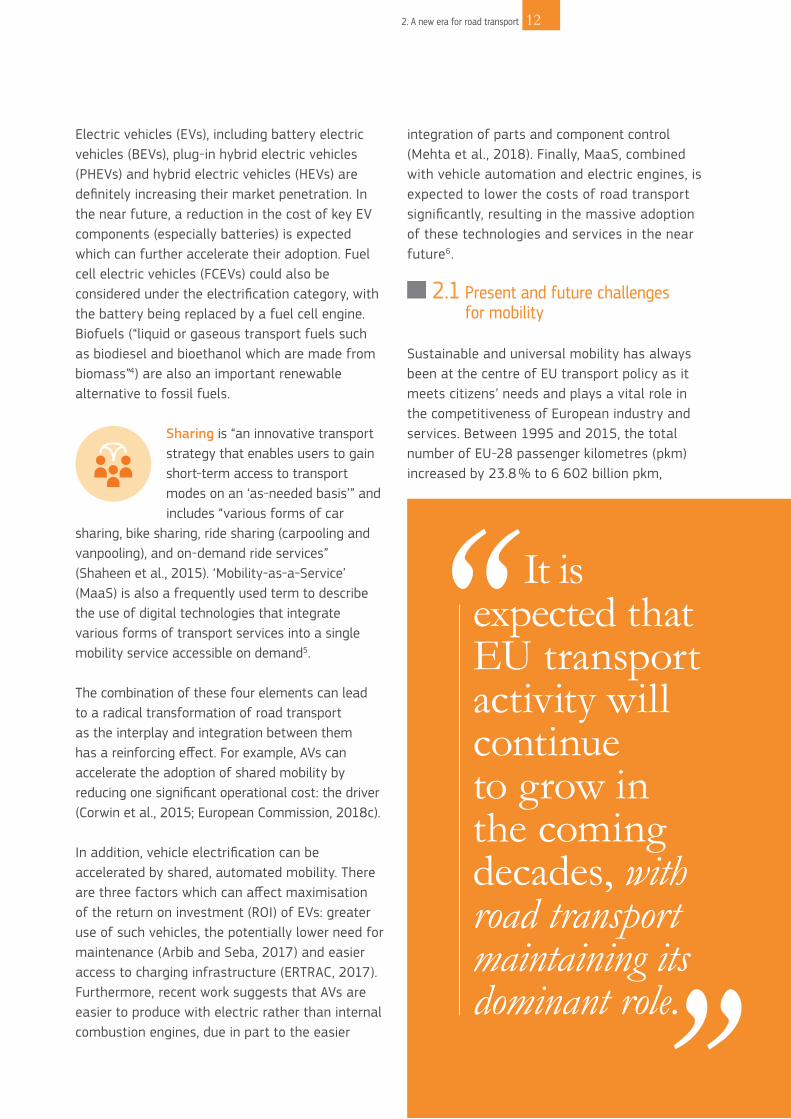
Electric vehicles (EVs), including battery electric vehicles (BEVs), plug-in hybrid electric vehicles (PHEVs) and hybrid electric vehicles (HEVs) are definitely increasing their market penetration. In the near future, a reduction in the cost of key EV components (especially batteries) is expected which can further accelerate their adoption. Fuel cell electric vehicles (FCEVs) could also be considered under the electrification category, with the battery being replaced by a fuel cell engine. Biofuels (“liquid or gaseous transport fuels such as biodiesel and bioethanol which are made from biomass”4) are also an important renewable alternative to fossil fuels.
Sharing is “an innovative transport strategy that enables users to gain short-term access to transport modes on an ‘as-needed basis’” and includes “various forms of car
sharing, bike sharing, ride sharing (carpooling and vanpooling), and on-demand ride services” (Shaheen et al., 2015). ‘Mobility-as-a-Service’ (MaaS) is also a frequently used term to describe the use of digital technologies that integrate various forms of transport services into a single mobility service accessible on demand5.
The combination of these four elements can lead to a radical transformation of road transport as the interplay and integration between them has a reinforcing effect. For example, AVs can accelerate the adoption of shared mobility by reducing one significant operational cost: the driver (Corwin et al., 2015; European Commission, 2018c).
In addition, vehicle electrification can be accelerated by shared, automated mobility. There are three factors which can affect maximisation of the return on investment (ROI) of EVs: greater use of such vehicles, the potentially lower need for maintenance (Arbib and Seba, 2017) and easier access to charging infrastructure (ERTRAC, 2017). Furthermore, recent work suggests that AVs are easier to produce with electric rather than internal combustion engines, due in part to the easier
integration of parts and component control (Mehta et al., 2018). Finally, MaaS, combined with vehicle automation and electric engines, is expected to lower the costs of road transport significantly, resulting in the massive adoption of these technologies and services in the near future6.
2.1 Present and future challenges for mobility
Sustainable and universal mobility has always been at the centre of EU transport policy as it meets citizens’ needs and plays a vital role in the competitiveness of European industry and services. Between 1995 and 2015, the total number of EU-28 passenger kilometres (pkm) increased by 23.8 % to 6 602 billion pkm,
It is expected that EU transport activity will continue to grow in the coming decades, with road transport maintaining its dominant role.
2. A new era for road transport 12

Figure 2: Road passenger transport activity evolution since 2005 and up to 2050 (in billion passenger kilometres - pkm) Source: Own elaborations based on data used by the European Commission7
1 000
2 000
3 000
4 000
5 000
6 000
7 000
8 000
2005 2010 2015 2020 2025 2030 2035 2040 2045 2050
0
billi
on p
km
Year
Two-wheelers
Private cars
Public road transport
2005 2010 2015 2020 2025 2030 2035 2040 2045 2050
0
1 000
2 000
3 000
billi
on tk
m
Year
Heavy-duty vehicles
Light-duty vehicles
13 2. A new era for road transport
Figure 3: Road freight transport activity evolution since 2005 and up to 2050 (in billion tonne kilometres - tkm) Source: Own elaborations based on data used by the European Commission7
the vast majority of which were covered by passenger cars (around 4 700 billion pkm, as reported in Figure 2) (European Commission, 2017f).
It is expected that EU transport activity will continue to grow in the coming decades, with road
transport maintaining its dominant role (European Commission, 2016e). Specifically, growth in road passenger transport is estimated at 16 % during 2010-2030 and at 30 % for 2010-2050. Road freight transport is projected to increase by 33 % by 2030 and 55 % by 20507 (Figure 2 and 3).

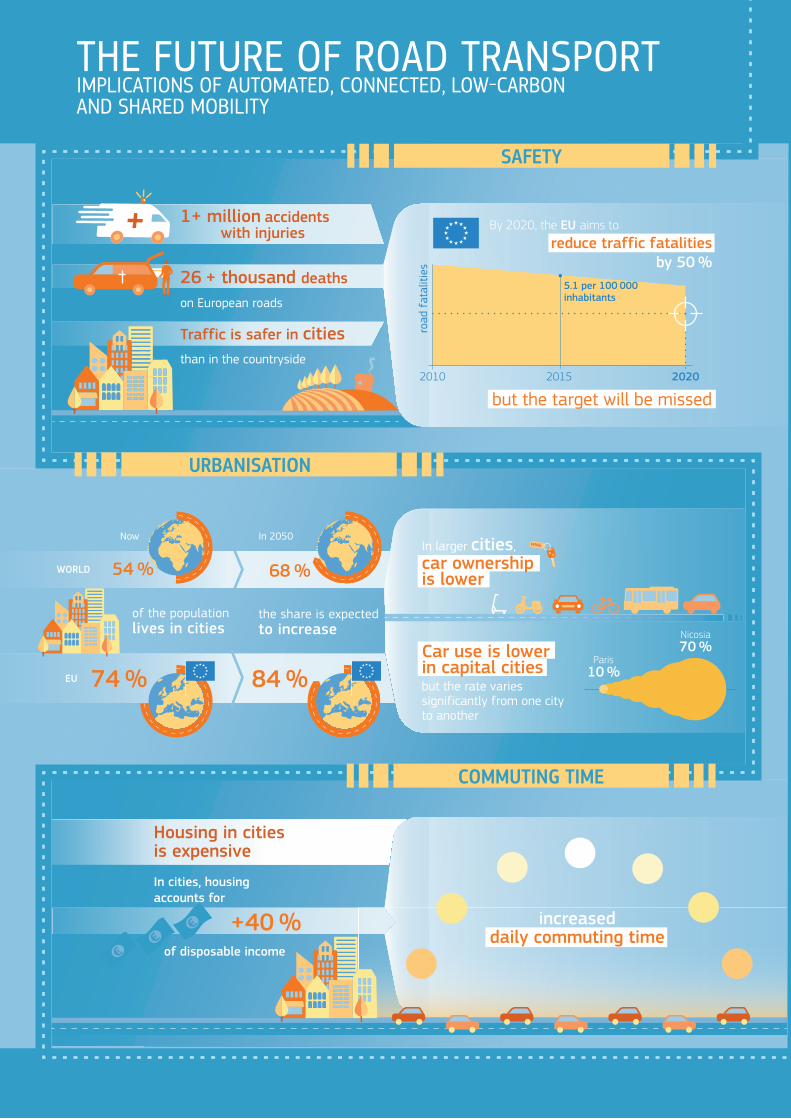
Challenges facing road transport Safety In 2015, a total of 26 134 road traffic deaths and 1.09 million road accidents causing personal injuries occurred on EU-28 roads (European Commission, 2017f). Compared to their national average, cities score much better in terms of traffic safety, with almost all recording lower fatality rates (European Commission, 2016f). The EU aims to reduce traffic fatalities by 50 % by 2020 compared to 2010. However, in recent years, EU fatalities have deviated from the target and it would appear that the figures will not be reached (European Commission, 2018f). The 50 % reduction target corresponds to a fatality rate of less than 3.1 fatalities per 100 000 inhabitants. In 2015, the EU-28 had 5.1 fatalities per 100 000 inhabitants (European Commission, 2017f).
Urbanisation Globally, in 2015, more than 50 % of people live in urban areas. In Europe, this figure is 75 % (Vandecasteele et al., 2019). According to the UN, it is foreseen that urbanisation will continue to grow – reaching 68 % globally and 84 % in Europe by 2050 (United Nations, 2018). In general, an already dense and growing urban population means that the global challenges faced in relation to transport and mobility are intensified in urban areas. In larger cities, car ownership tends to be lower than the national average as people in cities prefer other modes of transport (i.e. public transport, walking and cycling) (European Commission, 2016f). Capital cities have the lowest rates of residents using cars although the variation between cities is remarkable, ranging from more than 70 % in Nicosia, Cyprus to less than 10 % in Paris, France (European Commission, 2016f).
Commuting times Housing in cities is expensive (e.g. on average, more than 40 % of disposable income (European Commission, 2016f)). This calls for more daily in/out city commuting for those going to work.
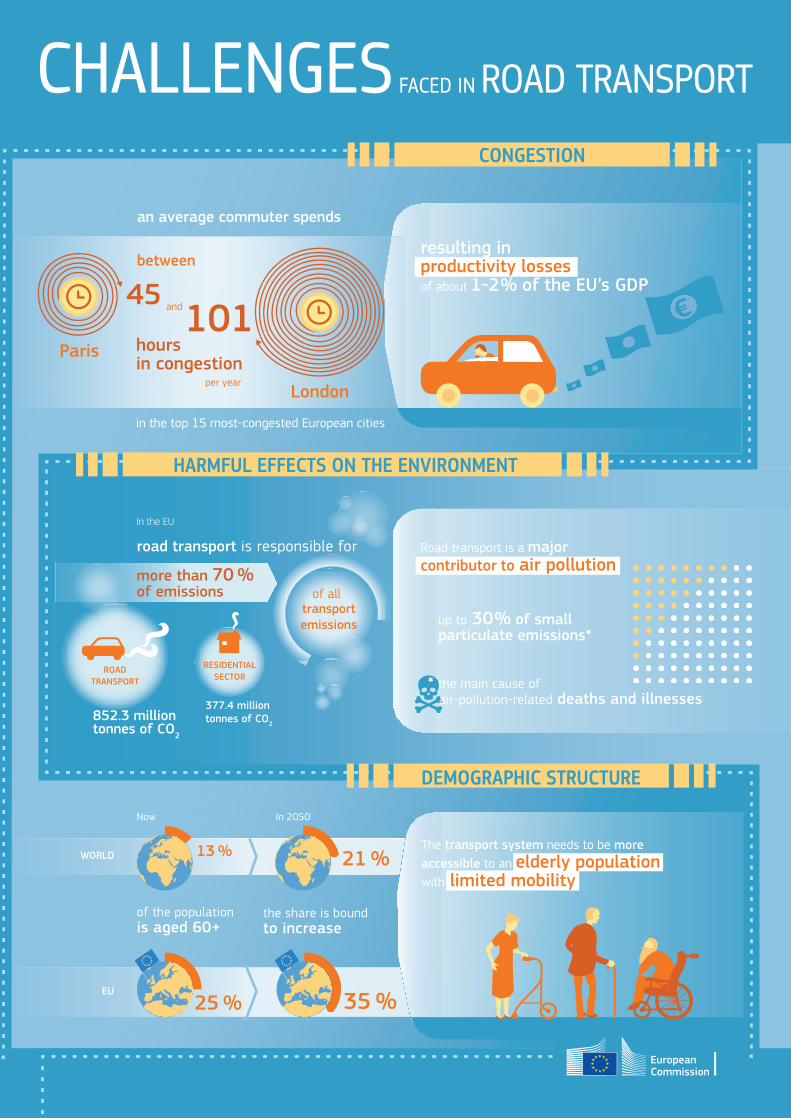
Congestion Productivity losses from road congestion account for approximately 1-2 % of the EU’s gross domestic product (GDP)8. In 2015, on average, commuters spent between 45 (Paris) and 101 (London) hours in congestion (INRIX, 2015), accounting for the top 15 most-congested European cities.
Environment According to the European Commission, in 2015, in the EU-28, 852.3 million tonnes of CO2 were emitted by road transport, constituting more than 70 % of emissions from all modes of transport (European Commission, 2017f). Transport is also a significant and growing contributor to air pollution. In particular, it is estimated that road transport is responsible for up to 30 % of small particulate matter (PM) emissions in European cities and is the main cause of air-pollution-related deaths and illnesses (World Health Organization, 2015).
In 2015, in the EU, 852.3 million tonnes of CO2 were emitted by road transport, constituting more than 70 % of emissions from all modes of transport.
2. A new era for road transport 14

Demography Settlements need to accommodate a growing elderly population. Globally, the number of people aged 60 years and over is projected to more than double by 2050 and those aged 80 years and over are expected to triple by 2050, compared to 2017 (United Nations, 2017). In 2017, the share of the European population aged 60 years and over was 25 % and this proportion is projected to increase
up to 35 % by 2050 (United Nations, 2017). Authorities can facilitate active ageing by ensuring that public spaces, transport and buildings are accessible to people with limited mobility. Settlements have very diverse demographic structures, requiring mobility systems that can be adapted to become more inclusive and accessible to everyone.
15 2. A new era for road transport
SAFETY CONGESTION
URBANISATION
COMMUTING TIME
HARMFUL EFFECTS ON THE ENVIRONMENT
DEMOGRAPHIC STRUCTURE
1+ million accidents with injuries
26 + thousand deaths
on European roads
Now
WORLD
EU
In 2050
Traffic is safer in citiesthan in the countryside
Housing in citiesis expensive
In cities, housing accounts for
increased daily commuting time
of disposable income
of the population lives in cities
the share is expected to increase
of the population is aged 60+
the share is boundto increase
74 %
+40 %
54 %
84 %
68 %
Paris10 %
Nicosia70 %
Paris
and
per yearLondonbut the target will be missed
road
fat
aliti
es
reduce traffic fatalities by 50 %
By 2020, the EU aims to
2010 20202015
In larger cities, car ownership is lower
Car use is lowerin capital citiesbut the rate varies significantly from one city to another
hoursin congestion
an average commuter spends
in the top 15 most-congested European cities
between
45101
resulting in productivity losses of about 1-2 % of the EU’s GDP
In the EU
Road transport is a majorcontributor to air pollution
852.3 million tonnes of CO2
377.4 million tonnes of CO2
RESIDENTIAL SECTOR
ROAD TRANSPORT
up to 30 % of small particulate emissions*
* the main cause of air-pollution-related deaths and illnesses
The transport system needs to be more accessible to an elderly population with limited mobility
road transport is responsible for
more than 70 % of emissions
5.1 per 100 000 inhabitants
25 %
13 %
35 %
21 %
Now
WORLD
EU
In 2050
of all transport emissions
THE FUTURE OF ROAD TRANSPORT IMPLICATIONS OF AUTOMATED, CONNECTED, LOW-CARBON AND SHARED MOBILITY
CHALLENGES FACED IN ROAD TRANSPORT

2.2 Technology outlook
Figure 4 links transport-related technologies to European research and innovation (R&I) projects9. This illustration identifies fuel cell and hydrogen fuel technologies as the category receiving the most funding. Two large projects under Horizon 2020 (H2020), called ‘H2ME’ and ‘H2ME2’, are responsible for the largest part of the funding. The EVs category, which covers a large number of technologies and projects, comes second in terms of funding. A notable
observation is that EV technologies are researched relatively frequently by small and medium-sized enterprises (SMEs). Another revolutionary technology theme, CAVs, is in fourth place. Innovations in more established technologies are found under the vehicle power-train theme in third place.
In addition to public spending in the field, the private sector is making huge investments fuelled by investment funds looking for competitive revenues in a period of low interest rates. Vehicle
2. A new era for road transport 18
Figure 4: Extract of transport technologies funded under Horizon 2020 (H2020)Note: FC = fuel cells; EV = electric vehicles; ADAS = advanced driver assistance systems; VDM = vehicle design and manufacturing; TMS = traffic management systems; EM = energy management; EC = emission control; MaaS = mobility as a service; HVAC = heating, ventilation and air-conditioning; CAD = computer aided designSource: own elaborations based on TRIMIS data
Freighttechnologies
EV batteriesand EM
CAD
FC an
d hy
droge
n fue
l
Satellite
navigation
EC systems
MaaS
Manufacturing
processes
CAVs
Safety
systems
Electricvehicles
HVA
C
Vehicle
propulsion
Info
rmat
ion
syst
ems
Sensor
technologies
TMS
ADAS
VDM
Noi
se
optim
isatio
n
EV support
technologies
7
23
5
3 21
12
11
12
9
56
294
35
23
7
21
23
14
7
3
9
73
28
8
327
43
18
81
8
119
39
6
172
31
6
10
47
23
14
5
Number of projects
Budget (million €)

-
continuouslateral longitudinal
control
continuouslateral
longitudinalcontrol lateral
longitudinalcontrol
recognise performance limits
require driver to resume control
within sufficient time margin
cope with all situations automatically
cope with all situations automatically
in a specific use case in a defined use case during the entire journeyin a specific use case
during defined use
continuous monitoring
sporadic monitoring be ready to resume
control
drivernot required
drivernot required
0
1 2 3
4
5
eyes on, hands on
already on the market awaited 2020-2030
eyes off, hands offtemporary hands off
or
Figure 5: Summary of Society of Automotive Engineers (SAE) International levels of driving automation for on-road vehicles Source: own elaborations based on European Commission (2018c)
manufacturers, ICT companies, automotive suppliers and dynamic start-ups are competing for a share of the global passenger economy, estimated to be worth USD 7 trillion in 2050 (Strategy Analytics, 2017).
This is generating a systemic race towards the development of technological enablers for future transport solutions. Under such conditions, there is a risk of inflated expectations whereby aggressive companies speculate for short-term revenues for their shareholders. Following this phase, the speculative bubble usually bursts, causing many companies to fail. Only a few survive and continue to actually improve the technology.
This is similar to what happened to major bike-sharing players, which are generally struggling to survive today after a period of constant over-evaluation. According to the Gartner Hype Cycle, CAVs, for example, are slowly moving from the peak of inflated expectations to the next phase (the trough of disillusionment) (Panetta, 2018). Something similar is happening to shared mobility service providers, currently in their ‘bubble’ phase – with a very high market valuation without ever
having made a profit. Therefore, over the coming years, developments in mobility technologies in general will be decisive in understanding how the situation will evolve in the future.
Connected and automated vehiclesAutomated driving is classified within five distinct levels of automation for existing vehicles or vehicles planned to be deployed in the future (SAE International, 2016) (Figure 5). These levels primarily identify whether it is the human or the machine in charge of the DDT: they range from level 0 where the DDT is entirely performed by the human driver (no automation) to level 5 where the DDT is entirely performed by the automated driving system (full automation). The DDT comprises both the vehicle’s lateral control (steering) and its longitudinal control (accelerating, braking), together with monitoring the environment, referred to as object and event detection and response (OEDR). The operational design domain (ODD) delimits the geographical, road, environmental, traffic, speed and temporal conditions where the automated driving system is expected to operate parts of the DDT and applies to levels 1 to 4 automation (level 5 automation has an unlimited ODD).
19 2. A new era for road transport

The automation level of an automated driving system, its ODD and whether it behaves independently or in a cooperative way with other vehicles and the infrastructure are the three primary attributes of CAVs (Shladover, 2018 in Ciuffo et al., 2018).
From a technological point of view, automated driving systems are still being developed and tested, with some recent severe and fatal accidents (Claybrook and Kildare, 2018), and some delays over the ambitious targets set by certain key players in the field (Hawkins, 2017). Significant technological challenges to making fully automated driving a reality remain (Marshall, 2017), with training algorithms considered a crucial step towards ensuring safe and efficient vehicle operation in every driving situation (Nash, 2018).
Nevertheless, supported by years of research, development and testing in real driving conditions10, different vehicle brands and models offering advanced connectivity and automation features (levels 1 to 3) will hit the market in the coming years (Muoio, 2016). In Europe, the first C-ITS safety-related services will start to be deployed by vehicle manufacturers and road operators as of
2019 (European Commission, 2016a). An important enabler of the large-scale deployment of C-ITS is the recently adopted Commission Delegated Regulation C(2019) 1789 final on the deployment and operational use of C-ITS11, which provides the necessary legal certainty and framework for interoperability. It is expected that there will be a long period during which these new technologies will coexist with conventional vehicles (European Commission, 2017a), with great uncertainty as to when they might dominate road travel. Some optimistic estimates anticipate that by 2030, 95 % of US passenger miles travelled will be served by on-demand autonomous EVs owned by fleet operators, accounting for 60 % of the entire US vehicle fleet (Arbib and Seba, 2017). Other authors (Litman, 2016) conservatively estimate that by 2050, between 50 % and 80 % of distance travelled will be in AVs, constituting between 40 % and 60 % of the vehicle fleet. Figure 6 shows some estimates from the literature of AV sales up to 2055.
Another relevant ongoing debate focuses on the communication technologies to be used in future CAVs (Fildes and Campbell, 2017). As regards cross-border testing, the European Commission (EC), the Member States (MS) and industry have
Figure 6: Range of sales projections for AVs (fully automated, or level 5, as described below) until 2055 (as % of AVs of the total vehicles sold) Note: sc = scenario
AV S
hare
%
0
10
20
30
40
50
60
70
80
90
100
2020 2025 2030 2035 2040 2045 2050 2055 2060
Transport Systems Catapult (2017) - sc1
Transport Systems Catapult (2017) - sc2
Transport Systems Catapult (2017) - sc3
Litman (2016)
Milakis et al. (2017), Underwood (2014), Rangarajan and Dunoyer (2014), Bierstedt et al. (2014), Litman (2015), Juliussen and Carlson (2014) - as cited by Nieuwenhuijsen et al. (2018)
Year
2. A new era for road transport 20

jointly discussed three categories of use cases for connected and automated mobility (CAM): private transport, collective transport, and freight and truck, and prioritised use cases to illustrate their expected benefits12. From this prioritisation, fully automated urban vehicles and automated shuttles and buses came top on the list while automated parking use cases were rated the lowest of all. This reflects that collective transport use cases are expected to provide more benefits than those linked to private mobility. However, a clear agreement has not been reached as public and private expectations of cooperative, connected and automated mobility (CCAM) are very different. The private sector needs to find a sustainable business model that promotes European industry
competitiveness but is also in line with mobility policy goals. To achieve this, the EC is establishing a single EU-wide platform grouping all relevant public and private stakeholders to coordinate open road testing of CCAM and make the link with pre-deployment activities. Proper legislative safeguards must be established to regulate testing and deployment of CAVs on the road, ensuring proper protection for road users. Moreover, given the pace of technological development in the field, a rapid response is needed from the regulators. A recent study has identified the Netherlands as the world leader in preparedness for AVs, followed by Singapore, Norway, USA and Sweden (KPMG International, 2019).
Whether CAVs have the potential to actually deliver the full range of expected benefits will ultimately depend on three factors: their penetration speed, their effectiveness, and their potentially negative impacts. Often, studies tend to be overly optimistic about the future of CAVs by overestimating the first two factors while ignoring or neglecting the third. Radical changes would only be possible once level 4 automation has been achieved13 or rather, after the proportion of road trips taken in AVs reaches a critical mass. Lower automation levels would definitely contribute to improving the safety and comfort of users.
Decarbonisation of road transportAt the EU level, the short- and medium-term agenda includes increasingly stricter regulations in terms of CO2 and pollutant emissions and aims at accelerated penetration of renewable energies coupled with improvements in energy efficiency and an ambition to reduce the dependence on fossil fuels. This agenda fosters greater electrification of transport (ERTRAC, 2017). In a medium timescale, and alongside the decarbonisation of EU’s electricity generation system, EVs represent an ever-more important means of decarbonising road transport. Through smart charging technologies, EVs could act as flexible loads and even bidirectionally, as decentralised storage resources possibly supporting stabilisation of the grid (Eurelectric, 2015).
Proper legislative safeguards must be established to regulate testing and deployment of connected and automated vehicles on the road, ensuring proper protection for road users.
21 2. A new era for road transport

In the electromobility field, the prospects for technology developments for batteries may, in the short-term, include lowering costs and increasing energy density while, at the same time, limiting the cobalt content in the cathode chemistries (Steen et al., 2017). In the next decade, solid-state electrolytes may replace current liquid electrolyte-based Li-ion batteries, bringing improved volumetric energy density and safety (Janek and Zeier, 2016). In the long term, Li-Air batteries, which have the highest theoretical energy density among all known battery technologies, may further improve the range of vehicles (Sun, 2017). However, several basic technological barriers must be overcome before these batteries can be
considered for mass production. The learning curve, and thus the technical evolution for classical Li-ion batteries has been and remains steep (Schmidt et al., 2017; Tsiropoulos et al., 2018; Weiss et al., 2019) (Figure 7), resembling that of photovoltaic modules a couple of years earlier. It will enable battery-powered EVs to soon become competitive, in front of a backdrop of these vehicles which are still ahead of FCEVs in terms of energy efficiency. Improved cooling systems in vehicle battery packs, using advanced technologies such as heat pipes, for example, can manage much higher charging (and discharging) power into such a battery pack. In 2018, this led to the successful development, testing and demonstration of
Figure 7: Cost evolution of Li-ion batteries Source: Schmidt et al. (2017). Reprinted by permission from Springer Nature: Springer Nature, Nature Energy, The future cost of electri-cal energ y storage based on experience rates, Schmidt, O., Hawkes, A., Gambhir, A. and Staffell, I., 2017.
2. A new era for road transport 22
1997
2004
20082010
2013
2013
1995
2016
2015
20152016
2015
2007
emerging
maturing
mature
20152014
1956
2014
2011
1983 2013
1989 2012
Pumped hydro Utility, -1±8 %
Lead-acid Multiple, 4±6 %
Lead-acidResidential, 13±5 %
Lithium-ionElectronics, 30±3 %
Lithium-ion EV, 16±4 %
Lithium-ionResidential, 12±4 %
Lithium-ionUtility, 12±3 %
Nickel-metal hydrideHEV, 11±1 %
Sodium-sulphurUtility, -
Vanadium redox-flowUtility, 11±9 %
ElectrolysisUtility, 18±6 %
Fuel cellsResidential, 18±2 %
system pack module battery
0.00150
100
200
500
1 000
2 000
5 000
10 000
20 000
Cumulative installed nominal capacity GWhcap
Prod
uct
pric
e U
SD20
15 p
er k
Wh ca
p
0.01 0.1 1 10 100 1 000 10 000
350kW charging of EVs with the Combined Charging System (CCS) standard – i.e. enabling the recharge of around 400km in 20 minutes – with the roll-out phase of such advanced infrastructure on strategic US and EU highway corridors ongoing, and a new generation of EVs capable of using it due to appear on the market in 2019.
Alternative charging technologies (e.g. battery swapping, wireless charging, rapid bus charging during stops, supercapacitors, dynamic on-road charging) have triggered interest by promising to alleviate some of the disadvantages of the current charging technologies, such as the length of charging time (Spöttle et al., 2018). However, at the moment, apart from rapid bus charging14, the majority of these are not yet commercially viable on a large scale. In addition, dynamic wireless power transfer coils integrated into roads are still at the research stage.
Increasing the vehicle range and reducing the charging time and cost will enable BEVs to become a viable alternative for intense urban and extra-urban use, like pooled and shared vehicles,
taxis, buses, and all kinds of urban delivery and service fleets, the latter increasing significantly due to the growth in internet shopping and an ageing society. The electrification of such intensively used urban vehicles is also raising concerns and requires proof of their practical viability, an issue not to be underestimated in citizens’ and businesses’ decision-making. Other technological developments are ongoing in the area of a smarter recharging infrastructure permitting demand-side management (DSM) of charging, embedding electromobility in smart grids and smart building energy management systems, and vehicle-to-grid (V2G) integration.
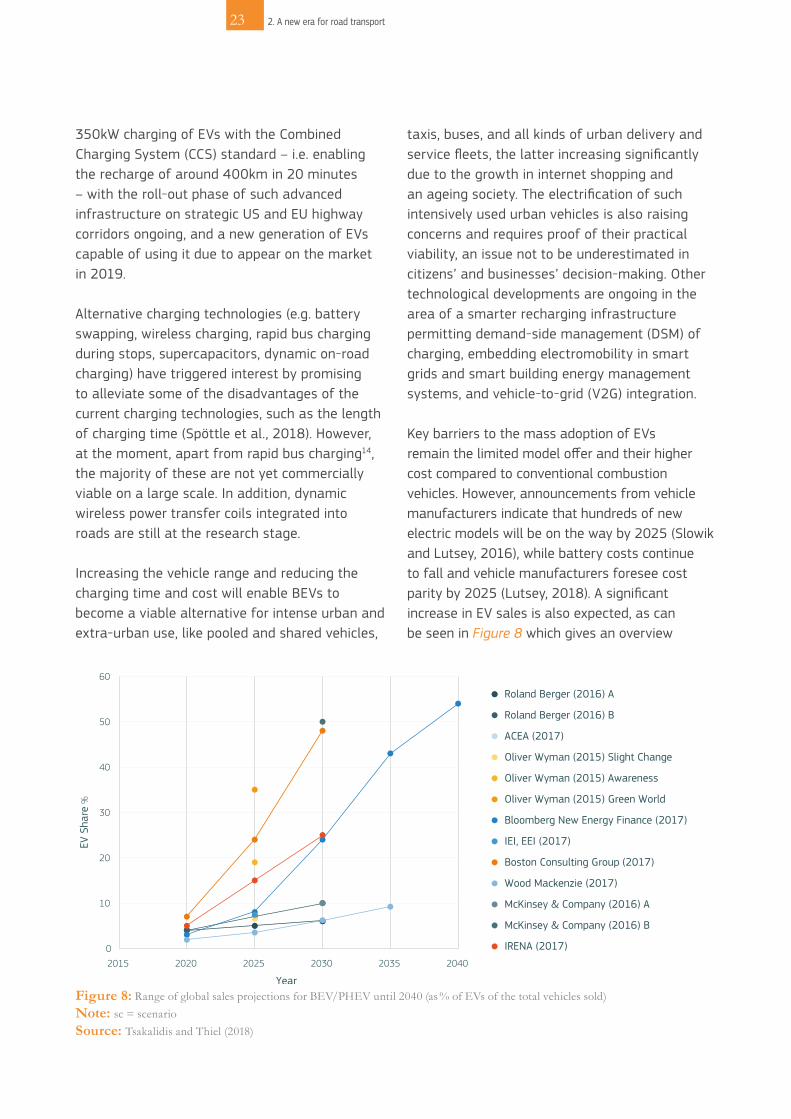
Key barriers to the mass adoption of EVs remain the limited model offer and their higher cost compared to conventional combustion vehicles. However, announcements from vehicle manufacturers indicate that hundreds of new electric models will be on the way by 2025 (Slowik and Lutsey, 2016), while battery costs continue to fall and vehicle manufacturers foresee cost parity by 2025 (Lutsey, 2018). A significant increase in EV sales is also expected, as can be seen in Figure 8 which gives an overview
Figure 8: Range of global sales projections for BEV/PHEV until 2040 (as % of EVs of the total vehicles sold) Note: sc = scenarioSource: Tsakalidis and Thiel (2018)
0
10
20
30
40
50
60
2015 2020 2025 2030 2035 2040
EV S
hare
%
Year
Roland Berger (2016) A
Roland Berger (2016) B
ACEA (2017)
Oliver Wyman (2015) Slight Change
Oliver Wyman (2015) Awareness
Oliver Wyman (2015) Green World
Bloomberg New Energy Finance (2017)
IEI, EEI (2017)
Boston Consulting Group (2017)
Wood Mackenzie (2017)
McKinsey & Company (2016) A
McKinsey & Company (2016) B
IRENA (2017)
23 2. A new era for road transport

of selected projections on the future of the EV market share until 2040, according to relevant literature sources. The progress in sales is linked to a range of supporting policies (e.g. emission regulation), consumer incentives (at purchase or operational), charging infrastructure deployment, and local awareness and promotional campaigns.
The evolution of FCEVs remains very uncertain. Introducing a policy package with coherent pro-FCEV policy measures could have a dramatic effect on the uptake of fuel cell cars in the EU-28. A recent study (Blanco et al., forthcoming 2019) linked energy system optimisation and a system dynamics simulation model15 to explore scenarios with a 95 % CO2 emissions reduction target. Under the ‘Ambitious Hydrogen (H2)’ scenario, the policy bundle favouring FCEVs comprised investment in research and development (R&D) to improve the fuel cell system, purchase subsidies from authorities and discounts by manufacturers (both lowering the capital expenses (CAPEX)), fuel subsidies (lowering the operating expenses (OPEX)) and investment in refuelling infrastructure to promote H2 station deployment. Under this scenario, the number of fuel cell cars in use will reach almost 77 million in 2050, accounting for over 26 % of the EU-28 car stock. Therefore, they should not be disregarded among the available options for the future, especially for heavy-duty vehicles (HDVs) (Pocard, 2018; ZumMallen, 2018; Field, 2018).
In fact, future infrastructure and public policies must promote a diversification and share of vehicles from the wide spectrum of technologies and fuels, giving way to H2 (FCEVs), biofuels, electricity (BEVs) and others. Diversification is key for a smarter transport sector. Energy transition and the concept of smart energy and smarter use should take into account an increasing variety of sources, thereby reducing the supply industry’s bargaining power to the benefit of the consumer. With the diversification of energy source/carrier, concerns being raised about the electricity grid or hydrogen, for example, would be diminished.
Thus, variety reduces infrastructure dependency. Diversification and shares of total vehicle fleet should be taken into account in the design of public policies.
Shared mobilityA transition to MaaS, especially if focused on the sharing/pooling aspect rather than on maintaining individual mobility, is suggested as a promising alternative to reducing the negative impacts of road transport (European Commission, 2017k). A few relevant definitions (extracted from (Shaheen et al., 2015) include:
Car sharing: a programme whereby individuals pay a fee each time to have temporary access to a vehicle without the costs and responsibilities of ownership. Individuals typically access vehicles by joining an organisation that maintains a fleet of vehicles deployed in lots at specific locations. Companies like car2go, DriveNow and Zipcar belong to this category.
Preliminary studies on users’ willingness to use (or pay for) automated vehicles seem to reflect an overall positive acceptance of these new systems.
242. A new era for road transport

Ride sharing (car/van pooling): formal or informal shared rides among drivers and passengers with similar origin-destination pairings. Companies such as BlaBlaCar are part of this category.
Ride sourcing (also known as Transportation Network Companies (TNCs) or ride-hailing): prearranged and on-demand transport services for compensation, which connect drivers of personal vehicles with passengers. Companies like Lyft or Uber are included under this category.
These services are already popular in several urban areas worldwide. For instance, ride-sourcing companies have invested billions of dollars in the development of successful user-centred technologies and services (Arbib and Seba, 2017). Collectively, these companies drove 500 000 passengers per day in New York City in 2016 (Schaller, 2017), tripling the number of passengers driven the previous year. Likewise, in the Americas, car-sharing companies quadrupled their customer base in the period from 2009 to 2014 (Shaheen and Cohen, 2014). As already mentioned, in spite of the progress made, such companies are finding it difficult to become profitable, which poses a question as to their financial sustainability and future survival.
2.3 Overview of user uptake
Connected and automated vehiclesPreliminary studies on user willingness to use (or pay for) AVs seem to reflect an overall positive acceptance of these new systems (World Economic Forum, 2015; Yano Research Institute, 2018; Bansal and Kockelman, 2017; Kyriakidis et al., 2015). There are gender and age differences: male users seem to be more willing to use AVs than female counterparts (Hohenberger et al., 2016) and young people tend to show greater willingness to use or pay for AVs compared to elderly people (Bansal and Kockelman, 2017; Dungs et al., 2016)16. Users have also expressed willingness to pay for different services offered in AVs, with those relating to communication (e.g. social networks) and productivity ranking
highest in their ratings compared to, for example, entertainment-related services (Dungs et al., 2016). It has also been found that automation in public transport is positively perceived by the vast majority of users (Pakusch and Bossauer, 2017). Experience is thought to influence the future use of the technologies, thereby increasing the chances that users opt for AVs.
However, a significant portion of the population still has a negative attitude towards driverless vehicles. According to a 2017 Eurobarometer survey, between 52 % and 63 % of users would feel uncomfortable being driven in a full AV (Figure 9). However, it is interesting that the attitude was less negative than that reported in a previous Eurobarometer survey (Hudson et al., 2019) where around 70 % of respondents said they would have been uncomfortable in a self-driving car or truck. This shows that as people become more aware of the trend towards vehicle automation, the more prone they are to accept it. In reality, over time, other studies have presented a downward trend in the intention to use an AV, especially as a result of the first accidents involving (partially) AVs17.
0 20 40 60 80 100
RURALVILLAGE
SMALL / MID-SIZE TOWN
LARGE TOWN
Comfortable
Moderately comfortable
Uncomfortable
percentage
Figure 9: Answers to the question: How comfortable would you feel ‘Being driven in a driverless car in traffic?’Source: European Commission (2017i)
25 2. A new era for road transport

In all cases, it is clear that safety is critical. Even if AVs lead to fewer road accidents in the future (which nevertheless still requires many years of fundamental R&D (Shladover, 2018 in Ciuffo et al., 2018)), such accidents might receive more attention than those involving human drivers. As noted in the EC Communication from May 2017, “in order for automated mobility to gain societal acceptance only the highest safety and security standards will suffice” (European Commission, 2018c). It is interesting to note that in recent years the number of users who are sceptical about the safety of AVs appears to be falling globally (Giffi et al., 2018).
Another societal concern relates to the perceived impacts on the labour force in transport operations and car manufacturing, which cannot be underestimated (impacts on employment are discussed in Chapter 10). A further issue relates to a love of driving and the perception of the car as a symbol of status and individual fulfilment, of the unconscious desire for escape (Kroger, 2016 in Maurer et al., 2016) and, what is more, of masculinity (Berscheid, 2016). All these elements could be challenged by automation and the abandonment of car ownership. Moreover, the impact of AVs on a more efficient use of travel time (e.g. reading, working or even sleeping) still needs to be quantified (Rychel, 2017; Singleton, 2018). User acceptance is an area that requires further study both now and in the future, to feed into the design of future mobility solutions.
Decarbonisation of road transport – electromobilityIn 2017, the JRC conducted a stated preference survey (a follow-up of a survey in 2012) among 1 248 European car owners to investigate the evolution of consumer attitudes and preferences towards low- and zero-emission power-train technologies (Gómez Vilchez et al., 2017). When asked about their next purchase, almost half of the sample decided against an electric or fuel cell car. The respondents mentioned the high purchase price as the key limiting factor, followed
by limited recharging infrastructure, insufficient e-range and excessive charging time. Overall, European car drivers’ attitudes to electric cars remained relatively stable between 2012 and 2017. In another JRC survey on travel, 37 % of participants expressed a willingness to purchase a hybrid or electric car if they had to buy a new car in the near future (Fiorello et al., 2019).
Shared mobilityAutomation has the potential to make car sharing more attractive to end-users, covering the first/last mile of a user’s trip which is currently achieved by walking, cycling or other means (Firnkorn and Müller, 2015). Car sharing is more likely to be adopted by city-centre residents and degree graduates (Prieto et al., 2017). Similarly, in addition to the urban/non-urban factor, age seems to play a role in the use of car-sharing services, with more young people than older ones using them (Figure 10)18.
2.4 The complexity of the transport system
Transport systems are “internally complex systems, made up of many elements influencing each other both directly and indirectly, often nonlinearly, and with many feedback cycles” (Cascetta, 2009). Furthermore, transport policies have significant implications for the economy, land use, environment, quality of life, and social cohesion. In this respect, they have a “bearing on many, often conflicting, interests, as can easily be seen from the heated debates that accompany almost all decisions concerning transportation at all scales” (Cascetta, 2009). Dealing with the complexity of the transport system is the only way to ensure effective and resilient policies. However, this is not a simple task which is why many of the solutions adopted fail to remain effective over time. Understanding certain elements of the basis of transport complexity is essential to comprehend many of the arguments presented in this report (Box 1).
262. A new era for road transport

27
In the light of previous evidence, the assumption that CAVs will solve (or contribute to solving) congestion problems appears questionable at the very least. Although automation in transport may increase the overall capacity of the (mainly road) transport system, there are no guarantees as to the final effect on the service level of the system unless CAVs are included in a broader context of urban and transport planning. As in the past, when road network development and thus the vehicle-centric society was vigorously lobbied by the automotive industry, especially in the US (Norton, 2011), the risk today is once again to return the car to the centre of our lives and cities, possibly to an even greater extent, thereby intensifying the adverse effects of its disproportionate use.
Understanding how new technology options will change transport and mobility requires analysis of the dynamic interaction between the demand for transporting people and goods and new opportunities offered by the transport system.
For example, if private vehicle ownership remains dominant in the future (Bösch et al., 2018; Cohen and Cavoli, 2018), in spite of an increase in road transport capacity, the projected increase in travel might be high enough to pose significant challenges to the system. In this case, it is crucial to have solutions at hand, such as alternative governance approaches, which can help to deal with emerging issues.
Furthermore, new governance will not only be needed in the long run – when all vehicles will probably be automated and connected – but will also be required in the shorter term when new technologies interact with conventional vehicles. Correct ways to manage the (potentially long) transition are necessary to avoid bringing more problems than solutions to relatively inefficient and saturated transport opportunities.
In the light of previous evidence, the assumption that connected and automated vehicles will solve (or contribute to solving) congestion problems appears questionable at the very least.
2. A new era for road transport
Figure 10: Answers to the question: ‘Do you own a car-sharing subscription?’Source: Fiorello et al. (2019)
0
5
10
15
20
25
--
perc
enta
ge
under 40 years old over 40 years old
Yes Don't know what carsharing is

28
Figure 11: Schematic representation of the relationship between land use, transport demand and transport supply systems
Understanding transport phenomena requires a broad range of competencies, which makes it challenging to propose truly effective initiatives. Figure 11 is a schematic representation of the transport system complexity. The system comprises transport supply (the physical and organisational elements providing transport opportunities), and transport demand (taking advantage of the opportunities to travel). The maximum volume of people and goods that can be transported represents the transport system’s capacity. The level of service of the different transport opportunities (namely, the different transport infrastructures/modes) depends on the relationship between transport demand and transport capacity. If the capacity increases (which is the usual way to deal with transport inefficiency), the system is able to attract additional demand (internal
feedback loop) which, over time, will saturate the system again (a situation referred to as the Braess’ Paradox (Braess, 1968)). If the service level of transport infrastructures remains high for some time, the accessibility of space increases and can affect the location of both households and economic activities. This, in turn, generates additional travel demand which, over a longer time scale, can help to reduce the service level of the transport infrastructure (external feedback loop). For example, this ‘longer-term’ feedback loop explains a significant part of the ‘urban sprawl’ phenomenon: the availability of public transport systems (especially in Europe) and efficient highway systems (particularly in the USA) has enabled people to relocate further from city centres in search of better or more affordable living conditions (Di Mento and Ellis, 2013).
box 1. Complexities of the transport system
levels of serviceper infrastructure
spaceaccessibility
-
demand for infrastructure
travel demand
household location
activities location
facilitiesand services
capacity ofinfrastructure
levels of serviceper infrastructure
internal feedback loop
external feedback loop
2. A new era for road transport

29 2. A new era for road transport

3. New mobility paradigms 30
SUMMARY
In future, the transport of people and goods will be affected by different factors. Apart from economic growth, which has always been correlated with increases in transport activities, new technologies and trends can significantly change the way in which we interact with the space. Both a decline or increase in travel activity are possible, depending on the new opportunities enabled by disruptive technologies and services, although the evidence until now suggests that increases in vehicle travel activity are likely to occur for both passenger and freight transport. It is of paramount importance to support the introduction and testing of new mobility services through a network of living labs where people can be engaged from the early stages of systems development. Such environments provide the necessary evidence to shape suitable regulatory actions. This chapter explores how the identified drivers of future mobility by road can affect the demand for travel.
30

31 3. New mobility paradigms
NEW MOBILITY PARADIGMS
CHANGES IN TRAVEL DEMAND AND USE OF TRANSPORT MODES Vehicle automation, connectivity and shared mobility can contribute to modifying the demand for road transport activities in several ways. The simplest mechanisms are those which have a direct impact on the demand for travelling, such as the availability of new opportunities (enabled by AVs or MaaS services) for underserved users like the disabled, elderly or young people without a driving licence. Other solutions do not have a direct effect on the demand for travelling but have an impact on the number of vehicles needed to satisfy this demand (referred to as the vehicles’ demand). All those systems able to increase vehicle occupancy (e.g. car-pooling or real-time ride-hailing services) can have an effect on vehicles’ demand, i.e. by influencing the number of vehicles required to serve the same demand. However, in this case, things start to become more complex. Instead of eliminating vehicles from the road19, car-pooling services can attract people from other modes of transport. If introduced at a low price, car-pooling systems can attract cyclists, pedestrians (Le Vine et al., 2014; Polis, 2018) and users from public transport (Barrios et al., 2018) both at the local scale and for longer-distance services. In this case, they will not contribute to reducing the number of vehicles on the road but can have a detrimental effect on the financial sustainability of the other modes (due to reduced income). This can lead to a deterioration in their level of service (e.g. lower frequency of public transport services), possibly causing a further shift to the road (thereby increasing congestion rather than reducing it).
A similar situation can happen with vehicle-pooling which can reduce the number of vehicles on the road to free up road capacity. In turn, available road space can attract users from other transport modes. As previously mentioned, this is part of the complexity of the transport system and these mechanisms have been widely documented in the literature.
It is believed that the other ‘sharing’ services in the transport system – car sharing and ride hailing – also contribute to more efficient and sustainable road transport. Here the situation is even more complex. Car sharing can reduce the vehicles’ stock (the total number of vehicles available to people), but not the number of vehicles currently on the
31
New road transport technologies and trends can affect travel demand and mode choice, possibly leading to a significant growth in road travel.

road to satisfy mobility needs unless they are also used in a shared way. The mechanism by which car sharing can work is different. Not owning a vehicle (and thus not having direct and easy access to it) can encourage a more careful analysis of the different options available and therefore support the shift to other modes, although this very much depends on the quality of the alternative services. A study in the Netherlands, where alternative transport modes and opportunities are widely available, shows over 30 % less car ownership among car-sharing users and around 15 % fewer vehicle kilometres than before the use of car sharing (Nijland and van Meerkerk, 2017).
The same is not true for ride hailing. Indeed, a study carried out in the USA found that, on average, ride-hailing users do not possess significantly fewer vehicles than their non-ride-hailing counterparts, and have more vehicles than those who only use public transport (Clewlow and Mishra, 2017). While some ride-hailing users reduce the distance they drive, the distance travelled in ride-hailing vehicles increases. According to another study (Schaller, 2018), the increase was as large as 160 % on US urban roads while a 10-30 % shift from public transport to ride-hailing services was indicated elsewhere (Sperling, 2018). As further confirmation, a study carried out in five US metropolitan areas showed that approximately 55 % of ride-hailing users would have either used public transport, cycled/walked or simply avoided the trip if the service had not been available (Clewlow and Mishra, 2017). Therefore, rather than reducing congestion, ride-hailing leads to greater pressure on the road transport system.
Connectivity is not only a new feature for advanced vehicles but also provides important support for promoting multimodality. Online tools and mobile apps are becoming increasingly available in cities and represent a very important tool for quickly understanding the transport opportunities offered by a multimodal network. They are particularly useful the first time a traveller uses the transport system. However, evidence has shown that when
users have a good understanding of the multimodal network, the key elements in their choice of public transport are efficiency and reliability rather than the available information (Duboz, 2018). As transport costs users money, the only way to persuade them to choose more sustainable options is to provide a public transport system which is faster and at least as safe, secure and reliable as personal mobility. This is evident from a recent survey carried out by the JRC (Fiorello et al., 2019) which shows that public transport uptake is much more pronounced in urban than extra-urban contexts due to the generally higher level of service for public transport and lower level for private transport in urban areas (Figure 12). In non-urban areas, older people tend to prefer the private option more than younger people because they have higher incomes.
The situation is further complicated by the introduction of CAVs. If private vehicle ownership remains dominant in the future (Bösch et al., 2018; Cohen and Cavoli, 2018), the projected increases in travel might be high enough to pose significant challenges to the system.
Figure 12: How do you usually make your most frequent trip? Source: Fiorello et al. (2019)
URB
AN
NON-URBAN
60 %50 %
40 %30 %
20 %10 %
0 %
over
40 ye
ars o
ld
unde
r 40 y
ears
old
private transport public transport walk / bicycle
32323. New mobility paradigms

Under the assumption that the price of automation will drop sufficiently to allow for mass-market introduction, AVs will improve the travel experience so much that a significant increase in the number of trips and changes in people’s activities and travel behaviour can be expected (Harb et al., 2018). This will happen gradually: at the beginning, as with many technological innovations in the automotive industry, automation will be rather expensive and, consequently, will only be affordable for wealthy consumers (Wadud, 2017; Milakis et al., 2018), thereby increasing inequality among transport users.
In the longer term, once the purchase and use costs of CAVs fall enough to enable their massive uptake, impacts on demand can be expected both for vehicle ownership and transport activity levels. Some authors (Wadud et al., 2016) estimate that AVs can cut the cost of travel by as much as 80 %, which in turn drives up kilometres travelled by 60 %. Where CAVs can be used as shared shuttle services, several studies show that they would be able to serve the demands of private urban mobility with a significantly lower number of vehicles. However, this would increase the total number of vehicle kilometres travelled as a result of their repositioning, travelling empty to pick up new passengers or reach a specific location. Therefore, any potential reduction in vehicles’ demand linked to shared CAVs might be nullified by greater empty-running travel. Figure 13 shows different usage scenarios for CAVs and shared services, indicating that only with a significant increase in average vehicle occupancy (AVO) can vehicle miles travelled (VMT) be reduced (scenario where AVO is equal to 2.0). In the situation where, due to their repositioning, the average occupancy of vehicles will be even lower than today, vehicles’ activity in the USA is estimated to more than double in 2050 when compared to 2015 values (Silberg et al., 2015). These results are in line with the outcomes of a recent microeconomic study which concluded that the induced travel demand due to lower travel costs can be as much as 50 % higher than the current level (Taiebat et al., 2019).
Likewise, in the case of CAVs, a decline in the demand for public transport has been observed in a recent study (Levin and Boyles, 2015), as using AVs and avoiding parking fees through drop-off and return trip becomes cost advantageous. In reality, in many cases, automated shuttles could be used very efficiently to complement public transport by providing the last-mile service required to attract people from personal mobility services (Sperling, 2018). Without drivers, such a system will be cheaper than today’s public transport. In addition, greater flexibility and modularity in the vehicle concept (Figure 14 provides an example) can help to dynamically adapt the size of shared automated convoys to actual mobility demand (demand-responsive
Some authors estimate that automated vehicles can cut the cost of travel by as much as 80 %, which in turn drives up kilometres travelled by 60 %.
3333 3. New mobility paradigms

public transport), which would contribute to further reducing the service’s operation costs and enhancing the system’s competitiveness (Chow, 2018).
It is also important to mention here the plethora of light and electrified personal mobility options (bikes, scooters, etc.) which are now populating many cities around the world as pay-per-use services. If integrated in the multimodal transport system, they are a viable way to attract people to the public transport system as they can be used to cover the first/last mile in the transport chain. The correct integration of the different transport opportunities is important for their financial sustainability. Most of the companies which provide new mobility options have never made a profit (in spite of their high valuation), with some of them (also among the most successful in terms of numbers of users) recently declaring bankruptcy. Rather than just isolated cases, this seems to be the general trend now for car- and bike-sharing providers, which reinforces the need for a more rationale governance of the overall transport system, based on a careful analysis of the actual transport demand.
Finally, the importance of people’s education and awareness should not be ignored. In the past, this has already proven to be a very important tool for supporting the uptake of more sustainable mobility options (Gärling et al., 2009; Hiselius and Rosqvist, 2016). In the presence of so many statements about the environmental performance of new mobility solutions, it is of particular importance that ad-hoc information campaigns are carried out to encourage people to make the right choices.
Another important piece of the puzzle relates to freight transport (Box 2).
In future, public authorities will have a greater responsibility to ensure that the potential offered by new technologies and mobility solutions will contribute to making the future transport system more efficient and sustainable. As already advocated, new governance of the multimodal transport system will be required and will go well beyond the road to ensure cooperation among all the actors involved.
Figure 13: Vehicle miles traveled (VMT )in the USA in the period 1950-2050 Note: AVO Average vehicle occupancySource: Silberg et al. (2015)
34343. New mobility paradigms
2.0
1.67
1.2
0.95
19500
1.0
2.0
3.0
4.0
5.0
6.0
7.0
1960 1970
AVO
1980
historical forecasted
1990 2000 2010 2020 2030 2040 2050
2015
trill
ions
of
mile
s
Vehicle milestravelled (VMT)
Forecasted VMT<1More cars on the roadthan people
Forecasted VMT=1.2Car can drive your parentsand take the kids to practice
Forecasted VMT status quo occupancyAVO= 1.67
Forecasted VMT =2Car-pooling and ride-sharing takes off

Figure 14: Automated shuttles can vary in size and internal features according to user needs and demand
3535 3. New mobility paradigms

To support policy, it is important that research continues to ensure clear evidence from the mechanisms regulating any changes in transport demand. To achieve this, it will be important to establish a number of ‘living labs’ in Europe where new mobility solutions can be introduced and tested via a proper process of public and stakeholder engagement. Recently, a few living
labs have been established to test new vehicle technologies and transport solutions in a real-world environment20. In addition, a platform should also be created where these living labs could exchange the results of their work in order to disseminate the lessons learned and support the rapid uptake of successful solutions.
3636
box 2. Freight transport activity
3. New mobility paradigms
Although for long-distance transport, connectivity and information technology (IT) could help to satisfy the transport demand with fewer vehicles (namely reducing the number of trips where trucks travel empty), the big challenge is posed by the shorter delivery cycles increasingly on offer by e-commerce providers. In this case, and especially when people ask to receive goods within a few hours, it is almost impossible to combine cargo to minimise travelling. Consequently, conventional logistic operators are progressively being replaced by individual transport services using personal vehicles to deliver goods. This may significantly increase the transport demand and worsen negative traffic-related impacts (Rutter et al., 2017). Since road capacity imposes a limit on short-term e-commerce and traffic
congestion could affect the reliability of these services, retailers are developing new options. As cyclists are today’s symbols of alternative delivery options, the future will see automation playing a central role, with electric robots and drones increasingly occupying pavements and the urban sky (Figure 15) (Paddeu et al., 2019). Another challenge comes from potential modal shifts, as transporting goods by road can become more convenient than using other modes of transport. More intensified road freight travel activity, especially if combined with increased passenger road travel too, could challenge the capacity of the road transport system and would require a significant integrated approach among different modes of transport (Paddeu et al., 2019). The fight for the available space has begun.

Figure 15: Example of an alternative future delivery solution
3737 3. New mobility paradigms

4. Transport supply system and new governance options 38
SUMMARY
Vehicle connectivity and automation are considered a fundamental step towards making transport more efficient. Their ability to better sense the environment and react faster and in a more rational way than drivers is expected to significantly increase road capacity. Communication and cooperation among all road users are essential to bring about such road-capacity benefits. In addition, vehicle connectivity opens up a totally new form of road transport governance which enables individual vehicle choices to be acted upon. New governance can play a key role in reducing the attractiveness of personal mobility in favour of high-frequency public transport. It should not just focus on the mode of road transport but should consider the whole range of transport opportunities available to citizens. But the implementation of this concept requires thorough real-world testing. A network of living labs where new governance can be tested with public engagement can be a very important tool for shaping the future of mobility. This chapter discusses the extent to which an increase in road capacity can really be expected with these technologies.
38

39 4. Transport supply system and new governance options
TRANSPORT SUPPLY SYSTEM AND
NEW GOVERNANCE OPTIONS
The capacity of a road network21 depends on many factors, such as the road geometry, its physical condition, the existing signalisation and, of course, the characteristics of its users and the choices they make while driving. Assuming that the road infrastructure will not change from either a physical or a functional point of view, the network capacity will only depend on the behaviour of its users in their driving choices. Such choices mainly relate to two dimensions of the driving task (Michon, 1985):
• Tactical/operational choices (related to vehicle manoeuvring/control e.g. speed, acceleration, gap from other vehicles, etc.);
• Strategical choices (related to trip planning, e.g. departure time, route, etc.).
As regards the first dimension, CAVs are expected to increase road capacity as they will in theory be able to react faster to external stimuli. In reality, however, the situation is more complex than this. First of all, CAVs are designed primarily to be safe. Although algorithms will improve their understanding and adaptation of traffic situations over time, they will probably not accept the risks that humans – in order to achieve their short-term goals (namely minimising travel time/costs,
reaching their destination at the right time, etc.) – are (usually unconsciously) willing to accept. Although, hopefully, CAVs will significantly reduce congestion caused by road accidents, they will not necessarily increase road capacity (Mattas et al., 2019). In addition, the effect of strictly enforcing existing traffic rules on road capacity is still to be understood and assessed.
Other elements considered to be important for increasing future road capacity are the homogeneity of driving behaviour and the
39
Vehicle connectivity can support completely new forms of governance for road transport which can influence individual vehicle choices.

capability of AVs to delay – or in some cases even prevent – the appearance of traffic breakdown phenomena on highways (Mahmassani, 2016; Talebpour and Mahmassani, 2016; Kesting et al., 2008; Kesting et al., 2010). In reality, since different manufacturers will implement different algorithms in their vehicles, these will evolve over time, different levels of automation will coexist on our roads for many years, and in each AV different operation modes are expected to coexist, flow homogeneity is not expected to significantly increase any time soon (Xiao et al., 2018). As for AVs’ ability to prevent traffic breakdowns, although several solutions have been proposed (Liu et al., 2018), whether they will actually be implemented in real systems remains to be seen. Intelligent transport system (ITS) solutions implemented in today’s road networks represent just a small percentage of what has been proposed by the scientific community. In light of how investment plans are being carried out, there is a delay of approximately 10 to 20 years from the emergence of a new solution to its actual implementation. AVs can help to change this picture as many options can be implemented directly inside vehicles by manufacturers and require little investment in infrastructure. However, vehicle design focuses on user comfort and safety. Although driving efficiency is certain to be considered, it seems likely that vehicle manufacturers will implement human-resembling vehicle operations (to increase user’ acceptance of such systems) rather than traffic-smoothing ones, unless this is explicitly requested by regulators and road authorities (Makridis et al., 2018). Since vehicle manufacturers will gradually take over the liability in case of accidents, unless traffic-friendly vehicles make them both safer and more comfortable to travel in, traffic will not be among the parameters considered in vehicle design.
Taking the above into account, recent studies have shown that only with an efficient and effective vehicle-to-vehicle (V2V) communication in place can an improvement in the service level of existing traffic conditions be expected.
0.00.0
0.2 0.4 0.6 0.8 1.0
1.0
1.0
0.8
0.6
0.4
0.2
0.0
0.8
0.6
0.4
0.2
CAVs penetration rate %M
anua
l veh
icles
pen
etra
tion
rate
%
AVs penetration rate %
Harmonic Average Speed Km/h
20 30 40 50 60 70 80 90
Figure 16: Effect of different penetration levels of AVs and CAVs in a real highway scenario Source: Mattas et al. (2018)
Only with an efficient and effective vehicle-to-vehicle communication in place can an improvement in the service level of existing traffic conditions be expected.
40404. Transport supply system and new governance options

In particular, it has been shown that applying state-of-the-art algorithms to simulate AVs and CAVs in a realistic highway scenario, with approximately 20 % of CAVs, traffic flow starts to improve and that at 100 % penetration rate the capacity of the road system being examined increases by approximately 20 % (Figure 16) (Mattas et al., 2018). On the contrary, if no connectivity is in place, traffic flow is expected to worsen significantly and overall capacity to collapse as soon as AVs reach a significant penetration rate (approximately 25 %).
As regards strategical vehicle choice, the availability of reliable and frequently updated information on traffic conditions is usually considered essential for optimising routing and reducing individual travel time. In reality, however, this is only true for unforeseen situations (e.g. accidents, sudden closure of a road stretch, etc.), while in normal conditions information will not substantially improve a situation. The reason is that, just like humans, CAVs will also choose the best path to minimise their individual travel costs22. For this reason, over time, CAVs will also choose their route uniformly across different alternative paths in a way that the cost will be approximately the same everywhere23.
The situation could change if CAVs were to make their strategical choices to minimise total travel costs across the network rather than individually. The concept was introduced by John
Glen Wardrop in 1952 when he suggested that a central authority could distribute vehicles over the road network in an optimal way (defined “system optimum” or “social Wardrop equilibrium”) in order to increase overall network capacity. Wardrop also introduced the concept of “Price of Anarchy” to quantify the loss in transport efficiency due to the lack of coordination. Some authors (Belov et al., 2019) have estimated that in a simple but representative network configuration24, vehicles' coordination can increase road network capacity by 30 % and more than halve the overall travel time (Figure 17). In the same study, they have also shown the limited impact that updated and reliable traffic information alone (namely without coordination) may have to increase network capacity in normal flow conditions.
Although derived from a simulation model applied to a relatively simple case study, results reported in Figure 17 show a clear and important trend which is quite well known among transport scientists: information alone will not improve the road transport system unless all the players cooperate and coordinate. As regards the approach to achieve system optimum, the need for centralised management, as assumed by Wardrop, is currently being debated as decentralised self-organisation strategies can also be applied (Helbing, 2015).
Vehicle cooperation is already part of the EU’s policy debate (Box 3).
4141 4. Transport supply system and new governance options

It is very important to underline that, at least in Europe, the policy process already considers ‘cooperation’ among all service providers of equal importance to vehicle connectivity and automation. Automation and connectivity will only reach their full potential when the cooperative element is included. Cooperative mobility is understood as the negotiation of manoeuvres between vehicles to enable safer and more efficient interaction among different mobility actors (pedestrians, bicycles, cars, buses, trams, trucks, scooters, etc.). Furthermore, in the final
report from the discussions taking place during the second phase of the C-ITS platform, steered by the EC Directorate-General for Mobility and Transport (European Commission, 2017a), an additional element is also being considered: not only do all the actors involved need to cooperate but public authorities will need to play the role of an ‘orchestra conductor’ to ensure that all the players contribute to a more efficient transport system. This role has yet to be defined in practice, but for the time being it seems that just having it there for the future policy debate is sufficient.
Figure 17: Example of effects from information alone and information and coordination on travel time and network capacity (dotted lines represent uncertainty boundaries around the mean) Source: own elaborations based on Belov et al. (2019)
Today
Information
Information and coordination
Travel time today=100
140
120
100
80
60
40
20
0
Today
Information
Information and coordination
Network capacity today=100
140
120
100
80
60
40
20
0
4242
box 3. An orchestra conductor for a more efficient transport system
4. Transport supply system and new governance options

Another way to increase network capacity is to regulate access to the transport system. Apart from those highways characterised by ramp-metering control (see, for example, Papageorgiou and Kotsialos, 2002 for an overview) and some urban areas where certain types of Urban Vehicle Access Regulation schemes (UVARs) apply25, access to the road is always granted to vehicles (freely or subject to a per-use fee), unlike other modes of transport (e.g. air, rail). This gives road users a feeling of freedom that is impossible to achieve with other types of transport. Regulating access to the road network to prevent the degradation of traffic conditions can both improve traffic and reduce this feeling of freedom. As is the case for system optimum, access regulation can be achieved through both centralised (Belov, 2017) and decentralised strategies (Gao and Li-Shiuan, 2014).
System optimum routing and access regulation are just two examples of alternative road governance approaches enabled by vehicle connectivity, and thus, in theory, available in just a few years from now. Rethinking road governance is extremely important to avoid the situation whereby an increase in system capacity together with more comfort and a greater sense of reliability may ensure that future mobility remains – and possibly even more so – based on use of the car. This could put public transport systems at risk and contribute to increasing inequality and inefficiency in mobility. On the contrary, if used to foster cooperation and coordination by all actors involved, new technologies offer an unprecedented opportunity to reshape mobility, focusing on people and their needs while simultaneously reducing potential negative impacts. Managing the road network by limiting access to vehicles and directing them to avoid congestion, granting preferential access to high-occupancy, emergency and other special vehicles, as well as to public transport and other shared mobility operators, and by maximising accessibility to the public transport system will soon be technically possible. Combining road governance with dedicated highly accessible infrastructures for
pedestrians, cyclists and all new emerging modes, along with high-frequency and reliable public transport, can really change the way transport is used. However, such a transformation is as much about policy as it is about technology. The need for new governance models in the transport system is beginning to emerge in the scientific debate and will need to be taken seriously in shaping the future of transport and mobility (Pangbourne et al., 2019).
In addition, a network of European living labs where new options and governance models can be applied and tested with the direct and proactive engagement of citizens would be a very important step towards ensuring that the solutions adopted can really deliver what they promise. This is particularly important in a sector in which technical and social issues are strongly inertwined. For example, the extent to which it is acceptable that individual travel choices (such as the route/mode to use, departure time, speed to maintain, etc.) are handed over to the transport system deserves people’s attention and participation to avoid the automation of road transport being perceived as just the first experiment in preparations for automating society as a whole (Helbing, 2015).
System optimum routing and access regulation are just two examples of alternative road governance approaches enabled by vehicle connectivity.
4343 4. Transport supply system and new governance options
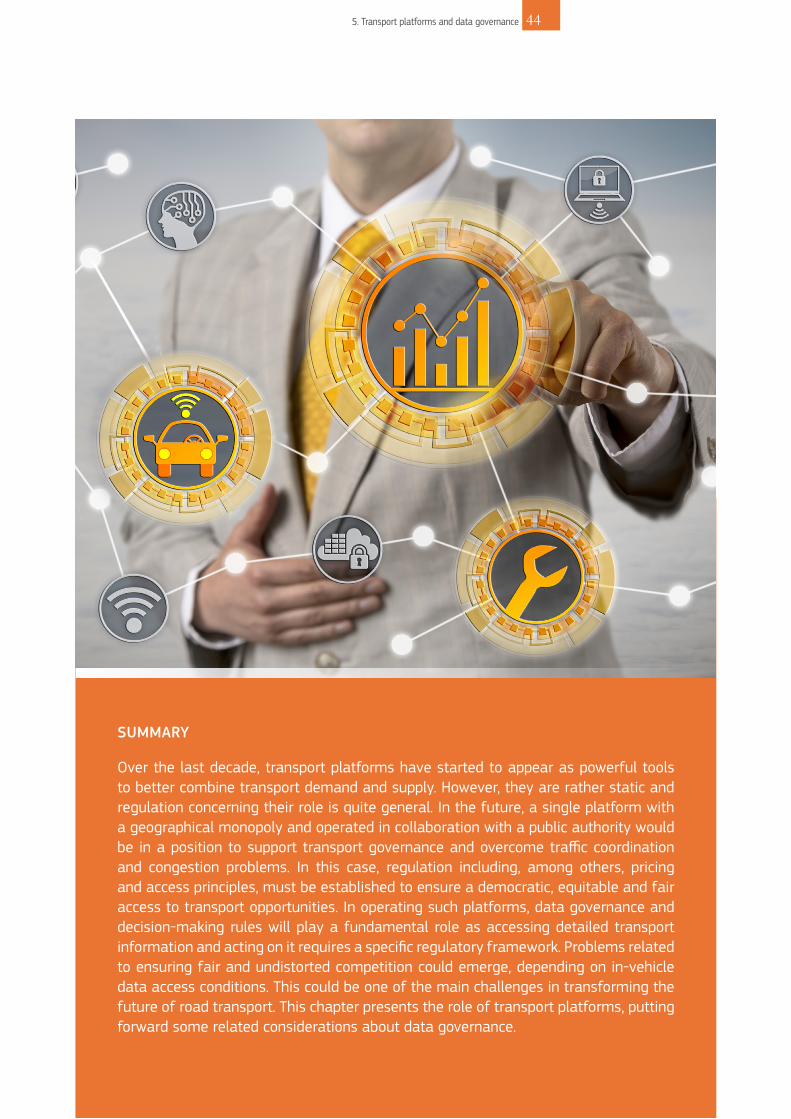
5. Transport platforms and data governance 44
SUMMARY
Over the last decade, transport platforms have started to appear as powerful tools to better combine transport demand and supply. However, they are rather static and regulation concerning their role is quite general. In the future, a single platform with a geographical monopoly and operated in collaboration with a public authority would be in a position to support transport governance and overcome traffic coordination and congestion problems. In this case, regulation including, among others, pricing and access principles, must be established to ensure a democratic, equitable and fair access to transport opportunities. In operating such platforms, data governance and decision-making rules will play a fundamental role as accessing detailed transport information and acting on it requires a specific regulatory framework. Problems related to ensuring fair and undistorted competition could emerge, depending on in-vehicle data access conditions. This could be one of the main challenges in transforming the future of road transport. This chapter presents the role of transport platforms, putting forward some related considerations about data governance.
44

45 5. Transport platforms and data governance
TRANSPORT PLATFORMS AND
DATA GOVERNANCE Connectivity and digital data technology have created a direct relationship between the transport system and its users that was impossible to imagine in the pre-digital era. Consumers enter queries into their apps and reveal their location, destination and transport mode preferences. Central platforms can match these preferences with the available supply of transport services, taking into account capacity constraints (Meurs and Timmermans, 2017). In some countries, for example, trains and toll roads already operate with variable congestion-dependent pricing schedules. Most ride-hailing apps also adjust prices to deal with limited capacity26. This leaves consumers free to choose their preferred combination of prices, timing and other personal demand factors. In this sense, central platforms developed in collaboration with the public sector can represent a viable option to implementing the new transport governance described in the previous chapter.
The number of transport services platforms, including MaaS (Jittrapirom et al., 2017), has rapidly grown over the last decade (Figure 18). They can collect a variety of transport options into services bundles that match the needs of different types of users and with prices that reflect variability in supply and demand and seek to avoid congestion. They may combine flexible individual means of transport with less flexible time- and route-bound collective public transport services. They may propose different pricing formulas (pay-per-ride, subscription fee, congestion pricing,
toll-road pricing, etc.). These platforms generate network effects: direct network effects occur when greater consumer participation increases coordination efficiency and therefore attracts more consumers to the platform. Indirect network effects occur when more consumer participation attracts more transport service providers to the platform, and vice versa. The pricing of access to platform services, for both consumers and service suppliers, will play an important role in generating network effects.
However, today’s platforms are rather passive, offering transport services but without much active coordination and congestion management between them. To support the development of new transport governance approaches and reduce congestion costs, platforms must become more
45
Data governance and decision-making rules will play a vital role in the operation of future transport platforms, with the support of regulation.
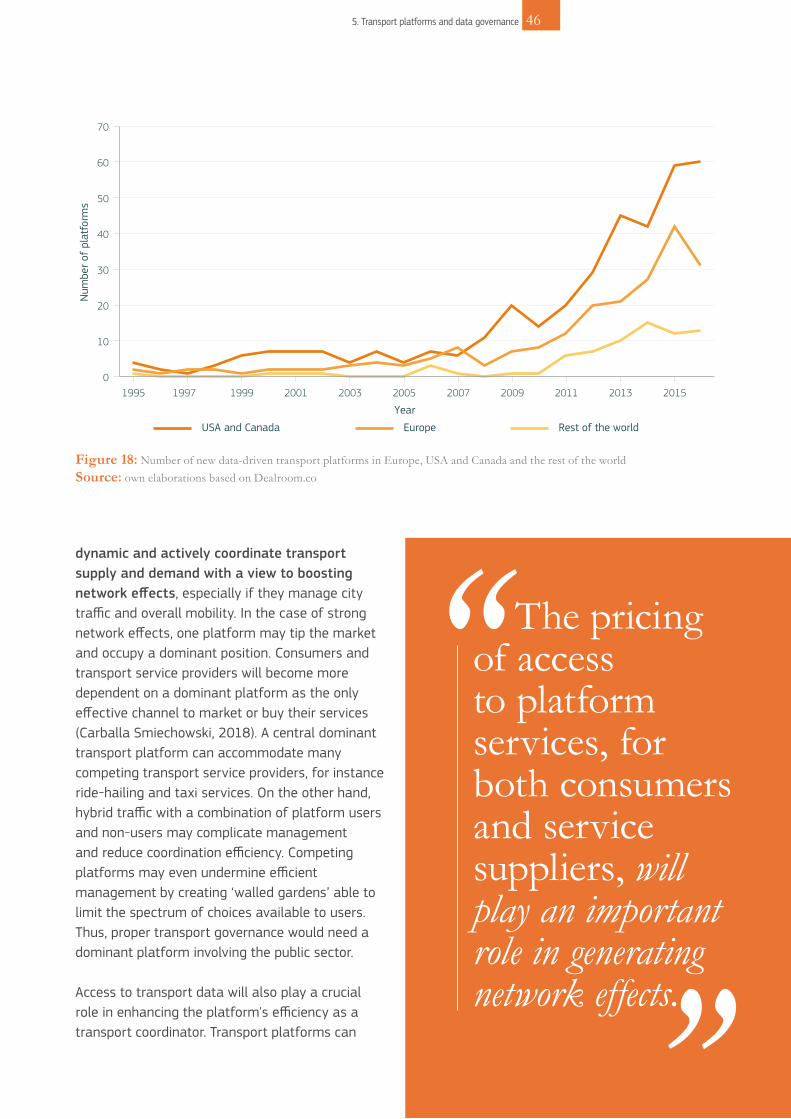
Figure 18: Number of new data-driven transport platforms in Europe, USA and Canada and the rest of the worldSource: own elaborations based on Dealroom.co
0
10
20
30
40
50
60
70
1995 1997 1999 2001 2003 2005 2007 2009 2011 2013 2015
Year
Num
ber
of p
latf
orm
s
EuropeUSA and Canada Rest of the world
dynamic and actively coordinate transport supply and demand with a view to boosting network effects, especially if they manage city traffic and overall mobility. In the case of strong network effects, one platform may tip the market and occupy a dominant position. Consumers and transport service providers will become more dependent on a dominant platform as the only effective channel to market or buy their services (Carballa Smiechowski, 2018). A central dominant transport platform can accommodate many competing transport service providers, for instance ride-hailing and taxi services. On the other hand, hybrid traffic with a combination of platform users and non-users may complicate management and reduce coordination efficiency. Competing platforms may even undermine efficient management by creating ‘walled gardens’ able to limit the spectrum of choices available to users. Thus, proper transport governance would need a dominant platform involving the public sector.
Access to transport data will also play a crucial role in enhancing the platform's efficiency as a transport coordinator. Transport platforms can
The pricing of accessto platform services, for both consumers and service suppliers, will play an important role in generating network effects.
46465. Transport platforms and data governance

aggregate supply-and-demand data across a wide range of consumers and private and public transport service providers. This includes personal identification, location and destination data, vehicle data and possibly some mechanical car data, error codes in case of mechanical failures and delays, parking data, pricing and financial data, etc. Data aggregation across many users on the supply-and-demand side of the transport market gives large platforms a better market overview than individual service suppliers operating through the platform. Indirect network effects provide service suppliers with wider market reach when they operate through the platform compared to running a service on their own. That makes them dependent on the platform and weakens their economic position in terms of conditions for service delivery. The same factors also make consumers more dependent on the platform, and they may switch between competing platforms to get the best deals.
The data may attract a wide variety of other services providers to the platform, such as accommodation and catering services, vehicle repair services, advertisers and consumer retail services, data-processing firms, start-ups and service application developers, etc. It is easy to imagine that a big city mobility data platform would have exclusive access to a vast amount of valuable data for all kinds of applications. Even a car-only platform would contain data that far exceeds the value of what car manufacturers or automated individual driving services providers could accumulate. In the CAV ecosystem, car manufacturers could have a privileged position over independent service providers, if they retain exclusive control of the data generated by their vehicles (through the so-called “extended vehicle concept”, i.e. an external server owned by the vehicle manufacturers) (Martens and Mueller-Langer, 2018; Kerber, 2018). Different market failures could appear under these circumstances, such as concerns about competition in the markets for after-market and complementary services, innovation in relation to the choice of
technological solutions, and consumer choice with regard to information and privacy. In fact, a 2017 study (McCarthy et al., 2017) identified the extended vehicle concept as incompatible with the principle of fair and undistorted competition and recommended the so-called “on-board application platform” (i.e. an in-vehicle data platform controlled by car owners) as the best alternative in the long term following the five guiding principles that were agreed during the C-ITS platform policy discussions (European Commission, 2016a; European Commission, 2016d). It is arguable that vehicle manufacturers will fight for the extended vehicle concept and will only make in-use vehicle data available when forced to do so. In this situation, access to data can potentially represent a major barrier to introducing new governance of the overall transport system.
When a transport platform becomes a dominant provider of transport services it can use this market power to affect individual transport decisions.
4747 5. Transport platforms and data governance

When a transport platform becomes a dominant provider of transport services it can use this market power to affect individual transport decisions. City authorities may also decide to make the participation of consumers and transport providers in transport platforms mandatory and impose a number of rules to improve the efficiency of transport management. The dominant platform would effectively acquire a geographical monopoly (like many other infrastructure utility operators, such as water, electricity, railways, toll roads, etc.) for the management of traffic. Transport platforms may be provided by a private for-profit firm or a public authority and can regulate transport by means of a central prescriptive approach or by setting the rules to achieve better coordination and effective collective action in a market with a fixed supply of infrastructure (Grant-Muller and Xu, 2014). Monopolies create pricing as well as democracy issues and since they deal with a service which has a strong public character, they will require supervision by a regulator concerning pricing, access rules and other operating conditions.
A key question here is: what is the platform’s objective? As a for-profit firm, it would seek to maximise profits. However, utility regulators may impose restrictions and other objectives on such behaviour. Would the platform seek to reduce environmental pollution, possibly at a cost to drivers, or would it aim to maximise the welfare of consumers by minimising traffic time or cost, or would it seek to reduce pressure on infrastructure and city finances? There may be trade-offs between these objectives with some users benefitting while others lose out as a result of these decisions. These are public policy choices that are partially dependent on data-governance rules. Commercial platforms will try to deal with these trade-offs in order to maximise revenue from the data. Non-commercial platforms may have other objectives although it is not clear how that could help to manage the trade-offs. The regulator will have to decide how the transport platform should handle the trade-offs between private and public costs and benefits. Some considerations on data-governance rules are presented in Box 4.
The EC’s Third Mobility Package (May 2018) underlines the importance of data governance, announcing that “the Commission will continue monitoring the situation on access to in-vehicle data and resources and will consider further options for an enabling framework for vehicle data sharing to enable fair competition in the provision of services in the digital single market, while ensuring compliance with the legislation on the protection of personal data”. This element can represent a strong constraint in the attempt to transform governance of the future transport system. In developing the related policy instruments, it will be extremely important to engage citizens in the discussion from the very beginning to understand the possible concerns and, as reported at the end of the previous chapter, to avoid the automation of transport and mobility being perceived as just the first experiment in preparing for the automation of society as a whole.
The regulator will have to decide how the transport platform should handle the trade-offs between private and public costs and benefits.
48485. Transport platforms and data governance
In this respect, data-governance rules will be a very important element of future policy development in setting up new governance models for the transport system. How will the platform manage access to that dataset over which it has exclusive control? Access to upstream data has important implications for downstream transport service markets. The platform can monopolise access to the data in order to extract more revenue from suppliers and consumers (Martens and Muller-Langer, 2018). The platform may even decide to start producing its own transport services, in direct competition with other service suppliers, because it has much better market information than individual services suppliers. This leads to questions about the pricing of access to the services offered
by the platform. For example, can competing providers of similar mobility services bid for access to specific consumer requests in a fair market with level-playing-field access? Alternatively, all participants in the platform may have open and free access to the data. This is unlikely, however, as it would violate privacy and commercial secrets. An alternative intermediate strategy for the platform is to restrict data access and sell indirect data-based services without giving direct access to the raw data. That preserves privacy but also strengthens the platform’s monopolistic use of the data. Again, regulators will have to oversee the platform's privileged market overview and access to data in order to ensure a fair distribution of welfare for all stakeholders.
4949
box 4. Data governance
5. Transport platforms and data governance

6. Infrastructure requirements 50
SUMMARY
The transition towards future road transport systems must be supported by appropriate technological and technical advances and all the relevant infrastructure, the latter being one of the main elements of the transport system. Alternative Fuels Infrastructure (AFI) includes all the necessary recharging and refuelling infrastructure, both in terms of recharging and refuelling stations, as well as the development or reinforcement of the respective distribution grids. Public recharging and refuelling infrastructure is a key enabler for increasing transport electrification and the penetration of clean fuels. Connectivity and automation will require the deployment of the appropriate supporting digital infrastructure. In this chapter, these infrastructure-related components which support the transition in the road transport system are reviewed.
50

51 6. Infrastructure requirements
INFRASTRUCTURE REQUIREMENTS
6.1 Recharging and refuelling infrastructure
The uptake of low-emission mobility depends on consumer buy-in, which is facilitated by smooth access to the infrastructure and its affordability. Therefore, enabling consumers to experience mobility seamlessly is a key requirement.
EU Directive 2014/94/EU on the deployment of AFI requires Member States (MS) to ensure, by means of their National Policy Frameworks (NPF), that an appropriate number of recharging and refuelling points that are accessible to the public are put in place, targeting in particular urban and suburban agglomerations and the core Trans-European Transport Network (TEN-T) (European Parliament and Council of the European Union, 2014). The alternative fuels that demand specific infrastructure solutions and for which the AFI Directive required future targets from MS are electricity, compressed natural gas (CNG), liquefied natural gas (LNG), and hydrogen. Analysis of the NPFs (European Commission, 2019b) shows that 26 MS provided targets for publicly accessible recharging points for 2020 and that electricity is the preferred alternative fuel in most MS. Figure 19 shows the current supply of recharging points and EVs in different EU MS.
Targets for 2025 regarding hydrogen refuelling points were included in the NPFs by 15 MS, some of which have ambitious plans (De Miguel et al., 2018). For CNG refuelling points, although 24 MS provided targets for 2020, these are very divergent, splitting the MS into two groups: one group is pessimistic while the other considers that
CNG is a priority. In the case of LNG refuelling points for HDVs along the TEN-T Core Network of roads, 21 MS put forward targets for 2025. The total estimated investment needs for publicly accessible AFI in the EU corresponding to the development foreseen in the impact assessment for the proposal for CO2 emission performance standards for cars and vans post-2020 (European Commission, 2017j) amounts to about EUR 5.2 billion by 2020 and an additional EUR 16 billion to EUR 22 billion by 2025 (European Commission, 2017l). The EC is advising that, to address these significant needs, public financial support should be used to trigger significant private investment. Table 1 summarises the information on AFI and alternative fuel vehicles delivered by MS. Then, Box 5 discusses the situation concerning the recharging points targeted for 2020.
51
Recharging/refuelling and digital infrastructure are key enablers of future automated, connected, low-carbon and shared mobility.

10 EVs/recharging point
15 EVs/recharging point
20 EVs/recharging point
0
1 000
2 000
3 000
4 000
5 000
6 000
0 50 100 150 200 250
EVs
per
100
000
inha
bita
nts
Recharging points per 100 000 inhabitants
IS
NL
NO
LUSECHAT
DK
0
50
100
150
200
250
300
0 5 10 15 20 25 30 35
DE
EE
SIMT
FR
BE
UK
PT
ITLVHUROPL CY
ETBGGR CZ SK HR
ES
FI
IE
Figure 19: Supply of recharging points and EVs across EuropeSource: Tsakalidis and Thiel (2018)
YearNo. of MS
providing AFI targets
No. of AFI targets
No. of existing AFI (03/2017)
AFI target attainment
level(%)
No. of MS providing AF vehicle estimates
Future share of AF vehicles
(range of %)
CNG 2020 24 4 020 2 990 74.38 12 0.04 - 3.27
LNG 2025 21 384 ~74 19.27 8 0.01 - 4.38**
Hydrogen 2025 15 765 108 14.12 6 <0.01 - 0.10
Electricity 2020 26 16 5949 73 452 44.26 24 0.06 - 9.22
Table 1: Summary of AFI and alternative fuel vehicles information delivered by MS in 2017*HDVsNote: No. = number; AF = alternative fuel; MS = member state; AFI = alternative fuel infrastructureSource: own elaborations based on European Commission (2019b)
52526. Infrastructure requirements

The existence of a sufficient and reliable recharging infrastructure is one of the main elements required for an electrified transport system as it increases people’s confidence that BEVs will reliably meet their travel needs and helps to reduce range anxiety. In this context, it has been observed that the lack of available recharging infrastructure has been one of the main reasons affecting user acceptance of EVs (Gómez Vilchez et al., 2017). For consumers to experience mobility seamlessly, the infrastructure needs to be digitally connected, and consumers should have access to timely and reliable information about the location and availability of recharging points. Interoperable EU-wide electromobility payment systems are also needed (and are under development), based on open standards and providing transparent, easily understandable and timely price information. A system similar to roaming for telecommunications may be necessary.
With a growing number of recharging points and increasing charging speeds (i.e. charging power available), potential grid restrictions may need to be tackled through targeted infrastructure investments in smart grids and grid reinforcements and upgrades. Smart grids could enable EVs to act as flexible loads and a decentralised storage resource that could minimise or avoid grid reinforcement (Eurelectric, 2015). With DSM, the EV charging process could be controlled by shifting the charging period to times of lower demand, reducing or increasing the charging power, or even interrupting the recharging of the vehicle’s battery in case of emergency situations. This is a way of smart charging an EV, i.e. “the charging cycle can be altered by external events, allowing for adaptive charging habits, providing the EV with the ability to integrate into the whole power system in a grid- and user-friendly way” (CEN-CENELEC E-Mobility
By planning around 170 000 publicly accessible recharging points by 2020 (an increase of about 126 % from the situation in March 2017), the national plans fall short of EC estimates for infrastructure from the AFI Directive’s impact assessment (European Commission, 2013) (i.e. around 400 000 publicly accessible recharging points corresponding to 4 million EVs on the road). They are not coherent at the EU level since their level of ambition varies greatly across MS (e.g. estimated shares of EVs for 2020 range from 0.06 % to 9.22 % of vehicle stock). The NPFs’ assessment shows that the ratio of publicly accessible recharging points per EV will decline in almost all MS (from an average of 1 per 6 EVs to 1 per 20 EVs in 2020 at the EU level); infrastructure gaps will remain and cross-border continuity will not be guaranteed if no additional action is taken (European Commission, 2017d). There must be a much greater commitment to
roll out publicly accessible recharging points in the EU, which requires a greater willingness by public and private actors to collaborate and invest in an easily accessible recharging infrastructure (European Commission, 2017l). The EC estimates the investment needs in MS to create a minimum publicly accessible recharging infrastructure in 2020 will be up to EUR 900 million. MS should plan publicly accessible recharging infrastructure deployment and EV uptake in an ambitious and balanced way (the AFI Directive gives an indicative sufficiency ratio of one publicly accessible recharging point per 10 EVs). Diversified support measures should be put in place to help achieve these plans, such as financial incentives (e.g. subsidies for installing recharging points, tax reductions/exemptions, acquisition bonuses) and non-financial incentives (e.g. access to restricted areas and lanes, parking priorities, preferential speed limits).
5353
box 5. Electricity targets in the EU
6. Infrastructure requirements

Coordination Group and CEN-CENELEC-ETSI Smart Grid Coordination Group, 2015). Smart charging can also be the optimisation of an EV’s charging power profile with the aim of maximising local energy production from renewable sources27. Finally, EVs could bring even greater flexibility to the system by supplying power back to the grid or home in a V2G (Beltramo et al., 2017) or vehicle-to-building (V2B) scenario. One obvious advantage of a vehicle-to-everything (V2X) operation is that the vehicle’s battery can be used to store energy during times of excess power generation from renewable energy sources – for example, from rooftop photovoltaic installations – and discharge it at times of high demand. From the supporting infrastructure point of view, i.e. in addition to the technical requirements of the vehicle and the
recharging point, smart charging on a wide scale should take into consideration the constraints of the power system, the potential for variable energy pricing offered by the energy market, and information about the energy mix. V2G, V2B and smart charging services should be fully enabled to ensure the efficient integration of electromobility into the electricity system. Interoperability between the many different systems and components involved is a prerequisite for achieving the mobility requirements of both user and grid in a safe, secure, reliable, sustainable and efficient manner.
6.2 Infrastructure public safety
The increasing penetration of electromobility in our daily lives raises questions about the potential impact on human health of the exposure to electromagnetic fields. Potential hazards may impact vehicle drivers and passengers as well as other users and bystanders (Ruddle, 2018). Complex waveforms characterise emitted fields with a broad spectrum. They are generated by different sources (vehicles, charging devices) and during different operations (traction, conductive and wireless charging, communications), resulting in different possible exposure scenarios (i.e. exposure to low-frequency magnetic fields, possible interference with active implanted medical or body-worn devices, and exposure to high-frequency radio transmissions).
While there is no robust scientific evidence about the long-term effects of electromagnetic field exposure, direct and indirect physiological effects are well known. In addition, to keep pace with changes at the legislative and regulatory policy levels, specific standards on measurement and calculation methods to assess human exposure to electric, magnetic and electromagnetic fields generated by electronic and electrical equipment related to the automotive environment are being developed and are expected by 2020 (IEC TS 63204 ed.1).
Electric vehicles could bring even greater flexibility to the system by supplying power back to the grid or home in a vehicle-to-grid or vehicle-to-building scenario.
54546. Infrastructure requirements

Moreover, the rush towards increased battery power and fast-charging solutions, with the new generation reaching power levels of 350 kW to overcome the range anxiety and reduce the recharging time, is resulting in higher-power voltages, in-rush currents and controlled fluctuating currents of hundreds of amps and consequently stronger and time-varying fields. In view of the massive penetration into cities, extra care in planning and mapping isolated underground cables and managing their operation will be required along with establishing specific limits for electro and magnetic emissions.
As regards hydrogen, traditionally, the major demand for it has been driven by industrial applications and is still based on methane as feedstock, which means that hydrogen production is not carbon free. In addition, such hydrogen production often occurs at an industrial site where the gas is used on-site and does not leave the factory. Nowadays, electrolysis coupled with renewable electricity is the standard process for delivering green (i.e. carbon-free) hydrogen. In general, this technology is already mature and is also being increasingly deployed in the industrial environment as a means of decarbonising selected industrial processes. In view of the possible market uptake of hydrogen as a fuel for mobility applications, gas-specific safety aspects must be considered along the whole supply chain.
There are various ways of transporting hydrogen from the production site to the refuelling stations. One of the solutions used today is via trailers on the road. This is convenient because it does not require additional infrastructure investments. However, the road transport of compressed or liquid hydrogen is regulated by strict European regulations which do not allow for a cheap upscale of the quantities transported. In view of the above-mentioned market uptake, other solutions are required. While demonstration projects worldwide are field-testing hydrogen distribution in existing natural gas pipelines, the preferred solution now is the production of hydrogen at the refuelling station
by means of on-site electrolysers. International and European safety standards are available which aim to guarantee, among other technical requirements, safety conditions for operators and the public similar to those of incumbent mobility technologies. In particular, the above-mentioned AFI Directive has contributed significantly to their development. These standards also facilitate the work of designers and local administrators towards the permitting processes of refuelling stations, although such processes still require EU-wide harmonisation and simplification. One critical technological and safety aspect is the station-vehicle interface during refuelling, on which pre-normative research, field testing and standardisation efforts have recently focused. This is one of the areas still expected to profit from current European demonstration projects concerning captive and public fleets.
In addition to specific safety requirements related to new refuelling/charging infrastructure, the future massive deployment of EVs requires a review of the generic safety provisions adopted in the past for other road infrastructure elements, specifically tunnels. European Directive 2004/54/EC defines minimum safety requirements for tunnels in the TEN-T (European Parliament and Council of the European Union, 2004). More recently, the Third Mobility Package (European Commission, 2018b) has shown a strong focus on traffic safety (among other topics), including the infrastructure dimension along the same TEN-T corridors. However, to date, the approach to tunnel safety has been technology neutral, assuming a homogeneous incumbent technology for transport and mobility based on liquid fuels. Risk assessments used in preparations for the directive are based on accident statistics in which alternative fuels, particularly gaseous fuels and batteries, play a negligible role. With market uptake of EVs already up to 20 -30 % of the total European fleet, it will be necessary to verify if the provision of preventive and mitigation measures are still relevant for the new hazards (battery flammability and toxicity, hydrogen flammability, etc.).
5555 6. Infrastructure requirements

6.3 Digital infrastructure
In the context of vehicle automation and connectivity, digital services will play a key role not only in enabling technological advancements but also giving users confidence and new possibilities. Digital infrastructure must be further deployed and reinforced to ensure that Europe’s transport system fully reaps the benefits of the transition to low-emission mobility. Transport electrification, for example, will contribute to a greater share of distributed generation and will underline the need to deploy smart grid applications in the power system, based on communication technologies and software applications. With the aim of bolstering consumer acceptance, AFI must be accompanied by digital measures, such as EU-wide mobile applications mapping
out station locations, as well as interoperable payment systems. Early on, the EU adopted the so-called ITS Directive 2010/40/EU (European Parliament and Council of the European Union, 2010). Among other areas, it encompasses the provision of EU-wide real-time traffic information (RTTI) services (European Commission, 2015c) and multimodal travel information (MMTI) services (European Commission, 2017b). The availability, through national access points (NAPs), of accurate and up-to-date static road data, dynamic road-status data and traffic data is crucial for providing real-time traffic information across the EU (European Commission, 2015c). In order to increase multimodality for passengers, in particular shifting towards greener modes of transport, data sharing of information such as timetables is key, as is ensuring some degree of data format standardisation and interoperability (e.g. applying DATEX II standard for road transport) (European Commission, 2017b). Indeed, EU ITS policy initiatives are also aligned with the Digital Single Market, notably the European Electronic Communications Code (EECC), with an emphasis on aligning regulatory practices in the EU regarding spectrum licensing, regulatory certainty and securing the necessary investment to improve mobile connectivity everywhere in the EU by 2025.
The uptake of digital services for transport will open up further possibilities. Enabling automation is only part of the vision – for the transport system to fully reap the benefits of it, vehicles and infrastructure must be connected, bringing more efficient traffic management, improving the capacity of existing links and increasing safety while reducing infrastructure maintenance costs by continuously monitoring the network, for instance. Computation power and algorithms, communication bandwidth and latency will be critical for the performance and roll-out pace of new technologies defining the future of transport. All of this will be supported by transport digital infrastructure, a term encompassing the systems (in-vehicle and on-the-road sensors and transmitters), as well as physical resources
5656
As automation evolves, so does the need to provide a digital representation of the reality as well as requirements for data processing and data exchanges.
6. Infrastructure requirements

(notably, the spectrum) and information (maps, general traffic conditions beyond close range, etc.) that enable vehicles to become connected and to interact with the environment (other vehicles, road and traffic signals, etc.) in a way that helps transport activity. As automation evolves, so does the need to provide a digital representation of the reality as well as requirements for data processing and data exchanges between the vehicle and its surroundings.
In 2018, the EC published the Communication ‘On the road to automated mobility: An EU strategy for mobility of the future’ (European Commission, 2018c) underlining the importance of connectivity and digital infrastructure development in achieving CAVs. To provide legal certainty and foster public and private engagement, a clear regulatory framework is needed, ensuring harmonisation while, at the same time, leaving room for innovation. Therefore, it is useful to focus on functionalities rather than technological solutions. To this end, the Commission has identified a set of services, with significant benefits and a high degree of maturity, which are ideal for early deployment (European Commission, 2016a). These services will also dictate the needs in terms of data and communication services. Among them, accurate location applications, together with high-definition map services, will be critical. Positioning systems remain technically
challenging and European initiatives, such as the European Geostationary Navigation Overlay Service (EGNOS), are being funded to make progress in this area. In this respect, the Global Navigation Satellite System (GNSS), the EU’s own Galileo satellite constellation, is now providing initial services and will become fully operational in 2020, providing real-time positioning accuracy in the metre range and higher (down to centimetres), to be achieved by a combination of technologies (correction algorithms, more powerful chips, etc.). Previous experience in delivering navigation services as a public regulated service (PRS) might pave the wave regarding the provision of encrypted and secure location information. PRS is a specific service available only for authorised governmental users in the fields of public safety and security (police, civil protection, fire brigades, ambulances, etc.) as well as critical infrastructures and defence.
Thus, digital infrastructure is key to unleashing the potential of ITS and CAVs and therefore defining a data-management strategy framed under a standardised architecture and based on the implementation of technical, functional and organisational standards and profiles. The sheer size of the investment needs not only for infrastructure deployment but also for R&D is expected to be overshadowed by the benefits brought by this new transport paradigm.
5757 6. Infrastructure requirements

7. Communication technologies and cybersecurity 58
SUMMARY
The deployment of future transport technologies like CAVs will be based on two es-sential elements: connectivity and trust. Connectivity allows vehicles to receive useful information about road conditions, potential hazards, the presence of neighbouring vehicles (including non-line of sight in obstructed/reduced visibility conditions), as well as to support a wide range of applications. A CAV can combine the information re-ceived from its sensors (e.g. camera, radar, LiDAR, ultrasound) and the connectivity systems to improve overall vehicle performance and make more informed and intel-ligent decisions. The ultimate goal of V2X communication technologies is to provide uncompromised passenger safety and interoperability of CAV services regardless of the underlying standard being used. Trust in the data and the functions provided by the technologies around us affects our professional and personal lives, as people are increasingly dependent on complex ICT systems which support our daily activities. These systems can be vulnerable to attacks, which can be particularly critical in the transport domain. Cybersecurity activities are focused on the protection of these ICT systems and their users through a combination of policy and technological actions. In this chapter, communication and cybersecurity challenges are presented in the con-text of the forces shaping the future of road transport.
58

59 7. Communication technologies and cybersecurity
COMMUNICATION TECHNOLOGIES AND
CYBERSECURITY 7.1 Communication technologies
Vehicle communications services are built on a variety of V2X28 standards in a similar way as Wi-Fi and cellular technologies have been implemented in smartphones, tablets and laptops. However, communication standards in the transport sector must meet much more complex requirements in terms of road safety and interoperability since people’s lives are at stake on European roads. Overall, the ultimate goal from a transport system perspective is to achieve uncompromised passenger safety and the interoperability of C-ITS services regardless of the communications standard being applied.
Following extensive work in various stakeholder fora, it has been concluded that Europe needs a hybrid approach to communication technologies, which means:
• Combining complementary technologies featuring different advantages, notably short-and long-range communication;
• Being communication-layer agnostic (i.e. the rest of the system is unaware of which communications standard is being used), thereby facilitating the integration of future technologies;
• Acknowledging that, today, this hybrid approach combines 3G/4G and ITS-G5,
both of which are mature, well-tested and widely deployed communication technologies. In addition, they are complementary as 3G/4G leverages the coverage of existing networks and ITS-G5 offers low latency for safety-related services.
This approach was reflected in the European strategy on C-ITS, adopted by the Commission in November 2016 (European Commission, 2016a).
Current V2X standards are the mature and tested ITS-G5 from the European Telecommunications Standards Institute (ETSI) and the emerging LTE-
59
Connectivity and trust will be essential elements in future vehicles, supported by vehicle-to-everything communication technologies and cybersecurity practices.

V2X from the Third-Generation Partnership Project (3GPP). Both technologies aim to operate in the 5.9 GHz radio-frequency band. However, they are not interoperable – i.e. in their current form neither of the two standards defines a mechanism to send and receive messages to/from each other.
As regards the standard specification and commercial roll-out of C-ITS services based on these communication technologies, ITS-G5 and LTE-V2X are in very different situations. On the one hand, ITS-G5 has already been tested for a decade, with commercial ITS-G5 devices already available and being deployed in Europe as of 2019 by vehicle manufacturers and EU MS on the C-Roads Platform29. On the other hand, the first technical specifications for LTE-V2X (3GPP Technical Specifications, Rel.14) were publicly released in June 201730. LTE-V2X chipsets are currently under development and testing, with test devices expected to be available in 2019.
In terms of market presence, ITS-G5 has gained an established position compared to LTE-V2X, with fully operational infrastructure and vehicle deployments across different EU MS. As regards technology performance and reliability, the situation remains unclear as there is still a lack of experimental benchmarking studies for both technologies due to the limited availability of LTE-V2X test devices. Furthermore, the impact of LTE-V2X on toll collection and the enforcement of drive and rest time for truck drivers must be examined.
Radio spectrum availability for V2V services in the EU is also challenging future vehicle communication technologies. EC Decision 2008/671 (‘5.9 GHz ITS Decision’) (European Commission, 2008) introduced harmonised conditions for the availability and efficient use of the 5875-5905 MHz spectrum for ITS safety-related applications in the EU. This is a technology-neutral decision – i.e. it does not make any particular choice about the V2X technology to be deployed in the EU. However, technology neutrality in the 5.9 GHz band means that any technology aiming to operate in this frequency band must be able to coexist with the other technologies which have already been deployed, such as electronic toll charging or the digital tachograph on the 5.8 GHz frequency band, in the same and adjacent bands to avoid harmful interference. In practical terms, this involves defining, implementing and testing spectrum coexistence mechanisms. The Commission has given a mandate (European Commission, 2017h) to the European Conference of Postal and Telecommunications Administrations (CEPT) to study the extension of the 5.9 GHz band to higher frequencies, as well as its situation in terms of coexisting among various technologies. Working groups at both CEPT and ETSI are discussing and conducting standardisation work to analyse such potential coexistence solutions. To summarise, spectrum coexistence is expected to be a major challenge for emerging V2X technologies in the years ahead, especially since uncompromised road safety, interoperability and backward compatibility with already deployed C-ITS services must be ensured in any case.
Communication standards in the transport sector must meet much more complex requirements in terms of road safety and interoperability.
60607. Communication technologies and cybersecurity

7.2 Cybersecurity
The current and future design and deployment of vehicle applications and services must include security and privacy requirements to protect critical functions such as driver assistance, collision warning, automatic energy braking and vehicle safety communications. These aspects are particularly relevant in the context of vehicle automation and connectivity, where safety hazards due to security threats are possible (and could have a significant impact). Practical attacks have already been demonstrated by research communities around the world (Miller and Valasek, 2015). Privacy aspects are also becoming increasingly important, since sensors and connectivity in future vehicles may enable the collection and distribution of data from users, thereby generating privacy risks. The need for adequate support for cybersecurity and data protection has also been highlighted by a recent EU Communication (European Commission, 2018c).
Security and privacy aspects were not adequately addressed in previous generations of automotive systems due to various factors, including:
• Economics of cybersecurity: the design and deployment of security and privacy solutions were difficult to justify from a market point of view either because they were not requested by regulatory frameworks or because of lack of user awareness.
• The vehicle was isolated from the external world because it was not connected. Electronic systems in the vehicle did not have external interfaces apart from those used by the manufacturers and workshops for testing and diagnostics purposes.
With the evolution of the automotive world towards CAVs, vehicles are going to be connected between one another or with the infrastructure. In security terminology, this means that security threats for surface attacks will grow. In other words, hackers
can exploit new connectivity interfaces to tamper with the vehicle, potentially generating safety hazards. Cybersecurity threats can be directed either at the vehicle itself and/or at the infrastructure. Infrastructure can be manipulated to provide false information to the vehicle or to provide services inadequately. For example, the EV charging system can be manipulated with denial of service (DoS) consequences for the electric infrastructure (European Network for Cyber Security, 2017).
While some cybersecurity attacks may simply be related to the activity of a research group or based on the whimsical effort of a hacker to prove his/her technical capability, there could be more serious reasons to tamper with CAVs, such as infringing a regulation. Box 6 gives an example of an AV being tampered with to provide false information.
The cybersecurity of these future vehicles is going to be very complex: the most promising approach is a combination of legislative, technical, methodological and governance aspects which must be integrated in a coordinated way.
Sensors and connectivity in future vehicles may enable the collection and distribution of data from users, thereby generating privacy risks.
6161 7. Communication technologies and cybersecurity

Below, we highlight the following actions and areas of work to foster the secure design and deployment of CAVs in Europe:
• Defining a risk-based methodology to identify and prioritise the main risks for CAVs. The methodology should take into account the cybersecurity risks to the vehicle and infrastructure providing important functions for future vehicles, including (but not limited to) traffic management, charging EVs, safety-related applications, and so on.
• Ensuring that security and privacy solutions are embedded in the design of CAVs (e.g. vehicle design). This can be achieved either by inserting specific requirements (i.e. baseline requirements) in the regulations or by ensuring that standards include such solutions to support the concepts of ‘security by design’ and ‘privacy by design’. The validation and enforcement of such designs can be ensured by the validation and certification (e.g. type approval) processes which already exist in the road transport sector and which can evolve to address the new challenges
from CAVs. Future synergies and interfaces between different infrastructures (e.g. energy grid for charging vehicles or multimodal transport for commercial vehicles) should also be investigated to ensure that adequate measures are taken before and during the deployment of future road transport technologies.
• Setting up a governance structure, which could be based on existing European and MS entities, for the definition, deployment and enforcement of processes at the European level. Cybersecurity is often a balance between the definition of adequate processes and the identification of proper solutions. Sustainable processes are needed because vehicles have a long life cycle during which new vulnerabilities can appear that must be addressed in a coordinated way at the European level.
• Promoting an international coordinated effort to support harmonised approaches at the global level, given that others like the USA, Asian countries and Australia are also working on cybersecurity for CAVs.
6262
In future, AVs will have to abide by regulations similar to those existing today. In this context, implementing and monitoring those regulations might exploit connectivity and automation. A potential scenario is an automated commercial vehicle carrying heavy loads on its journey to a manufacturing facility. The road to the manufacturing facility is relatively long, but there is a possible short cut where heavy-load traffic is not permitted. This would make considerable savings on time and would cut transport costs.
The infrastructure managers (also automated) receive data from the automated commercial vehicles to allow their passage throughout the road infrastructure. An AV is tampered with to provide false information (e.g. lower weight) from its internal sensors to the infrastructure managers, thus allowing it to use the short cut. Because of the AV’s heavy payload, a bridge on the short cut collapses, causing potentially serious hazards for other vehicles with passengers.
box 6. Regulation infringement by automated vehicles creates safety hazards
7. Communication technologies and cybersecurity

To address some of the previous actions, on 30 November 2016, the EC adopted a Communication: ‘A European Strategy on Cooperative Intelligent Transport Systems, a milestone towards cooperative, connected and automated mobility’ (European Commission, 2016a). One of the strategy’s key actions concerns the design and implementation of an EU C-ITS Security Credential Management System (CCMS) for C-ITS messages. The implementation of the EU CCMS is urgently needed for European C-ITS deployments, in both the learning and testing phase as well as for any commercial large-scale market introduction. Therefore, the EC developed a ‘Certificate Policy for Deployment and Operation of European Cooperative Intelligent Transport Systems (C-ITS)’ and a ‘Security Policy
and Governance Framework for Deployment and Operation of European Cooperative Intelligent Transport Systems (C-ITS)’ in the framework of the C-ITS Deployment Platform31.
Both policies for the definition of the EU CCMS for C-ITS in Europe have become an important part of the recently approved Delegated Regulation C(2019) 1789 final on C-ITS under the ITS Directive 2010/40/EU, which establishes the minimal legal requirements for secure interoperability between all C-ITS stations, such as vehicles and road infrastructure. Interoperability will enable all C-ITS stations to exchange messages with any other C-ITS station securely within the open and trusted C-ITS network32.
6363 7. Communication technologies and cybersecurity

8. Legislation and standardisation 64
SUMMARY
The transition to a modern and low-carbon mobility is a key focus for the EC which is embodied in its priority to develop a forward-looking climate change policy. Together with increasingly stricter regulations in terms of CO2 and pollutant emissions, the transition to CAM will require regulatory changes and new practices. For instance, aspects such as vehicle type approval, safety regulations, liability or data sharing will need to be addressed in the new CAV context. Flexible regulatory frameworks are becoming essential to cope with the rapid pace of transport disruption and to enable rapid adaptation to the needs and evidence arising during the transition. Standardisation in the transition to future mobility by road is also discussed. This chapter considers legislation and standardisation challenges in the new road transport era.
64

In order to meet EU commitments from the 21st Conference of the Parties to the United Nations Framework Convention on Climate Change, held in Paris in December 2015, the decarbonisation of the transport sector must be accelerated to ensure that GHG emissions and air-pollutant emissions are on track towards zero-emission by the middle of the century. The Commission has set out concrete actions to reach this goal (European Commission, 2016b), building on three main pillars:
1. Increasing the efficiency of the transport system by making the most of digital technologies, smart pricing and further encouraging the shift to lower-emission transport modes;
2. Speeding up the deployment of low-emission alternative energy for transport, such as advanced biofuels, electricity, hydrogen and renewable synthetic fuels, and removing obstacles to the electrification of transport;
3. Moving to zero-emission vehicles. While further improvements to the internal combustion engine (ICE) will be needed, Europe must accelerate the transition towards low- and zero-emission vehicles.
Following this strategy, the Commission adopted a wide-ranging set of initiatives as part of three ‘Europe on the Move’ packages in 2017 and 2018:
The first mobility package (European Commission, 2017e) aims to improve the functioning of the road-haulage market and help enhance workers’
social and employment conditions. This will be done by stepping up enforcement, fighting illegal employment practices, cutting the administrative burden for companies, and bringing more clarity to existing rules, for instance concerning the application of national minimum wage laws.
The second mobility package (European Commission, 2017c) includes new CO2 standards for new cars and vans to help manufacturers to embrace innovation and supply low-emission vehicles to the market and to meet targets for 2025 and 2030; the Clean Vehicles Directive to promote clean mobility solutions in public procurement tenders; an action plan and investment solutions for the trans-European
65 8. Legislation and standardisation
LEGISLATION AND STANDARDISATION
65
Main regulatory changes will be required in the transition to future mobility, especially for connected and automated vehicles, supported by flexible regulatory frameworks.

deployment of AFI; and revision of the Combined Transport Directive promoting the combined use of different modes of transport for freight, and a battery initiative.
The aim of the third mobility package (European Commission, 2018b) is to allow all Europeans to benefit from safer traffic, less-polluting vehicles and more advanced technological solutions, while supporting the competitiveness of EU industry. The initiatives include an integrated policy for the future of road safety with measures for vehicles, pedestrians and infrastructure safety; the first-ever CO2 standards for HDVs; a strategic action plan for the development and manufacturing of batteries in Europe (European Commission, 2019a); and a forward-looking strategy on CAM.
The uptake of AVs is likely to require regulatory adjustments and/or changes in well-established practices. Licensing for road testing, product safety and standardisation, data protection and cybersecurity, liability and intellectual property (IP) rights, are some of the issues that are being addressed by lawmakers or discussed at different policy levels (Holder, 2018). As regards road testing, licences are being granted in different countries to allow testing on private or, in some cases, public roads, too. It remains to be seen what impact, if any, differences in licensing conditions will have on the industry. Even more crucial is the discussion on safety and cybersecurity (see Chapter 7), and on the liability framework. Some countries (Germany and the UK33) have recently passed legislation addressing responsibility or insurance-related issues. The need for a data-governance framework has also been put forward in previous sections (see Chapter 5).
Last but not least, there may be a change of paradigm as regards IP. A recent report by the European Patent Office (EPO) shows "a dramatic rise in patent applications on SDVs [Self-Driving Vehicles] … in recent years" (Ménière et al., 2018) while also noting that a large number of applications concern areas that are usually not part of the automotive industry (e.g. tech
companies) and diverse categories of operators: from large companies to small innovators. This may require new collaborations and IP strategies that differ from established practices within the sector.
Some of the challenges mentioned above have been addressed by the EC's Communication ‘On the road to automated mobility’, published as part of the third and final mobility package34. The Communication, primarily inspired by the GEAR 2030 Final Report (European Commission, 2017g), sets out the Commission’s agenda for CAM. It announces a set of actions that will impact the framework for automated transport, dealing with, among others, issues such as vehicle approval, safety regulations, liability or data sharing.
The EU Vehicle Approval Framework – which lays down harmonised rules and principles for the type-approval of motor vehicles put into circulation in the internal market – was revised in 2018 to increase the strictness of vehicle type approval prior to their entry into the EU market (European Parliament and Council of the European Union, 2018). In the near future, the Commission is determined to work together with the MS on a new approach to certifying AVs which will be "less specific and more adapted to the evolutionary nature of these vehicles" (European Commission, 2018c).
Within the third mobility package, a revision of the General Safety Regulation (GSR) for motor vehicles has been introduced (European Commission, 2018d). The proposal "lays down specific requirements for AVs and, in particular provides a list of areas of safety, for which detailed rules and technical provisions need to be further developed as a basis for the deployment of AVs"35. It refers, among other aspects, to systems that replace the driver’s control of the vehicle, including steering, accelerating and braking; systems that provide the vehicle with real-time information on the state of the vehicle
66668. Legislation and standardisation

and the surrounding area; driver readiness monitoring systems; event (accident) data recorders for AVs; and a harmonised format for the exchange of data, for instance, for multi-brand vehicle platooning36. The proposed text empowers the Commission to adopt delegated acts to lay down requirements relating to the systems and other items listed above along with detailed rules concerning specific test procedures and technical requirements for the type approval of AVs concerning such requirements. At present, automated driving technologies can already be approved via an exemption procedure37 requested at MS level, which is then mutually recognised by the other MS. In order to harmonise the application of the exemption procedure, to ensure fair competition and transparency among MS, the EC has recently released official guidelines for type approval of AVs38 (SAE levels 3 and 4).
At the same time, a similar discussion is ongoing at the United Nations Economic Commission for Europe (UNECE) level, where a dedicated Working Party on Automated/Autonomous and Connected Vehicles (GRVA) was created under the World Forum for Harmonization of Vehicle Regulations (WP.29). WP.29 confirmed that activities on automated/autonomous and connected driving were a high priority, and established five new subgroups within the GRVA to deal with specific aspects in that area. In addition, the Commission aims to intensify coordination with MS on traffic rules and has adopted a delegated regulation under the ITS Directive to ensure secure and trustworthy communication between vehicles and infrastructure39. Finally, the Commission will also assess whether any change is needed to the regulations on driving licences, driver training or driving time.
Liability is another critical aspect that has gained prominence in discussions about the most appropriate regulatory framework for autonomous transport. At the EU level, the Motor Insurance Directive (MID) (European Parliament and Council of the European Union, 2009) and, in a horizontal way, the Product Liability Directive (PLD) (European Parliament and Council of the European Union, 1985) regulate some aspects of the liability framework that are complemented by national regimes. Evaluation of the MID has concluded that, at this stage, no adjustments are needed40. As regards the PLD, an expert group41 has been set up to examine and clarify the interpretation of key provisions of the PLD as well as to explore to what extent existing liability schemes can be adapted to the emerging market realities following the development of new technologies. The group is expected to provide guidelines on application of the PLD and to publish a report on the broader implications for potential gaps in, and orientations for, liability and safety frameworks for artificial intelligence (AI), the Internet of Things (IoT) and robotics. It must be also remembered that, in the above-mentioned regulation, the EC – following advice from GEAR 2030 – has proposed
Automated driving tech- nologies can already be approved via an exemption procedure requested at Member State level, which is then mutually recognised by the other MS.
6767 8. Legislation and standardisation

the use of data recorders for AVs to establish a clear understanding of who is driving the vehicles: the machine or the driver (European Commission, 2018c).
Connected vehicles will generate a new and large amount of data with great potential for downstream services. In this respect, the EC has confirmed that it will continue to monitor the situation and has announced its intention in the future to adopt a Recommendation on a data governance framework that will enable data sharing (European Commission, 2018c).
In addition, ethical aspects are very important as AVs should be safe and respect human dignity and personal freedom of choice. The Commission has recently set up the High-Level Expert Group on
AI which will develop draft ethical guidelines for AI, while MS have established a task force on the ethical aspects of CAVs to specify those ethical issues to be jointly addressed at the EU level.
As a follow-up to the Communication, the Commission launched a public consultation on the main challenges facing the deployment of CAVs. The consultation ultimately requested feedback on "cybersecurity threats and trust issues, data governance aspects, privacy and data protection needs, as well as the different aspects of technology needs"42.
An international comparison places Singapore, UK, New Zealand, Finland and the Netherlands as the top five countries whose legislation and policies are judged to be better prepared for AVs (Figure 20).
Sing
apor
e
7.857.60 7.53
7.30 7.27
6.92 6.90 6.826.65 6.63
6.41 6.24 6.23 6.12
5.74 5.71
4.88 4.84 4.79
4.44
3.89
3.37
2.50
1.71
1.23
Uni
ted
King
dom
New
Zea
land
Finl
and
The
Net
herla
nds
Ger
man
y
Nor
way
Cana
da
Uni
ted
Stat
es
Swed
en
Uni
ted
Arab
Em
irate
s
Aust
ralia
Aust
ria
Fram
ce
Japa
n
Sout
h Ko
rea
Czec
h Re
publ
ic
Isra
el
Spai
n
Chin
a
Hun
gary
HRu
ssia
Indi
a
Mex
ico
Braz
il
Figure 20: Country scores for AV policy and legislationSource: KPMG international (2019)
68688. Legislation and standardisation

6969
The USA’s Department for Transportation has recently released the document ‘Preparing for the future of Transportation: Automated Vehicles 3.0 (AV 3.0)’ which builds upon the former voluntary guidance ‘Automated Driving Systems 2.0: A Vision for Safety’. Their approach to safety focuses on self-certification rather than type approval.
Only some European countries are well positioned in AV policy readiness due to difficulties in adapting to the fast-changing technologies and services. Flexible regulatory frameworks will be needed so that new needs and evidence arising during the transition can be taken into consideration.
Box 7 discusses the role of standards in future road mobility.
Standards contribute to economies of scale – i.e. production and operational costs are reduced and solutions are made available to more customers – and to interoperability. While they prevent customers being locked into one single vendor, they also ensure industrial partners’ investments are supported in the long term.
A 2017 report from the UK (Fleming et al., 2017) identifies 15 priority topics for developing standards for CAVs. Among them, four achieved very high priority in terms of impact and feasibility criteria: V2V and V2I communications, traffic and road-space management, cybersecurity and verification of CAV technologies for supply chain security.
Standards help the CAV industry primarily by improving safety in AV deployment and by supporting systems integration and connectivity (Figure 21).
Further standardisation efforts are also required to ensure the interoperability of the recharging infrastructure covering fast charging beyond 50kW up to 350kW, wireless charging, charging-demand management, V2G integration and the underlying communication protocols, and roaming for EV charging, among others. This process aims to maintain the current levels of comfort, safety and seamless cross-border interoperability for users (Tsakalidis and Thiel, 2018).
box 7. Standardisation as a market enabler
Figure 21: Ways in which standards can support the CAV industrySource: Fleming et al. (2017)
8. Legislation and standardisation
Improving safety in deployment of automated vehicles
Promoting interoperability and cost benefits
Promoting coherent frameworks for CAV deployment
Promoting consumer confidence and/or addressing public concerns
Building on and harnessing existing industry strengths (e.g. expertise)
Opening up international markets for UK innovators
Fostering collaboration and openness of supply chains
Attracting inward investment
Providing an alternative to regulation
Aiding the creation of intellectual property by UK-based organisations
Other
Supporting systems integration and connectivity
Supporting infrastructure development
60%
51%
51%
50%
58%
51%
78
66
66
64
56
53
45
33
32
26
7
75
66

9. Economy 70
SUMMARY
Vehicle automation and connectivity, along with low-carbon transport technologies and sharing, have the potential to transform road transport, with varying economic implications across sectors. While it is clear that these transformations can offer clear economic opportunities, radical changes can also be expected both in our economy and society. For instance, some sectors, such as electronics and software, telecommunications, data services and digital media industries, should benefit from a greater demand for new components and new mobility services. Other impacts, such as on domestic vehicle sales, are more difficult to assess due to the complex intersectoral linkages within the EU economy and with the rest of the world. This chapter presents some of the potential economic impacts of these future road mobility trends while analysing research and innovation (R&I) and patenting trends in this context.
70

The economic sectors most likely to experience major transformations are presented in Figure 22 (Alonso Raposo et al., 2018).
Road transport is essential for economic performance: it can bring some negative socio-economic impacts, congestion being among the most costly. In 2012, a study released by the JRC (Christidis and Ibáñez Rivas, 2012) estimated that the annual cost of congestion in EU MS varied between 0.5 % and 1.7 % of GDP. Estimates for a limited number of EU countries in recent research are in line with JRC findings, ranging from 1 % to 2 % of GDP (Grillo and Laperrouze, 2013; INRIX, 2014). The cost associated with the time lost due to congestion is partly determined by the value of travel time savings, which could be considered as the traveller’s value of time (VoT). Socio-demographic characteristics, such as gender, age or income, have a significant influence on VoT (Cyganski et al., 2015; Steck et al., 2018), which can be also affected by technology disruption such as automation (Milakis et al., 2017b). Research into VoT estimations gives different results depending on the given variables. Nonetheless, it appears that VoT for AVs is lower than for that for conventional vehicles43. In (Steck et al., 2018), the estimation of VoT for AVs was 1.99€/h versus 4.49€/h for conventional vehicles. Similar although higher value trends were provided by (Van den Berg and Verhoef, 2016) where VoT for AVs would be equal to 6.26€/h versus 8.37€/h for conventional vehicles. VoT plays an important role in the business sector as it increases the cost of doing business, and freight transport is of particular interest from the automation perspective. Although research on this subject is scarce, the VoT computed for freight transport in the Netherlands was 38€/h (De Jong et al., 2014). Similarly, this would tend to decrease when automated trucks and other future road-transport technologies are deployed in the sector.
As far as the automotive sector is concerned, CAVs may increase vehicle sales in line with growth in travel activity. The higher the level of automation, the stronger the effect will be on vehicle kilometres travelled, mainly as a result of reduced driving costs (including changes in VoT) and new users, including young people, the elderly or the disabled. While this could have a positive effect on vehicle sales, it could also make congestion worse. On the other hand, the development of new shared mobility services may increase vehicle usage intensity and lead to new business models, but the resulting decline in vehicle ownership may considerably reduce vehicle sales.
While the impact of future road mobility trends on vehicle sales is currently not clear (e.g. automation increasing the consumer base but vehicle sharing reducing private ownership), it will undoubtedly change the vehicle manufacturing supply chain, favouring new components.
71 9. Economy
ECONOMY
71
The potential economic impacts of future road mobility trends vary significantly across different sectors, with engagement in research and innovation playing a key role.

Any change in the automotive manufacturing input structure would affect providers of new components and traditional suppliers in opposite directions, with further downstream supply-chain implications. CAVs will increasingly rely on sophisticated electronics, which could positively impact the electronics and software sector. Similar positive implications are expected for the telecommunications, data services and digital media sectors, as in-vehicle connectivity grows and becomes pervasive (e.g. 5G networks to support data exchange in CAVs).
Relying on a fundamentally different and less-complex power-train technology than the ICE, EVs have less moving and wearing parts (UBS, 2017) and a battery which currently represents a significant share of total vehicle costs (Bloomberg New Energy Finance, 2017b). In terms of battery raw materials, dynamic market simulations (Gómez Vilchez, 2018) show that a doubling of nickel and cobalt prices might lead to a 9 % increase in the battery price. Advances in the
cathode chemistry for Li-ion batteries, in solid-state batteries and in energy density, have the potential to mitigate the economic impact of such price shocks. Currently, the majority of battery-cell manufacturing is in Asia (Deutsche Bank, 2016), and it is very likely that this key vehicle component will have to be mainly imported into the EU, unless well-timed policy and business actions are implemented. With a Li-ion battery price of USD 209/kWh at the end of 2017 (Bloomberg New Energy Finance, 2018), the economic cost related to battery imports for deploying 217 465 EVs in the EU-2844 in the same year is estimated at around EUR 900 million45 for the car market alone. Based on the assessment of MS NPFs required by Directive 2014/94 (European Parliament and Council of the European Union, 2014), it is projected that there will be over 3 million EVs in use in the EU in 2020. The European Battery Alliance46, which features industrial battery-cell manufacturing projects in the EU, projects a battery market value of EUR 250 billion annually from 2025 onwards. In the context of
1.5
0 1 2 3 4 5 6 7
Valu
e ad
ded
bill
ion
euro
Persons employed million
Automotive (manuf. and sales)
Electronics & so�ware
Telecommunication
Freight transport
Passenger transport
Insurance
Maintenance & repair
Data services
Digital media
Power
3.1
2.5
2.1
0.30.60.8
0.4
1.7
1.4
Figure 22: State of the main sectors affected by connectivity and automation, showing value added (VA), people employed and share of VA in the total EU-28 in 2015 (the latter indicated at the centre of each bubble as %)Source: Alonso Raposo et al., (2018)
72729. Economy

this alliance, an aspirational target was recently communicated47: the European ambition to supply the world EV market with 30 % of the batteries required by 2030. Investment in EVs, including R&D, is expected to increase rapidly in the coming years (International Energy Agency, 2018a).
It is predicted that the freight transport sector will become an early adopter of CAV technologies (Wadud, 2017; Shladover, 2017 as cited in Paddeu et al., 2019), especially due to declining operational costs (e.g. salaries, fuel) and greater efficiency in logistics. Moreover, potential efficiency gains from the deployment of CAVs in freight transport would generate opportunities within the economy as a whole, as other economic sectors would benefit from lower-cost services to transport goods and products by road. Besides a modal shift48, the implications could include enhanced economic integration through higher trade intensities.
Similarly, potentially lower-cost services in passenger transport could have a wider economic impact as households might redirect consumption expenditure towards other goods and services, (depending on how future transformations affect transport demand by mode, as discussed in Chapter 3). On the downside, future transformations could be detrimental for more sustainable modes of transport in the passenger sector, such as public transport, walking and cycling (Polis, 2018). This could be detrimental to people’s health, which can also have an economic impact.
In the insurance sector, higher safety levels could lead to possible discounts in motor vehicle premiums. Based on the discounts currently applied to vehicles equipped with collision-avoidance systems (Palmer, 2015, as cited in Wadud, 2017), estimations indicate potential reductions in insurance premiums of 10-30 % in 2025 and 15-40 % in 2050 compared to today. A lower crash rate would also drive the predicted changes in the maintenance and repair sector,
with revenues falling as a result of the lower demand for crash-related repairs (Thierer and Hagemann, 2015).
Further macroeconomic impacts could also arise through a restructuring of energy supply as a result of the large-scale electrification of road transport. A shift from fossil fuels to electricity would affect the economic performance of extraction, transformation and supply activities, while lower fossil fuel imports would improve the EU’s trade balance (fluctuating strongly with oil prices) (Vandyck et al., 2018b). Large-scale electrification could also put upward pressure on electricity prices, with wider implications for consumer energy bills and the EU’s industrial competitiveness. In addition, this could have an impact on national income as taxes from fossil fuels would be reduced. On the other hand, the deployment of connected EVs as a flexibility solution for grid management could facilitate the integration of renewables (Després et al., 2017)
Any change in the automotive manufacturing input structure would affect providers of new components and traditional suppliers in opposite directions.
7373 9. Economy

and have positive cost implications (the net impact of road transport electrification on emissions of GHGs and other air pollutants will depend on the pace of the decarbonisation of the electricity supply, analysed in Chapter 11). The net impact of any of the above structural shifts on EU GDP, investment, consumption and trade balance, (as well as on sectoral employment, as discussed in Chapter 10), will also depend to a large extent on the EU’s competitive position on international markets (for vehicles, key components, fuel etc.). The EU should capitalise on and reinforce its international competitiveness in the area of sustainable and digital transport technologies.
R&I strengthen competitiveness and, in Europe, both private investments and public funds are allocated to the transport sector. Business enterprise expenditure on R&D (BERD) defines the investment made by firms which, for the transport sector49, was EUR 36.3 billion in 201550. Motor vehicle manufacturers counted for more than 80 % of the total BERD, the production of other transport equipment made up almost 18 %, and the transportation and storage sector represented no more than 1.5 %.
Figure 23 gives an insight into the geospatial distribution of road transport research funding. The scope covers a total of 342 H2020 projects, involving over 1 142 unique organisations. The circles represent the participating organisations and the total allocated funds per region are also provided. Interestingly, the figure highlights those regions that succeed in attracting large amounts of funding, and identifies clusters of beneficiaries.
Sustainable transport, in the form of more sustainable, innovative and efficient transport systems, is one of the four core research priorities of the research, innovation and competitiveness dimension of the Energy Union (European Commission, 2015a). The priority is further reflected in the Strategic Energy Technology (SET) Plan for Actions on batteries and e-mobility and renewable fuels (European Commission, 2015d).
According to the latest JRC figures (Fiorini et al., 2017; Pasimeni et al., 2018a), the EU spends more on R&I in sustainable transport technologies (batteries, e-mobility and renewable fuels)51 than other major economies, accounting for EUR 6.4 billion in 201452. JRC research estimates that the industry contributes 89 % of this investment. Two-thirds of the R&I investments from the EU private sector in the area of sustainable transport are dedicated to topics related to road-transport technologies, batteries and e-mobility (Pasimeni et al., 2018b). While in the EU the private sector provides the majority of R&I funds, in other major economies, such as the USA and China, public funds are more significant (Figure 24), estimated at 65 % and 47 % of the total, respectively, for 2014. In the international mobility competition, China, with the support of its government, is developing an ambitious
An aspi rational target was recently communicated: the European ambition to supply the world electric-vehicle market with 30 % of the batteries required by 2030.
74749. Economy

plan to create an ecosystem for mobility: it is the top world car producer (including electric vehicles) and producer of batteries and is making significant investments in shared and autonomous mobility53.
R&I engagement in transport can also be defined by the number of patents54 filed. Patent filings in technologies related to energy storage, energy management and charging of EVs55 have almost tripled globally since 2005 (Figure 25). Japan leads the trend in technologies related to energy storage, energy management and charging of EVs, with twice as many filings as in the EU, which is in
second place. Nonetheless, the EU and US have a larger share of high-value patents – i.e. more than half the patents filed from EU and US applicants are protected in more than one patent office, indicating a focus on international markets. Japan accounts for 46 % of all high-value patents since 2000, the EU for 27 % and the USA for 15 %. Applicants based in the EU tend to protect inventions in the USA and China (45 % and 27 % of the high-value inventions originating from the EU, respectively). Notable European companies in the top 20 for patent filings are Robert Bosch, ZF Friedrichshafen AG (also known as the ZF Group), BMW and Daimler, all of which are based in Germany.
EU contribution to region (million euro)
EU contribution to organisation (million euro)
1
10
20
0
5
10
15
20
30
40
50
60
70
Figure 23: Research funding for road transport in Horizon 2020 (H2020) projectsSource: TRIMIS data, including Horizon 2020 (H2020) road transport projects until December 2018
7575 9. Economy
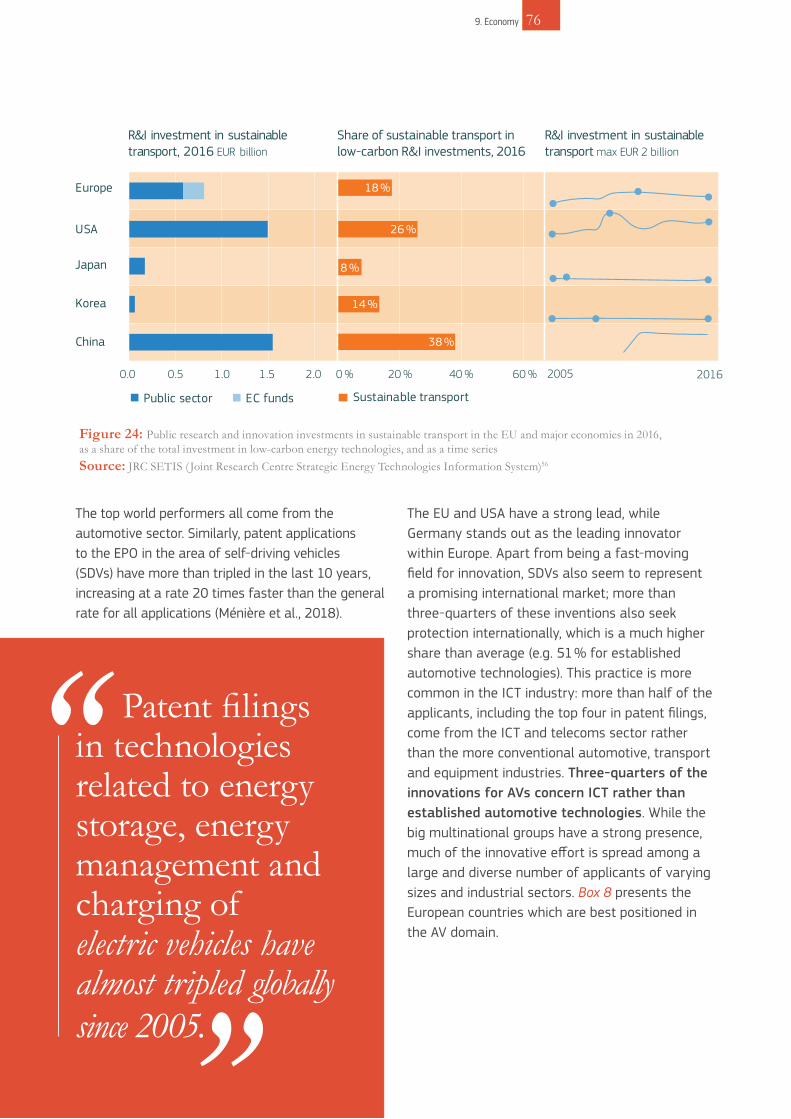
0.0 0.5 1.0 1.5 2.0 0 % 20 % 40 % 60 %
Europe
USA
Japan
Korea
China
Public sector EC funds Sustainable transport
2005 2016
R&I investment in sustainable transport, 2016 EUR billion
Share of sustainable transport in low-carbon R&I investments, 2016
R&I investment in sustainabletransport max EUR 2 billion
18 %
26 %
8 %
14 %
38 %
The top world performers all come from the automotive sector. Similarly, patent applications to the EPO in the area of self-driving vehicles (SDVs) have more than tripled in the last 10 years, increasing at a rate 20 times faster than the general rate for all applications (Ménière et al., 2018).
The EU and USA have a strong lead, while Germany stands out as the leading innovator within Europe. Apart from being a fast-moving field for innovation, SDVs also seem to represent a promising international market; more than three-quarters of these inventions also seek protection internationally, which is a much higher share than average (e.g. 51 % for established automotive technologies). This practice is more common in the ICT industry: more than half of the applicants, including the top four in patent filings, come from the ICT and telecoms sector rather than the more conventional automotive, transport and equipment industries. Three-quarters of the innovations for AVs concern ICT rather than established automotive technologies. While the big multinational groups have a strong presence, much of the innovative effort is spread among a large and diverse number of applicants of varying sizes and industrial sectors. Box 8 presents the European countries which are best positioned in the AV domain.
Patent filings in technologies related to energy storage, energy management and charging of electric vehicles have almost tripled globally since 2005.
7676
Figure 24: Public research and innovation investments in sustainable transport in the EU and major economies in 2016, as a share of the total investment in low-carbon energy technologies, and as a time seriesSource: JRC SETIS ( Joint Research Centre Strategic Energy Technologies Information System)56
9. Economy

Figure 25: Patent filings in technologies related to energy storage, energy management and charging EVs in the EU and major economies (left); and flow of high-value patents (filing for protection in more than one patent office) for five major intellectual property offices (IPOs) (right)Note: EU-28 = Europe; CN = China;, KR = Korea; JP = Japan; US = United States; ROW = rest of the worldSource: JRC SETIS (2018)
0.0
0.5
1.0
1.5
2.0
2.5
3.0
3.5
2005 2007 2009 2011 2013
Pate
nt f
amili
es/in
vent
ions
thou
sand
s
Year
Japan
Europe Korea
China
United States
Rest of the world
KR
CN
EU-28
JP
US
ROW
China
Europe
Japan
United States
Others
Korea
IPO office
Flow
of
high
-val
ue p
aten
ts
Country of applicant
The most AV-ready country is European – the Netherlands – followed by Singapore with Norway coming third (KPMG International, 2019). The study considered 25 different variables, aggregated into 4 pillars: policy and legislation, technology and innovation, infrastructure, and consumer acceptance.
In general, European countries are well positioned, especially when it comes to policy and legislation, and technology and innovation. Germany scores the highest marks on industrial partnerships and is the third country worldwide
for AV-related patents (Japan being the first). Finland and Sweden host the headquarters of most AV technology firms in Europe57. Norway, Sweden and the Netherlands have the highest market share of EVs. In terms of infrastructure, the Netherlands is predominant, not only in Europe but also compared to the rest of the world. The quality of the roads58 and density of EV charging stations are all better in the Netherlands than in any other European country. Norway also achieved a very good score, second only to Singapore, in the GSM Association (GSMA) global connectivity index for infrastructures.
7777
box 8. The Netherlands, Norway, Sweden, Finland and Germany are ready for AVs
9. Economy

10. Employment and skills 78
SUMMARY
A transition to automated driving will entail profound changes in the labour market, progressively making some occupations and skills less relevant while, at the same time, increasing demand for other job profiles. On the one hand, the production of vehicles will change (not just because of a transition towards CAVs but also due to widespread EV production). On the other hand, the transport system will undergo a transformation. Both trends will have an impact on employment and tasks in a range of economic sectors. For example, land transport and transport via pipelines is identified as the largest sector that could face transformations linked to the deployment of future technologies in road transport. The use of a tasks-analysis approach suggests the changing nature of jobs as automation is introduced – e.g. professional drivers could take on a more technical or customer-oriented role. This chapter puts forward some future perspectives for transport-related sectors in terms of employment needs, building on an understanding of the current situation and recent trends.
78
79 10. Employment and skills
EMPLOYMENT AND SKILLS
Figure 26 shows the evolution of employment in 2008-2017 in 10 sectors which are expected to be affected by the future road mobility trends that have been identified. As sector information is given on an aggregate NACE level59, it should be noted that not all those employed in some of the sectors analysed have jobs that are directly linked to the land-transport sector and, more specifically, to road transport.
With 6.02 million people employed in 2017 (2.75 % of EU-28 total employment), ‘Land transport and transport via pipelines’ (NACE code H49) is understood to be the largest sector that could face transformations linked to the deployment of these transformative technologies in road transport.
Figure 27 shows which occupations are predominant in a selection of the sectors discussed above. In the ‘Land transport and transport via pipelines’ (NACE code H49), drivers are the core occupation (ISCO code 83) with almost two thirds (65.4 %) of those employed in the sector performing the tasks required for that specific job profile. Drivers’ occupations also play an important role in ‘Warehousing and support activities for transportation’ (NACE code H52), with a 21.6 % share of employment in 2014.
While CAV technologies may well reduce demand for professional drivers, they could also help to make driving jobs more attractive and remedy current driver shortages. According to different scenarios, the current 3.2 million truck-driving jobs in Europe may decline to 2.3 million or even down to 0.5 million by 2040 (ITF, 2017). Today,
AVs cannot perform all the tasks required in most driving-related jobs and there is much uncertainty if they ever will do (Litman, 2018). What is clear is that the effects on employment will not be restricted to the land-transport sector but will impact all sectors that employ drivers, such as warehousing and support, wholesale trade or postal and courier activities. Other occupations and sectors might be affected too – for example, with an increasing labour demand for ICT professionals in the computer programming, consultancy and related activities sector. History shows that, even if the short-term effects of effective technology implementation had an adverse impact on workers (The White House, 2016), in the long run, technology advancements led to higher job creation (ITF, 2017). Recent estimations of the number of jobs endangered
79
Future road mobility trends will have varying impacts on the labour market, affecting the demand for different jobs, tasks within jobs and skills.

0.0
1 000.0
2 000.0
3 000.0
4 000.0
5 000.0
6 000.0
7 000.0
2008 2009 2010 2011 2012 2013 2014 2015 2016 2017
Land transport and transport via pipelines Wholesale and retail trade and repair of motor vehicles and motorcycles
Manufacture of motor vehicles, trailers and semi-trailers Computer programming, consultancy and related activities
Warehousing and support activities for transportation Manufacture of computer, electronic and optical products
Manufacture of electrical equipment Insurance, reinsurance and pension funding, except compulsory social security
Telecommunications Information service activities
Year
Pers
ons
empl
oyed
tho
usan
ds
Figure 26: Evolution of employment in EU-28 selected economic sectors 2008-2017 in thousandsSource: own elaborations using data from Eurostat Labour Force Survey (LFS)60
Figure 27: Occupational profiles for specific transport-related sectors for EU-28 in 2014Source: own elaborations using data from the European Jobs Monitor (EJM) database61
0 % 10 % 20 % 30 % 40 % 50 % 60 % 70 % 80 % 90 % 100 %
Manufacture of motor vehicles
Wholesale, retail and repairof motor vehicles
Warehousing and support activities for transportation
Land transport and transport via pipelines
Computer programming,consultancy and related activities
Drivers and mobile plant operators Clerical support workers Technicians and associate professionals
Managers Elementary occupations Services and sales workers
Metal, machinery and related trades workers Professionals Cra� and related trades workers
Plant and machine operators and assemblers
808010. Employment and skills

by automation range from 47 % of US jobs in one study (Frey and Osborne, 2017) to just 9 % of jobs in OECD countries by other authors (Arntz et al., 2016). The latter figure focuses on the automation of tasks within occupations and suggests the changing nature of jobs as automation is introduced.
Further impacts on employment are also expected from the electrification of road transport. A greater deployment of BEVs could reduce demand for the labour force employed in ‘Wholesale, retail and repair of motor vehicles’ (NACE code G45). Studies (Danielis et al., 2018; Mitropoulos et al., 2017; Letmathe and Suares, 2017) investigating the cost of vehicle ownership have predicted a fall in maintenance costs for BEVs of between 15-30 % compared to ICE vehicles, based on the structural differences and characteristics of these vehicles. Evidence gathered in support of the EC’s ‘Proposal for post-2020 CO2 targets for cars and vans’ (European Commission, 2017j) suggests that employment impacts could also be expected in the ‘Manufacture of motor vehicles, trailers and semi-trailers’. Based on scenarios for the uptake of various power-trains, the ‘Electric Mobility and Employment’ study (Fraunhofer IAO, 2012) analysed how electrification of the power train affects personnel structures. In all scenarios, employment is projected to be higher in 2030 compared to the starting point, although the BEV scenario is expected to be the least labour-intensive scenario in the long run. The study also highlights the positive role of hybrid vehicles in the transition phase in terms of total employment in vehicle manufacturing, resulting from a higher number of components.
The position within a country’s wage structure is a relatively good proxy for understanding how attractive a specific economic sector could be for the available labour force or young people entering the labour market (Figure 28). The deployment of future vehicle technologies in the transport sector could influence countries’ wage structures. It seems plausible that in future drivers could be required to have a more technical background and enhanced
skills and would receive a premium for those capabilities compared to the current situation. On the other hand, as AVs become more developed, it is possible that the wages of ICT workers (software engineers, database analysts, computer engineers, etc.) will rise (Cutean, 2017). However, a recent study has shown that, for the time being, the salaries of drivers working for shared mobility service providers are close to the poverty line (Ridester, 2018). It is therefore very important to monitor how this trend will evolve to protect the population concerned.
A transition towards CAVs would impact the skills required for different job profiles in some sectors, including vehicle production and maintenance and transport. This presents a challenge for education and training systems which have to equip future graduates with the necessary knowledge and competencies. It can also affect the existing workforce which might need additional training in newly required skills to make the successful transition towards new job opportunities.
While connected and automated vehicle technol-ogies may well reduce demand for professional drivers, they could also help to make driving jobs more attractive.
8181 10. Employment and skills

For example, all types of drivers will be significantly affected by CAV technologies: taxi and bus, metro, urban rail, truck, public transport and delivery drivers are all expected to lose many of their duties. In addition to potential reductions in the number of drivers needed, the role of professional drivers would be radically transformed and could turn into a more technical or customer-oriented role.
Figure 29 presents the standardised task score for the occupation ‘Drivers and mobile plant operators’ (ISCO code 83) for different sectors where this occupation represents an important part of employment. The indicators summarised are based on the framework developed by (Fernández-Macías et al., 2016). Driving tasks require low to medium skills over most areas with small peaks in technical literacy, problem-solving, and repetitive and standardised tasks, while teamwork requirements are low. The fact that technical literacy tasks are moderately high might help drivers to gather new
knowledge. Furthermore, it is relevant to note the current low levels of ICT use in the three driver groups, whereas there will be a growing demand for ICT skills in the future64.
Future vehicle technologies have the potential to change the task structure of future driving occupations. Therefore, it is of the utmost importance to identify the skillset required to master new tasks in order to support policies that ensure adaptation of the labour force to new requirements and the respective training of young professionals. According to the Skillful project (Skillful project, 2017), in a transition period where transport is partly automated, drivers will have to learn how to use automation applications and will have to become familiar with technology and information sharing in order to provide mobility services. Taxi drivers could provide e-services on the road (e.g. ticketing). At an advanced stage of automation, they could operate vehicles from control centres (ITF, 2017).
0
10
20
30
40
50
60
70
80
90
100
RO ES LU DE AT NL UK IT FR SE FI LV HR PL LT GR BE HU PT CZ DK EE SK BG SI MT IE CY
Manufacture of motor vehicles Wholesale, retail and repair of motor vehicles
Land transport sector and transport via pipelines Warehousing and support activities for transportation
Computer programming, consultancy and related activities Manufacture of electrical equipment
EU-28 countries
Ave
rage
per
cent
ile p
ositi
on
Figure 28: Relative wage position for specific transport-related sectors in EU Member States in 201462
Source: own elaborations using data from the European Jobs Monitor (EJM) database63
828210. Employment and skills

The deployment of CAV technologies could increase the number of high-skill jobs related to computer, electronics and software since the demand for IT specialists – who can create, manage and operate specific transport-related software and mobile computerised systems – will increase (Skillful project, 2017). Figure 30 presents the standardised task score for two categories of occupations pre-eminent in the ‘Computer
programming, consultancy and related activities sector’ (NACE code 62).
Both occupations exhibit a similar distribution of tasks, characterised by more pronounced peaks and troughs than the aforementioned drivers’ profile. Analytic and programming tasks are more important in the work of ICT professionals. This difference could be attributed to the fact that ICT
Figure 29: Task profile of drivers and mobile plant operatorsSource: own elaborations using data from the European Jobs Monitor (EJM) database65
Drivers and mobile plant operators
land transport and transport via pipelines warehousing and support activities for transportationpostal and courier activities
0
0.1
0.2
0.3
0.4
0.5
0.6
0.7
0.8
0.9
1
physical intellectual literacy numeracy problem solving social methods tools
stre
ngth
dext
erity
busi
ness
tech
nica
l
hum
aniti
es
acco
untin
g
anal
ytic
prob
lem
solv
ing
serv
ing
selli
ng
teac
hing
man
agin
g
auto
nom
y
team
wor
k
repe
titiv
e
stan
dard
mac
hine
s
office
ICT
prog
ram
min
g
Task content, methods and tools
Task
inte
nsity
Task content, methods and tools
8383
0
0.1
0.2
0.3
0.4
0.5
0.6
0.7
0.8
0.9
1
physical intellectual literacy numeracy problem solving social methods tools
stre
ngth
dext
erity
busi
ness
tech
nica
l
hum
aniti
es
acco
untin
g
anal
ytic
prob
lem
solv
ing
serv
ing
selli
ng
teac
hing
man
agin
g
auto
nom
y
team
wor
k
repe
titiv
e
stan
dard
mac
hine
s
office
ICT
prog
ram
min
gComputer programming, consultancy and related activities
ICT professionals ICT technicians
Task content, methods and tools
Task
inte
nsity
Figure 30: Task profile of ICT professionals and techniciansSource: own elaborations using data from the European Jobs Monitor (EJM) database66
10. Employment and skills

professionals must perform R&D activities, while ICT technicians mainly ensure the smooth running of the systems. The skills set currently required for both groups can be seen as an example of which additional skills will become increasingly demanded in the transport sector during the transition to vehicle automation – especially those skills related to problem-solving, autonomy, and office ICT. For instance, the maintenance and repair industry will require ICT skills in addition to traditional vehicle-repair skills (Thierer and Hagemann, 2015).
ICT automotive specialists, programmers and software developers will have to specialise in new programming languages for industry and mobile-phone-service applications, while mechanical and mechatronic engineers will have to acquire skills in machine learning, computer sciences and big data in response to the introduction of automation in the transport sector. It is important to note that a shortage of ICT professionals has been identified for 2020 (European Commission, 2016c).
Two new occupations – ‘system analysts’ and ‘electronic technicians and software engineers’
– have been identified as emerging during the transition to future mobility (Skillful project, 2017). While the first group will analyse the interaction between the road and vehicle, the second will develop custom software to respond to the sophistication of vehicles’ electronic and digital features. Recent labour market experiences suggest that new occupations will be mainly skewed on the higher part of skills distribution (ITF, 2017).
Several considerations concerning the training of professional drivers are presented in Box 9.
The more gradual the introduction of future mobility technologies, the higher the probability that negative implications on employment can be absorbed by European society’s economic system. A slow CAV uptake or an informative awareness campaign could enable workers to qualify on time and mitigate their transition costs (ITF, 2017). To support transition, retraining or income assistance programmes could be used (Rea et al., 2017), as well as other measures such as change management or social dialogue67.
New training programmes for professional drivers are currently being undertaken by large truck companies (for instance, Scania (Salvetti, 2017)), to keep abreast of the latest technologies (e.g. collision avoidance, driver-awareness systems) and ensure that drivers are adequately trained to use them (Yankelevich et al., 2018). The situation for small truck companies is different as they mainly rely on training provided by truck dealers. This suggests that drivers from small truck companies might need support in order to be prepared for
future technologies like automation, making this one area on which to possibly target future educational and training efforts (Yankelevich et al., 2018). However, the adoption of automation technologies might come at a later stage for small truck companies, given the high investment needed to change the fleet. Directive 2003/59/EC sets some requirements regarding the initial qualification and periodic training of professional drivers for the carriage of goods or passengers (European Parliament and Council of the European Union, 2003).
8484
box 9. Training programmes for professional drivers
10. Employment and skills

8585
The role of professional drivers would be radically transformed and could turn into a more technical or customer-oriented role.
10. Employment and skills

11. Energy use and emissions 86
SUMMARY
Future trends in road transport promise to support the reduction of energy consumption, air pollutant and CO2 emissions from the transport sector. Vehicle electrification has certainly played a major role in this respect, both in terms of contributions towards improving local air quality and overall energy consumption and CO2 emissions (including in-use and life-cycle perspectives). However, combined with the other trends, especially as regards an increase in vehicle activities, the net reduction in transport’s contribution to overall GHG emissions and energy consumption might turn out to be less pronounced than expected. Future transport governance will need to ensure that the transport sector will be able to deliver both in terms of higher efficiency and lower energy consumption. This chapter presents some implications of future vehicle technologies as regards energy use and emissions.
86

87 11. Energy use and emissions
ENERGY USE AND EMISSIONS
Transport represents almost a quarter of Europe’s GHG emissions and, together with heating, is the main cause of air pollution in cities. The transport sector has not seen the same gradual decline in emissions as other sectors: emissions only started to fall in 2007 and still remain higher than in 1990 (Figure 31). Within the transport sector, road transport is by far the biggest emitter, accounting for more than 70 % of all GHG emissions from transport in 2014. Between 2007 and 2013, there was a decline in emissions from road transport (-10 %) due – among other factors – to the economic downturn. However, since then they have been picking up and by 2016, final energy consumption in transport was comparable to that in 2005.
From the point of view of air-quality-related emissions (e.g. for nitrogen oxides – NO2, primary particulate matter), a downward trend can be observed in the period from 1990 to 2016 for the transport sector69. Nonetheless, air quality in cities is still an issue which is linked to the transport sector mainly for the increasing NO2 concentration in urban areas.
Achieving the UN’s Sustainable Development Goals (SDGs) requires reducing the pressure from the transport sector on the environment (European Economic and Social Committee, 2018). To this end, the EC defined a strategy and a series of practical legislative actions for the period 2016-2018 (European Commission, 2016b; European Commission, 2017c; European Commission, 2017e; European Commission, 2018b) (see Chapter 8 on legislation and standardisation), including new CO2 emission
targets for LDVs and HDVs for the period post-2020 (European Commission, 2017c; European Commission, 2018b)70. The strategy is complex and very comprehensive, requiring all actors involved, including cities and local authorities, to play their role in delivering it.
On 28 November 2018, the Commission presented its strategic long-term vision for a prosperous, modern, competitive and climate-neutral economy by 2050 (European Commission, 2018a). The in-depth analysis in support of Communication COM(2018)773 ‘A Clean Planet for all – A European long-term strategic vision for a prosperous, modern, competitive and climate neutral economy’ indicates that, in 2017, transport emissions, excluding international aviation and maritime, represented close to 22 % of total emissions.
87
Although future trends in road transport could reduce energy use and emissions, growth in travel activity might counterbalance such benefits.

GHG emissions from transport continue to rise and, in 2017, were 20 % higher than in 1990 (excluding international aviation and maritime). The strategy (European Commission, 2018a) makes the shift to a clean, safe and connected mobility one of the top strategic priorities to deliver on the Paris Agreement and to ensure a competitive and climate-neutral EU economy by 2050. It highlights the possibility of decarbonising the transport sector by using alternative means of transport, connected and automated driving combined with the roll-out of EVs and enhanced use of alternative fuels.
While it recognises that different types of transport will have different needs, the strategy identifies road transport as the mode where electrification could be most suitable
26 %energy supply
17 %industry
18 %land transport
11 %residential/commercial
10 %agriculture
3 %waste
3 %international aviation
3 %international shipping
10 %CO2 biomass
0
200
400
600
800
1 000
1 200
1400
1 600
1 800
2 000
1990 1995 2000 2005 2010 2015
MT
CO2 e
quiv
alen
t
-
energy supply
industry
land transport
residential/commercial
agriculture
waste
international aviation
international shipping CO2 biomass
Year
Figure 31: Greenhouse gas (GHG) emissions by source in the EU-28 in 2015 (above) and its evolution in the period 1990-2015 (below)Note: * land transport includes international aviation but excludes international maritimeSource: own elaborations based on European Environment Agency (2012) and the EC's Directorate-General for Climate Action website68
888811. Energy use and emissions

Air quality in cities is still an issue which is linked to the transport sector mainly for the increasing NO2 concentration in urban areas.
8989
(in particular for cars and vans, but also for buses, powered two-wheelers and e-bikes, and possibly urban delivery).
In 2016, liquid fossil fuels represented 95 % of the energy consumed in the transport sector: air transport and waterborne transport relied almost entirely on petroleum products, road transport depended on petroleum products for 95 % of its energy use, and rail transport for 30 % of its energy use. The EU share of renewable energy in transport reached 7.1 % in 2016.
In 2017, for the first time, petrol cars became the most sold vehicles in the EU ahead of diesel cars, constituting almost 53 % of sales.
The role of biofuels in driving down emissions is discussed in Box 10.
Biodiesel is the most widely used form of renewable energy in transport with 11 million tonnes of oil equivalent (Mtoe) in 2016, followed by bioethanol with 2.6 Mtoe. The consumption of biofuels has declined slightly since 2014 from the peak levels registered in 2012.
Biofuel mandates in the EU and elsewhere in the world require either an increase in agricultural production or a reduction in feedstock consumption by other sectors. If feedstock is made available because the use of crops for food is reduced, there is no induced change in land use although there is a conflict with food security. If feedstock production rises across the system as a result of the policy on biofuels, this will generally come with an increase in land use for agriculture, causing land-use change either directly or indirectly.
Biofuels enable a reduction in GHG emissions even though tailpipe emissions are the same
as for fossil fuels. Their GHG emissions reduction capacity is linked to the notion of ‘biogenic carbon content’ which – simply put – means the carbon released during combustion is sequestered from the atmosphere while the feedstocks were growing. Nevertheless, biofuel supply chains are dependent on fossil fuels from feedstock cultivation (including fertiliser applications) for conversion into drop-in fuels and distribution to point of use. For biofuels to contribute to net emission reductions, the sum of the carbon released by biofuels at every stage of their production and conversion and any associated emissions of CO2eq GHG must be less than the carbon emitted by using fossil fuels such as gasoline and diesel. Considering the wide variety of feedstocks and the soils on which they are grown, the performance levels in terms of emission reduction potential are different, with some enabling a reduction in emissions and others not contributing to any net savings compared to fossil fuels.
box 10. Decarbonising road transport with biofuels
11. Energy use and emissions

In 2016, renewable electricity in transport represented 1.9 Mtoe, and its contribution has recently increased significantly, with the vast majority being consumed in rail transport (only around 2 % in road transport) (European Commission, 2018a).
The average specific fuel consumption of the EU’s passenger car fleet dropped from around 7.4 litres/100km in 2005 to 6.9 litres/100km in 2015. However, the average CO2 emissions from a new car sold in the EU rose by 0.4 gCO2/km in 2017 to 118.5 gCO2/km, according to provisional data published by the European Environment Agency (EEA) (European Environment Agency, 2018a).
Going forward, the decarbonisation of road transport will be key to achieving the EU’s climate objectives.
The European Road Transport Advisory Council (ERTRAC) has carried out a study on the technical feasibility of European road transport CO2 emission reduction by 2050. Within its CO2 working group, ERTRAC experts identified detailed measures for improving vehicle efficiency, making transport smoother, and reducing transport, and assessed
their potential impacts by 2050. They also defined four road-vehicle-fleet composition scenarios with different degrees of fleet electrification (HE - highly electrified, HEH – highly electrified + hydrogen, ME – moderately electrified, and Mix – mixed scenario). JRC’s DIONE fleet impact model was used to derive quantitative scenario results (Krause et al., 2019). Figure 32 shows the resulting real-world CO2 emissions under the different fleet-composition scenarios. According to the study, ambitious reductions in CO2 emissions from road transport of more than 60 % compared to 1990 (black line in the figure), are technically achievable by 2050. In this case, a combined approach of fleet electrification and technical measures for improving vehicle efficiency, making transport smoother and reducing activity, is required.
Given the current market share and existing projects, in the study, EVs mainly refer to BEVs. However, the same results (tank-to-wheel CO2 emissions) would be achieved with FCEVs.
Alongside the EC’s long-term strategy, in the Global Climate and Energy Outlook 2018 (Keramidas et al., 2018) the JRC analysed GHG emissions in transport (not only road) looking at
0
100
200
300
400
500
600
700
800
900
1 000
EU-28 2015
Ref20162050
EUCO30,2030
40 % of1990 RD
HE Base
HEHBase
ME Base
Mix Base
HE Opt
HE Pess
HEH Opt
HEH Pess
ME Opt
ME Pess
Mix Opt
Mix Pess
References Fleet composition effect, no measures
All measures employed (A&B&C)
MtC
O2
Figure 32: 2050 road transport tank-to-wheel million tonnes CO2 emissions (MtCO2), references, base scenarios and all measuresNote: HE = highly electrified, HEH = highly electrified + hydrogen, ME = moderately electrified, and Mix = mixed scenarioSource: own elaborations based on Krause et al. (forthcoming 2019)
909011. Energy use and emissions

a broader diversification in the fuel mix across modes (electrification, biofuels, hydrogen, natural gas, synthetic fuels) as well as technological fuel-efficiency gains and other operational improvements. The results of the study show that global GHG emissions in transport could be halved between 2015 and 2050, contributing to mitigation of global warming to 2 °C and below by the end of the century (Figure 33).
From all the scenarios analysed in the different studies, it is clear that a significant contribution to reducing CO2 emissions from transport will come from vehicle electrification. The new European CO2 targets for passenger cars set an ambitious 37.5 % reduction of CO2 emissions in 2030 compared to 2020 levels – this cannot be achieved without a significant market share of PHEVs, BEVs and FCEVs. This will be possible thanks to a significant reduction in the vehicle price expected in the coming years (Gómez
Vilchez et al., 2017; Arbib and Seba, 2017) and to the wide availability of recharging points for users (European Parliament and Council of the European Union, 2014).
In addition to CO2, EVs will have an immediate effect on air quality as they come with no tail-pipe emissions, even if non-exhaust emissions from traffic remain, and there could be a switch of emissions from cities to rural areas where energy is produced (depending on the mix of energy sources used). In any case, where there is maximum human exposure (namely in the city centres), EVs represent a plug-and-play solution to improve the current situation. The JRC studies highlight the potential for synergies between air quality and climate policy, both in the global context of the Paris Agreement (Vandyck et al., 2018a, Kitous et al., 2017) and at the city level for the Covenant of Mayors (Rivas et al., 2015; Monforti-Ferrario et al., 2018).
9191
Emiss
ions 2
015
Mobilit
y
Non-C
O 2
emiss
ions
Biofu
els
Hydrog
en
Foss
il fue
ls sw
itch
Electr
ificat
ion
Energ
y effi
cienc
y
Emiss
ions 2
050
0
2
4
6
8
10
GtC
O2-
eq
8.0
2.7-0.1
-0.7-0.7
-0.8
-1.5
-2.94.0
Drivers Options
Figure 33: Transport GHG mitigation options from 2015 to 2050, central 2 °C scenario, world, in billion tonnes of CO2 equivalent (GtCO2-eq)Note: ‘Mobility’: greater emissions due to the growth in population and the economy (passenger and freight traffic). ‘Hydrogen’, ‘Biofuels’, ‘Electrification’: emissions prevented by the use of these fuels (emissions from their production accounted elsewhere). ‘Fossil fuels switch’: substitution of oil with natural gas and synthetic methane – includes international aviation and maritime bunkers.Source: POLES-JRC 2018 (Keramidas et al., 2018)
11. Energy use and emissions

Returning to CO2, it is important to underline that the effectiveness of EVs in reducing overall CO2 emissions also depends on the energy mix used to produce electrical energy and on the CO2 emissions from vehicle production and end-of-life (EoL) (namely from its entire life cycle). A recent study from the International Energy Agency shows that when analysing the current energy production mix in the 35 most-developed countries, on average, EVs are able reduce overall CO2 emissions by 25-30 % (International Energy Agency, 2018b). Bearing in mind the improvements that will also come from the electric energy production sector, it is expected that this improvement will be even higher in the future.
If the EV market evolves as expected, the future challenge will certainly be in the effective management of the electricity grid which will need to cope with peaks of increased demand when thousands of vehicles simultaneously request electric energy to recharge their batteries (Paffumi et al., 2015). Support for this problem may come from FCEVs, where the production of the energy carrier and refuelling the vehicle does not need to happen simultaneously, as is the case for grid-based recharging of EVs. Whether FCEVs will reach sufficient maturity to enter the vehicle market on a large scale and a reasonable price remains to be seen.
Finally, in addition to a change in the vehicles’ power train, energy efficiency gains can come from the intensity of transport activities and vehicle operations.
Reducing transport activities can be achieved either by promoting life and work models which are less dependent on physical displacement, such as teleworking, video- or teleconferencing, etc., or by combining the transport and mobility needs of goods and people to cut the number of vehicles used. Public transport systems, ride-sharing and car-pooling are all initiatives moving towards reducing the number of vehicles required
to serve the same transport demand. As already mentioned, the complexity of the transport sector may jeopardise the effect of some of the aforementioned strategies (e.g. as recent evidence has shown (Barrios et al., 2018), if ride-sharing services attract large numbers of people from public transport, they will lead to an increase in overall energy consumption and pollution). Therefore, a new and more comprehensive governance of the transport system will be needed which aims to optimise the number of vehicles to serve the overall transport demand. Interestingly, support for this may also come from EV deployment. Indeed, a recent survey (Donati et al., 2015) has shown that EV users tend to be more parsimonious than others about the choices they make (in terms of distance travelled and use of the car). As discussed previously, affecting users’ perception of freedom with respect to their private or individual vehicle and their travel choices is the first and most effective way to reduce car use and therefore the related negative impacts of transport.
The way in which a vehicle is operated introduces a very high degree of variability and unpredictability into energy consumption calculations71. Lighter and more aerodynamic vehicles will have better fuel economy, as will better road infrastructures. Truck platooning, for example, can reduce the energy consumption of vehicles following each other closely by reducing the aerodynamic resistance of the vehicles in the platoon (Alam et al., 2015)72. In addition, it is well known that improvements in traffic flow have a positive effect on fuel consumption. In reality, this is true for the ICE. EVs have a totally different efficiency pattern, the effect of which is clearly shown in Figure 34. The two curves for ICE vehicles achieve a minimum fuel consumption of between 100 and 120km/h. However, the minimum energy consumption for EVs is achieved at a much lower speed (30-50km/h). Thus, any improvement in traffic flow will increase the electric energy consumption.
929211. Energy use and emissions

By combining the different factors contributing to energy consumption, a recent study has found that the reduction in energy consumption of vehicles that are electric, connected and automated can be lower than normally expected (in the order of 9 % (Gawron et al., 2018)). This means that if CAVs increase road capacity and more vehicles are attracted to the road, CAVs’ overall impact on total energy consumption is likely be negative. Along these lines, a recent microeconomic study has shown that the additional travel demand induced by CAVs can generate a rebound effect able to increase the overall energy consumption in road transport by up to 30 % (Taiebat et al., 2019). Similar dynamics may arise from the introduction of new transport options for last-mile freight delivery services (such as drones and automated robots). In spite of their limited size and weight and their potential to take LCVs off the road, drones are forced to go back to their hive due to limitations in weight and range (e.g. up to 2.3 kg and 16 km, according to Paddeu et al., 2019), which can lead to higher energy consumption than that of conventional diesel vehicles (Figliozzi, 2017). Clearly, it is important to consider future transport governance where all the actors and solutions must be coordinated to achieve a system as efficient as possible for both its quality of service and its environmental impacts.
The additional travel demand induced by connected and automated vehicles can generate a rebound effect able to increase the overall energ y consumption in road transport by up to 30 %.
9393
0
0.1
0.2
0.3
0.4
0.5
0.6
0.7
0
2
4
6
8
10
12
14
16
0 20 40 60 80 100 120 140
Elec
tric
ene
rgy
cons
umpt
ion kW
h/km
Fuel
con
sum
ptio
n l/1
00km
Average speed km/h
PC-ICE LCV-ICE PC-EV LCV-EV
Figure 34: Relationship between speed-fuel consumption (for internal combustion engine ICE vehicles) and speed-electric energy consumption (for electric vehicles EVs) for two vehicle categories (passenger car, PC and light-commercial vehicles, LCV)Source: own elaborations based on Fiori et al. (2019)
11. Energy use and emissions

12. Sustainability of material supply 94
SUMMARY
Future road-based mobility trends will imply dramatic changes in the technologies used both at the vehicle level (e.g. car, truck, bus, vans, two-wheelers or totally new equipment) and at the infrastructure level (roads, communication infrastructure, charging stations, specialised parking areas, etc.). While transport will become progressively free of its dependency on fossil fuels, new technologies will rely intensively on a variety of raw materials. Some of these have been flagged as critical for the EU economy, as well as different speciality materials which are largely produced outside the EU. In many cases, the availability of such materials is currently limited and controlled by a few countries. After a long-lasting dependence on oil-producing countries, the EU risks becoming subsidiary to new countries controlling the mining and refining of raw materials. The real risk is that certain raw materials could become the ‘new oil’ (Simon, 2018). This chapter discusses a shift in the environmental impacts from the use phase of vehicles towards their manufacturing and end of life (EoL) stages, highlighting the importance of implementing a life-cycle thinking approach. The efficient and clean recycling of materials at the EoL will reduce the pressure of material supply risks and contribute to the sustainability of future mobility.
94

95 12. Sustainability of material supply
SUSTAINABILITY OF MATERIAL
SUPPLY In line with current EU raw materials policy73 and SDG objectives, future mobility will have to rely on a sustainable, continuous and adequate supply of raw materials. A sustainable supply means being able to meet the demands from the economic sectors, without compromising natural and social systems. Supply can be assured by materials extracted within the EU (e.g. opening new mines or ramping up existing ones), by the sustainable supply of materials from non-EU countries, and by the provision of secondary raw materials from recycling waste and products in stock (the so-called urban mining74).
Access to materials at reasonable prices will be necessary to prevent them from becoming a bottleneck in the development of new technologies and ambitious future mobility scenarios in the EU (Blagoeva et al., 2016). Hence, a challenge for future mobility is to ensure a stable supply of materials to meet the demand arising from new transport technologies and services. Special materials are essential for several key functions and components of future mobility technologies, in particular: batteries (essential for electrification), magnets (for high-efficiency engines), electronics (for connectivity and sharing), sensors (for automation and connectivity), and lightweight structural parts (for electrification and overall for robust and efficient vehicles and infrastructures). Supply risks for mobility concern several materials (e.g. Co, B, In, Mg, Pt, Pd, Ta, Sc, V, graphite and rare-earth elements), which have already been
95
A challenge for future mobility is to ensure a sustainable and responsible supply of raw materials to meet the demands of new technologies and services.
TODAY FUTURE MOBILITY
OIL
LINEAR
production
userecycle
usenon-recyclable waste
USE PHASE
MATERIALSLi
Mg
V Mn Co Ni
Pd
W
Nb
Pt Au
Ag
Cu
CIRCULAR
LIFE CYCLE
DEPENDENCY
ECONOMY
FOCUS
production
end of life
useproduction
use
end of life
production

identified as ‘critical’ for the EU75. Other materials could become critical in the near future (e.g. Li, Mn, Ni, Zr) due to their increased use in new technologies. The supply risks associated with electrification are discussed in Box 11.
There is also a high risk that materials strategic for the transition to low-carbon mobility will fuel conflicts in the world. In 2016, 55 % of the world’s
cobalt was mined by the Democratic Republic of the Congo (DRC)77, including cobalt which was also mined illegally there. It is likely that the DRC will remain the main cobalt supplier in the future (Alves Dias et al., 2018). Since cobalt mining in the DRC has so often been linked to violence, the mineral has been dubbed the “blood diamonds of this decade” (Church et al., 2018). Despite the low percentage (below 5 % of global supply), illegal
9696
The electrification of mobility will redefine, in particular, the market in traction batteries. The demand for lithium, cobalt and graphite is expected to increase exponentially in the coming decades (especially if the current battery technology is maintained). Future demand for several rare-earth elements (e.g. neodymium, praseodymium and dysprosium) will also grow as a result of their use in permanent magnets for electric motors (assuming the adoption of current technologies). On the other hand, the demand for some materials, such as platinum and palladium used in catalytic converters, is expected to decline
(Lenson, 2016). Based on 2030 forecasts for the market penetration of EVs, it is estimated that the demand for lithium, cobalt and graphite will increase by about 25 times, and the demand for rare-earth elements by 10 times (Figure 35). These growth rates may be even higher if based on latest and more ambitious scenarios describing the uptake of EVs in 2030 and beyond76. However, the estimated demand for raw materials needed for developing electrification could be lower than expected if, for example, greater vehicle sharing in future mobility scenarios leads to significantly fewer EVs being used.
box 11. Material supply in electrified mobility
Figure 35: Demand forecast in the EU for selected critical raw materials for the BEV, PHEV and HEV sectorsSource: European Commission (2018e)
EU m
ater
ial d
eman
d fo
r hy
brid
and
ele
ctric
veh
icle
s to
nnes
EU m
ater
ial d
eman
d fo
r hy
brid
and
ele
ctric
veh
icle
s to
nnes
22k
20k
18k
16k
14k
12k
10k
8k
6k
4k
2k
0k
220k
200k
180k
160k
140k
120k
100k
80k
60k
40k
20k
0k
800
700
600
500
400
300
200
100
0
2015 2030 2015 2030 2015 2030 2015 2030 2015 20302015 2030
Lithium Neodymium Praseodymium Dysprosium
Technology BEV PHEV HEV
Cobalt
Battery Electric traction motorGraphite
2 565 %
2 382 %
2 577 % 954 %
941 % 937 %
12. Sustainability of material supply

9797
cobalt in the supply chain has greatly concerned battery end-users, mainly due to the corporate social responsibility impact on their businesses (Oxford Institute for Energy Studies, 2018). In future, sustainable manufacturing will avoid producing efficient and comfortable vehicles at the cost of social impacts on other countries. On the contrary, for future mobility to be environmentally and socially sustainable, the supply of critical materials should represent an opportunity for growth in several developing countries.
The development of new shared mobility services could unlock new and more resource-efficient solutions. For example, used traction batteries can be removed from EVs to be remanufactured and reused again in new vehicles. Alternatively, used batteries can be repurposed for stationary energy-storage applications (e.g. in residential or office buildings) to reduce the costs of storing energy systems in buildings, especially those equipped with renewable energy plants (Podias et al., 2018). Used batteries can also be extracted from vehicles for material recycling.
Reused solutions (for batteries or other vehicle parts) will ensure a more efficient use of raw materials overall. Remanufacturing, in particular, already represents a resource-efficient practice for reusing mechanic and mechatronic components. The 30 million spare parts remanufactured for cars and trucks each year represent more than 50 % of spare parts overall, and have a market value of about EUR 12 billion (Weiland, 2012). In future, more remanufacturing processes are expected for electronic components, batteries and permanent magnet motors. These parts can be directly reused provided that design-for-disassembly strategies are adopted to facilitate their extraction from EoL vehicles.
Overall, if vehicles and systems are well designed, such resource-efficient solutions are likely to partially reduce pressure on the supply of raw materials. Currently, this potential is only being exploited in part as these strategies are only
beginning to emerge in the EU. However, they still have huge potential, especially for future big mobility companies managing large fleets of vehicles.
Stocks of EV batteries in the EU (red arrows in Figure 36) could increase dramatically by 2030 as the result of higher sales, remanufacturing and second uses. Although extending the lifetime of batteries (through remanufacturing and repurposing) could ensure more efficient use of raw materials, it might significantly delay the availability of secondary raw materials such as cobalt and lithium (Bobba et al., 2019). Reuse and recycling practices will have to be synergistically optimised since reused components will have to be recycled when their performance becomes too low. In the coming decades, it is expected that recycling processes for batteries will rapidly develop in order to optimise the recovery of raw materials (including fractions currently being lost) and the production of high-quality secondary raw materials (Mathieux et al., 2017).
The demand for novel raw materials combined with the progressive abandoning of fossil fuels for operating our future mobility will imply a shift in the environmental impact from direct emissions during the use phase of vehicles (as discussed in Chapter 11) towards their manufacturing and EoL stages, as well as to indirect impacts (due to e.g. electricity production). As anticipated in Chapter 11, the adoption of life-cycle thinking78 allows for consideration of all the environmental impacts arising along the entire supply chain – from the extraction of raw materials to their processing during manufacturing, to the use phase up to vehicle disposal. This approach avoids future mobility shifting environmental impacts from one life stage to another or from one type of impact (e.g. climate change) to another (e.g. human toxicity). Life-cycle thinking implies taking into account all the different impacts that can arise from mobility, such as the potential effects on, among others, climate change, air quality,
12. Sustainability of material supply

human toxicity, eutrophication, resource and land use. Life-cycle thinking is also closely connected to the closing-the-loop target to achieve a circular economy (European Commission, 2015b). Synergistically applied, these concepts enable the identification and optimisation of the above-mentioned resource-efficient solutions to reduce the overall impacts of future mobility.
Following a life-cycle approach, research was done into the environmental impacts of current EU mobility and future scenarios up to 2030 (Sala et al., 2019). This analysis assumed an increase in the future transport demand with constant material efficiency within the mobility system. The study concluded that the share of the impacts, for life-cycle stages other than the use stage (i.e. vehicle production, EoL, infrastructure production), could increase up to 220 %, depending on the type of impact considered. Among the emerging concerns, the growing use of critical and precious raw materials (such as gold used in sophisticated electronics for control, power conversion and battery management systems) was identified. If these additional material consumptions are achieved, they would provoke an increase of more
than 30 % of the life-cycle impact on mineral and metal resource consumption79 and freshwater eutrophication. However, considering that future mobility may entail more efficient and circular use of materials in the vehicles’ life cycle, there may be potential benefits. Indeed, the improved efficiency of future mobility could reduce the overall impact of transport. For example, a recent study (Gawron et al., 2018) estimated that CAV subsystems could increase vehicle primary energy use and GHG emissions by 3–20 % (due to increases in power consumption, weight, drag, and data transmission). However, when the potential operational effects of CAV systems are included, the net result is a reduction of up to 9 % in energy and GHG emissions in the baseline case.
Another study (Soo et al., 2015) investigated how measures to reduce vehicle emissions in the use phase (as lightweight materials and multi-material components) have consequently created long-term problems in terms of difficult recycling of the waste using current technologies. To improve the resource efficiency of future vehicles, additional efforts should be focused on better designs for disassembly and recycling solutions, such
9898
Figure 36: Modelling of traction battery stocks and flows in the EU in 2030 taking into account a high development scenario for repurposing; the arrows’ thickness is proportional to battery flowsNote: the arrows’ thickness is proportional to battery flowsSource: own elaborations based on Bobba et al. (2019)
12. Sustainability of material supply
EV sales
batteries in EVs
recycling
SRMs
to p
rodu
ctio
n
batteries from car dealers (spent)
remanufacturing
second-use
batteries stock
EV stock

as reducing the use of metal accessories and fasteners, and facilitating the dismantling and recycling of interior and exterior trims (Tian and Chen, 2014).
The production of traction batteries will also be key for the sustainability of future mobility. For example, Li-ion battery manufacturing (using composite cathode material for PHEVs) was relevant for all the impact categories assessed (Cusenza et al., 2019), while recovery of valuable materials (e.g. cobalt and nickel sulphates) and other metal fractions (e.g. aluminium and steel) are particularly relevant for several impact categories.
To summarise, the transition towards sustainable mobility in EU should be based on two pillars. First, greater attention should be paid to making
production and vehicle EoL more efficient and reducing the related environmental impacts. Secondly, these benefits should not be nullified by more demand for mobility services. Greater impacts resulting from the manufacturing of new and more technologically advanced vehicles can be offset by improving the resource efficiency of the transport sector by means of more reuse and recycling. To benefit all those concerned, future automated, connected, decarbonised and shared mobility will need to address the social and environmental impacts due to the sourcing of raw materials for the vehicles. It will also have to be circular and optimised from the life-cycle perspective for the vehicles. It is only under these conditions that future automated, connected, low-carbon and shared mobility will be able to contribute positively to achieving the SDGs’ high targets.
The adoption of life-cycle thinking allows for consideration of all the environmental impacts arising along the entire supply chain.
9999 12. Sustainability of material supply

13. Privacy, democracy and social fairness 100
SUMMARY
Research into the wider impacts of CAVs is still at an early stage, especially as regards their implications for society and its values. CAVs are expected to reduce travel costs, increase accessibility, change land-use patterns and location choices as well as induce sustainability-oriented modal shifts in mobility (Milakis, 2019). CAVs may be beneficial in terms of social equity, providing access to private mobility for user groups currently not able to access it, such as the elderly or disabled. At the same time, CAVs and other new mobility solutions raise issues in terms of privacy, democracy and equity. As CAVs utilise multiple sources and sets of digitally stored personal data, keeping both personal and proprietary information safe is a key issue. CAVs will impact social hierarchies as they will change the use of public space, land-use patterns, living and working location choices, etc. They can either offer or limit physical mobility to specific social or identity groups. Their behaviour will not be fully predictable, thereby raising concerns of accountability and transparency, to mention but a few. Responsible innovation and good governance of CAVs must address the complexity of the issues at stake and try to create versatile mobility ecosystems that disrupt the monoculture of ‘automobility’ and respond to the potential benefits of other forms of sustainable and quality-of-life-focused mechanised and non-mechanised personal mobility. A network of European living labs can enable the introduction of new transport opportunities with the direct engagement of citizens to verify their usefulness in achieving the transport improvements they promise. This chapter sheds some light on the social dimension of the transition to CAM.
100

101 13. Privacy, democracy and social fairness
PRIVACY, DEMOCRACY AND SOCIAL
FAIRNESS Technologies, including self-driving ones, are not autonomous – they (are made to) shape the worlds they are embedded in. CAVs are permeated with visions of the world in which they are deployed. As previous research has shown (Urry, 2004), automobility is a self-organising, non-linear ‘technosocial system’ that spreads the world over and includes cars, drivers, non-drivers, roads and roadside infrastructure, petroleum and electric supplies, multifold artefacts, technologies, signs as well as regulatory apparatus. It also has profound impacts on the social aspects of work, entertainment and family. Suburbanisation, for instance, has been one impact of the car culture: the automobility culture has had wider social effects beyond providing seamless and effective mobility. It has created the automobile city, transforming the time-space ‘scapes’ of the modern urban/suburban dweller (Sheller and Urry, 2000) as well as the automobile ‘subject’, together with his desires and performance of status, man/womanhood and power (Böhm et al., 2006).
Therefore, transition to CAVs, as well as any transformation in the transport sector, should take into consideration social science findings about the challenges and impacts of an automobility-dominated urban environment. CAVs may make demands on building new infrastructures, improvements and redesign of roads, regulation and human behaviour. They will also demand new skills and responsibilities from both users and non-users. Responsible innovation and good governance of
CAVs must address these challenges while trying to create versatile mobility ecosystems that disrupt the monoculture of automobility and address the potential benefits of other forms of sustainable and quality-of-life-focused mechanised and non-mechanised personal mobility. Beyond the arguable benefits that CAVs will bring, reflecting on the transition must address questions about how CAVs will be embedded in society, as well as anticipating the social impacts beyond transport issues. Innovation and policy dealing with future transport challenges should create a responsive ecosystem involving and engaging different stakeholders who will be impacted by unforeseen changes in the social constellations created by new transport arrangements.
101
Responsible innovation and good governance of the future road transport system must address the multiple complex societal issues at stake.

This chapter considers the possible implications of future mobility solutions on privacy, democracy and equity. As will be discussed, when considering the potential issues at stake, the creation of regulatory sandboxes and living labs is advised where new technologies and mobility solutions can be tested with the engagement of citizens and other stakeholders, allowing them to observe and influence any possible implications.
13.1 Privacy
CAVs and other connected mobility options collect, store and use data in multiple ways. The principles of ‘privacy-by-design’80, and ‘privacy-by-default’81 should apply without any manual input from the end-user. The application of such principles must be reassessed time and again to fit both the societal expectations of privacy and developments in data applications in technology. Privacy-by-design should apply to broad sets of data, including personal identification, location- based service (LBS) data (location and time,
destinations, travel time, etc.), LBS derivatives (habits or characteristics based on LBS data), video and audio surveillance and derivatives, pass-through (e.g. emails, photos, passwords, websites, music, videos, etc.), to name but a few. The principles of privacy must apply to a broad number of stakeholders who provide, use and store such data, including users, manufacturers, operating systems/control and application systems developers, mobility-as-a-service providers, maintenance and repair companies, insurance companies, enforcement agencies and regulatory bodies, once again to name but a few.
To keep up with innovation in CAVs, traditional automotive manufacturers are transforming their business models. Besides hardware, they are also producing innovative software that leverages the immense amount of data CAVs will generate to continuously improve CAV services for users. Under the EU’s General Data Protection Regulation (GDPR), any entity processing personal data on behalf of data controllers will also have direct obligations to safeguard privacy and data use. Stakeholders across the CAV value chain will need to enter into carefully structured agreements which identify each party’s obligations regarding the use and protection of personal data and the apportionment of risk where data breach may occur. This is particularly important as authorities can impose fines of up to 4 % of annual global turnover for breaches of principles governing data processing and data subjects’ rights under the GDPR.
Gaining the trust of stakeholders is key to the successful transition to CAVs. If users do not trust the fact that their personal data is protected and adequate safeguards have been put in place to ensure security and privacy, they will opt out of data use and sharing. This would significantly restrict the improvement of CAVs and the usability of their services. Stakeholders will conduct comprehensive data-protection impact assessments, analyse any potential exposure under the applicable data-protection legislation
Any entity processing personal data on behalf of data controllers will also have direct obligations to safeguard privacy and data use.
10210213. Privacy, democracy and social fairness

and implement appropriate measures to ensure ongoing compliance. Such measures are to be applied as early as possible in the development of new CAV technologies, as privacy-by-design is an essential part of the GDPR.
As CAVs are fully connected to the world around them, the risk of hacking and security breaches is growing. This is important as it is not only personal data that may be compromised but lives may also be put at risk. During the process of CAV transition, manufacturers and other players across the CAV value chain must work closely together with regulators, certification entities, other key stakeholders and user organisations to establish a clear set of guidelines over the short to medium term and a formal set of regulations over the long term. Regulatory sandboxes may be applied to experiment with more flexible regulatory arrangements.
13.2 Democracy
Democracy is usually defined as a political system that provides the opportunity to choose and replace a government through free and fair elections; the active participation of the people, as citizens in political and civil life; protection of the human rights of all citizens; and a rule of law in which the law and procedures apply equally to all citizens (Diamond, 1999; Diamond, 2004). This may be translated into technology and mobility transitions as special attention to political and social fairness, social inclusion, privacy and human rights, as well as the transparency and accountability of all processes related to innovation and mobility.
Automobility has been dominated by economic visions of competitiveness and efficiency as well as social imaginaries of status, independence and comfort. It has arguably added social benefits while, at the same time, creating serious inequalities, social uncertainties and negative environmental impacts. (Re)creating a connected, automated and omnipresent car-dominated
mobility ecosystem may impact citizens in multiple ways. Point-to-point CAM will limit situations of social inclusion by using ever-more public space for mobility infrastructure. Efficient and seamless transport systems may limit participation in the political process by hindering the access of specific cultural or social groups (either by pricing them out of using such systems or because they lack the skills to use them), as well as severely restricting the availability and use of public spaces for social and political interaction.
As vehicles will be fully connected and users will not be driving, CAVs may also increase access to politically and socially relevant information through social media and other social platforms increasing the challenges posed by ‘filter bubbles’ (the intellectual isolation that can occur when platforms use algorithms to select information it is assumed a user wants to see), further
Efficient and seamless transport systems may limit participation in the political process by hindering the access of specific cultural or social groups.
103103 13. Privacy, democracy and social fairness

assisting the spread of a post-truth and post-trust political culture (Bozdag and van den Hoven, 2015). Therefore, innovation, development and the deployment of CAVs must anticipate and respond to potential social impacts on democratic principles such as accountability, transparency, trust and social inclusion.
At the opposite end of the spectrum, the benefits of future mobility, enhanced access, the declining social exclusion of vulnerable groups, connectedness, and sharing, may enhance political participation, engagement, and political inclusion, thereby widening the democratic process (Vecchio, 2017).
To avoid the traps of policy push and regulatory blockage, regulatory sandboxes and living labs should be created in which innovators, citizens and other stakeholders may experiment together with new technologies. Involving and engaging knowledge of diverse stakeholders will ensure that innovation in CAVs includes complex social impacts and uncertainties. Regulators will learn and adjust regulatory regimes since CAV deployment requires constant regulatory adaptation.
Beyond ethical considerations, societies have not yet found ways to meet societal concerns and expectations when developing new technologies that include machine learning, AI and multidimensional connectivity. For example, CAVs use machine learning to address the complexities of driving in different environments, terrains and social settings. In this sense, CAVs are not finalised products or fully formed technologies, nor will they ever be. The algorithms that drive CAVs are continuously updated with new data to handle any eventuality that may arise on the move. Machine learning in specific CAVs may be a fleet learning – any information that helps the system to better understand eventualities will be shared with all other CAVs within a specific, privately owned fleet rather than across the entire mobility system. One of the challenges to the democratic process lies in this ‘privatisation of learning’, which jeopardises
both public trust and the potential long-term benefits of CAVs discussed in previous chapters.
The politics of algorithms, also in transport technologies, is key for the future of democracy. In many ways, algorithms tend to be ‘black boxes’: devices which can be viewed in terms of inputs and outputs but without any knowledge of their internal workings. In addition, as algorithms that enable CAVs to navigate the complexities of their environments become more specialised and complex, even their creators may no longer be able to understand them. Algorithmic accountability in terms of the legibility of algorithms is a major challenge. Algorithms in CAVs are tasked with engaging with uncertain and complicated
Involving and engaging know-ledge of diverse stakeholders will ensure that innovation in connected and automated vehicles includes complex social impacts and uncertainties.
10410413. Privacy, democracy and social fairness

environments, the complexities of which cannot be captured by a set of simple and formal rules. Therefore, a ‘right to explanation’ (Goodman and Flaxman, 2016) is required as algorithmic decisions may have a profound impact on people’s lives.
In addition, incorporating social and ethical values, as well as other societal concerns must be reflected in the design of CAVs as AI systems. For CAVs to be safe, trusted and accepted, AI should be designed to take up ethical considerations and moral consequences in an accountable, responsible and transparent way82. This may include ethical considerations beyond privacy and data security, including ethical dilemmas in different road-use situations impacting different stakeholders. Similar to privacy-by-design, ‘values-in-design’ (Friedman et al., 2006 in Zhang and Galletta, 2006) methodologies are to be applied that have human values as their main focus. This process is a theoretically grounded approach to technology design that accounts for human values in a principled, systematic and comprehensive manner.
Following the principles of accountability, responsibility and transparency (ART) in algorithmic decision-making that enable CAVs to operate, special attention must be paid to democratising the process of (social) learning. Advances in machine learning should be made public and shared across the whole system and must not remain proprietary to just one company or technology provider. Frameworks and processes of responsible research and innovation (RRI) (Von Schomberg, 2013 in Owen et al., 2013) should be applied, paying attention not only to the risks and challenges of new technologies but also to public concern as to how and why specific innovations happen in autonomous mobility systems.
It is also interesting to note that disruptive technologies, CAVs included, claim to offer solutions to past social pathologies of technological development, such as inequality,
social exclusion or ethical dilemmas. Innovation in CAVs suggests a special form of ‘solutionism’ that frames the present as deficient as regards a specific mobility technology fix that will provide an appropriate, technologically and socially beneficial solution – a situation referred to as ‘technopoly’ by Postman (Postman, 1992). This is exemplified by claims that CAVs can provide a solution to human driving mistakes. While the number and gravity of accidents will probably be reduced, other problems, ethical challenges and social contingencies will emerge. Institutions and individuals need to build and develop an appropriate reflexive capacity to diverge from a technology-fix approach and focus on social learning, complex assessments of impacts and responsiveness to challenges thereof, both in the sense that people learn and assess impacts socially and that societies learn, reflect and respond constantly.
13.3 Social fairness
CAVs are also discussed as vehicles for social improvement (Bilger, 2013). They are promoted as offering social benefits beyond efficiency, sustainability and connectivity. It is suggested that automation technologies practically remove the barriers to driving. They may enhance the potential mobility of those who are prevented from driving, such as the elderly or underaged population, people with medical conditions or those without a driving licence. Existing in-vehicle autonomous technologies, such as collision warning, lane-departure warning, parking assist, navigation assist, etc., are beneficial to older and less-experienced drivers, helping them to avoid accidents and improving their comfort. Such technologies can enable the elderly to use cars safely by compensating for the decline or loss of functional abilities (Eby et al., 2016). However, these user groups also have special needs when it comes to interacting with new technologies and tend to avoid or even reject them due to a lack of skills, ability or desire (digital divide) (Simões and Pereira, 2009). In addition, new pricing models
105105 13. Privacy, democracy and social fairness

which attempt to address greater demand (both in terms of general road use and peak-hour use) may also adversely impact poorer user groups who may be priced out of accessing these new modes of mobility.
A transport system is fair if, and only if, it provides a sufficient level of accessibility to all under most circumstances (Martens, 2017). In this respect, during the transition to CAVs, special care and attention should be given to vulnerable groups in accordance to the principles of justice which argue that social and economic inequalities must be arranged to the greatest benefit of the least advantaged. Insufficient or a lack of transport, as well as the lack of skills to use versatile and affordable means of transport, are the primary cause of people’s inability to escape poverty, find jobs, meet daily subsistence needs, including the social needs of spending time with family and friends. This is especially relevant in gendered contexts causing specific harm to women in need.
In addition to CAVs, future transport will see the emergence of new mobility opportunities increasing the access of specific social groups to efficient and affordable public transport options. The wide availability of last-mile options, however, may hinder the choice of more active transport modes, such as walking or cycling, with negative impacts on public health. In addition, if new transport opportunities enter into competition with public transport and eventually contribute to reducing its efficiency, they can further limit accessibility for poorer social groups and thereby reduce transport equity. Interventions in the transport system are only socially legitimate as long as they have no detrimental impact on the accessibility levels experienced by those who already experience poor accessibility levels. One problem is that transition to CAVs requires major investments in roadside and other transport infrastructure. The high costs of new infrastructure may adversely impact vulnerable groups. Limited resources will cause the diversion of funds from enhancing traditional, public modes of transport, will reduce investment in new forms of public transport and infrastructure for traditional modes of transport, like cycling, and will obstruct the creation of urban environments that help reduce mechanised mobility and invest in non-mechanised mobility, such as improving the pedestrian infrastructure.
An additional risk in terms of equity lies in the optimisation of the system. Research results suggest that the traffic management systems that utilise data from CAVs can maximise the capacity of the transport system through dynamic congestion pricing, capping the number of vehicles using the system at any given moment, or even limiting vehicle ownership (Belov, 2017). This may also adversely impact poorer user groups who may be priced out of high-demand travel time slots. The traffic management system would be able to know the identity, position and transport activity of every vehicle user, at any given moment, including their history and their expected future behaviour. While technical solutions based on
Future transport will see the emergence of new mobility opportunities increasing the access of specific social groups to efficient and affordable public transport options.
10610613. Privacy, democracy and social fairness

CAVs may maximise the total benefit for society, the risk is that the cost of accessing the system would be regressive, becoming proportionally too high for the lower-income population and thus actually hurting vulnerable social groups. The combination of equity and privacy issues with the potentially higher degrees of automation in traffic management raises the question of democracy in transport activity. While the current conventional transport system allows for anonymous access to all, new solutions based on CAVs will highlight the trade-offs between individual freedom and system efficiency.
As for privacy and democracy, and for equity and fairness, too, the complexity of the issues at stake makes it very difficult to anticipate all the possible implications of new mobility options. Setting up a network of European living labs where new mobility solutions can be tested with the direct engagement of citizens can help both public and private entities to ensure that the new options will be financially sustainable while simultaneously contributing to improving the transport system.
Some ethical considerations are discussed in Box 12.
107107
A recent article published in Nature (Awad et al., 2018) explored moral decision-making as regards AVs. The investigation presented volunteers worldwide with scenarios involving AVs and unavoidable accidents with pedestrians and passengers. Participants had to decide which lives the vehicle would either spare or take based on factors such as gender, age, fitness and even species of the potential victims. The results suggest that while there are some universal moral preferences across the globe (saving the largest number of lives, prioritising the young, and valuing humans over animals), ethics varied significantly between different cultures, sometimes leading to controversial moral preferences (e.g. discriminating against overweight or homeless people). The answer to the question whether the behaviour of AVs conflicts with the moral values of society can be a decisive factor for user acceptance.
In Germany, an Ethics Commission on CAVs was established in September 2016, with experts from academia, society, the automotive industry and the digital technology sector. In June 2017, they delivered a report with 20 ethical rules as initial guidelines for policymakers and lawmakers, setting out special requirements in terms of
safety, human dignity, personal freedom of choice and data autonomy (German Federal Ministry of Transport and Digital Infrastructure, 2017).
In the US, Google’s algorithms misidentified images of people with dogs and black people as gorillas. As AI expert Vivienne Ming explained, machine-learning systems often reflect biases in the real world. Some systems struggle to recognise non-white people because they were trained on internet images which are overwhelmingly white (Barr, 2015).
CAVs are made possible by major advances in AI and machine learning. However, in CAV advancement, the so-called Moravec’s paradox (named after Hans Moravec, an early robotics expert), seems particularly important. According to him “[T]he hard problems are easy and the easy problems are hard” (Pinker, 1995). The challenge that is particularly hard is that while driving is a relatively simple task, it is easy to create a set of rules that see driving as an engineering task so CAVs are then optimised to solve these tasks. However, the world of mechanised mobility is also a social world with many social and behavioural uncertainties.
box 12. New ethical issues in transport
13. Privacy, democracy and social fairness

14. The urban road context 108
SUMMARY
Transport and land use have a strong historical relationship. A disruption in the transport sector will have strong impacts on urban and land-use development. Without an active policy by local authorities, the reduced costs of travelling enabled by the new trends and technology options may put the vehicle back at the centre of urban mobility and intensify the problems that have affected urban living over the last century. At the same time, new technologies provide the tools to achieve a new comprehensive governance of the mobility options available in the city. Shared and individual transport, public transport and soft transport options should all help to satisfy peoples’ mobility needs in a sustainable and equitable way. City administrations must ensure that instead of competing for profit, all actors in the mobility landscape will cooperate in achieving this overarching goal. In addition to transport governance, cities have the option to rethink the urban fabric in order to reduce the need for mobility. In Europe, there are important initiatives and platforms to support the work of urban planners and promote the exchange of information and best practices. This chapter addresses ways in which cities can support the transition towards sustainable urban mobility.
108

109 14. The urban road context
THE URBAN ROAD CONTEXT
Mobility and urban development have always been strongly linked. Medieval cities were limited in size by the distance one could travel on foot. In the 18th and 19th centuries, urban expansion typically followed the paths of tram links (Xie and Levinson, 2010). The last major revolution in urban mobility began in 1885 when Karl Friedrich Benz received the first patent for an automobile powered by an ICE83. Some years later (1908), the Long Island Motor Parkway opened “the world’s first road designed and built for daily use of the automobile” (Patton, 2008). Since then, the private automobile has become an omnipresent component of the urban fabric and arguably has influenced the development of the modern city in ways far beyond any other single technology.
In light of this, any revolution in both the mobility paradigm and transport system may generate a deep transformation of urban and land-use development. One of the main arguments is that the new technologies help to reduce generalised transport costs, and congestion in particular. This would cause a significant increase in the accessibility of many areas, favouring expansion, and would “render public transport superfluous except for dense urban areas” (Meyer et al., 2017). To avoid this problem, it is very important that cities shape their needs in order to integrate new technologies in their overall transport system (Legacy et al., 2019). If they fail to meet that challenge, the risk is that vehicles rather than people will once again be at the centre of the mobility revolution, and any positive impacts potentially coming from the new technologies could be completely lost (Freudendal-Pedersen and Kesselring, 2016; Fraedrich et al., 2018).
More urban challenges are addressed in the JRC report entitled ‘The Future of Cities’ (Vandecasteele et al., 2019).
The need for more sustainable and integrative planning processes to deal with the complexity of urban mobility has been widely recognised. New approaches to urban mobility planning emerge as local authorities seek to develop strategies that can stimulate a shift towards cleaner and more sustainable modes of transport.
Policies at the city level which favour the use of multimodal transport, increasing the density of services and promoting relocation close to working places, while limiting car access, will reduce the need for car-based transport in cities and hence transport-related negative impacts. Regulating access to parts of the city (through pricing or advanced traffic management systems)
109
Cities must play an active role in shaping a sustainable urban transport system, promoting public transport and reducing overall travel demand.

is crucial in a traveller’s decision whether to drive, take public transport, cycle or walk.
There are several measures in which cities can invest to help the transition to sustainable urban mobility.
Optimising public transportThe first and most important measure towards sustainable urban mobility is the correct optimisation of public transport.
To compete with the car, public transport must be fast, frequent and easily accessible. This may require action to ensure that buses and trams are not hindered by congestion.
Cities can also promote denser (re)development close to high-frequency public transport stops. The network length (in road, as regards bus travel) required per person declines with population density (Figure 37). This means that the denser a city, the more cost-effective and efficient the public transport can be (i.e. fewer stops). Figure 37 also shows that there is an optimal density, in the order of 1 000 people/km2, above which there is no significant further reduction in network length.
Optimising public transport also implies efficient integration between the different available modes, so that they can be accessed and priced in a seamless and coordinated way. Online platforms can help a lot as a means of integrating the different transport options. Ride-sharing and ride-hailing services can both help to better connect the existing modes and solve the last-mile connection, which is usually the most important factor preventing the use of public transport. Online platforms can also offer their users other important incentives as they increase the perceived reliability of the service by providing real-time information on congestion, vehicle arrival times and occupancy rates.
The optimisation of public transport faces many challenges. Highly subsidised public transport
systems have always represented a significant cost for urban administrations. Security, safety, tidiness and comfort are other elements that discourage the use of public transport in favour of individual mobility options. Without integration into the urban mobility plan, new mobility services, such as car sharing, ride sharing and ride-hailing, can attract users from public transport thereby threatening its financial sustainability. The MaaS concept originates from the importance of avoiding such competition and integrating all the available options to make car ownership unnecessary. Governance of the system also plays a crucial role here. If MaaS means that users can always take a taxi, then the negative impact of traffic will not be reduced. The case of Helsinki in Finland is presented in Box 13.
Any revolution in both the mobility paradigm and transport system may generate a deep transformation of urban and land-use development.
11011014. The urban road context

Y = 30.04x-0.505
R² = 0.83
Luton, UKLondon, UK
Oxford, UK
Leiden, NL
Umeå, SE
Kuopio, FI
Tartu, EE
Delft, NL
Donostia-San Sebastián, ESRiga LV
0 500 1000 1500 2000 2500 3000 3500 4000 4500 5000
Population density by functional urban areas person/km2
0
1
2
3
4
5
6
7
8
9
10
11
12
13
Net
wor
k le
ngth
per
per
son
met
res
base
d on
obs
erve
d PT
sto
ps
Figure 37: Population density and observed network length per person in European citiesNote: PT = public transportSource: own elaborations based on Kompil et al. (2018)
111111
In the Finnish capital (and in a few other cities), companies offer the option to take out a monthly subscription to local transport, car sharing, bike sharing, car rental and taxi in order to make car ownership unnecessary in the city. The system provides city dwellers with different mobility alternatives that are easy to use, cheap, flexible and well-coordinated, competing with owning a private car. Users interact through a smartphone app that acts as both a journey planner and payment transaction platform. It is planned to expand the system to even further modes of transport such as ferries and other mobility solutions.
The system’s main success is in the coordination of the different operators working in Helsinki. The process is not simple which is why it is still ongoing. In addition, from a public governance perspective, a few issues still need to be addressed. Without proper governance, such a system, which is based on a monthly subscription, may encourage the shift to individual mobility options (such as car sharing/rental or taxi), increasing the number of kilometres travelled and urban congestion. In addition, accessing the transport system requires a mobile phone and a credit card, which may represent a major barrier for some segments of the urban population.
box 13. Case study: Helsinki (Finland) plans to make car ownership a thing of the past84
14. The urban road context

Incentivising alternative modes of transportIn Europe, while car use has grown on average, in cities people have been making more use of other modes of transport. Capital cities have the lowest rates of residents using cars, with large variations between countries, ranging from more than 70 % in Nicosia to less than 10 % in Paris. Walking and cycling, for example, are important alternative transport modes in European cities. Some cities have been extremely successful in promoting these, with more than half the trips made on foot or by bike. Many other cities could boost walking and cycling by making such trips more attractive and convenient. An increasing number of cities are banning cars from certain areas of, or the whole city centre, freeing up the space taken by the road network and parking for alternative modes of personal travel (cycling, walking, personal light EVs), and additional public space for more creative uses (see the case of Pontevedra in Spain presented in Box 14). Cities are incentivising
the use of multimodal transport and new alternative modes of transport (shared e-bikes, scooters, walking) by making them easier to use. Apps help to find the best way of getting from place to place, and bicycle-sharing points are already increasingly popular in cities of all sizes. In future, new transport governance enabled by CAVs could increase the number of options available to urban mobility planners. The infrastructure may be made available dynamically depending on the time of day and/or specific conditions. Vehicle access can be granted until an acceptable traffic density is reached. The key challenge for urban authorities is to acquire the necessary competences and tools to properly manage multimodal traffic.
Reducing overall travel demand While new transport technologies have the potential to cut travel time and increase the convenience of travel, some alternatives applied at the city level may reduce the overall need for personal travel.
112112
According to the philosophy of the mayor of this small city (80 000 inhabitants) in north-western Spain, “owning a car doesn’t give you the right to occupy the public space... People don’t like being told they can’t drive wherever they want, but while people claim it as a right, in fact what they want are privileges.” Cars were banned from the city, street parking was removed in favour of underground parking lots, surface parking lots were closed in the city centre and moved to the periphery, and roundabouts replaced traffic lights. Public spaces were redesigned, adding more green spaces, benches, playgrounds and enlarging pavements. And a metro-style pedestrian map was published to encourage walking in the city.
Since these measures were implemented, benefits on safety, emissions, health, urban growth and the economy have been accrued: from 30 deaths
in traffic accidents in the period 1996-2006, to 3 in the subsequent 10 years, and zero since 2009. CO2 emissions are 70 % lower. Almost three-quarters of the former car journeys are now made by walking or cycling. The city has gained 12 000 new inhabitants. Small businesses in the city have benefited over large commercial centres85. Among the negative impacts, citizens complain about congestion on the periphery and a lack of parking spaces and public transport services from the periphery to the centre. Five-minute parking areas to drop off children at school also appear to be missing.
This is an example of a policy that puts users at the heart of the city, as opposed to the conventional city model that focuses on private motorised vehicles. Other cities are now joining the car-free movement (Garfield, 2018).
box 14. Case study: Pontevedra (Spain), ‘A Humanized City’ (Global Site Plans - The Grid, 2014)
14. The urban road context

In particular, the future trend is going towards redesigning cities to decrease the need for travel. New urban developments are promoting higher-density housing, thereby making public transport more efficient whilst also promoting a new ‘work, live, play’ urban model where all the necessary services/housing/entertainment are within walking distance.
Bringing services to the peopleAn increasing number of workers can now work away from the office. In 2017, in urban Europe, 14 % of the population teleworked at least once a week, reducing the need to commute. Online shopping has also increased dramatically recently, leading to fewer ‘shopping trips’. However, fewer requirements for personal transport were offset by more trips performed by last-mile delivery vehicles. The use of electric drones for last-mile delivery could replace traditional delivery trucks and reduce congestion and emissions (although in terms of energy consumption they will probably lead to an increase when compared to traditional diesel-
powered LCVs). Recent research has identified that up to 7.5 % of the EU-28 population could have access to home-delivery services (dispatched from drone beehives) if such services were legally authorised (Figure 38).
The EC promotes sustainable urban mobility and greater use of clean and energy-efficient vehicles through a number of initiatives. The 2013 Urban Mobility Package sets out a concept for sustainable urban mobility plans (SUMPs) that has emerged from a broad exchange between stakeholders and planning experts across the EU. The concept describes the main features of a modern and sustainable urban mobility and transport plan. The European Platform on SUMPs supports the transition towards competitive and resource-efficient mobility systems in European cities by:
• Supporting the further development of the SUMP concept and the tools required for its successful application by local planning authorities;
113113
Figure 38: Percentage of population potentially covered by drone services and estimated return of drone delivery hives per countrySource: own elaborations based on Aurambout et al. (2019)
14. The urban road context
EU Countries where drone delivery would have a positive economic return
25 %
20 %
15 %
10 %
5 %
0 %FI SE DK
percentage of population covered estimated return
PL GR HU IE PT NL IT FR DE UK EU-28
20
25
30
35
40
45
50
15
10
5
0
mill
ion
euro
perc
enta
ge o
f po
pula
tion
cove
red

• Providing the Mobility Plans portal86 to disseminate relevant information, publications and tools; and
• Facilitating coordination and cooperation across the different EU-supported actions through a coordinating group.
SUMP 2.0 has been driving the creation of new EU SUMP guidelines with respect to societal and technological developments and insights gained since 2013 in the implementation of SUMPs. Ultimately, SUMP 2.0 is helping to close the gap between urban planning and urban mobility.
In addition to the European Platform on SUMPs, the EC helps European cities to tackle urban mobility challenges by:
• Supporting exchange and capacity building on sustainable urban development through, among others, the European URBACT programme;
• Improving the quality and availability of data and statistics for urban transport systems, operations and decision-making at local, regional, national and EU level; and
• Providing financial support for urban mobility projects through EU Cohesion Policy, H2020, the Connecting Europe Facility (CEF), as well as other financial instruments.
The CIVITAS Initiative also helps cities across Europe implement and test innovative and integrated strategies that address energy, transport and environmental objectives. Almost 60 European cities have been co-funded by the EC to implement innovative measures in clean urban transport – an investment amounting to well over EUR 300 million. The larger CIVITAS Forum Network comprises almost 200 cities that are committed to implementing and integrating sustainable urban mobility measures.
11411414. The urban road context

THE WAY FORWARD
Technological drivers and new sharing trends are revolutionising transport. Policymakers must use this opportunity to ensure that the future of transport is cleaner and more equitable than today’s car-centred approach.
New technologies and new business models are transforming not only our vehicles but everything about how we get around and how we live our lives.
However, on their own, new transport technologies will not spontaneously make our lives better without upgrading our transport systems and policies to the 21st century.
Transport systems are extremely complex and their elements often influence each other in unexpected ways. New technologies alone may make traffic worse by reducing costs and raising demand, while also increasing overall energy use.
Uncoordinated competition among service providers and a lack of leadership by transport authorities could lead to more traffic problems and an unbalanced provision of capacity.
Under current trends, road transport will continue to be the main mode of transport in the future, with private cars having a dominant role and generating unacceptable costs for society.
Thus, reducing the role of private cars has the potential to significantly reduce the impact of the transport sector without relinquishing our transport needs.
To ensure that the future of transport is cleaner and more equitable than today’s car-centred approach, policymakers must improve governance systems and involve citizens in the roll-out of innovative mobility solutions.
Public authorities must define and coordinate all actors in the public interest to establish efficient and equitable governance for complex, multimodal transport systems.
EU policymakers should establish a network of European living labs where innovative mobility solutions are tested and rolled out with the direct involvement of citizens.
The massive changes on the horizon represent an opportunity to move towards a transport system that is more efficient, safer, less polluting and more accessible to larger parts of society than the current car-centred one.
15. The way forward 116

Endnotes 118118
1 The term externalities refers to negative road transport side effects such as accidents, emissions, congestion, noise, etc.
2 The development of a mass production and consumption economic model was initiated by the revolution in vehicle
production processes. This economic model is also referred to as Fordism: https://www.britannica.com/topic/Fordism
3 Thus, this contributes to achieving the UN’s Sustainable Development Goals (SDGs) (European Economic and
Social Committee, 2018). In particular, Goal 11 (Make cities and human settlements inclusive, safe, resilient and
sustainable), Target 11.2 says “by 2030, provide access to safe, affordable, accessible and sustainable transport
systems for all, improving road safety, notably by expanding public transport, with special attention to the needs
of those in vulnerable situations, women, children, persons with disabilities and older persons”. (Indicators and a
Monitoring Framework, Launching a data revolution for the Sustainable Development Goals site, available at:
http://indicators.report/goals/goal-11/ (last accessed 7 March 2019)).
4 European Commission’s site on biofuels: https://ec.europa.eu/energy/en/topics/renewable-energy/biofuels
5 MaaS alliance: https://maas-alliance.eu/
6 In 2021, 4-10 times cheaper per mile when considering investment and operation and 2-4 times cheaper when only
considering vehicle operation with regard to individually owned vehicles today (Arbib and Seba, 2017).
7 Baseline data used by the European Commission (2018a).
8 The total cost of road congestion for the EU is estimated at 1 % of GDP but can exceed 2 % of GDP for some highly
urbanised regions (Christidis and Ibáñez Rivas, 2012).
9 Currently, there are over 2 000 FP7 and H2020 projects in the Transport Research and Innovation Monitoring and
Information System (TRIMIS) database (https://trimis.ec.europa.eu/) which provides support for the Strategic Transport
Research and Innovation Agenda (STRIA).
10 In 2018, major companies collectively drove around 2 million miles in AV mode in California (McCarthy, 2019). There
are varying levels of maturity across the available systems, with performances ranging from below one mile driven
per disengagement (i.e. cases where a car’s software detects a failure or the driver perceives a failure, resulting
in control being seized) to more than 11 000 miles (McCarthy, 2019). Making a conservative assumption that an
accident would only occur in 10 % of the disengagements, the best-performing AV model would have an accident
approximately every 100 000 miles. According to the US Bureau of Transport Statistics (https://www.bts.gov, last
accessed on 21 March 2019) the current rate for normal cars is 1 accident every 500 000 miles. This shows that
many years of continuous development may be necessary before all AVs become safer than normal cars.
11 Road Safety: new rules clear way for clean, connected and automated mobility on EU roads, 13 March 2019,
available at: https://ec.europa.eu/transport/themes/its/news/2019-03-13-c-its_en
12 European Commission’s site on Cooperative, Connected and Automated Mobility (CCAM), Cooperation on cross-border
testing of CCAM, Annex: Discussion within the European ITS Committee on Cross-border testing:
https://ec.europa.eu/transport/themes/its/c-its_en
13 Vehicles with level-4 automation will represent a turning point at which the reference would be to car users rather
than car drivers. As there will be no requirement to pay attention to driving (at least at specific conditions for level-4
and at any condition for level-5 automation), the vehicle user will be free to use the travelling time for other activities.
14 Environmental Engineering news, Electric buses to connect Geneva airport: https://environmentalengineering.org.uk/
news/electric-buses-to-connect-geneva-airport-2993/
15 JRC Powertrain Technology Transition Market Agent Model (PTTMAM): https://ec.europa.eu/jrc/en/pttmam and JRC-EU-
Times model: https://ec.europa.eu/jrc/en/scientific-tool/jrc-eu-times-model-assessing-long-term-role-energy-technologies
ENDNOTES

119 Endnotes119
16 40 % of users in the 25-34 years age group compared to 23.4 % in the 45-54 years age group. Elderly people seem
to prefer driving-assistance functionalities over partial or full automation (Abraham et al., 2016).
17 Abraham et al. (2016) and Abraham et al. (2017) conducted a similar survey in two moments in time, to analyse
users’ concerns about full automation.
18 In the context of this study, urban is defined as settlements of over 250 000 inhabitants.
19 The number of vehicles might decrease significantly but these vehicles would be used more intensely (e.g. new
users such as the elderly or disabled, empty vehicle travelling, and shifts from other modes).
20 Among others, it is worth mentioning the UK Smart Mobility Living Lab (https://www.smartmobility.london/), the
Slovenian AV Living Lab (http://avlivinglab.com/), the Catalonia Living Lab (http://catalonialivinglab.com/services/
public-roads/) and the JRC Living Lab for Future Mobility Solutions, currently under development. In addition to
living labs, proving grounds for testing advanced vehicle functionalities in a safe and realistic environment are
also being developed. The most advanced proving grounds are Astazero (http://www.astazero.com/) and ZalaZone
(https://zalazone.hu/).
21 For the sake of simplicity in the report, the term capacity is used to identify both the maximum number of vehicles
a road segment can accommodate and the maximum number of vehicles a road network can serve in a given
amount of time, which is usually referred to as network productivity.
22 Travel costs, referred to as generalised cost of travel, are a combination of travel time, related monetary costs and
other factors that can affect user’ preference for one route over another.
23 This is defined as “user equilibrium” or “selfish Wardrop equilibrium” from the seminal work of John Geln Wardrop
(Wardrop and Whitehead, 1952a and 1952b).
24 A Braess-like network with one origin-destination (OD) pair and three routes is used in the study. Such a type of network
has been widely used in the literature to show elementary phenomena related to traffic assignment and equilibrium.
25 For example, the German Low Emission Zones (LEZ), Umweltzone, forbid vehicles with pollutant emissions over the
limits set by the Air Quality Directive (Directive 1999/30/EC) from entering certain city areas.
26 For example, the Uber surge pricing algorithm.
27 For example, the Solar Smart Charging project: https://smartsolarcharging.eu/en/
28 The term V2X indicates different communication flows among different entities: vehicle to vehicle (V2V), vehicle to
infrastructure (V2I), vehicle to pedestrian (V2P) and other possible flows.
29 C-ROADS Platform website: https://www.c-roads.eu/platform.html
30 3GPP, Release 14: http://www.3gpp.org/release-14
31 European Commission’s site on CCAM: https://ec.europa.eu/transport/themes/its/c-its_en
32 Road Safety: new rules clear way for clean, connected and automated mobility on EU roads, 13 March 2019,
available at: https://ec.europa.eu/transport/themes/its/news/2019-03-13-c-its_en
33 Schaub (2017). For UK, see Automated and Electric Vehicles Act 2018, available at: http://www.legislation.gov.uk/
ukpga/2018/18/contents/enacted.
34 Europe on the Move: Commission completes its agenda for safe, clean and connected mobility, 17 May 2018,
available at: https://ec.europa.eu/transport/modes/road/news/2018-05-17-europe-on-the-move-3_en
35 Explanatory Memorandum (European Commission, 2018d).
36 Art. 11 (European Commission, 2018d).
37 Directive 2007/46/EC on the approval of motor vehicles (Article 20) to be replaced by Regulation (EU) No.
858/2018 on vehicle approval and market surveillance) (Article 39) from 1 September 2020 (European Parliament
and Council of the European Union, 2018).
38 Guidelines on the exemption procedure for the EU approval of automated vehicles, 9 April 2019, available at:
http://ec.europa.eu/growth/content/guidelines-exemption-procedure-eu-approval-automated-vehicles_en
39 Road Safety: new rules clear way for clean, connected and automated mobility on EU roads, 13 March 2019,
available at: https://ec.europa.eu/transport/themes/its/news/2019-03-13-c-its_en

Endnotes 120120
40 REFIT review of the Motor Insurance Directive, available at: https://ec.europa.eu/info/law/better-regulation/initiatives/
ares-2017-3714481_en. In this respect, see also European Commission (2018c).
41 Call for expert on liability and new technologies, 2018, available at: https://ec.europa.eu/growth/content/call-experts-
group-liability-and-new-technologies_en
42 Public consultation on Recommendation on Connected and Automated Mobility (CAM), October 2018, available at:
https://ec.europa.eu/info/consultations/public-consultation-recommendation-connected-and-automated-
mobility-cam_en
43 Most of the sources provide similar results for what concerns the impact that AVs have on VoT. According to the
literature, VoT measures the willingness to pay for a unit of travel time (i.e. euros/hour), thus it represents the cost
spent on driving. It appears that VoT is lower for AVs than for conventional vehicles since AVs offer travellers the
opportunity to regain time formerly lost to driving as productive time (working, eating, sleeping). In this sense,
the time spent in a car is less costly because of the opportunity to use travel time for leisure or economically
productive tasks.
44 European Alternative Fuels Observatory (EAFO), available at: http://www.eafo.eu
45 Assuming an average battery size of 12 kWh for PHEVs and 40 kWh for BEVs, an import share of 95 % and a
conversion rate equal to 0.86 USD/€.
46 European Battery Alliance site: https://ec.europa.eu/growth/industry/policy/european-battery-alliance_en
47 A video is available here: https://www.electrive.net/2018/11/13/altmaier-europa-soll-30-der-akkuzell-
nachfrage-decken/
48 If automation in the freight road transport sector leads to all goods being transported by road, the road transport
system might collapse as a result of the higher demand for road space (Paddeu et al., 2019). This calls for an
integrated approach among different modes of transport with the support of policymakers (Paddeu et al., 2019).
49 Transport sector defined as the sum of economic sectors: C29, C30, H in NACE Rev. 2 classification.
50 These data refer to the EU-28 aggregate calculated on the basis of available data from MS. JRC preliminary
estimations suggest the BERD in the transport sector will reach up to EUR 42 billion in 2015 (Grosso et al., 2019).
51 As defined in the context of the Energy Union Research, Innovation and Competitiveness priorities and the
integrated Strategic Energy Technology Plan.
52 Most recent year for which data for an assessment for the private sector can be provided.
53 China’s plans for the electrified, autonomous and shared future of the car, 4 April 2019: https://www.economist.
com/briefing/2019/04/06/chinas-plans-for-the-electrified-autonomous-and-shared-future-of-the-car.
54 The term ‘patent’ refers to patent families, which include all documents (supplementary applications, or
applications to different authorities) relevant to a single invention, to avoid multiple counting.
55 Codes and subsets of Y0T 10/6xx, Y0T 10/7xx, Y0T 90/1xx, Y04S 30/1xx of the CPC classification.
56 JRC SETIS (Joint Research Centre Strategic Energy Technologies Information System), Data collection and analysis
on R&I investments and patenting trends in support of the State of the Energy Union Report, JRC.C7 Knowledge for
Energy Union, 2018.
57 Number of firms per million people.
58 From the World Economic Forum's global competitiveness report 2018 (World Economic Forum, 2018, as cited
in KPMG International, 2019)
59 NACE (Nomenclature statistique des Activités économiques dans la Communauté Européenne) Rev.2 (Eurostat,
2008) two digits’ level.
60 Eurostat Labour Force Survey (LFS) data: http://ec.europa.eu/eurostat/data/database?node_code=lfsi
61 European Jobs Monitor (EJM) database from Eurofound: https://www.eurofound.europa.eu/es/observatories/
emcc/european-jobs-monitor

121 Endnotes121
62 The relative wage position indicator reflects the percentile that each sector occupies in a country’s wage structure.
The wage indicator used is the median hourly wage in each occupation-by-sector combination in each country,
a measure derived from European Earnings Structure Survey 2010 and European Labour Force Survey data.
For more details, see: https://www.eurofound.europa.eu/publications/report/2017/occupational-change-and-wage-
inequality-european-jobs-monitor-2017
63 European Jobs Monitor (EJM) database from Eurofound: https://www.eurofound.europa.eu/es/observatories/emcc/
european-jobs-monitor
64 Land transport sector dependency on ICT-based and specialised equipment and products will increase in the
future (CEDEFOP, 2014).
65 European Jobs Monitor (EJM) database from Eurofound: https://www.eurofound.europa.eu/es/observatories/emcc/
european-jobs-monitor
66 European Jobs Monitor (EJM) database from Eurofound: https://www.eurofound.europa.eu/es/observatories/emcc/
european-jobs-monitor.
67 European Commission’s site on Employment, social affairs and inclusion: https://ec.europa.eu/social/main.
jsp?langId=en&catId=782
68 EC’s Directorate-General For Climate Action website: https://ec.europa.eu/clima/policies/transport_en
69 EEA National Emission Ceiling Directive Data viewer: https://www.eea.europa.eu/data-and-maps/
dashboards/necd-directive-data-viewer-1
70 Agreement between the Council and Parliament on the first-ever HDV CO2 emission reduction targets achieved on
19 February 2019: https://www.consilium.europa.eu/en/press/press-releases/2019/02/19/heavy-duty-vehicles-eu-
presidency-agrees-with-parliament-on-europe-s-first-ever-co2-emission-reduction-targets/ The 2030 target for HDVs
is a reduction of 30 % in CO2 compared to 35 % for LDVs for the same period.
71 For a thorough review, please refer to Zacharof et al. (2016) and Fontaras et al. (2017).
72 In reality, it seems that some manufacturers are cutting back their plans in this context given the lack of evidence
regarding actual fuel savings (Campbell, 2019).
73 See Pillar 1 of Annex 2 ‘Strategic Action Plan on Batteries’ (European Commission, 2018a).
74 See, for example, the H2020 project ProSUM: http://www.prosumproject.eu/
75 European Commission’s site on critical raw materials: http://ec.europa.eu/growth/sectors/raw-materials/specific-
interest/critical_fr.
76 See, for example, Bloomberg New Energy Finance (2018).
77 EU Science Hub Raw Materials Information system (RMIS): http://rmis.jrc.ec.europa.eu/?page=rm-profiles#/Cobalt
78 The life-cycle thinking approach is acknowledged by the scientific community overall and concretely applied
through the life-cycle assessment (LCA) methodology (ISO 14040, 2006).
79 Results based on the Abiotic Depletion Potential impact category.
80 Any action that involves processing, storing and using personal data must be done with data protection and
privacy in mind at every step.
81 Once a product or service has been released to the public, the strictest privacy settings must apply.
82 As discussed in the JRC report ‘Artificial Intelligence - A European perspective’ (Craglia et al., 2018).
83 Karl Benz: https://www.britannica.com/biography/Karl-Benz
84 Helsinki Aims to Be Car-Free by 2025, Smart Cities Dive: https://www.smartcitiesdive.com/ex/
sustainablecitiescollective/helsinki-aims-be-car-free-2025/297026/
85 Concello de Pontevedra’s site: a few results of the transformation:
http://ok.pontevedra.gal/en/few-results-of-the-transformation/
86 Eltis, The urban mobility observatory: http://www.eltis.org
LIST OF ABBREVIATIONS
3GPP Third-Generation Partnership Project
5G Fifth generation of communication networks
ADAS Advanced driver assistance systems
AF Alternative fuels
AFI Alternative fuels infrastructure
AI Artificial Intelligence
AVs Automated vehicles
AVO Average vehicle occupancy
BERD Business enterprise expenditure on R&D (BERD)
BEV Battery electric vehicles
CAD Computer aided design
CAM Connected and automated mobility
CAVs Connected and automated vehicles
CCAM Cooperative, connected and automated mobility
CCMS C-ITS Security Credential Management System
CCS Combined charging system
CEF Connecting Europe Facility
CEPT European Conference of Postal and Telecommunications Administrations
C-ITS Cooperative Intelligent Transport System
CNG Compressed natural gas
DDT Dynamic driving task
DSM Demand-side management
EC European Commission
EEA European Environment Agency
EECC European Electronic Communications Code
EGNOS European Geostationary Navigation Overlay Service
EJM European Jobs Monitor
EM Energy management
EoL End-of-life
EPO European Patent Office
ERTRAC European Road Transport Advisory Council
ETSI European Telecommunications Standards Institute
EU European Union
EVs Electric vehicles
FC Fuel cell
FCEV Fuel cell electric vehicle
GDP Gross domestic product
List of abbreviations 122122

GDPR General Data Protection Regulation
GHG Greenhouse gas
GNSS Global Navigation Satellite Systems
GSM Global System for Mobile Communications
GSMA GSM Association
GSR General Safety Regulation
HDV Heavy-duty vehicle
HEV Hybrid electric vehicle
HPC High power charger
HVAC Heating, ventilation and air-conditioning
ICT Information and communication technology
IEA International Energy Agency
ICE Internal combustion engine
IEC International Electrotechnical Commission
IEEE Institute of Electrical and Electronic Engineers
IoT Internet of Things
IP Intellectual property
IPO Intellectual Property Office
ISCO International Standard Classification of Occupation
ISO International Organization for Standardization
IT Information technology
ITS Intelligent transport system
JRC Joint Research Centre
LBS Location-based service
LCA Life-cycle analysis
LCV Light commercial vehicle
LDV Light-duty vehicle
LEZ Low emission zone
LiDAR Light detection and ranging
LNG Liquefied natural gas
LPG Liquefied petroleum gas
LTE-V2X Long-term evolution vehicular to X
LTZ Limited traffic zone
MaaS Mobility-as-a-Service
MID Motor Insurance Directive
MMTI Multimodal travel information
MS Member State
NACE Nomenclature generale des activités économiques dans les Communautés européennes
NAP National access point
NPF National policy framework
OD Origin-destination
ODD Operational design domain
OEDR Object and event detection and response
PC Passenger car
pkm Passenger kilometres
PM Particulate matter
123 List of abbreviations123

PLD Product Liability Directive
PRS Public regulated service
PT Public transport
R&D Research and development
R&I Research and innovation
RADAR Radio detection and ranging
RoI Return on investment
RoW Rest of the world
RRI Responsible research and innovation
RTTI Real-time traffic information
SAE Society of Automotive Engineers
sc Scenario
SDG Sustainable Development Goal
SDV Self-driving vehicle
SET Strategic Energy Technology
SETIS Strategic Energy Technologies Information System
STRIA Strategic Transport Research and Innovation Agenda
SUMP Sustainable Urban Mobility Plan
TEN-T Trans-European Transport Network
tkm Tonne kilometres
TMS Traffic management system
TNS Transportation Network Companies
TRIMIS Transport Research and Innovation Monitoring and Information System
UVARs Urban Vehicle Access Regulation scheme
V2B Vehicle-to-building
V2G Vehicle-to-grid
V2I Vehicle-to-infrastructure
V2N Vehicle-to-network
V2P Vehicle-to-pedestrian
V2V Vehicle-to-vehicle
V2X Vehicle-to-everything
VA Value added
VDM Vehicle design and manufacturing
VMT Vehicle miles travelled
VoT Value of time
WHO World Health Organization
List of abbreviations 124124


Abraham, H., Lee, C., Brady, S., Fitzgerald, C., Mehler, B., Reimer, B. and Coughlin, J.F., ‘Autonomous Vehicles, Trust, and
Driving Alternatives: A survey of consumer preferences’, White Paper, 2016.
Abraham, H., Reimer, B., Seppelt, B. and Fitzgerald, C., ‘Consumer Interest in Automation: Preliminary Observations
Exploring a Year’s Change’, White Paper, 2017.
ACEA, Electric Vehicles. ACEA - European Automobile Manufacturers’ Association. Retrieved 30 November 2017; available
at: http://www.acea.be/industry-topics/tag/category/electric-vehicles (last accessed 26 March 2019).
Alam, A., Besselink, B., Turri, V., Martensson, J., Johansson, K.H., Heavy-duty vehicle platooning for sustainable freight
transportation: A cooperative method to enhance safety and efficiency, IEEE Control Systems 35(6), 2015, pp. 34-56.
Alonso Raposo, M., Grosso, M., Després, J., Fernández Macías, E., Galassi, C., Krasenbrink, A., Krause, J., Levati, L.,
Mourtzouchou, A., Saveyn, B., Thiel, C. and Ciuffo, B., An analysis of possible socio-economic effects of a Cooperative,
Connected and Automated Mobility (CCAM) in Europe – Effects of automated driving on the economy, employment
and skills; EUR 29226 EN, Publications Office of the European Union, Luxembourg, 2018, ISBN 978-92-79-85857-4,
doi:10.2760/777, JRC111477.
Alves Dias, P., Blagoeva, D., Pavel, C., Arvanitidis, N., Cobalt: demand-supply balances in the transition to electric
mobility; EUR 29381 EN, Publications Office of the European Union, Luxembourg, 2018, ISBN 978-92-79-94311-9,
doi:10.2760/97710, JRC112285.
Arbib, J. and Seba, T., Rethinking Transportation 2020-2030: The Disruption of Transportation and the Collapse of the
Internal-Combustion Vehicle and Oil Industries, RethinkX, 2017.
Arntz, M., Gregory, T. and Zierahn, U., The Risk of Automation for Jobs in OECD Countries: A Comparative Analysis,
No. 189, OECD Publishing, 2016; available at: https://www.ifuturo.org/sites/default/files/docs/automation.pdf
(last accessed 12 April 2018).
Aurambout, J.P., Gkoumas, K., and Ciuffo, B., Last mile delivery by drones: an estimation of viable market potential and
access to citizens across European cities, European Transport Research Review (in press), 2019.
Awad, E., Dsouza, S., Kim, R., Schulz, J., Henrich, J., Shariff, A., Bonnefon, J.F. and Rahwan, I., The Moral Machine
experiment. Nature, 563, 2018, pp. 59-64.
Bansal, P. and Kockelman, K.M., ‘Forecasting Americans’ long-term adoption of connected and autonomous vehicle
technologies’, Transportation Research Part A: Policy and Practice, Vol. 95, 2017, pp. 49-63.
Barr, A., Google Mistakenly Tags Black People as ‘Gorillas,’ Showing Limits of Algorithms, 1 July 2015, The Wall Street
Journal, available at: https://blogs.wsj.com/digits/2015/07/01/google-mistakenly-tags-black-people-as-gorillas-
showing-limits-of-algorithms/ (last accessed 13 February 2019).
Barrios, J.M., Hochberg, Y.V. and Yi, H., The Cost of Convenience: Ridesharing and Traffic Fatalities, 3 October 2018,
Chicago Booth Research Paper No. 27; available at: https://ssrn.com/abstract=3259965 or http://dx.doi.org/
10.2139/ssrn.3259965
Belov, A.V., An issue of traffic engineering with appearance of highly automated vehicles. Nauka i tehnika v dorozhnoy
otrasli [Science and Engineering for Highways], Vol.3. Moscow, 2017.
Belov, A., Ciuffo, B., Mattas, K., Makridis, M., The Simulation-Based Price of Anarchy Estimation with Different Model
Parameters. IEEE Transactions on Intelligent Transportation System, 2019.
Beltramo, A., Julea, A., Refa, N., Drossinos, Y., Thiel, C. and Quoilin, S., Using electric vehicles as flexible resource in power
systems: A case study in the Netherlands, 14th International Conference on the European Energy Market (EEM 2017),
Dresden, Germany, 6-9 June 2017, doi:10.1109/EEM.2017.7982006.
Berscheid, A-L., Masculinity in danger? Autonomous cars as cultural challenge, 15 April 2016, available at:
https://www.2025ad.com/latest/automated-driving-and-masculinity/ (last accessed 12 February 2019).
REFERENCES
References 126126
127 References127
Bilger, B., Auto correct: Has the self-driving car at last arrived, 2013; available at:
www.newyorker.com/reporting/2013/11/25/131125fa_fact_bilger (last accessed 14 February 2019).
Blagoeva, D.T., Alves Dias, P., Marmier, A. and Pavel, C.C., Assessment of potential bottlenecks along the materials supply
chain for the future deployment of low-carbon energy and transport technologies in the EU, wind power, photovoltaic and
electric vehicles technologies, time frame: 2015-2030, 2016, EUR 28192 EN; doi:10.2790/08169.
Blanco, H., Gómez Vilchez, J.J., Nijs, W., Thiel, C., Faaij, A., Soft-linking of a behavioural model for transport with energy
system cost optimization applied to hydrogen in EU, forthcoming 2019.
Bloomberg New Energy Finance, EV market trends and outlook, 2017a; available at: https://www.transportenvironment.
org/sites/te/files/EV market trends and outlook %28by Colin McKerracher%29.pdf (last accessed 14 March 2019).
Bloomberg New Energy Finance, Why Battery Cost Could Put the Brakes on Electric Car Sales, 2017b; available at:
https://about.bnef.com/blog/why-battery-cost-could-put-the-brakes-on-electric-car-sales (last accessed 26 October 2018).
Bloomberg New Energy Finance, Long-term Electric Vehicle Outlook 2018, 2018.
Bobba, S., Mathieux, F. and Blengini, G.A., ‘How will second-use of batteries affect stocks and flows in the EU? A model for
traction Li-ion batteries’, Resources, Conservation & Recycling, Vol. 145, 2019, pp. 279-291,
https://doi.org/10.1016/j.resconrec.2019.02.022
Böhm, S., Jones, C., Land, C. and Paterson, M., Against Automobility, London: Blackwell, 2006.
Bösch, P.M., Becker, F., Becker, H. and Axhausen, K.W., ‘Cost-based Analysis of Autonomous Mobility Services’, Transport
Policy, Vol. 64, 2018, pp. 76-91.
Boston Consulting Group, The Electric Car Tipping Point; available at: https://www.slideshare.net/
TheBostonConsultingGroup/the-electric-car-tipping-point-81666290 (last accessed 1 December 2017).
Bozdag, E. and van den Hoven, J., ‘Breaking the filter bubble: democracy and design’, Ethics and Information Technology,
2015, 17(4).
Braess, D., Ueber ein Paradoxon der Verkehrsplanung, Unternehmensforschung 12, 1968, pp. 258-268.
Campbell, T., Mercedes switches focus away from platooning trials, 4 February 2019, Truck News; available at:
https://www.commercialfleet.org/news/truck-news/2019/02/04/mercedes-switches-focus-away-from-platooning-trials
(last accessed 14 March 2019).
Carballa Smiechowski, B., Determinants of coopetition through data sharing in Maas, in a special issue ‘Big Data, value
creation and new forms of competition’ (Benyayer, L.D. and Zerbib, R. coord.) of Management & Data Science, 2018.
Cascetta, E., Transportation Systems Analysis, Models and Applications, Springer, 2009, doi: 10.1007/978-0-387-75857-2.
CEDEFOP, Automotive sector and clean vehicles, Analytical Highlight, EU Skills Panorama 2014, 2014; available at:
http://skillspanorama.cedefop.europa.eu/sites/default/files/EUSP_AH_Automotive_0.pdf (last accessed 12 April 2018).
CEN-CENELEC E-Mobility Coordination Group and CEN-CENELEC-ETSI Smart Grid Coordination Group, Smart Charging of
Electric Vehicles in relation to Smart Grid, E-Mobility Smart Charging, WG Smart Charging, May 2015.
Christidis, P. and Ibáñez Rivas, J.N., Measuring road congestion, EUR 25550 EN, Publications Office of the European Union,
Luxembourg, 2012, ISBN 978-92-79-27015-4, doi:10.2791/15282, JRC69961.
Chow, J.Y.J., Informed Urban Transport Systems: Classic and Emerging Mobility Methods towards Smart Cities, Elsevier,
2018, ISBN 978-0-12-813613-3.
Church, C. and Crawford, A., Green Conflict Minerals: The fuels of conflict in the transition to a low-carbon economy,
Report of the International Institute for Sustainable Development, 2018; available at:
https://www.iisd.org/story/green-conflict-minerals/ (last accessed 26 November 2018).
Claybrook, J. and Kildare, S., ‘Autonomous vehicles: No driver…no regulation?’, Science 6 July 2018, Vol. 361, Issue 6397,
pp. 36-37, doi:10.1126/science.aau2715.
Clewlow, R. and Mishra G., Disruptive Transportation: The Adoption, Utilization, and Impacts of Ride-Hailing in the United
States, Research Report – UCD-ITS-RR-17-07, Institute of Transportation Studies, UC Davis, October 2017.
Cohen, T. and Cavoli, C., ‘Automated vehicles: exploring possible consequences of government (non)intervention for
congestion and accessibility’, Transport Reviews, 39(1), 2018, pp. 129-151.
Corwin, S., Vitale, J., Kelly, E. and Cathles, E., The future of mobility: How transportation technology and social trends are

References 128128
creating a new business ecosystem, Deloitte LLP, 2015; available at: https://www2.deloitte.com/insights/us/en/focus/
future-of-mobility/transportation-technology.html (last accessed 12 April 2018).
Craglia, M. (ed.), Annoni, A., Benczur, P., Bertoldi, P., Delipetrev, P., De Prato, G., Feijoo, C., Fernandez Macias, E., Gomez, E.,
Iglesias, M., Junklewitz, H., López Cobo, M., Martens, B., Nascimento, S., Nativi, S., Polvora, A., Sanchez, I., Tolan, S., Tuomi,
I., Vesnic Alujevic, L., Artificial Intelligence - A European Perspective, EUR 29425 EN, Publications Office, Luxembourg,
2018, ISBN 978-92-79-97217-1, doi:10.2760/11251, JRC113826.
Cusenza, M.A., Bobba, S., Ardente, F., Cellura, M. and Di Persio, F., Energy and environmental assessment of a traction
lithium-ion battery pack for plug-in hybrid electric vehicles, Journal of Cleaner Production, Vol. 215, 2019, pp. 634-649,
10.1016/j.jclepro.2019.01.056.
Cutean, A., Autonomous vehicles and the future of work in Canada, Information and Communications Technology Council
(ICTC), Ottawa (Canada), 2017; available at: https://www.ictc-ctic.ca/wp-content/uploads/2018/01/ICTC_-Autonomous-
Vehicles-and-The-Future-of-Work-in-Canada-1-1.pdf (last accessed 13 February 2019).
Cyganski, R., Fraedrich, E. and Lenz, B., Travel-time valuation for automated driving: A use-case-driven study. In Annual
Meeting of the Transportation Research Board, Vol. 15, No. 4259, 2015, pp. 11-15.
Danielis, R., Giansoldati, M. and Rotaris, L., A probabilistic total cost of ownership model to evaluate the current and future
prospects of electric cars uptake in Italy, Energy Policy 119, 2018, pp. 268-281.
De Miguel, N., Acosta, B., Thiel, C., Moretto, P., Julea, A., European Member States' strategies for the deployment of a
hydrogen refuelling infrastructure, European Hydrogen Energy Conference 2018, Costa del Sol, Spain, 14-16 March 2018.
De Jong, G., Kouwenhoven, M., Bates, J., Koster, P., Verhoef, E., Tavasszy, L., Warffemius, P., New SP-values of time and
reliability for freight transport in the Netherlands, Transport Research Part E 64, pp. 71-87, 2014.
Després, J., Mima, S., Kitous, A., Criqui, P., Hadjsaid, N. and Noirot, I., Storage as a flexibility option in power systems with
high shares of variable renewable energy sources: a POLES-based analysis, Energy Economics, Vol. 64, No. Suppl C, 2017,
pp. 638-650.
Diamond, L., Developing Democracy: Toward Consolidation, Baltimore: Johns Hopkins University Press, 1999, pp. 1-23.
Diamond, L., What is Democracy?, Lecture at Hilla University for Humanistic Studies, 21 January 2004; available at:
https://web.stanford.edu/~ldiamond/iraq/WhaIsDemocracy012004.htm (last accessed 11 February 2019).
Di Mento, J.F.C. and Ellis, C., Changing Lanes. Visions and Histories of Urban Freeways, MIT Press, 2013, ISBN:
9780262526777.
Donati, A., Dilara, P., Thiel, C., Spadaro, A., Gkatzoflias, D., Drossinos, Y., Individual mobility, From conventional to electric
cars, Report JRC97690, 2015, ISBN 978-92-79-51894-2, doi. 10.2790/405373.
Duboz, A., The intention to use real-time multimodal information to change travel behaviour: the use of psychosocial
variables for the market segmentation (doctoral dissertation) 2018.
Dungs, J., Herrmann, F., Duwe, D., Schmidt, A., Stegmüller, S., Gaydoul, R., Peters, P.L. and Sohl, M., The Value of Time,
Potential for user-centred services offered by autonomous driving, Fraunhofer IAO and Horváth & Partners, Stuttgart,
2016; available at: https://blog.iao.fraunhofer.de/images/blog/studie-value_of_time.pdf (last accessed 12 April 2018).
Eby, D.W., Molnar, L.J., Zhang, L., St. Louis, R.M., Zanier, N., Kostyniuk, L.P. and Stanciu, S., Use, Perceptions, and Benefits of
Automotive Technologies among Aging Drivers. Injury Epidemiology 2016, Vol. 3, issue 1, pp. 28-48.
ERTRAC, European Roadmap Electrification of Road Transport, 2017, 3rd edition, version 10; available at: https://www.
ertrac.org/uploads/images/5. Electrification Roadmap ERTRAC2017.pdf (last accessed 25 November 2018).
Eurelectric, Smart charging : steering the charge, driving the change, 2015, Brussels, doi:org/D/2015/12.105/7.
European Commission, Commission Decision of 5 August 2008 on the harmonised use of radio spectrum in the 5875-
5905 MHz frequency band for safety-related applications of Intelligent Transport Systems (ITS), 2008/671/EC, 2008.
European Commission, Staff Working Document – Impact Assessment Accompanying the document Proposal for a
Directive on the deployment of alternative fuels infrastructure, SWD/2013/05 final, 2013.
European Commission, Energy Union Package – A Framework Strategy for a Resilient Energy Union with a Forward-
Looking Climate Change Policy, COM/2015/80 final, Brussels, 25.2.2015, 2015a.

129 References129
European Commission, Closing the loop – An EU action plan for the Circular Economy, Communication from the
Commission to the European Parliament, the Council, the European Economic and Social Committee and the Committee
of the Regions, COM(2015) 614 final, 2015b.
European Commission, Commission Delegated Regulation (EU) 2015/962 of 18 December 2014 supplementing Directive
2010/40/EU of the European Parliament and of the Council with regard to the provision of EU-wide real-time traffic
information services (text with EEA relevance), OJ L 157, 23.6.2015, 2015c, pp. 21-31.
European Commission, Towards an Integrated Strategic Energy Technology (SET) Plan: Acceleration the European Energy
System Transformation, COM(2015) 6317 final, Brussels, 15.9.2015, 2015d.
European Commission, A European strategy on Cooperative Intelligent Transport Systems, a milestone towards
cooperative, connected and automated mobility. Communication from the Commission to the European Parliament, the
Council, the European Economic and Social Committee and the Committee of the Regions, COM(2016) 766 final, 2016a.
European Commission, A European Strategy for Low-Emission Mobility, Communication from the Commission to the
European Parliament, the Council, the European Economic and Social Committee and The Committee of the Regions,
COM/2016/501 final, 2016b.
European Commission, Analytical underpinning for a New Skills Agenda for Europe, Commission Staff Working Document,
SWD(2016), 195 final, Accompanying the Communication document A New Skills Agenda for Europe: Working together
to strengthen human capital, employability and competitiveness, COM(2016) 381 final, 2016c.
European Commission, C-ITS platform PHASE I, Final Report, 2016d; available at: https://ec.europa.eu/transport/sites/
transport/files/themes/its/doc/c-its-platform-final-report-january-2016.pdf (last accessed 12 January 2019).
European Commission, EU Reference Scenario 2016: Energy, transport and GHG emissions – Trends to 2050, Office for
official publications of the European communities, Luxembourg, 2016e, available at: https://ec.europa.eu/energy/sites/
ener/files/documents/20160713%20draft_publication_REF2016_v13.pdf (last accessed 12 April 2018).
European Commission, The State of European Cities 2016, Cities leading the way to a better future, Luxembourg:
Publications Office of the European Union, 2016f, ISBN 978-92-79-63278-5, doi:10.2776/770065.
European Commission, C-ITS platform PHASE II-Cooperative Intelligent Transport Systems towards Cooperative, Connected
and Automated Mobility, Final Report, 2017a, available at: https://ec.europa.eu/transport/sites/transport/files/2017-09-c-
its-platform-final-report.pdf (last accessed 12 April 2018).
European Commission, Commission Delegated Regulation (EU) 2017/1926 of 31 May 2017 supplementing Directive
2010/40/EU of the European Parliament and of the Council with regard to the provision of EU-wide multimodal travel
information services (Text with EEA relevance), OJ L 272, 21.10.2017, 2017b, p. 1–13.
European Commission, Delivering on low-emission mobility: A European Union that protects the planet, empowers its
consumers and defends its industry and workers, Communication from the Commission to the European Parliament, the
Council, the European Economic and Social Committee, and the Committee of the Regions, COM/2017/0675 final, 2017c.
European Commission, Detailed Assessment of the National Policy Frameworks, SWD/2017/0365 final, Brussels, 2017d.
European Commission, Europe on the Move: An agenda for a socially fair transition towards clean, competitive and
connected mobility for all, Communication from the Commission to the European Parliament, the Council, the European
Economic and Social Committee and the Committee of the Regions, COM/2017/283, 2017e.
European Commission, EU Transport in figures, Statistical Pocketbook, 2017f, available at: https://ec.europa.eu/transport/
facts-fundings/statistics/pocketbook-2017_en (last accessed 5 March 2018).
European Commission, GEAR 2030, High Level Group on the Competitiveness and Sustainable Growth of the Automotive
Industry in the European Union: final report, 2017g, available at: https://ec.europa.eu/docsroom/documents/26081/
attachments/1/translations/en/renditions/native (last accessed 12 April 2018).
European Commission, Radio Spectrum Committee Working Document, Mandate to CEPT to study the extension of the
Intelligent Transport Systems (ITS) safety-related band at 5.9 GHz, RSCOM17-26 rev2, 2017h.
European Commission, Special Eurobarometer 460: Attitudes towards the impact of digitisation and automation on daily
life, Wave EB87.1 – TNS opinion & social, 2017i.

References 130130
European Commission, Staff Working Document – Impact Assessment Accompanying the document Proposal for a
Regulation of the European Parliament and of the Council setting emission performance standards for new passenger
cars and for new light commercial vehicles as part of the Union’s integrated approach to reduce CO2 emissions from light-
duty vehicles and amending Regulation (EC) No 715/2007 (recast), SWD/2017/650 final, 2017j.
European Commission, Towards clean, competitive and connected mobility: the contribution of Transport Research and
Innovation to the Mobility package, SWD(2017) 223 final, 2017k.
European Commission, Towards the broadest use of alternative fuels – an Action Plan for Alternative Fuels Infrastructure,
under Article 10(6) of Directive 201/94/EU, including the assessment of national policy frameworks under Article 10(2)
of Directive 2014/94/EU SWD/2017/036, Brussels, 2017l.
European Commission, A Clean Planet for all, A European long-term strategic vision for a prosperous, modern, competitive
and climate neutral economy, Communication from the Commission to the European Parliament, the European Council,
the Council, the European Economic and Social Committee, the Committee of the Regions and the European Investment
Bank, COM(2018) 773, 2018a.
European Commission, Europe on the Move. Sustainable Mobility for Europe: safe, connected, and clean, Communication
from the Commission to the European Parliament, the Council, the European Economic and Social Committee, and the
Committee of the Regions, COM/2018/293 final, 2018b.
European Commission, On the road to automated mobility: An EU strategy for mobility of the future, Communication
from the Commission to the European Parliament, the Council, the European Economic and Social Committee and the
Committee of the Regions, COM/2018/283, 2018c.
European Commission, Proposal for a REGULATION OF THE EUROPEAN PARLIAMENT AND OF THE COUNCIL on type-
approval requirements for motor vehicles and their trailers, and systems, components and separate technical units
intended for such vehicles, as regards their general safety and the protection of vehicle occupants and vulnerable road
users, amending Regulation (EU) 2018/… and repealing Regulations (EC) No 78/2009, (EC) No 79/2009 and (EC) No
661/2009, COM/2018/286 final – 2018/0145 (COD), 2018d.
European Commission, Raw Materials Scoreboard 2018, EIP on Raw Materials, 2018e, available at:
https://publications.europa.eu/s/jxvW, (last accessed 13 February 2019).
European Commission, ROAD SAFETY IN THE EUROPEAN UNION: Trends, statistics and main challenges, 2018f, available
at: https://ec.europa.eu/transport/road_safety/sites/roadsafety/files/vademecum_2018.pdf (last accessed 13 December
2018).
European Commission, Report on the implementation of the strategic action plan on batteries: Building a strategic
battery value chain in Europe, Report from the Commission to the European Parliament, the Council, the European
Economic and Social Committee, the Committee of the Regions and the European Investment Bank, COM/2019/176, 9
April 2019, 2019a.
European Commission, Staff Working Document - Report on the Assessment of the Member States National Policy
Frameworks for the development of the market as regards alternative fuels in the transport sector and the deployment of
the relevant infrastructure pursuant to Article 10 (2) of Directive 2014/94/EU, SWD/2019/0029 final, 2019b.
European Economic and Social Committee, Role of transport in realising the sustainable development goals, and
consequent implications for EU policy-making, Own-initiative opinion, TEN/661, 2018, available at:
https://www.eesc.europa.eu/en/our-work/opinions-information-reports/opinions/role-transport-realising-sustainable-
development-goals-and-consequent-implications-eu-policy-making-own-initiative (last accessed 26 November 2018).
European Environment Agency, Total greenhouse gas emissions by sector (%) in EU-27, 2012.
European Environment Agency, No improvements on average CO2 emissions from new cars in 2017, 2018a, available at:
https://www.eea.europa.eu/highlights/no-improvements-on-average-co2 (last accessed 5 February 2019).
European Network for Cyber Security, EV Charging Systems Security Requirements, 2017, available at:
https://encs.eu/wp-content/uploads/2017/10/EV-Charging-Systems-Security-Requirements.pdf
(last accessed 5 February 2019).

131 References131
European Parliament and Council of the European Union, Council Directive 85/374/EEC of 25 July 1985 on the
approximation of the laws, regulations and administrative provisions of the Member States concerning liability for
defective products, OJ L 210, 7.8.1985, 1985, pp. 29-33.
European Parliament and Council of the European Union, Directive 2003/59/EC of the European Parliament and of the
Council of 15 July 2003 on the initial qualification and periodic training of drivers of certain road vehicles for the carriage
of goods or passengers, amending Council Regulation (EEC) No 3820/85 and Council Directive 91/439/EEC and repealing
Council Directive 76/914/EEC, OJ L 226, 2003, pp. 4-17.
European Parliament and Council of the European Union, Directive 2004/54/EC of the European Parliament and of the
Council of 29 April 2004 on minimum safety requirements for tunnels in the Trans-European Road Network, OJ L 167,
2004, pp. 39-91.
European Parliament and Council of the European Union, Directive 2009/103/EC of the European Parliament and of the
Council of 16 September 2009 relating to insurance against civil liability in respect of the use of motor vehicles, and the
enforcement of the obligation to insure against such liability (text with EEA relevance), OJ L 263, 7.10.2009, 2009, pp. 11-31.
European Parliament and Council of the European Union, Directive 2010/40/EU of the European Parliament and of the
Council of 7 July 2010 on the framework for the deployment of Intelligent Transport Systems in the field of road transport
and for interfaces with other modes of transport (text with EEA relevance). OJ L 207, 2010, pp. 1-13.
European Parliament and Council of the European Union, Directive 2014/94/EU of the European Parliament and of the
Council of 22 October 2014 on the deployment of alternative fuels infrastructure (text with EEA relevance), OJ L 307,
2014, pp. 1-20.
European Parliament and Council of the European Union, Regulation (EU) 2018/858 of the European Parliament and of
the Council of 30 May 2018 on the approval and market surveillance of motor vehicles and their trailers, and of systems,
components and separate technical units intended for such vehicles, amending Regulations (EC) No 715/2007 and (EC)
No 595/2009 and repealing Directive 2007/46/EC, OJ L 151, 2018, pp. 1-218.
Eurostat, NACE Rev.2-Statistical Classification of Economic Activities in the European Community, 2008; available at:
http://ec.europa.eu/eurostat/documents/3859598/5902521/KS-RA-07-015-EN.PDF (last accessed 2 April 2018).
Fernández-Macías, E., Hurley, J. and Bisello, M., What do Europeans do at work? A task-based analysis: European Jobs
Monitor 2016, Publications Office of the European Union, Luxembourg, 2016.
Field, K., Toyota Rolls Out Version 2.0 of its Hydrogen Fuel Cell Truck, Dubbed the “Beta Truck”, 30 July 2018; available at:
https://cleantechnica.com/2018/07/30/toyota-rolls-out-version-2-0-of-its-hydrogen-fuel-cell-truck-dubbed-the-beta-truck/
(last accessed 15 February 2019).
Figliozzi, M.A., ‘Lifecycle modeling and assessment of unmanned aerial vehicles (Drones) CO2e emissions’, Transportation
Research Part D: Transport and Environment, Vol. 57, pp. 251-261: https://doi.org/10.1016/j.trd.2017.09.011
Fildes, N. and Campbell, P., Telecoms versus carmakers in race to get connected, Financial Times, 13 November 2017;
available at: https://www.ft.com/content/6c1b7f60-a9d3-11e7-93c5-648314d2c72c (last accessed 9 February 2018).
Fiorello, D. and Zani, L., (authors), Navajas, E. and Christidis, P. (editors), EU Survey on issues related to transport and
mobility, JRC Technical Report (JRC115858), forthcoming 2019.
Fiori, C., Arcidiacono, V., Fontaras, G., Makridis, M., Mattas, K., Marzano, V., Thiel, C. and Ciuffo, B., ‘The effect of an
electrified mobility on the relationship between traffic conditions and energy consumption’, forthcoming in Transportation
Research Part D: Transport and Environment, 2019.
Fiorini, A., Georgakaki, A., Pasimeni, F. and Tzimas, E., Monitoring R&I in Low-Carbon Energy Technologies, EUR 28446
EN, Publications Office of the European Union, Luxembourg, 2017, ISBN 978-92-79-65591-3, doi:10.2760/434051;
available at: https://setis.ec.europa.eu/related-jrc-activities/jrc-setis-reports/monitoring-ri-low-carbon-energy-technologies
Firnkorn, J. and Müller, M., ‘Free-Floating Electric Carsharing-Fleets in Smart Cities: The Dawning of a Post-Private Car Era
in Urban Environments?’, Environmental Science & Policy, Vol. 45, 2015, pp. 30-40.
Fleming, N., Peters, A., Garcia-Mogollon, A., Cordell, L., Serrano, D. and Harrod Booth, J., Connected and autonomous
vehicles, A UK standards strategy, Summary report, BSI and Transport systems Catapult, 2017.

References 132132
Fontaras, G., Zacharof, N.-G. and Ciuffo, B., Fuel consumption and CO2 emissions from passenger cars in Europe –
Laboratory versus real-world emissions, Progress in Energy and Combustion Science, 60, 2017, pp. 97-131.
Fraedrich, E., Heinrichs, D., Bahamonde Birke, F.J. and Cyganski, R., ‘Autonomous driving, the built environment and policy
implications’, Transport Research Part A: Policy and Practice, 2018.
Fraunhofer IAO, Elektromobilität und Beschäftigung – Wirkungen der Elektrifizierung des Antriebsstrangs auf
Beschäftigung und Standortumgebung (ELAB), 2012, http://www.muse.iao.fraunhofer.de/content/dam/iao/muse/de/
documents/AbgeschlosseneProjekte/elab-abschlussbericht.pdf (last accessed 13 February 2019).
Freudendal-Pedersen, M. and Kesselring, S., Mobilities, ‘Futures & the City: repositioning discourses – changing perspectives
– rethinking policies’, Mobilities, Vol. 11, issue 4, 2016, pp. 575-586, doi:10.1080/17450101.2016.1211825.
Frey, C.B. and Osborne, M.A., ‘The future of employment: How susceptible are jobs to computerisation?’, Technological
Forecasting and Social Change, Vol. 114, Issue C, Oxford Martin, 2017, pp. 254-280.
Friedman, B., Kahn, P. and Borning, A., Value sensitive design and information systems. In Zhang, P. and Galletta, D.
(eds.), Human-Computer Interaction and Management Information Systems: Foundations. M.E. Sharpe, New York,
2006, pp. 348-372.
Gao, Jason H. and Li-Shiuan, P., RoadRunner: Infrastructureless Vehicular Congestion Control, The 21st Intelligent Transport
Systems World Congress, Detroit, Michigan, 2014.
Garfield, L., 13 cities that are starting to ban cars, Business Insider, 1 June 2018, available at:
https://www.businessinsider.com/cities-going-car-free-ban-2017-8?IR=T (last accessed 13 February 2019).
Gärling, T., Bamberg, S., Friman, M., Fujii, S. and Richter, J., Implementation of soft transport policy measures to reduce
private car use in urban areas, In Panels of the Energy Efficiency and Behavior Conference. European Council for an
Energy Efficient Economy, 2009.
Gawron, J.H., Keoleian, G.A., De Kleine, R.D., Wallington, T.J. and Chul Kim, H., ‘Life Cycle Assessment of Connected and
Automated Vehicles: Sensing and Computing Subsystem and Vehicle Level Effects’, Environmental Science & Technology,
2018, 52 (5), pp 3249-3256.
German Federal Ministry of Transport and Digital Infrastructure, Ethics Commission-Automated and Connected
Driving, 2017; available at: https://www.bmvi.de/SharedDocs/EN/publications/report-ethics-commission.pdf?__
blob=publicationFile (last accessed 12 April 2018).
Giffi, C.A., Vitale Jr., J., Schiller, T. and Robinson, R., A reality check on advanced vehicle technologies, Evaluating the big
bets being made on autonomous and electric vehicles, Deloitte Insights; available at:
https://www2.deloitte.com/insights/us/en/industry/automotive/advanced-vehicle-technologies-autonomous-
electric-vehicles.html (last accessed 4 March 2019).
Global Site Plans – The Grid, Pontevedra, Spain increases downtown livability by reducing vehicle access, Smart Cities
Dive, 24 September 2014; available at: https://www.smartcitiesdive.com/ex/sustainablecitiescollective/pontevedra
-spain-increases-downtown-livability-reducing-vehicle-access/999306/, (last accessed 13 February 2019).
Gómez Vilchez, J., Harrison, G., Kelleher, L., Smyth, A., Thiel, C., with contributions from Lu, H. and Rohr, C., Quantifying the
factors influencing people’s car type choices in Europe: Results of a stated preference survey, EUR 28975 EN, Publications
Office of the European Union, Luxembourg, 2017, ISBN 978-92-79-77201-6, doi:10.2760/695017, JRC109452.
Gómez Vilchez, J., Exploring the Battery Market for Electric Cars, Presented at the 36th International Conference of the
System Dynamics Society, Reykjavík, Iceland, August 2018.
Goodman, B. and Flaxman, S., European Union regulations on algorithmic decision-making and a ‘right to explanation’,
2016; available at: https://arxiv.org/abs/1606.08813.
Grant-Muller, S. and Xu, M., ‘The Role of Tradable Credit Schemes in Road Traffic Congestion Management’, Transport
Reviews, 34:2, 2014, pp. 128-149, doi: 10.1080/01441647.2014.880754.
Grillo, F. and Laperrouze, J., Measuring the Cost of Congestion on Urban Area and the Flexible Congestion Rights, Journal
of Management and Sustainability, 3(2), 2013, pp. 40-55.
Grosso, M., van Balen, M., Ortega Hortelano, A., Haq, G., Gkoumas, K., Tsakalidis, A. and Pekár, F. Innovation Capacity

133 References133
of the European Transport Sector, A macro-level analysis, EUR 29749 EN, Publications Office of the European Union,
Luxembourg, 2019, ISBN 978-92-76-03655-5, doi 10.2760/581596, JRC116565.
Harb, M., Xiao, Y., Circella, G., Mokhtarian, P.L., Wlaker, J.L., ‘Projecting travelers into a world of self-driving vehicles:
estimating travel behavior implications via a naturalistic experiment’, Transportation, Vol. 45, Issue 6, 2018, pp 1671-
1685, doi: 10.1007/s11116-018-9937-9.
Hawkins, A., Volvo is reportedly scaling back its ambitious self-driving car experiment: The automaker had planned to deliver
100 autonomous SUVs to families in Sweden, China, and the UK, The Verge, 14 December 2017; available at:
https://www.theverge.com/2017/12/14/16776466/volvo-drive-me-self-driving-car-sweden-delay (last accessed 5
February 2018).
Helbing, D., The Automation of Society is Next: How to Survive the Digital Revolution, 2015, ISBN 9781518835414.
Hiselius, L.W. and Rosqvist, L.S., ‘Mobility Management campaigns as part of the transition towards changing social
norms on sustainable travel behaviour’, Journal of cleaner production, 123, 2016, pp. 34-41.
Hohenberger, C., Spörrle, M. and Welpe, I.M., ‘How and why do men and women differ in their willingness to use
automated cars? The influence of emotions across different age groups’, Transportation Research Part A: Policy and
Practice, Vol. 94, 2016, pp. 374-385.
Holder, C., Draft Scoping Paper, Background document for the Workshop on Legal and regulatory implications of Artificial
Intelligence, organised by EIT/DG JRC of the EC on 23 November 2018 in Brussels.
Hudson, J., Orviska, M. and Hunady, J., ‘People’s attitudes to autonomous vehicles’, Transportation Research Part A: Policy
and Practice, Vol. 121, 2019, pp. 164-176.
IEI and EEI, Report Plug-in Electric Vehicle Sales Forecast Through 2025 and the Charging Infrastructure Required, 2017.
International Energy Agency, World Energy Investment, 2018a; available at: https://www.iea.org/wei2018
(last accessed 26 October 2018).
International Energy Agency, Hybrid and Electric Vehicles – The Electric Drive Automates, 2018b; available at:
http://www.ieahev.org/assets/1/7/HEV_TCP_Report2018-web.pdf
INRIX, The future economic and environmental costs of gridlock in 2030, An assessment of the direct and indirect
economic and environmental costs of idling in road traffic congestion to households in the UK, France, Germany and the
USA, 2014.
INRIX, Traffic Scorecard 2015, 2015; available at: http://inrix.com/wp-content/uploads/2016/11/INRIX_2015_Traffic_
Scorecard.pdf (last accessed 18 October 2018).
IRENA, Electric Vehicles – Technology Brief, IRENA – International Renewable Energy Agency, 2017; available at:
http://www.irena.org/-/media/Files/IRENA/Agency/Publication/2017/IRENA_Electric_Vehicles_2017.pdf
(last accessed 14 March 2019).
ISO 14040:2006 Environmental management – Life cycle assessment – Principles and framework, 2006; available at:
https://www.iso.org/standard/37456.html (last accessed 18 December 2018).
ITF, Managing the Transition to Driverless Road Freight Transport, International Transport Forum Policy Papers, No. 32,
OECD Publishing, 2017; available at: http://dx.doi.org/10.1787/0f240722-en (last accessed 12 April 2018).
Janek, J. and Zeier, W.G., ‘A solid future for battery development’, Nature Energy, Vol. 1, article number 16141, 2016,
doi:10.1038.
Jittrapirom, P, Caiati, V., Feneri, A., Ebrahimigharehbaghi, S., Alonso-González, M. and Narayan, J., ‘Mobility as a Service: A
Critical Review of Definitions, Assessments of Schemes, and Key Challenges’, Urban Planning 2017, Vol. 2, Issue 2, 2017,
pp 13-25.
Juliussen, E. and Carlson, J., Emerging Technologies: Autonomous Cars - Not if, but when, 2014; available at: https://
supplierinsight.ihsmarkit.com/_assets/sampledownloads/auto-tech-report-emerging-tech-autonomous-car-2013-
sample_1404310053.pdf (last accessed 14 March 2019).
Keramidas, K., Tchung-Ming, S., Diaz-Vazquez, A.R., Weitzel, M., Vandyck, T., Després, J., Schmitz, A., Rey Los Santos, L.,
Wojtowicz, K., Schade, B., Saveyn, B., Soria-Ramirez, A., Global Energy and Climate Outlook 2018: Sectoral mitigation
References 134134
options towards a low-emissions economy – Global context to the EU strategy for long-term greenhouse gas emissions
reduction, EUR 29462 EN, Publications Office of the European Union, Luxembourg, 2018, ISBN 978-92-79-97462-5,
doi:10.2760/67475, JRC113446.
Kerber, W., Data Governance in Connected Cars: The Problem of Access to In-Vehicle Data, JIPITEC (Journal of Intellectual
Property, Information Technology and Electronic Commerce Law), 2018; available at SSRN:
https://ssrn.com/abstract=3285240
Kesting, A., Treiber, M., Schönhof, M. and Helbing, D., ‘Adaptive cruise control design for active congestion avoidance’,
Transportation Research Part C: Emerging Technologies, 16(6), 2008, pp. 668-683.
Kesting, A., Treiber, M. and Helbing, D., Enhanced intelligent driver model to access the impact of driving strategies on
traffic capacity, Philosophical Transactions of the Royal Society A 368(1928), 2010, pp. 4585-4605.
Kitous, A., Keramidas, K., Vandyck, T., Saveyn, B., Van Dingenen, R., Spadaro, J. and Holland, M., Global Energy and Climate
Outlook 2017: How climate policies improve air quality, JRC Science for Policy Report, JRC107944, EUR 28798, 2017.
Kompil, M., Barranco, R.R. and Lavalle, C., Urban form efficiency and access to public transport services, Working paper
presented at the NECTAR Cluster 6 Workshop on accessibility in urban modelling: from measurement to policy instruction,
18–19 June 2018, Lyon, France.
KPMG International, Autonomous Vehicles Readiness Index: Assessing countries’ preparedness for autonomous
vehicles, 2019; available at: https://assets.kpmg/content/dam/kpmg/xx/pdf/2019/02/2019-autonomous-vehicles-
readiness-index.pdf (last accessed 5 June 2019).
Krause, J., Thiel, C., Tsokolis, D., Samaras, Z., Rota, C., Ward, A., Prenninger, P., Coosemans, T. and S. Neugebauer, EU Road
Vehicle Energy Consumption and CO2 emissions by 2050 - Expert-Based Scenarios, Energy Policy, forthcoming 2019.
Kroger, F., Automated Driving in its Social, Historical and Cultural Contexts, In Maurer, M., Gerdes, J.C., Lenz, B. and Winner,
H. (eds.), Autonomous Driving: Technical, Legal and Social Aspects, 2016, doi:10.1007/978-3-662-48847-8_3.
Kyriakidis, M., Happee, R. and de Winter, J.C., ‘Public opinion on automated driving: Results of an international
questionnaire among 5000 respondents’, Transportation Research Part F: Traffic psychology and behaviour, Vol. 32,
2015, pp. 127-140.
Le Vine, S., Adamou, O. and Polak, J., ‘Predicting new forms of activity/mobility patterns enabled by shared-mobility
services through a needs-based stated-response method: case study of grocery shopping’, Transport Policy, Vol. 32,
2014, pp. 60-68.
Legacy, C., Ashmore, D., Scheurer, J., Stone, J. and Curtis, C., ’Planning the driverless city’, Transport Reviews, Vol. 39, issue 1,
2019, pp. 84-102, doi: 10.1080/01441647.2018.1466835.
Lenson, B., New Cars that Could Affect the Future of Catalytic Converters, 30 March 2016; available at:
http://www.specialtymetals.com/blog/2016/3/30/new-cars-that-could-affect-the-future-of-catalytic-converters
(last accessed 13 February 2019).
Letmathe, P. and Suares, M., ‘A consumer-oriented total cost of ownership model for different vehicle types in Germany’,
Transportation Research Part D: Transport and Environment, Vol. 57, 2017, pp. 314-335.
Levin, M.W. and Boyles, S.D., ‘Effects of Autonomous Vehicle Ownership on Trip, Mode, and Route Choice’, Transportation
Research Record: Journal of the Transportation Research Board, Vol. 2493, 2015, pp. 29-38.
Litman, T., Autonomous vehicle implementation predictions. Implications for Transport Planning, Victoria Transport Policy
Institute, 2016.
Litman, T., Autonomous vehicle implementation predictions, Victoria Transport Policy Institute, 2018; available at:
https://www.vtpi.org/avip.pdf (last accessed 12 April 2018).
Liu, H., Kana, X., Shladover, S.E., Lua, X.Y. and Ferlis, R.E., ‘Modeling impacts of Cooperative Adaptive Cruise Control on
mixed traffic flow in multi-lane freeway facilities’, Transportation Research Part C: Emerging Technologies, Vol. 95, 2018,
pp. 261-279.
Lutsey, N., Briefing: Modernizing vehicle regulations for electrification, ICCT:Washington DC, 2018; available at:
https://www.theicct.org/publications/modernizing-regulations-electrification (last accessed 25 November 2018).

135 References135
Mahmassani, H.S., 50th Anniversary Invited Article – Autonomous Vehicles and Connected Vehicle Systems: Flow and
Operations Considerations, Transportation Science, Vol. 50, Issue 4, 2016, pp. 1139-1393.
Makridis, M., Mattas, K., Borio, D., Giuliani, R., and Ciuffo, B., Estimating reaction time in Adaptive Cruise Control System,
in: 2018 IEEE Intelligent Vehicles Symposium (IV), 2018 IEEE Intelligent Vehicles Symposium (IV), 2018, pp. 1312–1317,
https://doi.org/10.1109/IVS.2018.8500490.
Marshall, A., After Peak Hype, Self-Driving Cars enter the Trough of Disillusionment, Transportation, 29 December 2017;
available at: https://www.wired.com/story/self-driving-cars-challenges/ (last accessed 14 February 2018).
Martens, B. and Muller-Langer, F., Access to digital car data and competition in aftersales services, JRC Digital Economy
working paper 2018-06, 2018.
Martens, K., Transport Justice: Designing Fair Transportation Systems, 2017, London, Routledge.
Mathieux, F., Ardente, F., Bobba, S., Nuss, P., Blengini, G., Alves Dias, P., Blagoeva, D., Torres De Matos, C., Wittmer, D., Pavel,
C., Hamor, T., Saveyn, H., Gawlik, B., Orveillon, G., Huygens, D., Garbarino, E., Tzimas, E., Bouraoui, F. and Solar, S., Critical
Raw Materials and the Circular Economy – Background report. JRC Science-for-policy report, EUR 28832 EN, Publications
Office of the European Union, Luxembourg, 2017, ISBN 978-92-79-74282-8 doi:10.2760/378123 JRC108710.
Mattas, K., Makridis, M., Hallac, P., Alonso Raposo, M., Thiel, C., Toledo, T. and Ciuffo, B., ‘Simulating deployment of
connectivity and automation on the Antwerp ring road’, IET Intelligent Transport systems Journal, Vol. 12(9), 2018, pp.
1036-1044, ISSN 1751-956X, doi:10.1049/iet-its.2018.5287.
Mattas, K., Makridis, M., Alonso Raposo, M., Ciuffo, B., How the Responsibility-Sensitive Safety Framework Affects Traffic Flows
on a Freeway Microsimulation Scenario. Transportation Research Board, 98th Annual Meeting, 2019, Washington DC.
McCarthy, M., Seidl, M., Mohan, S., Hopkin, J., Stevens, A. and Ognissanto, F., Access to In-vehicle Data and Resources,
Report prepared by TRL for European Commission DG MOVE, European Commission, Brussels, 2017.
McCarthy, N., The Self-Driving Car Companies Going the Distance, 25 February 2019; available at https://www.statista.
com/chart/17144/test-miles-and-reportable-miles-per-disengagement/ (last accessed 7 March 2019).
McKinsey & Company, Automotive Revolution - Perspective Towards 2030, 2016.
Mehta, D., Sapun, P. and Hamke, A-K., In-depth: eMobility 2018, Statista Mobility Market Outlook – Trend Report, 2018.
Ménière, Y., Rudyk, I. and Tsitsilonis, L., Patents and self-driving vehicles, The inventions behind automated driving,
November 2018, ISBN 978-3-89605-221-6.
Meurs, H. and Timmermans, H., Mobility as a Service as a Multi-Sided Market: Challenges for Modeling, mimeo,
Transportation Research Board, 2017.
Meyer, J., Becker, H., Bösch, P.M. and Axhausen, K.W., ‘Autonomous Vehicles: the Next Jump in accessibilities?’, Research in
Transportation Economics, Vol. 62, 2017, pp. 80-91: https://doi.org/10.1016/j.retrec.2017.03.005.
Michon, J.A., ‘A critical view of driver behavior models: What do we know, what should we do?’ In L. Evans and R.C.
Schwing (Eds.), Human behavior and traffic safety, 1985, pp. 485-520, New York, Plenum Press.
Milakis, D., Snelder, M., van Arem, B., van Wee, B., Correia, G., Development and transport implications of automated
vehicles in the Netherlands: scenarios for 2030 and 2050. Eur. J. Transp. Infrastruct. Res. 17 (1), 2017a, pp. 63-85.
Milakis, D., van Arem, B., and van Wee, B., ‘Policy and society related implications of automated driving: A review of
literature and directions for future research’, Journal of Intelligent Transportation Systems, vol. 21, No. 4, 2017b, pp. 324-
348, DOI:10.1080/15472450.2017.1291351.
Milakis, D., Kroesen, M. and van Wee, B., ‘Implications of automated vehicles for accessibility and location choices:
Evidence from an expert-based experiment’, Journal of Transport Geography, 2018, 68, pp. 142-148.
Milakis, D., ‘Long-term implications of automated vehicle: an introduction’, Transport reviews, 2019, 39:1, pp. 1-8.
Miller, C. and Valasek, C., Remote exploitation of an unaltered passenger vehicle, Black Hat USA, 2015, 91.
Mitropoulos, L.K., Prevedouros, P.D. and Kopelias, P., ‘Total cost of ownership and externalities of conventional, hybrid and
electric vehicle’, Transportation Research Procedia, Vol. 24, 2017, pp. 267-274.
Monforti-Ferrario, F., Kona, A., Peduzzi, E., Pernigotti, D. and Pisoni, E., The impact on air quality of energy saving measures in
the major cities signatories of the Covenant of Mayors initiative, Environment international, Vol. 118, 2018, pp. 222-234.

References 136136
Muoio, D., Here are all the companies racing to put driverless cars on the road by 2020, 7 April 2016:
http://uk.businessinsider.com/google-apple-tesla-race-to-develop-self-driving-cars-by-2020-2016-4?r=US&IR=T/#tesla-
is-aiming-to-have-its-driverless-technology-ready-by-2018-1 (accessed on 30 January 2017).
Nash, M., ‘Training, not tech, is slowing AV development’, Automotive Megatrends Magazine, Q1 2018, pp. 53-55;
available at: https://www.automotiveworld.com/articles/training-not-tech-slowing-av-development/
(last accessed 12 April 2018).
Nieuwenhuijsen, J., Correia, G.H., de Almeida, Milakis, D., van Arem, B. and van Daalen, E., ‘Towards a Quantitative
Method to Analyze the Long-Term Innovation Diffusion of Automated Vehicles Technology Using System Dynamics’,
Transportation Research Part C: Emerging Technologies, Vol. 86, 2018, pp. 300-327.
Nijland, H. and van Meerkerk, J., ‘Mobility and environmental impacts of car sharing in the Netherlands’, Environmental
Innovation and Societal Transitions, Vol. 23, 2017, pp. 84-91.
Norton, P.D., Fighting Traffic. The Dawn of the Motor Age in the American City, MIT Press, 2011, ISBN 9780262516129.
Oliver Wyman, Future of ICE: why accelerating R&D spend is critical for future competitiveness & to reach 50g CO2/km,
2015 ICE research needs workshop, ERTRAC Workshop, 2 June 2015, Brussels, ERTRAC; available at: http://www.ertrac.
org/uploads/documents_publications/2015 ICE workshop/R Cornubert Oliver Wyman.pdf (last accessed 14 March 2019).
Owen, R., Bessant, J. and Heintz, M., Responsible innovation: managing the responsible emergence of science and
innovation in society: John Wiley & Sons, 2013.
Paddeu, D., Calvert, T., Clark, B. and Parkhurst, G., New Technology and Automation in Freight Transport and Handling
Systems, Future of Mobility: Evidence Review, Foresight, Government Office for Science, 2019; available at: https://assets.
publishing.service.gov.uk/government/uploads/system/uploads/attachment_data/file/781295/automation_in_freight.pdf
(last accessed 7 March 2019).
Paffumi, E., De Gennaro, M., Martini, G. and Scholz, H., ‘Assessment of the potential of electric vehicles and charging
strategies to meet urban mobility requirements’, Transportmetrica A: Transport Science. Vol. 11, 2015, pp. 22-60.
Pakusch, C. and Bossauer, P., ‘User acceptance of fully autonomous public transport’, In Proceedings of the 14th
international joint conference on e-business and telecommunications, Vol. 4, 2017, pp. 52-60.
Palmer, K., Driverless cars will shave ‘£265’ off insurance premiums in five years, The Telegraph, 2015; available at:
http://www.telegraph.co.uk/finance/personalfinance/insurance/motorinsurance/11623218/Driverless-cars-will-shave-265-
off-insurance-premiums-in-five-years.html (last accessed 26 October 2018).
Panetta, K., 5 Trends Emerge in the Gartner Hype Cycle for Emerging Technologies, 2018. Hype Cycle for Emerging
Technologies, 16 August 2018; available at: https://www.gartner.com/smarterwithgartner/5-trends-emerge-in-gartner-
hype-cycle-for-emerging-technologies-2018/ (last accessed 21 March 2019).
Pangbourne, K., Stead, D., Mladenović, M. and Milakis, D., ‘Questioning Mobility as a Service: Unanticipated societal and
governance implications’, Transportation Research Part A: Policy and Practice, 2019.
Papageorgiou, M. and Kotsialos, A., Freeway Ramp Metering: An Overview, IEEE Transactions on Intelligent Transportation
Systems, Vol. 3, No. 4, 2002, pp. 271-281.
Pasimeni, F., Fiorini, A. and Georgakaki, A., Patent-based Estimation Procedure of Private R&D: The Case of Climate
Change and Mitigation Technologies in Europe, SPRU Working Paper Series (SWPS), 2018a, 2018-06: 1-22. ISSN 2057-
6668; available at: www.sussex.ac.uk/spru/swps2018-06
Pasimeni, F., Fiorini, A., Georgakaki, A., Marmier, A., Jimenez Navarro, J.P. and Asensio Bermejo, J.M., SETIS Research &
Innovation country dashboards, 2018b, European Commission, Joint Research Centre (JRC) [Dataset]
PID: http://data.jrc.ec.europa.eu/dataset/jrc-10115-10001
Patton, P., A 100-Year-Old Dream: A Road Just for Cars, The New York Times, 9 October 2008; available at:
https://www.nytimes.com/2008/10/12/automobiles/12LIMP.html?mcubz=2 (last accessed 13 February 2019).
Pinker, S., The Language Instinct: The New Science of Language and Mind, London, Penguin, 1995.
Pocard, N., Fuel Cell Trucks: Solution to Heavy Duty Transport Emissions? Hydrogen Fuel Cell Trucks, 17 May 2018;
available at: https://blog.ballard.com/fuel-cell-truck (last accessed 15 February 2019).

137 References137
Podias, A., Pfrang, A., Di Persio, F., Kriston, A., Bobba, S., Mathieux, F., Messagie, M. and Boon-Brett, L., ‘Sustainability
Assessment of Second Use Applications of Automotive Batteries: Ageing of Li-Ion Battery Cells in Automotive and Grid-
Scale Applications’, World Electric Vehicle Journal, 2018, Vol. 9, Issue 24, http://doi.org/10.3390/wevj9020024
Polis, Road Vehicle Automation and Cities and Regions, Polis-European Cities and Regions Networking for Innovative
Transport Solutions, 2018; available at: https://www.polisnetwork.eu/uploads/Modules/PublicDocuments/polis_
discussion_paper_automated_vehicles.pdf (last accessed 6 October 2018).
Postman, N., Technopoly: The Surrender of Culture to Technology, Vintage Books A Division of Random House, Inc., ISBN
0-679-74540-8, 1992.
Prieto, M., Baltas, G. and Stan, V., ‘Car Sharing Adoption Intention in Urban Areas: What Are the Key Sociodemographic
Drivers?’, Transportation Research Part A: Policy and Practice, Vol. 101, 2017, pp. 218-227.
Rangarajan, D. and Dunoyer, A., The global market for ADAS will grow to €7.2 billion by 2020, 2014.
Rea, B., Stachura, S., Wallace, L. and Pankratz, D.M., Making the Future of Mobility Work: How the New Transportation
Ecosystem Could Reshape Jobs and Employment, Deloitte Review, 2017; available at: https://www2.deloitte.com/content/
dam/insights/us/articles/3876_Making-the-FoM-work/DUP_Making-FoM-work-reprint.pdf (last accessed 12 April 2018).
Ridester, Ridester’s 2018 Independent Driver Earnings Survey, 2018; available at:
https://www.ridester.com/2018-survey/#introduction (last accessed 21 March 2019).
Rivas, S., Melica, G., Kona, A., Zancanella, P., Serrenho, T., Iancu, A., Koffi, B., Gabrielaitiene, I., Janssens-Maenhout, G. and
Bertoldi, P., The Covenant of Mayors: In-depth Analysis of Sustainable Energy Actions Plans, JRC Science for Policy Report,
JRC95656, EUR 27526, 2015.
Roland Berger, Integrated Fuels and Vehicles Roadmap to 2030+, Roland Berger GmbH, Munich, 2016.
Ruddle, A.R., Towards a risk-based approach for the design of highly resilient future vehicles, Proceedings of 7th Transport
Research Arena TRA 2018, 16-19 April 2018, Vienna, Austria.
Rutter, A., Bierling, D., Lee, D., Morgan, C., Warner, J., How Will E-commerce Growth Impact Our Transportation Network?
Texas A&M Transportation Institute, 2017.
Rychel, A., “Motion sickness will jeopardize comfort in driverless cars”, 22 August 2017; available at: https://www.2025ad.
com/updates/motion-sickness-in-driverless-cars/ (last accessed 12 February 2019).
SAE International, J3016 Taxonomy and Definitions for Terms Related to Driving Automation Systems for On-Road Motor
Vehicles, Surface vehicle recommended practice, 2016.
Sala, S., Benini, L., Beylot, A., Castellani, V., Cerutti, A., Corrado, S., Crenna, E., Diaconu, E., Sanyé-Mengual, E., Secchi, M.,
Sinkko, T., Consumption and Consumer Footprint: methodology and results. Indicators and Assessment of the environmental
impact of EU consumption. Joint Research Centre Technical Report, 2019, JRC113607, ISBN: 978-92-79-97255-3.
Salvetti, S., Trasporto pesante, la sostenibilità è l’orizzonte di Scania, LIFEGATE, 5 April 2017; available at:
https://www.lifegate.it/persone/stile-di-vita/trasporto-sostenibilita-scania (last accessed 6 March 2018).
Schaller, B., The New Automobility: Lyft, Uber and the Future of American Cities, 25 July 2018; available at: http://www.
schallerconsult.com/rideservices/automobility.pdf (last accessed 12 December 2018).
Schaller, B., Turns out, Uber is clogging the streets, 27 February 2017; available at: http://www.nydailynews.com/opinion/
turns-uber-clogging-streets-article-1.2981765 (last accessed 21 September 2017).
Schaub, Self-driving Cars: Who will be Liable? 29 August 2017; available at: https://www.kwm.com/en/knowledge/
insights/self-driving-cars-who-will-be-liable-20170829 (last accessed 13 February 2019).
Schmidt, O., Hawkes, A., Gambhir, A. and Staffell, I., ‘The future cost of electrical energy storage based on experience
rates’, Nature Energy, Vol. 2, Article number: 17110, 2017.
Shaheen, S. and Cohen, A., Innovative mobility carsharing outlook, Carsharing market overview, analysis and trends.
University of California, Berkeley, Transportation Sustainability Research Center, Vol. 3, issue 2, 2014; available at: http://
innovativemobility.org/wp-content/uploads/2016/02/Innovative-Mobility-Industry-Outlook_World-2016-Final.pdf (last
accessed 26 March 2019).
Shaheen, S., Chan, N., Bansal, A. and Cohen, A., Shared Mobility: Definitions, Industry Developments, and Early

References 138138
Understanding Bikesharing, Carsharing, On-Demand Ride Services, Ridesharing, Shared Mobility, 2015; available at:
http://innovativemobility.org/?project=shared-mobility-definitions-industry-developments-and-early-understanding
(last accessed 13 December 2018).
Sheller, M. and Urry, J., ‘The City and the Car’, International Journal of Urban and Regional Research, Vol. 24, Issue 4,
2000, pp. 737-757.
Shladover, S., Connected and automated vehicle policy development for California, Policy Briefs 3, doi:10.7922.
G25Q4T10, 2017.
Shladover, S., Traffic Management Challenges with Connected and Automated Vehicles, In Ciuffo, B., Alonso Raposo, M.,
Mourtzouchou, A., Belov, A., Makridis, M., Mattas, K., Mogno, C., 2nd Symposium on Management of Future motorway
and urban Traffic Systems (MFTS 2018) – Booklet of abstracts – Ispra, 11-12 June 2018, EUR 29248 EN, Publications
Office of the European Union, Luxembourg, 2018, ISBN 978-92-79-87680-6, doi:10.2760/722699, JRC112141.
Silberg, G., Mayor, T., Dubner, T., Anderson, J. and Shin, L., The clockspeed dilemma, KPMG, 2015; available at:
https://home.kpmg.com/xx/en/home/insights/2015/12/the-clockspeed-dilemma-gary-silberg-head-of-automotive-
kpmg-us.html (last accessed 12 April 2018).
Simões, A. and Pereira, M., Older drivers and new in-vehicle technologies: Adaptation and long-term effects, M. Kurosu
(Ed.), Human centred design, Springer, Heidelberg, 2009, pp. 552-561.
Simon, F., EU’s Sefcovic: Real risk that ‘raw materials become the new oil’, 20 November 2018; available at:
https://www.euractiv.com/section/circular-economy/interview/eus-sefcovic-raw-materials-could-become-the-new-oil/
(last accessed 13 February 2019).
Singleton, P.A., ‘Discussing the “positive utilities” of autonomous vehicles: will travellers really use their time productively?’
Transport Reviews, Vol. 39, Issue 1, 2018, pp. 50-65.
Skillful project, Future scenarios on skills and competences required by the transport sector in the short, mid and long-
term, Deliverable D1.1, 2017; available at: http://skillfulproject.eu/library?id=7603# (last accessed 23 November 2018).
Slowik, P. and Lutsey, N., Evolution of incentives to sustain the transition to a global electric vehicle fleet, ICCT: Washington
DC, 2016; available at: https://www.theicct.org/publications/evolution-incentives-sustain-transition-globalelectric-vehicle-fleet
(last accessed 25 November 2018).
Soo, V.K., Compston, P. and Doolan, M., ‘Interaction between new car design and recycling impact on life cycle
assessment’, Procedia CIRP, 29, 2015, pp. 426-431, 10.1016/j.procir.2015.02.055.
Sperling, D., Three Revolutions: Steering Automated, Shared, and Electric Vehicles to a Better Future, Island Press, 2018.
Spöttle, M., Jörling, K., Schimmel, M., Staats, M., Grizzel, L., Jerram, L., Drier, W., Gartner, J., Research for TRAN Committee
– Charging infrastructure for electric road vehicles. European Parliament, Policy Department for Structural and Cohesion
Policies, 2018, Brussels.
Steck, F., Kolarova, V., Bahamonde-Birke, F., Trommer, S. and Lenz, B., ‘How autonomous driving may affect the value of
travel time savings for commuting’, Transportation research record, 2018, 0361198118757980.
Steen, M., Lebedeva, N., Di Persio, F. and Brett, L., EU Competitiveness in Advanced Li-ion Batteries for E-Mobility
and Stationary Storage Applications – Opportunities and Actions, JRC Science for Policy Report, EUR 28837 EN, doi:
10.2760/75757, 2017.
Strategy Analytics, Accelerating the Future: The Economic Impact of the Emerging Passenger Economy, 2017; available
at: https://newsroom.intel.com/newsroom/wp-content/uploads/sites/11/2017/05/passenger-economy.pdf?cid=em-elq-
26916&utm_source=elq&utm_medium=email&utm_campaign=26916&elq_cid=1494219 (last accessed 21 March 2019).
Sun, Y.-K., ‘Direction for Development of Next-Generation Lithium-Ion Batteries’, ACS Energy Letters, Vol. 2, 2017, pp.
2694-2695, doi:10.1021/acsenergylett.7b01027.
Taiebat, M., Stolper, S. and Xu, M., Forecasting the Impact of Connected and Automated Vehicles on Energy Use: A
Microeconomic Study of Induced Travel and Energy Rebound. 2019; available at: https://arxiv.org/abs/1902.00382
(last accessed 26 March 2019).

139 References139
Talebpour, A. and Mahmassani, H.S., Influence of connected and autonomous vehicles on traffic flow stability and
throughput, Transportation Research Part C: Emerging Technology, Vol. 71, 2016, pp. 143-163.
Tian, J. and Chen, M., Sustainable design for automotive products: dismantling and recycling of end-of-life vehicles,
Waste Manage, Oxford, Vol. 34, Issue 2, 2014, pp. 458-467.
The Oxford Institute for Energy Studies, Disruptive change in the transport sector. Forum Issue 112 – March 2018; available
at: https://www.oxfordenergy.org/publications/oxford-energy-forum-disruptive-change-transport-sector-issue-112/
(last accessed 25 November 2018).
The White House, Artificial Intelligence, Automation, and the Economy, 2016; available at: https://www.whitehouse.gov/
sites/whitehouse.gov/files/images/EMBARGOED%20AI%20Economy%20Report.pdf (last accessed 12 April 2018).
Thierer, A.D. and Hagemann, R., ‘Removing Roadblocks to Intelligent Vehicles and Driverless Cars’, Wake Forest
Journal of Law & Policy, Vol. 5, No. 2, 2015, pp. 339-391; available at: https://www.mercatus.org/system/files/
Thierer%26Hagemann-RoadblockstoDriverlessCars%28FINAL%29.pdf (last accessed 26 October 2018).
Transport systems Catapult, Market Forecast for Connected and Autonomous Vehicles, 2017; available at:
https://assets.publishing.service.gov.uk/government/uploads/system/uploads/attachment_data/file/642813/15780_TSC_
Market_Forecast_for_CAV_Report_FINAL.pdf (last accessed 14 March 2019).
Tsakalidis, A. and Thiel, C., Electric vehicles in Europe from 2010 to 2017: is full-scale commercialisation beginning?
An overview of the evolution of electric vehicles in Europe, EUR 29401 EN, Publications Office of the European Union,
Luxembourg, 2018, ISBN 978-92-79-96720-7, doi:10.2760/565748, JRC112745.
Tsiropoulos, I., Tarvydas, D., Lebedeva, N., Li-ion batteries for mobility and stationary storage applications – Scenarios for
costs and market growth, EUR 29440 EN, Publications Office of the European Union, Luxembourg, 2018, ISBN 978-92-
79-97254-6, doi:10.2760/87175, JRC113360.
UBS, Q-Series UBS Evidence Lab Electric Car Teardown – Disruption Ahead? 2017.
Underwood, S., Michigan connected and automated vehicle working group, Michigan, 2014.
United Nations, World Population Prospects: The 2017 Revision, Key Findings and Advance Tables 2017 revision,
Department of Economic and Social Affairs, Population Division, Working Paper No. ESA/P/WP/248, New York, 2017,
available at: https://esa.un.org/unpd/wpp/Publications/Files/WPP2017_KeyFindings.pdf (last accessed 9 April 2019).
United Nations, World Urbanization Prospects 2018, DESA / Population Division, 2018; available at:
https://population.un.org/wup/ (last accessed 25 November 2018).
Urry, J., ‘The ‘System’ of Automobility’, Theory, Culture & Society, 2004, pp. 25-39.
Van den Berg, V.A. and Verhoef, E.T., ‘Autonomous cars and dynamic bottleneck congestion: The effects on capacity, value
of time and preference heterogeneity’, Transportation Research Part B: Methodological, Vol. 94, 2016, pp. 43-60.
Vandecasteele I., Baranzelli C., Siragusa A., Aurambout J.P. (Eds.), Alberti V., Alonso Raposo M., Attardo C., Auteri D.,
Barranco R., Batista F., Benczur P., Bertoldi P., Bono F., Bussolari I., Caldeira S., Carlsson J., Christidis P., Christodoulou A.,
Ciuffo B., Corrado S., Fioretti C., Galassi M. C., Galbusera L., Gawlik B., Giusti F., Gomez J., Grosso M., Guimarães Pereira
Â., Jacobs-Crisioni C., Kavalov B., Kompil M., Kucas A., Kona A., Lavalle C., Leip A., Lyons L., Manca A.R., Melchiorri M.,
Monforti-Ferrario F., Montalto V., Mortara B., Natale F., Panella F., Pasi G., Perpiña C., Pertoldi M., Pisoni E., Polvora A.,
Rainoldi A., Rembges D., Rissola G., Sala S., Schade S., Serra N., Spirito L., Tsakalidis A., Schiavina M., Tintori G., Vaccari
L., Vandyck T., Van Ham D., Van Heerden S., Van Noordt C., Vespe M., Vetters N., Vilahur Chiaraviglio N., Vizcaino P., Von
Estorff U., Zulian G., The Future of Cities – Opportunities, challenges and the way forward, EUR 29752 EN, Publications
Office, Luxembourg, 2019, ISBN 978-92-76-03848-1, doi: 10.2760/364135, JRC116711.
Vandyck, T., Keramidas, K., Kitous, A., Spadaro, J., Van Dingenen, R., Holland, M. and Saveyn, B., ‘Air Quality Co-Benefits for
Human Health and Agriculture Counterbalance Costs to Meet Paris Agreement Pledges’, Nature Communications, Vol. 9,
Article Number: 4939, 2018a.
Vandyck, T., Kitous, A., Saveyn, B., Keramidas, K., Los Santos, L.R., Wojtowicz, K., Economic Exposure to Oil Price Shocks
and the Fragility of Oil-Exporting Countries, Energies, 11, 2018b, 827.

References 140140
Vecchio, G., ‘Democracy on the move? Bogotá’s urban transport strategies and the access to the city’, City, Territory
and Architecture, 2017, 4 (1):15.
Von Schomberg, R., A vision of responsible innovation. In R. Owen, J. Bessant, & M. Heintz (Eds.), Responsible innovation:
managing the responsible emergence of science and innovation in society: John Wiley & Sons, 2013.
Wadud, Z., MacKenzie, D. and Leiby, P., ‘Help or hindrance? The Travel, Energy and Carbon Impacts of Highly Automated
Vehicles’, Transportation Research Part A: Policy and Practice, Vol. 86, 2016, pp. 1-18.
Wadud, Z., ‘Fully Automated Vehicles: A Cost of Ownership Analysis to Inform Early Adoption’, Transportation Research
Part A: Policy and Practice, Vol. 101, 2017, pp. 163-176.
Wardrop, J.G. and Whitehead, J.I., Correspondence. Some Theoretical Aspects of Road Traffic Research, ICE Proceedings:
Engineering Divisions, 1952a, 1 (5): 767. doi:10.1680/ipeds.1952.11362.
Wardrop, J.G. and Whitehead, J.I., Road Paper. Some Theoretical Aspects of Road Traffic Research, ICE Proceedings of the
Institution of Civil Engineers, 1952b, 1 (3): 325-362. doi:10.1680/ipeds.1952.11259.
Weiland, F.J., Make new again: Remanufacturing, Rebuilding, Refurbishing, 2012, ISBN: 978-3-00-052381-6.
Weiss, M., Zerfass, A. and Helmers, E., ‘Fully electric and plug-in hybrid cars – An analysis of learning rates, user costs, and
costs for mitigating CO2 and air pollutant emissions’, Journal of Cleaner Production, Vol. 212, 2019, pp. 1478-1489.
Wood Mackenzie, 2035: can EVs put the brakes on oil demand? 2017; available at:
https://www.woodmac.com/news/editorial/2035-electric-vehicles-oil-demand/
World Health Organization, WHO’s Source Apportionment Database for PM10 and PM2.5 Updated to August 2014, WHO,
Geneva, 2015; available at: http://www.who.int/quantifying_ehimpacts/global/source_apport/
(last accessed 12 November 2018).
World Economic Forum, Self-Driving Vehicles in an Urban Context, Press briefing 24 November 2015:
http://www3.weforum.org/docs/WEF_Press release.pdf (last accessed 25 November 2018).
World Economic Forum, The Global Competitiveness Report, 2018; available at:
http://www3.weforum.org/docs/GCR2018/05FullReport/TheGlobalCompetitivenessReport2018.pdf
Xiao, L., Wang, M., Schakel, W., Van Arem, B., ‘Unravelling effects of cooperative adaptive cruise control deactivation
on traffic flow characteristics at merging bottlenecks’, Transportation Research Part C: Emerging Technologies, Vol. 96,
2018, pp. 380-397.
Xie, F. and Levinson, D., ‘How streetcars shaped suburbanization: A Granger-causality analysis of land use and transit in
the Twin Cities’, Journal of Economic Geography, Vol. 10, Issue 3, 2010, pp. 453-470.
Yankelevich, A., Rikard, R.V., Kadylak, T., Hall, M.J., Mack, E.A., Verboncoeur, J.P., Cotten, S.R., Preparing the Workforce for
Automated Vehicles, 2018; available at: https://ouravfuture.org/resources/american-center-for-mobility-preparing-the-
workforce-for-automated-vehicles/ (last accessed 28 November 2018).
Yano Research Institute, Consumer Survey on Automated Driving Systems in Japan, US and Europe: Key Research
Findings 2017, 2018; available at: https://www.yanoresearch.com/press/press.php/001794 (last accessed 12 April 2018).
Zacharof, N., Fontaras, G., Ciuffo, B., Tsiakmakis, S., Anagnostopoulos, K., Marotta, A., Pavlovic, J., Review of in use factors
affecting the fuel consumption and CO2 emissions of passenger cars, 2016, European Commission, JRC100150.
ZumMallen, R., 1,000 Hyundai Fuel Cell Electric Trucks Headed for Switzerland, 21 September 2018; available at:
https://www.trucks.com/2018/09/21/hyundai-fuel-cell-electric-trucks-switzerland/ (last accessed 15 February 2019).

141 List of boxes and tables141
LIST OF BOXESAND TABLES
Box 1. Complexities of the transport system 28
Box 2. Freight transport activity 36
Box 3. An orchestra conductor for a more efficient transport system 42
Box 4. Data governance 49
Box 5. Electricity targets in the EU 53
Box 6. Regulation infringement by AVs creates safety hazards 62
Box 7. Standardisation as a market enabler 69
Box 8. The Netherlands, Germany and Sweden are ready for AVs 77
Box 9. Training programmes for professional drivers 84
Box 10. Decarbonising road transport with biofuels 89
Box 11. Material supply in electrified mobility 96
Box 12. New ethical issues in transport 107
Box 13. Case study: Helsinki (Finland) plans to make car ownership a thing of the past 111
Box 14. Case study: Pontevedra (Spain), ‘A Humanized City’ (Global Site Plans - The Grid, 2014) 112
Table 1: Summary of AFI and alternative fuel vehicles information delivered by MS in 2017 52

List of figures 142142
Figure 1: Enabling factors and societal implications of automated, connected, low-carbon and shared mobility 9
Figure 2: Road passenger transport activity evolution since 2005 and up to 2050 13
Figure 3: Road freight transport activity evolution since 2005 and up to 2050 13
Figure 4: Extract of transport technologies funded under H2020 18
Figure 5: Summary of SAE international levels of driving automation for on-road vehicles 19
Figure 6: Range of sales projections for AVs until 2055 20
Figure 7: Cost evolution of Li-ion batteries 22
Figure 8: Range of global sales projections for BEV/PHEV until 2040 23
Figure 9: Answers to the question: How comfortable would you feel ‘Being driven in a driverless car in traffic?’ 25
Figure 10: Answers to the question: ‘Do you own a car-sharing subscription?’ 27
Figure 11: Schematic representation of the relationship between land use, transport demand
and transport supply systems 28
Figure 12: How do you usually make your most frequent trip 32
Figure 13: VMT in the USA in the period 1950-2050 34
Figure 14: Automated shuttles can vary in size and internal features according to user needs and demand 35
Figure 15: Example of an alternative future delivery solution 37
Figure 16: Effect of different penetration levels of AVs and CAVs in a real highway scenario 40
Figure 17: Example of effects from information alone and information and coordination on travel time
and network capacity 42
Figure 18: Number of new data-driven transport platforms in Europe, USA and Canada and the rest of the world 46
Figure 19: Supply of recharging points and EVs across Europe 52
Figure 20: Country scores for AV policy and legislation 68
Figure 21: Ways in which standards can support the CAV industry 69
Figure 22: State of the main sectors affected by connectivity and automation, showing value added,
people employed and share of value added in the total EU-28 in 2015 72
Figure 23: Research funding for road transport in Horizon 2020 projects 75
Figure 24: Public R&I investments in sustainable transport in the EU and major economies in 2016,
as a share of the total investment in low-carbon energy technologies, and as time series 76
Figure 25: Patent filings in technologies related to energy storage, energy management and charging
EVs in the EU and major economies; and flow of high-value patents (filing for protection in more
than one patent office) for five major intellectual property offices (IPOs) 77
Figure 26: Evolution of employment in EU-28 selected economic sectors 2008-2017 80
Figure 27: Occupational profiles for specific transport-related sectors for EU-28 in 2014 80
Figure 28: Relative wage position for specific transport-related sectors in EU Member States in 2014 82
Figure 29: Task profile of drivers and mobile plant operators 83
LIST OF FIGURES

Figure 30: Task profile of ICT professionals and technicians 83
Figure 31: GHG emissions by source in the EU-28 in 2015 and its evolution in the period 1990-2015 88
Figure 32: 2050 road transport tank-to-wheel million tonne CO2 emissions (MtCO
2), references, base
scenarios and all measures 90
Figure 33: Transport GHG mitigation options from 2015 to 2050, central 2 °C scenario, world,
in billion tonnes of CO2 equivalent (GtCO
2-eq) 91
Figure 34: Relationship between speed-fuel consumption (for ICE vehicles) and speed-electric
energy consumption (for EVs) for two vehicle categories (passenger car, PC and light-commercial vehicles, LCV) 93
Figure 35: Demand forecast in the EU for selected critical raw materials for the BEV, PHEV and HEV segments 96
Figure 36: Modelling of traction battery stocks and flows in the EU in 2030 taking into account
a high development scenario for repurposing; the arrows’ thickness is proportional to battery flows 98
Figure 37: Population density and observed network length per person in European cities 111
Figure 38: Percentage of population potentially covered by drone services and estimated
return of drone delivery hives per country 113
List of figures143

The main contributors to this report were: María Alonso Raposo, Fulvio Ardente, Jean-Philippe Aurambout, Gianmarco Baldini, Laura Cassio, Panayotis Christidis, Aris Christodoulou, Biagio Ciuffo, Amandine Duboz, Sofia Felici, Jaime Ferragut, Aliki Georgakaki, Konstantinos Gkoumas, Monica Grosso, María Iglesias, Andreea Julea, Jette Krause, Bertin Martens, Fabrice Mathieux, Gerhard Menzel, Silvia Mondello, Elena Navajas Cawood, Ferenc Pekar, Ioan-Cristinel Raileanu, Harald Scholz, Marie Tamba, Anastasios Tsakalidis, Mitchell van Balen, Ine Vandecasteele from the European Commission (EC) Joint Research Centre (JRC), and Robert Braun from the Institute for Advanced Studies (IHS).
Other contributors were: Patricia Alves Dias, Claudia Baranzelli, Darina Blagoeva, Silvia Bobba, Pravir Chawdhry, Sara Corrado, Nestor Duch Brown, Enrique Fernández Macías, Gianluca Fulli, Maria Cristina Galassi, Jonatan Gómez Vilchez, Marton Hajdu, Akos Kriston, Carlo Lavalle, Laura Lonza, Alexandre Lucas, Fabio Marques dos Santos, Michail Makridis, Antonios Marinopoulos, Alain Marmier, Konstantinos Mattas, Fabrizio Minarini, Pietro Moretto, Barbara Mortara, Elena Paffumi, Francesco Pasimeni, Claudiu Pavel, Enrico Pisoni, Serenella Sala, Bert Saveyn, Natalia Serra, Christian Thiel, Germana Trentadue, Paolo Tecchio and Andreas Uihlein.
We would like to express our gratitude to the following panel of experts for their comments and support:
• Constantinos Antoniou (Technical University of Munich, Germany)• Robert Braun (IHS - Institut für Höhere Studien - Institute for Advanced Studies, Austria)• Yannis Drossinos (European Commission Joint Research Centre, Italy)• Georgios Fontaras (European Commission Joint Research Centre, Italy)• Alexander Froetscher (AustriaTech, Austria)• Umberto Fugiglando (Senseable City Lab, MIT - Massachusetts Institute of Technology, USA)• Suzanne Hoadley (Polis, Belgium)• Satu Innamaa (VTT - Technical Research Centre of Finland, Finland)• George Kamiya (IEA - International Energy Agency, France)• Carlos Lima Azevedo (DTU - Technical University of Denmark, Denmark)• Alessandro Marotta (European Commission Joint Research Centre, Italy)• Gereon Meyer (VDI/VDE Innovation + Technik GmbH, Germany)• Dimitris Milakis (DLR - German Aerospace Center, Germany)• João Peças Lopes (INESC Porto - Institute for Systems and Computer Engineering, Porto, Portugal)• Adolfo Perujo Mateos del Parque (European Commission Joint Research Centre, Italy)• Cristina Pronello (Sorbonne universités, UTC - University of Technology of Compiègne, France)• Jasja Tijink and Richard Lax (Kapsch, Austria)• Diana Urge-Vorsatz (Central European University, Hungary)• Herman Van der Auweraer (Siemens Industry Software, Belgium)
ACKNOWLEDGEMENTS

GETTING IN TOUCH WITH THE EU
IN PERSONAll over the European Union there are hundreds of Europe Direct information centres. You can find the address of the centre nearest you at: https://europa.eu/european-union/contact_en
ON THE PHONE OR BY EMAILEurope Direct is a service that answers your questions about the European Union. You can contact this service:- by freephone: 00 800 6 7 8 9 10 11 (certain operators may charge for these calls),- at the following ndard number: +32 22999696, or- by electronic mail via: https://europa.eu/european-union/contact_en
FINDING INFORMATION ABOUT THE EU
ONLINEInformation about the European Union in all the official languages of the EU is available on the Europa website at: https://europa.eu/european-union/index_en
EU PUBLICATIONSYou can download or order free and priced EU publications from EU Bookshop at: https://publications.europa.eu/en/publications. Multiple copies of free publications may be obtained by contacting Europe Direct or your local information centre (see https://europa.eu/european-union/contact_en).
EU LAW AND RELATED DOCUMENTSFor access to legal information from the EU, including all EU law since 1952in all the official language versions, go to EUR-Lex at: http://eur-lex.europa.eu
OPEN DATA FROM THE EUThe EU Open Data Portal (http://data.europa.eu/euodp/en) provides access to datasets from the EU. Data can be downloaded and reused for free, for both commercial and non-commercial purposes.

JRC MissionAs the science and knowledge service of the European Commission, the Joint Research Centre’s mission is to support EU policies with independent evidence throughout the whole policy cycle.
@EU_ScienceHub
EU Science Hub - Joint Research Centre
EU Science, Research and Innovation
EU Science Hub
EU Science Hub ec.europa.eu/jrc
The European Commission’s science and knowledge service Joint Research Centre
ISBN 978-92-76-14318-5 doi:10.2760/668964
KJ-1A-2974
8-EN-N