ROAD TRANSPORT YEAR BOOK (2006-07) - Delhi High Court
240
ROAD TRANSPORT YEAR BOOK (2006-07) TRANSPORT RESEARCH WING, MINISTRY OF SHIPPING, ROAD TRANSPORT & HIGHWAYS GOVERNMENT OF INDIA NEW DELHI MARCH 2009
-
Upload
khangminh22 -
Category
Documents
-
view
1 -
download
0
Transcript of ROAD TRANSPORT YEAR BOOK (2006-07) - Delhi High Court

ROAD TRANSPORT YEAR BOOK (2006-07)
TRANSPORT RESEARCH WING, MINISTRY OF SHIPPING, ROAD TRANSPORT & HIGHWAYS
GOVERNMENT OF INDIA NEW DELHI
MARCH 2009

OFFICERS AND STAFF ASSOCIATED WITH THE PREPARATION OF THE PUBLICATION Shri Kuntal Sen Sarma, Joint Director Shri J.Rajesh Kumar,Deputy Director Smt. Renu Kukreja,Jr. Investigator

PREFACE
The Transport Research Wing (TRW) of the Ministry of Shipping, Road Transport & Highways has traditionally been providing inputs by way of data, research and analysis pertaining to Roads, Road Transport, Ports, Shipping, and Inland Water Transport to the different Divisions of the Ministry of Shipping, Road Transport & Highways. In respect of Road Transport Sector, the TRW used to bring out “Motor Transport Statistics”, which was a compilation of motor transport data. The last issue of this publication was brought out in 2005. The TRW had felt that there was need for a more comprehensive and analytical publication relating to Road Transport Sector, in view of the growing importance of this prime mode of transport and its contribution to the economic and social development of the country. It is with this objective in view that a new publication titled “Road Transport Year Book” was launched in 2005. The present issue “Road Transport Year Book 2006-07” is the third issue in the series. The “Road Transport Year Book” intends to present the information in an overarching framework covering the different facets of the Road Transport Sector. The Transport Research Wing gratefully acknowledges the guidance and encouragement from Shri. Brahm Dutt, Secretary, Department of Road Transport & Highways in bringing out this publication. As this is the third issue, constructive suggestions from the users of the information would help in improving its quality and coverage.
(Arvind Kumar) Advisor (Transport Research)
Ministry of Shipping, Road Transport & Highways, March, 2009 Government of India

CC OO NN TT EE NN TT SS
Table No.
Subject Page No.
Selected Economic Indicators Overview of the Road Transport Sector SECTION – I
I
XI
ROAD TRANSPORT SECTOR AT A GLANCE
1.1 Total Number of Registered Motor Vehicles in India (1951-2006) 1
1.2 Total Number of Registered Motor Vehicles in India (State-wise) (1998-2006) 2
1.3 Total Registered Motor Vehicles in Metropolitan Cities of India (1998-2006) 3
1.4 Number of Buses Owned by the Public and Private Sectors in India (1961-2006) 4
1.5 Total Bus Fleet and Buses in Public Sector (SRTUs) (State-wise) – As on 31st March
(2005 & 2006)
5
1.6 Performance of State Road Transport Undertakings (SRTUs) (2006-07 to 2007-08) 6
1.7 Road Accidents in India,1970-2007 ( Data Relates to Calendar Year) 7
1.8 Revenue Realised from Road Transport (Centre) (1950-51 to 2005-06) 8
1.9 Revenue Realised from Road Transport (States) (1950-51 to 2005-06) 9
1.10 Freight Movement by Road Transport & Railways, 1950-51 to 2005-06 10
1.11 Passenger Movement by Road Transport & Railways, 1950-51 to 2005-06 11
SECTION – II
PROFILE OF MOTOR VEHICLES REGISTRATION (STATE/UT-WISE)
2.1 Total Registered Motor Vehicles (Category-wise) in India by States/UTs (As on 31st
March, 2006)
12-15
2.2 Total Registered Motor Vehicles (Category-wise) in India by States/UTs (As on 31st
March, 2005)
16-19
2.3.1 to 2.3.35
State/UT-wise Number of Registered Motor Vehicles (Transport & Non-Transport) in India – 2004-05 & 2005-06
20-89
SECTION – III
PROFILE OF MOTOR VEHICLES REGISTRATION (CITIES)
3.1 Total Registered Motor Vehicles (Category-wise) in Metropolitan Cities of India (As on 31st March, 2006)
90-91
3.2 Total Registered Motor Vehicles (Category-wise) in Metropolitan Cities of India (As on 31st March, 2005)
92-93
3.3 Total Registered Motor Vehicles (in Metropolitan Cities) of India – (As on 31.3.2005 & 31.3.2006)
94-103

Table No.
Subject Page No.
SECTION – IV
PROFILE OF PERMITS & LICENCES ISSUED
4.1 Number of Vehicles in Use (State/UT-wise) (As per Primary Permit Valid As on 31.3.2005 & 31.3.2006)
104-118
4.2 Information Regarding National Permits and Fines Recovered During 2004-05 to 2006-07
119
4.31 Total Number of Valid Drivers’ Licences Issued as on 31.3.2005 120
4.32 Total Number of Valid Drivers’ Licences Issued as on 31.3.2006
4.33 Total Number of Valid Drivers’ Licences Issued as on 31.3.2007
4.41 Total Number of Valid Drivers’ Licences Issued During the Year 2004-05 121
4.42 Total Number of Valid Drivers’ Licences Issued During the Year 2005-06
4.43 Total Number of Valid Drivers’ Licences Issued During the Year 2006-07
4.51 Number of Conductors’ Licences Issued as on 31.3.2005 & During 2004-05 122
4.52 Number of Conductors’ Licences Issued as on 31.3.2006 & During 2005-06 122
4.53 Number of Conductors’ Licences Issued as on 31.3.2007 & During 2006-07 122
SECTION – V
MOTOR VEHICLE TAXATION AND SRTUs FARE STRUCTURE
5.1 State-wise Rates of Motor Vehicle Taxes on Personalised Vehicles, Taxis and Auto-rickshaws
123-134
5.2 State-wise Rates of Motor Vehicle Taxes on Goods Transport 135-144
5.3 State-wise Rates of Motor Vehicle Taxes on Passenger Transport 145-150
5.4.1 Fare Structure in State Road Transport Undertakings for Urban/Town Services 151-154
5.4.2 Fare Structure in State Road Transport Undertakings for Rural Services
SECTION – VI 155-156
ROAD SAFETY
6.1 Number of Motor Vehicle Accidents in India (State-wise) – 2001-2007 157
6.2 Number of Persons Killed and Injured by Motor Vehicles in India (State-wise) – 2001-
2007
158
6.3 Number of Motor Vehicle Accidents in Metropolitan Cities – 2000-2007 159
6.4 Number of Persons Killed and Injured by Motor Vehicles in Metropolitan Cities –
2000-2007
160
6.5
Road Accidents, Persons Killed and Injured: 1970-2007 SECTION – VII
161
STATE ROAD TRANSPORT UNDERTAKINGS
7.1 Physical Performance of State Road Transport Undertakings (Year Ending March, 2007 & March, 2008)
162-173
7.2 Financial Performance of State Road Transport Undertakings (Year Ending March, 2007 & March, 2008)
174-200

Table No.
Subject Page No.
SECTION – VIII
MISCELLANEOUS
8.1 Revenue Realised from Motor Vehicle Taxes, Fees etc. for 2004-05 202
8.2 Revenue Realised from Motor Vehicle Taxes, Fees etc. for 2005-06
8.3 Revenue Realised from Motor Vehicle Taxes, Fees etc. for 2005-06
Outlay & Expenditure (Centre and States) for Road Transport Sector During IX Plan and X Plan
203
Road Transport Outlay & Expenditure During the IX Plan and X Plan (State Sector) 204
Length of National Highways in India – State-wise (As on 31st March) - 2003 to 2008 205
Road Length in India (Surfaced & Un-surfaced) (State-wise) – As on 31.3.2004 206
Production of Motor Vehicles in India (2000-01 to 2006-07) 207
Sale of Motor Vehicles in India ( including Exports) – (2000-01 to 2004-05) 208
Production of Bicycles in the Country – 1950-51 to 2004-05 209
ANNEXURE
Glossary of Important Road Transport Terms i-v


1950-51 1960-61 1970-71 1980-81 1990-91 2000-01 2001-02 2002-03 2003-04 2004-05 2005-06 2006-07 2007-081 2 3 4 5 6 7 8 9 10 11 12 12 12Economic IndicatorsGDP at factor costi) At current prices(Rs crore)
9719 16512 42981 132520 515032 1925017 2097726 2261415 2538171 2877706 3275670 3790063 4304000
ii) At constant prices1999-2000 prices(Rs. crore)
224786 329825 474131 641921 1083572 1864300 1972606 2048287 2222758 2388384 2612847 2864309 3123000
Per Capita NetNational Product at1999-2000 prices (Rs)
5708 7121 8091 8594 11535 16172 16764 17101 18317 19325 20858 22553 NA
Index of industrialproduction (Base1993-94=100)
7.9@ 15.6 28.1 43.1 91.6 162.6 167 176.6 189 204.8 221.5 247.1 268
Index of agriculturalproduction (Basetriennium ending1981-82
46.2 68.8 85.9 102.1 148.4 165.7 178.8 150.4 183 177.3 191.6 197.1 NA
Population (million) 359 434 541 679 839 1019 1040 1056 1072 1089 1106 1122 NAOUTPUT(a)Foodgrains(million tones)
50.8 82 108.4 129.6 176.4 196.8 212.9 174.8 213.5 198.4 208.6 217.3 NA
(b) Finished Steel(million tonnes)
1 2.4 4.6 6.8 13.5 31.2 31.1 35.4 38.6 41.3 44.4 50.2 NA
(d) Coal (includingignite) (million tonnes)
32.3 55.2 76.3 119 225.5 332.6 352.6 367.2 389.3 412.9 437.1 462 NA
(e) Crude oil (milliontonnes)
0.3 0.5 6.8 10.5 33 32.4 32 33 33.4 34 32.2 34 NA
(f) Electricitygenerated (utilitiesonly) (Billion KWH)
5 16.9 56 111 264.3 499.5 517.4 531 558 587 617 662 NA
Wholesale priceindex average (Base1993-94=100)
6.8 7.9 14.3 36.8 73.7 155.7 161.3 166.8 175.9 187.3 195.6 206.2 NA
Consumer priceindex for IWAverage(Base 1982=100)
17 21 38 81 193 444 463 482 500 520 542 125 NA
313518 559314(RE) (BE)
FOREIGN TRADE(i) Exports (Rs. crore) 606 642 1535 6711 32553 203571 209018 255137 293367 375340 456418 571779 NA
US $ Million 1269 1346 2031 8486 18143 44560 43827 52719 63843 83535 103092 126360 NA
(ii) ImportsRs. crore 608 1122 1634 12549 43198 230873 245200 297206 359108 501065 660409 840506 NAUS $ million 1273 2353 2162 15869 24075 50536 51413 61412 78150 111516 149167 185747 NACargo handled atmajor ports (MT)
19.38 33.12 55.58 80.27 151.67 281.13 287.58 313.55 344.8 383.76 423.57 463.78 519.24(P)
Cargo handled atminor ports (MT)
NA 4.41 6.69 6.73 12.78 87.37 95.52 108.3 118.86 136.96 150.12 184.92 196.38(P)
Cargo carried byRailways (BTKM)
37.6 72.3 110.7 147.7 235.8 312.4 333.2 353.2 381.2 411.3 441.8 483.4
Passenger carried byRailways (BPKM)
66.5 77.7 118.1 208.6 295.6 457 490.9 515 541.2 575.7 615.6
Cargo carried byroad (BTKMs)
6 14.0* 47.7* 90.9* 145.1* 494 515 545 595 646 658.9 766.2 NA
Passenger carried byroad (BPKM)
23 80.9* 210.0* 541.8* 767.7* 2075.5 2413.1 2814.7 3070.2 3469.3 4251.7 NA NA
(P) Denotes Provisional Figure'@- Relates to the Calender Year 1950
247177
111.8
185737 186315
NA
210203
140.5 154.7117 125.3
224827 193142Plan outlay (Rs. crore)(Centre+States/UTs)
260^ 1117 2524 15023 58369
Selected Economic Indicators
Source: 1.Economic Survey 2007-08 2. Ministry of Railways 3. CSO 4. Working Group Reports of the Tenth and Eleventh Five Year Plans
18.6 48.8 97.6(c) Cement (Milliontonnes)
2.7 8 14.3 106.9
I

II
Overview of Road Transport Sector
Road transport is vital to the economic development and social integration of the country.
Road transport fulfils a major role in the Indian economy involving a wide range of industries
and services from vehicle manufacturers and suppliers to infrastructure builders, services,
energy providers, public authorities, insurance and many others. Road transport, together
with the other modes of transport, provides indispensable mobility for all citizens and goods
and contributes to the economic prosperity of a nation. It is a key factor to social, regional
and economic cohesion, including the development of rural areas. However, the impact of
road transport on the environment and health remains a major challenge in many aspects.
Easy accessibility, flexibility of operations, door-to-door service and reliability have earned
road transport an increasingly higher share of both passenger and freight traffic vis-à-vis
other transport modes. In addition to these factors, transit time, availability of capacity on
alternative modes, quality and reliability of the service, associated costs like warehousing and
demurrage etc. all influence the choice of the mode of transport. The alternative modes of
transport viz. roadways, railways, waterways, airways, mass transit etc., each contribute to
the transportation requirements of the economy. Transport sector accounts for a share of 6.4
per cent in India’s Gross Domestic Product (GDP). The composition of various sub-sectors of
the transport sector in terms of GDP is given in Table 1.
Table 1 Share of Different Modes of Transport in GDP
Sector
1999-
2000
2000-
01
2001-
02
2002-
03
2003-
04
2004-
05
2005-06 2006-07
As percentage of GDP (at factor cost and constant prices)
Transport of which:
5.8 6.0 5.9 6.2 6.3 6.6 6.5 6.4
Railways 1.2 1.2 1.2 1.2 1.2 1.2 1.2 1.2
Road Transport 3.8 3.9 3.8 4.1 4.3 4.5 4.5 4.5 Water Transport 0.2 0.2 0.2 0.2 0.2 0.2 0.2 0.2 Air Transport 0.2 0.2 0.2 0.2 0.2 0.2 0.2 0.2 Services * 0.5 0.5 0.5 0.5 0.5 0.5 0.5 0.5
* Services incidental to transport. Source: Central Statistical Organisation The share in GDP of Railways is exclusive of Financial Intermediation Services indirectly Measured(F.I.S.M.); for other modes it includes F.I.S.M.

III
However, road transport has emerged as the dominant segment in India’s transportation
sector with a share of 4.5 per cent in India’s GDP in comparison to railways that has a mere
1.2 per cent share of GDP in 2006-07 as per the revised data on National Accounts released
by the Central Statistical Organisation (CSO). It may be noted that the entire increase in
percentage share of transport in GDP since 1999-2000 has come from road transport sector
only, with share of other modes remaining nearly constant. Second, over the last seven years
(1999-2000 to 2006-07) for which detailed revised data is available from the CSO, the
average annual growth in road transport sector at around 9.4 per cent was much higher than
the overall annual average GDP growth of 6.9 per cent. The growth rates across various
modes have varied with road transport growing at a much higher rate compared to other
competing modes (Table 2) despite significant barriers to inter-State road freight and
passenger movement compared to inland water, railways and air transport which do not face
rigorous enroute checks/barriers.
Table 2 Average Annual Growth Rates (%) in Transport Sector GDP* Sector 2006-07/1999-2000
Overall GDP 6.9
Transport 8.6
Railways 6.8
Other Transport: 9.4
Road 9.4
Water 7.9
Air 7.7
Services ** 6.4
* GDP at factor cost in real terms (1999-2000 prices) ; ** Services incidental to Transport

IV
Growth in Number of Registered Motor Vehicles
India had 89.6 million registered motor vehicles at the end of fiscal year 2005-06.
Personalized mode (constituting mainly two wheelers and cars) accounted for more than four-
fifth of the motor vehicles in the country compared to their share of little over three-fifth in
1951(Table-3). Further break up of motor vehicle population reflects preponderance of two-
wheelers with a share of more than 72 per cent in total vehicle population, followed by
passenger cars at 13 per cent and other vehicles (a heterogeneous category which includes 3
wheelers (LMV Passengers), trailers, tractors, etc.) around 9 per cent. In contrast to
personalized mode, the share of buses in total registered vehicles has declined from 11.1% in
1951 to 1.1 during 2006. Also, the share of goods vehicle at about 5% in vehicle population
is modest in comparison to the size of the economy. The share of buses in the vehicle
population at about 1 per cent possibly indicates the slow growth in public transport.
Table 3 – India: Composition of Vehicle Population (% of total)
Year end March
2 Wheelers Cars, Jeeps etc.
Buses Goods Vehicle
Others Total (Million)
(as % age of total vehicle population) 1951 8.8 52.0 11.1 26.8 1.3 0.31 1961 13.2 46.6 8.6 25.3 6.3 0.66 1971 30.9 36.6 5.0 18.4 9.1 1.86 1981 48.6 21.5 3.0 10.3 16.6 5.39 1991 66.4 13.8 1.5 6.3 11.9 21.37 2001 70.1 12.8 1.2 5.4 10.5 54.99 2002 70.6 12.9 1.1 5.0 10.4 58.92 2003 70.9 12.8 1.1 5.2 10.0 67.01 2004 71.4 13.0 1.1 5.2 9.4 72.72 2005 72.1 12.7 1.1 4.9 9.1 81.50
2006(P) 72.2 12.9 1.1 4.9 8.8 89.61 Note: Others include Tractors, Trailers, 3 Wheelers & etc. (P): Provisional
With a rising income and greater need for mobility the personalized mode of transport is
likely to grow in importance in the coming years. The proliferation in the personalized mode
of transport has serious implications for traffic congestion, energy efficiency and pollution.
The growth in number of registered vehicles amongst different categories of vehicles during
the period (1991 to 2006) which coincides with era of significant economic reforms shows
compound annual growth rate (CAGR) of about 10% in total vehicle registrations with
V
variation across vehicle categories. Personalized category of motor vehicles, viz., two
wheelers and cars grew at a CAGR 10.6% and 9.5% respectively which was higher
compared to growth in buses (7.6% per annum) and goods vehicles (8.2% per annum). The
higher growth in personalized motor vehicles reflects rising disposable income; easing of
supply side restraints (lifting of licensing, Quantitative Restrictions etc.); and availability of
more convenient financing options. In contrast, slower growth in goods vehicle category to
some extent shows changes in structure of economy and shift from commodity producing
sector (agriculture and industry) towards services which are far less material intensive
together with higher input costs ( tyres etc.) and a plethora of regulations.
Growth in terms of CAGR of registered vehicles amongst the States and Union Territories for
the quinquennium ending 2006 (2001-2006) shows that total vehicle population in terms of
registration grew at 10.3 %. Several States exceeded the all-India growth rate and clocked
CAGR of over 11%. These States include Andhra Pradesh, Assam, Chhattisgarh, Karnataka,
Kerala, Orissa, Sikkim, Tamil Nadu, Tripura and Uttarakhand.
Over the quinquennium ending 2006, 23 metros posted a CAGR of 8.3% in the number of
total vehicle registrations. These 23 metros accounted for a share of about 28 % of the total
number of vehicle registrations in the country in 2006. Significantly, it was the second tier
cities like Coimbatore (12.9%), Madurai (10.9%), Nagpur (14.6%) and Vishakhapatnam
(17.2%) which have posted growth rates of about 11% or more. In contrast, Delhi and
Mumbai showed far lower CAGRs of 4.3% and 6.2% respectively while Chennai posted a
much higher growth of 13.2%. Ahmedabad City’s vehicle population had grown at a higher
CAGR of 16 % during this period of 2001to 2006.
The growth of vehicular traffic on roads has been far greater than the growth in road network;
as a result the main arteries face capacity saturation. Between 1951 and 2004 the motor
vehicle population grew at a CAGR of close to 11 per cent (10.9 %) compared to CAGR of
3.6 per cent in the total road length with National Highway segment increasing by 2.3 per
cent only. A noteworthy aspect has been the step-up in the growth of National Highway
network in recent years which has grown at CAGR of about 4.5 per cent with total vehicle
population growing at 10 per cent CAGR during 1991-2006(Table-4).

VI
Table 4 - Compound Annual Growth Rate (in %) in Vehicles and Road Length Period
Vehicles Roads Two -
Wheelers Cars HVs Others Total NHs SHs&
PWD Rural Urban Project Total
2006/1951 15.2 8.1 7.2 14.8 10.9 2.2 - - - - - 1961/1951 12.5 6.9 6.8 26.5 8.1 1.9 4.0 - - - 2.7 1971/1961 20.7 8.2 6.9 15.0 10.9 0.0 2.6 6.0 4.5 - 5.7 1981/1971 16.3 5.5 5.1 18.1 11.2 2.9 4.5 5.9 5.5 3.5 5.0 1991/1981 18.4 9.8 8.9 10.9 14.8 0.6 2.1 4.0 4.3 1.2 3.0 2001/1991 10.5 9.1 7.8 8.6 9.9 5.5 3.1 1.4 3.0 0.6 2.1 2004/1991 10.5 9.4 7.9 7.9 9.9 5.3 2.3 1.9 3.7 1.7 2.3 2006/1991 10.6 9.5 8.1 7.9 10.0 4.5 - - - -
Note: HVs includes buses & trucks; NHs : National Highways; SHs : State Highways; PWD: Public Works Department.

VII
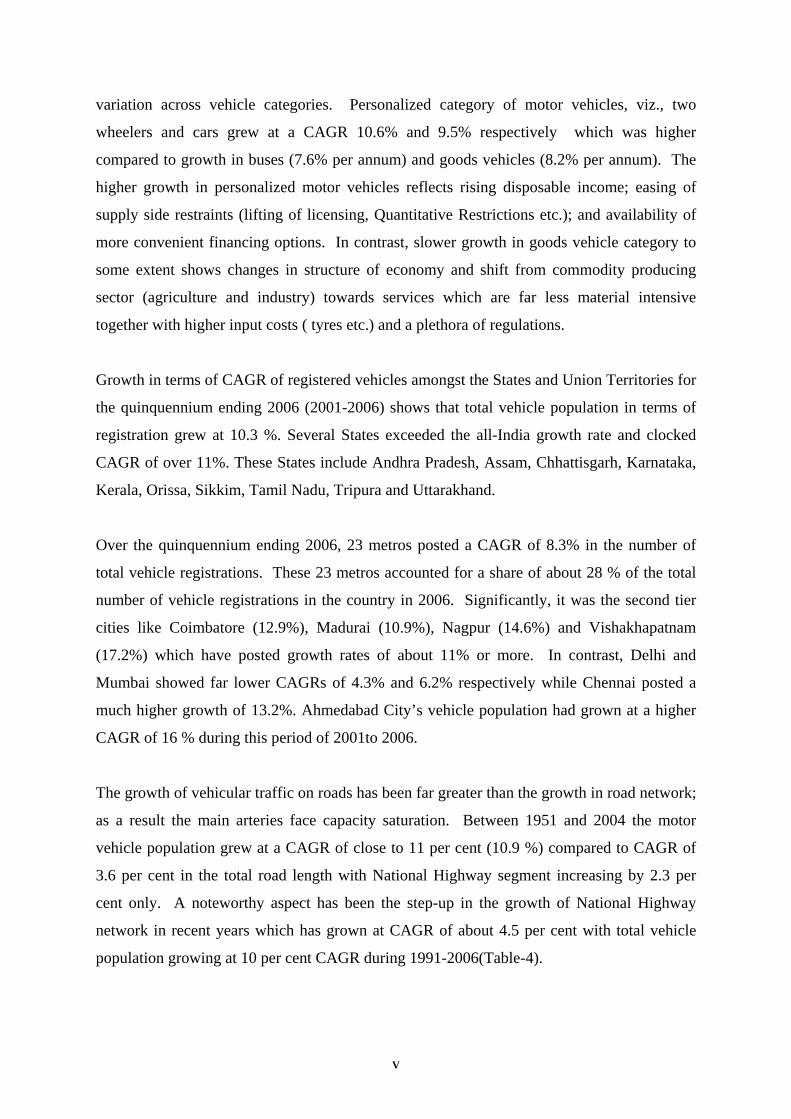
Box: 1-Dynamics of Motorisation
The economic growth, increasing disposable income, and increasing urbanization is creating greater demand for transport and the number of vehicles on India’s road system is growing rapidly. India like many other counties in Asia has experienced high annual growth rate in excess of 10 %. This is equivalent to doubling vehicle fleets in about seven years. This factor coupled with high proportion of two motorized vehicles and the relatively young age of the majority of the population, all make India’s road safety a challenging problem. The current private vehicle ownership level in India is still low in comparison to the industrialized countries. In these more motorized countries it has been found the shape of private vehicle ownership curve over time approximates an S curve. In the early years (at the tail of the curve), the vehicle ownership growth is slow and steady but this is followed by a period of rapid expansion or “explosive” growth (i.e. the steep part of the curve), before growth slows down again towards the top of the curve as it approaches theoretical saturation level (i.e. when it is assumed that all who want vehicles will have acquired them). At that stage, the rate of increase is expected to drop until it just keeps pace with the number of new drivers, since all existing demand will already have been met. It has been found in the more motorized countries that vehicle ownership growth rates do not begin to level out until ownership levels of about 500 vehicles per 1,000 populations or higher are achieved. Consequently, the experiences of the more motorized countries would suggest that, despite the rapid increases already being experienced in the developing regions, many countries are still at the bottom of the growth curve and have yet to enter the very steep “explosive” growth part of the vehicle ownership curve. The S-shaped motorization curve is based on developed countries experience where two-and three-wheeled motor vehicles did not play an important role. In many parts of the Asian region, two-and-three-wheeled motor vehicles dominate the motor vehicle population and the vehicle growth rate. With motorcycles a much more affordable vehicle type, motorization levels may well increase at even higher rates than found in the developed world. Source: Road Safety Guidelines for the Asian and Pacific Region; Section: Road Safety Trends in the No.2 Asian and Pacific Region, Asian Development Bank.
VIII
Source: Road Safety Guidelines for the Asian and Pacific Region; Section: Road Safety Trends in the No.2 Asian and Pacific Region, Asian Development Bank.

IX
Cross Country Comparison of Vehicular Penetration
Table 5 portrays the vehicular penetration across select developed and developing countries in
the world. The Table reflects vehicle fleet ratios in terms of three parameters: (i) passenger
cars per 1000 persons; (ii) total vehicle population (excluding two wheelers) per 1000
persons; and (iii) two wheelers per 1000 persons in conjunction with the per capita Gross
National Income (GNI) in terms of US dollars.
Table 5 – Vehicular Penetration of Select Developed & Developing Countries
Country GNI per capita
2006 (US $)
Per 1000 Person
Passenger Cars Total Vehicles Two Wheelers
Developed
U.S.A. 44710 461 675 21
U.K. 40560 457 517 20
Japan 38630 441 586 104
Germany 36810 565 598 48
France 36560 496 598 41
Developing
Mexico 7830 147 222 7
Malaysia 5620 225 272 236
South Africa 5390 103 151 6
Brazil 4710 136 170 37
China, P.R. 2000 18 28 62
India 820 10 22 58
Source: International Road Federation’s “World Road Statistics, 2008”, except for India
It is apparent from the Table 5 that there is positive association between car/ total vehicle per
1000 person and the per capita income. Developed countries like Germany and USA have car
penetration rates (car/1000 persons) which are higher by factors of about 31 and 26 to that of
China and by factors of 57 and 46 to that of India.. With rising per capita income in India this
ratio is likely to see rapid surge in the coming years. In case of India the penetration level of
two wheelers (two wheelers / 1000 persons) is much higher compared to developed countries.
At lower levels of income it is an affordable and cost effective means of personalized
mobility. However, this ratio is much lower compared to Malaysia in particular.
X
Motor Vehicle Taxation
The avowed purpose of motor vehicle tax (MVT) is to defray the costs of road maintenance
out of revenue realized from user charges. Besides motor vehicle taxation is also geared to
fulfill other objectives like the reduction of both congestion and pollution. However,
multiplicity of objectives results in complex tax structures, cross-classifications and
unintended economic and welfare effects. Broadly the rationale behind motor vehicle
taxation is two-fold. First, levies on the road transport sector can be justified as approximate
user charges. MVT in the form of registration charges are essentially a charge on access to
road network. In fact, the more a motor vehicle is used, the less the vehicle charge per
kilometer travelled. But while access charges may vary according to vehicle type, they do not
discriminate according to usage. The current structure of MVT in India is primarily based on
ownership and only indirectly linked to consumption (of the road transport service). Hence it
is not a perfect user charge. Second, MVT is supported on the ground that it has a fast
growing base and an important source of tax revenue for the States.
MVT is being levied in all States and UTs except the UT of Lakshadweep. Existing tax
structure for commercial vehicles shows wide variations among States. There are different
bases for computation and different rates, leading to differing incidence of taxes per vehicle
in different States. In fact, it is not easy to make comparisons of rates levied on different
types of vehicles in different States. Inter-State comparisons are somewhat difficult for the
following reasons:
a) different classification principles for the taxation of vehicles in different States;
b) variations in the application of ‘lifetime’ and annual tax rates to vehicle categories;
c) use of specific and ad valorem rates;
d) multiplicity of rates.
Several criteria have been adopted to differentiate motor vehicles for taxation purposes across
the States making comparisons of incidence difficult.
Two Wheelers: Most of the States have switched over to life time tax (LTT) except a few in
the North East (Manipur, Mizoram & Tripura). In some States, tax slabs for LTT for two-
wheelers are based on engine capacity (Himachal, Punjab, Puducherry, Daman & Diu, West

XI
Bengal and Rajasthan); in some it is the unladen weight (Assam, Meghalaya Gujarat,
Haryana, Bihar). Other States follow life time tax based on purely the value/cost of the
vehicle (Andhra Pradesh, Karnataka, Tamilnadu, Kerala, Maharashtra, Chhattisgarh, Madhya
Pradesh, Orissa and Delhi).
Cars: Prior to the introduction of LTT, motor cars and jeeps were differentiated either on
unladen weight or on engine capacity basis. The former reflects the fact that weight has an
effect on variable road maintenance costs while engine capacity is an imperfect proxy for fuel
use. Some of the States/UTs which follow engine capacity are West Bengal and J&K while
Puducherry, Daman & Diu follow unladen weight as the basis. In Himachal Pradesh basis of
MVT is engine capacity in conjunction with the percentage of cost of vehicle (COV). Some
like Bihar, Rajasthan and Chandigarh follow the basis of seating capacity. However, most of
the States now follow life time tax based on the value/cost of the vehicle (Assam, Delhi, Uttar
Pradesh, Maharashtra, Rajasthan, Gujarat, Chhattisgarh, Madhya Pradesh, Andhra, Kerala,
Karnataka, Tamilnadu and Haryana). Gujarat has further made distinction in cars using petrol
and diesel with the latter bearing a higher ad valorem incidence.
The system of ‘lifetime taxation’ has now become fairly universal in case of personalized
mode (two-wheelers and passenger cars). However, some States in the North East and Daman
& Diu are among the few States, which still continue with quarterly/annual taxation.
Passenger Vehicles: In the case of passenger transport vehicles like stage or contract
carriages, the seating capacity forms the basis for levying tax .Motor vehicle taxation of
passenger buses is mainly on the basis of an upper seating capacity limit ( per seat per
quarter/annum) and treated differently from motor cars and jeeps. Sometimes it is extended to
cover authorized standees as well (Maharashtra, Gujarat and Tamilnadu). In many States
differentiation in tax treatment of passenger buses is also accorded on the basis of type of
service (Ordinary/Luxury/Express etc). Some States, for example, Madhya Pradesh,
Chhattisgarh, Orissa, Andhra Pradesh also include the distance that the vehicle is permitted to
ply as an additional element for determining the quantum of tax. There is another system
also. Routes are divided into different categories in terms of region with a different rate of
tax for each. This system is prevalent in Uttar Pradesh (based on region rural versus urban).
Another distinction peculiar to the taxation of commercial passenger vehicles is that between

XII
stage carriages (with fixed stopping points on specified routes) and contract carriages
(including taxis) hired on time or distance basis.
Goods Vehicles: The terms “heavy” and “light commercial” goods vehicles are defined in
the Motor Vehicles Act, 1988, essentially on the basis of weight. In general, taxation of
passenger vehicles depends on the seating capacity, while goods vehicles are almost always
taxed on the basis of the registered laden weight (RLW) – also known as gross vehicle weight
(GVW) or unladen weight (ULW) or registered payload (the difference between RLW and
ULW). For goods vehicles, in most of the States, the basis for taxation is registered laden
weight (RLW)/gross vehicle weight (GVW). As far as tax on goods vehicle is concerned, the
de facto tax rate everywhere is a specific rate calculated on the basis of ULW, GVW/RLW or
payload.
Multiple Axle Vehicles: Some of the states like Andhra Pradesh and Kerala in particular
have attempted to put differential rate of motor vehicle taxation favoring multiple axle
vehicles over conventional heavy vehicles/trailers in the same size class in terms of gross
vehicle weight. For instance in Andhra Pradesh the motor vehicle taxation on multi axle
goods vehicle is 25% less than what is applicable to conventional double axle goods vehicles.
Taxes on Transport vehicles plying on inter state routes: Passenger Buses (SRTU or
private) plying on inter state routes covered by an inter-state agreement are subject to MVT
only at their state (state of registration). However, buses (SRTUs or private) plying on inter
state routes not covered by agreement are subject to MVT at both the states. The inter se tax
structure between goods and passenger vehicles indicates that light passenger vehicles
(personal and commercial cabs) are lower taxed than light goods vehicles, but rates on
medium and heavy vehicles are much higher for passenger than goods vehicles.

XIII
Road Accidents
During the calendar year 2007, number of road accidents reported at 4,79,216 were higher by
about 4 per cent compared with 4,60,920 accidents reported in the year 2006. The numbers
of persons injured and killed as a result of road accidents during 2007 were 5,13,340 and
1,14,444 respectively and were higher by 3.4 % and 8.2 % compared to 4,96,481 and
1,05,749 reported for the preceding year.
The CAGR (Compound annual growth rate) in number of accidents, injuries, fatalities and
motor vehicles (registered) have moderated during 1990s (1990-2000 and 1990-2006) after a
spurt during the 1980s (1980 to 1990) [Table:6]. Moderation in the growth of accidents,
fatalities and injuries during 1990s has taken place in the backdrop of lower growth in the
number of registered vehicles and step up in the growth of road network.
Table 6 – Compound Annual Growth Rate ( in %):Select Road Accident Parameters
Period
Total Number In Kilometre Accidents Injuries Fatalities Registered vehicles Road Length
1980/1970 3.0 4.5 5.2 12.4 2.3 1990/1980 6.3 8.4 8.5 15.5 2.9 2000/1990 3.3 5.0 3.8 9.8 5.3 2006/2000 2.8 3.7 5.0 10.6 2.2# 2007/2000 2.9 3.7 5.5 - - 2006/1990 3.1 4.5 4.3 10.1 4.4@
Note: - # refers to CAGR for the period 2004/2000; @ refers to CAGR for the period 2004/1990.
Normalized/standardized accident rates for India in terms of number of accidents per lakh
persons, per ten thousand motor vehicles and per ten thousand kilometers of the road length
indicates that:
• Number of accidents per lakh population shows an increasing trend [from 21.2 in
1970 to 22.8 in 1980 to 33.8 in 1990 to 38.6 in 2000 and further to 42.4 in 2007];
• A significant decline in the number of accidents per ten thousand motor vehicles is
discernible [from 814 in 1970, 339 accidents in 1980, 148 in 1990, 80 accidents in
2000 and further to 51 in 2006] ;
• However, the number of accidents per ten thousand kilometers of the road length
indicates a fluctuating movement over the period 1970 to 2004 [an increase from 960
in 1970 to 1027 in 1980 and a further increase to 1425 in 1990; followed by a decline

XIV
to 1266 in 1991 and a further fall to 1089 in 1993; and subsequently through several
ups and downs reaching 1187 in 2004] ;
• The number of persons injured per lakh of population indicates a more than three fold
increase [from 13 in 1970 to 45 in 2007]. Similarly, persons killed per lakh of
population indicate a more than three fold jump [from 2.7 in 1970 to 10 in 2007];
• The number of persons injured per 10,000 vehicles has declined significantly
[from 500 in 1970 to about 55 in 2006]. Similarly, the number of persons killed
per 10,000 vehicles in the country has also fallen sharply [from about 104 in 1970 to
around 12 in 2006];
• The number of persons injured and killed per ten thousand km of road length has
more than doubled since 1970 [number of persons injured has increased from 590 in
1970 to 1283 in 2004; while number of persons killed increased from 122 in 1970 to
256 in 2004].
An analysis of state level data shows that Maharashtra, Tamil Nadu, Karnataka and Andhra
Pradesh account for about 47% of the total road accidents with around two-fifth share in the
total number of persons killed in road accidents.
Among the states, Kerala and Gujarat stand out in contrast as regards accidents. Kerala offers
an interesting case as it accounts for 4% share in total registered vehicles(in 2006) in India
compared to its much higher share in total road accidents (9.1% in 2006 and 8.3% in 2007)
and persons injured in road accidents (10 % in 2006 and 9.4% in 2007). However, Kerala
accounts for a lower share of 3.4% in 2006 (3.3 % in 2007) in the total road accident related
deaths. On the other hand, Gujarat accounts for 9.6 % in the number of registered vehicles
but lower shares of 6.8%, 6.8 % and 5.8% in total accidents, persons injured and killed
respectively due to road accidents during 2006.
A city level analysis indicates that 23 metropolitan cities account for 18.7% of road accidents
in India along with 11.2% of persons injured and 9.4% of persons killed in such accidents
during 2007. Mumbai leads the list with maximum number of road accidents (29,906)
followed by Delhi (8,620), Bengaluru (8,418) and Chennai (7,570). However, both Mumbai
and Delhi reported lower figures vis-à-vis accidents reported during 2006. However, both
Bengaluru and Chennai reported more accidents in 2007 than in the previous year. Varanasi

XV
has reported the lowest number (308) of accidents among these 23 cities in 2007. Delhi has
reported the largest number of fatalities during 2007 (2141 persons killed) followed by
Chennai (1146 deaths) and Bengaluru (961 deaths) during 2007.
XVI
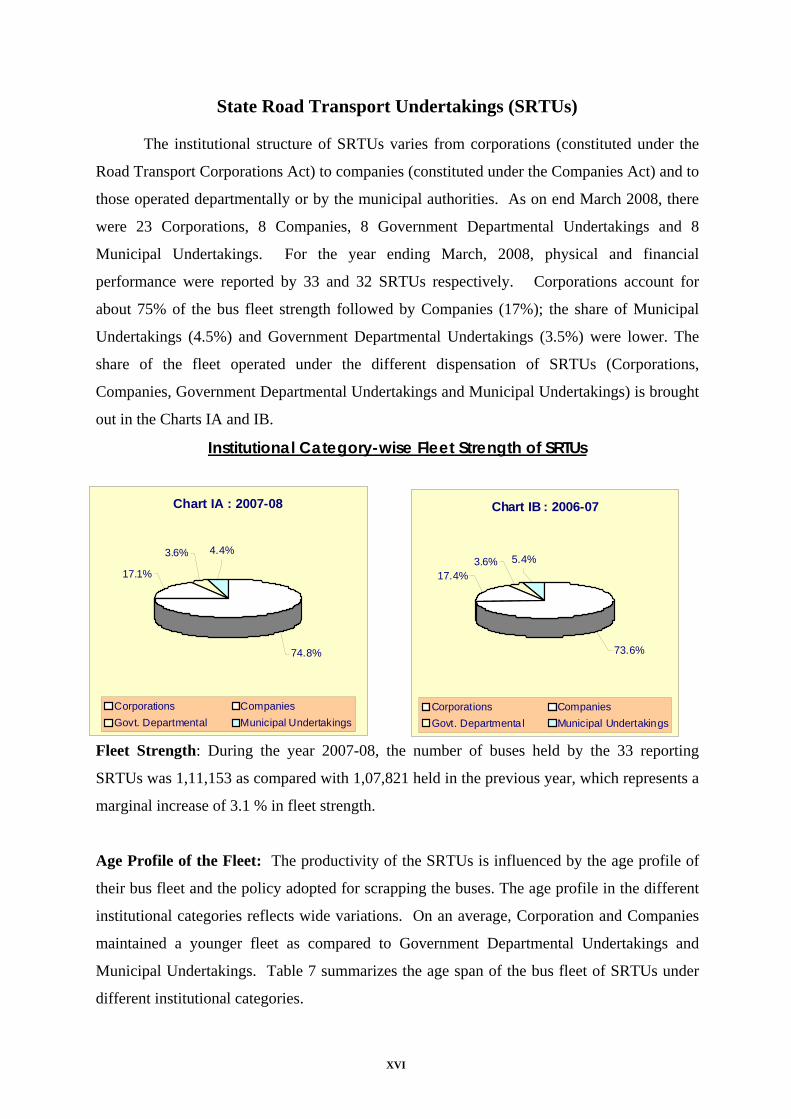
State Road Transport Undertakings (SRTUs)
The institutional structure of SRTUs varies from corporations (constituted under the
Road Transport Corporations Act) to companies (constituted under the Companies Act) and to
those operated departmentally or by the municipal authorities. As on end March 2008, there
were 23 Corporations, 8 Companies, 8 Government Departmental Undertakings and 8
Municipal Undertakings. For the year ending March, 2008, physical and financial
performance were reported by 33 and 32 SRTUs respectively. Corporations account for
about 75% of the bus fleet strength followed by Companies (17%); the share of Municipal
Undertakings (4.5%) and Government Departmental Undertakings (3.5%) were lower. The
share of the fleet operated under the different dispensation of SRTUs (Corporations,
Companies, Government Departmental Undertakings and Municipal Undertakings) is brought
out in the Charts IA and IB.
Institutional Category-wise Fleet Strength of SRTUs
Fleet Strength: During the year 2007-08, the number of buses held by the 33 reporting
SRTUs was 1,11,153 as compared with 1,07,821 held in the previous year, which represents a
marginal increase of 3.1 % in fleet strength.
Age Profile of the Fleet: The productivity of the SRTUs is influenced by the age profile of
their bus fleet and the policy adopted for scrapping the buses. The age profile in the different
institutional categories reflects wide variations. On an average, Corporation and Companies
maintained a younger fleet as compared to Government Departmental Undertakings and
Municipal Undertakings. Table 7 summarizes the age span of the bus fleet of SRTUs under
different institutional categories.
Chart IB : 2006-07
73.6%
17.4%3.6% 5.4%
Corporations CompaniesGovt. Departmenta l Municipal Undertakings
Chart IA : 2007-08
4.4%3.6%
17.1%
74.8%
Corporations CompaniesGovt. Departmental Municipal Undertakings

XVII
Table 7 - Age Profile of SRTUs Fleet (as on end March 2008) Sl.
No. Category of SRTU Lowest Average Age of
Fleet (yrs.) Highest Average Age
of Fleet (yrs.) 1. Corporations 2.80 8.99 2. Companies 3.36 7.19 3. Departmental 4.00 7.46 4. Municipal 5.61 10.50
Staff Strength: The total number of staff deployed by the 33 reporting SRTUs for the year
ending March, 2008 was 6.59 lakh which is higher by 3.1 % as compared to total staff
strength of 6.39 lakh during the previous year. The highest number of staff per bus was
reported by Mizoram ST (12.59) and the lowest was in Orissa SRTC (4.36).
Operational Productivity Parameters
The common indicator of physical productivity include: (i) Fleet Utilisation (ii) Vehicle
Productivity (iii) Fuel Efficiency (iv) Staff Productivity (v) Occupancy Ratio. The
productivity of the SRTUs in terms of the above mentioned parameters, for the year ending
March, 2008 and 2007 year are given in the Table 7.
Table 8 - Physical Performance Indicators (2006-07 & 2007-08) Type of SRTU Fleet
Utilisation %
Occupancy Ratio %
Staff Productivity
(km/staff/day)
Vehicle Productivity (km/bus/day)
Fuel Efficiency
(KMPL) 2006-
07 2007-
08 2006-
07 2007-
08 2006-
07 2007-
08 2006-
07 2007-
08 2006-
07 2007-
08
Corporations
Average 83.32 84.22 64.28 67.99 48.42 48.92 254.99 252.79 4.61 4.57
Highest 99.39 99.47 86.76 86.70 75.90 78.41 366.12 371.84 5.45 5.41
Lowest 50.08 55.47 45.82 47.23 19.07 17.61 119.84 117.49 3.70 3.56
Companies
Average 89.54 90.44 79.00 77.22 62.54 59.03 384.66 399.35 4.88 4.90
Highest 96.04 96.66 96.08 91.01 78.82 78.25 566.18 585.95 5.24 5.38
Lowest 74.46 76.01 56.01 53.52 32.14 31.18 191.08 191.29 3.83 3.94
Departmental
Average 76.26 75.96 67.90 78.31 35.79 36.04 194.82 193.48 3.98 3.90
Highest 96.88 95.44 92.00 92.00 64.38 64.19 331.03 325.31 5.03 4.97
Lowest 50.91 51.85 41.21 70.00 5.02 4.57 62.10 57.58 3.12 2.92
Municipal
Average 80.79 79.36 67.41 67.53 15.86 16.18 132.34 134.14 3.43 3.30
Highest 90.62 89.59 77.36 71.26 23.80 25.26 190.71 187.62 3.81 3.52
Lowest 73.61 72.35 60.60 64.32 4.43 4.33 36.72 35.43 3.20 3.10

XVIII
Fleet Utilisation: Fleet Utilisation is the ratio of the buses on road to the average fleet held
by an Undertaking. The average fleet utilization for all the reporting SRTUs was 92.38 % in
2007-08. The Andhra Pradesh SRTC recorded the highest utilization of 99.47 % whereas the
lowest was observed in Mizoram ST (51.85 %).
Vehicle Productivity: Vehicle productivity is the average number of revenue earning km.
performed by a bus per day, and is an important parameter. The average vehicle productivity
recorded by all the reporting SRTU was 270.3 km/bus/day in the year 2007-08. The highest
level of vehicle productivity (km/bus/day) was recorded by State Express TC Tamil Nadu
Ltd. (585.95 kms) and the lowest was Thane MT (35.43 kms).
Fuel Efficiency: Average kilometer per litre of fuel reflects the fuel efficiency in operation.
Out of the 33 reporting SRTUs, for which comparable data is available, as many as 12 SRTUs
posted improvement; while 20 SRTUs showed a decrease during the year ending March, 2008
vis-à-vis the previous year. One SRTU (Maharashtra SRTC) maintained a status quo in fuel
efficiency. The highest fuel efficiency recorded was by North Eastern Karnataka SRTC (5.41
km/litre) and the lowest by Mizoram ST (2.92 km/litre). Chart II provides the range of fuel
efficiency across the various institutional categories of SRTUs.

Chart II: Fuel Efficiency - 2007-08(kmllitre)
---Ii>"'-'-:
-- - --- - -..(1:,--,.l
---- .. ---
(~..,.
MunicipalUndertakings
- --~
Staff Productivity: It is measured by the average revenue earnings km performed per staff
per day. The average staff productivity for all reporting SRTUs was 46.83 km/staff/day in
2007-08. The highest staff productivity was observed in Rajasthan SRTC (78.41 km/staff/day)
and the lowest in Thane MT (4.33 km/staff/day).
Occupancy Ratio: Occupancy ratio reflects the passenger kilometers performed to passenger
kilometres offered. The average occupancy ratio of all reporting SRTUs taken together was
about 69 % in the year 2007-08. The range in the occupancy ratios of the four categories of
Undertakings viz. Corporations, Companies, Government Departmental undertaking and
Corporations Companies Govt. Dept.Undertakings
Municipal Undertakings for the year ending March, 2008 is given in Table 9.
Category of SRTU
_.-_._- l-~Hi9hest---
151. No. [
r:-
f2.
Iir
1
J:!JLowest j
Table 9 -SRTUs:Occupancy Ratio (fiscal year ending March 2008)
[ Highest Occupancy Ratio (%)
I 86.70(Calcutta STC)
I 91.01 (SETCTNLtd.)
I 92. OO(Chandigarh STU)
I t71.26 (Thane MT)
Category of 5RTU
I Corporations
I Companies
I Departmental
I Municipal
XIX
[ Lowest Occupancy Ratio (%)
I 47.23 (Maharashtra SRTC)
I 53.52 (Kadamba TC)
I 70.00 (Nagaland ST)
I 64.32(Pune MT)I

XX
Passengers Carried: The total number of passengers carried by the 30 reporting SRTUs for
the year ending March, 2008 stood at 2231.70 crore passengers which is higher than 2161.40
crore passengers carried during the year ending March, 2007 (an increase of 3.25% in this
period).
Road Safety
As per the information, total number of recorded road accidents increased by 4.1% from
21,866 during the year ending March, 2007 to 22,765 in the year 2008. Concomitantly, the
total number of fatal accidents increased marginally by 0.6 % from 4,471 to 4,497 during the
same period. However, the percentage of fatal accidents to total accidents declined from
20.4% to 19.8% between the two years. At the disaggregated level, Maharashtra SRTC
recorded the highest number of road accidents (3450 accidents) whereas both Mizoram State
Transport and Nagaland State Transport reported nil accidents.
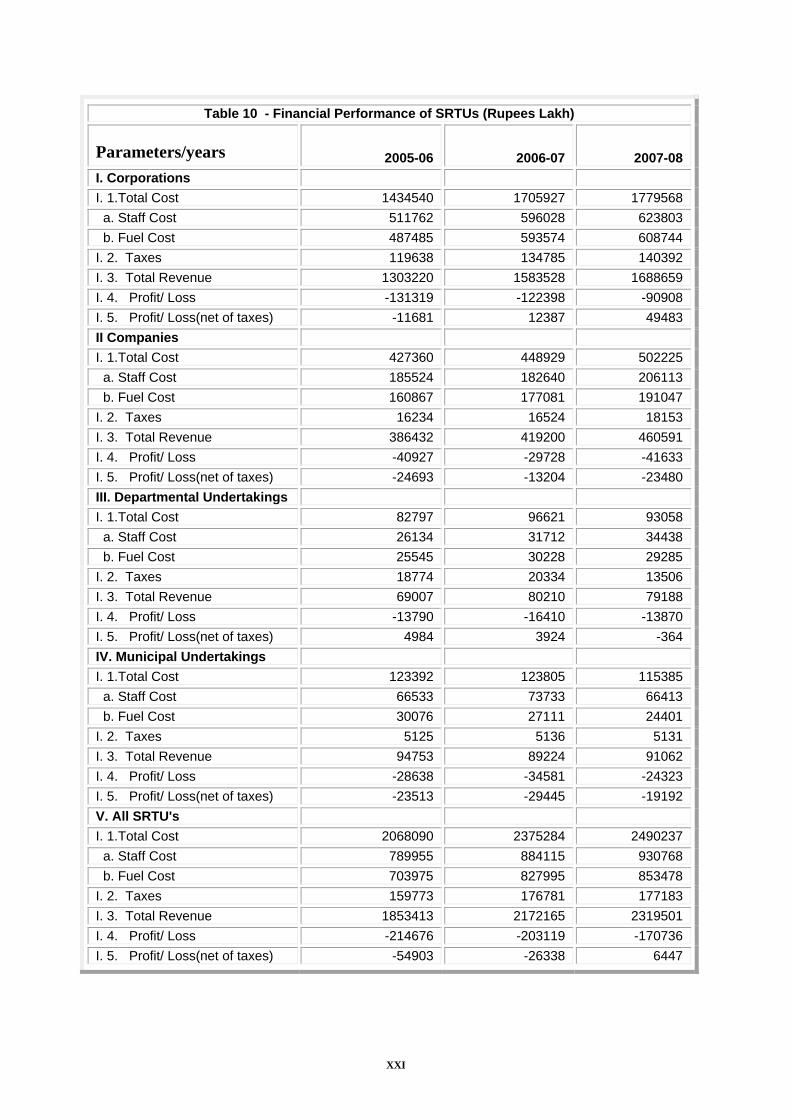
Financial Parameters
Table 10 gives a snapshot picture of financial performance of SRTUs in terms of institutional
categories and for all reporting SRTUs. The magnitude of losses remains large. However,
adjustments for taxes paid by the SRTUs yields lower net losses and even surplus in certain
categories of SRTUs.
XXI
Table 10 - Financial Performance of SRTUs (Rupees Lakh)
Parameters/years 2005-06 2006-07 2007-08I. Corporations I. 1.Total Cost 1434540 1705927 1779568 a. Staff Cost 511762 596028 623803 b. Fuel Cost 487485 593574 608744I. 2. Taxes 119638 134785 140392I. 3. Total Revenue 1303220 1583528 1688659I. 4. Profit/ Loss -131319 -122398 -90908I. 5. Profit/ Loss(net of taxes) -11681 12387 49483II Companies I. 1.Total Cost 427360 448929 502225 a. Staff Cost 185524 182640 206113 b. Fuel Cost 160867 177081 191047I. 2. Taxes 16234 16524 18153I. 3. Total Revenue 386432 419200 460591I. 4. Profit/ Loss -40927 -29728 -41633I. 5. Profit/ Loss(net of taxes) -24693 -13204 -23480III. Departmental Undertakings I. 1.Total Cost 82797 96621 93058 a. Staff Cost 26134 31712 34438 b. Fuel Cost 25545 30228 29285I. 2. Taxes 18774 20334 13506I. 3. Total Revenue 69007 80210 79188I. 4. Profit/ Loss -13790 -16410 -13870I. 5. Profit/ Loss(net of taxes) 4984 3924 -364IV. Municipal Undertakings I. 1.Total Cost 123392 123805 115385 a. Staff Cost 66533 73733 66413 b. Fuel Cost 30076 27111 24401I. 2. Taxes 5125 5136 5131I. 3. Total Revenue 94753 89224 91062I. 4. Profit/ Loss -28638 -34581 -24323I. 5. Profit/ Loss(net of taxes) -23513 -29445 -19192V. All SRTU's I. 1.Total Cost 2068090 2375284 2490237 a. Staff Cost 789955 884115 930768 b. Fuel Cost 703975 827995 853478I. 2. Taxes 159773 176781 177183I. 3. Total Revenue 1853413 2172165 2319501I. 4. Profit/ Loss -214676 -203119 -170736I. 5. Profit/ Loss(net of taxes) -54903 -26338 6447

XXII
Cost Structure
Table 11 indicates the cost structure of the reporting SRTUs for the year ending March, 2007
and 2008. The staff and fuel costs are the major components of the operating cost. These
account for more than 70% of the total costs; staff costs alone account for 37% of the costs.
The performance of all the reporting SRTUs reveals that non-operating costs accounted for
only 23% of the total costs during quarter ending March 2008. Taxes accounted for 7% of the
total costs.
Table 11 - SRTUs: Cost Structure and Its Components (per cent share in total cost) Sl. No. Cost Component Year Ending
A. OPERATING COST March, 2007 March, 2008 1 Staff 37 37 2 Fuel and Lubricants 35 34 3 Tyres and Tubes 3 3 4 Spares and Materials 2 3 B. NON-OPERATING COST
1. Interest 5 5 2. Depreciation 5 6 3. Taxes 7 7 4 Others 6 5
Note: Figures indicating per cent shares have been rounded off
*****


SSEECCTTIIOONN –– II
RROOAADD TTRRAANNSSPPOORRTT SSEECCTTOORR AATT AA GGLLAANNCCEE

Total Number of Registered Motor Vehicles in India - 1951-2006 ( In thousands)Year All Two Cars, Jeeps Buses Goods Others*
(As on Vehicles Wheelers and Taxis Vehicles31st March)
1 2 3 4 5 6 7
1951 306 27 159 34 82 4
Table No. 1.1
1956 426 41 203 47 119 16
1961 665 88 310 57 168 42
1966 1099 226 456 73 259 85
1971 1865 576 682 94 343 1701971 1865 576 682 94 343 170
1976 2700 1057 779 115 351 398
1981 5391 2618 1160 162 554 897
1986 10577 6245 1780 227 863 1462
1991 21374 14200 2954 331 1356 2533
1996 33786 23252 4204 449 2031 3850
2001 54991 38556 7058 634 @ 2948 5795
2002 58924 41581 7613 635 @ 2974 6121
2003 67007 47519 8599 721 @ 3492 6676
2004 72718 51922 9451 768 @ 3749 6828
2005 81501 58799 10320 892 @ 4031 7457
2006 (P) 89618 64743 11526 992 @ 4436 7921
* : Others include tractors, trailors, three wheelers ( passenger vehicles)/LMV and other miscellaneous vehicles which are not separately classified.@ : Includes omni buses. (P) : Provisional

( In thousands )STATES / UTs 2000 2001 2002 2004 2005 2006(P)
1 2 3 4 5 6 7 8STATESAndhra Pradesh 3636 3966 4389 5002 5720 6458 7218Arunachal Pradesh 21 * 21 * 21 * 21 * 21 * 22 22Assam 453 542 596 657 727 815 914Bihar 871 # 949 1024 1121 751 1352 1432Chhattisgarh - 857 948 1076 1216 1375 1541Goa 319 341 366 397 436 482 529Gujarat 5189 5576 6008 6508 7087 7817 8622Haryana 1733 1949 2122 2279 2548 2854 3087Himachal Pradesh 193 217 244 269 289 301 334Jammu & Kashmir 299 330 364 399 439 478 524Jharkhand - 909 984 1101 1217 1357 1505Karnataka 3393 3537 3636 3738 3977 5436 6220Kerala 1782 2112 2315 2552 2792 3122 3559Madhya Pradesh 3457 3095 3173 3459 3804 4188 4609Maharashtra 6114 6760 7414 8134 8969 9936 10966Manipur 77 77 $ 90 97 106 114 124Meghalaya 58 62 67 73 73 ^ 92 104Mizoram 27 31 34 37 42 47 52Nagaland 145 160 177 162 172 172 184Orissa 982 1096 1215 1359 1525 1715 1932Punjab 2296 ** 2910 3103 3308 3529 3876 4035Rajasthan 2712 2943 3197 3487 3834 4261 4754Sikkim 12 12 13 15 17 20 22Tamil Nadu 4611 5162 5658 8005 8575 9257 10054
2003
Total Registered Motor Vehicles in India ( State-Wise) As on 31st MarchTable No. 1.2
Tripura 45 50 57 66 76 73 106Uttarakhand - 364 406 457 516 573 643Uttar Pradesh 4627 4921 5171 5928 6460 7344 7989West Bengal 1690 1690 $ 1690 $ 2366 2548 $ 2681 2872TOTAL STATES 44742 50639 54482 62073 67466 76218 83953UTsA & N Islands 23 * 25 28 28 + 28 + 37 41Chandigarh 386 ** 386 ** 386 ** 562 586 617 647D & N Haveli 13 * 13 * 13 * 31 35 40 45Daman & Diu 34 37 41 44 48 51 55Delhi 3424 3635 3699 3971 4237 4187 4487Lakshadweep 4 4 5 5 5 5 6Puducherry 231 252 270 293 313 347 384TOTAL UTs 4115 4352 4442 4934 5252 5283 5665GRAND TOTAL 48857 54991 58924 67007 72718 81502 89618* : Data relates to 1996-97. ** : Data relates to 1997-98 ^ :Data relates to 2002-03$ : Data relates to 1999-00. + : Data relates to 2001-02# : Figures for Bihar only, excluding Jharkhand.(P) : ProvisionalNote : Consequent on formation of three States (Chhattisgarh, Jharkhand and Uttarakhand), separate data is available only from 2000-01.

Total Registered Motor Vehicles In Metropolitan Cities
(as on 31st March)
Metro Cities 2001 2002 2003 2004 2005 2006(P)1 3 4 5 6 7 8
AHMEDABAD 846 899 978 1075 1632 1780
BENGALURU 1593 1680 1771 1891 2232 2617
BHOPAL 309 333 361 392 428 476
CHENNAI 1257 1356 1895 2015 2167 2338
COIMBATORE 409 448 578 630 682 750
DELHI 3635 3699 3971 4237 4186 4487
HYDERABAD 951 $ 1241 1319 1356 1433 1522
INDORE 517 550 592 645 705 771
JAIPUR 644 * 693 753 824 923 1051
KANPUR 370 385 425 425 ^ 425 ^ 425 ^
KOCHI 152 ** 152 166 166 ^ 166 ^ 166 ^
KOLKATA 664 @ 801 842 875 911 948
LUCKNOW 465 556 615 615 ^ 615 ^ 615 ^
LUDHIANA 646 685 728 771 771 & 771 &
MADURAI 219 240 281 304 330 364
GREATER MUMBAI 1030 1069 1124 1199 1295 1394
(In thousands)Table No. 1.3
NAGPUR 416 459 503 543 770 824
PATNA 293 313 336 336 ^ 378 405
PUNE 620 658 697 755 827 874
SURAT 534 575 633 692 692 & 692 &
VADODARA 475 506 546 586 586 & 586 &
VARANASI 333 339 366 366 ^ 366 ^ 366 ^
VISAKHAPATNAM 209 $ 364 393 412 435 462
* : Data relates to district. ^ : Data relates to the year 2003 '@ : Data relates to the year 1998.(P) : Provisional.
& : Data relates to the year 2004** : Data Reported for 2002 has been used.$ : Data relates to the year 1999.
Table No. 1.3

Number of Buses Owned by the Public and Private Sectors in India (1961-2006)
1 2 3 4
1961 18.0 38.8 56.8
1966 26.5 47.0 73.5
1971 … … 94.0
1976 52.2 62.8 115.0
1981 69.6 92.3 161.9
1986 84.0 143.3 227.3
1991 106.1 225.0 331.1
1996 111.1 338.7 449.8
2001 115.0 518.9 633.9 *
2002 114.7 520.3 635.0 *
2003 114.9 605.9 720.8 *
Year (As on 31st March)
( In thousands)
Public Sector Private Sector Total
Table No.1.4
2004 111.4 656.2 767.6 *
2005 113.3 779.4 892.7 *
2006 (P) 112.1 879.9 992.0 *
* : Includes omni - buses. (P) : Provisional. ... : Not Indicated.Note : Public sector buses are owned and operated by STUs which are on road/in use. The buses of private sector are derived from total number of buses net of those in public sector.

Total Bus Fleet and Buses in Public Sector (SRTUs) (State-wise) (As on 31st March) (In numbers)
Public Sector Total $ Public Sector Total $1 2 3 4 5
STATESAndhra Pradesh 18429 57726 17659 63582Arunachal Pradesh 228 678 228 682Assam 340 10776 340 11378Bihar 558 16158 637 16271Chhattisgarh … 22294 … 24955Goa 433 5267 414 5689Gujarat 8704 52286 8836 54446Haryana 3294 11297 3332 19986Himachal Pradesh 1689 7012 1672 7261Jammu & Kashmir 684 20954 704 21654Jharkhand … 9878 … 10238Karnataka 13059 89294 14669 95627Kerala 4401 95486 4401 127574Madhya Pradesh 1571 25990 … 27997Maharashtra 21721 63405 21199 66754Manipur 25 3150 25 3371Meghalaya 58 3285 60 3497Mizoram 55 672 55 704Nagaland 221 4079 209 4410Orissa 261 17392 261 18563Punjab 2511 19855 1911 21136Rajasthan 4345 58092 4343 60979
STATES / UTs 20062005
Table No. 1.5
Sikkim 86 1118 85 1435Tamil Nadu 16860 102504 16982 109948Tripura 98 1877 89 1974Uttarakhand 875 6361 899 7578Uttar Pradesh 5843 41325 6205 45564West Bengal 2892 33613 2916 43599UTsA & N Islands 138 839 142 993Chandigarh 417 2211 417 2358D & N Haveli … 162 … 182Daman & Diu … 427 … 458Delhi 3470 102624 3469 106240Lakshadweep … 72 … 86Puducherry … 4628 … 4915Grand Total 113266 892787 112159 992084$ : Includes omni buses.… : Not indicated

Performance of State Road Transport Undertakings (SRTUs)
Sl.No. Parameter 2001-02 2002-03 2003-04 2004-05 2005-06 2006-07 2007-08
1 Reporting SRTUs (Nos) 43 43 41 42 36 33 33
A Fl t
Table No. 1.6
2 Average Fleet held(Nos) 102986 102160 103302 102526 111254 107821 111153
3 Fleet Utilisation (%) 90.73 91.92 92.93 92.77 91.90 92.19 92.38
Occupancy Ratio
Table No. 1.6
4 Occupancy Ratio (%) 62.66 63.45 62.36 64.33 65.94 67.87 68.89
5 Vehicle Productivity (km/bus/day) 292.61 299.77 296.38 294.64 258.73 267.98 270.34
6Staff Productivity (R i 42 62 44 71 46 41 46 26 42 97 47 35 46 83
Table No. 1.6
6 (Revenue earning kms/staff/day)
42.62 44.71 46.41 46.26 42.97 47.35 46.83
7 Fuel Efficiency(KMPL) 4.22 4.26 4.33 4.40 4.36 4.49 4.46
8 Revenue/km. 13 40 14 22 14 99 16 18 17 15 18 53 19 26
Table No. 1.6
8 (Rupees) 13.40 14.22 14.99 16.18 17.15 18.53 19.26
9 Cost/km. (Rupees) 18.19 18.99 20.87 22.64 25.13 26.41 28.29
10 Profit/Loss per km (Rupees ) -4.79 -4.77 -5.88 -6.46 -7.98 -7.88 -9.03
Table No. 1.6
10 km.(Rupees.) 4.79 4.77 5.88 6.46 7.98 7.88 9.03
Note : Data relates to reporting SRTUs.KMPL :Kilometres Per Litre.Source: For 2006-07 & 2007-08: Latest reported data. For 2005-06: Review of Performance of SRTUs, April 2005-March 2006.For 2003-04 & 2004-05: Road Transport Year Book 2004-05.For 2001-02 & 2002-03: Motor Transport Statistics of India 2001-2002.
Table No. 1.6
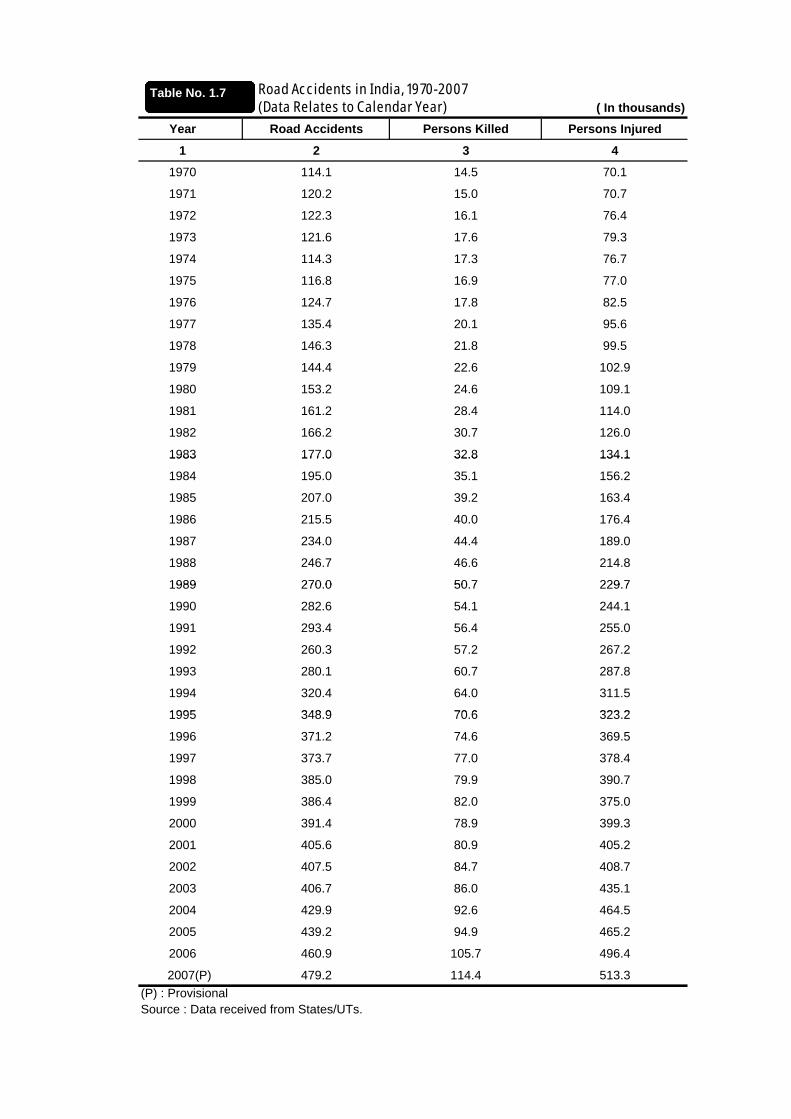
Road Accidents in India, 1970-2007 (Data Relates to Calendar Year) ( In thousands)
Year Road Accidents Persons Killed Persons Injured
1 2 3 4
1970 114.1 14.5 70.1
1971 120.2 15.0 70.7
Table No. 1.7
1972 122.3 16.1 76.4
1973 121.6 17.6 79.3
1974 114.3 17.3 76.7
1975 116.8 16.9 77.0
1976 124.7 17.8 82.5
1977 135.4 20.1 95.6
Table No. 1.7
1978 146.3 21.8 99.5
1979 144.4 22.6 102.9
1980 153.2 24.6 109.1
1981 161.2 28.4 114.0
1982 166.2 30.7 126.0
1983 177.0 32.8 134.1
Table No. 1.7
1983 177.0 32.8 134.1
1984 195.0 35.1 156.2
1985 207.0 39.2 163.4
1986 215.5 40.0 176.4
1987 234.0 44.4 189.0
1988 246.7 46.6 214.8
1989 270 0 50 7 229 7
Table No. 1.7
1989 270.0 50.7 229.7
1990 282.6 54.1 244.1
1991 293.4 56.4 255.0
1992 260.3 57.2 267.2
1993 280.1 60.7 287.8
1994 320.4 64.0 311.5
1995 348 9 70 6 323 2
Table No. 1.7
1995 348.9 70.6 323.2
1996 371.2 74.6 369.5
1997 373.7 77.0 378.4
1998 385.0 79.9 390.7
1999 386.4 82.0 375.0
2000 391.4 78.9 399.3
Table No. 1.7
2001 405.6 80.9 405.2
2002 407.5 84.7 408.7
2003 406.7 86.0 435.1
2004 429.9 92.6 464.5
2005 439.2 94.9 465.2
2006 460.9 105.7 496.4
Table No. 1.7
2007(P) 479.2 114.4 513.3
Source : Data received from States/UTs.(P) : Provisional
Table No. 1.7

Revenue Realised from Road Transport (Centre) - 1950-51 to 2006-07 ( Rs. in crores )
TotalImport Excise Import Excise Import Excise Import Excise
Duty Duty Duty Duty Duty (a) Duty Duty Duty1 2 3 4 5 6 7 8 9 10
Year
Motor Vehicles Tyre & Tubes High Speed Motor Spirit& Accessories. Diesel Oil
Table No. 1.8
1950-51 9.4 … 0.1 4.0 19.4 1.9 (b) … 34.8
1955-56 10.2 … 0.1 5.6 7.1 22.6 (b) … 45.6
1960-61 14.8 10.5 0.9 13.4 7.5 64.6 (b) … 111.7
1965-66 26.9 20.8 0.2 28.8 29.4 166.2 (b) … 272.3
1970 71 14 3 28 0 1 0 54 9 4 3 349 3 (b) 451 81970-71 14.3 28.0 1.0 54.9 4.3 349.3 (b) … 451.8
1975-76 54.8 82.3 1.4 134.5 21.7 243.6 8.2 … 546.5
1980-81 52.7 250.4 1.6 288.3 106.7 223.2 8.0 … 930.9
1985-86 198.4 482.3 … 492.9 32.7 454.7 5.7 794.0 2460.7
1990-91 351 8 1510 9 803 4 727 6 1202 3 4596 01990-91 351.8 1510.9 … 803.4 … 727.6 … 1202.3 4596.0
1995-96 1122.9 2446.1 … 1597.0 … 1235.2 … 1631.5 8032.7
1996-97 1463.1 3201.2 … 1754.8 … 2084.7 … 2118.8 10820.6
1997-98 1175.3 3825.8 … 1442.9 … 2197.2 … 2942.0 11583.2
1998-99 1080.7 3965.6 … 1403.2 … 3293.1 … 4442.0 14184.6
1999-00 1483.9 4949.5 … 1514.7 … 8003.7 … 5000.7 20952.5
2000-01 1429.4 5604.8 … 1382.1 … 9863.7 … 5581.0 23861.0
2001-02 965.6 4898.1 … 1360.0 … 12207.1 … 8500.8 27931.6
2002-03 1227.8 5341.0 … 1393.2 … 11607.6 … 11562.8 31132.4
2003-04 1438.1 5572.4 … 1087.0 … 14461.3 … 12575.0 35133.8
2004-05 1857.0 6845.0 … 1431.0 … 15701.0 … 13792.0 39626.0
2005-06 2088.0 6965.0 … 1106.0 … 22278.0 … 17554.0 49991.0
2006-07 3161.0 6810.0 … 1246.0 … 25060.0 … 18303.0 54580.0
… : Not indicated.(a) : Includes figures for R.D. oil and Diesel Oil.(b) : Includes High Speed Diesel OilSource : Directorate of Data Management, Central Excise and Customs
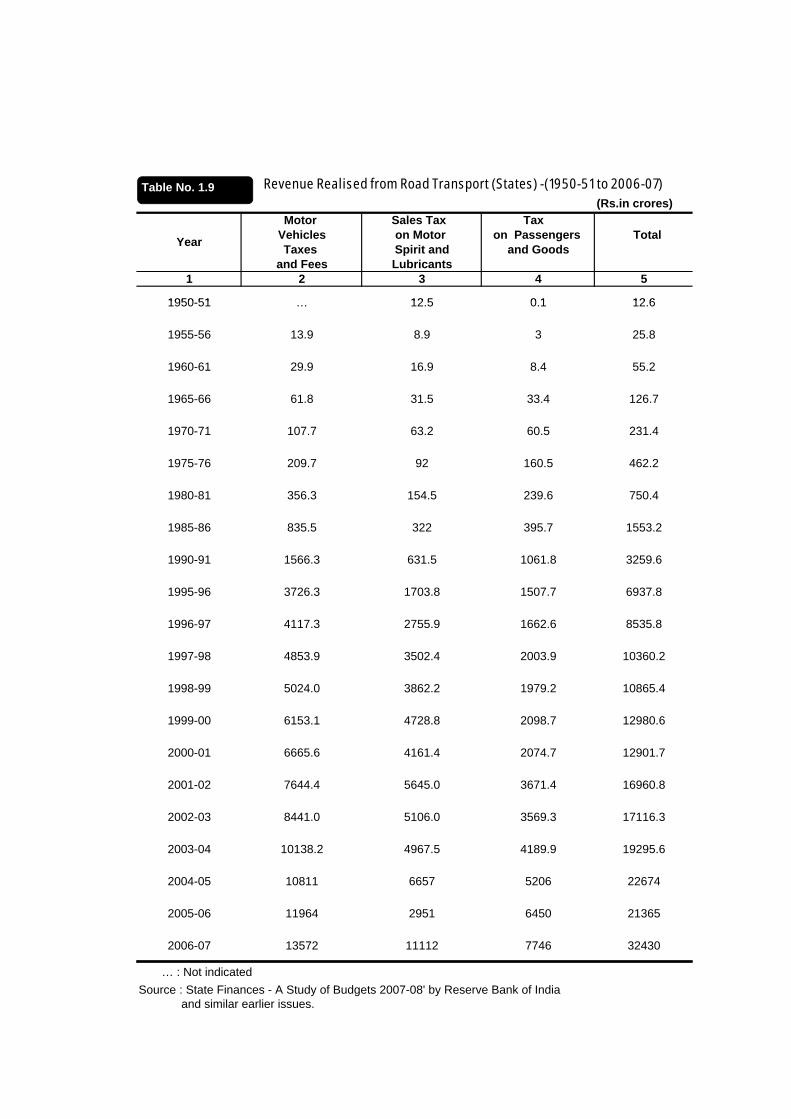
Revenue Realised from Road Transport (States) -(1950-51 to 2006-07) (Rs.in crores)
Motor Sales Tax Tax Vehicles on Motor on Passengers TotalTaxes Spirit and and Goods
and Fees Lubricants1 2 3 4 5
1950 51 12 5 0 1 12 6
Year
Table No. 1.9
1950-51 … 12.5 0.1 12.6
1955-56 13.9 8.9 3 25.8
1960-61 29.9 16.9 8.4 55.2
1965-66 61.8 31.5 33.4 126.7
1970 71 107 7 63 2 60 5 231 41970-71 107.7 63.2 60.5 231.4
1975-76 209.7 92 160.5 462.2
1980-81 356.3 154.5 239.6 750.4
1985-86 835.5 322 395.7 1553.2
1990-91 1566.3 631.5 1061.8 3259.6
1995-96 3726.3 1703.8 1507.7 6937.8
1996-97 4117.3 2755.9 1662.6 8535.8
1997-98 4853.9 3502.4 2003.9 10360.2
1998-99 5024.0 3862.2 1979.2 10865.4
1999-00 6153.1 4728.8 2098.7 12980.6
2000-01 6665.6 4161.4 2074.7 12901.7
2001-02 7644.4 5645.0 3671.4 16960.8
2002-03 8441.0 5106.0 3569.3 17116.3
2003-04 10138.2 4967.5 4189.9 19295.6
2004-05 10811 6657 5206 22674
2005-06 11964 2951 6450 21365
2006-07 13572 11112 7746 32430
… : Not indicatedSource : State Finances - A Study of Budgets 2007-08' by Reserve Bank of India and similar earlier issues.

Freight Movement by Road Transport & Railways, 1950-51 to 2006-07
(Billion Tonne Kilometres) Year Road Transport Railways **
1950-51 6.0* 37.6
(13.8) (86.2)
1960-61 14.0 72.3
(16 2) (83 8)
Table No. 1.10Table No. 1.10
(16.2) (83.8)
1970-71 47.7 110.7
(30.1) (69.9)
1980-81 90.9 147.7
(38.1) (61.9)
1990-91 145.1 235.8
(38.1) (61.9)
1999-2000 467.0 305.2
(60.5) (39.5)
2000-01 494.0 312.4
(61.3) (38.7)
2001-02 515.0 333.2
(60.7) (39.3)
2002 03 545 0 353 22002-03 545.0 353.2
(60.7) (39.3)
2003-04 595.0 381.2
(61.0) (39)
2004-05 646 411.3
(61.3) (38.7)
2005-06 658.9 441.8
(60.0) (40.0)
2006-07 766.2 483.4
'(61.3) '(38.7)Figures in parentheses indicate percentages
Note: 1. Figures for Road Transport from 1960-61 to 1990-91 are estimated based on percentage share of Road Transport and Railways given in the Working Group Report on Road Transport, Tenth Five Year Plan, 2002-07 2. Figures for Road Transport from 1999-2000 have been estimated by Transport
** Data on Railway traffic from Ministry of Railways' Year Books. Source: * Tenth Plan Document
2. Figures for Road Transport from 1999 2000 have been estimated by Transport Research Wing, Ministry of Shipping, Road Transport & Highways, Government of India
4. Figures for Road Transport from 2005-06 to 2006-07 have been estimated by Transport Research Wing, Ministry of Shipping, Road Transport & Highways, Government of India
3. Figures for Road Transport from 2000-01 to 2004-05 have been estimated by the Sub- Group on Passenger and Goods Road Traffic for the Eleventh Five Year Plan 2007-12

Passenger Movement by Road Transport & Railways, 1950-51 to 2005-06
(Billion Passenger Kilometres) Year Road Transport Railways **
1950-51 23.0* 66.5
(15.4) (84.6)
1960-61 80.9 77.7
Table No. 1.11
(51.0) (49.0)
1970-71 210.0 118.1
(64.0) (36.0)
1980-81 541.8 208.6
(72.2) (27.8)
1990-91 767.7 295.6
(72.2) (27.8)
1999-2000 1831.6 430.7
(81.0) (19.0)
2000-01 2075.5 457.0
(82.0) (18.0)
2001-02 2413.1 490.9
(83.1) (16.9)
2002-03 2814.7 515.0
(84.5) (15.5)
2003-04 3070.2 541.2
(85.0) (15.0)
2004-05 3469.3 575.7
(85.8) (14.2)2005-06 4251.7 615.6
(87.4) (12.6)Figures in parentheses indicate percentages(P) - Provisional Note: 1. Figures for Road Transport from 1960-61 to 1990-91 are estimated based on percentage share of Road Transport and Railways given in the Working Group Report on Road Transport, Tenth Five Year Plan 2002-07 2. Figures for Road Transport from 1999-2000 to 2000-01 have been estimated by Transport Research Wing, Ministry of Shipping, Road Transport & Highways, Government of India
Figures in parentheses indicate percentages
3. Figures for Road Transport from 2001-02 to 2004-05 have been estimated by the Sub- Group on Passenger and Goods Road Traffic for the Eleventh Five Year Plan 2007-12 4. Figures for Road Transport for the Year 2005-06 has been estimated by Transport Research Wing, Ministry of Shipping, Road Transport & Highways, Government of India
** Data on Railway traffic from Ministry of Railways' Year Books.Source: * Tenth Plan Document

Table No. 1.9 Cargo Handled by Major and Minor Ports, 1950-51 to 2006-07
(Million Tonnes)Year Major Ports Minor Ports
1950-51 19.38 N.A.
1960-61 33.12 4.41
1970-71 55.58 6.69
1980-81 80.27 6.73
1990-91 151.67 12.78
2000-01 281.13 87.37
2001-02 287.58 95.52
Table No. 1.12
2002-03 313.55 108.30
2003-04 344.80 118.87
2004-05 383.76 136.96
2005-06 423.57 150.12
2006-07 463.78 184.92
Source: Transport Research Wing

Select Countries: Vehicle Fleet Ratios per 1000 Persons
CountryGNI per capita
2006 (US $) Passenger Cars Total Vehicle Population*
Brazil 4710 136 (2004) 170 (2004)
China P.R. 2000 18 (2006) 28 (2006)
France 36560 496 (2006) 598 (2006)
Germany 36810 565 (2006) 598 (2006)
India 820 10 (2006) 22 (2006)
Japan 38630 441 (2004) 586 (2004)
Korea, Republic 17690 240 (2006) 328 (2006)
Malaysia 5620 225 (2003) 272 (2003)
Mexico 7830 147 (2006) 222 (2006)
Table No. 1.13
Philippines 1390 9 (2005) 14 (2005)
Russian Federation 57708 188 (2006) 228 (2006)
South Africa 5390 103 (2006) 151 (2006)
United Kingdom 40560 457 (2005) 517 (2005)
U.S.A. 44710 461 (2005) 675 (2005)* Total Vehicle Population refers to vehicle in use excluding two-wheelers.For India, registered vehicle population has been used.Passenger Cars also include Jeeps & Taxis.GNI - Gross National Income.Figures within parentheses indicate the latest year for which data is available.Source: World Road Statistics, 2008.

Select Countries: Two Wheelers per 1000 Persons
Country * Two WheelersPopulation
(2006)GNI per capita
2006(US $)Two Wheelers per 1000
Persons
Brazil (2004) 7039675 189322987 4710 37
China P.R. (2006) 81473064 1311797692 2000 62
France (2006) 2482000 61256600 36560 41
Germany (2006) 3969103 82374900 36810 48
India (2006) 64743126 1114202000 820 58
Italy (2005) 4118775 58842800 31990 70
Japan (2004) 13290000 127756000 38630 104
Korea, Rep.(2006) 1747925 48418077 17690 36
Malaysia (2003) 6164958 26113731 5620 236
Mexico (2006) 706204 104221361 7830 7
Philippines (2005) 1973700 86263713 1390 23
Portugal (2003) 579215 10589300 17850 55
Table No. 1.14
Spain (2003) 1513526 44121300 27340 34
South Africa(2006) 280693 47391025 5390 6
Sri Lanka (2003) 1740799 19886000 1310 88
Taipei (2006) 13557028 22970000 N.A. 590
U. K.(2005) 1206000 60550100 40560 20
U.S.A. (2005) 6227146 299398000 44710 21
Vietnam (2002) 10988543 84108100 700 131Source: World Road Statistics, 2008 for all countries in r/o GNI, Population & 2-WheelersFor India, 2-wheelers data as reported by States & Population figure projected by RGI, Census.* Figures within parentheses indicate the latest year for which 2-wheeler data has been reported.

SSEECCTTIIOONN –– IIII
PPRROOFFIILLEE OOFF MMOOTTOORR VVEEHHIICCLLEE RREEGGIISSTTRRAATTIIOONN
((SSTTAATTEE//UUTT--WWIISSEE))
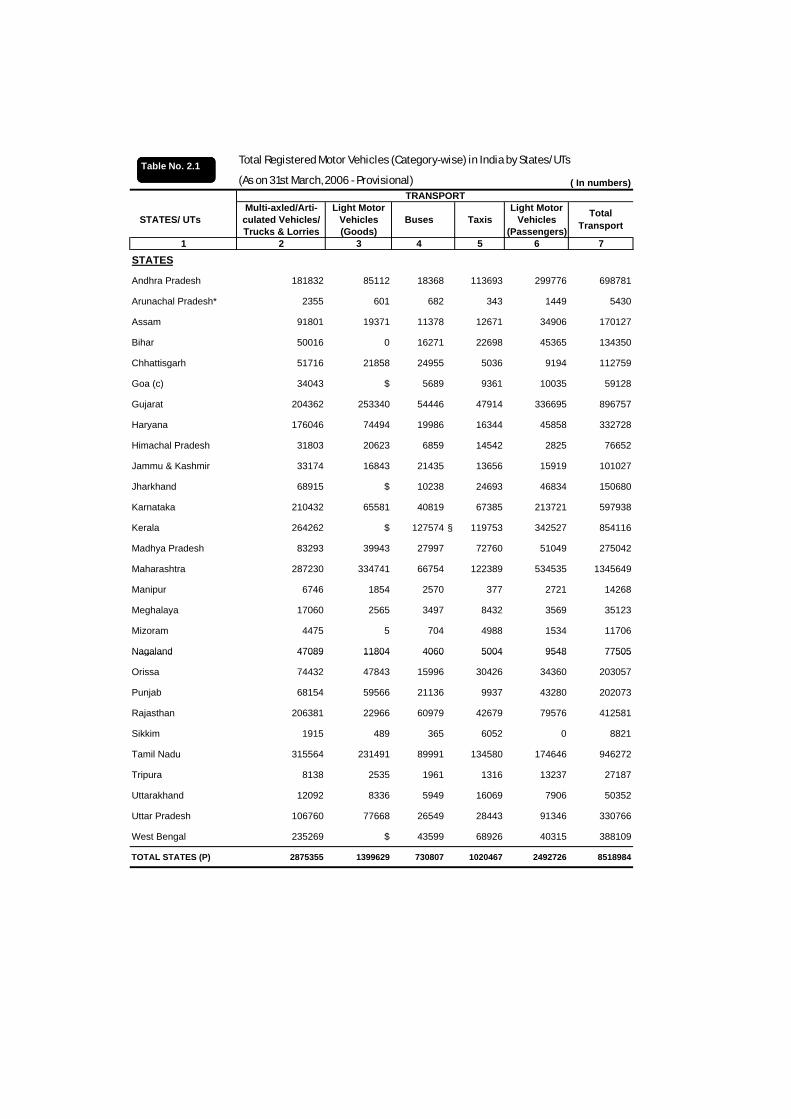
Total Registered Motor Vehicles (Category-wise) in India by States/UTs
(As on 31st March, 2006 - Provisional) ( In numbers)
Multi-axled/Arti- Light Motor Light Motor STATES/ UTs culated Vehicles/ Vehicles Buses Taxis Vehicles
Trucks & Lorries (Goods) (Passengers)1 2 3 4 5 6 7
STATES
Andhra Pradesh 181832 85112 18368 113693 299776 698781
Arunachal Pradesh* 2355 601 682 343 1449 5430
Assam 91801 19371 11378 12671 34906 170127
Bihar 50016 0 16271 22698 45365 134350
Chhattisgarh 51716 21858 24955 5036 9194 112759
Goa (c) 34043 $ 5689 9361 10035 59128
Gujarat 204362 253340 54446 47914 336695 896757
Haryana 176046 74494 19986 16344 45858 332728
Himachal Pradesh 31803 20623 6859 14542 2825 76652
Jammu & Kashmir 33174 16843 21435 13656 15919 101027
Jharkhand 68915 $ 10238 24693 46834 150680
Karnataka 210432 65581 40819 67385 213721 597938
Kerala 264262 $ 127574 § 119753 342527 854116
Madhya Pradesh 83293 39943 27997 72760 51049 275042
Maharashtra 287230 334741 66754 122389 534535 1345649
Manipur 6746 1854 2570 377 2721 14268
Meghalaya 17060 2565 3497 8432 3569 35123
Mizoram 4475 5 704 4988 1534 11706
Nagaland 47089 11804 4060 5004 9548 77505
TRANSPORT
Total Transport
Table No. 2.1
Nagaland 47089 11804 4060 5004 9548 77505
Orissa 74432 47843 15996 30426 34360 203057
Punjab 68154 59566 21136 9937 43280 202073
Rajasthan 206381 22966 60979 42679 79576 412581
Sikkim 1915 489 365 6052 0 8821
Tamil Nadu 315564 231491 89991 134580 174646 946272
Tripura 8138 2535 1961 1316 13237 27187
Uttarakhand 12092 8336 5949 16069 7906 50352
Uttar Pradesh 106760 77668 26549 28443 91346 330766
West Bengal 235269 $ 43599 68926 40315 388109
TOTAL STATES (P) 2875355 1399629 730807 1020467 2492726 8518984
Table No. 2.1

Total Registered Motor Vehicles (Category-wise) in India by States/UTs
(As on 31st March, 2006 - Provisional) ( In numbers)
Multi-axled/Arti- Light Motor Light Motor STATES/ UTs culated Vehicles/ Vehicles Buses Taxis Vehicles
Trucks & Lorries (Goods) (Passengers)1 2 3 4 5 6 7
UTs
A & N Islands 1716 76 658 246 2997 5693
Chandigarh 1766 8039 2307 1771 2000 15883
D & N Haveli 6072 1750 176 123 539 8660
Daman & Diu 2223 2316 420 43 976 5978
Delhi 57682 67144 25963 15569 96149 262507
Lakshadweep 0 347 13 0 273 633
Puducherry 6965 4903 1997 1626 4665 20156
UTs TOTAL (P) 76424 84575 31534 19378 107599 319510
GRAND TOTAL (P) 2951779 1484204 762341 1039845 2600325 8838494
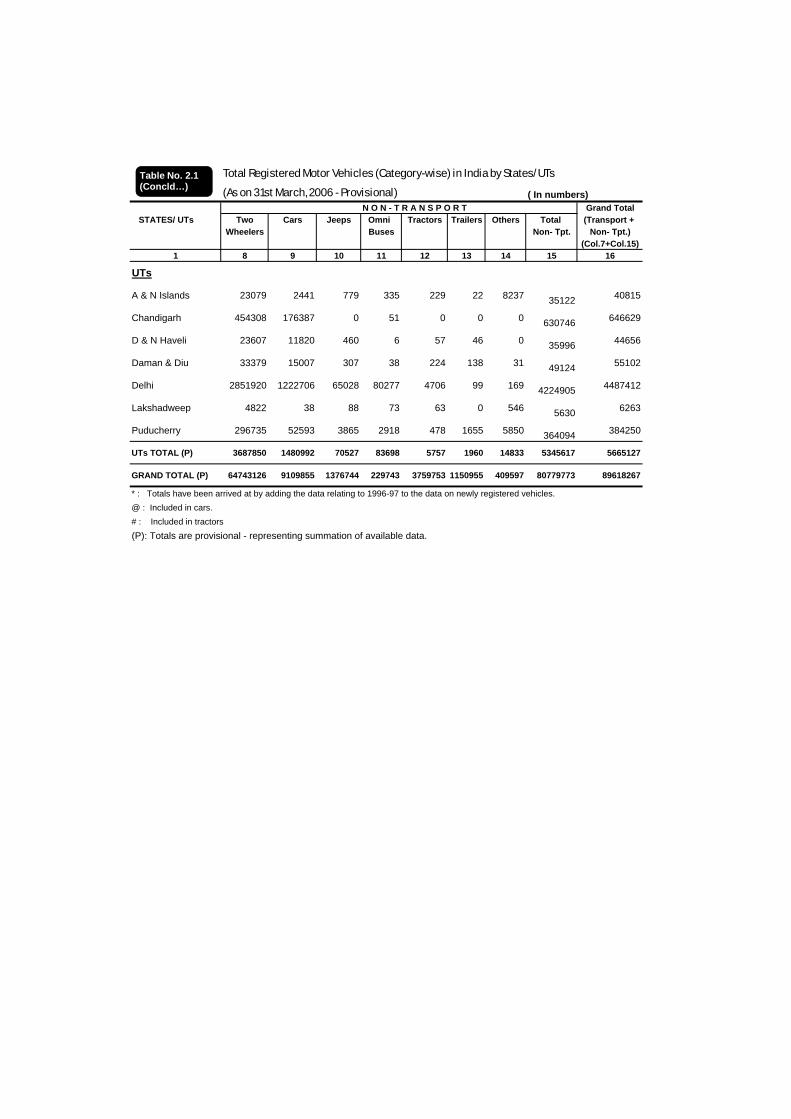
* : Totals have been arrived at by adding the data relating to 1996-97 to the data on newly registered vehicles.$ : Included in Multi-axled/Articulated Vehicles/Trucks & Lorries.(c): LMV(passengers) includes 6538 Motorcycles on hire also.(P): Totals are provisional - representing summation of available data.§ : Includes Omni Buses
TRANSPORT
Total Transport
Table No. 2.1(Contd…)

Total Registered Motor Vehicles (Category-wise) in India by States/UTs
(As on 31st March, 2006 - Provisional) ( In numbers)Grand Total
STATES/ UTs Two Cars Jeeps Omni Tractors Trailers Others Total (Transport + Wheelers Buses Non- Tpt. Non- Tpt.)
(Col.7+Col.15)1 8 9 10 11 12 13 14 15 16
STATES
Andhra Pradesh 5707383 576329 65377 45214 66613 51881 6617 6519414 7218195
Arunachal Pradesh* 11112 2595 2284 0 345 155 180 16671 22101
Assam 541275 145029 15080 0 11270 9050 22192 743896 914023
Bihar 964594 76896 41863 0 130477 75594 8569 1297993 1432343
Chhattisgarh 1247658 59591 8575 0 58733 50684 2849 1428090 1540849
Goa 375571 89547 @ 0 0 0 4773 469891 529019
Gujarat 6352109 703968 122864 0 311385 217790 17417 7725533 8622290
Haryana 1881174 373659 95450 0 382581 0 21434 2754298 3087026
Himachal Pradesh 187883 58005 9544 402 0 0 1042 256876 333528
Jammu & Kashmir 297656 98309 11058 219 12818 587 1869 422516 523543
Jharkhand 1164854 113500 30962 0 20968 16819 7268 1354371 1505051
Karnataka 4512910 635205 41989 54808 166685 167622 43213 5622432 6220370
Kerala 2099652 498472 73158 0 15162 2264 15880 2704588 3558704
Madhya Pradesh 3526416 185700 38291 0 376771 192742 13665 4333585 4608627
Maharashtra 7691856 1165365 300023 0 229362 204733 29446 9620785 10966434
Manipur 86931 11233 8568 801 1446 612 270 109861 124129
Meghalaya 31008 22351 11300 0 487 2607 1240 68993 104116
Mizoram 24737 6286 3712 0 246 264 4925 40170 51876
Nagaland 42851 37513 22481 350 1891 772 353 106211 183716
N O N - T R A N S P O R T
Table No. 2.1(Contd…)
Nagaland 42851 37513 22481 350 1891 772 353 106211 183716
Orissa 1530295 82686 30547 2567 42189 34679 5975 1728938 1931995
Punjab 2975198 335284 41670 0 472873 481 7581 3833087 4035160
Rajasthan 3393916 269861 147840 0 464443 59564 5822 4341446 4754027
Sikkim 5282 3053 3769 1070 24 0 0 13198 22019
Tamil Nadu 7936778 840433 55673 19957 102744 44015 108041 9107641 10053913
Tripura 61968 6656 4358 13 89 100 5397 78581 105768
Uttarakhand 486734 59368 6944 1629 34155 1401 2802 593033 643385
Uttar Pradesh 6083655 615739 112837 19015 791411 14579 21132 7658368 7989134
West Bengal 1833820 556230 @ 0 58828 # 34812 2483690 2871799
TOTAL STATES (P) 61055276 7628863 1306217 146045 3753996 1148995 394764 75434156 83953140
Table No. 2.1(Contd…)
Total Registered Motor Vehicles (Category-wise) in India by States/UTs
(As on 31st March, 2006 - Provisional) ( In numbers)N O N - T R A N S P O R T Grand Total
STATES/ UTs Two Cars Jeeps Omni Tractors Trailers Others Total (Transport + Wheelers Buses Non- Tpt. Non- Tpt.)
(Col.7+Col.15)1 8 9 10 11 12 13 14 15 16
UTs
A & N Islands 23079 2441 779 335 229 22 8237 35122 40815
Chandigarh 454308 176387 0 51 0 0 0 630746 646629
D & N Haveli 23607 11820 460 6 57 46 0 35996 44656
Daman & Diu 33379 15007 307 38 224 138 31 49124 55102
Delhi 2851920 1222706 65028 80277 4706 99 169 4224905 4487412
Lakshadweep 4822 38 88 73 63 0 546 5630 6263
Puducherry 296735 52593 3865 2918 478 1655 5850 364094 384250
UTs TOTAL (P) 3687850 1480992 70527 83698 5757 1960 14833 5345617 5665127
GRAND TOTAL (P) 64743126 9109855 1376744 229743 3759753 1150955 409597 80779773 89618267
* : Totals have been arrived at by adding the data relating to 1996-97 to the data on newly registered vehicles.@ : Included in cars.# : Included in tractors
(P): Totals are provisional - representing summation of available data.
Table No. 2.1(Concld…)

Total Registered Motor Vehicles (Category-wise) in India by States/UTs
(As on 31st March, 2005) ( In numbers)
Multi-axled/Arti- Light Motor Light Motor STATES/ UTs culated Vehicles/ Vehicles Buses Taxis Vehicles
Trucks & Lorries (Goods) (Passengers)1 2 3 4 5 6 7
STATES
Andhra Pradesh 162156 75845 16909 97516 281236 633662
Arunachal Pradesh* 2334 576 678 334 1441 5363
Assam 87118 16852 10776 11440 32386 158572
Bihar 49437 0 16158 22271 42050 129916
Chhattisgarh 45805 19254 22294 4736 8219 100308
Goa (c) 31053 $ 5267 9036 9763 55119
Gujarat 191159 227652 52286 43714 296758 811569
Haryana 166437 67991 11297 17294 43239 306258
Himachal Pradesh 29142 18148 6687 14695 3717 72389
Jammu & Kashmir 31515 13949 20735 12344 15054 93597
Jharkhand 65662 $ 9878 23289 40714 139543
Karnataka 172383 49530 38052 56226 202298 518489
Kerala 234191 $ 95486 § 100012 320851 750540
Madhya Pradesh 81436 34377 25990 67570 47976 257349
Maharashtra 266004 293843 63405 113380 515249 1251881
Manipur 6314 1490 2480 369 2630 13283
Meghalaya © 15819 1907 3285 7180 3001 31192
Mizoram 4061 0 672 4316 1336 10385
Nagaland 44002 10733 3863 4721 9100 72419
TRANSPORT
Total Transport
Table No. 2.2
Nagaland 44002 10733 3863 4721 9100 72419
Orissa 62486 40916 15012 26365 30310 175089
Punjab 64967 53799 19855 9616 39664 187901
Rajasthan 191207 17674 58092 37761 71711 376445
Sikkim 1769 417 355 5467 0 8008
Tamil Nadu 293486 216456 82547 124370 163545 880404
Tripura 7664 1872 1864 1232 11881 24513
Uttarakhand 10816 6969 5279 14605 7060 44729
Uttar Pradesh 101355 63768 25081 27810 80037 298051
West Bengal 223826 $ 33613 65110 56038 378587
TOTAL STATES 2643604 1234018 647896 922779 2337264 7785561
Table No. 2.2
Total Registered Motor Vehicles (Category-wise) in India by States/UTs
(As on 31st March, 2005) ( In numbers)
Multi-axled/Arti- Light Motor Light Motor STATES/ UTs culated Vehicles/ Vehicles Buses Taxis Vehicles
Trucks & Lorries (Goods) (Passengers)1 2 3 4 5 6 7
UTs
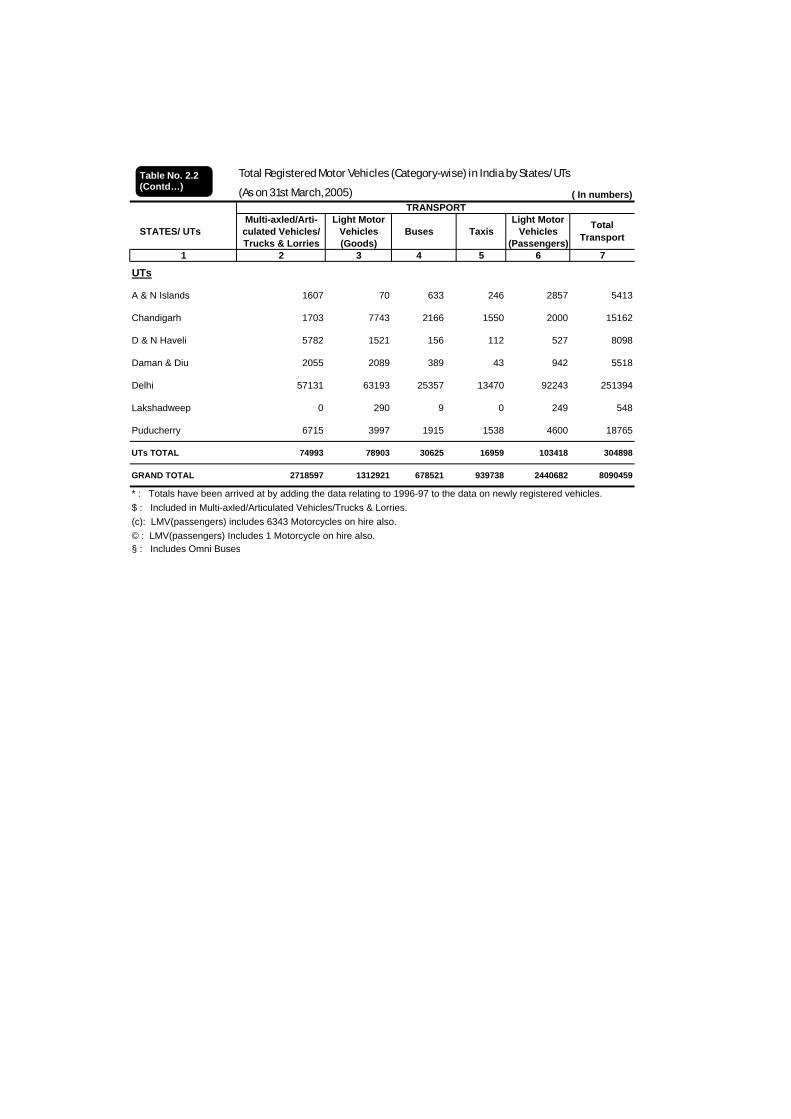
A & N Islands 1607 70 633 246 2857 5413
Chandigarh 1703 7743 2166 1550 2000 15162
D & N Haveli 5782 1521 156 112 527 8098
Daman & Diu 2055 2089 389 43 942 5518
Delhi 57131 63193 25357 13470 92243 251394
Lakshadweep 0 290 9 0 249 548
Puducherry 6715 3997 1915 1538 4600 18765
UTs TOTAL 74993 78903 30625 16959 103418 304898
GRAND TOTAL 2718597 1312921 678521 939738 2440682 8090459
* : Totals have been arrived at by adding the data relating to 1996-97 to the data on newly registered vehicles.$ : Included in Multi-axled/Articulated Vehicles/Trucks & Lorries.(c): LMV(passengers) includes 6343 Motorcycles on hire also.© : LMV(passengers) Includes 1 Motorcycle on hire also.§ : Includes Omni Buses
TRANSPORT
Total Transport
Table No. 2.2(Contd…)

Total Registered Motor Vehicles (Category-wise) in India by States/UTs
(As on 31st March, 2005) ( In numbers)Grand Total
STATES/ UTs Two Cars Jeeps Omni Tractors Trailers Others Total (Transport + Wheelers Buses Non- Tpt. Non- Tpt.)
(Col.7+Col.15)1 8 9 10 11 12 13 14 15 16
STATES
Andhra Pradesh 5116696 485709 61692 40817 64456 49346 5543 5824259 6457921
Arunachal Pradesh* 11051 2468 2271 0 338 155 179 16462 21825
Assam 476378 124275 14808 0 10823 8953 21430 656667 815239
Bihar 903261 71834 39542 0 126968 73154 7263 1222022 1351938
Chhattisgarh 1117136 51622 7855 0 51355 44553 2463 1274984 1375292
Goa 342087 80619 @ 0 0 0 4478 427184 482303
Gujarat 5744353 632154 117809 0 290219 206498 14670 7005703 7817272
Haryana 1729236 312072 90513 0 394111 0 21477 2547409 2853667
Himachal Pradesh 167906 51019 8278 325 0 0 862 228390 300779
Jammu & Kashmir 273265 85812 10778 219 11882 569 1734 384259 477856
Jharkhand 1049303 102186 26773 0 18055 14761 6357 1217435 1356978
Karnataka 3957762 539518 43804 51242 144355 142785 37661 4917127 5435616
Kerala 1819884 428327 72227 0 14496 2001 34607 2371542 3122082
Madhya Pradesh 3176549 166393 37704 0 355625 180981 13372 3930624 4187973
Maharashtra 6926576 1039800 283016 0 212466 197169 25057 8684084 9935965
Manipur 80557 9532 8269 670 1348 587 251 101214 114497
Meghalaya 27237 19186 10490 0 466 2504 1053 60936 92128
Mizoram 21816 5565 3576 0 231 260 4757 36205 46590
Nagaland 39989 34866 21999 216 1859 740 311 99980 172399
N O N - T R A N S P O R T
Table No. 2.2(Contd…)
Nagaland 39989 34866 21999 216 1859 740 311 99980 172399
Orissa 1360582 74265 29938 2380 37279 30019 5808 1540271 1715360
Punjab 2877147 300594 36751 0 466063 417 7233 3688205 3876106
Rajasthan 3016763 234297 137384 0 432686 58136 5018 3884284 4260729
Sikkim 4957 2505 3293 763 13 0 0 11531 19539
Tamil Nadu 7292507 783892 54575 19957 95344 41396 89112 8376783 9257187
Tripura 34450 5784 4283 13 82 99 3506 48217 72730
Uttarakhand 433981 50303 6734 1082 32884 1129 2467 528580 573309
Uttar Pradesh 5652044 499148 106897 16244 742717 10283 19102 7046435 7344486
West Bengal 1687045 528101 @ 0 55164 # 31658 2301968 2680555
TOTAL STATES 55340518 6721846 1241259 133928 3561285 1066495 367429 68432760 76218321
Table No. 2.2(Contd…)
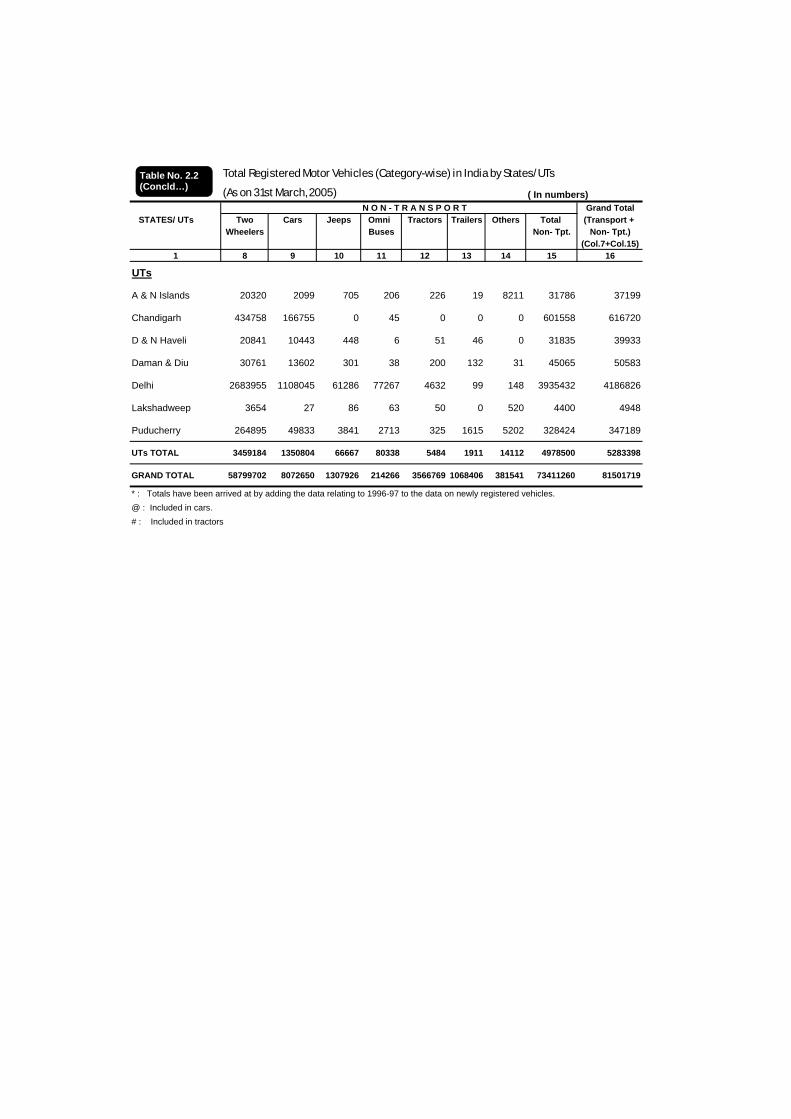
Total Registered Motor Vehicles (Category-wise) in India by States/UTs
(As on 31st March, 2005) ( In numbers)N O N - T R A N S P O R T Grand Total
STATES/ UTs Two Cars Jeeps Omni Tractors Trailers Others Total (Transport + Wheelers Buses Non- Tpt. Non- Tpt.)
(Col.7+Col.15)1 8 9 10 11 12 13 14 15 16
UTs
A & N Islands 20320 2099 705 206 226 19 8211 31786 37199
Chandigarh 434758 166755 0 45 0 0 0 601558 616720
D & N Haveli 20841 10443 448 6 51 46 0 31835 39933
Daman & Diu 30761 13602 301 38 200 132 31 45065 50583
Delhi 2683955 1108045 61286 77267 4632 99 148 3935432 4186826
Lakshadweep 3654 27 86 63 50 0 520 4400 4948
Puducherry 264895 49833 3841 2713 325 1615 5202 328424 347189
UTs TOTAL 3459184 1350804 66667 80338 5484 1911 14112 4978500 5283398
GRAND TOTAL 58799702 8072650 1307926 214266 3566769 1068406 381541 73411260 81501719
* : Totals have been arrived at by adding the data relating to 1996-97 to the data on newly registered vehicles.@ : Included in cars.# : Included in tractors
Table No. 2.2(Concld…)

Number of Registered Motor Vehicles (Transport)State : ANDHRA PRADESH ( In numbers)
2004-05 2005-06 31.3.2005 31.3.20061 2 3 4 5
I.Multiaxled / Articulated Vehicles 1244 1288 7755 9043
Type of Vehicles Newly registered Total registered as on
Table No. 2.3.1
II.Trucks & Lorries 17765 18387 154401 172789
III. Light Motor Vehicles (Goods)
a) Four Wheelers 2539 2628 40567 43195b) Three Wheelers 6415 6639 35278 41917 b) Three Wheelers 6415 6639 35278 41917
Total III 8954 9267 75845 85112
IV. Buses
a) Stage carriages 0 0 2344 2344b) Contract carriages 124 128 2705 2833 b) Contract carriages 124 128 2705 2833
c) Private service vehicles 270 279 4955 5234 d) Other buses 1017 1052 6905 7957
Total IV 1411 1459 16909 18368
V. Taxis
a) Motor cabs 825 854 36746 37600 b) Maxi cabs 13400 13869 38989 52589 c) Other taxis 1664 1723 21781 23504
Total V 15889 16446 97516 113693
VI. Light Motor Vehicles (Passengers)VI. Light Motor Vehicles (Passengers)
a) Three seaters 16284 16854 232520 249375 b) Four to six seaters 1627 1684 48716 50401
Total VI 17911 18538 281236 299776
VII. Motor cycles on hire 0 0 0 0VII. Motor cycles on hire 0 0 0 0
Total Transport ( I to VII ) 63174 65385 633662 698781

Number of Registered Motor Vehicles (Non-Transport)State : ANDHRA PRADESH ( In numbers)
2004-05 2005-06 31.3.2005 31.3.20061 2 3 4 5
Type of Vehicles Newly registered Total registered as on
Table No. 2.3.1 (Concld…)
1 2 3 4 5I. Two wheelers
a) Scooters 107368 110603 1791474 1902077
b) Mopeds 66670 68678 1355774 1424452
c) Motor cycles 399375 411406 1969448 2380854
Total I 573413 590687 5116696 5707383
II. Cars 87971 90621 485709 576329
III. Jeeps 3578 3685 61692 65377
IV. Omni buses 4268 4397 40817 45214
V. Tractors 2093 2156 64456 66613
VI. Trailers 2461 2535 49346 51881
VII. Other vehicles not covered 1043 1074 5543 6617
Total Non-Transport (I to VII) 674827 695155 5824259 6519414
Grand Total
(Transport + Non Transport) 738001 760540 6457921 7218195(Transport + Non-Transport) 738001 760540 6457921 7218195
... :- Not indicated.Note : Totals are provisional, representing summation of available data.
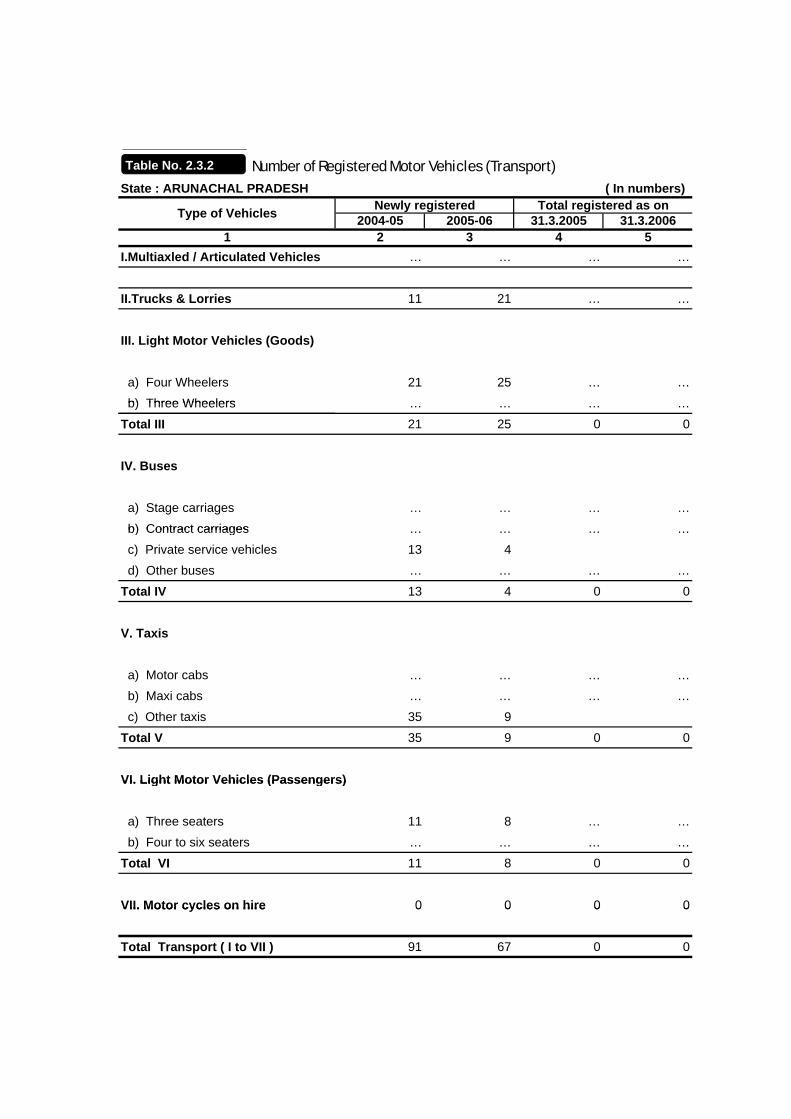
Number of Registered Motor Vehicles (Transport)State : ARUNACHAL PRADESH ( In numbers)
2004-05 2005-06 31.3.2005 31.3.20061 2 3 4 5
I.Multiaxled / Articulated Vehicles … … … …
Type of Vehicles Newly registered Total registered as on
Table No. 2.3.2
II.Trucks & Lorries 11 21 … …
III. Light Motor Vehicles (Goods)
a) Four Wheelers 21 25 … …b) Three Wheelers b) Three Wheelers … … … …
Total III 21 25 0 0
IV. Buses
a) Stage carriages … … … …b) Contract carriages b) Contract carriages … … … …
c) Private service vehicles 13 4 d) Other buses … … … …
Total IV 13 4 0 0
V. Taxis
a) Motor cabs … … … … b) Maxi cabs … … … … c) Other taxis 35 9
Total V 35 9 0 0
VI. Light Motor Vehicles (Passengers)VI. Light Motor Vehicles (Passengers)
a) Three seaters 11 8 … … b) Four to six seaters … … … …
Total VI 11 8 0 0
VII. Motor cycles on hire 0 0 0 0VII. Motor cycles on hire 0 0 0 0
Total Transport ( I to VII ) 91 67 0 0

Number of Registered Motor Vehicles (Non-Transport)State : ARUNACHAL PRADESH ( In numbers)
2004-05 2005-06 31.3.2005 31.3.20061 2 3 4 5
Type of Vehicles Newly registered Total registered as on
Table No. 2.3.2 (Concld…)
1 2 3 4 5I. Two wheelers
a) Scooters 446 61 … …
b) Mopeds … … … …
c) Motor cycles … … … …
Total I 446 61 0 0
II. Cars 128 127 … …
III. Jeeps 11 13 … …
IV. Omni buses … … … …
V. Tractors 5 7 … …
VI. Trailers … … … …
VII. Other vehicles not covered … 1 … …
Total Non-Transport (I to VII) 590 209 0 0
Grand Total
(Transport + Non Transport) 681 276 0 0(Transport + Non-Transport) 681 276 0 0
... :- Not indicated.Note : Totals are provisional, representing summation of available data.
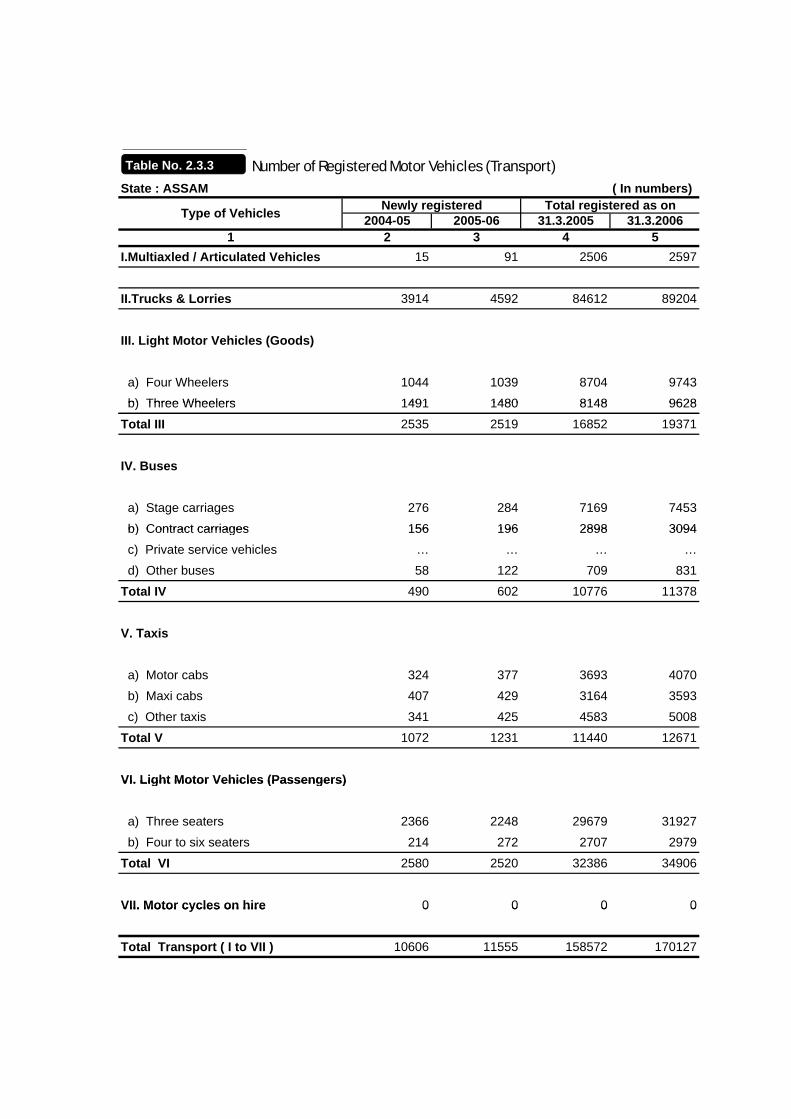
Number of Registered Motor Vehicles (Transport)State : ASSAM ( In numbers)
2004-05 2005-06 31.3.2005 31.3.20061 2 3 4 5
I.Multiaxled / Articulated Vehicles 15 91 2506 2597
Type of Vehicles Newly registered Total registered as on
Table No. 2.3.3
II.Trucks & Lorries 3914 4592 84612 89204
III. Light Motor Vehicles (Goods)
a) Four Wheelers 1044 1039 8704 9743b) Three Wheelers 1491 1480 8148 9628 b) Three Wheelers 1491 1480 8148 9628
Total III 2535 2519 16852 19371
IV. Buses
a) Stage carriages 276 284 7169 7453b) Contract carriages 156 196 2898 3094 b) Contract carriages 156 196 2898 3094
c) Private service vehicles … … … … d) Other buses 58 122 709 831
Total IV 490 602 10776 11378
V. Taxis
a) Motor cabs 324 377 3693 4070 b) Maxi cabs 407 429 3164 3593 c) Other taxis 341 425 4583 5008
Total V 1072 1231 11440 12671
VI. Light Motor Vehicles (Passengers)VI. Light Motor Vehicles (Passengers)
a) Three seaters 2366 2248 29679 31927 b) Four to six seaters 214 272 2707 2979
Total VI 2580 2520 32386 34906
VII. Motor cycles on hire 0 0 0 0VII. Motor cycles on hire 0 0 0 0
Total Transport ( I to VII ) 10606 11555 158572 170127

Number of Registered Motor Vehicles (Non-Transport)State : ASSAM ( In numbers)
2004-05 2005-06 31.3.2005 31.3.20061 2 3 4 5
Type of Vehicles Newly registered Total registered as on
Table No. 2.3.3 (Concld…)
1 2 3 4 5I. Two wheelers
a) Scooters 7047 9501 222407 231908
b) Mopeds 272 307 21960 22267
c) Motor cycles 50279 55089 232011 287100
Total I 57598 64897 476378 541275
II. Cars 18212 20754 124275 145029
III. Jeeps 542 272 14808 15080
IV. Omni buses … … … …
V. Tractors 543 447 10823 11270
VI. Trailers 213 97 8953 9050
VII. Other vehicles not covered 706 762 21430 22192
Total Non-Transport (I to VII) 77814 87229 656667 743896
Grand Total
(Transport + Non Transport) 88420 98784 815239 914023(Transport + Non-Transport) 88420 98784 815239 914023
... :- Not indicated.Note : Totals are provisional, representing summation of available data.

Number of Registered Motor Vehicles (Transport)State : BIHAR ( In numbers)
2004-05 2005-06 31.3.2005 31.3.20061 2 3 4 5
I.Multiaxled / Articulated Vehicles … … … …
Type of Vehicles Newly registered Total registered as on
Table No. 2.3.4
II.Trucks & Lorries 489 579 49437 50016
III. Light Motor Vehicles (Goods)
a) Four Wheelers … … … …b) Three Wheelers b) Three Wheelers … … … …
Total III 0 0 0 0
IV. Buses
a) Stage carriages … … … …b) Contract carriages b) Contract carriages … … … …
c) Private service vehicles … … … … d) Other buses 146 113 16158 16271
Total IV 146 113 16158 16271
V. Taxis
a) Motor cabs … … … … b) Maxi cabs … … … … c) Other taxis 284 427 22271 22698
Total V 284 427 22271 22698
VI. Light Motor Vehicles (Passengers)VI. Light Motor Vehicles (Passengers)
a) Three seaters 2882 3273 39823 43096 b) Four to six seaters 284 427 2227 2269
Total VI 3166 3700 42050 45365
VII. Motor cycles on hire 0 0 0 0VII. Motor cycles on hire 0 0 0 0
Total Transport ( I to VII ) 4085 4819 129916 134350

Number of Registered Motor Vehicles (Non-Transport)State : BIHAR ( In numbers)
2004-05 2005-06 31.3.2005 31.3.20061 2 3 4 5
Type of Vehicles Newly registered Total registered as on
Table No. 2.3.4 (Concld…)
1 2 3 4 5I. Two wheelers
a) Scooters … … … …
b) Mopeds … … … …
c) Motor cycles … … … …
Total I 73281 61333 903261 964594
II. Cars 3499 5062 71834 76896
III. Jeeps 1836 2321 39542 41863
IV. Omni buses 146 113 16158 16271
V. Tractors 5244 3509 126968 130477
VI. Trailers 3056 2440 73154 75594
VII. Other vehicles not covered 410 1306 7263 8569
Total Non-Transport (I to VII) 87472 76084 1238180 1314264
Grand Total
(Transport + Non Transport) 91557 80903 1368096 1448614(Transport + Non-Transport) 91557 80903 1368096 1448614
... :- Not indicated.Note : Totals are provisional, representing summation of available data.

Number of Registered Motor Vehicles (Transport)State : CHHATTISGARH ( In numbers)
2004-05 2005-06 31.3.2005 31.3.20061 2 3 4 5
I.Multiaxled / Articulated Vehicles 1116 1363 2386 3749
Type of Vehicles Newly registered Total registered as on
Table No. 2.3.5
II.Trucks & Lorries 4276 4548 43419 47967
III. Light Motor Vehicles (Goods)
a) Four Wheelers 1745 1632 13197 14829b) Three Wheelers 823 972 6057 7029 b) Three Wheelers 823 972 6057 7029
Total III 2568 2604 19254 21858
IV. Buses
a) Stage carriages 123 113 2166 2279b) Contract carriages b) Contract carriages … … … …
c) Private service vehicles … … … … d) Other buses 2548 2548 20128 22676
Total IV 2671 2661 22294 24955
V. Taxis
a) Motor cabs 311 300 4736 5036 b) Maxi cabs … … … … c) Other taxis … … … …
Total V 311 300 4736 5036
VI. Light Motor Vehicles (Passengers)VI. Light Motor Vehicles (Passengers)
a) Three seaters 464 668 5755 6423 b) Four to six seaters 281 307 2464 2771
Total VI 745 975 8219 9194
VII. Motor cycles on hire 0 0 0 0VII. Motor cycles on hire 0 0 0 0
Total Transport ( I to VII ) 11687 12451 100308 112759
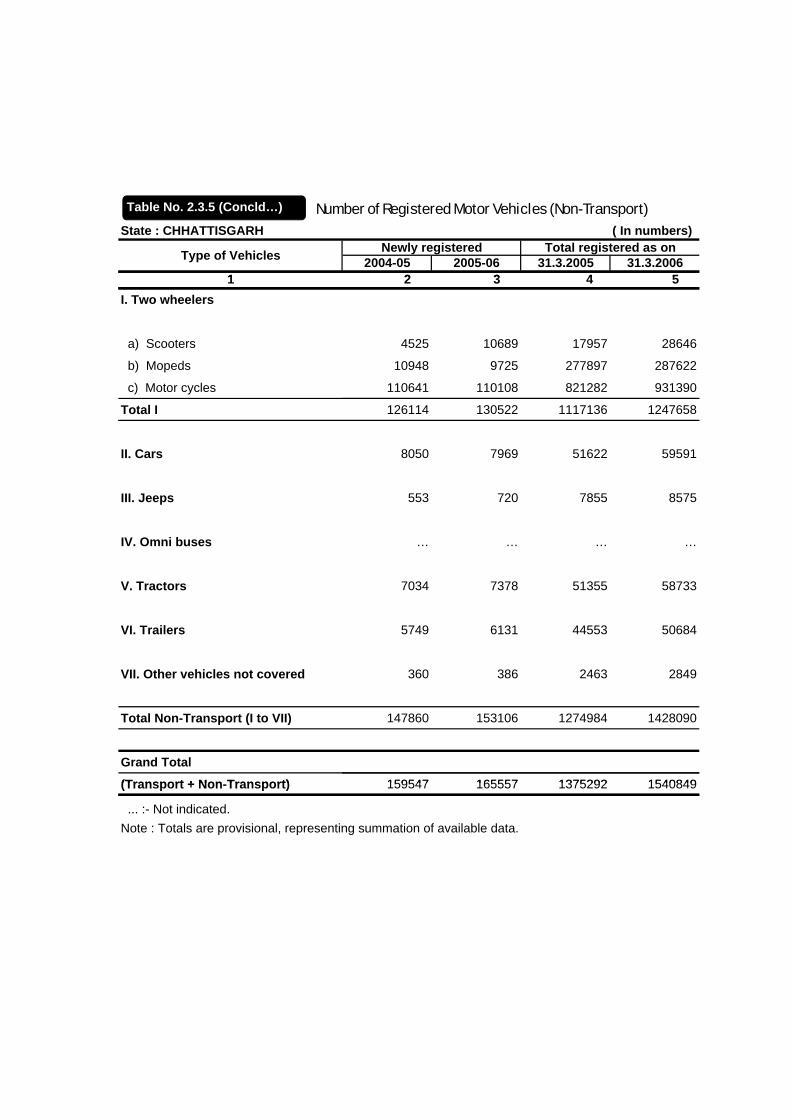
Number of Registered Motor Vehicles (Non-Transport)State : CHHATTISGARH ( In numbers)
2004-05 2005-06 31.3.2005 31.3.20061 2 3 4 5
Type of Vehicles Newly registered Total registered as on
Table No. 2.3.5 (Concld…)
1 2 3 4 5I. Two wheelers
a) Scooters 4525 10689 17957 28646
b) Mopeds 10948 9725 277897 287622
c) Motor cycles 110641 110108 821282 931390
Total I 126114 130522 1117136 1247658
II. Cars 8050 7969 51622 59591
III. Jeeps 553 720 7855 8575
IV. Omni buses … … … …
V. Tractors 7034 7378 51355 58733
VI. Trailers 5749 6131 44553 50684
VII. Other vehicles not covered 360 386 2463 2849
Total Non-Transport (I to VII) 147860 153106 1274984 1428090
Grand Total
(Transport + Non Transport) 159547 165557 1375292 1540849(Transport + Non-Transport) 159547 165557 1375292 1540849
... :- Not indicated.Note : Totals are provisional, representing summation of available data.

Number of Registered Motor Vehicles (Transport)State : GOA ( In numbers)
2004-05 2005-06 31.3.2005 31.3.20061 2 3 4 5
I.Multiaxled / Articulated Vehicles 10 115 … …
Type of Vehicles Newly registered Total registered as on
Table No. 2.3.6
II.Trucks & Lorries 1427 1212 … …
III. Light Motor Vehicles (Goods)
a) Four Wheelers 669 1239 … … b) Three Wheelers 621 424 … …)
Total III 1290 1663 31053 $ 34043 $
IV. Buses
a) Stage carriages … … … … b) Contract carriages … … … … c) Private service vehicles … … … … d) Other buses … … … …
Total IV 399 422 5267 5689
V. Taxis
) M t b a) Motor cabs … … … … b) Maxi cabs … … … … c) Other taxis … … … …
Total V 763 325 9036 9361
VI. Light Motor Vehicles (Passengers)
a) Three seaters 108 77 3420 3497 b) Four to six seaters … … … …
Total VI 108 77 3420 3497
VII. Motor cycles on hire 280 195 6343 6538
Total Transport ( I to VII ) 4277 4009 55119 59128
Table No. 2.3.6
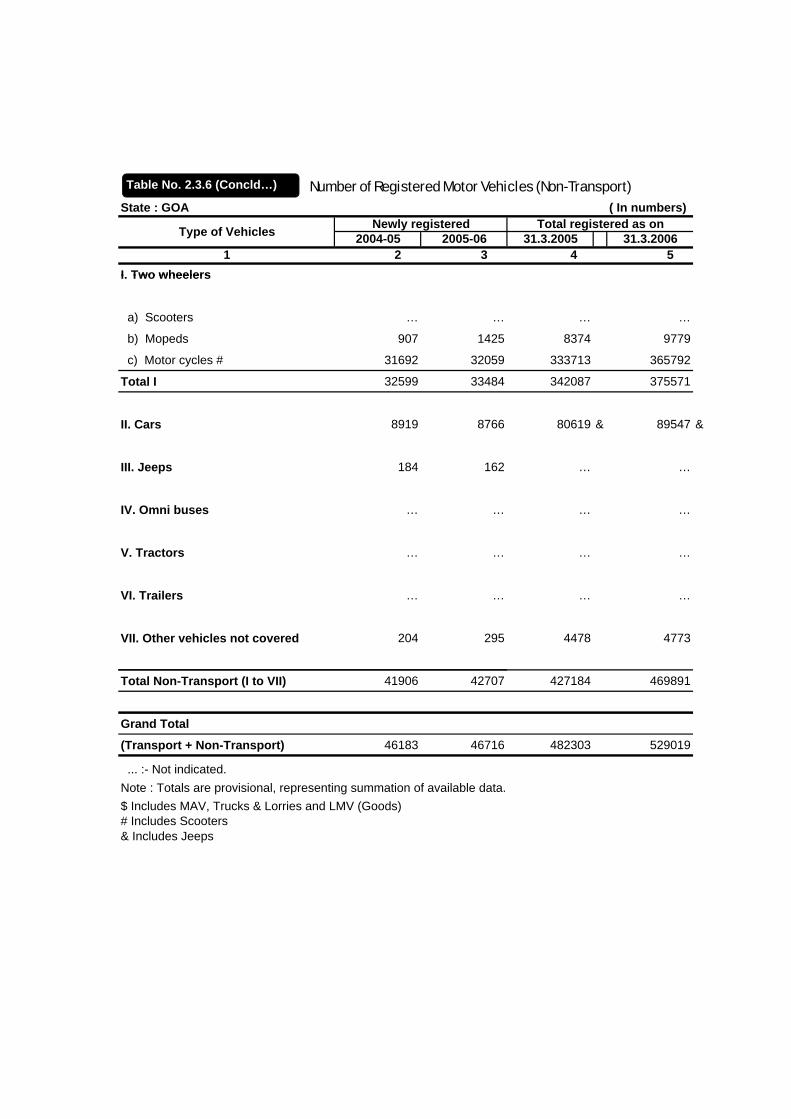
Number of Registered Motor Vehicles (Non-Transport)State : GOA ( In numbers)
2004-05 2005-06 31.3.2005 31.3.20061 2 3 4 5
I Two wheelers
Type of Vehicles Newly registered Total registered as on
Table No. 2.3.6 (Concld…)
I. Two wheelers
a) Scooters … … … …
b) Mopeds 907 1425 8374 9779
c) Motor cycles # 31692 32059 333713 365792
Total I 32599 33484 342087 375571
II. Cars 8919 8766 80619 & 89547 &
III. Jeeps 184 162 … …
IV. Omni buses … … … …
V. Tractors … … … …
VI. Trailers … … … …
VII. Other vehicles not covered 204 295 4478 4773
Total Non-Transport (I to VII) 41906 42707 427184 469891
Grand Total
(Transport + Non-Transport) 46183 46716 482303 529019
... :- Not indicated.Note : Totals are provisional, representing summation of available data.$ Includes MAV, Trucks & Lorries and LMV (Goods)# Includes Scooters& Includes Jeeps
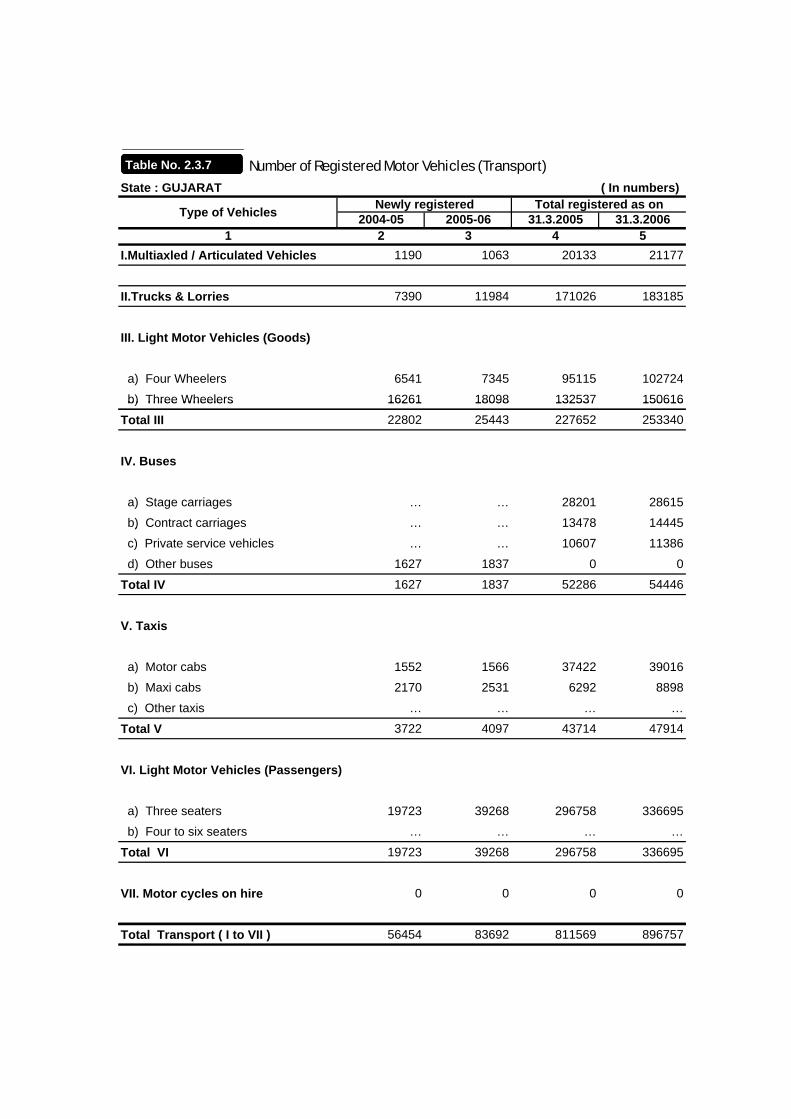
Number of Registered Motor Vehicles (Transport)State : GUJARAT ( In numbers)
2004-05 2005-06 31.3.2005 31.3.20061 2 3 4 5
I.Multiaxled / Articulated Vehicles 1190 1063 20133 21177
Type of Vehicles Newly registered Total registered as on
Table No. 2.3.7
II.Trucks & Lorries 7390 11984 171026 183185
III. Light Motor Vehicles (Goods)
a) Four Wheelers 6541 7345 95115 102724
b) Three Wheelers 16261 18098 132537 150616 b) Three Wheelers 16261 18098 132537 150616
Total III 22802 25443 227652 253340
IV. Buses
a) Stage carriages … … 28201 28615
b) Contract carriages … … 13478 14445) g
c) Private service vehicles … … 10607 11386
d) Other buses 1627 1837 0 0
Total IV 1627 1837 52286 54446
V. Taxis
a) Motor cabs 1552 1566 37422 39016
b) Maxi cabs 2170 2531 6292 8898
c) Other taxis … … … …
Total V 3722 4097 43714 47914
VI. Light Motor Vehicles (Passengers)
a) Three seaters 19723 39268 296758 336695
b) Four to six seaters … … … …
Total VI 19723 39268 296758 336695
VII. Motor cycles on hire 0 0 0 0
Total Transport ( I to VII ) 56454 83692 811569 896757
Table No. 2.3.7

Number of Registered Motor Vehicles (Non-Transport)State : GUJARAT ( In numbers)
2004-05 2005-06 31.3.2005 31.3.20061 2 3 4 5
I Two wheelers
Type of Vehicles Newly registered Total registered as on
Table No. 2.3.7 (Concld…)
I. Two wheelers
a) Scooters 521606 547049 4303544 4849816
b) Mopeds 61619 61165 1440809 1502293
c) Motor cycles … … … …
Total I 583225 608214 5744353 6352109
II. Cars 59273 71308 632154 703968
III. Jeeps 6467 4812 117809 122864
IV. Omni buses … … … …
V. Tractors 14709 21172 290219 311385
VI. Trailers 6912 11312 206498 217790
VII. Other vehicles not covered 2011 2876 14670 17417
Total Non-Transport (I to VII) 672597 719694 7005703 7725533
Grand Total
(Transport + Non-Transport) 729051 803386 7817272 8622290
... :- Not indicated. ... : Not indicated.Note : Totals are provisional, representing summation of available data.

Number of Registered Motor Vehicles (Transport)State : HARYANA ( In numbers)
2004-05 2005-06 31.3.2005 31.3.20061 2 3 4 5
I.Multiaxled / Articulated Vehicles 9004 5533 37722 41332
Type of Vehicles Newly registered Total registered as on
Table No. 2.3.8
II.Trucks & Lorries 11171 10711 128715 134714
III. Light Motor Vehicles (Goods)
a) Four Wheelers 6013 5202 42405 43775
b) Three Wheelers 3061 3127 25586 30719 b) Three Wheelers 3061 3127 25586 30719
Total III 9074 8329 67991 74494
IV. Buses
a) Stage carriages 583 917 6612 7975
b) Contract carriages 543 1619 1850 9129) g
c) Private service vehicles 403 415 498 666
d) Other buses 634 240 2337 2216
Total IV 2163 3191 11297 19986
V. Taxis
a) Motor cabs 2034 471 12941 13252
b) Maxi cabs 3 361 2381 1209
c) Other taxis 429 172 1972 1883
Total V 2466 1004 17294 16344
VI. Light Motor Vehicles (Passengers)
a) Three seaters 3642 2304 35895 35939
b) Four to six seaters 1338 3164 7344 9919
Total VI 4980 5468 43239 45858
VII. Motor cycles on hire 0 0 0 0
Total Transport ( I to VII ) 38858 34236 306258 332728
Table No. 2.3.8

Number of Registered Motor Vehicles (Non-Transport)State : HARYANA ( In numbers)
2004-05 2005-06 31.3.2005 31.3.20061 2 3 4 5
I Two wheelers
Type of Vehicles Newly registered Total registered as on
Table No. 2.3.8 (Concld…)
I. Two wheelers
a) Scooters 30715 29204 735711 750976
b) Mopeds 8803 7415 190444 186357
c) Motor cycles 145198 193120 803081 943841
Total I 184716 229739 1729236 1881174
II. Cars 41428 61593 312072 373659
III. Jeeps 3627 3227 90513 95450
IV. Omni buses 0 0 0 0
V. Tractors 16371 16720 394111 382581
VI. Trailers 0 0 0 0
VII. Other vehicles not covered 797 103 21477 21434
Total Non-Transport (I to VII) 246939 311382 2547409 2754298
Grand Total
(Transport + Non-Transport) 285797 345618 2853667 3087026
... :- Not indicated. ... : Not indicated.Note : Totals are provisional, representing summation of available data.

Number of Registered Motor Vehicles (Transport)State : HIMACHAL PRADESH ( In numbers)
2004-05 2005-06 31.3.2005 31.3.20061 2 3 4 5
I.Multiaxled / Articulated Vehicles 62 144 145
Type of Vehicles Newly registered Total registered as on
Table No. 2.3.9
II.Trucks & Lorries Ж 3243 28998 31658
III. Light Motor Vehicles (Goods)
a) Four Wheelers
b) Three Wheelers b) Three Wheelers
Total III 0 2867 18148 20623
IV. Buses
a) Stage carriages 380 6382 6536
b) Contract carriages 32 305 323) g
c) Private service vehicles 0 0 0 0
d) Other buses 0 0 0 0
Total IV 0 412 6687 6859
V. Taxis
a) Motor cabs 531 8834 8598
b) Maxi cabs 763 5861 5944
c) Other taxis 0 0 0
Total V 0 1294 14695 14542
VI. Light Motor Vehicles (Passengers)
a) Three seaters 41 2933 2040
b) Four to six seaters 20 784 785
Total VI 0 61 3717 2825
VII. Motor cycles on hire 0 0 0 0
Total Transport ( I to VII ) 0 7939 72389 76652
Table No. 2.3.9

Number of Registered Motor Vehicles (Non-Transport)State : HIMACHAL PRADESH ( In numbers)
2004-05 2005-06 31.3.2005 31.3.20061 2 3 4 5
I Two wheelers
Type of Vehicles Newly registered Total registered as on
Table No. 2.3.9 (Concld…)
I. Two wheelers
a) Scooters 6968 119466 126209
b) Mopeds 185 1517 1674
c) Motor cycles 13347 46923 60000
Total I 0 20500 167906 187883
II. Cars 7550 51019 58005
III. Jeeps 1536 8278 9544
IV. Omni buses 84 325 402
V. Tractors
VI. Trailers
VII. Other vehicles not covered 221 862 1042
Total Non-Transport (I to VII) 0 29891 228390 256876
Grand Total
(Transport + Non-Transport) 0 37830 300779 333528
... :- Not indicated. ... : Not indicated.Note : Totals are provisional, representing summation of available data.Ж - Includes Tractors, Trailers and Tankers registered as Commercial Vehicles

Number of Registered Motor Vehicles (Transport)State : JAMMU & KASHMIR ( In numbers)
2004-05 2005-06 31.3.2005 31.3.20061 2 3 4 5
I.Multiaxled / Articulated Vehicles 8 96 38 134
Type of Vehicles Newly registered Total registered as on
Table No. 2.3.10
II.Trucks & Lorries 1549 1563 31477 33040
III. Light Motor Vehicles (Goods)
a) Four Wheelers 878 1439 6827 8266
b) Three Wheelers 799 1455 7122 8577 b) Three Wheelers 799 1455 7122 8577
Total III 1677 2894 13949 16843
IV. Buses
a) Stage carriages 428 414 19233 19647
b) Contract carriages 140 248 515 763) g
c) Private service vehicles 25 0 897 897
d) Other buses 3 38 90 128
Total IV 596 700 20735 21435
V. Taxis
a) Motor cabs 0 15 1893 1908
b) Maxi cabs 1490 986 8796 9782
c) Other taxis 529 313 1655 1966
Total V 2019 1314 12344 13656
VI. Light Motor Vehicles (Passengers)
a) Three seaters 585 775 14840 15615
b) Four to six seaters 214 90 214 304
Total VI 799 865 15054 15919
VII. Motor cycles on hire 0 0 0 0
Total Transport ( I to VII ) 6648 7432 93597 101027
Table No. 2.3.10

Number of Registered Motor Vehicles (Non-Transport)State : JAMMU & KASHMIR ( In numbers)
2004-05 2005-06 31.3.2005 31.3.20061 2 3 4 5
I Two wheelers
Type of Vehicles Newly registered Total registered as on
Table No. 2.3.10 (Concld…)
I. Two wheelers
a) Scooters 7092 5113 194942 200055
b) Mopeds 792 2015 9402 11417
c) Motor cycles 11770 17263 68921 86184
Total I 19654 24391 273265 297656
II. Cars 11625 12497 85812 98309
III. Jeeps 85 280 10778 11058
IV. Omni buses 219 0 219 219
V. Tractors 913 936 11882 12818
VI. Trailers 8 18 569 587
VII. Other vehicles not covered 108 135 1734 1869
Total Non-Transport (I to VII) 32612 38257 384259 422516
Grand Total
(Transport + Non-Transport) 39260 45689 477856 523543
... :- Not indicated. ... : Not indicated.Note : Totals are provisional, representing summation of available data.
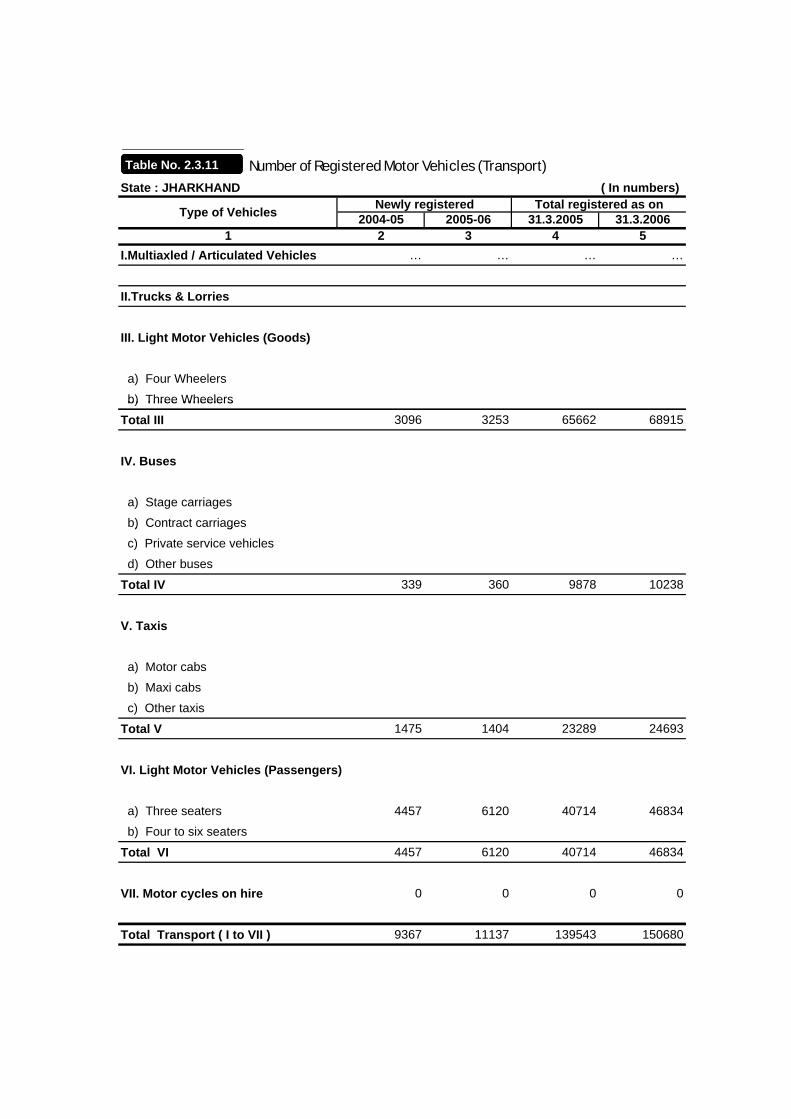
Number of Registered Motor Vehicles (Transport)State : JHARKHAND ( In numbers)
2004-05 2005-06 31.3.2005 31.3.20061 2 3 4 5
I.Multiaxled / Articulated Vehicles … … … …
Type of Vehicles Newly registered Total registered as on
Table No. 2.3.11
II.Trucks & Lorries
III. Light Motor Vehicles (Goods)
a) Four Wheelers
b) Three Wheelers b) Three Wheelers
Total III 3096 3253 65662 68915
IV. Buses
a) Stage carriages
b) Contract carriages) g
c) Private service vehicles
d) Other buses
Total IV 339 360 9878 10238
V. Taxis
a) Motor cabs
b) Maxi cabs
c) Other taxis
Total V 1475 1404 23289 24693
VI. Light Motor Vehicles (Passengers)
a) Three seaters 4457 6120 40714 46834
b) Four to six seaters
Total VI 4457 6120 40714 46834
VII. Motor cycles on hire 0 0 0 0
Total Transport ( I to VII ) 9367 11137 139543 150680
Table No. 2.3.11
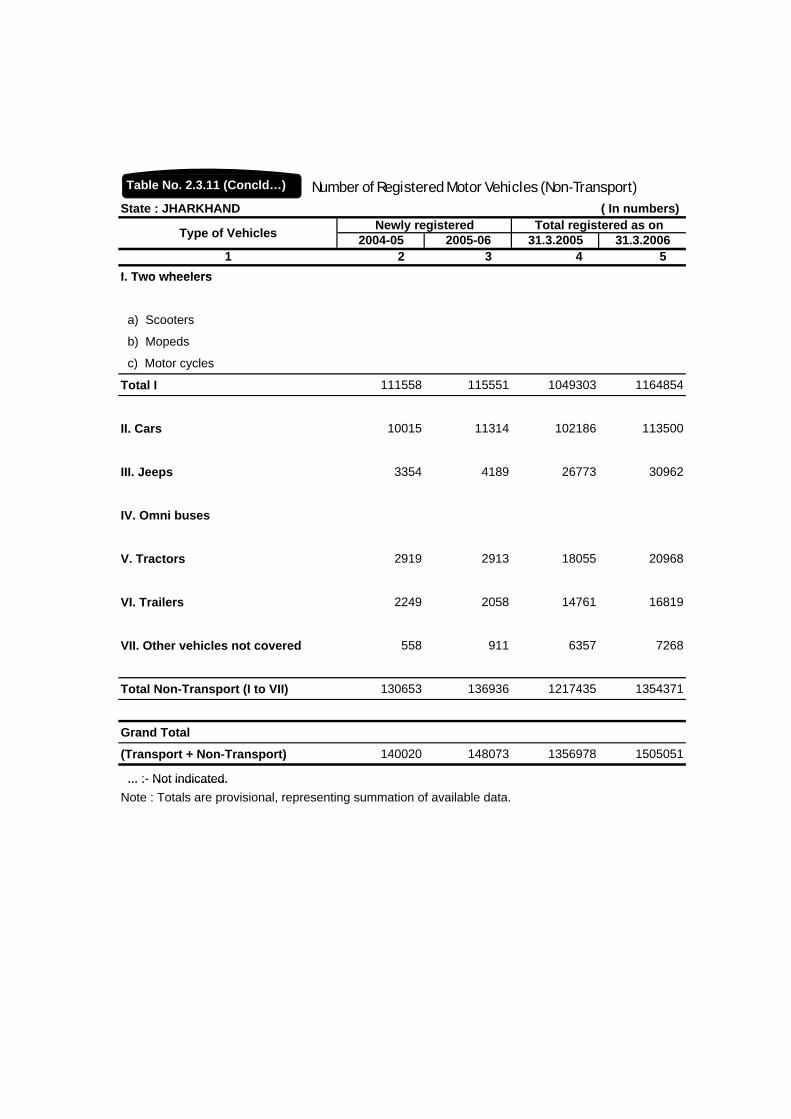
Number of Registered Motor Vehicles (Non-Transport)State : JHARKHAND ( In numbers)
2004-05 2005-06 31.3.2005 31.3.20061 2 3 4 5
I Two wheelers
Type of Vehicles Newly registered Total registered as on
Table No. 2.3.11 (Concld…)
I. Two wheelers
a) Scooters
b) Mopeds
c) Motor cycles
Total I 111558 115551 1049303 1164854
II. Cars 10015 11314 102186 113500
III. Jeeps 3354 4189 26773 30962
IV. Omni buses
V. Tractors 2919 2913 18055 20968
VI. Trailers 2249 2058 14761 16819
VII. Other vehicles not covered 558 911 6357 7268
Total Non-Transport (I to VII) 130653 136936 1217435 1354371
Grand Total
(Transport + Non-Transport) 140020 148073 1356978 1505051
... :- Not indicated. ... : Not indicated.Note : Totals are provisional, representing summation of available data.
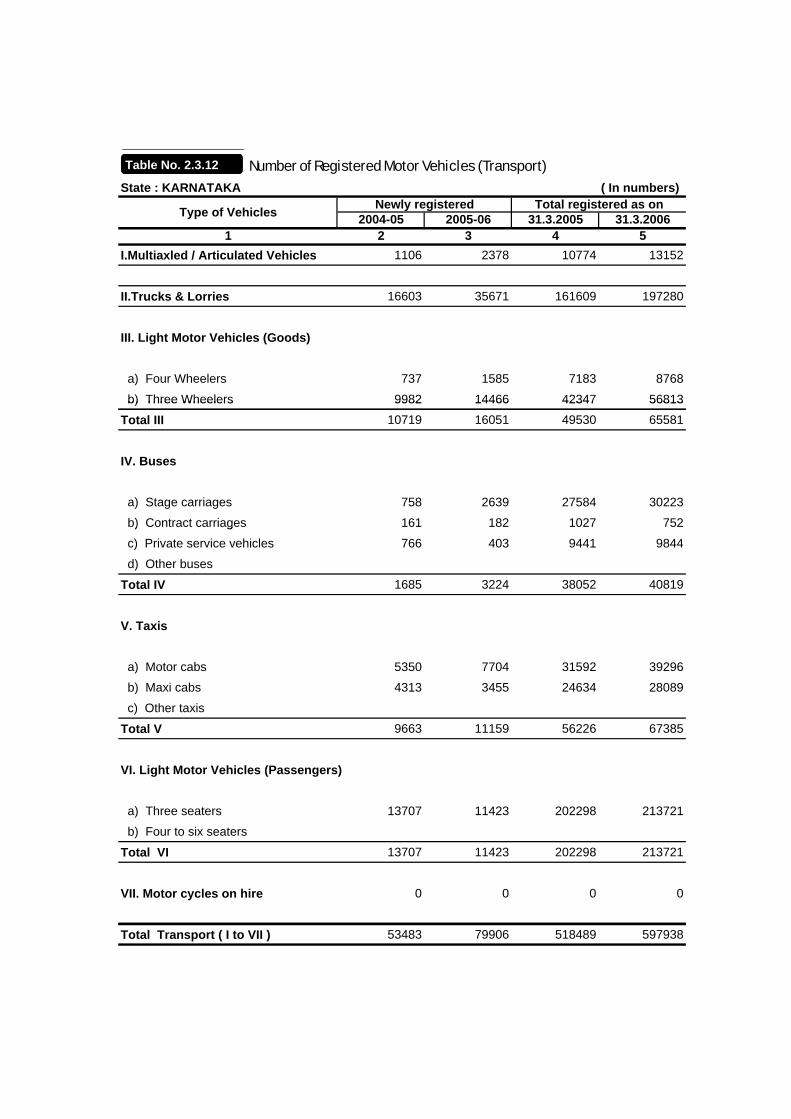
Number of Registered Motor Vehicles (Transport)State : KARNATAKA ( In numbers)
2004-05 2005-06 31.3.2005 31.3.20061 2 3 4 5
I.Multiaxled / Articulated Vehicles 1106 2378 10774 13152
Type of Vehicles Newly registered Total registered as on
Table No. 2.3.12
II.Trucks & Lorries 16603 35671 161609 197280
III. Light Motor Vehicles (Goods)
a) Four Wheelers 737 1585 7183 8768
b) Three Wheelers 9982 14466 42347 56813 b) Three Wheelers 9982 14466 42347 56813
Total III 10719 16051 49530 65581
IV. Buses
a) Stage carriages 758 2639 27584 30223
b) Contract carriages 161 182 1027 752) g
c) Private service vehicles 766 403 9441 9844
d) Other buses
Total IV 1685 3224 38052 40819
V. Taxis
a) Motor cabs 5350 7704 31592 39296
b) Maxi cabs 4313 3455 24634 28089
c) Other taxis
Total V 9663 11159 56226 67385
VI. Light Motor Vehicles (Passengers)
a) Three seaters 13707 11423 202298 213721
b) Four to six seaters
Total VI 13707 11423 202298 213721
VII. Motor cycles on hire 0 0 0 0
Total Transport ( I to VII ) 53483 79906 518489 597938
Table No. 2.3.12

Number of Registered Motor Vehicles (Non-Transport)State : KARNATAKA ( In numbers)
2004-05 2005-06 31.3.2005 31.3.20061 2 3 4 5
I Two wheelers
Type of Vehicles Newly registered Total registered as on
Table No. 2.3.12 (Concld…)
I. Two wheelers
a) Scooters … … … …
b) Mopeds … … … …
c) Motor cycles 401021 555148 3957762 4512910
Total I 401021 555148 3957762 4512910
II. Cars 70578 95687 539518 635205
III. Jeeps 1506 1910 43804 41989
IV. Omni buses 5941 3566 51242 54808
V. Tractors 12824 22330 144355 166685
VI. Trailers 10555 24837 142785 167622
VII. Other vehicles not covered 3948 27793 37661 43213
Total Non-Transport (I to VII) 506373 731271 4917127 5622432
Grand Total
(Transport + Non-Transport) 559856 811177 5435616 6220370
... :- Not indicated. ... : Not indicated.Note : Totals are provisional, representing summation of available data.
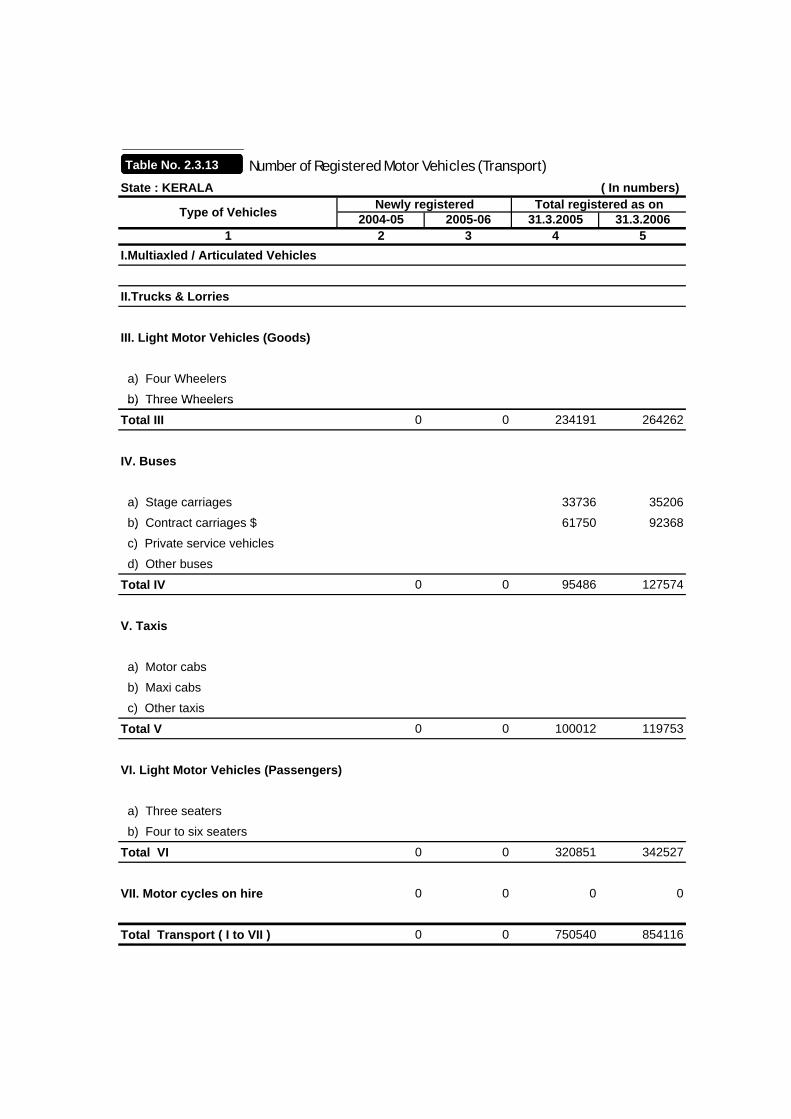
Number of Registered Motor Vehicles (Transport)State : KERALA ( In numbers)
2004-05 2005-06 31.3.2005 31.3.20061 2 3 4 5
I.Multiaxled / Articulated Vehicles
Type of Vehicles Newly registered Total registered as on
Table No. 2.3.13
II.Trucks & Lorries
III. Light Motor Vehicles (Goods)
a) Four Wheelers
b) Three Wheelers b) Three Wheelers
Total III 0 0 234191 264262
IV. Buses
a) Stage carriages 33736 35206
b) Contract carriages $ 61750 92368) g $
c) Private service vehicles
d) Other buses
Total IV 0 0 95486 127574
V. Taxis
a) Motor cabs
b) Maxi cabs
c) Other taxis
Total V 0 0 100012 119753
VI. Light Motor Vehicles (Passengers)
a) Three seaters
b) Four to six seaters
Total VI 0 0 320851 342527
VII. Motor cycles on hire 0 0 0 0
Total Transport ( I to VII ) 0 0 750540 854116
Table No. 2.3.13

Number of Registered Motor Vehicles (Non-Transport)State : KERALA ( In numbers)
2004-05 2005-06 31.3.2005 31.3.20061 2 3 4 5
I Two wheelers
Type of Vehicles Newly registered Total registered as on
Table No. 2.3.13 (Concld…)
I. Two wheelers
a) Scooters
b) Mopeds
c) Motor cycles
Total I 0 0 1819884 2099652
II. Cars 428327 498472
III. Jeeps 72227 73158
IV. Omni buses
V. Tractors 14496 15162
VI. Trailers 2001 2264
VII. Other vehicles not covered 34607 15880
Total Non-Transport (I to VII) 0 0 2371542 2704588
Grand Total
(Transport + Non-Transport) 0 0 3122082 3558704
... :- Not indicated. ... : Not indicated.Note : Totals are provisional, representing summation of available data.$ includes Omni Buses

Number of Registered Motor Vehicles (Transport)State : MADHYA PRADESH ( In numbers)
2004-05 2005-06 31.3.2005 31.3.20061 2 3 4 5
I.Multiaxled / Articulated Vehicles 779 2236 2752 4454
Type of Vehicles Newly registered Total registered as on
Table No. 2.3.14
II.Trucks & Lorries 6223 3670 78684 78839
III. Light Motor Vehicles (Goods)
a) Four Wheelers 2604 3162 19170 21857
b) Three Wheelers 2347 2787 15207 18086 b) Three Wheelers 2347 2787 15207 18086
Total III 4951 5949 34377 39943
IV. Buses
a) Stage carriages 1752 2472 25126 27149
b) Contract carriages 26 31 864 848) g
c) Private service vehicles … … … …
d) Other buses … … … …
Total IV 1778 2503 25990 27997
V. Taxis
a) Motor cabs 1098 915 12043 12775
b) Maxi cabs 5939 5089 55527 59985
c) Other taxis … … … …
Total V 7037 6004 67570 72760
VI. Light Motor Vehicles (Passengers)
a) Three seaters 1806 2637 40056 42721
b) Four to six seaters 737 576 7920 8328
Total VI 2543 3213 47976 51049
VII. Motor cycles on hire 0 0 0 0
Total Transport ( I to VII ) 23311 23575 257349 275042
Table No. 2.3.14

Number of Registered Motor Vehicles (Non-Transport)State : MADHYA PRADESH ( In numbers)
2004-05 2005-06 31.3.2005 31.3.20061 2 3 4 5
I Two wheelers
Type of Vehicles Newly registered Total registered as on
Table No. 2.3.14 (Concld…)
I. Two wheelers
a) Scooters 294054 336785 2570201 2909579
b) Mopeds 17016 11106 606348 616837
c) Motor cycles … … … …
Total I 311070 347891 3176549 3526416
II. Cars 20073 21305 166393 185700
III. Jeeps 1672 1447 37704 38291
IV. Omni buses … … … …
V. Tractors 28528 22041 355625 376771
VI. Trailers 16578 11730 180981 192742
VII. Other vehicles not covered 375 276 13372 13665
Total Non-Transport (I to VII) 378296 404690 3930624 4333585
Grand Total
(Transport + Non-Transport) 401607 428265 4187973 4608627
... :- Not indicated. ... : Not indicated.Note : Totals are provisional, representing summation of available data.

Number of Registered Motor Vehicles (Transport)State : MAHARASHTRA ( In numbers)
2004-05 2005-06 31.3.2005 31.3.20061 2 3 4 5
I.Multiaxled / Articulated Vehicles 2589 1633 7288 11097
II.Trucks & Lorries 19092 17713 258716 276133
III. Light Motor Vehicles (Goods)
a) Four Wheelers 17641 17919 167455 185514 b) Three Wheelers 19933 22077 126388 149227
Total III 37574 39996 293843 334741
IV. Buses
a) Stage carriages 1399 1906 29024 29506 b) Contract carriages 5557 3253 18043 19208 c) Private service vehicles 1396 854 7605 8494 d) Other buses 1482 747 8733 9546
Total IV 9834 6760 63405 66754
V. Taxis
Type of Vehicles Newly registered Total registered as on
Table No. 2.3.15
a) Motor cabs … … … … b) Maxi cabs … … … … c) Other taxis … … … …
Total V 11233 11365 113380 122389
VI. Light Motor Vehicles (Passengers)
a) Three seaters 27378 29599 515249 534535 b) Four to six seaters … … … …
Total VI 27378 29599 515249 534535
VII. Motor cycles on hire … … … …
Total Transport ( I to VII ) 107700 107066 1251881 1345649
Table No. 2.3.15

Number of Registered Motor Vehicles (Non-Transport)State : MAHARASHTRA ( In numbers)
2004-05 2005-06 31.3.2005 31.3.20061 2 3 4 5
I. Two wheelers
a) Scooters 75603 83202 1640891 1715355
b) Mopeds 52140 47180 1213288 1242889
c) Motor cycles 571809 621434 4072397 4733612
Total I 699552 751816 6926576 7691856
II. Cars 119463 128627 1039800 1165365
III. Jeeps 17703 15351 283016 300023
IV. Omni buses … … … …
V. Tractors 10670 15545 212466 229362
VI. Trailers 5673 8340 197169 204733
VII. Other vehicles not covered 1332 3234 25057 29446
Type of Vehicles Newly registered Total registered as on
Table No. 2.3.15 (Concld…)
Total Non-Transport (I to VII) 854393 922913 8684084 9620785
Grand Total
(Transport + Non-Transport) 962093 1029979 9935965 10966434
... :- Not indicated.Note : Totals are provisional, representing summation of available data.

Number of Registered Motor Vehicles (Transport)State : MANIPUR ( In numbers)
2004-05 2005-06 31.3.2005 31.3.20061 2 3 4 5
I.Multiaxled / Articulated Vehicles … … … …
Type of Vehicles Newly registered Total registered as on
Table No. 2.3.16
II.Trucks & Lorries 351 432 6314 6746
III. Light Motor Vehicles (Goods)
a) Four Wheelers 273 361 1479 1840b) Three Wheelers 11 3 11 14 b) Three Wheelers 11 3 11 14
Total III 284 364 1490 1854
IV. Buses
a) Stage carriages 58 69 1741 1810b) Contract carriages 3 0 75 75 b) Contract carriages 3 0 75 75
c) Private service vehicles 4 6 36 42 d) Other buses 12 15 628 643
Total IV 77 90 2480 2570
V. Taxis
a) Motor cabs … … … … b) Maxi cabs 0 0 11 11 c) Other taxis 6 8 358 366
Total V 6 8 369 377
VI. Light Motor Vehicles (Passengers)VI. Light Motor Vehicles (Passengers)
a) Three seaters 108 91 2592 2683 b) Four to six seaters 1 38 38
Total VI 109 91 2630 2721
VII. Motor cycles on hire … … … …VII. Motor cycles on hire … … … …
Total Transport ( I to VII ) 827 985 13283 14268

Number of Registered Motor Vehicles (Non-Transport)State : MANIPUR ( In numbers)
2004-05 2005-06 31.3.2005 31.3.20061 2 3 4 5
Type of Vehicles Newly registered Total registered as on
Table No. 2.3.16 (Concld…)
1 2 3 4 5I. Two wheelers
a) Scooters 2786 3325 52783 56108
b) Mopeds 180 230 3401 3631
c) Motor cycles 2258 2819 24373 27192
Total I 5224 6374 80557 86931
II. Cars 1502 1701 9532 11233
III. Jeeps 397 299 8269 8568
IV. Omni buses 100 131 670 801
V. Tractors 85 98 1348 1446
VI. Trailers 7 25 587 612
VII. Other vehicles not covered 30 19 251 270
Total Non-Transport (I to VII) 7345 8647 101214 109861
Grand Total
(Transport + Non Transport) 8172 9632 114497 124129(Transport + Non-Transport) 8172 9632 114497 124129
... :- Not indicated.Note : Totals are provisional, representing summation of available data.

Number of Registered Motor Vehicles (Transport)State : MEGHALAYA ( In numbers)
2004-05 2005-06 31.3.2005 31.3.20061 2 3 4 5
I.Multiaxled / Articulated Vehicles 2 0 2 2
Type of Vehicles Newly registered Total registered as on
Table No. 2.3.17
II.Trucks & Lorries 1037 1241 15817 17058
III. Light Motor Vehicles (Goods)
a) Four Wheelers 332 571 … …
b) Three Wheelers 462 87 … … b) Three Wheelers 462 87 … …
Total III 794 658 1907 2565
IV. Buses
a) Stage carriages 162 134 … …
b) Contract carriages 104 48 … …) g
c) Private service vehicles 64 30 … …
d) Other buses 0 0 … …
Total IV 330 212 3285 3497
V. Taxis
a) Motor cabs 633 674 … …
b) Maxi cabs 252 204 … …
c) Other taxis 310 374 … …
Total V 1195 1252 7180 8432
VI. Light Motor Vehicles (Passengers)#
a) Three seaters … … … …
b) Four to six seaters … … … …
Total VI 599 569 3000 3569
VII. Motor cycles on hire 1 0 1 0
Total Transport ( I to VII ) 3958 3932 31192 35123
Table No. 2.3.17

Number of Registered Motor Vehicles (Non-Transport)State : MEGHALAYA ( In numbers)
2004-05 2005-06 31.3.2005 31.3.20061 2 3 4 5
I Two wheelers #
Type of Vehicles Newly registered Total registered as on
Table No. 2.3.17 (Concld…)
I. Two wheelers #
a) Scooters 695 454 … …
b) Mopeds 1 1 … …
c) Motor cycles 2748 3315 … …
Total I 3444 3770 27237 31008
II. Cars 2548 3165 19186 22351
III. Jeeps 571 810 10490 11300
IV. Omni buses 0 0 0 0
V. Tractors 19 21 466 487
VI. Trailers 134 103 2504 2607
VII. Other vehicles not covered 69 187 1053 1240
Total Non-Transport (I to VII) 6785 8056 60936 68993
Grand Total
(Transport + Non-Transport) 10743 11988 92128 104116
... :- Not indicated. ... : Not indicated.Note : Totals are provisional, representing summation of available data.# Disaggregated Figures are Not available

Number of Registered Motor Vehicles (Transport)State : MIZORAM ( In numbers)
2004-05 2005-06 31.3.2005 31.3.20061 2 3 4 5
I.Multiaxled / Articulated Vehicles 47 67 95 158
Type of Vehicles Newly registered Total registered as on
Table No. 2.3.18
II.Trucks & Lorries 572 543 3966 4317
III. Light Motor Vehicles (Goods)
a) Four Wheelers # … … … …
b) Three Wheelers 0 5 0 5 b) Three Wheelers 0 5 0 5
Total III 0 5 0 5
IV. Buses
a) Stage carriages 101 47 672 704
b) Contract carriages 0 0 0 0) g
c) Private service vehicles 0 0 0 0
d) Other buses 0 0 0 0
Total IV 101 47 672 704
V. Taxis
a) Motor cabs 376 573 3593 4110
b) Maxi cabs 197 189 723 878
c) Other taxis 0 0 0 0
Total V 573 762 4316 4988
VI. Light Motor Vehicles (Passengers)
a) Three seaters 222 218 1336 1534
b) Four to six seaters 0 0 0 0
Total VI 222 218 1336 1534
VII. Motor cycles on hire … … … …
Total Transport ( I to VII ) 1515 1642 10385 11706
Table No. 2.3.18

Number of Registered Motor Vehicles (Non-Transport)State : MIZORAM ( In numbers)
2004-05 2005-06 31.3.2005 31.3.20061 2 3 4 5
I Two wheelers @
Type of Vehicles Newly registered Total registered as on
Table No. 2.3.18 (Concld…)
I. Two wheelers @
a) Scooters … … … …
b) Mopeds … … … …
c) Motor cycles … … … …
Total I 2576 3117 21816 24737
II. Cars 746 878 5565 6286
III. Jeeps 160 189 3576 3712
IV. Omni buses … … … …
V. Tractors 23 17 231 246
VI. Trailers 13 9 260 264
VII. Other vehicles not covered 174 198 4757 4925
Total Non-Transport (I to VII) 3692 4408 36205 40170
Grand Total
(Transport + Non-Transport) 5207 6050 46590 51876
... :- Not indicated. ... : Not indicated.Note : Totals are provisional, representing summation of available data. # Included Under Trucks and Lorries @ No separate Classification available with RTOs

Number of Registered Motor Vehicles (Transport)State : NAGALAND ( In numbers)
2004-05 2005-06 31.3.2005 31.3.20061 2 3 4 5
I.Multiaxled / Articulated Vehicles 1423 983 6271 7254
Type of Vehicles Newly registered Total registered as on
Table No. 2.3.19
II.Trucks & Lorries 1560 2104 37731 39835
III. Light Motor Vehicles (Goods)
a) Four Wheelers 1362 972 4014 4986
b) Three Wheelers 128 99 6719 6818 b) Three Wheelers 128 99 6719 6818
Total III 1490 1071 10733 11804
IV. Buses
a) Stage carriages 22 81 1172 1253
b) Contract carriages 328 85 2086 2171) g
c) Private service vehicles 5 9 159 168
d) Other buses 3 22 446 468
Total IV 358 197 3863 4060
V. Taxis
a) Motor cabs 190 119 3593 3712
b) Maxi cabs 48 36 623 659
c) Other taxis 35 128 505 633
Total V 273 283 4721 5004
VI. Light Motor Vehicles (Passengers)
a) Three seaters 707 448 8434 8882
b) Four to six seaters 102 0 666 666
Total VI 809 448 9100 9548
VII. Motor cycles on hire … … … …
Total Transport ( I to VII ) 5913 5086 72419 77505
Table No. 2.3.19

Number of Registered Motor Vehicles (Non-Transport)State : NAGALAND ( In numbers)
2004-05 2005-06 31.3.2005 31.3.20061 2 3 4 5
I Two wheelers
Type of Vehicles Newly registered Total registered as on
Table No. 2.3.19 (Concld…)
I. Two wheelers
a) Scooters 2565 983 25324 26307
b) Mopeds 11 0 228 228
c) Motor cycles 672 1879 14437 16316
Total I 3248 2862 39989 42851
II. Cars 1593 2647 34866 37513
III. Jeeps 350 482 21999 22481
IV. Omni buses 9 134 216 350
V. Tractors 32 32 1859 1891
VI. Trailers 44 32 740 772
VII. Other vehicles not covered 37 42 311 353
Total Non-Transport (I to VII) 5313 6231 99980 106211
Grand Total
(Transport + Non-Transport) 11226 11317 172399 183716
... :- Not indicated. ... : Not indicated.Note : Totals are provisional, representing summation of available data.

Number of Registered Motor Vehicles (Transport)State : ORISSA ( In numbers)
2004-05 2005-06 31.3.2005 31.3.20061 2 3 4 5
I.Multiaxled / Articulated Vehicles 393 999 2270 3269
Type of Vehicles Newly registered Total registered as on
Table No. 2.3.20
II.Trucks & Lorries 11600 10947 60216 71163
III. Light Motor Vehicles (Goods)
a) Four Wheelers 2529 3125 24341 27466
b) Three Wheelers 3708 3802 16575 20377 b) Three Wheelers 3708 3802 16575 20377
Total III 6237 6927 40916 47843
IV. Buses
a) Stage carriages 432 655 9664 10319
b) Contract carriages 252 245 4168 4413) g
c) Private service vehicles 61 69 797 866
d) Other buses 14 15 383 398
Total IV 759 984 15012 15996
V. Taxis
a) Motor cabs 2901 2671 16711 19382
b) Maxi cabs 791 1107 6413 7520
c) Other taxis 313 283 3241 3524
Total V 4005 4061 26365 30426
VI. Light Motor Vehicles (Passengers)
a) Three seaters 4552 3650 27582 31232
b) Four to six seaters 400 400 2728 3128
Total VI 4952 4050 30310 34360
VII. Motor cycles on hire … … … …
Total Transport ( I to VII ) 27946 27968 175089 203057
Table No. 2.3.20

Number of Registered Motor Vehicles (Non-Transport)State : ORISSA ( In numbers)
2004-05 2005-06 31.3.2005 31.3.20061 2 3 4 5
I Two wheelers
Type of Vehicles Newly registered Total registered as on
Table No. 2.3.20 (Concld…)
I. Two wheelers
a) Scooters 8634 8582 387844 396426
b) Mopeds 19685 18857 272231 291088
c) Motor cycles 125660 142274 700507 842781
Total I 153979 169713 1360582 1530295
II. Cars 7966 8421 74265 82686
III. Jeeps 594 609 29938 30547
IV. Omni buses 142 187 2380 2567
V. Tractors 3796 4910 37279 42189
VI. Trailers 3574 4660 30019 34679
VII. Other vehicles not covered 232 167 5808 5975
Total Non-Transport (I to VII) 170283 188667 1540271 1728938
Grand Total
(Transport + Non-Transport) 198229 216635 1715360 1931995
... :- Not indicated. ... : Not indicated.Note : Totals are provisional, representing summation of available data.
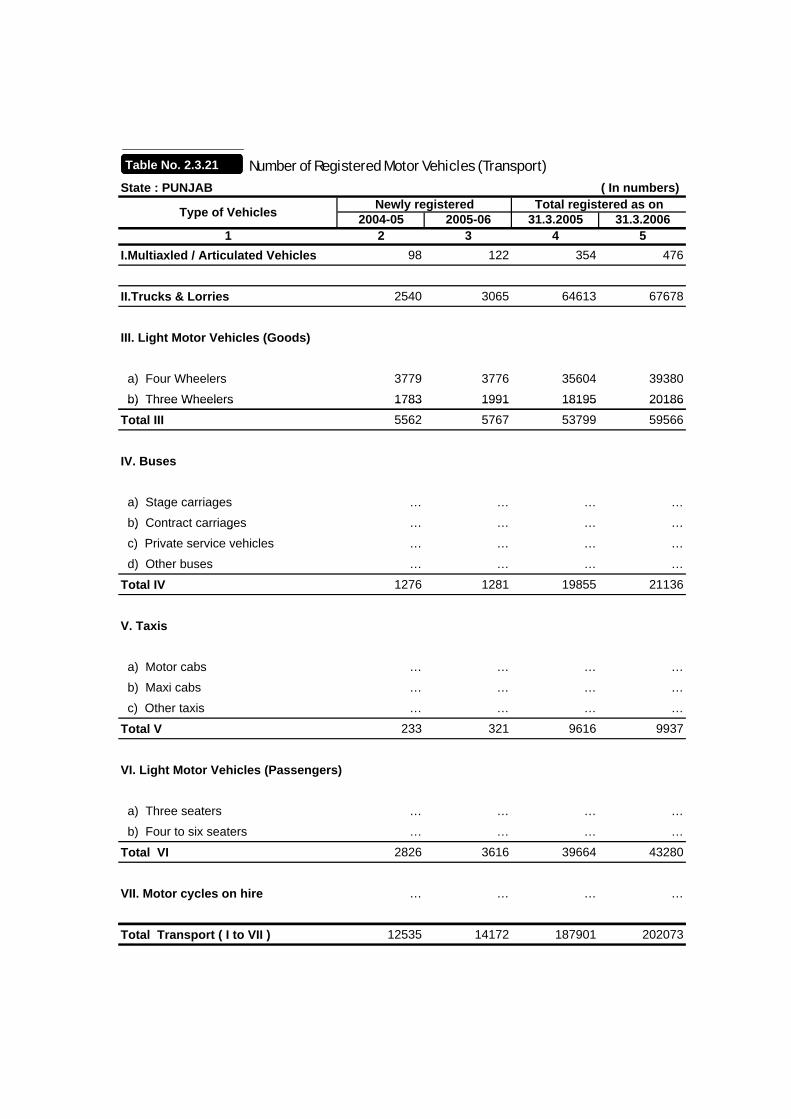
Number of Registered Motor Vehicles (Transport)State : PUNJAB ( In numbers)
2004-05 2005-06 31.3.2005 31.3.20061 2 3 4 5
I.Multiaxled / Articulated Vehicles 98 122 354 476
Type of Vehicles Newly registered Total registered as on
Table No. 2.3.21
II.Trucks & Lorries 2540 3065 64613 67678
III. Light Motor Vehicles (Goods)
a) Four Wheelers 3779 3776 35604 39380
b) Three Wheelers 1783 1991 18195 20186 b) Three Wheelers 1783 1991 18195 20186
Total III 5562 5767 53799 59566
IV. Buses
a) Stage carriages … … … …
b) Contract carriages … … … …) g
c) Private service vehicles … … … …
d) Other buses … … … …
Total IV 1276 1281 19855 21136
V. Taxis
a) Motor cabs … … … …
b) Maxi cabs … … … …
c) Other taxis … … … …
Total V 233 321 9616 9937
VI. Light Motor Vehicles (Passengers)
a) Three seaters … … … …
b) Four to six seaters … … … …
Total VI 2826 3616 39664 43280
VII. Motor cycles on hire … … … …
Total Transport ( I to VII ) 12535 14172 187901 202073
Table No. 2.3.21

Number of Registered Motor Vehicles (Non-Transport)State : PUNJAB ( In numbers)
2004-05 2005-06 31.3.2005 31.3.20061 2 3 4 5
I Two wheelers
Type of Vehicles Newly registered Total registered as on
Table No. 2.3.21 (Concld…)
I. Two wheelers
a) Scooters 178867 191472 2259226 2350698
b) Mopeds 11099 6779 617921 624500
c) Motor cycles
Total I 189966 198251 2877147 2975198
II. Cars 33215 34690 300594 335284
III. Jeeps 3954 4923 36751 41670
IV. Omni buses … … … …
V. Tractors 7049 6810 466063 472873
VI. Trailers 7 64 417 481
VII. Other vehicles not covered 280 348 7233 7581
Total Non-Transport (I to VII) 234471 245086 3688205 3833087
Grand Total
(Transport + Non-Transport) 247006 259258 3876106 4035160
... :- Not indicated. ... : Not indicated.Note : Totals are provisional, representing summation of available data.

Number of Registered Motor Vehicles (Transport)State : RAJASTHAN ( In numbers)
2004-05 2005-06 31.3.2005 31.3.20061 2 3 4 5
I.Multiaxled / Articulated Vehicles ... ... ... ...
Type of Vehicles Newly registered Total registered as on
Table No. 2.3.22
II.Trucks & Lorries 17655 15174 191207 206381
III. Light Motor Vehicles (Goods)
a) Four Wheelers # ... ... ... ...
b) Three Wheelers 4073 5292 17674 22966 b) Three Wheelers 4073 5292 17674 22966
Total III 4073 5292 17674 22966
IV. Buses
a) Stage carriages ... ... 23215 23605
b) Contract carriages ... ... 2143 2187) g
c) Private service vehicles ... ... ... ...
d) Other buses ... ... 32734 35187
Total IV 2156 2887 58092 60979
V. Taxis
a) Motor cabs … … … …
b) Maxi cabs 1040 1464 … …
c) Other taxis 3853 3454 … …
Total V 4893 4918 37761 42679
VI. Light Motor Vehicles (Passengers)
a) Three seaters 5981 6651 61128 67779
b) Four to six seaters 1150 1214 10583 11797
Total VI 7131 7865 71711 79576
VII. Motor cycles on hire … … … …
Total Transport ( I to VII ) 35908 36136 376445 412581
Table No. 2.3.22

Number of Registered Motor Vehicles (Non-Transport)State : RAJASTHAN ( In numbers)
2004-05 2005-06 31.3.2005 31.3.20061 2 3 4 5
I Two wheelers
Type of Vehicles Newly registered Total registered as on
Table No. 2.3.22 (Concld…)
I. Two wheelers
a) Scooters 21801 24804 … …
b) Mopeds 21902 20315 … …
c) Motor cycles 280885 332034 … …
Total I 324588 377153 3016763 3393916
II. Cars 30306 35564 234297 269861
III. Jeeps 9328 10456 137384 147840
IV. Omni buses … … … …
V. Tractors 25163 31757 432686 464443
VI. Trailers 1123 1428 58136 59564
VII. Other vehicles not covered 507 804 5018 5822
Total Non-Transport (I to VII) 391015 457162 3884284 4341446
Grand Total
(Transport + Non-Transport) 426923 493298 4260729 4754027
... :- Not indicated. ... : Not indicated.Note : Totals are provisional, representing summation of available data. # Included in Trucks & Lorries

Number of Registered Motor Vehicles (Transport)State : SIKKIM ( In numbers)
2004-05 2005-06 31.3.2005 31.3.20061 2 3 4 5
I.Multiaxled / Articulated Vehicles … … … …
Type of Vehicles Newly registered Total registered as on
Table No. 2.3.23
II.Trucks & Lorries 150 146 1769 1915
III. Light Motor Vehicles (Goods)
a) Four Wheelers 64 72 417 489
b) Three Wheelers … … … … b) Three Wheelers … … … …
Total III 64 72 417 489
IV. Buses
a) Stage carriages 3 2 258 260
b) Contract carriages … … … …) g
c) Private service vehicles 5 8 97 105
d) Other buses … … … …
Total IV 8 10 355 365
V. Taxis
a) Motor cabs 240 235 2535 2770
b) Maxi cabs 280 350 2932 3282
c) Other taxis … … … …
Total V 520 585 5467 6052
VI. Light Motor Vehicles (Passengers)
a) Three seaters … … … …
b) Four to six seaters … … … …
Total VI 0 0 0 0
VII. Motor cycles on hire … … … …
Total Transport ( I to VII ) 742 813 8008 8821
Table No. 2.3.23

Number of Registered Motor Vehicles (Non-Transport)State : SIKKIM ( In numbers)
2004-05 2005-06 31.3.2005 31.3.20061 2 3 4 5
I Two wheelers
Type of Vehicles Newly registered Total registered as on
Table No. 2.3.23 (Concld…)
I. Two wheelers
a) Scooters 163 125 4113 4238
b) Mopeds … … … …
c) Motor cycles 112 200 844 1044
Total I 275 325 4957 5282
II. Cars 635 548 2505 3053
III. Jeeps 430 476 3293 3769
IV. Omni buses 276 307 763 1070
V. Tractors 4 11 13 24
VI. Trailers … … … …
VII. Other vehicles not covered … … … …
Total Non-Transport (I to VII) 1620 1667 11531 13198
Grand Total
(Transport + Non-Transport) 2362 2480 19539 22019
... :- Not indicated. ... : Not indicated.Note : Totals are provisional, representing summation of available data.

Number of Registered Motor Vehicles (Transport)State : TAMILNADU ( In numbers)
2004-05 2005-06 31.3.2005 31.3.20061 2 3 4 5
I.Multiaxled / Articulated Vehicles 344 697 53596 54293
Type of Vehicles Newly registered Total registered as on
Table No. 2.3.24
II.Trucks & Lorries 16907 21381 239890 261271
III. Light Motor Vehicles (Goods)
a) Four Wheelers 8499 10525 148824 159349
b) Three Wheelers 3643 4510 67632 72142 b) Three Wheelers 3643 4510 67632 72142
Total III 12142 15035 216456 231491
IV. Buses
a) Stage carriages 1254 1724 31011 32735
b) Contract carriages 378 426 18597 19023) g
c) Private service vehicles 358 707 6567 7274
d) Other buses 3650 4587 26372 30959
Total IV 5640 7444 82547 89991
V. Taxis
a) Motor cabs 5822 8026 73385 81411
b) Maxi cabs 1869 1762 42838 44600
c) Other taxis 306 422 8147 8569
Total V 7997 10210 124370 134580
VI. Light Motor Vehicles (Passengers)
a) Three seaters 8885 10546 150227 160773
b) Four to six seaters 468 555 13318 13873
Total VI 9353 11101 163545 174646
VII. Motor cycles on hire … … … …
Total Transport ( I to VII ) 52383 65868 880404 946272
Table No. 2.3.24

Number of Registered Motor Vehicles (Non-Transport)State : TAMILNADU ( In numbers)
2004-05 2005-06 31.3.2005 31.3.20061 2 3 4 5
I Two wheelers
Type of Vehicles Newly registered Total registered as on
Table No. 2.3.24 (Concld…)
I. Two wheelers
a) Scooters 90360 88201 1186519 1274720
b) Mopeds 107226 109085 2989423 3098508
c) Motor cycles 360716 446985 3116565 3563550
Total I 558302 644271 7292507 7936778
II. Cars 52512 56541 783892 840433
III. Jeeps 588 1098 54575 55673
IV. Omni buses 0 0 19957 19957
V. Tractors 4458 7400 95344 102744
VI. Trailers 1486 2619 41396 44015
VII. Other vehicles not covered 12208 18929 89112 108041
Total Non-Transport (I to VII) 629554 730858 8376783 9107641
Grand Total
(Transport + Non-Transport) 681937 796726 9257187 10053913
... :- Not indicated. ... : Not indicated.Note : Totals are provisional, representing summation of available data.

Number of Registered Motor Vehicles (Transport)State : TRIPURA ( In numbers)
2004-05 2005-06 31.3.2005 31.3.20061 2 3 4 5
I.Multiaxled / Articulated Vehicles … … … …
Type of Vehicles Newly registered Total registered as on
Table No. 2.3.25
II.Trucks & Lorries 448 474 7664 8138
III. Light Motor Vehicles (Goods)
a) Four Wheelers 97 119 593 712
b) Three Wheelers 285 574 1279 1823 b) Three Wheelers 285 574 1279 1823
Total III 382 693 1872 2535
IV. Buses
a) Stage carriages 44 60 1517 1577
b) Contract carriages 51 45 318 363) g
c) Private service vehicles 5 7 29 21
d) Other buses
Total IV 100 112 1864 1961
V. Taxis
a) Motor cabs 4 12 64 76
b) Maxi cabs 4 7 8 15
c) Other taxis 103 65 1160 1225
Total V 111 84 1232 1316
VI. Light Motor Vehicles (Passengers)
a) Three seaters 1052 1186 7999 9185
b) Four to six seaters 248 170 3882 4052
Total VI 1300 1356 11881 13237
VII. Motor cycles on hire … … … …
Total Transport ( I to VII ) 2341 2719 24513 27187
Table No. 2.3.25

Number of Registered Motor Vehicles (Non-Transport)State : TRIPURA ( In numbers)
2004-05 2005-06 31.3.2005 31.3.20061 2 3 4 5
I Two wheelers
Type of Vehicles Newly registered Total registered as on
Table No. 2.3.25 (Concld…)
I. Two wheelers
a) Scooters 314 241 24153 24394
b) Mopeds 74 85 1580 1664
c) Motor cycles 7200 7184 8717 35910
Total I 7588 7510 34450 61968
II. Cars 777 872 5784 6656
III. Jeeps 109 75 4283 4358
IV. Omni buses 2 … 13 13
V. Tractors 5 7 82 89
VI. Trailers 2 1 99 100
VII. Other vehicles not covered 1888 1891 3506 5397
Total Non-Transport (I to VII) 10371 10356 48217 78581
Grand Total
(Transport + Non-Transport) 12712 13075 72730 105768
... :- Not indicated. ... : Not indicated.Note : Totals are provisional, representing summation of available data.

Number of Registered Motor Vehicles (Transport)State : UTTRAKHAND ( In numbers)
2004-05 2005-06 31.3.2005 31.3.20061 2 3 4 5
I.Multiaxled / Articulated Vehicles 0 1 66 67
Type of Vehicles Newly registered Total registered as on
Table No. 2.3.26
II.Trucks & Lorries 1017 1275 10750 12025
III. Light Motor Vehicles (Goods)
a) Four Wheelers 756 762 3794 4556
b) Three Wheelers 551 605 3175 3780 b) Three Wheelers 551 605 3175 3780
Total III 1307 1367 6969 8336
IV. Buses
a) Stage carriages 267 262 3828 4090
b) Contract carriages 70 87 393 480) g
c) Private service vehicles 12 26 165 191
d) Other buses 304 295 893 1188
Total IV 653 670 5279 5949
V. Taxis
a) Motor cabs 313 448 9031 9479
b) Maxi cabs 907 1016 5284 6300
c) Other taxis - - 290 290
Total V 1220 1464 14605 16069
VI. Light Motor Vehicles (Passengers)
a) Three seaters 159 599 3563 4162
b) Four to six seaters 102 247 3497 3744
Total VI 261 846 7060 7906
VII. Motor cycles on hire … … … …
Total Transport ( I to VII ) 4458 5623 44729 50352
Table No. 2.3.26

Number of Registered Motor Vehicles (Non-Transport)State : UTTRAKHAND ( In numbers)
2004-05 2005-06 31.3.2005 31.3.20061 2 3 4 5
I Two wheelers
Type of Vehicles Newly registered Total registered as on
Table No. 2.3.26 (Concld…)
I. Two wheelers
a) Scooters 10378 11512 180407 191919
b) Mopeds 1358 782 50142 50924
c) Motor cycles 30994 40459 203432 243891
Total I 42730 52753 433981 486734
II. Cars 8083 9065 50303 59368
III. Jeeps 282 210 6734 6944
IV. Omni buses 295 547 1082 1629
V. Tractors 903 1271 32884 34155
VI. Trailers 231 272 1129 1401
VII. Other vehicles not covered 345 335 2467 2802
Total Non-Transport (I to VII) 52869 64453 528580 593033
Grand Total
(Transport + Non-Transport) 57327 70076 573309 643385
... :- Not indicated. ... : Not indicated.Note : Totals are provisional, representing summation of available data.

Number of Registered Motor Vehicles (Transport)State : UTTAR PRADESH ( In numbers)
2004-05 2005-06 31.3.2005 31.3.20061 2 3 4 5
I.Multiaxled / Articulated Vehicles 2004 3180 7164 11995
Type of Vehicles Newly registered Total registered as on
Table No. 2.3.27
II.Trucks & Lorries 8354 7604 94191 94765
III. Light Motor Vehicles (Goods)
a) Four Wheelers 6469 7041 39043 44616
b) Three Wheelers 4260 5216 24725 33052 b) Three Wheelers 4260 5216 24725 33052
Total III 10729 12257 63768 77668
IV. Buses
a) Stage carriages 1129 1102 16063 13549
b) Contract carriages 140 290 1542 1564) g
c) Private service vehicles 249 368 1215 1871
d) Other buses 647 1019 6261 9565
Total IV 2165 2779 25081 26549
V. Taxis
a) Motor cabs 1043 1581 8583 14469
b) Maxi cabs 200 163 5032 3624
c) Other taxis 803 666 14195 10350
Total V 2046 2410 27810 28443
VI. Light Motor Vehicles (Passengers)
a) Three seaters 4197 8478 38183 48287
b) Four to six seaters 3448 4149 41854 43059
Total VI 7645 12627 80037 91346
VII. Motor cycles on hire … … … …
Total Transport ( I to VII ) 32943 40857 298051 330766
Table No. 2.3.27

Number of Registered Motor Vehicles (Non-Transport)State : UTTAR PRADESH ( In numbers)
2004-05 2005-06 31.3.2005 31.3.20061 2 3 4 5
I Two wheelers
Type of Vehicles Newly registered Total registered as on
Table No. 2.3.27 (Concld…)
I. Two wheelers
a) Scooters 41790 56519 1474639 1496935
b) Mopeds 17016 14443 496084 499256
c) Motor cycles 606783 698221 3681321 4087464
Total I 665589 769183 5652044 6083655
II. Cars 52311 60090 499148 615739
III. Jeeps 6511 8301 106897 112837
IV. Omni buses 1528 2431 16244 19015
V. Tractors 42714 52705 742717 791411
VI. Trailers 97 149 10283 14579
VII. Other vehicles not covered 994 1073 19102 21132
Total Non-Transport (I to VII) 769744 893932 7046435 7658368
Grand Total
(Transport + Non-Transport) 802687 934789 7344486 7989134
... :- Not indicated. ... : Not indicated.Note : Totals are provisional, representing summation of available data.

Number of Registered Motor Vehicles (Transport)State : WEST BENGAL ( In numbers)
2004-05 2005-06 31.3.2005 31.3.20061 2 3 4 5
I.Multiaxled / Articulated Vehicles
Type of Vehicles Newly registered Total registered as on
Table No. 2.3.28
II.Trucks & Lorries
III. Light Motor Vehicles (Goods)
a) Four Wheelers
b) Three Wheelers b) Three Wheelers
Total III 8500 11443 223826 235269
IV. Buses
a) Stage carriages
b) Contract carriages) g
c) Private service vehicles
d) Other buses
Total IV 1500 9986 33613 43599
V. Taxis
a) Motor cabs
b) Maxi cabs
c) Other taxis
Total V 2500 3816 65110 68926
VI. Light Motor Vehicles (Passengers)
a) Three seaters
b) Four to six seaters
Total VI 17749 3500 56038 40315
VII. Motor cycles on hire … … … …
Total Transport ( I to VII ) 30249 28745 378587 388109
Table No. 2.3.28

Number of Registered Motor Vehicles (Non-Transport)State : WEST BENGAL ( In numbers)
2004-05 2005-06 31.3.2005 31.3.20061 2 3 4 5
I Two wheelers
Type of Vehicles Newly registered Total registered as on
Table No. 2.3.28 (Concld…)
I. Two wheelers
a) Scooters
b) Mopeds
c) Motor cycles
Total I 105719 146775 1687045 1833820
II. Cars 33596 28129 528101 556230
III. Jeeps * * * *
IV. Omni buses … … … …
V. Tractors 7273 3214 55164 58828
VI. Trailers # # # #
VII. Other vehicles not covered 0 3154 31658 34812
Total Non-Transport (I to VII) 146588 181272 2301968 2483690
Grand Total
(Transport + Non-Transport) 176837 210017 2680555 2871799
* :- Included in cars.# :- Included in tractors. ... :- Not indicated.Note : Totals are provisional, representing summation of available data.
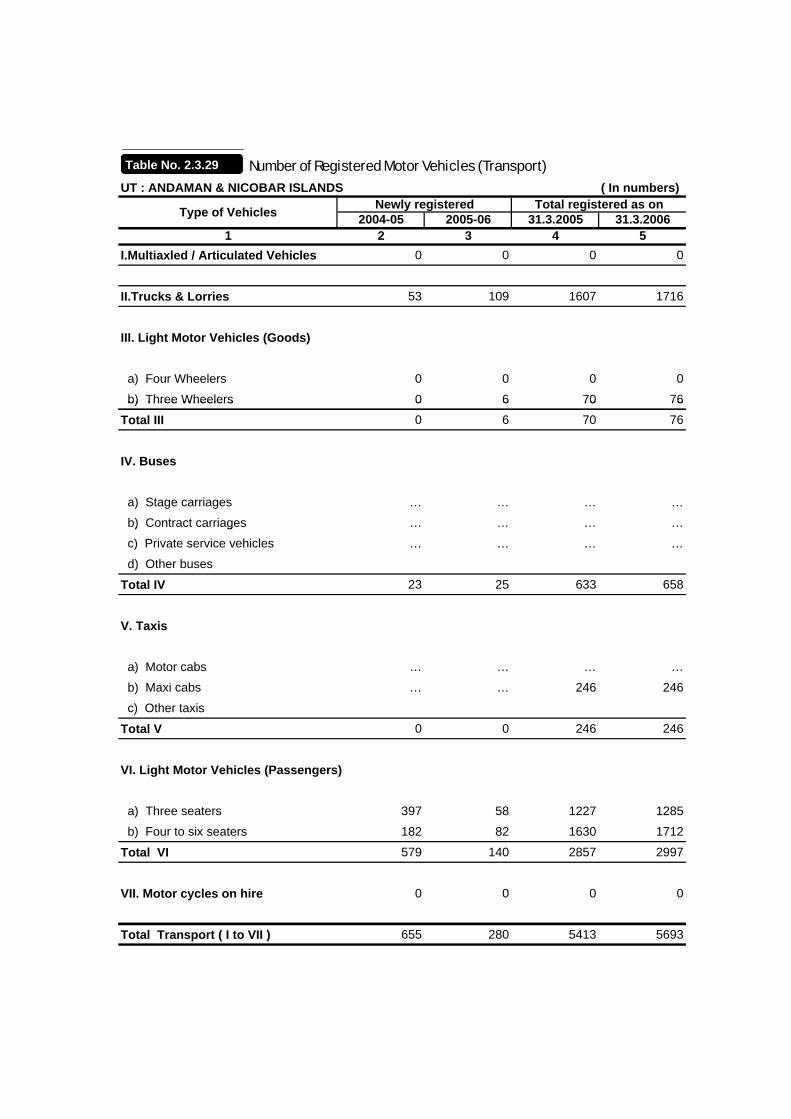
Number of Registered Motor Vehicles (Transport)UT : ANDAMAN & NICOBAR ISLANDS ( In numbers)
2004-05 2005-06 31.3.2005 31.3.20061 2 3 4 5
I.Multiaxled / Articulated Vehicles 0 0 0 0
Type of Vehicles Newly registered Total registered as on
Table No. 2.3.29
II.Trucks & Lorries 53 109 1607 1716
III. Light Motor Vehicles (Goods)
a) Four Wheelers 0 0 0 0
b) Three Wheelers 0 6 70 76 b) Three Wheelers 0 6 70 76
Total III 0 6 70 76
IV. Buses
a) Stage carriages … … … …
b) Contract carriages … … … …) g
c) Private service vehicles … … … …
d) Other buses
Total IV 23 25 633 658
V. Taxis
a) Motor cabs … … … …
b) Maxi cabs … … 246 246
c) Other taxis
Total V 0 0 246 246
VI. Light Motor Vehicles (Passengers)
a) Three seaters 397 58 1227 1285
b) Four to six seaters 182 82 1630 1712
Total VI 579 140 2857 2997
VII. Motor cycles on hire 0 0 0 0
Total Transport ( I to VII ) 655 280 5413 5693
Table No. 2.3.29

Number of Registered Motor Vehicles (Non-Transport)UT : ANDAMAN & NICOBAR ISLANDS ( In numbers)
2004-05 2005-06 31.3.2005 31.3.20061 2 3 4 5
I Two wheelers
Type of Vehicles Newly registered Total registered as on
Table No. 2.3.29 (Concld…)
I. Two wheelers
a) Scooters 29 40 9039 9079
b) Mopeds 193 250 896 1146
c) Motor cycles 1348 2469 10385 12854
Total I 1570 2759 20320 23079
II. Cars 299 342 2099 2441
III. Jeeps 60 74 705 779
IV. Omni buses 31 129 206 335
V. Tractors 6 3 226 229
VI. Trailers 0 3 19 22
VII. Other vehicles not covered 13 26 8211 8237
Total Non-Transport (I to VII) 1979 3336 31786 35122
Grand Total
(Transport + Non-Transport) 2634 3616 37199 40815
... :- Not indicated. ... : Not indicated.Note : Totals are provisional, representing summation of available data.

Number of Registered Motor Vehicles (Transport)UT : CHANDIGARH ( In numbers)
2004-05 2005-06 31.3.2005 31.3.20061 2 3 4 5
I.Multiaxled / Articulated Vehicles 7 0 7 7
Type of Vehicles Newly registered Total registered as on
Table No. 2.3.30
II.Trucks & Lorries 25 63 3317 3380
III. Light Motor Vehicles (Goods)
a) Four Wheelers 191 213 5252 5465
b) Three Wheelers 93 83 2491 2574 b) Three Wheelers 93 83 2491 2574
Total III 284 296 7743 8039
IV. Buses
a) Stage carriages 417 … 417 417
b) Contract carriages 120 … 120 120) g
c) Private service vehicles 30 45 310 355
d) Other buses 80 96 1319 1415
Total IV 647 141 2166 2307
V. Taxis
a) Motor cabs 170 158 1520 1678
b) Maxi cabs 30 63 30 93
c) Other taxis … … … …
Total V 200 221 1550 1771
VI. Light Motor Vehicles (Passengers)
a) Three seaters … 2000 2000 2000
b) Four to six seaters … … … …
Total VI 0 2000 2000 2000
VII. Motor cycles on hire 0 0 0 0
Total Transport ( I to VII ) 1163 2721 16783 17504
Table No. 2.3.30

Number of Registered Motor Vehicles (Non-Transport)UT : CHANDIGARH ( In numbers)
2004-05 2005-06 31.3.2005 31.3.20061 2 3 4 5
I Two wheelers
Type of Vehicles Newly registered Total registered as on
Table No. 2.3.30 (Concld…)
I. Two wheelers
a) Scooters 17841 19550 434758 454308
b) Mopeds … … … …
c) Motor cycles … … … …
Total I 17841 19550 434758 454308
II. Cars 9143 9632 166755 176387
III. Jeeps … … … …
IV. Omni buses 9 6 45 51
V. Tractors … … … …
VI. Trailers … … … …
VII. Other vehicles not covered … … … …
Total Non-Transport (I to VII) 26993 29188 601558 630746
Grand Total
(Transport + Non-Transport) 28156 31909 618341 648250
... :- Not indicated. ... : Not indicated.Note : Totals are provisional, representing summation of available data.

Number of Registered Motor Vehicles (Transport)UT : DADRA & NAGAR HAVELI ( In numbers)
2004-05 2005-06 31.3.2005 31.3.20061 2 3 4 5
I.Multiaxled / Articulated Vehicles 8 22 368 390
Type of Vehicles Newly registered Total registered as on
Table No. 2.3.31
II.Trucks & Lorries 287 268 5414 5682
III. Light Motor Vehicles (Goods)
a) Four Wheelers 171 114 903 1017
b) Three Wheelers 160 115 618 733 b) Three Wheelers 160 115 618 733
Total III 331 229 1521 1750
IV. Buses
a) Stage carriages 0 1 54 55
b) Contract carriages 2 17 70 87) g
c) Private service vehicles 0 2 32 34
d) Other buses 0 0 0 0
Total IV 2 20 156 176
V. Taxis
a) Motor cabs 4 11 112 123
b) Maxi cabs 0 0 0 0
c) Other taxis 0 0 0 0
Total V 4 11 112 123
VI. Light Motor Vehicles (Passengers)
a) Three seaters 22 10 522 532
b) Four to six seaters 5 2 5 7
Total VI 27 12 527 539
VII. Motor cycles on hire 0 0 0 0
Total Transport ( I to VII ) 659 562 8098 8660
Table No. 2.3.31

Number of Registered Motor Vehicles (Non-Transport)UT : DADRA & NAGAR HAVELI ( In numbers)
2004-05 2005-06 31.3.2005 31.3.20061 2 3 4 5
I Two wheelers
Type of Vehicles Newly registered Total registered as on
Table No. 2.3.31 (Concld…)
I. Two wheelers
a) Scooters 157 118 … …
b) Mopeds 109 223 … …
c) Motor cycles 2694 2425 … …
Total I 2960 2766 20841 23607
II. Cars 1173 1377 10443 11820
III. Jeeps 19 12 448 460
IV. Omni buses 0 0 6 6
V. Tractors 7 6 51 57
VI. Trailers 0 0 46 46
VII. Other vehicles not covered 0 0 0 0
Total Non-Transport (I to VII) 4159 4161 31835 35996
Grand Total
(Transport + Non-Transport) 4818 4723 39933 44656
... :- Not indicated. ... : Not indicated.Note : Totals are provisional, representing summation of available data.

Number of Registered Motor Vehicles (Transport)UT : DAMAN & DIU ( In numbers)
2004-05 2005-06 31.3.2005 31.3.20061 2 3 4 5
I.Multiaxled / Articulated Vehicles 31 44 457 501
Type of Vehicles Newly registered Total registered as on
Table No. 2.3.32
II.Trucks & Lorries 128 124 1598 1722
III. Light Motor Vehicles (Goods)
a) Four Wheelers 117 95 1372 1467
b) Three Wheelers 143 132 717 849 b) Three Wheelers 143 132 717 849
Total III 260 227 2089 2316
IV. Buses
a) Stage carriages … … 61 61
b) Contract carriages 22 20 166 186) g
c) Private service vehicles 0 0 130 130
d) Other buses 6 11 32 43
Total IV 28 31 389 420
V. Taxis
a) Motor cabs 0 0 1 1
b) Maxi cabs 0 0 42 42
c) Other taxis 0 0 0 0
Total V 0 0 43 43
VI. Light Motor Vehicles (Passengers)
a) Three seaters 52 34 931 965
b) Four to six seaters 0 0 11 11
Total VI 52 34 942 976
VII. Motor cycles on hire 0 0 0 0
Total Transport ( I to VII ) 499 460 5518 5978
Table No. 2.3.32

Number of Registered Motor Vehicles (Non-Transport)UT : DAMAN & DIU ( In numbers)
2004-05 2005-06 31.3.2005 31.3.20061 2 3 4 5
I Two wheelers
Type of Vehicles Newly registered Total registered as on
Table No. 2.3.32 (Concld…)
I. Two wheelers
a) Scooters 406 365 … …
b) Mopeds 477 484 … …
c) Motor cycles 1847 1769 … …
Total I 2730 2618 30761 33379
II. Cars 1324 1405 13602 15007
III. Jeeps 6 6 301 307
IV. Omni buses 0 0 38 38
V. Tractors 35 24 200 224
VI. Trailers 8 6 132 138
VII. Other vehicles not covered 1 0 31 31
Total Non-Transport (I to VII) 4104 4059 45065 49124
Grand Total
(Transport + Non-Transport) 4603 4519 50583 55102
... :- Not indicated. ... : Not indicated.Note : Totals are provisional, representing summation of available data.
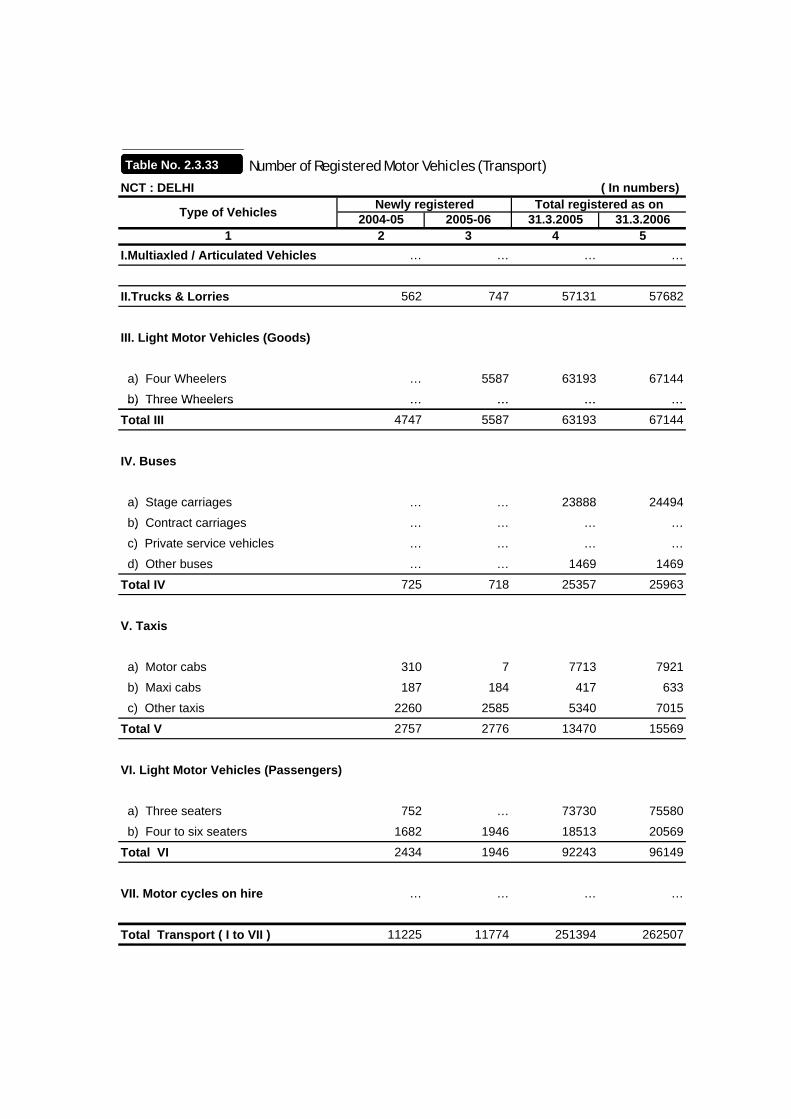
Number of Registered Motor Vehicles (Transport)NCT : DELHI ( In numbers)
2004-05 2005-06 31.3.2005 31.3.20061 2 3 4 5
I.Multiaxled / Articulated Vehicles … … … …
Type of Vehicles Newly registered Total registered as on
Table No. 2.3.33
II.Trucks & Lorries 562 747 57131 57682
III. Light Motor Vehicles (Goods)
a) Four Wheelers … 5587 63193 67144
b) Three Wheelers … … … … b) Three Wheelers … … … …
Total III 4747 5587 63193 67144
IV. Buses
a) Stage carriages … … 23888 24494
b) Contract carriages … … … …) g
c) Private service vehicles … … … …
d) Other buses … … 1469 1469
Total IV 725 718 25357 25963
V. Taxis
a) Motor cabs 310 7 7713 7921
b) Maxi cabs 187 184 417 633
c) Other taxis 2260 2585 5340 7015
Total V 2757 2776 13470 15569
VI. Light Motor Vehicles (Passengers)
a) Three seaters 752 … 73730 75580
b) Four to six seaters 1682 1946 18513 20569
Total VI 2434 1946 92243 96149
VII. Motor cycles on hire … … … …
Total Transport ( I to VII ) 11225 11774 251394 262507
Table No. 2.3.33

Number of Registered Motor Vehicles (Non-Transport)NCT : DELHI ( In numbers)
2004-05 2005-06 31.3.2005 31.3.20061 2 3 4 5
I Two wheelers
Type of Vehicles Newly registered Total registered as on
Table No. 2.3.33 (Concld…)
I. Two wheelers
a) Scooters 43821 48312 1978115 2022647
b) Mopeds 523 1244 68412 68780
c) Motor cycles 139620 194757 637428 760493
Total I 183964 244313 2683955 2851920
II. Cars 112662 111580 1108045 1222706
III. Jeeps 3897 1740 61286 65028
IV. Omni buses 1961 53 77267 80277
V. Tractors 69 46 4632 4706
VI. Trailers … … 99 99
VII. Other vehicles not covered 18 6 148 169
Total Non-Transport (I to VII) 302571 357738 3935432 4224905
Grand Total
(Transport + Non-Transport) 313796 369512 4186826 4487412
... :- Not indicated. ... : Not indicated.Note : Totals are provisional, representing summation of available data.

Number of Registered Motor Vehicles (Transport)UT : LAKSHADWEEP ( In numbers)
2004-05 2005-06 31.3.2005 31.3.20061 2 3 4 5
I.Multiaxled / Articulated Vehicles 0 0 0 0
Type of Vehicles Newly registered Total registered as on
Table No. 2.3.34
II.Trucks & Lorries 0 0 0 0
III. Light Motor Vehicles (Goods)
a) Four Wheelers 6 12 42 54
b) Three Wheelers 14 45 248 293 b) Three Wheelers 14 45 248 293
Total III 20 57 290 347
IV. Buses
a) Stage carriages 4 4 9 13
b) Contract carriages 0 0 0 0) g
c) Private service vehicles 0 0 0 0
d) Other buses 0 0 0 0
Total IV 4 4 9 13
V. Taxis
a) Motor cabs 0 0 0 0
b) Maxi cabs 0 0 0 0
c) Other taxis 0 0 0 0
Total V 0 0 0 0
VI. Light Motor Vehicles (Passengers)
a) Three seaters 5 24 249 273
b) Four to six seaters 0 0 0
Total VI 5 24 249 273
VII. Motor cycles on hire 0 0 0 0
Total Transport ( I to VII ) 29 85 548 633
Table No. 2.3.34

Number of Registered Motor Vehicles (Non-Transport)UT : LAKSHADWEEP ( In numbers)
2004-05 2005-06 31.3.2005 31.3.20061 2 3 4 5
I Two wheelers
Type of Vehicles Newly registered Total registered as on
Table No. 2.3.34 (Concld…)
I. Two wheelers
a) Scooters 10 25 425 450
b) Mopeds 0 0 525 525
c) Motor cycles 195 1143 2704 3847
Total I 205 1168 3654 4822
II. Cars 6 11 27 38
III. Jeeps 1 2 86 88
IV. Omni buses 6 10 63 73
V. Tractors 5 13 50 63
VI. Trailers 0 0 0 0
VII. Other vehicles not covered 17 26 520 546
Total Non-Transport (I to VII) 240 1230 4400 5630
Grand Total
(Transport + Non-Transport) 269 1315 4948 6263
... :- Not indicated. ... : Not indicated.Note : Totals are provisional, representing summation of available data.

Number of Registered Motor Vehicles (Transport)UT : PUDUCHERRY ( In numbers)
2004-05 2005-06 31.3.2005 31.3.20061 2 3 4 5
I.Multiaxled / Articulated Vehicles 15 154 166 320
Type of Vehicles Newly registered Total registered as on
Table No. 2.3.35
II.Trucks & Lorries 112 96 6549 6645
III. Light Motor Vehicles (Goods)
a) Four Wheelers 489 778 2604 3382
b) Three Wheelers 11 128 1393 1521 b) Three Wheelers 11 128 1393 1521
Total III 500 906 3997 4903
IV. Buses
a) Stage carriages 69 25 1638 1663
b) Contract carriages 5 28 157 185) g
c) Private service vehicles 1 18 78 96
d) Other buses 6 11 42 53
Total IV 81 82 1915 1997
V. Taxis
a) Motor cabs 3 13 62 75
b) Maxi cabs 36 25 97 122
c) Other taxis 111 50 1379 1429
Total V 150 88 1538 1626
VI. Light Motor Vehicles (Passengers)
a) Three seaters 317 60 4538 4598
b) Four to six seaters 7 5 62 67
Total VI 324 65 4600 4665
VII. Motor cycles on hire … … … …
Total Transport ( I to VII ) 1182 1391 18765 20156
Table No. 2.3.35

Number of Registered Motor Vehicles (Non-Transport)UT : PUDUCHERRY ( In numbers)
2004-05 2005-06 31.3.2005 31.3.20061 2 3 4 5
I Two wheelers
Type of Vehicles Newly registered Total registered as on
Table No. 2.3.35 (Concld…)
I. Two wheelers
a) Scooters … … … …
b) Mopeds … … … …
c) Motor cycles … … … …
Total I 29457 31840 264895 296735
II. Cars 2191 2760 49833 52593
III. Jeeps 3 24 3841 3865
IV. Omni buses 604 205 2713 2918
V. Tractors 134 153 325 478
VI. Trailers 35 40 1615 1655
VII. Other vehicles not covered 633 648 5202 5850
Total Non-Transport (I to VII) 33057 35670 328424 364094
Grand Total
(Transport + Non-Transport) 34239 37061 347189 384250
... :- Not indicated. ... : Not indicated.Note : Totals are provisional, representing summation of available data.

SSEECCTTIIOONN –– IIIIII
PPRROOFFIILLEE OOFF MMOOTTOORR VVEEHHIICCLLEESS
RREEGGIISSTTRRAATTIIOONN ((CCIITTIIEESS))
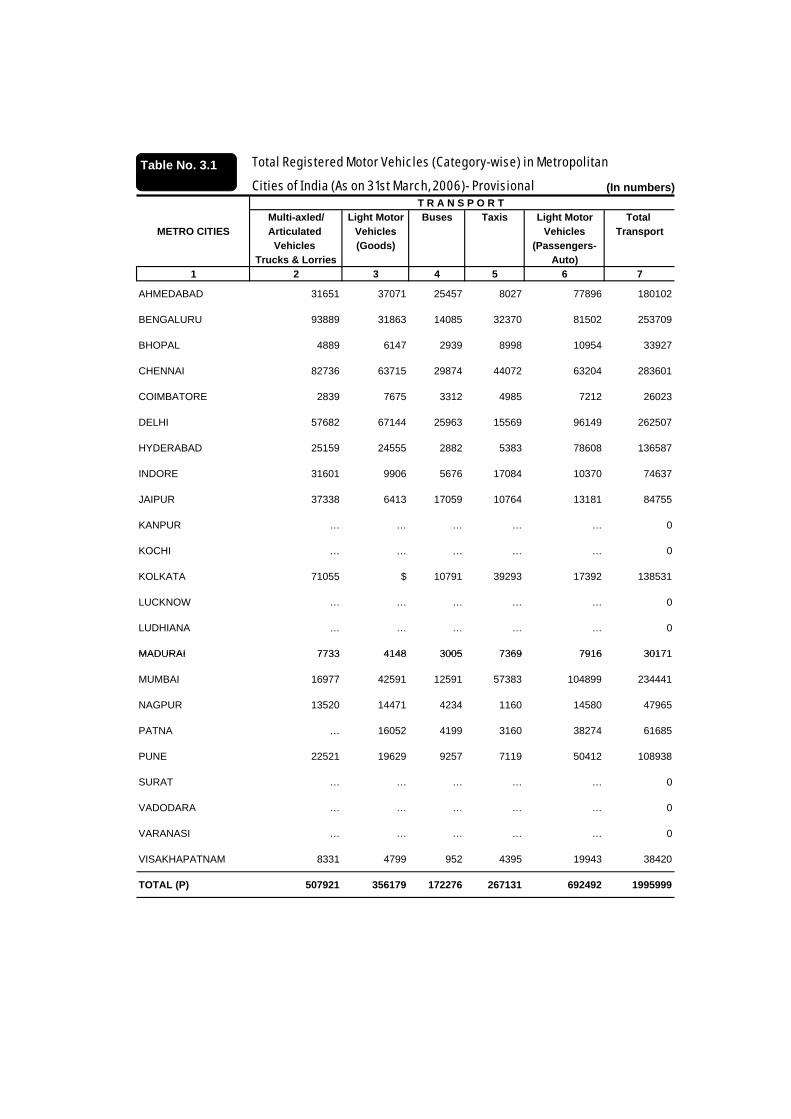
Total Registered Motor Vehicles (Category-wise) in Metropolitan
Cities of India (As on 31st March, 2006)- Provisional (In numbers)
Multi-axled/ Light Motor Buses Taxis Light Motor Total METRO CITIES Articulated Vehicles Vehicles Transport
Vehicles (Goods) (Passengers-Trucks & Lorries Auto)
1 2 3 4 5 6 7
AHMEDABAD 31651 37071 25457 8027 77896 180102
BENGALURU 93889 31863 14085 32370 81502 253709
BHOPAL 4889 6147 2939 8998 10954 33927
CHENNAI 82736 63715 29874 44072 63204 283601
COIMBATORE 2839 7675 3312 4985 7212 26023
DELHI 57682 67144 25963 15569 96149 262507
HYDERABAD 25159 24555 2882 5383 78608 136587
INDORE 31601 9906 5676 17084 10370 74637
JAIPUR 37338 6413 17059 10764 13181 84755
KANPUR … … … … … 0
KOCHI … … … … … 0
KOLKATA 71055 $ 10791 39293 17392 138531
LUCKNOW … … … … … 0
LUDHIANA … … … … … 0
MADURAI 7733 4148 3005 7369 7916 30171
T R A N S P O R T
Table No. 3.1
MADURAI 7733 4148 3005 7369 7916 30171
MUMBAI 16977 42591 12591 57383 104899 234441
NAGPUR 13520 14471 4234 1160 14580 47965
PATNA … 16052 4199 3160 38274 61685
PUNE 22521 19629 9257 7119 50412 108938
SURAT … … … … … 0
VADODARA … … … … … 0
VARANASI … … … … … 0
VISAKHAPATNAM 8331 4799 952 4395 19943 38420
TOTAL (P) 507921 356179 172276 267131 692492 1995999

Total Registered Motor Vehicles (Category-wise) in Metropolitan
Cities of India (As on 31st March, 2006)- Provisional (In numbers)Grand Total
Total (TransportMETRO CITIES Two Cars Jeeps Omni Tractors Trailers Others Non- + Non-
Wheelers Buses Trans- Transport)port (C.7+C.15)
1 8 9 10 11 12 13 14 15 16
AHMEDABAD 1307107 216782 21704 30236 19182 5115 1600126 1780228
BENGALURU 1896907 400476 5147 22132 14177 12670 12147 2363656 2617365
BHOPAL 387308 37015 2816 … 10132 4110 396 441777 475704
CHENNAI 1592543 392679 12160 8769 2332 11620 34768 2054871 2338472
COIMBATORE 630744 74474 4745 303 6441 131 7570 724408 750431
DELHI 2851920 1222706 65028 80277 4706 99 169 4224905 4487412
HYDERABAD 1140795 189304 33062 11813 393 0 10445 1385812 1522399
INDORE 605191 66013 4342 … 11382 7829 1731 696488 771125
JAIPUR 789737 115773 29844 … 26542 2861 994 965751 1050506
KANPUR … … … … … … … 0 0
KOCHI … … … … … … … 0 0
KOLKATA 419656 363752 (a) 0 4840 (b) 21147 809395 947926
LUCKNOW … … … … … … … 0 0
LUDHIANA … … … … … … … 0 0
MADURAI 300373 20656 1438 77 4278 1365 5327 333514 363685
N O N - T R A N S P O R T
Table No. 3.1(Concld…)
MADURAI 300373 20656 1438 77 4278 1365 5327 333514 363685
MUMBAI 714209 408890 23566 0 1402 987 10152 1159206 1393647
NAGPUR 695590 53750 15266 0 4821 4837 1686 775950 823915
PATNA 279890 45168 8907 6866 2702 343533 405218
PUNE 647360 97925 12910 0 2610 2319 2347 765471 874409
SURAT … … … … … … … 0 0
VADODARA … … … … … … … 0 0
VARANASI … … … … … … … 0 0
VISAKHAPATNAM 383935 31306 3474 1359 2993 88 920 424075 462495
TOTAL (P) 14643265 3736669 235502 124730 136192 74964 117616 19068938 21064937
... : Not Indicated ( a ) : Included in cars. (b) : Included in tractors
$ : included in Multiaxled/ Articulated vehicles ( P ) : Provisional representing summation of available data.

Total Registered Motor Vehicles (Category-wise) in Metropolitan
Cities of India (As on 31st March, 2005) (In numbers)
Multi-axled/ Light Motor Buses Taxis Light Motor Total METRO CITIES Articulated Vehicles Vehicles Transport
Vehicles (Goods) (Passengers-Trucks & Lorries Auto)
1 2 3 4 5 6 7
AHMEDABAD 30928 33518 24891 7376 58700 155413
BENGALURU 66263 23800 13234 24111 80810 208218
BHOPAL 4622 5232 2759 8202 10127 30942
CHENNAI 79996 59775 28616 41015 58317 267719
COIMBATORE 2072 6847 3163 4442 6744 23268
DELHI 57131 63193 25357 13470 92243 251394
HYDERABAD 24308 23725 2785 5200 75950 131968
INDORE 29843 8346 5222 15402 10300 69113
JAIPUR 34902 4569 16403 9360 11170 76404
KANPUR … … … … … 0
KOCHI … … … … … 0
KOLKATA 69836 $ 10532 38045 16431 134844
LUCKNOW … … … … … 0
LUDHIANA … … … … … 0
MADURAI 6820 3570 2699 5954 7528 26571
T R A N S P O R T
Table No. 3.2
MADURAI 6820 3570 2699 5954 7528 26571
MUMBAI 16708 38235 12256 58049 104104 229352
NAGPUR 13266 13973 4531 1011 14308 47089
PATNA … 15831 4159 3085 36134 59209
PUNE 21157 17759 8892 5604 45308 98720
SURAT … … … … … 0
VADODARA … … … … … 0
VARANASI … … … … … 0
VISAKHAPATNAM 8050 4636 920 4247 19268 37121
TOTAL 465902 323009 166419 244573 647442 1847345

Total Registered Motor Vehicles (Category-wise) in Metropolitan
Cities of India (As on 31st March, 2005) (In numbers)Grand Total
Total (TransportMETRO CITIES Two Cars Jeeps Omni Tractors Trailers Others Non- + Non-
Wheelers Buses Trans- Transport)port (C.7+C.15)
1 8 9 10 11 12 13 14 15 16
AHMEDABAD 1202828 201612 21038 … 28754 18479 4544 1477255 1632668
BENGALURU 1639782 326803 8043 20787 10939 9903 8453 2024710 2232928
BHOPAL 347571 31815 2973 … 10034 3961 680 397034 427976
CHENNAI 1464838 366490 12149 8769 2327 11618 33496 1899687 2167406
COIMBATORE 575041 67661 4485 303 6189 91 5414 659184 682452
DELHI 2683955 1108045 61286 77267 4632 99 148 3935432 4186826
HYDERABAD 1071168 177750 31044 11092 369 0 9807 1301230 1433198
INDORE 551729 60029 4331 … 11073 7610 1698 636470 705583
JAIPUR 692512 99732 26714 0 24100 2861 811 846730 923134
KANPUR … … … … … … … 0 0
KOCHI … … … … … … … 0 0
KOLKATA 405669 345503 (a) 0 4838 (b) 21067 777077 911921
LUCKNOW … … … … … … … 0 0
LUDHIANA … … … … … … … 0 0
MADURAI 273810 19585 1214 77 3979 1336 3446 303447 330018
N O N - T R A N S P O R T
Table No. 3.2(Concld…)
MADURAI 273810 19585 1214 77 3979 1336 3446 303447 330018
MUMBAI 647892 382898 22354 0 1406 986 10052 1065588 1294940
NAGPUR 650001 48605 13551 … 4830 4881 1415 723283 770372
PATNA 260807 41384 … … 8705 6803 1630 319329 378538
PUNE 614340 96418 11619 0 2419 2112 2153 729061 827781
SURAT … … … … … … … 0 0
VADODARA … … … … … … … 0 0
VARANASI … … … … … … … 0 0
VISAKHAPATNAM 360502 29395 3262 1276 2810 83 864 398192 435313
TOTAL 13442445 3403725 224063 119571 127404 70823 105678 17493709 19341054
... : Not Indicated ( a ) : Included in cars. (b) : Included in tractors
$ : included in Multiaxled/ Articulated vehicles ( P ) : Provisional representing summation of available data.
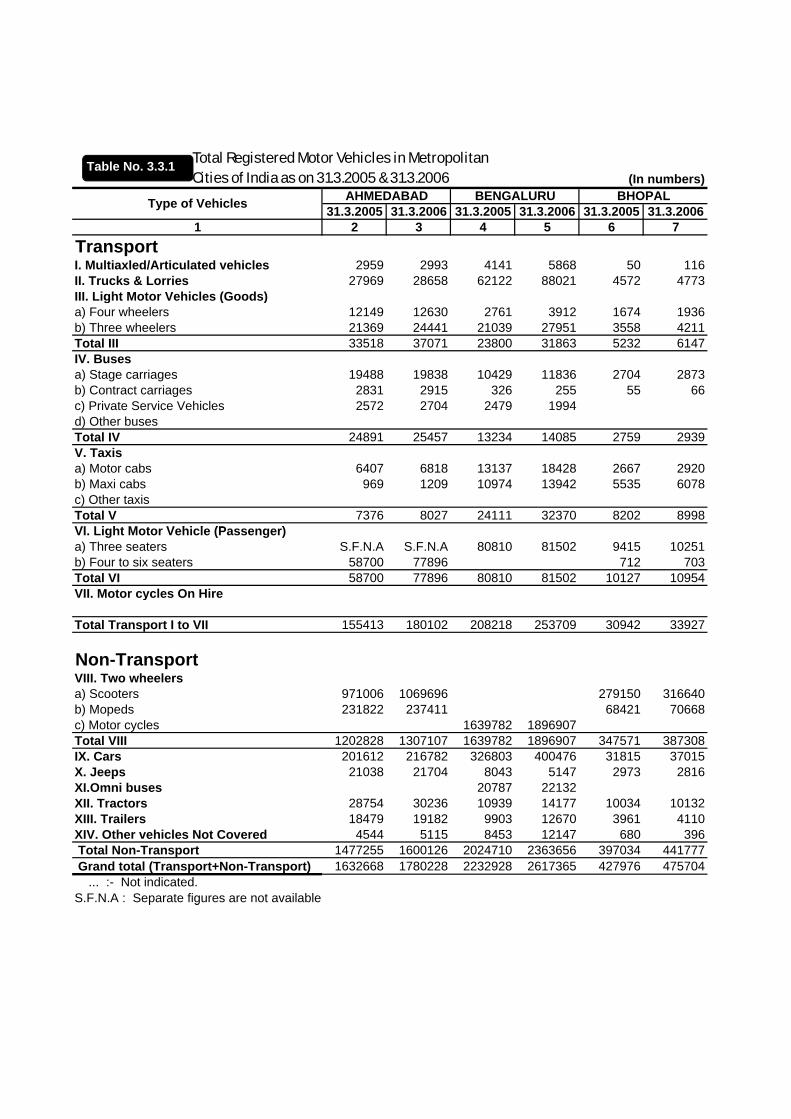
Total Registered Motor Vehicles in Metropolitan (In numbers)
31.3.2005 31.3.2006 31.3.2005 31.3.2006 31.3.2005 31.3.20061 2 3 4 5 6 7
TransportI. Multiaxled/Articulated vehicles 2959 2993 4141 5868 50 116
BHOPAL Cities of India as on 31.3.2005 & 31.3.2006
Type of Vehicles AHMEDABAD BENGALURU
Table No. 3.3.1
II. Trucks & Lorries 27969 28658 62122 88021 4572 4773III. Light Motor Vehicles (Goods)a) Four wheelers 12149 12630 2761 3912 1674 1936b) Three wheelers 21369 24441 21039 27951 3558 4211Total III 33518 37071 23800 31863 5232 6147IV. Busesa) Stage carriages 19488 19838 10429 11836 2704 2873b) Contract carriages 2831 2915 326 255 55 66c) Private Service Vehicles 2572 2704 2479 1994d) Other busesTotal IV 24891 25457 13234 14085 2759 2939V. Taxisa) Motor cabs 6407 6818 13137 18428 2667 2920b) Maxi cabs 969 1209 10974 13942 5535 6078c) Other taxisTotal V 7376 8027 24111 32370 8202 8998VI Li ht M t V hi l (P )VI. Light Motor Vehicle (Passenger)a) Three seaters S.F.N.A S.F.N.A 80810 81502 9415 10251b) Four to six seaters 58700 77896 712 703Total VI 58700 77896 80810 81502 10127 10954VII. Motor cycles On Hire
Total Transport I to VII 155413 180102 208218 253709 30942 33927
N T tNon-TransportVIII. Two wheelersa) Scooters 971006 1069696 279150 316640b) Mopeds 231822 237411 68421 70668c) Motor cycles 1639782 1896907Total VIII 1202828 1307107 1639782 1896907 347571 387308IX. Cars 201612 216782 326803 400476 31815 37015X. Jeeps 21038 21704 8043 5147 2973 2816pXI.Omni buses 20787 22132XII. Tractors 28754 30236 10939 14177 10034 10132XIII. Trailers 18479 19182 9903 12670 3961 4110XIV. Other vehicles Not Covered 4544 5115 8453 12147 680 396 Total Non-Transport 1477255 1600126 2024710 2363656 397034 441777 Grand total (Transport+Non-Transport) 1632668 1780228 2232928 2617365 427976 475704 ... :- Not indicated.S.F.N.A : Separate figures are not availablep g

Total Registered Motor Vehicles in Metropolitan (In numbers)
31.3.2005 31.3.2006 31.3.2005 31.3.2006 31.3.2005 31.3.20061 2 3 4 5 6 7
TransportI. Multiaxled/Articulated vehicles 37400 37418 464 484 … …
DELHI Cities of India as on 31.3.2005 & 31.3.2006
Type of Vehicles CHENNAI COIMBATORE
Table No. 3.3.1(Contd…)
II. Trucks & Lorries 42596 45318 1608 2355 57131 57682III. Light Motor Vehicles (Goods)a) Four wheelers 46834 49592 3244 3824 63193 67144b) Three wheelers 12941 14123 3603 3851 … …Total III 59775 63715 6847 7675 63193 67144IV. Busesa) Stage carriages 3870 3931 869 908 23888 24494b) Contract carriages 14051 14085 430 469 … …c) Private Service Vehicles 1674 1738 549 573 … …d) Other buses 9021 10120 1315 1362 1469 1469Total IV 28616 29874 3163 3312 25357 25963V. Taxisa) Motor cabs 31188 33537 3000 3393 7713 7921b) Maxi cabs 8616 9200 1367 1496 417 633c) Other taxis 1211 1335 75 96 5340 7015Total V 41015 44072 4442 4985 13470 15569VI Li ht M t V hi l (P )VI. Light Motor Vehicle (Passenger)a) Three seaters 52425 57068 6706 7151 73730 75580b) Four to six seaters 5892 6136 38 61 18513 20569Total VI 58317 63204 6744 7212 92243 96149VII. Motor cycles On Hire 0 0 0 0 0 0
Total Transport I to VII 267719 283601 23268 26023 251394 262507
N T tNon-TransportVIII. Two wheelersa) Scooters 293127 313266 107375 122642 1978115 2022647b) Mopeds 462688 469711 213568 222663 68412 68780c) Motor cycles 709023 809566 254098 285439 637428 760493Total VIII 1464838 1592543 575041 630744 2683955 2851920IX. Cars 366490 392679 67661 74474 1108045 1222706X. Jeeps 12149 12160 4485 4745 61286 65028pXI.Omni buses 8769 8769 303 303 77267 80277XII. Tractors 2327 2332 6189 6441 4632 4706XIII. Trailers 11618 11620 91 131 99 99XIV. Other vehicles Not Covered 33496 34768 5414 7570 148 169 Total Non-Transport 1899687 2054871 659184 724408 3935432 4224905 Grand total (Transport+Non-Transport) 2167406 2338472 682452 750431 4186826 4487412 ... :- Not indicated.

Total Registered Motor Vehicles in Metropolitan (In numbers)
31.3.2005 31.3.2006 31.3.2005 31.3.2006 31.3.2005 31.3.20061 2 3 4 5 6 7
TransportI. Multiaxled/Articulated vehicles 1474 1526 755 1983 … …
JAIPUR Cities of India as on 31.3.2005 & 31.3.2006
Type of Vehicles HYDERABAD INDORE
Table No. 3.3.1(Contd…)
II. Trucks & Lorries 22834 23633 29088 29618 34902 37338III. Light Motor Vehicles (Goods)a) Four wheelers 11944 12362 4688 5395 … …b) Three wheelers 11781 12193 3658 4511 4569 6413Total III 23725 24555 8346 9906 4569 6413IV. Busesa) Stage carriages 58 60 4856 5308 … …b) Contract carriages 744 770 366 368 … …c) Private Service Vehicles 1235 1278 … …d) Other buses 748 774 … …Total IV 2785 2882 5222 5676 16403 17059V. Taxisa) Motor cabs 834 864 2042 2266 … …b) Maxi cabs 1181 1223 13360 14818 … …c) Other taxis 3185 3296 … …Total V 5200 5383 15402 17084 9360 10764VI Li ht M t V hi l (P )VI. Light Motor Vehicle (Passenger)a) Three seaters 71691 74200 9642 9712 9909 11907b) Four to six seaters 4259 4408 658 658 1261 1274Total VI 75950 78608 10300 10370 11170 13181VII. Motor cycles On Hire
Total Transport I to VII 131968 136587 69113 74637 76404 84755
N T tNon-TransportVIII. Two wheelersa) Scooters 155792 165919 467200 520108 … …b) Mopeds 310949 331161 84529 85083 … …c) Motor cycles 604427 643715 … …Total VIII 1071168 1140795 551729 605191 692512 789737IX. Cars 177750 189304 60029 66013 99732 115773X. Jeeps 31044 33062 4331 4342 26714 29844pXI.Omni buses 11092 11813 … …XII. Tractors 369 393 11073 11382 24100 26542XIII. Trailers 0 0 7610 7829 2861 2861XIV. Other vehicles Not Covered 9807 10445 1698 1731 811 994 Total Non-Transport 1301230 1385812 636470 696488 846730 965751 Grand total (Transport+Non-Transport) 1433198 1522399 705583 771125 923134 1050506 ... :- Not indicated.

Total Registered Motor Vehicles in Metropolitan (In numbers)
31.3.2005 31.3.2006 31.3.2005 31.3.2006 31.3.2005 31.3.20061 2 3 4 5 6 7
TransportI. Multiaxled/Articulated vehicles … … … … … …
KOLKATA Cities of India as on 31.3.2005 & 31.3.2006
Type of Vehicles KANPUR KOCHI
Table No. 3.3.1(Contd…)
II. Trucks & Lorries … … … … … …III. Light Motor Vehicles (Goods) a) Four wheelers … … … … … …b) Three wheelers … … … … … …Total III 0 0 0 0 69836 71055IV. Busesa) Stage carriages … … … … … …b) Contract carriages … … … … … …c) Private Service Vehicles … … … … … …d) Other buses … … … … … …Total IV 0 0 0 0 10532 10791V. Taxisa) Motor cabs … … … … … …b) Maxi cabs … … … … … …c) Other taxis … … … … … …Total V 0 0 0 0 38045 39293VI Li ht M t V hi l (P )VI. Light Motor Vehicle (Passenger)a) Three seaters … … … … … …b) Four to six seaters … … … … … …Total VI 0 0 0 0 16431 17392VII. Motor cycles On Hire
Total Transport I to VII 0 0 0 0 134844 138531
N T tNon-TransportVIII. Two wheelersa) Scooters … … … … … …b) Mopeds … … … … … …c) Motor cycles … … … … … …Total VIII 0 0 0 0 405669 419656IX. Cars … … … … 345503 363752X. Jeeps … … … … (a) (a)p ( ) ( )XI.Omni buses … … … … … …XII. Tractors … … … … 4838 4840XIII. Trailers … … … … (b) (b)XIV. Other vehicles Not Covered … … … … 21067 21147 Total Non-Transport 0 0 0 0 777077 809395 Grand total (Transport+Non-Transport) 0 0 0 0 911921 947926 ... :- Not indicated.(a) :Included in cars.( )(b) : Included in tractors
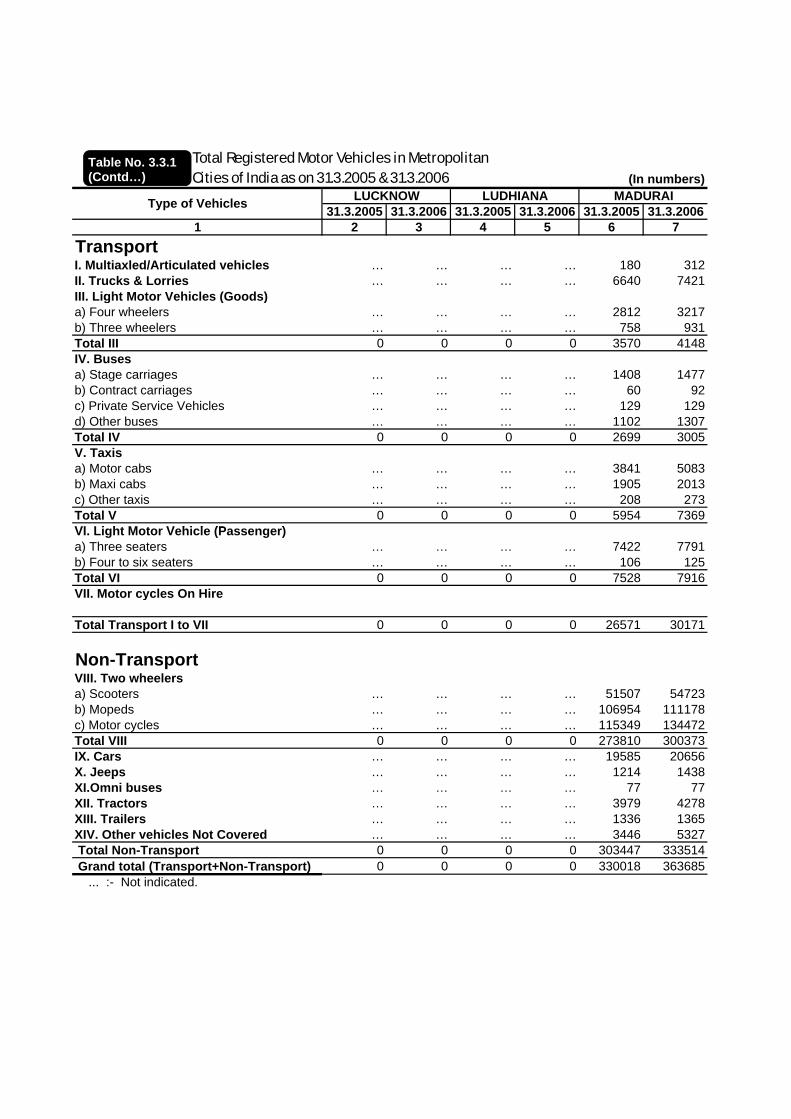
Total Registered Motor Vehicles in Metropolitan (In numbers)
31.3.2005 31.3.2006 31.3.2005 31.3.2006 31.3.2005 31.3.20061 2 3 4 5 6 7
TransportI. Multiaxled/Articulated vehicles … … … … 180 312
MADURAI Cities of India as on 31.3.2005 & 31.3.2006
Type of Vehicles LUCKNOW LUDHIANA
Table No. 3.3.1(Contd…)
II. Trucks & Lorries … … … … 6640 7421III. Light Motor Vehicles (Goods) a) Four wheelers … … … … 2812 3217b) Three wheelers … … … … 758 931Total III 0 0 0 0 3570 4148IV. Busesa) Stage carriages … … … … 1408 1477b) Contract carriages … … … … 60 92c) Private Service Vehicles … … … … 129 129d) Other buses … … … … 1102 1307Total IV 0 0 0 0 2699 3005V. Taxisa) Motor cabs … … … … 3841 5083b) Maxi cabs … … … … 1905 2013c) Other taxis … … … … 208 273Total V 0 0 0 0 5954 7369VI Li ht M t V hi l (P )VI. Light Motor Vehicle (Passenger)a) Three seaters … … … … 7422 7791b) Four to six seaters … … … … 106 125Total VI 0 0 0 0 7528 7916VII. Motor cycles On Hire
Total Transport I to VII 0 0 0 0 26571 30171
N T tNon-TransportVIII. Two wheelersa) Scooters … … … … 51507 54723b) Mopeds … … … … 106954 111178c) Motor cycles … … … … 115349 134472Total VIII 0 0 0 0 273810 300373IX. Cars … … … … 19585 20656X. Jeeps … … … … 1214 1438pXI.Omni buses … … … … 77 77XII. Tractors … … … … 3979 4278XIII. Trailers … … … … 1336 1365XIV. Other vehicles Not Covered … … … … 3446 5327 Total Non-Transport 0 0 0 0 303447 333514 Grand total (Transport+Non-Transport) 0 0 0 0 330018 363685 ... :- Not indicated.
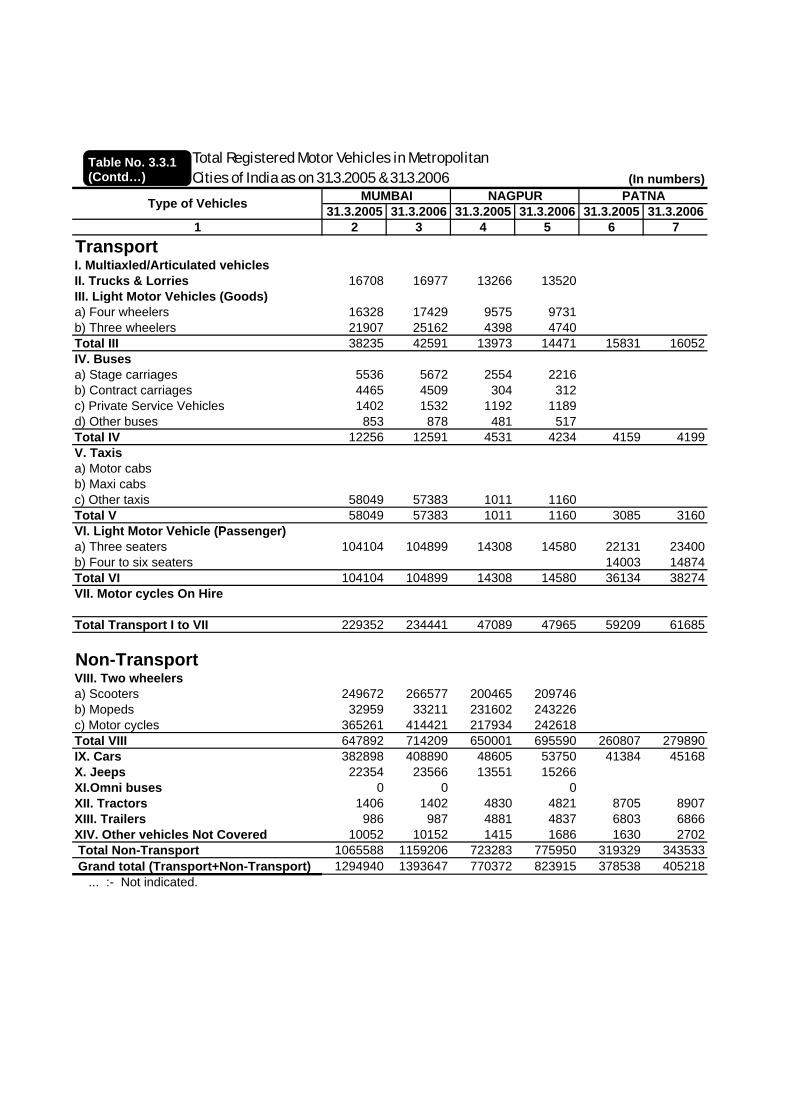
Total Registered Motor Vehicles in Metropolitan (In numbers)
31.3.2005 31.3.2006 31.3.2005 31.3.2006 31.3.2005 31.3.20061 2 3 4 5 6 7
TransportI. Multiaxled/Articulated vehicles
PATNA Cities of India as on 31.3.2005 & 31.3.2006
Type of Vehicles MUMBAI NAGPUR
Table No. 3.3.1(Contd…)
II. Trucks & Lorries 16708 16977 13266 13520III. Light Motor Vehicles (Goods)a) Four wheelers 16328 17429 9575 9731b) Three wheelers 21907 25162 4398 4740Total III 38235 42591 13973 14471 15831 16052IV. Busesa) Stage carriages 5536 5672 2554 2216b) Contract carriages 4465 4509 304 312c) Private Service Vehicles 1402 1532 1192 1189d) Other buses 853 878 481 517Total IV 12256 12591 4531 4234 4159 4199V. Taxisa) Motor cabsb) Maxi cabsc) Other taxis 58049 57383 1011 1160Total V 58049 57383 1011 1160 3085 3160VI Li ht M t V hi l (P )VI. Light Motor Vehicle (Passenger)a) Three seaters 104104 104899 14308 14580 22131 23400b) Four to six seaters 14003 14874Total VI 104104 104899 14308 14580 36134 38274VII. Motor cycles On Hire
Total Transport I to VII 229352 234441 47089 47965 59209 61685
N T tNon-TransportVIII. Two wheelersa) Scooters 249672 266577 200465 209746b) Mopeds 32959 33211 231602 243226c) Motor cycles 365261 414421 217934 242618Total VIII 647892 714209 650001 695590 260807 279890IX. Cars 382898 408890 48605 53750 41384 45168X. Jeeps 22354 23566 13551 15266pXI.Omni buses 0 0 0XII. Tractors 1406 1402 4830 4821 8705 8907XIII. Trailers 986 987 4881 4837 6803 6866XIV. Other vehicles Not Covered 10052 10152 1415 1686 1630 2702 Total Non-Transport 1065588 1159206 723283 775950 319329 343533 Grand total (Transport+Non-Transport) 1294940 1393647 770372 823915 378538 405218 ... :- Not indicated.
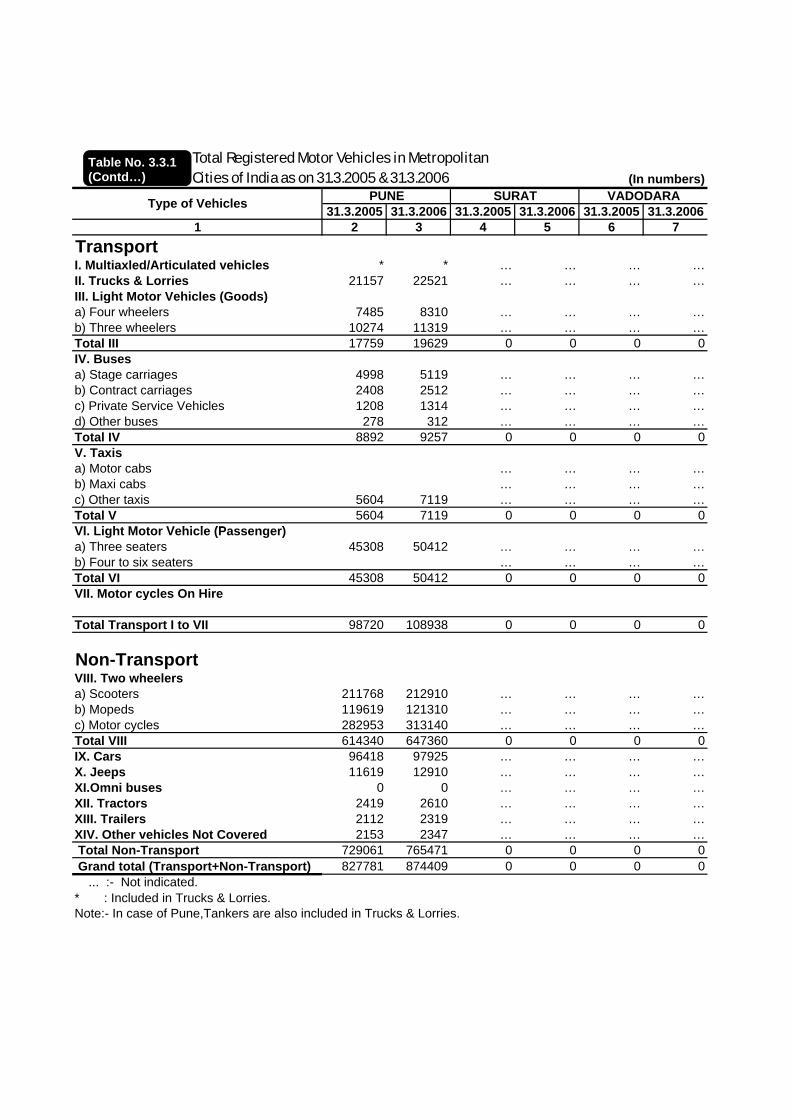
Total Registered Motor Vehicles in Metropolitan (In numbers)
31.3.2005 31.3.2006 31.3.2005 31.3.2006 31.3.2005 31.3.20061 2 3 4 5 6 7
TransportI. Multiaxled/Articulated vehicles * * … … … …
VADODARA Cities of India as on 31.3.2005 & 31.3.2006
Type of Vehicles PUNE SURAT
Table No. 3.3.1(Contd…)
II. Trucks & Lorries 21157 22521 … … … …III. Light Motor Vehicles (Goods) a) Four wheelers 7485 8310 … … … …b) Three wheelers 10274 11319 … … … …Total III 17759 19629 0 0 0 0IV. Busesa) Stage carriages 4998 5119 … … … …b) Contract carriages 2408 2512 … … … …c) Private Service Vehicles 1208 1314 … … … …d) Other buses 278 312 … … … …Total IV 8892 9257 0 0 0 0V. Taxisa) Motor cabs … … … …b) Maxi cabs … … … …c) Other taxis 5604 7119 … … … …Total V 5604 7119 0 0 0 0VI Li ht M t V hi l (P )VI. Light Motor Vehicle (Passenger)a) Three seaters 45308 50412 … … … …b) Four to six seaters … … … …Total VI 45308 50412 0 0 0 0VII. Motor cycles On Hire
Total Transport I to VII 98720 108938 0 0 0 0
N T tNon-TransportVIII. Two wheelersa) Scooters 211768 212910 … … … …b) Mopeds 119619 121310 … … … …c) Motor cycles 282953 313140 … … … …Total VIII 614340 647360 0 0 0 0IX. Cars 96418 97925 … … … …X. Jeeps 11619 12910 … … … …pXI.Omni buses 0 0 … … … …XII. Tractors 2419 2610 … … … …XIII. Trailers 2112 2319 … … … …XIV. Other vehicles Not Covered 2153 2347 … … … … Total Non-Transport 729061 765471 0 0 0 0 Grand total (Transport+Non-Transport) 827781 874409 0 0 0 0 ... :- Not indicated.* : Included in Trucks & Lorries.Note:- In case of Pune,Tankers are also included in Trucks & Lorries.
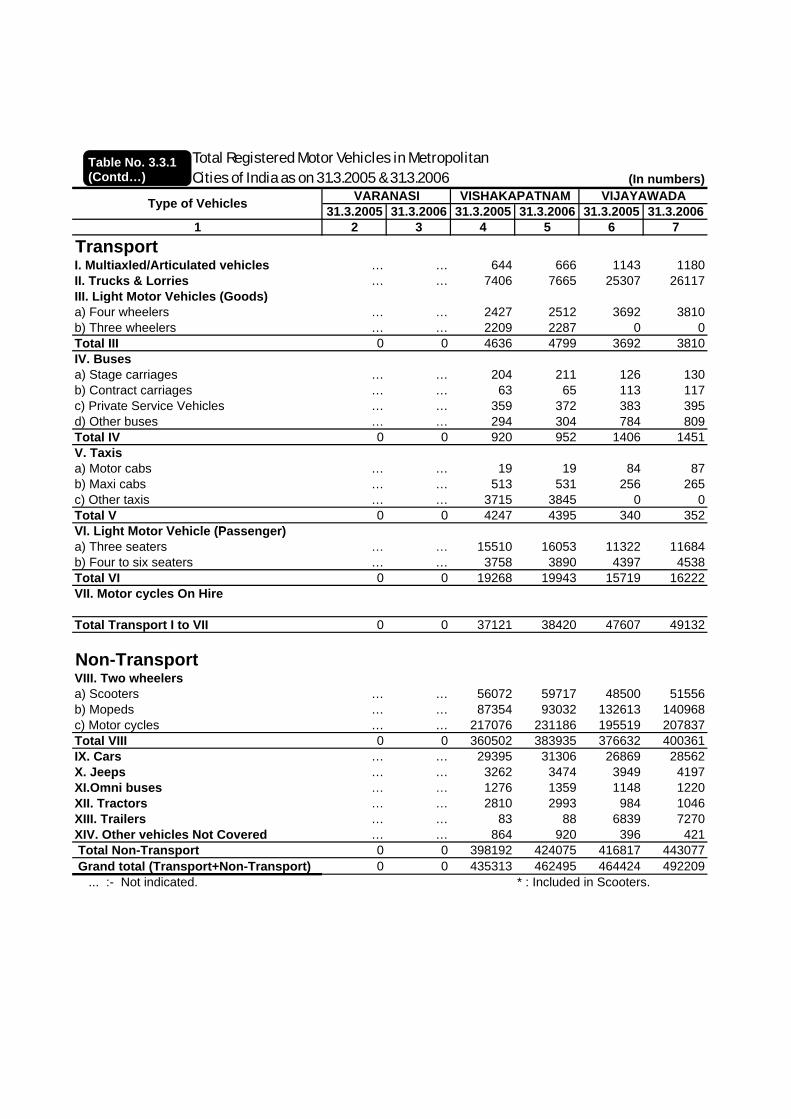
Total Registered Motor Vehicles in Metropolitan (In numbers)
31.3.2005 31.3.2006 31.3.2005 31.3.2006 31.3.2005 31.3.20061 2 3 4 5 6 7
TransportI. Multiaxled/Articulated vehicles … … 644 666 1143 1180
VIJAYAWADA Cities of India as on 31.3.2005 & 31.3.2006
Type of Vehicles VARANASI VISHAKAPATNAM
Table No. 3.3.1(Contd…)
II. Trucks & Lorries … … 7406 7665 25307 26117III. Light Motor Vehicles (Goods)a) Four wheelers … … 2427 2512 3692 3810b) Three wheelers … … 2209 2287 0 0Total III 0 0 4636 4799 3692 3810IV. Busesa) Stage carriages … … 204 211 126 130b) Contract carriages … … 63 65 113 117c) Private Service Vehicles … … 359 372 383 395d) Other buses … … 294 304 784 809Total IV 0 0 920 952 1406 1451V. Taxisa) Motor cabs … … 19 19 84 87b) Maxi cabs … … 513 531 256 265c) Other taxis … … 3715 3845 0 0Total V 0 0 4247 4395 340 352VI Li ht M t V hi l (P )VI. Light Motor Vehicle (Passenger)a) Three seaters … … 15510 16053 11322 11684b) Four to six seaters … … 3758 3890 4397 4538Total VI 0 0 19268 19943 15719 16222VII. Motor cycles On Hire
Total Transport I to VII 0 0 37121 38420 47607 49132
N T tNon-TransportVIII. Two wheelersa) Scooters … … 56072 59717 48500 51556b) Mopeds … … 87354 93032 132613 140968c) Motor cycles … … 217076 231186 195519 207837Total VIII 0 0 360502 383935 376632 400361IX. Cars … … 29395 31306 26869 28562X. Jeeps … … 3262 3474 3949 4197pXI.Omni buses … … 1276 1359 1148 1220XII. Tractors … … 2810 2993 984 1046XIII. Trailers … … 83 88 6839 7270XIV. Other vehicles Not Covered … … 864 920 396 421 Total Non-Transport 0 0 398192 424075 416817 443077 Grand total (Transport+Non-Transport) 0 0 435313 462495 464424 492209 ... :- Not indicated. * : Included in Scooters.

SSEECCTTIIOONN –– IIVV
PPRROOFFIILLEE OOFF PPEERRMMIITTSS && LLIICCEENNCCEESS IISSSSUUEEDD

Number of Vehicles in Use (State/UT-wise)
(As per Primary Permit Valid As on 31.3.2005 & 31.3.2006) ( In numbers)
31-3-2005 31-3-2006 31-3-2005 31-3-20061 2 3 4 5
A. Stage carriages
Category ANDHRA PRADESH ARUNACHAL PRADESH
Table No. 4.1
A. Stage carriages Public (STU) … … … … Private … … … … Total 0 0 0 0
B. Contract carriages Auto rickshaw … … 35 27 Ordinary taxi … … 19 20 Ordinary taxi … … 19 20 Motor Cab (SP) … … … … Motor Cab (AIP) … … … … Maxi Cab (SP) … … … … Maxi Cab (AIP) … … … … Omni Bus (SP) … … … … Omni Bus (AIP) … … … …
Any other Any other … … … … Total 0 0 54 47
C. Private Service Vehicles Educational Institution Bus … … 18 22 Ambulance … … 8 14
Fire Fighter 10 13 Fire Fighter … … 10 13 Any other … … 13 17 Total 0 0 49 66
D. Goods carriages Lorry (SP) … … … … Lorry (NP) … … … …
Tankers (SP) Tankers (SP) … … … … Tankers (NP) … … … … Tractor & Trailer … … … … Light Motor Vehicles … … … … Multiaxled/Articulated (SP) … … … … Multiaxled/Articulated (NP) … … … … Any other … … … …
T t l 0 0 0 0 Total 0 0 0 0 Grand Total (A+B+C+D) 0 0 103 113STU : State Transport Undertaking NP : National PermitSP : State Permit ... :- Not indicated.AIP : All India Permit
Table No. 4.1
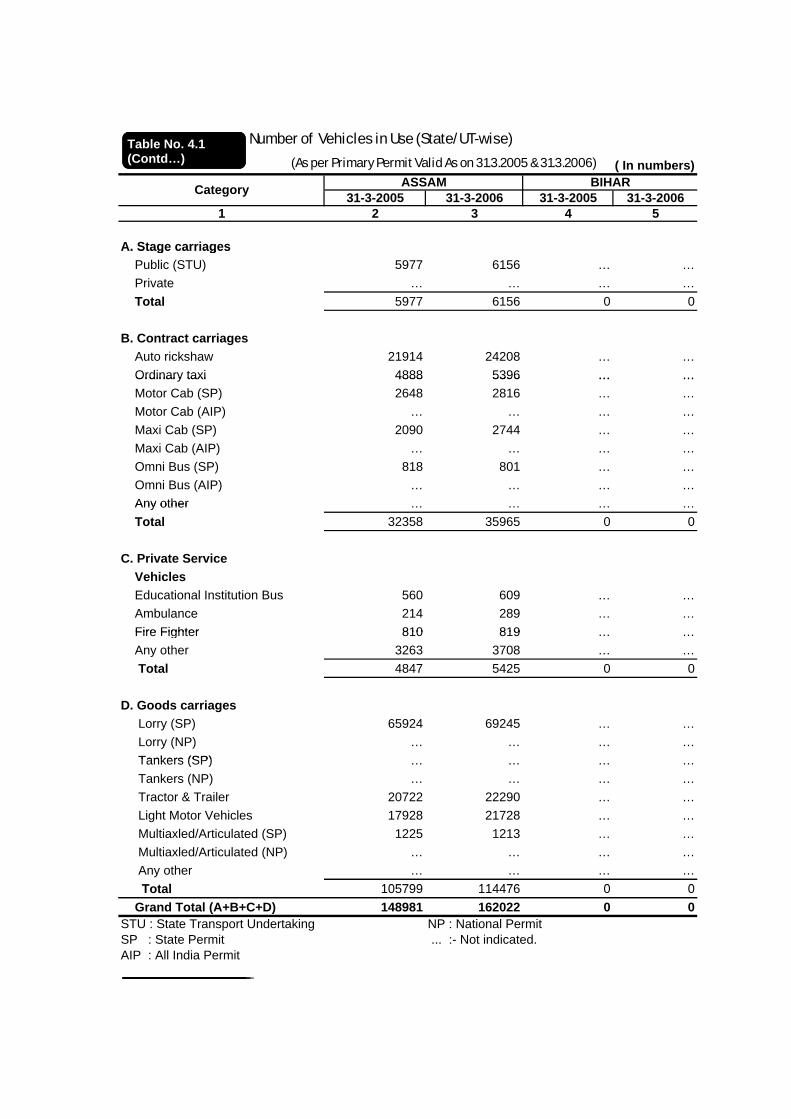
Number of Vehicles in Use (State/UT-wise)
(As per Primary Permit Valid As on 31.3.2005 & 31.3.2006) ( In numbers)
31-3-2005 31-3-2006 31-3-2005 31-3-20061 2 3 4 5
A. Stage carriages
Category ASSAM BIHAR
Table No. 4.1(Contd…)
A. Stage carriages Public (STU) 5977 6156 … … Private … … … … Total 5977 6156 0 0
B. Contract carriages Auto rickshaw 21914 24208 … … Ordinary taxi 4888 5396 … … Ordinary taxi 4888 5396 … … Motor Cab (SP) 2648 2816 … … Motor Cab (AIP) … … … … Maxi Cab (SP) 2090 2744 … … Maxi Cab (AIP) … … … … Omni Bus (SP) 818 801 … … Omni Bus (AIP) … … … …
Any other Any other … … … … Total 32358 35965 0 0
C. Private Service Vehicles Educational Institution Bus 560 609 … … Ambulance 214 289 … …
Fire Fighter 810 819 Fire Fighter 810 819 … … Any other 3263 3708 … … Total 4847 5425 0 0
D. Goods carriages Lorry (SP) 65924 69245 … … Lorry (NP) … … … …
Tankers (SP) Tankers (SP) … … … … Tankers (NP) … … … … Tractor & Trailer 20722 22290 … … Light Motor Vehicles 17928 21728 … … Multiaxled/Articulated (SP) 1225 1213 … … Multiaxled/Articulated (NP) … … … … Any other … … … …
T t l 105799 114476 0 0 Total 105799 114476 0 0 Grand Total (A+B+C+D) 148981 162022 0 0STU : State Transport Undertaking NP : National PermitSP : State Permit ... :- Not indicated.AIP : All India Permit
Table No. 4.1(Contd…)

Number of Vehicles in Use (State/UT-wise)
(As per Primary Permit Valid As on 31.3.2005 & 31.3.2006) ( In numbers)
31-3-2005 31-3-2006 31-3-2005 31-3-20061 2 3 4 5
A. Stage carriages
Category CHHATTISGARH GOA
Table No. 4.1(Contd…)
A. Stage carriages Public (STU) … … 365 369 Private 2407 3378 16 33 Total 2407 3378 381 402
B. Contract carriages Auto rickshaw … … 5 13 Ordinary taxi … … 20 24 Ordinary taxi … … 20 24 Motor Cab (SP) … … … … Motor Cab (AIP) … … … … Maxi Cab (SP) … … … … Maxi Cab (AIP) … … … … Omni Bus (SP) … … … … Omni Bus (AIP) … … … …
Any other 110 113 18 36 Any other 110 113 18 36 Total 110 113 43 73
C. Private Service Vehicles Educational Institution Bus … … 6 16 Ambulance … … … …
Fire Fighter Fire Fighter … … … … Any other … … … … Total 0 0 6 16
D. Goods carriages Lorry (SP) … … 185 290 Lorry (NP) 29355 34298 … …
Tankers (SP) Tankers (SP) … … … … Tankers (NP) … … 22 49 Tractor & Trailer … … 8 22 Light Motor Vehicles … … 95 203 Multiaxled/Articulated (SP) … … … … Multiaxled/Articulated (NP) … … … … Any other 54398 65592 … …
T t l 83753 99890 310 564 Total 83753 99890 310 564 Grand Total (A+B+C+D) 86270 103381 740 1055STU : State Transport Undertaking NP : National PermitSP : State Permit ... :- Not indicated.AIP : All India Permit
Table No. 4.1(Contd…)

Number of Vehicles in Use (State/UT-wise)
(As per Primary Permit Valid As on 31.3.2005 & 31.3.2006) ( In numbers)
31-3-2005 31-3-2006 31-3-2005 31-3-20061 2 3 4 5
A. Stage carriages
Category GUJARAT HARYANA
Table No. 4.1(Contd…)
A. Stage carriages Public (STU) … … 3691 2429 Private … … 801 1968 Total 0 0 4492 4397
B. Contract carriages Auto rickshaw … … 31010 29102 Ordinary taxi … … 2708 3727 Ordinary taxi … … 2708 3727 Motor Cab (SP) … … 240 286 Motor Cab (AIP) … … 585 779 Maxi Cab (SP) … … 1049 478 Maxi Cab (AIP) … … 7034 6920 Omni Bus (SP) … … 486 0 Omni Bus (AIP) 0 1
Any other 0 109 Any other 0 109 Total 0 0 43112 41402
C. Private Service Vehicles Educational Institution Bus … … 3958 3787 Ambulance … … 22 46
Fire Fighter 9 21 Fire Fighter … … 9 21 Any other … … 52 97 Total 0 0 4041 3951
D. Goods carriages Lorry (SP) 40742 32563 Lorry (NP) 72491 70419
Tankers (SP) 476 1063 Tankers (SP) … … 476 1063 Tankers (NP) … … 1350 1323 Tractor & Trailer … … 3340 1685 Light Motor Vehicles 22400 23458 Multiaxled/Articulated (SP) … … 299 7989 Multiaxled/Articulated (NP) … … 11985 20661 Any other … … 17064 0
T t l 0 0 170147 159161 Total 0 0 170147 159161 Grand Total (A+B+C+D) 0 0 221792 208911STU : State Transport Undertaking NP : National PermitSP : State Permit ... :- Not indicated.AIP : All India Permit
Table No. 4.1(Contd…)
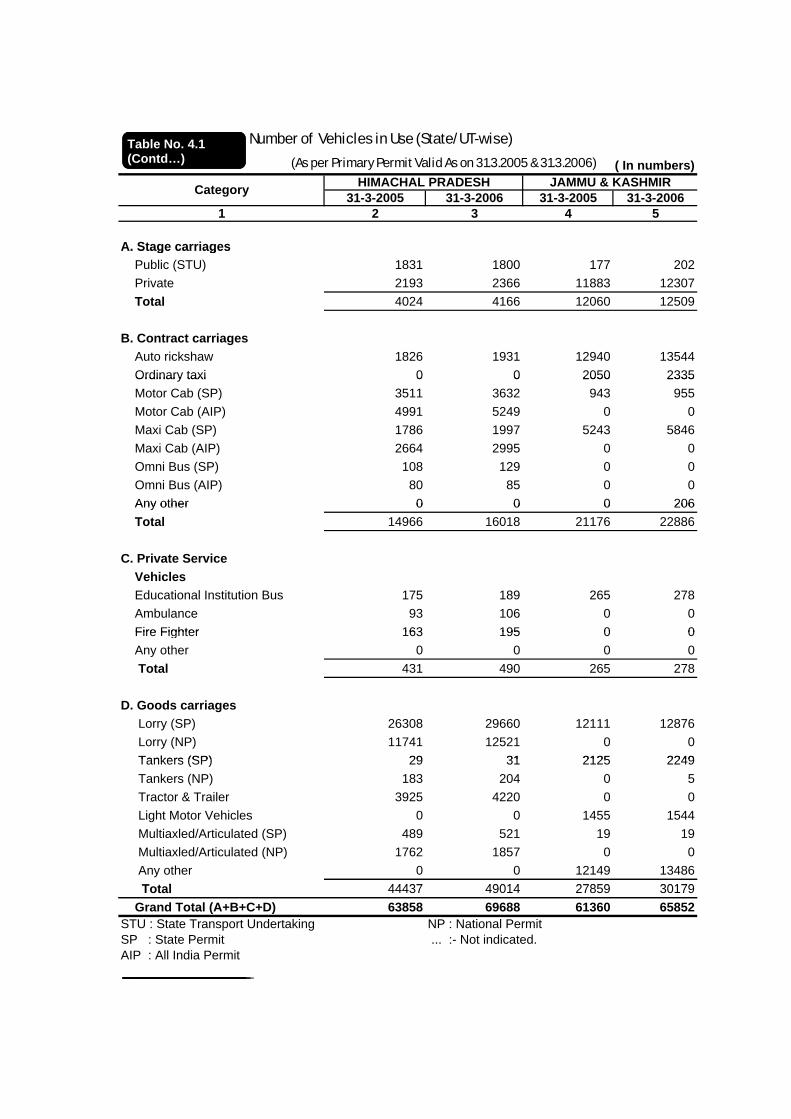
Number of Vehicles in Use (State/UT-wise)
(As per Primary Permit Valid As on 31.3.2005 & 31.3.2006) ( In numbers)
31-3-2005 31-3-2006 31-3-2005 31-3-20061 2 3 4 5
A. Stage carriages
Category HIMACHAL PRADESH JAMMU & KASHMIR
Table No. 4.1(Contd…)
A. Stage carriages Public (STU) 1831 1800 177 202 Private 2193 2366 11883 12307 Total 4024 4166 12060 12509
B. Contract carriages Auto rickshaw 1826 1931 12940 13544 Ordinary taxi 0 0 2050 2335 Ordinary taxi 0 0 2050 2335 Motor Cab (SP) 3511 3632 943 955 Motor Cab (AIP) 4991 5249 0 0 Maxi Cab (SP) 1786 1997 5243 5846 Maxi Cab (AIP) 2664 2995 0 0 Omni Bus (SP) 108 129 0 0 Omni Bus (AIP) 80 85 0 0
Any other 0 0 0 206 Any other 0 0 0 206 Total 14966 16018 21176 22886
C. Private Service Vehicles Educational Institution Bus 175 189 265 278 Ambulance 93 106 0 0
Fire Fighter 163 195 0 0 Fire Fighter 163 195 0 0 Any other 0 0 0 0 Total 431 490 265 278
D. Goods carriages Lorry (SP) 26308 29660 12111 12876 Lorry (NP) 11741 12521 0 0
Tankers (SP) 29 31 2125 2249 Tankers (SP) 29 31 2125 2249 Tankers (NP) 183 204 0 5 Tractor & Trailer 3925 4220 0 0 Light Motor Vehicles 0 0 1455 1544 Multiaxled/Articulated (SP) 489 521 19 19 Multiaxled/Articulated (NP) 1762 1857 0 0 Any other 0 0 12149 13486
T t l 44437 49014 27859 30179 Total 44437 49014 27859 30179 Grand Total (A+B+C+D) 63858 69688 61360 65852STU : State Transport Undertaking NP : National PermitSP : State Permit ... :- Not indicated.AIP : All India Permit
Table No. 4.1(Contd…)
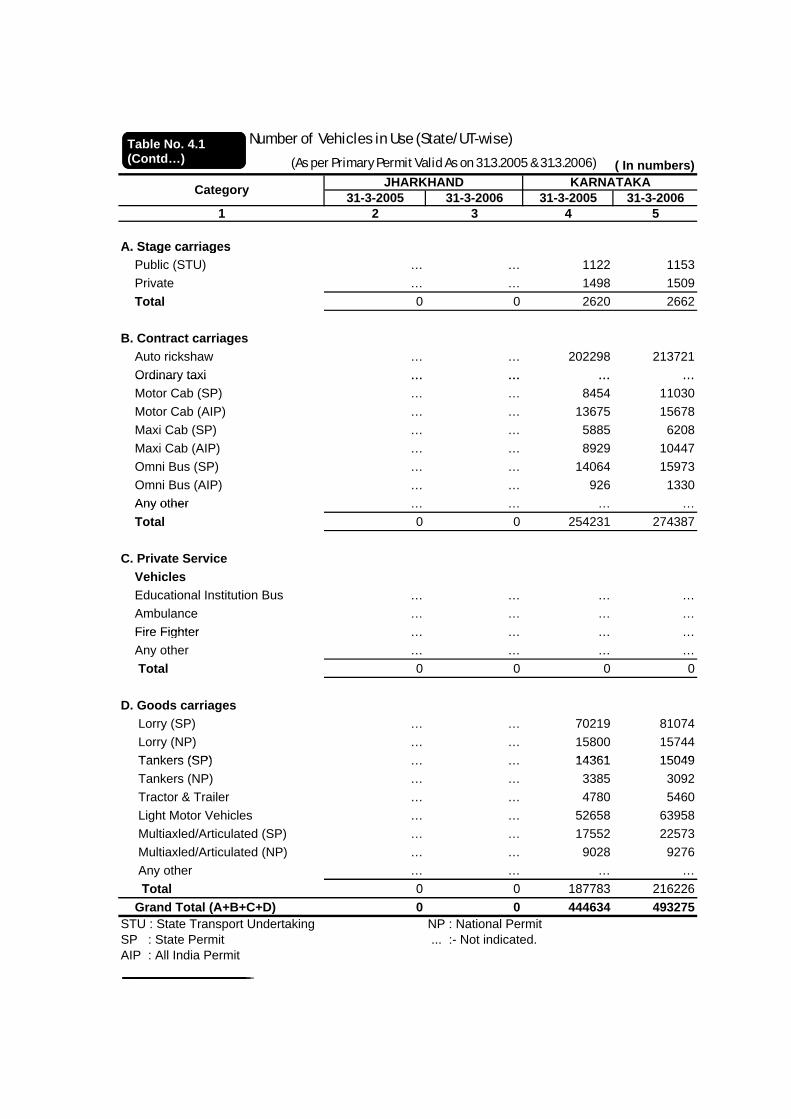
Number of Vehicles in Use (State/UT-wise)
(As per Primary Permit Valid As on 31.3.2005 & 31.3.2006) ( In numbers)
31-3-2005 31-3-2006 31-3-2005 31-3-20061 2 3 4 5
A. Stage carriages
Category JHARKHAND KARNATAKA
Table No. 4.1(Contd…)
A. Stage carriages Public (STU) … … 1122 1153 Private … … 1498 1509 Total 0 0 2620 2662
B. Contract carriages Auto rickshaw … … 202298 213721 Ordinary taxi … … … … Ordinary taxi … … … … Motor Cab (SP) … … 8454 11030 Motor Cab (AIP) … … 13675 15678 Maxi Cab (SP) … … 5885 6208 Maxi Cab (AIP) … … 8929 10447 Omni Bus (SP) … … 14064 15973 Omni Bus (AIP) … … 926 1330
Any other Any other … … … … Total 0 0 254231 274387
C. Private Service Vehicles Educational Institution Bus … … … … Ambulance … … … …
Fire Fighter Fire Fighter … … … … Any other … … … … Total 0 0 0 0
D. Goods carriages Lorry (SP) … … 70219 81074 Lorry (NP) … … 15800 15744
Tankers (SP) 14361 15049 Tankers (SP) … … 14361 15049 Tankers (NP) … … 3385 3092 Tractor & Trailer … … 4780 5460 Light Motor Vehicles … … 52658 63958 Multiaxled/Articulated (SP) … … 17552 22573 Multiaxled/Articulated (NP) … … 9028 9276 Any other … … … …
T t l 0 0 187783 216226 Total 0 0 187783 216226 Grand Total (A+B+C+D) 0 0 444634 493275STU : State Transport Undertaking NP : National PermitSP : State Permit ... :- Not indicated.AIP : All India Permit
Table No. 4.1(Contd…)

Number of Vehicles in Use (State/UT-wise)
(As per Primary Permit Valid As on 31.3.2005 & 31.3.2006) ( In numbers)
31-3-2005 31-3-2006 31-3-2005 31-3-20061 2 3 4 5
A. Stage carriages
Category KERALA MADHYA PRADESH
Table No. 4.1(Contd…)
A. Stage carriages Public (STU) … … … … Private … … 6653 7932 Total 0 0 6653 7932
B. Contract carriages Auto rickshaw … … 11947 11593 Ordinary taxi … … … … Ordinary taxi … … … … Motor Cab (SP) … … 2690 2838 Motor Cab (AIP) … … … … Maxi Cab (SP) … … 3411 3299 Maxi Cab (AIP) … … 910 1152 Omni Bus (SP) … … … … Omni Bus (AIP) … … … …
Any other Any other … … … … Total 0 0 18958 18882
C. Private Service Vehicles Educational Institution Bus … … … … Ambulance … … … …
Fire Fighter Fire Fighter … … … … Any other … … … … Total 0 0 0 0
D. Goods carriages Lorry (SP) … … 95644 107455 Lorry (NP) … … 67607 74002
Tankers (SP) Tankers (SP) … … … … Tankers (NP) … … … … Tractor & Trailer … … … … Light Motor Vehicles … … … … Multiaxled/Articulated (SP) … … … … Multiaxled/Articulated (NP) … … … … Any other … … … …
T t l 0 0 163251 181457 Total 0 0 163251 181457 Grand Total (A+B+C+D) 0 0 188862 208271STU : State Transport Undertaking NP : National PermitSP : State Permit ... :- Not indicated.AIP : All India Permit
Table No. 4.1(Contd…)

Number of Vehicles in Use (State/UT-wise)
(As per Primary Permit Valid As on 31.3.2005 & 31.3.2006) ( In numbers)
31-3-2005 31-3-2006 31-3-2005 31-3-20061 2 3 4 5
A. Stage carriages
Category MAHARASHTRA MANIPUR
Table No. 4.1(Contd…)
A. Stage carriages Public (STU) … … … … Private … … 1456 1518 Total 6986 7006 1456 1518
B. Contract carriages Auto rickshaw 481178 498161 2419 2524 Ordinary taxi … … 308 312 Ordinary taxi … … 308 312 Motor Cab (SP) … … … … Motor Cab (AIP) … … … … Maxi Cab (SP) … … 10 8 Maxi Cab (AIP) … … … … Omni Bus (SP) … … 60 60 Omni Bus (AIP) … … … …
Any other 117624 128505 Any other 117624 128505 … … Total 598802 626666 2797 2904
C. Private Service Vehicles Educational Institution Bus 3516 3824 11 11 Ambulance … … 26 28
Fire Fighter Fire Fighter … … … … Any other 5257 5320 … … Total 8773 9144 37 39
D. Goods carriages Lorry (SP) … … 4410 4516 Lorry (NP) … … 150 150
Tankers (SP) 251 258 Tankers (SP) … … 251 258 Tankers (NP) … … 60 60 Tractor & Trailer … … … … Light Motor Vehicles … … … … Multiaxled/Articulated (SP) … … … … Multiaxled/Articulated (NP) … … … … Any other … … … …
T t l 431240 485244 4871 4984 Total 431240 485244 4871 4984 Grand Total (A+B+C+D) 1045801 1128060 9161 9445STU : State Transport Undertaking NP : National PermitSP : State Permit ... :- Not indicated.AIP : All India Permit
Table No. 4.1(Contd…)
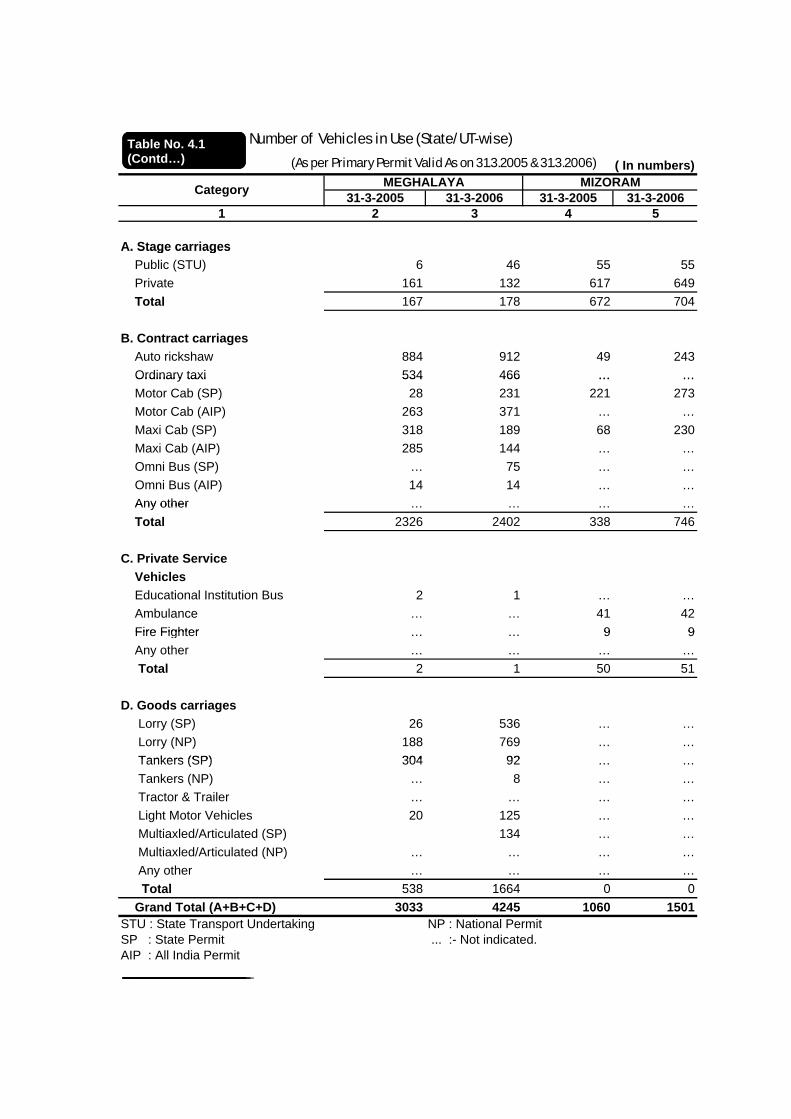
Number of Vehicles in Use (State/UT-wise)
(As per Primary Permit Valid As on 31.3.2005 & 31.3.2006) ( In numbers)
31-3-2005 31-3-2006 31-3-2005 31-3-20061 2 3 4 5
A. Stage carriages
Category MEGHALAYA MIZORAM
Table No. 4.1(Contd…)
A. Stage carriages Public (STU) 6 46 55 55 Private 161 132 617 649 Total 167 178 672 704
B. Contract carriages Auto rickshaw 884 912 49 243 Ordinary taxi 534 466 … … Ordinary taxi 534 466 … … Motor Cab (SP) 28 231 221 273 Motor Cab (AIP) 263 371 … … Maxi Cab (SP) 318 189 68 230 Maxi Cab (AIP) 285 144 … … Omni Bus (SP) … 75 … … Omni Bus (AIP) 14 14 … …
Any other Any other … … … … Total 2326 2402 338 746
C. Private Service Vehicles Educational Institution Bus 2 1 … … Ambulance … … 41 42
Fire Fighter 9 9 Fire Fighter … … 9 9 Any other … … … … Total 2 1 50 51
D. Goods carriages Lorry (SP) 26 536 … … Lorry (NP) 188 769 … …
Tankers (SP) 304 92 Tankers (SP) 304 92 … … Tankers (NP) … 8 … … Tractor & Trailer … … … … Light Motor Vehicles 20 125 … … Multiaxled/Articulated (SP) 134 … … Multiaxled/Articulated (NP) … … … … Any other … … … …
T t l 538 1664 0 0 Total 538 1664 0 0 Grand Total (A+B+C+D) 3033 4245 1060 1501STU : State Transport Undertaking NP : National PermitSP : State Permit ... :- Not indicated.AIP : All India Permit
Table No. 4.1(Contd…)

Number of Vehicles in Use (State/UT-wise)
(As per Primary Permit Valid As on 31.3.2005 & 31.3.2006) ( In numbers)
31-3-2005 31-3-2006 31-3-2005 31-3-20061 2 3 4 5
A. Stage carriages
Category NAGALAND ORISSA
Table No. 4.1(Contd…)
A. Stage carriages Public (STU) … … 225 212 Private … … 5772 6183 Total 0 0 5997 6395
B. Contract carriages Auto rickshaw … … 10346 12023 Ordinary taxi … … 837 730 Ordinary taxi … … 837 730 Motor Cab (SP) … … 9722 11017 Motor Cab (AIP) … … 977 1011 Maxi Cab (SP) … … 5866 6264 Maxi Cab (AIP) … … 0 0 Omni Bus (SP) … … 203 95 Omni Bus (AIP) … … 0 0
Any other 1153 1202 Any other … … 1153 1202 Total 0 0 29104 32342
C. Private Service Vehicles Educational Institution Bus … … 175 250 Ambulance … … 147 157
Fire Fighter 25 33 Fire Fighter … … 25 33 Any other … … 305 359 Total 0 0 652 799
D. Goods carriages Lorry (SP) … … 45127 49293 Lorry (NP) … … 2346 2297
Tankers (SP) 1036 1265 Tankers (SP) … … 1036 1265 Tankers (NP) … … 108 176 Tractor & Trailer … … 19610 23166 Light Motor Vehicles … … 2778 3859 Multiaxled/Articulated (SP) … … 953 2455 Multiaxled/Articulated (NP) … … 951 937 Any other … … 2839 3000
T t l 0 0 75748 86448 Total 0 0 75748 86448 Grand Total (A+B+C+D) 0 0 111501 125984STU : State Transport Undertaking NP : National PermitSP : State Permit ... :- Not indicated.AIP : All India Permit
Table No. 4.1(Contd…)
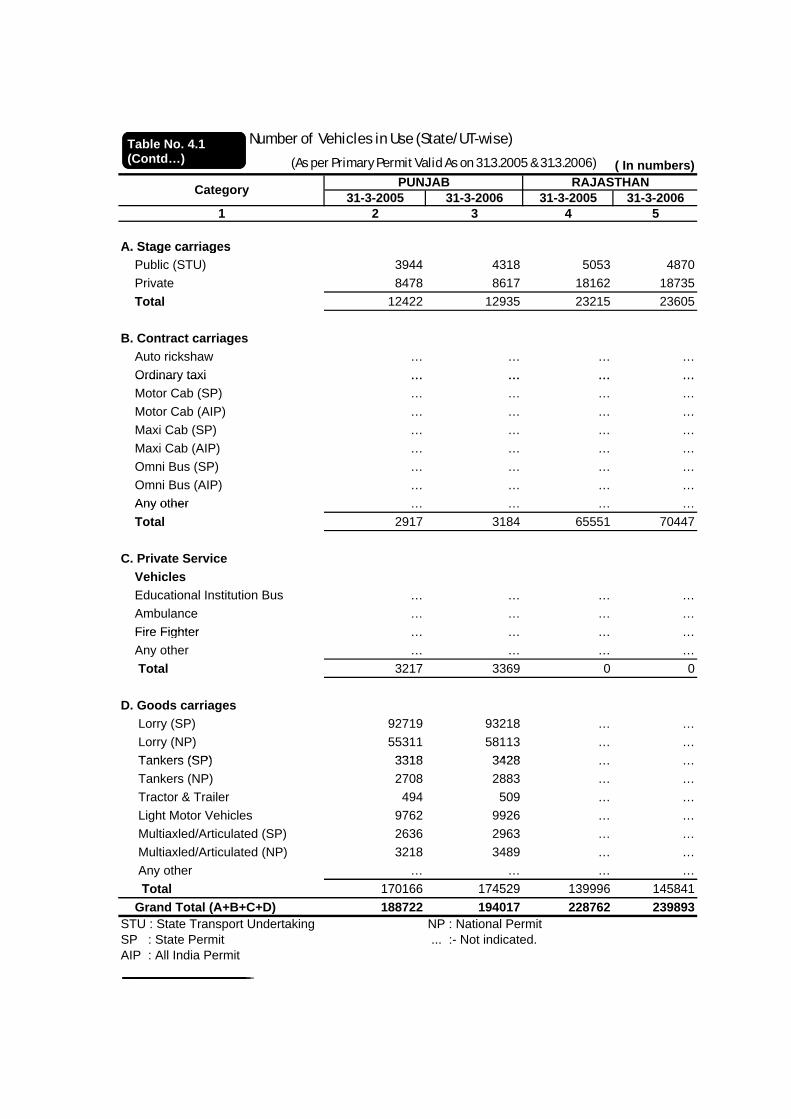
Number of Vehicles in Use (State/UT-wise)
(As per Primary Permit Valid As on 31.3.2005 & 31.3.2006) ( In numbers)
31-3-2005 31-3-2006 31-3-2005 31-3-20061 2 3 4 5
A. Stage carriages
Category PUNJAB RAJASTHAN
Table No. 4.1(Contd…)
A. Stage carriages Public (STU) 3944 4318 5053 4870 Private 8478 8617 18162 18735 Total 12422 12935 23215 23605
B. Contract carriages Auto rickshaw … … … … Ordinary taxi … … … … Ordinary taxi … … … … Motor Cab (SP) … … … … Motor Cab (AIP) … … … … Maxi Cab (SP) … … … … Maxi Cab (AIP) … … … … Omni Bus (SP) … … … … Omni Bus (AIP) … … … …
Any other Any other … … … … Total 2917 3184 65551 70447
C. Private Service Vehicles Educational Institution Bus … … … … Ambulance … … … …
Fire Fighter Fire Fighter … … … … Any other … … … … Total 3217 3369 0 0
D. Goods carriages Lorry (SP) 92719 93218 … … Lorry (NP) 55311 58113 … …
Tankers (SP) 3318 3428 Tankers (SP) 3318 3428 … … Tankers (NP) 2708 2883 … … Tractor & Trailer 494 509 … … Light Motor Vehicles 9762 9926 … … Multiaxled/Articulated (SP) 2636 2963 … … Multiaxled/Articulated (NP) 3218 3489 … … Any other … … … …
T t l 170166 174529 139996 145841 Total 170166 174529 139996 145841 Grand Total (A+B+C+D) 188722 194017 228762 239893STU : State Transport Undertaking NP : National PermitSP : State Permit ... :- Not indicated.AIP : All India Permit
Table No. 4.1(Contd…)

Number of Vehicles in Use (State/UT-wise)
(As per Primary Permit Valid As on 31.3.2005 & 31.3.2006) ( In numbers)
31-3-2005 31-3-2006 31-3-2005 31-3-20061 2 3 4 5
A. Stage carriages
Category SIKKIM TAMILNADU
Table No. 4.1(Contd…)
A. Stage carriages Public (STU) 258 260 17436 17635 Private 97 105 6271 6760 Mini Bus … … 3869 4285 Total 355 365 56256 28680
B. Contract carriages Auto rickshaw … … 122832 133639 Auto rickshaw … … 122832 133639 Ordinary taxi … … 1223 1612 Motor Cab (SP) 2535 2770 35922 42797 Motor Cab (AIP) … … 4826 7051 Maxi Cab (SP) 2932 3282 23043 24591 Maxi Cab (AIP) … … 797 939 Omni Bus (SP) … … 327 310
Omni Bus (AIP) 151 153 Omni Bus (AIP) … … 151 153 Any other … … … … Total 5467 6052 189121 211092
C. Private Service Vehicles Educational Institution Bus 9 12 5876 8099
Ambulance 2946 3211 Ambulance … … 2946 3211 Fire Fighter … … 854 1419 Any other 59 59 4485 5330 Total 68 71 14161 18059
D. Goods carriages Lorry (SP) … … 101901 122813
Lorry (NP) 24160 27791 Lorry (NP) … … 24160 27791 Tankers (SP) 1769 1915 7084 8538 Tankers (NP) … … 1373 1579 Tractor & Trailer 13 24 43052 50519 Light Motor Vehicles 417 489 74380 101637 Multiaxled/Articulated (SP) … … 9196 8187 Multiaxled/Articulated (NP) … … 1922 2211
A th Any other … … … … Total 2199 2428 263068 323275 Grand Total (A+B+C+D) 8089 8916 522606 581106STU : State Transport Undertaking NP : National PermitSP : State Permit ... :- Not indicated.AIP : All India Permit
Table No. 4.1(Contd…)

Number of Vehicles in Use (State/UT-wise)
(As per Primary Permit Valid As on 31.3.2005 & 31.3.2006) ( In numbers)
31-3-2005 31-3-2006 31-3-2005 31-3-20061 2 3 4 5
A. Stage carriages
Category TRIPURA UTTARAKHAND
Table No. 4.1(Contd…)
A. Stage carriages Public (STU) 130 142 60 63 Private 406 407 2261 1790 Mini Bus 46 61 … … Bus 44 45 … … Total 626 655 2321 1853
B. Contract carriagesB. Contract carriages Auto rickshaw 5245 5796 2370 2438 Ordinary taxi 31 47 1769 1360 Motor Cab (SP) 6 6 1314 1431 Motor Cab (AIP) 12 24 61 280 Maxi Cab (SP) 22 17 428 544 Maxi Cab (AIP) 1 3 217 203
Omni Bus (SP) 121 166 342 212 Omni Bus (SP) 121 166 342 212 Omni Bus (AIP) 18 21 4 8 Any other 752 4107 … … Total 6208 10187 6505 6476
C. Private Service Vehicles
Educational Institution Bus 90 91 234 159 Educational Institution Bus 90 91 234 159 Ambulance 2 2 … … Fire Fighter … … … … Any other 6 11 … … Total 98 104 234 159
D. Goods carriagesLorry (SP) 563 1346 9798 10371 Lorry (SP) 563 1346 9798 10371
Lorry (NP) 752 4107 1912 1941 Tankers (SP) 4030 18 41 38 Tankers (NP) 15 105 122 207 Tractor & Trailer 97 1107 256 466 Light Motor Vehicles 956 59 504 654 Multiaxled/Articulated (SP) … … … …
M lti l d/A ti l t d (NP) Multiaxled/Articulated (NP) … … … … Any other 220 320 … … Total 6633 7062 12633 13677 Grand Total (A+B+C+D) 13565 18008 21693 22165STU : State Transport Undertaking NP : National PermitSP : State Permit ... :- Not indicated.AIP : All India Permit
Table No. 4.1(Contd…)

Number of Vehicles in Use (State/UT-wise)
(As per Primary Permit Valid As on 31.3.2005 & 31.3.2006) ( In numbers)
31-3-2005 31-3-2006 31-3-2005 31-3-20061 2 3 4 5
A. Stage carriages
Category UTTAR PRADESH WEST BENGAL
Table No. 4.1(Contd…)
A. Stage carriages Public (STU) 2085 3856 … … Private 10464 9283 … … Total 12549 13139 0 0
B. Contract carriages Auto rickshaw 25174 30694 … … Ordinary taxi 12250 11728 … … Ordinary taxi 12250 11728 … … Motor Cab (SP) 654 656 … … Motor Cab (AIP) 1086 1319 … … Maxi Cab (SP) 816 1567 … … Maxi Cab (AIP) 73 74 … … Omni Bus (SP) 5 112 … … Omni Bus (AIP) 7 18 … …
Any other 17079 14833 Any other 17079 14833 … … Total 57144 61001 0 0
C. Private Service Vehicles Educational Institution Bus 1822 2365 … … Ambulance 195 240 … …
Fire Fighter 47 47 Fire Fighter 47 47 … … Any other 100 85 … … Total 2164 2737 0 0
D. Goods carriages Lorry (SP) 61391 65433 … … Lorry (NP) 23293 22290 … …
Tankers (SP) 3623 4898 Tankers (SP) 3623 4898 … … Tankers (NP) 2602 2817 … … Tractor & Trailer 354 203 … … Light Motor Vehicles 12640 12426 … … Multiaxled/Articulated (SP) 4277 4118 … … Multiaxled/Articulated (NP) 2741 2903 … … Any other 748 1 … …
T t l 111669 115089 0 0 Total 111669 115089 0 0 Grand Total (A+B+C+D) 183526 191966 0 0STU : State Transport Undertaking NP : National PermitSP : State Permit ... :- Not indicated.AIP : All India Permit
Table No. 4.1(Contd…)
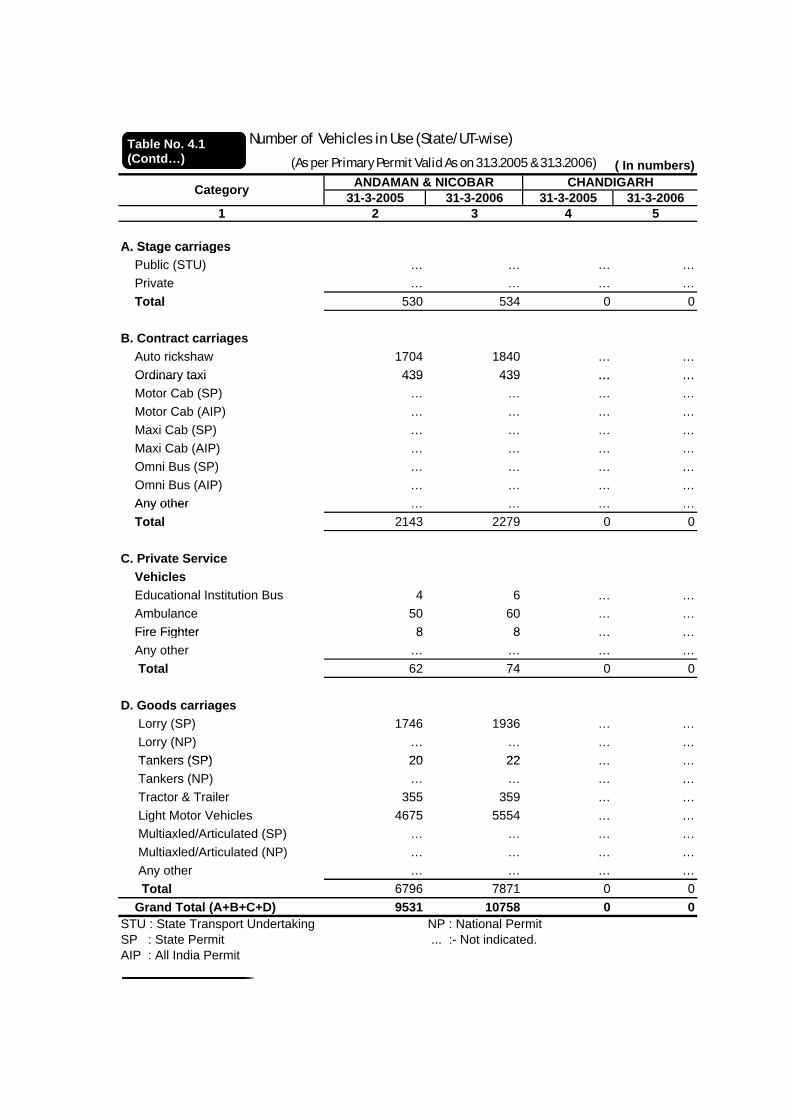
Number of Vehicles in Use (State/UT-wise)
(As per Primary Permit Valid As on 31.3.2005 & 31.3.2006) ( In numbers)
31-3-2005 31-3-2006 31-3-2005 31-3-20061 2 3 4 5
A. Stage carriages
Category ANDAMAN & NICOBAR CHANDIGARH
Table No. 4.1(Contd…)
A. Stage carriages Public (STU) … … … … Private … … … … Total 530 534 0 0
B. Contract carriages Auto rickshaw 1704 1840 … … Ordinary taxi 439 439 … … Ordinary taxi 439 439 … … Motor Cab (SP) … … … … Motor Cab (AIP) … … … … Maxi Cab (SP) … … … … Maxi Cab (AIP) … … … … Omni Bus (SP) … … … … Omni Bus (AIP) … … … …
Any other Any other … … … … Total 2143 2279 0 0
C. Private Service Vehicles Educational Institution Bus 4 6 … … Ambulance 50 60 … …
Fire Fighter 8 8 Fire Fighter 8 8 … … Any other … … … … Total 62 74 0 0
D. Goods carriages Lorry (SP) 1746 1936 … … Lorry (NP) … … … …
Tankers (SP) 20 22 Tankers (SP) 20 22 … … Tankers (NP) … … … … Tractor & Trailer 355 359 … … Light Motor Vehicles 4675 5554 … … Multiaxled/Articulated (SP) … … … … Multiaxled/Articulated (NP) … … … … Any other … … … …
T t l 6796 7871 0 0 Total 6796 7871 0 0 Grand Total (A+B+C+D) 9531 10758 0 0STU : State Transport Undertaking NP : National PermitSP : State Permit ... :- Not indicated.AIP : All India Permit
Table No. 4.1(Contd…)

Number of Vehicles in Use (State/UT-wise)
(As per Primary Permit Valid As on 31.3.2005 & 31.3.2006) ( In numbers)
31-3-2005 31-3-2006 31-3-2005 31-3-20061 2 3 4 5
A. Stage carriages
Category DADRA & NAGAR HAVELI DAMAN & DIU
Table No. 4.1(Contd…)
A. Stage carriages Public (STU) … … … … Private 54 55 … … Total 54 55 0 0
B. Contract carriages Auto rickshaw 522 532 … … Ordinary taxi 4 … … … Ordinary taxi 4 … … … Motor Cab (SP) 112 123 … … Motor Cab (AIP) 3 4 … … Maxi Cab (SP) … … … … Maxi Cab (AIP) … … … … Omni Bus (SP) 5 7 … … Omni Bus (AIP) … … … …
Any other Any other … … … … Total 646 666 0 0
C. Private Service Vehicles Educational Institution Bus 14 … … … Ambulance 7 8 … …
Fire Fighter 8 Fire Fighter 8 … … … Any other … … … … Total 29 8 0 0
D. Goods carriages Lorry (SP) … … … … Lorry (NP) … … … …
Tankers (SP) Tankers (SP) … … … … Tankers (NP) … … … … Tractor & Trailer … … … … Light Motor Vehicles … … … … Multiaxled/Articulated (SP) … … … … Multiaxled/Articulated (NP) … … … … Any other … … … …
T t l 6812 7216 0 0 Total 6812 7216 0 0 Grand Total (A+B+C+D) 7541 7945 0 0STU : State Transport Undertaking NP : National PermitSP : State Permit ... :- Not indicated.AIP : All India Permit
Table No. 4.1(Contd…)

Number of Vehicles in Use (State/UT-wise)
(As per Primary Permit Valid As on 31.3.2005 & 31.3.2006) ( In numbers)
31-3-2005 31-3-2006 31-3-2005 31-3-20061 2 3 4 5
A. Stage carriages
Category DELHI LAKSHADWEEP
Table No. 4.1(Contd…)
A. Stage carriages Public (STU) … … … … Private … … … … Total 0 0 0 0
B. Contract carriages Auto rickshaw … … … … Ordinary taxi … … … … Ordinary taxi … … … … Motor Cab (SP) … … … … Motor Cab (AIP) … … … … Maxi Cab (SP) … … … … Maxi Cab (AIP) … … … … Omni Bus (SP) … … … … Omni Bus (AIP) … … … …
Any other Any other … … … … Total 0 0 0 0
C. Private Service Vehicles Educational Institution Bus … … … … Ambulance … … … …
Fire Fighter Fire Fighter … … … … Any other … … … … Total 0 0 0 0
D. Goods carriages Lorry (SP) … … … … Lorry (NP) … … … …
Tankers (SP) Tankers (SP) … … … … Tankers (NP) … … … … Tractor & Trailer … … … … Light Motor Vehicles … … … … Multiaxled/Articulated (SP) … … … … Multiaxled/Articulated (NP) … … … … Any other … … … …
T t l 0 0 0 0 Total 0 0 0 0 Grand Total (A+B+C+D) 0 0 0 0STU : State Transport Undertaking NP : National PermitSP : State Permit ... :- Not indicated.AIP : All India Permit
Table No. 4.1(Contd…)

Number of Vehicles in Use (State/UT-wise)
(As per Primary Permit Valid As on 31.3.2005 & 31.3.2006)
31-3-2005 31-3-20061 2 3
A. Stage carriages
Category PUDUCHERRY
Table No. 4.1(Contd…)
A. Stage carriages Public (STU) 45 57 Private 537 608 Total 582 665
B. Contract carriages Auto rickshaw 2240 2411 Ordinary taxi Ordinary taxi Motor Cab (SP) … … Motor Cab (AIP) … … Maxi Cab (SP) 470 511 Maxi Cab (AIP) … … Omni Bus (SP) 532 591 Omni Bus (AIP) … …
Any other 937 944 Any other 937 944 Total 4179 4457
C. Private Service Vehicles Educational Institution Bus 70 94 Ambulance 17 23
Fire Fighter 2 3 Fire Fighter 2 3 Any other 10 10 Total 99 130
D. Goods carriages Lorry (SP) … … Lorry (NP) 2717 2782
Tankers (SP) 67 69 Tankers (SP) 67 69 Tankers (NP) 105 105 Tractor & Trailer 234 258 Light Motor Vehicles 331 418 Multiaxled/Articulated (SP) 45 52 Multiaxled/Articulated (NP) 68 73 Any other 336 404
T t l 3903 4161 Total 3903 4161 Grand Total (A+B+C+D) 8763 9413STU : State Transport Undertaking NP : National PermitSP : State Permit ... :- Not indicated.AIP : All India Permit
Table No. 4.1(Contd…)

2004-05 2005-06 2006-07 2004-05 2005-06 2006-07 2004-05 2005-06 2006-07 2004-05 2005-06 2006-07Andhra Pradesh 16185 14122 19075 71134 86267 105288 1043.71 1127.63 1427.62 1404.54 1294.83 2032.71Arunachal Pradesh … … … … … … … … … … … … Assam 696 491 534 156 218 246 31.10 30.15 20.60 10.08 8.19 6.19Bihar 318 430 530 68148 71775 74862 558.67 382.34 1566.87 … … … Chhattisgarh 5052 4359 6094 29355 34298 46103 2884.00 3686.00 4213.00 2884.00 3686.00 4213.00Goa 58 75 59 … … … … … … … … …
Gujarat 33953 28833 42815 97741 93383 146315 30668 # 30419 # 20586 # … … … Haryana 24976 19065 30803 57377 61892 74363 1268.81 3708.15 4780.97 601.82 593.87 871.22Himachal Pradesh 1693 1461 1740 … … … 2.89 3.26 3.57 152.13 167.91 186.64
Jammu & Kashmir 3460 3609 3546 4195 4385 4531 361.99 426.87 426.12 26.63 45.82 31.61Jharkhand 2334 2129 2505 18463 26376 41600 912.28 1292.03 1021.47 390.98 553.73 437.77
Karnataka 28213 28112 35882 112500 97500 115000 1351.45 1405.31 1141.99 2589.98 2765.36 5426.56
Kerala 1357 1641 1286 46968 47110 47265 … … … … … …
Madhya Pradesh 7848 6940 10375 … 61600 79060 3348.00 4237.00 2266.00 503.00 909.00 3672.00
Maharashtra 13415 12416 10504 142928 148503 179086 794.33 2986.39 4101.68 16831.08 19450.64 20571.18
Manipur 308 340 345 372 409 357 … … … … … …
Meghalaya 427 395 461 … … … … … 105.07 … … 0.74
Mizoram 17 31 19 390 488 550 … … … 5.42 6.41 8.76
Information regarding National Permits and Fines Recovered during 2004-05 to 2006-07
States/Uts
Number of National Permits issued by the States/UTs
Number of National Permits endorsed by the States/UTs
Amount of fine recovered on account of overloading of trucks
(Rs. in lakh)
Amount of fine recovered for offences other than overloading
of trucks (Rs. in lakh)
Table No. 4.2
Nagaland 2145 2053 2754 8460 10601 12413 … … … 11.58 120.47 30.09
Orissa 3723 3670 3740 43058 43851 55627 1236.97 1481.83 1547.65 7418.54 9099.58 10156.20
Punjab 15315 21483 19278 52721 59409 51560 … … … … … …
Rajasthan 15664 27727 25092 126591 127513 144007 14481.03 15591.09 10208.56 15562.25 19189.40 16304.95
Sikkim 0 0 0 0 0 0 0.82 0.60 1.00 0.63 1.14 1.22
Tamil Nadu 9743 10527 12168 74597 78997 83050 309.56 365.62 468.78 144.29 164.67 186.39
Tripura 35 45 94 315 387 435 0.80 0.95 1.10 0.64 0.85 1.40
Uttar Pradesh 10824 10686 14658 145278 177103 192930 3071.43 3148.61 4958.22 1071.77 1002.78 1616.25
Uttarakhand 713 611 759 295 291 393 3.44 3.79 5.42 0.28 0.34 0.71
West Bengal 4227 4143 5887 13248 13005 12055 … … … … … …
A & N Islands 0 0 0 0 0 0 0.00 0.00 0.00 28.24 31.95 27.83
Chandigarh 16 21 25 25020 36274 37546 77.74 31.58 31.39 … … …
Dadra and Nagar Haveli 198 224 365 49 40 68 4.20 1.95 3.58 8.52 3.96 7.27
Daman & Diu 174 149 205 … … … 0.73 12.06 1.35 0.83 0.29 1.91
Delhi 3977 3163 4026 160000 172000 162000 49.81 13.68 16.36 569.72 455.09 502.97
Lakshadweep 0 0 0 0 0 0 0.00 0.00 0.00 0.00 0.00 0.00Puducherry 150 102 94 879 416 315 14.63 6.77 3.66 14.92 13.64 12.16Source : State/UTs Transport Commissioner' Office # Includes Fees recovered on account of overloading & other fines.
… : Not Indicated Fines Recovered by the Government of Assam are Provisional Figures

Male Female Total (2+3) Male Female Total (5+6) Male Female Total (8+9) Male (2+5+8) Female (3+6+9) Total(4+7+10)1 2 3 4 5 6 7 8 9 10 11 12 13
STATES Andhra Pradesh 751462 332 751794 733338 684 734022 3134890 255478 3390368 4619690 256494 4876184Arunachal Pradesh … … … … … … … … … … … … Assam 63980 7 63987 86521 38 86559 548905 4868 553773 699406 4913 704319Bihar 62245 0 62245 0 0 0 338550 10314 348864 400795 10314 411109Chhatisgarh 12930 0 12930 94243 0 94243 753277 83282 836559 860450 83282 943732Goa 36605 9 36614 29124 28 29152 228832 67218 296050 294561 67255 361816Gujarat … … 993921 … … 404144 … … 5509534 … … 6907599Haryana 766 0 766 100736 0 100736 1972422 190996 2163418 2073924 190996 2264920Himachal Pradesh 30359 0 30359 5032 0 5032 65327 7802 73129 100718 7802 108520J & K 17868 0 17868 60394 0 60394 270197 18899 289096 348459 18899 367358Jharkhand … … … … … … … … … … … … Karnataka … … … … … … … … … … 4211929Kerala … … … … … … … … … … … … Madhya Pradesh … … 268584 … … 42544 … … 2129486 2440614Maharashtra … … 2399146 … … 3129883 … … 8959100 … … 14488129Manipur 8027 0 8027 39898 0 39898 154486 12113 166599 202411 12113 214524Meghalaya 18030 18030 47714 128 47842 18617 2835 21452 84361 2963 87324Mizoram 35514 0 35514 0 0 0 47482 236 47718 82996 236 83232Nagaland … … … … … … … … … … … … Orissa 40658 17 40675 120452 49 120501 1070277 84867 1155144 1231387 84933 1316320Punjab … … … … … … … … … … … … Rajasthan … … 27224 … … 3388963 … … 513116 … … 3929303Sikkim … … … … … … … … … … … … Tamilnadu 1926646 20707 1947353 566802 16682 583484 6085462 594661 6680123 8578910 632050 9210960
Total Number of Valid Drivers' Licences Issued As on 31.3.2005
STATES / UTs
Professional Non professional Total Authorised to drive Public Service
Vehicles Others
Table No. 4.31
a adu 1926646 20707 9 353 566802 16682 583 8 6085462 594661 6680 3 85 89 0 63 050 9 0960Tripura 27859 0 27859 205 0 205 59804 274 60078 87868 274 88142Uttar Pradesh 664015 7 664022 184189 59 184248 4946100 226907 5173007 5794304 226973 6021277Uttarakhand 25223 0 25223 93473 2 93475 496615 84065 580680 615311 84067 699378West Bengal … … … … … … … … … … … … UTsA&N Islands … … … … … … … … … … … … Chandigarh … … … … … … … … 514857 … … 514857D&N Haveli … … … … … … … … … … … 9780Daman & Diu … … … … … … … … … … … … Delhi … … … … … … … … … … … … Lakshadweep 0 0 0 0 0 0 6225 73 6298 6225 73 6298Puducherry 64334 1302 65636 17 4 21 112577 10739 123316 176928 12045 188973Source : State/Uts Transport Commissioner Office …:- Not indicated.

Male Female Total (2+3) Male Female Total (5+6) Male Female Total (8+9) Male (2+5+8) Female (3+6+9) Total(4+7+10)1 2 3 4 5 6 7 8 9 10 11 12 13
STATES Andhra Pradesh 776261 341 776602 755339 698 756037 3260285 260588 3520873 4791885 261627 5053512Arunachal Pradesh … … … … … … … … … … … … Assam 69182 7 69189 98191 38 98229 604448 5140 609588 771821 5185 777006Bihar 80918 0 80918 0 0 0 406260 12376 418636 487178 12376 499554Chhatisgarh 13639 0 13639 96849 0 96849 831231 88962 920193 941719 88962 1030681Goa 38002 9 38011 30703 28 30731 243528 72058 315586 312233 72095 384328Gujarat … … 1052160 … … 404144 … … 6360283 … … 7816587Haryana 933 0 933 115458 0 115458 2082096 201605 2283701 2198487 201605 2400092Himachal Pradesh 36342 0 36342 5272 3 5275 82644 8394 91038 124258 8397 132655J & K 18504 0 18504 61183 0 61183 282564 20253 302817 362251 20253 382504Jharkhand … … … … … … … … … … … … Karnataka … … … … … … … … … … … 5084807Kerala … … … … … … … … … … … … Madhya Pradesh … … 283551 … … 52536 … … 2347063 … … 2683150Maharashtra … … 2544563 … … 3319681 … … 9536574 … … 15400818Manipur 8524 0 8524 46364 0 46364 167332 15690 183022 222220 15690 237910Meghalaya 20968 20968 53795 128 53923 21493 3971 25464 96256 4099 100355Mizoram 38137 0 38137 0 0 0 52465 356 52821 90602 356 90958Nagaland … … … … … … … … … … … … Orissa 37170 42 37212 112715 2104 114819 842152 61135 903287 992037 63281 1055318Punjab … … … … … … … … … … … … Rajasthan … … 27224 … … 3819198 … … 541867 … … 4388289Sikkim … … … … … … … … … … … …
Total Number of Valid Drivers' Licences Issued As on 31.3.2006
STATES / UTs
Professional Non professional Total Authorised to drive Public Service
Vehicles Others
Table No. 4.32
Tamilnadu 2140097 32698 2172795 625690 20875 646565 6587974 686106 7274080 9353761 739679 10093440Tripura 27519 0 27519 176 0 176 46544 270 46814 74239 270 74509Uttar Pradesh 822116 370 822486 187476 3 187479 5391749 224235 5615984 6401341 224608 6625949Uttarakhand 28741 0 28741 97366 3 97369 537472 93676 631148 663579 93679 757258West Bengal … … … … … … … … … … … … UTsA&N Islands … … … … … … … … … … … … Chandigarh … … … … … … … … 555076 … … 555076D&N Haveli … … … … … … … … … … … 10280Daman & Diu … … … … … … … … … … … … Delhi … … … … … … … … … … … … Lakshadweep 0 0 0 0 0 0 6611 82 6693 6611 82 6693Puducherry 71711 1302 73013 36 11 47 124859 13153 138012 196606 14466 211072Source : State/Uts Transport Commissioner Office …:- Not indicated.
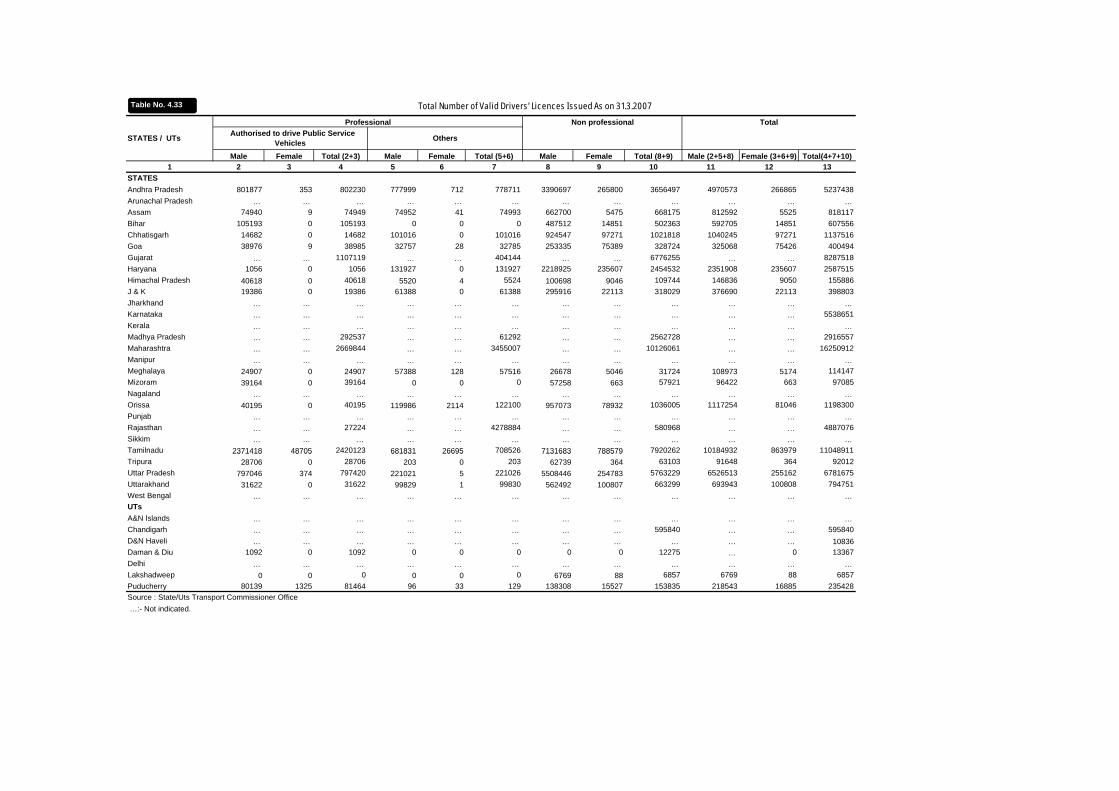
Male Female Total (2+3) Male Female Total (5+6) Male Female Total (8+9) Male (2+5+8) Female (3+6+9) Total(4+7+10)1 2 3 4 5 6 7 8 9 10 11 12 13
STATES Andhra Pradesh 801877 353 802230 777999 712 778711 3390697 265800 3656497 4970573 266865 5237438Arunachal Pradesh … … … … … … … … … … … … Assam 74940 9 74949 74952 41 74993 662700 5475 668175 812592 5525 818117Bihar 105193 0 105193 0 0 0 487512 14851 502363 592705 14851 607556Chhatisgarh 14682 0 14682 101016 0 101016 924547 97271 1021818 1040245 97271 1137516Goa 38976 9 38985 32757 28 32785 253335 75389 328724 325068 75426 400494Gujarat … … 1107119 … … 404144 … … 6776255 … … 8287518Haryana 1056 0 1056 131927 0 131927 2218925 235607 2454532 2351908 235607 2587515Himachal Pradesh 40618 0 40618 5520 4 5524 100698 9046 109744 146836 9050 155886J & K 19386 0 19386 61388 0 61388 295916 22113 318029 376690 22113 398803Jharkhand … … … … … … … … … … … … Karnataka … … … … … … … … … … … 5538651Kerala … … … … … … … … … … … … Madhya Pradesh … … 292537 … … 61292 … … 2562728 … … 2916557Maharashtra … … 2669844 … … 3455007 … … 10126061 … … 16250912Manipur … … … … … … … … … … … … Meghalaya 24907 0 24907 57388 128 57516 26678 5046 31724 108973 5174 114147Mizoram 39164 0 39164 0 0 0 57258 663 57921 96422 663 97085Nagaland … … … … … … … … … … … … Orissa 40195 0 40195 119986 2114 122100 957073 78932 1036005 1117254 81046 1198300Punjab … … … … … … … … … … … … Rajasthan … … 27224 … … 4278884 … … 580968 … … 4887076Sikkim … … … … … … … … … … … … Tamilnadu 2371418 48705 2420123 681831 26695 708526 7131683 788579 7920262 10184932 863979 11048911
Total Number of Valid Drivers' Licences Issued As on 31.3.2007
STATES / UTs
Professional Non professional Total Authorised to drive Public Service
Vehicles Others
Table No. 4.33
a adu 2371418 48705 0 3 681831 26695 085 6 7131683 788579 9 0 6 0 8 93 8639 9 0 89Tripura 28706 0 28706 203 0 203 62739 364 63103 91648 364 92012Uttar Pradesh 797046 374 797420 221021 5 221026 5508446 254783 5763229 6526513 255162 6781675Uttarakhand 31622 0 31622 99829 1 99830 562492 100807 663299 693943 100808 794751West Bengal … … … … … … … … … … … … UTsA&N Islands … … … … … … … … … … … … Chandigarh … … … … … … … … 595840 … … 595840D&N Haveli … … … … … … … … … … … 10836Daman & Diu 1092 0 1092 0 0 0 0 0 12275 … 0 13367Delhi … … … … … … … … … … … … Lakshadweep 0 0 0 0 0 0 6769 88 6857 6769 88 6857Puducherry 80139 1325 81464 96 33 129 138308 15527 153835 218543 16885 235428
…:- Not indicated.Source : State/Uts Transport Commissioner Office

Total Total Total Male Female Total
Number of Drivers' Licences Issued During the Year 2004-05
STATES / UTs
Professional Non professional TotalAuthorised to drive public
Service VehiclesOthers
Table No. 4.41
Male FemaleTotal (2+3) Male Female
Total (5+6) Male Female
Total (8+9)
Male (2+5+8)
Female (3+6+9)
Total (4+7+10)
1 2 3 4 5 6 7 8 9 10 11 12 13STATES Andhra Pradesh 37836 94 37930 33705 199 33904 264845 16666 281511 336386 16959 353345Arunachal Pradesh … … … … … … … … … … … … Assam 4694 0 4694 11075 0 11075 53092 239 53331 68861 239 69100Bihar 8115 0 8115 0 0 0 68541 1557 70098 76656 1557 78213Chhatisgarh 952 0 952 3042 0 3042 76102 2054 78156 80096 2054 82150Goa 1856 0 1856 2186 0 2186 13779 4587 18366 17821 4587 22408Gujarat … … 38088 … … … … … 272376 … … 310464Haryana 528 0 528 6404 0 6404 120116 15575 135691 127048 15575 142623Haryana 528 0 528 6404 0 6404 120116 15575 135691 127048 15575 142623Himachal Pradesh 9014 0 9014 191 0 191 25808 899 26707 35013 899 35912J & K 3190 0 3190 3027 3027 52134 5310 57444 58351 5310 63661Jharkhand … … … … … … … … … … … …Karnataka … … … … … … … … … … … …Kerala … … … … … … … … … … … …M dh P d h 11358 0 11358 7183 37 7220 184424 19517 203941 202965 19554 222519Madhya Pradesh 11358 0 11358 7183 37 7220 184424 19517 203941 202965 19554 222519Maharashtra … … 112662 … … 161030 … … 675210 … … 948902Manipur 372 0 372 6930 0 6930 8528 1228 9756 15830 1228 17058Meghalaya 4702 0 4702 6642 0 6642 3421 762 4183 14765 762 15527Mizoram 2890 0 2890 0 0 0 4218 15 4233 7108 15 7123Nagaland … … … … … … … … … … … …Nagaland … … … … … … … … … … … …Orissa 3007 0 3007 7176 2 7178 105652 16223 121875 115835 16225 132060Punjab 0 … … … … … … …Rajasthan … … … … … 390056 … … 32701 422757Sikkim 4056 0 4056 0 0 0 2356 7 2363 6412 7 6419Tamilnadu 194048 11425 205473 45978 1422 47400 438577 72085 510662 678603 84932 763535Tripura 1576 0 1576 44 0 44 7002 52 7054 8622 52 8674Tripura 1576 0 1576 44 0 44 7002 52 7054 8622 52 8674Uttar Pradesh 38328 4 38332 7870 3 7873 764531 28109 792640 810729 28116 838845Uttarakhand 20047 0 20047 3269 2 3271 45868 3755 49623 69184 3757 72941West Bengal … … … … … … … … … … … …UTsA&N Islands 973 0 973 0 0 0 2432 21 2453 3405 21 3426A&N Islands 973 0 973 0 0 0 2432 21 2453 3405 21 3426Chandigarh … … … … … … … … 37062 … … 37062D&N Haveli … … … … … … … … … … … 335Daman & Diu 5 0 5 0 0 0 688 108 796 693 108 801Delhi … … … … … … … … … … … …Lakshadweep 0 0 0 0 0 0 857 13 870 857 13 870Puducherry 6209 0 6209 17 4 21 15287 2069 17356 21513 2073 23586Puducherry 6209 0 6209 17 4 21 15287 2069 17356 21513 2073 23586 … :- Not indicated.
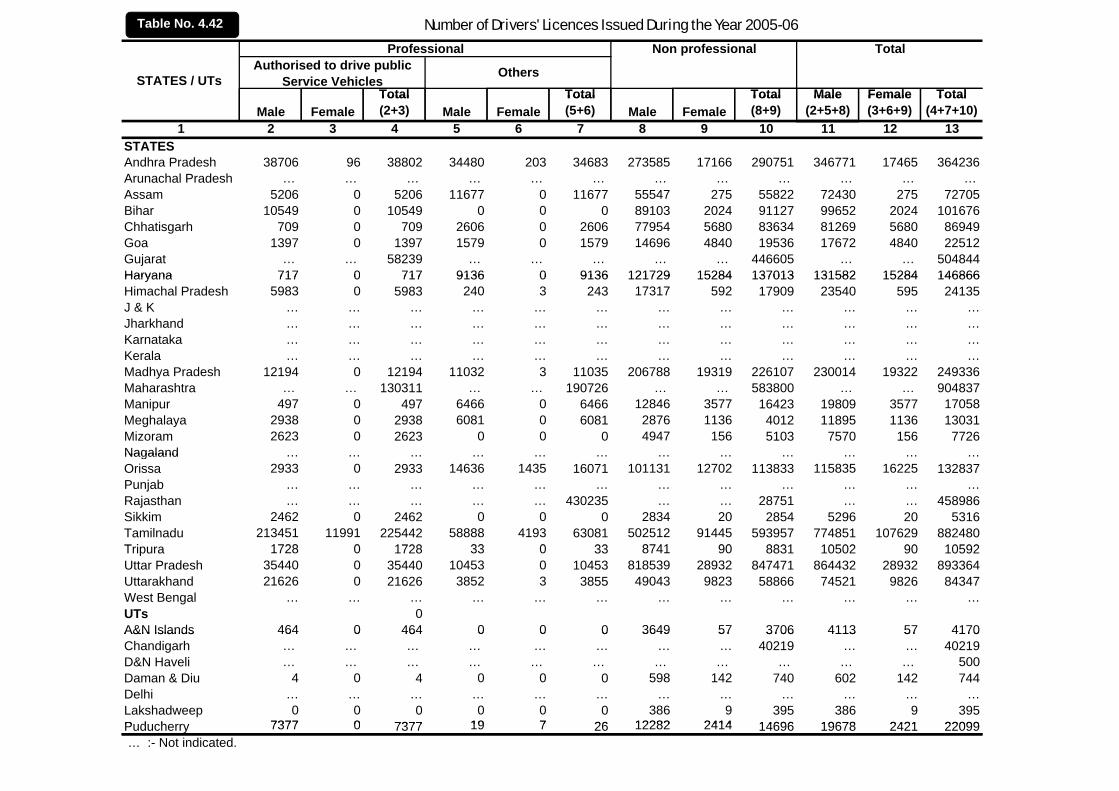
Total Total Total Male Female Total
Number of Drivers' Licences Issued During the Year 2005-06
STATES / UTs
Professional Non professional TotalAuthorised to drive public
Service VehiclesOthers
Table No. 4.42
Male FemaleTotal (2+3) Male Female
Total (5+6) Male Female
Total (8+9)
Male (2+5+8)
Female (3+6+9)
Total (4+7+10)
1 2 3 4 5 6 7 8 9 10 11 12 13STATES Andhra Pradesh 38706 96 38802 34480 203 34683 273585 17166 290751 346771 17465 364236Arunachal Pradesh … … … … … … … … … … … … Assam 5206 0 5206 11677 0 11677 55547 275 55822 72430 275 72705Bihar 10549 0 10549 0 0 0 89103 2024 91127 99652 2024 101676Chhatisgarh 709 0 709 2606 0 2606 77954 5680 83634 81269 5680 86949Goa 1397 0 1397 1579 0 1579 14696 4840 19536 17672 4840 22512Gujarat … … 58239 … … … … … 446605 … … 504844Haryana 717 0 717 9136 0 9136 121729 15284 137013 131582 15284 146866Haryana 717 0 717 9136 0 9136 121729 15284 137013 131582 15284 146866Himachal Pradesh 5983 0 5983 240 3 243 17317 592 17909 23540 595 24135J & K … … … … … … … … … … … …Jharkhand … … … … … … … … … … … …Karnataka … … … … … … … … … … … …Kerala … … … … … … … … … … … …Madhya Pradesh 12194 0 12194 11032 3 11035 206788 19319 226107 230014 19322 249336Maharashtra … … 130311 … … 190726 … … 583800 … … 904837Manipur 497 0 497 6466 0 6466 12846 3577 16423 19809 3577 17058Meghalaya 2938 0 2938 6081 0 6081 2876 1136 4012 11895 1136 13031Mizoram 2623 0 2623 0 0 0 4947 156 5103 7570 156 7726Nagaland … … … … … … … … … … … …Nagaland … … … … … … … … … … … …Orissa 2933 0 2933 14636 1435 16071 101131 12702 113833 115835 16225 132837Punjab … … … … … … … … … … … …Rajasthan … … … … … 430235 … … 28751 … … 458986Sikkim 2462 0 2462 0 0 0 2834 20 2854 5296 20 5316Tamilnadu 213451 11991 225442 58888 4193 63081 502512 91445 593957 774851 107629 882480T i 1728 0 1728 33 0 33 8741 90 8831 10502 90 10592Tripura 1728 0 1728 33 0 33 8741 90 8831 10502 90 10592Uttar Pradesh 35440 0 35440 10453 0 10453 818539 28932 847471 864432 28932 893364Uttarakhand 21626 0 21626 3852 3 3855 49043 9823 58866 74521 9826 84347West Bengal … … … … … … … … … … … …UTs 0A&N Islands 464 0 464 0 0 0 3649 57 3706 4113 57 4170A&N Islands 464 0 464 0 0 0 3649 57 3706 4113 57 4170Chandigarh … … … … … … … … 40219 … … 40219D&N Haveli … … … … … … … … … … … 500Daman & Diu 4 0 4 0 0 0 598 142 740 602 142 744Delhi … … … … … … … … … … … …Lakshadweep 0 0 0 0 0 0 386 9 395 386 9 395P d h 7377 0 7377 19 7 26 12282 2414 14696 19678 2421 22099Puducherry 7377 0 7377 19 7 26 12282 2414 14696 19678 2421 22099 … :- Not indicated.
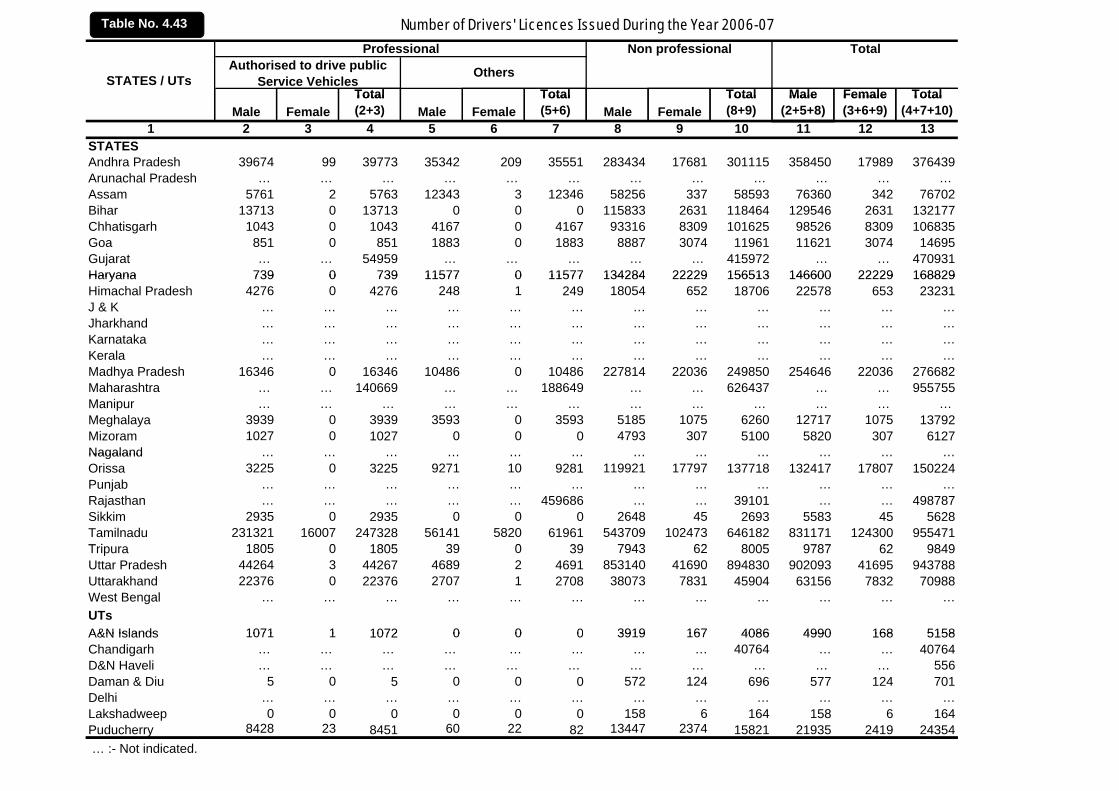
Total Total Total Male Female Total
Number of Drivers' Licences Issued During the Year 2006-07
STATES / UTs
Professional Non professional TotalAuthorised to drive public
Service VehiclesOthers
Table No. 4.43
Male FemaleTotal (2+3) Male Female
Total (5+6) Male Female
Total (8+9)
Male (2+5+8)
Female (3+6+9)
Total (4+7+10)
1 2 3 4 5 6 7 8 9 10 11 12 13STATES Andhra Pradesh 39674 99 39773 35342 209 35551 283434 17681 301115 358450 17989 376439Arunachal Pradesh … … … … … … … … … … … … Assam 5761 2 5763 12343 3 12346 58256 337 58593 76360 342 76702Bihar 13713 0 13713 0 0 0 115833 2631 118464 129546 2631 132177Chhatisgarh 1043 0 1043 4167 0 4167 93316 8309 101625 98526 8309 106835Goa 851 0 851 1883 0 1883 8887 3074 11961 11621 3074 14695Gujarat … … 54959 … … … … … 415972 … … 470931Haryana 739 0 739 11577 0 11577 134284 22229 156513 146600 22229 168829Haryana 739 0 739 11577 0 11577 134284 22229 156513 146600 22229 168829Himachal Pradesh 4276 0 4276 248 1 249 18054 652 18706 22578 653 23231J & K … … … … … … … … … … … …Jharkhand … … … … … … … … … … … …Karnataka … … … … … … … … … … … …Kerala … … … … … … … … … … … …Madhya Pradesh 16346 0 16346 10486 0 10486 227814 22036 249850 254646 22036 276682Maharashtra … … 140669 … … 188649 … … 626437 … … 955755Manipur … … … … … … … … … … … … Meghalaya 3939 0 3939 3593 0 3593 5185 1075 6260 12717 1075 13792Mizoram 1027 0 1027 0 0 0 4793 307 5100 5820 307 6127Nagaland … … … … … … … … … … … …Nagaland … … … … … … … … … … … …Orissa 3225 0 3225 9271 10 9281 119921 17797 137718 132417 17807 150224Punjab … … … … … … … … … … … …Rajasthan … … … … … 459686 … … 39101 … … 498787Sikkim 2935 0 2935 0 0 0 2648 45 2693 5583 45 5628Tamilnadu 231321 16007 247328 56141 5820 61961 543709 102473 646182 831171 124300 955471T i 1805 0 1805 39 0 39 7943 62 8005 9787 62 9849Tripura 1805 0 1805 39 0 39 7943 62 8005 9787 62 9849Uttar Pradesh 44264 3 44267 4689 2 4691 853140 41690 894830 902093 41695 943788Uttarakhand 22376 0 22376 2707 1 2708 38073 7831 45904 63156 7832 70988West Bengal … … … … … … … … … … … …UTsA&N Islands 1071 1 1072 0 0 0 3919 167 4086 4990 168 5158A&N Islands 1071 1 1072 0 0 0 3919 167 4086 4990 168 5158Chandigarh … … … … … … … … 40764 … … 40764D&N Haveli … … … … … … … … … … … 556Daman & Diu 5 0 5 0 0 0 572 124 696 577 124 701Delhi … … … … … … … … … … … …Lakshadweep 0 0 0 0 0 0 158 6 164 158 6 164
8428 23 60 22 13447 2374Puducherry 8428 23 8451 60 22 82 13447 2374 15821 21935 2419 24354 … :- Not indicated.

Number of Conductors' Licences Issued As on 31.3.2005 & During 2004-05
Male Female Total Male Female Total1 2 3 4 5 6 7
STATES Andhra Pradesh 433499 45138 478637 1111 256 1367Arunachal Pradesh
STATES/UTs Licences valid at the end of the year New licences issued during the year
Table No. 4.51
Arunachal Pradesh … … … … … …Assam 34096 0 34096 588 0 588Bihar 4209 0 4209 … … …Chhatisgarh 13308 0 13308 327 0 327Goa 11458 6 11464 91 0 91Gujarat ** 229391 1024Haryana 208463 0 208463 24679 0 24679Himachal Pradesh 19637 4 19641 624 6 630J & K … … … … … …Jharkhand … … … … … …Karnataka ** 815509 12673Kerala … … … … … …Madhya Pradesh ** … … 69025 … … 304Maharashtra ** 921766 29338Maharashtra 921766 29338Manipur … … … … … …Meghalaya 4899 27 4926 621 0 621Mizoram 110 0 110 342 0 342Nagaland … … … … … …Orissa 13992 0 13992 438 0 438Punjab … … … … … …R j th **Rajasthan ** 94290 2037Sikkim … … … … … …Tamilnadu 550003 4750 554753 23691 1457 25148Tripura 7110 0 7110 140 0 140Uttar Pradesh … … … … … …Uttarakhand 31717 0 31717 372 0 372West Bengal … … … … … …g … … … … … …UTsA&N Islands … … … … … …Chandigarh 558 0 558 207 0 207D&N Haveli … … … … … …Daman & Diu … … … … … …Delhi … … … … … …Lakshadweep 0 0 0 0 0 0Lakshadweep 0 0 0 0 0 0Puducherry 1195 4 1199 34 0 34Source : State/UTs Transport Commissioner Office** Breakup not available
Table No. 4.51
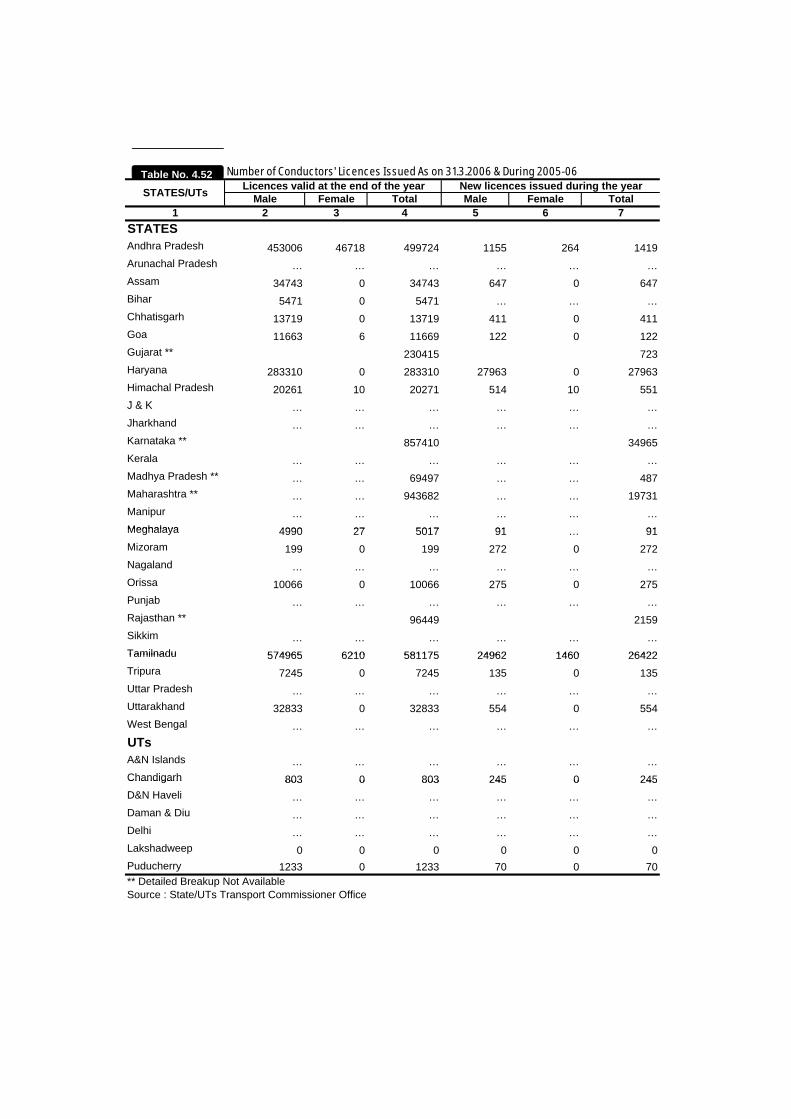
Number of Conductors' Licences Issued As on 31.3.2006 & During 2005-06
Male Female Total Male Female Total1 2 3 4 5 6 7
STATES Andhra Pradesh 453006 46718 499724 1155 264 1419Arunachal Pradesh … … … … … …
STATES/UTs Licences valid at the end of the year New licences issued during the yearTable No. 4.52
Assam 34743 0 34743 647 0 647Bihar 5471 0 5471 … … …Chhatisgarh 13719 0 13719 411 0 411Goa 11663 6 11669 122 0 122Gujarat ** 230415 723Haryana 283310 0 283310 27963 0 27963Himachal Pradesh 20261 10 20271 514 10 551J & KJ & K … … … … … …Jharkhand … … … … … …Karnataka ** 857410 34965Kerala … … … … … …Madhya Pradesh ** … … 69497 … … 487Maharashtra ** … … 943682 … … 19731Manipur … … … … … …Meghalaya 4990 27 5017 91 91Meghalaya 4990 27 5017 91 … 91Mizoram 199 0 199 272 0 272Nagaland … … … … … …Orissa 10066 0 10066 275 0 275Punjab … … … … … …Rajasthan ** 96449 2159Sikkim … … … … … …Tamilnadu 574965 6210 581175 24962 1460 26422Tamilnadu 574965 6210 581175 24962 1460 26422Tripura 7245 0 7245 135 0 135Uttar Pradesh … … … … … …Uttarakhand 32833 0 32833 554 0 554West Bengal … … … … … …UTsA&N Islands … … … … … …Chandigarh 803 0 803 245 0 245Chandigarh 803 0 803 245 0 245D&N Haveli … … … … … …Daman & Diu … … … … … …Delhi … … … … … …Lakshadweep 0 0 0 0 0 0Puducherry 1233 0 1233 70 0 70** Detailed Breakup Not AvailableSource : State/UTs Transport Commissioner Office

Number of Conductors' Licences Issued As on 31.3.2007 & During 2006-07
Male Female Total Male Female Total1 2 3 4 5 6 7
STATES Andhra Pradesh 471127 48119 519246 1201 272 1473Arunachal Pradesh … … … … … …
STATES/UTs Licences valid at the end of the year New licences issued during the yearTable No. 4.53
Assam 35470 0 35470 727 0 727Bihar 7112 0 7112 … … …Chhatisgarh 14002 0 14002 283 0 283Goa 11785 6 11791 78 0 78Gujarat ** 231138 943Haryana 324670 0 324670 58264 0 58264Himachal Pradesh 21782 38 21820 980 18 998J & KJ & K … … … … … …Jharkhand … … … … … …Karnataka ** 900157 23330Kerala 0 0Madhya Pradesh ** … … 70069 … … 853Maharashtra ** … … … … … …Manipur … … … … … …Meghalaya 5068 27 5095 78 0 78Meghalaya 5068 27 5095 78 0 78Mizoram 211 0 211 201 0 201Nagaland … … … … … …Orissa 9782 0 9782 274 0 274Punjab … … … … … …Rajasthan ** 99420 2971Sikkim … … … … … …Tamilnadu 602402 7782 610184 27437 1572 29009Tamilnadu 602402 7782 610184 27437 1572 29009Tripura 7323 0 7323 88 0 88Uttar Pradesh … … … … … …Uttarakhand 33582 0 33582 749 0 749West Bengal … … … … … …UTsA&N Islands 0 0 0 0 0 0Chandigarh 1022 0 1022 219 0 219Chandigarh 1022 0 1022 219 0 219D&N Haveli … … … … … …Daman & Diu 16 0 16 … … …Delhi 0 0Lakshadweep 0 0 0 0 0 0Puducherry 1303 0 1303 172 0 172** Detailed Breakup Not AvailableSource : State/UTs Transport Commissioner Office

SSEECCTTIIOONN –– VV
MMOOTTOORR VVEEHHIICCLLEE TTAAXXAATTIIOONN && SSRRTTUUss FFAARREE SSTTRRUUCCTTUURREE

TABLE NO.5.1
STATE-WISE RATES OF MOTOR VEHICLE TAXES ON PERSONALISED VEHICLES, TAXIS AND AUTORICKSHAWS 1. ANDHRA PRADESH (AS ON 31-3-2004)
a) Two Wheelers One Time Tax (Life Tax) 9% of the cost of the vehicle. b) Cars One Time Tax (Life Tax) 9% of the cost of the vehicle.
c) Taxis Rs. 311/- Per Seat/Per Quarter. d) Auto-Rickshaws Passenger: 6 seater: Rs. 200/- Per Seat/Per Quarter. 4 seater: Rs. 100/- Per Seat/Per Quarter. Goods: Rs. 510/- Per Seat/Per Quarter. 2. ARUNACHAL PRADESH (AS ON 31-3-2006) a) Two wheelers One Time Tax (5 Years) Rs. 400/- b) Cars One Time Tax (5 Years) Rs. 2000/-
c) Taxis Rs.1400/- Per Year. d) Auto-Rickshaws One Time Tax (3 Years) Rs. 450/- 3. ASSAM (AS ON 31-3-2006) a) Two wheelers One Time Tax (15 Years):
Less than 65 kg. ULW - Rs. 1500/- From 65 kgs. to 90 kgs. ULW - Rs. 2500/- From 90 kgs. to 135 kgs. ULW - Rs. 3500/- More than 135 kgs. - Rs. 4000/- b) Cars One Time Tax (15 Years):
Original cost price upto Rs. 3 lakhs - 3% of the cost. Original cost price upto 15 lakhs - 4% of the cost. Original cost price above 15 lakhs - 5% of the cost. Original cost price above 20 lakh - 7% of the cost. Old vehicle requiring to be registered in Assam on transfer from another state : One time tax is fixed after allowing depreciation @ rate of 7% per annum of the tax payable for a new vehicle of the same category at the current cost price.

c) Taxis Upto 6 passenger Rs.2750 PY plus 690
quarterly for city. Rs. 5000 PY plus 1250 for all over the State.
d) Auto-Rickshaws One Time Tax (15 Years): Rs.3500/- 4. BIHAR (AS ON 31-3-2007)
a) Two wheeler One Time Tax 3% of the cost of vehicles excluding sales tax or specified tax, whichever is higher.
Upto 50 Kgs. - Rs. 900/- 50 to 100 Kgs. - Rs. 1200/-
More than 100 kgs. - Rs. 1500/-
b) Cars/Jeeps One Time Tax 3% of the cost of vehicles excluding sales tax or Rs.3750/-, whichever is higher.
c) Taxis Rs.528/- per annum+ Rs.1600/- per annum. (MVT+Additional Tax) d) Auto-Rickshaws Rs. 528/- per annum + Rs.1600/- per annum. (MVT+Additional Tax) 5. CHHATTISGARH (AS ON 31-3-2006) a) Two wheelers Life time tax @ 4% of the cost of the vehicle. b) Cars Life time tax @ 5% of the cost up to Rs. 5 lakhs. There after 6% of the cost of the vehicle. c) Taxis Rs. 200/- Per Seat /Per Quarter for All India Tourist Permit.
Rs. 150/- Per Seat /Per Quarter for other than All India Tourist Permit.
d) Auto-Rickshaws Life time tax @ 2% of the cost of the vehicle. 6. GOA (31-3-2007) a) Two wheelers Life time tax @ 7% of vehicle cost.
b) Cars One time tax @ 3.5% of vehicle cost c) Taxis Rs.400 /- Per Annum
d) Auto-Rickshaws Passenger vehicles: Rs.155/- Per Annum Goods vehicle: Rs.700/- Per Annum

7. GUJARAT (AS ON 31-3-2006) a) Two wheelers ULW upto 50 Kgs - Rs.500/- (Lump sum Tax)
Above 50 to 100 kgs - Rs.1000/- (Lump sum Tax) Above 100 kgs -Rs.2000/- (Lump sum Tax)
b) Cars Petrol/CNG/LPG driven vehicle – 6% of the cost of
the vehicle. Diesel driven vehicle – 7.5% of the cost of vehicle.
c) Taxis Petrol /CNG/LPG driven vehicle – 5% of the cost of
the vehicle. Diesel driven vehicle – 7.5% of the cost of vehicle.
d) Auto-Rickshaws: Petrol /CNG/LPG driven vehicles:
Upto 3 passengers - Rs.2500/- (Lump sum Tax) Upto 4 passengers- Rs.8000/- (Lump sum Tax) Upto 5 passengers - Rs.8900/- (Lump sum Tax) Upto 6 passengers - Rs.9800/- (Lump sum Tax) Diesel driven vehicles: Upto 3 passengers - Rs.3750/- (Lump sum Tax) Upto 4 passengers- Rs.12000/- (Lump sum Tax) Upto 5 passengers - Rs.13350/- (Lump sum Tax) Upto 6 passengers - Rs.14700/- (Lump sum Tax)
8. HARYANA (AS ON 31-3-2006)
a) Two-wheelers ULW below 90.72 Kgs - Rs.150/- Above 90.72 Kgs - Rs.500/-
b) Cars Lump sum One Time Tax :
Original cost price upto Rs. 4 lakhs - Rs.2000/- Original cost price above 4 lakhs and upto 10 lakhs – 1 % of the value of the car. Original cost price above 10 lakh -1.5 % of the value of the car.
c) Maxi-Cabs Rs. 200/- Per Seat Per Annum. d) Motor- Cabs Rs. 100/- Per Seat Per Annum.

9. HIMACHAL PRADESH (AS ON 30-6-2007) a) Two wheelers Upto 50 cc - 3% of the cost of the Vehicle (One
time Tax) Exceeding 50 cc - 4% of the cost of the Vehicle (One time Tax)
b) Cars Upto 1000 cc – 2.5 % of the cost of the Vehicle
(One time Tax) Exceeding 1000 cc - 3% of the cost of the Vehicle
(One time Tax) c) Maxi Cabs Rs. 750/- Per Seat/Per Annum. d) Motor Cab Rs. 350/- Per Seat/Per Annum. e) Auto-rickshaws Rs. 200/- Per Seat/Per Annum. 10. JAMMU & KASHMIR (AS ON 31-3-2006)
a) Two Wheelers Scooter: One time Tax of Rs. 2400/- Motor Cycle: One time Tax of Rs. 4000/- b) Cars One time Tax of Rs. 6000/- upto 14 HP One time Tax of Rs. 20000/- above 14 HP c) Taxis Rs. 250/- Per Quarter d) Auto-Rickshaws Rs. 375/- Per Quarter
11. KARNATAKA (AS ON 31-3-2007)
a) Two Wheelers Upto 300 cc and cost of vehicle exceeding Rs. 50,000/- 7% of the cost of the vehicle. Cost of the vehicle exceeding Rs.50,000/- 9% of the Cost of the vehicle. (Life time). b) Cars/Jeeps a) Cost of vehicle not exceeding Rs. 5 lakhs – 9% of the cost of the vehicle. (Life time). b) Cost of vehicle exceeding Rs. 5 lakhs and upto Rs.10 Lakhs – 10% of the cost of the vehicle. (Life time). c) Cost of vehicle exceeding Rs.10 lakhs and upto Rs.10 Lakhs – 12% of the cost of the vehicle. (Life time). c) Taxis Rs. 100 /- Per Quarter d) Auto-Rickshaws Life time Tax of Rs. 2500 life time for passengers as well as goods carriers (Laden Weight not exceeding 1500 Kgs).

12 KERALA (AS ON 01-04-2007)
a) Two Wheelers Below 95 cc - Rs.35 /- Per Quarter Above 95 cc - Rs. 45/- Per Quarter
b) Car ULW not more than 750 kgs.- Rs. 320/- payable every two years. ULW more than750 but not more than1500 kgs. – Rs. 430/- payable every two years.
ULW Above 1500 Kgs -Rs430/- payable every two years.
c) Auto-Rickshaws Petrol Driven- Rs.120/- Diesel Driven - Rs.130/-
13. MADHYA PRADESH (AS ON 31-3-2006) a) Two wheelers Motor Cycle- ULW upto 70 kgs- Rs. 18/- Per Quarter ULW Above 70 kgs - Rs. 28/- Per Quarter b) Cars ULW upto 800 kgs - Rs. 64/- Per Quarter Above 800 to 1600 kgs - Rs. 94/- Per Quarter Above 1600 to 2400 kgs - Rs. 112/- Per Quarter Above 2400 to 3200 kgs - Rs.132 /- Per Quarter Above 3200 kgs. - Rs. 150/- Per Quarter c) Taxis N.A. d) Auto-rickshaws Upto 3 passengers- Rs.40/- Per Seat Per Quarter.
More than 3 passengers and upto 6 Passengers- Rs. 150.00 per seat per quarter or lumpsum at the rate of-
(a) 7 Percent of the cost of the new vehicle (b) 2 percent of the cost of other vehicles for
which life time tax has already been paid.

14. MAHARASHTRA (AS ON 31-3-2007) a) Two wheelers One time Tax of 7% of the cost of vehicle b) Cars One time Tax of 7 % of the cost of vehicle c) Taxis Taxi (4+1) - Rs.450 /- Per Annum Cool Cab- Rs.200/- per Passenger Per Annum Tourist Taxi- AC : Rs. 400/- per Passenger Per Annum non AC: Rs. 300/- per Passenger Per Annum Imported: Rs. 600 /- per Passenger Per Annum d) Auto-rickshaws One time Tax of 7 % of the cost of vehicle 15. MANIPUR (AS ON 31-3-2006) a) Two wheelers Rs. 100/-Per Annum. b) Cars Rs.260 /-Per Annum. c) Taxis Rs. 300 /-Per Annum. plus Rs. 480/- passenger tax Per Annum.. d) Auto-rickshaws Rs.120/-Per Annum. plus Rs. 60/- passenger tax. 16. MEGHALAYA (AS ON 31-3-2005),
a) Two wheelers Upto 90 kgs (ULW) - Rs. 65/-Per Annum. Above 90 kgs (ULW) - Rs.100 /-Per Annum. b) Cars Rs 225/-Per Annum. (If it is 14 HP or less) 275/-Per Annum. (If it exceeds 14 HP) c) Taxis Local -Rs.460 /-Per Annum. Maxi cab- Rs.2000 /-Per Annum. d) Auto-Rickshaws Rs. 200/-Per Annum.
17. MIZORAM (AS ON 31-3-2007)
a) Two wheelers Rs.150/- Per Annum b) Cars Rs.500/- Per Annum
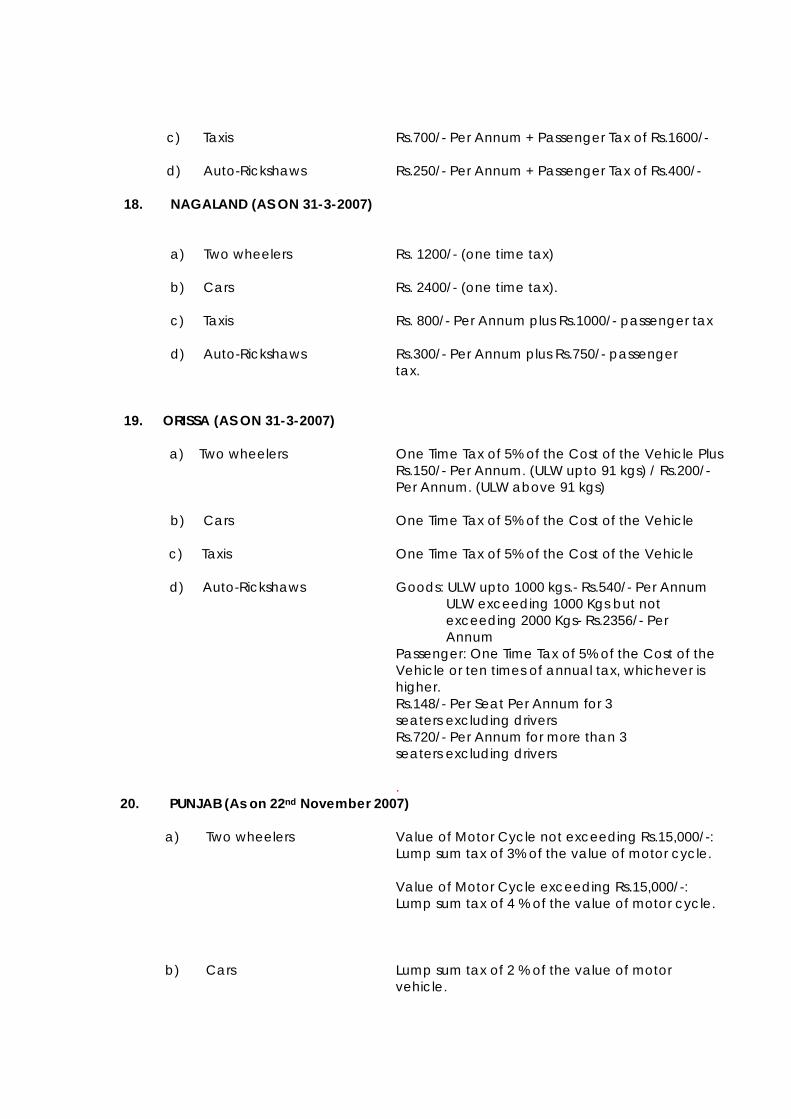
c) Taxis Rs.700/- Per Annum + Passenger Tax of Rs.1600/- d) Auto-Rickshaws Rs.250/- Per Annum + Passenger Tax of Rs.400/-
18. NAGALAND (AS ON 31-3-2007)
a) Two wheelers Rs. 1200/- (one time tax) b) Cars Rs. 2400/- (one time tax). c) Taxis Rs. 800/- Per Annum plus Rs.1000/- passenger tax d) Auto-Rickshaws Rs.300/- Per Annum plus Rs.750/- passenger tax.
19. ORISSA (AS ON 31-3-2007) a) Two wheelers One Time Tax of 5% of the Cost of the Vehicle Plus Rs.150/- Per Annum. (ULW upto 91 kgs) / Rs.200/- Per Annum. (ULW above 91 kgs) b) Cars One Time Tax of 5% of the Cost of the Vehicle c) Taxis One Time Tax of 5% of the Cost of the Vehicle d) Auto-Rickshaws Goods: ULW upto 1000 kgs.- Rs.540/- Per Annum ULW exceeding 1000 Kgs but not exceeding 2000 Kgs- Rs.2356/- Per Annum Passenger: One Time Tax of 5% of the Cost of the Vehicle or ten times of annual tax, whichever is higher. Rs.148/- Per Seat Per Annum for 3 seaters excluding drivers Rs.720/- Per Annum for more than 3 seaters excluding drivers . 20. PUNJAB (As on 22nd November 2007) a) Two wheelers Value of Motor Cycle not exceeding Rs.15,000/-: Lump sum tax of 3% of the value of motor cycle. Value of Motor Cycle exceeding Rs.15,000/-: Lump sum tax of 4 % of the value of motor cycle. b) Cars Lump sum tax of 2 % of the value of motor vehicle.

c) Taxis Maxi Cab - Rs.750/- Per Seat Per Annum Motor Cab - Rs.750/- Per Seat Per Annum d) Three Wheelers Autorickshaw upto 6 seats excluding driver- Rs.400/- Per Seat Per Annum 21. RAJASTHAN (AS ON 31-3-2006)
a) Two wheelers Upto 100 cc - 5% of the cost of the Vehicle (One time Tax)
Exceeding 100 cc and Upto 150cc – 6 % of the cost of the Vehicle (One time Tax)
More than 150 cc - 7% of the cost of the vehicle. (One time Tax)
b) Cars Seating Capacity upto 5 including driver and cost up to 4 Lakhs- 4% of the cost of the Vehicle (One time Tax) Seating Capacity upto 5 including driver and cost more than 4 lakhs and up to 8 Lakhs- 5% of the cost of the Vehicle (One time Tax) Seating Capacity upto 5 including driver and cost More than 8 Lakhs- 6 % of the cost of the Vehicle (One time Tax) Seating Capacity more than 5 including driver and upto 10 including driver and cost up to 4 Lakhs- 5.5% of the cost of the Vehicle (One time Tax) Seating Capacity more than 5 including driver and upto 10 including driver and cost more than 4 lakhs and up to 8 Lakhs-6.5% of the cost of the Vehicle (One time Tax) Seating Capacity more than 5 including driver and upto 10 including driver and cost more than 8 lakhs -7% of the cost of the Vehicle (One time Tax)
c) Taxis N.A. d) Auto-Rickshaws Cost of the Vehicle upto 1.5 Lakhs- 3% of the cost
of the vehicle (One time Tax) Cost of the Vehicle above 1.5 Lakhs- 4% of the cost
of the vehicle (One time Tax) Cost of the Chassis upto 1.5 Lakhs- 3.75 % of the
cost of the Chassis (One time Tax) Cost of the Chassis above 1.5 Lakhs- 5 % of the cost
of the Chassis (One time Tax)

22. SIKKIM a) Two wheelers N.A. b) Cars N.A. c) Taxis N.A. d) Auto-Rickshaws N.A.
23. TAMIL NADU (AS ON 31-3-2007) a) Two wheelers Life Time Tax of 8% of Ex-Factory Price of the Vehicle. (W.e.f. 01-06-2008) b) Cars Life Time Tax of 8% of Ex-Factory Price of the Vehicle. (W.e.f. 01-06-2008) c) Taxis Ordinary taxi - Rs.4000/- every five years. Tourist Taxi- Rs.6500 /- every five years. d) Auto-Rickshaws 3+1 Vehicle- Rs.1400 /- every five years. 5+1 Vehicle- Rs.4000 /- every five years.
24. TRIPURA (AS ON 31-3-2007) a) Two wheelers Rs.110/- Per Annum b) Cars Rs.275/- Per Annum c) Taxis Rs.440/- Per Annum d) Auto-Rickshaws Passengers - Rs.150 /- Per Annum Goods – Rs.105/- Per Annum
25. UTTAR PRADESH (AS ON 31-3-2008) a) Two Wheelers Less than 50 cc – Rs.1000/- (One Time Tax) 50cc and above- Rs.1600/-(One time Tax)
b) Cars Petrol driven vehicle – One time Tax of 2.5% of the cost of the vehicle. Diesel driven vehicle – One time Tax of 5% of the cost of the vehicle.
c) Taxis Seating Capacity of 6+1- Quarterly Motor Vehicle Tax of Rs. 230/- + Passenger Tax of Rs.2000/-
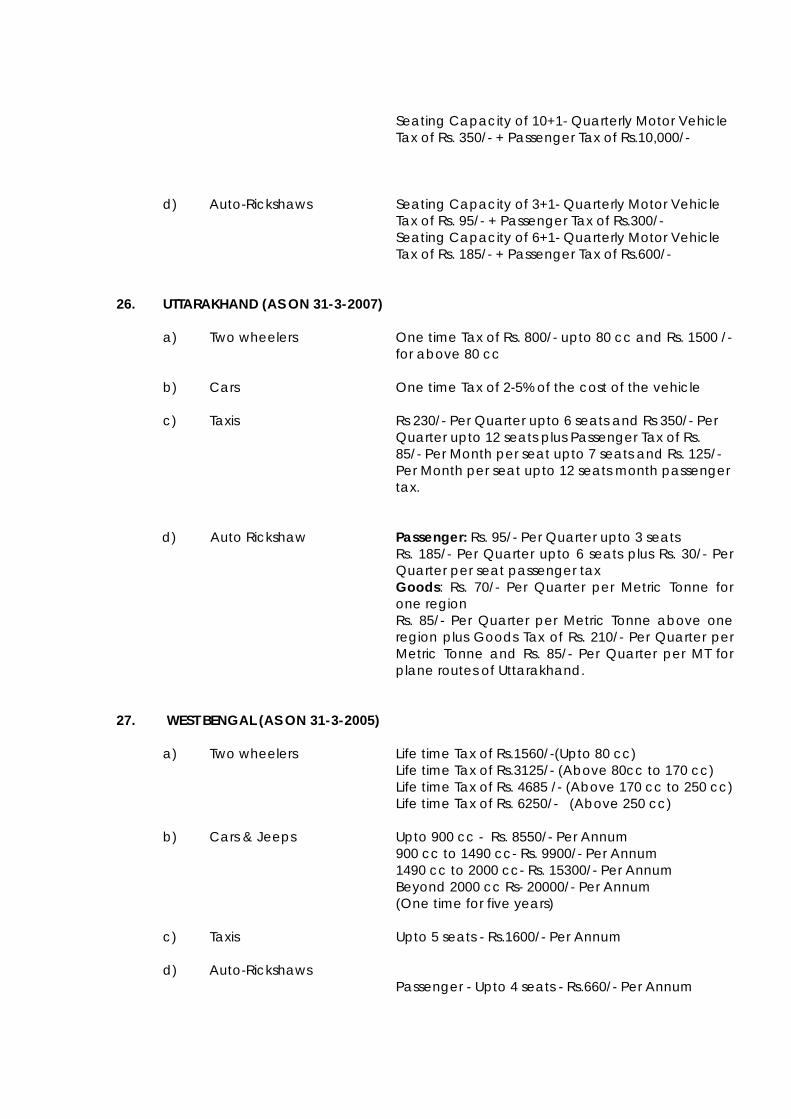
Seating Capacity of 10+1- Quarterly Motor Vehicle Tax of Rs. 350/- + Passenger Tax of Rs.10,000/-
d) Auto-Rickshaws Seating Capacity of 3+1- Quarterly Motor Vehicle Tax of Rs. 95/- + Passenger Tax of Rs.300/- Seating Capacity of 6+1- Quarterly Motor Vehicle Tax of Rs. 185/- + Passenger Tax of Rs.600/- 26. UTTARAKHAND (AS ON 31-3-2007)
a) Two wheelers One time Tax of Rs. 800/- upto 80 cc and Rs. 1500 /- for above 80 cc b) Cars One time Tax of 2-5% of the cost of the vehicle c) Taxis Rs 230/- Per Quarter upto 6 seats and Rs 350/- Per Quarter upto 12 seats plus Passenger Tax of Rs. 85/- Per Month per seat upto 7 seats and Rs. 125/-
Per Month per seat upto 12 seats month passenger tax.
d) Auto Rickshaw Passenger: Rs. 95/- Per Quarter upto 3 seats Rs. 185/- Per Quarter upto 6 seats plus Rs. 30/- Per
Quarter per seat passenger tax Goods: Rs. 70/- Per Quarter per Metric Tonne for
one region Rs. 85/- Per Quarter per Metric Tonne above one
region plus Goods Tax of Rs. 210/- Per Quarter per Metric Tonne and Rs. 85/- Per Quarter per MT for plane routes of Uttarakhand.
27. WEST BENGAL (AS ON 31-3-2005) a) Two wheelers Life time Tax of Rs.1560/-(Upto 80 cc) Life time Tax of Rs.3125/- (Above 80cc to 170 cc) Life time Tax of Rs. 4685 /- (Above 170 cc to 250 cc) Life time Tax of Rs. 6250/- (Above 250 cc) b) Cars & Jeeps Upto 900 cc - Rs. 8550/- Per Annum 900 cc to 1490 cc- Rs. 9900/- Per Annum 1490 cc to 2000 cc- Rs. 15300/- Per Annum Beyond 2000 cc Rs- 20000/- Per Annum (One time for five years) c) Taxis Upto 5 seats - Rs.1600/- Per Annum d) Auto-Rickshaws Passenger - Upto 4 seats - Rs.660/- Per Annum

Goods - Upto 2000 kg Rs. 600/- Per Annum
28. ANDAMAN & NICOBAR ISLANDS (AS ON 31-3-2007) a) Two wheelers Rs.25/- Per Annum. b) Cars Rs.60/- Per Annum. c) Taxis Rs.75/- Per Annum. d) Auto-Rickshaws Passengers - Rs.60/- Per Annum. Goods: Rs.60/- Per Annum.
29. CHANDIGARH (AS ON 31-3-2007) a) Two-wheelers Moped – One Time Tax of Rs.150/- (for 15 yrs.). Motor cycles/scooter – One Time Tax of Rs500/- (for 15 yrs.). b) Cars 4 seats - One Time Tax of Rs.1800/- (for 15 yrs.). 5 seats - One Time Tax of Rs.2100/- (for 15 yrs.). 6 seats - One Time Tax of Rs.2400/- (for 15 yrs.).
7 seats - One Time Tax of Rs.4260 /- (for 15 yrs.). 8 seats - One Time Tax of Rs.5010/- (for 15 yrs.). 9 seats - One Time Tax of Rs.5760/- (for 15 yrs.). 10 seats - One Time Tax of Rs.6510/- (for 15 yrs.). 11 seats - One Time Tax of Rs.8010/- (for 15 yrs.). 12 seats - One Time Tax of Rs.9510/- (for 15 yrs.).
c) Taxis Rs.100/- Per Seat Per Year. d) Auto-Rickshaws Rs.320/- Per Year (Passengers) Rs.320/- Per Year (Goods)
30. DADRA & NAGAR HAVELI (AS ON 31-3-2007) a) Two wheelers Not exceeding 100 kgs of ULW - Rs.70/- Per Annum
Above 100 kgs of ULW - Rs.90/- Per Annum
b) Cars ULW upto 750 kgs- Rs.120/- Per Annum Above 750 to 2250 kgs- Rs.270/- Per Annum Above 2250 to 3000 kgs. Rs.300 PY. Above 3000 to 3750 kgs. Rs.375 PY. c) Taxis Rs.360/- Per Annum d) Auto-Rickshaws Rs.240/- Per Annum
31. DAMAN & DIU (AS ON 31-3-2007) a) Two wheelers Upto 50 cc - Rs.15/- Per Annum More than 50 cc - Rs.60/- Per Annum

b) Cars ULW upto 850 kgs - Rs.200/- Per Annum Above 850 to 1200 kgs ULW - Rs.250/- Per Annum Above 1200 to 2500 kgs ULW - Rs.350/- Per Annum Above 2500 to 5000 kgs ULW -Rs.400/- Per Annum For every 1000 kgs or part thereof in excess of 5000 Kgs ULW : Rs.60/- Per Annum
c) Taxis Upto 3 seats - Rs.225/- Per Annum Upto 4 seats - Rs.250/- Per Annum Upto 5 seats - Rs.270 /- Per Annum For every additional seat upto maximum 7 seats: Rs.25/- Per Annum
d) Auto-Rickshaws Upto 3 seats for private purpose – Rs.60/- Per Annum Upto 3 seaters used for hire – Rs.90/- Per Annum 32. DELHI
a) Two wheelers One Time Tax of Two Percent of the Cost of the Vehicle b) Cars Motor Vehicle costing upto Rs.Four Lakhs- One Time Tax of Two Percent of the Cost of the Vehicle Motor Vehicle costing more than Rs.Four Lakhs- One Time Tax of Two Percent of the Cost of the Vehicle c) Taxis N.A. d) Auto-Rickshaws N.A.
33. PUDUCHERRY (AS ON 31-3-2007) a) Two wheelers Motor cycles upto 70 cc - Rs.50/- Per Annum Motor cycles Upto 150 cc - Rs.100/- Per Annum Above 150 cc - Rs.150 /- Per Annum b) Cars N.A. c) Taxis Tax in respect of tourist taxi - Rs. 190/- Per Quarter Tax in respect of maxi cab - Rs. 110/- Per Seat Per Quarter (for 12 seats). d) Auto-Rickshaws Rs. 65/- Per Quarter.
Source: Offices of State Transport Commissioners/UT Admns. RLW: Registered Laden Weight ULW: Un Laden Weight N.A.: Not Available. Note:- Compiled on the basis of latest information made available by States/UTs.
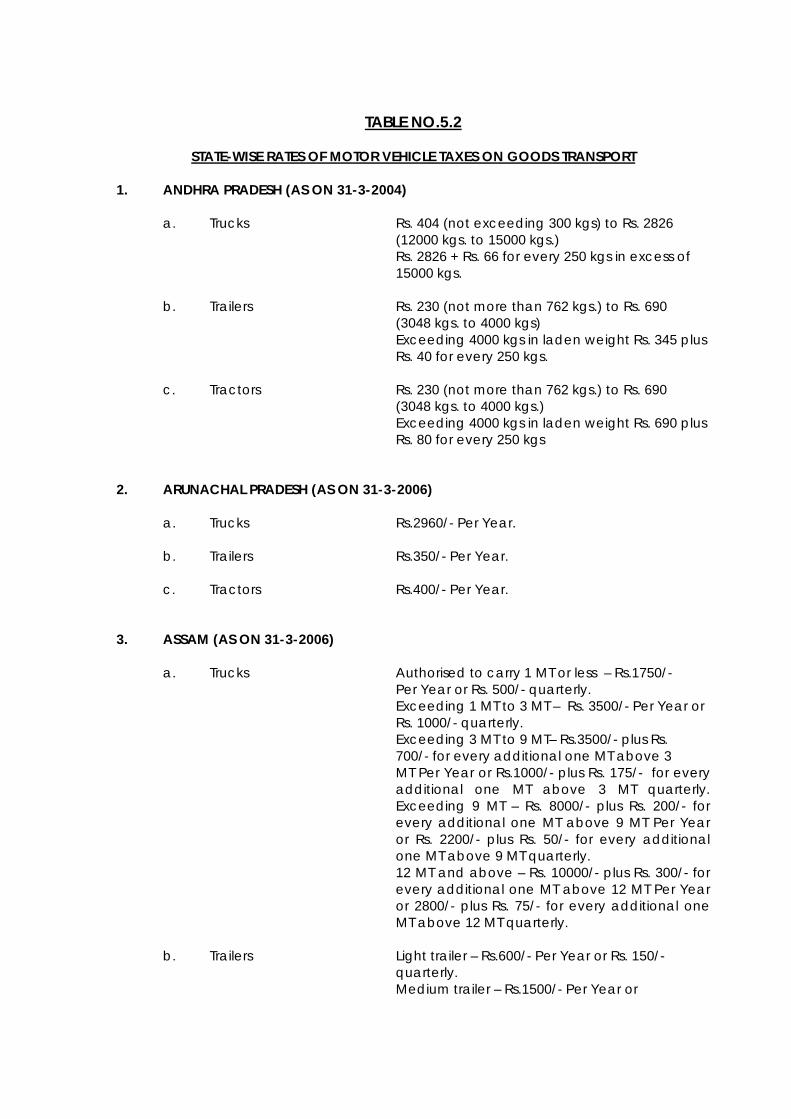
TABLE NO.5.2
STATE-WISE RATES OF MOTOR VEHICLE TAXES ON GOODS TRANSPORT 1. ANDHRA PRADESH (AS ON 31-3-2004) a. Trucks Rs. 404 (not exceeding 300 kgs) to Rs. 2826 (12000 kgs. to 15000 kgs.) Rs. 2826 + Rs. 66 for every 250 kgs in excess of 15000 kgs. b. Trailers Rs. 230 (not more than 762 kgs.) to Rs. 690
(3048 kgs. to 4000 kgs) Exceeding 4000 kgs in laden weight Rs. 345 plus
Rs. 40 for every 250 kgs. c. Tractors Rs. 230 (not more than 762 kgs.) to Rs. 690
(3048 kgs. to 4000 kgs.) Exceeding 4000 kgs in laden weight Rs. 690 plus
Rs. 80 for every 250 kgs
2. ARUNACHAL PRADESH (AS ON 31-3-2006) a. Trucks Rs.2960/- Per Year. b. Trailers Rs.350/- Per Year. c. Tractors Rs.400/- Per Year. 3. ASSAM (AS ON 31-3-2006) a. Trucks Authorised to carry 1 MT or less – Rs.1750/- Per Year or Rs. 500/- quarterly. Exceeding 1 MT to 3 MT – Rs. 3500/- Per Year or Rs. 1000/- quarterly. Exceeding 3 MT to 9 MT– Rs.3500/- plus Rs. 700/- for every additional one MT above 3
MT Per Year or Rs.1000/- plus Rs. 175/- for every additional one MT above 3 MT quarterly. Exceeding 9 MT – Rs. 8000/- plus Rs. 200/- for every additional one MT above 9 MT Per Year or Rs. 2200/- plus Rs. 50/- for every additional one MT above 9 MT quarterly. 12 MT and above – Rs. 10000/- plus Rs. 300/- for every additional one MT above 12 MT Per Year or 2800/- plus Rs. 75/- for every additional one MT above 12 MT quarterly.
b. Trailers Light trailer – Rs.600/- Per Year or Rs. 150/- quarterly. Medium trailer – Rs.1500/- Per Year or

Rs. 375/- quarterly. Heavy trailer – Rs.2500/- Per Year or Rs. 675/- quarterly. c. Tractors Upto 2 MT Rs.600/- Per Year or 150/- quarterly. Above 2 MT upto 5 MT.Rs.1200/- Per Year or Rs. 300/- quarterly. Exceeding 5 MT Rs.2000/- Per Year or Rs. 500/- quarterly. 4. BIHAR (AS ON 31-3-2007) a. Trucks Upto 500 kgs. RLW- Rs.298.50/- Per Annum + Rs. 310/-Per annum (Motor Vehicle Tax + Additional Tax) Exceeding 500 kgs.but not exceeding 2000 Kgs. RLW- Rs.298.50/- Per Annum + Rs. 34/- for every addional 250 Kgs. or part thereof above 500 Kgs. + Rs.310/- + Rs.232.50 per annum for every additional 500 kgs. or part thereof above 500 kgs. (Motor Vehicle Tax + Additional Tax) Exceeding 2000 kgs.but not exceeding 4000 Kgs. RLW- Rs.502.50/- Per Annum + Rs. 42/- for every additional 250 Kgs. or part thereof above 2000 Kgs. + Rs.310/- + Rs.232.50 per annum for every additional 500 kgs. or part thereof above 2000 kgs. (Motor Vehicle Tax + Additional Tax) Exceeding 4000 kgs.but not exceeding 8000 Kgs. RLW- Rs.838.50/- Per Annum + Rs. 51.50/- for every additional 250 Kgs. or part thereof above 4000 Kgs. + Rs.310/- + Rs.232.50 per annum for every additional 500 kgs. or part thereof above 4000 kgs. (Motor Vehicle Tax + Additional Tax) Exceeding 8000 kgs.8 RLW- Rs.1662.50/- Per Annum + Rs. 186.50/- for every additional 250 Kgs. or part thereof above 8000 Kgs. + Rs.310/- + Rs.232.50 per annum for every additional 500 kgs. or part thereof above 8000 kgs. (Motor Vehicle Tax + Additional Tax) b. Trailers Upto 500 kgs. RLW- Rs.253/- Per Annum + Rs. 1440/-Per annum (Motor Vehicle Tax + Additional Tax) Exceeding 500 kgs.but not exceeding 2000 Kgs. RLW- Rs.253/- Per Annum + Rs. 29/- for every addional 250 Kgs. or part thereof above 500 Kgs. + Rs.1440/- (Motor Vehicle Tax + Additional Tax) Exceeding 2000 kgs.but not exceeding 4000 Kgs. RLW- Rs.432/- Per Annum + Rs. 40/- for every additional 250 Kgs. or part thereof above

2000 Kgs. + Rs.1440/-(Motor Vehicle Tax + Additional Tax) Exceeding 4000 kgs.but not exceeding 8000 Kgs. RLW- Rs.760/- Per Annum + Rs. 49.50/- for every additional 250 Kgs. or part thereof above 4000 Kgs. + Rs.1440/- + Rs.160/- per annum for every additional 1000 kgs. or part thereof above 5000 kgs. (Motor Vehicle Tax + Additional Tax) Exceeding 8000 kgs.8 RLW- Rs.1568/- Per Annum + Rs. 120/- for every additional 250 Kgs. or part thereof above 8000 Kgs. + Rs.1440/- + Rs.160 per annum for every additional 1000 kgs. or part thereof above 5000 kgs. (Motor Vehicle Tax + Additional Tax) c. Tractors Rs.100/- per annum 5. CHATTISGARH (AS ON 31-3-2006) a. Trucks Rs. 300/- Per Quarter up to 2000 kg. GVW. There
after Rs. 75 /- Per Quarter for each 500 kg or part thereof.
b. Trailers Rs.75 /-per 500 Kgs. Per Quarter Rs.175 /- Per Quarter in case ULW does not exceed 1000 Kgs. Rs.225 /- Per Quarter in case ULW exceeds 1000 kgs. but does not exceed 2000 Kgs. Rs.300 /- Per Quarter thereafter for each additional 1000 kgs or part thereof. Rs.100 /- Per Quarter for each trailer. c. Tractors Rs.175/- Per Quarter upto 1000 Kg ULW Rs. 225 /- Per Quarter for 1000 to 2000 Kg ULW 6. GOA (31-3-2007) a. Trucks Rs.700/- per annum Per thousand Kgs. b. Trailers Rs.40/- per annum Per Hundred Kgs. c. Tractors One time tax @ 3.5% of vehicle cost.
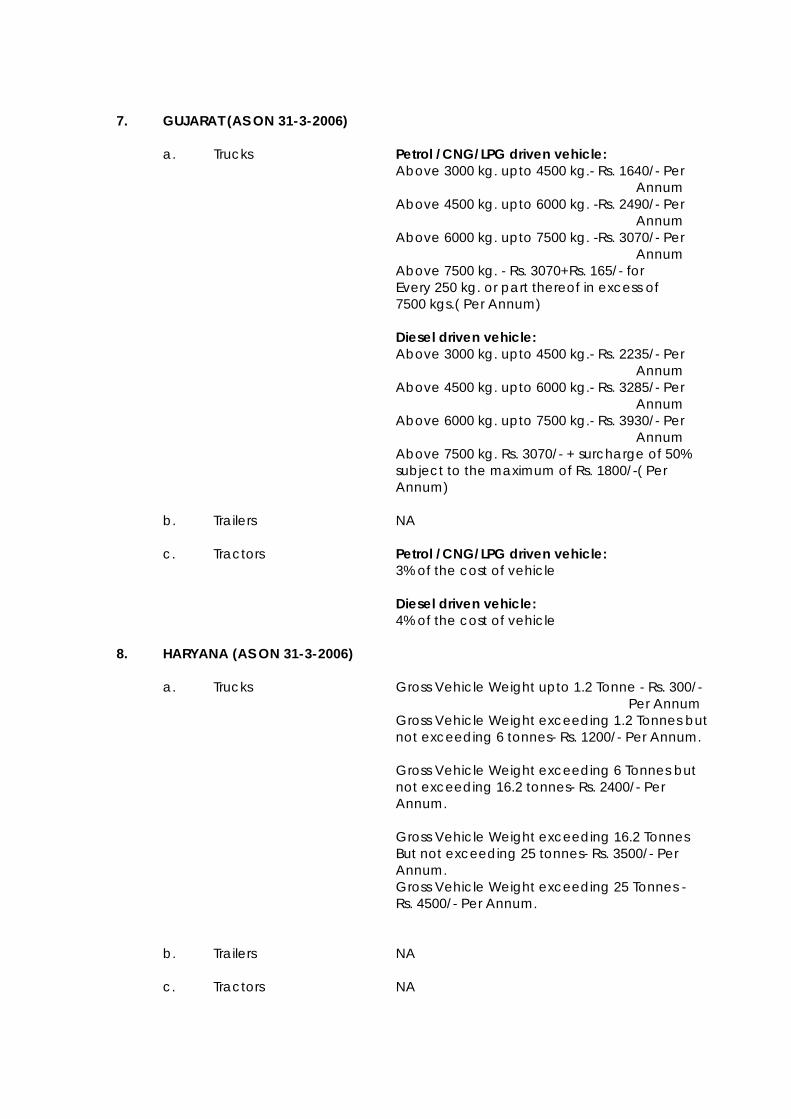
7. GUJARAT (AS ON 31-3-2006) a. Trucks Petrol /CNG/LPG driven vehicle: Above 3000 kg. upto 4500 kg.- Rs. 1640/- Per Annum Above 4500 kg. upto 6000 kg. -Rs. 2490/- Per Annum Above 6000 kg. upto 7500 kg. -Rs. 3070/- Per Annum Above 7500 kg. - Rs. 3070+Rs. 165/- for Every 250 kg. or part thereof in excess of 7500 kgs.( Per Annum) Diesel driven vehicle: Above 3000 kg. upto 4500 kg.- Rs. 2235/- Per Annum Above 4500 kg. upto 6000 kg.- Rs. 3285/- Per Annum Above 6000 kg. upto 7500 kg.- Rs. 3930/- Per Annum Above 7500 kg. Rs. 3070/- + surcharge of 50% subject to the maximum of Rs. 1800/-( Per Annum) b. Trailers NA c. Tractors Petrol /CNG/LPG driven vehicle: 3% of the cost of vehicle Diesel driven vehicle: 4% of the cost of vehicle 8. HARYANA (AS ON 31-3-2006) a. Trucks Gross Vehicle Weight upto 1.2 Tonne - Rs. 300/- Per Annum Gross Vehicle Weight exceeding 1.2 Tonnes but not exceeding 6 tonnes- Rs. 1200/- Per Annum. Gross Vehicle Weight exceeding 6 Tonnes but not exceeding 16.2 tonnes- Rs. 2400/- Per Annum. Gross Vehicle Weight exceeding 16.2 Tonnes But not exceeding 25 tonnes- Rs. 3500/- Per Annum. Gross Vehicle Weight exceeding 25 Tonnes - Rs. 4500/- Per Annum. b. Trailers NA c. Tractors NA
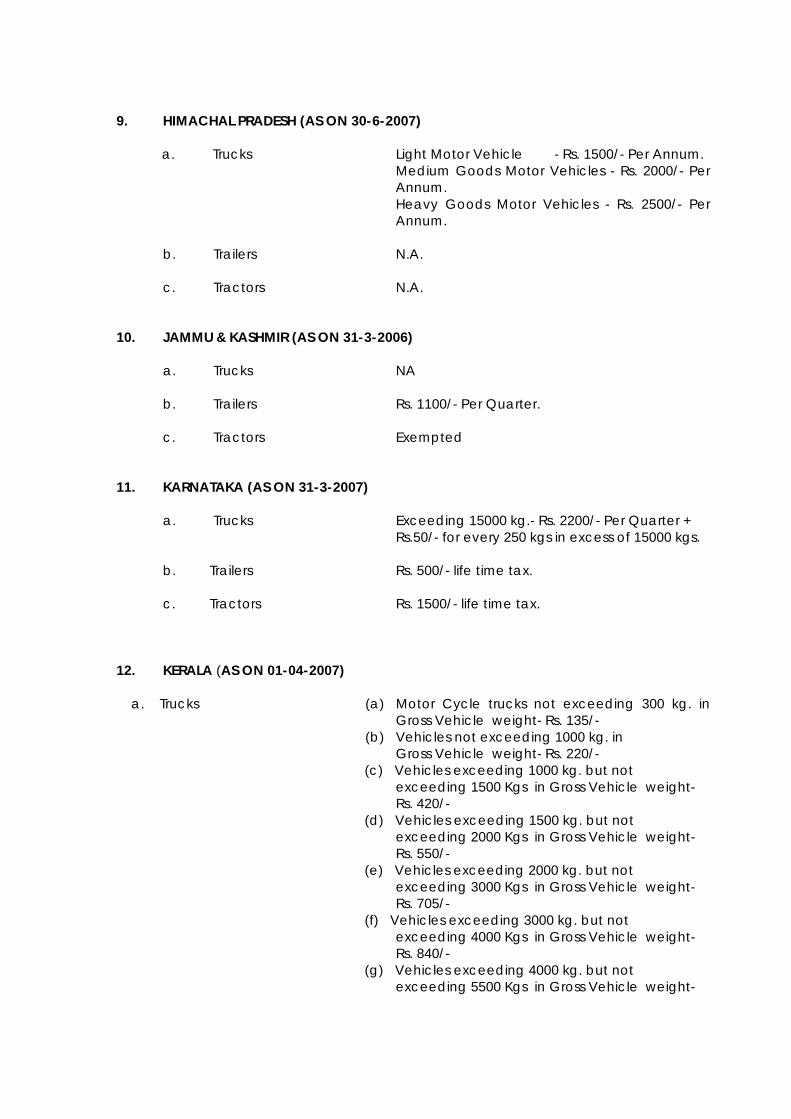
9. HIMACHAL PRADESH (AS ON 30-6-2007) a. Trucks Light Motor Vehicle - Rs. 1500/- Per Annum. Medium Goods Motor Vehicles - Rs. 2000/- Per
Annum. Heavy Goods Motor Vehicles - Rs. 2500/- Per
Annum.
b. Trailers N.A. c. Tractors N.A. 10. JAMMU & KASHMIR (AS ON 31-3-2006) a. Trucks NA b. Trailers Rs. 1100/- Per Quarter. c. Tractors Exempted 11. KARNATAKA (AS ON 31-3-2007) a. Trucks Exceeding 15000 kg.- Rs. 2200/- Per Quarter + Rs.50/- for every 250 kgs in excess of 15000 kgs. b. Trailers Rs. 500/- life time tax.
c. Tractors Rs. 1500/- life time tax.
12. KERALA (AS ON 01-04-2007)
a. Trucks (a) Motor Cycle trucks not exceeding 300 kg. in Gross Vehicle weight- Rs. 135/-
(b) Vehicles not exceeding 1000 kg. in Gross Vehicle weight- Rs. 220/-
(c) Vehicles exceeding 1000 kg. but not exceeding 1500 Kgs in Gross Vehicle weight- Rs. 420/- (d) Vehicles exceeding 1500 kg. but not exceeding 2000 Kgs in Gross Vehicle weight- Rs. 550/- (e) Vehicles exceeding 2000 kg. but not exceeding 3000 Kgs in Gross Vehicle weight- Rs. 705/- (f) Vehicles exceeding 3000 kg. but not exceeding 4000 Kgs in Gross Vehicle weight- Rs. 840/- (g) Vehicles exceeding 4000 kg. but not exceeding 5500 Kgs in Gross Vehicle weight-

Rs. 1210/- (h) Vehicles exceeding 5500 kg. but not exceeding 7000 Kgs in Gross Vehicle weight- Rs. 1430/- (i) Vehicles exceeding 7000 kg. but not exceeding 9000 Kgs in Gross Vehicle weight- Rs. 1760/- (j) Vehicles exceeding 9000 kg. but not exceeding 9500 Kgs in Gross Vehicle weight- Rs. 1870/- (k) Vehicles exceeding 9500 kg. but not exceeding 10500 Kgs in Gross Vehicle weight- Rs. 2090/- (l) Vehicles exceeding 10500 kg. but not exceeding 11000 Kgs in Gross Vehicle weight- Rs. 2310/- (m) Vehicles exceeding 11000 kg. but not exceeding 12000 Kgs in Gross Vehicle weight- Rs. 2530/- (n) Vehicles exceeding 12000 kg. but not exceeding 13000 Kgs in Gross Vehicle weight- Rs. 2750/- (o) Vehicles exceeding 13000 kg. but not exceeding 14000 Kgs in Gross Vehicle weight- Rs. 2970/- (p) Vehicles exceeding 14000 kg. but not exceeding 15000 Kgs in Gross Vehicle weight- Rs. 3080/- (q) Vehicles exceeding 15000 kgs. in Gross Vehicle weight- Rs. Rs. 3080/- + Rs.110/- for every 250 Kgs or part therof in excess of 15000 Kgs
b. Trailers (used for carrying goods) Vary as per weight- upto 1000 Kg.- Rs.155/- to weight 15000Kg.- Rs.2310/- + Rs.110/- for every 250 kg. or part thereof in excess of 15000 Kgs
c. Tractors Rs. 220/-
13. MADHYA PRADESH (AS ON 31-3-2006) (a) Trucks RLW Upto 2000 kgs. –Rs. 600/- Per Quarter or life time tax of 10% of the cost of the vehicle. RLW exceeds 2000 Kgs. But does not exceed 4000 Kgs.- Rs. 900/- Per Quarter RLW exceeds 4000 Kgs. But does not exceed 6000 Kgs- Rs.1300/- Per Quarter RLW exceeds 6000 Kgs. But does not exceed 8000 Kgs- Rs.1700/- Per Quarter RLW exceeds 8000 Kgs. But does not exceed 10000 Kgs- Rs.2100/-Per Quarter

RLW exceeds 10000 Kgs. But does not exceed 12000 Kgs- Rs.2500/- Per Quarter RLW exceeds 12000 Kgs. But does not exceed 14000 Kgs- Rs.2900/- Per Quarter RLw exceeds 14000 Kgs. But does not exceed 16000 Kgs – Rs. 3300/- Per Quarter RLW exceeds 16000 Kgs. But does not exceed 18000 Kgs- Rs. 3700/- Per Quarter and thereafter for each additional 2000 Kgs. Or Part thereof- Rs. 500/- Per Quarter
b) Trailers N.A.
c) Tractors N.A.
14. MAHARASHTRA (AS ON 31-3-2007)
a) Trucks Truck having 16500 Kgs G.V.W. – Rs. 12150/- Per
Annum.
b) Trailers Goods Trailers having 16500 Kgs G.V.W. – Rs. 12150/- Per Annum.
c) Tractors ULW upto 2250 Kgs - Rs 600/- Per Annum. . (Other than agricultural use)
15. MANIPUR (AS ON 31-3-2006) a) Trucks Rs. 1880/- Per Annum upto 5 tonnes, Rs. 320/- for every additional 1 tonne. Plus Goods tax 6 paisa/rupee on freight or lump sum basis. b) Trailers Rs. 360/- Per Annum c) Tractors Rs. 160/- Per Annum
16. MEGHALAYA (AS ON 31-3-2005)
a) Trucks Upto 1 MT or less of authorized load of goods Rs. 600/- Per Annum For every additional ½ Metric Tonne of authorized load of goods- Rs.180 /- Per Annum Articulated Vehicles-: upto 22600 KGs GVW- Rs.8000/- Per Annum Exceeding 22,000 KGs but not exceeding 26400 KGs GVW- Rs.10,000/- Per Annum Exceeding 26400 KGs but not exceeding 36600 KGs GVW- Rs.14,000/- Per Annum

Exceeding 36,600 KGs but not exceeding 50000 KGs GVW- Rs.18,000/- Per Annum Exceeding 50,000 KGs GVW- Rs.22,500/- Per Annum Plus Rs.760/- for every additional 500 KGs GVW or part therof above 50,000 KGs. b) Trailers Light Trailer : Rs. 120/- Per Annum Medium Trailer: Rs. 220/- Per Annum Heavy Trailer: Rs. 460/- Per Annum c) Tractors Not exceeding 2 MT - Rs. 120/- Per Annum Exceeding 2 MT but not exceeding 3 ½ MT - Rs. 240/- Per Annum Exceeding 3½ MT - Rs. 460/- Per Annum
17. MIZORAM (AS ON 31-3-2007)
a) Trucks Rs.4735/- Per Annum + Goods Tax of Rs.2750/- b) Trailers Rs. 125 /- Per Annum c) Tractors Rs. 150 /- Per Annum
18. NAGALAND (AS ON 31-3-2007) a) Trucks Rs.340 /- Per Annum for First ½ M.T. plus Rs. 1500 Goods tax Per Annum Rs.150 /- Per Annum for every ½ M.T next. b) Trailers Rs.2400 /- (one time tax)
c) Tractors Rs.500 /- Per Annum
19. ORISSA (AS ON 31-3-2007)
a) Trucks ULW not exceeding 1000 kgs -Rs. 540/- Per Annum ULW exceeding 1000 to 2000 kgs -Rs. 2356 /- Per Annum ULW Above 2000 to 5000 kgs -Rs. 2890/- Per Annum ULW Above 5000 to 10000 kgs - Rs. 4955/- Per Annum ULW Above 10000 to 13000 kgs - Rs. 7179/- Per Annum ULW Above 13000 to 16200 kgs -Rs. - 10440 /- Per Annum

ULW Exceeding 16200 KGs- Rs. - 10440 /- Per Annum Plus Rs.375/- for every addl. 500 kgs or Part thereof in excess of 16200 kgs. Additional Tax payable in respect of goods vehicles used for Drawing trailers
1. For each trailer not exceeding 1000 KGs in laden weight – Rs.292/- Per Annum
2. For each trailer exceeding 1000 KGs but not exceeding 3000KGs- Rs.1120/- Per Annum.
3. For each trailer exceeding 3000 KGs- Rs.2238/- Per Annum.
b) Trailers Rs.2000/- Per Annum c) Tractors Rs.2700/- Per Annum
20. PUNJAB (As on 22.11. 2007)
a) Trucks Goods Vehicle not exceeding 1.2 Tonnes in Gross Vehicle weight- Rs. 3000/- Per Annum. Goods Vehicle exceeding 1.2 tonnes but Not exceeding 6 tonnes in Gross Vehicle Weight- Rs. 4000/- Per Annum Goods Vehicle exceeding 6 tonnes but Not exceeding 16.2 tonnes in Gross Vehicle Weight- Rs. 5000/- Per Annum Goods Vehicle exceeding 16.2 tonnes but Not exceeding 25 tonnes in Gross Vehicle Weight- Rs. 8000/- Per Annum Goods Vehicle exceeding 25 tonnes in Gross Vehicle Weight- Rs. 15000/- Per Annum
b) Trailers N.A. c) Tractors Permit Holders of Tractors with trolleys used for commercial purpose within the radius of 25Km from the place of permit holders residence- Rs.2000/- Per Annum
21. RAJASTHAN (AS ON 31-3-2006) a) Trucks 1. Articulated Vehicle a) Cost of the Vehicle/Chassis Upto Rs 10 lakhs – 2 % of the cost of the horse (Annual Road Tax) + 0.40% of the cost of the horse (Supplementary Road Tax) b) Cost of the Vehicle/Chassis above Rs 10 lakhs – Rs.20,000/- +Rs.50 for every Rs. one

lakh or part therof of cost exceeding Rs. 10 lakhs(Annual Road Tax) +Rs. 4000/- (Supplementary Road Tax)+ Rs.50 for every Rs. one lakh or part therof of cost exceeding Rs. 10 lakhs (Supplementary Road Tax) 2. Other than Articulated Vehicle: a) Cost of the chassis/vehicle upto Rs. 3 Lakhs - 1.5% of the cost of the chassis/ vehicle subject to a maximum of Rs. 2250/- (Annual Road Tax) + 1% of the cost of the Chassis/ vehicle (Supplementary Road Tax) b) Cost of the chassis/vehicle more than 3 Lakhs and upto Rs. 6 Lakhs- Rs.2250/- Plus - 0.75 % of the cost of the chassis/ vehicle exceeding Rs.3 Lakhs(Annual Road Tax) + Rs. 2000/- + 0.35% of the cost of the Chassis/ vehicle Exceeding Rs.3 Lakhs (Supplementary Road Tax) c) Cost of the chassis/vehicle more than 6 Lakhs and upto Rs. 10 Lakhs- Rs.4500/- Plus - 0.95 % of the cost of the chassis/ vehicle exceeding Rs.6 Lakhs(Annual Road Tax) + Rs.3050/- + 0.5% of the cost of the Chassis/ vehicle Exceeding Rs.6 Lakhs (Supplementary Road Tax) d) Cost of the chassis/vehicle more than Rs. 10 Lakhs- Rs.8300/- Plus Rs. 50/- for every Rs.one lakh or part therof of cost exceeding Rs.10 Lakhs. (Annual Road Tax) + Rs.5050/- + Rs.50/- for every Rs.one lakh or part therof of cost exceeding Rs.10 Lakhs (Supplementary Road Tax)
b) Trailers 4% of the cost of the trailer (used as goods Vehicle). c) Tractors For agriculture purpose: 0.3% of the cost.
22. SIKKIM a) Trucks N.A. b) Trailers N.A.
c) Tractors : N.A.

23. TAMIL NADU (AS ON 31-3-2007)
a) Trucks LMV Goods Vehicle with GVW upto 750Kgs- Rs.600/- Per Quarter LMV Goods Vehicle with GVW above 750Kgs to 1500 Kgs- Rs.600/- Per Quarter LMV Goods Vehicle with GVW above 1500Kgs to 3000 Kgs - Rs.600/- Per Quarter Goods Vehicle with GVW exceeding 3000Kgs but not exceeding 4500 Kgs - Rs.950/- Per Quarter Goods Vehicle with GVW exceeding 4500 kgs but not exceeding 9000 kgs - Rs.1500/- Per Quarter Goods Vehicle with GVW exceeding 9000 kgs but not exceeding 12000 kgs - Rs.1900/- Per Quarter Goods Vehicle with GVW exceeding 12000 kgs but not exceeding 13000 kgs - Rs.2100/- Per Quarter Goods Vehicle with GVW exceeding 13000 kgs but not exceeding 15000 kgs - Rs.2500/- Per Quarter Goods Vehicle with GVW exceeding 15000 kgs
- Rs.2500/- Per Quarter +Rs.75/- for 250 Kgs and part thereof.
b) Trailers N.A.
c) Tractors Exempted
24. TRIPURA
a) Trucks N.A. b) Trailers N.A. c) Tractors N.A.
25. UTTAR PRADESH (AS ON 31-3-2008)
a) Trucks Motor Vehicle Taxes of Rs. 70/- per Quarter Per Metric Tonne of GVW of the vehicle or part thereof - (for one region) + Goods Tax of Rs.100/- Per Quarter.
Motor Vehicle Taxes of Rs. 85/- per Quarter Per
Metric Tonne of GVW of the vehicle or part thereof (for more than one region in Uttar

Pradesh and For National Permit Vehicles) + Goods Tax of Rs.130/- Per Quarter.
b) Trailers Motor Vehicle Taxes of Rs. 70/- per Quarter Per
Metric Tonne of GVW of the vehicle or part thereof - (for one region) + Goods Tax of Rs.100/- Per Quarter.
Motor Vehicle Taxes of Rs. 85/- per Quarter Per
Metric Tonne of GVW of the vehicle or part thereof (for more than one region in Uttar Pradesh and For National Permit Vehicles) + Goods Tax of Rs.130/- Per Quarter.
c) Tractors Fixed Rs.45/-Per Quarter 26. UTTARAKHAND (AS ON 31-3-2007) a) Trucks Rs. 70/-Per Metric Tonne Per Quarter for one
region Rs. 85/-Per Metric Tonne Per Quarter above one
region quarterly plus Goods Tax of Rs. 210 /-Per Metric Tonne Per Quarter and Rs.85 Per Metric Tonne for Plain Routes of Uttarakhand.
b) Tractors Rs. 70/-Per Metric Tonne Per Quarter for one
region Rs. 85/-Per Metric Tonne Per Quarter above one
region quarterly plus Goods Tax of Rs. 210 /-Per Metric Tonne Per Quarter and Rs.85 Per Metric Tonne for Plain Routes of Uttarakhand.
c) Trailers Rs. 70/-Per Metric Tonne Per Quarter for one
region Rs. 85/-Per Metric Tonne Per Quarter above one
region quarterly plus Goods Tax of Rs. 210 /-Per Metric Tonne Per Quarter and Rs.85 Per Metric Tonne for Plain Routes of Uttarakhand.
. 27. WEST BENGAL (AS ON 31-3-2005) a) Trucks Upto 2000 kgs- Rs. 150/- Per Quarter Upto 3500 kgs - Rs. 262.50/- Per Quarter Upto 5500 kgs - Rs. 525/- Per Quarter
Upto 7000 kgs. - Rs. 712.50/- Per Quarter Upto 9000 kgs. - Rs. 862.50/- Per Quarter Upto 12000 kgs. - Rs. 1387.50/- Per Quarter Upto 14000 kgs. - Rs. 1875 /- Per Quarter
upto 15000 kgs. - Rs. 2062.50/- Per Quarter

upto 16250 kgs.- Rs. 2325/- Per Quarter Rs. 1550/- Per Quarter + Rs. 37.50/- Per Quarter for every addl. 250 kgs. + 50% of quarter tax (above 16250 kgs). Rs. 4293.75 (Vehicles having RLW 25000 kgs). Rs. 4631.25 (Vehicles having RLW 26400 kgs). Rs. 5643.75 (Vehicles having RLW 31000 kgs.)
b) Trailers Rs. 187.50 Per Quarter (upto 2000 kgs) Rs. 337.50 Per Quarter (upto 4000 kgs). Rs. 506..25 Per Quarter ( upto 6000 kgs). Rs. 731.25 Per Quarter (upto 8000 kgs.) Rs. 1087.50 Per Quarter ( upto 10000 kgs) Rs. 1612.50 Per Quarter ( upto 12000 kgs.) Rs. 1968.75 Per Quarter ( upto 13000 kgs.) Rs. 2231.25 Per Quarter ( upto 14000 kgs.) Rs. 2493.75 Per Quarter ( upto 15000 kgs.) Rs. 1662.50 Per Quarter + 50 for every addl. 250
kgs. (Above 15000 kgs.)
c) Tractors Rs. 1600 /- Per Annum (ULW 500) Rs. 1705/- Per Annum (ULW 750).
Rs. 1810 /- Per Annum (ULW 1000) Rs. 1915 /- Per Annum (ULW 1250) Rs. 2020 /- Per Annum (ULW 1500) Rs. 2125 /- Per Annum (ULW 1725) Rs. 2230 /- Per Annum (ULW 2000) Rs. 2380 /- Per Annum (ULW 2250) Rs. 2530 /- Per Annum (ULW 2500) Rs. 2680 /- Per Annum (ULW 2750) Rs. 2830 /- Per Annum (ULW 3000) Rs. 2980 /- Per Annum (ULW 3250) Rs. 3130 /- Per Annum (ULW 3500) Rs. 3280 /- Per Annum (ULW 3750) Rs. 3430 /- Per Annum (ULW 4000) Rs. 3955 /- Per Annum (ULW 4250) Rs. 4480 /- Per Annum (ULW 4500) Rs. 5005 /- Per Annum (ULW 5000) Rs. 5530 /- Per Annum (ULW 5250) Rs. 6055 /- Per Annum (ULW 5500) Rs. 6580 /- Per Annum (ULW 5750) Rs. 7105 /- Per Annum (ULW 6000) Rs. 7630 /- Per Annum (ULW 6250) Rs. 8155 /- Per Annum (ULW 6500) Rs. 8680 /- Per Annum (ULW 6750) Rs. 9205 /- Per Annum (ULW 7000) Rs. 9730 /- Per Annum (ULW 7250) Rs, 10255 /- Per Annum (ULW 7500) Rs. 10780 /- Per Annum (ULW 7750) Rs. 11305 /- Per Annum (ULW 8000) Rs. 11830/- Per Annum (ULW 10000) Rs. 16630 /- Per Annum (ULW 15000) Rs. 28630 /- Per Annum (ULW 20000)

Rs. 40630 /- Per Annum (ULW 25000) Rs. 52630/- Per Annum (ULW 30000)
28. ANDAMAN & NICOBAR ISLANDS (AS ON 31-3-2007)
a) Trucks Rs.100/- Per Annum. b) Trailers N.A. c) Tractors Rs.75/- Per Annum.
29. CHANDIGARH (AS ON 31-3-2007)
a) Trucks ULW 1-2 tone – Rs. 660/- Per Annum ULW 2-3 tone – Rs. 840 /- Per Annum ULW 3-4 tone – Rs. 1200 /- Per Annum ULW above 4 tone – Rs. 1500 /- Per Annum b) Trailers NIL c) Tractors Rs.840/- Per Annum 30. DADRA & NAGAR HAVELI (AS ON 31-3-2007)
a) Trucks Rs.6232/- Per Annum for Laden Weight upto 35200 Kgs. b) Trailers Rs.360/- Per Annum for unLaden Weight upto 2045 Kgs. c) Tractors Rs.1248/- Per Annum for Laden Weight upto 5200 Kgs.
31. DAMAN & DIU (AS ON 31-3-2007) a) Trucks (including three Wheeler pick - up vans) i) Diesel driven – For every 100 kgs of RLW or part thereof Rs. 18/- Per Annum ii) Driven on fuel other than diesel – For every 100 kgs. of RLW or part thereof Rs. 15/- Per Annum
b) Trailers N.A. c) Tractors N.A.
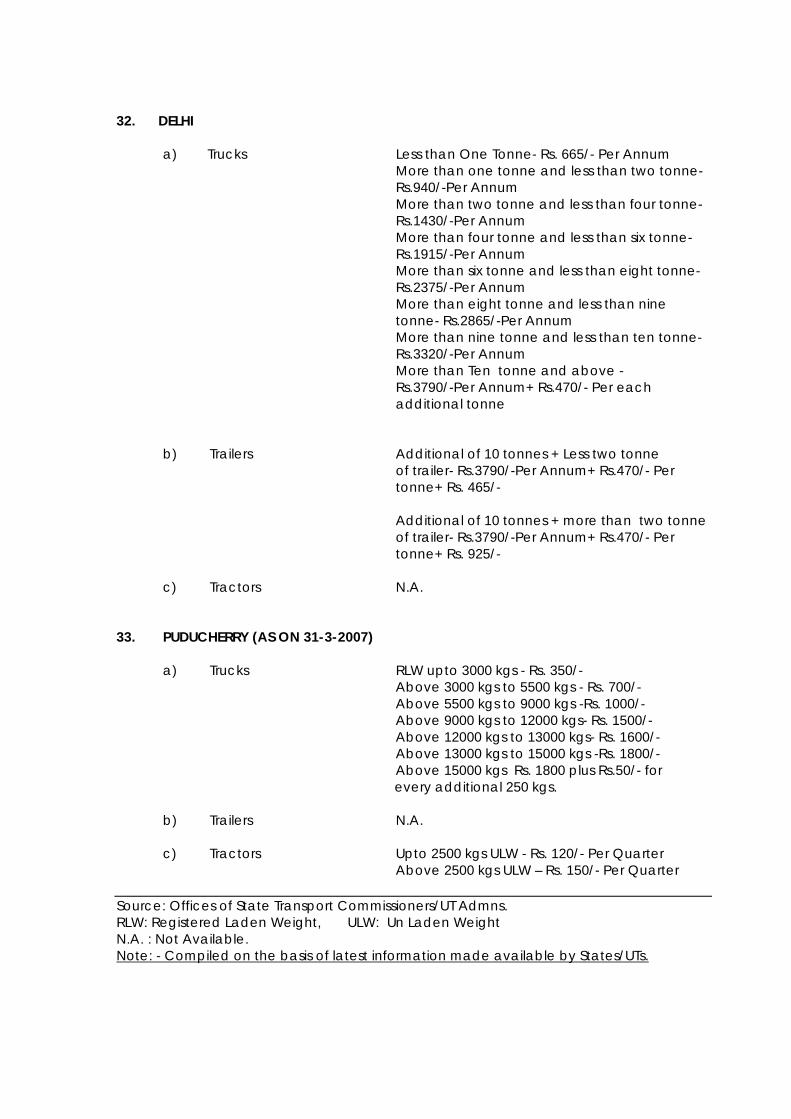
32. DELHI a) Trucks Less than One Tonne- Rs. 665/- Per Annum More than one tonne and less than two tonne- Rs.940/-Per Annum More than two tonne and less than four tonne- Rs.1430/-Per Annum More than four tonne and less than six tonne- Rs.1915/-Per Annum More than six tonne and less than eight tonne- Rs.2375/-Per Annum More than eight tonne and less than nine tonne- Rs.2865/-Per Annum More than nine tonne and less than ten tonne- Rs.3320/-Per Annum More than Ten tonne and above - Rs.3790/-Per Annum+ Rs.470/- Per each additional tonne b) Trailers Additional of 10 tonnes + Less two tonne of trailer- Rs.3790/-Per Annum+ Rs.470/- Per tonne+ Rs. 465/-
Additional of 10 tonnes + more than two tonne of trailer- Rs.3790/-Per Annum+ Rs.470/- Per tonne+ Rs. 925/-
c) Tractors N.A.
33. PUDUCHERRY (AS ON 31-3-2007)
a) Trucks RLW upto 3000 kgs - Rs. 350/- Above 3000 kgs to 5500 kgs - Rs. 700/- Above 5500 kgs to 9000 kgs -Rs. 1000/- Above 9000 kgs to 12000 kgs- Rs. 1500/- Above 12000 kgs to 13000 kgs- Rs. 1600/- Above 13000 kgs to 15000 kgs -Rs. 1800/- Above 15000 kgs Rs. 1800 plus Rs.50/- for every additional 250 kgs. b) Trailers N.A. c) Tractors Upto 2500 kgs ULW - Rs. 120/- Per Quarter Above 2500 kgs ULW – Rs. 150/- Per Quarter Source: Offices of State Transport Commissioners/UT Admns. RLW: Registered Laden Weight, ULW: Un Laden Weight N.A. : Not Available. Note: - Compiled on the basis of latest information made available by States/UTs.

TABLE NO.5.3
STATE-WISE RATES OF MOTOR VEHICLE TAXES ON PASSENGER TRANSPORT
1. ANDHRA PRADESH (AS ON 31-3-2004) a) STAGE CARRIAGE APSRTC –
Moffusil services: 7% on Gross Traffic Earnings. Urban services: 5% on Gross Traffic Earnings. Private – : Town Service : Ordinary services: Rs. 330/- to Rs. 660/- (on daily kilometerage) Express services: Rs. 822/- Moffusil Services : Ordinary Services : Rs. 414/- to Rs. 948/- (on daily kilometerage) Express Services : Rs. 1092/- to Rs. 3500/- (on daily kilometerage)
b) CONTRACT CARRIAGE Tourist permit – Rs. 3500/- Per Seat/Per Quarter.
State wide permit – Rs. 2500/- Per Seat/Per Quarter. District wide permit – Rs. 1150/- Per Seat/Per Quarter. Idle contract carriage – Rs. 850/- Per Seat/Per Quarter.
2. ARUNACHAL PRADESH (AS ON 31-3-2007)
BUSES One Time Tax of Rs. 40,000/- 3. ASSAM (AS ON 31-3-2006)
BUSES Passenger capacity 13 to 30 persons - Rs. 8000/- Per
Annum or Rs. 2200 quarterly. More than 30 passengers - Rs. 8000 /- Per Annum plus Rs. 90/- Per Annum for every seat above 30 or Rs. 2200/- Per Quarter plus Rs. 23/- Per Quarter for every additional seat above 30 Omni Tourist Bus - Rs. 14000/- Per Annum or Rs. 3500/- Per Quarter Deluxe Express Buses with passengers carrying capacity more than 30 - Rs. 10000/- Per Annum plus Rs. 100/- for every seat above 31 or Rs. 2500/- Per Quarter plus Rs. 25/- for every additional seat above 31 quarterly. All Assam Super Deluxe Contract Carriage - Rs. 50000/- Per Annum or Rs.12500/- quarterly.

4. BIHAR (AS ON 31-3-2007)
BUSES a) Seating Capacity of not less than 13 persons and not more than 26 persons- Rs.1583.50 Per Annum for 13 persons + 105.50 for every additional person beyond 13 and upto 26 persons. + Additional tax of Rs.240/- for every seat per annum for seating capacity more than 6 but not exceeding 15 persons exclusive of driver
b) Seating Capacity of not less than 27 persons and not more than 32 persons- Rs.3036/- Per Annum for 27 persons + Rs. 79/- for every additional person beyond 27 and upto 32 persons. + Additional tax of Rs.320/- for every seat per annum for seating capacity more than 15 but not exceeding 32 persons exclusive of driver
c) Seating capacity of more than 33 persons- Rs. 3485/- er annum for 33 persons plus Rs. 53/- for every additional person beyond 33 persons + Additional tax of Rs. 416/- per seat per annum for seating capacity exceeding 32 persons exclusive of driver and conductor.
5. CHATTISGARH (AS ON 31-3-2007) a) STAGE CARRIAGE Ordinary Bus upto 100 kms - Rs. 160/- Per Seat/Per
Month; there after Rs. 10/-per seat per month for 10 km. or part there of.
Deluxe Air-conditioned Bus upto 100 kms - Rs. 250/-
Per Seat/Per Month; there after Rs. 20/- per seat per month for 10 km. or part there of.
Express Bus upto 100 kms Rs. 200/- Per Seat/Per
Month; there after Rs. 15/- for 10 km Per Seat/Per Month or part there of.
b) CONTRACT CARRIAGE N.A 6. GOA (AS ON 31-3-2007) BUSES Rs. 50 per seat Per Annum plus Rs.30+Rs.50+Rs.100 per
seat for passengers, goods and other taxes respectively.
7. GUJARAT (AS ON 31-3-2007)
a) STAGE CARRIAGE For Petrol/CNG/LPG driven vehicles :

More than 6 passengers but not more than 9 passengers - Rs. 600/- Per Annum plus Rs. 60/- for every addl. passenger in addition to six passengers. More than 9 passengers - Rs. 840/- Per Annum plus Rs. 72 per seating accommodation for every such passenger and Rs. 36 per standing accommodation for every such passenger. For Diesel driven vehicles : The rate shown above (Petrol Vehicle Rates) + surcharge of 50% subject to the maximum limit of Rs. 636/-.
b) CONTRACT CARRIAGE A. Ordinary Passenger Buses
For Petrol/CNG/LPG driven vehicles : Upto 12 seats - Rs. 1200/- per seat Per Annum 13 to 20 seats - Rs. 2700/- per seat Per Annum More than 20 seats - Rs. 3600/- per seat Per Annum For Diesel driven vehicles : The rate shown above (Petrol Vehicle Rates) + surcharge of 50% subject to the maximum limit of Rs. 1100/-. B. Luxury Buses For Petrol/CNG/LPG driven vehicles : Upto 20 seats - Rs. 4500/- per seat Per Annum More than 20 seats - Rs. 6000/- per seat Per Annum For Diesel driven vehicles : The rate shown above (Petrol Vehicle Rates) + surcharge of 50% subject to the maximum limit of Rs. 1100/-. C.Sleeper Coaches For Petrol/CNG/LPG driven vehicles : Upto 20 seats - Rs. 9000/- per seat Per Annum More than 20 seats - Rs. 12000/- per seat Per Annum For Diesel driven vehicles : The rate shown above (Petrol Vehicle Rates) + surcharge of 50% subject to the maximum limit of Rs. 1100/-.
8. HARYANA (AS ON 31-3-2007)
a) STAGE CARRIAGE Stage Carriages plying for hire and used for the
transport of passengers excluding the driver and conductor – Rs.550/- Per Seat Per Annum subject to a maximum of Rs.35,000/- Stage Carriages plying for hire under a permit issued under the Faridabad and Gurgoan City Private Bus Service Scheme, 2004 – Rs.18000/- Per Annum(For half Body Bus) and Rs. 30,000/- Per Annum( for Full Body Bus)
b) CONTRACT CARRIAGE Contract Carriages plying under a permit issued

under the Faridabad and Gurgoan City Private Bus Service Scheme, 2004 – Rs.18000/- Per Annum(For half Body Bus) and Rs. 30,000/- Per Annum( for Full Body Bus) Contract Carriages owned by any religious institution and used by exclusively for the carriage of its personal and devotees as the case may be- Rs.200/- Per Seat Per Annum. Maxi Cabs plying on contract for hire or reward and used for the transport of passenger excluding the driver - Rs.200/- Per Seat Per Annum Motor Cabs plying on contract carriage for hire or reward and used for the transport of passengers excluding the driver- Rs.100/- Per Seat Per Annum.
9. HIMACHAL PRADESH (AS ON 30-6-2007)
a) STAGE CARRIAGE Ordinary/express/semi Deluxe/Deluxe/Air-
conditioned Buses (for First Fifteen years from the date of Registration).- Rs.500/- Per Seat Per Annum(Subject to a maximum of Rs.35,000/- Per Annum.) Ordinary/express/semi Deluxe/Deluxe/Air-conditioned Buses (After Fifteen years from the date of Registration.- Rs.550/- Per Seat Per Annum(Subject to a maximum of Rs.35,000/- Per Annum.) Mini Buses (for First Fifteen years from the date of Registration). - Rs.500/- Per Seat Per Annum (Subject to a maximum of Rs.25,000/- Per Annum.) Mini Buses (After Fifteen years from the date of Registration. - Rs.550/- Per Seat Per Annum (Subject to a maximum of Rs.25, 000/- Per Annum.)
b) CONTRACT CARRIAGE Maxi Cab: Rs. 750/- Per Seat Per Annum( Subject to a
maximum of Rs. 15,000/- Per Annum) Motor Cab: Rs. 350/- Per Seat Per Annum( Subject to a maximum of Rs. 10,000/- Per Annum) Auto Rickshaw: Rs.200/- Per Seat Per Annum( Subject to a maximum of Rs. 5,000/- Per Annum) Contract Carriage Buses: Rs.1000/- Per Seat Per Annum( Subject to a maximum of Rs. 35,000/- Per

Annum)
10. JAMMU & KASHMIR (AS ON 31-3-2006)
BUSES Motor Vehicle Taxes of Rs. 1100/- Per Quarter Plus
Passenger tax of Rs. 200/- Per Seat Per Quarter. 11. JHARKHAND a) STAGE CARRIAGE N.A b) CONTRACT CARRIAGE N.A 12. KARNATAKA (AS ON 31-3-2007)
a) STAGE CARRIAGES City Service Buses- Rs. 300/- per seat Per Quarter
Mofussil Service Buses- Rs. 500/- per seat Per Quarter b) CONTRACT CARRIAGE Service Buses- Complying Rule 151(2) of the KMV
Rule 1989- Rs. 750/- per seat Per Quarter Service Buses other than above- Rs.2000/- per seat Per Quarter Special Permit Buses- Rs.600/- per seat Per Quarter Luxury Buses complying Rule 128 of CMV Rules,1989 – Rs.2000/- per seat Per Quarter Fleet Owner Buses- Percentage on Revenue of STU:
- 5% on City Service Vehicles. - 7% on Vehicles other than City Services.
13. KERALA (AS ON 31-7-2007)
a) STAGE CARRIAGE Ordinary Services- For every seated passenger(other
than driver and conductor) which the vehicle is permitted to carry- Rs. 600/- Per Quarter Fast Passenger and Express Services for every seated passenger (other than driver and conductor) which the vehicle is permitted to carry- Rs. 690/- Per Quarter. For every Standing passenger the vehicle( whether ordinary, fast passenger or express service) is permitted to carry- Rs. 210/- Per Quarter For every Standing passenger if the vehicle with only city/town permit( whether ordinary, fast passenger or express service) is permitted to carry- Rs. 150/- Per Quarter
b) CONTRACT CARRIAGE Vehicles permitted to operate within the state more

than 12 passengers but not more than 20 passengers for every passenger – Rs. 530/- Per Quarter More than 20 passengers, for every passenger- Rs. 750/- Per quarter Vehicles operating inter state more than 12 passenger, for every passenger-Rs.1540/- per quarter
14. MADHYA PRADESH (AS ON 31-3-2006)
a) STAGE CARRIAGE Vehicle Permitted to carry more than 6 passengers
and plying as stage carriage on city routes/on adjacent area as notified by the State Government- Rs.80/- Per Quarter. In respect of vehicle permitted to ply as express service for every passengers which the vehicle is permitted to carry.- Rs. 60/- Per Quarter In respect of vehicles permitted to ply as air-conditioned service or deluxe or express service for every passengers which the vehicle is permitted to carry and where the total distance permitted to be covered by the service in a day-
1. Does not exceeds 100 KM(for air –conditioned/deluxe service) – Rs. 250/- Per Seat Per Month
2. Does not exceeds 100 KM (for express service)- Rs.200/- Per Seat Per month
3. there after for each 10 KM or part thereof- (for air –conditioned/deluxe service) – Rs. 20/- Per Seat Per Month
4. there after for each 10 KM or part thereof- (for express service) – Rs. 15/- Per Seat Per Month
In respect of vehicles permitted to ply as ordinary service for every passenger which the vehicle is permitted to carry and where the total distance permitted to be covered by a vehicle in a day-
1. Does not exceeds 100 KM- Rs. 160/- Per Seat Per Month
2. there after for each 10 KM or part thereof- Rs. 10/- Per Seat Per Month
b) CONTRACT
CARRIAGE Vehicle permitted to carry more than six passengers and plying as contract carriage covered by all India tourist permit issued by Madhya Pradesh State under sub-vehicles (9) of section 88 of the motor vehicle Act. 1988 for which the vehicle is permitted to carry- (a) for maxi cab vehicle having capacity Exceeding six and upto
12( excluding driver)- Rs 150/- per seat per month or lump sum tax at the rate of (i) 10 percent of the cost of a new vehicle recoverable in two equal installments in a year. (ii) 5 percent of the cost of older vehicles for which life time tax has already been paid. (b) For vehicles having more than twelve seats (excluding driver)- Rs 150/- per seat per month Vehicle permitted to carry more than six passengers and playing with in the state as contract carriage for each seat (other than the driver) which the vehicle is permitted to carry- (a) for maxi cab vehicle having seating capacity exceeding six and upto 12 (excluding driver)- Rs.300/- Per Seat Per Quarter (b) for vehicle having more than twelve seat ( excluding driver)-
1. for ordinary bus- Rs.500/- Per Seat Per Month 2. for air-conditioned bus /deluxe bus - Rs.600/-
Per Seat Per Month
15. MAHARASHTRA (AS ON 31-3-2007)
a) MSRTC AND OTHER Rs. 71/- per passenger Per Annum plus passenger tax
of 17.5% of fare collected. b) CONTRACT CARRIAGE- Plying in City Area
Rs.1500/- per passenger Per Annum
c) CONTRACT CARRIAGE - TOURIST BUSES
Rs. 4600 per passenger Per Annum
d) AC BUSES Rs. 5600 per passenger Per Annum 16. MANIPUR (AS ON 31-3-2007)
BUSES Rs. 1000/- Per Annum upto 16 seats and Rs. 80/- for
every additional seat plus passenger tax of 6 paise/rupee on passenger fare or lump sum basis.

17. MEGHALAYA (AS ON 31-3-2005)
a) STAGE CARRIAGE Mini Bus- Upto 30 seats- Rs. 100/- per seat per
annum Omni Bus- above 30 seats- Rs. 80/- per seat per annum.
b) CONTRACT CARRIAGE Tourist Buses - Rs. 120/- per seat per annum 18. MIZORAM (AS ON 31-3-2007)
BUSES Rs. 100/- Per Seat Per Annum 19. NAGALAND (AS ON 31-3-2007)
BUSES Motor Vehicle Tax of Rs.120/- Per Annum + Passenger
Tax of Rs.1250/- Per Annum 20. ORISSA (AS ON 31-3-2007)
a) STAGE CARRIAGE Upto 160 km a day- Rs. 748/- per seat per annum
(Ordinary) and Rs. 1067/- per seat per annum (Express). Above 160 km. To 240 km. Rs. 916 /-per seat per annum (Ordinary) and Rs. 1316/- per seat per annum (Express). Above 240 km to 320 km. Rs.1200/- per seat per annum (ordinary) and Rs. 1795/- per seat per annum (Express). Exceeding 320 km. Rs. 1440/- per seat per annum (ordinary) Rs. 2040/- per seat per annum (Express).
b) CONTRACT CARRIAGE For seating more than 3 persons but not more than
25 Persons, for every person for which the vehicle is permitted to carry, excluding the driver.- Rs.720/- Per Seat Per Annum For seating more than 25 persons, for every person for which the vehicle is permitted to carry, excluding the driver.- Rs.150/- Per Seat Per Annum
22. PUNJAB (As on 22.11. 2007)
a) STAGE CARRIAGE 1. Big Buses:-
a) Ordinary Buses- Rs.2.25 Per Kilometer Per Vehicle Per Day
b) Ordinary HV AC Buses(3*2 Seats)- Rs.1.00 Per

Kilometer Per Vehicle Per Day c) Integral Coach- Rs.0.50 Per Kilometer Per
Vehicle Per Day 2. Stage Carriage Buses coming from Other States:-
a) Buses Registered in other states plying as stage carriage in Punjab which are countersigned under reciprocal agreements- Rs. 3.70 Per Kilometer Per Vehicle Per Day
b) Buses Registered in other states plying as stage carriage in Punjab which are not countersigned under reciprocal agreements- Rs. 5.00 Per Kilometer Per Vehicle Per Day
3. Mini Buses registered in the State of Punjab:- Rs.30,000/- Per Annum
b) CONTRACT CARRIAGE 1. Tourist Buses:-
a) Ordinary- Rs.6,000/- Per Seat Per Annum b) Deluxe- Rs.6,000/- Per Seat Per Annum c) Air Conditioned- Rs.5,000/- Per Seat Per
Annum d) Integral Coach- Rs. 4,000/- Per Seat Per
Annum 2. All India Tourist Permits or any other similar permits registered in other states entering the state of Punjab:-
a) Ordinary Buses- Rs.2,000/- Per Day Per Vehicle(on 24hours basis)
b) Deluxe Buses- Rs. 3,000/- Per Day Per Vehicle(on 24hours basis)
c) Air Conditioned Buses- Rs.4,000/- Per Day Per Vehicle(on 24hours basis)
3. Omni Bus having Nine Seats excluding driver registered in other states entering and plying in the state of Punjab:- Rs.150/- Per Day
23. RAJASTHAN (AS ON 31-3-2006) a) STAGE CARRIAGE (Covered by Permit)
Purchased as Complete Vehicle: Cost of vehicle upto Rs. 4 lakh – 0.45% of the cost of vehicle (maximum of Rs. 12000) (Annual Road Tax) + Special Road Tax as applicable Cost of vehicle above Rs. 4 lakh – 0.70% of the cost of vehicle (maximum of Rs. 12000) ( Annual Road Tax) + Special Road Tax as applicable Purchased as Chassis : Cost of Chassis upto Rs. 4 lakh – 0.50% of the cost of vehicle (maximum of Rs. 12000) ( Annual Road Tax) +
Special Road Tax as applicable Cost of the Chassis above Rs. 4 lakh – 1.00% of the cost of vehicle (maximum of Rs. 12000) ( Annual Road Tax) + Special Road Tax as applicable
b) CONTRACT CARRIAGE (Covered by Permit)
Purchased as Complete Vehicle: Cost of vehicle upto Rs. 4 lakh – 0.45% of the cost of vehicle (maximum of Rs. 12000) (Annual Road Tax) + Special Road Tax as applicable Cost of vehicle above Rs. 4 lakh – 0.70% of the cost of vehicle (maximum of Rs. 12000) ( Annual Road Tax) + Special Road Tax as applicable Purchased as Chassis : Cost of Chassis upto Rs. 4 lakh – 0.50% of the cost of vehicle (maximum of Rs. 12000) ( Annual Road Tax) + Special Road Tax as applicable Cost of the Chassis above Rs. 4 lakh – 1.00% of the cost of vehicle (maximum of Rs. 12000) ( Annual Road Tax) + Special Road Tax as applicable
24. SIKKIM
a) STAGE CARRIAGE N.A. b) CONTRACT CARRIAGE N.A. 25. TAMIL NADU (AS ON 31-3-2007)
a) STAGE CARRIAGE (More than Six Passengers)
Metropolitan Area (Chennai City Operations): Rs. 80/- Per Seat Per Quarter plus 25% surcharge. Town Bus Service: Rs. 325/- Per Seat Per Quarter plus 10% surcharge. Express/Mofussil Bus Service: Rs. 400/- Per Seat Per Quarter plus 25% surcharge. Mini Bus: Rs.160/- Per Seat Per Quarter plus 25% surcharge.
b) CONTRACT CARRIAGE
Ordinary Passenger Bus (Upto 12 Passengers- Maxi Cabs) - Rs. 275/- Per Seat Per Quarter.(w.e.f. 01-01-2006) Ordinary Passenger Bus (12 Passengers to 20 passengers) - Rs. 3000/- Per Seat Per Quarter. Ordinary Passenger Bus (More than 20 Passengers) - Rs. 3000/- Per Seat Per Quarter. Luxury Bus (Upto 20 Passengers) - Rs. 3000/- Per Seat Per Quarter. Luxury Bus (Above 20 Passengers) - Rs. 3000/- Per Seat Per Quarter. Sleeper Coach(Upto 20 Passengers) – Not Applicable Sleeper Coach(Above 20 Passengers) – Not Applicable
Private Service Vehicle- Rs. 150/- Per Seat Per Quarter.
26. TRIPURA a) STAGE CARRIAGE N.A. b) CONTRACT CARRIAGE N.A. 27. UTTAR PRADESH (AS ON 31-3-2008)
BUSES Rs.40/- Per Seat Per Quarter(Average Motor Vehicle
Taxes) + Rs.350/- Per Seat Per Quarter(Average Passenger Taxes)
28. UTTARAKHAND (AS ON 31-3-2007)
BUSES Upto 20 seats Rs. 350/- Per Quarter plus Rs. 30 per
seat Per Quarter and upto 35 seats Rs.590/- Per Quarter plus Rs. 35/- per seat Per Quarter Contract Carriage- Rs. 160/- per seat per month
29. WEST BENGAL a) STAGE CARRIAGE Ordinary Stage Carriage- Rs.31.25 per quarter for
each seat + 10% of quarterly total tax b) CONTRACT CARRIAGE N.A. 30. ANDAMAN & NICOBAR ISLAND
a) STAGE CARRIAGE N.A. b) CONTRACT CARRIAGE N.A. 31. CHANDIGARH (AS ON 31-3-2007)
BUSES Seating capacity less than 30 seats - Rs. 3000/- Per
Annum Seating capacity more than 30 seats-Rs. 4200/- Per Annum
32. DADRA & NAGAR HAVELI (AS ON 31-3-2007)
BUSES Passenger Tax of Rs. 4920/- Per Bus Per Annum(Bus
Seating Capacity of 56)

33. DAMAN & DIU (AS ON 31-3-2006)
BUSES Upto 18 seats - Rs. 600/- Per Annum. For every
additional seat above 18 seats- Rs. 35/- Per Annum Rs. 1.50 per seat per km per month (passenger tax) or Rs. 24 per seat per month at the option of operator
34. DELHI a) STAGE CARRIAGE N.A b) CONTRACT CARRIAGE N.A. 35. PUDUCHERRY (AS ON 31-3-2007)
a) STAGE CARRIAGE Intra State Ordinary - Rs. 250/- Per Seat/Per Quarter.
Inter State Express Rs. 350/- Per Seat/Per Quarter. Inter State Ordinary – Rs. 340/- Per Seat/Per Quarter.
b) CONTRACT CARRIAGE 13 to 27 seats - Rs. 250/- Per Seat/Per Quarter.
Above 27 seats - Rs. 300/- Per Seat/Per Quarter. Above 54 seats (Ordinary) - Rs. 350 /- Per Seat/Per Quarter. Tax in respect of tourist vehicle - Rs. 750/- Per Seat/Per Quarter.
Source: Officers of State Transport Commissioners/UT Admns. N.A.: Not Available. Note: - Compiled on the basis of latest information made available by States/UTs.
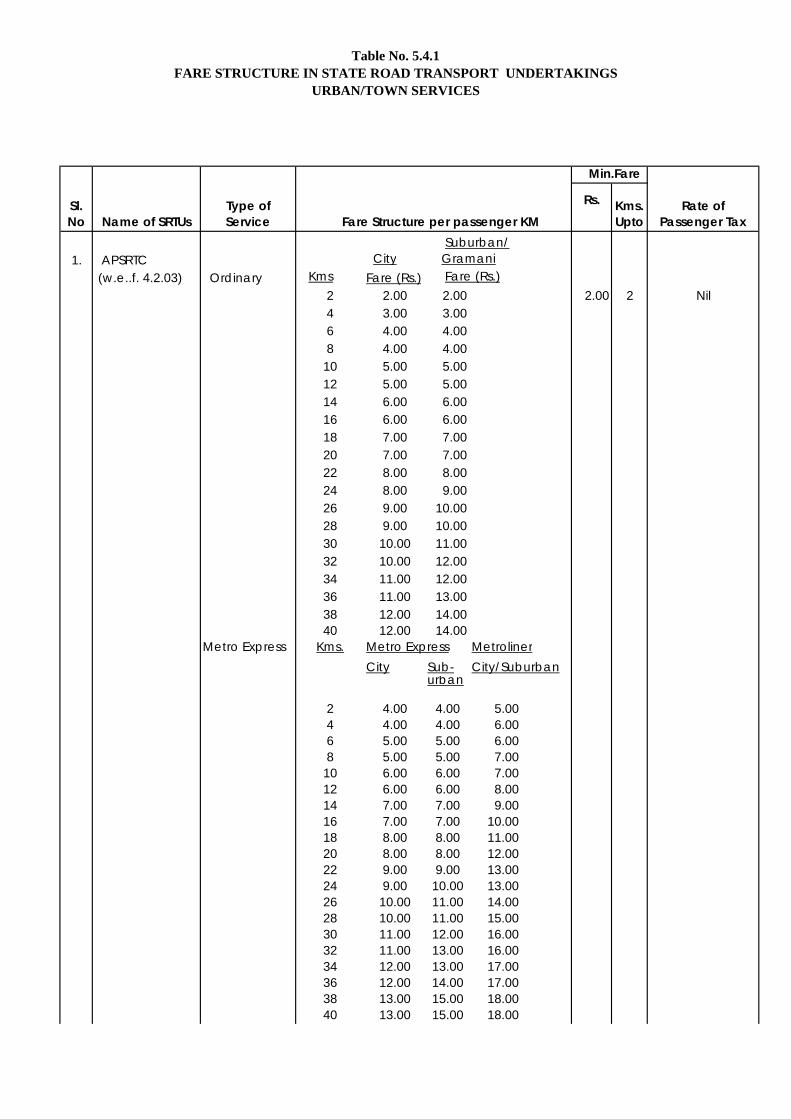
Table No. 5.4.1 FARE STRUCTURE IN STATE ROAD TRANSPORT UNDERTAKINGS
URBAN/TOWN SERVICES
Rs.
Suburban/1. APSRTC City Gramani
(w.e..f. 4.2.03) Ordinary Kms Fare (Rs.) Fare (Rs.) 2 2.00 2.00 2.00 2 Nil4 3.00 3.00
6 4.00 4.008 4.00 4.00
10 5.00 5.0012 5.00 5.0014 6.00 6.0016 6.00 6.0018 7.00 7.0020 7.00 7.0022 8.00 8.0024 8.00 9.0026 9.00 10.0028 9.00 10.0030 10.00 11.0032 10.00 12.0034 11.00 12.0036 11.00 13.0038 12.00 14.0040 12.00 14.00
Metro Express Kms. Metro Express MetrolinerCity Sub- City/Suburban
urban
2 4.00 4.00 5.004 4.00 4.00 6.006 5.00 5.00 6.008 5.00 5.00 7.00
10 6.00 6.00 7.0012 6.00 6.00 8.0014 7.00 7.00 9.0016 7.00 7.00 10.0018 8.00 8.00 11.0020 8.00 8.00 12.0022 9.00 9.00 13.0024 9.00 10.00 13.0026 10.00 11.00 14.0028 10.00 11.00 15.0030 11.00 12.00 16.0032 11.00 13.00 16.0034 12.00 13.00 17.0036 12.00 14.00 17.0038 13.00 15.00 18.0040 13.00 15.00 18.00
Type of Service Fare Structure per passenger KM
Sl. No Name of SRTUs
Kms. Upto
Rate of Passenger Tax
Min.Fare

Table No. 5.4.1 FARE STRUCTURE IN STATE ROAD TRANSPORT UNDERTAKINGS
URBAN/TOWN SERVICES
Rs.Type of Service Fare Structure per passenger KM
Sl. No Name of SRTUs
Kms. Upto
Rate of Passenger Tax
Min.Fare
2 Maharashtra SRTC Ordinary 69.37 paise per passenger Km 3.00 2 @ 3.5% on (w.e.f. 21.6.06) traffic revenue
3 Karnataka Ordinary(City) 34.76 2.50 2 SRTC Suburban 34.76 3.00 4 (w.e.f. 11.6.06)
4 North Western Karnataka RTC
Ordinary 41.54 3.00 2
(w.e.f. 11.6.06) Express 41.54 3.00 2
5 North Eastern Karnataka RTC Ordinary 37.50 3.00 2 (w.e.f. 11.6.06) and Express
6 BEST Ordinary Dist Fare in Rs. (w.e.f.25.1.05) in Kms. Ord. Limited A/C
3 4.00 4.50 13.00 4.00 3 3.5% on Traffic5 4.50 5.50 17.00 Revenue7 5.00 6.00 19.00
10 7.00 8.00 25.00 15 9.00 10.00 29.0020 11.00 12.00 33.0025 13.00 15.00 37.0030 14.00 16.00 41.0035 15.00 18.00 45.00
Above Rs. 2/- for every Rs. 5/- for every35 Kms addl. 5 Kms or addl. 5 Kms or
part thereof part thereof
7 DTC Ordinary Kms. Fare (Rs.) (w.e.f.17.5.02) 4 2.00 2.00 4
5-8 5.00 9-12 7.00 Above 12 10.00
Express /Ltd 10.00 Flat fareNight 10.00 Flat fare
8 BMTC (w.e.f. 11.6.06) City 54.58 3.00 2 Nil

Table No. 5.4.1 FARE STRUCTURE IN STATE ROAD TRANSPORT UNDERTAKINGS
URBAN/TOWN SERVICES
Rs.Type of Service Fare Structure per passenger KM
Sl. No Name of SRTUs
Kms. Upto
Rate of Passenger Tax
Min.Fare
Suburban 47.00 3.00 2 Nil Pushpak 92.02 4.00 2 Nil
9 Chandigarh TU Ordinary Kms. Rs. (w.e.f. 15.12.03) 2 2.00 2.00 2
2-3 3.00
3-5 5.00
5-7 8.00 above 7 Kms 9.00
10 Thane MTU Ordinary Kms. Rs. Kms. Rs. (w.e.f. 1.1.03) 2 3.00 22 10.00 3.00 2 Fare in-
4 4.00 24 12.00 cludes 3.5%
6 5.00 26 13.00 Pass.Tax and
8 6.00 28 13.00 15 paise child
10 6.50 30 14.00 nutrition
12 7.00 32 15.00 charge per ticket
14 8.00 34 15.00
16 8.00 36 15.00
18 10.00 38 15.00
20 10.00 40 16.00
11 Kolhapur MTU Ordinary Kms. Rs. Kms. Rs. (w.e.f. 22.11.05)
2 4.00 18 11.00 4.0 2 included in fare 4 5.00 20 11.00 @ 3.50%
6 5.00 22 12.00
8 6.00 24 13.00
10 7.00 26 14.00
12 8.00 28 15.00
14 9.00 30 15.00
16 10.00 32 16.00
12 Tripura RTC Rs.
(w.e.f. 1.10.05) Ordinary 3.00 3.00 4.00

Table No. 5.4.1 FARE STRUCTURE IN STATE ROAD TRANSPORT UNDERTAKINGS
URBAN/TOWN SERVICES
Rs.Type of Service Fare Structure per passenger KM
Sl. No Name of SRTUs
Kms. Upto
Rate of Passenger Tax
Min.Fare
13 Tamil Nadu Kms Ordinary LSS/PP (w.e.f.6.12.01) (Rs.) (Rs.)
Salem, 2 2.00 2.50
Kumbakonam, 4 2.00 2.50
Madurai, 6 3.00 3.50
Coimbatore, 8 3.00 3.50
Villupuram 10 3.50 4.00
12 4.00 4.50
14 4.00 4.50
16 4.50 5.00
18 4.50 5.00
20 5.00 5.50
22 5.00 5.50
24 5.50 6.00
26 6.00 6.50
28 6.00 6.50
30 6.00 6.50
32 6.00 6.50
34 6.00 6.50
36 6.50 7.00
38 6.50 7.00
40 6.50 7.00
42 7.00 7.50
44 7.00 7.50
46 7.00 7.50
Express Express fare 50% extra
Limited Stop 50 paise over ordinary fares
Deluxe Double the LSS fares
Night Double the normal fares
M. Service Flat rate
14 Gujarat SRTC (w.e.f. 15.7.06) Ordinary 57.02 paise per passenger km 2.00 2 1% included

Table No. 5.4.1 FARE STRUCTURE IN STATE ROAD TRANSPORT UNDERTAKINGS
URBAN/TOWN SERVICES
Rs.Type of Service Fare Structure per passenger KM
Sl. No Name of SRTUs
Kms. Upto
Rate of Passenger Tax
Min.Fare
in fare
Muni. Limit Muni. Limit15 Ahmedabad Ordinary Kms. Rs. Kms. Rs.
MTS (w.e.f. 5.11.04) 2 2.00 18 8.00 2.00 2 1% on
4 3.00 20 9.00 fare 6 4.00 22 9.00 collection 8 5.00 24 10.00 10 6.00 26 10.00 12 7.00 28 11.00 14 7.00 30 11.00 16 8.00 32 11.00
16 Pune MT Ordinary Kms. Rs. Kms. Rs. (w.e.f.4.2.06)
2 3.00 32 18.00 3.00 2 Fare includes4 5.00 34 18.00 Pass.tax 6 6.00 36 19.00 @3.5% and8 7.00 38 19.00 15 Ps.
10 8.00 40 20.00 surcharge12 9.00 42 20.00 for each14 10.00 44 21.00 ticket.16 12.00 46 21.0018 12.00 48 21.00 20 14.00 50 22.00 22 14.00 52 22.00 24 16.00 54 23.0026 16.00 56 23.0028 17.00 58 24.0030 17.00 60 24.00
25% extra on Jatra (fair) and night services on above fare
17 Calcultta STC Ordinary 48.68 4.00 3 (w.e.f. 3.10.05) Special 48.19 4.50 4
District 41.68 4.00 4 Mid-day 50.19 4.50 4 Green Line 43.53 4.50 3 Executive 90.36 8.00 5
18 Orissa SRTC Ordinary Kms. Rs. (w.e.f.1.8.06) 0 - 3 4.00
4- 6 4.50 7 -10 5.00 11 - 15 5.50

Table No. 5.4.1 FARE STRUCTURE IN STATE ROAD TRANSPORT UNDERTAKINGS
URBAN/TOWN SERVICES
Rs.Type of Service Fare Structure per passenger KM
Sl. No Name of SRTUs
Kms. Upto
Rate of Passenger Tax
Min.Fare
16 - 20 7.50 21 - 25 9.50
19 Rajasthan SRTC A/c Low floor Ordinaryw.e.f. w.e.f. w.e.f.
22/2/08 15.1.07 12.7.06Kms. Rs. Rs. Rs.0-2 5.00 4.00 3.002-4 8.00 5.00 4.004-6 10.00 6.00 5.00
6-10 12.00 7.00 6.0010-15 16.00 8.00 7.0015-20 20.00 10.00 9.0020-25 25.00 13.00 10.0025-30 30.00 15.00 12.0030-35 35.00 18.00 14.00
above 35 40.00 20.00 16.00
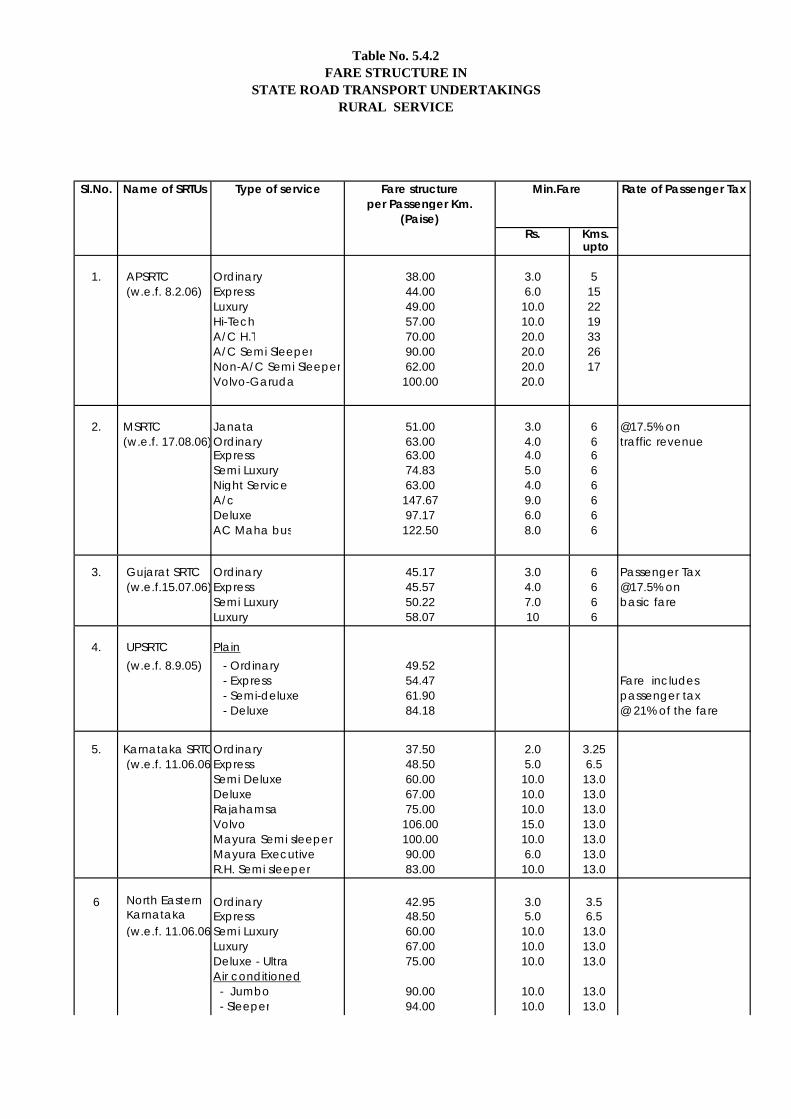
Table No. 5.4.2 FARE STRUCTURE IN
STATE ROAD TRANSPORT UNDERTAKINGS RURAL SERVICE
Sl.No. Name of SRTUs Type of service Fare structure per Passenger Km.
(Paise)
Rate of Passenger Tax
Rs. Kms. upto
1. APSRTC Ordinary 38.00 3.0 5 (w.e.f. 8.2.06) Express 44.00 6.0 15
Luxury 49.00 10.0 22Hi-Tech 57.00 10.0 19A/C H.T 70.00 20.0 33A/C Semi Sleeper 90.00 20.0 26Non-A/C Semi Sleeper 62.00 20.0 17Volvo-Garuda 100.00 20.0
2. MSRTC Janata 51.00 3.0 6 @17.5% on (w.e.f. 17.08.06)Ordinary 63.00 4.0 6 traffic revenue
Express 63.00 4.0 6Semi Luxury 74.83 5.0 6Night Service 63.00 4.0 6A/c 147.67 9.0 6Deluxe 97.17 6.0 6AC Maha bus 122.50 8.0 6
3. Gujarat SRTC Ordinary 45.17 3.0 6 Passenger Tax
(w.e.f.15.07.06)Express 45.57 4.0 6 @17.5% onSemi Luxury 50.22 7.0 6 basic fareLuxury 58.07 10 6
4. UPSRTC Plain (w.e.f. 8.9.05) - Ordinary 49.52
- Express 54.47 Fare includes - Semi-deluxe 61.90 passenger tax - Deluxe 84.18 @ 21% of the fare
5. Karnataka SRTCOrdinary 37.50 2.0 3.25 (w.e.f. 11.06.06 Express 48.50 5.0 6.5
Semi Deluxe 60.00 10.0 13.0Deluxe 67.00 10.0 13.0Rajahamsa 75.00 10.0 13.0Volvo 106.00 15.0 13.0Mayura Semi sleeper 100.00 10.0 13.0Mayura Executive 90.00 6.0 13.0R.H. Semi sleeper 83.00 10.0 13.0
6 North Eastern Ordinary 42.95 3.0 3.5 Karnataka Express 48.50 5.0 6.5 (w.e.f. 11.06.06 Semi Luxury 60.00 10.0 13.0
Luxury 67.00 10.0 13.0Deluxe - Ultra 75.00 10.0 13.0Air conditioned - Jumbo 90.00 10.0 13.0 - Sleeper 94.00 10.0 13.0
Min.Fare

Table No. 5.4.2 FARE STRUCTURE IN
STATE ROAD TRANSPORT UNDERTAKINGS RURAL SERVICE
Sl.No. Name of SRTUs Type of service Fare structure per Passenger Km.
(Paise)
Rate of Passenger Tax
Rs. Kms. upto
Min.Fare
- Semi-Sleeper 86.00 10.0 13.0
7 RSRTC Ordinary 40.00 2.0 5 (w.e.f.12.7.06) Express 47.00 3.0 5
A/C 125.00 6.0 5Deluxe 75.00 4.0 5Semi Deluxe 50.00 3.0 5
8 Haryana Ordinary 50.00 Passenger Tax State Transport Express 62.50 @ 25% on basic (w.e.f. 1.4.06) Super Deluxe 75.00 fare w.e.f. 1.4.07
Deluxe 100.00A/C Coaches 175.00
9 North Western Ordinary 37.49 2.0 3.25 Karnataka RTC Express 48.64 5.0 6.50 (w.e.f. 11.6.06) A/C 90.00 10.0
Super Deluxe 75.12 10.0Volvo 106.00Semi-luxury 60.13 10.0 10.0Luxury 67.14 10.0 10.0Delux 67.14 10.0 10.0
10 Pondicherry Ordinary 49.00 4.00 9 5.0* RTC Express 61.25 (paise) (w.e.f .31.3.07) Deluxe 98.00 * Special Road Tax
Semi Luxury 73.50 charged on sanctionA/C 122.50 scheduled km
11 Punjab State Ordinary 49.00 Transport Express 61.25 (w.e.f. 1.7.06) Semi luxury 73.50
Deluxe 98.00A/C 122.50
12 South Bengal Express 45.00 STC Night 50.00 (w.e.f. 3.10.05)
13 Orissa SRTC Ordinary 40.00 2.0 Nil (w.e.f. 1.8.06) Express 42.00 5.0
Deluxe 55.00 13.0

Table No. 5.4.2 FARE STRUCTURE IN
STATE ROAD TRANSPORT UNDERTAKINGS RURAL SERVICE
Sl.No. Name of SRTUs Type of service Fare structure per Passenger Km.
(Paise)
Rate of Passenger Tax
Rs. Kms. upto
Min.Fare
Deluxe A/C 67.00 13.0
14 Kadamba I. Stage Carriages: Transport Corporation (i) Minimum fare
upto 3 km. 400.0 a) Seating capacity (ii) 3 - 5 kms. 500.0 x Rs. 30/- (iii) For subsequent km. and part there 40.0II. Luxury: b) Standing capacity (i) Minimum fare 800.0 1/3 of the seating (ii) 3 - 5 kms. 1000.0 capacity (iii) For subsequent @ Rs. 30/- km. and part there 80.0III. City Buses (i) For the first stage 400.0 Fare includes passenge (ii) For subsequent km. or part thereof 45.0
15 Tamil Nadu Ordinary Plain Road 28.00 3.5 10 (w.e.f .6.12.2001Ghat Road 31.00 3.0 6 Coimbatore, Express 32.00 10.0 30 Salem, Express-Ghat 37.00 12.0 30 KumbakonnamExpress/Semi Deluxe 32.00 10.0 30 Madurai, Lux./Super Deluxe 38.00 12.0 30 Villupuram, & Lux/Super Deluxe-Ghat 42.00 13.0 30 SETC-TN Video Coach *38.00 12.0 30 * Plus Rs. 5/- extra per
Air Bus 52.00 20.0 30 passenger
16 Himachal RTC Ordinary/ Night (w.e.f . 9.4.03) - Hill 74.00 - Plain 47.50
Deluxe - Hill 148.00
- Plain 95.00A/C 296.00 Express

Table No. 5.4.2 FARE STRUCTURE IN
STATE ROAD TRANSPORT UNDERTAKINGS RURAL SERVICE
Sl.No. Name of SRTUs Type of service Fare structure per Passenger Km.
(Paise)
Rate of Passenger Tax
Rs. Kms. upto
Min.Fare
- Hill 92.50 - Plain 59.40Fare included SpecialRoad Tax given below: Paise per Km/seat1. N.H. Road 7.082. N.H. (State) 5.753. State Highway 4.794. Other Road 3.84
17 Calcutta STC Ordinary 41.00 5.0 10 (w.e.f. 3.10.05) Night Service 41.00 5.0 10
Inter-State/Semi-Deluxe 47.00 9.0 20
18 Nagaland ST (w.e.f. 25.11.05 Express 59.60 5.0 5 Rs. 110/- per seat
Semi-Luxury 74.40 5.0 5 per yearSuper Deluxe 86.50 5.0 5
19 Tripura RTC Ordinary 34.00 3.0 4 (w.e.f. 1.10.05) Express 38.50 6.0 13
Deluxe 58.50 10.0 13

SSEECCTTIIOONN –– VVII
RROOAADD SSAAFFEETTYY

Number of Motor Vehicle Accidents in India - 2001-2007 (State-wise)
STATES / UTs 2001 2002 2003 2004 2005 2006 2007(P)1 2 3 4 5 6 7 8
STATES Andhra Pradesh 30031 27634 34826 38940 37131 43559 44325Arunachal Pradesh 264 244 245 241 231 250 240Assam 2516 2625 3262 3688 4258 4694 4403Bihar 2873 5339 6141 4027 3768 5594 7774Chhatisgarh 8751 8664 10521 10600 11164 11934 12296Goa 2818 3419 3244 3525 3577 3707 4020Gujarat 32523 31735 30604 30630 30515 31547 33623Haryana 8393 8748 8690 9321 9298 10314 11998Himachal Pradesh 2371 2524 2680 2808 2797 2727 2955Jammu & Kashmir 4610 5394 5904 6257 5664 5593 5864Jharkhand 4028 4711 4211 4614 5013 4980 5285Karnataka 33000 35784 37658 38869 40330 43411 46363Kerala 38361 38762 39496 41219 42295 41728 39917Madhya Pradesh 26239 26929 30164 32445 35123 38041 41981Maharashtra 74521 66876 65686 67720 72408 75413 73661Manipur 409 520 523 468 600 521 538Meghalaya 600 172 617 433 428 435 300Mizoram 83 96 122 83 96 95 77Nagaland 102 84 101 140 226 194 239Orissa 6405 6848 6668 7278 7593 7729 8213Punjab 4171 4692 4429 4346 4599 4927 5208Rajasthan 19999 20571 21933 23243 23115 23348 23885Sikkim 109 228 131 159 189 188 150T il d 51978 53503 51025 52508 53866 55145 59140
Table No. 6.1
Tamilnadu 51978 53503 51025 52508 53866 55145 59140Tripura 544 624 676 645 657 793 801Uttarakhand 1061 1117 1222 1252 1332 1461 1529Uttar Pradesh 20473 20684 14286 18493 18325 19489 21522West Bengal 16954 17974 10444 14431 12597 11324 11660UTsA&N Islands 181 168 180 215 205 154 173Chandigarh 492 494 442 417 530 517 534Dadra & Nagar Haveli 88 80 73 111 127 103 116Daman & Diu 53 68 72 61 62 57 60Delhi 9344 8699 8863 9087 9351 9299 8620Lakshadweep 6 3 1 3 5 10 2Puducherry 1286 1484 1586 1633 1780 1639 1744TOTAL (STATES/UTs) 405637 407497 406726 429910 439255 460920 479216(P) : ProvisionalSource:- Data received from States/UTs
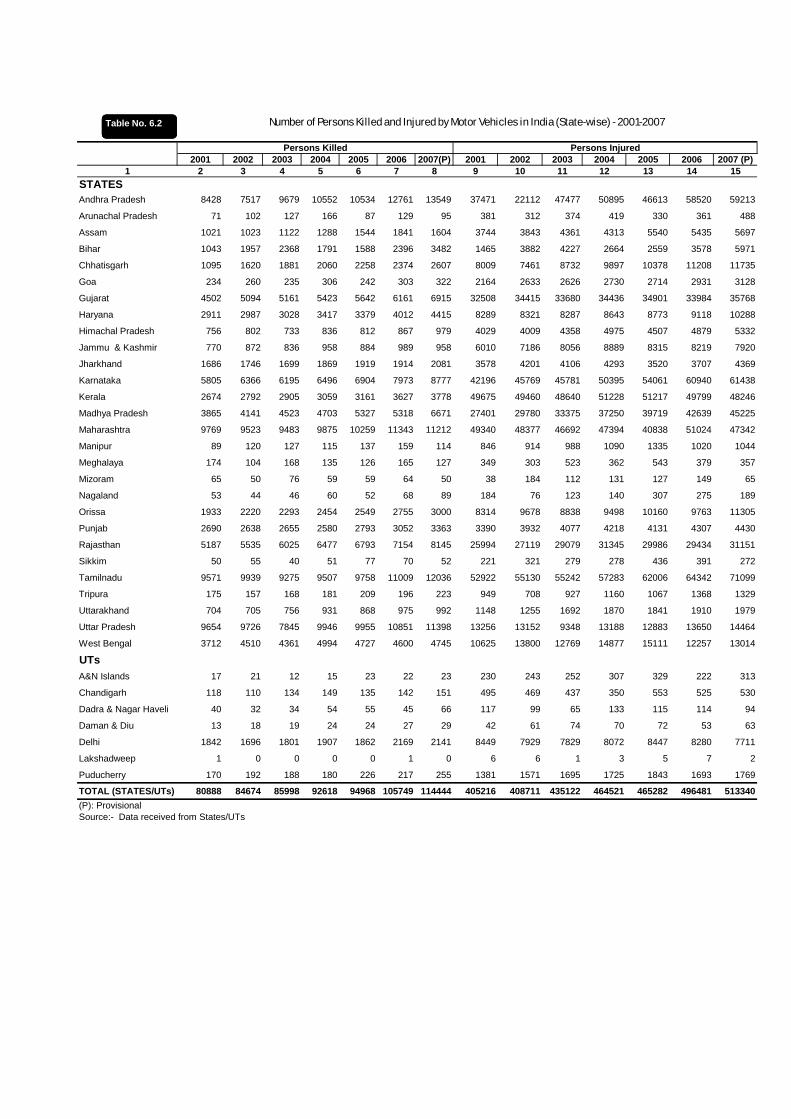
2001 2002 2003 2004 2005 2006 2007(P) 2001 2002 2003 2004 2005 2006 2007 (P)1 2 3 4 5 6 7 8 9 10 11 12 13 14 15
STATES Andhra Pradesh 8428 7517 9679 10552 10534 12761 13549 37471 22112 47477 50895 46613 58520 59213
Arunachal Pradesh 71 102 127 166 87 129 95 381 312 374 419 330 361 488
Assam 1021 1023 1122 1288 1544 1841 1604 3744 3843 4361 4313 5540 5435 5697
Bihar 1043 1957 2368 1791 1588 2396 3482 1465 3882 4227 2664 2559 3578 5971
Chhatisgarh 1095 1620 1881 2060 2258 2374 2607 8009 7461 8732 9897 10378 11208 11735
Goa 234 260 235 306 242 303 322 2164 2633 2626 2730 2714 2931 3128
Gujarat 4502 5094 5161 5423 5642 6161 6915 32508 34415 33680 34436 34901 33984 35768
Haryana 2911 2987 3028 3417 3379 4012 4415 8289 8321 8287 8643 8773 9118 10288
Himachal Pradesh 756 802 733 836 812 867 979 4029 4009 4358 4975 4507 4879 5332
Jammu & Kashmir 770 872 836 958 884 989 958 6010 7186 8056 8889 8315 8219 7920
Jharkhand 1686 1746 1699 1869 1919 1914 2081 3578 4201 4106 4293 3520 3707 4369
Karnataka 5805 6366 6195 6496 6904 7973 8777 42196 45769 45781 50395 54061 60940 61438
Kerala 2674 2792 2905 3059 3161 3627 3778 49675 49460 48640 51228 51217 49799 48246
Madhya Pradesh 3865 4141 4523 4703 5327 5318 6671 27401 29780 33375 37250 39719 42639 45225
Maharashtra 9769 9523 9483 9875 10259 11343 11212 49340 48377 46692 47394 40838 51024 47342
Manipur 89 120 127 115 137 159 114 846 914 988 1090 1335 1020 1044
Meghalaya 174 104 168 135 126 165 127 349 303 523 362 543 379 357
Mizoram 65 50 76 59 59 64 50 38 184 112 131 127 149 65
Nagaland 53 44 46 60 52 68 89 184 76 123 140 307 275 189
Orissa 1933 2220 2293 2454 2549 2755 3000 8314 9678 8838 9498 10160 9763 11305
Punjab 2690 2638 2655 2580 2793 3052 3363 3390 3932 4077 4218 4131 4307 4430
Rajasthan 5187 5535 6025 6477 6793 7154 8145 25994 27119 29079 31345 29986 29434 31151
Sikkim 50 55 40 51 77 70 52 221 321 279 278 436 391 272
Tamilnadu 9571 9939 9275 9507 9758 11009 12036 52922 55130 55242 57283 62006 64342 71099
Tripura 175 157 168 181 209 196 223 949 708 927 1160 1067 1368 1329
Uttarakhand 704 705 756 931 868 975 992 1148 1255 1692 1870 1841 1910 1979
Persons Killed Persons Injured
Number of Persons Killed and Injured by Motor Vehicles in India (State-wise) - 2001-2007 Table No. 6.2
Uttar Pradesh 9654 9726 7845 9946 9955 10851 11398 13256 13152 9348 13188 12883 13650 14464
West Bengal 3712 4510 4361 4994 4727 4600 4745 10625 13800 12769 14877 15111 12257 13014
UTsA&N Islands 17 21 12 15 23 22 23 230 243 252 307 329 222 313
Chandigarh 118 110 134 149 135 142 151 495 469 437 350 553 525 530
Dadra & Nagar Haveli 40 32 34 54 55 45 66 117 99 65 133 115 114 94
Daman & Diu 13 18 19 24 24 27 29 42 61 74 70 72 53 63
Delhi 1842 1696 1801 1907 1862 2169 2141 8449 7929 7829 8072 8447 8280 7711
Lakshadweep 1 0 0 0 0 1 0 6 6 1 3 5 7 2
Puducherry 170 192 188 180 226 217 255 1381 1571 1695 1725 1843 1693 1769
TOTAL (STATES/UTs) 80888 84674 85998 92618 94968 105749 114444 405216 408711 435122 464521 465282 496481 513340(P): ProvisionalSource:- Data received from States/UTs
Table No. 6.2

CITIES 2000 2001 2002 2003 2004 2005 2006 2007(P)1 2 3 4 5 6 7 8 9
AHMEDABAD 3014 2718 2652 2569 2435 2460 2601 2605
BENGALURU 8391 9026 9856 10505 9131 7709 7576 8418
BHOPAL … … 2003 2262 2411 2691 2851 3448
Number of Motor Vehicle Accidents in Select Metropolitan Cities - 2000-2007Table No. 6.3
CHENNAI 4878 5280 3682 4243 4890 4499 7400 7570
COIMBATORE … 1347 1137 1105 1223 1214 1306 1494
DELHI 10245 9344 8699 8864 9087 9351 9189 8620
HYDERABAD 2492 2617 3039 3427 3525 3088 3477 3286
INDORE 2326 2617 3057 3983 3909 3140 3122 3341
JAIPUR 2474 1924 1862 1973 2042 2367 2379 2316
Table No. 6.3
JAIPUR 2474 1924 1862 1973 2042 2367 2379 2316
KANPUR 1042 1030 1113 874 900 898 887 1236
KOCHI 2947 3211 2798 2958 3123 3050 2738 2764
KOLKATA 11036 10555 8592 8737 3751 2180 2276 2396
LUCKNOW … … 1218 920 921 957 1008 1122
LUDHIANA 270 417 531 498 423 438 473 898
Table No. 6.3
MADURAI 1753 1023 949 875 906 836 727 661
MUMBAI 26450 26329 25470 25162 25677 29265 30484 29906
NAGPUR 1569 1703 1320 1395 1540 1627 1708 1646
PATNA … … … … … … 281 896
PUNE 2384 2199 1981 1833 2119 2141 2133 2347
Table No. 6.3
SURAT 1210 … 1764 1409 1484 1441 1347 1495
VADODARA 1916 1672 1500 1631 1547 1494 1435 1457
VARANASI 271 … 329 225 … 229 239 308
VISAKHAPATNAM 915 … 1017 1163 969 1025 1532 1596
TOTAL 85583 83012 84569 86611 82013 82100 87169 89826
(P) : Provisional
Table No. 6.3
(P) : Provisional ... : - Not indicated.Source:- Data received from States/UTs.
Table No. 6.3
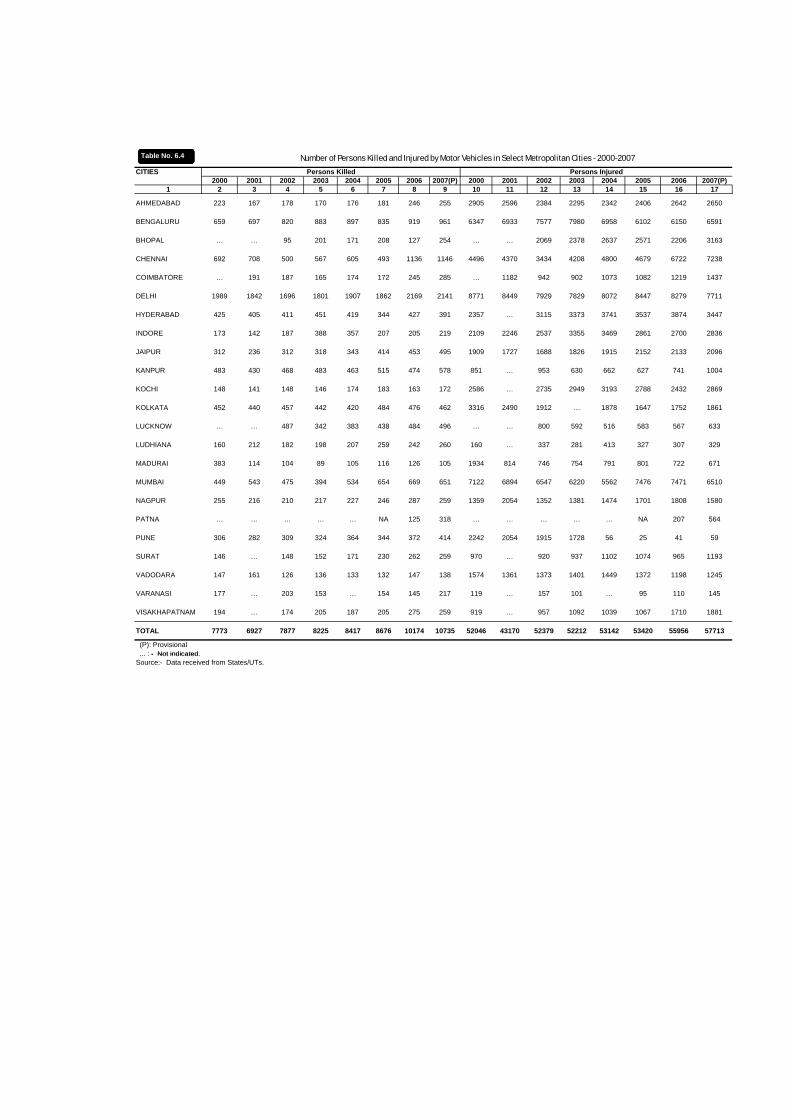
CITIES2000 2001 2002 2003 2004 2005 2006 2007(P) 2000 2001 2002 2003 2004 2005 2006 2007(P)
1 2 3 4 5 6 7 8 9 10 11 12 13 14 15 16 17
AHMEDABAD 223 167 178 170 176 181 246 255 2905 2596 2384 2295 2342 2406 2642 2650
BENGALURU 659 697 820 883 897 835 919 961 6347 6933 7577 7980 6958 6102 6150 6591
BHOPAL … … 95 201 171 208 127 254 … … 2069 2378 2637 2571 2206 3163
CHENNAI 692 708 500 567 605 493 1136 1146 4496 4370 3434 4208 4800 4679 6722 7238
COIMBATORE 191 187 165 174 172 245 285 1182 942 902 1073 1082 1219 1437
Persons Killed Persons Injured
Number of Persons Killed and Injured by Motor Vehicles in Select Metropolitan Cities - 2000-2007Table No. 6.4
COIMBATORE … 191 187 165 174 172 245 285 … 1182 942 902 1073 1082 1219 1437
DELHI 1989 1842 1696 1801 1907 1862 2169 2141 8771 8449 7929 7829 8072 8447 8279 7711
HYDERABAD 425 405 411 451 419 344 427 391 2357 … 3115 3373 3741 3537 3874 3447
INDORE 173 142 187 388 357 207 205 219 2109 2246 2537 3355 3469 2861 2700 2836
JAIPUR 312 236 312 318 343 414 453 495 1909 1727 1688 1826 1915 2152 2133 2096
KANPUR 483 430 468 483 463 515 474 578 851 … 953 630 662 627 741 1004
KOCHI 148 141 148 146 174 183 163 172 2586 … 2735 2949 3193 2788 2432 2869
Table No. 6.4
KOLKATA 452 440 457 442 420 484 476 462 3316 2490 1912 … 1878 1647 1752 1861
LUCKNOW … … 487 342 383 438 484 496 … … 800 592 516 583 567 633
LUDHIANA 160 212 182 198 207 259 242 260 160 … 337 281 413 327 307 329
MADURAI 383 114 104 89 105 116 126 105 1934 814 746 754 791 801 722 671
MUMBAI 449 543 475 394 534 654 669 651 7122 6894 6547 6220 5562 7476 7471 6510
NAGPUR 255 216 210 217 227 246 287 259 1359 2054 1352 1381 1474 1701 1808 1580
PATNA … … … … … NA 125 318 … … … … … NA 207 564
Table No. 6.4
PUNE 306 282 309 324 364 344 372 414 2242 2054 1915 1728 56 25 41 59
SURAT 146 … 148 152 171 230 262 259 970 … 920 937 1102 1074 965 1193
VADODARA 147 161 126 136 133 132 147 138 1574 1361 1373 1401 1449 1372 1198 1245
VARANASI 177 … 203 153 … 154 145 217 119 … 157 101 … 95 110 145
VISAKHAPATNAM 194 … 174 205 187 205 275 259 919 … 957 1092 1039 1067 1710 1881
TOTAL 7773 6927 7877 8225 8417 8676 10174 10735 52046 43170 52379 52212 53142 53420 55956 57713
(P): Provisional: - Not indicated
Table No. 6.4
... : - Not indicated.Source:- Data received from States/UTs.
Table No. 6.4

Sl.No. YEAR
TOTAL NO. OF ROAD
ACCIDENTS (IN NUMBERS )
TOTAL NO. OF PERSONS
KILLED ( IN NUMBERS )
TOTAL NO. OF PERSONS
INJURED (IN NUMBERS)
POPULATION OF INDIA (IN THOUSANDS)
TOTAL NO. OF REGD. MOTOR VEHICLES (
IN THOUSANDS)
ROAD LENGTH (IN KMS)
NO. OF ACCIDENTS PER
LAKH POPULATION
NO. OF ACCIDENTS
PER TEN THOUSAND VEHICLES
NO. OF ACCIDENTS
PER TEN THOUSAND
KMS. ROADS
NO. OF PERSONS
KILLED PER LAKH
POPULATION
NO. OF PERSONS
KILLED PER TEN
THOUSAND VEHICLES
NO. OF PERSONS
KILLED PER TEN THOUSAND
KMS. ROADS
NO. OF PERSONS
INJURED PER LAKH
POPULATION
NO. OF PERSONS
INJURED PER TEN
THOUSAND VEHICLES
NO. OF PERSONS
INJURED PER TEN THOUSAND
KMS. ROADS
1 2 3 4 5 6 7 8 9 10 11 12 13 14 15 16 17
1 1970 114100 14500 70100 539000 1401 1188728 21.2 814 959.8 2.7 103.5 122.0 13.0 500 589.7
2 1980 153200 24000 109100 673000 4521 1491873 22.8 339 1026.9 3.6 53.1 160.9 16.2 241 731.3
3 1990 282600 54100 244100 835000 19152 1983867 33.8 148 1424.5 6.5 28.2 272.7 29.2 127 1230.4
4 1991 295131 56278 255000 852250 21374 2331086 34.6 138 1266.1 6.6 26.3 241.4 29.9 119 1093.9
5 1992 275541 60113 267200 869000 23507 2482289 31.7 117 1110.0 6.9 25.6 242.2 30.7 114 1076.4
6 1993 284646 60380 287800 886000 25505 2614662 32.1 112 1088.7 6.8 23.7 230.9 32.5 113 1100.7
7 1994 325864 64463 311500 904000 27660 2890950 36.0 118 1127.2 7.1 23.3 223.0 34.5 113 1077.5
8 1995 351999 70781 323200 924359 30295 2975035 38.1 116 1183.2 7.7 23.4 237.9 35.0 107 1086.4
9 1996 371204 74665 369502 941579 33786 3202515 39.4 110 1159.1 7.9 22.1 233.1 39.2 109 1153.8
10 1997 373671 76977 378361 959792 37332 3298788 38.9 100 1132.8 8.0 20.6 233.3 39.4 101 1147.0
11 1998 385018 79919 390674 978081 41368 3228356 39.4 93 1192.6 8.2 19.3 247.6 39.9 94 1210.1
12 1999 386456 81966 375051 996130 44875 3296650 38 8 86 1172 3 8 2 18 3 248 6 37 7 84 1137 7
Road Accidents,Persons Killed and Injured: 1970-2007Table No. 6.5
12 1999 386456 81966 375051 996130 44875 3296650 38.8 86 1172.3 8.2 18.3 248.6 37.7 84 1137.7
13 2000 391449 78911 399265 1014825 48857 3316078 38.6 80 1180.5 7.8 16.2 238.0 39.3 82 1204.0
14 2001 405637 80888 405216 1033249 54991 3346667 39.3 74 1212.1 7.8 14.7 241.7 39.2 74 1210.8
15 2002 407497 84674 408711 1050640 58924 3383344 38.8 69 1204.4 8.1 14.4 250.3 38.9 69 1208.0
16 2003 406726 85998 435122 1068214 67007 3553468 38.1 61 1144.6 8.1 12.8 242.0 40.7 65 1224.5
17 2004 429910 92618 464521 1079887 72718 3621508 39.8 59 1187.1 8.6 12.7 255.7 43.0 64 1282.7
18 2005 439255 94968 465282 1101318 81501 * 39.9 54 * 8.6 11.7 * 42.2 57 *
19 2006 460920 105749 496481 1114202 89618 * 41.4 51 * 9.5 11.8 * 44.6 55 *
20 2007 479216 114444 513340 1131043 * * 42.4 * * 10.1 * * 45.4 * ** Under Compilation

SSEECCTTIIOONN -- VVIIII
SSTTAATTEE RROOAADD TTRRAANNSSPPOORRTT
UUNNDDEERRTTAAKKIINNGGSS
SSEECCTTIIOONN -- VVIIIIII
MMIISSCCEELLLLAANNEEOOUUSS
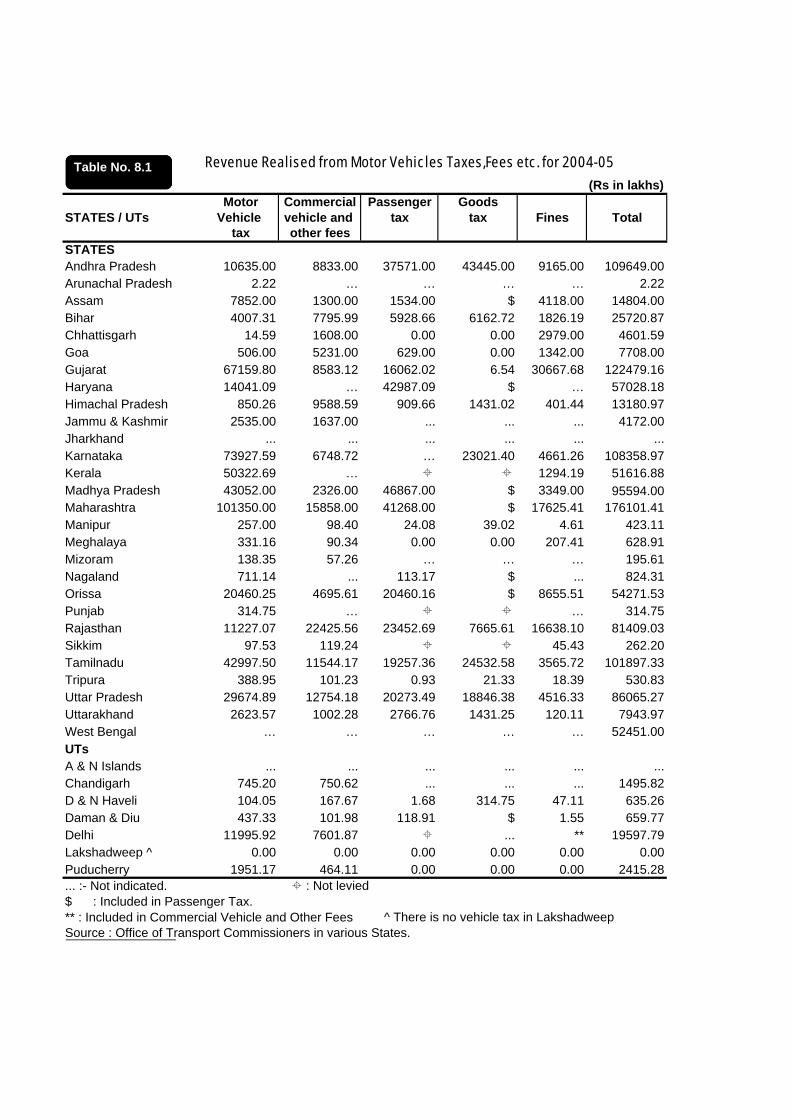
Revenue Realised from Motor Vehicles Taxes,Fees etc. for 2004-05
(Rs in lakhs)Motor Commercial Passenger Goods
STATES / UTs Vehicle vehicle and tax tax Fines Totaltax other fees
STATES Andhra Pradesh 10635.00 8833.00 37571.00 43445.00 9165.00 109649.00Arunachal Pradesh 2.22 … … … … 2.22Assam 7852.00 1300.00 1534.00 $ 4118.00 14804.00Bihar 4007.31 7795.99 5928.66 6162.72 1826.19 25720.87Chhattisgarh 14.59 1608.00 0.00 0.00 2979.00 4601.59Goa 506.00 5231.00 629.00 0.00 1342.00 7708.00Gujarat 67159.80 8583.12 16062.02 6.54 30667.68 122479.16Haryana 14041.09 … 42987.09 $ … 57028.18Himachal Pradesh 850.26 9588.59 909.66 1431.02 401.44 13180.97Jammu & Kashmir 2535.00 1637.00 ... ... ... 4172.00Jharkhand ... ... ... ... ... ...Karnataka 73927.59 6748.72 … 23021.40 4661.26 108358.97Kerala 50322.69 … 1294.19 51616.88Madhya Pradesh 43052.00 2326.00 46867.00 $ 3349.00 95594.00Maharashtra 101350.00 15858.00 41268.00 $ 17625.41 176101.41Manipur 257.00 98.40 24.08 39.02 4.61 423.11Meghalaya 331.16 90.34 0.00 0.00 207.41 628.91Mizoram 138.35 57.26 … … … 195.61Nagaland 711.14 ... 113.17 $ ... 824.31Orissa 20460.25 4695.61 20460.16 $ 8655.51 54271.53Punjab 314.75 … … 314.75Rajasthan 11227.07 22425.56 23452.69 7665.61 16638.10 81409.03Sikkim 97.53 119.24 45.43 262.20
Table No. 8.1
Tamilnadu 42997.50 11544.17 19257.36 24532.58 3565.72 101897.33Tripura 388.95 101.23 0.93 21.33 18.39 530.83Uttar Pradesh 29674.89 12754.18 20273.49 18846.38 4516.33 86065.27Uttarakhand 2623.57 1002.28 2766.76 1431.25 120.11 7943.97West Bengal … … … … … 52451.00UTsA & N Islands ... ... ... ... ... ...Chandigarh 745.20 750.62 ... ... ... 1495.82D & N Haveli 104.05 167.67 1.68 314.75 47.11 635.26Daman & Diu 437.33 101.98 118.91 $ 1.55 659.77Delhi 11995.92 7601.87 ... ** 19597.79Lakshadweep ^ 0.00 0.00 0.00 0.00 0.00 0.00Puducherry 1951.17 464.11 0.00 0.00 0.00 2415.28... :- Not indicated. : Not levied $ : Included in Passenger Tax.** : Included in Commercial Vehicle and Other Fees ^ There is no vehicle tax in LakshadweepSource : Office of Transport Commissioners in various States.
Table No. 8.1

Revenue Realised from Motor Vehicles Taxes,Fees etc. for 2005-06
(Rs in lakhs)Motor Commercial Passenger Goods
STATES / UTs Vehicle vehicle and tax tax Fines Totaltax other fees
STATES Andhra Pradesh 24050.00 13741.00 41116.00 45859.00 10653.00 135419.00Arunachal Pradesh 2.30 ... ... ... ... 2.30Assam 9859.00 1437.00 1552.00 $ 3834.00 16682.00Bihar 4805.91 9349.64 7110.16 7390.87 2190.14 30846.72Chhattisgarh 14.78 1999.00 0.00 0.00 3686.00 5699.78Goa 588.00 5799.00 670.00 0.00 1466.00 8523.00Gujarat 76823.75 9739.84 15624.91 12.36 30419.39 132620.25Haryana 11610.89 5601.60 42771.71 $ ... 59984.20Himachal Pradesh 929.29 8812.44 822.28 1475.03 466.10 12505.14Jammu & Kashmir 3139.00 1705.42 ... ... ... 4844.42Jharkhand ... ... ... ... ... ...Karnataka 77550.55 7105.22 ... 27603.26 4426.53 116685.56Kerala 53375.98 ... 1472.14 54848.12Madhya Pradesh 49915.69 5877.50 57858.00 $ ... 113651.19Maharashtra 112674.00 18855.00 49982.00 $ 22437.03 203948.03Manipur 258.22 101.38 25.11 38.61 3.79 427.11Meghalaya 396.69 210.88 0.00 0.00 176.77 784.34Mizoram 160.04 79.06 71.60 $ ... 310.70Nagaland 741.43 ... 136.76 $ ... 878.19Orissa 25207.00 4777.59 25207.18 $ 10581.41 65773.18Punjab 335.15 ... ... 335.15Rajasthan 13392.43 25893.43 8497.19 19906.34 19906.34 87595.73Sikkim 151.61 183.45 75.90 410.96
Table No. 8.2
Tamilnadu 46187.40 17877.00 18567.81 26266.78 4115.00 113013.99Tripura 424.28 121.69 1.09 32.79 16.61 596.46Uttar Pradesh 33248.73 22700.16 26843.35 20848.78 4651.37 108292.39Uttarakhand 2825.43 1155.05 2804.15 1403.47 183.00 8371.10West Bengal 37030.00 16461.00# 62.75 $ ... 53553.75UTsA & N Islands ... ... ... ... ... ...Chandigarh 840.18 1088.22 ... ... ... 1928.40D & N Haveli 107.08 192.03 1.70 371.43 98.23 770.47Daman & Diu 479.77 105.98 117.98 $ 13.36 717.09Delhi 21762.31 8111.25 ... ** 29873.56Lakshadweep ^ 0.00 0.00 0.00 0.00 0.00 0.00Puducherry 2213.51 398.75 0.00 0.00 0.00 2612.26... :- Not indicated. ** : Included in Commercial Vehicle and Other Fees$ : Included in Passenger Tax. : Not levied # Includes Fines ^ There is no vehicle tax in LakshadweepSource : Office of Transport Commissioners in various States.
Table No. 8.2

Revenue Realised from Motor Vehicles Taxes,Fees etc. for 2006-07
(Rs in lakhs)Motor Commercial Passenger Goods
STATES / UTs Vehicle vehicle and tax tax Fines Totaltax other fees
STATES Andhra Pradesh 393.00 15546.00 58275.00 53336.00 9646.00 137196.00
Table No. 8.3
Arunachal Pradesh 2.80 ... ... ... ... 2.80Assam 10745.00 1489.00 1583.00 $ 2679.00 16496.00Bihar 3287.51 6395.67 4863.75 5055.77 1498.18 21100.88Chhattisgarh 18.74 2351.00 0.00 0.00 4213.00 6582.74Goa 1056.00 6248.00 869.00 0.00 3017.00 11190.00Gujarat 88683.38 10837.48 586.70 3.86 20586.18 120697.60Haryana 21023.44 1342.66 42513.20 $ ... 64879.30Hi h l P d h 987 06 9226 79 947 11 1762 79 513 59 13437 34Himachal Pradesh 987.06 9226.79 947.11 1762.79 513.59 13437.34Jammu & Kashmir 4330.87 1972.34 ... ... ... 6303.21Jharkhand ... ... ... ... ... ...Karnataka 94664.09 8696.92 ... 28167.29 3798.84 135327.14Kerala 59471.32 ... 1777.55 61248.87Madhya Pradesh 50253.00 7240.00 74460.00 $ 6016.00 137969.00Maharashtra 161835.00 22265.00 21800.00 $ 24672.86 230572.86Manipur ... ... ... ... ... 409.52Manipur ... ... ... ... ... 409.52Meghalaya 418.05 194.37 0.00 0.00 276.09 888.51Mizoram 178.63 101.51 72.30 $ ... 352.44Nagaland 1152.53 ... 209.69 $ ... 1362.22Orissa 25056.18 5820.54 25549.00 $ 11703.85 68129.57Punjab 365.74 ... ... 365.74Rajasthan 21058.96 27621.56 28195.30 8664.90 16802.71 102343.43Sikkim 267.18 187.88 150.46 605.52Tamil Nadu 54339.56 17140.25 23728.25 28825.11 3235.88 127269.05Tripura 415.24 50.10 0.80 34.33 17.63 518.10Uttar Pradesh 37200.89 11363.35 32643.19 23025.48 8810.60 113043.51Uttarakhand 3371.25 1365.49 3154.21 1479.01 162.01 9531.97West Bengal 33376.00 16874.00 # 103.07 $ ... 50353.07UTsA & N Islands ... ... ... ... ... ...Chandigarh 984 98 1126 39 2111 37Chandigarh 984.98 1126.39 ... ... ... 2111.37D & N Haveli 120.57 208.00 1.92 454.30 106.01 890.80Daman & Diu 540.88 124.68 132.29 $ 3.26 801.11Delhi 25852.26 10431.70 ... ** 36283.96Lakshadweep ^ 0.00 0.00 0.00 0.00 0.00 0.00Puducherry 2516.79 393.96 0.00 0.00 0.00 2910.75... :- Not indicated. ** : Included in Commercial Vehicle and Other Fees$ : Included in Passenger Tax. : Not levied $ : Included in Passenger Tax. # Includes Fines ^ There is no vehicle tax in LakshadweepSource : Office of Transport Commissioners in various States.
Table No. 8.3
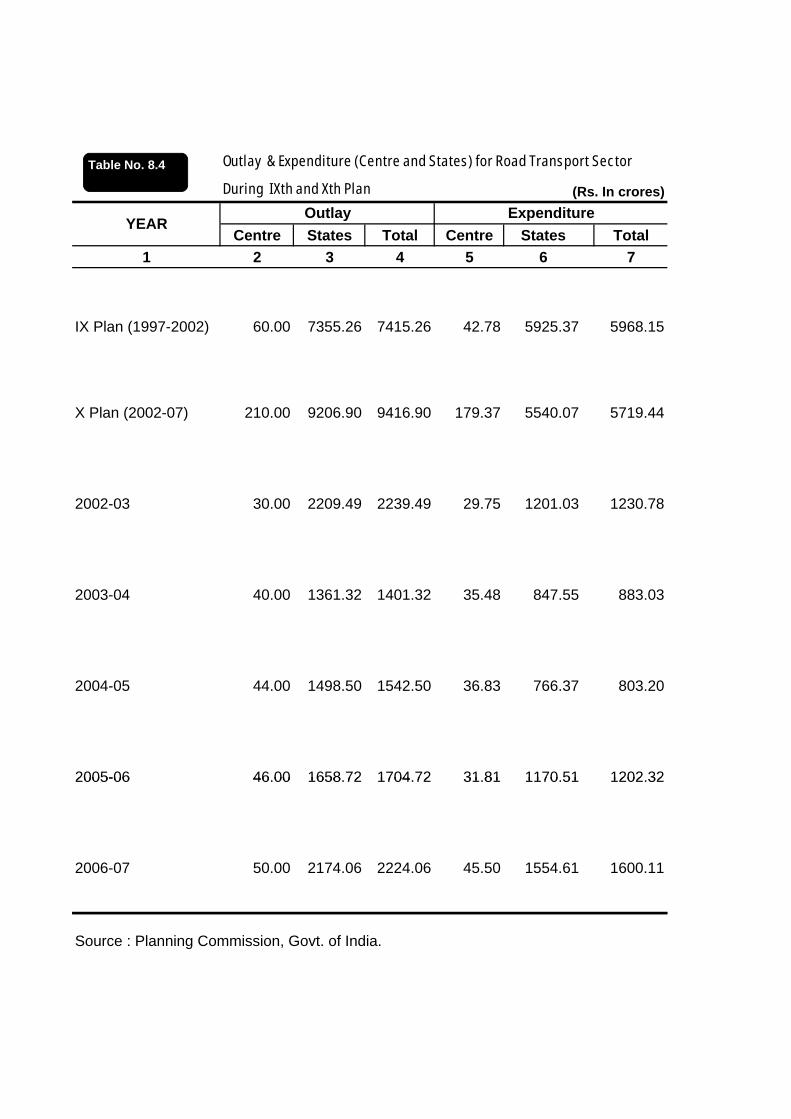
Outlay & Expenditure (Centre and States) for Road Transport Sector
During IXth and Xth Plan (Rs. In crores)
Centre States Total Centre States Total1 2 3 4 5 6 7
YEARExpenditureOutlay
Table No. 8.4
IX Plan (1997-2002) 60.00 7355.26 7415.26 42.78 5925.37 5968.15
X Plan (2002-07) 210.00 9206.90 9416.90 179.37 5540.07 5719.44
2002-03 30.00 2209.49 2239.49 29.75 1201.03 1230.78
2003-04 40.00 1361.32 1401.32 35.48 847.55 883.03
2004-05 44.00 1498.50 1542.50 36.83 766.37 803.20
2005-06 46 00 1658 72 1704 72 31 81 1170 51 1202 322005-06 46.00 1658.72 1704.72 31.81 1170.51 1202.32
2006-07 50.00 2174.06 2224.06 45.50 1554.61 1600.11
Source : Planning Commission, Govt. of India.
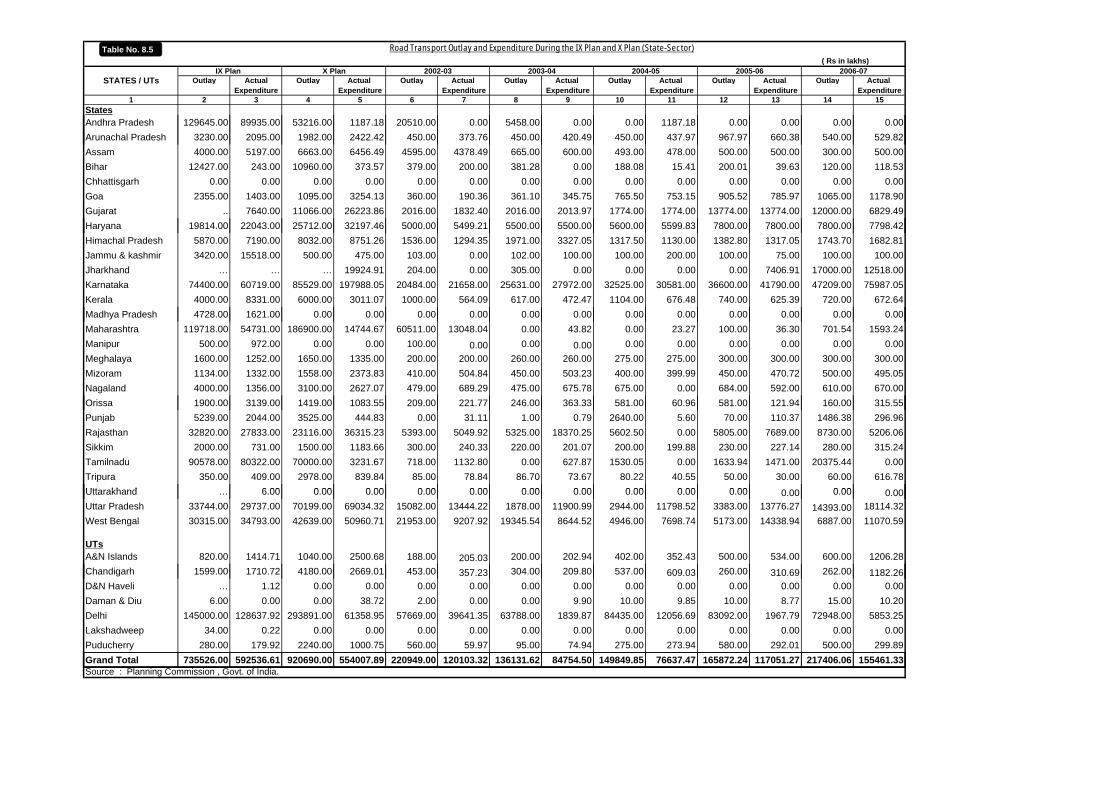
( Rs in lakhs)
Outlay Actual Outlay Actual Outlay Actual Outlay Actual Outlay Actual Outlay Actual Outlay Actual Expenditure Expenditure Expenditure Expenditure Expenditure Expenditure Expenditure
1 2 3 4 5 6 7 8 9 10 11 12 13 14 15StatesAndhra Pradesh 129645.00 89935.00 53216.00 1187.18 20510.00 0.00 5458.00 0.00 0.00 1187.18 0.00 0.00 0.00 0.00
2003-042002-03X Plan
Road Transport Outlay and Expenditure During the IX Plan and X Plan (State-Sector)
2005-06 2006-072004-05STATES / UTs
IX Plan
Table No. 8.5
Arunachal Pradesh 3230.00 2095.00 1982.00 2422.42 450.00 373.76 450.00 420.49 450.00 437.97 967.97 660.38 540.00 529.82Assam 4000.00 5197.00 6663.00 6456.49 4595.00 4378.49 665.00 600.00 493.00 478.00 500.00 500.00 300.00 500.00Bihar 12427.00 243.00 10960.00 373.57 379.00 200.00 381.28 0.00 188.08 15.41 200.01 39.63 120.00 118.53Chhattisgarh 0.00 0.00 0.00 0.00 0.00 0.00 0.00 0.00 0.00 0.00 0.00 0.00 0.00 0.00Goa 2355.00 1403.00 1095.00 3254.13 360.00 190.36 361.10 345.75 765.50 753.15 905.52 785.97 1065.00 1178.90Gujarat .. 7640.00 11066.00 26223.86 2016.00 1832.40 2016.00 2013.97 1774.00 1774.00 13774.00 13774.00 12000.00 6829.49Haryana 19814.00 22043.00 25712.00 32197.46 5000.00 5499.21 5500.00 5500.00 5600.00 5599.83 7800.00 7800.00 7800.00 7798.42Himachal Pradesh 5870.00 7190.00 8032.00 8751.26 1536.00 1294.35 1971.00 3327.05 1317.50 1130.00 1382.80 1317.05 1743.70 1682.81Jammu & kashmir 3420.00 15518.00 500.00 475.00 103.00 0.00 102.00 100.00 100.00 200.00 100.00 75.00 100.00 100.00Jharkhand … … … 19924.91 204.00 0.00 305.00 0.00 0.00 0.00 0.00 7406.91 17000.00 12518.00Karnataka 74400.00 60719.00 85529.00 197988.05 20484.00 21658.00 25631.00 27972.00 32525.00 30581.00 36600.00 41790.00 47209.00 75987.05Kerala 4000.00 8331.00 6000.00 3011.07 1000.00 564.09 617.00 472.47 1104.00 676.48 740.00 625.39 720.00 672.64Madhya Pradesh 4728.00 1621.00 0.00 0.00 0.00 0.00 0.00 0.00 0.00 0.00 0.00 0.00 0.00 0.00Maharashtra 119718.00 54731.00 186900.00 14744.67 60511.00 13048.04 0.00 43.82 0.00 23.27 100.00 36.30 701.54 1593.24Manipur 500.00 972.00 0.00 0.00 100.00 0.00 0.00 0.00 0.00 0.00 0.00 0.00 0.00 0.00Meghalaya 1600.00 1252.00 1650.00 1335.00 200.00 200.00 260.00 260.00 275.00 275.00 300.00 300.00 300.00 300.00Mizoram 1134.00 1332.00 1558.00 2373.83 410.00 504.84 450.00 503.23 400.00 399.99 450.00 470.72 500.00 495.05Nagaland 4000.00 1356.00 3100.00 2627.07 479.00 689.29 475.00 675.78 675.00 0.00 684.00 592.00 610.00 670.00O i 1900 00 3139 00 1419 00 1083 55 209 00 221 77 246 00 363 33 581 00 60 96 581 00 121 94 160 00 315 55Orissa 1900.00 3139.00 1419.00 1083.55 209.00 221.77 246.00 363.33 581.00 60.96 581.00 121.94 160.00 315.55Punjab 5239.00 2044.00 3525.00 444.83 0.00 31.11 1.00 0.79 2640.00 5.60 70.00 110.37 1486.38 296.96Rajasthan 32820.00 27833.00 23116.00 36315.23 5393.00 5049.92 5325.00 18370.25 5602.50 0.00 5805.00 7689.00 8730.00 5206.06Sikkim 2000.00 731.00 1500.00 1183.66 300.00 240.33 220.00 201.07 200.00 199.88 230.00 227.14 280.00 315.24Tamilnadu 90578.00 80322.00 70000.00 3231.67 718.00 1132.80 0.00 627.87 1530.05 0.00 1633.94 1471.00 20375.44 0.00Tripura 350.00 409.00 2978.00 839.84 85.00 78.84 86.70 73.67 80.22 40.55 50.00 30.00 60.00 616.78Utt kh d 6 00 0 00 0 00 0 00 0 00 0 00 0 00 0 00 0 00 0 00 0 00Uttarakhand … 6.00 0.00 0.00 0.00 0.00 0.00 0.00 0.00 0.00 0.00 0.00 0.00 0.00Uttar Pradesh 33744.00 29737.00 70199.00 69034.32 15082.00 13444.22 1878.00 11900.99 2944.00 11798.52 3383.00 13776.27 14393.00 18114.32West Bengal 30315.00 34793.00 42639.00 50960.71 21953.00 9207.92 19345.54 8644.52 4946.00 7698.74 5173.00 14338.94 6887.00 11070.59
UTsA&N Islands 820.00 1414.71 1040.00 2500.68 188.00 205.03 200.00 202.94 402.00 352.43 500.00 534.00 600.00 1206.28Chandigarh 1599.00 1710.72 4180.00 2669.01 453.00 357.23 304.00 209.80 537.00 609.03 260.00 310.69 262.00 1182.26D&N Haveli … 1.12 0.00 0.00 0.00 0.00 0.00 0.00 0.00 0.00 0.00 0.00 0.00 0.00Daman & Diu 6.00 0.00 0.00 38.72 2.00 0.00 0.00 9.90 10.00 9.85 10.00 8.77 15.00 10.20Delhi 145000.00 128637.92 293891.00 61358.95 57669.00 39641.35 63788.00 1839.87 84435.00 12056.69 83092.00 1967.79 72948.00 5853.25Lakshadweep 34.00 0.22 0.00 0.00 0.00 0.00 0.00 0.00 0.00 0.00 0.00 0.00 0.00 0.00Puducherry 280.00 179.92 2240.00 1000.75 560.00 59.97 95.00 74.94 275.00 273.94 580.00 292.01 500.00 299.89Grand Total 735526.00 592536.61 920690.00 554007.89 220949.00 120103.32 136131.62 84754.50 149849.85 76637.47 165872.24 117051.27 217406.06 155461.33Source : Planning Commission , Govt. of India.

Length of National Highways in India - State-wise (As on 31st March) ( In Kms.)
Sl. No. States/UTs 2003 2004 2005 2006 2007 2008
1 2 3 4 5 6 7 8STATES
1 Andhra Pradesh 4038 4472 4472 4472 4472 4472
Table No. 8.6
1 Andhra Pradesh 4038 4472 4472 4472 4472 44722 Arunachal Pradesh 392 392 392 392 392 3923 Assam 2836 2836 2836 2836 2836 28364 Bihar 3502 3537 3537 3537 3642 36425 Chhattisgarh 1774 2184 2184 2184 2184 21846 Goa 269 269 269 269 269 2697 Gujarat 2461 2871 2871 2871 3245 32458 Haryana 1361 1468 1468 1468 1512 15128 Haryana 1361 1468 1468 1468 1512 15129 Himachal Pradesh 1188 1208 1208 1208 1208 1208
10 Jammu & Kashmir 823 823 823 823 1245 124511 Jharkhand 1413 1805 1805 1805 1805 180512 Karnataka 3570 3843 3843 3843 3843 384313 Kerala 1440 1440 1440 1440 1440 145714 Madhya Pradesh 4664 5200 5200 5200 4670 467015 Maharashtra 3626 4176 4176 4176 4176 417616 Manipur 954 959 959 959 959 95917 Meghalaya 717 810 810 810 810 81018 Mizoram 927 927 927 927 927 92719 Nagaland 369 494 494 494 494 49420 Orissa 3301 3704 3704 3704 3704 370421 Punjab 1553 1557 1557 1557 1557 155722 Rajasthan 4597 5585 5585 5585 5585 558523 Sikkim 62 62 62 62 62 6224 Tamil Nadu 3758 4183 4183 4183 4462 446225 Tripura 400 400 400 400 400 40026 Uttar Pradesh 4942 5599 5599 5599 5874 587427 Uttarakhand 1075 1991 1991 1991 1991 199128 West Bengal 1951 2325 2325 2325 2377 252428 West Bengal 1951 2325 2325 2325 2377 2524
UNION TERRITORIES29 Andaman & Nicobar Islands 0 300 300 300 300 30030 Chandigarh 24 24 24 24 24 2431 Dadra & Nagar Haveli 0 0 0 0 0 032 Daman & Diu 0 0 0 0 0 033 Delhi 72 72 72 72 72 7234 Lakshadweep 0 0 0 0 0 034 Lakshadweep 0 0 0 0 0 035 Puducherry 53 53 53 53 53 53
Total 58112 65569 65569 65569 66590 66754

Road Length in India (Surfaced and Unsurfaced)
State-wise (As on 31.3.2004)STATES / UTs Surfaced Unsurfaced Total
1 2 3 4StatesAndhra Pradesh 128308 77817 206125Arunachal Pradesh 6062 9650 15712
Table No. 8.7
Arunachal Pradesh 6062 9650 15712Assam 22422 170558 192980Bihar 28491 45343 73834Chhattisgarh 39160 34833 73993Goa 7369 2871 10240Gujarat 129981 13679 143660Haryana 26754 1919 28673Hi h l P d h 17956 14626 32582Himachal Pradesh 17956 14626 32582Jammu & kashmir 8962 12133 21095Jharkhand 3817 7966 11783Karnataka 136288 63824 200112Kerala 76943 66333 143276Madhya Pradesh 80660 84680 165340Maharashtra 212001 60683 272684M i 3839 8760 12599Manipur 3839 8760 12599Meghalaya 6687 3014 9701Mizoram 2764 2134 4898Nagaland 6570 14077 20647Orissa 32670 181150 213820Punjab 31662 14105 45767Rajasthan 95196 49702 144898Sikkim 1652 411 2063Tamil Nadu 133175 37648 170823Tripura 9080 14776 23856Uttarakhand 16783 41271 58054Uttar Pradesh 182057 62385 244442West Bengal 51164 38535 89699
UTsA&N Islands 1481 0 1481Chandigarh 1637 0 1637D&N Haveli 610 22 632Daman & Diu 316 2 318Delhi 21126 8686 29812Lakshadweep 160 0 160pPuducherry 2252 348 2600Grand Total 1526055 1143941 2669996 *Note: * Excludes 51511 KM of Pradhan Mantri Gram Sadak Yojana and 9 lakh km of rural roads constructed under Jawahar Rozgar Yojana.

CATEGORY 2000-01 2001-02 2002-03 2003-04 2004-05 2005-06 2006-07 2007-08
1 2 3 4 5 6 7 8 9
M&HCVs 87784 96752 120502 166123 214807 219295 294258 291114
Production of Motor Vehicles in India (In numbers)Table No. 8.8
LCVs 68922 65756 83195 108917 138896 171788 225724 254062
TOTAL COMM. VEHICLES 156706 162508 203697 275040 353703 391083 519982 545176
CARS 513415 500301 557410 782562 960487 1046133 1238021 1416482CARS 513415 500301 557410 782562 960487 1046133 1238021 1416482
MULTI UTILITY VEHICLES 127519 169418 165920 206998 249389 263167 307202 345649
SCOOTERS 879759 937506 848434 935279 987498 1021013 943944 1074933
MOTOR CYCLES 2183785 2906323 3876175 4355168 5193894 6207690 7112281 6503532
MOPEDS 694974 427498 351612 332294 348437 379994 379987 430827
ELECTRIC TWO WHEELERS 0 0 0 0 0 0 30454 16757
TOTAL TWO WHEELERS 3758518 4271327 5076221 5622741 6529829 7608697 8466666 8026049
THREE WHEELERS 203234 212748 276719 356223 374445 434423 556126 500592
GRAND TOTAL 4759392 5316302 6279967 7243564 8467853 9743503 11087997 10833948GRAND TOTAL 4759392 5316302 6279967 7243564 8467853 9743503 11087997 10833948
Source : Society of Indian Automobile Manufacturers , New Delhi.
Note : M & HCVs = Medium and Heavy Commercial Vehicles. LCVs = Light Commercial Vehicles.
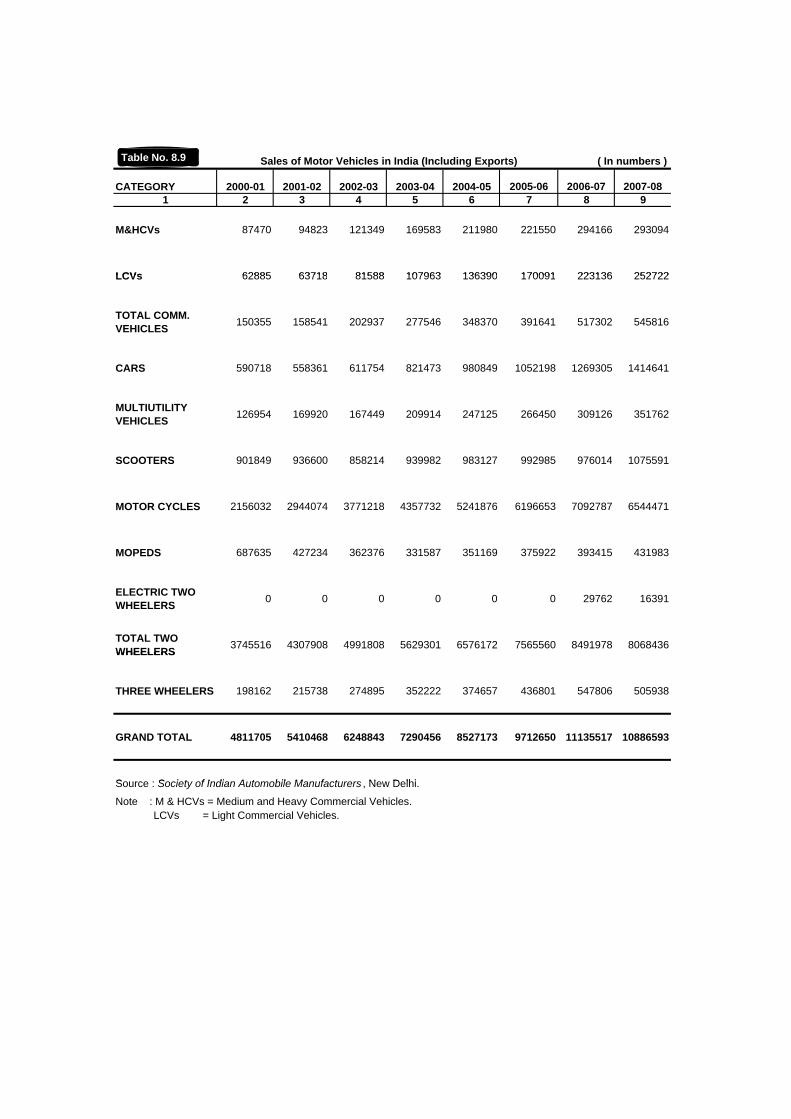
CATEGORY 2000-01 2001-02 2002-03 2003-04 2004-05 2005-06 2006-07 2007-081 2 3 4 5 6 7 8 9
M&HCVs 87470 94823 121349 169583 211980 221550 294166 293094
LCVs 62885 63718 81588 107963 136390 170091 223136 252722
( In numbers ) Sales of Motor Vehicles in India (Including Exports) Table No. 8.9
LCVs 62885 63718 81588 107963 136390 170091 223136 252722
TOTAL COMM. VEHICLES 150355 158541 202937 277546 348370 391641 517302 545816
CARS 590718 558361 611754 821473 980849 1052198 1269305 1414641
MULTIUTILITY VEHICLES 126954 169920 167449 209914 247125 266450 309126 351762
SCOOTERS 901849 936600 858214 939982 983127 992985 976014 1075591
MOTOR CYCLES 2156032 2944074 3771218 4357732 5241876 6196653 7092787 6544471
MOPEDS 687635 427234 362376 331587 351169 375922 393415 431983
ELECTRIC TWO WHEELERS 0 0 0 0 0 0 29762 16391
TOTAL TWO WHEELERS 3745516 4307908 4991808 5629301 6576172 7565560 8491978 8068436WHEELERS
THREE WHEELERS 198162 215738 274895 352222 374657 436801 547806 505938
GRAND TOTAL 4811705 5410468 6248843 7290456 8527173 9712650 11135517 10886593
S S i t f I di A t bil M f t N D lhiSource : Society of Indian Automobile Manufacturers , New Delhi.
Note : M & HCVs = Medium and Heavy Commercial Vehicles. LCVs = Light Commercial Vehicles.
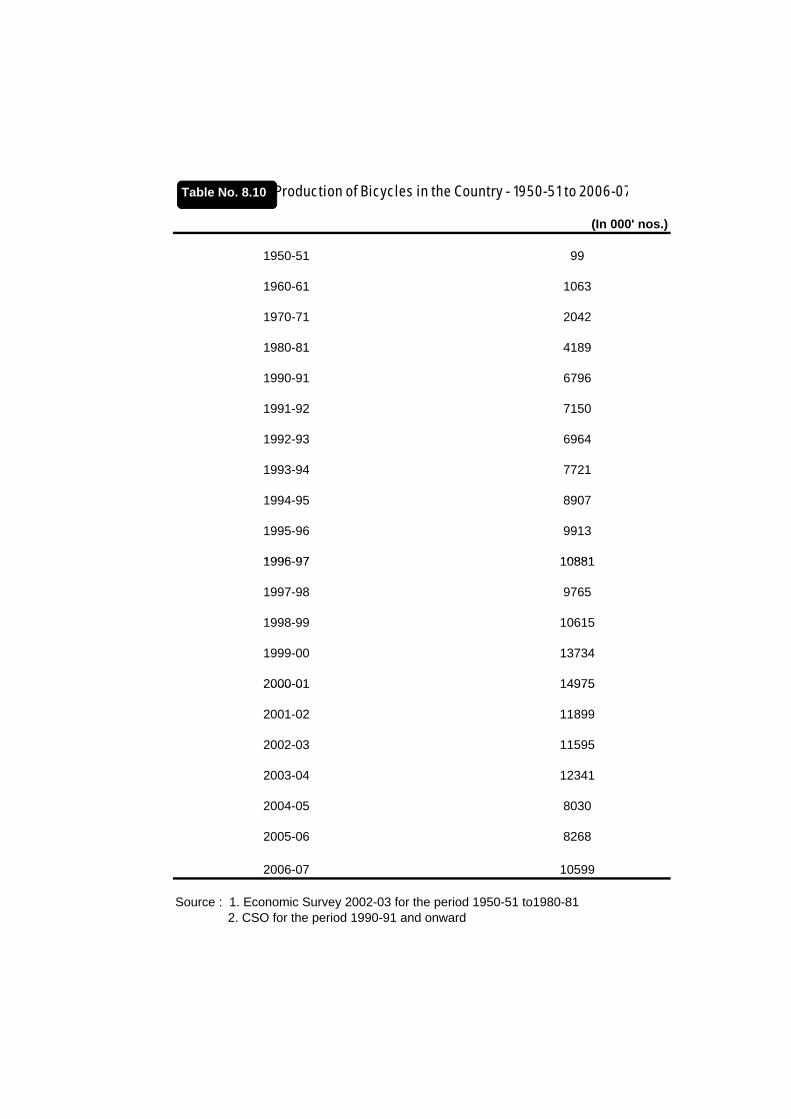
(In 000' nos.)
1950-51 99
1960-61 1063
Production of Bicycles in the Country - 1950-51 to 2006-07Table No. 8.10
1970-71 2042
1980-81 4189
1990-91 6796
1991-92 7150
1992 93 69641992-93 6964
1993-94 7721
1994-95 8907
1995-96 9913
1996 97 108811996-97 10881
1997-98 9765
1998-99 10615
1999-00 13734
2000-01 149752000-01 14975
2001-02 11899
2002-03 11595
2003-04 12341
2004-05 8030
2005-06 8268
2006-07 10599
Source : 1. Economic Survey 2002-03 for the period 1950-51 to1980-81 2. CSO for the period 1990-91 and onward

AANNNNEEXXUURREESS
GLOSSARY OF IMPORTANT TERMS
TERMS DEFINITIONS ADMINISTRATIVE STAFF
Includes all the staff working in the Depots and Divisions, other than those in Traffic Staff, Workshop and Maintenance Staff.
AVERAGE CARRYING CAPACITY
The Average carrying capacity is calculated as follows: AVERAGE Total Seating & Standing for all vehicles on road CARRYING = ----------------------------------------------------------- CAPACITY Total Number of vehicles on road
AVERAGE ROUTE DISTANCE
AVERAGE Total route kilometers of all the routes ROUTE = ------------------------------------------------ DISTANCE Total Number of routes
ARTICULATED VEHICLE
Articulated vehicle means a motor vehicle to which a semi trailer is attached.
AXLE WEIGHT Axle weight means in relating to an axle of a vehicle the total weight transmitted by the several wheels attached to that axle to the surface on which the vehicle rests.
CERTIFICATION OF REGISTRATION
Certificate of registration means the certificate issued by a competent authority to the effect that a motor vehicle has been duly registered in accordance with the provision of Motor Vehicle Act, 1988.
CONDUCTOR
Conductor in relation to a stage carriage, means a person engaged in collecting fares from passengers, regulating their entrance into, or exit from the stage carriage and performing such other functions as may be prescribed.
CONDUCTOR’S LICENCE
Conductor’s Licence means the Licence issued by a competent authority authorising the person specified to act as a conductor.
CONTRACT CARRIAGE
Contract carriage means motor vehicle which carries a passenger of passengers for hire or reward and is engaged under a contract, whether expressed or implied, to the use to such vehicle or any person authorized by him in this behalf on fixed or an agreed rate or sum.
a) On a time basis, whether or not with reference to any route or distance: or
b) From one point to another, and in either case, without stopping to pick up or set down passengers not included in the contract any where during the journey, and includes:-
i) a maxi-cab; and ii) a motor-cab not withstanding that separate fares are
charged for its passengers.
DEALER Dealer includes a person who is engaged :- a) in the manufacture of motor vehicles; or b) in building, bodies for attachment to chassis; or c) in the repair of motor vehicles; or d) in the business of hypothecation, leasing or hire purchase of motor vehicle.
DRIVER Driver in relation to a motor vehicle is the person who acts as a steersman of the motor vehicle.
DRIVING LICENCE Driving Licence means the licence issued by a competent authority authorising the person specified therein to drive, otherwise than a learner, a motor vehicle or a motor vehicle of any specified class or description.
EDUCATIONAL INSTITUTION BUS
Educational Institution Bus means an omni bus, which is owned by a college, school or other educational institution and used solely for the purpose of transporting students or staff of the educational institution in connection with any of its activities.
FARES Fares include sums payable for season ticket or in respect of the hire of a contract carriage.
GOODS Goods includes Livestock, and anything (other than equipment ordinarily used with the vehicle) carried by a vehicle except living persons, but does not include luggage or personal effects carried in motor car or in a trailer attached to a motor car or the personal luggage of passengers travelling in the vehicle.
GOODS CARRIAGE Goods carriage means any motor vehicle contracted or adapted for use solely for the carriage of goods, or any motor vehicle not so constructed or adapted when used for the carriage of goods.
GROSS VEHICLE WEIGHT
Gross Vehicle Weight means in respect of any vehicle the total weight of the vehicle and load certified and registered by the registering authority as permissible for that vehicle.
HEAVY GOODS VEHICLE
Heavy Goods Vehicle means any goods carriage the gross-vehicle weight of which, or a tractor or a road-roller the unladen weight of either of which, exceeds 12,000 Kilograms.
HEAVY PASSENGER MOTOR VEHICLE
Heavy Passenger Motor Vehicle means any public service vehicle or private service vehicle or educational institution bus or omnibus the gross vehicle weight of any of which, or a motor car the unladen weight of which, exceed 12,000 kilograms.

INVALID CARRIAGE Invalid Carriage means a motor vehicle specially designed and constructed and not merely adapted, for the use of a person suffering from some physical defect or disability and used solely by or for such a person.
LEARNER'S LICENCE Learner's Licence means the Licence issued by a competent authority under Chapter II authorising the person specified therein to drive as a learner, a motor vehicle or a motor vehicle of any specified class or description.
LIGHT MOTOR VEHICLE
Light Motor Vehicle means a transport vehicle or omnibus the gross vehicle weight of either of which or a motor car or tractor or road-roller the unladen weight of any of which, does not exceed 6,000 Kilograms.
MAXI CAB Maxi cab means any motor vehicle constructed or adapted to carry more than six passengers, but not more than twelve passengers excluding the driver, for hire or reward.
MEDIUM GOODS VEHICLE
Medium goods vehicle means any goods carriage other than a Light Motor Vehicle or a Heavy Goods Vehicle.
MEDIUM PASSENGER MOTOR VEHICLE
Medium Passenger Motor Vehicle means any public service vehicle or private service vehicle, or educational institutional bus other than a motor cycle, invalid carriage, Light Motor Vehicle or Heavy Passenger Motor Vehicle.
MOTOR CAB Motor Cab means any motor vehicle constructed or adapted to carry not more than six passengers excluding the driver for hire or reward.
MOTOR CAR Motor Car means any motor vehicle other than transport vehicle, omnibus, road roller, tractor, motorcycle or invalid carriage.
MOTOR CYCLE Motor Cycle means a two-wheeled motor vehicle, inclusive of any detachable side-car having an extra wheel, attached to the motor vehicle.
MOTOR VEHICLE Motor Vehicle means any mechanically propelled vehicle adapted for use upon road whether the power of propulsion is transmitted there to from an external or internal source and includes a chassis to which a body has not been attached and a trailer; but does not include a vehicle running upon fixed rails or a vehicle of a special type adapted for use only in a factory (or in any other enclosed premises) or a vehicle having less than four wheels fitted with engine capacity of not exceeding thirty five cubic centimetres.
OMNIBUS Omnibus means any motor vehicle constructed or adapted to carry more than six persons excluding the driver.

OWNER Owner means a person in whose name a motor vehicle stands registered, and where such person is a minor, the guardian of such minor, and in relation to a motor vehicle which is the subject of a hire-purchase, agreement, or an agreement of lease or an agreement of hypothecation the persons in possession of the vehicle under that agreement.
PERMIT Permit means a permit issued by a state or regional transport authority or an authority prescribed in this behalf authorising the use of a motor vehicle as a transport vehicle.
PRIVATE SERVICE VEHICLE
Private service vehicle means a motor vehicle constructed or adapted to carry more than six persons excluding the driver and ordinarily used by or on behalf of the owner of such vehicle for the purpose of carrying persons for, or in connection with, his trade or business otherwise than for hire or reward but does not include a motor vehicle used for public purpose.
PUBLIC PLACE Public place means a road, street, way or other place, whether a thoroughfare or not, to which the public have a right of access, and includes any place or stand at which passengers are picked up or set down by a stage carriage.
PUBLIC SERVICE VEHICLE
Public Service Vehicle means any motor vehicle used or adapted to be used for the carriage of passengers for hire or reward, and includes a maxi-cab, a motor cab, contract carriage, and stage carriage.
REGISTERED AXLE WEIGHT
Registered Axle Weight means in respect of the axle of any vehicle, the axle weight certified and registered by the registering authority as permissible for that axle.
ROUTE Route means a line of travel which specifies the highway which may be traversed by a motor vehicle between one terminus and another.
SEMI-TRAILER Semi-trailer means a trailer drawn by a motor vehicle and so constructed that a part of it is super-imposed on, a part of its weight is borne by, the drawing vehicle.
STAGE-CARRIAGE Stage carriage means a motor vehicle constructed or adapted to carry more than six passengers excluding the driver for hire or reward at separate fares paid by or for individual passengers, either for the whole journey or for stages of the journey.

STATE TRANSPORT UNDERTAKING
State Transport Undertaking means any undertaking providing road transport service, where such undertaking is carried on by :- i) the Central Government or a State Government; ii) any Road Transport Corporation established under section 3 of the Road Transport Corporation Act, 1950. iii) Any municipality or any corporation or company owned or controlled by the Central Government or one or more State Governments, or by the Central Government and one or more State Government.
TOURIST VEHICLE Tourist vehicle means a contract carriage constructed or adapted and equipped and maintained in accordance with such specification as may be prescribed in this behalf;
TRACTOR Tractor means a motor vehicle which is not itself constructed-to carry any load (other than equipment used for the purpose of propulsion) but excludes a road roller.
TRAFFIC SIGNS Traffic signs include all signals, warning sign posts, direction posts, marking on the road or other devices for the information, guidance or direction of drivers of motor vehicles.
TRAILER Trailer means any vehicle, other than a semi trailer, and a side car, drawn or intended to be drawn by a motor vehicle.
TRANSPORT VEHICLE
Transport Vehicle means a public service vehicle or a goods vehicle.
UNLADEN WEIGHT Unladen Weight means the weight of a vehicle or trailer include all equipment ordinarily used with the vehicle or trailer when working, but excluding the weight of a driver or attendant; and where alternative parts or bodies are used, the unladen weight of the vehicle means the weight of the vehicle with the heaviest such alternative part or body.
WEIGHT Weight means the total weight transmitted for the time being by the wheels of a vehicle to the surface on which the vehicle rests.