
India Habitat Centre, Lodhi Road, New Delhi Date - Forum of ...
38
1 MINUTES OF THE ELEVENTH MEETING OF THE FORUM OF REGULATORS ( FOR ) Venue : India Habitat Centre, Lodhi Road, New Delhi Date : 2 nd March, 2009 The meeting was chaired by Dr. Pramod Deo, Chairperson, CERC/FOR. The list of participants is at Annexure-I . Item No.1A : Confirmation of the minutes of the 10 th meeting of FOR held on 30 th January, 2009 at Chennai and consideration of Action Taken Report. The meeting confirmed the minutes of the Chennai meeting as circulated. The Forum also noted the Action Taken Report as contained in Appendix-II of the Agenda Note. A brief discussion took place on the issue of compilation of information for Regulatory Information Management System. Chairperson, PSERC said that some special efforts were required at the level of utilities to compile the information and that is why sending the information to FOR Secretariat was taking time. After discussions, there was a consensus that utilities should be asked to institutionalize an IT based system to regularly compile information required for RIMS and submit the same to the SERC concerned. The Forum agreed that RIMS was a useful tool for enhancing the efficacy of regulatory process and the Secretariat should continue to make efforts to compile and update the information under RIMS on the basis of data provided by SERCs. Item No.1B : Proposed MOU between FOR and CPUC, CEC, LBNL. After consideration, the Forum endorsed the final draft of the MOU and approved its signing by the Chairperson. Item No.2 : CERC Regulations on Terms & Conditions of Tariff for the period 2009-14 and FOR Recommendations. Secretary, FOR made two presentations, namely on ‘CERC Regulations on Terms & Conditions of Tariff for the period 2009-14’ and on FOR Recommendations on seven important areas pertaining to distribution segment including staffing of ERCs. A copy of each of these two
-
Upload
khangminh22 -
Category
Documents
-
view
2 -
download
0
Transcript of India Habitat Centre, Lodhi Road, New Delhi Date - Forum of ...

1
MINUTES OF THE
ELEVENTH MEETING OF THE FORUM OF REGULATORS ( FOR )
Venue : India Habitat Centre, Lodhi Road, New Delhi Date : 2nd March, 2009
The meeting was chaired by Dr. Pramod Deo, Chairperson, CERC/FOR. The list of participants is at Annexure-I. Item No.1A : Confirmation of the minutes of the 10th meeting of FOR held on
30th January, 2009 at Chennai and consideration of Action Taken Report.
The meeting confirmed the minutes of the Chennai meeting as circulated. The Forum also noted the Action Taken Report as contained in Appendix-II of the Agenda Note.
A brief discussion took place on the issue of compilation of information for Regulatory Information Management System. Chairperson, PSERC said that some special efforts were required at the level of utilities to compile the information and that is why sending the information to FOR Secretariat was taking time. After discussions, there was a consensus that utilities should be asked to institutionalize an IT based system to regularly compile information required for RIMS and submit the same to the SERC concerned. The Forum agreed that RIMS was a useful tool for enhancing the efficacy of regulatory process and the Secretariat should continue to make efforts to compile and update the information under RIMS on the basis of data provided by SERCs. Item No.1B : Proposed MOU between FOR and CPUC, CEC, LBNL. After consideration, the Forum endorsed the final draft of the MOU and approved its signing by the Chairperson. Item No.2 : CERC Regulations on Terms & Conditions of Tariff for the
period 2009-14 and FOR Recommendations. Secretary, FOR made two presentations, namely on ‘CERC Regulations on Terms & Conditions of Tariff for the period 2009-14’ and on FOR Recommendations on seven important areas pertaining to distribution segment including staffing of ERCs. A copy of each of these two
2
presentations is at Annexure-II & III. In the discussions subsequent to the presentations, the following main points emerged:
i) Regarding the recommendations of FOR for implementing pay package of CPSUs for the staff of the ERCs (both at centre and state level), there was a consensus that pay package as applicable in Schedule A CPSUs should be adopted. Secretary, Ministry of Power assured to take appropriate action for implementation of this recommendation of FOR, including advising the State Governments in the matter.
ii) There was a consensus that the standard bidding document for Case-1 under the competitive bidding guidelines for procurement of power by distribution licensees may be issued by Ministry of Power as early as possible because a common bidding document across the states would help in early finalization of power procurement contracts and in turn would facilitate capacity addition.
iii) It was suggested by Secretary, Ministry of Power that the SERCs may simplify the procedure for recovery of additional energy charges by the generators on account of use of imported coal. It emerged that generally the SERCs have allowed automatic fuel surcharge adjustment upto a limit beyond which the generators are required to seek approval of SERCs. It was agreed that SERCs would further streamline the process and also ask the utilities to plan the procurement of imported fuel in advance as far as possible. It was also suggested that the generators should enter into fuel purchase contracts of longer duration in order to obtain better prices.
iv) The need of promoting non-conventional energy sources by setting reasonable renewable purchase obligations and also enforcing penalties for non-compliance thereof was emphasized. It was also noted that a number of SERCs had permitted a preferential rate of ROE for the renewable energy and some of the SERCs had also reduced the cross-subsidy surcharge on purchase of renewable energy by the consumers.
v) Secretary, Ministry of Power said that there was a need of proper coordination at state level for forecasting the demand and planning the procurement of electricity in advance. After discussions, there was a consensus that power procurement was the statutory obligation of the distribution companies under the Electricity Act and the State Governments should facilitate capacity building of distribution utilities to discharge this obligation in an efficient and effective manner. Central Electricity Authority might help the distribution utilities in setting up their planning cells for demand forecasting and power procurement. The state level coordination forums as envisaged in the Electricity Act, 2003 may also facilitate this matter.
vi) There was also a suggestion that perhaps an exercise might be started to identify the areas where certain amendments were required in the Electricity Act. It was however, felt that caution needs to be exercised in the matter as the implementation of a number of reform oriented provisions of the Act was in progress and the same should not be affected by such an exercise.
3
Item No.3 : Discussion on Demand Side Management (DSM). Item No.4 : Presentation by Bureau of Energy Efficiency (BEE) on ‘Bachat
Lamp Yojana’ and ‘Scheme for Star Rating of Office Building’ and Interaction with US Regulators on DSM & Energy Efficiency:
The following presentations were made on Demand Side Management:
- Various energy efficiency measures being taken by Bureau of Energy Efficiency in India with particular focus on “DSM Initiatives in India” by Dr. Ajay Mathur, Director General, Bureau of Energy Efficiency (Copy at Annexure-IV)
- “Policies and Strategies in California to Achieve Maximum Energy Savings” by Ms. Dian M. Grueneich, Commissioner, California Public Utilities Commission. (Copy at Annexure-V)
- “Energy Efficiency Lessons and Plans from California” by Mr. Arthur H. Rosenfeld, Commissioner California Energy Commission (Copy at Annexure-VI)
The following were the key points that emerged during the discussions subsequent to the
presentations:
i) In US, energy efficiency is being pursued mainly for economic benefits to the local economy and for the consumers.
ii) Energy efficiency efforts got a special boost in California after the oil crisis and it also led to the formation of the Energy Commission in the State.
iii) A significant component of the recent stimulus to US economy is for promoting energy efficiency measures.
iv) For promoting devices like CFLs, it has been found more useful to give upstream subsidy (to manufacturer) in order to reduce transaction costs.
v) Bureau of Energy Efficiency was requested to circulate to every SERC a full set of documents relating to various initiatives taken by BEE.
During this session of the meeting, a teleconference was also held with Mr. Jon
Wellinghoff, Acting Chairman of the Federal Energy Regulatory Commission (FERC). Mr. Wellinghoff highlighted the major activities being taken by FERC for enhancing reliability, promoting non-discriminatory open access and effectively monitoring the wholesale power markets in US. FERC is also paying special attention to appropriate interventions at planning stage for ensuring open access to renewable energy sources. They are giving equal importance to demand side and supply side measures. FERC has powers to direct the Regional Transmission Organisations (RTOs), or transmission service providers for creating a new transmission capacity. In the process of overseeing the power markets, FERC not only investigates the violations but also disgorges unjust profits. It has also formulated anti-manipulation rules under which market transactions are filtered.

4
Item No.5: Any other item It was agreed that the next meeting of the Forum of Regulators would be held in second week of June 2009 in New Delhi.
The meeting ended with a vote of thanks to the Chair.
****

5
/ ANNEXURE – I /
LIST OF PARTICIPANTS ATTENDED THE ELEVENTH MEETING
OF
FORUM OF REGULATORS ( FOR )
HELD ON 02ND MARCH, 2009
AT “MAPLE” HALL, CONVENTION CENTRE
INDIA HABITAT CENTRE, NEW DELHI
S. No.
NAME ERC
01. Dr. Pramod Deo Chairperson
CERC – in Chair.
02. Shri A. Raghotham Rao Chairperson
APERC
03. Shri S.K. Misra Chairperson
CSERC
04. Dr. P.K. Mishra Chairperson
GERC
05. Shri Bhaskar Chatterjee Chairperson
HERC
06. Shri Yogesh Khanna Chairperson
HPERC
07. Shri K.B. Pillai Chairperson
J&KSERC
08. Shri Mukhtiar Singh Chairperson
JSERC
09. Shri V.K. Garg Chairperson
Joint ERC for Goa & all UTs except Delhi
10. Shri Rin Sanga Chairperson
Joint ERC for Manipur & Mizoram
11. Shri C. Balakrishnan Chairperson
KSERC
12. Dr. J.L. Bose Chairperson
MPERC
13. Shri V.P. Raja Chairperson
MERC

6
14. Shri Jai Singh Gill Chairperson
PSERC
15. Shri D.C. Samant Chairperson
RERC
16. Shri S. Kabilan Chairperson
TNERC
17. Shri Rajesh Awasthi Chairperson
UPERC
18. Shri Manoranjan Karmarkar Chairperson
TERC
19. Shri Himdari Dutta Member
AERC
20. Shri S.K. Jayaswal Member
BERC
21. Shri Vishwanath Hiremath Member
KERC
22. Shri Alok Kumar Secretary
CERC
23. Shri Sushanta K. Chatterjee Deputy Chief (Regulatory Affairs)
CERC
SPECIAL INVITEES
24. Shri V.S. Sampath
Secretary (Power) Ministry of Power
25. Dr. Ajay Mathur Director General
Bureau of Energy Efficiency (BEE)
FOREIGN DELEGATION
26. Dian Grueneich
Commissioner California Public Utilities Commission, USA
27. Dr. Arthur H. Rosenfeld Commissioner
California Energy Commission, USA
28. Dr. Jayant A. Sathaye Sr. Scientist & Leader, International Energy Studies Group
Lawrence Berkeley National Laboratory (LBNL)

ANNEXURE-II
1
CENTRAL ELECTRICITY REGULATORY COMMISSION
HIGHLIGHTS OF
TARIFF REGULATIONS FOR 2009-14
PHILOSOPHY
• Balance between ‘investment promotion’ and‘protection of consumer interest’
• Light handed regulation based on norms.
• Norms aimed at inducing efficiency inti ‘ l t bl t p t p f ’ d
2
operation, are ‘relatable to past performance’, anddo ‘take into consideration latest technologicaladvancements, fuel, vintage of equipments’.
• Regulatory certainty through multi-yearprinciples.
Specific Provisions
3
p
RETURN ON EQUITY…
• Pre-Tax ROE
– as against the earlier practice of post tax
return
• Beneficiaries not to bear the burden of
4
income tax on
– earnings, like UI earning, incentive earning
and efficiency gains.

ANNEXURE-II
2
RETURN ON EQUITY
• Base rate for allowing return on equityraised from 14% to 15.5% to attractinvestment.– Additional 0.5% for timely completion of projects.
5
• Base rate to be grossed up by applicable taxrate for the company. Benefit of tax holiday to be available to the project
developer.
DEPRECIATION
• Depreciation rates for initial 12 yearsapproximate 5.28%– Spread over beyond 12 years.
• No provision for Advance Against
6
p gDepreciation (AAD)
• AAD was on case to case basis
• New dispensation will encouragecontracting longer term debt.
PROVISIONS PROMOTING HYDRO DEVELOPMENT
• In addition to increased RoE anddepreciation rate approximating 5.28%,following provisions to boost developmentof hydro projects:– Depreciation to be allowed on land for
7
Depreciation to be allowed on land forreservoir.
– Developers insulated from hydrological riskduring the first 10 years.
– Enhanced free power and rehabilitation costallowed according to new Tariff Policy, forexpediting project implementation.
HYDRO DEVELOPMENT …..
• Tariff for hydro projects has beenrestructured to incentivise supply of peakingpower.
• Additional capitalization:– On account of damage caused of natural
8
calamities (but not due to flooding ofpowerhouse attributable to negligence ofGenco) after adjusting for insurance proceeds.
– Due to any additional work which has becomenecessary for successful and efficient plantoperation.
ANNEXURE-II
3
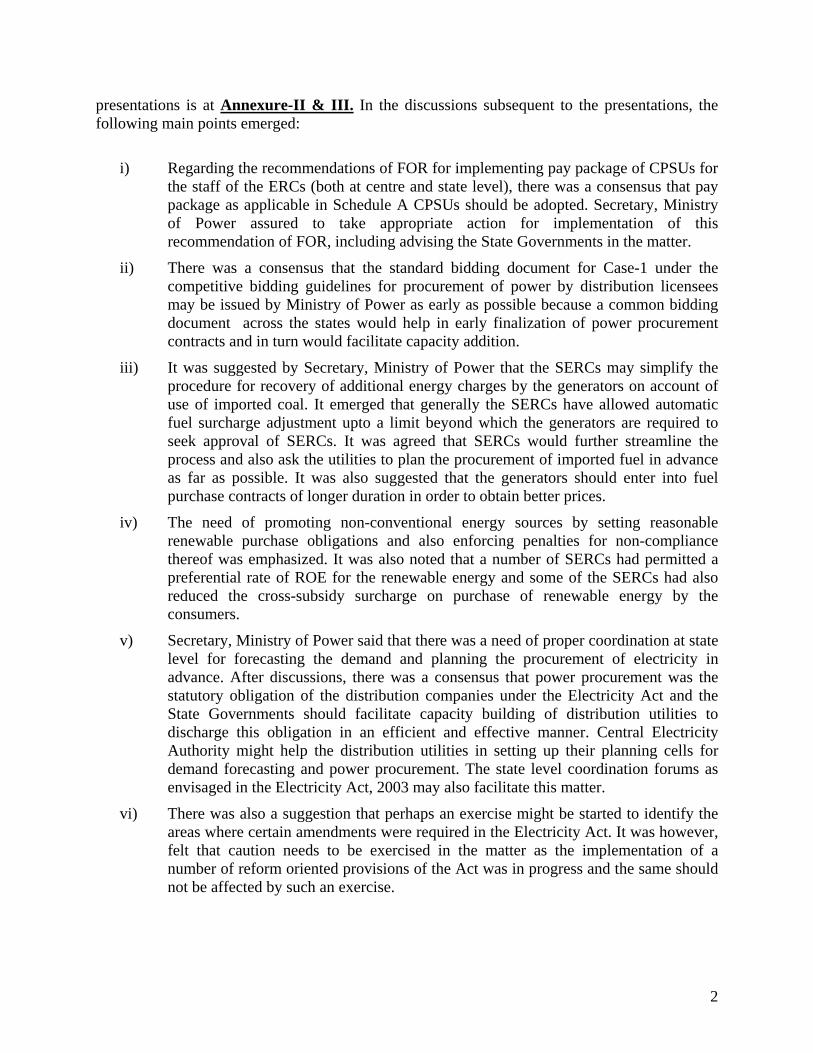
NORMS OF OPERATION
• Regulatory philosophy of CERC, toincentivise efficiency gains and toperiodically pass improvements tobeneficiaries, continued.
• Norms of operation tightened based on
9
actual performance, with room for gains forefficiency improvements.
• Target availability for recovery of fixed costfor thermal plants raised from 80% to 85%.
NORMS OF OPERATION….
• Station heat rate, tightened for existingstations
• For new stations, a new methodology withoperating margin of 6.5% with respect todesign heat rate.– Maximum permissible heat rate to ensure that
10
Maximum permissible heat rate to ensure thatinefficient machines are not procured.
• Norm for secondary fuel oil consumptionreduced from 2 ml per unit to 1 ml per unit.
• Savings in secondary fuel oil consumption tobe shared with the beneficiaries in the ratioof 50:50.
O&M NORMS
• Reasonable compensation for pay hikefactored into O&M norms.
11
• Escalation for O&M expenditure @5.72%
OTHER HIGHLIGHTS
• Thermal power projects to have two optionsto take care of R&M beyond useful life:– Option-I : Special allowance on the basis of perMW per year.
– Option-II : Comprehensive R&M with costbenefit analysis
12
• Incentive linked to availability, toincentivise higher availability (instead ofplant load factor) of power plants.
• Upfront tariff fixation for regulatorycertainty. Truing up along with next tariffperiod.
ANNEXURE-II
4
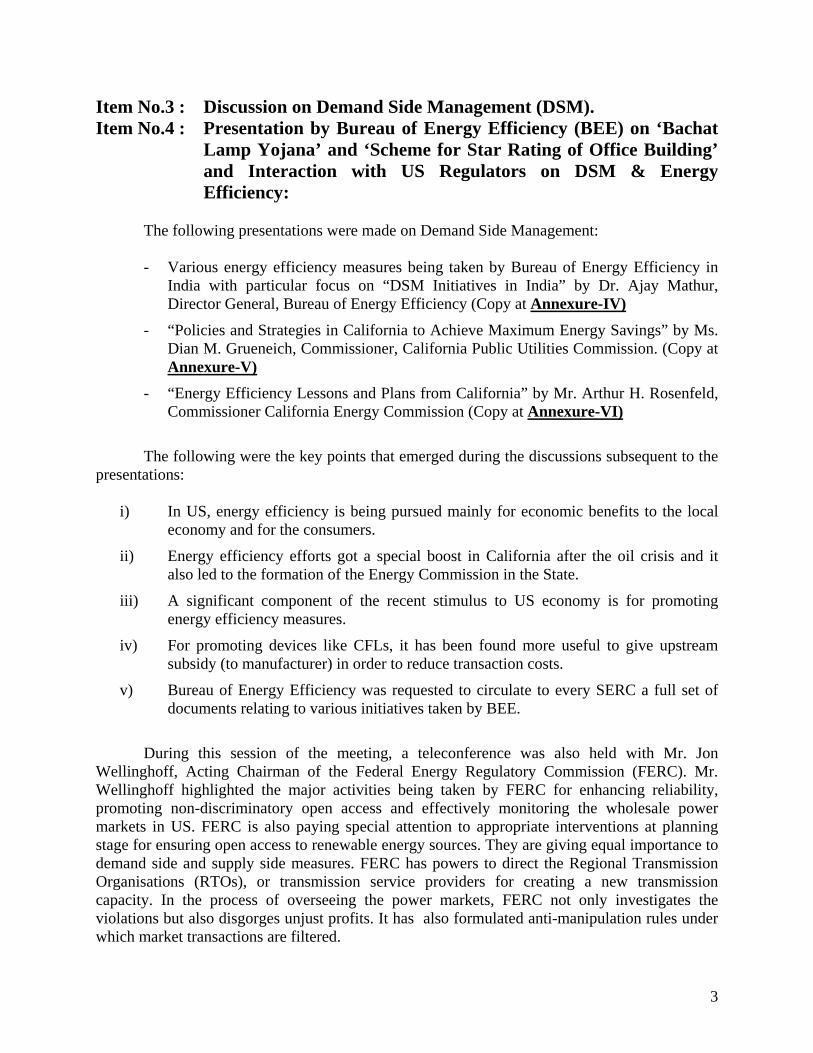
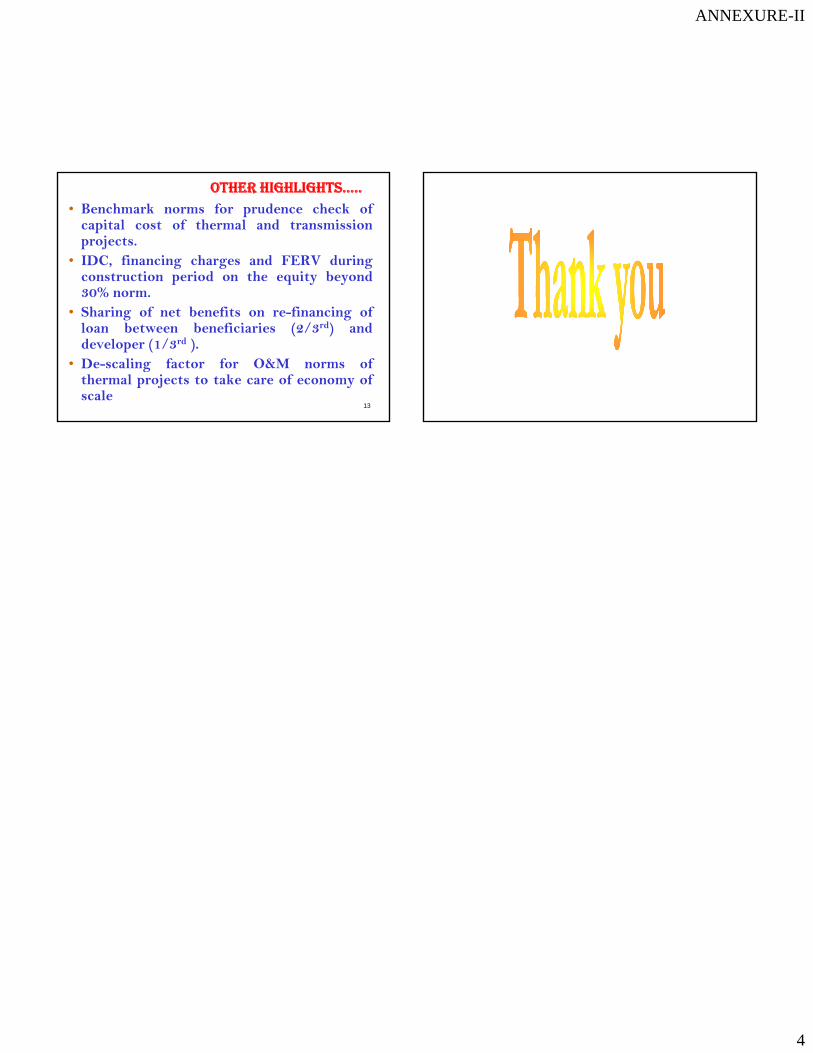
OTHER HIGHLIGHTS…..
• Benchmark norms for prudence check ofcapital cost of thermal and transmissionprojects.
• IDC, financing charges and FERV duringconstruction period on the equity beyond30% norm.
13
30% o .• Sharing of net benefits on re-financing ofloan between beneficiaries (2/3rd) anddeveloper (1/3rd ).
• De-scaling factor for O&M norms ofthermal projects to take care of economy ofscale

ANNEXURE-III
1
Forum of Regulators:
Recommendations
1
on
Key Issues
11th Meeting of ‘FOR’
2nd March,2009
In this presentation…..
FOR Recommendations on:
1. Protection of Consumer’s Interest
2. Open Access : Theory and Practice
3. Loss Reduction Strategies
2
4. Policies on Renewables
5. Demand Side Management and Energy Efficiency
6. Multi Year Tariff Framework and Distribution
Margin
7. Staffing of Electricity Regulatory Commissions
1. ‘FOR’ Recommendations on
3
1. FOR Recommendations on “Protection of Consumer’s Interest”
• Model Consumer Charter: Incorporating rights
and obligations of consumers recommended.
• CGRF should be located at a place which is
easily accessible by the consumer.
SERC l ti t hibit t f
Protection of Consumers’ Interest
4
• SERC regulations to prohibit engagement of
lawyers in CGRF.
• Regulations to provide non-compliance of CGRF
orders as contravention of the regulations of
SERC
- making licensee liable for action under
section 142 of the Act.

ANNEXURE-III
2
• Time limit for disposal of grievances by the
CGRF.
- after which consumer should have the right to approach
the ombudsman for settlement of non-redressal of his
grievance
Protection of Consumers’ Interest
5
grievance.
• Office of Ombudsman should be funded by
SERCs
- A separate budgetary allocation in SERC budget.
- SERC may recover such expenses from the licensees
directly.
• Consumer Advocacy:
- NGOs should be involved for consumer education and
empowerment.
- FOR to financially support identified competent NGOs or
eminent persons to take up/contest important consumer
related cases in High Courts APTEL and the Supreme Court
Protection of Consumers’ Interest
6
related cases in High Courts, APTEL, and the Supreme Court
- SERCs to organize regular orientation courses for capacity
building of consumer advocates.
• Provision in the GoI rule stipulating requirement
of submission of report by ombudsman to be
institutionalized by SERCs.
2. ‘FOR’ Recommendations on
7
2. FOR Recommendations on “Open Access : Theory and Practice”
Open Access : Theory and Practice
• Independence of SLDC
- SLDC not to report to transmission or trading licensee.
- Reporting requirements could be on lines of State
Electoral Officer under Election Commission.
• Operation of SLDC
8
- with STU as a subsidiary of transmission utility as stop-
gap arrangement;
- by a separate entity as soon as possible
• State Governments be advised to phase out
single buyer model.
MoP may take up these issues with State
Governments
ANNEXURE-III
3
Open Access : Theory and Practice
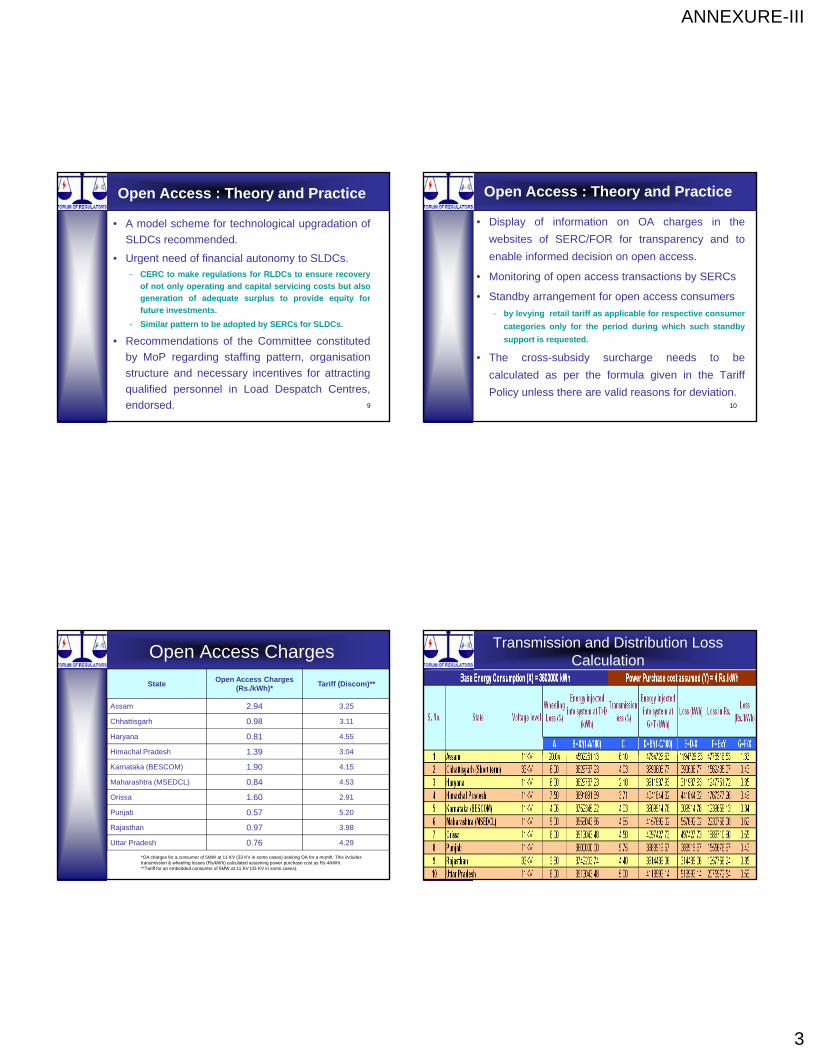
• A model scheme for technological upgradation of
SLDCs recommended.
• Urgent need of financial autonomy to SLDCs.- CERC to make regulations for RLDCs to ensure recovery
of not only operating and capital servicing costs but also
generation of adequate surplus to provide equity for
9
generation of adequate surplus to provide equity for
future investments.
- Similar pattern to be adopted by SERCs for SLDCs.
• Recommendations of the Committee constituted
by MoP regarding staffing pattern, organisation
structure and necessary incentives for attracting
qualified personnel in Load Despatch Centres,
endorsed.
Open Access : Theory and Practice
• Display of information on OA charges in the
websites of SERC/FOR for transparency and to
enable informed decision on open access.
• Monitoring of open access transactions by SERCs
• Standby arrangement for open access consumers
10
• Standby arrangement for open access consumers
- by levying retail tariff as applicable for respective consumer
categories only for the period during which such standby
support is requested.
• The cross-subsidy surcharge needs to be
calculated as per the formula given in the Tariff
Policy unless there are valid reasons for deviation.
Open Access Charges
StateOpen Access Charges
(Rs./kWh)*Tariff (Discom)**
Assam 2.94 3.25
Chhattisgarh 0.98 3.11
Haryana 0.81 4.55
Himachal Pradesh 1.39 3.04
Karnataka (BESCOM) 1.90 4.15
Maharashtra (MSEDCL) 0.84 4.53
Orissa 1.60 2.91
Punjab 0.57 5.20
Rajasthan 0.97 3.98
Uttar Pradesh 0.76 4.29
*OA charges for a consumer of 5MW at 11 KV (33 KV in some cases) seeking OA for a month. This includes transmission & wheeling losses (Rs/kWh) calculated assuming power purchase cost as Rs 4/kWh.**Tariff for an embedded consumer of 5MW at 11 KV (33 KV in some cases).
Transmission and Distribution Loss Calculation
ANNEXURE-III
4
3. ‘FOR’ Recommendations on
13
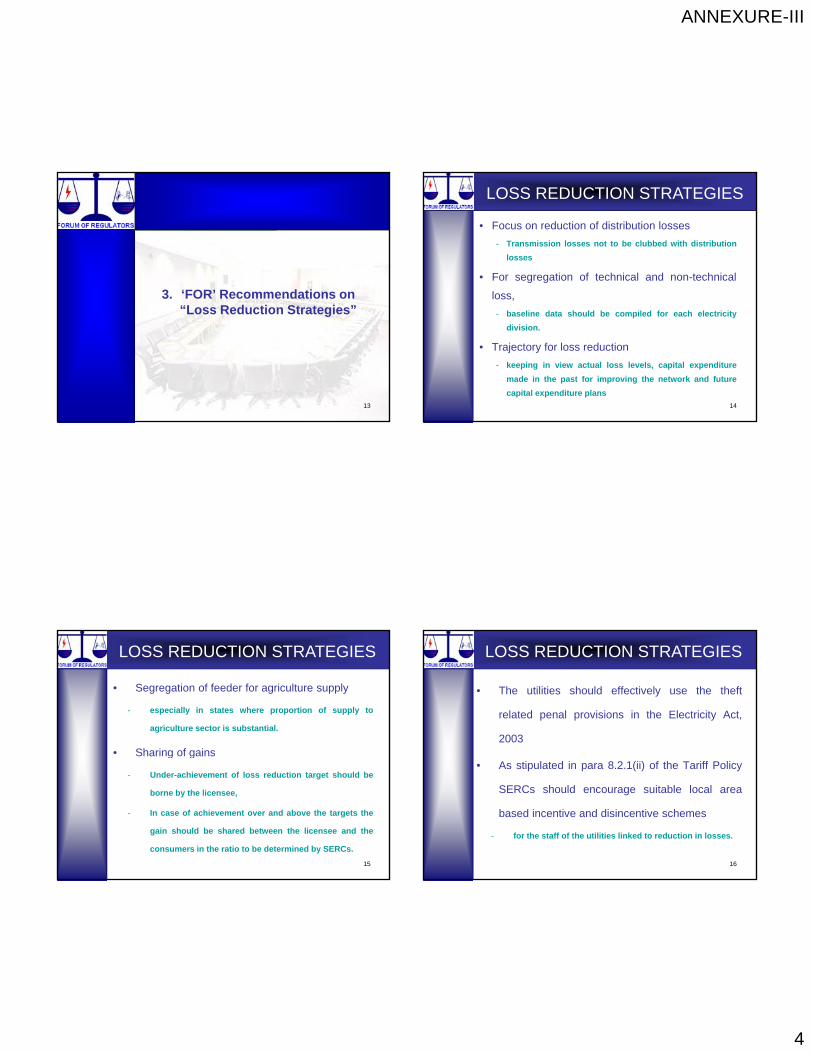
3. FOR Recommendations on “Loss Reduction Strategies”
• Focus on reduction of distribution losses
- Transmission losses not to be clubbed with distribution
losses
• For segregation of technical and non-technical
loss
LOSS REDUCTION STRATEGIES
14
loss,
- baseline data should be compiled for each electricity
division.
• Trajectory for loss reduction
- keeping in view actual loss levels, capital expenditure
made in the past for improving the network and future
capital expenditure plans
• Segregation of feeder for agriculture supply
- especially in states where proportion of supply to
agriculture sector is substantial.
• Sharing of gains
LOSS REDUCTION STRATEGIES
15
Sharing of gains
- Under-achievement of loss reduction target should be
borne by the licensee,
- In case of achievement over and above the targets the
gain should be shared between the licensee and the
consumers in the ratio to be determined by SERCs.
• The utilities should effectively use the theft
related penal provisions in the Electricity Act,
2003
LOSS REDUCTION STRATEGIES
16
• As stipulated in para 8.2.1(ii) of the Tariff Policy
SERCs should encourage suitable local area
based incentive and disincentive schemes
- for the staff of the utilities linked to reduction in losses.

ANNEXURE-III
5
4. ‘FOR’ Recommendations on
17
4. FOR Recommendations on “Policies on Renewables”
Policies on Renewables
• Mininum level of Renewable Purchase Obligation
(RPO) at 5% till 2010 on lines of National Action
Plan on Climate Change;
N d f f ilit ti f k f ti it
18
• Need for facilitative framework for connectivity
and inter-State exchange of power.
• Suitable mechanism like Renewable Energy
Certificate (REC) to promote RE sources.
Policies on Renewables
• Preferential tariff based on the cost-plus
approach for non firm RE- based projects during
loan period- after which they should be allowed to compete.
• Bidding Guidelines under section 63 of the Act
19
needs to be framed by the Ministry of Power, in
consultation with MNRE for bidding amongst:- (a) RE sources which can be scheduled, such as
bagasse-based generation; and
- (b) generation projects which cannot be scheduled and
which have availed of preferential tariff during the debt
repayment period.
Policies on Renewables
• GBIs are preferable to capital subsidies for
promotion of RE technologies.
• GBIs should be announced upfront, which could
20
be factored in the tariff to be set by ERCs.
ANNEXURE-III
6
5. ‘FOR’ Recommendations on
21
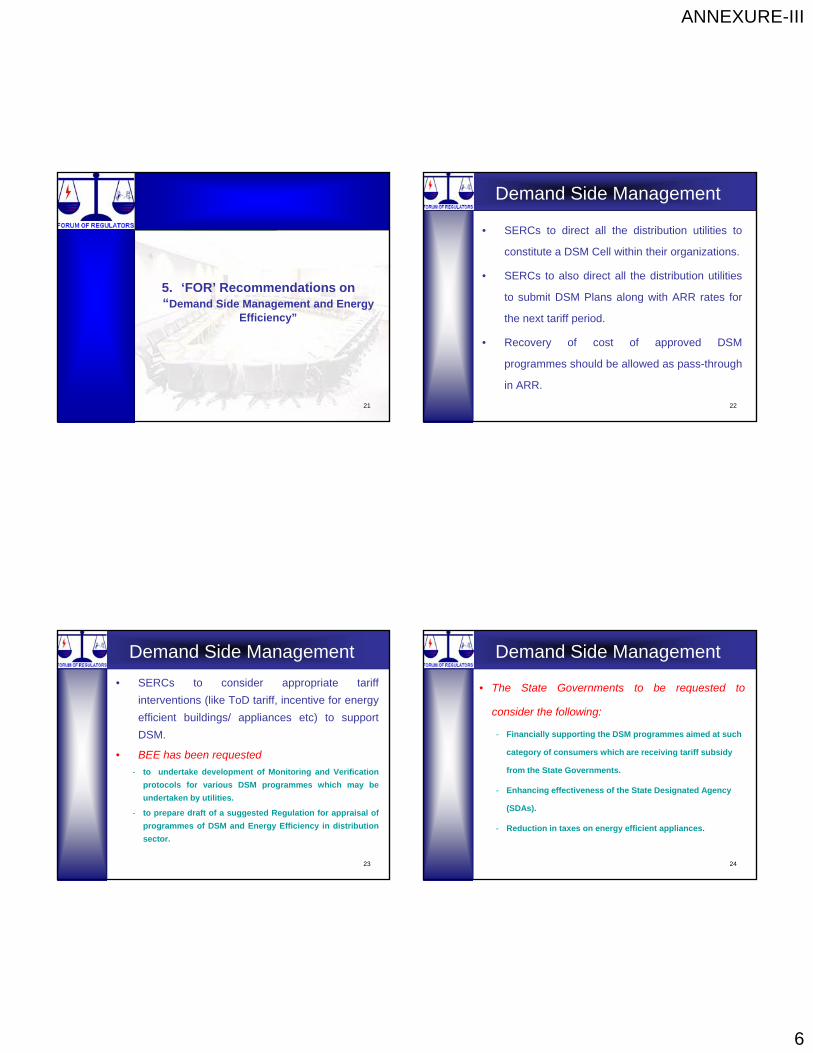
“Demand Side Management and Energy Efficiency”
• SERCs to direct all the distribution utilities to
constitute a DSM Cell within their organizations.
• SERCs to also direct all the distribution utilities
to submit DSM Plans along with ARR rates for
Demand Side Management
22
to submit DSM Plans along with ARR rates for
the next tariff period.
• Recovery of cost of approved DSM
programmes should be allowed as pass-through
in ARR.
• SERCs to consider appropriate tariff
interventions (like ToD tariff, incentive for energy
efficient buildings/ appliances etc) to support
DSM.
• BEE has been requested
Demand Side Management
23
• BEE has been requested
- to undertake development of Monitoring and Verification
protocols for various DSM programmes which may be
undertaken by utilities.
- to prepare draft of a suggested Regulation for appraisal of
programmes of DSM and Energy Efficiency in distribution
sector.
Demand Side Management
• The State Governments to be requested to
consider the following:
- Financially supporting the DSM programmes aimed at such
category of consumers which are receiving tariff subsidy
24
g y g y
from the State Governments.
- Enhancing effectiveness of the State Designated Agency
(SDAs).
- Reduction in taxes on energy efficient appliances.
ANNEXURE-III
7
6. ‘FOR’ Recommendations on “ ff
25
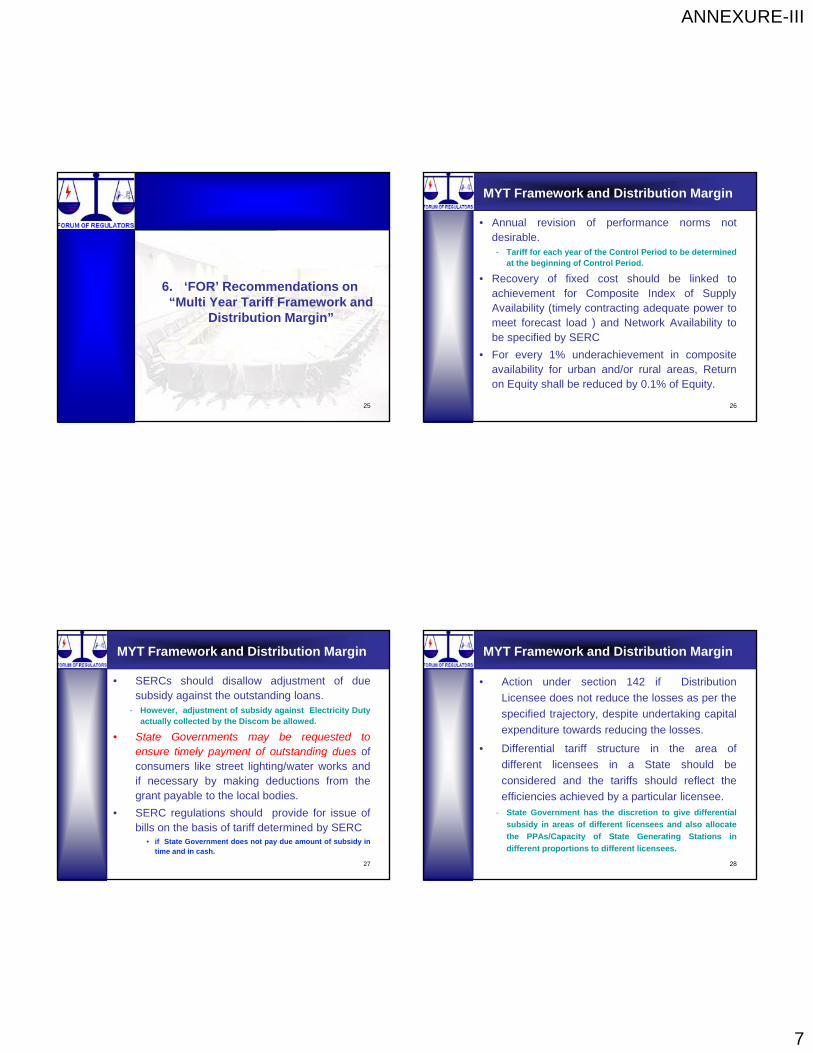
“Multi Year Tariff Framework and Distribution Margin”
MYT Framework and Distribution Margin
• Annual revision of performance norms notdesirable.- Tariff for each year of the Control Period to be determined
at the beginning of Control Period.
• Recovery of fixed cost should be linked toachievement for Composite Index of Supply
26
ac e e e o Co pos e de o Supp yAvailability (timely contracting adequate power tomeet forecast load ) and Network Availability tobe specified by SERC
• For every 1% underachievement in compositeavailability for urban and/or rural areas, Returnon Equity shall be reduced by 0.1% of Equity.
MYT Framework and Distribution Margin
• SERCs should disallow adjustment of duesubsidy against the outstanding loans.
- However, adjustment of subsidy against Electricity Dutyactually collected by the Discom be allowed.
• State Governments may be requested toensure timely payment of outstanding dues of
27
e su e t e y pay e t o outsta d g dues oconsumers like street lighting/water works andif necessary by making deductions from thegrant payable to the local bodies.
• SERC regulations should provide for issue ofbills on the basis of tariff determined by SERC
• if State Government does not pay due amount of subsidy intime and in cash.
MYT Framework and Distribution Margin
• Action under section 142 if Distribution
Licensee does not reduce the losses as per the
specified trajectory, despite undertaking capital
expenditure towards reducing the losses.
• Differential tariff structure in the area of
28
different licensees in a State should be
considered and the tariffs should reflect the
efficiencies achieved by a particular licensee.- State Government has the discretion to give differential
subsidy in areas of different licensees and also allocate
the PPAs/Capacity of State Generating Stations in
different proportions to different licensees.
ANNEXURE-III
8
7. ‘FOR’ Recommendations on
29
“Staffing of Electricity Regulatory Commissions”
Staffing of ERCs
• ERCs should have autonomy on staffing.- IIPA recommendation to MoP : “the Commissions should
have full autonomy in matters relating to staffing pattern,organizational structure and adequate power to recruitstaff, as required. An overall ceiling on expenditure could,however, be fixed.
30
• Adequate revenues should be generated throughfees so that dependence on governmentexchequer reduces. This will make case forreasonable compensation structure for staff ofERCs. An overall ceiling on expenditure (basedon revenue being realized by an ERC) mayhowever be fixed.
Staffing of ERCs
• Compensation packages should be attractive
- Vacancies especially against posts for professionals due
to pay packages not being attractive enough to adequately
meet expectations of professionals from PSUs/open
market.
- Attractive pay package required also to compensate
31
Attractive pay package required also to compensate
government officers for the loss of various facilities such
as housing, medical etc.
• To attract competent people, compensation
package (including pay and other perquisites) as
applicable in Central PSUs should be adopted.
Staffing of ERCs
• In the absence of facility of government
accommodation, ERC should have powers to hire
leased housing for the staff.
• ERC Chairperson should have authority to
sanction participation of staff of the Commission
32
sanction participation of staff of the Commission
in international programmes in professional areas
of functions.
Ministry of Power may consider these
recommendations for implementation for
CERC and for SERCs through State
Governments.
ANNEXURE-III
9
THANK YOU
33
THANK YOU

ANNEXURE-IV
1
DSM Initiatives in India
Presentation to FORBy
Dr. Ajay Mathur, Director General
Bureau of Energy EfficiencyMarch, 2009
Energy Conservation potential assessed as at present (IEP) (15% by DSM) -
20000MW
Verified Energy Savings :
-During X Plan period
-During 2007-08
- 877 * MW
623 MW
Energy Efficiency Potential and Outcome
2
-During 2007-08-Estimated for 2008-09
623 MW1200 MW
-Target for XI Plan period (5% reduction of energy consumption)
- 10000 MW
* Only as indicated by participating units in the National Energy Conservation awardscheme, for the previous five years.
Legal and Policy Interventions to Promote Energy Efficiency
• Energy Conservation Act, 2001, overcomes some market barriers by enabling:– Setting of minimum energy standards for, and affixing
energy-consumption labels on appliances and equipment
– Promulgation of Energy Conservation Building Codes– Energy use monitoring, verification and reporting by gy g, p g y
large energy users, and the establishment of energy consumption norms for these consumers
• BEE and SDAs set up to promote:– Demand-side management by distribution companies– Enhancing energy conservation in existing buildings,
especially through Energy Service Companies (ESCOs)– Outreach and awareness programmes
3
•Inclusive and sustainable development strategy, sensitive toclimate change.•Achieving national growth objectives through a qualitativechange in direction leading to further mitigation of greenhousegas emissions.•Devising efficient and cost-effective strategies for end useDemand Side Management ESCO delivery mechanisms CDM
Policy Objectives
4
Demand Side Management- ESCO delivery mechanisms, CDM,etc•Engineering new and innovative forms of market, regulatoryand voluntary mechanisms to promote energy efficiency•Effecting implementation of programmes through uniquelinkages, including with civil society and local governmentinstitutions and through public-private-partnership.•International cooperation
ANNEXURE-IV
2
Bachat Lamp Yojana to promote energy efficient and high qualityCFLs as replacement for incandescent bulbs in households.
Standards & Labeling Scheme targets high energy end useequipment and appliances to lay down minimum energyperformance standards.
Energy Conservation Building Code (ECBC) sets minimum energyperformance standards for new commercial buildings.
Agricultural and Municipal DSM targeting replacement of
Energy Efficiency – Action Plan
5
Agricultural and Municipal DSM targeting replacement ofinefficient pumpsets, street lighting, etc.
Operationalising EC Act by Strengthening Institutional Capacity ofState Designated Agencies (SDAs) : The scheme seeks to buildinstitutional capacity of the newly created SDAs to perform theirregulatory, enforcement and facilitative functions in the respectiveStates.
Energy Efficiency Improvement in Small and Medium Enterprises(SMEs): To stimulate energy efficiency measures in 25 high energyconsuming small and medium enterprise clusters.
A market based mechanism to enhance cost effec-tiveness ofimprovements in energy efficiency in energy-intensive largeindustries and facilities, through certification of energysavings that could be traded. (Perform Achieve and Trade)Accelerating the shift to energy efficient appliances indesignated sectors through innovative measures to make the
National Mission for Enhanced Energy Efficiency- 4 New Initiatives
6
products more affordable. (Market Transformation for EnergyEfficiency))Creation of mechanisms that would help finance demandside management programmes in all sectors by capturingfuture energy savings. (Energy Efficiency Financing Platform(EEFP))Developing fiscal instruments to promote energy efficiencynamely Framework for Energy Efficient EconomicDevelopment (FEEED)
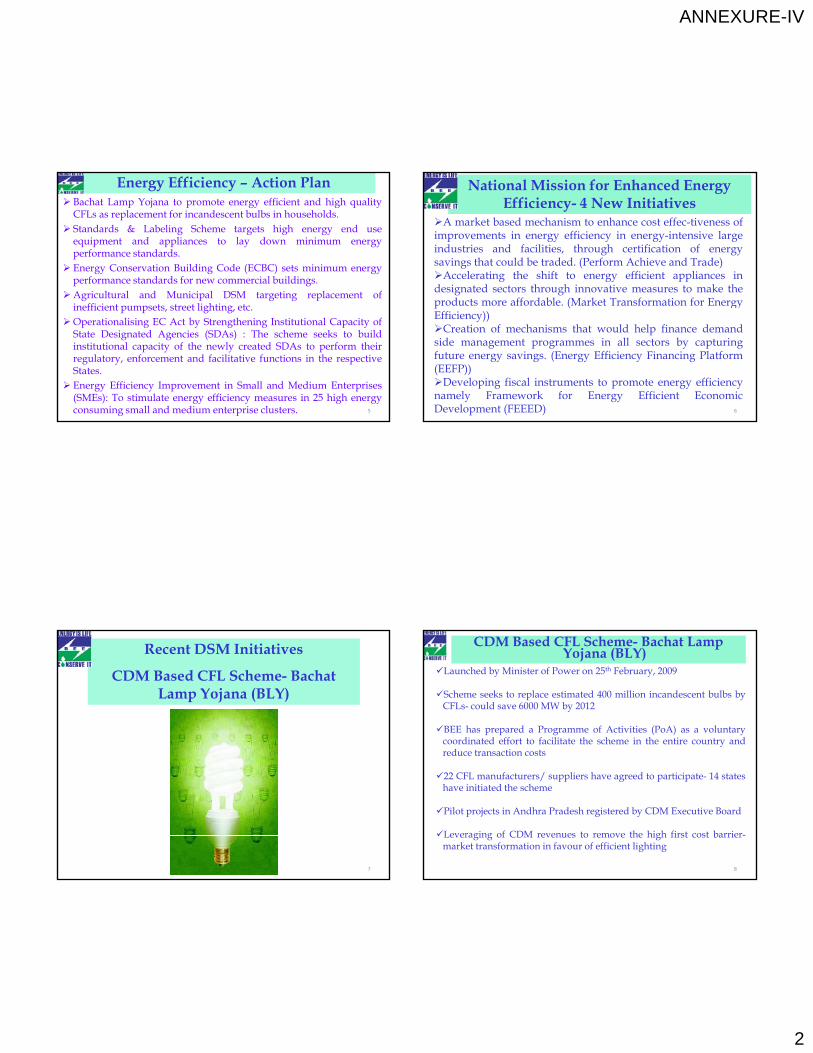
Recent DSM Initiatives
CDM Based CFL Scheme- Bachat Lamp Yojana (BLY)
7
CDM Based CFL Scheme- Bachat Lamp Yojana (BLY)
Launched by Minister of Power on 25th February, 2009
Scheme seeks to replace estimated 400 million incandescent bulbs byCFLs- could save 6000 MW by 2012
BEE has prepared a Programme of Activities (PoA) as a voluntarycoordinated effort to facilitate the scheme in the entire country andreduce transaction costs
8
reduce transaction costs
22 CFL manufacturers/ suppliers have agreed to participate- 14 stateshave initiated the scheme
Pilot projects in Andhra Pradesh registered by CDM Executive Board
Leveraging of CDM revenues to remove the high first cost barrier-market transformation in favour of efficient lighting
ANNEXURE-IV
3
Basic Objectives of BLY
Replace inefficient incandescent bulbs with CFLsfor households only
Reduce price of CFL to that of incandescent bulb-project developer (CFL Manufacturer/ DISCOM)provides initial investment
Use CDM to recover balance cost Monitor energy consumption reduction in a project Monitor energy consumption reduction in a project
area as outlined in AMS-II.C of CDM-EB CERs generated after monitoring, validation and
oversight of CDM Executive Board (CDM-EB) sold ininternational markets
Revenue from sale of CERs used to serviceinvestments-Estimated revenue/ CFL of Rs. 25 peryear- cost recovered in 2-3 years.
Potential reduction in power consumption~6,000 -10,000 MW – XI plan target 4000 MW
Project Steps
Define project area- DISCOM based Manufacturer/ Trader of CFL for provision of
adequate numbers of bulbs required Preparation of Project Design Document (PDD) as
per CDM-EB approved templates Validation of PDD by certified agencies of CDM-EB-
presently 5 6 in Indiapresently 5-6 in India PDD, on validation, considered and recommended
by Designated National Authority (DNA) of CDM-EB- MOEF
DNA recommended PDD posed for final approval ofCDM-EB
Monitoring/ validation commences as per AMS-II.Cunder this framework
Programmatic Approach to reduce individualproject transaction costs for replicability
Programmatic Approach
Programmatic approach allowed as a voluntary,coordinated effort- AMS-II.C allowed to be used inPoA by EB in July, 2007
Allows for an umbrella framework with manyindividual projects under an approved methodology
The multiple PDDs (called CDM Project Activities-Design Documents CPA-DD) part of the PoADesign Documents CPA-DD) part of the PoA
All PDDs have same monitoring/ validationrequirements
Approval process of individual PDDs simplifiedsubstantially- no individual approval of PDDs byEB
PoA can be run by any agency includinggovernment
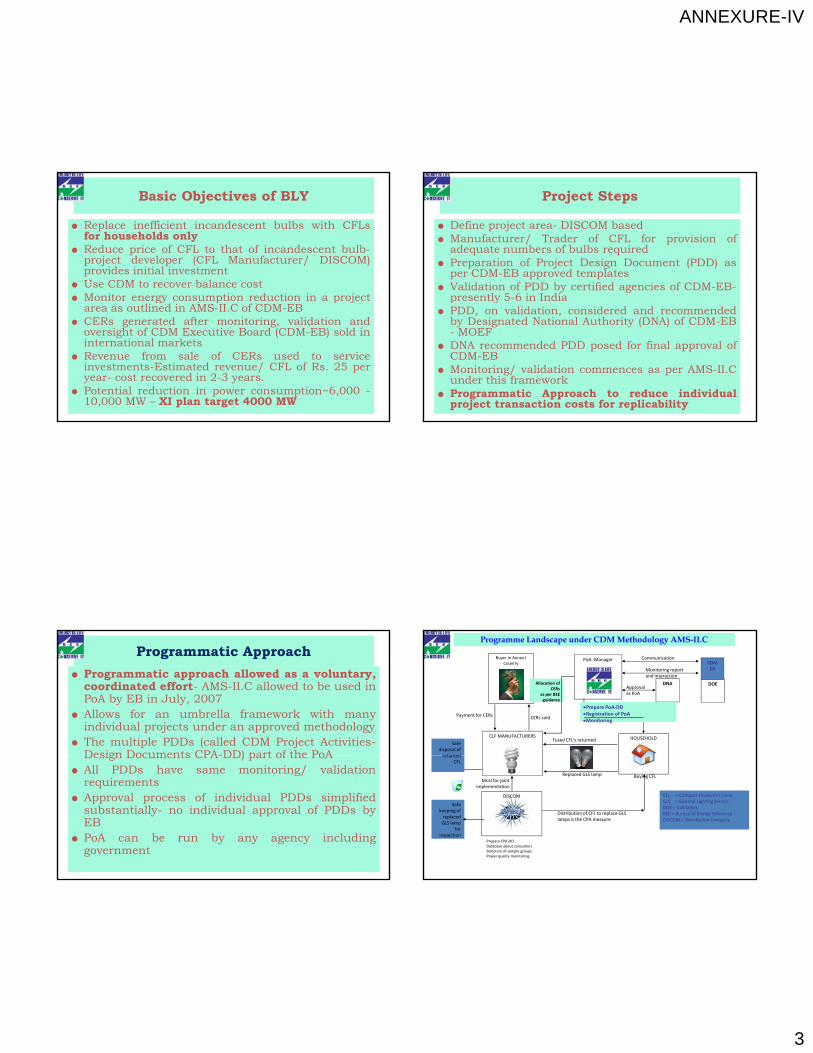
Buyer in Annex I Country
CLF MANUFACTURERS
PoA ‐Manager
HOUSEHOLD
DOE
CDM EB
Payment for CERs CERs sold
Allocation of CERs
as per BEE guidance
Monitoring report and interaction
Fused CFL’s returned
DNAApproval as PoA
Safe disposal of returned
Prepare PoA‐DDRegistration of PoAMonitoring
Programme Landscape under CDM Methodology AMS-II.C
Communication
Distribution of CFL to replace GLS lamps is the CPA measure
DISCOM
Replaced GLS lamp
CFL = Compact Florescent LampGLS = General Lighting ServiceDOE = ValidatorsBEE = Bureau of Energy EfficiencyDISCOM = Distribution Company
returned CFL
Prepare CPA‐DDDatabase about consumersSelection of sample groupsPower quality monitoring
MoU for joint implementation
Buying CFL
Safe keeping of replaced GLS lamp
for inspection

ANNEXURE-IV
4
Role of BEE
• Awareness and information• Development of Programme of Activities Design
Document (POA-DD)• Registration of Programme of Activities with UNFCCC
CDM Executive Board.• Monitoring of CFL use in sample households• Support the CFL manufacturers/ DISCOMs toSupport the CFL manufacturers/ DISCOMs to
prepare CDM Programme Activity Design Documents(CPA-DDs)
• Inclusion of CPA-DDs under the PoA after validation• Facilitate verification of CERs and recommend their
allocation to the CFL manufacturers / DISCOMaccording to their share in emissions reductions in aspecified period
Role of DISCOM• Database of households to include name of
users/address/average electricity consumption• Assist in selection of Project sample group (PSG),
Project sample buffer group (PSBG), Projectcross-check group (PCCG) as required under AMS-II.C
• Information on Grid voltage supplied to• Distribution of CFL Lamps and exchange of
incandescent lamps• Safe keeping of replaced GLS lamps for
independent inspection• Determination of the power correction factor• Estimation of technical distribution losses in the
electricity grid
Role of CFL Suppliers
• Provide CFL at the price comparable to GLSlamps.
• Preparing CDM Programme Activity DesignDocuments (CPA-DDs) for CDM project andsubmitting them to BEE.
• Collection of fused CFLs through buy-backCollection of fused CFLs through buy backschemes, and arranging for their safe disposal.
• Distribution of CFLs in association with DISCOM• Initial investment for the cost differential• Free Replacement of CFL during the life of
project• Tripartite Agreement between BEE, DISCOM
and CFL Supplier
Groups involved in CFL Methodology AMS-II.C
PSG
Project area (i)
PCCG
Total project area is DISCOM area
1 Million CFL (18 Watt)distributed to replace 100 watt GLSwill based on the Indian grid emissionfactor of 0.86 tCO2/MWh earn about50,000‐75,000 tons of CO2 per yeardepending on average annual hoursof illumination of the entire CFLpopulation, between 1000 and 1500
PSG = Project sample groupPCCG = Project cross‐check group
Assumption for one project area (i)‐ GPS mapped‐ 1 million CFLs distributed‐ PSG, PCCG about 4 x 200 = 800 households

ANNEXURE-IV
5
Monitoring by GSM Based Smart Meters Monitoring Steps under AMS-II.C
• Step 1: Determination of the project area(s)-Based on DISCOM areas each with amaximum of 1 million CFLs – could bemore than 1 CPA area in a DISCOM with acap of 60 GWh (60 MUs) (around 1 millionCFL )CFLs).
• Step 2: Establishment of a project activityimplementation plan
• Step 3: Installation of measurementequipment
• Step 4: Establishment of PSBG• Step 5: Establishment of CPA database
Monitoring Steps under AMS-II.C…
• Step 6: Monitoring of utilization hours inthe PSG
• Step 7: Determination of the powercorrection factor
• Step 8: Calculation of the mean andstandard deviation of household electricityconsumption for lightingconsumption for lighting
• Step 9: Estimation of technical distributionlosses in the electricity grid
• Step 10: Cross-check of monitoring resultsby random sampling of households notincluded in the PSG and PSBG
• Step 11: Calculation of emissionreductions
Large potential for energy savings both in government andcommercial office buildings.
The regulation, promotion and facilitation of energyefficiency in commercial buildings is one of the key thrustareas of BEE.
Energy Conservation Building Code (ECBC)
STAR RATING FOR OFFICE BUILDINGS
Energy Conservation Building Code (ECBC)
• specifies standards for new, large, energy -efficientcommercial buildings.
Energy Service Companies(ESCOs)
•upgrade the energy efficiency of existing governmentbuildings through retrofitting on performance contractingmode.
ANNEXURE-IV
6
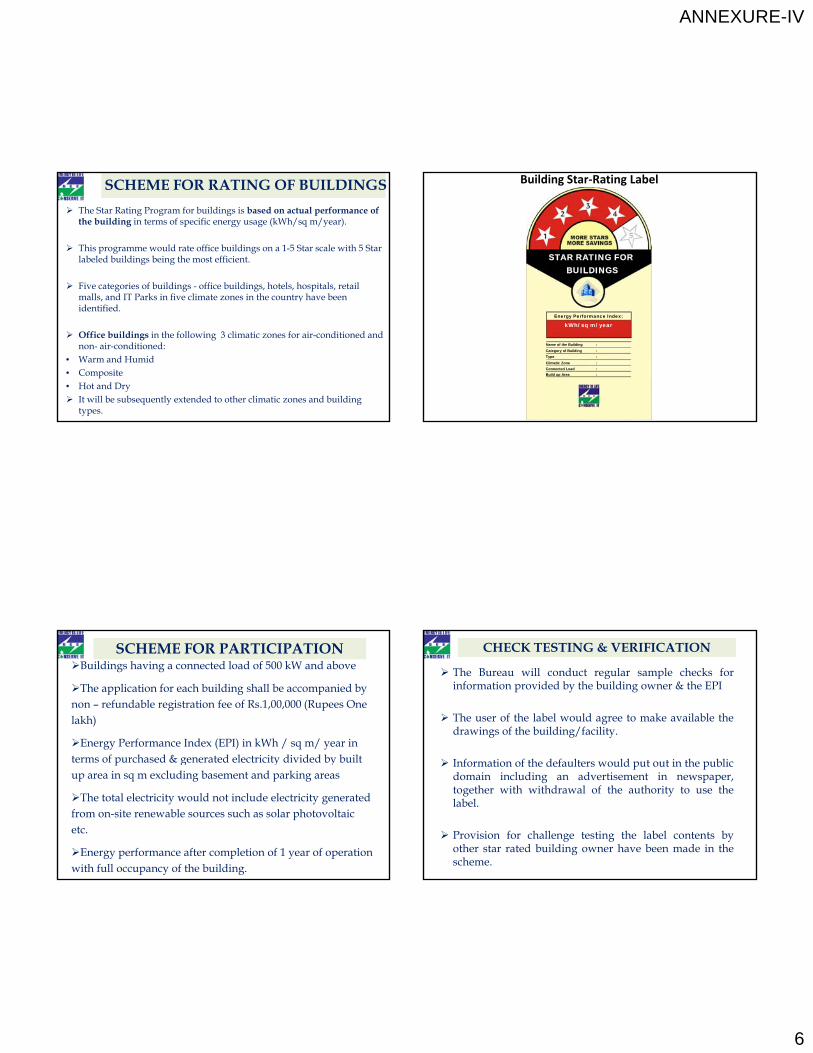
The Star Rating Program for buildings is based on actual performance of the building in terms of specific energy usage (kWh/sq m/year).
This programme would rate office buildings on a 1-5 Star scale with 5 Star labeled buildings being the most efficient.
Five categories of buildings - office buildings, hotels, hospitals, retail malls and IT Parks in five climate zones in the country have been
SCHEME FOR RATING OF BUILDINGS
malls, and IT Parks in five climate zones in the country have been identified.
Office buildings in the following 3 climatic zones for air-conditioned and non- air-conditioned:
• Warm and Humid• Composite• Hot and Dry It will be subsequently extended to other climatic zones and building
types.
STAR RATING FORBUILDINGS
Building Star‐Rating Label
Energy Performance Index:
Category of Building :
Type :
Climatic Zone :
Connected Load :
Build up Area :
Name of the Building :
kWh/ sq m/ year
SCHEME FOR PARTICIPATION Buildings having a connected load of 500 kW and above
The application for each building shall be accompanied by non – refundable registration fee of Rs.1,00,000 (Rupees One lakh)
Energy Performance Index (EPI) in kWh / sq m/ year in f h d & d l i i di id d b b il terms of purchased & generated electricity divided by built
up area in sq m excluding basement and parking areas
The total electricity would not include electricity generated from on-site renewable sources such as solar photovoltaic etc.
Energy performance after completion of 1 year of operation with full occupancy of the building.
CHECK TESTING & VERIFICATION
The Bureau will conduct regular sample checks forinformation provided by the building owner & the EPI
The user of the label would agree to make available thedrawings of the building/facility.
Information of the defaulters would put out in the publicdomain including an advertisement in newspaper,together with withdrawal of the authority to use thelabel.
Provision for challenge testing the label contents byother star rated building owner have been made in thescheme.

ANNEXURE-IV
7
BANDWIDTHS – AC Area> 50%EPI(Kwh/sqm/year) Star Label
190‐165 1 Star
165‐140 2 Star
140‐115 3 Star
115‐90 4 Star
Below 90 5 Star
EPI(Kwh/sqm/year) Star Label( / q /y )
200‐175 1 Star
175‐150 2 Star
150‐125 3 Star
125‐100 4 Star
Below 100 5 Star
EPI(Kwh/sqm/year) Star Label
180‐155 1 Star
155‐130 2 Star
130‐105 3 Star
105‐80 4 Star
Below 80 5 Star
BANWIDTHS- LESS THAN 50% AIR CONDITIONING
EPI(Kwh/sqm/year) Star Label
80‐70 1 Star
70‐60 2 Star
60‐50 3 Star
50‐40 4 Star
Below 40 5 Star
EPI(Kwh/sqm/year) Star Label( / q /y )
85‐75 1 Star
75‐65 2 Star
65‐55 3 Star
55‐45 4 Star
Below 45 5 Star
EPI(Kwh/sqm/year) Star Label
75‐65 1 Star
65‐55 2 Star
55‐45 3 Star
45‐35 4 Star
Below 35 5 Star
Visit us at www.bee-india.nic.in
ANNEXURE-V
1
March 2009
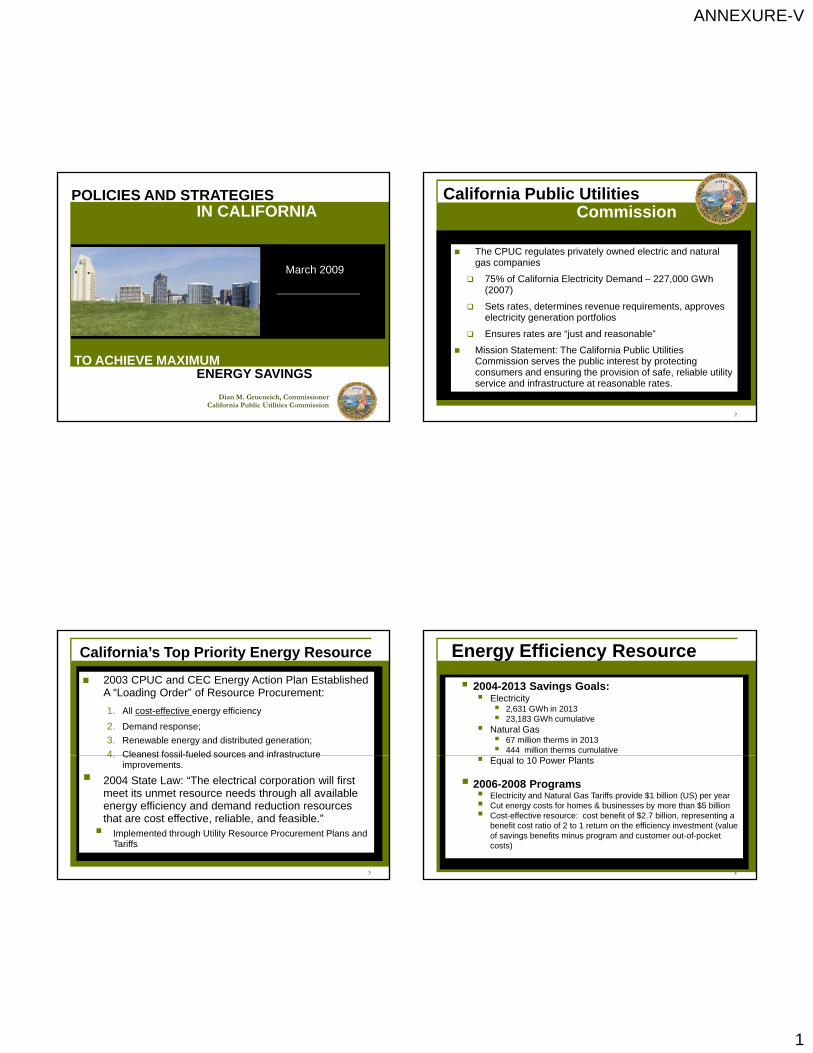
IN CALIFORNIAPOLICIES AND STRATEGIES
March 2009
March 2009
ENERGY SAVINGS TO ACHIEVE MAXIMUM
Dian M. Grueneich, CommissionerCalifornia Public Utilities Commission
The CPUC regulates privately owned electric and natural gas companies
75% of California Electricity Demand – 227,000 GWh (2007)
California Public Utilities Commission
2
Sets rates, determines revenue requirements, approves electricity generation portfolios
Ensures rates are “just and reasonable”
Mission Statement: The California Public Utilities Commission serves the public interest by protecting consumers and ensuring the provision of safe, reliable utility service and infrastructure at reasonable rates.
2003 CPUC and CEC Energy Action Plan Established A “Loading Order” of Resource Procurement:
1. All cost-effective energy efficiency
2. Demand response;
3. Renewable energy and distributed generation;
4 Cleanest fossil-fueled sources and infrastructure
California’s Top Priority Energy Resource
3
4. Cleanest fossil-fueled sources and infrastructure improvements.
2004 State Law: “The electrical corporation will first meet its unmet resource needs through all available energy efficiency and demand reduction resources that are cost effective, reliable, and feasible.” Implemented through Utility Resource Procurement Plans and
Tariffs
2004-2013 Savings Goals: Electricity 2,631 GWh in 2013 23,183 GWh cumulative
Natural Gas 67 million therms in 2013 444 million therms cumulative
Energy Efficiency Resource
4
Equal to 10 Power Plants
2006-2008 Programs Electricity and Natural Gas Tariffs provide $1 billion (US) per year Cut energy costs for homes & businesses by more than $5 billion Cost-effective resource: cost benefit of $2.7 billion, representing a
benefit cost ratio of 2 to 1 return on the efficiency investment (value of savings benefits minus program and customer out-of-pocket costs)

ANNEXURE-V
2
Energy Efficiency Goals Through 2020
30,000
35,000
Goals set for CPUC‐regulated utilities from 2004 through 2020, in accordance with best available data on energy efficiency potential.
Wh
5
0
5,000
10,000
15,000
20,000
25,000
2004 2005 2006 2007 2008 2009 2010 2011 2012 2013 2014 2015 2016 2017 2018 2019 2020
• Based primarily on existing technologies and rates of adoption
Ann
ual G
W
A Strategic Plan for California
Long-term (through 2020), statewide utility Energy Efficiency Strategic Plan
Build foundation for continual advancement of energy efficient technologies and practices.
Shift emphasis from easy to i l t h t li d
6
implement, short lived programs, e.g. CFLs, to savings in the built environment
Interactive Energy Efficiency Web Portal
A strategy for achieving and exceeding aggressive state goals, by leveraging industrial, commercial and residential sector efforts.
ANNEXURE-VI
1
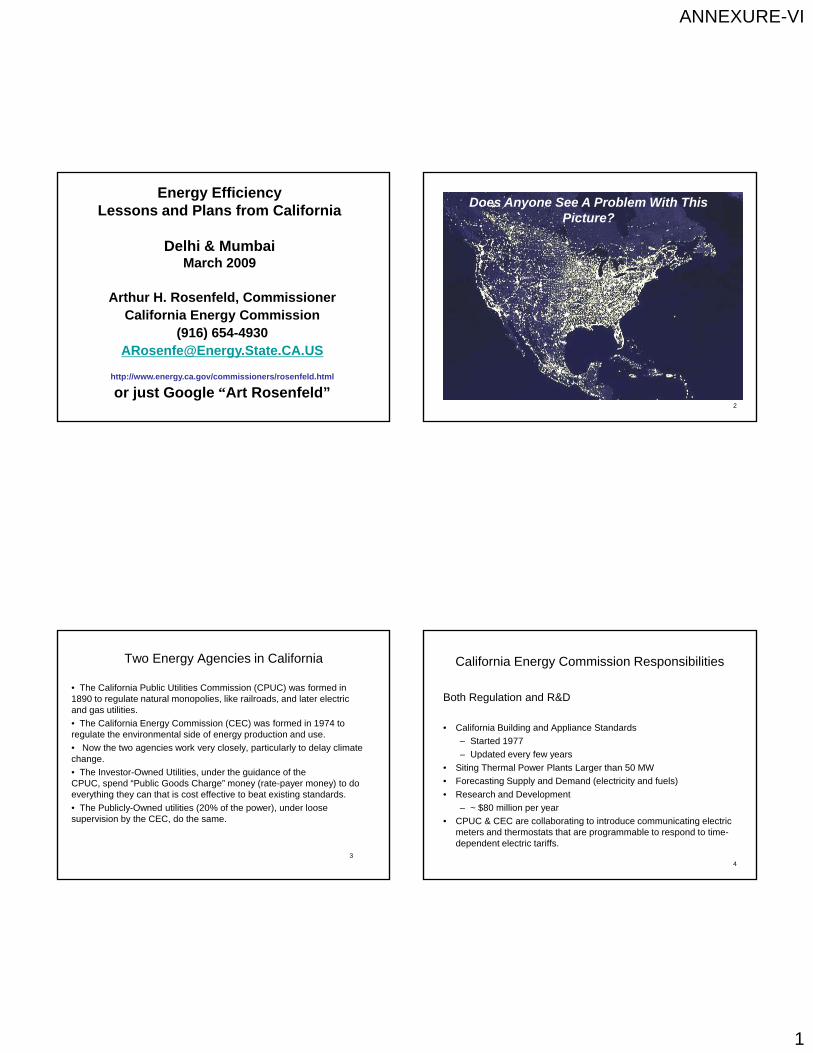
Energy Efficiency Lessons and Plans from California
Delhi & Mumbai March 2009
Arthur H Rosenfeld CommissionerArthur H. Rosenfeld, CommissionerCalifornia Energy Commission
(916) [email protected]
http://www.energy.ca.gov/commissioners/rosenfeld.html
or just Google “Art Rosenfeld”
Does Anyone See A Problem With This Picture?
2
Two Energy Agencies in California
• The California Public Utilities Commission (CPUC) was formed in 1890 to regulate natural monopolies, like railroads, and later electric and gas utilities.
• The California Energy Commission (CEC) was formed in 1974 to regulate the environmental side of energy production and use.
• Now the two agencies work very closely, particularly to delay climate change.
• The Investor-Owned Utilities, under the guidance of the CPUC, spend “Public Goods Charge” money (rate-payer money) to do everything they can that is cost effective to beat existing standards.
• The Publicly-Owned utilities (20% of the power), under loose supervision by the CEC, do the same.
3
California Energy Commission Responsibilities
Both Regulation and R&D
• California Building and Appliance Standards
– Started 1977
– Updated every few years
4
– Updated every few years
• Siting Thermal Power Plants Larger than 50 MW
• Forecasting Supply and Demand (electricity and fuels)
• Research and Development
– ~ $80 million per year
• CPUC & CEC are collaborating to introduce communicating electric meters and thermostats that are programmable to respond to time-dependent electric tariffs.
ANNEXURE-VI
2
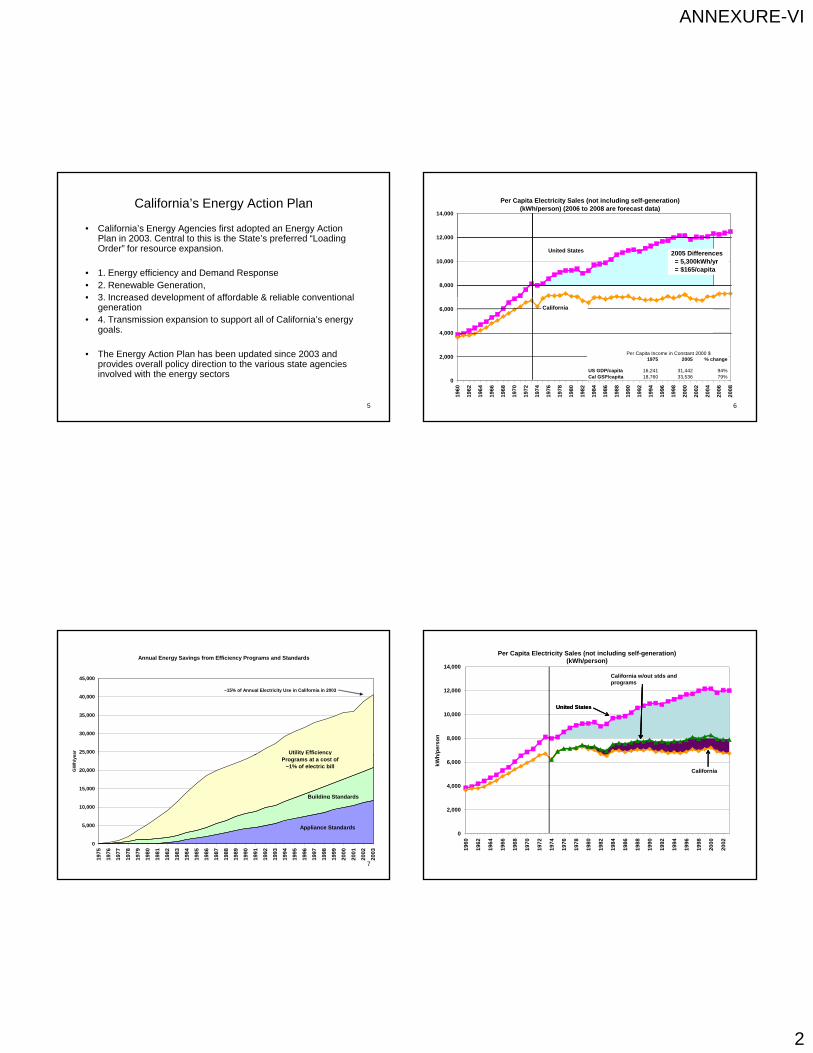
California’s Energy Action Plan
• California’s Energy Agencies first adopted an Energy Action Plan in 2003. Central to this is the State’s preferred “Loading Order” for resource expansion.
• 1. Energy efficiency and Demand Response• 2. Renewable Generation,• 3 Increased development of affordable & reliable conventional
5
• 3. Increased development of affordable & reliable conventional generation
• 4. Transmission expansion to support all of California’s energy goals.
• The Energy Action Plan has been updated since 2003 and provides overall policy direction to the various state agencies involved with the energy sectors
Per Capita Electricity Sales (not including self-generation)(kWh/person) (2006 to 2008 are forecast data)
8,000
10,000
12,000
14,000
United States 2005 Differences = 5,300kWh/yr = $165/capita
6
0
2,000
4,000
6,000
19
60
19
62
19
64
19
66
19
68
19
70
19
72
19
74
19
76
19
78
19
80
19
82
19
84
19
86
19
88
19
90
19
92
19
94
19
96
19
98
20
00
20
02
20
04
20
06
20
08
California
Per Capita Income in Constant 2000 $1975 2005 % change
US GDP/capita 16,241 31,442 94%Cal GSP/capita 18,760 33,536 79%
Annual Energy Savings from Efficiency Programs and Standards
25,000
30,000
35,000
40,000
45,000
ear Utility Efficiency
~15% of Annual Electricity Use in California in 2003
7
0
5,000
10,000
15,000
20,000
19
75
19
76
19
77
19
78
19
79
19
80
19
81
19
82
19
83
19
84
19
85
19
86
19
87
19
88
19
89
19
90
19
91
19
92
19
93
19
94
19
95
19
96
19
97
19
98
19
99
20
00
20
01
20
02
20
03
GW
h/y
e
Appliance Standards
Building Standards
y yPrograms at a cost of
~1% of electric bill
8,000
10,000
12,000
14,000
h/p
erso
n
Per Capita Electricity Sales (not including self-generation)(kWh/person)
United States
California w/out stds and programs
United States
California w/out stds and programs
0
2,000
4,000
6,000
1960
1962
1964
1966
1968
1970
1972
1974
1976
1978
1980
1982
1984
1986
1988
1990
1992
1994
1996
1998
2000
2002
kWh
California

ANNEXURE-VI
3
Impact of Standards on Efficiency of 3 Appliances
75%70
80
90
100
110
72 =
100
)
Effective Dates of National Standards
=
Effective Dates of State Standards
=
Gas Furnaces
9
Source: S. Nadel, ACEEE,
in ECEEE 2003 Summer Study, www.eceee.org
60%
25%20
30
40
50
60
1972 1974 1976 1978 1980 1982 1984 1986 1988 1990 1992 1994 1996 1998 2000 2002 2004 2006
Year
Ind
ex (
197
Refrigerators
Central A/C
SEER = 13
New United States Refrigerator Use v. Time
and Retail Prices
1,200
1,400
1,600
1,800
2,000
Use
(kw
h)
or
Pri
ce($
)
15
20
25
me
(cu
bic
fee
t)
Refrigerator Size (cubic ft)
$ 1,270
~ 1 Ton CO2/year~ 100 gallons Gasoline/year
10Source: David Goldstein
0
200
400
600
800
1,000
1947 1952 1957 1962 1967 1972 1977 1982 1987 1992 1997 2002
Ave
rag
e A
nn
ual
En
erg
y
0
5
10
Ref
rig
erat
or
volu
m
Energy Use per Refrigerator(kWh/Year)
Refrigerator Pricein 1983 $
$ 462
Annual Energy Saved vs. Several Sources of Supply
nuclear energy
500
600
700
800
h/y
ear
In the United States
11
Energy Saved Refrigerator Stds
renewables
100 Million 1 KW PV systems
conventional hydro
0
100
200
300
400
Bil
lion
kW
h
= 80 power plants of 500 MW each
Value of Energy to be Saved (at 8.5 cents/kWh, retail price) vs. Several Sources of Supply in 2005 (at 3 cents/kWh, wholesale price)
Energy Saved Refrigerator Stds
100 Million 1 KW PV systems
nuclear energy
15
20
25
ear
in 2
005
In the United States
12
renewables
conventional hydro
0
5
10
Bill
ion
$ (
US
)/ye
ANNEXURE-VI
4
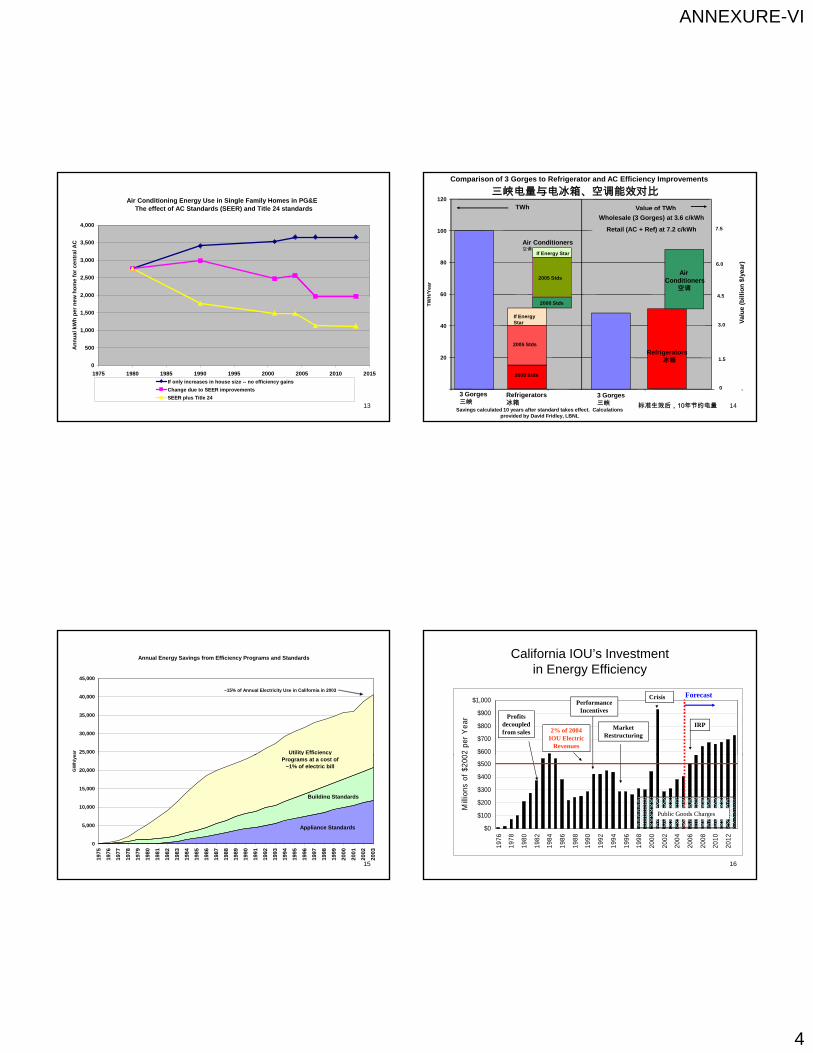
Air Conditioning Energy Use in Single Family Homes in PG&E The effect of AC Standards (SEER) and Title 24 standards
2,000
2,500
3,000
3,500
4,000
w h
om
e fo
r ce
ntr
al A
C
13
0
500
1,000
1,500
2,000
1975 1980 1985 1990 1995 2000 2005 2010 2015
An
nu
al k
Wh
pe
r n
ew
If only increases in house size -- no efficiency gains
Change due to SEER improvements
SEER plus Title 24
60
80
100
120
Air Conditioners空调
TWh
2005 Stds
If Energy Star
H/Y
ea
r
4.5
6.0
7.5
llio
n $
/yea
r)
Comparison of 3 Gorges to Refrigerator and AC Efficiency Improvements
Value of TWh
Air Conditioners
空调
Wholesale (3 Gorges) at 3.6 c/kWh
Retail (AC + Ref) at 7.2 c/kWh
三峡电量与电冰箱、空调能效对比
14
0
20
40
3 Gorges三峡
Refrigerators冰箱
2000 Stds
2000 Stds
2005 Stds
If Energy Star
TW
H
1.5
4.5
3.0 Val
ue
(bi
Savings calculated 10 years after standard takes effect. Calculations provided by David Fridley, LBNL
3 Gorges三峡
Refrigerators冰箱
标准生效后,10年节约电量
Annual Energy Savings from Efficiency Programs and Standards
25,000
30,000
35,000
40,000
45,000
ear Utility Efficiency
~15% of Annual Electricity Use in California in 2003
15
0
5,000
10,000
15,000
20,000
1975
1976
1977
1978
1979
1980
1981
1982
1983
1984
1985
1986
1987
1988
1989
1990
1991
1992
1993
1994
1995
1996
1997
1998
1999
2000
2001
2002
2003
GW
h/y
e
Appliance Standards
Building Standards
y yPrograms at a cost of
~1% of electric bill
California IOU’s Investment in Energy Efficiency
$600
$700
$800
$900
$1,000
02 p
er Y
ear
Forecast
Profits decoupled from sales
Performance Incentives
Market Restructuring
Crisis
IRP2% of 2004
IOU Electric Revenues
16
$0
$100
$200
$300
$400
$500
1976
1978
1980
1982
1984
1986
1988
1990
1992
1994
1996
1998
2000
2002
2004
2006
2008
2010
2012
Mill
ions
of
$200
Public Goods Charges

ANNEXURE-VI
5
White Roofs
17
Temperature Rise of Various Materials in Sunlight
50
40
e R
ise
(°C
) Galvanized Steel
IR-Refl. Black
Blac
k Pa
int
ingl
e
leleat.em
ent C
oat.
emen
t Coa
t.
0.0 0.2 0.4 0.6 0.8 1.0
30
20
10
0
Tem
pera
ture
Gre
en A
spha
lt Sh
Red
Cla
y Ti
le
Lt. R
ed P
ain
Lt. G
reen
Pai
nt
Whi
te A
spha
lt Sh
ingl
Whi
te A
spha
lt Sh
ingl
Al R
oof C
oa
Opt
ical
Whi
teO
ptic
al W
hite
Whi
te P
aint
Whi
te P
aint Whi
te C
eW
hite
Ce
Solar Absorbance
18
White is ‘cool’ in Bermuda
19
and in Santorini, Greece
20
ANNEXURE-VI
6
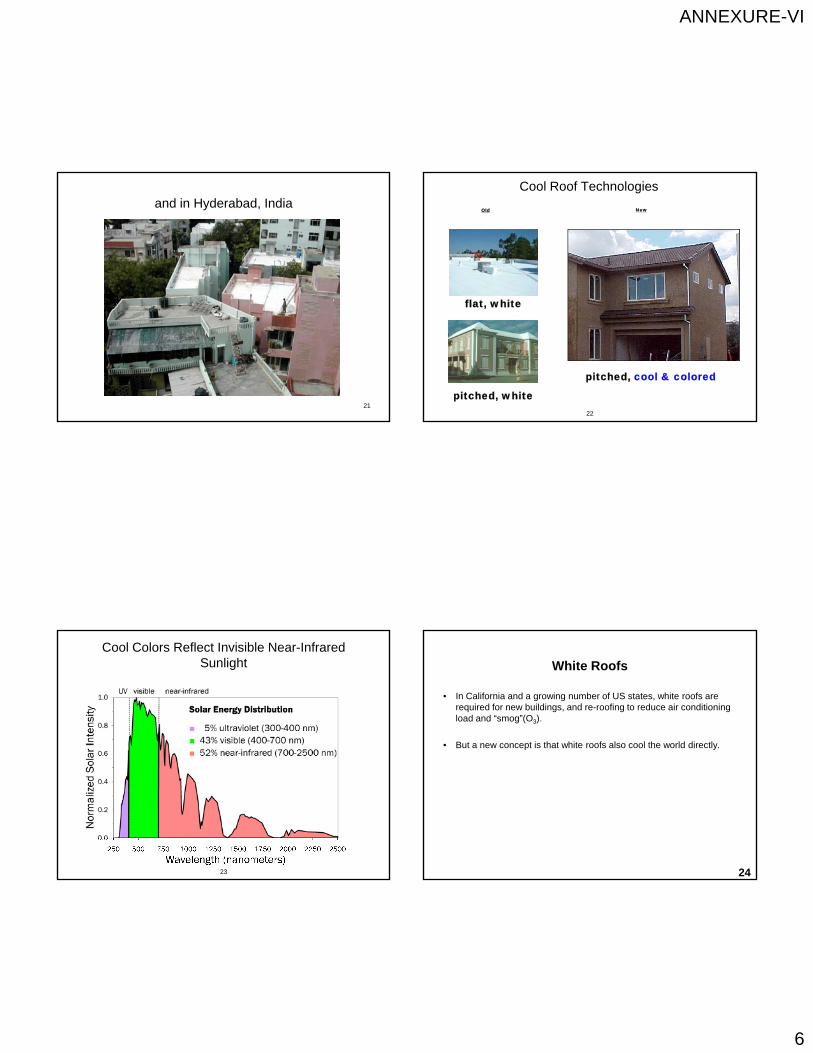
and in Hyderabad, India
21
Cool Roof Technologies
Old New
22
flat, white
pitched, white
pitched, cool & colored
Cool Colors Reflect Invisible Near-Infrared Sunlight
23
White Roofs
• In California and a growing number of US states, white roofs are required for new buildings, and re-roofing to reduce air conditioning load and “smog”(O3).
• But a new concept is that white roofs also cool the world directly.
24
ANNEXURE-VI
7
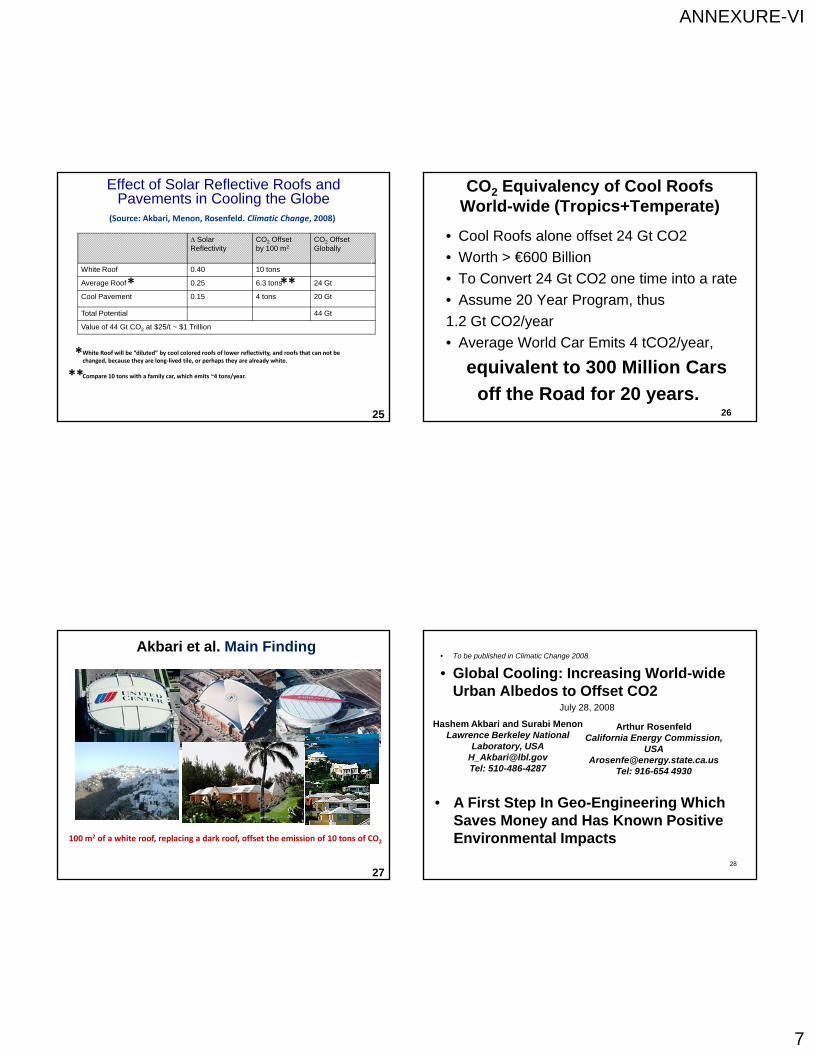
Effect of Solar Reflective Roofs and Pavements in Cooling the Globe
∆ Solar Reflectivity
CO2 Offset by 100 m2
CO2 OffsetGlobally
White Roof 0.40 10 tons
Average Roof 0.25 6.3 tons 24 Gt
Cool Pavement 0 15 4 tons 20 Gt
(Source: Akbari, Menon, Rosenfeld. Climatic Change, 2008)
* **Cool Pavement 0.15 4 tons 20 Gt
Total Potential 44 Gt
Value of 44 Gt CO2 at $25/t ~ $1 Trillion
White Roof will be “diluted” by cool colored roofs of lower reflectivity, and roofs that can not be changed, because they are long‐lived tile, or perhaps they are already white.
Compare 10 tons with a family car, which emits ~4 tons/year.
*
**
25
CO2 Equivalency of Cool RoofsWorld-wide (Tropics+Temperate)
• Cool Roofs alone offset 24 Gt CO2
• Worth > €600 Billion
• To Convert 24 Gt CO2 one time into a rate
Ass me 20 Year Program th s
26
• Assume 20 Year Program, thus
1.2 Gt CO2/year
• Average World Car Emits 4 tCO2/year,
equivalent to 300 Million Cars
off the Road for 20 years.
Akbari et al. Main Finding
100 m2 of a white roof, replacing a dark roof, offset the emission of 10 tons of CO2
27
• To be published in Climatic Change 2008.
• Global Cooling: Increasing World-wide Urban Albedos to Offset CO2
July 28, 2008
Hashem Akbari and Surabi MenonLawrence Berkeley National
Laboratory, USAH Akb i@lbl
Arthur RosenfeldCalifornia Energy Commission,
USA
28
[email protected]: 510-486-4287
[email protected]: 916-654 4930
• A First Step In Geo-Engineering Which Saves Money and Has Known Positive Environmental Impacts
ANNEXURE-VI
8
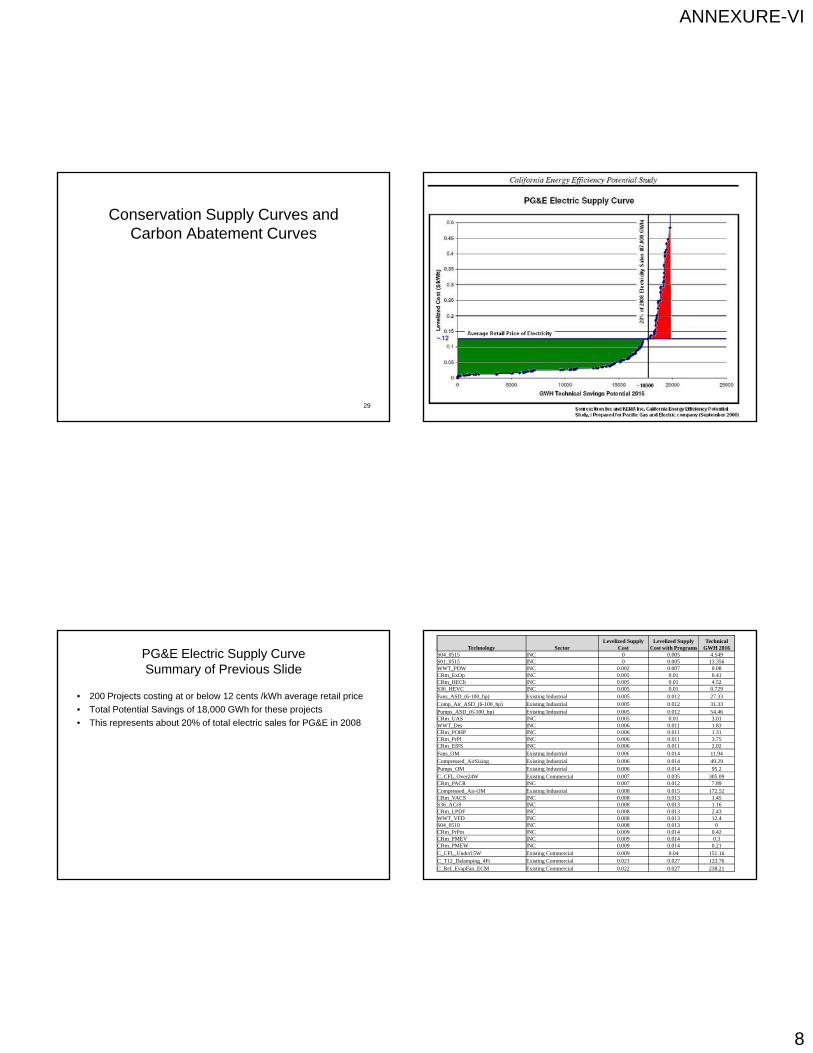
Conservation Supply Curves and Carbon Abatement Curves
29
PG&E Electric Supply CurveSummary of Previous Slide
• 200 Projects costing at or below 12 cents /kWh average retail price
• Total Potential Savings of 18,000 GWh for these projects
• This represents about 20% of total electric sales for PG&E in 2008
Technology SectorLevelized Supply
CostLevelized Supply
Cost with ProgramsTechnical
GWH 2016S04_0515 INC 0 0.005 4.549S01_0515 INC 0 0.005 13.356WWT_PDW INC 0.002 0.007 0.08CRm_ExOp INC 0.005 0.01 0.41CRm_HECh INC 0.005 0.01 4.52S36_HEVC INC 0.005 0.01 0.729Fans_ASD_(6-100_hp) Existing Industrial 0.005 0.012 27.33Comp_Air_ASD_(6-100_hp) Existing Industrial 0.005 0.012 31.33Pumps_ASD_(6-100_hp) Existing Industrial 0.005 0.012 54.46CRm_UAS INC 0.005 0.01 3.01WWT_Des INC 0.006 0.011 1.83CRm_POHP INC 0.006 0.011 1.31CRm_PrPl INC 0.006 0.011 3.75CRm_EfFS INC 0.006 0.011 2.02Fans OM Existing Industrial 0.006 0.014 11.94Fans_OM Existing Industrial 0.006 0.014 11.94Compressed_AirSizing Existing Industrial 0.006 0.014 49.29Pumps_OM Existing Industrial 0.006 0.014 95.2C_CFL_Over24W Existing Commercial 0.007 0.035 305.09CRm_PACR INC 0.007 0.012 7.89Compressed_Air-OM Existing Industrial 0.008 0.015 172.52CRm_VACS INC 0.008 0.013 1.45S36_ACrS INC 0.008 0.013 1.16CRm_LPDF INC 0.008 0.013 2.43WWT_VFD INC 0.008 0.013 12.4S04_0510 INC 0.008 0.013 0CRm_PrPm INC 0.009 0.014 0.42CRm_PMEV INC 0.009 0.014 0.3CRm_PMEW INC 0.009 0.014 0.21C_CFL_Under15W Existing Commercial 0.009 0.04 151.16C_T12_Delamping_4Ft Existing Commercial 0.021 0.027 123.76C_Ref_EvapFan_ECM Existing Commercial 0.022 0.027 238.21

ANNEXURE-VI
9
Electricity Conservation Supply Curve 220 MeasuresCalifornia in 2011 -- Levelized Cost and kWh saved
$0.15
$0.20
$0.25
zed
in 2
011
$)
SPT (years)
33
$0.00
$0.05
$0.10
0 10,000 20,000 30,000 40,000 50,000GWh saved per year (and % of 2011 California Load)
Source: California’s Secret Energy Surplus: The Potential For Energy Efficiency, Rufo and Coito, 9/2002
$ p
er k
Wh
(le
veli
Area = Net Benefit ( $3.4 Billion/year)
Area = Cost ( $1.7 Billion/year)(14%)(7%)
SPT (years)
0
2
4
6
8
10
Electricity Conservation Supply Curve 220 Mesurestranslated to Carbon Dioxide Reduction curve
California in 2011 -- (1 kwh reduction saves 1 pound of CO2)
$100
$200
$300
O2
$ p
er
ton
ne
34
-$300
-$200
-$100
$0
0 5 10 15 20 25
Million Metric Tonnes Saved per year
co
st
of
con
ser
ved
CO
Area = Net Benefit ( $3.4 Billion/year)
Area = Cost ( $1.7 Billion/year)
SPT (years)
0
2
4
6
8
10
Reducing U.S. Greenhouse Gas Emissions:
How Much at What Cost?
Reducing U.S. Greenhouse Gas Emissions:
How Much at What Cost?
US Greenhouse Gas Abatement Mapping Initiative
December 12, 2007
Abatement cost <$50/ton
U.S. mid-range abatement curve – 2030
0
30
60
90
3.20
CostReal 2005 dollars per ton CO2e
1.0 1.2 1.4 1.8 2.00.2 2.2 2.4 2.6 2.8 3.01.60.4 0.6 0.8
Residential electronics
Residential buildings –Lighting
Fuel economy packages – Light trucks
Commercial buildings –Combined heat and power
Coal mining –Methane mgmt
Commercial buildings –Control systems
Distributed solar PV
Residential buildings –Shell retrofits
Nuclear new-build
Active forest management
Commercial buildings –HVAC equipment efficiency
Solar CSP
Residential buildings –HVAC equipment efficiency
Industrial process improve-ments
Residential water heaters
Coal power plants–CCS rebuilds with EOR
Potential
Afforestation of cropland
Source: McKinsey analysis
-120
-220
-30
-60
-90
-230
Commercial electronics
Commercial buildings –LED lighting
Fuel economy packages – Cars
Commercial buildings –CFL lighting
Cellulosicbiofuels
Industry –Combined heat and power
Existing power plant conversion efficiency improvements
Conservation tillage
Natural gas and petroleum systems management
Afforestation of pastureland
Reforestation
Winter cover crops
Onshore wind –Medium penetration
Coal power plants – CCS new builds with EOR
Biomass power – Cofiring
Onshore wind –High penetration
Industry –CCS new builds on carbon-intensive processes
Coal power plants – CCS new builds
Coal power plants –CCS rebuilds
Coal-to-gas shift – dispatch of existing plants
Car hybridi-zation
Manufacturing – HFCs mgmt
Residential buildings –New shell improvements
PotentialGigatons/year
Commercial buildings –New shell improvements
Onshore wind –Low penetration
36
ANNEXURE-VI
10
37
8% 17% 25% 33% 42% 50% 58%
37
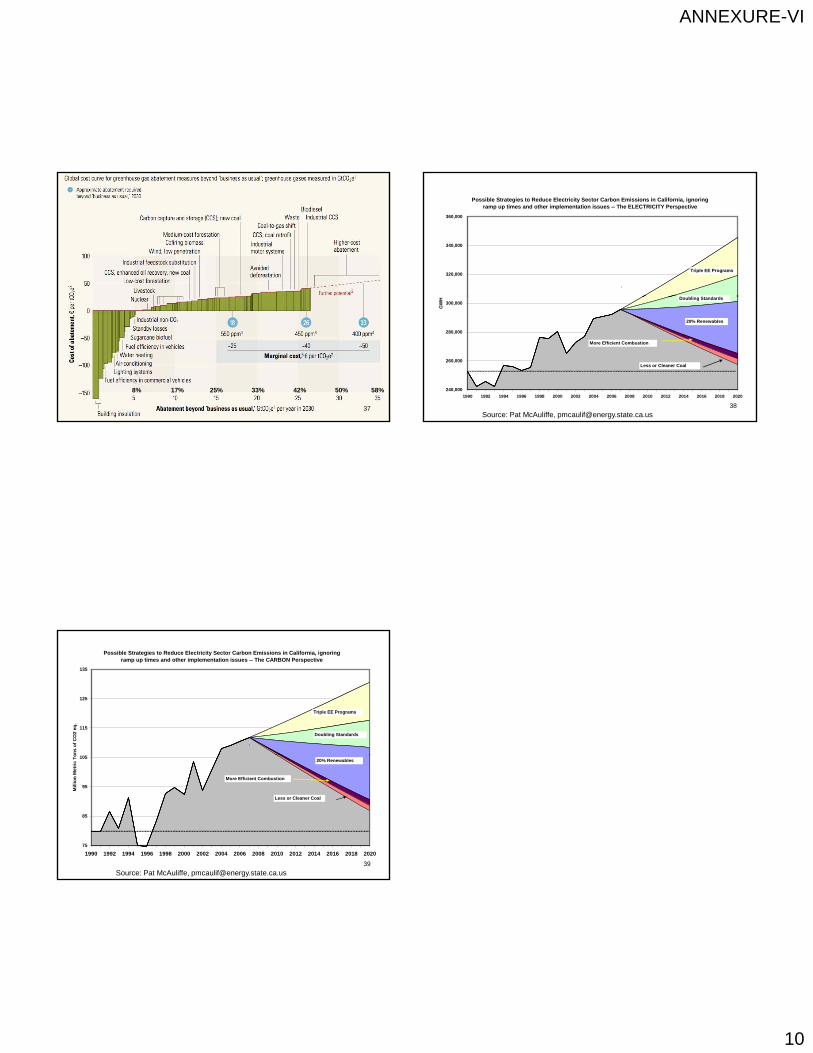
Possible Strategies to Reduce Electricity Sector Carbon Emissions in California, ignoring ramp up times and other implementation issues -- The ELECTRICITY Perspective
320,000
340,000
360,000
Triple EE Programs
D bli St d d
38
Source: Pat McAuliffe, [email protected]
240,000
260,000
280,000
300,000
1990 1992 1994 1996 1998 2000 2002 2004 2006 2008 2010 2012 2014 2016 2018 2020
GW
H Doubling Standards
20% Renewables
More Efficient Combustion
Less or Cleaner Coal
115
125
135
on
s o
f C
O2
eq.
Triple EE Programs
Doubling Standards
Possible Strategies to Reduce Electricity Sector Carbon Emissions in California, ignoring ramp up times and other implementation issues -- The CARBON Perspective
39
Source: Pat McAuliffe, [email protected]
75
85
95
105
1990 1992 1994 1996 1998 2000 2002 2004 2006 2008 2010 2012 2014 2016 2018 2020
Mill
ion
Met
ric
To
20% Renewables
More Efficient Combustion
Less or Cleaner Coal