Road pricing: lessons from London
47
Economic Policy April 2006 Printed in Great Britain © CEPR, CES, MSH, 2006. Road pricing LESSONS FROM LONDON Blackwell Publishing Ltd Oxford, UK ECOP Economic Policy 0266-4658 © CEPR, CES, MSH, 2006. April 2006 45 Original Article ROAD PRICING GEORGINA SANTOS and GORDON FRASER Road pricing LESSONS FROM LONDON SUMMARY This paper assesses the original London Congestion Charging Scheme (LCCS) and its impacts, and it simulates the proposed extension which will include most of Kensington and Chelsea. It also touches upon the political economy of the congestion charge and the increase of the charge from £5 to £8 per day. The possibility of transferring the experience to Paris, Rome and New York is also discussed. The LCCS has had positive impacts. This was despite the considerable political influences on the charge level and location. It is difficult to assess the impacts of the increase of the charge from £5 to £8, which took place in July 2005, because no data have yet been released by Transport for London. The proposed extension of the charging zone does not seem to be an efficient change on economic grounds, at least for the specific boundaries, method of charging and level of charging that is currently planned. Our benefit cost ratios computed under different assumptions of costs and benefits are all below unity. Overall, the experience shows that simple methods of congestion charging, though in no way resembling first-best Pigouvian taxes, can do a remarkably good job of creating benefits from the reduction of congestion. Nevertheless, the magnitude of these benefits can be highly sensitive to the details of the scheme, which therefore need to be developed with great care. — Georgina Santos and Gordon Fraser
Transcript of Road pricing: lessons from London

Economic Policy April 2006 Printed in Great Britaincopy CEPR CES MSH 2006
Road pricing
LESSONS FROM LONDON
Blackwell Publishing LtdOxford UKECOPEconomic Policy0266-4658copy CEPR CES MSH 2006April 200645Original ArticleROAD PRICINGGEORGINA SANTOS and GORDON FRASERRoad pricingLESSONS FROM LONDON
SUMMARY
This paper assesses the original London Congestion Charging Scheme (LCCS) andits impacts and it simulates the proposed extension which will include most ofKensington and Chelsea It also touches upon the political economy of the congestioncharge and the increase of the charge from pound5 to pound8 per day The possibility oftransferring the experience to Paris Rome and New York is also discussed
The LCCS has had positive impacts This was despite the considerable politicalinfluences on the charge level and location It is difficult to assess the impacts ofthe increase of the charge from pound5 to pound8 which took place in July 2005 becauseno data have yet been released by Transport for London The proposed extensionof the charging zone does not seem to be an efficient change on economic groundsat least for the specific boundaries method of charging and level of charging thatis currently planned Our benefit cost ratios computed under different assumptionsof costs and benefits are all below unity Overall the experience shows that simplemethods of congestion charging though in no way resembling first-best Pigouviantaxes can do a remarkably good job of creating benefits from the reduction ofcongestion Nevertheless the magnitude of these benefits can be highly sensitive tothe details of the scheme which therefore need to be developed with great care
mdash Georgina Santos and Gordon Fraser
ROAD PRICING 265
Economic Policy April 2006 pp 263ndash310 Printed in Great Britaincopy CEPR CES MSH 2006
Road pricing lessons from London
Georgina Santos and Gordon Fraser
University of Oxford University of Cambridge
1 INTRODUCTION
Traffic congestion affects towns and cities in developed and developing countriesGiven that the theoretically attractive Pigouvian internalization of the marginalexternality is not practical and a second best charge would still require a fair amountof information it is worth asking what is the way forward This paper addresses thatquestion using the London Congestion Charging Scheme (LCCS) and its proposedextension as its test example We aim at answering the following questions
1 What are the lessons that can be learned from the original Scheme for othertowns and cities considering the introduction of road pricing
2 Will the proposed extension yield net social benefits
We are grateful to Transport for London for providing us with the trip matrices for London cordon data for the proposedextension and public transport data and to the Department for Transport for providing us with the speed-flow curves andadvice on how to compute environmental benefits None of the views or results reported in this paper are in any way endorsedby either of these organizations and any errors are the authorsrsquo sole responsibility We are also indebted to two anonymousreferees and to the discussants of our paper David Newbery and Neil Gandal and to Panel members who attended the October2005
Economic Policy
Panel Meeting in London for comments and suggestions that substantially improved the paper Thanks arealso due to Farideh Ramjerdi from the Institute of Transport Economics in Norway for an update on the Norwegian urbantolls Georgina Santos gratefully acknowledges support from the Rees Jeffreyrsquos Fund
Paul Seabright was the Managing Editor in charge of this paper
266 GEORGINA SANTOS AND GORDON FRASER
3 What group is likely to benefit from the proposed extension and how does thisgroup regard the plan
The results of the cost-benefit analysis and the assessment of the different groupsthat are likely to gain or lose are restricted to the London case and its specific Schemedesign If the charging zone covered a different area traffic flows and times savingswould be different
Decisions such as the boundaries of the charging zone or the charge level are notalways guided by efficiency principles but rather by political forces and lobbiesThe final result will be the combined effect from different pressure and politicalgroups and this may or may not lead to increases in welfare
In the case of London we find that the original congestion charging zone andcongestion charge internalized the average congestion externality We cannot drawdefinite conclusions on the increase of the charge from pound5 to pound8 For the proposedextension we find that the benefit-cost ratio would be lower than unity and thereforethe project would not be justified on economic grounds
This can be translated to other towns and cities that may be considering theintroduction of road pricing and in general to other sectors of the economy wherethere are market imperfections While simple and easy-to-administer solutions mayyield important gains in efficiency they may also yield losses if they are influencedby political interests even when they had potential to yield gains had the details ofthe policy not been so affected by pressure groups Despite the lobbying and pressuregroups that influenced the design of the London Scheme it has according to Transportfor London (2003 Table 3 2004b Table 61) yielded net benefits and accordingto our analysis presented in Section 35 internalized the average congestion exter-nality This does not necessarily constitute a general conclusion the influence ofpolitical factors may reduce or eliminate the welfare benefits of a project
2 OVERVIEW OF OTHER SCHEMES
It is common in the road pricing literature to confuse schemes that were designedto finance infrastructure with schemes that were designed to reduce congestion Thisis the case for example of the Norwegian urban tolls which lsquoshould be viewed inthe light of the limited public funds for financing the necessary road infrastructureto cope with the growing trafficrsquo (Ramjerdi
et al
2004 p 237) A cordon toll schemewas implemented in Bergen in 1986 with the objective of providing funding fora package of road projects Oslo followed in 1990 and Trondheim in 1991 Morerecently Kristiansand Stavanger Toslashnsberg and Namsos also implemented cordontolls As of 2005 those are the seven urban tolls in operation in Norway
The schemes in Oslo Kristiansand Toslashnsberg and Namsos do not differentiate bytime of the day The scheme in Bergen does not differentiate by time of the day butthere is no charge on Sundays and holidays The one in Trondheim does differentiate
ROAD PRICING 267
by time of the day Inbound traffic is tolled Monday to Friday from 600 am to 600 pmwith different fees according to time of the day The toll is higher between 600 am and1000 am for those using the electronic system The scheme in Stavanger differentiatesby time of the day Inbound traffic is tolled Monday to Friday from 600 am to 600 pmThe toll is higher between 700 am and 1000 am and between 200 pm and 500 pm
The different schemes have achieved the objective of financing transport projectsfor which they were originally designed approved and implemented In some casesthey now also finance public transport and environmental projects The question iswhether they could be turned into congestion charging schemes with the additionalaim of managing traffic demand during busy periods The Road Act and RoadTraffic Act in Norway have been amended in order to enable local authorities tointroduce congestion charging if they wish to The authorities in Bergen and Osloare currently considering the possibility of managing congestion with some kind oftime-varying toll However as of 2005 none of the seven systems has yet beentransformed into a demand management tool
It is also common in the road pricing literature to bring in examples of motorwayand even bridge and tunnel tolling These types of charging are essentially differentfrom urban road pricing Motorway tolling has been in place for decades not just inEuropean countries such as France Italy and Spain but also around the worldRevenues from motorway tolls have typically financed the development andor main-tenance of motorways More recently some countries in Europe have introduced orare considering the introduction of motorway tolls for goods vehicles heavier than12 tonnes in line with Directive 199962EC (
Official Journal of the EuropeanCommunities
1999) This is the case of Germany for example where after sometechnological problems a toll collection system for goods vehicles heavier than 12 tonneswas finally implemented on all motorways on 1 January 2005 Switzerland
1
andAustria have since 2001 and 2004 respectively an even more comprehensive tollingsystem that charges goods vehicles heavier than 35 tonnes
2
Other schemes this time aimed at managing demand although not precisely in citycentres are in place in the US They vary from high occupancytoll (HOT) laneswhere low occupancy vehicles are charged a toll while high-occupancy vehicles areallowed to use the lanes for free or at a discounted toll rate to newly constructedexpress lanes with tolls similar to the M6 toll in England where a parallel motorwaysegment is built near a very busy existing motorway so that drivers have the optionof spending less time on the road at the cost of the toll
Road pricing as a demand management tool in city centres other than London hasonly been implemented in Durham and Singapore The impacts of these schemes arebriefly outlined below
1
Switzerland is not a member of the EU and therefore does not need to abide by its laws
2
As of December 2005 amendment COM(2003) 448 to Directive 199962EC which proposes charging goods vehicles over35 tonnes rather than 12 tonnes has not been passed yet
268 GEORGINA SANTOS AND GORDON FRASER
21 The Singapore Schemes
The schemes in Singapore have become classic examples of road pricing in theliterature It should be borne in mind however that Singapore is a fairly particularcase as it is an island city-state that measures only 42 km east to west and 23 kmnorth to south with a dominating political party (the Peoplersquos Action Party) that hasbeen in power (winning all the elections) since 1959 This makes the Singapore roadpricing schemes unique cases in unique circumstances
211 Area Licensing Scheme ndash 1975 to 1998
The first road pricing schemeto have ever been implemented anywhere in the world was the Singapore AreaLicensing Scheme (ALS) on 2 June 1975 Vehicles were charged on entry (and laterexit in the evenings) into the restricted zone (RZ) Vehicles entering the 7 km
2
RZ whichincluded the central business district were required to purchase a paper area licencein advance and display it on their windscreen This was then valid for entry anunlimited number of times while valid
The system was manually enforced by officers standing at the boundaries ofthe RZ Violators were fined Although the vehicles that were exempt varied overthe years by 1989 the only exemptions were granted to public transport busesand emergency vehicles (Willoughby 2000) There were no discounts for residentsalthough residents could avoid paying a charge by driving in the zone withoutcrossing the boundary
ALS increased average speeds from 19 to 36 km per hour (Phang and Toh 1997p 99) Traffic volumes during the morning peak hours fell by 45 and car entriesdecreased by 70 (Willoughby 2000 p 10)
212 Electronic Road Pricing ndash 1998 till present
Although ALS was successfulin drastically reducing traffic volumes and congestion at a minimal operating costthere were a number of problems with the scheme such as bunching of traffic justbefore and after the restricted hours manual enforcement prone to error and a generalperception that a paper based ALS scheme was becoming out-of-place in a city-statethat was becoming high-tech and aspired to be regarded as such (Santos
et al
2004)Thus on 1 September 1998 an Electronic Road Pricing (ERP) scheme replaced the ALS(and also a paper permit system that had been introduced on some expressways outsidethe city centre) This ERP is as of 2005 still the only one of its kind in the world
With ERP there is not one charging area with a defined boundary but rather linksthat are charged Charging times vary but in general these are from 730 am to 700pm on central roads and from 730 am to 930 am on expressways and outer roads
Vehicles equipped with In-vehicle Units (IUs) that have a smart card inserted inthem are charged automatically each time they cross a gantry without the need toslow down If motorists pass through an operational ERP gantry without a properlyinserted smart card or with a smart card that has insufficient balance to pay the
ROAD PRICING 269
charge a valid transaction will not take place When this happens the enforcementcameras take a digital picture of the rear licence plate and the registered keeper ofthe vehicle is then fined The only vehicles exempt are emergency vehicles ERPrates published on the Land Transport Authority website vary with vehicle typetime of day and location of the gantry In February 2003 a graduated ERP rate wasintroduced in the first five minutes of the time slot with a higher charge in order todiscourage motorists from speeding up or slowing down to avoid higher charges Forexample on some gantries where the charge for passenger cars would be S$150between 830 and 900 am and S$050 between 900 and 930 am it is now S$1between 830 and 835 am S$150 between 835 and 855 am and S$1 between 855and 900 am when it changes to S$050
Menon (2000 p 42) reports that although ERP charges were lower than ALScharges one year after the introduction of ERP traffic volumes in the RZ had fallenby 15 for the whole day and by 16 during the morning peak although there hadbeen an increase between 630 and 700 pm the last half-hour of ERP operation Atthe same time traffic volumes had increased in the pre-ERP period 700 to 730 ammainly as a result of vehicles avoiding the charge Some months had also seen anincrease in traffic in the post-ERP period 700 to 730 pm Speeds did not increasesince the idea was not to increase ALS speeds but rather to have a fine-tuned systemthat would charge road users more accurately for actual usage
22 The Durham Scheme
The Durham Scheme is a small and modest example of road pricing Although it canbe seen as the first scheme to have been implemented in England after the TransportAct 2000
3
was passed it does not really represent a typical road user charging projectmainly because of its limited scale Nonetheless the objective of the charge whichwas to reduce traffic demand on a piece of road was achieved and therefore theexample deserves at least a mention
On 1 October 2002 Durham County Council implemented a pound2 charge for allvehicles using Saddler Street and the Market Place between 1000 am and 400 pmMonday to Saturday (Durham County Council 2003) Saddler Street is a narrowroad and the only public access to the historic city centre where the Cathedral andthe Castle are as well as some businesses a school parts of Durham Universityand a small number of private houses This historic city centre is also known as thePeninsula as it is surrounded by the River Wear
Since it is a one road toll the charge is paid on exit from the area on a ticketingmachine which does not give any change and is monitored by Closed Circuit
3
The Transport Act 2000 gave local authorities in England and Wales powers to introduce road user charges andor workplaceparking levies to tackle congestion when it appeared it would help achieve the policies in the charging authorityrsquos local transportplan
270 GEORGINA SANTOS AND GORDON FRASER
Television (CCTV) Alternatively payment is accepted before 600 pm at theNational Car Parks (NCP) Parking Shop
A small number of exemptions apply including emergency vehicles City CouncilLiveried vehicles Public Utility vehicles on emergency duty Bullion Vehicles RoyalMail and Recovery Vehicles The Dean and Chapter of Durham Cathedral thepermanent residents on the Peninsula and the University are all issued with a limitednumber of exemption permits as are the parents of the youngest children atthe Chorister School (Durham County Council 2003) Finally a small number oftransponders are issued for attachment to vehicles with high frequency use Thesetransponders are attached to the windscreens of vehicles so that the bollard can detectthem and lower automatically
Although drivers who fail to pay the charge are still permitted to use the roada penalty notice is issued to the vehiclersquos registered keeper if payment is not madebefore the end of the working day The number of violators however is negligibleVehicles are recorded on the CCTV system and owners traced through the Driverand Vehicle Licensing Agency (DVLA)
The number of vehicles using the road from the Market Place to the Cathedralafter the scheme was introduced fell by between 50 and 80 depending on thetraffic count used as the base (Durham County Council 2003 Vehicle Usage LogData Collection Chart 3) The number of pedestrians increased by 10 on averagefrom 14 000ndash14 500 a day to 15 000ndash16 000 a day (Durham County Council 2003Pedestrian Count Data Collection Chart 13)
Although the scheme is not technologically advanced it is a measure that hasproved effective for the purpose intended to reduce traffic on one road in the historicPeninsula
3 THE LONDON SCHEME
The London Congestion Charging Scheme (LCCS) started on 17 February 2003The Scheme implemented and operated by Transport for London (TfL) is an arealicensing system All vehicles entering leaving driving or parking on a public roadinside the zone between 700 am and 630 pm Monday to Friday excluding publicholidays are charged pound8 The charge was originally pound5 but was changed to pound8 on4 July 2005
4
The limit of the charging area is given by the Inner Ring Road whichmainly surrounds Central London No charge is made for driving on the Inner RingRoad itself
The charging area is relatively small It only covers 21 km
2
(8 square miles)representing 13 of the total 1579 km
2
(617 square miles) of Greater London
4
The analysis in this section is made on the basis of data that was released by TfL before the increase As of 15 December nodata after the increase to pound8 has been published Although TfL has been gathering data since the increase they would like tointerpret it before it is released in the public domain
ROAD PRICING 271
There are 174 entry and exit boundary points around the zone Traffic signs makeit clear where exactly the charging zone is
There are a variety of 90ndash100 discounts as well as exemptions A summary isshown in Table 1
The charge has to be paid in advance or on the day until 1000 pm with latepayment available between 1000 pm and midnight but with the charge rising topound10 The charge can be paid daily weekly monthly or yearly
Enforcement is undertaken with video cameras that provide high-quality videosignals to Automatic Number Plate Recognition (ANPR) software which reads andrecords each number plate with a 90 accuracy rate At midnight images of allthe vehicles that have been in the congestion charging zone are checked againstthe vehicle registration numbers of vehicles which have paid their congestion chargefor that day The computer keeps the registration numbers of vehicles that shouldhave paid but have not done so A manual check of each recorded image is thenmade and a Penalty Charge Notice is then issued to the registered keeper of thevehicle
Table 1 Exemptions and discounts
Discountstatus Category
Fully exempt Motorcycles mopeds and bicyclesEmergency vehiclesPublic service vehicles with 9 or more seats licensed as busesVehicles used by disabled persons that are exempt from VEDa
Licensed London taxis and mini-cabs
100 discount with free registration
Certain military vehiclesLocal government service vehicles (eg refuse trucks street maintenance)Vehicles with 9 or more seats not licensed as buses (eg community minibuses)
100 discount with a one-off pound10 registration
Vehicles driven for or by individuals or institutions that are BlueBadge holdersb
100 discount with pound10 registration per year
Alternative fuel vehicles ndash requires emission savings 40 aboveEuro IV standardsRoadside assistance and recovery vehicles (eg motoring organizations such as the Automobile Association)
90 discount with pound10 registration per year
Vehicles registered to residents of the central zone
a VED Vehicle excise dutyb Blue Badges which existed before the scheme was implemented are special parking permits issued to disabledpeople to allow them to park near shops stations and other facilities The badge belongs to the disabled personwho qualifies for it (who may or may not be a car driver) and can be used in any vehicle they are travelling inThe discount applies to individual Blue Badge holders anywhere in the EC
Source wwwcclondoncomexemptionsshtml
272 GEORGINA SANTOS AND GORDON FRASER
31 Impacts on traffic
According to TfL (2004a Fig 3 p 7) the average travel rate in the charging zoneduring the first year of the scheme was between 35 and 37 minutes per km whichis equivalent to an average speed of between 16 and 17 km per hour This representsan increase of between 14 and 21 with respect to the average speed pre-chargingwhich was 14 km per hour
The total number of vehicles with four or more wheels entering the zone duringthe charging hours was reduced by 18 (TfL 2005a) Table 2 presents the key changesin traffic entering and leaving the charging zone
As expected there was a reduction of potentially chargeable vehicles and anincrease in exempt vehicles
Since traffic travelling on the Inner Ring Road does not pay the congestioncharge TfL expected that through traffic with origin and destination outside thecharging zone would divert and use the Inner Ring Road instead This indeedhappened raising the total vehicle per km on the Inner Ring Road by 4 whencompared with 2002 (TfL 2004a b) However improved traffic managementarrangements were put into place on the Inner Ring Road before the Schemestarted and this prevented an increase in congestion For example between one andtwo seconds were taken off green light time on radial roads which were anticipatedwould have less traffic and added on to green light time on the Inner RingRoad That combined with the end of disruptions linked to roadworks in thearea during 2002 made a sufficient difference to keep the Ring Road operatingsatisfactorily with marginally lower levels of congestion during 2003 when com-pared to pre-charging conditions (TfL 2004b p 15) Although during 2004 theInner Ring Road did not have higher levels of congestion due to re-routing trafficlevels of congestion were comparable to pre-charging conditions (TfL 2005bpp 13ndash14)
Table 2 Percentage changes of vehicles entering and leaving the charging zone in 2003 and 2004
Changeinbound ()
Changeoutbound ()
Changeinbound ()
Changeoutbound ()
2003 vs 2002 2003 vs 2002 2004 vs 2003 2004 vs 2003
Cars minus33 minus35 minus1 minus2Taxis +17 +8 minus1 0Buses and coaches +23 +21 +8 +4Vans minus11 minus15 minus1 minus1Lorries and other minus11 minus12 minus5 minus5Pedal cycles +19 +6 +8 +8Powered two-wheelers +12 +5 minus3 minus4
Source TfL (2005a Fig 11 p 25)
ROAD PRICING 273
Traffic outside the Inner Ring Road did not change much Speed surveysconducted in 2004 show that the main radial routes approaching the zone were onlymarginally less congested than before the LCCS was introduced (TfL 2005b p 18)
32 Impacts on public transport
Before the Scheme started TfL increased the number of bus places with a combina-tion of more frequent services new and altered routes and bigger buses (TfL 2004a)There was an increase in bus passengers both in 2003 and 2004 Table 3 summarizesthe main changes
The reasons for the increase in bus patronage can be found not just in the LCCSand cars users wanting to avoid the charge by switching mode but also in the induceddemand in response to large-scale London-wide improvements to the bus network(TfL 2005b p 45)
Bus reliability in recent years has increased not just as a result of reduced conges-tion in the charging zone but also as result of increased investment on buses (TfL2005b)
Average bus speeds increased by 7 inside the charging zone and by 3 onsections close to the zone and on the Inner Ring Road during the first year ofcharging (TfL 2004a) Additional time waited by passengers over and above theroute schedule decreased by 24 across Greater London and by 30 in and aroundthe charging zone (TfL 2005a)
TfL had predicted an increase of 1 in Underground patronage This did nothappen Underground usage across London and especially in Central Londondecreased (TfL 2005b) The reason for this decrease is obviously not related to thecongestion charge in any way If anything the congestion charge might have causeda marginal increase in demand The reasons for the decrease in passenger levelson the London Underground are probably linked to longer-term mode transfer toimproved bus services the slowdown of the economy and the decrease in tourism in
Table 3 Bus passengers and buses crossing the charging zone boundary
AM peak (700 amndash1000 am) Charging hours (700 amminus630 pm)
Inbound Inbound Outbound
Passengers Buses Passengersper bus
Passengers Buses Passengersper bus
Passengers Buses Passengersper bus
Autumn 2002 77 000 2400 32 193 000 8280 23 163 000 7800 21Autumn 2003 106 000 2950 36 264 000 10 500 25 211 000 9900 21Percentage difference
+38 +23 +12 +37 +27 +8 +29 +26 +2
Source TfL (2005b Fig 27 p 45)
274 GEORGINA SANTOS AND GORDON FRASER
London and the temporary closure of the Central Line in 2003 following a derail-ment at Chancery Lane station in January (TfL 2005b) During 2004 Undergroundpatronage recovered returning to 2002 levels (TfL 2005b)
Although no data have been published for the year 2004 there was no change inrail travel to the charging zone during 2003 after the LCCS was implemented (TfL2004b 2005b)
33 Impacts on the economy
TfL (2005b p 4) reports that the impact of the Scheme on business performance inthe charging zone has been broadly neutral They measure business performance in termsof variables such as employment numbers of businesses turnover and profitability andfind no evidence of any effect from the scheme They also report that the commercialand residential property markets do not seem to have been affected by the charge eitherThey also report that an econometric analysis conducted at Imperial CollegeLondon shows that the congestion charge has had no impact on the central Londonretail sales (p 5) The trend of the economy in London has been similar to the trendof the economy in the UK although with more pronounced peaks and troughs
34 Generalized cost elasticity of demand
Using the changes in speed and trips registered after the Scheme was implementedthe elasticity of demand for trips with respect to generalized travel costs in Londoncan be estimated We did this for cars taxis and light goods vehicles (LGVs) both tosee what the sensitivity of response was to the charge and to input the correspondingvalues in our model of the extension which we explain in the Technical Appendixon the
Economic Policy
websiteThe reason for using a generalized cost (GC) elasticity of demand rather than a
congestion charge elasticity of demand is that the charge increased from zero (beforethe LCCS was implemented) to pound5 leaving no room to use the standard formula
η
=
∆
q
∆
p
p
q
where
p
would have been the congestion charge
5
This is not aserious problem in transport economics because of two reasons (a) the congestioncharge is just one component of the generalized cost of a trip which also includesvehicle operating costs and time costs and (b) the time costs are likely to change oncethe congestion charge has been introduced
Given (a) the generalized cost elasticity of demand can be computed Demand canbe measured by vehicle per km or by trips For our model we needed the elasticity
5
Since we are interested in the sensitivity of demand from drivers to the pound5 charge the typical solution of computing the arcelasticity using the average of the two prices (pound0 and pound5) cannot be implemented in this study As we do not know the functionalform linking demand for trips and the generalized cost of a trip we simply compute the point elasticity using the original priceand quantity as our base
ROAD PRICING 275
of demand for trips and so that is what we estimated The generalized cost elasticityof demand for trips gives a measure of the sensitivity of driversrsquo response whendeciding on the number of trips when the generalized cost of those trips changesNeedless to say since the congestion charge is just one component of the generalizedcost if the congestion charge elasticity of demand could be computed this would belower (in absolute value) Dodgson
et al
(2002 p 28) argue that the sensitivity ofdemand to generalized cost changes will broadly be equal to the fuel price elasticitydivided by the fuel share of generalized cost Using the same reasoning we could saythat the congestion charge elasticity will roughly be equal to the generalized costelasticity multiplied by the congestion charge share of generalized cost We return tothis point later
Given (b) it is actually more accurate to estimate the generalized cost elasticityrather than the congestion charge elasticity With a congestion charge time costs arelikely to be lower and this needs to be taken into account when assessing the responsefrom drivers to the charge There will also be an increase in reliability Dodgson
et al
(2002 p 34) argue that reliability benefits are worth approximately 25 of timebenefits and this was the assumption we made for our calculations
The details of the elasticity calculations are presented in a Technical Appendix onthe
Economic Policy
website These follow guidelines from the Department for Transport(DfT 2004a) on values of time (VOT) and vehicle operating costs (VOC) Theformula used and the results obtained are summarized in Box 1
If we follow the suggestion by Dodgson
et al
(2002 p 28) and multiply these valuesby the congestion charge share of generalized cost we get rough estimates of thecongestion charge elasticities of demand The congestion charge represents 28of the GC of a trip by car and 23 of the GC of a trip by LGV which yieldsa congestion charge elasticity of
minus
027 for cars and
minus
012 for LGVs This exercisecannot be conducted in the case of taxis as the congestion charge they pay is zeroIn any case it should be noted that these congestion charge elasticities are inferredfrom GC point elasticities of demand for the specific change in GC and quantityexperienced in 2002ndash2003 In principle they should not be translated to other yearsor other GC or congestion charge changes
Box 1 GC elasticity of demand for trips
The formula used to compute the GC elasticity of demand for trips was
η = ∆q∆GC GCq
where q is number of trips by the relevant mode and GC is Generalized Costof a trip by the relevant mode (car taxi or LGV) The values we found withdata ex-post are minus096 for cars minus267 for taxis and minus053 for LGVs
276 GEORGINA SANTOS AND GORDON FRASER
The reason for the high elasticity in the case of cars can be found in the availabilityof public transport in London The relatively low elasticity in the case of LGV islinked to their lack of freedom to work outside normal business hours which is whenthe charge applies
The GC elasticity of demand for trips by taxi is very high
minus
267 This can beexplained by the substitution effect between cars and taxis The cross price elasticityof demand for trips by taxi with respect to the GC of trips by car is approximately035
6
Unfortunately when calculating this cross price elasticity the GC of trips bytaxi cannot be held constant as it also changes because the average speed in thecharging zone is higher If we use this estimated cross price elasticity of 035 we mayassume that when the GC of trips by car increases by 35 (as it was the case inLondon for the years 2002 to 2003) the demand for trips by taxi will increase1225 The demand for trips by taxi increased 1250 What this is telling us isthat most of the increase in demand for trips by taxi can be explained by the increasein the GC of trips by car rather than by the decrease in the GC of trips by taxi Theown price elasticity of demand for trips by taxi is capturing the substitution effectresulting from the increase in the GC of trips by car
35 Area marginal congestion cost
If traffic is assumed to be homogeneous inside the charging zone area marginalcongestion costs (MCC) can be computed using the following standard equation
MCC
=
esq bs(q)
where b is value of time in pence per passenger car unit (PCU)7 per hour s is speedin km per hour dependent on traffic volume8 in the area q in PCUs per hour andesq is the elasticity of speed with respect to traffic volume
The details of the area MCC calculations are presented in the Technical Appendixon the Economic Policy website We estimate the area MCC pre-charging at 157 penceper PCUkm and the area MCC post-charging (with data ex-post) at 148 pence perPCUkm The area MCC decreased by 57 after the implementation of theScheme Although detailed speed data on different chargeable vehicles is notavailable the MCC in pence per PCUkm can be converted using the relevant PCUratings Thus the pre- and post-charging MCC for LGVs is 2355 and 222 penceper LGVkm respectively Similarly the pre- and post-charging MCC for lorries is
6 This is computed as the percentage change in trips by taxi divided by the percentage change in the GC of trips by car asdetailed in the Technical Appendix on the Economic Policy website7 PCU is a measure of the relative disruption that different vehicle types impose on the network A car has a PCU rating of 1an LGV has a PCU rating of 15 a heavy goods vehicle (HGV) has a PCU rating of 25 or 3 a bus has a PCU rating of 25a motorcycle has a PCU rating of 05 and a bicycle has a PCU rating of 02 In the US passenger car equivalents (PCE) areused instead The meaning however is the same8 Since it is an area rather than a link that we are considering we need to talk about traffic volume rather than traffic flow
ROAD PRICING 277
roughly 3925 and 370 pence per HGVkm respectively The three different charge-able vehicle types (cars LGVs and HGVs) with different congestive effects pay thesame charge which means that they are not paying for the MCC they produce Table4 shows the average efficient number of kilometres that each vehicle type would needto drive inside the charging zone if the pound5 charge (500 pence) were to reflect thecongestion externality Using the vehiclekm from TfL (2005b Table 15 p 29) andthe total traffic counts in the congestion zone provided to us by TfL (and availableon the Technical Appendix on the Economic Policy website) we can compute the averagenumber of kilometres travelled by the different vehicle types inside the congestioncharging zone on a typical weekday which are also presented in Table 4 The areaMCC per vehicle type multiplied by the actual km driven gives an estimate of theefficient charge which would vary per vehicle type The efficient charges are alsopresented in Table 4
The key findings from this section are
bull Cars are overcharged and goods vehicles are undercharged
bull Interestingly if we compute the average of these average MCC internalizingcharges weighted by the different vehicle types circulating in the congestionzone9 we get an average congestion charge of pound423
bull The average charge per vehicle received by TfL is just 15 above what they wouldreceive if each vehicle type internalized their average MCC and paid a chargeaccordingly Given that the pound5 charge when the Scheme was initially implementedwas not decided on any MCC calculation it seems rather surprising
bull The pound5 congestion charge internalized the average congestion externality
Santos and Shaffer (2004) use older data and different values of time and arrive atpre- and post-charging MCC values of 1865 pence per PCUkm and 182 pencePCUkm respectively Performing similar calculations as the ones described above theaverage of the area MCC internalizing charges weighted by the different vehicletypes is pound520 very close to the pound5 charge
9 The average number of cars in 2003 (post-charging) in the congestion charging zone on a typical weekday was 255 256 theaverage number of LGVs was 98 542 and the average number of HGVs was 27 953 These values were provided by TfL onrequest and are published in the Technical Appendix on the Economic Policy website
Table 4 Area MCC and the pound5 charge
Efficient km with a pound5 charge
Actual km with a pound5 charge
Efficient chargewith actual km
Cars 338 200 pound296Vans 225 274 pound608Lorries 135 250 pound927
Source Own calculations detailed in the Technical Appendix on the Economic Policy website
278 GEORGINA SANTOS AND GORDON FRASER
36 Other road transport externalities
Apart from congestion vehicles impose three other costs on the rest of societyaccidents environmental costs and road damage (Newbery 1990) The way in whichthese externalities can be internalized to achieve an efficient equilibrium depends onthe nature of the externality
Transport accidents for example impose a range of impacts on people andorganizations DfT (2004b TAG Unit 341) describes them as follows
bull Those closely related to the number of casualties medical and healthcare costslost economic output pain grief and suffering
bull Those closely related to the number of accidents material damage police andfire service costs insurance administration legal and court costs
Accident externalities are already being internalized at least up to a point Thequestion is lsquowhat fraction of external costs are not reflected in insurance costsrsquoand lsquohow much should be related to distance drivenrsquo (Newbery 2005) Edlin (2002)DeCorla-Souza (2002) and Greenberg (2003) argue that insurance could take theform of charges per mile rather than per year Other factors such as driving recordtype of car etc could also be considered Discussing the different ways in which roadtraffic accident externalities can be internalized however falls beyond the scope ofthis paper
Since the main road transport environmental externalities (ie global warmingand pollution) are related to fuel emissions which in turn are closely linked to fuelconsumption it seems practical to tax fuel Fuel duties are a reasonably effective wayof dealing with the environmental externality of road transport In the UK theseare complemented with differentiated vehicle excise duties to reflect the differentemissions per unit of fuel consumed by different vehicle types Thus diesel vehicles paya higher vehicle excise duty than petrol vehicles because they are more pollutingNewbery (1998) examines the environmental costs of road transport in the UK andcompares them with current levels of transport taxes He concludes that transporttaxes in the UK lsquoappear to more than cover the full social and environmental costsof transport as well as the cost of providing infrastructurersquo (p 23)
Finally road damage costs in Europe are typically borne by the highway authoritywho will repair the damage caused by the passage of vehicles (Newbery 1990) In theUK the highway authority follows a condition-responsive maintenance strategyThus each road is repaired when its condition reaches a predetermined state Ifmaintenance is condition-responsive then it is not necessary to charge vehicles for thedamage they do to vehicles coming after them which have to drive on a damagedtarmac as on average the condition of the road remains constant (Newbery 1990)The resources to repair highways in the UK ultimately come from the Treasurywhich in turn receives pound315 billion in concept of fuel duties Value Added Tax onfuel duties and Vehicle Excise Duties (National Statistics Online 2004) Heavier
ROAD PRICING 279
vehicles pay a higher Vehicle Excise Duty For example as of 2005 a goods vehiclenot heavier than 7500 kg pays an annual Vehicle Excise Duty of pound165 whereas agoods vehicle between 27000 and 44000 kg pays pound650 unless it is 4 or more axledrigid in which case it pays pound1200 (Driver and Vehicle Licensing Agency 2005)
Since accidents and road damage can be treated separately the two candidates forcorrective charges are the environmental and congestion externalities The environ-mental externality can be easily dealt with by taxing fuel The congestion externalityon the other hand needs a finer system which will at least differentiate between peakand off-peak times and hence between peak and off-peak traffic conditions This iswhat the London congestion charge essentially does To estimate environmental andaccident externalities in London and expect them to be internalized by a congestioncharge which was designed to reduce congestion (not accidents or environmentaldamage) would not be technically correct Indeed at a conference in London inMarch 2003 Malcolm Murray-Clark (Director of Congestion Charging TfL) explainedthat reducing environmental externalities was never an objective of the LCCS10 Thereason why alternative fuel vehicles get a 100 discount (in practice they do not paythe charge) has no emissions reduction purpose but rather is intended as an addedenvironmental benefit possible within the structure of the LCCS
Box 2 summarizes the objectives of the LCCS Since the congestion charge wasnever intended to internalize any externality other than congestion any assessmentof its efficiency should concentrate on the congestion externality
37 Increase of the charge from pound5 to pound8
On 4 July 2005 the congestion charge was increased from pound5 to pound8 Although TfLdid not publish any data following the increase in time for the final revision of the
10 Congestion Charging Seminar organized by the Institution of Highways and Transportation Imperial College London 19March 2003
Box 2 Objectives of the LCCS
The main objective of the LCCS has always been lsquoto reduce traffic congestionin and around the charging zonersquo (TfL 2004b p 7) It was also expected tocontribute to four of the Mayorrsquos ten priorities for transport as set out in hisTransport Strategy (Greater London Authority 2001) lsquoto reduce congestionto make radical improvements in bus services to improve journey time reliabilityfor car users and to make the distribution of goods and services more reliablesustainable and efficientrsquo (TfL 2004b p 7)
280 GEORGINA SANTOS AND GORDON FRASER
present study one can expect that the increase in the charge caused further decreasesin traffic The reduction in traffic (vehicles with four or more wheels) that was forecastas a result of the variation was between 2 and 6 during charging hours (TfL 2005cAnnex 5 p 5) This would imply a congestion charge elasticity of demand for tripsby all vehicles with four or more wheels put together (and converted to PCUs) ofbetween minus003 and minus0111 The inferred congestion charge elasticities we estimatedin Section 34 were minus027 for cars and minus012 for LGVs These were estimatedhowever from point GC elasticities that correspond to the period when the chargewas first introduced Since we do not know the demand schedule we cannot becertain about elasticity values on other segments of the curve Also the congestioncharge elasticity of between minus003 and minus01 that TfL seems to have assumed whenpredicting the possible changes in traffic corresponds to all vehicles with four ormore wheels This would include taxis and buses which would increase with thecongestion charge No further assessment can be carried out until new travel timesand traffic counts are released by TfL
4 IS THE PROPOSED EXTENSION A GOOD IDEA
On 30 September 2005 the mayor of London approved plans to extend the LondonCongestion Charging Zone (CZ) This followed the publication of his Transport StrategyRevision (Greater London Authority 2004) in August 2004 and a number of publicconsultations both on the Transport Strategy Revision and on the Extension Order
The proposed area of westward extension covers all of the Royal Borough ofKensington and Chelsea (KC) and also areas of the City of Westminster that werenot covered by the existing scheme Figure 1 shows the whole of the area includingthe proposed extension
As with the original Scheme there will be no charge on the boundary route aroundthe extended charging zone There will also be a free corridor north to south throughthe proposed extended zone which is the boundary of the original congestion chargingzone and is showed as a white line on the map
The operation of the scheme which will start on 19 February 2007 will be almostidentical to that for the CZ Car LGV and HGV drivers will be charged pound8 per dayto enter into the new enlarged zone and the same discounts will apply as before Thecharging hours will end at 600 pm instead of 630 pm and also from September2006 payments will be accepted until midnight on the next charging day after avehicle has entered the zone
All residents living within the extended charging zone boundary will be entitledto a 90 discount This discount will also be extended beyond the charging zone
11 This is computed as the percentage change in quantity (between 2 and 6) over the percentage change in the charge (60as the charge increased from pound5 to pound8)
ROAD PRICING 281
boundary This extended residentsrsquo discount zone affects some areas around theexisting central London scheme as well as the proposed Western Extension12
We model13 the expanded congestion charging area as a rectangular grid which isa close geometric approximation to the actual shape of the area
41 Surplus impacts
The analysis in this section employs the approach to cost-benefit analysis presentedin TAG Unit 353 (DfT 2004c) by calculating benefits by mode
The model presented in the Technical Appendix on the Economic Policy websiteuses a speed flow curve with linear segments This translates directly into an averagesocial cost curve with linear segments shown in Figure 214 When agents decidewhether or not to take a trip they consider their marginal private cost (MPC) whichin the presence of only congestion externalities is equal to the average social cost
12 Extending discounts to residents beyond the charging zone was a decision made as a result of comments received during the2004 consultation on the Transport Strategy Revision13 The details of the model are presented in the Technical Appendix on the Economic Policy website14 Except for the congestion externality all other externalities associated with making a trip are ignored for the time being
Figure 1 Map of the proposed charging area
Source httpwwwtflgovuktflcc-exmapsshtml
282 GEORGINA SANTOS AND GORDON FRASER
(ASC) If the ASC per km of a representative vehicle is c and the total social cost ofa flow of q vehicles is C = cq then when an additional vehicle is added to the flowthe total social cost will be increased by
MSC = dCdq = c (q) + qdcdq
where MSC is marginal social cost In the literature the MPC is usually set equal tothe ASC The reason is that an individual car driver will experience the averagesocial costs including congestion costs as his or her MPC The MSC is the sum ofthe MPC and the marginal congestion cost (MCC) or congestion externality givenby qdcdq This is the standard model of the economics of congestion for a link Theregulatorrsquos problem is to set a corrective charge equal to the MCC to internalize thecongestion externality For the case of London a constant pound8 area charge is set thatdoes not vary according to which linear segment of the MSC curve is appropriate tothe road conditions To aid analysis however it will be assumed that the plannerintroduces a congestion charge exactly equal to the MCC This assumption will belater relaxed
Figure 2 shows the optimal congestion charging policy As discussed above thecharging authority can achieve the socially optimal level of flow q by imposing acharge equal to MSC(q) minus MPC(q) This will confront drivers with their MSC oftravel as opposed to the MPC thus eliminating the area of welfare loss ε Thus thenet benefit to society will be equal to area ε which can be computed by β minus α(Newbery 1990 Rietveld and Verhoef 1998)
For the purposes of the model Figure 2 is purely illustrative Road users are notassumed to be homogeneous as in Figure 2 In reality some groups of users experi-ence an overall fall in cost by virtue of exemption from the charge or from traveltime and vehicle cost savings exceeding the charge A fall in cost implies an increasein demand for these groups these groups are said to be lsquopriced onto the roadsrsquo Thecomputation of the benefit of being priced onto the roads is exactly analogous to thecomputation of area α in the case where users are priced off The surplus change tousers priced on or off the roads is computed by the Rule of a Half (ROH) The ROHis simply the change in total cost divided by 2 α = ((q1 minus q )(C 2 minus C1))2 As is madeclear by the diagram the ROH will be exactly equal to the change in surplus whenthe demand curve is linear If the demand curve is not in fact linear then the ROHwill just be an approximation
The area β which is the fall in costs (excluding the charge) to existing users iscomputed in a two-step process First area (β + λ) which is equal to the revenuecollected is computed by multiplying the charge by the quantity of vehicles payingfor each group The area β for each group is obtained by subtracting λ from (β + λ)λ is calculated by multiplying the difference between generalized costs before andafter charging by the quantity of vehicles This is the simplest method of computingβ given the outputs of the model In no way does this process treat revenue as a netbenefit The area λ is simply the transfer that is required to endogenize the marginal
ROAD PRICING 283
external cost of travel and as a result is netted out Put another way all of the revenue(β + λ) accrues to the charging authority here TfL however part of this revenue isa net benefit in the form of lower real travel costs C
Using this methodology the change in total surplus equivalent to area ε on Figure 2is pound682 million per year using 2007 as the base year and 2004 prices This does notmean that all users are better off In fact most users will be worse off
One word should be said about the treatment of fuel taxes in our model Travelcosts include time costs vehicle operating costs and the congestion charge15 In allcases the lsquoperceivedrsquo cost was used Vehicle operating costs include fuel and non-fuelcosts Fuel costs include fuel duties as these are paid (and perceived) by all driversValue Added Tax (VAT) on the other hand which is applied on the pre-fuel priceand on the fuel duty is not paid (perceived) by working vehicles as these get a VATrebate Therefore VAT for working vehicles was not included in the vehicle operatingcost of working vehicles in our model
Before moving on to the next section the incidence of benefits and disbenefitsdeserves some discussion If travel is classified as an intermediate good the DiamondndashMirrlees productive efficiency result applies ndash the first best level of travel should bepursued regardless of distributional impacts (Diamond and Mirrlees 1971) Certainlyfreight transport is an intermediate good passenger transport could be thought of asan intermediate good since it is consumed in the production of work services Ifpassenger transport is not an intermediate good then it should be taxed like all other
15 When the congestion cost is introduced time costs will typically go down
Figure 2 Surplus analysis of road pricing
284 GEORGINA SANTOS AND GORDON FRASER
consumption goods to minimize overall tax distortion16 Even if the DiamondndashMirrlees result applies it is worthwhile discussing the incidence of benefits of the schemealthough they will not be taken into account in the cost benefit analysis Table 5shows a breakdown of the changes in user surplus The total change in user surplusis equivalent to area (minusλminusα) on Figure 2
Clearly the biggest losers are those who have a destination or origin in KC andcannot change their route to avoid the charge The biggest winners are the KCresidents who can drive into the CZ at 80 pence per day17 instead of pound8 per dayFurther disaggregation of surplus changes would reveal that taxi drivers and passen-gers benefit most since they are exempt from the charge but still experience the speedbenefits Aside from taxi drivers those with high value of time benefit next most inparticular those driving cars for work purposes North-South through traffic experi-ences an increase in total surplus This is quite surprising given a substantialproportion of traffic is forced to route around the zone thus facing an increase in costThe reason for this result is that the extra cost of routing round is small relative tothe gain for taxi drivers and passengers who experience the free lunch of higherspeeds at no extra cost
The main conclusion that can be drawn from this analysis is that there will be verydifferent benefits and costs to different groups Origin and destination the possibilityof changing route the mode of transport used and the purpose of the trip (work ornon-work) are all determinants of the impacts of a road pricing scheme on differentgroups These determinants will have different effects depending on the exactlocation of the boundary of the charging zone The numbers that we computed areof course specific to the Extension as proposed by Transport for London and the pound8charge Any city considering the introduction of a road pricing scheme be it cordonbased or an area licence as in the case of London or any other type of scheme willneed to estimate the incidence on each group and even investigate different scheme
16 Newbery (1990) discusses this problem in detail17 They need to pay the congestion charge for five consecutive days in order to qualify for that discount
Table 5 Surplus breakdown resulting from our model of the Western Extension
GroupChange in user surplus
(pound per year)
North-South (inboundoutbound) minus54 900 963East-West (not fromto CZ) minus35 551 869East-West (fromto CZ) 33 650 310Internal 13 096 328North-South through 3 044 130East-West through 7 304 499
Source Own calculations
ROAD PRICING 285
designs and their impacts before making a decision These findings are in line withthose from Santos and Rojey (2004) who conclude that the distributional impacts aretown and scheme specific They assess the different impacts on different incomegroups living in different areas of three English towns (Cambridge Bedford andNorthampton) and find different results in each case No universal conclusions canbe made on the distributional impacts except that these depend on the precisecharacteristics of the town and scheme in question
Finally before proceeding on to the analysis of the indirect effects of expanding thecharging zone it is worthwhile testing the sensitivity of the results to the elasticitiesassumed Table 6 shows the figures corresponding to elasticities 20 higher and 20lower than those used
The figures in Table 6 are a reassurance of the robustness of the model Speedsand traffic figures move in the expected directions and the change in total surplus isrelatively insensitive to the elasticity employed The result that may seem surprisingis that the change in total surplus falls with elasticity Although this may seem coun-terintuitive at first sight it should be borne in mind that the increase in total surplusincreases with the elasticity only when the only possible response from drivers is to canceltheir trip In this model drivers have the option of switching route Switching effectsare costly and these costs may offset part of the gain of the initial traffic reduction18
42 Other impacts
421 Environmental benefits Although the Western Extension is not designedto yield environmental benefits it will bring some Table 7 gives our estimates of the
18 Santos (2004) uses a different transport model for other towns and also finds that when there are important switching effectsthe benefits of a congestion charge decrease with the elasticity
Table 6 Sensitivity analysis of speed and surplus with respect to elasticities assumed in our model of the Western Extension
Elasticity
Ex-post traffic KC (per hour) Speed Surplus analysis
IntoOut of Internal Through kmh ∆ in total surplus (pound per year)
minus20 27 213 9 589 3 625 2101 71 821 946Actual 26 813 9 727 3 678 2117 68 150 969+20 26 421 9 875 3 732 2130 64 278 250
Note The GC elasticities computed in Section 34 (minus096 for cars minus267 for taxis and minus053 for LGVs) wereincreased and decreased by 20 per cent and input into the model The benefits to bus passengers are ignoredin the surplus analysis These are dealt with in Section 423
Source Own calculations
286 GEORGINA SANTOS AND GORDON FRASER
potential environmental benefits The details of the calculations can be found in theTechnical Appendix on the Economic Policy website As it can be seen from the tablethere is a wide range of values which reflects the considerable uncertainty attachedto them
The 12 fall in carbon dioxide emissions shown in Table 7 is not out of line with thereported 19 fall in carbon dioxide emissions experienced after the implementationof the initial charging scheme in the CZ (TfL 2004b p 94 Beevers and Carslaw2005) especially bearing in mind that the fall in traffic in KZ is expected to be muchlower than that originally experienced in the CZ when the charge was first introduced
Although there has been no attempt to quantify the changes in carbon monoxideemissions TfL (2004b p 93 2005b p 101) gives a preliminary percentage reductionof 12 in nitrogen oxides and particulate matter emissions in the CZ This is morethan twice what our model predicts for particulate matter For nitrogen oxides ourmodel estimates an increase rather than a decrease
This important difference could be worrying if it had an important effect in theestimate of the benefit-cost ratio Luckily this is not the case If we assume thatparticulate matter and nitrogen oxides emissions in KC decrease 12 just as TfLclaims happened in the CZ the discounted environmental benefits over the ten-yearperiod are pound17 million (low estimate) and pound47 million (high estimate) This showsthat even when assuming large decreases in emissions and using the highest possibleenvironmental prices the increase in benefit caused by the reduction in emissions issmall relative to the change in total surplus estimated at pound682 million per year inSection 41 above The key aspect of this comparison is that the pound682 value isannual whereas the environmental benefit of pound47 is for the ten years of the durationof the scheme
It should also be noted that TfL (2005b) states that lsquoit is not possible to detectchanges in measured air quality that could be associated with the introduction of
Table 7 Welfare benefits of the reduction in emissions in our model of the Western Extension
Pollutant Change in yearly
emissions ( tonnes)
Change in yearly
emissions ()
Discounted welfare effect (pound for 10 year period)
Low estimate High estimate
Carbon dioxide 1 9924 120 1 473 403 1 473 403Particulate matter 02 53 15 707 842 006Nitrogen oxides minus14 minus24 minus14 177 minus232 082Carbon monoxide 339 190 3 066 24 525Total 1 477 998 2 107 853
Note All monetary values are in 2007 values and 2004 pricesCarbon dioxide tonnes have been converted to tonnes of carbon Only one central estimate was used forcarbon emissionsSource Own calculations (details of the prices used are described in the Technical Appendix on the EconomicPolicy website)
ROAD PRICING 287
congestion chargingrsquo (p 101) This means that computing environmental changes aspart of the benefits of the extension might constitute an overestimate of the positivechanges that the scheme could deliver Furthermore TfL (2005d Point 772 p 112)states that lsquoemissions changes of the scale forecast would generally be expected toresult in relatively small changes in concentrationsrsquo and lsquowould not be expected to bedetectable by conventional air quality measurements and would be obscuredby extraneous factors such as climatersquo Notwithstanding that we produce estimatesof benefits excluding and including the environmental impacts in the cost benefitanalysis of Section 43
422 Accidents The Third Annual Report claims that lsquotraffic changes brought aboutby the scheme have been responsible for between 40 and 70 additional accidentssaved per year in comparison with the background trendrsquo (TfL 2005b p 5) Fromtraffic accidents involving personal injury in London about 87 are slight just under13 are serious and just under 1 are fatal (TfL 2005b Figure 78 p 106 TfL2001 Table 16 p 28 TfL 2004d Table 611 p 50)19 Applying these shares to theupper and lower bounds of 40 and 70 accidents saved as reported by TfL (2005b)the increase in social surplus due to accidents savings could be anywhere betweenpound21 and pound37 million per year at 2007 values and 2004 prices20 TfL (2005d Table74 p 100) claims that the reduction in accidents would yield benefits of betweenpound5 million and pound10 million per year This is an exaggeration and we wonder whatseverity of accident shares TfL assumed when estimating these numbers
Using data from the Transport Statistics for London 2001 (TfL 2001 Table 16 p 28)and from the London Travel Report (TfL 2004d Table 611 p 50) we conductedour independent calculations
Table 8 shows the number of casualties in London for the period 2000ndash2003 thecost per casualty and the total cost of casualties per year
The point we are trying to make here is that the reduction in casualty costs maynot be related to the LCCS This reduction was pound151 million between 2001 and2002 when there was no congestion charging and pound144 million between 2002 and2003 The statistics suggest that there is a long-term downward trend in both thenumber of accidents and casualties that is not in any way related to the LCCS butrather to accident reduction measures
Nonetheless and as we do not have enough data to make a definitive assessmentwe shall include the high and low estimates of accident savings of pound37 and pound21
19 Figure 78 (TfL 2004b) corresponds to traffic accidents on the Inner Ring Road and within the charging zone only but theshares are the same as those derived from Table 16 in TfL (2001) and Table 611 in TfL (2004d) which cover the whole ofGreater London20 These numbers were computed following the DfT (2004b) guidelines A fatal accident has a cost of pound10488 a seriousaccident has a cost of pound4742 and a slight accident has a cost of pound2763 at 2004 prices These values include insuranceadministration damage to property and police costs A fatal casualty has a cost of pound17 million a serious casualty has a cost ofpound192044 and a slight casualty has a cost of pound14808 also at 2004 prices
288 GEORGINA SANTOS AND GORDON FRASER
million per year at the time of considering potential additional benefits of the exten-sion of the zone
423 Public transport effects The impact of the extension of the congestioncharging zone on public transport is quite complicated since revenues from thescheme are required by law to be reinvested in the transport sector21
Average bus speeds in practice are lower than car speeds since buses are requiredto slow down and stop to collect passengers As a result the predicted change injourney times for buses resulting from the expansion will differ to those for cars Thispaper infers a journey time saving for buses by assuming that the average bus journeyin KC takes 7 minutes 20 seconds longer than the equivalent journey by car Thisexcess journey time was calculated using a basket of routes available on the TfLwebsite and journey planning software The same data was used to calculate anaverage journey distance for bus trips in KC
The average trip distance and excess travel time were used together with the ex-post and ex-ante car speeds to calculate a bus journey time saving From this the totalsurplus impact of reduced journey times was obtained by multiplying first by the totalnumber of bus passengers obtained from screen-line survey data provided by TfLand then by the bus weighted average value of time computed in the TechnicalAppendix on the Economic Policy website22 The estimated change in total surplus andother key bus passenger details are given in Table 9
TfL (2005d p 100) estimates the benefits to bus users at pound15 million to pound21million per year They include not just time savings due to higher average speeds aswe do but also increased reliability and falls in waiting time Another reason for the
21 Although all net revenues have to be invested in the transport sector they do not necessarily have to be invested in publictransport They can be allocated to road safety (research engineering works and education campaigns) safer routes to schoolswalking and cycling to name but a few Having said that most net revenues (though not all) from the LCCS have been andcontinue to be allocated to bus network improvements (higher frequencies additional routes enhanced route supervision andconversion to higher capacity routes)22 This procedure implicitly assumes that the number of passengers per bus stays constant throughout the entire duration of thetrip through KC
Table 8 Cost of road traffic casualties in London
Fatal casualties Serious casualties Slight casualties
No Cost (pound) No Cost (pound) No Cost (pound)
2001 299 511 million 5769 1108 million 38483 570 million2002 282 481 million 5320 1022 million 36127 535 million2003 272 464 million 4872 936 million 33378 494 million
Cost per casualty 2001ndash2003
1709031 192044 14808
Source TfL (2001 Table 16 p 28) and TfL (2004d Table 611 p 50)
ROAD PRICING 289
difference between our estimate and TfLrsquos is that we suspect that we have assumed alow share of bus passengers making trips by bus in the course of work Given ourfrustrated attempts to obtain data on the share of trip purpose of bus passengers inLondon during charging hours we assumed national shares which might be differentfrom those in London As a consequence the working value of time was only appliedto 15 of bus passengersrsquo time savings which may explain in part our lowerestimate Out of curiosity we re-estimated the benefits for bus passengers assumingthat 15 made trips during working hours as part of their work The benefits in thatcase were pound113 million per year closer to TfLrsquos estimate
Although the estimate given above does not take into account any benefits fromfalls in waiting time the omission is realistic given the assumptions of the trafficmodel It is assumed that there is no variation in speeds throughout the charging dayand bus frequencies are essentially a policy variable so the model predicts no changein waiting time In reality due to non-constant speeds and also due to the hypothecationof revenues resulting in extra buses excess waiting times are expected to fall by alarge amount
In addition to that the figure above assumes a static number of bus passengersIn reality some of those priced off the roads will switch to bus transport
For the reasons discussed above the figure of pound81 million is probably anunderestimate of the benefits to bus passengers
424 Other impacts One of the main concerns expressed in the public consultationwas the potential negative impacts of the expansion on businesses
On the whole the business impacts of the CZ scheme were quite minor Initialstudies by TfL (2003) and Bell et al (2004) documented large negative impacts Initialfalls in retail activity have since been reversed (TfL 2005b p 69) however and it islikely that most of the negative effects attributed to the scheme were due to otherfactors such as the Iraq war or the closure of the central line (TfL 2004b p 88)Besides the strong presence of financial and business services which were positivelyimpacted by the LCCS is likely to have compensated any negative impacts on othersectors (TfL 2005d Point 744 p 96)
These results from the CZ cannot be regarded as transferable to KC There are anumber of differences between KC and CZ which means that the business impactscan be expected to be different These are
Table 9 Surplus benefits to bus passengers in our model of the Western Extension
Passengers per hour Drivers per hour Change in total surplus (poundyear)
9669 446 8102009
Source Own calculations
290 GEORGINA SANTOS AND GORDON FRASER
bull There are only 170000 employees in KC whereas there are 11 million in CZ(TfL 2005d Point 741 p 95)
bull The share of retail hotel and restaurants employee jobs in KC is 32 whereasit is only 12 in CZ (TfL 2005d Point 742 p 96)
bull The share of financial and business services employee jobs in KC is 25whereas it is 52 in CZ (TfL 2005d Point 742 p 96)
With these considerations in mind the overall negative impacts in KC could bemore pronounced than in CZ (TfL 2005d Point 745 p 96) especially at individuallevel TfL has neither quantified the potential negative impacts nor included them inany cost-benefit analysis
Another impact that has been recognized by TfL since the start of the proposal isthe traffic effects that the expansion would have on the original CZ For the purposeof the cost-benefit analysis allowance must be made for the expected negative feed-back of the extension on traffic speeds in the CZ TfL initially assumed an annualdisbenefit of pound10 million per year to account for the negative impact of residents ofKC being priced onto the roads and travelling into the CZ at much lower cost (TfL2004c p 10) In a later report (TfL 2005d Point 757 p 99) they adjusted thatvalue to pound6 to pound9 million per year We use all three values (pound6 pound9 and pound10 millionper year) and we also assume much larger disbenefits of pound20 and pound30 million peryear We do this to test the sensitivity of the benefit cost ratio There is a greaterproportion of car travel by residents in KC when compared to the CZ which meansthat a higher proportion of households will be entitled to the residentsrsquo discount (TfL2004c p 3) and thus tempted to drive in the CZ at 80 pence per day
Finally another aspect that needs to be taken into account is that just as inthe original CZ the Western Extension could impose potentially large compliancecosts on charge payers The time cost of paying the charge will vary depending onthe means used to pay for instance users can currently pay on the internet by phoneby SMS or at retailers TfL (2005d p 101) estimates compliance costs at between pound6and pound7 million per year In private correspondence with TfL compliance costs weredescribed as a lsquonotional allowance for time and effort in complying with the chargersquoDue to lack of an alternative estimate we assume the same values as TfL (2005d)
43 Cost-benefit analysis
The objective of this section is to replicate the cost-benefit analysis conducted byTfL thus providing an independent check of their figures Although we compute thebenefits with our transport model described in the Technical Appendix on theEconomic Policy website we use TfLrsquos cost estimates
Second-round transport effects such as those from investment of the scheme areomitted the analysis concentrates on the direct and indirect impacts discussed aboveIt should be borne in mind that both the benefits computed with our transport
ROAD PRICING 291
model and the costs taken from TfL (2005d) are projections and not numbers basedon actual responses as the Western Extension will not start until February 2007
431 Costs of the scheme The level of costs assumed and their profile over timeis critical to the outcome of the cost-benefit analysis We follow TfL (2005d) and theircost assumptions A summary of the cost information provided in this report ispresented in Table 10 All numbers in TfL (2005d) are expressed in 2005 valuesand prices Since our study is in 2007 values and 2004 prices we made the relevantconversions
432 Discount rate and changes over time The model only applies to theyear 2007 since it employs 2007 values of time To facilitate a cost-benefit analysis
Table 10 TfLrsquos estimated costs (pound million 2007 values and 2004 prices)
2004 2005 2006 2007 2008 2009 2010 2011 2012 2013 2014 2015 2016
Scheme DMPI Low 100 349 552 187 79 104 147 246 38 38 38 39 39High 100 349 552 233 79 104 147 246 38 38 38 39 39
Scheme operationLow 00 01 46 245 229 230 241 240 228 228 232 226 226High 00 01 50 271 254 254 263 263 251 252 256 250 250
Note DMPI design management procurement and implementation
Source TfL (2005d Table 76 p 104 and Table 77 p 105)
Box 3 What do TfLrsquos costs include
Scheme design management procurement and implementation costs include
bull Additional staff costs
bull Set-up capital costs
bull Notional costs of equipment renewals
bull Enforcement infrastructure set up costs
bull Traffic management costs
bull Other TfL costs such as consultation and monitoring
Scheme operation costs include
bull Service provider costs
bull Enforcement infrastructure costs
bull Contracted enforcement costs
bull Business operations costs
292 GEORGINA SANTOS AND GORDON FRASER
however it is assumed that the benefits for subsequent years are equal to those in2007 The TfL report on the extension also assumes a constant profile of benefits(TfL 2005d Point 7547 p 107) This is because trends in opposite directions suchas inflation eroding benefits and rising real income (and subsequently rising value oftime) increasing them tend to cancel out23
Two further assumptions are necessary a 35 discount rate and a schemelength of ten years The 35 discount rate is that recommended by the TreasuryGreen Book (HM Treasury 2003) A scheme length of ten years is chosen forconsistency with TfL who chose this time period because it is the legislated periodof hypothecation
433 Cost-benefit table Traditionally schemes are evaluated using a benefit-costratio (BCR) The Transport Analysis Guidance (DfT 2004d TAG Unit 354) defines theBCR as follows
The Net Present Value of a scheme is the discounted stream of benefits accruingto road users (PVB) less the discounted stream of costs borne by the relevant publicbody (PVC) Thus the BCR seeks to provide a measure of the benefit per unit of costincurred
For the Western Extension the revenue of the scheme exceeds the cost and hencethe PVC will be negative Moreover since most of the benefits of the scheme accrueto TfL in the form of the area β in Figure 2 the PVB to road users will be negativeAlthough calculating the BCR above would yield a positive number it would essen-tially be meaningless This is a problem the DfT recognize lsquothe BCR is of limitedvalue where projects (road user charging for example) result in significant revenuesaccruing to public accountsrsquo (DfT 2004d TAG Unit 354) To retain the interpreta-tion of the measure of benefit per unit of cost we use the adjusted BCR definedbelow (ABCR)
23 The Le ChatelierndashSamuelson principle predicts that the long-run elasticity of travel demand with respect to travel costs willbe greater than the short-run elasticity A higher elasticity in a model where the only possible response to increases in price isdemand reduction would imply higher net benefits This however is not the case of the London Scheme or its extension wherehigher elasticities yield lower net economic benefits The possible reasons for this are explained in Section 41 Indeed this isnot uncommon in models that allow drivers to change route in order to avoid paying the charge
BCR Net Present Value (NPV) + Present Value Cost to Public Accounts (PVC)
Present Value Cost to Public Accounts (PVC)
BCR = Present Value of Benefits (PVB)
Present Value Cost to Public Accounts (PVC)since NPV = PVB ndash PVC)
=
rArr (
ABCR = Present Value of Total Surplus Gain
Present Value Costs Excluding Revenue
ROAD PRICING 293
The Present Value of Total Surplus Gain is the sum of the social gain (β minus α) the benefitsto bus users the benefits from the reduction in emissions and accidents the disbenefitsof higher traffic in the CZ and the disbenefits of compliance costs The Present ValueCosts Excluding Revenue is simply the costs of implementing and running thescheme Therefore the ABCR gives an indication of the benefits per unit of cost
Table 11 gives the cost-benefit analysis for the first year of operation An additionalcost (or disbenefit) that needs to be taken into account is the decrease in benefits inthe CZ due to the earlier finish As explained at the beginning of Section 4 the finishtime of the Scheme will be brought forward to 600 once the charging zone isexpanded The time savings of the CZ will therefore be reduced TfL (2005d Point7539 p 106) estimate this cost will fall in the range of pound7 million to pound12 millionat 2005 values and prices (pound73 million to pound125 million at 2007 values and 2004prices) Similarly according to TfL (2005d Table 76 p 104 and Table 77 p 105)since the charging hours will be reduced there will be a modest operating cost savingof pound1 million at 2005 values and prices (pound104 million at 2007 values and 2004 prices)
Table 12 shows the discounted costs and benefits of the extension
Table 11 Projected costs and benefits of the Western Extension for the year 2007pound million at 2007 values and 2004 prices
Costs Benefits
Scheme costs Change in total surplus excludingHigh sensitivity 432 time savings to bus usersLow sensitivity 504 environmental and accident benefits 682
Additional bus costs Time savings to bus users 81High sensitivity 156Low sensitivity 114 Disbenefit CZ from 600 pm finish minus81 to minus138
Reduced costs in central zone from 600 pm finish
minus104 Feedback effects on CZ minus10
Total benefits 525 to 582
Charge payer compliance costs Environmental and accident benefitsHigh sensitivity minus73 High estimate 38Low sensitivity minus125 Low estimate 23
Total costs Total benefits including environmental and accident benefits
High sensitivity 5046 High estimate 620Low sensitivity 4826 Low estimate 548
Notes The values above are only valid for the year 2007 Most years though not all are assumed to have thesame costs and benefits The years 2004 to 2006 have some costs but no benefits Some costs also vary in lateryears (see Table 10 above)
TfL (2005d) produced two sets of cost estimates those corresponding to a high sensitivity from drivers (40 percent would suppress their trips) and those corresponding to a low sensitivity from drivers (33 per cent wouldsuppress their trips) They do not however provide the relevant elasticity values
Source The benefits were computed with our model of the Western Extension described in the TechnicalAppendix on the Economic Policy website The costs are taken from Table 10 above and from TfL (2005d Table76 p 104 and Table 77 p 105)
294 GEORGINA SANTOS AND GORDON FRASER
The highest ABCR estimate which corresponds to the maximum possible environ-mental and accident benefits is 09 This allows us to answer the question this sectionproposed ndash lsquoIs the proposed extension a good idearsquo The answer is a tentative lsquonorsquoFollowing the guidelines presented in DfT (2004e) this scheme would be classifiedas lsquopoorrsquo value for money
If we assumed feedback effects in the CZ in the order of pound6 million to pound9 millionper year like TfL (2005d) does the benefit-cost ratio excluding environmental andaccident benefits would improve marginally to fall in the range 080 to 085 In thesame way the benefit-cost ratio would decrease to 054 to 060 if we assumed thedisbenefit of increased traffic in the CZ due to a very high proportion of KCresidentsrsquo making use of their discount to drive in CZ to be pound20 million to pound30million per year
TfL (2005d Table 79 p 108) gives benefit-cost ratios of 08 and 115 which arenot too different from those estimated in Table 12 Under the assumption of highresponse from drivers however TfLrsquos predicts that the Western Extension would beeconomically viable yielding a BCR just above unity24
If we include TfLrsquos highest estimates for accident savings and bus benefits of pound10million and pound21 million per year respectively instead of our estimates the BCR goesup to 118 which is close to TfLrsquos upper bound estimate
24 According to DfT (2004e) this would be a project classified as lsquolowrsquo value for money
Table 12 Cost-benefit analysis of the Western Extension pound million at 2007 valuesand 2004 prices 10 year horizon
Statistic pound million discounted
PVB exc environmental and accident benefitsHigh estimate 490Low estimate 432
PVB inc environmental and accident benefitsHigh estimate 509Low estimate 466
PVCHigh sensitivity 584Low sensitivity 582
BCR exc environmental and accident benefitsHighest estimate 084Lowest estimate 074
BCR inc environmental and accident benefitsHighest estimate 090Lowest estimate 078
Source Own calculations
ROAD PRICING 295
The differences between our analysis and TfLrsquos boil down to two types of dif-ferences the first is linked to cost and benefit components included or excluded fromthe calculations and their estimates and the second is linked to the traffic model andthe different assumptions embedded into it The first set of differences is described inBox 4 The second set of differences could only be described if we had full access tothe transport model that TfL used including all speed-flow relationships linkscharacteristics together with the exact shares of trip purposes elasticities and valuesof time assumed We do not have access to any of this All we can say is that wefollowed government guidelines closely The details of all the assumptions made inour transport model are detailed in the Technical Appendix on the Economic Policywebsite
While our PVBs range from pound432 million to pound509 million TfLrsquos range from pound433million to pound627 million (after making the relevant price conversions to makecomparisons possible) As explained above however if we include TfLrsquos estimates ofaccidents and bus benefits our PVBs upper range goes up to pound635 million surprisinglyclose to TfLrsquos given that our transport model was built independently
5 THE POLITICS OF CONGESTION CHARGING
The original LCCS charge does not constitute a first-best charge or a second-bestcharge either It does not vary with vehicle type or time of the day Yet it is anexample of how a quick and dirty solution can yield net economic benefits
Box 4 Costs and benefits
CostsWe use TfLrsquos cost assumptions as described in Table 10 and Box 3 We do notestimate these independently The only differences arise in the year in whichthey are expressed
BenefitsThe benefits which we estimate independently include
bull Change in total surplus in the form of time savings to cars taxis andLGVs (equivalent to area ε on Figure 2)
bull Bus benefits in the form of time savings to bus users but excludingincrease in reliability and decrease in waiting time
bull Disbenefit from negative impacts from increased traffic in the CZ
bull Disbenefit in the CZ from earlier finish at 600 pmWe also add environmental and accident benefits in some of the calculationsin Table 11
296 GEORGINA SANTOS AND GORDON FRASER
The level of the charge was not chosen on the basis of a calculation of the MCCFurthermore due to the rather crude nature of an area licensing scheme the systemlacks the ability to adequately charge differentiated prices both temporally andspatially Ultimately the mayor settled upon the pound5 charge deciding that it providedadequate incentive to achieve significant congestion reduction but with less publicbacklash likely to be associated with a pound10 charge which had been under consider-ation Also the proposed HGV charge of pound15 (3 times the car charge) was reducedto be the same as that for cars mainly as a result of the responses of the commercialvehicles sector to the public consultations The pound5 charge was adopted for all vehicletypes regardless of their different congestive effects
In July 2005 the charge was increased from pound5 to pound8 This was done despitethe opposition of those who responded to the public consultation on the potentialincrease (and a few other changes) Presumably respondents were more likely to bepeople or organizations who strongly opposed the increase and non-respondentswere probably people and organizations that either were indifferent or did not supportthe increase enough to make their voice heard From those responding there wassubstantial opposition The new charge is pound8 for all vehicle types Given that thedisruption produced by a HGV is higher than that produced by a car to charge boththe same amount cannot be justified on any economic grounds
This is an example of how politics can influence the level of the charge which froman economic point of view should be equal to the MCC of each vehicle type On theone hand the pressure from the haulage industry ensured a uniform charge On theother hand despite the public opposition expressed in the consultation the chargewas increased by 60 There is a possibility that if the charge had been higher forHGVs in the first place no increase would have taken place
The ROCOL (2000) recommendation on charging times was 700 am to 700 pmMonday to Friday excluding public holidays However the LCCS hours of operationare 700 am to 630 pm At a conference in London in March 2003 MalcolmMurray-Clark (Director of Congestion Charging TfL) explained that the decision to
Box 5 Three political decisions
There were three decisions that TfL had to make when designing the originalScheme (a) the level of the charge and whether it was going to differ byvehicle type or time of the day (b) the times when the Scheme was going tooperate and (c) the exact limits of the CZ All three decisions could havebeen based on economic principles However they were based on politicalconsiderations and the results of an extensive consultation process in whichTfL engaged before the mayor confirmed the final Scheme Order
ROAD PRICING 297
change the evening end-time was primarily a result of lobbying by the entertainmentcommunity It was argued that having the charge apply until 700 pm would discouragetheatre-goers from entering the CZ
The exact limits of the CZ were also slightly changed a few times before the finalScheme Order was confirmed This was again based on pressure groups wanting toqualify for the 90 discount and from businesses wanting to be excluded from theCZ in the fear they would suffer losses
All three major decisions described in Box 5 were based on political considerationsrather than on economic efficiency Yet the LCCS is a success congestion hasdecreased travel times have decreased and average speed has increased This indeedshows that much can be achieved with an unsophisticated policy that is easy toimplement
The technology used in the LCCS is also very simple The method was chosen dueto its relative ease of implementation as compared to full-scale electronic road pricingANPR technology was selected as a feasible intermediate between an inexpensivebut inefficient paper-based system and a sophisticated yet complex and expensiveelectronic road pricing system (ROCOL 2000)25
The three decisions on charge level times of operation and limits of the area arenot trivial Indeed it has been shown that making mistakes on any of these can causelosses Santos et al (2001) for example simulate cordon tolls in eight English townsand find that if the toll is set at a level too different from the optimal one it can causeloss of welfare rather than any gain May et al (2002) Verhoef (2002) and Mun et al(2003) arrive at similar conclusions and endeavour to find methods for identifyingoptimal toll locations and levels Their models are theoretical and cannot be appliedto real world situations In any case there is both theoretical and empirical evidencethat shows that charge level (which in turn is linked to charging times) and locationare of fundamental importance for the success of a scheme
With these matters being so important it is surprising that planners will base theirdecisions on political judgment May et al (2004) report that officials in charge ofdesigning cordons in England26 will typically aim at avoiding adverse impacts gainingpublic acceptance and being practical Approaches they cite include focusing on thecity centre together with any major traffic generators on its fringes placing the cordonwithin the city centre ring road if one existed using a simple charge structure withuniform charges for all crossing points and keeping the charge at a level sufficientlylow to be acceptable among others
On the other hand it may be argued that a large policy decision such as thecongestion charge should be influenced by political factors namely the views of
25 TfL is in the process of examining how new technology could support the original Scheme and its extension and how it couldsupport more advanced schemes (TfL 2005e)26 Their paper summarizes the results of in-depth interviews with practitioners in six UK local authorities who at the time wereconsidering the implementation of congestion charging
298 GEORGINA SANTOS AND GORDON FRASER
Londoners The LCCS has so far succeeded to the point that Londoners re-electedthe mayor in 2003 They are unhappy with having to pay the charge but happy withthe benefits from the charge
The change from pound5 to pound8 might yield similar results It is too early and there areno data to make an assessment but further reductions in traffic in spite of the costsimposed on those changing route travel time or travel mode may produce furtherincreases in social surplus
51 The Western Extension
Just as the design of the original Scheme was Subject to the influence of differentpressure groups so is the design of the Western Extension
When the charging zone is finally extended in February 2007 the charging timeswill be shortened to finish at 600 pm This was a decision made in response to therepresentations mainly from business representatives received during the consultationon the draft Transport Strategy Revision (TfL 2005d Point 2224 p 12)
The exact limits of the zone the free corridors and the residentsrsquo discount zoneswere also shaped up taking into account the different views received especiallyduring the preliminary consultation which took place in early 2005 (TfL 2005d p 3)
Residents living just outside the zone boundaries are more likely to suffer negativeimpacts given that many of their local services (such as libraries health centres andleisure facilities) may be located inside the zone In other cases the designated residentsrsquoparking is inside the zone and there may be no practical alternative arrangementsfor them to park outside TfL assessed the different representations on a case-by-casebasis and granted a number of additional residentsrsquo discount zones which areactually outside the limits of the Western Extension Some areas outside the originalcharging zone were also included in the extended residentsrsquo discount zone
511 Public consultation The results of the consultation on the extension showstrong opposition Again as in the case of the consultation on the increase from pound5to pound8 the respondents were probably people and organizations that opposed andwanted to prevent the variation from being confirmed
Seventy per cent of the members of the public who responded and 80 of thebusinesses that responded opposed the extension (TfL 2005d p 42) The detailedresults are puzzling however For example residents in CZ could have been expectedto support the extension After all if they needed to travel to KC by car they wouldhave to pay the charge anyway and if the zone were extended they would benefitfurther from time savings experienced in KC In Section 41 residents in KC wereidentified as the biggest winners and as such they could have also been expected tosupport the extension On top of benefiting from time savings in KC they wouldalso be entitled to use CZ making use of their residentsrsquo discount Furthermore KCresidents that currently do not drive during charging hours may be attracted to the
ROAD PRICING 299
roads making use of their discount with which they will be able to drive in CZSurprisingly 66 of CZ respondents and 72 of KC respondents opposed and only27 of CZ respondents and 23 of KC respondents supported the proposal for theWestern Extension (Accent 2005 Table 22 p 85) Our only explanation for thisoutcome is that they misperceive the benefits they would grasp
As explained in Section 41 the biggest losers are those who have a destination ororigin in KC and cannot change their route to avoid the charge This category of tripmakers includes for example residents in the rest of London who understandablyopposed the proposal From the lsquorest of Londonrsquo residents responding 78 opposed(Accent 2005 Table 22 p 85)
Although a public consultation is a useful exercise and part of a healthy democ-racy it may not always be representative especially when only those who stronglyoppose are the ones likely to respond TfL commissioned Accent to conduct anattitudinal survey that would lsquoprovide a representative sample of Londonersrsquo viewsincluding those within the proposed western extensionrsquo in order to lsquoassess howrepresentative the consultation findings arersquo (Accent 2005 p 167) As suspected theresponses differ For example when asked whether they thought it was important totackle congestion in the area of the proposed extension there were fairly differentresults
bull In the consultation 47 of general public and 52 of businesses thought it wasunimportant and 41 of general public and 34 of businesses thought it wasimportant (Accent 2005 p iii)
bull In the attitudinal survey 62 of respondents thought it was important and 16thought it was unimportant
Most of the respondents to the public consultation disagree with the principle ofthe extension or even congestion charging to such a degree that when invited tomake further comments on questions relating to the extension boundary charginghours and free through routes the main response in all cases was that lsquothere was noneed for the proposed western extensionrsquo (Accent 2005 pp 79ndash80)
52 General lessons
The LCCS is an economic and political success The lessons that can be drawn fromthe experience and that we suggest should be taken into account by other towns andcities considering the idea of road pricing are as follows
bull Inform the public and listen to the public Before it was implemented the proposal onthe congestion charging scheme in London was sent out for public consultationtwice As explained above the level of the charge the charging times and thecharging zone limits were all influenced by the results of the consultation Afterthe mayor confirmed the Scheme but before it started three million leaflets were
300 GEORGINA SANTOS AND GORDON FRASER
delivered to every household in London twice The leaflets contained informationon where the charging area was who would be affected and what those affectedwould need to do Information on the scheme was broadcast on all main radiostations and TV channels and published in most newspapers A website withinformation and the possibility of making inquiries was also opened in July 2002
bull Do not make the final decision subject to a referendum The mayor of London wasdetermined to introduce congestion charging and even made it a central part ofhis manifesto for election in May 2000 He was happy to conduct public consul-tations but he never made the final decision subject to the result of any referen-dum The city of Edinburgh in Scotland on the other hand which had beencontemplating the possibility of introducing road pricing since 2001 when theTransport (Scotland) Act 2001 (Acts of the Scottish Parliament 2001) was passedmade the decision subsequent to an affirmative referendum in Edinburgh About74 of Edinburgh residents who participated in the referendum voted lsquonorsquo andthe plans were abandoned as a result27 Although the mayor in London waselected with a manifesto that contained a proposal on congestion charging and re-elected three years later it is not clear that a referendum would have supportedthe LCCS Congestion charging was just one of the many policies proposed andimplemented by the mayor
bull Make a careful cost benefit analysis In London several alternatives were evaluatedeach one accompanied by a cost-benefit analysis Do also a sensitivity analysis ofthe results to the assumptions made in particular elasticities Before a scheme isimplemented there are no data on how drivers will respond to the charge anderrors in the elasticities assumed will have costs The cost of these errors shouldnot turn a viable scheme into a non-viable one
bull Make a careful assessment of the distributional effects This assessment should concen-trate on who will gain from the scheme and who will lose This will depend onthe scheme design and on the characteristics of the town in question such aswhere people live and what mode of transport they use It will also depend onthe availability of non-chargeable modes and facilities such as public transportand dedicated cycle lanes
bull Consider the geographical characteristics of the town or city in question Although a licensingscheme like the London one may work in towns and cities that have a dense andcongested network in the city centre it may not work in places that have othertypes of congestion Towns that do not have dense road networks may only suffercongestion on the main avenues or motorways In those cases it might provemore effective to introduce tolls on just those roads
bull Do not restrict the charge level to the result of MCC calculations Using a first best policywhen there are imperfections in other related markets will not yield an efficient
27 Over 60 of eligible voters participated in the postal referendum held from 7ndash21 February 2005 making it a success interms of turnout
ROAD PRICING 301
outcome Furthermore a second best policy will also be typically very difficult todesign let alone implement TfL did not even estimate the MCC
6 BRIEF ACCOUNT OF OTHER CITIES
With the success of the LCCS in reducing traffic levels and increasing speeds it isworth asking whether the experience is transferable to other cities The answer tothat is maybe A lsquomaybersquo rather than a lsquoyesrsquo stems from the fact that different citieshave different road layouts and different transport systems not to mention differentsocio-economic and geographic characteristics Apart from these differences thepolitical circumstances may be favourable or unfavourable for the introduction ofcongestion charging
In the case of London there was a clear political commitment from the mayorPolitical will may even be the main reason for the achievements of the LCCS Thisis not the case in Paris for example where the mayor PS Bertrand Delanoeuml has nointention of introducing road pricing (Les Dosiers du Net 2003) There is no legisla-tion that would allow him to do so and he does not seem to be interested in havingthat legislation passed either
Although relatively expensive for the taxpayer public transport in Paris has areputation of being good The urban area of Paris is 2723 km2 (1051 square miles)and is very densely populated in comparison with other Western cities includingLondon At the 1999 French census the population density in the city of Paris was20164 inhabitants per km2 (52225 inhabitants per square mile) (Wikipedia 2004a)With such dense population an exemption to residents would probably be needed togain public acceptability for a road charging scheme This would in turn jeopardizethe gains in efficiency that could be derived from road pricing
However the most important factor is that there is a lack of political will Theposition of the Parisian government is that road pricing constitutes lsquoa negative meas-ure to solve traffic problems which generates perverse effects of social segregationrsquo(Le Monde 2003) They would rather improve public transport in order to encouragedrivers to leave the car at home They look at the LCCS lsquowith interestrsquo but lsquofor themoment such a system does not appear to be a measure that could be applied inParisrsquo (Les Dosiers du Net 2003)
Rome on the other hand already has a system in place which has some similaritieswith the LCCS The scheme is described in Box 6
In the US the problem of congestion is so serious that commuters there rank trafficamong the top three policy problems together with the economy education andorcrime (Kockelman and Kalmanje 2005)
Cities in the US vary in geographical size population and density One city thathas severe congestion and where a similar scheme to the one in London could beconsidered is New York
302 GEORGINA SANTOS AND GORDON FRASER
New York is the city with the highest population in the US with 8 million people in800 km2 (309 square miles) (Wikipedia 2004b) When the whole of the New York Met-ropolitan Area is taken into account NewYorkndashNewark (state of NewYorkndashNew JerseyndashConnecticut has a population of over 17 million in an area of 30671 km2 (11842 squaremiles) and a travel time index of 139 (Schrank and Lomax 2005) This index is com-puted as the ratio of the travel time during the peak period to the time required to makethe same trip at free-flow speeds An index of 139 indicates that a trip made duringpeak times takes 39 longer than a trip made in free-flow conditions For examplea 50 minute trip in free-flow conditions takes almost 70 minutes during the peak period
The Manhattan area can be compared to central London and a system like theLCCS would perhaps have a chance of working There are charges to cross some ofthe tunnels and bridges although these are very different from the LCCS
Zupan and Perrotta (2003) explore the idea of congestion pricing in New York inthe light of the LCCS They conclude that the equivalent charging area would be
Box 6 The Limited Traffic Zone in Rome
The Limited Traffic Zone (LTZ) scheme is a combination of different permittypes that allow different movements in the different sectors in which the zonehas been divided (STA 2005) Although most permits are valid during all thehours during which the scheme operates goods vehicles have additionalrestrictions regarding times
The scheme operates in the historic centre only which has an area of 46km2 (18 square miles) representing only 036 per cent of the area of Romewhich is 1290 km2 (500 square miles) The area is considerably smaller thanthe London CZ which as pointed out in Section 3 represents 13 per cent ofthe total area of Greater London
The crucial difference between the LCCS and the scheme in Rome is thatin London all those willing to pay the charge in order to use the CZ can doso whereas in Rome the city centre is closed in the first instance and thosewishing to drive in it need to get a permit Not everyone can qualify for apermit which means that drivers willing to pay may not be allowed into theLTZ Those who qualify include residents night workers doctors journalistsand disabled people among others Residents and registered disabled also getIn-Vehicle Units for free This technology has some similarities with the oneused in Singapore and uses an In-Vehicle Unit with a smart card given tothem for free
About 70000 trips per day are made through into or out of the area(PRoGR$SS 2004) compared to just over 600000 in the London CZ
ROAD PRICING 303
Manhattanrsquos Central Business District (CBD) This area is very similar to the LondonCZ each weekday over 800000 motor-vehicles enter the Manhattan CBD which isjust under 22 km2 (85 square miles) Only 22 of the traffic pay to enter at the twotunnels under the Hudson River operated by the Port Authority of New York andNew Jersey and the two tunnels under the East River operated by the MetropolitanTransportation Authority
Zupan and Perrotta (2003) model four different charging schemes showing a rangeof options for pricing some or all of the 19 entry points to Manhattanrsquos CBD These are
(a) Flat charges on the East River Bridges of the same level as the Metropolitan Trans-portation Authority (MTA) currently charges on the two parallel MTA tunnels
(b) Charges that vary with time of day on East River bridges with MTA chargesmodified to match them
(c) A system similar to the LCCS charging at 60th Street which is the boundary ofManhattan CBD for 13 daytime hours on weekdays combined with flat chargeson the East River during the same time period
(d) A full variable pricing system with variable charges at all entries including theEast River bridges MTA crossings and at 60th Street
They conclude that all four systems would generate substantial revenues Thesewould be US$700 million US$740 million US$760 million and US$17 billion forthe four schemes respectively (Zupan and Perrotta 2003)
Schemes (a) and (b) would reduce daily entries by about 5 or over 40000vehicles (Zupan and Perrotta 2003) Schemes (c) and (d) would reduce daily entriesby 9 and 13 respectively or over 73000 and 105000 vehicles The result of thiswould be an increase in average speed and a reduction in travel time Zupan andPerrotta (2003) do not provide estimates of these
7 CONCLUSIONS
This paper assessed the original London Congestion Charging Scheme and its impactsand it simulated and analysed the proposed extension to include most of Kensingtonand Chelsea It also touched upon the political economy of the congestion charge andthe increase of the charge from pound5 to pound8 per day The possibility of transferring theexperience to Paris Rome and New York was also discussed
The LCCS has had positive impacts This was despite the charge level and locationhaving been influenced by pressure groups It is difficult to assess the impacts of theincrease of the charge from pound5 to pound8 which took place in July 2005 because no datahave been released by TfL
The proposed extension of the charging zone does not seem to be an efficientchange on economic grounds at least for the specific boundaries method of charg-ing and level of charging that is currently planned Our benefit-cost ratios com-puted under different assumptions of costs and benefits are all below unity Having
304 GEORGINA SANTOS AND GORDON FRASER
said that if we use TfLrsquos highest estimates of accident savings and bus benefits thebenefit-cost ratio increases to just above unity making the scheme economicallyviable
Our model however is limited and our results should not be taken as definitiveFirst the model used is a partial equilibrium analysis Mode switching was notmodelled explicitly and the substitution effects of taxing people to drive into KC wereomitted Heavy goods vehicles were not included in the model either We used trafficdata provided by TfL before the increase to pound8 in CZ By the time the extension isimplemented in February 2007 the higher charge will have been in place for 19months and traffic patterns and vehicle counts may have settled at a different levelthan the one we used as our basis
An important consideration is that the ABCR is sensitive to both the costs of thescheme and the values of time assumed This paper has provided no independentcorroboration of the costs published by TfL (2005d) If these costs are an overestimatethen the scheme may be more viable
The values of time assumed here follow government guidelines as explained in theTechnical Appendix on the Economic Policy website In a sensitivity analysis providedin the same Appendix we find that the VOT would need to be 20 higher beforethe lowest cost BCR reaches unity
Other towns and cities may find the experience of London useful and even con-template the possibility of introducing a similar scheme A crude and easy to enforcepolicy can indeed increase welfare as long as the political economy influencing itsdesign does not jeopardize its intended effect Nonetheless although the CZ mayyield net benefits it is not clear the Western Extension will
The CBD in Manhattan may be the most similar area to the original CZ and maythus be a place where a similar scheme could be implemented Rome already has apermit system for entry into the historic centre The main difference between theRome scheme and the LCCS is that in London anyone willing to pay the charge todrive inside the CZ can do so whereas in Rome a permit is needed first Noteverybody qualifies for such a permit which means that traffic is regulated with aquantity (command-and-control type) policy rather than a market mechanismFinally Paris does not even have the necessary legislation in place There is nopolitical interest in the introduction of any measure that would charge road usersThe mayor of Paris prefers to concentrate on the carrot only rather on both the carrotand the stick Public transport investment has priority in Paris and no proposals onroad pricing have ever been considered
The original LCCS has demonstrated the merits of an area licence to internalizeat least part of the congestion externality The use of imperfect instruments to dealwith market failures is not new in the design of real-world economic policies It ishowever the first piece of evidence in the Western world of a pricing scheme tomanage traffic demand It works but attention is drawn to the potential inefficiencyof the politics involved in the specification of such measures
ROAD PRICING 305
Lessons from the Western Extension cannot be drawn yet as it will only beimplemented in February 2007 despite the fact that the BCRs as computed by TfL(2005d p 108) are 08 and 115 casting some doubt on the economic viability ofthe scheme The main lesson from the original congestion charging system in Londonon the other hand is that a simple imperfect instrument may internalize part of theexternality and yield gains even when it is influenced by political factors
Discussion
David NewberyUniversity of Cambridge and CEPR
Transport economists predicted the percentage reduction in traffic (and the roughlydouble resulting reduction in congestion) for the original London CongestionCharging Scheme remarkably accurately vindicating the long-standing claim goingback to Smeed in the 1960s that congestion charging in London makes sense Santosand Fraser (SF) are to be congratulated on developing a simple and surprisingly accu-rate spreadsheet model to predict the benefits of extending the London CongestionCharging Scheme from its original Central Zone (CZ) to Kensington and Chelsea(KC) Their model was calibrated from the ex post evidence of the CZ trafficresponses and combined with Transport for Londonrsquos (TfL) cost estimates to predictthe congestion charge (CC) revenue and the benefit-cost ratio neither of which sup-port the extension SF also compare the original pound5 CC with the estimated marginalcongestion cost (MCC) in the original CZ and show that while on average the CCis very close to the MCC for cars the CC is almost twice the MCC while for goodsvehicles the charge is about half the MCC Increasing the CC to pound8 worsens theposition of cars while not fully correcting the underpricing of goods vehicles Never-theless the original CZ scheme was politically feasible and appears to have hadnegligible adverse effects on business (perhaps because although 70000 daily carjourneys into the CZ were priced off the road only 5000 fewer individuals havestopped entering the CZ)
Although the size of KC is only slightly less than the CZ the population mix isquite different ndash CZ has 11 million employees and few residents while KC has only170000 employees while its 233000 residents will now benefit from a 90 reduc-tion in the CC to enter the CZ The success of the CZ scheme does not guaranteethe success of its extension Indeed the ex post evaluation conducted by TfL (2004a)shows that although the original LCCS produced a net annual benefit of pound50 millionthis was the difference between a gross surplus of pound180 million and very high costsof pound130 million giving a benefit-cost ratio of less than 14 Part of the high cost isthe entirely reasonable expenditure on more buses (pound20 million per year) whichproduced a greater benefit (pound30 million per year) but the larger part (pound110 million
306 GEORGINA SANTOS AND GORDON FRASER
per year) was the scheme administration and compliance costs Such costs are oftenignored in policy analysis where it is incorrectly assumed that lsquogetting the pricesrightrsquo (ie introducing a CC and setting it at the right level) will produce costlessbenefits Perhaps in some future nirvana when all vehicles have already installed GPSsystems for other reasons (eg navigation theft detection etc) the extra costs of roadpricing will be reduced to the point that they almost self-evidently produce net socialbenefits but that moment has clearly not yet arrived
Santos and Fraser estimate the gross benefits of the KC extension as pound55ndash62million per year Comparing their (comparably adjusted) estimates with those of TfLdiscounted at 35 real over 10 years SF estimate gross benefits of between pound432ndash635 million compared with TfLrsquos estimate of pound433ndash627 million remarkably close28
However TfLrsquos cost estimates (which SF adopt) of pound582ndash584 million make the KCextension unattractive (with SFrsquos highest estimated benefit-cost ratio at 09 admit-tedly without some of the bus benefits that TfL includes) What is perhaps moresurprising is that TfLrsquos own estimates (on the basis of which the scheme was presum-ably approved) show that the undiscounted costs over 10 years are pound680ndash840 millionand the CC revenues (which are higher than the gross benefits) are only pound640ndash680million giving a loss to the London budget of pound0ndash200 million) Given that thescheme produces net negative user benefits (ie users pay a higher CC than the extragain in reduced congestion) it is hard to see who on earth would support the schemeIs this a case of over-optimism engendered by the (to critics and outsiders) surprisingsuccess of the original scheme or the hubris of a non-driving mayor entranced bypublic transport
My final comment relates to those bus benefits which have been under-appreciatedby casual observers Several analysts most recently Small (2005) have remarked onthe virtuous circle that congestion charging can give rise to via bus improvementsCongestion charging leads to a modal switch to buses With a fixed budget to subsi-dize bus operations the resulting increased bus demand and fare revenue allows anincreased frequency and thus shorter waiting times at bus stops Reduced congestionmeans higher bus speeds so both effects reduce the cost of travelling by bus belowits original level and stimulate a further modal switch to buses further reducingcongestion increasing frequency and so on in a virtuous circle (which the mayoranticipated by expanding service ahead of demand) Ken Small shows perhapssurprisingly that in a typical US city (with a far less good bus service than London)bus ridership could rise by 30 (compared to only 6 in the already well-utilizedLondon case) This would lower the average user cost by 117 of the original busfare (remember that the user cost includes the cost of time as well as the fare) andproduce additional benefits of 35 of the original cost of bus transport
28 The adjustments add in TfLrsquos extra accident and bus benefits and convert prices to the same base year TfLrsquos model is aconsiderably more sophisticated model of traffic flows on all streets and intersections and similar models often cost hundredsof thousands of pounds to build and calibrate
ROAD PRICING 307
To summarize rather crude and simple congestion charging can yield net benefitsa considerable fraction of which derive from the increased efficiency of public trans-port (overwhelmingly buses) Santos and Fraser have shown that a relatively simplemodel allows a surprisingly accurate estimate of the gross benefits of the proposedextension to the west The disappointing feature of this extension is that the very highcosts of even such simple schemes put their economic justification at risk Althoughthe original scheme had positive net benefits the extension appears not only sociallyunprofitable but also costly to the London budget Now that transport economists havemade the first giant step of demonstrating a practical example of a viable urban con-gestion charging scheme (outside a city state) the next steps will be to use their skills tooptimize the design (charge levels by time and cordon location) and for the technologiststo drive down the costs so that the gross benefits are translated into positive net benefits
Panel discussion
Political acceptance of the congestion charge
Chris Giles (Financial Times) pointed out that the congestion charge was opposedby the bulk of the media at the point of its introduction with the widespread expec-tation that congestion would build up on the outside and east of the zone Despiteits simplicity panel members were struck by the enormous cost of the scheme whichmay prevent it being adopted in other cities It was asked if this cost would drop astechnology improves Paul Seabright asked what level of government would ideallymastermind the adoption of similar schemes in other cities ndash a small local chargingscheme becomes less attractive as more outsiders come into and use a zone Animportant question is the overlap between voters and the gainersresidents
Measurement of benefit on congestion
Chris Pissardes and Richard Portes drew attention to the fact that many Londoners(and taxi drivers) believe that in the period leading up to the introduction of the chargeroads were deliberately made more congested than normal and therefore the benefitson congestion as measured relative to those years over-state the true improvement
Gilles Duranton suggested that the welfare measurement could be broadened toinclude factors other than retail sales for example the overall assessment of thechanges depends on what kind of city and lifestyle we want
Tax effects
Bas Jacobs said that as transport is an intermediary good in production then aPigouvian tax can be computed However if there is also a consumption aspect to
308 GEORGINA SANTOS AND GORDON FRASER
transport then taxing it would have an income effect (Because drivers have differentutilities of income there is a distribution effect of the charge This could mean largerbenefits because the gainers are poor) It may be important to consider the interactionof the congestion charge with other taxes Georgina Santos replied that the conges-tion charge may reduce the labour supply for commuters who already have to paylabour taxes By law in the UK however revenues cannot be used to reduce labourtaxes
Christian Gollier pointed out that the authors did not include the long-termbenefits of the charge whereby people and businesses may relocate and the land usein London thus becomes more efficient
WEB APPENDIX
Available at httpwwweconomic-policyorg
REFERENCES
Accent (2005) lsquoWestern Extension to the Central London Congestion Charging Scheme ndashReport on Public Consultation and Attitudinal Surveyrsquo Final Report prepared for Transportfor London September httpwwwtflgovuktflcc-expdfsreportsAnnexA-AccentReportpdf
Acts of the Scottish Parliament (2001) Transport (Scotland) Act 2001 asp 2 HMSO Londonhttpwwwhmsogovuklegislationscotlandacts200120010002htm
Beevers SD and DC Carslaw (2005) lsquoThe impact of congestion charging on vehicle emissionsin Londonrsquo Atmospheric Environment 39(1) 1ndash5
Bell MGH MA Quddus J-D Schmoumlcker and A Fonzone (2004) The Impact of the Conges-tion Charge on the Retail Sector Centre for Transport Studies Imperial College London AprilhttpwwwjohnlewispartnershipcoukassetspdfBellReportpdf
Decorla-Souza P (2002) lsquoEstimating the benefits from mileage-based vehicle insurance taxesand feesrsquo Transportation Research Record 1812 171ndash78
Department for Transport (2004a) Transport Analysis Guidance Values of Time and Operating CostsTAG Unit 356 December httpwwwwebtagorgukwebdocuments3_Expert5_Economy_Objective354htm
mdash (2004b) Transport Analysis Guidance The Accidents Sub-Objective TAG Unit 341 Aprilhttpwwwwebtagorgukwebdocuments3_Expert4_Safety_Objective341htm
mdash (2004c) Transport Analysis Guidance Transport User Benefit Calculation TAG Unit 353 Aprilhttpwwwwebtagorgukwebdocuments3_Expert5_Economy_Objective353htm3
mdash (2004d) Transport Analysis Guidance Cost Benefit Analysis TAG Unit 354 April httpwwwwebtagorgukwebdocuments3_Expert5_Economy_Objective354htm
mdash (2004e) Guidance on Value for Money December httpwwwdftgovukstellentgroupsdft_aboutdocumentspagedft_about_033477hcsp
Diamond PA and JA Mirrlees (1971) lsquoOptimal taxation and public production I Productiveefficiencyrsquo American Economic Review 61 8ndash27
Dodgson J J Young and J van der Veer (2002) Paying for Road Use Technical Report A reportto the Commission for Integrated Transport National Economic Research Associates(NERA) London February
Driver and Vehicle Licensing Agency (2005) Rates of Vehicle Excise Duty httpwwwdvlagovukvehiclestaxationhtm
Durham County Council (2003) Saddler Street Road User Charge Monitoring Report httpwwwdurhamgovukdurhamccuspnsfpwsRoads+-+Saddler+Street+Road+User+Charge+Monitoring+Report
Edlin AS (2002) lsquoPer-mile premiums for auto insurancersquo Department of Economics UCBerkeley httpideasrepecorgpwpawuwple0303001html
ROAD PRICING 309
Greenberg A (2003) lsquoComparing the benefits of mileage and usage pricing incentives withother government transportation expendituresrsquo published in the CD-ROM of the 82ndAnnual Meeting of the Transportation Research Board
Greater London Authority (2001) The Mayorrsquos Transport Strategy httpwwwlondongovukmayorstrategiestransporttrans_stratjsp
mdash (2004) The Mayorrsquos Transport Strategy Revision httpwwwlondongovukmayorcongestpdftransportstrategyrevisionpdf
HM Treasury (2003) Green Book Appraisal and Evaluation in Central Government London httpgreenbooktreasurygovuk
Kockelman K and S Kalmanje (2005) lsquoCredit-based congestion pricing A policy proposaland the publicrsquos responsersquo Transportation Research Part A 39(7) 671ndash90
Les Dosiers du Net (2003) lsquoChargeacute des Transports agrave la mairie de Paris Denis Baupin prendposition le 17 feacutevrier 2003 contre la mise en place drsquoun peacuteage urbain agrave Parisrsquo Paris 17February httpwwwdossiersdunetcomarticlephp3id_article=23
Le Monde (2003) lsquoLes eacutelus srsquointerrogent sur lrsquoopportuniteacute drsquoinstaurer des peacuteages urbainsrsquo 28November httpwwwlemondefr
May AD R Liu SP Shepherd and A Sumalee (2002) lsquoThe impact of cordon design onthe performance of road pricing schemesrsquo Transport Policy 9(3) 209ndash20
May AD SP Shepherd and A Sumalee (2004) lsquoOptimal locations and charges for cordonschemesrsquo in G Santos (ed) Road Pricing Theory and Evidence Elsevier Oxford 87ndash105
Menon A (2000) lsquoERP in Singapore ndash A perspective one year onrsquo Traffic Engineering andControl 41(2) 40ndash45
Mun S K Konishi and K Yoshikawa (2003) lsquoOptimal cordon pricingrsquo Journal of UrbanEconomics 54(1) 21ndash38
National Statistics Online (2004) lsquoTax revenues taxes and excise duties EnvironmentalAccounts Government revenues from environmental taxes (pound million)rsquo httpwwwstatisticsgovukSTATBASEExpodataSpreadsheetsD5688xls
Newbery DM (1990) lsquoPricing and congestion economic principles relevant to pricing roadsrsquoOxford Review of Economic Policy 6(2) 22ndash38
mdash (1998) Fair Payment from Road-users A Review of the Evidence on Social and Environmental CostsAutomobile Association Basingstoke
mdash (2005) lsquoRoad user and congestion chargesrsquo in S Cnossen (ed) Theory and Practice of ExciseTaxation Smoking Drinking Gambling Polluting and Driving Oxford University Press Oxford
Official Journal of the European Communities (1999) lsquoL 18742 Directive 199962EC ofthe European Parliament and of the Council of 17 June 1999rsquo httpeuropaeuintcommtransportinfr-charginglibrarydirective1999-62pdf
Phang SY and RS Toh (1997) lsquoFrom manual to electronic road congestion pricing TheSingapore experience and experimentrsquo Transportation Research ndash Part E 33(2) 97ndash106
PRoGR$SS (2004) Rome httpwwwprogress-projectorgProgressromehtmlPrudrsquohomme R and JP Bocarejo (2005) lsquoThe London Congestion Charge A tentative
economic appraisalrsquo Transport Policy 12(3) 279ndash87Ramjerdi F H Minken and K Oslashstmoe (2004) lsquoNorwegian urban tollsrsquo in G Santos (ed)
Road Pricing Theory and Evidence Elsevier Oxford 237ndash49Rietveld P and E Verhoef (1998) lsquoSocial feasibility of policies to reduce externalities in
transportrsquo in KJ Button and ET Verhoef (eds) Pricing Traffic Congestion and the EnvironmentEdward Elgar Lincolnshire
ROCOL Working Group (2000) Road Charging Options for London A Technical Assessment TheStationary Office London httpwwwgosgovukgoltransport161558228862228869
Santos G (2004) lsquoUrban congestion charging A second best alternativersquo Journal of TransportEconomics and Policy 38(3) 345ndash69
Santos G D Newbery and L Rojey (2001) lsquoStatic vs demand sensitive models and theestimation of efficient cordon tolls An exercise for eight English townsrsquo TransportationResearch Record 1747 44ndash50
Santos G and L Rojey (2004) lsquoDistributional impacts of road pricing The truth behind themythrsquo Transportation 31(1) 21ndash42
Santos G and B Shaffer (2004) lsquoPreliminary results of the London Congestion ChargingSchemersquo Public Works Management and Policy 9(2) 164ndash81
Santos G W Li and W Koh (2004) lsquoTransport policies in Singaporersquo in G Santos (ed)Road Pricing Theory and Evidence Elsevier Oxford 209ndash35
310 GEORGINA SANTOS AND GORDON FRASER
Schrank D and T Lomax (2005) The 2005 Urban Mobility Report Appendix B ndash MethodologyTexas Transportation Institute The Texas AampM University System May httpmobilitytamueduumsreportmethodologystm
Small K (2005) lsquoUnnoticed lessons from London Road pricing and public transitrsquo AccessSpring 26 10ndash15 available at httpwwwuctcnetaccessaccessasp
STA (2005) STA Servizi per la Mobilitagrave Permessi per il centro storico (ZTL) httpwwwstaromait
TfL (Transport for London) (2001) Transport Statistics for London 2001 httpwwwtflgovuktflpdfdocsstats2001pdf
mdash (2003) Congestion Charging Six Months On October httpwwwtflgovuktfldownloadspdfcongestion-chargingcc-6monthsonpdf
mdash (2004a) Congestion Charging ndash Update on Scheme Impacts and Operations February httpwwwtflgovuktfldownloadspdfcongestion-chargingcc-12monthsonpdf
mdash (2004b) Congestion Charging Central London ndash Impacts Monitoring Second Annual Report Aprilhttpwwwtflgovuktflcclondoncc_monitoring-2nd-reportshtml
mdash (2004c) Annex E Report to the Mayor Economic Assessment High Level Economic Impact Assessmentof the Draft Transport Strategy Revision Central London Congestion Charging July httpwwwtflgovuktfldownloadspdfcongestion-charginge-economic-assessmentpdf
mdash (2004d) London Travel Report 2004 httpwwwtflgovuktflpdfdocsltrlondon-travel-report-2004pdf
mdash (2005a) Impacts Monitoring January 2005 httpwwwtflgovuktflcclondonpdfsimpacts-monitoring-report-january-2005pdf
mdash (2005b) Congestion Charging Central London ndash Impacts Monitoring Third Annual Report AprilhttpwwwtflgovuktflcclondonpdfsThirdAnnualReportFinalpdf
mdash (2005c) The Greater London (Central Zone) Congestion Charging Variation No 5 Order 2004 Reportto the Mayor of London March httpwwwtflgovuktfldownloadspdfcongestion-chargingv05VO5_RTMpdf
mdash (2005d) Proposed Western Extension of the Central London Congestion Charging Scheme Report tothe Mayor following consultation with stakeholders businesses other organisations and thepublic September httpwwwtflgovuktflcc-extfl-reportshtml
mdash (2005e) London Congestion Charging Technology Trials Stage 1 Report February httpwwwtflgovuktfldownloadspdfcongestion-chargingtechnology-trialspdf
Verhoef E (2002) lsquoSecond-best congestion pricing in general networks Heuristic algorithmsfor finding second-best optimal toll levels and toll pointsrsquo Transportation Research B 36(8)707ndash29
Wikipedia (2004a) lsquoParisrsquo httpwikipediafindthelinkscompaParishtmlmdash (2004b) lsquoNew Yorkrsquo httpenwikipediaorgwikiNew_YorkWilloughby C (2000) lsquoSingaporersquos experience in managing motorization and its relevance to
other countriesrsquo Discussion Paper TWU-43 TWU Series The World Bank April httpwwwworldbankorgtransportpublicattwu_43pdf
Zupan J and A Perrotta (2003) lsquoAn exploration of motor vehicle congestion pricing in NewYorkrsquo paper presented at the ENO Transportation Foundation conference on congestionpricing in New York City 3ndash4 November httpwwwrpaorgpdfRPA_Congestion_Pricing_NYpdf
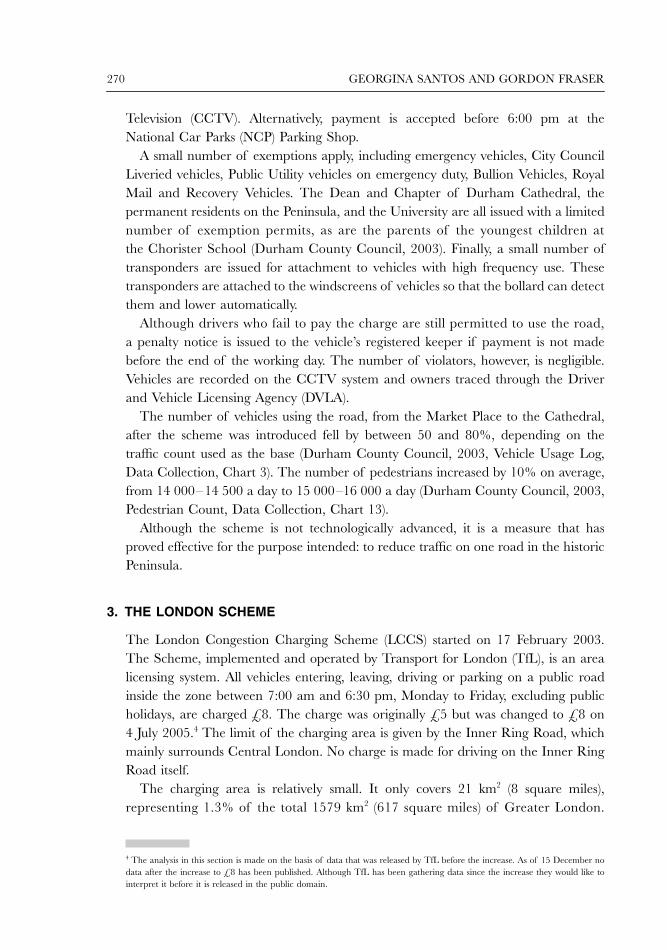
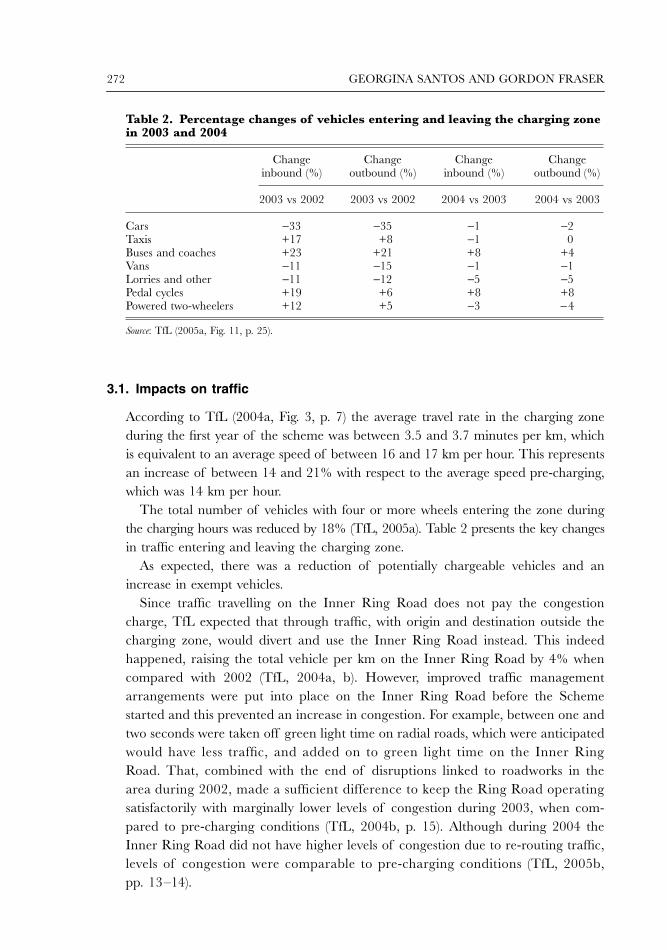
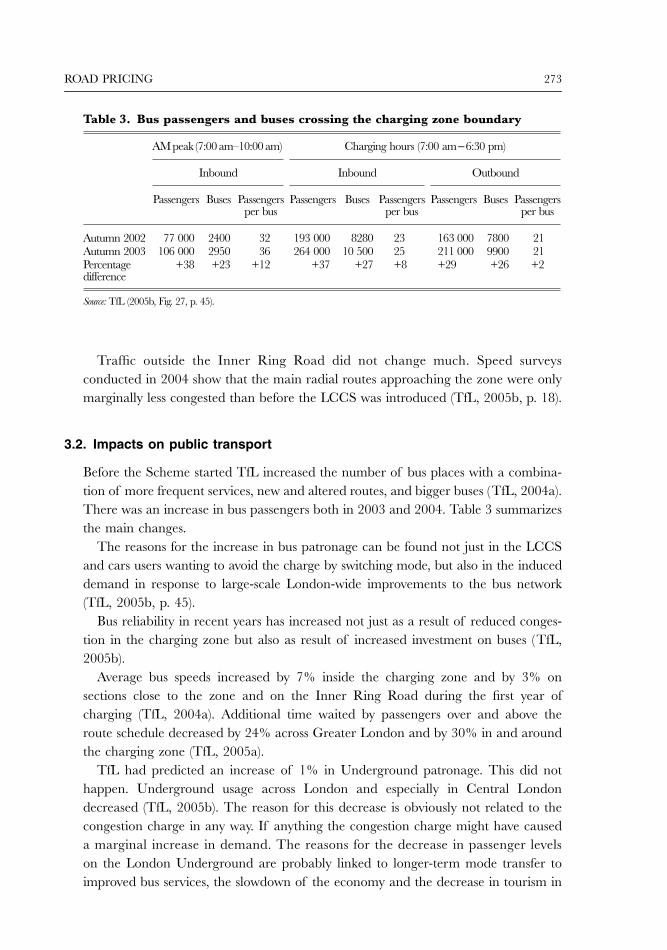
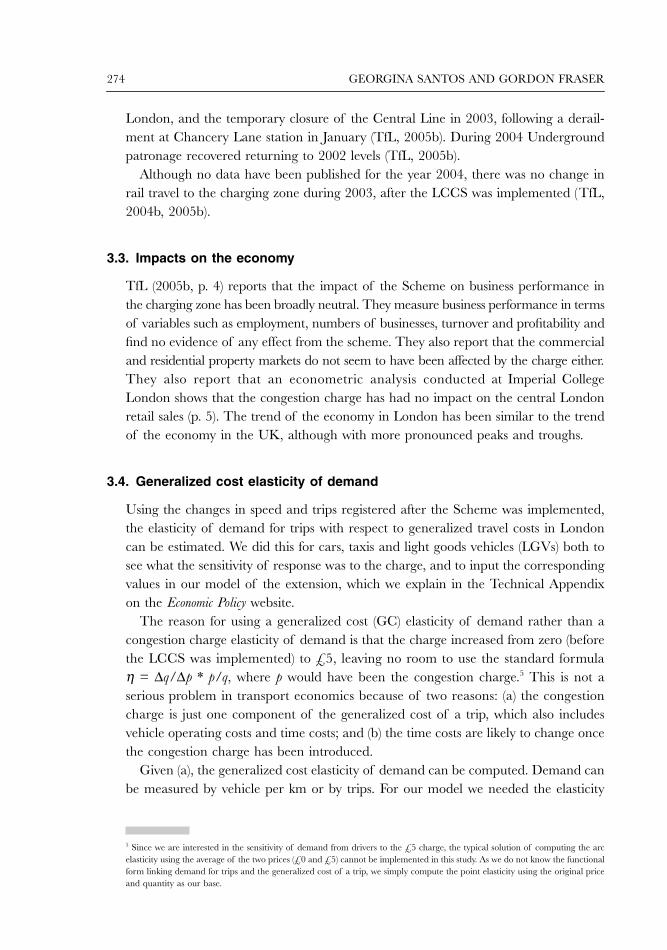
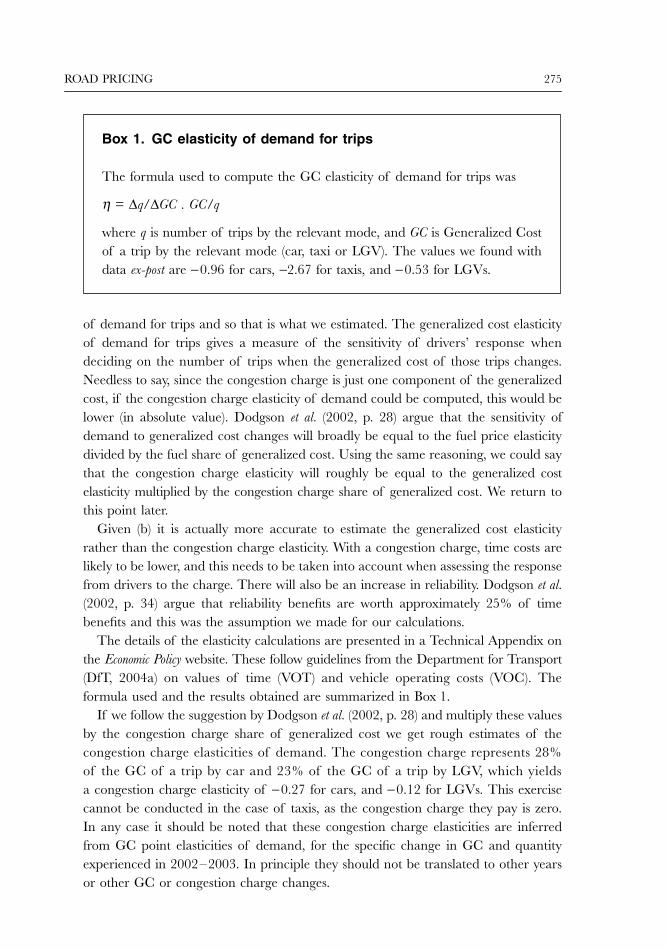
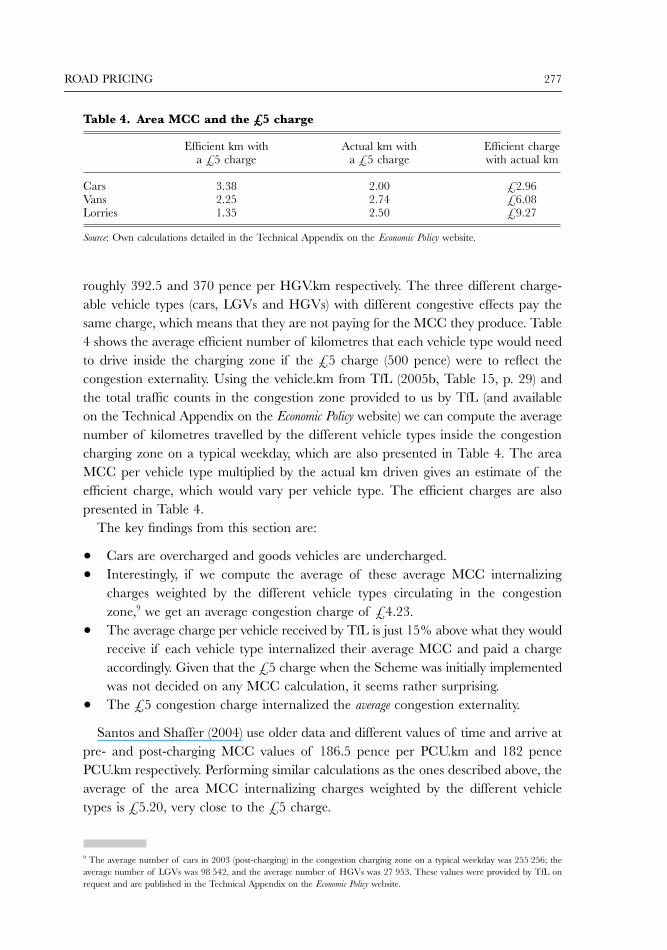
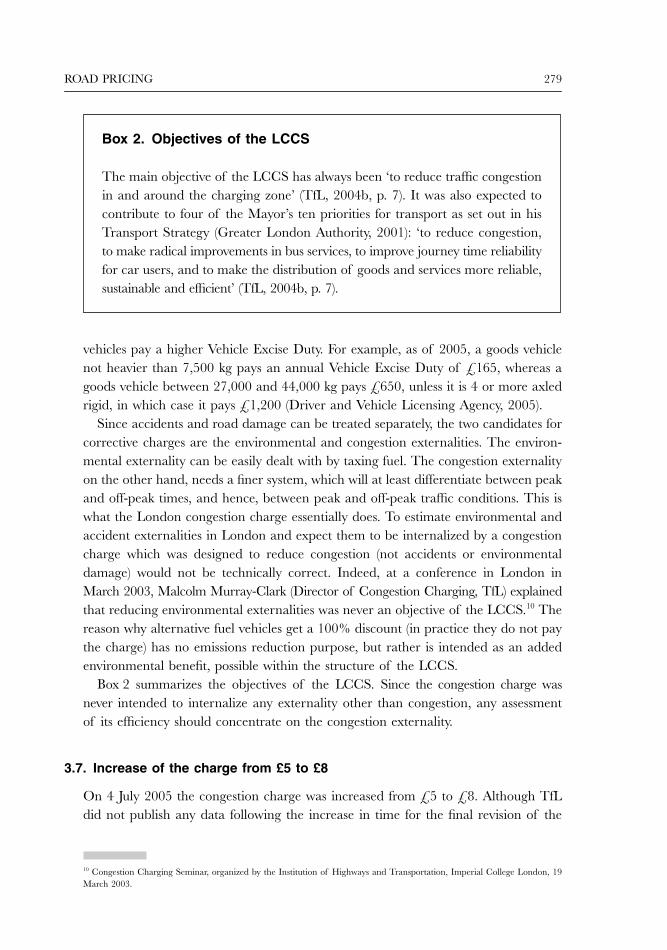
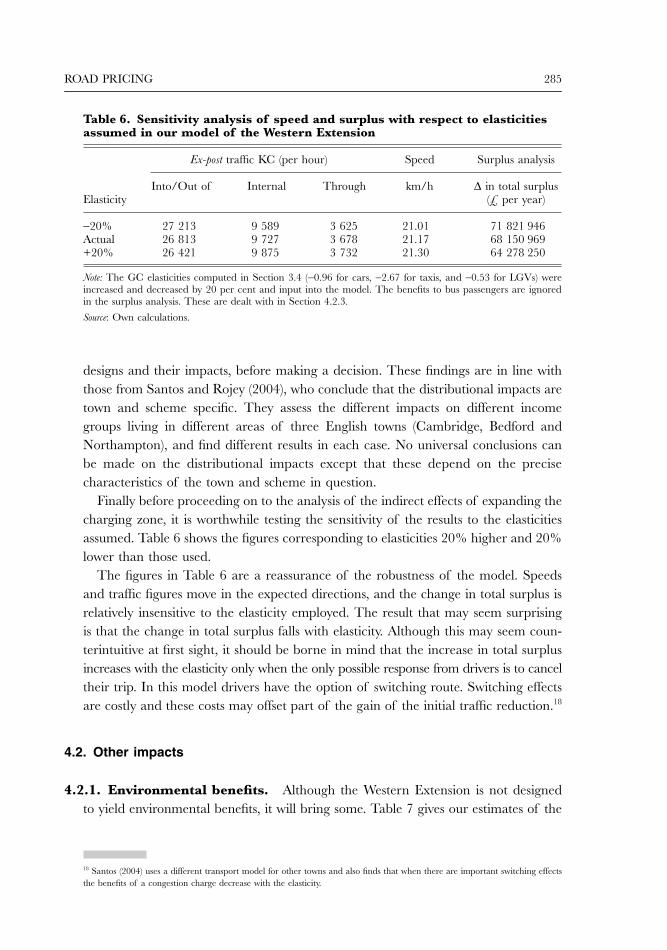
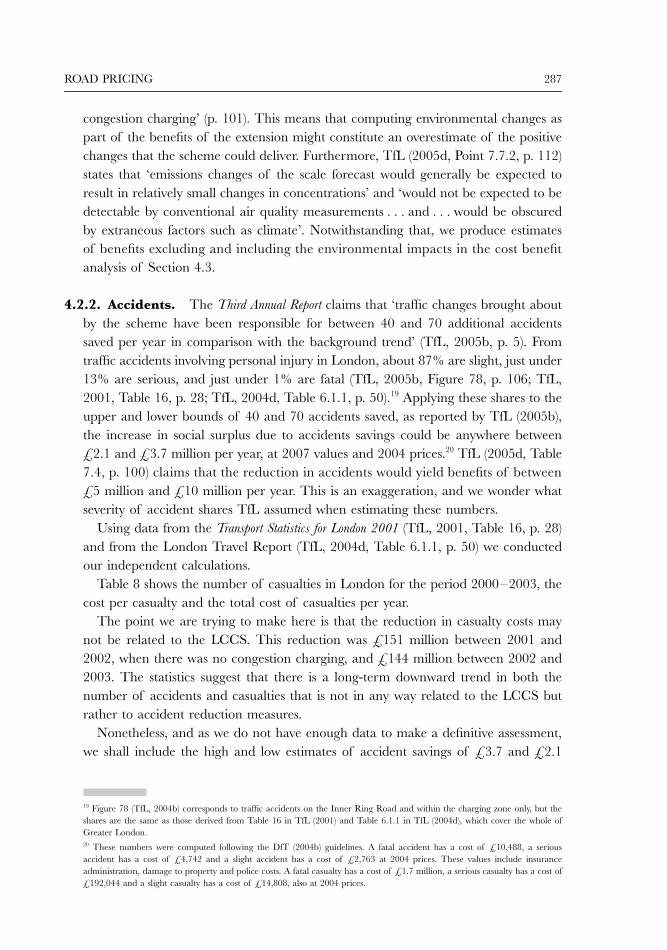
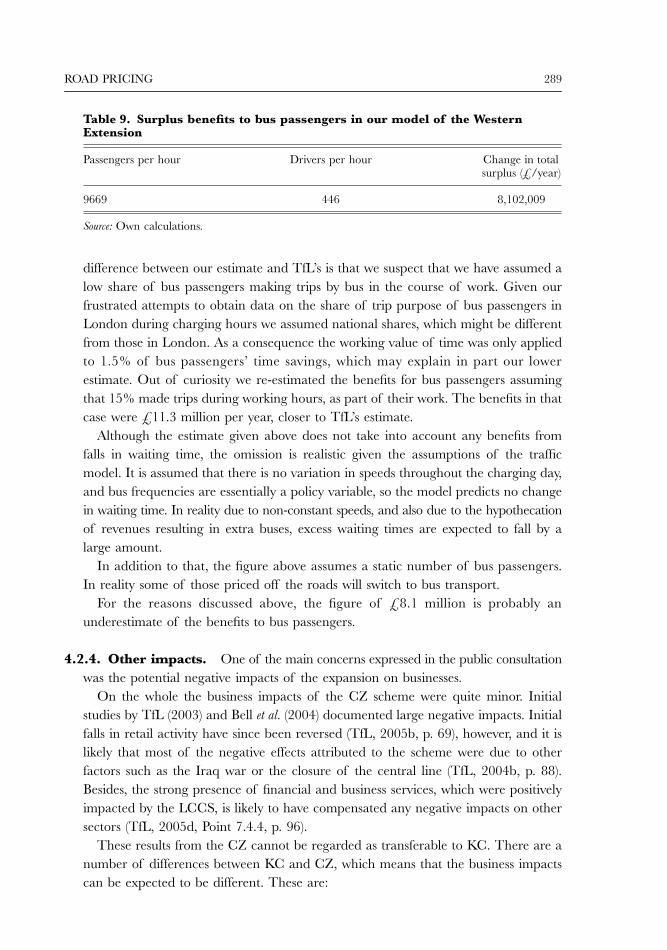