rnA interference as a tool for functional ... - mediaTUM
178
TECHNISCHE UNIVERSITäT MüNCHEN Lehrstuhl für Entwicklungsgenetik Peter Weber Vollständiger Abdruck der von der Fakultät Wissenschaftszentrum Weihenstephan für Ernährung, Landnutzung und Umwelt der Technischen Universität München zur Erlangung des akademischen Grades eines Doktors der Naturwissenschaften genehmigten Dissertation. Vorsitzender: Univ.-Prof. Dr. A. Gierl Prüfer der Dissertation: 1. Univ.-Prof. Dr. W. Wurst 2. apl. Prof. Dr. J. Adamski Die Dissertation wurde am 30.11.2009 bei der Technischen Universität München eingereicht und durch die Fakultät Wissenschaftszentrum Weihenstephan für Ernährung, Landnutzung und Umwelt am 18.02.2010 angenommen. RNA interference as a tool for functional neurogenetics and the role of microRNAs in brain function
-
Upload
khangminh22 -
Category
Documents
-
view
0 -
download
0
Transcript of rnA interference as a tool for functional ... - mediaTUM

Technische UniversiTäT MünchenLehrstuhl für entwicklungsgenetik
Peter Weber
vollständiger Abdruck der von der Fakultät Wissenschaftszentrum Weihenstephan für ernährung, Landnutzung und Umwelt der Technischen Universität München zur erlangung des akademischen Grades eines
Doktors der naturwissenschaftengenehmigten Dissertation.
vorsitzender: Univ.-Prof. Dr. A. Gierl Prüfer der Dissertation: 1. Univ.-Prof. Dr. W. Wurst 2. apl. Prof. Dr. J. Adamski
Die Dissertation wurde am 30.11.2009 bei der Technischen Universität München eingereicht und durch die Fakultät Wissenschaftszentrum Weihenstephan für ernährung, Landnutzung und Umwelt am 18.02.2010 angenommen.
rnA interference as a tool forfunctional neurogenetics and the role
of micrornAs in brain function
ii
Index
Index1. Introduction: Elucidation and applications of RNA interference (RNAi) 1
1.1. rnA in the spotlight 11.2. historical perspective on rnAi 2
1.2.1. Posttranscriptional gene silencing (PTGs) in plants 21.2.2. The discovery of rnAi 3
1.3. elucidation of the molecular mechanism behind rnAi 41.3.1. Discovery of the rnAi pathway 41.3.2. Genetic screens for mutants lacking rnA induced gene silencing 51.3.3. characterization of Dicer and risc 51.3.4. Action of rnA-dependent rnA polymerase (rdrP) in amplification
and transition 91.3.5. systemic spreading of rnAi 11
1.4. Biological functions of rnAi 121.4.1. Alterations in chromatin structure 121.4.2. viral defence in plants 141.4.3. Transposon silencing 141.4.4. rnAi in development 15
1.5. rnAi as a tool 151.5.1. rnAi in mammalian cells 161.5.2. rules for the design of functional sirnAs 171.5.3. vector systems for expression of shrnAs 171.5.4. in vivo rnAi in mice 191.5.5. rnAi in the adult mouse brain 21
1.6. Micro rnAs (mirnAs) as novel functional genetic units 231.6.1. identification and cloning of mirnAs 231.6.2. Biogenesis and mode of action 241.6.3. Functions of micrornAs 261.6.4. expression studies of mirnAs 271.6.5. specific roles of mirnAs in the brain 30
1.7. Aim of the thesis 34
2. Materials and methods 36
2.1. Materials 362.1.1. chemicals 362.1.2. enzymes 38

iii
Index
2.1.3. nucleotides und nucleic acids 382.1.4. Kits and other expendable items 392.1.5. Devices and equipment 40
2.2. Media and basic buffers 412.3. Oligonucleotides 43
2.3.1. DnA oligonucleotides 432.3.2. rnA oligonucleotides 442.3.3. LnA modified oligonucleotides 45
2.4 vectors: 452.4.1. Plasmids 452.4.2. viral vectors 462.4.3. riboprobes for in situ hybridization 46
2.5. Antibodies 472. 6. Organisms 47
2.6.1. Bacterial strains 472.6.2. eucaryotic cells 472.6.3. Animals 47
2.7. Molecular biology methods 482.7.1. Bacterial culture 482.7.2 DnA techniques 502.7.3. rnA techniques 552.7.4. Protein techniques 642.7.5. cell culture techniques 69
2.8. Animal experiments 732.8.1. Mouse housing and breeding 732.8.2. stereotactic surgery 742.8.3 injection of sirnAs 742.8.4. viral injection 752.8.5. Perfusion 752.8.6. clearing of brain tissue 752.8.7. Paraffin embedding of brains 762.8.8. sectioning of brains 762.8.9. Generation of transgenic mouse lines 77
2.9 Microscopy and image acquisition 772.9.1. Brightfield, darkfield, and fluorescence microscopy 772.9.2. Ultramicroscopy 782.9.3. image processing 78

iv
Index
2.10. statistics, bioinformatics and computational analysis 782.10.1. statistics for pairwise group comparisons 782.10.2. statistics and analysis of mirnA arrays 782.10.3. DnA alignment, BLAsT and digital vector construction 79
3. Results 80
3.1. establishment of a novel rnAi expression vector 803.1.1. introduction: rnA polymerase i (Pol i) 803.1.2. rnAi vector construction 813.1.3. Functional characterisation of the novel vector: silencing of reporter
constructs 823.1.4. Molecular characterization of the novel vector 84
3.2. In vivo rnAi in mouse brain 883.2.1. stereotactic injections into the mouse brain 893.2.2. non-viral delivery of sirnAs 893.2.2. viral vectors for rnAi delivery 90
3.3. regulation of mirnAs by neuronal activity 953.3.1. hypothesis: involvement of mirnAs in dendritic regulation of protein
translation upon neuronal activity 953.3.2. induction of strong neuronal activity in mouse brains by treatment with
kainic acid 963.3.3. Analysis of differential mirnA expression by macro arrays 96
3.4. expression studies of mirnAs 1063.4.1. catalog of mirnAs expressed in mouse hippocampus 1063.4.2. Development of an in situ hybridization technology for mirnAs 1093.4.3. expression analysis of candidate mirnAs with putative relevance to brain
development or function 111
4. Discussion 123
4.1. Generation of a novel Pol-i based rnAi vector 1234.2. In vivo rnAi 1244.3. regulation of mirnAs by neuronal activity 1284.4. expression studies of mirnAs 131
5. Summary 138
6. Abbreviations 140
7. References 143
8. Acknowledgements 174

�
�. Introduction
1. Introduction: Elucidation and applica-tions of RNA interference (RNAi)
1.1. RNA in the spotlightThe importance of rnA molecules has been underestimated for decades as compared to their e importance of rnA molecules has been underestimated for decades as compared to their prominent sibling DnA. rnA has only been believed to be a transient messenger in transferring DnA’s information into protein.But during the last years rnA biology has been one of the most innovative fields in science since the discovery of small rnA species with important functions on regulation of gene expression, cell differentiation and stabilisation of the genome’s integrity struck a new path in fundamental biology and added a new link to our understanding of life 1-3.The phenomenon of sequence specific gene silencing induced by double stranded rnA (dsrnA) is called rnA interference (rnAi). When dsrnA is introduced into cells, genes with sequence homology to this dsrnA are suppressed. This phenomenon was newly discovered when experi-ments with sense and antisense rnA-mediated gene inhibition were accidently combined 4.The impact on the scientific community was tremendous and scientific publications on this topic have been arising since then (Figure 1). The view on rnA has been revolutionized, similar to some other great discoveries in life sciences such as DnA as molecule of heredity, the immune system of mammals, and prions. Therefore the “science” journal quoted rnAi as the most important scientific topic in 2002 5 and in the
0
500
1,000
1,500
2,000
2,500
3,000
3,500
4,000
4,500
1995
1996
1997
1998
1999
2000
2001
2002
2003
2004
2005
2006
2007
2008
Quantum MechanicsRNAi
Figure 1: RNAi as novel highly dynamic research field. On the left side the cover of the last “Science” issue of the year 2002 is shown in which the editors termed small RNAs as the most important topic of that year 5. On the right side a bar plot illustrates the number of publications listed in Web of Science® under the topic “RNA interference” or “RNAi” from the year 1995 to 2008 compared to the publication count with the topic “quantum mechanics” in the same time
�
�. Introduction
year 2006 Andrew Z. Fire and craig c. Mello have been awarded with the nobel Prize in Physi-ology or Medicine “for their discovery of rnA interference - gene silencing by double-stranded rnA”. Additionally victor Ambros, David Baulcombe, and Gary ruvkun won the Albert Lask-the Albert Lask-er Basic Medical research Award in 2008 “for discoveries that revealed an unanticipated world of tiny rnAs that regulate gene function in plants and animals” 6.revealing the biology underlying rnAi in different species, the unexpected observation of gene silencing and other phenomena were integrated into a more comprehensive view on the role of rnA in the regulation of gene expression.
1.2. Historical perspective on RNAiin the middle of the 1980s, a novel technique was established utilizing antisense rnA to inhibit gene function in cultured murine cells 7. DnA expression constructs were generated by excis-ing the protein coding sequence of a cloned gene and this sequence was reinserted in reverse orientation in relation to the promoter. These constructs showed inhibition either injected or transfected into cells.injection of in vitro transcribed antisense rnA into Drosophila embryos 8 resulted in specific down regulation of the targeted genes. This antisense rnA technique also worked in transgenic organisms 9 and in an inducible manner 10. Thereby the antisense rnA was believed to hybrid-ize to the mrnA by Watson crick base pairing and thus prohibiting mrnA translation of this specific gene.in the course of time, rnAi technology has been used widely for evaluating gene function in all genetic model organisms. The most prominent example for this application is the so called Flavr savr® transgenic tomato (1988). This tomato was generated by the calgene start-up company and became the first engineered food to gain FDA approval in 1994. in these transgenic tomato plants, the polygalacturonase gene expression was inhibited by antisense technology leading to a longer time in which the ripe fruits can be stored without getting soft. it was supposed that with this feature farmers would be able to ripen the tomatoes on the vine, with the benefit that already ripe tomatoes are cropped and transported to consumers. in doing so the tomatoes are thought to have more flavor than the ones that are ripened after transportation induced by ethylene. viewed from our present knowledge of rnA function, this technique induces posttranscrip- from our present knowledge of rnA function, this technique induces posttranscrip-tional gene silencing (PTGs) but not simply prevents mrnA translation via hybridization.
�.�.�. Posttranscriptional gene silencing (PTGS) in plants
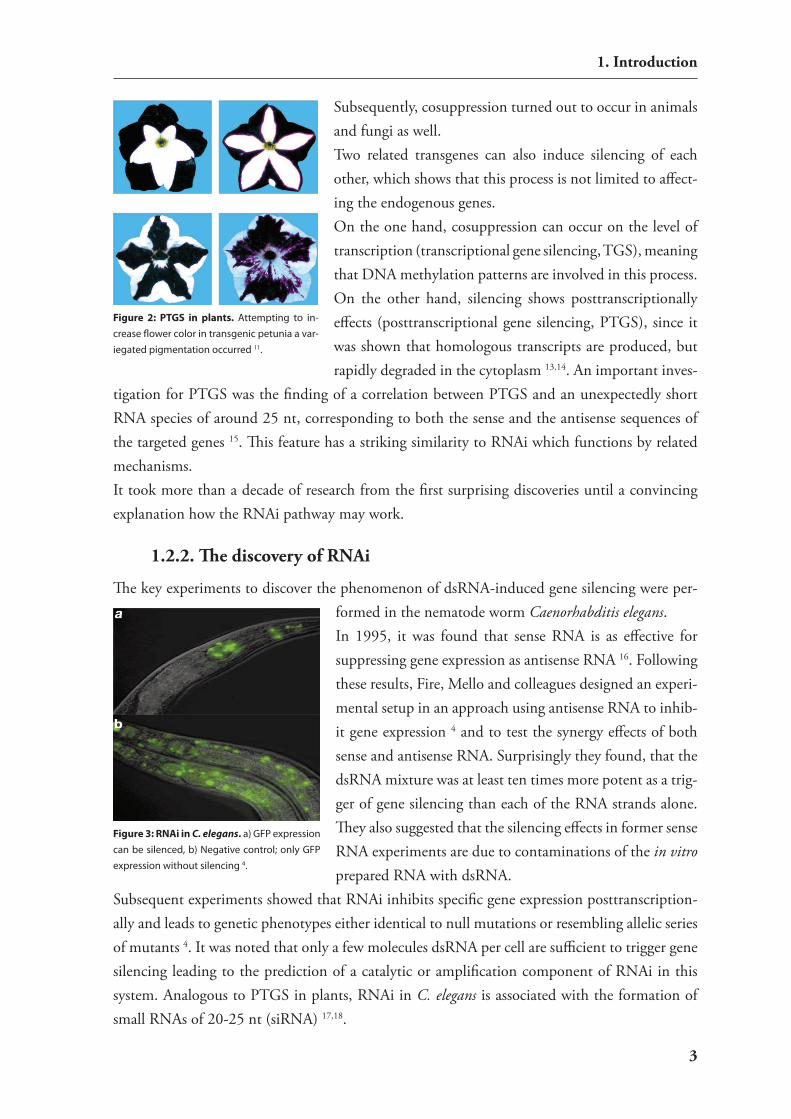
The first evidence for induced gene silencing was given accidentally by an attempt to increase the petal color of petunia (Figure 2). extra copies of pigment producing genes were introduced into transgenic plants. surprisingly, the result was not an increase of flower pigmentation but a variegated or completely white color 11,12. Therefore, this phenomenon was called cosuppression.
�
�. Introduction
subsequently, cosuppression turned out to occur in animals and fungi as well.Two related transgenes can also induce silencing of each other, which shows that this process is not limited to affect-ing the endogenous genes. On the one hand, cosuppression can occur on the level of transcription (transcriptional gene silencing, TGs), meaning that DnA methylation patterns are involved in this process. On the other hand, silencing shows posttranscriptionally effects (posttranscriptional gene silencing, PTGs), since it was shown that homologous transcripts are produced, but rapidly degraded in the cytoplasm 13,14. An important inves-
tigation for PTGs was the finding of a correlation between PTGs and an unexpectedly short rnA species of around 25 nt, corresponding to both the sense and the antisense sequences of the targeted genes 15. This feature has a striking similarity to rnAi which functions by related mechanisms.it took more than a decade of research from the first surprising discoveries until a convincing explanation how the rnAi pathway may work.
�.�.�. The discovery of RNAi
The key experiments to discover the phenomenon of dsrnA-induced gene silencing were per-formed in the nematode worm Caenorhabditis elegans.in 1995, it was found that sense rnA is as effective for suppressing gene expression as antisense rnA 16. Following these results, Fire, Mello and colleagues designed an experi-mental setup in an approach using antisense rnA to inhib-it gene expression 4 and to test the synergy effects of both sense and antisense rnA. surprisingly they found, that the dsrnA mixture was at least ten times more potent as a trig-ger of gene silencing than each of the rnA strands alone. They also suggested that the silencing effects in former sense rnA experiments are due to contaminations of the in vitro prepared rnA with dsrnA.
subsequent experiments showed that rnAi inhibits specific gene expression posttranscription-ally and leads to genetic phenotypes either identical to null mutations or resembling allelic series of mutants 4. it was noted that only a few molecules dsrnA per cell are sufficient to trigger gene silencing leading to the prediction of a catalytic or amplification component of rnAi in this system. Analogous to PTGs in plants, rnAi in C. elegans is associated with the formation of small rnAs of 20-25 nt (sirnA) 17,18.
Figure 2: PTGS in plants. Attempting to in-crease flower color in transgenic petunia a var-iegated pigmentation occurred 11.
Figure 3: RNAi in C. elegans. a) GFP expression can be silenced, b) Negative control; only GFP expression without silencing 4.

�
�. Introduction
1.3. Elucidation of the molecular mechanism behind RNAiinsights into the generation and function of these sirnA molecules could be accomplished by a combination of biochemical approaches and classical genetic dissection.
�.�.�. Discovery of the RNAi pathway
in a cell free system derived from Drosophila embryos, the targeted mrnA degradation together with associated sirnA formation could be stimulated 19. in this system, it was shown that sub-strate mrnAs are cleaved at regular intervals of 21-23 nt in the region covered by the introduced dsrnA. Transfection of dsrnA into cultured Drosophila s2 cells showed comparable results and a sequence specific nuclease activity could be partially copurified from these cells with small rnAs of about 25 nt in length 20. This gave the hint that the sirnA serves as a template to target a nuclease to the specific mrnA to be degraded.The final proof that sirnAs are real intermediates in this pathway mediating sequence specific mrnA degradation has been given by showing that chemically synthesized rnA duplexes simi-lar to sirnAs can guide specific target cleavage in vitro 21,22 and in vivo 23. This was an important finding in using rnAi in mammalian systems as well (more detailed in chapter 1.5.1).Taken together these results established the model for a pathway through which rnAi works (Figure 4). in a two step process, the dsrnA of about 200bp in length homologous to an endog-in a two step process, the dsrnA of about 200bp in length homologous to an endog-
enous gene is diced by a dsrnA specific nuclease into 21-23bp sirnAs, consisting of a double stranded rnA, each strand with a two nucleotide 3’ overhang and a 5’ phosphate terminus 19,22.This sirnA guides a nuclease-contain-ing protein complex named risc (for rnAi-induced silencing complex) to the substrate by base pairing of the antisense strand of the sirnAs to the mrnA. Us-Us-ing hydrolysis of ATP, risc cuts with its endonuclease activity in the region ho-mologous to the sirnA 24. subsequentlysubsequently this triggers the destruction of the specific mrnA.it was soon suggested that rnAse iii pro-teins were involved in the production of sirnAs because of their discrete length.
AAAAAAA...
m7G
ds RNA ~200 bp
mRNA
siRNA ~21 bp3' overhang5'
5'
3'
3'
Dicer
RISC
Degradation
Figure 4: Basic RNAi pathway. Long dsRNA is cleaved by Dicer into siR-NAs, which are dsRNAs with 3’ overhangs. Subsequently, siRNAs guide mRNA targeting and cleavage by RISC, which leads to the degradation of the mRNA.
�
�. Introduction
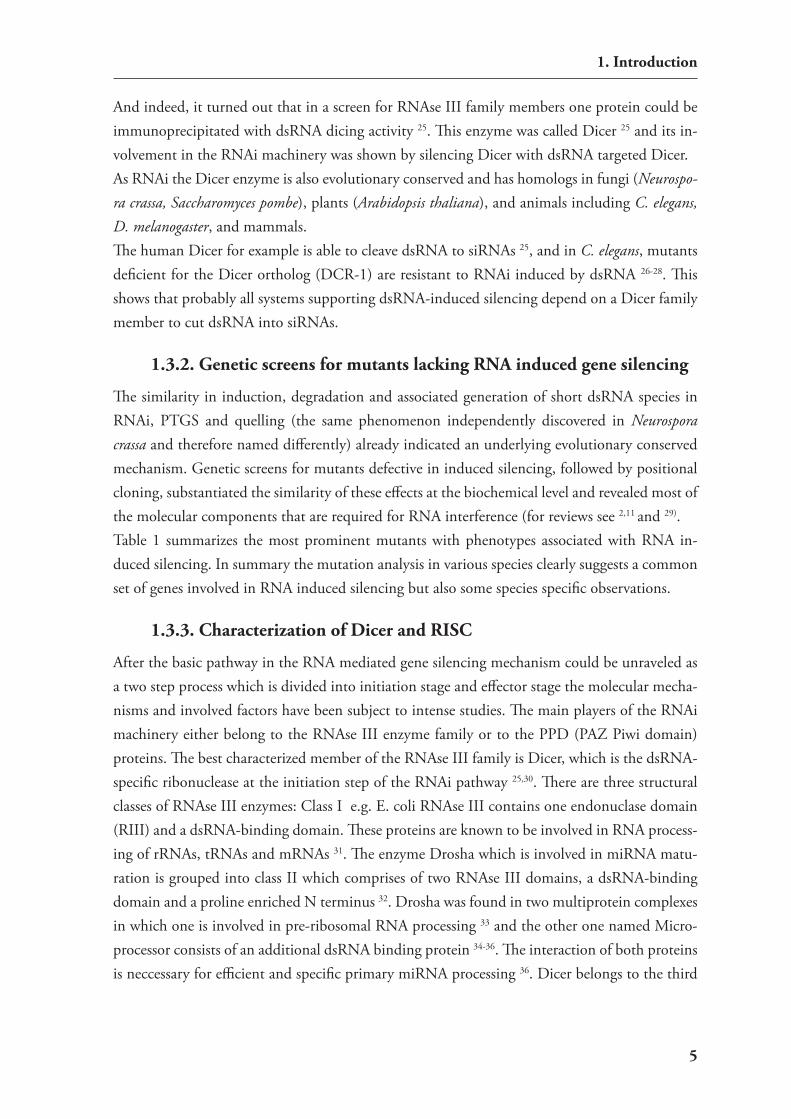
And indeed, it turned out that in a screen for rnAse iii family members one protein could be immunoprecipitated with dsrnA dicing activity 25. This enzyme was called Dicer 25 and its in-volvement in the rnAi machinery was shown by silencing Dicer with dsrnA targeted Dicer.As rnAi the Dicer enzyme is also evolutionary conserved and has homologs in fungi (Neurospo-ra crassa, Saccharomyces pombe), plants (Arabidopsis thaliana), and animals including C. elegans, D. melanogaster, and mammals. The human Dicer for example is able to cleave dsrnA to sirnAs 25, and in C. elegans, mutants deficient for the Dicer ortholog (Dcr-1) are resistant to rnAi induced by dsrnA 26-28. This shows that probably all systems supporting dsrnA-induced silencing depend on a Dicer family member to cut dsrnA into sirnAs.
�.�.�. Genetic screens for mutants lacking RNA induced gene silencing
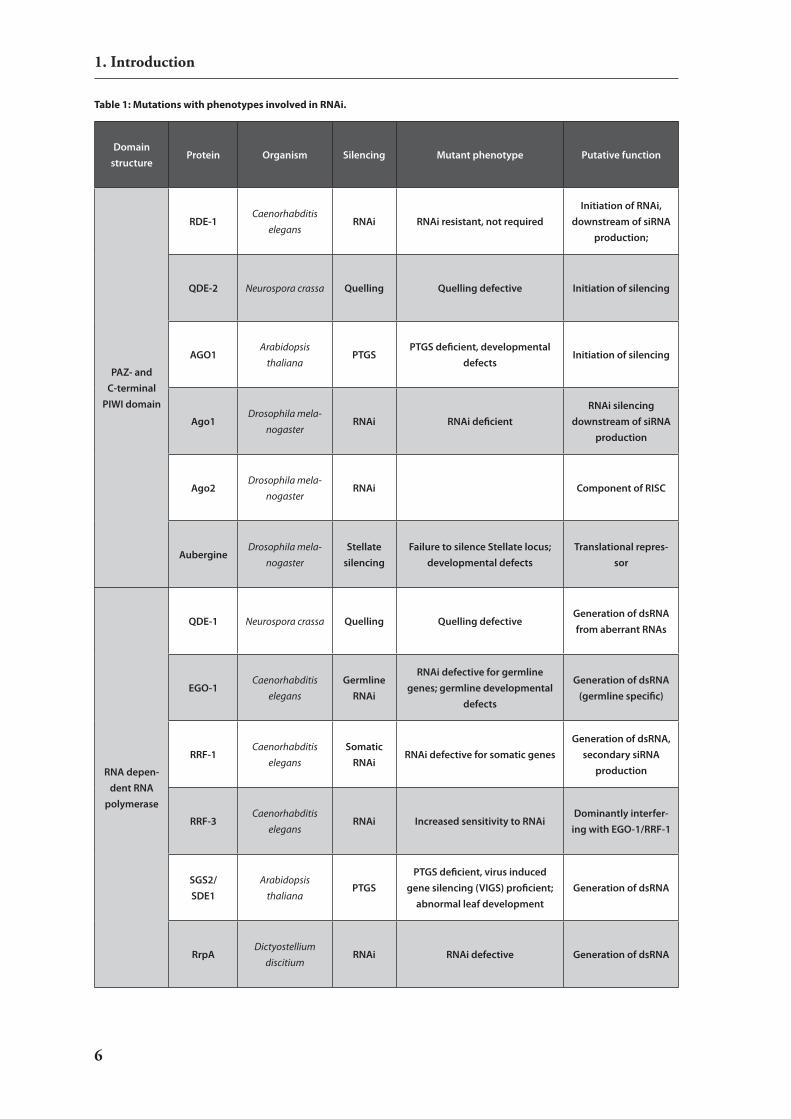
The similarity in induction, degradation and associated generation of short dsrnA species in rnAi, PTGs and quelling (the same phenomenon independently discovered in Neurospora crassa and therefore named differently) already indicated an underlying evolutionary conserved mechanism. Genetic screens for mutants defective in induced silencing, followed by positional cloning, substantiated the similarity of these effects at the biochemical level and revealed most of the molecular components that are required for rnA interference (for reviews see 2,11 and 29). Table 1 summarizes the most prominent mutants with phenotypes associated with rnA in-duced silencing. in summary the mutation analysis in various species clearly suggests a common set of genes involved in rnA induced silencing but also some species specific observations.
�.�.�. Characterization of Dicer and RISC
After the basic pathway in the rnA mediated gene silencing mechanism could be unraveled as a two step process which is divided into initiation stage and effector stage the molecular mecha-nisms and involved factors have been subject to intense studies. The main players of the rnAi machinery either belong to the rnAse iii enzyme family or to the PPD (PAZ Piwi domain) proteins. The best characterized member of the rnAse iii family is Dicer, which is the dsrnA-specific ribonuclease at the initiation step of the rnAi pathway 25,30. There are three structural classes of rnAse iii enzymes: class i e.g. e. coli rnAse iii contains one endonuclase domain (riii) and a dsrnA-binding domain. These proteins are known to be involved in rnA process-ing of rrnAs, trnAs and mrnAs 31. The enzyme Drosha which is involved in mirnA matu-ration is grouped into class ii which comprises of two rnAse iii domains, a dsrnA-binding domain and a proline enriched n terminus 32. Drosha was found in two multiprotein complexes in which one is involved in pre-ribosomal rnA processing 33 and the other one named Micro-processor consists of an additional dsrnA binding protein 34-36. The interaction of both proteins is neccessary for efficient and specific primary mirnA processing 36. Dicer belongs to the third
�
�. Introduction
Domain structure
Protein Organism Silencing Mutant phenotype Putative function
PAZ- and C-terminal
PIWI domain
RDE-1Caenorhabditis
elegansRNAi RNAi resistant, not required
Initiation of RNAi, downstream of siRNA
production;
QDE-2 Neurospora crassa Quelling Quelling defective Initiation of silencing
AGO1Arabidopsis
thalianaPTGS
PTGS deficient, developmental defects
Initiation of silencing
Ago1Drosophila mela-
nogasterRNAi RNAi deficient
RNAi silencing downstream of siRNA
production
Ago2Drosophila mela-
nogasterRNAi Component of RISC
AubergineDrosophila mela-
nogasterStellate
silencingFailure to silence Stellate locus;
developmental defectsTranslational repres-
sor
RNA depen-dent RNA
polymerase
QDE-1 Neurospora crassa Quelling Quelling defectiveGeneration of dsRNA from aberrant RNAs
EGO-1Caenorhabditis
elegansGermline
RNAi
RNAi defective for germline genes; germline developmental
defects
Generation of dsRNA (germline specific)
RRF-1Caenorhabditis
elegansSomatic
RNAiRNAi defective for somatic genes
Generation of dsRNA, secondary siRNA
production
RRF-3Caenorhabditis
elegansRNAi Increased sensitivity to RNAi
Dominantly interfer-ing with EGO-1/RRF-1
SGS2/SDE1
Arabidopsis thaliana
PTGSPTGS deficient, virus induced
gene silencing (VIGS) proficient; abnormal leaf development
Generation of dsRNA
RrpADictyostellium
discitiumRNAi RNAi defective Generation of dsRNA
Table 1: Mutations with phenotypes involved in RNAi.

�
�. Introduction
Domain structure
Protein Organism Silencing Mutant phenotype Putative function
RNA helicase-,
PAZ-, RNAse III- and
dsRNA-bind-ing-domains
DicerDrosophila mela-
nogasterRNAi RNAi defective
Dicing long dsRNA into siRNAs; miRNAs
production
Dicer Homo sapiens RNAi RNAi defectiveGeneration of siRNAs
and miRNAs
DCR-1Caenorhabditis
elegansRNAi
RNAi defective; developmental timing defects; sterile
Dicing long dsRNA into siRNAs; stRNAs
and miRNAs produc-tion
dsRNA-bin-ding
RDE-4Caenorhabditis
elegansRNAi RNAi defective
Initiation of RNAi; generation of siRNAs
Putative RNA-
helicase domains (various types)
Mut6Chlamydomonas
reinhardtii
Deficient in transgene silencing; transposon activation; failure to
degrade aberrant RNAsRNA unwinding
SDE3Arabidopsis
thalianaPTGS PTGS deficient; VIGS proficient RNA unwinding
SMG-2Caenorhabditis
elegansRNAi
Failure to sustain RNAi after initiation
RNA unwinding
MUT-14Caenorhabditis
elegansRNAi
RNAi deficient for germline-ex-pressed genes
RNA unwinding
Spindle-EDrosophila mela-
nogasterStellate silecing
Failure to silence Stellate locus; developmental defects; activa-
tion of retrotransposonsRNA unwinding
RNAse D domain
MUT-7Caenorabditis
elegansRNAi
RNAi deficient for germline-ex-pressed genes, cosuppression
defectiveRNA-degradation
RecQ DNA helicase
QDE-3Neurospora
CrassaQuelling Quelling defective
Generation of aber-rant RNAs
Chromatin remodelling
DDM1Arabidopsis
thalianaPTGS PTGS deficient
Chromatin remodel-ling
Table 1: Mutations with phenotypes involved in RNAi (continued).
�
�. Introduction
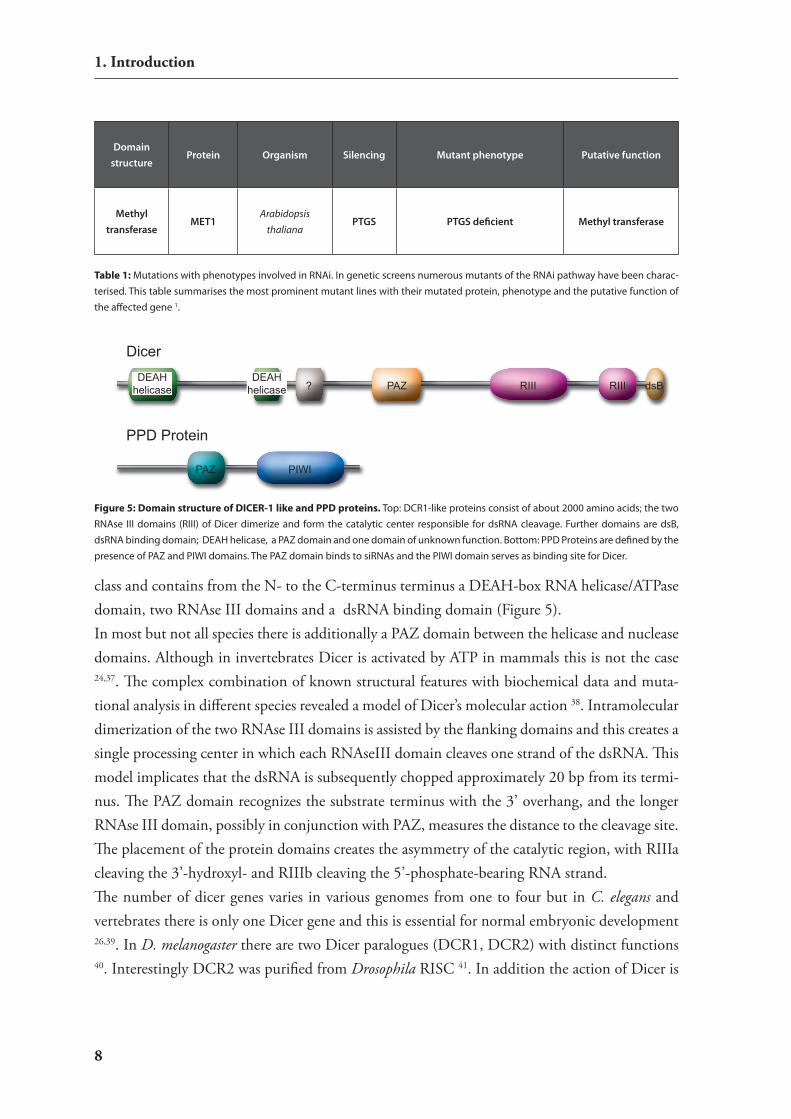
class and contains from the n- to the c-terminus terminus a DeAh-box rnA helicase/ATPase domain, two rnAse iii domains and a dsrnA binding domain (Figure 5).in most but not all species there is additionally a PAZ domain between the helicase and nuclease domains. Although in invertebrates Dicer is activated by ATP in mammals this is not the case 24,37. The complex combination of known structural features with biochemical data and muta-tional analysis in different species revealed a model of Dicer’s molecular action 38. intramolecular dimerization of the two rnAse iii domains is assisted by the flanking domains and this creates a single processing center in which each rnAseiii domain cleaves one strand of the dsrnA. This model implicates that the dsrnA is subsequently chopped approximately 20 bp from its termi-nus. The PAZ domain recognizes the substrate terminus with the 3’ overhang, and the longer rnAse iii domain, possibly in conjunction with PAZ, measures the distance to the cleavage site. The placement of the protein domains creates the asymmetry of the catalytic region, with riiia cleaving the 3’-hydroxyl- and riiib cleaving the 5’-phosphate-bearing rnA strand.The number of dicer genes varies in various genomes from one to four but in C. elegans and vertebrates there is only one Dicer gene and this is essential for normal embryonic development 26,39. in D. melanogaster there are two Dicer paralogues (Dcr1, Dcr2) with distinct functions 40. interestingly Dcr2 was purified from Drosophila risc 41. in addition the action of Dicer is
Domain structure
Protein Organism Silencing Mutant phenotype Putative function
Methyl transferase
MET1Arabidopsis
thalianaPTGS PTGS deficient Methyl transferase
Table 1: Mutations with phenotypes involved in RNAi. In genetic screens numerous mutants of the RNAi pathway have been charac-terised. This table summarises the most prominent mutant lines with their mutated protein, phenotype and the putative function of the affected gene 1.
Dicer
PPD Protein
PAZ PIWI
PAZ RIII RIII dsB?DEAH
helicaseDEAH
helicase
Figure 5: Domain structure of DICER-1 like and PPD proteins. Top: DCR1-like proteins consist of about 2000 amino acids; the two RNAse III domains (RIII) of Dicer dimerize and form the catalytic center responsible for dsRNA cleavage. Further domains are dsB, dsRNA binding domain; DEAH helicase, a PAZ domain and one domain of unknown function. Bottom: PPD Proteins are defined by the presence of PAZ and PIWI domains. The PAZ domain binds to siRNAs and the PIWI domain serves as binding site for Dicer.
�
�. Introduction
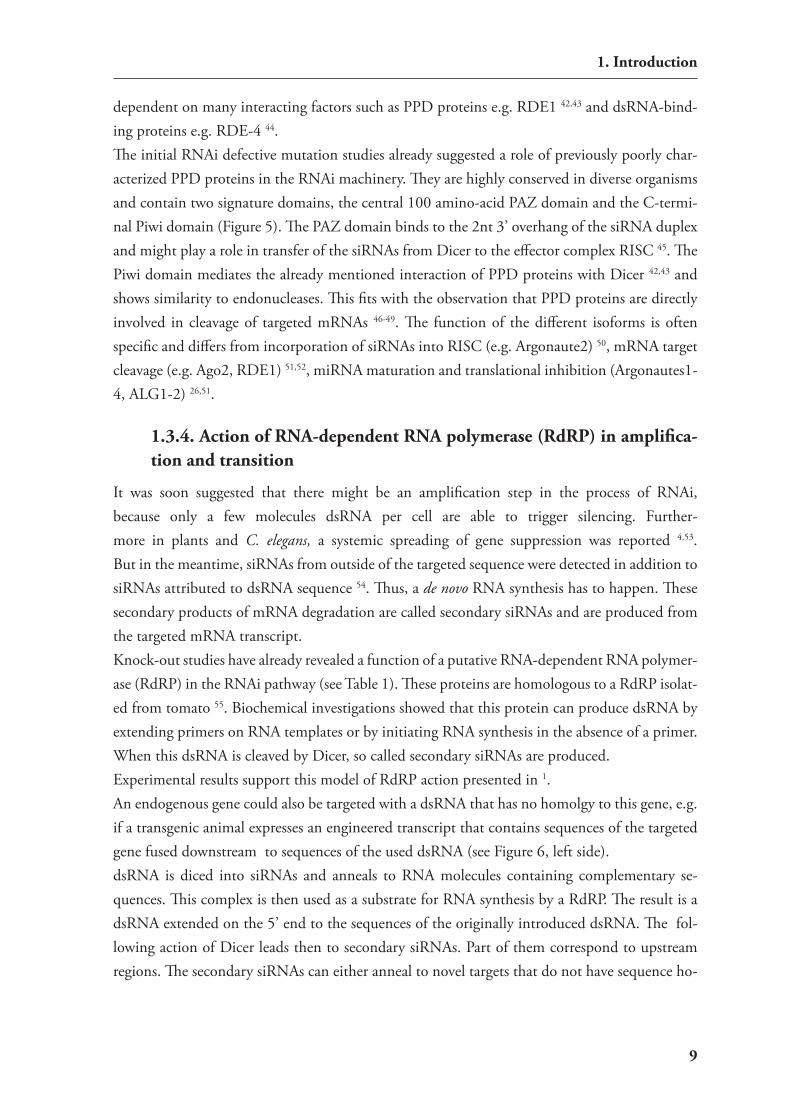
dependent on many interacting factors such as PPD proteins e.g. rDe1 42,43 and dsrnA-bind-ing proteins e.g. rDe-4 44.The initial rnAi defective mutation studies already suggested a role of previously poorly char-acterized PPD proteins in the rnAi machinery. They are highly conserved in diverse organisms and contain two signature domains, the central 100 amino-acid PAZ domain and the c-termi-nal Piwi domain (Figure 5). The PAZ domain binds to the 2nt 3’ overhang of the sirnA duplex and might play a role in transfer of the sirnAs from Dicer to the effector complex risc 45. The Piwi domain mediates the already mentioned interaction of PPD proteins with Dicer 42,43 and shows similarity to endonucleases. This fits with the observation that PPD proteins are directly involved in cleavage of targeted mrnAs 46-49. The function of the different isoforms is often specific and differs from incorporation of sirnAs into risc (e.g. Argonaute2) 50, mrnA target cleavage (e.g. Ago2, rDe1) 51,52, mirnA maturation and translational inhibition (Argonautes1-4, ALG1-2) 26,51.
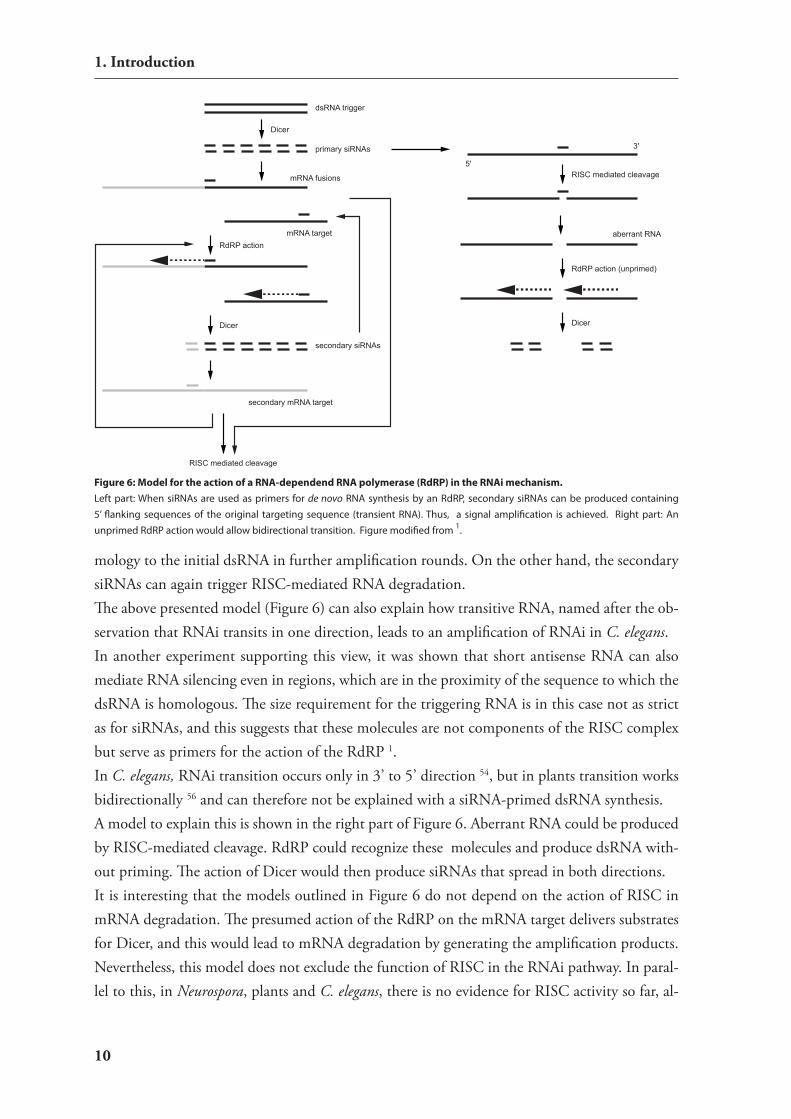
�.�.�. Action of RNA-dependent RNA polymerase (RdRP) in amplifica-tion and transition
it was soon suggested that there might be an amplification step in the process of rnAi, because only a few molecules dsrnA per cell are able to trigger silencing. Further-more in plants and C. elegans, a systemic spreading of gene suppression was reported 4,53. But in the meantime, sirnAs from outside of the targeted sequence were detected in addition to sirnAs attributed to dsrnA sequence 54. Thus, a de novo rnA synthesis has to happen. These secondary products of mrnA degradation are called secondary sirnAs and are produced from the targeted mrnA transcript.Knock-out studies have already revealed a function of a putative rnA-dependent rnA polymer-ase (rdrP) in the rnAi pathway (see Table 1). These proteins are homologous to a rdrP isolat-ed from tomato 55. Biochemical investigations showed that this protein can produce dsrnA by extending primers on rnA templates or by initiating rnA synthesis in the absence of a primer. When this dsrnA is cleaved by Dicer, so called secondary sirnAs are produced.experimental results support this model of rdrP action presented in 1.An endogenous gene could also be targeted with a dsrnA that has no homolgy to this gene, e.g. if a transgenic animal expresses an engineered transcript that contains sequences of the targeted gene fused downstream to sequences of the used dsrnA (see Figure 6, left side).dsrnA is diced into sirnAs and anneals to rnA molecules containing complementary se-quences. This complex is then used as a substrate for rnA synthesis by a rdrP. The result is a dsrnA extended on the 5’ end to the sequences of the originally introduced dsrnA. The fol-lowing action of Dicer leads then to secondary sirnAs. Part of them correspond to upstream regions. The secondary sirnAs can either anneal to novel targets that do not have sequence ho-
�0
�. Introduction
mology to the initial dsrnA in further amplification rounds. On the other hand, the secondary sirnAs can again trigger risc-mediated rnA degradation.The above presented model (Figure 6) can also explain how transitive rnA, named after the ob-servation that rnAi transits in one direction, leads to an amplification of rnAi in C. elegans.in another experiment supporting this view, it was shown that short antisense rnA can also mediate rnA silencing even in regions, which are in the proximity of the sequence to which the dsrnA is homologous. The size requirement for the triggering rnA is in this case not as strict as for sirnAs, and this suggests that these molecules are not components of the risc complex but serve as primers for the action of the rdrP 1.in C. elegans, rnAi transition occurs only in 3’ to 5’ direction 54, but in plants transition works bidirectionally 56 and can therefore not be explained with a sirnA-primed dsrnA synthesis.A model to explain this is shown in the right part of Figure 6. Aberrant rnA could be produced by risc-mediated cleavage. rdrP could recognize these molecules and produce dsrnA with-out priming. The action of Dicer would then produce sirnAs that spread in both directions.it is interesting that the models outlined in Figure 6 do not depend on the action of risc in mrnA degradation. The presumed action of the rdrP on the mrnA target delivers substrates for Dicer, and this would lead to mrnA degradation by generating the amplification products. nevertheless, this model does not exclude the function of risc in the rnAi pathway. in paral-lel to this, in Neurospora, plants and C. elegans, there is no evidence for risc activity so far, al-
dsRNA trigger
primary siRNAs
secondary siRNAs
mRNA fusions
mRNA target
secondary mRNA target
Dicer
Dicer Dicer
RdRP action (unprimed)
RISC mediated cleavage
RdRP action
RISC mediated cleavage
3'
5'
aberrant RNA
Figure 6: Model for the action of a RNA-dependend RNA polymerase (RdRP) in the RNAi mechanism. Left part: When siRNAs are used as primers for de novo RNA synthesis by an RdRP, secondary siRNAs can be produced containing 5’ flanking sequences of the original targeting sequence (transient RNA). Thus, a signal amplification is achieved. Right part: An unprimed RdRP action would allow bidirectional transition. Figure modified from 1.

��
�. Introduction
though it is well established in Drosophila and mammalian cells. viewing it from the other side, homologs of the rdrP have neither been found in the Drosophila nor in the human genome. Thus, the silencing mechanism could be more divergent in different species than initially antici-pated. But nevertheless, experiments with Drosophila cell extracts suggest that there might be rdrP priming by sirnAs 57. But the role of rdrP seems to be not obligatory at least in human cells. There is still rnA-induced silencing, although modified sirnAs in which the 3’ terminus was blocked and therefore could not serve as primers have been used as triggers 58.so far, it is still not clear whether rnA silencing operates via an rdrP in some species and via risc in others. The production of aberrant rnA could as well be initiated by alterations in the chromatin struc-ture, which is known to expand as well. Also the involvement of chromatin remodelling genes in rnAi was shown in genetic screens.The model involving aberrant rnAs processed by rdrP could also explain another observation in Drosophila, where transcriptional and posttranscriptional silencing occurs in the absence of any homology in the transcribed rnA and therefore is different from transitive rnAi in C. elegans 59.There is another member of the rdrP family, rrF-3, which makes C. elegans supersensitive to rnAi 54. This phenotype could be explained if rrF-3 interfered with the action of eGO-1 and rFF-3.
�.�.�. Systemic spreading of RNAi
Another intersting feature of rnAi and PTGs is the systemic spreading of specific silencing in plants and C. elegans.in these species, rnA-mediated silencing is not restricted to individual cells or specific regions - it can spread from the initiation site to distant tissues.in this context, two features have to be present: Beside the amplification of sirnAs that medi-ate silencing (see 1.3.4.) there is the interesting question of how and which signals are able to spread silencing effects from cell to cell (for short range transport) and throughout the whole organism (for long range transport).The most convincing data have been achieved with grafting experiments in plants 53. They showed that sequence-specific silencing is unidirectionally trans-mitted from tissues of the root system (called stock) to upper vegetative tissues (called scions). Therefore, it was suggested that there must be a diffusible silencing agent. in these experiments, effects were only visible when the scions express the targeted gene in higher levels than in wild-type scions 60. This suggests that only a limited number of triggers reach the distant effector sites and again some kind of signal amplification might be neccesary.in C. elegans, GFP expression can be silenced both in the germline and in most somatic tissues when dsrnAs against GFP are fed 61,62. But food-induced silencing is not complete, neuronal
��
�. Introduction
cells seem to be less sensitive than the other tissues to silencing signals. however, if dsrnA is expressed in these cells, rnAi works.Looking for mutants that are defective in systemic spreading of rnAi in C. elegans (but not only in the uptake of dsrnA) three complementation groups were identified: sid-1, sid-2 and sid-3. Among these systemic rnAi deficient mutants, sid-1 was cloned and encodes a transmembrane domain that the cell requires autonomously 63. Perhaps this protein is neccesary for the transport of the transmissible silencing signal. in C. elegans, the transmission of rnAi is not very effective, maybe due to limited intercellular transport.The transmittable silencing signal has yet not been identified in any species, however, it is be-lieved that dsrnAs, possibly generated by the action of rdrP or sirnAs, are the transferred molecules.
1.4. Biological functions of RNAiThe combination of mutation studies and biochemical analyses show that PTGs, rnAi and quelling are not only resulting from the progressive action of Dicer and risc, but there are also other proteins involved bridging rnAi to processes such as translation, transposition, viral defence and interactions with epigenetic events.
�.�.�. Alterations in chromatin structure
There is evidence for a connection between rnA silencing and epigenetic events, at least in plants. The definition of epigenetics has been altered in the course of research and might be shifted again when including rnA-induced phenomena. nevertheless, today epigenetics de-scribe changes in gene expression that may result in mutant phenotypes, without altering the DnA sequence, such as methylation of DnA. These changes can be reversed for example, by the loss of methylation and do not follow Mendelian rules of inheritance. epigenetic effects can be inherited, but do not neccesarily have to. (For review see 64)When histone h3, one of the chromatin’s protein components, is deacetylated and methylated on lysine 9, the associated DnA is methylated. This locks the chromatin into a silencing state 65. Although histone methylation and rnAi seemed to be separate mechanisms, recent studies show that both effects share a common pathway.The first hints of a connection came from the plant mutants MeT1 and DDM1, coding for a methyltransferase (MeT1) and a chromatin remodelling complex (DDM1) respectively, were found 66-68. When plants which are mutated at these loci, are crossed with transgenic plants car-rying a PTGs- or TGs silenced reporter construct, the silencing effects are basically released in the progeny 67. The exact analyses of the observed effects suggests, that ddm1 might be nec-cessary for the establishment of PTGs and met1 for the maintainance of PTGs, which is also supported by another study 66.

��
�. Introduction
Genomic methylation can also be induced by dsrnA at sites of sequence homology 69. Methyla-tion in the coding sequence seems to have no effect on transcription of this locus, but silencing occurs at the posttranscriptional level.On the other hand, if promoter sequences are methylated, transcriptional gene silencing (TGs) is induced 70, which is stable and heritable, in contrast to PTGs 66.in further experiments, genes that are involved in gene silencing were found to be also involved in DnA methylation and alterations in chromosme structure (among these AGO1 and piwi a Argonaute-2 homolog) 52,59. Which means that at least in some species there are rnA-induced transcriptional silencing effects that can explain gene silencing by increasing the density of DnA packaging. But only little is known how the genomic DnA is recognized, what is the trigger for silencing and how it is guided into the nucleus. it is possible that a variant of risc, containing a chromatin remodelling complex instead of a ribonuclease exists and targets genomic DnA via the action of sirnAs. This model is supported by observations that relatives of Dicer and risc are required for silencing the repeats in the centromere region of the chromsome in Schizosac-charomyces pombe (unpublished but noted in 2).A connection between epigenetic effects on identity and function of the centromere has also been noted before the discovery of rnAi involvement 71. very recent findings with fission yeast lacking rnAi machinery support this idea.There might be also a biological role of rnAi in genome organisation by forming heterochro-matic domains. it is well known that centromeric heterochromatin structures are neccesary for chromsome segregation and sister chromatid cohesion during mitosis and meiosis (for review see ref. 72). in this case, rnAi mutant cells were not able to properly form heterochromatin at their centromeres and subsequently correct segregation was abolished 73. This study demonstrates that the fission yeast rnAi machinery is required for the proper regulation of chromosome architec-ture during mitosis and meiosis. Thus, a role of rnAi in cell cycle regulation and cancer can be implicated.Beyond this, aberrant DnA methylation could lead to the silencing of tumor suppressor genes. Therefore, DnA hypermethylation is associated with many forms of cancer and even be used as marker for diagnosis 74.related mechanisms of gene silencing may be responsible for X chromosomal inactivation in female mammalian cells, because histone methylation, eventually affecting the whole chromo-some, is followed by DnA methylation 75. Associated with the inactive X chromosome, poly-comb group proteins have been found 76, which are known to organize chromatin into open or close conformations. in doing so, chromatin domains are shielded from remodelling enzymes and, thus, heritable patterns of gene expression are created. in other experiments, it was found that polycomb proteins are also involved in rnA-induced silencing 77 and under particular con-ditions, polycomb proteins are even required for rnAi function 78.

��
�. Introduction
in Tetrahymena it was shown that rnAi-related mechanisms are even involved in genome re-arrangement 79,80. in this organism the gene, TWi1 is homologous to piwi and is required for elimination of DnA during chromosome rearrangement. specific expression of small rnAs was associated in wild-type cells but not in TWi1 knockout cells.it can be proposed that these small rnAs function to specify sequences to be eliminated by a mechanism similar to rnA-mediated gene silencing.
�.�.�. Viral defence in plants
Other studies demonstrated the importance of rnA-mediated silencing in protective functions. in plants, PTGs is an important component in viral defence, because plant viruses can induce viral-induced gene silencing (viGs), which is following the same pathway as PTGs but is trig-gered by viral infection (reviewed in ref. 29,81). Plants exhibiting transgene induced PTGs of a virus sequence are immune to this virus 82.There are also reports in wild-type plants that recovery from viral infection is associated with specific viral rnA degradation, and these plants are subsequently resistant to infection with the same virus 83.The first observations of cross-protection in plants go back to the 1920s. it was observed that plants can be protected from a harmful virus by prior infection with a mild closeley related virus strain. To date this phenomenon can be explained, although plants do not have an immune response similar to vertebrates at all.A number of PTGs-deficient mutations in Arabidopsis (sgs2/sde1, sgs3, sde3, and ago1) pro-duce plants that are hypersusceptible to viral infection by cytomegalovirus (cMv) 84,85.it is estimated that around 90% of plant viruses have a rnA genome and, therefore, they have to reverse transcribe their genome prior to replication. During this process, either rnA/DnA hybrids are produced and trigger viGs or viral rnA is recognized as aberrant.Other plant viruses have developed strategies to counteract or escape PTGs, because many viruses can inhibit PTGs completely (e.g. tobamovirus Tvcv) or at least partially (cMv) in Arabidopsis 84. some of the inhibitory viral proteins have been identified and show inhibition when applied without infection. Unfortunately, there are no similarities among these different proteins, and it is mostly unknown how they work.
�.�.�. Transposon silencing
rnA viruses share reverse transcription during replication as well as other features with ret-rotransposons and transposons.Transposable elements have some common structural organisa-tion and are able to be released from the DnA integrating at another site with the help of en-zymes called transposases. rnAi can also be functionally linked to protecting genome’s integrity from these endogenous parasitic nucleic acids. some rnAi-deficient C. elegans strains show a
��
�. Introduction
very high mutation rate due to increased mobility of transposable elements 77,86, and similar ob-servations were made in other species. For example, in Drosophila, the loss of the rnA helicase spindle e, which is known to be in-volved in dsrnA induced silencing of the stellate genes and thereby relieves them from silenc-ing. Furthermore the phentype shows a derepression of retrotransposons in the germline 87.A further hint for a direct targeting of retrotransposon transcripts comes from the detection of sirnA derived from retrotransposons in Trypanosoma brucei 88. it has been shown previously, that dsrnA-induced silencing exists in this organism 89. in plants, many studies show a connection between transposon inactivation and methylation 90-93 as well as the involvement of methylation in transposon inactivation 94,95. The connection between methylation and rnAi- induced silencing has been discussed, but it is still not clear whether the methylation itself inactivates the transposon or whether changes in chromatin struc-ture are secondary effects. During reverse transcription, retrotransposons produce DnA/rnA hybrids which are able to mediate PTGs, as was shown in viGs. however, there are more modes of action possible how dsrnA or hairpin rnA (which triggers gene silencing just like dsrnA) can be produced by transposons. Transposons have so-called long terminal repeats (LTr) and terminal inverted repeats. Depending on the orientation of two integrated transposons or the orientation of these repeats within one transposon there are multiple possibilities to produce dsrnA or hairpins rnAs during transcription (ref. 29).
�.�.�. RNAi in development
in the course of research for rnAi products a novel gene class so called micrornAs (mirnAs) have been discovered. mirnAs are generally encoded in the genome and biogenesis of the func-tional molecule is dependent on the rnAi pathway. Generally mirnAs down-regulate their target genes and among other functions are higly involved in regulation of developmental pro-cesses. This is described in detail in chapter 1.6.3.
1.5. RNAi as a toolThe discovery and elucidation of rnA interference and its mechanism as well as the exploration of micro rnAs as functional genetic elements have revolutionised the scientific view on rnA. But beyond the thrilling questions on the biological role of these newly discovered rnA species, this technology has just paved the way for a variety of reverse genetics applications.it seems as if it was just in time, after the complete sequencing of several genomes and the devel-opment of DnA microarray technologies. Although they gave the proper basis for the develop-ment of modern functional genomics, there is more to study of how the genome works. rnA interference is a suitable method for selectively inducing and silencing the expression of each individual gene. Therefore, rnAi enables completely new possibilities to address the function of
��
�. Introduction
particular genes without altering the genome structure.The potential of this technique leads even a paradoxical situation as it is used to reveal its own mechanism and identify genes required for rnA interference 78.in plants for example the conventional “knock-out” strategies use insertional mutagenesis with heterologous maize transposons 96, Agrobacterium-mediated T-DnA insertions 97,98 or antisense rnA technology. These techniques are now complemented with the possibility to effectively generate specific and conditional knock-down phenotypes using hairpin rnAs 99,100.in C. elegans, high throughput studies have been performed to generate knock-down phenotypes on a genomewide scale 101-103.
�.�.�. RNAi in mammalian cells
in the beginning of the discovery of rnA-induced gene silencing, only scientists working with plants or C. elegans were able to use rnAi for functional genetics in rnA-induced knock down studies. in the early rnAi experiments, dsrnA molecules of about 500 bp were used to trigger gene silencing 4,104-106.The obstacle in mammalian cells was that they activate antiviral defense mechanisms when dsrnAs longer than 30 bp were introduced into the cells 107,108. some established responses after this treatment are the activation of a dsrnA-responsive protein kinase (PKr) and the produc-tion of interferon, which results in an unspecific degradation of rnA transcripts and a general inhibition of protein synthesis. exceptions were only shown in embryonic stem cells or embry-onic teratocarcinoma cells in which long dsrnA were able to specifically trigger rnAi 109,110.But with the elucidation of the rnAi pathway and the discovery of sirnAs, all mammalian cells became amenable to rnAi. In vitro synthesized 21 nt sirnAs greatly bypassed general cellular responses and induced gene specific silencing in mammalian cells 111,112. Functional sirnAs can be produced in different ways: First, rnA oligonucleotides can be synthesized via a solid phase synthesis and annealed to functional sirnAs with 3’ overhang. secondly, they can be in vitro transcribed with T7 rnA polymerase, and finally, dsrnA can be digested in vitro by RNAse III from Escherichia coli into siRNAs.Chemically synthesised RNA is rather expensive but quickly accessible and has a good puri-ty, whereas the in vitro transcription procedure provides a siRNA with far reduced costs. The in vitro digest of long dsRNA with RNAse III produces a mixture of small RNA molecules. This has the advantage that it is not neccesary to test for functional targeting sequences. But on the other hand, this may lead to unwanted silencing of related genes or of genes with short stretches of sequence homology.The delivery of siRNAs is normally performed by lipofection procedures. This is a good ap-proach for large scale screening.

��
�. Introduction
�.�.�. Rules for the design of functional siRNAs
since the discovery of sirnAs, mammalian systems have become accessible for rnA interfer-ence 111. This has a great impact on large-scale screening of candidate genes in cell culture by transfection of synthetic sirnAs. On the one hand biochemical knowledge and on the other hand the combination of empirical approaches with statistical methods revealed some guidelines for effective sirnA design but yet some sequences occur to be not effective in gene silencing:Like their natural archetypes functional sirnAs harbour two or three nucleotides of 3’ over-hang. Most often two 2’-deoxythymidines are used as overhang to protect the molecules from exonucleases. The 19 nt targeting sequence of the sirnA has to be fully homologous to the target gene and should not be located in introns, UTrs or within 75 bases from the terminus of the mrnA. ideally nonspecific effects are minimised by choosing sequences in BLAsT searches that show minimal homolgy to other trancripts.since only one strand the so called guide strand of the sirnA is loaded into the risc complex 113 it was shown that the relative stabilities of the base pairs at the 5’ ends of the two sirnA strands determine the degree to which each strand participates in the rnAi pathway 114. it is believed that the single stranded sirnA is loaded from the 5’ end into risc and the strand with the less stable 5’ end is preferrently incorporated. Thus sirnAs should be designed in a way that the 3’ end of the double strand is destabilised by A/T residues or chemical modifications. several studies tried to extract rules for efficient sirnAs running supervised clustering methods on huge systematic datasets of sirnA silencing 115-117. For more in depth discussion on specific design rules see 118.But the sirnA-mediated gene silencing is of a transient nature and therefore, it does neither allow an inducible nor a heritable expression. As a consequence, it is not suitable for the genera-tion of stable cell lines and transgenic animals.To circumvent these problems, vectors expressing sirnAs or precursors, that are processed to functional sirnA are needed.
�.�.�. Vector systems for expression of shRNAs
Furthermore, vector-based systems for the delivery of sirnAs and stable gene suppression are available 119, which additionally enables to use rnAi in viral vectors or transgenic animals.The commonly used expression vectors to express proteins are based on rnA polymerase ii (Pol ii)-dependent promoter systems. The cell uses Pol ii-derived transcription for the synthesis of all protein-encoding mrnAs. These primary transcripts are extensively modified by splicing, addition of a 5’ cap nucleotide and long repetitions of adenine residues so called polyA tails. These modifications lead however, to a block of rnA-induced silencing and therefore make Pol ii-based vectors inapplicable for the expression of sirnA.But in eucaryotic cells, there are three rnA polymerases with different features serving for dif-

��
�. Introduction
ferent functions that might be suitable for rnAi mediating vectors (Table 2).rnA polymerase iii (Pol iii) naturally transcribes trnAs, the 5s rrnA and some snrnAs. On the other hand, the cellular function of rnA polymerase i (Pol i) is to express rrnA, except of the 5s rrnA. The transcripts of both enzymes are modified after synthesis only by splicing, and therefore, vectors containing promoters for each of these enzymes are potentially able to mediate rnAi. nevertheless, to the present, experiments have only been performed utilizing Pol iii.in early 2002, a milestone in developing vectors for rnAi in mammals was achieved.intracellular transcription of small rnA molecules were obtained by cloning sirnA templates into rnA polymerase iii transcription units between a polymerase iii promoter and a transcrip-a transcrip-tion termination site of 4-5 thymidine residues. These transcription units normally encode small. These transcription units normally encode small nuclear rnA (snrnA) U6 or the human rnAse P rnA h1, and thus, its promoter is calledand thus, its promoter is called U6 promoter, or h1 promoter respectively.initially there were two different approaches: either sense and antisense strand constituting the sirnAs are transcribed from individual promoters, (Figure 7a) 120, 121 or so called short hairpin transcripts are produced from a single promoter (Figure 7b) 122-125.The transcript of shrnA-expressing vectors is terminated at position 1-4 of the termination site and folds into a hairpin structure with a 29 bp stem having perfect homology an 8 nt loop and at the 3’ end 1-4U-overhangs. The end of the loop of the shrnAs is processed in vivo, reminiscent to the processing of mirnAs, and this generates a 21 nt sirnA molecule, which in turn initiates rnAi (see also chapter 1.6.2 and Figure 9 for analogy to mirnA processing).Gene silencing via both types of expression vectors is as efficient as directly transfected sirnAs. in case (b) the efficiency appears to be best propably because hairpin formation is more efficient
Features Polymerase I Polymerase II Polymerase III
Type of RNAs synthesized rRNA (excluding the 5S rRNA)mRNAs and some small nuclear
RNAs (snRNAs)tRNAs, the 5S rRNA and some snRNAs
Post-transcriptional processing Limited (only splicing)Extensive (splicing, capping at the 5’ end, polyadenylation at
the 3’ end
Limited (only spli-cing)
Transcription initiation and termination
Clearly defined Not clearly defined Clearly defined
Inducible and tissue- or cell type specific promoters
Not available Numerous systems availableOnly few inducible
available
Species specificityHigh (even between closely
related species)No No
Table 2: Features of the different RNA polymerases.
Table 2: Since RNA polymerase I and III transcripts are only spliced and have no further posttranscriptional processing, they can be used in expression vectors to transcribe functional siRNAs or shRNAs. By doing so generation of stable gene suppression can be achieved via the RNAi mechanism. Beyond that transcription initiation and termination is well characterized in these two systems. A unique feature of the Pol I transcription is its species specificity.

��
�. Introduction
when sense and antisense strand are connected which increases the propability of hybridization. Today the most used vectors for the stable expression of sirnAs transcribe shrnAs from Pol iii promoters that are based on the U6 snrnA gene or the the human h1 rnA. nevertheless, shortly after the development of U6 or h1 promoter based vectors, there was a report on the inhibition of gene expression based on mirnAs 126. in this case, the mir-30 precursor was the template, of which the stem sequence was substituted with different targeting sequences. in deed, the authors showed that these constructs were processed similar to the natural mir-30 and were able to silence endogenous genes in human cells. since mirnAs are transcribed from Pol ii promoters, in this special case posttranscriptional modifications do not disturb the silencing potency of these artifical mirnAs. The vector development to stably express sirnAs enabled anThe vector development to stably express sirnAs enabled an additional option in functional genetics to establish transgenic rnAi.The established vectors have been further developed into inducible or conditional systems in two basic approaches. either irreversible induction of shrnA expression in transgenic animals is achieved by adapting the commonly used cre/LoxP recombination system (for details see chapters 1.5.4. and 1.5.5). Or true reversible gene knock-down is achieved by using doxycyclinerue reversible gene knock-down is achieved by using doxycycline dependent shrnA transcription systems. Thereby either steric hindrance, epigenetic represion or transactivation of Tet-on and Tet-off systems have been adapted to both Pol iii promoters and mirnA-based Pol ii promoters reviewed in 127.
�.�.�. in vivo RNAi in mice
rnA interference has been used not only in cell culture but also in adult mice. initially animals were treated systemically with sirnAs by hydrodynamics-based transfection, i. e. injection of either sirnA or shrnA expression vectors into the tail vein 128,129. in the following important improvements in increasing delivery or stability of synthetic sirnAs could be achieved by in-troduction of several chemical modifications 130-132. in addition to direct modifying synthetic sirnAs alternative delivery strategies using carrier molecules have been developed since sirnAs as highly charged molecules do not cross cell membranes by free diffusion. cationic polyethyl-enimines (Pei) have been used for in vivo transfection 133-135. Also a large number of liposome based carriers have bee used successfully to mediate rnAi like lipid-polyethylene glycol (PeG)
Figure 7: Vector-based systems to induce RNAi based on Pol III transcription units. (a) shows an approach to express two short RNA molecules from individual promoters. These RNA molecules are tran-scribed from an U6 promoter in sense and antisense orientation respectively. Thus, the transcripts can hy-bridize and form functional siRNAs. (b) an inverted re-peat consisting of a target sequence in both sense and antisense orientation separated by a short (8 nt) spacer is transcribed from an U6 promoter. The RNA can form a fold back strucure, which is processed into siRNAs in a similar manner as miRNAs.
Pol IIIPromoter
ProcessingTranscriptionInverted Repeat
shRNA
Pol IIIPromoter
Sense
Terminator
Sense
Pol IIIPromoter
Transcription/Hybridzation
a)
b)
Terminator
Terminator UUUUUU
3'3'
siRNA
3'3'
siRNA

�0
�. Introduction
to encapsulate sirnAs 136,137. This approach was used excsessively in experiments to silence path-ogenic viruses and was able to confere resistance to infection. remarkably the observed silencing effects in liver sustained to more than a week. But to facilitate long term rnAi silencing vectors expressing shrnAs have been used in animals. This is mostly achieved by viral transduction based on gene therapy vectors. Depending on the cell type under investigation adenovirus (Av), retrovirus (rv), herpes simplex, adeno-associated virus (AAv) or lentiviruses (Lv) are applied. Also stable expression of shrnAs in blastocytes or embryonic stem cells was shown either by direct injection 138 or viral transduction 139. Transgenic animals can be derived from such treated stem-cells or blastocytes. rnAi mediated targeting of genes within embryonic stem cells reca-pitulate the phenotypes of traditional knock-out mice 140-142.Thus, using transgenic rnAi approaches it is possible to perform knock-down studies in ani-mals without established embryonic stem cell technology like rat 143 and goat 144.An interesting feature of rnAi is that it is mediated by diffusible molecules (sirnAs) which works in trans also under hemizygous conditions and thus phenotypes can be directly assessed in embryos or adult animals generated from es cells by tetraploid aggregation without further breeding 142.in transgenic animals either generated from virus transduced es cells or by pronuclear injection a conditional rnAi approach can be achieved by using the available cre-mediated activating or inactivating vectors 145-148. in the activating configuration a stuffer sequence that is flanked by modified loxP sites is placed between a U6 promoter TATA box and the shrnA sequence. Upon cre-mediated excision of the stuffer sequence the functionality of the U6 promoter is restored 146,147. Another group inserted a loxP flanked stop cassette harbouring termination sequences into the loop region of a U6 driven shrnA vector 148. initially the construct only expresses the sense region of the hairpin which does not trigger rnAi. After recombination the transcriptional stop is removed and functional shrnAs lead to gene silencing. The inactivating approach removes the whole Pol iii expression cassette via cre recombination and thus stops shrnA production.conventional transgenic approaches are already available to influence gene expression in a tem-poral and region specific manner utilizing the cre/loxP system to induce conditional null muta-tions 149,150. This system has refined the analysis of gene function, but the experimental set-up does not allow reversible changes. One of the advantages of rnAi mechanisms is that they do not influence DnA structure and are therefore in principle reversible as the transient effects of sirnAs directly introduced into mammalian cells show. Giving the possibility to suppress gene expression specifically without destroying or mutating the genome, rnAi is likeley to be the best approach in medical treatment of viral infections by gene-based therapy. indeed, several in vivo studies have been performed in order to target hepatitis B 137,151 152 and hiv-1 153,154 with rnAi and were rather successful. in doing so not only new infections could be prevented but also existing infections could be dampended. This very promissing approach could become as

��
�. Introduction
important as the discovery of penicillin in the treatment of bacterial infections, especially if ways were found to achieve systemic spreading of rnAi in mammals as it was shown in C. elegans 155. rnAi will be also very useful to understand viral pathology by knock-down viral genes.in summary, this recent technique of rnA-induced gene silencing will have a great impact on the analysis of gene function and of yet unknown cellular processes. Future will also include gene-based therapy and anti-viral medication.
�.�.�. RNAi in the adult mouse brain
The basic application methods described in 1.5.4. have been also applied to the brain. neverthe-less, there are two major drawbacks: Firstly, since the blood brain barrier prevents the transition of most macromolecules from blood into brain tissue systemic approaches using intravenous in-jections have limited applications for rnAi to the brain. Although by using so called molecular Trojan horses such approaches have been successful 156 they do not allow to target distinct brain areas or cell types. secondly for unknown reasons neurons are more difficult to transfect than many other cell types. Primary neurons or brain parenchyma are particularly challenging.Applications of naked sirnA have only moderate effects on gene expression in primary neurons and although such molecules are taken up by endocytosis there are not sufficient cytoplasmic sirnA levels to trigger efficient rnAi 157. Also direct injection of sirnAs into the rat striatum did not produce the expected silencing effect 158. Later only few labs report robust silencing in the mammalian brain via naked sirnAs mostly applied chronically using intraventricular infusion aided by osmotic minipumps 159,160. nevertheless, this system is limited in preferential targeting cells adjacent to the ventricular zone. Liposomic transfection agents are efficiently used to deliver sirnAs to cells 161 and also lead to silencing in primary neurons 162 but high cytotoxicity limits their use for primary neurons or in the brain 163. Therefore so called artificial virus-like particles which are peptide-based carriers have been used in addition 163. Another popular approach is local injections of formulations of sirnAs in polymer based chemical complexes (most often polyethylenimine (Pei)). This pro-chemical complexes (most often polyethylenimine (Pei)). This pro-cedure was suitable to elicit site specific knock-down phenotypes in the hippocampus 164, the ventral tegmental area (vTA) 157 and the hypothalamus 165. Beyond that intracerebroventricularintracerebroventricular (icv) injections of polymer complexes of sirnAs have also been succesfully used to target sirnAs to adjacent brain regions 157,166.Although direct injections of sirnAs into the brain are fast approaches their disadvantage is the lack of long term silencing and the limited targeting possibilities of brain regions or cell types. To circumvent these obstacles vector based rnAi has also been used in brain research. Two approaches are mostly used either expression of shrnAs from viral vectors or in traditional transgenic approaches.A particular important but challenging aim for neuroscientists is the development of animal

��
�. Introduction
models of neurological disorders like Parkinson’s disease (PD). so far the published transgenic approaches have strong limitations since the widely used cre/loxP system is limited in spatial and temporal resolution thus vector based rnAi might be a promising technology for improvement. Due to the needs to treat nondividing cells and to mediate long-term suppression of gene ex-pression most brain-based studies have focused on the use of shrnA expression vectors derived from AAvs 167-169 170 or Lvs 171,172. nevertheless, also the other available viral vectors (adenoviral systems 173, herpes-simplex systems 174), as well as synthetic sirnAs 159,160 have been used suc-cesfully. examples of utilising rnAi to generate neurological or behavioral models include the introduction of an AAv shrnA against tyrosine hydroxylase into mid-brain dopaminergic neu-rons as a model for PD, as well as the AAv expression of an shrnA corresponding to the Leptin receptor as a model of feeding behavior 167,168.rnAi has also been explored for the potential treatment of neurodegenerative disease, particu-larly those associated with a dominant genetic inheritance. Many neurodegenerative disorders are associated with the expression of an aberrant protein that may be inappropriately aggregated, deposited, sequestrated, or mislocalized. numerous groups have hypothesized that the induc-tion of rnAi directed against these proteins may modulate disease progression. such an ap-proach seems particularly appealing since rnAi might allow to target the heterozygote mutant variants in an allele specific fashion. Associated studies have included the use of shrnAs to tar-get the huntingtin protein of huntington’s disease in rodent models 169,175,176. DYT1 silencing showed promising effects for the treatment of dystonia 171, and the targeting of ataxin-1 to treat spinocerebellar ataxia 170. in addition, studies targeting the superoxide dismutase gene have been conducted in models of amyotropic lateral sclerosis172.To avoid the serious obstacles of in vivo delivery of vectors into neural cells of the mouse brain conditional transgenic approaches have been deployed in addition.Therefore, conditional vectors had to be developed from which transgenic shrnA expression can be restricted to brain tissues. As an irreversible alternative to chemical induction various vector designs for cre/loxP regulated rnAi have been described which are analog to condi-tional knockout or knock in strategies (described in chapter 1.5.1) . shrnA production can be prevented by a removable transcriptional stop element. via cre mediated recombination the transcriptional block is removed and shrnAs can be produced 146,148,177,178. The advantage of such vectors is the compatibility with the large collection of available mouse strains that express cre recombinase in specific cell types. Thus they can be used to activate or deactivate condi-tional shrnA vectors at different developmental stages and in selected cell types of the mouse brain 179.Generation of transgenic mice harbouring such rnAi constructs has been accomplished either by pronuclear injection 138,140,180, by lentiviral infection 147 or by electroporation of es cells 142. Although successful the random integration of shrnA expressing cassettes in such approaches

��
�. Introduction
requires time consuming screening of the offspring due to the unpredictable influence of the ge-nomic environment of the integration site and the vector copy number on transgene expression 142,180. Also multiple insertions might induce unwanted cre mediated recombination events.hence, the latest improvement utilizes a single-copy approach by targeted integration into the well characterized rosa26 locus 148,181. This is accomplished by recombinase mediated cassette exchange (rMce) in es cells as fast and reproducible alternative to conventional homologous recombination.Another specific advantage is the possibility for brain specific knock-down of multiple genes at the same time either by targeting homologous sequences in gene families or by expressing inde-pendent transcripts utilising a combination of shrnA expression cassettes 182.
1.6. Micro RNAs (miRNAs) as novel functional genetic unitsrecently the revolutionary discovery of tiny dsrnA molecules endogenously present in the organism have drawn a lot of attention as novel functional units expressed from the genome. The mature molecules are short 21-24 nucleotides noncoding rnAs referred to as micrornAs (mirnAs) 183-185. subsequently an intense search for this new gene class has begun, and hun-dreds of genes have been identified in various organisms like plants, worms, flies, humans and propably exist in all other species. Although they have been overlooked for a long time the num-ber of mirnAs identifed is more than 3% of the known protein coding genes and this portion is similar to large gene families like transcription factors.
�.�.�. Identification and cloning of miRNAs
The founding members were the genes lin-4 and let-7 in C. elegans, which both control devel-opmental timing as small non-coding rnA molecules 183,186-188. These genes were identified because they produced mutant phenotypes in produced mutant phenotypes in C. elegans showing retarded larval development and some cells failed to divide and differentiate at the correct developmental stage 189-191. it was found that both of these genes act by basepairing with the 3’ untranslated regions (UTr) of the rnA of the targeted gene 192-194 and thereby repress the targeted rnA at the translational level 195,196. homologs to let-7 have been found in various animals including humans 197.The initial discovery of lin-4 was more than 20 years ago but at that time the novel mechanism but at that time the novel mechanism of gene regulation was believed to be an exotic finding, which is not of general interest. The discovery of small rnA species as effector molecules in the rnAi pathway put the focus back on small rnA molecules and unexpectedly the search for rnAi products, which have the sameand unexpectedly the search for rnAi products, which have the same size as mature mirnAs 198 revealed that mirnAs are rather abundant molecules. But there are additional reasons why mirnAs have been overlooked for a long time: Biochemical approaches in gene finding are very difficult, due to the technical limitations when working with small
��
�. Introduction
rnA species. Using approaches for detection of rnA transcripts these small rnAs run out of the gels under standard conditions. The lack of structural signatures additionally complicated bioinformatic analyses.nevertheless, in the following years cloning of mirnAs was used very succesful as an aproach for mirnA identification. Transcripts were size fractionated at a size of about 22 nt. The isolated rnAs were then ligated to synthetic oligomeres with T4 rnA ligase, concatemerized and subse-quently reverse transcribed. The obtained DnA molecules are amplified via Pcr, cloned into a vector and finally sequenced 183,199. in the meantime, a uniform system for mirnA annotation has been established. The genes encoding mirnAs are named with a “mir” prefix and a unique identifying number (mir-1, mir-2...) 200. strict criteria have been established to distignuish mir-nAs from other non-coding rnA species according to length, predicted secondary structure, phylogenetic sequence conservation and increased precursor accumulation when Dicer function is reduced. shortly later the mirBase sequence Database (former mirnA registry), which is a searchable database of published mirnA sequences and annotation has been launched online 201,202: (http://microrna.sanger.ac.uk/).The combination of cloning approaches and bioinformatical methods identified hundreds of mirnA genes (see e.g. 203,204). in mice 547 and in humans 706 mirnAs have currently been identified (mirBase 13). But still today many mirnAs might remain unidentified and estima-tions exceed the number of mirnAs in the human genome by far (tens of thousands) 205. The future use of next generation sequencing technologies will be a very useful tool to identify novel mirnAs even expressed at low levels 206-208. Database analyses revealed that most of the sequenc-Database analyses revealed that most of the sequenc-es derive from intronic or inter-genic regions of the genome. some mir genes are organized in clusters in the genome and, therefore, are believed to be processed from a single polycistronic rnA 209,210.
�.�.�. Biogenesis and mode of action
The biogenesis of mature mirnAs is well understood: rnA polymerase ii generates the primary rnA polymerase ii generates the primary mirnA transcript (pri-mirnA) in the nucleus 211,212, which is cut by an rnAse iii enzyme called Drosha in concert with Pasha a double stranded rnA binding protein 213. This produces secondary precursors (pre-mirnA) of 70-100 nucleotides in length 214 that in turn is exported to the cytoplasm by exportin 5 215,216. These pre-mirnA precursors were the first discoveredThese pre-mirnA precursors were the first discovered precursurs and bioinformatic characterisation showed, similar to predictions from lin-4 and let-7 that they form hairpin shaped, incompletely double stranded structures hairpin shaped, incompletely double stranded structures incompletely double stranded structures 188,217 (Figure 8). The precursor molecules are processed rapidly, and cleavage by Dicer (another rnAse iii) together(another rnAse iii) together with Loquacious (another double stranded rnA binding protein) only releases the mature mir-only releases the mature mir-nA (formerly called small temporal rnA (strnA) ) a ssrnA of about 22 nt, which is loaded into a risc-like protein complex.
��
�. Introduction
This strnA targets the 3’ UTr of a mrnA, but like lin-4 or let-7, they do not form perfect duplexes with their target sequences 218. This results in suppression of target gene activity at the translational level but does not trigger rnA degradation 194,195. nevertheless, an in vitro experi-ment showed that synthetic pre-let-7 rnA can also trig-ger rnAi when a perfect complementary target rnA is present 219 and the cleavage of target mrnAs induced by mirnAs with perfect or almost perfect homolgy seems to be a natural mechansim in plants 220. vice versa it was shown that sirnAs with mirnA sequences do not mark the target for degradation but for translational inhibition like natural mirnAs 221. in addition to the translational inhibition of mirnAs they might also increase mrnA de-cay. cytoplasmatic foci have been described and termed P-bodies (or GW-bodies) that contain mirnAs, mrnAs and further molecular components of rnAi related path-ways 222-226. it is believed that mrnAs targeted by mirnAs are located in or form P-bodies which might be sites for mrnA degradation (for review see 227).The experimental results fit into a model, that there are two related but distinct pathways involved: if there is perfect complementarity, Dicer produces sirnA and the complex
with risc leads to a targeted mrnA degradation (Figure 9, left). On the other hand, bulged secondary structures due to mismatches in complementation lead to the formation of strnA. This is probably achieved by Dicer as well, because the requirement for the Argonaute family proteins Alg-1 and Alg-2 in strnA biogenesis as well as in strnA-mediated suppression was shown 26 (Figure 9, right).in this view, risc could be seen as a flexible modular machinery. Depending on the type of the incorporated rnA a different set of proteins (e.g. from the Argonaute family) might be present in risc-like complexes and excert functions like methyltransferases, nucleases or translational repressors. Thus rnA would act not only in target recognition, but mainly the secondary struc-ture would also be the signal for a distinct arrangement of modules in risc.The requirements for target recognition (for detailed review see 228) are not fully understood although a strong Watson-crick based seed pairing of nucleotides 2-8 of the micrornA to the target seems to be obligatory 229,230. Also thermodynamic profiles, and secondary structures are known to influence target specificity. This limits the power of bioinformatical approaches to
5’
3’
U
U
UU
UU
UU
U
UU
U
UUU
UU
U
U
U
U
U
U
U
U
U
G
G
G
GGG
GG
GGG
G
G
G
G
G
GG
G
G
GG
GA
AA
A
A
A
AA
A
AAAA
AA
A
A
A A
A
AA
A
A
AA
C
C
CCC
CCC
C
C
C C
C
C
C
C
C
C
C CC
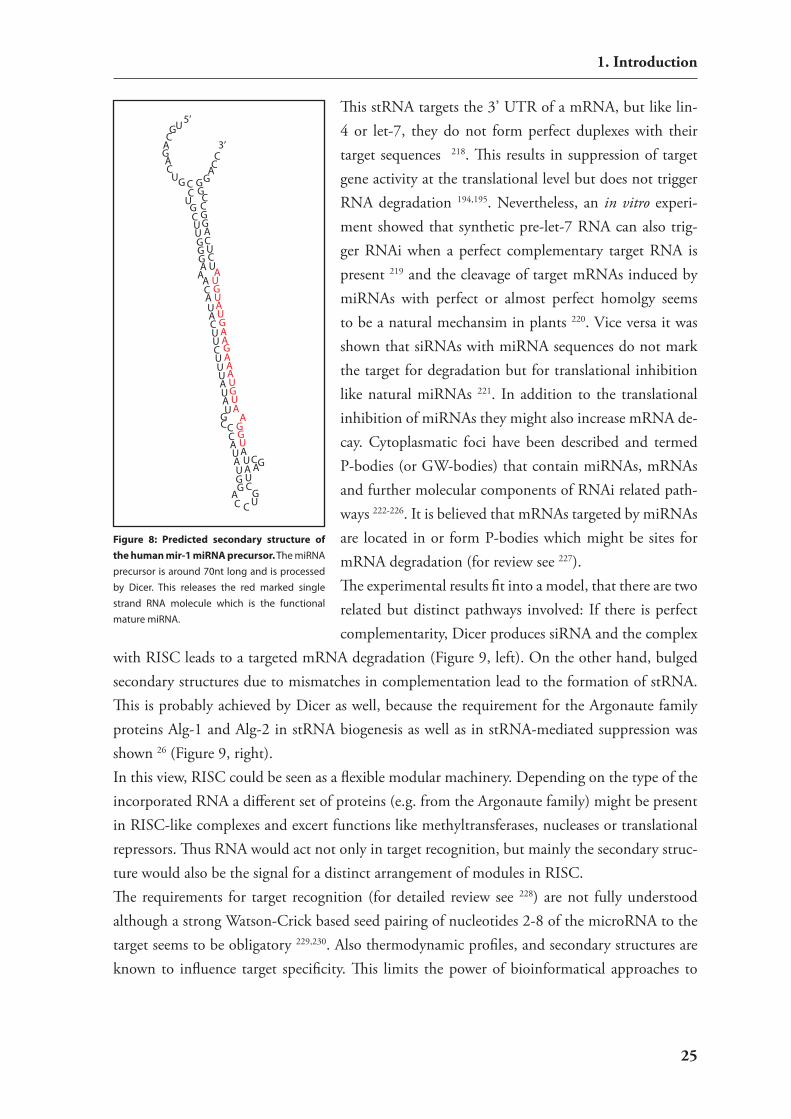
Figure 8: Predicted secondary structure of the human mir-1 miRNA precursor. The miRNA precursor is around 70nt long and is processed by Dicer. This releases the red marked single strand RNA molecule which is the functional mature miRNA.

��
�. Introduction
predict putative mirnA targets but it can be assumed that 30-90% of all protein coding genes are regulated by mirnAs 205,231-235. On the other hand a single mirnA can regulate 100 –200 target genes 230,236,237 and a target gene can have multiple target sites for mirnAs 238. This raises the hypothesis that mirnAs form large regulatory networks to fine tune gene expression 239 but yet most predicted target gene interactions are not experimentally verified.The finding of naturally occuring mirnAs had a great impact on the use of rnAi as a tool as well (discussed in greater detail in chapter 1.5.3). Mimiking the mirnA precursor structure, artificial systems for the delivery of sirnA have been established either so called shrnA vectors or expression vectors based on the sequences of the mir-30 precursor (chapter 1.5.3.).
�.�.�. Functions of microRNAs
The great number of mirnAs, the high degree of conservation among various animal speciesthe high degree of conservation among various animal species and their ubiquitous existence suggest fundamental biological roles 240-242. since their initial dis-covery as regulators of developmental timing, mirnAs have been implicated in many additional functions.The known roles of mirnAs are widespread ranging from development, cell cycle regulation and lineage determination 243,244. Among the most striking findings is the involvement of mir-nAs in cancer. Aberrant expression profiles of various mirnAs in tumor samples point to an important and general role in cancer 245-252. Most of the mirnAs showed a significant down-regulation in various tumors as compared to normal tissue. This is in line with findings that
dsRNA silencing trigger
siRNA
perfecthomology
stRNA
Dicer
Degradation Translational inhibition
RISC-likecomplex
m7G AAAAA... m7G AAAAA...
RISC-likecomplex
Dicer
shRNA assilencingtrigger
Dicer
miRNAhairpinprecursor
Figure 9: Intracellular processing of dsRNA. Depending on the grade of homology dsRNA is differently processed in the cell. If there is no mismatch in the targeting sequence (colored in green), siRNAs are produced by either dsRNA or shRNA, which leads to mRNA degradation. If there is incomplete basepairing producing a bulged secondary structure (blue colored) stRNA (later termed miRNA) is produced and mediates translational inhibition.

��
�. Introduction
DnA hypermethylation of mirnA loci occurs 253. nevertheless, there is also overexpression of mirnAs with antiapoptotic activity most prominently the entire mir-17 cluster 254,255.recent findings link the biology of mirnAs also to viral biology. it is known that viruses express mirnAs 256 that interfere with cellular protein expression and are also able to manipulate the host cells’ mirnA expression 257-259.Among the best characterized functions of mirnAs at the molecular level is its involvement in fine tuning of circadian rhythm 260 and cardiac development 261,262. Also important findings point to the involvement of particular mirnAs to neuronal functions. Mir-124a is exclusively expressed in neurons 263-266 and ectopic expression in (non-neuronal) heLa cells leads to a re-markable shift of the transcriptome towards neuronal expression profiles 236. Thus mir-124a is believed to control cell identity in neurons and probably homeostasis of differentiated neurons. Another interesting finding is the involvement of mir-134 in synaptic functions 267.As already seen in the founding mirnAs lin-4 and let-7, mirnAs are important for animal development 188,217. important additional insight have been obtained from experiments using Dicer depleted animals which are unable to process mature mirnAs. embryonic stem (es) cells derived from such mice fail to differentiate 268 and Dicer knock-out in combination with deple-tion of maternal Dicer protein in zebrafish show mainly morphogenesis defects during gastrula-tion and brain development 269.Looking at the entire set of predicted mirnA:target interactions it is likely that all biological functions and processes are influenced by mirnA-mediated gene regulation. half of the mam-malian trancripts are under selective pressure to maintain pairing to mirnAs 270. in bioinfor-matic predictions for conserved mirnA-targets an enrichment for certain cellular fuctions is hardly found.From the initial findings in which the mirnAs are believed to switch off their targets a “mutual exclusive” expression model had been established 271. nevertheless, more recent findings indicate that although mrnAs are repressed in tissues where the targeting mirnA is expressed they are still detectable 272,273. Although there are examples in which mirnAs act as a switch or failsafe mechanism that completely shuts down gene activity, the majority of mirnA:target interactions have modest effects on target protein expression 274 and thus are presumed to be interactions for fine-tuning protein levels in complex networks.
�.�.�. Expression studies of miRNAs
The expression of mirnAs, e. g. of lin-4 and let-7 can be very strictly limited to distinct life pe-riods and tissues, which discriminates mirnAs from other non-coding rnA species like trnAs or rrnAs.initially to acknowledge mirnAs as functional units it was important to show that mirnAs are temporally and spatially regulated and in deed it was found that the spatial and temporal

��
�. Introduction
expression patterns of lin-4 and let-7 cor-relate with the repression of their targets 191. The short size of mature mirnAs ren-ders expression studies extremely difficult and thus specific techniques or adaptations of existing technology needed to be estab-lished. For an overview see Figure. 10.The first indications of differential expres-sion of mirnAs came from cloning stud-ies. Many neuronal mirnAs have been cloned from brain, but not from other or-gans, which suggests a brain specific func-tion 263,264. To this end the established clon-ing procedures (see chapter 1.6.1) can be used as high-throughput semi-quantitative tool for expression analysis 204,275. in such an analysis the relative cloning frequencies of small rnAs are suggested to represent their
relative concentration within a sample. These early exploratory studies confirmed dynamic ex-pression patterns during animal development 276-278. recent advantages in deep sequencing ap-proaches are very promising to identify novel mirnAs and could allow acurate quantification also of low expressed mirnAs without the neccesity of cloning procedures 279.The most standardized and widely used method to detect mirnAs is northern-blotting. in this method, the sample containing mirnA is run on an denaturating polyacrylamide electrophore-sis gel which fractionates the short rnA species. next, the mirnA is transferred to a nitrocellu-lose membrane, analog to protein Western-blots in wet or semi-dry transfer systems via an elec-tric field. The membrane in turn is soaked in a solution containing a fluorescent or radiolabeled oligonucleotide probe which is complementary to the target mirnA 183,184,187. The disadvantages of northern-blots of mirnAs are the low sensitivity, which results in high amounts of required material. Additionally the technology is time consuming, which prevents using northern-blots for high-throughput analysis. nevertheless this, is the only method that directly allows to distin-guish between precursors and mature mirnAs.Although initially the establishment of microarray platforms for mirnAs was thought to be impossible some researchers succeeded and the technology greatly improved from the initial attempts 280-284. in the meantime there are even commercial tools from all major array manufac-turers available 285-288. When performing mirnA microarray experiments, sample preparation, enrichment, labeling and analysis has to be performed with specific care (reviewed in 289 and
1993 2002 2004 2006 2008
Hundrets ofmiRNAs found
First miRNA discovered
Expression profiling and functional characterisation
RT-PCR
Micro-Array
Cloning and sequencing
Northern-blotting
in-situ
NGS
Figure 10: Time course of published technologies to study miRNA expression.
��
�. Introduction
discussed in detail in chapter 4.3.).For validation of microarrays or expression analysis of a limited number of genes quantitative rT-Pcr (qrT-Pcr) methods are the gold standard for mrnAs 290,291. This method shows a much higher sensitivity than arrays allowing the analysis of small amounts of biological speci-men like specific organs or cell types. in a first step qrT-Pcr had been adapted for quan-tification of the longer mirnA precursors (pre-mirnAs) 292. nevertheless the expression of precursors do not neccesarily have to correlate with the amount of functional mature mirnA molecules since there is additional processing involved which might be one level of regulation. Due to the short length of mirnAs major modifications to standard qrT-Pcr are neccesary and two different technologies have been developed. One approach uses polyadenylated total rnA including mirnAs which is in turn reverse transcribed with a poly(T)adapter primer. Amplification via real-time Pcr was accomplished with a mirnA specific forward primer and a reverse primer designed to be complementary to the poly(T) adapter 293. The second approach utilizes reverse transcription primers that partially hybridize to themselves to form a stem-loop. The overlapping single strand binds to the 3’ portion of the mirnA and the resulting cDnA consists of the mirnA sequence elongated by the hairpin sequence. The cDnA can be used as template in a conventional TaqMan Pcr with a mirnA specific forward primer, a loop sequence containg reverse primer and a TaqMan probe 294. The use of a hairpin rT primer sig-nificantly increases specificity and sensitivity as compared to conventional linear ones likely due to the base stacking and spatial constraint of the stem–loop structure. The base stacking could improve the thermal stability and extend the effective footprint of rT primer/rnA duplex that may be required for effective rT from relatively shorter rT primers. The spatial constraint of the stem–loop structure may prevent it from binding double-stranded genomic DnA molecules and, therefore, eliminate the need of TaqMan mirnA assays for rnA sample preparation. Both qrT-Pcr methods should additionally be suitable for multiplexing allowing high throughput approaches 295.spatial resolution is rather limited to sample fractionation or tissue preparation in above re-viewed methods. Therefore to elucidate detailed expression patterns or identify expression in individual cell types in situ technologies are required although such analysis is time consuming and can hardly be performed in high-throughput. Due to the lack of reliable in situ hybridiza-tion protocols in first indirect detection attempts transgenetic sensor constructs were silenced 296. in this system transgenic mice carried a construct in which a constitutively expressed lacZ expression cassette was fused to a mirnA binding site in its 3’ untranslated region (UTr). At expression sites of the corresponding mirnA the construct with the modified 3’UTr was re-pressed as compared to animals carrying the construct without mirnA binding sites. Thus weak or absent X-gal staining displays the expression pattern of the corresponding mirnAs similar to a photographic negative.
�0
�. Introduction
The low hybridization energy of the binding of mature mirnAs to in situ probes is due to the short length of the molecule and rendered the development of conventional in situ hybridiza-tion (ish) procedures difficult. Although there are published approaches using either long rnA probes complementary to mirnA loci to detect mirnA precursor molecules 266 or short oligo probes to detect mature mirnAs 297,298 such approaches have limitations and are only able to reveal signals from highly expressed mirnAs. The key in establishment of reliable and sensi-tive mirnA in situ protocols was the use of chemically modified nucleotides so called locked nucleic acids (LnA) 299 in DnA oligonucleotide probes. This modification sterically increases the thermal stability of Watson-crick basepairing (for details see chapter 3.4.2.). Therefore the first publication presenting whole mount ish using such probes in zebrafish had great impact 265. in this broad study, expression signals of 115 mirnAs in embryonic developmental stages were presented and compared with microarray results. Later on the whole mount ish method was further optimized and adapted to mouse embryos 300. in summary, both studies show that most analyzed mirnAs were expressed in a highly tissue-specific manner during segmentation and later stages, but not early in development, which suggests that their role is not in tissue fate establishment but in differentiation or maintenance of tissue identity. A diverse range of tissue specific expression patterns was found with emphasis on the muscular, circulatory, digestive, skeletal and nervous system, thereby more than half of the analyzed mirnAs were expressed in the central nervous system.in vertebrates whole mount ish is limited to early embryonic stages since larger size and dense cell structure of older animals prevent penetration and perfusion of the probe into the tissue. To circumvent this problem several labs established ish on sections 301 or dissected tissues 288,302,303. These analyses in mice revealed detailed expression patterns of mirnAs in cartilage (mir-140) the eye, the inner ear (mir-96, mir-182, mir-183) and the brain (mir-431) and additionally demonstrate that LnA-oligos can reveal mirnA expression patterns at cellular resolution. More recently a catalog of mirnA expression patterns in the developing chicken has been pub-lished 304-306. Most mirnAs showed tissue specific expression patterns that are evolutionary con-served between zebrafish, chicken and mice although in some caseses also specific differences exist. Again only few mirnAs were detectable in early embryonic stages strengthening the idea that mirnAs do not control embryonic patterning but differentiation and post-differentiation processes like tissue identity and organogenesis.
�.�.�. Specific roles of miRNAs in the brain
Many mirnAs are developmentally regulated and show tissue-specific expression patterns in the cns, including dozens that are exlusively expressed in neurons 263-266. These mirnAs may play important roles in neuronal development, neuronal function, or both 289,307-309.Meaningful insight in the function of mirnas in the cns came from a well thought approach.

��
�. Introduction
Knocking out Dicer depletes maturation of pre-mirnAs and thus no functional mirnAs are produced in the cell. Dicer knock-out in zebrafish leads to a general growth arrest at later em-bryogenesis and the animals die at young age 39. Due to the specific embryonal development in zebrafish additional removal of maternal mirnA supply is required, which in contrast to the previous experiment also leads to strong early embryonic phenotypes. Although no major disruption in early patterning events could be observed these animals exhibited gross morpho-logical defects particularly in the nervous system and the mid-hindbrain boundary which most interstingly could be rescued by injection of mir-430 alone 269.Loss of Dicer in mature neurons showed that mirnAs are essential for maintaining their struc-tural integrity such as in Drosophila loss of Dicer-1 leads to an increased neurodegeneration 310. selective ablation of Dicer in a cell type specific way has also been performed in conditional mouse mutants and depletion in the purkinje cell layer of the cerebellum has been shown to leadepletion in the purkinje cell layer of the cerebellum has been shown to lead to cerebellar degeneration and ataxia 311 and knock-out in post-mitotic midbrain dopaminergic neurons caused progressive cell loss in the respective brain region 312.These approaches are unable to reveal individual functions of mirnAs and beyond that Dicer might have functions others than in rnAi. Therefore, various additional techniques can be ap-various additional techniques can be ap-plied. Gain and loss of function approaches have been performed by using genetic knock-outs/overexpression or specific modified oligonucleotides (2’-O-methyl-antisense oligos, Antagomirs, mircUrY LnA micrornA knockdown probes). When introduced into cells these artificial molecules bind to mirnAs and render them ineffective 313-316. The numerous literature findings on the neuronal functions of individual mirnAs and their targets are summarized in table 3. Also these data point to the importance of neuronal mirnAssummarized in table 3. Also these data point to the importance of neuronal mirnAs for neuronal differentiation, identity and survival. But beyond that also dendritic and so far unknown functions could be assigned to mirnAs in the brain.mirnAs have also been directly implicated in the etiology of neuronal diseases. in a gene ex-pression study with postmortem sporadic Alzheimer’s disease (AD) brains differential mirnA expression was found as compared to controls 333. AD is a neurodegenerative process, which is accompanied with the production of aberant amyloid beta (Aβ) peptides in cells of the brain. mirnAs interact with the BAce-1/β secretase genes which catalyze a rate-limiting step for Aβ production, and its increased expression has been reported among AD patients 334. mir-29a, mir-29b-1 and mir-9 regulate BAce-1 expression in vitro and it was found that expression of the mir-29a/b-1 cluster is significantly decreased in AD patients 335, which results in abnormal high accumulation of BAce-1 protein and Aβ levels among AD patients.similar to the findings in AD two studies report altered expression profiles in schizophrenic patients as compared to controls. 16 mirnAs were differentially expressed in the prefrontal cortex 336 and mir-181b was upregulated in affected subjects in the temporal cortex 337. Further-more, genetic data identified mir-219 in a putative susceptibility locus for schizophrenia 338.
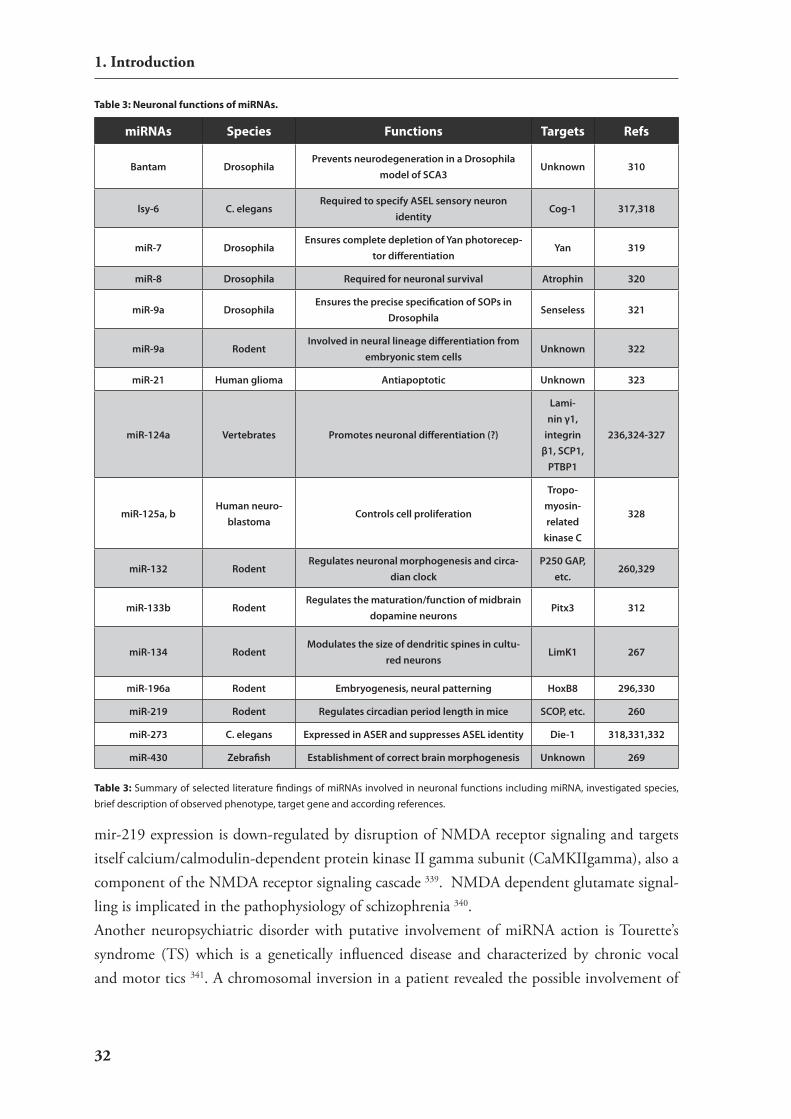
��
�. Introduction
mir-219 expression is down-regulated by disruption of nMDA receptor signaling and targets itself calcium/calmodulin-dependent protein kinase ii gamma subunit (caMKiigamma), also a component of the nMDA receptor signaling cascade 339. nMDA dependent glutamate signal-ling is implicated in the pathophysiology of schizophrenia 340.Another neuropsychiatric disorder with putative involvement of mirnA action is Tourette’s syndrome (Ts) which is a genetically influenced disease and characterized by chronic vocal and motor tics 341. A chromosomal inversion in a patient revealed the possible involvement of
Table 3: Neuronal functions of miRNAs.
miRNAs Species Functions Targets Refs
Bantam DrosophilaPrevents neurodegeneration in a Drosophila
model of SCA3Unknown 310
lsy-6 C. elegansRequired to specify ASEL sensory neuron
identityCog-1 317,318
miR-7 DrosophilaEnsures complete depletion of Yan photorecep-
tor differentiationYan 319
miR-8 Drosophila Required for neuronal survival Atrophin 320
miR-9a DrosophilaEnsures the precise specification of SOPs in
DrosophilaSenseless 321
miR-9a RodentInvolved in neural lineage differentiation from
embryonic stem cellsUnknown 322
miR-21 Human glioma Antiapoptotic Unknown 323
miR-124a Vertebrates Promotes neuronal differentiation (?)
Lami-nin γ1,
integrin β1, SCP1,
PTBP1
236,324-327
miR-125a, bHuman neuro-
blastomaControls cell proliferation
Tropo-myosin-related
kinase C
328
miR-132 RodentRegulates neuronal morphogenesis and circa-
dian clockP250 GAP,
etc.260,329
miR-133b RodentRegulates the maturation/function of midbrain
dopamine neuronsPitx3 312
miR-134 RodentModulates the size of dendritic spines in cultu-
red neuronsLimK1 267
miR-196a Rodent Embryogenesis, neural patterning HoxB8 296,330
miR-219 Rodent Regulates circadian period length in mice SCOP, etc. 260
miR-273 C. elegans Expressed in ASER and suppresses ASEL identity Die-1 318,331,332
miR-430 Zebrafish Establishment of correct brain morphogenesis Unknown 269
Table 3: Summary of selected literature findings of miRNAs involved in neuronal functions including miRNA, investigated species, brief description of observed phenotype, target gene and according references.
��
�. Introduction
a region on chromosome 13q31.1 with Ts. This region is in proximity to slit and Trk-like 1 (sLiTrK1) as a candidate gene. Genetic and molecular characterisation of this candidate in a large cohort revealed that there is a single base pair mutation in the 3’ UTr associated with the syndrom. This mutation is located inside a predicted binding site for mir-189 and was shown to be functionally relevant on expression levels of sLiTrK1 and influences dendritic growth 342.Another protein implicated in rnAi is the fragile X mental retardation protein 1 (FMrP) 343. Loss of FMrP function causes fragile X syndrome, the most common form of inherited mental retardation in humans 344. it is known that many mrnAs associate with FMrP-containing pro-tein complexes 345,346, but it is still unclear which rnA species directly bind to FMrP. Although the exact function of FMrP at the molecular level still remains unknown, it appears to be as-sociated with the mirnA pathway. it was purified with risc 347 and forms a complex with Ar-gonaute 2 (Ago2) in Drosophila s2 cells 348 that also contains Dicer and mirnAs. nevertheless, these studies could not attribute a critical role to FMrP in risc. Mutant mice or flies lacking FMrP or dFMr1 are viable but show mild aberrations in the nervous system caused by various defects in spine and synapse formation 349-352, axonal and dendritic growth and branching 353-355 and neurogenesis 356. Although FMrP is a multifunctional protein involved in several different stages of rnA metabolism, its effects on neuronal development are probably mediated at least in part through the mirnA pathway. Further dissection of the exact role of dFMr1 and FMrP in risc will help explain the link between the mirnA pathway and human mental disorders.in summary, there is increasing knowledge about the involvement of mirnAs in brain disease emerging but detailed elucidation of the molecular targets is largely missing. The detailed eluci-dation of the spatial and temporal patterns of mirnA expression in the developing mammalian central nervous system is a prerequisite to understand their detailed function and is a useful aid in approaches to identify potential target genes.

��
�. Introduction
1.7. Aim of the thesisThe aimed work covers two related but distinct topics. The establishment of the rnAi technol-ogy for applications in functional neuroscience and the initial investigation of biological roles of mirnAs in the mouse brain. since at the starting point of the work the field of small rnA biology was very young the tools to address basic biological questions in laboratory experiments were not yet fully developed. That’s why it became apparent that great effort of the work would have to be put into technology and method development. Thus, it was not expected to accom-plish a complete biological view in the frame of the presented work. Taken this into account the mentioned two part strategy was chosen. Although rnAi mediated silencing and elucidation of biological roles of mirnAs cover a broad thematic spectrum many of the methods that had to be developed would be applicable to both topics.The first project line aimed at development and characterization of an expression vector to medi-ate stable rnAi. so far there was no real alternative to rnAi vectors based on Pol iii transcrip-tion units and this project should for the first time use a Pol i promoter for the expression of shrnAs. The experiments were planned to be solely performed in cell culture models since the designated read out of the assays was the specific down regulation of genes targeted by the vec-tor. The novel vector should be first tested for its silencing properties within reporter assays and later be used for additional knock-down of endogenous genes. That way the experiments could be performed efficiently and with fast output. For a complete characterization of the vector it would be additionally required to show that the observed effects were on the one hand medi-ated via the rnAi pathway and on the other hand depend on Pol i activity. in addition to that vector development project it was desired also to induce rnAi mediated gene knock-down in the living animal. In vivo rnAi seemed to be a very appealing alternative to the conventional time consuming production of transgenic knock-out animals. Thereby, the long term goal was to induce knock-down phenotypes of candidate genes that are supposedly involved in anxiety related behaviour or brain pathology. in a technology oriented approach the efficient delivery of molecules that trigger rnAi to cells in the brain should be accomplished. in addition this proj-ect was intended as a proof of concept for non-transgenic rnAi in the mammalian brain.in the second line of research two more projects were planned to address the role of mirnAs in the mouse brain. since at the time only very limited knowledge was available these initial proj-ects should cover exploratory experiments. in an unbiased approach it was intended to elucidate whether mirnAs are regulated upon neuronal activity and thus, might be involved in synaptic plasticity. Therefore, differential expression analysis of hippocampal mirnAs from animals ei-ther treated with kainate or saline was aimed using array technology. A prerequisite for func-tional studies of novel genes possibly involved in neuronal function is their detailed expression analysis in the developing and adult nervous system. Although highly needed at that time no in situ hybridization technology on tissue sections was available for mirnAs due to specificity

��
�. Introduction
problems inherent to the short length of the transcripts. Thus, the intention of a second project on mirnAs was to establish a specific and sensitive protocol for in situ hybridization and to determine the spatial and temporal expression patterns of selected candidate genes.

��
�. Materials and methods
2. Materials and methods
2.1. Materials
�.�.�. Chemicals
Chemical Substance Source
Acrylamide:Bisacrylamide (29:1) Sigma, Deisenhofen
Adenosintriphosphate Sigma, Deisenhofen
Agar, Agarose Invitrogen GmbH, Karlsruhe
Agarose (low melting temperature), SeaPlaque Biozym, Oldendorf
Ammoniumpersulfat (APS) Sigma, Deisenhofen
Ampicillin Sigma, Deisenhofen
Ampuwa-Water Fresenius AG, Bad Homburg
Beta(2)-Mercaptoethanol Sigma, Deisenhofen
Boric Acid Sigma, Deisenhofen
Bradford reagent Bio-Rad Laboratories GmbH, München
Bromophenolblue MERCK, Darmstadt
BSA (bovine serum albumin) Sigma, Deisenhofen
Chloroform MERCK, Darmstadt
CompleteTM Mini, EDTA free, protease inhibitor cocktail tablets Roche, Mannheim
Cresylviolett Merck, Darmstadt
D(-)Luciferin (from Photinus pyralis) Roche, Mannheim
Dapi Sigma, Deisenhofen
DEPC (Diethylpyrocarbonate) Roth, Karlsruhe
Dextran sulfate Sigma, Deisenhofen
Dimethylsulfoxid (DMSO) Sigma, Deisenhofen
DTT (Dithiothreitol) MERCK, Darmstadt
Dulbecco´s Modified Eagle Medium (DMEM) Invitrogen GmbH, Karlsruhe
EBSS 10xw/o Calcium and Magnesium
Invitrogen GmbH, Karlsruhe
EDTA (Ethylendiamintetracetate) Sigma, Deisenhofen
Ethanol MERCK, Darmstadt
Ethidiumbromide Sigma, Deisenhofen
Fetal calf serum (FCS) Invitrogen GmbH, Karlsruhe
Ficoll 400 Sigma, Deisenhofen
Formamide Roth, Karlsruhe

��
�. Material and methods
Chemical Substance Source
Gelatine Sigma, Deisenhofen
Glutamine Invitrogen GmbH, Karlsruhe
Glycerol Sigma, Deisenhofen
Glycin Sigma, Deisenhofen
H2O2 MERCK, Darmstadt
HCl Roth, Karlsruhe
Hepes Invitrogen GmbH, Karlsruhe
In vivo Jet PEI PEQLAB Biotechnologie GmbH, Erlangen
Isofluran Abbott, Chicago, IL, USA
Isopropanol Roth, Karlsruhe
Kainic Acid (KA) Sigma, Deisenhofen
Kanamycin Sigma, Deisenhofen
Kodak GBX developer Sigma, Deisenhofen
KODAK GBX Fixer Sigma, Deisenhofen
Kodak NBT-2 photographic emulsion Sigma, Deisenhofen
Leukaemia inhibiting factor Millipore, Billerica, USA
Magnesiumchloride (MgCl2) Hexahydrate MERCK, Darmstadt
Metacam Bayer
Non-fat dried milk powder Nestlé, Vevey, Switzerland
Paraffin MERCK, Darmstadt
Paraformaldehyde (PFA) Sigma, Deisenhofen
PBS sterile 10X (pH 7,4) Invitrogen GmbH, Karlsruhe
Penicillin-Streptomycin-Amphotericin Invitrogen GmbH, Karlsruhe
Phenol Roth, Karlsruhe
Polyvinilpyrolidone Sigma, Deisenhofen
Reporter Lysis Buffer (for Luciferase-Assay)
Promega, Mannheim
RNA later ICE Ambion, Austin, TX, USA
Rotihistol Roth, Karlsruhe, Germany
RPMI 1640 medium with 10% Newborn Serum Invitrogen GmbH, Karlsruhe
Sarcosyl (N-lauroylsarcosine) Sigma, Deisenhofen
SDS (Sodiumdecylsulfate) Roth, Karlsruhe
Sodium hydroxide (NaOH) Roth, Karlsruhe, Germany
Sodium pyruvate Sigma, Deisenhofen
Sodiumacetate MERCK, Darmstadt
Sodiumhydroxide MERCK, Darmstadt
Szintillation fluid Roth, Karlsruhe
Tetramethylethylendiamin (TEMED) Bio-Rad Laboratories GmbH, München

��
�. Materials and methods
Chemical Substance Source
Tris (Tris-(hydroxymethyl)-aminomethane) Roth, Karlsruhe
Trizma Base Sigma, Deisenhofen
Trypsin-EDTA 10X Invitrogen GmbH, Karlsruhe
Tween-20 Bio-Rad Laboratories GmbH, München
Urea Sigma, Deisenhofen
Vectashield Mounting Medium (Fluoreszenz) Vector Laboratories inc., Burlingame, CA, USA
α-Amanitin Sigma, Deisenhofen
�.�.�. Enzymes
Enzymes Source
DNase I, RNase-free Roche, Mannheim
Pfu Polymerase (cloned) Stratagene, Heidelberg
Proteinase K Sigma, Deisenhofen
Restriction enzymes with 10x Buffer New England BioLabs, New England, USA
RNase A Roche, Mannheim
RNasin Promega, Mannheim
SAP (alkaline phosphatase from shrimp) Roche, Mannheim
SP6-RNA polymerase Roche, Mannheim
T4 DNA Ligase Roche, Mannheim
T4 DNA Polymerase New England BioLabs, New England, USA
T4 Polynucleotide Kinase (PNK) Roche, Mannheim
T7-RNA polymerase Roche, Mannheim
Taq DNA Polymerase Roche, Mannheim
Terminal transferase (TdT) Roche, Mannheim
�.�.�. Nucleotides und nucleic acids
Nucleotides/Nucleic Acids Source
Desoxyribonucleotides (dATP, dCTP, dGTP, dTTP) Roche, Mannheim
DNA-Molecular Weight Markers: 1kb LadderSmart Ladder
Roche, MannheimEurogentec, Belgien
Locked Nucleic Acid (LNA)-modified oligonucleotides Exiqon, Vedbaek, Denmark
Oligonucleotides ( PCR-Primers) MWG-Biotech, Ebersberg
p(dN)6 Boehringer, Mannheim

��
�. Material and methods
Nucleotides/Nucleic Acids Source
Plasmid vectors
pRLSV40pGL3controlpBluescript II KS (-)pU6-shluc (pSHAG-ff)pU6 (pSHAG)pcDNA3
Promega, MannheimPromega, MannheimStratagene, HeidelbergProf. G. Hannon (Cold Spring Harbor, N.Y.)Prof. G. Hannon (Cold Spring Harbor, N.Y.)Invitrogen, Karlsruhe
Ribonucleotides (ATP, CTP, GTP, UTP)
α32P-UTP PerkinElmer, Waltham, USA
α-thio-35S-dATP PerkinElmer, Waltham, USA
35S-thio-rUTP PerkinElmer, Waltham, USA
γ32P-ATP PerkinElmer, Waltham, USA
�.�.�. Kits and other expendable items
Kits/expendable items Source
Bacterial dishes Greiner Labortechnik, Frickenhausen
BCA assay kit Pierce, Rockford, IL, USA
Bio Rad Protein Assay Bio-Rad Laboratories GmbH, München
BioMax MR from Kodak Sigma, Deisenhofen
Cell culture dishes (gamma sterilised)Peske, Aindling-Pichl; Nunc, Fisher Scientific GmbH, Schwerte
DIG Wash and Block Buffer Set Roche, Mannheim
Dual Luciferase Reporter Assay System Promega, Mannheim
ECL Plus GE Healthcare, Buckinghamshire, UK
EffecteneTransfection Reagent QIAGEN, Hilden
Falcon-Tubes Becton Dickinson, Europe
Glass capillariesPeske, Aindling-Pichl; Nunc, Fisher Scientific GmbH, Schwerte
Hamilton canula Hamilton Company Europe, Bonaduz, GR, Switzerland
Hybond N+ Nylon Membrane Amersham
Immobilon polyvinylidene difluoride (PVDF) membrane Millipore, Billerica, USA
in vivo jetPEI Polyplus-transfection Inc., New York, USA
Lipofectamine 2000 Reagent Invitrogen, Karlsruhe
M.O.M. kit Vector Laboratories inc., Burlingame, CA, USA
Microtiterplates Microlite –1+ (Rundboden) Peske, Aindling-Pichl
mini Quick Spin Oligo Columns Roche, Mannheim, Germany
MirVana Probe and Marker Kit Ambion, Austin, TX, USA
NBT/BCIP Stock Solution Roche, Mannheim, Germany
�0
�. Materials and methods
Kits/expendable items Source
Parafilm M American National Can TM Chicago,USA
PCR-Reaction Tubes Peske, Aindling-Pichl
peqGold RNAPure Peqlab, Erlangen
Pipette Tips Sarstedt, Nürnbrecht
QIAprep Plasmid Purification Kit (Midi and Maxi) QIAGEN, Hilden
QIAquick Gel Extraction Kit QIAGEN, Hilden
QIAquick PCR Purification Kit QIAGEN, Hilden
Reaction Tubes (1.5 / 2.0 ml) Eppendorf, Hamburg
Serological Pipettes (gamma sterilised) Peske, Aindling-Pichl
Slides (for Histology) Fisher Scientific
Super Frost slides Menzel-Gläser, Braunschweig, Germany
TSA signal amplification kit Perkin Elmer
Vacuum filters (gamma sterilised) Peske, Aindling-Pichl
X-ray film (Western) Fuji Photo Film, Tokyo, Japan
�.�.�. Devices and equipment
Device Source
Autoclave Type 24 Melag, Berlin
Autoklav Typ 24 Melag Avanti
AxioCam MRc5 color ccd camera Zeiss, Göttingen Germany
AxioCam MRm greyscale ccd camera Zeiss, Göttingen Germany
Axioplan 2 microscope Zeiss, Göttingen Germany)
Biofuge Pico Heraeus Instruments Biofuge Pico Heraeus Instruments
Chambers for DNA-Electrophoresis MWG-Biotech, Ebersberg
Cooled Centifuge J2-MC (Rotors: JLA-16.250/JA-20) Beckman Instruments, USA
Counting Chamber (for cells) Neubauer improved with cover slide
Peske, Aindling-Pichl
Developing automate (XP 2000) 3M Kodak
Evaporator Halothan Vapor 19 Drägerwerk AG & Co. KGaA, Lübeck
EXFO X-Cite 120 fluorescence illuminator EXFO Photonic Solutions Inc., Mississauga, Canada
Freezers (-20°C) Liebherr, Ochsenbach
Freezers (-80°C) Heraeus, Hanau
Gel Documentation Gel Print 2000i MWG-Biotech, Ebersberg
Glass Ware Schott, Mainz
Heater, Agitator IKA Labortechnik, Staufen
Heating Block Thermomixer 5436 Eppendorf,
Heating Blocks Thermomixer 5436 Eppendorf, Hamburg

��
�. Material and methods
Device Source
Incubator for Cell Culture (5% CO2-ambiance) Heraeus, Hanau
Kryostat 2800 Frigocut Reichert-Jung
Kryostat HM 560 M Microm
LaminAir Flow Cabinet HB2472 Kendro Laboratory Products, Hanau
Leica MZ APO stereomicroscope Leica, Wetzlar, Germany
Microlitre Centrifuge Biofuge Pico Haraeus, Hanau
Multilabel Counter Wallac 1420 Victor Oy Perkin Elmer,
OP Microscope Zeiss,
Orbital Mixer Unimax 2010 Heidolph, Nürnberg
PCR-Machines Robo Cycler Gradient 96 Stratagene, Heidelberg
pH-Meter pH 538 WTW, Weilheim
Pipets Gilson, USA
Pipetting Device pipetus-akku Roth, Karlsruhe
Power Supply for Electrophoresis Pharmacia Biotech, Freiburg
Refridgerator (4°C) Liebherr, Ochsenbach
Seral Full desalination plant Seralpur PRO 90 CN Seral, Ransbach-Baumbach
Single Pan Balances 40SM-200A/LP 4200 S Precisa, Dietikon, Schweiz/ Sartorius, Göttingen
Spectrophotometer DU640 Beckman Instruments, USA
Stereotactic device (David Kopf, Tujunga, CA, USA)
Trefflab Pellet Mixer for 1,5ml Tube Peske, Aindling-Pichl
UV-Stratalinker 2400 Stratagene
UV-Transilluminator, Faust 366nm Konrad Benda, Wiesloch
Vortex MS1 Minishaker IKA Labortechnik, Staufen
Waterbath GFL, Burgwedel
2.2. Media and basic buffersMedium/Buffer Contents
1x PBS/sterile50 ml 10xPBS450 ml ddH2O (autoclaved)sterile filtered (0,2 µm)
Ampicillin/Kanamycin 100 mg/ml of the salt in 75% Ethanol (Storage at –20°C)
BES-buffered saline 2X50mM BES280 mM NaCl1.5 mM Na2HPO4
Denhardt’s solution 50X
10g Ficoll 40010g bovine serum albumin10g polyvinylpyrrolidoneto 1l DEPC H2O (stored in 50ml aliquots at –20°C)

��
�. Materials and methods
Medium/Buffer Contents
DEPC-H2O2 ml DEPC in 2 l ddH2O were mixed vigorously, left at RT for at least 4 h and autoclaved afterwards 2x.
DMEM complete
500 ml DMEM50 ml FCS (heat inactivated at 56°C for 30 min)5 ml 100x glutamine+ antibiotics
dNTP-Mix10 mM of each Desoxynucleotidetriphosphate(dATP, dCTP, dGTP und dTTP)
heat inactivated RNase A40 mg RNase A in 4 ml 1xTEheat for 10 minutes to 95°C, let cool, store aliquots at –20°C
LB (Luria-Bertani)-Medium1,0% Trypton0,5% Yeast Extract1,0% NaCl, autoclaved
Loading Buffer for DNA-Gels 5x
20% Ficoll0,05% Bromphenolblue0,05% Xylencyanol40 mM EDTA
Maleat Buffer150 mM NaCl100 mM Maleic Acidadjust to pH 7.5
Northern blot hybridization solution6X SSC5X Denhardt’s solution0.2% SDS
Northern blot prehybridization solution6X SSC10X Denhardt’s solution0.2% SDS
Northern blot prehybridization solution (for DNA probes)
6X SSC10X Denhardt’s solution0.2% SDS
Northern blot washing solution6X SSC0.2% SDS
NTE2,5M NaCl50mM Tris 8.025mM EDTA 8.0
PBS-Buffer 10X
120 mM NaCl2,7 mM KCl7 mM Na2HPO4pH 7,4 ; autoclaved
PBT1 x PBS0.05 % Tween 20 (for 1 l + 5 ml 10 % Tween)
SSC 20X175.3g NaCl88.2g sodium citrateto 1l DEPC H2O
TAE Buffer 50X2 M Tris-Base1 M Sodium acetate50 mM EDTA (pH=8,0), autoclaved

��
�. Material and methods
Medium/Buffer Contents
TBE 10X0.9M Tris base0.9M Boric acid20mM EDTA
TBS
8g NaCl0.2g KCl25mM 1 M Tris 7.5to 100ml with water
TBST20 mM Tris base150 mM NaCl0.1% Tween 20
TE-Buffer 0,1X plus RNase A1 mM Tris-HCl (pH 7,2)1 mM EDTA 100 µg/ml RNase A (heat inactivated)
TMN (also called MTN)
0,1 M Tris 0,1 M NaCl0,05 M MgCl2-6H2Oadjust to pH 9.5
TN 10X1M Tris1,5M NaCladjust to pH 7.5
TNB
0,1 M Tris0,15 M NaCl0,5 % ( = 2,5 g) blocking reagent (NEN)dissolve in 60°C for 1h; store aliquots at –20°C
TNT1 x TN0,05 % Tween-20
Trypsin-EDTA80 ml H2O10 ml EBSS10 ml 10x Trypsin-EDTA sterile filtered(0,2 µm)
Western transfer buffer:25 mM Tris base192mM Glycin10% Metanol0.5g SDS per liter
2.3. Oligonucleotides
�.�.�. DNA oligonucleotides
All DnA oligonucleotides have been ordered at MWG Biotech.Name Sequence Used for
5S rRNA 5’-TTA GCT TCC GAG ATC A-3’ Control oligo probe for Northern blot
con.as5’-GGG AAT GTA CAT GTG TAA TAG CTC CTC TCT TGA AGG AGC TAT TAC ACA TGT AC-3‘
Construction and cloning of a control silen-cing construct
con.s5’-AGG TGT ACA TGT GTA ATA GCT CCT TCA AGA GAG GAG CTA TTA CAC ATG TAC AT-3‘
Construction and cloning of a control silen-cing construct

��
�. Materials and methods
Name Sequence Used for
Luc 1st 5´-ATC AGG TGG CTC CCG CTG AAT TGG AAT CC-3´ Creation of a probe for Northern blot
Luc 2nd 5´-AAT GGA TTC CAA CTC AGC GAG AGC CAC CCG AT-3´ Creation of a probe for Northern blot
M13 for 5´-TGT AAA ACG ACG GCC AGT-3´Screening of constructed plasmids via PCR;Sequencing
M13 rev 5´-AGC GGA TAA CAA TTT CAC AC-3´ Screening of constructed plasmids via PCR;Sequencing
MCS.as5´-GGG ATA GTC TTC CCA TGG TAC CAA TTG ATA TCT AGA GCT CGA GAT CTT CGA AGA CGT AC-3´
Construction and cloning of a multiple clo-ning site into a Pol I driven Vector; antisense strand
MCS.s5´-GTC TTC GAA GAT CTC GAG CTC TAG ATA TCA ATT GGT ACC ATG GGA AGA CTA-3´
Construction and cloning of a multiple cloning site into a Pol I driven Vector; sense strand
P1 5’-CAA TTT CAC ACA GGA AAC AGC TAT GAC C-3’Construction and cloning of backbone for Pol I based RNAi vectors pw-bc and pE3sp-bc
P2 5’-ATG TCT TCG AAG TCC ATG GTA CCT ATC TCC AGG TC-3’Construction and cloning of backbone for Pol I based RNAi vectors pw-bc and pE3sp-bc
P3 5’-ACC ATG GAC TTC GAA GAC TAT CCC CCC CAA CTT CG-3’Construction and cloning of backbone for Pol I based RNAi vectors pw-bc and pE3sp-bc
P4 5’-GTC ACG ACG TTG TAA AAC GAC GGC CAG T-3’Construction and cloning of backbone for Pol I based RNAi vectors pw-bc and pE3sp-bc
shErk2.as5’-GGG AAT GGA AGA TCT GAA TTG TAT AAT AAC AAG CTT CTT ATT ATA CAA TTC AGA TCT TCC-3’
Construction and cloning of the silencing hairpin construct against MAP kinase p42 (ERK2)
shERK2.s 5’-AGG TGG AAG ATC TGA ATT GTA TAA TAA GAA GCT TGT TAT TAT ACA ATT CAG ATC TTC CAT-3‘
Construction and cloning of the silencing hairpin construct against MAP kinase p42 (ERK2)
shluc.as5´-GGG AAT GGA TTC CAA CTC AGC GAG AGC CAC CCG ATC AAG CTT CAT CAG GTC GTG GCT CCC GCT GAA TTG GAA TCC-3´
Construction and cloning of the silencing hairpin construct against Firefly Luciferase
shluc.s5´-AGG TGG ATT CCA ATT CAG CGG GAG CCA CCT GAT GAA GCT TGA TCG GGT GGCTCT CGC TGA GTT GGA ATC CAT-3´
Construction and cloning of the silencing hairpin construct against Firefly Luciferase
�.�.�. RNA oligonucleotides
All rnA oligonucleotides for constitution of sirnAs have been ordered at Dharmacon/invitro-gen. Mir-16 oligo was used as northern oligo probe and taken from mirvana kit (Ambion).
Name Sequence
Dicer human.as 5’-CAT CCA GCA GTG GCT GGT TGA-3’
Dicer human.s 5’-TCT CAA CCA GCC ACT GCT GGA-3’
Dicer mouse.as 5’-UUC CAG CAG CUC AAC CUG GUA-3’
Dicer mouse.s 5’-AAA AUA CCA GGU UGA GCU GCU-3’
Luc.as 5’-AAA GCU UCA UGA GUC GCA UUC-3’
Luc.s 5’-UCG AAG UAC UCA GCG UAA GUG-3’

��
�. Material and methods
Name Sequence
Mir-16 5’-UAG CAG CAC GUA AAU AUU GGC G-3’
Stealth-CBP1.as 5’-AUG AAG CAG UAG AAC CAG CUG CUG C-3’
Stealth-CBP1.s 5’-GCA GCA GCU GGU UCU ACU GCU UCA U-3’
Stealth-CBP2.as 5’-UAU UCU GAU AGC UGU AGU AGG CUG C-3’
Stealth-CBP2.s 5’-GCA GCC UAC UAC AGC UAU CAG AAU A-3’
�.�.�. LNA modified oligonucleotides
All LnA modified oligonucleotides have been ordered at exiqon and were used as probes for in situ hybridization.
Name Sequence
mmu-mir-1 5’-TAC ATA CTT CTT TAC ATT CCA-3’
mmu-mir-124a 5’-GGC ATT CAC CGC GTG CCT TA-3’
mmu-mir-125b 5’-TCA CAA GTT AGG GTC TCA GGG A-3’
mmu-mir-132 5’-CGA CCA TGG CTG TAG ACT GTT A-3’
mmu-mir-134 5’-CCC CTC TGG TCA ACC AGT CAC A-3’
mmu-mir-206 5’-CCA CAC ACT TCC TTA CAT TCC A-3’
mmu-mir-219 5’-AGA ATT GCG TTT GGA CAA TCA-3’
mmu-mir-9 5’-CAT ACA GCT AGA TAA CCA AAG A-3’
shRNA 5’-GCA AAC GTC CTG GAG TAT ATA CTG A-3’
2.4 Vectors::
�.�.�. Plasmids
Vector Length Description Basic Features Reference
pBluescript II KS (-) 3.0 kb Cloning VectorF1 (-) Ori, β-Galactosidase, MCS, lac promoter, Ampr
Stratagene, Heidelberg
PE3MCS 3.439 kb RNAi cloning vectorMouse Pol I-Promoter, Enhancer, Terminator, Ampr, MCS
generated
pE3sp-bc 3.382 kb Ribosomal MinigeneMouse Pol I-Promoter, Enhancer, Terminator, Ampr
Maria Brenz Verca, MPI for Psychiatry, Munich
pE3sp-sh-Con 3.454 kbshRNA expression vector
Expresses control sh-RNA; inserted into PE3MCS
generated
pE3sp-sh-Erk2 3.454 kbshRNA expression vector
Expresses sh-ERK2; inserted into PE3MCS
generated
pE3sp-sh-Luc 3.454 kbshRNA expression vector
Expresses sh-luc; inserted into PE3MCS
generated

��
�. Materials and methods
Vector Length Description Basic Features Reference
pGL3control 5.256 kbMammalian Expres-sion Vector for Firefly Luciferase
SV 40, Ampr, f1 ori, poly A, firefly luciferase+
Promega, Mannheim
pRLSV40 3.7 kbMammalian Expres-sion Vector for Renilla Luciferase
SV 40 Enhancer/Promoter/ori/poly A, renilla luciferase+, Ampr
Promega, Mannheim
pSHAG ~3 kbEmpty backbone for shRNA expression cassette
U6 snRNA transcription unit for expression of shRNAs, pENTR/D-TOPO backbone, Kanamycinr
Greg Hannon, Cold Spring Harbor Laboratory
pSHAG-FF ~3 kbshRNA expressing Vector
U6 snRNA transcription unit, inverted repeat targeting firefly luciferase, pENTR/D-TOPO back-bone, Kanamycinr
Greg Hannon, Cold Spring Harbor Laboratory
pW-bc ~3.3 kb Ribosomal MinigeneMouse Pol I-Promoter, Termina-tor, Ampr
Masha Brenz Verca, MPI for Psychiatry, Munich
�.�.�. Viral vectors
VectorSero-type
Descrip-tion
Basic Features Reference
AAV ½ CMV-EGFP AAV1/2 Reporter Expresses GFP from hCMV promoter Sebastian Kügler, Göttingen
AAV ½ sh-GFP AAV1/2 RNAi VectorExpresses shRNA targeting eGFP from h1 promoter and dsRed from synapsin promoter
Sebastian Kügler, Göttingen
AAV ½ sh-Luc AAV1/2 RNAi VectorExpresses shRNA targeting firefly luci-ferase from h1 promoter and dsRed from synapsin promoter
Sebastian Kügler, Göttingen
AAV 1 CMV-EGFP AAV1 Reporter Expresses GFP from hCMV promoter Sebastian Kügler, Göttingen
AAV 2 sh-GFP AAV2 RNAi VectorExpresses shRNA targeting eGFP from h1 promoter and dsRed from synapsin promoter
Sebastian Kügler, Göttingen
AAV 2 sh-Luc AAV2 RNAi VectorExpresses shRNA targeting firefly luci-ferase from h1 promoter and dsRed from synapsin promoter
Sebastian Kügler, Göttingen
�.�.�. Riboprobes for in situ hybridization
Probe target Size Target accession Position in transcript
GFP 724 bp U55762 676-1400
CRHR1 696 bp NM_007762 1732-2428
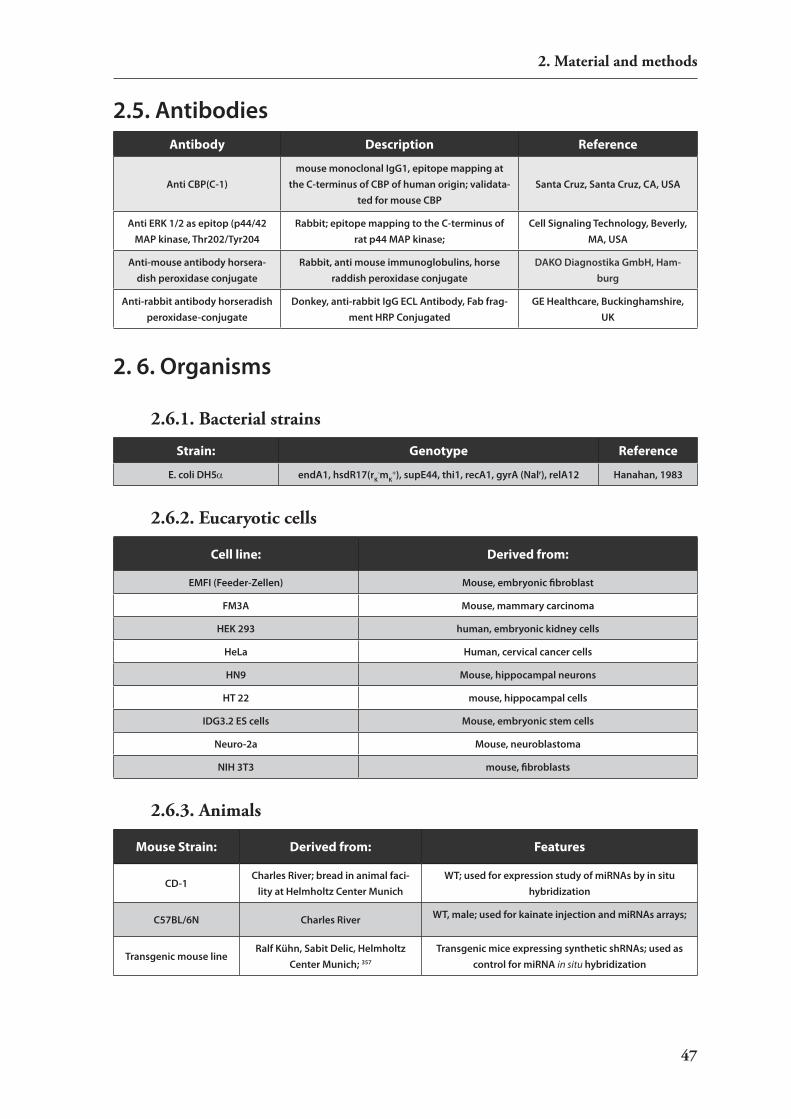
��
�. Material and methods
2.5. AntibodiesAntibody Description Reference
Anti CBP(C-1)mouse monoclonal IgG1, epitope mapping at
the C-terminus of CBP of human origin; validata-ted for mouse CBP
Santa Cruz, Santa Cruz, CA, USA
Anti ERK 1/2 as epitop (p44/42 MAP kinase, Thr202/Tyr204
Rabbit; epitope mapping to the C-terminus of rat p44 MAP kinase;
Cell Signaling Technology, Beverly, MA, USA
Anti-mouse antibody horsera-dish peroxidase conjugate
Rabbit, anti mouse immunoglobulins, horse raddish peroxidase conjugate
DAKO Diagnostika GmbH, Ham-burg
Anti-rabbit antibody horseradish peroxidase-conjugate
Donkey, anti-rabbit IgG ECL Antibody, Fab frag-ment HRP Conjugated
GE Healthcare, Buckinghamshire, UK
2. 6. Organisms
�.�.�. Bacterial strains
Strain: Genotype Reference
E. coli DH5α endA1, hsdR17(rK-mK
+), supE44, thi1, recA1, gyrA (Nalr), relA12 Hanahan, 1983
�.�.�. Eucaryotic cells
Cell line: Derived from:
EMFI (Feeder-Zellen) Mouse, embryonic fibroblast
FM3A Mouse, mammary carcinoma
HEK 293 human, embryonic kidney cells
HeLa Human, cervical cancer cells
HN9 Mouse, hippocampal neurons
HT 22 mouse, hippocampal cells
IDG3.2 ES cells Mouse, embryonic stem cells
Neuro-2a Mouse, neuroblastoma
NIH 3T3 mouse, fibroblasts
�.�.�. Animals
Mouse Strain: Derived from: Features
CD-1Charles River; bread in animal faci-
lity at Helmholtz Center MunichWT; used for expression study of miRNAs by in situ
hybridization
C57BL/6N Charles River WT, male; used for kainate injection and miRNAs arrays;
Transgenic mouse lineRalf Kühn, Sabit Delic, Helmholtz
Center Munich; 357
Transgenic mice expressing synthetic shRNAs; used as control for miRNA in situ hybridization

��
�. Materials and methods
Mouse Strain: Derived from: Features
Transgenic mouse lineClaudia Kühne, Jan Deussing; in the
group; unpublished
Transgenic, female; knock-in mice expressing CRHR1 fused with GFP instead of WT CRHR1; used for virally
mediated RNAi study
All animal experiments were conducted in accordance with the guide for the care and use of lab-oratory animals of the government of Bavaria, Germany. Timed matings were conducted with cD-1 mice for expression analysis by in situ hybridization. For the kainate injections and array analysis male c57BL/6n mice were purchased from charles river Germany (Dutch breeding stock)
2.7. Molecular biology methods
�.�.�. Bacterial culture
DnA in plasmids were augmented by growing them in bacterial culture. They replicate extra-chromosomal DnA in form of plasmids independently from the chromosome. Bacteria are rugged, easy to handle and with a cell division cycle of about 20 minutes they grow very fast. Using antibiotic resistance selection pressure for maintainance of plasmids can be ap-plied.To work under sterile conditions all the following procedures were performed next to a bunsen burner flame and only sterile dishes and pipete tips were used.
2.7.1.1. Production of competent bacteria
1 ml of a fresh over night culture of E. coli Dh5α-bacteria was inoculated into 100 ml LB-Me-dium and shaked at 37°c with 175 rpm. When the culture has reached a density of OD600nm 0.3-0.5 the cells were placed on ice, followed by a centrifugation at 4°c for 10 min with 3000 rpm. resuspension of the pellet in ice cold 50 ml 0,1 M cacl2 / 15% glycerine. The suspension is chilled on ice for 30 min. The centrifugation was repeated one time with resuspension in 10ml volume.The competent cells were stored as 250 ml-aliquots in 1.5 ml eppendorf Tubes at –80°c. Quick-freezing was performed in a mixture of ethanol with dry ice.
2.7.1.2. Growing of bacteria
Bacteria can be grown as suspension in liquid culture or if it is needed to separate single clones, colonies can be produced, growing bacteria on solid plates.• Liquid culture: 50 ml LB-medium is put in an erlenmeyer flask and supplemented with an
antibiotic for selection. For ampicillin and kanamycin, final concentrations of 50 – 100 µg/ml

��
�. Material and methods
respectively were used. Then the bacteria were either inoculated with an inoculation loop (for colonies or glycerol stocks) or an over night grown starter culture (3ml) was diluted 1:1000 with the prepared LB-medium. cells were grown at 37°c on an orbital shaker not longer than 14 hours.
• Bacterial culture on plates:culture on plates: 6 g “select Agar” was mixed into 250 ml h2O dest. and autoclaved immediateley which constitutes 2x Agar and can be stored at 4°c. To cast plates 2x LB-medium was warmed in a 50°c waterbath while the 2x Agar was melted in a microwave. Mixing both liquids dilutes the LB-Agar to working concentration and antibiotics (that are heat instable) were added after chilling down to <60°c in a final concentration of 50 – 100 mg/ml. Finally bacterial dishes were filled with the warm LB-Agar and stored at 4°c no longer than four weeks. Plates were inoculated with a small amount (~300 ml) of liquid bacterial culture, pipetted onto the plates and dispensed with a Drygalski-spatula. Then the plates were incubated at 37°c for about 12 hours or until colonies were visible.
2.7.1.�. �ran�formation of bacteria�� ce�����2.7.1.�. �ran�formation of bacteria�� ce�����
Artificial incorporation of DnA into bacterial cells is called transformation and was used to am-plify plasmid DnA. in addition after a DnA ligation reaction a transformation leads to grow-ing of the products as a single type of plasmid in bacterial clones.Therefore, competent bacteria were transferred from -80°c and thawn on ice. After resuspension by pipeting up and down 200 ml of the cell suspension was distributed into precooled eppendorf tubes and kept on ice. After adding 10 ml of the corresponding plasmid DnA (approx. 1 ng or one third of the com-plete ligation reaction) the solution was mixed well with the pipet and incubated for additional 5 min on ice. if a ligation product was transformed without gel extraction the ligation mix was preheated at 65 °c first. in the meantime bacterial dishes were distributed open on the desk to allow them to evaporate condensation water, derived from the storage at 4 °c and a LB culture flask was put into a 50°c water bath in order to prewarm it. After the 5 min. incubation, the first temperature shock was applied by putting the tubes at 37°c for 3 min, followed by an in-cubation on ice for further 5 min. For the second temperature shock 1 ml of the prewarmed LB (50°c waterbath), was pipeted to the bacteria after alowing to cool down in the pipet to 40°c, mixed well by inverting the tube and incubated at 37°c for at least 5 min. During this time the bacteria can recover and start expressing resistance genes. The bacteria were then harvested in a microcentrifuge for 30 sec at full speed. The supernatant can then be decanted and the bacteria in the pellet are resuspended in the remaining liquid (approx. 100ml) which was finally plated onto agar plates with apropriate antibiotic supplement. The dishes were incubated overnight at 37°c with the lid faced to the ground. After 14-16 h grown colonies should be clearly visible. if the density of the colonies is too high, it is recommended to plate the transformed cells at some variety in density.

�0
�. Materials and methods
�.�.� DNA techniques
2.7.2.1. DNA manipu��ation and genera�� c��oning technique�
• Digest with Restriction enzymes: restriction enzymes (restriction endonucleases) are pro-teins, that have the ability to cut DnA in a sequence specific manner and therefore were used to linearize vectors and to generate DnA-fragments that are supposed to be constructed with-in a ligation reaction. During the work presented here type ii and type iii restriction endo-nucleases, that mostly recognize tetra-, penta- or hexanucleotide sequences with palindromic structure, were used. Type ii enzymes cut DnA within the palindromic recognition sequence whereas type iii restriction endonucleases cut outside the recognition site. in doing so they generate blunt-, or when they cut with offset, sticky ends. The reactions were performed in the manufacturer’s recommended incubation buffers for 2-12 hours at the particular enzyme’s temperature optimum. 1-30 µg DnA were digested with 5-10 units of enzyme in a volume of 10-200µl. Attention should be paid, that the enzyme volume is not more than 10% of the final reaction volume, because otherwise some enzymes, that are stored 50% (v/v) glycerol at -20°c, might show so called star activity, when they work in more than 5% (v/v) glycerol. This means, that enzyme’s substrate specificity is decreased and DnA sequences lacking the specific cutting site are digested. The digestion reaction (namely it’s products) was controlled by gel electrophoresis.
• Isolation of DNA Fragments: For cloning purposes it is important to isolate distinct DnA fragments, that have been created with restriction digests. Therefore, DnA fragments are sepa-rated by gel electrophoresis and the detected bands with desired sizes are cut out from the gel with a scalpell. To minimize Uv induced mutations - so called photoknickings in the DnA the gel for preparative purposes was only illuminated by a low intensity of Uv light and with a greater wavelength than for analytical gels. The cut gel pieces were transferred into ice cold 1.5 ml eppendorf tubes and stored at -20°c.
• Joining DNA Fragments with T�-DNA-Ligase: A DnA ligase is an enzyme which catalyzes the connection of DnA fragments by generating phosphodiester bonds between 5’ and 3’ ends of DnA fragments. This reaction is called a ligation.After separation of DnA fragments in a preparative (low melting) agarose gel (see 2.7.2.1) the excised bands were used with-out further purification e.g. DnA gel extraction. Based on the fact that low melting agarose can be melted at 65°c and will stay in the liquid state at 37°c, which allows quicker work than in conventional methods but comprises a higher risk for mutations due to the heating steps in presence of ethidium bromide during the following transformation. About 2.5 µg of total DnA has been loaded per lane onto a preparative DnA gel. The bands of the des-ignated DnA fragments were cut accurateley during visualizing them on a transilluminator (isolation of DnA fragments). next the excised bands were melted in a heating block at 65°c

��
�. Material and methods
mixed well with a vortexer and quick spun. The volume of an excised band is approximaivly 100 µl and was adjusted to approx. 200 µl with water and then kept in the heating block. To keep the DnA in solution when ligating melted agarose fragments all tubes, pipette tips and solution have to be prewarmed in a heating block, waterbath or for tips by direct contact with sterile preheated (65°c ) water. 5 µl of the 10x Ligation Buffer have been added together with water. The amount of water was calculated in order to give a final reaction volume of 50 µl (together with the volumes for the DnA fragments and the enzyme). equimolar amounts (or various ratios) of each DnA fragment was then added to the reaction mixture. nevertheless, it is important to use a concentration of less than 0.5 fmol/µl for each DnA fragment. This means that when you use 2.5 µg of a fragment of 3kb in an excised band of 200 µl volume the contribution of 4 µl of melted agarose of this fragment into 50 µl end ligation volume leads to a final concentration of 0.5 fmol/µl, so as much as required. higher concentrations lead to the formation of multimers, too low concentrations preferentially lead to intramolecular reactions like vector closing himself. Finally 0.2 – 1U of the ligase enzyme were added to the reaction mixture and incubated over night at various temperature conditions depending on the type of ligation. Ligations with overhangs were incubated at 0-4 °c for better hybridization whereas ligations with only blunt ends are not dependent on temperature because there is no kind of hybridization. Ligations with mixed ends can be incubated with a temperature gradient from 0°c to room temperature on melting ice in a beaker at room temperature.
2.7.2.2. Preparation of P��a�mid DNA
DnA in plasmids were augmented by growing them in bacterial culture. Afterwards the plas-mids have to be isolated and purified from the other cellular contents.• Plasmid purification for analytical purpose: To analyze constructed plasmid DnA small
amounts of DnA (2-10 mg) were purified by the use of Quiaprep spin Miniprep Kits (Quia-gen, hilden) following the manufacturer’s protocol.
• Plasmid purification for preparative purpose: For transfection experiments or sequencing larger amounts and a higher grade of DnA’s purity are necessary. Therefore QiAprep Plasmid Purification Kit (Midi and Maxi) Kits were used with the manufacturer’s protocol.
2.7.2.�. Po��ymera�e Chain Reaction (PCR)
The polymerase chain reaction is an enzymatic approach to amplify specific DnA-sequences. Therefore, thermo-stable DnA polymerases are used (e.g. Taq polymerase). DnA polymerases can not generate a DnA molecule de novo but add nucleotides to an existing 3’ hydroxyl group by catalyzing a phosphodiester bond in a template depending manner. Therefore oligonucleotides that serve as primers are required and define the position of the amplified DnA (amplicon) on the template. This method allows to increase very few copies of a DnA sequence to visible bands

��
�. Materials and methods
on an agarose gel. The conditions for this reaction have to be optimized for each pair of primers on the selected matrix. in doing so the variable parameters are the concentrations of the primers (cprimer), the Mg2+-concentration (cMg2+) and the annealing temperature (TAnnealing) of the primers, which is depending on the length and the Gc content. For all of the Pcr-reactions, performed within the scope of this work the following conditions were used: cprimer: 10 µM cMg
2+: 1.5 mM Mgcl2
TAnnealing: 55°c
The reaction cycles therefore were:
1 cycle 5 min 95°c
35 cycles 30 sec. 95°c
1 min 54°c
1 min 72°c
1 cycle 5 min 72°c
1 cycle holding 4°c
For a final reaction volume of 25 ml the reactions were pipeted after the following scheme into a special Pcr reaction tube:
ddh2O 12 ml
dnTP-Mix, 5mM 1 ml
10x Taq-Polymerase Buffer (roche) 2.5 ml
5’-Primer 2,5 ml
3’-Primer 2.5 ml
DnA-Template (50-100 ng) 5 ml
Taq-Polymerase (1 U/ml) 0.5 ml
To generate cloning fragments novel restriction sites have been introduced into the fragment via the sequence of mismatch primers. During the replication process the Pcr product will be prolongated by this mismatching sequence. There were at least six nucleotides upstream of the novel restriction site in the mismatch primer, because otherwise restriction endonucleases are not able to recognize this target sequence and to cut the fragment.The reaction mix for the introduction of restriction sites via Pcr is the same as above, but may be upscaled. The Pcr conditions on the other hand have to be altered.in the first cycles a lower annealing temperature was used, because the primers can not hybridise

��
�. Material and methods
at full length and have some bases of 5’prime overhang.After the first cycles the annealing temperature was rised, because then the full length primer can bind to the newly synthesized template.Therefore the reaction conditions were as follow:
1 cycle 10 min 95°c
5 cycles 1 min 95°c
2 min 50°c
1 min 72°c
20 cycles 1 min. 95°c
2 min 60°c
1 min 72°c
1 cycle 10 min 72°c
1 cycle holding 4°c
2.7.2.4. DNA agaro�e ge�� e��ectrophore�i�
To separate DnA-fragments or to determine their length, agarose gel electrophoresis is used. Because of its negatively charged phosphate backbone, DnA migrates in the gel matrix from the negative to the positive pole, when an electrical field is applied. in doing so its motility within a gel is indirectly proportional to its length but also depends on secondary structure and -espe-cially in circular DnA fragments- on higher order organization of the topology e.g. supercoiling. The length yield to separate DnA fragments in an agarose gel is for double stranded DnA about 100bp – 14 kb. To adjust the gel’s resolution to the fragment lengths, concentrations from 0.8% to 2% of agarose were used in TAe buffer to prepare the gel. For a fragment length of about 100 bp a 2% agarose gel was used, and for fragments over 2kb an agarose gel of 0.8 % is suitable. To visualize DnA the dye ethidium bromide (etBr) at a concentration of 0.5 mg/ ml was used in the gel. To make these gels, agarose was weighed and solved in TAe-buffer by heating the mix-ture in a microwave. For loading of DnA probes onto the gel DnA was mixed with 1/10 vol. of 5x loading buffer. Beside the probes so called DnA ladders were used to estimate the fragment lengths and DnA amount of the probe since the DnA ladder contains defined amounts and sizes of DnA molecules. The migration and separation of DnA fragments was achieved by ap-plying a constant electrical field of 2.5 v/cm for 1-2 h to the gel whereby TAe-Buffer is used as running buffer and serves as electrolytic solution.To examine the seperated DnA fragments they can be visualised by Uv-illumination, because of the added etBr. For documentation a photo was made with a ccd-camera and printed. if the DnA fragments were supposed to be used for
��
�. Materials and methods
cloning, a preparative agarose gel was run in addition.Therefore the protocol is just the same except the use of a special low melting agarose to prepare the gels and no photo was taken (for further procedure see isolation of DnA fragments).
2.7.2.5. Ge�� extraction
Although ligations can be performed with the cut out low melting agarose bands directly, some approaches make it necessary to purify the DnA from an excised gel band e. g. when you wish to control the purity of the DnA. in this case the excised band was treated with the QiAquick Gel extraction Kit following the manufacturer’s protocol.
2.7.2.6. Spectrophotometric determination of DNA/RNA concentration
For many applications it is necessary to use defined amounts of DnA and therefore the yield of DnA or rnA is subsequently measured after DnA or rnA isolation. To determine the concentration and yield of DnA a spectralphotometer is used. nucleic acids have a maximum of light absorption at 260nm. Following the law of Lambert-Beer the concentration of nucleic acids can be determined by the light absorbtion at this wavelength, since the absorbtion A is a linear function of it’s concentration (at least for diluted solutions):
A=εcd
c=concentration; d=thickness of the cuvette; ε=extinction coefficient
in practical use, the optical density of a 1:100 dilution of the DnA/rnA sample was measured and the concentration was calculated after the following formula.DnA: OD260 x 50 (factor for extinction coeffizient) x 100 (dilution factor) = concentration in mg/ml
rnA: OD260 x 40 (factor for extinction coefficient) x 100 (dilution factor) = concentration in mg/ml
An absorbtion value OD 260 > 0.5-0.6 was avoided by further dilutions, because in this range the law of Lambert-Beer is not obeyed any more. To control for contaminations with proteins an additional measurement of the absorption at 280 nm was performed, because this is the absorp-tion maximum for proteins. A quotient of OD260/OD280 around 1.8 for DnA or 2.0 for rnA samples is desired.

��
�. Material and methods
�.�.�. RNA techniques
2.7.�.1. RNA-extraction
One way to challenge gene expression, is to analyze transcription. The rnA extraction with peqGOLD rnA Pure (Peqlab) is based on cell lysis and separation of rnA in the aqueous phase of a phenol, guanidinisothiocanate and chloroform mixture. The procedure has been performed as described in the manufacturer’s protocol.
2.7.�.2. Northern b��ot for �hort RNA�
• RNA extraction: in the peqGold rnA isolation procedure mirnAs are retained and thus standard isolation was also performed for short rnA species. nevertheless, column based rnA purification procedures should be avoided since this approaches loose at least partially mirnAs.
• Quality control of RNA: The integrity of the isolated rnA was checked by non-denaturating agarose gel electrophoresis. 1mg of total rnA was mixed with northern loading buffer of the mirvana Probe and Marker Kit (Ambion) and separated on a 0.8% gel. The quality criterion was the presence of two strong ribosomal bands (18s and 28s) and ideally the quantitative ratio of 28s/18s is thereby two.
• Gel electrophoresis: short rnA species lower than 100 bp can not be separated on a standard agarose gel. Therefore analog to protein gels denaturating 15% acryamide gels were used: 7.2g Urea,
1.5ml 10X TBe, 5.6ml 40% acrylamide, to 15ml nuclease free water stir to mix, then add 75ml 10% ammonium persulfate 15ml TeMeD
Mix briefly and pour gel immediately.30 µg of total rnA was loaded onto the gel in Gel loading buffer ii (mirvana Kit, Ambion) and the gel was run at 100-130v in 1X TBe as running buffer until the bromophenol blue dye of the loading buffer had been migrated to the end of the gel. no rnA ladder was used since that would require a radioactive ladder but rnA fragment size was determined by the migration of loading buffer dyes (bromophenol blue ~10nt; xylene cyanol ~30nt).• Northern transfer onto membranes: The separated short rnA fragments have been trans-
ferred from the gel to hybond n+ nylon membranes (Amersham) in a semidry Western blot-ting aparatus (Biorad). The mebmrane was soaked in 0.25 TBe and a stack of three sheets of blotting paper (Whatman) soaked in 0.25X TBe was placed above and below the sandwich

��
�. Materials and methods
gel/membrane. The transfer was performed at 120mA constant current for 2h. Afterwards the rnA was Uv cross-linked to the membrane in a crosslinker (Uv-stratalinker 2400, strata-gene) by radiation of a 120mJ burst over 30 sec.
• Check transfer: The transfer of short rnAs was controlled by staining of the dry membrane with Methylene blue: 15 min. 5% acetic acid; 10 min staining (0.5M sodium acetate ph 5.2; 0.04% methylene blue; 10 min. washing with water. The membrane was destained by washing in 5% acetic acid.
• Probe labelling: DnA or rnA oligonucleotides were 5’end labelled with T4 polynucleotide kinase (PnK).
2 ml DnA/rnA oligo [0.5M]4pmol (4ml) γ32PATP (4000-7000ci/mmol; 10-150mci/ml)1ml 10X PnK buffer1ml T4 PnK (10U/ml)to 10 ml with water; incubation for 1h at 37°c
• Probe purification: 5’ end labelled oligonucleotides were purified from unincorporated nu-cleotides by column purification with the mirvana Probe and Marker Kit (Ambion) according to the manufacturer’s protocoll. All labelled probe has been used for subsequent hybridization on membranes.
• Hybridization of DNA oligo-probes: The blotted membranes were prehybridized in prehy-bridization solution (6X ssc; 10X Denhardt’s solution; 0.2% sDs) for >1h at 65°c. After6X ssc; 10X Denhardt’s solution; 0.2% sDs) for >1h at 65°c. After for >1h at 65°c. After discarding of the buffer the radiolabelled probe was added to the hybridization buffer (6X6X ssc; 5X Denhardt’s solution; 0.2% sDs) and incubated with the membrane over night at and incubated with the membrane over night at room temperature. Unbound probes were washed three times with northern blot wash solu-tion (6X ssc; 0.2% sDs) twice at 37°c and once at 42°c.(6X ssc; 0.2% sDs) twice at 37°c and once at 42°c.twice at 37°c and once at 42°c.
• Exposure of the membrane: After the final wash the blot was sealed in a plastic bag and ex-posed to X-ray film (Kodak Biomax Mr) for 6-12h.
2.7.�.�. In vitro tran�cription a��ay
In vitro transcription assays were performed in a collaboration with ingrid Grummt (DKFZ, heidelberg). nuclear extracts were prepared from exponentially growing FM3A cells. To assaynuclear extracts were prepared from exponentially growing FM3A cells. To assay Pol i-specific transcription, 25 ml assays contained 50 ng of template DnA (pe3sP-shLuc), 30 mg of nuclear extract proteins, 12 mM Tris-hcl, [ph 7.9], 0.1 mM eDTA, 5 mM Mgcl2, 80 mM Kcl, 10 mM creatine phosphate, 12% (v/v) glycerol, 0.66 mM each of ATP, GTP and cTP, 0.012 mM UTP and 0.1 mci [α-32P]UTP (5,000 ci/mmol, Perkin elmer). For Pol iii-specific transcription, assays contained 500 ng of template DnA (pU6-shLuc), 30 mg of nuclear extract proteins, 12 mM hepes-KOh, [ph 7.9], 0.14 mM eDTA, 5 mM Mgcl2, 60 mM Kcl,

��
�. Material and methods
1 mM creatine phosphate, 3 mM DTT, 12% (v/v) glycerol, 0.4 mM each of ATP, GTP and cTP, 0.004 mM UTP and 0.1 mci [a-32P]UTP (5,000 ci/mmol, Perkin elmer). Transcription reactions were carried out in the absence or presence of α-amanitin (200 mg/ml, sigma). After incubation for 60 min at 30°c, rnA was extracted and analyzed on non-denaturing 6% poly-acrylamide gels.
2.7.�.4. Array hybridization of miRNA�
Preparation and hybridization of mirnA arrays were performed in a collaboration with Anna Krichevsky (harvard Medical school, Boston) as published 280.
2.7.�.5. Radioactive in situ hybridization (ISH) with riboprobe�
• Template amplification: All necessary in situ probes had been cloned into the pcrii-TOPO or pBluescript ii Ks vector. After heat shock transformation single bacteria clones were inoculated in LB medium and plasmid DnA was prepared using QiAprep spin Mini-prep Kit (Quiagen). Using T3, sp6 and/or T7 primers a Pcr was performed:Using T3, sp6 and/or T7 primers a Pcr was performed:
Pcr reaction (50 µl):
0.5 µl plasmid template 1 µl Primer 1 (10 pmol, MWG) 1 µl Primer 2 (10 pmol, MWG) 1 µl dnTPs (10 mM each, roche)1 µl dnTPs (10 mM each, roche) 5 µl 10 × reaction Buffer iv (ABgene) 3 µl Mgcl3 µl Mgcl2 solution (25 mM, ABgene)
0.5 µl Thermoprime Plus DnA Polymerase (5 U/µl, ABgene) 38 µl h2O (Ampuwa)
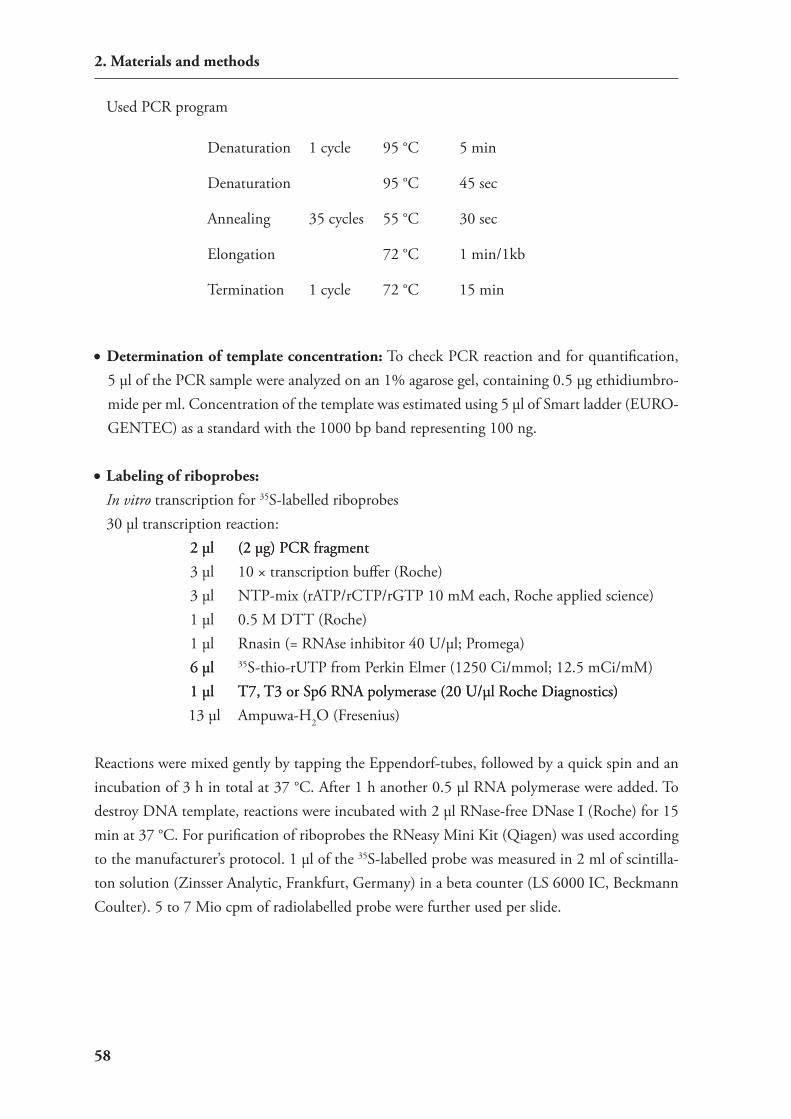
��
�. Materials and methods
Used Pcr program
Denaturation 1 cycle 95 °c 5 min
Denaturation
35 cycles
95 °c 45 sec
Annealing 55 °c 30 sec
elongation 72 °c 1 min/1kb
Termination 1 cycle 72 °c 15 min
• Determination of template concentration: To check Pcr reaction and for quantification, 5 µl of the Pcr sample were analyzed on an 1% agarose gel, containing 0.5 µg ethidiumbro-mide per ml. concentration of the template was estimated using 5 µl of smart ladder (eUrO-GenTec) as a standard with the 1000 bp band representing 100 ng.
• Labeling of riboprobes: In vitro transcription for 35s-labelled riboprobes 30 µl transcription reaction:
2 µl (2 µg) Pcr fragment2 µl (2 µg) Pcr fragment 3 µl 10 × transcription buffer (roche) 3 µl nTP-mix (rATP/rcTP/rGTP 10 mM each, roche applied science) 1 µl 0.5 M DTT (roche) 1 µl rnasin (= rnAse inhibitor 40 U/µl; Promega) 6 µl6 µl 35s-thio-rUTP from Perkin elmer (1250 ci/mmol; 12.5 mci/mM) 1 µl T7, T3 or sp6 rnA polymerase (20 U/µl roche Diagnostics)1 µl T7, T3 or sp6 rnA polymerase (20 U/µl roche Diagnostics)
13 µl Ampuwa-h2O (Fresenius)
reactions were mixed gently by tapping the eppendorf-tubes, followed by a quick spin and an incubation of 3 h in total at 37 °c. After 1 h another 0.5 µl rnA polymerase were added. To destroy DnA template, reactions were incubated with 2 µl rnase-free Dnase i (roche) for 15 min at 37 °c. For purification of riboprobes the rneasy Mini Kit (Qiagen) was used according to the manufacturer’s protocol. 1 µl of the 35s-labelled probe was measured in 2 ml of scintilla-ton solution (Zinsser Analytic, Frankfurt, Germany) in a beta counter (Ls 6000 ic, Beckmann coulter). 5 to 7 Mio cpm of radiolabelled probe were further used per slide.
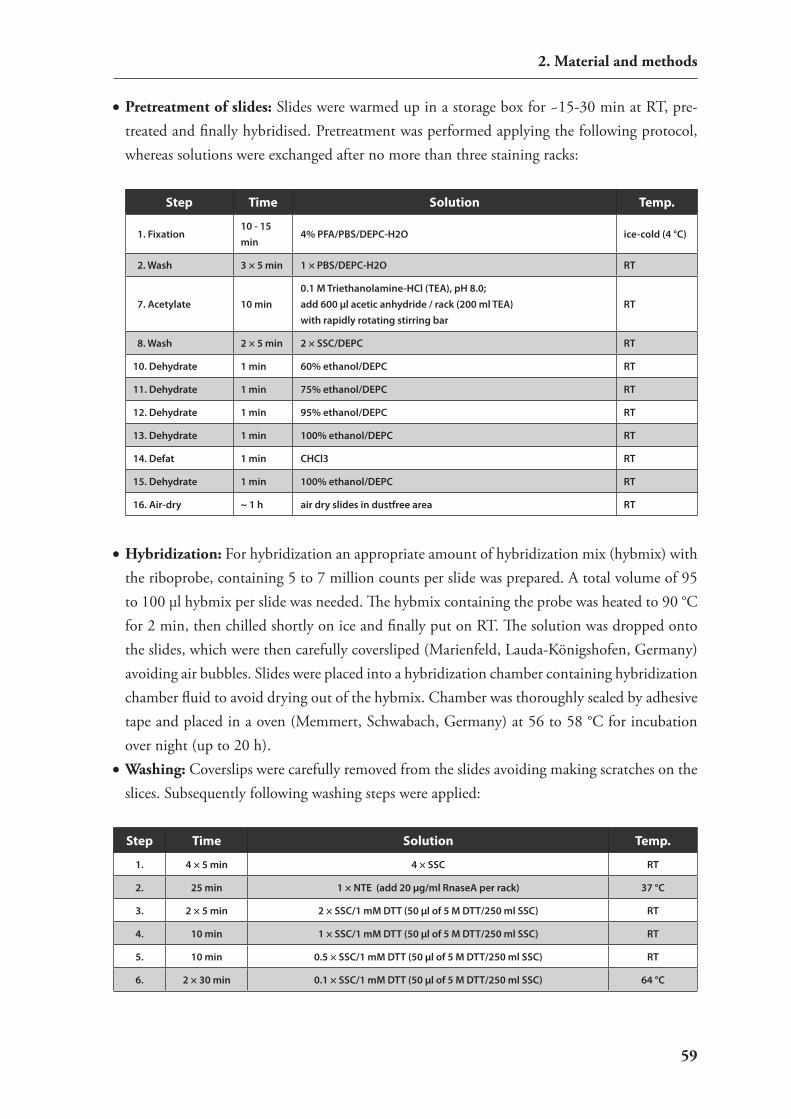
��
�. Material and methods
• Pretreatment of slides: slides were warmed up in a storage box for ~15-30 min at rT, pre-treated and finally hybridised. Pretreatment was performed applying the following protocol, whereas solutions were exchanged after no more than three staining racks:
Step Time Solution Temp.
1. Fixation10 - 15 min
4% PFA/PBS/DEPC-H2O ice-cold (4 °C)
2. Wash 3 × 5 min 1 × PBS/DEPC-H2O RT
7. Acetylate 10 min0.1 M Triethanolamine-HCl (TEA), pH 8.0;add 600 µl acetic anhydride / rack (200 ml TEA)with rapidly rotating stirring bar
RT
8. Wash 2 × 5 min 2 × SSC/DEPC RT
10. Dehydrate 1 min 60% ethanol/DEPC RT
11. Dehydrate 1 min 75% ethanol/DEPC RT
12. Dehydrate 1 min 95% ethanol/DEPC RT
13. Dehydrate 1 min 100% ethanol/DEPC RT
14. Defat 1 min CHCl3 RT
15. Dehydrate 1 min 100% ethanol/DEPC RT
16. Air-dry ~ 1 h air dry slides in dustfree area RT
• Hybridization: For hybridization an appropriate amount of hybridization mix (hybmix) with the riboprobe, containing 5 to 7 million counts per slide was prepared. A total volume of 95 to 100 µl hybmix per slide was needed. The hybmix containing the probe was heated to 90 °c for 2 min, then chilled shortly on ice and finally put on rT. The solution was dropped onto the slides, which were then carefully coversliped (Marienfeld, Lauda-Königshofen, Germany) avoiding air bubbles. slides were placed into a hybridization chamber containing hybridization chamber fluid to avoid drying out of the hybmix. chamber was thoroughly sealed by adhesive tape and placed in a oven (Memmert, schwabach, Germany) at 56 to 58 °c for incubation over night (up to 20 h).
• Washing: coverslips were carefully removed from the slides avoiding making scratches on the slices. subsequently following washing steps were applied:
Step Time Solution Temp.
1. 4 × 5 min 4 × SSC RT
2. 25 min 1 × NTE (add 20 µg/ml RnaseA per rack) 37 °C
3. 2 × 5 min 2 × SSC/1 mM DTT (50 µl of 5 M DTT/250 ml SSC) RT
4. 10 min 1 × SSC/1 mM DTT (50 µl of 5 M DTT/250 ml SSC) RT
5. 10 min 0.5 × SSC/1 mM DTT (50 µl of 5 M DTT/250 ml SSC) RT
6. 2 × 30 min 0.1 × SSC/1 mM DTT (50 µl of 5 M DTT/250 ml SSC) 64 °C

�0
�. Materials and methods
Step Time Solution Temp.
7. 2 × 10 min 0.1 × SSC RT
8. 1 min 30% Ethanol/300 mM NH4OAc RT
9. 1 min 50% Ethanol/300 mM NH4OAc RT
10. 1 min 70% Ethanol/300 mM NH4OAc RT
11. 1 min 95% Ethanol RT
12. 1 min 100% Ethanol RT
slides were then air dried in a dust free area for at least 1 h. solutions had to be changed when using more than three staining racks.• Autoradiography: For autoradiography dried slides were exposed to special high performance
X-ray films (BioMax Mr film from Kodak) for different time intervals (1-5 days).• Dipping and Development: The slides were dipped in a prewarmed photographic emul-
sion (KODAK nTB-2 emulsion diluted 1:2 with Ampuwa water) for about 5 sec and dried o/n at room temperature. The next day, slides were stored in with tape sealed light-tight black boxes containing silica gel capsules (roth), as desiccant at 4 °c for different expo-sure times varying between 1-8 weeks depending on the signal intensity of the X-ray films. For development boxes were equilibrated to room temperature for 2 h, before slides were de-veloped in KODAK D 19 developer (sigma-Aldrich) for 3-4 minutes. Then a rinsing step in tap water for 30 seconds followed. slides were dipped in KODAK fixer (sigma-Aldrich) for 5-7 minutes and finally rinsed in tap water again for 25 min. To scrap emulsion off the back side of the slides a strong razor blade was utilized. After that, slides were air dried.
• Nissl staining: The end of the whole slide treatment represented the counterstaining with the cresylviolett dye, with which rnA of the rough endoplasmatic reticulum – the nissl substance – in the neuronal cytoplasma can be stained.
Step Time Solution Temperature
1. 15 min 0.5% Cresyl Violet Acetate RT
2. 1 min water RT
3. 2 × 1 min 70% EtOH RT
4. 5 sec 96% EtOH + 1 ml acetic acid RT
5. 2 × 1 min 96% EtOH RT
6. 2 × 2 min 100% EtOH RT
7. 2 × 5 min Xylol (Roth) RT
After staining, the brain sections were embedded with DPX mounting medium (Fluka chemie AG, Buchs, switzerland) and coverslips were carefully put onto the slides.
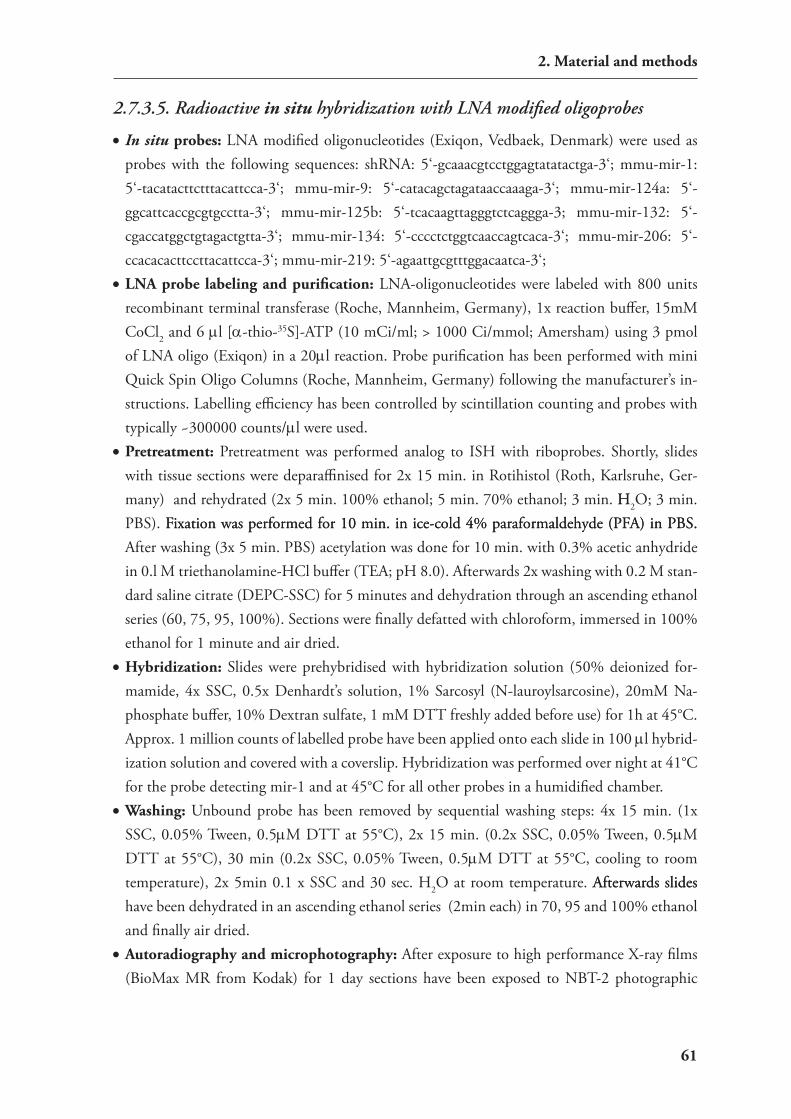
��
�. Material and methods
2.7.�.5. Radioactive in situ hybridization with LNA modified o��igoprobe�
• In situ probes: LnA modified oligonucleotides (exiqon, vedbaek, Denmark) were used as probes with the following sequences: shrnA: 5‘-gcaaacgtcctggagtatatactga-3‘; mmu-mir-1: 5‘-tacatacttctttacattcca-3‘; mmu-mir-9: 5‘-catacagctagataaccaaaga-3‘; mmu-mir-124a: 5‘-ggcattcaccgcgtgcctta-3‘; mmu-mir-125b: 5‘-tcacaagttagggtctcaggga-3; mmu-mir-132: 5‘-cgaccatggctgtagactgtta-3‘; mmu-mir-134: 5‘-cccctctggtcaaccagtcaca-3‘; mmu-mir-206: 5‘-ccacacacttccttacattcca-3‘; mmu-mir-219: 5‘-agaattgcgtttggacaatca-3‘;
• LNA probe labeling and purification: LnA-oligonucleotides were labeled with 800 units recombinant terminal transferase (roche, Mannheim, Germany), 1x reaction buffer, 15mM cocl2 and 6 ml [α-thio-35s]-ATP (10 mci/ml; > 1000 ci/mmol; Amersham) using 3 pmol of LnA oligo (exiqon) in a 20ml reaction. Probe purification has been performed with mini Quick spin Oligo columns (roche, Mannheim, Germany) following the manufacturer’s in-structions. Labelling efficiency has been controlled by scintillation counting and probes with typically ~300000 counts/ml were used.
• Pretreatment: Pretreatment was performed analog to ish with riboprobes. shortly, slides with tissue sections were deparaffinised for 2x 15 min. in rotihistol (roth, Karlsruhe, Ger-many) and rehydrated (2x 5 min. 100% ethanol; 5 min. 70% ethanol; 3 min. hh2O; 3 min. PBs). Fixation was performed for 10 min. in ice-cold 4% paraformaldehyde (PFA) in PBs.Fixation was performed for 10 min. in ice-cold 4% paraformaldehyde (PFA) in PBs. After washing (3x 5 min. PBs) acetylation was done for 10 min. with 0.3% acetic anhydride in 0.l M triethanolamine-hcl buffer (TeA; ph 8.0). Afterwards 2x washing with 0.2 M stan-dard saline citrate (DePc-ssc) for 5 minutes and dehydration through an ascending ethanol series (60, 75, 95, 100%). sections were finally defatted with chloroform, immersed in 100% ethanol for 1 minute and air dried.
• Hybridization: slides were prehybridised with hybridization solution (50% deionized for-mamide, 4x ssc, 0.5x Denhardt’s solution, 1% sarcosyl (n-lauroylsarcosine), 20mM na-phosphate buffer, 10% Dextran sulfate, 1 mM DTT freshly added before use) for 1h at 45°c. Approx. 1 million counts of labelled probe have been applied onto each slide in 100 ml hybrid-ization solution and covered with a coverslip. hybridization was performed over night at 41°c for the probe detecting mir-1 and at 45°c for all other probes in a humidified chamber.
• Washing: Unbound probe has been removed by sequential washing steps: 4x 15 min. (1x ssc, 0.05% Tween, 0.5mM DTT at 55°c), 2x 15 min. (0.2x ssc, 0.05% Tween, 0.5mM DTT at 55°c), 30 min (0.2x ssc, 0.05% Tween, 0.5mM DTT at 55°c, cooling to room temperature), 2x 5min 0.1 x ssc and 30 sec. h2O at room temperature. Afterwards slidesAfterwards slides have been dehydrated in an ascending ethanol series (2min each) in 70, 95 and 100% ethanol and finally air dried.
• Autoradiography and microphotography: After exposure to high performance X-ray films (BioMax Mr from Kodak) for 1 day sections have been exposed to nBT-2 photographic

��
�. Materials and methods
emulsion (Kodak) 1:1 in water for 2-3 weeks, developed in Kodak D19 developer and fixed with Kodak fixer. histological counterstaining was performed with cresylviolett.
2.7.�.6. DIG ��abe����ed in �itu hybridization with LNA modified o��igoprobe� on robot
• In situ probes: LnA modified oligonucleotides (exiqon, vedbaek, Denmark) were used as probes with the following sequences: mmu-mir-1: 5‘-tacatacttctttacattcca-3‘; mmu-mir-9: 5‘-catacagctagataaccaaaga-3‘; mmu-mir-124a: 5‘-ggcattcaccgcgtgcctta-3‘; mmu-mir-206: 5‘-cca-cacacttccttacattcca-3‘
• LNA probe labeling and purification: LnA-oligonucleotides were labeled analog to radioac-tive labelling of LnA oligo probes but incorporating digoxygenin (DiG) dATP with 800 units recombinant terminal transferase (roche, Mannheim, Germany), 1x reaction buffer, 15mM cocl2 and using 3 pmol of LnA oligo (exiqon) in a 20ml reaction. Probe purification has been performed with mini Quick spin Oligo columns (roche, Mannheim, Germany) fol-lowing the manufacturer’s instructions. Labelling efficiency has been controlled by dot blots compared to references.
• Robotprogram:
DAY 1
cycles volume time reagent temp
3 + 2 350 µl 5 min 0,6 % H2O2/MeOH no detergent! 24 o
7 350 µl 5 min PBS
2 350 µl 5 min 0, 2 N HCl
4 350 µl 5 min PBS
1 400 µl 5 min Proteinasebuffer
2 350 µl 10 min Proteinase K 2 ug/ml/Cryo/14.5d
7 350 µl 5 min PBS
2 350 µl 10 min 4 % PFA
7 350 µl 5 min PBS
1 350 µl 15 min Hyb. Mix + DTT 1,5 mg/ml 24 o
1 350 µl 30 min Hyb. Mix (heat) →64 o
1 350 µl 6 h Dig-Probes (150-) 300 ng/ml 64 o
2,5 h then again probe added, incubation continued for 3 h
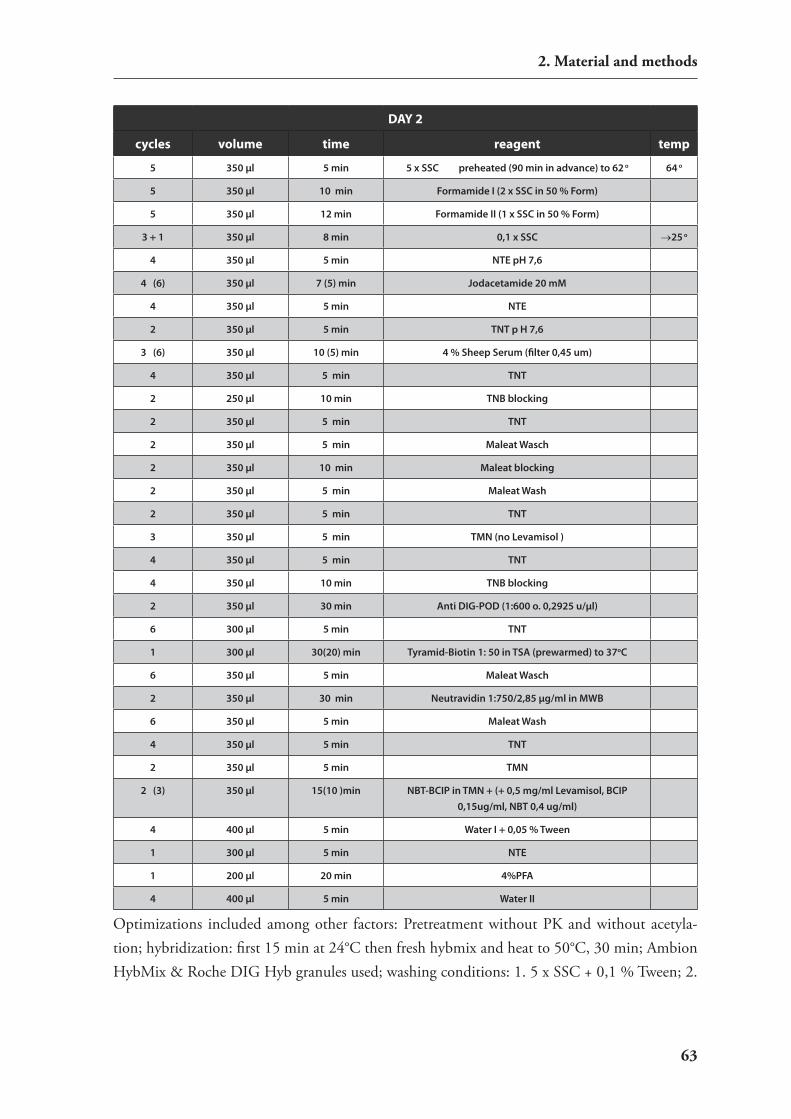
��
�. Material and methods
DAY 2
cycles volume time reagent temp
5 350 µl 5 min 5 x SSC preheated (90 min in advance) to 62 o 64 o
5 350 µl 10 min Formamide I (2 x SSC in 50 % Form)
5 350 µl 12 min Formamide II (1 x SSC in 50 % Form)
3 + 1 350 µl 8 min 0,1 x SSC →25 o
4 350 µl 5 min NTE pH 7,6
4 (6) 350 µl 7 (5) min Jodacetamide 20 mM
4 350 µl 5 min NTE
2 350 µl 5 min TNT p H 7,6
3 (6) 350 µl 10 (5) min 4 % Sheep Serum (filter 0,45 um)
4 350 µl 5 min TNT
2 250 µl 10 min TNB blocking
2 350 µl 5 min TNT
2 350 µl 5 min Maleat Wasch
2 350 µl 10 min Maleat blocking
2 350 µl 5 min Maleat Wash
2 350 µl 5 min TNT
3 350 µl 5 min TMN (no Levamisol )
4 350 µl 5 min TNT
4 350 µl 10 min TNB blocking
2 350 µl 30 min Anti DIG-POD (1:600 o. 0,2925 u/µl)
6 300 µl 5 min TNT
1 300 µl 30(20) min Tyramid-Biotin 1: 50 in TSA (prewarmed) to 37oC
6 350 µl 5 min Maleat Wasch
2 350 µl 30 min Neutravidin 1:750/2,85 µg/ml in MWB
6 350 µl 5 min Maleat Wash
4 350 µl 5 min TNT
2 350 µl 5 min TMN
2 (3) 350 µl 15(10 )min NBT-BCIP in TMN + (+ 0,5 mg/ml Levamisol, BCIP 0,15ug/ml, NBT 0,4 ug/ml)
4 400 µl 5 min Water I + 0,05 % Tween
1 300 µl 5 min NTE
1 200 µl 20 min 4%PFA
4 400 µl 5 min Water II
Optimizations included among other factors: Pretreatment without PK and without acetyla-tion; hybridization: first 15 min at 24°c then fresh hybmix and heat to 50°c, 30 min; Ambion hybMix & roche DiG hyb granules used; washing conditions: 1. 5 x ssc + 0,1 % Tween; 2.

��
�. Materials and methods
x ssc + 50 % Formamid; 3.2 x ssc (to cool) 4. 0.2 x ssc + 0,1 % Tween• Detection: Detection was performed with Anti DiG antibody horseradish peroxidase conju-
gated and the TsA signal amplification kit (perkin elmer) using nBT-BciP (roche) as sub-strate according to the manufacturer’s protocols.
�.�.�. Protein techniques
2.7.4.1. Protein-Extraction:
Genetic studies on protein level are inevitable for characterizing gene function and interaction.cell lysis of eucaryotic cells was achieved by various methods and buffers, which have to be ad-justed according to cell type and downstream applications• For Western Blotting: hn9 cells grown in 6-well plates were washed once with cold PBs col-
lected in 500 ml PBs using a cell scraper and transferred into an eppendorf tube. Following centrifugation cells were resuspended in Ampuwa water with protease inhibitors (roche Mini). cells from 3 wells of a 6-well plate were pooled in a total volume of 60 ml and sonicated The lysates were cleared by centrifugation (5 min at 13000 rpm at 4°c) and the protein content was quantified by Bradford reagent (Bio-rad). iDG3.2 es cells from each 10-cm plate were lysed at 48 hours after transfection in 500 ml lysis buffer (2% sDs, 50 mM Tris ph 6.8, 50 mM DTT, 10% c, protease inhibitors (roche Mini), 0.01% bromophenol blue). Protein concentration was determined in lysis buffer without dye using the BcA assay kit (Pierce).
• For Dual Luciferase Assay: Preparation of cell lysates for the dual luciferase assay was per-formed from heK293, hT22, hn9, neuro-2a and heLa cells by using the 5x Passive Lysis Buffer (PLB), which is purchased with the dual luciferase kit (Promega). The 1X working concentration of the lysis buffer was achieved by dilution with distilled water. cells were first washed with PBs and after removal 100 ml (for a 24 well plate) 1 x PLB was dispensed into each culture well. subsequently the culture plates were incubated for 15 min at room tempera-ture, shaking on an orbital mixer. After that the lysates were finally transferred into eppendorf tubes. For dual luciferase assays the lysate does not have to be cleared and half of the protein lysate was used in subsequent assay. Within the PLB the luciferase proteins are stable for at least 6 hours at room temperature and up to 16 hours on ice. Freezing at –20oc is suitable for short-term storage up to 1 month. For longer storage times storage at –70 oc is recom-mended.
��
�. Material and methods
2.7.4.2. Protein quantification:
The protein determination referring to Bradford is a colorimetric method to determine yields of protein in which a differential color change of a dye binding to protein occurs in response to various concentration of protein. The coomassie Brilliant Blue G-250 dye (Bio-rad Protein Assay) binds mainly to basic and aromatic amino acids in a protein and thereby shifts its light absorbance maximum from 465nm to 595nm. This reaction can be assayed by photometric measurments. Finally the protein concentration can be determined with the law of Lambert Beer and a standard curve. First the protein samples were diluted 1:100 with deionised water to a final volume of 500 ml and mixed well. Then defined standards of protein concentrations were made with 5mg/ml, 10 mg/ml, 15 mg/ml, 20 mg/ml and 25 mg/ml by diluting a BsA protein standard of 1.4 mg/ml with water. it is especially important to mix each dilution well with a vortexer and to work quickly, so that the proteins do not sink in the tube.100 ml of each sample and standards were pipeted in doublets into a transparent 96-well-plate. Then 50 ml of staining solution was added into each well and the light absorbtion of the filled wells was measured at 595nm with a photometer. To finally determine the protein concentration, the mean value of the two identical samples is calculated. Then the values of the standards are transformed into a calibration curve via linear regression analysis and using this calibrator the unkown concentrations were determined.
2.7.4.�. Dua�� Lucifera�e A��ay:
in dual reporter assays two individual reporter genes were transfected into the same cell and later the activity of both of them was measured sequentially. The so called “experimental” reporter is conditionally expressed, depending on the experimental setup, while the activity of the cotrans-fected “control” reporter provides an internal control, which can be used as baseline and nor-malization reference. in doing so the experimental accuracy is improved, since e. g. fluctuations in transfection efficiency are calculated out.in the rnAi vector silencing experiments, firefly and renilla luciferase activities were measuredfirefly and renilla luciferase activities were measured using the Dual Luciferase Assay Kit (Promega). Thereby the firefly luciferase was the experimen-Thereby the firefly luciferase was the experimen-tal reporter and the independent renilla luciferase served as the control reporter. Both luciferases which catalyse a chemiluminscent reaction with different substrates are widely used as reporters. On the one hand the assay is very sensitive, because the light production has a high quantum ef-ficiency and shows on the other hand very low background luminescense in host cells. Addition-ally the enzyme kinetics allows yields of linear results over at least eight orders of magnitude. 50 µl of the cell lysates were used to assess luciferase activities according to the manufacturer’saccording to the manufacturer’s protocol with following exceptions. The reconstituted 50x stop&Glo substrate was diluted 1:100 with stop&Glo Buffer. 50 ml of LArii were pipeted into 50 ml of the cell extracts that have already been dispensed in Microlite microtiter plates. Finally 50 ml stop&Glo reagent
��
�. Materials and methods
(1:100) were applied to the protein extracts. Th The luminescense produced in the assays were measured in a luminometer (storm, Perkin elmer).
2.7.4.4. SDS-po��yacry��amide ge�� e��ectrophore�i� (PAGE):
• Preparation of the gel: sDs polyacrylamide gel elecrophoresis allows the separation of pro-tein-mixtures according to their molecular weight. The detergent sDs (sodiumdodecylsulfate) complexes proteins, masks the natural charge and destroys their secondary structure, which means that for the electrophoresis conformational and sequence-specific effects are mainly removed out. This makes the proteins migrate in the electrical field, only according to their molecular weight. in addition mercaptoethanol, which is contained in the sample buffer re-duces intra- and intermolecular disulfid bonds and therefore denatures tertiary and quartary structures. For sDs PAGe a vertical Bio rad gel apparatus was used. Depending on the mo-lecular weight of the proteins, gels containing 7-15% acrylamide can be poured, but in the presented work 10% gels was used. Upon this resolving gel, a 4% stacking gel was poured. After the apparatus is prepared, you pipet the buffers for the gels without APs and TeMeD. since these two substances will start the radical polymerisation they were added just prior to pouring the gel:
resolving gel per gel (7.5%, 6ml): 2.41 ml h2O 1.5 ml Lower Tris Buffer (3M Tris-hcl; 0.8%sDs; ph 8.8) 2 ml Acrylamide:Bisacrylamide (29:1)2 ml Acrylamide:Bisacrylamide (29:1) 3030 ml sDs (20%) 60 ml APs (10%) 2.4 ml TeMeD
stacking gel per gel (5%, 2ml): 1.37 ml h2O 0.25 mlUpper Tris Buffer (0.3M Tris-hcl; 0.2%sDs; ph6.8) 340 ml Acrylamide:Bisacrylamide (29:1) 10 ml sDs (20%) 20 ml APs (10%) 2ml TeMeD
To avoid air bubbles the surface of the poured resolving gel was covered with about 0.5 ml of isopropanol. After full polymerisation the isopropanol was discarded and the stacking gel was poured on top analogous to the resolving gel. The gel volume was filled completely and the the comp was put into the liquid, avoiding bubbles as much as possible.
• Preparation of the samples: Before loading onto the gel 20 mg of the samples were dena-

��
�. Material and methods
tured 1:1 in 2X loading buffer (125mM Tris hcl, ph 6.8; 4% sDs, 0.004% bromphenolb-lue, 20% glycerol) for 5 min at 65 oc quickly centrifuged and then loaded onto the gel.
• Loading of the gel: After polymerisation, the gels were mounted in the electrophoresis ap-paratus which was flooded with electrophoresis buffer (25mM Tris hcl, ph 8.3; 250mM Glycin, 0.1%sDs). The maximum sample volume, that can be loaded is approx. 30 ml per slot and to allow slow sample flow the samples were applied with a 20 ml pipet, otherwise the sample might not sediment to the slot but spill over into another lane. similar to agarose gels a protein marker (a mixture of proteins with distinct sizes) for size determination was additionally used.
Finally an electic field of 100-150v was applied to the gel for 1-2h to make the samples mi-grate.
2.7.4.5. We�tern b��ot ana��y�i�:
Western blot analysis is the most accurate way to detect specific protein expression since the size of the detected protein is additionally determined. First a sDs PAGe is peformed with the protein samples to seperate the fractions according to their size. For Western blotting a stained protein marker is used, that can later be seen on the blotting membrane. Then the proteins are transferred from a sDs PAGe onto a nitrocellulose membrane in an electrical field and immu-noprecipitated there. Finally these immunoprecipitates are detected.• Protein transfer: The transfer was performed with Bio rad’s criterion Blotter - a tank transfer
system - and an immobilon P Transfer membrane. The apparatus assembly was performed as described in the users manual. To avoid artefact signals handling of the membrane was per-formed with tweezers. A foam pad was placed on one side of the cassette holder and overlayed with one sheet of filter paper. To ensure an even transfer, air bubbles were removed by carefully rolling a pipette over the surface of each layer in the stack. Then the gel was placed on the filter paper and on top one sheet of the immobilon-P membrane cut to the gel dimensions is placed. stacking of the blot was completed by one sheet of filter paper and the second foam pad. it isit is important to soak all components of the blotting setup with transfer buffer, which is also used to fill the blotting tank.
Transfer Buffer: 25 mM Tris base 192 mM Glycin 10% Metanol
0.5g sDs per liter0.5g sDs per liter
Finally the blot was carried out over night at 4he blot was carried out over night at 4over night at 4 at 4 oc and 20 v. Then the blotting setup was disassembled and the membrane was incubated with 100% methanol for 10 sec. to drive out

��
�. Materials and methods
the water. Followed by 10 min drying on a Whatman filter, which improves protein binding and decreases background in immunodetection. Optionally this procedure was repeated with methanol and TBs/T incubation
• Immunopreciptation: To recognize specific proteins on the membrane, specific antibodies so called “primary antibodies” against the desired protein are used. in order to give a detectable signal there is in addition a “secondary antibody” which on the one hand recognizes parts of the primary antibody as epitop and is on the other hand conjugated with an enzyme or an flu-orescent chromophor. Membranes were blocked with 5% non-fat dried milk powder (nestlé, vevey, switzerland) in TBs/T (0.05% Tween-20; Biorad) for 2 hr at room temperature. The primary antibody recognising erK 1/2 as epitop (p44/42 MAP kinase, Thr202/Tyr204, cell signaling Technology, Beverly, MA) was diluted 1:1000 in TBs/T with 5% non-fat dried milk and incubated for 2 hr at room temperature. Afterwards, the blots were washed two times for 10 min each with washing buffer (TBs/T) and then incubated with horseradish peroxi-dase-conjugated anti-rabbit antibody (Ge healthcare, Buckinghamshire, UK). The secondary antibody was diluted 1:4000 in TBs/T 5% non-fat dried milk, incubated for 2 hr at room temperature and unbound antibody was removed by washing as above.
• Peroxidase detection: To detect the desired protein via the secondary antibody, a chemical reaction is performed, using the conjugated horseraddish peroxidase. With a chemilumines-cent detection reaction a highly sensitive method exhibiting only low background levels was chosen. Therefore, the formed immune complex was detected by ecL Plus (Ge healthcare, Buckinghamshire, UK) according to the manufacturer`s protocol and the chemiluminescent signal was exposed to X-ray film (Fuji Photo Film, Tokyo, Japan). A standard curve was per-formed using defined steps of increased luminescence activity to assess the linear range of the used films. For further analysis, only films with optical densities in the estimated linear range of the film were further processed and scanned with a canoscan 9900F. The band intensities were finally quantified using TinA software (raytest),
2.7.4.6. Immunohi�tochemi�try:
immunohistochemistry has been performed by Wolfgang Kelsch on 8 mm thick paraffin sec-tions of adult mous brains. First the sections were deparaffinized 2x in xylene for 10 min each (in cuvettes) and rehydrated with a descending ethanol series (2X 2 min. 100%, 2min. 95%, 5 min. 70%, 2X 2min water). After that the slides were incubated for 15 min in 0.3% h2O2 in h2O at room temperature (freshly prepared, 1.5 ml 30% h2O2 in 150 ml h2O). After that 3X washing in PBs for 2 min at room temperature and 30 min incubation in 5 mg/ml saponin (150 ml of 5 mg/ml stock in 150 ml h2O, stock stored at -20°c) at room temperature. Again 3x washing in PBs for 2 min at room temperature. Then the slides were removed from the cuvette, drained quickly, and tissue sections were encircled with Pap Pen. For all subsequent steps drying out of
��
�. Material and methods
the tissue sections was avoided.Blocking was performed for 20 min in 1.5% serum/PBs (15 ml of serum in 1 ml PBs) thereby the slides were placed horizontally in a humidified chamber. After one more wash with 1x PBs the immunoprecipitation can be performed.incubation with primary antibody that was diluted in 1% BsA/PBs was done overnight at 4°c or for 60 min at room temperature. Per slide 150ml were used and a negative control without primary antibody was included in the humidified chamber.After incubation the slides were rinsed quickly with PBs by using a Pasteure pipette and washed 3x in PBs in a cuvette.A biotinylated secondary antibody was added and incubated for 30 min at room temperature in humidified chamber, slides placed horizontally (anti-mouse or anti-rabbit igG) in the mean-while, the streptavidin-peroxidase complexes needed to incubate for at least 30 min on ice that were prepared previously according to the manufacturer’s protocoll (vectastain elite ABc kit).After washing 3x 5 min with PBs the streptavidin-peroxidase complex was incubated for 30 min at rT. Again wash was done 3x 5 min with PBs and the tissue was rinsed 30 seconds with TBs (10 mM Tris-hcl ph 7.8, 150 mM nacl) containing 0.5% Tween 20.To stain with diaminobenzidine (DAB) two DAB tablets and two h2O2 tablets were dissolved (sigma fast DAB tablets, D-4168) in 5 ml TBs, and vortexed vigorously for 1 min. DAB solu-tion was added to sections immediately. staining time was 5-15 min. under visual inspection through a binocular. To stop the reaction DAB solution was removed and slides were transfered into cuvettes with water. Finally slide were drained and dehydrate in an ethanol series (70%, 95%, 100%, in cuvette) for 30 seconds for each step. After washing 1x in xylene for 2 min and draining the slides are ready for mounting.
�.�.�. Cell culture techniques
2.7.5.1. �a�ic method� for mamma��ian ce���� cu��ture�a�ic method� for mamma��ian ce���� cu��ture
secondary cells are long term stable cultured cells, which have been derived from various carci-noma cells or immortalised cells and therefore divide potentially indefinitely. The used lines were adherent cells, which attach to the surface of the culture vessel via membrane bound proteins and glycoproteins. This makes it neccesary to use special cell culture dishes for cultivation. All mammalian cell cultures have been grown in a haereus incubator for cell culture at 37°c inincubator for cell culture at 37°c in 5% cO2 and water vapor saturated ambiance. Thereby the cell culture work has been performed aseptically in a LaminAir Flow cabinet hB2472. The cells have been microscopically observed every day and regularly provided with fresh medium by passage. The assignment of the total cell number was done via the counting chamber (for cells) neubauer improved.• Splitting of cells To keep the cell culture running regular splitting of the cells is essential.

�0
�. Materials and methods
splitting means that a portion of cells is separated from the running culture and put into fresh plates and medium. since maintainance of the cultures was performed in 10 cm dishes, the following protocol is for this type of vessel. The cells were grown to a confluency of about 90% which means that 90% of the vessel’s surface is covered with cells. When you observe this confluency state in the phase contrast microscope, the cells have to be splitted. Another indi-cator for a dense cell culture is, when the medium color changes from red to yellow. A rising ph value of the culture changes the color of the supplemented phenolphthalein and shows, that the nutrient content is exhausted. First the growth medium is discarded into a wash bottle with a pasteur pipete connected to a vacuum. Then the cells were washed with 5 ml PBs which was again discarded. On each dish 1 ml Trypsin-eDTA was applied, gently swiveled and incu-bated at 37°c for 2-3 min. in this time the trypsin (a protease) will lysate the proteins, which are neccesary for the cells to build connections with the ground. This leads to a detaching and separation of the cells. After that the cells were flushed away from the vessel surface by pipet-ing 5ml of culture medium up and down. The cell suspension is then transferred into a falcon tube and centrifuged for 4 min at 1200 rpm. The supernatant was removed and the pellet is resuspended in an adequate volume of medium. For example if the cells were resuspended in 5 ml medium and 0.5 ml of this cell suspension is put on the plate the resulting dilution is 1:10. This 0.5 ml of cell suspension was pipeted into a fresh cell culture plate with in this case 9.5 ml previously applied fresh growth medium, thus leading to a final volume of 10 ml in the vessel. The cells were dispenced on the whole plate surface by shaking and put the back into the incubator. Due to the different growing speed of the used cell lines, they usually have been splitted in different dilutions between 1:3 and 1:15 depending on the temporal confluency on the day of splitting.
• Freezing of cells: Performing studies in cell culture one should always preserve some cells in case contaminations or other problems with media supplements. But beyond that one should try to conserve cells, when they are in a state, that the experiments work because in the course of long term cultivation the cells might start growing weakly or being not transfectable any-more. First the cells are grown until they form a confluent monolayer. Then they are washed and trypsinized in the same way as for splitting. The cells are centrifuged for 4 min. at 1200 rpm and resuspended in 1 ml freezing medium (90% Fcs and 10% DMsO). since the freez-ing medium has a high content of DMsO, they should be transferred quickly into a cryotube and put into the precooled freezing container. This container is then stored at -80°c for 24 h and the cryotubes can then be stored in liquid nitrogen for a long time.
• Counting of cells: in some cell culture purposes like transfections it is necessary to use de-fined cell numbers. The counting was performed in parallel to splitting using the excess of cell suspension. A 1: 10 dilution of the cell suspension was prepared (20 ml cell suspension : 80 ml medium) and filled into the counting chamber (about 20 ml). The chamber has a defined

��
�. Material and methods
volume and the cell number can therefore be calculated from the counted number of cells in the engraved grid. For this the following formula is used:
n (number of counted cells) ⁄ 4 (number of counted squares) x 10 (dilution factor) x 104 (chamber volume) = c (concentration in cells / ml)
2.7.5.2. �ran�fection of p��a�mid� and �iRNA�:
The approach to introduce DnA into eucaryotic cells is called transfection. The cell membrane represents a general barrier for the introduction of macromolecules, but there are several strate-gies to overcome this barrier in different transfection approaches. A high transfection efficiency and reproducibility can be achieved when the DnA or rnA molecules are entrapped into cationic liposomes and delivered into the cytoplasm via membrane fusion. These liposomes can form slightly positively charged complexes with the cationic DnA and therefore these complexes can interact with the negatively charged cell surface. in any case the performance of the various commercially available cationic liposome reagents are highly dependent on the cell type and therefore have to be tested. Transfection of reporter plasmids or fluorescently labelled sirnAs have been done to control transfection efficiencies. For the re-porter assays different human- (heK 293, heLa) and mouse cell lines (hT22, hn9, neuro-2a) were transfected. cells were plated onto 24-well plates at a density of 2x 10⁵ cells/well (heK293 cells) or 8x 10⁴ cells/well (hT22 cells). hn9, neuro-2a and heLa cells were plated at different cell numbers. They were grown until they reached a confluency of 90-95% and then transfected. each well contained 500 µl of the respective culture medium but without antibiotics/antimy-cotics. cells were transfected either with effectene (Qiagen) or Lipofectamine 2000 (invitrogen) according to the manufacturer’s protocol. For analysis in Western blots hn9 cells were cultured and transfected in the same way as above but in 6-well format using 2 ml of medium per well. The total amount of plasmid DnA per well was kept equal and adjusted either with pBluescript (stratagene) or pcDnA3 (invitro-gen) if needed. All transfections were done at least in duplicate.
2.7.5.�. ES ce���� cu��ture:
Pluripotent embryonic stem (es) cells represent the inner cell mass of blastocysts and are able to differentiate into divergent cell types in vivo as well as in vitro. nevertheless it is possible to cultivate es cells and keep them undifferentiated 358,359. Therefore, they are usually cultivated under special conditions grown on feeder cells and supplemented with leukemia inhibiting fac-tor (LiF). The es cell culture in this work was performed in a collaboration with Dr. ralf Kühn (helmholtzcenterMunich, neuherberg).The mouse es cell line iDG3.2, used in this work, originates from the F1 generation of the mouse strains c57Bl/6J and 129svev/Tac. For short term cultivation for protein assays they

��
�. Materials and methods
were grown on gelatine-coated tissue culture plates in es cell medium (DMeM, 15% Fcs, 2 mM L-glutamine, 20 mM hepes, 1 mM sodium pyruvate, non-essential amino acids, 0.1 mM β-mercaptoethanol and 1500 U/ml leukaemia inhibiting factor (chemicon) in at 37°c and 5% cO2.
2.7.5.4. E��ectroporation of ES ce�����:
A highly effective physical method to introduce foreign DnA into es cells is electroporation, in which the cell membranes are permeabilized transiently with short electrical currents. in doing so circular plasmid DnA stays transiently in the cells and expression cassettes on the plasmid become active. similar to transfections also here cotransfection of several plasmids is possible.iDG3.2 es cells were harvested from their culture dish by trypsination, centrifuged at 1200 rpm for 5 min, washed with PBs, centrifuged again and resuspended in 800 µl PBs containing the DnA to be electroporated. To achieve a high transfection efficiency 50 µg of each of the plas-mids were used for 2x 10⁶ cells in a volume of 800 µl PBs by applying an electrical field of 330 volts for 3 ms to 4 mm cuvettes (Biorad). Afterwards cells were replated into one 10 cm culture dish and the medium was replaced 24 hours later.
2.7.5.5. Sp��itting of ES ce�����:
For expansion, cells were splitted every two days taking care that they do not grow to confluency. The medium was removed, and the cells were washed with PBs and trypsinized for 5 min at 37°c until cells detached from the surface. The trypsin action was blocked by adding an equal amount of medium to the cells and the suspension was resuspended by pipetting. Depending on the desired amount the cells were splitted onto several culture dishes. For determination of cell number, 10 µl of cell suspension were pipetted in a neubauer counting chamber and es cellsµl of cell suspension were pipetted in a neubauer counting chamber and es cellsl of cell suspension were pipetted in a neubauer counting chamber and es cells were counted analog to standard cell culture. Thereby the cell number of one quadrant multi-plied by 10,000 corresponded to the number of cells in one ml cell suspension.
2.7.5.6. Freezing and thawing of ES ce�����:
es cells were stored -80°c for short term storage (up to 2-3 months) or in liquid nitrogen for long term storage. cells were trypsinized as described above, centrifuged, resuspended in ice cold 1x freezing medium, and pipetted into a 2 ml cryovial. vials were frozen in a freezing container at -80°c. Due to the isopropanol in the freezing container the temperature is lowered very slowly inside until it reaches the final temperature of the freezer after several hours. For long term storage, the vials were then transferred into liquid nitrogen. For freezing of cells on multi well plates, cells were trypsinized, resuspended with a small amount of medium, and ice cold 2x freezing medium was added in a ratio of 1:1, so that the final concentration of freezing medium in each well was 1x. Plates were wrapped in cellulose and frozen at -80°c. The cellulose prevents
��
�. Material and methods
the fast freezing of the cells. cells were thawed in the water bath at 37°c, diluted with medium, centrifuged, resuspended in fresh medium, and plated on dishes with or without feeder cells. For small volumes of frozen cells, cells were diluted in a larger volume of medium and plated directly. For this procedure, medium was changed the next day as soon as possible to get rid of the DMsO from the freezing medium.
2.8. Animal experimentsAll animal experiments were conducted in accordance with the guide for the care and use of laboratory animals of the government of Bavaria, Germany.
�.�.�. Mouse housing and breeding
• Mice for kainic acid injection: A total of 25 male c57BL/6n mice were purchased from charles river Germany (Dutch breeding stock) at an age of 82-86 days. After their arrival, animals were kept singly in standard Macrolon type ii cages with sawdust bedding (Altromin Faser einstreu, Altromin Gmbh), tap water, and food ad libitum, at 22 ± 2°c room tempera-ture and 55% ± 5% humidity, under an inverse 12 h:12 h light-dark cycle (lights off: 08:00 a.m.). Animals were transferred from the vivarium to the laboratory 1–2 d before the experi-ment during the light phase of their cycle. During experiments, animals were kept in the same behavioral laboratory in which they were injected.
• Mice for miRNA in situ hybridization: Timed matings were conducted with cD-1 mice in standard Macrolon type ii cages with sawdust bedding (Altromin Faser einstreu, Altromin Gmbh), tap water, and food ad libitum. Females with vaginal plugs were considered to be at day 0.5 of gestation. Pregnant females were sacrificed at different time points of gestation and embryos were dissected free of maternal tissues. Whole embryos (e10, e14) or brains of e18 embryos were removed quickly and fixed in 4% paraformaldehyde (PFA) in PBs at 4°c over night. Adult mice were perfused for approx. 7 min. with 4% PFA in PBs before isolation of whole brains. Tissues were embedded in paraffin and serial sections at 8 µm thickness covering entire mouse embryos (e10, e14) were cut in sagittal orientation and brains (e18, adult) were cut in coronal, sagittal and transversal orientation, mounted on super Frost slides (Menzel-Gläser, Braunschweig, Germany) and stored at 4°c until used.
• Mice for viral injections: Mice were group housed (if not mentioned else) with five mice per cage at maximum in open cages (standard Macrolon type ii cages) with sawdust bedding (Altromin Faser einstreu, Altromin Gmbh) and maintained on a 12 hours light/dark cycle with food and water ad libitum. The temperature was 22 ± 2°c and relative humidity 55 ± 5%. For breeding single or double matings were set up and pups were weaned at an age of three weeks. At weaning mice got earmarks for identification. Transgenic animals were bred in a heterozygous setting (het/het) and genotyping was performed from cut tailtips by Pcr.

��
�. Materials and methods
�.�.�. Stereotactic surgery
To allow injections into defined target regions of the brain stereotactic surgery was performed.injections into defined target regions of the brain stereotactic surgery was performed. Thereby, a defined three dimensional coordinates system guides the injections and confluences of bone sutures in the skull were used as landmarks and reference to the coordinates system.The stereotactic surgery has been performed in collaboration with the rG Wotjak in the insti-tute in particular by Wolfgang Kelsch, Anja Mederer and Kornelia Kamprath. Mice were anaes-Mice were anaes-thesised in an exicator with isofluran (Forene, Abbott, Wiesbaden, Germany). After the animal got unconscious it was moved to the stereotactic device (David Kopf, Tujunga, cA, UsA) with adapted components and further supplied with 0.8-1% isofluran in oxygen by an evaporator (halothan vapor 19, Drägerwerk AG & co. KGaA, Lübeck) via an inhalation mask. After deep anaetshesia was established and no reflexes were detectable the head of the mice were fixed with metal bars placed caudally to the ears. To protect the eyes during anaeastesia they were covered with ointment (Bepanthen, Bayer). Body temperature was controlled by a rectally placed elec-tronic thermometer which controlls an electric heating pad that the mouse was laying on. Then hair on the head was removed with an electric shaver and the scalp was locally anesthesised with lidocaine and cut. After that 30% h2O2 was applied to the cranium to visualise the brain su-tures. Bregma was the overall zero for the stereotactic coordinates. Then the planned coordinatescoordinates were used to mill a circular area of the skull with a dental drill. The following coordinates in relation to bregma have been used. Dorsal hippocampus: anterior/posterior 1.6 mm; lateral 1.0 mm and ventral 1.8 mm; cortex: anterior/posterior 0.5 mm; lateral 2 mm and ventral 0.6 mm. The drilled bone segment was removed with a scalpell and the injection was performed.After the injection the scull was sutured with surgical fiber, isufluran supply was stopped and the animal was removed from the stereotact. The wake up period was controlled and the animal was orally given 1 ml of metacam (Boehringer ingelheim) as postoperative pain and inflamation reliever. The animals were single housed under standard conditions and inspected twice per day. For the first day during inspections another dose of metacam was applied.
�.�.� Injection of siRNAs
• Naked stealth siRNAs: 1 ml of a 20 mM solution of fluorescently (FiTc) labeled control sirnAs (BLOcK-iT Fluorescent Oligo, invotrogen, Paisley, UK) or strealth sirnAs (invitro-gen, Paisley, UK) was injected using a hamilton syringe (hamilton). Animals were killed 48h after injection to assess knock-down effects.
• In vivo jetPEI A broken sharp electrode glass capillary with a tip diameter of 7 µm is used to deliver 1 µl of solution in 25 min with continuous pressure derived form a 100ml syringe in a custom casting system. Therefore cBP and FiTc sirnA oligos were mixed in a ratio 80%/20% and the mix was used for in vivo jetPei transfection according to the manufacturer’s protocol (Polyplus-transfection inc., new York, UsA). The formulatuion was done with a ra-tio n/P=6. Thereby the n/P ratio is a measure of the ionic balance of the complexes and refers
��
�. Material and methods
to the number of nitrogen residues of jetPei per DnA phosphate. To keep the balance at a cationic side a n/P ratio of 2-3 is required since not every nitrogen atom of Pei is a cation. Animals were killed 48h after injection to assess knock-down effects.
�.�.�. Viral injection
The viral injections have been performed with glass capillary analog to injection of in vivo jetPei formulations. A broken sharp electrode glass capillary with a tip diameter of 7 µm was used to deliver 1 µl of solution in 10-25 min with continuous air pressure derived form a 100ml syringe in a custom casting system. The injection speed was visually estimated during the injection and the air pressure was adjusted accordingly by hand. ~108 transducing units (TU) were injected in a total volume of 1-2ml. Thereby, for loading of virus suspension a small piece of parafilm waspiece of parafilm was placed on the mouse brain and the viral suspension was applied as a drop onto the film. This suspension was sucked into the glass capillary already mounted onto the stereotact and injected. Animals were killed 3-4 weeks after injection to assess virus expression or knock-down effects.
�.�.�. Perfusion
Mice were anaesthesized and killed with isofluran and the thoracic cavity was opened to dissect the heart. Then a blunt perfusion canula was inserted through the left ventricle into the ascend-ing aorta and the right atrium was resected. Using a pump vessels were rinsed with PBs until the liver became pale and then perfusion was carried out with 4% paraformaldehyde/ PBs for ap-proximately 5 min. After perfusion was complete the mouse was decapitated and the brain was dissected removing bones and meninges. For postfixation the brain was kept in 4% paraformal-dehyde/PBs for 1 hour at rT to overnight at 4°c, depending on the subsequent procedure.
�.�.�. Clearing of brain tissue
clearing of whole brains removed from virus injected young adult mice has been described in detail by the collaborators 360.
Briefly: Day 1: Perfusion 4% PFA Postfix >1h 4% PFA at room temperature 100% etOh/DMsO (sigma) (4:1) over night at 4°c Day 2: 100% etOh/DMsO/h2O2 30% (4:1:1) over night at rT Day 3: 70% etOh 30 min. at room temperature, shaking 80% etOh 30 min. at room temperature, shaking 96% etOh 30 min. at room temperature, shaking 100% etOh 30 min. at room temperature, shaking 100% etOh over night at 4°c, shaking
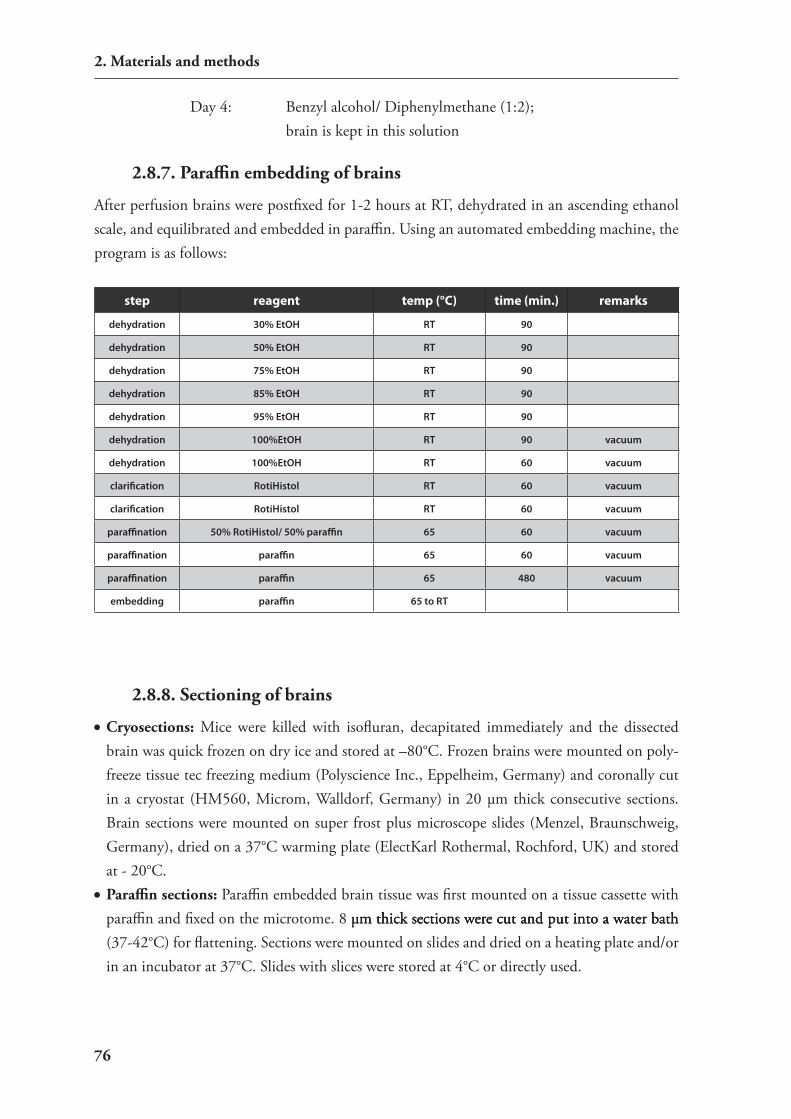
��
�. Materials and methods
Day 4: Benzyl alcohol/ Diphenylmethane (1:2); brain is kept in this solution
�.�.�. Paraffin embedding of brains
After perfusion brains were postfixed for 1-2 hours at rT, dehydrated in an ascending ethanol scale, and equilibrated and embedded in paraffin. Using an automated embedding machine, the program is as follows:
step reagent temp (°C) time (min.) remarks
dehydration 30% EtOH RT 90
dehydration 50% EtOH RT 90
dehydration 75% EtOH RT 90
dehydration 85% EtOH RT 90
dehydration 95% EtOH RT 90
dehydration 100%EtOH RT 90 vacuum
dehydration 100%EtOH RT 60 vacuum
clarification RotiHistol RT 60 vacuum
clarification RotiHistol RT 60 vacuum
paraffination 50% RotiHistol/ 50% paraffin 65 60 vacuum
paraffination paraffin 65 60 vacuum
paraffination paraffin 65 480 vacuum
embedding paraffin 65 to RT
�.�.�. Sectioning of brains
• Cryosections: Mice were killed with isofluran, decapitated immediately and the dissected brain was quick frozen on dry ice and stored at –80°c. Frozen brains were mounted on poly-freeze tissue tec freezing medium (Polyscience inc., eppelheim, Germany) and coronally cut in a cryostat (hM560, Microm, Walldorf, Germany) in 20 µm thick consecutive sections. Brain sections were mounted on super frost plus microscope slides (Menzel, Braunschweig, Germany), dried on a 37°c warming plate (electKarl rothermal, rochford, UK) and stored at - 20°c.
• Paraffin sections: Paraffin embedded brain tissue was first mounted on a tissue cassette with paraffin and fixed on the microtome. 8 µm thick sections were cut and put into a water bathµm thick sections were cut and put into a water bathm thick sections were cut and put into a water bath (37-42°c) for flattening. sections were mounted on slides and dried on a heating plate and/or in an incubator at 37°c. slides with slices were stored at 4°c or directly used.
��
�. Material and methods
�.�.�. Generation of transgenic mouse lines
• Generation of mice expressing shRNAs: The mouse has been generated by sabit Delic at the helmholtzcenterMunich, neuherberg). A detailed description of these animals is published 361. Briefly, the pshAG plasmid containing a human U6 promoter expression cassette for shr-nAs 357 was opened with Bseri/Bamhi and ligated with a specific shrnA oligonucleotide pair (5`-caa acg tcc tgg agt ata tac tga gaa gct tgt cag tat ata ctc cag gac gtt tgc ttt ttt gga aa-3`and 5`-gat ctt tcc aaa aaa gca aac gtc ctg gag tat ata ctg aca agc ttc tca gta tat act cca gga cgt ttg cg-3). A single copy of the obtained vector was inserted into the genomic rosa26 locus of es cells (iDG26.10-3) by recombinase mediated cassette exchange (rMce). From one trans-genic es cell clone es cell tetraploid mice were obtained and used for further breeding. The shrnA vector was efficiently transmitted through the germline and the transgenic mice were healthy, fertile and exhibited the same body weight as non-transgenic littermate controls.
• Generation of GFP-CRHR� mice: The mouse line has been created within the group by claudia Kühne and Jan Deussing. Briefly, the targeted introduction of eGFP into the crhr1 gene was performed by homologous recombination in embryonic stem cells. The targeting vector with 9.1 kb homology to the crhr1 gene locus consisted of an eGFP, which was in-serted in exon 2 of the crhr1 as well as a potentially self-excising selection marker, which is flanked by frt sites. Moreover, the exon 2 is flanked by loxP sites, which allows for condi-tional inactivation of crhr1. homologous recombination in es cells resulted in a modified crhr1 allele in which eGFP was introduced into exon 2 adjacent to the signal peptide cleavage site. This insertion is in frame and will result in a fusion of eGFP c-terminally to the crhr1 signal peptide. removal of the selection marker via FLP-mediated recombination resulted in the expression of a eGFP-crhr1 fusion protein (eGFP-crhr1 mouse line). eGFP-crhr1 was shown to be clearly recruited to the cell membrane in cell culture experi-ments.
2.9 Microscopy and image acquisition
�.�.�. Brightfield, darkfield, and fluorescence microscopy
Bright- and darkfield images have been captured with a color ccD camera (Axiocam Mrc5, Zeiss, Göttingen Germany) mounted onto a Leica MZ APO stereomicroscope (Leica, Wetzlar, Germany) using Axiovision rel.4.5 (Zeiss, Göttingen, Germany). exposure time was individu-ally adjusted for each image unless otherwise stated.Fluorescence images were aquired using a Axioplan 2 microscope (Zeiss, Göttingen Germany) with an adapted greyscale ccd camera Axiocam Mrm (Zeiss, Göttingen Germany) and an eXFO X-cite 120 fluorescence illuminator (eXFO Photonic solutions inc., Mississauga, can-ada).
��
�. Materials and methods
�.�.�. Ultramicroscopy
Ultramicroscopy of whole brains removed from virus injected young adult mice has been per-formed in a collaboration with christoph P. Mauch (rG Wotjak, MPi of Psychiatry); method described in detail in 360,362.
�.�.�. Image processing
• Microphotograps: image levels have been adjusted in Adobe Photoshop cs2, version 9 andimage levels have been adjusted in Adobe Photoshop cs2, version 9 and microscopically verified artefacts were digitally removed from the background. Descriptions and arrangements of images in panels have been done in Adobe illustrator cs2, version 9. callibrated scalebars for each magnification were saved to additional images in Axiovision rel.4.5 and redrawn in illustrator. False color fluorescent overlays have been achieved by copy-ing grayscale images of fluorescence signals into the red, green and blue channels of rGB im-ages in Photoshop. image levels have been adjusted for both channels individually according to an even overlay effect. When indicated composite images (adjusted assembly of multiple images taken) have been aligned in Photoshop using layer masks to smooth edges resulting from adjacent images.
• �D reconstruction of optical slices in ultramicroscopy: 3D image reconstruction was car-ried out with commercial 3D reconstruction software (Amira 4.1, Mercury computer sys-tems, Germany) from optical z-stacks. Details are published in 360,362
2.10. Statistics, bioinformatics and computational analy-sisin the figures only significant statistical tests are indicated with stars *** p<0.001, ** p<0.01, * p< 0.05.
�.�0.�. Statistics for pairwise group comparisons
For pairwise group comparisons two tailed student’s t-tests were performed in Microsoft excel 97-2000 and sPss 10. in in vitro silencing experiments all error bars show standard deviation and only significant contrasts are marked.
�.�0.�. Statistics and analysis of miRNA arrays
The data processing and statistics was performed in collaboration with Benno Pütz in the in-stitute. The analysis was performed in r version 2.8.1 (2008-12-22) 363, making use of several packages available either via crAn (http://cran.r-project.org); xtable for table output; Bio-conductor (http://www.bioconductor.org); beadarray providing routines to handle illumina r Beadstudio adapted data 364; limma for statistical routines 365.
��
�. Material and methods
normalisation of the background substracted data was performed using quantile and vsn func-tions from r.cluster analysis provides an easy way to visualise similarities between the expression profiles of the samples, yielding the dendrograms. Therefore the function hclust() is implemented in the used r packages.For differential expression analysis, functions from the limma package 365 can be used on the normalized log2- transformed expression values. significantly regulated genes are ranked using an empirical Bayes method by using the implementation ebayes () from the r package limma 365-367. The algorithm uses information from the ensemble of all samples to estimate the sample variance for each gene, taking into account the correlation structure within the samples 368. This approach aims at stabilizing the statistical analysis, especially for small array numbers. Genes that show no expression signals in any sample are considered irrelevant and excluded from the subsequent analysis in order not to underestimate the variances in the Bayesian estimation.Multiple testing is corrected for using the false dicovery rate (FDr) approach 366 which leads to the values in the adj.P.val column which is not to be interpreted as a significance measure. A value of e.g. 10% in the adj.P.val column indicates, that 10% of the probes which are in the table top of this probe are expected to be falsely detected and, therefore, about 90% of the probes can be considered significant. This does not imply any judgment about which of the probes these are.
�.�0.�. DNA alignment, BLAST and digital vector construction
To compare DnA sequences, they have been aligned using the algorithm published by Florence corpet 369. For this purpose the sequences were pasted into the web interface at http://prodes.toulouse.inra.fr/multalin/multalin.html with default parameters.For sequence analysis of DnA BLAsT (Basic local alignment search tool) searches have been perfomed in the databases of ncBi and celera Genomics.All DnA constructs and DnA sequence manipulations were generated in parallel to the cloning procedure in the vector nTi suite 6 (inforMax).

�0
�. Results
3. Results
3.1. Establishment of a novel RNAi expression vector
�.�.�. Introduction: RNA polymerase I (Pol I)
since its discovery, rnAi has rapidly evolved into a powerful technique to knock-down gene expression and gained ground as an indispensable tool to study gene function both in vitro and in vivo (chapter 1.5.). in plants and animals such as C. elegans and D. melanogaster, rnAi can be activated by long dsrnAs, which are processed by an intracellular machinery to short interfer-ing rnAs (sirnAs) (chapter 1.3.1).however, in mammalian cells long dsrnAs cause general translational inhibition and unspecific rnA degradation (chapter 1.5.1). These effects can be avoided by introducing in vitro-synthe-sized sirnAs into the cells 111,112. The resulting silencing is very pronounced, in particular due to the high sirnAs transfection efficiency, greatly exceeding the one for DnA vectors. Therefore, this technique has been widely adopted in experimental paradigms such as pathway profiling and drug screening. its major drawback, however, resides in the transient nature of silencing. studies on gene function often require the establishment of cell lines or transgenic organisms, in which sirnAs should be expressed from stably integrated cassettes.in expression vectors, sirnAs are often processed from a short hairpin rnA (shrnA) of ap-proximately 70 nucleotides in length, structurally similar to naturally occurring micrornA (mirnA) precursors. This sequence needs to fulfill strict length requirements to result in an effective sirnA. Transcripts generated from conventional polymerase ii (Pol ii) promoter-based vectors are therefore not suitable for such a purpose, as they undergo extensive post-transcrip-tional modifications such as capping and polyA tailing 111 370. To circumvent this problem, Pol iii promoter-driven cassettes were developed 120-123. More recently, the use of a cMv promoter to generate sirnAs was made possible by insertion of a human mirnA mir-30 precursor and neighbouring genomic sequences into the expression vector 371. here, an alternative method for expression of sirnAs is presented, using ribosomal transcription units driven by Pol i promot-ers. similarly to Pol iii-driven transcription, Pol i-mediated transcription is very robust, ubiq-uitous, devoid of extensive rnA modifications and is characterized by clearly defined transcrip-tion start and termination sites 372. in addition, it has no limits for transcript size, and even more importantly, possesses a high species specificity 373. This latter feature, which is unique among all rnA polymerases, provides an interesting potential regarding biosafety of experiments.

��
�. Results
�.�.�. RNAi vector construction
A new vector system supposedly suitable for expression of shrnAs has been generated in my Diploma thesis prior to the work presented here 374. in the following experiments this vector has been further used and carefully characterized.in general shrnAs are processed by Dicer to sirnAs, which serve as effector molecules in gene silencing 25. in order to be successfully recognized and processed by Dicer, shrnAs need to sat-isfy strict sequence and structure requirements. in particular, it is very important to fix precisely the transcription initiation and termination points, so that no nucleotide overhangs are present at either end of the resulting hairpin. The rules governing Pol i-dependent transcription have been extensively studied, making the design of such an exact transcript possible 372. Mouse Pol
i promoter encompasses sequences downstream of the transcription start, which are, however, not re-quired for efficient transcription. Only the presence of a purine nucleotide at position +1 appears to be indispensable 375. The tran-scription termination point is also precisely determined, being 15 bp upstream from the so called sal box terminator 375. The Pol i mi-nigene on pW contains a complete mouse Pol i promoter and several additional sequences between pro-moter and transcription termina-tion point. The cloning strategy followed in my diploma thesis 374 aimed at removing these additional sequences (Figure 11). After a two-step Pcr procedure, the Pol i pro-moter with termination sequences (Tx) was subcloned into either pW or pe3sP backbone. The lat-ter contains an enhancer sequence, which increases the efficiency of Pol-i dependent transcription 376. These vectors have been termed
P1 P3+1
P2 P4TxPol1 Promoter
P
TxpW
P
Tx
pW-bc
P
Tx
pE3SP-bc
E
Pst I
EcoR IKpn I
Bbs I
Kpn IBbs I
1. PCR(using Primers 1 and 2)
1. PCR(using Primers 3 and 4)
2. PCR(using Primers 1 and 4)
Pst I EcoR I
Pst I EcoR I
E pE
Pst I
EcoR IpW
Pst I
EcoR I
Figure 11: Construction of the vectors pW-bc and pE3SP-bc. Part of the pW ribosomal minigene was PCR amplified in two steps. Firstly, two fragments were generated using primers P1 and P2, or P3 and P4, respectively. Secondly, both fragments were joined by PCR with primers P1 and P4. The restriction sites PstI and EcoRI, introduced through PCR primers P1 and P4, were used to insert the resulting fragment into the pW and pE3SP (pE) vector backbones. P, mouse Pol I promoter; Tx, transcription termination signal; bc, basic construct; E, enhancer

��
�. Results
pW-bc and pe3sP-bc, respectively (Figure 12A). Between the promoter and the termi-nation sequence Tx, these vectors contain Kpni and Bbsi sites, which were used to in-sert a multiple cloning site (Mcs), resulting in plasmids pW-Mcs and pe3sP-Mcs, re-spectively (Figure 12B). The two Bbsi sites of the pe3sP-Mcs were used for cloning of the short hairpin sequence targeting fire-fly luciferase (Figure 12c). The sequence is identical to the one published by Paddison et al. 357. The construct was termed pe3sP-shLuc. Plasmid pe3sP-Mcs was used as control in experiments with silencing fire-fly luciferase and erk2 (Figures 13, 14 and 16; see below). The Bbsi restriction enzyme offers the advantage that the cleavage site is positioned outside the recognition se-quence of the nuclease; consequently, no strict sequence requirements are needed for the exact cleavage at the desired position. Moreover, Bbsi cleavage generates non-pal-indromic cohesive ends, thus allowing di-rectional cloning.
�.�.�. Functional characterisation of the novel vector: silencing of report-er constructs
�.1.�.1. Po�� I mediate� efficient RNAi �i��encing
Then, functional efficiency of pe3sP-shLuc in mediating silencing was investigated. Preliminary results in dual reporter assays already were encouraging that the novel vector system was able to mediate rnAi 374. pe3sP-shLuc was co-transfected into the mouse hippocampal cell line hT22 together with the vectors pGL3-con expressing firefly luciferase (the target of shLuc) and prL-sv40 expressing Renilla luciferase, which serves as an internal reference to normalize transfec-tion efficiency in dual reporter assyas. The pe3sP-shLuc construct was able to specifically sup-press the activity of firefly luciferase by 86 % (Figure 13A). This efficiency of suppression was comparable to the Pol iii-driven vector pU6-shLuc in own data and published results 357. The
5´---- GAAGGATTCCAATTCAGCGGGAGCCACCTGAT GCCTAAGGTTGAGTCGCTCTCGGTGGGCTA C
3´-TTA^ GTT
TxEnhancer
+1
KpnI BbsIP
TxEnhancer P MCS
basic construct (bc)
57 bp
BbsI (1)BglII (16)
BstBI (12)EcoRV (33)
KpnI (45)MunI (36)NcoI (45)SacI (27)
XbaI (27)
XhoI (20)
BbsI (57)
multiple cloning site (MCS)
short hairpin RNA targeting firefly luciferase or Erk2
TxEnhancer P
A
B
C
Figure 12: Schematic representation of vectors used in the pres-ent study. (A) pE3SP-bc, basic construct vector, containing the en-hancer for Pol I-dependent transcription, the sequence of mouse Pol I promoter (P) upstream of transcription start, a transcription termi-nation signal (Tx), and the KpnI and BbsI sites for cloning purposes. (B) pE3SP-MCS vector contains a multiple cloning site for additional cloning versatility. (C) pE3SP-shLuc and pE3SP-Erk2 express short hairpin RNAs targeting firefly luciferase and Erk2, respectively.

��
�. Results
effect was dose-dependent for both silencing constructs and reached its optimal efficiency at a silencer to reporter ratio of 10:1 (data not shown).
�.1.�.2. Po�� I mediated RNAi i� �pecie� �pecific
Unlike Pol ii and Pol iii, Pol i transcription exhibits a remarkable species specificity, even be-tween closely related species like mouse and human 373. To test whether this species specificity is maintained in the Pol i-dependent silencing constructs, silencing efficiencies of pe3sP-shLuc and pU6-shLuc were compared in mouse hT22 and human heK293 cells. Whereas human Pol iii promoter-driven silencer pU6-shLuc was efficient in cell lines of both species, pe3sP-shLuc was only active in mouse, but completely silent in human cells (Figure 13B). in order to distinguish the cell line-specific effect from the species-specific one, this experiment was repeated in two additional mouse (hn9 and neuro-2a), and one human (heLa) cell lines. Again, the silencing was only efficient in mouse cells, and absent in the human cell line (Figure 13c). This observation is a strong indication that transcription relies indeed on Pol i-mediated mecha-nisms.
B
A
C
******
******
******
**
1.41.21.00.80.60.40.20.0
1.21.00.80.60.40.20.0
pcDNA3 pE3sp-shluc
pE3sp-shluc pU6-shlucpBluescript
pE3sp-MCS
pU6-shluc
pU6
HEK293HT22
*** *** ****** ***
1.0
0.8
0.6
0.4
0.2
0.0pE3sp-shlucpU6-shluc
HeLaNeuro-2aHN9-2a
Figure 13: Pol I-dependent shRNA induces species-specific gene si-lencing. (A) Twenty four-well plates of HT22 mouse hippocampal cells were transfected with 80 ng/well of plasmid that directs the expression of firefly (pGL3-Con, Promega), 8 ng/well of plasmid expressing Renilla (pRL-SV40, Promega) luciferase and 800 ng/well of the indicated DNA. Luciferase activities were assayed 48 h after transfection using the Dual Luciferase Assay. Ratios of firefly to Renilla luciferase activities were normalized to a control transfected with vector pcDNA3, and the con-trol ratio was set to 1. The average of two independent experiments is shown, and each experiment was performed in duplicate; error bars in-dicate standard deviation. pE3SP-MCS and pU6 are empty vectors for corresponding shLuc-expressing plasmids pE3SP-shLuc and pU6-shLuc, respectively. *** p<0.001 Statistical significance was evaluated using the Student’s T-test. (B) Species specificity of Pol I-dependent gene silencing. Twenty four-well plates of HT22 mouse hippocampal cells or HEK293 hu-man embryonic kidney cells were transfected and the luciferase expres-sion was measured as in (A). Ratios of firefly to Renilla luciferase activities were normalized to a control transfected with pBluescript vector. The av-erage of two independent experiments is shown, and each experiment was performed in duplicate; error bars indicate standard deviations. *** p<0.001, ** p<0.005. (C) Species specificity of Pol I-dependent gene si-lencing. Twenty four-well plates of HeLa human epithelial cells, Neuro-2a mouse neuroblastoma cells or HN9 mouse embryonic hippocampal cells were transfected and the luciferase expression was measured as in (A). Ratios of firefly to Renilla luciferase activities are expressed as rela-tive values to the control sample that was transfected with the accor-dant empty expression vector (pU6 (for pU6-shLuc) and/or pE3SP-MCS (for pE3SP-shLuc) vectors. The control ratio was set to 1. The average of two independent experiments is shown, and each experiment was per-formed in triplicate; error bars indicate standard deviations. Statistical analysis was done using the Student’s T-test and asterisks indicate sig-nificant difference from the empty vector control. *** p<0.001.
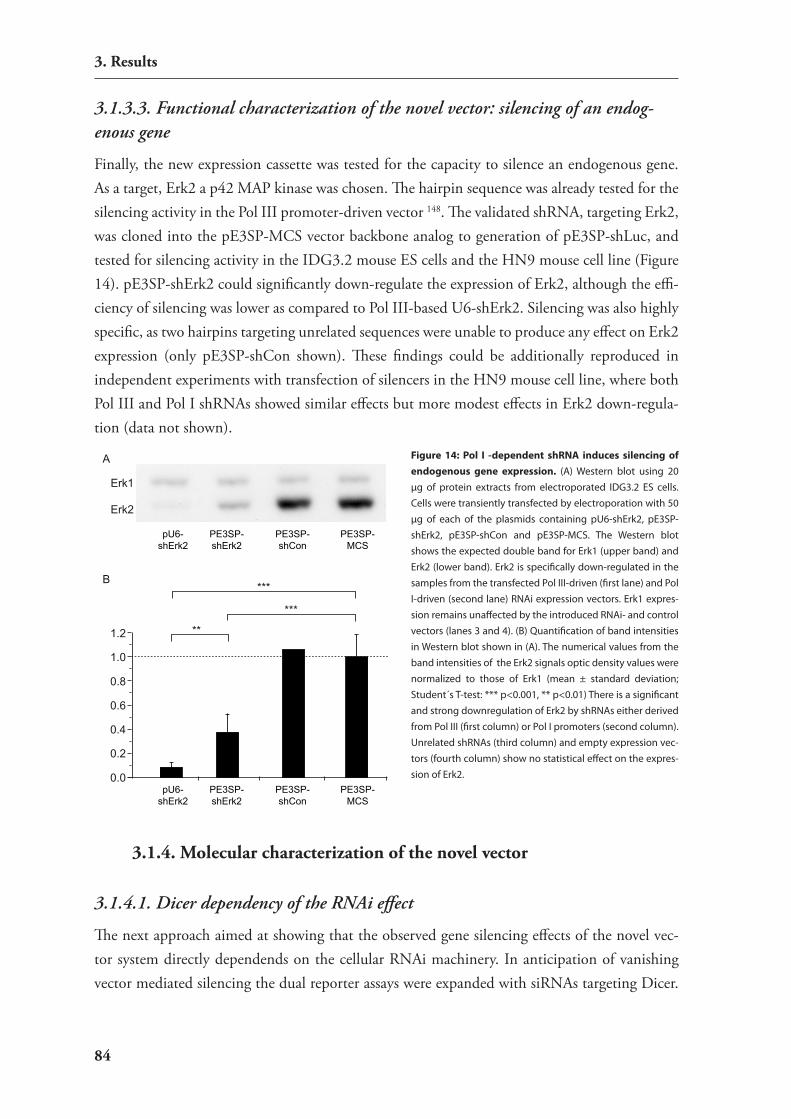
��
�. Results
�.1.�.�. Functiona�� characterization of the nove�� vector: �i��encing of an endog-enou� gene
Finally, the new expression cassette was tested for the capacity to silence an endogenous gene. As a target, erk2 a p42 MAP kinase was chosen. The hairpin sequence was already tested for the silencing activity in the Pol iii promoter-driven vector 148. The validated shrnA, targeting erk2, was cloned into the pe3sP-Mcs vector backbone analog to generation of pe3sP-shLuc, and tested for silencing activity in the iDG3.2 mouse es cells and the hn9 mouse cell line (Figure 14). pe3sP-sherk2 could significantly down-regulate the expression of erk2, although the effi-ciency of silencing was lower as compared to Pol iii-based U6-sherk2. silencing was also highly specific, as two hairpins targeting unrelated sequences were unable to produce any effect on erk2 expression (only pe3sP-shcon shown). These findings could be additionally reproduced in independent experiments with transfection of silencers in the hn9 mouse cell line, where both Pol iii and Pol i shrnAs showed similar effects but more modest effects in erk2 down-regula-tion (data not shown).
�.�.�. Molecular characterization of the novel vector
�.1.4.1. Dicer dependency of the RNAi effect
The next approach aimed at showing that the observed gene silencing effects of the novel vec-tor system directly dependends on the cellular rnAi machinery. in anticipation of vanishing vector mediated silencing the dual reporter assays were expanded with sirnAs targeting Dicer.
pU6-shErk2
PE3SP-shErk2
PE3SP-shCon
PE3SP-MCS
pU6-shErk2
PE3SP-shErk2
PE3SP-shCon
PE3SP-MCS
B
A
Erk1
Erk2
1.2
1.0
0.8
0.6
0.4
0.2
0.0
***
***
**
Figure 14: Pol I -dependent shRNA induces silencing of endogenous gene expression. (A) Western blot using 20 µg of protein extracts from electroporated IDG3.2 ES cells. Cells were transiently transfected by electroporation with 50 µg of each of the plasmids containing pU6-shErk2, pE3SP-shErk2, pE3SP-shCon and pE3SP-MCS. The Western blot shows the expected double band for Erk1 (upper band) and Erk2 (lower band). Erk2 is specifically down-regulated in the samples from the transfected Pol III-driven (first lane) and Pol I-driven (second lane) RNAi expression vectors. Erk1 expres-sion remains unaffected by the introduced RNAi- and control vectors (lanes 3 and 4). (B) Quantification of band intensities in Western blot shown in (A). The numerical values from the band intensities of the Erk2 signals optic density values were normalized to those of Erk1 (mean ± standard deviation; Student´s T-test: *** p<0.001, ** p<0.01) There is a significant and strong downregulation of Erk2 by shRNAs either derived from Pol III (first column) or Pol I promoters (second column). Unrelated shRNAs (third column) and empty expression vec-tors (fourth column) show no statistical effect on the expres-sion of Erk2.

��
�. Results
if it is a true rnAi effect the vectors should not produce luciferase silencing when Dicer is knocked-down since shrnA need to be processed by Dicer to produce functional sirnAs in the cell. This experiment has been performed several times in variations. First Pol i and Pol iii vectors were tested for si-lencing properties when novel designed sir-nAs targeting murine Dicer were cotrans-fected in hT22 cells. Thereby two different sequences have been used. The reproducible and pronounced result was specific silenc-ing with or without sirnAs against Dicer (data not shown). Thus reproduction of the results of Paddison et al. 357 should be the starting point in which pU6-shLuc did not produce any silencing when additionally sirnAs targeting Dicer were used (Figure 15). The original experiment was performed in hek293 cells so testing the mouse spe-
cific Pol i vector in hek293 cells would not have made sense. That’s why in Figure 15 only the postitive pU6-shLuc is shown with control.Although there is a solid silencing from 80-90% between control and the silencing vector the transfection of Dicer sirnAs did not show any effect and a t-test detects no significant changes of firefly luciferase expression to the sirnA group. in the mentioned literature the same sirnA sequence abolished silencing completely and the relative luciferase intensity went back to the control levels. This finding was reproduced three independent times. request to the original author did not reveal any major difference in the experimental setting that could explain the difference. The only suggestion might be a mixture of tubes that in reality the published sirnA sequence was not an effective one and that the published results may have been obtained with another sequence.
�.1.4.2. Detection of the RNAi mediating tran�cript�
Thus the strategy was adapted and the idea was now to have a more direct assay to prove that the cloned Pol i vector behaves in the predicted way in mediating rnAi. The detection of the shrnA transcribed from the rnAi vectors would be a good supporting evidence to the species specific observations that the observed silencing effects are not produced by general effects. For
0
0.2
0.4
0.6
0.8
1.0
1.2
Control
scrambled
pU6-shLuc1:1
scrambled
pU6-shLuc1:1
shDicer
pU6-shLuc1:3
scrambled
pU6-shLuc1:3
shDicer
***
Figure 15: Effect of Dicer knock-down by siRNAs on silencing of RNAi vectors. Twenty four-well plates of HEK293 cells were trans-fected with 100 ng/well of plasmid that directs the expression of fire-fly (pGL3-Con, Promega), 100 ng/well of plasmid expressing Renilla (pRL-SV40, Promega) luciferase and the indicated DNA plasmid at concentrations of 100ng (1:1) or 300ng (1:3). Plasmids pE3SP-shLuc and pU6-shLuc, respectively express an shRNA targeting firefly lucif-erase. The day before plasmid transfection either siRNAs targeting human Dicer or scrambeled siRNAs as control have been transfected. Luciferase activities were assayed 48 h after first transfection using the Dual Luciferase Assay. Ratios of firefly to Renilla luciferase activi-ties were normalized to a control transfected with vector pBluescript, and the control ratio was set to 1. The published siRNA against hu-man Dicer does not show an effect on function of the RNAi vector. The average of four replicates is shown; error bars indicate standard deviation. *** p<0.001 Statistical significance was evaluated using the Student’s T-test.

��
�. Results
this purpose a northern blot detection for short rnAs had to be established. standard agarose gels are unable to separate nucleic acids smaller in size than ~50nt. Thus to separate short rnA species like mirnAs more dense gels like polyacryl amide gels have to be used. When using these gels also the following transfer onto a membrane has to be changed since the standard transfer via capillary forces is not effective with such high density gels. similar to proteins in Western blots the separated rnA needs to be transferred in an electrical field. in addition, rnA purification with columns needs to be avoided for sample preparation since these column based fractionations discard most or all small rnA fragments. Another important difference to standard northern blots is that as probes either rnA or DnA oligos are used which can be end labeled with T4 polynucleotide kinase using 32P ATP. To establish this specialized method a stepwise procedure has been conducted. The first optimisations have been performed on detecting synthetic sirnAs (sirnAs targeting firefly luciferase) that have been loaded in various amounts onto the gel. With this approach sample separation on gel, transfer of small rnAs onto the membrane, probe label-ling and detection could be checked individually. This artificial setting has the additional advan-tage of avoiding backround signals due to interference with other cellular transcripts and giving the opportunity to detect precise and variable concentrations of short rnAs that are readily available from other experiments. After optimizations for sample separation on denaturating gels and probe labeling strong signals could be obtained with the antisense oligo to the firefly sirnA (data not shown). The next step was to use rnA extracts from untransfected cells and detect-ing the 5s ribosomal rnA (rrnA) species which is 112 nt in length and expressed at very high
levels in the cells. After strong signals could be obtained for endogenous 5s rrnA the same transfection setup has been used as before in the reporter assyas using the dual reporters (firefly and renilla luciferase) ei-ter pU6-shLuc, pe3sp-shLuc or according backbone vectors. effective silencing of the particular transfection samples was demon-strated in parallel by reporter assays (data not shown). With the remaining cells rnA extraction and northern blot procedure has been performed according to the op-timized protocol using a probe against the sense strand of the expressed hairpin of the rnAi vectors (sh-Luc) (Figure 16).interestingly in both cell lines hek293 and hT22 no specific transcript could be de-
Contro
l
pU6-s
hluc
pU6
pE3S
P-shluc
pE3S
P-MCS
Contro
l
pU6-s
hluc
pU6
pE3S
P-shluc
pE3S
P-MCS
Probe:shluc-sense
Probe:mir-16
Hek293 HT22
30nt
~20nt
Figure 16: Northern blot detecting shRNAs. (sh-luc) from pE3SP-shLuc and pU6-shLuc in RNA extracts from Hek293 and HT22 cells. Twenty four-well plates of cells were transfected with 80 ng/well of plasmid that directs the expression of firefly (pGL3-Con, Promega), 8 ng/well of plasmid expressing Renilla (pRL-SV40, Promega) lucifer-ase and 800ng of the indicated DNA plasmid. Plasmids pE3SP-shLuc and pU6-shLuc, express an shRNA targeting firefly luciferase and pE3SP-MCS and pU6 are empty vectors for corresponding controls. 48 hours after transfection RNA extraction has been performed and 30mg of total RNA was used for Northern Blot. (A) Detection of the RNAi transcript shluc-sense shows only a transcript of about 29 nt length from pU6-shluc vector. (B) As loading control a probe for mir-16 detects bands in all lanes.

��
�. Results
tected from the vector pe3sP-shluc (Fig 16 upper part). But strong signals appear from a band of about 29nt in the extracts from pU6-shluc transfected cells. This size fits to the product that is produced from the hairpin sequence sh-luc since the stem sequence is 29 nt in length. As ex-pected the control samples do not give any signal showing that the obtained bands are a specific hybridization event. As loading control and quality check for the northern procedure itself the membrane was hybridized with a probe detecting mir-16 after stripping off the sh-luc signal (Fig 16 lower part). in all lanes bands at the expected length of around 21nt is observed although there is a variation in signal intensity. nevertheless, in the hT22 cell extracts the lane where pe3sp-shluc is shown, there is an intense mir-16 signal that shows that the sample has been loaded onto the gel and transferred to the membrane in sufficient amounts to produce signals. For comparison pU6-shluc left to this sample shows slightly lower intensity for the mir-16 probe but delivers a strong band at 29 nt. Thus with this experiment an expression product could only be detected from pU6-shluc but not from pe3sP-shLuc. This finding was independently repro-duced several times.
so in the following another method to investigate which transcripts are produced from the two rnAi vectors was chosen by using an in vitro transcription assay. The expression of the shLuc hairpin has been analyzed in whole nuclear extracts in which pe3sP-sh-Luc was used as a template, and 32P-labelled UTP was incorporated into the primary transcript. As expected, a fragment of 60 nt was detected, corresponding to the unprocessed hairpin precursor shLuc (Figure 17A), but not the mature sirnAs. same results were obtained in an in vitro transcription assay using nuclear extracts, partially purified by DeAe ion exchange chromatog-raphy (data not shown). The lack of the mature sirnA in the nucleus is consistent with the notion that fi-nal processing to sirnA by Dicer takes place in the cytoplasm. Another consideration for the use of a a cell free system to detect transcripts was that such an assay might better tolerate poisoning by α-amanitin. α-amanitin is a potent toxin that is found in several members of the Amanita genus of mushrooms e.g. the Death cap. it is a cyclic peptide of 8 amino acids and is an inhibitor of rnA polymerases ii and iii. The affinity to Pol ii is much higher than to Pol iii thus
+- +-
~ 60nt
~ 150 nt
~ 120 nt
α-amanitin
+- +-α-amanitin
+-α-amanitin
A)
B)
C)
pE3SP-shLuc
pU6-shLuc
pU6-shLuc
pE3SP-shLuc
5SrRNA
*
Figure 17: In vitro transcription assay using plas-mids pE3SP-shLuc and pU6-shLuc in nuclear ex-tracts. Assays were done in absence or presence of α-amanitin, a specific inhibitor of Pol II- and Pol III-de-pendent transcription. (A) The expected band of 60 nt, corresponding to the expressed shRNA. (B) Additional fragment of 150 nt in length, resulting from pU6-sh-Luc (Pol III-dependent) transcription. (C) 5S rRNA tran-script (Pol III-dependent), used as a positive control for assay, and inhibition by a-amanitin. Asterisk indicates an unspecific signal, inherent to the transcription from nuclear extract of FM3A cells.

��
�. Results
depending on the used concentration one can selectively inhibit Pol ii or Pol ii and iii. rnA polymerase i dependent transcription is at any concentration insenstitive to α-amanitin. By us-ing this compound on the nuclear extracts for in vitro transcription one can determine which rnA polymerase transcribes a specific product.since the observed 60nt product from pe3sP-shLuc is insensitive to α-amanitin one can suggest that transcription was indeed mediated by Pol i activity. in contrast, when the Pol iii promoter-containing pU6-shLuc (Figure 17A,B) and 5s rrnA (Figure 17c) were used as templates, the transcription was completely inhibited by α-amanitin. notably, two α-amanitin-sensitive sig-nals were observed, when using pU6-shLuc as a template. The 60 nt transcript corresponded to the expected shLuc transcript, while the transcript of 150 nt indicates that initiation or/and termination of transcription have occurred at yet unidentified sites.in summary an alternative vector for sirnA/shrnA expression has been developed and charac-terized using a mouse rnA polymerase i promoter. This system might be useful for multiple ap-plications and is complement to the existing Pol iii based vector systems. This work was succes-fully published 377 and already got recognized by the research community since it has been cited several times and the presented vectors have been shipped upon request to various laboratories.
3.2. In vivo RNAi in mouse brain in the post-genomic area functional genetics is strongly depending on reverse genetics approach-es to generate gain and loss of function models in transgenic animals. Despite the high value of conventional models in recent years genetic tools that influence the expression of candidate genes in a conditional manner have become increasingly important. This is particularly true for brain research since the brain is an extremely heterogenous tissue and studying gene function in the context of behavior requires specific influence on gene function in distinct brain structures. The use of the established transgenic mouse lines which express cre recombinase under conditional promoters have adressed this issue and resulted in important new insights. nevertheless, only a limited number of brain specific cre mouse lines are available and none of them are restricted to a specific brain structure which might be helpful to elucidate the etiology of brain diseases.Therefore, the emerging rnAi technology seems to be also a powerful tool for molecular neuro-genetics. rnAi is believed to enable rapid and reversible production of altered gene expression in the brain but also offers a high flexiblity and specificity to target brain structures.in mammalian cells rnAi can be induced by short hairpin rnAs (shrnAs), which are processed intracellularly to short interfering rnAs (sirnAs). Alternatively, in vitro synthesized sirnAs can be applied directly. sirnAs easily enter cultured cells and the resulting silencing is very effi-cient. Therefore, this technique has widely been adopted in experimental paradigms of pathway profiling and drug screening. however, the in vivo application of rnAi remains a challenging task, which is particularly true for the central nervous system. The delivery of nucleic acids into
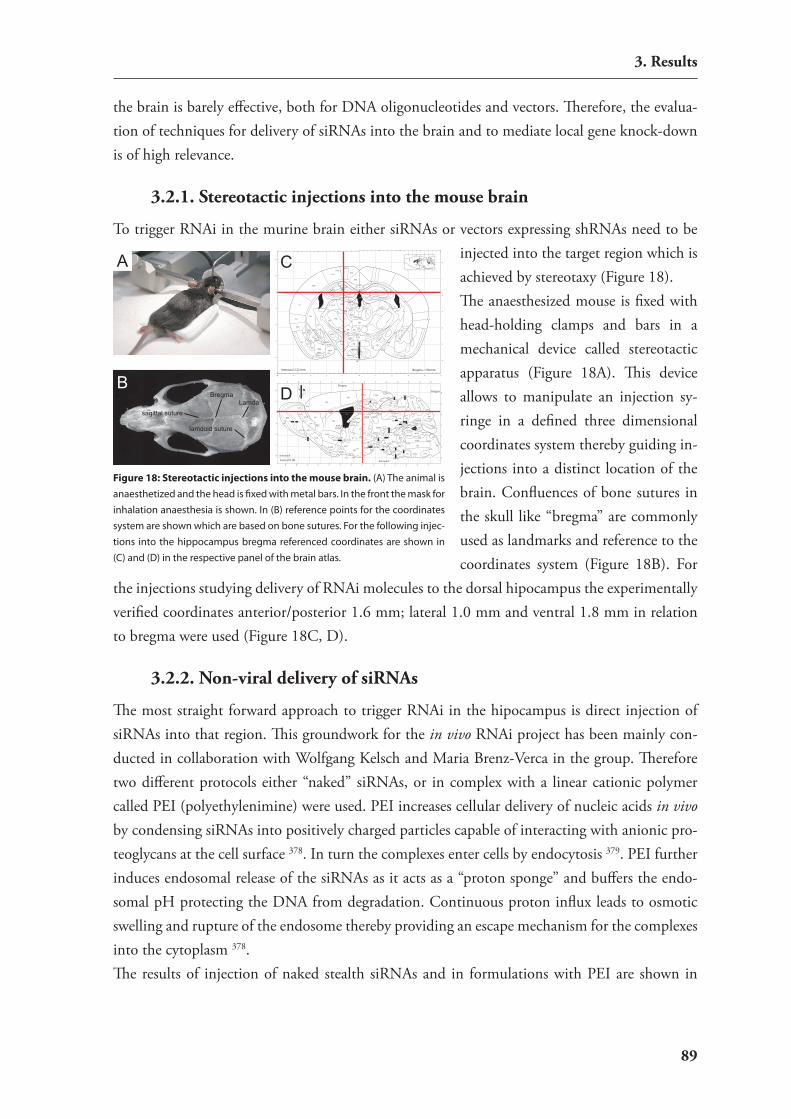
��
�. Results
the brain is barely effective, both for DnA oligonucleotides and vectors. Therefore, the evalua-tion of techniques for delivery of sirnAs into the brain and to mediate local gene knock-down is of high relevance.
�.�.�. Stereotactic injections into the mouse brain
To trigger rnAi in the murine brain either sirnAs or vectors expressing shrnAs need to be injected into the target region which is achieved by stereotaxy (Figure 18).The anaesthesized mouse is fixed with head-holding clamps and bars in a mechanical device called stereotactic apparatus (Figure 18A). This device allows to manipulate an injection sy-ringe in a defined three dimensional coordinates system thereby guiding in-jections into a distinct location of the brain. confluences of bone sutures in the skull like “bregma” are commonly used as landmarks and reference to the coordinates system (Figure 18B). For
the injections studying delivery of rnAi molecules to the dorsal hipocampus the experimentally verified coordinates anterior/posterior 1.6 mm; lateral 1.0 mm and ventral 1.8 mm in relation to bregma were used (Figure 18c, D).
�.�.�. Non-viral delivery of siRNAs
The most straight forward approach to trigger rnAi in the hipocampus is direct injection of sirnAs into that region. This groundwork for the in vivo rnAi project has been mainly con-ducted in collaboration with Wolfgang Kelsch and Maria Brenz-verca in the group. Therefore two different protocols either “naked” sirnAs, or in complex with a linear cationic polymer called Pei (polyethylenimine) were used. Pei increases cellular delivery of nucleic acids in vivo by condensing sirnAs into positively charged particles capable of interacting with anionic pro-teoglycans at the cell surface 378. in turn the complexes enter cells by endocytosis 379. Pei further induces endosomal release of the sirnAs as it acts as a “proton sponge” and buffers the endo-somal ph protecting the DnA from degradation. continuous proton influx leads to osmotic swelling and rupture of the endosome thereby providing an escape mechanism for the complexes into the cytoplasm 378. The results of injection of naked stealth sirnAs and in formulations with Pei are shown in
5 4 3 2 1 0 1 2 3 4 5
6
5
4
3
2
1
0
5432101234
6
5
4
3
2
1
0
15
0
2
4
6 0
2
4
6
02468 - 2 - 4
4 2 0 -2 - 4 - 6 - 8Bregma
Bregma
Bregma -1.58 mmInteraural 2.22 mm
S2
CPu Rt
PRhLGP
VPL
DEn LaVL
CeL
BSTIAPirVEn
BLV
ICeC
MePDBMP
MePV
PLCoACo
ME
VMHVL
VMHC
VMHDM3V
Arc
MGP
ZIDZIV
VM
LH DM
SubIPe
Xi
VRe
SubRe
Rh
LDVL
Po
LPMR
PoDG
MHbLHb
CL
Ang MDL
MDC
PV
VPM VL
PCCM
MDM IMD
RSG
CA1
OrPy
CA2
CA3SLu
LMolRad
Mol
DGGrDG
cc df
dhc
RSA
cg
alv
LDDMfr �
st
ec
ic
opt
st
I
fmfb
sox
mt
ns
rf
S1BF
AStr
CeMPV
BMA
D3VLV
hf
BLA
Ect
S1Tr
LaDL
MCLH
MPtALPtA
IG
A
B
C
DBregma
sagittal suture
lamdoid suture
Lamda
Figure 18: Stereotactic injections into the mouse brain. (A) The animal is anaesthetized and the head is fixed with metal bars. In the front the mask for inhalation anaesthesia is shown. In (B) reference points for the coordinates system are shown which are based on bone sutures. For the following injec-tions into the hippocampus bregma referenced coordinates are shown in (C) and (D) in the respective panel of the brain atlas.
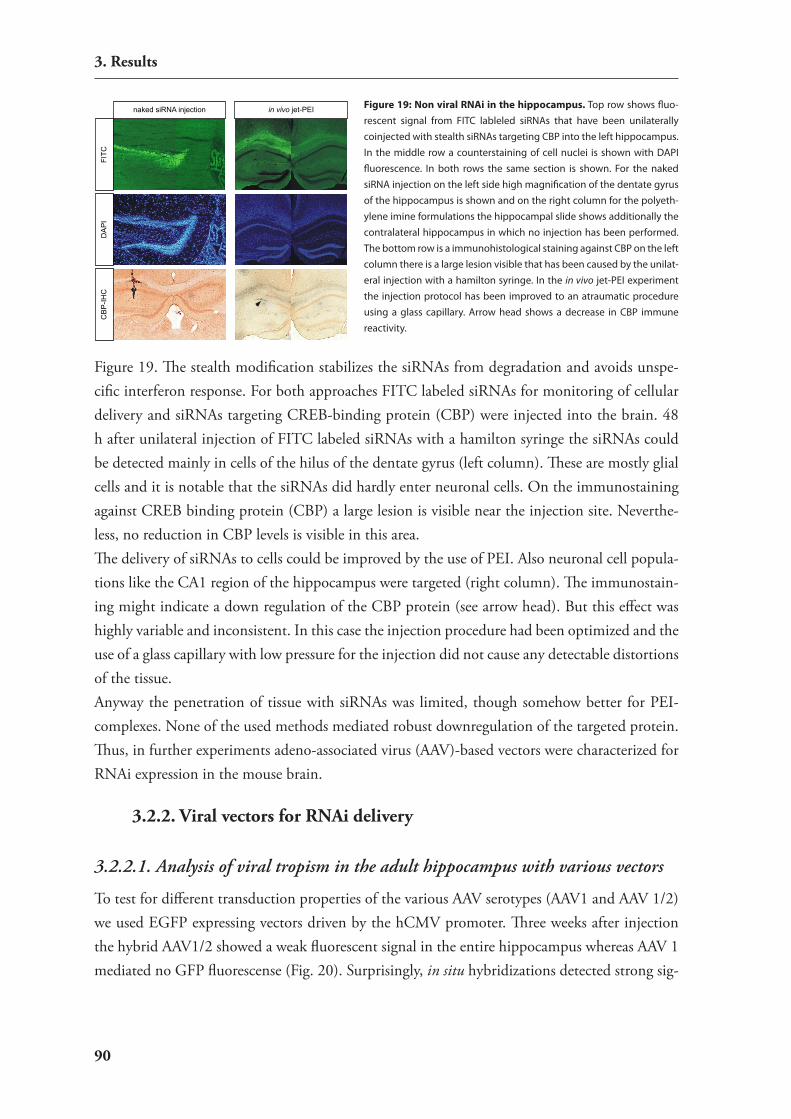
�0
�. Results
Figure 19. The stealth modification stabilizes the sirnAs from degradation and avoids unspe-cific interferon response. For both approaches FiTc labeled sirnAs for monitoring of cellular delivery and sirnAs targeting creB-binding protein (cBP) were injected into the brain. 48 h after unilateral injection of FiTc labeled sirnAs with a hamilton syringe the sirnAs could be detected mainly in cells of the hilus of the dentate gyrus (left column). These are mostly glial cells and it is notable that the sirnAs did hardly enter neuronal cells. On the immunostaining against creB binding protein (cBP) a large lesion is visible near the injection site. neverthe-less, no reduction in cBP levels is visible in this area.The delivery of sirnAs to cells could be improved by the use of Pei. Also neuronal cell popula-tions like the cA1 region of the hippocampus were targeted (right column). The immunostain-ing might indicate a down regulation of the cBP protein (see arrow head). But this effect was highly variable and inconsistent. in this case the injection procedure had been optimized and the use of a glass capillary with low pressure for the injection did not cause any detectable distortions of the tissue.Anyway the penetration of tissue with sirnAs was limited, though somehow better for Pei-complexes. none of the used methods mediated robust downregulation of the targeted protein. Thus, in further experiments adeno-associated virus (AAv)-based vectors were characterized for rnAi expression in the mouse brain.
�.�.�. Viral vectors for RNAi delivery
�.2.2.1. Ana��y�i� of vira�� tropi�m in the adu��t hippocampu� with variou� vector�
To test for different transduction properties of the various AAv serotypes (AAv1 and AAv 1/2) we used eGFP expressing vectors driven by the hcMv promoter. Three weeks after injection the hybrid AAv1/2 showed a weak fluorescent signal in the entire hippocampus whereas AAv 1 mediated no GFP fluorescense (Fig. 20). surprisingly, in situ hybridizations detected strong sig-
FITC
naked siRNA injection in vivo jet-PEID
AP
IC
BP
-IHC
Figure 19: Non viral RNAi in the hippocampus. Top row shows fluo-rescent signal from FITC lableled siRNAs that have been unilaterally coinjected with stealth siRNAs targeting CBP into the left hippocampus. In the middle row a counterstaining of cell nuclei is shown with DAPI fluorescence. In both rows the same section is shown. For the naked siRNA injection on the left side high magnification of the dentate gyrus of the hippocampus is shown and on the right column for the polyeth-ylene imine formulations the hippocampal slide shows additionally the contralateral hippocampus in which no injection has been performed. The bottom row is a immunohistological staining against CBP on the left column there is a large lesion visible that has been caused by the unilat-eral injection with a hamilton syringe. In the in vivo jet-PEI experiment the injection protocol has been improved to an atraumatic procedure using a glass capillary. Arrow head shows a decrease in CBP immune reactivity.

��
�. Results
nals for GFP in both cases. The hcMv is probably down-regulated especially in neurons after some time and the in situ probe binds to the unpacked dsDnA genome of the virus in the cell. A sense probe (not shown) gave similar signals which supports this hypothesis. A DnAse digest did not show a decrease in signal intensity. From these data one can conclude that AAv 1/2 is a well suited vector for gene transfer into the hippocampus in mice.
�.2.2.1. U��tramicro�copy of vira�� expre��ion in the hippocampu�
To get detailed information about the spatial spreading of viral particles and transduction prop-erties in all dimensions in the mouse brain a newly developed ultramicroscopy method was utilized 360. This technology which is able to observe macroscopic specimens in 3D reconstruc-tions from confocal images combines two old methods: ultramicroscopy 380 and clearance of biological specimens 381. Therefore, a microscope is used with so called light sheet illumination which means the object is illuminated from the side with a thin sheet of light. This results in the selective illumination of a single optical plane (genereated by two aligned illumination sources at opposite sides) and parts of the specimen above or below that plane are in the dark producing no interfering out-of-focus signal. Optical sections (z-stacks) are generated by stepwise moving the illumination pane and scanning through the entire height of the specimen. For each optical pane an image of the emitted fluorescense signal is aquired by a ccd camera which is mounted on a microscope. The individual images can finally be processed by 3D reconstruction software to generate three dimentional images of the specimen at micrometer resolution. This method has been initially developed for optically transparent objects and is not directly applicable for mouse brains. For that purpose the brain tissue needs to be cleared by immersion of the specimen in a medium with the same refraction index as protein. This equalizes the refraction index of intra- or extracellular compartments and enables light to be transmitted through the brain without being scattered. As a result the brain appears to be transparent when no light absorption occurs.
GFP ISH-GFP
DAPI
GFP ISH-GFP
DAPI
AAV 1/2 CMV-EGFP
AAV 1 CMV-EGFP
AAV
1/2
CM
V-E
GFP
AAV
1 C
MV-
EG
FP
Figure 20: Comparison of the transduction properties and GFP expression of two AAV serotypes. ~108 TU of a recombinant AAV1/2 (upper panel) or AAV1 serotype (bot-tom panel) have been unilaterally injected into the right hippocampus of adult mice. Both vectors have an identical GFP expression cassette driven by a CMV promoter. After incubation for three weeks brains have been removed and coronally cryo sectioned. The pictures show viral GFP expres-sion in the right hippocampus by fluorescence microscopy (upper left) and by autoradiography of in situ hybridizations with a radioactive probe against GFP (upper right). As histo-logical control a DAPI staining of cell nuclei is shown (lower left). AAV 1/2 shows focal transduction in the dorsal hippo-campus and produces strong signals for GFP fluorescense as well as in the in situ hybridization. AAV1 instead produces no GFP fluorescense but gives only strong signals in the in situ hybridization.

��
�. Results
Before applying the described meth-od AAv1/2- GFP has been injected bilateraly into the dorsal hippocam-pus of adult mouse brains. After 3 weeks incubation brains have been removed, cleared and analysed. Fig-ure 21 shows the obtained 3D im-ages and demonstrates the spreading of the GFP fluorescense throughout the entire dorsal hippocampus. since the shown images represent projec-tions through the mouse brain and not sections the architecture of hip-pocampal fields do not appear indi-vidually. nevertheless, all cell types of the hippocampus are transduced (Fig. 21A-L) and in the cranial part the fimbria-fornix of the hippocam-pus (Fig. 21A arrowhead) marks a distinct structure with strong viral expression. Also at the two injec-tion sites traces of signal can be seen throughout the images (marked with arrowhead in c). interestingly the GFP expression transmits ventrally via the fornix into thalamic nuclei
(marked with arrowhead in B). The GFP signal appears to be highly symmetric (Fig 21D and J) pointing out the high reproducibility of the established injection procedure and the constant transduction behavior of the viral particles for both hippocampal injections.
�.2.2.2. Proof of concept for vira����y mediated gene �i��encing in the adu��t mou�e�i��encing in the adu��t mou�e in the adu��t mou�e brain
After the optimization of viral delivery and characterization of a suitable vector the next step was to mediate rnAi from such a viral vector. The strategy for this approach is depicted in Figure 22. To avoid uncertainties in silencing efficiency of the rnAi vector a published viral expression cassette that has been shown to mediate rnAi against GFP was used 382. A collaboration with sebastian Kügler (viral vector Laboratory, Department of neurology, University of Göttingen)
A B C
D E F
G H I
J K L
Figure 21: Characterization of viral spreading of AAV1/2 vectors injected into the mouse hippocampus. ~108 transducing units of a AAV 1/2 expressing GFP from a synapsin promoter have been injected bilaterally into the dorsal hippocampus. After four weeks incubation the formalin perfused brain has been removed and cleared. The images show projections of the GFP fluores-cence in a three dimensional reconstruction of the adult mouse brain from optical slices. (A-F) show a 180° rotation of the reconstructed brain around the dorsal ventral axis. (G-L) show a 180° rotation of the reconstructed brain around the rostral caudal axis. Arrowheads mark different anatomical structures in (A) fimbria-fornix, in (B) thalamus, in (C) bilateral injection site.
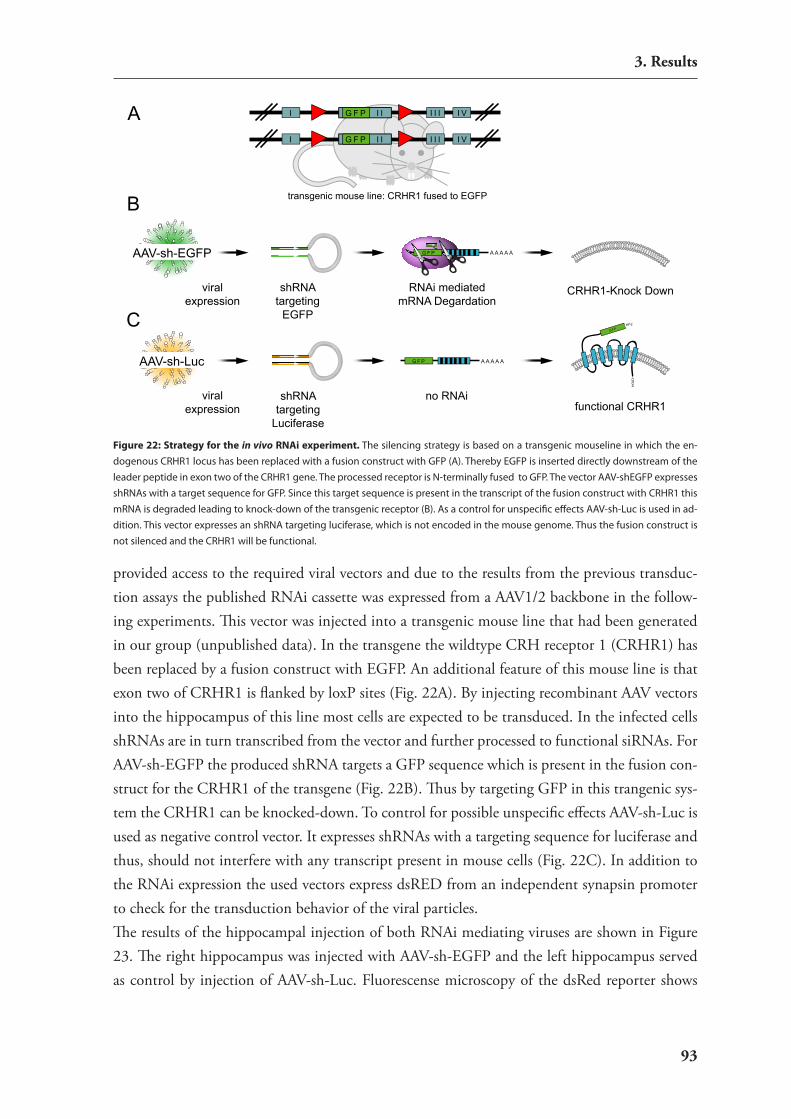
��
�. Results
provided access to the required viral vectors and due to the results from the previous transduc-tion assays the published rnAi cassette was expressed from a AAv1/2 backbone in the follow-ing experiments. This vector was injected into a transgenic mouse line that had been generated in our group (unpublished data). in the transgene the wildtype crh receptor 1 (crhr1) has been replaced by a fusion construct with eGFP. An additional feature of this mouse line is that exon two of crhr1 is flanked by loxP sites (Fig. 22A). By injecting recombinant AAv vectors into the hippocampus of this line most cells are expected to be transduced. in the infected cells shrnAs are in turn transcribed from the vector and further processed to functional sirnAs. For AAv-sh-eGFP the produced shrnA targets a GFP sequence which is present in the fusion con-struct for the crhr1 of the transgene (Fig. 22B). Thus by targeting GFP in this trangenic sys-tem the crhr1 can be knocked-down. To control for possible unspecific effects AAv-sh-Luc is used as negative control vector. it expresses shrnAs with a targeting sequence for luciferase and thus, should not interfere with any transcript present in mouse cells (Fig. 22c). in addition to the rnAi expression the used vectors express dsreD from an independent synapsin promoter to check for the transduction behavior of the viral particles.The results of the hippocampal injection of both rnAi mediating viruses are shown in Figure 23. The right hippocampus was injected with AAv-sh-eGFP and the left hippocampus served as control by injection of AAv-sh-Luc. Fluorescense microscopy of the dsred reporter shows
I I I I VI I IG F P
I I I I VI I IG F P
transgenic mouse line: CRHR1 fused to EGFP
AAV-sh-Luc
G F P A A A A A
A A A A AG F P
-CO
OH
NH2-
G F P
shRNAtargeting
EGFP
shRNAtargeting
Luciferase
RNAi mediatedmRNA Degardation
no RNAi
CRHR1-Knock Down
functional CRHR1
AAV-sh-EGFP
viralexpression
viralexpression
A
B
C
Figure 22: Strategy for the in vivo RNAi experiment. The silencing strategy is based on a transgenic mouseline in which the en-dogenous CRHR1 locus has been replaced with a fusion construct with GFP (A). Thereby EGFP is inserted directly downstream of the leader peptide in exon two of the CRHR1 gene. The processed receptor is N-terminally fused to GFP. The vector AAV-shEGFP expresses shRNAs with a target sequence for GFP. Since this target sequence is present in the transcript of the fusion construct with CRHR1 this mRNA is degraded leading to knock-down of the transgenic receptor (B). As a control for unspecific effects AAV-sh-Luc is used in ad-dition. This vector expresses an shRNA targeting luciferase, which is not encoded in the mouse genome. Thus the fusion construct is not silenced and the CRHR1 will be functional.

��
�. Results
pronounced expression from both viruses which indicates successful injection and transduction for both hippocampal sides (Fig. 23A). In situ hybrididisation for crhr1 shows a specific and local downregulation of the transgenic crh-receptor 1 in the denate gyrus of the right hippo-campus, which is the site where the GFP silencing vector was injected (Fig. 23B). Opposed to that the control vector shows no effect on crhr1 expression. To indicate that no tissue damage has been caused by the procedure a histological staining is shown in (Fig. 23c).To investigate whether this viral rnAi system can be expanded to other brain regions the above described approach has been repeated for the cortex. The right cortical hemisphere was injected with AAv2-sh-eGFP. Thus the GFP fusion transcript of the transgenic mouse line is targeted and AAv2-sh-luc is injected into the collateral hemisphere as negative control. The results were comparable to the findings in the hippocampus. Again the structural integrity of the tissue is shown (Fig. 24A).The dsred fluorescence reports viral expression indicating effective and wide spread transduction in the cortex and expanding into the corpus callosum (Fig. 24B). Only the fluorescence in the right hemisphere is shown but analog expression was verified microscopically in the left hemisphere. For better orientation Fig. 24A shows in red a scematic representation of the dsred fluorescent signal. expression analysis via in situ hybridization shows that the GFP targeting vector induces a specific downregulation of the crhr1-GFP transcript Fig. 24c. As opposed to the collateral side where no gene silencing is obvious. in Fig. 24A and c the dashed rectangle indicates the detail shown in B.
ISH-CRHR1
Cresyviolet
A
B
C
dsREDDAPI
Figure 23: Specific gene silencing in the mouse hippocampus by virally mediated RNAi. ~108 transducing units of two AAV1/2 based viruses have been injected into each side of the hippo-campus. On the right side AAV-shEGFP and as negative control AAV-sh-Luc on the left side. Af-ter incubation for three weeks brains have been removed and coronally cryo sectioned. (A) shows a composite image from fluorescence microsco-py detecting strong viral dsRED expression from both injections in the dentate gyrus. DsRED is overlayed with corresponding DAPI signals for anatomical display. (B) shows autoradiogarphy of in situ hybridization with a radioactive probe against CRHR1. In the right dentate gyrus of the hippocampus the signal is strongly reduced. As histological control for the in situ hybridization slide (C) shows cresylviolet staining of the same detail as in (B).
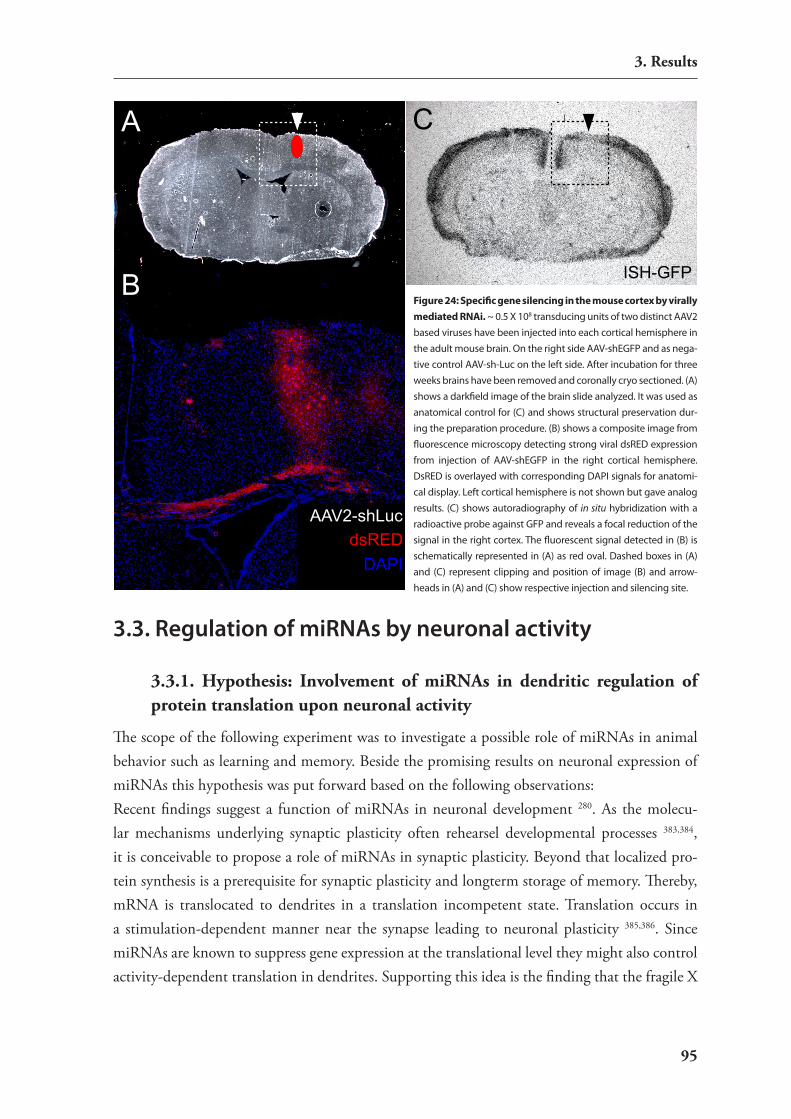
��
�. Results
3.3. Regulation of miRNAs by neuronal activity
�.�.�. Hypothesis: Involvement of miRNAs in dendritic regulation of protein translation upon neuronal activity
The scope of the following experiment was to investigate a possible role of mirnAs in animal behavior such as learning and memory. Beside the promising results on neuronal expression of mirnAs this hypothesis was put forward based on the following observations:recent findings suggest a function of mirnAs in neuronal development 280. As the molecu-lar mechanisms underlying synaptic plasticity often rehearsel developmental processes 383,384, it is conceivable to propose a role of mirnAs in synaptic plasticity. Beyond that localized pro-tein synthesis is a prerequisite for synaptic plasticity and longterm storage of memory. Thereby, mrnA is translocated to dendrites in a translation incompetent state. Translation occurs in a stimulation-dependent manner near the synapse leading to neuronal plasticity 385,386. since mirnAs are known to suppress gene expression at the translational level they might also control activity-dependent translation in dendrites. supporting this idea is the finding that the fragile X
A
B
dsREDDAPI
AAV2-shLuc
ISH-GFP
C
Figure 24: Specific gene silencing in the mouse cortex by virally mediated RNAi. ~ 0.5 X 10⁸ transducing units of two distinct AAV2 based viruses have been injected into each cortical hemisphere in the adult mouse brain. On the right side AAV-shEGFP and as nega-tive control AAV-sh-Luc on the left side. After incubation for three weeks brains have been removed and coronally cryo sectioned. (A) shows a darkfield image of the brain slide analyzed. It was used as anatomical control for (C) and shows structural preservation dur-ing the preparation procedure. (B) shows a composite image from fluorescence microscopy detecting strong viral dsRED expression from injection of AAV-shEGFP in the right cortical hemisphere. DsRED is overlayed with corresponding DAPI signals for anatomi-cal display. Left cortical hemisphere is not shown but gave analog results. (C) shows autoradiography of in situ hybridization with a radioactive probe against GFP and reveals a focal reduction of the signal in the right cortex. The fluorescent signal detected in (B) is schematically represented in (A) as red oval. Dashed boxes in (A) and (C) represent clipping and position of image (B) and arrow-heads in (A) and (C) show respective injection and silencing site.
��
�. Results
syndrome which manifests as severe cognitive impairment is often associated with the absence of the FMr1 gene product, which was shown to suppress translation in dendrites in the absence of proper synaptic input 387-389.it could be shown that FMr1 protein is probably a component of risc, which itself is associ-ated with mirnA function (summarized in390).
�.�.�. Induction of strong neuronal activity in mouse brains by treat-ment with kainic acid
The establishment of a pharmacological in vivo model of neuronal activity which induces syn-aptic plasticity was the prerequisite for further analysis of the involvement of mirnAs in such biological processes. Therefore, a well characterized and effective compound, kainic acid was chosen in the scope of the presented work.Kainic acid is a molecule isolated form seaweed and is widely used as a stong agonist of a subset of glutamate receptors, the ionotropic Glur5, Glur6 and Glur7 receptors, which function as gated ca2+ channels. Kainic acid induces a massive influx of ca2+ and, thus, depolarizes the neu-ron, leading to changes in intracellular signalling pathways and gene expression. Other studies showed that kainic acid-induced cellular changes considerably overlap with those observed to be involved in learning and memory as well as synaptic plasticity 391. Kainate given at higher doses induces (epileptic) seizures and is widely used as animal model for excitotoxicity, neurodegenera-tion, synaptic plasticity and epilepsy .since an involvement of mirnAs in synaptic plasticity has been proposed as a hypothetical idea in the literature there was not enough knowledge available for undertaking a candidate gene approach. Fortunately unbiased technologies had been developed at that time and a novel array technology for mirnAs had recently been developed and successfully used by Dr. Anna Krichevsky in Prof. Kosik’s laboratory (harvard Medical school, Boston, UsA) 280. A coopera-tion with this group gave us access to generate expression data with this novel and powerful method.
�.�.�. Analysis of differential miRNA expression by macro arrays
Using intraperitoneal injection of kainate into mice, the aim was to explore possible changes of mirnAs levels induced by neuronal depolarization.in essence the approach was to compare mice either injected with kainate or saline as control (Fig.25). After behavioral scoring to monitor the pharmacological effect of kainate treatment animals were killed and mirnAs isolated from the hippocampi of both animal groups were hybridised onto spotted macro arrays. comparison of the expression levels of hippocampal mir-nAs from treated and untreated animals may lead to the identification of candidate mirnAs that have possible functional roles in the brain.
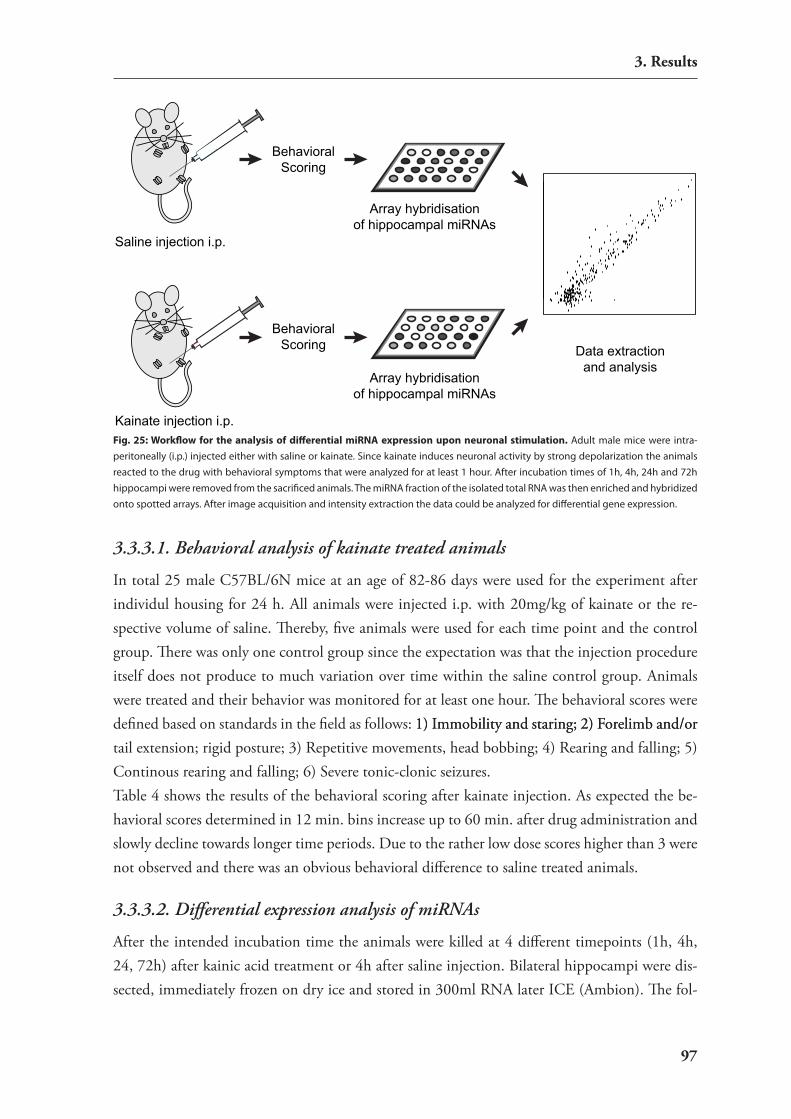
��
�. Results
�.�.�.1. �ehaviora�� ana��y�i� of kainate treated anima���
in total 25 male c57BL/6n mice at an age of 82-86 days were used for the experiment after individul housing for 24 h. All animals were injected i.p. with 20mg/kg of kainate or the re-spective volume of saline. Thereby, five animals were used for each time point and the control group. There was only one control group since the expectation was that the injection procedure itself does not produce to much variation over time within the saline control group. Animals were treated and their behavior was monitored for at least one hour. The behavioral scores were defined based on standards in the field as follows: 1) immobility and staring; 2) Forelimb and/or1) immobility and staring; 2) Forelimb and/or tail extension; rigid posture; 3) repetitive movements, head bobbing; 4) rearing and falling; 5) continous rearing and falling; 6) severe tonic-clonic seizures.Table 4 shows the results of the behavioral scoring after kainate injection. As expected the be-havioral scores determined in 12 min. bins increase up to 60 min. after drug administration and slowly decline towards longer time periods. Due to the rather low dose scores higher than 3 were not observed and there was an obvious behavioral difference to saline treated animals.
�.�.�.2. Differentia�� expre��ion ana��y�i� of miRNA�
After the intended incubation time the animals were killed at 4 different timepoints (1h, 4h, 24, 72h) after kainic acid treatment or 4h after saline injection. Bilateral hippocampi were dis-sected, immediately frozen on dry ice and stored in 300ml rnA later ice (Ambion). The fol-
Kainate injection i.p.
Saline injection i.p.
BehavioralScoring
BehavioralScoring Data extraction
and analysis
Array hybridisationof hippocampal miRNAs
Array hybridisationof hippocampal miRNAs
Fig. 25: Workflow for the analysis of differential miRNA expression upon neuronal stimulation. Adult male mice were intra-peritoneally (i.p.) injected either with saline or kainate. Since kainate induces neuronal activity by strong depolarization the animals reacted to the drug with behavioral symptoms that were analyzed for at least 1 hour. After incubation times of 1h, 4h, 24h and 72h hippocampi were removed from the sacrificed animals. The miRNA fraction of the isolated total RNA was then enriched and hybridized onto spotted arrays. After image acquisition and intensity extraction the data could be analyzed for differential gene expression.
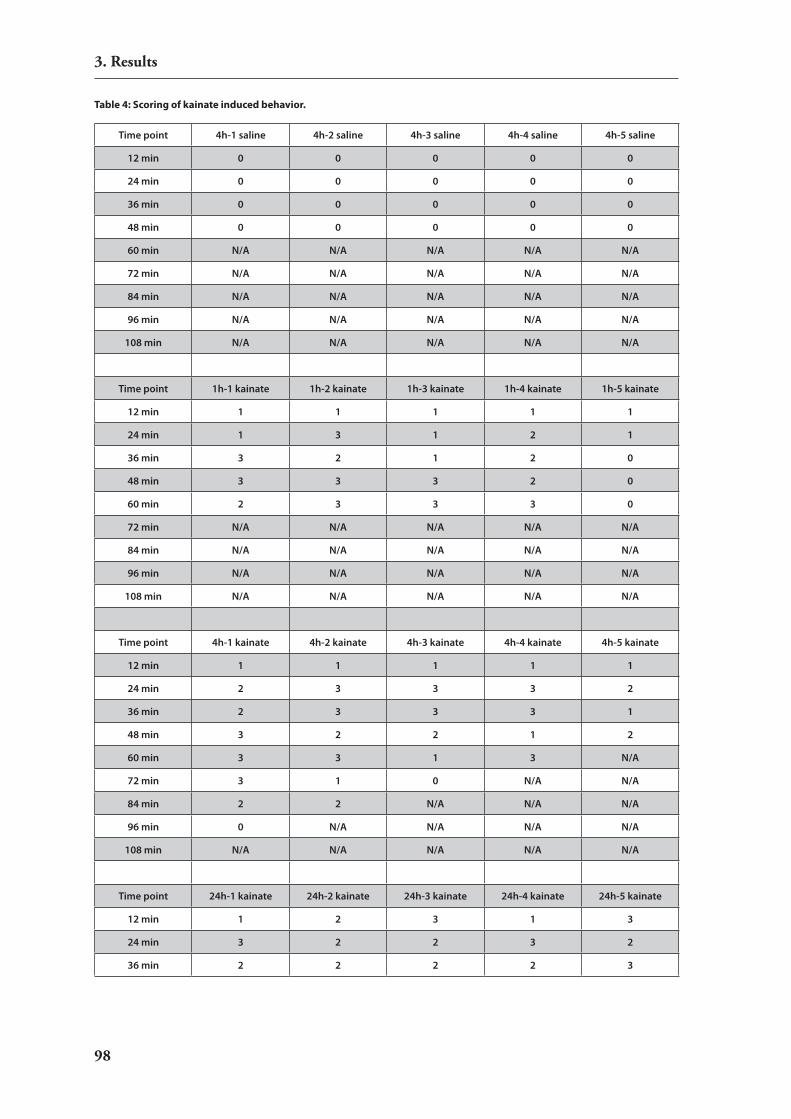
��
�. Results
Time point 4h-1 saline 4h-2 saline 4h-3 saline 4h-4 saline 4h-5 saline
12 min 0 0 0 0 0
24 min 0 0 0 0 0
36 min 0 0 0 0 0
48 min 0 0 0 0 0
60 min N/A N/A N/A N/A N/A
72 min N/A N/A N/A N/A N/A
84 min N/A N/A N/A N/A N/A
96 min N/A N/A N/A N/A N/A
108 min N/A N/A N/A N/A N/A
Time point 1h-1 kainate 1h-2 kainate 1h-3 kainate 1h-4 kainate 1h-5 kainate
12 min 1 1 1 1 1
24 min 1 3 1 2 1
36 min 3 2 1 2 0
48 min 3 3 3 2 0
60 min 2 3 3 3 0
72 min N/A N/A N/A N/A N/A
84 min N/A N/A N/A N/A N/A
96 min N/A N/A N/A N/A N/A
108 min N/A N/A N/A N/A N/A
Time point 4h-1 kainate 4h-2 kainate 4h-3 kainate 4h-4 kainate 4h-5 kainate
12 min 1 1 1 1 1
24 min 2 3 3 3 2
36 min 2 3 3 3 1
48 min 3 2 2 1 2
60 min 3 3 1 3 N/A
72 min 3 1 0 N/A N/A
84 min 2 2 N/A N/A N/A
96 min 0 N/A N/A N/A N/A
108 min N/A N/A N/A N/A N/A
Time point 24h-1 kainate 24h-2 kainate 24h-3 kainate 24h-4 kainate 24h-5 kainate
12 min 1 2 3 1 3
24 min 3 2 2 3 2
36 min 2 2 2 2 3
Table 4: Scoring of kainate induced behavior.
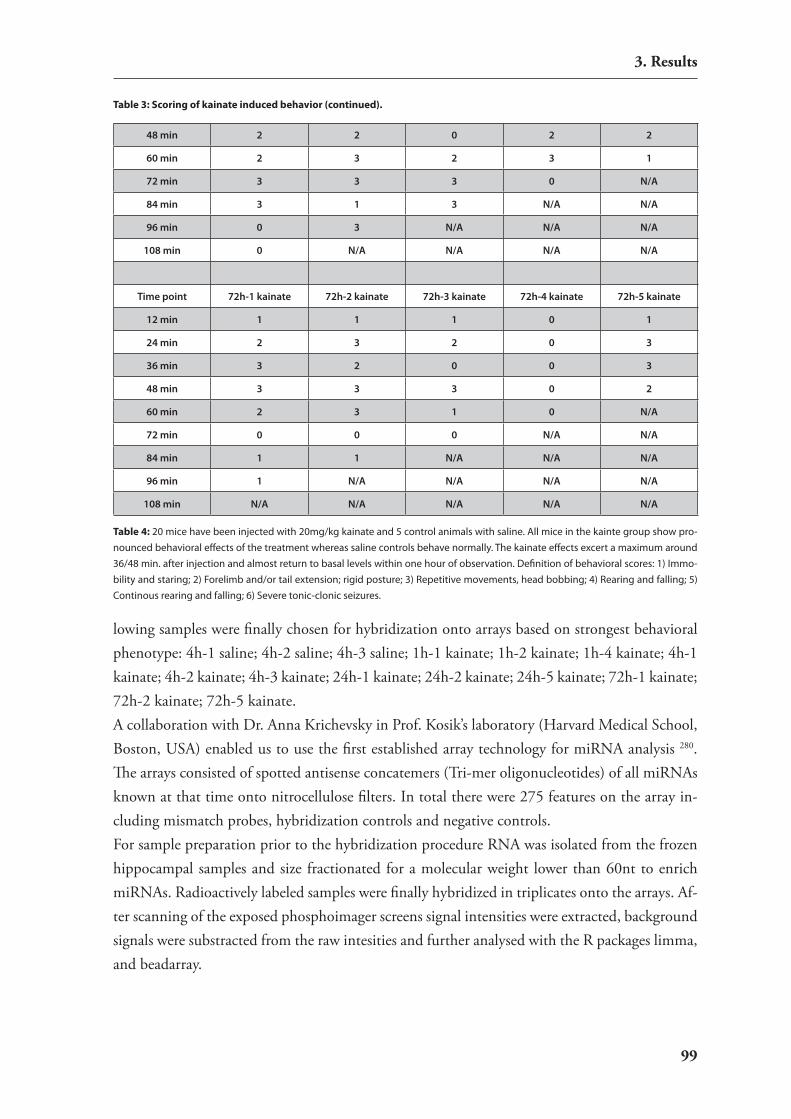
��
�. Results
lowing samples were finally chosen for hybridization onto arrays based on strongest behavioral phenotype: 4h-1 saline; 4h-2 saline; 4h-3 saline; 1h-1 kainate; 1h-2 kainate; 1h-4 kainate; 4h-1 kainate; 4h-2 kainate; 4h-3 kainate; 24h-1 kainate; 24h-2 kainate; 24h-5 kainate; 72h-1 kainate; 72h-2 kainate; 72h-5 kainate.A collaboration with Dr. Anna Krichevsky in Prof. Kosik’s laboratory (harvard Medical school, Boston, UsA) enabled us to use the first established array technology for mirnA analysis 280. The arrays consisted of spotted antisense concatemers (Tri-mer oligonucleotides) of all mirnAs known at that time onto nitrocellulose filters. in total there were 275 features on the array in-cluding mismatch probes, hybridization controls and negative controls.For sample preparation prior to the hybridization procedure rnA was isolated from the frozen hippocampal samples and size fractionated for a molecular weight lower than 60nt to enrich mirnAs. radioactively labeled samples were finally hybridized in triplicates onto the arrays. Af-ter scanning of the exposed phosphoimager screens signal intensities were extracted, background signals were substracted from the raw intesities and further analysed with the r packages limma, and beadarray.
48 min 2 2 0 2 2
60 min 2 3 2 3 1
72 min 3 3 3 0 N/A
84 min 3 1 3 N/A N/A
96 min 0 3 N/A N/A N/A
108 min 0 N/A N/A N/A N/A
Time point 72h-1 kainate 72h-2 kainate 72h-3 kainate 72h-4 kainate 72h-5 kainate
12 min 1 1 1 0 1
24 min 2 3 2 0 3
36 min 3 2 0 0 3
48 min 3 3 3 0 2
60 min 2 3 1 0 N/A
72 min 0 0 0 N/A N/A
84 min 1 1 N/A N/A N/A
96 min 1 N/A N/A N/A N/A
108 min N/A N/A N/A N/A N/A
Table 3: Scoring of kainate induced behavior (continued).
Table 4: 20 mice have been injected with 20mg/kg kainate and 5 control animals with saline. All mice in the kainte group show pro-nounced behavioral effects of the treatment whereas saline controls behave normally. The kainate effects excert a maximum around 36/48 min. after injection and almost return to basal levels within one hour of observation. Definition of behavioral scores: 1) Immo-bility and staring; 2) Forelimb and/or tail extension; rigid posture; 3) Repetitive movements, head bobbing; 4) Rearing and falling; 5) Continous rearing and falling; 6) Severe tonic-clonic seizures.

�00
�. Results
�.�.�.�. microRNA array data proce��ing and ana��y�i�
Despite the fact that microarray technology has developed into a standard method for molecular biology during the last decade no gold-standard for the analysis of such data emerged.This is in particular true for the use of array technology for mirnAs since this is a rather new approach. The first step in data processing of microarray data is the normalization (standardization). Anal-ogous to other quantitative techniques for comparison of different datasets it is neccesary to adjust the signal intensities. in microarray analysis, normalization aims at removing systematic effects (hybridization variance etc.), and at adjusting the data from different microarrays onto a common scale. Major sources of technical variation can be assumed due to the complex fabri-cation and hybridization chemistry of microarrays and thus the ideal normalization procedure would remove such technical variation from the dataset but retain the biological variance of the samples. various mathematical strategies are used for this purpose with the following assump-tions: Most genes are believed not to be differentially regulated and a linear relationship for the majority of genes is assumed. Two algorithms have been tested -one classical approach termed quantile normalization and a modern transformation called variance stabilization normalization (vsn). Quantile normalization is a non-parametric procedure that assumes that the distribution of expresion values is nearly the same in all samples. Then to normalize each array for each value, the quantile of that value in the distribution of probe intensities (gene expression level) is com-puted and the original value is transformed to that quantile’s value on a reference array (averaged over all arrays). The result is that the empirical distribution of values on all arrays is equal and only the ranks of the probes within this given set of values are changed. That means the highest expressed gene on array A will have the same expression value as on all other arrays (B, c, D, …) but the gene can change position from highest to lower places. Analog the values for all other genes are calculated. vsn aims at stabilzing variance over the whole intensity range and is based on a mathematical function (arsinh) 392. The rationale of this method is based on the observation that the variance of microarray data typically increase with their mean. For large intensities the function used for vsn is similar to the logarithmic function and for small intensities it is more similar to a linear function. This transformation finally results in a dataset in which the variance is homogenously distributed over the whole intensity range and thus the dependency of variance and mean is removed. This is important to meet the assumptions in further statistical tests and makes re-sults better comparable across intensities. Data normalization directly shapes and modifies the measured values and thus this procedure has a great impact on the resulting differential gene expression analysis.As described quantile normalisation produces equal values for all normalized arrays whereas vsn shows a more mild influence on the data leaving some variation in the distribution. Of note is that vsn does not produce median centered data.

�0�
�. Results
A basic challenge inherent to the amount of data generated by array methods is that such data can not be inspected individually. Thus data visualization techniques like scatter plots and sta-tistical approaches like correlation analysis are of great help for quality control. in the following scatter plots each point represents the measured intensity of a mirnA probe in two conditions (either two experimental groups or the same biological sample measured on two arrays). One is assigned to the x-axis and the other to the y-axis. Genes with equal expression in both condi-tions line up around the diagonal whereas differentially expressed genes will be plotted distant from the diagonal. Also non-linear effects can be identified if the plotted points align to a curved shape. in figure 26 both linearity of the overall shape and fitting to the diagonal are factors to be considered to estimate which normalization procedure leads to higher data quality. Another pa-rameter calculated and shown in Fig 26 is the Pearson correlation coefficient which indicates the strength of a linear relationship between two variables. Again the two variables here are expres-sion level either on two different arrays or within two different groups of samples. Mathematical correlation coefficients range from –1 to +1 but for array analysis only postive correlations are found. here higher correlation coefficients are interpreted as better data quality.To estimate the quality of the different normalization approaches on our data scatter plots and correlation coefficients of grouped datasets have been analyzed using both quantile and vsn nor-malization procedures. scatter plots and correlation coefficients compare two values in Fig. 26 the intensity of all genes in two experimental groups. since the experimental design includes 5 groups (saline, 1h, 4h, 24, 72h) the pairwise results are shown in a matrix.
saline
0 5 15 2 6 10
−55
15
05
15
0.85 1h
0.86 0.84 4h
−10
010
26
10 0.78 0.80 0.76 24h
−5 5 15
0.80 0.79
−10 0 10
0.72 0.79
0 5 15
05
15
72h
saline
7 9 7 8 9
79
11
79 0.97 1h
0.98 0.97 4h
79
11
78
9
0.92 0.95 0.92 24h
7 9 11
0.96 0.97
7 9 11
0.95 0.94
7 9
7972h
Groups (quantile norm.) Groups (vsn)
Figure 26: Effect of different normalization procedures on grouped expression data. To evaluate the otimal normalization proce-dure for the given dataset two normalization procedures are compared. Pairwise scatterplots (upper right) and correlation coefficients (lower left) in each panel are shown for both normalization methods (quantile normalization on the left and vsn on the right). The diagonal indicates the according group comparisons. On the upper right scatter plots and on the lower left the correlation coefficients are shown.

�0�
�. Results
From the group comparison the vsn method appears to be superior to the quantile normaliza-tion. in general the correlation coefficients are higher for vsn 0.96±0.02 as compared to quantile normalization 0.80 ± 0.04. Additionally the shape of the scatter plots fit better to the diagonal. especially the plotted points of all four scatterplots including the 24h group of the quantile nor-malized data show a curved shape indicating non-linear effects. Due to this result the following analyses are shown only for the vsn data although everything was calculated in parallel also with quantile normalized data.The true biological variation due to the kainate treatment is not known a priori and therefore it is difficult to judge what normalized data better represent true expression levels. scatter plots and correlations of technical replicates are easier to interprete since it is known that the expres-sion levels are equal for all genes in both samples. nevertheless, these are only a subset of all measured samples and normalization has to be performed over all arrays. Figure 27 shows rep-resentative scatter plots for technical replicates. Three replicates of sample 1 of the saline group before and after normalization are again compared pairwise. Minor deviations of the angle from the diagonal seen in raw data for example when comparing saline 1b with saline 1c are adjusted after normalisation. Additionally the mean correlation coefficient across all samples was 0,79 ±0,13 for the raw data and 0,86±0,13 for vsn normalized data. Thus also for technical replicates vsn normalization is increasing data acuracy.
To check if there is a technical problem with some individual samples that might be rejected as outliers from further analysis one can use hierarchical clustering methods which is a mathemati-cal procedure calculating a distance matrix across the gene expression profiles of all samples. This produces a measure for dissimilarity of expression profiles and clusters the samples accordingly. initially, each object is assigned to its own cluster and then the algorithm proceeds iteratively, at each stage joining the two most similar clusters, continuing until there is just a single cluster. The output can be visualized in dendrogramms as shown in figure 28.For vsn data the samples are distributed into two main clusters that are further divided into a dense tree of subclusters showing high similarity of the measured array samples. in the cluster
saline1a
5 10 15
48
1216
510
15
0.85 saline1b
4 6 8 12 16
0.85 0.82
5 10 15
510
15
saline1c
Raw data (sample1)
saline1a
6 7 8 9 11
68
1012
68
1012
0.90 saline1b
6 7 8 9 11
0.90 0.90
6 7 8 9 11
67
89
11
saline2a
VSN (sample1) Figure 27: Effect of different normaliza-tion procedures on technical replicates. The technical replicates of sample 1 of the the saline treated animals are compared representatively. Pairwise scatterplots (up-per right) and correlation coefficients (lower left) in each panel are shown before (left) and after vsn normalization (right). The diag-onal indicates sample comparisons. On the upper right scatter plots and on the lower left the correlation coefficients are shown.

�0�
�. Results
analysis no clear pattern can be recognized since the samples belonging to the same experimental groups do not always cluster together. Also technical replicates that in theory should have the most similar expression profiles are not always closest neighbors although there might be a trend that these samples are more similar than the others. nevertheless, the cluster analysis gives no indication that there are particular samples seen as clear outliers and thus all samples are fed into further statistical analsysis.Thus all samples are used for an AnOvA based statistical test that produces F-values giving the propability that one or more of the experimental groups differ from the others. The test statistics is calculated over all mirnA probes in all samples. Due to high number of tests when analyzing array data a lot of positive findings can be expected by chance. To compensate for that effect the p-values need to be corrected for multiple testing. in this case a false discovery rate (FDr) ap-proach has been used. A false dicovery rate of 10% should be interpreted that by chance 10% of the findings are false positives. in general the threshold for genes considered to be differentially regulated is at the 1% level. Table 5 shows the top 50 regulated probes ordered by p-value.The first seven probes give significant test statistic after correction for multiple testing at a 1% false discovery rate level. surprisingly one background and two control probes (x) are estimated to be significantly regulated.Beyond that the top regulated candidate is a trnA showing a 1.7 fold down regulation as strongest regulation 24h after kainate treatment. This leaves only 3 mirnA probes mir 214, mir 327, mir 321 putatively regulated in hippocampal neurons after kainate stimulation using the described analysis. Mir 214 is constantly down regulated throughout all timepoints showing no clear time course, mir 327 increases expression over time from negative to positive regulation over time and mir 321 also negatively regulated showing monotonic time curve.
Cluster Dendrogram
hclust (*, "complete")dv
salin
e2b
salin
e1c
KA
4h3a
KA
4h3b
salin
e2c
KA
4h3c
salin
e1a
salin
e1b
salin
e2a
KA
4h1c
KA
1h1c
KA
1h3c sa
line3
bK
A72
h3a
KA
72h3
bK
A24
h3b
KA
24h3
cK
A24
h3a
KA
1h3a
KA
1h3b
KA
4h1a
KA
4h1b
salin
e3c
salin
e3a
KA
72h2
bK
A72
h2a
KA
72h2
cK
A1h
1bK
A1h
1aK
A4h
2bK
A4h
2aK
A4h
2cK
A24
h1a
KA
24h2
aK
A72
h1a
KA
72h1
bK
A72
h1c
KA
1h2a
KA
1h2b
KA
24h1
bK
A24
h2b
KA
24h1
cK
A1h
2cK
A24
h2c
05
1015
Hei
ght
Figure 28: Dendrogram showing the results of hierarchical clustering for all measured samples. The clustering of samples shows similarities of gene expression profiles. The closer two samples are clustered the more similar expression profiles they have and the height on y-axis is a numerical measure for similarity. The samples fall into two main clusters with dense trees of subclusters. There is no obvious pattern seen in the clusters according to technical replicates or treatment groups.

�0�
�. Results
ID ELPS-
Name T01 T04 T24 T72 AveExpr F P.Value adj.P.Val
27 Thr tRNA -0.27 -0.32 -1.71 -0.37 13.30 9.143 0.000019 0.005359
187 mir214B -0.93 -0.57 -1.75 -0.79 11.98 8.404 0.000042 0.005796
150 x -0.52 0.04 -1.11 -0.82 11.59 7.886 0.000074 0.006746
78 mir327 -0.07 -0.27 0.25 0.69 12.58 7.375 0.000129 0.008131
200 mir-321 -1.63 -0.39 -1.86 -1.06 13.02 7.254 0.000148 0.008131
271 background 0.10 0.03 0.81 0.13 10.78 6.804 0.000246 0.009903
168 x -0.42 -0.08 -0.98 -0.60 11.43 6.783 0.000252 0.009903
188 mir217B -0.52 -0.17 -0.98 -0.35 11.82 6.602 0.000310 0.010673
214 mir-107 -0.51 0.30 -0.70 -0.59 11.69 5.780 0.000818 0.024993
48 mir131 0.73 0.15 0.75 0.27 13.26 5.630 0.000979 0.026934
152 x -1.25 -0.37 -2.36 -0.85 14.17 5.321 0.001428 0.035708
157 x 0.00 -0.47 0.02 0.91 14.55 5.042 0.002015 0.046176
176 x -0.41 -0.09 -0.82 -0.31 11.93 4.948 0.002267 0.047954
236 mir-290 0.42 -0.06 0.97 1.61 13.17 4.395 0.004564 0.089652
117 mir142-sT 0.03 -0.19 -0.04 0.74 11.63 4.151 0.006241 0.114423
135 x 0.01 -0.24 -0.09 0.62 12.94 4.025 0.007355 0.126421
59 rG1-as 0.75 -0.09 0.83 0.42 14.59 3.863 0.009082 0.139454
72 mir30dLonger -0.57 0.06 -0.48 -0.22 14.04 3.859 0.009128 0.139454
139 x -0.73 -0.43 -0.55 -0.42 11.25 3.795 0.009935 0.143801
129 miR198T -0.15 -0.25 -0.55 0.22 12.63 3.669 0.011718 0.158924
61 let-7bR -0.34 0.49 -0.25 -0.15 14.84 3.608 0.012705 0.158924
34 mir128 0.76 0.23 0.64 0.53 13.46 3.608 0.012714 0.158924
28 Ile tRNA -0.71 -0.73 -1.70 -0.43 13.75 3.558 0.013573 0.162285
239 miR-292-5p 0.38 0.03 0.41 1.15 11.92 3.489 0.014877 0.169135
55 mir124a-mis1 0.41 0.04 0.54 1.05 14.08 3.464 0.015381 0.169135
62 let-7dR 0.08 0.65 -0.20 0.04 15.23 3.422 0.016260 0.169135
46 mir125b 0.73 -0.04 0.34 -0.01 13.81 3.406 0.016606 0.169135
189 mir222B -0.09 0.13 -0.24 0.55 12.14 3.316 0.018745 0.184103
197 0.06 -0.05 0.44 0.14 10.70 3.225 0.021158 0.200477
70 mir29aR 0.69 0.37 0.75 0.49 14.64 3.200 0.021870 0.200477
140 x 0.25 -0.13 0.33 0.71 13.97 3.170 0.022785 0.202129
270 background 0.14 -0.32 0.95 -0.06 10.98 3.089 0.025393 0.211865
77 mir325 0.23 0.17 -0.08 -0.07 10.90 3.067 0.026153 0.211865
268 background 0.18 -0.16 0.96 0.24 11.02 3.066 0.026194 0.211865
63 let-7iR 0.40 0.76 -0.02 -0.05 12.36 3.031 0.027459 0.215753
18 partOfMir351 0.11 0.07 0.09 0.42 11.00 2.935 0.031248 0.233300
Table 5: Top 50 probes on miRNA array.
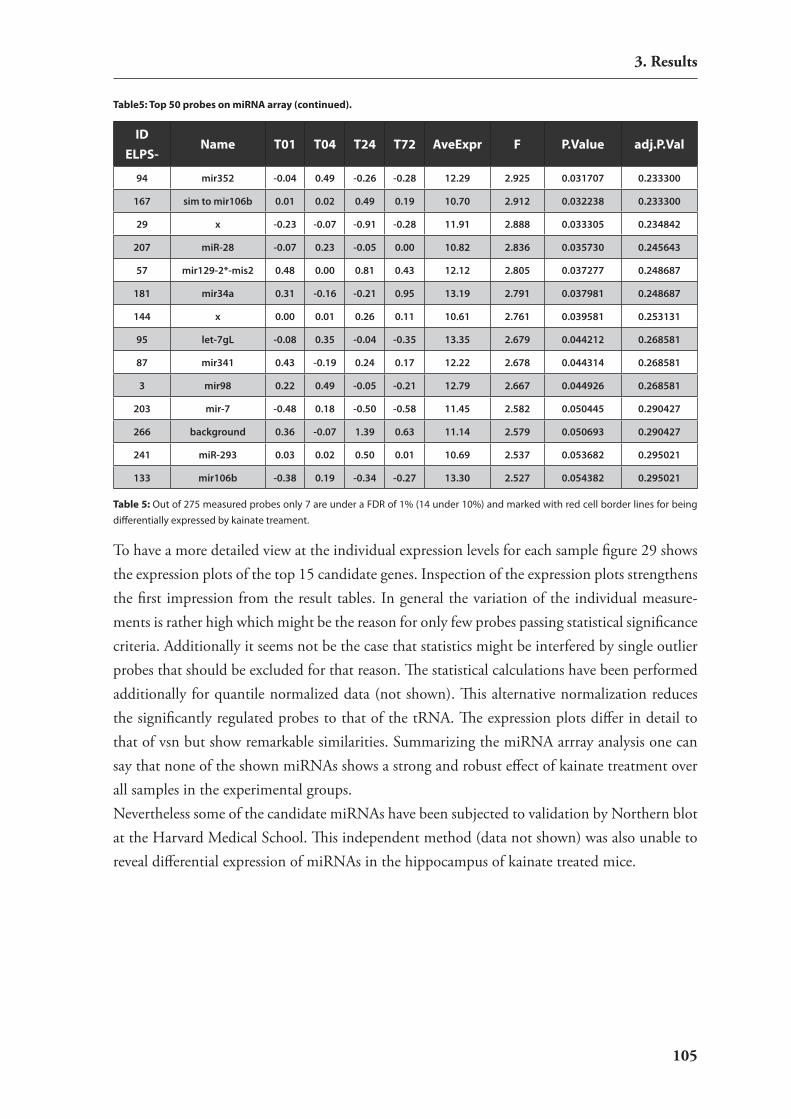
�0�
�. Results
To have a more detailed view at the individual expression levels for each sample figure 29 shows the expression plots of the top 15 candidate genes. inspection of the expression plots strengthens the first impression from the result tables. in general the variation of the individual measure-ments is rather high which might be the reason for only few probes passing statistical significance criteria. Additionally it seems not be the case that statistics might be interfered by single outlier probes that should be excluded for that reason. The statistical calculations have been performed additionally for quantile normalized data (not shown). This alternative normalization reduces the significantly regulated probes to that of the trnA. The expression plots differ in detail to that of vsn but show remarkable similarities. summarizing the mirnA arrray analysis one can say that none of the shown mirnAs shows a strong and robust effect of kainate treatment over all samples in the experimental groups.nevertheless some of the candidate mirnAs have been subjected to validation by northern blot at the harvard Medical school. This independent method (data not shown) was also unable to reveal differential expression of mirnAs in the hippocampus of kainate treated mice.
ID ELPS-
Name T01 T04 T24 T72 AveExpr F P.Value adj.P.Val
94 mir352 -0.04 0.49 -0.26 -0.28 12.29 2.925 0.031707 0.233300
167 sim to mir106b 0.01 0.02 0.49 0.19 10.70 2.912 0.032238 0.233300
29 x -0.23 -0.07 -0.91 -0.28 11.91 2.888 0.033305 0.234842
207 miR-28 -0.07 0.23 -0.05 0.00 10.82 2.836 0.035730 0.245643
57 mir129-2*-mis2 0.48 0.00 0.81 0.43 12.12 2.805 0.037277 0.248687
181 mir34a 0.31 -0.16 -0.21 0.95 13.19 2.791 0.037981 0.248687
144 x 0.00 0.01 0.26 0.11 10.61 2.761 0.039581 0.253131
95 let-7gL -0.08 0.35 -0.04 -0.35 13.35 2.679 0.044212 0.268581
87 mir341 0.43 -0.19 0.24 0.17 12.22 2.678 0.044314 0.268581
3 mir98 0.22 0.49 -0.05 -0.21 12.79 2.667 0.044926 0.268581
203 mir-7 -0.48 0.18 -0.50 -0.58 11.45 2.582 0.050445 0.290427
266 background 0.36 -0.07 1.39 0.63 11.14 2.579 0.050693 0.290427
241 miR-293 0.03 0.02 0.50 0.01 10.69 2.537 0.053682 0.295021
133 mir106b -0.38 0.19 -0.34 -0.27 13.30 2.527 0.054382 0.295021
Table5: Top 50 probes on miRNA array (continued).
Table 5: Out of 275 measured probes only 7 are under a FDR of 1% (14 under 10%) and marked with red cell border lines for being differentially expressed by kainate treament.
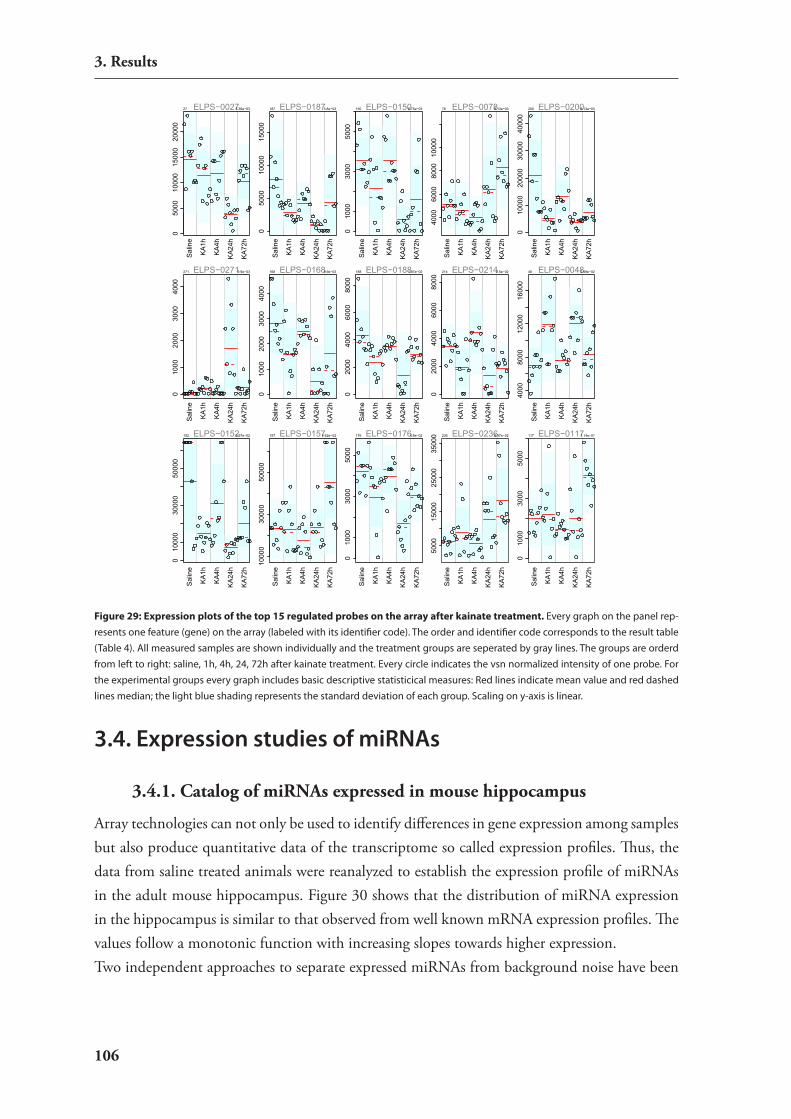
�0�
�. Results
3.4. Expression studies of miRNAs
�.�.�. Catalog of miRNAs expressed in mouse hippocampus
Array technologies can not only be used to identify differences in gene expression among samples but also produce quantitative data of the transcriptome so called expression profiles. Thus, the data from saline treated animals were reanalyzed to establish the expression profile of mirnAs in the adult mouse hippocampus. Figure 30 shows that the distribution of mirnA expression in the hippocampus is similar to that observed from well known mrnA expression profiles. The values follow a monotonic function with increasing slopes towards higher expression.Two independent approaches to separate expressed mirnAs from background noise have been
Figure 29: Expression plots of the top 15 regulated probes on the array after kainate treatment. Every graph on the panel rep-resents one feature (gene) on the array (labeled with its identifier code). The order and identifier code corresponds to the result table (Table 4). All measured samples are shown individually and the treatment groups are seperated by gray lines. The groups are orderd from left to right: saline, 1h, 4h, 24, 72h after kainate treatment. Every circle indicates the vsn normalized intensity of one probe. For the experimental groups every graph includes basic descriptive statisticical measures: Red lines indicate mean value and red dashed lines median; the light blue shading represents the standard deviation of each group. Scaling on y-axis is linear.
050
0010
000
1500
020
000
ELPS−00275.36e−0327
050
0010
000
1500
0
ELPS−01875.8e−03187
010
0030
0050
00
ELPS−01506.75e−03150
4000
6000
8000
1000
0
ELPS−00788.13e−0378
010
000
2000
030
000
4000
0
ELPS−02008.13e−03200
Sal
ine
KA
4h
KA
1h
KA
24h
KA72h
Sal
ine
KA
4h
KA
1h
KA
24h
KA72h
Sal
ine
KA
4h
KA
1h
KA
24h
KA72h
Sal
ine
KA
4h
KA
1h
KA
24h
KA72h
Sal
ine
KA
4h
KA
1h
KA
24h
KA72h
010
0020
0030
0040
00
ELPS−02719.9e−03271
010
0020
0030
0040
00ELPS−01689.9e−03168
020
0040
0060
008000
ELPS−01881.07e−02188
020
0040
0060
008000
ELPS−02142.5e−02214
4000
8000
1200
016
000
ELPS−00482.69e−0248
Sal
ine
KA
4h
KA
1h
KA
24h
KA72h
Sal
ine
KA
4h
KA
1h
KA
24h
KA72h
Sal
ine
KA
4h
KA
1h
KA
24h
KA72h
Sal
ine
KA
4h
KA
1h
KA
24h
KA72h
Sal
ine
KA
4h
KA
1h
KA
24h
KA72h
010
000
3000
050
000
ELPS−01523.57e−02152
1000
030
000
5000
0
ELPS−01574.62e−02157
010
0030
0050
00
ELPS−01764.8e−0217650
0015
000
2500
035
000 ELPS−02368.97e−02236
010
0030
0050
00
ELPS−01171.14e−01117
Sal
ine
KA
4h
KA
1h
KA
24h
KA72h
Sal
ine
KA
4h
KA
1h
KA
24h
KA72h
Sal
ine
KA
4h
KA
1h
KA
24h
KA72h
Sal
ine
KA
4h
KA
1h
KA
24h
KA72h
Sal
ine
KA
4h
KA
1h
KA
24h
KA72h
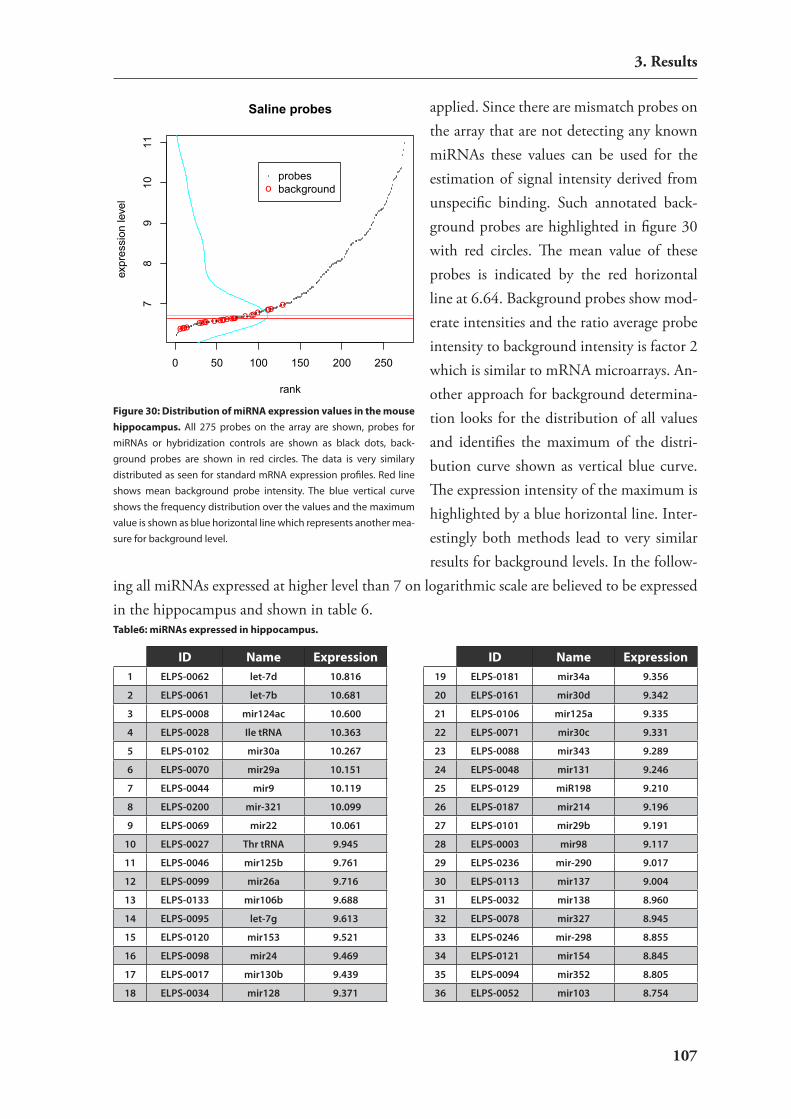
�0�
�. Results
applied. since there are mismatch probes on the array that are not detecting any known mirnAs these values can be used for the estimation of signal intensity derived from unspecific binding. such annotated back-ground probes are highlighted in figure 30 with red circles. The mean value of these probes is indicated by the red horizontal line at 6.64. Background probes show mod-erate intensities and the ratio average probe intensity to background intensity is factor 2 which is similar to mrnA microarrays. An-other approach for background determina-tion looks for the distribution of all values and identifies the maximum of the distri-bution curve shown as vertical blue curve. The expression intensity of the maximum is highlighted by a blue horizontal line. inter-estingly both methods lead to very similar results for background levels. in the follow-
ing all mirnAs expressed at higher level than 7 on logarithmic scale are believed to be expressed in the hippocampus and shown in table 6.
oooo oooo ooooooooo oooo ooo o
0 50 100 150 200 250
78
910
11
Saline probes
rank
expr
essi
on le
vel
oprobesbackground
Figure 30: Distribution of miRNA expression values in the mouse hippocampus. All 275 probes on the array are shown, probes for miRNAs or hybridization controls are shown as black dots, back-ground probes are shown in red circles. The data is very similary distributed as seen for standard mRNA expression profiles. Red line shows mean background probe intensity. The blue vertical curve shows the frequency distribution over the values and the maximum value is shown as blue horizontal line which represents another mea-sure for background level.
ID Name Expression1 ELPS-0062 let-7d 10.816
2 ELPS-0061 let-7b 10.681
3 ELPS-0008 mir124ac 10.600
4 ELPS-0028 Ile tRNA 10.363
5 ELPS-0102 mir30a 10.267
6 ELPS-0070 mir29a 10.151
7 ELPS-0044 mir9 10.119
8 ELPS-0200 mir-321 10.099
9 ELPS-0069 mir22 10.061
10 ELPS-0027 Thr tRNA 9.945
11 ELPS-0046 mir125b 9.761
12 ELPS-0099 mir26a 9.716
13 ELPS-0133 mir106b 9.688
14 ELPS-0095 let-7g 9.613
15 ELPS-0120 mir153 9.521
16 ELPS-0098 mir24 9.469
17 ELPS-0017 mir130b 9.439
18 ELPS-0034 mir128 9.371
Table6: miRNAs expressed in hippocampus.
ID Name Expression19 ELPS-0181 mir34a 9.356
20 ELPS-0161 mir30d 9.342
21 ELPS-0106 mir125a 9.335
22 ELPS-0071 mir30c 9.331
23 ELPS-0088 mir343 9.289
24 ELPS-0048 mir131 9.246
25 ELPS-0129 miR198 9.210
26 ELPS-0187 mir214 9.196
27 ELPS-0101 mir29b 9.191
28 ELPS-0003 mir98 9.117
29 ELPS-0236 mir-290 9.017
30 ELPS-0113 mir137 9.004
31 ELPS-0032 mir138 8.960
32 ELPS-0078 mir327 8.945
33 ELPS-0246 mir-298 8.855
34 ELPS-0121 mir154 8.845
35 ELPS-0094 mir352 8.805
36 ELPS-0052 mir103 8.754

�0�
�. Results
in the mouse hippocampus 112 mirnAs out of 275 measured probes are called expressed over background on the arrays presented here. in general trnAs are among the highest expressed probes which serves as control. Among the highest expressed mirnAs are let7, mir 124, mir 125 and mir 9. interestingly the mir 206 probe gives signals above background levels although
Table 6: miRNAs expressed in hippocampus (continued).
ID Name Expression37 ELPS-0188 mir217 8.739
38 ELPS-0023 mir103 8.643
39 ELPS-0119 mir143 8.642
40 ELPS-0087 mir341 8.609
41 ELPS-0189 mir222 8.588
42 ELPS-0011 mir30b 8.574
43 ELPS-0026 mir218 8.570
44 ELPS-0100 mir27 8.558
45 ELPS-0110 mir134 8.554
46 ELPS-0036 mir347 8.551
47 ELPS-0214 mir-107 8.521
48 ELPS-0063 let-7i 8.505
49 ELPS-0250 mir-320 8.502
50 ELPS-0104 mir101 8.464
51 ELPS-0007 mir181a 8.450
52 ELPS-0097 mir23b 8.371
53 ELPS-0203 mir-7 8.241
54 ELPS-0068 mir21 8.148
55 ELPS-0031 mir19b 8.111
56 ELPS-0042 mir221 8.085
57 ELPS-0232 mir-212 8.072
58 ELPS-0064 mir15a 8.068
59 ELPS-0050 mir103 8.067
60 ELPS-0001 mir16 8.059
61 ELPS-0117 mir142-s 8.033
62 ELPS-0107 mir126 8.017
63 ELPS-0239 miR-292-5p 8.015
64 ELPS-0114 mir139T 8.013
65 ELPS-0234 mir-219 7.978
66 ELPS-0080 mir332 7.977
67 ELPS-0128 miR197 7.971
68 ELPS-0065 mir15b 7.935
69 ELPS-0216 mir-138 7.922
70 ELPS-0112 mir136 7.921
71 ELPS-0082 mir334 7.846
72 ELPS-0086 mir340 7.795
73 ELPS-0006 mir323 7.794
74 ELPS-0244 mir-296 7.781
75 ELPS-0109 mir133 7.750
ID Name Expression76 ELPS-0090 mir256 7.709
77 ELPS-0041 mir328 7.703
78 ELPS-0222 mir-188 7.672
79 ELPS-0019 mir344 7.669
80 ELPS-0125 miR185 7.582
81 ELPS-0226 mir-195 7.538
82 ELPS-0132 mir92 7.513
83 ELPS-0049 mir132 7.506
84 ELPS-0131 miR204 7.506
85 ELPS-0009 mir191 7.416
86 ELPS-0124 miR184 7.413
87 ELPS-0230 mir-207 7.409
88 ELPS-0164 mir199a* 7.364
89 ELPS-0103 mir30a* 7.363
90 ELPS-0229 mir-202 7.329
91 ELPS-0043 mir351 7.324
92 ELPS-0016 mir342 7.278
93 ELPS-0105 mir124b 7.275
94 ELPS-0040 mir345 7.274
95 ELPS-0186 mir210 7.270
96 ELPS-0047 mir127 7.236
97 ELPS-0083 mir336 7.205
98 ELPS-0025 mir349 7.177
99 ELPS-0127 miR196 7.163
100 ELPS-0005 mir129-2* 7.155
101 ELPS-0024 SimToMir324-3p
7.148
102 ELPS-0089 mir346 7.146
103 ELPS-0156 sim to 17-5p. mir106a
7.126
104 ELPS-0211 miR-34b 7.085
105 ELPS-0077 mir325 7.053
106 ELPS-0035 mir329 7.046
107 ELPS-0030 mir338 7.025
108 ELPS-0202 mir-206 7.019
109 ELPS-0111 mir135 7.019
110 ELPS-0248 mir-300 7.014
111 ELPS-0033 let-7d* 7.013
112 ELPS-0237 miR-291-5p 7.004
Table 6: Probes with array signals above background levels are ordered by signal intensity. Expression levels are shown on log2-scale and the first column indicates the rank within this list.
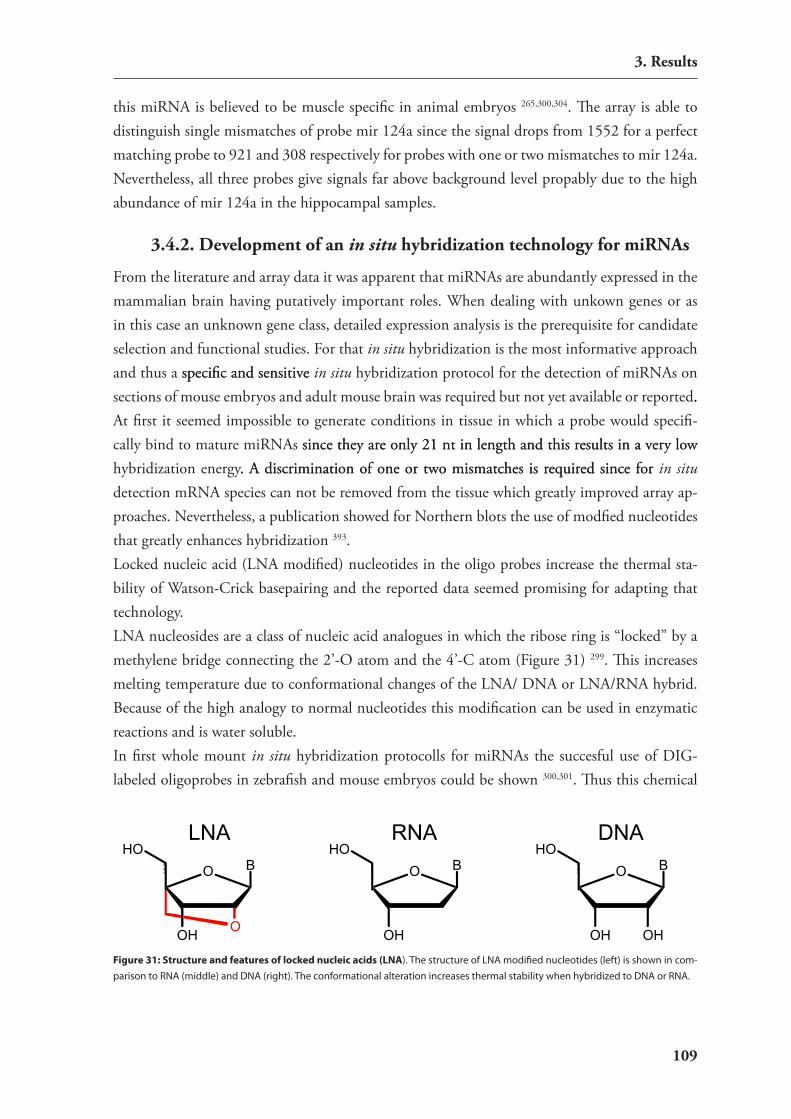
�0�
�. Results
this mirnA is believed to be muscle specific in animal embryos 265,300,304. The array is able to distinguish single mismatches of probe mir 124a since the signal drops from 1552 for a perfect matching probe to 921 and 308 respectively for probes with one or two mismatches to mir 124a. nevertheless, all three probes give signals far above background level propably due to the high abundance of mir 124a in the hippocampal samples.
�.�.�. Development of an in situ hybridization technology for miRNAs
From the literature and array data it was apparent that mirnAs are abundantly expressed in the mammalian brain having putatively important roles. When dealing with unkown genes or as in this case an unknown gene class, detailed expression analysis is the prerequisite for candidate selection and functional studies. For that in situ hybridization is the most informative approach and thus a specific and sensitive specific and sensitive in situ hybridization protocol for the detection of mirnAs on sections of mouse embryos and adult mouse brain was required but not yet available or reported.. At first it seemed impossible to generate conditions in tissue in which a probe would specifi-cally bind to mature mirnAs since they are only 21 nt in length and this results in a very lowsince they are only 21 nt in length and this results in a very low hybridization energy. A discrimination of one or two mismatches is required since for. A discrimination of one or two mismatches is required since for in situ detection mrnA species can not be removed from the tissue which greatly improved array ap-proaches. nevertheless, a publication showed for northern blots the use of modfied nucleotides that greatly enhances hybridization 393.Locked nucleic acid (LnA modified) nucleotides in the oligo probes increase the thermal sta-bility of Watson-crick basepairing and the reported data seemed promising for adapting that technology. LnA nucleosides are a class of nucleic acid analogues in which the ribose ring is “locked” by a methylene bridge connecting the 2’-O atom and the 4’-c atom (Figure 31) 299. This increases melting temperature due to conformational changes of the LnA/ DnA or LnA/rnA hybrid. Because of the high analogy to normal nucleotides this modification can be used in enzymatic reactions and is water soluble.in first whole mount in situ hybridization protocolls for mirnAs the succesful use of DiG-labeled oligoprobes in zebrafish and mouse embryos could be shown 300,301. Thus this chemical
OH
HO
O
O B
LNA
OH
HOO B
RNA
OH OH
HOO B
DNA
Figure 31: Structure and features of locked nucleic acids (LNA). The structure of LNA modified nucleotides (left) is shown in com-parison to RNA (middle) and DNA (right). The conformational alteration increases thermal stability when hybridized to DNA or RNA.
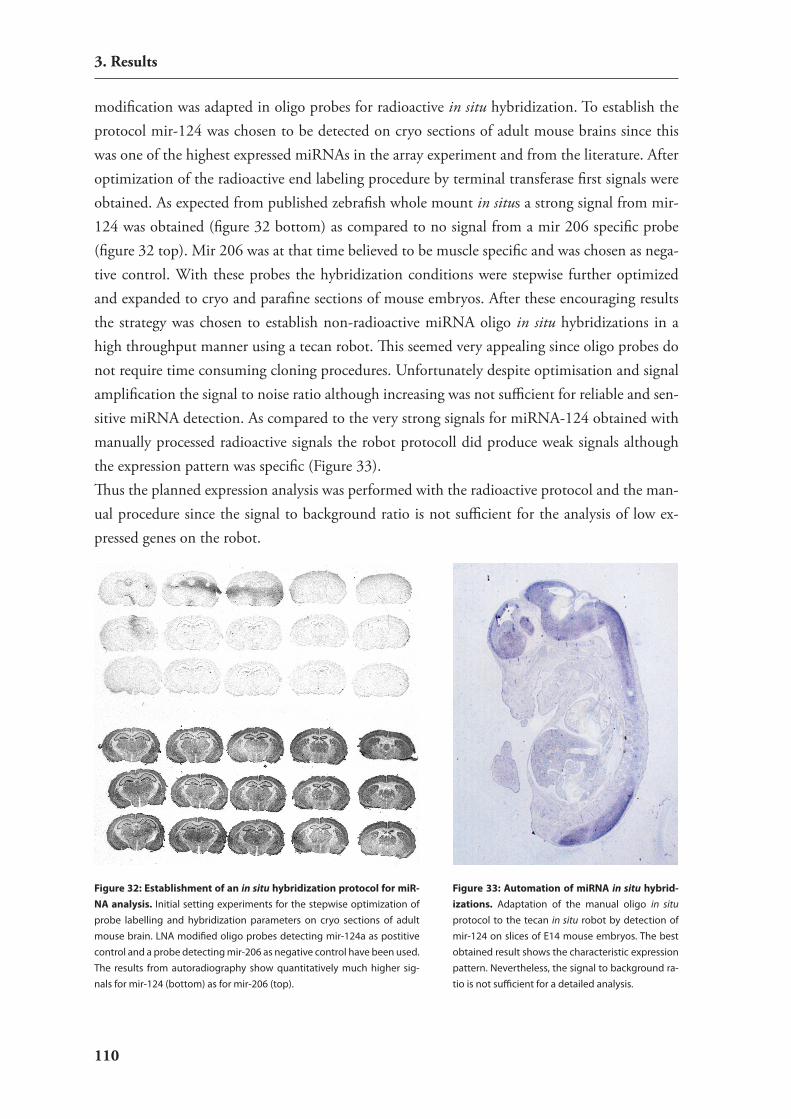
��0
�. Results
modification was adapted in oligo probes for radioactive in situ hybridization. To establish the protocol mir-124 was chosen to be detected on cryo sections of adult mouse brains since this was one of the highest expressed mirnAs in the array experiment and from the literature. After optimization of the radioactive end labeling procedure by terminal transferase first signals were obtained. As expected from published zebrafish whole mount in situs a strong signal from mir-124 was obtained (figure 32 bottom) as compared to no signal from a mir 206 specific probe (figure 32 top). Mir 206 was at that time believed to be muscle specific and was chosen as nega-tive control. With these probes the hybridization conditions were stepwise further optimized and expanded to cryo and parafine sections of mouse embryos. After these encouraging results the strategy was chosen to establish non-radioactive mirnA oligo in situ hybridizations in a high throughput manner using a tecan robot. This seemed very appealing since oligo probes do not require time consuming cloning procedures. Unfortunately despite optimisation and signal amplification the signal to noise ratio although increasing was not sufficient for reliable and sen-sitive mirnA detection. As compared to the very strong signals for mirnA-124 obtained with manually processed radioactive signals the robot protocoll did produce weak signals although the expression pattern was specific (Figure 33).Thus the planned expression analysis was performed with the radioactive protocol and the man-ual procedure since the signal to background ratio is not sufficient for the analysis of low ex-pressed genes on the robot.
Figure 32: Establishment of an in situ hybridization protocol for miR-NA analysis. Initial setting experiments for the stepwise optimization of probe labelling and hybridization parameters on cryo sections of adult mouse brain. LNA modified oligo probes detecting mir-124a as postitive control and a probe detecting mir-206 as negative control have been used. The results from autoradiography show quantitatively much higher sig-nals for mir-124 (bottom) as for mir-206 (top).
Figure 33: Automation of miRNA in situ hybrid-izations. Adaptation of the manual oligo in situ protocol to the tecan in situ robot by detection of mir-124 on slices of E14 mouse embryos. The best obtained result shows the characteristic expression pattern. Nevertheless, the signal to background ra-tio is not sufficient for a detailed analysis.
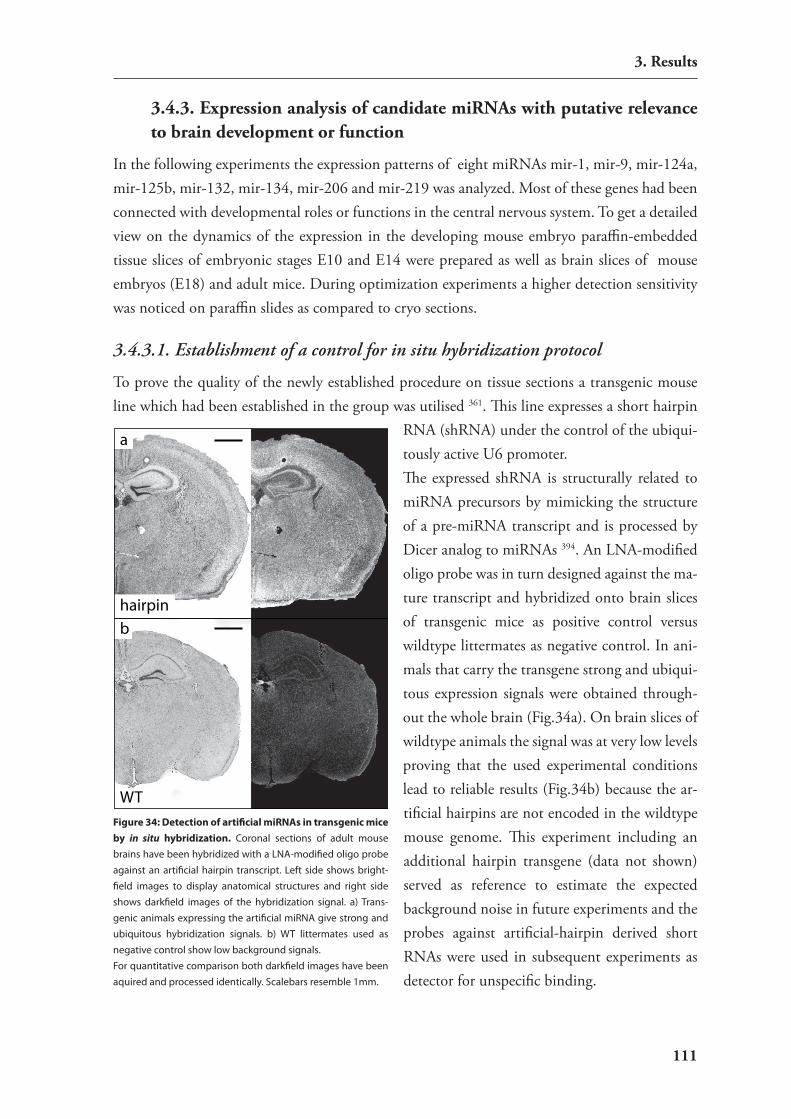
111
3. Results
3.4.3. Expression analysis of candidate miRNAs with putative relevance to brain development or function
In the following experiments the expression patterns of eight miRNAs mir-1, mir-9, mir-124a, mir-125b, mir-132, mir-134, mir-206 and mir-219 was analyzed. Most of these genes had been connected with developmental roles or functions in the central nervous system. To get a detailed view on the dynamics of the expression in the developing mouse embryo paraffin-embedded tissue slices of embryonic stages E10 and E14 were prepared as well as brain slices of mouse embryos (E18) and adult mice. During optimization experiments a higher detection sensitivity was noticed on paraffin slides as compared to cryo sections.
3.4.3.1. Establishment of a control for in situ hybridization protocol
To prove the quality of the newly established procedure on tissue sections a transgenic mouse line which had been established in the group was utilised 361. This line expresses a short hairpin
RNA (shRNA) under the control of the ubiqui-tously active U6 promoter. The expressed shRNA is structurally related to miRNA precursors by mimicking the structure of a pre-miRNA transcript and is processed by Dicer analog to miRNAs 394. An LNA-modified oligo probe was in turn designed against the ma-ture transcript and hybridized onto brain slices of transgenic mice as positive control versus wildtype littermates as negative control. In ani-mals that carry the transgene strong and ubiqui-tous expression signals were obtained through-out the whole brain (Fig.34a). On brain slices of wildtype animals the signal was at very low levels proving that the used experimental conditions lead to reliable results (Fig.34b) because the ar-tificial hairpins are not encoded in the wildtype mouse genome. This experiment including an additional hairpin transgene (data not shown) served as reference to estimate the expected background noise in future experiments and the probes against artificial-hairpin derived short RNAs were used in subsequent experiments as detector for unspecific binding.
hairpin
b
WT
a
Figure 34: Detection of artificial miRNAs in transgenic mice by in situ hybridization. Coronal sections of adult mouse brains have been hybridized with a LNA-modified oligo probe against an artificial hairpin transcript. Left side shows bright-field images to display anatomical structures and right side shows darkfield images of the hybridization signal. a) Trans-genic animals expressing the artificial miRNA give strong and ubiquitous hybridization signals. b) WT littermates used as negative control show low background signals.For quantitative comparison both darkfield images have been aquired and processed identically. Scalebars resemble 1mm.
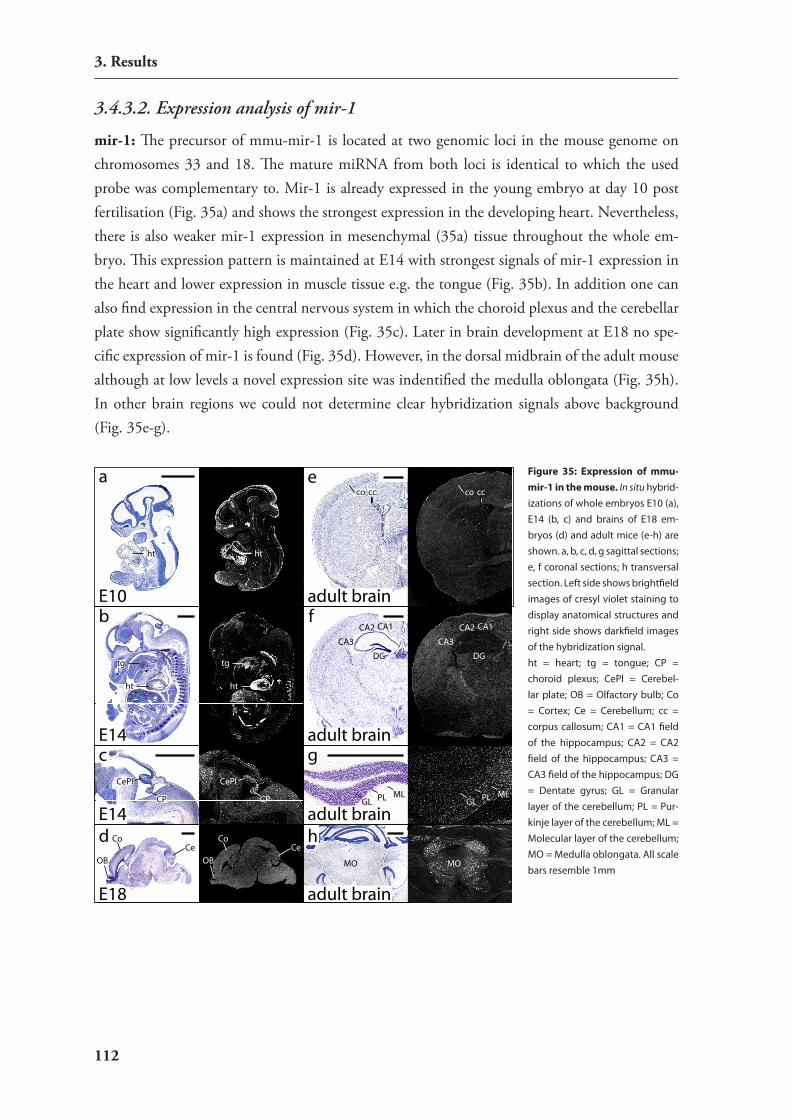
112
3. Results
3.4.3.2. Expression analysis of mir-1
mir-1: The precursor of mmu-mir-1 is located at two genomic loci in the mouse genome on chromosomes 33 and 18. The mature miRNA from both loci is identical to which the used probe was complementary to. Mir-1 is already expressed in the young embryo at day 10 post fertilisation (Fig. 35a) and shows the strongest expression in the developing heart. Nevertheless, there is also weaker mir-1 expression in mesenchymal (35a) tissue throughout the whole em-bryo. This expression pattern is maintained at E14 with strongest signals of mir-1 expression in the heart and lower expression in muscle tissue e.g. the tongue (Fig. 35b). In addition one can also find expression in the central nervous system in which the choroid plexus and the cerebellar plate show significantly high expression (Fig. 35c). Later in brain development at E18 no spe-cific expression of mir-1 is found (Fig. 35d). However, in the dorsal midbrain of the adult mouse although at low levels a novel expression site was indentified the medulla oblongata (Fig. 35h). In other brain regions we could not determine clear hybridization signals above background (Fig. 35e-g).
E10
a
E14
badult brain
e
adult brain
adult brain
f
E14
c
E18
d h
g
adult brain
MO MO
GLMLPL GL
MLPLCP
CePl
ht
ht
tg
ht
tg
ht
CePl
CP
CA1CA2
CA3
DG
CA1CA2
CA3
DG
ccco ccco
OB
CeCo
OB
CeCo
Figure 35: Expression of mmu-mir-1 in the mouse. In situ hybrid-izations of whole embryos E10 (a), E14 (b, c) and brains of E18 em-bryos (d) and adult mice (e-h) are shown. a, b, c, d, g sagittal sections; e, f coronal sections; h transversal section. Left side shows brightfield images of cresyl violet staining to display anatomical structures and right side shows darkfield images of the hybridization signal.ht = heart; tg = tongue; CP = choroid plexus; CePl = Cerebel-lar plate; OB = Olfactory bulb; Co = Cortex; Ce = Cerebellum; cc = corpus callosum; CA1 = CA1 field of the hippocampus; CA2 = CA2 field of the hippocampus; CA3 = CA3 field of the hippocampus; DG = Dentate gyrus; GL = Granular layer of the cerebellum; PL = Pur-kinje layer of the cerebellum; ML = Molecular layer of the cerebellum; MO = Medulla oblongata. All scale bars resemble 1mm
E10
a
E14
badult brain
e
adult brain
adult brain
f
E14
c
E18
d h
g
adult brain
MO MO
GLMLPL GL
MLPLCP
CePl
ht
ht
tg
ht
tg
ht
CePl
CP
CA1CA2
CA3
DG
CA1CA2
CA3
DG
ccco ccco
OB
CeCo
OB
CeCo
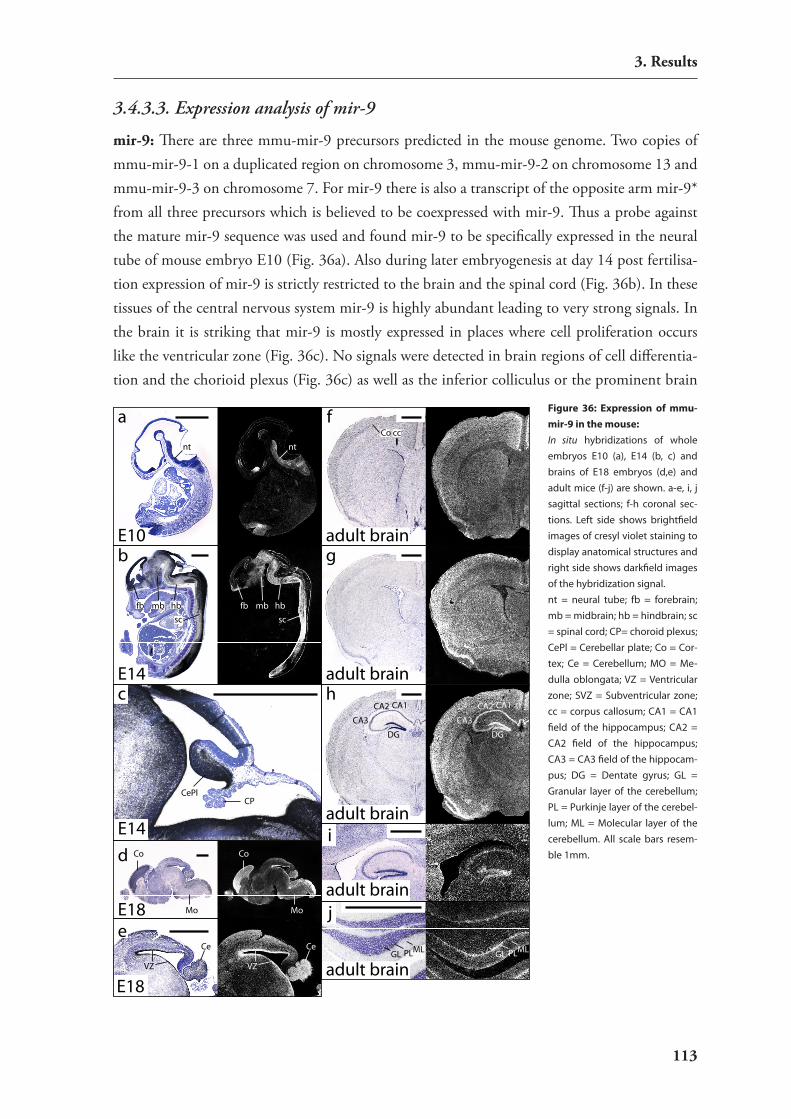
113
3. Results
3.4.3.3. Expression analysis of mir-9
mir-9: There are three mmu-mir-9 precursors predicted in the mouse genome. Two copies of mmu-mir-9-1 on a duplicated region on chromosome 3, mmu-mir-9-2 on chromosome 13 and mmu-mir-9-3 on chromosome 7. For mir-9 there is also a transcript of the opposite arm mir-9* from all three precursors which is believed to be coexpressed with mir-9. Thus a probe against the mature mir-9 sequence was used and found mir-9 to be specifically expressed in the neural tube of mouse embryo E10 (Fig. 36a). Also during later embryogenesis at day 14 post fertilisa-tion expression of mir-9 is strictly restricted to the brain and the spinal cord (Fig. 36b). In these tissues of the central nervous system mir-9 is highly abundant leading to very strong signals. In the brain it is striking that mir-9 is mostly expressed in places where cell proliferation occurs like the ventricular zone (Fig. 36c). No signals were detected in brain regions of cell differentia-tion and the chorioid plexus (Fig. 36c) as well as the inferior colliculus or the prominent brain
h
E10
E14
E14
a
b
d
c
E18e
E18
j
adult brain
adult brain
adult brain
adult brain
adult brain
f
g
i
nt nt
CePlCP
CA1CA2
CA3
DG
CA1CA2
CA3
DG
VZ
Ce
Mo
Co
VZ
Ce
Mo
Co
GL MLPL GL MLPL
hbmbfb
sc
hbmbfb
sc
ccCo
Figure 36: Expression of mmu-mir-9 in the mouse:In situ hybridizations of whole embryos E10 (a), E14 (b, c) and brains of E18 embryos (d,e) and adult mice (f-j) are shown. a-e, i, j sagittal sections; f-h coronal sec-tions. Left side shows brightfield images of cresyl violet staining to display anatomical structures and right side shows darkfield images of the hybridization signal.nt = neural tube; fb = forebrain; mb = midbrain; hb = hindbrain; sc = spinal cord; CP= choroid plexus; CePl = Cerebellar plate; Co = Cor-tex; Ce = Cerebellum; MO = Me-dulla oblongata; VZ = Ventricular zone; SVZ = Subventricular zone; cc = corpus callosum; CA1 = CA1 field of the hippocampus; CA2 = CA2 field of the hippocampus; CA3 = CA3 field of the hippocam-pus; DG = Dentate gyrus; GL = Granular layer of the cerebellum; PL = Purkinje layer of the cerebel-lum; ML = Molecular layer of the cerebellum. All scale bars resem-ble 1mm.

114
3. Results
nerves (not shown). Interestingly the ventral part of the cerebellar plate also displays high mir-9 expression. In the later brain (E18) mir-9 expression remains strong and is still most prominent in the ventricular zone (Fig. 36e). Lower expression levels were additionally found in cortex and cerebellum. Notably, the ventricular zone is not anymore the most prominent expression site for mir-9 expression in the adult brain (Fig. 36g + i). At this stage there is expression throughout the whole brain, slightly increased in cortex and hippocampus (Fig. 36f-h) and a very specific signal was obtained in the purkinje cell layer of the adult cerebellum (Fig. 36j).
3.4.3.4. Expression analysis of mir-124a
mir-124a: mmu-mir-124a is transcribed from three predicted precursor loci in the mouse ge-nome, mir-124-1 on chromosome 14, mir-124-2 on chromosome 3, and mir-124-on chromo-some 2. There is also a reported mature mir-124b sequence with a G insertion on position 12.
E10
a
E14 E14
E14
b c
d
E18
gE18
f
adult brain
j
k
adult brain
adult brain
l
adult brain
mE14
e
adult brain
h
adult brain
i
nt nt
an
re
CePl
OB Ce
Co
OB
CeHipCo
CP
VZSVZ
VZSVZ
OB Ce
Co
VZSVZ
OB
CeHipCo
GL MLPL Gl MLPL
CA1CA2
CA3
DG
CA1CA2
CA3
DGhbmbfb
sc
ccccco co
Figure 37: Expression of mmu-mir-124a in the mouse: In situ hybridizations of whole embryos E10 (a), E14 (b-e) and brains of E18 embryos (f,g) and adult mice (h-m) are shown. a-g and j,k sag-ittal sections; h,i and l,m coronal sections. Figs c and d show de-tails of E14 embryo: c cochlear tract with acoustic nerve and d developing eye with retina. For images a, f, g-k. Left side shows brightfield images of cresyl vio-let staining to display anatomical structures and right side shows darkfield images of the hybrid-ization signalnt = neural tube; fb = forebrain; mb = midbrain; hb = hindbrain; sc = spinal cord; an = acoustic nerve; re = retina; CP= choroid plexus; CePl = Cerebellar plate; VZ = Ventricular zone; SVZ = Subventricular zone; OB = Olfac-tory bulb; Co = Cortex; Ce = Cer-ebellum; cc = corpus callosum; CA1 = CA1 field of the hippo-campus; CA2 = CA2 field of the hippocampus; CA3 = CA3 field of the hippocampus; DG = Dentate gyrus; Hip = Hippocampus; GL = Granular layer of the cerebellum; PL = Purkinje layer of the cer-ebellum; ML = Molecular layer of the cerebellum. All scale bars resemble 1mm.

115
3. Results
The used probe was chosen to be specific for mmu-mir-124a since there are no indications for a mmu-mir124b variant in the mouse genome assembly. The expression starts before E 10 since high expression signals appear in the neural tube of the developing embryo (Fig. 37a). As soon as the central nervous system establishes mir-124a expression is strictly restricted to cells of neu-ronal origin with very high expression levels in the developing brain and spinal cord at E14 (Fig. 37b). Also efferent and afferent neurons give strong expression signals like the acoustic nerve (Fig. 37c), the retina (Fig. 37d), the Nervus trigeminus and the dorsal root ganglia (not shown). In contrast to mir-9 mir-124a is expressed in cell populations of the brain that are subjected to differentiation processes (Fig. 37e). Strong signals where detected in the subventricular zone and the corpus callosum whereas in the ventricular zone there is no indication for mir-124a expres-sion. This specific absence of expression in ventricles is maintained through E18 (Fig. 37f-g) to the adult brain (Fig. 37h). Although there is very high abundance of mir-124a in propably all differentiated neurons the highest signals could be detected in the cerebellum, the hippocampus and the olfactory bulb of both E18 and adult brain (Figs 37f, j). There is a distinct expression pattern in the cortical layers of the adult brain which was not obvious at E18 (Figs. 37h, i, j, l). In the adult mouse brain the strongest expression is found in the granule cell layer of the olfac-tory bulb (Fig. 37m). The expression in the adult cerebellum is strong showing no differentiation of the cellular layers (Fig. 37k).
3.4.3.5. Expression analysis of mir-125b
mir-125b: The precursor of mmu-mir-125b is located on chromosome 9 in the mouse genome and mature miRNAs are processed from both arms. In this work the better characterized mmu-miR-125b-5p was examined showing strong signals already at day 10 post fertilisation. The expression was ubiquitous and no distinct patterns were visible (Fig. 38a). This expression has changed in the E14 embryo. At this stage mir-125b expression is highest in the central nervous system but not as reported before 300 exclusive to the mid-hindbrain boundary (Fig. 38b). Nev-ertheless, a remaining expression in mesenchymal tissue was detectable throughout the embryo. Mir-125b also shows a strong expression throughout brain development where no cells were observed without positive in situ signal at stages E14 or E18 (Fig. 38c-e). This also holds true for the adult brain but in addition a novel pattern appeared in the cerebellum where the purkinje cells showed the most pronounced expression (Fig. 38h) although the expression remains strong throughout the entire brain (Fig. 38f-g).
3.4.3.6. Expression analysis of mir-132
mir-132: The precursor for mmu-mir-132 has been located to a single site on mouse chromosome 11 and so far only one mature form has been detected. Throughout the analysis in mouse embryos E10 and E14 mir-132 was not found expressed above background signal

116
3. Results
E10
a
E18
d
E14
b
E14
c
adult brain
h
E18
e
adult brain
f
adult brain
g
nt
so
nt
so
hbmbfb
sc
hbmbfb
sc
CePl
CP
VZSVZ
OB
CeCo
OB
CeCo
VZSVZ
Ce
VZSVZ
Ce
ccco ccco
CA1CA2
CA3
DG
CA1CA2
CA3
DG
GLML
PL GL PLML
E10
a
E18
d
E14
b
adult brain
f
adult brain
g
E14
c
E18
e
nt
ao
nt
ao
hbmbfb
sc
hbmbfb
sc
CePl
VZ
SVZ
CPCePl
VZ
SVZ
CP
Ce
Ce
Co
Ce
Ce
Co
VZ SVZ VZ SVZ
OBCeHipCo
OBCeHipCo
GL MLPL GL MLPL
Figure 38: Expression of mmu-mir-125b in the mouse: In situ hybrid-izations of whole embryos E10 (a), E14 (b,c) and brains of E18 embryos (d,e) and adult mice (f-h) are shown. a-e and h sagittal sections; f,g coro-nal sections. Left side shows bright-field images of cresyl violet staining to display anatomical structures and right side shows darkfield images of the hybridization signal, except for c which shows a brightfield image.nt = neural tube; fb = forebrain; mb = midbrain; hb = hindbrain; sc = spi-nal cord; so = somites; an = acous-tic nerve; re = retina; CP= choroid plexus; CePl = Cerebellar plate; VZ = Ventricular zone; SVZ = Subventricu-lar zone; OB = Olfactory bulb; Co = Cortex; Ce = Cerebellum; cc = corpus callosum; CA1 = CA1 field of the hip-pocampus; CA2 = CA2 field of the hippocampus; CA3 = CA3 field of the hippocampus; DG = Dentate gyrus; Hip = Hippocampus; GL = Granular layer of the cerebellum; PL = Pur-kinje layer of the cerebellum; ML = Molecular layer of the cerebellum. All scale bars resemble 1mm.
Figure 39: Expression of mmu-mir-132 in the mouse: In situ hybridiza-tions of whole embryos E10 (a), E14 (b,c) and brains of E18 embryos (d,e) and adult mice (f,g) are shown. a-g sagittal sections. Left side shows brightfield images of cresyl violet staining to display anatomical struc-tures and right side shows darkfield images of the hybridization signal.nt = neural tube; ao = aorta, fb = forebrain; mb = midbrain; hb = hind-brain; sc = spinal cord; CP= choroid plexus; CePl = Cerebellar plate; VZ = Ventricular zone; SVZ = Subventricu-lar zone; OB = Olfactory bulb; Co = Cortex; Ce = Cerebellum; DG = Den-tate gyrus; Hip = Hippocampus; GL = Granular layer of the cerebellum; PL = Purkinje layer of the cerebellum; ML = Molecular layer of the cerebel-lum. All scale bars resemble 1mm.
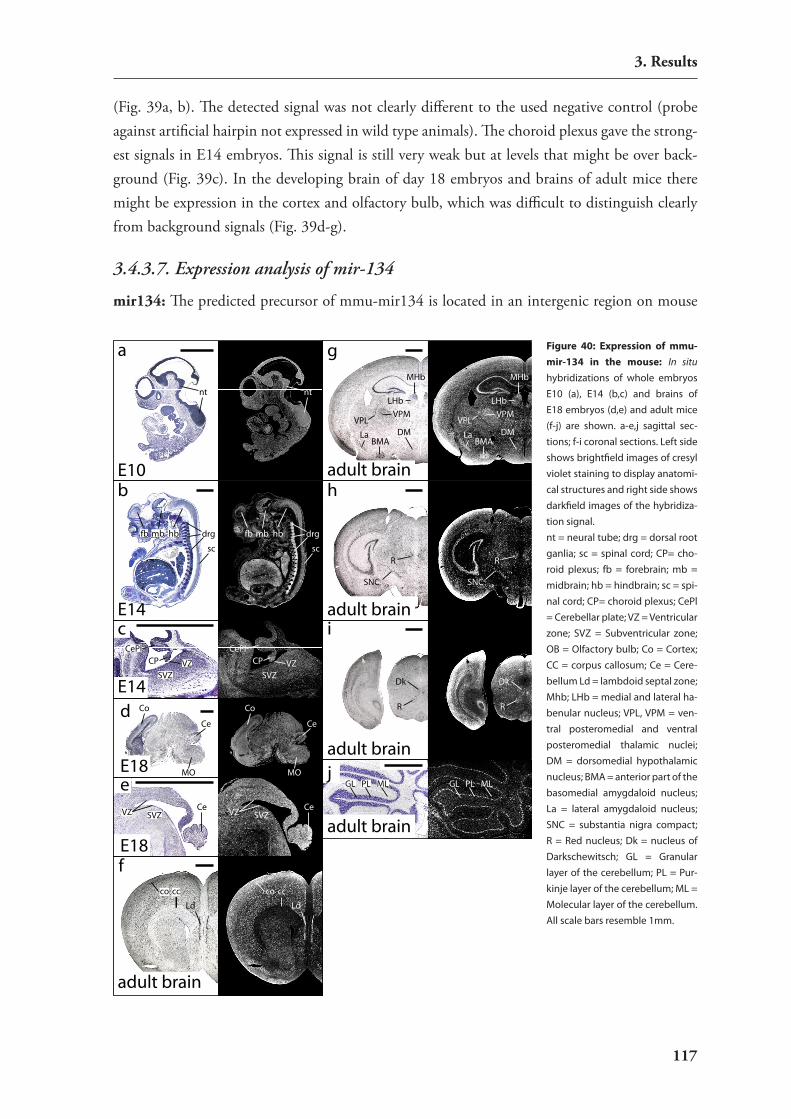
117
3. Results
(Fig. 39a, b). The detected signal was not clearly different to the used negative control (probe against artificial hairpin not expressed in wild type animals). The choroid plexus gave the strong-est signals in E14 embryos. This signal is still very weak but at levels that might be over back-ground (Fig. 39c). In the developing brain of day 18 embryos and brains of adult mice there might be expression in the cortex and olfactory bulb, which was difficult to distinguish clearly from background signals (Fig. 39d-g).
3.4.3.7. Expression analysis of mir-134
mir134: The predicted precursor of mmu-mir134 is located in an intergenic region on mouse
E10
a
E14
b
e
E18
adult brain
g
d
E18
E14
c
adult brain
f
adult brain
h
adult brain
i
adult brain
j
Ld
MHb
LHb
VPLDM
BMALa
VPM
SNC
R
R
Dk
nt nt
hbmbfb
sc sc
drg hbmbfb drg
CP VZSVZ
CePlCP VZ
SVZ
CePl
Ce
Co
Ce
MO
Ce
Co
MO
VZ SVZCe
VZ SVZ
ccco
Ld
ccco
MHb
LHb
VPLDM
BMALa
VPM
SNC
R
R
Dk
GL MLPL GL MLPL
Figure 40: Expression of mmu-mir-134 in the mouse: In situ hybridizations of whole embryos E10 (a), E14 (b,c) and brains of E18 embryos (d,e) and adult mice (f-j) are shown. a-e,j sagittal sec-tions; f-i coronal sections. Left side shows brightfield images of cresyl violet staining to display anatomi-cal structures and right side shows darkfield images of the hybridiza-tion signal.nt = neural tube; drg = dorsal root ganlia; sc = spinal cord; CP= cho-roid plexus; fb = forebrain; mb = midbrain; hb = hindbrain; sc = spi-nal cord; CP= choroid plexus; CePl = Cerebellar plate; VZ = Ventricular zone; SVZ = Subventricular zone; OB = Olfactory bulb; Co = Cortex; CC = corpus callosum; Ce = Cere-bellum Ld = lambdoid septal zone; Mhb; LHb = medial and lateral ha-benular nucleus; VPL, VPM = ven-tral posteromedial and ventral posteromedial thalamic nuclei; DM = dorsomedial hypothalamic nucleus; BMA = anterior part of the basomedial amygdaloid nucleus; La = lateral amygdaloid nucleus; SNC = substantia nigra compact; R = Red nucleus; Dk = nucleus of Darkschewitsch; GL = Granular layer of the cerebellum; PL = Pur-kinje layer of the cerebellum; ML = Molecular layer of the cerebellum. All scale bars resemble 1mm.

118
3. Results
chromosome 12. There is only one gene annotated from which one mature transcript is tran-scribed and the used in situ probe is complementary to the mature mir-134. In the young mouse embryo (E10) no clear differential expression pattern could be observed (Fig 40a). Expression is above the levels of the negative control but at modest levels. Nevertheless, there might be a slightly increased expression in the neural tube (Fig 40a). In the E14 embryo mir-134 is still expressed at low levels but present in the developing brain, spinal cord and pronounced in the dorsal root ganglia (Fig 40b, c). In the brains of E18 embryos (Fig 40d, e) and adult mice (Fig 40f-j) expression is increasing and a specific expression pattern is established. Notably a scat-tered expression in adult mouse brains was found indicating that not every cell is expressing mir-134. The expression was pronounced in cortical layers and the entire hippocampus. The strongest and most specific signals were found in specifc cells of the lambdoid septal zone Ld (Fig 40f ), the medial and lateral habenular nucleus Mhb, Lhb (Fig. 40g) and in most thalamic nuclei. The ventral posteromedial and ventral posteromedial thalamic nucleui VPL VPM, the dorsomedial hypothalamic nucleus (DM) and the anterior part of the basomedial amygdaloid nucleus (BMA) as well as the lateral amygdaloid nucleus (La) (Fig. 40g) gave expression signals. More rostral (Fig. 40h, i) we found most pronounced expression in the substantia nigra compact (SNC), in the Red nucleus R and in the nucleus of Darkschewitsch Dk. In addition strong ex-pression could be detected in the purkinje cells of the cerebellum (Fig. 40h) but also in distinct cells of the medial cerebellar nucleus (not shown).
3.4.3.8. Expression analysis of mir-206
mir-206: Is located in a cluster with mir-133b on chromosome 1 and there is only one mature transcript processed to which the used probe is complementary. Expression starts in the early mouse embryo before E10 mostly in the somites (Fig 41a). In later deveopment it shows a mus-cle specific expression in E14 embryos (Fig 41b). This results in a fiber shaped expression signal in all muscles e.g. in the tongue and the back muscles (Fig. 41d). Additionally a pronounced and specific expression is apparent in the choroid plexus (Fig. 41c). In the brains of E18 embryos (Fig 41e, f ) and in adult mice (Fig 41g, h) mostly ubiquitous expression can be detected that is only slightly above background levels whith pronounced expression in the hippocampus (not shown). In the cerebellum we obtained a clear pattern showing strong and specific mir-206 ex-pression in the purkinje cell (Fig 41i).
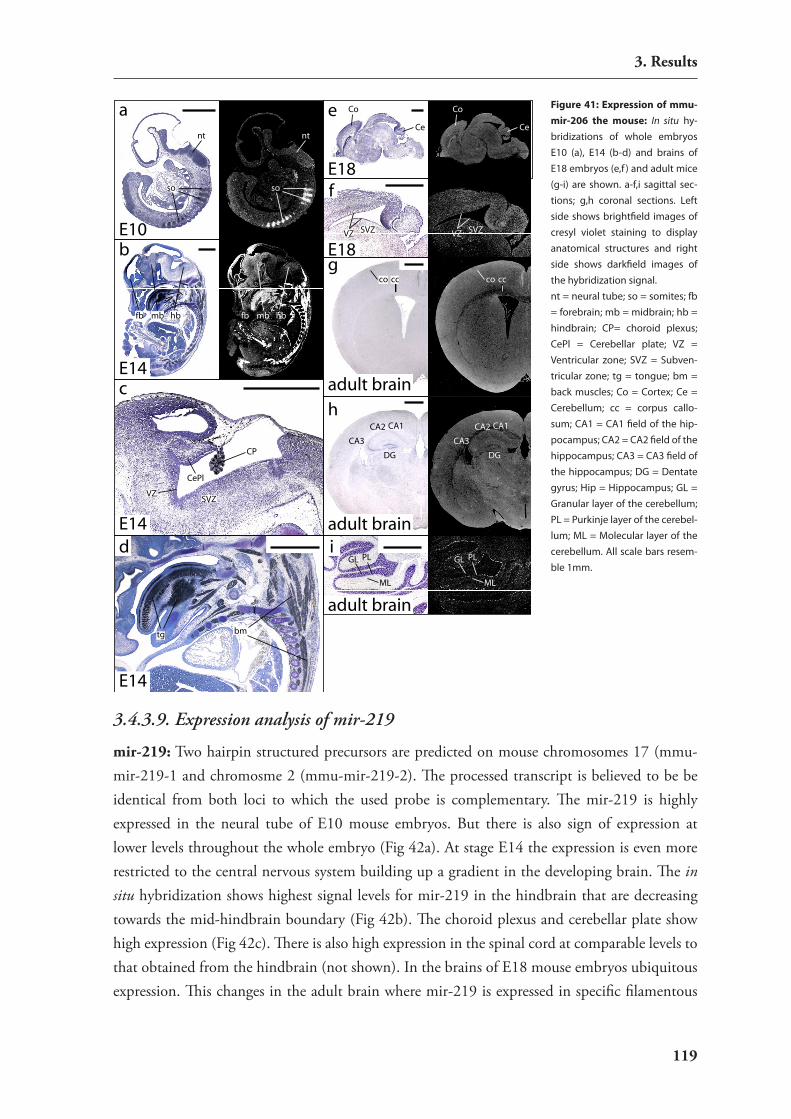
119
3. Results
3.4.3.9. Expression analysis of mir-219
mir-219: Two hairpin structured precursors are predicted on mouse chromosomes 17 (mmu-mir-219-1 and chromosme 2 (mmu-mir-219-2). The processed transcript is believed to be be identical from both loci to which the used probe is complementary. The mir-219 is highly expressed in the neural tube of E10 mouse embryos. But there is also sign of expression at lower levels throughout the whole embryo (Fig 42a). At stage E14 the expression is even more restricted to the central nervous system building up a gradient in the developing brain. The in situ hybridization shows highest signal levels for mir-219 in the hindbrain that are decreasing towards the mid-hindbrain boundary (Fig 42b). The choroid plexus and cerebellar plate show high expression (Fig 42c). There is also high expression in the spinal cord at comparable levels to that obtained from the hindbrain (not shown). In the brains of E18 mouse embryos ubiquitous expression. This changes in the adult brain where mir-219 is expressed in specific filamentous
c
E14
E10
a
E14
b
d
E14
adult brain
E18
e
E18
f
adult brain
g
adult brain
h
i
nt
so
tg
nt
so
bm
CePl
CP
VZSVZ
Ce
Co
Ce
Co
VZ SVZ VZ SVZ
ccco ccco
CA1CA2
CA3
DG
CA1CA2
CA3
DG
GL
ML
PL GL
ML
PL
hbmbfb hbmbfb
Figure 41: Expression of mmu-mir-206 the mouse: In situ hy-bridizations of whole embryos E10 (a), E14 (b-d) and brains of E18 embryos (e,f ) and adult mice (g-i) are shown. a-f,i sagittal sec-tions; g,h coronal sections. Left side shows brightfield images of cresyl violet staining to display anatomical structures and right side shows darkfield images of the hybridization signal.nt = neural tube; so = somites; fb = forebrain; mb = midbrain; hb = hindbrain; CP= choroid plexus; CePl = Cerebellar plate; VZ = Ventricular zone; SVZ = Subven-tricular zone; tg = tongue; bm = back muscles; Co = Cortex; Ce = Cerebellum; cc = corpus callo-sum; CA1 = CA1 field of the hip-pocampus; CA2 = CA2 field of the hippocampus; CA3 = CA3 field of the hippocampus; DG = Dentate gyrus; Hip = Hippocampus; GL = Granular layer of the cerebellum; PL = Purkinje layer of the cerebel-lum; ML = Molecular layer of the cerebellum. All scale bars resem-ble 1mm.

120
3. Results
structures. Highest expression levels are in the corpus callosum cc, lateral and medial septal nucleus LS, MS, (but not in the lamdoid septal zone LD), in the anterior part of the anterior commissure aca and at lower levels throughout the caudate putamen (Cpu) (Fig. 42e). Mov-ing caudal Fig 42f shows sites of highest mir-219 expression again in the corpus callosum (cc), cingulum (cg), the external capsule (ec) the fimbria hippocampus (fi) and the internal capsule (ic) but not in the medial globus pallidus. Prominent expression domains in the medial brain are the mammilothalamic tract (mt), and the fornix (f ). Also high signals are detectable in the medial and lateral habenular nucleus (MHB, LHB). Furthermore, a different section (Fig. 42g) identifies the external capsule (ec), the brachium superior colliculus (bsc) and the posterior com-missure (pc) as regions where mir-219 is highly expressed. Of note is also that we find distinct cells expressing mir-219 at more moderate levels in the cortex and mostly in thalamic structures. Again very high expression is shown in the white matter of the cerebellum (Fig. 42h) and in the medulla (not shown).Since the dynamic range of printed microphotographs is limited the quantitative results are ad-ditionally summarised in a tabular format by comparing expression differences of the various miRNAs within the analyzed developmental stages. Tables 7 and 8 show various body structures
badult brain
e
E18
dE14
c
adult brain
gadult brain
f
adult brain
h
E14
cc
cc
MHb
LHb
cg
ec
ic
fi
mt
f
bsc
ec
cg
pc
LS
Ld
MSaca
CPu
E10
ant nt
hbmbfb
sc
hbmbfb
sc
CP
VZSVZ
CePlCP
VZSVZ
CePl
CeCo
MO
CeCo
MO
cc
LS
Ld
MSaca
CPu
cc
MHb
LHb
cg
ec
ic
fi
mt
f
bsc
ec
cg
pc
GL
PL
ML
GL
PL
ML
Figure 42: Expression of mmu-mir-219 in the mouse: In situ hybridizations of whole embryos E10 (a), E14 (b,c) and brains of E18 embryos (d) and adult mice (e-h) are shown. a-d,h sagittal sections; e-g coronal sections. Left side shows brightfield images of cresyl violet staining to display anatomi-cal structures and right side shows darkfield images of the hybridiza-tion signal.nt = neural tube; fb = forebrain; mb = midbrain; hb = hindbrain; CP= choroid plexus; CePl = Cerebellar plate; VZ = Ventricular zone; SVZ = Subventricular zone; MO = Me-dulla oblongata; Co = Cortex; Ce = Cerebellum cc = corpus callosum; LS, MS = lateral and medial septal nucleus; LD = lamdoid septal zone; aca = in the anterior part of the an-terior commissure; Cpu = caudate putamen; cg = cingulum; ic, ec = internal and external capsule; mt = mammilothalamic tract; fi = fim-bria; f = fornix; MHB, LHB = medial and lateral habenular nucleus; bsc = brachium superior colliculus; pc = posterior commissure. All scale bars resemble 1mm.
121
3. Results
of E10 resp. E14 mouse embryos focussing on the central nervous system. Tables 9 and 10 sum-marize the data obtained in brains of E18 embryos and adult mice. Across all tables quantative expression is classified in 6 bins: – no expression; ± singnal in the range of background and nega-tive controls; + expressed above background; ++ moderate expression; +++ strong expression; ++++ expression peaks of the probe.
E10
mir-1mir-
9mir-124a mir-125b
mir-132
mir-134
mir-206
mir-219
forebrain
ne
ura
l tu
be
prosence-phalon
+ +++ ++++ +++ +- ++ + ++
midbrainmesence-
phalon+ +++ ++++ +++ +- ++ + +++
hind-brain
rhombence-phalon
+ +++ ++++ +++ +- ++ + +++
heart ++++ - - +++ +- + + ++
aorta ++ - - +++ + + ++ ++
mesen-chym
++ - - +++ +- + + +
somites ++ - - +++ +- + ++++ +
Table 7: Comparison of the expression levels of mmu-mir-1, mmu-mir-9, mmu-mir-124a, mmu-mir-125b, mmu-mir-132, mmu-mir-134, mmu-mir-206, mmu-mir-219 in E10 mouse embryos; – no expression; +- signal in the range of background and negative controls; + expressed above background; ++ moderate expression; +++ strong expression; ++++ expression peaks of the probe.
Table7: Quantitative comparison of the expression levels in E10 mouse embryos.
E14
mir-1 mir-9 mir-124a mir-125b mir-132 mir-134 mir-206 mir-219
forebrain +- +++ ++++ ++++ +- + +- +
midbrain +- +++ ++++ ++++ +- ++ +- ++
hindbrain + +++ ++++ ++++ +- ++ +- +++
choroid plexus ++ - ++ ++++ +- ++ ++ +
cerebellar plate + ++ +++ ++++ +- + +- +
ventricular zone +- ++++ +- ++++ +- + +- ++
subventricular zone + +++ ++++ ++++ +- + +- ++
sensory nerves - - +++ +- +- + +- +-
spinal cord +- +++ ++++ +++ +- ++ +- +++
basal ganglia +- +- +- +- +- +++ +- +++
heart +++ - - +- +- + +- -
muscle ++ - - +- +- + ++++ -
Table 8: Quantitative comparison of the expression levels in E14 mouse embryos.
Table 8: Comparison of the expression levels of mmu-mir-1, mmu-mir-9, mmu-mir-124a, mmu-mir-125b, mmu-mir-132, mmu-mir-134, mmu-mir-206, mmu-mir-219 in E14 mouse embryos; – no expression; +- signal in the range of background and negative controls; + expressed above background; ++ moderate expression; +++ strong expression; ++++ expression peaks of the probe.
122
3. Results
E18 brain
mir-1 mir-9mir-124a
mir-125b
mir-132
mir-134
mir-206
mir-219
fore
bra
in
olfactory bulb - +++ ++++ +++ +- ++ + +-
cortex - +++ ++++ ++++ +- ++ + +-
corpus callosum - +- +++ +++ +- +- +- +
hippocampus - ++ +++ +++ +- + + +-
mid
-b
rain
ventricular zone - ++++ ++++ ++++ +- + + +
subventricular zone
- ++ +++ +++ +- + + +
hindbrain cerebellum - +++ +++ +++ +- + + +
Table 9: Quantitative comparison of the expression levels in E18 mouse embryos.
Table 9: Comparison of the expression levels of mmu-mir-1, mmu-mir-9, mmu-mir-124a, mmu-mir-125b, mmu-mir-132, mmu-mir-134, mmu-mir-206, mmu-mir-219 in E18 mouse embryos; – no expression; +- signal in the range of background and negative controls; + expressed above background; ++ moderate expression; +++ strong expression; ++++ expression peaks of the probe.
adult brain
mir-1 mir-9mir-124a
mir-125b
mir-132
mir-134
mir-206
mir-219
fore
bra
in
olfactory bulb +- ++++ ++++ +++ +- ++++ + +
cortex +- ++++ ++++ +++ +- +++ + +
corpus callosum +- ++ + + +- +- +- ++++
hipp
ocam
pus CA1 - ++++ ++++ ++++ +- +++ ++ -
CA2 - ++++ +++ ++++ +- +++ ++ -
CA3 - +++ +++ ++++ +- ++++ ++ -
DG - ++++ +++ ++++ +- +++ ++ +-
mid
-b
rain ventricular zone +- ++ ++ +++ +- ++ + -
subventricular zone +- ++ ++ +++ +- ++ + -
hin
db
rain
cere
bellu
m
granular layer
+- ++ ++++ +++ +- +- + +-
purkinje layer
+- +++ ++++ +++ +- +++ +++ +-
molecu-lar layer
+- ++ +++ +++ +- +- + +-
white matter
+- ++ + +++ +- +- + ++++
Table 10: Quantitative comparison of the expression levels in the adult mouse brain.
Table 10: Comparison of the expression levels of mmu-mir-1, mmu-mir-9, mmu-mir-124a, mmu-mir-125b, mmu-mir-132, mmu-mir-134, mmu-mir-206, mmu-mir-219 in the adult mouse brain; – no expression; +- signal in the range of background and negative con-trols; + expressed above background; ++ moderate expression; +++ strong expression; ++++ expression peaks of the probe.
123
4. Discussion
4. Discussion
4.1. Generation of a novel Pol-I based RNAi vectorA ribosomal minigene-based vector for expression of shRNA under the control of a mouse Pol I promoter termed pE3SP-shLuc has been created and functionally characterized in this work. The presence of the primary transcript of correct length is shown to be expressed by in vitro transcription assays from this new vector. Thereby formation of the primary transcript is not sensitive to inhibition by the Pol II- and Pol III-specific toxin α-amanitin. This proves that the expression is initiated by a Pol I-specific promoter, and not by cryptic promoters for class II and class III RNA polymerases, whose activity might interfere with Pol I activity, as suggested previously 395,396. Nevertheless, Nortern blots were unable to detect the processed hairpin in the cell but this might be due to rapid incorporation into protein complexes or further processing steps. Interestingly, both the expected and longer primary transcripts where found, when a Pol III-dependent vector was used as a template in an in vitro transcription assay. This fact might suggest a read-through from the plasmid, probably due to leaky transcription termination in this vector. It was noted that the termination of transcription of Pol III relies strongly on the exact sequence of the termination signal and the proximity of the promoter 397,398. As the shRNA insert is very short, it might lead to interference between the enzymatic machineries responsible for transcription initiation and termination. It would be interesting to investigate whether this longer transcript is exported to the cytoplasm and can serve as a template for further processing by Dicer, resulting in the generation of functional siRNAs. This might at least be one attractive explanation for the the observed signal in Northern blots from a Pol III based vector pU6sh-luc which is not seen with the Pol I expression cassette. This aberrant transcript might be more stable or present at higher concentrations than the Pol I derived shRNA. Of course Northern blots are not suitable to define if this trancript is a functional substrate for RISC or not.The novel system shows efficient silencing of firefly luciferase gene in mouse but not in human cells by using the pE3SP-shLuc. Finally also the gene Erk2 was targeted and silencing could be proven by Western blots. This additionally demonstrates the efficacy and specificity of the ex-pression vector in silencing endogenous expression. The species specificity of Pol I-dependent transcription provides an important advantage in terms of experimental biosafety, as compared to other types of vectors. RNAi-mediated down-regulation is frequently used to systematically reveal the function of unknown genes, often using viral vectors, such as lentivirus 399-402. Lentiviral vectors currently used are designed to inactivate themselves once integrated into the genome. However, they still preserve the capacity to infect cells, including those of the human experimenter. The use of the mouse-specific Pol I promoter, which is silent in human cells, represents a considerable advantage. The next logical step in the
124
4. Discussion
development of Pol I-based expression vectors will be the generation of the Tet-inducible cassette to allow a regulated knockdown.Pol III-based vectors are now extensively used to express shRNAs in numerous systems 403. How-ever, an alternative method to express short RNA molecules may be required for particular ex-periments. A need to screen or modify Pol III promoters in order to obtain a strong and reliable inhibition in a particular cell type or organ has been reported 404,405. Occasionally, irreversible silencing of Pol III-dependent transcription was observed in stable expression systems. Thus, it would be desirable to systematically compare different Pol III- with Pol I-dependent vectors regarding efficiency, stability and toxicity issues.To further broaden the scope of Pol I-driven expression vectors, other minimal ribosomal mi-nigene vectors containing a multiple cloning site were constructed and might be of use for dif-ferent applications. Potentially, they can be used to express other types of functional RNA mol-ecules, such as snoRNAs or viral RNAs 375. Finally, it would be desirable to generate a reporter vector, expressing for example luciferase downstream of an IRES signal for cap-independent translation. Up to now, the attempts to create such a reporter largely failed because of above-mentioned reservations concerning the presence of cryptic Pol II recognition sites in ribosomal minigenes. Only one publication reported a construction of such a vector, based on a human Pol I promoter 406. However, the presented results strongly point to the specificity of Pol I-dependent transcription from these Pol I vectors.In conclusion, the Pol I-driven expression vectors might be a useful addition to the palette of RNAi-based tools for silencing gene function.
4.2. In vivo RNAiThe application of in vivo RNAi in the adult mouse brain is a very challenging approach spe-cifically when aiming at behavioral phenotyping. One important factor is the establishment of atraumatic and highly reproducible stereotactic injection conditions. That has been done for coordinates targeting the injection to the dorsal hippocampus. The use of a thin glass capillary has been shown to be highly beneficial for such an approach as compared to a large hamilton sy-ringe. An additional important factor for successful injections was the application of a very slow injection speed like 1µl/15min. An injection automate and a liquid flooded system is not ab-solutely neccesary for such a purpose. In the presented work air pressure was manually adapted to the system by a simple locking device and a standard syringe. This compresses the air in the tubing system and delivers a constant presure to the liquid in the injection capillary which was shown to be sufficicent for successful injection when done by a well trained person.The direct injection of synthetic siRNAs is certainly the most appealing approach. But never-theless the cellular delivery of the molecules into neurons in the hippocampus is at low levels and occurred mainly in glial cell populations of the dentate gyrus. This method was unable to

125
4. Discussion
mediate detectable silencing of the targeted CBP. It was shown in a few cases that injections of naked siRNAs into the ventricle is able to mediate RNAi. Thereby very high doses of siRNAs are injected by osmotic minipumps over a period of time 159,160. This is hardly practical since due to high siRNA consumption it is an extremely expensive apporach. Beyond that, this injection has been shown to silence cell populations proximal to the ventricle other cell types or brain formations like the hippocampus are presumably not targetable by this method. Nevertheless, confirming the presented data the reluctance of neurons to incorporate siRNAs and problems to elicit gene silencing by direct injection of siRNAs into the brain has been reported 157,158.Thus the next step was to increase cellular delivery of the siRNAs. A cationic polymere PEI has been shown to be sucessful in mediating hippocampal RNAi by siRNAs 164 and is presumably superior to alternative liposomal transfection methods since such approaches elicit high toxicity which might interfere with the observable phenotypes 163. Indeed the use of PEI resulted in an increased number of neuronal cells that showed fluorescent signals for the labeled siRNAs. With such formulations at least in some cases also a downregulation of the targeted CBP could be observed but this effect was highly variable.From these results it appeared that direct injections of siRNAs might be not the optimal method to set up functional large-scale studies of genes with putative behavioral phenotypes.Thus the use of viral vectors that express shRNAs seemed to be the most promising strategy. Currently three viral systems are mainly used in vivo for transduction of nervous system tissue - adenovirus (Ad), lentivirus (LV) and adeno-associated virus (AAV) 407. Adenoviral vectors are able to infect both dividing and non-dividing cells and can accommodate up to 8 kb of DNA. The DNA is not integrated into the host genome but viral proteins might elicit an inflammatory immune reaction 408 although deletion of all wild-type genes in new vectors may overcome this problem 409. Lentiviruses are another possible option for gene delivery into the barin. They be-long to the retrovirus class, integrate into the host genome and are related to HIV. The genomic integration raises safety concerns and working with these vectors can not be performed in stan-dard biosafety laboratories. They have been shown to be especially suitable for the transduction of non-dividing cells, such as neurons and allow a large packaging capacity of around ~9 kb. This would enable to express genes of interest in addition to shRNAs 410,411. Adeno-associated viral (AAV) vectors instead do not integrate into the host genome and do not have any known patho-genicity. A disadvantage is the rather small packaging capacity (~5 kb). Modern recombinant viruses with almost all viral genes removed are believed to be relatively safe systems 412.In the scope of this work vectors based on AAV have been chosen for triggering RNAi since they demonstrate good infection capacity, low immunogenity and the ability to generate long lasting viral gene expression 412,413. The disadvantages compared to other systems are not of high relevance for the intended use. Since shRNA expression cassettes are small the limited packag-ing capacity does not cause any limitations for RNAi applications. The used vectors even were
126
4. Discussion
designed in a way that two monocistronic expression cassettes have been placed in the vector. In addition to the shRNA expression cassette a dsRed reporter is expressed from an independent synapsin promoter. As opposed to wild type AAV the rAAV vectors do not integrate into the host genome but form episomal concatamers in the host cell nucleus. Although this greatly increases biosafety and allows the use of rAAV vectors under S1 conditions vector DNA is lost through cell division since episomal DNA is not replicated along with the host cell DNA. But for the adult brain that consists (with few exceptions) of post-mitotic cells these concatamers remain intact for the life of the host cell and allow long term gene expression.An essential component of AAV for cell binding, internalization and intracellular trafficking of viral particles is the surface of the capsid. Thus the capsid surface is crucial for initial infection steps and the AAV serotype has to be carefully considered for gene transfer appilcations since each capsid excerts a unique tissue tropism and transduction efficiency 414. Different serotypes of AAV utilize unique cellular receptors for internalisation thereby the primary receptor for AAV2 is heparin sulfate proteoglycan (HSPG). After initial cell recognition secondary receptors like aVb5 integrin, human fibroblast growth factor-1 (FGFR-1), or hepatocyte growth factor (c-met) mediate cellular entry 415-418. In total there are 11 known serotypes with different cellular targets and antigenic properties. About 100 genomic variants have been described, which may provide expanded tropism and cell delivery 419-421. The various serotypes also raise the possibility to tune transduction behavior by mixing or creating chimeric capsids and also the ratio in which two capsid genes are mixed may exhibit altered tropism 422 423.First a suitable AAV serotype for efficient transduction of the hippocampus was defined. There-fore an AAV1 and an AAV1/2 vector that both express GFP from a strong CMV promoter have been compared. Studies in other tissues than the brain suggest that in AAV1/2 the best trans-duction characteristics of both parent serotypes are combined 424. This finding was not directly transferrable to the hippocampus since the in situ signals of GFP show a very similar transduc-tion pattern in both vectors. Nevertheless, strong fluorescecne could only be seen from the chimeric AAV1/2. The reason might be that the CMV promoter is known to be shut-down in the hippocampus when used in AAV vectors 425. This effect also depends on the vector backbone and the presented data suggest that in AAV1/2 the CMV shutdown is delayed or decreased as compared to AAV1. The in situ hybridization against GFP might not only show GFP expression but might also detect the viral genome and thus this method does not show any differences. Another possibility is that the in situ hybridization is more sensitive than the fluorescence detec-tion and thus strong expression can be seen from both vectors. Since AAV1/2 could be shown as well suited to transduce the hippocampus and meets all requirements no further experiments have been conducted to proof the raised hypothesis. In the following the tropsim of AAV1/2 in the mouse hippocampus has been characterized for the first time. Therefore, a novel ultramicros-copy technology has been utilized called “glass brain”. This technology is able to image optical
127
4. Discussion
sections of the virally expressed GFP fluorescense in whole mouse brain. The obtained confocal images can be reconstructed to three dimensional views revealing the exact spatial spreading of viral transduction. This method shows that AAV1/2 is highly efficient in transduction of the entire dorsal hippocampus in mice. In addition the expression signals extend to thalamic regions via the fimbria-fornix of the hippocampus. The fimbria is a major route for afferent and efferent fibers of the hippocampal formation 426. The fornix is the continuation of this bundle of hippocampal output fibers it splits around the anterior commisure into the rostrally directed precommissural fornix which innervates the septal nuclei and the nucleus accumbens and the postcommissural fornix which is directed caudally and extends to the diencephalon. Two smaller bundles split off the postcommissural fornix of which one of them the subiculothalamic tract carries fibers to the anterior thalamic nuclei 427,428. The thalamic signals probably derive from anterogarde transport along the postcommissural fornix route since such an behavior has been described in the literature. Retrograde transport is a rare event for AAV although from the shown data this option can not be excluded 429. The obtained results can be additionally seen as proof of concept that the glass brain method might become a valuable tool for tracing experiments to elucidate neural projections and reveal interconnectivity of different brain regions. Although anterogarde and retrograde labelling techniques are well developed systematic studies of brain projections often suffer from limited imaging capacities. Techniques that image a large volume like the entire murine brain as one entity with high resolution would in principle allow to study all areal projections that exist in an individual brain. The elucidation of alterations in projections or connectivity of circuits in neural networks might give important novel insights in the archi-tecture of information processing, learning, and emotions. More global approaches to elucidate neuronal networks certainly require the use of different vectors as used in the work presented here. Transneuronal tracing by viral infection seems to be particularly interesting when com-bined with the powerful ultramicroscopy technology. Controlled infections with neurotropic viruses that spread sequentially within synaptically linked neuronal chains can be achieved with modestly virulent self-replicating viral vectors that cause only mild inflamation 430. The H129 strain of the Herpes simplex virus (HSV) has been used successfully as a highly specific antero-grade transneural marker in primates 431 and the Bartha strain of pseudorabies virus (PRV) is a promising vector for mainly retrograde transneural tracing in rodents 432.After defining a suitable vector and the injection parameters for efficient and reproducible viral transduction of the mouse hippocampus the next step was to proof that such an approach is able to mediate RNAi. Therefore a transgenic mouse line was utilized in which the endogenous CRHR1 has been replaced with a fusion construct of the wild-type receptor with GFP. By target-ing the GFP sequence embedded in the fusion transcript, the CRHR1 will be knocked down. It has been shown in various similar applications that fusion transcripts are sensitive to RNAi when an exogenous part is targeted by well characterized siRNAs 54,296,433. The great advantage of this
128
4. Discussion
strategy is the possibility to use a validated viral RNAi expression cassette that expresses siRNAs targeting GFP 382. To detect specific RNAi mediated silencing effects it is neccesary to control for off-target effects by using an unrelated siRNA sequence as negative control. Therefore a validated shRNA targeting firefly luciferase has been used in the same backbone as for GFP silencing. Both viral RNAi constructs express in addition to the shRNA, dsRed from a neuron specific synapsin promoter for monitoring of viral transduction. The presented data show specific focal gene si-lencing of the targeted transgenic GFP-CRHR1 construct in the hippocampus and the cortex of the adult mouse brain. Despite the use of the novel AAV1/2 vector in the hippocampus, for the cortical transduction the well established AAV2 vector system was chosen. The aim of this ex-periment was to generalize the viral RNAi approach and show silencing in a second brain region but the main scope of the project was hippocampal RNAi. By using the AAV2 serotype excessive testing of neural transduction in the cortex could be avoided since this vector has been routinely used for the rodent brain even if other less well characterized serotypes (like AAV5 or AAV1/2) might be more efficient 434. Although the presented silencing effects in both brain regions are very pronounced and robust throughout the presented experiments these results should be seen as preliminary. Further validation is required especially on protein level and with quantitative assesment. Unfortunately there is no antibody available that produces specific CRHR1 labeling and immunohistochemistry of the fusion protein with GFP antibodies does not produce usable signal intensities due to the moderate endogenous expression levels.In summary, the data show that the use of AAV for in vivo RNAi is a highly promissing approach for the adult mouse brain. This is in particular true for genes supposedly involved in behavioral phenotypes. The stable expression of shRNAs over months allows the animals to recover from brain surgery before behavioral testing. This is impossible when injecting siRNAs directly since this approach shows only transient silencing over a few days. A systematic bias introduced by the application procedure can be compensated by using proper controls but subtle phenotypes are likely to be lost if the animals are still influenced by post operative trauma or inflammation.An additional advantage of stable siRNA expression is that most diseases affecting the brain progress over long periods of time and thus potentially involved proteins might need to be knocked-out stably for months.
4.3. Regulation of miRNAs by neuronal activity To get an impression about the functional relevance of miRNAs in synaptic plasticity an unbi-ased approach was chosen by using the first available array technology for miRNA expression profiling. Thereby, the effect of kainate on hippocampal miRNA expression was analysed, which induces strong neuronal activity by depolarisation. Due to the short length of mature miRNAs a specific array hybridization is very challenging however it was shown that the used technology is able to produce meaningful data by combining miRNA enrichment in sample preparation
129
4. Discussion
with hybridizations to concatemer probes 280. In the kainate experiment the concept of stabiliz-ing variance with a combination of technical replicates and data normalization was followed. When using any array technology for expression profiling it is important to assess the reliability of the obtained data. This is not a trivial task for array experiments since there are no references or calibrators available and, thus, the quality estimations are generally based on analysis of the data itself. Scatter plots, correlation analysis and cluster analysis have been performed and de-termined that vsn normalization is superior to quantile normalization for the obtained dataset since the correlation between the experimental groups increased. It was additionally shown, us-ing technical replicates, that vsn normalization increases data quality and performs better than no normalization. From these results one might conclude that vsn is generally applicable not only for mRNA but also for miRNA expression data which is in agreement with the literature 435. In contrast to the data presented here Praderwand et al. find quantile normalization performs better than vsn on agilent miRNA arrays and this is also suggested by others 436. This obvious discrepancy might be due to platform specific differences of the data or due to influences of the specific samples or biological effects in each experiment. Careful validation of bioinformatic tools for miRNA expression arrays is urgently needed 437, which underlines the relevance of the presented data. Technology development on such detailed levels is often neglected since such studies are not considered high-yield in terms of career development (discussed in 437).The obtained correlation coefficient of technical replicates of 0.86 is similar to that of spotted cDNA arrays for mRNA detection. Nevertheless, spotted mRNA arrays are usually used in two channel settings (two colors), which circumvents the introduction of inter-spot variation into the data. This is not possible with the radioactive signal detection used here. Beyond that, modern oligo arrays show even higher reproducibility and correlations of technical replicates are in general higher than 0.99. The same reproducibility is provided by more recently developed industry standard applications for miRNA expression profiling. An additional advance of some of these assays is that the amount of input material could be reduced by a factor of more than 100. Cluster analysis did not reveal any grouping of samples according to biological or technical categories although two clusters were separated. This observation might be interpreted that the variation of samples (noise) is in a similar range as the putative biological effects.Despite the careful data optimisation some of the probes identified to be most likely differential-ly regulated were tRNAs or other controls. The obeserved regulation of tRNA species 24 h after kainate treatment might reflect general biological effects caused by neurotoxicity. In conclusion a robust effect of kainate treatment on the expression of miRNAs in the hippocampus could not be found on the array and this negative finding was confirmed by validation. One possibility is that miRNAs are not differentially regulated upon neuronal stimulation. This would be sup-ported by the notion that also an in vitro approach failed to identify miRNA expression changes when neurons were stimulated with Ca2+ (A. Krichevsky, personal communication). There are

130
4. Discussion
only few cases shown in which miRNA expression reacts on external stimuli, which might be due to indirect effects. Maybe except for developmental changes miRNA networks have more stabilising functions in order to maintain cell identity or state instead of confering dynamic behavior. According to the model that miRNAs might inhibit local protein synthesis alterations in abun-dance is not mandatory. miRNAs could just locally detach from their targets and proteins that are involved in the RNAi machinery could possibly mediate signals by external stimuli. This is supported by a study that demonstrates the mir-134 mediated repression of Limk1 mRNA in dendrites 267. Upon BDNF treatment Limk1 gets derepressed by an unkonwn mechanism and the spine size increases. Also similar findings come from studies in Drosophila where genes with important functions in synaptic protein synthesis (like CaMKII) are believed to be translational silenced 438. In this case localized proteasome-mediated degradation of a RISC component might release the translational blockIn addition, a putative mechanism could regulate the intracellular distribution of miRNAs, which could only be determined by analysis at subcellular resolution. Since it was shown that RNAi is functional and potent in axons and is able to regulate mRNA transcripts at subcel-lular levels 439 it might be promising to repeat the experiment with synaptosomal preparations of hippocampal neurons. Nevertheless, due to the large amount of total RNA required for the used macro arrays (20-50mg) this was not feasible in the scope of this work but in the mean-time superior methods have been developed that would allow such an approach. This might also circumvent the putative problem of diluting local expression changes at the synapse when analysing whole cells.Nevertheless, there is also supporting evidence that miRNAs might be transcriptionally regu-lated by kainate. The cAMP response element-binding (CREB) protein is known to be an im-portant transcription factor for neuronal plasticity and is activated by neuronal activity. On the search for CREB protein targets mir-132 was identified and found to repress the expression of MeCP2 329. After blocking of mir-132 function not only its target levels increased but also the expression of brain-derived neurotrophic factor (BDNF). Since BDNF is both a known target of MeCP2 and an activator of CREB the hypothesis was formulated that miR-132 is part of a homeostatic feedback loop to stabilize MeCP2 expression via BDNF-activated CREB. In turn mir-132 was shown to be upregulated in cell culture by forskolin stimulation 440 and in vivo by neuronal activity 441. Also another recent study identified changed expression levels of most hippocampal miRNAs by LTP or LTD 442. Almost 90% of the analyzed miRNAs changed their expression for more than two fold and almost all miRNA genes showed upregulation. Interest-ingly in this study tRNA control probes were used as positive controls for data normalization. Our data instead suggest that tRNAs might be down regulated upon neuronal stimulation. If this is true the published effects might be due to normalization artefacts. On the other hand if

131
4. Discussion
in reality all miRNAs increased their expression in a similar manner the established global nor-malization procedures might adjust these differences leading to no detectable differential gene expression. In particular the alternatively used quantile normalization in the presented work might give misleading results since it uses a single standard for all chips and assumes that no serious change in distribution occurs. This appears to be a rather strong assumption about gene distributions but in practice however genes move up and down roughly equally. It would need a great proportion of genes to be changed greatly and in one direction, to drive quantile nor-malization in error by more than 20%. This may well be true in studies that interfere with basal transcriptional effects. Opposed to the results presented here there is a great discrepancy of the qRT-PCR validation and the array results shown in Park et al. Thus, some doubts remain that there is strong global miRNA upregulation induced by neuronal stimulation. It seems not intui-tive that general miRNA mediated gene silencing is a biological useful mechanism upon LTP or LTD. Another study deals with the regulation of microRNAs miR-124, let-7d and miR-181a by cocaine induced plasticity in the mesolimbic dopaminergic system 443. In this study a solid up (miR-181a) and downregulation (miR-124, let-7d) was found in different brain regions.
4.4. Expression studies of miRNAs Expression studies of miRNAsBy array hybridization a catalog of hippocampal miRNA expression could be established. There-by the found expression profile is in good accordance to published results and similar approaches described in the literature. For more detailed comparison a recent published LNA oligo array was chosen since reliable data for hippocampus are present 444. The expression profiles show con-siderable overlap although the probe content of both arrays differs the common set of miRNAs can be compared. The genes of the let 7 family, mir-124a, mir-125b and mir-9 show highest expression on both arrays and is according to the data here in the range of the expression levels of tRNAs. Due to the high demand of the cell the copy number of tRNAs is together with rRNA extremely high. Only few discrepancies are obvious e.g. mir 34a which is low expressed in the published data is with a log2 value of 9.36 among the higher expressed miRNAs in the present data. Notably another probe detecting the same miRNA is below background levels. Mir127 in contrast shows relative high levels in Bak et al. but is only slightly above background (7.24) in the data set obtained here. A general notion is that the published array seems to have slightly higher sensitivity propably due to the use of LNA oligo probes.The analysis of the mir124a probes with no, one or two mismatches indicates that despite the use of standard oligos the performed array hybridization is able to discriminate single nucleotide mismatches nevertheless the specificity might be subject to improvement since especially high abundand transcripts might cause cross-hybridization which decreases data quality.After the initial determination of the miRNA expression profile in the adult hippocampus the results were encouraging to go into more detail. Although at that time there was no in situ hy-
132
4. Discussion
bridization protocol reported, the establishment of such a procedure was initiated. Due to the complex architecture of the mammalian brain it is of particular importance to resolve temporal and spatial expression patterns. No other tissue of the body is charactarized by such an amount of functionally disctinct cell groups and relevant cell interactions, thus for brain research in situ hybridzation of miRNAs is a necessary experimental complement to tissue level expression profiling 445.There have been numerous studies in vertebrates analysing miRNA expression profiles using cloning techniques, microarrays, Northern blot and qPCR. These methods have the advantages of high-throughput and being able to identify novel miRNAs (cloning). Nevertheless, they suffer from the limited spatial resolution. So far detailed expression analysis of mammalian miRNAs in situ is largely missing. This is certainly due to difficulties to obtain specific hybridization signals to the short mature forms of miRNAs but these obstacles can be overcome by using a chemical modification called locked nucleic acid (LNA) 300,301,393,446. By using such modified nucleotides a protocol for radioactive oligo in situ hybridization on mouse tissue sections was succesfully established.In the scope of this project a novel positive and negative control system was developed using transgenic mice that express artificial miRNAs. In doing so the ubiquitous expression of shRNAs trancribed from a U6 promoter was shown for the first time in mouse brains via in situ hy-bridization. The detected signals obtained with probes that are not homologous to any genomic sequence in transgenic mice and wild-type littermates gave important insights in the reliability and specificity of the established protocol. So far only scrambeled or mismatch-probes could be used as negative controls in wild type animals. This implies difficulties to judge if obtained signals that differ from the negative oligos reflect the true expression in cells. For oligo probes the design of negative controls is anyway challenging. There is a high chance that a 21nt oligo that has a similar sequence to the probe that it controls for shows high homology (with up to 3 mismatches) to other trancripts that are encoded in the genome. Beyond that the melting temperature of oligo sequences change greatly not only by G/C content but also by sequence ef-fects (nearest- neighbor effect) and other factors, which greatly complicates the design of proper mismatch control oligos. Thus in the presented approach the specific hybridization behavior of a probe that served later on as validated negative control could be determined.For miRNA detection mostly non radioactive in situ hybridization methods have been estab-lished but using a detection system different from the common digoxygenin labelled probes will enable double in situ hybridizations of two miRNAs at the same time. This might lead to inter-esting insights e.g. addressing the question if clustered miRNAs are coexpressed. Additionally autoradiography might reveal quantitative signal increments over a larger dynamic range. Prop-ably the combination of high sensitive radiolabelled probes and good hybridization conditions resulted in the high performance shown. Thereby, the hybridization buffers and procedures are
133
4. Discussion
based on long experience in in situ hybridization methodology and differs greatly from the later established miRNA in situ protocols by other groups 301,447.The partially known expression patterns of few miRNas could largely be confirmed but the refined analysis here reveals important differences and novel expression sites. mir-1 has been reported as being heart and muscle specific in whole mount in situs of zebrafish, chicken and mouse embryos 300,304,448. Consistently it appears to have crucial roles related to proper heart de-velopment and function 449,450. Additionally expression throughout embryonic mesenchym and in the central nervous system could be demonstrated as well as specific expression in the adult mouse brain. This finding is in agreement with a study using a sensitive RT-PCR based method. mir-1 expression turned out to be 100-1000 times lower in the adult mouse CNS than that of mir124 451. This emphasises the high sensitivity and dynamic range of the newly developed method. A microarray based approach supports this novel finding and also rates mir-1 among those miRNAs that are expressed in a region specific manner in the medulla oblongata of the adult brain 444.mir-9 plays an important role in neuronal development of Drosophila 321. In addition specific expression in the central nervous system of zebrafish and mice has been shown 265,297,300, which is supported by the results of this work. The expression in E10 embryos is restricted to the neural tube and until the stage E14 becomes more restricted to generate a specific expression pattern in the developing brain. In agreement with the literature 297,304 the strongest expression of mir-9 is found in ventricular cells in the brains of mouse embryos. But in adult mice no pronounced signals in ventricular cells can be observed. These findings support the hypothesis that mir-9 is involved in neurogenesis. Notably in zebrafish mir-9 is expressed in both proliferative and dif-ferentiating cells 452 but it has been shown that despite the high phylogenetic conservation of miRNAs there are remarkable differences in expression patterns among vertebrates which points out the relevance to analyze miRNA expression in all commonly used animal models 453.There is also a very high expression of mir-9 throughout the entire adult brain. The expression in the hippocampus is also very high, which is in agreement with the obtained array results. The specific adult role in the brain remains to be elucidated so far only the involvement in alcohol tolerance and Huntington’s disease has been implicated 454,455.The novel finding of pronounced mir-9 expression in the purkinje cell layer of the adult cer-ebellum suggests additional functions of mir-9 that might be specific for the adult mammalian brain.The otained expression patterns of mir-124a are in some ways complementary to that of mir-9, which again is supported by other studies 297. Although similar to mir-9, mir-124a is specifi-cally expressed in the central nervous system in the analyzed embryonic stages the expression in E14 embryos is more restricted to the subventricular zone, the choroid plexus and brain nerves. These are sites where mir-9 is not expressed and therefore mir124a is believed to be responsi-

134
4. Discussion
ble for neuronal differentiation and neuronal cell identity 297. A number of functional studies support this concept showing that mir-124 promotes neuronal cell identity or differentiation towards neuronal fate by repression of non-neuronal genes 236,322,325-327. One of the targets for mir-124a is PTBP1 (polymyridine-tract-binding protein) which represses the correct splicing of neuronal specific isoforms. The expression patterns of PTBP1 and 2 in the Allen brain atlas match to our obeserved expression pattern of mir-124 (http://brain-map.org). On the other hand mir-124 is regulated by the transcriptional repressor REST, which is mostly expressed in non-neuronal cells. To enter neuronal cell fate REST needs to be downregulated 324. But since we and others find specific patterns in the adult brain 297 with enhanced expression in the hip-pocampus, cerebellum and cortex creating a differential expression pattern in the cortical layers there might be roles of mir-124 beyond determination of neuronal cell fate. The finding of very high hippocampal expression is further supported by the presented array results. Thus, mir-124a mediated gene regulation might also be involved in signaling processes and facilitation of higher brain functions.A more detailed view on mir-125b expression again reveals nuances that have not been reported in previous studies. In general the described expression pattern in mouse embryos is observed with the highest expression in the central nervous system 300. But additionally lower expression in mesenchymal cells can be found demonstrating that mir-125b is not exclusively expressed in neuronal tissues. This finding is consistent with a putative function of mir-125 in tumor biology of tissues other than the brain 456-458. In whole mount in situ hybridization the most pronounced signal appeared in the mid-hindbrain boundary 300. The obtained results do not support such an exclusive signal on slices of E14 embryos but strong detection of mir-125b is found throughout the spinal cord and brain with lower expression in the forebrain. It might be that the three-di-mensional structure is responsible for the observed difference or that the slightly different devel-opmental stage shows a different expression pattern. It has been reported that the expression of mir-125b as a putative orthologue to the heterochronic lin-4 in C. elegans is also regulated over time in mammalian development 459. The cited study assessed mir-125b expression with North-ern blots in RNA samples from whole embryo. Expression started around embryonic day 10, reached a peak at E12.5 and declined again to low levels until birth. Although in situ hybridiza-tion should be seen as a semi-quantitative method such a temporal pattern is not seen at the expressed sites and the presented data suggest an increase in expression in neuronal tissue which persists from the embryonic to the adult brain. This is in agreement with Northern analysis of pure neuronal RNA preparations in which an increase in expression has been shown during em-bryogenesis with a slight decrease after birth 460. This study also shows a spatial decrease of mir-125 in the adult cerebellum as compared to the rest of the brain. The detailed expression pattern presented suggests that the differential expression in the purkinje cell layer in which the highest expression levels are found might be one of the contributing factors. Since this cell population
135
4. Discussion
is only a small fraction as compared to the total number of cells in the cerebellum a global view on cerebellar expression might produce misleading results. Mir-125b was found to be among the highest expressed miRNAs in the adult hippocampus on the elucidated array data which is in agreement to the in situ hybridization results.The embryonic function of mir-125b among others might be the organisation of the mid-hind-brain boundary but in the adult brain the highest found expression was in the purkinje cells again suggesting novel functions of mir-125 in the adult brain.Although mir-132 has been cloned from brain tissue, shown to be expressed in neurons and be-ing involved in a cAMP-response element binding protein (CREB) regulated neurite outgrowth 329 in the presented work it was not possible to determine its expression pattern. The obtained signals where ubiquitously and in the range of unspecific background except for the corpus cal-losum of E14 embryos. An estimation of the background signals can be done with the used in situ technology since additionally probes detecting artificial hairpin structured molecules that are not encoded in the mouse genome have been hybridized. Thus, we can rule out that there is a strong locally restricted expression of mir-132 in the adult mouse brain. Also other studies using cloning techniques observed difficulties to detect the low levels of mir-132 expression in mouse embryos 275 and the adult brain 204,461. On the presented array mir-132 was detected at low levels slightly above background supporting these findings. Mir-132 has been shown to be light induced in the suprachiasmatic nuclei and the piriform cortex 260. It might be that mir-132 requires extracellular stimuli to drive its expression to levels detectable by in situ hybridization in the adult brain. Along these lines it was recently shown that mir-132 is upregulated by neuronal activity 441.Another miRNA that has been implied in neuronal morphogenesis is mir-134 267. It is localised to the synapto-dedritic compartment of neurons and negatively regulates dendritic spines via targeting the mRNA of the protein kinase Limk1. Expression analysis via Northern blot revealed a brain specific expression in adult rats and was shown to reach into dendrites in cultured hip-pocampal neurons 267. This work presents for the first time a detailed expression analysis for this gene and finds it additionally expressed in all analysed embryonic stages. In the mouse embryo we find expression not restricted to the brain but slightly enriched in neuronal tissue with high-est signals in the dorsal root ganglia. This suggests unknown embryonic functions for mir-134. So far a developmental role has only been attributed in stem cells in which miR-134 alone can enhance the differentiation to ectodermal lineages 462.In the adult brain a distinct expression can be determined not only in the cortex and hippocam-pus as expected from cultured neurons but throughout many brain nuclei and in purkinje cells of the cerebellum. In addition the performed array finds medium levels of mir-134 in the adult hippocampus. Of interest is also the observation that signals for mir-134 are found in a scat-tered fashion and thus we believe that expression is limited to a subset of cells possibly neurons.

136
4. Discussion
Further studies are necessary to verify this hypothesis and to determine which cells in the adult brain exclusively express mir-134. Comparing the shown expression patterns of mir-134 with that of its known target Limk1 in the Allen brain atlas (http://brain-map.org) coexpression can be found in the cortex and the hippocampus, exactly those brain regions where an interaction had been demonstrated 267. In other brain regions no obvious coexpression can be seen which might fit into the mutually exclusive expression model for miRNAs and their targets 271.The expression pattern of mir-206 has been well studied in embryos of zebrafish, chicken and mice 265,300,304 and has been found to be specific for somites and muscles in animal embryos. One of the known targets of mir-206 is connexin 43 and promotes muscle development 463.These findings are in general confirmed on tissue sections in the current work but in addition lo-cal mir-206 expression sites could be found in the developing and adult mouse brain. Thus mir-206 is not exclusively expressed in muscle tissue and its biological role will have to be reassessed in the brain. Interestingly, an association study supports this hypothesis and detects a correlation of mir-206 polymorphisms with schizophrenia 464. Also additional evidence for this issue arises from the hippocampal gene expression profile that detects mir-206 as expressed. The array signal is modest and only slightly above background, nevertheless also the in situ hybridizations show weak expression signals in the adult brain with slight increase in the hippocampus.The most dynamic expression during development was observed for mir-219. It is ubiquitously expressed in young embryos and then increases specifically in the central nervous system where at E14 a gradient is formed from hind to midbrain. Thus during embryogenesis mir-219 might be involved in the organisation of the mid-hindbrain boundary. This observed gradient disap-pears during later embryonic stages and results in a distinct expression pattern in which fibers are highly pronounced in the adult brain. The expression implies different brain-specific roles for mir-219 in the developing and adult brain. Similar functional shifts in time or organ are well established for protein coding genes. mir-219 has been shown to be involved in circadian rhythm by targeting the gene CLOCK in the suprachiasmatic nucleus 260. Also in the expression analysis mir-219 is found to be expressed in this nucleus at basal levels. The main expression sites are, however in the corpus callosum and the white matter of the cerebellum. Thus it is likely that mir-219 is additionally involved in fiber formation or maintainance. Again the expression of CLOCK in the Allen brain atlas is largely complementary to the obtained expression pattern of mir-219. Specific expression patterns of mir-219 are also suggested by Bak and colleagues 444 but their microarray approach is not able to unravel the cell specific expression pattern presented here. Notably two independent studies found mir-219 among the genes most significantly down regulated in synaptosomes or dendrites 465,466 which supports the raised issue of differntial ex-pression in non-neuronal cell populations. A recent publication proposes mir-219 to be func-tionally involved in fast NMDA receptor neurotransmission and implies a link to schizophrenia. An integral role for mir-219 in the expression of behavioral aberrations associated with NMDA
137
4. Discussion
receptor hypofunction was shown 339. Consistent with that role calcium/calmodulin-dependent protein kinase II gamma subunit (CaMKIIgamma) was determined as target gene. Interest-ingly Kocerha et al. detect mir-219 down-regulation in frontal cortex and hippocampus upon their interventions. The presented array approach suggests that mir-219 might be expressed in adult hippocampus but these data are at low levels around background intensities. Instead the presented in situ quantifaction hardly detects mir-219 in the hippocampus and the main expres-sion sites are neither in cortical nor hippocampal structures. Following the study of Kocerha et al. some inconsistencies of the published data have been discussed in a commentary 467. Thus the published results may have to be reinterpreted after further experiments and including the expression study shown here. Integrating more functional and expression data might put the findings into a broader scope than currently anticipated.To summarize the conducted expression study can confirm some basic expression patterns that have been obtained by whole mount in situ hybridization or high-throughput technologies. Nevertheless, the presented results imply the neccesity to analyze miRNA expression in great detail since local expression might be overseen by such methods. Comparing detailed expression patterns of miRNAs and their putative targets is a promising approach for future functional studies.

138
5. Summary
5. Summary
RNA interference (RNAi) has been discovered as a post-transcriptional gene-silencing phe-nomenon, in which a specific degradation of mRNA is induced by homologous double
stranded RNAs (dsRNAs) of different origin. During the last few years, RNAi has emerged as a powerful tool in functional genomics and can be induced in vitro either by application of synthetic short interfering RNAs (siRNAs), or by intracellular expression of siRNAs or short hairpin RNAs (shRNAs) from transfected vectors. The most widely used promoters for siRNA/shRNA expression vectors are based on polymerase III (Pol III)-dependent transcription. In the presented work an alternative vector for siRNA/shRNA expression, using a ribosomal minigene-based vector for expression of shRNA under the control of a mouse RNA polymerase I (Pol I) promoter was established and characterized on the functional and molecular level. Robust and efficient silencing of a reporter system as well as of an endogenous gene could be demonstrated in a variety of cultured cell lines and embryonic stem cells. As expected from the known high species-specificity of Pol I transcription the induced RNAi silencing was also shown to be spe-cies specific for mouse cells. Thus the established Pol I-based RNAi expression system provides an important biosafety advantage for the human experimentor with respect to silencing of genes with unknown functions in mice. Furthermore, using in vitro transcription assays the vector was characterized on the molecular level and exhibited the transcription of the expected shRNA precursors that are generated by Pol I. The novel Pol I-driven expression vectors will be a useful addition to the palette of RNAi-based tools for silencing gene function.Plasmids or RNA molecules that trigger RNAi easily enter cultured cells and the resulting silenc-ing is very efficient. However, the in vivo application of RNAi remains a challenging task, and it is particularly true for the central nervous system. Therefore, the delivery of siRNAs into theTherefore, the delivery of siRNAs into the adult mouse brain was evaluated by injecting fluorescently labelled siRNAs into the hippocam-pus. Two different protocols were used either injection of “naked” siRNAs, or in complex with polyethylenimine (PEI). In both cases the penetration of tissue was limited, though somewhat better for PEI-complexes. Injections of CREB-binding protein (CBP)-directed siRNAs into the brain only showed an inconsistent down-regulation of target protein with the PEI protocol. These results indicate that direct injections of siRNAs might be not the optimal method to set up functional large-scale studies of genes with putative behavioral phenotypes.To overcome these obstacles adeno-associated virus (AAV)-based vectors were further used for RNAi expression. These viral vector systems demonstrate good infection capacity and low im-munogenity. In first setting experiments suitable AAV vector serotypes for hippocampal trans-duction were identified and the tissue tropsim of a novel recombinant AAV1/2 serotype was analyzed in detail with in situ hybridization, standard fluorescence microscopy and ultramicros-copy. The 3D images obtained with the latter method show that neuronal tracing experiments to unravel brain circuity might be feasible with a modified experimental setup. In the following

139
5. Summary
a proof of concept study showed that the evaluated AAV-vectors are efficient in triggering RNAi when injected into the adult mouse hippocampus and cortex.A second project line dealt with micro RNAs (miRNAs) which represent a novel gene classmicro RNAs (miRNAs) which represent a novel gene class initially found in experiments to explore RNAi products. They were found to be small non-cod-ing RNAs that act as repressors of gene activity by interfering with target mRNA translation or integrity. During the last decade, miRNA research was among the most innovative fields in biology and numerous studies point towards the importance of miRNA dependent regulation in development and in the central nervous system. Thus the involvement of miRNAs in neuronal plasticity was examined. Kainate a strong inducer of neuronal activity was injected into mice and differential miRNA expression to control animals was examined with array hybridizations. The obtained data did not reveal any regulation of miRNA expression upon neuronal activation in the adult mouse hippocampus. Nevertheless, the control data were used to characterize the gene expression profile of miRNAs in the adult hippocampus. Detailed expression analysis of miRNAs is an important prerequisite for following functional studies and thus a novel sensitive and specific radioactive LNA oligo in situ hybridization protocol was established for tissue sec-tions. Using this method the temporal and spatial expression patterns of eight miRNAs during late mouse development (E10, E14, E18) and in the adult brain were elucidated. Thereby the focus was on miRNAs with expected neuronal functions (mir-1, mir-9, mir-124a, mir-125b, mir-132, mir-134, mir-206 and mir-219). The presented work is the first systematic and de-tailed expression study of mammalian miRNAs in the developing and adult central nervous system that will guide further functional experiments and will be a useful aid for approaches to identify potential target genes.
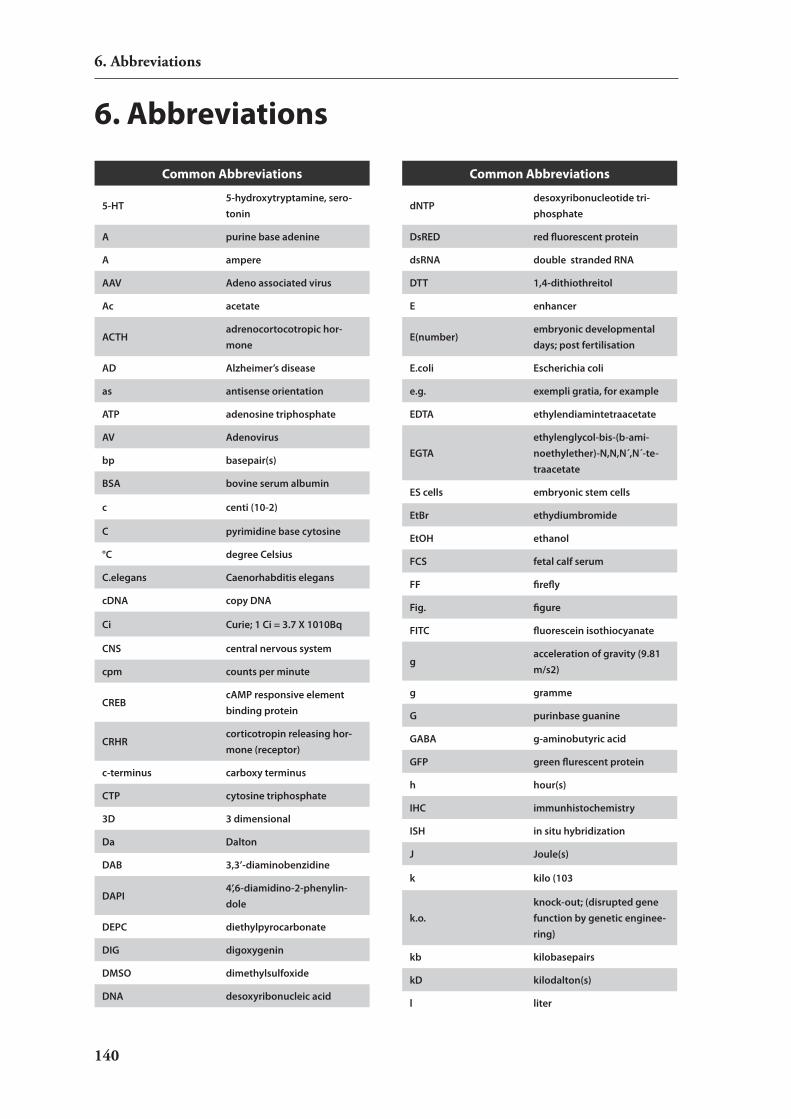
140
6. Abbreviations
6. Abbreviations
Common Abbreviations
5-HT 5-hydroxytryptamine, sero-tonin
A purine base adenine
A ampere
AAV Adeno associated virus
Ac acetate
ACTH adrenocortocotropic hor-mone
AD Alzheimer’s disease
as antisense orientation
ATP adenosine triphosphate
AV Adenovirus
bp basepair(s)
BSA bovine serum albumin
c centi (10-2)
C pyrimidine base cytosine
°C degree Celsius
C.elegans Caenorhabditis elegans
cDNA copy DNA
Ci Curie; 1 Ci = 3.7 X 10¹⁰Bq
CNS central nervous system
cpm counts per minute
CREB cAMP responsive element binding protein
CRHRcorticotropin releasing hor-mone (receptor)
c-terminus carboxy terminus
CTP cytosine triphosphate
3D 3 dimensional
Da Dalton
DAB 3,3’-diaminobenzidine
DAPI4’,6-diamidino-2-phenylin-dole
DEPC diethylpyrocarbonate
DIG digoxygenin
DMSO dimethylsulfoxide
DNA desoxyribonucleic acid
Common Abbreviations
dNTP desoxyribonucleotide tri-phosphate
DsRED red fluorescent protein
dsRNA double stranded RNA
DTT 1,4-dithiothreitol
E enhancer
E(number)embryonic developmental days; post fertilisation
E.coli Escherichia coli
e.g. exempli gratia, for example
EDTA ethylendiamintetraacetate
EGTA ethylenglycol-bis-(b-ami-noethylether)-N,N,N´,N´-te-traacetate
ES cells embryonic stem cells
EtBr ethydiumbromide
EtOH ethanol
FCS fetal calf serum
FF firefly
Fig. figure
FITC fluorescein isothiocyanate
g acceleration of gravity (9.81 m/s2)
g gramme
G purinbase guanine
GABA g-aminobutyric acid
GFP green flurescent protein
h hour(s)
IHC immunhistochemistry
ISH in situ hybridization
J Joule(s)
k kilo (103
k.o. knock-out; (disrupted gene function by genetic enginee-ring)
kb kilobasepairs
kD kilodalton(s)
l liter

141
6. Abbreviations
Common Abbreviations
lacZ ß-Galactosidase
LB Luria Broth
LIF leukemia inhibiting factor
LNA locked nucleic acid
Luc luciferase
Luc firefly-luciferase
LV lentivirus
M Mega (106
m meter
µ micro-(10-6)
m milli (10-3)
M molar (mol/l)
MCS multiple cloning site
min minute(s)
miRNA micro RNA
mRNA messenger ribonucleic acid
n nano
neo neomycin
NMDA N-methyl-D-aspartate
nt nucleotides
n-terminus amino terminus
o/n over night
OD optical density
p pico (10-12)
p p-value for statistical analysis
PAGEpolyacrylamide gel electro-phoresis
PBS phosphate buffered saline
PCR polymerase chain reaction
PD Parkinson’s disease
PFA paraformaldehyde
pHnegative decade logarithm of the H+ concentration
Pol I RNA polymerase I
Pol III RNA polymerae III
PTGS post-transcriptional gene silencing
RdRPRNA dependend RNA poly-merase
Common Abbreviations
Ren renilla
resp. respectively
RISCRNA induced silencing complex
RMCE recombinase mediated cas-sette exchange
RNA ribonucleic acid
RNAi RNA interference
RNase ribonuclease
RNasin ribonuclease-inhibitor
rpm rounds per minute
rRNA ribosomal RNA
RT room temperature
RT-PCR reverse transcription PCR
Ssvedberg, sedimentation coefficient
s sense orientation
SDS sodium dodecyl sulfate
sec. or s second(s)
sh short hairpin
shRNA short hairpin RNA
siRNA short interfering RNA
SNPsingle-nucleotide polymor-phism
snRNA small nuclear RNA
SSC sodium saline citrate
stRNA small temporal RNA
T pyrimidine base thymine
Tab. table
TAE tris acetate with EDTA
TB tris buffer
TBE tris borate with EDTA
TBS tris buffered saline
TBS(T) tris buffered saline (with Tween)
TE tris-EDTA
temp. temperature
Tris trishydroxymethyl-ami-noethane

142
6. Abbreviations
Common Abbreviations
tRNA transfer ribonucleic acid
Tx terminator sequence
u unit(s)
UTP uracil triphosphate
UV ultraviolet
V volt(s)
Vol volume
vsnvariance stabilizing norma-lization
wt wildtype
μ micro (10-6)
Anatomical Abbreviations
acaanterior part of the anterior commissure
an acoustic nerve
ao aorta
BMAanterior part of the basome-dial amygdaloid nucleus
bsc brachium superior colliculus
CAfield of Ammon’s horn, hip-pocampus
CA1CA1 field of the hippocam-pus
CA2CA2 field of the hippocam-pus
CA3CA3 field of the hippocam-pus
cc corpus callosum
Ce Cerebellum
CePl Cerebellar plate
cg cingulum
Co Cortex
CP choroid plexus
Cpu caudate putamen
DG Dentate gyrus
Dk nucleus of Darkschewitsch
DMdorsomedial hypothalamic nucleus
f fornix
Anatomical Abbreviations
fb forebrain
G Dentate gyrus
GLGranular layer of the cere-bellum
hb hindbrain
Hip Hippocampus
ht heart
ic, ec internal and external capsule
LGranular layer of the cere-bellum
La lateral amygdaloid nucleus
Ld lambdoid septal zone
LD lamdoid septal zone
LHB lateral habenular nucleus
LS lateral septal nucleus
mb midbrain
MHB medial habenular nucleus
MLMolecular layer of the cere-bellum
MO Medulla oblongata
MS medial septal nucleus
mt mammilothalamic tract
nt neural tube
OB Olfactory bulb
pc posterior commissure
PLPurkinje layer of the cere-bellum
R Red nucleus
re retina
sc spinal cord
SNC substantia nigra compacta
so somites
SVZ Subventricular zone
tg tongue
VPL ventral posterolateral
VPMventral posteromedial thala-mic nuclei
VZ Ventricular zone

143
7. References
7. References 1 M. Tijsterman, R. F. Ketting, and R. H. Plasterk, “The genetics of RNA silencing,”
Annu. Rev. Genet. 36, 489 (2002). 2 G. J. Hannon, “RNA interference,” Nature 418(6894), 244 (2002). 3 K. Jaronczyk, J. B. Carmichael, and T. C. Hobman, “Exploring the functions of RNA
interference pathway proteins: some functions are more RISCy than others?,” Biochem. J. 387(Pt 3), 561 (2005).
4 A. Fire, et al., “Potent and specific genetic interference by double-stranded RNA in
Caenorhabditis elegans,” Nature 391(6669), 806 (1998). 5 J. Couzin, “Breakthrough of the year. Small RNAs make big splash,” Science 298(5602),
2296 (2002). 6 J. R. Neilson and P. A. Sharp, “Small RNA regulators of gene expression,” Cell 134(6),
899 (2008). 7 J. G. Izant and H. Weintraub, “Inhibition of thymidine kinase gene expression by anti-
sense RNA: a molecular approach to genetic analysis,” Cell 36(4), 1007 (1984). 8 U. B. Rosenberg, et al., “Production of phenocopies by Kruppel antisense RNA injec-
tion into Drosophila embryos,” Nature 313(6004), 703 (1985). 9 T. E. Crowley, et al., “Phenocopy of discoidin I-minus mutants by antisense transforma-
tion in Dictyostelium,” Cell 43(3 Pt 2), 633 (1985). 10 T. J. McGarry and S. Lindquist, “Inhibition of heat shock protein synthesis by heat-
inducible antisense RNA,” Proc. Natl. Acad. Sci. U. S. A 83(2), 399 (1986). 11 C. Napoli, C. Lemieux, and R. Jorgensen, “Introduction of a Chimeric Chalcone Syn-
thase Gene into Petunia Results in Reversible Co-Suppression of Homologous Genes in trans,” Plant Cell 2(4), 279 (1990).
12 A. R. van der Krol, et al., “Flavonoid genes in petunia: addition of a limited number
of gene copies may lead to a suppression of gene expression,” Plant Cell 2(4), 291 (1990).
13 F. de Carvalho, et al., “Suppression of beta-1,3-glucanase transgene expression in homo-
zygous plants,” EMBO J. 11(7), 2595 (1992). 14 R. Van Blokland, et al., “Transgene-mediated suppression of chalcone synthase expres-
sion in Petunia hybrida results from an increase in RNA turnover,” Plant J. 6, 861 (1994).

144
7. References
15 A. J. Hamilton and D. C. Baulcombe, “A species of small antisense RNA in posttran-scriptional gene silencing in plants,” Science 286(5441), 950 (1999).
16 S. Guo and K. J. Kemphues, “par-1, a gene required for establishing polarity in C. el-
egans embryos, encodes a putative Ser/Thr kinase that is asymmetrically distributed,” Cell 81(4), 611 (1995).
17 S. Parrish and A. Fire, “Distinct roles for RDE-1 and RDE-4 during RNA interference
in Caenorhabditis elegans,” RNA. 7(10), 1397 (2001). 18 S. Parrish, et al., “Functional anatomy of a dsRNA trigger: differential requirement for
the two trigger strands in RNA interference,” Mol. Cell 6(5), 1077 (2000). 19 P. D. Zamore, et al., “RNAi: double-stranded RNA directs the ATP-dependent cleavage
of mRNA at 21 to 23 nucleotide intervals,” Cell 101(1), 25 (2000). 20 S. M. Hammond, et al., “An RNA-directed nuclease mediates post-transcriptional gene
silencing in Drosophila cells,” Nature 404(6775), 293 (2000). 21 S. M. Elbashir, W. Lendeckel, and T. Tuschl, “RNA interference is mediated by 21- and
22-nucleotide RNAs,” Genes Dev. 15(2), 188 (2001). 22 S. M. Elbashir, et al., “Functional anatomy of siRNAs for mediating efficient RNAi in
Drosophila melanogaster embryo lysate,” EMBO J. 20(23), 6877 (2001). 23 S. M. Elbashir, et al., “Duplexes of 21-nucleotide RNAs mediate RNA interference in
cultured mammalian cells,” Nature 411(6836), 494 (2001). 24 A. Nykanen, B. Haley, and P. D. Zamore, “ATP requirements and small interfering
RNA structure in the RNA interference pathway,” Cell 107(3), 309 (2001). 25 E. Bernstein, et al., “Role for a bidentate ribonuclease in the initiation step of RNA
interference,” Nature 409(6818), 363 (2001). 26 A. Grishok, et al., “Genes and mechanisms related to RNA interference regulate expres-
sion of the small temporal RNAs that control C. elegans developmental timing,” Cell 106(1), 23 (2001).
27 R. F. Ketting, et al., “Dicer functions in RNA interference and in synthesis of small RNA
involved in developmental timing in C. elegans,” Genes Dev. 15(20), 2654 (2001). 28 S. W. Knight and B. L. Bass, “A role for the RNase III enzyme DCR-1 in RNA interfer-
ence and germ line development in Caenorhabditis elegans,” Science 293(5538), 2269 (2001).
29 P. M. Waterhouse, M. B. Wang, and T. Lough, “Gene silencing as an adaptive defence
against viruses,” Nature 411(6839), 834 (2001).

145
7. References
30 B. Lamontagne, et al., “The RNase III family: a conserved structure and expanding functions in eukaryotic dsRNA metabolism,” Curr. Issues Mol. Biol. 3(4), 71 (2001).
31 A. W. Nicholson, “Function, mechanism and regulation of bacterial ribonucleases,”
FEMS Microbiol. Rev. 23(3), 371 (1999). 32 B. K. Kay, M. P. Williamson, and M. Sudol, “The importance of being proline: the
interaction of proline-rich motifs in signaling proteins with their cognate domains,” FASEB J. 14(2), 231 (2000).
33 H. Wu, et al., “Human RNase III is a 160-kDa protein involved in preribosomal RNA
processing,” J. Biol. Chem. 275(47), 36957 (2000). 34 R. I. Gregory, et al., “The Microprocessor complex mediates the genesis of microRNAs,”
Nature 432(7014), 235 (2004). 35 A. M. Denli, et al., “Processing of primary microRNAs by the Microprocessor com-
plex,” Nature 432(7014), 231 (2004). 36 J. Han, et al., “The Drosha-DGCR8 complex in primary microRNA processing,” Genes
Dev. 18(24), 3016 (2004). 37 H. Zhang, et al., “Human Dicer preferentially cleaves dsRNAs at their termini without
a requirement for ATP,” EMBO J. 21(21), 5875 (2002). 38 H. Zhang, et al., “Single processing center models for human Dicer and bacterial RNase
III,” Cell 118(1), 57 (2004). 39 E. Wienholds, et al., “The microRNA-producing enzyme Dicer1 is essential for zebraf-
ish development,” Nat. Genet. 35(3), 217 (2003). 40 Y. S. Lee, et al., “Distinct roles for Drosophila Dicer-1 and Dicer-2 in the siRNA/miR-
NA silencing pathways,” Cell 117(1), 69 (2004). 41 J. W. Pham, et al., “A Dicer-2-dependent 80s complex cleaves targeted mRNAs during
RNAi in Drosophila,” Cell 117(1), 83 (2004). 42 N. Tahbaz, et al., “Characterization of the interactions between mammalian PAZ PIWI
domain proteins and Dicer,” EMBO Rep. 5(2), 189 (2004). 43 F. A. Kolb, et al., “Human dicer: purification, properties, and interaction with PAZ
PIWI domain proteins,” Methods Enzymol. 392, 316 (2005). 44 H. Tabara, et al., “The dsRNA binding protein RDE-4 interacts with RDE-1, DCR-1,
and a DExH- box helicase to direct RNAi in C. elegans,” Cell 109(7), 861 (2002). 45 J. B. Ma, K. Ye, and D. J. Patel, “Structural basis for overhang-specific small interfering
RNA recognition by the PAZ domain,” Nature 429(6989), 318 (2004).

146
7. References
46 J. J. Song, et al., “Crystal structure of Argonaute and its implications for RISC slicer activity,” Science 305(5689), 1434 (2004).
47 J. Liu, et al., “Argonaute2 is the catalytic engine of mammalian RNAi,” Science
305(5689), 1437 (2004). 48 T. A. Rand, et al., “Biochemical identification of Argonaute 2 as the sole protein re-
quired for RNA-induced silencing complex activity,” Proc. Natl. Acad. Sci. U. S. A 101(40), 14385 (2004).
49 J. S. Parker, S. M. Roe, and D. Barford, “Crystal structure of a PIWI protein sug-
gests mechanisms for siRNA recognition and slicer activity,” EMBO J. 23(24), 4727 (2004).
50 K. Okamura, et al., “Distinct roles for Argonaute proteins in small RNA-directed RNA
cleavage pathways,” Genes Dev. 18(14), 1655 (2004). 51 G. Meister, et al., “Human Argonaute2 mediates RNA cleavage targeted by miRNAs
and siRNAs,” Mol. Cell 15(2), 185 (2004). 52 M. Fagard, et al., “AGO1, QDE-2, and RDE-1 are related proteins required for post-
transcriptional gene silencing in plants, quelling in fungi, and RNA interference in animals,” Proc. Natl. Acad. Sci. U. S. A 97(21), 11650 (2000).
53 J. C. Palauqui, et al., “Systemic acquired silencing: transgene-specific post-transcrip-
tional silencing is transmitted by grafting from silenced stocks to non- silenced scions,” EMBO J. 16(15), 4738 (1997).
54 T. Sijen, et al., “On the role of RNA amplification in dsRNA-triggered gene silencing,”
Cell 107(4), 465 (2001). 55 W. Schiebel, et al., “Isolation of an RNA-directed RNA polymerase-specific cDNA
clone from tomato,” Plant Cell 10(12), 2087 (1998). 56 F. E. Vaistij, L. Jones, and D. C. Baulcombe, “Spreading of RNA targeting and DNA
methylation in RNA silencing requires transcription of the target gene and a putative RNA-dependent RNA polymerase,” Plant Cell 14(4), 857 (2002).
57 C. Lipardi, Q. Wei, and B. M. Paterson, “RNAi as random degradative PCR: siRNA
primers convert mRNA into dsRNAs that are degraded to generate new siRNAs,” Cell 107(3), 297 (2001).
58 T. Holen, et al., “Positional effects of short interfering RNAs targeting the human co-
agulation trigger Tissue Factor,” Nucleic Acids Res. 30(8), 1757 (2002). 59 M. Pal-Bhadra, U. Bhadra, and J. A. Birchler, “RNAi related mechanisms affect both
transcriptional and posttranscriptional transgene silencing in Drosophila,” Mol. Cell 9(2), 315 (2002).

147
7. References
60 J. C. Palauqui and H. Vaucheret, “Transgenes are dispensable for the RNA degradation step of cosuppression,” Proc. Natl. Acad. Sci. U. S. A 95(16), 9675 (1998).
61 L. Timmons, D. L. Court, and A. Fire, “Ingestion of bacterially expressed dsRNAs
can produce specific and potent genetic interference in Caenorhabditis elegans,” Gene 263(1-2), 103 (2001).
62 L. Timmons and A. Fire, “Specific interference by ingested dsRNA,” Nature 395(6705),
854 (1998). 63 W. M. Winston, C. Molodowitch, and C. P. Hunter, “Systemic RNAi in C. elegans re-
quires the putative transmembrane protein SID-1,” Science 295(5564), 2456 (2002). 64 G. Cavalli, “Chromatin as a eukaryotic template of genetic information,” Curr. Opin.
Cell Biol. 14(3), 269 (2002). 65 E. J. Richards and S. C. Elgin, “Epigenetic codes for heterochromatin formation and
silencing: rounding up the usual suspects,” Cell 108(4), 489 (2002). 66 L. Jones, F. Ratcliff, and D. C. Baulcombe, “RNA-directed transcriptional gene silenc-
ing in plants can be inherited independently of the RNA trigger and requires Met1 for maintenance,” Curr. Biol. 11(10), 747 (2001).
67 J. B. Morel, et al., “DNA methylation and chromatin structure affect transcriptional
and post- transcriptional transgene silencing in Arabidopsis,” Curr. Biol. 10(24), 1591 (2000).
68 I. J. Furner, M. A. Sheikh, and C. E. Collett, “Gene silencing and homology-depen-
dent gene silencing in Arabidopsis: genetic modifiers and DNA methylation,” Genetics 149(2), 651 (1998).
69 M. Wassenegger, et al., “RNA-directed de novo methylation of genomic sequences in
plants,” Cell 76(3), 567 (1994). 70 M. F. Mette, et al., “Transcriptional silencing and promoter methylation triggered by
double- stranded RNA,” EMBO J. 19(19), 5194 (2000). 71 G. H. Karpen and R. C. Allshire, “The case for epigenetic effects on centromere identity
and function,” Trends Genet. 13(12), 489 (1997). 72 R. C. Allshire, “Centromeres, checkpoints and chromatid cohesion,” Curr. Opin. Gen-
et. Dev. 7(2), 264 (1997). 73 I. M. Hall, K. Noma, and S. I. Grewal, “RNA interference machinery regulates chromo-
some dynamics during mitosis and meiosis in fission yeast,” Proc. Natl. Acad. Sci. U. S. A 100(1), 193 (2003).

148
7. References
74 I. H. Wong and Y. M. Lo, “New markers for cancer detection,” Curr. Oncol. Rep. 4(6), 471 (2002).
75 E. Heard, et al., “Methylation of histone H3 at Lys-9 is an early mark on the X chromo-
some during X inactivation,” Cell 107(6), 727 (2001). 76 W. Mak, et al., “Mitotically stable association of polycomb group proteins eed and enx1
with the inactive x chromosome in trophoblast stem cells,” Curr. Biol. 12(12), 1016 (2002).
77 H. Tabara, et al., “The rde-1 gene, RNA interference, and transposon silencing in C.
elegans,” Cell 99(2), 123 (1999). 78 N. R. Dudley, J. C. Labbe, and B. Goldstein, “Using RNA interference to identify genes
required for RNA interference,” Proc. Natl. Acad. Sci. U. S. A 99(7), 4191 (2002). 79 K. Mochizuki, et al., “Analysis of a piwi-related gene implicates small RNAs in genome
rearrangement in tetrahymena,” Cell 110(6), 689 (2002). 80 K. Mochizuki and M. A. Gorovsky, “A Dicer-like protein in Tetrahymena has distinct
functions in genome rearrangement, chromosome segregation, and meiotic prophase,” Genes Dev. 19(1), 77 (2005).
81 P. M. Waterhouse and A. F. Fusaro, “Plant science. Viruses face a double defense by
plant small RNAs,” Science 313(5783), 54 (2006). 82 R. Marathe, et al., “RNA viruses as inducers, suppressors and targets of post- transcrip-
tional gene silencing,” Plant Mol. Biol. 43(2-3), 295 (2000). 83 F. G. Ratcliff, S. A. MacFarlane, and D. C. Baulcombe, “Gene silencing without DNA.
rna-mediated cross-protection between viruses,” Plant Cell 11(7), 1207 (1999). 84 P. Mourrain, et al., “Arabidopsis SGS2 and SGS3 genes are required for posttranscrip-
tional gene silencing and natural virus resistance,” Cell 101(5), 533 (2000). 85 T. Dalmay, et al., “SDE3 encodes an RNA helicase required for post-transcriptional
gene silencing in Arabidopsis,” EMBO J. 20(8), 2069 (2001). 86 R. F. Ketting, et al., “Mut-7 of C. elegans, required for transposon silencing and RNA
interference, is a homolog of Werner syndrome helicase and RNaseD,” Cell 99(2), 133 (1999).
87 A. A. Aravin, et al., “Double-stranded RNA-mediated silencing of genomic tandem
repeats and transposable elements in the D. melanogaster germline,” Curr. Biol. 11(13), 1017 (2001).

149
7. References
88 A. Djikeng, et al., “RNA interference in Trypanosoma brucei: cloning of small interfer-ing RNAs provides evidence for retroposon-derived 24-26-nucleotide RNAs,” RNA. 7(11), 1522 (2001).
89 H. Ngo, et al., “Double-stranded RNA induces mRNA degradation in Trypanosoma
brucei,” Proc. Natl. Acad. Sci. U. S. A 95(25), 14687 (1998). 90 T. P. Brutnell and S. L. Dellaporta, “Somatic inactivation and reactivation of Ac as-
sociated with changes in cytosine methylation and transposase expression,” Genetics 138(1), 213 (1994).
91 J. L. Bennetzen, “The Mutator transposable element system of maize,” Curr. Top. Mi-
crobiol. Immunol. 204, 195 (1996). 92 M. Schlappi, R. Raina, and N. Fedoroff, “Epigenetic regulation of the maize Spm trans-
posable element: novel activation of a methylated promoter by TnpA,” Cell 77(3), 427 (1994).
93 W. M. Liu, et al., “Alu transcripts: cytoplasmic localisation and regulation by DNA
methylation,” Nucleic Acids Res. 22(6), 1087 (1994). 94 T. Singer, C. Yordan, and R. A. Martienssen, “Robertson’s Mutator transposons in A.
thaliana are regulated by the chromatin-remodeling gene Decrease in DNA Methyla-tion (DDM1),” Genes Dev. 15(5), 591 (2001).
95 A. Miura, et al., “Mobilization of transposons by a mutation abolishing full DNA meth-
ylation in Arabidopsis,” Nature 411(6834), 212 (2001). 96 S. Hanley, et al., “Identification of transposon-tagged genes by the random sequencing
of Mutator-tagged DNA fragments from Zea mays,” Plant J. 23(4), 557 (2000). 97 P. J. Krysan, J. C. Young, and M. R. Sussman, “T-DNA as an insertional mutagen in
Arabidopsis,” Plant Cell 11(12), 2283 (1999). 98 E. C. McKinney, et al., “Sequence-based identification of T-DNA insertion mutations
in Arabidopsis: actin mutants act2-1 and act4-1,” Plant J. 8(4), 613 (1995). 99 N. A. Smith, et al., “Total silencing by intron-spliced hairpin RNAs,” Nature 407(6802),
319 (2000). 100 S. V. Wesley, et al., “Construct design for efficient, effective and high-throughput gene
silencing in plants,” Plant J. 27(6), 581 (2001). 101 S. K. Kim, “Functional genomics: the worm scores a knockout,” Curr. Biol. 11(3), R85-
R87 (2001). 102 K. Ashrafi, et al., “Genome-wide RNAi analysis of Caenorhabditis elegans fat regulatory
genes,” Nature 421(6920), 268 (2003).

150
7. References
103 R. S. Kamath, et al., “Systematic functional analysis of the Caenorhabditis elegans ge-nome using RNAi,” Nature 421(6920), 231 (2003).
104 C. F. Chuang and E. M. Meyerowitz, “Specific and heritable genetic interference by
double-stranded RNA in Arabidopsis thaliana,” Proc. Natl. Acad. Sci. U. S. A 97(9), 4985 (2000).
105 L. Misquitta and B. M. Paterson, “Targeted disruption of gene function in Drosophila
by RNA interference (RNA-i): a role for nautilus in embryonic somatic muscle forma-tion,” Proc. Natl. Acad. Sci. U. S. A 96(4), 1451 (1999).
106 T. Tuschl, et al., “Targeted mRNA degradation by double-stranded RNA in vitro,”
Genes Dev. 13(24), 3191 (1999). 107 C. Baglioni and T. W. Nilsen, “Mechanisms of antiviral action of interferon,” Interferon
5, 23 (1983). 108 B. R. Williams, “Role of the double-stranded RNA-activated protein kinase (PKR) in
cell regulation,” Biochem. Soc. Trans. 25(2), 509 (1997). 109 E. Billy, et al., “Specific interference with gene expression induced by long, double-
stranded RNA in mouse embryonal teratocarcinoma cell lines,” Proc. Natl. Acad. Sci. U. S. A 98(25), 14428 (2001).
110 S. Yang, et al., “Specific double-stranded RNA interference in undifferentiated mouse
embryonic stem cells,” Mol. Cell Biol. 21(22), 7807 (2001). 111 S. M. Elbashir, et al., “Duplexes of 21-nucleotide RNAs mediate RNA interference in
cultured mammalian cells,” Nature 411(6836), 494 (2001). 112 N. J. Caplen, et al., “Specific inhibition of gene expression by small double-stranded
RNAs in invertebrate and vertebrate systems,” Proc. Natl. Acad. Sci. U. S. A 98(17), 9742 (2001).
113 J. Martinez, et al., “Single-stranded antisense siRNAs guide target RNA cleavage in
RNAi,” Cell 110(5), 563 (2002). 114 D. S. Schwarz, et al., “Asymmetry in the assembly of the RNAi enzyme complex,” Cell
115(2), 199 (2003). 115 A. Reynolds, et al., “Rational siRNA design for RNA interference,” Nat. Biotechnol.
22(3), 326 (2004). 116 B. Jagla, et al., “Sequence characteristics of functional siRNAs,” RNA. 11(6), 864
(2005). 117 D. Huesken, et al., “Design of a genome-wide siRNA library using an artificial neural
network,” Nat. Biotechnol. 23(8), 995 (2005).
151
7. References
118 W. Li and L. Cha, “Predicting siRNA efficiency,” Cell Mol. Life Sci. 64(14), 1785 (2007).
119 T. Tuschl, “Expanding small RNA interference,” Nat. Biotechnol. 20(5), 446 (2002). 120 N. S. Lee, et al., “Expression of small interfering RNAs targeted against HIV-1 rev tran-
scripts in human cells,” Nat. Biotechnol. 20(5), 500 (2002). 121 M. Miyagishi and K. Taira, “U6 promoter-driven siRNAs with four uridine 3’ over-
hangs efficiently suppress targeted gene expression in mammalian cells,” Nat. Biotech-nol. 20(5), 497 (2002).
122 T. R. Brummelkamp, R. Bernards, and R. Agami, “A system for stable expression of
short interfering RNAs in mammalian cells,” Science 296(5567), 550 (2002). 123 C. P. Paul, et al., “Effective expression of small interfering RNA in human cells,” Nat.
Biotechnol. 20(5), 505 (2002). 124 P. J. Paddison, A. A. Caudy, and G. J. Hannon, “Stable suppression of gene expression
by RNAi in mammalian cells,” Proc. Natl. Acad. Sci. U. S. A 99(3), 1443 (2002). 125 M. T. McManus, et al., “Gene silencing using micro-RNA designed hairpins,” RNA
8(6), 842 (2002). 126 Y. Zeng, E. J. Wagner, and B. R. Cullen, “Both natural and designed micro RNAs can
inhibit the expression of cognate mRNAs when expressed in human cells,” Mol. Cell 9(6), 1327 (2002).
127 M. Wiznerowicz, J. Szulc, and D. Trono, “Tuning silence: conditional systems for RNA
interference,” Nat. Methods 3(9), 682 (2006). 128 D. L. Lewis, et al., “Efficient delivery of siRNA for inhibition of gene expression in
postnatal mice,” Nat. Genet. 32(1), 107 (2002). 129 A. P. McCaffrey, et al., “RNA interference in adult mice,” Nature 418(6893), 38
(2002). 130 V. Hornung, et al., “Sequence-specific potent induction of IFN-alpha by short inter-
fering RNA in plasmacytoid dendritic cells through TLR7,” Nat. Med. 11(3), 263 (2005).
131 A. D. Judge, et al., “Design of noninflammatory synthetic siRNA mediating potent
gene silencing in vivo,” Mol. Ther. 13(3), 494 (2006). 132 J. Soutschek, et al., “Therapeutic silencing of an endogenous gene by systemic adminis-
tration of modified siRNAs,” Nature 432(7014), 173 (2004).

152
7. References
133 M. Grzelinski, et al., “RNA interference-mediated gene silencing of pleiotrophin through polyethylenimine-complexed small interfering RNAs in vivo exerts antitumoral effects in glioblastoma xenografts,” Hum. Gene Ther. 17(7), 751 (2006).
134 S. Werth, et al., “A low molecular weight fraction of polyethylenimine (PEI) displays
increased transfection efficiency of DNA and siRNA in fresh or lyophilized complexes,” J. Control Release 112(2), 257 (2006).
135 M. Thomas, et al., “Full deacylation of polyethylenimine dramatically boosts its gene
delivery efficiency and specificity to mouse lung,” Proc. Natl. Acad. Sci. U. S. A 102(16), 5679 (2005).
136 T. W. Geisbert, et al., “Postexposure protection of guinea pigs against a lethal ebola virus
challenge is conferred by RNA interference,” J. Infect. Dis. 193(12), 1650 (2006). 137 D. V. Morrissey, et al., “Potent and persistent in vivo anti-HBV activity of chemically
modified siRNAs,” Nat. Biotechnol. 23(8), 1002 (2005). 138 H. Hasuwa, et al., “Small interfering RNA and gene silencing in transgenic mice and
rats,” FEBS Lett. 532(1-2), 227 (2002). 139 G. Tiscornia, et al., “A general method for gene knockdown in mice by using lentiviral
vectors expressing small interfering RNA,” Proc. Natl. Acad. Sci. U. S. A 100(4), 1844 (2003).
140 M. A. Carmell, et al., “Germline transmission of RNAi in mice,” Nat. Struct. Biol.
10(2), 91 (2003). 141 D. A. Rubinson, et al., “A lentivirus-based system to functionally silence genes in prima-
ry mammalian cells, stem cells and transgenic mice by RNA interference,” Nat. Genet. 33(3), 401 (2003).
142 T. Kunath, et al., “Transgenic RNA interference in ES cell-derived embryos recapitu-
lates a genetic null phenotype,” Nat. Biotechnol. 21(5), 559 (2003). 143 C. T. Dann, et al., “Heritable and stable gene knockdown in rats,” Proc. Natl. Acad. Sci.
U. S. A 103(30), 11246 (2006). 144 M. C. Golding, et al., “Suppression of prion protein in livestock by RNA interference,”
Proc. Natl. Acad. Sci. U. S. A 103(14), 5285 (2006). 145 A. L. Garcia-Otin and F. Guillou, “Mammalian genome targeting using site-specific
recombinases,” Front Biosci. 11, 1108 (2006). 146 G. Tiscornia, et al., “CRE recombinase-inducible RNA interference mediated by lenti-
viral vectors,” Proc. Natl. Acad. Sci. U. S. A 101(19), 7347 (2004).

153
7. References
147 A. Ventura, et al., “Cre-lox-regulated conditional RNA interference from transgenes,” Proc. Natl. Acad. Sci. U. S. A 101(28), 10380 (2004).
148 C. Hitz, W. Wurst, and R. Kuhn, “Conditional brain-specific knockdown of MAPK
using Cre/loxP regulated RNA interference,” Nucleic Acids Res. 35(12), e90 (2007). 149 K. Rajewsky, et al., “Conditional gene targeting,” J. Clin. Invest 98(3), 600 (1996). 150 A. R. Utomo, A. Y. Nikitin, and W. H. Lee, “Temporal, spatial, and cell type-specific
control of Cre-mediated DNA recombination in transgenic mice,” Nat. Biotechnol. 17(11), 1091 (1999).
151 A. P. McCaffrey, et al., “Inhibition of hepatitis B virus in mice by RNA interference,”
Nat. Biotechnol. 21(6), 639 (2003). 152 S. L. Uprichard, et al., “Clearance of hepatitis B virus from the liver of transgenic mice
by short hairpin RNAs,” Proc. Natl. Acad. Sci. U. S. A 102(3), 773 (2005). 153 J. M. Jacque, K. Triques, and M. Stevenson, “Modulation of HIV-1 replication by RNA
interference,” Nature 418(6896), 435 (2002). 154 P. Kumar, et al., “T cell-specific siRNA delivery suppresses HIV-1 infection in human-
ized mice,” Cell 134(4), 577 (2008). 155 P. A. Sharp, “RNA interference--2001,” Genes Dev. 15(5), 485 (2001). 156 W. M. Pardridge, “shRNA and siRNA delivery to the brain,” Adv. Drug Deliv. Rev.
59(2-3), 141 (2007). 157 A. Salahpour, et al., “Local knockdown of genes in the brain using small interfering
RNA: a phenotypic comparison with knockout animals,” Biol. Psychiatry 61(1), 65 (2007).
158 R. Isacson, et al., “Lack of efficacy of ‘naked’ small interfering RNA applied directly to
rat brain,” Acta Physiol Scand. 179(2), 173 (2003). 159 D. R. Thakker, et al., “siRNA-mediated knockdown of the serotonin transporter in the
adult mouse brain,” Mol. Psychiatry 10(8), 782, 714 (2005). 160 D. R. Thakker, et al., “Neurochemical and behavioral consequences of widespread gene
knockdown in the adult mouse brain by using nonviral RNA interference,” Proc. Natl. Acad. Sci. U. S. A 101(49), 17270 (2004).
161 B. Dalby, et al., “Advanced transfection with Lipofectamine 2000 reagent: primary neu-
rons, siRNA, and high-throughput applications,” Methods 33(2), 95 (2004). 162 A. M. Krichevsky and K. S. Kosik, “RNAi functions in cultured mammalian neurons,”
Proc. Natl. Acad. Sci. U. S. A 99(18), 11926 (2002).

154
7. References
163 L. Tonges, et al., “Stearylated octaarginine and artificial virus-like particles for transfec-tion of siRNA into primary rat neurons,” RNA. 12(7), 1431 (2006).
164 M. Peters, et al., “RNA interference in hippocampus demonstrates opposing roles for
CREB and PP1alpha in contextual and temporal long-term memory,” Genes Brain Be-hav. 8(3), 320 (2009).
165 S. Decherf, Z. Hassani, and B. A. Demeneix, “In vivo siRNA delivery to the mouse hy-
pothalamus shows a role of the co-chaperone XAP2 in regulating TRH transcription,” Methods Mol. Biol. 433, 355 (2008).
166 Y. L. Wang, et al., “Clinico-pathological rescue of a model mouse of Huntington’s dis-
ease by siRNA,” Neurosci. Res. 53(3), 241 (2005). 167 J. D. Hommel, et al., “Local gene knockdown in the brain using viral-mediated RNA
interference,” Nat. Med. 9(12), 1539 (2003). 168 J. D. Hommel, et al., “Leptin receptor signaling in midbrain dopamine neurons regu-
lates feeding,” Neuron 51(6), 801 (2006). 169 E. Rodriguez-Lebron, et al., “Intrastriatal rAAV-mediated delivery of anti-huntingtin
shRNAs induces partial reversal of disease progression in R6/1 Huntington’s disease transgenic mice,” Mol. Ther. 12(4), 618 (2005).
170 H. Xia, et al., “RNAi suppresses polyglutamine-induced neurodegeneration in a model
of spinocerebellar ataxia,” Nat. Med. 10(8), 816 (2004). 171 P. Gonzalez-Alegre, et al., “Silencing primary dystonia: lentiviral-mediated RNA inter-
ference therapy for DYT1 dystonia,” J. Neurosci. 25(45), 10502 (2005). 172 G. S. Ralph, et al., “Silencing mutant SOD1 using RNAi protects against neurodegen-
eration and extends survival in an ALS model,” Nat. Med. 11(4), 429 (2005). 173 H. Xia, et al., “siRNA-mediated gene silencing in vitro and in vivo,” Nat. Biotechnol.
20(10), 1006 (2002). 174 C. S. Hong, et al., “Herpes simplex virus RNAi and neprilysin gene transfer vectors
reduce accumulation of Alzheimer’s disease-related amyloid-beta peptide in vivo,” Gene Ther. 13(14), 1068 (2006).
175 S. Q. Harper, et al., “RNA interference improves motor and neuropathological abnor-
malities in a Huntington’s disease mouse model,” Proc. Natl. Acad. Sci. U. S. A 102(16), 5820 (2005).
176 N. R. Franich, et al., “AAV vector-mediated RNAi of mutant huntingtin expression is
neuroprotective in a novel genetic rat model of Huntington’s disease,” Mol. Ther. 16(5), 947 (2008).

155
7. References
177 V. Kasim, M. Miyagishi, and K. Taira, “Control of siRNA expression utilizing Cre-loxP recombination system,” Nucleic Acids Res. Suppl (3), 255 (2003).
178 V. Kasim, M. Miyagishi, and K. Taira, “Control of siRNA expression using the Cre-loxP
recombination system,” Nucleic Acids Res. 32(7), e66 (2004). 179 A. Nagy and L. Mar, “Creation and use of a Cre recombinase transgenic database,”
Methods Mol. Biol. 158, 95 (2001). 180 X. Coumoul, et al., “Conditional knockdown of Fgfr2 in mice using Cre-LoxP induced
RNA interference,” Nucleic Acids Res. 33(11), e102 (2005). 181 C. Hitz, et al., “Generation of shRNA transgenic mice,” Methods Mol. Biol. 530, 101
(2009). 182 P. Steuber-Buchberger, W. Wurst, and R. Kuhn, “Simultaneous Cre-mediated condi-
tional knockdown of two genes in mice,” Genesis. 46(3), 144 (2008). 183 M. Lagos-Quintana, et al., “Identification of novel genes coding for small expressed
RNAs,” Science 294(5543), 853 (2001). 184 N. C. Lau, et al., “An abundant class of tiny RNAs with probable regulatory roles in
Caenorhabditis elegans,” Science 294(5543), 858 (2001). 185 R. C. Lee and V. Ambros, “An extensive class of small RNAs in Caenorhabditis elegans,”
Science 294(5543), 862 (2001). 186 N. C. Lau, et al., “An abundant class of tiny RNAs with probable regulatory roles in
Caenorhabditis elegans,” Science 294(5543), 858 (2001). 187 R. C. Lee and V. Ambros, “An extensive class of small RNAs in Caenorhabditis elegans,”
Science 294(5543), 862 (2001). 188 B. J. Reinhart, et al., “The 21-nucleotide let-7 RNA regulates developmental timing in
Caenorhabditis elegans,” Nature 403(6772), 901 (2000). 189 M. Chalfie, H. R. Horvitz, and J. E. Sulston, “Mutations that lead to reiterations in the
cell lineages of C. elegans,” Cell 24(1), 59 (1981). 190 B. J. Reinhart, et al., “The 21-nucleotide let-7 RNA regulates developmental timing in
Caenorhabditis elegans,” Nature 403(6772), 901 (2000). 191 V. Ambros, “Control of developmental timing in Caenorhabditis elegans,” Curr. Opin.
Genet. Dev. 10(4), 428 (2000). 192 B. Wightman, I. Ha, and G. Ruvkun, “Posttranscriptional regulation of the heteroch-
ronic gene lin-14 by lin- 4 mediates temporal pattern formation in C. elegans,” Cell 75(5), 855 (1993).

156
7. References
193 E. G. Moss, R. C. Lee, and V. Ambros, “The cold shock domain protein LIN-28 con-trols developmental timing in C. elegans and is regulated by the lin-4 RNA,” Cell 88(5), 637 (1997).
194 F. J. Slack, et al., “The lin-41 RBCC gene acts in the C. elegans heterochronic pathway
between the let-7 regulatory RNA and the LIN-29 transcription factor,” Mol. Cell 5(4), 659 (2000).
195 P. H. Olsen and V. Ambros, “The lin-4 regulatory RNA controls developmental timing
in Caenorhabditis elegans by blocking LIN-14 protein synthesis after the initiation of translation,” Dev. Biol. 216(2), 671 (1999).
196 K. Seggerson, L. Tang, and E. G. Moss, “Two genetic circuits repress the Caenorhabditis
elegans heterochronic gene lin-28 after translation initiation,” Dev. Biol. 243(2), 215 (2002).
197 A. E. Pasquinelli, et al., “Conservation of the sequence and temporal expression of let-7
heterochronic regulatory RNA,” Nature 408(6808), 86 (2000). 198 M. Lagos-Quintana, et al., “Identification of novel genes coding for small expressed
RNAs,” Science 294(5543), 853 (2001). 199 A. Aravin and T. Tuschl, “Identification and characterization of small RNAs involved in
RNA silencing,” FEBS Lett. 579(26), 5830 (2005). 200 V. Ambros, et al., “A uniform system for microRNA annotation,” RNA 9(3), 277
(2003). 201 S. Griffiths-Jones, “The microRNA Registry,” Nucleic Acids Res. 32(Database issue),
D109-D111 (2004). 202 S. Griffiths-Jones, “miRBase: the microRNA sequence database,” Methods Mol. Biol.
342, 129 (2006). 203 V. Ambros, et al., “MicroRNAs and other tiny endogenous RNAs in C. elegans,” Curr.
Biol. 13(10), 807 (2003). 204 P. Landgraf, et al., “A mammalian microRNA expression atlas based on small RNA li-
brary sequencing,” Cell 129(7), 1401 (2007). 205 K. C. Miranda, et al., “A pattern-based method for the identification of MicroRNA
binding sites and their corresponding heteroduplexes,” Cell 126(6), 1203 (2006). 206 E. Berezikov, et al., “Diversity of microRNAs in human and chimpanzee brain,” Nat.
Genet. 38(12), 1375 (2006). 207 N. Fahlgren, et al., “High-throughput sequencing of Arabidopsis microRNAs: evidence
for frequent birth and death of MIRNA genes,” PLoS ONE. 2(2), e219 (2007).
157
7. References
208 M. Bar, et al., “MicroRNA discovery and profiling in human embryonic stem cells by deep sequencing of small RNA libraries,” Stem Cells 26(10), 2496 (2008).
209 A. E. Pasquinelli, «MicroRNAs: deviants no longer,» Trends Genet. 18(4), 171 (2002). 210 Y. Lee, et al., «MicroRNA maturation: stepwise processing and subcellular localization,»
EMBO J. 21(17), 4663 (2002). 211 Y. Lee, et al., «MicroRNA genes are transcribed by RNA polymerase II,» EMBO J.
23(20), 4051 (2004). 212 C. Z. Chen, et al., “MicroRNAs modulate hematopoietic lineage differentiation,” Sci-
ence 303(5654), 83 (2004). 213 Y. Zeng, R. Yi, and B. R. Cullen, “Recognition and cleavage of primary microRNA
precursors by the nuclear processing enzyme Drosha,” EMBO J. 24(1), 138 (2005). 214 J. Krol, et al., “Structural features of microRNA (miRNA) precursors and their rel-
evance to miRNA biogenesis and small interfering RNA/short hairpin RNA design,” J. Biol. Chem. 279(40), 42230 (2004).
215 R. Yi, et al., “Exportin-5 mediates the nuclear export of pre-microRNAs and short hair-
pin RNAs,” Genes Dev. 17(24), 3011 (2003). 216 E. Lund, et al., “Nuclear export of microRNA precursors,” Science 303(5654), 95
(2004). 217 R. C. Lee, R. L. Feinbaum, and V. Ambros, “The C. elegans heterochronic gene lin-4 en-
codes small RNAs with antisense complementarity to lin-14,” Cell 75(5), 843 (1993). 218 I. Ha, B. Wightman, and G. Ruvkun, “A bulged lin-4/lin-14 RNA duplex is sufficient
for Caenorhabditis elegans lin-14 temporal gradient formation,” Genes Dev. 10(23), 3041 (1996).
219 G. Hutvagner and P. D. Zamore, “A microRNA in a multiple-turnover RNAi enzyme
complex,” Science 297(5589), 2056 (2002). 220 C. Llave, et al., “Cleavage of Scarecrow-like mRNA targets directed by a class of Arabi-
dopsis miRNA,” Science 297(5589), 2053 (2002). 221 J. G. Doench, C. P. Petersen, and P. A. Sharp, “siRNAs can function as miRNAs,” Genes
Dev. 17(4), 438 (2003). 222 J. Liu, et al., “A role for the P-body component GW182 in microRNA function,” Nat.
Cell Biol. 7(12), 1261 (2005). 223 J. Liu, et al., “MicroRNA-dependent localization of targeted mRNAs to mammalian
P-bodies,” Nat. Cell Biol. 7(7), 719 (2005).

158
7. References
224 G. Meister, et al., “Identification of novel argonaute-associated proteins,” Curr. Biol. 15(23), 2149 (2005).
225 K. M. Pauley, et al., “Formation of GW bodies is a consequence of microRNA genesis,”
EMBO Rep. 7(9), 904 (2006). 226 A. Jakymiw, et al., “The role of GW/P-bodies in RNA processing and silencing,” J. Cell
Sci. 120(Pt 8), 1317 (2007). 227 S. P. Chan and F. J. Slack, “microRNA-mediated silencing inside P-bodies,” RNA Biol.
3(3), 97 (2006). 228 D. P. Bartel, “MicroRNAs: target recognition and regulatory functions,” Cell 136(2),
215 (2009). 229 A. Stark, et al., “Identification of Drosophila MicroRNA targets,” PLoS Biol. 1(3), E60
(2003). 230 B. P. Lewis, et al., “Prediction of mammalian microRNA targets,” Cell 115(7), 787
(2003). 231 I. Bentwich, “Prediction and validation of microRNAs and their targets,” FEBS Lett.
579(26), 5904 (2005). 232 M. Legendre, A. Lambert, and D. Gautheret, “Profile-based detection of microRNA
precursors in animal genomes,” Bioinformatics 21(7), 841 (2005). 233 E. Berezikov and R. H. Plasterk, “Camels and zebrafish, viruses and cancer: a microR-
NA update,” Hum. Mol. Genet. 14 Spec No. 2, R183-R190 (2005). 234 X. Xie, et al., “Systematic discovery of regulatory motifs in human promoters and 3’
UTRs by comparison of several mammals,” Nature 434(7031), 338 (2005). 235 B. P. Lewis, C. B. Burge, and D. P. Bartel, “Conserved seed pairing, often flanked by
adenosines, indicates that thousands of human genes are microRNA targets,” Cell 120(1), 15 (2005).
236 L. P. Lim, et al., “Microarray analysis shows that some microRNAs downregulate large
numbers of target mRNAs,” Nature 433(7027), 769 (2005). 237 P. S. Linsley, et al., “Transcripts targeted by the microRNA-16 family cooperatively
regulate cell cycle progression,” Mol. Cell Biol. 27(6), 2240 (2007). 238 A. Krek, et al., “Combinatorial microRNA target predictions,” Nat. Genet. 37(5), 495
(2005). 239 N. Rajewsky, “microRNA target predictions in animals,” Nat. Genet. 38 Suppl, S8
(2006).

159
7. References
240 M. Lagos-Quintana, et al., “New microRNAs from mouse and human,” RNA 9(2), 175 (2003).
241 L. P. Lim, et al., “The microRNAs of Caenorhabditis elegans,” Genes Dev. 17(8), 991
(2003). 242 L. P. Lim, et al., «Vertebrate microRNA genes,» Science 299(5612), 1540 (2003). 243 V. Ambros, “The functions of animal microRNAs,” Nature 431(7006), 350 (2004). 244 D. P. Bartel, “MicroRNAs: genomics, biogenesis, mechanism, and function,” Cell
116(2), 281 (2004). 245 M. S. Nicoloso, et al., “MicroRNAs in the pathogeny of chronic lymphocytic leukae-
mia,” Br. J. Haematol. 139(5), 709 (2007). 246 M. S. Nicoloso and G. A. Calin, “MicroRNA involvement in brain tumors: from bench
to bedside,” Brain Pathol. 18(1), 122 (2008). 247 H. W. Hwang and J. T. Mendell, “MicroRNAs in cell proliferation, cell death, and tu-
morigenesis,” Br. J. Cancer 94(6), 776 (2006). 248 G. A. Calin, et al., “MicroRNA profiling reveals distinct signatures in B cell chronic
lymphocytic leukemias,” Proc. Natl. Acad. Sci. U. S A 101(32), 11755 (2004). 249 M. Metzler, et al., “High expression of precursor microRNA-155/BIC RNA in children
with Burkitt lymphoma,” Genes Chromosomes Cancer 39(2), 167 (2004). 250 M. Z. Michael, et al., “Reduced accumulation of specific microRNAs in colorectal neo-
plasia,” Mol. Cancer Res. 1(12), 882 (2003). 251 J. Takamizawa, et al., “Reduced expression of the let-7 microRNAs in human lung
cancers in association with shortened postoperative survival,” Cancer Res. 64(11), 3753 (2004).
252 G. A. Calin, et al., “A MicroRNA signature associated with prognosis and progression
in chronic lymphocytic leukemia,” N. Engl. J. Med. 353(17), 1793 (2005). 253 A. Lujambio and M. Esteller, “CpG island hypermethylation of tumor suppressor mi-
croRNAs in human cancer,” Cell Cycle 6(12), 1455 (2007). 254 J. T. Mendell, “miRiad roles for the miR-17-92 cluster in development and disease,”
Cell 133(2), 217 (2008). 255 L. He, et al., “A microRNA polycistron as a potential human oncogene,” Nature
435(7043), 828 (2005).

160
7. References
256 V. Nair and M. Zavolan, “Virus-encoded microRNAs: novel regulators of gene expres-sion,” Trends Microbiol. 14(4), 169 (2006).
257 C. H. Lecellier, et al., “A cellular microRNA mediates antiviral defense in human cells,”
Science 308(5721), 557 (2005). 258 J. Huang, et al., “Cellular microRNAs contribute to HIV-1 latency in resting primary
CD4+ T lymphocytes,” Nat. Med. 13(10), 1241 (2007). 259 B. Berkhout, “A balancing act: viruses and miRNAs,” J. Formos. Med. Assoc. 107(1), 1
(2008). 260 H. Y. Cheng, et al., “microRNA modulation of circadian-clock period and entrain-
ment,” Neuron 54(5), 813 (2007). 261 N. Liu, et al., “microRNA-133a regulates cardiomyocyte proliferation and suppresses
smooth muscle gene expression in the heart,” Genes Dev. 22(23), 3242 (2008). 262 S. U. Morton, et al., “microRNA-138 modulates cardiac patterning during embryonic
development,” Proc. Natl. Acad. Sci. U. S. A 105(46), 17830 (2008). 263 M. Lagos-Quintana, et al., “Identification of tissue-specific microRNAs from mouse,”
Curr. Biol. 12(9), 735 (2002). 264 J. Kim, et al., “Identification of many microRNAs that copurify with polyribosomes in
mammalian neurons,” Proc. Natl. Acad. Sci. U. S A 101(1), 360 (2004). 265 E. Wienholds, et al., “MicroRNA expression in zebrafish embryonic development,” Sci-
ence 309(5732), 310 (2005). 266 A. A. Aboobaker, et al., “Drosophila microRNAs exhibit diverse spatial expression pat-
terns during embryonic development,” Proc. Natl. Acad. Sci. U. S A 102(50), 18017 (2005).
267 G. M. Schratt, et al., “A brain-specific microRNA regulates dendritic spine develop-
ment,” Nature 439(7074), 283 (2006). 268 C. Kanellopoulou, et al., “Dicer-deficient mouse embryonic stem cells are defective in
differentiation and centromeric silencing,” Genes Dev. 19(4), 489 (2005). 269 A. J. Giraldez, et al., “MicroRNAs regulate brain morphogenesis in zebrafish,” Science
308(5723), 833 (2005). 270 R. C. Friedman, et al., “Most mammalian mRNAs are conserved targets of microR-
NAs,” Genome Res. 19(1), 92 (2009). 271 A. Stark, et al., “Animal MicroRNAs confer robustness to gene expression and have a
significant impact on 3’UTR evolution,” Cell 123(6), 1133 (2005).

161
7. References
272 K. K. Farh, et al., “The widespread impact of mammalian MicroRNAs on mRNA re-pression and evolution,” Science 310(5755), 1817 (2005).
273 P. Sood, et al., “Cell-type-specific signatures of microRNAs on target mRNA expres-
sion,” Proc. Natl. Acad. Sci. U. S A 103(8), 2746 (2006). 274 D. Baek, et al., “The impact of microRNAs on protein output,” Nature 455(7209), 64
(2008). 275 J. Mineno, et al., “The expression profile of microRNAs in mouse embryos,” Nucleic
Acids Res. 34(6), 1765 (2006). 276 P. Y. Chen, et al., “The developmental miRNA profiles of zebrafish as determined by
small RNA cloning,” Genes Dev. 19(11), 1288 (2005). 277 A. A. Aravin, et al., “The small RNA profile during Drosophila melanogaster develop-
ment,” Dev. Cell 5(2), 337 (2003). 278 S. Takada, et al., “Mouse microRNA profiles determined with a new and sensitive clon-
ing method,” Nucleic Acids Res. 34(17), e115 (2006). 279 C. J. Creighton, J. G. Reid, and P. H. Gunaratne, “Expression profiling of microRNAs
by deep sequencing,” Brief. Bioinform. (2009). 280 A. M. Krichevsky, et al., “A microRNA array reveals extensive regulation of microRNAs
during brain development,” RNA 9(10), 1274 (2003). 281 C. G. Liu, et al., “An oligonucleotide microchip for genome-wide microRNA profiling
in human and mouse tissues,” Proc. Natl. Acad. Sci. U. S A 101(26), 9740 (2004). 282 T. Babak, et al., “Probing microRNAs with microarrays: tissue specificity and functional
inference,” RNA 10(11), 1813 (2004). 283 Y. Sun, et al., “Development of a micro-array to detect human and mouse microRNAs
and characterization of expression in human organs,” Nucleic Acids Res. 32(22), e188 (2004).
284 C. G. Liu, et al., “Expression profiling of microRNA using oligo DNA arrays,” Methods
44(1), 22 (2008). 285 H. Wang, R. A. Ach, and B. Curry, “Direct and sensitive miRNA profiling from low-
input total RNA,” RNA 13(1), 151 (2007). 286 J. Chen, et al., “Highly sensitive and specific microRNA expression profiling using
BeadArray technology,” Nucleic Acids Res. 36(14), e87 (2008). 287 C. J. Loscher, et al., “Altered retinal microRNA expression profile in a mouse model of
retinitis pigmentosa,” Genome Biol. 8(11), R248 (2007).

162
7. References
288 M. D. Weston, et al., “MicroRNA gene expression in the mouse inner ear,” Brain Res. 1111(1), 95 (2006).
289 A. M. Krichevsky, “MicroRNA profiling: from dark matter to white matter, or identify-
ing new players in neurobiology,” ScientificWorldJournal. 7, 155 (2007). 290 K. J. Livak and T. D. Schmittgen, “Analysis of relative gene expression data using real-
time quantitative PCR and the 2(-Delta Delta C(T)) Method,” Methods 25(4), 402 (2001).
291 C. A. Heid, et al., “Real time quantitative PCR,” Genome Res. 6(10), 986 (1996). 292 T. D. Schmittgen, et al., “A high-throughput method to monitor the expression of mi-
croRNA precursors,” Nucleic Acids Res. 32(4), e43 (2004). 293 R. Shi and V. L. Chiang, “Facile means for quantifying microRNA expression by real-
time PCR,” Biotechniques 39(4), 519 (2005). 294 C. Chen, et al., “Real-time quantification of microRNAs by stem-loop RT-PCR,” Nu-
cleic Acids Res. 33(20), e179 (2005). 295 K. Lao, et al., “Multiplexing RT-PCR for the detection of multiple miRNA species in
small samples,” Biochem. Biophys. Res. Commun. 343(1), 85 (2006). 296 J. H. Mansfield, et al., “MicroRNA-responsive ‘sensor’ transgenes uncover Hox-like
and other developmentally regulated patterns of vertebrate microRNA expression,” Nat. Genet. 36(10), 1079 (2004).
297 M. Deo, et al., “Detection of mammalian microRNA expression by in situ hybridiza-
tion with RNA oligonucleotides,” Dev. Dyn. 235(9), 2538 (2006). 298 R. C. Thompson, M. Deo, and D. L. Turner, “Analysis of microRNA expression by in
situ hybridization with RNA oligonucleotide probes,” Methods 43(2), 153 (2007). 299 S. K. Singh, et al., “LNA (locked nucleic acids): synthesis and high-affinity nucleic acid
recognition,” (4), 455 (1998). 300 W. P. Kloosterman, et al., “In situ detection of miRNAs in animal embryos using LNA-
modified oligonucleotide probes,” Nat. Methods 3(1), 27 (2006). 301 G. Obernosterer, J. Martinez, and M. Alenius, “Locked nucleic acid-based in situ detec-
tion of microRNAs in mouse tissue sections,” Nat. Protoc. 2(6), 1508 (2007). 302 L. Tuddenham, et al., “The cartilage specific microRNA-140 targets histone deacetylase
4 in mouse cells,” FEBS Lett. 580(17), 4214 (2006). 303 G. Wheeler, et al., “Identification of new central nervous system specific mouse microR-
NAs,” FEBS Lett. 580(9), 2195 (2006).
163
7. References
304 D. K. Darnell, et al., “MicroRNA expression during chick embryo development,” Dev. Dyn. 235(11), 3156 (2006).
305 D. K. Darnell, et al., “GEISHA: an in situ hybridization gene expression resource for
the chicken embryo,” Cytogenet. Genome Res. 117(1-4), 30 (2007). 306 P. B. Antin, et al., “Gallus expression in situ hybridization analysis: a chicken embryo
gene expression database,” Poult. Sci. 86(7), 1472 (2007). 307 F. B. Gao, “Posttranscriptional control of neuronal development by microRNA net-
works,” Trends Neurosci. 31(1), 20 (2008). 308 X. Cao, et al., “Noncoding RNAs in the mammalian central nervous system,” Annu.
Rev. Neurosci. 29, 77 (2006). 309 K. S. Kosik, «The neuronal microRNA system,» Nat. Rev. Neurosci. 7(12), 911
(2006). 310 J. Bilen, et al., «MicroRNA pathways modulate polyglutamine-induced neurodegenera-
tion,» Mol. Cell 24(1), 157 (2006). 311 A. Schaefer, et al., “Cerebellar neurodegeneration in the absence of microRNAs,” J. Exp.
Med. 204(7), 1553 (2007). 312 J. Kim, et al., «A MicroRNA feedback circuit in midbrain dopamine neurons,» Science
317(5842), 1220 (2007). 313 J. Krutzfeldt, et al., “Silencing of microRNAs in vivo with ‘antagomirs’,” Nature
438(7068), 685 (2005). 314 I. Naguibneva, et al., “An LNA-based loss-of-function assay for micro-RNAs,” Biomed.
Pharmacother. 60(9), 633 (2006). 315 G. Meister, et al., “Sequence-specific inhibition of microRNA- and siRNA-induced
RNA silencing,” RNA 10(3), 544 (2004). 316 G. Hutvagner, et al., “Sequence-specific inhibition of small RNA function,” PLoS Biol.
2(4), E98 (2004). 317 R. J. Johnston and O. Hobert, “A microRNA controlling left/right neuronal asymmetry
in Caenorhabditis elegans,” Nature 426(6968), 845 (2003). 318 O. Hobert, “Architecture of a microRNA-controlled gene regulatory network that di-
versifies neuronal cell fates,” Cold Spring Harb. Symp. Quant. Biol. 71, 181 (2006). 319 X. Li and R. W. Carthew, “A microRNA mediates EGF receptor signaling and promotes
photoreceptor differentiation in the Drosophila eye,” Cell 123(7), 1267 (2005).
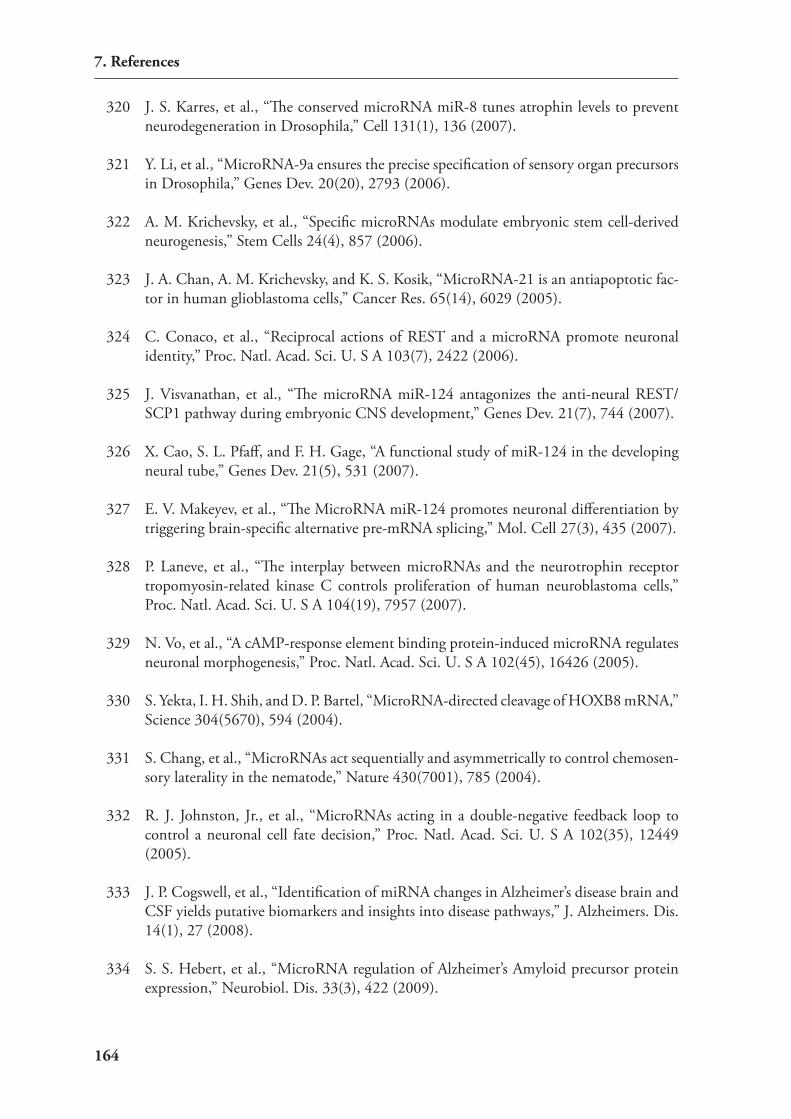
164
7. References
320 J. S. Karres, et al., “The conserved microRNA miR-8 tunes atrophin levels to prevent neurodegeneration in Drosophila,” Cell 131(1), 136 (2007).
321 Y. Li, et al., “MicroRNA-9a ensures the precise specification of sensory organ precursors
in Drosophila,” Genes Dev. 20(20), 2793 (2006). 322 A. M. Krichevsky, et al., “Specific microRNAs modulate embryonic stem cell-derived
neurogenesis,” Stem Cells 24(4), 857 (2006). 323 J. A. Chan, A. M. Krichevsky, and K. S. Kosik, “MicroRNA-21 is an antiapoptotic fac-
tor in human glioblastoma cells,” Cancer Res. 65(14), 6029 (2005). 324 C. Conaco, et al., “Reciprocal actions of REST and a microRNA promote neuronal
identity,” Proc. Natl. Acad. Sci. U. S A 103(7), 2422 (2006). 325 J. Visvanathan, et al., “The microRNA miR-124 antagonizes the anti-neural REST/
SCP1 pathway during embryonic CNS development,” Genes Dev. 21(7), 744 (2007). 326 X. Cao, S. L. Pfaff, and F. H. Gage, “A functional study of miR-124 in the developing
neural tube,” Genes Dev. 21(5), 531 (2007). 327 E. V. Makeyev, et al., “The MicroRNA miR-124 promotes neuronal differentiation by
triggering brain-specific alternative pre-mRNA splicing,” Mol. Cell 27(3), 435 (2007). 328 P. Laneve, et al., “The interplay between microRNAs and the neurotrophin receptor
tropomyosin-related kinase C controls proliferation of human neuroblastoma cells,” Proc. Natl. Acad. Sci. U. S A 104(19), 7957 (2007).
329 N. Vo, et al., “A cAMP-response element binding protein-induced microRNA regulates
neuronal morphogenesis,” Proc. Natl. Acad. Sci. U. S A 102(45), 16426 (2005). 330 S. Yekta, I. H. Shih, and D. P. Bartel, “MicroRNA-directed cleavage of HOXB8 mRNA,”
Science 304(5670), 594 (2004). 331 S. Chang, et al., “MicroRNAs act sequentially and asymmetrically to control chemosen-
sory laterality in the nematode,” Nature 430(7001), 785 (2004). 332 R. J. Johnston, Jr., et al., “MicroRNAs acting in a double-negative feedback loop to
control a neuronal cell fate decision,” Proc. Natl. Acad. Sci. U. S A 102(35), 12449 (2005).
333 J. P. Cogswell, et al., “Identification of miRNA changes in Alzheimer’s disease brain and
CSF yields putative biomarkers and insights into disease pathways,” J. Alzheimers. Dis. 14(1), 27 (2008).
334 S. S. Hebert, et al., “MicroRNA regulation of Alzheimer’s Amyloid precursor protein
expression,” Neurobiol. Dis. 33(3), 422 (2009).
165
7. References
335 S. S. Hebert, et al., “Loss of microRNA cluster miR-29a/b-1 in sporadic Alzheimer’s disease correlates with increased BACE1/beta-secretase expression,” Proc. Natl. Acad. Sci. U. S. A 105(17), 6415 (2008).
336 D. O. Perkins, et al., “microRNA expression in the prefrontal cortex of individuals with
schizophrenia and schizoaffective disorder,” Genome Biol. 8(2), R27 (2007). 337 N. J. Beveridge, et al., “Dysregulation of miRNA 181b in the temporal cortex in schizo-
phrenia,” Hum. Mol. Genet. (2008). 338 B. Roig, et al., “The discoidin domain receptor 1 as a novel susceptibility gene for
schizophrenia,” Mol. Psychiatry 12(9), 833 (2007). 339 J. Kocerha, et al., “MicroRNA-219 modulates NMDA receptor-mediated neurobehav-
ioral dysfunction,” Proc. Natl. Acad. Sci. U. S. A 106(9), 3507 (2009). 340 J. T. Coyle, “Glutamate and schizophrenia: beyond the dopamine hypothesis,” Cell
Mol. Neurobiol. 26(4-6), 365 (2006). 341 H. S. Singer, “Tourette’s syndrome: from behaviour to biology,” Lancet Neurol. 4(3),
149 (2005). 342 J. F. Abelson, et al., “Sequence variants in SLITRK1 are associated with Tourette’s syn-
drome,” Science 310(5746), 317 (2005). 343 K. Garber, et al., «Transcription, translation and fragile X syndrome,» Curr. Opin. Gen-
et. Dev. 16(3), 270 (2006). 344 O. Penagarikano, J. G. Mulle, and S. T. Warren, “The pathophysiology of fragile x syn-
drome,” Annu. Rev. Genomics Hum. Genet. 8, 109 (2007). 345 V. Brown, et al., “Microarray identification of FMRP-associated brain mRNAs and
altered mRNA translational profiles in fragile X syndrome,” Cell 107(4), 477 (2001). 346 K. Y. Miyashiro, et al., “RNA cargoes associating with FMRP reveal deficits in cellular
functioning in Fmr1 null mice,” Neuron 37(3), 417 (2003). 347 A. A. Caudy, et al., “Fragile X-related protein and VIG associate with the RNA interfer-
ence machinery,” Genes Dev. 16(19), 2491 (2002). 348 A. Ishizuka, M. C. Siomi, and H. Siomi, “A Drosophila fragile X protein interacts with
components of RNAi and ribosomal proteins,” Genes Dev. 16(19), 2497 (2002). 349 E. A. Nimchinsky, A. M. Oberlander, and K. Svoboda, “Abnormal development of den-
dritic spines in FMR1 knock-out mice,” J. Neurosci. 21(14), 5139 (2001). 350 Y. Q. Zhang, et al., “Drosophila fragile X-related gene regulates the MAP1B homolog
Futsch to control synaptic structure and function,” Cell 107(5), 591 (2001).

166
7. References
351 A. W. Grossman, et al., “Hippocampal pyramidal cells in adult Fmr1 knockout mice exhibit an immature-appearing profile of dendritic spines,” Brain Res. 1084(1), 158 (2006).
352 B. E. Pfeiffer and K. M. Huber, “Fragile X mental retardation protein induces synapse
loss through acute postsynaptic translational regulation,” J. Neurosci. 27(12), 3120 (2007).
353 T. C. Dockendorff, et al., “Drosophila lacking dfmr1 activity show defects in circadian
output and fail to maintain courtship interest,” Neuron 34(6), 973 (2002). 354 J. Morales, et al., “Drosophila fragile X protein, DFXR, regulates neuronal morphology
and function in the brain,” Neuron 34(6), 961 (2002). 355 C. I. Michel, R. Kraft, and L. L. Restifo, “Defective neuronal development in the mush-
room bodies of Drosophila fragile X mental retardation 1 mutants,” J. Neurosci. 24(25), 5798 (2004).
356 M. Castren, et al., “Altered differentiation of neural stem cells in fragile X syndrome,”
Proc. Natl. Acad. Sci. U. S. A 102(49), 17834 (2005). 357 P. J. Paddison, et al., “Short hairpin RNAs (shRNAs) induce sequence-specific silencing
in mammalian cells,” Genes Dev. 16(8), 948 (2002). 358 A. G. Smith, et al., “Inhibition of pluripotential embryonic stem cell differentiation by
purified polypeptides,” Nature 336(6200), 688 (1988). 359 R. L. Williams, et al., “Myeloid leukaemia inhibitory factor maintains the developmen-
tal potential of embryonic stem cells,” Nature 336(6200), 684 (1988). 360 H. U. Dodt, et al., “Ultramicroscopy: three-dimensional visualization of neuronal net-
works in the whole mouse brain,” Nat. Methods 4(4), 331 (2007). 361 S. Delic, et al., “Genetic Mouse Models for Behavioral Analysis through Transgenic
RNAi Technology,” Genes Brain Behav. (2008). 362 K. Becker, et al., “Ultramicroscopy: 3D reconstruction of large microscopical speci-
mens,” J. Biophotonics. 1(1), 36 (2008). 363 R Development Core Team, r: a language and environment for statistical computing. (R
Foundation for Statistical Computing, Vienna, Austria, 2007). 364 M. J. Dunning, et al., “beadarray: R classes and methods for Illumina bead-based data,”
Bioinformatics. 23(16), 2183 (2007). 365 G. K. Smyth, “Limma: Linear Models for Microarray Data.,”in Bioinformatics and
Computational Biology Solutions using R and Bioconductor, edited by R. Gentleman, et al. (Springer, New York, 2005), pp.397-420.

167
7. References
366 Y. Benjamini and Y. Hochberg, “Controlling the False Discovery Rate - A Practical and Powerful Approach to Multiple Testing,” 57(1), 289 (1995).
367 G. K. Smyth, “Linear models and empirical bayes methods for assessing differential ex-
pression in microarray experiments,” Stat. Appl. Genet. Mol. Biol. 3, Article3 (2004). 368 G. K. Smyth, J. Michaud, and H. S. Scott, “Use of within-array replicate spots for as-
sessing differential expression in microarray experiments,” Bioinformatics. 21(9), 2067 (2005).
369 F. Corpet, “Multiple sequence alignment with hierarchical clustering,” Nucleic Acids
Res. 16(22), 10881 (1988). 370 P. J. Paddison, et al., “Short hairpin RNAs (shRNAs) induce sequence-specific silencing
in mammalian cells,” Genes Dev. 16(8), 948 (2002). 371 H. Zhou, X. G. Xia, and Z. Xu, “An RNA polymerase II construct synthesizes short-
hairpin RNA with a quantitative indicator and mediates highly efficient RNAi,” Nucleic Acids Res. 33(6), e62 (2005).
372 I. Grummt, “Regulation of mammalian ribosomal gene transcription by RNA poly-
merase I,” Prog. Nucleic Acid Res. Mol. Biol. 62, 109 (1999). 373 J. Heix and I. Grummt, “Species specificity of transcription by RNA polymerase I,”
Curr. Opin. Genet. Dev. 5(5), 652 (1995). 374 P Weber, Diploma Thesis, “Establishment of a Pol I mediated RNA interference”, Tech-
nical University Munich (2003). 375 A. Zobel, G. Neumann, and G. Hobom, “RNA polymerase I catalysed transcription of
insert viral cDNA,” Nucleic Acids Res. 21(16), 3607 (1993). 376 A. Kuhn, U. Deppert, and I. Grummt, “A 140-base-pair repetitive sequence element in
the mouse rRNA gene spacer enhances transcription by RNA polymerase I in a cell-free system,” Proc. Natl. Acad. Sci. U. S. A 87(19), 7527 (1990).
377 M. S. Brenz Verca, et al., “Development of a species-specific RNA polymerase I-based
shRNA expression vector,” Nucleic Acids Res. 35(2), e10 (2007). 378 O. Boussif, et al., “A versatile vector for gene and oligonucleotide transfer into cells in
culture and in vivo: polyethylenimine,” Proc. Natl. Acad. Sci. U. S. A 92(16), 7297 (1995).
379 K. A. Mislick and J. D. Baldeschwieler, “Evidence for the role of proteoglycans in cat-
ion-mediated gene transfer,” Proc. Natl. Acad. Sci. U. S. A 93(22), 12349 (1996). 380 H. Siedentopf and R. Zsigmondy, „Über die Sichtbarmachung und Größenbestimmung
ultramikroskopischer Teilchen, mit besonderer Anwendung auf Goldrubingläser.,“ 10, 1 (1903).
168
7. References
381 W Spalteholz, „Über Das Durchsichtigmachen Von Menschlichen Und Tierischen Präparaten.,“in (S. Hierzel, Leipzig, 1914).
382 U. Michel, et al., “Long-term in vivo and in vitro AAV-2-mediated RNA interference in
rat retinal ganglion cells and cultured primary neurons,” Biochem. Biophys. Res. Com-mun. 326(2), 307 (2005).
383 K. R. Jones, et al., “Targeted disruption of the BDNF gene perturbs brain and sensory
neuron development but not motor neuron development,” Cell 76(6), 989 (1994). 384 M. Korte, et al., “Hippocampal long-term potentiation is impaired in mice lacking brain-
derived neurotrophic factor,” Proc. Natl. Acad. Sci. U. S. A 92(19), 8856 (1995). 385 A. M. Krichevsky and K. S. Kosik, “Neuronal RNA granules: a link between RNA lo-
calization and stimulation-dependent translation,” Neuron 32(4), 683 (2001). 386 J. D. Richter and L. J. Lorenz, “Selective translation of mRNAs at synapses,” Curr.
Opin. Neurobiol. 12(3), 300 (2002). 387 I. J. Weiler, et al., “Fragile X mental retardation protein is translated near synapses in
response to neurotransmitter activation,” Proc. Natl. Acad. Sci. U. S. A 94(10), 5395 (1997).
388 B. Laggerbauer, et al., “Evidence that fragile X mental retardation protein is a negative
regulator of translation,” Hum. Mol. Genet. 10(4), 329 (2001). 389 Z. Li, et al., “The fragile X mental retardation protein inhibits translation via interacting
with mRNA,” Nucleic Acids Res. 29(11), 2276 (2001). 390 R. W. Carthew, “RNA interference: the fragile X syndrome connection,” Curr. Biol.
12(24), R852-R854 (2002). 391 K. J. Ressler, et al., “Regulation of synaptic plasticity genes during consolidation of fear
conditioning,” J. Neurosci. 22(18), 7892 (2002). 392 W. Huber, et al., “Variance stabilization applied to microarray data calibration and to
the quantification of differential expression,” Bioinformatics. 18 Suppl 1, S96 (2002). 393 A. Valoczi, et al., “Sensitive and specific detection of microRNAs by northern blot
analysis using LNA-modified oligonucleotide probes,” Nucleic Acids Res. 32(22), e175 (2004).
394 V. Pekarik, “Design of shRNAs for RNAi-A lesson from pre-miRNA processing: pos-
sible clinical applications,” Brain Res. Bull. 68(1-2), 115 (2005). 395 S. T. Smale and R. Tjian, “Transcription of herpes simplex virus tk sequences under the
control of wild-type and mutant human RNA polymerase I promoters,” Mol. Cell Biol. 5(2), 352 (1985).

169
7. References
396 M. A. Lopata, D. W. Cleveland, and B. Sollner-Webb, “RNA polymerase specificity of mRNA production and enhancer action,” Proc. Natl. Acad. Sci. U. S. A 83(18), 6677 (1986).
397 E. Myslinski, et al., “An unusually compact external promoter for RNA polymerase III
transcription of the human H1RNA gene,” Nucleic Acids Res. 29(12), 2502 (2001). 398 S. Gunnery, Y. Ma, and M. B. Mathews, “Termination sequence requirements vary
among genes transcribed by RNA polymerase III,” J. Mol. Biol. 286(3), 745 (1999). 399 M. Li and J. J. Rossi, “Lentiviral vector delivery of siRNA and shRNA encoding genes
into cultured and primary hematopoietic cells,” Methods Mol. Biol. 309, 261 (2005). 400 C. Raoul, et al., “Lentiviral-mediated silencing of SOD1 through RNA interference
retards disease onset and progression in a mouse model of ALS,” Nat. Med. 11(4), 423 (2005).
401 R. Taulli, et al., “RNAi technology and lentiviral delivery as a powerful tool to suppress
Tpr-Met-mediated tumorigenesis,” Cancer Gene Ther. 12(5), 456 (2005). 402 R. J. Fish and E. K. Kruithof, “Short-term cytotoxic effects and long-term instability of
RNAi delivered using lentiviral vectors,” BMC. Mol. Biol. 5, 9 (2004). 403 M. Miyagishi and K. Taira, “RNAi expression vectors in mammalian cells,” Methods
Mol. Biol. 252, 483 (2004). 404 C. P. Paul, “Subcellular distribution of small interfering RNA: directed delivery through
RNA polymerase III expression cassettes and localization by in situ hybridization,” Methods Enzymol. 392, 125 (2005).
405 D. Boden, et al., “Promoter choice affects the potency of HIV-1 specific RNA interfer-
ence,” Nucleic Acids Res. 31(17), 5033 (2003). 406 T. D. Palmer, et al., “Efficient expression of a protein coding gene under the control of
an RNA polymerase I promoter,” Nucleic Acids Res. 21(15), 3451 (1993). 407 P. Lingor and M. Bahr, “Targeting neurological disease with RNAi,” Mol. Biosyst. 3(11),
773 (2007). 408 K. Kajiwara, et al., “Immune responses to adenoviral vectors during gene transfer in the
brain,” Hum. Gene Ther. 8(3), 253 (1997). 409 R. Alba, A. Bosch, and M. Chillon, “Gutless adenovirus: last-generation adenovirus for
gene therapy,” Gene Ther. 12 Suppl 1, S18-S27 (2005). 410 D. Trono, “Lentiviral vectors: turning a deadly foe into a therapeutic agent,” Gene Ther.
7(1), 20 (2000).
170
7. References
411 L. F. Wong, et al., “Lentivirus-mediated gene transfer to the central nervous system: therapeutic and research applications,” Hum. Gene Ther. 17(1), 1 (2006).
412 A. L. Peel and R. L. Klein, “Adeno-associated virus vectors: activity and applications in
the CNS,” J. Neurosci. Methods 98(2), 95 (2000). 413 X. Xiao, et al., “Gene transfer by adeno-associated virus vectors into the central nervous
system,” Exp. Neurol. 144(1), 113 (1997). 414 K. M. Van Vliet, et al., “The role of the adeno-associated virus capsid in gene transfer,”
Methods Mol. Biol. 437, 51 (2008). 415 K. Qing, et al., “Human fibroblast growth factor receptor 1 is a co-receptor for infection
by adeno-associated virus 2,” Nat. Med. 5(1), 71 (1999). 416 C. Summerford and R. J. Samulski, “Membrane-associated heparan sulfate proteoglycan
is a receptor for adeno-associated virus type 2 virions,” J. Virol. 72(2), 1438 (1998). 417 C. Summerford, J. S. Bartlett, and R. J. Samulski, “AlphaVbeta5 integrin: a co-receptor
for adeno-associated virus type 2 infection,” Nat. Med. 5(1), 78 (1999). 418 Y. Kashiwakura, et al., “Hepatocyte growth factor receptor is a coreceptor for adeno-as-
sociated virus type 2 infection,” J. Virol. 79(1), 609 (2005). 419 C. L. Chen, et al., “Molecular characterization of adeno-associated viruses infecting
children,” J. Virol. 79(23), 14781 (2005). 420 M. Schmidt, et al., “Identification and characterization of novel adeno-associated virus
isolates in ATCC virus stocks,” J. Virol. 80(10), 5082 (2006). 421 G. Gao, L. H. Vandenberghe, and J. M. Wilson, “New recombinant serotypes of AAV
vectors,” Curr. Gene Ther. 5(3), 285 (2005). 422 S. Ramasamy, et al., “The MUC1 and galectin-3 oncoproteins function in a microRNA-
dependent regulatory loop,” Mol. Cell 27(6), 992 (2007). 423 E. Kohlbrenner, et al., “Successful production of pseudotyped rAAV vectors using a
modified baculovirus expression system,” Mol. Ther. 12(6), 1217 (2005). 424 B. Hauck, L. Chen, and W. Xiao, “Generation and characterization of chimeric recom-
binant AAV vectors,” Mol. Ther. 7(3), 419 (2003). 425 R. L. Klein, et al., “Neuron-specific transduction in the rat septohippocampal or nigros-
triatal pathway by recombinant adeno-associated virus vectors,” Exp. Neurol. 150(2), 183 (1998).
171
7. References
426 Per Andersen, Richard Morris, and David Amaral, “Hippocampal Neuroanatomy,”in The Hippocampus Book, 1 ed. edited by Per Andersen, Richard Morris, and David Amaral (Oxford Univ Pr, 2006), pp.37-114.
427 L. W. Swanson and W. M. Cowan, “Hippocampo-hypothalamic connections: origin in
subicular cortex, not ammon’s horn,” Science 189(4199), 303 (1975). 428 N. S. Canteras and L. W. Swanson, “Projections of the ventral subiculum to the amyg-
dala, septum, and hypothalamus: a PHAL anterograde tract-tracing study in the rat,” J. Comp Neurol. 324(2), 180 (1992).
429 N. L. Chamberlin, et al., “Recombinant adeno-associated virus vector: use for trans-
gene expression and anterograde tract tracing in the CNS,” Brain Res. 793(1-2), 169 (1998).
430 A. D. Loewy, “Viruses as transneuronal tracers for defining neural circuits,” Neurosci.
Biobehav. Rev. 22(6), 679 (1998). 431 M. C. Zemanick, P. L. Strick, and R. D. Dix, “Direction of transneuronal transport of
herpes simplex virus 1 in the primate motor system is strain-dependent,” Proc. Natl. Acad. Sci. U. S. A 88(18), 8048 (1991).
432 A. S. Jansen, M. W. Wessendorf, and A. D. Loewy, “Transneuronal labeling of CNS
neuropeptide and monoamine neurons after pseudorabies virus injections into the stel-late ganglion,” Brain Res. 683(1), 1 (1995).
433 Q. Du, et al., “Validating siRNA using a reporter made from synthetic DNA oligo-
nucleotides,” Biochem. Biophys. Res. Commun. 325(1), 243 (2004). 434 L. Tenenbaum, et al., “Recombinant AAV-mediated gene delivery to the central nervous
system,” J. Gene Med. 6 Suppl 1, S212-S222 (2004). 435 S. Pradervand, et al., “Impact of normalization on miRNA microarray expression profil-
ing,” RNA. 15(3), 493 (2009). 436 C. G. Liu, et al., “MicroRNA expression profiling using microarrays,” Nat. Protoc. 3(4),
563 (2008). 437 T. S. Davison, C. D. Johnson, and B. F. Andruss, “Analyzing micro-RNA expression
using microarrays,” Methods Enzymol. 411, 14 (2006). 438 S. I. Ashraf and S. Kunes, “A trace of silence: memory and microRNA at the synapse,”
Curr. Opin. Neurobiol. 16(5), 535 (2006). 439 U. Hengst and S. R. Jaffrey, “Function and translational regulation of mRNA in devel-
oping axons,” Semin. Cell Dev. Biol. 18(2), 209 (2007).

172
7. References
440 M. E. Klein, et al., “Homeostatic regulation of MeCP2 expression by a CREB-induced microRNA,” Nat. Neurosci. 10(12), 1513 (2007).
441 A. S. Nudelman, et al., “Neuronal activity rapidly induces transcription of the CREB-
regulated microRNA-132, in vivo,” Hippocampus (2009). 442 C. S. Park and S. J. Tang, “Regulation of microRNA expression by induction of bidirec-
tional synaptic plasticity,” J. Mol. Neurosci. 38(1), 50 (2009). 443 V. Chandrasekar and J. L. Dreyer, “microRNAs miR-124, let-7d and miR-181a regulate
Cocaine-induced Plasticity,” Mol. Cell Neurosci. (2009). 444 M. Bak, et al., “MicroRNA expression in the adult mouse central nervous system,”
RNA (2008). 445 P. T. Nelson and B. R. Wilfred, “In situ hybridization is a necessary experimental com-
plement to microRNA (miRNA) expression profiling in the human brain,” Neurosci. Lett. (2009).
446 E. Varallyay, J. Burgyan, and Z. Havelda, “Detection of microRNAs by Northern blot
analyses using LNA probes,” Methods 43(2), 140 (2007). 447 A. N. Silahtaroglu, et al., “Detection of microRNAs in frozen tissue sections by fluores-
cence in situ hybridization using locked nucleic acid probes and tyramide signal ampli-fication,” Nat. Protoc. 2(10), 2520 (2007).
448 G. Wheeler, et al., “In situ detection of animal and plant microRNAs,” DNA Cell Biol.
26(4), 251 (2007). 449 Y. Zhao, et al., “Dysregulation of cardiogenesis, cardiac conduction, and cell cycle in
mice lacking miRNA-1-2,” Cell 129(2), 303 (2007). 450 B. Yang, et al., “The muscle-specific microRNA miR-1 regulates cardiac arrhythmo-
genic potential by targeting GJA1 and KCNJ2,” Nat. Med. 13(4), 486 (2007). 451 T. Mishima, et al., “RT-PCR-based analysis of microRNA (miR-1 and -124) expression
in mouse CNS,” Brain Res. 1131(1), 37 (2007). 452 M. Kapsimali, et al., “MicroRNAs show a wide diversity of expression profiles in the
developing and mature central nervous system,” Genome Biol. 8(8), R173 (2007). 453 B. Ason, et al., “Differences in vertebrate microRNA expression,” Proc. Natl. Acad. Sci.
U. S A 103(39), 14385 (2006). 454 A. Z. Pietrzykowski, et al., “Posttranscriptional regulation of BK channel splice variant
stability by miR-9 underlies neuroadaptation to alcohol,” Neuron 59(2), 274 (2008).

173
7. References
455 A. N. Packer, et al., “The bifunctional microRNA miR-9/miR-9* regulates REST and CoREST and is downregulated in Huntington’s disease,” J. Neurosci. 28(53), 14341 (2008).
456 M. V. Iorio, et al., “MicroRNA gene expression deregulation in human breast cancer,”
Cancer Res. 65(16), 7065 (2005). 457 M. Ozen, et al., “Widespread deregulation of microRNA expression in human prostate
cancer,” Oncogene (2007). 458 G. K. Scott, et al., “Coordinate suppression of ERBB2 and ERBB3 by enforced expres-
sion of micro-RNA miR-125a or miR-125b,” J. Biol. Chem. 282(2), 1479 (2007). 459 B. R. Schulman, A. Esquela-Kerscher, and F. J. Slack, “Reciprocal expression of lin-
41 and the microRNAs let-7 and mir-125 during mouse embryogenesis,” Dev. Dyn. 234(4), 1046 (2005).
460 L. Smirnova, et al., “Regulation of miRNA expression during neural cell specification,”
Eur. J. Neurosci. 21(6), 1469 (2005). 461 X. Tang, et al., “A simple array platform for microRNA analysis and its application in
mouse tissues,” RNA 13(10), 1803 (2007). 462 Y. M. Tay, et al., “MicroRNA-134 modulates the differentiation of mouse embryonic
stem cells, where it causes post-transcriptional attenuation of Nanog and LRH1,” Stem Cells 26(1), 17 (2008).
463 C. Anderson, H. Catoe, and R. Werner, “MIR-206 regulates connexin43 expression
during skeletal muscle development,” Nucleic Acids Res. 34(20), 5863 (2006). 464 T. Hansen, et al., “Brain expressed microRNAs implicated in schizophrenia etiology,”
PLoS ONE. 2(9), e873 (2007). 465 M. J. Kye, et al., “Somatodendritic microRNAs identified by laser capture and multi-
plex RT-PCR,” RNA 13(8), 1224 (2007). 466 G. Lugli, et al., “Expression of microRNAs and their precursors in synaptic fractions of
adult mouse forebrain,” J. Neurochem. 106(2), 650 (2008). 467 J. T. Coyle, “MicroRNAs suggest a new mechanism for altered brain gene expression in
schizophrenia,” Proc. Natl. Acad. Sci. U. S. A 106(9), 2975 (2009).

174
8. Acknowledgements
8. Acknowledgements
I wish to thank Prof. Dr. W. Wurst, Prof. Dr. Dr. Dr. F. Holsboer, Prof. Dr. Beat Lutz and Dr. J.M. Deussing for continous support, supervision and financing of the research.
I greatly appreciate the time and effort of the examination board for evaluation and examination of my thesis: Prof. Dr. W. Wurst, Prof. Dr. Jerzy Adamski, Prof. Dr. A. Gierl.
I want to express my deep gratitude to all colleagues, collaborators and partners for their help: Martin Ableitner, Maria Brenz-Verca, Johannes Breu, Marisa Brockmann, Astrid Cannich, Gérome Cavaillé, Gabriella Czepek, Anika Daschner, Nina Dedic, Sabit Delic, Bettina Dörr, Stefanie Ehrenberg, Barbara Fackelmeier, Constanze Fey, Franz Peter Fischer, Nadine Franke, Cornelia Graf, Ingrid Grummt, Eisabeth Guell, Lisa R. Halbsgut, Greg Hannon, Heike Hermann, Carola Hetzel, Tanja Holjevac, Kornelia Kamprath, Anna Krichevsky, Franz Katzl, Wolfgang Kelsch, Leonid G. Khaspenkov, Ruth Klafke, Torsten Klengel, Helena Kronsbein, Sebastian Kügler, Ralf Kühn, Claudia Kühne, Annerose Kurz-Drexler, Leo Kutzer, Susanne Laaß, Kristin Lerche, Myrto Logothetis, Giovanni Marsicano, Federiko Massa, Christine Mayer, Anna Mederer, Robert Menz, Katja Meyer, Sabrina Meyr, Katja Möllmann, Krisztina Monory, Tanja Orschmann, Nilima Prakash, Benno Pütz, Damian Refojo, Florian Riese, Marcel Schieven, Marion Schumacher, Michel Steiner, Regine Stöger, Dietrich Trümbach, Stefanie Unkmeir, Albin Varga, Michale Vincenzo, Annette Vogl, Daniela Vogt-Weisenhorn, Sandra Walser, Katharine Webb, Christian Weber, Gertraud Weber, Rudolf Weber, Jochen Weber, Barbara Wölfel, Carsten Wotjak, Juliane Wunsch.