RhPt and Ni Based Catalysts for Fuel Reforming ... - DiVA Portal
114
RhPt and Ni Based Catalysts for Fuel Reforming in Energy Conversion ANGÉLICA V. GONZÁLEZ ARCOS Doctoral Thesis Stockholm, Sweden 2015
-
Upload
khangminh22 -
Category
Documents
-
view
1 -
download
0
Transcript of RhPt and Ni Based Catalysts for Fuel Reforming ... - DiVA Portal
RhPt and Ni Based Catalysts for Fuel Reforming inEnergy Conversion
ANGÉLICA V. GONZÁLEZ ARCOS
Doctoral ThesisStockholm, Sweden 2015
TRITA-CHE Report 2015:10ISSN 1654-1081ISBN 978-91-7595-440-0
KTH School of Chemical Science and EngineeringSE-100 44 Stockholm
SWEDEN
Akademisk avhandling som med tillstånd av Kungl Tekniska högskolan framläg-ges till offentlig granskning för avläggande av Doctor of Philosophy in ChemicalEngineering Thursday, 5 March at 10:00 i Lecture hall F3, Lindstedtsvägen 26Kungl Tekniska högskolan. SE-100 44 StockholmFaculty Opponent: Prof. Anker Degn Jensen, Danmarks Tekniske Universitet, Lyng-by, DanmarkCover: SEM image, customized by Giovani Sanchéz.
© Angélica V. González Arcos , March 2015
Tryck: Universitetsservice US AB

To my family, my source of
motivation and praise
iv
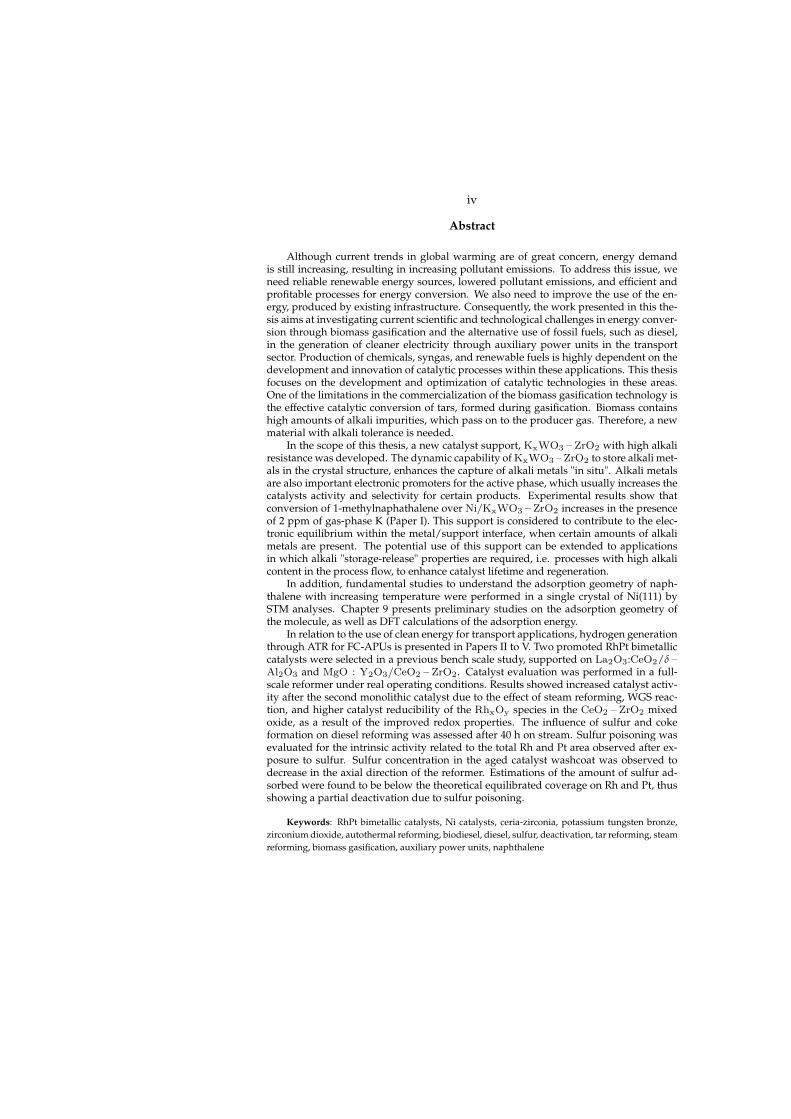
Abstract
Although current trends in global warming are of great concern, energy demandis still increasing, resulting in increasing pollutant emissions. To address this issue, weneed reliable renewable energy sources, lowered pollutant emissions, and efficient andprofitable processes for energy conversion. We also need to improve the use of the en-ergy, produced by existing infrastructure. Consequently, the work presented in this the-sis aims at investigating current scientific and technological challenges in energy conver-sion through biomass gasification and the alternative use of fossil fuels, such as diesel,in the generation of cleaner electricity through auxiliary power units in the transportsector. Production of chemicals, syngas, and renewable fuels is highly dependent on thedevelopment and innovation of catalytic processes within these applications. This thesisfocuses on the development and optimization of catalytic technologies in these areas.One of the limitations in the commercialization of the biomass gasification technology isthe effective catalytic conversion of tars, formed during gasification. Biomass containshigh amounts of alkali impurities, which pass on to the producer gas. Therefore, a newmaterial with alkali tolerance is needed.
In the scope of this thesis, a new catalyst support, KxWO3 – ZrO2 with high alkaliresistance was developed. The dynamic capability of KxWO3 – ZrO2 to store alkali met-als in the crystal structure, enhances the capture of alkali metals "in situ". Alkali metalsare also important electronic promoters for the active phase, which usually increases thecatalysts activity and selectivity for certain products. Experimental results show thatconversion of 1-methylnaphathalene over Ni/KxWO3 – ZrO2 increases in the presenceof 2 ppm of gas-phase K (Paper I). This support is considered to contribute to the elec-tronic equilibrium within the metal/support interface, when certain amounts of alkalimetals are present. The potential use of this support can be extended to applicationsin which alkali "storage-release" properties are required, i.e. processes with high alkalicontent in the process flow, to enhance catalyst lifetime and regeneration.
In addition, fundamental studies to understand the adsorption geometry of naph-thalene with increasing temperature were performed in a single crystal of Ni(111) bySTM analyses. Chapter 9 presents preliminary studies on the adsorption geometry ofthe molecule, as well as DFT calculations of the adsorption energy.
In relation to the use of clean energy for transport applications, hydrogen generationthrough ATR for FC-APUs is presented in Papers II to V. Two promoted RhPt bimetalliccatalysts were selected in a previous bench scale study, supported on La2O3:CeO2/δ –Al2O3 and MgO : Y2O3/CeO2 – ZrO2. Catalyst evaluation was performed in a full-scale reformer under real operating conditions. Results showed increased catalyst activ-ity after the second monolithic catalyst due to the effect of steam reforming, WGS reac-tion, and higher catalyst reducibility of the RhxOy species in the CeO2 – ZrO2 mixedoxide, as a result of the improved redox properties. The influence of sulfur and cokeformation on diesel reforming was assessed after 40 h on stream. Sulfur poisoning wasevaluated for the intrinsic activity related to the total Rh and Pt area observed after ex-posure to sulfur. Sulfur concentration in the aged catalyst washcoat was observed todecrease in the axial direction of the reformer. Estimations of the amount of sulfur ad-sorbed were found to be below the theoretical equilibrated coverage on Rh and Pt, thusshowing a partial deactivation due to sulfur poisoning.
Keywords: RhPt bimetallic catalysts, Ni catalysts, ceria-zirconia, potassium tungsten bronze,zirconium dioxide, autothermal reforming, biodiesel, diesel, sulfur, deactivation, tar reforming, steamreforming, biomass gasification, auxiliary power units, naphthalene
v
Sammanfattning
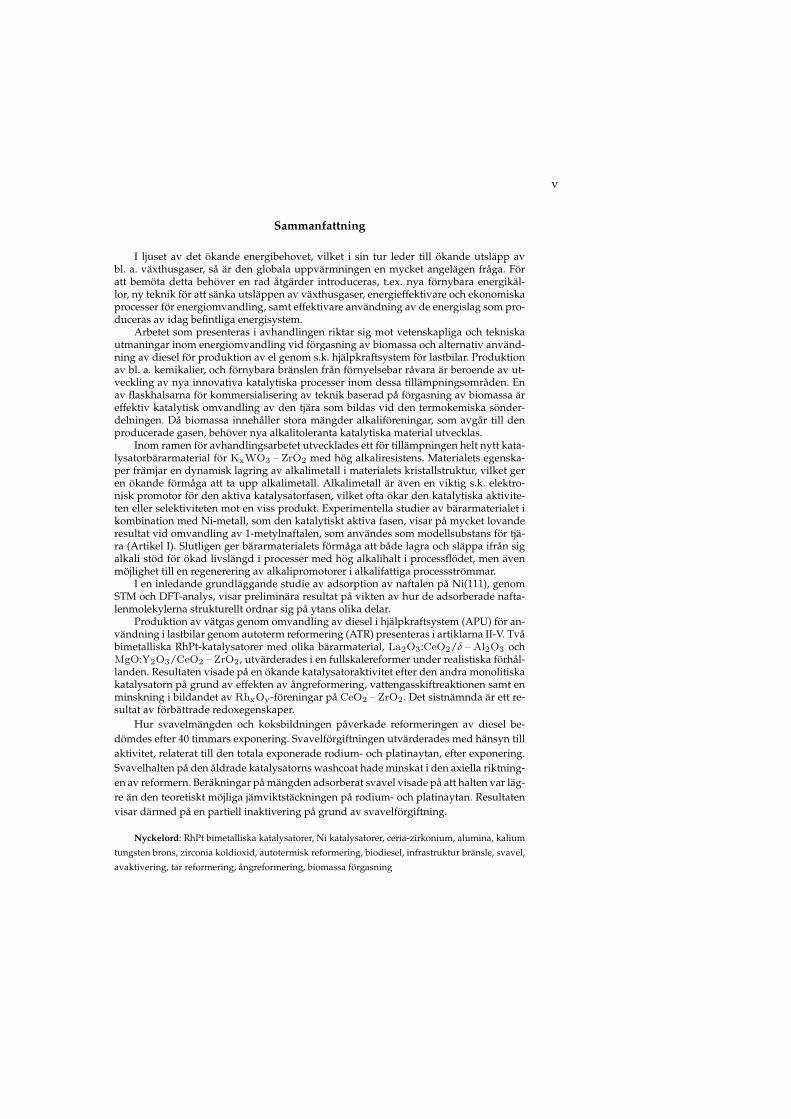
I ljuset av det ökande energibehovet, vilket i sin tur leder till ökande utsläpp avbl. a. växthusgaser, så är den globala uppvärmningen en mycket angelägen fråga. Föratt bemöta detta behöver en rad åtgärder introduceras, t.ex. nya förnybara energikäl-lor, ny teknik för att sänka utsläppen av växthusgaser, energieffektivare och ekonomiskaprocesser för energiomvandling, samt effektivare användning av de energislag som pro-duceras av idag befintliga energisystem.
Arbetet som presenteras i avhandlingen riktar sig mot vetenskapliga och tekniskautmaningar inom energiomvandling vid förgasning av biomassa och alternativ använd-ning av diesel för produktion av el genom s.k. hjälpkraftsystem för lastbilar. Produktionav bl. a. kemikalier, och förnybara bränslen från förnyelsebar råvara är beroende av ut-veckling av nya innovativa katalytiska processer inom dessa tillämpningsområden. Enav flaskhalsarna för kommersialisering av teknik baserad på förgasning av biomassa äreffektiv katalytisk omvandling av den tjära som bildas vid den termokemiska sönder-delningen. Då biomassa innehåller stora mängder alkaliföreningar, som avgår till denproducerade gasen, behöver nya alkalitoleranta katalytiska material utvecklas.
Inom ramen för avhandlingsarbetet utvecklades ett för tillämpningen helt nytt kata-lysatorbärarmaterial för KxWO3 – ZrO2 med hög alkaliresistens. Materialets egenska-per främjar en dynamisk lagring av alkalimetall i materialets kristallstruktur, vilket geren ökande förmåga att ta upp alkalimetall. Alkalimetall är även en viktig s.k. elektro-nisk promotor för den aktiva katalysatorfasen, vilket ofta ökar den katalytiska aktivite-ten eller selektiviteten mot en viss produkt. Experimentella studier av bärarmaterialet ikombination med Ni-metall, som den katalytiskt aktiva fasen, visar på mycket lovanderesultat vid omvandling av 1-metylnaftalen, som användes som modellsubstans för tjä-ra (Artikel I). Slutligen ger bärarmaterialets förmåga att både lagra och släppa ifrån sigalkali stöd för ökad livslängd i processer med hög alkalihalt i processflödet, men ävenmöjlighet till en regenerering av alkalipromotorer i alkalifattiga processströmmar.
I en inledande grundläggande studie av adsorption av naftalen på Ni(111), genomSTM och DFT-analys, visar preliminära resultat på vikten av hur de adsorberade nafta-lenmolekylerna strukturellt ordnar sig på ytans olika delar.
Produktion av vätgas genom omvandling av diesel i hjälpkraftsystem (APU) för an-vändning i lastbilar genom autoterm reformering (ATR) presenteras i artiklarna II-V. Tvåbimetalliska RhPt-katalysatorer med olika bärarmaterial, La2O3:CeO2/δ – Al2O3 ochMgO:Y2O3/CeO2 – ZrO2, utvärderades i en fullskalereformer under realistiska förhål-landen. Resultaten visade på en ökande katalysatoraktivitet efter den andra monolitiskakatalysatorn på grund av effekten av ångreformering, vattengasskiftreaktionen samt enminskning i bildandet av RhxOy-föreningar på CeO2 – ZrO2. Det sistnämnda är ett re-sultat av förbättrade redoxegenskaper.
Hur svavelmängden och koksbildningen påverkade reformeringen av diesel be-dömdes efter 40 timmars exponering. Svavelförgiftningen utvärderades med hänsyn tillaktivitet, relaterat till den totala exponerade rodium- och platinaytan, efter exponering.Svavelhalten på den åldrade katalysatorns washcoat hade minskat i den axiella riktning-en av reformern. Beräkningar på mängden adsorberat svavel visade på att halten var läg-re än den teoretiskt möjliga jämviktstäckningen på rodium- och platinaytan. Resultatenvisar därmed på en partiell inaktivering på grund av svavelförgiftning.
Nyckelord: RhPt bimetalliska katalysatorer, Ni katalysatorer, ceria-zirkonium, alumina, kalium
tungsten brons, zirconia koldioxid, autotermisk reformering, biodiesel, infrastruktur bränsle, svavel,
avaktivering, tar reformering, ångreformering, biomassa förgasning

Papers referred to in this thesis
I. Angélica V. González, Matteo Diomedi, Roberto Lanza, Klas Engvall. Effectof potassium electrochemical promotion on Ni-based catalysts for biomass-tar reforming. Submitted.
II. Xanthias Karatzas, Kjell Jansson, Angélica V. González, Jazaer Dawody, LarsJ. Pettersson. Autothermal reforming of low-sulfur diesel over bimetallic Rh-Pt supported on Al2O3, CeO2 – ZrO2, SiO2 and TiO2. Applied Catalysis B 106(2011) 476-487
III. Angélica V. González, Xanthias Karatzas, Lars J. Pettersson. Autothermal re-forming of Fisher-Tropsch diesel over alumina and ceria-zirconia supportedcatalysts. Fuel 107(2013)162-169.
IV. Angélica V. González, Lars J. Pettersson. Full-scale auto thermal reformingfor transport applications: The effect of diesel fuel quality. Catalysis Today210 (2013) 19-25.
V. Angélica V. González, J. Rostrup-Nielsen, Klas Engvall, Lars J. Pettersson.Promoted RhPt bimetallic catalyst supported on δ -Al2O3 and CeO2 – ZrO2during full-scale auto thermal reforming for automotive applications: post-mortem characterization. Applied Catalysis A: General 491 (2015) 8-16.
vii
viii
Contribution to publications
I. The author had the responsibility for writing this paper. In addition to the de-sign and construction of the experimental set-up, the catalyst developmentand evaluation was also carried out by me. Initial evaluation of catalysts wasa joint effort between myself and Matteo Diomedi, under my supervision.The work function analyses were performed by Gabriela Maniak.
II. The main person responsible for writing this paper was Xanthias Karatzas.The experimental work was a joint effort between myself and Xanthias Ka-ratzas. TEM analyses were performed by Kjell Jansson.
III. The author had the main responsibility in writing this paper. I performed allexperimental work. Reactor design was performed by Xanthias Karatzas.
IV. The author had the main responsibility in writing this paper. Additionally,all experimental work and posterior analysis was also performed by the aut-hor of this thesis.
V. The author had the main responsibility in writing this paper, as well as thedesign and execution of all the experimental work. Sulfur analyses were per-formed by Stig Torben Røen and Lars Frøsig Østergaard.
Other publications andconference/seminar contributions
Papers
1. A.V. González, Bård Lindström, Henrik M.J. Kusar. Catalytic combustion oftetradecane and Fischer-Tropsch diesel on metal oxide catalysts. Submitted.
Oral presentations
1. A.V. González, K. Engvall. The effect of gas-phase alkali on Ni-based cata-lysts for biomass tar reforming. Oral presentation given at the 23rd CanadianSymposium of Catalysis on the 14th of May, 2014. Edmonton, Canada.
2. A.V. González, J. Rostrup-Nielsen, K. Engvall, L.J. Pettersson. Full-scale hyd-rogen generation of transport applications: Characterization of aged catalyst.Oral presentation in discussion symposia at the EuropaCat XI, 2013. Lyon,France. Awarded with EFCATS student award for scientific contribution.
3. A.V. González, X. Karatzas, L.J. Pettersson. Full-scale autothermal reformingfor transport applications. Oral presentation at International Symposium onCatalysis for Clean Energy and Sustainable Chemistry. 2012 Jun 27th, Madrid,Spain.
4. A.V. González and L.J. Pettersson. Catalytic hydrogen production for auto-motive applications. Oral presentation given at: KTH-Energy Seminar, 2011Feb 23; Stockholm, Sweden.
5. X. Karatzas, A.V. González, A. Grant, J. Dawody, L.J. Pettersson, Hydrogengeneration from low-sulphur diesel over Rh-based metallic monolithic cata-lyst. Oral presentation given at: 14th Nordic Symposium on Catalysis, 2010August 29; Marienlyst, Denmark.
Posters
1. A.V. Gonzalez, K. Engvall. The effect of gas-phase alkali on Ni-based ca-talysts supported on KxWO3 – ZrO2 for biomass tar reforming. Presented
ix
x
on The 7th Tokyo Conference on advance catalytic science and technology(TOCAT7), Kyoto, June 2014. Awarded as the best poster by ACS Catalysis.
2. A.V. González, J. Rostrup-Nielsen, K. Engvall, L.J. Pettersson. Full-scale hyd-rogen generation of transport applications: Characterization of aged catalyst.Poster presented at the EuropaCat XI, 2013. Lyon, France.
3. A.V. González, L. Arkatova, K. Engvall. Ni3Al intermetallides for biomass-derived tar reforming. Poster presented at the 23th NAM , 2013 June 4, Lou-isville, Kentucky, USA.
4. A.V. González, V. Nemanova, P.H. Moud, K. Engvall. Renewable waste: Apuzzle for scientist but the key for sustainable development. Poster winnerof the ABB best poster award at KTH Energy dialogue 2012.
5. A.V. González, H. Kusar. Catalytic combustion of tetradecane and Fischer-Tropsch diesel on metal oxide catalyst. Poster presented at the 7th Interna-tional Conference on Environmental Catalysis, 2012 Sept 2, Lyon, France.
6. A.V. González and L.J. Pettersson, Material for hydrogen generation frombiofuels. Poster presented at KTH Energy Initiative-an Energy day at KTH,2011 Nov 9; Stockholm, Sweden.
7. A.V. González and L.J. Pettersson, CeO2 – ZrO2 and Al2O3 supported cata-lysts for autothermal reforming of Fischer-Tropsch diesel. Poster presentedat: 10th EuropaCat, 2011 Sept 1; Glasgow, Scotland.
8. A.V. González and L.J. Pettersson, CeO2 – ZrO2 and Al2O3 supports for au-tothermal reforming of rapeseed methyl ester (RME) and commercial diesel(MK1, EN 590). Poster presented at: 22nd North American catalyst societymeeting, 2011 Jun 6; Detroit, Michigan.
9. A.V. González and L.J.Pettersson, Hydrogen production in an on-board fu-el processor for automotive applications. Poster presented and awarded asbest poster at: KTH Energy Initiative-an Energy day at KTH, 2010 Nov 24;Stockholm, Sweden.
Preface
Thanks to technological advances, we have a developed world in which we allneed energy for transport, to heat our houses, and for industrial processes. Weexpect to have food, clothes, jobs, a healthy life for our family and access to te-chnology. Besides, the need for a comfortable lifestyle for some privilege people,and basic access for most of the global population, we are also concerned aboutsustainable development and environmental quality. Nevertheless, global energydemand is steadily increasing due to continuous population growth and the in-dustrialization of developing countries. Presently, at least 80% of the global energyused is based on fossil fuels. Fossil fuel combustion is the primary source of ant-hropogenic Greenhouse gas (GHG) emissions. Carbon dioxide (CO2) is the mainGHG, with approximately 35 Gt released globally to the atmosphere in 2014, accor-ding to the International Energy Agency (IEA) [1, 2]. If these emissions continueto increase at the current rate, the expected result is a 4 °C increase in the ave-rage global temperature by 2050, representing potentially disastrous consequencesworldwide, including droughts, famine, population displacement, and irreversib-le ecosystem damage [3]. Two sectors produced nearly two-thirds of global CO2emissions in 2012: electricity and heat generation, by far the largest, accountedfor 42%, while transport accounted for 23%, according to the latest report on CO2emissions from fuel combustion presented by the IEA [2].
In order to reduce fossil fuel emissions and achieve sustainable energy systems,three main approaches are needed: a dramatic shift to renewable energy sourcessuch as wind, hydro, solar, geothermal, and biomass (wood, straw, grain, andvarious biological waste materials); increasingly efficient use of available ener-gy sources; and an increasing transition from coal to cleaner fossil fuels such asnatural gas. Although significant progress has been made in reducing GHG emis-sions through local, national, and international policies, as well as technologicaladvancements, more effort is required to mitigate the increasing danger of climatechange, and a growing amount of research is being directed at renewable energyconversion.
Use of renewable fuels and integration of Fuel cell auxiliary power units (FC-APUs) in vehicles have been considered as ways to mitigate issues such as pollu-tant emissions, oil dependence, and greenhouse emissions in the transport sector.Although fuel cells use hydrogen as the energy carrier for electrical output, they
xi
xii
are limited in the transport sector due to safety in hydrogen storage and poor fuelinfrastructure. Such limitations can be overcome by using renewable fuels, suchas biodiesel or synthetic diesel. Emissions can be reduced with the catalytic con-version of biofuels into synthesis gas, better known as syngas, for multi-fuelledauxiliary power units.
Syngas, composed of a mixture of Hydrogen (H2), Carbon monoxide (CO),and CO2 is also used for the production of renewable fuels such as biodiesel andFischer-Tropsch diesel. The generation of syngas through biomass gasification in-volves three main steps: the pretreatment of biomass, gasification, and the upgra-ding of the gasification products (H2, CO, CO2, CH4, tar, and others). Tars, heavypolyaromatic hydrocarbons that are generally classified as hydrocarbons with ahigher molecular weight than benzene, are formed during the gasification step andpose a significant obstacle, as they can agglomerate and clog the piping system,causing damage to downstream units. Physical tar removal requires lowering thetemperature of the system, and results in a reduction in overall efficiency. Ideal-ly, tar removal could be accomplished by thermochemical conversion to syngasat high temperatures; however, tars are difficult to convert due to their polyaro-matic nature and resulting high thermal stability. Catalytic reforming is importantfor the optimization of the key technologies described in this thesis: biomass gasi-fication and hydrogen generation for automotive applications. Through catalyticreforming, tars can be converted into syngas, increasing the yield of high energygrade gases produced, as well as reducing potential losses of thermal efficiencyduring the upgrading step. Similarly, hydrogen generation though catalytic refor-ming of diesel will eventually promote the full commercialization of the APUstechnology in the transport sector.
The focus of this thesis is on the conversion of two energy sources, biomass anddiesel, into syngas that is used towards the production of biofuels and hydrogen-rich gas, commonly used in FC-APUs. Syngas is generated through several proces-ses, such as biomass gasification and fuel reforming. Two fuel reforming processesof interest for this thesis are tar reforming following biomass gasification, and die-sel reforming. Additionally, this thesis includes the development, analysis, andperformance evaluation of Ni-based catalysts in tar reforming, and RhPt-basedcatalysts in diesel reforming.
Thesis Outline
This doctoral thesis is comprised of three parts: Part 1 presents a general introduc-tion to syngas production through biomass derived tars and commercial diesel,the different fuel processing technologies, and currently used reforming catalysts;Part 2 includes experimental procedures and analytic techniques used in this the-sis; and Part 3 focuses on experimental results and associated discussions.
Contents
Contents xiii
I Introduction 1
1 Tar reforming in biomass gasification systems 31.1 Biomass as a feedstock . . . . . . . . . . . . . . . . . . . . . . . . . . 31.2 Biomass gasification . . . . . . . . . . . . . . . . . . . . . . . . . . . 4
1.2.1 Gas impurities and upgrading . . . . . . . . . . . . . . . . . 71.2.2 Tar Conversion . . . . . . . . . . . . . . . . . . . . . . . . . . 7
2 Diesel reforming for automotive applications 112.1 Auxiliary power units . . . . . . . . . . . . . . . . . . . . . . . . . . 122.2 Diesel as fuel . . . . . . . . . . . . . . . . . . . . . . . . . . . . . . . . 122.3 Fuel processing for H2 production . . . . . . . . . . . . . . . . . . . 14
3 Fuel processing technologies 173.1 Reforming modes . . . . . . . . . . . . . . . . . . . . . . . . . . . . . 173.2 Selection of reforming modes . . . . . . . . . . . . . . . . . . . . . . 21
4 Catalysis in fuel reforming 234.1 Substrates . . . . . . . . . . . . . . . . . . . . . . . . . . . . . . . . . 234.2 Catalyst deactivation . . . . . . . . . . . . . . . . . . . . . . . . . . . 25
4.2.1 Sulfur poisoning . . . . . . . . . . . . . . . . . . . . . . . . . 264.2.2 Sintering . . . . . . . . . . . . . . . . . . . . . . . . . . . . . . 26
4.3 The role of alkali . . . . . . . . . . . . . . . . . . . . . . . . . . . . . . 264.3.1 Alkali interactions . . . . . . . . . . . . . . . . . . . . . . . . 28
4.4 Catalysts for tar reforming . . . . . . . . . . . . . . . . . . . . . . . . 294.5 Catalysts for on-board H2 generation . . . . . . . . . . . . . . . . . . 30
5 Objectives of the work 33
xiii
xiv
II Experimental methodology 35
6 Reactor set-ups 376.1 Laboratory-scale steam reformer . . . . . . . . . . . . . . . . . . . . 37
6.1.1 Experimental procedure . . . . . . . . . . . . . . . . . . . . . 396.2 Full-scale (5kW) ATR reformer . . . . . . . . . . . . . . . . . . . . . 40
6.2.1 Experimental procedure . . . . . . . . . . . . . . . . . . . . . 40
7 Catalyst development 437.1 Catalyst preparation . . . . . . . . . . . . . . . . . . . . . . . . . . . 437.2 Catalyst characterization . . . . . . . . . . . . . . . . . . . . . . . . . 43
7.2.1 Surface are and pore size by N2 Adsorption . . . . . . . . . . 447.2.2 Chemisorption . . . . . . . . . . . . . . . . . . . . . . . . . . 447.2.3 Temperature programmed methods . . . . . . . . . . . . . . 447.2.4 Work function measurements . . . . . . . . . . . . . . . . . . 457.2.5 Spectroscopy methods . . . . . . . . . . . . . . . . . . . . . . 457.2.6 Microscopy methods . . . . . . . . . . . . . . . . . . . . . . . 46
III Results and discussion 49
8 Steam reforming of MNP (Paper I) 518.1 Catalyst development . . . . . . . . . . . . . . . . . . . . . . . . . . 518.2 Characterization . . . . . . . . . . . . . . . . . . . . . . . . . . . . . . 53
8.2.1 Promoting effect of K . . . . . . . . . . . . . . . . . . . . . . . 548.3 MNP steam reforming . . . . . . . . . . . . . . . . . . . . . . . . . . 58
8.3.1 SR over Ni/MgOAl2O3 . . . . . . . . . . . . . . . . . . . . . 588.3.2 SR over Ni/KxWO3 – ZrO2 . . . . . . . . . . . . . . . . . . . 598.3.3 Effect of gas-phase K in tar reforming . . . . . . . . . . . . . 62
9 Naphthalene adsorption geometry on Ni(111) 659.1 Adsorption of naphthalene with increasing temperature . . . . . . 65
10 Catalysts for diesel reforming (Papers II, III- V) 6910.1 RhPt bimetallic catalysts (Paper II, III) . . . . . . . . . . . . . . . . . 69
10.1.1 Characterization . . . . . . . . . . . . . . . . . . . . . . . . . 7010.2 Multifuel Autothermal reforming (Paper II, III) . . . . . . . . . . . . 71
10.2.1 Effect of operating conditions . . . . . . . . . . . . . . . . . . 7310.3 Post-mortem evaluation (Paper V) . . . . . . . . . . . . . . . . . . . 75
10.3.1 Carbon content . . . . . . . . . . . . . . . . . . . . . . . . . . 7510.3.2 Sulfur profile . . . . . . . . . . . . . . . . . . . . . . . . . . . 79

CONTENTS xv
IV Final remarks 81
11 Conclusions and future work 8311.1 On tar reforming and electrochemical promotion of alkali . . . . . . 8311.2 On diesel reforming for H2 generation in APUs . . . . . . . . . . . . 85
12 Acknowledgments 87
References 89


Part I
Introduction
1

Chapter 1
Tar reforming in biomass gasificationsystems
According to the recent energy outlook in the transport sector, the IEA has iden-tified biomass as a potential sustainable energy source that could substantiallycontribute to the global energy demand of modern society [4], since bioenergycomprises 60% of total gross inland electrical energy use [5]. Biomass usage isgrowing, not only for the production of heat and electric power through directcombustion, but also as a feedstock in the production of chemicals such as syngas,methanol, and hydrocarbons for automotive applications. Rather than extractingenergy from biomass through direct combustion, it is preferable to gasify biomassand upgrade it via catalytic reforming to syngas, which serves as an intermediatein the production of hydrogen gas in addition to various other chemicals, such asthe Fischer-Tropsch diesel/waxes.
1.1 Biomass as a feedstock
Biomass can be defined as varying compositions of organic material, derived fromplants, animals, and waste. However, in practice, it is a non-homogeneous feed-stock obtained from many agricultural crops and organic waste, used for powergeneration [6]. It is considered a green energy source, as the amount of CO2 gen-erated during its conversion is equal to the amount of CO2 absorbed by the livingorganism from the environment during its lifetime. From a chemical point of view,biomass consists of hemicellulose (a mixture of polysaccharides), cellulose (a glu-cose polymer), lignin (a miscellaneous mixture of organic high molecular-weightcompounds), and a small percentage of other substances (inorganic matter). Themost significant properties of this feedstock for the thermochemical conversion ofbiomass are the following: lower heating value (LHV), ash content, alkali metalcontent, certain amounts of fixed carbon and volatiles, and cellulose/lignin ra-tio [7].
3
4
1.2 Biomass gasification
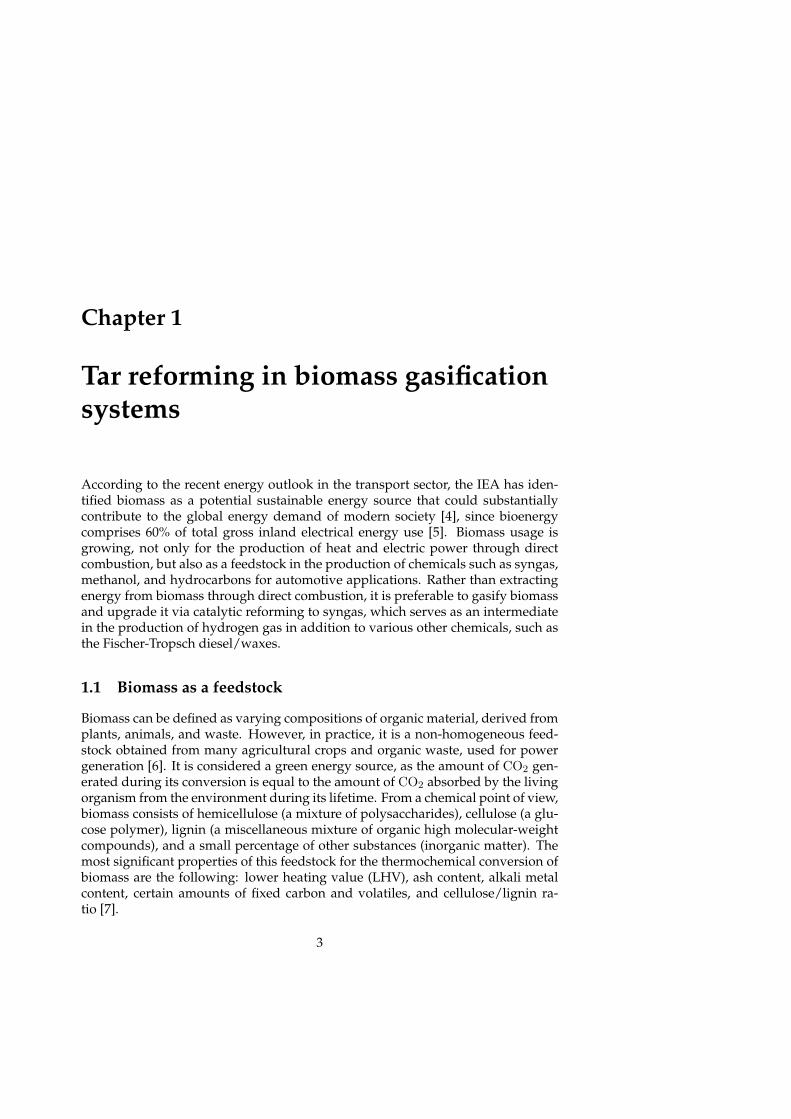
The conversion of biomass is generally performed by means of biochemical andthermochemical processes [8]. Thermochemical conversion includes pyrolysis,gasification, and combustion. While combustion of biomass is the most directand technically simplest process, the overall efficiency of generating heat frombiomass energy is rather low [9, 10]. Gasification has many advantages over com-bustion. It can use low-value feedstocks and convert them not only into electricity,but also into other chemical energy carriers [11]. Biomass gasification also confersa few significant advantages: the feedstock can be any type of biomass, includingagricultural residues, forestry residues, non-fermentable byproducts from biore-finaries, and even organic municipal waste. Depending on the gasification tem-perature, two types of product gas can be obtained, as shown in Figure 1.1: a lowtemperature gas product if below 1000 °C, and a biosyngas that is generated attemperatures between 1200 to 1400 °C [12]. The product gas can be further con-verted through reforming into biosyngas, or used for the production of syntheticnatural gas (SNG) and for power generation. The biosyngas can be converted viacatalytic processing into a variety of fuels (H2, Fischer-Tropsch (FT) diesels, syn-thetic gasoline) and chemicals (methanol, urea) as substitutes for petroleum-basedchemicals; and the products are more compatible with existing petroleum refin-ing operations [13, 14]. The major disadvantages include the high cost associatedwith cleaning of the product gas from tar and alkali components. In addition, thesystem inefficiency due to the required high temperatures, and the unproven useof products (syngas and bio-oil) as transportation fuels create great barriers in thefull commercialization of this technology. The major disadvantages include thehigh cost associated with cleaning the product gas of tar and alkali components.In addition, the system inefficiency due to the required high temperatures, andthe unproven use of the products (i.e., syngas and bio-oil) as transportation fuels,create great barriers in the full commercialization of this technology.
Conversion of biomass into high gaseous energy carriers involves different
Figure 1.1: Biomass gasification products and applications. Adapted from [12].
1.2. BIOMASS GASIFICATION 5
methods, depending on the end-user application and desired products [6]. In gen-eral, gasification is the thermochemical conversion of carbon containing fuels, i.e.biomass into a gaseous energy carrier. The general reaction (not balanced) of gasi-fication of biomass is shown in Equation 1.1.
CHxOy (biomass) +O2 (21% of air) +H2O (steam)→ CH4 +CO+CO2
+H2 +H2O (unreacted steam) +C (char) +C2 – C5 +C6H6 + tar(1.1)
The process of biomass gasification begins with the pretreatment or processingof biomass, which depends on the feedstock to enhance gasification efficiency andincrease the energy content of the final product gas. The pretreatment may includesize reduction, drying, and torrefaction, among others steps.
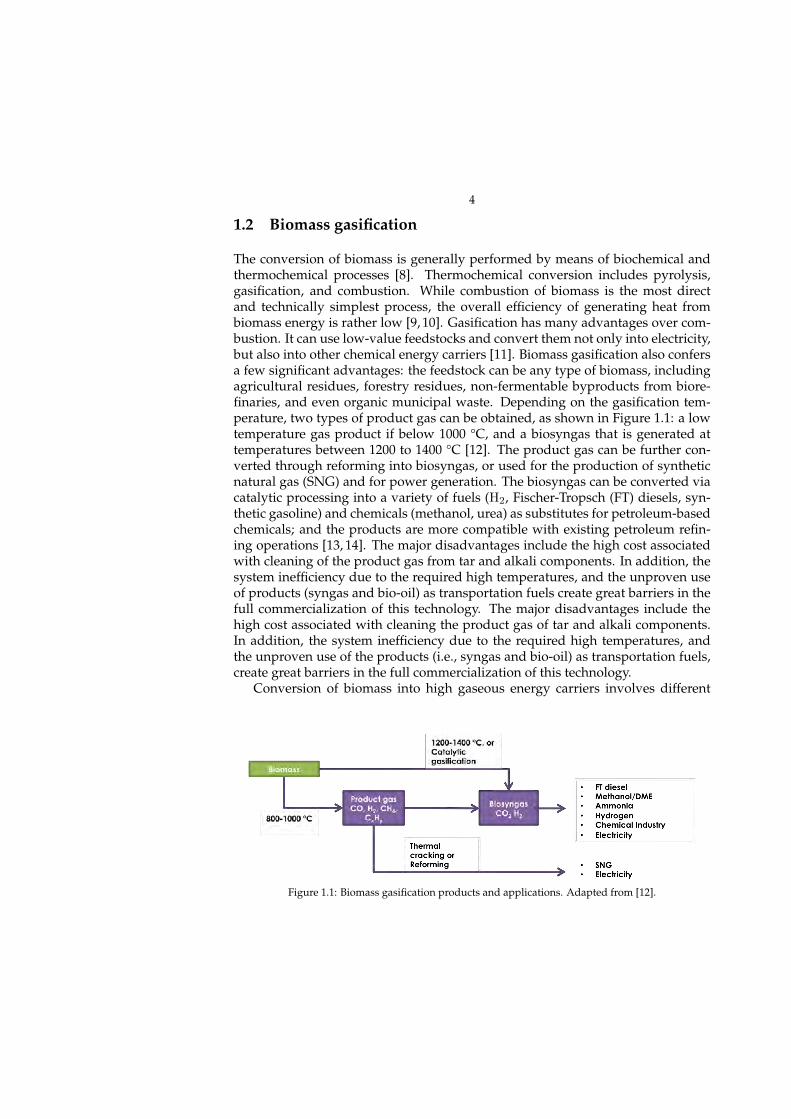
In the gasification stage, mainly cellulose, hemicellulose and lignin are con-verted to char and gases due to thermal decomposition. The pyrolytic char is fur-ther converted during gasification at temperatures between 800 and 1300 °C, byaddition of the oxidation agents O2, H2O, CO, air or mixtures of these, producingpermanent gases. The final product gas composition greatly depends on the gasifi-cation process, the gasification agent, and the biomass composition. The producergas can be a mixture of H2, CO, CO2, CH4, (C2 - C5), tar, char, ash, and inorganiccomponents. The constant composition of the "syngas" produced through biomass
Figure 1.2: Steps in gas upgrading process. Adapted from [15].
6
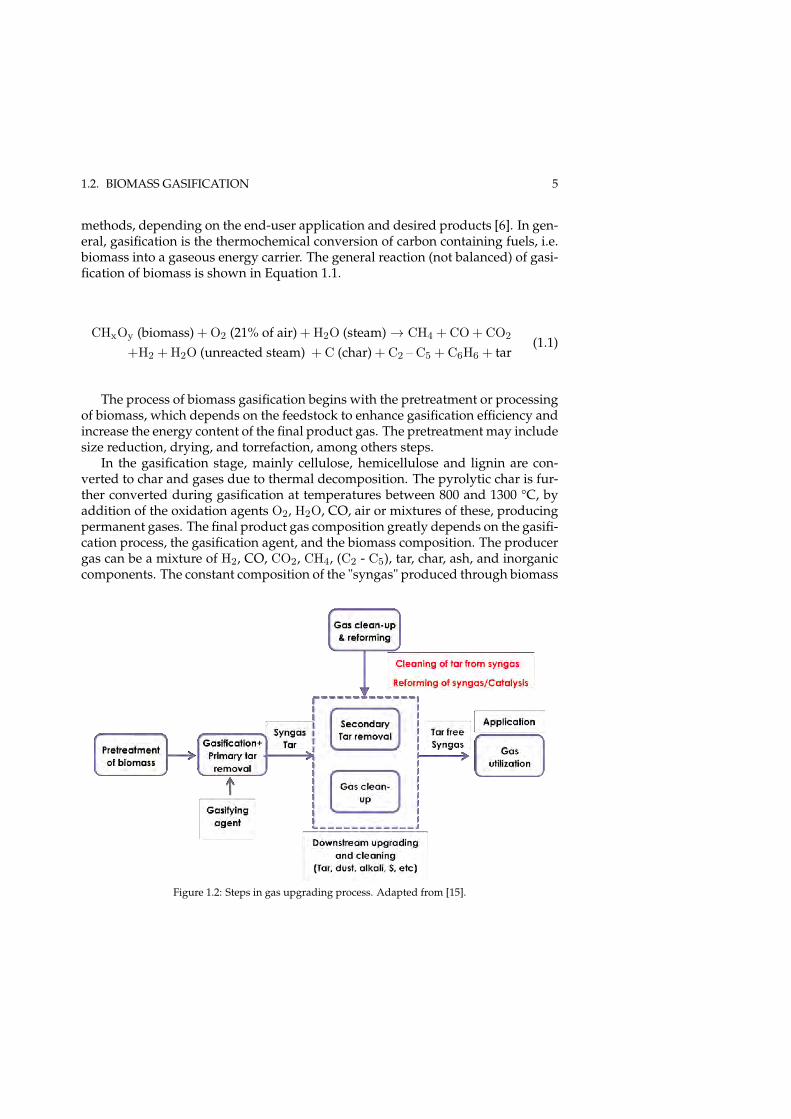
Table 1.1: Advantages and disadvantages of gasification technologies. Adapted from [16, 17].
Type Advantages Disadvantages
Downdraft fixed Simple construction Low moisture is requiredHigh carbon formation Limited scale-up potentialLow tar content Poor heat exchangeHigh ash content
Updraft fixed Simple construction High tar contentHigh thermal efficiency Limited scale-up potentialHigh carbon conversion Poor heat exchangeHigh ash content
Bubbling fluidized Good temperature control Operation difficultGood gas-solid mixing More particulatesModerate tar content Ash not moltenEasy start-up and stopHigh conversion efficiencyGood scale-up potentialBroad particle distribution
Circulating fluidized High carbon conversion Operation is difficultModerate tar content Ash not moltenHigh conversion efficiency More costlyGood scale-up potentialBroad particle distribution
gasification is a challenge in commercialization of this technology, in addition tothe removal of undesired products, such as tars and inorganic materials. Table 1.1shows the most common types of biomass gasification as well as their benefits inseveral applications.
Tar is a generic term used for organic compounds found in the product gas,with the exception of gaseous hydrocarbons. It is also the part of the biomass thatdoes not decompose completely into lighter gases. Tars are produced under thethermal or partial oxidation regimes (gasification) of any organic material, andare generally assumed to be largely aromatic. However, other definitions for tarcan also be applied, such as organic molecules with Mw > benzene (78 g/mol),in which benzene is not considered to be a tar. It is worth mentioning that tarscondense at T < 300 °C [9].
Tar can also be classified as primary, secondary, or tertiary according to Milneet al. [18]. The three main components of wood are classified as primary tars,which contain a great deal of oxygen. Primary tars are present in the gasifier attemperatures between 500 to 800 °C. Secondary tars are conformed by the resid-ual primary tars, including alkylated mono- and diaromatics such as pyridine,furan, dioxin, and thiophene. Secondary tars are normally distributed betweenthe temperatures of 700 to 850 °C. Tertiary tars can be divided into alkyl and con-densed tars. Alkyl tertiary tars consist of methyl derivatives of aromatics such asmethyl naphthalene, toluene, and methylacenaphthylene [18]. Condensed tertiarytars are composed of aromatic components without substituents such as benzene,
1.2. BIOMASS GASIFICATION 7
naphthalene, and pyrene [19, 20]. The temperature range in which these compo-nents have been identified in the gasifier is from 700 to 1000 °C. Tertiary tars are themost stable molecules, and are also classified as polynuclear aromatic hydrocar-bons (PAH). They are responsible for the generation of particulate matter, or soot.If not removed, tars may condense, causing pipe blockages, forming deposits onthe walls of downstream equipment such as heat exchangers, and reforming cata-lysts for syngas production, combustion engines, and fuel cells.
In order to obtain favorable results from biomass gasification, it is importantto integrate the design of a gasification reactor, the gas cleaning method used, andthe end-user application. Depending on the end-user application, two types ofreactors can be used: fixed-bed reactors, between them, the downdraft fixed bed(DDFB) reactor is suitable for small scale systems (1-10 MWth). Fluidized bed reac-tors, where circulating fluidised bed (CFB) reactors are suitable for large systems(>10 MWth). For the purpose of syngas production, large-scale units are prefer-able, in ranges from 100 to 200 MWth. In particular, the pressurized bubbling flu-idized bed (BFB) reactor, in which oxygen is blown through the fuel, is often usedfor syngas production. Thus, the fluidized bed configurations, shown in Table1.1, integrated with gas cleaning units, are the preferred technologies. However,systems such as the entrained flow gasifier (100 MWth) can also be used, due toexisting gas cleaning technologies that are optimized for large-scale processes.
1.2.1 Gas impurities and upgrading
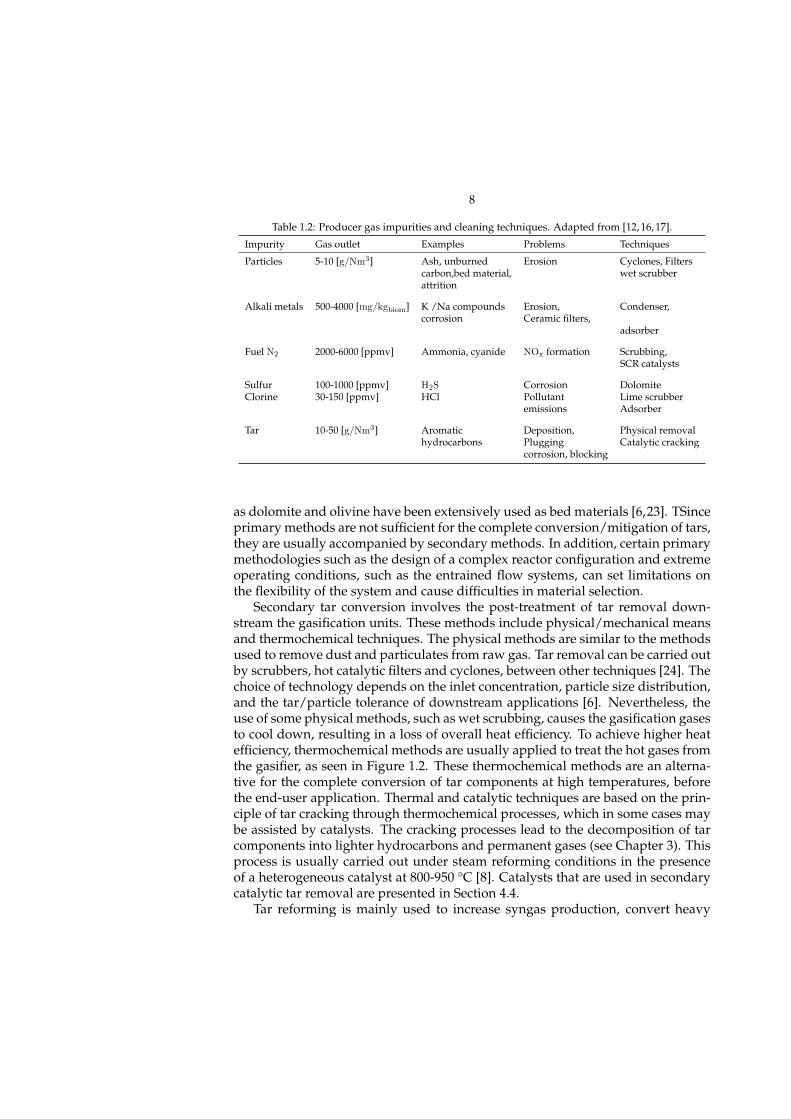
The gas at the outlet of the gasifier usually contains different impurities and un-desired products. These can be classified into three main types: solid particu-lates (unconverted char and ash); inorganic impurities (halides, alkali, sulfur com-pounds, nitrogen); and organic impurities (tar, aromatics, carbon dioxide). Theupgrading units have two main objectives: removing the undesired impurities,and conditioning the raw gas with the optimal H2 and CO ratio depending onthe end-user application [6, 21]. Cleaning methods are divided into wet and drymethods. Wet methods include scrubbers and cooling towers. Dry methods in-clude ceramic or metallic filters, and electrostatic precipitation. The eliminationof particles is usually carried out by cyclones [22]. Different problems involvinggas impurities, as well as the technologies available to resolve these problems, arepresented in Table 1.2.
1.2.2 Tar Conversion
Methodologies for removal of tars can be classified in primary and secondarymethods (see In Figure 1.2). Primary removal is understood as all measures takento limit the tar formation or to convert tars in the gasification step. For example,use of bed materials with or without certain catalytic activity for tar conversion,the optimization of gasification conditions, and the design and configuration ofthe biomass gasifier are all considered to be primary methods [11]. Minerals such
8
Table 1.2: Producer gas impurities and cleaning techniques. Adapted from [12, 16, 17].
Impurity Gas outlet Examples Problems Techniques
Particles 5-10 [g/Nm3] Ash, unburned Erosion Cyclones, Filterscarbon,bed material, wet scrubberattrition
Alkali metals 500-4000 [mg/kgbiom] K /Na compounds Erosion, Condenser,corrosion Ceramic filters,
adsorber
Fuel N2 2000-6000 [ppmv] Ammonia, cyanide NOx formation Scrubbing,SCR catalysts
Sulfur 100-1000 [ppmv] H2S Corrosion DolomiteClorine 30-150 [ppmv] HCl Pollutant Lime scrubber
emissions Adsorber
Tar 10-50 [g/Nm3] Aromatic Deposition, Physical removalhydrocarbons Plugging Catalytic cracking
corrosion, blocking
as dolomite and olivine have been extensively used as bed materials [6,23]. TSinceprimary methods are not sufficient for the complete conversion/mitigation of tars,they are usually accompanied by secondary methods. In addition, certain primarymethodologies such as the design of a complex reactor configuration and extremeoperating conditions, such as the entrained flow systems, can set limitations onthe flexibility of the system and cause difficulties in material selection.
Secondary tar conversion involves the post-treatment of tar removal down-stream the gasification units. These methods include physical/mechanical meansand thermochemical techniques. The physical methods are similar to the methodsused to remove dust and particulates from raw gas. Tar removal can be carried outby scrubbers, hot catalytic filters and cyclones, between other techniques [24]. Thechoice of technology depends on the inlet concentration, particle size distribution,and the tar/particle tolerance of downstream applications [6]. Nevertheless, theuse of some physical methods, such as wet scrubbing, causes the gasification gasesto cool down, resulting in a loss of overall heat efficiency. To achieve higher heatefficiency, thermochemical methods are usually applied to treat the hot gases fromthe gasifier, as seen in Figure 1.2. These thermochemical methods are an alterna-tive for the complete conversion of tar components at high temperatures, beforethe end-user application. Thermal and catalytic techniques are based on the prin-ciple of tar cracking through thermochemical processes, which in some cases maybe assisted by catalysts. The cracking processes lead to the decomposition of tarcomponents into lighter hydrocarbons and permanent gases (see Chapter 3). Thisprocess is usually carried out under steam reforming conditions in the presenceof a heterogeneous catalyst at 800-950 °C [8]. Catalysts that are used in secondarycatalytic tar removal are presented in Section 4.4.
Tar reforming is mainly used to increase syngas production, convert heavy
1.2. BIOMASS GASIFICATION 9
polyaromatic components sufficiently to allow the syngas to cool for further pro-cessing without fouling or precipitation, and remove the energy stored in tars,increasing the heat efficiency of the system. It is important to reduce tar to thelevels required for end-user applications. As observed in Table 1.2, most of theimpurities found at the outlet of the gasifier exceed the requirements for end-userapplications. Examples include the tar levels in industrial applications such asinternal combustion systems (50 mg/Nm3), gas turbines (5 mg/Nm3), and syngasproduction for synthetic fuel (0.1 mg/Nm3) [12].
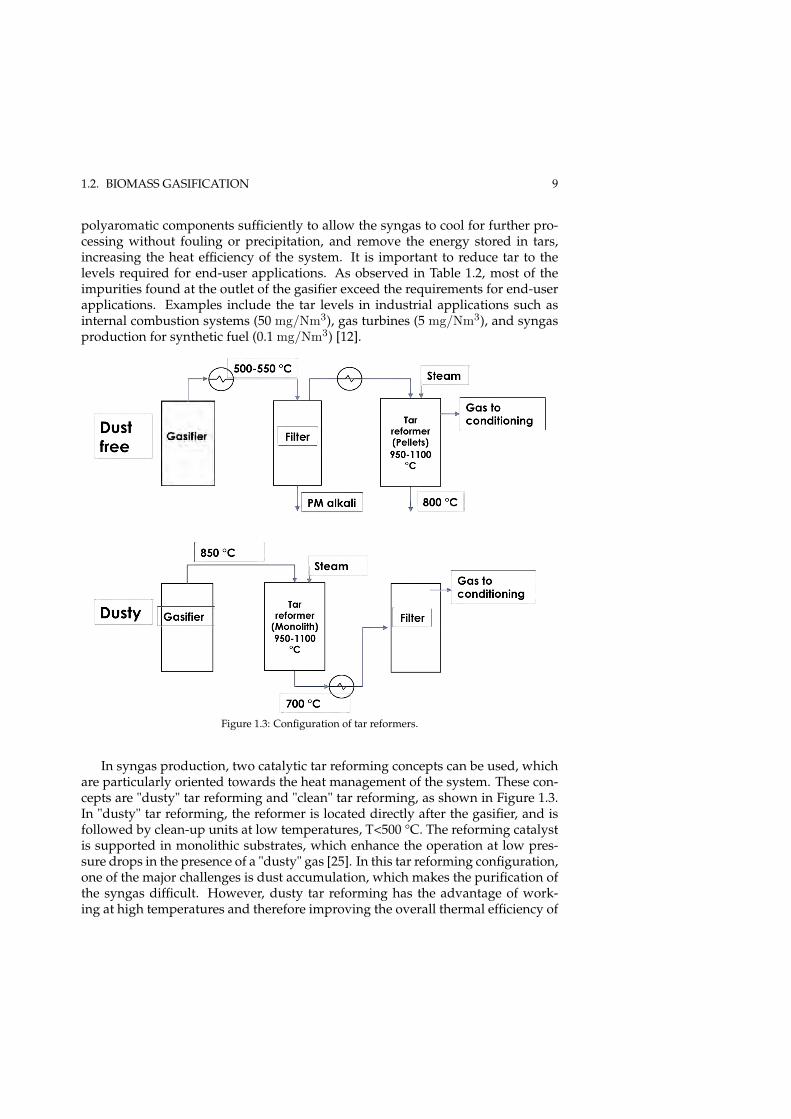
Figure 1.3: Configuration of tar reformers.
In syngas production, two catalytic tar reforming concepts can be used, whichare particularly oriented towards the heat management of the system. These con-cepts are "dusty" tar reforming and "clean" tar reforming, as shown in Figure 1.3.In "dusty" tar reforming, the reformer is located directly after the gasifier, and isfollowed by clean-up units at low temperatures, T<500 °C. The reforming catalystis supported in monolithic substrates, which enhance the operation at low pres-sure drops in the presence of a "dusty" gas [25]. In this tar reforming configuration,one of the major challenges is dust accumulation, which makes the purification ofthe syngas difficult. However, dusty tar reforming has the advantage of work-ing at high temperatures and therefore improving the overall thermal efficiency of
10
the system, since no cooling is needed. This process can be optimized, depend-ing on the type of reformer used. As described in Section 3.1, the reformer canhave three main configurations: Steam reforming (SR), Partial Oxidation (POX),and Autothermal reforming (ATR). The ATR is the most thermal efficient of thethree configurations, since it does not require external heating, and can operate atthermoneutral conditions [26]. However some of the energy stored in the biomassgas will be used in the reaction, affecting the overall efficiency of the system.
On the other hand, in a clean tar reforming configuration, high temperatureT>750 °C gas filters are located before the tar reformer to remove ash/dust fromthe gasifier. The "dust-free" gas continues to the tar reformer usually containinga pelletized catalyst. Clean tar reforming is mainly used for the production ofchemicals, clean syngas, and fuels. This configuration has increased robustnessand operability, in spite of the high catalyst loading required [25]. In terms of thethermal efficiency of both configurations, as shown in Figure 1.3, the dust free orclean configuration requires lowering the gas temperature for the removal of par-ticles, which reduces the efficiency of the system. This is generally compensatedfor with the use of autothermal reformers. However, in the dusty configuration, ithas been proven that removing tar from hot gas coming directly from the gasifieravoids reducing the overall thermal efficiency.
Chapter 2
Diesel reforming for automotiveapplications
The largest energy users and sources of CO2 emissions in the transport sector areheavy-duty trucks used in commercial and military applications. Emissions gener-ated during engine idling are of particular interest, since they have been identifiedas an economic and environmental concern. In past decades, governments and in-dustry have established several policies and measures to reduce the environmen-tal impact of fossil fuels. These include limits on particulates and CO emissions,such as the first European emission legislation, (EURO I), which was establishedin 1993 for the transport sector. Directives in the transport sector from the Eu-ropean Union (EU), EURO II-VI, led to decreasing the emission limits of exhaustgases from heavy-duty vehicles to 1.5 g/kWh for CO and 0.4 g/kWh for NOx by2013. Consequently, significant reductions in NOx, CO, and HC emissions havebeen achieved, to the levels established in EURO VI, which came into effect in2014 [27, 28].
Different approaches have been taken in industry in order to meet these strin-gent legislations. For example, emissions generated by the engine idling of heavy-duty trucks have been reduced by the use of auxiliary electrical supplies, alsoknown as Auxiliary Power Units (APUs), to generate the additional energy neededfor non-propulsion purposes such as powering comfort accessories, climate con-trol devices, audio equipment, and TV [26].
APUs use hydrogen fuel cells as an electrical supply. However, fuel cells usehydrogen-rich gas, which is problematic due to the lack of infrastructures for hy-drogen gas distribution and storage safety. In order to overcome these limitations,the production of hydrogen in an on-board fuel processor by a catalytic reformingprocess serves as a viable alternative. Diesel is considered to be a practical liq-uid fuel source for on-board hydrogen production, and can be readily supplied byexisting infrastructures [29].
11
12
2.1 Auxiliary power units
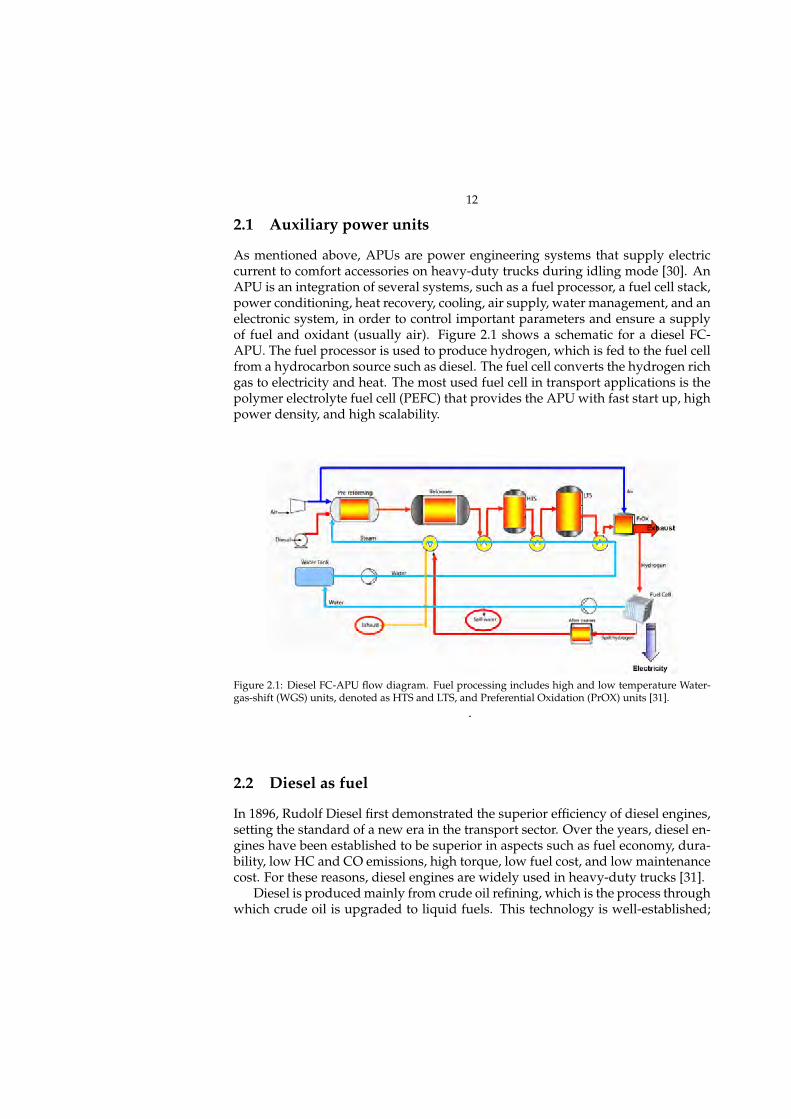
As mentioned above, APUs are power engineering systems that supply electriccurrent to comfort accessories on heavy-duty trucks during idling mode [30]. AnAPU is an integration of several systems, such as a fuel processor, a fuel cell stack,power conditioning, heat recovery, cooling, air supply, water management, and anelectronic system, in order to control important parameters and ensure a supplyof fuel and oxidant (usually air). Figure 2.1 shows a schematic for a diesel FC-APU. The fuel processor is used to produce hydrogen, which is fed to the fuel cellfrom a hydrocarbon source such as diesel. The fuel cell converts the hydrogen richgas to electricity and heat. The most used fuel cell in transport applications is thepolymer electrolyte fuel cell (PEFC) that provides the APU with fast start up, highpower density, and high scalability.
Figure 2.1: Diesel FC-APU flow diagram. Fuel processing includes high and low temperature Water-gas-shift (WGS) units, denoted as HTS and LTS, and Preferential Oxidation (PrOX) units [31].
.
2.2 Diesel as fuel
In 1896, Rudolf Diesel first demonstrated the superior efficiency of diesel engines,setting the standard of a new era in the transport sector. Over the years, diesel en-gines have been established to be superior in aspects such as fuel economy, dura-bility, low HC and CO emissions, high torque, low fuel cost, and low maintenancecost. For these reasons, diesel engines are widely used in heavy-duty trucks [31].
Diesel is produced mainly from crude oil refining, which is the process throughwhich crude oil is upgraded to liquid fuels. This technology is well-established;
2.2. DIESEL AS FUEL 13
however, minor changes in it have taken place due to reduction of feedstock andthe stringent legislation for fuel quality requirements [32]. Processes such as frac-tional distillation, reforming, hydrocracking, and impurity removal are used togenerate gasoline, diesel, jet diesel, and fuel oils. Gasoline is used for light vehi-cles, while diesel is used for heavy vehicles, rail transport, and marine engines [33].In addition, the composition of crude oil greatly depends on its source and the ge-ographic location of the source. The resulting light products of oil refining areknown as Liquefied petroleum gas (LPG), and are widely used in heat and powergeneration.
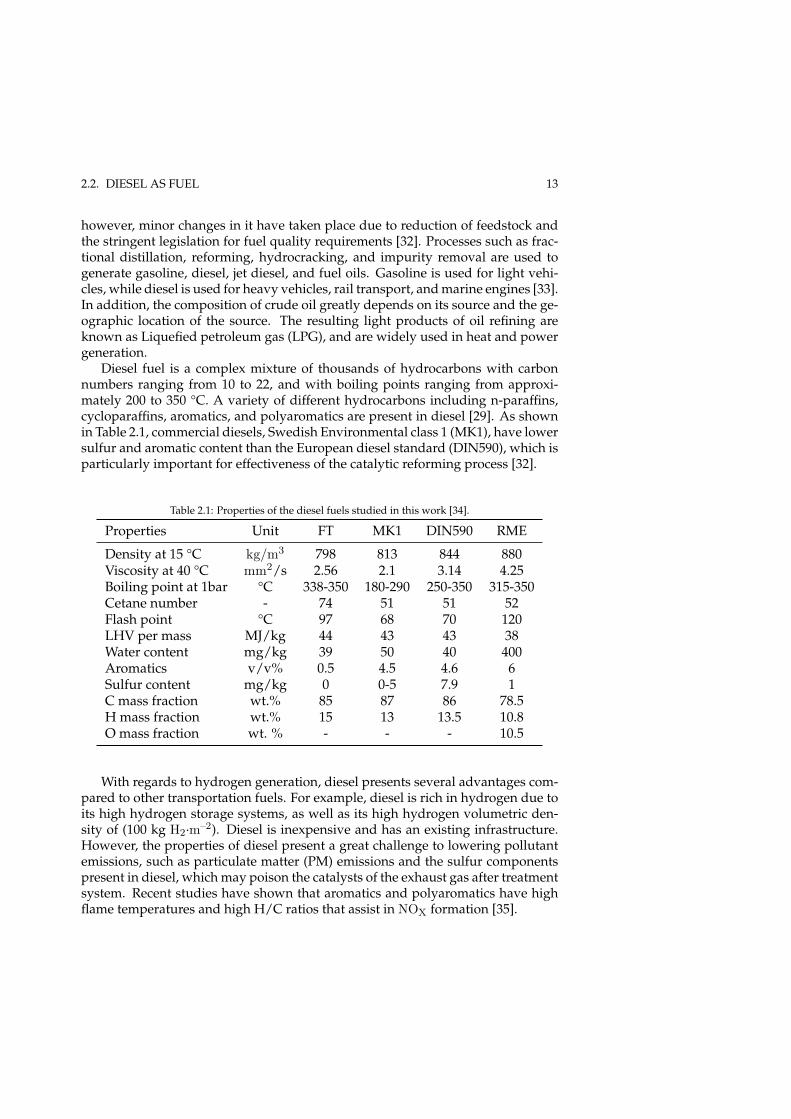
Diesel fuel is a complex mixture of thousands of hydrocarbons with carbonnumbers ranging from 10 to 22, and with boiling points ranging from approxi-mately 200 to 350 °C. A variety of different hydrocarbons including n-paraffins,cycloparaffins, aromatics, and polyaromatics are present in diesel [29]. As shownin Table 2.1, commercial diesels, Swedish Environmental class 1 (MK1), have lowersulfur and aromatic content than the European diesel standard (DIN590), which isparticularly important for effectiveness of the catalytic reforming process [32].
Table 2.1: Properties of the diesel fuels studied in this work [34].
Properties Unit FT MK1 DIN590 RME
Density at 15 °C kg/m3 798 813 844 880Viscosity at 40 °C mm2/s 2.56 2.1 3.14 4.25Boiling point at 1bar °C 338-350 180-290 250-350 315-350Cetane number - 74 51 51 52Flash point °C 97 68 70 120LHV per mass MJ/kg 44 43 43 38Water content mg/kg 39 50 40 400Aromatics v/v% 0.5 4.5 4.6 6Sulfur content mg/kg 0 0-5 7.9 1C mass fraction wt.% 85 87 86 78.5H mass fraction wt.% 15 13 13.5 10.8O mass fraction wt. % - - - 10.5
With regards to hydrogen generation, diesel presents several advantages com-pared to other transportation fuels. For example, diesel is rich in hydrogen due toits high hydrogen storage systems, as well as its high hydrogen volumetric den-sity of (100 kg H2·m–2). Diesel is inexpensive and has an existing infrastructure.However, the properties of diesel present a great challenge to lowering pollutantemissions, such as particulate matter (PM) emissions and the sulfur componentspresent in diesel, which may poison the catalysts of the exhaust gas after treatmentsystem. Recent studies have shown that aromatics and polyaromatics have highflame temperatures and high H/C ratios that assist in NOX formation [35].
14
2.3 Fuel processing for H2 production
As mentioned in the previous section, diesel has a high hydrogen volumetric den-sity, making it a potential hydrogen source in transport applications such as inte-grated FC-APUs in heavy duty trucks. Diesel FC-APUs require high overall effi-ciency and a high hydrogen production rate. Krumpelt et al. [36] mentioned thefollowing performance targets to be met in 50 kW fuel processors for automotivetechnologies and passenger cars:
• Ability to undergo multiple startups/shutdowns.
• Achieve maximum power from a cold start (-20 °C) in 1 min.
• Respond to changes in the power demand from 10 to 90 % in 1 s.
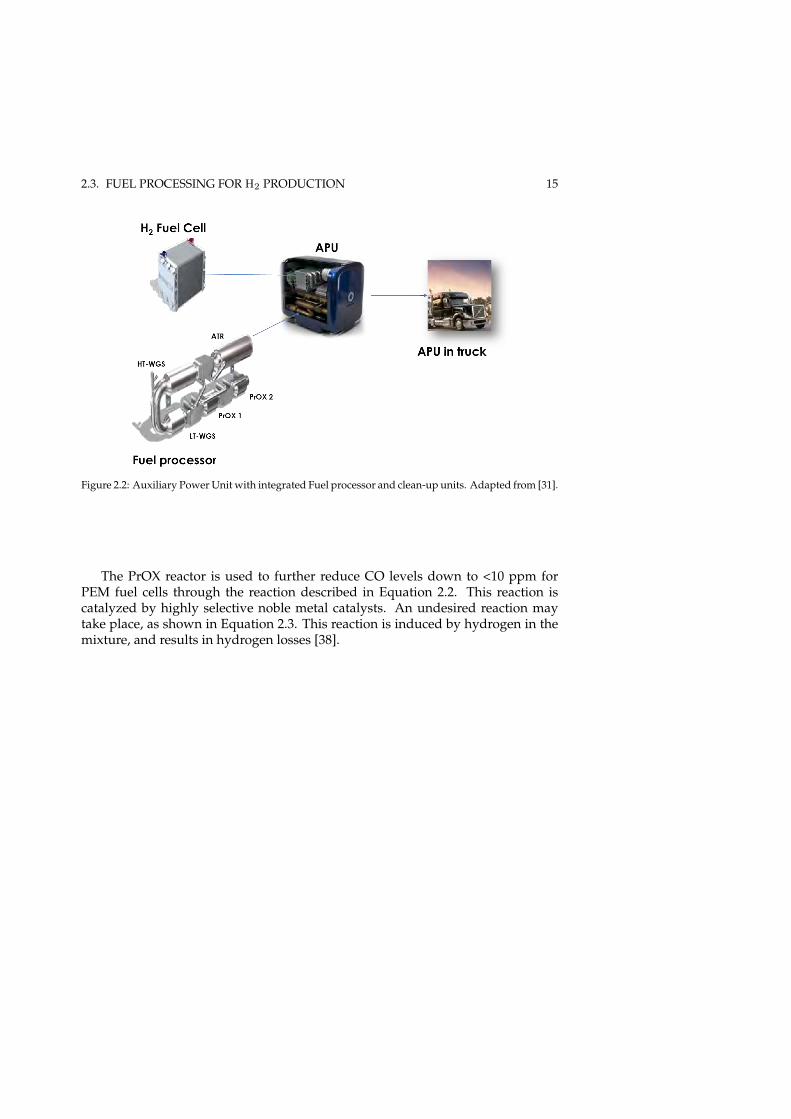
Fuel processing in on-board hydrogen generation takes place in a fuel reformerfed with commercial diesel, which is converted to a gas mixture of H2, CO, CO2,CH4, N2, H2O, and other unconverted hydrocarbons. The conversion of dieseltakes place at temperatures between 700 and 850 °C, depending on the nature ofthe diesel fuel and the reaction conditions. The diesel reformer can be operatedin different modes; however, given the particular requirements of mobile appli-cations, the most cost-efficient mode is the ATR of diesel over a heterogeneouscatalyst. Both the fuel reforming modes used and the catalyst preferred for mobileapplications are described in Chapters 3 and 4. The integrated fuel processor in anAPUs consists of a fuel reformer, high temperature (HT-WGS) and low tempera-ture (LT-WGS) WGS units, and preferential oxidation units (see Figure 2.2).
The product gas from the fuel reformer, which is intended to be used in poly-mer electrolyte membrane (PEM) fuel cells, must be cleaned of CO, to avoid anodecatalyst poisoning at levels <10 ppm, before reaching the fuel cell. Poisoning of thePEM by carbon monoxide is one of the main concerns regarding the gas stream ina fuel processor. Several techniques can be used to remove CO downstream fromthe fuel processor, as follows: WGS units, PrOX, and methanation and selectiveoxidation reactors along with membrane separators [37]. The process most fre-quently used is the WGS reaction in combination with preferential oxidation.
The WGS reaction is used to reduce the carbon monoxide level to below 1-2vol % by carrying out the conversion of CO into CO2 using steam as a reactant(see Equation 2.1). The WGS reaction is thermodynamically limited. Due to itsexothermicity, the reaction is divided into two steps that are referred to as the lowtemperature shift and the high temperature shift.
CO+H2O⇔ H2 +CO2 – ∆H298 = 41kJmol–1 (2.1)
CO+ 1/2O2 → CO2 (2.2)
H2 + 1/2O2 → H2O (2.3)
2.3. FUEL PROCESSING FOR H2 PRODUCTION 15
Figure 2.2: Auxiliary Power Unit with integrated Fuel processor and clean-up units. Adapted from [31].
The PrOX reactor is used to further reduce CO levels down to <10 ppm forPEM fuel cells through the reaction described in Equation 2.2. This reaction iscatalyzed by highly selective noble metal catalysts. An undesired reaction maytake place, as shown in Equation 2.3. This reaction is induced by hydrogen in themixture, and results in hydrogen losses [38].

Chapter 3
Fuel processing technologies
Fuel processing is the conversion of hydrocarbons, alcohols, and other fuels intogas mixtures containing CO, CO2, and H2, also known as reformate [39], by hydro-genation reactions. The first step in fuel processing is reforming, in which syngasis produced. During reforming, hydrocarbon molecules are broken down to theirelemental form. This process is usually carried out in the gas phase, and heteroge-neously catalyzed [29, 40]. Downstream processes are used not only to completethe conversion of the remaining hydrocarbons, but also to clean up the raw refor-mate gas afterwards. The clean-up process may contain WGS and PrOX systems(see Section 1.2.1).
Syngas production is carried out by different technologies, depending on thefeedstock. Most of the industrial syngas production is derived from fossil fuelssuch as coal, natural gas, gasoline, diesel, methanol, and dimethyl ether [41, 42].Syngas can also be generated from renewable sources like biomass, solar, andwind energies via electrolysis [43, 44].
3.1 Reforming modes
The generation of syngas can be carried out through both oxidative and non-oxidative processes. Non-oxidative processes involve the conversion of hydro-carbons by splitting the C-H bonds using e.g. heat or plasma radiation. Theseprocesses do not require oxidizing agents [43]. Oxidative processes are carried outat high operating temperatures, above 700 °C, in the presence of oxidants such asoxygen, air, steam, carbon dioxide, hydrocarbons, and mixtures of these.
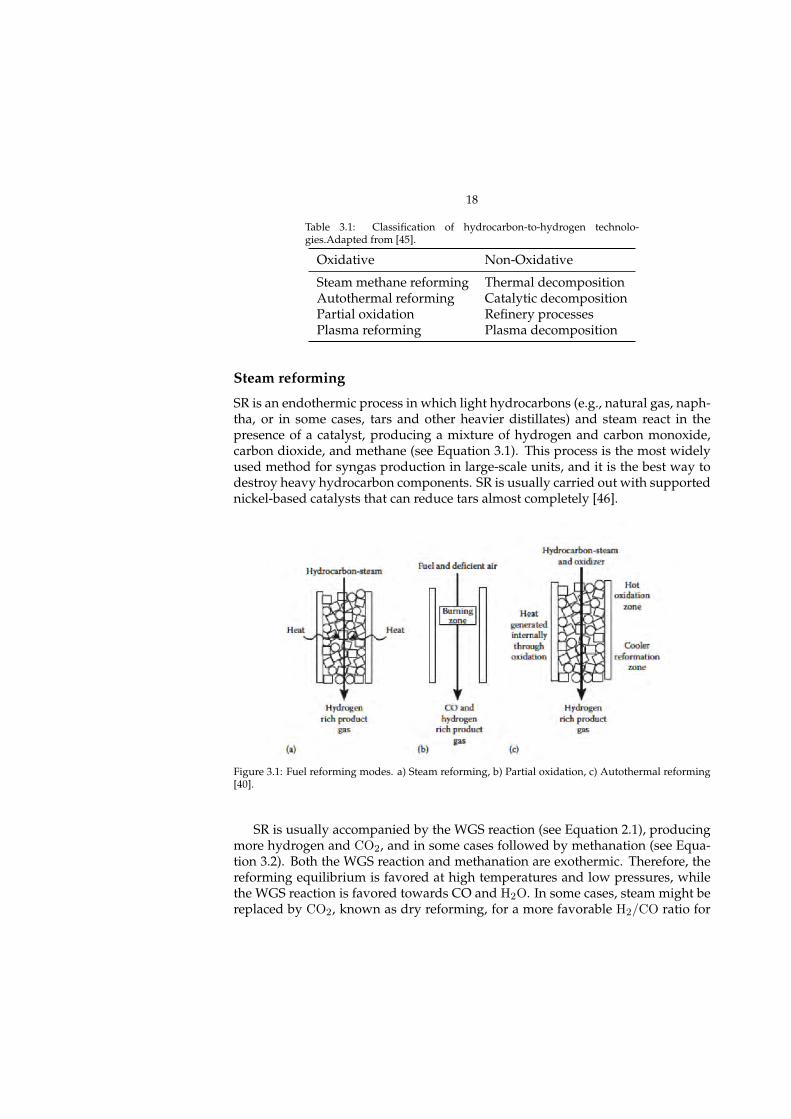
Syngas can be produced via different routes, as shown in Table 3.1. This thesisfocuses on syngas production via oxidative methods. Oxidative methods are car-ried out in various reactor configurations in which heat can be applied externally,extracted from the combustion of fuel in deficient air conditions (also known aspartial oxidation), and generated internally through oxidation, ATR (see Figure3.1) [40]. The following sections introduce these methodologies.
17
18
Table 3.1: Classification of hydrocarbon-to-hydrogen technolo-gies.Adapted from [45].
Oxidative Non-Oxidative
Steam methane reforming Thermal decompositionAutothermal reforming Catalytic decompositionPartial oxidation Refinery processesPlasma reforming Plasma decomposition
Steam reforming
SR is an endothermic process in which light hydrocarbons (e.g., natural gas, naph-tha, or in some cases, tars and other heavier distillates) and steam react in thepresence of a catalyst, producing a mixture of hydrogen and carbon monoxide,carbon dioxide, and methane (see Equation 3.1). This process is the most widelyused method for syngas production in large-scale units, and it is the best way todestroy heavy hydrocarbon components. SR is usually carried out with supportednickel-based catalysts that can reduce tars almost completely [46].
Figure 3.1: Fuel reforming modes. a) Steam reforming, b) Partial oxidation, c) Autothermal reforming[40].
SR is usually accompanied by the WGS reaction (see Equation 2.1), producingmore hydrogen and CO2, and in some cases followed by methanation (see Equa-tion 3.2). Both the WGS reaction and methanation are exothermic. Therefore, thereforming equilibrium is favored at high temperatures and low pressures, whilethe WGS reaction is favored towards CO and H2O. In some cases, steam might bereplaced by CO2, known as dry reforming, for a more favorable H2/CO ratio for
3.1. REFORMING MODES 19
different synthesis (see Equation 3.3). However, SR is traditionally the establishedmethod for converting natural gas and other hydrocarbons into syngas [47]. Thisreaction is irreversible over most reforming catalysts [14].
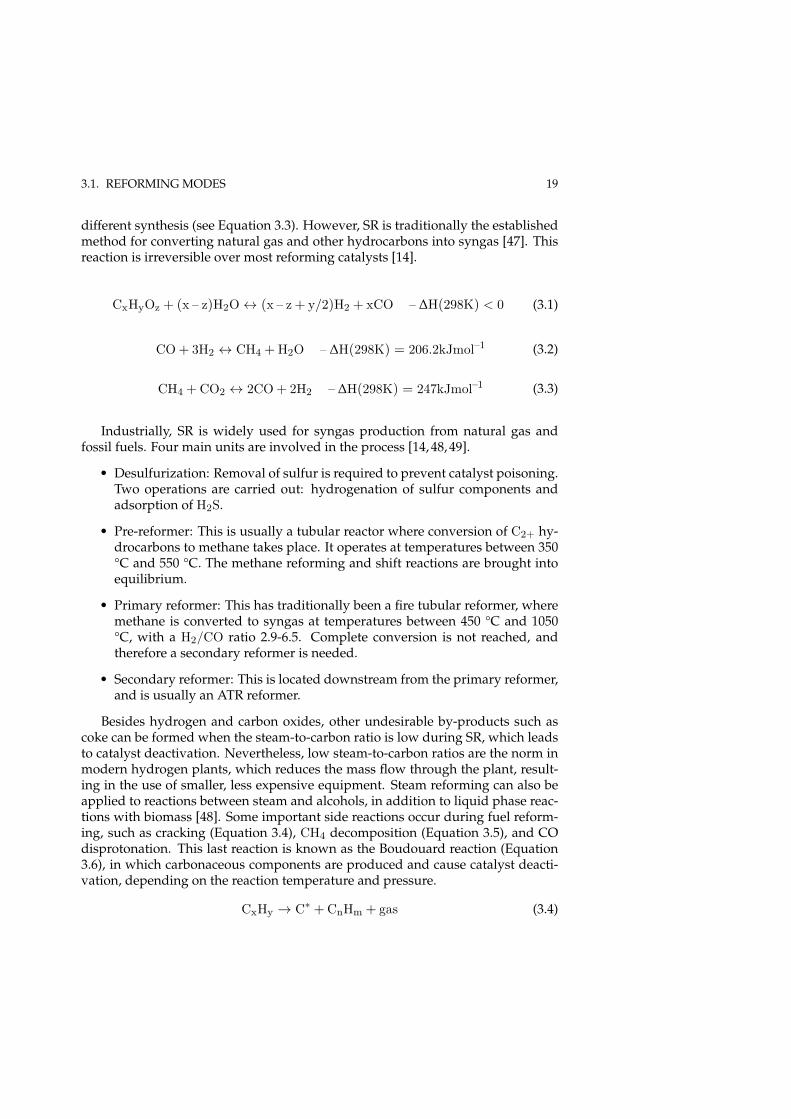
CxHyOz + (x – z)H2O↔ (x – z+ y/2)H2 + xCO – ∆H(298K) < 0 (3.1)
CO+ 3H2 ↔ CH4 +H2O – ∆H(298K) = 206.2kJmol–1 (3.2)
CH4 +CO2 ↔ 2CO+ 2H2 – ∆H(298K) = 247kJmol–1 (3.3)
Industrially, SR is widely used for syngas production from natural gas andfossil fuels. Four main units are involved in the process [14, 48, 49].
• Desulfurization: Removal of sulfur is required to prevent catalyst poisoning.Two operations are carried out: hydrogenation of sulfur components andadsorption of H2S.
• Pre-reformer: This is usually a tubular reactor where conversion of C2+ hy-drocarbons to methane takes place. It operates at temperatures between 350°C and 550 °C. The methane reforming and shift reactions are brought intoequilibrium.
• Primary reformer: This has traditionally been a fire tubular reformer, wheremethane is converted to syngas at temperatures between 450 °C and 1050°C, with a H2/CO ratio 2.9-6.5. Complete conversion is not reached, andtherefore a secondary reformer is needed.
• Secondary reformer: This is located downstream from the primary reformer,and is usually an ATR reformer.
Besides hydrogen and carbon oxides, other undesirable by-products such ascoke can be formed when the steam-to-carbon ratio is low during SR, which leadsto catalyst deactivation. Nevertheless, low steam-to-carbon ratios are the norm inmodern hydrogen plants, which reduces the mass flow through the plant, result-ing in the use of smaller, less expensive equipment. Steam reforming can also beapplied to reactions between steam and alcohols, in addition to liquid phase reac-tions with biomass [48]. Some important side reactions occur during fuel reform-ing, such as cracking (Equation 3.4), CH4 decomposition (Equation 3.5), and COdisprotonation. This last reaction is known as the Boudouard reaction (Equation3.6), in which carbonaceous components are produced and cause catalyst deacti-vation, depending on the reaction temperature and pressure.
CxHy → C∗ +CnHm + gas (3.4)
20
CH4 ↔ C+ 2H2 (3.5)
2CO↔ C+CO2 (3.6)
Catalytic partial oxidation
POX uses sub-stoichiometric oxygen in fuel-rich conditions to achieve completecombustion of hydrocarbons. Hence, the reaction rate is higher than SR; however,unlike SR, the H2 yield per carbon in the fuel is lower in POX. Partial oxidationcan be carried out with or without a catalyst. For non-catalytic POX, the reactiontemperature needs to be above 1000 °C in order to achieve high reaction rates.Catalyzed POX has gained increasing attention due to its lower operating temper-atures, better reaction control, and lower risk of coke formation. Partial oxidationinitiates faster due to its exothermicity, and can also be used in small systems suchas APUs. Nevertheless, POX also carries certain disadvantages, such as a higheroperating temperature, which complicates material selection and can cause severecarbon formation in the form of carbonaceous materials such as soot and coke [50].For biosyngas production, pure oxygen is used due to dilution effects.
CxHyOz + (x – z)/2(O2 + 3.76N2)
→ (y/2)H2 + xCO+ 3.76(x – z)/2N2 ∆H(298K) < 0(3.7)
Autothermal reforming
In ATR, steam oxidant and fuel are fed simultaneously to a catalytic adiabatic re-actor. The ATR reactor consists of a burner, a combustion chamber, and a catalyticbed. ATR can be considered a combination of endothermic steam reforming andexothermic partial oxidation, from which thermo-neutral conditions are attained.The feed is introduced to the hot catalytic (or burner) zone, mixed with steamand a substoichiometric quantity of oxygen or air. The global reaction is shownin Equation 3.8. For biosyngas production, pure oxygen is used due to dilutioneffects.
CxHyOz + n(O2 + 3.76N2) + (x – 2n – z)H2O→ (x – 2n – z+ y/2)H2 + xCO+ 3.76nN2 ∆H(298K) = 0
(3.8)In the combustion zone, mainly POX takes place, followed by homogeneous gas-phase reactions in the thermal and catalytic zone, where SR and WGS reactionsoccur. Heat generated in the thermal zone supplies the heat needed for the en-dothermic steam reforming (see Equation 3.1) reaction [26,50]. The operating con-dition in which it is usually operated involves O2/C ratios between 0.5 and 0.6,
3.2. SELECTION OF REFORMING MODES 21
with oxygen as the oxidant [48]. Autothermal reforming has higher energy effi-ciency compared to other processes, due to its ability to carry out reactions withminimal need for heat transfer. The operation of ATR is controlled by the degree ofexothermicity and endothermicity, by adjusting the O2/C and H2O/C ratios [47].However, due to heat losses, the ATR reformer is usually carried out with higherO2/C ratios.
3.2 Selection of reforming modes
The choice of technology depends on the scale of operation and also on the de-sired product stoichiometry [48]. As previously described, steam reforming is thepreferred reforming mode for syngas production from natural gas and other hy-drocarbons in large-scale production.
Steam reforming has advantages, such as high hydrogen concentration andlong-term stability at steady state, but it requires a high volume reactor due toits endothermicity. However, SR is limited by operating temperature control andconsequently has a slow response to power demand in large-scale units. Conse-quently, ATR reactors are the most cost-effective alternative for fuel cell applica-tions.
In addition, POX operates at very high temperatures, which may result in ther-mal tension on the reactor system [14,32,51]. The H2/CO ratio produced in ATR ishigher than that produced in POX alone, due to the presence of steam. ATR is themost feasible mode for the conversion of alternative fuels, such as pyrolysis oils,and for the conversion of raw biomass gasification products, such as tars [40].
ATR can also be used in small or medium sized fuel processors, since it re-duces the size and heat transfer limitations of the steam reformer, while achievinghigh H2 concentrations with less coking and faster start-up. It requires less com-plicated reactor designs and lower reactor weights, permits a wider selection ofconstruction materials, and requires lower fuel consumption in start-ups [38].

Chapter 4
Catalysis in fuel reforming
Reforming catalysts ideally have high activity, selectivity, mechanical strength, at-trition resistance, a large pore volume, thermal stability, and elevated surface areaper unit volume. Although some catalytic materials are composed of a single ac-tive substance, most catalysts have four main parts: carriers, support, promoters,and active components.
The carriers, or substrates, are responsible for providing improved mechanicalproperties to the catalyst [47]. The support provides the shape and size of thecatalyst, thereby defining the surface area and the porous structure [52]. Smalltraces of promoters and active phase metals are finely dispersed in the internalsurface of the support; to achieve this, a bulky material with a high surface area isoften used as the support.
Promoters play a key role by significantly improving catalyst performance.These are added to the catalyst mixture in small amounts to obtain enhanced ac-tivity, selectivity, or stability effects. They are adsorbed onto the catalyst, wherethey interact with the active metal and the support [47]. On their own, promotersusually have no activity for a specific reaction. They can be classified as texturalpromoters, which act as stabilizers of certain physical properties in the catalyst, oras structured promoters, which can stabilize certain support structures and mod-ify the electronic structure of the active phase and the support.
The active components involved in the main chemical reaction can be classifiedas metals, sulfides, or oxides, depending on their conductivity and the reaction inwhich they are involved.
4.1 Substrates
Traditionally, catalytic pellets have been chosen due to their low crush and abra-sion tendencies, and also for their ability to cause increased turbulence in the re-actor. However, according to Wright and Butler [53], "packed bed reactors requirethe optimization of two main factors, variation of the effectiveness of a catalyst
23
24
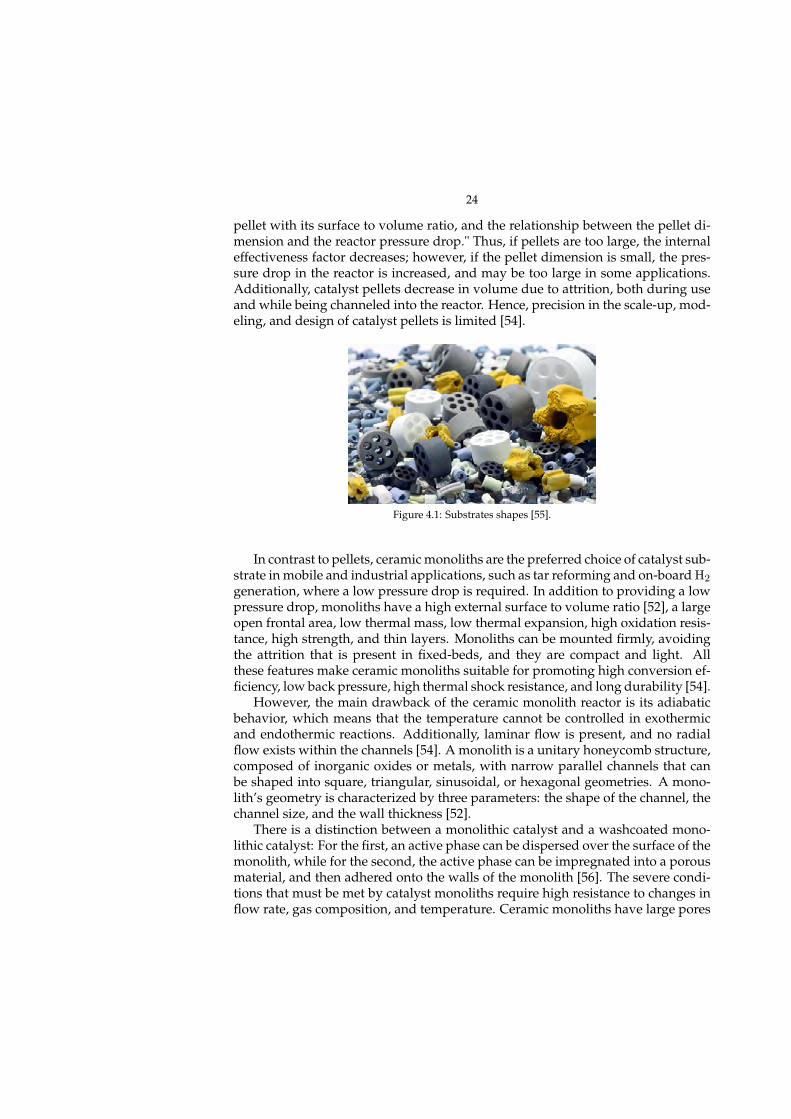
pellet with its surface to volume ratio, and the relationship between the pellet di-mension and the reactor pressure drop." Thus, if pellets are too large, the internaleffectiveness factor decreases; however, if the pellet dimension is small, the pres-sure drop in the reactor is increased, and may be too large in some applications.Additionally, catalyst pellets decrease in volume due to attrition, both during useand while being channeled into the reactor. Hence, precision in the scale-up, mod-eling, and design of catalyst pellets is limited [54].
Figure 4.1: Substrates shapes [55].
In contrast to pellets, ceramic monoliths are the preferred choice of catalyst sub-strate in mobile and industrial applications, such as tar reforming and on-board H2generation, where a low pressure drop is required. In addition to providing a lowpressure drop, monoliths have a high external surface to volume ratio [52], a largeopen frontal area, low thermal mass, low thermal expansion, high oxidation resis-tance, high strength, and thin layers. Monoliths can be mounted firmly, avoidingthe attrition that is present in fixed-beds, and they are compact and light. Allthese features make ceramic monoliths suitable for promoting high conversion ef-ficiency, low back pressure, high thermal shock resistance, and long durability [54].
However, the main drawback of the ceramic monolith reactor is its adiabaticbehavior, which means that the temperature cannot be controlled in exothermicand endothermic reactions. Additionally, laminar flow is present, and no radialflow exists within the channels [54]. A monolith is a unitary honeycomb structure,composed of inorganic oxides or metals, with narrow parallel channels that canbe shaped into square, triangular, sinusoidal, or hexagonal geometries. A mono-lith’s geometry is characterized by three parameters: the shape of the channel, thechannel size, and the wall thickness [52].
There is a distinction between a monolithic catalyst and a washcoated mono-lithic catalyst: For the first, an active phase can be dispersed over the surface of themonolith, while for the second, the active phase can be impregnated into a porousmaterial, and then adhered onto the walls of the monolith [56]. The severe condi-tions that must be met by catalyst monoliths require high resistance to changes inflow rate, gas composition, and temperature. Ceramic monoliths have large pores
4.2. CATALYST DEACTIVATION 25
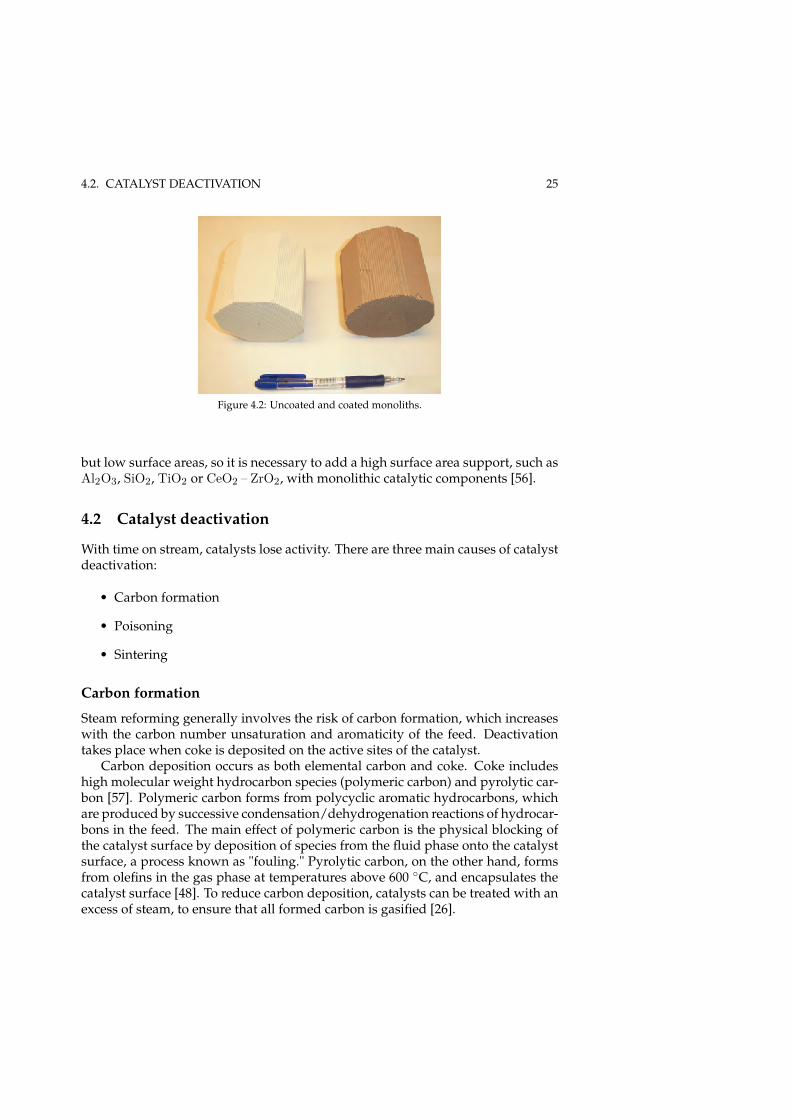
Figure 4.2: Uncoated and coated monoliths.
but low surface areas, so it is necessary to add a high surface area support, such asAl2O3, SiO2, TiO2 or CeO2 – ZrO2, with monolithic catalytic components [56].
4.2 Catalyst deactivation
With time on stream, catalysts lose activity. There are three main causes of catalystdeactivation:
• Carbon formation
• Poisoning
• Sintering
Carbon formation
Steam reforming generally involves the risk of carbon formation, which increaseswith the carbon number unsaturation and aromaticity of the feed. Deactivationtakes place when coke is deposited on the active sites of the catalyst.
Carbon deposition occurs as both elemental carbon and coke. Coke includeshigh molecular weight hydrocarbon species (polymeric carbon) and pyrolytic car-bon [57]. Polymeric carbon forms from polycyclic aromatic hydrocarbons, whichare produced by successive condensation/dehydrogenation reactions of hydrocar-bons in the feed. The main effect of polymeric carbon is the physical blocking ofthe catalyst surface by deposition of species from the fluid phase onto the catalystsurface, a process known as "fouling." Pyrolytic carbon, on the other hand, formsfrom olefins in the gas phase at temperatures above 600 ◦C, and encapsulates thecatalyst surface [48]. To reduce carbon deposition, catalysts can be treated with anexcess of steam, to ensure that all formed carbon is gasified [26].
26
4.2.1 Sulfur poisoning
Very low concentrations of sulfur in the feed stream can lead to complete catalystdeactivation due to strong sulfur chemisorption on metal surfaces [48, 58]. Underreforming conditions, all S atoms react to form H2S. The adsorption equilibriumof sulfur is shown in Equation 4.1.
H2S+Me↔ Me – S+H2 (4.1)
Additionally, sulfur and coke tolerance can be improved by adding alkali metalssuch as Mg and K, as well as Mn, as reported by Nilsson et al. [42], Qi et. al [41],and Ferrandon et. al [59]. These alkaline promoters diminish surface acidity byneutralizing acid sites, which could catalyze coke deposition through a carboniumion mechanism. The promoters also regenerate the catalyst. Qi et. al [41] reportedthe increment in catalyst activity from adding Mn and Mg, which lower the noblemetal loading of the catalyst.
4.2.2 Sintering
The effects of thermal sintering include the loss of active surface area, phase trans-formations, and reduction of the support surface area due to pore destruction [47].Sintering occurs at high operating temperatures, and is generally enhanced by thepresence of water vapor. Under these conditions, the formation and migration ofMe(OH)2 occur.
4.3 The role of alkali
Extensive research in understanding alkali interactions on metallic surfaces andtheir effect on catalytic activity has been conducted in recent years [60–64], mainlydue to the significant beneficial effects that alkali metals present in multiple indus-trial processes such as the dehydrogenation of ethylbenzene to styrene, the vana-dium catalyst for the sulfuric acid process, ammonia synthesis, Fischer-Tropschsynthesis, and biomass gasification.
Alkali metals and alkali earth metals are structural promoters that show dif-ferent effects, depending on the reaction conditions. These elements can enhancecatalyst activity by modifying the electronic structure of the metal surface [65].This process occurs as a result of their ability to modify chemisorptive propertiesof the catalyst surface, and to affect the strength of the chemisorptive bond of re-actants and intermediates. These electronic interactions are due to the electrondonor nature of alkali metals, which enhances the chemisorption of electron ac-ceptor species such as carbon monoxide and oxygen. In general, alkalis modifythe electron density of an alkali-promoted metal.
The effects of alkalis as promoters are important in biomass gasification andtar reforming, since one of the major reasons for reduced catalyst activity in these
4.3. THE ROLE OF ALKALI 27
processes is the volatilization of alkali and alkaline materials from the catalyststructure and biomass.
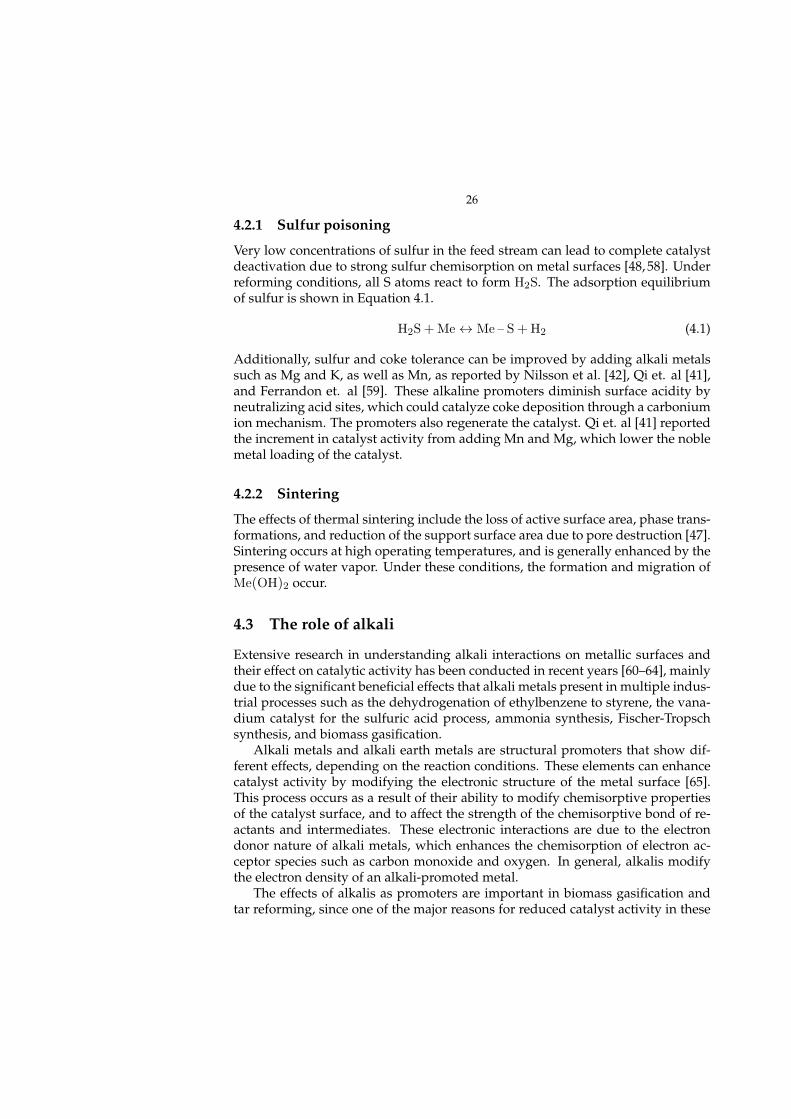
Alkali content in the gasifier causes the risk of bed collapsing due to the ag-glomeration of alkali silicates, leading to plugging and corrosion. Furthermore,the deposition of alkali and chlorine compounds over heat-exchanger surfaces re-duces heat transfer and causes corrosion, thereby reducing the efficiency of thesystem. To reduce the volatilization of alkali metals, metals such as Nb and Zr canbe added. In some cases, an increase of the partial pressure of CO2 in the reactormay help to reduce the volatilization of Na [66–68]. Additional problems, such asthe loss of catalyst material and the catalyst’s interactions with alkali componentsin the gas phase, affect the performance of the catalyst, which in turn may increasethe catalyst life-cycle cost.
In contrast, alkalis increase the interactions between coke and steam [69], andare usually used as catalytic promoters in fuel reforming. They are also used inmany other catalytic applications, including ammonia synthesis, VOC reduction,FT synthesis, the synthesis of alcohols, and high temperature applications suchas hot corrosion. For example, in hydrocarbon reforming, an alkali is added as apromoter to remove carbonaceous deposits on the catalyst surface. However, Ni-based catalysts adsorb potassium ions on the Ni step sides, reducing the numberof available active sites for reaction. In other words, the turn-over frequency isreduced, greatly affecting the overall reaction rate [48].
Despite the use of Ni and alkalis in catalytic applications for many years, theunderstanding of their participation in reforming reactions of oxygenated hydro-carbons in tar [49], and the positive or negative effects of gas-phase alkali con-centration limits on the catalyst surface, remain unclear, as shown in Figure 4.3.
Figure 4.3: Consequences of alkali release in biomass gasification technologies and downstream pro-cesses.
28
In particular, interactions related to surface properties, such as chemical compo-sition, oxidation state, surface distribution of alkali, existence of physisorbed andchemisorbed alkali, are the subject of study. The metal-support interactions aremore complex due to the other gas-phase components present, such as sulfur, H2O,H2, CO, CO2, and hydrocarbons.
4.3.1 Alkali interactions
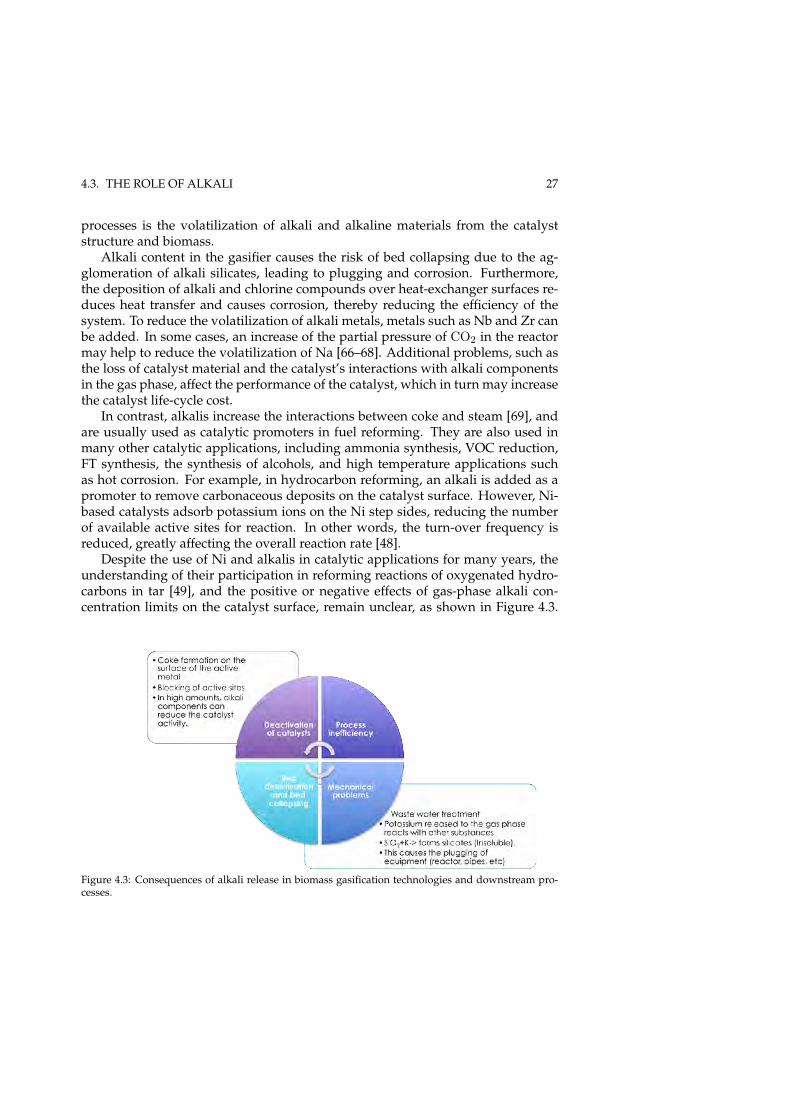
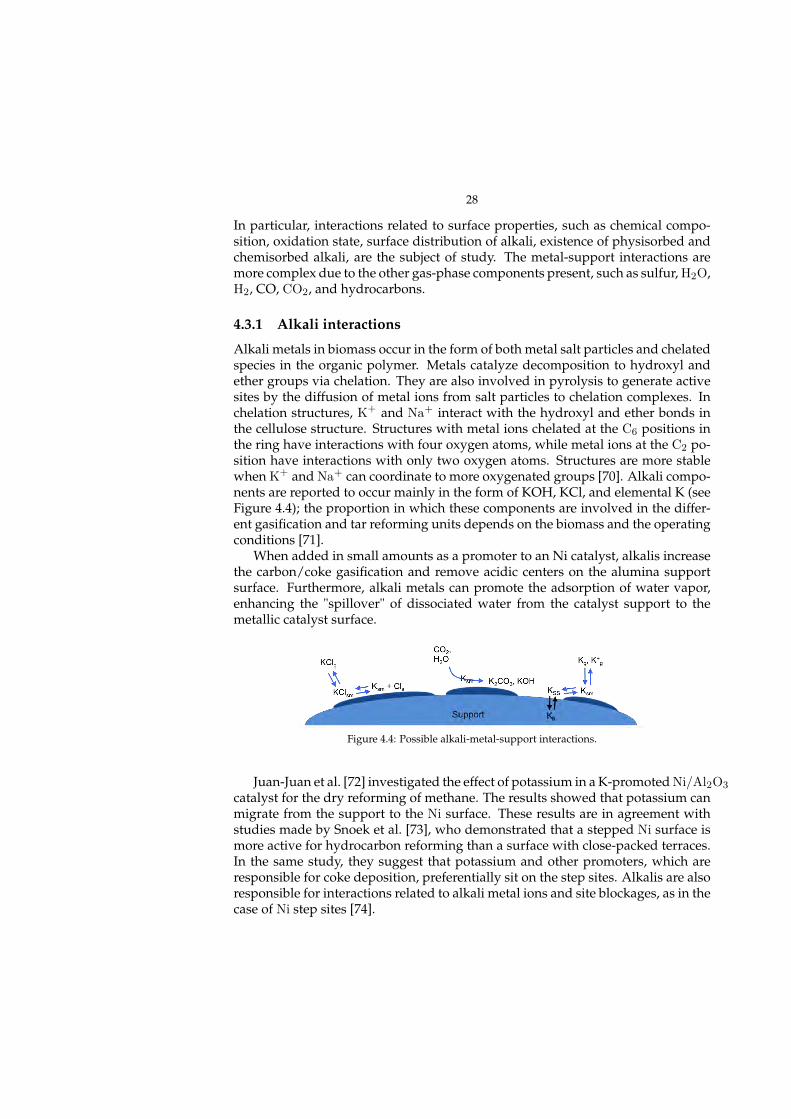
Alkali metals in biomass occur in the form of both metal salt particles and chelatedspecies in the organic polymer. Metals catalyze decomposition to hydroxyl andether groups via chelation. They are also involved in pyrolysis to generate activesites by the diffusion of metal ions from salt particles to chelation complexes. Inchelation structures, K+ and Na+ interact with the hydroxyl and ether bonds inthe cellulose structure. Structures with metal ions chelated at the C6 positions inthe ring have interactions with four oxygen atoms, while metal ions at the C2 po-sition have interactions with only two oxygen atoms. Structures are more stablewhen K+ and Na+ can coordinate to more oxygenated groups [70]. Alkali compo-nents are reported to occur mainly in the form of KOH, KCl, and elemental K (seeFigure 4.4); the proportion in which these components are involved in the differ-ent gasification and tar reforming units depends on the biomass and the operatingconditions [71].
When added in small amounts as a promoter to an Ni catalyst, alkalis increasethe carbon/coke gasification and remove acidic centers on the alumina supportsurface. Furthermore, alkali metals can promote the adsorption of water vapor,enhancing the "spillover" of dissociated water from the catalyst support to themetallic catalyst surface.
Figure 4.4: Possible alkali-metal-support interactions.
Juan-Juan et al. [72] investigated the effect of potassium in a K-promoted Ni/Al2O3catalyst for the dry reforming of methane. The results showed that potassium canmigrate from the support to the Ni surface. These results are in agreement withstudies made by Snoek et al. [73], who demonstrated that a stepped Ni surface ismore active for hydrocarbon reforming than a surface with close-packed terraces.In the same study, they suggest that potassium and other promoters, which areresponsible for coke deposition, preferentially sit on the step sites. Alkalis are alsoresponsible for interactions related to alkali metal ions and site blockages, as in thecase of Ni step sites [74].
4.4. CATALYSTS FOR TAR REFORMING 29
Fundamental studies of alkali adsorption/desorption mechanisms have beenconducted on real and ideal surfaces using several techniques, such as surfaceionization [66], the non-Faradaic electrochemical modification of catalytic activ-ity (NEMCA) effect, and more [75]. The results of such studies indicate that theaddition of alkalis causes a decrease in the work function, inducing surface recon-structions [61].
The volatilization of alkali components represents a significant loss in catalystactivity for syngas production. Matzukata et al. [76] reported on the volatilizationof alkali components from biomass due to the formation of alkali metals and theirhigh vapor pressures. In the same paper, they present that the migration of alkalican either be into the carbon bulk or from the carbon surface to the gas phase.The migration will depend on the reducibility of the oxidation state of the alkalimetal. Even though many advances have been made in characterizing the catalystsurface interaction and reaction kinetics, the capability of the support crystallinematrix to store alkali for the purpose of avoiding alkali volatilization during thereaction is still unclear.
It is also significant that alkali desorbs to the catalyst surface in the form ofclusters, which can be subsequently used for the elimination of the carbon layerthat forms over the catalyst surface during processes. The addition of potassiumincreases the reducibility of nickel species by hydrogen, because it modifies theinteraction of nickel oxide with the support [72].
Rostrup Nielsen et al. [48, 69] demonstrated that all group VII metals show asignificant decrease in turn-over frequency when a catalyst contains alkali. Thealkali results in larger adsorption of steam onto the catalyst, as reflected by a neg-ative reaction order with respect to steam. This adsorption is most pronounced onless acidic supports. Thus, it could indicate that the alkali works on nickel via thegas phase. Kotarba et al. [77] and Engvall et al. [66] reported for the dehydrogena-tion of ethylbenzene (EB) to styrene that the most active phase for a K2Fe22O34catalyst was the KFeO2. However, during the catalyst life cycle, potassium is des-orbed in the form of K+2 and K2O. Desorption or the loss of promoter is one ofthe main problems leading to catalyst deactivation. The potassium migration tothe catalyst surface of an iron catalyst showed that the formation of clusters onthe catalyst surface promotes desorption of potassium with a lower desorptionactivation energy [78], [79].
4.4 Catalysts for tar reforming
Reforming catalysts could be exposed to severe operating conditions, at tempera-tures between 500 and 900 °C and pressures up to 30 bar. The catalyst should havesufficient activity, resistance to carbon formation, and mechanical strength. Cata-lysts for tar reforming can be classified as primary and secondary catalysts. Theseclassifications are related to the primary and secondary tar removal technologiespreviously described in Section 1.2.2.
30
Nickel-based catalysts supported on dolomite and olivine have been used toincrease tar conversion in primary technologies [23]. Furthermore, alkali carbon-ates have also been used as primary catalysts in tar conversion, showing increas-ing carbon reactivity by the addition of 10 wt % of K2CO3 to the gasificationbed [24, 80].
Secondary tar reforming is usually carried out over Ni-based catalysts. Thesehave been used extensively for fossil fuel reforming, due to their activity and lowcost. It is generally accepted that the most active phase for tar conversion is metal-lic Ni, which is also responsible for the activation of H2O and CO2 in the reformingreaction and WGS reaction [11]. However, Ni is sensitive to coke formation andpoisoning, particularly by H2S, and to alkali-containing compounds [11,51,65]. In-vestigations on the catalyst activity of Ni/Al2O3 presented high deactivation after30 min on stream, and the same trend was observed for Ni/MgO. Ni/MgO/Al2O3showed low resistance to coke; however, the addition of alkali oxides into the cat-alytic support significantly influenced its carbon resistance and reduced the rateof coke formation.
Kuchonthara et al. [81] evaluated the catalyst activity for hydrogen productionover K2CO3/NiO/Al2O3 during tar steam reforming at 800 °C with steam concen-tration of 50 vol%. They observed that the addition of potassium on the catalystgreatly improved coke reduction and tar conversion, in addition to the thermalstability given by K2CO3, which suppress the thermal sintering of nickel particles.However, the catalyst experienced a significant reduction in activity at tempera-tures above 900 °C. This reduction occurs because potassium carbonate is a stablecompound on the catalyst support. However, it will decompose under a steamreaction, resulting in a KOH partial pressure over the catalyst and in the reformereffluent [48].
In order to reduce the alkali poison of the Ni catalyst, new catalyst composi-tions were evaluated by several research groups [11, 82–84], who suggested theuse of core shell catalysts, which contain a core section where Ni/Al2O3 is located.The core is then introduced in a SiO2 zeolite to reduce the adsorption of alkalimetals in the Ni catalyst.
4.5 Catalysts for on-board H2 generation
Noble metals such as platinum, rhodium, ruthenium, palladium, and rhenium in-corporated into carefully engineered oxide supports, such as ceria-containing ox-ides, aluminum oxide, and perovskite-like metal oxides, are generally used in hightemperature reforming applications, particularly in transport applications [26].Noble metals are preferred in this case due to their high catalytic activity andlonger lifetime. Given their high cost, they are usually used in small amounts,promoted, or stabilized in catalytic supports.
Previous research shows that the role of catalytic supports in reforming cata-lysts determines not only mechanical or structural matters, but also the catalyst
4.5. CATALYSTS FOR ON-BOARD H2 GENERATION 31
activity, selectivity, thermal stability, and carbon tolerance with a chemical role inthe production of oxygen vacancies. Of particular interest are CeO2/ZrO2 mixedoxides, which are used as catalytic supports. Due to their Oxygen storage capacity(OSC), they facilitate the reaction by reoxidizing the surfaces of promoters, carbonspecies, and carbon containing products, as reported by N. Srisiriwat et. al [85].This ability is observed in oxides such as CeO2, CeO2 – ZrO2, and ZrO2 stabilizedwith yttrium [86].
Studies on the activity and thermal stability of the catalysts described abovehave been performed over a number of catalyst formulations. For example, stud-ies on autothermal reforming reported by Kaila et. al [87,88] with simulated gaso-line and diesel fuels over Rh and Pt as active components showed high activitywhen Rh/ZrO2 catalyst was used. The selectivity towards hydrogen productionwas improved, and less coke formation was achieved, compared to using a Ni cat-alyst in the same reaction. Moreover, the bimetallic RhPt catalyst exhibited higheractivity than the monometallic Rh/ZrO2.
The thermal stability of various catalytic supports has been evaluated, particu-larly those over Ce/Zr. Barbier et al. [89] evaluated the thermal stability of severalCe/Zr supports, and reported that with a Ce/Zr ratio of 16/84, the most stablephase is the tetragonal structure up to 1200 °C. Other factors, such as the presenceof steam, were also evaluated, resulting in a reduction of sintering for Ni- and Rh-based catalysts supported on Al2O3. Studies on the activity of a Ni catalyst overCeO2 – ZrO2, with a ratio of 15/85 %, were carried out by Kusakabe et al. [90], whoshowed that 3 wt % of the noble metals Rh and Pt presented higher activity thanthe 10 wt% of Ni present in the catalyst.
Catalyst studies with different supports have shown the superiority of Rh overPt or Pd for the reforming of high sulfur content fuels, as demonstrated by Nils-son et al. [42] or Ferrandon et al. [59]. As an example, Sigarov et al. [91] stud-ied the performance of Co, Mn, Rh, BaO, La2O3/Al2O3, and SiO2 in a dieselATR reactor loaded with two cylindrical metallic monoliths, at the following re-actor conditions: O2/C = 0.5, S/C= 1.5-1.7. The maximum hydrogen yield wasreached at 18 mol/mol (fuel) with a GHSV= 2000-10.000 h–1, at 840-880 °C. Re-sults showed that the most effective combination of catalyst reactor locations wasthe Co3O4/MnO4 – BaO-based catalyst located at the beginning of the reformer,followed by the Rh/MnO4 – BaO catalyst. This combination resulted in a productgas composition of H2 = 32%, CH4 = 1% CO2 = 12%.
Kang et. al [92] analyzed the effect of gadolinium doped ceria in a reform-ing catalyst in comparison with an Al2O3 supported catalyst. The Pt/Gd – CeO2presented higher hydrogen yields than the Rh and Ru at 800 °C.

Chapter 5
Objectives of the work
• To design and develop a lab-scale steam reformer for tar mitigation, and toperform a fundamental analysis of gas-phase components under tar steamreforming.
• To develop new catalysts for biomass tar mitigation, taking into account thesensitiveness to alkali and Cl components.
• To investigate the effect of gas-phase components within the complex kinet-ics of alkalis in a gas-surface-bulk system. This catalyst and bulk systemcould be understood as an alkali storage/release system. Investigation ofthis mechanism was carried out in metal oxides at high temperatures.
• To evaluate reforming catalysts in a full-scale (5kW) diesel reformer for syn-gas production through ATR. This work was focused on the design and ac-tivity assessment of RhPt-based catalysts supported on two catalytic sup-ports, Al2O3 and CeO2 – ZrO2, under realistic operating conditions.
• To account for end-use fuel flexibility by using Swedish commercial diesel(Swedish Environmental Class 1, MK1), Fischer-Tropsch diesel (FT), Biodiesel(RME), and European standard diesel (DIN 590); and to assess the catalyticperformance and perform the post-mortem catalyst evaluation under the dif-ferent diesel qualities.
33

Part II
Experimental methodology
35

Chapter 6
Reactor set-ups
This thesis involved the use of two main systems in the evaluation of catalytic ac-tivity for tar and diesel reforming. Tar reforming experiments were performed inorder to evaluate the activity of three Ni-based catalysts and the effect of gas-phasealkali, fed to the reactor, on catalytic activity during steam reforming of a modeltar component (see Section 6.1). Furthermore, full-scale ATR was performed overbimetallic RhPt catalysts on two supports. An evaluation of catalytic activity un-der realistic operating conditions was performed, and four diesel qualities werealso evaluated (see Section 6.2).
6.1 Laboratory-scale steam reformer
A laboratory-scale steam reformer was designed and constructed in order to ac-quire a fundamental understanding of the gas-phase effects in tar reforming cat-alysts. During these experiments, a tar model component, 1-Methylnaphthalene(MNP) was used, with the molecular formula C11H10.
The tar reformer set-up is composed of a tubular quartz reactor (ID=10 mm,L=280mm), in which a catalytic fixed bed is placed. The reactor is mounted in avertical furnace with three Proportional integral derivative (PID) temperature con-trolled zones for uniform temperature profiles along the furnace. The temperaturein the reactor can be regulated from ambient up to 1100 ◦C. Process temperatureswere measured with K-type thermocouples placed before and after the catalystfixed-bed, supported on a porous quartz plate. The reactor set-up schematic isshown in Figure 6.1.
The feed to the reactor consisted of N2, H2, O2, and CO, and was regulated bythermal mass flow controllers (Bronkhorst®). In addition, aerosol particles werefed with an alkali ultrasonic nebulizer (925-KCW-6T), which generates aerosolflows from 4 cm3/min to 80 cm3/min of a liquid solution. The nebulizer was fedwith a liquid solution of KNO3 with an aerosol concentration of 2 ppm. Deionizedwater was fed into the reformer with two parallel syringe pumps (WPI Aladdin)
37
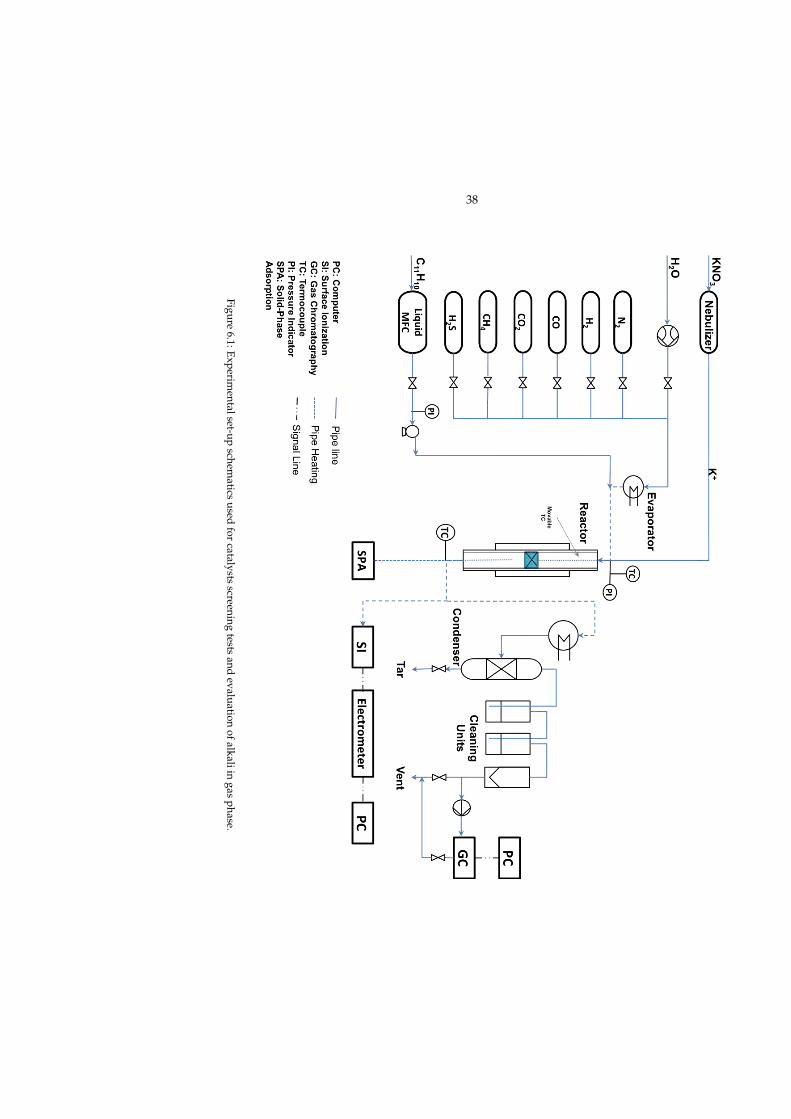
38
Figure6.1:Experim
entalset-upschem
aticsused
forcatalysts
screeningtests
andevaluation
ofalkaliingas
phase.
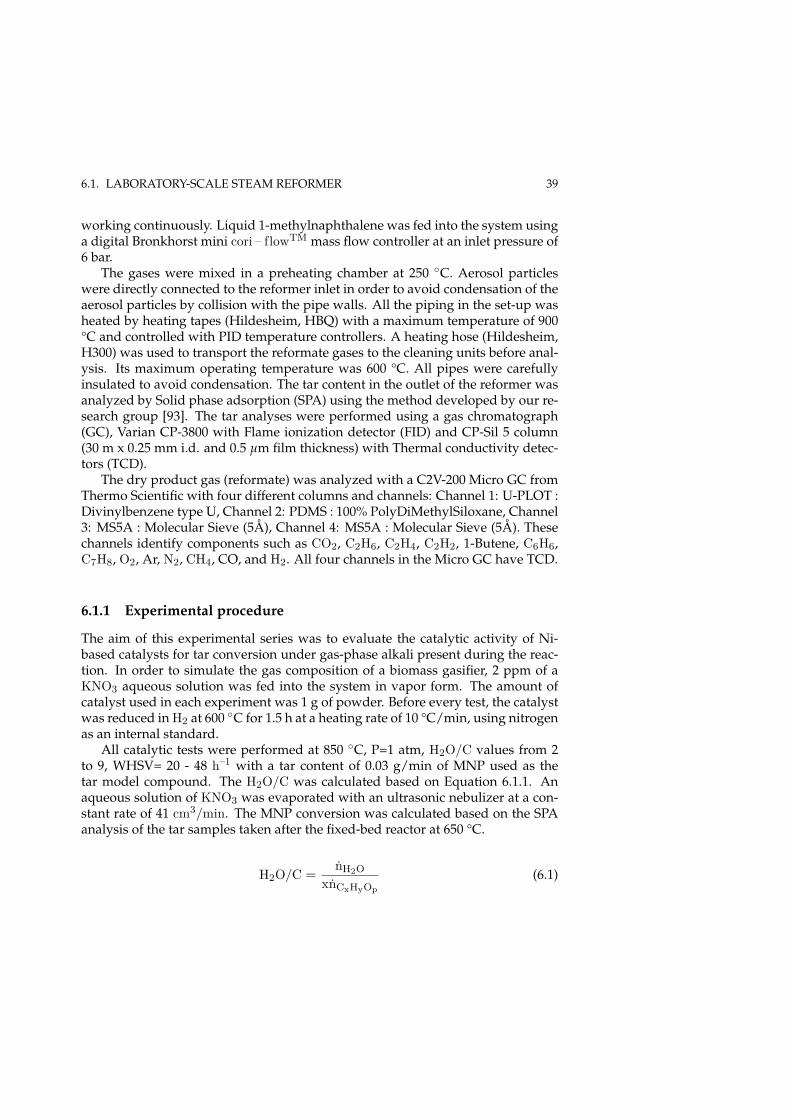
6.1. LABORATORY-SCALE STEAM REFORMER 39
working continuously. Liquid 1-methylnaphthalene was fed into the system usinga digital Bronkhorst mini cori – flowTM mass flow controller at an inlet pressure of6 bar.
The gases were mixed in a preheating chamber at 250 ◦C. Aerosol particleswere directly connected to the reformer inlet in order to avoid condensation of theaerosol particles by collision with the pipe walls. All the piping in the set-up washeated by heating tapes (Hildesheim, HBQ) with a maximum temperature of 900°C and controlled with PID temperature controllers. A heating hose (Hildesheim,H300) was used to transport the reformate gases to the cleaning units before anal-ysis. Its maximum operating temperature was 600 °C. All pipes were carefullyinsulated to avoid condensation. The tar content in the outlet of the reformer wasanalyzed by Solid phase adsorption (SPA) using the method developed by our re-search group [93]. The tar analyses were performed using a gas chromatograph(GC), Varian CP-3800 with Flame ionization detector (FID) and CP-Sil 5 column(30 m x 0.25 mm i.d. and 0.5 µm film thickness) with Thermal conductivity detec-tors (TCD).
The dry product gas (reformate) was analyzed with a C2V-200 Micro GC fromThermo Scientific with four different columns and channels: Channel 1: U-PLOT :Divinylbenzene type U, Channel 2: PDMS : 100% PolyDiMethylSiloxane, Channel3: MS5A : Molecular Sieve (5Å), Channel 4: MS5A : Molecular Sieve (5Å). Thesechannels identify components such as CO2, C2H6, C2H4, C2H2, 1-Butene, C6H6,C7H8, O2, Ar, N2, CH4, CO, and H2. All four channels in the Micro GC have TCD.
6.1.1 Experimental procedure
The aim of this experimental series was to evaluate the catalytic activity of Ni-based catalysts for tar conversion under gas-phase alkali present during the reac-tion. In order to simulate the gas composition of a biomass gasifier, 2 ppm of aKNO3 aqueous solution was fed into the system in vapor form. The amount ofcatalyst used in each experiment was 1 g of powder. Before every test, the catalystwas reduced in H2 at 600 ◦C for 1.5 h at a heating rate of 10 °C/min, using nitrogenas an internal standard.
All catalytic tests were performed at 850 ◦C, P=1 atm, H2O/C values from 2to 9, WHSV= 20 - 48 h–1 with a tar content of 0.03 g/min of MNP used as thetar model compound. The H2O/C was calculated based on Equation 6.1.1. Anaqueous solution of KNO3 was evaporated with an ultrasonic nebulizer at a con-stant rate of 41 cm3/min. The MNP conversion was calculated based on the SPAanalysis of the tar samples taken after the fixed-bed reactor at 650 °C.
H2O/C =nH2O
xnCxHyOp(6.1)
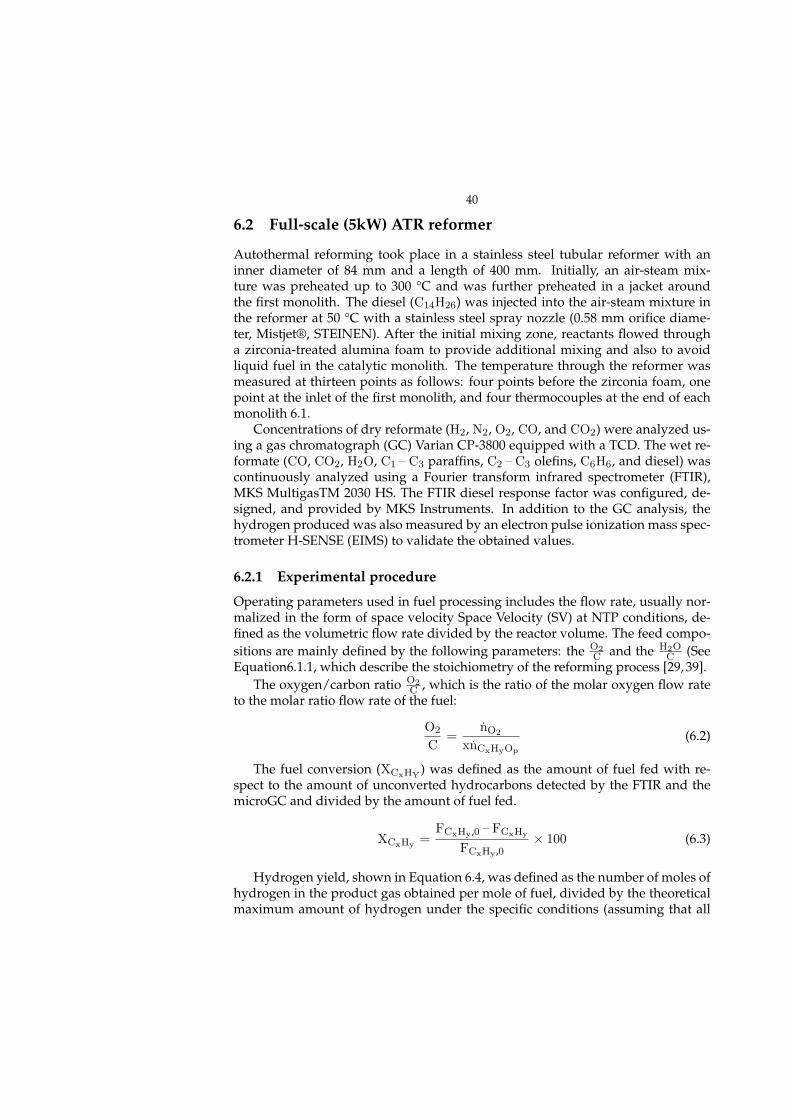
40
6.2 Full-scale (5kW) ATR reformer
Autothermal reforming took place in a stainless steel tubular reformer with aninner diameter of 84 mm and a length of 400 mm. Initially, an air-steam mix-ture was preheated up to 300 °C and was further preheated in a jacket aroundthe first monolith. The diesel (C14H26) was injected into the air-steam mixture inthe reformer at 50 °C with a stainless steel spray nozzle (0.58 mm orifice diame-ter, Mistjet®, STEINEN). After the initial mixing zone, reactants flowed througha zirconia-treated alumina foam to provide additional mixing and also to avoidliquid fuel in the catalytic monolith. The temperature through the reformer wasmeasured at thirteen points as follows: four points before the zirconia foam, onepoint at the inlet of the first monolith, and four thermocouples at the end of eachmonolith 6.1.
Concentrations of dry reformate (H2, N2, O2, CO, and CO2) were analyzed us-ing a gas chromatograph (GC) Varian CP-3800 equipped with a TCD. The wet re-formate (CO, CO2, H2O, C1 – C3 paraffins, C2 – C3 olefins, C6H6, and diesel) wascontinuously analyzed using a Fourier transform infrared spectrometer (FTIR),MKS MultigasTM 2030 HS. The FTIR diesel response factor was configured, de-signed, and provided by MKS Instruments. In addition to the GC analysis, thehydrogen produced was also measured by an electron pulse ionization mass spec-trometer H-SENSE (EIMS) to validate the obtained values.
6.2.1 Experimental procedure
Operating parameters used in fuel processing includes the flow rate, usually nor-malized in the form of space velocity Space Velocity (SV) at NTP conditions, de-fined as the volumetric flow rate divided by the reactor volume. The feed compo-sitions are mainly defined by the following parameters: the O2
C and the H2OC (See
Equation6.1.1, which describe the stoichiometry of the reforming process [29, 39].The oxygen/carbon ratio O2
C , which is the ratio of the molar oxygen flow rateto the molar ratio flow rate of the fuel:
O2C =
nO2
xnCxHyOp(6.2)
The fuel conversion (XCxHY ) was defined as the amount of fuel fed with re-spect to the amount of unconverted hydrocarbons detected by the FTIR and themicroGC and divided by the amount of fuel fed.
XCxHy =FCxHy,0 – FCxHy
FCxHy,0× 100 (6.3)
Hydrogen yield, shown in Equation 6.4, was defined as the number of moles ofhydrogen in the product gas obtained per mole of fuel, divided by the theoreticalmaximum amount of hydrogen under the specific conditions (assuming that all
6.2. FULL-SCALE (5KW) ATR REFORMER 41
Figu
re6.
2:5
kWA
TRre
form
erfo
rH2
gene
rati
on.
42
carbon reacts to form CO2). The reformer efficiency was calculated as shown inEquation 6.5. The product ratio was used to evaluate CO2 selectivity relative toCO.
YH2 [%] =nH2Formed
TheoreticalH2yield× 100 (6.4)
ηRef =FH2LHVH2
FFuelLHVFuel× 100 (6.5)
SCO2 [%] =FCO2
FCO2 + FCO(6.6)
Chapter 7
Catalyst development
7.1 Catalyst preparation
The most common way to introduce the active material onto a support is by dryimpregnation, also known as Incipient wetness (IW) technique.
This technique is based on the pore volume of the catalytic support. Oncethe support is filled with a salt precursor solution, its surface becomes wet. Thisimpregnation was repeated as many times as needed until the desired weight per-centage of the active phase was reached (see Papers I & II for detailed catalystpreparation). Once all precursors were impregnated in the support, a calcinationstep was performed to remove the remaining content of precursors, and to obtainthe desired structure of the catalyst.
The following steps are related to the preparation of monolithic catalysts usedin Papers II-V. The calcined powders were mixed with ethanol and then ball milledfor 24h in order to obtain suitable slurries for dip coating. The ceramic monolithwas immersed in the slurry, and after withdrawal, excess slurry was removed byblowing air through the channels. The number of dips varied depending on theintended load of washcoat on the ceramic substrate. In this work, the monolithiccatalysts were loaded with 20 wt% the total weight of the uncoated monolith. Be-tween dips, the catalysts were dried at 110 °C for 30 min. Once ball milled, thesamples were calcined at 800 °C for 3 h in air. The calcination temperature waschosen with a margin of 100 °C according to the maximum operating temperatureof the reformer. In order to use it for characterization, a part of the impregnatedwashcoat was treated separately in the same manner as the monolithic catalyst.This procedure can be followed by drying the support between coatings.
7.2 Catalyst characterization
Catalyst characterization was performed to analyze the physical properties andstructure of the catalyst before and after the catalytic evaluation. This is of im-
43
44
portance since changes in the internal structure and possible deposition of certaincomponents in the catalyst affect its performance and therefore its reforming ac-tivity.
7.2.1 Surface are and pore size by N2 Adsorption
Among existing methods to measure the internal specific surface area, the poredimension, and their volume distribution in a catalyst, the Brunauer Emmet andTeller (BET) andBarrett-Joyner-Halenda (BJH) methods are currently the most com-monly used [47]. BET uses the physical adsorption of N2 at –196 °C at certain par-tial pressures with the volume adsorbed in a monolayer. The volume adsorbed isthen corrected to the number of moles adsorbed, and the number of N2 moleculesoccupying a certain area is calculated.
7.2.2 Chemisorption
Chemisorption is the formation of an irreversibly adsorbed monolayer, due tostrong interaction forces that include covalent and ionic bonds. The measurementof the quantity of gas adsorbed gives the metal surface area and the metal dis-persion on the coverage area if the stoichiometry of the chemisorption reaction isknown [47].
The metal dispersion and the crystallite size of active metals on the catalystsupport for the H2 and CO chemisorption experiments were estimated. Beforemeasurements, the samples were evacuated at 50 ◦C for 30 min followed by re-duction in H2 to remove surface oxides. Initially, a H2 isotherm was recordedat 35 ◦C, followed by the measurement of a physisorption isotherm after 30 minof degassing at 35 ◦C. The difference was used to calculate the volume of H2chemisorbed.
7.2.3 Temperature programmed methods
Temperature programmed (TPx) methods involve the response measurement of asolid as the temperature is changed. In heterogeneous catalysis, the objective isto understand the gas-solid interactions and surface reactivity. Thus, TPx meth-ods comprise monitoring surface processes between the solid and the surround-ing gas via continuous analysis of the gas-phase composition as the temperatureis raised. In this thesis, temperature programmed reduction (TPR) and oxidation(TPO) were used to analyze the oxidation state of fresh and aged samples.
During TPR, a solid catalyst was exposed to a flow of reducing gas mixture(H2/N2 or H2/Ar) while the temperature was linearly increased. The rate of reduc-tion was followed by the measure of gas composition at the outlet of the reactor.
TPR includes the measurement of total H2 consumption, from which the de-gree of reduction, and thus the average oxidation state after reduction, can becalculated.
7.2. CATALYST CHARACTERIZATION 45
TPO was performed to distinguish the type and the amount of coke presentin aged samples. Additionally, quantification of the total carbon formation wasobtained by thermogravimetric analyses (TGA).
7.2.4 Work function measurements
In principle, if an electric field influences polarizable gas molecules, their electricequilibrium will be changed, and their electron clouds will be shifted with respectto the positive charge. This shift occurs in the same way when such molecules arein contact with a phase boundary, for example when a molecule is adsorbed on ametal surface [94].
Therefore, the polarization of a metal surface is the principle of the work func-tion energy, Φ, which is the energy required to remove an electron from the highestfilled level in the Fermi distribution of a solid to the vacuum [95]. The measure-ment of work function is not a measurement of the bulk, but of the surface of themetal. The electron deformation caused by the adsorbed molecules has a strong ef-fect on the chemical behavior of the metal, such as changing the activation energyof a catalyzed chemical reaction [94].
Work function measurements were carried out under vacuum at 10–7 mbarwith the use of samples pressed into pellets (diameter 10 mm, 8 MPa). Standard-ization of samples was carried out by heating the samples to 400 °C for 15 min. Thecontact potential difference (VCPD) measurements were carried out by the Kelvindynamic condenser method with a KP6500 probe (McAllister Technical Services)at 150 °C. The reference electrode was a standard stainless steel plate with a di-ameter of 3 mm (Φref= 4.1 eV), provided by the manufacturer. The work functionvalues were obtained as eVCPD = Φref – Φsample.
7.2.5 Spectroscopy methods
X-ray diffraction
Powder diffraction is a technique through which the crystalline structure of a sam-ple is characterized. X-ray diffraction is one of the techniques that provides aquantitative and qualitative analysis of the compounds present in a solid sample.The method is based on the X-ray diffraction pattern, which is unique for eachcrystalline substance, allowing a match to be made between an unknown patternand an authentic sample. A diffractometer using Ni-filtered Cu α K radiation andscanning 2θ from 10 to 90◦ in the scan mode (0.02, 1 s) was used.
Crystal phases were determined by comparing sample diffractograms withpowder diffraction database files (ICDD/JPCDS).
Atomic absorption spectroscopy
The quantification of potassium in the fresh and aged samples was performedusing an atomic absorption spectrometer (Perkin Elmer, 1100B AAS analyzer),
46
equipped with a ALUMINA ™hollow cathode lamp for potassium. An acetylene-air flame was used for the analysis, with a fuel-oxidant ratio of 2.5:8.0 L/min.200-300 mg of catalyst were dissolved in boiling HNO3 in a standard flask andafterwards diluted with distilled water. The instrument was calibrated internallyusing a standard solution for potassium (Perkin Elmer Pure atomic spectrometrystandard solution).
Inductively coupled plasma-Optical emission (ICP-OES)
The sulfur content in the aged monoliths was analyzed at the inlet and outlet ofboth monolith samples. The analysis was performed with closed microwave di-gestion of 0.2-0.3 g finely crushed samples in duplicate at 200 ◦C with 12 ml 37%HCl and 4 ml 65% HNO3 (aqua regia) followed by quantification by ICP-OES anal-ysis at the 181.972 nm sulfur emission line.
7.2.6 Microscopy methods
Scanning and Transmission electron microscopy
Transmission electron microscopy (TEM) was used to determine the morphologyand particle size distribution of Rh and Pt species in the aged samples. Samplesof ∼ 0.1 g were ground using a pestle and suspended in isopropanol for analysis.One droplet of the mixture was then placed onto a carbon film containing holessupported in a TEM copper grid of 200 mesh. The samples were then analyzed us-ing an Analytical Field Emission Transmission Electron Microscope, JEOL 2100F.High resolution images were obtained using scanning transmission electron mi-croscopy (STEM), and elemental analyses were obtained using an Energy Disper-sive Spectrometer (EDS) from Oxford Instruments, model INCA Energy 250.
Scanning tunneling microscopy (STM)
Scanning tunneling microscopy (STM) is a microscopy method that allows imag-ing of a real space with atomic resolution. This technique is based on the quan-tum tunneling effect, which allows the electron to tunnel through a potential bar-rier between two conductors, provided that the gap is small enough (i.e., a fewÅngströms). The tunneling effect is the result of overlap between the wave func-tion of two conductive surfaces. The transition takes place via this wave functionoverlap, despite the gap of a few Ångströms. In this case, electrons can tunnelin both directions, from one conductor to another, causing a zero net current. Inorder to achieve a net current, a bias is applied between the two conductors. In anexperimental STM set up, a very sharp (ideally monoatomically sharp) conductivetip (commonly made of W or Pt-Ir) scans over a relatively flat surface. The surfacehas to be metal or semiconductor for the tunneling effect to happen. Therefore, thismeasurement requires samples of high quality and careful surface science samplepreparations.
7.2. CATALYST CHARACTERIZATION 47
The experiments were done in a RHK UHV 3500 SPM system; with a base pres-sure 3× 10–11 Torr. The sample was prepared by repeated cycles of Ar-sputtering(1 kV) and annealing at 800 °C, until a sharp (1x1) LEED (low energy electrondiffraction) pattern was observed with low background and STM showed a smoothsurface with large flat terraces. Sample heating was done by electron bombard-ment, and the temperature was measured with a pyrometer from 300 °C andhigher. STM was done using etched W and Au tips. The bias was applied tothe tip; negative bias thus corresponds to imaging empty states and positive biasimages the filled states on the surface. Naphthalene was deposited through aprecision leak valve at 5x10⁻⁸ Torr. Exposures are given in Langmuir (L), where1L = 1x10⁻⁶ Torr sec. It takes about 6.5 L to reach a full monolayer at room tem-perature.
Naphtalene adsoption on Ni(111)
The experiments were done in a RHK UHV 3500 SPM system; with a base pressure3.10–11 Torr. The sample was prepared by repeated cycles of Ar-sputtering (1 kV)and annealing at 800 °C, until a sharp (1x1) LEED (low energy electron diffraction)pattern was observed with low background and STM showed a smooth surfacewith large flat terraces. Sample heating was done by electron bombardment, andthe temperature was measured with a pyrometer from 300 °C and higher. STMwas done using etched W and Au tips. The bias was applied to the tip; negativebias thus corresponds to imaging empty states and positive bias images the filledstates on the surface. Naphthalene was deposited through a precision leak valveat 5.10–8 Torr. Exposures are given in Langmuir (L), where 1L = 1.10–6 Torr.sec. Ittakes about 6.5 L to reach a full monolayer at room temperature.


Part III
Results and discussion
49

Chapter 8
Steam reforming of MNP (Paper I)
Sensitiveness to alkali components has been one of the major causes of catalystdeactivation in the steam reforming of tar. This chapter focuses on investigationsaimed at acquiring a fundamental understanding of the processes related to gas-phase alkali influencing tar (MNP, model tar component) steam reforming overalkali promoted Ni-based catalysts. Particular efforts were devoted to the devel-opment of a novel catalyst support, in which the alkali components present in thegas phase of a reaction system can be used to reduce the alkali losses from thesupport bulk.
8.1 Catalyst development
As was previously discussed in Section 4.3, alkali components in the catalyst orin the biomass feed affect the overall performance of a biomass-tar reformer. Thissection will present results and discuss the development of a new catalytic sup-port, which could be used to act as alkali storage, as well as efficient tar reformingcatalytic support of Ni-based catalyst.
Different oxides and minerals have been researched for use in the conversionof tar in secondary reformers, as described in Section 4.4. However, few studieswere found on the use or application of the electrochemical properties of gas-phasealkali components present in the producer gas during biomass gasification. There-fore, motivated by this lack, a search for alternative materials with electrochemicalproperties that could interact with gas-phase alkali components was initiated.
The selection of materials for this purpose was based on the following criteria:
• They should be able to store/release alkali metals/ions at certain reactionconditions
• They should have electrochemical mobility within the material itself
• Thermo/physical stability at high temperatures
51
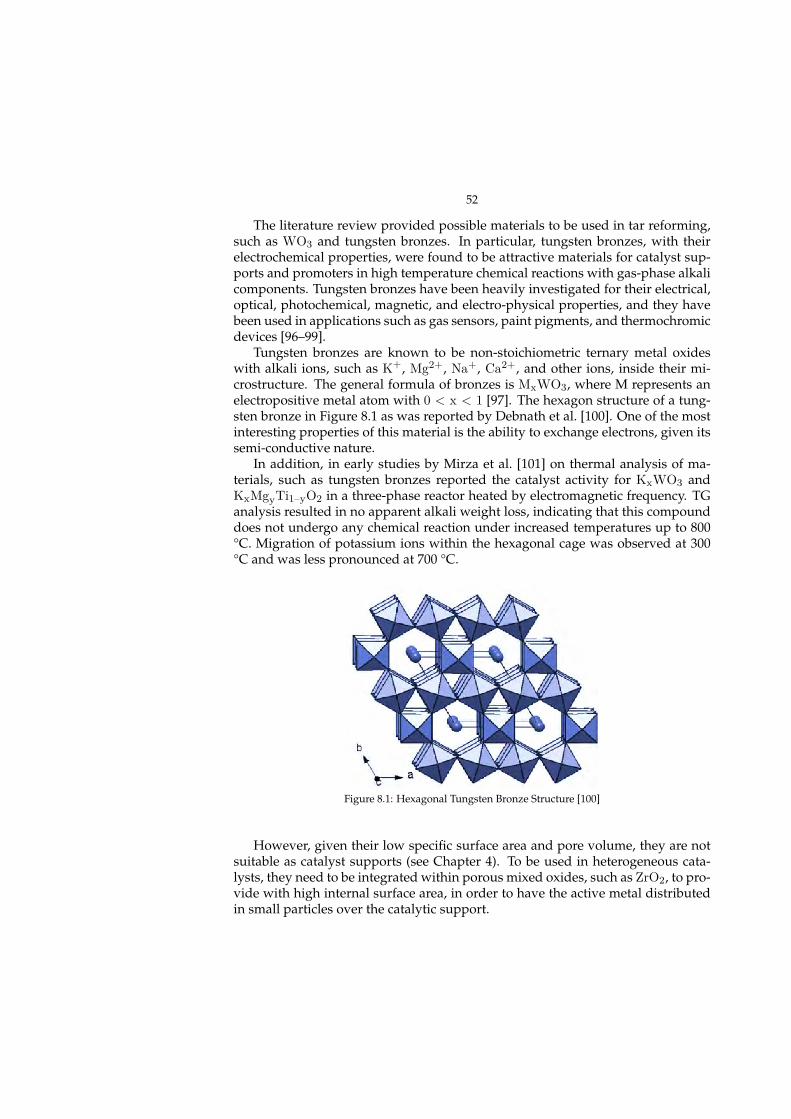
52
The literature review provided possible materials to be used in tar reforming,such as WO3 and tungsten bronzes. In particular, tungsten bronzes, with theirelectrochemical properties, were found to be attractive materials for catalyst sup-ports and promoters in high temperature chemical reactions with gas-phase alkalicomponents. Tungsten bronzes have been heavily investigated for their electrical,optical, photochemical, magnetic, and electro-physical properties, and they havebeen used in applications such as gas sensors, paint pigments, and thermochromicdevices [96–99].
Tungsten bronzes are known to be non-stoichiometric ternary metal oxideswith alkali ions, such as K+, Mg2+, Na+, Ca2+, and other ions, inside their mi-crostructure. The general formula of bronzes is MxWO3, where M represents anelectropositive metal atom with 0 < x < 1 [97]. The hexagon structure of a tung-sten bronze in Figure 8.1 as was reported by Debnath et al. [100]. One of the mostinteresting properties of this material is the ability to exchange electrons, given itssemi-conductive nature.
In addition, in early studies by Mirza et al. [101] on thermal analysis of ma-terials, such as tungsten bronzes reported the catalyst activity for KxWO3 andKxMgyTi1–yO2 in a three-phase reactor heated by electromagnetic frequency. TGanalysis resulted in no apparent alkali weight loss, indicating that this compounddoes not undergo any chemical reaction under increased temperatures up to 800°C. Migration of potassium ions within the hexagonal cage was observed at 300°C and was less pronounced at 700 °C.
Figure 8.1: Hexagonal Tungsten Bronze Structure [100]
However, given their low specific surface area and pore volume, they are notsuitable as catalyst supports (see Chapter 4). To be used in heterogeneous cata-lysts, they need to be integrated within porous mixed oxides, such as ZrO2, to pro-vide with high internal surface area, in order to have the active metal distributedin small particles over the catalytic support.
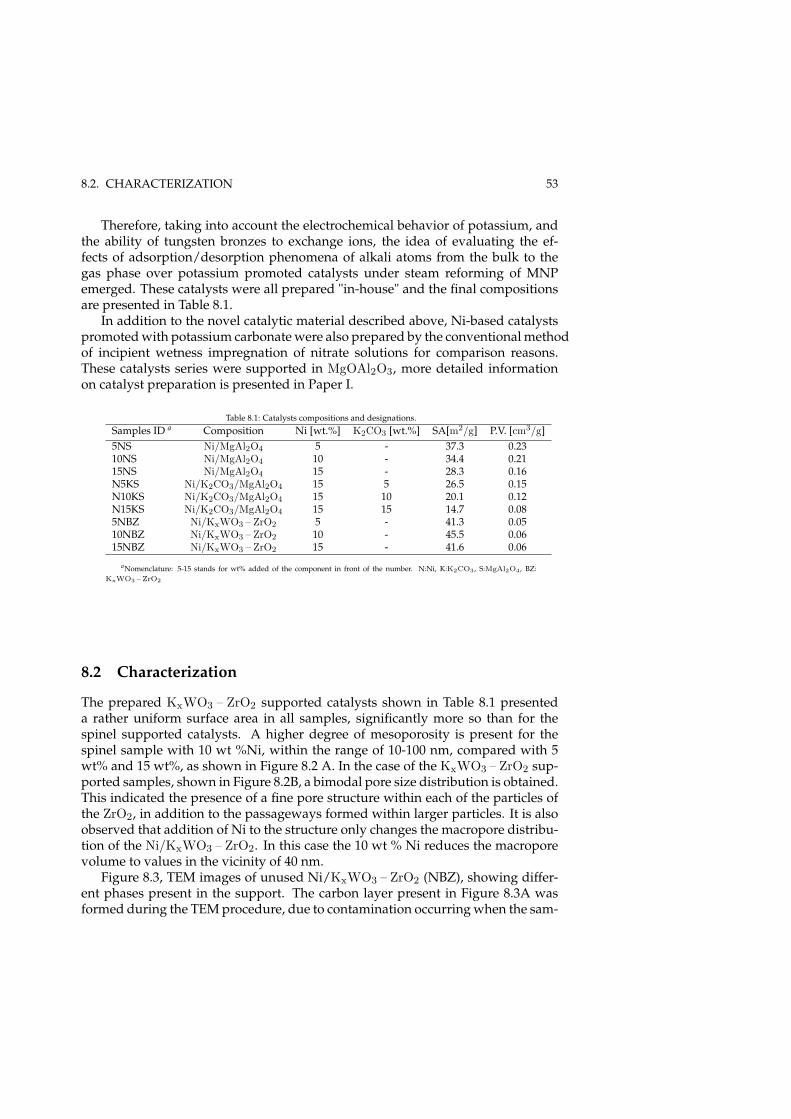
8.2. CHARACTERIZATION 53
Therefore, taking into account the electrochemical behavior of potassium, andthe ability of tungsten bronzes to exchange ions, the idea of evaluating the ef-fects of adsorption/desorption phenomena of alkali atoms from the bulk to thegas phase over potassium promoted catalysts under steam reforming of MNPemerged. These catalysts were all prepared "in-house" and the final compositionsare presented in Table 8.1.
In addition to the novel catalytic material described above, Ni-based catalystspromoted with potassium carbonate were also prepared by the conventional methodof incipient wetness impregnation of nitrate solutions for comparison reasons.These catalysts series were supported in MgOAl2O3, more detailed informationon catalyst preparation is presented in Paper I.
Table 8.1: Catalysts compositions and designations.
Samples ID a Composition Ni [wt.%] K2CO3 [wt.%] SA[m2/g] P.V. [cm3/g]5NS Ni/MgAl2O4 5 - 37.3 0.2310NS Ni/MgAl2O4 10 - 34.4 0.2115NS Ni/MgAl2O4 15 - 28.3 0.16N5KS Ni/K2CO3/MgAl2O4 15 5 26.5 0.15N10KS Ni/K2CO3/MgAl2O4 15 10 20.1 0.12N15KS Ni/K2CO3/MgAl2O4 15 15 14.7 0.085NBZ Ni/KxWO3 – ZrO2 5 - 41.3 0.0510NBZ Ni/KxWO3 – ZrO2 10 - 45.5 0.0615NBZ Ni/KxWO3 – ZrO2 15 - 41.6 0.06
aNomenclature: 5-15 stands for wt% added of the component in front of the number. N:Ni, K:K2CO3, S:MgAl2O4, BZ:KxWO3 – ZrO2
8.2 Characterization
The prepared KxWO3 – ZrO2 supported catalysts shown in Table 8.1 presenteda rather uniform surface area in all samples, significantly more so than for thespinel supported catalysts. A higher degree of mesoporosity is present for thespinel sample with 10 wt %Ni, within the range of 10-100 nm, compared with 5wt% and 15 wt%, as shown in Figure 8.2 A. In the case of the KxWO3 – ZrO2 sup-ported samples, shown in Figure 8.2B, a bimodal pore size distribution is obtained.This indicated the presence of a fine pore structure within each of the particles ofthe ZrO2, in addition to the passageways formed within larger particles. It is alsoobserved that addition of Ni to the structure only changes the macropore distribu-tion of the Ni/KxWO3 – ZrO2. In this case the 10 wt % Ni reduces the macroporevolume to values in the vicinity of 40 nm.
Figure 8.3, TEM images of unused Ni/KxWO3 – ZrO2 (NBZ), showing differ-ent phases present in the support. The carbon layer present in Figure 8.3A wasformed during the TEM procedure, due to contamination occurring when the sam-
54
Figure 8.2: Pore size distribution of fresh samples supported on A) Ni/MgAl2O4 and B)Ni/KxWO3 –ZrO2. Numbers 5, 10 and 15 stand for wt % Ni loaded in each sample.
ple was in contact with the electron beam during the analysis. A mix of differentmorphologies of tungsten oxides were observed to be present; for example, Figure8.3B shows the crystalline lattice of KxWO3. Ni is present in the form of NiO onthe surface of ZrO2 and KxWO3 – ZrO2, as illustrated in Figures 8.3C and D.
8.2.1 Promoting effect of K
| The influence of potassium addition to the catalyst support was evaluated interms of the electronic interactions that addition of potassium may have intro-duced by changing the catalyst surface work function. The work function gives ameasure of the energy needed to remove an electron from the outmost layer of ametallic surface. It depends on the material and on the detailed structure of thesurface. In addition to the the electron distribution at the surface, and how a sur-face dipole layer is formed. The addition of alkali metals like K to Ni, will changethe geometric electron distribution and the work function.
Work function is of importance in catalysis since in the adsorption of molecules,an electronic interaction between the catalyst surface and the reactant moleculestakes place. Nevertheless, the relation between work function and the adsorp-tion energy of a molecule is not straight forward. This relationship depends onhow the electron exchange between the surface-adsorbate bond takes place. A re-cent initiated study addressing this issue is described in Chapter 9. The electronexchange from potassium and the surface contribute to the bond strength (theadsorption energy). However, the extent of this contribution depends on the de-tailed geometry and electronic structure of the molecule and of the bond/reactionsite on the surface. In general, the most important function of the catalyst is tofeed electrons into empty antibonding molecular orbitals, thereby weakening the
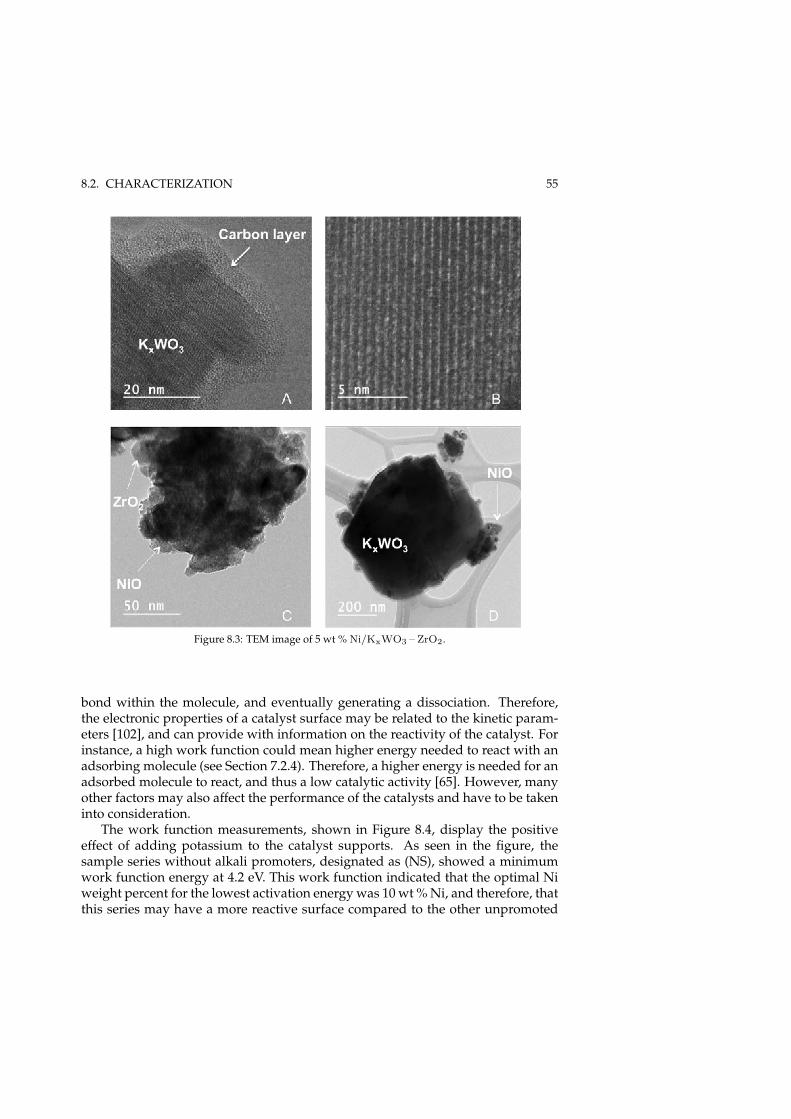
8.2. CHARACTERIZATION 55
Figure 8.3: TEM image of 5 wt % Ni/KxWO3 – ZrO2.
bond within the molecule, and eventually generating a dissociation. Therefore,the electronic properties of a catalyst surface may be related to the kinetic param-eters [102], and can provide with information on the reactivity of the catalyst. Forinstance, a high work function could mean higher energy needed to react with anadsorbing molecule (see Section 7.2.4). Therefore, a higher energy is needed for anadsorbed molecule to react, and thus a low catalytic activity [65]. However, manyother factors may also affect the performance of the catalysts and have to be takeninto consideration.
The work function measurements, shown in Figure 8.4, display the positiveeffect of adding potassium to the catalyst supports. As seen in the figure, thesample series without alkali promoters, designated as (NS), showed a minimumwork function energy at 4.2 eV. This work function indicated that the optimal Niweight percent for the lowest activation energy was 10 wt % Ni, and therefore, thatthis series may have a more reactive surface compared to the other unpromoted
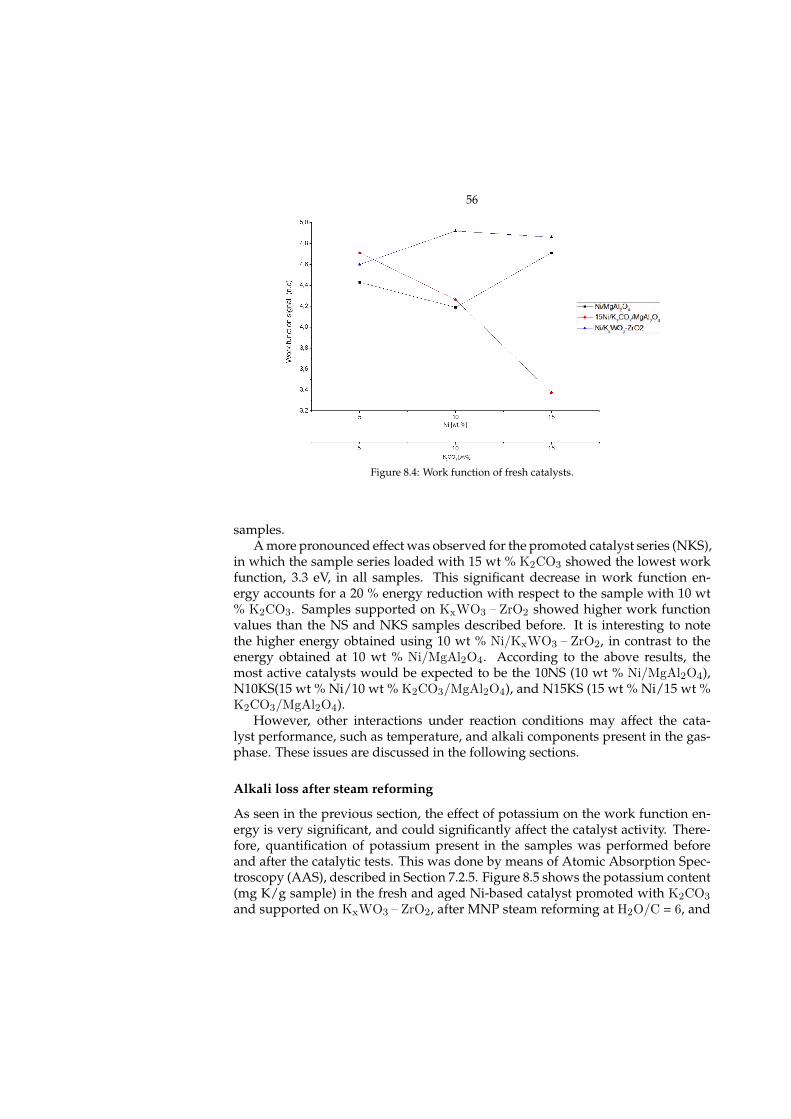
56
Figure 8.4: Work function of fresh catalysts.
samples.A more pronounced effect was observed for the promoted catalyst series (NKS),
in which the sample series loaded with 15 wt % K2CO3 showed the lowest workfunction, 3.3 eV, in all samples. This significant decrease in work function en-ergy accounts for a 20 % energy reduction with respect to the sample with 10 wt% K2CO3. Samples supported on KxWO3 – ZrO2 showed higher work functionvalues than the NS and NKS samples described before. It is interesting to notethe higher energy obtained using 10 wt % Ni/KxWO3 – ZrO2, in contrast to theenergy obtained at 10 wt % Ni/MgAl2O4. According to the above results, themost active catalysts would be expected to be the 10NS (10 wt % Ni/MgAl2O4),N10KS(15 wt % Ni/10 wt % K2CO3/MgAl2O4), and N15KS (15 wt % Ni/15 wt %K2CO3/MgAl2O4).
However, other interactions under reaction conditions may affect the cata-lyst performance, such as temperature, and alkali components present in the gas-phase. These issues are discussed in the following sections.
Alkali loss after steam reforming
As seen in the previous section, the effect of potassium on the work function en-ergy is very significant, and could significantly affect the catalyst activity. There-fore, quantification of potassium present in the samples was performed beforeand after the catalytic tests. This was done by means of Atomic Absorption Spec-troscopy (AAS), described in Section 7.2.5. Figure 8.5 shows the potassium content(mg K/g sample) in the fresh and aged Ni-based catalyst promoted with K2CO3and supported on KxWO3 – ZrO2, after MNP steam reforming at H2O/C = 6, and
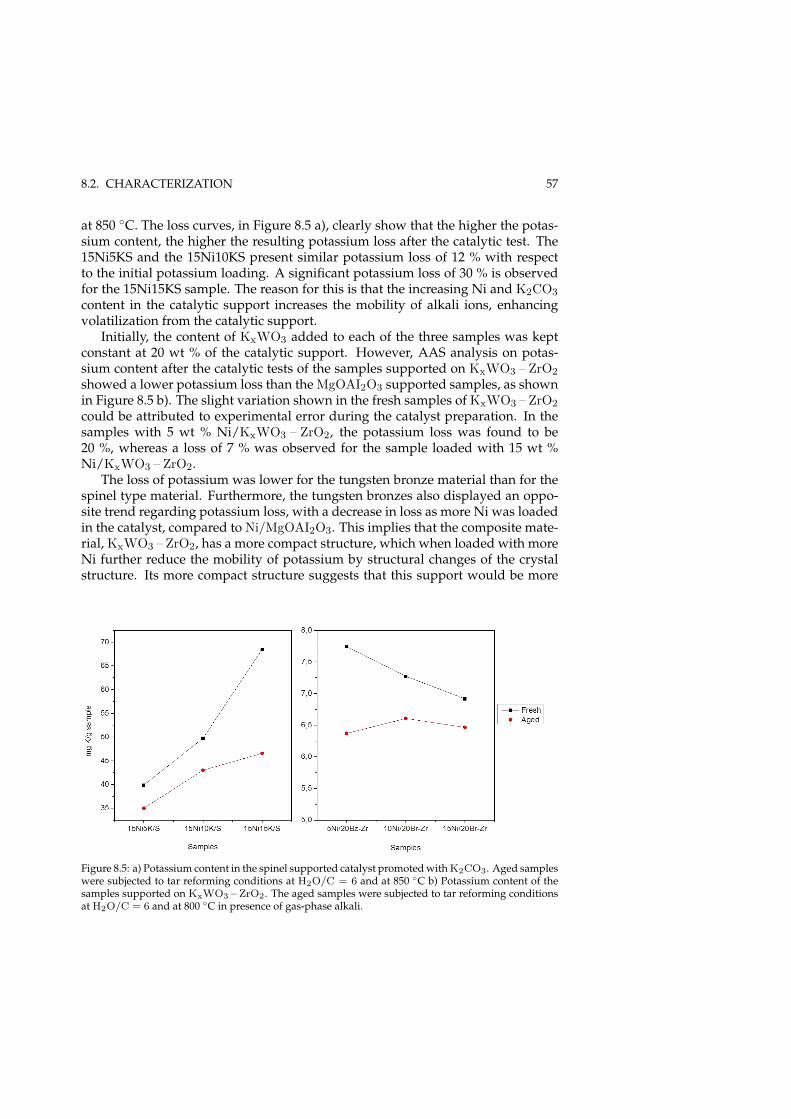
8.2. CHARACTERIZATION 57
at 850 ◦C. The loss curves, in Figure 8.5 a), clearly show that the higher the potas-sium content, the higher the resulting potassium loss after the catalytic test. The15Ni5KS and the 15Ni10KS present similar potassium loss of 12 % with respectto the initial potassium loading. A significant potassium loss of 30 % is observedfor the 15Ni15KS sample. The reason for this is that the increasing Ni and K2CO3content in the catalytic support increases the mobility of alkali ions, enhancingvolatilization from the catalytic support.
Initially, the content of KxWO3 added to each of the three samples was keptconstant at 20 wt % of the catalytic support. However, AAS analysis on potas-sium content after the catalytic tests of the samples supported on KxWO3 – ZrO2showed a lower potassium loss than the MgOAI2O3 supported samples, as shownin Figure 8.5 b). The slight variation shown in the fresh samples of KxWO3 – ZrO2could be attributed to experimental error during the catalyst preparation. In thesamples with 5 wt % Ni/KxWO3 – ZrO2, the potassium loss was found to be20 %, whereas a loss of 7 % was observed for the sample loaded with 15 wt %Ni/KxWO3 – ZrO2.
The loss of potassium was lower for the tungsten bronze material than for thespinel type material. Furthermore, the tungsten bronzes also displayed an oppo-site trend regarding potassium loss, with a decrease in loss as more Ni was loadedin the catalyst, compared to Ni/MgOAI2O3. This implies that the composite mate-rial, KxWO3 – ZrO2, has a more compact structure, which when loaded with moreNi further reduce the mobility of potassium by structural changes of the crystalstructure. Its more compact structure suggests that this support would be more
Figure 8.5: a) Potassium content in the spinel supported catalyst promoted withK2CO3. Aged sampleswere subjected to tar reforming conditions at H2O/C = 6 and at 850 ◦C b) Potassium content of thesamples supported on KxWO3 – ZrO2. The aged samples were subjected to tar reforming conditionsat H2O/C = 6 and at 800 ◦C in presence of gas-phase alkali.
58
durable in terms of alkali loss under steam reforming conditions.
8.3 MNP steam reforming
Evaluation of the conversion of MNP over the samples previously characterizedwas carried out under steam reforming conditions at H2O/C 3, 6, and 9 at a con-stant temperature of 850 ◦C with WHSV = 20-48 h–1. In addition, the effect of Niloading in the catalyst was evaluated with three Ni loadings: 5, 10, and 15 wt %Ni.
8.3.1 SR over Ni/MgOAl2O3
Effect of Ni wt %
Figure 8.6 presents gas selectivities for permanent gases, benzene, and naphtha-lene. The figure shows an increase in hydrogen yield and CO selectivities withincreasing nickel content in the NS catalysts series. These increases are due to thereversed WGS and the SR equilibrium reactions taking place. This observationalso explains the low levels of CO2 as the Ni content increases. Figure 8.7 showsthe MNP conversion as a function of the Ni content in the catalyst. A maximum isobserved for 10NS, which may be directly related to the results of work functionenergy, as described in Section 8.2.1.
Effect of water content
Results showed that the MNP conversion was enhanced by higher water con-tent, as was previously reported by Rostrup-Nielsen et al. [51]. In excess of wa-ter, polyaromatic hydrocarbons are converted to methane, benzene, and naphtha-lene, while reducing CO2, because fewer combustion reactions occur as shownin the gas selectivities obtained for the Ni/MgO – Al2O3 in Figure 8.6. Conse-quently, methane selectivity increases as the water content increases, and in thiscase methanation might have taken place simultaneously with the WGS reactions.No significant variation was observed for benzene and naphthalene. Interestingly,the samples 10NS yielded the maximum conversion in both cases of H2O/C ratios3 and 6.
In view of the above results, it is clear that increasing nickel content leads tothe production of syngas, with a conversion of MNP between 90 to 93 %. Thereactivity of the different samples can also be related to the work function analysisperformed in the previous sections.
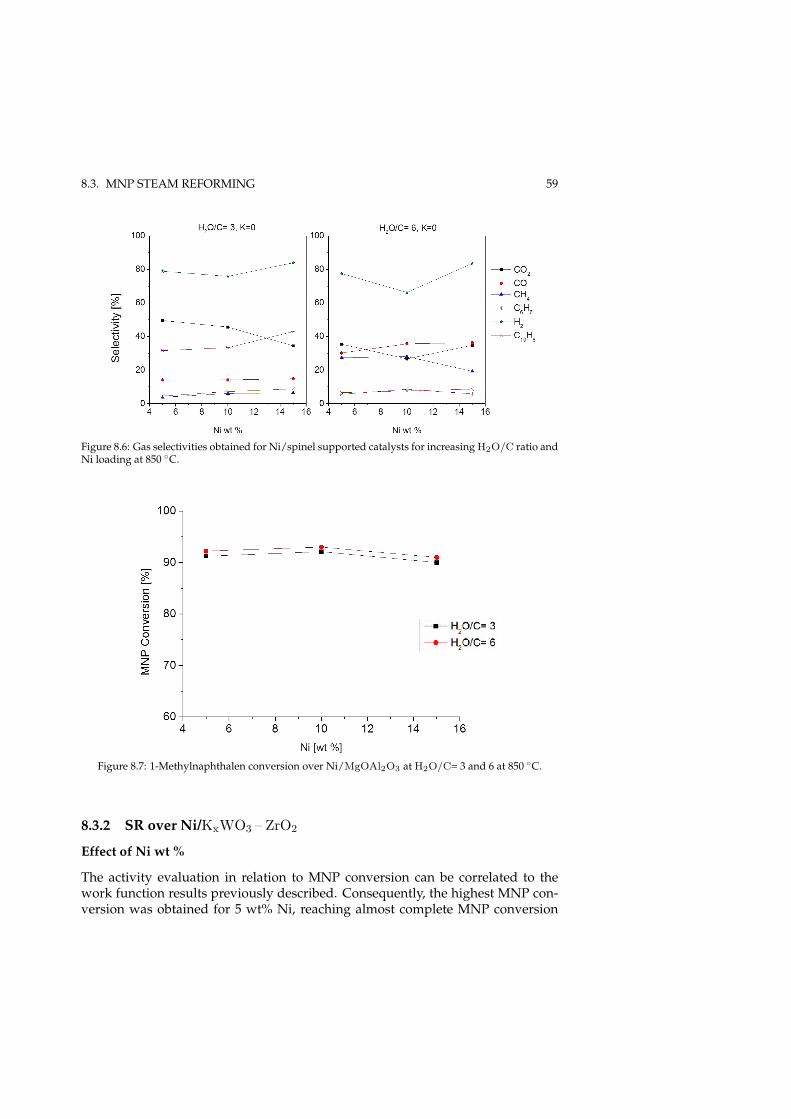
8.3. MNP STEAM REFORMING 59
Figure 8.6: Gas selectivities obtained for Ni/spinel supported catalysts for increasing H2O/C ratio andNi loading at 850 ◦C.
Figure 8.7: 1-Methylnaphthalen conversion over Ni/MgOAl2O3 at H2O/C= 3 and 6 at 850 ◦C.
8.3.2 SR over Ni/KxWO3 – ZrO2
Effect of Ni wt %
The activity evaluation in relation to MNP conversion can be correlated to thework function results previously described. Consequently, the highest MNP con-version was obtained for 5 wt% Ni, reaching almost complete MNP conversion
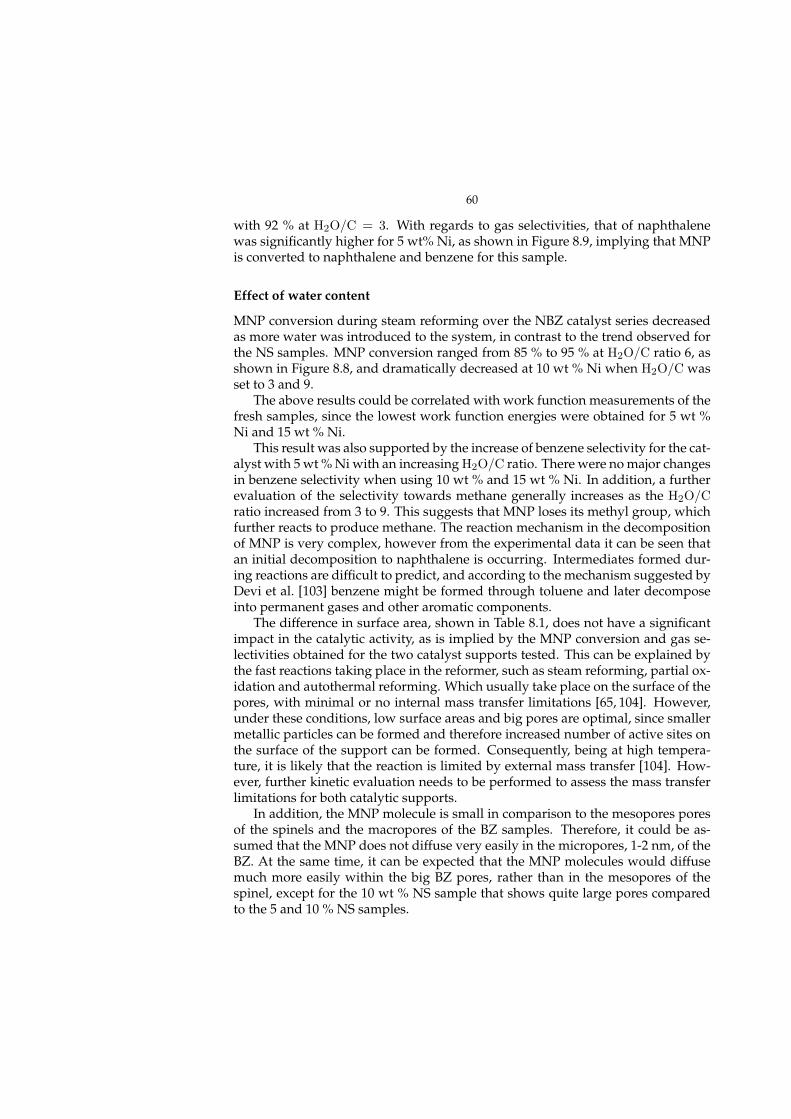
60
with 92 % at H2O/C = 3. With regards to gas selectivities, that of naphthalenewas significantly higher for 5 wt% Ni, as shown in Figure 8.9, implying that MNPis converted to naphthalene and benzene for this sample.
Effect of water content
MNP conversion during steam reforming over the NBZ catalyst series decreasedas more water was introduced to the system, in contrast to the trend observed forthe NS samples. MNP conversion ranged from 85 % to 95 % at H2O/C ratio 6, asshown in Figure 8.8, and dramatically decreased at 10 wt % Ni when H2O/C wasset to 3 and 9.
The above results could be correlated with work function measurements of thefresh samples, since the lowest work function energies were obtained for 5 wt %Ni and 15 wt % Ni.
This result was also supported by the increase of benzene selectivity for the cat-alyst with 5 wt % Ni with an increasing H2O/C ratio. There were no major changesin benzene selectivity when using 10 wt % and 15 wt % Ni. In addition, a furtherevaluation of the selectivity towards methane generally increases as the H2O/Cratio increased from 3 to 9. This suggests that MNP loses its methyl group, whichfurther reacts to produce methane. The reaction mechanism in the decompositionof MNP is very complex, however from the experimental data it can be seen thatan initial decomposition to naphthalene is occurring. Intermediates formed dur-ing reactions are difficult to predict, and according to the mechanism suggested byDevi et al. [103] benzene might be formed through toluene and later decomposeinto permanent gases and other aromatic components.
The difference in surface area, shown in Table 8.1, does not have a significantimpact in the catalytic activity, as is implied by the MNP conversion and gas se-lectivities obtained for the two catalyst supports tested. This can be explained bythe fast reactions taking place in the reformer, such as steam reforming, partial ox-idation and autothermal reforming. Which usually take place on the surface of thepores, with minimal or no internal mass transfer limitations [65, 104]. However,under these conditions, low surface areas and big pores are optimal, since smallermetallic particles can be formed and therefore increased number of active sites onthe surface of the support can be formed. Consequently, being at high tempera-ture, it is likely that the reaction is limited by external mass transfer [104]. How-ever, further kinetic evaluation needs to be performed to assess the mass transferlimitations for both catalytic supports.
In addition, the MNP molecule is small in comparison to the mesopores poresof the spinels and the macropores of the BZ samples. Therefore, it could be as-sumed that the MNP does not diffuse very easily in the micropores, 1-2 nm, of theBZ. At the same time, it can be expected that the MNP molecules would diffusemuch more easily within the big BZ pores, rather than in the mesopores of thespinel, except for the 10 wt % NS sample that shows quite large pores comparedto the 5 and 10 % NS samples.
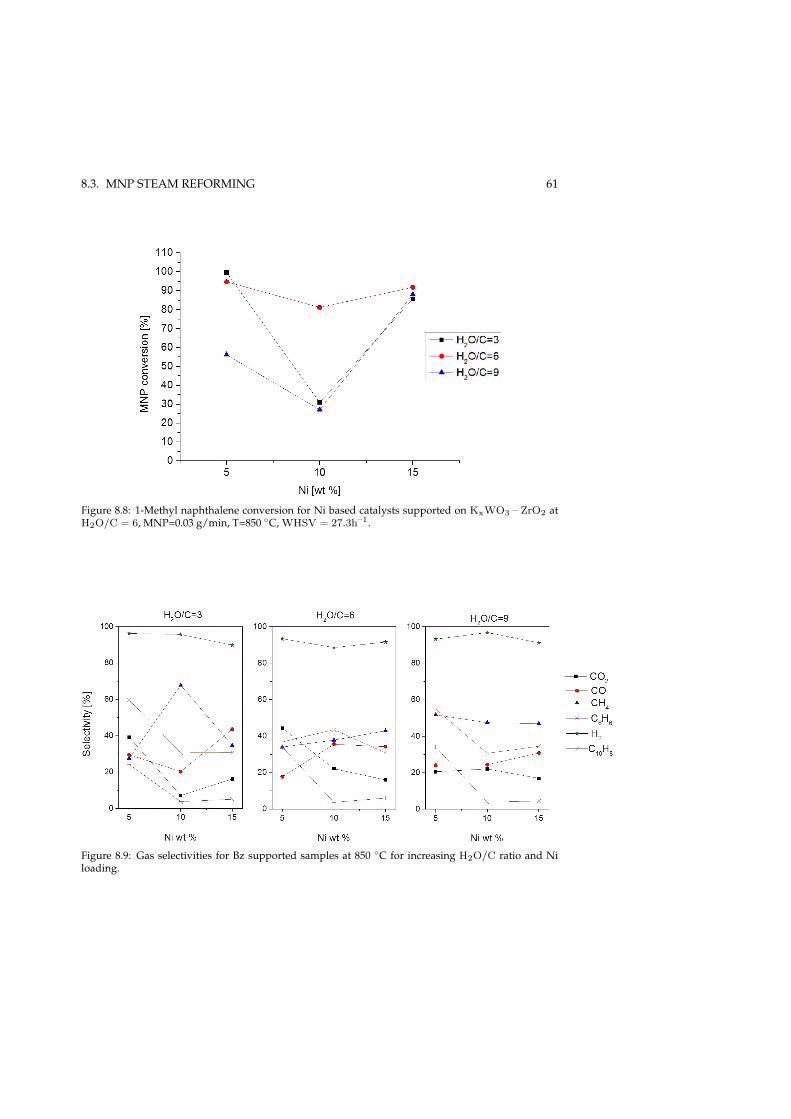
8.3. MNP STEAM REFORMING 61
Figure 8.8: 1-Methyl naphthalene conversion for Ni based catalysts supported on KxWO3 – ZrO2 atH2O/C = 6, MNP=0.03 g/min, T=850 ◦C, WHSV = 27.3h–1.
Figure 8.9: Gas selectivities for Bz supported samples at 850 ◦C for increasing H2O/C ratio and Niloading.
62
To distinguish whether the MNP is thermally cracked before reaching the pores,in the following section a blank test was performed to assess the thermal crackingcontribution to the overall MNP conversion.
8.3.3 Effect of gas-phase K in tar reforming
Assessment of the effect of potassium in the gas phase was carried out by meansof blank experiments with an alumina filler in the reactor (Vereinigte Füllkörper-Fabriken, DURANIT Inert Balls D99 with a size of 1/8”), with and without theaddition of alkali. The intent of these experiments was to evaluate the extent ofthermal cracking and the influence of gas-phase alkali in the process. Figures8.10A and B present the results. Figure 8.10A displays the MNP conversion, 25%,without the addition of potassium. This MNP conversion is merely due to dueto thermal cracking of molecules and gas-phase reactions taking place under suchconditions [105, 106].
In a second experiment, shown in Figure 8.10B, potassium in the form of aerosolparticles (2 ppm, KNO3) was fed into the reactor for 2 hours at H2O/C = 6, result-ing in a 10 % increase in MNP conversion compared to the previous test. Thisincrease in MNP conversion indicates that the addition of potassium (aerosol) in-fluences the interactions of the cracking molecules at these temperatures.
Figure 8.10: MNP conversion during steam reforming for Ni-based catalysts supported on MgOAl2O3and KxWO3 – ZrO2 H2O/C = 6, MNP=0.03 g/min, T=850 ◦C, SV = 27.3h–1.A) Depicts experimen-tal data without addition of gas-phase potassium. B) Steam reforming experiments with 2 ppm ofpotassium in form of aerosol.
A similar evaluation was performed over the Ni-based catalysts prepared withand without gas-phase potassium (see Table 8.1). Steam reforming of MNP with-out the addition of potassium, shown in Figure 8.10A, resulted in a MNP conver-sion of 85 % for 5NS and 15NS.
8.3. MNP STEAM REFORMING 63
As described previously, the MNP conversion that was obtained during exper-iments over the NBZ catalyst series followed the same trend as the work functionmeasurements described in Section 8.2.1, with a minimum in MNP conversion forthe 10NBZ sample. Furthermore, the effect of the addition of 2 ppm of aerosolparticles to the system is shown in Figure 8.10B. The results show a shift in theconversion curve for the NBZ series, compared to the previous experiments, with-out the addition of potassium aerosol particles. As seen in the figure, a clear in-creasing trend is visible with maximum MNP conversions above 90 %, with theexception of 5NBZ. These results provide evidence of the electrochemical promo-tion effect given by interactions between alkali species present in the gas phaseof the reactor and the catalyst support. An increased concentration of gas-phasealkali may have resulted in an increased electric potential in the boundary of themetal and the support [75]. Therefore, increasing the net charge of the gas-phasealkali may have resulted in a stronger polarization of the metal, thus lowering thework function of the catalyst surface [94] under reaction conditions. These resultscould also mean that an increase of gas-phase alkali will increase the concentrationof surface-adsorbed alkali until surface saturation, that is, the surface coverage atwhich gas-phase alkali and surface alkali are believed to be in equilibrium [107].

Chapter 9
Naphthalene adsorption geometry onNi(111)
This chapter presents initial investigations on the interaction of naphthalene witha Ni(111) single crystal. The main research questions in this area focus on thecracking mechanism of the molecule (i.e., which bonds are cracked first), the tem-perature at which the cracking occurs, and the effect of co-adsorbates. In addi-tion, the adsorption site and geometrical ordering of the naphthalene on the metalsurface is investigated. The interaction of naphthalene with the surface is oftenobserved in surface reactions and adsorbate ordering on single crystal, as well asin the way the substrates cut along different atomic planes. On Pt(111), orderedlayers of naphthalene were observed in low energy electron diffraction (LEED); a(6x6) periodicity at 150 °C [108] and a (6x3) periodicity at 100 °C [109] were de-tected. On Pt(100), however, the over-layer was poorly ordered [108].
Naphthalene is considered to be the most stable tar molecule, and is thereforeused as a model tar compound. In addition, naphthalene has multiple uses asa chemical intermediate in industrial and pharmaceutical applications [110, 111].Identifying the interactions of naphthalene in heterogeneous catalytic processesis important for optimizing reforming and upgrading systems for renewable en-ergy sources. In particular, Ni-based catalysts have been used in fuel reforming,so a fundamental understanding of gas-phase interaction at high temperatures isneeded [74, 112].
9.1 Adsorption of naphthalene with increasing temperature
This is a brief summary of ongoing experimental and theoretical studies of naph-thalene adsorption and desorption on Ni(111) from ambient temperature up to 495°C (see Section 7.2.6). Adsorption of naphthalene at room temperature results in amolecular monolayer, as shown in the STM images presented in Figure 9.1.
Figure 9.1A is a 150x150 nm2 filled state image showing a large terrace on the
65
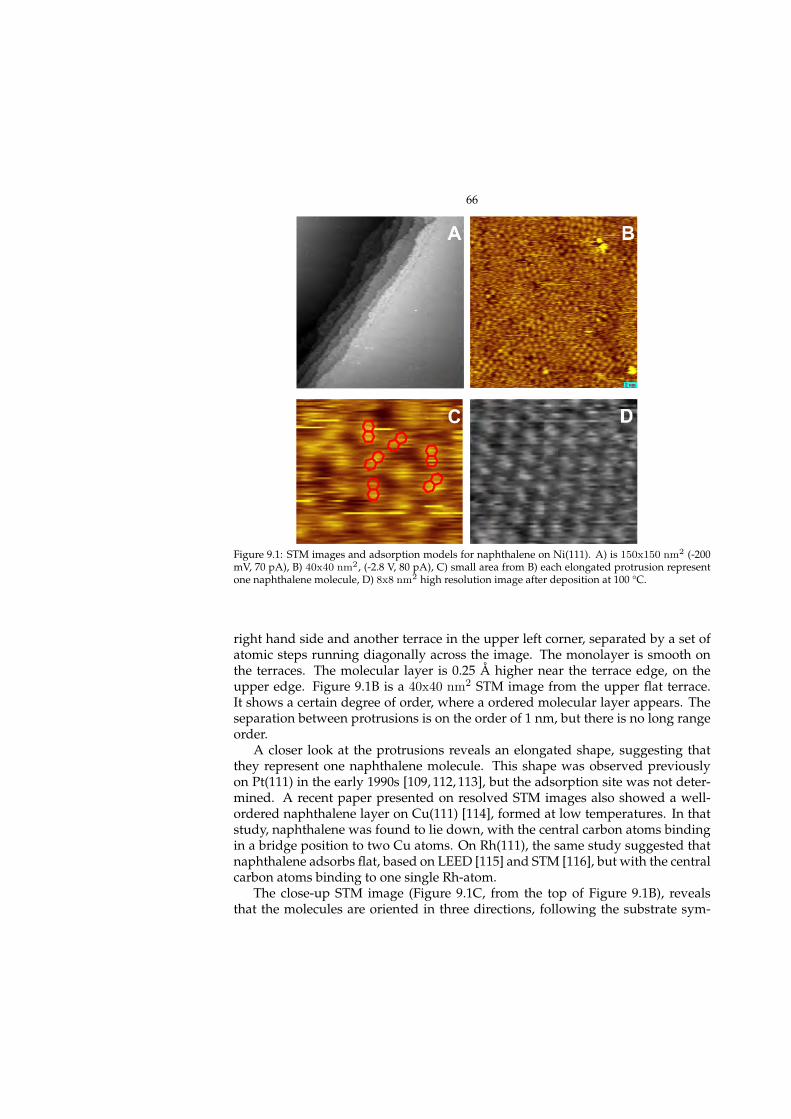
66
Figure 9.1: STM images and adsorption models for naphthalene on Ni(111). A) is 150x150 nm2 (-200mV, 70 pA), B) 40x40 nm2, (-2.8 V, 80 pA), C) small area from B) each elongated protrusion representone naphthalene molecule, D) 8x8 nm2 high resolution image after deposition at 100 °C.
right hand side and another terrace in the upper left corner, separated by a set ofatomic steps running diagonally across the image. The monolayer is smooth onthe terraces. The molecular layer is 0.25 Å higher near the terrace edge, on theupper edge. Figure 9.1B is a 40x40 nm2 STM image from the upper flat terrace.It shows a certain degree of order, where a ordered molecular layer appears. Theseparation between protrusions is on the order of 1 nm, but there is no long rangeorder.
A closer look at the protrusions reveals an elongated shape, suggesting thatthey represent one naphthalene molecule. This shape was observed previouslyon Pt(111) in the early 1990s [109, 112, 113], but the adsorption site was not deter-mined. A recent paper presented on resolved STM images also showed a well-ordered naphthalene layer on Cu(111) [114], formed at low temperatures. In thatstudy, naphthalene was found to lie down, with the central carbon atoms bindingin a bridge position to two Cu atoms. On Rh(111), the same study suggested thatnaphthalene adsorbs flat, based on LEED [115] and STM [116], but with the centralcarbon atoms binding to one single Rh-atom.
The close-up STM image (Figure 9.1C, from the top of Figure 9.1B), revealsthat the molecules are oriented in three directions, following the substrate sym-
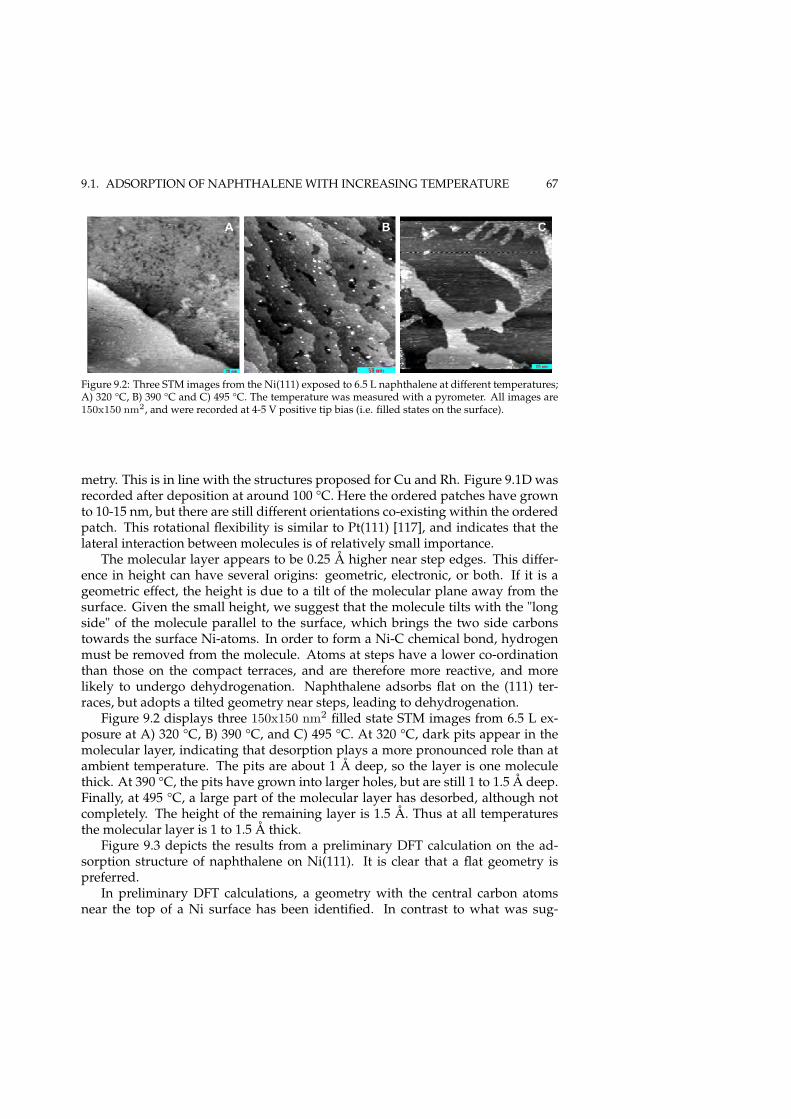
9.1. ADSORPTION OF NAPHTHALENE WITH INCREASING TEMPERATURE 67
Figure 9.2: Three STM images from the Ni(111) exposed to 6.5 L naphthalene at different temperatures;A) 320 °C, B) 390 °C and C) 495 °C. The temperature was measured with a pyrometer. All images are150x150 nm2, and were recorded at 4-5 V positive tip bias (i.e. filled states on the surface).
metry. This is in line with the structures proposed for Cu and Rh. Figure 9.1D wasrecorded after deposition at around 100 °C. Here the ordered patches have grownto 10-15 nm, but there are still different orientations co-existing within the orderedpatch. This rotational flexibility is similar to Pt(111) [117], and indicates that thelateral interaction between molecules is of relatively small importance.
The molecular layer appears to be 0.25 Å higher near step edges. This differ-ence in height can have several origins: geometric, electronic, or both. If it is ageometric effect, the height is due to a tilt of the molecular plane away from thesurface. Given the small height, we suggest that the molecule tilts with the "longside" of the molecule parallel to the surface, which brings the two side carbonstowards the surface Ni-atoms. In order to form a Ni-C chemical bond, hydrogenmust be removed from the molecule. Atoms at steps have a lower co-ordinationthan those on the compact terraces, and are therefore more reactive, and morelikely to undergo dehydrogenation. Naphthalene adsorbs flat on the (111) ter-races, but adopts a tilted geometry near steps, leading to dehydrogenation.
Figure 9.2 displays three 150x150 nm2 filled state STM images from 6.5 L ex-posure at A) 320 °C, B) 390 °C, and C) 495 °C. At 320 °C, dark pits appear in themolecular layer, indicating that desorption plays a more pronounced role than atambient temperature. The pits are about 1 Å deep, so the layer is one moleculethick. At 390 °C, the pits have grown into larger holes, but are still 1 to 1.5 Å deep.Finally, at 495 °C, a large part of the molecular layer has desorbed, although notcompletely. The height of the remaining layer is 1.5 Å. Thus at all temperaturesthe molecular layer is 1 to 1.5 Å thick.
Figure 9.3 depicts the results from a preliminary DFT calculation on the ad-sorption structure of naphthalene on Ni(111). It is clear that a flat geometry ispreferred.
In preliminary DFT calculations, a geometry with the central carbon atomsnear the top of a Ni surface has been identified. In contrast to what was sug-
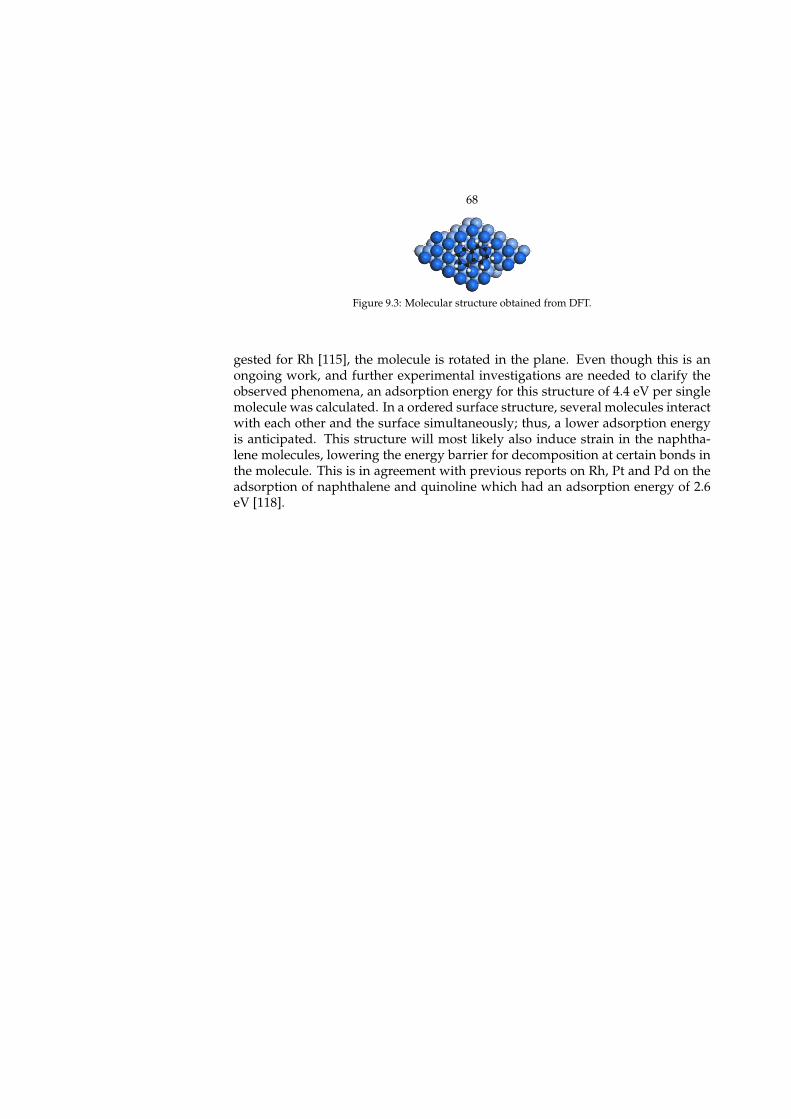
68
Figure 9.3: Molecular structure obtained from DFT.
gested for Rh [115], the molecule is rotated in the plane. Even though this is anongoing work, and further experimental investigations are needed to clarify theobserved phenomena, an adsorption energy for this structure of 4.4 eV per singlemolecule was calculated. In a ordered surface structure, several molecules interactwith each other and the surface simultaneously; thus, a lower adsorption energyis anticipated. This structure will most likely also induce strain in the naphtha-lene molecules, lowering the energy barrier for decomposition at certain bonds inthe molecule. This is in agreement with previous reports on Rh, Pt and Pd on theadsorption of naphthalene and quinoline which had an adsorption energy of 2.6eV [118].

Chapter 10
Catalysts for diesel reforming (PapersII, III- V)
In this chapter, three main topics are addressed. Firstly, we provide the full-scalecatalyst evaluation for H2 production in an on-board autothermal reformer, in-cluded in Paper II, in order to confirm the validity of earlier catalytic activity re-sults performed in a bench scale reactor. This evaluation takes into account thefact that catalyst activity from process simulation at bench scale reactors mightgive inaccurate information regarding mass transfer limitations and catalyst de-activation. In addition, temperature gradients may differ, since the bench-scalereactor often operates in an isothermal regime, while full-scale reactors operatealmost adiabatically [119].
Secondly, in Paper III, multi-fuel studies were performed, aimed at acquiringa better understanding of the operating conditions needed for reforming dieselfuels with different chemical compositions and an increasing sulfur content. Thesestudies are of importance for FC-APU commercialization, given the increasing useof renewable fuels and the need for a more robust system under increasing dieselsulfur content.
Finally, a post-mortem analysis of the catalyst was performed to evaluate theeffect of reaction conditions and sulfur content on the catalyst. This analysis isdiscussed in Paper IV.
10.1 RhPt bimetallic catalysts (Paper II, III)
As previously mentioned, ATR for H2 production was performed in a bench scalereactor under diesel MK1 (sulfur < 10 ppm) reforming using bimetallic RhPt cat-alysts supported on δ – Al2O3 and CeO2 – ZrO2. Results showed 96% diesel con-version and 38 vol% H2 in the product gas for the CeO2 – ZrO2 supported catalyst.In addition, the catalyst characterization elucidated the key role played by thesupport in the catalyst activity enhancement [120]. Supports such as CeO2 – ZrO2
69
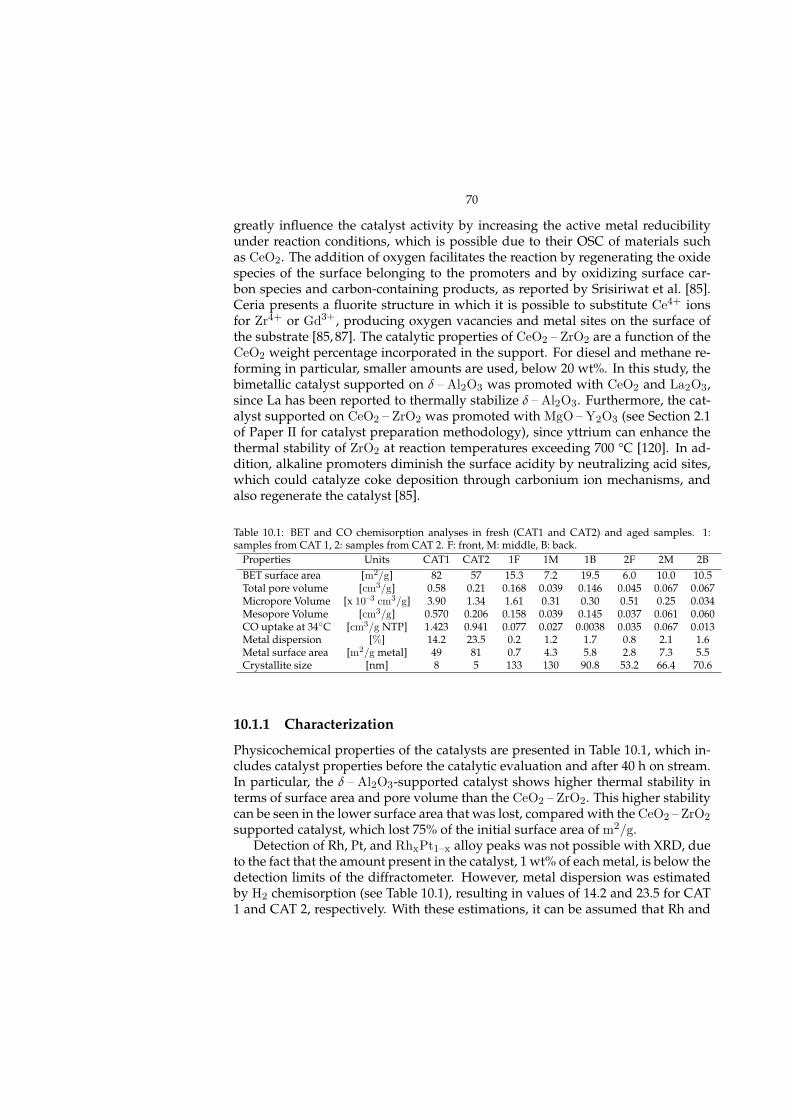
70
greatly influence the catalyst activity by increasing the active metal reducibilityunder reaction conditions, which is possible due to their OSC of materials suchas CeO2. The addition of oxygen facilitates the reaction by regenerating the oxidespecies of the surface belonging to the promoters and by oxidizing surface car-bon species and carbon-containing products, as reported by Srisiriwat et al. [85].Ceria presents a fluorite structure in which it is possible to substitute Ce4+ ionsfor Zr4+ or Gd3+, producing oxygen vacancies and metal sites on the surface ofthe substrate [85, 87]. The catalytic properties of CeO2 – ZrO2 are a function of theCeO2 weight percentage incorporated in the support. For diesel and methane re-forming in particular, smaller amounts are used, below 20 wt%. In this study, thebimetallic catalyst supported on δ – Al2O3 was promoted with CeO2 and La2O3,since La has been reported to thermally stabilize δ – Al2O3. Furthermore, the cat-alyst supported on CeO2 – ZrO2 was promoted with MgO – Y2O3 (see Section 2.1of Paper II for catalyst preparation methodology), since yttrium can enhance thethermal stability of ZrO2 at reaction temperatures exceeding 700 °C [120]. In ad-dition, alkaline promoters diminish the surface acidity by neutralizing acid sites,which could catalyze coke deposition through carbonium ion mechanisms, andalso regenerate the catalyst [85].
Table 10.1: BET and CO chemisorption analyses in fresh (CAT1 and CAT2) and aged samples. 1:samples from CAT 1, 2: samples from CAT 2. F: front, M: middle, B: back.
Properties Units CAT1 CAT2 1F 1M 1B 2F 2M 2BBET surface area [m2/g] 82 57 15.3 7.2 19.5 6.0 10.0 10.5Total pore volume [cm3/g] 0.58 0.21 0.168 0.039 0.146 0.045 0.067 0.067Micropore Volume [x 10–3 cm3/g] 3.90 1.34 1.61 0.31 0.30 0.51 0.25 0.034Mesopore Volume [cm3/g] 0.570 0.206 0.158 0.039 0.145 0.037 0.061 0.060CO uptake at 34◦C [cm3/g NTP] 1.423 0.941 0.077 0.027 0.0038 0.035 0.067 0.013Metal dispersion [%] 14.2 23.5 0.2 1.2 1.7 0.8 2.1 1.6Metal surface area [m2/g metal] 49 81 0.7 4.3 5.8 2.8 7.3 5.5Crystallite size [nm] 8 5 133 130 90.8 53.2 66.4 70.6
10.1.1 Characterization
Physicochemical properties of the catalysts are presented in Table 10.1, which in-cludes catalyst properties before the catalytic evaluation and after 40 h on stream.In particular, the δ – Al2O3-supported catalyst shows higher thermal stability interms of surface area and pore volume than the CeO2 – ZrO2. This higher stabilitycan be seen in the lower surface area that was lost, compared with the CeO2 – ZrO2supported catalyst, which lost 75% of the initial surface area of m2/g.
Detection of Rh, Pt, and RhxPt1–x alloy peaks was not possible with XRD, dueto the fact that the amount present in the catalyst, 1 wt% of each metal, is below thedetection limits of the diffractometer. However, metal dispersion was estimatedby H2 chemisorption (see Table 10.1), resulting in values of 14.2 and 23.5 for CAT1 and CAT 2, respectively. With these estimations, it can be assumed that Rh and
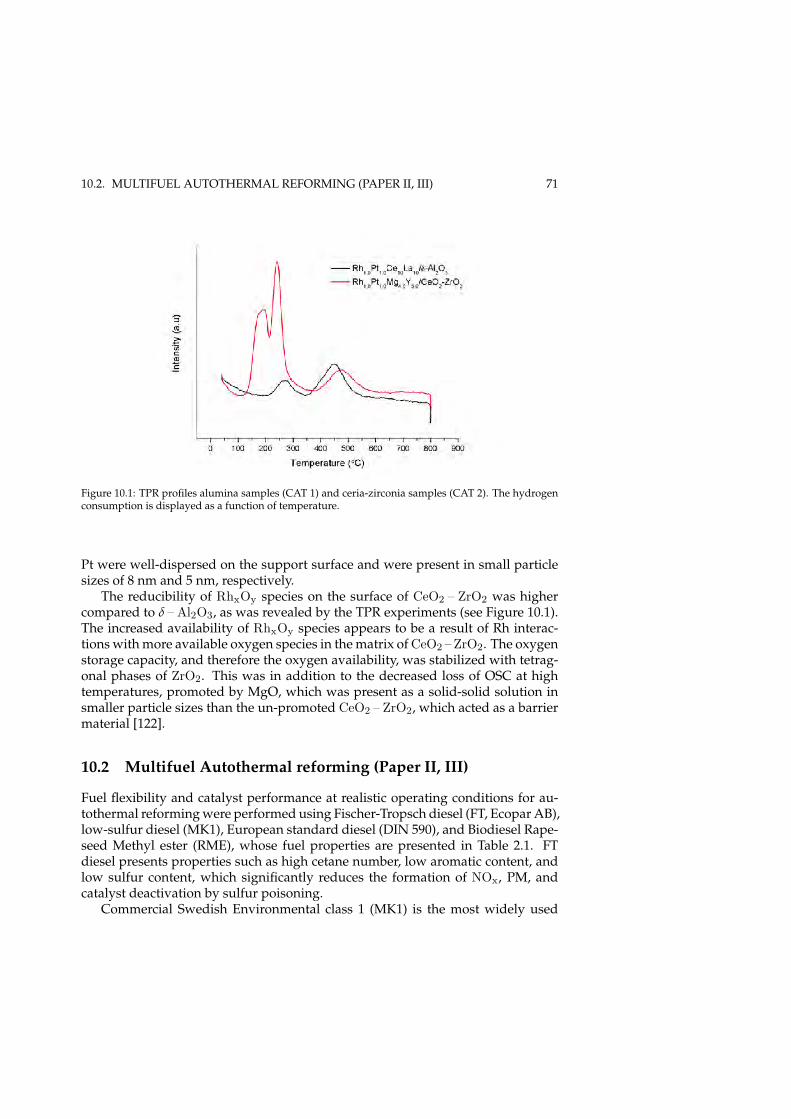
10.2. MULTIFUEL AUTOTHERMAL REFORMING (PAPER II, III) 71
Figure 10.1: TPR profiles alumina samples (CAT 1) and ceria-zirconia samples (CAT 2). The hydrogenconsumption is displayed as a function of temperature.
Pt were well-dispersed on the support surface and were present in small particlesizes of 8 nm and 5 nm, respectively.
The reducibility of RhxOy species on the surface of CeO2 – ZrO2 was highercompared to δ – Al2O3, as was revealed by the TPR experiments (see Figure 10.1).The increased availability of RhxOy species appears to be a result of Rh interac-tions with more available oxygen species in the matrix of CeO2 – ZrO2. The oxygenstorage capacity, and therefore the oxygen availability, was stabilized with tetrag-onal phases of ZrO2. This was in addition to the decreased loss of OSC at hightemperatures, promoted by MgO, which was present as a solid-solid solution insmaller particle sizes than the un-promoted CeO2 – ZrO2, which acted as a barriermaterial [122].
10.2 Multifuel Autothermal reforming (Paper II, III)
Fuel flexibility and catalyst performance at realistic operating conditions for au-tothermal reforming were performed using Fischer-Tropsch diesel (FT, Ecopar AB),low-sulfur diesel (MK1), European standard diesel (DIN 590), and Biodiesel Rape-seed Methyl ester (RME), whose fuel properties are presented in Table 2.1. FTdiesel presents properties such as high cetane number, low aromatic content, andlow sulfur content, which significantly reduces the formation of NOx, PM, andcatalyst deactivation by sulfur poisoning.
Commercial Swedish Environmental class 1 (MK1) is the most widely used
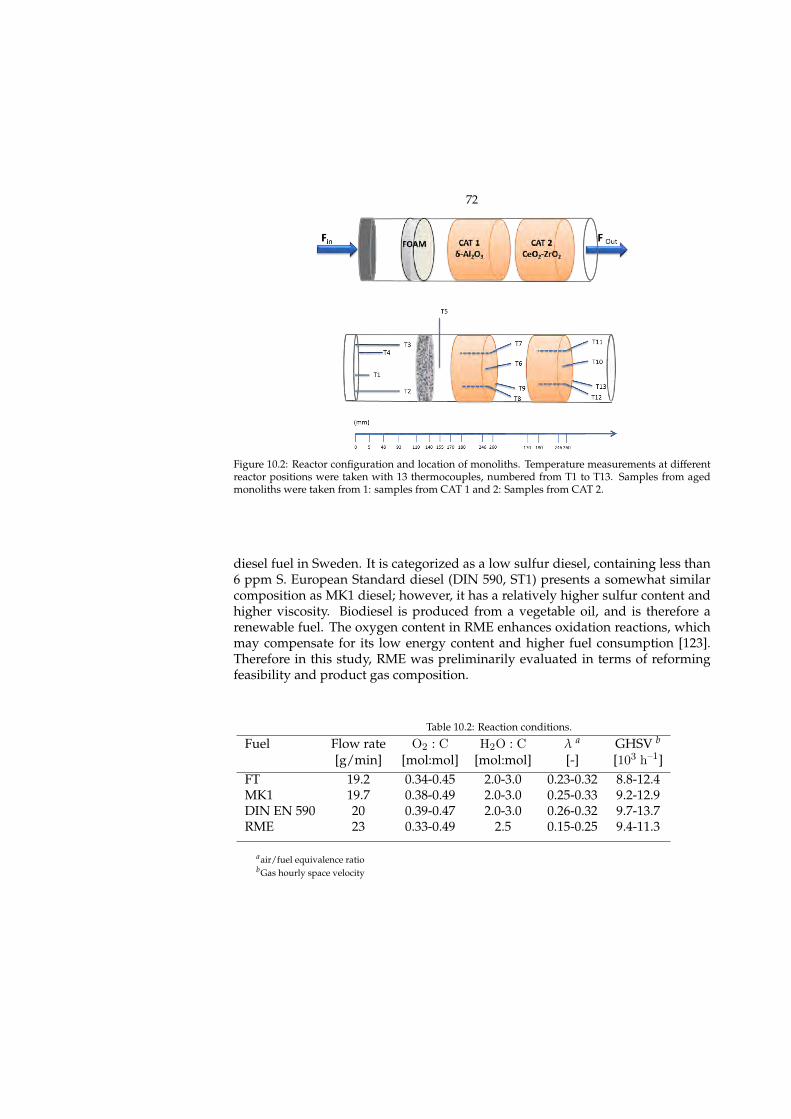
72
Figure 10.2: Reactor configuration and location of monoliths. Temperature measurements at differentreactor positions were taken with 13 thermocouples, numbered from T1 to T13. Samples from agedmonoliths were taken from 1: samples from CAT 1 and 2: Samples from CAT 2.
diesel fuel in Sweden. It is categorized as a low sulfur diesel, containing less than6 ppm S. European Standard diesel (DIN 590, ST1) presents a somewhat similarcomposition as MK1 diesel; however, it has a relatively higher sulfur content andhigher viscosity. Biodiesel is produced from a vegetable oil, and is therefore arenewable fuel. The oxygen content in RME enhances oxidation reactions, whichmay compensate for its low energy content and higher fuel consumption [123].Therefore in this study, RME was preliminarily evaluated in terms of reformingfeasibility and product gas composition.
Table 10.2: Reaction conditions.
Fuel Flow rate O2 : C H2O : C λ a GHSV b
[g/min] [mol:mol] [mol:mol] [-] [103 h–1]FT 19.2 0.34-0.45 2.0-3.0 0.23-0.32 8.8-12.4MK1 19.7 0.38-0.49 2.0-3.0 0.25-0.33 9.2-12.9DIN EN 590 20 0.39-0.47 2.0-3.0 0.26-0.32 9.7-13.7RME 23 0.33-0.49 2.5 0.15-0.25 9.4-11.3
aair/fuel equivalence ratiobGas hourly space velocity

10.2. MULTIFUEL AUTOTHERMAL REFORMING (PAPER II, III) 73
(a)
(b)
Figure 10.3: a) Temperature profiles along the ATR reformer, b) Results for fuel conversion (Xfuel)at O2/C ∼ 0.3 – 0.49, H2O/C = 2.5, GHSV = 8000 – 13000 h–1, after CAT 2. H2 in equilibrium40% [121], values obtained after 4 h at the corresponding operating conditions. FT: Fischer TropschDiesel, MK1: Swedish environmental Class 1, DIN 590: European standard diesel, RME: RapeseedBiodiesel.
10.2.1 Effect of operating conditions
ATR experiments were performed in a full-scale reformer loaded with two mono-lithic catalysts, which were strategically located according to the reaction condi-tions to which they were subjected (see Figure10.2): oxidation reactions (exother-mic) and steam reforming (endothermic). Since partial oxidation was believed totake place at the beginning of the catalyst bed, followed by steam reforming in thelater part of the bed, the bimetallic RhPt catalysts supported on stabilized Al2O3
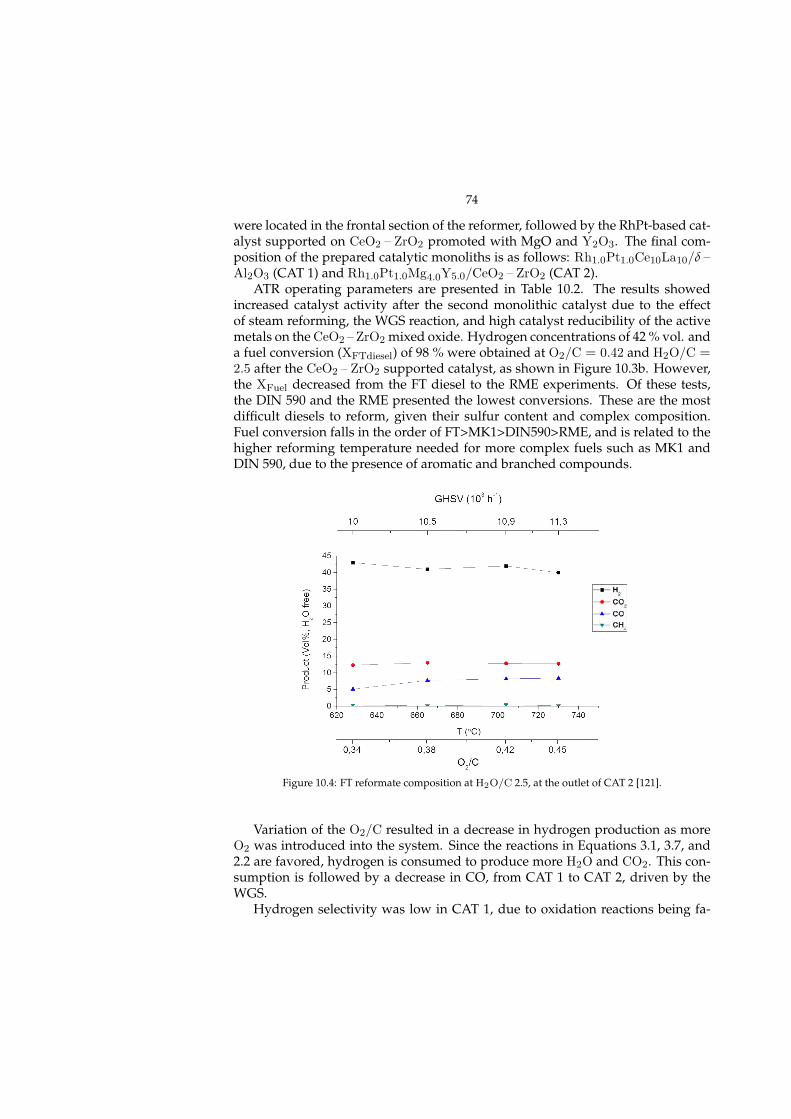
74
were located in the frontal section of the reformer, followed by the RhPt-based cat-alyst supported on CeO2 – ZrO2 promoted with MgO and Y2O3. The final com-position of the prepared catalytic monoliths is as follows: Rh1.0Pt1.0Ce10La10/δ –Al2O3 (CAT 1) and Rh1.0Pt1.0Mg4.0Y5.0/CeO2 – ZrO2 (CAT 2).
ATR operating parameters are presented in Table 10.2. The results showedincreased catalyst activity after the second monolithic catalyst due to the effectof steam reforming, the WGS reaction, and high catalyst reducibility of the activemetals on the CeO2 – ZrO2 mixed oxide. Hydrogen concentrations of 42 % vol. anda fuel conversion (XFTdiesel) of 98 % were obtained at O2/C = 0.42 and H2O/C =2.5 after the CeO2 – ZrO2 supported catalyst, as shown in Figure 10.3b. However,the XFuel decreased from the FT diesel to the RME experiments. Of these tests,the DIN 590 and the RME presented the lowest conversions. These are the mostdifficult diesels to reform, given their sulfur content and complex composition.Fuel conversion falls in the order of FT>MK1>DIN590>RME, and is related to thehigher reforming temperature needed for more complex fuels such as MK1 andDIN 590, due to the presence of aromatic and branched compounds.
Figure 10.4: FT reformate composition at H2O/C 2.5, at the outlet of CAT 2 [121].
Variation of the O2/C resulted in a decrease in hydrogen production as moreO2 was introduced into the system. Since the reactions in Equations 3.1, 3.7, and2.2 are favored, hydrogen is consumed to produce more H2O and CO2. This con-sumption is followed by a decrease in CO, from CAT 1 to CAT 2, driven by theWGS.
Hydrogen selectivity was low in CAT 1, due to oxidation reactions being fa-
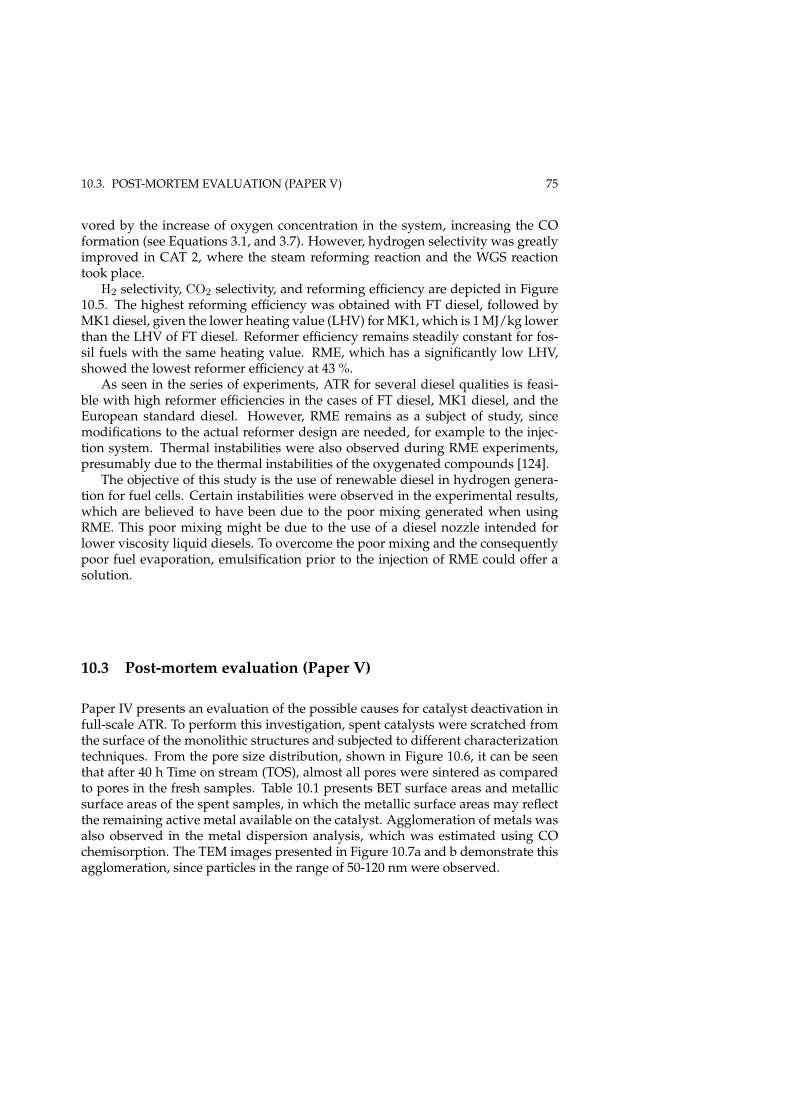
10.3. POST-MORTEM EVALUATION (PAPER V) 75
vored by the increase of oxygen concentration in the system, increasing the COformation (see Equations 3.1, and 3.7). However, hydrogen selectivity was greatlyimproved in CAT 2, where the steam reforming reaction and the WGS reactiontook place.
H2 selectivity, CO2 selectivity, and reforming efficiency are depicted in Figure10.5. The highest reforming efficiency was obtained with FT diesel, followed byMK1 diesel, given the lower heating value (LHV) for MK1, which is 1 MJ/kg lowerthan the LHV of FT diesel. Reformer efficiency remains steadily constant for fos-sil fuels with the same heating value. RME, which has a significantly low LHV,showed the lowest reformer efficiency at 43 %.
As seen in the series of experiments, ATR for several diesel qualities is feasi-ble with high reformer efficiencies in the cases of FT diesel, MK1 diesel, and theEuropean standard diesel. However, RME remains as a subject of study, sincemodifications to the actual reformer design are needed, for example to the injec-tion system. Thermal instabilities were also observed during RME experiments,presumably due to the thermal instabilities of the oxygenated compounds [124].
The objective of this study is the use of renewable diesel in hydrogen genera-tion for fuel cells. Certain instabilities were observed in the experimental results,which are believed to have been due to the poor mixing generated when usingRME. This poor mixing might be due to the use of a diesel nozzle intended forlower viscosity liquid diesels. To overcome the poor mixing and the consequentlypoor fuel evaporation, emulsification prior to the injection of RME could offer asolution.
10.3 Post-mortem evaluation (Paper V)
Paper IV presents an evaluation of the possible causes for catalyst deactivation infull-scale ATR. To perform this investigation, spent catalysts were scratched fromthe surface of the monolithic structures and subjected to different characterizationtechniques. From the pore size distribution, shown in Figure 10.6, it can be seenthat after 40 h Time on stream (TOS), almost all pores were sintered as comparedto pores in the fresh samples. Table 10.1 presents BET surface areas and metallicsurface areas of the spent samples, in which the metallic surface areas may reflectthe remaining active metal available on the catalyst. Agglomeration of metals wasalso observed in the metal dispersion analysis, which was estimated using COchemisorption. The TEM images presented in Figure 10.7a and b demonstrate thisagglomeration, since particles in the range of 50-120 nm were observed.
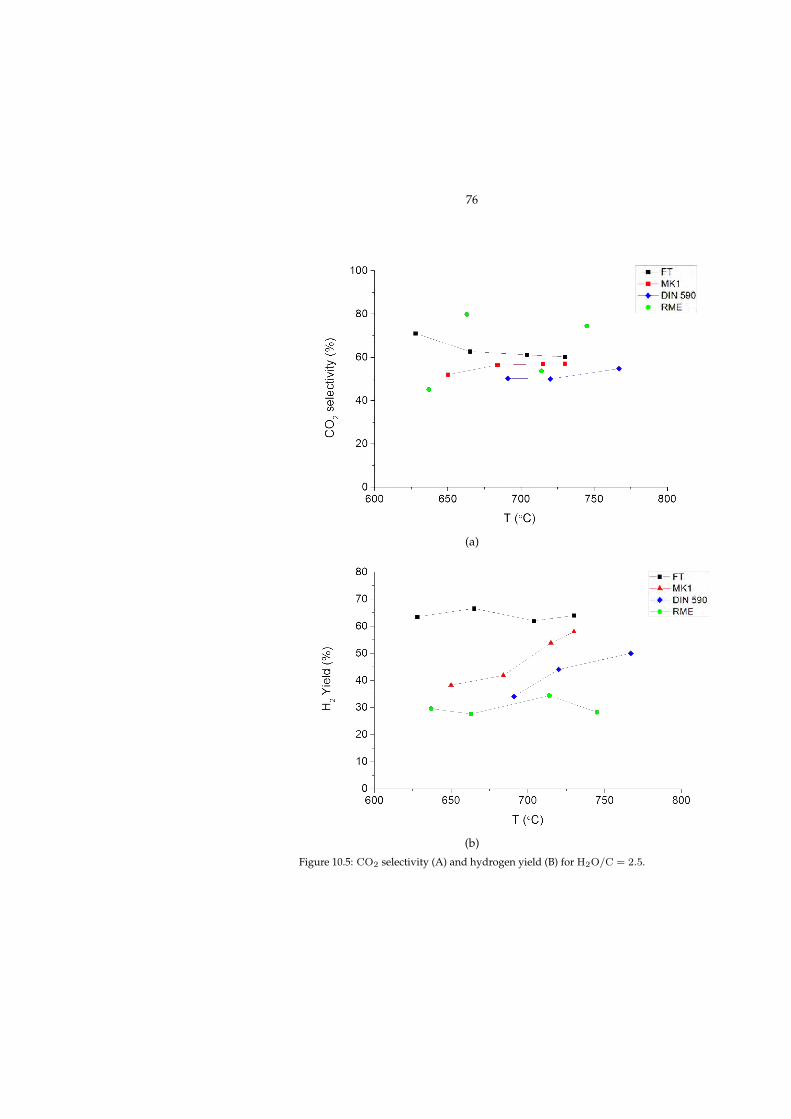
76
(a)
(b)
Figure 10.5: CO2 selectivity (A) and hydrogen yield (B) for H2O/C = 2.5.
10.3. POST-MORTEM EVALUATION (PAPER V) 77
Figure 10.6: BJH Pore size distribution of the fresh and aged samples, CAT 1:1 : 1 RhPt/10 : 10La2O3 : CeO2/δ – Al2O3 and CAT 2: 1 : 1 Rh : Pt/5 : 4 MgO : Y2O3/CeO2 – ZrO2. Spent catalystsare designated with F:Front, M:Middle, B:Back. Samples taken after being subjected to the followingconditions: O2/C = 0.3 – 0.49 and H2O/C = 2 – 3, GHSV = 8000 – 13000 h–1, and T = 650 – 800◦C.
10.3.1 Carbon content
The TPO results from samples in the middle and back of CAT 1 display a singlepeak in the temperature interval of∼ 350– 800 ◦C, with higher intensity than in thefront of the sample, indicating an increased amount of coke undergoing oxidation.The oxygen uptake at ∼ 400 – 800 ◦C in the middle of CAT 1 indicates a possibleoxidation of polymeric carbonaceous material, known as gum-like carbon, whichis mainly deposited on the metallic surface [48, 57]. With regards to the amount ofcarbon formed in the frontal section of the CAT 1, TGA analysis resulted in a totalcarbon loss of 0.43%, as shown in Table 10.3. The carbon deposits increased in themiddle and back sections of the first monolith due to the lower available oxygenand the lower temperatures, 780 ◦C and 700 ◦C.
The amount of carbon in the middle of CAT 1 was double the amount in theback section. This difference can be related to the absence of oxygen at high tem-peratures, promoting polymeric reactions. Furthermore, pyrolytic carbon forms attemperatures above 600 ◦C, mainly originating from polyaromatic and aromatichydrocarbons that are produced by the partial oxidation of diesel and other ther-
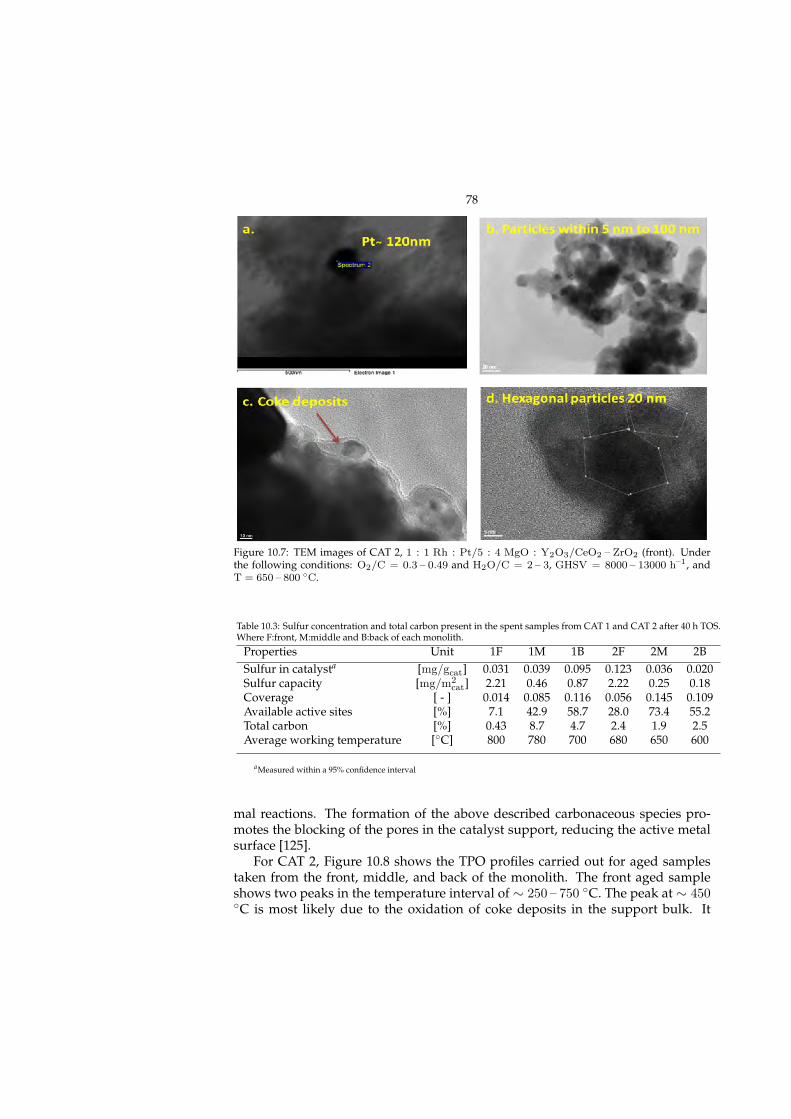
78
Figure 10.7: TEM images of CAT 2, 1 : 1 Rh : Pt/5 : 4 MgO : Y2O3/CeO2 – ZrO2 (front). Underthe following conditions: O2/C = 0.3 – 0.49 and H2O/C = 2 – 3, GHSV = 8000 – 13000 h–1, andT = 650 – 800 ◦C.
Table 10.3: Sulfur concentration and total carbon present in the spent samples from CAT 1 and CAT 2 after 40 h TOS.Where F:front, M:middle and B:back of each monolith.
Properties Unit 1F 1M 1B 2F 2M 2BSulfur in catalysta [mg/gcat] 0.031 0.039 0.095 0.123 0.036 0.020Sulfur capacity [mg/m2
cat] 2.21 0.46 0.87 2.22 0.25 0.18Coverage [ - ] 0.014 0.085 0.116 0.056 0.145 0.109Available active sites [%] 7.1 42.9 58.7 28.0 73.4 55.2Total carbon [%] 0.43 8.7 4.7 2.4 1.9 2.5Average working temperature [◦C] 800 780 700 680 650 600
aMeasured within a 95% confidence interval
mal reactions. The formation of the above described carbonaceous species pro-motes the blocking of the pores in the catalyst support, reducing the active metalsurface [125].
For CAT 2, Figure 10.8 shows the TPO profiles carried out for aged samplestaken from the front, middle, and back of the monolith. The front aged sampleshows two peaks in the temperature interval of ∼ 250 – 750 ◦C. The peak at ∼ 450◦C is most likely due to the oxidation of coke deposits in the support bulk. It
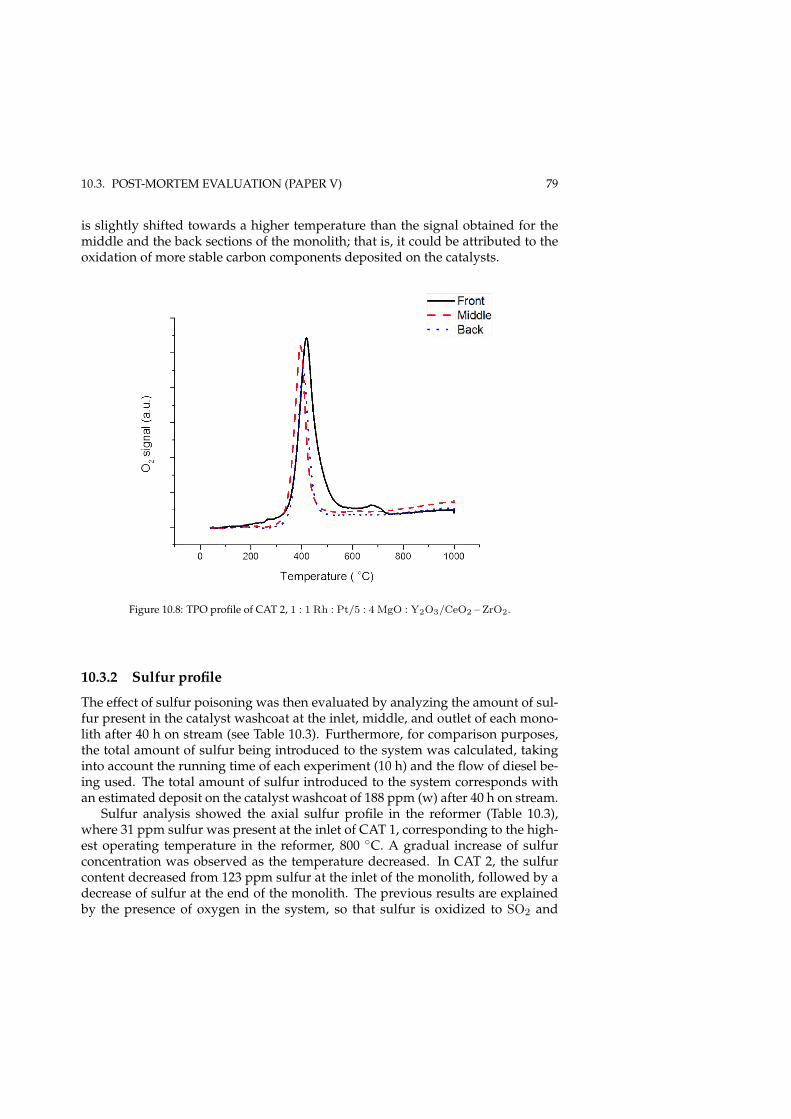
10.3. POST-MORTEM EVALUATION (PAPER V) 79
is slightly shifted towards a higher temperature than the signal obtained for themiddle and the back sections of the monolith; that is, it could be attributed to theoxidation of more stable carbon components deposited on the catalysts.
Figure 10.8: TPO profile of CAT 2, 1 : 1 Rh : Pt/5 : 4 MgO : Y2O3/CeO2 – ZrO2.
10.3.2 Sulfur profile
The effect of sulfur poisoning was then evaluated by analyzing the amount of sul-fur present in the catalyst washcoat at the inlet, middle, and outlet of each mono-lith after 40 h on stream (see Table 10.3). Furthermore, for comparison purposes,the total amount of sulfur being introduced to the system was calculated, takinginto account the running time of each experiment (10 h) and the flow of diesel be-ing used. The total amount of sulfur introduced to the system corresponds withan estimated deposit on the catalyst washcoat of 188 ppm (w) after 40 h on stream.
Sulfur analysis showed the axial sulfur profile in the reformer (Table 10.3),where 31 ppm sulfur was present at the inlet of CAT 1, corresponding to the high-est operating temperature in the reformer, 800 ◦C. A gradual increase of sulfurconcentration was observed as the temperature decreased. In CAT 2, the sulfurcontent decreased from 123 ppm sulfur at the inlet of the monolith, followed by adecrease of sulfur at the end of the monolith. The previous results are explainedby the presence of oxygen in the system, so that sulfur is oxidized to SO2 and
80
therefore not adsorbed on the catalyst. This means that rhodium stays active aslong as oxygen is present. After oxygen depletion, SO2 is reduced to H2S, whichis subsequently chemisorbed on the catalyst [48].
Fundamental research on sulfur adsorption on metal catalysts has been car-ried out in studies on hydrogen sulfide chemisorption on noble metals and on Ni,which is structurally similar to Rh [58,126]. Rostrup-Nielsen and Christiansen [48]demonstrated that the hydrogen sulfide chemisorption on Ni(110) presented amonolayer of sulfur (S/Ni=0.5) corresponding to 440 ppm S in 1 m2/g of Ni,which can also be related to the surface area obtained by hydrogen chemisorp-tion. Therefore, in order to evaluate the degree of sulfur poisoning on the catalystsused in this study, the equilibrated sulfur coverage was estimated using the sul-fur content present in the fuel feeds, shown in Table 2.1, and the thermodynamicdata published by Oudar and Wise [58]. In addition, the actual sulfur capacity(ppmS/m2RhPt) was related to the surface area previously determined by COchemisorption, shown in Table 10.3. The equilibrated sulfur coverage on the RhPtcatalyst was approximately 0.19, according to the estimated values obtained afterbiodiesel ATR tests. Results for the sulfur coverage of the aged samples after 40 hon stream were in the range of 0.014 - 0.145. The lowest value was obtained at thefront of CAT 1, where the maximum temperature of 800 ◦C was reached in the re-former, causing most of the active sites to disappear due to thermal sintering. Theresults show that the metal particles are partially covered by sulfur, having about58 % of the catalyst active sites available in the back sections of both monoliths.These results give an indication of the activity of the catalyst after being subjectedto four different diesel qualities and sulfur concentrations. It was observed thatabout half of the active sites were free of sulfur poisoning. However, factors suchas sintering and carbon deposition were still present in the catalyst.
The estimate of available active surface area for reaction after sulfur poisoningis an approximation and is generally difficult to determine precisely. This is dueto factors such as the crystal configurations and metal-S interactions that directlyinfluence the adsorption of sulfur. Other factors influencing the chemisorption ofsulfur on metal surfaces are the adsorption equilibrium, the H2S/H2 ratio, temper-ature, and diffusion effects. However, the estimation and results obtained in thisstudy are in agreement with other research describing Rh- and Pt-based catalystsas highly resistant towards sulfur poisoning. These catalysts are suitable alterna-tives for after-treatment and auxiliary power systems in automotive applications,as well as in the catalytic conversion of biomass-derived tar [127, 128]. Moreover,experimental studies of sulfur resistance on RhPt-based catalysts corroborate itslow sulfur sensitivity during ATR [129]. In brief, the bimetallic RhPt catalystssupported on δ – Al2O3 and CeO2 – ZrO2 were partially deactivated due to sulfurpoisoning. Table 10.3 shows the percent of surface area that was not covered bysulfur and could potentially be used for reactions.

Part IV
Final remarks
81

Chapter 11
Conclusions and future work
11.1 On tar reforming and electrochemical promotion of alkali
Catalyst sensitivity to alkali components and the double effect that these metalspossess raise great challenges in setting optimal operating parameters during re-forming, as well as during the catalyst lifetime. These challenges are of particularimportance in the reforming of biomass gasification products, which in generalcontain alkali species that reach the reformer in the form of aerosols in the gasphase. Examination of the current literature reveals a limited understanding of therole that alkali play in the reforming of tar. With the aim of gaining a fundamentalunderstanding of such interactions, a new catalytic material and a methodologyfor catalytic activity tests were developed in this study. Optimization of materialperformance under reaction conditions in the presence of gas-phase alkali metalswas achieved. During this thesis, a tar reformer and an alkali feed system weredesigned and constructed "in-house" for the evaluation of the steam reforming ofa surrogate tar component (MNP), and for evaluation of the catalysts that weredeveloped.
Chapter 8 describes the findings on the application of alternative materialswith electrochemical properties in the steam reforming of MNP. The search forthese alternative materials was performed with three main requirements: the ma-terial should be able to store/release alkali metal/ions at certain reaction condi-tions; the material should have electrochemical mobility within itself, so that elec-trochemical promotion is favored; and the material should have thermal and phys-ical stability at high temperatures. The outcome of this study was the developmentof a novel catalytic support in the form of a composite material of potassium tung-sten bronzes and zirconia structures (Ni/KxWO3 – ZrO2), which have particularelectrochemical properties and the capability to store/release alkali in situ duringtar reforming. To the best of the author’s knowledge, this formulation has notbeen used in this application before, nor has it been used as a catalytic support.
The composite support gave shape to a series of supported nickel catalysts with
83
84
increasing Ni loading. The main conclusion drawn from the catalyst screeningtests was that a higher MNP conversion was obtained with the Ni/KxWO3 – ZrO2than with the Ni/MgOAl2O3 samples. Contrary to the trends obtained in the workfunction measurements of the fresh samples. This, however, can have an explana-tion in the mass transfer conditions of both supports. In particular, the bimodalpore distribution of KxWO3 – ZrO2 enhances the transport of reactants to the ac-tive sites. This may also be attributed to a better dispersion of the Ni particles onthe macropores of the support. Future work, in this respect, would be to investi-gate the mass transfer contributions taking place in both supports, in addition to amore detail characterization of the catalyst structures, which is an ongoing work.
The additional electronic interactions generated by the addition of 2 ppm of Kduring the reaction resulted in an increased MNP conversion for both supports.Thus, giving rise to higher catalyst activity and lower potassium loss from the cat-alyst support. The catalytic evaluation of the Ni/KxWO3 – ZrO2 samples showedalmost complete MNP conversion at 850 °C. In addition, increased Ni loading wasseen to enhance the syngas production, while low Ni loading and high water con-tent enhanced tar conversion over tungsten bronzes. A further evaluation of theselectivity towards methane generally increases as the H2O/C ratio increased from3 to 9. This suggests that MNP loses its methyl group, which further reacts to pro-duce methane. The reaction mechanism in the decomposition of MNP is verycomplex, particularly the intermediates formed during reactions are difficult topredict.
The adsorption/desorption phenomena of alkali atoms from the bulk of a tung-sten bronze-containing support to the gas phase showed that the addition of 2ppm alkali in the form of aerosol compounds to the reformer had positive effectson MNP conversion. The promoting effect of alkali implies that gas-phase alkaliinduce a change in the surface work function of the catalyst, thus increasing cata-lyst reactivity.
These results imply that further evaluation and more detailed investigationsare needed on the interactions occurring in the gas-metal-support interface. More-over, this study’s evaluation of the change in electrical potential of the gas-phasecompositions could be further analyzed by the use of online instruments such assurface ionization detectors. This instrument is included in the design of the tarreformer, and with further technical development it could be fully implementedas an additional analytic method.
Even though several fundamental studies exist on the catalytic behavior of Ni-based catalysts, there is still work to be done on the identification and possibleinteractions of potassium species in the presence of aromatic molecules, such asnaphthalene with metal surfaces. Consequently, in an attempt to investigate thepossible adsorption mechanism/geometry of molecules such as MNP or naphtha-lene in a Ni(111) single crystal at increasing temperatures, a fundamental evalua-tion of this issue is presented in Chapter 9. STM and theoretical calculations areongoing; however, preliminary information obtained by the adsorption of naph-thalene suggested that the molecule adsorbed flat on the surface of Ni(111), with
11.2. ON DIESEL REFORMING FOR H2 GENERATION IN APUS 85
no clear definition of the site on which it is adsorbed. The geometry of the ad-sorbed molecules was also seen to be modified to some degree, presenting elon-gated bond distances.
11.2 On diesel reforming for H2 generation in APUs
In more applied research, the hydrogen generation of a full scale ATR reformer(5kW) integrated in APUs for automotive applications is described in Chapter10. The main outcome of this investigation was the assessment of fuel flexibil-ity performance under realistic conditions, using renewable fuels with particularphysicochemical properties. In addition, the optimization and deactivation causesof reforming catalysts were investigated. Two monolithic catalysts were prepared,Rh1.0Pt1.0Ce10La10/Al2O3 (CAT 1) and Rh1.0Pt1.0Mg4.0Y5.0/CeO2 – ZrO2 (CAT2), and were sequentially placed in the axial direction of the reformer length.
It can be concluded that the system studied is able to perform outstandinglywith Fischer-Tropsch diesel. The fuel flexibility capability of the system was val-idated by using different diesel qualities for hydrogen production with up to 70% reformer efficiency. However, further improvements are needed to be able touse biodiesel qualities in which thermal instabilities are observed. These thermalinstabilities were encountered due to poor fuel mixing prior to the entrance of thefirst monolithic catalyst. Evaluation of the FT diesel showed fuel conversion to bearound 97 %, however, and no stability problems were observed, implying thatcertain technical improvements in the mixing system of the reformer are neededfor future work.
From ATR experiments, hydrogen production and fuel conversion show anupward trend from RME < DIN 590 < MK1 < FT, reaching 42 vol.% H2 (dry gas)and 97% conversion for FT diesel. The reforming of aromatics and branched com-pounds at temperatures above 750 °C influences hydrogen generation, which de-creases at high temperatures. In addition, the product gas distribution was highlydependent on the WGS reaction, as well as on the fuel composition and reformerdesign. Furthermore, catalyst deactivation after ATR experiments in a full-scalereformer was evaluated related to the total Rh and Pt metal surface area after thesulfur-containing experiments. Samples of aged catalysts were taken at differentlengths of the monolithic catalysts in order to observe the effect of thermal aging,particularly at the front sections of the monoliths, and the blocking of the catalyticsurface by carbon deposition.
It was concluded that the bimetallic RhPt catalysts supported on δ – Al2O3 andCeO2 – ZrO2 were partially deactivated due to sulfur poisoning. Due to the largedecrease in pore volume and surface area, the sulfur capacity was reduced. Theestimated sulfur coverage of the active metals after 40 h on stream reached valuesof 0.145, which is below the equilibrated sulfur coverage of 0.19 after tests withDIN 590. Analyses of carbon formation showed the deposition of carbonaceoussubstances on the catalyst surface, which in some cases produced encapsulation
86
of metal particles as well as the formation of carbon layers over the catalyst. Thethermal sintering of the samples was identified by particle size distribution withvalues ranging from ∼ 5 – 150 nm in CAT 1 to ∼ 5 – 100 nm in CAT 2, showing theformation of metal agglomeration and the encapsulation of metal particles. Car-bon deposition drastically reduced the active surface area. Lower carbon depositswere observed in the frontal section of CAT 1 as a result of high temperatures;however, at the middle and back sections of CAT 1, the amount of carbon contentincreased to about 4 %. In the same sections of CAT 2, the amount of measuredcarbon deposited was approximately 2.5 %.
The above results indicate that the location of different supports along the re-former could potentially reduce carbon deposition and sulfur poisoning. The si-multaneous use of different catalyst formulations is vital to take advantage of par-ticular operating conditions, such as the oxidizing and reducing ATR operatingconditions, which can potentially enhance catalyst performance.
Chapter 12
Acknowledgments
I would like to thank Prof. Lars J. Pettersson for giving me the opportunity to domy doctoral studies at KTH. Thank you for being a good teacher, for your supportand sense of humor, for encouraging me to learn something new everyday, andfor valuable advice on places to visit. Thanks also to Prof. Klas Engvall for sup-port and guidance during the last years of my PhD studies, and for giving me thefreedom to explore new ideas. I appreciate the opportunities you both gave me todevelop as a person and as a professional during my time as PhD student. Thankyou for the several occasions on which you gave me the opportunity to travel andmake one of my passions part of my work.
I would like to gratefully acknowledge the Swedish Energy Agency, the SwedishGasification Center consortium, academic and industrial partners (Powercell, VolvoTechnology, E.ON, and Andritz) for their financial support that made this workpossible.
I would like to express my appreciation to Prof. Jens Rostrup-Nielsen forhis advice and suggestions on different aspects of my work and also for alwayswilling to transfer his experience. I am thankful to Stig Torben Røen and LarsFrøsig Østergaard who kindly assisted me with sulfur analyses at Haldor-Topsøe.Thanks to Prof. Mats Göthelid for his interesting and funny conversations in thelab, and for guiding me though the complex world of material physics. Thanksalso to Kjell Jansson, at Stockholm University, for providing me with SEM/TEMimages, as well as for some very interesting discussions. Thanks to Prof. AndrzejKotarba, and his students at the Jagiellonian University, for the work functionmeasurements.
Many thanks to Roberto Lanza and Henrik Kusar for their advice and supportthroughout my work. Thanks to Xanthias Karatzas, who supported and encour-aged me throughout my time as master’s student at KET, for his patience andtransfer of knowledge of both catalysis and the golden rules of being a PhD stu-dent. Special thanks to Larisa Arkatova, Mikael Lundgren and Iraj Bavarian fortheir help, support and advise during my long days in the lab. Thanks to Bo Karls-
87

88
son and Alberto Becker in the workshop, for their assistance with the constructionof the reactor.
Thanks to all the people at Chemical Technology division because in one wayor another you have contributed to make this work possible and to make myworking days enjoyable. Thank you for your discussions, jokes, advice, sup-port and help. Thanks to Jorge Velasco, for always being willing to discuss andsuggest solutions, for sharing his books database, and more. Thanks to LinaNorberg Samuelsson for her patience and willingness to share her knowledgeand language skills with everyone. Thanks to Zari Muzavi, Fátima Pardo, JavierBarrientos, Vera Nemanova, Pouya Haghighi Moud, Rodrigo Suarés Paris, LuisLopéz, Jonas Granestrand, Moa Ziethén Granlund, Matteo Lualdi, Francessco Re-gali, Robert Andersson, Francessco Montecchio, Sandra Dahlin, Sara Sebelius, andSara Lögdberg.
I would also like to thank Prof. Sven Järås and Assoc. Prof. Magali Boutonnetfor sharing interesting information and their enthusiasm about conferences dur-ing the catalysis meetings. Furthermore, I am very grateful to Alex Gojkovic forhis unconditional support and help with the language checking throughout thewriting of this thesis.
Thanks to bachelor’s students Sabine Yohannes, Karolina Seigel, and Katia As-cue for their patience and enthusiasm during the starting up of the reactor. Thanksalso to diploma workers Matteo Diomedi, and Olof Forsberg with whom I had thepleasure to work with during this project.
My deepest and warmest gratitude to my true and adopted families in Colom-bia, Spain and Sweden, and to my friends for their love, encouragement, supportand wise advice when I needed it: for being my source of motivation and appreci-ation.
References
[1] IEA. CO2 Emissions from Fuel Combustion. 2014th ed. IEA, Paris (2014).
[2] http://www.iea.org/topics/climatechange/. Climate Change, Accessed:5th January 2015 (2014).
[3] H. Grabl, J. Kokott, M. Kulessa, J. Luther, F. Nuscheler, R. Sauerborn, H.-J. Schellnhuber, R. Schubert, E.-D. Schulze. World in transition: Towardssustainable energy systems. Earthscan, London, UK (2004).
[4] M. V. der Hoeven. Outlook on biofuels. Tech. rep., International EnergyAgency (2013).
[5] European Union. Renewable Energy progress and biofuels sustainability.Tech. rep., European Union (2013).
[6] P. Basu. Biomass Gasification and Pyrolysis, practical design and theory.Elsevier, Kidlington, Oxford (2010).
[7] P. McKendry. Bioresour. Technol. 83 (2002) 37–46.
[8] B. Matas Güell, J. Sandquist, L. Sørum. J. Energy Resour. Technol. 135 (2012)014 001.
[9] A. Bridgewater. Fuel 74 (1995) 631–653.
[10] M. Gassner, F. Maréchal. Biomass and bioenergy 33 (2009) 1587–1604.
[11] Y. Richardson, J. Blin, A. Julbe. Prog. Energy Combust. Sci. 38 (2012) 765–781.
[12] H. Knoef (Ed.). Handbook of biomass gasification. BTG biomass technologygroup BV, Enschede , The Netherlands (2005).
[13] G. Knothe. Prog. Energy Combust. Sci. 36 (2010) 364–373.
[14] R. Trane, S. Dahl, M. Skjøth-Rasmussen, A. Jensen. Int. J. Hydrogen Energy37 (2012) 6447–6472.
89

90
[15] L. Devi, K. Ptasinski, F. Janssen. Biomass Bioenergy 24 (2003) 125–140.
[16] V. Nemanova. Biomass gasification in ABFB: Tar mitigation. Ph.D. thesis,KTH Royal Institute of Technology, Chemical Engineering and Technology,Stockholm (2014).
[17] R. Warnecke. Biomass Bioenergy 18 (2000) 489–497.
[18] T. A. Milne, R. J. Evans. Biomass Gasifier “ Tars ”: Their Nature, Forma-tion, and Conversion. Tech. Rep. November, National Renewable EnergyLaboratory, Golden, Colorado (1998).
[19] V. Sricharoenchaikul, W. J. Frederick, P. Agrawal. Ind. Eng. Chem. Res. 41(2002) 5650–5658.
[20] W. Torres, S. S. Pansare, J. G. Goodwin. Catal. Rev. 49 (2007) 407–456.
[21] M. Zevenhoven-Onderwater, R. Backman. Fuel 80 (2001).
[22] K. Engvall, H. Kusar, K. Sjöström, L. J. Pettersson. Top. Catal. 54 (2011) 949–959.
[23] L. Devi, M. Craje, P. Thüne, K. J. Ptasinski, F. J. Janssen. Applied CatalysisA: General 294 (2005) 68–79.
[24] S. Anis, Z. Zainal. Renew. Sustain. Energy Rev. 15 (2011) 2355–2377.
[25] K. Andersson, P. Nielsen. In: AIChE (Ed.), Environmental division; core pro-gramming topic at the 2013 AIChE Spring meeting and 9th global congresson process safety. Curran Associates, Inc., Red Hook, NY (2013) page 250.
[26] D. Shekhawat, D. A. Berry, D. J. Haynes, J. J. Spivey. Fuel 88 (2009) 817–825.
[27] European Council. Emissions from heavy duty vehicles (Euro VI): certifica-tion rules. Tech. rep., European Union (2009).
[28] R. Hogg. Life Beyond Euro VI. Automotive Megatrends Magazine (2014).
[29] D. Shekhawat, D. A. Berry, J. J. Spivey. Fuel Cells: Technologies for FuelProcessing. Elsevier (2011).
[30] J. Larminie, A. Dicks. Fuel Cells Systems Explained. 2nd ed. Wiley & Sons(2007).
[31] X. Karatzas. Rhodium diesel-reforming catalysts for fuel cell applications.Ph.D. thesis, KTH Royal Institute of Technology, Chemical Engineering andTechnology, Stockholm (2011).
[32] C. H. Bartholomew, R. J. Farrauto. Petruleum refining and processing,chap. 9. Second ed. AIChE/Wiley Press (2005) .
REFERENCES 91
[33] S. McAllister, J.-Y. Chen, A. Fernandez-Pello. In: F. F. Ling (Ed.), Fundamen-tals of Combustion Processes. Springer, New York (2011) .
[34] A. V. González, L. J. Pettersson. Catal. Today 210 (2013) 19–25.
[35] R. M. Heck, R. J. Farrauto, S. T. Gulati. In: Catalytic Air Pollution Control,pages 440–449. John Wiley & Sons, Inc. (2009) .
[36] M. Krumpelt, T. R. Krause, J. D. Carter, J. P. Kopasz, S. Ahmed. Catal. Today77 (2002) 3–16.
[37] J. R. Lattner. Int. J. Hydrogen Energy 29 (2004) 393–417.
[38] G. Kolb. Catalyst Technology for Distributed Fuel Processing Applications,pages 57–127. Wiley-VCH Verlag GmbH & Co. KGaA (2008) .
[39] G. Kolb. Fuel Processing, chap. 2, pages 3–15. Wiley-VCH Verlag GmbH &Co. KGaA (2008) .
[40] P. A. Erickson, H.-Y. Tang, D. R. Vernon. In: S. Sherif, D. Yogi Goswami,E. Lee Stefanakos, A. Steinfeld (Eds.), Handbook of Hydrogen Energy,chap. 3, pages 23–60. CRC Press, Boca Raton (2014) .
[41] A. Qi, B. Peppley, K. Karan. Fuel Processing Technology 88 (2007) 3–22.
[42] M. Nilsson. Hydrogen generation from dimethyl ether by autothermal re-forming. Ph.D. thesis, KTH Royal Institute of Technology, Chemical Engi-neering and Technology (2007).
[43] I. Dincer, C. Zamfirescu. Advanced Power Generation Systems. Elsevier(2014).
[44] A. F. Ghenciu. Curr. Opin. Solid State Mater. Sci. 6 (2002) 389–399.
[45] N. Z. Muradov. Production of Hydrogen from Hydrocarbons, pages 33–101.CRC Press (2008) .
[46] R. Coll, J. Salvado, X. Farriol, D. Montane. Fuel Process. Technol. 74 (2001)19–31.
[47] C. H. Bartholomew, R. J. Farrauto. Fundamentals of industrial catalytic pro-cesses. AIChE/Wiley Press (2005).
[48] J. Rostrup-Nielsen, L. J. Christiansen. Concepts in syngas manufacture. Im-perial College Press, London (2011).
[49] R. Trane-Restrup, S. Dahl, A. Jensen. Int. J. Hydrogen Energy 39 (2014) 7735–7746.
[50] I. Kang, J. Bae. J. Power Sources 159 (2006) 1283–1290.

92
[51] J. Rostrup-Nielsen, J. Sehested, J. Nørskov. Adv. Catal. 47 (2002) 65–139.
[52] J. W. Geus. In: J. Regalbuto (Ed.), Catalysts Science and Engineering,chap. 15. CRC Press Taylor & Francis Group, Boca Raton (2007) .
[53] C. J. Wright, G. Butler. In: Stud. Surf. Sci. Catal., Studies in Surface Scienceand Catalysis, vol. 16, pages 159–168. Elsevier (1983) .
[54] J. A. Moulijn, A. Cybulski. Structured catalysts and reactors. Marcel Dekker,New York (1998).
[55] Haldor Topsoe A/S. http://www.topsoe.com/products/catalysts (Re-trieved February 2015).
[56] R. M. Heck, R. J. Farrauto, S. T. Gulati. Catalalytic Air Pollution Control.John Wiley & Sons, Inc. (2009).
[57] E. E. Petersen, A. T. Bell. Catalyst Deactivation, vol. 30. CRC Press LLC,Berkeley, California (1987).
[58] J. Oudar, H. Wise. Deactivation and Poisoning of Catalysts. Chemical In-dustries, Taylor & Francis, Dekker, New York (1985).
[59] M. Ferrandon, T. Krause. Appl. Catal. A: Gen. 311 (2006) 135–145.
[60] R. Gerlach. Surf. Sci. 17 (1969) 32–68.
[61] R. Imbihl. Prog. Surf. Sci. 85 (2010) 241–278.
[62] R. M. Lambert, A. Palermo, F. J. Williams, M. S. Tikhov. Solid State Ionics136–137 (2000) 677–685.
[63] P. Panagiotopoulou, D. I. Kondarides. J. Catal. 260 (2008) 141–149.
[64] Y. Wu, M. Liu, Z. Ma, T. S. Xing. Catal. Today 175 (2011) 196–201.
[65] I. Chorkendorff, J. W. Niemantsverdriet. Concepts of Modern Catalysis andKinetics. 2nd ed. Wiley-VCH, Weinheim (2007).
[66] K. Engvall, L. Holmlid, P. G. Menon. Appl. Catal. 77 (1991) 235–241.
[67] R. Meijer, M. Weeda, F. Kapteijn, J. A. Moulijn, N. Achtergracht. Carbon 29(1991) 929–941.
[68] D. M. Quyn, J.-i. Hayashi, C.-Z. Li. Fuel Process. Technol. 86 (2005) 1241–1251.
[69] J. R. Rostrup-Nielsen. Journal of Catalysis 33 (1974) 184–201.
[70] A. Saddawi, J. Jones, A. Williams. Fuel Process. Technol. 104 (2012) 189–197.

REFERENCES 93
[71] A. Norheim, D. Lindberg, J. E. Hustad, R. Backman. Energy & Fuels 23(2009) 920–925.
[72] J. Juan-Juan, M. Román-Martínez, M. Illán-Gómez. Appl. Catal. A: Gen 301(2006) 9–15.
[73] J.-W. Snoeck, G. Froment, M. Fowles. J. Catal. 169 (1997) 250–262.
[74] H. S. Bengaard, I. Alstrup, I. Chorkendorff, S. Ullmann, J. R. Rostrup-Nielsen, J. K. Nørskov. J. Catal. 187 (1999) 238–244.
[75] C. G. Vayenas, S. Bebelis, I. V. Yentekakis, H. G. Lintz. Catal. Today 11 (1992)303–438.
[76] M. Matsukata, E. Kikuchi, Y. Morita. Fuel 71 (1992) 705–707.
[77] A. Kotarba, M. Hagström, K. Engvall, J. B. C. Pettersson. React. Kinet. Catal.Lett. 63 (1998) 219–224.
[78] K. Engvall, L. Holmlid, A. Kotarba, J. B. C. Pettersson, P. G. Menon,P. Skaugset. Appl. Catal. A Gen. 134 (1996) 239–246.
[79] J. Lundin, T. Hansson, J. B. C. Pettersson. Appl. Surf. Sci. 74 (1994) 343–349.
[80] D. Sutton, B. Kelleher, J. R. H. Ross. Fuel Process. Technol. 73 (2001) 155–173.
[81] P. Kuchonthara, B. Puttasawat, P. Piumsomboon, L. Mekasut, T. Vitidsant.Korean J. Chem. Eng. 29 (2012) 1525–1530.
[82] P. Wang, L. Zhou, G. Li, H. Lin, Z. Shao, X. Zhang, B. Yi. Int. J. HydrogenEnergy 37 (2012) 2588–2595.
[83] J. Zhou, X. Zhang, J. Zhang, H. Liu, L. Zhou, K. Yeung. Catal. Commun. 10(2009) 1804–1807.
[84] D. J. Haynes, A. Campos, M. W. Smith, D. A. Berry, D. Shekhawat, J. J.Spivey. Catal. Today 154 (2010) 210–216.
[85] N. Srisiriwat, S. Therdthianwong, A. Therdthianwong. Int. J. Hydrogen En-ergy 34 (2009) 2224–2234.
[86] S. Ahmed, M. Krumpelt. Int. J. Hydrogen Energy 26 (2001) 291–301.
[87] R. K. Kaila, A. Gutierrez, A. O. I. Krause. Appl. Catal. B: Environ. 84 (2008)324–331.
[88] R. K. Kaila, A. Gutierrez, R. Slioor, M. Kemell, M. Leskela, A. O. I. Krause.Appl. Catal. B: Environ. 84 (2008) 223–232.
[89] J. Barbier, L. Oliviero, B. Renard, D. Duprez. Top. Catal. 33 (2005) 77–86.
94
[90] K. Kusakabe, K.-I. Sotowa, T. Eda, Y. Iwamoto. Fuel Process. Technol. 86(2004) 319–326.
[91] A. B. Shigarov, V. V. Kireenkov, V. A. Kuzmin, N. A. Kuzin, V. A. Kirillov.Catal. Today 144 (2009) 341–349.
[92] I. Kang, S. Yoon, G. Bae, J. H. Kim, J. Bae, D. Lee, Y. Song. Catal. Today 136(2008) 249–257.
[93] C. Brage, Q. Z. Yu, G. X. Chen, K. Sjöström. Biomass Bioenergy 18 (2000)87–91.
[94] R. Suhrmann. Adv. Catal. 7 (1955) 303–352.
[95] M. Seah. Work function. www.kayelaby.npl.co.uk, Last accesed: January 22,2015 (2015).
[96] I. Szilágyi, E. Santala, M. Heikkilä, M. Kemell, T. Nikitin, L. Khriachtchev,M. Räsänen, M. Ritala, M. Leskelä. J. Therm. Anal. Calorim. 105 (2011) 73–81.
[97] L. Bartha, A. Kiss, T. Szalay. Int. J. Refract. Met. Hard Mater. 13 (1995) 77–91.
[98] P. Dickens, M. Whittingham. Q. Rev. Chem. Soc. (1968).
[99] M. F. Pye, P. G. Dickens. Materials research bulletin 14 (1979) 1397–1402.
[100] M. M. R. Shakil, T. Debnath, C. H. Ruscher, A. Hussain. J. Bangladesh Chem.Soc. 25 (2012) 38–45.
[101] M. Mirza, J. Walls, S. A. A. Jayaweera. Thermochim. Acta 152 (1989) 203–213.
[102] G. Maniak, P. Stelmachowski, A. Kotarba, Z. Sojka, V. Rico-Pérez, A. Bueno-López. Appl. Catal. B: Environ. 136-137 (2013) 302–307.
[103] L. Devi, K. J. Ptasinski, F. J. J. G. Janssen. Ind. Eng. Chem. Res. 44 (2005)9096–9104.
[104] C. N. Satterfield. Heterogenous catalysis in industrial practice. 2nd ed.Krieger Publishing Company, Malabar, Florida (1991).
[105] S. Kim, H.-H. Carstensen, A. M. Dean, J. Bae. Int. J. Hydrogen Energy 37(2012) 7545–7553.
[106] I. Y. Kang, H. H. Carstensen, A. M. Dean. Journal of Power Sources 196(2011) 2020–2026.
[107] C. Vayenas, S. Bebelis, C. Pliangos, S. Brosda, D. Tsiplakides. Promotion inHeterogeneous Catalysis, chap. 2, pages 15–90. Springer US (2001) .
REFERENCES 95
[108] J. Gland, G. Somorjai. Surf. Sci. 38 (1973) 157–186.
[109] D. Dahlgren, J. C. Hemminger. Surf. Sci. 109 (1981) L513–L518.
[110] C. Brage, Q. Yu, G. Chen, K. Sjöström. Biomass Bioenergy 18 (2000) 87–91.
[111] K.-H. Ernst, Y. Kuster, R. Fasel, C. McFadden, U. Ellerbeck. Surf. Sci. 530(2003) 195–202.
[112] B. Hammer, J. K. Nørskov. Adv. Catal. 45 (2000).
[113] S. Chiang. Chem. Rev. 97 (1997) 1083–1096.
[114] T. Yamada, Y. Takano, M. Isobe, K. Miyakubo, T. Munakata. Chem. Phys.Lett. 546 (2012) 136–140.
[115] R. Lin, R. Koestner, M. van Hove, G. Somorjai. Surf. Sci. 134 (1983) 161.
[116] J. Inukai, M. Wakisaka, K. Itaya. Jap. J. Appl. Phys 43 (2004) 4554.
[117] V. M. Hallmark. J. Vac. Sci. Technol. B Microelectron. Nanom. Struct. 9 (1991)1111.
[118] G. Santarossa, M. Iannuzzi, A. Vargas, A. Baiker. ChemPhysChem 9 (2008)401–413.
[119] J. R. Rostrup-Nielsen, P. E. Højlund-Nielsen. Deactivation and poisoning ofcatalysts. New York (1985).
[120] X. Karatzas, K. Jansson, A. Gonzalez, J. Dawody, L. J. Pettersson. Appl.Catal. B 106 (2011) 476–487.
[121] A. V. González, X. Karatzas, L. J. Pettersson. Fuel 107 (2013) 162–169.
[122] N. Kakuta, Y. Kudo, T. Eguchi, H. Ohkita, T. Mizushima, T. Yamomoto,M. Yasuda. Stud. Surf. Sci. Catal 162 (2006) 777–784.
[123] P. Soltic, D. Edenhauser, T. Thurnheer, D. Schreiber, A. Sankowski. Fuel 88(2009) 1–8.
[124] A. Tsolakis, A. Megaritis, D. Yap. Energy 33 (2008) 462–470.
[125] D. Trimm. Catal. Today 37 (1997) 233–238.
[126] R. I. Hegde, J. M. White. J. Phys. Chem. 90 (1986) 296–300.
[127] C. H. Bartholomew. Appl. Catal. A 212 (2001) 17–60.
[128] C. Hulteberg. Int. J. Hydrogen Energy 37 (2012) 3978–3992.
[129] S. Anis, Z. Zainal. Renew. Sust. Energ. Rev. 15 (2011) 2355–2377.

Glossary
CO2 Carbon dioxide. xi, xii, 17
H2 Hydrogen. xii, 17, 24, 69
AAS Atomic Absorption Spectroscopy. 56
APUs Auxiliary Power Units. 11, 14, 20
ATR Autothermal reforming. 9, 14, 17, 19, 20, 21, 31, 33, 37, 69
BET Brunauer Emmet and Teller. 44
BJH Barrett-Joyner-Halenda. 44
CO Carbon monoxide. xii, 17
DIN590 European diesel standard. 13
EU European Union. 11
FC-APUs Fuel cell auxiliary power units. xi, xii, 13
FID Flame ionization detector. 39
FT Fischer-Tropsch diesel. 33
FTIR Fourier transform infrared spectrometer. 40
GHG Greenhouse gas. xi
IEA International Energy Agency. xi
IW Incipient wetness. 43
LPG Liquefied petroleum gas. 12
97
98
MK1 Swedish Environmental class 1. 13
MNP 1-Methylnaphthalene. 37, 39, 51, 52, 56, 58
OSC Oxygen storage capacity. 30, 69, 71
PID Proportional integral derivative. 37, 39
POX Partial Oxidation. 9, 20, 21
PrOX Preferential Oxidation. 12, 14, 15, 17
SPA Solid phase adsorption. 39
SR Steam reforming. 9, 17, 18, 20, 21
SV Space Velocity. 40
TCD Thermal conductivity detectors. 39, 40
TOS Time on stream. 75, 77
WGS Water-gas-shift. 12, 14, 17, 18, 20, 30, 58