Rheological evaluation of non-Newtonian Mexican nixtamalised maize and dry processed masa flours
12
Rheological evaluation of non-Newtonian Mexican nixtamalised maize and dry processed masa flours M.C. N u~ nez-Santiago a , E. Santoyo b, * , L.A. Bello-P erez a , S. Santoyo-Guti errez c a Centro de Desarrollo de Productos Bi oticos (IPN) Km. 8.5 Carr. Yautepec-Jojutla. Col. San Isidro Yautepec, Mor. 62731, Mexico b Centro de Investigaci on de Energ ıa (UNAM), Apartado Postal 34 Priv. Xochicalco s/n, Centro. Temixco, Mor. 62580, Mexico c Instituto de Investigaciones El ectricas, Unidad Geotermia, Av. Reforma 113, Col. Palmira, Temixco, Mor. 62490, Mexico Received 1 August 2002; accepted 5 January 2003 Abstract An experimental programme for evaluating the rheological properties of thirteen maize flour samples collected from several Mexican commercial producers was conducted. Measurements of shear stress and shear rate were performed under calibrated conditions using a rotational Haake viscometer. A comprehensive analysis of the rheometric data obtained during the experimental runs was carried out for studying the actual non-Newtonian behaviour of the maize flour pastes. Non-Newtonian rheological models based on the classical Power Law, the Robertson–Stiff and the Rational Polynomial were used for fitting the rheometric data over a wide range of shear rates (24–3200 s 1 ). The best description of the non-Newtonian behaviour in most of the maize flour pastes was obtained using the Rational Polynomial Model. Details of the experimental methodology and the results obtained in the rheological evaluation are outlined. Ó 2003 Elsevier Science Ltd. All rights reserved. Keywords: Non-Newtonian fluids; Masa; Nixtamalisation; Effective viscosity; RVA measurement 1. Introduction The nixtamalisation of maize is an ancient process developed by the Aztecs which is still used in the pro- duction of high quality ‘‘tortillas’’ and other maize related food products (such as ‘‘pozole’’). The maize grains are ground after alkali and heating treatments in a process known as nixtamalisation (Mensah-Agyapong & Horner, 1992; Ar ambula, Barr on, Gonz alez, Moreno, & Luna, 2001). After grinding and washing the ‘‘nixta- mal’’ with water, a soft paste known as ‘‘masa’’ is ob- tained. This product is widely used in Mexico for the production of tortillas (Campus-Baypoli, Rosas-Burgos, Torres-Ch avez, Ramirez-Wong, & Serna-Sald ıvar, 1999). In spite of the production of masa is carried out at industrial and commercial scale, there is no an ap- propriated quality control of the nixtamalisation pro- cess. Such a problem sometimes causes a low quality production of tortillas due to a poor texture and physi- cal stability. The masa obtained from the nixtamalisa- tion is a m elange characterised by a mixture of starch polymers containing starch gelatinised granules, intact starch granules, pieces of endosperm, and some lipids (G omez, Rooney, Waniska, & Pflugfelder, 1987). The alkali-thermal treatment used in the nixtamali- sation, acts on the components of cell walls for con- verting the hemicellulose into soluble gums (Ar ambula, Mauricio, Figueroa, Gonz alez-Hern andez, & Ordorica, 1999). This treatment has several functions, such as, to gelatinise the starch, to saponify part of the lipids, and also to solubilise some proteins surrounding the starch granules (Rooney & Suhendro, 1999). Cooking and grinding treatments must be also carried out at optimum levels for producing a masa with a high quality. Since nixtamalisation typically provides the rheological and texture properties of the masa products, gelatinisation must be carefully controlled because large amounts of gelatinised starch can produce stickiness, which could affect the handling of the masa (Rooney & Suhendro, 1999). In spite of the traditional nixtamalisation is widely used in Mexico for producing fresh commercial masas, there are other industrial processes where the main target is to produce nixtamalised maize flours (NMF). Journal of Food Engineering 60 (2003) 55–66 www.elsevier.com/locate/jfoodeng * Corresponding author. Tel.: +52-55-56229774; fax: +52-55- 56229791. E-mail address: [email protected] (E. Santoyo). 0260-8774/03/$ - see front matter Ó 2003 Elsevier Science Ltd. All rights reserved. doi:10.1016/S0260-8774(03)00018-9
-
Upload
independent -
Category
Documents
-
view
4 -
download
0
Transcript of Rheological evaluation of non-Newtonian Mexican nixtamalised maize and dry processed masa flours
Journal of Food Engineering 60 (2003) 55–66
www.elsevier.com/locate/jfoodeng
Rheological evaluation of non-Newtonian Mexican nixtamalisedmaize and dry processed masa flours
M.C. N�uu~nnez-Santiago a, E. Santoyo b,*, L.A. Bello-P�eerez a, S. Santoyo-Guti�eerrez c
a Centro de Desarrollo de Productos Bi�ooticos (IPN) Km. 8.5 Carr. Yautepec-Jojutla. Col. San Isidro Yautepec, Mor. 62731, Mexicob Centro de Investigaci�oon de Energ�ııa (UNAM), Apartado Postal 34 Priv. Xochicalco s/n, Centro. Temixco, Mor. 62580, Mexico
c Instituto de Investigaciones El�eectricas, Unidad Geotermia, Av. Reforma 113, Col. Palmira, Temixco, Mor. 62490, Mexico
Received 1 August 2002; accepted 5 January 2003
Abstract
An experimental programme for evaluating the rheological properties of thirteen maize flour samples collected from several
Mexican commercial producers was conducted. Measurements of shear stress and shear rate were performed under calibrated
conditions using a rotational Haake viscometer. A comprehensive analysis of the rheometric data obtained during the experimental
runs was carried out for studying the actual non-Newtonian behaviour of the maize flour pastes. Non-Newtonian rheological
models based on the classical Power Law, the Robertson–Stiff and the Rational Polynomial were used for fitting the rheometric data
over a wide range of shear rates (24–3200 s�1). The best description of the non-Newtonian behaviour in most of the maize flour
pastes was obtained using the Rational Polynomial Model. Details of the experimental methodology and the results obtained in the
rheological evaluation are outlined.
� 2003 Elsevier Science Ltd. All rights reserved.
Keywords: Non-Newtonian fluids; Masa; Nixtamalisation; Effective viscosity; RVA measurement
1. Introduction
The nixtamalisation of maize is an ancient process
developed by the Aztecs which is still used in the pro-
duction of high quality ‘‘tortillas’’ and other maize
related food products (such as ‘‘pozole’’). The maize
grains are ground after alkali and heating treatments in
a process known as nixtamalisation (Mensah-Agyapong
& Horner, 1992; Ar�aambula, Barr�oon, Gonz�aalez, Moreno,& Luna, 2001). After grinding and washing the ‘‘nixta-
mal’’ with water, a soft paste known as ‘‘masa’’ is ob-
tained. This product is widely used in Mexico for the
production of tortillas (Campus-Baypoli, Rosas-Burgos,
Torres-Ch�aavez, Ramirez-Wong, & Serna-Sald�ııvar,1999). In spite of the production of masa is carried out
at industrial and commercial scale, there is no an ap-
propriated quality control of the nixtamalisation pro-cess. Such a problem sometimes causes a low quality
production of tortillas due to a poor texture and physi-
cal stability. The masa obtained from the nixtamalisa-
*Corresponding author. Tel.: +52-55-56229774; fax: +52-55-
56229791.
E-mail address: [email protected] (E. Santoyo).
0260-8774/03/$ - see front matter � 2003 Elsevier Science Ltd. All rights res
doi:10.1016/S0260-8774(03)00018-9
tion is a m�eelange characterised by a mixture of starchpolymers containing starch gelatinised granules, intact
starch granules, pieces of endosperm, and some lipids
(G�oomez, Rooney, Waniska, & Pflugfelder, 1987).
The alkali-thermal treatment used in the nixtamali-
sation, acts on the components of cell walls for con-
verting the hemicellulose into soluble gums (Ar�aambula,Mauricio, Figueroa, Gonz�aalez-Hern�aandez, & Ordorica,
1999). This treatment has several functions, such as, togelatinise the starch, to saponify part of the lipids, and
also to solubilise some proteins surrounding the starch
granules (Rooney & Suhendro, 1999). Cooking and
grinding treatments must be also carried out at optimum
levels for producing a masa with a high quality. Since
nixtamalisation typically provides the rheological and
texture properties of the masa products, gelatinisation
must be carefully controlled because large amounts ofgelatinised starch can produce stickiness, which could
affect the handling of the masa (Rooney & Suhendro,
1999).
In spite of the traditional nixtamalisation is widely
used in Mexico for producing fresh commercial masas,
there are other industrial processes where the main
target is to produce nixtamalised maize flours (NMF).
erved.
56 M.C. N�uu~nnez-Santiago et al. / Journal of Food Engineering 60 (2003) 55–66
These flours must be re-hydrated to produce masaproducts, such as tortillas (Flores-Far�ııas et al., 2000).For studying the quality of commercial masas and
NMF, and considering the physical differences that ac-
tually exist between them, a dehydration process must
be applied to the commercial masas to obtain a homo-
geneous pulverised material (here defined as dry pro-
cessed masa flours, DPMF).
For evaluating and to compare the quality features ofthese DPMF samples, a comprehensive experimental
programme needs to be carried out for determining their
chemical composition and also, the measure of their
physicochemical properties. Generally, the determina-
tion of the chemical composition in either masa or flour
samples includes analyses of ash, fat, protein, and
moisture content (e.g. Mart�ıınez-Bustos, Garc�ııa, Chang,S�aanchez-Sinencio, & Figueroa, 2000). The particle sizedistribution (PSD), pH, the water retention capacity
(WRC), and the rheological properties are the major
physicochemical analyses to be determined (e.g Flores-
Far�ııas et al., 2000; Ar�aambula et al., 2001). PSD, pH and
WRC are readily carried out by standardised methods
commonly found in the literature (Flores-Far�ııas et al.,2000; Mart�ıınez-Bustos et al., 2000).The determination of the rheological properties
(shear rate, shear stress, and effective viscosity) is a more
complex experimental task due to the non-Newtonian
nature that the maize flour pastes typically exhibit.
Comprehensive studies of the rheological behaviour of
pastes prepared with DPMF or NMF samples have
been seldom reported in the literature. The rheological
measurements of flour pastes are frequently performed
by use of simple rapid viscosity analysers (RVA), whichmay have some disadvantages to predict absolute values
of viscosity (e.g. Tecante & Doublier, 1999). Some ex-
perimental rheological works using RVA have been
performed by Almeida-Dom�ıınguez, Cepeda, and Roo-ney (1996), Campus-Baypoli et al. (1999), Flores-Far�ııaset al. (2000), Mart�ıınez-Bustos et al. (2000), and Ar�aam-bula et al. (2001). These viscometers measure the torque
produced during the cooking of the starches, which islater used for calculating the viscosity in thoroughly
arbitrary units, known as Brabender units (BU). Such
units do not provide an actual quantitative measure-
ment of the viscosity (Thomas & Atwell, 1999). How-
ever, RVA measurements are qualitatively used to
obtain reproducible gelatinisation and pasting profiles
by a careful control programme of the mixing, heating
and cooling processes. Since this kind of measurementdoes not provide data related to flow curves, nor
quantitative data of the effective viscosity, they actually
present a clear disadvantage for studying the non-
Newtonian behaviour exhibited by the paste samples.
In this context, rotational measurements of shear
stress and shear rate are preferred for defining more
accurately the actual non-Newtonian behaviour of the
pastes, as well as for a better estimation of the effectiveviscosity. In the present work, we have carried out an
experimental rheological programme using a rotational
Haake viscometer to measure rheometric properties of
some Mexican maize flour pastes. The goal of this work
is to present the rheometric results obtained in this ex-
perimental programme for evaluating the non-Newto-
nian rheological behaviour of twenty-six Mexican maize
flour pastes. The classical Power Law, as well as theother two available non-Newtonian rheological models
such as Robertson–Stiff and the Rational Polynomial
have been successfully employed, for the first time in the
food industry, to analyse and to fit the rheometric data
obtained.
1.1. Non-Newtonian rheological models
The choice of appropriate rheological models, to-
gether with the fitting procedures, can sometimes result
in poor fits of the rheometric data. Hence, the experi-
mental data analysis using non-Newtonian rheologicalmodels has been recognised as a difficult task for the
accurate and reliable prediction of the viscosity in flour
pastes (e.g. Rao & Tattiyakul, 1999). It has been gene-
rally accepted that the Ostwald-de Waele or better
known as the Power Law model (PLM) typifies the
rheological behaviour of rheometric data for a wide
variety of non-Newtonian fluids, including starch-
in-water pastes (e.g. Holland, 1964; Lauzon & Reid,1979; Doublier, 1987; Holland & Bragg, 1995; Santoyo,
1997; Rao & Tattiyakul, 1999; Santoyo, Santoyo-
Guti�eerrez, Garc�ııa, Espinosa, & Moya, 2001; Sopade &
Kiaka, 2001). However, it has also been observed, at
higher shear rate and shear stress values, that PLM does
not always describes the non-Newtonian pattern of the
rheometric data measured at the laboratory. Such a
problem enables other complex non-Newtonian modelsto be employed for improving the fit goodness of these
rheometric data.
Starch-in-water flour pastes are widely recognised as
complex substances both rheologically and chemically.
Such features enable the pastes to be generalised as non-
Newtonian fluids because there is no single constitutive
equation to describe exactly their relationship between
the shear stress (srz) and the shear rate (c ¼ dvz=dr) overa wide range of shear rates (e.g. Holdsworth, 1993;
Thebaudin, Lefebre, & Doublier, 1998; Tecante &
Doublier, 1999). Three major categories of non-New-
tonian fluids are basically recognised, namely, time in-
dependent, time dependent and viscoelastic (Holland,
1964; Holland & Bragg, 1995; Santoyo et al., 2001). The
time independent category has received a substantial
degree of attention in comparison with the other twocategories. The large majority of starch-in-water pastes
falls into this category (e.g. Thebaudin et al., 1998;
Tecante & Doublier, 1999; Sopade & Kiaka, 2001). As
M.C. N�uu~nnez-Santiago et al. / Journal of Food Engineering 60 (2003) 55–66 57
was earlier mentioned, it has been generally acceptedthat starch-in-water pastes can be moderately typified by
the Ostwald-de Waele or PLM, which is described by the
following equation:
srz ¼ k � cn ð1Þ
where k and n are defined as the consistency index andthe dimensionless flow behaviour index, respectively.
The development and the validation of this equation are
fully reported by Lauzon and Reid (1979), and Muller
(1973). There are other available non-Newtonian mo-
dels, such as Herschel-Bulkley, Casson, Mizrahi-Berk,Heinz-Casson, Vocadlo, and the generalised Herschel-
Bulkley (see Sopade & Kiaka, 2001), which have been
sometimes used for describing the rheological behaviour
of these pastes. Most of these non-Newtonian models
(including the PLM) have shown an appropriate fit of
raw rheological data collected from the analysis of
starch-in-water pastes, at low shear rates (e.g. Thebau-
din et al., 1998; Chamberlain & Rao, 1999; Tecante &Doublier, 1999). However, at higher shear rates (ranging
from 600 to 3200 s�1), it has been generally observed
that some of these rheological models do not describe
accurately the non-Newtonian behaviour.
Such a limitation motivated in this work to evaluate
alternative non-Newtonian models (Robertson–Stiff:
RSM, and the Rational Polynomial: RPM) in order to
obtain a better fit of the rheometric data in a wide rangeof shear rates (24–3200 s�1). It is very important to point
out that these models have not been used before in the
rheological studies of food products. In fact, these
models have been successfully employed in the oil and
geothermal industries for describing reliably the non-
Newtonian behaviour of drilling fluids during the con-
struction of deep producer wells (e.g. Robertson & Stiff,
1976; Santoyo, 1997; Kumar, Saboo, Sheth, Pilehvari, &Serth, 2000; Santoyo et al., 2001).
Robertson and Stiff (1976) proposed an improved
mathematical equation to describe a yield stress in a
pseudoplastic non-Newtonian fluid. In this model, they
combined both the classical Bingham plastic and the
traditional PLM patterns by use of the following equa-
tion:
srz ¼ Aðc þ CÞB ð2Þ
where A, B and C coefficients are parameters that de-
pend on the shear rate. When B ¼ 1 and C ¼ 0, the
equation describes the form of a Newtonian fluid; if
B ¼ 1 and C 6¼ 0, the fluid behaviour is represented as a
Bingham plastic. Finally, if B 6¼ 1 and C ¼ 0 are pre-
sented as a Power Law fluid. The parameters A and Bcan be considered similarly to the parameters of the
PLM. However, the parameter C, has a somewhat dif-ferent implication than the yield stress of the Bingham
model. In this model, C appears as a correction to the
shear rate rather than the shear stress, and the term
(c þ C) can be considered as the effective shear rate orthe shear rate that would be required for a Power Law
fluid to produce the same shear stress.
The last non-Newtonian model used was the Rational
Polynomial Model (RPM), which was originally pro-
posed by Kumar et al. (2000). These authors suggested
using a ratio of two polynomial functions as a general
correlating equation to obtain a better fitting of experi-
mental rheometric data. The RPM is apparently suitableto accurately describe the rheogram of virtually any time
independent non-Newtonian fluid. In fact, high accu-
racy should be achieved with a reduced number of ad-
justable parameters, as is usually required by the limited
number of rheometric data to be obtained with most of
commercial rheometers. The equation of the RPM is
represented by the following equation:
srz ¼P1c þ P2c2 þ P3c3
1þ Q1c þ Q2c2 þ Q3c3ð3Þ
where P1, P2, P3, Q1, Q2 and Q3 are parameters that
strongly depend on the shear rate according to the
rheological theory proposed by Kumar et al. (2000).
1.2. Effective viscosity of starch-in-water pastes
The effective viscosity of starch-in-water pastes is
estimated by an application of any of the above des-
cribed rheological models (PLM, RSM or RPM) to the
shear stress and the shear rate data collected from sim-
ple rotational coaxial viscometers (e.g. Haake RV20).
However, dynamic and direct measurements of the fluidviscosity can be reliably determined by use of sophisti-
cated viscometers, such as Haake CV20 (Tecante &
Doublier, 2002). For the purposes of our experimental
work, the shear stress data were measured using a
Haake RV20 viscometer at shear rates that normally
ranged from 0.1 s�1 to 3200 s�1 under isothermal con-
ditions.
2. Experimental procedure
2.1. Sample preparation
Ten crude masa samples (M-1 to M-10) were directlyobtained from several commercial tortilla producers of
the South of Mexico (Acapulco, Gro.). These masa
samples were carefully dried in a convective oven at 45
�C, grounded with a mortar, sieved through a 100 USsieve, and stored at room temperature in glass sealed
containers, to obtain the DPMF samples to be evaluated
(M-1 to M-10). On the other hand, the NMF samples
were obtained from the two largest flour producercompanies of M�eexico (MASECA, Le�oon, Gto.; andMINSA, Tlanepantla, Edo. de M�eexico), here identifiedas M-11 and M-12 samples, respectively. A control masa
%M
oist
ure
5
10
15
%Pr
otei
n
6
8
10
%Fa
t
5
10
15
Crude maize flour samples
M-1 M-2 M-3 M-4 M-5 M-6 M-7 CMS M-8 M-9 M-10 M-11 M-12
%A
sh
1
2
3
(a)
(b)
(c)
(d)
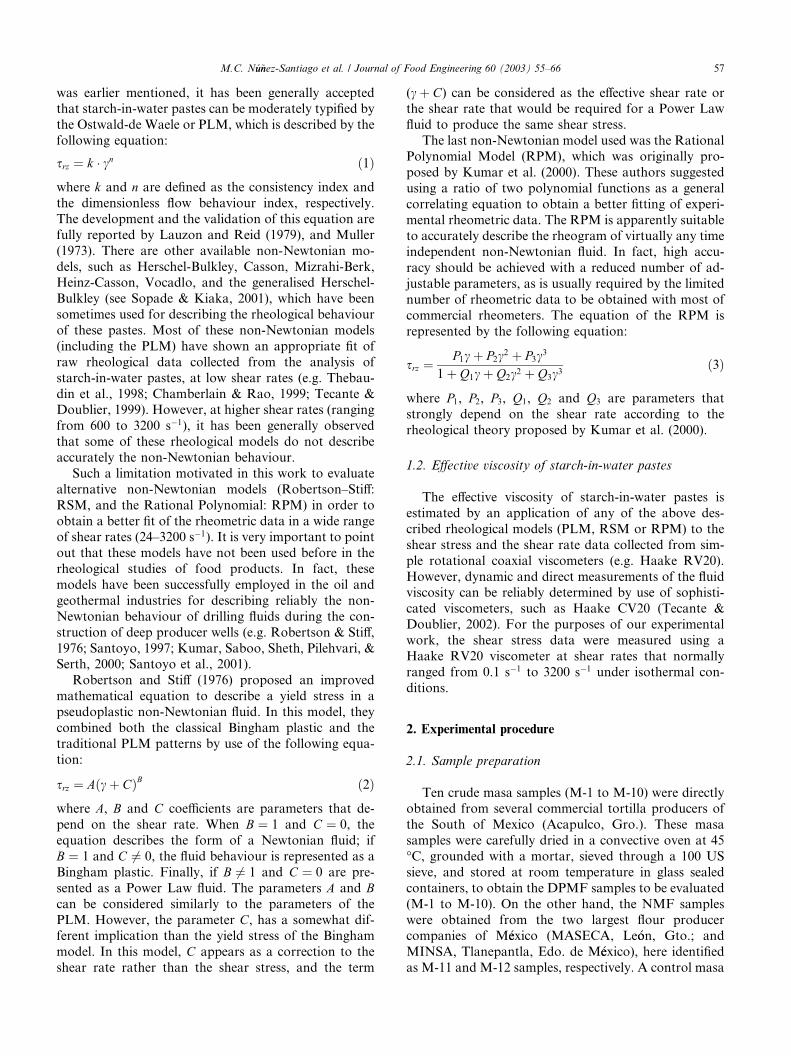
Fig. 1. Results of the chemical composition of the commercial crude
maize flours. The error bars were not plotted for samples which pre-
sented small experimental errors.
58 M.C. N�uu~nnez-Santiago et al. / Journal of Food Engineering 60 (2003) 55–66
sample (CMS) was additionally prepared at laboratoryconditions using a strict control of the nixtamalisation
process. CMS was elaborated from commercial maize
treated with lime (with a concentration of 1% w/w) and
cooked for one hour at 92 �C. The nixtamal so producedwas then ground in a commercial windmill. This masa
was finally dried at the same conditions than those used
with DPMF and NMF samples. CMS sample was used
in the present experimental work, for having a referencesample under controlled conditions of nixtamalisation,
since DPMF and NMF samples were collected under
unknown nixtamalisation conditions.
2.2. Pasting procedure
Two set of samples with concentrations of 5% and
15% (w/v) were separately prepared using crude DPMF,
NFM and CMS. A total number of twenty-six pastesamples was so elaborated for carrying out the experi-
mental work (twenty pastes were prepared using DPMF,
four from NMF and two samples were set up by use of
the CMS). All the samples were homogeneously mixed
with deionised water at room temperature using a con-
tinuous magnetic stirring to avoid settling. All the
-in-water samples were then heated up to 80 �C (at a heat-ing rate of 1.5 �C/min), and keep them under isothermalconditions for 10 min. The paste samples were finally
cooled down to 60 �C (at a cooling rate of 1.5 �C/min).
2.3. Determination of the chemical composition
The determination of the chemical composition in the
crude masa samples (M-1 to M-10) involved a typical
bromatologic analysis of ash, fat, protein and moisture
content. Moisture content was determined by gravime-
try after heating (130� 2 �C for 2 h) using 3 g of sample.Ash, protein, and fat tests were analysed according to
standardised American Association of Cereal Chemists
methods sections: 08-01, 46-13, and 30-25, respectively
(Grami, 2000).
2.4. Measurement of rheological properties
The raw rheological data (srz and c) were measured ina rotational viscometer (Haake RV20) using a cone/platesystem (2 cm diameter with an angle of 1�). The instru-ment was previously calibrated using a standard solution
of known viscosity (12 Pa � s at 25 �C). Two consecutiveup–down shear rate scans from 0 to 3200 s�1, followed by
a descent scan from 3200 to 0.1 s�1, in a total time of 12
min were used for logging the rheometric data of each
sample. Such an experimental task was employed ac-
cording to the methodology reported by Tecante andDoublier (1999). The experimental errors obtained for
the rotational speed and the torque measurements were
smaller than 3% and 5%, respectively.
3. Results and discussion
3.1. Chemical composition
Results of the chemical composition of the dried
crude masa samples (M-1 to M-12 and CMS) are shown
in Fig. 1. As can be seen, the moisture content (in per-
cent) for all the masa samples was completely different
(Fig. 1a). Moisture content ranged from 4.2% to 12.1%.Most of the crude DPMF samples (M-1 to M-10) were
characterised by lower values of moisture content (4.2%
to 10.4%), while crude NMF samples (M-11 and M-12)
exhibited higher values. The CMS showed an inter-
mediate moisture content of 7:3%� 0:1%. The vari-
ability and heterogeneity observed in most of the sample
moisture values are probably due to the different nix-
tamalisation processes, which were used for preparingeach sample.
The analysis of fat content obtained in the samples
also showed very different values as was expected (Fig.
1b). Such a variability was confirmed by applying sig-
nificance statistical tests of ANOVA (one-way with a
significance level a ¼ 0:05% or 95% confidence level),
which enable to define that these samples actually come
M.C. N�uu~nnez-Santiago et al. / Journal of Food Engineering 60 (2003) 55–66 59
from different sample populations. The highest values offat content were obtained for CMS and some crude
DPMF samples (M-4, M-5, M-8 and M-9), while NMF
samples showed lower values, which were similar to
those obtained for the remaining DPMF (M-1–M-3,
M-6, M-7, and M-10).
The protein content of the samples showed an aver-
age value of 8:2%� 0:5%, which could be considered
constant for all the samples (Fig. 1c). Such an averagevalue was slightly higher than some values reported for
maize flours (e.g., Mart�ıınez-Bustos et al., 2000). TheCMS samples showed a protein content of 7:6%� 0:3%.The ash content of the samples indicated an average
value of 1:2%� 0:3%, which could be considered con-stant for all the samples (Fig. 1d). Such an average value
was slightly higher than some values reported for maize
flours (Flores-Far�ııas et al., 2000). The CMS sampleshowed an ash content value of 1:4%� 0:1%.
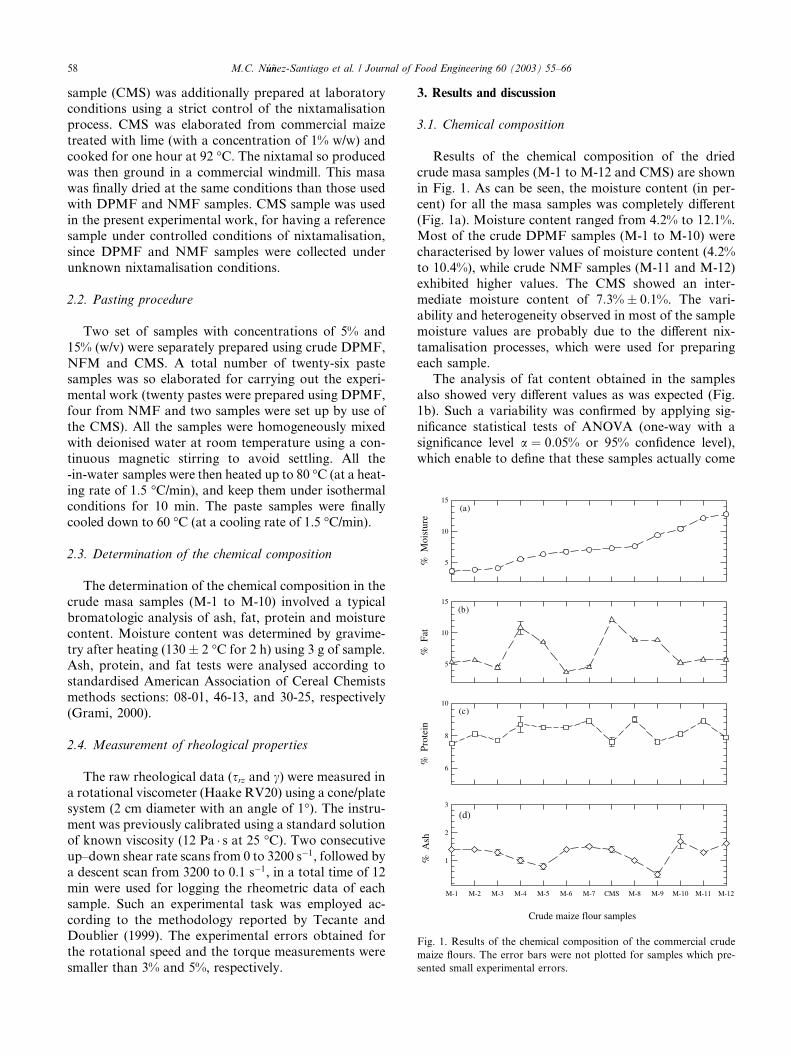
Table 1
Measurements of shear stress and shear rate obtained in the rheological eva
c(s�1)
s (Pa)
DPMF-
1
DPMF-
2
DPMF-
3
DPMF-
4
DPMF-
5
DPMF-
6
D
7
24 5.0 2.1 3.4 2.2 0.4 1.4 1
32 6.2 4.3 4.1 2.7 1.1 2.2 3
40 7.9 5.3 4.8 3.9 1.8 3.4 3
51 7.9 9.7 5.0 8.6 2.5 4.5 4
68 11.4 10.4 8.8 10.8 4.0 7.1 7
89 13.6 14.0 9.1 13.7 4.4 7.2 7
114 19.7 15.3 12.9 17.5 6.2 10.6 10
149 22.1 17.7 14.4 19.8 6.5 11.6 11
191 27.9 22.6 18.6 25.3 9.0 15.6 15
245 30.3 24.6 19.8 27.2 9.2 16.0 16
318 37.2 29.6 23.2 33.9 12.4 19.9 19
403 40.9 32.5 26.2 36.4 13.0 21.9 21
683 54.9 42.7 34.3 48.8 18.0 29.6 29
1141 72.2 56.7 45.3 65.5 25.0 39.2 39
1906 95.9 74.7 60.2 87.3 34.5 52.5 52
3177 124.0 98.8 79.9 116.9 48.1 69.8 69
DPMF-
14
DPMF-
15
DPMF-
16
DPMF-
17
DPMF-
18
DPMF-
19
D
20
24 2.2 3.2 4.8 3.9 2.7 2.5
32 3.2 5.4 6.2 5.4 3.1 4.7
40 5.9 8.7 7.9 6.9 5.4 11.3
51 7.6 10.4 8.5 7.6 4.3 12.8
68 9.6 12.1 11.5 11.0 8.1 15.5
89 11.9 13.2 14.8 11.1 7.3 12.4 1
114 15.7 18.2 20.6 16.4 13.2 20.9 1
149 19.0 20.2 15.7 18.7 13.7 18.2 1
191 25.3 26.3 29.9 24.1 23.8 29.3 2
245 28.8 29.8 28.7 27.9 25.3 27.7 2
318 35.7 36.7 44.0 37.4 34.3 40.3 3
403 41.5 42.0 48.0 38.5 40.0 42.3 3
683 59.0 61.3 70.5 56.0 57.5 60.8 5
1141 84.0 84.9 96.8 83.0 85.3 87.0 7
1906 104.8 113.1 123.8 109.5 114.0 115.5 10
3177 131.5 145.7 146.3 137.0 142.0 144.8 13
3.2. Measurement of rheological properties
Twenty-six maize paste samples were rheologically
analysed. A total number of 416 measurements of shear
stress (s in Pa) and shear rate (c in s�1) data were logged.Table 1 summarises all the rheometric data measured for
the paste samples considered in the present experimental
work. Such data set comprises sixteen viscometer dial
readings of shear rate ranging from 24 to 3177 s�1 foreach sample analysed. These data profiles were sepa-
rately plotted, in order to determine their particular
behaviour of each paste sample in a classical plot of
shear stress versus shear rate (commonly known as
rheogram or flow curve). For discussion purposes and
also, in order to limit the size of the paper, only four
plots of the total number of experimental runs have been
selected (Fig. 2a–d). Such data correspond to the rheo-logical evaluation of the DPMF-4, CMS-2, NCF-3 and
luation of DPMF and NMF samples
PMF- DPMF-
8
DPMF-
9
DPMF-
10
DPMF-
11
DPMF-
12
DPMF-
13
.4 3.2 1.4 2.5 6.0 3.3 4.2
.2 3.6 2.6 3.6 6.8 4.6 5.0
.4 6.2 3.4 5.0 8.0 11.1 7.2
.5 7.7 4.1 8.2 7.9 13.9 9.0
.1 10.5 5.9 10.1 11.7 15.2 13.4
.2 11.8 9.5 12.2 11.6 18.8 16.0
.6 15.5 12.2 15.4 18.1 21.8 20.6
.6 17.9 14.4 17.0 17.3 14.9 22.9
.6 22.4 18.5 21.3 29.3 29.9 31.4
.0 27.2 20.3 23.4 24.7 24.5 32.2
.9 32.9 24.2 28.2 34.1 38.6 42.2
.9 36.6 27.4 30.7 38.5 37.2 45.2
.6 49.9 37.5 41.3 58.0 58.5 67.5
.2 66.8 48.8 54.6 78.5 83.3 92.5
.5 90.5 65.3 72.8 105.0 112.1 127.8
.8 121.7 83.3 96.0 133.0 143.6 142.8
PMF- CMS-
1
CMS-
2
NMF-
1
NMF-
2
NMF-
3
NMF-
4
4.1 1.8 4.7 2.6 0.5 3.2 6.6
5.9 2.4 7.8 3.6 0.9 6.0 9.6
6.8 3.4 8.5 5.5 1.4 6.1 10.9
8.5 4.5 11.3 8.1 1.8 8.9 12.4
8.6 5.3 12.4 9.4 3.1 10.0 15.7
1.8 5.5 15.5 12.6 5.6 11.9 17.2
7.3 7.8 18.2 17.1 8.6 16.7 22.9
3.1 8.1 20.9 19.6 10.7 17.4 23.2
5.2 11.3 27.7 25.5 14.9 25.1 32.1
1.9 11.6 29.3 27.7 16.2 27.8 33.2
3.7 14.4 40.3 33.8 20.7 36.5 45.4
2.8 16.0 42.3 38.0 23.4 39.6 45.6
0.3 22.0 60.8 51.8 32.3 60.4 67.9
6.5 30.4 87.0 84.6 39.6 87.0 92.6
8.8 41.2 115.5 93.0 61.5 114.8 120.4
5.0 56.0 144.8 123.5 82.9 142.1 147.4
-1
0 1000 2000 3000-1
0 1000 2000 3000
(Pa)
0
50
100
150
200
(Pa)
0
50
100
150
200
(c) (d)
(a) (b)
PLMRSMRPM
Exp. data CMS 2PLMRSMRPM
Exp. data DPMF-4
PLMRSMRPM
Exp. data NMF 3
PLMRSMRPM
Exp. data DPMF 13
ττ
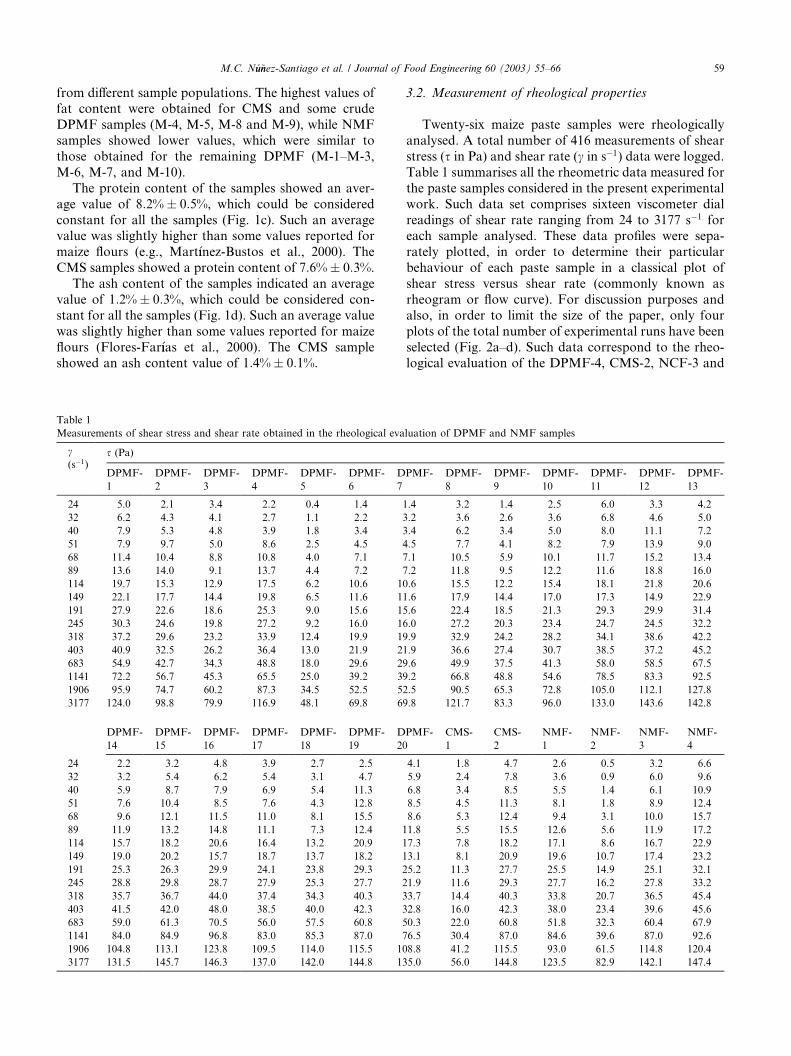
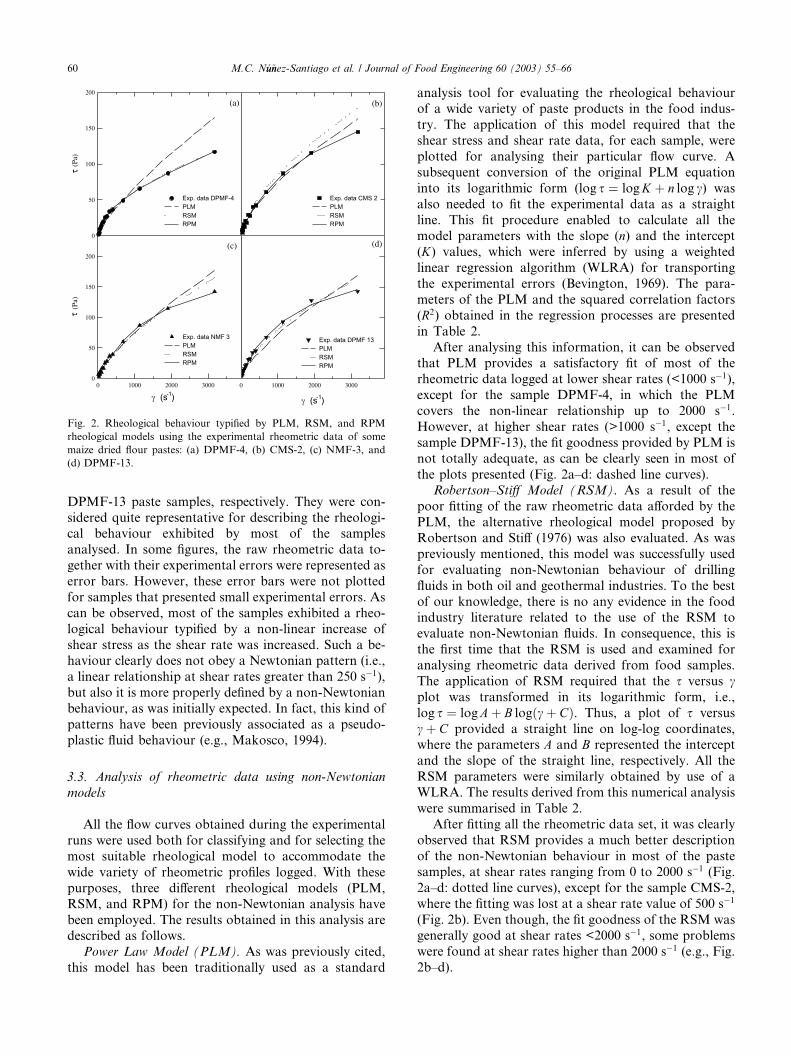
Fig. 2. Rheological behaviour typified by PLM, RSM, and RPM
rheological models using the experimental rheometric data of some
maize dried flour pastes: (a) DPMF-4, (b) CMS-2, (c) NMF-3, and
(d) DPMF-13.
60 M.C. N�uu~nnez-Santiago et al. / Journal of Food Engineering 60 (2003) 55–66
DPMF-13 paste samples, respectively. They were con-
sidered quite representative for describing the rheologi-cal behaviour exhibited by most of the samples
analysed. In some figures, the raw rheometric data to-
gether with their experimental errors were represented as
error bars. However, these error bars were not plotted
for samples that presented small experimental errors. As
can be observed, most of the samples exhibited a rheo-
logical behaviour typified by a non-linear increase of
shear stress as the shear rate was increased. Such a be-haviour clearly does not obey a Newtonian pattern (i.e.,
a linear relationship at shear rates greater than 250 s�1),
but also it is more properly defined by a non-Newtonian
behaviour, as was initially expected. In fact, this kind of
patterns have been previously associated as a pseudo-
plastic fluid behaviour (e.g., Makosco, 1994).
3.3. Analysis of rheometric data using non-Newtonian
models
All the flow curves obtained during the experimental
runs were used both for classifying and for selecting the
most suitable rheological model to accommodate the
wide variety of rheometric profiles logged. With these
purposes, three different rheological models (PLM,
RSM, and RPM) for the non-Newtonian analysis have
been employed. The results obtained in this analysis aredescribed as follows.
Power Law Model (PLM). As was previously cited,
this model has been traditionally used as a standard
analysis tool for evaluating the rheological behaviourof a wide variety of paste products in the food indus-
try. The application of this model required that the
shear stress and shear rate data, for each sample, were
plotted for analysing their particular flow curve. A
subsequent conversion of the original PLM equation
into its logarithmic form (log s ¼ logK þ n log c) wasalso needed to fit the experimental data as a straight
line. This fit procedure enabled to calculate all themodel parameters with the slope (n) and the intercept(K) values, which were inferred by using a weighted
linear regression algorithm (WLRA) for transporting
the experimental errors (Bevington, 1969). The para-
meters of the PLM and the squared correlation factors
(R2) obtained in the regression processes are presentedin Table 2.
After analysing this information, it can be observedthat PLM provides a satisfactory fit of most of the
rheometric data logged at lower shear rates (<1000 s�1),
except for the sample DPMF-4, in which the PLM
covers the non-linear relationship up to 2000 s�1.
However, at higher shear rates (>1000 s�1, except the
sample DPMF-13), the fit goodness provided by PLM is
not totally adequate, as can be clearly seen in most of
the plots presented (Fig. 2a–d: dashed line curves).Robertson–Stiff Model (RSM). As a result of the
poor fitting of the raw rheometric data afforded by the
PLM, the alternative rheological model proposed by
Robertson and Stiff (1976) was also evaluated. As was
previously mentioned, this model was successfully used
for evaluating non-Newtonian behaviour of drilling
fluids in both oil and geothermal industries. To the best
of our knowledge, there is no any evidence in the foodindustry literature related to the use of the RSM to
evaluate non-Newtonian fluids. In consequence, this is
the first time that the RSM is used and examined for
analysing rheometric data derived from food samples.
The application of RSM required that the s versus cplot was transformed in its logarithmic form, i.e.,
log s ¼ logAþ B logðc þ CÞ. Thus, a plot of s versus
c þ C provided a straight line on log-log coordinates,where the parameters A and B represented the interceptand the slope of the straight line, respectively. All the
RSM parameters were similarly obtained by use of a
WLRA. The results derived from this numerical analysis
were summarised in Table 2.
After fitting all the rheometric data set, it was clearly
observed that RSM provides a much better description
of the non-Newtonian behaviour in most of the pastesamples, at shear rates ranging from 0 to 2000 s�1 (Fig.
2a–d: dotted line curves), except for the sample CMS-2,
where the fitting was lost at a shear rate value of 500 s�1
(Fig. 2b). Even though, the fit goodness of the RSM was
generally good at shear rates <2000 s�1, some problems
were found at shear rates higher than 2000 s�1 (e.g., Fig.
2b–d).
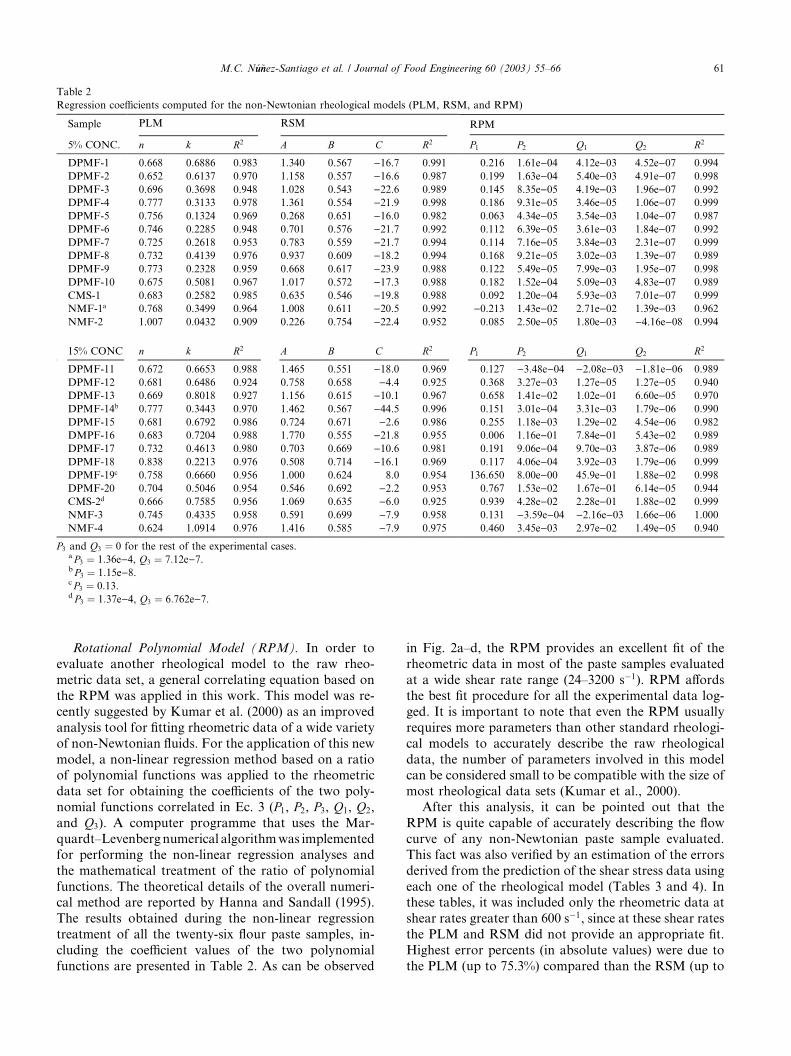
Table 2
Regression coefficients computed for the non-Newtonian rheological models (PLM, RSM, and RPM)
Sample PLM RSM RPM
5% CONC. n k R2 A B C R2 P1 P2 Q1 Q2 R2
DPMF-1 0.668 0.6886 0.983 1.340 0.567 )16.7 0.991 0.216 1.61e)04 4.12e)03 4.52e)07 0.994
DPMF-2 0.652 0.6137 0.970 1.158 0.557 )16.6 0.987 0.199 1.63e)04 5.40e)03 4.91e)07 0.998
DPMF-3 0.696 0.3698 0.948 1.028 0.543 )22.6 0.989 0.145 8.35e)05 4.19e)03 1.96e)07 0.992
DPMF-4 0.777 0.3133 0.978 1.361 0.554 )21.9 0.998 0.186 9.31e)05 3.46e)05 1.06e)07 0.999
DPMF-5 0.756 0.1324 0.969 0.268 0.651 )16.0 0.982 0.063 4.34e)05 3.54e)03 1.04e)07 0.987
DPMF-6 0.746 0.2285 0.948 0.701 0.576 )21.7 0.992 0.112 6.39e)05 3.61e)03 1.84e)07 0.992
DPMF-7 0.725 0.2618 0.953 0.783 0.559 )21.7 0.994 0.114 7.16e)05 3.84e)03 2.31e)07 0.999
DPMF-8 0.732 0.4139 0.976 0.937 0.609 )18.2 0.994 0.168 9.21e)05 3.02e)03 1.39e)07 0.989
DPMF-9 0.773 0.2328 0.959 0.668 0.617 )23.9 0.988 0.122 5.49e)05 7.99e)03 1.95e)07 0.998
DPMF-10 0.675 0.5081 0.967 1.017 0.572 )17.3 0.988 0.182 1.52e)04 5.09e)03 4.83e)07 0.989
CMS-1 0.683 0.2582 0.985 0.635 0.546 )19.8 0.988 0.092 1.20e)04 5.93e)03 7.01e)07 0.999
NMF-1a 0.768 0.3499 0.964 1.008 0.611 )20.5 0.992 )0.213 1.43e)02 2.71e)02 1.39e)03 0.962
NMF-2 1.007 0.0432 0.909 0.226 0.754 )22.4 0.952 0.085 2.50e)05 1.80e)03 )4.16e)08 0.994
15% CONC n k R2 A B C R2 P1 P2 Q1 Q2 R2
DPMF-11 0.672 0.6653 0.988 1.465 0.551 )18.0 0.969 0.127 )3.48e)04 )2.08e)03 )1.81e)06 0.989
DPMF-12 0.681 0.6486 0.924 0.758 0.658 )4.4 0.925 0.368 3.27e)03 1.27e)05 1.27e)05 0.940
DPMF-13 0.669 0.8018 0.927 1.156 0.615 )10.1 0.967 0.658 1.41e)02 1.02e)01 6.60e)05 0.970
DPMF-14b 0.777 0.3443 0.970 1.462 0.567 )44.5 0.996 0.151 3.01e)04 3.31e)03 1.79e)06 0.990
DPMF-15 0.681 0.6792 0.986 0.724 0.671 )2.6 0.986 0.255 1.18e)03 1.29e)02 4.54e)06 0.982
DMPF-16 0.683 0.7204 0.988 1.770 0.555 )21.8 0.955 0.006 1.16e)01 7.84e)01 5.43e)02 0.989
DPMF-17 0.732 0.4613 0.980 0.703 0.669 )10.6 0.981 0.191 9.06e)04 9.70e)03 3.87e)06 0.989
DPMF-18 0.838 0.2213 0.976 0.508 0.714 )16.1 0.969 0.117 4.06e)04 3.92e)03 1.79e)06 0.999
DPMF-19c 0.758 0.6660 0.956 1.000 0.624 8.0 0.954 136.650 8.00e)00 45.9e)01 1.88e)02 0.998
DPMF-20 0.704 0.5046 0.954 0.546 0.692 )2.2 0.953 0.767 1.53e)02 1.67e)01 6.14e)05 0.944
CMS-2d 0.666 0.7585 0.956 1.069 0.635 )6.0 0.925 0.939 4.28e)02 2.28e)01 1.88e)02 0.999
NMF-3 0.745 0.4335 0.958 0.591 0.699 )7.9 0.958 0.131 )3.59e)04 )2.16e)03 1.66e)06 1.000
NMF-4 0.624 1.0914 0.976 1.416 0.585 )7.9 0.975 0.460 3.45e)03 2.97e)02 1.49e)05 0.940
P3 and Q3 ¼ 0 for the rest of the experimental cases.a P3 ¼ 1:36e)4, Q3 ¼ 7:12e)7.b P3 ¼ 1:15e)8.c P3 ¼ 0:13.d P3 ¼ 1:37e)4, Q3 ¼ 6:762e)7.
M.C. N�uu~nnez-Santiago et al. / Journal of Food Engineering 60 (2003) 55–66 61
Rotational Polynomial Model (RPM). In order to
evaluate another rheological model to the raw rheo-
metric data set, a general correlating equation based on
the RPM was applied in this work. This model was re-
cently suggested by Kumar et al. (2000) as an improved
analysis tool for fitting rheometric data of a wide variety
of non-Newtonian fluids. For the application of this new
model, a non-linear regression method based on a ratioof polynomial functions was applied to the rheometric
data set for obtaining the coefficients of the two poly-
nomial functions correlated in Ec. 3 (P1, P2, P3, Q1, Q2,
and Q3). A computer programme that uses the Mar-
quardt–Levenbergnumerical algorithmwas implemented
for performing the non-linear regression analyses and
the mathematical treatment of the ratio of polynomial
functions. The theoretical details of the overall numeri-cal method are reported by Hanna and Sandall (1995).
The results obtained during the non-linear regression
treatment of all the twenty-six flour paste samples, in-
cluding the coefficient values of the two polynomial
functions are presented in Table 2. As can be observed
in Fig. 2a–d, the RPM provides an excellent fit of the
rheometric data in most of the paste samples evaluated
at a wide shear rate range (24–3200 s�1). RPM affords
the best fit procedure for all the experimental data log-
ged. It is important to note that even the RPM usually
requires more parameters than other standard rheologi-
cal models to accurately describe the raw rheological
data, the number of parameters involved in this modelcan be considered small to be compatible with the size of
most rheological data sets (Kumar et al., 2000).
After this analysis, it can be pointed out that the
RPM is quite capable of accurately describing the flow
curve of any non-Newtonian paste sample evaluated.
This fact was also verified by an estimation of the errors
derived from the prediction of the shear stress data using
each one of the rheological model (Tables 3 and 4). Inthese tables, it was included only the rheometric data at
shear rates greater than 600 s�1, since at these shear rates
the PLM and RSM did not provide an appropriate fit.
Highest error percents (in absolute values) were due to
the PLM (up to 75.3%) compared than the RSM (up to
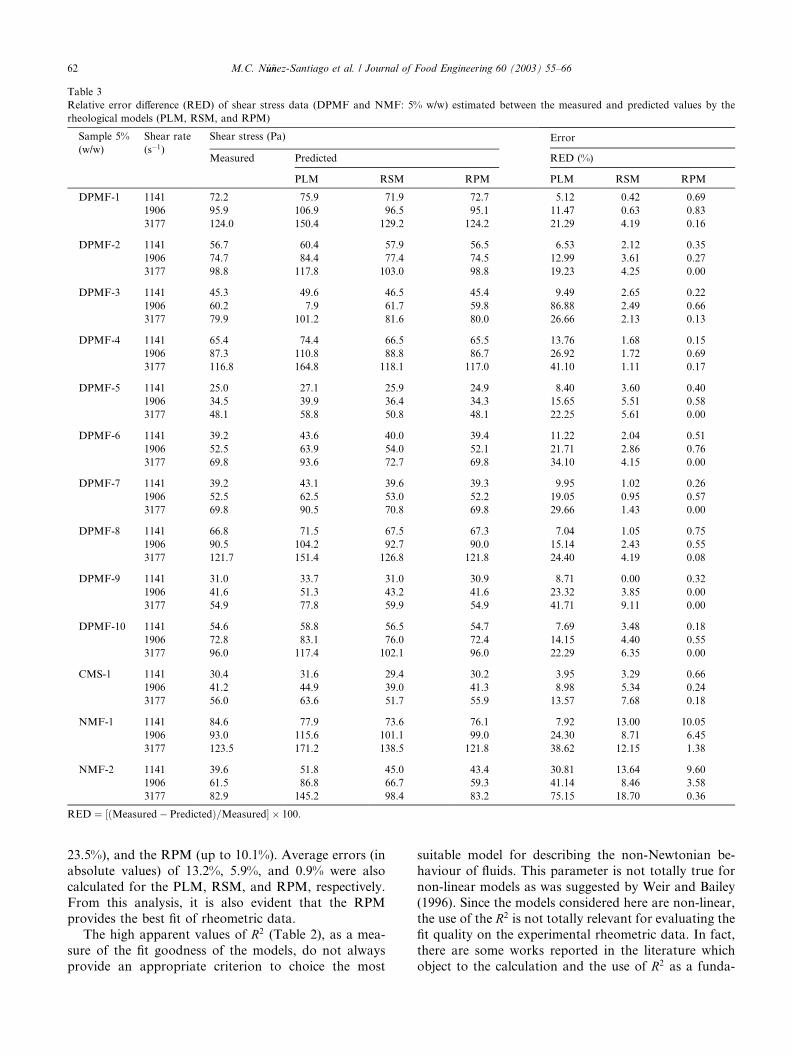
Table 3
Relative error difference (RED) of shear stress data (DPMF and NMF: 5% w/w) estimated between the measured and predicted values by the
rheological models (PLM, RSM, and RPM)
Sample 5%
(w/w)
Shear rate
(s�1)
Shear stress (Pa) Error
Measured Predicted RED (%)
PLM RSM RPM PLM RSM RPM
DPMF-1 1141 72.2 75.9 71.9 72.7 5.12 0.42 0.69
1906 95.9 106.9 96.5 95.1 11.47 0.63 0.83
3177 124.0 150.4 129.2 124.2 21.29 4.19 0.16
DPMF-2 1141 56.7 60.4 57.9 56.5 6.53 2.12 0.35
1906 74.7 84.4 77.4 74.5 12.99 3.61 0.27
3177 98.8 117.8 103.0 98.8 19.23 4.25 0.00
DPMF-3 1141 45.3 49.6 46.5 45.4 9.49 2.65 0.22
1906 60.2 7.9 61.7 59.8 86.88 2.49 0.66
3177 79.9 101.2 81.6 80.0 26.66 2.13 0.13
DPMF-4 1141 65.4 74.4 66.5 65.5 13.76 1.68 0.15
1906 87.3 110.8 88.8 86.7 26.92 1.72 0.69
3177 116.8 164.8 118.1 117.0 41.10 1.11 0.17
DPMF-5 1141 25.0 27.1 25.9 24.9 8.40 3.60 0.40
1906 34.5 39.9 36.4 34.3 15.65 5.51 0.58
3177 48.1 58.8 50.8 48.1 22.25 5.61 0.00
DPMF-6 1141 39.2 43.6 40.0 39.4 11.22 2.04 0.51
1906 52.5 63.9 54.0 52.1 21.71 2.86 0.76
3177 69.8 93.6 72.7 69.8 34.10 4.15 0.00
DPMF-7 1141 39.2 43.1 39.6 39.3 9.95 1.02 0.26
1906 52.5 62.5 53.0 52.2 19.05 0.95 0.57
3177 69.8 90.5 70.8 69.8 29.66 1.43 0.00
DPMF-8 1141 66.8 71.5 67.5 67.3 7.04 1.05 0.75
1906 90.5 104.2 92.7 90.0 15.14 2.43 0.55
3177 121.7 151.4 126.8 121.8 24.40 4.19 0.08
DPMF-9 1141 31.0 33.7 31.0 30.9 8.71 0.00 0.32
1906 41.6 51.3 43.2 41.6 23.32 3.85 0.00
3177 54.9 77.8 59.9 54.9 41.71 9.11 0.00
DPMF-10 1141 54.6 58.8 56.5 54.7 7.69 3.48 0.18
1906 72.8 83.1 76.0 72.4 14.15 4.40 0.55
3177 96.0 117.4 102.1 96.0 22.29 6.35 0.00
CMS-1 1141 30.4 31.6 29.4 30.2 3.95 3.29 0.66
1906 41.2 44.9 39.0 41.3 8.98 5.34 0.24
3177 56.0 63.6 51.7 55.9 13.57 7.68 0.18
NMF-1 1141 84.6 77.9 73.6 76.1 7.92 13.00 10.05
1906 93.0 115.6 101.1 99.0 24.30 8.71 6.45
3177 123.5 171.2 138.5 121.8 38.62 12.15 1.38
NMF-2 1141 39.6 51.8 45.0 43.4 30.81 13.64 9.60
1906 61.5 86.8 66.7 59.3 41.14 8.46 3.58
3177 82.9 145.2 98.4 83.2 75.15 18.70 0.36
RED ¼ ½ðMeasured� PredictedÞ=Measured � 100.
62 M.C. N�uu~nnez-Santiago et al. / Journal of Food Engineering 60 (2003) 55–66
23.5%), and the RPM (up to 10.1%). Average errors (in
absolute values) of 13.2%, 5.9%, and 0.9% were also
calculated for the PLM, RSM, and RPM, respectively.
From this analysis, it is also evident that the RPM
provides the best fit of rheometric data.
The high apparent values of R2 (Table 2), as a mea-sure of the fit goodness of the models, do not always
provide an appropriate criterion to choice the most
suitable model for describing the non-Newtonian be-
haviour of fluids. This parameter is not totally true for
non-linear models as was suggested by Weir and Bailey
(1996). Since the models considered here are non-linear,
the use of the R2 is not totally relevant for evaluating thefit quality on the experimental rheometric data. In fact,
there are some works reported in the literature which
object to the calculation and the use of R2 as a funda-
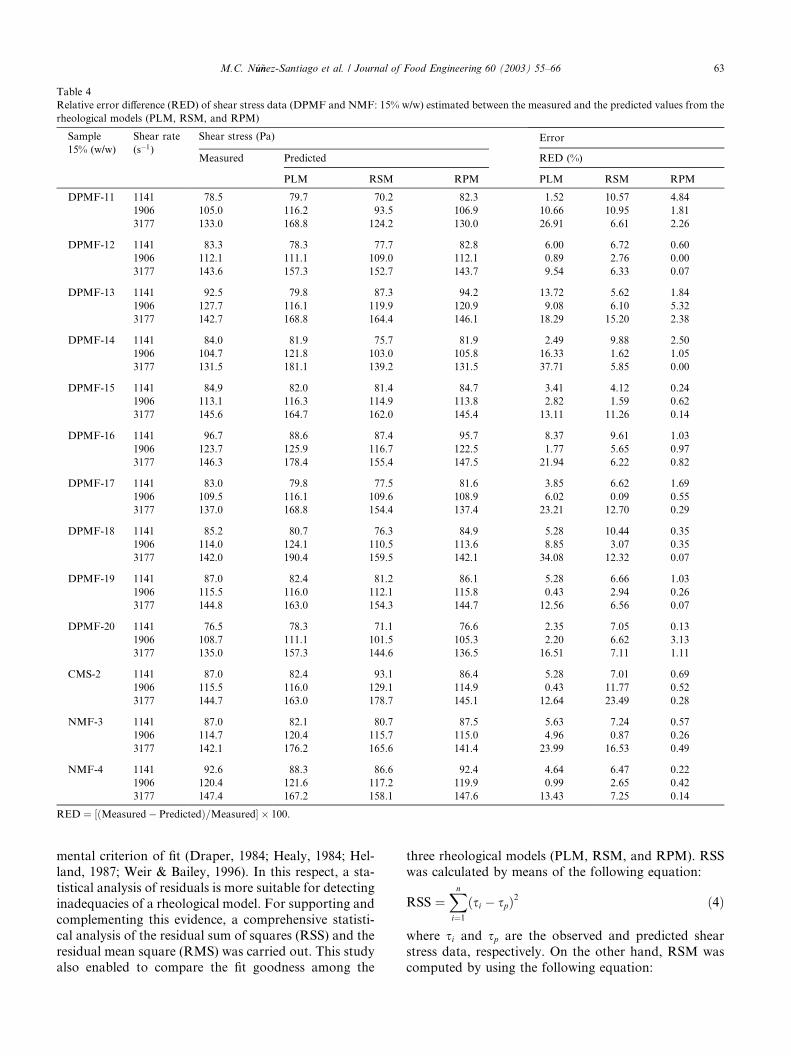
Table 4
Relative error difference (RED) of shear stress data (DPMF and NMF: 15% w/w) estimated between the measured and the predicted values from the
rheological models (PLM, RSM, and RPM)
Sample
15% (w/w)
Shear rate
(s�1)
Shear stress (Pa) Error
Measured Predicted RED (%)
PLM RSM RPM PLM RSM RPM
DPMF-11 1141 78.5 79.7 70.2 82.3 1.52 10.57 4.84
1906 105.0 116.2 93.5 106.9 10.66 10.95 1.81
3177 133.0 168.8 124.2 130.0 26.91 6.61 2.26
DPMF-12 1141 83.3 78.3 77.7 82.8 6.00 6.72 0.60
1906 112.1 111.1 109.0 112.1 0.89 2.76 0.00
3177 143.6 157.3 152.7 143.7 9.54 6.33 0.07
DPMF-13 1141 92.5 79.8 87.3 94.2 13.72 5.62 1.84
1906 127.7 116.1 119.9 120.9 9.08 6.10 5.32
3177 142.7 168.8 164.4 146.1 18.29 15.20 2.38
DPMF-14 1141 84.0 81.9 75.7 81.9 2.49 9.88 2.50
1906 104.7 121.8 103.0 105.8 16.33 1.62 1.05
3177 131.5 181.1 139.2 131.5 37.71 5.85 0.00
DPMF-15 1141 84.9 82.0 81.4 84.7 3.41 4.12 0.24
1906 113.1 116.3 114.9 113.8 2.82 1.59 0.62
3177 145.6 164.7 162.0 145.4 13.11 11.26 0.14
DPMF-16 1141 96.7 88.6 87.4 95.7 8.37 9.61 1.03
1906 123.7 125.9 116.7 122.5 1.77 5.65 0.97
3177 146.3 178.4 155.4 147.5 21.94 6.22 0.82
DPMF-17 1141 83.0 79.8 77.5 81.6 3.85 6.62 1.69
1906 109.5 116.1 109.6 108.9 6.02 0.09 0.55
3177 137.0 168.8 154.4 137.4 23.21 12.70 0.29
DPMF-18 1141 85.2 80.7 76.3 84.9 5.28 10.44 0.35
1906 114.0 124.1 110.5 113.6 8.85 3.07 0.35
3177 142.0 190.4 159.5 142.1 34.08 12.32 0.07
DPMF-19 1141 87.0 82.4 81.2 86.1 5.28 6.66 1.03
1906 115.5 116.0 112.1 115.8 0.43 2.94 0.26
3177 144.8 163.0 154.3 144.7 12.56 6.56 0.07
DPMF-20 1141 76.5 78.3 71.1 76.6 2.35 7.05 0.13
1906 108.7 111.1 101.5 105.3 2.20 6.62 3.13
3177 135.0 157.3 144.6 136.5 16.51 7.11 1.11
CMS-2 1141 87.0 82.4 93.1 86.4 5.28 7.01 0.69
1906 115.5 116.0 129.1 114.9 0.43 11.77 0.52
3177 144.7 163.0 178.7 145.1 12.64 23.49 0.28
NMF-3 1141 87.0 82.1 80.7 87.5 5.63 7.24 0.57
1906 114.7 120.4 115.7 115.0 4.96 0.87 0.26
3177 142.1 176.2 165.6 141.4 23.99 16.53 0.49
NMF-4 1141 92.6 88.3 86.6 92.4 4.64 6.47 0.22
1906 120.4 121.6 117.2 119.9 0.99 2.65 0.42
3177 147.4 167.2 158.1 147.6 13.43 7.25 0.14
RED ¼ ½ðMeasured� PredictedÞ=Measured � 100.
M.C. N�uu~nnez-Santiago et al. / Journal of Food Engineering 60 (2003) 55–66 63
mental criterion of fit (Draper, 1984; Healy, 1984; Hel-
land, 1987; Weir & Bailey, 1996). In this respect, a sta-
tistical analysis of residuals is more suitable for detecting
inadequacies of a rheological model. For supporting and
complementing this evidence, a comprehensive statisti-
cal analysis of the residual sum of squares (RSS) and the
residual mean square (RMS) was carried out. This study
also enabled to compare the fit goodness among the
three rheological models (PLM, RSM, and RPM). RSS
was calculated by means of the following equation:
RSS ¼Xn
i¼1ðsi � spÞ2 ð4Þ
where si and sp are the observed and predicted shear
stress data, respectively. On the other hand, RSM was
computed by using the following equation:
Non-Newtonian rheological models
PLM RSM RPM
Res
idua
lmea
nsq
uare
(RM
S)
0
50
100
150
200
250
Confidence level (95 %)
outliers
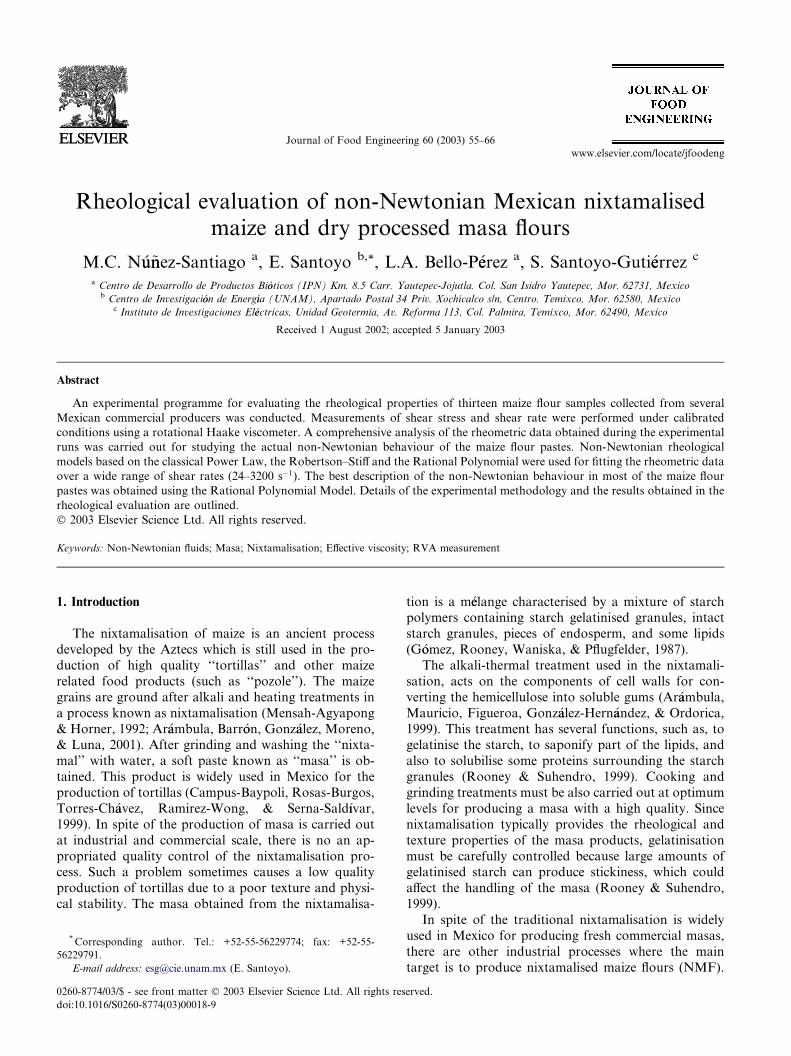
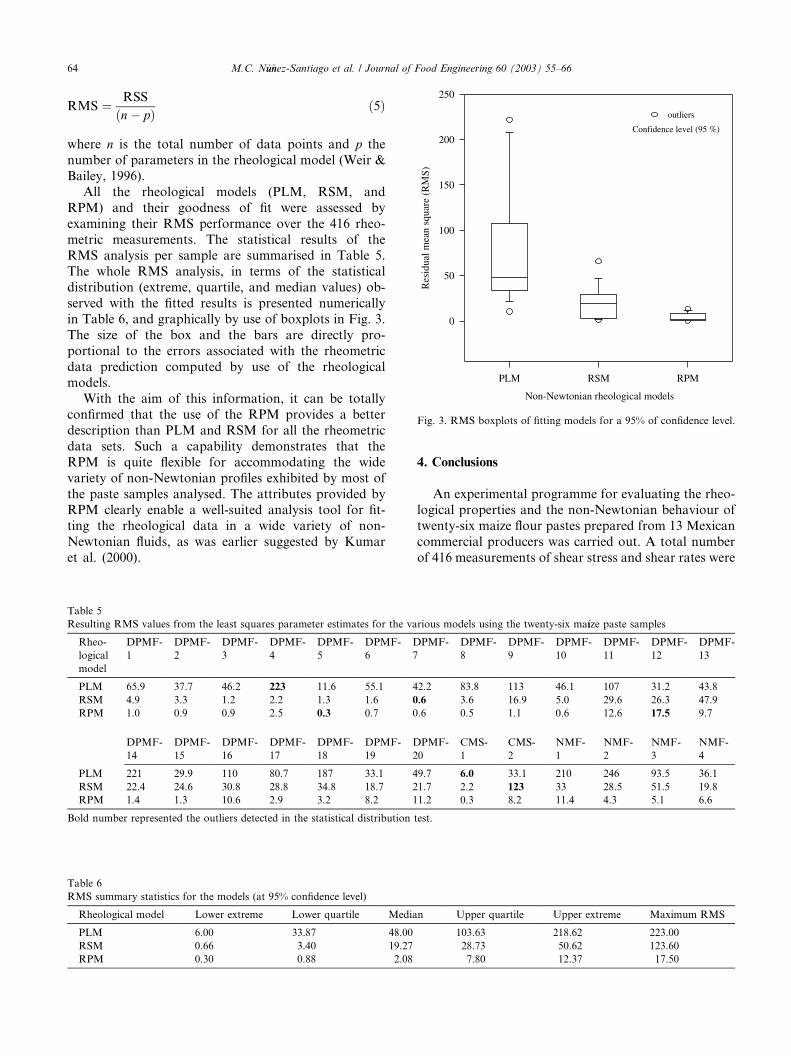
Fig. 3. RMS boxplots of fitting models for a 95% of confidence level.
64 M.C. N�uu~nnez-Santiago et al. / Journal of Food Engineering 60 (2003) 55–66
RMS ¼ RSS
ðn� pÞ ð5Þ
where n is the total number of data points and p thenumber of parameters in the rheological model (Weir &
Bailey, 1996).
All the rheological models (PLM, RSM, and
RPM) and their goodness of fit were assessed by
examining their RMS performance over the 416 rheo-
metric measurements. The statistical results of theRMS analysis per sample are summarised in Table 5.
The whole RMS analysis, in terms of the statistical
distribution (extreme, quartile, and median values) ob-
served with the fitted results is presented numerically
in Table 6, and graphically by use of boxplots in Fig. 3.
The size of the box and the bars are directly pro-
portional to the errors associated with the rheometric
data prediction computed by use of the rheologicalmodels.
With the aim of this information, it can be totally
confirmed that the use of the RPM provides a better
description than PLM and RSM for all the rheometric
data sets. Such a capability demonstrates that the
RPM is quite flexible for accommodating the wide
variety of non-Newtonian profiles exhibited by most of
the paste samples analysed. The attributes provided byRPM clearly enable a well-suited analysis tool for fit-
ting the rheological data in a wide variety of non-
Newtonian fluids, as was earlier suggested by Kumar
et al. (2000).
Table 5
Resulting RMS values from the least squares parameter estimates for the va
Rheo-
logical
model
DPMF-
1
DPMF-
2
DPMF-
3
DPMF-
4
DPMF-
5
DPMF-
6
D
7
PLM 65.9 37.7 46.2 223 11.6 55.1 4
RSM 4.9 3.3 1.2 2.2 1.3 1.6 0
RPM 1.0 0.9 0.9 2.5 0.3 0.7 0
DPMF-
14
DPMF-
15
DPMF-
16
DPMF-
17
DPMF-
18
DPMF-
19
D
2
PLM 221 29.9 110 80.7 187 33.1 4
RSM 22.4 24.6 30.8 28.8 34.8 18.7 2
RPM 1.4 1.3 10.6 2.9 3.2 8.2 1
Bold number represented the outliers detected in the statistical distribution
Table 6
RMS summary statistics for the models (at 95% confidence level)
Rheological model Lower extreme Lower quartile Media
PLM 6.00 33.87 48.00
RSM 0.66 3.40 19.27
RPM 0.30 0.88 2.08
4. Conclusions
An experimental programme for evaluating the rheo-
logical properties and the non-Newtonian behaviour of
twenty-six maize flour pastes prepared from 13 Mexican
commercial producers was carried out. A total number
of 416 measurements of shear stress and shear rates were
rious models using the twenty-six ma�ııze paste samples
PMF- DPMF-
8
DPMF-
9
DPMF-
10
DPMF-
11
DPMF-
12
DPMF-
13
2.2 83.8 113 46.1 107 31.2 43.8
.6 3.6 16.9 5.0 29.6 26.3 47.9
.6 0.5 1.1 0.6 12.6 17.5 9.7
PMF-
0
CMS-
1
CMS-
2
NMF-
1
NMF-
2
NMF-
3
NMF-
4
9.7 6.0 33.1 210 246 93.5 36.1
1.7 2.2 123 33 28.5 51.5 19.8
1.2 0.3 8.2 11.4 4.3 5.1 6.6
test.
n Upper quartile Upper extreme Maximum RMS
103.63 218.62 223.00
28.73 50.62 123.60
7.80 12.37 17.50
M.C. N�uu~nnez-Santiago et al. / Journal of Food Engineering 60 (2003) 55–66 65
used for evaluating the non-Newtonian behaviour ofthese samples.
The classical Power law (PLM), the Robertson–Stiff
(RSM) and the rational polynomial (RPM) models have
been used for fitting the rheometric data over a wide
range of shear rates. From the experimental data and a
comprehensive statistical methodology, it has been
clearly demonstrated that there are far more appropriate
rheological models (RSM and RPM) to be consideredthan the classical PLM. RSM provided a more satis-
factory fit of the rheometric data at shear rates ranging
from 0 to 2000 s�1. However, RPM was consistently
more capable of providing excellent fluid characterisa-
tion over a wide range of shear rates examined in this
experimental work (24–3200 s�1). Considering all these
results, it can be concluded that the RPM can be con-
sidered as a reliable analysis tool for studying thenon-Newtonian behaviour of fluids, also in the food
industry.
Research is underway for extending the present sta-
tistical methodology to the evaluation of a wide number
of the rheological models available in the literature.
Acknowledgements
Financial support from the Instituto Polit�eecnicoNacional, M�eexico (Project CGPI-200098) are gratefullyacknowledged. The second author expresses additional
thanks to the Master�s of Engineering programme atUAEM-Mor due to the opportunity to teach an applied
statistics course, which motivated to write this paper
together with the M.Sc student (first author) and the
other authors.
References
Almeida-Dom�ıınguez, H. D., Cepeda, M., & Rooney, L. (1996).
Properties of commercial nixtamalized corn flour. Cereal Foods
World, 41, 624–630.
Ar�aambula, V. G., Barr�oon, A. L., Gonz�aalez, H. J., Moreno, M. E., &
Luna, B. G. (2001). Efecto del tiempo de cocimiento y reposo del
grano de ma�ıız (Zea mayz L.) nixtamalizado, sobre las car�aacter�ıısti-cas fisicoqu�ıımicas, reol�oogicas, estructurales y texturales del grano,
masa y tortillas de ma�ıız. Archivos Latinoamericanos de Nutrici�oon,
51, 187–194.
Ar�aambula, V. G., Mauricio, S. R. A., Figueroa, C. J. D., Gonz�aalez-Hern�aandez, J., & Ordorica, F. C. A. (1999). Corn masa and
tortillas from extruded instant corn flour containing hydrocolloids
and lime. Engineering Processing, 64, 120–124.
Bevington, P. R. (1969). Data reduction and error analysis for physical
sciences. New York, USA: McGraw-Hill.
Campus-Baypoli, O. N., Rosas-Burgos, E. C., Torres-Ch�aavez, P. I.,
Ramirez-Wong, B., & Serna-Sald�ııvar, S. O. (1999). Physicoche-mical changes of starch during maize tortilla production. Starch/
Starke, 51, 173–177.
Chamberlain, E. K., & Rao, M. A. (1999). Rheological properties of
acid converted waxy maize starches in water and 90% DMSO/10%
water. Carbohydrated Polymers, 40, 251–260.
Doublier, J. L. (1987). A rheological comparison of wheat, maize, faba
bean and smooth pea starches. Journal of Cereal Science, 5, 247–
262.
Draper, N. R. (1984). The Box–Wetz criterion versus R2. Journal of
Royal Statistical Society of America, 147(4), 100–103.
Flores-Far�ııas, R., Mart�ıınez-Bustos, F., Salinas-Moreno, Y., Chang,
Y. K., Gonz�aalez-Hern�aandez, J., & R�ııos, E. (2000). Physicochemical
and rheological characteristics of commercial nixtamalised Mexi-
can maize flours for tortillas. Journal of the Science of Food and
Agriculture, 80, 657–664.
G�oomez, M. H., Rooney, L. W., Waniska, R. D., & Pflugfelder, R. L.
(1987). Dry corn masa flours for tortilla and snack food produc-
tion. Cereal Foods World, 32, 372–377.
Grami, B. (2000). Approved methods of the American Association of
Cereal Chemists. Sections: : 08-01, 46-13, and 30-25, 10th edition.
American Association of Cereal Chemists, Minneapolis, USA.
Hanna, O., & Sandall, O. (1995). Computational Methods in Chemical
Engineering. Upper Saddle River, NJ, pp. 185–196.
Healy, M. J. R. (1984). The use of R2 as a measure of goodness of fit.Journal of Royal Statistical Society of America, 147(4), 608–
609.
Helland, I. S. (1987). On the interpretation and use of R2 in regressionanalysis. Biometrics, 43(1), 61–69.
Holland, F. A. (1964). Another look at non-Newtonian flow. Chemical
Engineering, August, 17, 4.
Holland, F. A., & Bragg, R. (1995). Fluid flow for chemical engineers.
London, UK, p. 358.
Holdsworth, S. D. (1993). Rheological models used for the prediction
of the flow properties of food products. Transaction of the
Institution of Chemical Engineering, 71, 139–179.
Kumar, A., Saboo, S., Sheth, S., Pilehvari, A., & Serth, R. (2000).
Correlation of rheometric data and hydraulic calculations using
rational polynomials. Chemical Engineering Communication, 183,
99–117.
Lauzon, R. V., & Reid, K. I. G. (1979). New rheological model offers
field alternative. The Oil and Gas Journal, 5, 51–57.
Makosco, Ch. W. (1994). Rheology: principles, measurements, and
applications. USA: Wiley-VCH, pp. 83–92.
Mart�ıınez-Bustos, F., Garc�ııa, M. N., Chang, Y. K., S�aanchez-Sinencio,
F., & Figueroa, C. J. C. (2000). Characteristics of nixtamalised
maize flours produced with the use of microwave heating produced
with the use of microwave heating during alkaline cooking. Journal
of Science Food Agricultural, 80, 651–656.
Mensah-Agyapong, J., & Horner, W. F. (1992). Nixtamalisation of
Maize (Zea mays. L) using a single screw cook-extrusion process on
lime-treated grits. Journal of Science Food Agriculture, 60, 509–514.
Muller, H. G. (1973). An introduction to food rheology. London, UK:
Heinemann, pp. 36–55.
Rao, M. A., & Tattiyakul, J. (1999). Granule size and rheological
behavior of heated tapioca starch dispersions. Carbohydrate
Polymers, 38, 123–132.
Robertson, R. E., & Stiff, H. A. (1976). An improved mathematical
model of relating shear stress to shear rate in drilling fluids and
cement slurries. Society of Petroleum Engineers Journal, 2, 31–37.
Rooney, L. W., & Suhendro, E. L. (1999). Perspectives on nixtamali-
zation (alkaline cooking) of maize for tortillas and snacks. Cereal
Foods World, 44, 466–470.
Santoyo, E. (1997). Transient numerical simulation of heat transfer
processes during drilling of geothermal well. Ph.D. Thesis.
University of Salford. UK., pp. 136–138.
Santoyo, E., Santoyo-Guti�eerrez, S., Garc�ııa, A., Espinosa, G., & Moya,
S. L. (2001). Rheological property measurement of drilling fluids
used in geothermal wells. Applied Thermal Engineering, 21, 283–
302.

66 M.C. N�uu~nnez-Santiago et al. / Journal of Food Engineering 60 (2003) 55–66
Sopade, P. A., & Kiaka, K. (2001). Rheology and microstructure of
sago starch from Papua New Guinea. Journal of Food Engineering,
50, 47–57.
Tecante, A., & Doublier, J. L. (1999). Steady flow and viscoelastic
behavior of cross-linked waxy corn starch-j-carrageenan pastes
and gels. Carbohydrate Polymers, 40, 221–231.
Tecante, A., & Doublier, J. L. (2002). Rheological investigation of the
interaction between amylose and carageenan. Carbohydrate Poly-
mers, 49, 177–183.
Thebaudin, J. Y., Lefebre, A. C., & Doublier, J. L. (1998). Rheology of
starch pastes of different origins: Applications to starch-based
Sauces. Food Science and Technology––Lebensmitted-Wisserschaft
& Technologie, 31(4), 354–360.
Thomas, D. J., & Atwell, W. A. (1999). Starches, pp. 19–22. American
Association of Cereal Chemists, Minneapolis, USA.
Weir, I. S., & Bailey, W. J. (1996). A statistical study of rheological
models for drilling fluids. Society of Petroleum Engineers Journal,
12, 473–486.