Characterization of Nopal cactus cladode flours regarding ...
27
Characterization of Nopal cactus cladode flours regarding dietary fiber and starch content, and their effects on postprandial glycemic regulation Zhuohuan Li 2021
-
Upload
khangminh22 -
Category
Documents
-
view
0 -
download
0
Transcript of Characterization of Nopal cactus cladode flours regarding ...
Characterization of Nopal cactus cladode flours regarding dietary fiber and starch content, and their
effects on postprandial glycemic regulation
Zhuohuan Li
2021
2
Department of Food Technology, Engineering and Nutrition Faculty of Engineering Lund University SE-221 85 Lund, Sweden
Master of science thesis, which, has been publicly defended on 17th, June, 2021 at 13:00 through online meeting, for the degree of Master of Science in Food Technology and Nutrition
Supervisors:
Dr. Anne Nilsson
Dr. Juscelino Tovar
Examiner:
Professor Margareta Nyman
3
Table of Contents
Abstract............................................................................................................................. 1
Introduction ...................................................................................................................... 2
Materials and Methods ..................................................................................................... 4
Materials ................................................................................................................................... 4
Preparation of the breads .......................................................................................................... 4
Determination of available starch content ................................................................................. 5
Determination of dietary fiber contents ..................................................................................... 6
Determination of the Hydrolysis Index using the chewing method ............................................. 6
Meal Study ................................................................................................................................ 7
Statistics .................................................................................................................................... 7
Result and Discussion ........................................................................................................ 9
Content of available starch in different breads ........................................................................... 9
Content of dietary fiber in different breads ................................................................................ 9
Hydrolysis Index ....................................................................................................................... 11
Meal study ................................................................................................................................ 14 Effects of nopal on postprandial glycemic and insulinemic responses ...................................................... 14 The influences on appetite variables ......................................................................................................... 16
Conclusion ....................................................................................................................... 19
Reference ........................................................................................................................ 20
Appendix ......................................................................................................................... 23
Acknowledgement ........................................................................................................... 24
1
Abstract Background: Previous study found that 2 batches of Nopal flour supplied by the same suppliers at different time was performing different results in in vitro studies and the quality of Nopal flour might thus be different. Besides, investigation on whether the soluble or the insoluble fraction of the Nopal flour suspensions contributed to the glycemic modulation was still necessary. Method: Composite wheat/nopal breads were made by including different batches of Nopal flour and soluble and insoluble fractions of the water suspension of one batch Nopal flour. The contents of available starch and dietary fiber were measured. The chewing/digestion method, an in vitro procedure mimicking intestinal hydrolysis and absorption of starch, was performed to calculate the hydrolysis index, which can be used to predict the actual glycemic index, for comparisons between batches and fractions with white bread as control. A pilot meal study with the participation of 7 healthy subjects was performed to investigate the postprandial glycemic and insulinemic modulation of different fractions and the Nopal flour breads. In the meantime, subjective appetite variables were also evaluated. Result: Breads made from 3 batches of Nopal flour showed different results in the in vitro experiment, although their dietary fiber contents were similar. Thus, there were differences among the 3 batches of Nopal flour and the contents of dietary fiber were unlikely the reason for the different results in the in vitro experiment. Breads made for comparison of soluble and insoluble fractions of Nopal flour had little influence on the starch hydrolysis rate or hydrolysis index of this in vitro experiment. Although no significant difference could be found between these two breads, it is still reasonable to believe that the bread made from the soluble fraction contained higher amount of soluble dietary fiber. The pilot meal study provided no statistical evidence to prove that the selected batch of Nopal flour had any effect on postprandial glycemic and insulinemic modulation, though differences on the averages could be found among their mean values of the glycemic and insulinemic peaks and sectional incremental area under curve (iAUC). Differences among 3 Nopal sample breads could hardly be found in the result of 3 appetite-related variables, fullness, hunger and desire to eat. This lack of statistical power could result from the limited number of subjects. Due to the little performance on these experiments, the conclusion on whether soluble or insoluble fraction contributes to the modulating effect on glycemic and insulinemic responses and appetite variables could not be drawn.
2
Introduction Opuntia ficus-indica, also known as Nopal cactus or prickly pear cactus, is a plant cultivated in tropical and subtropical areas such as Mexico, South America and South Africa [1]. It is not only used as a traditional herbal remedy helping wound healing, but also introduced to Mexican diet due to its antidiabetic effect [2-4]. In the past decades, numerous studies revealed the health beneficial potential of Nopal, especially cladodes of Nopal which contain high amount of dietary fiber, and thus a better understanding on Nopal cladodes has been given [5]. While Nopal cladodes reduce the severity of irritable bowel disease in short term by the abundant dietary fiber, considerable amounts of secondary metabolites like phenolic compounds impart in vitro and in vivo antioxidant effect to Nopal cladodes [6-8]. More importantly, in animal models Nopal cladodes can attenuate metabolic disorders like diabetes not only from the glycemic aspect but also through generating wider impacts on metabolic symptoms such as adiposity, intestinal inflammation, hepatic steatosis, oxidative stress and endotoxemia [9-11]. These effects showed the great potentials of Nopal as a natural ingredient in functional foods and the utilization of cladodes of Nopal will surely valorize the cultivation of this plant. However, the results of some Nopal studies have led to a more complicated situation. According to previous studies performed in our lab, a composite bread made from wheat flour and flour of Nopal cladodes (Nopal flour) showed a lower glycemic index (GI) than the white wheat bread reference (white bread, WB) [12, 13]. To further investigate whether the soluble or insoluble dietary fiber components of nopal flour contribute differentially to this effect, the soluble and insoluble fractions from a water suspension of Nopal flour were separated and their effect on glycemic and insulinemic responses were studied [14, 15]. Although the results indicated that the composite bread made from insoluble fraction, which should contain higher amount of insoluble dietary fiber, was main factor responsible for the modulation of postprandial blood glucose and insulin concentrations, the dietary fiber analysis showed that the separation was not successful due to the considerable amount of insoluble dietary fiber retained in the soluble fractions and vice versa [14, 15]. Besides, due to the different physical forms of the two fractions, the two sample breads had a great difference on their portion sizes, which affected the result of appetite variables. Therefore, it was necessary to develop a novel method to improve the efficiency in separating soluble and insoluble fractions and design better recipes that could be used for comparisons. When a better separation strategy was found, another question came along. The result of in vitro experiments using a new batch of Nopal flour indicated that none of the flour, soluble or insoluble fractions had effect on the in vitro activity of α-amylase. Moreover, the Nopal flour itself would not reduce the Hydrolysis Index (HI, an in vitro method to predict GI) of available starch when measured in a system that combines α-amylolysis and diffusion of the digestion products from a dialysis tube, with the intention to simulate digestion and absorption in the gastro-intestinal tract [16]. This result contradicted with the previous in vitro results showing that breads made form soluble and insoluble fractions of Nopal reduced the HI of white bread, which led to the suggestion that there might be important differences among different batches of Nopal [14].
3
In this study, the experiments were designed aiming to not only find out whether the batch difference of Nopal flour exists but also re-evaluate the glycemic modulating effect of soluble and insoluble fractions of Nopal separated by the optimized method. Moreover, the contents of dietary fiber and in vitro HI of breads made from 3 different batches of Nopal flour would be determined. These results might prove whether there was a difference in HI among breads made from the 3 batches of Nopal flour and whether their contents of dietary fiber play an important role giving different HI values. On the other hand, the effect on postprandial glycemic and insulinemic modulation was investigated using composite breads prepared with one selected batch of Nopal flour and its two fractions separated by the improved separation method. The results of these in vitro and in vivo experiments should reveal which fraction of Nopal flour contributes most to the postprandial glycemia-modulating effect. Meanwhile, appetite-related variables were evaluated through visual analogy questionnaires since the influences on satiety and prolonged fullness could also make of Nopal a product/ ingredient of economic potential.
4
Materials and Methods Materials 3 batches of Nopal (Opuntia ficus-indica) cladodes flour were available for the experiments. The earliest batch came in late 2018 and it was stored in (transparent) plastic bags. The newest batch that came in March 2020 was stored in brown paper bags. Both were supplied by Veralmex (Monterrey, Nuevo Leon State, Mexico). The second earliest batch stored in silver (plastic) bags came in late 2019 and it was supplied by Tierra de Colores (Melchor Ocampo, Mexico State, Mexico). Preparation of the breads In order to investigate the quality differences on modulating glycemic responses among the 3 batches of Nopal flour, 3 types of white bread based composite breads were made by substituting 25% of wheat flour (mass/mass) by Nopal flour from the 3 different batches in our lab. A typical white wheat bread was made as the reference bread. Chronologically, breads made from the earliest batch of Nopal flour were called N1 (breads made from Nopal flour came firstly), bread made from Nopal flour from the second batch was named N2, and breads made from the newest batch of Nopal flour was abbreviated as N3. The most abundant amount of Nopal flour batch was N3 and chosen for the investigation on its glycemic modulating effects of the soluble and insoluble fractions, since there was enough amount of sample for the planned meal study, and to any other possible study in the future. Using this batch, two additional breads were made; one white wheat bread supplemented with the insoluble fraction from N3 (named IB, Insoluble fraction Bread) (see below for the description of nopal flour fractions), and another white wheat bread supplemented with N3 and the soluble fraction extracted from N3 (named NSB, the Nopal flour with Soluble fraction Bread). For the separation of soluble and insoluble fractions, 134 g Nopal flour were divided into 4 portions with the weight at 33.5 g for each portion. 4.5 times mass of water was added into each portion and the portions were blended by a straight-line stirrer at 110 rpm for 10 min (STIR 20, InterMed, Denmark). Afterwards, these 4 portions were centrifugated for 30 min at 4200 rpm (TX1000 rotor @Sorvall ST 40R, Thermo Fisher, USA) and the liquid phases were vacuum-filtered and collected. The residues, which were in paste form, were blended and centrifugated under the same conditions once more. The total liquid phase collected after these two processes was called as the “soluble fraction” and the paste residues after these treatments were the “insoluble fraction”. The insoluble fraction contained not only separated Nopal-derived material but also adsorbed water. It was used to substitute for 134 g Nopal flour and certain amount of water in the bread recipe. During bread making, since the insoluble fraction consists of dry insoluble fraction as well as water, the 4 portions of insoluble fractions were gathered and weighed as x. The water added into the insoluble fraction bread (IB) was calculated as: 𝑤𝑎𝑡𝑒𝑟(𝑔) = (360𝑔(𝑤𝑎𝑡𝑒𝑟𝑖𝑛𝑡ℎ𝑒𝑟𝑒𝑐𝑖𝑝𝑒) + 134𝑔) − 𝑥(𝑔) (2.1) The NSB contained 134 g Nopal flour as well as soluble fraction substituting for water. During bread making, the soluble fraction was weighted as y and accordingly the water added into the NSB was calculated as:
5
𝑤𝑎𝑡𝑒𝑟(𝑔) = 360𝑔 − 𝑦(𝑔) (2.2) The breads were made in the Custom Loaf Bread Maker (Breville BBM800XL, U.S.A.) by the “Basic” protocol. Pastes of NSB and IB were kneaded manually before putting into the bread maker. The recipes of all these breads are shown in Table.1.
Table.1 Recipes of test breads
Test Bread Wheat flour (g) Water (g) Yeast (g) Salt (g) Sample
WB 530 360 4.6 4.6
NSB 396 360-y 4.6 4.6 134 g Nopal flour and y g soluble fraction
IB 396 494-x 4.6 4.6 x g insoluble fraction
N1 396 360 4.6 4.6 134 g Nopal flour
N2 396 360 4.6 4.6 134 g Nopal flour
N3 396 360 4.6 4.6 134 g Nopal flour
Same amounts of Nopal flour were used in different breads but they were from different batches. NSB and IB used the same batch of Nopal flour as N3, and soluble and insoluble fractions of each NSB and IB were separated from 4 portions containing, in total 134 g Nopal flour and 603 g water. WB: white bread, NSB: Breads made from Nopal flour (newest batch) with an extra portion of soluble fraction, IB: Breads made from insoluble fraction of Nopal flour (newest batch) suspensions, N3: Breads made from Nopal flour arrived in March 2020, N2: Breads made from Nopal flour arrived in late 2019 and N1: Breads made from Nopal flour arrived in late 2019. For the meal study, the bread mass equivalent to 25 g available starch was used as a portion size to serve to the subjects. Determination of available starch content The available starch contents in the breads was determined by the method introduced by Tovar et al. (1990) [17]. On the one hand, dry matter percentages of the fresh breads after drying in the oven at 105°C overnight was calculated (DS1). On the other hand, fresh breads were dried over-night in air at ambient conditions, and then the dry matter percentages of the air-dried bread samples were then calculated as DS2. For the determination of available starch, air-dried breads were used after milling and sieving under 0.8 mm and 500 mg of the milled samples were suspended in 10 mL sodium phosphate buffer. The solutions were then homogenized by magnetic stirring. 40 µL Termamyl was added into the solutions and the solutions were incubated in boiling water for 20 min with stirring every 5 minutes. After boiling, the solutions were diluted to 50 mL. 1 mL diluted solution, 1 mL 0.3 mol/L NaAc-buffer (14.08 g sodium acetate in 1 L, pH adjusted to 4.75 with acetate) as well as 50 µL amyloglucosidase were transferred into a tube which then were mixed and incubated at 60°C for 30 min with stirring every 5 min. Finally, the liquid in the tubes were diluted to 100 mL in
6
volumetric flasks. To determine the hydrolyzed glucose content, 1 mL liquid from the 100 mL-diluted solutions, 1 mL water and 4 mL GLOX (glucose oxidase, and possible peroxidase for generating the chromogen) -reagent (2.8 g in 50 mL water, G6125, Sigma-Aldrich, U.S.A.) were added into tubes. These tubes were mixed well and incubated at ambient temperature for 60 min. Afterwards, the tubes were centrifuged for 5 min at 3000 rpm and their absorbances at 450 nm were measured (SPECTROstar Nano, BMG Labtech, Germany). Glucose solutions at different concentrations (maximum 100 µg/mL) were used as the standard curve for quantification with the conversion factor as 0.9. Since the results (z’) from this experiment were for air-dried breads, the available starch contents in fresh breads (z) were calculated by the following equation:
𝑧(𝑔 𝑔⁄ ) = !!($/$)'()
× 𝐷𝑆1 (2.3) Determination of dietary fiber contents The soluble and insoluble dietary fiber contents were determined by the method introduced by Asp. (1983) [18]. Around 1 g air-dried and milled bread samples were suspended in 25 mL 0.1 N sodium phosphate buffer (12.1 g NaH2PO4·H20, 2.2 g Na2HPO4·2H20 in 1 L of water, adjust pH to 6.9) and mixed well by magnetic stirring. Afterward, 40 µL Termamyl was added into the solutions and the solutions were incubate for 25 min under boiling water. After incubation, 0.2 mol/L HCl was added into the solutions to adjust the pH to 1.5±0.1 for the following addition of 1 mL 100 mg/mL pepsin-suspension. Subsequently, the solutions were incubated at 40°C for 60 min in a shaking water bath (Speed:3, Tecator 1024 shaking water bath, FOSS, Denmark) and then neutralized to pH=6.8±0.1 with 1 mol/L NaOH. 1 mL pancreatin-suspension (50 mg/mL) was added into the neutralized solutions, and they were further incubated at 40°C for 60 min under shaking. After these enzymatic reactions, the pH of the solutions was adjusted to 4.5±0.1 which is the isoelectric point of most proteins. The insoluble dietary fiber of the solutions was collected by filtering the solutions in the fiber analysis system and the insoluble dietary fiber was filtered out on the weighted funnels containing about 500 mg Celite. While the filtrates of the solutions were collected into flasks, the residues in the funnels were washed twice with 10 mL water, 95% ethanol and 99.5% ethanol respectively. The filtrates in the flasks were diluted to 100 mL and then mixed with 400 mL warm 95% ethanol. The flasks were stood for 60 min for precipitation of soluble dietary fiber. Afterwards, the contents in the flasks were filtered with new funnels containing about 500 mg Celite and the filter cakes were washed twice with 10 mL 78% ethanol, 95% ethanol and 99.5% ethanol, respectively. The funnels were then dried overnight in an oven at 105°C and weighed. Each sample was run in triplicate and which, resulted in 3 funnels of insoluble dietary fiber and 3 funnels of soluble dietary fiber for each sample. One of the 3 funnels of each type of dietary fiber was burned in the muffle furnace at 550°C overnight and weighed to measure the ash content in the fiber residues, while the remaining two funnels were used to measure the protein content in the fiber residues. The dietary fiber contents were calculated by subtracting the average weight of the 3 residues with the ash content and protein content obtained. Determination of the Hydrolysis Index using the chewing method The determination of the Hydrolysis Index was based on the in vitro method developed by Granfeldt et al. (1992) with some modifications, and the purpose to predict glycemic index
7
(GI) [19]. For each run of this experiment, 4-5 healthy subjects were invited to chew bread samples (15 times), containing an equivalent amount of available starch (1 g). The residues as well as the liquid (amylase buffer (15.15 g KH2PO4, 19.8 g Na2HPO4 and 2 g NaCl in 5 L water, adjusted pH to 6.9±0.1)) used for 1 min mouth flushing, were collected into beakers containing 5 mL amylase buffer and 1 mL 50 mg/mL pepsin-suspensions acidified by 10 drops 2 mol/L HCl. Afterwards, subjects washed their mouths with 5 mL amylase buffer, and the saliva obtained after chewing 1 minute were also collected into the same beakers. The residues were then manually reduced to small pieces with a blunt blade and acidified with another 10 drops 2 mol/L HCl. The suspensions were incubated at 37°C for 30 min with stirring every 10 min. After incubation, the suspensions were neutralized with 2 mol/L NaOH to pH=6.9±0.1 and transferred to a syringe with 30 mL volume one by one. 1 mL α-amylase (110 U/mL) as well as amylase buffer were added until the syringe was filled. The suspension in the syringe was then transferred into a dialysis tube with the final length of 13 cm. This dialysis tube (width: 45 mm, molecular weight cut-off: 12-14 kDalton, Spectra/Por2, U.S.A.) was placed into a beaker containing 800 mL amylase buffer. 1 mL dialysate were collected at 30 min interval in the following 3 hours and mixed with 1 mL DNS (3,5-dinitrosalicylic acid) solution (10 g 2-hydroxyl-3,5-dinitrosalicylic acid, 300 g K-Na tartrate tetrahydrate and 16 g NaOH in 1000 mL water)). The mixtures were incubated in boiling water for 10 min and then cooled down in cool water for 10 min. Finally, the mixtures were diluted with 8 mL deionized water and their absorbances at 450 nm were measured. The calibration curve with maximal maltose concentration at 1 mg/mL was established in every run of this experiment and the conversion factor of maltose to starch is 0.95[17]. Meal Study White wheat bread (WB, reference), Nopal bread (N3), Nopal flour with soluble fraction bread (NSB) and Insoluble Nopal fraction bread (IB) were chosen as the 4 test products used in the meal study. The study has been approved by Etikprövningsmyndigheten (the Swedish Ethical Review Authority) in Uppsala (Dnr. 2019-00980). 9 subjects were recruited into the meal study. Due to the possible too large test portions, the size of the bread portions was decreased to correspond to 25 g available starch instead of 50 g normally used. Seven healthy subjects (age = 25±1.4 years old, female = 5, male = 2, BMI= 22.37±1.20 kg/m2, fasting glucose = 5.15±0.10 pmol/L) finished the 4 meals with at least 6 days washout period between each visit. Subjects were asked to finish the test products as well as a cup of water (250 mL) in 15 min. Blood samples were collected after sitting still for at least 10 min (0 min) and at 15, 30, 45, 60, 90, 120 min after their first bite of the test breads. The blood glucose levels were quantified by Glucose 201 + HemoCue calibrated with GlucoTrol-NG (p-equival 6.4±0.9, EuroTrol, Netherland) everyday, while the insulin levels were measured by the ELISA assay kit produced by Mercodia (Product number: 10-1113-10, Mercodia, Sweden) following the supplier instructions. At each time point, the appetite variables were also assessed by visual analog questionnaires evaluating three appetite-related variables: fullness, hunger and desire to eat. Statistics GraphPad Prism 8.2.0 was used for analysis and data visualization. Student’s t-test was used when comparing two groups and One way Analysis of Variance (ANOVA) was used for the analysis of significant differences among three or more groups. The general linear model
8
ANOVA analysis was performed on data in meal study for adjusting deviations from repeated measurements and the Andreas-Darling test was used for normal distribution test. In case of non-normally distributed data, Box-cox transformation was performed before ANOVA[20, 21]. The post-hoc analysis used Tukey (for groups with same number of samples) and Holm-Sidak (for groups with different number of samples) methods. For the comparisons of glycemia and insulinemia, the incremental area under curves (iAUCs) with fasting glucose levels at baseline were used for comparisons when there was no significant difference in the values at 0min of each bread. For the comparison of appetite-variables, the area under curves (AUCs) were calculated and used for comparison when there was no significant difference on the scales of each sample at 0min. P<0.05 indicates the existence of significant difference. Results of post-hoc analysis were presented alphabetically. Starting with the highest value marked “a”, the same letter indicates no significant differences among groups while the later letters indicate significant differences among groups. Data were expressed as mean±SD (standard deviation) except for the data in meal study part where data were expressed as mean±SEM (standard error of mean).
9
Result and Discussion Content of available starch in different breads The contents of available starch in different breads are shown in Table.2.
Table.2 Contents of available starch on test breads
Sample Available starch
contents of air-dry breads (g/100 g)
DS1 (g/g) DS2 (g/g)
Available starch
contents on dry matter
basis (g/100 g)
Available starch
contents of fresh breads
(g/100 g)
Size of the bread
portions with 25 g available
starch
WB 75.00±6.90 0.51±0.01 0.94±0.00 79.79±7.34a 41.23±3.79a 60.64
N1 52.89±0.17 0.54±0.00 0.93±0.00 56.87±0.18b 30.83±0.10b 81.10
N2 53.25±2.88 0.53±0.00 0.93±0.00 57.26±3.10b 30.35±1.64b 82.38
N3 54.00±2.78 0.53±0.01 0.93±0.00 58.07±2.99b 30.64±1.58b 81.58
NSB 48.55±1.02 0.55±0.00 0.91±0.00 53.35±1.13b 29.45±0.621c 84.88
IB 54.27±0.41 0.50±0.01 0.91±0.00 59.63±0.45b 30.04±0.23c 83.22
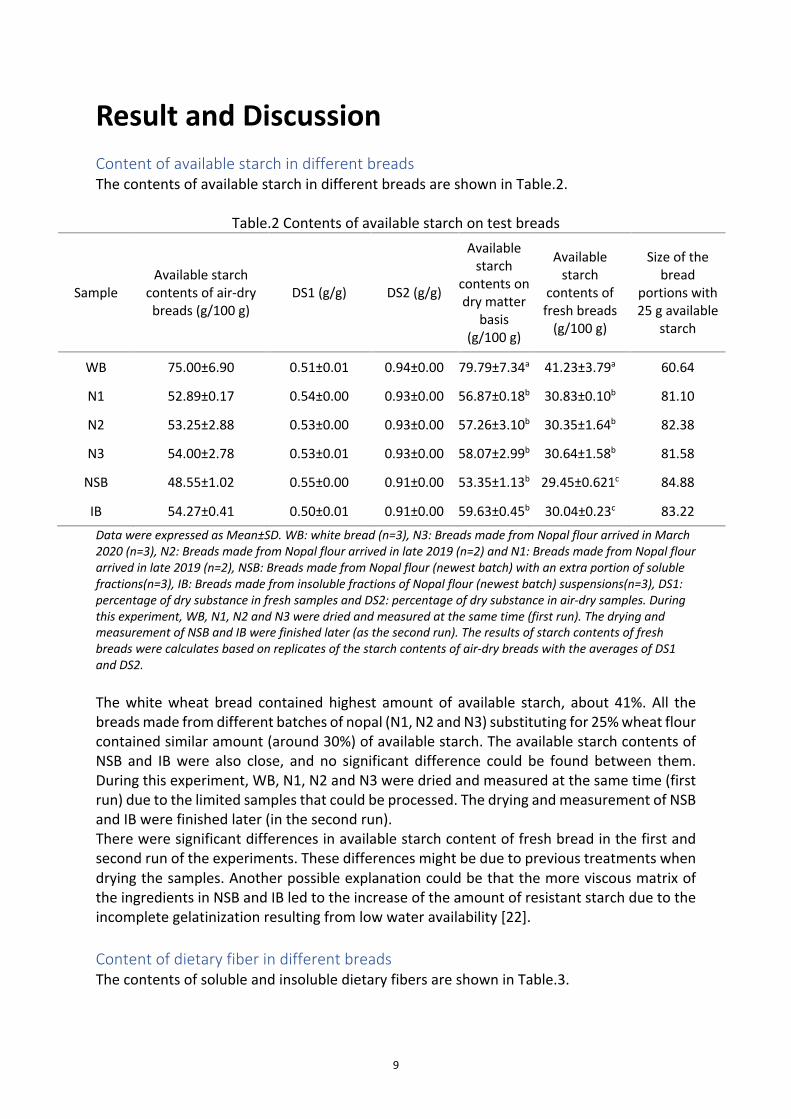
Data were expressed as Mean±SD. WB: white bread (n=3), N3: Breads made from Nopal flour arrived in March 2020 (n=3), N2: Breads made from Nopal flour arrived in late 2019 (n=2) and N1: Breads made from Nopal flour arrived in late 2019 (n=2), NSB: Breads made from Nopal flour (newest batch) with an extra portion of soluble fractions(n=3), IB: Breads made from insoluble fractions of Nopal flour (newest batch) suspensions(n=3), DS1: percentage of dry substance in fresh samples and DS2: percentage of dry substance in air-dry samples. During this experiment, WB, N1, N2 and N3 were dried and measured at the same time (first run). The drying and measurement of NSB and IB were finished later (as the second run). The results of starch contents of fresh breads were calculates based on replicates of the starch contents of air-dry breads with the averages of DS1 and DS2. The white wheat bread contained highest amount of available starch, about 41%. All the breads made from different batches of nopal (N1, N2 and N3) substituting for 25% wheat flour contained similar amount (around 30%) of available starch. The available starch contents of NSB and IB were also close, and no significant difference could be found between them. During this experiment, WB, N1, N2 and N3 were dried and measured at the same time (first run) due to the limited samples that could be processed. The drying and measurement of NSB and IB were finished later (in the second run). There were significant differences in available starch content of fresh bread in the first and second run of the experiments. These differences might be due to previous treatments when drying the samples. Another possible explanation could be that the more viscous matrix of the ingredients in NSB and IB led to the increase of the amount of resistant starch due to the incomplete gelatinization resulting from low water availability [22]. Content of dietary fiber in different breads The contents of soluble and insoluble dietary fibers are shown in Table.3.
10
Table.3 Contents of dietary fiber in different breads
Sample Soluble dietary
fiber (g/100 g of dry matter)
Insoluble dietary fiber
(g/100 g of dry matter)
Proportion of soluble dietary fiber to total
dietary fiber (%)
Soluble dietary fiber (g/ portion1)
Insoluble dietary fiber (g/ portion1)
WB 2.03±0.13b 3.53±0.17b 35.94±2.65a 0.63±0.04b 1.09±0.05c
NSB 4.90±0.28a 15.68±0.82a 23.81±0.88a 2.29±0.13a 7.32±0.38a
IB 3.56±0.72ab 15.51±1.20a 18.64±3.12ab 1.48±0.30a 6.45±0.50b
N3 3.45±1.84a 13.61±0.38a 19.74±9.03a 1.49±0.80a 5.88±0.17b
N1 4.81±0.15a 12.84±0.43a 27.54±0.07a
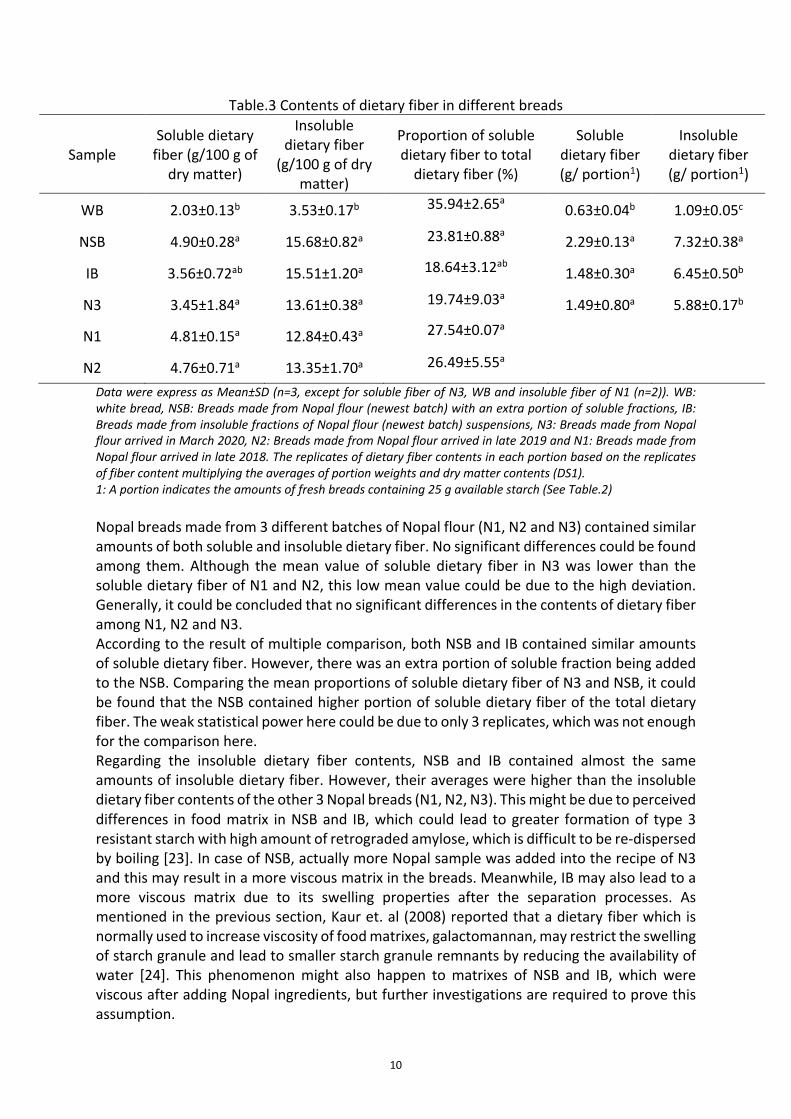
N2 4.76±0.71a 13.35±1.70a 26.49±5.55a Data were express as Mean±SD (n=3, except for soluble fiber of N3, WB and insoluble fiber of N1 (n=2)). WB: white bread, NSB: Breads made from Nopal flour (newest batch) with an extra portion of soluble fractions, IB: Breads made from insoluble fractions of Nopal flour (newest batch) suspensions, N3: Breads made from Nopal flour arrived in March 2020, N2: Breads made from Nopal flour arrived in late 2019 and N1: Breads made from Nopal flour arrived in late 2018. The replicates of dietary fiber contents in each portion based on the replicates of fiber content multiplying the averages of portion weights and dry matter contents (DS1). 1: A portion indicates the amounts of fresh breads containing 25 g available starch (See Table.2) Nopal breads made from 3 different batches of Nopal flour (N1, N2 and N3) contained similar amounts of both soluble and insoluble dietary fiber. No significant differences could be found among them. Although the mean value of soluble dietary fiber in N3 was lower than the soluble dietary fiber of N1 and N2, this low mean value could be due to the high deviation. Generally, it could be concluded that no significant differences in the contents of dietary fiber among N1, N2 and N3. According to the result of multiple comparison, both NSB and IB contained similar amounts of soluble dietary fiber. However, there was an extra portion of soluble fraction being added to the NSB. Comparing the mean proportions of soluble dietary fiber of N3 and NSB, it could be found that the NSB contained higher portion of soluble dietary fiber of the total dietary fiber. The weak statistical power here could be due to only 3 replicates, which was not enough for the comparison here. Regarding the insoluble dietary fiber contents, NSB and IB contained almost the same amounts of insoluble dietary fiber. However, their averages were higher than the insoluble dietary fiber contents of the other 3 Nopal breads (N1, N2, N3). This might be due to perceived differences in food matrix in NSB and IB, which could lead to greater formation of type 3 resistant starch with high amount of retrograded amylose, which is difficult to be re-dispersed by boiling [23]. In case of NSB, actually more Nopal sample was added into the recipe of N3 and this may result in a more viscous matrix in the breads. Meanwhile, IB may also lead to a more viscous matrix due to its swelling properties after the separation processes. As mentioned in the previous section, Kaur et. al (2008) reported that a dietary fiber which is normally used to increase viscosity of food matrixes, galactomannan, may restrict the swelling of starch granule and lead to smaller starch granule remnants by reducing the availability of water [24]. This phenomenon might also happen to matrixes of NSB and IB, which were viscous after adding Nopal ingredients, but further investigations are required to prove this assumption.
11
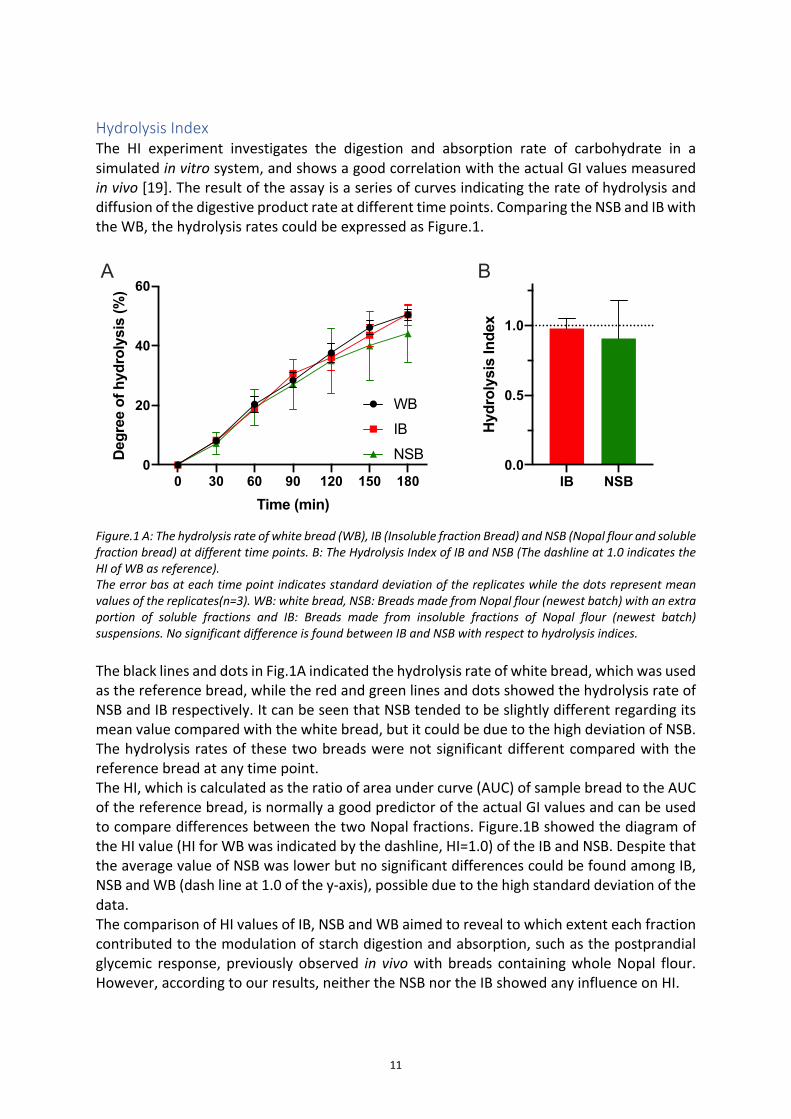
Hydrolysis Index The HI experiment investigates the digestion and absorption rate of carbohydrate in a simulated in vitro system, and shows a good correlation with the actual GI values measured in vivo [19]. The result of the assay is a series of curves indicating the rate of hydrolysis and diffusion of the digestive product rate at different time points. Comparing the NSB and IB with the WB, the hydrolysis rates could be expressed as Figure.1.
Figure.1 A: The hydrolysis rate of white bread (WB), IB (Insoluble fraction Bread) and NSB (Nopal flour and soluble fraction bread) at different time points. B: The Hydrolysis Index of IB and NSB (The dashline at 1.0 indicates the HI of WB as reference). The error bas at each time point indicates standard deviation of the replicates while the dots represent mean values of the replicates(n=3). WB: white bread, NSB: Breads made from Nopal flour (newest batch) with an extra portion of soluble fractions and IB: Breads made from insoluble fractions of Nopal flour (newest batch) suspensions. No significant difference is found between IB and NSB with respect to hydrolysis indices. The black lines and dots in Fig.1A indicated the hydrolysis rate of white bread, which was used as the reference bread, while the red and green lines and dots showed the hydrolysis rate of NSB and IB respectively. It can be seen that NSB tended to be slightly different regarding its mean value compared with the white bread, but it could be due to the high deviation of NSB. The hydrolysis rates of these two breads were not significant different compared with the reference bread at any time point. The HI, which is calculated as the ratio of area under curve (AUC) of sample bread to the AUC of the reference bread, is normally a good predictor of the actual GI values and can be used to compare differences between the two Nopal fractions. Figure.1B showed the diagram of the HI value (HI for WB was indicated by the dashline, HI=1.0) of the IB and NSB. Despite that the average value of NSB was lower but no significant differences could be found among IB, NSB and WB (dash line at 1.0 of the y-axis), possible due to the high standard deviation of the data. The comparison of HI values of IB, NSB and WB aimed to reveal to which extent each fraction contributed to the modulation of starch digestion and absorption, such as the postprandial glycemic response, previously observed in vivo with breads containing whole Nopal flour. However, according to our results, neither the NSB nor the IB showed any influence on HI.
0 30 60 90 120 150 1800
20
40
60
Time (min)
Deg
ree
of h
ydro
lysi
s (%
)
WB
IB
NSB
IB NSB0.0
0.5
1.0
Hyd
roly
sis
Inde
x
A B
12
The original idea of calculating HI values for NSB and IB was to determine which fraction would contribute to the glycemic modulating effect in the in vitro experiment. As previous study showed, bread made from insoluble fraction likely to influence the HI but the result in figure.1B showed that IB had no effect on the HI value [14]. Moreover, NSB, made from Nopal flour with an extra portion of soluble fraction, did not lower the HI values and thus the soluble fraction would not impact on the HI value. Therefore, it is impossible to figure out which of the fractions that contributes to the possible glycemic modulating effect by comparing NSB and IB with N3 from this in vitro experiment. Despite of the good correlation reported between HI and GI, such a good agreement is not always the case[19]. As an in vitro experiment, it considers the influences of sample on both the activity of α-amylase as well as the absorption (diffusion) of hydrolyzed starch. With regards to the former, the activity of α-amylase can be reduced by small inhibitory molecules, such as acarbose and certain types of flavonoids, and dietary fiber, like β-glucans, which can entangle the enzyme and thus prevent it from reacting with its substrates, as it happens in the presence of β-glucans [25, 26]. Besides, the entangled layer produced by some types of dietary fibers may also physically impede the diffusion of hydrolysis products into the dialysate. In a previous study, simpler diffusion experiments using only glucose and freeze-dried Nopal fractions as content in the dialysis tubes were performed, and there were no differences among neither soluble fractions nor insoluble fractions on the diffusion of glucose. [16]. This conclusion was further proved by results from a simplified HI experiment with soluble starch and soluble and insoluble fractions of Nopal as substrates, which indicates no effect on the hydrolysis rate of the soluble starch[16]. The result in Figure.1 thus further indicates that food matrixes of these Nopal breads (NSB, IB) have no effect on modulating the HI. Of note, Nuñez-Loṕez et al. (2013) reported that the flour of young age of Nopal cladodes affects the glucose diffusion in an in vitro model and that this effect decreases as the maturation of Nopal proceeds. Fresher cladodes of Nopal contain higher amount of soluble fiber leading to higher viscosity of the water suspensions, while more soluble fiber is converted to insoluble fiber in aged samples. It was believed that the soluble fiber and the viscous matrix formed contributed to the impediment of glucose diffusion. [27] Comparing with this report, it could be assumed that the N3 is a batch containing relatively aged Nopal flour and thus little effect on glucose diffusion in the dialysis tube models could be found. Nevertheless, it is still necessary to further investigate the possible modulation effect of these breads on glycemic and insulinemic response of human being. Rather than interacting with enzyme or forming hindering layers, small molecule components may be absorbed into blood circulation and interact directly or indirectly with other target organs or cells leading to the modulation of glycemic and insulinemic responses as well as appetite perception. Nopal flour contains considerable amounts of these components, such as rutin, ferulic acid and quercetin, and their possible physiological consequences could not be evaluated through the HI experiment [1, 28-30]. Highland barley is one of similar examples whose phenolic compounds, including quercetin and ferulic acid, affected glucose metabolism and insulin regulation on hepatic cells through IRS-1/PI3K/Akt signaling pathway and thus results in hypoglycemic effect [31, 32]. Therefore, Nopal flour may not affect the glycemic response through interfering with the intestinal hydrolysis and absorption of starch but through other mechanisms, which remain unknown.
13
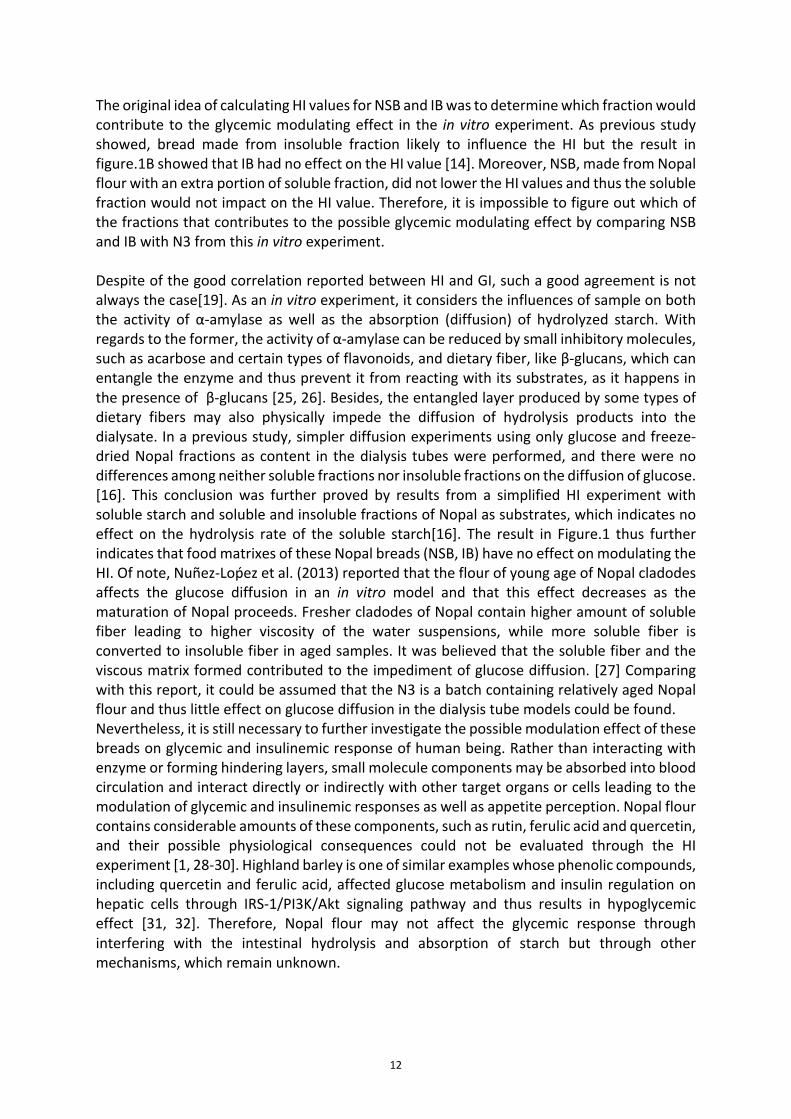
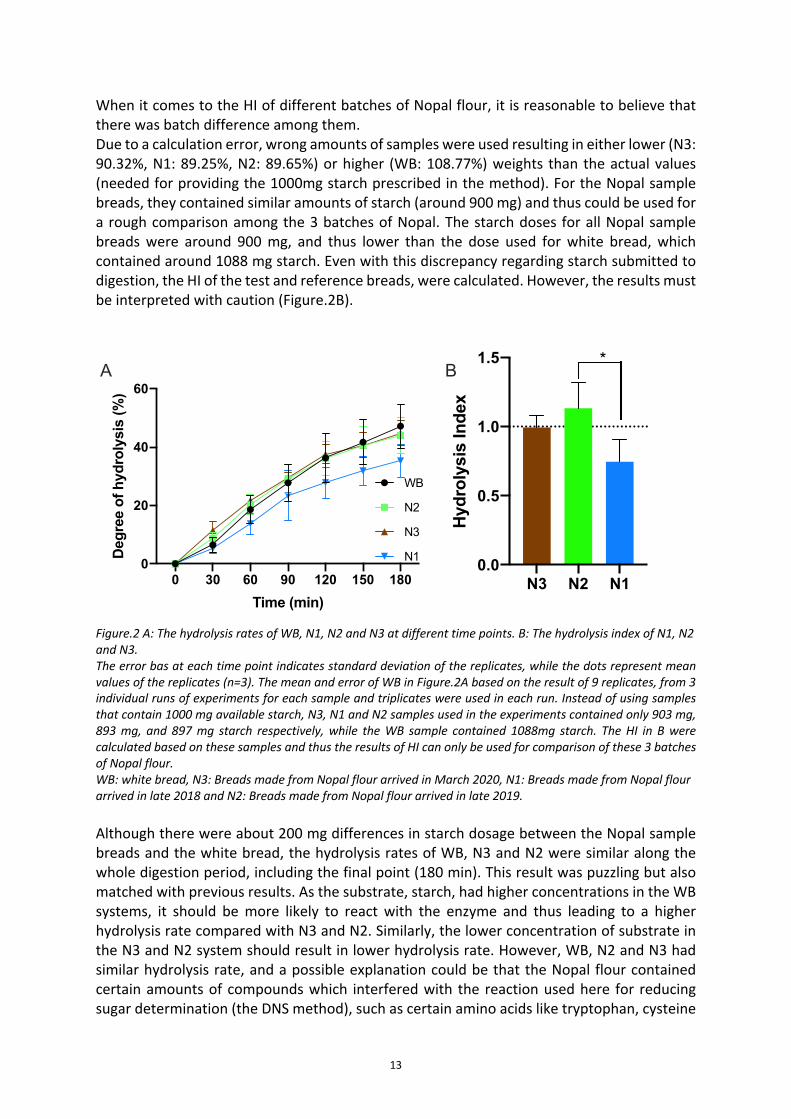
When it comes to the HI of different batches of Nopal flour, it is reasonable to believe that there was batch difference among them. Due to a calculation error, wrong amounts of samples were used resulting in either lower (N3: 90.32%, N1: 89.25%, N2: 89.65%) or higher (WB: 108.77%) weights than the actual values (needed for providing the 1000mg starch prescribed in the method). For the Nopal sample breads, they contained similar amounts of starch (around 900 mg) and thus could be used for a rough comparison among the 3 batches of Nopal. The starch doses for all Nopal sample breads were around 900 mg, and thus lower than the dose used for white bread, which contained around 1088 mg starch. Even with this discrepancy regarding starch submitted to digestion, the HI of the test and reference breads, were calculated. However, the results must be interpreted with caution (Figure.2B).
Figure.2 A: The hydrolysis rates of WB, N1, N2 and N3 at different time points. B: The hydrolysis index of N1, N2 and N3. The error bas at each time point indicates standard deviation of the replicates, while the dots represent mean values of the replicates (n=3). The mean and error of WB in Figure.2A based on the result of 9 replicates, from 3 individual runs of experiments for each sample and triplicates were used in each run. Instead of using samples that contain 1000 mg available starch, N3, N1 and N2 samples used in the experiments contained only 903 mg, 893 mg, and 897 mg starch respectively, while the WB sample contained 1088mg starch. The HI in B were calculated based on these samples and thus the results of HI can only be used for comparison of these 3 batches of Nopal flour. WB: white bread, N3: Breads made from Nopal flour arrived in March 2020, N1: Breads made from Nopal flour arrived in late 2018 and N2: Breads made from Nopal flour arrived in late 2019. Although there were about 200 mg differences in starch dosage between the Nopal sample breads and the white bread, the hydrolysis rates of WB, N3 and N2 were similar along the whole digestion period, including the final point (180 min). This result was puzzling but also matched with previous results. As the substrate, starch, had higher concentrations in the WB systems, it should be more likely to react with the enzyme and thus leading to a higher hydrolysis rate compared with N3 and N2. Similarly, the lower concentration of substrate in the N3 and N2 system should result in lower hydrolysis rate. However, WB, N2 and N3 had similar hydrolysis rate, and a possible explanation could be that the Nopal flour contained certain amounts of compounds which interfered with the reaction used here for reducing sugar determination (the DNS method), such as certain amino acids like tryptophan, cysteine
0 30 60 90 120 150 1800
20
40
60
Time (min)
Deg
ree
of h
ydro
lysi
s (%
)
WB
N2
N3
N1
N3 N2 N10.0
0.5
1.0
1.5
Hyd
roly
sis
Inde
x
*A B
14
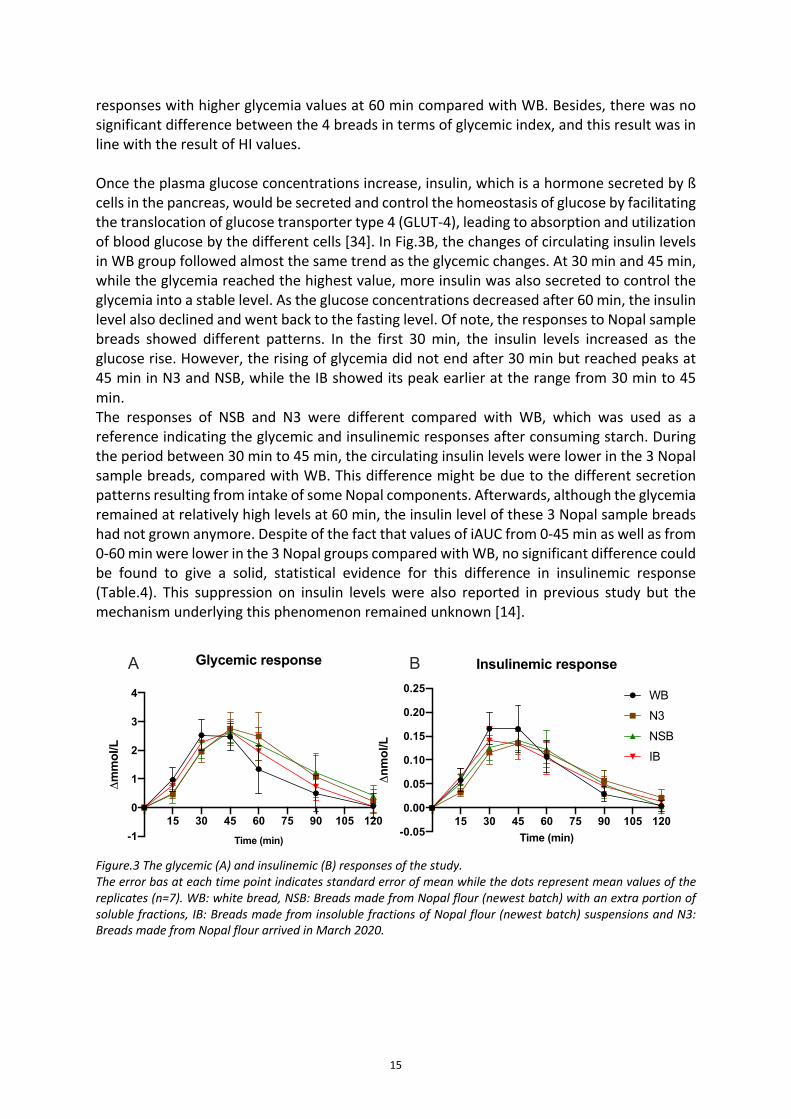
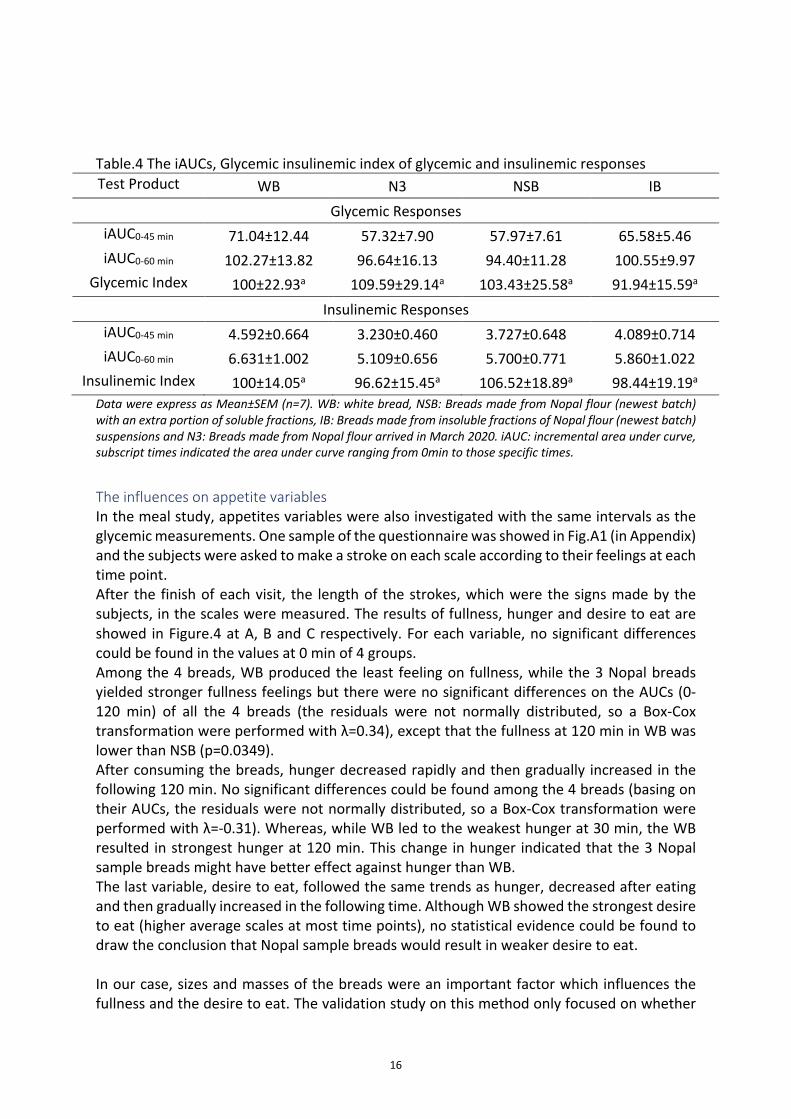
and histidine [33]. The abnormal increase in the HI model adding Nopal samples with starch as substrate has been observed in previous study (data not shown). Previous study on amino acid composition on Nopal cladodes did not show abnormally high contents of those amino acids which have the ability to interfere with the reaction, such as tryptophan, cysteine, histidine and tyrosine [1]. Besides, no increased reducing power was found in the dialysate of sample tested in the HI model by omitting starch or α-amylase in the reaction system, which indicates a more complicated reason than additional reducing compounds underneath this phenomenon[16]. By comparing HI values, it was found that N1 resulted in lower hydrolysis index than NS (p<0.05), but not lower than WB or N3. No significant differences could be found among WB, N2 and N3. Comparing the result of the HI experiment with the contents of dietary fiber, it was reasonable to believe that the content of soluble dietary fiber would contribute to the effect of Nopal flour on the HI experiment. As mentioned in previous discussion, Nuñez-Loṕez et al. (2013) suggested that the soluble dietary fiber in Nopal cladodes leading to high viscosity of the matrixes may hinder the diffusion of glucose and the performance of this effect will be weakened during the maturation that drives the transformation of soluble dietary fiber into insoluble dietary fiber [27]. The newest batch, that was used to make N3, might contain flour of aged Nopal cladodes, but its content of dietary fiber did not show any increase in insoluble dietary fiber (Table.3). Moreover, N3 contained a low average soluble dietary fiber content led to a HI value close to 1, indicating no impact on the hydrolysis of starch and diffusion of the hydrolysate. While N1 and N2 contained similar amounts of soluble dietary fiber, they resulted in totally different HI values. Of note, the determined dietary fiber in our case includes the matrixes of breads so the dietary fiber was not the same as the dietary fiber from Nopal flour solely. Therefore, more systematic experiments and analysis are necessary to further investigate the mechanism underlying the interaction between Nopal flour and the in vitro hydrolysis experiments. Overall, these results indicate the different commercial batches of Nopal cladode flours may differ in their ability to modify the HI when incorporate in composite breads. The contents of soluble dietary fiber are not the cause of this difference. Meal study Aiming to investigate the possible modulatory effect of Nopal flour on postprandial glycemic responses, WB, N3, NSB and IB were served to the subjects (n=7) as their first meal in the morning. Their fasting glucose and insulin concentrations were measured in blood, and appetite relating markers were evaluated through visual analogue scales (VAS). After their first bite, their glycemia, insulinemia as well as appetite were measured at different time intervals (15 min or 30 min) in the following 120 min. Effects of nopal on postprandial glycemic and insulinemic responses The mean glycemic responses after the WB and nopal test breads are shown in Figure.3A. Comparing with the white bread, all the 3 Nopal sample breads tended to postpone the peak of the postprandial glucose excursion. While the glucose peak after WB came at 30 min, all the 3 Nopal sample breads postponed the glucose peak to 45 min. Afterward, the glucose concentrations after the 3 nopal test breads remained higher than the WB at 60 min and 90 min. Table.4 showed the incremental area under curve (iAUC) of the glycemic responses at 0-45 min and 0-60 min. In case of the WB, the glycemia climbed quickly to the peak at 30 min and thus led to higher iAUC at 0-45 min. Whereas, Nopal sample breads resulted in slower
15
responses with higher glycemia values at 60 min compared with WB. Besides, there was no significant difference between the 4 breads in terms of glycemic index, and this result was in line with the result of HI values. Once the plasma glucose concentrations increase, insulin, which is a hormone secreted by ß cells in the pancreas, would be secreted and control the homeostasis of glucose by facilitating the translocation of glucose transporter type 4 (GLUT-4), leading to absorption and utilization of blood glucose by the different cells [34]. In Fig.3B, the changes of circulating insulin levels in WB group followed almost the same trend as the glycemic changes. At 30 min and 45 min, while the glycemia reached the highest value, more insulin was also secreted to control the glycemia into a stable level. As the glucose concentrations decreased after 60 min, the insulin level also declined and went back to the fasting level. Of note, the responses to Nopal sample breads showed different patterns. In the first 30 min, the insulin levels increased as the glucose rise. However, the rising of glycemia did not end after 30 min but reached peaks at 45 min in N3 and NSB, while the IB showed its peak earlier at the range from 30 min to 45 min. The responses of NSB and N3 were different compared with WB, which was used as a reference indicating the glycemic and insulinemic responses after consuming starch. During the period between 30 min to 45 min, the circulating insulin levels were lower in the 3 Nopal sample breads, compared with WB. This difference might be due to the different secretion patterns resulting from intake of some Nopal components. Afterwards, although the glycemia remained at relatively high levels at 60 min, the insulin level of these 3 Nopal sample breads had not grown anymore. Despite of the fact that values of iAUC from 0-45 min as well as from 0-60 min were lower in the 3 Nopal groups compared with WB, no significant difference could be found to give a solid, statistical evidence for this difference in insulinemic response (Table.4). This suppression on insulin levels were also reported in previous study but the mechanism underlying this phenomenon remained unknown [14].
Figure.3 The glycemic (A) and insulinemic (B) responses of the study. The error bas at each time point indicates standard error of mean while the dots represent mean values of the replicates (n=7). WB: white bread, NSB: Breads made from Nopal flour (newest batch) with an extra portion of soluble fractions, IB: Breads made from insoluble fractions of Nopal flour (newest batch) suspensions and N3: Breads made from Nopal flour arrived in March 2020.
15 30 45 60 75 90 105 120-1
0
1
2
3
4
Time (min)
Δm
mol
/L
Glycemic response
15 30 45 60 75 90 105 120-0.05
0.00
0.05
0.10
0.15
0.20
0.25
Time (min)
Δnm
ol/L
Insulinemic response
WB
N3
NSB
IB
A B
16
Table.4 The iAUCs, Glycemic insulinemic index of glycemic and insulinemic responses Test Product WB N3 NSB IB
Glycemic Responses iAUC0-45 min 71.04±12.44 57.32±7.90 57.97±7.61 65.58±5.46
iAUC0-60 min 102.27±13.82 96.64±16.13 94.40±11.28 100.55±9.97
Glycemic Index 100±22.93a 109.59±29.14a 103.43±25.58a 91.94±15.59a
Insulinemic Responses iAUC0-45 min 4.592±0.664 3.230±0.460 3.727±0.648 4.089±0.714 iAUC0-60 min 6.631±1.002 5.109±0.656 5.700±0.771 5.860±1.022
Insulinemic Index 100±14.05a 96.62±15.45a 106.52±18.89a 98.44±19.19a
Data were express as Mean±SEM (n=7). WB: white bread, NSB: Breads made from Nopal flour (newest batch) with an extra portion of soluble fractions, IB: Breads made from insoluble fractions of Nopal flour (newest batch) suspensions and N3: Breads made from Nopal flour arrived in March 2020. iAUC: incremental area under curve, subscript times indicated the area under curve ranging from 0min to those specific times.
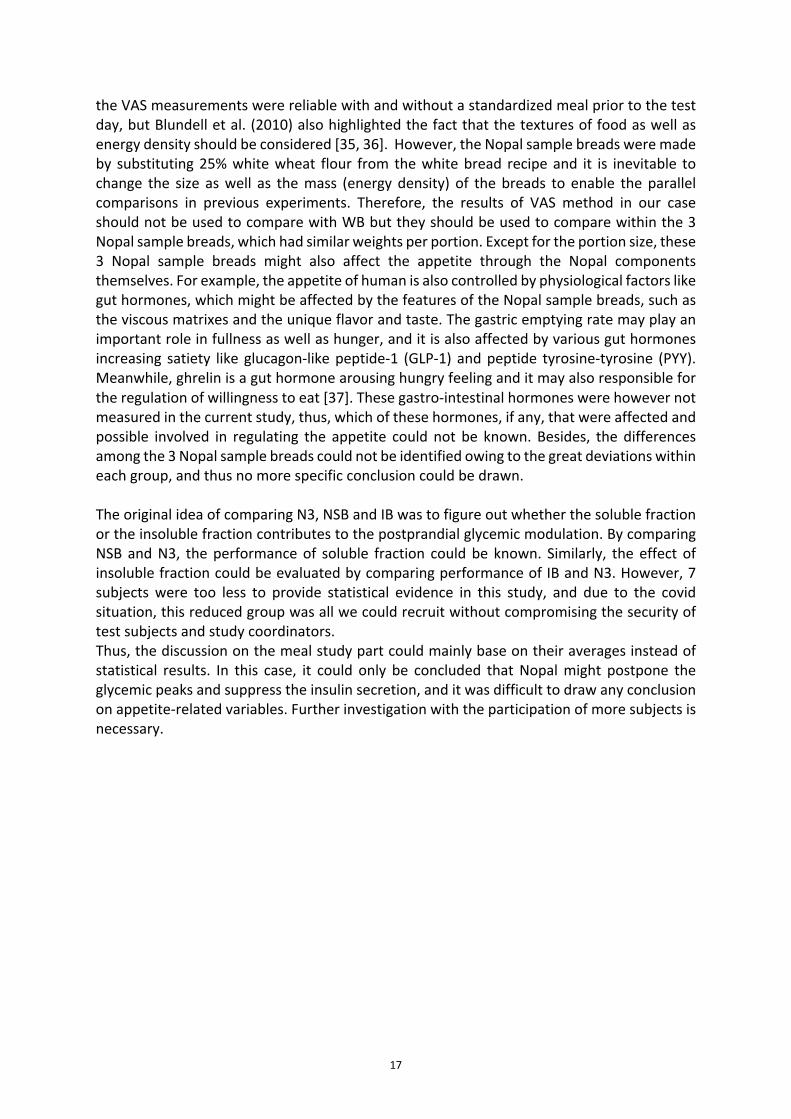
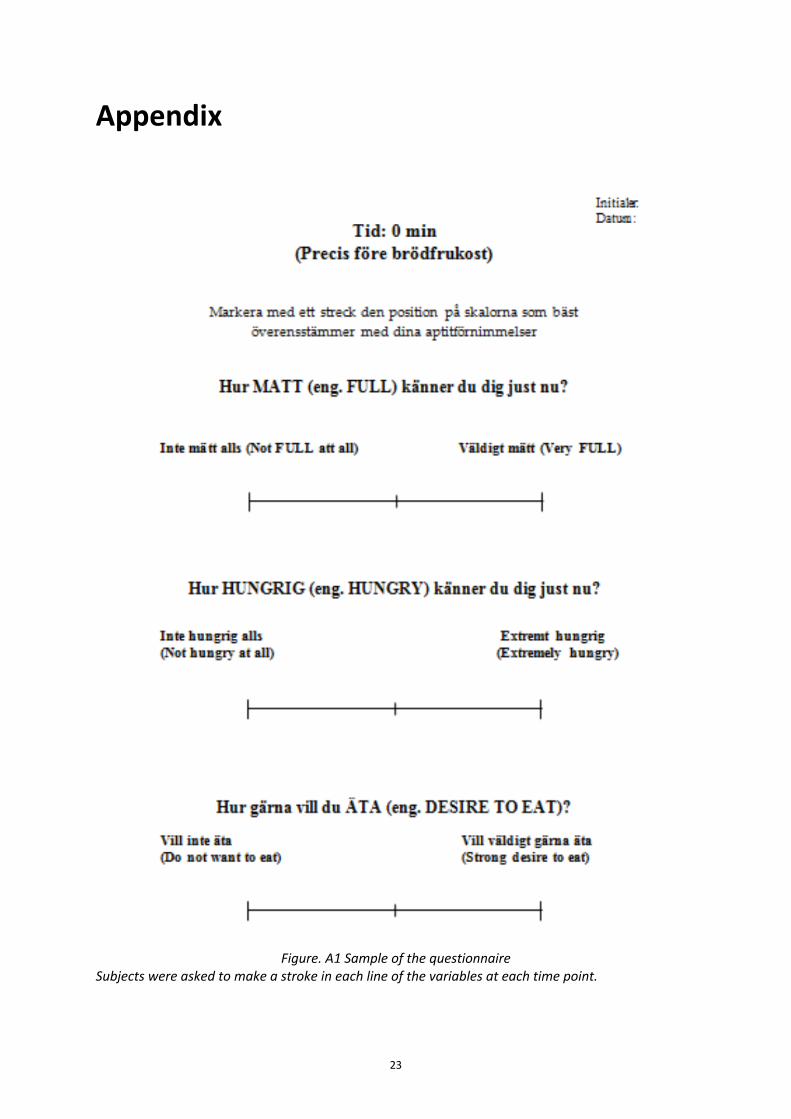
The influences on appetite variables In the meal study, appetites variables were also investigated with the same intervals as the glycemic measurements. One sample of the questionnaire was showed in Fig.A1 (in Appendix) and the subjects were asked to make a stroke on each scale according to their feelings at each time point. After the finish of each visit, the length of the strokes, which were the signs made by the subjects, in the scales were measured. The results of fullness, hunger and desire to eat are showed in Figure.4 at A, B and C respectively. For each variable, no significant differences could be found in the values at 0 min of 4 groups. Among the 4 breads, WB produced the least feeling on fullness, while the 3 Nopal breads yielded stronger fullness feelings but there were no significant differences on the AUCs (0-120 min) of all the 4 breads (the residuals were not normally distributed, so a Box-Cox transformation were performed with λ=0.34), except that the fullness at 120 min in WB was lower than NSB (p=0.0349). After consuming the breads, hunger decreased rapidly and then gradually increased in the following 120 min. No significant differences could be found among the 4 breads (basing on their AUCs, the residuals were not normally distributed, so a Box-Cox transformation were performed with λ=-0.31). Whereas, while WB led to the weakest hunger at 30 min, the WB resulted in strongest hunger at 120 min. This change in hunger indicated that the 3 Nopal sample breads might have better effect against hunger than WB. The last variable, desire to eat, followed the same trends as hunger, decreased after eating and then gradually increased in the following time. Although WB showed the strongest desire to eat (higher average scales at most time points), no statistical evidence could be found to draw the conclusion that Nopal sample breads would result in weaker desire to eat. In our case, sizes and masses of the breads were an important factor which influences the fullness and the desire to eat. The validation study on this method only focused on whether
17
the VAS measurements were reliable with and without a standardized meal prior to the test day, but Blundell et al. (2010) also highlighted the fact that the textures of food as well as energy density should be considered [35, 36]. However, the Nopal sample breads were made by substituting 25% white wheat flour from the white bread recipe and it is inevitable to change the size as well as the mass (energy density) of the breads to enable the parallel comparisons in previous experiments. Therefore, the results of VAS method in our case should not be used to compare with WB but they should be used to compare within the 3 Nopal sample breads, which had similar weights per portion. Except for the portion size, these 3 Nopal sample breads might also affect the appetite through the Nopal components themselves. For example, the appetite of human is also controlled by physiological factors like gut hormones, which might be affected by the features of the Nopal sample breads, such as the viscous matrixes and the unique flavor and taste. The gastric emptying rate may play an important role in fullness as well as hunger, and it is also affected by various gut hormones increasing satiety like glucagon-like peptide-1 (GLP-1) and peptide tyrosine-tyrosine (PYY). Meanwhile, ghrelin is a gut hormone arousing hungry feeling and it may also responsible for the regulation of willingness to eat [37]. These gastro-intestinal hormones were however not measured in the current study, thus, which of these hormones, if any, that were affected and possible involved in regulating the appetite could not be known. Besides, the differences among the 3 Nopal sample breads could not be identified owing to the great deviations within each group, and thus no more specific conclusion could be drawn. The original idea of comparing N3, NSB and IB was to figure out whether the soluble fraction or the insoluble fraction contributes to the postprandial glycemic modulation. By comparing NSB and N3, the performance of soluble fraction could be known. Similarly, the effect of insoluble fraction could be evaluated by comparing performance of IB and N3. However, 7 subjects were too less to provide statistical evidence in this study, and due to the covid situation, this reduced group was all we could recruit without compromising the security of test subjects and study coordinators. Thus, the discussion on the meal study part could mainly base on their averages instead of statistical results. In this case, it could only be concluded that Nopal might postpone the glycemic peaks and suppress the insulin secretion, and it was difficult to draw any conclusion on appetite-related variables. Further investigation with the participation of more subjects is necessary.
18
Figure.4 Variation of fullness (A), hunger (B) and desire to eat (C) evaluated through visual analogue scale
questionnaires. The error bas at each time point indicates standard error of mean while the dots represent mean values of the replicates (n=7). WB: white bread, NSB: Breads made from Nopal flour (newest batch) with an extra portion of soluble fractions, IB: Breads made from insoluble fractions of Nopal flour (newest batch) suspensions and N3: Breads made from Nopal flour arrived in March, 2020.
0 30 60 90 1200
20
40
60
80
100
Time (min)
VAS
(mm
)
Fullness
WBN3NSBIB
0 30 60 90 1200
20
40
60
80
100
Time (min)
VAS
(mm
)
Hunger
WBN3NSBIB
0 30 60 90 1200
20
40
60
80
100
Time (min)
VAS
(mm
)
Desire to eat
WBN3NSBIB
A
B
C

19
Conclusion In order to compare the effects of Nopal cladodes flour on actual bread matrixes, Nopal sample breads were made from 3 different batches of Nopal flour. The breads exhibited different HI, measured by an in vitro model, which mimics the hydrolysis and absorption of starch in human body to predict actual GI values. The results proved that the 3 batches of Nopal flour were different on their ability to delay the hydrolysis and absorption of starch. Thus, it is reasonable to believe that there were quality differences in the 3 batches of Nopal flour and this difference likely affected the glycemic responses. The contents of dietary fiber in these Nopal sample breads resulting in different HI values were similar, and it was reasonable to believe that the quality difference was not due to the contents of dietary fiber. Further investigations were performed using the newest Nopal batch, that came in March 2020. This batch was not only investigated before with respect to the effects on prandial glycemic responses, and there was enough Nopal flour for accomplishing the meal study and possible future studies [16]. Consequently, three breads were made from WB supplemented with 1. Nopal flour, 2. insoluble fractions of Nopal flour and 3. Nopal flour with an extra portion of soluble fraction, respectively. The result of the in vitro HI experiment indicated that none of the 3 breads (N3, IB and NSB) would affect the hydrolysis and absorption of starch in this model. In the following human pilot meal study consisting of 7 healthy subjects, the 3 Nopal sample breads tended to postpone the reach of glycemic peaks and lower insulin responses, but no statistical differences were detected to further support these findings. Besides, the appetite variables, including fullness, hunger and desire to eat, were also evaluated through visual analogue scale method. The changes of appetite after eating 3 Nopal sample breads might be different comparing with the white bread, but there was no conclusion could be drawn with the support of statistical evidence. To sum up, there are differences among the 3 batches of Nopal flour on their ability to interfere starch hydrolysis and/or the diffusion of the hydrolysis products in the in vitro model. Contents of dietary fiber are unlikely to be the reason for these differences. 3 Nopal sample breads, made by one of the Nopal flour batches and its two fractions, showed no significant differences on postprandial glycemic and insulinemic responses as well as appetite-related variables. The limited number of subjects was important to the lack of statistical power. More experiments with improved designs, sufficient subjects and various focuses are necessary for further elucidation of the quality difference and possible modulating effect of Nopal flour on glycemic responses and appetite control.
20
Reference 1. El-Mostafa, K., et al., Nopal cactus (Opuntia ficus-indica) as a source of bioactive
compounds for nutrition, health and disease. Molecules, 2014. 19(9): p. 14879-14901.
2. Figueroa-Pérez, M.G., et al., Phytochemical composition and in vitro analysis of nopal (O. ficus-indica) cladodes at different stages of maturity. International Journal of Food Properties, 2018. 21(1): p. 1728-1742.
3. Di Lorenzo, F., et al., The polysaccharide and low molecular weight components of Opuntia ficus indica cladodes: Structure and skin repairing properties. Carbohydrate polymers, 2017. 157: p. 128-136.
4. Trombetta, D., et al., Effect of polysaccharides from Opuntia ficus-indica (L.) cladodes on the healing of dermal wounds in the rat. Phytomedicine, 2006. 13(5): p. 352-358.
5. Sáenz, C., Cladodes: a source of dietary fiber. Journal of the Professional Association for Cactus Development, 1997. 2: p. 117-123.
6. Remes-Troche, J.M., et al., Nopal fiber (Opuntia ficus-indica) improves symptoms in irritable bowel syndrome in the short term: a randomized controlled trial. Neurogastroenterology & Motility, 2020: p. e13986.
7. Msaddak, L., et al., Opuntia ficus-indica cladodes as a functional ingredient: bioactive compounds profile and their effect on antioxidant quality of bread. Lipids in health and disease, 2017. 16(1): p. 1-8.
8. Avila-Nava, A., et al., Extract of cactus (Opuntia ficus indica) cladodes scavenges reactive oxygen species in vitro and enhances plasma antioxidant capacity in humans. Journal of functional foods, 2014. 10: p. 13-24.
9. Moran-Ramos, S., et al., Nopal feeding reduces adiposity, intestinal inflammation and shifts the cecal microbiota and metabolism in high-fat fed rats. PloS one, 2017. 12(2): p. e0171672.
10. Morán-Ramos, S., et al., Opuntia ficus indica (nopal) attenuates hepatic steatosis and oxidative stress in obese Zucker (fa/fa) rats. The Journal of nutrition, 2012. 142(11): p. 1956-1963.
11. Sánchez-Tapia, M., et al., Nopal (Opuntia ficus indica) protects from metabolic endotoxemia by modifying gut microbiota in obese rats fed high fat/sucrose diet. Scientific reports, 2017. 7(1): p. 1-16.
12. Mogard, K., Nopal (Opuntia Ficus Indica) Reduces Appetite in Healthy Humans. Faculty of Medicine, Lund University, 2019. Bachelor Thesis.
13. Rikte, C., Stabilizing Effect of Opuntia Ficus Indica on Blood Glucose Regulation in Healthy Humans. Faculty of Medicine, Lund University, 2019. Bachelor Thesis.
14. Deenissai, W., Soluble and insoluble fractions from nopal (Opuntia ficus) cladodes improve postprandial glycaemic regulation: a crossover randomized study in healthy volunteers. Master Thesis, 2020.
15. Kieu, P.D., Water Insoluble Fraction of Nopal (Opuntia ficus) Cladodes Beneficially Affects Postprandial Appetite-related Variables, while the Soluble Fraction Has No Effect: A Randomized Crossover Study in Healthy Volunteers. Master Thesis, 2020.
16. Li, Z., In vitro evaluation of the hypoglycemic effect of nopal and its soluble and insoluble fractions. Advance Course Report, 2020.
21
17. Tovar, J., I.M. Bjoerck, and N.G. Asp, Starch content and. alpha.-amylolysis rate in precooked legume flours. Journal of Agricultural and Food Chemistry, 1990. 38(9): p. 1818-1823.
18. Asp, N.G., et al., Rapid enzymic assay of insoluble and soluble dietary fiber. Journal of Agricultural and Food Chemistry, 1983. 31(3): p. 476-482.
19. Granfeldt, Y., et al., An in vitro procedure based on chewing to predict metabolic response to. European Journal of Clinical Nutrition, 1992. 46: p. 649-660.
20. Box, G.E. and D.R. Cox, An analysis of transformations. Journal of the Royal Statistical Society: Series B (Methodological), 1964. 26(2): p. 211-243.
21. Wessa, P. Box-Cox Normality Plot (v1.1.12) in Free Statistics Software (v1.2.1). Office for Research Development and Education 2016 [cited 2021 April 30th]; Available from: http://www.wessa.net/rwasp_boxcoxnorm.wasp/.
22. Singh, J., A. Dartois, and L. Kaur, Starch digestibility in food matrix: a review. Trends in Food Science & Technology, 2010. 21(4): p. 168-180.
23. Sajilata, M.G., R.S. Singhal, and P.R. Kulkarni, Resistant starch–a review. Comprehensive reviews in food science and food safety, 2006. 5(1): p. 1-17.
24. Kaur, L., et al., Starch–cassia gum interactions: A microstructure–Rheology study. Food Chemistry, 2008. 111(1): p. 1-10.
25. Sales, P.M., et al., α-Amylase inhibitors: a review of raw material and isolated compounds from plant source. Journal of Pharmacy & Pharmaceutical Sciences, 2012. 15(1): p. 141-183.
26. Zhang, H., et al., Interaction between barley β-glucan and corn starch and its effects on the in vitro digestion of starch. International journal of biological macromolecules, 2019. 141: p. 240-246.
27. Nuñez-López, M.A., O. Paredes-López, and R. Reynoso-Camacho, Functional and hypoglycemic properties of nopal cladodes (O. ficus-indica) at different maturity stages using in vitro and in vivo tests. Journal of agricultural and food chemistry, 2013. 61(46): p. 10981-10986.
28. Jung, E.H., et al., Hypoglycemic effects of a phenolic acid fraction of rice bran and ferulic acid in C57BL/KsJ-db/db mice. Journal of Agricultural and Food Chemistry, 2007. 55(24): p. 9800-9804.
29. Ahmed, O.M., et al., Antihyperglycemic, antihyperlipidemic and antioxidant effects and the probable mechanisms of action of Ruta graveolens infusion and rutin in nicotinamide-streptozotocin-induced diabetic rats. Diabetologia croatica, 2010. 39(1).
30. Shi, G.-J., et al., In vitro and in vivo evidence that quercetin protects against diabetes and its complications: A systematic review of the literature. Biomedicine & Pharmacotherapy, 2019. 109: p. 1085-1099.
31. Deng, N., et al., Assessment of the phenolic profiles, hypoglycemic activity, and molecular mechanism of different highland barley (Hordeum vulgare L.) varieties. International journal of molecular sciences, 2020. 21(4): p. 1175.
32. Deng, N., et al., IRS-1/PI3K/Akt pathway and miRNAs are involved in whole grain highland barley (Hordeum vulgare L.) ameliorating hyperglycemia of db/db mice. Food & Function, 2020. 11(11): p. 9535-9546.
33. Teixeira, R.S.S., et al., Amino acids interference on the quantification of reducing sugars by the 3, 5-dinitrosalicylic acid assay mislead carbohydrase activity measurements. Carbohydrate research, 2012. 363: p. 33-37.
22
34. Khan, A. and J. Pessin, Insulin regulation of glucose uptake: a complex interplay of intracellular signalling pathways. Diabetologia, 2002. 45(11): p. 1475-1483.
35. Flint, A., et al., Reproducibility, power and validity of visual analogue scales in assessment of appetite sensations in single test meal studies. International journal of obesity, 2000. 24(1): p. 38-48.
36. Blundell, J., et al., Appetite control: methodological aspects of the evaluation of foods. Obesity reviews, 2010. 11(3): p. 251-270.
37. Pradhan, G., S.L. Samson, and Y. Sun, Ghrelin: much more than a hunger hormone. Current opinion in clinical nutrition and metabolic care, 2013. 16(6): p. 619.
23
Appendix
Figure. A1 Sample of the questionnaire
Subjects were asked to make a stroke in each line of the variables at each time point.

24
Acknowledgement Firstly, I would like to show my sincere appreciation to my supervisors, Dr. Anne Nilsson and Dr. Juscelino Tovar, who always instruct me with patience and kindness. Thank you for your suggestions, comments and enlightening discussions. I am grateful that you spent your precious time on talking with me and solving my puzzles. You are the best supervisors that I have ever known. I would like to show my gratitude to my colleagues, Omar Sokrat and Shenghongyi Zhu, for their great collaboration and patient communication. They are excellent lab partners, and I would never be able to finish this project without them. I would like to thank Mohammad Mukul Hossain, Olexandr Fedkiv and Hans Bolinsson for their patient and professional instructions on experimental detail. I would like to thank Margareta Nyman, the examiner of this degree project, for her critical review and instructive comments of the thesis and the defense. I am grateful to all the subjects who participated in the meal study. You are brave and kind. It is people like you who enable nutritional scientists to make progress in nutrition research. I appreciate the company of all my friends. Finally, I would like to thank Sylvia Wang. You are the green light that burns all night at your dock.