Rhamnolipid Production by Pseudomonas aeruginosa JC2 in Different N-Heterocylic Aromatic...
12
Rhamnolipid Production by Pseudomonas Aeruginosa GIM 32 Using Different Substrates Including Molasses Distillery Wastewater An-hua Li & Mei-ying Xu & Wei Sun & Guo-ping Sun Received: 16 May 2010 / Accepted: 10 August 2010 # Springer Science+Business Media, LLC 2010 Abstract A rhamnolipid production strain newly isolated from oil-contaminated soil was identified as Pseudomonas aeruginosa GIM32 by its morphology and 16S rDNA sequence analysis. The effect of carbon source and carbon to nitrogen (C/N) ratio on rhamnolipids production was investigated. Palm oil was favorable as a carbon source for rhamnolipid production. The maximum biomass and rhamnolipid concentration were 8.24 g/L and 30.4 g/L, respectively, with an optimization medium containing 50 g/L palm oil and 5 g/L sodium nitrate. Molasses distillery wastewater as an unconventional substrate for rhamnolipid production was investigated. It was found that 2.6 g/L of rhamnolipids was produced; this amount was higher than that of past reports using wastewater as a substrate. In addition, 44% of the chemical oxygen demand of wastewater was removed at the same time under the optimization condition. Eleven kinds of different molecular weight rhamnolipid homologues were identified in the rhamnolipids obtained from molasses distillery wastewater by P. aeruginosa GIM32 by LC–MS analysis. Keywords Rhamnolipids . Pseudomonas aeruginosa . Molasses distillery wastewater . Biosurfactant Introduction Biosurfactants produced by a variety of microorganisms such as bacteria, fungi, and yeasts are amphiphilic compounds which can reduce surface and interfacial tension. The molecular structures of these biosurfactants comprise a hydrophilic portion, which may consist of mono-, oligo- or polysaccharides, amino acids or peptides or phosphate groups, Appl Biochem Biotechnol DOI 10.1007/s12010-010-9066-1 A.-h. Li South China Botanical Garden, Chinese Academy of Sciences, Guangzhou 510650, China M.-y. Xu : W. Sun : G.-p. Sun (*) Guangdong Institute of Microbiology, Guangdong Provincial Key Laboratory of Microbial Culture Collection and Application Guangzhou, Guangzhou, Guangdong 510070, China e-mail: [email protected]
-
Upload
independent -
Category
Documents
-
view
0 -
download
0
Transcript of Rhamnolipid Production by Pseudomonas aeruginosa JC2 in Different N-Heterocylic Aromatic...

Rhamnolipid Production by Pseudomonas AeruginosaGIM 32 Using Different Substrates Including MolassesDistillery Wastewater
An-hua Li & Mei-ying Xu & Wei Sun & Guo-ping Sun
Received: 16 May 2010 /Accepted: 10 August 2010# Springer Science+Business Media, LLC 2010
Abstract A rhamnolipid production strain newly isolated from oil-contaminated soil wasidentified as Pseudomonas aeruginosa GIM32 by its morphology and 16S rDNA sequenceanalysis. The effect of carbon source and carbon to nitrogen (C/N) ratio on rhamnolipidsproduction was investigated. Palm oil was favorable as a carbon source for rhamnolipidproduction. The maximum biomass and rhamnolipid concentration were 8.24 g/L and30.4 g/L, respectively, with an optimization medium containing 50 g/L palm oil and 5 g/Lsodium nitrate. Molasses distillery wastewater as an unconventional substrate forrhamnolipid production was investigated. It was found that 2.6 g/L of rhamnolipids wasproduced; this amount was higher than that of past reports using wastewater as a substrate.In addition, 44% of the chemical oxygen demand of wastewater was removed at the sametime under the optimization condition. Eleven kinds of different molecular weightrhamnolipid homologues were identified in the rhamnolipids obtained from molassesdistillery wastewater by P. aeruginosa GIM32 by LC–MS analysis.
Keywords Rhamnolipids . Pseudomonas aeruginosa . Molasses distillery wastewater .
Biosurfactant
Introduction
Biosurfactants produced by a variety of microorganisms such as bacteria, fungi, and yeastsare amphiphilic compounds which can reduce surface and interfacial tension. Themolecular structures of these biosurfactants comprise a hydrophilic portion, which mayconsist of mono-, oligo- or polysaccharides, amino acids or peptides or phosphate groups,
Appl Biochem BiotechnolDOI 10.1007/s12010-010-9066-1
A.-h. LiSouth China Botanical Garden, Chinese Academy of Sciences, Guangzhou 510650, China
M.-y. Xu :W. Sun : G.-p. Sun (*)Guangdong Institute of Microbiology, Guangdong Provincial Key Laboratory of Microbial CultureCollection and Application Guangzhou, Guangzhou, Guangdong 510070, Chinae-mail: [email protected]

and a hydrophobic portion, which is composed of fatty acids or fatty alcohols. Those makeup glycolipids, lipopeptides, fatty acids, polysaccharide–protein complexes, peptides,phospholipids, and neutral lipids. Biosurfactants have advantages over synthetic surfactantssuch as lower toxicity, higher biodegradability, ecological acceptability, and effectiveness atextremes of temperature, pH, and salinity. These properties make surfactants to be one ofversatile class of chemical products, used on a variety of applications in pharmaceutical,cosmetic, detergent, and food industry [1–3].
Although biosurfactants have many advantages, their prices are not competitive withthose of the chemical surfactants. This is ascribable to high production costs caused by lowproductivity and the expense of raw material. Hence, biosurfactants have not beencommercialized extensively. However, the use of cheaper renewable substrates, optimalgrowth and production conditions, and the adoption of high-production microbial strainsshould reduce the costs of biosurfactant production [4].
The wastewater produced by the cane molasses-based distillery industry is characterizedwith extremely high chemical oxygen demand (COD) and biochemical oxygen demand [5].The cost of the complicated molasses wastewater treatment is quite high. Furthermore, asthis kind of wastewater includes different organic compounds such as acetic acid, lacticacid, glycerol, and various sugars and inorganic salts well suited to be good nutriments formicroorganism growth, direct treatment accounts for an enormous waste of materialresources [6, 7].
In this study, we described a Pseudomonas aeruginosa strain newly isolated from oil-contaminated soil that exhibits high production of rhamnolipids. Then the optimum carbonsource and carbon to nitrogen (C/N) ratio conditions were achieved for high rhamnolipidproduction. Further, we successfully make use of molasses distillery wastewater as a culturemedium to reduce the cost of production, and the COD of wastewater was cut downsimultaneously. Finally, the composition and characteristics of rhamnolipids secreted byP. aeruginosa GIM32 were determined.
Materials and Methods
Medium Compositions
The mineral salts (MS) medium used for biosurfactant production was composed of (L−1):5 g NaNO3, 2 g KH2PO4, 1.5 g K2HPO4, 0.2 g MgSO4·7H2O, 0.02 g CaCl2, and 0.024 gFeSO4·7H2O and supplemented with 1 ml trace element solution containing (L−1): 0.75 gZnSO4·7H2O, 0.08 g CoCl2·6H2O, 0.075 g CuSO4·5H2O, 0.5 g MnSO4·H2O, 0.15 g H3BO3,and 0.06 g NaMoO4·2H2O. For screening strain, the MS medium was supplied with 30 g/Lglucose, 30 g/L soy oil, or 20 g/L diesel, respectively, as a sole carbon source.
For evaluating the effect of carbon source, MS medium was separately supplementedwith 50 g/L of four kinds of vegetable oil as insoluble carbon sources. For evaluatingappropriate C/N ratio, firstly, the concentration of palm oil was fixed at 50 g/L, whileNaNO3 was supplied at 2, 3, 4, 5, 6, 7 g/L, resulting in a C/N ratio of 138, 92, 69, 55, 46and 39, respectively. Then, the concentration of NaNO3 was maintained at 5 g/L, and thepalm oil concentration was supplied at 20, 30, 40, 50, 60, and 70 g/L, resulting in a C/Nratio of 22, 33, 44, 55, and 66. The pH value of the media mentioned above was adjustedpH to 6.8 by 6.0 M HCl and was sterilized at 121 °C for 20 min.
Chemical properties of molasses distillery wastewater are shown in Table 1. Thewastewater obtained from the manufacture of alcohol was stored at 4 °C until needed. For
Appl Biochem Biotechnol

exploring dilution rate and wastewater pH effect, the wastewater was prepared by addingthe tap water to make series dilutions and pH value adjusted used Ca(OH)2. The wastewaterwas autoclaved at 115 °C for 20 min.
Bacterial Strain Screening
The oil-contaminated soil samples utilized for microbial strain isolation were collected fromZhongyuan oilfield in Henan Province, China. A few grams of soil samples were added tothe flask containing screening medium and incubated at 30 °C for 48 h. Then 0.1 ml ofserial dilutions of fermented broth were spread on Luria-Bertani (LB) agar and cultivated at30 °C for 48 h. The isolated colonies were picked and inoculated in the test tube containingscreening medium and cultivated at 30 °C for 48 h. The cell suspension of each test tubewas tested for the presence of biosurfactant using a drop-collapsing test [8]. The strains ofproducing biosurfactant were maintained in LB liquid with 20% glycerol at −30 °C. Thecritical micelle dilution (CMD) method, which was determined by measuring the surfacetension of serial dilutions of supernatant from fermentation broth, was used as a criterionfor selecting high production strain.
The high production strain GIM32 was identified using the Biolog plates system and16S rDNA sequencing. The primers 27f (5′-AGAGTTTGATCCTGGCTCAG) and 1492r(5′-TACGGTTACCTTGTTACGACTT) were used to amplify the 16S rDNA. The strainGIM32 was identified by comparing its 16S rDNA sequence rDNA sequence with those inthe National Center for Biotechnology Information (NCBI) basic local alignment searchtool (BLAST) for their pairwise identities.
Fermentation Conditions
The same fermentation condition was used for culturing strain GIM32 with the MS mediaand wastewater medium. One loop of the strain GIM32 cell from LB agar slant wastransferred into a 200-ml flask containing 40 ml LB liquid medium and cultivated at 35 °Con a shaker (220 rpm) for 18 h. The seed (3% v/v inoculum) was inoculated into a 500-mlflask containing 100 ml fermentation medium. Flask cultures were incubated for 120 h (MSmedium) or 72 h (wastewater medium) on a reciprocal shaker (120 rpm) at 35 °C. Duringthe course of batch fermentation, samples were taken at designated time intervals from theliquid culture to determine biomass, COD, and rhamnolipids yield.
Chemical components Concentration
Total organic carbon (mg/L) 56,910±500
Total nitrogen (mg/L) 9,890±350
Calcium (mg/L) 7,360±200
Total phosphorus (mg/L) 111±5
Magnesium (mg/L) 6,920±430
Sulfate (mg/L) 7,520±610
pH 4.16±0.1
COD (mg/L) 171,200±2,600
Total sugar (mg/L) 132,700±2,800
Reducing sugar (mg/L) 16,170±400
Table 1 Composition of molas-ses distillery wastewater
Appl Biochem Biotechnol
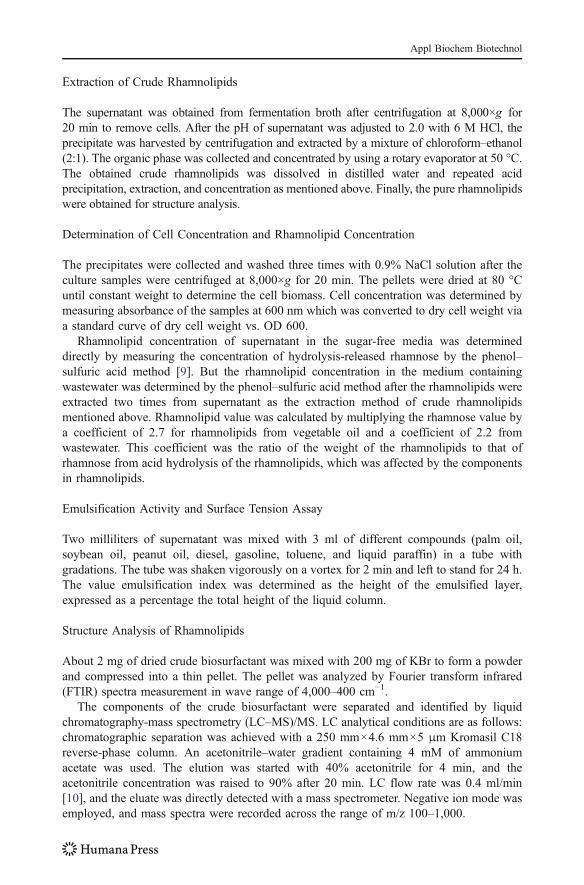
Extraction of Crude Rhamnolipids
The supernatant was obtained from fermentation broth after centrifugation at 8,000×g for20 min to remove cells. After the pH of supernatant was adjusted to 2.0 with 6 M HCl, theprecipitate was harvested by centrifugation and extracted by a mixture of chloroform–ethanol(2:1). The organic phase was collected and concentrated by using a rotary evaporator at 50 °C.The obtained crude rhamnolipids was dissolved in distilled water and repeated acidprecipitation, extraction, and concentration as mentioned above. Finally, the pure rhamnolipidswere obtained for structure analysis.
Determination of Cell Concentration and Rhamnolipid Concentration
The precipitates were collected and washed three times with 0.9% NaCl solution after theculture samples were centrifuged at 8,000×g for 20 min. The pellets were dried at 80 °Cuntil constant weight to determine the cell biomass. Cell concentration was determined bymeasuring absorbance of the samples at 600 nm which was converted to dry cell weight viaa standard curve of dry cell weight vs. OD 600.
Rhamnolipid concentration of supernatant in the sugar-free media was determineddirectly by measuring the concentration of hydrolysis-released rhamnose by the phenol–sulfuric acid method [9]. But the rhamnolipid concentration in the medium containingwastewater was determined by the phenol–sulfuric acid method after the rhamnolipids wereextracted two times from supernatant as the extraction method of crude rhamnolipidsmentioned above. Rhamnolipid value was calculated by multiplying the rhamnose value bya coefficient of 2.7 for rhamnolipids from vegetable oil and a coefficient of 2.2 fromwastewater. This coefficient was the ratio of the weight of the rhamnolipids to that ofrhamnose from acid hydrolysis of the rhamnolipids, which was affected by the componentsin rhamnolipids.
Emulsification Activity and Surface Tension Assay
Two milliliters of supernatant was mixed with 3 ml of different compounds (palm oil,soybean oil, peanut oil, diesel, gasoline, toluene, and liquid paraffin) in a tube withgradations. The tube was shaken vigorously on a vortex for 2 min and left to stand for 24 h.The value emulsification index was determined as the height of the emulsified layer,expressed as a percentage the total height of the liquid column.
Structure Analysis of Rhamnolipids
About 2 mg of dried crude biosurfactant was mixed with 200 mg of KBr to form a powderand compressed into a thin pellet. The pellet was analyzed by Fourier transform infrared(FTIR) spectra measurement in wave range of 4,000–400 cm−1.
The components of the crude biosurfactant were separated and identified by liquidchromatography-mass spectrometry (LC–MS)/MS. LC analytical conditions are as follows:chromatographic separation was achieved with a 250 mm×4.6 mm×5 μm Kromasil C18reverse-phase column. An acetonitrile–water gradient containing 4 mM of ammoniumacetate was used. The elution was started with 40% acetonitrile for 4 min, and theacetonitrile concentration was raised to 90% after 20 min. LC flow rate was 0.4 ml/min[10], and the eluate was directly detected with a mass spectrometer. Negative ion mode wasemployed, and mass spectra were recorded across the range of m/z 100–1,000.
Appl Biochem Biotechnol

Results and Discussion
Isolation and Identification of Bacterial Strain for Biosurfactant Production
Several biosurfactant production strains were isolated from soil samples, from which onestrain, GIM32, was selected for further study as the highest producer by critical micelledilution (CMD) method. The colony of strain GIM32 was circular, smooth, sticky, andwhite. The cell was Gram negative, non-spore forming, rod-shaped, and motile by means ofa single polar flagellum. The alignment of the partial 16S rDNA of the GIM32 strain withsequences obtained from BLAST searching at NCBI server showed 99% similarity to P.aeruginosa. Therefore, the GIM32 strain was identified as a number of P. aeruginosa. Thesequence of the 16S rRNA gene of the strain GIM32 is available under the GenBankaccession number HM067869. The biosurfactant secreted by P. aeruginosa has beenconsidered to be rhamnolipids in many reports [11] and also identified by subsequent FTIRand LC–MS analysis in this study.
Effects of Carbon Source on Rhamnolipid Production
Five vegetable oils were used to investigate their effects on rhamnolipid production by P.aeruginosa GIM32, as shown in Fig. 1. The result shows that palm oil was the mostsuitable carbon source for rhamnolipid production, by which the yield reached 30.4 g/L ofrhamnolipids. The other vegetable oils also yielded more than 24 g/L of rhamnolipidproduction. About 8 g/L biomass was gained from vegetable oils as carbon source.
P. aeruginosa can utilize many substrates such as carbohydrates, hydrocarbon, lipid,alcohols, etc., for growth and rhamnolipid production [12]. The vegetable oils are the mostavailable carbon sources in all substrates. Though vegetable oils are insoluble in water, theycan easily be emulsified and utilized by P. aeruginosa coupling to rhamnolipid production.Insoluble vegetable oils in a high concentration, even up to 160 g/L, were harmless to
Fig. 1 The effect of carbon source on rhamnolipid production and dry cell weight
Appl Biochem Biotechnol

bacterial cells; this made it possible to use it for high-density fermentation [1]. Furthermore,at the same concentration, vegetable oil or soapstock can generate about twice as muchenergy as glucose by catabolism. In addition, vegetable oils can be easily hydrolyzed toproduce long-chain fatty acids, which are important precursors for rhamnolipid synthesis[13]. Strains of P. aeruginosa could produce more than 15 g/L of rhamnolipids whenutilizing vegetable oil, animal oil, or their byproducts as a carbon source in previous reports[14–17]. If glucose, the most common substrate, was used as the only carbon source, therhamnolipid production did not exceed about 10 g/L in previous reports [18, 19]. Therefore,vegetable oils are the most appropriate carbon sources for rhamnolipid production.
Effect of Carbon to Nitrogen (C/N) Ratio on Rhamnolipid Production
The influence of C/N was investigated at a constant palm oil concentration (50 g/L). Asshown in Fig. 2a, the rhamnolipid production reached the maximum values at 5 g/L ofnitrate concentration (C/N ratio of 55). The production slightly declined as the nitratecontent increased to 6 and 7 g/L (C/N ratio of 46 and 39). The biomass reached a maximumat 48 h and exhibited a positive relationship with the nitrate concentration. While thebiomass exhibited a marked reduction at 120 h during culturing with a high nitrateconcentration, under low nitrate concentration, it did not decrease with longer cultivationtime.
The effect of C/N ratio with a constant nitrate concentration (50 g/L) was alsoinvestigated. The data from Fig. 2b suggested that palm oil concentration had a greatinfluence on biomass concentration and rhamnolipid production. The maximum biomasswas gained at a palm oil concentration of 40 g/L (C/N ratio of 44) and did not risesignificantly with an increase in concentration. However, the maximum rhamnolipidproduction was reached by using 50 g/L palm oil (C/N ratio of 55). An insufficient carbonsource would limit the cell growth and lead to lower biomass; the cell would then age anddie in the later stages of cultivation. In contrast, an excess carbon source has no obviouseffect on biomass or rhamnolipid production; the only effect is the increase in cost of theculture medium. Thus, a carbon source supply of 50 g/L is appropriate for rhamnolipidproduction (C/N ratio 55:1).
For an appropriate C/N ratio, some reports have considered that high-productionrhamnolipids were achieved under a nitrogen-limiting condition [11, 16]. Other reportshave found that the optimal C/N ratio varied with strains and carbon sources [17]. However,the biomass should also be taken into consideration. The nitrogen source supplied shouldsatisfy the growth condition for a higher biomass, since high production of the strain mustbe accompanied by higher biomass. A carbon source not only provides energy for cellmetabolism, but also is used as a raw material for rhamnolipid synthesis at the stable phase.Thus, a high biomass and sufficient carbon source supply conditions should be very helpfulin enhancing rhamnolipid production.
Utilizing Molasses Distillery Wastewater as a Medium for Rhamnolipid Production
The optimal culture conditions, including appropriate pH (7.8) and dilution ratio (1:1), weredetermined by a series of experiments (data not shown). The wastewater pH was reducedfrom 7.8 to 6.5 after sterilization. The data acquired during cultivation of P. aeruginosaGIM32 in molasses distillery wastewater are presented in Fig. 3. The cell was able to growwell and secreted rhamnolipids using the half-strength of molasses distillery wastewateralone. The maximum biomass reached after culturing for 24 h was 2.7 g/L. The 2.6-g/L
Appl Biochem Biotechnol

rhamnolipids were obtained at 64 h, and the COD of the wastewater decreased from86,900 mg/L to 48,600 mg/L. More than 52.5% of the rhamnolipids were produced during36–48 h of culturing. After 48 h, the rhamnolipid production did not increase significantly,and the biomass obviously decreased. After culturing with P. aeruginosa GIM32, the CODof the wastewater decreased to 56%, and 2.6 g/L rhamnolipids were obtained from
Fig. 2 The effect of carbon to nitrogen (C/N) ratio on rhamnolipid production by P. aeruginosa GIM32 witha constant 50 g/L of palm oil concentration and b constant 5 g/L of NaNO3 concentration
Appl Biochem Biotechnol

wastewater at 60 h; thus, the complex, troublesome wastewater could be transformed intouseful things.
Rhamnolipid production (2.6 g/L) using molasses distillery wastewater as an alternativemedium production was lower than that by medium containing vegetable oils, but is 2.6 g/Lmuch higher than in previous reports: 0.9 g/L rhamnolipid production by distillery andwhey wastes [20], 0.24 g/L rhamnose production with molasses [21], and 0.206 g/Lrhamnolipids with condensed molasses fermentation soluble [22]. The higher rhamnolipidproduction may be due to the excellent GIM32 strain and the suitable wastewater. Althoughthe rhamnolipid production from wastewater was not higher than from vegetable oils, usingwastewater as a growth substrate is a relatively inexpensive and economical process, whichmight make it more competitive with synthetics. What is more, 44% COD of wastewaterwas removed after rhamnolipid production, lowering the cost of wastewater treatment.
The utilization of the wastewater could reduce environmental pollution at processingindustries while decreasing the cost of rhamnolipid production. However, it is uneconomical toextract pure rhamnolipids from this complicated wastewater culture broth. Rhamnolipids havemany potential applications in the bioremediation environmental, including heavy-metalremoval, hydrocarbon degradation, and pesticide degradation, which do not require purerhamnolipids. Therefore, the low-cost acid precipitation method was an efficient andeconomical means for the recovery of crude rhamnolipids. Alternatively, the fermented liquidcontaining rhamnolipids might be directly injected into oil well for oil recovery [2]. Althoughthe rhamnolipid production was low, the wastewater substrate was low cost, and there was noneed to supply a carbon source or inorganic salts. Moreover, the yield may greatly increaseusing new processes such as solid-state culturing [20] or rest cell process [23] for furtherreducing of cost. More than half of the COD, including dark brown pigments, could not beutilized by P. aeruginosa GIM32. A similar result was reported of only 31% of CODreduction by Hansenula for single cell protein production [7]. Co-culturing P. aeruginosa anda decolorization microorganism strain may alleviate this problem by further enhancing COD
Fig. 3 The fermentation process course in half-strength molasses distillery wastewater. COD (squares),rhamnolipid production (circles), and dry cell weight (triangles) were measured every other 12 h duringincubation time
Appl Biochem Biotechnol

Palm oi
l
Soybea
n oil
Peanut o
il
Diesel
Gasoli
ne
Toluen
e
Liquid
paraf
fin0
10
20
30
40
50
60
70
80
90
100
Organic matters type
Em
ulsi
fica
tion
inde
x (%
)
Fig. 4 Emulsification index of the rhamnolipids with various organic matters
4000 3000 2000 1000 00
20
40
60
80
100
CH2, CH
3
Tra
nsm
itta
nce
(%)
Wavenumbers (cm-1)
1051
3364
2927
2855
1738
1651
O-H
C=O
COO-
C-O-C
Fig. 5 Fourier transform infrared (FTIR) transmittance spectrum of rhamnolipids
Appl Biochem Biotechnol

and the color removal rate at the same time; this would be similar to the combinedSaccharomyces cerevisiae and Coriolus versicolor treatment process [24].
Characterization of Rhamnolipids Produced from Molasses Distillery Wastewaterby P Aeruginosa GIM32
The emulsification index of the rhamnolipids for non-polar organic solvents was shown inFig. 4. The emulsification indexes reached 71–73% with vegetable oils, suggesting apotential application as a cleaning and emulsifying agent in the food industry. Moreover,the emulsification indexes for diesel (68%) and gasoline (64%) suggested that thisrhamnolipid product has the potential to be applied in bioremediation and oil recovery.
Table 2 Structure and relative abundances of rhamnolipids homologues produced from molasses distillerywastewater by P. aeruginosa GIM32
Molecularweight
Possible chemical structure Fragment ions Relative abundance(%)
479 RhaRhaC10 Rha,C10 0.7
503 RhaC10C10 RhaC10, C10C10, C10 14.1
529 RhaC10C12:1 RhaC10, C10C12:1, C12:1, C10 3.5
531 RhaC10C12,RhaC12C10 RhaC12, RhaC10, C10C12, C12, C10 5.8
593 RhaRhaC8C8 RhaRhaC10C6 RhaRhaC8, RhaRhaC10 0.5
621 RhaRhaC8C10, RhaRhaC10C8 RhaRha C8, RhaRhaC10 13.0
647 RhaRhaC10C10:1,
RhaRhaC8C12:1
RhaRhaC10,RhaRhaC8 1.9
649 RhaRhaC10C10 RhaRhaC10, C10C10 32.6
675 RhaRhaC10C12:1 RhaRhaC10 12.0
677 RhaRhaC10C12,
RhaRhaC12C10
RhaRhaC10, RhaRhaC12, C10C12,C12
13.3
705 RhaRhaC12C12,
RhaRhaC14C10
RhaRhaC12, RhaRhaC14, C14C10,C12C12
2.6
Fig. 6 Possible structure of rhamnolipids fragment ions at m/z 649 identified by tandem mass spectrometry
Appl Biochem Biotechnol
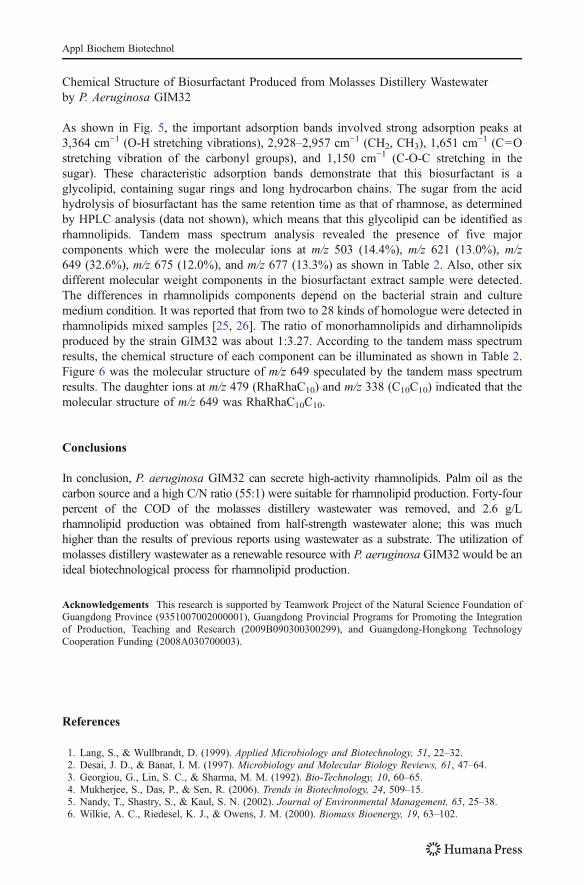
Chemical Structure of Biosurfactant Produced from Molasses Distillery Wastewaterby P. Aeruginosa GIM32
As shown in Fig. 5, the important adsorption bands involved strong adsorption peaks at3,364 cm−1 (O-H stretching vibrations), 2,928–2,957 cm−1 (CH2, CH3), 1,651 cm−1 (C=Ostretching vibration of the carbonyl groups), and 1,150 cm−1 (C-O-C stretching in thesugar). These characteristic adsorption bands demonstrate that this biosurfactant is aglycolipid, containing sugar rings and long hydrocarbon chains. The sugar from the acidhydrolysis of biosurfactant has the same retention time as that of rhamnose, as determinedby HPLC analysis (data not shown), which means that this glycolipid can be identified asrhamnolipids. Tandem mass spectrum analysis revealed the presence of five majorcomponents which were the molecular ions at m/z 503 (14.4%), m/z 621 (13.0%), m/z649 (32.6%), m/z 675 (12.0%), and m/z 677 (13.3%) as shown in Table 2. Also, other sixdifferent molecular weight components in the biosurfactant extract sample were detected.The differences in rhamnolipids components depend on the bacterial strain and culturemedium condition. It was reported that from two to 28 kinds of homologue were detected inrhamnolipids mixed samples [25, 26]. The ratio of monorhamnolipids and dirhamnolipidsproduced by the strain GIM32 was about 1:3.27. According to the tandem mass spectrumresults, the chemical structure of each component can be illuminated as shown in Table 2.Figure 6 was the molecular structure of m/z 649 speculated by the tandem mass spectrumresults. The daughter ions at m/z 479 (RhaRhaC10) and m/z 338 (C10C10) indicated that themolecular structure of m/z 649 was RhaRhaC10C10.
Conclusions
In conclusion, P. aeruginosa GIM32 can secrete high-activity rhamnolipids. Palm oil as thecarbon source and a high C/N ratio (55:1) were suitable for rhamnolipid production. Forty-fourpercent of the COD of the molasses distillery wastewater was removed, and 2.6 g/Lrhamnolipid production was obtained from half-strength wastewater alone; this was muchhigher than the results of previous reports using wastewater as a substrate. The utilization ofmolasses distillery wastewater as a renewable resource with P. aeruginosa GIM32 would be anideal biotechnological process for rhamnolipid production.
Acknowledgements This research is supported by Teamwork Project of the Natural Science Foundation ofGuangdong Province (9351007002000001), Guangdong Provincial Programs for Promoting the Integrationof Production, Teaching and Research (2009B090300300299), and Guangdong-Hongkong TechnologyCooperation Funding (2008A030700003).
References
1. Lang, S., & Wullbrandt, D. (1999). Applied Microbiology and Biotechnology, 51, 22–32.2. Desai, J. D., & Banat, I. M. (1997). Microbiology and Molecular Biology Reviews, 61, 47–64.3. Georgiou, G., Lin, S. C., & Sharma, M. M. (1992). Bio-Technology, 10, 60–65.4. Mukherjee, S., Das, P., & Sen, R. (2006). Trends in Biotechnology, 24, 509–15.5. Nandy, T., Shastry, S., & Kaul, S. N. (2002). Journal of Environmental Management, 65, 25–38.6. Wilkie, A. C., Riedesel, K. J., & Owens, J. M. (2000). Biomass Bioenergy, 19, 63–102.
Appl Biochem Biotechnol

7. Shojaosadati, S. A., Khalilzadeh, R., Jalilzadeh, A., & Sanaei, H. R. (1999). Resources, Conservationand Recycling, 27, 125–38.
8. Jain, D. K., Collinsthompson, D. L., Lee, H., & Trevors, J. T. (1991). Journal of MicrobiologicalMethods, 13, 271–79.
9. Dubois, M., Gilles, K. A., Hamilton, J. K., Rebers, P. A., & Smith, F. (1956). Analytical Chemistry, 28,350–56.
10. Deziel, E., Lepine, F., Milot, S., & Villemur, R. (2000). Biochimica Et Biophysica Acta Molecular andCell Biology of Lipids, 1485, 145–52.
11. Soberon-Chavez, G., Lepine, F., & Deziel, E. (2005). Applied Microbiology and Biotechnology, 68, 718–25.12. Perfumo, A., Banat, I. M., Canganella, F., & Marchant, R. (2006). Applied Microbiology and
Biotechnology, 72, 132–38.13. Maier, R. M., & Soberon-Chavez, G. (2000). Applied Microbiology and Biotechnology, 54, 625–33.14. Zhu, Y., Gan, J. J., Zhang, G. L., Yao, B., Zhu, W. J., & Meng, Q. (2007). Journal of Zhejiang University
Science A, 8, 1514–20.15. Sim, L., Ward, O. P., & Li, Z. Y. (1997). Journal of Industrial Microbiology & Biotechnology, 19, 232–38.16. Abalos, A., Maximo, F., Manresa, M. A., & Bastida, J. (2002). Journal of Chemical Technology and
Biotechnology, 77, 777–84.17. Lee, K. M., Hwang, S. H., Ha, S. D., Jang, J. H., Lim, D. J., & Kong, J. Y. (2004). Biotechnology and
Bioprocess Engineering, 9, 267–73.18. Wu, J. Y., Yeh, K. L., Lu, W. B., Lin, C. L., & Chang, J. S. (2008). Bioresource Technology, 99, 1157–64.19. Lee, Y., Lee, S. Y., & Yang, J. W. (1999). Bioscience, Biotechnology, and Biochemistry, 63, 946–47.20. Dubey, K., & Juwarkar, A. (2001). World Journal of Microbiology & Biotechnology, 17, 61–69.21. Patel, R. M., & Desai, A. J. (1997). Letters in Applied Microbiology, 25, 91–94.22. Wei, Y. H., Chou, C. L., & Chang, J. S. (2005). Biochemical Engineering Journal, 27, 146–54.23. Trummler, K., Effenberger, F., & Syldatk, C. (2003). European Journal of Lipid Science and Technology,
105, 563–71.24. Jia, C. Y., Kang, R. J., Zhang, Y. H., Cong, W., & Cai, Z. L. (2007). Bioresource Technology, 98, 967–70.25. Deziel, E., Lepine, F., Dennie, D., Boismenu, D., Mamer, O. A., & Villemur, R. (1999). Biochimica Et
Biophysica Acta-Molecular and Cell Biology of Lipids, 1440, 244–52.26. Thanomsub, B., Pumeechockchai, W., Limtrakul, A., Arunrattiyakorn, P., Petchleelaha, W., Nitoda, T., et al.
(2006). Bioresource Technology, 97, 2457–61.
Appl Biochem Biotechnol