Exchange of polycyclic aromatic hydrocarbons among the atmosphere, water, and sediment in coastal...
10
EXCHANGE OF POLYCYCLIC AROMATIC HYDROCARBONS AMONG THE ATMOSPHERE, WATER, AND SEDIMENT IN COASTAL EMBAYMENTS OF SOUTHERN CALIFORNIA, USA LISA D. SABIN,*y KEITH A. MARUYA, y WENJIAN LAO, y DARIO DIEHL, y DAVID TSUKADA, y KEITH D. STOLZENBACH, z and KENNETH C. SCHIFF y ySouthern California Coastal Water Research Project, 3535 Harbor Boulevard, Suite 110, Costa Mesa, California 92626, USA zDepartment of Civil and Environmental Engineering, 5732J Boelter Hall, University of California, Los Angeles, California 90095-1593, USA (Submitted 16 April 2009; Returned for Revision 2 June 2009; Accepted 2 September 2009) Abstract —The present study investigated cross-media transport between both the sediment and the water column and between the water column and the atmosphere, to understand the role of each compartment as a source or a sink of polycyclic aromatic hydrocarbons (PAH) in southern California, USA, coastal waters. Concentrations of PAH were measured in the atmosphere, water column, and sediment at four water-quality-impaired sites in southern California: Ballona Creek Estuary, Los Angeles Harbor, Upper Newport Bay, and San Diego Bay. These concentrations were used to calculate site-specific sediment–water and atmosphere–water exchange fluxes. The net sediment–water exchange of total PAH (t-PAH) was positive, indicating that sediments were a source to the overlying water column. Furthermore, the net atmosphere–water exchange (gas exchange þ dry particle deposition) of t-PAH was typically positive also, indicating the water column was a net source of PAH to the surrounding atmosphere through gas exchange. However, in all cases, the magnitude of the diffusive flux of PAH out of the sediments and into the water column far exceeded input or output of PAH through air/ water exchange processes. These results demonstrate the potential importance of contaminated sediments as a source of PAH to the water column in coastal waters of southern California. Environ. Toxicol. Chem. 2010;29:265–274. # 2009 SETAC Keywords —Atmospheric deposition Sediment flux Polycyclic aromatic hydrocarbon INTRODUCTION Polycyclic aromatic hydrocarbons (PAH) are directly emitted into the atmosphere and discharged into water bodies and may accumulate in coastal estuarine and marine sediments [1–3]. Anthropogenic sources of PAH in the atmosphere are primarily from fossil fuel combustion (e.g., gasoline and diesel vehicle exhaust, power plant, and industrial emissions). Anthro- pogenic sources to the water and sediment include atmospheric deposition, direct discharges of petroleum products from shipping activities to coastal waters, industrial and wastewater sources, and urban stormwater runoff [4–7]. Managing PAH levels in contaminated water bodies requires understanding of the transport among the atmosphere, water column, and bottom sediments. In other regions, a number of studies have investigated the role of the atmosphere as a potential source of PAH to polluted water bodies, especially near urban centers [8–12]. Significant research has been conducted on the accumulation of PAH in sediments, partitioning between the sediment and porewater and exchange between the overlying water and contaminated bottom sediments [5,13–22]. However, few studies offer synoptic measurements to calculate both the air–water and the sediment–water exchange fluxes for a given water body. Furthermore, no studies have been conducted on atmospheric deposition of PAH in the coastal waters of southern California, USA. The Southern California Bight (SCB) is located adjacent to the second most populous region in the United States, including the cities of Los Angeles and San Diego. This region has some of the worst air quality in the nation, with high atmospheric concentrations of PAH. Furthermore, coastal urban embay- ments within the SCB are enriched in PAH relative to near- shore coastal waters [1]. A recent survey of sediments in the SCB found more than 70% of the SCB area was contaminated with anthropogenic organic compounds, including PAH, and the highest concentrations were associated with bays, harbors, and estuaries [23]. In contrast to the legacy organochlorines (e.g., DDT and polychlorinated biphenyl), which have been banned from production and use for nearly three decades, PAH continue to be introduced into the southern California environ- ment via multiple sources. The goal of the present study was to examine the potential importance of different environmental compartments as sources or sinks of PAH in the SCB. The objectives were to characterize the distribution of PAH in the atmosphere, the water column, and the sediment and to quantify the magnitude and direction of exchange among these compartments in selected bays, harbors, and estuaries of the SCB. MATERIALS AND METHODS Concentrations of PAH were measured in the atmosphere (gas and particle phase), the water column (dissolved and sorbed to suspended particulate matter [SPM]), and the surface sediment, along with measurements of total suspended solids (TSS) and total organic carbon at four sites in the SCB. From these measurements, fluxes between compartments were Environmental Toxicology and Chemistry, Vol. 29, No. 2, pp. 265–274, 2010 # 2009 SETAC Printed in the USA DOI: 10.1002/etc.54 * To whom correspondence may be addressed ([email protected]). Published online 4 November 2009 in Wiley InterScience (www.interscience.wiley.com). 265
-
Upload
independent -
Category
Documents
-
view
1 -
download
0
Transcript of Exchange of polycyclic aromatic hydrocarbons among the atmosphere, water, and sediment in coastal...

Environmental Toxicology and Chemistry, Vol. 29, No. 2, pp. 265–274, 2010# 2009 SETAC
Printed in the USADOI: 10.1002/etc.54
EXCHANGE OF POLYCYCLIC AROMATIC HYDROCARBONS AMONG THE ATMOSPHERE,
WATER, AND SEDIMENT IN COASTAL EMBAYMENTS OF SOUTHERN CALIFORNIA, USALISA D. SABIN,*y KEITH A. MARUYA,y WENJIAN LAO,y DARIO DIEHL,y DAVID TSUKADA,y KEITH D. STOLZENBACH,zand KENNETH C. SCHIFFy
ySouthern California Coastal Water Research Project, 3535 Harbor Boulevard, Suite 110, Costa Mesa, California 92626, USA
zDepartment of Civil and Environmental Engineering, 5732J Boelter Hall, University of California, Los Angeles, California 90095-1593, USA
(Submitted 16 April 2009; Returned for Revision 2 June 2009; Accepted 2 September 2009)
* T(lisas@
Pub(www.
Abstract—The present study investigated cross-media transport between both the sediment and the water column and between the watercolumn and the atmosphere, to understand the role of each compartment as a source or a sink of polycyclic aromatic hydrocarbons (PAH)in southern California, USA, coastal waters. Concentrations of PAH were measured in the atmosphere, water column, and sediment atfour water-quality-impaired sites in southern California: Ballona Creek Estuary, Los Angeles Harbor, Upper Newport Bay, and SanDiego Bay. These concentrations were used to calculate site-specific sediment–water and atmosphere–water exchange fluxes. The netsediment–water exchange of total PAH (t-PAH) was positive, indicating that sediments were a source to the overlying water column.Furthermore, the net atmosphere–water exchange (gas exchangeþ dry particle deposition) of t-PAH was typically positive also,indicating the water column was a net source of PAH to the surrounding atmosphere through gas exchange. However, in all cases, themagnitude of the diffusive flux of PAH out of the sediments and into the water column far exceeded input or output of PAH through air/water exchange processes. These results demonstrate the potential importance of contaminated sediments as a source of PAH to thewater column in coastal waters of southern California. Environ. Toxicol. Chem. 2010;29:265–274. # 2009 SETAC
Keywords—Atmospheric deposition Sediment flux Polycyclic aromatic hydrocarbon
INTRODUCTION
Polycyclic aromatic hydrocarbons (PAH) are directly
emitted into the atmosphere and discharged into water bodies
and may accumulate in coastal estuarine and marine sediments
[1–3]. Anthropogenic sources of PAH in the atmosphere are
primarily from fossil fuel combustion (e.g., gasoline and diesel
vehicle exhaust, power plant, and industrial emissions). Anthro-
pogenic sources to the water and sediment include atmospheric
deposition, direct discharges of petroleum products from
shipping activities to coastal waters, industrial and wastewater
sources, and urban stormwater runoff [4–7]. Managing PAH
levels in contaminated water bodies requires understanding of
the transport among the atmosphere, water column, and bottom
sediments.
In other regions, a number of studies have investigated the
role of the atmosphere as a potential source of PAH to polluted
water bodies, especially near urban centers [8–12]. Significant
research has been conducted on the accumulation of PAH in
sediments, partitioning between the sediment and porewater
and exchange between the overlying water and contaminated
bottom sediments [5,13–22]. However, few studies offer
synoptic measurements to calculate both the air–water and
the sediment–water exchange fluxes for a given water body.
Furthermore, no studies have been conducted on atmospheric
deposition of PAH in the coastal waters of southern California,
USA.
o whom correspondence may be addressedsccwrp.org).
lished online 4 November 2009 in Wiley InterScienceinterscience.wiley.com).
265
The Southern California Bight (SCB) is located adjacent to
the second most populous region in the United States, including
the cities of Los Angeles and San Diego. This region has some
of the worst air quality in the nation, with high atmospheric
concentrations of PAH. Furthermore, coastal urban embay-
ments within the SCB are enriched in PAH relative to near-
shore coastal waters [1]. A recent survey of sediments in the
SCB found more than 70% of the SCB area was contaminated
with anthropogenic organic compounds, including PAH, and
the highest concentrations were associated with bays, harbors,
and estuaries [23]. In contrast to the legacy organochlorines
(e.g., DDT and polychlorinated biphenyl), which have been
banned from production and use for nearly three decades, PAH
continue to be introduced into the southern California environ-
ment via multiple sources.
The goal of the present study was to examine the potential
importance of different environmental compartments as sources
or sinks of PAH in the SCB. The objectives were to characterize
the distribution of PAH in the atmosphere, the water column,
and the sediment and to quantify the magnitude and direction of
exchange among these compartments in selected bays, harbors,
and estuaries of the SCB.
MATERIALS AND METHODS
Concentrations of PAH were measured in the atmosphere
(gas and particle phase), the water column (dissolved and
sorbed to suspended particulate matter [SPM]), and the surface
sediment, along with measurements of total suspended solids
(TSS) and total organic carbon at four sites in the SCB. From
these measurements, fluxes between compartments were
Karlenem
Text Box
SCCWRP #0608

266 Environ. Toxicol. Chem. 29, 2010 L.D. Sabin et al.
estimated, including gas exchange between the atmosphere and
the water column, dry deposition of particles from the atmos-
phere to the water surface, sedimentation of SPM in the water
column to the bottom sediment, and diffusive flux between
sediment pore water and the water column. Gas exchange was
estimated based on a modified two-film transfer model with
inputs of wind speed and Henry’s Law constants. For sediment–
water exchange, pore-water concentrations were estimated from
measured sediment concentrations and the organic-carbon nor-
malized partition coefficient. A simple diffusive flux model
based on concentration gradients between pore water and the
water column was used to calculate the exchange flux. Dry
deposition and sedimentation fluxes were estimated from meas-
ured concentrations and assumed deposition and sedimentation
velocities, respectively.
Sample collection
Four coastal estuaries within the SCB were sampled for PAH
during the summer and fall of 2006 (Fig. 1). All study sites were
located near urban areas with varying degrees of local con-
taminant sources and historical sources of PAH, and all sites are
listed as impaired on the State of California 303(d) list because
of elevated levels of PAH in fish tissue, sediment, and/or the
water column [24]. The Ballona Creek Estuary (BCE) site,
adjacent to Santa Monica Bay, is primarily urbanized, with no
Fig. 1. Map of sample collection sites (CA, USA) for air, water, and sediment. BCBay; SDB, San Diego Bay.
permitted wastewater or industrial discharges. The Los Angeles
Harbor (LAH) site, adjacent to a heavily urbanized area, is the
largest commercial port in the United States. The Upper New-
port Bay (UNB) site is the largest coastal wetland in southern
California and drains a watershed that is primarily residential/
commercial [7]. The San Diego Bay (SDB) site is home to one
of the largest naval facilities in the United States and is also
adjacent to a large urban area.
All air samples were collected at land-based sites selected to
be generally representative of PAH sources near the target water
bodies, and not influenced by other sources not present at the
water bodies themselves. Air samples for BCE were collected
on a rooftop approximately 4 km directly south of the estuary, at
a coastal site upwind of urban PAH sources. Similarly to the
estuary, this location was influenced predominantly by onshore
flow of marine air. Air samples for the LAH site were collected
at an existing South Coast Air Quality Management District
(SCAQMD) site located 3 km directly downwind of the inner
harbor. The PAH sources near this site were predominantly the
same as those at the Inner Harbor where the water/sediment
samples were collected, which was located in the Consolidated
Slip shipping basin, near the mouth of Dominguez Channel. Air
samples for the UNB site were collected inside the University of
California, Irvine, Marsh Reserve, located 2 km directly down-
wind of the water/sediment collection site inside the bay, near
E, Ballona Creek Estuary; LAH, Los Angeles Harbor; UNB, Upper Newport

Table 1. Site specific sampling informationa
Site MatrixNo. samples
collectedCollectiondate(s) (2006)
Airtemperature (8C)
Windspeed (m/s)
Total suspendedsolids (mg/L)
Sediment totalorganic carbon
Ballona Creek Estuary,CA, USA
Air 1 Oct 31–2 Nov 20� 4 3.4� 0.8Water 1 Aug 6 4.9Sediment 3 Jul 13 1.1%
Jul 25Sep 25
Los Angeles Harbor,CA, USA
Air 3 Sept 19–21 20� 2 2.0� 0.5Oct 18–20Oct 24–26
Water 3 Sept 11–18 5.1� 1.7Sept 22–25Nov 13–18
Sediment 4 Sep 18 5.6%� 0.3%Sep 14Sep 22Oct 22
Upper Newport Bay,CA, USA
Air 1 Aug 16–18 24� 4 2.2� 0.3Water 1 Jul 22 18Sediment 4 Jul 22 1.3%
San Diego Bay,CA, USA
Air 1 Sept 27–29 21� 1 2.8� 0.6Water 2 Sept 15–18 1.1� 0.7
Sept 27–Oct 1Sediment 2 Sep 15 2.91%
a Mean� standard deviation for temperature, wind speed, total suspended solids, and sediment total organic carbon.
Multimedia exchange of PAH in southern California coastal waters Environ. Toxicol. Chem. 29, 2010 267
the mouth of San Diego Creek. Air samples for the SDB site
were collected from the roof of the San Diego Naval Station,
adjacent to the bay, approximately 30 m from where the water/
sediment samples were collected inside the bay at the mouth of
Chollas Creek.
Each site was sampled at least once in each compartment
(air, water, and sediment; Table 1). Daily meteorological data
(temperature and wind speed) were obtained from nearby
National Weather Service stations (Los Angeles International
Airport, Long Beach Airport, John Wayne Airport, and San
Diego Lindbergh Field for BCE, LAH, UNB, and SDB, respec-
tively; National Climatic Data Center [NCDC], 2006; http://
www.ncdc.noaa.gov/oa.ncdc.html).
Air samples were collected using a high-volume sampler
(Anderson Instruments) equipped with a quartz fiber filter
(QFF; Whatman; 0.7-mm pore size) to collect particle-phase
compounds, followed by a polyurethane foam (PUF) plug (7 cm
long and 6 cm in diameter) held in a glass sleeve to collect gas-
phase compounds. The gas phase was operationally defined as
the concentration retained on the PUF. A sample flow rate of
0.25 m3/min was used over a period of 24 to 48 h. Prior to
sampling, QFFs were wrapped in aluminum foil and baked at
4258C for 6 h, then stored in hexane-rinsed aluminum-foil-lined
Petri dishes. Polyurethane foam plugs were cleaned by extrac-
tion with pesticide-grade acetone for 24 h, followed by extrac-
tion using 10% diethyl ether/90% n-hexane mixture for 4 h,
dried, then stored in precleaned glass jars with hexane-rinsed,
aluminum-foil-lined lids. After sampling, the QFFs and PUFs
were returned to their original jars, wrapped in aluminum foil,
transported to the laboratory in an ice chest, and stored at 48C.
Water column samples for the dissolved phase, operationally
defined as filtrates passing through a 0.7-mm glass fiber filter
(GFF), and the particle phase were collected with an Infiltrex
100 in situ water pumping system (Axys Environmental Sys-
tems), described in detail previously [25]. Briefly, water is
continuously pumped through a stack of eight GFFs (Whatman;
0.7-mm pore size) to retain particles and a polytetrafluoro-
ethylene (PTFE) column packed with XAD-II resin (Supelco)
to extract dissolved organics. The pump was positioned in the
water column 1 m above the sediment–water interface. The unit
was anchored on the seafloor by two iron chain links and
suspended in the water column with a subsurface float. The
pump flow rate was set at 200 to 400 ml/min. After sampling,
the PTFE column was processed within 24 h, and GFFs were
stored at �208C.
Discrete water samples were collected with 5-L Niskin
bottles for determination of TSS. Discrete samples were imme-
diately sealed in containers with Teflon1-lined lids and trans-
ported to the laboratory on ice, then stored at 48C.
Surface sediment (top 5 cm) was collected with either a
stainless-steel modified Van Veen or petite Ponar grab and
transferred into precleaned 500-ml glass jars. One grab per site
was collected on each day of sampling. The sediment samples
were placed on ice for transport and then stored in the laboratory
at �208C.
Analytical procedures
In total, 28 individual PAH with two to six rings were
targeted in the present study (Table 2). Total PAH (t-PAH)
was defined as the sum of these 28 compounds.
All laboratory glassware was washed with soap and water,
rinsed with deionized water, and kilned at approximately 5008Cfor at least 4 h. Sediment samples were freeze-dried before
extraction. The PTFE columns with XAD-II resin were eluted
with dichloromethane (DCM). The glass fiber filters and QFFs
were extracted with DCM using an ASE300 accelerated solvent
extraction system (Dionex). Extraction conditions were as
follows: 1008C, 1,500 psi, stationary time 5 min, flushing
volume 60%. Three extraction cycles were carried out for each
sample. The PUF samples were Soxhlet extracted with
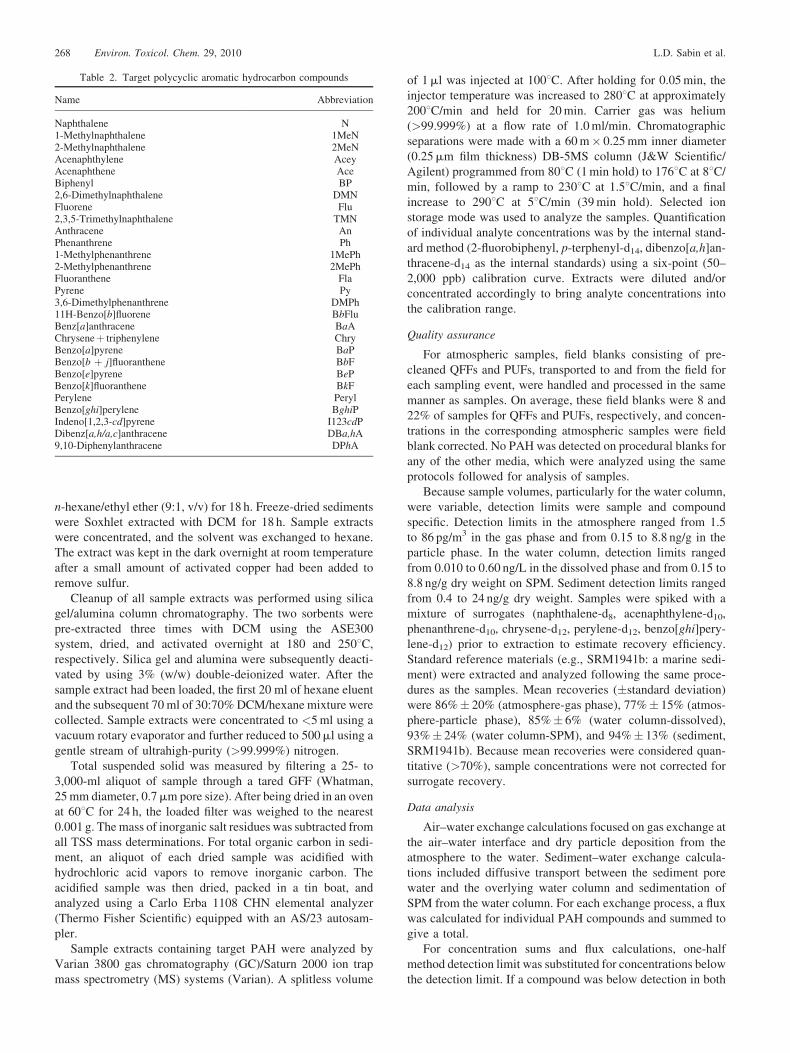
Table 2. Target polycyclic aromatic hydrocarbon compounds
Name Abbreviation
Naphthalene N1-Methylnaphthalene 1MeN2-Methylnaphthalene 2MeNAcenaphthylene AceyAcenaphthene AceBiphenyl BP2,6-Dimethylnaphthalene DMNFluorene Flu2,3,5-Trimethylnaphthalene TMNAnthracene AnPhenanthrene Ph1-Methylphenanthrene 1MePh2-Methylphenanthrene 2MePhFluoranthene FlaPyrene Py3,6-Dimethylphenanthrene DMPh11H-Benzo[b]fluorene BbFluBenz[a]anthracene BaAChryseneþ triphenylene ChryBenzo[a]pyrene BaPBenzo[b þ j]fluoranthene BbFBenzo[e]pyrene BePBenzo[k]fluoranthene BkFPerylene PerylBenzo[ghi]perylene BghiPIndeno[1,2,3-cd]pyrene I123cdPDibenz[a,h/a,c]anthracene DBa,hA9,10-Diphenylanthracene DPhA
268 Environ. Toxicol. Chem. 29, 2010 L.D. Sabin et al.
n-hexane/ethyl ether (9:1, v/v) for 18 h. Freeze-dried sediments
were Soxhlet extracted with DCM for 18 h. Sample extracts
were concentrated, and the solvent was exchanged to hexane.
The extract was kept in the dark overnight at room temperature
after a small amount of activated copper had been added to
remove sulfur.
Cleanup of all sample extracts was performed using silica
gel/alumina column chromatography. The two sorbents were
pre-extracted three times with DCM using the ASE300
system, dried, and activated overnight at 180 and 2508C,
respectively. Silica gel and alumina were subsequently deacti-
vated by using 3% (w/w) double-deionized water. After the
sample extract had been loaded, the first 20 ml of hexane eluent
and the subsequent 70 ml of 30:70% DCM/hexane mixture were
collected. Sample extracts were concentrated to <5 ml using a
vacuum rotary evaporator and further reduced to 500ml using a
gentle stream of ultrahigh-purity (>99.999%) nitrogen.
Total suspended solid was measured by filtering a 25- to
3,000-ml aliquot of sample through a tared GFF (Whatman,
25 mm diameter, 0.7mm pore size). After being dried in an oven
at 608C for 24 h, the loaded filter was weighed to the nearest
0.001 g. The mass of inorganic salt residues was subtracted from
all TSS mass determinations. For total organic carbon in sedi-
ment, an aliquot of each dried sample was acidified with
hydrochloric acid vapors to remove inorganic carbon. The
acidified sample was then dried, packed in a tin boat, and
analyzed using a Carlo Erba 1108 CHN elemental analyzer
(Thermo Fisher Scientific) equipped with an AS/23 autosam-
pler.
Sample extracts containing target PAH were analyzed by
Varian 3800 gas chromatography (GC)/Saturn 2000 ion trap
mass spectrometry (MS) systems (Varian). A splitless volume
of 1ml was injected at 1008C. After holding for 0.05 min, the
injector temperature was increased to 2808C at approximately
2008C/min and held for 20 min. Carrier gas was helium
(>99.999%) at a flow rate of 1.0 ml/min. Chromatographic
separations were made with a 60 m� 0.25 mm inner diameter
(0.25mm film thickness) DB-5MS column (J&W Scientific/
Agilent) programmed from 808C (1 min hold) to 1768C at 88C/
min, followed by a ramp to 2308C at 1.58C/min, and a final
increase to 2908C at 58C/min (39 min hold). Selected ion
storage mode was used to analyze the samples. Quantification
of individual analyte concentrations was by the internal stand-
ard method (2-fluorobiphenyl, p-terphenyl-d14, dibenzo[a,h]an-
thracene-d14 as the internal standards) using a six-point (50–
2,000 ppb) calibration curve. Extracts were diluted and/or
concentrated accordingly to bring analyte concentrations into
the calibration range.
Quality assurance
For atmospheric samples, field blanks consisting of pre-
cleaned QFFs and PUFs, transported to and from the field for
each sampling event, were handled and processed in the same
manner as samples. On average, these field blanks were 8 and
22% of samples for QFFs and PUFs, respectively, and concen-
trations in the corresponding atmospheric samples were field
blank corrected. No PAH was detected on procedural blanks for
any of the other media, which were analyzed using the same
protocols followed for analysis of samples.
Because sample volumes, particularly for the water column,
were variable, detection limits were sample and compound
specific. Detection limits in the atmosphere ranged from 1.5
to 86 pg/m3 in the gas phase and from 0.15 to 8.8 ng/g in the
particle phase. In the water column, detection limits ranged
from 0.010 to 0.60 ng/L in the dissolved phase and from 0.15 to
8.8 ng/g dry weight on SPM. Sediment detection limits ranged
from 0.4 to 24 ng/g dry weight. Samples were spiked with a
mixture of surrogates (naphthalene-d8, acenaphthylene-d10,
phenanthrene-d10, chrysene-d12, perylene-d12, benzo[ghi]pery-
lene-d12) prior to extraction to estimate recovery efficiency.
Standard reference materials (e.g., SRM1941b: a marine sedi-
ment) were extracted and analyzed following the same proce-
dures as the samples. Mean recoveries (�standard deviation)
were 86%� 20% (atmosphere-gas phase), 77%� 15% (atmos-
phere-particle phase), 85%� 6% (water column-dissolved),
93%� 24% (water column-SPM), and 94%� 13% (sediment,
SRM1941b). Because mean recoveries were considered quan-
titative (>70%), sample concentrations were not corrected for
surrogate recovery.
Data analysis
Air–water exchange calculations focused on gas exchange at
the air–water interface and dry particle deposition from the
atmosphere to the water. Sediment–water exchange calcula-
tions included diffusive transport between the sediment pore
water and the overlying water column and sedimentation of
SPM from the water column. For each exchange process, a flux
was calculated for individual PAH compounds and summed to
give a total.
For concentration sums and flux calculations, one-half
method detection limit was substituted for concentrations below
the detection limit. If a compound was below detection in both

Multimedia exchange of PAH in southern California coastal waters Environ. Toxicol. Chem. 29, 2010 269
air and water for gas exchange, or both water and sediment for
diffusive sediment–water exchange, no flux calculation was
made.
Gas exchange model
Calculations of gas exchange between the atmosphere and
the water were based on a modified two-film resistance model
[26,27]. In this model, the rate of transfer is controlled by
diffusion across the air–water interface. The net flux is
defined by
F ¼ kol ðCw � Ca=H0Þ (1)
where F is the net flux (ng/m2/day), kol is the overall mass transfer
coefficient (m/day), Cw and Ca are the dissolved and gaseous
phase concentrations (ng/m3) in water and air, respectively, and
H0 is the dimensionless Henry’s Law constant. The reciprocal of
kol is the sum of the resistance to mass transfer in the air and
water, as
1=kol ¼ 1=kw þ 1=ðka � H0Þ (2)
where kw and ka are the water-side and air-side mass transfer
coefficients, respectively. The following correlation was used to
calculate ka for H2O vapor [28]:
kaðH2OÞ � 0:2 � u10 þ 0:3 (3)
where kaðH2OÞ is the mass transfer coefficient in air for H2O (cm/
s), and u10 is the wind speed (m/s) above the water surface at
10 m.
The following equation was used to calculate kw for CO2
[29]:
kwðCO2Þ ¼ 0:45 � u101:64 (4)
where kwðCO2Þ is the mass transfer coefficient in water for CO2.
The relationships in Equations 3 and 4 have been used previously
by a number of researchers to calculate gas exchange of organic
compounds over water [30–32].
Because the rate of transfer is related to the molecular
diffusivity, these estimates for kaðH2OÞ and kwðCO2Þ allow pre-
diction of ka and kw for other compounds of interest with the
following relationships [28]:
kaðunknownÞ ¼ kaðH2OÞ � ½DaðunknownÞ=DaðH2OÞ�0:67(5)
where Da is the molecular diffusivity in air, and
kwðunknownÞ ¼ kwðCO2Þ � ½ScðunknownÞ=ScðCO2Þ��1=2
(6)
where Sc is the Schmidt number, calculated by dividing the
kinematic viscosity of seawater at 208C (cm2/s) by the molecular
diffusivity in water (Dw).
Mean air and water concentrations and mean wind speeds
from each site were used in the above equations to calculate the
net gas exchange flux at each site. Other inputs included the
temperature-dependent molecular diffusivities of individual
compounds in air (Da) and water (Dw) and temperature-dependent
Henry’s Law constants. The Da and Dw for 208C were
calculated based on the method of Fuller et al. [33] and Wilke
and Chang [34], respectively, employing the LeBas molar
volume estimates as needed. Temperature-corrected Henry’s
Law constants for 208C were obtained from Bamford et al. [35],
when reported, or otherwise from compiled chemical properties
[36].
Dry particle deposition model
Dry particle deposition was calculated from measured par-
ticle concentrations in the air and the particle deposition
velocity:
F ¼ Cp � Vd (7)
where F is the dry deposition flux (ng/m2/d), Cp (ng/m3) is the
particle-phase concentration of the compound in the air, and Vd
(cm/s) is the dry deposition velocity of the particles in the air. A
deposition velocity of 0.2 cm/s was used for the present study,
as recommended by the Integrated Atmospheric Deposition
Network [8].
Diffusive flux model
The model of diffusive exchange between the water column
and the sediment was based on Fick’s gradient-flux law, assum-
ing a well-mixed upper sediment layer (top 5 cm) and equili-
brium between the sediment and the porewater up to the
boundary layer. The flux across the sediment–water interface
was calculated as follows:
F ¼ ks ðCpw � CwÞ (8)
where F is the diffusive flux between the sediment and the water
column (ng/m2/day); Cw and Cpw are the water column and pore-
water concentrations (ng/m3), respectively; and ks (m/day) is the
sediment–water mass transfer coefficient. Compound specific ks
values were calculated as follows [28]:
ks ¼ Dw=h (9)
where Dw (m2/day) is the temperature-dependent molecular
diffusion coefficient and h (m) is the thickness of the boundary
layer. A typical value for h of 5� 10�4 m was used [28].
Sediment pore-water concentrations were calculated from
sediment concentrations as follows:
Cpw ¼ Csed=ðKOC � fOCÞ (10)
where Cpw (ng/m3) is the concentration in the pore water, Csed
(ng/g) is the concentration in the sediment, KOC (ml/g) is the
organic carbon normalized partition coefficient, and fOC is
the fraction of organic carbon in the sediment. The KOC values
were obtained from compiled chemical properties [37,38]. The
average value for sediments was used when available.
Sedimentation model
Sedimentation of organic compounds sorbed to SPM in the
water column was calculated analogously to the dry particle
deposition flux:
F ¼ Ws � Cs (11)
where Cs (ng/m3) is the sorbed concentration of organic
compound on SPM in the water column and Ws (m/day) is the
sedimentation velocity. A value of 1 m/day was used for Ws [39].

270 Environ. Toxicol. Chem. 29, 2010 L.D. Sabin et al.
RESULTS AND DISCUSSION
Sampling conditions and multimedia concentrations
Daily average wind speeds during atmospheric sampling at
the four sites ranged from 2.0 to 3.4 m/s, and daily average
temperatures ranged from 20 to 248C (Table 1). Mean TSS in
the water column ranged from 1.1 to 18 mg/L, and sediment
organic carbon ranged from 1.1 to 5.6% (Table 1). Detectable
concentrations of PAHs were found in air, water, and sediment
at all sites (Table 3).
Atmospheric concentrations of t-PAH (gasþ particle)
ranged from 3.6 to 28 ng/m3. The gas phase accounted for
90% of the total atmospheric concentrations at all sites. The
majority of the particle phase was made up of of four- to six-ring
PAH (56–83%), whereas the gas phase was dominated by two-
or three-ring PAH (55–73%), except at SDB (45%). Concen-
trations of individual PAH ranged from not detected (ND) to
11 ng/m3 in the gas phase and from ND to 0.68 ng/m3 in the
particle phase. The largest contributors to t-PAH
(gasþ particle) were phenanthrenes (parent and methylated),
fluoranthene, and pyrene (73–96%).
Water column concentrations of t-PAH ranged from 5.6 to
74 ng/L in the dissolved phase and from 3.3 to 72 ng/L on SPM.
Concentrations of individual PAH ranged from ND to 22 ng/L
in the dissolved phase and from ND to 17 ng/L on SPM. As
in the atmosphere, phenanthrenes (parent and methylated),
fluoranthene, and pyrene dominated water concentrations,
contributing between 57 and 70% in the dissolved phase and
between 48 and 78% in the sorbed phase. Most of the remaining
PAH on SPM was contributed by other four- to six-ring PAH
compounds (e.g., benzo[bþ j]fluoranthene, chrysene, etc.).
Concentrations of t-PAH in the sediment ranged from 657 to
11,000 ng/g dry weight. Four- to six-ring compounds dominated
(85–91%). Individual PAH concentrations in the sediment
ranged from ND to 1,600 ng/g dry weight. Typically, the largest
contributions were from fluoranthene (10–12%), pyrene (11–
18%), and chrysene (12–15% at all sites except UNB).
For all media, concentrations generally followed the pattern
of highest to lowest as follows: LAH > SDB > BCE > UNB.
Higher PAH concentrations, especially in the water and sedi-
ment at LAH and SDB, are not surprising, insofar as both water
bodies are heavily used for commercial and/or military shipping
Table 3. Polycyclic aromatic hydrocarbon (PAH) concentrations in each medium
Sitea Compoundb
Atmosphere
Gaseous (ng/m3) Particulate (ng/m3)
BCE t-PAH 15.5 1.712–3 ring PAH 8.6 0.414–6 ring PAH 6.9 1.3
LAH t-PAH 26� 9.4 2.06� 1.722–3 ring PAH 19� 5.5 0.36� 0.124–6 ring PAH 7.0� 3.9 1.7� 1.6
UNB t-PAH 3.3 0.2632–3 ring PAH 2.2 0.0534–6 ring PAH 1.1 0.21
SDB t-PAH 22 2.52–3 ring PAH 10 1.14–6 ring PAH 12 1.4
a BCE¼Ballona Creek Estuary, CA, USA; LAH¼Los Angeles Harbor, CA, USAb t-PAH¼ sum of the 28 target PAH compounds listed in Table 2. SPM¼ suspen
activities, and historical sediment contamination at these sites
has been well documented [16,19]. In addition, both LAH and
SDB are adjacent to heavily urbanized areas, with numerous
potential PAH sources, including atmospheric emissions (e.g.,
heavy-duty truck traffic, industrial activities, congested road-
ways), stormwater runoff draining highly urbanized watersheds
[1,6], and direct discharges (e.g., oil spills). Both UNB and BCE
are also adjacent to urban areas, but neither site had the
commercial/military shipping activities or heavy industrial
activities that were associated with LAH and SDB. Concen-
trations in all media at UNB were at least one order of
magnitude lower than at the other three sites. This was not
surprising, insofar as UNB is the watershed with the lowest
degree of urbanization and the greatest percentage of open
space among the sample sites by far.
The concentration ranges of PAH observed in the present
study were generally within the range of concentrations
reported elsewhere for urban areas (Table 4). The highest air
concentrations of PAH in southern California were approxi-
mately 20 to 40% lower than those in other highly urban coastal
areas (San Francisco, Baltimore, New York–New Jersey), but
dissolved water concentrations were nearly twice as high at
LAH compared with Baltimore Harbor, seven times higher than
those in San Francisco Estuary, and similar to those in New
York Harbor. Sediment concentrations in the present study were
generally within the range observed in these same urban
harbors.
PAH distributions and sources
With few exceptions, the distributions of PAH compounds
within the same medium were similar across sites, indicating a
similar mix of sources within a given medium across the region.
PAH distributions within the same medium were strongly
correlated between LAH and SDB for both sediment and water
column (both dissolved and on SPM; r> 0.93, p< 0.001).
Moderate to strong correlations within the same medium were
found across most sites for the atmosphere and the water column
(0.47 < r < 0.98, p< 0.01). Exceptions included SDB and UNB,
which were not significantly correlated ( p> 0.15) with other
sites in the atmospheric particle phase (SDB) and water column
(UNB).
by site (mean concentrations� standard deviation are given where n > 1)
Water column
Sediment (g dry wt)Dissolved (ng/L) SPM (ng/L)
10.6 19.2 2,460� 3,1205.1 14 360� 4205.5 5.2 2,100� 2,700
74� 15.1 72� 31 11,000� 1,28036� 7.7 28� 12 1,500� 18038� 7.4 44� 19 9,500� 1,100
5.6 3.3 657� 2562.9 1.9 77� 252.7 1.4 580� 230
53� 4.8 44� 41.1 6,740� 53620� 3.5 31� 33 640� 7633� 1.3 13� 8.1 6,100� 460
; UNB¼Upper Newport Bay, CA, USA; SDB¼San Diego Bay, CA, USA.ded particulate matter.

Table 4. Comparison of total polycyclic aromatic hydrocarbon (t-PAH) concentrations in the atmopshere, water column, and sediment
Southern California,USAa
San FranciscoEstuary, CA, USAb,c
Baltimore Harbor,MD, USAd,e,f
New York/New Jersey Harbor,USAg,h
AtmosphereGas phase (ng/m3) 3.3–26 6.7–31 39 13–44Particle phase (ng/m3) 0.26–2.5 2.1 0.83–3.0
Water columnDissolved (ng/m3) 5,600–74,000 6,633–10,859 44,820 10,677–72,183
Sediment (ng/g dry wt) 657–11,000 955–3,884 90–46,200 5,887
a This study; range of site means.b Tsai et al. [42]; air t-PAH¼ 39, dissolved water t-PAH¼ 26.c Pereira et al. [43]; sediment t-PAH¼ 21; data reported for 0–10 cm depth only.d Dachs et al. [9]; air t-PAH¼ 24.e Bamford et al. [11]; dissolved water t-PAH¼ 13.f Ashley et al. [44]; sediment t-PAH¼ 32.g Gigliotti et al. [12]; air/water t-PAH¼ 36.h Lamoureux et al. [45]; sediment t-PAH¼ 26.
Multimedia exchange of PAH in southern California coastal waters Environ. Toxicol. Chem. 29, 2010 271
The distributions of PAH compounds across media within a
given site were also similar, again linking these compartments
and suggesting a similar mix of sources across media within a
site. In all cases, the strongest correlations between PAH
distributions across media were observed at LAH (0.58 < r< 0.75, p< 0.001). Moderate correlations were observed
between PAH distributions in the atmospheric gas phase and
the dissolved water column (r> 0.49, p< 0.008) except at SDB,
and the dissolved water column and the sediment pore water
(0.411 < r < 0.72, p< 0.03) at all sites. Moderate correlations
were also observed between PAH distributions in the sediment
and on SPM (0.45 < r< 0.75, p< 0.02) at all sites.
Differentiation between major source categories (pyrogenic
vs petrogenic) was evaluated through characteristic diagnostic
ratios (Fig. 2). With few exceptions, the diagnostic ratios used
were indicative of predominantly pyrolytic sources (e.g., com-
bustion) of PAH in the sediment and water column at most sites
0
0.05
0.1
0.15
0.2
0.25
0.3
00.40.20
Fla/(F
An/(An+Ph)
Petrogenic
SDB
SDB
Fig. 2. Polycyclic aromatic hydrocarbon diagnostic ratios. Fla, fluoranthene; Py, pyr0.4¼ petrogenic sources; An/(Anþ Ph)> 0.1¼ pyrogenic,< 0.1¼ petrogenic sour
(anthracene/(anthraceneþ phenanthrene) > 0.1 and fluoran-
thene/(fluorantheneþ pyrene) > 0.4) [40]. This is not surpris-
ing, in that the study sites are all located within/adjacent to large
urban centers, with an abundance of both current and historical
combustion emission sources of PAH, including atmospheric
emissions and watershed sources (e.g., runoff). The exception
was SDB, which had diagnostic ratios indicative of a mix of
petrogenic and pyrolytic sources both in the sediment and on
SPM. This suggests that, in addition to atmospheric and water-
shed sources of combustion-derived PAH, direct discharges of
petroleum products, such as oil spills/leaks (which are not
unexpected because of the large amount of shipping activities),
likely contributed to PAH concentrations in the bay as well.
Exchange between the atmosphere and the water column
The net gas exchange flux (volatilization–absorption) was
positive (net volatilization) at UNB, SDB, and LAH and
1.210.8.6
la+Py)
SedimentH2O-SPMH2O - dissAir-PM
Pyrogenic
ene; An, anthracene; Ph, phenanthrene. (Fla)/(FlaþPy)>0.4¼ pyrogenic,<ces. SDB, San Diego Bay (CA, USA) site; SPM, suspended particulate matter.
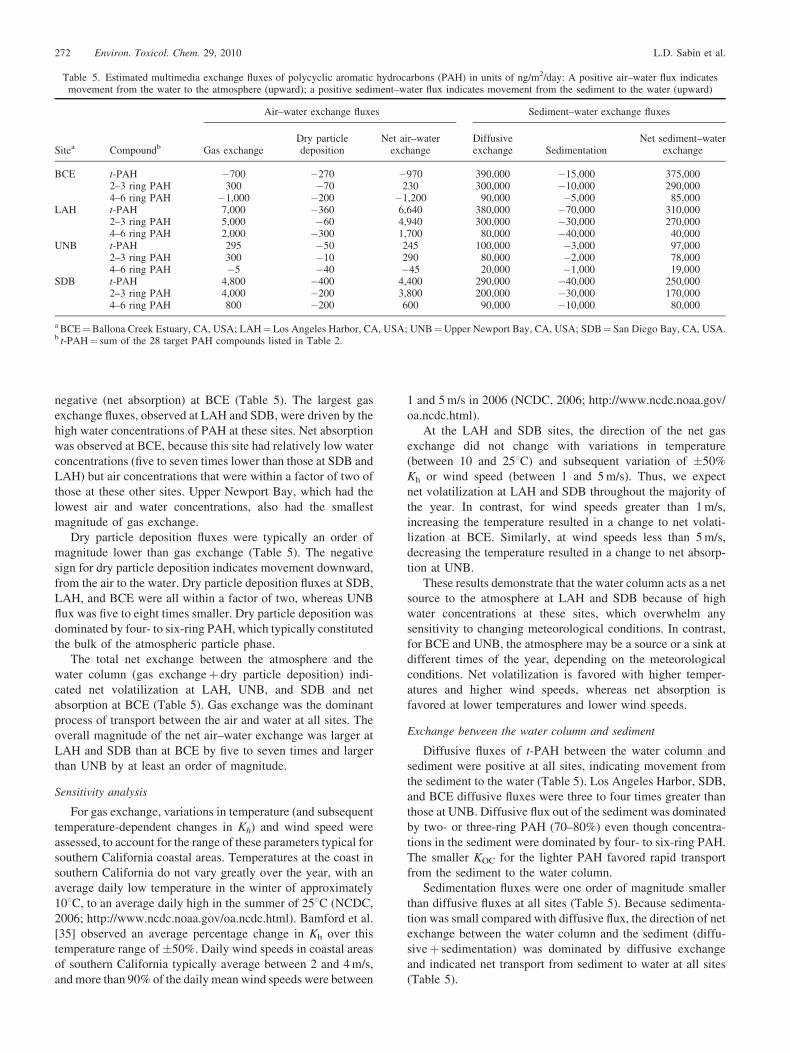
Table 5. Estimated multimedia exchange fluxes of polycyclic aromatic hydrocarbons (PAH) in units of ng/m2/day: A positive air–water flux indicatesmovement from the water to the atmosphere (upward); a positive sediment–water flux indicates movement from the sediment to the water (upward)
Sitea Compoundb
Air–water exchange fluxes Sediment–water exchange fluxes
Gas exchangeDry particledeposition
Net air–waterexchange
Diffusiveexchange Sedimentation
Net sediment–waterexchange
BCE t-PAH �700 �270 �970 390,000 �15,000 375,0002–3 ring PAH 300 �70 230 300,000 �10,000 290,0004–6 ring PAH �1,000 �200 �1,200 90,000 �5,000 85,000
LAH t-PAH 7,000 �360 6,640 380,000 �70,000 310,0002–3 ring PAH 5,000 �60 4,940 300,000 �30,000 270,0004–6 ring PAH 2,000 �300 1,700 80,000 �40,000 40,000
UNB t-PAH 295 �50 245 100,000 �3,000 97,0002–3 ring PAH 300 �10 290 80,000 �2,000 78,0004–6 ring PAH �5 �40 �45 20,000 �1,000 19,000
SDB t-PAH 4,800 �400 4,400 290,000 �40,000 250,0002–3 ring PAH 4,000 �200 3,800 200,000 �30,000 170,0004–6 ring PAH 800 �200 600 90,000 �10,000 80,000
a BCE¼Ballona Creek Estuary, CA, USA; LAH¼Los Angeles Harbor, CA, USA; UNB¼Upper Newport Bay, CA, USA; SDB¼San Diego Bay, CA, USA.b t-PAH¼ sum of the 28 target PAH compounds listed in Table 2.
272 Environ. Toxicol. Chem. 29, 2010 L.D. Sabin et al.
negative (net absorption) at BCE (Table 5). The largest gas
exchange fluxes, observed at LAH and SDB, were driven by the
high water concentrations of PAH at these sites. Net absorption
was observed at BCE, because this site had relatively low water
concentrations (five to seven times lower than those at SDB and
LAH) but air concentrations that were within a factor of two of
those at these other sites. Upper Newport Bay, which had the
lowest air and water concentrations, also had the smallest
magnitude of gas exchange.
Dry particle deposition fluxes were typically an order of
magnitude lower than gas exchange (Table 5). The negative
sign for dry particle deposition indicates movement downward,
from the air to the water. Dry particle deposition fluxes at SDB,
LAH, and BCE were all within a factor of two, whereas UNB
flux was five to eight times smaller. Dry particle deposition was
dominated by four- to six-ring PAH, which typically constituted
the bulk of the atmospheric particle phase.
The total net exchange between the atmosphere and the
water column (gas exchangeþ dry particle deposition) indi-
cated net volatilization at LAH, UNB, and SDB and net
absorption at BCE (Table 5). Gas exchange was the dominant
process of transport between the air and water at all sites. The
overall magnitude of the net air–water exchange was larger at
LAH and SDB than at BCE by five to seven times and larger
than UNB by at least an order of magnitude.
Sensitivity analysis
For gas exchange, variations in temperature (and subsequent
temperature-dependent changes in Kh) and wind speed were
assessed, to account for the range of these parameters typical for
southern California coastal areas. Temperatures at the coast in
southern California do not vary greatly over the year, with an
average daily low temperature in the winter of approximately
108C, to an average daily high in the summer of 258C (NCDC,
2006; http://www.ncdc.noaa.gov/oa.ncdc.html). Bamford et al.
[35] observed an average percentage change in Kh over this
temperature range of �50%. Daily wind speeds in coastal areas
of southern California typically average between 2 and 4 m/s,
and more than 90% of the daily mean wind speeds were between
1 and 5 m/s in 2006 (NCDC, 2006; http://www.ncdc.noaa.gov/
oa.ncdc.html).
At the LAH and SDB sites, the direction of the net gas
exchange did not change with variations in temperature
(between 10 and 258C) and subsequent variation of �50%
Kh or wind speed (between 1 and 5 m/s). Thus, we expect
net volatilization at LAH and SDB throughout the majority of
the year. In contrast, for wind speeds greater than 1 m/s,
increasing the temperature resulted in a change to net volati-
lization at BCE. Similarly, at wind speeds less than 5 m/s,
decreasing the temperature resulted in a change to net absorp-
tion at UNB.
These results demonstrate that the water column acts as a net
source to the atmosphere at LAH and SDB because of high
water concentrations at these sites, which overwhelm any
sensitivity to changing meteorological conditions. In contrast,
for BCE and UNB, the atmosphere may be a source or a sink at
different times of the year, depending on the meteorological
conditions. Net volatilization is favored with higher temper-
atures and higher wind speeds, whereas net absorption is
favored at lower temperatures and lower wind speeds.
Exchange between the water column and sediment
Diffusive fluxes of t-PAH between the water column and
sediment were positive at all sites, indicating movement from
the sediment to the water (Table 5). Los Angeles Harbor, SDB,
and BCE diffusive fluxes were three to four times greater than
those at UNB. Diffusive flux out of the sediment was dominated
by two- or three-ring PAH (70–80%) even though concentra-
tions in the sediment were dominated by four- to six-ring PAH.
The smaller KOC for the lighter PAH favored rapid transport
from the sediment to the water column.
Sedimentation fluxes were one order of magnitude smaller
than diffusive fluxes at all sites (Table 5). Because sedimenta-
tion was small compared with diffusive flux, the direction of net
exchange between the water column and the sediment (diffu-
siveþ sedimentation) was dominated by diffusive exchange
and indicated net transport from sediment to water at all sites
(Table 5).

Multimedia exchange of PAH in southern California coastal waters Environ. Toxicol. Chem. 29, 2010 273
Sensitivity analysis
Sediment pore-water concentrations were estimated from
equilibrium partitioning based on literature KOC values and
sediment concentrations. Literature KOC values for some com-
pounds can vary by as much as 50% because of differences in
methods of determining KOC as well as differences in sorbing
properties of the test soil carbon [41]. Sensitivity analysis using
KOC values of �50% produced diffusive flux estimates with the
same direction of exchange and within the same order of
magnitude as the fluxes reported in Table 5.
Significance of air–water and sediment–water fluxes
The results from the present study are the first to estimate
air–water exchange rates of PAH for coastal embayments of
southern California and then to compare those rates with other
exchange processes. In all cases, the magnitude of the diffusive
flux of PAH out of the sediments and into the water column far
exceeds input or output of PAH through air–water exchange
processes. For example, the water area of the Port of Los
Angeles (POLA) is approximately 13 km2. Based on the air–
water and sediment–water exchange fluxes estimated for LAH,
the net sediment contribution of PAH to the water column
of POLA is approximately 1,500 kg/year, whereas the net
removal of PAH from the water column into the atmosphere
through air–water exchange is approximately 32 kg/year. Thus,
because of high sediment concentrations, input to the water
column from the sediment far exceeds input/output from
the water column resulting from air–water exchange. These
results imply an additional removal mechanism from the
water column, which is likely water movements associated
with local coastal currents. Other potential input mechanisms
not quantified in the present study include watershed sources
(e.g., storm- and dry-weather runoff), and resuspension of
contaminated sediment (and subsequent desorption of PAH
from resuspended sediments). Estimates for loading rates of
PAH from watershed sources to the target waterbodies are
limited, but available data include stormwater runoff from
the Los Angeles River watershed (located adjacent to LAH),
ranging from 35 to 150 kg/year [6]. This suggests that watershed
sources exceed direct atmospheric inputs but remain at least an
order of magnitude less than sediment input at LAH. These
results demonstrate the importance of contaminated sediments
as a source of PAH to the water column in coastal waters of
southern California.
There are a number of limitations to the exchange estimates
calculated in the present study. First, the small sample size
(n< 5) at each site limits the applicability of the exchange
estimates to larger spatial and temporal scales. Second, atmos-
pheric samples were collected at land-based sites from 30 m
(SDB) to as much as 4 km (BCE) from water collection sites. To
minimize this limitation, every effort was made to select sites
that were downwind of their target waterbody and generally
representative of the number and types of PAH sources at the
waterbody. Third, there are uncertainties in a number of liter-
ature-derived input parameters (e.g., Kh, KOC) in the exchange
models used in this paper. Finally, the equilibrium-partitioning
model used here to predict partitioning between the sediment
and the pore water may overestimate pore-water concentrations
[14].
Despite the limitations of the present study, the fluxes
reported here provide a reasonable estimate of movement
between compartments based on parameters that were easily
quantified for the systems studied. In addition, these results
provide previously unavailable gas exchange and dry atmos-
pheric deposition flux estimates for southern California coastal
water bodies. These order-of-magnitude estimates indicate that
sediments remain a source of PAH to the water column and, at
the most polluted sites, to the local/regional atmosphere via
volatilization from the water column. Because of high sediment
concentrations, input to the water column from the sediment far
exceeds input/output from the water column resulting from air–
water exchange, under the conditions studied here (e.g., quies-
cent, nonstormwater conditions). A larger number of samples
and additional measurement parameters (e.g., resuspension
fluxes) would be required to refine the exchange estimates from
the present study.
Acknowledgement—We thank Chuck Katz, Mark Edson, and Hadrianna
delos Santos of the United States Navy; William Bretz from the UCI Marsh
Reserve; Mas Dojiri from the City of Los Angeles; and Philip Fine and
Sumner Wilson from the South Coast Air Quality Management District for
their cooperation. Also, we express our appreciation for the Southern
California Coastal Water Research Project personnel Rachel McPherson and
Sandy Nguyen for their assistance in collecting the field data.
REFERENCES
1. Zeng EY, Vista CL. 1997. Organic pollutants in the coastal environmentoff San Diego, California. 1. Source identification and assessment bycompositional indices of polycyclic aromatic hydrocarbons. EnvironToxicol Chem 16:179–188.
2. Menzie CA, Hoeppner SS, Cura JJ, Freshman JS, LaFrey EN. 2002.Urban and suburban storm water runoff as a source of polycyclicaromatic hydrocarbons (PAHs) to Massachusetts estuarine and coastalenvironments. Estuaries 25:165–176.
3. Mai B, Qi S, Zeng E, Yang Q, Zhang G, Fu J, Sheng G, Peng P, Wang Z.2003. Distribution of polycyclic aromatic hydrocarbons in the coastalregion off Macao, China: Assessment of input sources and transportpathways using compositional analysis. Environ Sci Technol 37:4855–4863.
4. Hoffman EJ, Mills GL, Latimer JS, Quinn JG. 1984. Urban runoff as asource of polycyclic aromatic hydrocarbons to coastal waters. EnvironSci Technol 18:580–587.
5. Simcik MF, Eisenreich SJ, Golden KA, Liu S-P, Lipiatou E,Swackhamer DL, Long DT. 1996. Atmospheric loading of polycyclicaromatic hydrocarbons to Lake Michigan as recorded in the sediments.Environ Sci Technol 30:3039–3046.
6. Stein ED, Tiefenthaler LL, Schiff K. 2006. Watershed-based sources ofpolycyclic aromatic hydrocarbons in urban storm water. Environ ToxicolChem 25:373–385.
7. Peng J, Maruya K, Schiff K, Tsukada D, Diehl DW, Lao W, Gan J, ZengEY. 2007. Organochlorine pesticides and other trace organic contam-inants in the Upper Newport Bay watershed. Technical Report 512.Southern California Coastal Water Research Project, Costa Mesa, CA,USA.
8. Hoff RM, Strachan WMJ,Sweet CW, Shackleton M, BidlemanTF, BriceKA, Burniston DA, Cussion S, Gatz DF, Harlin K, Schroeder WH. 1996.Atmospheric deposition of toxic chemicals to the Great Lakes: a reviewof data through 1994. Atmos Environ 30:3505–3527.
9. Dachs J, Glenn TRI, Gigliotti CL, Brunciak PA, Totten LA, Nelson ED,Franz TP, Eisenreich SJ. 2002. Processes driving the short-termvariability of polycyclic aromatic hydrocarbons in the Baltimore andnorthern Chesapeake Bay atmosphere, USA. Atmos Environ 36:2281–2295.
10. Franz TP, Eisenreich SJ, Holsen TM. 1998. Dry deposition of particulatepolychlorinated biphenyls and polycyclic aromatic hydrocarbons toLake Michigan. Environ Sci Technol 32:3681–3688.
11. Bamford HA, Offenberg JH, Larsen RK, Ko FC, Baker JE. 1999.Diffusive exchange of polycyclic aromatic hydrocarbons across the

274 Environ. Toxicol. Chem. 29, 2010 L.D. Sabin et al.
air–water interface of the Patapsco River, an urbanized subestuary of theChesapeake Bay. Environ Sci Technol 33:2138–2144.
12. Gigliotti CL, Brunciak PA, Dachs J, Glenn TRI, Nelson ED, Totten LA,Eisenreich SJ. 2002. Air–water exchange of polycyclic aromatichydrocarbons in the New York–New Jersey, USA, harbor estuary.Environ Toxicol Chem 21:235–244.
13. Gschwend PM, Hites RA. 1981. Fluxes of polycyclic aromatichydrocarbons to marine and lacustrine sediments in the northeasternUnited States. Geochim Cosmochim Acta 45:2359–2367.
14. McGroddy SE, Farrington JW. 1995. Sediment porewater partitioning ofpolycyclic aromatic hydrocarbons in three cores from Boston Harbor,Massachusetts. Environ Sci Technol 29:1542–1550.
15. Maruya K, Risebrough RW, Horne AJ. 1996. Partitioning of polynucleararomatic hydrocarbons between sediments from San Francisco Bay andtheir porewaters. Environ Sci Technol 30:2942–2947.
16. Fairey R, Roberts C, Jacobi M, Lamerdin S, Clark R, Downing J, Long E,Hunt J, Anderson B, Newman J, Tjeerdema R, Stephenson M, Wilson C.1998. Assessment of sediment toxicity and chemical concentrations inthe San Diego Bay region, California, USA. Environ Toxicol Chem17:1570–1581.
17. Latimer JS, Davis WR, Keith DJ. 1999. Mobilization of PAHs and PCBsfrom in-place contaminated marine sediments during simulatedresuspension events. Estuar Coast Shelf Sci 49:577–595.
18. Mitra S, Dellapenna TM, Dickhut RM. 1999. Polycyclic aromatichydrocarbon distribution within lower Hudson River estuarine sedi-ments: physical mixing vs sediment geochemistry. Estuar Coast ShelfSci 49:311–326.
19. Anderson BS, Hunt JW, Phillips BM, Fairey R, Roberts CA, Oakden JM,Puckett HM, Stephenson M, Tjeerdema RS, Long ER, Wilson CJ, LyonsJM. 2001. Sediment quality in Los Angeles Harbor, USA: A triadassessment. Environ Toxicol Chem 20:359–370.
20. Wang X-C, Zhang Y-X, Chen RF. 2001. Distribution and partitioning ofpolycyclic aromatic hydrocarbons (PAHs) in different size fractions insediments fromBoston Harbor United States. Mar PollutBull42:1139–1149.
21. Bay SM, Zeng EY, Lorenson TD, Tran K, Alexander C. 2003. Temporaland spatial distributions of contaminants in sediments of Santa MonicaBay, California. Mar Environ Res 56:255–276.
22. Lohmann R, Macfarlane JK, Gschwend PM. 2005. Importance of blackcarbon to sorption of native PAHs, PCBs, and PCDDs in Boston and NewYork Harbor sediments. Environ Sci Technol 39:141–148.
23. Maruya KA, Schiff K. 2009. The extent and magnitude of sedimentcontamination in the Southern California Bight. In Lee HJ, NormarkWR, eds, Earth Science in the Urban Ocean: The Southern CaliforniaContinental Borderland. Geological Society of America Special Paper454. Geological Society of America, Boulder, CO, pp 399–412.
24. State Water Resources Control Board. 2003. Approval of the 2002Federal Clean Water Act Section 303(d) list of Water Quality LimitedSegments. Resolution 2003-0009. Sacramento, CA, USA.
25. Zeng E, Yu CC, Tran K. 1999. In situ measurements of chlorinatedhydrocarbons in the water column off the Palos Verdes Peninsula,California. Environ Sci Technol 33:392–398.
26. Whitman WG. 1923. The two film theory of gas absorption. Chem MetalEngineer 29:146–148.
27. Liss PS, Slater PG. 1974. Flux of gases across the air–sea interface.Nature 247:181–184.
28. Schwarzenbach RP, Gschwend PM, Imboden DM. 1993. EnvironmentalOrganic Chemistry. John Wiley & Sons, New York, NY, USA.
29. Wanninkhoff R. 1992. Relationship between windspeed and gasexchange over the ocean. J Geophys Res 97:7373–7382.
30. Achman DR, Hornbuckle KC, Eisenreich SJ. 1993. Volatilization ofpolychlorinated biphenyls from Green Bay, Lake Michigan. Environ SciTechnol 27:75–87.
31. Eisenreich SJ, Hornbuckle KC, Achman DR. 1997. Air–water exchangeof semivolatile organic chemicals in the Great Lakes. In Baker JE, ed,Atmospheric Deposition of Contaminants to the Great Lakes and CoastalWaters. SETAC, Pensacola, FL, USA, pp 109–135.
32. Totten LA, Brunciak PA, Gigliotti CL, Dachs J, Glenn TRI, Nelson ED,Eisenreich SJ. 2001. Dynamic air–water exchange of polychlorinatedbiphenyls in the New York–New Jersey Harbor Estuary. Environ SciTechnol 35:3834–3840.
33. Fuller EN, Schettler PD, GiddingsJC. 1966. A new method for predictionof binary gas-phase diffusion coefficients. Indust Engineer Chem 58:19–27.
34. Wilke CR, Chang P. 1955. Correlation of diffusion coefficients in dilutesolutions. Am Inst Chem Engineer J 1:264–270.
35. Bamford HA, Poster DL, Baker JE. 1999. Temperature dependence ofHenry’s Law constants of thirteen polycyclic aromatic hydrocarbonsbetween 48C and 318C. Environ Toxicol Chem 18:1905–1912.
36. Mackay D, Shiu W-Y, Ma K-C. 1999. Physical–Chemical Propertiesand Environmental Fate and Degradation Handbook. CRC, Boca Raton,FL, USA.
37. Delle Site A. 2001. Factors affecting sorption of organic compounds innatural sorbent/water systems and sorption coefficients for selectedpollutants. A review. J Phys Chem Ref Data 30:187–439.
38. Mackay D, Shiu W-Y, Ching MK. 1992. Illustrated Handbook ofPhysical–Chemical Properties and Environmental Fate for OrganicChemicals, Vol II—Polynuclear Aromatic Hydrocarbons, Polychlori-nated Dioxins, and Dibenzofurans. Lewis, Boca Raton, FL, USA.
39. Mackay D. 2001. Multimedia Environmental Models: The FugacityApproach 2nd ed. CRC, Boca Raton, FL, USA.
40. Yunker MB, Macdonald RW, Vingarzan R, Mitchell RH, Goyette D,Sylvestre S. 2002. PAHs in the Fraser River basin: a critical appraisal ofPAH ratios as indicators of PAH source and composition. Org Geochem33:489–515.
41. Karickhoff SW, Brown DW, Scott TA. 1979. Sorption of hydrophobicpollutants on natural sediments. Water Res 13:214–248.
42. Tsai P, Hoenicke R, Yee D, Baker JE, Bamford HA. 2005. San FranciscoBay Atmospheric Deposition Pilot Study Part 3: Dry Deposition of PAHsand PCBs. Final Report 408. San Francisco Estuary Institute, Oakland,CA, USA.
43. Pereira WE, Hostettler FD, Luoma SN, van Green A, Fuller CC, AnimaRJ. 1999. Sedimentary record of anthropogenic and biogenic polycyclicaromatic hydrocarbons in San Francisco Bay, California. Mar Chem64:99–113.
44. Ashley JTF, Baker JE. 1999. Hydrophobic organic contaminants insurficial sediments of Baltimore Harbor: Inventories and sources.Environ Toxicol Chem 18:838–849.
45. Lamoureux EM, Brownawell BJ. 1999. Chemical and biologicalavailability of sediment-sorbed hydrophobic organic contaminants.Environ Toxicol Chem 18:1733–1741.