Review of Environment and Earth Sciences - Scinapse
22
77 © 2014 Conscientia Beam. All Rights Reserved. WELL LOG SEQUENCE STRATIGRAPHIC AND PALYNOLOGICAL ANALYSIS OF LATE MIOCENE TO PLIOCENE AGBADA FORMATION, SOUTHWESTERN NIGER DELTA BASIN, NIGERIA Olajide Femi Adebayo 1 1 Department of Geology, Ekiti State University, Ado-Ekiti, Nigeria ABSTRACT Sequence stratigraphic interpretation of Chev-1, 2, and 3 wells offshore western Niger delta basin was carried out based on the vertical relationship of the lithofacies associations, electronic well-log, palynologic and foraminiferal data and the existing stratigraphic framework of the Neogene succession in the Niger delta basin. Each well was analyzed in terms of the system tracts, maximum flooding surfaces and sequence boundaries. The recovered palynomorphs together with planktonic foraminifera suggest Late Miocene to Pliocene age. The palynological assemblages exhibit cyclic changes which are here related to the sedimentary evolution.Eighteen depositional sequences were recognized; there are five in Chev-1, ten in Chev-2 and seven in Chev-3. Three of those in Chev-1 and Chev-2 are correlatable while one is correlatable between Chev-2 and 3. These sequence stratigraphic data are matched with existing global standard biostratigraphic zonation scheme and global eustatic curve in order to allow a correlation of sequence beyond local and regional scales. Keywords: Depositional sequence, System tracts, Palynomorph, Well-Log, Sequence stratigraphy, Foraminifera. Contribution/ Originality The study contributes to the existing literature on the Niger Delta Basin by integrating sedimentology, biostratigraphy, well logging and sequence stratigraphy to detect depositional sequences that can serve as reservoirs to substantially increase the oil reserves in the basin. It documents eighteen sequences based mainly on palynological signature in the basin. 1. INTRODUCTION The underlying concepts and principles of sequence stratigraphy have recently become handy among the exploration experts in the oil and gas industry. This discipline is assisting the biostratigraphers, geophysicsts, petroleum geologists and others to jointly analyze oil well data and update old ones to solve exploration and production problems. The concept of modern sequence stratigraphy according to Adebayo [1] is used to place geological surfaces, which represent relative sea rises and falls, within a chronostratigraphic Review of Environment and Earth Sciences 2014 Vol.1, No.2, pp. 77-98 ISSN(e): 2313-8440 ISSN(p): 2409-2150 DOI: 10.18488/journal.80/2014.1.2/80.2.77.98 © 2014 Conscientia Beam. All Rights Reserved.
-
Upload
khangminh22 -
Category
Documents
-
view
2 -
download
0
Transcript of Review of Environment and Earth Sciences - Scinapse

77
© 2014 Conscientia Beam. All Rights Reserved.
WELL LOG SEQUENCE STRATIGRAPHIC AND PALYNOLOGICAL
ANALYSIS OF LATE MIOCENE TO PLIOCENE AGBADA FORMATION,
SOUTHWESTERN NIGER DELTA BASIN, NIGERIA
Olajide Femi Adebayo1
1Department of Geology, Ekiti State University, Ado-Ekiti, Nigeria
ABSTRACT
Sequence stratigraphic interpretation of Chev-1, 2, and 3 wells offshore western Niger delta basin was
carried out based on the vertical relationship of the lithofacies associations, electronic well-log, palynologic
and foraminiferal data and the existing stratigraphic framework of the Neogene succession in the Niger
delta basin. Each well was analyzed in terms of the system tracts, maximum flooding surfaces and sequence
boundaries. The recovered palynomorphs together with planktonic foraminifera suggest Late Miocene to
Pliocene age. The palynological assemblages exhibit cyclic changes which are here related to the sedimentary
evolution.Eighteen depositional sequences were recognized; there are five in Chev-1, ten in Chev-2 and
seven in Chev-3. Three of those in Chev-1 and Chev-2 are correlatable while one is correlatable between
Chev-2 and 3. These sequence stratigraphic data are matched with existing global standard
biostratigraphic zonation scheme and global eustatic curve in order to allow a correlation of sequence
beyond local and regional scales.
Keywords: Depositional sequence, System tracts, Palynomorph, Well-Log, Sequence stratigraphy, Foraminifera.
Contribution/ Originality
The study contributes to the existing literature on the Niger Delta Basin by integrating
sedimentology, biostratigraphy, well logging and sequence stratigraphy to detect depositional
sequences that can serve as reservoirs to substantially increase the oil reserves in the basin. It
documents eighteen sequences based mainly on palynological signature in the basin.
1. INTRODUCTION
The underlying concepts and principles of sequence stratigraphy have recently become handy
among the exploration experts in the oil and gas industry. This discipline is assisting the
biostratigraphers, geophysicsts, petroleum geologists and others to jointly analyze oil well data
and update old ones to solve exploration and production problems.
The concept of modern sequence stratigraphy according to Adebayo [1] is used to place
geological surfaces, which represent relative sea rises and falls, within a chronostratigraphic
Review of Environment and Earth Sciences
2014 Vol.1, No.2, pp. 77-98 ISSN(e): 2313-8440 ISSN(p): 2409-2150 DOI: 10.18488/journal.80/2014.1.2/80.2.77.98 © 2014 Conscientia Beam. All Rights Reserved.

Review of Environment and Earth Sciences, 2014, 1(2): 77-98
78
© 2014 Conscientia Beam. All Rights Reserved.
framework. It is a process-oriented approach to the interpretation of sedimentary successions and
draws upon the understanding of depositional processes to describe or predict the occurrence,
extent, and geometry of sedimentary facies. The fundamental processes that control the variation
in strata patterns and lithofacies distribution are accommodation and sedimentation.
Accommodation is created by a combination of subsidence and sea level changes while the filling
of the basin is a consequence of sediment supply, which is controlled by the combined effects of
basin geometry, physiography, provenance, and climate. Consequently, sequence stratigraphy
helps in the recognition and prediction of reservoir, seal and source-rock facies, thus reducing
uncertainties at the exploration stage and improving correlation of reservoir units for
exploitation [2].
The most valuable attribute in sequence stratigraphic interpretation is that it can be used to
generate a geologically sound model consistent with available multidisciplinary data. Each type of
data contributes to the different pieces of geological puzzle encountered by the geoscientists
working in the oil industry. For example, seismic data provide the large-scale framework of
stratal geometries, both locally and regionally. Well-log interpretation may supply finer scale
information on lithology and depositional systems. Biostratigraphic data may be used to ascertain
condensed sections, chronostratigraphic surfaces, paleobathymetry, and climatic conditions. Thus,
expertise in these disciplines as well as an integrative strategy is required to generate this model,
implying the need for a multidisciplinary interpretation team.
The fundamental unit of sequence stratigraphy is a depositional sequence usually called a
sequence. It is defined by Adeonipekun [3] as a relatively conformable succession of genetically
related strata arranged in system tracts and bounded top and base by unconformities and their
correlative conformities. The depositional sequence was subdivided into lowstand, transgressive,
and highstand systems tracts on the basis of internal surfaces that correspond to changes in the
direction of shoreline shift from regression to transgression and vice versa [4]. Stratigraphically
important system tracts surfaces are, by convention, characterized by extinction and first
appearance datum of globally recognized marker species of planktonic foraminifera and calcareous
nannofossils [5].
Sequence-stratigraphic interpretations based on palynological analysis have proven to be
effective in different geographic regions and time intervals. Some of these studies [6-14] have
established the direct relationship between the palynological record and sea-level fluctuations.
Poumot [6] was the first to tie cyclic patterns of terrestrial palynomorph distribution on tropical
coastal settings to a sequence-stratigraphic framework. He correlated palynological assemblages
dominated by fern spores and forest pollen to the lowstand, higher abundances of palm pollen to
early sea-level rise and an increase of mangrove pollen to the later transgressive phase. Poumot
[6] explained these fluctuations of pollen and spore assemblage composition on grounds of the
environmental preferences of the parent plants and palynomorph transport. A similar pattern was
described by Doust and Omatsola [7] who noticed that during lowstand deposition, palynological
assemblages were dominated by terrestrial palynomorphs produced by both hydrophilic and
xerophilic plants; highstand deposition was however characterized by an increase of
Review of Environment and Earth Sciences, 2014, 1(2): 77-98
79
© 2014 Conscientia Beam. All Rights Reserved.
palynomorphs derived from hydrophilic plants only. Chow [8] employed the ratio of the
stratigraphic occurrence of the fossils of Rhizophora and Camptostemon for sequence stratigraphic
deductions in offshore Sabah and Sarawak, Malaysia. The inverse relationship in the occurrence
trends of the two genera in relation to system tracts was employed, noting that the ratio of
Rhizophora : Camptostemon was high in HST and low in LST and TST. This discovery was used to
solve problems that were beyond the resolution ability of the seismic method (due to the great
depth) and the method was thus recommended for areas of poor foraminiferal and nannofossils
data. In another study, [11] reported high spore content in lowstand system tracts and a
gradually decreasing trend in spore abundance in transgressive systems tracts. The
environmental preferences of certain groups of marine palynomorphs also provide valuable
information on sea-level changes [9]; [15]; [16]; [17]; [14] (Figs. 1&2).
Morley [18] pioneered the attempt to employ palynology in sequence stratigraphic study in
the Neogene Niger Delta when he compared the palynological characterization of system tracts
from the Niger delta and Southeast Asia (India, Indonesia, and Malaysia). The study emphasized
that in the Tertiary basins, application of palynology is principally in correlation rather than
dating and concluded that the integration of data from both palynomorphs and marine
microfossils (foraminifera, nannofossils) can provide a much better basis for system tracts
interpretation than when used singly.
Well logging gives the oil industry the ability to evaluate formations, their porosity and
fluids, and is instrumental in transferring what was once hit-and-miss into a science-based
process. Most of the world's petroleum occurs in sedimentary rocks. The location of petroleum
reserves requires an understanding of the nature of the rocks in which these reserves occur, and
well logs are one of the primary sources for such data. Well logs are particularly useful in the
description and characterization of sedimentary rocks and their pore fluids. Well logs are a
fundamental method of formation analysis since they measure the physical properties of the rock
matrix and pore fluids. They provide formation data not directly accessible by means other than
coring. Well logs can be used to extend data obtained from core analysis to wells from which only
logs are available. Utilizing log-derived measurements of such petro-physical properties makes it
practical to determine, for example, lithology, porosity, shale volume, water and hydrocarbon
saturation and type, when oil and/or gas are present and to estimate permeability, to predict
water cut, calculate residual oil saturation, detect overpressured zones and correlate
stratigraphy.The most common log types are spontaneous potential, resistivity, gamma ray,
sonic, neutron, density, dipmeter and caliper. Spontaneous potential and gamma ray logs are
commonly used for the interpretation of siliciclastic successions in lithological terms.Well logs
analysis may serve several interrelated purposes including, at an increasing scale of observation,
the evaluation of rock and fluid phases in the subsurface, the interpretation of paleodepositional
environments based on log motifs, and stratigraphic correlations based on pattern matching and
the recognition of marker beds [2].
Several palynological studies have been carried out in the Niger delta basin, however, despite
the well-known occurrence of diverse palynomorph assemblages in the area, their application as a

Review of Environment and Earth Sciences, 2014, 1(2): 77-98
80
© 2014 Conscientia Beam. All Rights Reserved.
tool for sequence-stratigraphic interpretation has rarely been fully explored. In the present study,
palynological data from three wells in the basin (integrated with other data) are analyzed and
interpreted within a sequence-stratigraphic framework with a view toward understanding the
important stratal horizons and determining their respective ages.
1.1. Geologic Setting
The Niger Delta Basin is situated in the Gulf of Guinea, located on the West African
continental margin (Fig. 2). It extends throughout what [19] defined as the Niger Delta
Province. The basin contains upper Cretaceous to Recent marine to fluvial deposits overlying
oceanic crust and fragments of the African continental crust [20]; [21]. The Delta proper began
developing in the Eocene. From the Eocene to the present, the delta has prograded
southwestward, forming depobelts that represent the most active portion of the delta at each
stage of development [20]. The depobelt are characterised by enormous progradational and
agradational paralic sequences with some retrogradational marine deposits at intervals.The
sedimentary sequence in the Tertiary basin consists in ascending order of three diachronous
formations, namely: Akata (marine beds), Agbada (transitional sand-shale beds) and Benin
(continental sediments) formations.
2. MATERIALS AND METHODS
Four types of data were used for the study, specifically, electronic well-log, lithologic,
palynological and foraminiferal data (Plate) (See [22]; [23]; for some other palynomorphs used).
The well-logs include gamma ray, resistivity, neutron and density logs. Each system tract
exhibits a characteristic electronic log that is used in recognizing the particular sequence it
represents. The composite logs available for Chev-1, 2, 3 wells distinguish the sedimentary
components in terms of lithologies, paleoenvironments, maximum flooding surfaces, sequence
boundaries, highstand, transgressive and lowstand system tracts. In addition, the coarsening and
fining upward sequences correspond to progradational and retrogradational phases respectively
(Fig. 3). The theoretical model used for this study to establish the character of deposition of the
system tracts, and the miospores contained is discussed with reference to the models of Saller, et
al. [24]; Morley [18]; Schioler, et al. [25] and Adebayo and Ojo [2].
3. RESULTS AND DISCUSSION
3.1. Sequence Stratigraphy of CHEV-1 Well
Sequence 1 (5,800-5,600ft)
This sequence is at the basal part of the stratigraphical interval considered for this well
(Table 1). The lowest end of this interval is not well represented on the log. However, it is
characterized by very high gamma ray and low resistivity. The only systems tract penetrated in
this interval is highstand systems tract (HST). Flooding pattern is apparent at depth 5,700ft as
marked by high foraminifera population and diversity with the appearance of Globigerinoides
obliquus and G. quadrilobatus. Globigerinoides immaturus also occur at this level to mark a marine

Review of Environment and Earth Sciences, 2014, 1(2): 77-98
81
© 2014 Conscientia Beam. All Rights Reserved.
bioevent. The log pattern indicated that a fairly thick radioactive sandstone occupy the base of the
studied interval of the well. The sequence boundary is located at a point marked by very low
gamma ray and very high resistivity value located at depth 5,600ft.
Sequence 2 (5,600-5,050ft)
This sequence is well represented on the log and characterized by rapid alternation of sand
and shale lithofacies at the lower segment while the upper part is defined by thick intercalated
shales. A lowstand systems tract is located within interval 5,600-5,490ft. It is made up of sand
bodies separated by thin shale beds. The lithofacies are deposited in environments that vary from
channel fill at the base to upper shoreface at the top. This tract is characterized by arenaceous
foraminifera such as Alveolophragmium crassum and Ammobaculites ssp.
The transgressive systems tract ranges from 5,490-5,300ft. It is characterized by frequent
alternation of sand and shale facies as a result of unstable sedimentation processes. Upward
coarsening sequences are exhibited occasionally. The sediments are probably deposited in a lower
shoreface paleoenvironment. The maximum flooding surface is present at depth 5,300ft,
characterized by high gamma ray and very low resistivity compared to its surrounding and base
occurrence of Retistephanocolporites gracilis. The presence of Neogloboquadrina dutretrei at 5,400ft
corroborated this marine event, which is equivalent to 5.0 Ma. The highstand systems tract
(5,300-5,050ft) has two main thickly bedded shales of about 70ft in thickness, intercalated by thin
sands. The facies is light grey in colour, fissile and fairly ferruginized in nature within clay
laminae. The sediment is suggested to have been deposited in a marine setting. The sequence
boundary is located at depth 5,050ft where there was a change from aggradational log pattern to
progradational marking the 3.7Ma SB event
Sequence 3 (5,050-4,300ft)
This interval is well represented on the log. The lower part consists of thick sandstone body
with intervening clay laminae while the upper part consists of cyclical sedimentary packages
comprising moderate to thick shale beds with thin intervening sandstones. The lowstand systems
tract is located at interval 5,050-4,940ft. It is characterized by very thick sandstone of about 260ft
and associated clay breaks with a paloenvironment that varies from channel fill to upper
shoreface. However, a retrogradational sequence is well established within this interval from the
occurrence of fining upward sequence.
The transgressive systems tract occurs within 4,940-4,620ft; composed of intercalation of
sand and shale facies deposited in upper shoreface but probably lower shoreface at the base of the
interval. This tract is characterized by an improvement in the occurrence of calcareous benthics
and the presence of a few planktics. The maximum flooding surface is placed at depth 4,620ft,
characterized by very high gamma ray and sharp decrease/very-low resistivity value and marked
by the occurrence of dinoflagellate cysts, Marginulina costata, Lenticulina inornata and
Quiqueloculina lamarkiana. The highstand systems tract ranges from interval 4,620-4,300ft. The
interval is composed of moderately thick shale units with intervening sandstone bed of about 40ft

Review of Environment and Earth Sciences, 2014, 1(2): 77-98
82
© 2014 Conscientia Beam. All Rights Reserved.
thick with upward coarsening units of a progradational sequence deposited in a typical marine
setting. The highest foraminiferal population and diversity of the analyzed interval lies within
this sequence, marking the 2.7Ma marine event of Catuneanu [5].
Sequence 4 (3,560-4,400ft)
This interval is wide and complex in term of sedimentation processes. The upper part is
composed of cyclical depositional packages. The sequence boundary is located at 4,325ft, defined
by relatively low gamma ray and sharp increase in resistivity values while the maximum flooding
surface is placed at 3,755ft with very high gamma ray and very low resistivity values. The
lowstand systems tract is located within interval 4,400-4,260ft. It is a fairly thick sandstone body
of about 140ft, characterized by moderately low gamma ray and very low resistivity values. The
sediments are suggested to have been deposited in the channel-levee complex and lower shoreface
environments. The transgressive systems tract ranges in depth from 3,755-4,245ft. The upper
and lower parts of this interval are sandy shales separated by thin shale facies. The sand-shale
ratio decreases upward, depicting an occasional progradational interval within an overall
retrogradational sequence. The sediments within this interval are deposited in different
environments such as marine, lower shoreface and upper shoreface. The highstand systems tract
is located at 3,560-3,755ft. It is about 195ft thick, dominated by shale facies separated by thin
sand beds except the upper section that contains relatively thick sand interbeds. Therefore, this
interval is further defined by upward coarsening sedimentary package referred to as
progradational sequence. This sequence is deposited in environment that varies from marine
through lower shoreface to upper shoreface settings.
Sequence 5 (3,560 – 3,160ft)
This interval is characterized by the alternation of sand and shale facies. The sequence
boundary is located at 3,430ft, marked by a sharp base, very low gamma ray and high resistivity
values. This is supported by the occurrence of shell fragments and the absence of foraminifera.
This level is probably equivalent to 2.4 Ma marine event of Catuneanu [5] The lowstand system
tract lies within the intervals of 3,350-3,560ft. It is characterized by relatively thick sandstone
body with short intervening shale units. However, the transgrssive systems tract lies between
intervals 3,160ft and 3,350ft. It is predominantly shaly at the base but becomes sandy towards the
upper limit of the interval. The depositional environment varies from channel fill to upper
shoreface within the lowstand system tract and from upper shoreface to lower shoreface within
the trangressive systems tract. Foraminifera and palynomorph populations and diversities are
relatively low.
3.2. Sequence Stratigraphy of CHEV-2 Well
Sequence 1 (8,992-8,615ft)
This is an incomplete sequence because the sequence boundary and lowstand systems tract
are not penetrated. The transgressive systems tract is located between intervals 8,992-8,690ft

Review of Environment and Earth Sciences, 2014, 1(2): 77-98
83
© 2014 Conscientia Beam. All Rights Reserved.
(Table 2). The interval is made up of shale units separated by sandstone beds. The large
separation of the neutron-density logs and relative abundant occurrence of foraminifera indicate
that the shale units are mainly marine in nature, whereas the sandstone beds are of lower
shoreface at the upper part but vary from upper shoreface to lower shoreface for the basal
sandstone unit. The maximum flooding surface is placed at 8,690ft. This surface is marked by the
maximum separation between the neutron-density values. However, the highstand systems tract
lies between intervals 8,690-8,615ft and characterized by upward increase in resistivity values.
The sediments are mainly intercalated sands and shales deposited in lower shoreface setting.
Sequence 2 (8,615-8,385ft)
This interval is relatively short-ranged in depth. The sequence boundary is located at 8,595ft
on the basis of low gamma rays and high resistivity values. The lowstand system tract is located
within the interval 8,615-8,565ft. The basal part is marked by low to high gamma rays and high
resistivity indicating a radioactive sandstone bed. The radioactive channel sands are characterized
by little or no separation between the neutron and density porosities in a depth plot. The
transgressive system tract lies between intervals 8,565-8,435ft. It is defined by high gamma ray
and low resistivity values. The sediments contained are mainly heterolithic in nature and
deposited in a lower shoreface environment. This resulted in an upward decrease in clay content.
The maximum flooding surface is located at 8,435ft on the basis of high gamma ray and very low
resistivity values compared to their surroundings. The highstand systems tract lies between
8,435-8,385ft. It is characterized by upward increase in resistivity values for the flooding surfaces.
The gradual coarsening upward of prograding shoreface deposit from marine shales to lower
shoreface sands is clearly reflected in a bell-shaped neutron-density log separation.
Sequence 3 (8,385-8,050ft)
In this interval the maximum flooding surface is placed at 8,120ft which is characterized by
relatively high gamma rays and very low resistivity. It also corresponds to the surface with very
low neutron and density values compared with its surroundings. The sequence boundary is
located at 8,330ft; this is defined by low gamma ray and high resistivity values. The lowstand
systems tract lies between 8,385-8,235ft, a section characterized by sandstone body of about 150ft
thick. The interval is further defined by very low gamma ray and maximum resistivity values.
The sandstones are typical of the channel fill at the upper end while the lower part houses upper
and lower shorefaces sandstones. The transgressive systems tract straddles the intervals between
8,235-8,120ft, and characterized by shale facies. The interval comprises of three storey
sedimendary packages characterized by upward decrease in neutron-density plots. The higstand
systems tract lies between intervals 8,120-8,050ft. It is characterized by uphole increase in the
neutron-density value. The interval is predominantly shaly with intervening sandstone beds.

Review of Environment and Earth Sciences, 2014, 1(2): 77-98
84
© 2014 Conscientia Beam. All Rights Reserved.
Sequence 4 (8,050-7,765ft)
The lower portion of this sequence is sandy while the upper part is predominantly shaly. The
maximum flooding surface is located at 7,860ft on the basis of very high gamma ray, low
resistivity and uphole increase in neutron and porosity values. This is supported by the first
appearance of Ammobaculites strathearnesis marking the recognition of 6.0Ma bioevent [5]. The
sequence boundary is placed at 7,590ft on the basis of relatively high neutron and density values,
high resistivity and relatively low gamma ray. The lowstand systems tract lies between 8,050-
7,915ft, is characterized by relatively low gamma ray and very high resistivity values. This is
composed of sandstone bodies with intervening shale streaks. The very high neutron-density
values also point to the presence of sandstone deposits. The globular or bell shaped porosity plots
suggest a lower shoreface depositional setting interbedded with channel filled sandstone.
The transgressive systems tract of interval 7,860-7,763ft is very short in thickness and
characterized by upward-fining sequence. The interval is composed of intercalated sandstone and
shale facies.The predominantly shaly interval 7,869-7,765ft represents the highstand systems
tract. It is characterized by one storey sedimentary package showing coarsening upward
sedimentary sequence (progradational depositional sequence).
Sequence 5 (7,765-6,885ft)
This commences with a lowstand systems tract, which covers the interval 7,765-7,470ft. It is
dominated by basal channel fill sandstone with characteristic upward-coarsening log motifs. The
sandstone facies consists of stacked lower shoreface and upper shoreface at the upper and lower
segments respectively. The transgressive systems tract (7,470-7,005ft) consists of upward-fining
gamma log patterns with the highest point and a corresponding lowest resistivity value. The
highstand systems tract interval (7,005-6,885ft) is characterized by an aggradational log pattern
and a diagnostic upward-coarsening trend. At 6,880ft, a sequence boundary with characteristic
change from aggradational to progradational log patterns is recognized.
Sequence 6 (6,885-5,935ft)
Lowstand systems tract (6,885-6,710) is predominantly dominated by sandstone facies. The
interval is defined by thick channel-filled sandstone at the upper part while the lower part is of
lower shoreface heterolith deposit. The transgressive system tract interval (6,710-6,305) is
characterized by overall upward-fining gamma log patterns peaking at 6,305ft and a
corresponding lowest resistivity value. This depth is the maximum flooding surface which
corresponds to 5.0Ma of Catuneanu [5]. The highstand systems tract (6,305-5,935ft) is
characterized by a coarsening-upward log patterns and aggradational log motifs characteristic of
channel deposits. The sequence boundary located at 5,935ft corresponds to the lower diversity of
sporomorphs at this level.

Review of Environment and Earth Sciences, 2014, 1(2): 77-98
85
© 2014 Conscientia Beam. All Rights Reserved.
Sequence 7 (5,935-5,420ft)
The lowstand system tract lies within 5,935-5,730ft interval. Upward coarsening distributary
channel deposits characterize this tract. This is supported by the very low gamma ray and little or
no separation between neutron and density signatures. Sporomorphs population is equally high.
The transgressive tract of this sequence commences at 5,730ft with an overall fining-upward log
motif, which terminates at 5,630ft. The interval is characterized by rapid alternation of sand and
shale facies. The maximum flooding surface is placed at 5,630ft on the basis of highest relative
neutron porosity value and the corresponding lowest resistivity compared to the surrounding
flooding surfaces. The highstand systems tract ranges from 5,630-5,420ft. It is characterized by
upward-increasing resistivity and upward-decreasing neutron-porosity. The thick marine shale
sequence consists of three-storey stacking pattern separated by sandstone bodies as reflected by
the bell-shaped neutron-density log. The sequence boundary located at 5,335ft corresponds to
3.7Ma SB.
Sequence 8 (5,420-5,000ft)
The lowstand systems tract (5,420-5,300ft) is characterized by two blocky shaped sandstone
bodies defined by very low gamma ray and supported by little or no separation between the
curve-plot of neutron and density porosities. The transgrssive systems tract ranges from 5,300-
5,155ft. It is characterized by the alternation of shale and sand lithofacies of the lower shoreface
environment. The top of this tract marked the maximum flooding surface as shown by very high
gamma ray, very low resistivity responses and the highest foraminiferal population. The
highstand systems tract (5,155-5,000ft) is a one-storey sedimentary package. The sequence
boundary is located at 5,000ft depth.
Sequence 9 (5,000-4,470ft)
The lowstand systems tract lies within 5,000-4,880ft interval. It is mainly composed of sand
with some retrogradational materials at the upper part. The transgressive systems tract (4,880-
4,600ft) is made up of shales with minor sand beds. The characteristic very high gamma ray, high
neutron-density and very low resistivity logs placed the maximum flooding surface at 4,600ft.
The interval 4,600-4,470ft belongs to the highstand systems tract. It is mainly a shaly facies
capped by sandstone. This coarsening-upward log pattern is characteristic of aggradational to
progradational log motif, which is delimited by a sequence boundary at 4470ft.
Sequence 10 (4,470-4,075ft)
This sequence is incomplete as it consists of only the lowstand and transgressive systems
tracts. The lowstand systems tract (4,365-4,470ft) is composed of whitish to brownish coloured
sandstone, which is moderately and poorly sorted. The LST might have been deposited within the
distributary channel to upper shoreface environments. The transgressive systems tract (4,365-
4,075ft) is characterized by sand and shale facies suggesting a range from typical marine shale at
the base through lower shoreface to upper shoreface. The maximum flooding surface is placed at
Review of Environment and Earth Sciences, 2014, 1(2): 77-98
86
© 2014 Conscientia Beam. All Rights Reserved.
4,075ft based on the very high gamma ray, very low resistivity and very high neutron and density
responses at this level. A sequence boundary is at 4,470ft. It is characterized by very low gamma
ray, relatively high and moderate values of neutron and density logs.
3.3. Sequence Stratigraphy of CHEV-3 Well
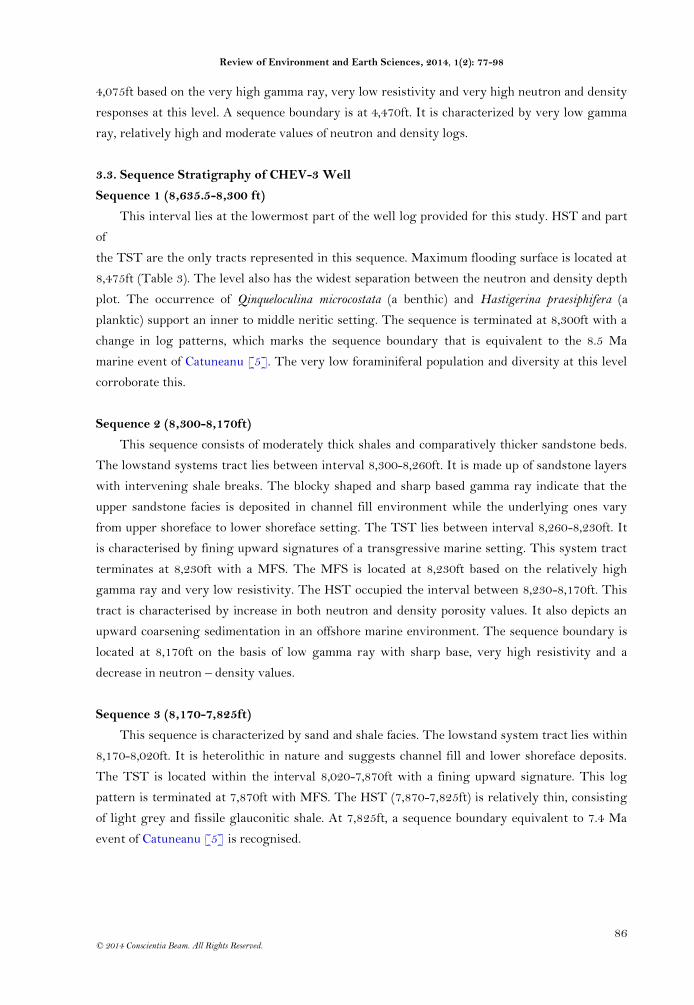
Sequence 1 (8,635.5-8,300 ft)
This interval lies at the lowermost part of the well log provided for this study. HST and part
of
the TST are the only tracts represented in this sequence. Maximum flooding surface is located at
8,475ft (Table 3). The level also has the widest separation between the neutron and density depth
plot. The occurrence of Qinqueloculina microcostata (a benthic) and Hastigerina praesiphifera (a
planktic) support an inner to middle neritic setting. The sequence is terminated at 8,300ft with a
change in log patterns, which marks the sequence boundary that is equivalent to the 8.5 Ma
marine event of Catuneanu [5]. The very low foraminiferal population and diversity at this level
corroborate this.
Sequence 2 (8,300-8,170ft)
This sequence consists of moderately thick shales and comparatively thicker sandstone beds.
The lowstand systems tract lies between interval 8,300-8,260ft. It is made up of sandstone layers
with intervening shale breaks. The blocky shaped and sharp based gamma ray indicate that the
upper sandstone facies is deposited in channel fill environment while the underlying ones vary
from upper shoreface to lower shoreface setting. The TST lies between interval 8,260-8,230ft. It
is characterised by fining upward signatures of a transgressive marine setting. This system tract
terminates at 8,230ft with a MFS. The MFS is located at 8,230ft based on the relatively high
gamma ray and very low resistivity. The HST occupied the interval between 8,230-8,170ft. This
tract is characterised by increase in both neutron and density porosity values. It also depicts an
upward coarsening sedimentation in an offshore marine environment. The sequence boundary is
located at 8,170ft on the basis of low gamma ray with sharp base, very high resistivity and a
decrease in neutron – density values.
Sequence 3 (8,170-7,825ft)
This sequence is characterized by sand and shale facies. The lowstand system tract lies within
8,170-8,020ft. It is heterolithic in nature and suggests channel fill and lower shoreface deposits.
The TST is located within the interval 8,020-7,870ft with a fining upward signature. This log
pattern is terminated at 7,870ft with MFS. The HST (7,870-7,825ft) is relatively thin, consisting
of light grey and fissile glauconitic shale. At 7,825ft, a sequence boundary equivalent to 7.4 Ma
event of Catuneanu [5] is recognised.
Review of Environment and Earth Sciences, 2014, 1(2): 77-98
87
© 2014 Conscientia Beam. All Rights Reserved.
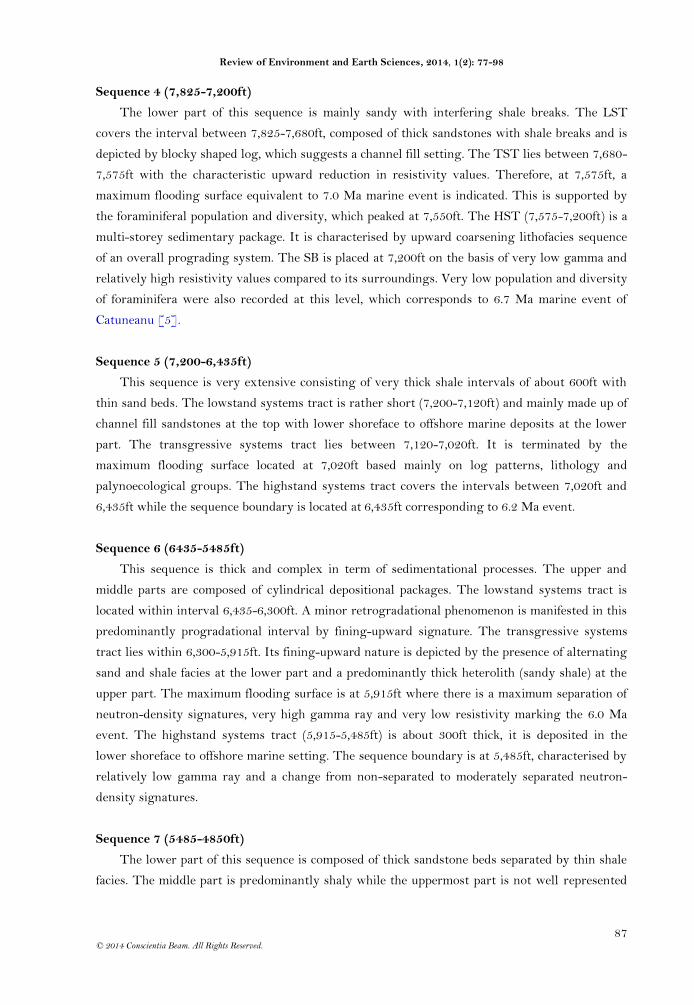
Sequence 4 (7,825-7,200ft)
The lower part of this sequence is mainly sandy with interfering shale breaks. The LST
covers the interval between 7,825-7,680ft, composed of thick sandstones with shale breaks and is
depicted by blocky shaped log, which suggests a channel fill setting. The TST lies between 7,680-
7,575ft with the characteristic upward reduction in resistivity values. Therefore, at 7,575ft, a
maximum flooding surface equivalent to 7.0 Ma marine event is indicated. This is supported by
the foraminiferal population and diversity, which peaked at 7,550ft. The HST (7,575-7,200ft) is a
multi-storey sedimentary package. It is characterised by upward coarsening lithofacies sequence
of an overall prograding system. The SB is placed at 7,200ft on the basis of very low gamma and
relatively high resistivity values compared to its surroundings. Very low population and diversity
of foraminifera were also recorded at this level, which corresponds to 6.7 Ma marine event of
Catuneanu [5].
Sequence 5 (7,200-6,435ft)
This sequence is very extensive consisting of very thick shale intervals of about 600ft with
thin sand beds. The lowstand systems tract is rather short (7,200-7,120ft) and mainly made up of
channel fill sandstones at the top with lower shoreface to offshore marine deposits at the lower
part. The transgressive systems tract lies between 7,120-7,020ft. It is terminated by the
maximum flooding surface located at 7,020ft based mainly on log patterns, lithology and
palynoecological groups. The highstand systems tract covers the intervals between 7,020ft and
6,435ft while the sequence boundary is located at 6,435ft corresponding to 6.2 Ma event.
Sequence 6 (6435-5485ft)
This sequence is thick and complex in term of sedimentational processes. The upper and
middle parts are composed of cylindrical depositional packages. The lowstand systems tract is
located within interval 6,435-6,300ft. A minor retrogradational phenomenon is manifested in this
predominantly progradational interval by fining-upward signature. The transgressive systems
tract lies within 6,300-5,915ft. Its fining-upward nature is depicted by the presence of alternating
sand and shale facies at the lower part and a predominantly thick heterolith (sandy shale) at the
upper part. The maximum flooding surface is at 5,915ft where there is a maximum separation of
neutron-density signatures, very high gamma ray and very low resistivity marking the 6.0 Ma
event. The highstand systems tract (5,915-5,485ft) is about 300ft thick, it is deposited in the
lower shoreface to offshore marine setting. The sequence boundary is at 5,485ft, characterised by
relatively low gamma ray and a change from non-separated to moderately separated neutron-
density signatures.
Sequence 7 (5485-4850ft)
The lower part of this sequence is composed of thick sandstone beds separated by thin shale
facies. The middle part is predominantly shaly while the uppermost part is not well represented

Review of Environment and Earth Sciences, 2014, 1(2): 77-98
88
© 2014 Conscientia Beam. All Rights Reserved.
by the log. The maximum flooding surface is placed at 5180ft where there is a high gamma ray
and low resistivity values.
The correlation of the depositional sequences of the three wells was carried out based on the
constructed chronostratigraphic panel (Fig 4). According to Van Wagoner, et al. [26], the
regressive infilling nearshore marine and outer neritic sandstones should be the target for good
productive reservoirs. Van Wagoner, et al. [27] also have documented that hydrocarbons are
pooled within the Miocene third-order LSTs, which yielded a focused model for development of
abundant, undiscovered Miocene reserves in the northern Gulf of Mexico shelf province.
Therefore, correlation of wells in the shallow offshore Niger Delta and the identification of
petroleum targets can be faced with less hardship if the palynological signature and the related
marine events can be predicted. When prospecting, prediction of sand at specific locations is
required while the prediction of sand-body geometries is desired during field delineation and
development. However, sand are not distributed evenly across the offshore basin floor either
stratigraphically or arealy [28], hence, locating these sand bodies requires the prediction of sand
fairways (river channels into the offshore sites). This is achievable with a good knowledge of the
sequence architecture of a basin from shallow to deep-water setting. The LST sand that lies
directly on 3.7 Ma sequence boundary is more extensive in Chev-2 (200ft thick) than CHEV-1
(60ft thick), indicating that the fairway of one of the delta lobes [29] in the western part of the
basin was along CHEV-2 during this period. The percentage of planktic foraminifera in the
studied wells supported this assertion because CHEV-2 has the lowest (8%) confirming the
suggestion of Whiteman [30] that clastic materials brought offshore through river channel
destroys marine-dependent microfaunas.
4. CONCLUSION
This study revealed that 18 depositional sequences were recognized, five for CHEV-1, ten for
CHEV-2 and seven for CHEV-3. Three of those in CHEV-1 and 2 are correlatable while one is
correlatable between CHEV-2 and 3. A total of six marine maximum flooding surfaces within
Late Miocene to Late Pliocene were recognized when the significant palynological signatures
obtained in this study were integrated with foraminiferal, electronic logs and lithologic studies.
These are 7.4, 7.0, 6.0, 5.0, 2.7 and 2.0 Ma [5], having a resolution in the order of ≤1 Ma and
being locally applicable in shale-dominated facies. This work compares very favourably with
planktonic foraminiferal and nannofossil zonation scheme [26]. It should however, be noted that
it is not in all cases that these palynological events are exactly co-eval with the marine events,
though, they are in such cases close to them, either above or below.
REFERENCES
[1] O. F. Adebayo, "Palynology of late miocene to pliocene agbada formation, Niger Delta basin,
Nigeria," Elixir Geoscience, vol. 56, pp. 13370-13373, 2013.
Review of Environment and Earth Sciences, 2014, 1(2): 77-98
89
© 2014 Conscientia Beam. All Rights Reserved.
[2] O. F. Adebayo and A. O. Ojo, "Miocene-pliocene vegetation and cdynamics of the Niger Delta
basin based on palynological signatures," Journal of Environment and Earth Science, vol. 4, pp. 58-67,
2014.
[3] P. A. Adeonipekun, "Application of late tertiary palynofloral changes as a biostatigraphic tool in
the Offshore Western Niger Delta," An Unpublished Thesis Submitted to the University of
Ibadan, 2007.
[4] J. Benkhelil, "The origin and evolution of the cretaceous benue trough, Nigeria," Journal of African
Science, vol. 8, pp. 251–282, 1989.
[5] O. Catuneanu, Principles of sequence stratigraphy, 1st ed. The Netherlands: Elsevier, Amsterdam,
2006.
[6] Y. C. Chow, "Palynological climatic biosignal as a high resolution tool for sequence stratigraphical
studies, Offshore Sabah and Sarawak, Malaysia," Unpublished Paper for Shell Petroleum Company,
1995.
[7] H. Doust and E. Omatsola, "Niger Delta, in, Edwards, J. D., and Santogrossi, P.A., eds.,
Divergent/passive margin basins," American Association of Petroleum Geologists Memoir, vol. 48, pp.
239-248, 1990.
[8] J. E. Ejedawe, "Patterns of incidence of oil reserves in Niger Delta basin," American Association of
Petroleum Geologists Bulletin, vol. 65, pp. 1574-1585, 1981.
[9] S. Garzon, S. Warny, and P. J. Bart, "A palynological and sequence-stratigraphic study of
Santonian–maastrichtian strata from the Upper Magdalena valley basin in central Colombia,"
Palynology, vol. 36, pp. 112-133, 2012.
[10] W. A. Gregory and G. F. Hart, "Towards a predictive model for palynologic response to sea level
changes," Palaios, vol. 7, pp. 3-33, 1992.
[11] B. U. Haq, J. Hardenbol, and P. R. Vail, "Chronology of flunctuating sea levels since triassic,"
Nature, vol. 235, pp. 1156-1167, 1987.
[12] T. F. Hentz and H. Zeng, "High-frequency miocene sequence stratigraphy, Offshore Louisiana:
Cycle framework and influence on production distribution in a mature shelf province," American
Association of Petroleum Geologists Bulletin, vol. 87, pp. 197–230, 2003.
[13] M. Holtz and M. E. Dais, "Taphonomy of palynological records in a sequence stratigraphic
framework: An example from thr earlier permian parana basin of Southern Brazil," Review of
Paleobotany and Palynology, vol. 99, pp. 217-233, 1998.
[14] T. R. Klett, T. S. Ahlbrandt, J. W. Schmoker, and J. L. Dolton, "Ranking of the world’s oil and gas
provinces by known petroleum volumes," U.S. Geological Survey Open-file Report, 1997.
[15] O. V. Kostenko, S. J. Naruk, W. Hack, M. Poupon, H. Meyer, M. Mora-Glukstad, C. Anowai, and
M. Mordi, "Structural evaluation of column-height controls at a toe-thrust discovery, deep-water
Niger Delta," American Association of Petroleum Geologists Bulletin, vol. 92, pp. 1615–1638, 2008.
[16] H. Li and D. Habib, "Dinoflagellate stratigraphy and its response to sea level change in
cenomanian-turonian sections of the Western interior of the United States," Palaios, vol. 11, pp.
15–30, 1996.

Review of Environment and Earth Sciences, 2014, 1(2): 77-98
90
© 2014 Conscientia Beam. All Rights Reserved.
[17] E. A. Mancini, O. Jamal, M. Badali, K. Liu, and W. C. Parcell, "Sequence-stratigraphic analysis of
jurassic and cretaceous strata and petroleum exploration in the central and eastern gulf coastal
plain, United States," American Association of Petroleum Geologists Bulletin, vol. 92, pp. 1655 –1686,
2008.
[18] R. J. Morley, "Biostratigraphic characterization of system tracts in tertiary sedimentary basins,"
Proceedings of the International Symposium on Sequence Stratigraphy in SE Asia by Indonesian
Petroleum Association, pp. 49-71.
[19] F. E. Oboh-Ikuenobe, "Correlating palynofacies assemblges with sequence stratigraphy in the
upper cretaceous (Campanian) sedimentary rocks of the brook cliffs, east-central Utah," Geological
Society of America Bulletin, vol. 108, pp. 1275-1294, 1996.
[20] H. W. Posamentier and G. P. Allen, "Siliciclastic sequence stratigraphy: Concepts and
applications," SEPM Concepts in Sedimentology and Paleontology, pp. 1-210, 1999.
[21] H. W. Posamentier, J. M. T., and P. R. Vail, Eustatic controls on clastic deposition I- Conceptual
framework. In: C. K. Wilgus, Bruce S. Hastings, Christopher G. St C.Kendall, H. W. Posamentier, C. A.
Ross, and J. C. van Wagoner (Eds). Sea level changes- an integrated approach vol. 42: SEPM Special
Publication.
[22] V. Rull, "Ecostratigraphic study of paleocene and early eocene palynological cyclicity in Northern
South America," Palaios, vol. 15, pp. 14-24, 2000.
[23] V. Rull, "High-impact palynology in petroleum geology: Applications from Venezuela (Northern
South America)," American Association of Petroleum Geologists Bulletin, vol. 86, pp. 279–300, 2002.
[24] A. H. Saller, J. T. Noah, A. P. Ruzuar, and R. Schneider, "Linked lowstand delta to basin-floor fan
deposition, Offshore Indonesia: An analog for deep-water reservoir systems," America Association of
Petroleun Geologists Bulletin, vol. 88, pp. 21–46, 2004.
[25] P. Schioler, H. Brinkhuis, L. Roncaglia, and G. J. Wilson, "Dinoflagellate biostratigraphy and
sequence stratigraphy of the type maastrichtian (Upper Cretaceous), ENCI quarry, the
Netherlands," Science, vol. 1, pp. 65–95, 1997.
[26] J. C. Van Wagoner, H. W. Posamentier, R. M. Mitchum, P. R. Vail, J. F. Sarg, T. S. Loutit, and J.
Hardenbol, "An overview of sequence stratigraphy and key definitions. In: Wilgus, C. K., Hastings,
B. S., Kendall, C. G St. S., Posamentier, H. w., Ross, C. A., Van Wagoner, J. C. (Eds). Sea-level
changes: An integrated approach," Society of Economic Paleontologists and Mineralogists, Special
Publication, vol. 42, pp. 39-45, 1988.
[27] J. C. Van Wagoner, R. M. Mitchum Jr, K. M. Campion, and V. D. Rahmanian, "Siliciclastic
sequence stratigraphy in well logs, core sand outcrops: Concepts for high-resolution correlation of
time facies," American Association of Petroleum Geologists Methods in Exploration Series, vol. 7, pp. 1-
55, 1990.
[28] S. Warny and J. H. Wrenn, "Upper Neogene dinoflagellate cyst ecostratigraphy of the atlantic
coast of Morocco," Micropaleontology, vol. 48, pp. 257–272, 2002.
[29] S. Warny, P. J. Bart, and J. P. Suc, "Timing and progression of climatic, tectonic and glacioeustatic
influences on the messinian salinity crisis," Palaeogeography, Palaeoclimatology and Palaeoecology, vol.
202, pp. 59–66, 2003.

Review of Environment and Earth Sciences, 2014, 1(2): 77-98
91
© 2014 Conscientia Beam. All Rights Reserved.
[30] A. J. Whiteman, "Nigeria: Its petroleum geology, resources and potentials," Graham and Trotman,
London, vol. I&II, pp. 1-394, 1982.
[31] H. W. Posamentier and P. R. Vail, Eustatic controls on clastic deposition. II. Sequence and systems tract
models. In: Wilgus, C.K., Hastings, B.S., Kendall, C.G.St.C., Posamentier, H.W., Ross, C.A., Van Wagoner,
J.C. (Eds.). Sea level changes––an integrated approach vol. 42: SEPM Special Publication, 1988.
[32] C. Poumot, "Palynological evidence for eustatic events in the tropical Neogene," Bulletin des Centres
de Recherches Exploration-Production Elf Aquitaine, vol. 13, pp. 437–453, 1989.
[33] D. D. Evamy, J. Haremboure, P. Kamerling, W. A. Knaap, F. A. Mollot, and P. H. Rowlands,
"Hydrocarbon habitat of tertiary Niger Delta," American Association of Petroleum Geologists Bulletin,
vol. 62, pp. 1-39, 1978.
Fig-1. Schematic model showing the distribution of palynological assemblages from onshore– offshore and their
relationship to an idealized sequence-stratigraphic section (After[14]).

Review of Environment and Earth Sciences, 2014, 1(2): 77-98
92
© 2014 Conscientia Beam. All Rights Reserved.
Fig.-2. Correspondence between the phases of the palynocycles and the depositional systems of the sequence stratigraphic
analysis SB= sequence boundary, MFS= maximum flooding surface [13, 23].
Fig 3. Sedimentary Basins in Nigeria Showing the Niger Delta Basin and the Study Area (Modified from [30, 31];
Benkhelil [4], [32]).

Review of Environment and Earth Sciences, 2014, 1(2): 77-98
93
© 2014 Conscientia Beam. All Rights Reserved.
Peregrinipollisnigericus, 2.Psilatricolporitesoperculatus, 3.Palaeocystodinum spp., 4.Microforaminiferal wall lining, 5-
6.Zonocostitesramonae, 7.Retitricolpitesbendeensis,
8.Retibrevitricolporitesobodoensis,9.Pachydermitesdiederixi,10.Monoporitesannulatus,
11.Quinqueloculinalamarckiana(foraminifera).
Fig- 4.A Section of the Well Log of Chev-2 well.

Review of Environment and Earth Sciences, 2014, 1(2): 77-98
94
© 2014 Conscientia Beam. All Rights Reserved.
Table-1. Sequence Stratigraphy of Chev-1 Well
DEPTH
FT
EPOCH
Evamy, et al.
[33]
SEQUENCE (This Work)
SYSTEM TRACT
(This Work)
AGE After Haq, et al. [11] (Ma)
BIO EVENTS
3150 3500 4000 4500 4750 5000 5300 5600 6000
L
AT
E P
LIO
CE
NE
P900
5
3250 TST
SB 2.4 2.7 SB 3.7 5.0 SB 5.5
Top
Retitricolpites bendensis Top Retibrevitricolpoites obodoensis Base
Podocarpus milanjianus
Uphole decrease of Zonocostites ramonae Base Retistephanocolporites gracilis Base Nymphaea lotus
LST 3430
4
HST 3755 4000 TST LST 4400
3
HST 4620 TST 4920
EA
RL
Y P
LIO
CE
NE
P800
5050 LST
2
HST 5300
L
AT
E M
IOC
EN
E
TST 5500 5600 LST
1
5700 HST 5800

Review of Environment and Earth Sciences, 2014, 1(2): 77-98
95
© 2014 Conscientia Beam. All Rights Reserved.
Table-2.Sequence Stratigraphy of Chev-2 Well
DEPTH FT
EPOCH
Evamy, et al.
[33]
SEQUENCE
SYSTEM TRACT
AGE After Haq, et al. [11] (Ma)
BIO EVENTS
4500 5000 5500 6000 6500 7000 7500 8000 8500
E
AR
LY
PL
IOC
EN
E
P880
10
4365 TST 3.4 SB 3.7 3-9 SB 4.2 5.0 SB 5.5 6.0
Marginulina costata Quantitative top Bridellia cf. ferruginea Quantitative top Psilatricolpitesoperculatus Quantitative top Cyperussp Ampycorynascalaris caudata Qantitative base Nymphaea lotus
4470 LST
9
4600 HST TST 4700 4900 LST HST 5155
8
7
5300 TST 5420 LST 5630 HST
P870
5730 TST LST 5935
6
HST 6305
TST 6710
L;ST 6810
L
AT
E M
IOC
EN
E
P860
5
7005 HST TST 7470 LST 7765
4 7860 HST 7915 TST
P850
8050 LST 3 8120 HST
8235 TST 8385 LST
2
8435 HST
8565 TST 8615 LST
1 8690 HST
TST

Review of Environment and Earth Sciences, 2014, 1(2): 77-98
96
© 2014 Conscientia Beam. All Rights Reserved.
Table-3.Sequence Stratigraphy of Chev-3 Well
DEPTH FT
EPOCH
Evamy, et al. [33]
SEQUENCE
SYSTEM TRACT
AGE After Haq, et al. [11] (Ma)
BIO EVENTS
4150 5000 6000 7000 8000
LA
TE
MIO
CE
NE
P850
7
?SB5.5
6.0
SB6.2
6.4
SB 6.7
7.0
SB 7.4
?8.2
SB ?8.5
Minimmum occurrence Zonocostitesramonae
FAD: Lenticulina costata
FAD: Spirosplectammina
wrightii Top occurrence Peregrinipollis nigericus (Brachystegia cf.eurycoma) Base occurrence
Cyperus spp. FAD: Textularina96oncave FAD: Orbulinauniversa Acme Psilatricolporites operculatus FAD: Globigerinoides obliquus Uphole increase Monoporites Annulatus
5180 HST
5390 TST 5485 LST
6
HST 5915 TST 6300 6435 LST
P840
5
HST 7020
7120 TST
P830
7200 LST
4
HST 7575 7680 TST
7825 LST
3
7870 HST 8020 TST 8170 LST
2
8230 HST 8260 TST 8370 LST
1
8475 HST
8635.5 TST

Review of Environment and Earth Sciences, 2014, 1(2): 77-98
97
© 2014 Conscientia Beam. All Rights Reserved.
Fig-4. Correlation of the Depositional Sequences in Chev-1, 2, 3
MFS = Maximum Flooding Surface, TST = Transgressive Systems Tract, HST = Highstand Systems TractLST = Lowstand Systems
Tract, SB = Sequence Boundary.
Palynostratigraphic Charts

Review of Environment and Earth Sciences, 2014, 1(2): 77-98
98
© 2014 Conscientia Beam. All Rights Reserved.
Views and opinions expressed in this article are the views and opinions of the author(s), Review of Environment and Earth Sciences shall not be responsible or answerable for any loss, damage or liability etc. caused in relation to/arising out of the use of the content.