Figure 3 - Indonesian Journal of Earth Sciences
14
Indonesian Journal of Earth Sciences, Vol. 1, No. 2 (2021): 84-97 84 P-ISSN: 2798-1134 | E-ISSN: 2797-3549 | DOI: 10.52562/injoes.v1i2.253 Indonesian Journal of Earth Sciences http://journal.moripublishing.com/index.php/injoes Electrical Resistivity and Geotechnical Attributes and The Dynamics of Foundation Vulnerability Musa Adesola Bawallah 1 , Stephen Olubusola Ilugbo 2 * , Kesyton Oyamenda Ozegin 3 , Babatunde A Adebo 2 , Isaac Aigbedion 3 , Kazeem Adeyinka Salako 4 1 Department of Applied Geophysics, Federal University of Technology, Akure, Nigeria 2 Department of Physics, Lead City University, Ibadan, Nigeria 3 Department of Physics, Ambrose Alli University, Ekpoma, Nigeria 4 Department of Geophysics, Federal University of Technology Minna, Nigeria * Correspondence: [email protected], [email protected] Received: 12 October 2021; Accepted: 7 December 2021; Published: 27 December 2021 Abstract: This research evaluates the significance of geotechnical and Electrical Resistivity methods in studying structural integrity as fundamental factors that may account for failure in a typical sedimentary environment of Ukpenu Primary School, Ekpoma, Edo State, Nigeria. Two methods were used in this study such as the Electrical Resistivity approach involving the use of Lateral Horizontal Profiling (LHP), 2D Electrical Resistivity Tomography (ERT), and Vertical Electrical Sounding (VES) techniques. While geotechnical method involved the collection of soil samples from the study locations for the characterization of the soil properties that are very vital to foundation studies. Nine VES were carried out using Schlumberger array with current electrode spacing varying from 1 to 40 m, with 2-D ERT using Dipole-Dipole electrode array with inter-station separation of 5 m and an expansion factor varied from 1 to 5 while LHP involve Wenner array with an electrode spacing of 5 m interval and was used to determine the vulnerability factors for the building sustainability. The VES interpretation results were used to determine the second-order parameters for the determination of vulnerability. The results obtained from the two methods review that both are very fundamental to foundation dynamics. However, electrical attributes were found to give better information in terms of depth, lateral extent, layer stratification, and nature of materials which make it an indispensable tool over geotechnical attributes whose depth of investigation is up to a maximum of 5 m which poses great limitation in the evaluation of structural integrity, against stress, and strain occasion by geodynamic activities that often result into fracture, crack, highly weathered formation that usually goes beyond the shallow depth of investigation. Therefore, it can be stated that resistivity attributes account for 90% of the major contributing factors that affect foundation vulnerability. Keywords: Geotechnical Studies, 2D ERT, Lateral Horizontal Profiling, VES, Vulnerability Factor, Structural Integrity INTRODUCTION The issues concerning foundation studies have remained a burning concern in the mind of geoscientists and civil engineers (Bawallah et al., 2020). Whereas, the spates of foundation vulnerability and subsequent failures that were reported in some parts of African and especially Nigeria has assumed a worrisome dimension, hence to evaluate the factors that are responsible for this foundation vulnerability in terms of depth of investigations, nature of materials, structural trends, geodynamic factors, the relevance of Electrical Resistivity and Geotechnical attributes and their significance in evaluation of foundation sustainability (Ilugbo et al., 2018; Ozegin et al., 2019a; Bawallah et al., 2019a; Bawallah et al., 2019b; Bawallah et al., 2020; Oyedele et al., 2020).
-
Upload
khangminh22 -
Category
Documents
-
view
7 -
download
0
Transcript of Figure 3 - Indonesian Journal of Earth Sciences

Indonesian Journal of Earth Sciences, Vol. 1, No. 2 (2021): 84-97
84
P-ISSN: 2798-1134 | E-ISSN: 2797-3549 | DOI: 10.52562/injoes.v1i2.253
Indonesian Journal of Earth Sciences
http://journal.moripublishing.com/index.php/injoes
Electrical Resistivity and Geotechnical Attributes and The Dynamics of
Foundation Vulnerability
Musa Adesola Bawallah1, Stephen Olubusola Ilugbo
2* , Kesyton Oyamenda Ozegin
3,
Babatunde A Adebo2
, Isaac Aigbedion3, Kazeem Adeyinka Salako
4
1Department of Applied Geophysics, Federal University of Technology, Akure, Nigeria
2Department of Physics, Lead City University, Ibadan, Nigeria
3Department of Physics, Ambrose Alli University, Ekpoma, Nigeria
4Department of Geophysics, Federal University of Technology Minna, Nigeria
*Correspondence: [email protected], [email protected]
Received: 12 October 2021; Accepted: 7 December 2021; Published: 27 December 2021
Abstract: This research evaluates the significance of geotechnical and Electrical Resistivity methods in studying
structural integrity as fundamental factors that may account for failure in a typical sedimentary environment
of Ukpenu Primary School, Ekpoma, Edo State, Nigeria. Two methods were used in this study such as the
Electrical Resistivity approach involving the use of Lateral Horizontal Profiling (LHP), 2D Electrical Resistivity
Tomography (ERT), and Vertical Electrical Sounding (VES) techniques. While geotechnical method involved
the collection of soil samples from the study locations for the characterization of the soil properties that are
very vital to foundation studies. Nine VES were carried out using Schlumberger array with current electrode
spacing varying from 1 to 40 m, with 2-D ERT using Dipole-Dipole electrode array with inter-station
separation of 5 m and an expansion factor varied from 1 to 5 while LHP involve Wenner array with an
electrode spacing of 5 m interval and was used to determine the vulnerability factors for the building
sustainability. The VES interpretation results were used to determine the second-order parameters for the
determination of vulnerability. The results obtained from the two methods review that both are very
fundamental to foundation dynamics. However, electrical attributes were found to give better information
in terms of depth, lateral extent, layer stratification, and nature of materials which make it an indispensable
tool over geotechnical attributes whose depth of investigation is up to a maximum of 5 m which poses great
limitation in the evaluation of structural integrity, against stress, and strain occasion by geodynamic activities
that often result into fracture, crack, highly weathered formation that usually goes beyond the shallow depth
of investigation. Therefore, it can be stated that resistivity attributes account for 90% of the major
contributing factors that affect foundation vulnerability.
Keywords: Geotechnical Studies, 2D ERT, Lateral Horizontal Profiling, VES, Vulnerability Factor, Structural
Integrity
INTRODUCTION
The issues concerning foundation studies have remained a burning concern in the mind of
geoscientists and civil engineers (Bawallah et al., 2020). Whereas, the spates of foundation
vulnerability and subsequent failures that were reported in some parts of African and especially
Nigeria has assumed a worrisome dimension, hence to evaluate the factors that are responsible for
this foundation vulnerability in terms of depth of investigations, nature of materials, structural
trends, geodynamic factors, the relevance of Electrical Resistivity and Geotechnical attributes and
their significance in evaluation of foundation sustainability (Ilugbo et al., 2018; Ozegin et al., 2019a;
Bawallah et al., 2019a; Bawallah et al., 2019b; Bawallah et al., 2020; Oyedele et al., 2020).

Bawallah et al. (2021)
Indonesian Journal of Earth Sciences 85
Moreover, the Electrical Resistivity attributes take into consideration the nature of geological
materials i.e. structural settings, both lateral and depth extent from the topsoil to a depth of 100
meters and sometimes beyond, whereas, civil engineering site investigation takes into account
geotechnical attributes such as nature of the soil, stratification, and settings up to a maximum depth
of 3 – 5 meters. Therefore, it brings to mind the pertinent issues of which among these attributes
is most fundamental and inevitable, which most times the civil engineers do not seem to appreciate
the inevitability of Electrical resistivity attributes in foundation studies (Akintorinwa & Adesoji 2009;
Adebiyi et al., 2018; Ilugbo et al., 2018; Adebo et al., 2019).
Therefore, this study is a direct consequence of the need to harmonize this school of thought
to evaluating both Electrical Resistivity and geotechnical attributes, to establish the indispensability
of both approaches to foundation studies. Over the years, geophysicists have found the Electrical
Resistivity Method to be of major application in the identification of soil type, layer stratification,
delineation of structural settings, structural disposition, lateral and depth extent of geological
materials, and its disposition to foundations in terms of integrity and vulnerability to failure
(Akintorinwa & Adeusi, 2009, Oyedele et al., 2011, Adelusi et al., 2013, Adelusi et al., 2014, Ozegin
et al., 2019b).
However, in recent times, it has become a matter of public interest, the need for foundation
sustainability and the most appropriate and relevant approach to be used in other to reduce or
minimize failure arising from building constructions. However, the focus of these present studies
is to carry out an evaluation of Electrical Resistivity attributes in the sedimentary environments of
Nigeria, where most of the reported cases of foundation failures occurred and compare it with
geotechnical attributes to be able to determine the significance of geophysical investigation in
engineering construction purposes.
METHOD
Site Description and Geology of The Study Area
The study was carried out at Ukpenu Primary School, Ekpoma, Edo State, Nigeria (Figure
1). It is situated between the UTM coordinates of Eastings 744900 - 745000 m and Northings
182030 - 182150 m. The elevation ranges from 239 to 290 m above sea level. The accessibility of
the study area is mainly by road and footpaths. The study area falls within the Anambra Basin
covering Eguare Ekpoma town and Ukpenu extension in Esan West Local Government Area of Edo
State, Nigeria (Figure 2).
The average annual temperature in Ekpoma is 24.8°C. Precipitation is lowest in January;
with an average of 11 mm. The greatest amount of precipitation occurs in September with an
average of 303 mm. At an average temperature of 26.6°C, March is the hottest month of the year.
The lowest average temperatures in the year occur in August when it is around 23.0°C. Between
the driest and wettest months, the precipitation is 292 mm. The variation in temperatures
throughout the year is 3.6°C.
The area of study is underlain by Bende–Ameki Formation while the nearby area is
underlain with 3% of Imo shale and Ogwashi–Asaba. The area is underlain by clay, shale, sandstone,
limestone, and sand. The Niger Delta sediment includes Benin, Agbada, and Akata formations and
they range in age from Eocene to recent (Kogbe, 1978; Aigbedion, 2007; Okeke, 2011; Salufu,
2014). Aigbedion et al., 2019).
Geotechnical Investigation
The samples for the geotechnical test were collected at five different points into a plastic
bag and transported to the soil laboratory for analysis, the soil was air-dried and crushed into small
pieces (Figure 3). The crushed samples were then sieved through various sieves openings ranging
from 0.0063 mm to 10.0 mm. The sieved soil was wetted with tap water, the moister soil was
sealed in a plastic bag and stored for 2 days to allow moisture equilibrium, and hydra soil was later
used for other geotechnical tests. Some tests were repeated for some locations to ensure the
reliability of the test result.

Bawallah et al. (2021)
Indonesian Journal of Earth Sciences 86
The basics test conducted include the plastic index, unconfined compressive strength,
hydrometer test, specific gravity, dry unit weight, particle size distribution; compaction test and
atterberg’s limit of the soil were performed according to British standard (BS 1377:1990). The data
of these index properties were used to classify the soil following the United Soil Classification
System (USCS) classification.
The final results from the geotechnical test were correlated with geophysical investigation
results to provide information on the variation of strata and physical strength across the site.
Figure 1. (a) Map of Nigeria and Edo State (b) Map of Edo State and Esan West Local Govt. (c) Map of
Esan West Local Govt. Showing the Study Area (d) Base Map of the Study Location.
Figure 2. Geological Map of Ekpoma Showing the Study Location (modified after Salufu and Ujuanbi,
2015)

Bawallah et al. (2021)
Indonesian Journal of Earth Sciences 87
Geophysical Investigation
In this method, three Electrical Resistivity techniques were used, viz; Vertical Electrical
Sounding (VES), 2-D Electrical Resistivity Tomography (ERT), and Lateral Horizontal Profiling (LHP)
with corresponding configurations such as Schlumberger, Dipole-Dipole, and Wenner (Figure 3).
Nine (9) sounding stations were occupied along the traverses, and the current electrode
spacing (AB/2) was varied from 1 to 40 m. To process the electrical resistivity data, the apparent
resistivity values were plotted against the electrode spread (AB/2). This was subsequently
interpreted quantitatively using the partial curve matching method and computer-assisted 1-D
forward modeling with WinResist 1.0 version software.
The results from the VES interpretation were used to determine second-order parameters
such as the total transverse resistance (T) and the total longitudinal conductance (s). The dipole-
dipole data were inverted using 2-D subsurface images using the DIPPRO™ 4.0 inversion software.
The inter-electrode spacing of 5 m was adopted while the inter-dipole expansion factor (n) was
varied from 1 to 5. Lateral Horizontal Profiling (LRP) techniques were taken at a = 5, 10, 15, and
20 m which give useful information on the nature and trends of the sub-surface and structural
trends, and the data obtained were inverted using 2-D subsurface images using the Resis2D software.
The data from Dipole-dipole and Lateral Horizontal Profiling were used to determine the
vulnerability factor for each of the length spread. The final results from both geotechnical and
Electrical Resistivity techniques were correlated with each other.
The Below equation was generated to determine vulnerability factors
Failure index = A (1)
where A = addition of all the percentage ratings for failure index
Stability Index = B (2)
where B = addition of all the percentage ratings for stability index
Vulnerability Factor = A/B (3)
Figure 3. Data Acquisition Map of the Study Area

Bawallah et al. (2021)
Indonesian Journal of Earth Sciences 88
RESULTS AND DISCUSSION
Geotechnical Results
The details of various results obtained from both field and laboratory tests are shown in
(Table 1). The dry unit weight ranges from 19.38 to 19.60 kilo Newton per cubic meter (KN/m3),
which suggests a density index less than the required standard of 85% index stability and hence
may also account for partial vulnerability or structural failure. The plasticity index obtained from
the soil analysis ranges from 10.2 to 11.9 % which implies that compressibility is low (Burmister,
1997) and encourages cracks that may lead to foundation vulnerability to failure. Grain size analysis
for the five sample points gave relevant information on the number of fines i.e. less than 0.075
mm sieves, these ranges from 34.4 to 36.7 % which is good enough to support stability. The
specific gravity was used to determine the rate of voids within the soil sample which ranges from
2.64 to 2.65. This is the water content at which the soil will behave like a viscous mud flowing
under its weight. The liquid limit test has values ranging from 29.4 to 32.2 % which is fairly good
enough to support foundation integrity. The compaction test/analysis indicated that the optimum
moisture content (OMC) and maximum dry density (MDD) ranges from 13.6 to 14.2 % and 19.38
to 19.49 kilo Newton per meter cube (KN/m3) which is good enough to support stability.
The unconfined compressive strength value varies from 181 to 227 kilo Pascal (Kpa) (Table
6 to 10) which may be good but not the best for foundation/structural strength and hence may be
partly responsible for foundation vulnerability.
Table 1. Results summary and soil classification
Sample code L1 S1 L1 S2 L1 S3 L1 S4 L1 S5
Natural moisture content (%) 13.25 14.15 14.1 14.15 14.15
Specific gravity 2.64 2.65 2.65 2.65 2.65
Linear shrinkage value (%) 7.1 6.4 5.7 6.4 5.0
Liquid limit, WL (%) 32.2 31.3 31.2 30.4 29.4
Plastic limit, WP (%) 20.5 19.4 19.4 19.9 19.2
Plasticity index, PI (%) 11.7 11.9 11.8 10.5 10.2
% of Soil Passing 2.36mm sieve 98.5 98.6 98.6 98.7 98.8
% of Soil Passing 425µm sieve 71.4 75.4 76.3 72.4 76.9
% of Soil Passing 75µm sieve 35.6 34.5 35.4 34.4 36.7
Optimum Moisture Content, (%) 13.6 14.0 13.9 14.2 14.0
Maximum Dry Density, (kg/m3) 1852.1 1834.0 1838.6 1825.0 1834.0
Unconfined compressive strength,
(kPa)
212.1 212.9 227.2 211.2 181.8
Group index, GI 1.8 1.7 3.4 1.0 0.7
AASHTO classification A-2-6 A-2-6 A-2-6 A-2-6 A-2-6
USCS Classification code CL CL CL CL CL
Degree of Expansion based on
Linear Shrinkage Value
Marginal Marginal Marginal Marginal Non-
critical
Geophysical Results
Dipole-dipole pseudosection
The analysis of the 2D resistivity imaging using dipole-dipole gave relevant information on
the structure settings along the study areas (Figure 4a). Two distinctive formations were obtained
from the structural settings, a shallow layer horizon of fewer than 5 m with resistivity variations
ranging from 184 to 870 Ωm, reflecting resistivity attributes of moderate structural stability and
integrity. While below this layer is an underlying formation of about 25 m thickness with high
resistivity attributes values ranging from 1617 to 10899 Ωm, indicative of a layer formation with
high structural integrity.
Bawallah et al. (2021)
Indonesian Journal of Earth Sciences 89
Figure 4. Dipole-Dipole Pseudosection along traverse one(a), traverse two(b)
The results obtained revealed the presence of two distinctive formation/structural settings
characterized by fairly thick upper layer horizon with apparently low resistivity attributes,
characterized of a weak zone/formation with layer resistivity varying from 94.6 to 230 Ωm and
layer thickness ranging from 5 to 15 m. this was underlain by a fairly competent but thin layer
formation with resistivity attributes ranging from 444 to 8328 Ωm. The characteristic feature of
this formation that makes it vulnerable is the drastic fall in the apparent resistivity attributes with
depth (Figure 4b).
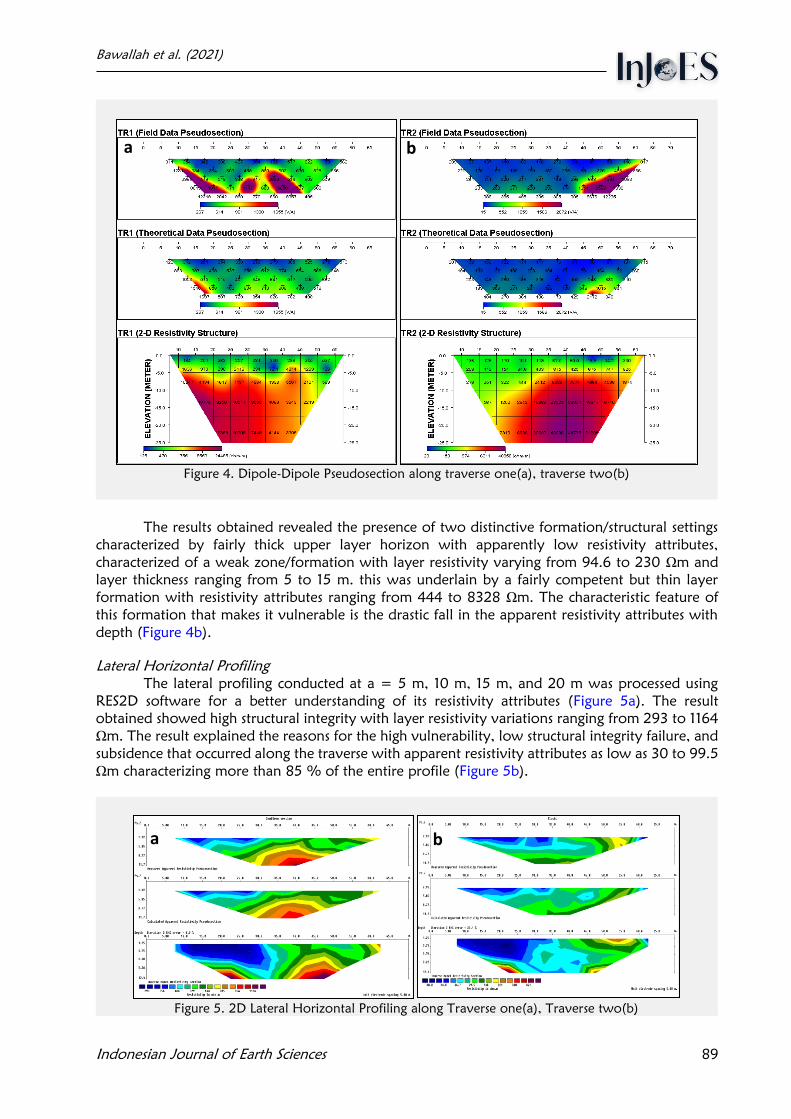
Lateral Horizontal Profiling
The lateral profiling conducted at a = 5 m, 10 m, 15 m, and 20 m was processed using
RES2D software for a better understanding of its resistivity attributes (Figure 5a). The result
obtained showed high structural integrity with layer resistivity variations ranging from 293 to 1164
Ωm. The result explained the reasons for the high vulnerability, low structural integrity failure, and
subsidence that occurred along the traverse with apparent resistivity attributes as low as 30 to 99.5
Ωm characterizing more than 85 % of the entire profile (Figure 5b).
Figure 5. 2D Lateral Horizontal Profiling along Traverse one(a), Traverse two(b)
a b
a b

Bawallah et al. (2021)
Indonesian Journal of Earth Sciences 90
Geoelectric Section
Following the results obtained from the Wenner profiling and dipole-dipole, further
investigation was conducted using Vertical Electrical Sounding (VES) based on suspended
anomalous zones as identified by the two techniques (Figure 6a). The geoelectric section along this
traverse indicated a topsoil horizon that was made up of competent materials with resistivity values
ranging from 226 to 657 Ωm, while next layer material was also considered to be made up of
competent materials with layer resistivity variations ranging from 212 to 1071 Ωm.
The third layer formation was considered to be made up of competent materials with
resistivity variations ranging from 618 to 3417 Ωm. This reflected the effective correlation with
both the lateral resistivity and dipole-dipole techniques.
The finding obtained from traverse two characterized the area into very weak, moderately
weak, and competent formation. The topsoil, clayey sand/sand formation, and moderately
resistive sandstone with resistivity variations ranging from 73 to 236 Ωm, 157 to 228 Ωm, and 469
to 1268 Ωm (Figure 6b). Thereby justifying the reason for failure and subsidence that occurred and
showing effective correlation with the two other techniques used along the traverse.
Figure 6. Geoelectric Section along Traverse one(a), Traverse two(b)
Dar-Zarrouk Parameters
Total Longitudinal Conductance & Total Transverse Resistance
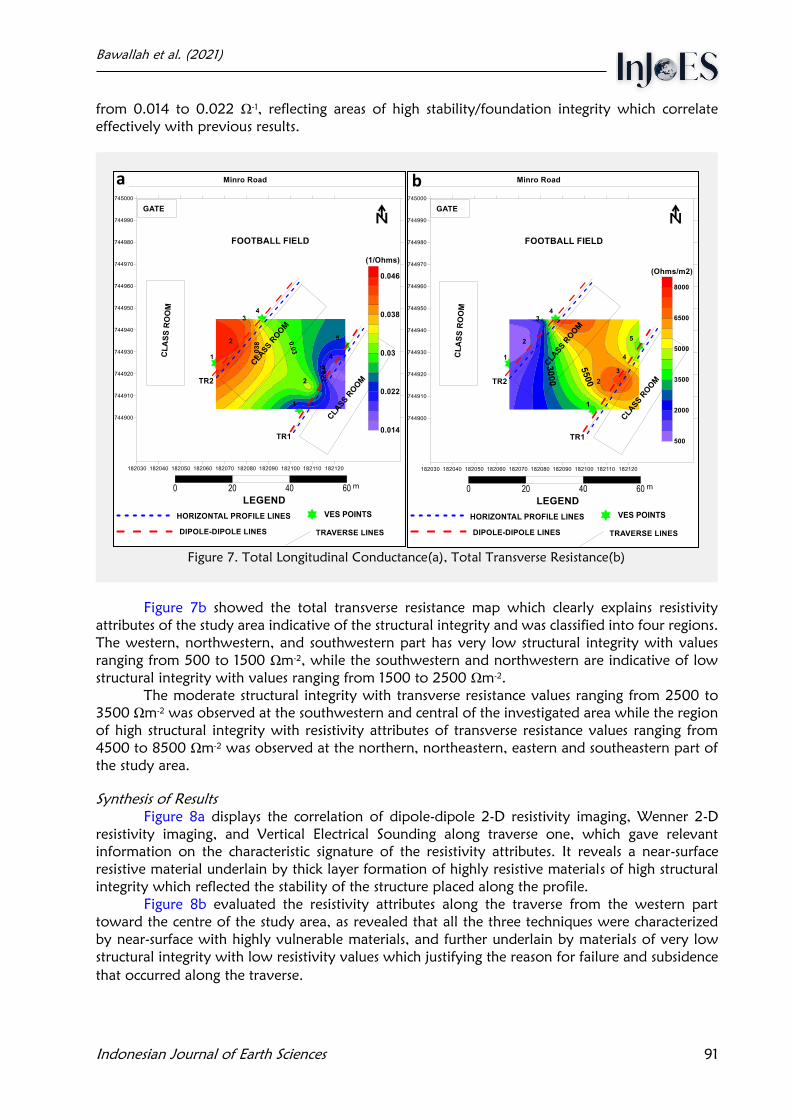
The result obtained from the second-order parameters using the Da-zarrouk principle
demonstrates the reason for the failure that occurred mainly as a function of resistivity attributes
(Figure 7a). The map was classified into three distinctive regions, mainly regions of high
longitudinal conductance with values ranging from 0.038 to 0.046 Ω-1, reflecting zones of high
vulnerability at Northwestern, western and central parts of the study area.
The second region falls within the central, northern, and southern regions with values
ranging from 0.025 to 0.038 Ω-1, indicating region/zone of moderate weakness, while the third
region reflects high resistivity attributes with very low total longitudinal conductance values ranging
a
b
Bawallah et al. (2021)
Indonesian Journal of Earth Sciences 91
from 0.014 to 0.022 Ω-1, reflecting areas of high stability/foundation integrity which correlate
effectively with previous results.
Figure 7. Total Longitudinal Conductance(a), Total Transverse Resistance(b)
Figure 7b showed the total transverse resistance map which clearly explains resistivity
attributes of the study area indicative of the structural integrity and was classified into four regions.
The western, northwestern, and southwestern part has very low structural integrity with values
ranging from 500 to 1500 Ωm-2, while the southwestern and northwestern are indicative of low
structural integrity with values ranging from 1500 to 2500 Ωm-2.
The moderate structural integrity with transverse resistance values ranging from 2500 to
3500 Ωm-2 was observed at the southwestern and central of the investigated area while the region
of high structural integrity with resistivity attributes of transverse resistance values ranging from
4500 to 8500 Ωm-2 was observed at the northern, northeastern, eastern and southeastern part of
the study area.
Synthesis of Results
Figure 8a displays the correlation of dipole-dipole 2-D resistivity imaging, Wenner 2-D
resistivity imaging, and Vertical Electrical Sounding along traverse one, which gave relevant
information on the characteristic signature of the resistivity attributes. It reveals a near-surface
resistive material underlain by thick layer formation of highly resistive materials of high structural
integrity which reflected the stability of the structure placed along the profile.
Figure 8b evaluated the resistivity attributes along the traverse from the western part
toward the centre of the study area, as revealed that all the three techniques were characterized
by near-surface with highly vulnerable materials, and further underlain by materials of very low
structural integrity with low resistivity values which justifying the reason for failure and subsidence
that occurred along the traverse.
a b

Bawallah et al. (2021)
Indonesian Journal of Earth Sciences 92
Figure 8. Correlation of Results along Traverse one(a), Traverse two(b)
Vulnerability Factors
Vulnerability Factor for Lateral Horizontal Profiling (LRP) along Traverse One
For a better understanding of the structural setting in order of their various soil horizons,
the integrity and vulnerability factor were considered as one of the major contributing resistivity
attributes to foundation studies at various lateral resistivity traverse spread of a = 5 m, 10 m, 15
m, and 20 m. The soil integrity and vulnerability to failure was evaluated, and these various spreads
of “a” were considered as a function of the various depths and lithological integrity variations
along the various layer formations.
Therefore, at L.R.P of a = 5, considering the resistivity attributes responsible for the failure,
six (6) factors were considered in order of soil lithologies. These were classified into A, B, C, D, E,
and F as it affects foundation integrity. Based on lithologies occurrence, the various lithology
distribution against the total number of sampled points, the percentage rating of resistivity
attributes for the vulnerability was determined.
The failure index was determined from the summation of the percentage per data points
that are contributing to failure which was considered as A, B, and C, while the stability index is
determined by the addition of all the contributing factors to stability which are D, E, and F. The
vulnerability factor was determined by dividing the attribute failure index with the stability index.
This procedure was repeated for all the various spread of a = 5 m, 10 m 15 m, and 20 m which
enabled the determination of vulnerability or stability at various layers.
Based on analysis, the following results were obtained at a = 5 m, 10 m, 15 m, and 20 m
(Table 2). The analysis of the results obtained indicated that the vulnerability factor for the building
to fail was zero.
a b

Bawallah et al. (2021)
Indonesian Journal of Earth Sciences 93
Table 2. Vulnerability Factor for a of 5, 10, 15 and 20 m along Traverse One
S/N A B C D E F
Resistivity Value Range 0 – 50 50 – 150 150 – 250 250 –
500
500 – 1000 >1000
Lithologies Clay/Silt Sandy
Clay
Clayey
Sand
Sand Resistive/Dry
Sand
Sandstone
a = 5 m - - - 7 6 -
Percentage Rating (%) - - - 53.8 46.2 -
a = 10 m - - - 3 8 -
Percentage Rating (%) - - - 27.27 72.73 -
a = 15 m - - - - 9 -
Percentage Rating (%) - - - - 100 -
a = 20 m - - - - 3 4
Percentage Rating (%) - - - - 42.86 51.14
Vulnerability Factor for Lateral Horizontal Profiling along Traverse Two
The same approach was carried out along this traverse for the various spread length. The
analysis of the results obtained indicated that vulnerability factor for the building to fail was 100
% at a = 5 m, 10 m, 15 m, and 20 m (Table 3). Hence, this was what leads to a major crack and
sinking that were observed along the classrooms in traverse two.
Table 3. Vulnerability Factor for a of 5, 10, 15 and 20 m along Traverse two
S/N A B C D E F
Resistivity Value Range 0 – 50 50 – 150 150 – 250 250 –
500
500 – 1000 >1000
Lithologies Clay/Silt Sandy
Clay
Clayey
Sand
Sand Resistive/Dry
Sand
Sandstone
a = 5 m 5 6 2 - - -
Percentage Rating (%) 38.46 46.15 15.39 - - -
a = 10 m - 8 2 - - -
Percentage Rating (%) - 80 20 - - -
a = 15 m - 7 2 - - -
Percentage Rating (%) - 77.78 22.22 - - -
a = 20 m - 5 2 - - -
Percentage Rating (%) - 71.43 28.57 - - -
Vulnerability Factor for Dipole-Dipole along Traverse One
The analysis of the data obtained was also carried out using the same guiding principle
adopted for Wenner profiling to reflect on the resistivity attributes contributing to failure at various
soil horizons of dipole-dipole configurations, representing n of 1 = 5 m, n of 2 = 10 m, n of 3 =
15 m, n of 4 = 20 m and n of 5 = 25 m.
The data distribution points also followed the same principle and data distribution range
of A, B, C, D, E, and F, from the results obtained at n of 1, the vulnerability factor indicated 0.38
% which reflects a weak topsoil horizon, while at n of 2, the result obtains indicated that the
resistivity attribute for failure is zero. Furthermore, for n of 3, 4, and 5, the vulnerability factor for
the building to fail is zero (0%) (Table 4).
The analysis indicated that the vulnerability factor for the building to fail is zero percent
reflecting a high degree of stability along this traverse which exhibited an effective correlation with
Wenner array configuration. From the analysis of dipole-dipole, any vulnerability factors greater
than one percent (1%) represents various degree of weakness while less than one percent present
stability.

Bawallah et al. (2021)
Indonesian Journal of Earth Sciences 94
Table 4. Vulnerability Factor for n = 1 to 5 along Traverse One
S/N A B C D E F
Resistivity Value Range 0 – 50 50 – 150 150 – 250 250 –
500
500 – 1000 >1000
Lithologies Clay/Silt Sandy
Clay
Clayey
Sand
Sand Resistive/Dry
Sand
Sandstone
n = 1 - - 3 5 3 -
Percentage Rating (%) - - 27.27 45.46 27.27 -
n = 2 - - - 3 6 1
Percentage Rating (%) - - - 30 60 10
n = 3 - - - 2 5 2
Percentage Rating (%) - - - 22.22 55.56 22.22
n = 4 - - - 1 3 4
Percentage Rating (%) - - - 12.5 37.5 50
n = 5 - - - 1 3 3
Percentage Rating (%) - - - 14.29 42.86 42.86
Vulnerability Factor for Dipole-Dipole along Traverse Two
The result obtained using the same approach indicated that vulnerability of resistivity
attributes to fails at n of 1 which is equivalent to 5 m was 5%, reflecting major weak zone with a
failure index of 83.34 % and stability index of 16.67 % while at n of 2 which is equivalent to 10
m. The failure index was 72.73 % and the stability index was obtained to be 22.22 %, while the
resistivity attribute characterizing the vulnerability factor for failure was 3.67 % indicative of the
high vulnerability factor that the building will fail.
At n of 3 which corresponds to 15 m, the result obtained indicates a failure index of 40 %
and a stability index of 60 %, while the vulnerability factor for the building to fail was 0.67 %
which implies a moderately weak formation/horizon. At n of 4 which corresponds to 20 m, the
results obtained from the analysis of resistivity attributes at that horizon indicated that the failure
index was 22.22 %, while the stability index was 77.77 %. Subsequently, the vulnerability factor
for failure was reflected partly weak formation and at n of 5 which represents the highest thickness
and depth, the failure index obtained was 0% while the stability index was 100 %.
Furthermore, the vulnerability factor for failure was zero percent (0%), implying a high
degree of soil stability and competence. Since the foundation of the building was laid within the
upper 5 m, the vulnerability factor that the building will fail was high within the upper 10 m, which
leads to a major crack and sinking that were observed along the classrooms (Table 5).
Table 5. Vulnerability Factor for n of 1 to 5 along Traverse Two
S/N A B C D E F
Resistivity Value Range 0 – 50 50 – 150 150 – 250 250 –
500
500 – 1000 >1000
Lithologies Clay/Silt Sandy
Clay
Clayey
Sand
Sand Resistive/Dry
Sand
Sandstone
n = 1 2 6 2 1 1 -
Percentage Rating (%) 16.67 50 16.67 8.33 8.33 -
n = 2 - 2 6 2 - 1
Percentage Rating (%) - 18.18 54.55 18.18 - 9.09
n = 3 - 1 3 3 1 2
Percentage Rating (%) - 10 30 30 10 20
n = 4 - - 2 4 - 3
Percentage Rating (%) - - 22.22 44.44 - 33.33
n = 5 - - - 6 - 2
Percentage Rating (%) - - - 75 - 25

Bawallah et al. (2021)
Indonesian Journal of Earth Sciences 95
Correlation of Vulnerability Factor of Wenner Profiling and Dipole-Dipole Along Traverse One
and Two
The result obtained from the vulnerability factor of Lateral Horizontal profiling and 2D
ERT along traverse one and two at the various spread length of a = 5, 10, 15 20 m, and n of 1 to
5 showed effective correlation. The results were able to explain as well as justify the reason for the
high degrees of stability of the structure along traverse one and the reason for structural failures
and subsidence that occurred along traverse two (Figure 9).
Correlation of Geophysical and Geotechnical Methods
The results obtained from the two methods advance that resistivity attributes give better
information in terms of depth, lateral extent, layer stratification, layer lithology, and nature of the
material which makes it indispensable over geotechnical attributes. The geotechnical attributes give
relevant information but are all limited to a maximum depth of 5 m, which has a great limitation
in the area of carrying out a complete evaluation of structural integrity against subsurface weak
zones that often goes beyond the shallow depth of investigation.
Figure 9. Structure along traverse one and two
CONCLUSION
The advantages and overriding benefits of Electrical Resistivity investigation over
geotechnical method in terms of depth, lithological evaluation, and structural integrity have been
advanced in this study. It has justified that the Electrical Resistivity method gives better information
and major contributing factors that account for vulnerability and structural integrity to failure.
ACKNOWLEDGEMENT
The authors gratefully acknowledge Prof. Aina, A. O. for his valuable contribution to
improving the quality of this research work.
Bawallah et al. (2021)
Indonesian Journal of Earth Sciences 96
AUTHORS NOTE
The authors confirm that the data supporting the findings of the study are available within
the article and its supplementary materials. Authors have declared that no competing interests exist
and the data was not used as an avenue for any litigation but the advancement of knowledge.
REFERENCES
Adebo B.A., Layade G. O., Ilugbo S. O., Hamzat A. A. & Otobrise H. K., (2019). Mapping of
Subsurface Geological Structures using Ground Magnetic and Electrical Resistivity Methods
within Lead City University, Southwestern Nigeria. Kada Journal of Physics, 2(2), 64-73.
Adebiyi, A. D., Ilugbo, S. O., Ajayi, C. A., Ojo, O. A., & Babadiya, E. G. (2018). Evaluation of
pavement instability section using integrated geophysical and geotechnical methods in a
sedimentary terrain, Southern Nigeria. Asian Journal of Geological Research, 1(3), 1-13.
Adelusi, A. O., Akinlalu, A. A., & Daramola, B. W. (2014). Integrated geophysical methods for post
construction studies: Case study of Omuo Comprehensive High School, Omuo Ekiti,
Southwestern, Nigeria. Global J, of Sci. Frontier, 14(2), 2249-4626.
Adelusi, A. O., Akinlalu, A. A., & Nwachukwu, A. I. (2013). Integrated geophysical investigation
for post-construction studies of buildings around School of Science area, Federal University
of Technology, Akure, Southwestern, Nigeria. International Journal of Physical Sciences,
8(15), 657-669. https://doi.org/10.5897/IJPS2012.0204
Aigbedion, I., Bawallah, M. A., Ilugbo, S. O., Abulu, F. O., Eguakhide, V., Afuaman, E. W., &
Ukubile, B. (2019). Geophysical Investigation for Pre-Foundation Studies at RCCG, Calvary
Love Parish 2, Ukpenu, Ekpoma, Edo State, Nigeria. International Journal of Research and
Innovation in Applied Science, 4(5), 39-45.
Aigbedion, I. (2007). Geophysical investigation of road failure using electromagnetic profiles along
Opoji, Uwenlenbo and Illeh in Ekpoma-Nigeria. Middle East Journal of Scientific Research,
2(3–4), 111-113.
Akintorinwa, O. J., & Adeusi, F. A. (2009). Integration of geophysical and geotechnical
investigations for a proposed lecture room complex at the Federal University of Technology,
Akure, SW, Nigeria. Journal of Applied Sciences, 2(3), 241-254.
Akintorinwa, O. J., & Adesoji, J. I. (2009). Application of geophysical and geotechnical
investigations in engineering site evaluation. International Journal of physical sciences, 4(8),
443-454.
Bawallah, M. A., Ayuks, M. A., Ilugbo, S. O., Ozegin, K. O., Oyedele, A. A., Aigbedion, I., Aina,
A. O., Whetode, J. M., & Ladipo, K. O. (2019a). Geodynamics and its implications to
environmental protection: A case study of Aule area, Akure, Ondo State, Southwestern,
Nigeria. Applied Journal of Physical Science, 1(3), 37-53.
Bawallah M.A., Ilugbo S.O., Aigbedion I., Aina A.O. & Oyedele A.A., (2019b). Modeling of
subsurface integrity using Dar-Zarrouk parameters: A case study of Ikekogbe UBE Primary
School, Ekpoma, Edo State, Nigeria. Journal of Geography, Environment and Earth Science
International, 22(1), 1-17.
Bawallah M.A., Oyedele A.A., Ilugbo S.O., Ozegin K.O., Ojo B.T., Olutomilola O.O., Airewele E.
& Aigbedion I. (2020). Evaluation of structural defects and the dynamic of stress and strain
Bawallah et al. (2021)
Indonesian Journal of Earth Sciences 97
on a building along Oluwole Area, Southwestern Nigeria. Applied Journal of Physical
Science, 2(2), 23-37.
Burmister, F. (1997). Advance Soil Mechanics 2nd
Edition 471pp
Ilugbo, S. O., Adebiyi, A. D., Olaogun, S. O., & Egunjobi, T. (2018). Application of electrical
resistivity method in site characterization along Ado–Afao Road, Southwestern Nigeria.
Journal of Engineering Research and Reports, 1(4), 1-16.
https://doi.org/10.9734/jerr/2018/v1i49871
Olubusola, I. S., Babatunde, A. A., Adegbola, A. O., Olaoluwa, A. O., & Owolabi, E. H. (2018).
Geophysical and geotechnical studies of a proposed structure at Akure, Southwestern
Nigeria. Journal of Engineering Research and Reports, 2(2), 1-12.
https://doi.org/10.9734/jerr/2018/v2i29910
Kogbe, C. A. (1978). Geology of Niger. Elizabelt publishing company Lagos – Nigeria.
Okeke, O. C., Onyekuru, S. O., Uduehi, G., & Israel, H. O. (2011). Geology and hydrogeology of
Northern Ishan district, Edo State, Southwestern Nigeria. International Research Journal of
Geology and Mining, 1(1), 1-11.
Oyedele, A. A., Bawallah, M. A., Ozegin, K. O., Ilugbo, S. O., Ajayi, C. A. & Aigbedion, I. (2020).
Probability functions of road failures in a typical basement complex region, South-western
Nigeria: A case study of Akure - Oba Ile Airport Road. International Journal of Water
Resources and Environmental Engineering, 12(2), 10-21.
https://doi.org/10.5897/IJWREE2019.0906
Oyedele K. F., Oladele S. & Adedoyin O. (2011). Application of Geophysical and Geotechnical
Methods to Site Characterization for Construction Purposes at Ikoyi, Lagos, Nigeria. Journal
of Earth Sciences and Geotechnical Engineering, 1(1), 87-100.
Ozegin, K. O., Bawallah, M. A., Ilugbo, S. O., Oyedele, A. A., & Oladeji, J. F. (2019a). Effect of
geodynamic activities on an existing dam: A case study of Ojirami Dam, Southern Nigeria.
Journal of Geoscience and Environment Protection, 7(9), 200-213.
https://doi.org/10.4236/gep.2019.79014
Ozegin, K. O., Bawallah, M. A., Ilugbo, S. O., Olaogun, S. O., Oyedele, A. A. & Iluore, K. (2019a).
Susceptibility test for road construction: A case study of Shake Road, Irrua, Edo State, Global
Journal of Science Frontier Research: H Environment & Earth Science, 19(1), 45–53.
Salufu, S. O. (2014). The geology of Ekpoma. Journal of Science, 1(10), 11 – 132.
Salufu, S. O., & Ujuanbi, O. (2015). The geology and structural geology of Ekpoma And Irrua:
Implication for the hydrology and hydrogeologic setting of the areas. Nigerian Annals of
Natural Sciences, 15(1), 131-138.
Copyright (c) 2021 by the authors. This work is licensed under a Creative Commons Attribution-ShareAlike 4.0 International License.