Indonesian Physical Review
15
Indonesian Physical Review Volume 4 Issue 3, September 2021 P-ISSN: 2615-1278, E-ISSN: 2614-7904 166 Displacement sensor based on glass optical fiber for measuring landslide with various configuration Annamaintin Kobong Lebang 1 , A Arifin 1 , Bualkar Abdullah 1 1 Departement of Physics, Faculty of Mathematics and Natural Science, Hasanuddin University, Indonesia E-mail: [email protected] ARTICLE INFO ABSTRACT Article info: Received: 30-08-2021 Revised: 20-09-2021 Accepted: 30-09-2021 Keywords: Displacement; GOF; Landslide; OTDR; Sensor; SMS How To Cite: Lebang, A.K., Arifin, A., Abdullah, B. (2021). Displacement sensor based on glass optical fiber for measuring landslide with various configuration. Indonesian Physical Review, 4(3) pp. 166-180 DOI: https://doi.org/10.29303/ip r.v4i3.124 The research has measured the landslide using a displacement sensor based on Glass Optical Fiber (GOF) and Optical Time Domain Reflectometer (OTDR). The sensor manufacture process consists of various materials, structures, configurations, diameters, and directions. The sensor is made using GOF with a single-mode structure and single mode-multimode-Singlemode (SMS) structure. Each system is given a variety of configurations, namely gamma, bowknot, and three loops configuration. Each arrangement is provided a variation of the indentation diameter in three displacement directions. The test results will be read as the power loss on the OTDR in dB units. The results obtained were then compared between two materials, two structures, and directions. Displacement resulting landslides and changes to the sensor, causing power losses, and affecting the characteristics of each sensor. We found the best measurement results with the sensitivity value of 0.241 dB/mm and the resolution value of 0.004 mm. The displacement sensor has been made for measuring landslide in the laboratory-scale simulation based on GOF and OTDR with easier fabrication, easy operation, high sensitivity, better resolution and can be connected to a computer Copyright © 2021 Authors. All rights reserved. Introduction Landslides are events that shift the soil due to rainfall, earthquakes, and soil displacement [1]. In Indonesia, landslides are natural disasters that cause casualties, property loss, environmental damage, and psychological impact. From 2011 to 2016, around that 23% of the biggest disasters that occurred in Indonesia were landslides [2]. Based on this data shows the importance of monitoring and early detection of soil displacement. Landslide monitoring is divided into two groups, namely tracking of surface shifts and monitoring of underground changes. Landslide monitoring has been carried out using several existing techniques and sensors. Many monitoring techniques traditionally use boreholes, such as inclinometers, tiltmeters, extensometers. These tools can measure the landslide in the environment, are sensitive enough but require a complex system, and are expensive [3-6]. Landslide monitoring has developed using optical fiber. The optical fiber as
-
Upload
khangminh22 -
Category
Documents
-
view
0 -
download
0
Transcript of Indonesian Physical Review

Indonesian Physical Review Volume 4 Issue 3, September 2021 P-ISSN: 2615-1278, E-ISSN: 2614-7904
166
Displacement sensor based on glass optical fiber for measuring landslide with various configuration Annamaintin Kobong Lebang1, A Arifin1, Bualkar Abdullah1 1 Departement of Physics, Faculty of Mathematics and Natural Science, Hasanuddin University, Indonesia E-mail: [email protected]
ARTICLE INFO
ABSTRACT
Article info: Received: 30-08-2021 Revised: 20-09-2021 Accepted: 30-09-2021
Keywords: Displacement; GOF;
Landslide; OTDR; Sensor;
SMS
How To Cite: Lebang, A.K., Arifin, A., Abdullah, B. (2021). Displacement sensor based on glass optical fiber for measuring landslide with various configuration. Indonesian Physical Review, 4(3) pp. 166-180 DOI: https://doi.org/10.29303/ipr.v4i3.124
The research has measured the landslide using a displacement sensor based on Glass Optical Fiber (GOF) and Optical Time Domain Reflectometer (OTDR). The sensor manufacture process consists of various materials, structures, configurations, diameters, and directions. The sensor is made using GOF with a single-mode structure and single mode-multimode-Singlemode (SMS) structure. Each system is given a variety of configurations, namely gamma, bowknot, and three loops configuration. Each arrangement is provided a variation of the indentation diameter in three displacement directions. The test results will be read as the power loss on the OTDR in dB units. The results obtained were then compared between two materials, two structures, and directions. Displacement resulting landslides and changes to the sensor, causing power losses, and affecting the characteristics of each sensor. We found the best measurement results with the sensitivity value of 0.241 dB/mm and the resolution value of 0.004 mm. The displacement sensor has been made for measuring landslide in the laboratory-scale simulation based on GOF and OTDR with easier fabrication, easy operation, high sensitivity, better resolution and can be connected to a computer
Copyright © 2021 Authors. All rights reserved.
Introduction
Landslides are events that shift the soil due to rainfall, earthquakes, and soil displacement [1]. In Indonesia, landslides are natural disasters that cause casualties, property loss, environmental damage, and psychological impact. From 2011 to 2016, around that 23% of the biggest disasters that occurred in Indonesia were landslides [2]. Based on this data shows the importance of monitoring and early detection of soil displacement.
Landslide monitoring is divided into two groups, namely tracking of surface shifts and monitoring of underground changes. Landslide monitoring has been carried out using several existing techniques and sensors. Many monitoring techniques traditionally use boreholes, such as inclinometers, tiltmeters, extensometers. These tools can measure the landslide in the environment, are sensitive enough but require a complex system, and are expensive [3-6]. Landslide monitoring has developed using optical fiber. The optical fiber as

Indonesian Physical Review. 4(3): 166-180
167
the sensor can be used in various fields of measurement, including measuring solution pressure, temperature [6], vibration [7], displacement [8], load and crack [9-11], stress [12], fuel detection [13], health [14, 15], etc. Optical fiber is safe to use, has a high speed of light transmission, is resistant to corrosion, is not sensitive to electromagnetic waves, and does not conduct heat. In its use, the optical fiber can be combined with an OTDR as an instrument [1, 5-14].
In several studies, the optical fiber as a sensor can be combining with an OTDR and other devices with displacement principle for some measuring. The study has been carried out by Huang et al. (2018) about stress sensors based on OTDR with different materials [12]. The research was also carried out by Zheng et al. (2019 and 2020) about the principle of displacement based on optical fiber for landslide monitoring [4] and crack sensor [16]. Likewise, Cheng et al. (2020) combined a crack sensor's shape and optical splitter with a displacement principle [17]. However, some studies require special treatment because of the complex system and difficult fabrication. Therefore, in this study, the displacement sensor has been made using GOF and OTDR to measure landslides. OTDR works based on the principle of backscattered light to find several parameters in optical fiber measurements. The OTDR will transmit a laser beam signal into the fiber under test. Then the signal beam propagates along with the optical fiber until it reaches the end of the fiber and is reflected [6, 13]. Sensors have been made with various structures, configurations, and materials then embedded in the box. This study is expected to produce measurements of displacement with higher sensitivity, good resolution, easy to operate, and easier fabrication.
Principle and Experimental Method
GOF, soil, microdisplacement, fusion splicer, and OTDR are this study's primary tools and matters. In use, the types of GOF used are single-mode and multimode. For single-mode fibers (SMF), use a standard SMF28 type step-index (SI) with a core diameter of 8.3 μm and a Numerical Aperture (NA) of 0.13. At the same time, Thorlabs GIF50C was used as multimode fibers (MMF) graded-index type with a core diameter of 50 μm, cladding diameter of 125 μm, and NA of 0.20. The sensor has been made consists of two structures, namely Singlemode structure, and SMS structure. Each frame is made with a variety of configuration, indentations, and diameters. The first method in this study to make the sensor using a single-mode system with various formats is shown in Figure 1.
(a) (b) (c) Figure 1. Displacement sensor design with singlemode structure and variety of configuration (a)
gamma; (b) bowknot; (c) 3 loops.
After manufacturing the sensor with the single-mode, structure has been completed. The other method is to manufacture the sensor with the SMS structure that requires GOF consisting of SMF and MMF type. An MMF was spliced between two SMF by fusion splicer and shown in Figure 2. In this SMS structure, one section of the MMF is in the middle that is located between two SMF sections to be aligned along the same axis. There is interference between the two modes and the MMF in the SMS fiber structure and produces the maximum or minimum interference. Optimizing the MMF into the sensor can develop the function [18, 19] and sensor sensitivity with the displacement principle. The difference influences this in refractive index and NA between SMF and MMF on the SMS fiber structure
P-ISSN: 2615-1278, E-ISSN: 2614-7904
168
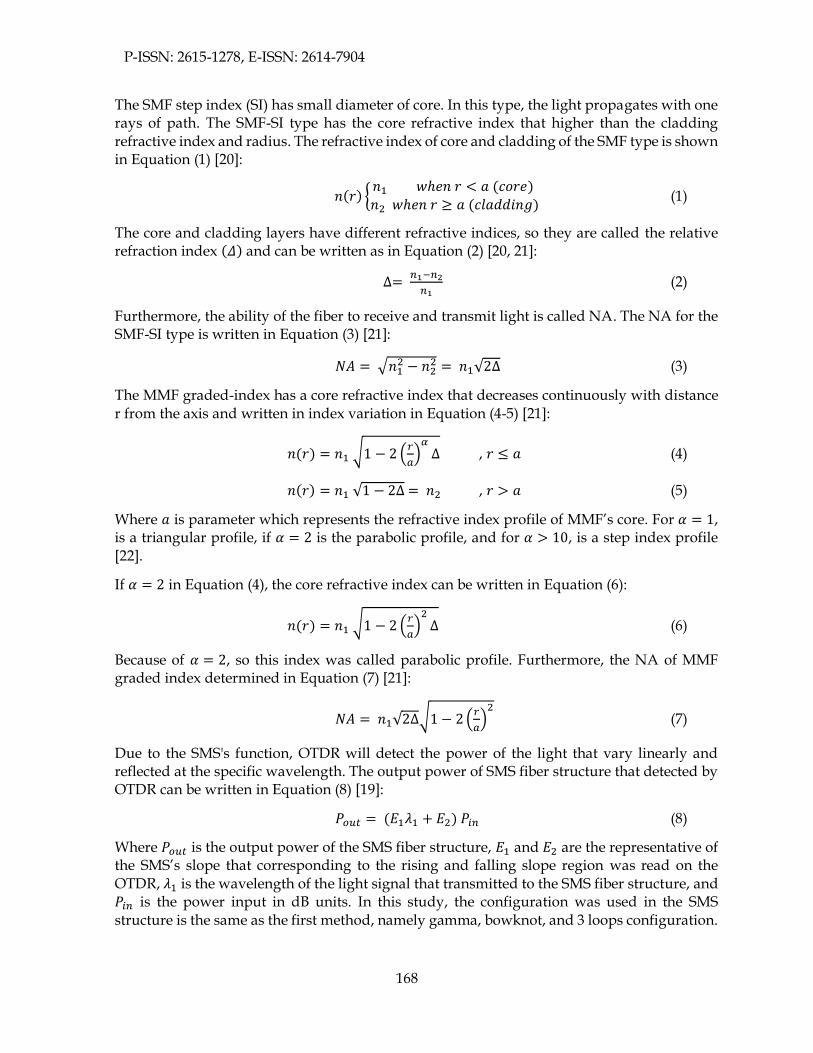
The SMF step index (SI) has small diameter of core. In this type, the light propagates with one rays of path. The SMF-SI type has the core refractive index that higher than the cladding refractive index and radius. The refractive index of core and cladding of the SMF type is shown in Equation (1) [20]:
𝑛(𝑟) {𝑛1 𝑤ℎ𝑒𝑛 𝑟 < 𝑎 (𝑐𝑜𝑟𝑒)
𝑛2 𝑤ℎ𝑒𝑛 𝑟 ≥ 𝑎 (𝑐𝑙𝑎𝑑𝑑𝑖𝑛𝑔) (1)
The core and cladding layers have different refractive indices, so they are called the relative refraction index (𝛥) and can be written as in Equation (2) [20, 21]:
∆= 𝑛1−𝑛2
𝑛1 (2)
Furthermore, the ability of the fiber to receive and transmit light is called NA. The NA for the SMF-SI type is written in Equation (3) [21]:
𝑁𝐴 = √𝑛12 − 𝑛2
2 = 𝑛1√2∆ (3)
The MMF graded-index has a core refractive index that decreases continuously with distance r from the axis and written in index variation in Equation (4-5) [21]:
𝑛(𝑟) = 𝑛1 √1 − 2 (𝑟
𝑎)
𝛼∆ , 𝑟 ≤ 𝑎 (4)
𝑛(𝑟) = 𝑛1 √1 − 2∆ = 𝑛2 , 𝑟 > 𝑎 (5)
Where 𝑎 is parameter which represents the refractive index profile of MMF’s core. For 𝛼 = 1, is a triangular profile, if 𝛼 = 2 is the parabolic profile, and for 𝛼 > 10, is a step index profile [22].
If 𝛼 = 2 in Equation (4), the core refractive index can be written in Equation (6):
𝑛(𝑟) = 𝑛1 √1 − 2 (𝑟
𝑎)
2∆ (6)
Because of 𝛼 = 2, so this index was called parabolic profile. Furthermore, the NA of MMF graded index determined in Equation (7) [21]:
𝑁𝐴 = 𝑛1√2∆√1 − 2 (𝑟
𝑎)
2 (7)
Due to the SMS's function, OTDR will detect the power of the light that vary linearly and reflected at the specific wavelength. The output power of SMS fiber structure that detected by OTDR can be written in Equation (8) [19]:
𝑃𝑜𝑢𝑡 = (𝐸1𝜆1 + 𝐸2) 𝑃𝑖𝑛 (8)
Where 𝑃𝑜𝑢𝑡 is the output power of the SMS fiber structure, 𝐸1 and 𝐸2 are the representative of the SMS’s slope that corresponding to the rising and falling slope region was read on the OTDR, 𝜆1 is the wavelength of the light signal that transmitted to the SMS fiber structure, and 𝑃𝑖𝑛 is the power input in dB units. In this study, the configuration was used in the SMS structure is the same as the first method, namely gamma, bowknot, and 3 loops configuration.

Indonesian Physical Review. 4(3): 166-180
169
(a)
(b) (c) (d) Figure 2. Displacement sensor design for measuring landslides with SMS structure consisting of (a)
the SMS structure generally; (b) gamma; (c) bowknot; and (d) 3 loops configuration.
The primary process in the manufacture of the displacement sensor using GOF and based on OTDR. The sensor consists of a single-mode structure only and an SMS structure with various configurations and indentation diameters. Then, each sensor is embedded inboxes. It aims to test the sensor’s response due to material differences. The schematic of the displacement sensor using GOF and based on OTDR for measuring landslide is shown in Figure 3.
Figure 3. The scheme of the displacement sensor using GOF and based on OTDR for measuring
landslide.
Figure 3 shows the sensor’s scheme for measuring landslides with the displacement principle. The sensor is embedded in two boxes. In this experiment was prepared two kinds of materials that are included in one of the boxes alternately. The first material is a mixture of soil. In contrast, the second material is ordinary sand, which is an initial study to see the effect of material differences on the sensor's output. We can set the box as a container for soil and sand length 50 cm, width 5 cm, and height 5 cm. One of the boxes is placed on the micro displacement as box one, while the other box, as box two, is attached to a wooden stand and alternately filled with soil and sand. The distance between box one and box two is set at 5 cm. One end of the sensor closest to the wooden stand is connected to the OTDR using a patch cord cable type subscriber connector (SC). The patch cord cable is marked with a yellow cable in the figure above.
The sensor consists of two structures, namely, only single-mode structure and SMS structure. Each system of the sensor with a variety of configurations, indentation diameters, and displacement is then embedded into two kinds of material alternately that mentioned before.

P-ISSN: 2615-1278, E-ISSN: 2614-7904
170
Box one and box two were set aligned along the same axis. The second box is filled with soil or sand partially as deep as 2.5 cm and the sensor embedding above it, then the soil and sand-filled again until the box is full. The configuration used consists of gamma, bowknot, and three loops configuration, respectively. For the diameter of the indentation was used 1 cm, 2 cm, and 3 cm. The displacement range is carried out in 0 mm – 10 mm with an increment of 0.5 mm. In this study, the displacement consists of three directions, namely abscissa, ordinate, and applicate, that refer to x, y, and z-axis, respectively, in Figure 3. Displacement will affect the soil or sand in the box to move in the same direction of the displacement and caused a change in diameter on the sensor. This displacement represents the land moving that indicates the landslides and can be developed for measuring landslides.
Measurement of the sensor is carried out when the OTDR is connected to the sensor. OTDR is an instrument for event measuring on optical fiber in the time domain. OTDR will send the light signal into the optical fiber with a specific wavelength (generally 1310 nm or 1550 nm). At the same time, the OTDR will calculate the time of signal transmission and the return of the light signal from the optical fiber to the OTDR. It aims to determine the distance between the measuring point and the event. This principle is known as the backscattering principle in optical fiber. The detector detects the returning light signal. The signals analyzer has the function of calculating the output from the detector and sending the measured value to the memory units on the controller. The microprocessor acts as a controller to store data, undertake mathematical operations on measured values , and identify optical fiber events as power losses. The final result will be displayed on the OTDR screen in the form of a graph of the time domain to power loss in dB units [23].
Result and Discussion
Research has been conducted to test and measure power loss to displacement with variations given to each sensor for a landslide. Initial measurements used a single model structure embedded in a soil box with various configurations and diameters. The configurations were used gamma, bowknot, and three loops. Each configuration is given a variety of indentations in diameter from 1 cm, 2 cm, and 3 cm. The result read on the OTDR. The measurement results of single-mode structure displacement sensor on the soil box for measuring landslide shown in the Figure 4.
(a) (b)

Indonesian Physical Review. 4(3): 166-180
171
(c)
Figure 4. The results of displacement sensor in soil box using singlemode structure for measuring
landslide with variety of diameter and configuration (a) gamma; (b) bowknot; and (c) 3 loops.
The results of the displacement sensor against power losses using a single-mode structure, variation in configurations, and diameters for measuring landslide are shown in Figure 4. The testing process starts from the displacement towards the y-axis with the value of 0 mm until 10 mm with an increment of 0.5 mm. The increase of the displacement will affect the diameter of the sensor to become smaller. Changes in the diameter of the sensor will affect the curvature of the radius to be smaller. When the curvature becomes smaller, it will result in changes in the intensity of the light emitted along with the optical fiber and impact changes in the output power that is read on the OTDR in dB units.
The measurement results can be analyzed using the characteristic values of each sensor. Sensor characteristics include the range, sensitivity, and resolution value. The range is the difference between the maximum power losses and minimum power losses, which is described by following Equation [8-11]:
∆ = 𝐿𝑚𝑎𝑥 − 𝐿𝑚𝑖𝑛 (9)
where 𝐿𝑚𝑎𝑥 is the maximum power losses and 𝐿𝑚𝑖𝑛 is the minimum power losses.
Sensitivity is the sensor’s ability to measure a certain quantity. Sensitivity is obtained by dividing the range and displacement difference. The sensitivity can be written into the following Equation. [9-11]:
𝑆 =∆
𝑥𝑚𝑎𝑥−𝑥𝑚𝑖𝑛=
∆
𝑦𝑚𝑎𝑥−𝑦𝑚𝑖𝑛=
∆
𝑧𝑚𝑎𝑥−𝑧𝑚𝑖𝑛 (10)
where 𝑥𝑚𝑎𝑥 , 𝑦𝑚𝑎𝑥, and 𝑧𝑚𝑎𝑥 are the maximum displacement in three directions that setting and given to the sensor. While for 𝑥𝑚𝑖𝑛 , 𝑦𝑚𝑖𝑛, and 𝑧𝑚𝑖𝑛 are the minimum displacement in three directions on sensor.
The resolution is the smallest value that can be measured by the sensor which can be written into the following Equation [8-11]:
𝑅 =𝑁
𝑆 (11)

P-ISSN: 2615-1278, E-ISSN: 2614-7904
172
Where N is the smallest scale of the value which can be measured by the OTDR, and S is the sensor’s sensitivity. The characteristics of the singlemode sensor structure with variations in configuration and diameter is shown in the Table 1.
Table 1. Sensor’s characteristics with singlemode structure variety of configuration and diameter in soil box.
Configuration Diameter Range (dB) Sensitivity (dB/mm) Resolution (mm)
Gamma
3 cm 0.142 0.014 0.070
2 cm 0.175 0.017 0.057
1 cm 0.228 0.022 0.043
Bowknot
3 cm 0.239 0.023 0.041
2 cm 0.278 0.027 0.035
1 cm 0.291 0.029 0.034
3 Loops
3 cm 0.503 0.050 0.019
2 cm 0.596 0.059 0.016
1 cm 0.757 0.075 0.013
Table 1 shows the sensor's characteristics value in the soil box using a single-mode structure with variations in configuration and diameter for measuring landslide. Each variation produces a different value that will affect the characteristics of each sensor. Characteristic results are obtained using mathematical operations from Equation (9) to Equation (11), the best characteristics with the highest value of range and sensitivity and the smallest value of resolution. This section obtained the best results in the three loops configuration 1 cm with 0.075 dB/mm sensitivity value and a resolution value of 0.013 mm. Subsequent research was carried out with the same type of sensor but embedded in different media, namely in the sandbox. In the second part of this research, the sensor with the single-mode structure, variations in configuration, and diameter is embedded in a sandbox. It aims to examine the effect of differences in two kinds of materials on the sensor's sensitivity. Each measurement uses the same structure, configuration, and diameter as before. The results of the displacement sensor measurements in the sandbox are shown in this Figure. 5.
(a) (b)

Indonesian Physical Review. 4(3): 166-180
173
(c)
Figure 5. The results of the displacement sensor in the sand box using singlemode structure for measuring landslide with variety of diameter and configuration (a) gamma; (b) bowknot; and (c) 3
loops.
Figure 5 shows the measurement results of the displacement sensor variation in configuration and diameters embedded on the sandbox for measuring landslide. The displacement is set up parallel to the sensor to the left or towards the y-axis with a displacement value like before. An increase in displacement will cause a shift in the material and impact the sensors that have been embedded in the sandbox. That changes are affect disturbed the intensity of light along with the optical fiber and causing power losses. Variations in diameter consist of 1 cm, 2 cm, and 3 cm. Every variation produced different characteristic values and shown in Table 2.
Table 2. Sensor’s characteristics with singlemode structure variety of configuration and diameter in sand box.
Configuration Diameter Range (dB) Sensitivity (dB/mm) Resolution (mm)
Gamma
3 cm 0.229 0.022 0.043
2 cm 0.253 0.025 0.039
1 cm 0.299 0.029 0.033
Bowknot
3 cm 0.274 0.027 0.037
2 cm 0.351 0.035 0.028
1 cm 0.433 0.043 0.023
3 Loops
3 cm 0.631 0.063 0.015
2 cm 0.846 0.084 0.011
1 cm 1.143 0.114 0.008
The characteristic of the sensor is shown in Table 2. The characteristics of each sensor show different results. It is influenced by the variation given to each sensor, resulting in different values. The best results are in the three loops configuration, a diameter of 1 cm, and obtained the range, sensitivity, and resolution value of 1.143 dB; 0.114 dB/mm; and 0.008 mm, respectively. The variations in the kind of material aim to see the sensor's responses to the difference in the material around the sensor.

P-ISSN: 2615-1278, E-ISSN: 2614-7904
174
Furthermore, a comparison of the measurement results between Table 1 and Table 2 has been carried out. In this case, the mass of soil and sand used is the same as 1,250 grams. The comparison results obtained those measurements on the sandbox have a higher sensitivity than those on the soil box. Therefore, the research at this step is appropriate with Huang et al. (2018), which states that material differences result in differences in power losses and increased sensitivity in sand compared to soil [12].
The following research is displacement sensors using the SMS structure with various configurations and diameters for measuring landslides. The SMS structure is a combination of two different structures consisting of SMF and MMF. The MMF is spliced with the SMF and forms the SMS structure [24]. The MMF optical fiber length is 10 cm. The configuration consists of gamma, bowknot, and three loops, with each configuration given a diameter variation of 1 cm, 2 cm, and 3 cm. The sensor embedded in the sandbox and the same shift in the y-axis direction with the same displacement value as the previous stage. Each variation of the displacement sensor measurement produces different power losses and response values displayed on the OTDR in dB units. The results of the displacement sensor with the SMS structure variation in configuration and diameter are shown in Figure 6.
(a) (b)
(c)
Figure 6. The measurement results of the sensor using SMS structure in the sandbox for measuring landslide variation in diameters and configurations (a) gamma; (b) bowknot; and (c) 3 loops.
The measurement results of the displacement sensors using the SMS structure with variations in diameter and configuration for measuring landslides are shown in Figure 6. Each sensor

Indonesian Physical Review. 4(3): 166-180
175
was embedded in a sandbox and given the displacement of 0 mm to 10 mm. When the sensor is displaced by microdisplacement, the diameter sensor becomes smaller so that the light intensity along the optical fiber is reduced because of the indentation in the sensor.
The light intensity on the fiber structure of the SMS is related to the radius of curvature and indentation. In addition, the value of the refractive index of the MMF graded-index on the SMS structure is affected by the distance r from the axis, which can also affect the light intensity along with the sensor structure of the SMS. These things impact the distribution of power and interference of light as the wave propagates along with the optical fiber toward bending. The total output power depends on the constructive and destructive interference along with the SMS structure. This output power is the sum of the input power and the combination of each mode in the single-mode and multimode structures, spliced into the SMS structure as written in Equation (8) before [24]. That changes will result in increased power losses which are read on the OTDR. The characteristic results of the SMS structure variety of configuration and diameter in the sandbox and the y-axis direction are shown in Table 3.
Table 3. Characteristics of the sensor with SMS structure variety of configuration and diameter to 𝑦 direction in sand box.
Configuration Diameter Range (dB) Sensitivity (dB/mm) Resolution (mm)
Gamma
3 cm 0.265 0.026 0.037
2 cm 0.314 0.034 0.031
1 cm 0.509 0.050 0.019
Bowknot
3 cm 0.491 0.049 0.020
2 cm 0.555 0.055 0.018
1 cm 0.623 0.062 0.016
3 Loops
3 cm 0.686 0.068 0.014
2 cm 0.967 0.096 0.010
1 cm 1.74 0.174 0.005
Table 3 shows different results from each sensor using the SMS structure on the y-axis with various configurations and diameters for measuring landslides. The best-expected results are in the configuration of 3 loops SMS structure using the diameter of 1 cm, with the sensitivity value of 0.174 dB/mm and resolution value of 0.005 mm. Furthermore, the comparison of the best results in Table 2 and Table 3 shows the characteristics of the SMS structure are better than the single-mode structure. The use of the SMS structure on the sensor produces a more excellent range and sensitivity value than the single-mode structure. Each sensor with SMS fiber structure to bend has a difference in sensitivity value [25]. An SMS fiber structure has advantages: higher sensitivity, long-range measuring operation, low cost, simple construction, ease of fabrication, and connection to system and device [26].
The last part is continued by measuring landslides with displacement principle in different axis directions in the sandbox using 3 loops configuration SMS structure and various diameters. The diameters are 1 cm, 2 cm, and 3 cm. In this section, the microdisplacement is placed below the sandbox so that the sandbox will follow the microdisplacement direction,
P-ISSN: 2615-1278, E-ISSN: 2614-7904
176
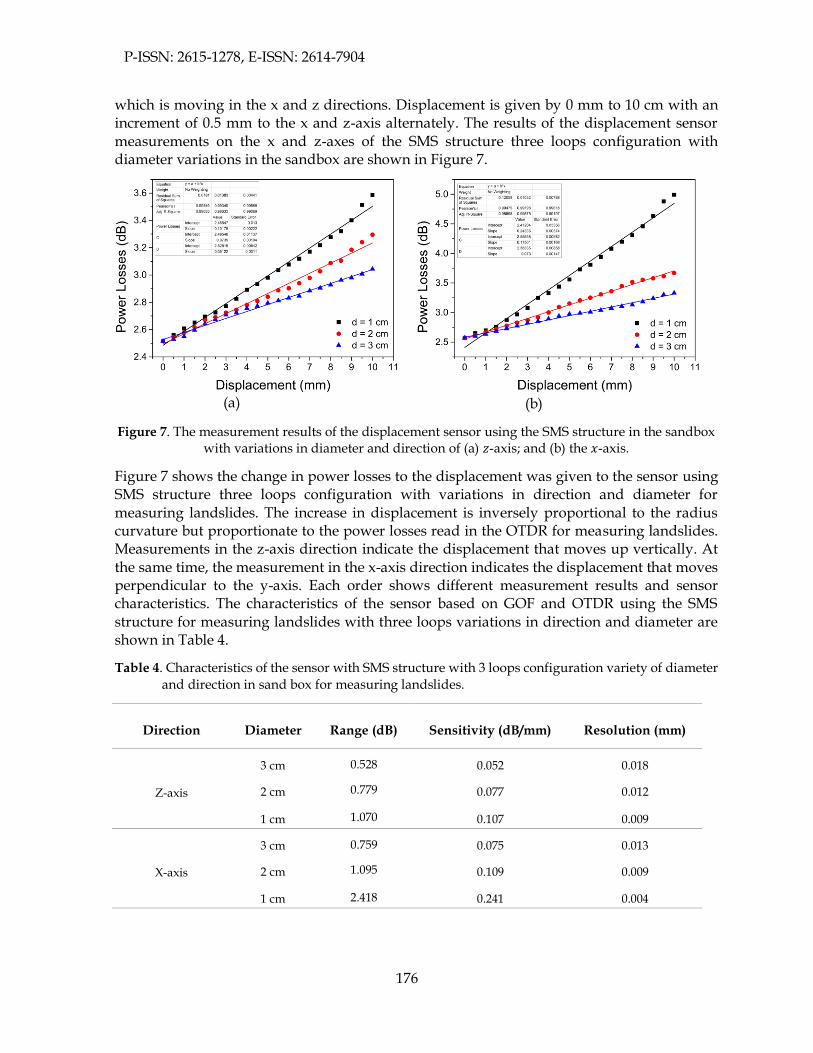
which is moving in the x and z directions. Displacement is given by 0 mm to 10 cm with an increment of 0.5 mm to the x and z-axis alternately. The results of the displacement sensor measurements on the x and z-axes of the SMS structure three loops configuration with diameter variations in the sandbox are shown in Figure 7.
(a) (b)
Figure 7. The measurement results of the displacement sensor using the SMS structure in the sandbox with variations in diameter and direction of (a) 𝑧-axis; and (b) the 𝑥-axis.
Figure 7 shows the change in power losses to the displacement was given to the sensor using SMS structure three loops configuration with variations in direction and diameter for measuring landslides. The increase in displacement is inversely proportional to the radius curvature but proportionate to the power losses read in the OTDR for measuring landslides. Measurements in the z-axis direction indicate the displacement that moves up vertically. At the same time, the measurement in the x-axis direction indicates the displacement that moves perpendicular to the y-axis. Each order shows different measurement results and sensor characteristics. The characteristics of the sensor based on GOF and OTDR using the SMS structure for measuring landslides with three loops variations in direction and diameter are shown in Table 4.
Table 4. Characteristics of the sensor with SMS structure with 3 loops configuration variety of diameter and direction in sand box for measuring landslides.
Direction Diameter Range (dB) Sensitivity (dB/mm) Resolution (mm)
Z-axis
3 cm 0.528 0.052 0.018
2 cm 0.779 0.077 0.012
1 cm 1.070 0.107 0.009
X-axis
3 cm 0.759 0.075 0.013
2 cm 1.095 0.109 0.009
1 cm 2.418 0.241 0.004
Indonesian Physical Review. 4(3): 166-180
177
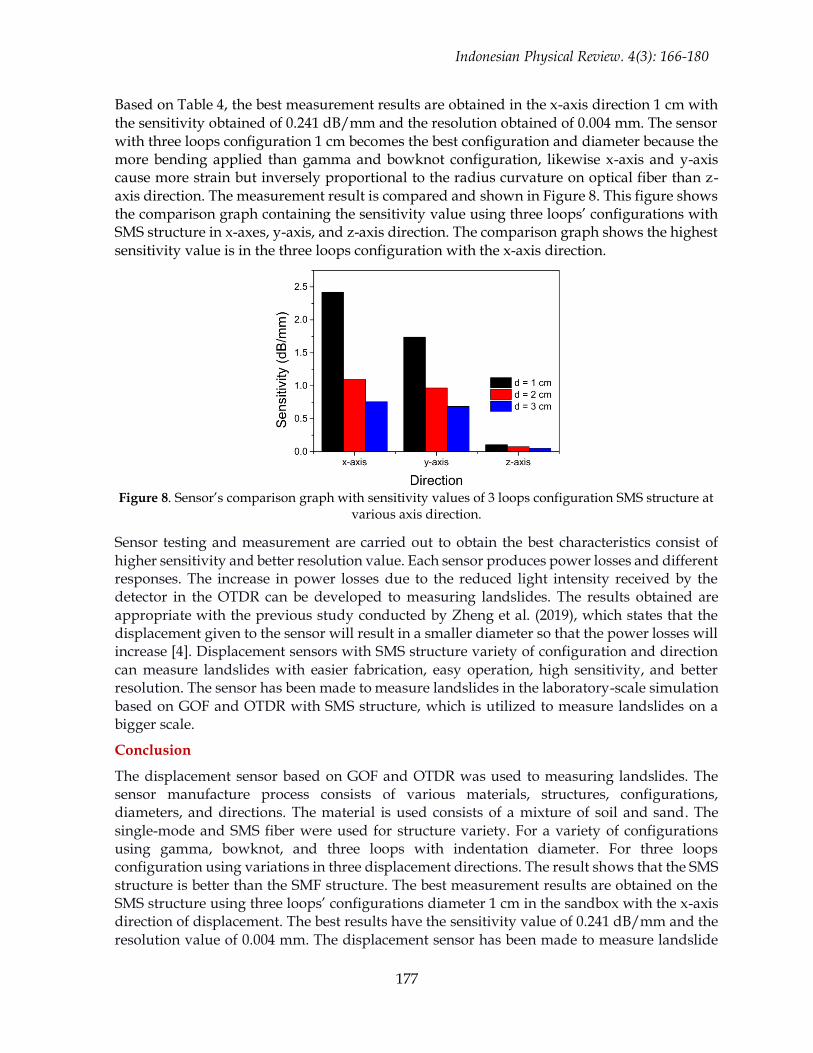
Based on Table 4, the best measurement results are obtained in the x-axis direction 1 cm with the sensitivity obtained of 0.241 dB/mm and the resolution obtained of 0.004 mm. The sensor with three loops configuration 1 cm becomes the best configuration and diameter because the more bending applied than gamma and bowknot configuration, likewise x-axis and y-axis cause more strain but inversely proportional to the radius curvature on optical fiber than z-axis direction. The measurement result is compared and shown in Figure 8. This figure shows the comparison graph containing the sensitivity value using three loops’ configurations with SMS structure in x-axes, y-axis, and z-axis direction. The comparison graph shows the highest sensitivity value is in the three loops configuration with the x-axis direction.
Figure 8. Sensor’s comparison graph with sensitivity values of 3 loops configuration SMS structure at
various axis direction.
Sensor testing and measurement are carried out to obtain the best characteristics consist of higher sensitivity and better resolution value. Each sensor produces power losses and different responses. The increase in power losses due to the reduced light intensity received by the detector in the OTDR can be developed to measuring landslides. The results obtained are appropriate with the previous study conducted by Zheng et al. (2019), which states that the displacement given to the sensor will result in a smaller diameter so that the power losses will increase [4]. Displacement sensors with SMS structure variety of configuration and direction can measure landslides with easier fabrication, easy operation, high sensitivity, and better resolution. The sensor has been made to measure landslides in the laboratory-scale simulation based on GOF and OTDR with SMS structure, which is utilized to measure landslides on a bigger scale.
Conclusion
The displacement sensor based on GOF and OTDR was used to measuring landslides. The sensor manufacture process consists of various materials, structures, configurations, diameters, and directions. The material is used consists of a mixture of soil and sand. The single-mode and SMS fiber were used for structure variety. For a variety of configurations using gamma, bowknot, and three loops with indentation diameter. For three loops configuration using variations in three displacement directions. The result shows that the SMS structure is better than the SMF structure. The best measurement results are obtained on the SMS structure using three loops’ configurations diameter 1 cm in the sandbox with the x-axis direction of displacement. The best results have the sensitivity value of 0.241 dB/mm and the resolution value of 0.004 mm. The displacement sensor has been made to measure landslide

P-ISSN: 2615-1278, E-ISSN: 2614-7904
178
in the laboratory-scale simulation based on GOF and OTDR with easier fabrication, easy operation, high sensitivity, better resolution, and connection to a computer. Sensors with SMS structure can be used for further research on landslide sensors in the more extensive field.
Acknowledgement
This research was supported by “PD-UNHAS 2021” Contract No. 752/UN-
4.22/PT.01.03/2021.
References
[1] Z. Yu, H. Dai, Q. Zhang, M. Zhang, L. Liu, J. Zhang, X. Jin (2018). High-resolution distributed strain sensing system for landslide monitoring. Optik 158 91-96. Doi: http://dx.doi.org/10.1016/j.ijleo.2017.12.013
[2] T. I. H. Sitorus (2020). Corporate Social Responsibility (CSR) Sebagai Alternatif Sumber Dana Penanggulangan Bencana Alam. Jurnal Dialog Penaggulangan Bencana 11 (2) 103-116. Available online from: https://bnpb.go.id/buku/jurnal-dialog-penanggulangan-bencana-volume-11-nomor-2-tahun-2020 . [Accessed August 10, 2021].
[3] M. Sharma, S. Laskar (2017). Landslide Mapping, monitoring and modeling techniques: a new approach using DOFS. IEEE Proceeding of Second International conference on Circuits, Control and Communication 21-24. Doi: http://dx.doi.org/10.1109/CCUBE.2017.8394149
[4] Y. Zheng, Z. W. Zhu, W. J. Li, D. M. Gu, W. Xiao (2019). Experimental research on a novel optic sensor based on OTDR for landslide monitoring. Measurement: 148 106926 1-9. Doi: https://doi.org/10.1016/j.measurement.2019.106926
[5] Y. Zheng, D. Huang, Z. W. Zhu, W. J. Li (2018). Experimental study on a parallel-series connected fiber-optic displacement sensor for landslide monitoring. Optic and Lasers in Engineering: 111 236-245. Doi: https://doi.org/10.1016/j.optlaseng.2018.08.017
[6] M. H. Younus, O. F. Ameen, N. Redzuan, N. Ahmad, R. K. R Ibrahim (2017). Fabrication and characterization of multimode optical fiber sensor for chemical temperature monitoring using optical time domain reflectometer. Karbala International Journal of Modern Science: xx 1-7. Doi: https://doi.org/10.1016/j.kijoms.2017.12.002
[7] C. S. Fernandes, M. T. M. R. Giraldi, M. J. Sousa, J. C. W. A. Costa, C. Gouveia, P. Jorge, M. A. R. Franco (2016). Curvature and Vibration Sensing Based on Core Diameter Mismatch Structures. IEEE Transactions on Instrumentation and Measurement: 1-8. Doi: https://doi.org/10.1109/TIM.2016.2571378
[8] A. Arifin, A. M. Hatta, M. S. Muntini, and A. Rubiyanto (2014). Bent of Plastic Optical Fiber with Structural Imperfections for Displacement Sensor. Indian Journal of Pure and Applied Physics, 52, 520-524. Doi: https://doi.org/10.1007/s13320-015-0225-4
[9] A. Arifin, A. Samsu, M. Yunus, B. Abdullah, D. Tahir (2019). Sensitivity Enhancement of Strain Sensor Based on Polymer Optical Fiber for Concrete Testing. IOP Conf.Journal of Physics 1341 082034. Doi: https://doi.org/10.1088/1742-6596/1341/8/082034
[10] A. Arifin, Kasmiah, M. Yunus, S. Dewang, B. Abdullah, D. Tahir (2019). Analysis characteristics embedded plastic optical fiber sensors for crack detection in concrete structures. IOP Conf series: Earth and Environmental and Science 235 1-5. Doi: https://doi.org/10.1088/1755-1315/235/1/012013

Indonesian Physical Review. 4(3): 166-180
179
[11] A. Arifin, N. I. Rusyam, A. K. Lebang, B. Abdullah, D. Tahir (2021). High sensitivity and resolution sensor plastic optical fiber for determining compressive and tensile tensor concrete applications. Journal of Physics: Conference Series 1763 012004. Doi: https://doi.org/10.1088/1742-6596/1763/1/012004
[12] H. S. Huang, J. S. Pan, Y. M Tseng, W. Fang, R. M. Shih (2018). Development of Optical Fiber Stress Sensor Based on OTDR. Springer International Publishing 215-222. Doi: https://doi.org/10.1007/978-3-319-63859-1_27
[13] M. H. Younus, O. F. Ameen, N. Redzuan, R. K. R Ibrahim, N. Redzuan (2016). Fuel detection system using OTDR with multimode fiber. Jurnal Teknologi: 79 (3) 107-112. Doi: https://doi.org/10.11113/jt.v79.7686
[14] A. Arifin, A. K. Lebang, M. Yunus, S. Dewang, I. Idris, D. Tahir (2019). Measurement Heart Rate Based on Plastic Optical Fiber Sensor. IOP Conf.Series: Journal of Physics: conf. Series UPIS 2018: 1170 (012074) 1-7. Doi: https://doi.org/10.1088/1742-6596/1170/1/012074
[15] A. Arifin, K. R. Amaliyah, A. K. Lebang, N. Hamrun, S. Dewang, D. Tahir (2021). Enhance sensitivity of plastic optical fiber sensor by spiral configuration for body temperature applications. Journal of Physics: Conference Series 1811 012026. Doi: https://doi.org/10.1088/1742-6596/1811/1/012026
[16] Y. Zheng, W. Xiao, Z. W. Zhu (2020). A simple macro-bending loss optical fiber crack sensor for the use over a large displacement range. Optical Fiber Technology 58 102280. Doi: https://doi.org/10.1016/j.yofte.2020.102280
[17] L. Cheng, F. Song, K. Zhang, Y. Li, J. Yang (2020). A U-shape-wound fiber macro-bending loss crack sensor improved by an optical splitter. Optical Fiber Technology 58 102259. Doi: https://doi.org/10.1016/j.yofte.2020.102259
[18] A. M. Hatta, K. Indriawati, T. Bestariyan, T. Humada, Sekartedjo (2013). SMS Fiber Structure for Temperature Measurement Using an OTDR. Photonic Sensors 3 (3) 262-266. Doi: https://doi.org/10.1007/s13320-013-0104-9
[19] K. Dey, S. Roy, P. Kishore, M. S. Shankar, B. Ramesh, R. Ranjan (2021). Analysisi and performance of edge filtering interrogation scheme for FBG sensor using SMS fiber and OTDR. Result in Optics 2 100039. Doi: https://doi.org/10.1016/j.rio.2020.100039
[20] S. M. Al-dabbagh, M. G. Said (2020). The influence of relative refractive index and core diameter on properties of singlemode optical fiber. Journal od Education and Science 29 (4) 124-139. Doi: https://doi,org/10.33899/edusj.2020.126908.1063
[21] S. Q. Mohammed, A. M. Al-Hindawi (2017). Study of Optical Fiber Design Parameter in Fiber Optics Communication. Kurdistan Journal of Applied Research (KJAR) 2 (3). Doi: http://doi.org/10.24017/science.2017.3.52
[22] M. J. Li, X. Chen, K. Li, J. E. Hurley, J. Stone (2019). Optical Fiber for 1310 nm Single-Mode and 850 nm Few-Mode Transmission. Proceedings of SPIE 10945 1094503. Doi: https://doi.org/10.1117/12.2516013
[23] J. Ilouno, I. J. Audu (2018). Optical Time Domain Optical Time Domain Reflectometer Assessment of Attenuation in Fiber Optic Communication System. Journal of Engineering Research and Reports 1 (4) 1-6. Doi: https://doi.org/10.9734/jerr/2018/v1i49864
[24] J. W. Costa, M. A. R. Franco, V. A. Serrao, C. M. B. Cordeiro, M. T. R. Giraldi (2019). Macrobending SMS fiber-optic anemometer and flow sensor. Fiber Optic Technology 52 101981. Doi: https://doi.org/10.1016/j.yofte.2019.101981

P-ISSN: 2615-1278, E-ISSN: 2614-7904
180
[25] Y. N. Pang, et al (2021). Wearable Optical Fiber Sensor Based on a Bend Singlemode-Multimode-Singlemode Fiber Structure for Respiration Monitoring. IEEE Sensors Journal 21 (4) 4610 – 4617. Doi: https://doi.org/10.1109/JSEN.2020.3032646
[26] H. Lin, F. Liu, Y. Dai, F. Mumtaz (2020). Relative humidity sensor based on FISM-SMS fiber structure coated with PVA film. Optik 207 164320. Doi: https://doi.org/10.1016/j.ijleo.2020.164320