Evidence from the LendingClub Consumer Platform - Scinapse
32
ISSN: 1962-5361 Disclaimer: This Philadelphia Fed working paper represents preliminary research that is being circulated for discussion purposes. The views expressed in these papers are solely those of the authors and do not necessarily reflect the views of the Federal Reserve Bank of Philadelphia or the Federal Reserve System. Any errors or omissions are the responsibility of the authors. Philadelphia Fed working papers are free to download at: https://philadelphiafed.org/research-and-data/publications/working-papers. Working Papers The Roles of Alternative Data and Machine Learning in Fintech Lending: Evidence from the LendingClub Consumer Platform Julapa Jagtiani Federal Reserve Bank of Philadelphia Catharine Lemieux Federal Reserve Bank of Chicago WP 18-15 Revised January 2019 April 2018 https://doi.org/10.21799/frbp.wp.2018.15
-
Upload
khangminh22 -
Category
Documents
-
view
2 -
download
0
Transcript of Evidence from the LendingClub Consumer Platform - Scinapse

ISSN: 1962-5361Disclaimer: This Philadelphia Fed working paper represents preliminary research that is being circulated for discussion purposes. The views expressed in these papers are solely those of the authors and do not necessarily reflect the views of the Federal Reserve Bank of Philadelphia or the Federal Reserve System. Any errors or omissions are the responsibility of the authors. Philadelphia Fed working papers are free to download at: https://philadelphiafed.org/research-and-data/publications/working-papers.
Working Papers
The Roles of Alternative Data and Machine Learning in Fintech Lending: Evidence from the LendingClub Consumer Platform
Julapa JagtianiFederal Reserve Bank of Philadelphia
Catharine LemieuxFederal Reserve Bank of Chicago
WP 18-15Revised January 2019April 2018https://doi.org/10.21799/frbp.wp.2018.15
0
The Roles of Alternative Data and Machine Learning in Fintech Lending: Evidence from the LendingClub Consumer Platform
Julapa Jagtiani*
Federal Reserve Bank of Philadelphia
Catharine Lemieux Federal Reserve Bank of Chicago
January 2019
Abstract Fintech has been playing an increasing role in shaping financial and banking landscapes. There have been concerns about the use of alternative data sources by fintech lenders and the impact on financial inclusion. We compare loans made by a large fintech lender and similar loans that were originated through traditional banking channels. Specifically, we use account-level data from LendingClub and Y-14M reports by bank holding companies with total assets of $50 billion or more. We find a high correlation with interest rate spreads, LendingClub rating grades, and loan performance. Interestingly, the correlations between the rating grades and FICO scores have declined from about 80 percent (for loans that were originated in 2007) to only about 35 percent for recent vintages (originated in 2014–2015), indicating that nontraditional alternative data have been increasingly used by fintech lenders. Furthermore, we find that the rating grades (assigned based on alternative data) perform well in predicting loan performance during the two years after origination. The use of alternative data has allowed some borrowers who would have been classified as subprime by traditional criteria to be slotted into “better” loan grades, which allowed them to get lower-priced credit. In addition, for the same risk of default, consumers pay smaller spreads on loans from LendingClub than from credit card borrowing. Keywords: fintech, LendingClub, marketplace lending, alternative data, shadow banking, P2P lending, peer-to-peer lending JEL Classification: G21, G28, G18, L21 __________________________________________ * [email protected] or 215-574-7284. The authors thank Erik Dolson, Raman Quinn Maingi, John Nguyen, and especially Leigh-Ann Wilkins for their research assistance. They also thank Onesime Epouhe for his assistance with the stress test data. Helpful comments and suggestions from Tracy Basinger, Robin Prager, Joe Hughes, Bob Hunt, Robert Wardrop, Raghu Rau, Paul Calem, Chris Cumming, Kathleen Hanley, and participants at the annual FDIC conference, the American Economic Association conference, and the annual NYU Fintech conference are appreciated. This paper is a revise of “The Roles of Alternative Data and Machine Learning in Fintech Lending: Evidence from the LendingClub Consumer Platform” by Julapa Jagtiani and Catharine Lemieux, Federal Reserve Bank of Philadelphia Working Paper 18-15, April 2018. Disclaimer: This working paper represents preliminary research that is being circulated for discussion purposes. The opinions expressed in this paper are the authors’ own views and do not necessarily represent the views of the Federal Reserve Bank of Philadelphia, the Federal Reserve Bank of Chicago, or the Federal Reserve System. Any errors or omissions are the responsibility of the authors. No statements here should be treated as legal advice. Philadelphia Fed working papers are free to download at https://philadelphiafed.org/research-and-data/publications/working-papers.
1
I. Introduction
Consumer credit has been growing steadily in recent years. As of September 2018, of the
nearly $4 trillion of the overall consumer credit (not secured by real estate), approximately 26
percent was credit card debt and only 6 percent was unsecured personal loans (Federal Reserve,
2018).1 Bricker et al. (2017) find that, based on the 2016 Survey of Consumer Finance, 20.8 percent
of families felt credit constrained, and this result has been fairly consistent over recent years. Oliver
Wyman (Carroll and Rehmani, 2017) estimates that as many as 60 million people may have been
unable to access credit because of their thin credit files or lack of credit history. It is likely that a
significant number of consumers in the subprime pool (based on the traditional measures) may not
be risky borrowers, but they were subject to excessive risk premiums that reflect their low credit
scores (based on inaccurate measures).
Fintech lending platforms have entered the unsecured personal loan space and have the
potential to fill this unmet demand for credit. Over the past decade, online alternative lenders have
evolved from platforms connecting individual borrowers with individual lenders2 to sophisticated
networks featuring institutional investors, direct lending (on their balance sheet), and
securitization transactions. The use of alternative data sources, big data and machine learning (ML)
technology, and other complex artificial intelligence (AI) algorithms could also reduce the cost of
making credit decisions and/or credit monitoring and lower operating costs for lenders. Fintech
lenders could potentially pass the benefits onto borrowers.
Alternative data, when included in the credit risk analysis, could paint a fuller and more
accurate picture about people’s financial lives and their creditworthiness, which could make it
possible for millions of American consumers to have access to affordable credit (Richard Cordray,
2017). Some fintech lenders have developed their own proprietary complex ML algorithms that use
big data and alternative data to evaluate borrowers’ credit risk. Through this new approach to
credit risk evaluation, some consumers with a short credit history — one that may not satisfy a
bank’s traditional lending requirements — could potentially get a loan from an online alternative
lender. Some fintech lenders specialize in making loans to those “below-prime” consumers — by
identifying those “invisible prime” consumers from the (traditional) subprime pool. Fintech lenders
could potentially make loans to below-prime consumers at lower costs than what they would have
received otherwise, and without the lenders incurring any more loss (because of a loan default)
than the expected level of loss on loans to average consumers.
1 The remaining 68 percent was student loan and auto-related debt. 2 This is frequently referred to in prior research as peer-to-peer (P2P).

2
Crosman reports in American Banker (June 14, 2016) that SoFi no longer uses FICO scores
when determining loan qualifications. In addition, Kabbage claims that FICO scores are not part of
its creditworthiness determination (although FICO scores are used for benchmarking and investor
reporting). In the American Banker article, Ron Suber, former president of Prosper Marketplace,
states that “Prosper gets 500 pieces of data on each borrower; the FICO score is just one data point.”
The company uses FICO scores to screen borrower candidates; a score of at least 640 is needed to
be considered for a loan. Prosper analyzes additional data to determine its ultimate credit decision.
These data sources were not normally used by traditional lenders.
We use personal installment loan-level data from LendingClub’s unsecured consumer
platform and compare it with similar loan-level data from traditional lenders to explore the
potential consumer benefits that fintech lenders provide. Specifically, we investigate two channels:
whether the use of alternative data (to build internal credit rating systems such as the one designed
by LendingClub) can improve consumers’ ability to access credit by allowing lenders to better
assess their true creditworthiness and whether the use of alternative data allows fintech lenders to
better risk price credit so some borrowers can get loans from fintech firms at a lower cost than they
could get from traditional banks.
Our results show that, over the years, alternative sources of information have been
increasingly used by fintech lenders to evaluate credit applications. The additional information is
outside what is typically included in traditional credit ratings or the traditional credit approval
criteria. Our results demonstrate that the correlation between the borrowers’ FICO scores (at the
time of loan application) and the rating grades assigned by LendingClub have dramatically declined
over the years, indicating an increasing usage of alternative data in the internal rating process. We
also find that credit spreads can be explained by information in LendingClub’s rating grades that is
not in the FICO score or in other obvious measures of credit risk. And, this orthogonal component is
also useful in predicting LendingClub’s loan performance over the two years after loan origination.
While it is not known exactly what specific set of alternative data are used by each of the
specific fintech lenders, some have mentioned information drawn from bank account transactions
such as utility or rent payments, other recurring transactions, and electronic records of deposit and
withdrawal transaction. Other items mentioned include insurance claims, credit card transactions,
3
consumer’s occupation or details about their education, their use of mobile phones and related
activities, Internet footprints, online shopping habit, investment choice, and so on.3
The rest of the paper is organized as follows. In Section II, we present the literature review.
Section III describes our data from various sources. Section IV discusses the roles of alternative
data and how they have been used in credit decision process. Section V explores the pricing of
credit (interest rate spreads) of loans originated by a fintech platform versus traditional
origination. Section VI further investigates the relationship between pricing and loan performance,
using regression analysis to control for other relevant risk factors. Section VII concludes and
discusses policy implications.
II. The Literature
Information asymmetries between lenders and borrowers have long been an important
topic of banking research, and more recently they have become a popular topic for fintech lending
research. Morse (2015) reviewed the existing literature developing around fintech lending with a
focus on whether the type of technologies employed by fintech firms can mitigate information
frictions in lending. She posits that the process of better capturing soft information contained in
proximity information and better profiling of loan applicants could improve the access to or price of
credit. Freedman and Jin (2017) demonstrate the value of friends of the applicant committing to
investing in the loan. They also show that this signal is more pronounced in lower credit grades,
thus supporting the use of alternative data such as social network in credit decisions. Similarly,
Everett (2010) finds that loans funded by investor groups perform better if someone in the group is
personally connected to the borrowers. Likewise, Lin, Prabhala, and Viswanathan (2013) find that
the credit quality of a borrower’s friends is related to improved success in fundraising, lower
interest rates, and a lower default rate. Social network and friends may also have negative impact
on consumer credit access. Lu, Gu, Ye, and Sheng (2012) find that the reverse relationship also
holds; they find a positive relationship between a friend’s default and a borrower’s probability of
default. Research findings so far are consistent with an argument that information drawn from
3 Concerns emerged that consumer privacy may be compromised in the process if information such as insurance claims, utility bills, bank account transactions, and social network details are used by lenders without a borrower’s consent.
4
social network and friends can be useful in credit risk evaluation, especially for those with thin
credit files.4
In addition to social networks and friends, researchers have investigated the potential for
other soft information to be leveraged in an online loan application. Michels (2012) finds that
voluntary disclosure of hard information (other than credit scores) such as income, income source,
education, and other debt is related to interest rates that consumers are charged. Herzenstein,
Sonenshein, and Dholakia (2011), through text analysis of borrower narratives, find limited
usefulness. Gao and Lin (2012) use text mining and find that more complex narratives are
correlated with higher default rates. Yencha, Nowak, and Ross (2018) also used text mining and
find that text descriptions of small businesses can predict whether a small business loan will be
funded. They also find that this information may be most useful for borrowers with low FICO
scores. Ravina (2012); Pope and Sydnor (2011); Duarte, Siegel, Gonzalez and Loureiro (2014); and
Young (2012) analyzed photo-based discrimination. The results are mixed; some findings of bias
lean toward attractive or trustworthy faces and against racial minorities. A central issue to the
value of this line of research is that, once borrowers understand that lenders are using this
information, they could choose to alter the way they submit text or photo information.
Alternative data could also be derived from local economic information. For example, some
fintech lenders can identify whether the loan applications are submitted from a high-crime area or
in an area where factories are being shut down or relocated. Previous studies have found evidence
that local economic information could serve as a possible relevant source of nontraditional
information by fintech lenders; see Crowe and Ramcharan (2013); Bertsch, Hull, and Zhang (2016);
Buchak, Matvos, Piskorski, and Seru (2017); Havrylchyk, Mariotto, Rahim, and Verdier (2018);
Chen, Hanson, and Stein (2017); Alyakoob, Rahman, and Wei (2017); and Jagtiani and Lemieux
(2018).
Advanced technology and AI/ML algorithms have made it less costly and more effective for
lenders to originate and service loans. Researchers have started to investigate whether fintech
lenders pass on the savings to consumers with lower credit costs and whether the pricing is
appropriate for the risk taken.5 A few studies have attempted to compare lending rates from online
4 However, inferring credit risk from an applicant’s social network and friends, rather than the consumers’ own credit performance could potentially be considered a fair lending violation. This is a topic for a separate research study. 5 Morse (2015) explores a number of issues related to fintech disruption and financial disintermediation. The paper concludes that at least some cost savings seem to accrue to investors (since 80 percent of P2P funds come from institutional investors) and that the borrowers’ social circles and local economic indicators are useful in predicting credit risk.
5
alternative platforms with traditional lending channels, but those studies have been subject to
significant data limitations and the results have been mixed. Mach, Carter, and Slattery (2014)
report that P2P small business borrowers paid higher rates for fintech loans compared with loans
obtained from traditional sources. However, they used data from LendingClub’s consumer platform
that were identified as small business purposes and were less likely to be comparable with small
business loans made by traditional banks.6 Demyanyk and Kolliner (2014) find that more
creditworthy consumers receive preferred rates using a P2P lender over borrowing with a credit
card. However, they used aggregate market rates as the comparison. In Germany, De Roure,
Pelizzon, and Tasca (2016), using data from Auxmoney, a German P2P lending site, find that
interest rates are comparable with loans made by P2P alternative lenders and those made by
traditional banks. However, the interest rates used as a comparison were market rates.
In a more recent paper, De Roure, Pelizzon and Thakor (2108) find that risk-adjusted rates
on P2P loans were lower than those on bank loans in Germany and concluded that P2P lenders
were bottom fishing. Jagtiani, Lambie-Hanson, and Lambie-Hanson (2018) find that, for FHA
mortgage borrowers (i.e., borrowers who are more likely to be underserved than the conventional
mortgage borrowers), fintech lenders offer a lower rate than traditional mortgage lenders on
average. In contrast, Buchak, Matvos, Piskorski, and Seru (2017), focusing on conventional
mortgage loans, find evidence that fintech mortgage borrowers are among the borrowers who
value fast and convenient services and that fintech lenders command an interest rate premium for
their services. Another interesting study that looked at risk pricing by LendingClub found that the
rates charged to higher-risk borrowers were not large enough to compensate for a higher
probability of default; see Emekter, Tu, Jirasakuldech, and Lu (2014). Our paper, using loan-level
data from both LendingClub and traditional banks, is able to overcome many of the data limitations
in previous studies, allowing us to compare how fintech lenders and traditional banks price
consumer credit.
Taking a different approach, Hughes, Jagtiani, and Moon (2018) compare the performance
of consumer loans made by large financial institutions with those made by LendingClub using a
novel approach to stochastic efficiency analysis. They find that LendingClub and the financial
institutions with the largest consumer portfolios were better at credit evaluation and loan
6 LendingClub started its small business lending platform in late 2014; in the four years since then, the volume has remained small. The consumer loans that are marked as “small business” purposes on LendingClub consumer platform represents less than 2 percent of all loans on the consumer platform, and they are treated as consumer loans.
6
management than financial institutions with smaller consumer portfolios. While LendingClub and
the largest banks did take on more credit risk, they remained closer to the efficient frontier. This is
consistent with work by Serrano-Cinca, Gutierrez-Nieto, and Lopez-Palacios (2015): Using data
from 2008 through 2014, they find the loan grades that LendingClub assigned were the most
predictive factor of defaults, suggesting that LendingClub was able to appropriately risk rank the
borrowers.
Another interesting research question is whether fintech lenders have made it easier for
consumers to become excessively leveraged, causing loans to perform poorly in the long run. In
other words, are fintech borrowers better off by being able to access this type of credit? The results
have been mixed. An interesting study by Danisewicz and Elard (2018) find that, when a U.S. Court
of Appeals verdict caused a decline in marketplace lending, there was a proportional and persistent
rise in personal bankruptcy, particularly among low-income households, suggesting that fintech
loans have a positive impact on consumer credit performance. However, Chava and Paradkar
(2018) look at the credit profile of marketplace lending borrowers who borrowed from
LendingClub to consolidate credit card debt, and they find that initially borrowers do reduce their
credit card debt, but within three quarters, they received more credit from their existing banking
relationships and experienced a significant increase in credit card defaults. They do not take into
consideration important information such as whether the borrowers also borrowed from other P2P
lenders, whether the borrowers have only one loan or multiple loans with P2P lenders, and so on.
They find that subprime borrowers felt the most impact. Di Maggio and Yao (2018) find similar
results.
Looking at the funding side of fintech consumer loans, Kraussl, Kraussl, Pollet, and Rinne
(2018) point out that LendingClub’s portfolio generated positive abnormal returns and, therefore,
could attract capital more easily to finance loan growth. In contrast, Balyuk and Davydenko (2018)
note that marketplace lending platforms have evolved from trading venues into credit
intermediaries. The fact that these platforms often have little skin in the game makes the fintech
lending market vulnerable to large institutional investors’ withdrawal from the market. The results
so far have been mixed on the impact on consumer, investors, or the economy overall. This is not
surprising because the business models and credit evaluation techniques in the fintech space have
been evolving rapidly over the past decade.
We use a unique data set that allows us to compare online alternative lending rates with
traditional credit card loans. We compare account-level credit card data that large banks submitted
to the Federal Reserve for stress testing with online consumer loans that were made for credit card
7
payoff (and debt consolidation) purposes. These data will allow us to investigate the determinants
for risk pricing used by LendingClub and the performance of these loans over time as well as
serving to compare these loans with similar loans made by traditional banks. If loans are
appropriately risk priced, this will provide some evidence that borrowers are not being enticed to
borrow because they are offered inappropriate interest rates and that some of the efficiencies that
accrue to marketplace lenders are being passed through to borrowers.
III. The Data
We use four main sources of data in this paper: data on loans that were originated through
online alternative channels (loan-level data from the LendingClub consumer platform); data on
loans that were originated from traditional banking channels (loan-level data from Y-14M reports
submitted by bank holding companies with over $50 billion in total assets); deposit market
concentration data and bank branch information, based on the FDIC Summary of Deposits database;
and economic factors from the U.S. Census Bureau and Haver Analytics database.
III.1 Fintech Loans
Our research on fintech consumer lending focuses on LendingClub for two reasons. First,
the company is one of the few lenders that have made their data publicly available. Second,
LendingClub is the largest fintech lender for personal loans, and therefore, the results here are
likely to apply more broadly. LendingClub reports detailed information about each loan application
that has been approved or denied since its inception in 2007. For each of the loans that were
funded, we collect characteristics of the borrowers (e.g., FICO scores at the time of loan application,
length of employment, debt-to-income (DTI) ratio, homeownership, borrower’s zip code);
characteristics of the loan (such as loan rate, maturity of the loan (three or five years), origination
date, whether the verification was needed, loan purpose as identified in the application); we also
collect monthly payment and performance of each loan in the sample from the origination month to
24 months after origination.
Our sample includes all consumer loans that were originated from 2007 to 2015. The
sample ends at 2015 (origination year) to allow us to observe loan performance over a two-year
period postorigination. In addition, we include LendingClub consumer loans in which borrowers
identified as being used only to pay off credit card balances or for debt consolidation, so that the
8
sample is directly comparable with credit card loans originated by banks.7 For most of the analysis,
we focus on 725,800 loans that were originated in 2010 to 2015 because data from the 2007–2009
origination vintages are less reliable, and the volume was very small initially. About 76 percent of
the sample loans were originated during the last two years of the sample, 2014–2015. We observe
the differences between these two lending channels in terms of credit risk rating, price of credit,
and loan performance.
III.2 Traditional Loans
We use comparable loan-level (credit card loan) data from the Federal Reserve’s Y-14M
reports, which are reported monthly by bank holding companies with over $50 billion in assets. We
use a 1 percent random sample of all credit card accounts reported in Y-14M data set. From this
data set, we focus on the reporting period 2014–2017 and include only those accounts that were
originated in 2014–2015 (allowing for up to a two-year performance period until 2017).8 We do
not include accounts that were originated prior to 2014 to avoid sample selection bias in our
analysis.9 Our final sample includes 53,186 Revolver accounts (i.e., consumers who are actually
borrowing, not just using credit card for transaction purposes) that were opened in 2014–2015.10
Credit card loans from Y-14M reports and LendingClub loans (that are used to pay off credit card
loans) are the most comparable products.
It is important to note that reported credit card balances are balances as of a specific
reporting date, rather than balances at the end of a statement (which varies across card accounts).
The reported card balances mostly reflect spending rather than extensions of credit. To correctly
compare fintech platform loans and traditional loans, we identify whether each card account is a
Revolver or a Transactor. Most cardholders are Transactors, and they do not actually borrow from
the bank. Since consumers report that they borrow from LendingClub to pay off their credit cards,
we compare the price (interest rate spread) and performance of LendingClub loans with credit card
7 At least 80 percent of LendingClub consumer loans in each year were used for this purpose. As of 2015, about 90 percent of LendingClub consumer loans are specified as being used to pay off credit card balances or for debt consolidation, as shown in Jagtiani and Lemieux (2018). 8 We note that these data are constrained by the limited number of reporters and thus may not represent the entire population of firms that issue credit cards. However, Y-14M reporters do represent over 80 percent of all credit cards issued by commercial banks. 9 Accounts that were originated earlier and were closed (owing to default or other reasons) would have been dropped from the Y-14M reports in 2014–2017. 10 The sample includes only consumer cards (business cards and corporate cards are not included) that were issued for general purposes and private-label cards. Charge cards are excluded because there is no associated credit limit for these cards.

9
loans, controlling for loan size, origination year, and other relevant risk factors. Some credit cards
have rewards (cash back or points) and/or a period of low-rate promotion period (e.g., in the first
six months) to encourage balance transfers from other cards. We also control for the promotion
period and rewards in our analysis.
For the most part, Y-14M reports contain similar information on the borrowers and other
risk characteristics as those reported in the LendingClub database (such as origination date,
origination amount, location of the borrowers, and borrowers’ credit scores). A few key variables
(such as homeownership and DTI ratio) are available for LendingClub loans but are not reported by
banks in the Y-14M report.
III.3 Economic and Other Control Factors
We collect various economic factors (e.g., local unemployment, local average household
income, local home price index, and local population) from the U.S. Census Bureau database and the
Haver Analytics database. We use the most appropriate and most granular level (three-digit zip
code, five-digit zip code, or county) of economic factors.11 Using the share of outstanding credit card
loans at each banking firm, we calculate local market concentration as measured by the Herfindahl-
Hirschman Index (HHI).
IV. The Role of Alternative Data
One of the attractive features of getting credit from alternative lenders is how quickly
lending decisions are made. An important advantage for fintech lenders is that they have access to
nontraditional data sources that are not used (or not available) to traditional bank lenders. The
additional sources of information may include consumers’ payment history (utility, rent, phone,
alimony, and so on) history, cash-flow data from bank accounts (revealing recurring payments and
transaction activities such as salary and cash withdrawals), credit card transactions, medical and
insurance claims, education and major, and social network as well as their online footprints,
shopping habits, and other personal information. Some of these data are available through the
various data aggregators and vendors that work directly for the lenders (providing white label
services) or through partnership with the lenders. Consumers are often required to authorize
lenders to access account information from their banks, credit cards, investments, or their mobile
phone. Information about the timing (e.g., applying for a loan at 3:00 a.m. may not be a good signal)
or location (e.g., sitting in a high-crime area) could potentially be included in the alternative
11 Note that LendingClub loan level data are reported with three-digit zip code level; thus, three-digit zip code level of economic factors is used in these cases.

10
information set. These factors are not reflected in the traditional credit measures such as risk
scores. Some lenders, such as PayPal, Square, and Amazon, have access to cash-flow information
from their own platforms, allowing them to lend to small businesses and start-ups that have
difficulty getting credit through the traditional lending channels because of thin credit files.
In the case of LendingClub, as applications are submitted online, LendingClub’s credit model
grades and prices the loan, and applicants receive immediate feedback about the loan terms for
which they are qualified. A verification process takes place before the loan is funded.12 Consumers
are assigned a rating grade from A to G based on the full set of information after the loan has been
approved. The loan application process can be summarized as shown in the diagram below.
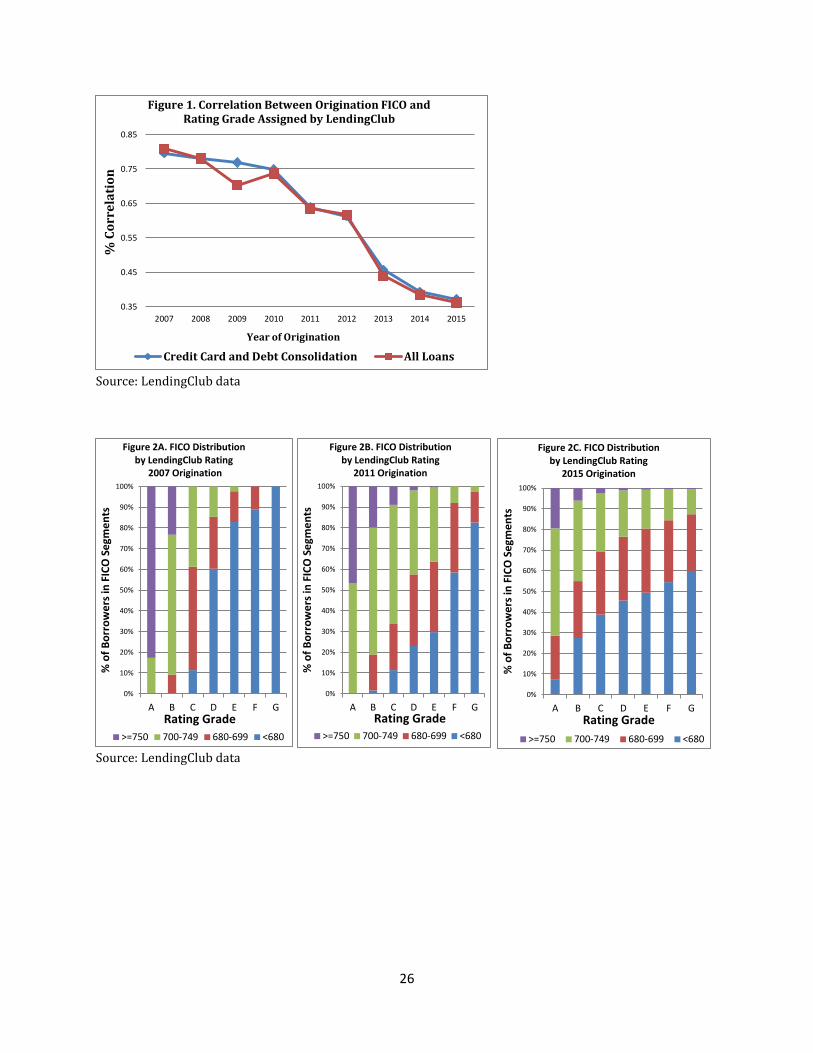
Our analysis indicates that the use of alternative data in assigning rating grades has been
increasing over the years. The correlation between LendingClub rating grades and FICO scores
declined from about 80 percent for loans that were originated in 2007 to only less than 35 percent
for loans that were originated in 2015 (see Figure 1).13 The credit grades are increasingly defined
12 For example, if the credit model data sources indicate the application is fraudulent, the application may be declined. If not, after an offer is presented, further income or employment verification may be requested. LendingClub has its own proprietary models that identify whether each loan application should be verified or not. As of 2015, about 70 percent of all loans made through the LendingClub platform were verified. 13 We convert LendingClub’s rating grades to numerical values, where A is 7, B is 6,… and G is 1. The declining correlation is robust; we also tried calculating the correlation when both the rating grades and the FICO scores are grouped into segments (FICO score is 1 if the FICO score is lower than 680; the FICO score is 2, 3, and 4 if it is 680 to 700, 700 to 750, and above 750, respectively), which also indicates that the correlation fell
11
using additional metrics beyond factors that are important in determining FICO scores.14 Figures
2A, 2B, and 2C present the composition of loans for each rating grade and how the composition has
evolved over the years for loans originated in 2007, 2011, and 2015, respectively. Some consumers
who would be considered subprime are slotted into the “better” loan grades. For loans originated in
2015 (see Figure 2C), about 8 percent that were A-rated were to borrowers with FICO scores below
680 (so-called subprime) and 28 percent of the B-rated borrowers had FICO scores in the subprime
range. This provides evidence that the use of additional information sources could allow some
borrowers with low FICO scores to access credit and potentially better pricing.
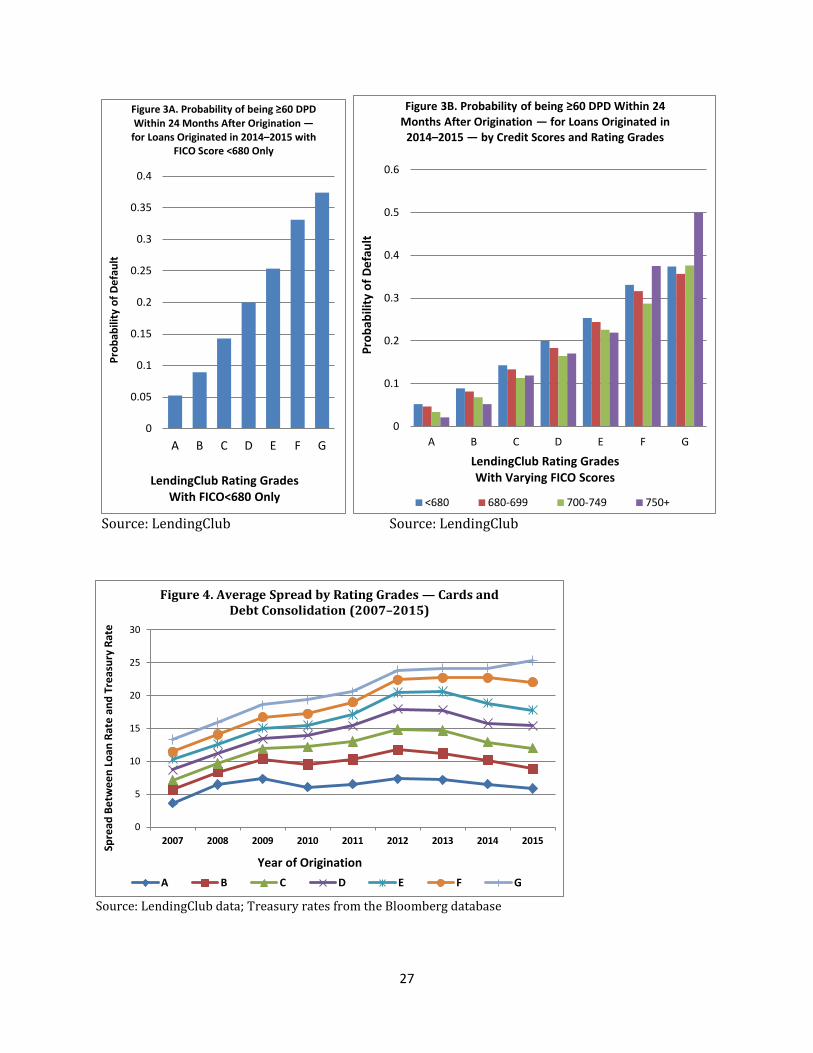
We further explore payment and default behavior of these subprime borrowers who are
rated highly by LendingClub. Figure 3A shows the probability of loans becoming delinquent (at
least 60 days past due (DPD)) within 24 month after origination for these subprime borrowers. The
default probability varies significantly across rating grades, with the average probability of default
(PD) below 5 percent for A-rated versus average PD of over 35 percent for G-rated, even though
they were all rated below 680 based on FICO scores.15 LendingClub’s use of alternative data seems
to enhance its ability to identify those subprime borrowers who are actually not risky for the so-
called the invisible prime borrowers.
Similarly, Figure 3B presents the average PD for all loans that were originated in 2014–
2015 by rating grades and FICO brackets. The average PD increases as the rating grades move from
A to G. A-rated borrowers on average have smaller PDs, and F-rated and G-rated borrowers have
higher PDs, regardless of their FICO scores. Superprime borrowers with FICO scores above 750
who were slotted into the F- and G-rated segments by LendingClub perform poorly, with an average
PD of about 40 percent. Again, the use of alternative data has allowed subprime borrowers who are
not risky to be separated from those who are and to potentially receive a loan at a better price.
from 81 percent (for loans that were originated in 2007) to 36 percent (for loans that were originated in 2015). 14 LendingClub has documented that its credit models have the Kolmogorov–Smirnov scores that outperform generic scores by identifying strong borrowers with lower FICO scores and vice versa. See the link from the LendingClub site for more details at https://www.lendingclub.com/public/income-verification.action. 15 We also observe the same probability of becoming delinquent during a shorter performance window of 12 months. The average PD was 3 percent for A-rated borrowers and 19 percent for G-rated borrowers for this one-year performance period. The results are robust when the performance period is expanded to two years.
12
V. Pricing of Credit — Fintech versus Traditional Loans
In this section, we explore the pricing of LendingClub loans versus similar loans from
traditional lenders. Pricing is measured in terms of the credit spread between the reported interest
rate and the matching Treasury rates for the same time to maturity. LendingClub uses its own loan
grades to differentiate interest rates offered to borrowers. Therefore, it is not surprising that we
observe a tight relationship between rating grades and interest rate spreads throughout the sample
period. Figure 4 shows that better-rated borrowers receive loans at a lower price (smaller spreads).
The relationship between the loan grades and spreads persist even after controlling for other
relevant risk and economic factors in the regression analysis.
We observe in Figure 4 that, while the rating grade and spreads are consistently in rank
order over the years: The spread differential between the A- and G-rated borrowers widened
significantly from about 6 percent to more than 20 percent for loans originated in 2015, when more
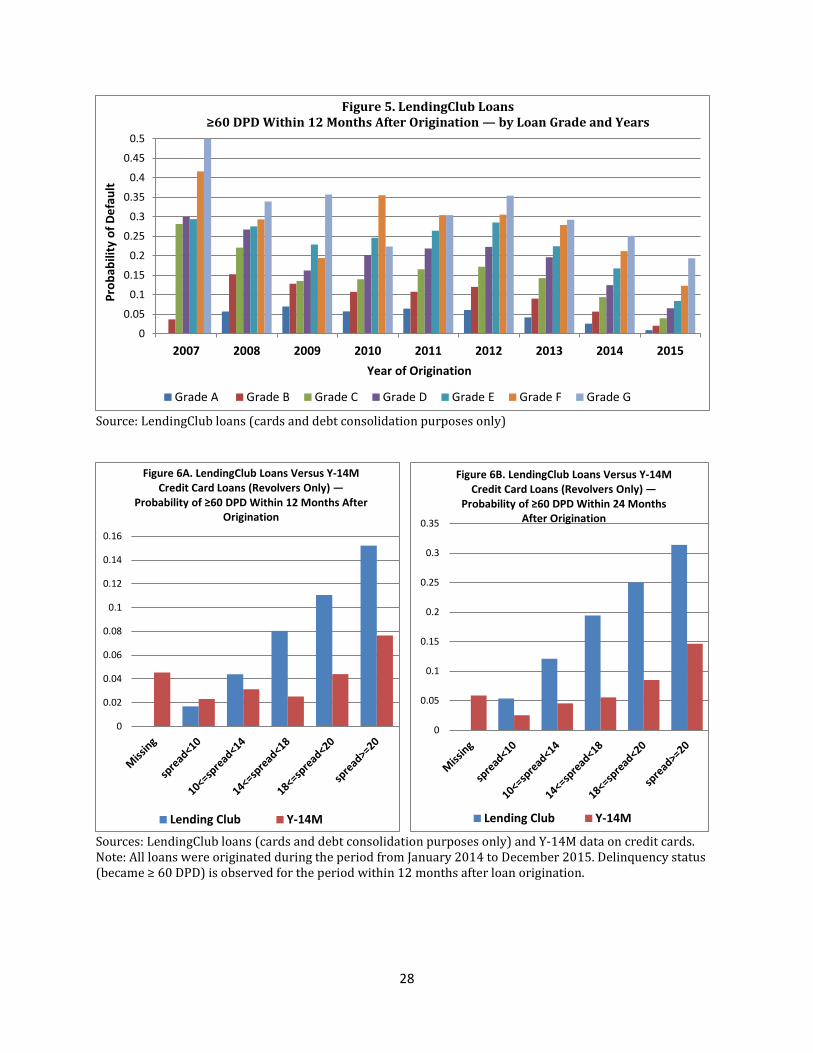
alternative data was being used in credit decisions (compared with earlier vintages). Figure 5
shows the average PD for all loans in each rating grade by year of origination; average PD and the
rating grades line up better for loans that were originated in later years. Focusing on loans that
were originated in 2015, the subprime borrower (with a FICO score below 680) who was slotted
into a B grade would have had to pay approximately 25 percent over Treasuries, instead of 9
percent over Treasuries (a meaningful difference), had he been slotted into the G-rated.16 The use
of additional information allows some borrowers who would be classified as subprime by
traditional criteria to be slotted into “better” loan grades and therefore obtain lower-priced credit.
More important, it does not appear that this credit is “mispriced” in terms of default risk, as shown
earlier in Figure 3A where the average PD for these subprime borrowers is closely related to loan
grades.
To summarize, we have so far observed a tight relationship between LendingClub’s
proprietary rating grades and credit spreads that LendingClub charged. We have also observed that
the correlation between LendingClub’s rating grades and FICO scores has declined dramatically
over the years, from about 80 percent for loans originated in 2007 to about 35 percent for loans
originated in 2014–2015, indicating an increasing role of alternative data sources used by
LendingClub. For loans that were originated in 2015, some of the A-rated borrowers actually had
FICO scores below 680 and were able to access credit at a lower rate. Following these borrowers up
16 In the next section, we see that the higher probability of default is observed for loans that were appropriately subject to larger credit spreads (higher price). The interest rate spreads appear to have a strong relationship with the likelihood of those becoming delinquent.

13
to 2 years later, we find that they did not have an increased likelihood of default. The rating grades
assigned by LendingClub have been effective in identifying the “invisible prime” from the subprime
pool of borrowers.17
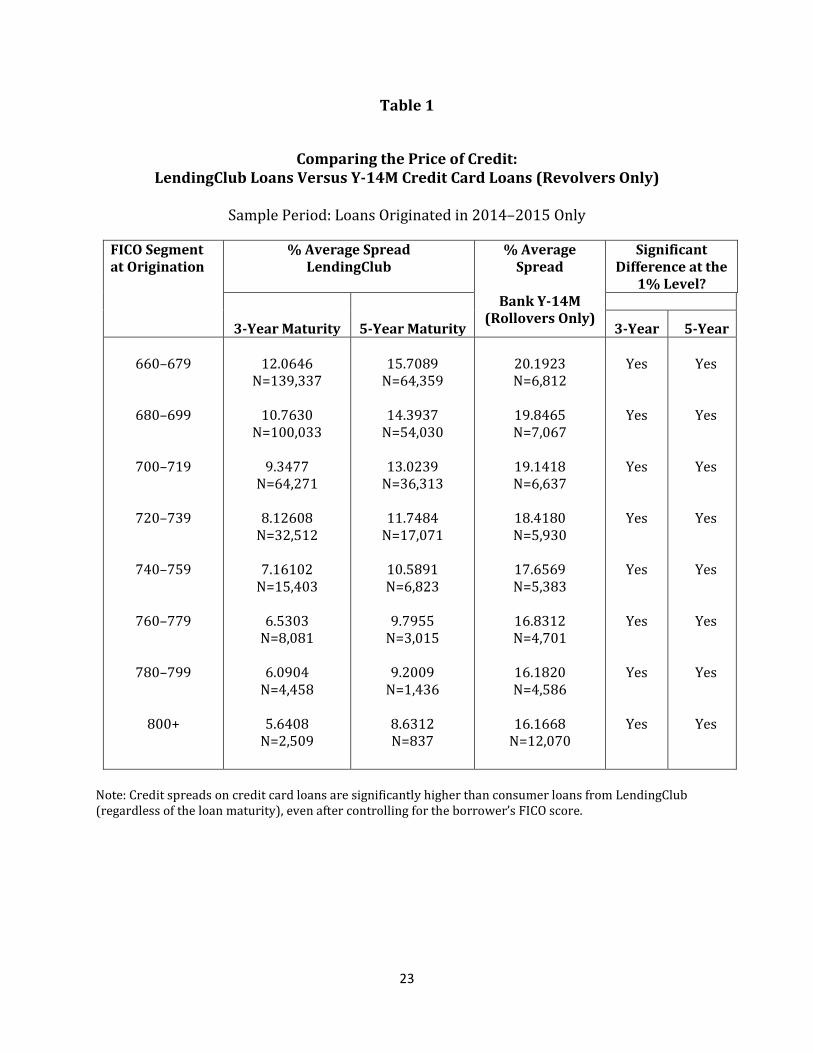
Table 1 shows the comparison of interest rate spreads that borrowers are charged on
LendingClub loans (to pay off credit card balances) versus the spreads that borrowers are charged
on traditional credit card loans for borrowers with the same FICO scores. For loans that were
originated in 2014–2015, spreads on credit card loans are significantly higher than those on
LendingClub loans, regardless of the maturity of the loans (three or five years). The spread
differentials (the savings to consumers) range from about 8 percent (for those with FICO scores
below 680) to more than 10 percent for those superprime borrowers (those with FICO scores of
800 or above). Because LendingClub charges origination fees, this analysis slightly overstates the
difference.18 Holding the FICO scores constant, LendingClub borrowers pay less than traditional
credit card borrowers.
Further, we can also show that holding fixed the probability of default fixed, LendingClub
borrowers pay smaller spreads than credit card borrowers. Figures 6A and 6B compare
delinquency rates across the credit spread brackets for LendingClub loans (to pay off credit card
balances) versus credit cards loans, for the period 12 months and 24 months after origination,
respectively. We focus on loans that were originated during 2014 and 2015 for both LendingClub
and Y-14M data.19 From the Y-14M data, we include only credit cards that carry a balance
(Revolvers). Cards that involved initial promotion low low-interest rates are also excluded from
this analysis. The analysis indicates that the average PD is consistently higher for LendingClub loans
for each segment of spreads, which means that if we hold the PD fixed, spreads are smaller for
LendingClub loans than for Y-14M credit card loans. This makes sense since otherwise consumers
would have little reason to take a loan from LendingClub to pay off their credit card balances. Given
the same credit risk (expected delinquency rate), consumers would be able to obtain credit at a
lower rate through LendingClub than through traditional credit card loans offered by banks.
17 LendingClub consumer loans only come in only two maturities: three or five years. 18 LendingClub interest rates (as reported on the LendingClub website) do not include one-time origination fees, which range from 1 percent to 5 percent of the origination amount, depending on the rating grade of the borrowers. The origination fee is usually deducted from the total loan amount, resulting in an approximately 1 percent and up to 2.5 percent increase in the effective annual percentage rate (APR). The interest rate from Y-14M data is an APR. 19 We do not include credit card accounts from the Y-14M database that were originated prior to 2014 — to avoid the sample survival bias — because cards that defaulted and were closed before 2014 would not be included in the Y-14M reports (as of 2014).
14
A few additional statistics are reported here related to the characteristics of LendingClub
borrowers relative to traditional borrowers and their true credit risk relative to traditional
borrowers. Figure 7 shows that for loans that were made to borrowers with the same FICO score
brackets and originated in the same period (2014–2015), the delinquency rate is slightly higher for
LendingClub borrowers than for credit card borrowers.20 These results imply that for consumers
with the same FICO scores, those who borrow from LendingClub tend to have a higher risk of
becoming delinquent on average. In addition, when we find that among LendingClub borrowers
with the same rating grades (A to G), homeowners are less likely to become delinquent on average,
as shown in Figure 8.
Finally, we explore whether LendingClub is more willing to make larger loans to more
creditworthy borrowers and smaller loans to those who may have trouble getting credit through
traditional channels. The data we have do not allow us to see if the origination amount is less than
the initial amount requested, but we explore the size of loans originated by LendingClub,
controlling for different credit risk variables. Figure 9A shows the share of LendingClub loans in the
various brackets of origination balances, controlling for FICO scores. The distribution of loan
balances across the FICO scores does not vary significantly for all borrowers with FICO scores
above 680. Average loan balances seem to be smaller for borrowers with FICO scores below 680.
Less than 10 percent of loan accounts originated in 2014–2015 were made with an origination
balance above $30,000, and less than 25 percent of loan accounts were originated with balance
above $24,000.
Unlike with FICO scores, when we control for the rating grades A to G, Figure 9B suggests a
relationship between loan origination amount and rating grade but the relationship is the opposite
of what one would expect under a credit rationing scenario. Lower loan grades (F-rated and G-
rated) are associated with larger origination amounts. About 18 percent of G-rated borrowers
received a loan with an origination amount larger than $30,000, compared with only 3 percent and
6 percent for A-rated and B-rated borrowers, respectively. Almost 40 percent of G-rated borrowers
received a loan from LendingClub with origination amount larger than $24,000. Of these G-rated
borrowers who receive a large loan (at least a $30,000 origination amount) from LendingClub, 90
percent of them have FICO scores below 700 and about 65 percent of them have FICO scores below
20 Note that a small number of credit card loans reported on Y-14M have missing FICO scores at origination and are noted in the missing FICO category in Figure 7. All cards that involved the initial promotion low-interest rates are excluded from this analysis.

15
680. These results suggest that LendingClub does not try to reduce its risk taking when making
loans to poorly rated borrowers by giving them smaller loans.
VI. Regression Analysis
Our analysis so far indicates that for loans that were originated in 2014 and 2015,
LendingClub’s rating grades A to G are based on information that is not highly correlated with the
borrowers’ FICO score and seem to do a good job of identifying the “invisible prime” (those who are
less-risky subprime borrowers). The rating grades are highly related to the borrowers’ probability
of becoming delinquent on their loans within two years of loan origination. For robustness testing,
the regression analysis in this section will demonstrate that the rating grades (which contain
alternative data) are superior to FICO scores in predicting defaults and for accurate risk pricing,
even after controlling for a set of other risk factors.
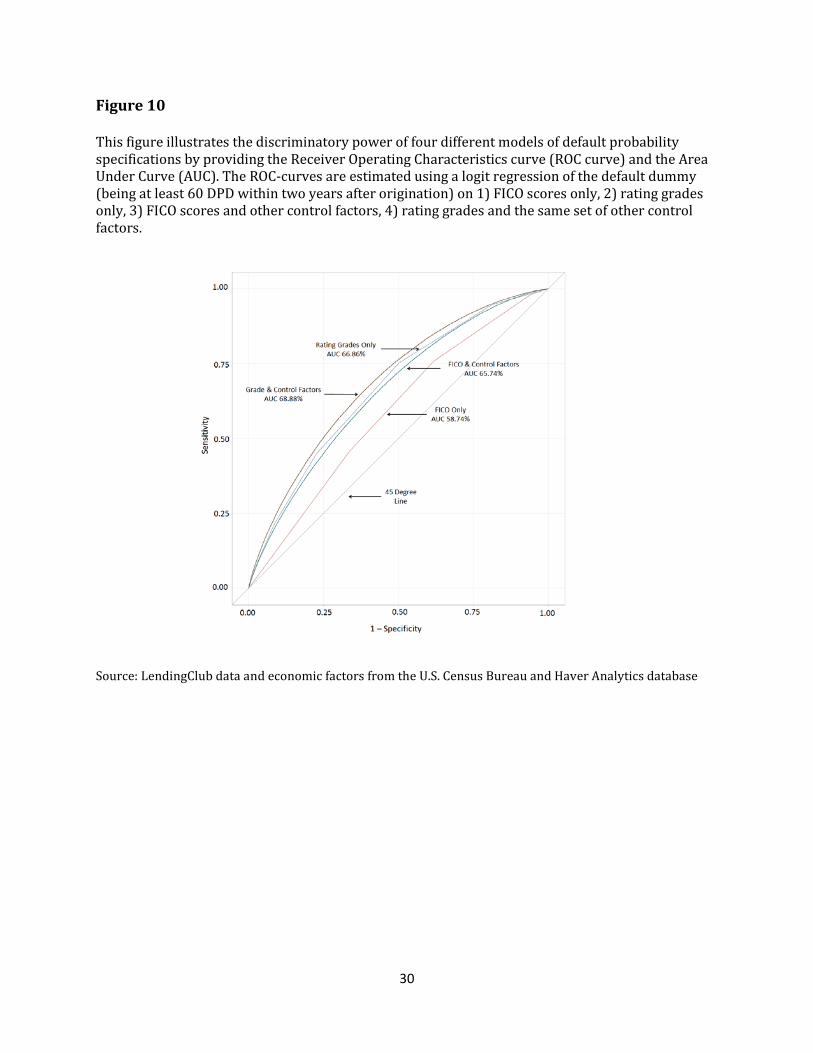
First, based on our logistic regression analysis (coefficients are not reported here) of default
probability (being at least 60 DPD within two years after origination), we present the Receiver
Operating Characteristic (ROC) curves in Figure 10. We plot the ROC curves for four different
default probability model specifications based on the following sets of explanatory variables: (1)
FICO scores only; (2) rating grades A to G only; (3) FICO scores and other control factors (such as
borrower’s income, debt-to-income ratio, length of employment, number of credit inquiries prior to
loan application, homeownership, and local economic environment, such as home price index (HPI)
and unemployment rate; and (4) rating grades A to G and the same set of other control factors as in
model (3). The results in Figure 10 show that Model (1), which uses FICO scores to predict
delinquency, does not perform as well as the other three models (its ROC lies closest to the 45-
degree line). In addition, we find that Model (2), which uses both FICO scores and the relevant set of
risk factors, does not perform as well as Model (3), which uses only rating grades A to G (without
other risk factors) to predict delinquency over the 24 months after origination. And Model (4),
which uses both rating grades A to G and the same set of risk factors used in Model (2), performs
slightly better than using the rating grades alone. These results are consistent with our earlier
findings that the rating grades assigned by LendingClub are more powerful in predicting the
borrower’s default probability than a set of FICO scores, other traditional risk variables, and
economic factors combined.
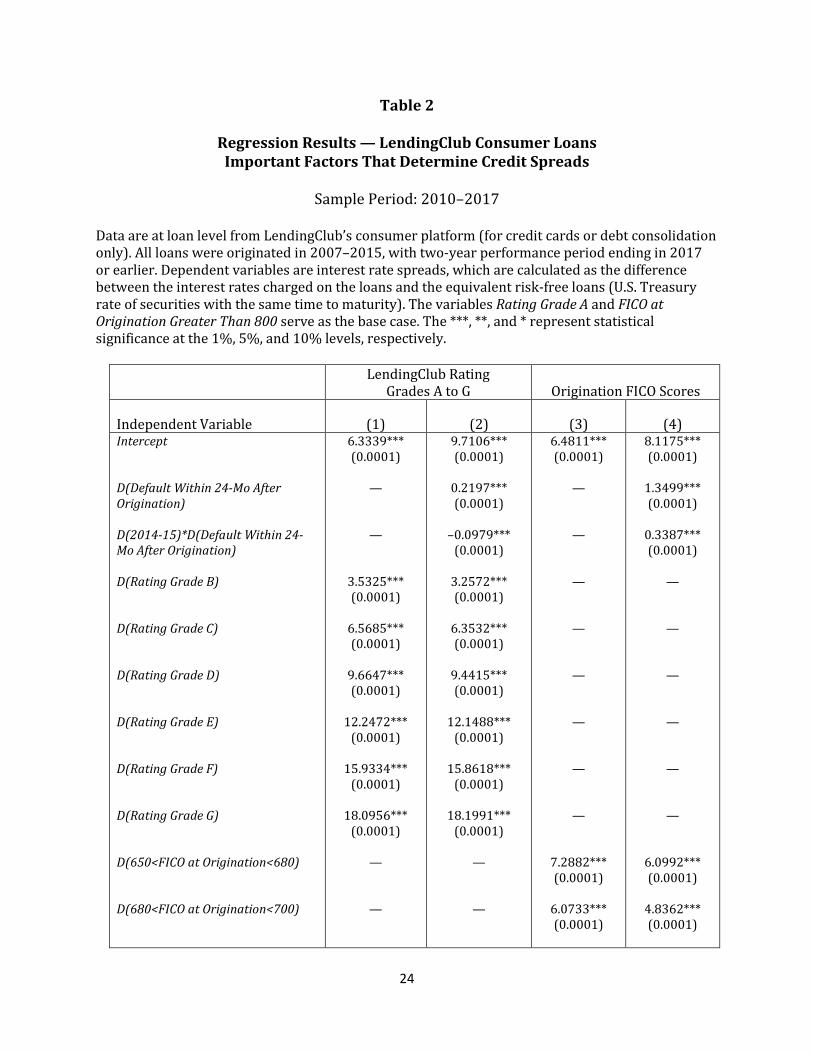
Furthermore, the regression results presented in Table 2 demonstrate that the rating
grades, which are highly correlated — as expected — with interest rates that the borrowers are
charged, are better at predicting the borrower’s default probability than FICO scores, other

16
borrower risk characteristics, and the economic conditions combined. The dependent variable is
the interest rate spread (on LendingClub loans).
First, we focus on columns 1 and 3 of Table 2. The key independent variables are the
various rating grades in column 1 and the FICO score segments in column 3. The results indicate
that there is a strong relationship between rating grades and credit spreads, with an adjusted R-
square of almost 90 percent, as shown in column 1. The coefficients for rating grades are all
statistically significantly positive and in rank order, in which the coefficients are positive for B-
rated and the coefficients are largest (positive) for G-rated loans. Unlike in column 1, the
relationship between credit spreads and FICO scores at origination (in column 3) is not as tight,
with an adjusted R-square of only about 18 percent. The coefficients for FICO scores are, as
expected, positive, statistically significant, and in rank order. These results confirm that while FICO
scores have been used by fintech lenders as an initial broad measure of credit risk, the FICO scores
alone are not granular enough to sufficiently predict each consumer’s default probability or to be
used for risk pricing.
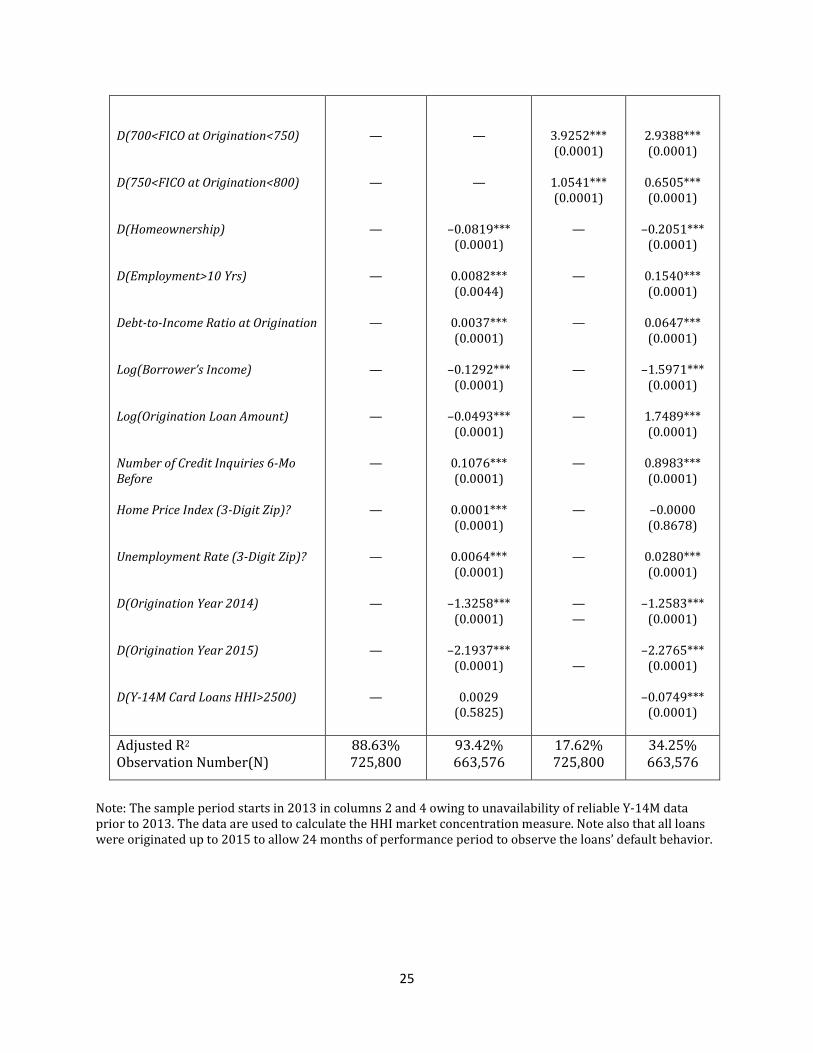
Next, we focus on columns 2 and 4. We include additional control factors that are intended
to capture borrowers’ risk characteristics and the local economic environment. Borrower risk
characteristics include DTI ratio at origination, homeownership, length of employment, income,
loan amount, and the number of consumer’s credit inquiries during the period before loan
origination. Economic factors included in the analysis are the local unemployment rate, the local
HPI, year dummies, and the HHI measure of the local credit market concentration in the borrower’s
zip code. Most important, in columns 2 and 4, we also include a dummy D (Default within 24-Mo
After Origination), indicating whether the loan defaulted (being at least 60 DPD within 24 months
after loan origination); and another dummy D (2014-15)*D(Default within 24-Mo After Origination),
indicating whether the loan was originated in 2014–2015 and defaulted within 24 months after
origination date.
The coefficient of the default indicator, D(Default within 24-Mo After Origination), is positive
and significant in both column 2 and column 4, indicating the positive relationship between credit
spreads and the actual default probability that is not fully captured by the other risk measures. We
note that the coefficient is, however, much larger in column 4 than in column 2 (1.3499 in column 4
and 0.2197 in column 2), implying that the default dummy picks up some of the risk factors specific
to the loan and the borrower that are not captured by the FICO scores in column 4, even after
controlling for a set of other relevant risk factors.

17
The second dummy indicator that identifies loans made in 2014–2015 that defaulted,
D(2014-15)*D(Default within 24-Mo After Origination), is significantly negative in column 2 but
significantly positive in column 4. In column 2, when the rating grades and other control factors are
included in the analysis, a combination of these two coefficients adds to a very small number
(0.2197–0.0979) compared with the equivalent number in column 4 (1.3499 + 0.3387), in which
FICO scores are included in the analysis (instead of the rating grades). For loans that were
originated in later years (2014–2015), when more alternative data were used in assigning rating
grades and in credit pricing, the rating grades and the set of risk factors (in column 2) capture much
of the risk for specific loans and borrowers. In contrast, when FICO scores are used instead of rating
grades (in column 4), much of the default risk was not fully captured by the model, resulting in
significantly large positive coefficients for the two default dummy variables (that indicate the
borrower’s actual defaults within two years after loan origination). Again, these results indicate
that the interest rate spread charged by LendingClub, based primarily on the rating grades (A to G)
and additional risk factors, is more predictive of default risk, consistent with our earlier results
presented in Figure 10.
Our control variables are mostly significant with the expected signs across all columns in
Table 2. For example, we observe a significantly positive relationship between interest rate spreads
that LendingClub charges and loan amount and the number of credit inquiries by the borrowers
within six months prior to loan origination (measuring how desperately the borrowers need
additional credit). In addition, we observe that LendingClub charges smaller credit spreads to
borrowers who own a home, have been employed for more than 10 years, and have a higher
income. The market concentration variable, D(Y-14M Card Loans HHI>2500), is either negative or
insignificant, implying that LendingClub is likely to offer loans at the lower rate to consumers who
live in the zip codes with a high consumer loan market concentration (areas that would benefit
from more lenders including fintech alternative lenders).
Overall, our results imply that the use of alternative data could provide increased access to
credit at a lower cost to those creditworthy individuals who have thin credit history or have poor
FICO scores. Fintech lenders should be cautious about which alternative data they use and to keep
in mind that some set of alternative data that may work well for some groups of consumers may not
be representative and stable enough to be used for others, depending on how the data were
collected.21
21 See Jagtiani, Vermilyea, and Wall (2018) for further discussion on the use of alternative data, big data, and machine learning in credit decisions.
18
VII. Conclusions
Fintech has been playing an increasing role in shaping the financial and banking landscape.
Technology has allowed both banks and fintech lenders to serve small businesses and consumers
without brick-and-mortar investments. In this paper, we explored the impact of fintech lending on
consumers’ ability to access credit and the price of credit. In addition, we explored the role of
alternative information sources potentially used by these nonbank alternative lenders. While the
alternative data sources and algorithms that online alternative lenders use have allowed for faster
and lower-cost credit assessments, these innovations could potentially carry a risk of disparate
treatment and fair lending violations.
Since our results are derived based on loans originated on the LendingClub platform (the
largest personal unsecured installment lenders), one should be cautious in extrapolating the
interpretation of our findings to all loans originated through other online alternative platforms. In
addition, our data on traditional lenders are based on Y-14M data, which are constrained by the
limited number of reporters (only the largest U.S. banks that are subject to CCAR stress testing),
excluding bank holding companies under $50 billion in total assets or credit unions.
We find that the use of nontraditional information from alternative data sources has
allowed consumers with fewer or inaccurate credit records (based on FICO scores) to have access
to credit. Some creditworthy consumers (but who have poor FICO scores) have been identified
using additional information and have been rated as low-risk borrowers by LendingClub. The
correlation between rating grades and FICO scores declined steadily from over 80 percent (for
loans that were originated in 2007) to about 35 percent for loans originated in 2015. Interestingly,
these rating grades (with only 35 percent correlation with FICO) continued to serve as a good
predictor of future loan delinquency over the next two years. There is additional (soft) information
in LendingClub’s own internal rating grades that is not already incorporated in the obvious
traditional risk factors. This has enabled some borrowers to be assigned better loan ratings and
receive lower-priced credit.
Our previous research in Jagtiani and Lemieux (2018) presented evidence that fintech
lenders fill credit gaps in areas where bank offices may be less available and provide credit to
creditworthy borrowers that banks may not be serving. Our further research in this paper finds
that loans from fintech lenders seem to be “appropriately” risk priced. Banks are responding to
these innovations by partnering with fintech firms. This relationship is evolving quickly.

19
Our results provide policy implications related to consumer protection. While consumers’
information and privacy should be protected by laws and regulations, certain alternative
information could play a key role in allowing lenders to fully understand the credit quality of the
potential borrowers and thus be willing to grant certain consumers access to credit that would not
have been granted otherwise. Banks could potentially benefit from the alternative data sources and
big data through partnership with online fintech lenders. Further research remains to be done to
fully explore other aspects of risk to borrowers presented by these new innovations such as
inherent bias in some alternative data and whether these fintech lending innovations have allowed
consumers to become excessively leveraged.
20
References
Alyakoob, M., M. Rahman, and Z. Wei (2017) “Where You Live Matters: The Impact of Local Financial Market Competition in Managing Online Peer-To-Peer Loans,” https://ssrn.com/abstract=2985099. Balyuk, T., and S. Davydenko (2018) “Reintermediation in Fintech: Evidence from Online Lending,” SSRN: https://ssrn.com/abstract=3189236. Bertsch, C., I. Hull, and X. Zhang (2016) “Monetary Normalizations and Consumer Credit: Evidence from Fed Liftoff and Online Lending,” Sveriges Riksbank Working Paper 319. Bricker, J., L. J. Dettling, A. Henriques, J. W. Hsu, L. Jacobs, K. B. Moore, S. Pack, J. Sabelhaus, J. Thompson, and R. A. Windle (2017) “Changes in U.S. Family Finances from 2013 to 2016: Evidence from the Survey of Consumer Finance,” Federal Reserve Bulletin, 103(3):1–42. Buchak, G., G. Matvos, T. Piskorski, and A. Seru (2017) “Fintech, Regulatory Arbitrage, and the Rise of Shadow Banks,” NBER Working Paper 23288. Carroll, P., and S. Rehmani (2017) “Alternative Data and the Unbanked,” Oliver Wyman Insights, http://www.oliverwyman.com/our-expertise/insights/2017/may/alternative-data-and-the-unbanked.html. Chava, S., and N. Paradkar (2018) “Winners and Losers of Marketplace Lending: Evidence from Borrower Credit Dynamics,” Georgia Tech Working Paper 18-16, SSRN: https://papers.ssrn.com/sol3/papers.cfm?abstract_id=3178322. Chen B. S., S. G. Hanson, and J. C. Stein (2017) “The Decline of Big Bank Lending to Small Banks: Dynamic Impacts on Local Credit and Labor Markets,” NBER Working Paper 23843. Consumer Financial Protection Bureau (2017) “CFPB Explores Impact of Alternative Data on Credit Access for Consumers Who Are Credit Invisible,” Press Release, https://www.consumerfinance.gov/about-us/newsroom/cfpb-explores-impact-alternative-data-credit-access-consumers-who-are-credit-invisible/. Cordray, R. (2017) “Prepared Remarks of CFPB Director Richard Cordray at the LendIt USA Conference,” New York, March 6, 2017, https://www.consumerfinance.gov/about-us/newsroom/prepared-remarks-cfpb-director-richard-cordray-lendit-usa-conference/ Crosman, P. (2016) “Will Fintechs Kill the FICO Score?” American Banker, June 14, 2016, https://www.americanbanker.com/news/will-fintechs-kill-the-fico-score. Crowe, C., and R. Ramcharan (2013). “House Prices and Household Credit Access: Evidence From Prosper.Com*,” Journal of Money, Credit and Banking, 45(6), September 2013, 1085–1115. Danisewicz, P., and I. Elard (2018) “The Real Effects of Financial Technology: Marketplace Lending and Personal Bankruptcy,” https://papers.ssrn.com/sol3/papers.cfm?abstract_id=3208908.

21
Demyanyk, Y., and D. Kolliner (2014) “Peer-to-Peer Lending Is Poised to Grow,” Federal Reserve Bank of Cleveland, https://www.clevelandfed.org/newsroom-and-events/publications/economic-trends/2014-economic-trends/et-20140814-peer-to-peer-lending-is-poised-to-grow.aspx. De Roure, C., L. Pelizzon, and P. Tasca (2016) “How Does P2P Lending Fit into the Consumer Credit Market,” Deutsche Bundesbank Discussion Paper 30, https://www.bundesbank.de/Navigation/EN/Bundesbank/Research/Research_centre/Discussion_papers/discussion_papers.html. De Roure, L. Pelizzon, and A. Thakor (2018) “P2P Lenders versus Banks: Cream Skimming or Bottom Fishing?” SAFE Working Paper 206, https://papers.ssrn.com/sol3/papers.cfm?abstract_id=3174632. Di Maggio, M. and V. Yao (2018) “Fintech Borrowers: Lax-Screening or Cream Skimming?” SSRN: https://ssrn.com/abstract=3224957. Duarte, J., S. Siegel, and L. Young (2012) “Trust and Credit: The Role of Appearance in Peer-to-Peer Lending,” The Review of Financial Studies, 25(8):2455–2484. Emekter, R., Y. Tu, B. Jirasakuldech, and M. Lu (2015) “Evaluating Credit Risk and Loan Performance in Online Peer-to-Peer (P2P) Lending,” Applied Economics, 47(1):54–70. Everett, C. R. (2010) “Group Membership, Relationship Banking and Loan Default Risk: The Case of Online Social Lending,” Banking and Finance Review, 7(2). Federal Reserve (2018) Consumer Credit, G.19, https://www.federalreserve.gov/releases/g19/current/. Freedman, S., and G. Jin (2017) “The Information Value of Online Social Networks: Lessons from Peer-to-Peer Lending,” International Journal of Industrial Organization, 51, 185–222. Gao, Q., and M. Lin (2012) “Linguistic Features and Peer-to-Peer Loan Quality: A Machine Learning Approach,” Working Paper, https://www.researchgate.net/publication/314805006_Linguistic_Features_and_Peer-to-Peer_Loan_Quality_A_Machine_Learning_Approach. Gonzalez, L., and Y.K. Loureiro (2014) “When Can a Photo Increase Credit?: The Impact of Lender and Borrower Profiles on Online P2P Loans,” Journal of Experimental and Behavioral Finance, (forthcoming), Fordham University Schools of Business Research Paper 2442416. Havrylchyk, O., C. Mariotto, T. Rahim, and M. Verdier (2018) “What Has Driven the Expansion of the Peer-to-Peer Lending?” SSRN at https://papers.ssrn.com/sol3/papers.cfm?abstract_id=2841316. Herzenstein, M., S. Sonenshein, and U. M. Dholakia (2011) “Tell Me a Good Story and I May Lend You My Money: The Role of Narratives in Peer-to-Peer Lending Decisions,” Journal of Marketing Research, 48:S138–S149. Hughes, J., J. Jagtiani, and C. Moon (2108) “Consumer Lending Efficiency: Commercial Banks Versus a Fintech Lender,” Working Paper, presented at the “Fintech and the New Financial Landscape”

22
conference at the Federal Reserve Bank of Philadelphia, November 13–14, 2018. https://philadelphiafed.org/bank-resources/supervision-and-regulation/events/2018/fintech. Jagtiani, J., and C. Lemieux (2018) “Do Fintech Lenders Penetrate Areas That Are Underserved by Traditional Banks?” Journal of Economics and Business, 100, online version April 2018, 43–54. Jagtiani, J., T. Vermilyea, and L. Wall (2018) “The Roles of Big Data and Machine Learning in Bank Supervision,” Banking Perspectives, The Clearing House publication, Q1:2018, https://www.theclearinghouse.org/banking-perspectives/2018/2018-q1-banking-perspectives/articles/big-data-ml-bank-supervision.
Jagtiani, J., L. Lambie-Hanson, and T. Lambie-Hanson (2018) “Fintech Mortgage Lending: Impact on Credit Access and Price,” Federal Reserve Bank of Philadelphia, work-in-progress.
Kraussl, R, Z. Kraussl, J. Pollet, and K. Rinne (2018) “Performance of Market Place Lenders: Evidence from Lending Club Payments Data,” Center for Financial Studies Working Paper Series 598. Lin, M., N. R. Prabhala, and S. Viswanathan (2013) “Judging Borrowers by the Company They Keep: Friendship Networks and Information Asymmetry in Online Peer-to-Peer Lending,” Management Science, 59(1):17–35. Lu, Y., B. Gu, Q. Ye, and Z. Sheng (2012) “Social Influence and Defaults in Peer-to-Peer Lending Networks,” Conference on Information Systems and Technology (CIST 2012) White Paper. Mach, T., C. Carter, and C. Slattery (2014) “Peer-to-Peer Lending to Small Businesses,” Federal Reserve Board of Governors, Finance and Economics Discussion Series 2014-10. Michels, J. (2012) “Do Unverifiable Disclosures Matter? Evidence from Peer-to-Peer Lending,” Accounting Review, 87(4):1385–1413. Morse, A. (2015) “Peer-to-Peer Crowdfunding: Information and the Potential for Disruption in Consumer Lending,” NBER Working Paper, www.nber.org/papers/w20899.pdf. Pope, D., and J. Sydnor (2011) “What’s in a Picture? Evidence of Discrimination from Prosper.com,” Journal of Human Resources, 46(1):53–92. Ravina, E. (2012) “Love & Loans: The Effect of Beauty and Personal Characteristics in Credit Markets,” Northwestern University Working Paper, November 2012, https://papers.ssrn.com/sol3/papers.cfm?abstract_id=1107307. Serrano-Cinca, C. B Gutierrez-Nieto, and L. Lopez-Palacios (2015) “Determinants of Default in P2P Lending,” https://journals.plos.org/plosone/article?id=10.1371/journal.pone.0139427. Yencha, C., A. Nowak, and A. Ross (2018) “Small Business Borrowing and Peer-To-Peer Lending: Evidence from Lending Club,” Contemporary Economic Policy, 36:2, pp. 318–336, SSRN: https://ssrn.com/abstract=3127875.
23
Table 1
Comparing the Price of Credit:
LendingClub Loans Versus Y-14M Credit Card Loans (Revolvers Only)
Sample Period: Loans Originated in 2014–2015 Only
FICO Segment at Origination
% Average Spread LendingClub
% Average Spread
Bank Y-14M
(Rollovers Only)
Significant Difference at the
1% Level?
3-Year Maturity 5-Year Maturity
3-Year 5-Year
660–679
680–699
700–719
720–739
740–759
760–779
780–799
800+
12.0646
N=139,337
10.7630 N=100,033
9.3477
N=64,271
8.12608 N=32,512
7.16102
N=15,403
6.5303 N=8,081
6.0904
N=4,458
5.6408 N=2,509
15.7089
N=64,359
14.3937 N=54,030
13.0239
N=36,313
11.7484 N=17,071
10.5891 N=6,823
9.7955
N=3,015
9.2009 N=1,436
8.6312 N=837
20.1923 N=6,812
19.8465 N=7,067
19.1418 N=6,637
18.4180 N=5,930
17.6569 N=5,383
16.8312 N=4,701
16.1820 N=4,586
16.1668
N=12,070
Yes
Yes
Yes
Yes
Yes
Yes
Yes
Yes
Yes
Yes
Yes
Yes
Yes
Yes
Yes
Yes
Note: Credit spreads on credit card loans are significantly higher than consumer loans from LendingClub (regardless of the loan maturity), even after controlling for the borrower’s FICO score.
24
Table 2
Regression Results — LendingClub Consumer Loans Important Factors That Determine Credit Spreads
Sample Period: 2010–2017
Data are at loan level from LendingClub’s consumer platform (for credit cards or debt consolidation only). All loans were originated in 2007–2015, with two-year performance period ending in 2017 or earlier. Dependent variables are interest rate spreads, which are calculated as the difference between the interest rates charged on the loans and the equivalent risk-free loans (U.S. Treasury rate of securities with the same time to maturity). The variables Rating Grade A and FICO at Origination Greater Than 800 serve as the base case. The ***, **, and * represent statistical significance at the 1%, 5%, and 10% levels, respectively.
LendingClub Rating Grades A to G Origination FICO Scores
Independent Variable (1) (2) (3) (4) Intercept D(Default Within 24-Mo After Origination) D(2014-15)*D(Default Within 24-Mo After Origination) D(Rating Grade B) D(Rating Grade C) D(Rating Grade D) D(Rating Grade E) D(Rating Grade F) D(Rating Grade G) D(650<FICO at Origination<680) D(680<FICO at Origination<700)
6.3339*** (0.0001)
—
—
3.5325*** (0.0001)
6.5685*** (0.0001)
9.6647*** (0.0001)
12.2472***
(0.0001)
15.9334*** (0.0001)
18.0956***
(0.0001)
—
—
9.7106*** (0.0001)
0.2197*** (0.0001)
–0.0979***
(0.0001)
3.2572*** (0.0001)
6.3532*** (0.0001)
9.4415*** (0.0001)
12.1488***
(0.0001)
15.8618*** (0.0001)
18.1991***
(0.0001)
—
—
6.4811*** (0.0001)
—
—
—
—
—
—
—
—
7.2882*** (0.0001)
6.0733*** (0.0001)
8.1175*** (0.0001)
1.3499*** (0.0001)
0.3387*** (0.0001)
—
—
—
—
—
—
6.0992*** (0.0001)
4.8362*** (0.0001)
25
D(700<FICO at Origination<750) D(750<FICO at Origination<800) D(Homeownership) D(Employment>10 Yrs) Debt-to-Income Ratio at Origination Log(Borrower’s Income) Log(Origination Loan Amount) Number of Credit Inquiries 6-Mo Before Home Price Index (3-Digit Zip)? Unemployment Rate (3-Digit Zip)? D(Origination Year 2014) D(Origination Year 2015) D(Y-14M Card Loans HHI>2500)
—
—
—
—
—
—
—
—
—
—
—
—
—
—
—
–0.0819*** (0.0001)
0.0082*** (0.0044)
0.0037*** (0.0001)
–0.1292***
(0.0001)
–0.0493*** (0.0001)
0.1076*** (0.0001)
0.0001*** (0.0001)
0.0064*** (0.0001)
–1.3258***
(0.0001)
–2.1937*** (0.0001)
0.0029
(0.5825)
3.9252*** (0.0001)
1.0541*** (0.0001)
—
—
—
—
—
—
—
—
— —
—
2.9388*** (0.0001)
0.6505*** (0.0001)
–0.2051***
(0.0001)
0.1540*** (0.0001)
0.0647*** (0.0001)
–1.5971***
(0.0001)
1.7489*** (0.0001)
0.8983*** (0.0001)
–0.0000 (0.8678)
0.0280*** (0.0001)
–1.2583***
(0.0001)
–2.2765*** (0.0001)
–0.0749***
(0.0001)
Adjusted R2 Observation Number(N)
88.63% 725,800
93.42% 663,576
17.62% 725,800
34.25% 663,576
Note: The sample period starts in 2013 in columns 2 and 4 owing to unavailability of reliable Y-14M data prior to 2013. The data are used to calculate the HHI market concentration measure. Note also that all loans were originated up to 2015 to allow 24 months of performance period to observe the loans’ default behavior.
26
Source: LendingClub data
Source: LendingClub data
0.35
0.45
0.55
0.65
0.75
0.85
2007 2008 2009 2010 2011 2012 2013 2014 2015
% C
orre
lati
on
Year of Origination
Figure 1. Correlation Between Origination FICO and Rating Grade Assigned by LendingClub
Credit Card and Debt Consolidation All Loans
0%
10%
20%
30%
40%
50%
60%
70%
80%
90%
100%
A B C D E F G
% o
f Bor
row
ers i
n FI
CO S
egm
ents
Rating Grade
Figure 2A. FICO Distribution by LendingClub Rating
2007 Origination
>=750 700-749 680-699 <680
0%
10%
20%
30%
40%
50%
60%
70%
80%
90%
100%
A B C D E F G
% o
f Bor
row
ers i
n FI
CO S
egm
ents
Rating Grade
Figure 2B. FICO Distributionby LendingClub Rating
2011 Origination
>=750 700-749 680-699 <680
0%
10%
20%
30%
40%
50%
60%
70%
80%
90%
100%
A B C D E F G
% o
f Bor
row
ers i
n FI
CO S
egm
ents
Rating Grade
Figure 2C. FICO Distribution by LendingClub Rating
2015 Origination
>=750 700-749 680-699 <680
27
Source: LendingClub Source: LendingClub
Source: LendingClub data; Treasury rates from the Bloomberg database
0
0.05
0.1
0.15
0.2
0.25
0.3
0.35
0.4
A B C D E F G
Prob
abili
ty o
f Def
ault
LendingClub Rating GradesWith FICO<680 Only
Figure 3A. Probability of being ≥60 DPD Within 24 Months After Origination —for Loans Originated in 2014–2015 with
FICO Score <680 Only
0
0.1
0.2
0.3
0.4
0.5
0.6
A B C D E F G
Prob
abili
ty o
f Def
ault
LendingClub Rating Grades With Varying FICO Scores
Figure 3B. Probability of being ≥60 DPD Within 24 Months After Origination — for Loans Originated in
2014–2015 — by Credit Scores and Rating Grades
<680 680-699 700-749 750+
0
5
10
15
20
25
30
2007 2008 2009 2010 2011 2012 2013 2014 2015Spre
ad B
etw
een
Loan
Rat
e an
d Tr
easu
ry R
ate
Year of Origination
Figure 4. Average Spread by Rating Grades — Cards and Debt Consolidation (2007–2015)
A B C D E F G
28
Source: LendingClub loans (cards and debt consolidation purposes only)
Sources: LendingClub loans (cards and debt consolidation purposes only) and Y-14M data on credit cards. Note: All loans were originated during the period from January 2014 to December 2015. Delinquency status (became ≥ 60 DPD) is observed for the period within 12 months after loan origination.
0
0.05
0.1
0.15
0.2
0.25
0.3
0.35
0.4
0.45
0.5
2007 2008 2009 2010 2011 2012 2013 2014 2015
Prob
abili
ty o
f Def
ault
Year of Origination
Figure 5. LendingClub Loans≥60 DPD Within 12 Months After Origination — by Loan Grade and Years
Grade A Grade B Grade C Grade D Grade E Grade F Grade G
0
0.02
0.04
0.06
0.08
0.1
0.12
0.14
0.16
Figure 6A. LendingClub Loans Versus Y-14M Credit Card Loans (Revolvers Only) —
Probability of ≥60 DPD Within 12 Months After Origination
Lending Club Y-14M
0
0.05
0.1
0.15
0.2
0.25
0.3
0.35
Figure 6B. LendingClub Loans Versus Y-14M Credit Card Loans (Revolvers Only) —
Probability of ≥60 DPD Within 24 Months After Origination
Lending Club Y-14M

29
Sources: LendingClub loans (cards and debt consolidation purposes only) that were originated in 2014 and 2015 only; Y-14M data on credit card accounts were issued to consumers during 2014–2015.
Source: LendingClub loans (cards and debt consolidation purposes only)
0
0.05
0.1
0.15
0.2
0.25
Figure 7. LendingClub vs. Y-14M Cards (Revolvers Only): Probability of ≥60 DPD Within
24 Mo — by FICO Scores
Lending Club Y-14M
0
0.05
0.1
0.15
0.2
0.25
0.3
0.35
0.4
0.45
A B C D E F G
Prob
abili
ty o
f Def
ault
LendingClub Rating Grade
Figure 8. LendingClub Loans Probability of ≥60 DPD Within 24 Months
by Loan Grades and Homeownership
NO YES
13% 9% 7% 8% 10%
33%27%
23% 24% 26%
27%
27%
25% 25%25%
14%
17%
18% 18% 17%
7%11%
15% 15% 15%
6% 9% 12% 9% 8%
0%
20%
40%
60%
80%
100%
650-679 680-699 700-749 750-799 800+
Figure 9A. Number of Accounts of LendingClub Loans (Originated in 2014–
2015) by Origination Balance, Controlling for FICO Scores
>$30,000 $24,000-30,000$18,000-24,000 $12,000-18,000$6,000-12,000 <$6,000
8% 11% 11% 9% 6% 5% 3%
31%33% 28%
23%18% 15%
13%
27%26%
26%
27%
27%27%
27%
16%15%
16%17%
20%20%
20%
15% 9%9%
11%14% 15%
19%
3% 6% 9% 12% 15% 17% 18%
0%
20%
40%
60%
80%
100%
A B C D E F G
Figure 9B. Number of Accounts of LendingClub Loans (Originated in 2014–
2015) by Origination Balance, Controlling for Rating Grades
>$30,000 $24,000-30,000$18,000-24,000 $12,000-18,000$6,000-12,000 <$6,000
30
Figure 10 This figure illustrates the discriminatory power of four different models of default probability specifications by providing the Receiver Operating Characteristics curve (ROC curve) and the Area Under Curve (AUC). The ROC-curves are estimated using a logit regression of the default dummy (being at least 60 DPD within two years after origination) on 1) FICO scores only, 2) rating grades only, 3) FICO scores and other control factors, 4) rating grades and the same set of other control factors.
Source: LendingClub data and economic factors from the U.S. Census Bureau and Haver Analytics database