Reversible Intramolecular Electron Transfer at the Single-Molecule Level
11
Communications Dateiname: Z51430 Pagina: 1 Pfad: L:/daten/Verlage/VCH/ACH/ Seite: 1 te von 11 Status Neusatz Umfang (Seiten): 11 Sprache English 3B2-Version: 7.51n/W (Jan 20 2003) Datum: 28 KW., 7. Juli 2003 (Montag) Zeit: 11:22:48 Uhr Single-Molecule Electron Transfer Reversible Intramolecular Electron Transfer at the Single-Molecule Level** Roel Gronheid, Alina Stefan, Mircea Cotlet, Johan Hofkens, Jianqiag Qu, Klaus Mɒllen, Mark Van der Auweraer, Jan W. Verhoeven, and Frans C. De Schryver* Investigation of the photophysical and photochemical proc- esses that occur in single molecules by means of fluorescence microscopy has rapidly developed over the last decade. [1, 2] We have focused on the photophysics of synthetic multichromo- phore systems and have shown evidence for intramolecular (excitation) energy migration, that is, energy hopping [3, 4] and directional FɆrster energy transfer. [5] Photoinduced electron transfer is another fundamental physical process, but it is more difficult to monitor by single-molecule spectroscopy. Electron transfer is usually an efficient mechanism for fluorescence quenching which leaves no signal to be detected at the single-molecule level. In some special cases, charge- transfer fluorescence may be observed after photoinduced electron transfer, [6] but its quantum yield is usually quite low and therefore less suited for single-molecule detection. Despite this difficulty some reports on forward electron transfer in single molecules exist in the literature. Interfacial electron transfer from a single molecule of a cresyl violet dye to the indium–tin oxide surface on which it was physisorbed was shown by Lu and Xie. [7] Weaker fluorescence and a decreased fluorescence lifetime with respect to the same molecule on a glass surface demonstrated the occurrence of electron transfer. In a similar way electron transfer between a guanine base and a dye linked to a DNA molecule could also be monitored, and conformational changes of DNA mole- cules were observed. [8–10] Intramolecular electron transfer in a synthetic system was recently demonstrated by Zang et al. [11] in a compound in which a perylenediimide dye that serves as the electron acceptor upon excitation is connected to an aniline donor. On a sufficiently polar substrate, no fluorescence from single molecules could be observed, but after protonation of the amine by treatment of the sample with hydrogen chloride, the molecules could be visualized. This experiment nicely dem- DOI: 10.1002/anie.200351430 DOI: 10.1002/ange.200351430 [*] Prof. Dr. F. C. De Schryver, R. Gronheid, A. Stefan, M. Cotlet, J. Hofkens, M. Van der Auweraer, J. W. Verhoeven Department of Chemistry Katholieke Universiteit Leuven Celestijnenlaan 200F, 3001 Heverlee (Belgium) Fax: (+ 32) 16-327-989 E-mail: [email protected] J. Qu, K. Mɒllen Max-Planck-Institut fɒr Polymerforschung Ackermannweg 10, 55128 Mainz (Germany) [**] This work was supported by the FWO, the Flemish ministry of education through GOA/1/2001, and the DWTC (Belgium) through IAP-V-03. R.G. thanks KU Leuven for a postdoctoral fellowship. The DFG and the BMBF are thanked for financial support.
Transcript of Reversible Intramolecular Electron Transfer at the Single-Molecule Level

Communications
Dateiname: Z51430 Pagina: 1Pfad: L:/daten/Verlage/VCH/ACH/ Seite: 1 te von 11Status Neusatz Umfang (Seiten): 11Sprache English 3B2-Version: 7.51n/W (Jan 20 2003)Datum: 28 KW., 7. Juli 2003 (Montag) Zeit: 11:22:48 Uhr
Single-Molecule Electron Transfer
Reversible Intramolecular Electron Transfer atthe Single-Molecule Level**
Roel Gronheid, Alina Stefan, Mircea Cotlet,Johan Hofkens, Jianqiag Qu, Klaus M�llen,Mark Van der Auweraer, Jan W. Verhoeven, andFrans C. De Schryver*
Investigation of the photophysical and photochemical proc-esses that occur in single molecules by means of fluorescencemicroscopy has rapidly developed over the last decade.[1,2] Wehave focused on the photophysics of synthetic multichromo-phore systems and have shown evidence for intramolecular(excitation) energy migration, that is, energy hopping[3,4] anddirectional F%rster energy transfer.[5] Photoinduced electrontransfer is another fundamental physical process, but it ismore difficult to monitor by single-molecule spectroscopy.Electron transfer is usually an efficient mechanism forfluorescence quenching which leaves no signal to be detectedat the single-molecule level. In some special cases, charge-transfer fluorescence may be observed after photoinducedelectron transfer,[6] but its quantum yield is usually quite lowand therefore less suited for single-molecule detection.
Despite this difficulty some reports on forward electrontransfer in single molecules exist in the literature. Interfacialelectron transfer from a single molecule of a cresyl violet dyeto the indium–tin oxide surface on which it was physisorbedwas shown by Lu and Xie.[7] Weaker fluorescence and adecreased fluorescence lifetime with respect to the samemolecule on a glass surface demonstrated the occurrence ofelectron transfer. In a similar way electron transfer between aguanine base and a dye linked to a DNA molecule could alsobe monitored, and conformational changes of DNA mole-cules were observed.[8–10]
Intramolecular electron transfer in a synthetic system wasrecently demonstrated by Zang et al.[11] in a compound inwhich a perylenediimide dye that serves as the electronacceptor upon excitation is connected to an aniline donor. Ona sufficiently polar substrate, no fluorescence from singlemolecules could be observed, but after protonation of theamine by treatment of the sample with hydrogen chloride, themolecules could be visualized. This experiment nicely dem-
DOI: 10.1002/anie.200351430 DOI: 10.1002/ange.200351430
[*] Prof. Dr. F. C. De Schryver, R. Gronheid, A. Stefan, M. Cotlet,J. Hofkens, M. Van der Auweraer, J. W. VerhoevenDepartment of ChemistryKatholieke Universiteit LeuvenCelestijnenlaan 200F, 3001 Heverlee (Belgium)Fax: (+32)16-327-989E-mail: [email protected]
J. Qu, K. M;llenMax-Planck-Institut f;r PolymerforschungAckermannweg 10, 55128 Mainz (Germany)
[**] This work was supported by the FWO, the Flemish ministry ofeducation through GOA/1/2001, and the DWTC (Belgium) throughIAP-V-03. R.G. thanks KU Leuven for a postdoctoral fellowship. TheDFG and the BMBF are thanked for financial support.

AngewandteChemie
Dateiname: Z51430 Pagina: 2Pfad: L:/daten/Verlage/VCH/ACH/ Seite: 2 te von 11Status Neusatz Umfang (Seiten): 11Sprache English 3B2-Version: 7.51n/W (Jan 20 2003)Datum: 28 KW., 7. Juli 2003 (Montag) Zeit: 11:22:49 Uhr
onstrated the occurrence of electron transfer, but it still doesnot allow details of the photophysics to be investigated at thesingle-molecule level as the molecules are “invisible” underconditions for which electron transfer is possible.
In principle, this limitation can be overcome if the energylevels of the locally excited state (LES) and charge-separatedstate (CSS) can be tuned such that they are close in energyand, moreover, nonradiative decay from the CSS to theground state (GS) is slow and inefficient (Scheme 1). Com-
petition of charge transfer with prompt fluorescence willresult in a fast component in the fluorescence decay. In theideal case, nonradiative decay from the CSS to the GS shouldnot compete with back electron transfer from the CSS to theLES. The competition may be mediated by the presence ofoxygen.[12] If the CSS decays mainly by back electron transferto the LES, this will result in delayed fluorescence from theLES, and hence the fluorescence spectrum remainsunchanged.
We recently reported a system that showed all the aboveproperties in diethyl ether.[12] The dendritic electron donor–-acceptor molecule consists of a triphenylamine core as donorand a perylenemonoimide chromophore as acceptor at therim of the dendrimer. As electron transfer can be observed inthis case by monitoring a state with high fluorescencequantum efficiency, we realized that such systems provideideal subjects for studying electron transfer at the single-molecule level.
The present study involved the electron donor–acceptordendrimer 1, which contains a perylenediimide, a verypromising chromophore for single-molecule spectroscopy, as“acceptor” core and a rigid polyphenylene skeleton of thesecond generation that prohibits backfolding and bears16 triphenylamine units (donors) at the rim. A perylenedii-mide-core dendrimer of the same generation but without thetriphenylamine arms (2) is used as model compound. Thesynthesis and some of the photophysical aspects will bereported separately.[13] From modeling studies of 1, thedistance from the nitrogen donor to the edge of the acceptorin the energy-optimized structure is calculated to be between18 and 23 ?. However, upon rotation about single bonds“rotational isomers” can be constructed with a donor–acceptor distance as short as 13 ?. Since the positive chargeon the amino group will be delocalized over the adjacentphenyl rings,[14] the edge-to-edge distances between donorand acceptor will be even shorter. However, since the degreeof delocalization will strongly depend on the conformation,the edge-to-edge distance between donor and acceptor, usedto describe distances for electron transfer, is difficult todefine. These distances are certainly shorter than the values
Scheme 1: Jablonski diagram of the CSS near the LES. The correspond-ing triplets of the CT and the LE states have been omitted for clarity.

AngewandteChemie
Dateiname: Z51430 Pagina: 3Pfad: L:/daten/Verlage/VCH/ACH/ Seite: 3 te von 11Status Neusatz Umfang (Seiten): 11Sprache English 3B2-Version: 7.51n/W (Jan 20 2003)Datum: 28 KW., 7. Juli 2003 (Montag) Zeit: 11:22:49 Uhr
given above. In nonpolar solvents, both compounds show thesame absorption and emission spectra (Figure 1). In toluene
there is a small red shift for 1 and 2 in both the absorption andemission spectra with respect to methylcyclohexane (MCH);this indicates better solvation of the LES of the dendrimer.
The fluorescence quantum yields of 1 and 2 in differentsolvents under deaerated conditions are given in Table 1. The
quantum yield of 1 drops drastically with increasing solventpolarity, whereas that of 2 does not. This is attributed toelectron transfer from one of the triphenylamine groups at therim of the dendrimer to the perylenediimide chromophore inthe core.
The fluorescence quantum yield of 1 in aerated toluenesolution is 0.51, whereas that of 2 is barely affected (0.91), inline with previous observations.[12] The fluorescence spectrum
Figure 1: Structures and absorption and emission spectra (lexc=540 nm) in toluene at room temperature of the electron donor–acceptor den-drimer 1 with the chromophore (acceptor) in the center and the donors at the rim, and its model compound 2, consisting of just the chromo-phore and the dendritic skeleton.
Table 1: Fluorescence quantum yields of 1 and 2 (lexc=543 nm) in degassed methylcyclohexane (MCH), toluene, and ethyl acetate (EtAc). For toluenethe quantum yields under aerated conditions are given in parentheses.
Solvent 1 2
MCH 0.91 0.99Toluene 0.65 (0.51) 0.95 (0.91)EtAc 0.036 0.81

AngewandteChemie
Dateiname: Z51430 Pagina: 4Pfad: L:/daten/Verlage/VCH/ACH/ Seite: 4 te von 11Status Neusatz Umfang (Seiten): 11Sprache English 3B2-Version: 7.51n/W (Jan 20 2003)Datum: 28 KW., 7. Juli 2003 (Montag) Zeit: 11:22:49 Uhr
of 1 does not change with solvent polarity, that is, all emissionoriginates from the locally excited state and not from a chargetransfer state. The effect of oxygen on the quantum yield of 1in toluene suggests the occurrence of back electron transfer inthis solvent. The more efficient quenching in ethyl acetate(EtAc) is due to a combination of faster electron transfer andmore efficient back electron transfer to the GS. This wasfurther explored by means of time-correlated single-photoncounting (TCSPC).
The results of the TCSPC measurements (all underdegassed conditions) are largely in line with the previouslystudied electron donor–acceptor dendritic structure.[12] Thefluorescence decay of model compound 2 measured at theemission maximum is monoexponential in all solvents.[15]
Fluorescence lifetimes of 6.4, 5.9, and 6.3 ns were found forMCH, toluene, and EtOAc respectively. The decay of thedonor–acceptor compound 1 is also monoexponential in theapolar solvent MCH with a decay time of 6.4 ns (emissiondetected at lmax= 585 nm), identical to that of the modelcompound. In EtOAc, the most polar solvent employed, onlyvery fast decay components are observed (triexponentialdecay, all components < 700 ps). The absence of any long-decay components indicates that back electron transfer to theLES does not occur, probably because it is a stronglyendothermic process, and back electron transfer to the GSbecomes faster in this solvent. This suggests that the drop inquantum yield in EtOAc is caused by fluorescence quenchingby forward electron transfer.
In toluene, of intermediate polarity, the fluorescencedecay of 1 can be fitted by four exponentials. Apart from thenormal fluorescence decay time of about 6 ns (0.65) of theperylenediimide chromophore, two fast (0.14 (0.15) and 1.6 ns(0.14)) and one slow decay component (ca. 12 ns (0.06)) areobserved for 543 nm excitation and 650 nm detection. (Thevalues in parentheses are the respective contributions.)
Considering the complexity of the fluorescence decaydynamics in the case of reversible electron transfer betweenone donor and one acceptor site,[12] we will not attempt to givea quantitative analysis of these decay times for a mixture ofconformational isomers of a compound that contains 16 donorsites and one acceptor site. Most important for the presentdiscussion is the attribution of the component with the shortdecay times to the forward electron transfer and that with thelong decay time (i.e., longer than the fluorescence decay timeof 2) to the back electron transfer. As previously discussed,this permits the direct detection of electron transfer at thesingle-molecule level.
The detection of single molecules at room temperature forprolonged times (several minutes) requires immobilization ofthe molecules. This is most conveniently done by embeddingthem in a polymer matrix. The polymeric equivalents in termsof polarity and polarizability of the solvents used in this studyare Zeonex (comparable with MCH), polystyrene (PS,comparable with toluene), and poly(methyl methacrylate),PMMA (comparable with EtOAc).
No significant differences between the fluorescenceintensity traces (Figure 2A and B) or the single-moleculeemission spectra of 1 and 2 were observed in either Zeonex or

AngewandteChemie
Dateiname: Z51430 Pagina: 5Pfad: L:/daten/Verlage/VCH/ACH/ Seite: 5 te von 11Status Neusatz Umfang (Seiten): 11Sprache English 3B2-Version: 7.51n/W (Jan 20 2003)Datum: 28 KW., 7. Juli 2003 (Montag) Zeit: 11:22:49 Uhr
PS. For most (~ 90%) of the traces, one stable level wasobserved until one-step photobleaching occurred. Both com-pounds are very robust in both matrices. Photobleaching ofthe compounds usually took 30 min or more, which corre-sponds to more than 1010 excitation/emission cycles for asingle chromophore. However, for efficiency reasons, mostmeasurements were stopped after a fixed measurement time(1–3 min).
As argued above, the single-molecule decay kineticsshould give insight into electron transfer at the single-molecule level. Although in our experimental setup therigorous exclusion of oxygen is not possible, the oxygenconcentration was lowered by a stream of nitrogen flowingover the sample. For the model compound 2 in Zeonex and inPS, the fluorescence decays monoexponentially, and thedecay time is constant over the entire trace for all studiedmolecules. The histograms of model compound 2 in Zeonexand in PS (Figure 3B and D) give broad (2.5–10 ns) mono-modal distributions at about 6 ns, close to the value of theensemble in solution. This broad distribution of decay timesnear 6 ns has already been reported for a zeroth-generationdendrimer with a perylenediimide core and phenoxy sub-stituents in the bay area.[16] It was argued that the twistedcentral chromophore that gives the 6-ns decay time issensitive to perturbations in the local environment.
Figure 2: Fluorescence intensity traces for single molecules of 2 (A) and 1 (B) in PS. I is the number of counts per time unit. The latter exhibits electrontransfer behavior and fluctuations of the short and long fluorescence decay components (bin size=10000 photons), which are shown in (C). t is thedecay time. From these data the rate constants for the back and forward electron transfer steps were calculated (D).[12]

AngewandteChemie
Dateiname: Z51430 Pagina: 6Pfad: L:/daten/Verlage/VCH/ACH/ Seite: 6 te von 11Status Neusatz Umfang (Seiten): 11Sprache English 3B2-Version: 7.51n/W (Jan 20 2003)Datum: 28 KW., 7. Juli 2003 (Montag) Zeit: 11:22:49 Uhr
The same broad distribution of decay times at about 6 ns isobserved for 1 in Zeonex (Figure 3A), but in this case about33% of the molecules account for a second distribution atabout 3 ns. For none of the investigated molecules were jumpsbetween the 3 and 6 ns levels observed under the presentconditions. A similar bimodal distribution was previouslyobserved for the zeroth-generation perylenediimide den-drimer in Zeonex matrix[15] and attributed to differentconformations of the phenoxy arms and a correspondingplanar or twisted conformation of the central chromophore.However, this 3-ns component is absent in the decay histo-grams of the model compound 2, so it must be related to thepresence of the amine groups at the rim of the dendrimer.Since the TCSPC measurements show that electron transferdoes not occur in 1 in the corresponding solvent MCH, it isunlikely that it occurs in Zeonex. Furthermore, a singleexponential decay of 3 ns would suggest an irreversible andhence slightly exergonic electron-transfer process, which isnot compatible with the low ion-solvating power of Zeonex.We suggest that these short decay times are caused bymolecules close to the glass–polymer interface. Owing to theamine groups at the rim of the dendritic structure of 1, thiscompound may be more strongly absorbed on the glasssurface than 2. Possibly, electron transfer near the polar glasssurface may occur even in Zeonex, and back electron transferfor this subset of the molecules occurs only to the GS.Alternatively, the adsorption of 1 on the glass surface mayinduce a conformational change of the core, which alsochanges the decay time.[16] This point is still under investiga-tion and is not the main focus of this paper. For the present
Figure 3: Histograms of the decay times t of individual molecules of 1 and 2 inZeonex (A and B, respectively) and in PS (C and D, respectively). For each com-pound–polymer combination, about 200 molecules were studied. In both matri-ces, 1 shows a multimodal distribution of decay times, whereas for 2 it is mon-omodal. The combination of 1 with PS has the only histogram displaying long(>10 ns) decay times indicative of the electron-transfer process. All moleculeswere analyzed with a monoexponential model, except for some of the moleculesof C (especially those with longer decay times), which had to be fitted biexpo-nentially. In this case, only the long decay times are included in the histogram.

AngewandteChemie
Dateiname: Z51430 Pagina: 7Pfad: L:/daten/Verlage/VCH/ACH/ Seite: 7 te von 11Status Neusatz Umfang (Seiten): 11Sprache English 3B2-Version: 7.51n/W (Jan 20 2003)Datum: 28 KW., 7. Juli 2003 (Montag) Zeit: 11:22:49 Uhr
investigation it is important that no decay times longer than10 ns are observed for 1 in Zeonex.
For 1 in PS (Figure 3C) the histograms show the same twodistributions of decay times as observed for 1 in Zeonex, oneat about 3 ns (ca. 43% of the molecules) and the other atabout 6 ns. However, for 1 in Zeonex or 2 in PS or Zeonex thelongest observed decay times are about 10 ns, whereas forcompound 1 in PS decay components of up to 29.9 ns areobserved. Whereas for 1 in Zeonex all decays were mono-exponential, some of those in PS (ca. 10%) show abiexponential decay, in particular those with long decaytimes. As argued above, these long decay times and biexpo-nential decay are indicative for the occurrence of backelectron transfer.
In general it is expected that all molecules that showreversible electron transfer display a biexponential decay.However, when forward electron transfer is too fast, the fastcomponent can not be resolved owing to the time resolutionof our setup (ca. 400 ps).
For those molecules of 1 that show reversible electrontransfer in PS, dynamic changes in the decay time wereobserved. Dynamic fluctuations of the decay times of theshort and the long component could be observed. An examplefor one molecule is given in Figure 2C. The fluctuations arelarger than the expected statistical noise (standard deviations= ~ 0.06 ns for the example given).[17] There appears to be acorrelation between the changes in the short and longcomponents. During the fluctuations no changes in thefluorescence intensity were observed (Figure 2B).
From the fluctuations in the decay times and theircontributions, the fluctuations in the rate constants forforward and back electron transfer can be calculated.[12,18]
These values are given in Figure 2D as a function of time forthe same molecule. From these values the corresponding freeenergy change for charge separation DGCS is calculated tovary between �250 and + 500 calmol�1. The energy separa-tion between the LES and the CSS is thus small; this wasmentioned as a prerequisite for the observation of long decaytimes. Apparently, the charge-separation process is slightlyendothermic for 1 in a PS matrix. The fluctuations observed inFigure 2C may have various origins. They may be caused byfluctuations in the polarity or polarizability of the localenvironment of the donor and/or acceptor. However, as thelocal environment mainly affects the relative position of theLES and CSS energy levels, they should be anticorrelated,because for a lower CSS, a faster forward and a slower backrate of energy transfer is expected. Figure 2D shows that thisis not the case; instead, they are correlated. Therefore, thefluctuations must be caused, at least to some extent, bychanges in the dendrimer itself. A possible explanation is avariation in the donor–acceptor orientation or distance. If wetake the asymptotic quenching rate kET0 to be 1011 s�1 (forDGCS close to zero) and the damping factor b as 1.2 ?�1,[19]
then the edge-to-edge donor–acceptor distance rangesbetween 21.0 and 22.2 ? in the case of the rate constants forthe molecule of Figure 2D. Given the large influence of b, theimportance of these values lies not in the absolute distances,although they fit reasonably well with the distances obtained

AngewandteChemie
Dateiname: Z51430 Pagina: 8Pfad: L:/daten/Verlage/VCH/ACH/ Seite: 8 te von 11Status Neusatz Umfang (Seiten): 11Sprache English 3B2-Version: 7.51n/W (Jan 20 2003)Datum: 28 KW., 7. Juli 2003 (Montag) Zeit: 11:22:49 Uhr
from modeling, but in that they show that the fluctuations canbe explained by very small variations in the donor–acceptordistance. The relatively long timescale (ms to s) on which thefluctuations occur indicates that there are local minima on theenergy surface which are probed by the molecule. Thissituation is reminiscent of large biomolecules, such asenzymes[20] and RNA,[21] which also show such “ruggedenergy landscapes”.
In a more polar polymer matrix than PS, such as PMMA,no fluorescence from single molecules of 1 in samples of thesame concentrations as those used for Zeonex and PS couldbe observed. On the other hand, compound 2 could still benormally imaged. This proves that irreversible electrontransfer in a medium of this polarity is too fast to competewith fluorescence.
We have demonstrated for the first time forward and backintramolecular electron transfer in a synthetic system at thesingle-molecule level by observing long decay times (i.e.,longer than those of the model compound) and biexponentialfluorescence decay. Dynamics in the forward and backelectron-transfer steps were observed and a rationale hasbeen presented. These fluctuations are attributed to changesin the local environment of the dendrimer, as well as tochanges in the dendritic structure itself. The fluctuations arereminiscent of those previously observed in biological sys-tems, and thus the polyphenylene denrimers with a triphenyl-amine–perylenediimide donor–acceptor function are modelsfor studying the details of such single-molecule dynamics.
Experimental Section
The synthesis of the dendrimers will be published separately.[13]
Samples for ensemble measurements in solution were degassed byat least three freeze–pump–thaw cycles. Single-molecule sampleswere prepared by spin-coating solutions of 1 or 2 (10�10
m) andpolymer (5 mgmL�1) in chloroform (Aldrich, spectrophotometricgrade) on a cover glass at 2000 rpm. This yields 100–150 nm thickpolymer films. Before spin-coating, cover glasses were carefullycleaned by sonication in acetone, sodium hydroxide (10%), andMilliQ water and by irradiation with UV light.
Steady-state spectroscopy was performed on a Perkin-ElmerLambda 40 spectrophotometer and a Spex Fluorolog-3 fluorimeter.Fluorescence quantum yields were determined by using cresyl violetin ethanol as reference compound (FF= 0.51).[22]
The setup for the single-molecule experiments has been describedelsewhere.[23] In brief, samples were mounted on an inverted micro-scope (Olympus IX 70) equipped with a scanning stage (PhysicsInstruments). Excitation with an 8 MHz picosecond laser occurred at543 nm through an oil-immersion objective (Olympus, 1.4 N.A., K60). Fluorescence was collected by the same objective, passed througha dichroic mirror, filtered with a notch filter (Kaiser Optics), anddetected with an avalanche photodiode (APD, SPCM 15, EG&G).The signal from the APD was registered by a time-correlated single-photon counting card (SPC 630, Picoquant) in the FIFO (first in, firstout) mode. From the FIFO data fluorescence intensity traces anddecay histograms were built.
In the picosecond time-correlated single-photon counting meas-urements, histograms were built by collecting the fluorescence in 4096channels. To accurately determine the long and short components,time increments of 2, 7.5, and 15 ps were used. The resultinghistograms were fitted globally by convolution with the instrumental

AngewandteChemie
Dateiname: Z51430 Pagina: 9Pfad: L:/daten/Verlage/VCH/ACH/ Seite: 9 te von 11Status Neusatz Umfang (Seiten): 11Sprache English 3B2-Version: 7.51n/W (Jan 20 2003)Datum: 28 KW., 7. Juli 2003 (Montag) Zeit: 11:22:49 Uhr
response function (30 ps, full width at half maximum) by using anexponential model.
Received: March 18, 2003 [Z51430]
.Keywords: dendrimers · donor–acceptor systems · electrontransfer · fluorescence · single-molecule studies
[1] W. E. Moerner, J. Phys. Chem. B 2002, 106, 910–927.[2] M. F. Garcia-Parajo, J. A. Veerman, R. Bouwhuis, R. Vallee,
N. F. Van Hulst, ChemPhysChem 2001, 2, 347–360.[3] J. Hofkens, M. Maus, T. Gensch, T. Vosch, M. Cotlet, F. K%hn, A.
Herrmann, K. MPllen, F. C. De Schryver, J. Am. Chem. Soc.2000, 122, 9278–9288.
[4] T. Vosch, J. Hofkens, M. Cotlet, F. K%hn, H. Fujiwara, R.Gronheid, K. Van der Biest, T. Weil, A. Herrmann, K. MPllen, S.Mukamel, M. Van der Auweraer, F. C. De Schryver, Angew.Chem. 2001, 113, 4779–44784; Angew. Chem. Int. Ed. 2001, 40,4643–4648.
[5] R. Gronheid, J. Hofkens, F. K%hn, T. Weil, E. Reuther, K.MPllen, F. C. De Schryver, J. Am. Chem. Soc. 2002, 124, 2418–2419.
[6] M. Goes, M. De Groot, M. Koeberg, J. W. Verhoeven, N. R.Lokan, M. J. Shephard, M. N. Paddon-Row, J. Phys. Chem. A2002, 106, 2129–2134.
[7] H. P. Lu, X. S. Xie, J. Phys. Chem. B 1997, 101, 2753–2757.[8] a) L. Edman, Q. Mets, R. Rigler, Proc. Natl. Acad. Sci. USA
1996, 93, 6710–6715; b) S. Wennmalm, L. Edman, R. Rigler,Proc. Natl. Acad. Sci. USA 1997, 94, 10641–10646.
[9] a) J. P. Knemeyer, N. Marme, M. Sauer, Anal. Chem. 2000, 72,3717–3724; b) M. Sauer, Angew. Chem. 2003, 115, 1834–1837;Angew. Chem. Int. Ed. 2003, 42, 1790–1793; c) H. Neuweiler, A.Schulz, A. C. Vaiana, J. C. Smith, S. Kaul, J. Wolfrum, M. Sauer,Angew. Chem. 2002, 114, 4964–4968; Angew. Chem. Int. Ed.2002, 41, 4769–4773.
[10] C. Eggeling, J. R. Fries, L. Brand, R. Gunther, C. A. M. Seidel,Proc. Natl. Acad. Sci. USA 1998, 95, 1556–1561.
[11] L. Zang, R. Liu, M. W. Holman, K. T. Nguyen, D. M. Adams, J.Am. Chem. Soc. 2002, 124, 10640–10641.
[12] M. Lor, J. Thielemans, L. Viaene, M. Cotlet, J. Hofkens, T. Weil,C. Hampel, K. MPllen, J. W. Verhoeven, M. Van der Auweraer,F. C. De Schryver, J. Am. Chem. Soc. 2002, 124, 9918–9925.
[13] J. Qu, A. Stefan, L. Doajun, F. C. De Schryver, K. MPllen,unpublished results..
[14] W. Verbouwe, L. Viaene, M. Van der Auweraer, F. C.De Schryver, H. Masuhara, R. Pansu, J. Faure, J. Phys. Chem.A 1997, 101, 8157–8165.
[15] If globally analyzed over the whole emission spectrum, the decayof 2 shows a rise component with a small contribution at thehigh-energy end of the emission spectrum. The detailed photo-physics of these molecules will be reported elsewhere.
[16] J. Hofkens, T. Vosch, M. Maus, F. K%hn, M. Cotlet, T. Weil, A.Herrmann, K.MPllen, F. C. De Schryver,Chem. Phys. Lett. 2001,333, 255–263.
[17] M. Maus, M. Cotlet, J. Hofkens, T. Gensch, F. C. De Schryver, J.Schaffer, C. A. M. Seidel, Anal. Chem. 2001, 73, 2078–2086.
[18] For each combination of decay times it is possible to calculatethe rate constants of charge separation, back reaction, andrecombination to the ground state or to a triplet state and thefree-energy change DGCS of the charge separation.[12] Theseparameters can be calculated from the decay times ti, tj, the ratioof the amplitudes aiaj of the two components of the corresponding
biexponential fluorescence decay, I(t)= a1 exp(�li ti)+aj exp(�lj tj), and the fluorescence lifetime t0 of the unquenchedacceptor with the following set of equations (li= 1/ti, lj= 1/tj,

AngewandteChemie
Dateiname: Z51430 Pagina: 10Pfad: L:/daten/Verlage/VCH/ACH/ Seite: 10 te von 11Status Neusatz Umfang (Seiten): 11Sprache English 3B2-Version: 7.51n/W (Jan 20 2003)Datum: 28 KW., 7. Juli 2003 (Montag) Zeit: 11:22:50 Uhr
k01= 1/t0): li= {(X+Y)+ffiffiffiffiffiffiffiffiffiffiffiffiffiffiffiffiffiffiffiffiffiffiffiffiffiffiffiffiffiffiffiffiffiffiffiffiffiffi½X�Y�2 þ 4 k21 k12
p}/2 and lj= {(X+
Y)�ffiffiffiffiffiffiffiffiffiffiffiffiffiffiffiffiffiffiffiffiffiffiffiffiffiffiffiffiffiffiffiffiffiffiffiffiffiffi½X�Y�2 þ 4k21 k12
p}/2 with ai
aj=
li�YY�lj
; and X=k01+k21 and
Y=k02+k12 (k21 is the forward electron transfer rate constant,k12 the back electron transfer rate constant, k01 the reciprocallifetime of the LES, and k02 the overall rate constant fordeactivation of the CSS state to the ground state).
[19] “Electron Transfer—From IsolatedMolecules to Biomolecules”:J. W. Verhoeven in Advances in Chemical Physics, Vol. 106,Part 1 (Eds.: J. Jortner, M. Bixon), Wiley, New York, 1999,pp. 603–644.
[20] H. P. Lu, L. Xun, X. S. Xie, Science 1998, 282, 1877–1882.[21] X. Zhuang, L. E. Bartley, H. P. Babcock, R. Russell, T. Ha, D.
Herschlag, S. Chu, Science 2000, 288, 2048–2051.[22] J. Olmsted, J. Phys. Chem. 1979, 83, 2581–2584.[23] M. Cotlet, J. Hofkens, M. Maus, F. C. De Schryver, Fluorescence
Spectroscopy, Imaging and Probes, New Tools in Chemical,Physical and Life Sciences (Eds.: R. Kraayenhof, A. J. W. G.Visser, H. C. Gerritsen), Springer, Heidelberg, 2002, pp. 131–152.
Dateiname: Z51430 Pagina: 11Pfad: L:/daten/Verlage/VCH/ACH/ Seite: 11 te von 11Status Neusatz Umfang (Seiten): 11Sprache English 3B2-Version: 7.51n/W (Jan 20 2003)Datum: 28 KW., 7. Juli 2003 (Montag) Zeit: 11:22:50 Uhr
Communications
Single-Molecule Electron Transfer
R. Gronheid, A. Stefan, M. Cotlet,J. Hofkens, J. Qu, K. M$llen,M. Van der Auweraer, J. W. Verhoeven,F. C. De Schryver* 2613 – 2624
Reversible Intramolecular ElectronTransfer at the Single-Molecule Level
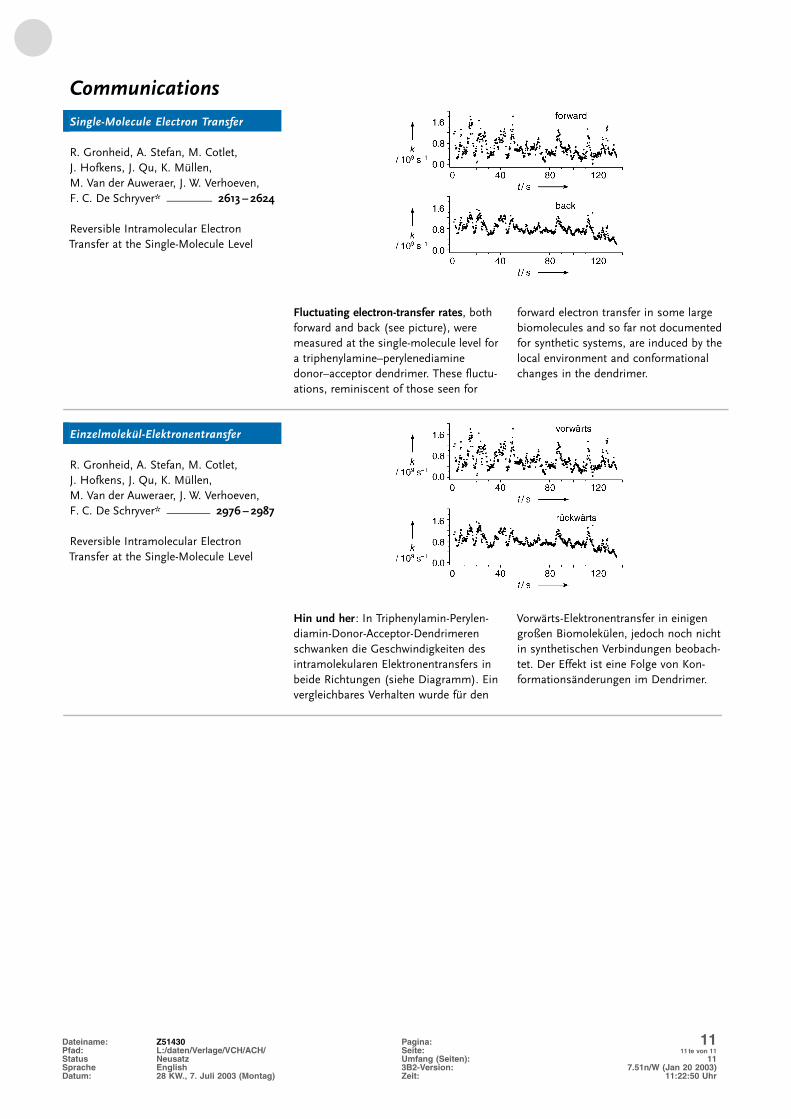
Fluctuating electron-transfer rates, bothforward and back (see picture), weremeasured at the single-molecule level fora triphenylamine–perylenediaminedonor–acceptor dendrimer. These fluctu-ations, reminiscent of those seen for
forward electron transfer in some largebiomolecules and so far not documentedfor synthetic systems, are induced by thelocal environment and conformationalchanges in the dendrimer.
Einzelmolek�l-Elektronentransfer
R. Gronheid, A. Stefan, M. Cotlet,J. Hofkens, J. Qu, K. M$llen,M. Van der Auweraer, J. W. Verhoeven,F. C. De Schryver* 2976 – 2987
Reversible Intramolecular ElectronTransfer at the Single-Molecule Level
Hin und her : In Triphenylamin-Perylen-diamin-Donor-Acceptor-Dendrimerenschwanken die Geschwindigkeiten desintramolekularen Elektronentransfers inbeide Richtungen (siehe Diagramm). Einvergleichbares Verhalten wurde f;r den
VorwIrts-Elektronentransfer in einigengroßen Biomolek;len, jedoch noch nichtin synthetischen Verbindungen beobach-tet. Der Effekt ist eine Folge von Kon-formationsInderungen im Dendrimer.