Reverse-Engineering Conference Rankings: What Does it Take to Make a Reputable Conference
22
Reverse-Engineering Conference Rankings: What Does it Take to Make a Reputable Conference? Peep K¨ ungas a,* , Svitlana Vakulenko a , Marlon Dumas a , Cristhian Parra b , Fabio Casati b a University of Tartu, Institute of Computer Science, J. Liivi 2, 50409 Tartu, Estonia b University of Trento, Department of Information Engineering and Computer Science, Via Sommarive 14, I-38123 Povo, Italy Abstract In recent years, several national and community-driven conference rankings have been compiled. These rankings are often taken as indicators of reputation and used for a variety of purposes, such as evaluating the performance of academic institutions and individual scientists, or selecting target conferences for paper submissions. Current rankings are based on a combination of objective criteria and subjective opinions that are collated and reviewed through largely manual processes. In this setting, the aim of this paper is to shed light into the fol- lowing question: to what extent existing conference rankings reflect objective criteria, specifically submission and acceptance statistics and bibliometric indi- cators? The paper specifically considers two conference rankings in the field of Computer Science: an Australian national ranking and an informal community- built ranking. It is found that, while in the former ranking acceptance rate is the dominant criterion, in the latter one, both acceptance rate and biblio- metric indicators are equally important determinants of rank. It is also found that in both rankings, top-tier conferences can be identified with relatively high accuracy through acceptance rates and bibliometric indicators. On the other hand, acceptance rates and bibliometric indicators fail to discriminate between * Corresponding author at: University of Tartu, Institute of Computer Science, J. Liivi 2, 50409 Tartu, Estonia. Tel.:+372 5568 5297. Email addresses: [email protected] (Peep K¨ ungas), [email protected] (Svitlana Vakulenko), [email protected] (Marlon Dumas), [email protected] (Cristhian Parra), [email protected] (Fabio Casati) Preprint submitted to Elsevier March 29, 2011
-
Upload
manchester -
Category
Documents
-
view
2 -
download
0
Transcript of Reverse-Engineering Conference Rankings: What Does it Take to Make a Reputable Conference

Reverse-Engineering Conference Rankings: What Doesit Take to Make a Reputable Conference?
Peep Kungasa,∗, Svitlana Vakulenkoa, Marlon Dumasa, Cristhian Parrab,Fabio Casatib
aUniversity of Tartu, Institute of Computer Science, J. Liivi 2, 50409 Tartu, EstoniabUniversity of Trento, Department of Information Engineering and Computer Science, Via
Sommarive 14, I-38123 Povo, Italy
Abstract
In recent years, several national and community-driven conference rankings have
been compiled. These rankings are often taken as indicators of reputation and
used for a variety of purposes, such as evaluating the performance of academic
institutions and individual scientists, or selecting target conferences for paper
submissions. Current rankings are based on a combination of objective criteria
and subjective opinions that are collated and reviewed through largely manual
processes. In this setting, the aim of this paper is to shed light into the fol-
lowing question: to what extent existing conference rankings reflect objective
criteria, specifically submission and acceptance statistics and bibliometric indi-
cators? The paper specifically considers two conference rankings in the field of
Computer Science: an Australian national ranking and an informal community-
built ranking. It is found that, while in the former ranking acceptance rate
is the dominant criterion, in the latter one, both acceptance rate and biblio-
metric indicators are equally important determinants of rank. It is also found
that in both rankings, top-tier conferences can be identified with relatively high
accuracy through acceptance rates and bibliometric indicators. On the other
hand, acceptance rates and bibliometric indicators fail to discriminate between
∗Corresponding author at: University of Tartu, Institute of Computer Science, J. Liivi 2,50409 Tartu, Estonia. Tel.:+372 5568 5297.
Email addresses: [email protected] (Peep Kungas), [email protected] (SvitlanaVakulenko), [email protected] (Marlon Dumas), [email protected] (Cristhian Parra),[email protected] (Fabio Casati)
Preprint submitted to Elsevier March 29, 2011
mid-tier and bottom-tier conferences.
Keywords: conference ranking, bibliometrics, conference acceptance rate,
reputation, objective criteria
1. Introduction
In terms of publication practices, a distinguishing feature of the field of
Computer Science, relative to the bulk of other research disciplines, is that
peer-reviewed conferences play a role almost as equally important as that of
established journals [1]. Indeed, conferences often have lower acceptance rates
and higher citations-per-paper than comparable journals [1]. One of the reasons
that has been advanced to explain this phenomenon is the need for shorter
dissemination cycles given the rapid evolution of the field.
The practice of conference publication in Computer Science, combined with
the rather large number of conferences, has engendered a need for conference
rankings that can serve as a proxy for quality in the context of researcher or
research group evaluations. One of the most systematic attempts at building a
conference ranking for Computer Science was initiated by the Computing Re-
search and Education Association of Australasia (CORE)1. Their initial 2005
draft ranking, manually established by a committee, classified 1500 computer
science conferences into 4 tiers (A+, A, B, C) and a separate tier for local con-
ferences (L)2. The tiers in this ranking were defined in terms of acceptance rate
– lower acceptance rates being associated with higher tiers, but without fix-
ing any numeric thresholds – and composition of Program Committees (PCs) –
PCs with representatives from top-universities being associated to higher tiers.
This initial ranking was opened for comments, allowing researchers to submit
requests to add new conferences or to amend the ranking of existing confer-
ences, taking into account the definitions of the tiers. Requests for amendments
were reviewed by a committee. After multiple iterations, the CORE ranking
1http://www.core.edu.au/2Subsequently, tiers A+ and A were merged and tier L was removed.
2

became part of the broader ERA Ranking managed by the Australian Research
Council3. Another conference ranking, namely Perfil-CC4 has been established
within the Brazilian Computer Science community through an open voting pro-
cedure based on a fixed set of conferences, without a committee-driven review
of the results of the voting. Finally, a third conference ranking5 – which we
call the “X-Rank” – has been compiled by a small group of researchers without
reference to any specific criteria and without any formalized process.
Generally speaking, conference rankings are constructed based on a mixture
of objective criteria and subjective opinions. This raises the following questions:
(i) to what extent existing (Computer Science) conference rankings are driven by
objective criteria? and (ii) which specific objective criteria drive these rankings
and what is their relative weight. In order to address these questions, this pa-
per applies machine learning techniques to “reverse-engineer” computer science
conference rankings in order to identify the features and rules that determine
the rank of a given conference.
Previous work by Silva Martins et al. [2, 3] have found that machine learning
models based on citation counts and submission/acceptance metrics can be used
to predict the rank of conferences in the Perfil-CC ranking with an accuracy of
up to 68% (measured in terms of F-score). In this paper, we extend this pre-
vious study to cover the two other conference rankings referenced above. Our
results confirm those of Silva Martins et al. [2, 3], particularly their observation
that acceptance rates are better predictors of conference ranking than citation
metrics, and that the constructed models are more accurate at distinguishing
between top-tier conferences and lower-tier conferences than they are at dis-
tinguishing between mid-tier and low-tier conferences. Furthermore, our study
finds that models with higher accuracy can be obtained in the context of the
ERA ranking (compared to the Perfil-CC ranking) while models with lower ac-
curacy are obtained in the case of the more informal X-Rank. These findings
3http://www.arc.gov.au/era/era_2010.htm4http://www.latin.dcc.ufmg.br/perfilccranking/5http://www3.ntu.edu.sg/home/assourav/crank.htm
3

suggest that objective criteria play a more important role in rankings that are
driven by formalized criteria and processes.
The rest of the paper is structured as follows. Section 2 describes the data
collection method and the characteristics of the collected data. Next, Section 3
presents the methods used to construct the machine learning models and sum-
marizes the experimental results. Section 4 discusses threats to validity. Finally,
Section 5 reviews related work while Section 6 draws conclusions.
2. Data Collection
In this section we briefly describe the data collected to train the machine
learning models, and the characteristics of these data.
For conferences rankings we used the following data sources:
1. Rank X: http://www3.ntu.edu.sg/home/assourav/crank.htm (mir-
rored with some modifications by http://dsl.serc.iisc.ernet.in/
publications/CS_ConfRank.htm)—a list of Computer Science confer-
ences containing (at the time of retrieval in October 2010) 527 entries
for conferences giving their acronymes, names, rankings and subdiscipline
of Computer Science;
2. Perfil-CC: http://www.latin.dcc.ufmg.br/perfilccranking/—
ranking of Computer Science conferences compiled to assess the
production quality of the top Brazilian Computer Science graduate
programs [4]. The conferences are ranked into three tiers (from top tier to
the bottom tier): A tier, B tier, and C tier based on the voting procedure
where Brazilian Computer Science researchers that hold an individual
grant from The Brazilian National Research Council and faculty members
of all Computer Science graduate programs in the country were invited
to participate;
3. ERA 2010: http://www.arc.gov.au/era/era_2010.htm—ERA 2010
ranking of conferences and journals compiled by the Australian Research
Council. The list of Computer Science conferences are ranked into three
4
tiers (from top tier to the bottom tier): A tier, B tier, and C tier. These
lists are the result of a consultation across all Computer Science depart-
ment in Australia. Basically, researchers propose that a conference be
classified as A, B or C, and these proposals are sent to a committee which
has to approve the tier of a conference (based on majority consensus). So
in a way ranking is based on a voting procedure. More details on ERA
ranking has been presented by Vanclay [5] together with some criticism
with respect to its journal rankings.
While the first ranking can be seen as a sort of ad hoc community-driven
ranking with no published evaluation criteria, the two last ones present national
rankings with well-documented ranking guidelines and revision procedures. In
fact, there is a large intersection [3] between the CORE (which is antecedent
of ERA 2010) and the Perfil-CC conference lists, the main exceptions being re-
gional and local conferences (e.g., Asian-pacific conferences) which are included
in the CORE list. It is important to note that Perfil-CC is a younger ranking
compared to ERA 2010 and therefore is based on less formal procedure. This
claim is based on the assumption that the longer ranking procedures are applied
more exceptions are handled and added to the ranking process.
For acceptance rates and other features data from the following sources were
extracted in October 2010:
• http://wwwhome.cs.utwente.nl/~apers/rates.html—database con-
ferences statistics from Peter Aper’s Stats Page;
• http://www.cs.wisc.edu/~markhill/AcceptanceRates_and_PCs.
xls—architecture conference statistics for conferences such as ISCA,
Micro, HPCA, ASPLOS by Prichard, Scopel, Hill, Sohi, and Wood;
• http://people.engr.ncsu.edu/txie/seconferences.htm—software
engineering conference statistics by Tao Xie;
• http://www.cs.ucsb.edu/~almeroth/conf/stats/—networking con-
ference statistics by Kevin C. Almeroth;
5

• http://web.cs.wpi.edu/~gogo/hive/AcceptanceRates/—statistics for
conferences in graphics/interaction/vision by Rob Lindeman;
• http://faculty.cs.tamu.edu/guofei/sec_conf_stat.htm—computer
security conference statistics by Guofei Gu;
Finally, for retrieving bibliometric data, such as the number of papers pub-
lished at a conference and the overall number of citations to conference papers,
we used Microsoft Academic Search (http://academic.research.microsoft.
com/). We retrieved data for 2511 Computer Science conferences.
Data distribution on conference acceptance rates with respect to the listed
sources is summarized in Figure 1 while data distribution with respect to the
past years is depicted in Figure 2. In both figures all instances of data records
for conferences are counted even if there is some redundancy due to listing of
the same conference in multiple sources. In Figure 1 the number of data records
is counted as the overall number of acceptance rates for all conferences for all
years for which we have data. The major data source is the Web page of Tao Xie
and Kevin C. Almeroth. In Figure 2 similarly the number of acceptance rate
entries per particular year are displayed. One can see that the data is mainly
about the period of 1995–2010.
After taking the arithmetic average of all acceptance rates for all years per
conference we compiled 6 datasets from three main datasets—one with confer-
ence acceptance rates, one with bibliometric indices and one with both accep-
tance rates and bibliometric indices. These three base datasets were matched
with ERA 2010 ranking and Rank X resulting in 6 datasets. Since some con-
ferences had either no acceptance rate information, no bibliometric data or no
ranking available, we had to prune these from the final datasets. Aggregated
data distribution with respect to rankings and features are summarized in Ta-
ble 1 and Table 2.
We also analyzed correlation between the ERA 2010 and Rank X7. Table 3
7Multiple versions of this ranking are circulating in the Web while its real origin and the
6

Figure 1: Data distribution with respect to sources.
Figure 2: Data distribution with respect to past years.
7

Table 1: Dataset size and distribution with respect to ranking classes with and withoutacceptance rates (AR).
Class Rank X ERA 2010 Rank X + AR ERA 2010 + AR
A 65 137 31 58B 113 117 36 19C 150 66 9 6
D6 199 0 17 0Total 527 320 93 83
Table 2: Dataset size and distribution with respect to features.
Dataset size ERA 2010 Rank X
Acceptance rates 83 93Bibliometrics 262 353
Combined 82 91
summarizes the correlation between these 2 rankings. Although the correlation
between these 2 rankings is statistically average (Pearson correlation of 0.555) in
general, for some research fields, such as Databases, there is larger correlation.
Generally ERA 2010 ranks conferences higher than Rank X, which is more
conservative from that perspective. Thus we can clearly state that although
the selected rankings agree on ranks of some conferences, in general there is no
strong relation between them.
In Figure 3 there is a pivot table with average citation per paper for each
ERA 2010 evaluation ranking (A,B,C) and subdiscipline of Computer Science
based on Microsoft Academic Search data. The figure shows that generally it is
true that proceedings of highly-rated conferences include higher citation per ar-
ticle, except in some subdisciplines such as Data Mining and Human-Computer
Interaction, Multimedia, Natural Language & Speech and Networks & Commu-
nications. It is interesting to note that according to Shi et al [6] Information
ranking methodology is unknown.
8
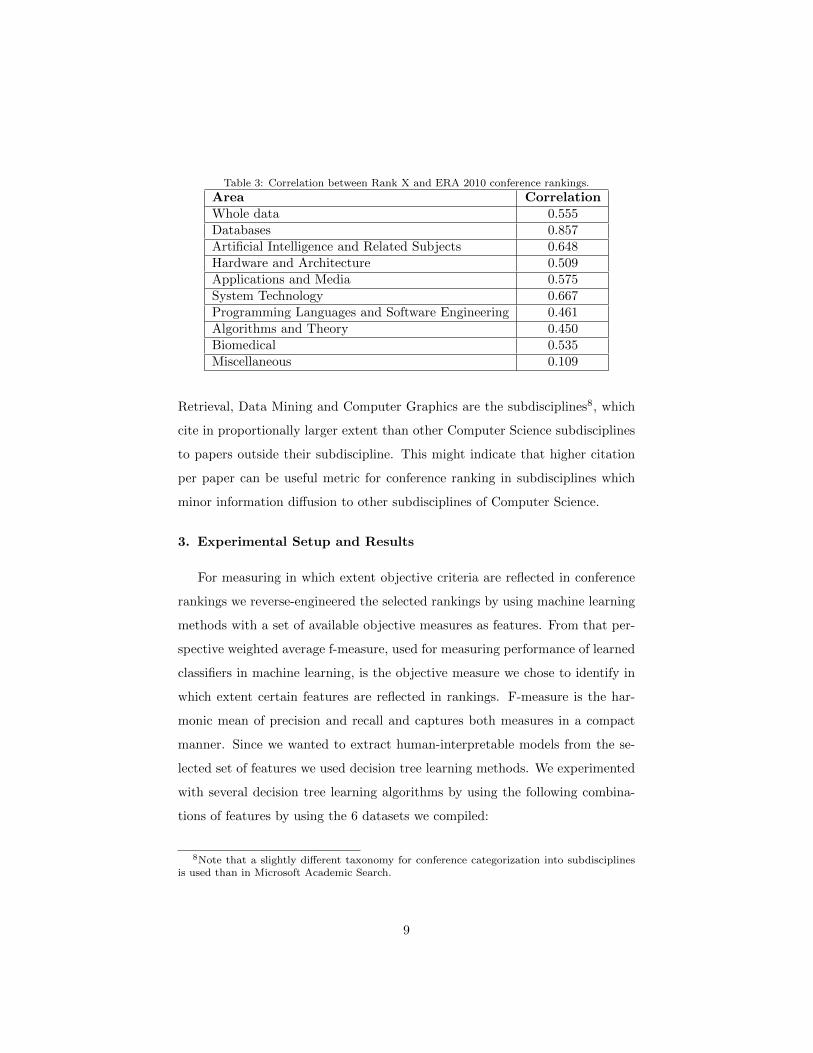
Table 3: Correlation between Rank X and ERA 2010 conference rankings.
Area CorrelationWhole data 0.555Databases 0.857Artificial Intelligence and Related Subjects 0.648Hardware and Architecture 0.509Applications and Media 0.575System Technology 0.667Programming Languages and Software Engineering 0.461Algorithms and Theory 0.450Biomedical 0.535Miscellaneous 0.109
Retrieval, Data Mining and Computer Graphics are the subdisciplines8, which
cite in proportionally larger extent than other Computer Science subdisciplines
to papers outside their subdiscipline. This might indicate that higher citation
per paper can be useful metric for conference ranking in subdisciplines which
minor information diffusion to other subdisciplines of Computer Science.
3. Experimental Setup and Results
For measuring in which extent objective criteria are reflected in conference
rankings we reverse-engineered the selected rankings by using machine learning
methods with a set of available objective measures as features. From that per-
spective weighted average f-measure, used for measuring performance of learned
classifiers in machine learning, is the objective measure we chose to identify in
which extent certain features are reflected in rankings. F-measure is the har-
monic mean of precision and recall and captures both measures in a compact
manner. Since we wanted to extract human-interpretable models from the se-
lected set of features we used decision tree learning methods. We experimented
with several decision tree learning algorithms by using the following combina-
tions of features by using the 6 datasets we compiled:
8Note that a slightly different taxonomy for conference categorization into subdisciplinesis used than in Microsoft Academic Search.
9

Figure 3: Average citation per paper with respect to conference rankings in different subdis-ciplines.
• conference statistics (average number of submissions over time, average
number of accepted paper over time, average acceptance rate over time,
rankings (both ERA 2010 and Rank X));
• bibliometric indicators (the overall number of articles, citations and cita-
tion per article) + conference ranking only (both ERA 2010 and Rank
X);
• conference statistics together with bibliometric indicators (both ERA 2010
and Rank X).
We extracted classification rules with the main decision tree learning
methods including ZeroR, IB1, J48, LADTree, BFTree, NaiveBayes, Naive-
BayesMultinominal, NaiveBayesUpdateable, OneR, RandomForest, and Ran-
domTree. The best-performing algorithms with respect to weighted average
f-measure are summarized in Table 4. Generally the best learning method was
10
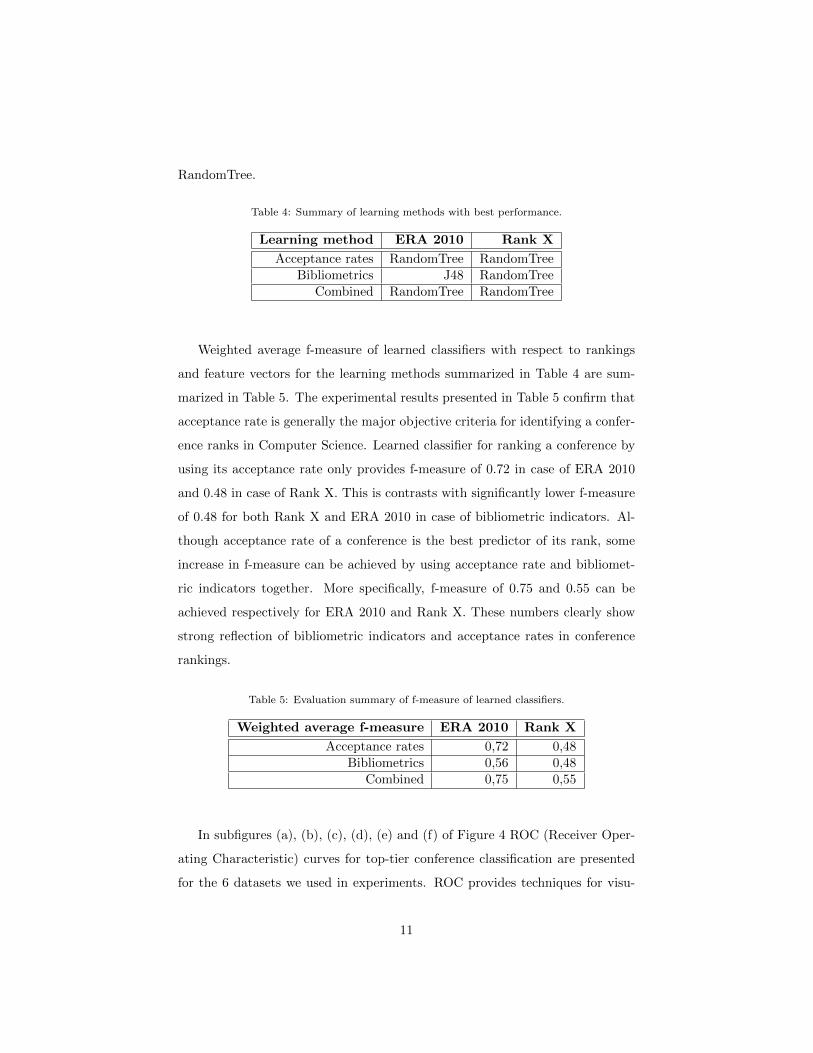
RandomTree.
Table 4: Summary of learning methods with best performance.
Learning method ERA 2010 Rank X
Acceptance rates RandomTree RandomTreeBibliometrics J48 RandomTree
Combined RandomTree RandomTree
Weighted average f-measure of learned classifiers with respect to rankings
and feature vectors for the learning methods summarized in Table 4 are sum-
marized in Table 5. The experimental results presented in Table 5 confirm that
acceptance rate is generally the major objective criteria for identifying a confer-
ence ranks in Computer Science. Learned classifier for ranking a conference by
using its acceptance rate only provides f-measure of 0.72 in case of ERA 2010
and 0.48 in case of Rank X. This is contrasts with significantly lower f-measure
of 0.48 for both Rank X and ERA 2010 in case of bibliometric indicators. Al-
though acceptance rate of a conference is the best predictor of its rank, some
increase in f-measure can be achieved by using acceptance rate and bibliomet-
ric indicators together. More specifically, f-measure of 0.75 and 0.55 can be
achieved respectively for ERA 2010 and Rank X. These numbers clearly show
strong reflection of bibliometric indicators and acceptance rates in conference
rankings.
Table 5: Evaluation summary of f-measure of learned classifiers.
Weighted average f-measure ERA 2010 Rank X
Acceptance rates 0,72 0,48Bibliometrics 0,56 0,48
Combined 0,75 0,55
In subfigures (a), (b), (c), (d), (e) and (f) of Figure 4 ROC (Receiver Oper-
ating Characteristic) curves for top-tier conference classification are presented
for the 6 datasets we used in experiments. ROC provides techniques for visu-
11
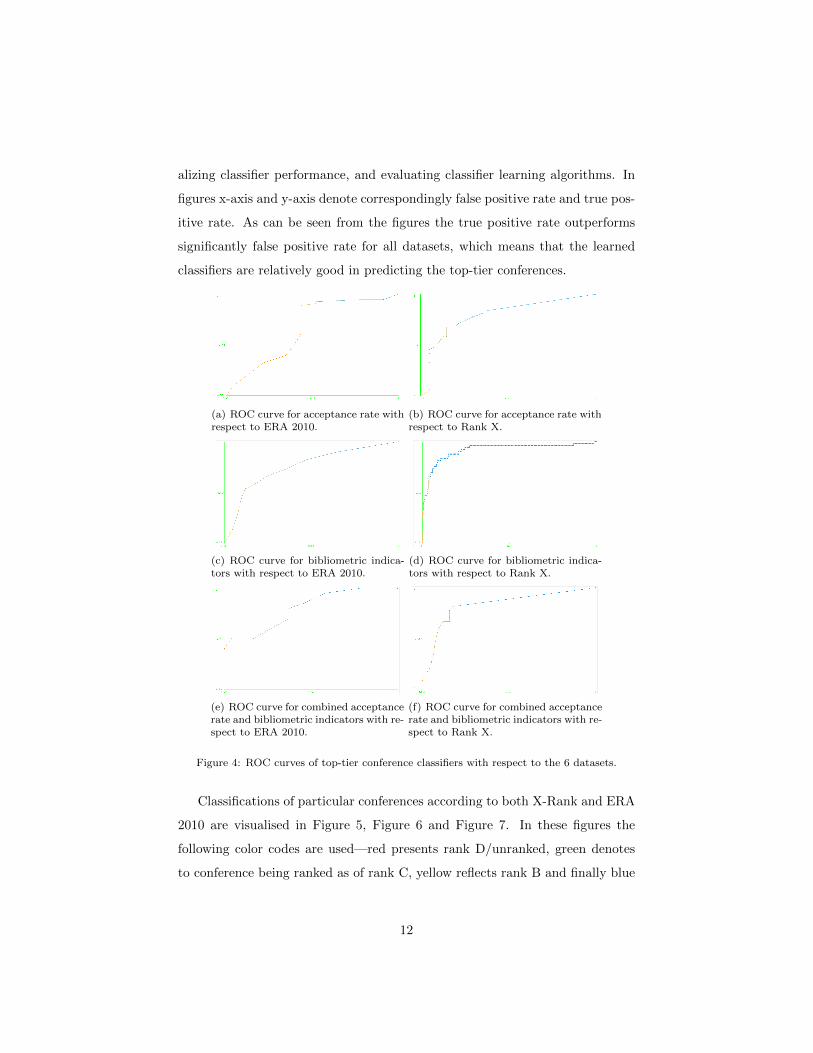
alizing classifier performance, and evaluating classifier learning algorithms. In
figures x-axis and y-axis denote correspondingly false positive rate and true pos-
itive rate. As can be seen from the figures the true positive rate outperforms
significantly false positive rate for all datasets, which means that the learned
classifiers are relatively good in predicting the top-tier conferences.
(a) ROC curve for acceptance rate withrespect to ERA 2010.
(b) ROC curve for acceptance rate withrespect to Rank X.
(c) ROC curve for bibliometric indica-tors with respect to ERA 2010.
(d) ROC curve for bibliometric indica-tors with respect to Rank X.
(e) ROC curve for combined acceptancerate and bibliometric indicators with re-spect to ERA 2010.
(f) ROC curve for combined acceptancerate and bibliometric indicators with re-spect to Rank X.
Figure 4: ROC curves of top-tier conference classifiers with respect to the 6 datasets.
Classifications of particular conferences according to both X-Rank and ERA
2010 are visualised in Figure 5, Figure 6 and Figure 7. In these figures the
following color codes are used—red presents rank D/unranked, green denotes
to conference being ranked as of rank C, yellow reflects rank B and finally blue
12

shows that a conference is ranked A (a top-tier conference). One can see from
the figures that rank A conferences are clearly separated from lower-ranked con-
ferences, while finer separation between other conferences is not possible while
using a classification function based on bibliometric indicators and conference
statistics.
The graph in Figure 5 visualizes conference rankings from citations per arti-
cle versus average conference acceptance rate perspective. The following classi-
fication rules, which we learned from the data for classifying rank A conferences,
can be visually perceived here:
• Average conference acceptance ratio < 0.23;
• Average conference acceptance ratio < 0.25 ∧ Citations per article ≥
0.76.
Figure 5: Citation per paper vs acceptance rate.
The graph in Figure 6 visualizes conference rankings from overall number of
citations to articles of a conference versus average conference acceptance rate
(throughout past years) perspective. The following classification rules, which
we learned for visualizing rank A conferences, are visualized here:
• Number of citations ≥ 5814;
13
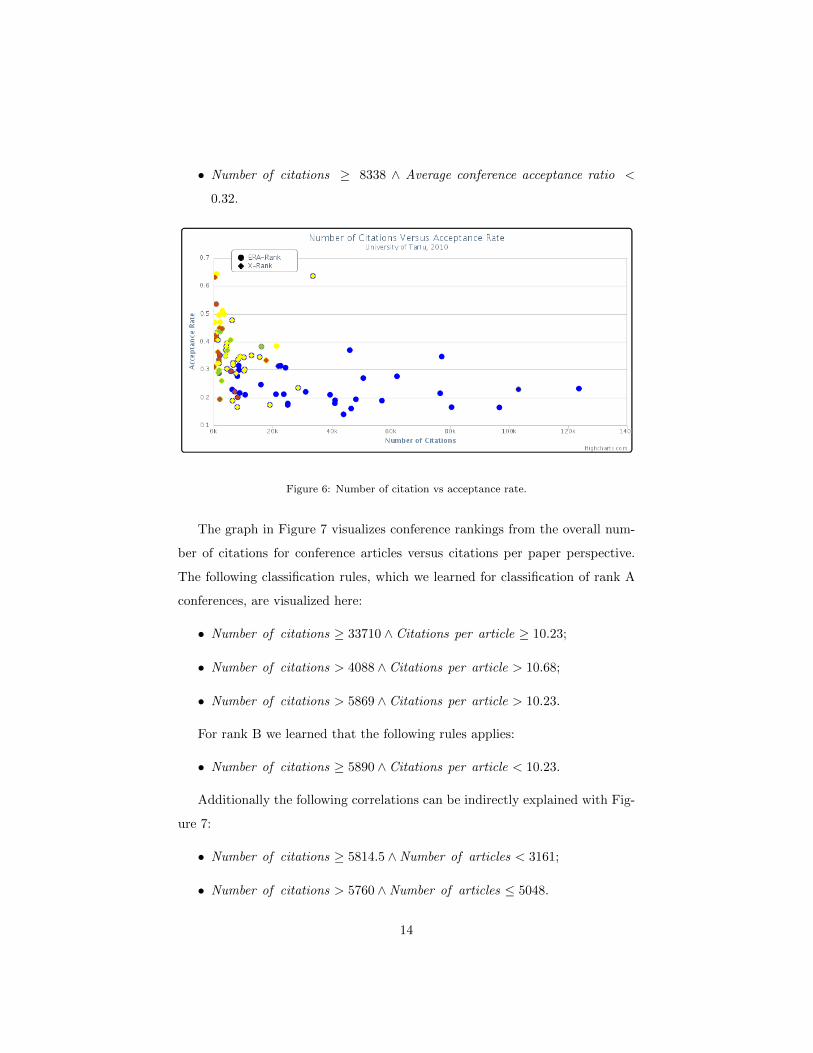
• Number of citations ≥ 8338 ∧ Average conference acceptance ratio <
0.32.
Figure 6: Number of citation vs acceptance rate.
The graph in Figure 7 visualizes conference rankings from the overall num-
ber of citations for conference articles versus citations per paper perspective.
The following classification rules, which we learned for classification of rank A
conferences, are visualized here:
• Number of citations ≥ 33710 ∧ Citations per article ≥ 10.23;
• Number of citations > 4088 ∧ Citations per article > 10.68;
• Number of citations > 5869 ∧ Citations per article > 10.23.
For rank B we learned that the following rules applies:
• Number of citations ≥ 5890 ∧ Citations per article < 10.23.
Additionally the following correlations can be indirectly explained with Fig-
ure 7:
• Number of citations ≥ 5814.5 ∧Number of articles < 3161;
• Number of citations > 5760 ∧Number of articles ≤ 5048.
14
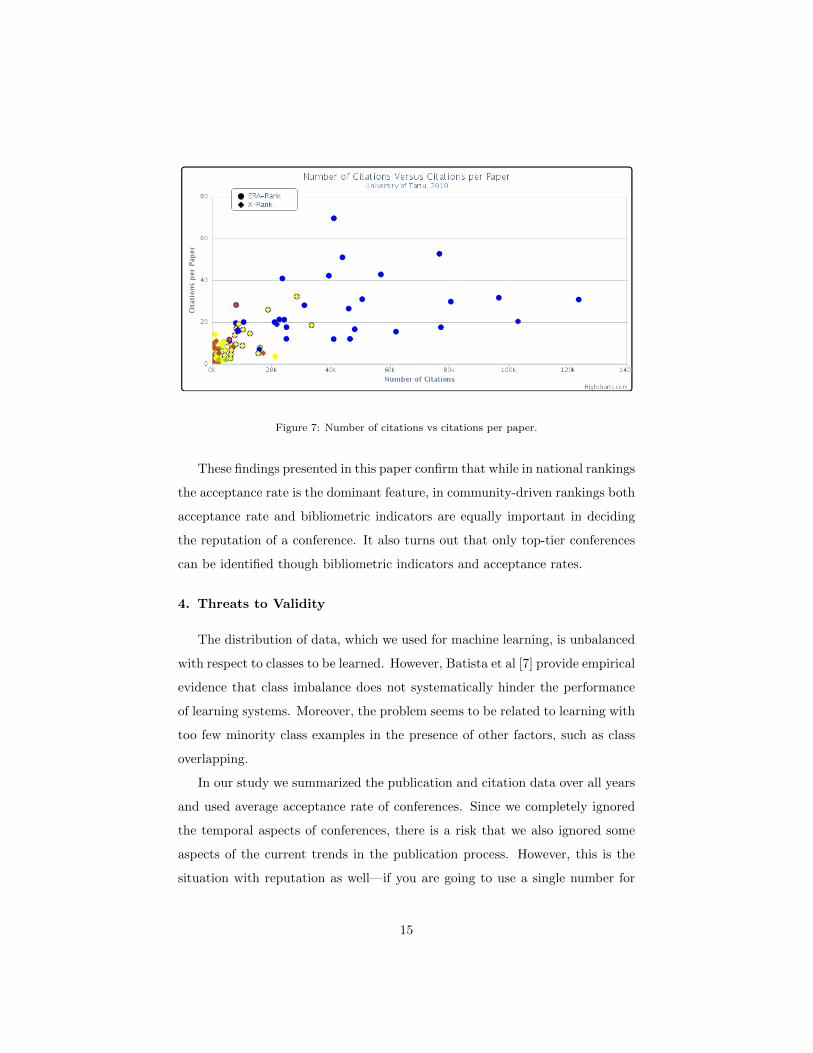
Figure 7: Number of citations vs citations per paper.
These findings presented in this paper confirm that while in national rankings
the acceptance rate is the dominant feature, in community-driven rankings both
acceptance rate and bibliometric indicators are equally important in deciding
the reputation of a conference. It also turns out that only top-tier conferences
can be identified though bibliometric indicators and acceptance rates.
4. Threats to Validity
The distribution of data, which we used for machine learning, is unbalanced
with respect to classes to be learned. However, Batista et al [7] provide empirical
evidence that class imbalance does not systematically hinder the performance
of learning systems. Moreover, the problem seems to be related to learning with
too few minority class examples in the presence of other factors, such as class
overlapping.
In our study we summarized the publication and citation data over all years
and used average acceptance rate of conferences. Since we completely ignored
the temporal aspects of conferences, there is a risk that we also ignored some
aspects of the current trends in the publication process. However, this is the
situation with reputation as well—if you are going to use a single number for
15

measuring reputation, then this is usually an aggregation of certain features
over time. However, the latter has been accepted in the studies of trust and
reputation.
Given that in different subdisciplines of Computer Science the publication
patterns vary, the predictive power of bibliographic indicators and acceptance
rates may depend also on the domain of the conference venue. For instance,
papers in larger domains attract more citations because of intra-community
references [8]. This aspect definitely needs further studies.
Finally, one may argue that by using the ERA 2010 ranking we reverse-
engineered this particular ranking. However, in fact it turns out that, although
the learned classification rules have significantly different f-measure between
ERA 2010 and Rank X, there is some consensus of both classifiers on automat-
ically classifying top-tier conferences.
5. Related Work
The most common approach to assess research consists in using bibliometric
indicators that range from very simple citation counts to sophisticated indexes
like the h-index [9] or the g-index [10]. Although these indicators have been
widely used in latter years, there are also voices arguing about its potential
problems. For example, some authors argue that H-index favors publishing
in bigger scientific domains over smaller ones [11, 8]. Laloe and Mosseri[11]
suggest that in order to maximize metrics such as H-index and G-index, the
authors should focus to more mainstream research topics with respect to more
revolutionary work, which have impact in long-term perspective.
The results of Shi et al [8] show that crossing-community, or bridging cita-
tion patterns are high risk and high reward since such patterns are characteristic
for both low and high impact papers. The same authors conclude that citation
networks of recently published paper are trending toward more bridging and
interdisciplinary forms. In the case of conferences it implies that more interdis-
ciplinary conferences should have higher potential for high impact.
16

One of the early steps in automated evaluation of scientific venues was the
work of Garfield [12] who proposed a measure for ranking journals and called it
the ImpactFactor. The initial version was an approximation of the average num-
ber of citations within a year given to the set of articles in a journal published
during the two preceding years.
Based on this early work, a variety of impact factors have been proposed
prominently exploiting the number of citations per articles. The latter ap-
proached led to measuring the popularity of the articles but not the prestige.
The latter is usually measured by scores similar to PageRank [13], which was
adopted to the citation network in order to rank scientific publication [14, 15].
Liu et al [16] extended the reach of PageRank from pure citation networks
to co-authorship networks while ranking scientists. Zhou et al [17] confirmed
through empirical findings that the ImpactFactor finds the popularity while
PageRank score shows the reputation.
Sidiropoulos and Manolopoulos [18] presented one of the first approaches to
automated ranking of collections of articles, including conference proceedings.
The ranking was based on analyzing citation networks. The main shortage
of this paper is that the rankings were not validated with respect to rankings
constructed by manually by a set of experts in the field.
Jensen et al [19] have identified that bibliometric indicators predict pro-
motions of researchers better than random assignment the best predictor for
promotion being H-index [9] followed by the number of published papers. The
study was performed on analyzing promotions of about 600 CNRS scientists.
Our results confirm that the same principles apply to conferences as well though
better predictor is the acceptance rate. Hamermesh and Pfann [20] identified
that the number of published papers has generally small impact for reputation
though it implies that a scholar is able to change jobs, and it also raises salaries.
We agree with the criticism of Adler et al [21] in the context of evaluating
researchers’ performance and impact of publications and venues based on biblio-
metric indicators, such as h-index, is that their meaning is not well understood
though the intuition is clear. Thus any automatically computed ranking, which
17

is based on a simplified model without any empirical validation, should be used
with care, especially when we aim at quantifying intangible properties such as
reputation with the help of quantifiable features. More specifically, some articles
are highly cited for reasons other than high quality and some research groups
are not reputable despite of the volume of publications or their citations.
Moed and Visser [22] analyzed rank correlation between peer ratings and
bibliometric indicators of research groups. It was found that the bibliometric
indicator showing the highest rank correlation with the quality peer ratings of
the Netherlands academic Computer Science groups, is the number of articles in
the Expanded WoS database. The authors propose that this can be interpreted
also as evidence that the extent to which groups published in refereed interna-
tional journals and in important conference proceedings (ACM, LNCS, IEEE)
has been an important criterion of research quality for the Review Committee.
Zhuang et al [23] identified and evaluated a set of heuristics to automatically
discriminate between top-tier and lower-tier conferences based on characteristics
of the Program Committees (PC). Among other things, they found that top-
tier conferences are characterized by larger PCs, more prolific PC members (in
terms of number of publications) and greater closeness between PC members in
the co-authorship graph. However, their study has limited applicability given
that it is based on collection of 20 top-tier conferences (ranked by the conference
impact factor) and 18 low-tier conferences identified manually by the authors.
This contrasts with the hundreds of entries found in the conference rankings
studied in this paper.
6. Conclusion
In this paper we presented our results on “reverse-engineering perceived rep-
utation of conferences with the aim to reveal to what extent existing conference
rankings reflect objective criteria, specifically submission and acceptance statis-
tics and bibliometric indicators. We used conference rankings as a metric for
their perceived reputation and used machine learning to figure out the rules,
18

which would enable identifying conference rankings in terms of their biblio-
metric indicators and acceptance rates. It turns out that acceptance rate of a
conference is generally the best predictor of its reputation for top-tier confer-
ences. However, combination of acceptance rates and bibliometric indicators,
more specifically the number of citations to articles in conference proceedings
and citations per article count, gives even better results for identifying top-tier
conferences both in community-driven and a national ranking.
We also found empirical evidence that acceptance rates and bibliometric
indicators are good features in identifying top-tier conferences from the rest,
whereas there is a little help of these features in distinguishing middle-tier and
bottom-tier conferences from each-other. This might indicate that other, in-
tangible features or subjective opinions, are those, which explain rankings of
conferences, which are not top-tier. Another explanation for this finding could
be that perceived reputation of conferences divides conferences into top-tier and
other conferences.
A recent study of the major database conferences and journals shows that
many of the citations reach back at least five years [24]. Thus citation statistics
takes time to accumulate and we probably have to target this aspect in our future
studies as well. As one of the future works we would like to run the experiments
with wider array of features such as conference location, season etc. Our current
intuition tells that in such a way a better classifier for distinguishing middle-tier
and bottom-tier conferences. Additionally we would like to learn more about
the dynamics of conferences to predict the perceived reputation of conferences
in their beginning.
Acknowledgement
The authors thank Luciano Garcıa-Banuelos, Marju Valge, Svetlana Vorot-
nikova and Karina Kisselite for their input during the initial phase of this work.
This work was funded by the EU FP7 project LiquidPublication (FET-Open
grant number 213360).
19

References
[1] A. Goodrum, K. W. McCain, S. Lawrence, C. L. Giles, Scholarly publishing
in the internet age: a citation analysis of computer science literature, Inf.
Process. Manage. 37 (5) (2001) 661–675.
[2] W. S. Martins, M. A. Goncalves, A. H. F. Laender, G. L. Pappa, Learning
to assess the quality of scientific conferences: a case study in computer
science, in: Proceedings of the Joint International Conference on Digital
Libraries (JCDL), Austin, TX, USA, June 2009, ACM, 2009, pp. 193–202.
[3] W. Silva Martins, M. A. Goncalves, A. H. F. Laender, N. Ziviani, Assess-
ing the quality of scientific conferences based on bibliographic citations,
Scientometrics 83 (1) (2010) 133–155.
[4] A. H. F. Laender, C. J. P. de Lucena, J. C. Maldonado, E. de Souza e
Silva, N. Ziviani, Assessing the research and education quality of the top
brazilian computer science graduate programs, SIGCSE Bull. 40 (2008)
135–145. doi:http://doi.acm.org/10.1145/1383602.1383654.
URL http://doi.acm.org/10.1145/1383602.1383654
[5] J. K. Vanclay, An evaluation of the australian research council’s jour-
nal ranking, Journal of Informetrics 5 (2) (2011) 265–274. doi:DOI:
10.1016/j.joi.2010.12.001.
[6] X. Shi, B. Tseng, L. Adamic, Information diffusion in computer science
citation networks, in: Proceedings of the International Conference on We-
blogs and Social Media (ICWSM 2009), 2009.
[7] G. E. Batista, R. C. Prati, M. C. Monard, A study of the behavior of sev-
eral methods for balancing machine learning training data, ACM SIGKDD
Explorations Newsletter 6 (1) (2004) 20–29.
[8] X. Shi, J. Leskovec, D. A. McFarland, Citing for high impact, in: Proceed-
ings of the 10th Annual Joint Conference on Digital Libraries, ACM, 2010,
pp. 49–58.
20
[9] J. E. Hirsch, An index to quantify an individual’s scientific research output,
Proceedings of the National Academy of Sciences 102 (46) (2005) 16569–
16572.
[10] L. Egghe, Theory and practice of the g-index, Scientometrics 69 (1) (2006)
131–152.
[11] F. Laloe, R. Mosseri, Bibliometric evaluation of individual researchers: not
even right... not even wrong!, Europhysics News 40 (5) (2009) 26–29.
[12] E. Garfield, Citation analysis as a tool in journal evaluation, American
Association for the Advancement of Science, 1972.
[13] L. Page, S. Brin, R. Motwani, T. Winograd, The PageRank citation rank-
ing: bringing order to the web, Tech. rep., Stanford Digital Library Tech-
nologies Project (1998).
[14] N. Ma, J. Guan, Y. Zhao, Bringing PageRank to the citation analysis,
Information Processing & Management 44 (2) (2008) 800–810.
[15] P. Chen, H. Xie, S. Maslov, S. Redner, Finding scientific gems with Google’s
PageRank algorithm, Journal of Informetrics 1 (1) (2007) 8–15.
[16] X. Liu, J. Bollen, M. L. Nelson, H. Van de Sompel, Co-authorship net-
works in the digital library research community, Information Processing &
Management 41 (6) (2005) 1462–1480.
[17] D. Zhou, S. A. Orshanskiy, H. Zha, C. L. Giles, Co-ranking authors and
documents in a heterogeneous network, in: Seventh IEEE International
Conference on Data Mining, ICDM 2007, IEEE, 2008, pp. 739–744.
[18] A. Sidiropoulos, Y. Manolopoulos, A new perspective to automatically rank
scientific conferences using digital libraries, Information Processing & Man-
agement 41 (2) (2005) 289–312.
21

[19] P. Jensen, J. B. Rouquier, Y. Croissant, Testing bibliometric indicators
by their prediction of scientists promotions, Scientometrics 78 (3) (2009)
467–479.
[20] D. S. Hamermesh, G. A. Pfann, Markets for reputation: evidence on quality
and quantity in academe, SSRN eLibrary.
URL http://ssrn.com/paper=1533208
[21] R. Adler, J. Ewing, P. Taylor, Citation statistics, Tech. rep., Joint
IMU/ICIAM/IMS Committee on Quantitative Assessment of Research
(2008).
URL http://www.mathunion.org/fileadmin/IMU/Report/
CitationStatistics.pdf
[22] H. F. Moed, M. S. Visser, Developing bibliometric indicators of research
performance in computer science: An exploratory study, Tech. Rep. CWTS
Report 2007-01, Centre for Science and Technology Studies (CWTS),
Leiden University, the Netherlands (2007).
URL http://www.cwts.nl/pdf/NWO\_Inf\_Final\_Report\_V\
_210207.pdf
[23] Z. Zhuang, E. Elmacioglu, D. Lee, C. L. Giles, Measuring conference quality
by mining program committee characteristics, in: Proceedings of the 7th
ACM/IEEE-CS Joint Conference on Digital Libraries, ACM, 2007, pp.
225–234.
[24] E. Rahm, A. Thor, Citation analysis of database publications, ACM Sig-
mod Record 34 (4) (2005) 48–53.
22