Returns on R&D investment: A comprehensive survey on the magnitude and evaluation methodologies
27
-
Upload
independent -
Category
Documents
-
view
0 -
download
0
Transcript of Returns on R&D investment: A comprehensive survey on the magnitude and evaluation methodologies

1
Returns on R&D investment: A comprehensive survey on the magnitude
and evaluation methodologies
Abstract
As technology and innovation seem to be contingent upon each other a great deal of attention
has been given to the importance of assessing the contribution of R&D investment to firm and
industry performance and, ultimately, to the economic performance of countries and regions.
In industrialised societies not only private but also public agents have allocated increasing
amounts of their resources to R&D activities, often considered the key path to innovativeness.
At the same time, due to advances in empirical research, increasingly more focused on the
micro (firms) rather than on the macro (country) level, old myths about the relationship
between R&D, innovation and success began to fall down. Firstly, the idea that innovation is
much broader than R&D has gained large support and has made it possible to identify other
sources of innovation, beyond excellence in R&D, which had been largely hidden or
neglected. As result, perceptions about small firms - or the so-called low-tech industries,
which either do not carry out any significant R&D activities or are likely to perform them
outside formal classifications - started to change. Secondly, the idea that more R&D
investment is always automatically bond to success - whatever criteria one may choose to
define success – has become nothing more than a utopia. In this paper we carry out an
analysis of the literature on the magnitude and evaluation of R&D. We identify the
methodologies used and analyse to what extent the magnitude of (eventual) R&D returns is
dependent on the methodology pursued and the level of analysis - firms (micro), industry
(meso), and regions/countries (macro) - considered. We conclude that methodological
approaches and levels of analysis determine, to some extent, the type of results obtained and,
thus, variances between them.
Keywords: Innovation and R&D indicators; Methodologies; Macro, meso and micro levels;
R&D payoff.
Andreia Cardoso Aurora A.C. Teixeira
INESC Porto INESC Porto; CEFUP; Faculdade de
Economia, Universidade do Porto
2
1. Introduction
In today’s knowledge-based societies the assumption that innovation plays a decisive role in
the economic growth of a country or region is prevalent (Bilbao-Osorio and Rodríguez-Pose,
2004; Howells, 2005). Within this innovation-demanding environment, technology and
technological advances emerge as driving forces of innovation and economic growth, which
explains the reason why increasing attention has been drawn to high-tech industries by
innovation policies, with the former being frequently addressed by the latter as fundamental
routes to economic growth (Bender, 2006).
Firms are systematically pushed to search for growth opportunities in the market, to get to the
market before their rivals and this means that they should be able to innovate at an
extraordinary fast pace (Karlsson et al., 2004), by developing or improving processes and
products and by generating ideas likely to be converted into commercially viable and
profitable products or services. The answer to all the challenges defying industries seems then
to rely on technology, apparently the only route to successful performance (Wakelin, 2001)
and, eventually, to rising standards of living, as Grossman and Helpman (1993) emphasized.
As technology and innovation seem to be contingent upon each other – even though, only
apparently - a great deal of attention has been given to the importance of assessing the
contribution of R&D investment to firm and industry performance and, ultimately, to the
economic performance of countries and regions. Indeed, in industrialised societies not only
private but also public agents have allocated increasing amounts of their resources to R&D
activities (Papadakis, 1995; Walwyn: 2007), often considered the key path to innovativeness.
As it was observed by the American Office of Technology Assessment (1986: 3), “[…]
economists have shown a strong positive correlation between research and development
(R&D) spending and economic growth. They have estimated private returns in excess of 20
percent per year and social returns in excess of 40 percent on private sector R&D
expenditures”. Thus, measuring the returns on R&D investment has become a top priority -
and also a challenge, if not a dilemma - , not only for economists and firms/industries
managers, but also for innovation policy decision-makers at the public level.
At the same time, due to advances in empirical research, increasingly more focused on the
micro (firms) rather than on the macro (country) level, old myths about the relationship
between R&D, innovation and success began to fall down. Firstly, the idea that innovation is
much broader than R&D has gained large support (Bougrand and Haudeville, 2002; Drake et
3
al., 2006; Bogers and Lhuillery, 2006) and has made it possible to identify other sources of
innovation, beyond excellence in R&D, which had been largely hidden or neglected. As result,
perceptions about small firms, or the so-called low-tech industries, which either did not carry
out any significant R&D activities, or performed them outside formal classifications, started
to change (Hoffman et al., 1998; Roper, 1999). Secondly, the idea that more R&D investment
is always automatically bond to success - whatever criteria one may choose to define
success – became nothing more than a utopia (Papadakis, 1995; Lefebvre et al., 1998).
In the present paper we aim at surveying the literature selected on the magnitude and
evaluation of R&D, and, possibly, of innovation. We began by considering journals which
were likely to address these issues more systematically in their editions: Research Policy,
Research Technology Management and Technovation. In a sort of snowball effect, the papers
surveyed led us then to articles of other journals. We identify the methodologies used and
analyse to what extent the magnitude of (eventual) R&D returns is dependent on the
methodology pursued and the level of analysis - firms (micro), industry (meso), and
regions/countries (macro) - considered.
The paper is structured as follows: in Section 2 we review the literature on R&D to analyze
the spectrum of methodologies which have been employed by several authors to assess the
returns on R&D investment and the different magnitudes reported by the studies surveyed.
Our analysis of the literature covered is organised according to the level of analysis (micro,
meso and macro) adopted by each study. In Section 3, we critically summarize the findings
and highlight the implications of the present survey as regards to methodological issues and to
the relationship between R&D and economic performance in traditional, low-tech industries.
2. Reviewing the magnitude of returns on R&D investment and methodologies for
assessing such returns
2.1. General overview
One of the dilemmas which challenge scholars, policymakers, and business managers is how
to conveniently assess whether R&D investments are coming to fruition or not. Since R&D
activities still have a central place in the innovation process for many (Drake et al., 2006),
measuring the impact of R&D spending, tracking its effectiveness, checking whether the costs
justify the expenses, are not clichés, but real concerns that are not to be overlooked in both
public and private sectors, since R&D activities compete with other activities in the run for
(scarce) resources allocation. These concerns for measurement are insightfully summarised in
4
the statement made by Oxman (cited in Karlsson et al., 2004: 179): “[measurement is] the
first step that leads to control and eventually to improvement. If you can’t measure something,
you can’t understand it. If you can’t understand it, you can’t control it. And if you can’t
control it, you can’t improve it”.
In result, different methodologies, ranging from more quantitative to more qualitative
approaches, have been employed to estimate the return on R&D investment and to facilitate
decision-making at different levels. However, consensus on how good a certain methodology
is to capture the mechanism driving the relationship between R&D and economic
performance is definitely lacking.
It is undeniably true that a great deal of research work carried out has found evidence of a
positive correlation between R&D investment and economic performance at different levels
of aggregation (Almeida and Teixeira, 2007). However, it is worth remembering that
correlation does not mean causality (Hartmann, 2003), and that the reasons why several
studies attempting to investigate on that relationship have led to divergent results and
conclusions must be ascertained.
As regards to this last statement, we are inclined to agree with Wieser’s (2005: 587) argument
that variations between studies can be partly explained by “methodological and conceptual
issues”. Almost a decade before, OTA (1986: 14) also acknowledged the difficulties of
describing the relationship between R&D investment and productivity growth as a causality
relationship, adding that different results produced by studies on this relationship were a
reflection of “the tentative and hypothetical nature of the methodologies” employed.
In this section we analyze studies that attempted to investigate on the empirical relationship
between RDI investment and economic performance. The studies surveyed vary both in the
level of analysis and in the methodologies selected. It follows that results and conclusions also
vary accordingly. We grouped the studies into four categories: macro (country and regional
level); meso (industry level), and micro (firm level).
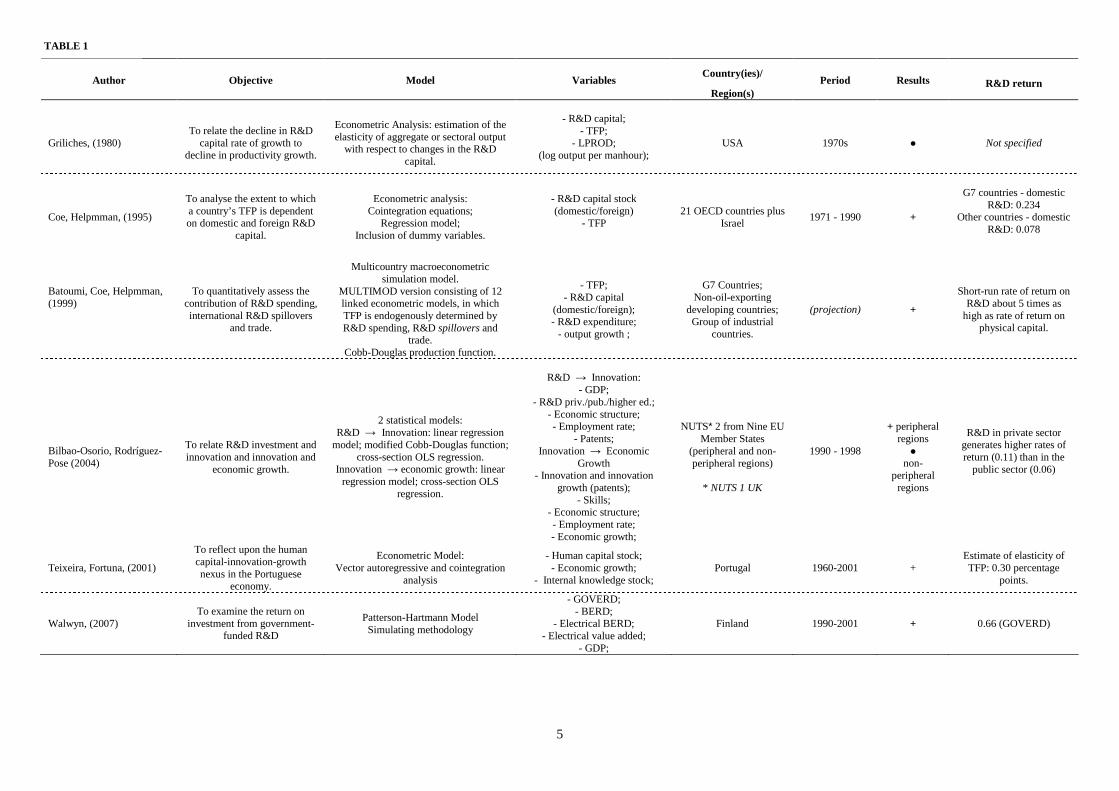
2.2. Macro (country and regional level) perspective
In the macro-perspective, countries and regions are the scope of analysis. At this level, the
aim is to analyse how R&D investment can be linked to the economic performance of a
country/region or a group of countries/regions. In this subsection, we analyze 6 studies which
cover different set of countries or regions and collect data from a time frame that goes from
the 70s to 2001.
5
Author Objective Model Variables Country(ies)/
Region(s) Period Results R&D return
Griliches, (1980)
To relate the decline in R&D
capital rate of growth to decline in productivity growth.
Econometric Analysis: estimation of the elasticity of aggregate or sectoral output
with respect to changes in the R&D capital.
- R&D capital;
- TFP; - LPROD;
(log output per manhour);
USA
1970s
●
Not specified
Coe, Helpmman, (1995)
To analyse the extent to which a country’s TFP is dependent on domestic and foreign R&D
capital.
Econometric analysis:
Cointegration equations; Regression model;
Inclusion of dummy variables.
- R&D capital stock (domestic/foreign)
- TFP
21 OECD countries plus
Israel
1971 - 1990
+
G7 countries - domestic
R&D: 0.234 Other countries - domestic
R&D: 0.078
Batoumi, Coe, Helpmman, (1999)
To quantitatively assess the
contribution of R&D spending, international R&D spillovers
and trade.
Multicountry macroeconometric
simulation model. MULTIMOD version consisting of 12 linked econometric models, in which TFP is endogenously determined by R&D spending, R&D spillovers and
trade. Cobb-Douglas production function.
- TFP;
- R&D capital (domestic/foreign); - R&D expenditure;
- output growth ;
G7 Countries;
Non-oil-exporting developing countries; Group of industrial
countries.
(projection)
+
Short-run rate of return on
R&D about 5 times as high as rate of return on
physical capital.
Bilbao-Osorio, Rodríguez-Pose (2004)
To relate R&D investment and innovation and innovation and
economic growth.
2 statistical models:
R&D → Innovation: linear regression model; modified Cobb-Douglas function;
cross-section OLS regression. Innovation → economic growth: linear
regression model; cross-section OLS regression.
R&D → Innovation:
- GDP; - R&D priv./pub./higher ed.;
- Economic structure; - Employment rate;
- Patents; Innovation → Economic
Growth - Innovation and innovation
growth (patents); - Skills;
- Economic structure; - Employment rate; - Economic growth;
NUTS* 2 from Nine EU
Member States (peripheral and non-peripheral regions)
* NUTS 1 UK
1990 - 1998
+ peripheral
regions ●
non-peripheral regions
R&D in private sector generates higher rates of return (0.11) than in the
public sector (0.06)
Teixeira, Fortuna, (2001)
To reflect upon the human capital-innovation-growth nexus in the Portuguese
economy.
Econometric Model: Vector autoregressive and cointegration
analysis
- Human capital stock; - Economic growth;
- Internal knowledge stock; Portugal 1960-2001 +
Estimate of elasticity of TFP: 0.30 percentage
points.
Walwyn, (2007) To examine the return on
investment from government-funded R&D
Patterson-Hartmann Model Simulating methodology
- GOVERD; - BERD;
- Electrical BERD; - Electrical value added;
- GDP;
Finland 1990-2001 + 0.66 (GOVERD)
TABLE 1
6
It is important to notice that in almost – if not in all – of the papers surveyed the assumption
of a quasi deterministic view that R&D investment is causatively related to the economic
performance of countries/regions is practically abandoned. It is also well worth noting that
here the magnitude of returns is likely to be larger than that of studies which remain at a lower
level of aggregation (namely micro/firm level).
Solow’s theory that economic growth could be prompted by improvements in technology led
economists to draw their attention to the importance of measuring the contribution of R&D
expenditure - as proxy to technological change - to productivity growth (Wakelin, 2001). This
concern for R&D measurement was specially acute in the 70’s, since productivity fell off
across several different countries and the slowdown in R&D expenditure was rapidly taken as
the main explanatory factor for such a slowdown.
In one of his earlier works, Griliches (1980) attempted to examine whether US slowing
productivity in the 70’s could be attributed, wholly or partly, to a decline in the growth of real
R&D expenditures, taking the manufacturing sector as the scope of analysis. He assumed ab
initio that it was not scientifically legitimate to explain US economic crisis – reflected in a
productivity slowdown - as the primary consequence of R&D spending decline. This
reluctance of Griliches to explain the relationship between R&D and growth through a linear
and simplistic model was prompted by the fact that, according to the author’s view, the 70’s
were not a particularly favourable period to assess the impact of R&D investment on growth,
since most of OECD countries had been affected by the oil price shocks (Hall and Mairesse,
1995). Moreover, how could R&D slowdown be made the culprit of productivity slowdown,
when the systems of measurement had neither been able to isolate that relationship from other
influential factors nor even included in calculations R&D externalities within and across
industries? (Griliches, 1980).
To support the hypothesis that no clear empirical relation could be found between R&D
expenditures slowdown and the US productivity slowdown, Griliches opted for an
econometric analysis and it followed that R&D coefficients declined as well as their statistical
significance, reaching values very close to zero in the period of 1969-1977.
According to Griliches (1980: 347), the significant drop of the R&D coefficient in that period,
could have been a reflection of the fact that “the large energy price shocks, the resulting
fluctuations in capacity utilization, the substantial increase in uncertainty about future
absolute and relative prices may have forced many firms away from their long-run production
frontiers. What we see in the data are not movements along the technological frontier, and

7
hence they should not and cannot be attributed to a variable whose role is to shift this frontier
outward”.
Relating this decrease to productivity slowdown in the 1970’s could be reductive, given the
fact that both R&D spillovers and R&D social returns had been neglected by national
accounts, favouring a distortion of the real impact of R&D capital on productivity. Moreover,
from Griliches’s point of view, in the period covered by his study, a significant fraction of
R&D investment was being diverted into defence, space exploration, health, environment and
into goods and services such as computers. However, the quality improvements resulting from
such expenditures were being left out of national accounts. What followed from this
miscalculation, was that the “slowdown in R&D that could have had a measurable impact was
not as large as the crude figures might indicate”, “since much of the slowdown in R&D” (pp.
344) had been taking place in the sectors mentioned above.
Coe and Helpman (1995) investigated the extent to which a country’s total factor productivity
was contingent upon its own R&D capital (domestic R&D capital) and upon foreign R&D
capital. Their primary assumption was that in a world where knowledge and information met
no frontiers and goods and services were traded at international scale, a country’s productivity
level would depend on domestic as well as on foreign R&D capital stocks. Using data from
the period of 1970-1990, the authors pursued an econometric analysis, in which cumulative
R&D expenditure was used as proxy for a stock of knowledge. For each country, two types of
stock of knowledge were constructed: one based on domestic R&D expenditure and another,
the foreign stock of knowledge, based on R&D spending of the country’s trade partners. As
regards to the construction of foreign R&D capital stocks, the authors used import weighed
sums of trade partner’s cumulative R&D spending, a procedure similar to that used by
Teleckyj in 1974 (Goto and Suzuki, 1989) to analyze how technology flowed across
industries. A calculation of the measure of TFP was made once again for each country.
Finally, the effects of domestic and foreign R&D capital stocks on total factor productivity
were estimated. To assess the relationship between TFP and domestic and foreign R&D
capital stocks, cointegrated equations were used due to their “attractive econometric
properties” (Coe and Helpman, 1995: 868).
Results of this study showed clear evidence that a country’s total factor productivity
(positively and significantly) depended on its domestic R&D capital stock as well on the
R&D capital stock of its trade partners.
Four years later (1999), Coe and Helpman joined Bayoumi for a research aiming at examining
quantitatively the contribution of R&D, international R&D spillovers and trade on a country’s
8
Total Factor Productivity (TFP) and output growth. Results of the simulating multicountry
macroeconometric model pursued confirmed the existence of a positive relation between
R&D and growth both in industrial and developing countries.
Using similar cointegration techniques, but focusing only in one country (Portugal) over four
decades (1960-2001), Teixeira and Fortuna (2004) conclude that R&D stock contributed
positively and significantly for Portuguese productivity in the period in analysis, although its
contribution was below that of human capital’s.
Bilbao-Osorio and Rodríguez-Pose (2004) argue that the deterministic approach to R&D
investment as an automatic driver to revenue has lost credibility. There are several other
factors that must be taken into account when assessing the effectiveness of R&D investment,
namely “socials filters” , that is, the social components of a region – type of labour market,
demography and education - which can be taken as explicable factors of why not all regions
are capable of turning their R&D into innovation and innovation efforts into economic growth
in a similar way. These “social filters”, differing from region to region, contribute to the
emergence of regional disparities, since regions’ capacities to profit from technology and to
reap the benefits of their investment in R&D vary. In the study conducted alongside Bilbao-
Osorio, Rodriguez-Pose went further with his argument on the role played by “social filters”,
by analyzing the major differences in the innovation and economic growth patterns between
peripheral and non-peripheral regions in Europe. The analysis unfolded in two different
phases. In the first one, the authors started by investigating the relationship between R&D
investment and innovation, for which a standard knowledge production function was used as
proposed by Griliches in 1979 and by Jaffe in 1986 and a log-log specification, except for the
variables represented as a percentage. Variables included in the regression model were:
patents (a proxy to innovation and, thus, the dependent variable), GDP, R&D investment as a
percentage of GDP, and the so-called social filters (skills; economic structure and
employment rate). The methodological model put forward to assess how R&D could be
linked to the genesis of innovation was highly “explanatory” as stated by the authors, who
conclude that the model was, however, more suitable for innovation in peripheral regions. In
the second phase, the authors attempted to examine the relationship between innovation and
economic growth, by using a linear regression model where innovation and innovation growth
were used as independent variables and socio-economic factors were once again added to the
equation. The main conclusion to be drawn from the results presented in this study is that
R&D investment has different impacts on innovation and economic growth depending on the
sectors or on the regions where it has been carried out.

9
Despite the fact that, in general, R&D activities are positively linked to the genesis of
innovation, sectors and regions do react indeed differently to R&D investment. Take, for
instance, the case of public and private sectors considered in the study surveyed: research
activities performed by the private sector had, comparatively, higher rates of return than the
research conducted by the public sector, which was not entirely surprising given the fact that
the private sector is far more interested in committing itself to a sort of research that can be
easily commercialized in the market (Bilbao-Osorio and Rodríguez-Pose, 2004). Another
worthwhile example is that of the role played by the private and public sectors as stimuli to
R&D activities and, therefore, to innovation and economic growth. As the authors suggested,
it was evident that in non-peripheral regions privately-funded research “seems to be the main
motor of innovation”, while in peripheral regions “it is the research conducted by higher
education institutions which reports positive returns” (pp. 452).
Although it is not our intention to overestimate the weight of “social filters” or the social
environment of a region, we should not dismiss Bilbao-Osorio and Rodrigues-Pose’s view
about the need not to ignore that variance in innovation patterns across regions should not be
dissociated from their socio-economic characteristics.
Focusing on government-funded R&D, Walwyn (2007) provides an interesting analysis of the
relationship between R&D and economic growth, taking Finland, and in particular, the
Finnish mobile phone industry, as the empirical context. Although the author acknowledges
that it is extremely difficult – if not impossible - to establish a clear link between R&D and
economic growth without taking the risk to plunge into ambiguous and not scientifically-
grounded conclusions, he argues that the mobile phone manufacturing sector in Finland
appears to be an exception to the rule, emerging as an interesting case study from which that
relationship can be assessed. Indeed, the author pointed out that the Finnish case provided the
possibility to isolate that relationship from other variables that are frequently said to exert
some degree of influence. Using economic data from 1990 up to 2001, the author investigated
the relationship between government-funded R&D and Business Expenditure in R&D
(BERD); between electrical BERD and electrical value added and, eventually, between BERD
and GDP, using the Patterson-Hartmann Model. Initially conceived to relate company-level
R&D expenditure to product revenue and to allow managers to use investment and wave
shapes to simulate hypothetical scenarios, more precisely, to simulate the probable outcomes
of R&D budget plan and control the time-lag between investment in product development and
its respective revenue (Hartmann, 2003), this model came to be rather appropriate to evaluate
the impact of government-funded R&D on the growth of the Finnish mobile phone
10
manufacturing sector and on the growth of Finland’s economy as a whole. Including
parameters such as product investment wave shape, product revenue wave shape, R&D
intensity, growth rate and sector or company gain, the model was quite useful not only
because it incorporated lengthy time delays between investment and growth but also because
it made possible to extract conclusions about the impact of both public and business R&D on
economic growth (Walwyn, 2007). Among Walwyn’s interesting findings, we highlight the
remarkably high return on R&D investment achieved by the Finnish government. By looking
at the data provided by Walwyn’s research, we have to agree with the author’s conclusion that
government R&D-funding in a promising sector – the cell phone sector - worked as a
stimulus to industry research investment in Finland, laying the framework within which the
private sector came to invest in R&D.
2.2. Meso (industry level) perspective
As regards to the meso perspective, the 5 papers covered in this section take (manufacturing
and non-manufacturing) industries as units of analysis. The following table summarizes the
main contents of each paper, indicating that, at the meso level too, definitive conclusions
about R&D and economic performance cannot be drawn.
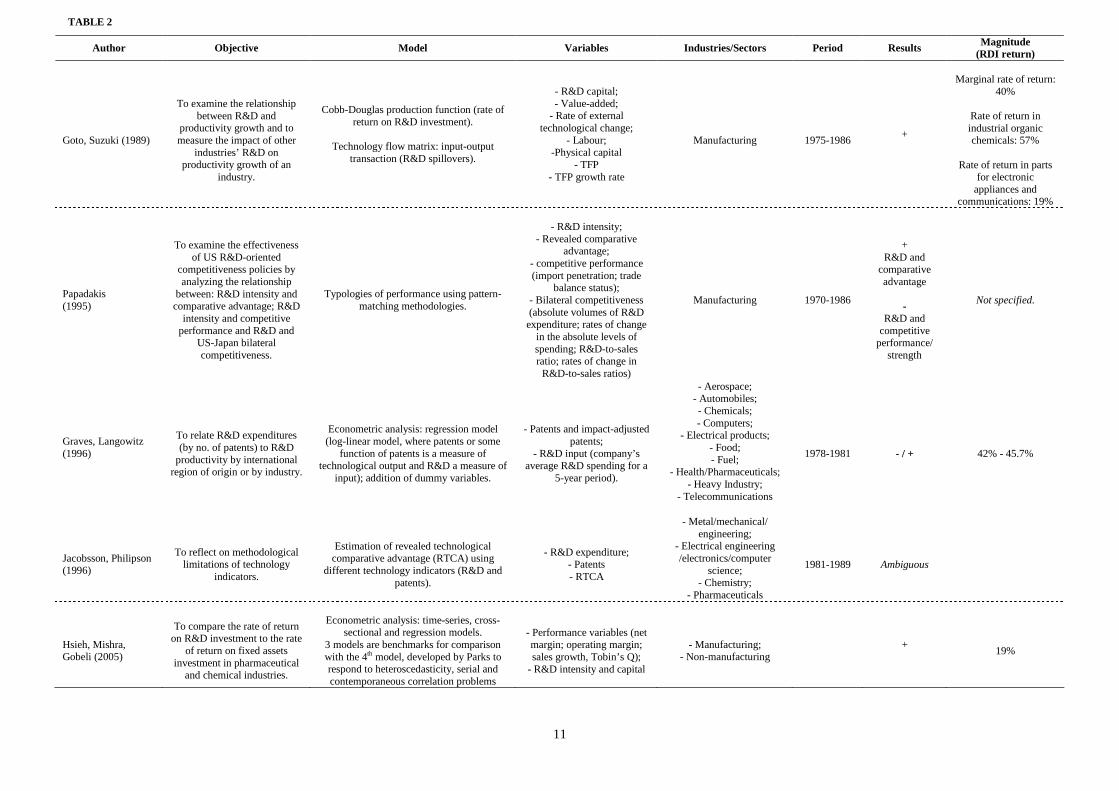
Our analysis starts with the study by Goto and Suzuki (1989). These authors, investigating on
the effects of R&D on the productivity growth of Japanese manufacturing industries, refined
the approach to this relationship by introducing in their methodological model a reformulated
concept of R&D capital and reached the conclusion that, for the sample considered, the
marginal rate of return on R&D investment was, on average, around 40% and that social
returns on R&D investment were larger than private returns. These results were obtained
through a two-step analysis: first, to estimate the rate of return on R&D investment, the
authors constructed series of R&D capital for the industries selected and used a Cobb-
Douglas production function with R&D capital as an input along with other more
conventional inputs such as capital and labour. In this model, the concept of R&D capital
gained special relevance. According to the authors, using R&D capital as an input is
worthwhile because “it reflects the amount of knowledge a firm or an industry has
accumulated”; describes “the firm or industry’s production process in terms of “R&D
intensity”, and indicates “the future potential of the firm or industry to develop new products
or processes” (Goto and Suzuki, 1989: 556).
11
Author Objective Model Variables Industries/Sectors Period Results Magnitude (RDI return)
Goto, Suzuki (1989)
To examine the relationship
between R&D and productivity growth and to measure the impact of other
industries’ R&D on productivity growth of an
industry.
Cobb-Douglas production function (rate of
return on R&D investment).
Technology flow matrix: input-output transaction (R&D spillovers).
- R&D capital; - Value-added;
- Rate of external technological change;
- Labour; -Physical capital
- TFP - TFP growth rate
Manufacturing
1975-1986
+
Marginal rate of return:
40%
Rate of return in industrial organic chemicals: 57%
Rate of return in parts
for electronic appliances and
communications: 19%
Papadakis (1995)
To examine the effectiveness
of US R&D-oriented competitiveness policies by analyzing the relationship
between: R&D intensity and comparative advantage; R&D
intensity and competitive performance and R&D and
US-Japan bilateral competitiveness.
Typologies of performance using pattern-
matching methodologies.
- R&D intensity;
- Revealed comparative advantage;
- competitive performance (import penetration; trade
balance status); - Bilateral competitiveness (absolute volumes of R&D expenditure; rates of change
in the absolute levels of spending; R&D-to-sales ratio; rates of change in R&D-to-sales ratios)
Manufacturing
1970-1986
+
R&D and comparative advantage
-
R&D and competitive
performance/ strength
Not specified.
Graves, Langowitz (1996)
To relate R&D expenditures (by no. of patents) to R&D
productivity by international region of origin or by industry.
Econometric analysis: regression model (log-linear model, where patents or some
function of patents is a measure of technological output and R&D a measure of
input); addition of dummy variables.
- Patents and impact-adjusted
patents; - R&D input (company’s
average R&D spending for a 5-year period).
- Aerospace; - Automobiles; - Chemicals; - Computers;
- Electrical products; - Food; - Fuel;
- Health/Pharmaceuticals; - Heavy Industry;
- Telecommunications
1978-1981
- / +
42% - 45.7%
Jacobsson, Philipson (1996)
To reflect on methodological
limitations of technology indicators.
Estimation of revealed technological comparative advantage (RTCA) using
different technology indicators (R&D and patents).
- R&D expenditure;
- Patents - RTCA
- Metal/mechanical/ engineering;
- Electrical engineering /electronics/computer
science; - Chemistry;
- Pharmaceuticals
1981-1989
Ambiguous
Hsieh, Mishra, Gobeli (2005)
To compare the rate of return
on R&D investment to the rate of return on fixed assets
investment in pharmaceutical and chemical industries.
Econometric analysis: time-series, cross-
sectional and regression models. 3 models are benchmarks for comparison with the 4th model, developed by Parks to respond to heteroscedasticity, serial and contemporaneous correlation problems
- Performance variables (net margin; operating margin; sales growth, Tobin’s Q);
- R&D intensity and capital
- Manufacturing;
- Non-manufacturing
+
19%
TABLE 2
12
Some remarks should be made, however, about the implications of using a model as the one
put forward in the study. First, time lag adjustments should be introduced, as “a certain length
of time is requested before R&D is completed and the product embodying the technology is
sold” (pp. 599). This time length varies from industry to industry. Second, difficulties in the
access to data that would allow the authors to distinguish R&D capital from other forms of
capital and R&D personnel from other types of workers have resulted in a double-counting
problem. Therefore, it is to conclude that “the rate of return should be interpreted as the
excess rate of return” (pp. 559). As regards to assessing the impact of other industries’ R&D
on the productivity growth of an industry, the authors built a technology flow matrix based on
Terlecckyj’s matrix to weight R&D spillovers between and within industries, and therefore,
how transferable technological knowledge would be. This transference may either occur
through knowledge diffusion or spillover or through a transaction. Results showed that the
technology flow matrix used by Goto and Suzuki and made up of R&D expenditure of
supplying industries presented a larger coefficient than each firm’s private R&D expenditure
when estimating TFP growth, leading the authors to conclude that the social return on R&D
investment exceed by far the rate of return on R&D private investment.
Just as an aside, in the debate on R&D payoff we should be aware that a significant part of the
effects of R&D investment is not always appropriated by firms’ accounts - and thus not
measured by them - so conclusions drawn from merely looking at statistical figures at firm
level may be misleading. As Bernstein (1989) underlines, a feature of R&D is that firms
cannot capture all of the benefits emanating from their own investment. It is to presuppose
that the R&D of a given input-supplying industry will affect the productivity growth of buyers,
which will certainly capture and incorporate some of the fruits of the former through the so-
called technology flow (cf. Goto, Suzuki, 1989; see also Bernstein, 1989). The R&D payoff
may not have been fully captured by the R&D intensive-industry, but the technology
externalities of that R&D will tend to favour the economic performance (e.g. productivity
growth) of the industries which purchase the products or services embodying the other
industry’s R&D. It is relevant to underline as well that due to the public good nature of
knowledge not all R&D benefits are reaped by the firm which makes the investment and sells
the goods. Some industries can have access to new knowledge without costs, that is to say,
without having carried out any kind of transaction with the industry or the industries which
have brought about a new technology.
13
Papadakis (1995) conducted a research aimed at exploring some questions related to the
assessment of the effectiveness of US R&D-oriented competitiveness policies. The author
brought to the fore the risky implications of relying on the too deterministic view which
related R&D efforts to a country’s capability to be competitive. Papadakis was aware that the
analytic models available to assess the relationship between R&D and economic performance
imposed severe limitations to prevent from any misleading interpretations. One of them was
related to the fact that current R&D as an empirical measure was only capturing the first stage
of technological change – the invention stage – neglecting the commercial adoption and
diffusion stages. Given this limitation, and in order to examine the relationships referred in
Table 2, the author developed a model which assumed the existence of a functional link
between a country’s industrial R&D efforts and its competitive performance. Three different
types of data were used and revealed comparative advantage, competitiveness and R&D
spending were calculated for the US industrial sectors. In the analysis R&D intensity, “is
represented […] by the categorization of industries into high, medium and low technology
groupings. The particular classification scheme employed here is used pervasively by OECD
and is based upon the R&D-to-output ratios of each industry. Thus, high-tech industries are
the most R&D intensive industries and low-tech industries the least R&D intensive” (pp. 573).
As regards to the relative strength of US and Japanese R&D efforts, it is important to mention
that four separate indicators of R&D activity were introduced in the analysis: absolute volume
of R&D expenditure, rates of change in the absolute levels of spending; R&D-to-sales ratios
and rates of change in R&D-to-sales rations. A ranked typology of R&D effort was then built.
One of the main findings of the bilateral analysis contradicts the widespread assumption that
R&D-intensive industries demonstrate always the strongest competitive performance. Indeed,
in Papadakis’s sample analysis, several high-tech industries reflecting higher commitment to
R&D were non-competitive. In a comparison between Japan and the United States, figures
showed, for instance, that “Japan’s competitive industries do not have any systematically
superior R&D effort relative to the US, and in two sectors, electronics and instruments,
Japan’s industrial R&D efforts are well below those of the United States. Moreover, there are
two Japanese industries which demonstrate superior R&D effort but are nonetheless
noncompetitive […]”. (1995: 576).
Papadakis’s conclusions bring to the fore the need to reject the common and fallacious idea
that considers high-tech, research-intensive and science-based industries as industries where
more prospects of economic growth seem to lie.
14
The PILOT report stated these types of industries tended to be regarded “as the main source
of highly sophisticated products that are not easily imitated elsewhere and, therefore, the
policy conclusion is that high-cost industrialised countries should concentrate their efforts on
promoting these industries.” (Bender, 2006: 6); on the other hand, non-research-intensive,
low-tech and medium-low tech industries tend to be marginalised by policy decision-makers,
as they are “presented as being less important as agents for change in major industrialised
countries”. (pp. 14). Under this logic, it is assumed that industries can only have better market
performance if they are able to constantly introduce innovation in their processes and/or
products, in a way that should not be easily replicated by other industries. Since in a
knowledge-based society technology is often taken as a prerequisite for innovation, the
emphasis is usually placed on the role of research-intensive industries as key drivers of
economic growth.
In the 90s, Graves and Langowitz focused their attention on the productivity of R&D
expenditures from a global multi-industry perspective. What they observed - by taking patents
and impact-adjusted patents as measures of innovative output and then by examining their
relationship with R&D spending - was that returns to scale in R&D decreased regardless of
country of origin or industry. Nonetheless, the rate of decreasing returns and the level of
returns to R&D differed across industries and also across regions. Just to mention, according
to the research carried out by the two authors, the chemical industry had always presented a
significantly higher level of returns than other industries. The authors put forward that this
could mean “that chemicals are inherently a more fertile ground for patentable research than
are other industries. Or it may mean that chemical companies consider patents to be of greater
importance to their survival, thus generally pursuing and receiving patents at a markedly
higher level than general industry, i.e., they have a higher propensity to patent”. (pp. 134).
This remark leads us to a study by Hsieh et al. (2003), which reported for the chemical and
pharmaceutical industries an average rate of return from R&D investment to operating margin
significantly higher than the industry cost of capital (ranging from 9% to 11%) and found
evidence that investment in R&D improves more significantly a firm’s market value than
investment in fixed assets. In this study, in order to investigate the linkage between R&D
spending level and four measures of company performance (net margin, operating margin,
sales growth and Tobin’s Q), the authors have constructed a sample of 39 firms from the
pharmaceutical and chemical industries, for which the data set required could be easily
available so as to avoid “estimation difficulty”. (pp. 143). Four different regression models
15
were then used. By implementing this methodology, which allowed “control for both
contemporaneous and firm specific serial correlation, as well as the feedback between firm
profitability and investments” the authors were able to “compare the rate of return from a
dollar investment on R&D to a dollar investment on fixed assets in pharmaceutical and
chemical industries” (pp. 148).
As regards to measures of R&D and economic performance, it is worth looking at the study
by Jacobsson and Langowitz (1996), which brought to the fore some of the methodological
implications of using R&D and patents as technology indicators. By selecting these two
indicators to analyse the country’s technological specialization, they aimed at assessing if
patents and R&D expenditure, when used separately, were consistent with the common
depiction of Sweden’s technological profile. Although this study is apparently not related to
the purposes of our paper, since the authors’ main point is not to evaluate the returns of R&D
expenditure but to reflect on the methodological limitations of using some technology
indicators to infer the technological profile of a country, we still believe that it is relevant to
be aware of the potentialities and drawbacks of opting for certain indicators in a
methodological model trying to assess the relationship between R&D and economic
performance. After estimating revealed technological comparative advantage (RTCA), using
R&D and patents as technology indicators, the authors found that it was particularly risky and
misleading to take a single technological indicator to assess the technological position of a
firm or country. This argument results from the fact that when the authors used R&D and
patents separately these indicators diverged significantly with respect to Sweden’s position in
pharmaceuticals: while the R&D data suggested a strong Swedish position, the patent data
indicated the opposite.
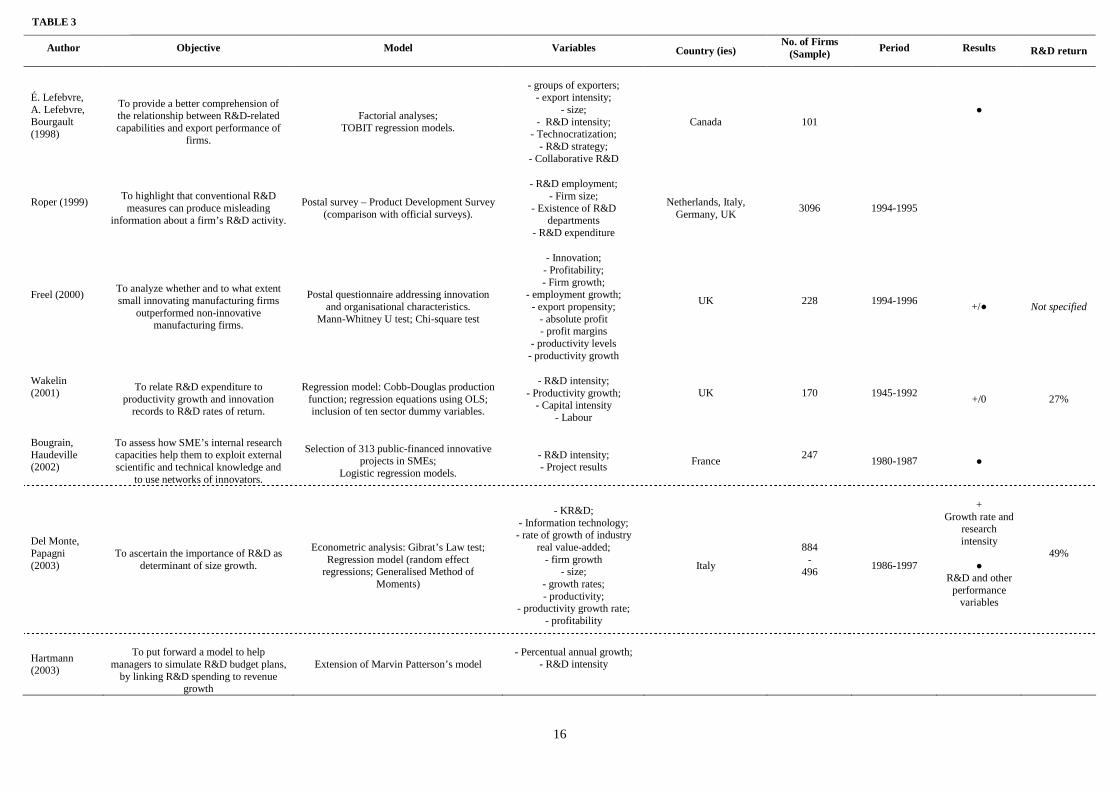
2.4. Micro perspective
In this sub-section, we will take an insight into the relationship between R&D and economic
performance from a firm perspective. The studies surveyed date from the late 1990s
onwards – thus, more recent than the studies considered in the two previous sub-sections. This
may be symptomatic of the fact that, increasingly attention is being given to the impact of
R&D on the performance of firms, challenged by today’s knowledge-oriented economy. Here
again, findings vary as showed in the following table:
16
Author Objective Model Variables Country (ies) No. of Firms
(Sample) Period Results R&D return
É. Lefebvre, A. Lefebvre, Bourgault (1998)
To provide a better comprehension of the relationship between R&D-related capabilities and export performance of
firms.
Factorial analyses;
TOBIT regression models.
- groups of exporters;
- export intensity; - size;
- R&D intensity; - Technocratization;
- R&D strategy; - Collaborative R&D
Canada
101
●
Roper (1999)
To highlight that conventional R&D measures can produce misleading
information about a firm’s R&D activity.
Postal survey – Product Development Survey
(comparison with official surveys).
- R&D employment;
- Firm size; - Existence of R&D
departments - R&D expenditure
Netherlands, Italy,
Germany, UK
3096
1994-1995
Freel (2000)
To analyze whether and to what extent small innovating manufacturing firms
outperformed non-innovative manufacturing firms.
Postal questionnaire addressing innovation
and organisational characteristics. Mann-Whitney U test; Chi-square test
- Innovation; - Profitability; - Firm growth;
- employment growth; - export propensity;
- absolute profit - profit margins
- productivity levels - productivity growth
UK 228 1994-1996
+/●
Not specified
Wakelin (2001)
To relate R&D expenditure to
productivity growth and innovation records to R&D rates of return.
Regression model: Cobb-Douglas production
function; regression equations using OLS; inclusion of ten sector dummy variables.
- R&D intensity;
- Productivity growth; - Capital intensity
- Labour
UK 170 1945-1992
+/0
27%
Bougrain, Haudeville (2002)
To assess how SME’s internal research capacities help them to exploit external scientific and technical knowledge and
to use networks of innovators.
Selection of 313 public-financed innovative
projects in SMEs; Logistic regression models.
- R&D intensity; - Project results
France
247
1980-1987 ●
Del Monte, Papagni (2003)
To ascertain the importance of R&D as determinant of size growth.
Econometric analysis: Gibrat’s Law test;
Regression model (random effect regressions; Generalised Method of
Moments)
- KR&D;
- Information technology; - rate of growth of industry
real value-added; - firm growth
- size; - growth rates; - productivity;
- productivity growth rate; - profitability
Italy
884 -
496
1986-1997
+
Growth rate and research intensity
●
R&D and other performance
variables
49%
Hartmann (2003)
To put forward a model to help
managers to simulate R&D budget plans, by linking R&D spending to revenue
growth
Extension of Marvin Patterson’s model - Percentual annual growth;
- R&D intensity
TABLE 3
17
As we have seen in the literature surveyed so far, the impact of R&D and innovation efforts
can be assessed using different variables. One of them is export performance. Lefebvre et al.
(1998) used this variable in a multidimensional conceptualization to study to what extent
export performance – measured by volume of sales and by final destination of those sales -
could be dependent on specific R&D-related capabilities in SMEs. Indeed, one of the authors’
most important contributions is that of the notion of R&D-related capabilities, because it
provides an interesting approach to R&D efforts as something more encompassing than
investment in R&D projects or staff. The core conclusion of the study is that firms need to
build on or diversify a set of complementary capabilities – previously identified by the
authors - to take fully advantage of that investment. These capabilities explain different export
performances. The argument presented is far-reaching, because it supports the idea that R&D
spending, although important, is not a sufficient condition to differentiate the export
behaviours of firms. On the other hand, it redirects the attention to the role played by other
determinants of those behaviours. At a certain point, firms are pushed to develop, beyond
traditional efforts, some R&D-related capabilities, such as network or collaborative R&D
engagement – a push which is, particularly, omnipresent in firms exporting to global markets.
Another study to be taken into consideration is that of Wakelin (2001), who studied the
contribution of a firm’s R&D expenditure on its productivity growth for a sample of 170 UK
firms for the manufacturing sector. Although the author acknowledged that examining this
relationship at a firm level implied one severe limitation, related to data quality and
availability, one of the advantages of taking firms as units of analysis is that their own R&D
efforts can be, in principle, isolated from “the technological improvements and advances that
are general to the sector” (pp 1079). Based on this assumption, the methodological model
pursued unfolded in three different steps: first, a Cobb Douglas production function including
R&D intensity was applied for a sample of 170 UK firms, for which data on R&D
expenditure were available, and several regression equations were estimated using OLS.
Results accounted for the existence of a positive relationship between R&D expenditure and
productivity growth. From the beginning, the author also assumed that the innovation history
of a firm could be determinant to its productivity growth, as, in principle, innovative firms are
“qualitatively different from non-innovating firms” (pp. 1079). Therefore, according to their
innovation background, firms were then divided into innovative firms and non-innovative
firms and then productivity growth was estimated for each group separately, using the model
which had been previously run. Results showed that the rate of return to R&D was
18
significantly higher for innovative than for non-innovative firms, leading the author to
conclude that “being an innovator does appear to be an important factor in influencing the rate
of return to R&D expenditure” (pp. 1084). Nonetheless, the author found evidence – through
the inclusion of sector dummy variables - that the sector to which a firm belonged appeared to
have a very important role in determining the level of returns to its own R&D expenditure,
which means that sector specificities may exert a significant degree of influence in
productivity growth. Indeed, firms belonging to sectors which were net users of innovations
presented higher rates of returns than firms located in other sectors.
In a research on SMEs internal research capacities, Bougrain and Haudeville (2002) showed
that R&D intensity, as an indicator of in-house innovative capability, failed to set the barrier
between failure and success for two main reasons: the first had to do with the type of
expenditures included by firms in R&D, which could vary from country to country; the
second was related to the limited amplitude of R&D as an indicator of innovation, especially
within small firms. As the authors argue, “R&D is only one source of innovation” (2002: 744).
This arguments is even more important to SMEs which tend to carry out research activities in
a less formally organized way, because, given the fact that these activities do not fit official
definitions of R&D activities, they will not be accounted for as so, leading to an
underestimation of R&D investment. This brings the author to conclude that R&D intensity
“cannot be satisfactory to analyse SME’s ability to innovate” (2002: 744). As a matter of fact,
the problems posed to these firms by conventional statistical definitions had been reported
earlier in a study by Kleinknecht (1987), and later by Stephen Roper (1999) in a cross-
international study on the impact of under-reporting of R&D in small firms. Roper argued that
the conventional indicators used to measure R&D at firm level– usually R&D expenditure
and employment – neglected the real level of R&D activity undertaken in small firms.
Moreover, since R&D classification and accounting were still very dependent on the internal
procedures of companies, the way was paved for distortions in international comparative
studies on business investment in R&D. Two of the reasons why R&D may be hard to track in
small firms are that: firstly, the type of R&D performed by them is usually more
developmental than fundamental research and, therefore, is more likely to be disseminated
throughout operational areas rather than in formal units; secondly, if we call on OCDE’s
definition of formal R&D, which places emphasis on “R&D performed inside an R&D
department and involving at least one full-time researcher” (Roper, 1999: 131), it becomes
difficult to frame small firms’ R&D within that definition, since their R&D tends to be less
19
formally organized. Under-estimation will be then likely to occur in firms where at least one
of the above mentioned situations happens, producing misleading data about R&D investment.
The conclusion is drawn from a comparative study between Germany and the U.K., where
R&D in small firms is organized differently. The study provides empirical evidence that the
differences regarding organizational settings of R&D in small firms will have a (positive or
negative) impact on the estimation of their R&D investments according to official indicators.
Another interesting question posed by a research conducted by Mark S.Freel (2000) was
whether and to what extent small innovating firms outperformed their non-innovative
counterparts. The question was not novel either to academic literature or to industrial policy,
both echoing a loud yes as an answer, which leads us to ask ourselves whether the relationship
between innovation and performance within small firms has been oversimplified by equivocal
premises. Having defined innovation as “the number of new products introduced […] as a
proportion of the firms product base” (2000: 196), Freel determined then a set of measures to
be employed in the study in order to clarify how innovation acted upon firm growth and
performance: growth in sales turnover and employment growth were selected to address firm
growth; and growth in employment, growth in profits, absolute profit, profit/head, profit
margins, productivity levels, productivity growth and export propensity to measure firm
performance. The author’s point of departure was appropriately summarized in the affirmative
answer to the rhetorical question posed above; indeed, in light of the literature and empirical
studies surveyed, Freel hypothesized that small innovation firms would present superior
performance compared to less innovative small firms in all measurement parameters
considered. In some cases, however, results ran counter premises or were ambiguous,
revealing the need for further research. Revisiting the main hypotheses put forward by the
author and comparing them with the sample data it is possible to suggest that innovative small
firms revealed superior performance in some parameters. As Freels argued there is robust
evidence to claim that “small innovating firms are marked by higher rates of growth than
small non-innovators” (2000: 207). Nonetheless, in other cases, results either differed from
previous assumptions or remained unclear. Take for instance sales growth: although small
innovative firms were likely to experience greater sales revenue than their less innovative
peers, results did not hold that they were more likely to grow. At the same time, findings
showed that there was either no significant or clear relationship between innovation and
export intensities, profitability and productivity levels. Therefore, once similar studies on
larger firms are taken into consideration, one of Freel’s main conclusions is that returns to
20
innovation may depend, to a certain extent, on firm size. This means that the common
assumption that innovation always pays off should be cautiously apprehended by firms, which
should be made aware of the nature of returns on innovation that they are more likely to have
and of the myriad of circumstances which can play a decisive role on their growth or
performance.
In a more recent empirical study on a panel of Italian firms, it was examined whether Italian
firms highly committed to R&D also presented higher rates of growth when compared to
those less or absolutely not engaged in R&D activities (Del Monte and Papagni, 2003).
According to the authors, it could be presumed that a positive relationship between R&D and
market performance existed: in this sense, a firm which deployed substantial resources to
R&D would be more innovative than others, and thus, more successful in the market, reaping
higher profits. Notwithstanding, the authors assumed as well their cautiousness by rejecting
the too deterministic view that investing in R&D translated necessarily into better market
performance. As they argued, in low-technological opportunity environments, such as those
of traditional sectors, neither the intensity of R&D nor the R&D investment of a firm blocked,
in general, the entry of new imitating firms in the market. As a result, the competitive
advantage of the most R&D-committed firm would be rapidly reduced, with other firms
arriving to the market and following the technological track of the former. The same idea that
R&D investment is not a sufficient condition for successful performance in the market applies
to sectors belonging to high-technological-opportunity environments, although in this case the
explanation differs. The authors stated that firms from sectors with high technological
opportunities could not always “introduce new technologies, deliver new products and
introduce organisational innovations at the pace required” (pp. 1006) in order to obtain a
competitive advantage that would ultimately result in a growth of profits. Prior to an
econometric assessment of the relationship between innovation and performance of Italian
firms, the authors attempted to analyze whether there were structural differences between
R&D firms and non-R&D firms. Therefore, a sample of 810 firms, made up of firms which
declared to conduct R&D and firms which did not - was constructed. A Student’s t-test on the
difference of means was carried out and variables such as size, growth rates, productivity,
productivity growth rate and profitability were included in the analysis. Results confirmed the
presumed assumption that R&D had a positive impact on a firm dynamics (pp. 1007). To
better estimate the relationship between innovation and performance of Italian firms, the
authors moved on to an econometric analysis, in which a regression model was used making it

21
possible to include major control variables. This analysis was carried out in two different
steps: first, a panel unit root test was implemented to verify if Gibrat’s Law occurred; as
results confirmed that firm size had a stochastic trend, it was then estimated the importance of
R&D as a determinant of the size growth of firms, for which a regression model was adopted.
The number of firms covered by the sample was reduced several variables measuring
innovation were added. Findings showed evidence that a relationship could be on average
established between variables measuring research intensity and the rate of growth.
Nonetheless, and as regards to the rate of profits, in particular, the authors observed that R&D
did not generate barriers to market entry, and, therefore, the increase in the market share of
the innovative firm did not mean necessarily more profits to the innovative firms. Even more
interesting and surprising was to ascertain that the effect of research on firm growth was
greater in the traditional sectors than in the more research-intensive ones, a result that,
according to the authors, could be somehow explained by the “peculiarity” (pp. 1012) of the
Italian industrial system, which still denoted a strong specialization in traditional sectors,
more competitive in relation to foreign firms. The idea that the type of technological-
opportunity environment – a term first coined by Scherer (Audretsch, 1995) - to which a
firm/industry belongs affects its behaviour towards innovation and R&D, in particular, has not
indeed been left out of the debate by authors. As mentioned, the concept was first used in the
60s by Scherer, who argued that not all industries were equally innovative and that this could
be explained by the technological environment they belonged to. Later in the 80s, Acs and
Audretsch (1988) reaffirmed the assumption that variations in the innovation activity of large
and small firms were contingent upon different economic and technological regimes.
So far, our literature review has focused on empirical studies carried out at firm level.
Nevertheless, it is well worth making again a short reference to Hartmann’s analytic forecast
model, an extension of Marvin Patterson’s model, according to which a causal linkage
between a firm’s R&D investment and its revenue could be established. According to
Hartmann, the model proposed, which reflected, to a certain extent, a slight deviation from the
Patterson’s model, would allow managers to use investment and wave shapes to simulate
hypothetical scenarios, more precisely, to simulate the probable outcomes of R&D budget
plans and control the time-lag between investment in product development and its respective
revenue, since returns, whatever their nature, are likely to manifest themselves not until some
years after product launch.

22
3. Conclusions
By taking an insight into the literature on R&D assessment we intended to highlight that by
tackling the issue from a wide spectrum of perspectives, with different definitions, variables,
methodologies and indicators, results and conclusions to be drawn on R&D and innovation
payoff are likely to differ as well, sometimes rather significantly. The main implication of this
argument is that the nature of the relationship between R&D and any other variable one might
considerer to assess R&D payoff is far more complex than the relationship common sense and
also academic knowledge have tended to depict. Perceptions in the academic field about this
relationship have changed however: most - if not all – of the articles surveyed were cautious
when it came to support the idea that R&D investment should be made at all costs.
Reinforcing the idea of complexity underlying the relationship between R&D and economic
performance and the skepticism of some studies to admit a causative linkage between them, is
also the observation that, when we move from a macro into a micro analysis, the magnitude of
R&D returns is less frequently mentioned, which may suggest that it is still a hard task,
mostly, at this level, to track the real effectiveness of R&D investment.
Table 4: Summary of R&D returns (in %)
In the table above, we can see that R&D returns are, at the micro level, higher in all indicators
(minimum, maximum and average), but we should bear in mind that only two of the studies
surveyed at that level provided us with the figures for those returns. Indeed, one would expect
that the magnitude of R&D returns to be higher at more aggregated levels of analysis, since
the social value of R&D is usually left out of firm’s accounts.
A final – but not least important - remark to be made is that some of the articles reviewed
called into question the need to redefine traditional systems of measurement in order to
include actors – such as small and low-tech firms – whose role has been either kept apart or
distorted in studies on returns on RD investment. Indeed, rethinking the role of small and low-
tech firms in the innovation process will require not only a change in the way R&D payoff is
Level Minimum Maximum Average
Macro 6.0 66.0 24.0
Meso 19.0 45.7 37.1
Micro 27.0 49.0 38.0
23
tackled, understood and measured, but also a change in the way innovation itself is perceived.
We should not ignore the fact that even in some of the articles which take the concept of
innovation as a core one, the operationalization of innovation takes place based on R&D
indicators, something which remind us of the centrality that is still given to R&D in the
innovation process, overshadowing other types of innovation measures.
References
Acs, Z. J and Audretsch, D.B. (1988): “Innovation in large and small firms: an empirical
analysis”, The American Economic Review, Vol. 78, No. 4: 678-690.
Almeida, A. and Teixeira, A. C. (2007), “Does patenting negatively impact on R&D
investment”, FEP Working Papers, 255: 1-43.
Audretsch, D. B, (1995), “Firm profitability, growth and innovation”, Review of Industrial
Organization, 10: 579-588.
Bender, G. on behalf on PILOT Consortium (2006), Peculiarities and Relevance of Non-
Research-Intensive Industries in the knowledge-based economy: 1-92.
Bayoumi, T., Coe, D. T, Helpam, E. (1999), “R&D spillovers and global growth”, Journal of
International Economics, 47: 399-428.
Bilbao-Osorio, B. and Rodríguez-Pose, A. (2004), “From R&D to Innovation and Economic
Growth in the EU”, Growth and Change, Vol. 35. No. 4: 434-455.
Bender, G. on behalf on PILOT Consortium (2006), Peculiarities and Relevance of Non-
Research-Intensive Industries in the knowledge-based economy: 1-92.
Bernstein, J. I. (1989), “The structure of Canadian inter-industry R&D spillovers, and the
rates of return to R&D”, The Journal of Industrial Economics, Vol. 37, No. 3: 315-328.
Bogers, M. and Lhuillery, S. (2006), Measuring Informal Innovatiom: From non-R&D to on-
line knowledge production, École Plytechnique Fédérale de Lausanne: 1-23.
Bougrain, F. and Haudeville, B. (2002), “Innovation, collaboration and SMEs internal
research capacities”, Research Policy, 31: 735-747.
Hall, B. H. and Mairesse, J. (1995), “Exploring the relationship between R&D and
productivity in French manufacturing firms”, Journal of Econometrics, 65: 263-293.
Coe, D. T and Helpman, E. (1995), “International R&D spillovers”, European Economic
Review, 39: 859-887.

24
Drake, P., Sakkab, N. and Jonash, R. (2006), “Maximizing return on innovation investment”,
Research Technology Management, November-December: 32-41.
Graves, S. B. and Langowitz, N. S. (1996), “R&D productivity: a global multi-industry
comparison”, Technological Forecasting, 53: 125-137.
Goto, A. and Suzuki, K. (1989), “R&D capital, rate of return on R&D investment and
spillover of R&D in Japanese manufacturing industries”, The Review of Economics and
Statistics, Vol. 71, No. 4: 555-564.
Griliches, Z. (1980), “R&D and productivity slowdown”, American Economic Association,
Vol. 70, No. 2: 343-3458.
Grossman, G.M. and Helpman, E. (1993), Innovation and growth in the global economy.
Cambridge, Mass.; and London England: MIT Press.
Freel, M. (2000), “Do small innovating firms outperform non-innovators?”, Small Business
Economics”, 14: 195-240.
Hartmann, G. (2003), “Linking R&D spending to revenue growth”, Research Technology
Management: 39-46.
Hsieh, P., Mishra, C. S., Gobeli, D. H. (2003), “The return on R&D versus Capital
Expenditures in Pharmaceutical and Chemical Industries”, IEEE Transactions on
Engineering Management, Vol. 50, No.2: 141-150.
Ho, Y. K., Keh, H. T. and Ong, J. M. (2005), “The effects of R&D and Advertising on Firm
Value: An examination of manufacturing and nonmanufacturing firms”, IEEE
Transactions on Engineering Management”, Vol. 52, No. 1: 3-14.
Hoffman, K., Parejo, M., Bessant, J. and Perren, L. (1998), “Samall firms, R&D, technology,
and innovation in the UK: a literature review”, Technovation, 18 (1): 39 – 55.
Howells, J. (2005), “Innovation and regional economic development: a matter of perspective?,
Research Policy, 34: 1220-1234.
Jacobsson, S. and Philipson, J. (1996), “Sweden’s technological profile: What can R&D and
patents tell and what do they fail to tell us”, Technovation, 26 (5): 245-253.
Karlsson, M., Trygg, L. and Elfström, B. (2004), “Measuring R&D productivity:
complementing the picture by focusing on research activities”, Technovation, 24: 179-
186.
25
Kleinknecht, A. (1987), “Measuring R&D in small firms: how much are we missing”, The
Journal of Industrial Economics, Vol. 36, No. 2: 253-256.
Lefebvre, E., Lefebvre, L. A., Bourgault, M. (1998), “R&D-related capabilities as
determinants of export performance”, Small Business Economics,10: 365-377.
Monte, A. del and Papagni, E. (2003), “R&D and the growth of firms: empirical analysis of a
panel of Italian firms”, Research Policy, 32: 1003-1041.
Papadakis, M. (1995), “The delicate task of linking industrial R&D to national
competitiveness”, Technovation, 15 (9): 569-583.
Roper, S. (1999), “Under-reporting of R&D in small firms: the impact on internal R&D
comparisons”, Small Business Economics, 12: 131-135.
Teixeira, A.A.C. and Fortuna, N. (2004), "Human capital, innovation capability and economic
growth in Portugal, 1960 - 2001”, Portuguese Economic Journal, 3 (3): 205-225.
US Congress, Office of Technology Assessment – OTA-TM (1986), Research funding as an
investment: can we measure the returns? A technical memorandum: 3-72.
Walwyn, D. (2007), “Finland and the mobile phone industry: A case study of the return on
investment from government-funded research and development”, Technovation, 27:
335-341.
Wieser, R. (2005), “Research and Development productivity and spillovers: empirical
evidence at firm level”, Journal of Economic Surveys, Vol.19, No. 4: 587-621.

26