Retrofit of pre‐Northridge steel moment‐resisting frames using fluid viscous dampers
20
RETROFIT OF PRE-NORTHRIDGE STEEL MOMENT-RESISTING FRAMES USING FLUID VISCOUS DAMPERS P. URIZ 1 * AND A. S. WHITTAKER 1 Department of Civil and Environmental Engineering, University of California, Berkeley, CA 94720, U.S.A. 2 Department of Civil, Structural, and Environmental Engineering, State University of New York, Buffalo, NY 14260, U.S.A. SUMMARY This paper describes a study of the use of linear fluid viscous damping devices for the seismic retrofit of a three- storey, pre-Northridge steel-framed building. Four part-perimeter moment frames resisted lateral forces in the building. One of the four perimeter frames was analysed using static pushover, incremental dynamic and nonlinear dynamic analysis to calculate likely beam plastic rotations in design and maximum earthquakes. Ten 10–50 (design) and two 2–50 (maximum) earthquake histories were used for the nonlinear dynamic analysis. The maximum beam plastic rotations exceeded 0020 radian for some of the design-earthquake histories and 0045 radian for one of the maximum-earthquake histories. Fluid viscous dampers were added to the frame using the procedures of FEMA 273 with the goal of eliminating plastic rotations in the beams of the frame in the design earthquake. Average reductions in the displacement of the frame by a factor exceeding 2 were achieved in the design earthquake with the addition of approximately 40% equivalent viscous damping. Although plastic rotations in the beams were substantially reduced, they were not eliminated for 7 of the 10 characterizations of the design earthquake; the calculated maximum beam plastic rotations exceeded the measured plastic rotation capacity of pre-Northridge steel moment-frame connections and so some fractures of the beam connections in this frame would not be unexpected. The addition of the dampers to the building frame led to substantial increases in the maximum base shear and column axial forces, which in practice would likely lead to strengthening of the columns and the foundations. The average maximum axial forces in the dampers calculated by response-history analysis exceeded the values calculated using the first-mode procedure of FEMA 273. Higher-mode effects must be considered using either response-history analysis or the procedures of FEMA 274 to adequately size and detail fluid viscous dampers and their connections to the structural framing. Copyright 2001 John Wiley & Sons, Ltd. 1. INTRODUCTION The M67 1994 Northridge earthquake in southern California caused more than US$40 billion of direct and indirect losses (Mahin, 1998). Although the magnitude of the loss was not unexpected for an earthquake of this magnitude and location, the damage to steel moment-resisting frames took most researchers and design professionals by surprise. Damage was identified in more than 150 buildings and was confined mainly to the moment-resisting beam–column connections. Damage took the form of failed complete joint penetration (CJP) groove welds, beam and column flange fractures, and column web and panel zone fractures. The damage from this earthquake forced the structural engineering community and the Federal Emergency Management Agency (FEMA) to search for conventional solutions to retrofit existing moment-frame buildings. The results of these studies that formed the SAC Phase II project have recently been published in FEMA 350 (FEMA, 2000). The use THE STRUCTURAL DESIGN OF TALL BUILDINGS Struct. Design Tall Build. 10, 371–390 (2001) Published online in Wiley InterScience (www.interscience.wiley.com). DOI:10.1002/tal.199 Copyright 2001 John Wiley & Sons, Ltd. Received September 2001 Accepted September 2001 * Correspondence to: P. Uriz, Graduate Research Assistant, Department of Civil and Environmental Engineering, Davis Hall, University of California, Berkeley, CA 94720, U.S.A. E-mail: [email protected]
-
Upload
sunybuffalo -
Category
Documents
-
view
2 -
download
0
Transcript of Retrofit of pre‐Northridge steel moment‐resisting frames using fluid viscous dampers
RETROFIT OF PRE-NORTHRIDGE STEEL MOMENT-RESISTINGFRAMES USING FLUID VISCOUS DAMPERS
P. URIZ1* AND A. S. WHITTAKER1Department of Civil and Environmental Engineering, University of California, Berkeley, CA 94720, U.S.A.
2Department of Civil, Structural, and Environmental Engineering, State University of New York, Buffalo, NY 14260, U.S.A.
SUMMARY
This paper describes a study of the use of linear fluid viscous damping devices for the seismic retrofit of a three-storey, pre-Northridge steel-framed building. Four part-perimeter moment frames resisted lateral forces in thebuilding. One of the four perimeter frames was analysed using static pushover, incremental dynamic and nonlineardynamic analysis to calculate likely beam plastic rotations in design and maximum earthquakes. Ten 10–50(design) and two 2–50 (maximum) earthquake histories were used for the nonlinear dynamic analysis. Themaximum beam plastic rotations exceeded 0�020 radian for some of the design-earthquake histories and 0�045radian for one of the maximum-earthquake histories. Fluid viscous dampers were added to the frame using theprocedures of FEMA 273 with the goal of eliminating plastic rotations in the beams of the frame in the designearthquake. Average reductions in the displacement of the frame by a factor exceeding 2 were achieved in thedesign earthquake with the addition of approximately 40% equivalent viscous damping. Although plastic rotationsin the beams were substantially reduced, they were not eliminated for 7 of the 10 characterizations of the designearthquake; the calculated maximum beam plastic rotations exceeded the measured plastic rotation capacity ofpre-Northridge steel moment-frame connections and so some fractures of the beam connections in this framewould not be unexpected. The addition of the dampers to the building frame led to substantial increases in themaximum base shear and column axial forces, which in practice would likely lead to strengthening of the columnsand the foundations. The average maximum axial forces in the dampers calculated by response-history analysisexceeded the values calculated using the first-mode procedure of FEMA 273. Higher-mode effects must beconsidered using either response-history analysis or the procedures of FEMA 274 to adequately size and detailfluid viscous dampers and their connections to the structural framing. Copyright 2001 John Wiley & Sons, Ltd.
1. INTRODUCTION
The M6�7 1994 Northridge earthquake in southern California caused more than US$40 billion of directand indirect losses (Mahin, 1998). Although the magnitude of the loss was not unexpected for anearthquake of this magnitude and location, the damage to steel moment-resisting frames took mostresearchers and design professionals by surprise. Damage was identified in more than 150 buildingsand was confined mainly to the moment-resisting beam–column connections. Damage took the formof failed complete joint penetration (CJP) groove welds, beam and column flange fractures, andcolumn web and panel zone fractures. The damage from this earthquake forced the structuralengineering community and the Federal Emergency Management Agency (FEMA) to search forconventional solutions to retrofit existing moment-frame buildings. The results of these studies thatformed the SAC Phase II project have recently been published in FEMA 350 (FEMA, 2000). The use
THE STRUCTURAL DESIGN OF TALL BUILDINGSStruct. Design Tall Build. 10, 371–390 (2001)Published online in Wiley InterScience (www.interscience.wiley.com). DOI:10.1002/tal.199
Copyright 2001 John Wiley & Sons, Ltd. Received September 2001Accepted September 2001
* Correspondence to: P. Uriz, Graduate Research Assistant, Department of Civil and Environmental Engineering, Davis Hall,University of California, Berkeley, CA 94720, U.S.A.E-mail: [email protected]
of energy dissipation or damping systems, termed a new technology by many structural engineers, forthe retrofit of vulnerable moment-frame buildings was not considered in the SAC Phase II project andprompted the study reported in this paper.
One objective of adding damping or energy dissipation devices to new and existing construction isto dissipate much or all of the earthquake-induced energy in disposable elements that do not form partof the gravity framing system. Damage to conventional components in critical locations such as beam–column connections in steel moment-resisting frames is thus substantially reduced or avoidedcompletely. Although testing and perhaps replacement of all supplemental damping devices in abuilding may be necessary after a design earthquake, evacuation of the building for repair might not benecessary and the total repair cost will likely be minor compared with the costs associated with repairand business interruption in a conventional framing as evinced by experiences following theNorthridge earthquake.
A code-compliant three-storey steel moment-resisting frame, typical of frames constructed inCalifornia prior to the Northridge earthquake, was selected for this investigation. The objective was torehabilitate the frame using energy dissipation devices in the form of fluid viscous dampers. Fluidviscous dampers were chosen for this study for two reasons. First, this type of damping device is themost widely used in the United States at the time of this writing. Second, some engineers in Californiahad suggested that pre-1994 code-compliant steel moment-resisting frames could be retrofitted withfluid viscous dampers alone to remain in the elastic range in a design earthquake on the West Coast ofthe United States. The original and retrofitted (damped) frames were analysed using static pushover,incremental dynamic and nonlinear dynamic analysis to estimate the maximum drifts and plastic hingerotations in design and maximum earthquakes. The results of these analyses are presented in thefollowing two sections.
2. ANALYSIS OF A PRE-NORTHRIDGE STEEL MOMENT-RESISTING FRAME
2.1 SAC Moment Frame
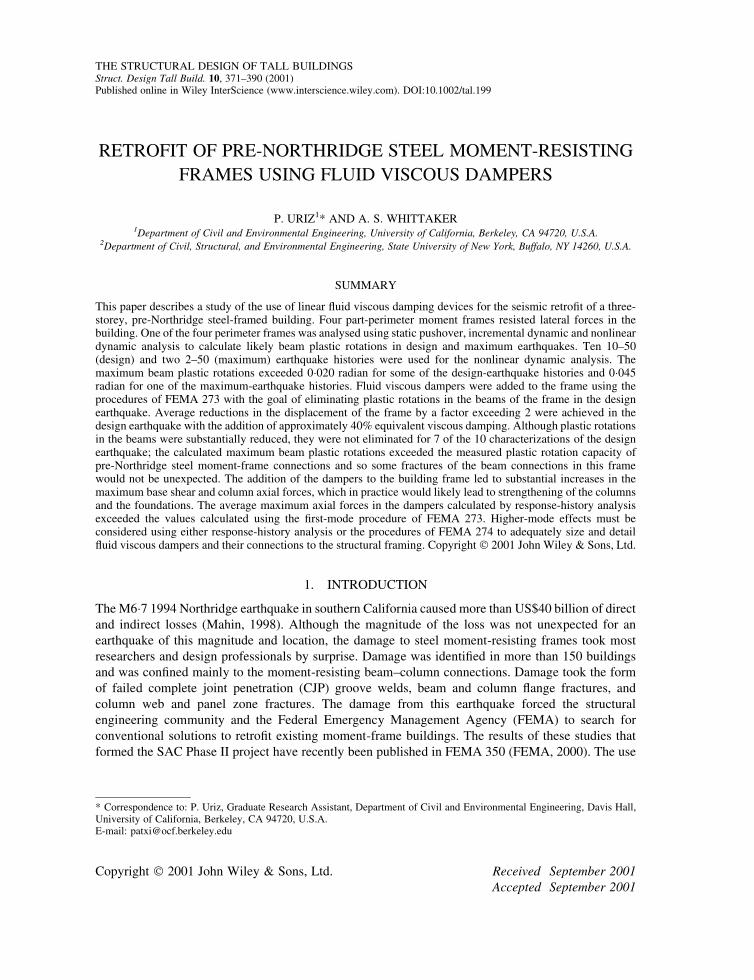
The three-storey prototype building was designed by an expert structural engineering consultancy inSouthern California for use by the SAC Joint Venture (Gupta and Krawinkler 1999). The building wasdesigned in accordance with the provisions of the 1994 Uniform Building Code (ICBO, 1994) as astandard, pre-Northridge office building on a stiff soil site (UBC classification S2) in Los Angeles. Afloor plan for the model building is presented in Figure 1. The shaded region represents the location of
Figure 1. Floor plan of the three-storey model building; shaded area, penthouse; heavy lines, special moment-resisting frames
372 P. URIZ AND A. S. WHITTAKER
Copyright 2001 John Wiley & Sons, Ltd. Struct. Design Tall Build. 10, 371–390 (2001)
the penthouse. The gravity dead and live loads assumed for design were (83, 20) psf or (4�0, 1�0) kPafor the roof level and (96, 20) psf or (4�6, 1�0) kPa for the second and third floors, respectively, and afacade dead load of 25 psf (1�2 kPa): representative values for a standard office building. Lateral forceswere resisted by perimeter special moment-resisting frames (SMRFs) composed of structural steel;these frames are shown as heavy lines in the figure. Two moment frames, each of three bays in length,resist lateral forces along each axis of the building. ASTM A36 steel was assumed for the beams andGrade 50 steel for the columns in accordance with common practice prior to the earthquake.
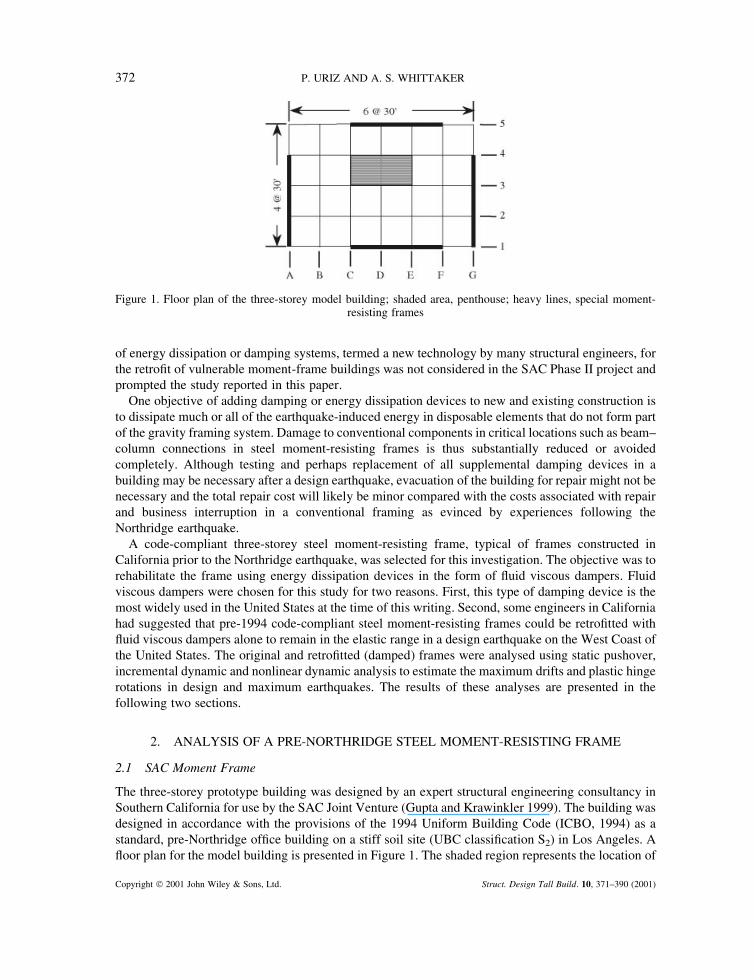
The three-bay moment-resisting frames were identical because they were symmetrically distributedabout the centre of mass of the building. Figure 2 is an elevation of the perimeter frame on grid line Gshowing the sizes of the beam and the column. Grids 1 and 4 bound the moment-resisting frame. Allconnections between grids 1 and 4 are moment resisting. The framing bounded by grids 4 and 5 iscomposed of shear (pinned) connections.
The reactive weight W, of the building was calculated using the loads of Gupta and Krawinkler(1999). Lumping the reactive weight of the penthouse at the roof level, the reactive weights at the roof,third, and second floors were 2282, 2138, and 2138 kips, respectively, for a total building reactiveweight of 6558 kips (29183 kN), and a total reactive weight per frame of 3279 kips (14592 kN). Usingthe provisions of the 1994 Uniform Building Code (ICBO, 1994), the period and design base shear forthe prototype building are 0�54 second and 0�076W, where the design base shear is calculated at theworking stress level. At the strength level, the design base shear for the building is approximately0�13W or 848 kips (3774 kips), or 424 kips (1886 kN) per frame.
2.2 Earthquake histories for dynamic analysis
The original and retrofitted frames were analysed using nonlinear static analysis, nonlinear dynamicanalysis and incremental nonlinear dynamic analysis. The ground motion histories that weredeveloped for the Los Angeles area as part of the SAC Phase II project (Sommerville, 1997) were usedfor the dynamic analysis. These histories were used in the SAC Project for topical investigations, casestudies and trial applications. The ground motions were grouped into several categories: NEHRP(National Earthquake Hazards Reduction Program) probabilistic ground motions, loose-soil groundmotions, and near-fault, impulsive ground motions. The NEHRP probabilistic ground motions weresplit into four sets: 2%, 10%, and 50% probability of exceedance in 50 years, and 50% probability ofexceedance in 30 years. Each of the ground motions in each group were derived from historical
Figure 2. Elevation of the three-bay moment resisting frame corresponding to that along grid line G of Figure 1
RETROFIT WITH FLUID VISCOUS DAMPERS 373
Copyright 2001 John Wiley & Sons, Ltd. Struct. Design Tall Build. 10, 371–390 (2001)
recordings and were scaled so that the average response spectrum in each set matched 1997 NEHRPspectrum for soil type SD at the corresponding hazard level.
Twelve earthquake histories forming six sets were selected from the SAC ground-motion databaseto estimate rotation demands on the moment connections in the prototype building. History sets LA 05/06, LA 09/10, LA 13/14, LA 15/16 and LA 17/18 were derived from the 1979 Imperial Valley, 1992Landers, 1994 Northridge (Newhall Station), 1994 Northridge (Rinaldi Station), 1994 Northridge(Sylmar Station) earthquakes, respectively, and are representative of earthquakes with 10% chance ofexceedance in 50 years (10–50): the UBC characterization of a design earthquake at the time of theNorthridge earthquake. The LA 21/22 history set was derived from the 1995 Kobe earthquake and is
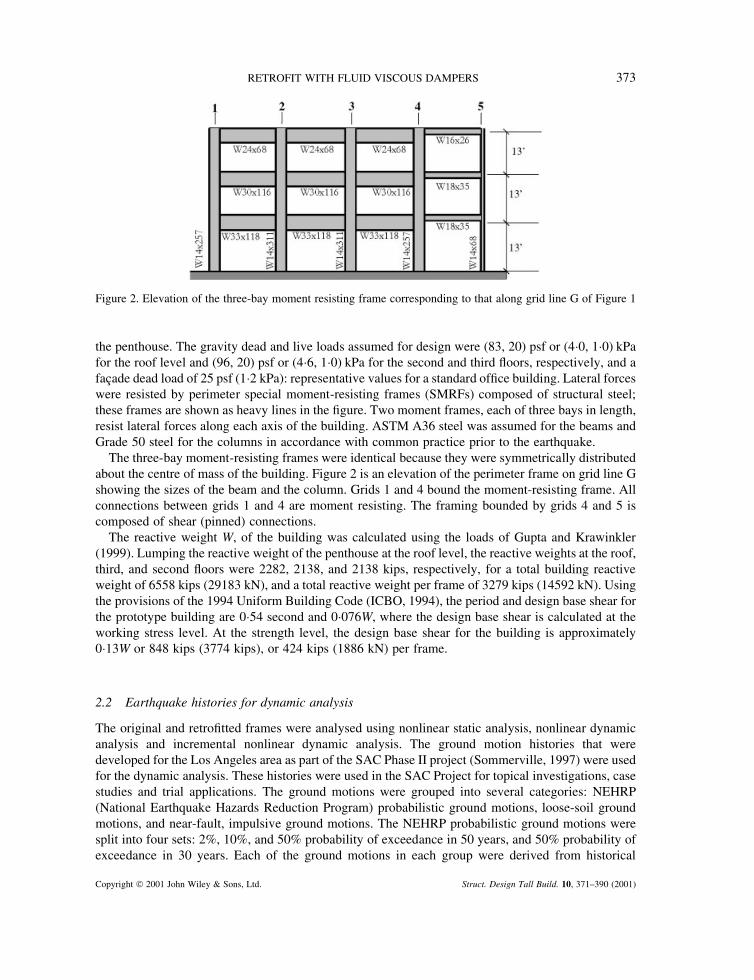
Figure 3. All 10–50 (10% chance of exceedance in 50 years) acceleration spectra with National EarthquakeHazards Reduction Program (NEHRP) and Uniform Building Code (UBC) design spectra (5% damping)
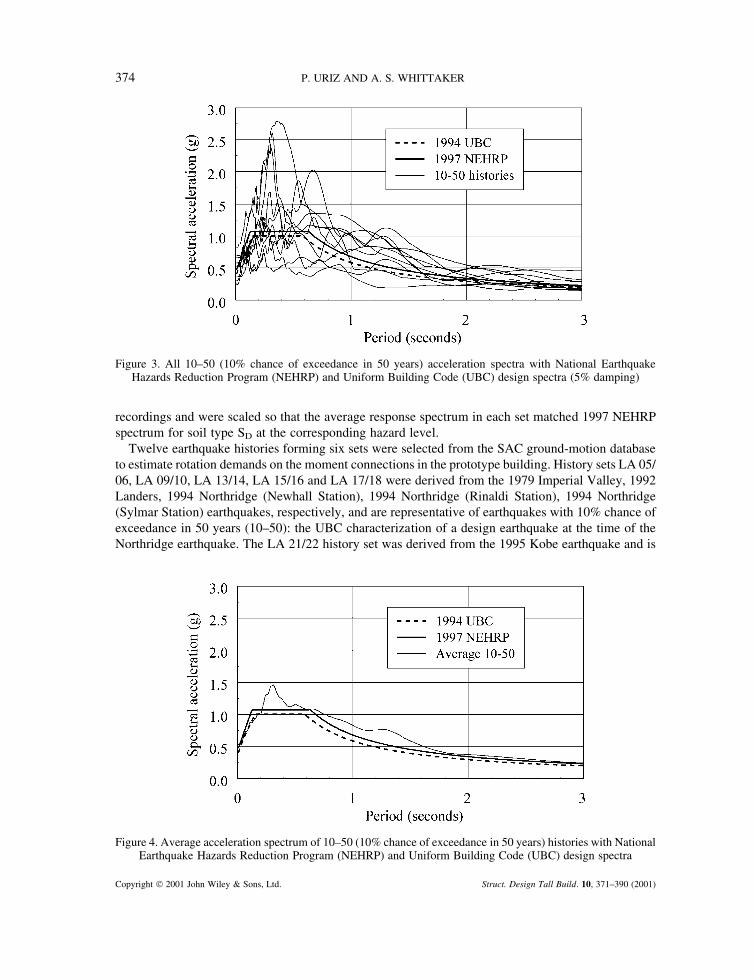
Figure 4. Average acceleration spectrum of 10–50 (10% chance of exceedance in 50 years) histories with NationalEarthquake Hazards Reduction Program (NEHRP) and Uniform Building Code (UBC) design spectra
374 P. URIZ AND A. S. WHITTAKER
Copyright 2001 John Wiley & Sons, Ltd. Struct. Design Tall Build. 10, 371–390 (2001)
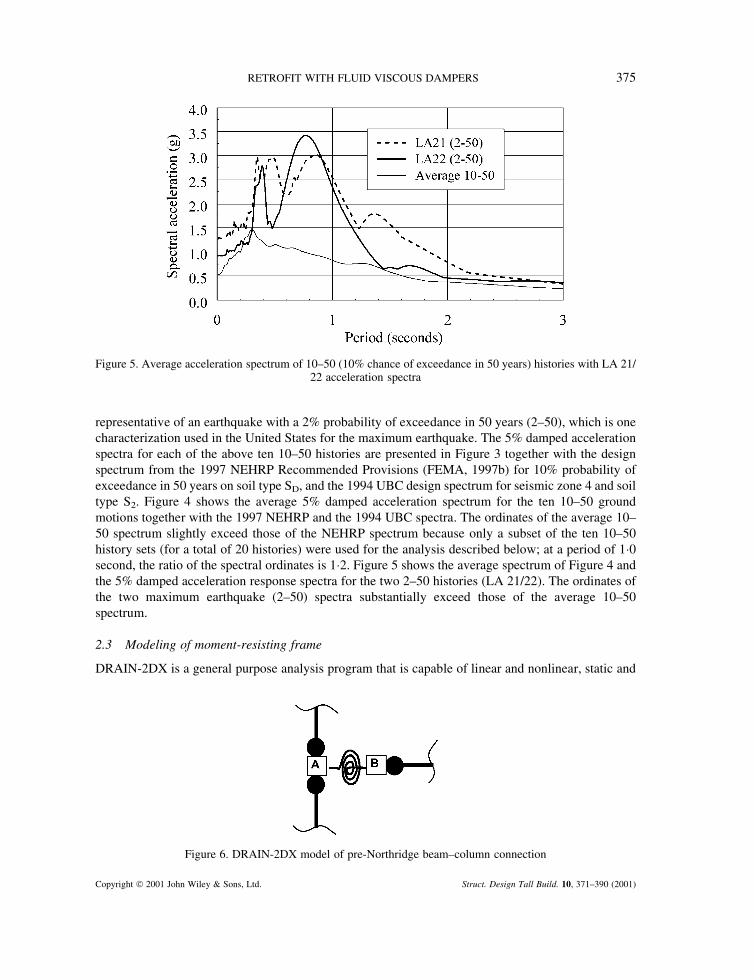
representative of an earthquake with a 2% probability of exceedance in 50 years (2–50), which is onecharacterization used in the United States for the maximum earthquake. The 5% damped accelerationspectra for each of the above ten 10–50 histories are presented in Figure 3 together with the designspectrum from the 1997 NEHRP Recommended Provisions (FEMA, 1997b) for 10% probability ofexceedance in 50 years on soil type SD, and the 1994 UBC design spectrum for seismic zone 4 and soiltype S2. Figure 4 shows the average 5% damped acceleration spectrum for the ten 10–50 groundmotions together with the 1997 NEHRP and the 1994 UBC spectra. The ordinates of the average 10–50 spectrum slightly exceed those of the NEHRP spectrum because only a subset of the ten 10–50history sets (for a total of 20 histories) were used for the analysis described below; at a period of 1�0second, the ratio of the spectral ordinates is 1�2. Figure 5 shows the average spectrum of Figure 4 andthe 5% damped acceleration response spectra for the two 2–50 histories (LA 21/22). The ordinates ofthe two maximum earthquake (2–50) spectra substantially exceed those of the average 10–50spectrum.
2.3 Modeling of moment-resisting frame
DRAIN-2DX is a general purpose analysis program that is capable of linear and nonlinear, static and
Figure 5. Average acceleration spectrum of 10–50 (10% chance of exceedance in 50 years) histories with LA 21/22 acceleration spectra
Figure 6. DRAIN-2DX model of pre-Northridge beam–column connection
RETROFIT WITH FLUID VISCOUS DAMPERS 375
Copyright 2001 John Wiley & Sons, Ltd. Struct. Design Tall Build. 10, 371–390 (2001)
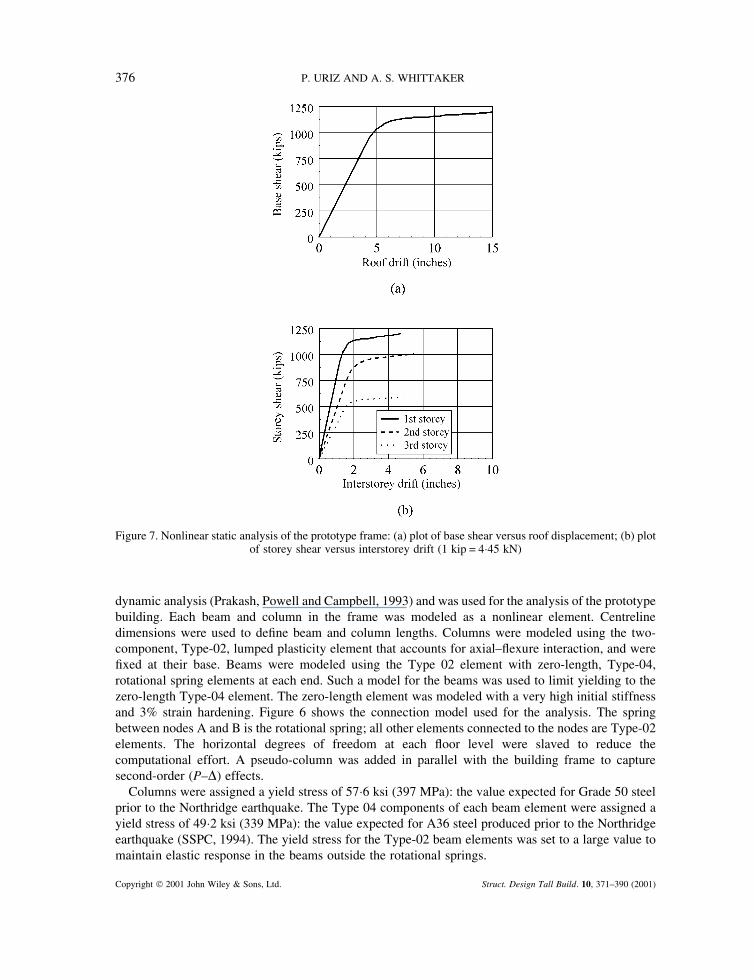
dynamic analysis (Prakash, Powell and Campbell, 1993) and was used for the analysis of the prototypebuilding. Each beam and column in the frame was modeled as a nonlinear element. Centrelinedimensions were used to define beam and column lengths. Columns were modeled using the two-component, Type-02, lumped plasticity element that accounts for axial–flexure interaction, and werefixed at their base. Beams were modeled using the Type 02 element with zero-length, Type-04,rotational spring elements at each end. Such a model for the beams was used to limit yielding to thezero-length Type-04 element. The zero-length element was modeled with a very high initial stiffnessand 3% strain hardening. Figure 6 shows the connection model used for the analysis. The springbetween nodes A and B is the rotational spring; all other elements connected to the nodes are Type-02elements. The horizontal degrees of freedom at each floor level were slaved to reduce thecomputational effort. A pseudo-column was added in parallel with the building frame to capturesecond-order (P–�) effects.
Columns were assigned a yield stress of 57�6 ksi (397 MPa): the value expected for Grade 50 steelprior to the Northridge earthquake. The Type 04 components of each beam element were assigned ayield stress of 49�2 ksi (339 MPa): the value expected for A36 steel produced prior to the Northridgeearthquake (SSPC, 1994). The yield stress for the Type-02 beam elements was set to a large value tomaintain elastic response in the beams outside the rotational springs.
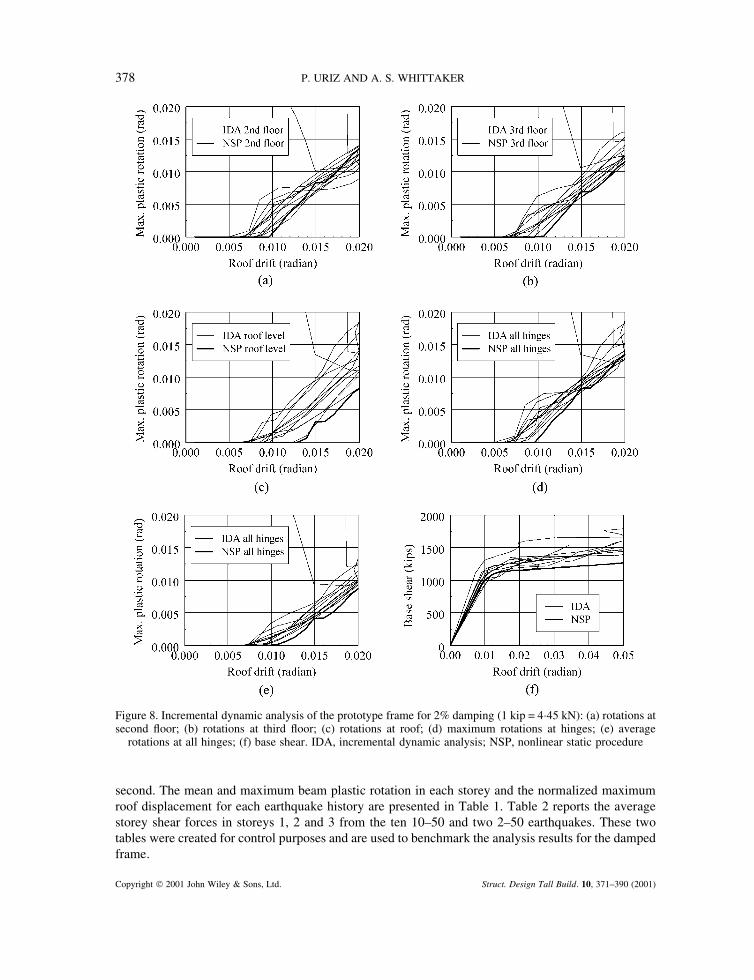
Figure 7. Nonlinear static analysis of the prototype frame: (a) plot of base shear versus roof displacement; (b) plotof storey shear versus interstorey drift (1 kip = 4�45 kN)
376 P. URIZ AND A. S. WHITTAKER
Copyright 2001 John Wiley & Sons, Ltd. Struct. Design Tall Build. 10, 371–390 (2001)

2.4 Frame response data
The frame of Figure 2 was analysed by nonlinear static analysis and nonlinear dynamic analysis.Vertical dead and live nodal and element loads were applied to the mathematical model prior to theresponse-history analysis. The first three periods of the building frame were 1�03 seconds, 0�33 second,and 0�17 second.
Prior to dynamic analysis, the frame was analysed using nonlinear static (pushover) analysis. A first-mode loading profile per FEMA 273 (FEMA, 1997a) was adopted for the pushover analysis. Theresults of the pushover analysis are shown in Figure 7–a base shear versus roof displacementrelationship in Figure 7(a) and storey shear versus interstory drift relationships [for a roofdisplacement of 15 inches (381 mm)] in Figure 7(b). The maximum strength of the frame wasapproximately 1200 kips (5340 KN).45 kN)
The frame from the prototype building was studied by nonlinear response-history analysis using theten 10–50 and the two 2–50 earthquake histories described previously. Two percent Raleigh dampingwas assumed for the response-history analysis, fixed at the first-mode period of 1�0 second and at 0�2
Table 1. Data from response-history analysis of the building frame for 2% inherent damping
Mean maximum plastic rotation (rads) Maximum plastic rotation (rads)
floor 2 floor 3 roof floor 2 floor 3 roof Roof drift ratioa
Designearthquake
LA 05 0�0055 0�0031 0�0003 0�0078 0�0050 0�0010 0�013LA 06 0�0013 0�0017 0�0006 0�0027 0�0034 0�0010 0�011LA 09 0�0156 0�0166 0�0138 0�0180 0�0184 0�0170 0�025LA 10 0�0075 0�0140 0�0142 0�0092 0�0158 0�0174 0�020LA 13 0�0118 0�0154 0�0169 0�0141 0�0176 0�0199 0�021LA 14 0�0123 0�0139 0�0168 0�0147 0�0158 0�0200 0�013LA 15 0�0224 0�0235 0�0228 0�0248 0�0253 0�0258 0�032LA 16 0�0253 0�0285 0�0266 0�0277 0�0303 0�0298 0�037LA 17 0�0067 0�0079 0�0075 0�0090 0�0098 0�0107 0�016LA 18 0�0120 0�0129 0�0158 0�0143 0�0145 0�0189 0�020
Average 0�0120 0�0137 0�0135 0�0142 0�0155 0�0161 0�021
Maximumearthquake
LA 21 0�0203 0�0270 0�0362 0�0237 0�0279 0�0381 0�029LA 22 0�0222 0�0439 0�0454 0�0268 0�0464 0�0483 0�029
Average 0�0212 0�0354 0�0408 0�0253 0�0372 0�0432 0�029
a Roof displacement divided by the building height of 39 feet (11�9 m).
Table 2. Average maximum frame storey shear forces for 2% inherent damping
Frame storey shear force (kips)a
storey 1 storey 2 storey 3
Design earthquake 1300 1072 802Maximum earthquake 1527 1182 1100
a 1 kip = 4�45 kN.
RETROFIT WITH FLUID VISCOUS DAMPERS 377
Copyright 2001 John Wiley & Sons, Ltd. Struct. Design Tall Build. 10, 371–390 (2001)
second. The mean and maximum beam plastic rotation in each storey and the normalized maximumroof displacement for each earthquake history are presented in Table 1. Table 2 reports the averagestorey shear forces in storeys 1, 2 and 3 from the ten 10–50 and two 2–50 earthquakes. These twotables were created for control purposes and are used to benchmark the analysis results for the dampedframe.
Figure 8. Incremental dynamic analysis of the prototype frame for 2% damping (1 kip = 4�45 kN): (a) rotations atsecond floor; (b) rotations at third floor; (c) rotations at roof; (d) maximum rotations at hinges; (e) average
rotations at all hinges; (f) base shear. IDA, incremental dynamic analysis; NSP, nonlinear static procedure
378 P. URIZ AND A. S. WHITTAKER
Copyright 2001 John Wiley & Sons, Ltd. Struct. Design Tall Build. 10, 371–390 (2001)
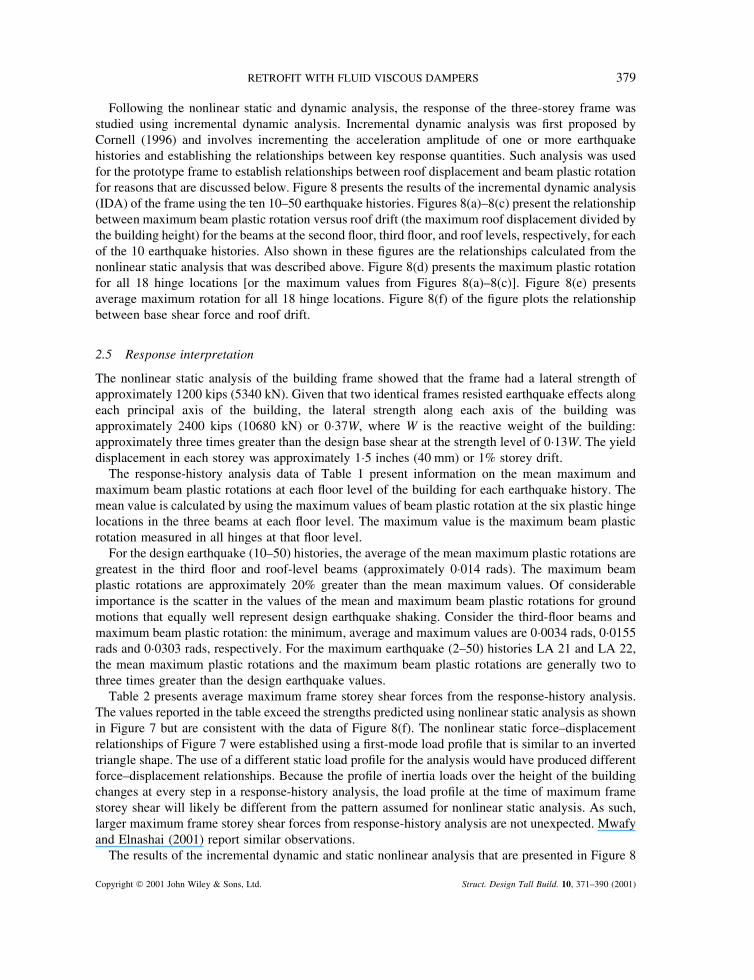
Following the nonlinear static and dynamic analysis, the response of the three-storey frame wasstudied using incremental dynamic analysis. Incremental dynamic analysis was first proposed byCornell (1996) and involves incrementing the acceleration amplitude of one or more earthquakehistories and establishing the relationships between key response quantities. Such analysis was usedfor the prototype frame to establish relationships between roof displacement and beam plastic rotationfor reasons that are discussed below. Figure 8 presents the results of the incremental dynamic analysis(IDA) of the frame using the ten 10–50 earthquake histories. Figures 8(a)–8(c) present the relationshipbetween maximum beam plastic rotation versus roof drift (the maximum roof displacement divided bythe building height) for the beams at the second floor, third floor, and roof levels, respectively, for eachof the 10 earthquake histories. Also shown in these figures are the relationships calculated from thenonlinear static analysis that was described above. Figure 8(d) presents the maximum plastic rotationfor all 18 hinge locations [or the maximum values from Figures 8(a)–8(c)]. Figure 8(e) presentsaverage maximum rotation for all 18 hinge locations. Figure 8(f) of the figure plots the relationshipbetween base shear force and roof drift.
2.5 Response interpretation
The nonlinear static analysis of the building frame showed that the frame had a lateral strength ofapproximately 1200 kips (5340 kN). Given that two identical frames resisted earthquake effects alongeach principal axis of the building, the lateral strength along each axis of the building wasapproximately 2400 kips (10680 kN) or 0�37W, where W is the reactive weight of the building:approximately three times greater than the design base shear at the strength level of 0�13W. The yielddisplacement in each storey was approximately 1�5 inches (40 mm) or 1% storey drift.
The response-history analysis data of Table 1 present information on the mean maximum andmaximum beam plastic rotations at each floor level of the building for each earthquake history. Themean value is calculated by using the maximum values of beam plastic rotation at the six plastic hingelocations in the three beams at each floor level. The maximum value is the maximum beam plasticrotation measured in all hinges at that floor level.
For the design earthquake (10–50) histories, the average of the mean maximum plastic rotations aregreatest in the third floor and roof-level beams (approximately 0�014 rads). The maximum beamplastic rotations are approximately 20% greater than the mean maximum values. Of considerableimportance is the scatter in the values of the mean and maximum beam plastic rotations for groundmotions that equally well represent design earthquake shaking. Consider the third-floor beams andmaximum beam plastic rotation: the minimum, average and maximum values are 0�0034 rads, 0�0155rads and 0�0303 rads, respectively. For the maximum earthquake (2–50) histories LA 21 and LA 22,the mean maximum plastic rotations and the maximum beam plastic rotations are generally two tothree times greater than the design earthquake values.
Table 2 presents average maximum frame storey shear forces from the response-history analysis.The values reported in the table exceed the strengths predicted using nonlinear static analysis as shownin Figure 7 but are consistent with the data of Figure 8(f). The nonlinear static force–displacementrelationships of Figure 7 were established using a first-mode load profile that is similar to an invertedtriangle shape. The use of a different static load profile for the analysis would have produced differentforce–displacement relationships. Because the profile of inertia loads over the height of the buildingchanges at every step in a response-history analysis, the load profile at the time of maximum framestorey shear will likely be different from the pattern assumed for nonlinear static analysis. As such,larger maximum frame storey shear forces from response-history analysis are not unexpected. Mwafyand Elnashai (2001) report similar observations.
The results of the incremental dynamic and static nonlinear analysis that are presented in Figure 8
RETROFIT WITH FLUID VISCOUS DAMPERS 379
Copyright 2001 John Wiley & Sons, Ltd. Struct. Design Tall Build. 10, 371–390 (2001)
are used in Section 3 below to aid in the selection of fluid viscous damping devices for therehabilitation of the prototype frame. Shown in the figure are relationships between maximum beamplastic rotation and roof drift. From Figures 8(a)–8(c) it can be seen that the static analysis resultsunderestimate the maximum beam plastic rotation for a given roof drift ratio (equal to the roofdisplacement divided by the height of the building) and that beam plastic rotations estimated usingnonlinear static analysis may be substantially unconservative.
Results from the SAC Phase 1 tests of pre-Northridge on unreinforced steel moment-resistingconnections (Whittaker, Gilani and Bertero, 1998) were used to judge the likely performance of theprototype building to design and maximum earthquake shaking. These full-scale tests were conductedon beam–column connections that were similar in size to those of the prototype building and so the
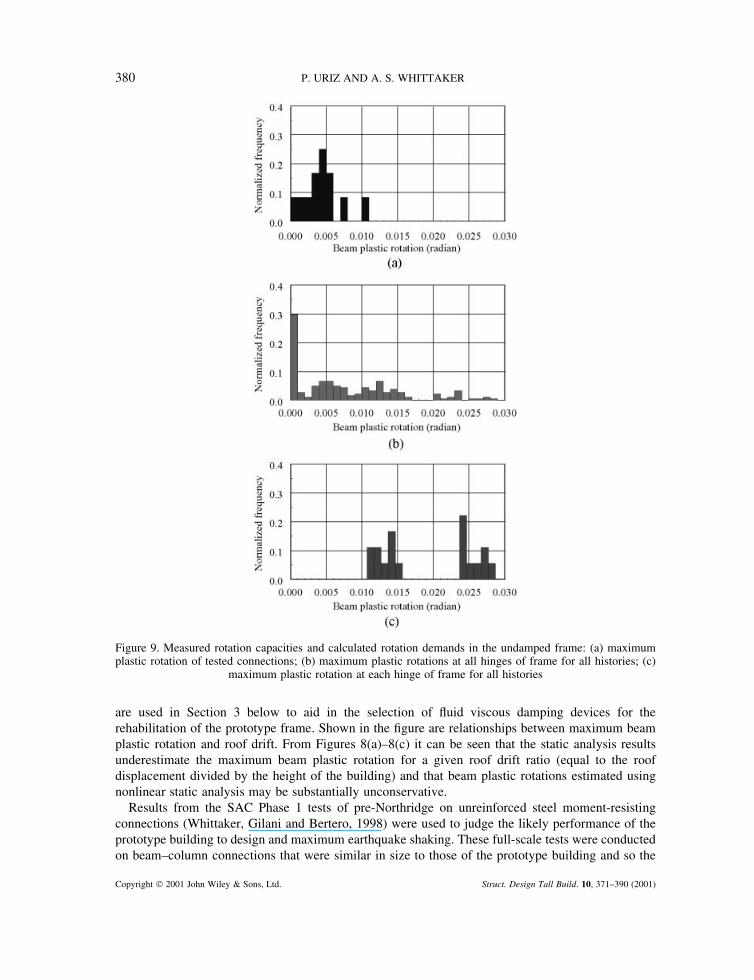
Figure 9. Measured rotation capacities and calculated rotation demands in the undamped frame: (a) maximumplastic rotation of tested connections; (b) maximum plastic rotations at all hinges of frame for all histories; (c)
maximum plastic rotation at each hinge of frame for all histories
380 P. URIZ AND A. S. WHITTAKER
Copyright 2001 John Wiley & Sons, Ltd. Struct. Design Tall Build. 10, 371–390 (2001)
results of these connection tests can be used to judge the likely behaviour of the moment-resistingconnections in the prototype building. Figure 9(a) shows a histogram of the measured maximum beamplastic rotations from the 12 full-scale connection tests (12 data points). Most of the measuredmaximum beam plastic rotations are grouped in the rotation range between 0 and 0�005 rads. Lowerand upper bound characterizations of maximum beam plastic rotation demand are presented in Figures9(b) and 9(c), respectively. Figure 9(b) shows the maximum beam plastic rotation at each of the 18moment connections (two per beam, three beams per level, two floor levels and the roof level) for eachof the 10–50 histories (180 data points). From Figure 9(b) it can be seen that approximately 30% of thebeam plastic rotations calculated by nonlinear dynamic analysis are small but more than 50% of thecalculated rotations are larger than 0�0035 rads: values that would likely be associated with fracture ofpre-Northridge beam–column connections. Figure 9(c) provides an alternate, more conservative,presentation of the calculated maximum beam plastic rotations. In this figure, the maximum beamplastic rotation for all ten 10–50 earthquake histories, at each of the 18 moment connections, ispresented (18 data points). This figure shows that if ten earthquake histories are used to predict themaximum rotation on each moment-resisting connection, the maximum calculated beam plasticrotation exceeds the maximum expected rotation capacity [see Figure 9(a)] in every location.
3. REHABILITATION OF THE FRAME USING FLUID VISCOUS DAMPERS
3.1 Introduction
The primary objective of the study presented in this paper was to rehabilitate the pre-Northridge steelmoment-frame building using fluid viscous dampers. Initially, the goal was to eliminate plasticrotations from all beams for all 10 representations of the design (10–50) earthquake. Preliminaryanalysis showed that this goal was unrealistic. Using the results of the incremental dynamic analysis,the roof drift would have to be reduced to less than 0�5% of the building height to achieve this goal:more than a sevenfold reduction from the maximum roof drift ratio of 0�037 and a fourfold reductionfrom the average drift ratio of 0�021. Numerous performance objectives were then studied using thedesign earthquake (10–50) as the characterization of the earthquake hazard. Because the dampers wereto be sized using the nonlinear static procedure of FEMA 273, one of the performance objectivesstudied was elimination of plastic rotations based on the nonlinear static analysis of the building frameand the 1997 NEHRP characterization of the design earthquake (see Figures 3 and 4). The results ofthis analytical study are presented below.
Because the nonlinear static procedure of FEMA 273 was to be used to size the fluid viscousdampers to achieve the displacement–response reductions presented above, and given that thisprocedure makes use of a target (roof) displacement, the results of the nonlinear static analysis of thebuilding frame presented in Figure 8 (thick solid lines denoted as NSP in the legends) were used toselect a target roof drift. From Figure 8 it can be seen that plastic rotations are eliminated at the secondfloor, third floor and roof levels at roof drifts of 0�010, 0�011, and 0�013 rads, respectively.Accordingly, a roof drift of 0�010 rads was selected as the target displacement, which corresponds to aroof displacement of 4�7 inches (120 mm).
3.2 Analysis of the damped building frame
The analysis procedure adopted to size the fluid viscous dampers deviated slightly from the proceduresset forth in FEMA 273 and 274 (FEMA, 1997a). Detailed procedures are set forth in FEMA 273 and274 to size fluid viscous dampers using the nonlinear static procedure (NSP) and to estimate the forcesin the dampers (and thus the building frame) due to higher-mode effects. Rather than adopting these
RETROFIT WITH FLUID VISCOUS DAMPERS 381
Copyright 2001 John Wiley & Sons, Ltd. Struct. Design Tall Build. 10, 371–390 (2001)
procedures verbatim, we chose to size the dampers using the first-mode procedure (or coefficientmethod) of FEMA 273 and to check the resulting design using nonlinear dynamic analysis.Information on the NSP is presented below for information.
The NSP of FEMA 273 makes use of a target displacement of a control node that is generallylocated at the roof level of a building. The general form of the target displacement (�t) equation is
�t � C0C1C2C3Sa�Te� �� T2e
4�2�1�
where C0 is a coefficient that relates roof displacement and spectral displacement, C1 is a coefficientthat relates maximum inelastic displacements to displacements calculated assuming linear elasticresponse, C2 is a coefficient that accounts for the effect of stiffness and strength degradation on themaximum displacement response, C3 is a coefficient that accounts for dynamic second-order effects,and Sa(Te,�) is the response-spectrum acceleration at the effective fundamental period (Te) anddamping ratio (�) of the building frame. The reader is referred to FEMA 274 (FEMA, 1997a) forbackground information on this equation and its limitations. Reductions in displacement response,measured through reductions in the target displacement, can be achieved by either adding stiffness andreducing Te, by adding damping and reducing Sa(Te,�), or a combination of the two approaches.
3.3 Trial sizes of fluid viscous dampers
To establish a target level of damping in the building frame, Equation (1) was first used to estimate thedisplacement of the undamped building. Setting C0 = 1�3 and setting the other three coefficients equalto unity, and using the 5% damped 1997 NEHRP spectrum of Figure 4 and a period of 1�03 seconds,the target displacement of the undamped building is approximately equal to:
�t � C0C1C2C3Sa�Te� �� T2e
4�2
� 1�3 � 0�66 � 386�40�8
� �1�032
4�2
� 11�1 inches �281 mm� �2�
where 0�66g is the 5% damped spectral acceleration at a period of 1�03 seconds and 0�8 is the FEMA273 damping factor (B1 in this instance) to convert a 5% damped spectrum ordinate to a 2% dampedspectrum ordinate (see table 2�15 of FEMA 273). Reducing the target displacement to 4�7 inches(120 mm) requires a total of 40% damping if no stiffness is added to the building frame. That is, thedamping factor B1 of table 2�15 (FEMA 273) must be increased from 0�8 to 1�9, which corresponds to areduction in displacement by a factor of 2�36.
The fluid viscous dampers were sized using equations presented in FEMA 273. The effectivedamping in the building frame is calculated as
�eff � �i �
�j
Wj
4�Wk� �i �
�j
Wj
4��12
�i
Fi�i��3�
where �i is the damping inherent to the building frame (assumed equal to 2% of critical), Wj is the workdone (energy dissipated) by damper j, and Fi and �i are, respectively, the inertia force and floor
382 P. URIZ AND A. S. WHITTAKER
Copyright 2001 John Wiley & Sons, Ltd. Struct. Design Tall Build. 10, 371–390 (2001)
displacement at level i corresponding to roof displacement �t. The work done by linear viscous device jin one complete cycle of loading can be calculated as
Wj � 2�2
TCj�
2rj �4�
where Cj is the damping constant for device j, �rj is the relative displacement along the axis of damper jcorresponding to roof displacement �t, and T is the secant period of the building at the roofdisplacement �t.
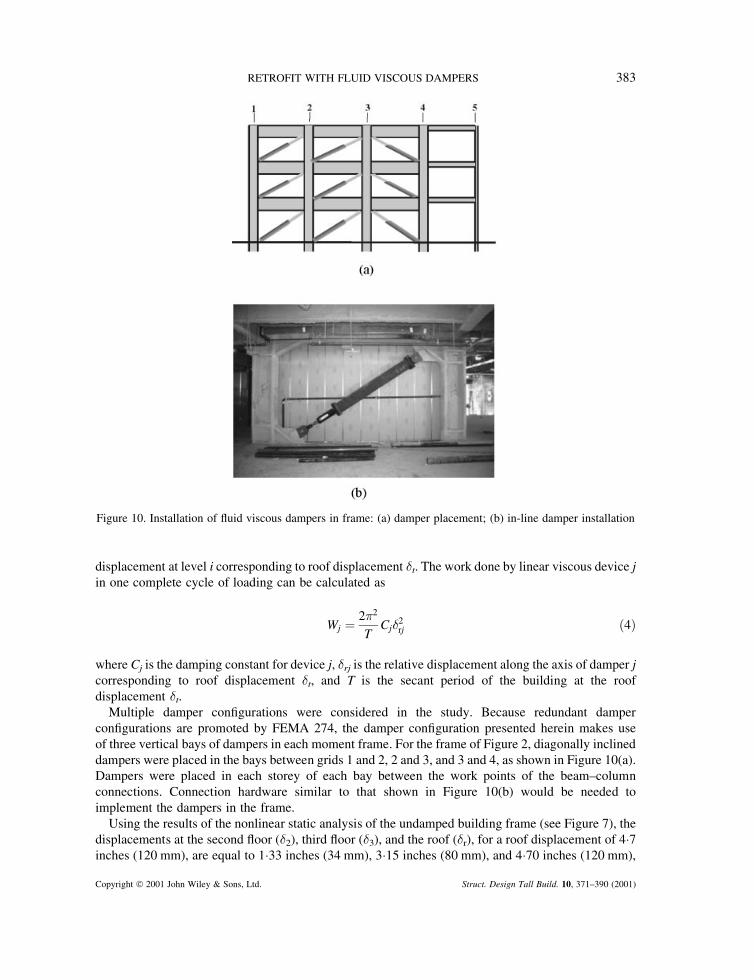
Multiple damper configurations were considered in the study. Because redundant damperconfigurations are promoted by FEMA 274, the damper configuration presented herein makes useof three vertical bays of dampers in each moment frame. For the frame of Figure 2, diagonally inclineddampers were placed in the bays between grids 1 and 2, 2 and 3, and 3 and 4, as shown in Figure 10(a).Dampers were placed in each storey of each bay between the work points of the beam–columnconnections. Connection hardware similar to that shown in Figure 10(b) would be needed toimplement the dampers in the frame.
Using the results of the nonlinear static analysis of the undamped building frame (see Figure 7), thedisplacements at the second floor (�2), third floor (�3), and the roof (�r), for a roof displacement of 4�7inches (120 mm), are equal to 1�33 inches (34 mm), 3�15 inches (80 mm), and 4�70 inches (120 mm),
Figure 10. Installation of fluid viscous dampers in frame: (a) damper placement; (b) in-line damper installation
RETROFIT WITH FLUID VISCOUS DAMPERS 383
Copyright 2001 John Wiley & Sons, Ltd. Struct. Design Tall Build. 10, 371–390 (2001)
respectively. The corresponding inertia forces from Figure 7(b) are 162 kips (720 kN), 324 kips (1440kN), and 487 kips (2167 kN), respectively. Assuming that the uniaxial fluid viscous dampers areinstalled in line with extremely stiff bracing (so as to realize all of the interstorey drift over the lengthof the damper), the relative displacement of each damper �rj is equal to �rcos�, where �r is the relativedisplacement between adjacent levels and � is the angle each damper makes with the horizontal plane.For dampers so placed in the three-storey frame, cos� = 0�92 and the relative displacements over thelengths of the dampers in the first, second, and third storeys are 1�22 inches (31 mm), 1�67 inches(42 mm), and 1�41 inches (36 mm), respectively. Because the building frame is elastic at the target roofdisplacement of 4�7 inches (120 mm), the secant period at maximum displacement is equal to 1�03seconds, from Section 2�4. Assuming that the damping constant Cj is equal for all dampers in thebuilding frame, the required value of Cj can be calculated using Equations (3) and (4). For a targetvalue of �eff = 0�40, the required value of Cj in each storey of the frame is equal to 70 kip in sec�1 (12�3kN mm sec�1) or 23�3 kip in sec�1 (4�1 kN -mm sec�1) per damper. The corresponding maximumaxial forces in each of the dampers in the first, second and third storeys are 175 kips (778 kN), 240 kips
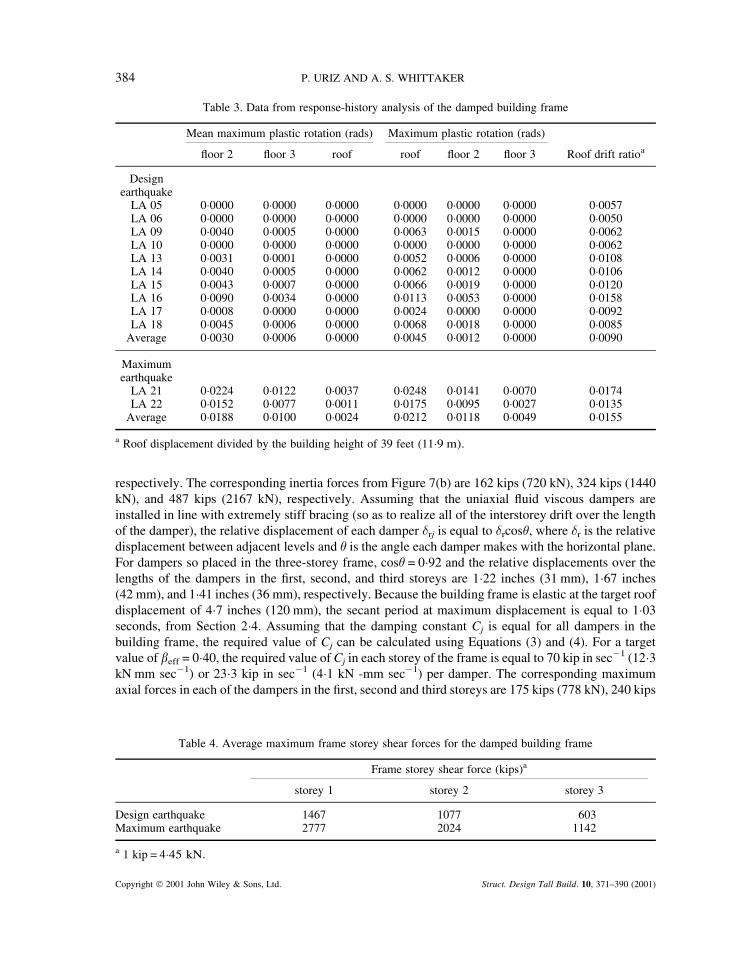
Table 3. Data from response-history analysis of the damped building frame
Mean maximum plastic rotation (rads) Maximum plastic rotation (rads)
floor 2 floor 3 roof roof floor 2 floor 3 Roof drift ratioa
Designearthquake
LA 05 0�0000 0�0000 0�0000 0�0000 0�0000 0�0000 0�0057LA 06 0�0000 0�0000 0�0000 0�0000 0�0000 0�0000 0�0050LA 09 0�0040 0�0005 0�0000 0�0063 0�0015 0�0000 0�0062LA 10 0�0000 0�0000 0�0000 0�0000 0�0000 0�0000 0�0062LA 13 0�0031 0�0001 0�0000 0�0052 0�0006 0�0000 0�0108LA 14 0�0040 0�0005 0�0000 0�0062 0�0012 0�0000 0�0106LA 15 0�0043 0�0007 0�0000 0�0066 0�0019 0�0000 0�0120LA 16 0�0090 0�0034 0�0000 0�0113 0�0053 0�0000 0�0158LA 17 0�0008 0�0000 0�0000 0�0024 0�0000 0�0000 0�0092LA 18 0�0045 0�0006 0�0000 0�0068 0�0018 0�0000 0�0085
Average 0�0030 0�0006 0�0000 0�0045 0�0012 0�0000 0�0090
Maximumearthquake
LA 21 0�0224 0�0122 0�0037 0�0248 0�0141 0�0070 0�0174LA 22 0�0152 0�0077 0�0011 0�0175 0�0095 0�0027 0�0135
Average 0�0188 0�0100 0�0024 0�0212 0�0118 0�0049 0�0155
a Roof displacement divided by the building height of 39 feet (11�9 m).
Table 4. Average maximum frame storey shear forces for the damped building frame
Frame storey shear force (kips)a
storey 1 storey 2 storey 3
Design earthquake 1467 1077 603Maximum earthquake 2777 2024 1142
a 1 kip = 4�45 kN.
384 P. URIZ AND A. S. WHITTAKER
Copyright 2001 John Wiley & Sons, Ltd. Struct. Design Tall Build. 10, 371–390 (2001)
(1068 kN), and 200 kips (890 kN), respectively, assuming sinusoidal loading to a displacement of �rj ata frequency of 0�97 Hz (1/1�03 Hz).
3.4 Damped frame response
The response of the frame incorporating the trial damper sizes of Section 3�3 was studied using the ten10–50 and the two 2–50 earthquake histories described in Section 2�2. The dampers were installed inall three bays of the moment frame of Figure 2. DRAIN-2DX does not include an explicit model for alinear fluid viscous damper. An elastic type-01 truss element with initial-stiffness-proportionaldamping was used to model the fluid viscous dampers. The axial stiffness (kj) of the truss element wasset to a small value so as not to affect the stiffness of the frame, and the stiffness-proportional-dampingvalue for the damper (�j, say) was calculated as �j = Cj/kj. The resulting hysteresis loop was that of alinear viscous damper with negligible stiffness.
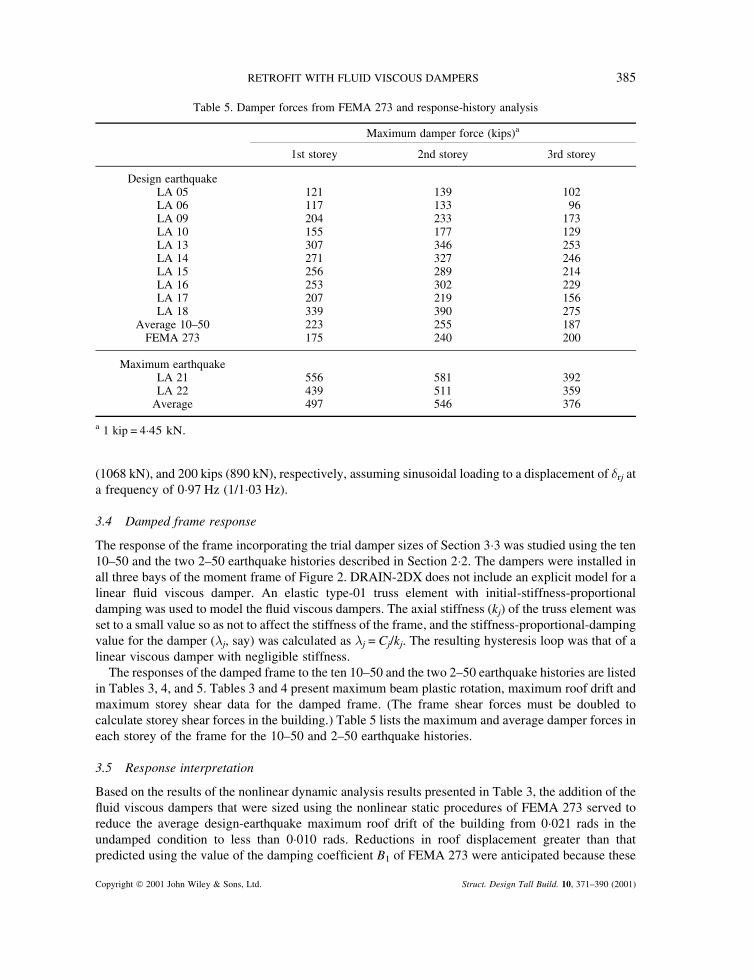
The responses of the damped frame to the ten 10–50 and the two 2–50 earthquake histories are listedin Tables 3, 4, and 5. Tables 3 and 4 present maximum beam plastic rotation, maximum roof drift andmaximum storey shear data for the damped frame. (The frame shear forces must be doubled tocalculate storey shear forces in the building.) Table 5 lists the maximum and average damper forces ineach storey of the frame for the 10–50 and 2–50 earthquake histories.
3.5 Response interpretation
Based on the results of the nonlinear dynamic analysis results presented in Table 3, the addition of thefluid viscous dampers that were sized using the nonlinear static procedures of FEMA 273 served toreduce the average design-earthquake maximum roof drift of the building from 0�021 rads in theundamped condition to less than 0�010 rads. Reductions in roof displacement greater than thatpredicted using the value of the damping coefficient B1 of FEMA 273 were anticipated because these
Table 5. Damper forces from FEMA 273 and response-history analysis
Maximum damper force (kips)a
1st storey 2nd storey 3rd storey
Design earthquakeLA 05 121 139 102LA 06 117 133 96LA 09 204 233 173LA 10 155 177 129LA 13 307 346 253LA 14 271 327 246LA 15 256 289 214LA 16 253 302 229LA 17 207 219 156LA 18 339 390 275
Average 10–50 223 255 187FEMA 273 175 240 200
Maximum earthquakeLA 21 556 581 392LA 22 439 511 359
Average 497 546 376
a 1 kip = 4�45 kN.
RETROFIT WITH FLUID VISCOUS DAMPERS 385
Copyright 2001 John Wiley & Sons, Ltd. Struct. Design Tall Build. 10, 371–390 (2001)
values are conservative (Ramirez et al., 2000). Mean maximum and maximum beam plastic rotationswere substantially reduced but not eliminated following the addition of the dampers. This result wasanticipated because the dampers were sized using the results of the nonlinear static analysis of theframe, and the data of Figure 8 clearly show that the nonlinear static procedure predicts smallermaximum beam plastic rotations for a given level of roof drift than does nonlinear dynamic analysis.
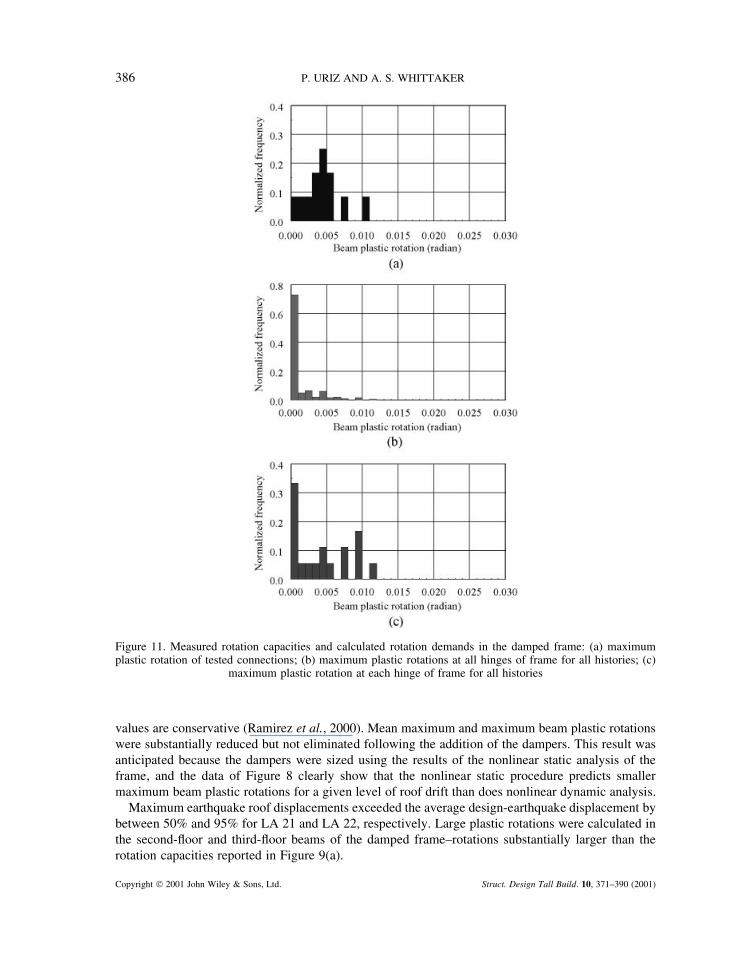
Maximum earthquake roof displacements exceeded the average design-earthquake displacement bybetween 50% and 95% for LA 21 and LA 22, respectively. Large plastic rotations were calculated inthe second-floor and third-floor beams of the damped frame–rotations substantially larger than therotation capacities reported in Figure 9(a).
Figure 11. Measured rotation capacities and calculated rotation demands in the damped frame: (a) maximumplastic rotation of tested connections; (b) maximum plastic rotations at all hinges of frame for all histories; (c)
maximum plastic rotation at each hinge of frame for all histories
386 P. URIZ AND A. S. WHITTAKER
Copyright 2001 John Wiley & Sons, Ltd. Struct. Design Tall Build. 10, 371–390 (2001)
Figure 11 presents histograms of measured rotation capacities and calculated rotation demands inthe damped frame. The measured rotation capacities of tested pre-Northridge connections of Figure9(a) are repeated in Figure 11(a) to simplify the comparison of measured rotation capacities andpredicted rotation demands. A comparison of Figures 9(b) and 11(b) and of Figures 9(c) and 11(c)shows the substantial reductions in maximum beam plastic rotation that resulted from the addition ofthe fluid viscous dampers. Further, a comparison of the measured rotation capacities of Figure 11(a)with the calculated rotation demands of Figures 11(b) and 11(c) clearly indicates that the likelihood offractured connections is dramatically reduced by the addition of the dampers.
The addition of the fluid viscous dampers to the frame led to substantial increases in average storeyshear forces for maximum earthquake shaking (see Tables 2 and 4 and the first-storey data). For thiscalculation, the storey shear is the sum of the shear forces in the columns and the axial forces in thedampers resolved into the horizontal plane. Although the deformations in the building frame aresubstantially reduced following the addition of the dampers, and although the shear forces in thecolumns are reduced (albeit not proportionally), the large resolved components of the damper forcescan lead to increases in the storey shear forces and the inertial forces that develop at each floor level.
The maximum forces that developed in the dampers during design and maximum earthquakeshaking are presented in Table 5. Also shown in this table are the preliminary estimates of the design-earthquake forces in the dampers calculated using the coefficient method of FEMA 273. The averagemaximum damper forces from the design-earthquake response-history analyses exceed the trial valuesestablished using the coefficient method of FEMA 273 in the lower two storeys of the frame. Thisresult is not unexpected because (1) the coefficient method utilizes first-mode information only, andhigher-modes are not considered in the calculation of the target displacement, and (2) the ordinate ofthe average 10–50 acceleration response spectrum at the fundamental period of the building (1�03seconds) exceeds that of the 1997 NEHRP spectrum upon which the preliminary estimates of thedesign-earthquake forces were based. However, as shown in other studies (e.g. Ramirez et al., 2000),higher-mode effects can substantially increase forces in velocity-dependent damping devices such asfluid viscous dampers and such effects must be accounted for in sizing the dampers and the framingused to connect the dampers to the structural frame. Two procedures that can be used to capture thesehigher-mode effects are those set forth in Section C9�3 of FEMA 274 and described in more detail inRamirez et al. (2000), and a response-history analysis as adopted in this paper. The maximum axialforces that develop in the dampers in the maximum-earthquake shaking of LA 21 and LA 22 are two tothree times larger than the average maximum forces calculated for design-earthquake shaking.Although the dampers were sized for a performance objective associated with design-earthquakeshaking, FEMA 273 writes that dampers must have sufficient force and displacement capacity (stroke)so as not to fail in a maximum earthquake. Accordingly, the dampers and their connection hardware inall three storeys of the frame would have to be sized for forces and displacements substantially greaterthan the average values calculated for design-earthquake shaking. Alternatively, nonlinear fluidviscous dampers with a velocity exponent of between 0�3 and 0�5 could be used to limit the forces thatdevelop in the dampers and their connection hardware for earthquake shaking greater than the design-earthquake shaking.
Table 6 lists the maximum tension and compression forces in the columns on grids 1, 2, 3 and 4 inthe damped and undamped configurations, for design and maximum earthquake shaking. In theundamped pre-Northridge frame, the differences between the maximum forces in the columns, tensionand compression, for design-earthquake and maximum-earthquake shaking, were negligible becausethe frame had substantially yielded in the design earthquake. (The roof displacement corresponding tothe design-earthquake average roof drift of 0�0021 rads listed in Table 1 is 10 inches.) Figure 7 clearlyshows that the undamped frame yields at a roof displacement substantially smaller than 10 inches(254 mm) and that increases in displacement beyond 10 inches results in only modest increases in
RETROFIT WITH FLUID VISCOUS DAMPERS 387
Copyright 2001 John Wiley & Sons, Ltd. Struct. Design Tall Build. 10, 371–390 (2001)
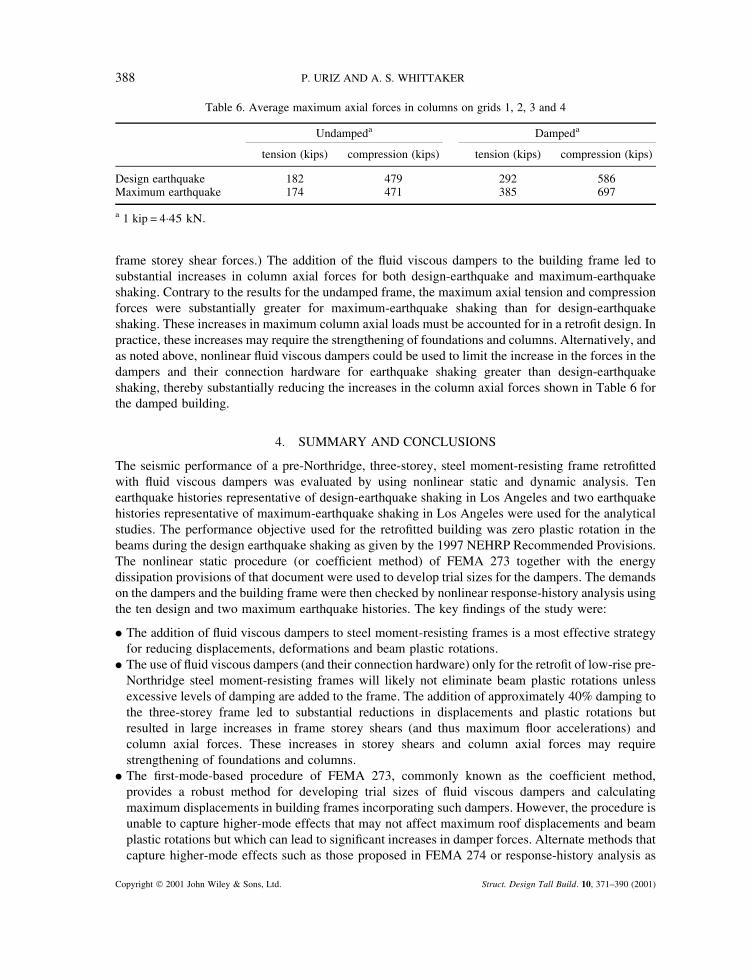
frame storey shear forces.) The addition of the fluid viscous dampers to the building frame led tosubstantial increases in column axial forces for both design-earthquake and maximum-earthquakeshaking. Contrary to the results for the undamped frame, the maximum axial tension and compressionforces were substantially greater for maximum-earthquake shaking than for design-earthquakeshaking. These increases in maximum column axial loads must be accounted for in a retrofit design. Inpractice, these increases may require the strengthening of foundations and columns. Alternatively, andas noted above, nonlinear fluid viscous dampers could be used to limit the increase in the forces in thedampers and their connection hardware for earthquake shaking greater than design-earthquakeshaking, thereby substantially reducing the increases in the column axial forces shown in Table 6 forthe damped building.
4. SUMMARY AND CONCLUSIONS
The seismic performance of a pre-Northridge, three-storey, steel moment-resisting frame retrofittedwith fluid viscous dampers was evaluated by using nonlinear static and dynamic analysis. Tenearthquake histories representative of design-earthquake shaking in Los Angeles and two earthquakehistories representative of maximum-earthquake shaking in Los Angeles were used for the analyticalstudies. The performance objective used for the retrofitted building was zero plastic rotation in thebeams during the design earthquake shaking as given by the 1997 NEHRP Recommended Provisions.The nonlinear static procedure (or coefficient method) of FEMA 273 together with the energydissipation provisions of that document were used to develop trial sizes for the dampers. The demandson the dampers and the building frame were then checked by nonlinear response-history analysis usingthe ten design and two maximum earthquake histories. The key findings of the study were:
� The addition of fluid viscous dampers to steel moment-resisting frames is a most effective strategyfor reducing displacements, deformations and beam plastic rotations.
� The use of fluid viscous dampers (and their connection hardware) only for the retrofit of low-rise pre-Northridge steel moment-resisting frames will likely not eliminate beam plastic rotations unlessexcessive levels of damping are added to the frame. The addition of approximately 40% damping tothe three-storey frame led to substantial reductions in displacements and plastic rotations butresulted in large increases in frame storey shears (and thus maximum floor accelerations) andcolumn axial forces. These increases in storey shears and column axial forces may requirestrengthening of foundations and columns.
� The first-mode-based procedure of FEMA 273, commonly known as the coefficient method,provides a robust method for developing trial sizes of fluid viscous dampers and calculatingmaximum displacements in building frames incorporating such dampers. However, the procedure isunable to capture higher-mode effects that may not affect maximum roof displacements and beamplastic rotations but which can lead to significant increases in damper forces. Alternate methods thatcapture higher-mode effects such as those proposed in FEMA 274 or response-history analysis as
Table 6. Average maximum axial forces in columns on grids 1, 2, 3 and 4
Undampeda Dampeda
tension (kips) compression (kips) tension (kips) compression (kips)
Design earthquake 182 479 292 586Maximum earthquake 174 471 385 697
a 1 kip = 4�45 kN.
388 P. URIZ AND A. S. WHITTAKER
Copyright 2001 John Wiley & Sons, Ltd. Struct. Design Tall Build. 10, 371–390 (2001)
used for this study should be used to calculate maximum forces in dampers and the framing used toconnect the dampers to the structural framing.
� Maximum-earthquake shaking can produce substantially larger forces in the structural framing anddampers than can design-earthquake shaking. Although the performance objective selected for thisstudy made use of design-earthquake shaking for the hazard, consideration must be given to theeffect of maximum-earthquake shaking on the building frame and dampers. Such consideration ispresented in FEMA 273, which requires dampers (either displacement-dependent or velocity-dependent) and their connections to the structural framing to be sized (axial forces anddisplacements) for the effects of maximum-earthquake shaking. The use of nonlinear fluid viscousdampers with a velocity exponent substantially less than one should be considered to limit theincrease in damper force for earthquake shaking greater than the design-earthquake shaking.
� Retrofit of the three-storey frame using fluid viscous dampers to substantially eliminate beam plasticrotations in the design earthquake did not substantially reduce the likelihood of beam–columnconnection fractures in a maximum earthquake (as characterized by the LA 21 and LA 22earthquake histories) because the resulting beam plastic rotations were still substantially greater thanthe measured rotation capacities of pre-Northridge connections.
ACKNOWLEDGEMENTS
The research work described in this paper was funded by the Pacific Earthquake Engineering Research(PEER) Center as part of its Summer Undergraduate Research Program. The authors thank ProfessorGerard Pardoen of PEER for funding and supporting this undergraduate research endeavour. Specialthanks are due to Professor Helmut Krawinkler of Stanford University for making available themathematical model of the three-storey frame, Professor Joel Conte of the University of California atSan Diego for insightful comments on the statistical evaluation of the data, and Professor MichaelConstantinou of the University at Buffalo for reviewing the manuscript.
REFERENCES
Cornell CA. 1996. Emilio Rosenblueth seminar: reliability based earthquake-resistant design – the future,Proceedings of the 11th World Conference on Earthquake Engineering, Permagon Elsevier Science: Oxford.
FEMA. 1997a. NEHRP Guidelines for the Seismic Rehabilitation of Buildings. Report FEMA 273 (Guidelines)and FEMA 274 (Commentary), Federal Emergency Management Agency, Washington, DC.
FEMA. 1997b. NEHRP Recommended Provisions for Seismic Regulations for New Buildings and OtherStructures, Part 1. Report FEMA 302, Federal Emergency Management Agency, Washington, DC.
FEMA. 2000. Recommended Seismic Design Criteria for New Steel Moment-frame Buildings. Report FEMA350, Federal Emergency Management Agency, Washington, DC.
Gupta A, Krawinkler H. 1999. Seismic demands for performance evaluation of steel moment resisting framestructures. Report 132, John A. Blume Earthquake Engineering Center, Stanford, CA.
ICBO. 1994. Uniform Building Code, International Conference of Building Officials, Whittier, CA.Mahin SA. 1998. Preface Remarks. Proceedings of the NEHRP Conference and Workshop on Research on the
Northridge, California Earthquake of January 17, 1994, California Universities for Research in EarthquakeEngineering, Richmond, CA.
Mwafy AM, Elnashai AS. 2001. Static pushover versus dynamic collapse analysis of RC buildings. EngineeringStructures, 23: 407–424.
Prakash V, Powell GH, Campbell S. 1993. DRAIN-2DX base program description and user guide. Report UCB/SEMM-93/17, Department of Civil and Environmental Engineering, University of California, Berkeley, CA.
Ramirez OM, Constantinou MC, Kircher CA, Whittaker AS, Johnson MW, Gomez JD. 2000. Development andevaluation of simplified procedures for analysis and design of buildings with passive energy dissipationsystems. Technical Report MCEER-00-0010, Multidisciplinary Center for Earthquake Engineering Research,State University of New York, Buffalo, NY.
RETROFIT WITH FLUID VISCOUS DAMPERS 389
Copyright 2001 John Wiley & Sons, Ltd. Struct. Design Tall Build. 10, 371–390 (2001)

SAC. 1996. Technical report: experimental investigations of beam-column sub assemblages. Report SAC-96-01,SAC Joint Venture, Sacramento, CA.
SSPC. 1994. Statistical Analysis of Tensile Data for Wide Flange Structural Shapes. Structural Shape ProducersCouncil.
Sommerville P. 1997. Development of ground motion time histories for phase 2 of the FEMA/SAC steel project.Report SAC/BD-97, SAC Joint Venture, Sacramento, CA.
Whittaker AS, Gilani ASJ, Bertero VV. 1998. Evaluation of pre-Northridge steel moment-resisting frame joints.The Structural Design of Tall Buildings 7: 263–283.
390 P. URIZ AND A. S. WHITTAKER
Copyright 2001 John Wiley & Sons, Ltd. Struct. Design Tall Build. 10, 371–390 (2001)