Resveratrol, a red wine polyphenol, attenuates ethanol-induced oxidative stress in rat liver
10
Cytotoxicity Gold Nanoparticles of Diameter 1.4 nm Trigger Necrosis by Oxidative Stress and Mitochondrial Damage Yu Pan, Annika Leifert, David Ruau, Sabine Neuss, Jo ¨rg Bornemann, Gu ¨nter Schmid, Wolfgang Brandau, Ulrich Simon, * and Willi Jahnen-Dechent* Gold nanoparticles (AuNPs) are generally considered nontoxic, similar to bulk gold, which is inert and biocompatible. AuNPs of diameter 1.4 nm capped with triphenylphosphine monosulfonate (TPPMS), Au1.4MS, are much more cytotoxic than 15-nm nanoparticles (Au15MS) of similar chemical compo- sition. Here, major cell-death pathways are studied and it is determined that the cytotoxicity is caused by oxidative stress. Indicators of oxidative stress, reactive oxygen species (ROS), mitochondrial potential and integrity, and mitochon- drial substrate reduction are all compromised. Genome-wide expression profiling using DNA gene arrays indicates robust upregulation of stress-related genes after 6 and 12 h of incubation with a 2 IC50 concentration of Au1.4MS but not with Au15MS nanoparticles. The caspase inhibitor Z-VAD-fmk does not rescue the cells, which suggests that necrosis, not apoptosis, is the pre- dominant pathway at this concentration. Pretreatment of the nanoparticles with reducing agents/antioxidants N-acetylcysteine, glutathione, and TPPMS reduces the toxicity of Au1.4MS. AuNPs of similar size but capped with glutathione (Au1.1GSH) likewise do not induce oxidative stress. Besides the size dependency of AuNP toxicity, ligand chemistry is a critical parameter determining the degree of cytotoxicity. AuNP exposure most likely causes oxidative stress that is amplified by mitochondrial damage. Au1.4MS nano- particle cytotoxicity is associated with oxidative stress, endogenous ROS production, and depletion of the intracellular antioxidant pool. Gold Nanoparticles Trigger Necrosis [ ] Prof. W. Jahnen-Dechent, Y. Pan Biomedical Engineering, Biointerface Laboratory RWTH Aachen University Pauwelsstrasse 30, 52074 Aachen (Germany) E-mail: [email protected] Prof. U. Simon, A. Leifert Inorganic Chemistry RWTH Aachen University Pauwelsstrasse 30, 52074 Aachen (Germany) E-mail: [email protected] D. Ruau Biomedical Engineering, Cell Biology RWTH Aachen University Pauwelsstrasse 30, 52074 Aachen (Germany) : Supporting Information is available on the WWW under http:// www.small-journal.com or from the author. DOI: 10.1002/smll.200900466 Dr. S. Neuss Pathology RWTH Aachen University Pauwelsstrasse 30, 52074 Aachen (Germany) Dr. J. Bornemann Electron Microscopy Facility, Medical Faculty RWTH Aachen University Pauwelsstrasse 30, 52074 Aachen (Germany) Prof. G. Schmid Inorganic Chemistry, University of Duisburg-Essen Universita ¨tsstrabe 5–7, 45117 Essen (Germany) Prof. W. Brandau Radiochemistry, University Hospital Essen Hufelandstrabe 55, 45122 Essen (Germany) Keywords: cell growth cytotoxicity gold nanoparticles oxidative stress small 2009, 5, No. 18, 2067–2076 ß 2009 Wiley-VCH Verlag GmbH & Co. KGaA, Weinheim 2067
-
Upload
independent -
Category
Documents
-
view
3 -
download
0
Transcript of Resveratrol, a red wine polyphenol, attenuates ethanol-induced oxidative stress in rat liver

Gold Nanoparticles Trigger Necrosis
Cytotoxicity
Gold Nanoparticles of Diameter 1.4 nm Trigger Necrosis byOxidative Stress and Mitochondrial DamageYu Pan, Annika Leifert, David Ruau, Sabine Neuss, Jorg Bornemann,Gunter Schmid, Wolfgang Brandau, Ulrich Simon,* and Willi Jahnen-Dechent*
Keywords:� cell growth
� cytotoxicity
� gold
� nanoparticles
� oxidative stress
Gold nanoparticles (AuNPs) are generally considered nontoxic, similar to
bulk gold, which is inert and biocompatible. AuNPs of diameter 1.4 nm capped
with triphenylphosphine monosulfonate (TPPMS), Au1.4MS, are much more
cytotoxic than 15-nm nanoparticles (Au15MS) of similar chemical compo-
sition. Here, major cell-death pathways are studied and it is determined that the
cytotoxicity is caused by oxidative stress. Indicators of oxidative stress, reactive
oxygen species (ROS), mitochondrial potential and integrity, and mitochon-
drial substrate reduction are all compromised. Genome-wide expression
profiling using DNA gene arrays indicates robust upregulation of stress-related
genes after 6 and 12h of incubation with a 2� IC50 concentration of Au1.4MS
but not with Au15MS nanoparticles. The caspase inhibitor Z-VAD-fmk does
not rescue the cells, which suggests that necrosis, not apoptosis, is the pre-
dominant pathway at this concentration. Pretreatment of the nanoparticles with
reducing agents/antioxidants N-acetylcysteine, glutathione, and TPPMS
reduces the toxicity of Au1.4MS. AuNPs of similar size but capped with
glutathione (Au1.1GSH) likewise do not induce oxidative stress. Besides the
size dependency of AuNP toxicity, ligand chemistry is a critical parameter
determining the degree of cytotoxicity. AuNP exposure most likely causes
oxidative stress that is amplified by mitochondrial damage. Au1.4MS nano-
particle cytotoxicity is associated with oxidative stress, endogenous ROS
production, and depletion of the intracellular antioxidant pool.
[�] Prof. W. Jahnen-Dechent, Y. Pan
Biomedical Engineering, Biointerface Laboratory
RWTH Aachen University
Pauwelsstrasse 30, 52074 Aachen (Germany)
E-mail: [email protected]
Prof. U. Simon, A. Leifert
Inorganic Chemistry
RWTH Aachen University
Pauwelsstrasse 30, 52074 Aachen (Germany)
E-mail: [email protected]
D. Ruau
Biomedical Engineering, Cell Biology
RWTH Aachen University
Pauwelsstrasse 30, 52074 Aachen (Germany)
: Supporting Information is available on the WWW under http://www.small-journal.com or from the author.
DOI: 10.1002/smll.200900466
Dr. S. Neuss
Pathology
RWTH Aachen University
Pauwelsstrasse 30, 52074 Aachen (Germany)
Dr. J. Bornemann
Electron Microscopy Facility, Medical Faculty
RWTH Aachen University
Pauwelsstrasse 30, 52074 Aachen (Germany)
Prof. G. Schmid
Inorganic Chemistry, University of Duisburg-Essen
Universitatsstrabe 5–7, 45117 Essen (Germany)
Prof. W. Brandau
Radiochemistry, University Hospital Essen
Hufelandstrabe 55, 45122 Essen (Germany)
small 2009, 5, No. 18, 2067–2076 � 2009 Wiley-VCH Verlag GmbH & Co. KGaA, Weinheim 2067

full papers U. Simon, W. Jahnen-Dechent, et al.
2068
1. Introduction
Nanomaterials are unique in that their electronic, chemical,
and physical properties enable many promising technical and
medicinal applications. It is widely accepted that nanomaterials
should be thoroughly tested for health hazards or ‘‘nanotoxi-
city’’,[1–3] but a balanced risk analysis is currently precluded by a
glaring lack of mechanistic knowledge of nanoparticle
toxicity.[4] In general terms, the biology of particle-induced
oxidative stress is an important mechanistic paradigm on which
nanomaterial toxicity can be based.[2] However, nanoparticle
toxicity can have multiple reasons: in the simplest case the
constituent materials of nanoparticles are toxic themselves,
such as cadmium-containing quantum dots.[5] Certain nano-
materials, most notably titanium dioxide particles, become
catalytically active upon photoactivation and thus may harm
cells and tissues.[6]
However, the very properties that make nanomaterials
unique may also cause toxicity.[7] Small size is the most
discriminating determinant mediating unique electronic,
chemical, mechanical, and optical properties of nanoscopic
versus bulk materials. Therefore ‘‘size’’ is considered critical in
nanomaterial toxicity. Unfortunately, variation of size in many
studies is intermingled with variation in chemical composition,
surface charge, ligand structure, and chemistry as well as aspect
ratio, which detracts from a firm conclusion that size is or is not
associated with toxicity of nanomaterials. It has been shown
that surface modifications of 12-nm colloidal gold nanoparticles
(AuNPs) greatly influence the cellular trajectory.[8] The
toxicity of nanoparticles also varies with their surface
functionalization.[9] From a certain size upward it appears that
what is actually perceived by cells is not the nanoparticle itself,
but the surface-associated molecules. Thus, molecules pre-
sented by the ‘‘nanoparticle scaffold’’ mediate biological
effects when presented in a specific conformation and
density.[10] This ‘‘nanogeometry’’ is a further confounder of
toxicity.[11] Along these lines, shape can also influence cellular
internalization of nanomaterials.[12] In summary, when particle
size exceeds the dimensions of single biological macro-
molecules, say a globular protein, and the material acts as a
scaffold attracting molecules or molecular complexes from
solution the nanomaterial itself may be chemically and
biologically inert, but due to its large surface-to-volume ratio
may assemble molecular complexes called the ‘‘nanoparticle
corona’’[13] with strong biological activity.
Furthermore, the nanomaterial itself may be innocuous, but
the shape or the aspect ratio may damage cells or tissues.
Asbestos fibers are a showcase example of the toxicity of
anisotropic materials causing chronic inflammation and
cancer.[14] Carbon nanofibers with a high aspect ratio[15] were
deemed potentially harmful, although this was not confirmed in
short-term experiments. Generally, it appears that nanoparti-
cles that cannot be cleared by phagocytic cells, such as
macrophages, will ‘‘pierce’’ the cells and will cause chronic
activation via, for example, the inflammosome molecular
activation complex.[16] This is one of the few examples for which
the target of particle interaction has been identified on the
molecular level. More candidates of interaction targets may be
gleaned from a recent study detailing the ‘‘bead proteome’’.[17]
www.small-journal.com � 2009 Wiley-VCH Verlag Gm
Thus, it remains to be demonstrated if materials of identical
composition become toxic by sheer reduction in size. We
hypothesized that AuNPs with triphenylphosphine mono-
sulfonate (TPPMS) shells should be the ideal nanomaterial to
answer this question. AuNPs can be made monodisperse with
distinct sizes, stability, and high yield.[18–22] Some of these gold
clusters proved cytotoxic.[23] We showed that a diameter
predominantly of 1.4 nm rendered AuNPs toxic in cell
cultures.[24] Sizes above 15 nm as well as particles smaller than
1 nm with identical core–shell chemistry were less toxic.
Herein, we present a detailed study of the cellular response
reactions toward exposure to AuNPs of diameter 1.4 nm
capped with TPPMS (Au1.4MS). Cell response was quick and
long lasting. Cells internalized the particles and mounted a
robust stress response on the level of membrane and
mitochondria integrity, and messenger RNA (mRNA) induc-
tion. Cell death predominantly by necrosis suggested strong
oxidative damage and mitochondrial permeability transition
(PT) as the prime cause of cell death. Our observation suggests
that Au1.4MS nanoparticles may produce reactive oxygen
species (ROS), which apart from the mitochondrial membrane
may also damage multiple targets along their cellular trajectory,
including lipids of the cell membrane, components of the
endocytic pathway, newly synthesized proteins, and DNA.
2. Results and Discussion
2.1. Cytotoxicity of AuNPs with Similar Size Dependson the Ligand Chemistry
Previously we reported that the cytotoxicity of AuNPs
depended on their size if the same ligand, TPPMS, was used
throughout. AuNPs 1.4 nm in diameter of the gold core
(Au1.4MS, 55 Au atoms) were more than 100-fold more toxic in
terms of [Au] than 15-nm particles consisting of identical
constituents (Au15MS). Here, we asked whether ligand
chemistry could influence the cytotoxicity of ultrasmall AuNPs.
To this end we incubated HeLa cervix carcinoma epithelial cells
with Au1.4MS and AuNPs of similar size but with glutathione
ligand (Au1.1GSH). We routinely treated the cells in their
logarithmic growth phase when they are most vulnerable to toxic
effects. We studied the cell response by vitality assays using
MTT (3-(4,5-dimethylthiazol-2-yl)-2,5-diphenyltetrazolium
bromide), flow cytometry, and fluorescence microscopy with
pathway-specific dyes as well by gene expression analysis using
DNA gene arrays.
Figure 1 shows that the IC50 of Au1.1GSH was 3130mM
(Figure 1, green curve), 65-fold higher than the IC50 of
Au1.4MS, which was 48mM (Figure 1, red curve). When we
mixed Au1.4MS and GSH (10 equiv) and added the mixture to
the cells (Figure 1, yellow curve), the IC50 of the mixture was
181mM and thus almost fourfold higher than that of Au1.4MS
alone. This result can be interpreted in two ways. First, excess
GSH could have replaced TPPMS as the ligand due to a
stronger Au�S bond as compared to the Au�P bond in the
starting compound, effectively creating Au1.4GSH. To further
investigate this, the mixture of Au1.4MS and GSH was
characterized by different means (see the Experimental Section
for details). The particles showed amphoteric behavior, that is,
bH & Co. KGaA, Weinheim small 2009, 5, No. 18, 2067–2076

Gold Nanoparticles Trigger Necrosis
Figure 1. IC50 of Au1.4MS- and Au1.1GSH-treated HeLa cells. Au1.1GSH
(green, IC50¼ 3130mM) has a 65-fold higher IC50 than Au1.4MS (red,
IC50¼48mM). The IC50 of Au1.4MS admixed with 10 equivalents of GSH
is intermediate at 181mM.
Figure 2. Flowcytometrydeterminationofoxidativestress.CM-H2DCFDA
staining shows that Au1.4MS but not Au15MS or Au1.1GSH induced
oxidative stress in HeLa cells. The green line represents the untreated
HeLacellsshowingnooxidativestress.ThepinklinerepresentsHeLacells
treated with 0.3% H2O2 for 30 min that suffered strong oxidative stress.
HeLa cells treated with 100mM Au1.4MS for 6, 12, 18, 24, and 48 h,
respectively, showed progressively increasing accumulation of
intracellular fluorescein and thus oxidative stress. The oxidative stress
induced by Au1.4MS was obvious after 12 h and steadily increased
until the end of the test at 48 h. In contrast, HeLa cells treated for 48 h
with 1000mM Au15MS or 1000mM Au1.1GSH showed no elevated
intracellular fluorescein and thus no oxidative stress, even at tenfold
higher concentration than Au1.4MS.
they were well soluble in acidic and basic solution. Zeta
potential measurements gave �48 mV in basic and þ25 mV in
acidic solution, compared to a value of�42 mV for Au1.4MS in
bidistilled water at pH 7, due to the acidity of the sulfonate
group. A 31P NMR spectrum of the washed reaction product
showed no signal at all, whereas an IR spectrum in KBr showed
typical signals of GSH, with the absence of the S�H stretching
vibration at 2526 cm�1, thus indicating that the GSH was
attached covalently to the gold surface via the SH group.[25]
Transmission electron microscopy (TEM) images display a
slightly broadened size distribution after ligand exchange but
still with a mean particle size of 1.4 nm. Thus, the Au1.4MS
nanoparticles had exchanged GSH ligand for TPPMS.
Alternatively, Au1.4MS may have caused oxidative stress
in the cells that was diminished in Au1.4MSþGSH or
Au1.1GSH, which contain thiols and are thus intrinsically
antioxidant.
2.2. Oxidative Stress and Mitochondrial DamageInduced by Au1.4MS Nanoparticles
The cell-permeable stain CM-H2DCFDA, which becomes
fluorescent upon oxidation by intracellular ROS, was employed
to directly demonstrate intracellular ROS by flow cytometry.
We used 0.3% H2O2 as a positive control. Figure 2 shows the
flow cytometry analysis of HeLa cells that were left untreated
and showed no fluorescence (green line), which indicated no
oxidative stress. Upon treatment with 0.3% H2O2 a marked
right shift towards stronger fluorescence indicated the forma-
tion of fluorescein and thus strong ROS generation in H2O2-
treated HeLa cells (pink line). ROS was likewise detected in
HeLa cells treated with 100mM Au1.4MS for 12 h (dark blue
line). Intracellular ROS content and thus fluorescence intensity
continuously increased until the end of the test at 48 h. In
contrast, both Au15MS (violet line) and Au1.1GSH (orange
line) did not trigger the formation of intracellular ROS even at
tenfold higher concentration. Treatment of the cells with
TPPMS alone also did not cause an increase in intracellular
fluorescence (not shown).
Oxidative stress is associated with protein and lipid
oxidation, ultimately leading to a profound alteration in
small 2009, 5, No. 18, 2067–2076 � 2009 Wiley-VCH Verlag Gmb
mitochondrial function thought to constitute the central
executioner of cell death.[26] A salient feature of mitochondrial
damage is the mitochondrial PT, which results in a sudden
increase in the permeability of the inner mitochondrial
membrane to solutes <1500 Da. This leakiness is readily
monitored with the fluorescent dye JC-1, which accumulates
along the mitochondrial potential (Dc) in mitochondria of
healthy cells. At high concentration JC-1 dimerizes and
fluoresces red. Upon PT the mitochondria become leaky and
release JC-1 into the cytoplasm where it fluoresces green as a
monomer. Figure 3A shows that untreated HeLa cells with
polarized mitochondria were stained bright red. Treating the
cells with Au1.4MS for 1, 6, 12, 18, and 24 h caused progressive
rounding up of the cells, loss of JC-1 dimers (red) in
mitochondria, and discharge of monomeric JC-1 (green) into
the cytoplasm (Figure 3B–F). This observation indicates that
PT and thus green cytoplasma fluorescence continuously
increased up to 24 h (Figure 3F), at which time most of the
HeLa cells stained green and thus positive for PT.
2.3. Au1.4MS Nanoparticles Kill Cells by Necrosis
When PT is induced in a massive way and lack of
mitochondrial activity rapidly depletes the cellular adeno-
sine-5’-triphosphate (ATP) supply, necrosis occurs, that is, the
primary disruption of the plasma membrane. When PT occurs
H & Co. KGaA, Weinheim www.small-journal.com 2069

full papers U. Simon, W. Jahnen-Dechent, et al.
Figure 3. Fluorescent mitochondria potential staining. JC-1 staining
indicated mitochondrial depolarization after incubation with Au1.4MS.
HeLa cells were incubated with 100mM Au1.4MS and stained with the
fluorescent dye JC-1. Red punctate staining indicated aggregation of JC-1
in intact mitochondria. Green staining of the cytoplasm indicated
mitochondrial PT and depolarization with concomitant discharge of JC-1
monomer into the cytoplasm. A) Untreated HeLa cells, B) 1 h of treatment
with 100mM Au1.4MS. C–F) Further incubation for C) 6, D) 12, E) 18 and
F) 24 h showed progressive and continued mitochondrial PT.
Figure 4. Fluorogenic caspase activity determination. Caspase 3/7
activity increased 6.5-fold in staurosporine-treated HeLa cells but only
twofold in Au1.4MS-treated cells. Caspase 3/7 activity was measured
using a fluorogenic protease substrate and is presented as relative
fluorescence units (RFUs). Treatment with 0.2mM staurosporine for 6–
18 h strongly enhanced caspase 3/7 after incubating the cells for 6 h and
the content of caspase 3/7 reached a peak after 12 h of incubation and
then decreased with longer incubation. 50mM Au1.4MS-treated cells had
low caspase 3/7 activity after the cells were incubated with Au1.4MS for
18 and 24 h.
Figure 5. Reversal of apoptosis by caspase inhibition. The caspase
inhibitor Z-VAD-fmk inhibited staurosporine-triggered apoptosis, but not
Au1.4MS-triggered necrosis.HeLacellswere leftuntreated or treatedwith
thecaspaseinhibitorZ-VAD-fmkorwithstaurosporine(STA)andAu1.4MS
as indicated. Z-VAD-fmk inhibited cell death in staurosporine-treated
cells, which suggested apoptosis as the predominant death pathway.
When HeLa cells were incubated with staurosporine alone, 47% of cells
survivedafter48 h.TheadditionofZ-VAD-fmkincreasedsurvivalto90and
84%, respectively. Z-VAD-fmk did not increase the survival of Au1.4MS-
treated cells, which suggests that necrosis was the predominant death
pathway.
2070
gradually, apoptogenic proteases are activated and can act on
nuclear and cytoplasmic substrates to execute apoptosis. This
explains why many compounds, including Au1.4MS,[24] induce
necrosis at high doses and apoptosis at lower, subnecrotic
doses.[27]
To confirm that the cells underwent necrosis instead of
apoptosis, we measured the caspase 3/7 activity (Figure 4) using
the fluorogenic substrate rhodamine 110 bis-(N-CBZ-L-
aspartyl-L-glutamyl-L-valyl-aspartic acid amide), Z-DEVD-
R110. Caspase 3/7 enzymes cleave the carboxy terminal to
the aspartate in the DEVD peptide, thus converting the
substrate into fluorescent rhodamine. Figure 4 shows that
staurosporine, a prototypic inducer of apoptosis, increased
intracellular caspase 3/7 activity sixfold over background within
6 h and reached peak activity after 12 h. Thereafter caspase 3/7
activity declined until the end of the experiment at 48 h. In
contrast, Au1.4MS-treated HeLa cells showed a comparatively
small caspase 3/7 induction of twofold peaking at 18 h.
To test if the increase in caspase 3/7 activity was necessary
and sufficient to trigger cell death, we employed the caspase
inhibitor Z-VAD-fmk. Apoptosis is predominantly caspase-
mediated and can be blocked by Z-VAD-fmk whereas necrosis
cannot. Figure 5 shows that the survival rate of staurosporine-
treated HeLa cells (white bars) increased from 47 to 90 and 83%
www.small-journal.com � 2009 Wiley-VCH Verlag Gm
after adding 500mM and 32mM Z-VAD-fmk, respectively. In
contrast, Z-VAD-fmk treatment did not increase cell survival
in Au1.4MS-treated HeLa cells, again suggesting that (sec-
ondary) necrosis not apoptosis occurred in these cells.
bH & Co. KGaA, Weinheim small 2009, 5, No. 18, 2067–2076
Gold Nanoparticles Trigger Necrosis
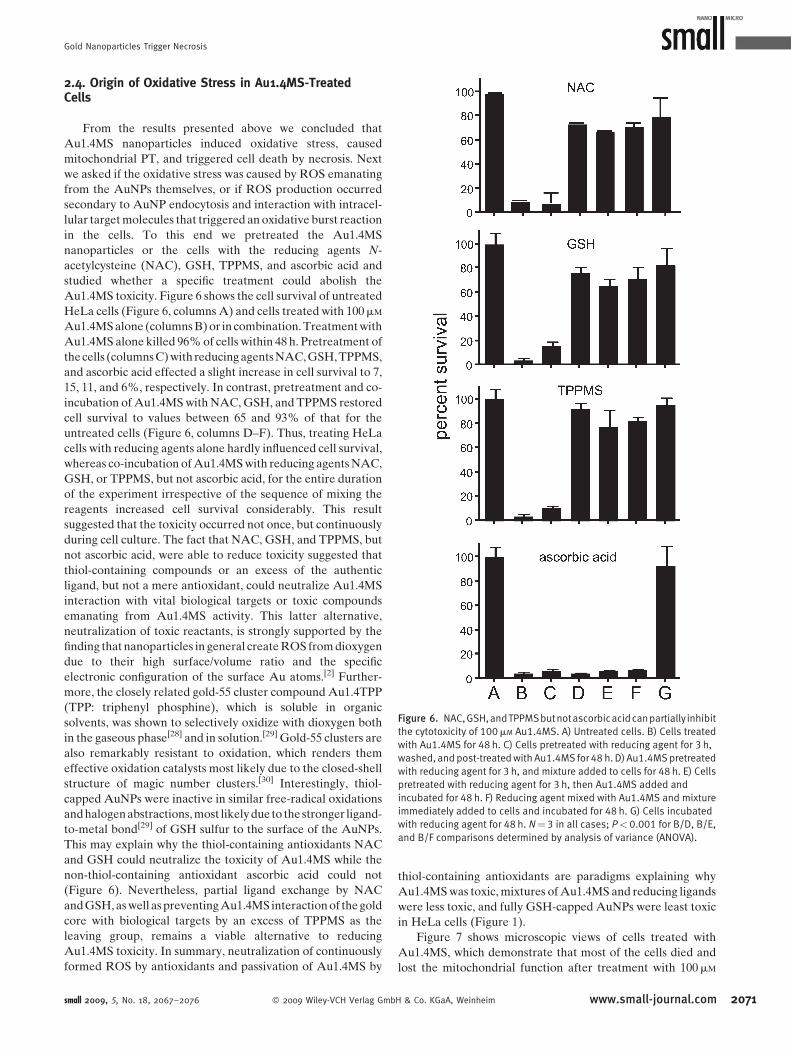
Figure 6. NAC,GSH,andTPPMSbutnotascorbicacidcanpartially inhibit
the cytotoxicity of 100mM Au1.4MS. A) Untreated cells. B) Cells treated
with Au1.4MS for 48 h. C) Cells pretreated with reducing agent for 3 h,
washed, and post-treated with Au1.4MS for 48 h. D) Au1.4MS pretreated
with reducing agent for 3 h, and mixture added to cells for 48 h. E) Cells
pretreated with reducing agent for 3 h, then Au1.4MS added and
incubated for 48 h. F) Reducing agent mixed with Au1.4MS and mixture
immediately added to cells and incubated for 48 h. G) Cells incubated
with reducing agent for 48 h. N¼ 3 in all cases; P< 0.001 for B/D, B/E,
and B/F comparisons determined by analysis of variance (ANOVA).
2.4. Origin of Oxidative Stress in Au1.4MS-TreatedCells
From the results presented above we concluded that
Au1.4MS nanoparticles induced oxidative stress, caused
mitochondrial PT, and triggered cell death by necrosis. Next
we asked if the oxidative stress was caused by ROS emanating
from the AuNPs themselves, or if ROS production occurred
secondary to AuNP endocytosis and interaction with intracel-
lular target molecules that triggered an oxidative burst reaction
in the cells. To this end we pretreated the Au1.4MS
nanoparticles or the cells with the reducing agents N-
acetylcysteine (NAC), GSH, TPPMS, and ascorbic acid and
studied whether a specific treatment could abolish the
Au1.4MS toxicity. Figure 6 shows the cell survival of untreated
HeLa cells (Figure 6, columns A) and cells treated with 100mM
Au1.4MS alone (columns B) or in combination. Treatment with
Au1.4MS alone killed 96% of cells within 48 h. Pretreatment of
the cells (columns C) with reducing agents NAC, GSH, TPPMS,
and ascorbic acid effected a slight increase in cell survival to 7,
15, 11, and 6%, respectively. In contrast, pretreatment and co-
incubation of Au1.4MS with NAC, GSH, and TPPMS restored
cell survival to values between 65 and 93% of that for the
untreated cells (Figure 6, columns D–F). Thus, treating HeLa
cells with reducing agents alone hardly influenced cell survival,
whereas co-incubation of Au1.4MS with reducing agents NAC,
GSH, or TPPMS, but not ascorbic acid, for the entire duration
of the experiment irrespective of the sequence of mixing the
reagents increased cell survival considerably. This result
suggested that the toxicity occurred not once, but continuously
during cell culture. The fact that NAC, GSH, and TPPMS, but
not ascorbic acid, were able to reduce toxicity suggested that
thiol-containing compounds or an excess of the authentic
ligand, but not a mere antioxidant, could neutralize Au1.4MS
interaction with vital biological targets or toxic compounds
emanating from Au1.4MS activity. This latter alternative,
neutralization of toxic reactants, is strongly supported by the
finding that nanoparticles in general create ROS from dioxygen
due to their high surface/volume ratio and the specific
electronic configuration of the surface Au atoms.[2] Further-
more, the closely related gold-55 cluster compound Au1.4TPP
(TPP: triphenyl phosphine), which is soluble in organic
solvents, was shown to selectively oxidize with dioxygen both
in the gaseous phase[28] and in solution.[29] Gold-55 clusters are
also remarkably resistant to oxidation, which renders them
effective oxidation catalysts most likely due to the closed-shell
structure of magic number clusters.[30] Interestingly, thiol-
capped AuNPs were inactive in similar free-radical oxidations
and halogen abstractions, most likely due to the stronger ligand-
to-metal bond[29] of GSH sulfur to the surface of the AuNPs.
This may explain why the thiol-containing antioxidants NAC
and GSH could neutralize the toxicity of Au1.4MS while the
non-thiol-containing antioxidant ascorbic acid could not
(Figure 6). Nevertheless, partial ligand exchange by NAC
and GSH, as well as preventing Au1.4MS interaction of the gold
core with biological targets by an excess of TPPMS as the
leaving group, remains a viable alternative to reducing
Au1.4MS toxicity. In summary, neutralization of continuously
formed ROS by antioxidants and passivation of Au1.4MS by
small 2009, 5, No. 18, 2067–2076 � 2009 Wiley-VCH Verlag Gmb
thiol-containing antioxidants are paradigms explaining why
Au1.4MS was toxic, mixtures of Au1.4MS and reducing ligands
were less toxic, and fully GSH-capped AuNPs were least toxic
in HeLa cells (Figure 1).
Figure 7 shows microscopic views of cells treated with
Au1.4MS, which demonstrate that most of the cells died and
lost the mitochondrial function after treatment with 100mM
H & Co. KGaA, Weinheim www.small-journal.com 2071

full papers U. Simon, W. Jahnen-Dechent, et al.
Figure 7. Viability test for intact mitochondria and respiratory activity.
Cells were treated for 48 h with A) Au1.4MS, B) a mixture of Au1.4MS and
GSH, C) Au1.1GSH, and D) GSH alone. MTT was added to the cells for 2 h to
measure respiratory activity and thus viability as the amount of MTT
reduced to formazan. Mitochondria stained dark blue due to formazan
accumulation. Please note that mixing Au1.4MS greatly reduced the
toxicity (A,C) and that Au1.1GSH and GSH were nontoxic to begin with.
2072
Au1.4MS (Figure 7A). When the cells were treated with a
mixture of Au1.4MS and GSH, most of the cells retained
normal morphology and mitochondrial activity (Figure 7B). As
Figure 8. Hierarchical cluster analysis and heat-maprepresentation of differentially regulated
genes in AuNP-treated HeLa cells. All gene chip analyses were performed in duplicate (_1,_2).
HeLa cells were left untreated (c) or were treated for 1, 6, and 12 h with Au1.4MS (s1h–s12h for
smallAuNPs)orwithAu15MS(b1h–b12hforbigAuNPs).Geneexpressionlevelsdeterminedby
Affymetrix gene chips were subjected to hierarchical cluster analysis. Upon treatment with
Au1.4MS, 35 genes were significantly upregulated. Each gene is depicted by a single row of
colored boxes. The color of the respective box in one row represents the expression value of the
gene transcript in one sample compared with the median expression level of the gene’s
transcript for all samples shown. Blue, transcript levels below median; white, transcript levels
equal to median; red, transcript levels higher than median.
a note of caution we would like to mention
that NAC, GSH, TPPMS, and ascorbic acid
were all able to reduce the vital dye MTT into
formazan in solution. Careful rinsing of the
cells before the addition of MTT effectively
excluded this extracellular reaction, which
may produce erroneously high survival
scores if it goes unnoticed. Thus, routine
microscopic observation of cells to demon-
strate that MTT was converted to formazan
only in mitochondria, not in the cytoplasm or
outside the cells, is strongly advised in this
kind of assay.
2.5. Stress-Related andInflammation-Related Genes AreUpregulated and Cell-Cycle-RelatedGenes Are Downregulated inAu1.4MS-Treated Cells
Having established that Au1.4MS was
cytotoxic because of continuous generation
of ROS, we asked whether the oxidative
stress would be reflected in the level of gene
expression. To this end we performed
genome-wide mRNA expression analysis
using Affymetrix gene chips. mRNA
was extracted from untreated cells and cells
treated with 100mM Au1.4MS and 1000mM
Au15MS after defined incubation periods
and reverse transcribed into complementary
DNA (cDNA). The level of glyceraldehyde-
www.small-journal.com � 2009 Wiley-VCH Verlag Gm
3-phosphate dehydrogenase (GAPDH) housekeeping gene
was independently measured by real-time polymerase chain
reaction (RT-PCR) to ensure that equal amounts of cDNA
entered the analysis (not shown). Our previous studies of AuNP
interaction with DNA[31,32] suggested that the toxicity of
Au1.4MS might be due to interference with DNA transcription.
However, the strongly enhanced expression of 35 genes after
exposure of HeLa cells to Au1.4MS and the continued
expression of GAPDH both argued against direct transcrip-
tional inhibition by Au1.4MS.
Figure 8 shows that a group of growth-related genes
(PTGER4, EDN1, NR4A1, C5orf13, NR4A3, EGR3, FOS,
EMP1, CALD1, SERPINE1, EGR1, DUSP5, ATF3, DUSP2)
were upregulated in HeLa cells treated with both Au1.4MS and
Au15MS at 1 h after the onset of treatment (s1h_1, s1h_2,
b1h_1, b1h_2). This reflected an initial growth response
triggered by addition of fresh media along with the Au1.4MS
and Au15MS, which illustrates a well-known short-term
phenomenon of cell culture and confirms the validity of the
gene chip expression study. A separate clustering of the gene
expression changes following treatment with the nontoxic
Au15MS confirmed an overlapping, almost identical group of
genes (EGR1, NR4A1, DUSP5, PPP1R3B, EDN1, FOS,
EGR1, EDN1, ADAMTS1, ATF3, PTGER4, CYR61) as
upregulated at 1 h after medium exchange irrespective of
toxicity (not shown). Following the initial growth response,
heat shock and stress-related genes were upregulated after 6 h
bH & Co. KGaA, Weinheim small 2009, 5, No. 18, 2067–2076

Gold Nanoparticles Trigger Necrosis
Figure 9. Flow cytometry of DNA content and cell division. A) Cells were
labeled with propidium iodide (PI) and analyzed by flow cytometry. Cells
treated with staurosporine showed a hypodiploid peak in DNA content
typical of G2/M arrest and apoptosis (arrow head), while untreated cells
and cells treated with Au1.4MS showed normal DNA content. B,C) Cells
were labeled with the fluorescent dye carboxyfluorescein succinimidyl
ester (CFSE) and further grown for 0, 1, 2, 3, and 4 days. Untreated cells
(B) underwent four cell divisions with a concomitant decrease in CFSE
fluorescence intensity. Cells treated with Au1.4MS (C) divided only once,
that is, they never entered a fresh cell cycle.
and strongly upregulated after 12 h in Au1.4MS-treated but not
in Au15MS-treated or untreated HeLa cells. This group of
genes (HSPA1A, DNAJA4, CHAC1, HSPA1A, DDIT3,
GEM, LOC387763, PGF, HSPA6, SESN2, LOC284561,
PPP1R15A, HMOX1, C16orf81, LOC344887, NGF, OSGIN1,
FOSL1, CXCL2, IL8) suggested that a robust stress response
had occurred in the Au1.4MS-treated cells (data summarized in
Table S1, Supporting Information). Highly elevated expression
of heat shock proteins has been demonstrated to inhibit
apoptosis at several stages including blocking of cytochrome c
release from mitochondria, thus preventing the formation of an
apoptosome and the activation of caspase-3,[33] ultimately
forcing cells into necrosis instead of apoptosis.
Taken together the gene expression profile in Au1.4MS is
fully compatible with an oxidative stress response leading to
necrosis. In addition, oxidative stress and inflammation-related
genes including glutathione S-transferase (GST), heme oxy-
genase-1 (HMOX1), oxidative stress induced growth inhibitor
(OSGIN1), and IL-8 were also upregulated. Most of the
downregulated genes are associated with the cell cycle,
including MEF2C, CCNG2, CCNE2, BRIP1, CCNE1,
BARD1, CCNJ, CDKN2C, FBXO4, and CDKN2B (data
not shown). In summary, this finding suggested that continuous
ROS generation was indeed the toxicity mechanism causing cell
damage. Early repair reactions were started, but downregula-
tion of the cell-cycle-associated genes shows that eventually
secondary necrosis ensued, most likely because the cells were
unable to repair the sustained multitarget damage that itself
results in the production of large amounts of endogenous ROS
and depletion of the intracellular antioxidant pool.
Next we asked if the oxidative stress toxicity and the
changes in gene expression would bring about a specific block in
the cell cycle due to interference with, for example, DNA
replication, or if cells simply stopped dividing because they died
of continued oxidative stress and secondary necrosis. The
protein p53 controls both the G2/M and the G1 cell-cycle
checkpoints and mediates reversible growth arrest in apoptotic
fibroblasts.[34] To gain insight into the cell-cycle progression in
the context of Au1.4MS cytotoxicity, we measured the cellular
DNA content and mitotic index of HeLa cells. Figure 9A shows
the result of a typical flow cytometric DNA content measure-
ment of HeLa cells. Untreated cells (black line) showed a minor
peak of propidium iodide (PI) fluorescence at 1.5� 103
depicting 4N cellular DNA content (G2 phase, about 20% of
cells) and a major peak of fluorescence at 8� 102 indicating 2N
cellular DNA content (G1 phase, 70% of cells). Cells staining
intermediately reside in the S phase. When the HeLa cells were
treated with staurosporine (Figure 9A, green line) to trigger
apoptosis, the relative proportion of cells in the G2 phase
increased to 50% indicating a G2/M block of the cells. Together
with the sub G1 peak and the low-fluorescence peak indicating
DNA fragments, this pattern was typical of apoptosis. Unlike
the staurosporine-treated cells, Au1.4MS-treated cells showed
no G2/M block, sub G1 or fragmented DNA peaks, which
suggests that these cells did not execute the late stages of
apoptosis, including DNA fragmentation, but went straight into
necrosis once the mitochondrial damage was done and PT had
occurred. This is further corroborated by the fact that caspase
activation, which is likewise a late event in apoptosis but not in
small 2009, 5, No. 18, 2067–2076 � 2009 Wiley-VCH Verlag GmbH & Co. KGaA, Weinheim www.small-journal.com 2073

full papers U. Simon, W. Jahnen-Dechent, et al.
2074
necrosis, was low in Au1.4MS-treated cells and furthermore,
that caspase inhibition by Z-VAD-fmk enhanced cell viability
in staurosporine-treated (apoptotic) cells but not in Au1.4MS-
treated (secondary necrotic) cells (Figures 4 and 5).
3. Conclusions
We have previously shown that triphenylphosphine sulfo-
nate-capped gold-55 clusters with a gold core of diameter 1.4 nm
(Au1.4MS) were more toxic than smaller or larger AuNPs with
similar chemical composition. Dose-dependently these com-
pounds predominantly effected necrosis. Herein, we extend this
finding in that AuNPs with similar size yet different ligand
capping with GSH were markedly less cytotoxic. The toxicity
profile of small AuNPs strikingly resembled their catalytic
properties in gas-phase or organic-phase oxidation and halogen
abstraction reactions. We therefore propose that the toxicity of
small AuNPs depends on their ability to trigger the intracellular
formation of ROS from dioxygen. In addition, the cells’ different
response to the various AuNP coatings might also reflect a
different uptake propensity. The cellular responses observed
after AuNPexposure indicatedastrongoxidative stressresponse
that exacerbated cellular ROS. The fact that antioxidants
reduced toxicity and that the cells executed a strong genomic
stress response both support this concept.
4. Experimental Section
AuNP synthesis: AuPPh3Cl, benzene, BF3 �OEt2, CH2Cl2,
diethylene glycol dimethyl ether, ethanol, HAuCl4 � 3H2O, H2SO4,
NaBH4, PPh3 and sodium citrate dihydrate were purchased from
diverse suppliers at the highest purity available. All chemicals
were used as received, and H2O was obtained from a Purelab
Plus water purification system. TPPMS was synthesized as
described.[35]
Au1.4MS and Au15MS were synthesized as described
previously.[24] Au1.1GSH was synthesized according to a pub-
lished protocol.[36] Briefly, HAuCl4 (100 mg, 0.25 mmol) was
dissolved in methanol (50 mL) and GSH (154 mg) was added. The
solution was cooled to 0 8C. A freshly prepared solution (12.5 mL)
of NaBH4 (0.2 M) was added dropwise over a period of 5 min,
during which the color of the solution changed from yellow to dark
brown. The reaction mixture was stirred for 30 min and the dark
brown precipitate formed was isolated by centrifugation. After
consecutive washings with a H2O/methanol mixture (1:10, v/v) and
pure methanol, the solid was dissolved in H2O and filtered
through a Milipore filter (pore diameter 20 nm). The H2O was
removed and the product was stored in solid form. The mean
particle size was determined by TEM (FEI Titan S). The sample was
prepared by placing a diluted solution (5mL) onto a carbon-coated
copper grid (Figure S1 in the Supporting Information).
Based on elemental analysis, the number of ligands per
nanoparticle was determined. For Au1.4MS a Au/MS ratio of
55:12 was obtained, while for Au1.1GSH a Au/GSH ratio of 28:11
was derived.
www.small-journal.com � 2009 Wiley-VCH Verlag Gm
Characterization of reaction mixture of Au1.4MS and GSH: For
the chemical analysis of the reaction product of Au1.4MS and
GSH, the reaction had to be conducted at higher concentrations
than for the cell tests but with the same ratio of Au1.4MS and
GSH. It was noticeable that in this case the particles became less
soluble in bidistilled water after an incubation time of 3 h at 37 8C.
The particles were easily isolated by centrifugation and washed
several times with water. The remaining residue was dissolved in
either basic (NaOH) or acidic (HCl) solution, a first hint that the
amphoteric GSH could have replaced the TPPMS on the particle
surface. A 31P NMR spectrum of the washed product in acidic D2O
showed no signal at all, at a comparable concentration and
measuring condition to a sample of Au1.4MS which showed a
signal at 36.5 ppm (Varian Mercury 200). Furthermore, the zeta
potentials of the basic and acidic solutions were determined as
�48 and þ25 mV, respectively, which corresponded well to the
functionalities of GSH (one free amine group that can be
protonated by HCl versus two free carboxylic acid groups that
can be deprotonated under basic conditions). The zeta potential
of Au1.4MS in bidistilled water at pH 7 was �42 mV, due to the
acidity of the sulfonate group (Malvern Zeta-Sizer). Moreover, an
IR spectrum of the reaction product in a KBr pellet was recorded
(Bruker Vertex 70; Figure S3 in the Supporting Information). A TEM
sample was prepared as explained above (data shown in Figure
S2 in the Supporting Information).
Cell culture and cytotoxicity assays: HeLa human cervix
carcinoma cells were cultured in low-glucose Dulbecco’s modified
Eagle’s medium (DMEM). Media contained 10% fetal calf serum,
L-glutamine (2.9 mg mL�1), streptomycin (1 mg mL�1), and
penicillin (1000 units mL�1). All cells were cultured at 37 8C in
water-saturated air supplemented with 5% CO2. Culture media
were changed every three days. Cells were passaged once a week.
Cell numbers were estimated wiith a cell counter (Schaerfe cell
counting system, Germany).
Cells were plated in 96-well microtiter plates at initial
densities of 2000 cells per well. The cell culture medium was
changed every three days. Cell growth was tested by
the colorimetric MTT assay, which measures the conversion of
the yellowish water-soluble tetrazolium salt to a water-insoluble
purple formazan product within viable breathing cells as a proxy
of cell number and viability. The water-insoluble formazan was
dissolved in a solvent mixture (100mL) consisting of isopropanol
(80mL) with hydrochloric acid (0.04mM) and 3% sodium dodecyl
sulfate (20mL). Absorption of the samples was measured with a
spectrophotometer at 584 nm. The amount of formazan produced
is directly proportional to the number of living cells in the well. All
experiments were done in triplicate.
Cytotoxicity was measured by using the MTT assay in the
logarithmic phase of cell growth. Cells were incubated for 72 h in
96-well microtiter plates before adding the nanoparticles. Fresh
medium containing increasing concentrations of nanoparticles
was added to each well and the cells were incubated for another
48 h. Phosphate-buffered saline (PBS, 10mL) containing MTT
(5 mg mL�1) was dispensed into each well. The plates were
incubated for 2 h. Formazan was solubilized and measured as
described above. The concentrations of materials were rechecked
after completion of the experiments by atomic absorption
spectroscopy of the authentic samples. IC50 values were
bH & Co. KGaA, Weinheim small 2009, 5, No. 18, 2067–2076

Gold Nanoparticles Trigger Necrosis
calculated according to a four-parameter logistic equation. Data
were plotted as a sigmoidal dose–response curve with variable
slope using GraphPad PRISM software. For each material, the IC50
values were determined from triplicate wells during the logarith-
mic cell growth phase. IC50 values derived from logarithmic cell
growth were routinely repeated in three independent experiments
with almost identical results.
DNA microarray gene expression analysis: DNA microarray
analysis was used to identify differentially expressed genes in
untreated and AuNP-treated HeLa cells. Total RNA was isolated
with a Qiagen RNeasy kit. RNA quality was assessed by using the
RNA 6000 Nano Assay kit (Agilent Bioanalyzer) and the quantity of
RNA was estimated with the NanoDrop 1000 spectrophotometer.
Total RNA was further processed according to the GeneChip Whole
Transcript Sense Target Labeling Assay Manual (Affymetrix, Santa
Clara, CA, USA). The fragmented, labeled sample was hybridized
to an Affymetrix GeneChip Human Genome U133A 2.0 array
(Affymetrix). Experimental procedures for the Human Genome
U133A 2.0 arrays were performed according to the Affymetrix
GeneChip Expression Analysis Technical Manual. Briefly, total RNA
(each 750 ng) was reverse-transcribed into double-stranded cDNA
using HPLC-purified T7-(dt) 24 primers and the GeneChip
Expression 3-Prime Amplification One-Cycle Target Labeling and
Control Reagents Kit. Subsequently, the purified double-stranded
cDNA was used as a template to synthesize biotinylated
complementary RNA probes. Hybridization to the DNA array,
containing 22 283 probe sets representing approximately 14 500
well-characterized human genes, was performed for 16 h at 45 8Cand 60 rpm. After washing and staining the probe array using the
Affymetrix Fluidics Station 450, the probe arrays were scanned
with the Affymetrix GeneChip Scanner 3000. Microarray expres-
sion analysis was carried out using Bioconductor[37] packages
under R1. Background correction and normalization were carried
out with the GCRM algorithm A. MAS 5.0 (Affymetrix) was used for
call detection.
Flow cytometric determination of oxidative stress: HeLa cells
were plated in six-well plates at initial densities of 40 000 in 2 mL
medium and grown for 72 h. Fresh medium containing nanopar-
ticles (100mM Au1.4MS, 1000mM Au1.1GSH, and Au15MS) was
added to the cells and incubated for 0, 6, 12, 18, 24, or 48 h. All
cell–material combinations were set up in triplicate. After the
AuNP incubation, cells were trypsinized and rinsed with PBS. After
rinsing, the cells were suspended in a buffer containing 5/6-
chloromethyl-20,70-dichlorodihydrofluorescein diacetate acetyl es-
ter (CM-H2DCFDA) (Molecuar Probes/Invitrogen). Cells were
incubated for 30 min at 37 8C as described by the manufacturer.
Briefly, CM-H2DCFDA powder (50mg) was dissolved in ethanol
(100mL) as stock solution and was kept at �20 8C. For cell assays
the stock solution was freshly diluted in PBS to a final working
concentration of 2.5mM. Cells incubated with 0.3% H2O2 for
30 min served as positive control; 20 000 cells were analyzed by
using FACSCalibur or FACSCanto flow cytometers and CELL-Quest
software (Becton–Dickinson).
Fluorescent mitochondria potential staining: HeLa cells were
plated in 96-well microtiter plates at initial densities of 2000 in
100mL medium and were incubated for 72 h before addition of
nanoparticles. Fresh medium containing 100mM Au1.4MS was
added to each well and the cells were incubated for an additional
small 2009, 5, No. 18, 2067–2076 � 2009 Wiley-VCH Verlag Gmb
0, 1, 6, 12, 18, or 24 h. All cell–material combinations were set up
in triplicate. At the end of the incubation, JC-1 stain (100mL;
Molecuar Probes/Invitrogen) at twofold working concentration was
added to each well and incubated for 30 min at 37 8C. Cells were
rinsed, mounted in fresh PBS, and analyzed by fluorescence
microscopy. A stock solution of JC-1 was prepared in dimethyl
sulfoxide (DMSO) at 2.5 mg mL�1 and kept at �20 8C. The working
concentration of JC-1 for HeLa cells was 3mg mL�1.
Fluorogenic caspase activity determination: HeLa cells were
plated in 96-well microtiter plates at initial densities of 2000 in
100mL medium and were incubated for 72 h before addition of
nanoparticles. The cells were rinsed and medium (30mL) contain-
ing 50mM Au1.4MS was added. Untreated cells served as a
negative control and cells treated with 0.2mM staurosporine
served as a positive control. Apoptosis was measured using the
fluorogenic caspase substrate Apo-ONE homogeneous caspase-3/
7 assay (Promega) as described by the manufacturer. Briefly, Apo-
ONE stock solution (100-fold working concentration) was diluted
50-fold in Apo-One buffer and a portion (30mL) was added to each
well and incubated at 23 8C for 3 h. The clear supernatant (50mL)
was transferred to a black microtiter plate and measured using a
Fluorostar plate fluorometer (BMG Labtech, Offenburg, Germany)
at an excitation wavelength of 485 nm and emission wavelength of
520 nm.
Inhibition of apoptosis: HeLa cells were plated in 96-well
microtiter plates at initial densities of 2000 in 100mL medium and
were incubated for 72 h before adding reagents. Cells were left
untreated or were pretreated with the caspase inhibitor Z-VAD-fmk
for 3 h (BACHEM N1510). A stock solution of 100 mM Z-VAD-fmk in
DMSO was prepared and kept at �20 8C. The working solution was
freshly prepared by diluting the stock solution in fresh cell culture
medium.
Inhibition of Au1.4MS cytotoxicity by reducing agent: HeLa
cells were plated in 96-well microtiter plates at initial densities of
2000 in 100mL medium and were incubated for 72 h before
adding reagents. Fresh medium containing nanoparticles and/or
reducing agents was added to each well and cells were incubated
for another 48 h. Final concentrations were NAC, 3 mM, GSH,
TPPMS, and ascorbic acid, 1 mM. Reducing agents were freshly
prepared by dissolving the powders in H2O to a concentration of
200 mM and further diluted in fresh cell culture medium to the
working concentration.
Fluorescent cell proliferation assay: HeLa cells were plated in
six-well plates and grown for 72 h. Cell culture medium was
removed and fresh medium containing the fluorescent cell-
staining dye carboxyfluorescein succinimidyl ester (CFSE, Invitro-
gen) was incubated for 30 min. Cells were rinsed with ice-cold PBS
for 10 min to quench all background fluorescence. Fresh cell
culture medium without or with 100mM Au1.4MS was added and
further incubated for 0, 1, 2, 3, or 4 days. A stock solution (10 mM)
in DMSO was kept at �20 8C. The stock solution was freshly
diluted in PBS to 5mM; 20 000 cells were analyzed using
FACSCalibur or FACSCanto flow cytometers and CELL-Quest soft-
ware (Becton–Dickinson).
Cell cycle and DNA content measurement using flow cytometry:
HeLa cells were plated in six-well plates and incubated for 72 h
before addition of nanoparticles. Fresh medium containing
nanoparticles (100mM Au1.4MS) was added to the cells, which
H & Co. KGaA, Weinheim www.small-journal.com 2075

full papers U. Simon, W. Jahnen-Dechent, et al.
2076
were incubated for 0, 24, or 32 h. All cell–material combinations
were set up in triplicate. After the AuNP incubation, cells were
trypsinized and rinsed with PBS. Washed cell pellets were fixed in
chilled 70% ethanol at 4 8C for 60 min. After fixation, the cells
were washed with PBS once again and resuspended in PBS
(250mL). RNAse (250mL, 1 mg mL�1) and PI (500mL, 0.1 mg
mL�1) were added and incubated at room temperature for 15 min
or overnight at 4 8C in the dark. Shortly before flow cytometry, the
cells were washed once with PBS; 20 000 cells were analyzed
using FACSCalibur or FACSCanto flow cytometers and CELL-Quest
software (Becton–Dickinson).
Acknowledgements
We thank J. Kleinen and W. Richtering, Physical Chemistry,
RWTH Aachen University, for the zeta potential measurements.
DNA microarray hybridization and expression data collection
were performed at the DNA Chip Facility of the IZKF-BioMAT
clinical research center, Medical Faculty, RWTH Aachen
University. Financial support by the German Science Founda-
tion (DFG) research training grant GRK1035, and investigator
grants Si609/9 and Ja562/13, is gratefully acknowledged.
[1] G. Oberdorster, E. Oberdorster, J. Oberdorster, Environ. Health
Perspect. 2005, 113, 823.
[2] A. Nel, T. Xia, L. Madler, N. Li, Science 2006, 311, 622.
[3] H. Fischer, W. Chan, Curr. Opin. Biotechnol. 2007, 18, 565.
[4] N. Lewinski, V. Colvin, R. Drezek, Small 2008, 4, 26.
[5] R. Hardman, Environ. Health Perspect. 2006, 114, 165.
[6] W. Lee, N. Pernodet, B. Li, C. Lin, E. Hatchwell, M. Rafailovich,
Chem. Commun. 2007, 4815.
[7] W. Jahnen-Dechent, U. Simon, Nanomedicine 2008, 3, 601.
[8] P. Nativo, I. Prior, M. Brust, ACS Nano 2008, 2, 1639.
[9] C. M. Goodman, C. D. McCusker, T. Yilmaz, V. M. Rotello, Biocon-
jugate Chem. 2004, 15, 897.
[10] W. Jiang, B. Kim, J. Rutka, W. Chan, Nat. Nanotechnol. 2008, 3,
145.
[11] M. Ferrari, Nat. Nanotechnol. 2008, 3, 131.
[12] S. Gratton, P. Ropp, P. Pohlhaus, J. Luft, V. Madden, M. Napier,
J. DeSimone, Proc. Natl. Acad. Sci. USA 2008, 105, 11613.
www.small-journal.com � 2009 Wiley-VCH Verlag Gm
[13] M. Lundqvist, J. Stigler, G. Elia, I. Lynch, T. Cedervall, K. Dawson,
Proc. Natl. Acad. Sci. USA 2008, 105, 14265.
[14] C. Dostert, V. Petrilli, R. Van Bruggen, C. Steele, B. T. Mossman,
J. Tschopp, Science 2008, 320, 674.
[15] V. Kagan, H. Bayir, A. Shvedova, Nanomedicine 2005, 1, 313.
[16] M. McDermott, J. Tschopp, Trends Mol. Med. 2007, 13, 381.
[17] L. Trinkle-Mulcahy, S. Boulon, Y. Lam, R. Urcia, F. Boisvert,
F. Vandermoere, N. Morrice, S. Swift, U. Rothbauer, H. Leonhardt,
A. Lamond, J. Cell Biol. 2008, 183, 223.
[18] L. R. Wallenberg, J. O. Bovin, G. Schmid, Surf. Sci. 1985, 156, 256.
[19] C. Becker, T. Fries, K. Wandelt, U. Kreibig, G. Schmid, J. Vac. Sci.
Technol. B 1991, 9, 810.
[20] G. Schmid, L. F. Chi, Adv. Mater. 1998, 10, 515.
[21] G. Schmid, B. Corain, Eur. J. Inorg. Chem. 2003, 3081.
[22] G. Schmid, U. Simon, Chem. Commun. 2005, 697.
[23] M. Tsoli, H. Kuhn, W. Brandau, H. Esche, G. Schmid, Small 2005, 1,
841.
[24] Y. Pan, S. Neuss, A. Leifert, M. Fischler, F. Wen, U. Simon,
G. Schmid, W. Brandau, W. Jahnen-Dechent, Small 2007, 3, 1941.
[25] M. Habeeb Mohammed, T. Pradeep, Chem. Phys. Lett. 2007, 449,
186.
[26] G. Kroemer, Cell Death Differ. 1997, 4, 443.
[27] G. Kroemer, Adv. Immunol. 1995, 58, 211.
[28] M. Turner, V. Golovko, O. Vaughan, P. Abdulkin, A. Berenguer-
Murcia, M. Tikhov, B. Johnson, R. Lambert, Nature 2008, 454, 981.
[29] P. Ionita, M. Conte, B. Gilbert, V. Chechik, Org. Biomol. Chem.
2007, 5, 3504.
[30] H. Boyen, G. Kastle, F. Weigl, B. Koslowski, C. Dietrich, P. Ziemann,
J. Spatz, S. Riethmuller, C. Hartmann, M. Moller, G. Schmid,
M. Garnier, P. Oelhafen, Science 2002, 297, 1533.
[31] Y. Liu, W. Meyer-Zaika, S. Franzka, G. Schmid, M. Tsoli, H. Kuhn,
Angew. Chem. 2003, 115, 2959; Angew. Chem. Int. Ed. 2003, 42,
2853.
[32] M. Tsoli, Ph.D. Thesis, Universitat Duisburg-Essen (Essen), 2004.[33] D. Mosser, R. Morimoto, Oncogene 2004, 23, 2907.
[34] M. Agarwal, A. Agarwal, W. Taylor, G. Stark, Proc. Natl. Acad. Sci.
USA 1995, 92, 8493.
[35] F. Joo, J. Kovacs, A. Katho, A. Benyei, T. Decuir, D. Darensbourg,
A. Miedaner, D. Dubois, Inorg. Synth. 1998, 32, 1.
[36] Y. Negishi, Y. Takasugi, S. Sato, H. Yao, K. Kimura, T. Tsukuda,
J. Am. Chem. Soc. 2004, 126, 6518.
[37] R. Gentleman, V. Carey, D. Bates, B. Bolstad, M. Dettling, S. Dudoit,
B. Ellis, L. Gautier, Y. Ge, J. Gentry, K. Hornik, T. Hothorn, W. Huber,
S. Iacus, R. Irizarry, F. Leisch, C. Li, M. Maechler, A. Rossini,
G. Sawitzki, C. Smith, G. Smyth, L. Tierney, J. Yang, J. Zhang,
Genome Biol. 2004, 5, R80.
bH & Co. KGaA, Weinheim
Received: March 17, 2009Revised: June 9, 2009Published online: July 29, 2009
small 2009, 5, No. 18, 2067–2076