Results of October 2014 Source Control Evaluation Sa
323
Addendum to Source Control Evaluation Report Regarding Stormwater Pathway: Results of October 2014 Source Control Evaluation Sampling and Analyses for Completion of Source Control Evaluation Western Star Truck Manufacturing Plant 6936 N Fathom Street Portland, Oregon (DEQ ECSI No. 2366) Prepared for: Daimler Trucks North America LLC March 12, 2015 Prepared by: Anna St. John, R.G.
-
Upload
khangminh22 -
Category
Documents
-
view
3 -
download
0
Transcript of Results of October 2014 Source Control Evaluation Sa
Addendum to Source Control Evaluation
Report Regarding Stormwater Pathway:
Results of October 2014 Source Control
Evaluation Sampling and Analyses for
Completion of Source Control Evaluation
Western Star Truck Manufacturing Plant
6936 N Fathom Street
Portland, Oregon
(DEQ ECSI No. 2366)
Prepared for:
Daimler Trucks North America LLC
March 12, 2015
Prepared by:
Anna St. John, R.G.

Addendum to Source Control Evaluation Report Regarding Stormwater Pathway: Results of October 2014 Source Control Evaluation Sampling and Analyses and Completion of Source Control Evaluation
Western Star Truck Manufacturing Plant
Bridgewater Group, Inc. iv
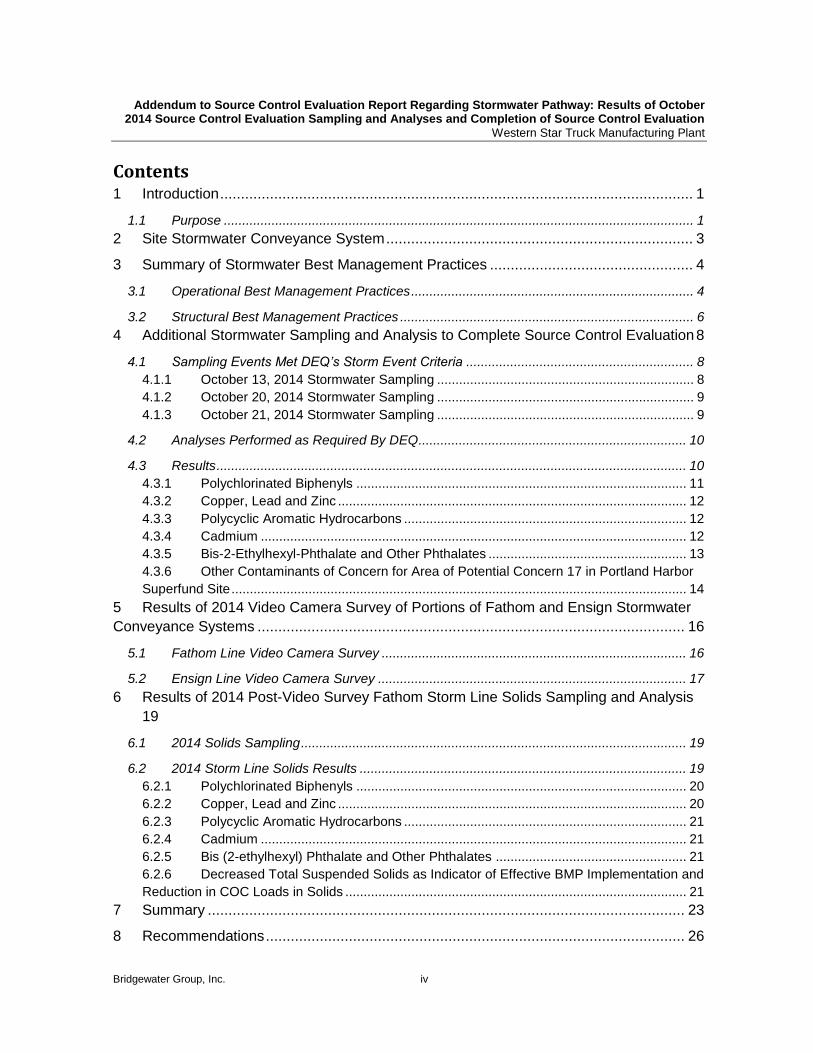
Contents 1 Introduction .................................................................................................................. 1
1.1 Purpose ................................................................................................................................ 1
2 Site Stormwater Conveyance System .......................................................................... 3
3 Summary of Stormwater Best Management Practices ................................................. 4
3.1 Operational Best Management Practices ............................................................................. 4
3.2 Structural Best Management Practices ................................................................................ 6
4 Additional Stormwater Sampling and Analysis to Complete Source Control Evaluation 8
4.1 Sampling Events Met DEQ’s Storm Event Criteria .............................................................. 8 4.1.1 October 13, 2014 Stormwater Sampling ...................................................................... 8 4.1.2 October 20, 2014 Stormwater Sampling ...................................................................... 9 4.1.3 October 21, 2014 Stormwater Sampling ...................................................................... 9
4.2 Analyses Performed as Required By DEQ......................................................................... 10
4.3 Results ................................................................................................................................ 10 4.3.1 Polychlorinated Biphenyls .......................................................................................... 11 4.3.2 Copper, Lead and Zinc ............................................................................................... 12 4.3.3 Polycyclic Aromatic Hydrocarbons ............................................................................. 12 4.3.4 Cadmium .................................................................................................................... 12 4.3.5 Bis-2-Ethylhexyl-Phthalate and Other Phthalates ...................................................... 13 4.3.6 Other Contaminants of Concern for Area of Potential Concern 17 in Portland Harbor
Superfund Site ............................................................................................................................ 14
5 Results of 2014 Video Camera Survey of Portions of Fathom and Ensign Stormwater
Conveyance Systems ....................................................................................................... 16
5.1 Fathom Line Video Camera Survey ................................................................................... 16
5.2 Ensign Line Video Camera Survey .................................................................................... 17
6 Results of 2014 Post-Video Survey Fathom Storm Line Solids Sampling and Analysis
19
6.1 2014 Solids Sampling ......................................................................................................... 19
6.2 2014 Storm Line Solids Results ......................................................................................... 19 6.2.1 Polychlorinated Biphenyls .......................................................................................... 20 6.2.2 Copper, Lead and Zinc ............................................................................................... 20 6.2.3 Polycyclic Aromatic Hydrocarbons ............................................................................. 21 6.2.4 Cadmium .................................................................................................................... 21 6.2.5 Bis (2-ethylhexyl) Phthalate and Other Phthalates .................................................... 21 6.2.6 Decreased Total Suspended Solids as Indicator of Effective BMP Implementation and
Reduction in COC Loads in Solids ............................................................................................. 21
7 Summary ................................................................................................................... 23
8 Recommendations ..................................................................................................... 26
Addendum to Source Control Evaluation Report Regarding Stormwater Pathway: Results of October 2014 Source Control Evaluation Sampling and Analyses and Completion of Source Control Evaluation
Western Star Truck Manufacturing Plant
Bridgewater Group, Inc. v
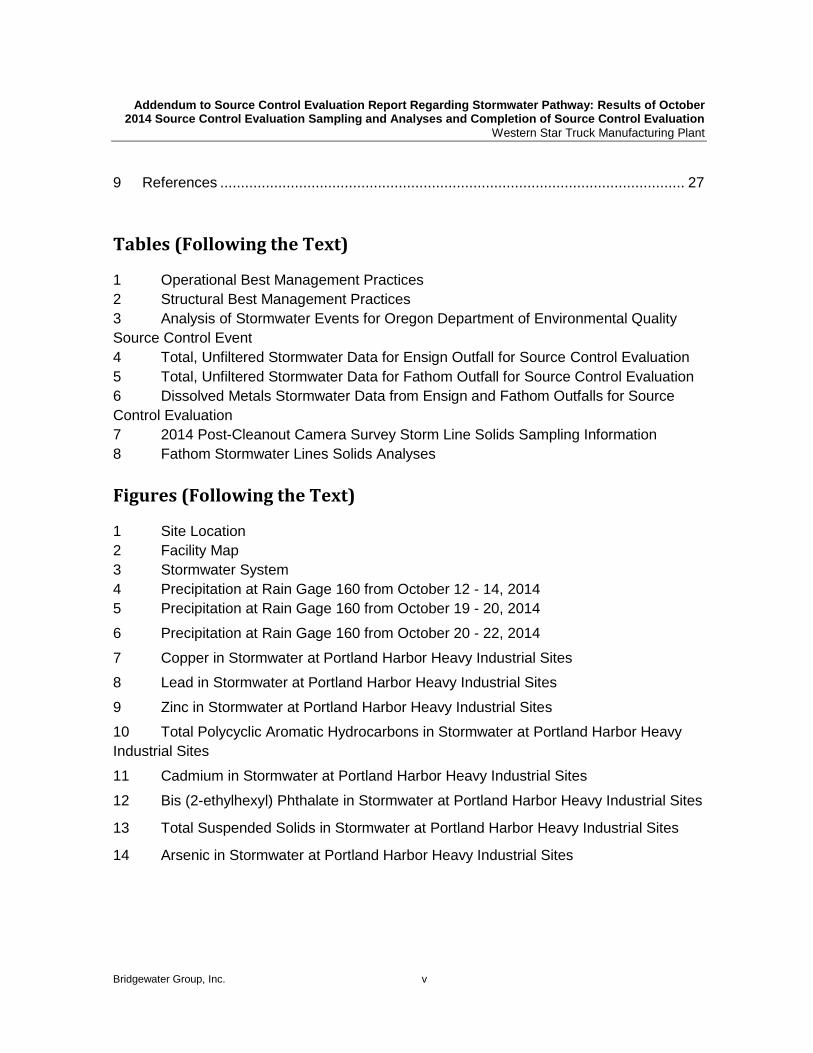
9 References ................................................................................................................ 27
Tables (Following the Text)
1 Operational Best Management Practices
2 Structural Best Management Practices
3 Analysis of Stormwater Events for Oregon Department of Environmental Quality
Source Control Event
4 Total, Unfiltered Stormwater Data for Ensign Outfall for Source Control Evaluation
5 Total, Unfiltered Stormwater Data for Fathom Outfall for Source Control Evaluation
6 Dissolved Metals Stormwater Data from Ensign and Fathom Outfalls for Source
Control Evaluation
7 2014 Post-Cleanout Camera Survey Storm Line Solids Sampling Information
8 Fathom Stormwater Lines Solids Analyses
Figures (Following the Text)
1 Site Location
2 Facility Map
3 Stormwater System
4 Precipitation at Rain Gage 160 from October 12 - 14, 2014
5 Precipitation at Rain Gage 160 from October 19 - 20, 2014
6 Precipitation at Rain Gage 160 from October 20 - 22, 2014
7 Copper in Stormwater at Portland Harbor Heavy Industrial Sites
8 Lead in Stormwater at Portland Harbor Heavy Industrial Sites
9 Zinc in Stormwater at Portland Harbor Heavy Industrial Sites
10 Total Polycyclic Aromatic Hydrocarbons in Stormwater at Portland Harbor Heavy
Industrial Sites
11 Cadmium in Stormwater at Portland Harbor Heavy Industrial Sites
12 Bis (2-ethylhexyl) Phthalate in Stormwater at Portland Harbor Heavy Industrial Sites
13 Total Suspended Solids in Stormwater at Portland Harbor Heavy Industrial Sites
14 Arsenic in Stormwater at Portland Harbor Heavy Industrial Sites
Addendum to Source Control Evaluation Report Regarding Stormwater Pathway: Results of October 2014 Source Control Evaluation Sampling and Analyses and Completion of Source Control Evaluation
Western Star Truck Manufacturing Plant
Bridgewater Group, Inc. vi
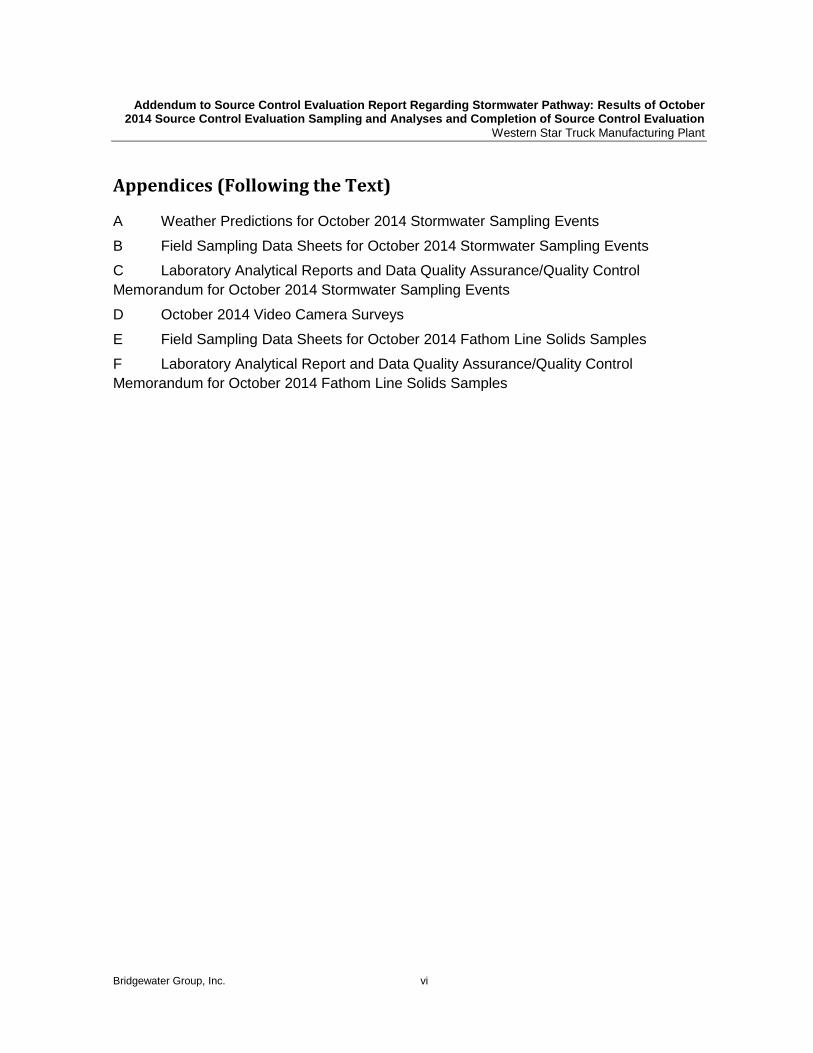
Appendices (Following the Text)
A Weather Predictions for October 2014 Stormwater Sampling Events
B Field Sampling Data Sheets for October 2014 Stormwater Sampling Events
C Laboratory Analytical Reports and Data Quality Assurance/Quality Control
Memorandum for October 2014 Stormwater Sampling Events
D October 2014 Video Camera Surveys
E Field Sampling Data Sheets for October 2014 Fathom Line Solids Samples
F Laboratory Analytical Report and Data Quality Assurance/Quality Control
Memorandum for October 2014 Fathom Line Solids Samples

Addendum to Source Control Evaluation Report Regarding Stormwater Pathway: Results of October 2014 Source Control Evaluation Sampling and Analyses and Completion of Source Control Evaluation
Western Star Truck Manufacturing Plant
Bridgewater Group, Inc. vii
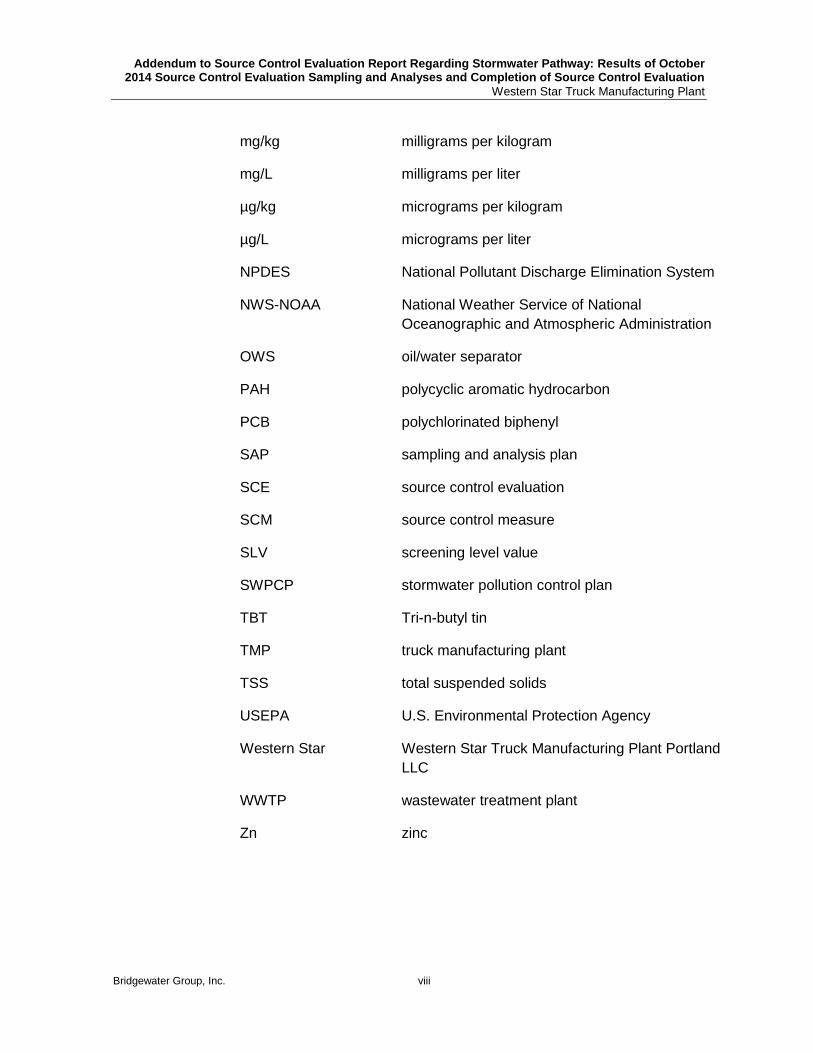
Acronyms and Abbreviations
Ag silver
AOPC#17 Area of potential concern in sediment in Swan
Island Basin of the Willamette River in the
Portland Harbor Superfund Site
As arsenic
AST aboveground storage tank
BEHP bis(2-ethylhexyl)phthalate
BMP best management practice
Bridgewater Bridgewater Group, Inc.
Cd cadmium
City City of Portland
COC contaminant of concern
Cu copper
DEQ Oregon Department of Environmental Quality
Di-n-BP di-n-butyl phthalate
DTNA Daimler Trucks North America LLC
DYNO Dynamometer
ECSI Environmental Cleanup Site Information
FSDS field sampling data sheet
Hg mercury
JSCS Joint Source Control Strategy
MDL method detection limit
MFA Maul Foster & Alongi, Inc.
MRL method reporting limit
Addendum to Source Control Evaluation Report Regarding Stormwater Pathway: Results of October 2014 Source Control Evaluation Sampling and Analyses and Completion of Source Control Evaluation
Western Star Truck Manufacturing Plant
Bridgewater Group, Inc. viii
mg/kg milligrams per kilogram
mg/L milligrams per liter
µg/kg micrograms per kilogram
µg/L micrograms per liter
NPDES National Pollutant Discharge Elimination System
NWS-NOAA National Weather Service of National
Oceanographic and Atmospheric Administration
OWS oil/water separator
PAH polycyclic aromatic hydrocarbon
PCB polychlorinated biphenyl
SAP sampling and analysis plan
SCE source control evaluation
SCM source control measure
SLV screening level value
SWPCP stormwater pollution control plan
TBT Tri-n-butyl tin
TMP truck manufacturing plant
TSS total suspended solids
USEPA U.S. Environmental Protection Agency
Western Star Western Star Truck Manufacturing Plant Portland
LLC
WWTP wastewater treatment plant
Zn zinc

Addendum to Source Control Evaluation Report Regarding Stormwater Pathway: Results of October 2014 Source Control Evaluation Sampling and Analyses and Completion of Source Control Evaluation
Western Star Truck Manufacturing Plant
Bridgewater Group, Inc. 1
1 Introduction
On behalf of Daimler Trucks North America LLC (DTNA), the Bridgewater Group, Inc.
(Bridgewater) is submitting this Addendum summarizing the results of October 2014
stormwater sampling and analysis at the Western Star Truck Manufacturing Plant (TMP)
facility in Portland, Oregon (see Figures 1 and 2). The sampling was conducted as required
by the 2002 Voluntary Cleanup Agreement between Freightliner LLC and the DEQ
(Agreement No. LQVC-NWR-02-02, effective December 2, 2002) and by a June 27, 2014,
letter from the DEQ (DEQ, 2014), and performed in a manner consistent with the 2010
Oregon Department of Environmental Quality’s (DEQ) Guidance for Evaluating the
Stormwater Pathway at Cleanup Sites (Stormwater Guidance). The approach and methods
for the sampling were presented in an April 2006 Stormwater Evaluation Work Plan (Work
Plan) and July 2006 revisions (Maul Foster & Alongi, Inc. [MFA], 2006 a and b), and the
DEQ’s June 15, 2006 and September 25, 2006 comments on the Work Plan and revisions
(DEQ 2006 a and b). In addition, this report includes the results of an October 2014 post-
cleanout video camera survey and sampling of solids in the stormwater line between the
Fathom Outfall and City of Portland (City) manhole AAJ831, as well as a video camera survey
to assess the potential accumulation of solids in part of the Ensign drainage area stormwater
system since 2007 and sources of dry weather flow to the Ensign Outfall. This report
supplements information in the 2011 Source Control Evaluation Report for Stormwater and
Groundwater (Bridgewater and MFA, 2011) and the 2013 Addendum to Source Control
Evaluation Report Regarding Stormwater Pathway, Including Results of 2012 Catch Basin
and Sediment Trap Solids Sampling and Analyses (Bridgewater, 2013).
1.1 Purpose
In its June 27, 2014, letter, the DEQ described the actions required of DTNA to complete the
source control evaluation (SCE) for the TMP. Specifically, DEQ’s June 27 letter identified the
following remaining actions:
a. Continue your work evaluating potential additional BMPs.
b. Collect one first-flush and a standard storm event stormwater sample as
described in DEQ's Portland Harbor Joint Source Control Strategy (JSCS) and
supporting documents.
Key aspects of the sampling to keep in mind:
i. Samples should be evaluated for all contaminants of concern (COCs) in
order to allow for a full comparison of the results to past sampling results.
ii. It is critical to take all possible measures to achieve method detection limits
for total polychlorinated biphenyls (PCBs) that are below the JSCS criteria of
0.064 nanograms per liter (ng/L), or at least below the 0.033 micrograms per
liter (µg/L) lowest screening level value (SLV) for individual Aroclors. DEQ
understands that these are very low detection limits, but several other projects

Addendum to Source Control Evaluation Report Regarding Stormwater Pathway: Results of October 2014 Source Control Evaluation Sampling and Analyses and Completion of Source Control Evaluation
Western Star Truck Manufacturing Plant
Bridgewater Group, Inc. 2
have been able to achieve acceptable detection limits, using sample cleanup
procedures in the event of matrix interference.
c. Completion of the next video survey of solids in Fathom and Ensign storm
water pipes to assess if the fall 2013 solids removals from these pipes was complete
and if there are ongoing accumulation of solids occurring in the pipes.
d. Assuming these final actions show that source control goals have been achieved,
preparation of a report documenting the investigations and actions taken can
then be submitted to DEQ.
e. An important line of evidence that DEQ will use will be a comparison of the Truck
Plant contaminants of concern (COCs) to the sediment area of potential concern
(AOPC) #17 contaminants of concern. AOPC # 17 is the area where site storm
water eventually discharges to in the Willamette River. The AOPC 17 CoCs include:
As (arsenic), Cd (cadmium), Cu (copper), Hg (mercury), Ag (silver), tributyl tin (TBT),
Zn (zinc), PAHs (polycyclic aromatic hydrocarbons), di-n-butylphthalate (di-n-BP),
phenol, PCBs and dieldrin.
Accordingly, after a brief overview of the TMP’s stormwater system configuration, this report
is organized to address each of these required actions. Summary responses to each action
above are provided in Section 7.
Addendum to Source Control Evaluation Report Regarding Stormwater Pathway: Results of October 2014 Source Control Evaluation Sampling and Analyses and Completion of Source Control Evaluation
Western Star Truck Manufacturing Plant
Bridgewater Group, Inc. 3
2 Site Stormwater Conveyance System
Figure 3 shows the layout of the stormwater system at the TMP. Stormwater runoff at the site
is routed to 36 lined catch basins, four oil/water separators (OWSs) and a StormFilter™
filtration system, and then discharges to the City’s stormwater system via two outfalls (see
Figures 2 and 3). The four OWSs include two that discharge to the sanitary sewer at the
Maintenance and the Aboveground Storage Tank (AST) areas, one that receives discharge
from the former Water Leak Test and current Temporary Truck Containment area that
discharges to the stormwater system, and one that discharges to an infiltrating bioswale.
There is also a fifth OWS in a recirculating water system in the new dynamometer (DYNO),
but no stormwater enters this system and it discharges initially to the recirculation treatment
system and ultimately to the sanitary sewer
The site's two outfalls are located near North Fathom Street and North Ensign Street (Fathom
and Ensign Outfalls, respectively). Both outfalls are equipped with emergency cut-off valves
to prevent releases from leaving the property in the event of accidental spills to the
stormwater system. Twenty catch basins discharge to the Ensign Outfall. Two catch basins in
the Ensign drainage area discharge to the sanitary sewer system. Fourteen catch basins
discharge to the Fathom Outfall. Stormwater from the TMP discharges to the City’s
conveyance system in drainage basin M-1 and ultimately to Swan Island Basin of the
Willamette River via City Outfall M-1. City manhole AAJ831 is located downstream from the
Fathom Outfall in a cul-de-sac in North Fathom Street.

Addendum to Source Control Evaluation Report Regarding Stormwater Pathway: Results of October 2014 Source Control Evaluation Sampling and Analyses and Completion of Source Control Evaluation
Western Star Truck Manufacturing Plant
Bridgewater Group, Inc. 4
3 Summary of Stormwater Best Management
Practices
The TMP has a series of operational and structural best management practices (BMPs) in
place, and it has continued to refine its existing BMPs as well as implement new BMPs over
the course of the TMP SCE. Operational BMPs are discussed in this section and an updated
summary of existing BMPs is provided in Tables 1 and 2, including BMPs implemented after
DTNA’s June 2014 meeting with DEQ and the City. Table 1 indicates in bold font all actions
implemented or revised since this list was last submitted to the DEQ in DTNA’s December
2011 Source Control Evaluation Report (Bridgewater and MFA, 2011).
3.1 Operational Best Management Practices
The TMP has an employee education program designed to inform plant personnel of the
goals and components of the stormwater pollution control plan (SWPCP), the spill response
procedures and the necessity of good housekeeping practices. This training is provided, at
least annually, to all maintenance personnel, employees who handle oil products and
employees who conduct activities outside of the manufacturing plant near facility catch
basins. Employees new to these positions receive stormwater orientation training within
30 calendar days of hire. The catch basins at the TMP are covered with metal grates that
prevent large debris and solids from entering the storm sewer system. Each catch basin also
has had an oil-absorbent and suspended solids filter insert since as early as 1995.
Good housekeeping is practiced throughout the facility to reduce the amount of potential
pollutants, such as diesel, oil and grease, and debris, which might come into contact with
stormwater and/or might be discharged in stormwater. These housekeeping procedures
include the following:
The facility is swept at a minimum of once per month by an outside commercial industrial sweeper. Additional sweeping is performed as needed. DTNA uses its weekly inspections as the mechanism to call for sweeping with the on-site industrial sweeper and other targeted cleaning methods in areas where sweeping is needed. DTNA documents each time a service request is made for sweeping, although there are additional times that sweeping occurs in the course of plant maintenance without a service request. In addition, DTNA uses its “5S” work practices which require inspections and clean-up sweeping, as needed, in areas where the transportation of paint dollies occurs.
Employees are trained to keep working areas neat and stormwater catch basins clear.
Weekly site walks by the DTNA management team are conducted to inspect the facility and identify issues that require corrective actions, including those associated with the stormwater system.

Addendum to Source Control Evaluation Report Regarding Stormwater Pathway: Results of October 2014 Source Control Evaluation Sampling and Analyses and Completion of Source Control Evaluation
Western Star Truck Manufacturing Plant
Bridgewater Group, Inc. 5
Scheduled preventive maintenance is practiced to reduce the amount of potential pollutants
that might come into contact with stormwater and/or that might be discharged with
stormwater. Preventive maintenance at the TMP includes the following:
The StormFilter™ unit is inspected monthly with inspections documented on the StormFilter O&M form. The unit is serviced and cleaned, as necessary, based on monthly inspections, and at a minimum of once per year.
Routine maintenance of equipment and vehicles (e.g., forklifts) is performed to prevent leakage of oil, grease, and fuels.
Product dispensing and filling connections at the bulk solvent and fuel ASTs are inspected weekly for damaged or leaking connection points.
All areas around the storage tanks and maintenance areas are inspected weekly for accumulation of oil and grease and sediment.
All AST secondary containment structures are inspected weekly for integrity and are serviced by DTNA’s janitorial staff, as needed.
All stormwater catch basins are inspected monthly to ensure proper water flow, and debris and solids accumulated in the bottoms of the catch basins and on the metal cover-grates are removed quarterly, or more frequently as needed.
All stormwater catch basins are equipped with oil-absorbent catch basin filters, and filters are replaced quarterly, or more frequently as needed. Floating oil-absorbent booms or other devices are used, as needed, to minimize the potential for oil and grease to contact stormwater runoff.
The outfalls are inspected monthly by removing the manhole and vault covers and checking runoff for floating solids, color or foam, and oil and grease sheen.
All OWSs are inspected monthly for proper functioning. They are serviced quarterly by an outside contractor that is authorized to vacuum or pump out accumulated sediment, residual oil and grease, and other residual contaminants and debris, as needed. Valves related to stormwater piping, including the valve from the tank farm secondary containment structure and the valve for the sump in the truck secondary containment, are inspected weekly.
Spill-control equipment is inspected weekly to ensure that necessary equipment is available and in good condition.
Areas where industrial activities or potential spills of significant materials could impact stormwater runoff are inspected weekly.
Truck parts are moved, as needed, to allow sweeping in less accessible areas. For new truck components that are received in plastic packaging and temporarily stored in
Addendum to Source Control Evaluation Report Regarding Stormwater Pathway: Results of October 2014 Source Control Evaluation Sampling and Analyses and Completion of Source Control Evaluation
Western Star Truck Manufacturing Plant
Bridgewater Group, Inc. 6
uncovered areas, DTNA ensures that the plastic packaging is properly disposed of when it is removed. The roof of the facility is inspected a few times per year, and solids are removed, as necessary.
Routine inspections enable DTNA to provide timely and cost-effective repairs to equipment and stormwater control structures.
3.2 Structural Best Management Practices
Structural BMPs are discussed in this section and summarized in Table 2. The structural BMPs in place at the TMP property include the following:
Four OWSs, as discussed above.
StormFilter™ filtration system at the Ensign Outfall, which was selected for its ability to remove zinc. DTNA has continued to work with the StormFilter™ manufacturer to enhance the performance of the system, including usage of the most effective filter media (-CSF® Leaf Media) for zinc and other soluble metals.
Coating of the TMP's galvanized roof with a Neogard® cover. Neogard® is a closed cell, high-density urethane foam with a top coat designed to provide a continuous seamless cover. Thus, the new Neogard® cover prevents stormwater from coming into contact with the galvanized roof.
Bioswale and associated OWS for new truck parking area in the Offline yard.
Bioswale and water recirculating system at the new DYNO and new Water Test.
Enclosure of and/or containment of operations using and/or generating hazardous substances and/or hazardous wastes.
Enclosure of and/or containment of areas used for storage of hazardous substances and/or hazardous wastes.
DTNA has labeled catch basins with “No dumping, drains to river” or similar message in areas where such a message appears necessary based on the location of the catch basin and type of operations. In addition, as indicated above, catch basin inserts are used in all of the catch basins.
DTNA utilizes a Temporary Truck Containment Area for leaking trucks. As indicated above, the catch basin in that area is equipped with a valve to prevent discharge to the storm system when trucks are present in the containment area.
In 2012, an emergency cut-off valve was installed in the Ensign Outfall to minimize the potential for a release to migrate from the property.
In 2013, an emergency cut-off valve was installed in the Fathom Outfall to minimize the potential for a release to migrate from the property.
Addendum to Source Control Evaluation Report Regarding Stormwater Pathway: Results of October 2014 Source Control Evaluation Sampling and Analyses and Completion of Source Control Evaluation
Western Star Truck Manufacturing Plant
Bridgewater Group, Inc. 7
DTNA continues to identify opportunities for implementation of additional structural BMPs
which would result in an overall reduction of COCs in stormwater. In fact, DTNA has
committed to implement an additional structural stormwater treatment measure (i.e.,
construction of a larger onsite infiltration facility) that will address a National Pollutant
Discharge Elimination System (NPDES) 1200-Z stormwater permit second-year geometric-
mean zinc benchmark exceedence in the Fathom drainage basin to substantially eliminate
offsite stormwater discharges of zinc and other contaminants of concern (COCs) identified in
the SCE. Specifically, the bioswale in the Offline truck parking area will be expanded to
manage all runoff from the Fathom drainage basin (Drainage Area 1) of the TMP, as
discussed in DTNA’s December 22, 2014, Tier II Waiver Request and Alternative Tier II
Stormwater Pollution Control Plan Revision (MFA, 2014).

Addendum to Source Control Evaluation Report Regarding Stormwater Pathway: Results of October 2014 Source Control Evaluation Sampling and Analyses and Completion of Source Control Evaluation
Western Star Truck Manufacturing Plant
Bridgewater Group, Inc. 8
4 Additional Stormwater Sampling and
Analysis to Complete Source Control
Evaluation
4.1 Sampling Events Met DEQ’s Storm Event Criteria
The DEQ’s June 27, 2014, letter required DTNA to collect stormwater samples from each
outfall during two storm events, at least one of which was required to be a “first-flush” storm
event. DTNA has collected samples during three events. Specifically, it obtained three
samples at the Fathom Outfall that qualify as either “first flush” or standard samples, two
samples at the Ensign Outfall that qualify as either “first flush” or standard samples, and one
sample at the Ensign Outfall that qualifies as a standard sample event. Table 3 summarizes
the events relative to the DEQ’s required criteria for the collection of first-flush and standard
stormwater samples in the Stormwater Guidance. A description of each storm event follows.
4.1.1 October 13, 2014 Stormwater Sampling
Stormwater samples were collected at the Ensign and Fathom Outfalls (see Figure 3) during
a storm event on October 13 at 11:57 p.m. at the Ensign Outfall and at 11:22 p.m. at the
Fathom Outfall. Table 3 summarizes the event. Figure 4 is a hydrograph of the event.
Appendix A contains weather predictions. Appendix B contains field sampling data sheets
(FSDSs). Appendix C contains the laboratory analytical report and data quality
assurance/quality control review.
There was no rain in the proceeding 24 hours. The National Weather Service (NWS - NOAA)
predicted one-half inch of rain during a storm lasting at least three hours. These conditions
meet the Stormwater Guidance requirements of an antecedent dry period of at least 24 hours
(as defined by <0.1 inch over the previous 24 hours), minimum predicted rainfall volume of
greater than 0.2 inch per event, and expected duration of storm event of at least 3 hours. A
total of 0.39 inch of precipitation was recorded between 9 p.m. on October 13 and 7 a.m. on
October 14.
Bridgewater arrived onsite at 10:45 p.m. Flow was observed in the outfalls at 11:10 p.m. at
the Fathom Outfall and 11:13 p.m. at the Ensign Outfall. A sample was collected within 0.5
hour of flow in the Fathom Outfall and within 0.75 hour in the Ensign Outfall. This event meets
the Stormwater Guidance’s requirement for the collection of a sample within the 0.5 hour
(first-flush) of flow to the stormwater system for the Fathom sample. The Fathom sample
would also meet the requirements for a standard sample, since it was collected within three
hours of 11:10 p.m.. The Ensign sample almost meets the requirements for a first flush
sample, but not quite (0.75 hours after initiation of flow), so it is treated as a standard sample
taken within the first three hours of flow to the stormwater system.
Addendum to Source Control Evaluation Report Regarding Stormwater Pathway: Results of October 2014 Source Control Evaluation Sampling and Analyses and Completion of Source Control Evaluation
Western Star Truck Manufacturing Plant
Bridgewater Group, Inc. 9
4.1.2 October 20, 2014 Stormwater Sampling
Stormwater samples were collected at the Ensign and Fathom Outfalls (see Figure 3) during
a storm event on October 20 at 3:15 a.m. at the Ensign Outfall and at 3:05 a.m. at the Fathom
Outfall. Table 3 summarizes the event. Figure 5 is a hydrograph of the event. Appendix A
contains weather predictions. Appendix B contains the FSDSs. Appendix C contains the
laboratory analytical report and data quality assurance/quality control review.
No rain was recorded in the 24 hours prior to the sampled event. The NWS predicted 0.1 to
0.25 inch overnight between October 19 and October 20 and another 0.1 to 0.25 inch on
October 20. These conditions meet the Stormwater Guidance requirements of an antecedent
dry period of at least 24 hours (as defined by <0.1 inch over the previous 24 hours), minimum
predicted rainfall volume of greater than 0.2 inch per event, and expected duration of storm
event of at least 3 hours. A total of 0.45 inch of precipitation was recorded between 11 p.m.
on October 19 and 4 p.m. on October 20.
Bridgewater arrived onsite at 1:30 a.m on October 20. Flow was observed in the Fathom
Outfall at 3:05 a.m. and in the Ensign Outfall at 3:10 a.m. Samples were collected at 3:05
a.m. and 3:15 a.m., respectively. A sample was collected within 0.5 hour of flow in the
outfalls. As a result, this event meets the Stormwater Guidance’s requirements for the
collection of either a sample within 0.5 hour (first-flush) or the first three hours (standard) of
flow to the stormwater system.
4.1.3 October 21, 2014 Stormwater Sampling
Stormwater samples were collected at the Ensign and Fathom Outfalls (see Figure 1) during
a storm event on October 21 at 11:45 a.m. at the Ensign Outfall and at 11:10 a.m. at the
Fathom Outfall. Table 3 summarizes the event. Figure 6 is a hydrograph of the event.
Appendix A contains weather predictions. Appendix B contains the FSDSs. Appendix C
contains the laboratory analytical report and data quality assurance/quality control review.
Less than 0.1 inch of precipitation was recorded in the previous 24 hours. The NWS predicted
0.1 to 0.25 inch overnight between October 21 and October 22 and another 1 to 2 inches on
October 22. These conditions meet the Stormwater Guidance requirements of an antecedent
dry period of at least 24 hours (as defined by <0.1 inch over the previous 24 hours), minimum
predicted rainfall volume of greater than 0.2 inch per event, and expected duration of storm
event of at least 3 hours. A total of 1.39 inch of precipitation was recorded between 11 p.m.
on October 21 and 5 p.m. on October 22.
Bridgewater arrived onsite at 10:15 p.m on October 21. Flow was observed in the Fathom
Outfall at 11:05 p.m. and in the Ensign Outfall at 11:43 pm. at the Ensign Outfall. Samples
were collected at 11:10 p.m. and 11:45 p.m., respectively. A sample was collected within 0.5
hour of flow in the outfalls. As a result, this event meets the Stormwater Guidance’s
Addendum to Source Control Evaluation Report Regarding Stormwater Pathway: Results of October 2014 Source Control Evaluation Sampling and Analyses and Completion of Source Control Evaluation
Western Star Truck Manufacturing Plant
Bridgewater Group, Inc. 10
requirement for the collection of a sample within 0.5 hour (first-flush) and the first three hours
(standard) of flow to the stormwater system.
4.2 Analyses Performed as Required By DEQ
As requested, DTNA analyzed samples for all site-related COCs previously identified by
DEQ1 for this SCE to allow for comparison to all previous results.2 In addition, DTNA
analyzed samples for the “contaminants of concern to the sediment area of potential concern
(AOPC) #17,” as identified in DEQ’s June 27, 2014 letter. The AOPC #17 includes the Swan
Island Basin of the Willamette River in the Portland Harbor Superfund Site. Specifically, all
stormwater samples were analyzed for total and dissolved metals (arsenic, cadmium,
chromium, copper, lead, mercury, silver and zinc) by U.S. Environmental Protection Agency
(USEPA) Method 200.8/245.2; polycyclic aromatic hydrocarbons (PAHs), phthalates, and
phenol by USEPA Method 625; polychlorinated biphenyls (PCBs) and dieldrin by USEPA
Method 608; tributyltin (TBT) by SW3510C/SW8270D-SIM GC/MS and total suspended solids
(TSS) by USEPA Method 160.2. Field sampling data sheets are included in Appendix B.
Samples were analyzed at Specialty Analytical in Clackamas, Oregon. Tables 4 through 6
summarize the stormwater analytical results for the Ensign and Fathom Outfall samples. In
order to meet the low screening level values (SLVs) for arsenic, cadmium, PCB Aroclors and
carcinogenic PAHs in Appendix D of the Stormwater Guidance, Specialty Analytical reported
the analytical results to the lower method detection limits (MDLs) in addition to the higher
method reporting limits (MRLs). Concentrations detected between the MDL and MRL are
qualified with a J as estimated (see Tables 4 though 6). The laboratory analytical reports are
included in Appendix C. The data were reviewed for quality and were found to be acceptable
for use, with associated qualifiers assigned. The data quality review memorandum is included
in Appendix C.
4.3 Results
The stormwater results are presented in Tables 4 through 6, and are compared to both JSCS
SLVs and, where available, to the comparative industrial stormwater criteria (i.e., compared
against the DEQ’s “knee of the curve” on stormwater charts in Appendix E of the Stormwater
Guidance). Unfiltered stormwater data from Ensign and Fathom outfalls were evaluated using
the rank- ordered stormwater concentration charts found in Appendix E of the DEQ’s
Stormwater Guidance. The stormwater comparison charts were created by the DEQ using
“whole, unfiltered” contaminant concentration data from stormwater samples collected at
Portland Harbor area heavy industrial sites, and they are intended to be used as a screening
1 See April 21, 2006, Maul Foster and Alongi, Inc. Stormwater Evaluation Work Plan, Truck Manufacturing Plant, section 6.1, as revised by attachments to July 14, 2006, letter to Mike Romero that incorporated DEQ’s June 15, 2006, comments. 2 DTNA mistakenly did not analyze for hexavalent chromium, but it did test for total chromium. In all previous samples, hexavalent chromium has been significantly below the JSCS SLV.
Addendum to Source Control Evaluation Report Regarding Stormwater Pathway: Results of October 2014 Source Control Evaluation Sampling and Analyses and Completion of Source Control Evaluation
Western Star Truck Manufacturing Plant
Bridgewater Group, Inc. 11
tool for distinguishing typical industrial stormwater from stormwater containing potentially
elevated contaminant concentrations.
Concentrations of detected compounds including arsenic, BEHP, cadmium, total chromium,
copper, lead, zinc, total PAHs, and TSS from the Ensign and Fathom Outfalls were overlaid
on the DEQ Appendix E stormwater plots, and are included as Figures 7 through 14, which
show the most recent sample results and also show all previous TMP SCE stormwater
sample results. One plot is presented for each analyte. Site-specific data overlaid on the DEQ
concentration plot can fall into two curve regions:
Upper-steeper portion of the curve: concentrations falling in this vertical region of the curve are an indication that uncontrolled contaminant sources may be present.
Lower-flatter portion of the curve: concentrations falling in this horizontal region of the curve suggest that stormwater is not being unusually impacted by contaminants at the site and are therefore representative of “typical” industrial stormwater for Portland Harbor area properties (DEQ, 2010).
The exact limits of these two regions were purposefully undefined to avert misinterpretation of
the screening results. At the transition from horizontal to vertical shape, most concentration
charts have a distinctive “knee” area.
Non-detected stormwater concentrations from the Ensign and Fathom Outfalls were removed
to maintain consistency with the DEQ data used to create the charts. Also, J-flagged data,
indicating that concentrations were estimated by the laboratory, were plotted as real data
points at face value.
Analytes are discussed below, in each case addressing the specific concerns raised in DEQ’s
June 27, 2014 letter.
4.3.1 Polychlorinated Biphenyls
DEQ’s June 27 letter acknowledged that PCBs had not been detected in previous stormwater
samples, but requested additional confirmatory sampling and analysis, with detection limits
below the JSCS criteria “or at least below the 0.033 µg/L lowest SLV for individual PCB
Aroclors.” As shown in Tables 4 and 5, PCBs were not detected in any samples. Detection
limits for individual PCB Aroclors ranged from <0.00368 µg/L to <0.00451 µg/L, an order of
magnitude lower than the required limit.
Thus, this additional sampling has confirmed the absence of PCBs in TMP stormwater
discharges.
Addendum to Source Control Evaluation Report Regarding Stormwater Pathway: Results of October 2014 Source Control Evaluation Sampling and Analyses and Completion of Source Control Evaluation
Western Star Truck Manufacturing Plant
Bridgewater Group, Inc. 12
4.3.2 Copper, Lead and Zinc
DEQ’s June 27 letter acknowledged that copper, lead and zinc, as measured in the more
recent DTNA samples, had been at “concentrations that are within comparative industrial
stormwater criteria (i.e. ‘below the knee of the curves’) and likely do not require further
stormwater controls.” DEQ stated that it would evaluate the results from these additional
sampling events to determine if sources of these chemicals are still below levels of concern.
As shown in Tables 4 and 5 and in Figures 7, 8 and 9, concentrations in these additional
sampling events remained below the knee of the curve, in the horizontal portion of the chart.
Additionally, all trend to the low end of previous concentrations. With respect to zinc, all
measured concentrations are well below the knee of the curve, and four of the six samples
were at the low end of previous concentrations, while two of the six samples were in the same
range as previous data. As noted in Section 3, DTNA has committed to implement an
additional stormwater treatment measure (i.e., construction of a larger onsite infiltration
facility) for zinc to substantially eliminate all off-site stormwater discharges containing zinc and
other COCs from the Fathom drainage basin. Specifically, the bioswale in the Offline truck
parking area will be expanded to manage all runoff from the Fathom drainage basin (Drainage
Area 1) of the TMP, as discussed in DTNA’s December 22, 2014, Tier II Waiver Request and
Alternative Tier II Stormwater Pollution Control Plan Revision (MFA, 2014).
Thus, this additional sampling has confirmed that copper, lead and zinc are not present at
levels of concern in TMP stormwater and/or will not be discharged from the Fathom Outfall
following installation of the new stormwater infiltration facility, which is anticipated to occur by
June 30, 2016, at the latest.
4.3.3 Polycyclic Aromatic Hydrocarbons
DEQ’s June 27 letter also acknowledged that PAHs, as measured in past stormwater
samples, had been at “concentrations that are within comparative industrial stormwater
criteria (i.e. ‘below the knee of the curves’) and likely do not require further stormwater
controls. Similar to copper, lead and zinc, DEQ asked DTNA to confirm this by analyzing
samples for PAHs during these additional sampling events.
As shown in Tables 4 and 5 and in Figure 10, individual and total PAH concentrations in these
additional sampling events remained far below the knee of the curves in Appendix E of DEQ’s
Stormwater Guidance, plotting in the horizontal portion of the chart. Thus, this additional
sampling has confirmed that PAHs are not present at levels of concern in TMP stormwater.
4.3.4 Cadmium
DEQ’s June 27 letter noted that DTNA would need to show that its additional BMPs have
resulted in better control of cadmium, to be demonstrated both through stormwater
measurements, discussed here, and in-line solids inspections, discussed in Sections 5 and 6
of this report.
Addendum to Source Control Evaluation Report Regarding Stormwater Pathway: Results of October 2014 Source Control Evaluation Sampling and Analyses and Completion of Source Control Evaluation
Western Star Truck Manufacturing Plant
Bridgewater Group, Inc. 13
The concentrations of total cadmium in stormwater from the October 2014 sampling events
ranged from 0.085 J µg/L to 0.421 µg/L. This range is below the range of prior sampling
events (0.113 µg/L to 2.5 µg/L) and below the knee of DEQ’s curve (see Figure 11),
demonstrating the positive impact of DTNA’s enhanced BMPs. Dissolved cadmium
concentrations showed the same trend with the October 2014 results ranging from non-detect
at 0.0518 µg /L to 0.283 µg/L, as compared to the range of previous results between 0.09 J
µg /L and 0.97 µg/L.
Although concentrations of dissolved cadmium were generally not below the JSCS SLV of
0.094 µg/L, the concentrations of total cadmium are below the estimated range of the “knee”
of stormwater curves in Appendix E of the DEQ’s Stormwater Guidance (i.e., 0.5 µg/L to 1.5
µg/L). Of note, the recent cadmium concentrations, overlaid on the DEQ’s curve, similarly
show a trend of improvement resulting from implementation of enhanced BMPs over time.
Most of the Ensign and Fathom Outfall cadmium data from 2007 through 2011 plot in the
middle, knee portion of the curve, with two of the earlier samples (from the Fathom Outfall, in
2007 and 2009) plotting in the upper vertical portion of the curve (see Figure 11). However, all
of the more recent data (collected in October 2014) plot below the lower portion of the knee
and in the horizontal portion of the curve, indicating that additional source control is not
necessary for this metal (see Figure 11). As noted above in Section 4.3.2, DTNA will be
implementing an NPDES-1200Z Tier II corrective action measure before June 30, 2016; this
measure includes expansion of an existing bioswale and infiltration of all stormwater runoff in
the Fathom drainage area. Thus, cadmium will not be discharged from the Fathom Outfall
following installation of the new stormwater infiltration facility.
4.3.5 Bis-2-Ethylhexyl-Phthalate and Other Phthalates
DEQ’s June 27 letter noted that DTNA would need to show that its additional BMPs have
resulted in better control of BEHP, to be demonstrated both through stormwater
measurements, discussed here, and in-line solids inspections, discussed in Section 5. BEHP
is not a COC in the sediment area of potential concern (AOPC #17) to which this stormwater
discharges.
The concentration of BEHP in stormwater from the October 2014 sampling events ranged
from 0.405J µg/L to 6.25 µg/L. The high concentration was measured in a sample collected
from Ensign Outfall on October 13 that contained 62 milligrams per liter (mg/L) of TSS, which
is unusually high when compared to all other sample results at the TMP (see Tables 4 and 5
and Figure 13). Other than that one outlier, results trended lower than prior sampling events
(which ranged from 0.181J µg/L to 19.7 µg/L) again demonstrating the impact of DTNA’s
enhanced BMPs. Three out of six results were above the JSCS SLV of 2.2 µg/L (see Figure
12). All October 2014 results, except the 6.25 µg/L October 13 result, are at the low end of the
“knee of the curve” of the DEQ’s stormwater curve in Appendix E of the Stormwater Guidance
(i.e., 4 µg/L to 10 µg/L) or in the flat area below the knee. Although there continues to be
Addendum to Source Control Evaluation Report Regarding Stormwater Pathway: Results of October 2014 Source Control Evaluation Sampling and Analyses and Completion of Source Control Evaluation
Western Star Truck Manufacturing Plant
Bridgewater Group, Inc. 14
variability in BEHP concentrations in TMP stormwater data, the variability is over a much
lower concentration range, generally falling in the low end of the knee or below the knee of
the curve. Thus, this additional sampling has confirmed that TMP has achieved control of
BEHP discharges.
After the 6.25 µg/L October 13 result, the next highest concentrations of BEHP have been
detected in the Fathom Outfall. As noted above in Section 4.3.2, DTNA will be implementing
an NPDES-1200Z Tier II corrective action measure before June 2016; this measure includes
the expansion of an existing bioswale and infiltration of all stormwater runoff in the Fathom
drainage area. Consequently, this corrective action will substantially eliminate stormwater
discharges from the Fathom drainage area including BEHP discharges.
DTNA also analyzed the samples for other phthalates. As shown in Tables 5 and 6, these
were all either not detected or were detected below the JSCS SLV with two exceptions. One
sample from the Ensign Outfall contained 7.44 µg/L of dimethylphthalate and the other two
samples contained 0.219J µg/L and 0.642J µg/L, well below the SLV of 3.0 µg/L. A different
sample from the Ensign Outfall contained 6.0 µg/L of di-n-octylphthalate (and the other two
results were non-detect). Neither of these phthalates is a COC for AOPC #17. While di-n-BP,
a COC for AOPC#17, was detected in four samples, detected concentrations were about an
order of magnitude less than the SLV of 3.0 µg/L.
4.3.6 Other Contaminants of Concern for Area of Potential Concern 17 in
Portland Harbor Superfund Site
DEQ’s June 27 letter stated that an important line of evidence for conclusion of the SCE
would be a comparison of the TMP site-specific COCs to the COCs for AOPC #17, the
ultimate discharge point for stormwater from the TMP via the City’s M-1 Outfall. DEQ
identified the AOPC #17 COCs as arsenic, cadmium, copper, mercury, silver, TBT, zinc,
PAHs, di-n-BP, phenol, PCBs, and dieldrin. Of these, cadmium, copper, zinc, PAHs, PCBs,
and di-n-BP have all been addressed above. None of the remaining COCs have been
identified as COCs associated with the TMP. Nonetheless, DTNA analyzed for them in the
October 2014 sampling events to confirm their absence.
The following were either not detected or not detected above their respective JSCS SLVs:
mercury, silver, TBT, phenol and dieldrin (see Tables 4 and 5). The method detection limit
(MDL) for dieldrin exceeded the SLV, but was the lowest available. Again, none of these
substances is a COC for the TMP.
Total arsenic was detected in three out of the six samples. Concentrations ranged from 0.340
J µg/L to 0.740 µg/L (see Tables 4 and 5 and Figure 14). The applicable water quality
standard for arsenic in Oregon is now 2.1 µg/L for total inorganic arsenic (see OAR 340-041-
0033, Table 40). No further action is required to address arsenic because the measured
concentrations are below the applicable water quality standard, concentrations plot below the
Addendum to Source Control Evaluation Report Regarding Stormwater Pathway: Results of October 2014 Source Control Evaluation Sampling and Analyses and Completion of Source Control Evaluation
Western Star Truck Manufacturing Plant
Bridgewater Group, Inc. 15
“knee of the curve” of the DEQ’s stormwater curve in Appendix E of the Stormwater
Guidance, and it is not a COC for the TMP.
Addendum to Source Control Evaluation Report Regarding Stormwater Pathway: Results of October 2014 Source Control Evaluation Sampling and Analyses and Completion of Source Control Evaluation
Western Star Truck Manufacturing Plant
Bridgewater Group, Inc. 16
5 Results of 2014 Video Camera Survey of
Portions of Fathom and Ensign Stormwater
Conveyance Systems
As requested in DEQ’s June 27 letter, DTNA performed video camera surveys in portions of
both the Fathom and Ensign stormwater lines. In the Fathom line, the survey was performed
in accordance with the October 10, 2013, Sampling and Analysis Plan (SAP) to evaluate
possible reaccumulation of solids in the line between the Fathom Outfall and City manhole
AAJ831 since the November 2013 cleanout (Pacific Groundwater Group [PGG], 2013). In the
Ensign line, the video camera survey was performed to investigate possible reaccumulation in
the line since the 2006-2007 cleanout and possible sources of dry weather flow to the lateral
from the southeast part of the facility. The following sections summarize the results.
5.1 Fathom Line Video Camera Survey
As noted in Section 2.3 of the SAP, it was planned that a second video camera survey of the
line between the Fathom Outfall and City manhole AAJ831 would be performed
approximately four months after the November 2013 line cleanout to determine if solids were
re-accumulating. Because of the relatively dry fall and winter of 2013 that the Portland area
experienced until February 2014, DTNA recommended that the post-cleanout camera survey
be performed in June or July of 2014. During a February 5, 2014, meeting, the DEQ agreed
with this recommendation. The video camera survey was further delayed due to facility
operations. The post-cleanout camera survey was performed on October 2, 2014, by Pacific
INT-R-TEK. The video and log is included in Appendix D.
The post-cleanout camera survey revealed the following:
The installation of the cut-off valve in a vault immediately downstream of the Fathom Outfall in 2013 has created a settling vault for larger solids. Solids have to be suspended in the water column to make it over an 8-inch-high barrier/joint into the main line to the City’s line. An estimated one to two inches of solids had accumulated in this vault in areas away from the center of the vault where the flow enters it from the Fathom Outfall.
Dry weather flow was observed from the east Fathom lateral to the TMP facility indicating that there are likely continued, intermittent discharges of potable water from the humidification systems associated with the paint booths. As previously reported in the January 20, 2014, Results of Dry Weather Flow Investigation to Fathom Outfall, which was shared with the City of Portland, this flow is of potable water, which discharge is authorized under condition 7.a.iii of the DTNA’s NPDES 1200-Z permit.
Medium- to coarse-grained, sand-sized solids were observed in the line downstream of the cut-off valve vault. Solids appeared to be primarily from roofing material (as interpreted by the camera crew) with some paint chips between 0 and
Addendum to Source Control Evaluation Report Regarding Stormwater Pathway: Results of October 2014 Source Control Evaluation Sampling and Analyses and Completion of Source Control Evaluation
Western Star Truck Manufacturing Plant
Bridgewater Group, Inc. 17
63 feet from the Fathom cut-off valve vault. An estimated 0.5 inch of solids was present in the bottom of the pipe.
The volume of solids increased at about 63 feet downstream from the cut-off valve vault where a low point in the line begins. While sand-sized material and paint chips were observed, there was also finer-grained, silt-sized material present that was “stirred up” by the camera while travelling down the line. The thickness increased to an estimated three inches between 63 and 75 feet and then decreased to two inches between 75 and 90 feet from the Fathom cut-off valve vault.
The results indicate that there are limited quantities of solids present in the Fathom drainage
area that are bypassing the catch basin inserts or coming from roof drains similar to other
sites. Based on DTNA’s TSS stormwater results, DTNA has significantly reduced the amount
of suspended solids in its stormwater discharge, although it cannot eliminate them entirely. It
has, however, reduced TSS concentrations significantly below the allowed TSS benchmark in
its NPDES 1200-Z permit. Further, as shown in Figure 13, DTNA currently does a better job
than most industrial permittees in Portland Harbor in reducing the amount of solids that are
discharged from its stormwater system.
Further, through the implementation of the NPDES Tier II actions described above, by June
2016 or earlier, DTNA will have substantially eliminated off-site stormwater discharges from
the Fathom drainage area. Once the bioswale expansion is completed, suspended solids in
the Fathom drainage area will be contained in the bioswale and not discharged from the site.
5.2 Ensign Line Video Camera Survey
Intermittent dry weather flow has been observed in a lateral to the Ensign Outfall from the
southeast part of the site (see Figure 3). This area receives discharges from roof drains and
paved areas near Dock 1 and from stormwater lines that run under the wastewater treatment
plant (WWTP). The line was surveyed on September 30, 2014 and October 7, 2014 by Pacific
INT-T-TEK. The line was relatively free of solids. Although flow was observed, the amount of
flow, a trickle, was too small to sample.
Two potential sources of dry weather flow were observed. There may be some groundwater
intrusion into a connection between two stormwater lines under the WWTP inside the
building; these pipes pre-date the construction of the WWTP in 2002 and are likely connected
to old roof drains added to the building during the 1984-1985 expansions. The video shows
that groundwater intrusion was occurring where one pipe connects to the main line, similar to
a T joint. In addition, there was a small amount of flow in the main line from an undetermined
source upstream of the connection of the above pipe to the main line, but the camera could
not be advanced any farther up the line due to the number of bends in the pipe. Process
water cannot enter these lines or the subsurface because the floor of the WWTP is coated
Addendum to Source Control Evaluation Report Regarding Stormwater Pathway: Results of October 2014 Source Control Evaluation Sampling and Analyses and Completion of Source Control Evaluation
Western Star Truck Manufacturing Plant
Bridgewater Group, Inc. 18
with epoxy to prevent fluids from entering the subsurface. The floor is designed to contain any
potential overflows, and no fluids are allowed to accumulate on the floor.
If the source of the dry weather flow is groundwater, groundwater is not impacted by site-
related COCs and is therefore not of concern for the SCE. Reconnaissance samples of
shallow groundwater collected in 2003 did not contain any volatile organic compounds, and
PAH and metals concentrations were below the JSCS SLVs and state ambient water quality
criteria (see Tables 6-12 through 6-14 and Figure 2-9, locations WF-5 through WF-7 and EF-
3, of the 2009 Remedial Investigation Report [MFA, 2009]).
Addendum to Source Control Evaluation Report Regarding Stormwater Pathway: Results of October 2014 Source Control Evaluation Sampling and Analyses and Completion of Source Control Evaluation
Western Star Truck Manufacturing Plant
Bridgewater Group, Inc. 19
6 Results of 2014 Post-Video Survey Fathom
Storm Line Solids Sampling and Analysis
Pursuant to the October 10, 2013 SAP and similar previous storm line solids sampling and
analyses, solids were collected from the 30-inch-diameter stormwater line downstream of the
Fathom Outfall between the cut-off valve vault and City manhole AAJ831 on October 10,
2014. These solids samples were collected to evaluate if the observed solids accumulating in
the Fathom stormwater line since November 2013 contain COCs for the stormwater SCE.
6.1 2014 Solids Sampling
On October 10, 2014, personnel with confined space training from Terra Hydr, Inc. entered
the cut-off valve vault manhole, walked down the sides of the pipe above the water line so as
not to disturb the solids, and sampled solids from 90 feet (adjacent to City manhole AAJ831)
upstream to the cut-off valve vault to minimize disturbing downstream materials. In-line solids
sample locations were determined by measuring the linear distance from the cutoff valve vault
(immediately downstream from the Fathom Outfall) with sample names reflecting the distance
downstream from the cut-off valve vault (e.g., Fathom 0-16 represents a sample collected
between 0 and 16 feet downstream of the cut-off valve vault). The samples were collected
inside the cut-off valve vault and from the pipe between the cut-off valve vault and City
manhole AAJ831. Consistent with the previous sampling, field personnel instructed the
analytical laboratory to homogenize each sample. FSDSs are included in Appendix E.
On the basis of the presence of solids, six in-line solids samples were collected at the
locations summarized in Table 7. Solids samples were collected in new, clean, laboratory-
supplied, 4 ounce, glass containers, packed in laboratory-supplied coolers, and filled with ice
as a temporary sample preservative. Samples were delivered to the analytical laboratory,
Specialty Analytical in Clackamas, Oregon, under chain-of-custody documentation. Samples
were analyzed for total cadmium, chromium, copper, lead, and zinc by USEPA Method
6010C; PCBs by USPEA 8082A; PAHs by USEPA 8270D SIM; and phthalates by USEPA
8270D.
6.2 2014 Storm Line Solids Results
Analytical results are summarized in Table 8 and included in Appendix F. Table 8 provides a
comparison of the 2014 concentrations to those in the line before the initial cleaning of the
Fathom storm lines in February 2007 and September 2010. In addition, the results are
compared to those collected in October 2013 before a thorough cleaning of the line between
the Fathom Outfall and City manhole AAJ832 conducted by DTNA in November 2013. Finally,
solids concentrations from samples collected from City manhole AAJ831 in 2003, 2009, and
2013 are also included for comparison. The data indicate that COC concentrations have
decreased substantially.
Analytical data were reviewed for quality and validated as documented by Proud Data
Services, on behalf of Bridgewater. The data are acceptable for use with appropriate

Addendum to Source Control Evaluation Report Regarding Stormwater Pathway: Results of October 2014 Source Control Evaluation Sampling and Analyses and Completion of Source Control Evaluation
Western Star Truck Manufacturing Plant
Bridgewater Group, Inc. 20
qualifiers assigned (see Appendix F for the Data Quality Assurance/Quality Control Review
Memorandum for more information).
6.2.1 Polychlorinated Biphenyls
Aroclor 1254 had been previously detected in solids removed from storm lines in the Fathom
drainage area and in City manhole AAJ831 (see Table 8), with concentrations ranging from
4.9 J micrograms per kilogram (µg/kg) in samples collected 23 feet downstream of the
Fathom Outfall in 2013 to 1,840 µg/kg in the solids removed from the storm lines in the
Fathom drainage area in 2007. But in October 2014, PCBs were not detected in any of the
solids samples collected between the Fathom cut-off valve vault and City manhole AAJ831
(see Table 8). The detection limit (0.33 µg/kg) is almost two orders of magnitude lower than
the SLV of 300 µg/kg for individual Aroclors. This absence of PCBs in solids is consistent with
the absence of PCBs in the stormwater samples discussed above in Section 4.
6.2.2 Copper, Lead and Zinc
Detected concentrations of copper, lead and zinc have exceeded the JSCS SLVs in the solids
removed from the lines in the Fathom drainage area and in City manhole AAJ831 (see Table
8). Historically, detected concentrations of copper ranged from 97,600 µg/kg in a sample
collected 60 feet downstream of the Fathom Outfall in 2013 to 479,000 µg/kg in a sample
collected 33.2 feet downstream of the Fathom Outfall in 2013. In 2014, detected copper
concentrations between the Fathom Outfall and City manhole AAJ831 were generally lower
than those measured before the 2013 cleanout and lower than those detected in City
manhole AAJ831 before the 2013 cleanout. Moreover, they are all below the DEQ’s
Stormwater Guidance’s “knee of the curve” for copper in stormwater sediments at industrial
sites in Portland Harbor.
Historically, detected concentrations of lead ranged from 6,690 µg/kg in a sample collected in
a stormwater line under the Offline area inside the TMP in 2010 to 587,000 µg/kg in solids
removed from the storm lines in the Fathom drainage area in 2007 (see Table 8). Similar to
copper, lead concentrations in 2014 were lower than those detected before the 2013 cleanout
and lower than those detected in City manhole AAJ831 before the 2013 cleanout.
Similar trends were observed for zinc; concentrations of zinc in 2014 were lower than those
detected before the 2013 cleanout (see Table 8). Detected concentrations of lead and zinc
are also below the Stormwater Guidance’s “knee of the curves” for lead and zinc in
stormwater sediments at industrial sites in Portland Harbor.
These decreasing concentration trends in the solids are consistent with the stormwater data
for copper, lead and zinc discussed above in Section 4, where concentrations are all below
their respective “knee of the curves” in the stormwater charts in Appendix E of DEQ’s
Stormwater Guidance.

Addendum to Source Control Evaluation Report Regarding Stormwater Pathway: Results of October 2014 Source Control Evaluation Sampling and Analyses and Completion of Source Control Evaluation
Western Star Truck Manufacturing Plant
Bridgewater Group, Inc. 21
6.2.3 Polycyclic Aromatic Hydrocarbons
DEQ’s June 27 letter acknowledged that PAHs in stormwater likely did not require further
stormwater controls. This conclusion is also supported by the 2014 solids data. No PAH
concentrations in solids collected between the Fathom cut-off valve and City manhole AAJ831
in 2014 exceeded the SLVs, where available (see Table 8).
6.2.4 Cadmium
Cadmium has been detected in solids removed from the storm lines in the Fathom drainage
area and in City manhole AAJ831 (see Table 8). Detected concentrations of cadmium have
exceeded the JSCS SLV of 1,000 µg/kg. Historically, cadmium concentrations ranged from
2,590 µg/kg in a 2013 sample collected between 63 and 75 feet downstream of the Fathom
cut-off valve vault to 53,300 µg/kg in a 2010 sample collected under the Offline area of the
TMP (see Table 8). Concentrations in 2014 were lower than those measured in the storm
lines before the 2013 cleanout and much lower than those measured in solids removed from
storm lines in the Fathom drainage area in 2007 and 2010 (see Table 8). This is consistent
with the observed decreases in cadmium concentrations in stormwater as discussed above in
Section 4.
6.2.5 Bis (2-ethylhexyl) Phthalate and Other Phthalates
Phthalates have been detected in solids removed from the Fathom drainage area and in City
manhole AAJ831 (see Table 8). Di-n-butylphthalate and BEHP concentrations exceeded the
JSCS SLVs. The 2014 BEHP concentrations were similar to the 2013 concentrations between
the Fathom Outfall and City manhole AAJ831, except the concentration near City manhole
AAJ831 is 63 percent lower than before the cleanout in 2013 (14,400 µg/kg versus 39,000
µg/kg) and 71 percent lower than the concentration in the June 2013 City manhole AAJ831
sample (14,400 µg/kg versus 49,000 µg/kg) (see Table 8).
6.2.6 Decreased Total Suspended Solids as Indicator of Effective BMP
Implementation and Reduction in COC Loads in Solids
It is important to note that, during this same 2007 to 2014 time period for the SCE, DTNA has
very effectively reduced the total amount of solids getting into its stormwater system. For
example, the average TSS concentration for DTNA’s NPDES 1200-Z stormwater samples
collected between from 1993 until 2007 (when the first stormwater line cleanout was
performed) was 41.9 milligrams per liter (mg/L). Since 2007, the average TSS concentration
has been 8.2 mg/L. Figure 13 shows DTNA’s TSS concentrations from all SCE samples
relative to heavy industrial sites in Portland Harbor. Almost all results plot in the flat portion of
the curve, showing that DTNA does a very good job of controlling solids, as compared to
other industrial sites. During this time, DTNA also installed the emergency cut-off valve in a
vault downstream of the Fathom Outfall. This vault includes an approximate 8-inch-high
lip/joint, which acts as an additional solids trap before stormwater leaves the DTNA property.

Addendum to Source Control Evaluation Report Regarding Stormwater Pathway: Results of October 2014 Source Control Evaluation Sampling and Analyses and Completion of Source Control Evaluation
Western Star Truck Manufacturing Plant
Bridgewater Group, Inc. 22
These observations regarding solids are consistent with the stormwater data discussed in
Section 4. The BMPs implemented by DTNA have resulted in both a decrease in the amount
of solids getting into the stormwater system and a decrease in COC concentrations in the
solids that get into the system. Improved stormwater quality at the TMP is the result of the
stormwater control measures and BMPs discussed in Section 3.

Addendum to Source Control Evaluation Report Regarding Stormwater Pathway: Results of October 2014 Source Control Evaluation Sampling and Analyses and Completion of Source Control Evaluation
Western Star Truck Manufacturing Plant
Bridgewater Group, Inc. 23
7 Summary
DTNA has completed all steps required in the DEQ’s June 27, 2014, letter for the evaluation
of the stormwater pathway and completion of the SCE at the DTNA TMP facility. The
following scopes of work were required in the DEQ’s June 27 letter. DTNA's responses are
provided in bold.
a. Continue your work evaluating potential additional BMPs .
Response: DTNA’s operational and structural BMPs are summarized in Section
3 and Tables 1 and 2 of this report.
b. Collect one first-flush and a standard storm event stormwater sample as
described in DEQ's Portland Harbor Joint Source Control Strategy (JSCS) and
supporting documents. Key aspects of the sampling to keep in mind:
i. Samples should be evaluated for all contaminants of concern (COCs) in order to allow for a full comparison of the results to past sampling results. It is critical to take all possible measures to achieve method detection limits for
total polychlorinated biphenyls (PCBs) that are below the JSCS criteria of
0.064 ng/L, or at least below the 0.033 ug/L lowest SLV for individual
Aroclors. DEQ understands that these are very low detection limits, but
several other projects have been able to achieve acceptable detection limits,
using sample cleanup procedures in the event of matrix interference.
Response: Bridgewater collected first-flush and standard storm event
samples on October 13, 20, and 21, 2014. The results are summarized in
Section 4 of this report. PCBs were not detected in any samples.
Detection limits for individual PCB Aroclors ranged from <0.00368 µg/L
to <0.00451 µg/L, an order of magnitude lower than the required limit.
This additional sampling has confirmed the absence of PCBs in TMP’s
stormwater discharges. Concentrations of copper, lead, zinc, cadmium,
and PAHs in these additional samples are below the knee of the DEQ’s
stormwater curves for heavy industrial sites in the Portland Harbor,
plotting in the horizontal portion of the charts. Concentrations of BEHP
have also decreased, with five of six samples below the knee of the
curve or in the very low portion of the knee. Importantly, BEHP is not a
COC in AOPC #17. Further, DTNA has committed to implement an
additional stormwater treatment measure (i.e., construction of a larger
onsite infiltration facility) to manage all runoff from the Fathom drainage
basin (Drainage Area 1) of the TMP. Stormwater in the Fathom drainage
area will be managed onsite via infiltration on or before June 30, 2016,

Addendum to Source Control Evaluation Report Regarding Stormwater Pathway: Results of October 2014 Source Control Evaluation Sampling and Analyses and Completion of Source Control Evaluation
Western Star Truck Manufacturing Plant
Bridgewater Group, Inc. 24
thereby lowering concentrations of these COCs in TMP’s stormwater
discharges.
c. Completion of the next video survey of solids in Fathom and Ensign stormwater
pipes to assess if the fall 2013 solids removals from these pipes was complete
and if there are ongoing accumulation of solids occurring in the pipes.
Response: The video survey of the Fathom Outfall to City manhole AAJ831
was performed on October 2, 2014 (see Section 5 of this report). The results
of the video survey and a copy of the DVD are included in Appendix D. Solids
were observed in the storm line. Solids were sampled on October 10, 2014
(see Section 6 of this report). No PCBs were detected, and the detection
limits were at concentrations below the JSCS SLVs for individual Aroclors,
where available. Site-related COCs including cadmium, copper, lead and zinc,
PAHs and phthalates were detected in the solids. The 2014 data indicate that
site-related COC concentrations in the solids getting into the stormwater lines
are lower than previous levels in the Fathom line and in City manhole AAJ831
and fewer solids are getting into the stormwater system.
A video survey of that portion of the Ensign stormwater line where dry
weather flow has been observed was performed on September 30 and
October 7, 2014 (see Appendix D of this report). The source of the dry
weather flow may be groundwater intrusion at the joint between two pipes
under the WWTP. The amount of flow was insufficient to sample. Note that
groundwater quality in inferred downgradient locations from this area is not
adversely impacted with site-related COCs on the basis on reconnaissance
samples collected in 2003. Therefore, no further action is recommended.
d. Assuming these final actions show that source control goals have been achieved,
preparation of a report documenting the investigations and actions taken can then
be submitted to DEQ.
Response: Documentation of the final actions is included in this report.
e. An important line of evidence that DEQ will use will be a comparison of the Truck Plant contaminants of concern (CoCs) to the sediment area of potential concern (AOPC) #17 contaminants of concern. AOPC #17 is the area where site stormwater eventually discharges to in the Willamette River. The AOPC 17 CoCs include: As, Cd, Cu, Hg, Ag, tributyl tin, Zn, PAHs, di-n-butylphthalate, phenol, PCBs and dieldrin.
Response: Of these, cadmium, copper, zinc, PAHs, and PCBs have all been
addressed above. None of the remaining COCs have been identified as COCs
associated with the TMP. Nonetheless, DTNA analyzed for them in the October
2014 sampling events to confirm their absence. The following were either not
detected or not detected above their respective JSCS SLVs: mercury, silver,
TBT, phenol, dieldrin, and di-n-butylphthalate. The MDL for dieldrin exceeded
Addendum to Source Control Evaluation Report Regarding Stormwater Pathway: Results of October 2014 Source Control Evaluation Sampling and Analyses and Completion of Source Control Evaluation
Western Star Truck Manufacturing Plant
Bridgewater Group, Inc. 25
the SLV, but was the lowest available. Total arsenic was detected in three out of
the six samples; concentrations ranged from 0.340 J µg/L to 0.740 µg/L. No
further action is required to address arsenic because the measured
concentrations are below the applicable water quality standard, concentrations
plot below the “knee of the curve” of the DEQ’s stormwater curve in Appendix E
of the Stormwater Guidance, and it is not a COC for the TMP.

Addendum to Source Control Evaluation Report Regarding Stormwater Pathway: Results of October 2014 Source Control Evaluation Sampling and Analyses and Completion of Source Control Evaluation
Western Star Truck Manufacturing Plant
Bridgewater Group, Inc. 26
8 Recommendations
No further source control evaluations or actions are necessary. DTNA recommends that DEQ
prepare a Source Control Decision for the TMP.
Addendum to Source Control Evaluation Report Regarding Stormwater Pathway: Results of October 2014 Source Control Evaluation Sampling and Analyses and Completion of Source Control Evaluation
Western Star Truck Manufacturing Plant
Bridgewater Group, Inc. 27
9 References
Bridgewater Group, Inc. (Bridgewater) and Maul Foster and Alongi, Inc. (MFA). 2011. Source
Control Evaluation Report for Stormwater and Groundwater. Western Star Truck
Manufacturing Plant, 6936 N Fathom Street, Portland, Oregon (DEQ ECSI No. 2366).
Prepared for Western Star Truck Plant Portland LLC. December 5.
Bridgewater 2013. Addendum to Source Control Evaluation Report regarding Stormwater
Pathway, including Results of 2012 Catch Basin and Sediment trap Solids Sampling and
Analyses, Western Star Truck Manufacturing Plant, 6936 N Fathom Street, Portland, Oregon
(DEQ ECSI No. 2366). Prepared for Western Star Truck Plant Portland LLC. March 22.
Oregon Department of Environmental Quality (DEQ). 2006a. Letter (re: Stormwater
Evaluation Work Plan, Freightliner Truck Manufacturing Plant, Portland, Oregon, ECSI
#2366), to Z. Gibson, Western Star Truck Manufacturing Plant, from M. Romero, Oregon
DEQ. June 15.
DEQ. 2006b. Letter (re: Stormwater Evaluation Work Plan, Freightliner Truck Manufacturing
Plant, Portland, Oregon, ECSI #2366), to Z. Gibson, Western Star Truck Manufacturing Plant,
from M. Romero, Oregon DEQ. September 25.
DEQ. 2010. Guidance for Evaluating the Stormwater Pathway at Upland Sites. Updated
October 2010.
DEQ. 2014. Letter (re: DEQ Update on Stormwater Source Control Evaluation for Western
Star Truck Manufacturing Plant LLC, 6936 North Fathom Street, Portland, Oregon), to T.
Parker, Western Star Truck Manufacturing Plant, from C. Harman, Oregon DEQ. June 27.
DEQ and U.S. Environmental Protection Agency (USEPA). 2005. Interim final Portland
Harbor Joint Source Control Strategy. September.
MFA. 2006a. Stormwater Evaluation Work Plan [for] Truck Manufacturing Plant, Freightliner LLC, Portland, Oregon. April 21. MFA. 2006b. Letter (re: Stormwater Evaluation Work Plan, Truck Manufacturing Plant, Freightliner LLC, 6936 North Fathom Street, Portland, Oregon), to M. Romero, Oregon DEQ from A. St. John, MFA. July 14. MFA. 2014. Tier II Waiver Request and Alternative Tier II Stormwater Pollution Control Plan Revision. Prepared for Western Star Truck Plant Portland LLC. December 22
Addendum to Source Control Evaluation Report Regarding Stormwater Pathway: Results of October 2014 Source Control Evaluation Sampling and Analyses and Completion of Source Control Evaluation
Western Star Truck Manufacturing Plant
Bridgewater Group, Inc. 28
Pacific Groundwater Group. 2013. In-Line Solids Cleanout Work Plan for Fathom Street Stormwater Conveyance System, Western Star Truck Manufacturing Plant, 6936 North Fathom Street, Portland, Oregon. October 10. U.S. Environmental Protection Agency. 1992. Supplemental Guidance to RAGS: Calculating the Concentration Term. OSWER Publication 9285.7-08I.

Tables
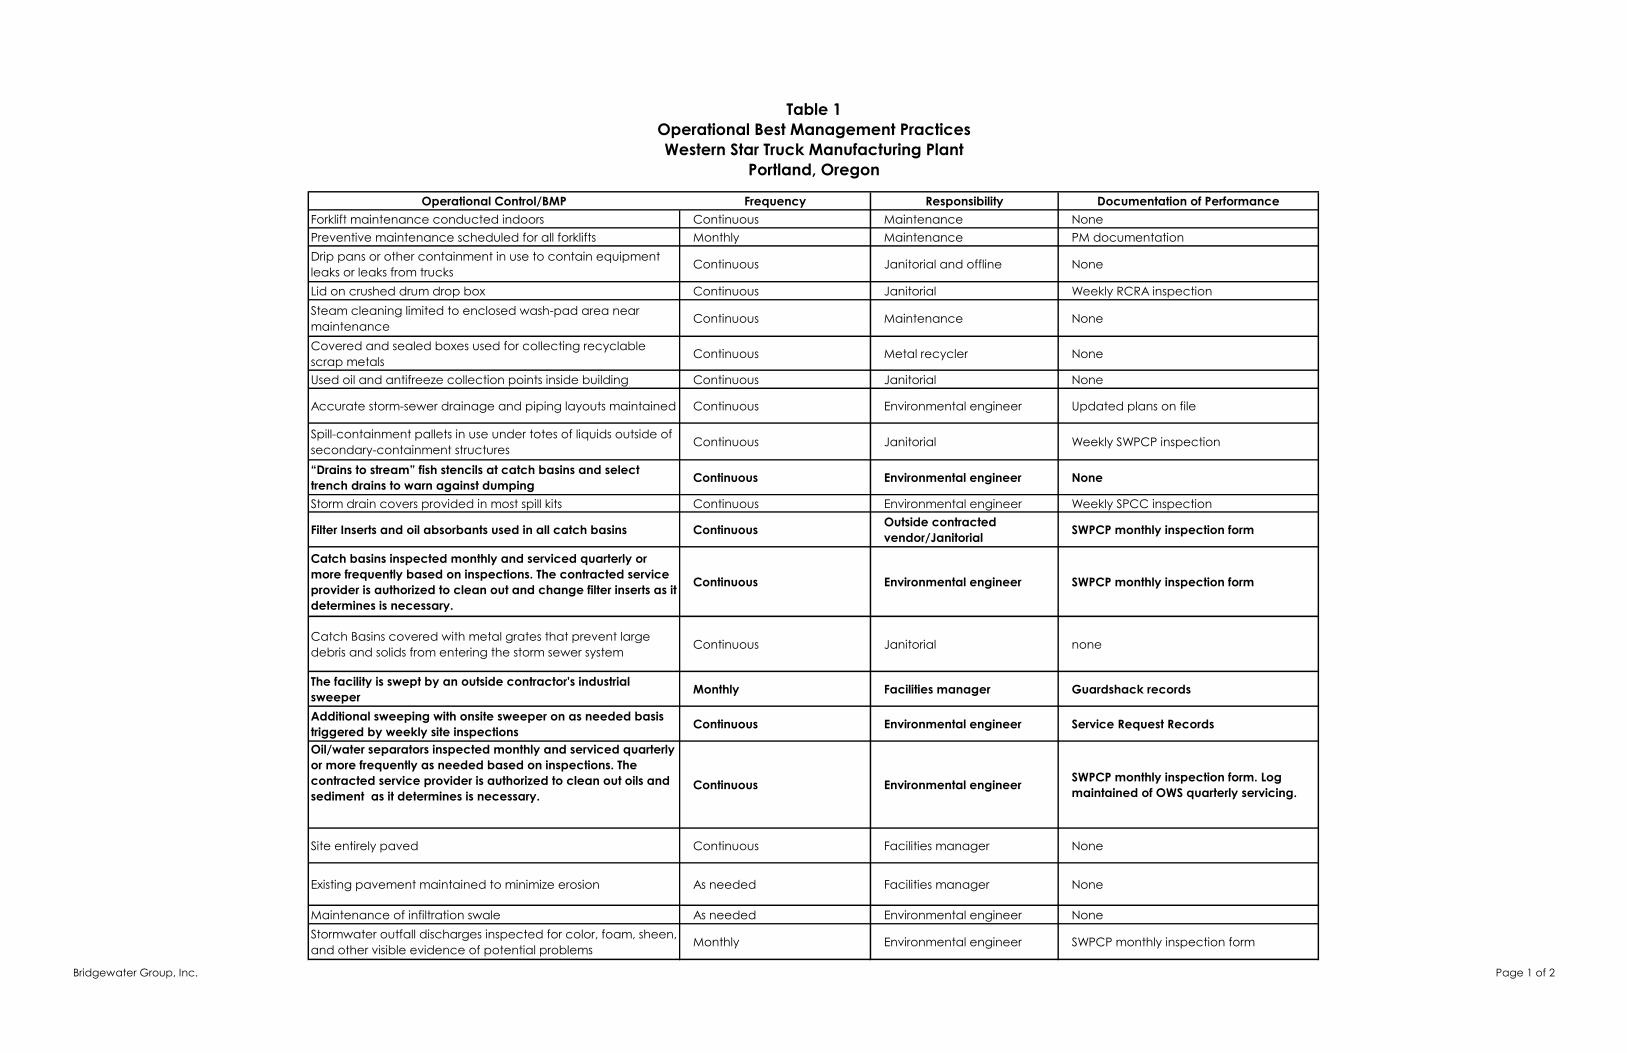
Table 1
Operational Best Management Practices
Western Star Truck Manufacturing Plant
Portland, Oregon
Operational Control/BMP Frequency Responsibility Documentation of Performance
Forklift maintenance conducted indoors Continuous Maintenance None
Preventive maintenance scheduled for all forklifts Monthly Maintenance PM documentation
Drip pans or other containment in use to contain equipment
leaks or leaks from trucksContinuous Janitorial and offline None
Lid on crushed drum drop box Continuous Janitorial Weekly RCRA inspection
Steam cleaning limited to enclosed wash-pad area near
maintenanceContinuous Maintenance None
Covered and sealed boxes used for collecting recyclable
scrap metalsContinuous Metal recycler None
Used oil and antifreeze collection points inside building Continuous Janitorial None
Accurate storm-sewer drainage and piping layouts maintained Continuous Environmental engineer Updated plans on file
Spill-containment pallets in use under totes of liquids outside of
secondary-containment structuresContinuous Janitorial Weekly SWPCP inspection
“Drains to stream” fish stencils at catch basins and select
trench drains to warn against dumping Continuous Environmental engineer None
Storm drain covers provided in most spill kits Continuous Environmental engineer Weekly SPCC inspection
Filter Inserts and oil absorbants used in all catch basins ContinuousOutside contracted
vendor/JanitorialSWPCP monthly inspection form
Catch basins inspected monthly and serviced quarterly or
more frequently based on inspections. The contracted service
provider is authorized to clean out and change filter inserts as it
determines is necessary.
Continuous Environmental engineer SWPCP monthly inspection form
Catch Basins covered with metal grates that prevent large
debris and solids from entering the storm sewer systemContinuous Janitorial none
The facility is swept by an outside contractor's industrial
sweeperMonthly Facilities manager Guardshack records
Additional sweeping with onsite sweeper on as needed basis
triggered by weekly site inspectionsContinuous Environmental engineer Service Request Records
Oil/water separators inspected monthly and serviced quarterly
or more frequently as needed based on inspections. The
contracted service provider is authorized to clean out oils and
sediment as it determines is necessary.Continuous Environmental engineer
SWPCP monthly inspection form. Log
maintained of OWS quarterly servicing.
Site entirely paved Continuous Facilities manager None
Existing pavement maintained to minimize erosion As needed Facilities manager None
Maintenance of infiltration swale As needed Environmental engineer None
Stormwater outfall discharges inspected for color, foam, sheen,
and other visible evidence of potential problemsMonthly Environmental engineer SWPCP monthly inspection form
Bridgewater Group, Inc. Page 1 of 2
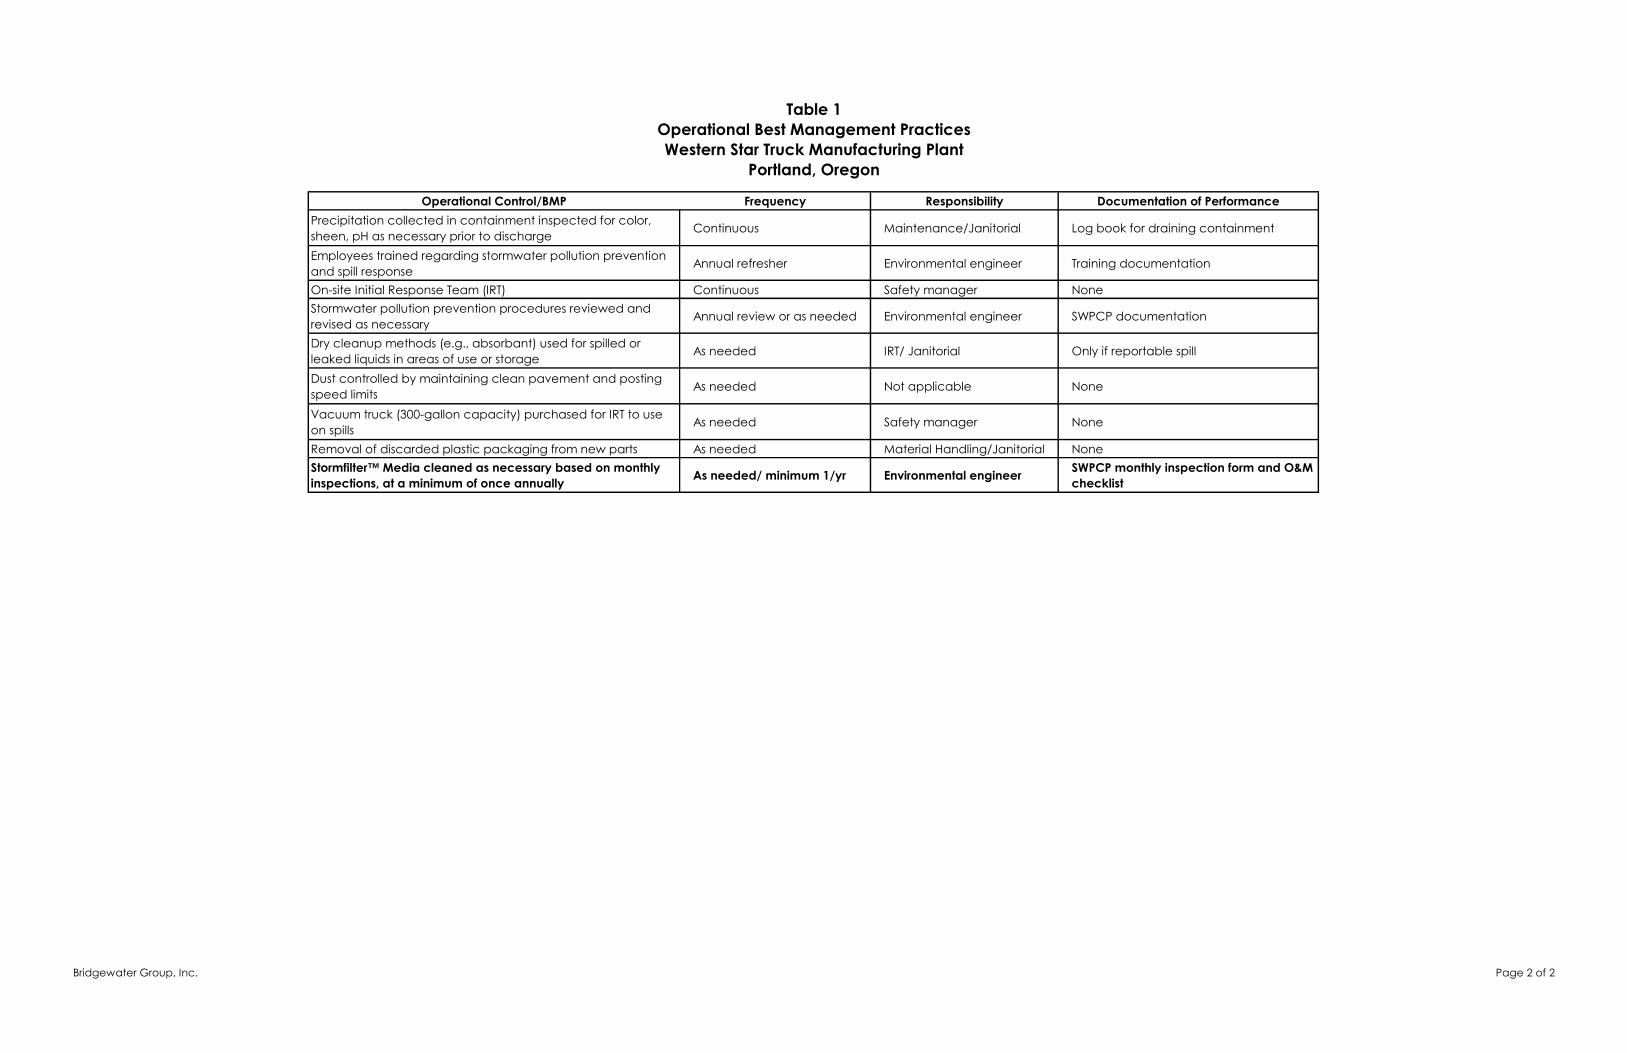
Table 1
Operational Best Management Practices
Western Star Truck Manufacturing Plant
Portland, Oregon
Operational Control/BMP Frequency Responsibility Documentation of Performance
Precipitation collected in containment inspected for color,
sheen, pH as necessary prior to dischargeContinuous Maintenance/Janitorial Log book for draining containment
Employees trained regarding stormwater pollution prevention
and spill responseAnnual refresher Environmental engineer Training documentation
On-site Initial Response Team (IRT) Continuous Safety manager None
Stormwater pollution prevention procedures reviewed and
revised as necessaryAnnual review or as needed Environmental engineer SWPCP documentation
Dry cleanup methods (e.g., absorbant) used for spilled or
leaked liquids in areas of use or storageAs needed IRT/ Janitorial Only if reportable spill
Dust controlled by maintaining clean pavement and posting
speed limitsAs needed Not applicable None
Vacuum truck (300-gallon capacity) purchased for IRT to use
on spillsAs needed Safety manager None
Removal of discarded plastic packaging from new parts As needed Material Handling/Janitorial None
Stormfilter™ Media cleaned as necessary based on monthly
inspections, at a minimum of once annuallyAs needed/ minimum 1/yr Environmental engineer
SWPCP monthly inspection form and O&M
checklist
Bridgewater Group, Inc. Page 2 of 2
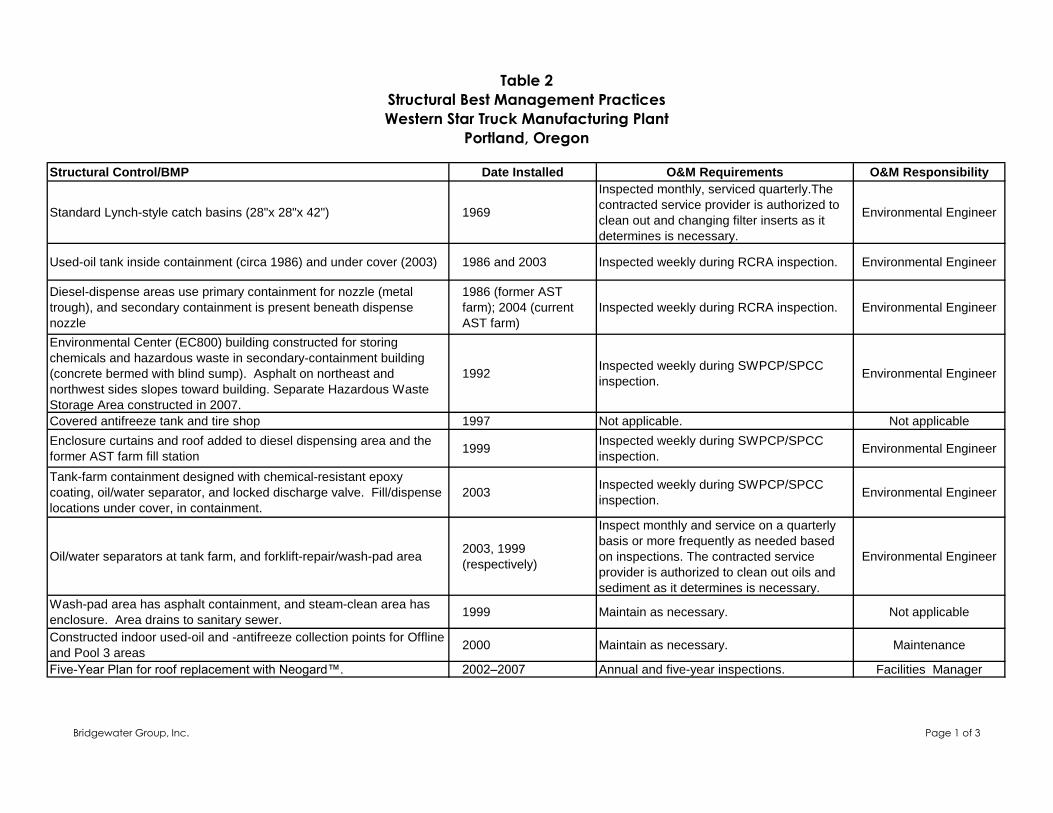
Table 2
Structural Best Management Practices
Western Star Truck Manufacturing Plant
Portland, Oregon
Structural Control/BMP Date Installed O&M Requirements O&M Responsibility
Standard Lynch-style catch basins (28"x 28"x 42") 1969
Inspected monthly, serviced quarterly.The
contracted service provider is authorized to
clean out and changing filter inserts as it
determines is necessary.
Environmental Engineer
Used-oil tank inside containment (circa 1986) and under cover (2003) 1986 and 2003 Inspected weekly during RCRA inspection. Environmental Engineer
Diesel-dispense areas use primary containment for nozzle (metal
trough), and secondary containment is present beneath dispense
nozzle
1986 (former AST
farm); 2004 (current
AST farm)
Inspected weekly during RCRA inspection. Environmental Engineer
Environmental Center (EC800) building constructed for storing
chemicals and hazardous waste in secondary-containment building
(concrete bermed with blind sump). Asphalt on northeast and
northwest sides slopes toward building. Separate Hazardous Waste
Storage Area constructed in 2007.
1992Inspected weekly during SWPCP/SPCC
inspection.Environmental Engineer
Covered antifreeze tank and tire shop 1997 Not applicable. Not applicable
Enclosure curtains and roof added to diesel dispensing area and the
former AST farm fill station1999
Inspected weekly during SWPCP/SPCC
inspection.Environmental Engineer
Tank-farm containment designed with chemical-resistant epoxy
coating, oil/water separator, and locked discharge valve. Fill/dispense
locations under cover, in containment.
2003Inspected weekly during SWPCP/SPCC
inspection.Environmental Engineer
Oil/water separators at tank farm, and forklift-repair/wash-pad area2003, 1999
(respectively)
Inspect monthly and service on a quarterly
basis or more frequently as needed based
on inspections. The contracted service
provider is authorized to clean out oils and
sediment as it determines is necessary.
Environmental Engineer
Wash-pad area has asphalt containment, and steam-clean area has
enclosure. Area drains to sanitary sewer.1999 Maintain as necessary. Not applicable
Constructed indoor used-oil and -antifreeze collection points for Offline
and Pool 3 areas2000 Maintain as necessary. Maintenance
Five-Year Plan for roof replacement with Neogard™. 2002–2007 Annual and five-year inspections. Facilities Manager
Bridgewater Group, Inc. Page 1 of 3
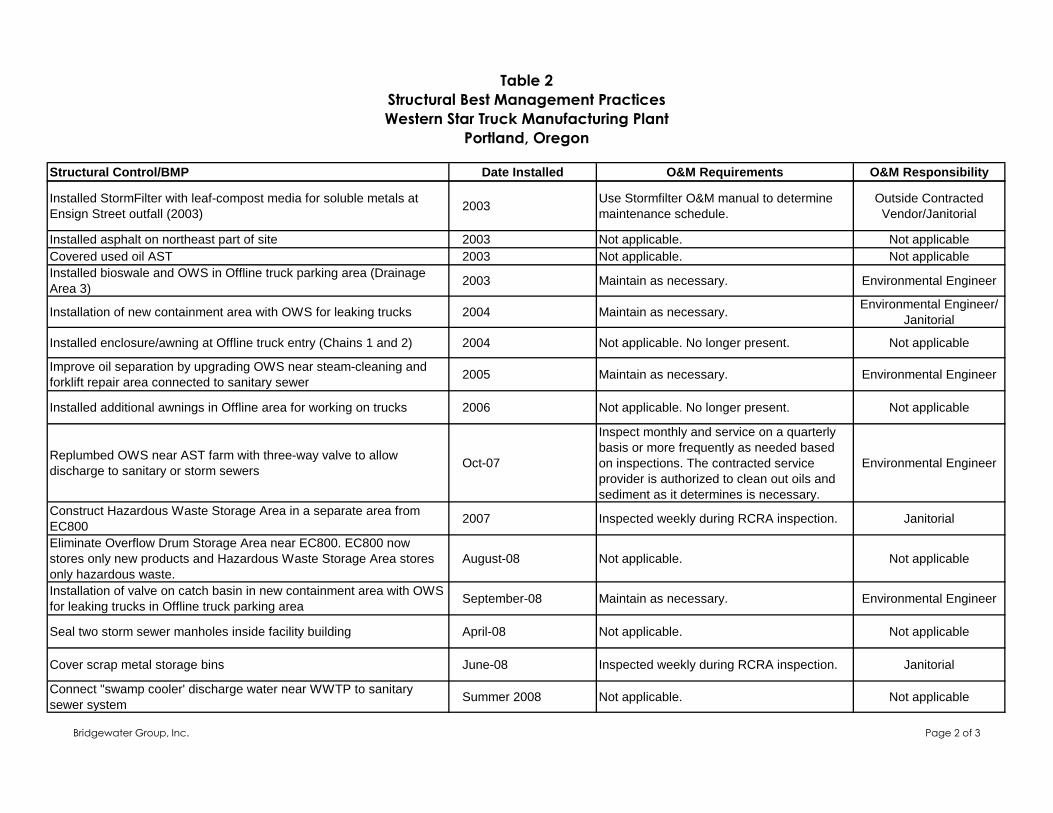
Table 2
Structural Best Management Practices
Western Star Truck Manufacturing Plant
Portland, Oregon
Structural Control/BMP Date Installed O&M Requirements O&M Responsibility
Installed StormFilter with leaf-compost media for soluble metals at
Ensign Street outfall (2003)2003
Use Stormfilter O&M manual to determine
maintenance schedule.
Outside Contracted
Vendor/Janitorial
Installed asphalt on northeast part of site 2003 Not applicable. Not applicable
Covered used oil AST 2003 Not applicable. Not applicable
Installed bioswale and OWS in Offline truck parking area (Drainage
Area 3)2003 Maintain as necessary. Environmental Engineer
Installation of new containment area with OWS for leaking trucks 2004 Maintain as necessary.Environmental Engineer/
Janitorial
Installed enclosure/awning at Offline truck entry (Chains 1 and 2) 2004 Not applicable. No longer present. Not applicable
Improve oil separation by upgrading OWS near steam-cleaning and
forklift repair area connected to sanitary sewer2005 Maintain as necessary. Environmental Engineer
Installed additional awnings in Offline area for working on trucks 2006 Not applicable. No longer present. Not applicable
Replumbed OWS near AST farm with three-way valve to allow
discharge to sanitary or storm sewersOct-07
Inspect monthly and service on a quarterly
basis or more frequently as needed based
on inspections. The contracted service
provider is authorized to clean out oils and
sediment as it determines is necessary.
Environmental Engineer
Construct Hazardous Waste Storage Area in a separate area from
EC8002007 Inspected weekly during RCRA inspection. Janitorial
Eliminate Overflow Drum Storage Area near EC800. EC800 now
stores only new products and Hazardous Waste Storage Area stores
only hazardous waste.
August-08 Not applicable. Not applicable
Installation of valve on catch basin in new containment area with OWS
for leaking trucks in Offline truck parking areaSeptember-08 Maintain as necessary. Environmental Engineer
Seal two storm sewer manholes inside facility building April-08 Not applicable. Not applicable
Cover scrap metal storage bins June-08 Inspected weekly during RCRA inspection. Janitorial
Connect "swamp cooler' discharge water near WWTP to sanitary
sewer systemSummer 2008 Not applicable. Not applicable
Bridgewater Group, Inc. Page 2 of 3

Table 2
Structural Best Management Practices
Western Star Truck Manufacturing Plant
Portland, Oregon
Structural Control/BMP Date Installed O&M Requirements O&M Responsibility
Install Pig Drain Barrier in catch basin near WWTP September 1, 2009 Not applicable. Not applicable
Install lids on any storage bins located outside of the building August 15, 2011 Inspect weekly during SPCC inspection
Install cut-off valve at Ensign Outfall to prevent offsite releases of large
spillsApril-12
Check for functionality on quarterly PM
scheduleMaintenance
Install cut-off valve at Fathom Outfall to prevent offsite releases of
large spillsSummer 2013
Check for functionality on quarterly PM
scheduleMaintenance
Cover openings of compactors at Receiving Dock 2013 Not applicable. Janitorial
Bridgewater Group, Inc. Page 3 of 3

Table 3
Analysis of Stormwater Events for DEQ Source Control Evaluation
Western Star Truck Manufacturing Plant
Portland, Oregon
Date Sample Timing (hydrograph) Storm Event Volume Notes
Criteria: Criteria:
a. Antecedent dry period of 24 hrs a. Predicted > 0.2” rainfall
b. Sample within 3 hrs for "Standard"
event and within 0.5 hour for "First Flush"
eventNo rain in proceeding 24 hours
Flow in Fathom Outfall at 23:10. Sample
collected at 23:22.
Flow in Ensign Outfall at 23:13. Sample collected
at 23:57.
Sampled < 0.5 hour at Fathom Outfall and 0.75
hour at Ensign Outfall after flow started
Actual total volume of rain event =
0.39”
No rain in proceeding 24 hours
Qualifying First Flush event. Sampled within 0.5 hour at both outfalls.
Flow in Fathom Outfall at 03:05. Sample
collected at 03:05.
Flow in Ensign Outfall at 03:10. Sample collected
at 03:15.
Actual total rain event volume of 0.45”
between Oct 19 at 23:00 and Oct 20 at
16:00
Sampled < 0.5 hour at both outfalls after flow
started
< 0.1 inch rain in proceeding 24 hours
Flow in Fathom Outfall at 23:05. Sample
collected at 2310.
Flow in Ensign Outfall at 23:43. Sample collected
at 23:45Actual total rain event volume of 1.39”
between Oct 21, 2014 at 23:00 and Oct
22, 2014 at 17:00Sampled < 0.5 hour at both outfalls after flow
started
Qualifying First Flush event. Sampled within 0.5 hour at both outfalls.
10/13/2014Qualifying First Flush and Standard event. Sampled within 0.5 hour (Fathom Outfall)
and 3 hours (Ensign Outfall).
10/20/2014
10/21/2014
NOAA predicted 0.1 - 0.25 inch night of
Oct 21, 2014, and another 1-2 inches
Oct 22, 2014 morning and afternoon
during event lasting at least three
hours.
NOAA predicted 0.25- 0.5 inch night of
Oct 13, 2014, and another 0.1 - 0.25
inch Oct 14, 2014 Morning, Afternoon
and Evening during event lasting at
least three hours.
NOAA predicted 0.1 - 0.25 inch night of
Oct 19, 2014, and another 0.1 - 0.25
inch Oct 20, 2014 Morning and
Afternoon during event lasting at least
three hours.
Bridgewater Group, Inc.
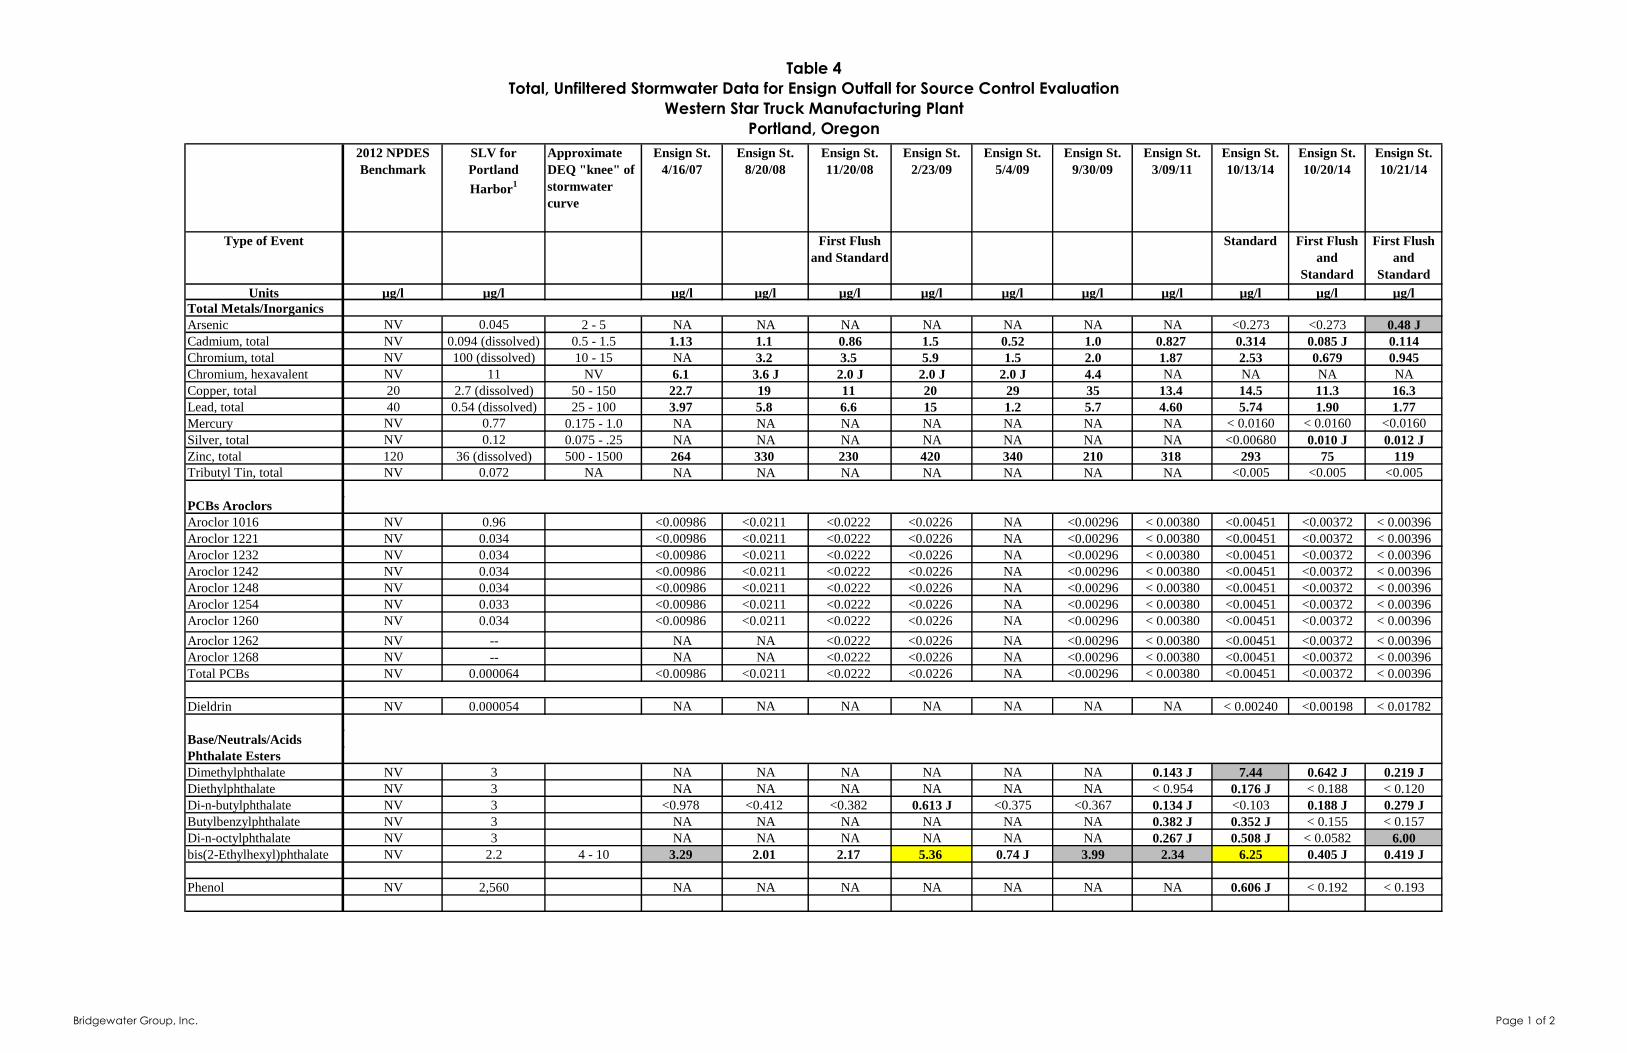
Table 4
Total, Unfiltered Stormwater Data for Ensign Outfall for Source Control Evaluation
Western Star Truck Manufacturing Plant
Portland, Oregon
P
r
e
-
2
0
2012 NPDES
Benchmark
SLV for
Portland
Harbor1
Approximate
DEQ "knee" of
stormwater
curve
Ensign St.
4/16/07
Ensign St.
8/20/08
Ensign St.
11/20/08
Ensign St.
2/23/09
Ensign St.
5/4/09
Ensign St.
9/30/09
Ensign St.
3/09/11
Ensign St.
10/13/14
Ensign St.
10/20/14
Ensign St.
10/21/14
Type of Event First Flush
and Standard
Standard First Flush
and
Standard
First Flush
and
Standard
Units µ µg/l µg/l µg/l µg/l µg/l µg/l µg/l µg/l µg/l µg/l µg/l µg/l
Total Metals/Inorganics
Arsenic NV NV 0.045 2 - 5 NA NA NA NA NA NA NA <0.273 <0.273 0.48 J
Cadmium, total NV NV 0.094 (dissolved) 0.5 - 1.5 1.13 1.1 0.86 1.5 0.52 1.0 0.827 0.314 0.085 J 0.114
Chromium, total NV NV 100 (dissolved) 10 - 15 NA 3.2 3.5 5.9 1.5 2.0 1.87 2.53 0.679 0.945
Chromium, hexavalent NV NV 11 NV 6.1 3.6 J 2.0 J 2.0 J 2.0 J 4.4 NA NA NA NA
Copper, total 20 2.7 (dissolved) 50 - 150 22.7 19 11 20 29 35 13.4 14.5 11.3 16.3
Lead, total 40 0.54 (dissolved) 25 - 100 3.97 5.8 6.6 15 1.2 5.7 4.60 5.74 1.90 1.77
Mercury NV NV 0.77 0.175 - 1.0 NA NA NA NA NA NA NA < 0.0160 < 0.0160 <0.0160
Silver, total NV NV 0.12 0.075 - .25 NA NA NA NA NA NA NA <0.00680 0.010 J 0.012 J
Zinc, total 120 36 (dissolved) 500 - 1500 264 330 230 420 340 210 318 293 75 119
Tributyl Tin, total NV NV 0.072 NA NA NA NA NA NA NA NA <0.005 <0.005 <0.005
PCBs Aroclors
Aroclor 1016 NV NV 0.96 <0.00986 <0.0211 <0.0222 <0.0226 NA <0.00296 < 0.00380 <0.00451 <0.00372 < 0.00396
Aroclor 1221 NV NV 0.034 <0.00986 <0.0211 <0.0222 <0.0226 NA <0.00296 < 0.00380 <0.00451 <0.00372 < 0.00396
Aroclor 1232 NV NV 0.034 <0.00986 <0.0211 <0.0222 <0.0226 NA <0.00296 < 0.00380 <0.00451 <0.00372 < 0.00396
Aroclor 1242 NV NV 0.034 <0.00986 <0.0211 <0.0222 <0.0226 NA <0.00296 < 0.00380 <0.00451 <0.00372 < 0.00396
Aroclor 1248 NV NV 0.034 <0.00986 <0.0211 <0.0222 <0.0226 NA <0.00296 < 0.00380 <0.00451 <0.00372 < 0.00396
Aroclor 1254 NV NV 0.033 <0.00986 <0.0211 <0.0222 <0.0226 NA <0.00296 < 0.00380 <0.00451 <0.00372 < 0.00396
Aroclor 1260 NV NV 0.034 <0.00986 <0.0211 <0.0222 <0.0226 NA <0.00296 < 0.00380 <0.00451 <0.00372 < 0.00396
Aroclor 1262 NV NV -- NA NA <0.0222 <0.0226 NA <0.00296 < 0.00380 <0.00451 <0.00372 < 0.00396
Aroclor 1268 NV NV -- NA NA <0.0222 <0.0226 NA <0.00296 < 0.00380 <0.00451 <0.00372 < 0.00396
Total PCBs NV NV 0.000064 <0.00986 <0.0211 <0.0222 <0.0226 NA <0.00296 < 0.00380 <0.00451 <0.00372 < 0.00396
Dieldrin NV NV 0.000054 NA NA NA NA NA NA NA < 0.00240 <0.00198 < 0.01782
Base/Neutrals/Acids
Phthalate Esters
Dimethylphthalate NV NV 3 NA NA NA NA NA NA 0.143 J 7.44 0.642 J 0.219 J
Diethylphthalate NV NV 3 NA NA NA NA NA NA < 0.954 0.176 J < 0.188 < 0.120
Di-n-butylphthalate NV NV 3 <0.978 <0.412 <0.382 0.613 J <0.375 <0.367 0.134 J <0.103 0.188 J 0.279 J
Butylbenzylphthalate NV NV 3 NA NA NA NA NA NA 0.382 J 0.352 J < 0.155 < 0.157
Di-n-octylphthalate NV NV 3 NA NA NA NA NA NA 0.267 J 0.508 J < 0.0582 6.00
bis(2-Ethylhexyl)phthalate NV NV 2.2 4 - 10 3.29 2.01 2.17 5.36 0.74 J 3.99 2.34 6.25 0.405 J 0.419 J
Phenol NV 2,560 NA NA NA NA NA NA NA 0.606 J < 0.192 < 0.193
Bridgewater Group, Inc. Page 1 of 2

Table 4
Total, Unfiltered Stormwater Data for Ensign Outfall for Source Control Evaluation
Western Star Truck Manufacturing Plant
Portland, Oregon
P
r
e
-
2
0
2012 NPDES
Benchmark
SLV for
Portland
Harbor1
Approximate
DEQ "knee" of
stormwater
curve
Ensign St.
4/16/07
Ensign St.
8/20/08
Ensign St.
11/20/08
Ensign St.
2/23/09
Ensign St.
5/4/09
Ensign St.
9/30/09
Ensign St.
3/09/11
Ensign St.
10/13/14
Ensign St.
10/20/14
Ensign St.
10/21/14
Type of Event First Flush
and Standard
Standard First Flush
and
Standard
First Flush
and
Standard
Units µ µg/l µg/l µg/l µg/l µg/l µg/l µg/l µg/l µg/l µg/l µg/l µg/l
Polycyclic Aromatic
Hydrocarbons
Naphthalene NV NV 0.2 NV <0.0476 0.0288 J 0.0200 J <0.00374 <0.00369 0.0591 0.017 J <0.048 <0.0063 <0.0068
2-Methylnaphthalene NV NV 0.2 NV NA NA NA NA NA NA NA NA NA NA
Acenaphthylene NV NV 0.2 NV <0.0476 <0.048 <0.0031 <0.00313 <0.00308 <0.00305 < 0.00510 <0.048 <0.0050 <0.0054
Acenaphthene NV NV 0.2 NV <0.0476 0.00961 J <0.00431 <0.00436 <0.00430 <0.00425 0.0053 J <0.048 0.0042 J 0.0045 J
Fluorene NV NV 0.2 NV <0.0476 0.0192 J 0.0200 J <0.00364 <0.00359 <0.00355 0.0044 J <0.048 < 0.0020 0.0024 J
Phenanthrene NV NV 0.2 NV <0.0476 0.0384 J 0.0400 J 0.111 0.010 J <0.00654 0.0414 0.12 0.0085 J 0.0090 J
Anthracene NV NV 0.2 NV <0.0476 0.00961 J 0.0200 J <0.00515 <0.00507 <0.00502 0.0037 J <0.048 0.0031 J 0.0035 J
Fluoranthene NV NV 0.2 NV <0.0476 0.0192 J 0.0300 J 0.0908 0.010 J <0.0035 0.0240 0.076 <0.0028 0.0078 J
Pyrene NV NV 0.2 NV 0.0952 0.0384 J 0.130 0.262 0.010 J <0.00371 0.0908 0.21 0.0090 J 0.013 J
Benzo(a)anthracene NV NV 0.018 NV <0.0476 0.0192 J 0.0300 J 0.101 <0.00252 <0.00249 0.0239 0.056 0.020 J 0.019 J
Chrysene NV NV 0.018 NV <0.0476 0.0192 J 0.0300 J 0.111 <0.00385 <0.00381 0.0331 0.088 0.0054 J 0.0069 J
Benzo(b)fluoranthene NV NV 0.018 NV <0.0476 0.00961 J 0.0300 J 0.0706 <0.00710 <0.00702 0.017 J 0.067 0.0053 J 0.0079 J
Benzo(k)fluoranthene NV NV 0.018 NV <0.0476 0.00961 J <0.00568 0.0505 J <0.00566 <0.0056 0.0037 J 0.025 J < 0.0014 0.0059 J
Benzo(a)pyrene NV NV 0.018 NV <0.0476 0.00961 J 0.0400 J <0.00608 0.010 J <0.00593 0.015 J 0.031 J 0.0042 J 0.0070 J
Indeno(1,2,3-cd)pyrene NV NV 0.018 NV <0.0476 0.00961 J 0.0300 J 0.0605 <0.00305 <0.00302 0.0031 J 0.031 J 0.0042 J 0.0025 J
Dibenz(a,h)anthracene NV NV 0.018 NV <0.0476 <0.048 <0.00309 <0.00312 <0.00308 <0.00304 0.0020 J 0.031 J 0.0050 J 0.0024 J
Benzo(g,h,i)perylene NV NV 0.2 NV <0.0476 0.0192 J 0.0400 J 0.121 <0.00309 <0.00306 0.015 J 0.11 0.010 J <0.0055
Total PAHs NV NV NV 2 - 4 0.476 0.307 0.468 0.993 0.064 0.091 0.302 0.965 0.080 0.101
Other Analytes
Total Suspended Solids 100,000 NV 11,000 10,000 17,000 50,000 3000 J 12,000 7,000 62,000 5,000 9,000
Notes
Value is less than "knee of curve" and greater than SLV
NA = not available
NV = no value
Value is less than "knee of curve," where applicable,
and greater than SLV
J = Concentration estimated between method detection limit (MDL) and practical
quantitation limit (PQL)
ug/L = micrograms per liter
1 See Table 3-1 of the DEQ-USEPA Portland Harbor Joint Source Control Strategy.
http://www.deq.state.or.us/lq/cu/nwr/PortlandHarbor/docs/JSCSFinal.pdf. Values for
cadmium, copper, hexavalent chromium, lead, mercury, and zinc apply to dissolved
concentrations (see Table 6).
Value is in "knee of curve" and greater than SLV,
where available
Bridgewater Group, Inc. Page 2 of 2
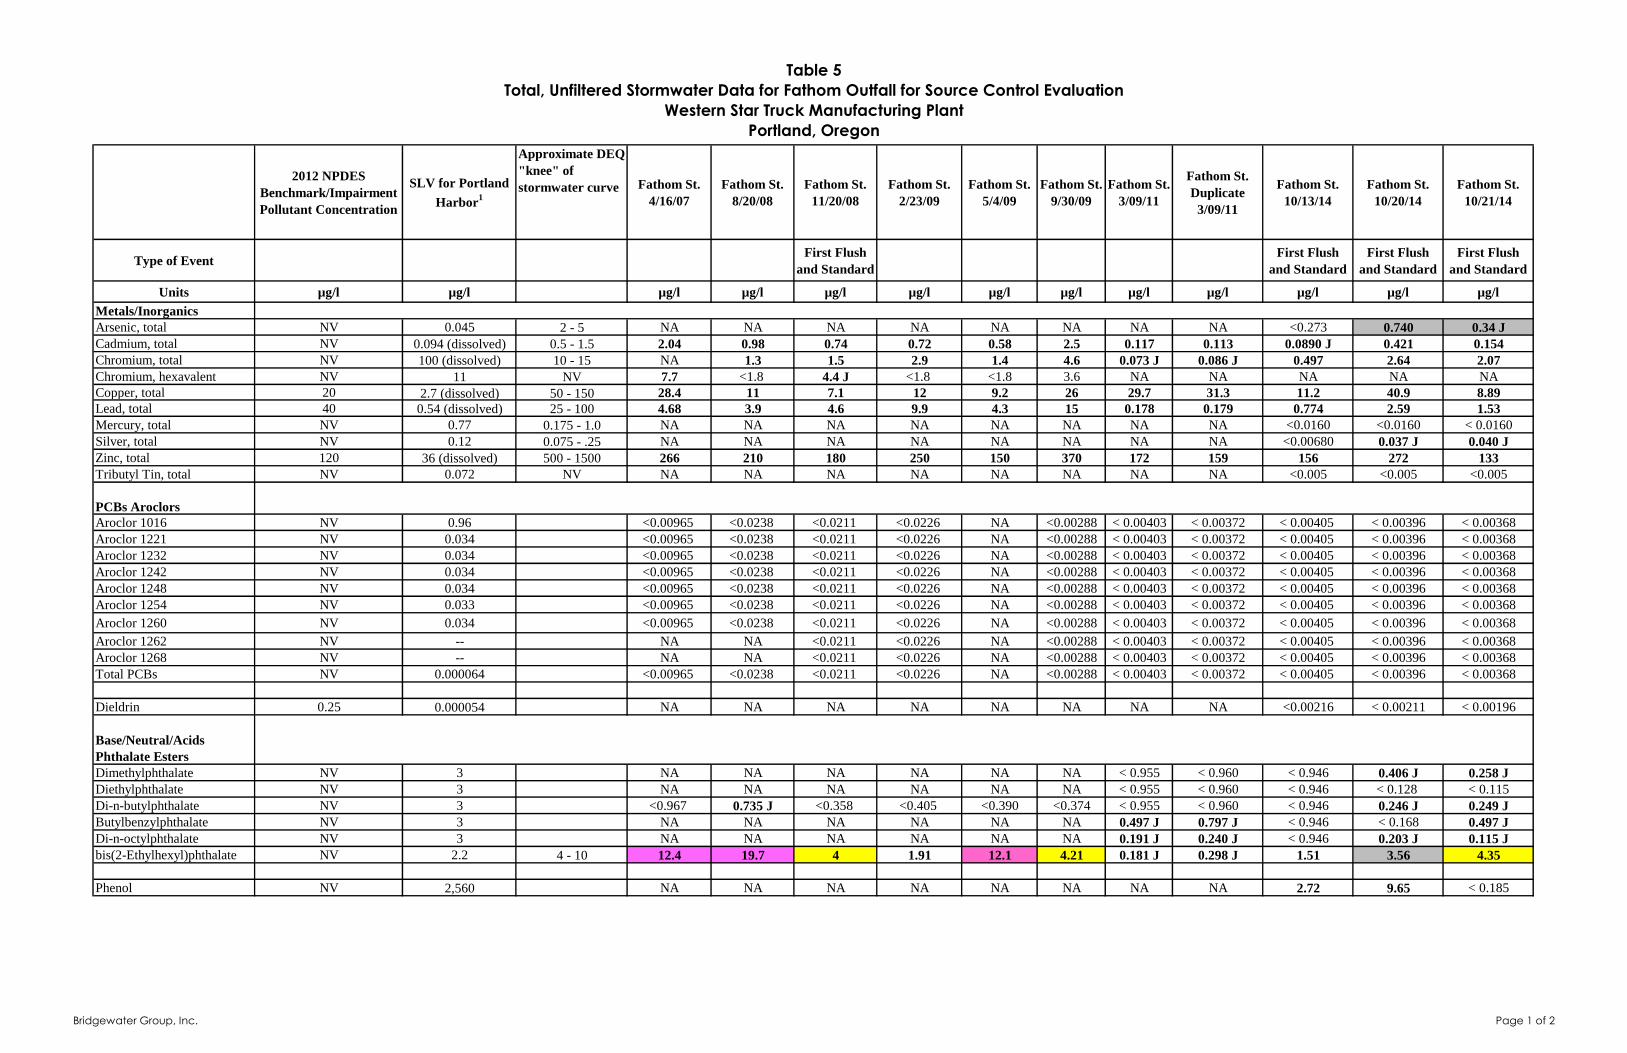
Table 5
Total, Unfiltered Stormwater Data for Fathom Outfall for Source Control Evaluation
Western Star Truck Manufacturing Plant
Portland, Oregon
2012 NPDES
Benchmark/Impairment
Pollutant Concentration
SLV for Portland
Harbor1
Approximate DEQ
"knee" of
stormwater curve Fathom St.
4/16/07
Fathom St.
8/20/08
Fathom St.
11/20/08
Fathom St.
2/23/09
Fathom St.
5/4/09
Fathom St.
9/30/09
Fathom St.
3/09/11
Fathom St.
Duplicate
3/09/11
Fathom St.
10/13/14
Fathom St.
10/20/14
Fathom St.
10/21/14
Type of EventFirst Flush
and Standard
First Flush
and Standard
First Flush
and Standard
First Flush
and Standard
Units µg/l µg/l µg/l µg/l µg/l µg/l µg/l µg/l µg/l µg/l µg/l µg/l µg/l
Metals/Inorganics
Arsenic, total NV 0.045 2 - 5 NA NA NA NA NA NA NA NA <0.273 0.740 0.34 J
Cadmium, total NV 0.094 (dissolved) 0.5 - 1.5 2.04 0.98 0.74 0.72 0.58 2.5 0.117 0.113 0.0890 J 0.421 0.154
Chromium, total NV 100 (dissolved) 10 - 15 NA 1.3 1.5 2.9 1.4 4.6 0.073 J 0.086 J 0.497 2.64 2.07
Chromium, hexavalent NV 11 NV 7.7 <1.8 4.4 J <1.8 <1.8 3.6 NA NA NA NA NA
Copper, total 20 2.7 (dissolved) 50 - 150 28.4 11 7.1 12 9.2 26 29.7 31.3 11.2 40.9 8.89
Lead, total 40 0.54 (dissolved) 25 - 100 4.68 3.9 4.6 9.9 4.3 15 0.178 0.179 0.774 2.59 1.53
Mercury, total NV 0.77 0.175 - 1.0 NA NA NA NA NA NA NA NA <0.0160 <0.0160 < 0.0160
Silver, total NV 0.12 0.075 - .25 NA NA NA NA NA NA NA NA <0.00680 0.037 J 0.040 J
Zinc, total 120 36 (dissolved) 500 - 1500 266 210 180 250 150 370 172 159 156 272 133
Tributyl Tin, total NV 0.072 NV NA NA NA NA NA NA NA NA <0.005 <0.005 <0.005
PCBs Aroclors
Aroclor 1016 NV 0.96 <0.00965 <0.0238 <0.0211 <0.0226 NA <0.00288 < 0.00403 < 0.00372 < 0.00405 < 0.00396 < 0.00368
Aroclor 1221 NV 0.034 <0.00965 <0.0238 <0.0211 <0.0226 NA <0.00288 < 0.00403 < 0.00372 < 0.00405 < 0.00396 < 0.00368
Aroclor 1232 NV 0.034 <0.00965 <0.0238 <0.0211 <0.0226 NA <0.00288 < 0.00403 < 0.00372 < 0.00405 < 0.00396 < 0.00368
Aroclor 1242 NV 0.034 <0.00965 <0.0238 <0.0211 <0.0226 NA <0.00288 < 0.00403 < 0.00372 < 0.00405 < 0.00396 < 0.00368
Aroclor 1248 NV 0.034 <0.00965 <0.0238 <0.0211 <0.0226 NA <0.00288 < 0.00403 < 0.00372 < 0.00405 < 0.00396 < 0.00368
Aroclor 1254 NV 0.033 <0.00965 <0.0238 <0.0211 <0.0226 NA <0.00288 < 0.00403 < 0.00372 < 0.00405 < 0.00396 < 0.00368
Aroclor 1260 NV 0.034 <0.00965 <0.0238 <0.0211 <0.0226 NA <0.00288 < 0.00403 < 0.00372 < 0.00405 < 0.00396 < 0.00368
Aroclor 1262 NV -- NA NA <0.0211 <0.0226 NA <0.00288 < 0.00403 < 0.00372 < 0.00405 < 0.00396 < 0.00368
Aroclor 1268 NV -- NA NA <0.0211 <0.0226 NA <0.00288 < 0.00403 < 0.00372 < 0.00405 < 0.00396 < 0.00368
Total PCBs NV 0.000064 <0.00965 <0.0238 <0.0211 <0.0226 NA <0.00288 < 0.00403 < 0.00372 < 0.00405 < 0.00396 < 0.00368
Dieldrin 0.25 0.000054 NA NA NA NA NA NA NA NA <0.00216 < 0.00211 < 0.00196
Base/Neutral/Acids
Phthalate Esters
Dimethylphthalate NV 3 NA NA NA NA NA NA < 0.955 < 0.960 < 0.946 0.406 J 0.258 J
Diethylphthalate NV 3 NA NA NA NA NA NA < 0.955 < 0.960 < 0.946 < 0.128 < 0.115
Di-n-butylphthalate NV 3 <0.967 0.735 J <0.358 <0.405 <0.390 <0.374 < 0.955 < 0.960 < 0.946 0.246 J 0.249 J
Butylbenzylphthalate NV 3 NA NA NA NA NA NA 0.497 J 0.797 J < 0.946 < 0.168 0.497 J
Di-n-octylphthalate NV 3 NA NA NA NA NA NA 0.191 J 0.240 J < 0.946 0.203 J 0.115 J
bis(2-Ethylhexyl)phthalate NV 2.2 4 - 10 12.4 19.7 4 1.91 12.1 4.21 0.181 J 0.298 J 1.51 3.56 4.35
Phenol NV 2,560 NA NA NA NA NA NA NA NA 2.72 9.65 < 0.185
Bridgewater Group, Inc. Page 1 of 2
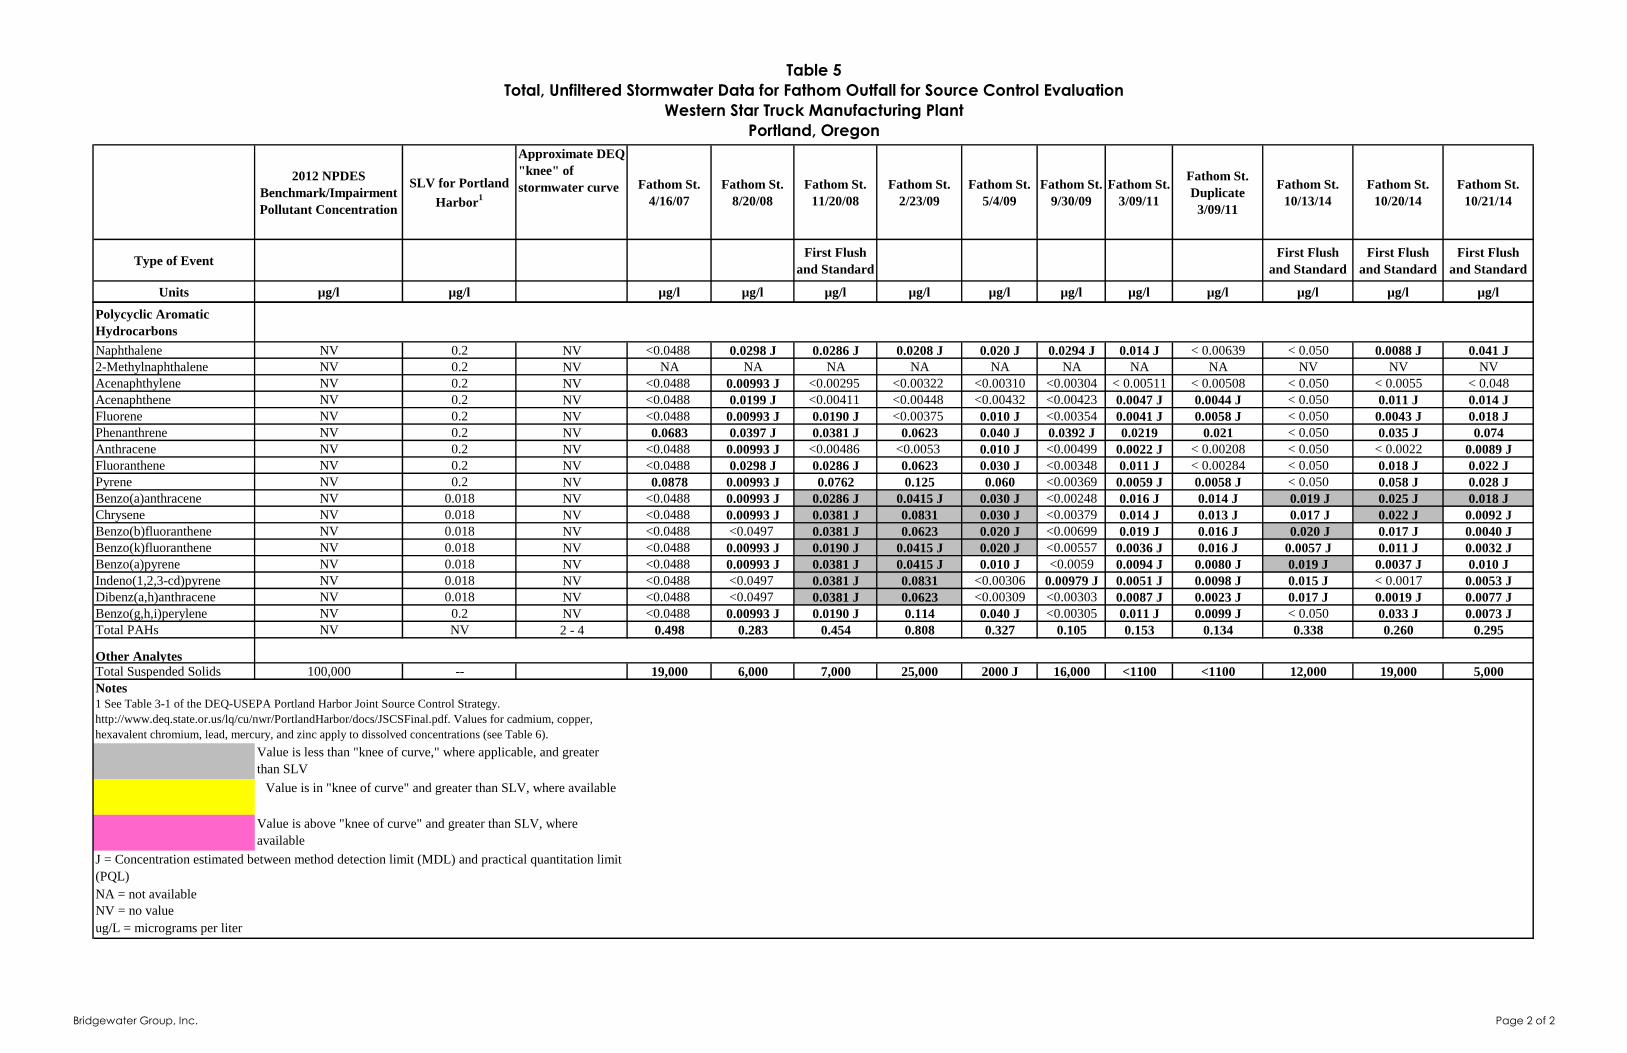
Table 5
Total, Unfiltered Stormwater Data for Fathom Outfall for Source Control Evaluation
Western Star Truck Manufacturing Plant
Portland, Oregon
2012 NPDES
Benchmark/Impairment
Pollutant Concentration
SLV for Portland
Harbor1
Approximate DEQ
"knee" of
stormwater curve Fathom St.
4/16/07
Fathom St.
8/20/08
Fathom St.
11/20/08
Fathom St.
2/23/09
Fathom St.
5/4/09
Fathom St.
9/30/09
Fathom St.
3/09/11
Fathom St.
Duplicate
3/09/11
Fathom St.
10/13/14
Fathom St.
10/20/14
Fathom St.
10/21/14
Type of EventFirst Flush
and Standard
First Flush
and Standard
First Flush
and Standard
First Flush
and Standard
Units µg/l µg/l µg/l µg/l µg/l µg/l µg/l µg/l µg/l µg/l µg/l µg/l µg/l
Polycyclic Aromatic
Hydrocarbons
Naphthalene NV 0.2 NV <0.0488 0.0298 J 0.0286 J 0.0208 J 0.020 J 0.0294 J 0.014 J < 0.00639 < 0.050 0.0088 J 0.041 J
2-Methylnaphthalene NV 0.2 NV NA NA NA NA NA NA NA NA NV NV NV
Acenaphthylene NV 0.2 NV <0.0488 0.00993 J <0.00295 <0.00322 <0.00310 <0.00304 < 0.00511 < 0.00508 < 0.050 < 0.0055 < 0.048
Acenaphthene NV 0.2 NV <0.0488 0.0199 J <0.00411 <0.00448 <0.00432 <0.00423 0.0047 J 0.0044 J < 0.050 0.011 J 0.014 J
Fluorene NV 0.2 NV <0.0488 0.00993 J 0.0190 J <0.00375 0.010 J <0.00354 0.0041 J 0.0058 J < 0.050 0.0043 J 0.018 J
Phenanthrene NV 0.2 NV 0.0683 0.0397 J 0.0381 J 0.0623 0.040 J 0.0392 J 0.0219 0.021 < 0.050 0.035 J 0.074
Anthracene NV 0.2 NV <0.0488 0.00993 J <0.00486 <0.0053 0.010 J <0.00499 0.0022 J < 0.00208 < 0.050 < 0.0022 0.0089 J
Fluoranthene NV 0.2 NV <0.0488 0.0298 J 0.0286 J 0.0623 0.030 J <0.00348 0.011 J < 0.00284 < 0.050 0.018 J 0.022 J
Pyrene NV 0.2 NV 0.0878 0.00993 J 0.0762 0.125 0.060 <0.00369 0.0059 J 0.0058 J < 0.050 0.058 J 0.028 J
Benzo(a)anthracene NV 0.018 NV <0.0488 0.00993 J 0.0286 J 0.0415 J 0.030 J <0.00248 0.016 J 0.014 J 0.019 J 0.025 J 0.018 J
Chrysene NV 0.018 NV <0.0488 0.00993 J 0.0381 J 0.0831 0.030 J <0.00379 0.014 J 0.013 J 0.017 J 0.022 J 0.0092 J
Benzo(b)fluoranthene NV 0.018 NV <0.0488 <0.0497 0.0381 J 0.0623 0.020 J <0.00699 0.019 J 0.016 J 0.020 J 0.017 J 0.0040 J
Benzo(k)fluoranthene NV 0.018 NV <0.0488 0.00993 J 0.0190 J 0.0415 J 0.020 J <0.00557 0.0036 J 0.016 J 0.0057 J 0.011 J 0.0032 J
Benzo(a)pyrene NV 0.018 NV <0.0488 0.00993 J 0.0381 J 0.0415 J 0.010 J <0.0059 0.0094 J 0.0080 J 0.019 J 0.0037 J 0.010 J
Indeno(1,2,3-cd)pyrene NV 0.018 NV <0.0488 <0.0497 0.0381 J 0.0831 <0.00306 0.00979 J 0.0051 J 0.0098 J 0.015 J < 0.0017 0.0053 J
Dibenz(a,h)anthracene NV 0.018 NV <0.0488 <0.0497 0.0381 J 0.0623 <0.00309 <0.00303 0.0087 J 0.0023 J 0.017 J 0.0019 J 0.0077 J
Benzo(g,h,i)perylene NV 0.2 NV <0.0488 0.00993 J 0.0190 J 0.114 0.040 J <0.00305 0.011 J 0.0099 J < 0.050 0.033 J 0.0073 J
Total PAHs NV NV 2 - 4 0.498 0.283 0.454 0.808 0.327 0.105 0.153 0.134 0.338 0.260 0.295
Other Analytes
Total Suspended Solids 100,000 -- 19,000 6,000 7,000 25,000 2000 J 16,000 <1100 <1100 12,000 19,000 5,000
Notes
NA = not available
NV = no value
J = Concentration estimated between method detection limit (MDL) and practical quantitation limit
(PQL)
1 See Table 3-1 of the DEQ-USEPA Portland Harbor Joint Source Control Strategy.
http://www.deq.state.or.us/lq/cu/nwr/PortlandHarbor/docs/JSCSFinal.pdf. Values for cadmium, copper,
hexavalent chromium, lead, mercury, and zinc apply to dissolved concentrations (see Table 6).
ug/L = micrograms per liter
Value is less than "knee of curve," where applicable, and greater
than SLV
Value is in "knee of curve" and greater than SLV, where available
Value is above "knee of curve" and greater than SLV, where
available
Bridgewater Group, Inc. Page 2 of 2
Table 6
Dissolved Metals in Stormwater from Ensign and Fathom Outfalls for Source Control Evaluation
Western Star Truck Manufacturing Plant
Portland, Oregon
Location Sample IDType of Stormwater
Event
Date
CollectedArsenic Cadmium Chromium Copper Lead Mercury Silver Zinc
0.045 (total) 0.094 NV (total) 2.7 0.540 0.77 0.12 (total) 36
Ensign-1206 12/20/2006 NA NA 1.00 U 4.99 1.00 U NA NA 258
TMP1-Ensign-041 04/16/2007 NA 0.69 NA 17 0.52 NA NA 220
ENS-082008 08/20/2008 NA 0.55 1.4 11 0.10 NA NA 250
ENS-112008 11/20/2008 NA 0.31 1.3 5.3 0.48 NA NA 150
ENS-022309 02/23/2009 NA 0.32 2.3 4.8 0.92 NA NA 190
ENS-050409 05/04/09 NA 0.30 1.5 22 0.25 NA NA 300
ENS-093009 09/30/09 NA 0.35 0.31 J 17 0.85 NA NA 120
ENS-101314 Standard 10/13/14 0.281 U 0.151 0.19 J 5.75 0.175 0.0160 U 0.011 J 168
ENS-102014First Flush and
Standard10/20/14 0.41 J 0.0518 U 0.36 J 7.77 0.284 0.0160 U 0.00700 U 64.8
ENS-102014First Flush and
Standard10/21/14 0.33 J 0.0518 U 0.34 J 10.6 0.373 0.0160 U 0.00700 U 70.4
Fathom-1206 12/20/2006 NA NA 1.00 U 4.01 1.00 U NA NA 180
TMP1-Fathom-041 04/16/2007 NA 0.94 NA 18 0.69 NA NA 160
FAT-082008 08/20/2008 NA 0.35 1.3 U 8.7 1.4 NA NA 130
FAT-112008 11/20/2008 NA 0.23 0.2 J 5.4 0.13 NA NA 130
FAT-022309 02/23/2009 NA 0.12 0.13 U 3.4 0.29 NA NA 170
FAT-050409 05/04/2009 NA 0.09 J 0.13 U 5.6 0.08 J NA NA 130
FAT-093009 09/30/2009 NA 0.97 0.49 J 16 1.0 NA NA 240
FAT-101314First Flush and
Standard10/12/2014 0.281 U 0.142 0.33 J 10.9 0.484 0.0160 U 0.011 J 137
FAT-102114First Flush and
Standard10/20/2014 0.645 0.283 0.666 33.7 0.783 0.0160 U 0.017 J 302
FAT-102114First Flush and
Standard10/21/2014 0.281 U 0.0518 U 0.703 4.89 0.396 0.0160 U 0.00700 U 36.5
Notes
Concentration > JSCS SLV
Bold = analyte detected.
mg/L = milligrams per liter.
NA = not applicable.
NPDES = National Pollutant Discharge Elimination System.
NV = no value.
SLV = screening level value
U = analysis conducted, but analyte not detected above reported sample quantitation limit.
ug/L = micrograms per liter
J = analyte was positively identified; associated numerical value is approximate concentration between the method detection limit and method reporting limit.
JSCS Screening Level Value (ug/L)
The source of each screening level value is documented in Table 3.1 of the Portland Harbor JSCS, which can be viewed at http://www.deq.state.or.us/lq/cu/nwr/PortlandHarbor/docs/JSCSFinalTable03_1.pdf . Values for cadmium,
copper, hexavalenet chromium, lead, mercury, and zinc apply to dissolved concentrations.
At Portland Harbor sites, drinking water maximum contaminant levels and preliminary remediation goals are also used as screening levels, per the Joint Source Control Strategy (JSCS). These values are applied when they are lower than
all other screening values.
Ensign Street Outfall
Fathom Street Outfall
Bridgewater Group, Inc. Page 1 of 1
Table 7
2014 Post-Camera Survey Fathom Storm Line Solids Sample Information
Western Star Truck Manufacturing Plant
Portland, Oregon
Description Location or Feet
from Cutoff
Valve Vault
Estimated
Depth
Approx.
Sample Size
Notes
Fathom Cutoff
Valve Vault
East and west
sides of vault
1-2 inches 8 oz Metal fragments. Paint
chips.
Fathom Line 0-16 ft. ½-inch 3 oz Sand-sized white
material (roofing?). Paint
chips.
Fathom Line 35-45 ft. ½-inch 3 oz Sand-sized white
material (roofing?). Paint
chips.
Fathom Line 45-65 ft. ½-inch 8 oz Sand-sized white
material (roofing?). Paint
chips.
Fathom Line 63-75 ft. 3 inches 7.5 oz Area of low spot or sag
in line. Increase in fine-
grained material. Paint
chips.
Fathom Line 75-90 2 inches 6 oz Area of low spot or sag
in line. Increase in fine-
grained material. Paint
chips.
Table 8
Fathom Stormwater Line Solids Analyses
Western Star Truck Manufacturing Plant Portland, Oregon
Screening
Level Value1
City
Manhole
AAJ831
8/12/2003
Fathom Line
2/10/2007
City
Manhole
AAJ831
10/06/2009
City
Manhole
AAJ831
11/10/2009
Fathom
Offline
Offline-1
9/29/2010
Fathom
Offline
Offline-2
9/29/2010
City
Manhole
AAJ831
(Upstream)
6/13/2013
City Manhole
AAJ831
(Downstream)
6/13/2013
Date 8/12/2003 2/10/2007 10/6/2009 11/10/2009 9/29/2010 9/29/2010 6/13/2013 6/13/2013
Units µg/kg µg/kg µg/kg µg/kg µg/kg µg/kg µg/kg µg/kg µg/kg
Metals/Inorganics
Cadmium 1,000 28,000 45,000 20,000 33,400 3,570 53,300 52,300 33,700 3,330 16,900 21,200 26,400 15,900 15,600 20,100 21,900 17,400 14,200 2,690 8,380 8,940 2,590 9,710
Chromium, total 111,000 280,000 296,000 179,000 165,000 8,540 92,800 272,000 339,000 219,000 118,000 124,000 66,600 55,500 68,800 73,500 72,900 78,800 1,330,000 243,000 193,000 316,000 70,300 128,000
Copper 149,000 176,000 209,000 127,000 181,000 NA NA 283,000 624,000 456,000 325,000 479,000 202,000 97,600 120,000 124,000 300,000 249,000 292,000 109,000 209,000 262,000 108,000 143,000
Lead 17,000 645,000 587,000 260,000 324,000 6,690 151,000 359,000 363,000 111,000 85,000 150,000 105,000 99,500 125,000 162,000 81,300 104,000 145,000 54,900 88,100 98,900 24,100 42,000
Zinc 459,000 902,000 957,000 588,000 813,000 29,600 638,000 1,530,000 1,080,000 2,220,000 1,890,000 1,460,000 873,000 593,000 715,000 917,000 1,190,000 1,470,000 1,230,000 673,000 795,000 983,000 419,000 502,000
PCBs Aroclors
Aroclor 1016 530 <13 <70.6 <10 <100 < 0.345 < 0.345 <35 <10 < 130 < 17 < 16 < 16 < 17 < 17 < 16 < 33 < 28 <0.33 <0.33 <0.33 <0.33 <0.33 <0.33
Aroclor 1221 -- <26 <70.6 <20 <200 < 0.345 < 0.345 <69.9 <20 < 140 < 34 130 < 31 44 < 33 240 < 39 < 43 <0.33 <0.33 <0.33 <0.33 <0.33 <0.33
Aroclor 1232 -- <13 <70.6 <10 <100 < 0.345 < 0.345 <35 <10 < 110 < 17 < 16 < 16 < 17 < 17 < 16 < 31 < 22 <0.33 <0.33 <0.33 <0.33 <0.33 <0.33
Aroclor 1242 -- <13 <70.6 <10 <100 < 0.345 < 0.345 NA NA < 22 < 17 31 15 J 17 130 68 < 20 < 22 <0.33 <0.33 <0.33 <0.33 <0.33 <0.33
Aroclor 1248 1,500 <13 <70.6 <10 <100 < 0.345 < 0.345 <35 <10 < 22 < 17 < 16 < 16 < 17 < 17 < 16 < 26 < 22 <0.33 <0.33 <0.33 <0.33 <0.33 <0.33
Aroclor 1254 300 276 1,840 166 963 < 0.345 < 0.345 519 81.8 < 22 4.9 J 370 230 140 1200 510 45 J 38 J <0.33 <0.33 <0.33 <0.33 <0.33 <0.33
Aroclor 1260 200 129 <70.6 121 <100 33.3 77.3 <35 <10 < 87 4.0 J <96 < 38 < 24 < 180 130 24 26 <0.33 <0.33 <0.33 <0.33 <0.33 <0.33
Aroclor 1262 -- NA NA <10 <100 < 0.345 < 0.345 <35 <10 < 22 < 17 < 16 < 16 < 17 < 17 < 16 < 20 < 22 <0.33 <0.33 <0.33 <0.33 <0.33 <0.33
Aroclor 1268 -- NA NA <10 <100 < 0.345 < 0.345 <35 <10 < 27 < 17 < 16 < 16 < 17 < 17 < 16 < 20 < 22 <0.33 <0.33 <0.33 <0.33 <0.33 <0.33
Total PCBs2 0.39 405 1,840 287 963 33.3 77.3 519 82 <22 8.9 J 531 245 201 1330 948 69 64 J <0.33 <0.33 <0.33 <0.33 <0.33 <0.33
Semivolatile Organic
Compounds
Phthalate Esters
Dimethylphthalate -- <345 NA <842 <1930 < 20 < 20 2,400 1,600 110 J < 270 130 J 110 J 55 J 200 200 1700 1100 183 3080 891 860 877 779
Diethylphthalate 600 <345 NA <842 <1930 < 21 < 21 < 350 < 200 < 220 < 270 < 180 < 180 < 73 < 190 < 180 < 450 < 490 <33.3 <166 <33.3 <33.3 <166 Q <33.3
Di-n-butylphthalate 60 <345 532 <842 <1930 < 48 65 860 460 290 J < 530 190 J < 360 69 J < 370 < 360 330 J 430 J 79.3 197 126 114 212 220
Butylbenzylphthalate -- <431 NA <842 <1930 150 280 2,200 1,800 1100 330 520 210 120 260 < 180 1000 1700 264 1040 811 1050 1060 488
Di-n-octylphthalate -- <345 NA 7,980 13,700 24 59 1,600 910 < 220 < 270 < 180 < 180 90 160 J 210 < 450 780 <33.3 <166 <33.3 <33.3 <166 Q <33.3
bis(2-Ethylhexyl)phthalate 330 14,800 18,000 11,300 31,700 680 1600 49,000 27,000 4100 5900 8800 5900 4100 11000 10000 28000 39000 2120 9580 9830 7570 8060 14400
Polycyclic Aromatic
Hydrocarbons
Naphthalene 561 368 169 169 235 NA NA 2,200 210 120 26 47 30 25 51 48 110 130 35.2 NA 27.2 53.3 93.8 52.1
2-Methylnaphthalene 200 2,380 NA NA NA NA NA 1300 240 18 11 280 42 48 90 150 52 69 NA NA NA NA NA NA
Acenaphthylene 200 <86 62.1 <84.7 <193 NA NA 120 < 40 16 23 < 16 7.1 J 7.9 J 9.4 J 28 J 13 21 <13.2 NA <13.2 <13.2 <13.2 <13.2
Acenaphthene 300 <86 92.3 <84.7 <193 NA NA 98 47 12 5.9 52 9.3 11 15 27 16 20 <13.2 NA <13.2 <13.2 <13.2 <13.2
Fluorene 536 <86 288 198 360 NA NA 400 160 25 21 160 40 36 53 89 53 75 15.3 NA 16.1 22.8 22.3 25.8
Phenanthrene 1,170 1290 1430 840 1,490 NA NA 2,200 810 280 270 980 230 210 320 580 450 620 73.2 NA 166 138 170 140
Anthracene 845 <86 128 89.1 <193 NA NA 470 470 23 210 62 25 23 30 57 31 47 17.5 NA 22.6 26.1 24.6 23.3
Fluoranthene 2,230 292 510 266 775 NA NA 2,100 800 390 1000 650 190 180 290 420 600 860 72.5 NA 210 121 140 201
Pyrene 1,520 602 702 266 605 NA NA 2,600 1,100 400 900 720 280 220 350 510 880 1300 119 NA 284 235 353 326
Benzo(a)anthracene 1,050 <86 <18.8 <84.7 198 NA NA 500 260 120 480 320 59 57 89 150 200 260 20.4 NA 76.2 47.6 79.2 82.6
Chrysene 1,290 <86 179 149 369 NA NA 770 350 240 J 560 470 120 J 110 J 170 J 280 J 400 570 72.3 NA 153 120 202 165
Benzo(b)fluoranthene -- <86 234 109 329 NA NA 770 370 260 650 440 90 92 140 280 310 440 59.2 NA 151 94.4 93.7 156
Benzo(k)fluoranthene 13,000 <86 156 <84.7 <193 NA NA 210 120 81 220 150 J 28 32 42 100 J 98 J 130 J <13.2 NA 46.5 30.5 27.6 48.7
Benzo(a)pyrene 1,450 <86 173 <84.7 209 NA NA 440 250 160 500 350 63 65 92 190 200 280 29.1 NA 46.5 55.3 55.8 115
Indeno(1,2,3-cd)pyrene 100 <86 <18.8 <84.7 <193 NA NA 350 220 150 350 250 J 57 61 80 160 200 J 280 J 21.3 NA 66.1 37 46.4 86.6
Dibenz(a,h)anthracene 1,300 <86 32 <84.7 <193 NA NA 92 59 34 96 66 13 15 22 34 45 58 <13.2 NA 19.9 17.3 22.4 22
Dibenzofuran -- NA NA NA NA NA NA NA NA 21 9.8 J < 58 < 20 < 14 < 24 < 37 30 J 37 J NA NA NA NA NA NA
Benzo(g,h,i)perylene 300 <86 156 <84.7 196 NA NA 500 320 210 360 270 79 71 110 190 290 420 46.6 NA 92.2 76.8 83.7 128
Other Analytes
Total Organic Carbon
(mg/kg)-- NA NA 28.6 38.5 NA NA 57.2 63.1
NA NA NA NA NA NA
Total Solids % -- NA NA 76 77 NA NA 57.2 63.1 56.4 75.6 79.8 80.3 78 77.9 78.9 64 58.9 NA NA NA NA NA NA
Notes:
Concentration > JSCS SLV
1The source of each SLV is documented in Table 3.1 of the Portland Harbor Joint Source Control Strategy, which can be viewed at http://www.deq.state.or.us/lq/cu/nwr/PortlandHarbor/docs/JSCSFinalTable03_1.pdf
2 Total polychlorinated biphenyls (PCBs) is the sum of the Aroclor detections or the value of the lowest detection limit.
-- = No value
J = Estimated concentration
Q - Detection levels elevated due to sample matrix
mg/kg = milligrams per kilogram (parts per million)
NA = Not analyzed
SLV = screening level value
ug/kg = micrograms per kilogram (parts per billion)
Detections are in bold
Screening level value exceedances are shaded
µg/kg µg/kgµg/kg µg/kg µg/kg µg/kgµg/kgµg/kgµg/kg µg/kg µg/kg µg/kg µg/kg µg/kg µg/kg
Fathom
Pipe_4.5
10/24/2013
Fathom Pipe_23.5
10/24/2013
Fathom
Pipe_33.2
10/24/2013
Fathom
Pipe_45.5
10/24/2013
Fathom Pipe_60
10/24/2013
Fathom
Pipe_65
10/24/2013
Fathom
Pipe_70
10/24/2013
Fathom
Pipe_75
10/24/2013
Fathom Pipe_75
(#2) 10/24/2013
Fathom Cutoff
Valve Vault
10/10/2014
Fathom 0-16
10/10/2014
Fathom 35-45
10/10/2014
Fathom 45-65
10/10/2014
Fathom 63-75
10/10/2014
Fathom 75-90
10/10/2014
10/24/2013 10/24/2013 10/24/2013 10/24/2013 10/24/2013 10/24/2013 10/24/2013 10/24/2013 10/24/2013 10/10/2014 10/10/201410/10/201410/10/201410/10/201410/10/2014
Bridgewater Group, Inc. Page 1 of 1
712473.2/016691.00008
Figures
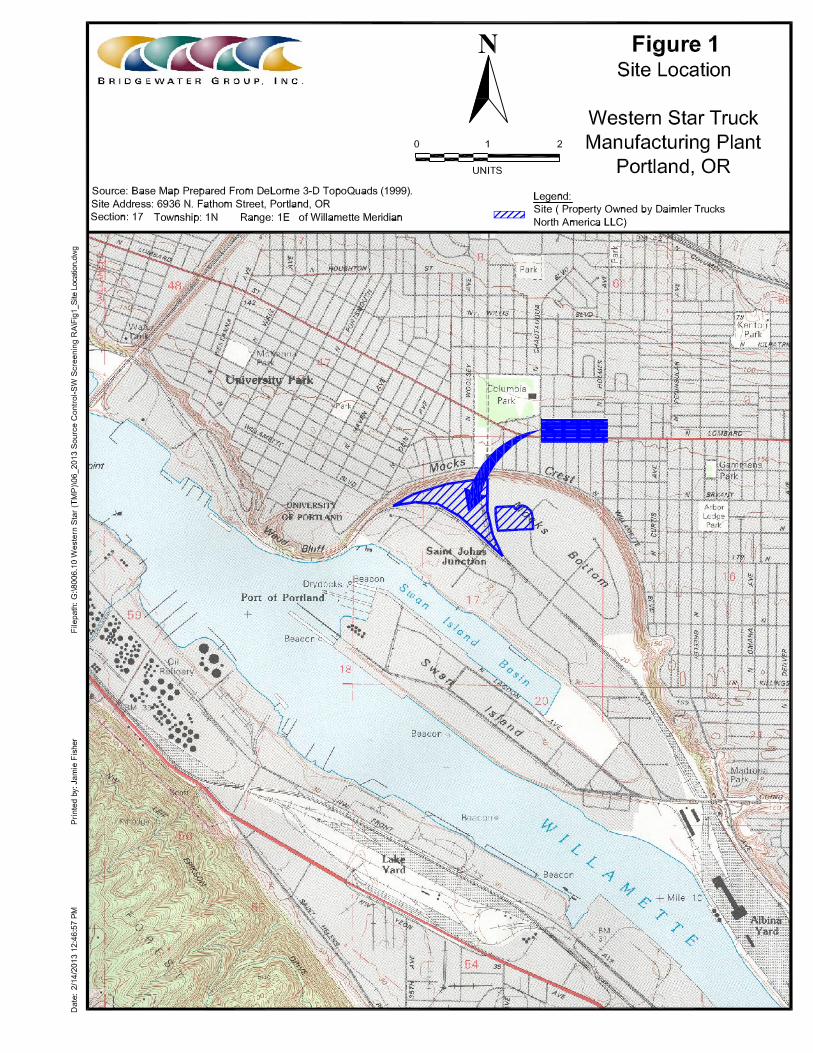
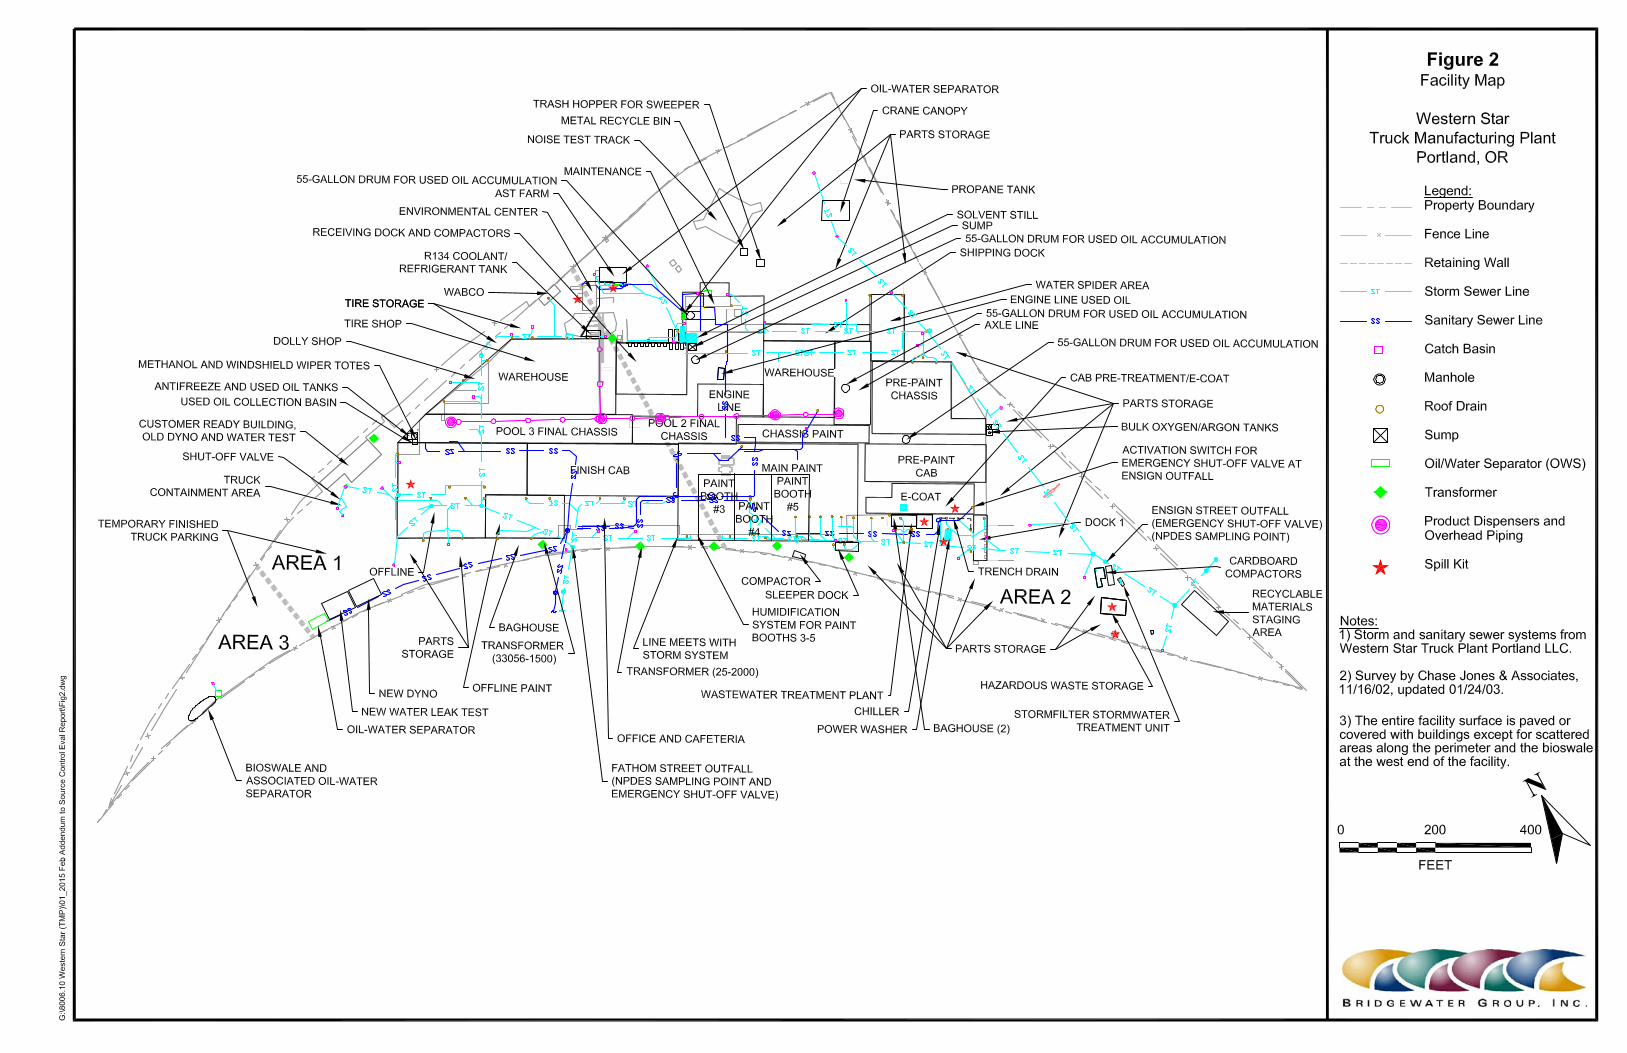
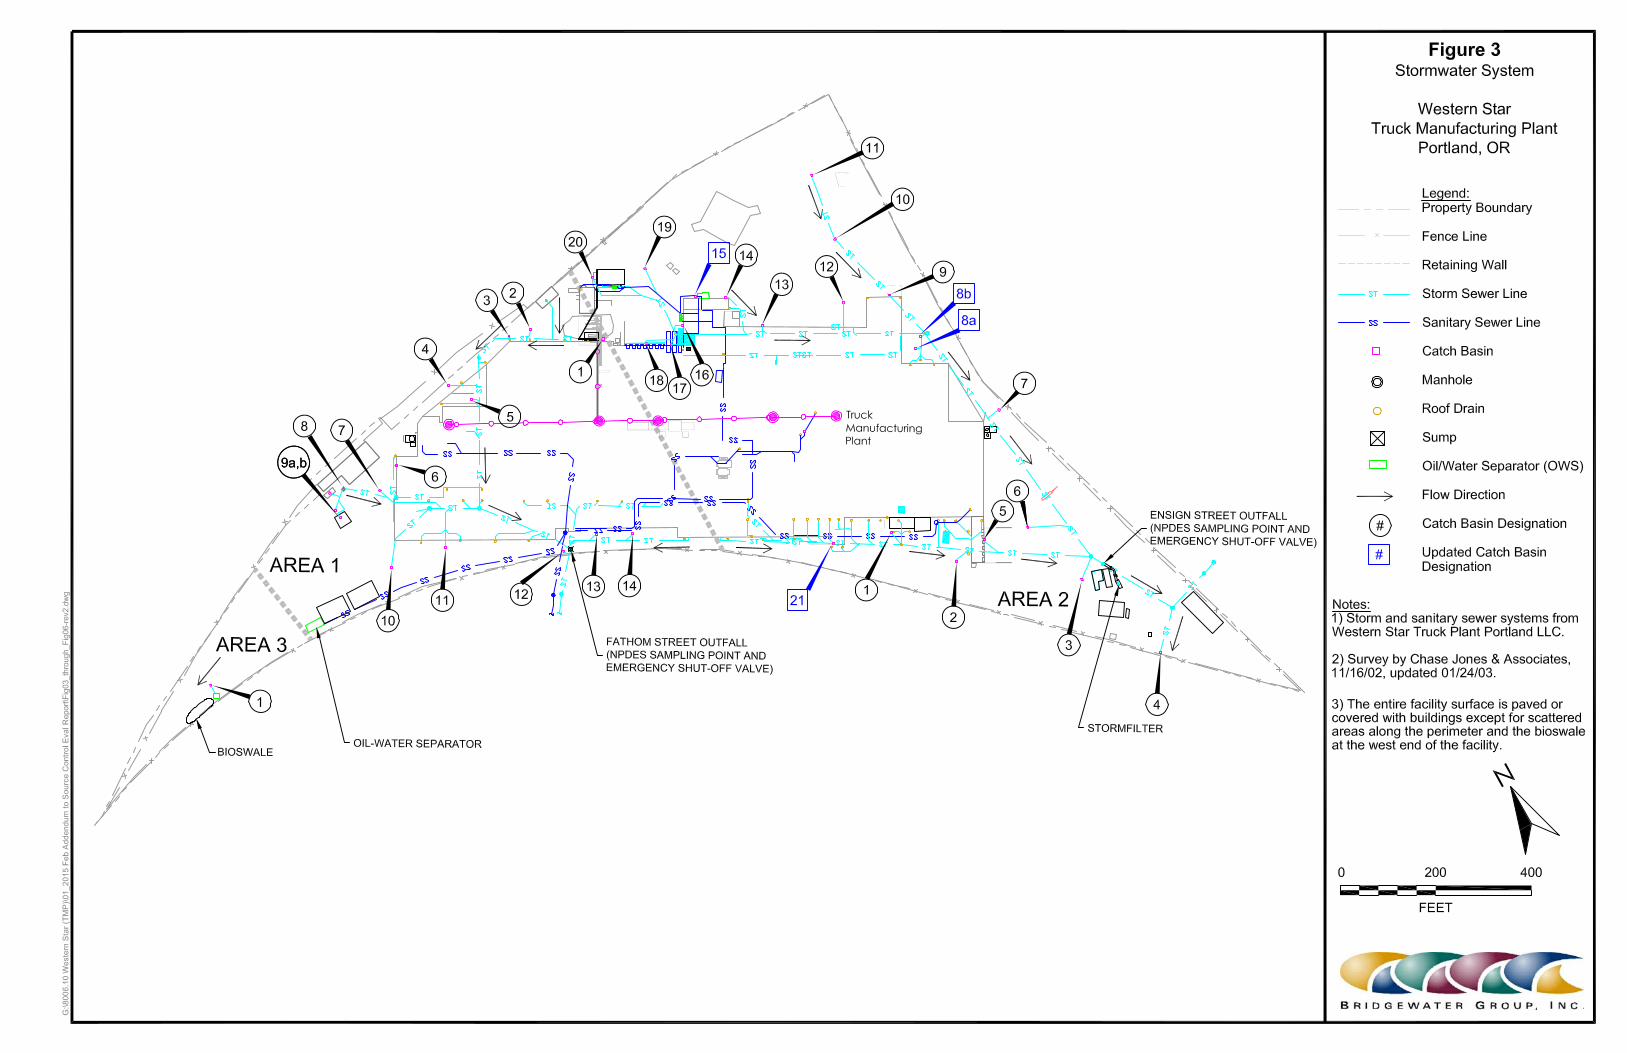

0
0.05
0.1
0.15
0.2
0.25
0.3
Rai
nfa
ll (i
nch
es)
Date
Figure 4 Precipitation at Rain Gage 160 from October 12 - October 14, 2014
(adjusted to Pacific Daylight Time)
Precipitation at Rain Gage 160 (adjusted to Pacific Daylight Time)
Sample Times on 10/13/14 between 23:22and 23:57
Flow at Fathom Outfall = 23:10 on 10/13/14 Flow at Ensign Outfall (StormFilter Pump On and Unit Discharging = 23:13 on 10/13/14
Antecedent Dry Period < 0.10 inch
NOAA Predicted Rainfall Event of 0.5 inch during event lasting at least 3 hours
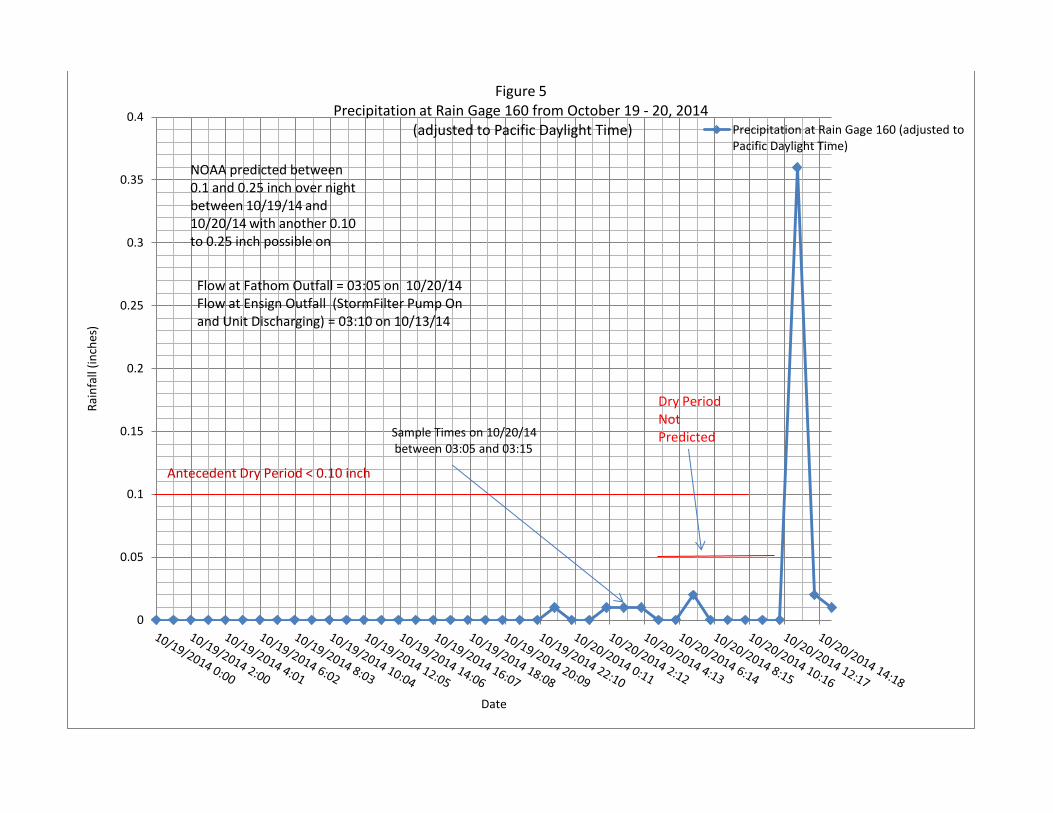
0
0.05
0.1
0.15
0.2
0.25
0.3
0.35
0.4
Rai
nfa
ll (i
nch
es)
Date
Figure 5 Precipitation at Rain Gage 160 from October 19 - 20, 2014
(adjusted to Pacific Daylight Time) Precipitation at Rain Gage 160 (adjusted to Pacific Daylight Time)
Sample Times on 10/20/14 between 03:05 and 03:15
Flow at Fathom Outfall = 03:05 on 10/20/14 Flow at Ensign Outfall (StormFilter Pump On and Unit Discharging) = 03:10 on 10/13/14
Antecedent Dry Period < 0.10 inch
NOAA predicted between 0.1 and 0.25 inch over night between 10/19/14 and 10/20/14 with another 0.10 to 0.25 inch possible on
Dry Period Not Predicted
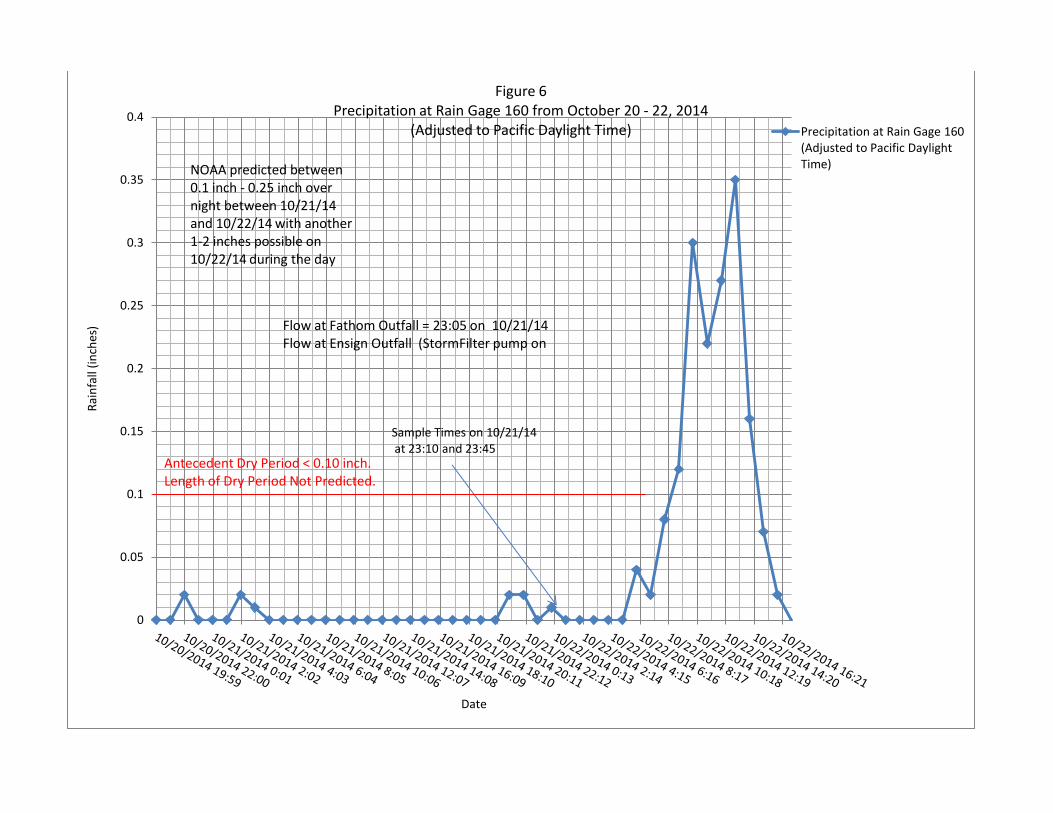
0
0.05
0.1
0.15
0.2
0.25
0.3
0.35
0.4
Rai
nfa
ll (i
nch
es)
Date
Figure 6 Precipitation at Rain Gage 160 from October 20 - 22, 2014
(Adjusted to Pacific Daylight Time) Precipitation at Rain Gage 160 (Adjusted to Pacific Daylight Time)
Sample Times on 10/21/14 at 23:10 and 23:45
Flow at Fathom Outfall = 23:05 on 10/21/14 Flow at Ensign Outfall (StormFilter pump on
Antecedent Dry Period < 0.10 inch. Length of Dry Period Not Predicted.
NOAA predicted between 0.1 inch - 0.25 inch over night between 10/21/14 and 10/22/14 with another 1-2 inches possible on 10/22/14 during the day

10
/13
/14
10
/21
/14
10
/13
/14
(Fa
tho
m)
and
10
/20
/14
(En
sign
)
10
/21
/14
0
50
100
150
200
250
300
350
400
450
500
0
20
40
60
80
10
0
12
0
14
0
16
0
18
0
20
0
22
0
24
0
26
0
28
0
30
0
32
0
34
0
36
0
38
0
40
0
ug/
l
Detected Values in Rank Order
Figure 7 Copper (ug/l) in Stormwater at
Portland Harbor Heavy Industrial Sites 7 Highest Values Excluded from Chart
DEQ Copper TMP Ensign
TMP Fathom
*Chart Displays Detected Values Only* 417 Total data points: 392 Detected values (7 excluded from chart) 25 Non-Detects or below reporting limits
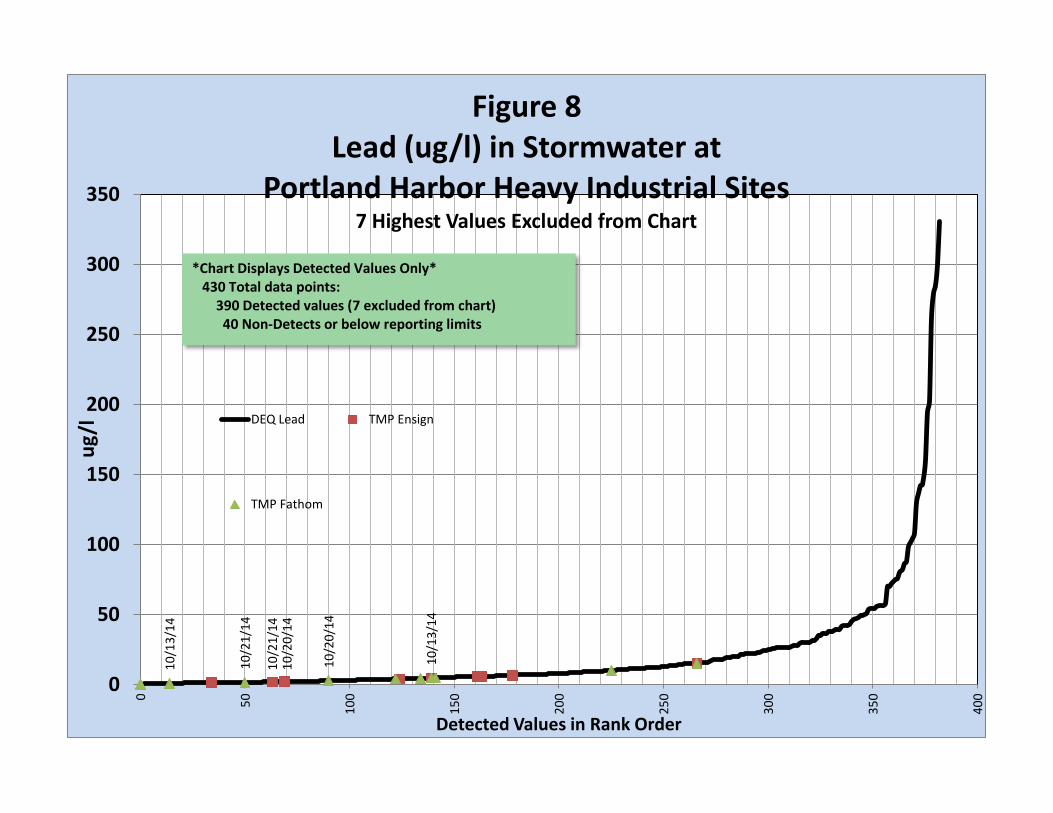
10
/21
/14
1
0/2
0/1
4
10
/13
/14
10
/13
/14
10
/20
/14
10
/21
/14
0
50
100
150
200
250
300
350
0
50
10
0
15
0
20
0
25
0
30
0
35
0
40
0
ug
/l
Detected Values in Rank Order
Figure 8 Lead (ug/l) in Stormwater at
Portland Harbor Heavy Industrial Sites 7 Highest Values Excluded from Chart
DEQ Lead TMP Ensign
TMP Fathom
*Chart Displays Detected Values Only* 430 Total data points: 390 Detected values (7 excluded from chart) 40 Non-Detects or below reporting limits

10
/20
/14
10
/21
/14
10
/13
/14
10
/13
/14
10
/20
/14
10
/21
/14
0
1000
2000
3000
4000
5000
6000
0
20
40
60
80
10
0
12
0
14
0
16
0
18
0
20
0
22
0
24
0
26
0
28
0
30
0
32
0
34
0
36
0
38
0
40
0
42
0
ug/
l
Detected Values in Rank Order
Figure 9 Zinc (ug/l) in Stormwater at
Portland Harbor Heavy Industrial Sites 12 Highest Values Excluded from Chart
DEQ Zinc TMP Ensign
TMP Fathom
*Chart Displays Detected Values Only* 437 Total data points: 429 Detected values (12 excluded from chart) 8 Non-Detects or below reporting limits
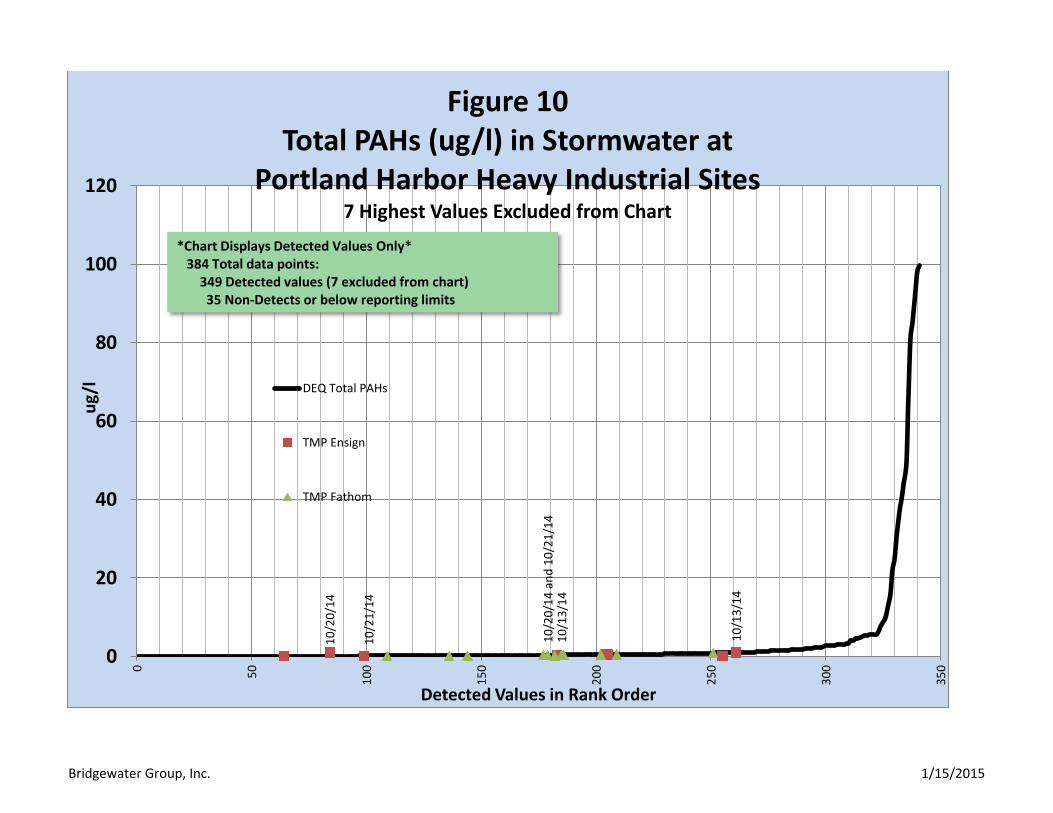
10
/20
/14
10
/21
/14
10
/13
/14
10
/20
/14
an
d 1
0/2
1/1
4
10
/13
/14
0
20
40
60
80
100
120
0
50
10
0
15
0
20
0
25
0
30
0
35
0
ug/
l
Detected Values in Rank Order
Figure 10 Total PAHs (ug/l) in Stormwater at
Portland Harbor Heavy Industrial Sites 7 Highest Values Excluded from Chart
DEQ Total PAHs
TMP Ensign
TMP Fathom
*Chart Displays Detected Values Only* 384 Total data points: 349 Detected values (7 excluded from chart) 35 Non-Detects or below reporting limits
Bridgewater Group, Inc. 1/15/2015
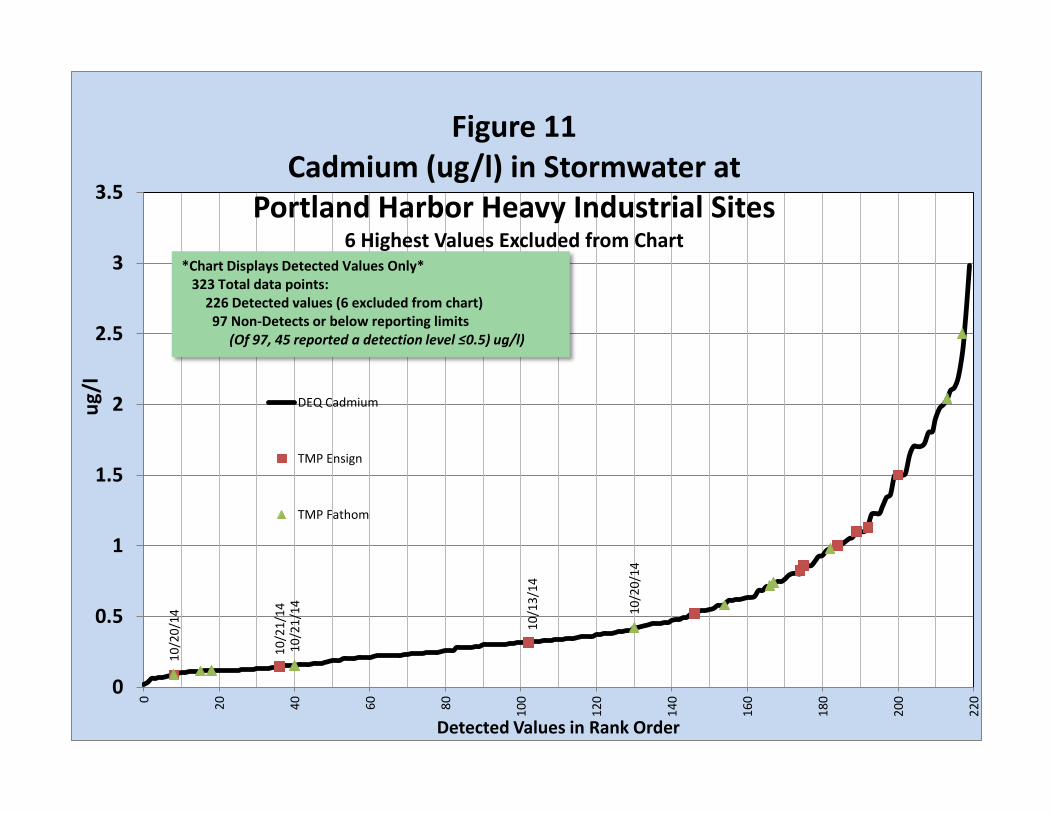
10
/21
/14
10
/13
/14
10
/20
/14
10
/20
/14
10
/21
/14
0
0.5
1
1.5
2
2.5
3
3.5
0
20
40
60
80
10
0
12
0
14
0
16
0
18
0
20
0
22
0
ug/
l
Detected Values in Rank Order
Figure 11 Cadmium (ug/l) in Stormwater at
Portland Harbor Heavy Industrial Sites 6 Highest Values Excluded from Chart
DEQ Cadmium
TMP Ensign
TMP Fathom
*Chart Displays Detected Values Only* 323 Total data points: 226 Detected values (6 excluded from chart) 97 Non-Detects or below reporting limits (Of 97, 45 reported a detection level ≤0.5) ug/l)
10
/20
/14
an
d 1
0/2
1/1
4
10
/13
/14
10
/13
/14
10
/20
/14
10
/21
/14
0
2
4
6
8
10
12
14
16
18
20
0
20
40
60
80
10
0
12
0
14
0
16
0
ug/
l
Detected Values in Rank Order
Figure 12 Bis(2-Ethylhexyl)phthalate in Stormwater at
Portland Harbor Heavy Industrial Sites 2 Highest Values Excluded from Chart
DEQ BEHP TMP Ensign
TMP Fathom
*Chart Displays Detected Values Only* 261 Total data points: 159 Detected values (2 excluded from chart) 102 Non-Detects or below reporting limits (Of 102, 91 reported a detection level ≤2.0 ug/l)
10
/20
/14
10
/13
/14
Ensi
gn 1
0/2
0/1
4 a
nd
Fat
ho
m 1
0/2
1/1
4
10
/21
/14
10
/13
/14
0
50
100
150
200
250
300
350
400
450
0
20
40
60
80
10
0
12
0
14
0
16
0
18
0
20
0
22
0
24
0
mg/
l
Detected Values in Rank Order
Figure 13 TSS (mg/l) in Stormwater at
Portland Harbor Heavy Industrial Sites 5 Highest Values Excluded from Chart
DEQ TSS TMP Ensign
TMP Fathom
*Chart Displays Detected Values Only* 288 Total data points: 235 Detected values (5 excluded from chart) 53 Non-Detects or below reporting limits (Of 53, 52 reported a detection level ≤10 mg/l)

10
/21
/14
10
/20
/14
10
/21
/14
0
1
2
3
4
5
6
7
8
9
10
0
20
40
60
80
10
0
12
0
14
0
16
0
18
0
20
0
ug
/l
Detected Values in Rank Order
Figure 14 Arsenic (ug/l) in Stormwater at
Portland Harbor Heavy Industrial Sites 9 Highest Values Excluded from Chart
DEQ Data
Fathom Outfall
Ensign Outfall
*Chart Displays Detected Values Only* 262 Total data points: 196 Detected values (9 excluded from chart) 66 Non-Detects or below reporting limits (Of 66, 62 reported a detection level ≤1.0 ug/l)

Appendix A
Weather Predictions for October 2014 Stormwater Sampling Events

From: Mike MurrayTo: [email protected]; Tony SilvaCc: "Ben"; "Jane-Clair Kerin"Subject: RE: Stormwater Sampling at Western Star TMP This Weekend - Next Week?Date: Sunday, October 19, 2014 2:53:43 PM
Hi Anna, I’m not sure how to interpret this (updated just now for this evening):
Tonight: Rain likely, mainly after 11pm. Mostly cloudy, with a low around 56. South wind 7 to 10 mph, with gusts as highas 20 mph. Chance of precipitation is 70%. New precipitation amounts between a tenth and quarter of an inch possible.
Monday Showers. High near 60. South wind 5 to 9 mph. Chance of precipitation is 100%. New precipitation amountsbetween a tenth and quarter of an inch possible.
Monday Night A 50 percent chance of showers. Mostly cloudy, with a low around 51. South southwest wind 7 to 9 mph.New precipitation amounts of less than a tenth of an inch possible.
Tuesday A 30 percent chance of rain. Mostly cloudy, with a high near 59. South wind around 8 mph. New precipitationamounts of less than a tenth of an inch possible.
I know DEQ wants a predicted amount of >0.2”, should we proceed with the sampling? If we waituntil an event with large amounts of precip predicted, it is likely we will be outside of the 24 hourdry period. Any thoughts? Thanks! MICHAEL R. MURRAY RG, LG | MAUL FOSTER & ALONGI, INC.
d. 503 501 5226 | p. 971 544 2139 | c. 503 310 0435 | f. 971 544 2140 | www.maulfoster.com2001 NW 19th Avenue, Suite 200, Portland, OR 97209
Please consider the environment before printing out this email.NOTICE: This email, and any attachments, is intended only for use by the named addressee(s) and may contain information that isprivileged, confidential or otherwise protected from disclosure. If you are not the intended recipient or the person responsible to deliver itto the intended recipient, you are hereby notified that any dissemination, distribution or copying of this email, and any attachments, isstrictly prohibited. If you have received this email in error, please immediately notify the sender by reply email and permanently deleteand/or destroy the original and all copies. Written MFA authorization is required for modification of final electronic work products. Distribution to others of any MFA electronic work products, whether or not they are modified, is prohibited without the express writtenconsent of MFA.
From: Anna St. John [mailto:[email protected]] Sent: Saturday, October 18, 2014 12:42 PMTo: Tony Silva; Mike MurrayCc: 'Ben'; 'Jane-Clair Kerin'; [email protected]: RE: Stormwater Sampling at Western Star TMP This Weekend - Next Week? Happy Saturday! Thanks for being available! You’ll probably need three other peeps so one group is at Fathom andone is at Ensign. I cc:d Ben and Jane at Hahn to see if they are available to help too. Should I askScout too? It takes a village. Here is the forecast for Sunday-Monday
Sunday Night Rain likely, mainly after 11pm. Mostly cloudy, with a low around 54. South wind around 7 mph.
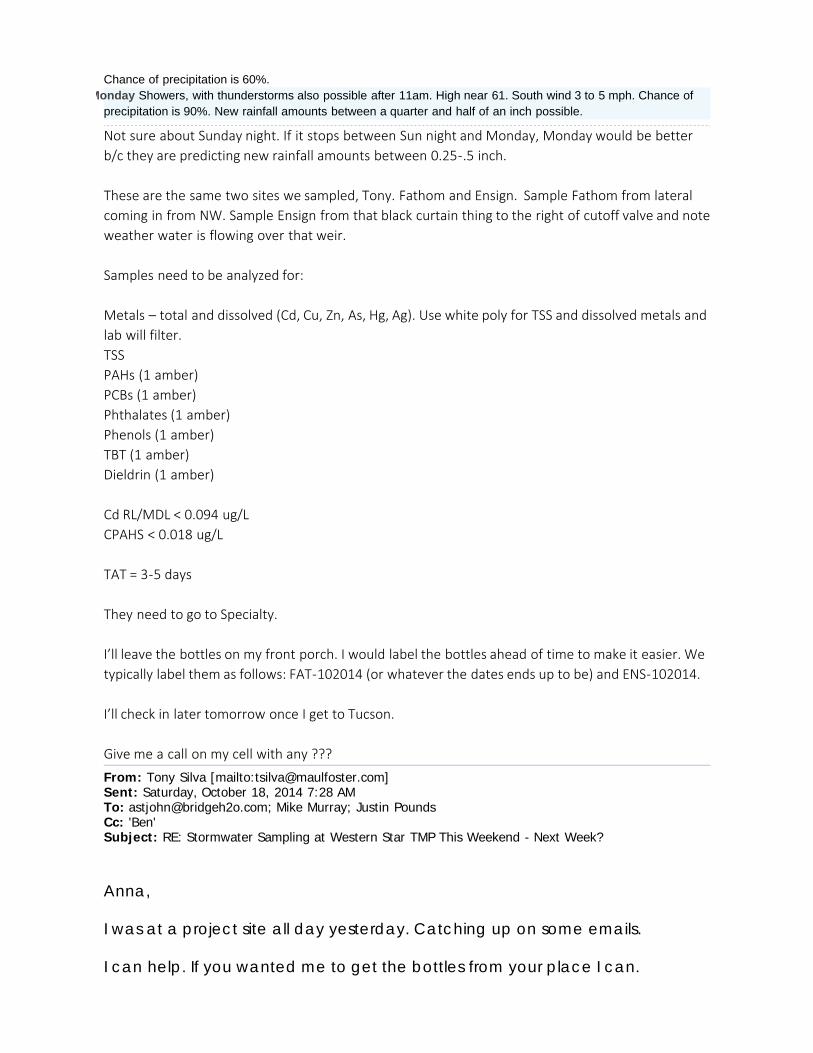
Chance of precipitation is 60%.
Monday Showers, with thunderstorms also possible after 11am. High near 61. South wind 3 to 5 mph. Chance of
precipitation is 90%. New rainfall amounts between a quarter and half of an inch possible.
Not sure about Sunday night. If it stops between Sun night and Monday, Monday would be betterb/c they are predicting new rainfall amounts between 0.25-.5 inch. These are the same two sites we sampled, Tony. Fathom and Ensign. Sample Fathom from lateralcoming in from NW. Sample Ensign from that black curtain thing to the right of cutoff valve and noteweather water is flowing over that weir. Samples need to be analyzed for: Metals – total and dissolved (Cd, Cu, Zn, As, Hg, Ag). Use white poly for TSS and dissolved metals andlab will filter.TSSPAHs (1 amber)PCBs (1 amber)Phthalates (1 amber)Phenols (1 amber)TBT (1 amber)Dieldrin (1 amber) Cd RL/MDL < 0.094 ug/LCPAHS < 0.018 ug/L TAT = 3-5 days They need to go to Specialty. I’ll leave the bottles on my front porch. I would label the bottles ahead of time to make it easier. Wetypically label them as follows: FAT-102014 (or whatever the dates ends up to be) and ENS-102014. I’ll check in later tomorrow once I get to Tucson. Give me a call on my cell with any ???
From: Tony Silva [mailto:[email protected]] Sent: Saturday, October 18, 2014 7:28 AMTo: [email protected]; Mike Murray; Justin PoundsCc: 'Ben'Subject: RE: Stormwater Sampling at Western Star TMP This Weekend - Next Week? Anna, I was at a project site all day yesterday. Catching up on some emails. I can help. If you wanted me to get the bottles from your place I can.

Appendix B
Field Sampling Data Sheets for October 2014 Stormwater Sampling Events

FIELD SAMPLING DATA SHEET
Sample I.D. Job Number: DTNA-001
Client: Date: 10/13/14
Project: Sampler: ASJ/TS
Weather: Time In/Out:
Sampling Method: Tubing Type:NA
Time
Volume
Purged
(liters)
Cumulative
Volume
Purged
(liters)
DTW
(btc)
Purge
Rate
(L/min)
pHTemp
(oC)
Cond
(mS/cm)
DO
(ppm)
ORP
(mV)
Turbidity
(NTUs)
+/-0.2 +/-0.5° C +/-5% +/- 0.5 ppm +/-20mV +/-10% <-- Stabilization Criteria
1157 NA NA NA NA 6.85 16 26.4 NA NA 24.2 AC
Clarity: VC = very cloudy, Cl = Cloudy, SC = slightly cloudy, AC = almost clear, C = clear
SAMPLING DATA
Sample ID: ENS-101314 Sampling Flow Rate NA Analytical Laboratory:
Sample Time: 1157 Final Depth to Water: NA Did Well Dewater? NA
# Containers/Type Preservative Analysis/Method Field Filtered Filter Size MS/MSD Duplicate ID
1 L Amber None PCBs and Dieldrin yes no
1 L Amber None PAHs yes no
1 L Amber None Phenols yes no
1 L Amber None BEHP yes no
1 L Amber None TBT yes no
500 mL poly HCL T Metals yes no
1000 mL poly None D Metals (lab filter) yes no
None TSSyes no
Flow at Fathom = 11:10 PM
Flow at Ensign (pump on and filter discharging)= 11:13 PM
Grab using telscoping pole and
glass beaker
COMMENTS
ENS-101314
DTNA
SW SCE
Sprinkles/Rain 10:45 PM/12:50 AM 10/14
Specialty
Clarity/Color
Other Remarks
1000 mL poly (with D
Metals)
FIELD SAMPLING DATA SHEET
Sample I.D. Job Number: DTNA-001
Client: Date: 10/13/14
Project: Sampler: ASJ/TS
Weather: Time In/Out:
Sampling Method: Tubing Type:NA
Time
Volume
Purged
(liters)
Cumulative
Volume
Purged
(liters)
DTW
(btc)
Purge
Rate
(L/min)
pHTemp
(oC)
Cond
(mS/cm)
DO
(ppm)
ORP
(mV)
Turbidity
(NTUs)
+/-0.2 +/-0.5° C +/-5% +/- 0.5 ppm +/-20mV +/-10% <-- Stabilization Criteria
1123 NA NA NA NA 7.06 16.7 75.8 NA NA 16 AC
Clarity: VC = very cloudy, Cl = Cloudy, SC = slightly cloudy, AC = almost clear, C = clear
SAMPLING DATA
Sample ID: FAT-101314 Sampling Flow Rate NA Analytical Laboratory:
Sample Time: 1123 Final Depth to Water: NA Did Well Dewater? NA
# Containers/Type Preservative Analysis/Method Field Filtered Filter Size MS/MSD Duplicate ID
1 L Amber None PCBs and Dieldrin yes no
1 L Amber None PAHs yes no
1 L Amber None Phenols yes no
1 L Amber None BEHP yes no
1 L Amber None TBT yes no
500 mL poly HCL T Metals yes no
1000 mL poly None D Metals (lab filter) yes no
None TSSyes no
Flow at Fathom = 11:10 PM
Flow at Ensign = 11:13 PM
Grab using telscoping pole and
glass beaker
COMMENTS
FAT-101314
DTNA
SW SCE
Sprinkles/Rain 10:45 PM/12:50 AM 10/14
Specialty
Clarity/Color
Other Remarks
1000 mL poly (with D
Metals)

FIELD SAMPLING DATA SHEET
Sample I.D. Job Number: DTNA-001
Client: Date: 10/20/14
Project: Sampler: MRM/TS
Weather: Time In/Out:
Sampling Method: Tubing Type:NA
Time
Volume
Purged
(liters)
Cumulative
Volume
Purged
(liters)
DTW
(btc)
Purge
Rate
(L/min)
pHTemp
(oC)
Cond
(mS/cm)
DO
(ppm)
ORP
(mV)
Turbidity
(NTUs)
+/-0.2 +/-0.5° C +/-5% +/- 0.5 ppm +/-20mV +/-10% <-- Stabilization Criteria
3:15 NA NA NA NA 6.8 17.4 76.1 NA NA 6.38 AC
Clarity: VC = very cloudy, Cl = Cloudy, SC = slightly cloudy, AC = almost clear, C = clear
SAMPLING DATA
Sample ID: ENS-102014 Sampling Flow Rate NA Analytical Laboratory:
Sample Time: 3:15 Final Depth to Water: NA Did Well Dewater? NA
# Containers/Type Preservative Analysis/Method Field Filtered Filter Size MS/MSD Duplicate ID
1 L Amber None PCBs and Dieldrin yes no
1 L Amber None PAHs yes no
1 L Amber None Phenols yes no
1 L Amber None BEHP yes no
1 L Amber None TBT yes no
500 mL poly HCL T Metals yes no
1000 mL poly None D Metals (lab filter) yes no
None TSSyes no
Flow at Fathom = 3:05 AM
Flow at Ensign (pump on and filter discharging)= 3:10 AM
Grab using telscoping pole and
glass beaker
COMMENTS
ENS-102014
DTNA
SW SCE
Sprinkles/Rain 1:30 AM/3:30 AM
Specialty
Clarity/Color
Other Remarks
1000 mL poly (with D
Metals)

FIELD SAMPLING DATA SHEET
Sample I.D. Job Number: DTNA-001
Client: Date: 10/20/14
Project: Sampler: MRM/TS
Weather: Time In/Out:
Sampling Method: Tubing Type:NA
Time
Volume
Purged
(liters)
Cumulative
Volume
Purged
(liters)
DTW
(btc)
Purge
Rate
(L/min)
pHTemp
(oC)
Cond
(mS/cm)
DO
(ppm)
ORP
(mV)
Turbidity
(NTUs)
+/-0.2 +/-0.5° C +/-5% +/- 0.5 ppm +/-20mV +/-10% <-- Stabilization Criteria
3:05 NA NA NA NA 7.21 17.4 178.8 NA NA 18.93 AC
Clarity: VC = very cloudy, Cl = Cloudy, SC = slightly cloudy, AC = almost clear, C = clear
SAMPLING DATA
Sample ID: FAT-102014 Sampling Flow Rate NA Analytical Laboratory:
Sample Time: 3:05 Final Depth to Water: NA Did Well Dewater? NA
# Containers/Type Preservative Analysis/Method Field Filtered Filter Size MS/MSD Duplicate ID
1 L Amber None PCBs and Dieldrin yes no
1 L Amber None PAHs yes no
1 L Amber None Phenols yes no
1 L Amber None BEHP yes no
1 L Amber None TBT yes no
500 mL poly HCL T Metals yes no
1000 mL poly None D Metals (lab filter) yes no
None TSSyes no
Flow at Fathom = 3:05 AM
Flow at Ensign (pump on and filter discharging)= 3:10 AM
Grab using telscoping pole and
glass beaker
COMMENTS
FAT-102014
DTNA
SW SCE
Sprinkles/Rain 1:30 AM/3:30 AM
Specialty
Clarity/Color
Other Remarks
1000 mL poly (with D
Metals)
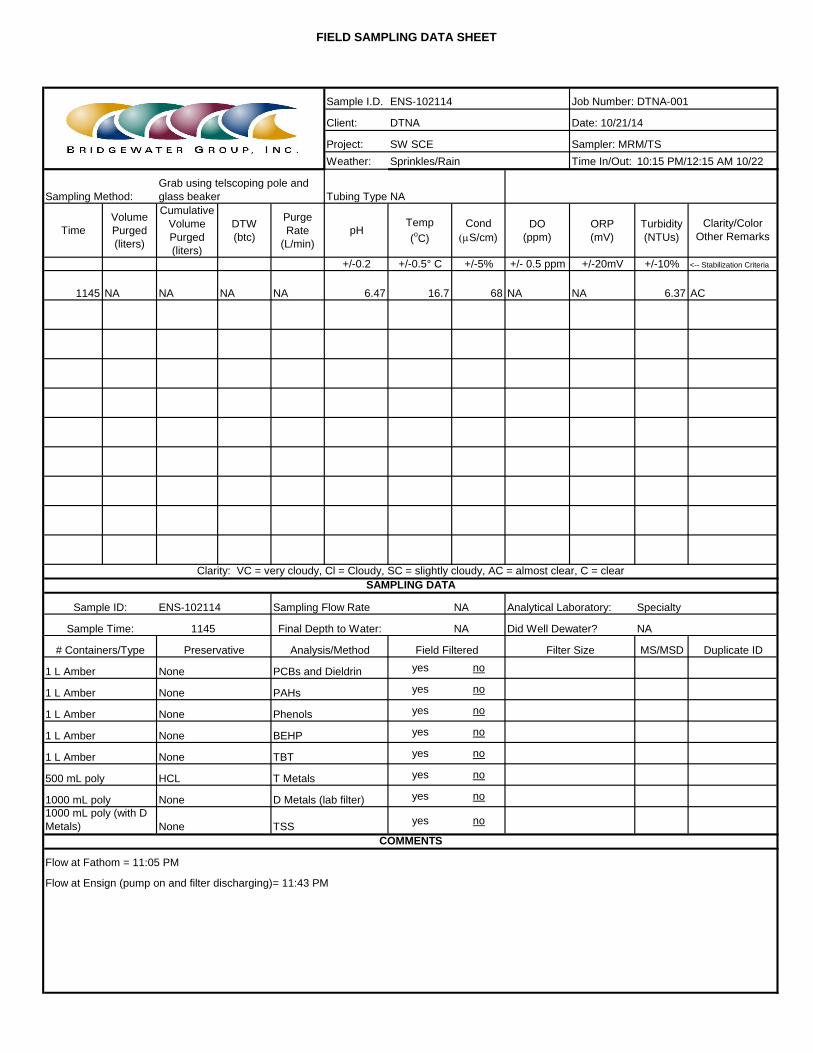
FIELD SAMPLING DATA SHEET
Sample I.D. Job Number: DTNA-001
Client: Date: 10/21/14
Project: Sampler: MRM/TS
Weather: Time In/Out:
Sampling Method: Tubing Type:NA
Time
Volume
Purged
(liters)
Cumulative
Volume
Purged
(liters)
DTW
(btc)
Purge
Rate
(L/min)
pHTemp
(oC)
Cond
(mS/cm)
DO
(ppm)
ORP
(mV)
Turbidity
(NTUs)
+/-0.2 +/-0.5° C +/-5% +/- 0.5 ppm +/-20mV +/-10% <-- Stabilization Criteria
1145 NA NA NA NA 6.47 16.7 68 NA NA 6.37 AC
Clarity: VC = very cloudy, Cl = Cloudy, SC = slightly cloudy, AC = almost clear, C = clear
SAMPLING DATA
Sample ID: ENS-102114 Sampling Flow Rate NA Analytical Laboratory:
Sample Time: 1145 Final Depth to Water: NA Did Well Dewater? NA
# Containers/Type Preservative Analysis/Method Field Filtered Filter Size MS/MSD Duplicate ID
1 L Amber None PCBs and Dieldrin yes no
1 L Amber None PAHs yes no
1 L Amber None Phenols yes no
1 L Amber None BEHP yes no
1 L Amber None TBT yes no
500 mL poly HCL T Metals yes no
1000 mL poly None D Metals (lab filter) yes no
None TSSyes no
Flow at Fathom = 11:05 PM
Flow at Ensign (pump on and filter discharging)= 11:43 PM
Grab using telscoping pole and
glass beaker
COMMENTS
ENS-102114
DTNA
SW SCE
Sprinkles/Rain 10:15 PM/12:15 AM 10/22
Specialty
Clarity/Color
Other Remarks
1000 mL poly (with D
Metals)

FIELD SAMPLING DATA SHEET
Sample I.D. Job Number: DTNA-001
Client: Date: 10/21/14
Project: Sampler: MRM/TS
Weather: Time In/Out:
Sampling Method: Tubing Type:NA
Time
Volume
Purged
(liters)
Cumulative
Volume
Purged
(liters)
DTW
(btc)
Purge
Rate
(L/min)
pHTemp
(oC)
Cond
(mS/cm)
DO
(ppm)
ORP
(mV)
Turbidity
(NTUs)
+/-0.2 +/-0.5° C +/-5% +/- 0.5 ppm +/-20mV +/-10% <-- Stabilization Criteria
11:10 NA NA NA NA 7.28 17 107 NA NA 7.03 AC
Clarity: VC = very cloudy, Cl = Cloudy, SC = slightly cloudy, AC = almost clear, C = clear
SAMPLING DATA
Sample ID: FAT-102114 Sampling Flow Rate NA Analytical Laboratory:
Sample Time: 11:10 Final Depth to Water: NA Did Well Dewater? NA
# Containers/Type Preservative Analysis/Method Field Filtered Filter Size MS/MSD Duplicate ID
1 L Amber None PCBs and Dieldrin yes no
1 L Amber None PAHs yes no
1 L Amber None Phenols yes no
1 L Amber None BEHP yes no
1 L Amber None TBT yes no
500 mL poly HCL T Metals yes no
1000 mL poly None D Metals (lab filter) yes no
None TSSyes no
Flow at Fathom = 11:05 PM
Flow at Ensign (pump on and filter discharging)= 11:43 PM
Grab using telscoping pole and
glass beaker
COMMENTS
FAT-102114
DTNA
SW SCE
Sprinkles/Rain 10:15 PM/12:15 AM 10/22
Specialty
Clarity/Color
Other Remarks
1000 mL poly (with D
Metals)

Appendix C
Laboratory Analytical Reports and Data Quality Assurance/Quality Control Memorandum for October 2014
Stormwater Sampling Events

DTNA-001-14Oct-QAQC-water.doc PAGE 1
DATA QUALITY ASSURANCE/
QUALITY CONTROL REVIEW PROJECT NO. DTNA-001 | NOVEMBER 12, 2014 | DAIMLER TRUCKS NA
This report reviews the analytical results for two water samples collected by the Bridgewater Group, Inc. at the Western Star Truck Manufacturing Plant on October 13, 2014 in Portland, Oregon.
Specialty Analytical Labs (SA) in Clackamas, Oregon performed most analyses. SA sent samples to Neilson Research Corporation (NRC) in Medford, Oregon for USEPA 200.8 analysis and to Analytical Resources, Incorporated (ARI) in Tukwila, Washington for tributyltin analysis by USEPA SW8270D. SA order number 1410089, NRC order number 1410655, and ARI job number ZF78 were reviewed. The analyses performed are listed below.
Analysis Reference
Metals, Dissolved Recoverable USEPA 200.8
Metals, Total Recoverable USEPA 200.8
Mercury, Total Aqueous USEPA 245.2
Mercury, Dissolved Aqueous USEPA 245.2
Polycyclic Aromatic Hydrocarbons (PAHs) USEPA 625
Base/Neutrals and Acids USEPA 625
Organochlorine Pesticides and PCBs USEPA 608
Tributyltin USEPA SW8270D
Total Suspended Solids SM 2540D
USEPA = U.S. Environmental Protection Agency
SM = Standard Methods for the Examination of Water and Wastewater
DATA QUALIFICATIONS
Analytical results were evaluated according to applicable sections of USEPA procedures (USEPA, 2008, 2010) and appropriate laboratory and method-specific guidelines (SA, 2012; APHA, 2012).
The data are considered acceptable for their intended use, with the appropriate data qualifiers assigned.
DOCUMENTATION AND TRANSPORT
Samples were transported under strict chain-of-custody (COC) procedures. ARI reported that samples received from SA for tributyltin analysis arrived at 9.3 °C, over the recommended maximum of 6 °C. The stability of the compound and its resistance to microbial degradation would indicate insignificant if any change in quantitation.

DTNA-001-14Oct-QAQC-water.doc PAGE 2
HOLDING TIMES, PRESERVATION, AND SAMPLE STORAGE
Holding Times
Extractions and analyses were performed within the recommended holding time criteria.
Preservation and Sample Storage
The samples were preserved and stored appropriately.
BLANKS
Method Blanks
Laboratory method blank analyses were performed at the required frequencies. Zinc was reported in the method blanks for both total and dissolved metals analyses, but at levels three orders of magnitude below sample concentrations. No degradation of data quality is suspected. No other target analytes were detected above the reporting limits (RLs) in method blanks.
Trip Blanks
Trip blanks were not required for this sampling event.
Field Blanks
Field blanks were not required for this sampling event.
Equipment Rinsate Blanks
Equipment rinsate blanks were not required for this sampling event, as all samples were collected using single-use equipment.
SURROGATE RECOVERY RESULTS
The samples were spiked with surrogate compounds to evaluate laboratory performance on individual samples.
Four of twelve Base/Neutrals and Acids surrogate recoveries exceeded upper control limits. One exceedance was attributed to matrix interference and two were still less than full recovery. All remaining surrogate recoveries were within acceptance limits.
MATRIX SPIKE/MATRIX SPIKE DUPLICATE RESULTS
Matrix spike/matrix spike duplicates (MS/MSD) are field samples spiked with target analytes to provide information on laboratory precision and accuracy specific to the sample matrix. The MS/MSD samples were extracted and analyzed at the required frequency. All recoveries were within acceptance limits for percent recovery and relative percent differences (RPDs).
DTNA-001-14Oct-QAQC-water.doc PAGE 3
LABORATORY CONTROL SAMPLE/LABORATORY CONTROL
SAMPLE DUPLICATE RESULTS
Laboratory control sample/laboratory control sample duplicates (LCS/LCSD) are laboratory prepared samples spiked with target analytes to provide information on laboratory precision and accuracy independent of possible field sample matrix interference. LCS extractions and analyses were performed at the required frequency. Recoveries for three Method 625 LCS/LCSD analytes and one additional LCSD analyte were marginally above the upper limits but still below 100%. Continuing calibration verification standards (CCVs) met criteria and no degradation of data quality is suspected.
RPD for one Method 625 LCS/LCSD analyte pair exceeded the RPD limit by less than 6%.
All other LCS/LCSD analytes were within acceptance limits for percent recovery and RPD.
LABORATORY DUPLICATE RESULTS
A laboratory duplicate is a sample that is split into subsamples at the lab. Each subsample is then analyzed and the results compared to test the precision of the laboratory measurements. The laboratory duplicate for total suspended solids exceeded the RPD limit. The laboratory assigned an RF qualifier to indicate a duplicate failure due to the result being at or near the method reporting limit. No degradation of data quality is suspected.
FIELD DUPLICATE RESULTS
Field duplicates were not required for this sampling event.
REPORTING LIMITS
SA, NRC, and ARI used routine reporting limits for non-detect results, with the exception of samples requiring dilutions because of high analyte concentrations and/or matrix interferences.
DATA PACKAGE
The data package was reviewed for transcription errors, omissions, and anomalies. None were found.
DTNA-001-14Oct-QAQC-water.doc
REFERENCES
USEPA. 2008. USEPA contract laboratory program, national functional guidelines for
organics data review. EPA 540/R-08/01. U.S. Environmental Protection Agency, Office of Emergency and Remedial Response. June.
USEPA. 2010. USEPA contract laboratory program, national functional guidelines for inorganics data review. EPA 540/R-94/013. U.S. Environmental Protection Agency, Office of Superfund Remediation and Technology Innovation. January.
SA. 2012. Quality assurance manual. Specialty Analytical, Clackamas, Oregon.
APHA. 2012. American Public Health Association (APHA), American Water Works Association (AWWA), Water Environment Federation (WEF), 2012. Standard Methods for the Examination of Water and Wastewater, 22nd Ed.
November 19, 2014
Bridgewater Group Inc.Anna St. John
Dear Anna St. John:
RE: SCE / DTNA-001
Order No.: 1410089
FAX (503) 675-1960TEL: (503) 675-5252
4500 SW Kruse WaySte 110Lake Oswego, OR 97035
Specialty Analytical11711 SE Capps Road, Ste B
Clackamas, Oregon 97015
Website: www.specialtyanalytical.comTEL: 503-607-1331 FAX: 503-607-1336
Specialty Analytical received 2 sample(s) on 10/14/2014 for the analyses presented in the following report.
Marty French
REVISED REPORT: Please see case narrative for information on revision.
There were no problems with the analysis and all data for associated QC met EPA or laboratory specifications, except where noted in the Case Narrative, or as qualified with flags. Results apply only to the samples analyzed. Without approval of the laboratory, the reproduction of this report is only permitted in its entirety.
If you have any questions regarding these tests, please feel free to call.
Sincerely,
Lab Director
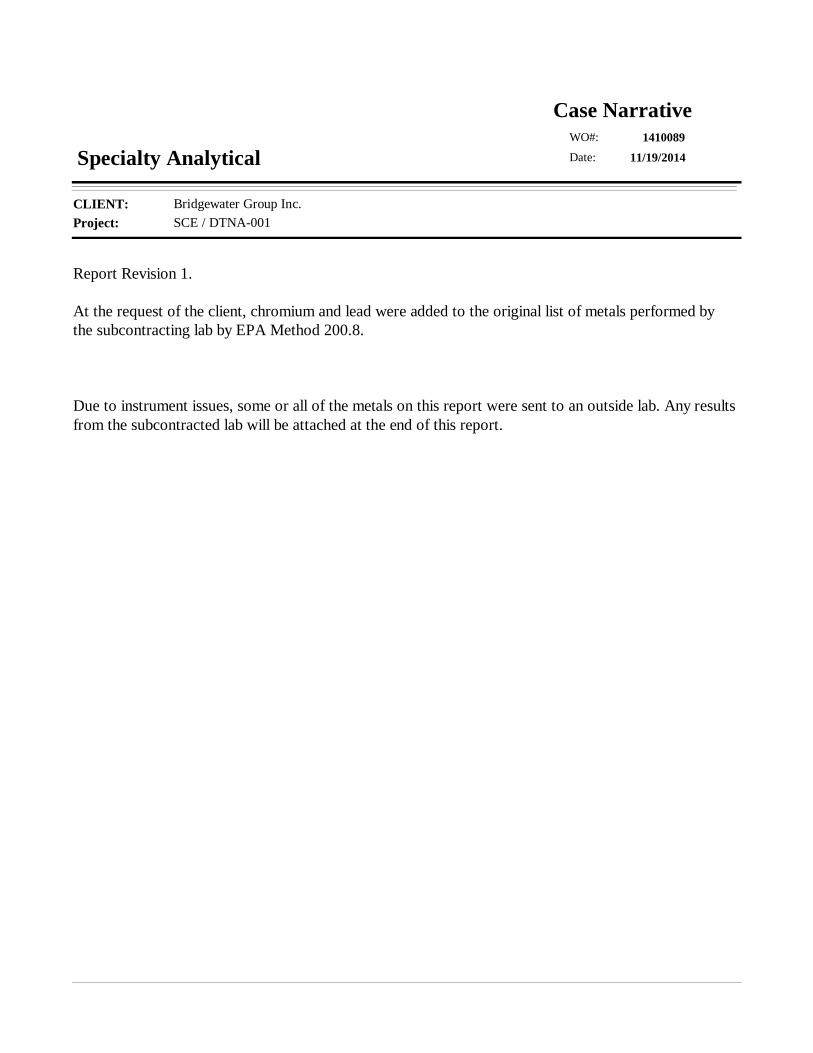
Project: SCE / DTNA-001CLIENT: Bridgewater Group Inc.
11/19/2014
Case Narrative1410089
Date:
WO#:
Specialty Analytical
Report Revision 1.
At the request of the client, chromium and lead were added to the original list of metals performed by the subcontracting lab by EPA Method 200.8.
Due to instrument issues, some or all of the metals on this report were sent to an outside lab. Any results from the subcontracted lab will be attached at the end of this report.
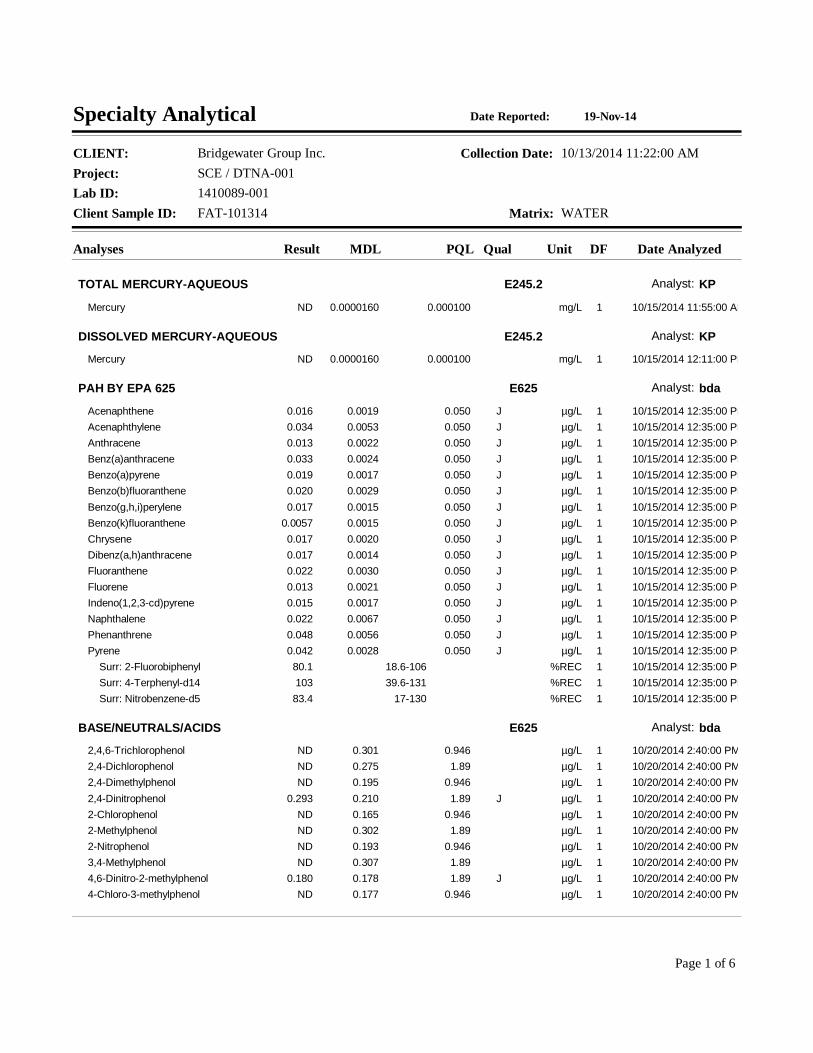
Project: SCE / DTNA-001
Client Sample ID: FAT-101314
Collection Date: 10/13/2014 11:22:00 AM
Matrix: WATER
CLIENT: Bridgewater Group Inc.
Lab ID: 1410089-001
19-Nov-14Specialty Analytical Date Reported:
Analyses Result Qual Unit Date AnalyzedDFMDL PQL
TOTAL MERCURY-AQUEOUS E245.2 Analyst: KP
Mercury 10/15/2014 11:55:00 AM0.0000160 mg/L 1ND 0.000100
DISSOLVED MERCURY-AQUEOUS E245.2 Analyst: KP
Mercury 10/15/2014 12:11:00 PM0.0000160 mg/L 1ND 0.000100
PAH BY EPA 625 E625 Analyst: bda
Acenaphthene J 10/15/2014 12:35:00 PM0.0019 µg/L 10.016 0.050
Acenaphthylene J 10/15/2014 12:35:00 PM0.0053 µg/L 10.034 0.050
Anthracene J 10/15/2014 12:35:00 PM0.0022 µg/L 10.013 0.050
Benz(a)anthracene J 10/15/2014 12:35:00 PM0.0024 µg/L 10.033 0.050
Benzo(a)pyrene J 10/15/2014 12:35:00 PM0.0017 µg/L 10.019 0.050
Benzo(b)fluoranthene J 10/15/2014 12:35:00 PM0.0029 µg/L 10.020 0.050
Benzo(g,h,i)perylene J 10/15/2014 12:35:00 PM0.0015 µg/L 10.017 0.050
Benzo(k)fluoranthene J 10/15/2014 12:35:00 PM0.0015 µg/L 10.0057 0.050
Chrysene J 10/15/2014 12:35:00 PM0.0020 µg/L 10.017 0.050
Dibenz(a,h)anthracene J 10/15/2014 12:35:00 PM0.0014 µg/L 10.017 0.050
Fluoranthene J 10/15/2014 12:35:00 PM0.0030 µg/L 10.022 0.050
Fluorene J 10/15/2014 12:35:00 PM0.0021 µg/L 10.013 0.050
Indeno(1,2,3-cd)pyrene J 10/15/2014 12:35:00 PM0.0017 µg/L 10.015 0.050
Naphthalene J 10/15/2014 12:35:00 PM0.0067 µg/L 10.022 0.050
Phenanthrene J 10/15/2014 12:35:00 PM0.0056 µg/L 10.048 0.050
Pyrene J 10/15/2014 12:35:00 PM0.0028 µg/L 10.042 0.050
Surr: 2-Fluorobiphenyl 10/15/2014 12:35:00 PM%REC 180.1 18.6-106
Surr: 4-Terphenyl-d14 10/15/2014 12:35:00 PM%REC 1103 39.6-131
Surr: Nitrobenzene-d5 10/15/2014 12:35:00 PM%REC 183.4 17-130
BASE/NEUTRALS/ACIDS E625 Analyst: bda
2,4,6-Trichlorophenol 10/20/2014 2:40:00 PM0.301 µg/L 1ND 0.946
2,4-Dichlorophenol 10/20/2014 2:40:00 PM0.275 µg/L 1ND 1.89
2,4-Dimethylphenol 10/20/2014 2:40:00 PM0.195 µg/L 1ND 0.946
2,4-Dinitrophenol J 10/20/2014 2:40:00 PM0.210 µg/L 10.293 1.89
2-Chlorophenol 10/20/2014 2:40:00 PM0.165 µg/L 1ND 0.946
2-Methylphenol 10/20/2014 2:40:00 PM0.302 µg/L 1ND 1.89
2-Nitrophenol 10/20/2014 2:40:00 PM0.193 µg/L 1ND 0.946
3,4-Methylphenol 10/20/2014 2:40:00 PM0.307 µg/L 1ND 1.89
4,6-Dinitro-2-methylphenol J 10/20/2014 2:40:00 PM0.178 µg/L 10.180 1.89
4-Chloro-3-methylphenol 10/20/2014 2:40:00 PM0.177 µg/L 1ND 0.946
Page 1 of 6
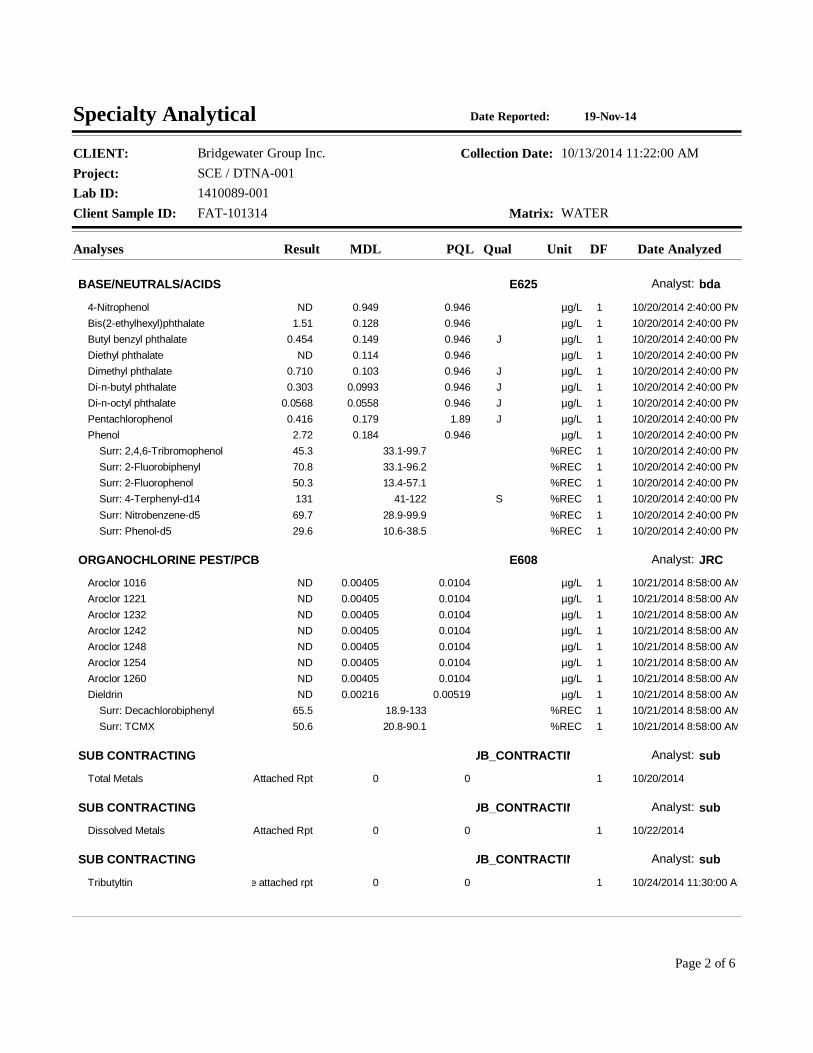
Project: SCE / DTNA-001
Client Sample ID: FAT-101314
Collection Date: 10/13/2014 11:22:00 AM
Matrix: WATER
CLIENT: Bridgewater Group Inc.
Lab ID: 1410089-001
19-Nov-14Specialty Analytical Date Reported:
Analyses Result Qual Unit Date AnalyzedDFMDL PQL
BASE/NEUTRALS/ACIDS E625 Analyst: bda
4-Nitrophenol 10/20/2014 2:40:00 PM0.949 µg/L 1ND 0.946
Bis(2-ethylhexyl)phthalate 10/20/2014 2:40:00 PM0.128 µg/L 11.51 0.946
Butyl benzyl phthalate J 10/20/2014 2:40:00 PM0.149 µg/L 10.454 0.946
Diethyl phthalate 10/20/2014 2:40:00 PM0.114 µg/L 1ND 0.946
Dimethyl phthalate J 10/20/2014 2:40:00 PM0.103 µg/L 10.710 0.946
Di-n-butyl phthalate J 10/20/2014 2:40:00 PM0.0993 µg/L 10.303 0.946
Di-n-octyl phthalate J 10/20/2014 2:40:00 PM0.0558 µg/L 10.0568 0.946
Pentachlorophenol J 10/20/2014 2:40:00 PM0.179 µg/L 10.416 1.89
Phenol 10/20/2014 2:40:00 PM0.184 µg/L 12.72 0.946
Surr: 2,4,6-Tribromophenol 10/20/2014 2:40:00 PM%REC 145.3 33.1-99.7
Surr: 2-Fluorobiphenyl 10/20/2014 2:40:00 PM%REC 170.8 33.1-96.2
Surr: 2-Fluorophenol 10/20/2014 2:40:00 PM%REC 150.3 13.4-57.1
Surr: 4-Terphenyl-d14 S 10/20/2014 2:40:00 PM%REC 1131 41-122
Surr: Nitrobenzene-d5 10/20/2014 2:40:00 PM%REC 169.7 28.9-99.9
Surr: Phenol-d5 10/20/2014 2:40:00 PM%REC 129.6 10.6-38.5
ORGANOCHLORINE PEST/PCB E608 Analyst: JRC
Aroclor 1016 10/21/2014 8:58:00 AM0.00405 µg/L 1ND 0.0104
Aroclor 1221 10/21/2014 8:58:00 AM0.00405 µg/L 1ND 0.0104
Aroclor 1232 10/21/2014 8:58:00 AM0.00405 µg/L 1ND 0.0104
Aroclor 1242 10/21/2014 8:58:00 AM0.00405 µg/L 1ND 0.0104
Aroclor 1248 10/21/2014 8:58:00 AM0.00405 µg/L 1ND 0.0104
Aroclor 1254 10/21/2014 8:58:00 AM0.00405 µg/L 1ND 0.0104
Aroclor 1260 10/21/2014 8:58:00 AM0.00405 µg/L 1ND 0.0104
Dieldrin 10/21/2014 8:58:00 AM0.00216 µg/L 1ND 0.00519
Surr: Decachlorobiphenyl 10/21/2014 8:58:00 AM%REC 165.5 18.9-133
Surr: TCMX 10/21/2014 8:58:00 AM%REC 150.6 20.8-90.1
SUB CONTRACTING SUB_CONTRACTING Analyst: sub
Total Metals 10/20/20140 1See Attached Rpt 0
SUB CONTRACTING SUB_CONTRACTING Analyst: sub
Dissolved Metals 10/22/20140 1See Attached Rpt 0
SUB CONTRACTING SUB_CONTRACTING Analyst: sub
Tributyltin 10/24/2014 11:30:00 AM0 1See attached rpt 0
Page 2 of 6
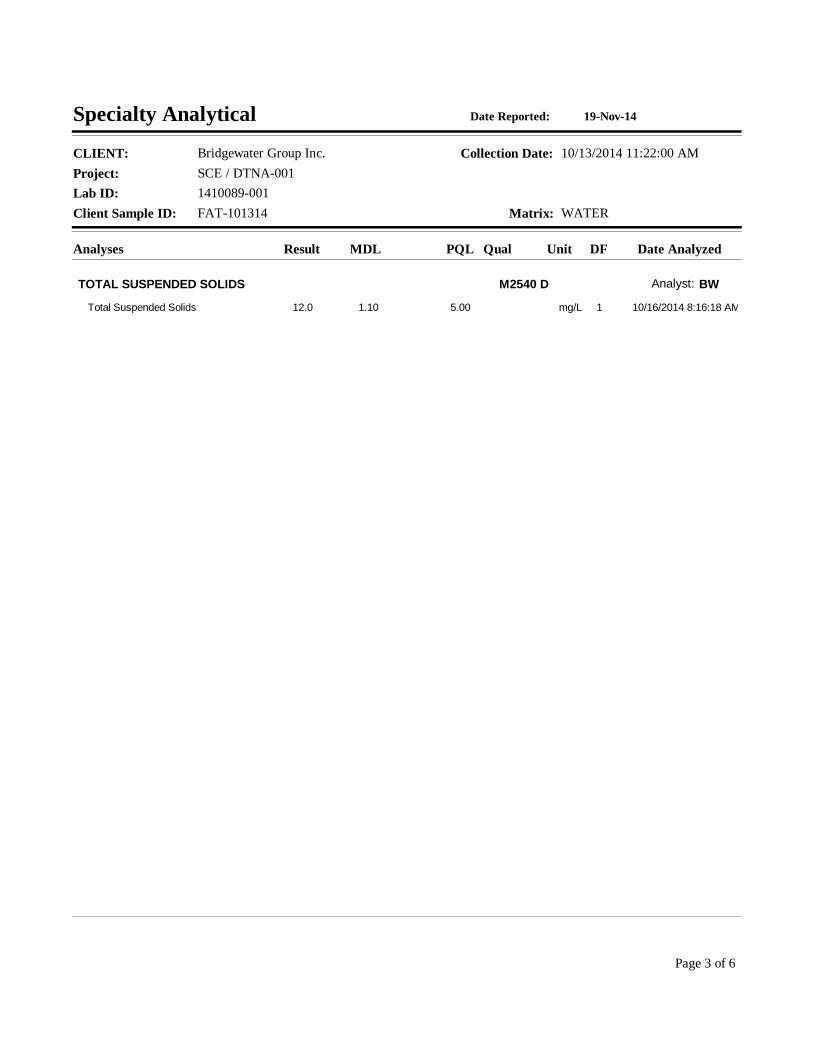
Project: SCE / DTNA-001
Client Sample ID: FAT-101314
Collection Date: 10/13/2014 11:22:00 AM
Matrix: WATER
CLIENT: Bridgewater Group Inc.
Lab ID: 1410089-001
19-Nov-14Specialty Analytical Date Reported:
Analyses Result Qual Unit Date AnalyzedDFMDL PQL
TOTAL SUSPENDED SOLIDS M2540 D Analyst: BW
Total Suspended Solids 10/16/2014 8:16:18 AM1.10 mg/L 112.0 5.00
Page 3 of 6

Project: SCE / DTNA-001
Client Sample ID: ENS-101314
Collection Date: 10/13/2014 11:57:00 AM
Matrix: WATER
CLIENT: Bridgewater Group Inc.
Lab ID: 1410089-002
19-Nov-14Specialty Analytical Date Reported:
Analyses Result Qual Unit Date AnalyzedDFMDL PQL
TOTAL MERCURY-AQUEOUS E245.2 Analyst: KP
Mercury 10/15/2014 11:57:00 AM0.0000160 mg/L 1ND 0.000100
DISSOLVED MERCURY-AQUEOUS E245.2 Analyst: KP
Mercury 10/15/2014 12:13:00 PM0.0000160 mg/L 1ND 0.000100
PAH BY EPA 625 E625 Analyst: bda
Acenaphthene J 10/15/2014 1:00:00 PM0.0018 µg/L 10.016 0.048
Acenaphthylene J 10/15/2014 1:00:00 PM0.0051 µg/L 10.017 0.048
Anthracene J 10/15/2014 1:00:00 PM0.0021 µg/L 10.028 0.048
Benz(a)anthracene 10/15/2014 1:00:00 PM0.0023 µg/L 10.056 0.048
Benzo(a)pyrene J 10/15/2014 1:00:00 PM0.0016 µg/L 10.031 0.048
Benzo(b)fluoranthene 10/15/2014 1:00:00 PM0.0028 µg/L 10.067 0.048
Benzo(g,h,i)perylene 10/15/2014 1:00:00 PM0.0014 µg/L 10.11 0.048
Benzo(k)fluoranthene J 10/15/2014 1:00:00 PM0.0014 µg/L 10.025 0.048
Chrysene 10/15/2014 1:00:00 PM0.0019 µg/L 10.088 0.048
Dibenz(a,h)anthracene J 10/15/2014 1:00:00 PM0.0014 µg/L 10.031 0.048
Fluoranthene 10/15/2014 1:00:00 PM0.0028 µg/L 10.076 0.048
Fluorene J 10/15/2014 1:00:00 PM0.0020 µg/L 10.023 0.048
Indeno(1,2,3-cd)pyrene J 10/15/2014 1:00:00 PM0.0016 µg/L 10.031 0.048
Naphthalene J 10/15/2014 1:00:00 PM0.0064 µg/L 10.022 0.048
Phenanthrene 10/15/2014 1:00:00 PM0.0054 µg/L 10.12 0.048
Pyrene 10/15/2014 1:00:00 PM0.0027 µg/L 10.21 0.048
Surr: 2-Fluorobiphenyl 10/15/2014 1:00:00 PM%REC 183.8 18.6-106
Surr: 4-Terphenyl-d14 10/15/2014 1:00:00 PM%REC 1107 39.6-131
Surr: Nitrobenzene-d5 10/15/2014 1:00:00 PM%REC 184.6 17-130
BASE/NEUTRALS/ACIDS E625 Analyst: bda
2,4,6-Trichlorophenol 10/20/2014 3:09:00 PM0.311 µg/L 1ND 0.978
2,4-Dichlorophenol 10/20/2014 3:09:00 PM0.284 µg/L 1ND 1.96
2,4-Dimethylphenol 10/20/2014 3:09:00 PM0.201 µg/L 1ND 0.978
2,4-Dinitrophenol 10/20/2014 3:09:00 PM0.217 µg/L 1ND 1.96
2-Chlorophenol 10/20/2014 3:09:00 PM0.170 µg/L 1ND 0.978
2-Methylphenol 10/20/2014 3:09:00 PM0.312 µg/L 1ND 1.96
2-Nitrophenol 10/20/2014 3:09:00 PM0.199 µg/L 1ND 0.978
3,4-Methylphenol 10/20/2014 3:09:00 PM0.317 µg/L 1ND 1.96
4,6-Dinitro-2-methylphenol 10/20/2014 3:09:00 PM0.184 µg/L 1ND 1.96
4-Chloro-3-methylphenol 10/20/2014 3:09:00 PM0.183 µg/L 1ND 0.978
Page 4 of 6
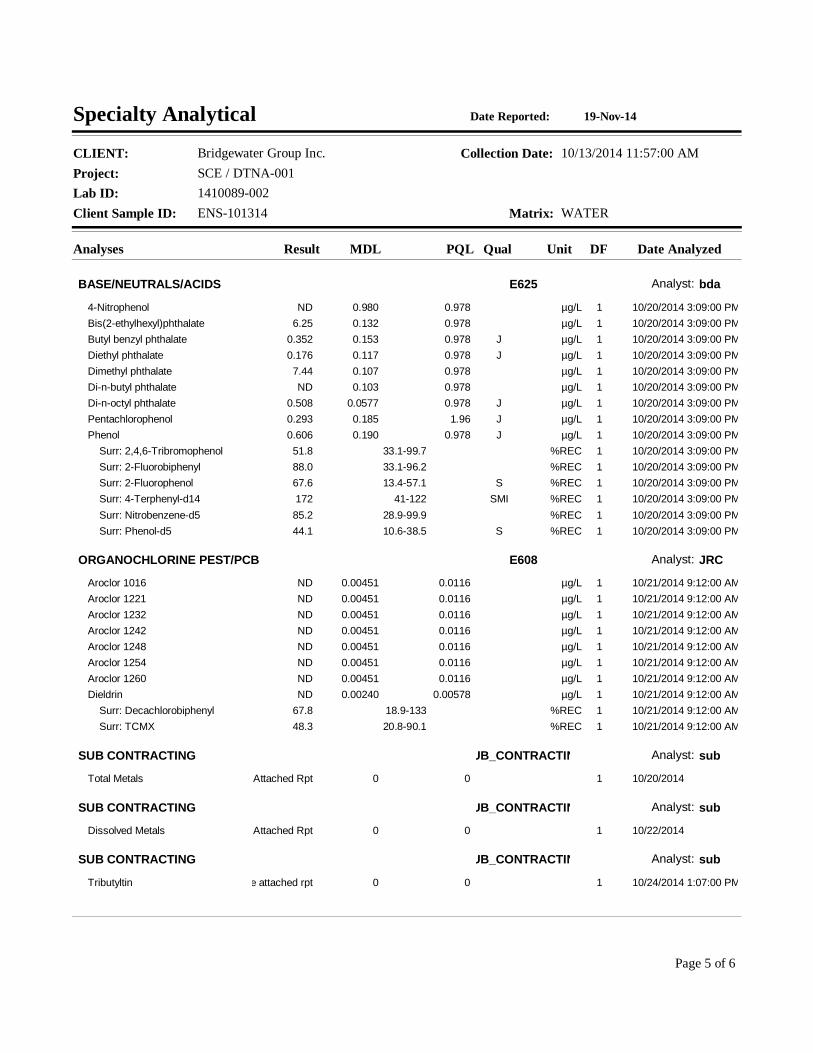
Project: SCE / DTNA-001
Client Sample ID: ENS-101314
Collection Date: 10/13/2014 11:57:00 AM
Matrix: WATER
CLIENT: Bridgewater Group Inc.
Lab ID: 1410089-002
19-Nov-14Specialty Analytical Date Reported:
Analyses Result Qual Unit Date AnalyzedDFMDL PQL
BASE/NEUTRALS/ACIDS E625 Analyst: bda
4-Nitrophenol 10/20/2014 3:09:00 PM0.980 µg/L 1ND 0.978
Bis(2-ethylhexyl)phthalate 10/20/2014 3:09:00 PM0.132 µg/L 16.25 0.978
Butyl benzyl phthalate J 10/20/2014 3:09:00 PM0.153 µg/L 10.352 0.978
Diethyl phthalate J 10/20/2014 3:09:00 PM0.117 µg/L 10.176 0.978
Dimethyl phthalate 10/20/2014 3:09:00 PM0.107 µg/L 17.44 0.978
Di-n-butyl phthalate 10/20/2014 3:09:00 PM0.103 µg/L 1ND 0.978
Di-n-octyl phthalate J 10/20/2014 3:09:00 PM0.0577 µg/L 10.508 0.978
Pentachlorophenol J 10/20/2014 3:09:00 PM0.185 µg/L 10.293 1.96
Phenol J 10/20/2014 3:09:00 PM0.190 µg/L 10.606 0.978
Surr: 2,4,6-Tribromophenol 10/20/2014 3:09:00 PM%REC 151.8 33.1-99.7
Surr: 2-Fluorobiphenyl 10/20/2014 3:09:00 PM%REC 188.0 33.1-96.2
Surr: 2-Fluorophenol S 10/20/2014 3:09:00 PM%REC 167.6 13.4-57.1
Surr: 4-Terphenyl-d14 SMI 10/20/2014 3:09:00 PM%REC 1172 41-122
Surr: Nitrobenzene-d5 10/20/2014 3:09:00 PM%REC 185.2 28.9-99.9
Surr: Phenol-d5 S 10/20/2014 3:09:00 PM%REC 144.1 10.6-38.5
ORGANOCHLORINE PEST/PCB E608 Analyst: JRC
Aroclor 1016 10/21/2014 9:12:00 AM0.00451 µg/L 1ND 0.0116
Aroclor 1221 10/21/2014 9:12:00 AM0.00451 µg/L 1ND 0.0116
Aroclor 1232 10/21/2014 9:12:00 AM0.00451 µg/L 1ND 0.0116
Aroclor 1242 10/21/2014 9:12:00 AM0.00451 µg/L 1ND 0.0116
Aroclor 1248 10/21/2014 9:12:00 AM0.00451 µg/L 1ND 0.0116
Aroclor 1254 10/21/2014 9:12:00 AM0.00451 µg/L 1ND 0.0116
Aroclor 1260 10/21/2014 9:12:00 AM0.00451 µg/L 1ND 0.0116
Dieldrin 10/21/2014 9:12:00 AM0.00240 µg/L 1ND 0.00578
Surr: Decachlorobiphenyl 10/21/2014 9:12:00 AM%REC 167.8 18.9-133
Surr: TCMX 10/21/2014 9:12:00 AM%REC 148.3 20.8-90.1
SUB CONTRACTING SUB_CONTRACTING Analyst: sub
Total Metals 10/20/20140 1See Attached Rpt 0
SUB CONTRACTING SUB_CONTRACTING Analyst: sub
Dissolved Metals 10/22/20140 1See Attached Rpt 0
SUB CONTRACTING SUB_CONTRACTING Analyst: sub
Tributyltin 10/24/2014 1:07:00 PM0 1See attached rpt 0
Page 5 of 6

Project: SCE / DTNA-001
Client Sample ID: ENS-101314
Collection Date: 10/13/2014 11:57:00 AM
Matrix: WATER
CLIENT: Bridgewater Group Inc.
Lab ID: 1410089-002
19-Nov-14Specialty Analytical Date Reported:
Analyses Result Qual Unit Date AnalyzedDFMDL PQL
TOTAL SUSPENDED SOLIDS M2540 D Analyst: BW
Total Suspended Solids 10/16/2014 8:20:18 AM1.10 mg/L 162.0 5.00
Page 6 of 6
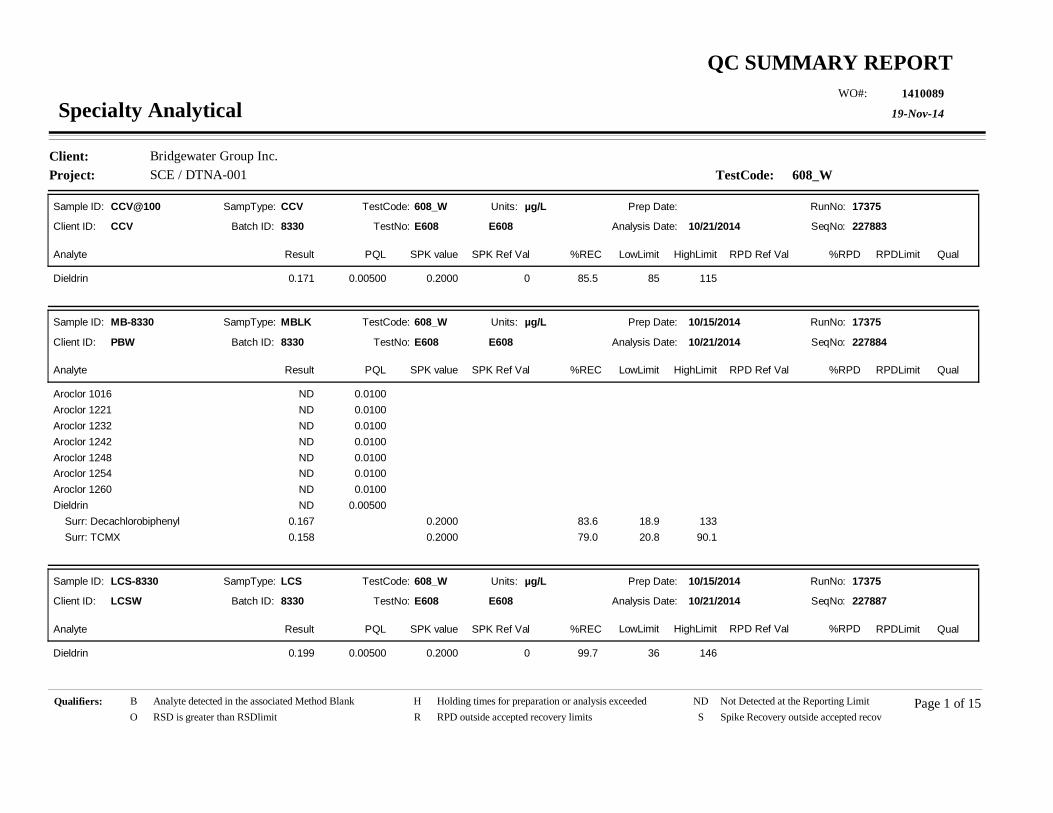
Project: SCE / DTNA-001Client: Bridgewater Group Inc.
TestCode: 608_W
19-Nov-14
QC SUMMARY REPORT1410089WO#:
Specialty Analytical
Sample ID: CCV@100
Batch ID: 8330 TestNo: E608 Analysis Date: 10/21/2014
Prep Date:
Analyte Result SPK value SPK Ref Val %REC RPD Ref Val %RPDLowLimit HighLimit RPDLimit Qual
Units: µg/L
PQL
Client ID: CCV
RunNo: 17375
SeqNo: 227883
CCVSampType: TestCode: 608_W
E608
Dieldrin 0.2000 85.5 85 1150.00500 00.171
Sample ID: MB-8330
Batch ID: 8330 TestNo: E608 Analysis Date: 10/21/2014
Prep Date: 10/15/2014
Analyte Result SPK value SPK Ref Val %REC RPD Ref Val %RPDLowLimit HighLimit RPDLimit Qual
Units: µg/L
PQL
Client ID: PBW
RunNo: 17375
SeqNo: 227884
MBLKSampType: TestCode: 608_W
E608
Aroclor 1016 0.0100ND
Aroclor 1221 0.0100ND
Aroclor 1232 0.0100ND
Aroclor 1242 0.0100ND
Aroclor 1248 0.0100ND
Aroclor 1254 0.0100ND
Aroclor 1260 0.0100ND
Dieldrin 0.00500ND
Surr: Decachlorobiphenyl 0.2000 83.6 18.9 1330.167
Surr: TCMX 0.2000 79.0 20.8 90.10.158
Sample ID: LCS-8330
Batch ID: 8330 TestNo: E608 Analysis Date: 10/21/2014
Prep Date: 10/15/2014
Analyte Result SPK value SPK Ref Val %REC RPD Ref Val %RPDLowLimit HighLimit RPDLimit Qual
Units: µg/L
PQL
Client ID: LCSW
RunNo: 17375
SeqNo: 227887
LCSSampType: TestCode: 608_W
E608
Dieldrin 0.2000 99.7 36 1460.00500 00.199
Qualifiers: Page 1 of 15B Analyte detected in the associated Method Blank H Holding times for preparation or analysis exceeded ND Not Detected at the Reporting LimitO RSD is greater than RSDlimit R RPD outside accepted recovery limits S Spike Recovery outside accepted recovery limits

Project: SCE / DTNA-001Client: Bridgewater Group Inc.
TestCode: 608_W
19-Nov-14
QC SUMMARY REPORT1410089WO#:
Specialty Analytical
Sample ID: LCSD-8330
Batch ID: 8330 TestNo: E608 Analysis Date: 10/21/2014
Prep Date: 10/15/2014
Analyte Result SPK value SPK Ref Val %REC RPD Ref Val %RPDLowLimit HighLimit RPDLimit Qual
Units: µg/L
PQL
Client ID: LCSS02
RunNo: 17375
SeqNo: 227888
LCSDSampType: TestCode: 608_W
E608
Dieldrin 0.2000 113 36 146 200.00500 0 0.1994 12.10.225
Sample ID: ccv@100
Batch ID: 8330 TestNo: E608 Analysis Date: 10/21/2014
Prep Date:
Analyte Result SPK value SPK Ref Val %REC RPD Ref Val %RPDLowLimit HighLimit RPDLimit Qual
Units: µg/L
PQL
Client ID: CCV
RunNo: 17375
SeqNo: 227889
CCVSampType: TestCode: 608_W
E608
Dieldrin 0.2000 107 85 1150.00500 00.214
Qualifiers: Page 2 of 15B Analyte detected in the associated Method Blank H Holding times for preparation or analysis exceeded ND Not Detected at the Reporting LimitO RSD is greater than RSDlimit R RPD outside accepted recovery limits S Spike Recovery outside accepted recovery limits
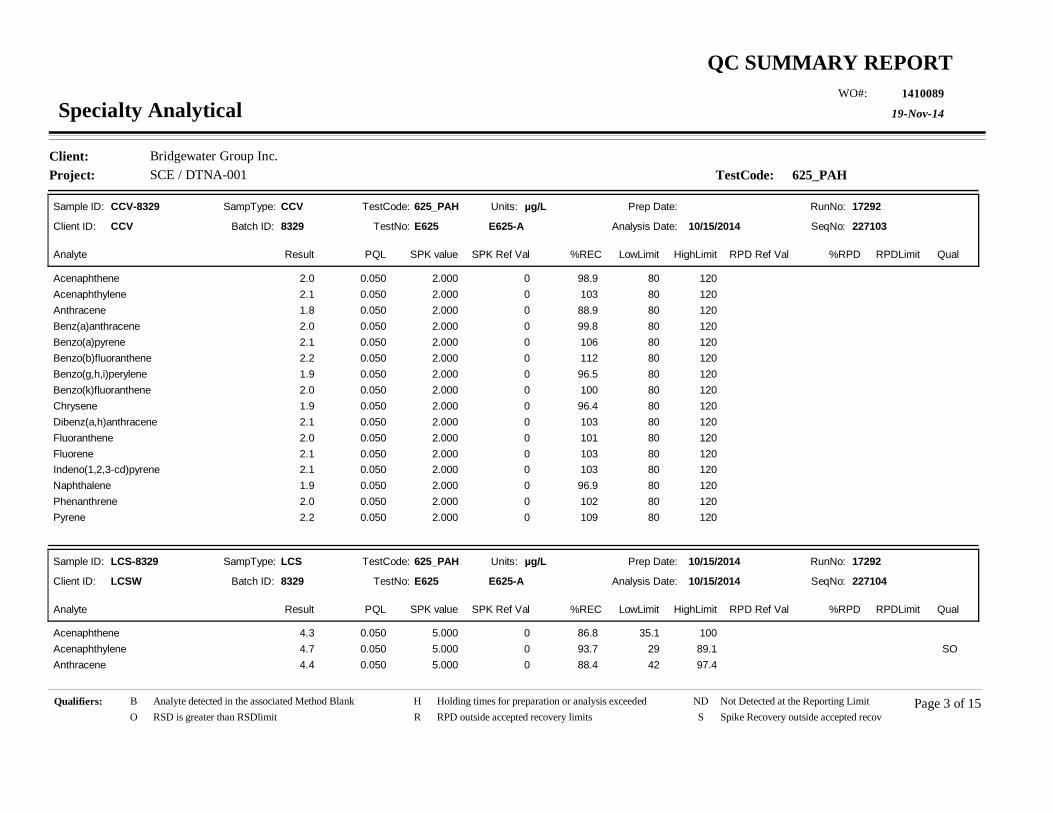
Project: SCE / DTNA-001Client: Bridgewater Group Inc.
TestCode: 625_PAH
19-Nov-14
QC SUMMARY REPORT1410089WO#:
Specialty Analytical
Sample ID: CCV-8329
Batch ID: 8329 TestNo: E625 Analysis Date: 10/15/2014
Prep Date:
Analyte Result SPK value SPK Ref Val %REC RPD Ref Val %RPDLowLimit HighLimit RPDLimit Qual
Units: µg/L
PQL
Client ID: CCV
RunNo: 17292
SeqNo: 227103
CCVSampType: TestCode: 625_PAH
E625-A
Acenaphthene 2.000 98.9 80 1200.050 02.0
Acenaphthylene 2.000 103 80 1200.050 02.1
Anthracene 2.000 88.9 80 1200.050 01.8
Benz(a)anthracene 2.000 99.8 80 1200.050 02.0
Benzo(a)pyrene 2.000 106 80 1200.050 02.1
Benzo(b)fluoranthene 2.000 112 80 1200.050 02.2
Benzo(g,h,i)perylene 2.000 96.5 80 1200.050 01.9
Benzo(k)fluoranthene 2.000 100 80 1200.050 02.0
Chrysene 2.000 96.4 80 1200.050 01.9
Dibenz(a,h)anthracene 2.000 103 80 1200.050 02.1
Fluoranthene 2.000 101 80 1200.050 02.0
Fluorene 2.000 103 80 1200.050 02.1
Indeno(1,2,3-cd)pyrene 2.000 103 80 1200.050 02.1
Naphthalene 2.000 96.9 80 1200.050 01.9
Phenanthrene 2.000 102 80 1200.050 02.0
Pyrene 2.000 109 80 1200.050 02.2
Sample ID: LCS-8329
Batch ID: 8329 TestNo: E625 Analysis Date: 10/15/2014
Prep Date: 10/15/2014
Analyte Result SPK value SPK Ref Val %REC RPD Ref Val %RPDLowLimit HighLimit RPDLimit Qual
Units: µg/L
PQL
Client ID: LCSW
RunNo: 17292
SeqNo: 227104
LCSSampType: TestCode: 625_PAH
E625-A
Acenaphthene 5.000 86.8 35.1 1000.050 04.3
Acenaphthylene 5.000 93.7 29 89.1 SO0.050 04.7
Anthracene 5.000 88.4 42 97.40.050 04.4
Qualifiers: Page 3 of 15B Analyte detected in the associated Method Blank H Holding times for preparation or analysis exceeded ND Not Detected at the Reporting LimitO RSD is greater than RSDlimit R RPD outside accepted recovery limits S Spike Recovery outside accepted recovery limits

Project: SCE / DTNA-001Client: Bridgewater Group Inc.
TestCode: 625_PAH
19-Nov-14
QC SUMMARY REPORT1410089WO#:
Specialty Analytical
Sample ID: LCS-8329
Batch ID: 8329 TestNo: E625 Analysis Date: 10/15/2014
Prep Date: 10/15/2014
Analyte Result SPK value SPK Ref Val %REC RPD Ref Val %RPDLowLimit HighLimit RPDLimit Qual
Units: µg/L
PQL
Client ID: LCSW
RunNo: 17292
SeqNo: 227104
LCSSampType: TestCode: 625_PAH
E625-A
Benz(a)anthracene 5.000 91.7 34.2 95.80.050 04.6
Benzo(a)pyrene 5.000 96.4 23.4 1030.050 04.8
Benzo(b)fluoranthene 5.000 98.1 36.6 99.50.050 04.9
Benzo(g,h,i)perylene 5.000 89.2 20.8 1200.050 04.5
Benzo(k)fluoranthene 5.000 91.3 39.7 93.40.050 04.6
Chrysene 5.000 81.0 39.1 1190.050 04.0
Dibenz(a,h)anthracene 5.000 89.9 5.05 89 SO0.050 04.5
Fluoranthene 5.000 92.1 42.4 95.90.050 04.6
Fluorene 5.000 91.3 37.4 88.4 SO0.050 04.6
Indeno(1,2,3-cd)pyrene 5.000 88.1 10.5 98.40.050 04.4
Naphthalene 5.000 77.3 25.6 1060.050 03.9
Phenanthrene 5.000 90.7 38.1 1060.050 04.5
Pyrene 5.000 100 41.3 1180.050 05.0
Sample ID: LCSD-8329
Batch ID: 8329 TestNo: E625 Analysis Date: 10/15/2014
Prep Date: 10/15/2014
Analyte Result SPK value SPK Ref Val %REC RPD Ref Val %RPDLowLimit HighLimit RPDLimit Qual
Units: µg/L
PQL
Client ID: LCSS02
RunNo: 17292
SeqNo: 227105
LCSDSampType: TestCode: 625_PAH
E625-A
Acenaphthene 5.000 85.8 35.1 100 200.050 0 4.338 1.104.3
Acenaphthylene 5.000 92.0 29 89.1 20 SO0.050 0 4.686 1.904.6
Anthracene 5.000 85.5 42 97.4 200.050 0 4.422 3.384.3
Benz(a)anthracene 5.000 91.6 34.2 95.8 200.050 0 4.585 0.06354.6
Benzo(a)pyrene 5.000 95.6 23.4 103 200.050 0 4.819 0.7864.8
Benzo(b)fluoranthene 5.000 100 36.6 99.5 20 SO0.050 0 4.903 2.325.0
Qualifiers: Page 4 of 15B Analyte detected in the associated Method Blank H Holding times for preparation or analysis exceeded ND Not Detected at the Reporting LimitO RSD is greater than RSDlimit R RPD outside accepted recovery limits S Spike Recovery outside accepted recovery limits

Project: SCE / DTNA-001Client: Bridgewater Group Inc.
TestCode: 625_PAH
19-Nov-14
QC SUMMARY REPORT1410089WO#:
Specialty Analytical
Sample ID: LCSD-8329
Batch ID: 8329 TestNo: E625 Analysis Date: 10/15/2014
Prep Date: 10/15/2014
Analyte Result SPK value SPK Ref Val %REC RPD Ref Val %RPDLowLimit HighLimit RPDLimit Qual
Units: µg/L
PQL
Client ID: LCSS02
RunNo: 17292
SeqNo: 227105
LCSDSampType: TestCode: 625_PAH
E625-A
Benzo(g,h,i)perylene 5.000 90.0 20.8 120 200.050 0 4.459 0.9654.5
Benzo(k)fluoranthene 5.000 91.9 39.7 93.4 200.050 0 4.564 0.6814.6
Chrysene 5.000 81.1 39.1 119 200.050 0 4.048 0.1384.1
Dibenz(a,h)anthracene 5.000 89.6 5.05 89 20 SO0.050 0 4.497 0.3744.5
Fluoranthene 5.000 92.2 42.4 95.9 200.050 0 4.607 0.09404.6
Fluorene 5.000 90.0 37.4 88.4 20 SO0.050 0 4.566 1.514.5
Indeno(1,2,3-cd)pyrene 5.000 88.3 10.5 98.4 200.050 0 4.403 0.2314.4
Naphthalene 5.000 74.5 25.6 106 200.050 0 3.866 3.733.7
Phenanthrene 5.000 89.0 38.1 106 200.050 0 4.534 1.874.5
Pyrene 5.000 98.1 41.3 118 200.050 0 5.000 1.944.9
Sample ID: MB-8329
Batch ID: 8329 TestNo: E625 Analysis Date: 10/15/2014
Prep Date: 10/15/2014
Analyte Result SPK value SPK Ref Val %REC RPD Ref Val %RPDLowLimit HighLimit RPDLimit Qual
Units: µg/L
PQL
Client ID: PBW
RunNo: 17292
SeqNo: 227106
MBLKSampType: TestCode: 625_PAH
E625-A
Acenaphthene J0.0500.011
Acenaphthylene J0.0500.0077
Anthracene J0.0500.0091
Benz(a)anthracene J0.0500.022
Benzo(a)pyrene J0.0500.013
Benzo(b)fluoranthene J0.0500.010
Benzo(g,h,i)perylene J0.0500.016
Benzo(k)fluoranthene J0.0500.0053
Chrysene J0.0500.011
Qualifiers: Page 5 of 15B Analyte detected in the associated Method Blank H Holding times for preparation or analysis exceeded ND Not Detected at the Reporting LimitO RSD is greater than RSDlimit R RPD outside accepted recovery limits S Spike Recovery outside accepted recovery limits
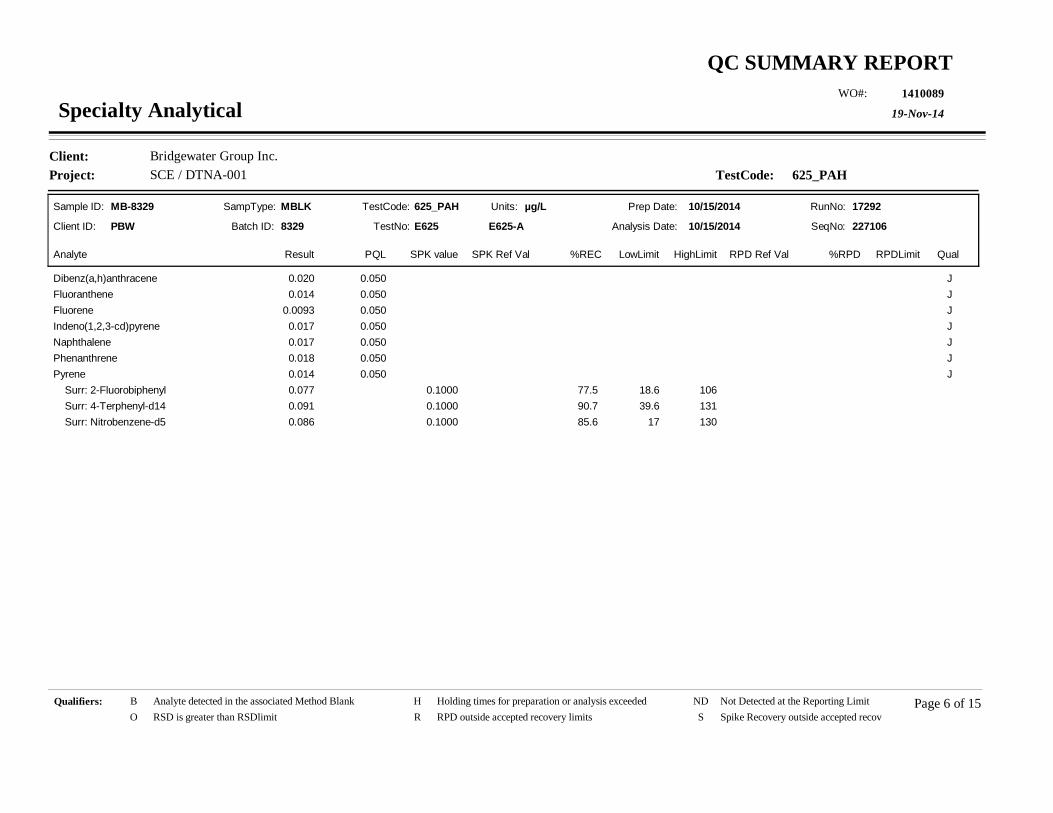
Project: SCE / DTNA-001Client: Bridgewater Group Inc.
TestCode: 625_PAH
19-Nov-14
QC SUMMARY REPORT1410089WO#:
Specialty Analytical
Sample ID: MB-8329
Batch ID: 8329 TestNo: E625 Analysis Date: 10/15/2014
Prep Date: 10/15/2014
Analyte Result SPK value SPK Ref Val %REC RPD Ref Val %RPDLowLimit HighLimit RPDLimit Qual
Units: µg/L
PQL
Client ID: PBW
RunNo: 17292
SeqNo: 227106
MBLKSampType: TestCode: 625_PAH
E625-A
Dibenz(a,h)anthracene J0.0500.020
Fluoranthene J0.0500.014
Fluorene J0.0500.0093
Indeno(1,2,3-cd)pyrene J0.0500.017
Naphthalene J0.0500.017
Phenanthrene J0.0500.018
Pyrene J0.0500.014
Surr: 2-Fluorobiphenyl 0.1000 77.5 18.6 1060.077
Surr: 4-Terphenyl-d14 0.1000 90.7 39.6 1310.091
Surr: Nitrobenzene-d5 0.1000 85.6 17 1300.086
Qualifiers: Page 6 of 15B Analyte detected in the associated Method Blank H Holding times for preparation or analysis exceeded ND Not Detected at the Reporting LimitO RSD is greater than RSDlimit R RPD outside accepted recovery limits S Spike Recovery outside accepted recovery limits

Project: SCE / DTNA-001Client: Bridgewater Group Inc.
TestCode: 625X_W
19-Nov-14
QC SUMMARY REPORT1410089WO#:
Specialty Analytical
Sample ID: LCSD-8354
Batch ID: 8354 TestNo: E625 Analysis Date: 10/20/2014
Prep Date: 10/17/2014
Analyte Result SPK value SPK Ref Val %REC RPD Ref Val %RPDLowLimit HighLimit RPDLimit Qual
Units: µg/L
PQL
Client ID: LCSS02
RunNo: 17365
SeqNo: 227779
LCSDSampType: TestCode: 625X_W
E625
2,4,6-Trichlorophenol 50.00 85.4 37 144 201.00 0 45.01 5.2742.7
2,4-Dichlorophenol 50.00 73.6 39 135 202.00 0 39.74 7.7436.8
2,4-Dimethylphenol 50.00 68.7 32 119 201.00 0 35.16 2.3934.3
2,4-Dinitrophenol 50.00 97.6 0.01 191 202.00 0 54.82 11.648.8
2-Chlorophenol 50.00 83.1 23 134 201.00 0 47.20 12.741.6
2-Methylphenol 50.00 71.0 46.9 80.3 02.00 0 40.13 12.335.5
2-Nitrophenol 50.00 90.5 29 182 201.00 0 47.89 5.6945.2
3,4-Methylphenol 50.00 68.2 38.4 83 02.00 0 39.29 14.134.1
4,6-Dinitro-2-methylphenol 50.00 105 0.01 181 202.00 0 59.16 11.952.5
4-Chloro-3-methylphenol 50.00 86.4 22 147 201.00 0 44.91 3.8643.2
4-Nitrophenol 50.00 54.4 0.01 132 201.00 0 29.49 8.1527.2
Bis(2-ethylhexyl)phthalate 50.00 114 8 158 201.00 0 56.23 1.5257.1
Butyl benzyl phthalate 50.00 109 0.01 152 20 R1.00 0 42.06 25.954.6
Diethyl phthalate 50.00 74.5 0.01 114 201.00 0 41.77 11.537.2
Dimethyl phthalate 50.00 92.0 0.01 112 201.00 0 50.11 8.5546.0
Di-n-butyl phthalate 50.00 72.9 1 118 201.00 0 38.75 6.1736.4
Di-n-octyl phthalate 50.00 97.3 4 146 201.00 0 53.51 9.5148.6
Pentachlorophenol 50.00 87.5 14 176 202.00 0 45.64 4.2743.7
Phenol 50.00 39.7 5 112 201.00 0 22.72 13.419.9
Sample ID: CCV-8354
Batch ID: 8354 TestNo: E625 Analysis Date: 10/20/2014
Prep Date:
Analyte Result SPK value SPK Ref Val %REC RPD Ref Val %RPDLowLimit HighLimit RPDLimit Qual
Units: µg/L
PQL
Client ID: CCV
RunNo: 17365
SeqNo: 227780
CCVSampType: TestCode: 625X_W
E625
Qualifiers: Page 7 of 15B Analyte detected in the associated Method Blank H Holding times for preparation or analysis exceeded ND Not Detected at the Reporting LimitO RSD is greater than RSDlimit R RPD outside accepted recovery limits S Spike Recovery outside accepted recovery limits

Project: SCE / DTNA-001Client: Bridgewater Group Inc.
TestCode: 625X_W
19-Nov-14
QC SUMMARY REPORT1410089WO#:
Specialty Analytical
Sample ID: CCV-8354
Batch ID: 8354 TestNo: E625 Analysis Date: 10/20/2014
Prep Date:
Analyte Result SPK value SPK Ref Val %REC RPD Ref Val %RPDLowLimit HighLimit RPDLimit Qual
Units: µg/L
PQL
Client ID: CCV
RunNo: 17365
SeqNo: 227780
CCVSampType: TestCode: 625X_W
E625
2,4,6-Trichlorophenol 40.00 114 80 1201.00 045.6
2,4-Dichlorophenol 40.00 104 80 1202.00 041.8
2,4-Dimethylphenol 40.00 104 80 1201.00 041.8
2,4-Dinitrophenol 40.00 99.2 80 1202.00 039.7
2-Chlorophenol 40.00 119 80 1201.00 047.7
2-Methylphenol 40.00 111 80 1202.00 044.5
2-Nitrophenol 40.00 119 80 1201.00 047.5
3,4-Methylphenol 40.00 118 80 1202.00 047.1
4,6-Dinitro-2-methylphenol 40.00 93.6 80 1202.00 037.4
4-Chloro-3-methylphenol 40.00 118 80 1201.00 047.0
4-Nitrophenol 40.00 96.7 80 1201.00 038.7
Bis(2-ethylhexyl)phthalate 40.00 110 80 1201.00 044.1
Butyl benzyl phthalate 40.00 92.7 80 1201.00 037.1
Diethyl phthalate 40.00 94.6 80 1201.00 037.8
Dimethyl phthalate 40.00 119 80 1201.00 047.4
Di-n-butyl phthalate 40.00 88.8 80 1201.00 035.5
Di-n-octyl phthalate 40.00 118 80 1201.00 047.2
Pentachlorophenol 40.00 105 80 1202.00 041.9
Phenol 40.00 119 80 1201.00 047.7
Sample ID: LCS-8354
Batch ID: 8354 TestNo: E625 Analysis Date: 10/20/2014
Prep Date: 10/17/2014
Analyte Result SPK value SPK Ref Val %REC RPD Ref Val %RPDLowLimit HighLimit RPDLimit Qual
Units: µg/L
PQL
Client ID: LCSW
RunNo: 17365
SeqNo: 227781
LCSSampType: TestCode: 625X_W
E625
Qualifiers: Page 8 of 15B Analyte detected in the associated Method Blank H Holding times for preparation or analysis exceeded ND Not Detected at the Reporting LimitO RSD is greater than RSDlimit R RPD outside accepted recovery limits S Spike Recovery outside accepted recovery limits

Project: SCE / DTNA-001Client: Bridgewater Group Inc.
TestCode: 625X_W
19-Nov-14
QC SUMMARY REPORT1410089WO#:
Specialty Analytical
Sample ID: LCS-8354
Batch ID: 8354 TestNo: E625 Analysis Date: 10/20/2014
Prep Date: 10/17/2014
Analyte Result SPK value SPK Ref Val %REC RPD Ref Val %RPDLowLimit HighLimit RPDLimit Qual
Units: µg/L
PQL
Client ID: LCSW
RunNo: 17365
SeqNo: 227781
LCSSampType: TestCode: 625X_W
E625
2,4,6-Trichlorophenol 50.00 90.0 37 1441.00 045.0
2,4-Dichlorophenol 50.00 79.5 39 1352.00 039.7
2,4-Dimethylphenol 50.00 70.3 32 1191.00 035.2
2,4-Dinitrophenol 50.00 110 0.01 1912.00 054.8
2-Chlorophenol 50.00 94.4 23 1341.00 047.2
2-Methylphenol 50.00 80.3 46.9 80.32.00 040.1
2-Nitrophenol 50.00 95.8 29 1821.00 047.9
3,4-Methylphenol 50.00 78.6 38.4 832.00 039.3
4,6-Dinitro-2-methylphenol 50.00 118 0.01 1812.00 059.2
4-Chloro-3-methylphenol 50.00 89.8 22 1471.00 044.9
4-Nitrophenol 50.00 59.0 0.01 1321.00 029.5
Bis(2-ethylhexyl)phthalate 50.00 112 8 1581.00 056.2
Butyl benzyl phthalate 50.00 84.1 0.01 1521.00 042.1
Diethyl phthalate 50.00 83.5 0.01 1141.00 041.8
Dimethyl phthalate 50.00 100 0.01 1121.00 050.1
Di-n-butyl phthalate 50.00 77.5 1 1181.00 038.8
Di-n-octyl phthalate 50.00 107 4 1461.00 053.5
Pentachlorophenol 50.00 91.3 14 1762.00 045.6
Phenol 50.00 45.4 5 1121.00 022.7
Sample ID: MB-8354
Batch ID: 8354 TestNo: E625 Analysis Date: 10/20/2014
Prep Date: 10/17/2014
Analyte Result SPK value SPK Ref Val %REC RPD Ref Val %RPDLowLimit HighLimit RPDLimit Qual
Units: µg/L
PQL
Client ID: PBW
RunNo: 17365
SeqNo: 227786
MBLKSampType: TestCode: 625X_W
E625
Qualifiers: Page 9 of 15B Analyte detected in the associated Method Blank H Holding times for preparation or analysis exceeded ND Not Detected at the Reporting LimitO RSD is greater than RSDlimit R RPD outside accepted recovery limits S Spike Recovery outside accepted recovery limits
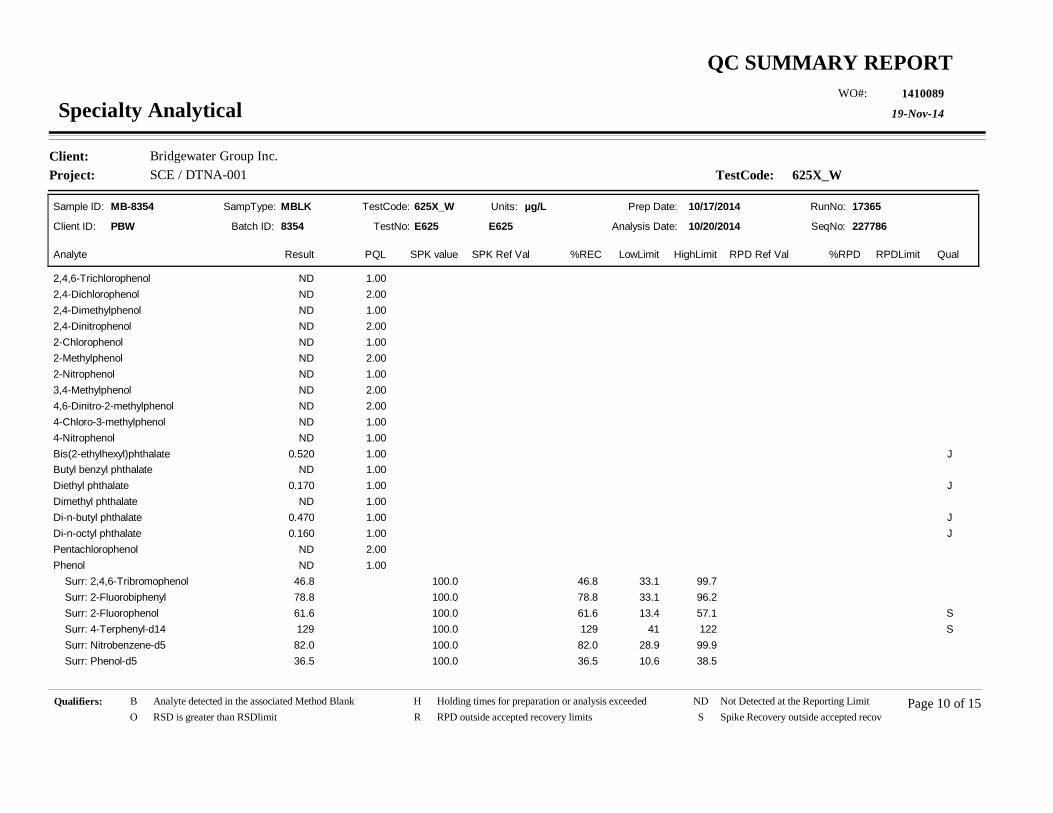
Project: SCE / DTNA-001Client: Bridgewater Group Inc.
TestCode: 625X_W
19-Nov-14
QC SUMMARY REPORT1410089WO#:
Specialty Analytical
Sample ID: MB-8354
Batch ID: 8354 TestNo: E625 Analysis Date: 10/20/2014
Prep Date: 10/17/2014
Analyte Result SPK value SPK Ref Val %REC RPD Ref Val %RPDLowLimit HighLimit RPDLimit Qual
Units: µg/L
PQL
Client ID: PBW
RunNo: 17365
SeqNo: 227786
MBLKSampType: TestCode: 625X_W
E625
2,4,6-Trichlorophenol 1.00ND
2,4-Dichlorophenol 2.00ND
2,4-Dimethylphenol 1.00ND
2,4-Dinitrophenol 2.00ND
2-Chlorophenol 1.00ND
2-Methylphenol 2.00ND
2-Nitrophenol 1.00ND
3,4-Methylphenol 2.00ND
4,6-Dinitro-2-methylphenol 2.00ND
4-Chloro-3-methylphenol 1.00ND
4-Nitrophenol 1.00ND
Bis(2-ethylhexyl)phthalate J1.000.520
Butyl benzyl phthalate 1.00ND
Diethyl phthalate J1.000.170
Dimethyl phthalate 1.00ND
Di-n-butyl phthalate J1.000.470
Di-n-octyl phthalate J1.000.160
Pentachlorophenol 2.00ND
Phenol 1.00ND
Surr: 2,4,6-Tribromophenol 100.0 46.8 33.1 99.746.8
Surr: 2-Fluorobiphenyl 100.0 78.8 33.1 96.278.8
Surr: 2-Fluorophenol 100.0 61.6 13.4 57.1 S61.6
Surr: 4-Terphenyl-d14 100.0 129 41 122 S129
Surr: Nitrobenzene-d5 100.0 82.0 28.9 99.982.0
Surr: Phenol-d5 100.0 36.5 10.6 38.536.5
Qualifiers: Page 10 of 15B Analyte detected in the associated Method Blank H Holding times for preparation or analysis exceeded ND Not Detected at the Reporting LimitO RSD is greater than RSDlimit R RPD outside accepted recovery limits S Spike Recovery outside accepted recovery limits
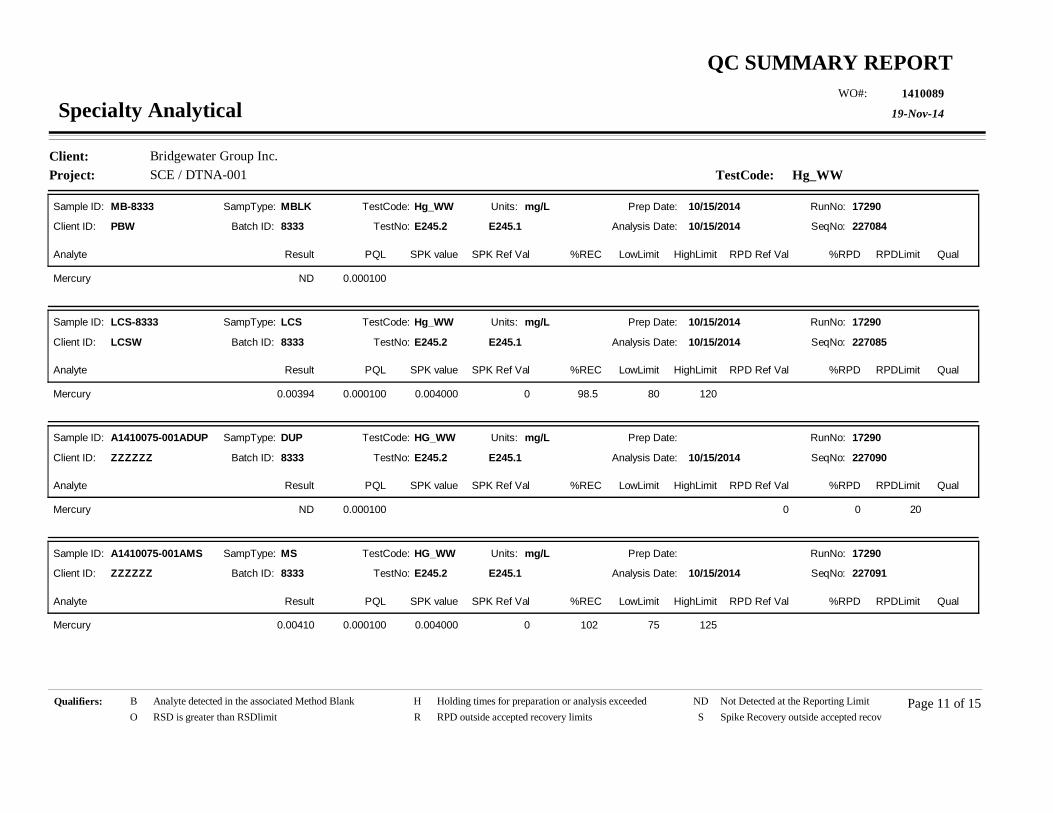
Project: SCE / DTNA-001Client: Bridgewater Group Inc.
TestCode: Hg_WW
19-Nov-14
QC SUMMARY REPORT1410089WO#:
Specialty Analytical
Sample ID: MB-8333
Batch ID: 8333 TestNo: E245.2 Analysis Date: 10/15/2014
Prep Date: 10/15/2014
Analyte Result SPK value SPK Ref Val %REC RPD Ref Val %RPDLowLimit HighLimit RPDLimit Qual
Units: mg/L
PQL
Client ID: PBW
RunNo: 17290
SeqNo: 227084
MBLKSampType: TestCode: Hg_WW
E245.1
Mercury 0.000100ND
Sample ID: LCS-8333
Batch ID: 8333 TestNo: E245.2 Analysis Date: 10/15/2014
Prep Date: 10/15/2014
Analyte Result SPK value SPK Ref Val %REC RPD Ref Val %RPDLowLimit HighLimit RPDLimit Qual
Units: mg/L
PQL
Client ID: LCSW
RunNo: 17290
SeqNo: 227085
LCSSampType: TestCode: Hg_WW
E245.1
Mercury 0.004000 98.5 80 1200.000100 00.00394
Sample ID: A1410075-001ADUP
Batch ID: 8333 TestNo: E245.2 Analysis Date: 10/15/2014
Prep Date:
Analyte Result SPK value SPK Ref Val %REC RPD Ref Val %RPDLowLimit HighLimit RPDLimit Qual
Units: mg/L
PQL
Client ID: ZZZZZZ
RunNo: 17290
SeqNo: 227090
DUPSampType: TestCode: HG_WW
E245.1
Mercury 200.000100 0 0ND
Sample ID: A1410075-001AMS
Batch ID: 8333 TestNo: E245.2 Analysis Date: 10/15/2014
Prep Date:
Analyte Result SPK value SPK Ref Val %REC RPD Ref Val %RPDLowLimit HighLimit RPDLimit Qual
Units: mg/L
PQL
Client ID: ZZZZZZ
RunNo: 17290
SeqNo: 227091
MSSampType: TestCode: HG_WW
E245.1
Mercury 0.004000 102 75 1250.000100 00.00410
Qualifiers: Page 11 of 15B Analyte detected in the associated Method Blank H Holding times for preparation or analysis exceeded ND Not Detected at the Reporting LimitO RSD is greater than RSDlimit R RPD outside accepted recovery limits S Spike Recovery outside accepted recovery limits
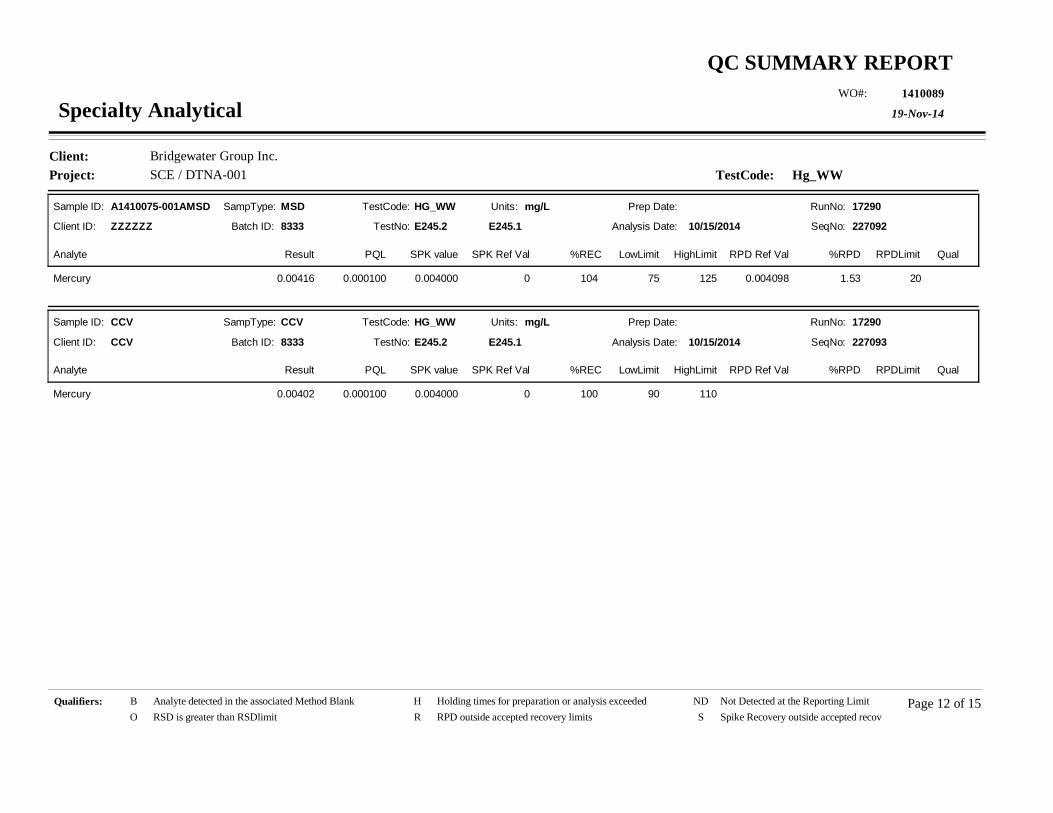
Project: SCE / DTNA-001Client: Bridgewater Group Inc.
TestCode: Hg_WW
19-Nov-14
QC SUMMARY REPORT1410089WO#:
Specialty Analytical
Sample ID: A1410075-001AMSD
Batch ID: 8333 TestNo: E245.2 Analysis Date: 10/15/2014
Prep Date:
Analyte Result SPK value SPK Ref Val %REC RPD Ref Val %RPDLowLimit HighLimit RPDLimit Qual
Units: mg/L
PQL
Client ID: ZZZZZZ
RunNo: 17290
SeqNo: 227092
MSDSampType: TestCode: HG_WW
E245.1
Mercury 0.004000 104 75 125 200.000100 0 0.004098 1.530.00416
Sample ID: CCV
Batch ID: 8333 TestNo: E245.2 Analysis Date: 10/15/2014
Prep Date:
Analyte Result SPK value SPK Ref Val %REC RPD Ref Val %RPDLowLimit HighLimit RPDLimit Qual
Units: mg/L
PQL
Client ID: CCV
RunNo: 17290
SeqNo: 227093
CCVSampType: TestCode: HG_WW
E245.1
Mercury 0.004000 100 90 1100.000100 00.00402
Qualifiers: Page 12 of 15B Analyte detected in the associated Method Blank H Holding times for preparation or analysis exceeded ND Not Detected at the Reporting LimitO RSD is greater than RSDlimit R RPD outside accepted recovery limits S Spike Recovery outside accepted recovery limits
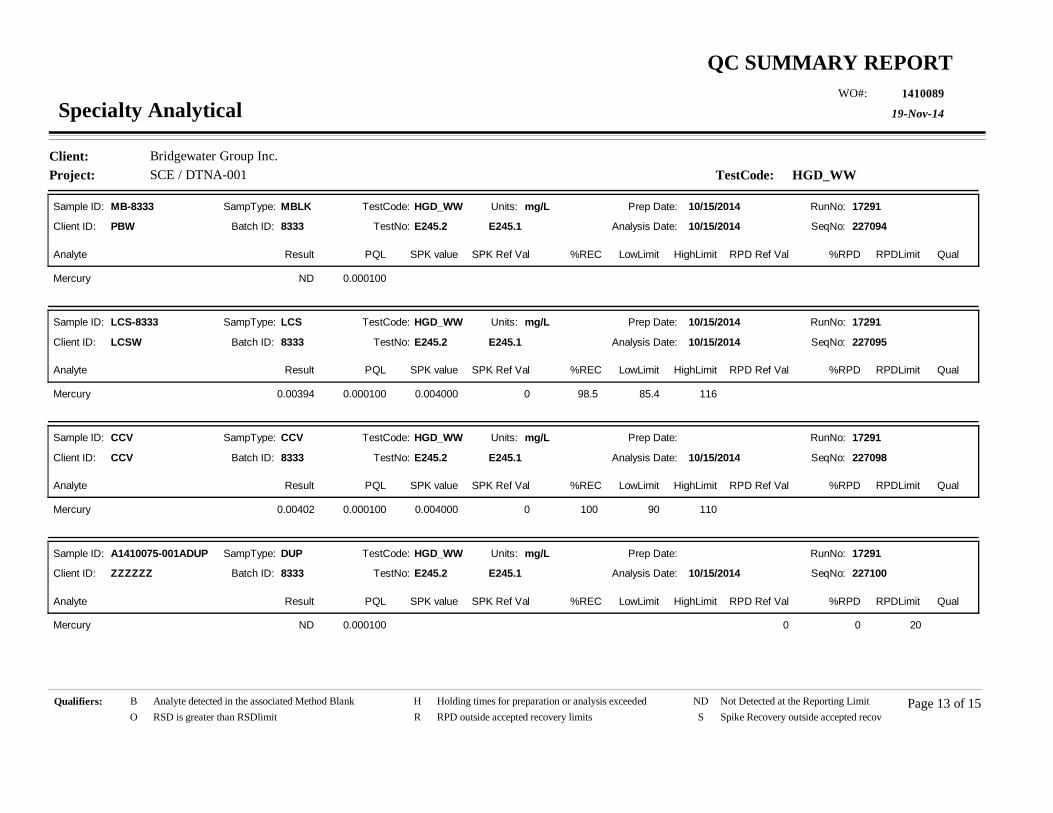
Project: SCE / DTNA-001Client: Bridgewater Group Inc.
TestCode: HGD_WW
19-Nov-14
QC SUMMARY REPORT1410089WO#:
Specialty Analytical
Sample ID: MB-8333
Batch ID: 8333 TestNo: E245.2 Analysis Date: 10/15/2014
Prep Date: 10/15/2014
Analyte Result SPK value SPK Ref Val %REC RPD Ref Val %RPDLowLimit HighLimit RPDLimit Qual
Units: mg/L
PQL
Client ID: PBW
RunNo: 17291
SeqNo: 227094
MBLKSampType: TestCode: HGD_WW
E245.1
Mercury 0.000100ND
Sample ID: LCS-8333
Batch ID: 8333 TestNo: E245.2 Analysis Date: 10/15/2014
Prep Date: 10/15/2014
Analyte Result SPK value SPK Ref Val %REC RPD Ref Val %RPDLowLimit HighLimit RPDLimit Qual
Units: mg/L
PQL
Client ID: LCSW
RunNo: 17291
SeqNo: 227095
LCSSampType: TestCode: HGD_WW
E245.1
Mercury 0.004000 98.5 85.4 1160.000100 00.00394
Sample ID: CCV
Batch ID: 8333 TestNo: E245.2 Analysis Date: 10/15/2014
Prep Date:
Analyte Result SPK value SPK Ref Val %REC RPD Ref Val %RPDLowLimit HighLimit RPDLimit Qual
Units: mg/L
PQL
Client ID: CCV
RunNo: 17291
SeqNo: 227098
CCVSampType: TestCode: HGD_WW
E245.1
Mercury 0.004000 100 90 1100.000100 00.00402
Sample ID: A1410075-001ADUP
Batch ID: 8333 TestNo: E245.2 Analysis Date: 10/15/2014
Prep Date:
Analyte Result SPK value SPK Ref Val %REC RPD Ref Val %RPDLowLimit HighLimit RPDLimit Qual
Units: mg/L
PQL
Client ID: ZZZZZZ
RunNo: 17291
SeqNo: 227100
DUPSampType: TestCode: HGD_WW
E245.1
Mercury 200.000100 0 0ND
Qualifiers: Page 13 of 15B Analyte detected in the associated Method Blank H Holding times for preparation or analysis exceeded ND Not Detected at the Reporting LimitO RSD is greater than RSDlimit R RPD outside accepted recovery limits S Spike Recovery outside accepted recovery limits
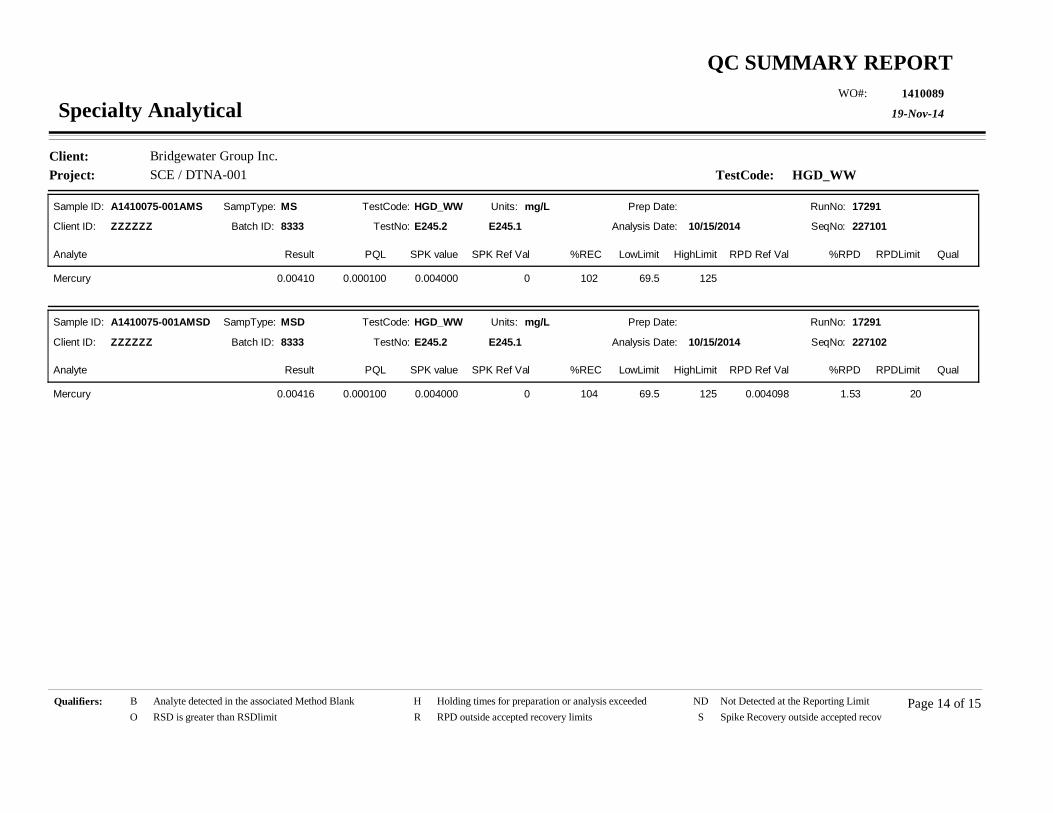
Project: SCE / DTNA-001Client: Bridgewater Group Inc.
TestCode: HGD_WW
19-Nov-14
QC SUMMARY REPORT1410089WO#:
Specialty Analytical
Sample ID: A1410075-001AMS
Batch ID: 8333 TestNo: E245.2 Analysis Date: 10/15/2014
Prep Date:
Analyte Result SPK value SPK Ref Val %REC RPD Ref Val %RPDLowLimit HighLimit RPDLimit Qual
Units: mg/L
PQL
Client ID: ZZZZZZ
RunNo: 17291
SeqNo: 227101
MSSampType: TestCode: HGD_WW
E245.1
Mercury 0.004000 102 69.5 1250.000100 00.00410
Sample ID: A1410075-001AMSD
Batch ID: 8333 TestNo: E245.2 Analysis Date: 10/15/2014
Prep Date:
Analyte Result SPK value SPK Ref Val %REC RPD Ref Val %RPDLowLimit HighLimit RPDLimit Qual
Units: mg/L
PQL
Client ID: ZZZZZZ
RunNo: 17291
SeqNo: 227102
MSDSampType: TestCode: HGD_WW
E245.1
Mercury 0.004000 104 69.5 125 200.000100 0 0.004098 1.530.00416
Qualifiers: Page 14 of 15B Analyte detected in the associated Method Blank H Holding times for preparation or analysis exceeded ND Not Detected at the Reporting LimitO RSD is greater than RSDlimit R RPD outside accepted recovery limits S Spike Recovery outside accepted recovery limits

Project: SCE / DTNA-001Client: Bridgewater Group Inc.
TestCode: TSS_WW
19-Nov-14
QC SUMMARY REPORT1410089WO#:
Specialty Analytical
Sample ID: MB-R17316
Batch ID: R17316 TestNo: M2540 D Analysis Date: 10/16/2014
Prep Date:
Analyte Result SPK value SPK Ref Val %REC RPD Ref Val %RPDLowLimit HighLimit RPDLimit Qual
Units: mg/L
PQL
Client ID: PBW
RunNo: 17316
SeqNo: 227315
MBLKSampType: TestCode: TSS_WW
Total Suspended Solids 5.00ND
Sample ID: LCS-R17316
Batch ID: R17316 TestNo: M2540 D Analysis Date: 10/16/2014
Prep Date:
Analyte Result SPK value SPK Ref Val %REC RPD Ref Val %RPDLowLimit HighLimit RPDLimit Qual
Units: mg/L
PQL
Client ID: LCSW
RunNo: 17316
SeqNo: 227316
LCSSampType: TestCode: TSS_WW
Total Suspended Solids 100.0 83.0 80 1055.00 083.0
Sample ID: 1410089-001BDUP
Batch ID: R17316 TestNo: M2540 D Analysis Date: 10/16/2014
Prep Date:
Analyte Result SPK value SPK Ref Val %REC RPD Ref Val %RPDLowLimit HighLimit RPDLimit Qual
Units: mg/L
PQL
Client ID: FAT-101314
RunNo: 17316
SeqNo: 227318
DUPSampType: TestCode: TSS_WW
Total Suspended Solids 20 RF5.00 12.00 52.67.00
Sample ID: 1410103-002DDUP
Batch ID: R17316 TestNo: M2540 D Analysis Date: 10/16/2014
Prep Date:
Analyte Result SPK value SPK Ref Val %REC RPD Ref Val %RPDLowLimit HighLimit RPDLimit Qual
Units: mg/L
PQL
Client ID: ZZZZZZ
RunNo: 17316
SeqNo: 227330
DUPSampType: TestCode: TSS_WW
Total Suspended Solids 205.00 26.00 16.722.0
Qualifiers: Page 15 of 15B Analyte detected in the associated Method Blank H Holding times for preparation or analysis exceeded ND Not Detected at the Reporting LimitO RSD is greater than RSDlimit R RPD outside accepted recovery limits S Spike Recovery outside accepted recovery limits

KEY TO FLAGS Rev. May 12, 2010
A This sample contains a Gasoline Range Organic not identified as a specific hydrocarbon product. The result was quantifiedagainst gasoline calibration standards
A1 This sample contains a Diesel Range Organic not identified as a specific hydrocarbon product. The result was quantifiedagainst diesel calibration standards.
A2 This sample contains a Lube Oil Range Organic not identified as a specific hydrocarbon product. The result was quantifiedagainst a lube oil calibration standard.
A3 The result was determined to be Non-Detect based on hydrocarbon pattern recognition. The product was carry-over fromanother hydrocarbon type.
A4 The product appears to be aged or degraded diesel.
B The blank exhibited a positive result great than the reporting limit for this compound.
CN See Case Narrative.
D Result is based from a dilution.
E Result exceeds the calibration range for this compound. The result should be considered as estimate.
F The positive result for this hydrocarbon is due to single component contamination. The product does not match anyhydrocarbon in the fuels library.
G Result may be biased high due to biogenic interferences. Clean up is recommended.
H Sample was analyzed outside recommended holding time.
HT At clients request, samples was analyzed outside of recommended holding time.
J The result for this analyte is between the MDL and the PQL and should be considered as estimated concentration.
K Diesel result is biased high due to amount of Oil contained in the sample.
L Diesel result is biased high due to amount of Gasoline contained in the sample.
M Oil result is biased high due to amount of Diesel contained in the sample.
MC Sample concentration is greater than 4x the spiked value, the spiked value is considered insignificant.
MI Result is outside control limits due to matrix interference.
MSA Value determined by Method of Standard Addition.
O Laboratory Control Standard (LCS) exceeded laboratory control limits, but meets CCV criteria. Data meets EPArequirements.
Q Detection levels elevated due to sample matrix.
R RPD control limits were exceeded.
RF Duplicate failed due to result being at or near the method-reporting limit.
RP Matrix spike values exceed established QC limits; post digestion spike is in control.
S Recovery is outside control limits.
SC Closing CCV or LCS exceeded high recovery control limits, but associated samples are non-detect. Data meets EPArequirements.
* The result for this parameter was greater that the maximum contaminant level of the TCLP regulatory limit.
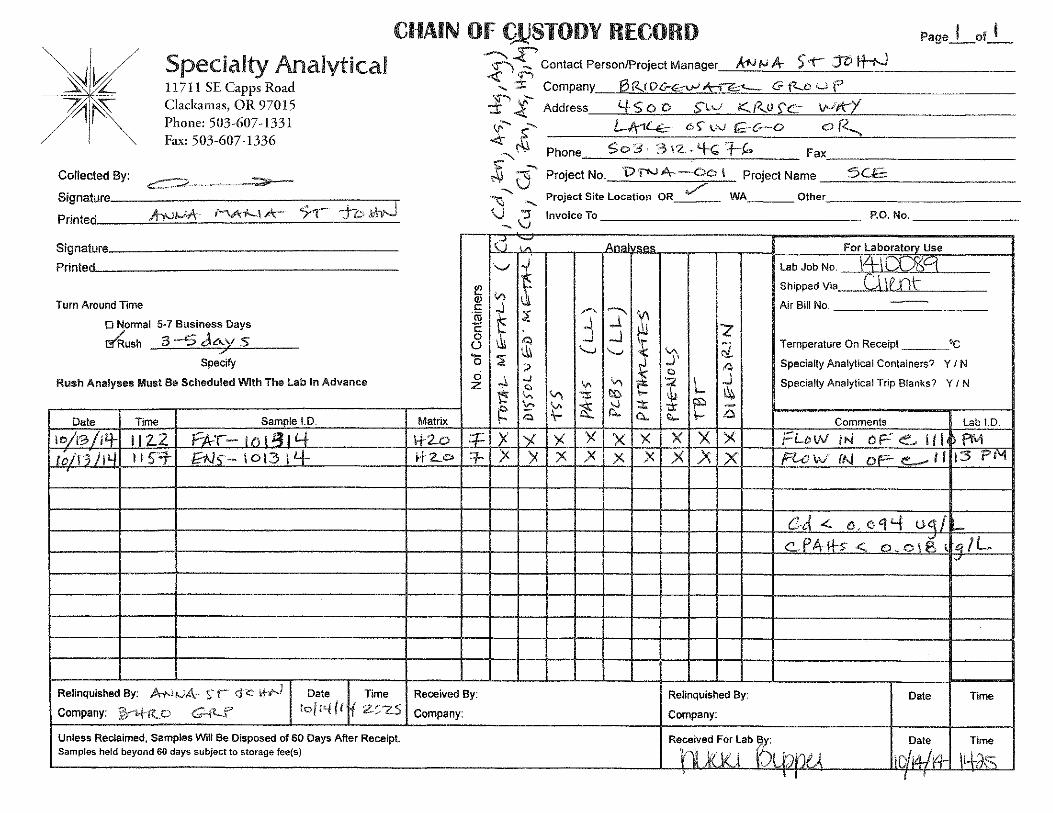
245 S Grape St Medford, OR 97501 (541) 770-5678
400 SE G St, Suite B Grants Pass, OR 97526 (541) 479-4053
www.nrclabs.com
NEILSON RESEARCH CORPORATION
Environmental Testing Laboratory
Specialty AnalyticalNikki Bippes
Dear Nikki Bippes:
RE: SA 1410089Order No.: 1410655
FAX: 503-607-1336TEL: 503-607-1331
11711 SE Capps Rd, #BClackamas, OR 97015
11/17/2014
Neilson Research Corporation received 2 sample(s) on 10/17/2014 for the analyses presented in the following report.
Alec C Smith
The results relate only to the parameters tested or to the sample as received by the laboratory. This report shall not be reproduced except in full, without the written approval of Neilson Research Corporation. If you have any questions regarding these test results, please feel free to call.
Sincerely,Neilson Research Corporation
Project Manager
Page 1 of 8

Neilson Research Corporation245 South Grape Street, Medford, Oregon 97501 541-770-5678 Fax 541-770-2901
Analysis Report ORELAP 100016EPA OR00028
Project: SA 1410089CLIENT: Specialty Analytical
Lab Order: 1410655CASE NARRATIVEDate:17-Nov-14
The analyses were performed according to the guidelines in the Neilson Research Corporation Quality Assurance Program. This report contains analytical results for the sample(s) as received by the laboratory.
Neilson Research Corporation certifies that this report is in compliance with the requirements of NELAP. No unusual difficulties were experienced during analysis of this batch except as noted below or qualified with data flags on the reports.
Corrected Report: Client added chromium and lead to the report 11/14/13 TK/NRC.
Page 1 of 1
Page 2 of 8
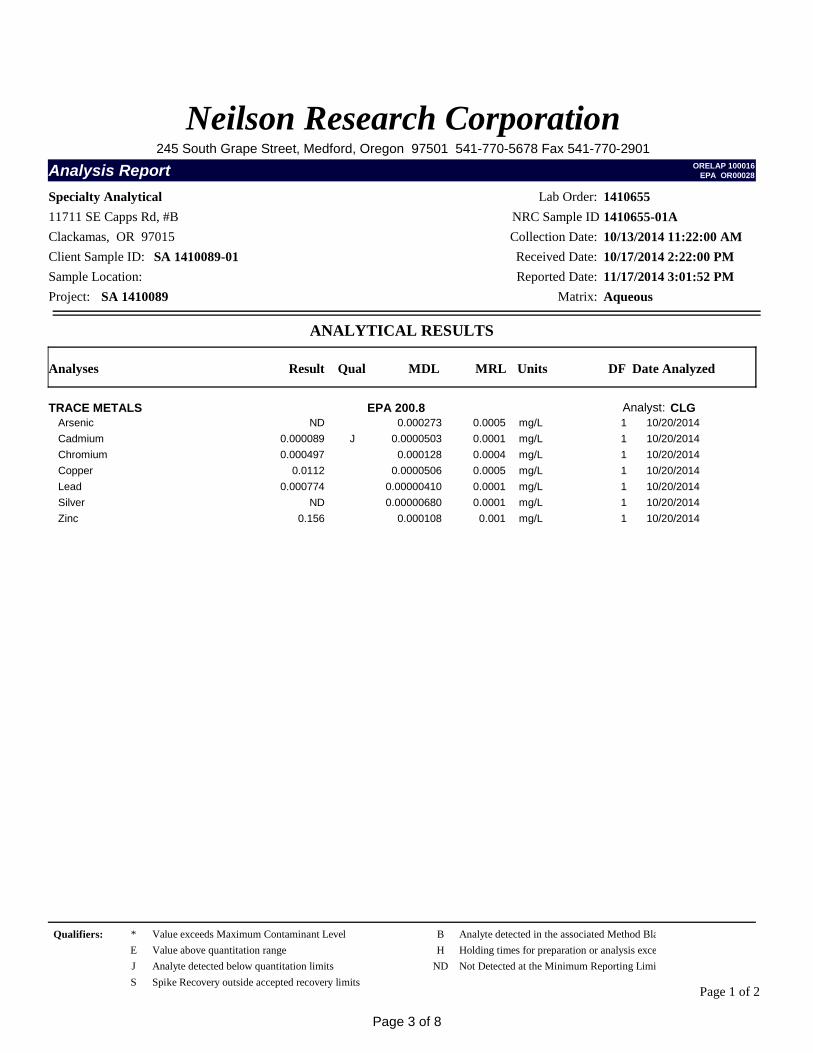
Analyses Result Qual Units Date AnalyzedMRL DFMDL
Project: SA 1410089
Collection Date: 10/13/2014 11:22:00 AM
Specialty Analytical Lab Order: 1410655
Reported Date: 11/17/2014 3:01:52 PM
ANALYTICAL RESULTS
Received Date: 10/17/2014 2:22:00 PM
Matrix: Aqueous
Client Sample ID: SA 1410089-01
NRC Sample ID 1410655-01AClackamas, OR 97015
Sample Location:
11711 SE Capps Rd, #B
Neilson Research Corporation245 South Grape Street, Medford, Oregon 97501 541-770-5678 Fax 541-770-2901
Analysis Report ORELAP 100016EPA OR00028
TRACE METALS EPA 200.8 Analyst: CLGArsenic 10/20/20140.0005 mg/L 1ND 0.000273Cadmium J 10/20/20140.0001 mg/L 10.000089 0.0000503Chromium 10/20/20140.0004 mg/L 10.000497 0.000128Copper 10/20/20140.0005 mg/L 10.0112 0.0000506Lead 10/20/20140.0001 mg/L 10.000774 0.00000410Silver 10/20/20140.0001 mg/L 1ND 0.00000680Zinc 10/20/20140.001 mg/L 10.156 0.000108
Qualifiers:
Page 1 of 2
* Value exceeds Maximum Contaminant Level B Analyte detected in the associated Method BlankE Value above quantitation range H Holding times for preparation or analysis exceededJ Analyte detected below quantitation limits ND Not Detected at the Minimum Reporting LimitS Spike Recovery outside accepted recovery limits
Page 3 of 8

Analyses Result Qual Units Date AnalyzedMRL DFMDL
Project: SA 1410089
Collection Date: 10/13/2014 11:57:00 AM
Specialty Analytical Lab Order: 1410655
Reported Date: 11/17/2014 3:01:52 PM
ANALYTICAL RESULTS
Received Date: 10/17/2014 2:22:00 PM
Matrix: Aqueous
Client Sample ID: SA 1410089-02
NRC Sample ID 1410655-02AClackamas, OR 97015
Sample Location:
11711 SE Capps Rd, #B
Neilson Research Corporation245 South Grape Street, Medford, Oregon 97501 541-770-5678 Fax 541-770-2901
Analysis Report ORELAP 100016EPA OR00028
TRACE METALS EPA 200.8 Analyst: CLGArsenic 10/20/20140.0005 mg/L 1ND 0.000273Cadmium 10/20/20140.0001 mg/L 10.000314 0.0000503Chromium 10/20/20140.0004 mg/L 10.00253 0.000128Copper 10/20/20140.0005 mg/L 10.0145 0.0000506Lead 10/20/20140.0001 mg/L 10.00574 0.00000410Silver 10/20/20140.0001 mg/L 1ND 0.00000680Zinc 10/20/20140.001 mg/L 10.293 0.000108
Qualifiers:
Page 2 of 2
* Value exceeds Maximum Contaminant Level B Analyte detected in the associated Method BlankE Value above quantitation range H Holding times for preparation or analysis exceededJ Analyte detected below quantitation limits ND Not Detected at the Minimum Reporting LimitS Spike Recovery outside accepted recovery limits
Page 4 of 8

NRC SOP QA-1104/AD-3100 Revision 1
Effective Date: 5/30/12
Neilson Research Corporation
DATA FLAGS
B Analyte detected in the associated method blank. BA BOD Alternative Calculation: The initial results performed by Standard Methods did not fall within parameters of the
Standard Methods calculation. An alternate approved calculation was performed using the HACH method and the value reported is an estimated concentration.
C Sample(s) does not meet NELAC/ORELAP sample acceptance criteria. See Case Narrative. C1 Sample(s) does not meet NELAC/ORELAP sample acceptance criteria for temperature. CF Results confirmed by re-analysis. CU Cleanup performed as specified by method. D1 The diesel elution pattern for the sample is not typical. D2 The sample appears to be a heavier hydrocarbon range than diesel. D3 The sample appears to be a lighter hydrocarbon range than diesel. D4 Detected hydrocarbons do not have pattern and range consistent with typical petroleum products and may be due to
biogenic interference. D5 Detected hydrocarbons in the diesel range appear to be weathered diesel. E Estimated value. ER Elevated reporting limit due to matrix. Report limits (MDLs, MRLs & PQLs) are adjusted based on variations in
sample preparation amounts, analytical dilutions, and percent solids, where applicable. FC Fecal Coliforms: Sample(s) received past 40 CFR Part 136 specified holding time. Results reported as estimated
values. G1 The gasoline elution pattern for the sample is not typical. G2 The sample appears to be a heavier hydrocarbon range than gasoline. G3 The sample appears to be a lighter hydrocarbon range than gasoline. G4 Detected hydrocarbons in the gasoline range appear to be weathered gasoline. HP Sample re-analysis performed outside of method specified holding time. HR Sample received outside of method specified holding time. HS Sample analyzed for volatile organics contained headspace. HT At the client’s request, the sample was analyzed outside of method specified holding time. H Analysis performed outside of method specified holding time. J Analyte detected below the Minimum Reporting Limit (MRL) and above the Method Detection Limit (MDL). The J
flag result is an estimated value and the user should be aware that this data is of limited reliability. MI Surrogate or Matrix Spike recovery is out of control limits due to matrix interference. Sample results may be biased. N See Case Narrative on page 2 of report. Q Closing continuing calibration verification (CCV) or laboratory control sample (LCS) exceeded high recovery limits,
but associated samples are non-detect and the sample results are not affected. Data meets EPA/NELAC requirements. R Relative percent difference (RPD) is outside of the accepted recovery limits. R1 Relative percent difference (RPD) is outside of the accepted recovery limits. However, analyses are not controlled on
RPD values for sample concentrations that are less than the reporting limit. R3 The relative percent difference (RPD) and/or percent recovery for the duplicate (DUP) or matrix spike (MS)/matrix
spike duplicate (MSD) cannot be accurately calculated due to the concentration of analyte already present in the sample.
R4 Duplicate analysis failed due to result being at or near method reporting limit. S Surrogate and/or matrix spike recovery is outside of the accepted recovery limits. Sample results may be biased. S1 Surrogate or matrix spike recovery is outside of control limits due to dilution necessary for analysis. SC Sub-contracted to another laboratory for analysis. T Toxicity Characteristic Leaching Procedure – Sample submitted contained < 0.5% solids. If the waste contains <0.5%
dry solids, the liquid portion of the waste, after filtration, is defined as the TCLP extract. # Value exceeds regulatory level for TCLP contaminant. X1 The motor oil elution pattern for the sample is not typical. X2 The sample appears to be a heavier hydrocarbon range than motor oil. X3 The sample appears to be a lighter hydrocarbon range than motor oil. * Value exceeds Maximum Contaminant Level or is outside the acceptable range.
Page 5 of 8

Project: SA 1410089
CLIENT: Specialty AnalyticalWork Order: 1410655
ANALYTICAL QC SUMMARY REPORTTestCode: ICPMS_200.8_W
17-Nov-14Date:Neilson Research Corporation
Sample ID: MB-31106
Batch ID: 31106 TestNo: EPA 200.8 Analysis Date: 10/20/2014
Prep Date: 10/20/2014
Analyte Result SPK value SPK Ref Val %REC RPD Ref Val %RPDLowLimit HighLimit RPDLimit Qual
Units: mg/L
MRL
Client ID: ZZZZZ
RunNo: 76405
SeqNo: 1136151
MBLKSampType: TestCode: ICPMS_200.8
(EPA 200.8)
Arsenic 0.000500NDCadmium 0.000100NDChromium 0.000400NDCopper 0.000500NDLead 0.000100NDSilver 0.000100NDZinc J0.001000.0005580
Sample ID: LCS-31106
Batch ID: 31106 TestNo: EPA 200.8 Analysis Date: 10/20/2014
Prep Date: 10/20/2014
Analyte Result SPK value SPK Ref Val %REC RPD Ref Val %RPDLowLimit HighLimit RPDLimit Qual
Units: mg/L
MRL
Client ID: ZZZZZ
RunNo: 76405
SeqNo: 1136152
LCSSampType: TestCode: ICPMS_200.8
(EPA 200.8)
Arsenic 0.1 96.6 85 1150.000500 00.09663Cadmium 0.1 98.3 85 1150.000100 00.09833Chromium 0.1 95.9 85 1150.000400 00.09587Copper 0.1 94.4 85 1150.000500 00.09437Lead 0.1 96.4 85 1150.000100 00.09638Silver 0.1 94.4 85 1150.000100 00.09443Zinc 0.1 97.5 85 1150.00100 0.0005580.09805
Sample ID: 1410655-02AMS
Batch ID: 31106 TestNo: EPA 200.8 Analysis Date: 10/20/2014
Prep Date: 10/20/2014
Analyte Result SPK value SPK Ref Val %REC RPD Ref Val %RPDLowLimit HighLimit RPDLimit Qual
Units: mg/L
MRL
Client ID: SA 1410089-02
RunNo: 76405
SeqNo: 1136163
MSSampType: TestCode: ICPMS_200.8
(EPA 200.8)
Arsenic 0.1 96.3 70 1300.000500 00.09628Cadmium 0.1 99.4 70 1300.000100 0.00031350.09973Chromium 0.1 94.5 70 1300.000400 0.0025270.09703Copper 0.1 92.7 70 1300.000500 0.014480.1072Lead 0.1 96.7 70 1300.000100 0.0057380.1024
Page 1 of 2
Qualifiers: E Value above quantitation range H Holding times for preparation or analysis exceeded J Analyte detected below quantitation limitsND Not Detected at the Minimum Reporting Limit R RPD outside accepted recovery limits S Spike Recovery outside accepted recovery limits
Page 6 of 8

Project: SA 1410089
CLIENT: Specialty AnalyticalWork Order: 1410655
ANALYTICAL QC SUMMARY REPORTTestCode: ICPMS_200.8_W
17-Nov-14Date:Neilson Research Corporation
Sample ID: 1410655-02AMS
Batch ID: 31106 TestNo: EPA 200.8 Analysis Date: 10/20/2014
Prep Date: 10/20/2014
Analyte Result SPK value SPK Ref Val %REC RPD Ref Val %RPDLowLimit HighLimit RPDLimit Qual
Units: mg/L
MRL
Client ID: SA 1410089-02
RunNo: 76405
SeqNo: 1136163
MSSampType: TestCode: ICPMS_200.8
(EPA 200.8)
Silver 0.1 95.1 70 1300.000100 00.09506Zinc 0.1 98.5 70 1300.00100 0.29280.3913
Sample ID: 1410655-02AMSD
Batch ID: 31106 TestNo: EPA 200.8 Analysis Date: 10/20/2014
Prep Date: 10/20/2014
Analyte Result SPK value SPK Ref Val %REC RPD Ref Val %RPDLowLimit HighLimit RPDLimit Qual
Units: mg/L
MRL
Client ID: SA 1410089-02
RunNo: 76405
SeqNo: 1136171
MSDSampType: TestCode: ICPMS_200.8
(EPA 200.8)
Arsenic 0.1 97.4 70 130 200.000500 0 0.09628 1.120.09736Cadmium 0.1 101 70 130 200.000100 0.0003135 0.09973 1.170.1009Chromium 0.1 94.1 70 130 200.000400 0.002527 0.09703 0.4440.09660Copper 0.1 94.6 70 130 200.000500 0.01448 0.1072 1.760.1091Lead 0.1 97.5 70 130 200.000100 0.005738 0.1024 0.7780.1032Silver 0.1 96.6 70 130 200.000100 0 0.09506 1.660.09665Zinc 0.1 104 70 130 200.00100 0.2928 0.3913 1.370.3967
Page 2 of 2
Qualifiers: E Value above quantitation range H Holding times for preparation or analysis exceeded J Analyte detected below quantitation limitsND Not Detected at the Minimum Reporting Limit R RPD outside accepted recovery limits S Spike Recovery outside accepted recovery limits
Page 7 of 8
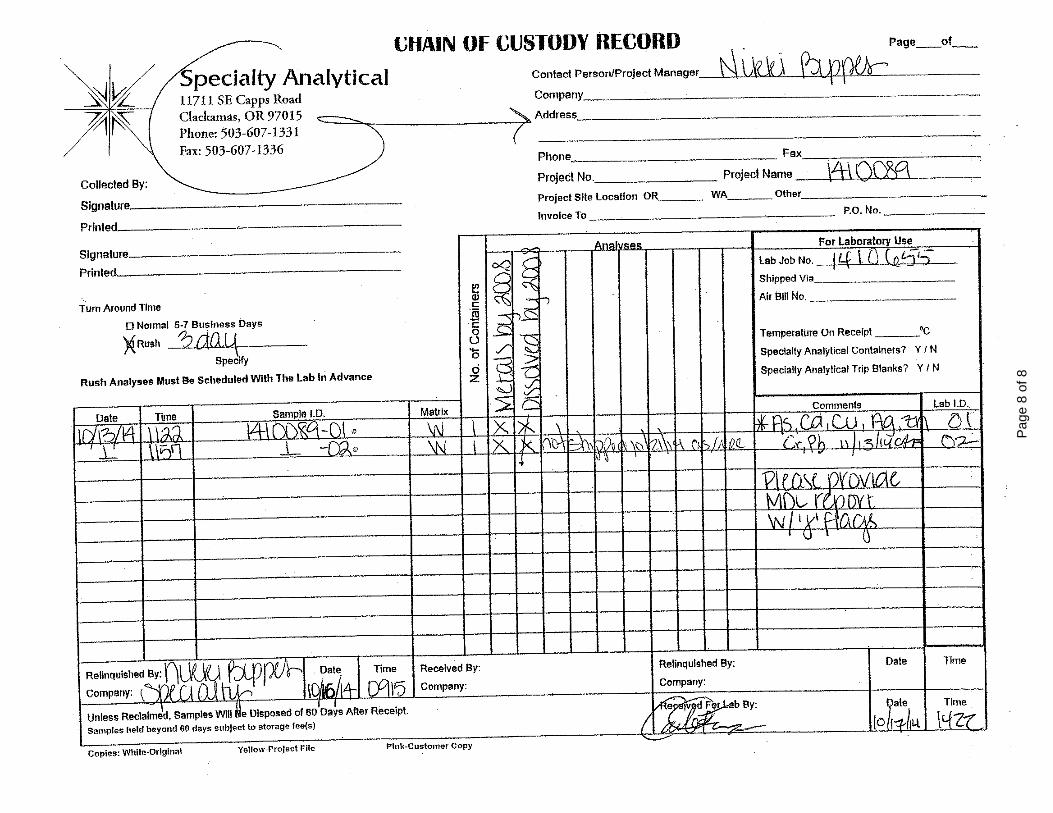
Pag
e 8
of 8

245 S Grape St Medford, OR 97501 (541) 770-5678
400 SE G St, Suite B Grants Pass, OR 97526 (541) 479-4053
www.nrclabs.com
NEILSON RESEARCH CORPORATION
Environmental Testing Laboratory
Specialty AnalyticalCindy Hillyard
Dear Cindy Hillyard:
RE: SA 1410089Order No.: 1410747
FAX 503-607-1336TEL: 503-607-1331
11711 SE Capps Rd, #BClackamas, OR 97015
11/18/2014
Neilson Research Corporation received 2 sample(s) on 10/21/2014 for the analyses presented in the following report.
Alec C Smith
The results relate only to the parameters tested or to the sample as received by the laboratory. This report shall not be reproduced except in full, without the written approval of Neilson Research Corporation. If you have any questions regarding these test results, please feel free to call.
Sincerely,Neilson Research Corporation
Project Manager
Page 1 of 8
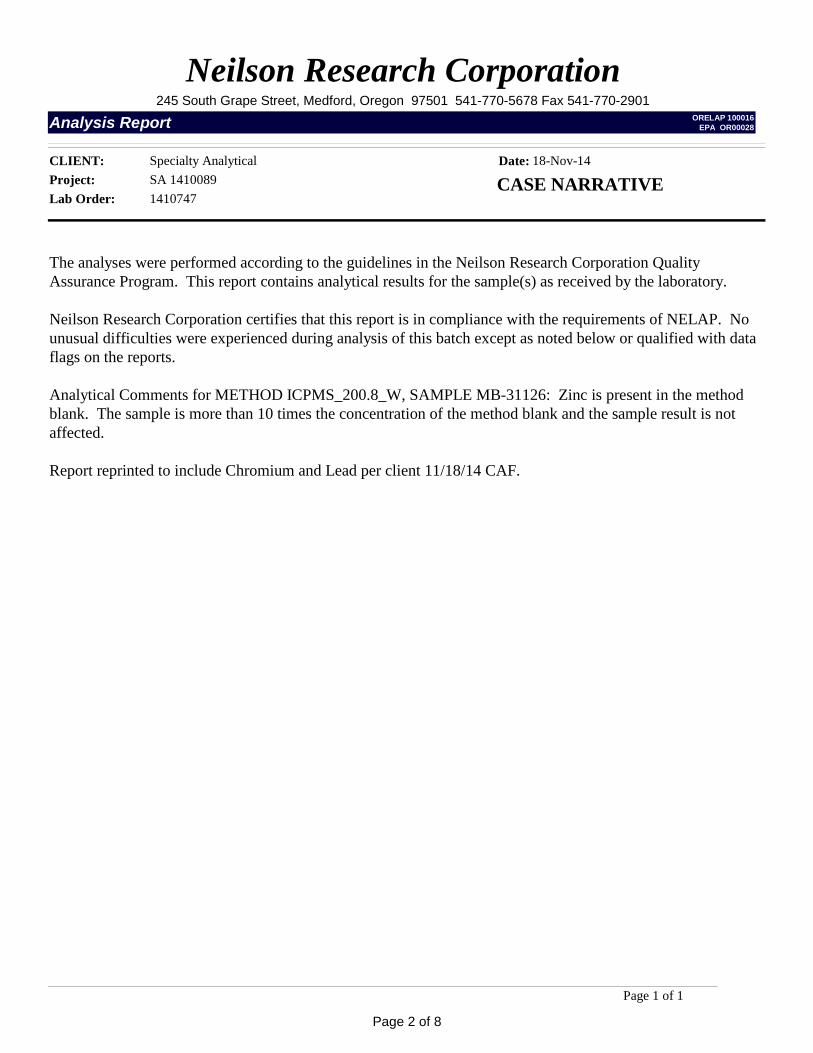
Neilson Research Corporation245 South Grape Street, Medford, Oregon 97501 541-770-5678 Fax 541-770-2901
Analysis Report ORELAP 100016EPA OR00028
Project: SA 1410089CLIENT: Specialty Analytical
Lab Order: 1410747CASE NARRATIVEDate: 18-Nov-14
The analyses were performed according to the guidelines in the Neilson Research Corporation Quality Assurance Program. This report contains analytical results for the sample(s) as received by the laboratory.
Neilson Research Corporation certifies that this report is in compliance with the requirements of NELAP. No unusual difficulties were experienced during analysis of this batch except as noted below or qualified with data flags on the reports.
Analytical Comments for METHOD ICPMS_200.8_W, SAMPLE MB-31126: Zinc is present in the method blank. The sample is more than 10 times the concentration of the method blank and the sample result is not affected.
Report reprinted to include Chromium and Lead per client 11/18/14 CAF.
Page 1 of 1
Page 2 of 8

Analyses Result Qual Units Date AnalyzedMRL DFMDL
Project: SA 1410089
Collection Date: 10/13/2014 11:22:00 AM
Specialty Analytical Lab Order: 1410747
Reported Date: 11/18/2014 1:21:17 PM
ANALYTICAL RESULTS
Received Date: 10/21/2014 2:55:00 PM
Matrix: Water
Client Sample ID: SA 1410089-01
NRC Sample ID 1410747-01AClackamas, OR 97015
Sample Location:
11711 SE Capps Rd, #B
Neilson Research Corporation245 South Grape Street, Medford, Oregon 97501 541-770-5678 Fax 541-770-2901
Analysis Report ORELAP 100016EPA OR00028
DISSOLVED TRACE METALS EPA 200.8 Analyst: CLGArsenic 10/22/20140.000515 mg/L 1ND 0.000281Cadmium 10/22/20140.000103 mg/L 10.000142 0.0000518Chromium J 10/22/20140.000412 mg/L 10.00033 0.000132Copper 10/22/20140.000515 mg/L 10.0109 0.0000521Lead 10/22/20140.000103 mg/L 10.000484 0.00000422Silver J 10/22/20140.000103 mg/L 10.000011 0.00000700Zinc 10/22/20140.00103 mg/L 10.137 0.000111
Qualifiers:
Page 1 of 2
* Value exceeds Maximum Contaminant Level B Analyte detected in the associated Method BlankE Value above quantitation range H Holding times for preparation or analysis exceededJ Analyte detected below quantitation limits ND Not Detected at the Minimum Reporting LimitS Spike Recovery outside accepted recovery limits
Page 3 of 8
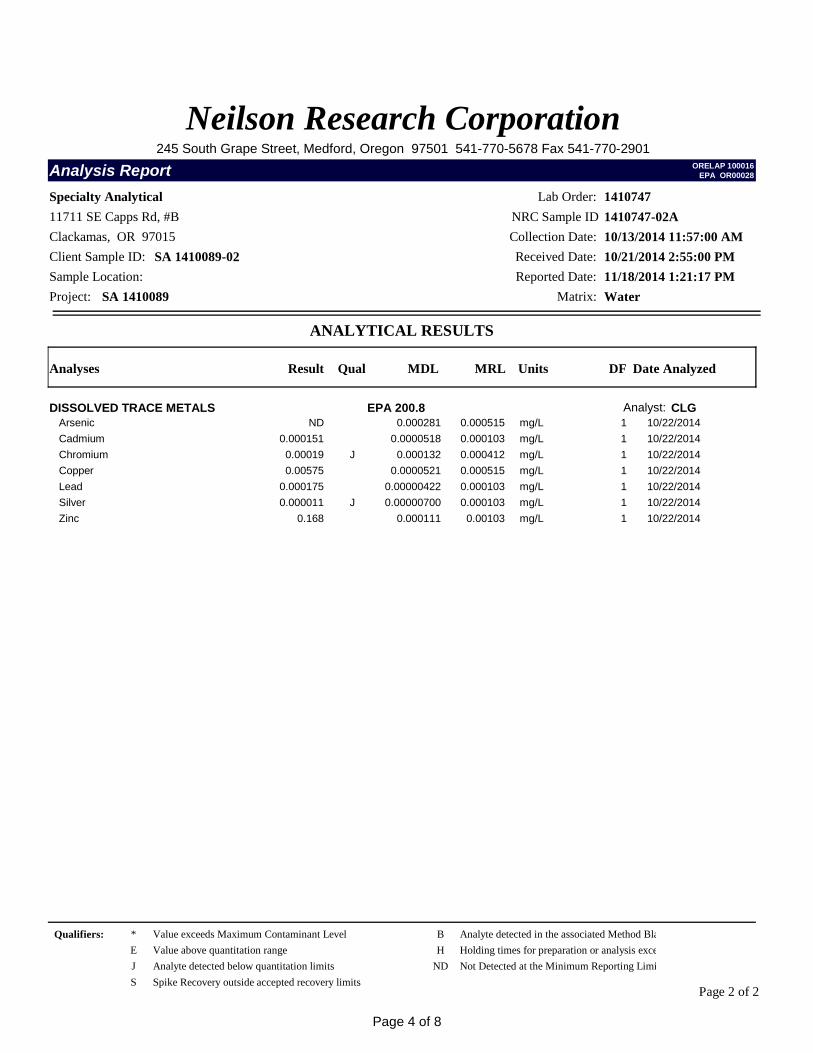
Analyses Result Qual Units Date AnalyzedMRL DFMDL
Project: SA 1410089
Collection Date: 10/13/2014 11:57:00 AM
Specialty Analytical Lab Order: 1410747
Reported Date: 11/18/2014 1:21:17 PM
ANALYTICAL RESULTS
Received Date: 10/21/2014 2:55:00 PM
Matrix: Water
Client Sample ID: SA 1410089-02
NRC Sample ID 1410747-02AClackamas, OR 97015
Sample Location:
11711 SE Capps Rd, #B
Neilson Research Corporation245 South Grape Street, Medford, Oregon 97501 541-770-5678 Fax 541-770-2901
Analysis Report ORELAP 100016EPA OR00028
DISSOLVED TRACE METALS EPA 200.8 Analyst: CLGArsenic 10/22/20140.000515 mg/L 1ND 0.000281Cadmium 10/22/20140.000103 mg/L 10.000151 0.0000518Chromium J 10/22/20140.000412 mg/L 10.00019 0.000132Copper 10/22/20140.000515 mg/L 10.00575 0.0000521Lead 10/22/20140.000103 mg/L 10.000175 0.00000422Silver J 10/22/20140.000103 mg/L 10.000011 0.00000700Zinc 10/22/20140.00103 mg/L 10.168 0.000111
Qualifiers:
Page 2 of 2
* Value exceeds Maximum Contaminant Level B Analyte detected in the associated Method BlankE Value above quantitation range H Holding times for preparation or analysis exceededJ Analyte detected below quantitation limits ND Not Detected at the Minimum Reporting LimitS Spike Recovery outside accepted recovery limits
Page 4 of 8

NRC SOP QA-1104/AD-3100 Revision 1
Effective Date: 5/30/12
Neilson Research Corporation
DATA FLAGS
B Analyte detected in the associated method blank. BA BOD Alternative Calculation: The initial results performed by Standard Methods did not fall within parameters of the
Standard Methods calculation. An alternate approved calculation was performed using the HACH method and the value reported is an estimated concentration.
C Sample(s) does not meet NELAC/ORELAP sample acceptance criteria. See Case Narrative. C1 Sample(s) does not meet NELAC/ORELAP sample acceptance criteria for temperature. CF Results confirmed by re-analysis. CU Cleanup performed as specified by method. D1 The diesel elution pattern for the sample is not typical. D2 The sample appears to be a heavier hydrocarbon range than diesel. D3 The sample appears to be a lighter hydrocarbon range than diesel. D4 Detected hydrocarbons do not have pattern and range consistent with typical petroleum products and may be due to
biogenic interference. D5 Detected hydrocarbons in the diesel range appear to be weathered diesel. E Estimated value. ER Elevated reporting limit due to matrix. Report limits (MDLs, MRLs & PQLs) are adjusted based on variations in
sample preparation amounts, analytical dilutions, and percent solids, where applicable. FC Fecal Coliforms: Sample(s) received past 40 CFR Part 136 specified holding time. Results reported as estimated
values. G1 The gasoline elution pattern for the sample is not typical. G2 The sample appears to be a heavier hydrocarbon range than gasoline. G3 The sample appears to be a lighter hydrocarbon range than gasoline. G4 Detected hydrocarbons in the gasoline range appear to be weathered gasoline. HP Sample re-analysis performed outside of method specified holding time. HR Sample received outside of method specified holding time. HS Sample analyzed for volatile organics contained headspace. HT At the client’s request, the sample was analyzed outside of method specified holding time. H Analysis performed outside of method specified holding time. J Analyte detected below the Minimum Reporting Limit (MRL) and above the Method Detection Limit (MDL). The J
flag result is an estimated value and the user should be aware that this data is of limited reliability. MI Surrogate or Matrix Spike recovery is out of control limits due to matrix interference. Sample results may be biased. N See Case Narrative on page 2 of report. Q Closing continuing calibration verification (CCV) or laboratory control sample (LCS) exceeded high recovery limits,
but associated samples are non-detect and the sample results are not affected. Data meets EPA/NELAC requirements. R Relative percent difference (RPD) is outside of the accepted recovery limits. R1 Relative percent difference (RPD) is outside of the accepted recovery limits. However, analyses are not controlled on
RPD values for sample concentrations that are less than the reporting limit. R3 The relative percent difference (RPD) and/or percent recovery for the duplicate (DUP) or matrix spike (MS)/matrix
spike duplicate (MSD) cannot be accurately calculated due to the concentration of analyte already present in the sample.
R4 Duplicate analysis failed due to result being at or near method reporting limit. S Surrogate and/or matrix spike recovery is outside of the accepted recovery limits. Sample results may be biased. S1 Surrogate or matrix spike recovery is outside of control limits due to dilution necessary for analysis. SC Sub-contracted to another laboratory for analysis. T Toxicity Characteristic Leaching Procedure – Sample submitted contained < 0.5% solids. If the waste contains <0.5%
dry solids, the liquid portion of the waste, after filtration, is defined as the TCLP extract. # Value exceeds regulatory level for TCLP contaminant. X1 The motor oil elution pattern for the sample is not typical. X2 The sample appears to be a heavier hydrocarbon range than motor oil. X3 The sample appears to be a lighter hydrocarbon range than motor oil. * Value exceeds Maximum Contaminant Level or is outside the acceptable range.
Page 5 of 8
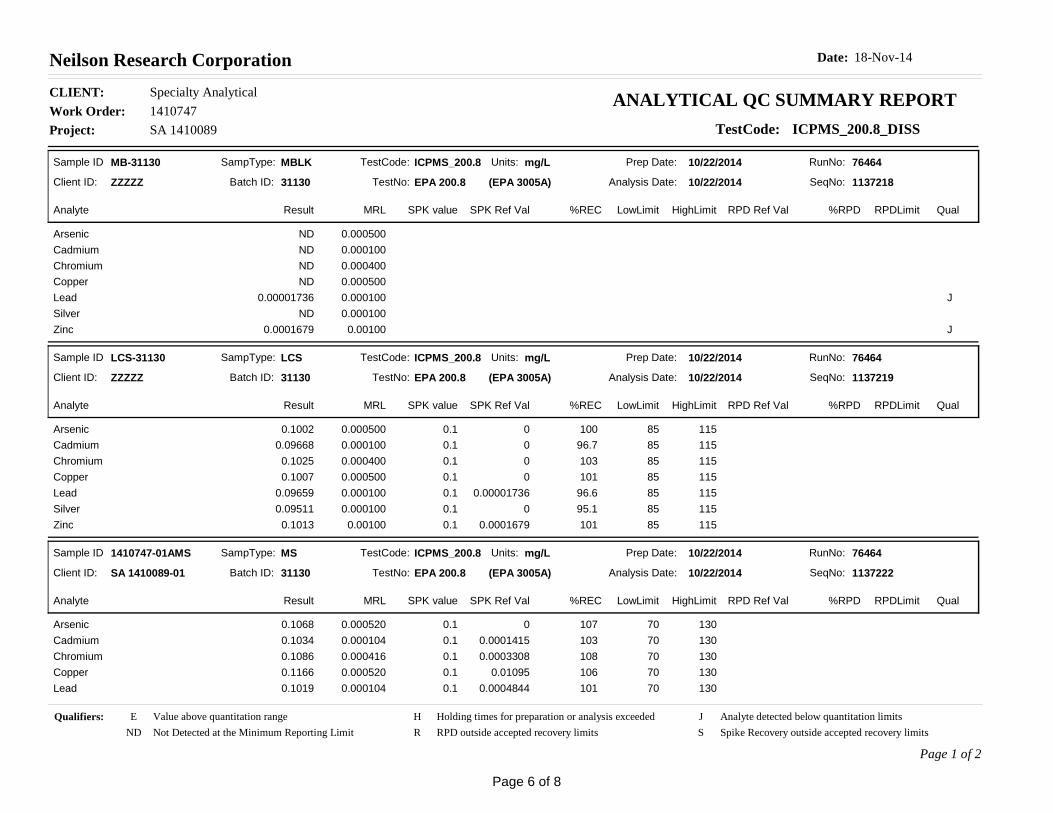
Project: SA 1410089
CLIENT: Specialty AnalyticalWork Order: 1410747
ANALYTICAL QC SUMMARY REPORTTestCode: ICPMS_200.8_DISS
18-Nov-14Date:Neilson Research Corporation
Sample ID MB-31130
Batch ID: 31130 TestNo: EPA 200.8 Analysis Date: 10/22/2014
Prep Date: 10/22/2014
Analyte Result SPK value SPK Ref Val %REC RPD Ref Val %RPDLowLimit HighLimit RPDLimit Qual
Units: mg/L
MRL
Client ID: ZZZZZ
RunNo: 76464
SeqNo: 1137218
MBLKSampType: TestCode: ICPMS_200.8
(EPA 3005A)
Arsenic 0.000500NDCadmium 0.000100NDChromium 0.000400NDCopper 0.000500NDLead J0.0001000.00001736Silver 0.000100NDZinc J0.001000.0001679
Sample ID LCS-31130
Batch ID: 31130 TestNo: EPA 200.8 Analysis Date: 10/22/2014
Prep Date: 10/22/2014
Analyte Result SPK value SPK Ref Val %REC RPD Ref Val %RPDLowLimit HighLimit RPDLimit Qual
Units: mg/L
MRL
Client ID: ZZZZZ
RunNo: 76464
SeqNo: 1137219
LCSSampType: TestCode: ICPMS_200.8
(EPA 3005A)
Arsenic 0.1 100 85 1150.000500 00.1002Cadmium 0.1 96.7 85 1150.000100 00.09668Chromium 0.1 103 85 1150.000400 00.1025Copper 0.1 101 85 1150.000500 00.1007Lead 0.1 96.6 85 1150.000100 0.000017360.09659Silver 0.1 95.1 85 1150.000100 00.09511Zinc 0.1 101 85 1150.00100 0.00016790.1013
Sample ID 1410747-01AMS
Batch ID: 31130 TestNo: EPA 200.8 Analysis Date: 10/22/2014
Prep Date: 10/22/2014
Analyte Result SPK value SPK Ref Val %REC RPD Ref Val %RPDLowLimit HighLimit RPDLimit Qual
Units: mg/L
MRL
Client ID: SA 1410089-01
RunNo: 76464
SeqNo: 1137222
MSSampType: TestCode: ICPMS_200.8
(EPA 3005A)
Arsenic 0.1 107 70 1300.000520 00.1068Cadmium 0.1 103 70 1300.000104 0.00014150.1034Chromium 0.1 108 70 1300.000416 0.00033080.1086Copper 0.1 106 70 1300.000520 0.010950.1166Lead 0.1 101 70 1300.000104 0.00048440.1019
Page 1 of 2
Qualifiers: E Value above quantitation range H Holding times for preparation or analysis exceeded J Analyte detected below quantitation limitsND Not Detected at the Minimum Reporting Limit R RPD outside accepted recovery limits S Spike Recovery outside accepted recovery limits
Page 6 of 8
Project: SA 1410089
CLIENT: Specialty AnalyticalWork Order: 1410747
ANALYTICAL QC SUMMARY REPORTTestCode: ICPMS_200.8_DISS
18-Nov-14Date:Neilson Research Corporation
Sample ID 1410747-01AMS
Batch ID: 31130 TestNo: EPA 200.8 Analysis Date: 10/22/2014
Prep Date: 10/22/2014
Analyte Result SPK value SPK Ref Val %REC RPD Ref Val %RPDLowLimit HighLimit RPDLimit Qual
Units: mg/L
MRL
Client ID: SA 1410089-01
RunNo: 76464
SeqNo: 1137222
MSSampType: TestCode: ICPMS_200.8
(EPA 3005A)
Silver 0.1 99.7 70 1300.000104 0.000010740.09973Zinc 0.1 106 70 1300.00104 0.13740.2435
Page 2 of 2
Qualifiers: E Value above quantitation range H Holding times for preparation or analysis exceeded J Analyte detected below quantitation limitsND Not Detected at the Minimum Reporting Limit R RPD outside accepted recovery limits S Spike Recovery outside accepted recovery limits
Page 7 of 8

Page 8 of 8

Jl F- Ana I yti cal Resou rces, I n co rpo rated
-/- Analvtical Chemists and ConsultantsIJ
24 November 2014
Nikki BippesSpecialty AnalyicalltTll SE Capps RoadClackamas, OR 97015
RE: Projects: 141017 4ll4l0l75lf 410089ARI Job No: ZK82
Dear Nikki:
Please find enclosed copies of the original chain of custody records and the final results forthe samples from the project referenced bbove. Analytical Resources, Inc. (ARI) originallyreceived these samples on October 17 and October 24, 2014. The samples were re-analyzed,for TBT as requested.
All samples were initially extracted on lllI9l14. The extract for sample 1410089-001 waslost before its extraction was complete. This sample was extracted a third time onIl/2ll14. The re-extraction proceeded without incident of note. The result for the lll2lll4extraction only has been submiued for this sample.
There were no fuither problems with these analyses.
A copy of these reports and all supporting data will remain on file with ARI. Please feelfree to contact me if you have any questions or require any additional information.
Respectfully,
ANALYTICAL RESOURCES. INC.I
\?,-t ,X'\ /1(r??WMaik D. Ha:ri$----Project Manager206/[email protected]
Enclosures
File ZK82
MDH/mdh
Page I of lg46'f 1 South 134th Place. Suite 100 r TukwilaWAg8l68 .2O6-695-6200 o 206-695-6201 fax

-,oCI
cn
=oa)otroe5ooa.o
'22otrcogrEE
€()FE
Tglla!o
|!.!a)oooaLau) a,
tD=to€5E;E*
5 ts
.)oG
C)
>@!oolrttoIotr43=E 39,
=cE;
pe-.Eit'83
aoIotr5IEooa-@!g
oo1E
oqrE
E4.9-30
EeF8F{'c)!a
c)
>s
R\
S+
=g- FE
Foota
ozod
lltltl|ltgtdiq*ll,F
otEIt)loIEIA
,oo,;)o
ooIIII_lIIIII
Eoto3)0o= g,3)ooA
o-c)oo-o-
oE'
t5o=t)oFLoooA(,oc0c)
I-FI-ta,-rJFIIrq--t)JJ,Lq-?IF-J
coq)oo6(,J&olrIo*q)ogFtDIo=?ott0
o(,6T'caaDE
F!t
€aoo3e!.t)
9a)o3ot-aoa>oco5g
!tll!lolglol('lqll\.
1
url.!F
IE
O0==
E)<
=F
IItIIIIIIItI
Jgd
E!o(:o0C)
iggg
]Euaq{-,aGF-brL,
tr0)nv)
9*.ltIf
PE
*" Se# : S
€a5ru#lffi -.1F
ARI Client: \40
COC i,lo(s):
Assigned ARI Job No:
tD Analytical Resources, Incorporated
a, Analytical Chemists and Consultants Cooler Receipt Form
Name: f4lo n<DeliverEd uy:@FupS Courier Hand Dellvered Other:-rreckins no, 7'7lb d894 147( ne
YES
@@*, ziot
@NO
NO
Were all botttes sealed in indivkluaf plastic bags? (G\ NO
Dd ail botfles anive in good condition (unbroken)? G', NoWere all botle labeb complete and legible? @ NO
Did the number of containers llsted on CoC match with the number of containers received? @ NoDid all bottte labels and tags agree with custody paper? llES '@
._.Were all botbE used conec{torlh€ requested analyses? (YED NO
Do any of the analyses (bottles) require preservation? (aftach preservation sheet, excluding VOCs)... @ YES NO
WereallVOo vialstree of airbubbles? @ YES NO
Was suftcient amount of sample s€nt in each bottle? .......... 1y?$ Nowas sutncreil amount or sampE 8€m an each botile? .......... ( yE$ NO,a \---lDate VOC Trip Blank was made at ARl... . ( rrAr
* Nottfy Pflect Uanager of dt*rqancies or concems n
Projecl
Prollmlnary Emmlnatlon Phate:
Were intad, prop€rly s(tned and dated custody seals attached to the outside of to cooler?
Were cBtody pap€c includ€d with the cooler?
Were custody papers ptoperly filled out (ink, signed, etc.) .............Temp€rstuG of Coole(s) ('C) (recommended 2.0$.0 'C for chemistry)Timc: _lf coohr temperature is out of complaance fil| oul fom 00070F
cooterAcceptedoy J y'h o.,"'
Log-ln Phase:
Was a temperature blank included in the cooler? YES
Whatkindofpad<ingmaterial wasused?... (BubbleWrair)fl*l{Gel Pad<siBaggiee FoamBlock Paper other:X-_-Z ---.-
{tY?$ffi \'--lv
Was Sample Spllt by ARI ' tG') YES Date/Time:- Eq.urpment- Sptit by:-
sampresLossedb$ - ..){\ "","' tUlZtJ 1t,J ,,^", I 173
Temp Gun lDf:
Samplo lD on Bottle samp|e lD on coc sample lD on BoHe Sample lD on GOC
l*1015-ror" l"t to /7 5-Dt4ton{-M7E t4bn>-oL
Addltqd Nolos, &scrqpaaclcs, C Resoludoas;
Bv: Dab:
rAlErlDdl*r ll Ht.s|..'-'&n ll arr-t
' .' ' li t^l-at-t
ElfiarltF Smell)t'sm'(<2mm)Pcabubblcc I -pb'( 2 to <4 mm )
Lrrgct"['(4to<6mm)Hcrdopacc)-hr'(>6mm)
0016F3r2no
EH.-#H : s-frS$ffr# *
Revision 014
Z"t-E&: #FG*;E*# i: r r- -ei, , *%.dSd"& f'6,t-.r
Cooler Receipt Form
aEotroe5t!oa.
,o
p-9e)cE
Ogro5e()FE
E(to=
=.>
5org
.!GC'
3'ooC
T, A
a, aD
:;TD
.BoE5
5_iggLl=
trooE
C)
;@.ltool!!.)':oa)oE
gF6*O
E!'ogo rts
E
fiEE?
g$EE
€3€.aooo=g=53
eo()l,EoEoooe!9org!o?aB
CaggEc)t
!+5EFoo
tc)
ozod
IIIII
gdflII
ooz,ttoEg.
IIIIIIIIcjz.C
)oPA
c,ooEE
xooL)
gooE
oor9I:u€t--at=
tLJ9lJeirF-;l:IOtoJEr3t)-)LI-2IaFtbJ
atoctoooIJ=orIog*o.ogIteoB'do0
o(tT!aaoFb!
DotE
l ttgt-
Ia3Do-ooO>-EotE
Ol
6tltlol.0lol6l61trlIDE
=E'
cr==
E>
(o
iggg
tu{-,rtF-i"(t.UonV,
I,EE= p{
i*E?o15o0ct
ffi${#S*: W
#ffi#*s

aL Analytical Resources, Incorporated
-4, Analytical Chemists and Consultants Gooler Receipt Form
ARI Cllcnt: \40
COC No(s):
Assigned ARI Job No:
Prullmlnary Enmln tlon Phae:
Wctc intad, propcdy slgned 8nd dated c$lody soels attachod to the outside of to cooler?
Wers custody papers Induded with tho cooler?
Were q.rgtody papec prcpedy lllled out (ink, eigned, €tc.) ........,....Temporetur€ ot Coob(s) ("C) (rscomtnsnded 2.0€.0 'C br chemistry)Time:_lf coolertgmpsrature F out of compllance
"lnKoooToF
,r1***,, l4(b fi4Deliwmd by,t6EFupS Couder Hand Delivercd oher:-rrackins no, 7-? lb O894 ..147(- xe
6c@No
t*rro"**. ffifmSZCoolerAcoepted by:
formsadatbch dl &,cumqrts
nWasatsmp€retureblankinduded inth€cooler? ..................,s.,''..i,.... YES (*!9|
wcre a[ botle8 seal€d in individual ptastic bags? .e No
Did all bottlec anive in good condition (unboken)? \try NO
were all botte labels complete and legible? @ No
Did the numbsrof contein€F listed on COC mdctr with the number of containers receiv€d? ................ @ NO
Dirl all bottte labeb and tra$ agree with custody papers? ................. YlS @wers all bottles used coned forthe requ,ested analyses? @ No
Do any of the analyses (bott€s) Bqulre pl€sawaton? (ettach pre€eilatlon sh€et, excluding VOCs),.. @ YES NO
Werc allVOC viab fise of air bubbles? @ YES No
Wassultlcieniamountof samplesent in each bottle? dO No-A V
Date VOC Trip Blank was made etARl,., '@Wessempl€sp|iibyAR|'1s)YEsDat€/Timo:-Equip'f€nt-Sp|itby:-
\-/t-
sampbsloggeoor, - .1i'h o "t, rclz4f t,/ rnnc' ll(6* Nofdfry Wod llanagcr ot il*rryhclg or concetns -
n^", f 100
*harkindorpad{ns"",";;;;;;;;:' 6ffi;ils';''*n* FoamBrock e"n", *"*l-I*\.\
Samole lD on gon|e Semple lD on coc samue ru on EoE|e ttample lD on COC
Li t6114-o|te i4!c tt4-re[- oll4 lo r-ztl- 6ozE t4 bt7.(42
A<onet ttotgs', rygcr€pettcteq & Resoludons.'
Bv: . lYn Dere: nlt'a ldFtrBrbtbr>4mm
oo-.&ttn
t.t],La ttxn
t. t.l
Smrll)"sn" (<2mm)Pcebubblcr I *pb" ( 2 to<tl mm )
Lrryc )'lg- ( 4 to<6 mm )
Herdrpacc)(hc" (>6mm)
0016F3t2110
HFq'#'E : ffi#ffiffiffi
Revision O14
Z."ij-* : Sr**ffi:3'ffi
Cooler Receipt Form
.sEotrgooJ|3oEI
E.o
';oE:Jotrc.!E
65eO
FE
To(,O
GccG
OE
398.a,
att
!i@=to=ECi-oYg
€tsloE()
@llo0a,L
=toEoEE
"$
E3
E3
E€
E=
8sorgE
gEE
-e€()g
>
--:AT
DEF
EF
E<
>
Td--
9E:.
BF
ggoc)c.o
d-odFoC'
Ec
ooIIIII
gIIII
Et
oEt6a)os(r,
6oEA
oEozC)
oEo-IIIIIIc;z.C
'ot
Eo.
L'0,CD
og6=ooE0-troIooC)
ocoo
I,I))Jar!:I-tD))h),_-(-I)0lT,*{J
CL
o(,oEootI:EAoEIoF!ri€I6oeI=aoCI
oo
oa,c61tsaa3=.>
!.E
Oole€vro
(,lDaoO=-aa!Fotr,3E
olGI
olilol3l!0lt-lr{)l
E*
s€
(f)tf|
gr-(.ir:rclr?N3ql'1 cog8=
xF
.F
r\g\od!iJIto(J
(!sane.(!Ov,N
-iiua-{-,-}(uF-l',.EU(uo.V
I
IEtot
;aItoao0o
Ets?*
1 L*h#**Fiil*
E *,"f* #,ffixiB
:#,
xoII
Hry{+
:ry r rywffi#5fii
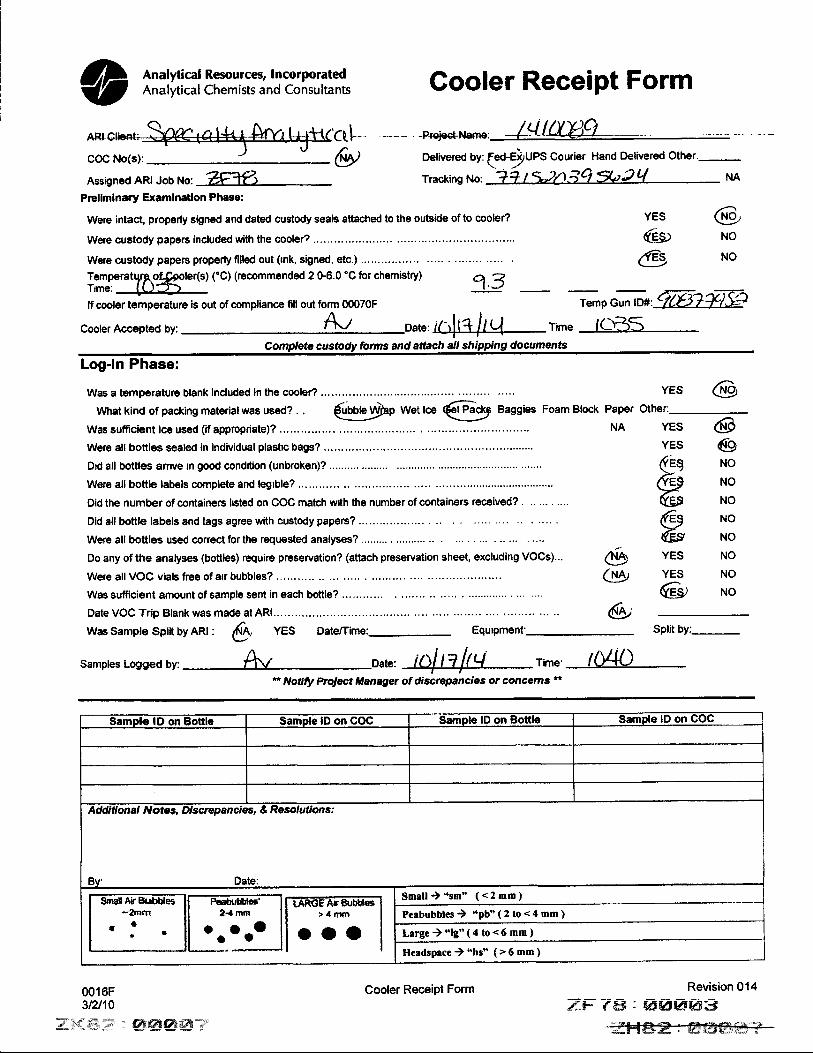
tD Anatytical Resources, Incorporated
at Analytical Chemists and Consultants Gooler Receipt Form(1
nnre Ctl-CoCNo(s): t t
@Assigned ARf Job No: ?fr?t
Prcllmlnary Exarnlnation Phase:
Ir[fjJbB'* fc) (recommended 2 0'6'0 "crorchemistry)
lf cooler temperature is out of compliance fill out form 00070F
--- -Preiee'Name ' -/]4 \'UUQ---
Were intacl, properly sbned and dated custody seals attached to the outsHe of to cooler?
Were custody papers included with the coolef
Were custody papers properlyfilled out (tnk, signed, etc.) ,............
?.3
YES
(es>
@
coorerAcceprec oy: r4.,,/ o"t"' /:rl(1 /l t{ rime ICBSComptete custody fonns and at'€,ch att shiwtng documents
@NO
NO
Delivered Ov: qeO-pUeS Courier Hand Delivered Other.-rrackins no' ?1 t n)43Q 3a94 xn
-remp ^**'Wryryilfi
Log-ln Phase:
Was a temperature blank included in the cooler?
what kind of packing materialwas used? . {g@p wet lce @9!i Baggies Foam Block
Was suffcient ice used (if appropriate)? ...... ,,. ...... .
Were all bottles sealed in individual plastE bags?
Dd all bottlG arnve rn good condilion (unbroken)?
Were all bottb labels cornplete and legtble?
Did the number of containers hsted on COC match wrth the number of containers received? . .. ... . ....
Did all bottle labels and tags agree with custody papers?
Were all bottles used conect for the requested analyses?
Do any of the analyses (bottles) require preservation? (attach preservation sheet, excluding VOCs)...
Were all VOC vials free of arr bubbles?
Was sufficient amount of sample sent in each bottle?
Date VOC Trip Blank was made at ARl... .., ......
was sample Split by ARI , 8, YEs Dateffime:- Equrpment'
YES
Other:-YES
YES
(ts\-'.-:,(/Ec\5)'
HYES
YES
€e@ot
Papet
NA
@
@@NO
NO
NO
NO
NO
NO
NO
NO
Split by:
samples Lossed uv' A,/ on"' i}ln ft I -rine' /04O** Natify Prolect *lanager of dlscrepancies or concems n
Sample lD on Bofrle uamob tu on srJr, Sample lD on Bottle Sample lD on cOC
Addittonal lVotes, Dlscrepanci*, l3 Resolut ons.'
Bv' Date:
RGE*reubd€r
roaPa*ul*lrs' Small)*sm" (<2mm)
Pcabubbles ) 'pb" ( 2 1o < 4 mm )
Large)"lg"(4to<6mm)Hcedsprce)"hs" (>6mm)
0016F312,10
tr3'{#tr r ffi##ffi1F
Revision 014
;{Ff*:@ffi**$*ffi
Cooler Receipt Form

SampJ.e ID
sampre rD cross Reference Report iiiiqe+@INCORPORATED
ARI Job No: ZK82Cl-ient: Specialty Analytical
Pro j ect Event : 1,41017 5 /1-41017 4 /l'41008 9
Proiect Name: N/A
ARI ARILab ID LIMST ID t'tatrix Samp]-e Date,/Time VTSR
1. 1410175-012. r4r0l15-023. 14]0]7 4-0L4 . 1.41,017 4-025. 1410089-0016. 1410089-002
zK82A 1,4-24995 Water 10/20/I4 15:05 1'O/24/74 11:00ZK82B 14-24996 Water t0/20/L4 15:15 10/24/1'4 11:00zK82c 14-24997 Water 10/2L/74 11:10 I0/24/I4 11:00zK82B 1,4-24998 Water 10/2I/I4 l-l-:45 1'0/24/14 11:00zK82C t4-24999 Water 1'0/13/14 L1-:22 70/24/I4 11:00zK82B t4-25000 Water 1.0/13/L4 11:57 L0/24/14 1l-:00
HF4#E : ###trS3
Printed 7t/1,8/14 Page 1 of 1

ORGAIVICS ANAIJYSIS DATA SHEETTributyl Tins by Sw8270D-SIM cclMsExtraction Method: SW3510CPage 1 of 1
Lab Sample ID: ZKa2ALIMS ID: L4-24995Matrix: WaterData Release Authorized:\\t:VReported: lL/21/t4
Dat.e Extracted: ll/19 /L4Date Analyzed: Ll/21,/L4 l-O:56Instrument/Anal-yst : NT12 /VTS
CAS Nurnber Analyte
ANALYTICALaiRESOURCES\7INCORPORATED
Sample ID: 1410175-01SAI{PLE
QC Report No: zK82-specialty Anal-yticalProj ect : l-41-0r-75 / 1,4LOL7 4 /l-410089
Event.: NADate Sampled: lO /20 /1-4
Date Received: lO/24/!4
Sample Amount: 150 mLFinal Extract. Volume: 0.50 mL
Dilution Factor: 1.00Afumina Cleanup: Yes
LOQ Result O
36643 *28 - 4 Tributyltin Ion U. UU5 < 0.005
Reported in pglr, (ppb)
TBT Suffogatse Recovery
Tripropyl Tin Chl-oride 52.72Tripentyl Tin Chloride 72.22
""f$sSeP: fe$&.#6frq;&FORM I
ffiF
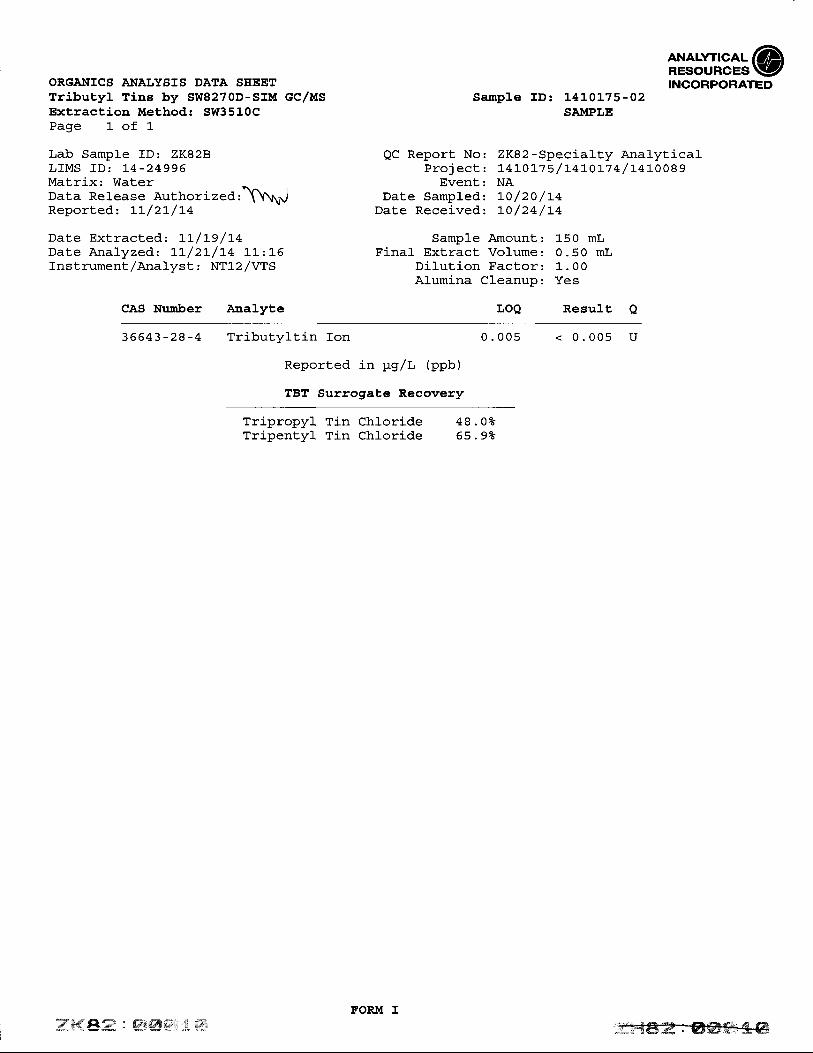
AN,^rv?r.^^r la*=$l'#;;@ORGA}IICS AI{ALYSIS DATA SIIEET INCORPORATEDTributyl Tine by SW8270D-SIM GCIMS Sample ID: L4L0L75-02Extraction Method: SW3510C SAIfPLEPage L of 1-
Lab Sample ID: ZK82B QC Report No: ZK82-Specialty AnalyticalLrMS fD: t4-24995 Project: 14101-75 /1,41,01,74/ l-410089Matrix: Water \^ Event: NAData Release Authorized, \\rl Date Sampled: !0/20/1,4Reported: LL/2L/14 Date Received: 1,0/24/L4
Date Extracted: lL/1-9/L4 Sample Amount: 150 mLDate Analyzed:. LT/2L/I4 11:16 Final- Extract Volume: 0.50 mLTnstrument/Ana1yst: NT12/VTS Dilution Factor: l-.00
Al-umina Cleanup: Yes
CAS Number Arralyte LOQ Result O
36543-28-4 Tributyltin Ion 0.005 < 0.005 U
Reported in pglr, (ppb)
TBT Surogate Recovery
Tripropyl Tin Chloride 48.0?Tripentyl Tin Chloride 65.9t
?r4ds"€p : {frflftffiFF #tFORM I
ffi

ORGAIIICS AI{ALYSIS DATA SHEETTributyl Tins by SW8270D-SIM GCIMSExtraction Method: SW3510CPage 1 of l-
Lab Samp1e ID: ZK82CLIMS ID: L4-24997Matrix: WaterData Release Authorizedt\\WReported: 1,!/2L/L4
Date Extracted: 1,1,/L9/14Date Anafyzed: 11,/2L/a4 L]-t37Instrument/Analyst : NTI-2 /VTS
CAS Nurnber Analyte
ANALYnCAL(aRESOURCES \ZINCORPORATED
sample rD: 1410174-01SAI{PLE
QC Report No: ZK82-Specialty Anal-ytical-Projecr : 1410175 / r4L0L7 4 /l-410089
Event: NADate Sampled: lo/zt/t+
Date Received: lo /24/14
Sample Arnount: 150 mLFinal- Extract Volume: 0.50 mL
Dilution Factor: 1.00Al-umina Cleanurr: Yes
LOQ Result O
36643 -28 - 4 Tributyltin lon 0.005 < 0.005 u
Reported in pg/t (ppb)
TBT Surogate Recovery
TripropylTripentyl
Chloride 50.4?Ch]oride 72.2t
'1 an'L l_n
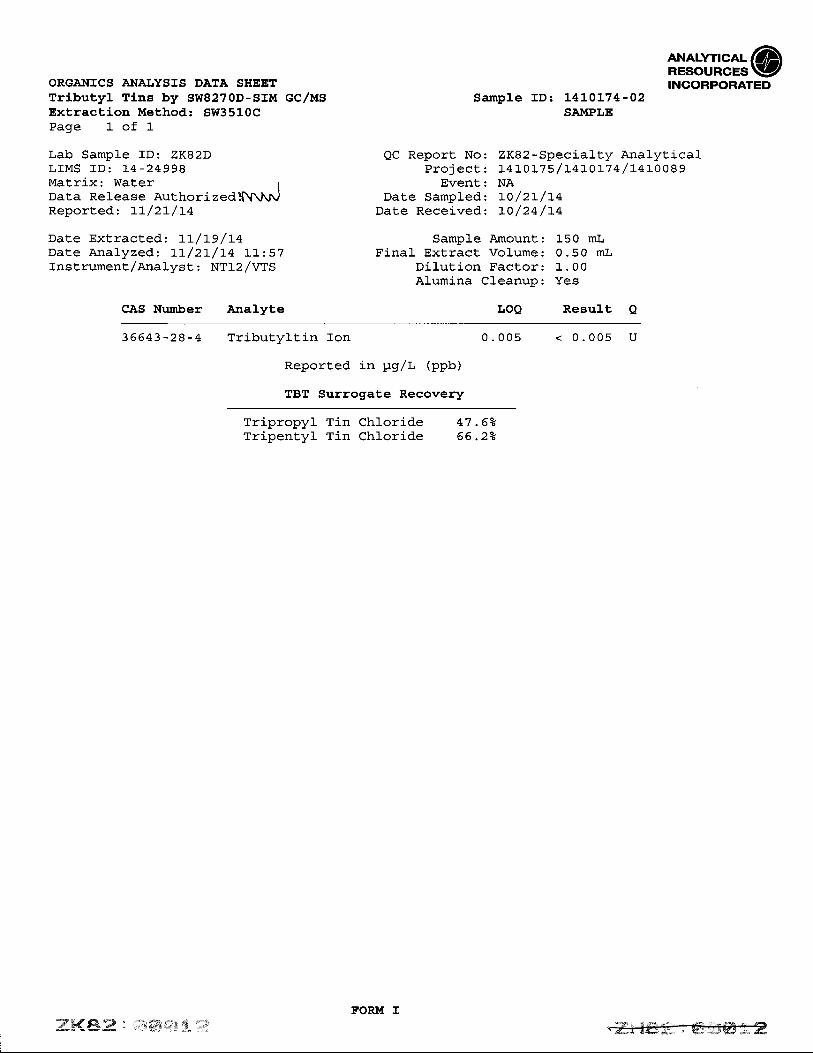
ixsbns*@INCORPORATEDORGAI{ICS AI{ALYSIS DATA SHEET
Tributyl Tins by SW8270D-SIM cClMSExtraction Method: SW3510CPage l- of L
Lab Sample ID: ZK82DLIMS ID: 1-4-24998Matrix: Water
iDaLa Release Authorized$\NJWReported t1/2L/La
Dat.e Extracted: 1,1- / 1,9 / 14Date Analyzed: LL/2L/L4 11:57Instrument/Analyst : NTI-2 /VTS
CAS Number Analyte
Sample ID: L LOL74-02SAI{PI.E
QC Report No:Proj ect:
Event:Date Sampled:
Date Received:
ZK82 -Specialty Analyticalt4tot7 s / t4!or7 4 / 1,410 0 I 9NAt0 /2!/t4L0/24/14
Sample Arnount: 150 mLFinal Extract VoLume: 0.50 mL
Diluti-on Factor: 1.00Alumina Cfeanup: Yes
LOQ Result O
35643 -28 -4 Tributyltin Ion 0.005
Reported in pg/L (ppb)
TBT Surrogate Recovery
< 0.005
TripropylTripentyl
Chloride 47.52Chloride 56.22
TinTin
trFf Se*P ' ffiSftffiq %F ,- r!!i r:, lll I r! !!! F ; I

Alsbffsrb@INCORPORATEDORGAIVICS AIVAI,YSIS DATA SHEET
Tributyl Tins by Sw8270D-SIM GCIMSExtraction Method: SW3510CPage l- of 1
Lab Samp1e ID: ZK82FLTMS ID:14-25000Matrix: WaterDat,a Release Authorized :'\nprReported: L1,/2L/L4
Date Extracted. 1,L/1,9/L4Date Analyzed: lL/2L/L4 12:I7Instrument/Analyst : NT12/VTS
CAS Nunber Arralyte
Sample ID: 1410089-002SAIVIPLE
QC Report No:Proj ect :
Event:Date Sampled:
Date Received:
ZK82 -Specialty AnalyticalaALOL1 5 / t4LOt7 4 / t4 r_0 08 9NAto/t3/1,4t0 /24 /1-4
Sample AmounL: 150 mLFinal Extract Volume: 0.50 mL
Di]ution FacLor: l- . 00Alumina Cleanup: Yes
LOQ Results
35643 -28-4 Tributvl-tin Ion 0.005 < 0.005 U
Reported in yg/L (ppb)
TBT Surrogate Recovery
Tripropyl TinTripentyl Tin
Chl-oride 55. 5?Chloride 78.2+

ORGAI{ICS AI{AI.YSIS DATA SHEETTributyl Tins by SW8270D-SIM GCIMSExtraction Method: SW3510CPage 1 of 1-
Lab Sample ID: MB-1L191-4LIMS ID:. 14-24995Matrix: WaterData Release Authorized.:^\jReported: LL/2L/1,4
Date Extracted : ll/19/1,4Date Analyzed: !!/21/14 09:56Instrument/.Anal-yst : NT12 /VTS
CAS Nurnber Arralyte
Sample ID: MB-111914METHOD BLA.I.IK
QC Report No: ZK82-Specialty AnalyticalProject : 141-0175 / L4tOt7 4 /1410089
Event: NADate Sampled: NA
Date Received: NA
Sample Arnount: 150 mLFinal Extract Volume: 0.50 mL
Dilution FacLor: l-.00Al-umina Cleanun: Yes
LOQ ReEult A
36643 -28 - 4 TribuLyltin Ion 0.005
Reported rn pg/t (ppb)
TBT Surrogate Recovery
Tripropyl Tin Chloride 53.8?Tripentyl Tin Chloride 73.3t
< 0.005
r9 & F9, F 4+'AiSgW&'t M ffi

ORGANICS ATiIALYSIS DATA SHEETTributyl Tine by SW8270D-SIM GCIMSPage l- of l-
Lab Sample ID: LCS-11191-4LIMS ID: L4-24995Matrix: Water
^\ IData Release Authorized:' 1\\JReport.ed: LL/21/14
Date Extracted LCS: !L/19/1,4
Date Analyzed LCS: ]-:-/Zt/t4 10:16r,csD: lL/2t/t4 10:36
InsLrument./.Analyst LCS : NTI-2/VTSLCSD: NT12/VTS
Analyte
ANALYTICAL II'ARESOUR;;;VINCORPORATED
Sample ID: LCS-111914I.AB CONTROL SAII'PLE
QC Report No: ZKB2-Specialty AnalyticalProject : 1410175 / LALOl',l 4 /141-0089
Date Sampled: NADate Received: NA
Sample Amount LCS: 150 mLLCSD: 150 mL
Final Extract Vol-ume LCS: 0.50 mLLCSD: 0.50 mL
Dilution Factor LCS: l-.00LCSD: 1.00
Alumina Cleanup: Yes
Sptke LCS spike LCSDLCS Added-LCS Recovery LCSD Added-LCSD Recovery RPD
Tributvltin lon 0.0s1 o.o74 68 .92
Reported in pgll (ppb)
RPD calculated using sampl-e concentrations per SW845.
TBT Surrogate Recovery
0.055 o.o74 7s.72 9.32
Tripropyl TinTripentyl Tin
ChlorideChloride
LCS LCSD52 .7t 60 .927L.5t 83.22
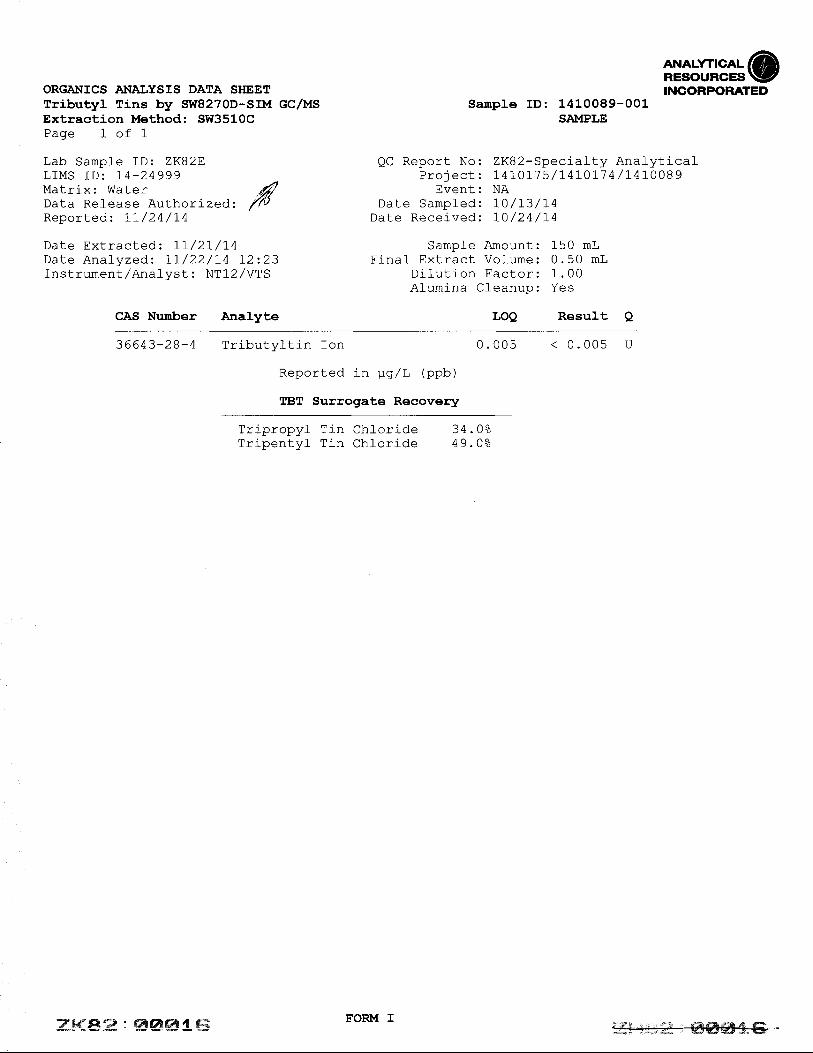
Arstilsrb@INCORPORATEDORGAI{ICS AI.IALYSIS DATA SHEET
Tributyl Tins by SW8270D-SIMExtraction Method: SW3510CPase 1 of 1
Lab Sample ID: ZK82ELIMS ID z 74-24999Matrix: WaterData Rel-ease Authorized:Reported: 7L / 24 / L4
Date Extracted z 1,1/ 2I / 1,4
Date Analyzedz 11,/22/14 L2:23Instrument/Analyst : NT12/VTS
CAS Nunber Anal-yte
,w
GClMS Sample ID: 1410089-001SAIVIPLE
A/- Pannrf NTn.
Proj ect :
Event:l-lrf a Qamnl od'
Date Received:
ZK82-Specialty Analyticalr 4L0r7 5 / 1 41,0L'7 4 / L 41,0 08 9NA70/13/14L0/24/14
Sample Amount: 150 mLFinal Extract Vol-ume: 0.50 mL
Di-lution Factor: 1.00Al-umina Cf eanup: Yes
LOQ Result A
36643-28-4 rrrluLJr 0.005 < 0.005
Ranarl-ad in rrnlT /nnl'r\!\EIrv! LEU rrl FrY / ! \Ilyy I
TBT Surrogate Recovery
L L Lt/L vuI L Chl-ori-deChloride
34.0%49 .02
f_+ " +*skFed s4j- F4 ;Fq i@ , (€-E ef$ Ai+E ' E g*e ffi-
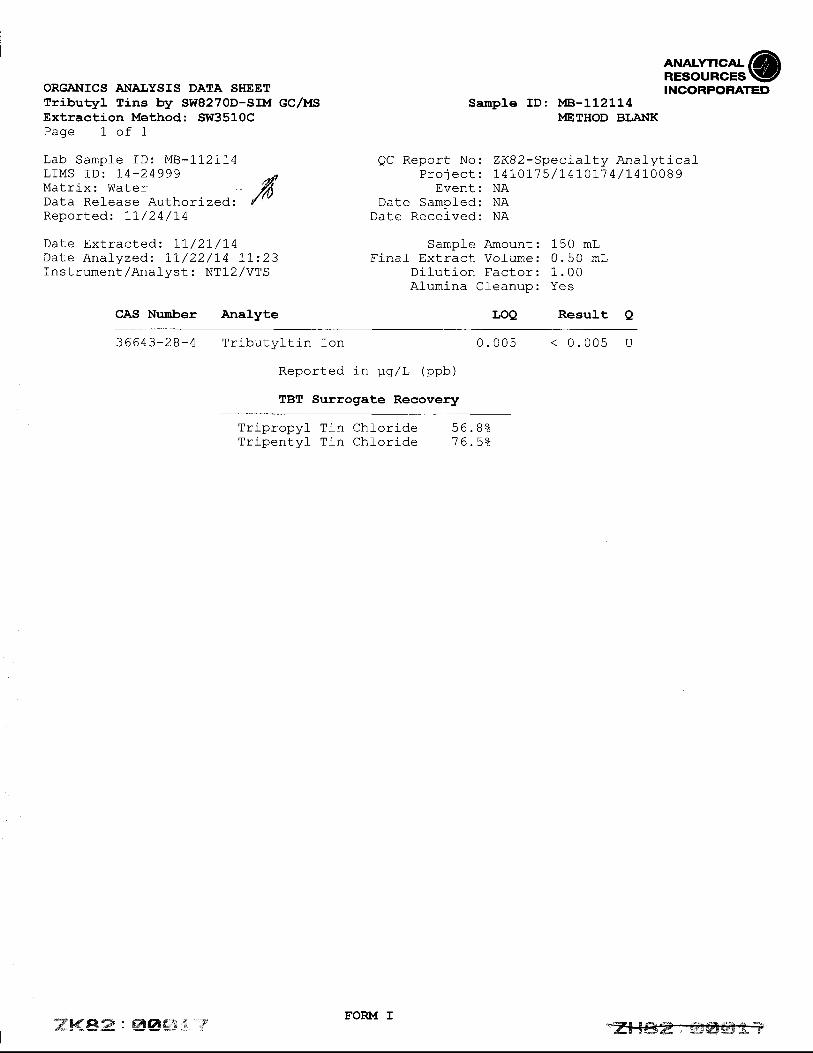
ORGA}IICS AI{AI,YSIS DATA SHEETTributyl Tins by SW8270D-SIM cClMSExtraction Mettrod: SW3510CPage 1 of 1
Lab Sample f D: MB-71,27I4LIMS ID: I4-24ggg .n,Matrix: Water /nData Release Authorizedz y'"Reported: I1,/24/14
Date Extracted: lI/2I/14Date Analyzed: LL/22/14 1L:23Instrument/Analyst : NT12/VTS
CAS Nunber AnaLyte
ANALYTICA'@RESOURCES\ZINCORPORATED
SampJ-e ID: MB-112114METHOD BI,ANK
QC Report No: ZK82-Specialty Analytical-Prol ect : 14 10175 /I41,O1,7 4 /141,0089
Event: NAD:fc Semnlori . NA
Date Recei-ved: NA
SampJ-e Amount:Finaf Extract Volume:
Dil-ution Factor:Alumina Cleanup:
LOQ
1-50 mL0.50 mL1.00Yes
Result O
36643-28- 4 0.005 < 0. 005
Ranarl-arl in ttn/I /nnl-r\]\sl'v!Leu rrr FrYl! \yt/v,/
TBT Surrogate Recovery
'l'rl nr^h\r | 'l'r n
'l rl nant\, I I'r hChforideChl-oride
56.8%76.52
J:F{ !ffii.ff : #W# 5" T FORM I

ORGAr{ICS AI\IALYSIS DATA SHEETTributyJ- Tins by SDI8270D-SIM GCIMSPage 1 of 1
Lab Sample ID: LCS-1,I2IIALIMS ID:. 14-24999Matrix: WaterData Rel-ease Authorized:Renortecl:. 11 /24 /14
LCSD: IL/22/1,4 12t03lnstrument/Analyst LCS: NT12/VTS
LCSD: NT12/VTS
Ana]-yte
ANALYT|GA'(aRESOURCES \!ZINCORPORATED
Sample ID: LCS-112114LAB CONTROL SAI"IPLE
QC Report No: ZKB2-Specialty AnalyticalProj ect: 14 10175 /1-4L011 4 /I470O89
Date Sampled: NADate Received: NA
LCSD: 0.50 mLDi-lution Factor LCS: 1.00
LCSD: 1.00Afumina Cleanup: Yes
Spike LCS Spike LCSDLCS Added-LCS Recovery LCSD Added-LCSD Recovery RPD
Date Extracted LCS: LI/2I/14 a:mnl a amnrrn+ r /-$. 150 mLLCSD: 150 mL
Date Anal-yzed LCS:. 11 /22/14 1-1-:43 Final Extract Vofume LCS: 0.50 mL
Tril-rrr+,,r+i- ran 0.048 0.0.74 64.9% 0.045 0.0.1 4 60.89 6.59
Reported in p,g/L (ppb)
RPD cafcufated using sample concentrations per SW846.
TBT Surrogate Recovery
LCS LCSDn- j ^-^^..r mr ^ ^hloride 51,.42 50.'72rrflrrvvJ! rrrr vlTripentyl Tin Chloride 72.6eo 74.Oeo
tr&.fffi.:# : ffis*4ffi€ Sq
FORM III
'=ffi

Arssffsr!@INCORPORATED
TBT SI'RROGATE RECOVERY SI'MIIARY
Matrix: Water
/ TPRT'I :(TPNT) :
Client ID
A1- Pannrf Ir'Tn. 7.K9,2-Qnaa i r I f rr An: I rzf i ce I
Project : 14I0I7 5 /L4L01-7 4 / 1470089Event: NA
TPRT TPNT TOT OUT
MB-111914LCS-111914LCSD- 1I1.9I41410175-01L4L0L'7 5-021_4IOt1 4-0L7410]-7 4-02MB_TI2I1,4LCS-II2T1-4LCSD-1121141410089-0011410089-002
T-.i ^-^^.,1 nr 6 .hf Orider!fy!vy)/
Tri-'oentvl Tin Chloride
53.8? 13.3252.'le" 7r.5260. 9? 83.2252 .'7 e" '7 2 .2eo48.0? 65.9e"50.48 12.2241 .62 66.2256.8U 16.5251.42 72.6250.7? 7 4.0234.02 49.0%55.53 J8.2e"
000000000000
QC LIMITS(2r_L20)(22-1,20)
Prep Method: SW3510CAnalytical- Method: Low TBT (Hexyl) 8270D-SIM
Log Number Range: 14-24995 to 14-25000
9^na I f df / Kx /
--ks+A q4'-q " f*d%im d e%
FORM-II TBT
- r+!i-*'i-----4-.8-E++ry-j s*es vr{,futr {tdtu ' *J#-#A 6P
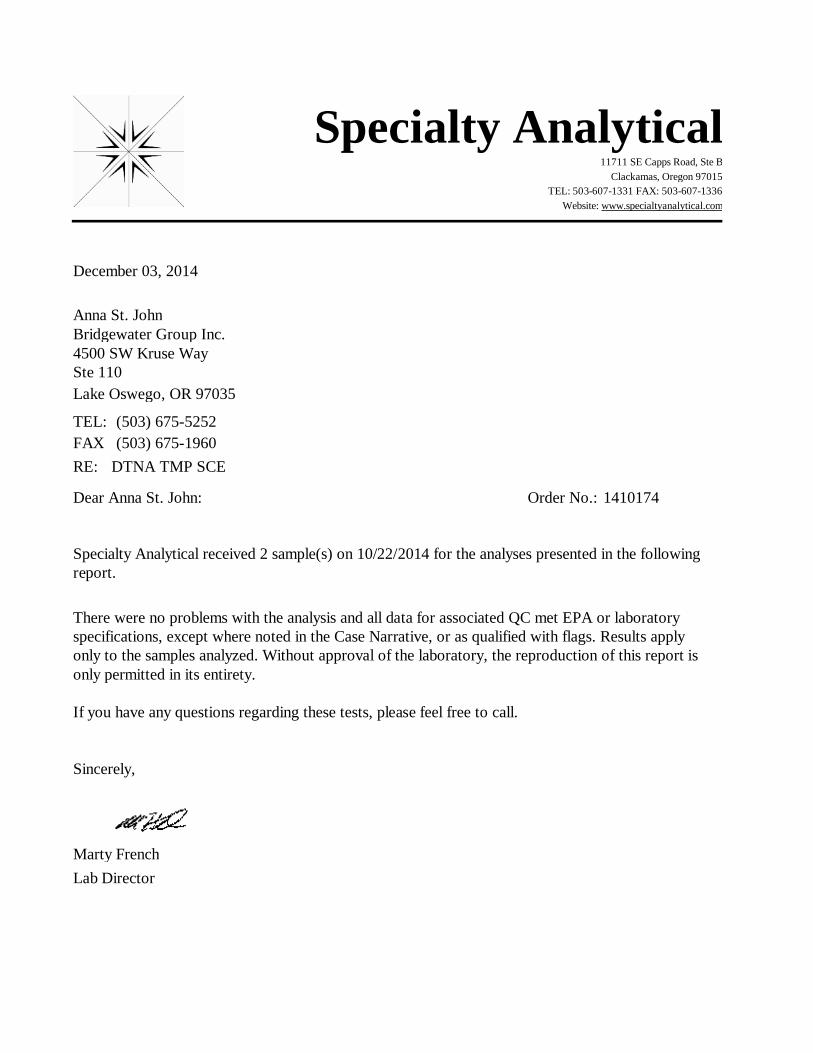
December 03, 2014
Bridgewater Group Inc.Anna St. John
Dear Anna St. John:
RE: DTNA TMP SCE
Order No.: 1410174
FAX (503) 675-1960TEL: (503) 675-5252
4500 SW Kruse WaySte 110Lake Oswego, OR 97035
Specialty Analytical11711 SE Capps Road, Ste B
Clackamas, Oregon 97015
Website: www.specialtyanalytical.comTEL: 503-607-1331 FAX: 503-607-1336
Specialty Analytical received 2 sample(s) on 10/22/2014 for the analyses presented in the following report.
Marty French
There were no problems with the analysis and all data for associated QC met EPA or laboratory specifications, except where noted in the Case Narrative, or as qualified with flags. Results apply only to the samples analyzed. Without approval of the laboratory, the reproduction of this report is only permitted in its entirety.
If you have any questions regarding these tests, please feel free to call.
Sincerely,
Lab Director
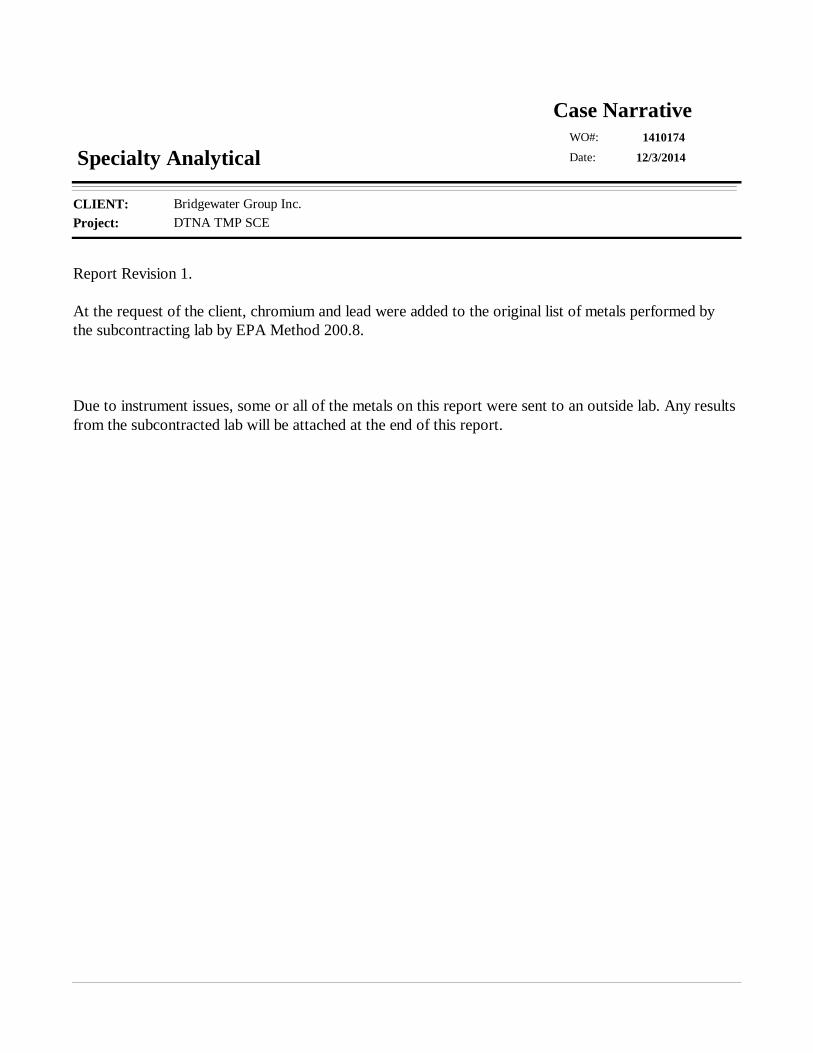
Project: DTNA TMP SCECLIENT: Bridgewater Group Inc.
12/3/2014
Case Narrative1410174
Date:
WO#:
Specialty Analytical
Report Revision 1.
At the request of the client, chromium and lead were added to the original list of metals performed by the subcontracting lab by EPA Method 200.8.
Due to instrument issues, some or all of the metals on this report were sent to an outside lab. Any results from the subcontracted lab will be attached at the end of this report.
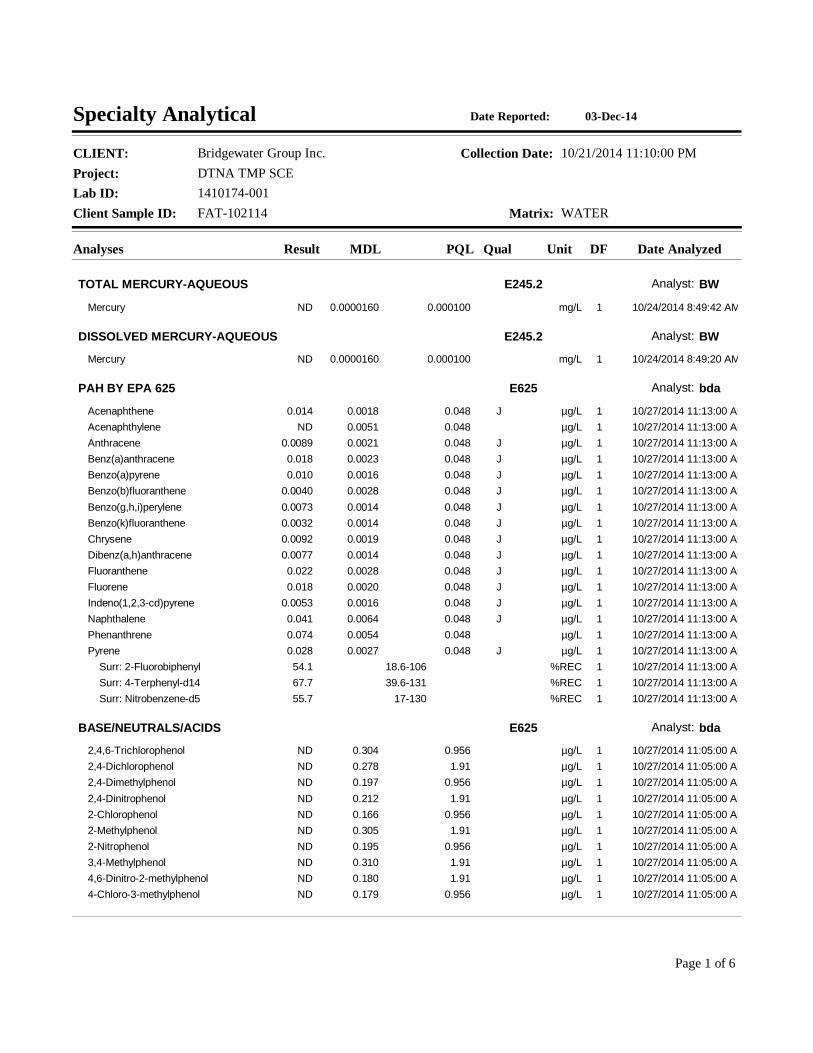
Project: DTNA TMP SCE
Client Sample ID: FAT-102114
Collection Date: 10/21/2014 11:10:00 PM
Matrix: WATER
CLIENT: Bridgewater Group Inc.
Lab ID: 1410174-001
03-Dec-14Specialty Analytical Date Reported:
Analyses Result Qual Unit Date AnalyzedDFMDL PQL
TOTAL MERCURY-AQUEOUS E245.2 Analyst: BW
Mercury 10/24/2014 8:49:42 AM0.0000160 mg/L 1ND 0.000100
DISSOLVED MERCURY-AQUEOUS E245.2 Analyst: BW
Mercury 10/24/2014 8:49:20 AM0.0000160 mg/L 1ND 0.000100
PAH BY EPA 625 E625 Analyst: bda
Acenaphthene J 10/27/2014 11:13:00 AM0.0018 µg/L 10.014 0.048
Acenaphthylene 10/27/2014 11:13:00 AM0.0051 µg/L 1ND 0.048
Anthracene J 10/27/2014 11:13:00 AM0.0021 µg/L 10.0089 0.048
Benz(a)anthracene J 10/27/2014 11:13:00 AM0.0023 µg/L 10.018 0.048
Benzo(a)pyrene J 10/27/2014 11:13:00 AM0.0016 µg/L 10.010 0.048
Benzo(b)fluoranthene J 10/27/2014 11:13:00 AM0.0028 µg/L 10.0040 0.048
Benzo(g,h,i)perylene J 10/27/2014 11:13:00 AM0.0014 µg/L 10.0073 0.048
Benzo(k)fluoranthene J 10/27/2014 11:13:00 AM0.0014 µg/L 10.0032 0.048
Chrysene J 10/27/2014 11:13:00 AM0.0019 µg/L 10.0092 0.048
Dibenz(a,h)anthracene J 10/27/2014 11:13:00 AM0.0014 µg/L 10.0077 0.048
Fluoranthene J 10/27/2014 11:13:00 AM0.0028 µg/L 10.022 0.048
Fluorene J 10/27/2014 11:13:00 AM0.0020 µg/L 10.018 0.048
Indeno(1,2,3-cd)pyrene J 10/27/2014 11:13:00 AM0.0016 µg/L 10.0053 0.048
Naphthalene J 10/27/2014 11:13:00 AM0.0064 µg/L 10.041 0.048
Phenanthrene 10/27/2014 11:13:00 AM0.0054 µg/L 10.074 0.048
Pyrene J 10/27/2014 11:13:00 AM0.0027 µg/L 10.028 0.048
Surr: 2-Fluorobiphenyl 10/27/2014 11:13:00 AM%REC 154.1 18.6-106
Surr: 4-Terphenyl-d14 10/27/2014 11:13:00 AM%REC 167.7 39.6-131
Surr: Nitrobenzene-d5 10/27/2014 11:13:00 AM%REC 155.7 17-130
BASE/NEUTRALS/ACIDS E625 Analyst: bda
2,4,6-Trichlorophenol 10/27/2014 11:05:00 AM0.304 µg/L 1ND 0.956
2,4-Dichlorophenol 10/27/2014 11:05:00 AM0.278 µg/L 1ND 1.91
2,4-Dimethylphenol 10/27/2014 11:05:00 AM0.197 µg/L 1ND 0.956
2,4-Dinitrophenol 10/27/2014 11:05:00 AM0.212 µg/L 1ND 1.91
2-Chlorophenol 10/27/2014 11:05:00 AM0.166 µg/L 1ND 0.956
2-Methylphenol 10/27/2014 11:05:00 AM0.305 µg/L 1ND 1.91
2-Nitrophenol 10/27/2014 11:05:00 AM0.195 µg/L 1ND 0.956
3,4-Methylphenol 10/27/2014 11:05:00 AM0.310 µg/L 1ND 1.91
4,6-Dinitro-2-methylphenol 10/27/2014 11:05:00 AM0.180 µg/L 1ND 1.91
4-Chloro-3-methylphenol 10/27/2014 11:05:00 AM0.179 µg/L 1ND 0.956
Page 1 of 6
Project: DTNA TMP SCE
Client Sample ID: FAT-102114
Collection Date: 10/21/2014 11:10:00 PM
Matrix: WATER
CLIENT: Bridgewater Group Inc.
Lab ID: 1410174-001
03-Dec-14Specialty Analytical Date Reported:
Analyses Result Qual Unit Date AnalyzedDFMDL PQL
BASE/NEUTRALS/ACIDS E625 Analyst: bda
4-Nitrophenol 10/27/2014 11:05:00 AM0.959 µg/L 1ND 0.956
Bis(2-ethylhexyl)phthalate 10/27/2014 11:05:00 AM0.129 µg/L 14.35 0.956
Butyl benzyl phthalate J 10/27/2014 11:05:00 AM0.150 µg/L 10.497 0.956
Diethyl phthalate 10/27/2014 11:05:00 AM0.115 µg/L 1ND 0.956
Dimethyl phthalate J 10/27/2014 11:05:00 AM0.104 µg/L 10.258 0.956
Di-n-butyl phthalate J 10/27/2014 11:05:00 AM0.100 µg/L 10.249 0.956
Di-n-octyl phthalate J 10/27/2014 11:05:00 AM0.0564 µg/L 10.115 0.956
Pentachlorophenol 10/27/2014 11:05:00 AM0.181 µg/L 1ND 1.91
Phenol 10/27/2014 11:05:00 AM0.185 µg/L 1ND 0.956
Surr: 2,4,6-Tribromophenol S 10/27/2014 11:05:00 AM%REC 1116 33.1-99.7
Surr: 2-Fluorobiphenyl S 10/27/2014 11:05:00 AM%REC 1126 33.1-96.2
Surr: 2-Fluorophenol 10/27/2014 11:05:00 AM%REC 135.4 13.4-57.1
Surr: 4-Terphenyl-d14 10/27/2014 11:05:00 AM%REC 1119 41-122
Surr: Nitrobenzene-d5 10/27/2014 11:05:00 AM%REC 172.8 28.9-99.9
Surr: Phenol-d5 10/27/2014 11:05:00 AM%REC 115.0 10.6-38.5
ORGANOCHLORINE PEST/PCB E608 Analyst: JRC
Aroclor 1016 10/28/2014 7:35:00 AM0.00368 µg/L 1ND 0.00943
Aroclor 1221 10/28/2014 7:35:00 AM0.00368 µg/L 1ND 0.00943
Aroclor 1232 10/28/2014 7:35:00 AM0.00368 µg/L 1ND 0.00943
Aroclor 1242 10/28/2014 7:35:00 AM0.00368 µg/L 1ND 0.00943
Aroclor 1248 10/28/2014 7:35:00 AM0.00368 µg/L 1ND 0.00943
Aroclor 1254 10/28/2014 7:35:00 AM0.00368 µg/L 1ND 0.00943
Aroclor 1260 10/28/2014 7:35:00 AM0.00368 µg/L 1ND 0.00943
Dieldrin 10/28/2014 7:35:00 AM0.00196 µg/L 1ND 0.00471
Surr: Decachlorobiphenyl 10/28/2014 7:35:00 AM%REC 185.5 18.9-133
Surr: TCMX 10/28/2014 7:35:00 AM%REC 153.7 20.8-90.1
SUB CONTRACTING SUB_CONTRACTING Analyst: sub
Total Metals 11/6/2014 10:20:00 AM0 1See attached rpt 0
SUB CONTRACTING SUB_CONTRACTING Analyst: sub
Dissolved Metals 11/12/20140 1See attached rpt 0
SUB CONTRACTING SUB_CONTRACTING Analyst: sub
Tributyltin 10/30/2014 3:30:00 PM0 1See attached rpt 0
Page 2 of 6

Project: DTNA TMP SCE
Client Sample ID: FAT-102114
Collection Date: 10/21/2014 11:10:00 PM
Matrix: WATER
CLIENT: Bridgewater Group Inc.
Lab ID: 1410174-001
03-Dec-14Specialty Analytical Date Reported:
Analyses Result Qual Unit Date AnalyzedDFMDL PQL
TOTAL SUSPENDED SOLIDS M2540 D Analyst: BW
Total Suspended Solids 10/27/2014 9:51:19 AM1.10 mg/L 15.00 5.00
Page 3 of 6

Project: DTNA TMP SCE
Client Sample ID: ENS-102114
Collection Date: 10/21/2014 11:45:00 PM
Matrix: WATER
CLIENT: Bridgewater Group Inc.
Lab ID: 1410174-002
03-Dec-14Specialty Analytical Date Reported:
Analyses Result Qual Unit Date AnalyzedDFMDL PQL
TOTAL MERCURY-AQUEOUS E245.2 Analyst: BW
Mercury 10/24/2014 8:57:42 AM0.0000160 mg/L 1ND 0.000100
DISSOLVED MERCURY-AQUEOUS E245.2 Analyst: BW
Mercury 10/24/2014 8:51:20 AM0.0000160 mg/L 1ND 0.000100
PAH BY EPA 625 E625 Analyst: bda
Acenaphthene J 10/27/2014 11:37:00 AM0.0019 µg/L 10.0045 0.051
Acenaphthylene 10/27/2014 11:37:00 AM0.0054 µg/L 1ND 0.051
Anthracene J 10/27/2014 11:37:00 AM0.0022 µg/L 10.0035 0.051
Benz(a)anthracene J 10/27/2014 11:37:00 AM0.0025 µg/L 10.019 0.051
Benzo(a)pyrene J 10/27/2014 11:37:00 AM0.0017 µg/L 10.0070 0.051
Benzo(b)fluoranthene J 10/27/2014 11:37:00 AM0.0030 µg/L 10.0079 0.051
Benzo(g,h,i)perylene J 10/27/2014 11:37:00 AM0.0015 µg/L 10.0055 0.051
Benzo(k)fluoranthene J 10/27/2014 11:37:00 AM0.0015 µg/L 10.0059 0.051
Chrysene J 10/27/2014 11:37:00 AM0.0020 µg/L 10.0069 0.051
Dibenz(a,h)anthracene J 10/27/2014 11:37:00 AM0.0015 µg/L 10.0024 0.051
Fluoranthene J 10/27/2014 11:37:00 AM0.0030 µg/L 10.0078 0.051
Fluorene J 10/27/2014 11:37:00 AM0.0022 µg/L 10.0024 0.051
Indeno(1,2,3-cd)pyrene J 10/27/2014 11:37:00 AM0.0017 µg/L 10.0025 0.051
Naphthalene 10/27/2014 11:37:00 AM0.0068 µg/L 1ND 0.051
Phenanthrene J 10/27/2014 11:37:00 AM0.0058 µg/L 10.0090 0.051
Pyrene J 10/27/2014 11:37:00 AM0.0029 µg/L 10.013 0.051
Surr: 2-Fluorobiphenyl 10/27/2014 11:37:00 AM%REC 150.4 18.6-106
Surr: 4-Terphenyl-d14 10/27/2014 11:37:00 AM%REC 163.6 39.6-131
Surr: Nitrobenzene-d5 10/27/2014 11:37:00 AM%REC 148.4 17-130
BASE/NEUTRALS/ACIDS E625 Analyst: bda
2,4,6-Trichlorophenol 10/27/2014 11:34:00 AM0.317 µg/L 1ND 0.997
2,4-Dichlorophenol 10/27/2014 11:34:00 AM0.290 µg/L 1ND 1.99
2,4-Dimethylphenol 10/27/2014 11:34:00 AM0.205 µg/L 1ND 0.997
2,4-Dinitrophenol 10/27/2014 11:34:00 AM0.221 µg/L 1ND 1.99
2-Chlorophenol 10/27/2014 11:34:00 AM0.173 µg/L 1ND 0.997
2-Methylphenol 10/27/2014 11:34:00 AM0.318 µg/L 1ND 1.99
2-Nitrophenol 10/27/2014 11:34:00 AM0.203 µg/L 1ND 0.997
3,4-Methylphenol 10/27/2014 11:34:00 AM0.323 µg/L 1ND 1.99
4,6-Dinitro-2-methylphenol 10/27/2014 11:34:00 AM0.187 µg/L 1ND 1.99
4-Chloro-3-methylphenol 10/27/2014 11:34:00 AM0.186 µg/L 1ND 0.997
Page 4 of 6
Project: DTNA TMP SCE
Client Sample ID: ENS-102114
Collection Date: 10/21/2014 11:45:00 PM
Matrix: WATER
CLIENT: Bridgewater Group Inc.
Lab ID: 1410174-002
03-Dec-14Specialty Analytical Date Reported:
Analyses Result Qual Unit Date AnalyzedDFMDL PQL
BASE/NEUTRALS/ACIDS E625 Analyst: bda
4-Nitrophenol 10/27/2014 11:34:00 AM1.00 µg/L 1ND 0.997
Bis(2-ethylhexyl)phthalate J 10/27/2014 11:34:00 AM0.135 µg/L 10.419 0.997
Butyl benzyl phthalate 10/27/2014 11:34:00 AM0.157 µg/L 1ND 0.997
Diethyl phthalate 10/27/2014 11:34:00 AM0.120 µg/L 1ND 0.997
Dimethyl phthalate J 10/27/2014 11:34:00 AM0.109 µg/L 10.219 0.997
Di-n-butyl phthalate J 10/27/2014 11:34:00 AM0.105 µg/L 10.279 0.997
Di-n-octyl phthalate 10/27/2014 11:34:00 AM0.0588 µg/L 16.00 0.997
Pentachlorophenol 10/27/2014 11:34:00 AM0.188 µg/L 1ND 1.99
Phenol 10/27/2014 11:34:00 AM0.193 µg/L 1ND 0.997
Surr: 2,4,6-Tribromophenol 10/27/2014 11:34:00 AM%REC 193.7 33.1-99.7
Surr: 2-Fluorobiphenyl S 10/27/2014 11:34:00 AM%REC 1105 33.1-96.2
Surr: 2-Fluorophenol 10/27/2014 11:34:00 AM%REC 136.0 13.4-57.1
Surr: 4-Terphenyl-d14 10/27/2014 11:34:00 AM%REC 1108 41-122
Surr: Nitrobenzene-d5 10/27/2014 11:34:00 AM%REC 171.1 28.9-99.9
Surr: Phenol-d5 10/27/2014 11:34:00 AM%REC 116.2 10.6-38.5
ORGANOCHLORINE PEST/PCB E608 Analyst: JRC
Aroclor 1016 10/28/2014 8:03:00 AM0.00396 µg/L 1ND 0.0101
Aroclor 1221 10/28/2014 8:03:00 AM0.00396 µg/L 1ND 0.0101
Aroclor 1232 10/28/2014 8:03:00 AM0.00396 µg/L 1ND 0.0101
Aroclor 1242 10/28/2014 8:03:00 AM0.00396 µg/L 1ND 0.0101
Aroclor 1248 10/28/2014 8:03:00 AM0.00396 µg/L 1ND 0.0101
Aroclor 1254 10/28/2014 8:03:00 AM0.00396 µg/L 1ND 0.0101
Aroclor 1260 10/28/2014 8:03:00 AM0.00396 µg/L 1ND 0.0101
Dieldrin 10/28/2014 8:03:00 AM0.00211 µg/L 1ND 0.00507
Surr: Decachlorobiphenyl 10/28/2014 8:03:00 AM%REC 192.0 18.9-133
Surr: TCMX 10/28/2014 8:03:00 AM%REC 123.6 20.8-90.1
SUB CONTRACTING SUB_CONTRACTING Analyst: sub
Total Metals 11/6/2014 10:45:00 AM0 1See attached rpt 0
SUB CONTRACTING SUB_CONTRACTING Analyst: sub
Dissolved Metals 11/12/20140 1See attached rpt 0
SUB CONTRACTING SUB_CONTRACTING Analyst: sub
Tributyltin 10/30/2014 3:44:00 PM0 1See attached rpt 0
Page 5 of 6

Project: DTNA TMP SCE
Client Sample ID: ENS-102114
Collection Date: 10/21/2014 11:45:00 PM
Matrix: WATER
CLIENT: Bridgewater Group Inc.
Lab ID: 1410174-002
03-Dec-14Specialty Analytical Date Reported:
Analyses Result Qual Unit Date AnalyzedDFMDL PQL
TOTAL SUSPENDED SOLIDS M2540 D Analyst: BW
Total Suspended Solids 10/27/2014 10:31:19 AM1.10 mg/L 19.00 5.00
Page 6 of 6

Project: DTNA TMP SCEClient: Bridgewater Group Inc.
TestCode: 608_W
03-Dec-14
QC SUMMARY REPORT1410174WO#:
Specialty Analytical
Sample ID: CCV@100
Batch ID: 8405 TestNo: E608 Analysis Date: 10/28/2014
Prep Date:
Analyte Result SPK value SPK Ref Val %REC RPD Ref Val %RPDLowLimit HighLimit RPDLimit Qual
Units: µg/L
PQL
Client ID: CCV
RunNo: 17497
SeqNo: 228962
CCVSampType: TestCode: 608_W
E608
Dieldrin 0.2000 97.7 85 1150.00500 00.195
Sample ID: MB-8405
Batch ID: 8405 TestNo: E608 Analysis Date: 10/28/2014
Prep Date: 10/24/2014
Analyte Result SPK value SPK Ref Val %REC RPD Ref Val %RPDLowLimit HighLimit RPDLimit Qual
Units: µg/L
PQL
Client ID: PBW
RunNo: 17497
SeqNo: 228963
MBLKSampType: TestCode: 608_W
E608
Aroclor 1016 0.0100ND
Aroclor 1221 0.0100ND
Aroclor 1232 0.0100ND
Aroclor 1242 0.0100ND
Aroclor 1248 0.0100ND
Aroclor 1254 0.0100ND
Aroclor 1260 0.0100ND
Dieldrin 0.00500ND
Surr: Decachlorobiphenyl 0.2000 93.9 18.9 1330.188
Surr: TCMX 0.2000 86.2 20.8 90.10.172
Sample ID: LCS-8405
Batch ID: 8405 TestNo: E608 Analysis Date: 10/28/2014
Prep Date: 10/24/2014
Analyte Result SPK value SPK Ref Val %REC RPD Ref Val %RPDLowLimit HighLimit RPDLimit Qual
Units: µg/L
PQL
Client ID: LCSW
RunNo: 17497
SeqNo: 228964
LCSSampType: TestCode: 608_W
E608
Dieldrin 0.2000 105 36 1460.00500 00.210
Qualifiers: Page 1 of 21B Analyte detected in the associated Method Blank H Holding times for preparation or analysis exceeded ND Not Detected at the Reporting LimitO RSD is greater than RSDlimit R RPD outside accepted recovery limits S Spike Recovery outside accepted recovery limits

Project: DTNA TMP SCEClient: Bridgewater Group Inc.
TestCode: 608_W
03-Dec-14
QC SUMMARY REPORT1410174WO#:
Specialty Analytical
Sample ID: LCSD-8405
Batch ID: 8405 TestNo: E608 Analysis Date: 10/28/2014
Prep Date: 10/24/2014
Analyte Result SPK value SPK Ref Val %REC RPD Ref Val %RPDLowLimit HighLimit RPDLimit Qual
Units: µg/L
PQL
Client ID: LCSS02
RunNo: 17497
SeqNo: 228965
LCSDSampType: TestCode: 608_W
E608
Dieldrin 0.2000 118 36 146 200.00500 0 0.2095 11.80.236
Sample ID: 1410174-001AMS
Batch ID: 8405 TestNo: E608 Analysis Date: 10/28/2014
Prep Date: 10/24/2014
Analyte Result SPK value SPK Ref Val %REC RPD Ref Val %RPDLowLimit HighLimit RPDLimit Qual
Units: µg/L
PQL
Client ID: FAT-102114
RunNo: 17497
SeqNo: 228967
MSSampType: TestCode: 608_W
E608
Dieldrin 0.2000 103 36 1460.00481 00.207
Sample ID: 1410174-002AMS
Batch ID: 8405 TestNo: E608 Analysis Date: 10/28/2014
Prep Date: 10/24/2014
Analyte Result SPK value SPK Ref Val %REC RPD Ref Val %RPDLowLimit HighLimit RPDLimit Qual
Units: µg/L
PQL
Client ID: ENS-102114
RunNo: 17497
SeqNo: 228969
MSSampType: TestCode: 608_W
E608
Dieldrin 0.2000 96.1 36 1460.00474 00.192
Sample ID: 1410175-001AMS
Batch ID: 8405 TestNo: E608 Analysis Date: 10/28/2014
Prep Date: 10/24/2014
Analyte Result SPK value SPK Ref Val %REC RPD Ref Val %RPDLowLimit HighLimit RPDLimit Qual
Units: µg/L
PQL
Client ID: ZZZZZZ
RunNo: 17497
SeqNo: 228971
MSSampType: TestCode: 608_W
E608
Dieldrin 0.2000 101 36 1460.00547 00.202
Qualifiers: Page 2 of 21B Analyte detected in the associated Method Blank H Holding times for preparation or analysis exceeded ND Not Detected at the Reporting LimitO RSD is greater than RSDlimit R RPD outside accepted recovery limits S Spike Recovery outside accepted recovery limits

Project: DTNA TMP SCEClient: Bridgewater Group Inc.
TestCode: 608_W
03-Dec-14
QC SUMMARY REPORT1410174WO#:
Specialty Analytical
Sample ID: CCV@100
Batch ID: 8405 TestNo: E608 Analysis Date: 10/28/2014
Prep Date:
Analyte Result SPK value SPK Ref Val %REC RPD Ref Val %RPDLowLimit HighLimit RPDLimit Qual
Units: µg/L
PQL
Client ID: CCV
RunNo: 17497
SeqNo: 228973
CCVSampType: TestCode: 608_W
E608
Dieldrin 0.2000 128 85 115 SC0.00500 00.257
Qualifiers: Page 3 of 21B Analyte detected in the associated Method Blank H Holding times for preparation or analysis exceeded ND Not Detected at the Reporting LimitO RSD is greater than RSDlimit R RPD outside accepted recovery limits S Spike Recovery outside accepted recovery limits

Project: DTNA TMP SCEClient: Bridgewater Group Inc.
TestCode: 625_PAH
03-Dec-14
QC SUMMARY REPORT1410174WO#:
Specialty Analytical
Sample ID: CCV-8406
Batch ID: 8406 TestNo: E625 Analysis Date: 10/27/2014
Prep Date:
Analyte Result SPK value SPK Ref Val %REC RPD Ref Val %RPDLowLimit HighLimit RPDLimit Qual
Units: µg/L
PQL
Client ID: CCV
RunNo: 17480
SeqNo: 228781
CCVSampType: TestCode: 625_PAH
E625-A
Acenaphthene 2.000 85.8 80 1200.050 01.7
Acenaphthylene 2.000 87.7 80 1200.050 01.8
Anthracene 2.000 84.1 80 1200.050 01.7
Benz(a)anthracene 2.000 86.5 80 1200.050 01.7
Benzo(a)pyrene 2.000 93.7 80 1200.050 01.9
Benzo(b)fluoranthene 2.000 91.5 80 1200.050 01.8
Benzo(g,h,i)perylene 2.000 87.1 80 1200.050 01.7
Benzo(k)fluoranthene 2.000 88.0 80 1200.050 01.8
Chrysene 2.000 85.1 80 1200.050 01.7
Dibenz(a,h)anthracene 2.000 90.5 80 1200.050 01.8
Fluoranthene 2.000 86.8 80 1200.050 01.7
Fluorene 2.000 87.9 80 1200.050 01.8
Indeno(1,2,3-cd)pyrene 2.000 90.2 80 1200.050 01.8
Naphthalene 2.000 85.6 80 1200.050 01.7
Phenanthrene 2.000 85.8 80 1200.050 01.7
Pyrene 2.000 86.7 80 1200.050 01.7
Sample ID: LCS-8406
Batch ID: 8406 TestNo: E625 Analysis Date: 10/27/2014
Prep Date: 10/24/2014
Analyte Result SPK value SPK Ref Val %REC RPD Ref Val %RPDLowLimit HighLimit RPDLimit Qual
Units: µg/L
PQL
Client ID: LCSW
RunNo: 17480
SeqNo: 228782
LCSSampType: TestCode: 625_PAH
E625-A
Acenaphthene 5.000 77.0 35.1 1000.050 03.9
Acenaphthylene 5.000 82.6 29 89.10.050 04.1
Anthracene 5.000 75.1 42 97.40.050 03.8
Qualifiers: Page 4 of 21B Analyte detected in the associated Method Blank H Holding times for preparation or analysis exceeded ND Not Detected at the Reporting LimitO RSD is greater than RSDlimit R RPD outside accepted recovery limits S Spike Recovery outside accepted recovery limits

Project: DTNA TMP SCEClient: Bridgewater Group Inc.
TestCode: 625_PAH
03-Dec-14
QC SUMMARY REPORT1410174WO#:
Specialty Analytical
Sample ID: LCS-8406
Batch ID: 8406 TestNo: E625 Analysis Date: 10/27/2014
Prep Date: 10/24/2014
Analyte Result SPK value SPK Ref Val %REC RPD Ref Val %RPDLowLimit HighLimit RPDLimit Qual
Units: µg/L
PQL
Client ID: LCSW
RunNo: 17480
SeqNo: 228782
LCSSampType: TestCode: 625_PAH
E625-A
Benz(a)anthracene 5.000 80.1 34.2 95.80.050 04.0
Benzo(a)pyrene 5.000 84.0 23.4 1030.050 04.2
Benzo(b)fluoranthene 5.000 84.8 36.6 99.50.050 04.2
Benzo(g,h,i)perylene 5.000 81.5 20.8 1200.050 04.1
Benzo(k)fluoranthene 5.000 74.3 39.7 93.40.050 03.7
Chrysene 5.000 72.8 39.1 1190.050 03.6
Dibenz(a,h)anthracene 5.000 85.0 5.05 890.050 04.3
Fluoranthene 5.000 80.6 42.4 95.90.050 04.0
Fluorene 5.000 81.3 37.4 88.40.050 04.1
Indeno(1,2,3-cd)pyrene 5.000 83.8 10.5 98.40.050 04.2
Naphthalene 5.000 69.4 25.6 1060.050 03.5
Phenanthrene 5.000 78.3 38.1 1060.050 03.9
Pyrene 5.000 80.9 41.3 1180.050 04.0
Sample ID: LCSD-8406
Batch ID: 8406 TestNo: E625 Analysis Date: 10/27/2014
Prep Date: 10/24/2014
Analyte Result SPK value SPK Ref Val %REC RPD Ref Val %RPDLowLimit HighLimit RPDLimit Qual
Units: µg/L
PQL
Client ID: LCSS02
RunNo: 17480
SeqNo: 228783
LCSDSampType: TestCode: 625_PAH
E625-A
Acenaphthene 5.000 70.6 35.1 100 200.050 0 3.852 8.723.5
Acenaphthylene 5.000 75.8 29 89.1 200.050 0 4.130 8.613.8
Anthracene 5.000 70.3 42 97.4 200.050 0 3.755 6.603.5
Benz(a)anthracene 5.000 73.5 34.2 95.8 200.050 0 4.006 8.643.7
Benzo(a)pyrene 5.000 76.7 23.4 103 200.050 0 4.201 9.103.8
Benzo(b)fluoranthene 5.000 76.1 36.6 99.5 200.050 0 4.241 10.93.8
Qualifiers: Page 5 of 21B Analyte detected in the associated Method Blank H Holding times for preparation or analysis exceeded ND Not Detected at the Reporting LimitO RSD is greater than RSDlimit R RPD outside accepted recovery limits S Spike Recovery outside accepted recovery limits

Project: DTNA TMP SCEClient: Bridgewater Group Inc.
TestCode: 625_PAH
03-Dec-14
QC SUMMARY REPORT1410174WO#:
Specialty Analytical
Sample ID: LCSD-8406
Batch ID: 8406 TestNo: E625 Analysis Date: 10/27/2014
Prep Date: 10/24/2014
Analyte Result SPK value SPK Ref Val %REC RPD Ref Val %RPDLowLimit HighLimit RPDLimit Qual
Units: µg/L
PQL
Client ID: LCSS02
RunNo: 17480
SeqNo: 228783
LCSDSampType: TestCode: 625_PAH
E625-A
Benzo(g,h,i)perylene 5.000 74.9 20.8 120 200.050 0 4.077 8.523.7
Benzo(k)fluoranthene 5.000 68.8 39.7 93.4 200.050 0 3.714 7.593.4
Chrysene 5.000 66.7 39.1 119 200.050 0 3.641 8.823.3
Dibenz(a,h)anthracene 5.000 78.2 5.05 89 200.050 0 4.251 8.323.9
Fluoranthene 5.000 75.1 42.4 95.9 200.050 0 4.029 7.103.8
Fluorene 5.000 74.5 37.4 88.4 200.050 0 4.063 8.673.7
Indeno(1,2,3-cd)pyrene 5.000 77.0 10.5 98.4 200.050 0 4.191 8.433.9
Naphthalene 5.000 64.0 25.6 106 200.050 0 3.471 8.133.2
Phenanthrene 5.000 72.2 38.1 106 200.050 0 3.917 8.093.6
Pyrene 5.000 74.2 41.3 118 200.050 0 4.043 8.623.7
Sample ID: MB-8406
Batch ID: 8406 TestNo: E625 Analysis Date: 10/27/2014
Prep Date: 10/24/2014
Analyte Result SPK value SPK Ref Val %REC RPD Ref Val %RPDLowLimit HighLimit RPDLimit Qual
Units: µg/L
PQL
Client ID: PBW
RunNo: 17480
SeqNo: 228784
MBLKSampType: TestCode: 625_PAH
E625-A
Acenaphthene J0.0500.0035
Acenaphthylene 0.050ND
Anthracene 0.050ND
Benz(a)anthracene J0.0500.012
Benzo(a)pyrene J0.0500.0062
Benzo(b)fluoranthene J0.0500.0047
Benzo(g,h,i)perylene J0.0500.0071
Benzo(k)fluoranthene J0.0500.0025
Chrysene J0.0500.0037
Qualifiers: Page 6 of 21B Analyte detected in the associated Method Blank H Holding times for preparation or analysis exceeded ND Not Detected at the Reporting LimitO RSD is greater than RSDlimit R RPD outside accepted recovery limits S Spike Recovery outside accepted recovery limits
Project: DTNA TMP SCEClient: Bridgewater Group Inc.
TestCode: 625_PAH
03-Dec-14
QC SUMMARY REPORT1410174WO#:
Specialty Analytical
Sample ID: MB-8406
Batch ID: 8406 TestNo: E625 Analysis Date: 10/27/2014
Prep Date: 10/24/2014
Analyte Result SPK value SPK Ref Val %REC RPD Ref Val %RPDLowLimit HighLimit RPDLimit Qual
Units: µg/L
PQL
Client ID: PBW
RunNo: 17480
SeqNo: 228784
MBLKSampType: TestCode: 625_PAH
E625-A
Dibenz(a,h)anthracene J0.0500.0041
Fluoranthene 0.050ND
Fluorene 0.050ND
Indeno(1,2,3-cd)pyrene J0.0500.0044
Naphthalene 0.050ND
Phenanthrene 0.050ND
Pyrene 0.050ND
Surr: 2-Fluorobiphenyl 0.1000 71.6 18.6 1060.072
Surr: 4-Terphenyl-d14 0.1000 78.2 39.6 1310.078
Surr: Nitrobenzene-d5 0.1000 69.1 17 1300.069
Sample ID: 1410174-001AMS
Batch ID: 8406 TestNo: E625 Analysis Date: 10/27/2014
Prep Date: 10/24/2014
Analyte Result SPK value SPK Ref Val %REC RPD Ref Val %RPDLowLimit HighLimit RPDLimit Qual
Units: µg/L
PQL
Client ID: FAT-102114
RunNo: 17480
SeqNo: 228789
MSSampType: TestCode: 625_PAH
E625-A
Acenaphthene 5.149 51.0 47 1450.051 0.014222.6
Acenaphthylene 5.149 55.3 33 1450.051 02.8
Anthracene 5.149 54.5 27 1330.051 0.0088922.8
Benz(a)anthracene 5.149 59.9 33 1430.051 0.017743.1
Benzo(a)pyrene 5.149 63.4 17 1630.051 0.010153.3
Benzo(b)fluoranthene 5.149 66.0 24 1590.051 0.0040403.4
Benzo(g,h,i)perylene 5.149 62.8 0.01 2190.051 0.0072873.2
Benzo(k)fluoranthene 5.149 56.6 11 1620.051 0.0031812.9
Chrysene 5.149 53.9 17 1680.051 0.0091602.8
Qualifiers: Page 7 of 21B Analyte detected in the associated Method Blank H Holding times for preparation or analysis exceeded ND Not Detected at the Reporting LimitO RSD is greater than RSDlimit R RPD outside accepted recovery limits S Spike Recovery outside accepted recovery limits

Project: DTNA TMP SCEClient: Bridgewater Group Inc.
TestCode: 625_PAH
03-Dec-14
QC SUMMARY REPORT1410174WO#:
Specialty Analytical
Sample ID: 1410174-001AMS
Batch ID: 8406 TestNo: E625 Analysis Date: 10/27/2014
Prep Date: 10/24/2014
Analyte Result SPK value SPK Ref Val %REC RPD Ref Val %RPDLowLimit HighLimit RPDLimit Qual
Units: µg/L
PQL
Client ID: FAT-102114
RunNo: 17480
SeqNo: 228789
MSSampType: TestCode: 625_PAH
E625-A
Dibenz(a,h)anthracene 5.149 65.8 0.01 2270.051 0.0076893.4
Fluoranthene 5.149 34.3 26 1370.051 0.022391.8
Fluorene 5.149 57.7 59 121 SMI0.051 0.017953.0
Indeno(1,2,3-cd)pyrene 5.149 64.5 0.01 1710.051 0.0053013.3
Naphthalene 5.149 38.4 21 1330.051 0.040602.0
Phenanthrene 5.149 60.4 54 1200.051 0.074143.2
Pyrene 5.149 57.9 52 1150.051 0.028313.0
Sample ID: 1410174-002AMS
Batch ID: 8406 TestNo: E625 Analysis Date: 10/27/2014
Prep Date: 10/24/2014
Analyte Result SPK value SPK Ref Val %REC RPD Ref Val %RPDLowLimit HighLimit RPDLimit Qual
Units: µg/L
PQL
Client ID: ENS-102114
RunNo: 17480
SeqNo: 228790
MSSampType: TestCode: 625_PAH
E625-A
Acenaphthene 5.118 63.0 47 1450.051 0.0045333.2
Acenaphthylene 5.118 68.4 33 1450.051 03.5
Anthracene 5.118 62.4 27 1330.051 0.0034893.2
Benz(a)anthracene 5.118 69.0 33 1430.051 0.019273.5
Benzo(a)pyrene 5.118 72.3 17 1630.051 0.0070083.7
Benzo(b)fluoranthene 5.118 74.7 24 1590.051 0.0078903.8
Benzo(g,h,i)perylene 5.118 73.9 0.01 2190.051 0.0055483.8
Benzo(k)fluoranthene 5.118 67.9 11 1620.051 0.0059033.5
Chrysene 5.118 62.3 17 1680.051 0.0068563.2
Dibenz(a,h)anthracene 5.118 79.0 0.01 2270.051 0.0024044.0
Fluoranthene 5.118 73.9 26 1370.051 0.0077993.8
Fluorene 5.118 68.8 59 1210.051 0.0023943.5
Qualifiers: Page 8 of 21B Analyte detected in the associated Method Blank H Holding times for preparation or analysis exceeded ND Not Detected at the Reporting LimitO RSD is greater than RSDlimit R RPD outside accepted recovery limits S Spike Recovery outside accepted recovery limits
Project: DTNA TMP SCEClient: Bridgewater Group Inc.
TestCode: 625_PAH
03-Dec-14
QC SUMMARY REPORT1410174WO#:
Specialty Analytical
Sample ID: 1410174-002AMS
Batch ID: 8406 TestNo: E625 Analysis Date: 10/27/2014
Prep Date: 10/24/2014
Analyte Result SPK value SPK Ref Val %REC RPD Ref Val %RPDLowLimit HighLimit RPDLimit Qual
Units: µg/L
PQL
Client ID: ENS-102114
RunNo: 17480
SeqNo: 228790
MSSampType: TestCode: 625_PAH
E625-A
Indeno(1,2,3-cd)pyrene 5.118 75.7 0.01 1710.051 0.0025053.9
Naphthalene 5.118 49.4 21 1330.051 02.5
Phenanthrene 5.118 70.7 54 1200.051 0.0090373.6
Pyrene 5.118 70.1 52 1150.051 0.012863.6
Sample ID: 1410175-002AMS
Batch ID: 8406 TestNo: E625 Analysis Date: 10/27/2014
Prep Date: 10/24/2014
Analyte Result SPK value SPK Ref Val %REC RPD Ref Val %RPDLowLimit HighLimit RPDLimit Qual
Units: µg/L
PQL
Client ID: ZZZZZZ
RunNo: 17480
SeqNo: 228791
MSSampType: TestCode: 625_PAH
E625-A
Acenaphthene 4.708 60.3 47 1450.047 0.0041812.8
Acenaphthylene 4.708 65.0 33 1450.047 03.1
Anthracene 4.708 61.4 27 1330.047 0.0031072.9
Benz(a)anthracene 4.708 66.1 33 1430.047 0.019633.1
Benzo(a)pyrene 4.708 68.8 17 1630.047 0.0041533.2
Benzo(b)fluoranthene 4.708 73.0 24 1590.047 0.0053483.4
Benzo(g,h,i)perylene 4.708 70.4 0.01 2190.047 0.010163.3
Benzo(k)fluoranthene 4.708 62.6 11 1620.047 02.9
Chrysene 4.708 60.7 17 1680.047 0.0054052.9
Dibenz(a,h)anthracene 4.708 74.7 0.01 2270.047 0.0050193.5
Fluoranthene 4.708 69.5 26 1370.047 03.3
Fluorene 4.708 66.1 59 1210.047 03.1
Indeno(1,2,3-cd)pyrene 4.708 72.3 0.01 1710.047 0.0041623.4
Naphthalene 4.708 46.2 21 1330.047 02.2
Phenanthrene 4.708 68.1 54 1200.047 0.0085223.2
Qualifiers: Page 9 of 21B Analyte detected in the associated Method Blank H Holding times for preparation or analysis exceeded ND Not Detected at the Reporting LimitO RSD is greater than RSDlimit R RPD outside accepted recovery limits S Spike Recovery outside accepted recovery limits
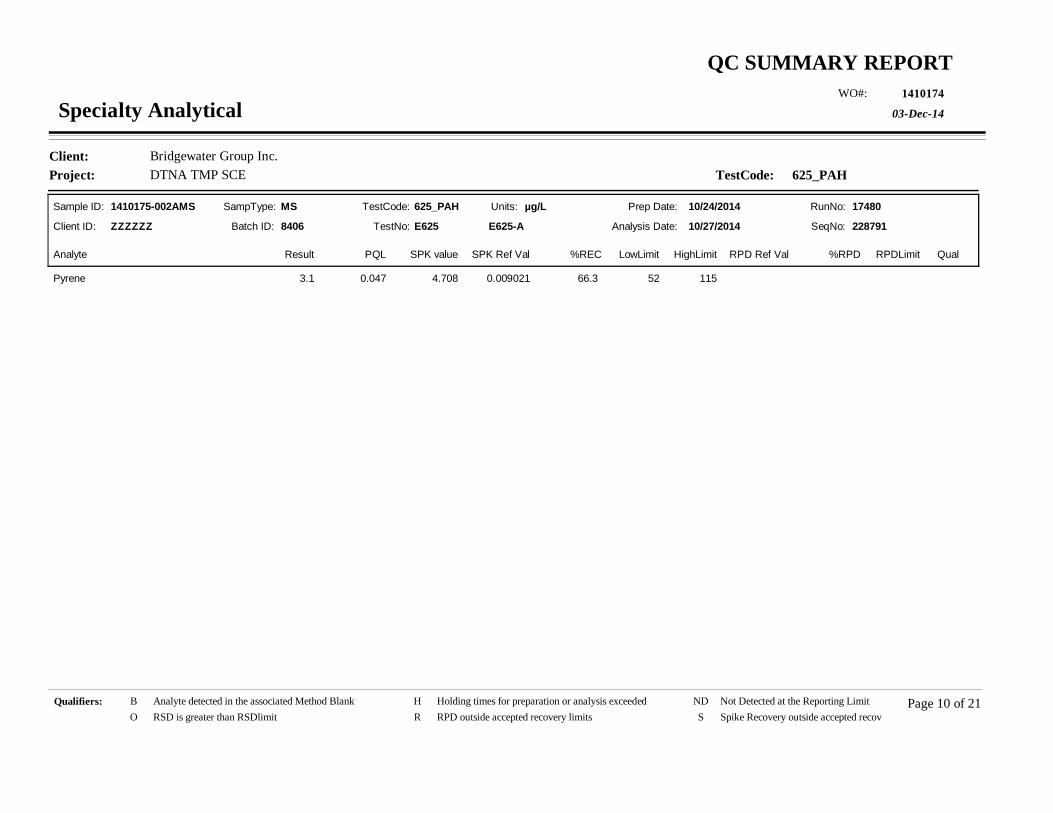
Project: DTNA TMP SCEClient: Bridgewater Group Inc.
TestCode: 625_PAH
03-Dec-14
QC SUMMARY REPORT1410174WO#:
Specialty Analytical
Sample ID: 1410175-002AMS
Batch ID: 8406 TestNo: E625 Analysis Date: 10/27/2014
Prep Date: 10/24/2014
Analyte Result SPK value SPK Ref Val %REC RPD Ref Val %RPDLowLimit HighLimit RPDLimit Qual
Units: µg/L
PQL
Client ID: ZZZZZZ
RunNo: 17480
SeqNo: 228791
MSSampType: TestCode: 625_PAH
E625-A
Pyrene 4.708 66.3 52 1150.047 0.0090213.1
Qualifiers: Page 10 of 21B Analyte detected in the associated Method Blank H Holding times for preparation or analysis exceeded ND Not Detected at the Reporting LimitO RSD is greater than RSDlimit R RPD outside accepted recovery limits S Spike Recovery outside accepted recovery limits
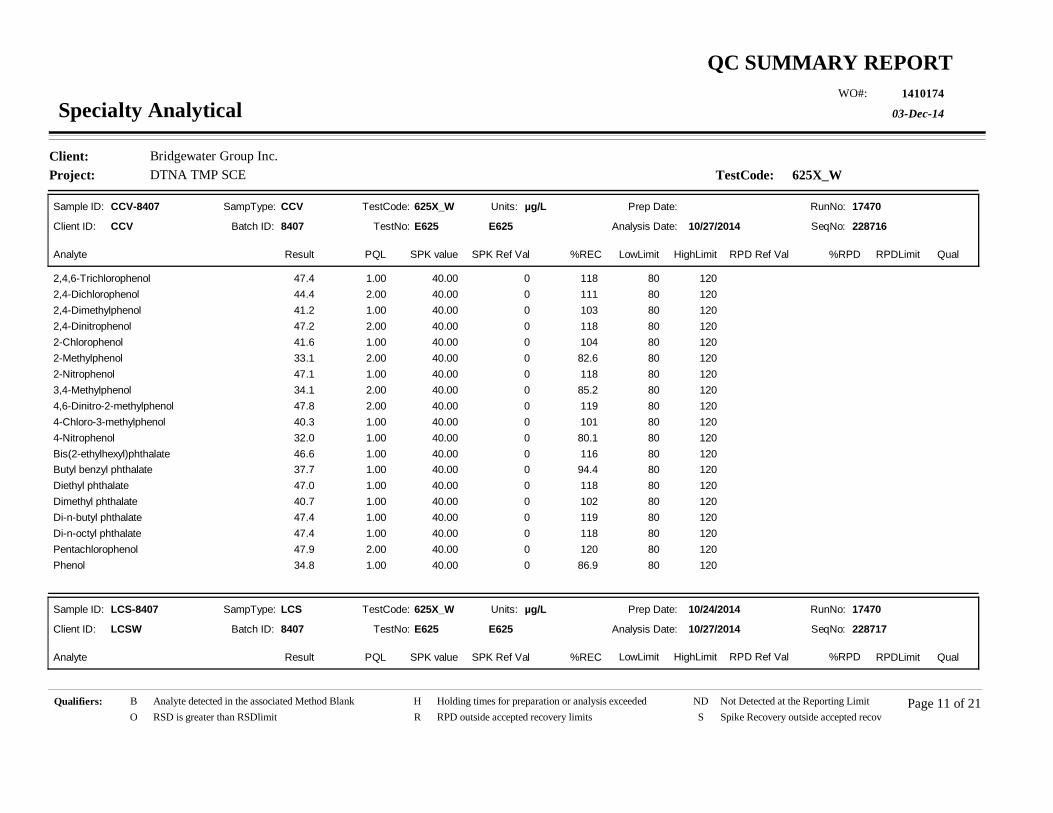
Project: DTNA TMP SCEClient: Bridgewater Group Inc.
TestCode: 625X_W
03-Dec-14
QC SUMMARY REPORT1410174WO#:
Specialty Analytical
Sample ID: CCV-8407
Batch ID: 8407 TestNo: E625 Analysis Date: 10/27/2014
Prep Date:
Analyte Result SPK value SPK Ref Val %REC RPD Ref Val %RPDLowLimit HighLimit RPDLimit Qual
Units: µg/L
PQL
Client ID: CCV
RunNo: 17470
SeqNo: 228716
CCVSampType: TestCode: 625X_W
E625
2,4,6-Trichlorophenol 40.00 118 80 1201.00 047.4
2,4-Dichlorophenol 40.00 111 80 1202.00 044.4
2,4-Dimethylphenol 40.00 103 80 1201.00 041.2
2,4-Dinitrophenol 40.00 118 80 1202.00 047.2
2-Chlorophenol 40.00 104 80 1201.00 041.6
2-Methylphenol 40.00 82.6 80 1202.00 033.1
2-Nitrophenol 40.00 118 80 1201.00 047.1
3,4-Methylphenol 40.00 85.2 80 1202.00 034.1
4,6-Dinitro-2-methylphenol 40.00 119 80 1202.00 047.8
4-Chloro-3-methylphenol 40.00 101 80 1201.00 040.3
4-Nitrophenol 40.00 80.1 80 1201.00 032.0
Bis(2-ethylhexyl)phthalate 40.00 116 80 1201.00 046.6
Butyl benzyl phthalate 40.00 94.4 80 1201.00 037.7
Diethyl phthalate 40.00 118 80 1201.00 047.0
Dimethyl phthalate 40.00 102 80 1201.00 040.7
Di-n-butyl phthalate 40.00 119 80 1201.00 047.4
Di-n-octyl phthalate 40.00 118 80 1201.00 047.4
Pentachlorophenol 40.00 120 80 1202.00 047.9
Phenol 40.00 86.9 80 1201.00 034.8
Sample ID: LCS-8407
Batch ID: 8407 TestNo: E625 Analysis Date: 10/27/2014
Prep Date: 10/24/2014
Analyte Result SPK value SPK Ref Val %REC RPD Ref Val %RPDLowLimit HighLimit RPDLimit Qual
Units: µg/L
PQL
Client ID: LCSW
RunNo: 17470
SeqNo: 228717
LCSSampType: TestCode: 625X_W
E625
Qualifiers: Page 11 of 21B Analyte detected in the associated Method Blank H Holding times for preparation or analysis exceeded ND Not Detected at the Reporting LimitO RSD is greater than RSDlimit R RPD outside accepted recovery limits S Spike Recovery outside accepted recovery limits
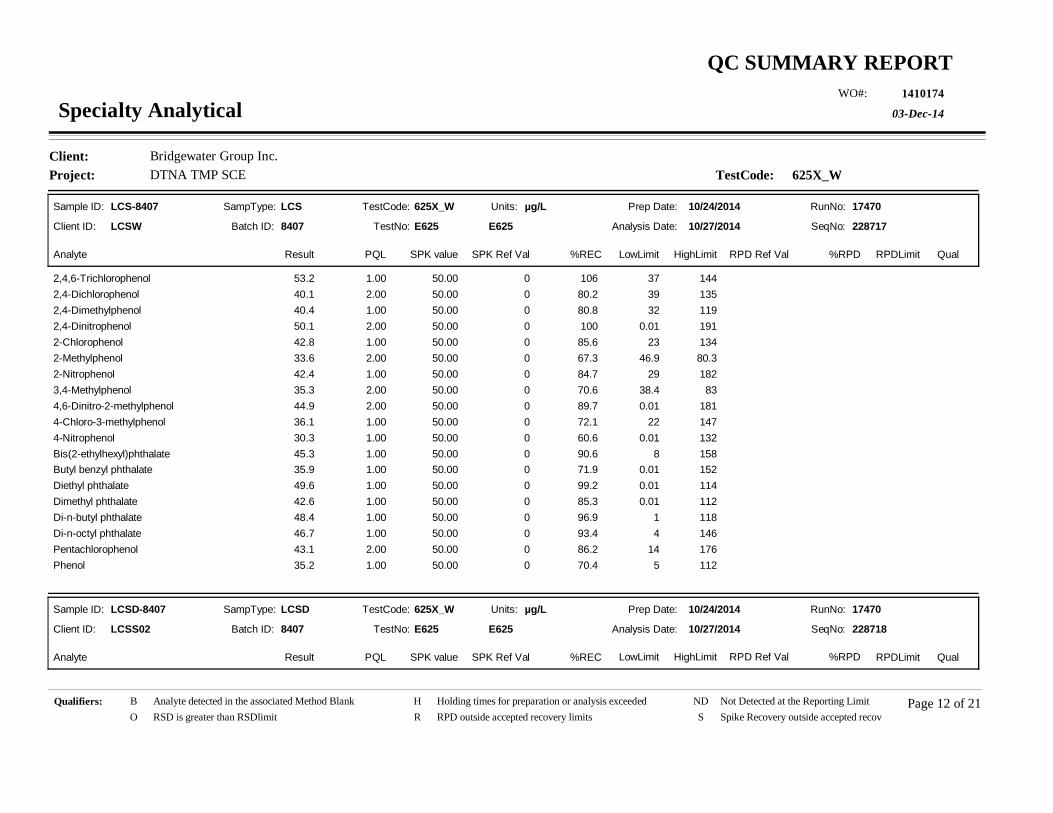
Project: DTNA TMP SCEClient: Bridgewater Group Inc.
TestCode: 625X_W
03-Dec-14
QC SUMMARY REPORT1410174WO#:
Specialty Analytical
Sample ID: LCS-8407
Batch ID: 8407 TestNo: E625 Analysis Date: 10/27/2014
Prep Date: 10/24/2014
Analyte Result SPK value SPK Ref Val %REC RPD Ref Val %RPDLowLimit HighLimit RPDLimit Qual
Units: µg/L
PQL
Client ID: LCSW
RunNo: 17470
SeqNo: 228717
LCSSampType: TestCode: 625X_W
E625
2,4,6-Trichlorophenol 50.00 106 37 1441.00 053.2
2,4-Dichlorophenol 50.00 80.2 39 1352.00 040.1
2,4-Dimethylphenol 50.00 80.8 32 1191.00 040.4
2,4-Dinitrophenol 50.00 100 0.01 1912.00 050.1
2-Chlorophenol 50.00 85.6 23 1341.00 042.8
2-Methylphenol 50.00 67.3 46.9 80.32.00 033.6
2-Nitrophenol 50.00 84.7 29 1821.00 042.4
3,4-Methylphenol 50.00 70.6 38.4 832.00 035.3
4,6-Dinitro-2-methylphenol 50.00 89.7 0.01 1812.00 044.9
4-Chloro-3-methylphenol 50.00 72.1 22 1471.00 036.1
4-Nitrophenol 50.00 60.6 0.01 1321.00 030.3
Bis(2-ethylhexyl)phthalate 50.00 90.6 8 1581.00 045.3
Butyl benzyl phthalate 50.00 71.9 0.01 1521.00 035.9
Diethyl phthalate 50.00 99.2 0.01 1141.00 049.6
Dimethyl phthalate 50.00 85.3 0.01 1121.00 042.6
Di-n-butyl phthalate 50.00 96.9 1 1181.00 048.4
Di-n-octyl phthalate 50.00 93.4 4 1461.00 046.7
Pentachlorophenol 50.00 86.2 14 1762.00 043.1
Phenol 50.00 70.4 5 1121.00 035.2
Sample ID: LCSD-8407
Batch ID: 8407 TestNo: E625 Analysis Date: 10/27/2014
Prep Date: 10/24/2014
Analyte Result SPK value SPK Ref Val %REC RPD Ref Val %RPDLowLimit HighLimit RPDLimit Qual
Units: µg/L
PQL
Client ID: LCSS02
RunNo: 17470
SeqNo: 228718
LCSDSampType: TestCode: 625X_W
E625
Qualifiers: Page 12 of 21B Analyte detected in the associated Method Blank H Holding times for preparation or analysis exceeded ND Not Detected at the Reporting LimitO RSD is greater than RSDlimit R RPD outside accepted recovery limits S Spike Recovery outside accepted recovery limits

Project: DTNA TMP SCEClient: Bridgewater Group Inc.
TestCode: 625X_W
03-Dec-14
QC SUMMARY REPORT1410174WO#:
Specialty Analytical
Sample ID: LCSD-8407
Batch ID: 8407 TestNo: E625 Analysis Date: 10/27/2014
Prep Date: 10/24/2014
Analyte Result SPK value SPK Ref Val %REC RPD Ref Val %RPDLowLimit HighLimit RPDLimit Qual
Units: µg/L
PQL
Client ID: LCSS02
RunNo: 17470
SeqNo: 228718
LCSDSampType: TestCode: 625X_W
E625
2,4,6-Trichlorophenol 50.00 118 37 144 201.00 0 53.23 10.459.1
2,4-Dichlorophenol 50.00 85.1 39 135 202.00 0 40.11 5.9542.6
2,4-Dimethylphenol 50.00 86.9 32 119 201.00 0 40.38 7.2843.4
2,4-Dinitrophenol 50.00 112 0.01 191 202.00 0 50.11 10.955.9
2-Chlorophenol 50.00 87.3 23 134 201.00 0 42.79 1.9443.6
2-Nitrophenol 50.00 92.5 29 182 201.00 0 42.37 8.8046.3
4,6-Dinitro-2-methylphenol 50.00 95.2 0.01 181 202.00 0 44.86 5.9147.6
4-Chloro-3-methylphenol 50.00 80.1 22 147 201.00 0 36.06 10.540.1
4-Nitrophenol 50.00 64.4 0.01 132 201.00 0 30.31 6.0532.2
Bis(2-ethylhexyl)phthalate 50.00 94.4 8 158 201.00 0 45.28 4.1147.2
Butyl benzyl phthalate 50.00 76.9 0.01 152 201.00 0 35.94 6.8038.5
Diethyl phthalate 50.00 103 0.01 114 201.00 0 49.61 3.3951.3
Dimethyl phthalate 50.00 87.3 0.01 112 201.00 0 42.64 2.3643.7
Di-n-butyl phthalate 50.00 95.7 1 118 201.00 0 48.45 1.2347.9
Di-n-octyl phthalate 50.00 95.1 4 146 201.00 0 46.69 1.8047.5
Pentachlorophenol 50.00 95.2 14 176 202.00 0 43.11 9.9247.6
Phenol 50.00 77.3 5 112 201.00 0 35.20 9.3738.7
Sample ID: MB-8407
Batch ID: 8407 TestNo: E625 Analysis Date: 10/27/2014
Prep Date: 10/24/2014
Analyte Result SPK value SPK Ref Val %REC RPD Ref Val %RPDLowLimit HighLimit RPDLimit Qual
Units: µg/L
PQL
Client ID: PBW
RunNo: 17470
SeqNo: 228719
MBLKSampType: TestCode: 625X_W
E625
2,4,6-Trichlorophenol 1.00ND
2,4-Dichlorophenol 2.00ND
Qualifiers: Page 13 of 21B Analyte detected in the associated Method Blank H Holding times for preparation or analysis exceeded ND Not Detected at the Reporting LimitO RSD is greater than RSDlimit R RPD outside accepted recovery limits S Spike Recovery outside accepted recovery limits
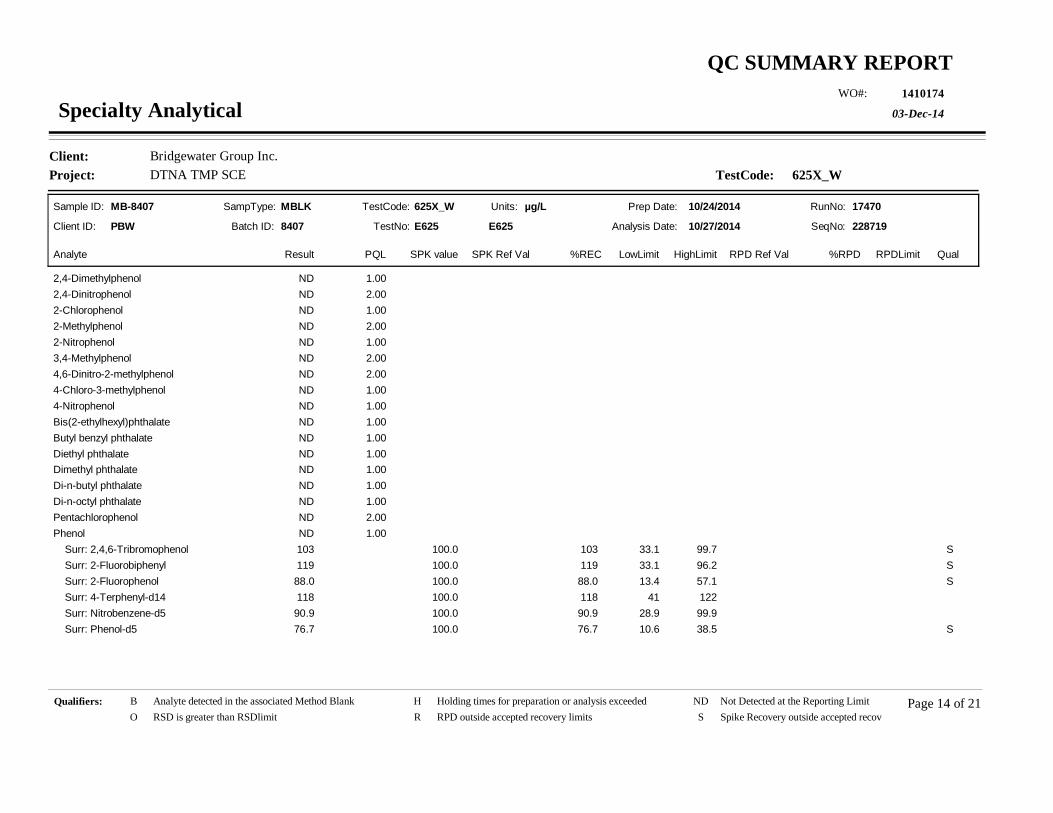
Project: DTNA TMP SCEClient: Bridgewater Group Inc.
TestCode: 625X_W
03-Dec-14
QC SUMMARY REPORT1410174WO#:
Specialty Analytical
Sample ID: MB-8407
Batch ID: 8407 TestNo: E625 Analysis Date: 10/27/2014
Prep Date: 10/24/2014
Analyte Result SPK value SPK Ref Val %REC RPD Ref Val %RPDLowLimit HighLimit RPDLimit Qual
Units: µg/L
PQL
Client ID: PBW
RunNo: 17470
SeqNo: 228719
MBLKSampType: TestCode: 625X_W
E625
2,4-Dimethylphenol 1.00ND
2,4-Dinitrophenol 2.00ND
2-Chlorophenol 1.00ND
2-Methylphenol 2.00ND
2-Nitrophenol 1.00ND
3,4-Methylphenol 2.00ND
4,6-Dinitro-2-methylphenol 2.00ND
4-Chloro-3-methylphenol 1.00ND
4-Nitrophenol 1.00ND
Bis(2-ethylhexyl)phthalate 1.00ND
Butyl benzyl phthalate 1.00ND
Diethyl phthalate 1.00ND
Dimethyl phthalate 1.00ND
Di-n-butyl phthalate 1.00ND
Di-n-octyl phthalate 1.00ND
Pentachlorophenol 2.00ND
Phenol 1.00ND
Surr: 2,4,6-Tribromophenol 100.0 103 33.1 99.7 S103
Surr: 2-Fluorobiphenyl 100.0 119 33.1 96.2 S119
Surr: 2-Fluorophenol 100.0 88.0 13.4 57.1 S88.0
Surr: 4-Terphenyl-d14 100.0 118 41 122118
Surr: Nitrobenzene-d5 100.0 90.9 28.9 99.990.9
Surr: Phenol-d5 100.0 76.7 10.6 38.5 S76.7
Qualifiers: Page 14 of 21B Analyte detected in the associated Method Blank H Holding times for preparation or analysis exceeded ND Not Detected at the Reporting LimitO RSD is greater than RSDlimit R RPD outside accepted recovery limits S Spike Recovery outside accepted recovery limits
Project: DTNA TMP SCEClient: Bridgewater Group Inc.
TestCode: 625X_W
03-Dec-14
QC SUMMARY REPORT1410174WO#:
Specialty Analytical
Sample ID: 1410175-001AMS
Batch ID: 8407 TestNo: E625 Analysis Date: 10/27/2014
Prep Date: 10/24/2014
Analyte Result SPK value SPK Ref Val %REC RPD Ref Val %RPDLowLimit HighLimit RPDLimit Qual
Units: µg/L
PQL
Client ID: ZZZZZZ
RunNo: 17470
SeqNo: 228767
MSSampType: TestCode: 625X_W
E625
2,4,6-Trichlorophenol 51.49 100 37 1441.03 051.5
2,4-Dichlorophenol 51.49 79.2 39 1352.06 040.8
2,4-Dimethylphenol 51.49 75.6 32 1191.03 038.9
2,4-Dinitrophenol 51.49 88.3 0.01 1912.06 045.5
2-Chlorophenol 51.49 73.5 23 1341.03 037.8
2-Methylphenol 51.49 53.8 55 126 SMI2.06 027.7
2-Nitrophenol 51.49 84.6 29 1821.03 043.5
3,4-Methylphenol 51.49 47.8 76 107 SMI2.06 024.6
4,6-Dinitro-2-methylphenol 51.49 58.1 0.01 1812.06 029.9
4-Chloro-3-methylphenol 51.49 9.80 22 147 SMI1.03 05.05
4-Nitrophenol 51.49 90.2 0.01 1321.03 046.5
Bis(2-ethylhexyl)phthalate 51.49 73.6 8 1581.03 3.55841.5
Butyl benzyl phthalate 51.49 71.0 0.01 1521.03 036.6
Diethyl phthalate 51.49 103 0.01 1141.03 053.0
Dimethyl phthalate 51.49 78.7 0.01 1121.03 0.406040.9
Di-n-butyl phthalate 51.49 72.1 1 1181.03 0.245737.4
Di-n-octyl phthalate 51.49 82.0 4 1461.03 0.203042.4
Pentachlorophenol 51.49 105 14 1762.06 054.1
Phenol 51.49 12.0 5 1121.03 9.64715.8
Sample ID: 1410175-002AMS
Batch ID: 8407 TestNo: E625 Analysis Date: 10/27/2014
Prep Date: 10/24/2014
Analyte Result SPK value SPK Ref Val %REC RPD Ref Val %RPDLowLimit HighLimit RPDLimit Qual
Units: µg/L
PQL
Client ID: ZZZZZZ
RunNo: 17470
SeqNo: 228792
MSSampType: TestCode: 625X_W
E625
Qualifiers: Page 15 of 21B Analyte detected in the associated Method Blank H Holding times for preparation or analysis exceeded ND Not Detected at the Reporting LimitO RSD is greater than RSDlimit R RPD outside accepted recovery limits S Spike Recovery outside accepted recovery limits
Project: DTNA TMP SCEClient: Bridgewater Group Inc.
TestCode: 625X_W
03-Dec-14
QC SUMMARY REPORT1410174WO#:
Specialty Analytical
Sample ID: 1410175-002AMS
Batch ID: 8407 TestNo: E625 Analysis Date: 10/27/2014
Prep Date: 10/24/2014
Analyte Result SPK value SPK Ref Val %REC RPD Ref Val %RPDLowLimit HighLimit RPDLimit Qual
Units: µg/L
PQL
Client ID: ZZZZZZ
RunNo: 17470
SeqNo: 228792
MSSampType: TestCode: 625X_W
E625
2,4,6-Trichlorophenol 47.21 88.7 37 1440.944 041.9
2,4-Dichlorophenol 47.21 77.0 39 1351.89 036.4
2,4-Dimethylphenol 47.21 64.8 32 1190.944 030.6
2,4-Dinitrophenol 47.21 56.8 0.01 1911.89 026.8
2-Chlorophenol 47.21 61.7 23 1340.944 029.1
2-Methylphenol 47.21 42.1 55 126 SMI1.89 019.9
2-Nitrophenol 47.21 73.3 29 1820.944 034.6
3,4-Methylphenol 47.21 40.3 76 107 SMI1.89 019.0
4,6-Dinitro-2-methylphenol 47.21 75.7 0.01 1811.89 035.7
4-Chloro-3-methylphenol 47.21 70.3 22 1470.944 033.2
4-Nitrophenol 47.21 5.40 0.01 1320.944 02.55
Bis(2-ethylhexyl)phthalate 47.21 85.3 8 1580.944 0.404740.7
Butyl benzyl phthalate 47.21 66.1 0.01 1520.944 031.2
Diethyl phthalate 47.21 95.4 0.01 1140.944 045.1
Dimethyl phthalate 47.21 82.5 0.01 1120.944 0.641739.6
Di-n-butyl phthalate 47.21 91.9 1 1180.944 0.187643.6
Di-n-octyl phthalate 47.21 84.5 4 1460.944 039.9
Pentachlorophenol 47.21 62.9 14 1761.89 0.197429.9
Phenol 47.21 15.1 5 1120.944 07.13
Qualifiers: Page 16 of 21B Analyte detected in the associated Method Blank H Holding times for preparation or analysis exceeded ND Not Detected at the Reporting LimitO RSD is greater than RSDlimit R RPD outside accepted recovery limits S Spike Recovery outside accepted recovery limits

Project: DTNA TMP SCEClient: Bridgewater Group Inc.
TestCode: Hg_WW
03-Dec-14
QC SUMMARY REPORT1410174WO#:
Specialty Analytical
Sample ID: MB-8401
Batch ID: 8401 TestNo: E245.2 Analysis Date: 10/24/2014
Prep Date: 10/24/2014
Analyte Result SPK value SPK Ref Val %REC RPD Ref Val %RPDLowLimit HighLimit RPDLimit Qual
Units: mg/L
PQL
Client ID: PBW
RunNo: 17440
SeqNo: 228396
MBLKSampType: TestCode: Hg_WW
E245.1
Mercury 0.000100ND
Sample ID: LCS-8401
Batch ID: 8401 TestNo: E245.2 Analysis Date: 10/24/2014
Prep Date: 10/24/2014
Analyte Result SPK value SPK Ref Val %REC RPD Ref Val %RPDLowLimit HighLimit RPDLimit Qual
Units: mg/L
PQL
Client ID: LCSW
RunNo: 17440
SeqNo: 228397
LCSSampType: TestCode: Hg_WW
E245.1
Mercury 0.004000 99.5 80 1200.000100 00.00398
Sample ID: 1410174-001CDUP
Batch ID: 8401 TestNo: E245.2 Analysis Date: 10/24/2014
Prep Date: 10/24/2014
Analyte Result SPK value SPK Ref Val %REC RPD Ref Val %RPDLowLimit HighLimit RPDLimit Qual
Units: mg/L
PQL
Client ID: FAT-102114
RunNo: 17440
SeqNo: 228399
DUPSampType: TestCode: Hg_WW
E245.1
Mercury 200.000100 0 0ND
Sample ID: 1410174-001CMS
Batch ID: 8401 TestNo: E245.2 Analysis Date: 10/24/2014
Prep Date: 10/24/2014
Analyte Result SPK value SPK Ref Val %REC RPD Ref Val %RPDLowLimit HighLimit RPDLimit Qual
Units: mg/L
PQL
Client ID: FAT-102114
RunNo: 17440
SeqNo: 228400
MSSampType: TestCode: Hg_WW
E245.1
Mercury 0.004000 99.9 75 1250.000100 00.00399
Qualifiers: Page 17 of 21B Analyte detected in the associated Method Blank H Holding times for preparation or analysis exceeded ND Not Detected at the Reporting LimitO RSD is greater than RSDlimit R RPD outside accepted recovery limits S Spike Recovery outside accepted recovery limits

Project: DTNA TMP SCEClient: Bridgewater Group Inc.
TestCode: Hg_WW
03-Dec-14
QC SUMMARY REPORT1410174WO#:
Specialty Analytical
Sample ID: 1410174-001CMSD
Batch ID: 8401 TestNo: E245.2 Analysis Date: 10/24/2014
Prep Date: 10/24/2014
Analyte Result SPK value SPK Ref Val %REC RPD Ref Val %RPDLowLimit HighLimit RPDLimit Qual
Units: mg/L
PQL
Client ID: FAT-102114
RunNo: 17440
SeqNo: 228401
MSDSampType: TestCode: Hg_WW
E245.1
Mercury 0.004000 99.9 75 125 200.000100 0 0.003994 0.02500.00400
Sample ID: CCV
Batch ID: 8401 TestNo: E245.2 Analysis Date: 10/24/2014
Prep Date:
Analyte Result SPK value SPK Ref Val %REC RPD Ref Val %RPDLowLimit HighLimit RPDLimit Qual
Units: mg/L
PQL
Client ID: CCV
RunNo: 17440
SeqNo: 228406
CCVSampType: TestCode: HG_WW
E245.1
Mercury 0.004000 109 90 1100.000100 00.00437
Qualifiers: Page 18 of 21B Analyte detected in the associated Method Blank H Holding times for preparation or analysis exceeded ND Not Detected at the Reporting LimitO RSD is greater than RSDlimit R RPD outside accepted recovery limits S Spike Recovery outside accepted recovery limits

Project: DTNA TMP SCEClient: Bridgewater Group Inc.
TestCode: HGD_WW
03-Dec-14
QC SUMMARY REPORT1410174WO#:
Specialty Analytical
Sample ID: MB-8401
Batch ID: 8401 TestNo: E245.2 Analysis Date: 10/24/2014
Prep Date: 10/24/2014
Analyte Result SPK value SPK Ref Val %REC RPD Ref Val %RPDLowLimit HighLimit RPDLimit Qual
Units: mg/L
PQL
Client ID: PBW
RunNo: 17446
SeqNo: 228467
MBLKSampType: TestCode: HGD_WW
E245.1
Mercury 0.000100ND
Sample ID: LCS-8401
Batch ID: 8401 TestNo: E245.2 Analysis Date: 10/24/2014
Prep Date: 10/24/2014
Analyte Result SPK value SPK Ref Val %REC RPD Ref Val %RPDLowLimit HighLimit RPDLimit Qual
Units: mg/L
PQL
Client ID: LCSW
RunNo: 17446
SeqNo: 228468
LCSSampType: TestCode: HGD_WW
E245.1
Mercury 0.004000 99.5 85.4 1160.000100 00.00398
Sample ID: A1410174-001CDUP
Batch ID: 8401 TestNo: E245.2 Analysis Date: 10/24/2014
Prep Date:
Analyte Result SPK value SPK Ref Val %REC RPD Ref Val %RPDLowLimit HighLimit RPDLimit Qual
Units: mg/L
PQL
Client ID: ZZZZZZ
RunNo: 17446
SeqNo: 228475
DUPSampType: TestCode: HGD_WW
E245.1
Mercury 200.000100 0 0ND
Sample ID: A1410174-001CMS
Batch ID: 8401 TestNo: E245.2 Analysis Date: 10/24/2014
Prep Date:
Analyte Result SPK value SPK Ref Val %REC RPD Ref Val %RPDLowLimit HighLimit RPDLimit Qual
Units: mg/L
PQL
Client ID: ZZZZZZ
RunNo: 17446
SeqNo: 228476
MSSampType: TestCode: HGD_WW
E245.1
Mercury 0.004000 99.9 69.5 1250.000100 00.00399
Qualifiers: Page 19 of 21B Analyte detected in the associated Method Blank H Holding times for preparation or analysis exceeded ND Not Detected at the Reporting LimitO RSD is greater than RSDlimit R RPD outside accepted recovery limits S Spike Recovery outside accepted recovery limits

Project: DTNA TMP SCEClient: Bridgewater Group Inc.
TestCode: HGD_WW
03-Dec-14
QC SUMMARY REPORT1410174WO#:
Specialty Analytical
Sample ID: A1410174-001CMSD
Batch ID: 8401 TestNo: E245.2 Analysis Date: 10/24/2014
Prep Date:
Analyte Result SPK value SPK Ref Val %REC RPD Ref Val %RPDLowLimit HighLimit RPDLimit Qual
Units: mg/L
PQL
Client ID: ZZZZZZ
RunNo: 17446
SeqNo: 228477
MSDSampType: TestCode: HGD_WW
E245.1
Mercury 0.004000 99.9 69.5 125 200.000100 0 0.003994 0.02500.00400
Sample ID: CCV
Batch ID: 8401 TestNo: E245.2 Analysis Date: 10/24/2014
Prep Date:
Analyte Result SPK value SPK Ref Val %REC RPD Ref Val %RPDLowLimit HighLimit RPDLimit Qual
Units: mg/L
PQL
Client ID: CCV
RunNo: 17446
SeqNo: 228478
CCVSampType: TestCode: HGD_WW
E245.1
Mercury 0.004000 108 90 1100.000100 00.00431
Qualifiers: Page 20 of 21B Analyte detected in the associated Method Blank H Holding times for preparation or analysis exceeded ND Not Detected at the Reporting LimitO RSD is greater than RSDlimit R RPD outside accepted recovery limits S Spike Recovery outside accepted recovery limits

Project: DTNA TMP SCEClient: Bridgewater Group Inc.
TestCode: TSS_WW
03-Dec-14
QC SUMMARY REPORT1410174WO#:
Specialty Analytical
Sample ID: MB-R17483
Batch ID: R17483 TestNo: M2540 D Analysis Date: 10/27/2014
Prep Date:
Analyte Result SPK value SPK Ref Val %REC RPD Ref Val %RPDLowLimit HighLimit RPDLimit Qual
Units: mg/L
PQL
Client ID: PBW
RunNo: 17483
SeqNo: 228812
MBLKSampType: TestCode: TSS_WW
Total Suspended Solids 5.00ND
Sample ID: LCS-R17483
Batch ID: R17483 TestNo: M2540 D Analysis Date: 10/27/2014
Prep Date:
Analyte Result SPK value SPK Ref Val %REC RPD Ref Val %RPDLowLimit HighLimit RPDLimit Qual
Units: mg/L
PQL
Client ID: LCSW
RunNo: 17483
SeqNo: 228813
LCSSampType: TestCode: TSS_WW
Total Suspended Solids 100.0 86.0 80 1055.00 086.0
Sample ID: 1410206-001ADUP
Batch ID: R17483 TestNo: M2540 D Analysis Date: 10/27/2014
Prep Date:
Analyte Result SPK value SPK Ref Val %REC RPD Ref Val %RPDLowLimit HighLimit RPDLimit Qual
Units: mg/L
PQL
Client ID: ZZZZZZ
RunNo: 17483
SeqNo: 228820
DUPSampType: TestCode: TSS_WW
Total Suspended Solids 205.00 189.0 1.57192
Sample ID: 1410214-003ADUP
Batch ID: R17483 TestNo: M2540 D Analysis Date: 10/27/2014
Prep Date:
Analyte Result SPK value SPK Ref Val %REC RPD Ref Val %RPDLowLimit HighLimit RPDLimit Qual
Units: mg/L
PQL
Client ID: ZZZZZZ
RunNo: 17483
SeqNo: 228828
DUPSampType: TestCode: TSS_WW
Total Suspended Solids 205.00 125.0 7.47116
Qualifiers: Page 21 of 21B Analyte detected in the associated Method Blank H Holding times for preparation or analysis exceeded ND Not Detected at the Reporting LimitO RSD is greater than RSDlimit R RPD outside accepted recovery limits S Spike Recovery outside accepted recovery limits
KEY TO FLAGS Rev. May 12, 2010
A This sample contains a Gasoline Range Organic not identified as a specific hydrocarbon product. The result was quantifiedagainst gasoline calibration standards
A1 This sample contains a Diesel Range Organic not identified as a specific hydrocarbon product. The result was quantifiedagainst diesel calibration standards.
A2 This sample contains a Lube Oil Range Organic not identified as a specific hydrocarbon product. The result was quantifiedagainst a lube oil calibration standard.
A3 The result was determined to be Non-Detect based on hydrocarbon pattern recognition. The product was carry-over fromanother hydrocarbon type.
A4 The product appears to be aged or degraded diesel.
B The blank exhibited a positive result great than the reporting limit for this compound.
CN See Case Narrative.
D Result is based from a dilution.
E Result exceeds the calibration range for this compound. The result should be considered as estimate.
F The positive result for this hydrocarbon is due to single component contamination. The product does not match anyhydrocarbon in the fuels library.
G Result may be biased high due to biogenic interferences. Clean up is recommended.
H Sample was analyzed outside recommended holding time.
HT At clients request, samples was analyzed outside of recommended holding time.
J The result for this analyte is between the MDL and the PQL and should be considered as estimated concentration.
K Diesel result is biased high due to amount of Oil contained in the sample.
L Diesel result is biased high due to amount of Gasoline contained in the sample.
M Oil result is biased high due to amount of Diesel contained in the sample.
MC Sample concentration is greater than 4x the spiked value, the spiked value is considered insignificant.
MI Result is outside control limits due to matrix interference.
MSA Value determined by Method of Standard Addition.
O Laboratory Control Standard (LCS) exceeded laboratory control limits, but meets CCV criteria. Data meets EPArequirements.
Q Detection levels elevated due to sample matrix.
R RPD control limits were exceeded.
RF Duplicate failed due to result being at or near the method-reporting limit.
RP Matrix spike values exceed established QC limits; post digestion spike is in control.
S Recovery is outside control limits.
SC Closing CCV or LCS exceeded high recovery control limits, but associated samples are non-detect. Data meets EPArequirements.
* The result for this parameter was greater that the maximum contaminant level of the TCLP regulatory limit.

Specialty AnalyticalNikki Bippes
Dear Nikki Bippes:
RE: SA 1410174Order No.: 1411152
FAX 503-607-1336TEL: 503-607-1331
11711 SE Capps Rd, #BClackamas, OR 97015
12/03/14
Neilson Research Corporation received 2 sample(s) on 11/05/14 for the analyses presented in the following report.
Alec C Smith
The results relate only to the parameters tested or to the sample as received by the laboratory. This report shall not be reproduced except in full, without the written approval of Neilson Research Corporation. If you have any questions regarding these test results, please feel free to call.
Sincerely,Neilson Research Corporation
Project Manager
Page 1 of 7

Neilson Research Corporation245 South Grape Street, Medford, Oregon 97501 541-770-5678 Fax 541-770-2901
Analysis Report ORELAP 100016EPA OR00028
Project: SA 1410174CLIENT: Specialty Analytical
Lab Order: 1411152CASE NARRATIVEDate: 03-Dec-14
The analyses were performed according to the guidelines in the Neilson Research Corporation Quality Assurance Program. This report contains analytical results for the sample(s) as received by the laboratory.
Neilson Research Corporation certifies that this report is in compliance with the requirements of NELAP. No unusual difficulties were experienced during analysis of this batch except as noted below or qualified with data flags on the reports.
Report reprinted to include MDL per client 11/18/14 CAF.
Report reprinted to include Chromium and Lead per client 11/19/14 CAF.
Page 1 of 1
Page 2 of 7
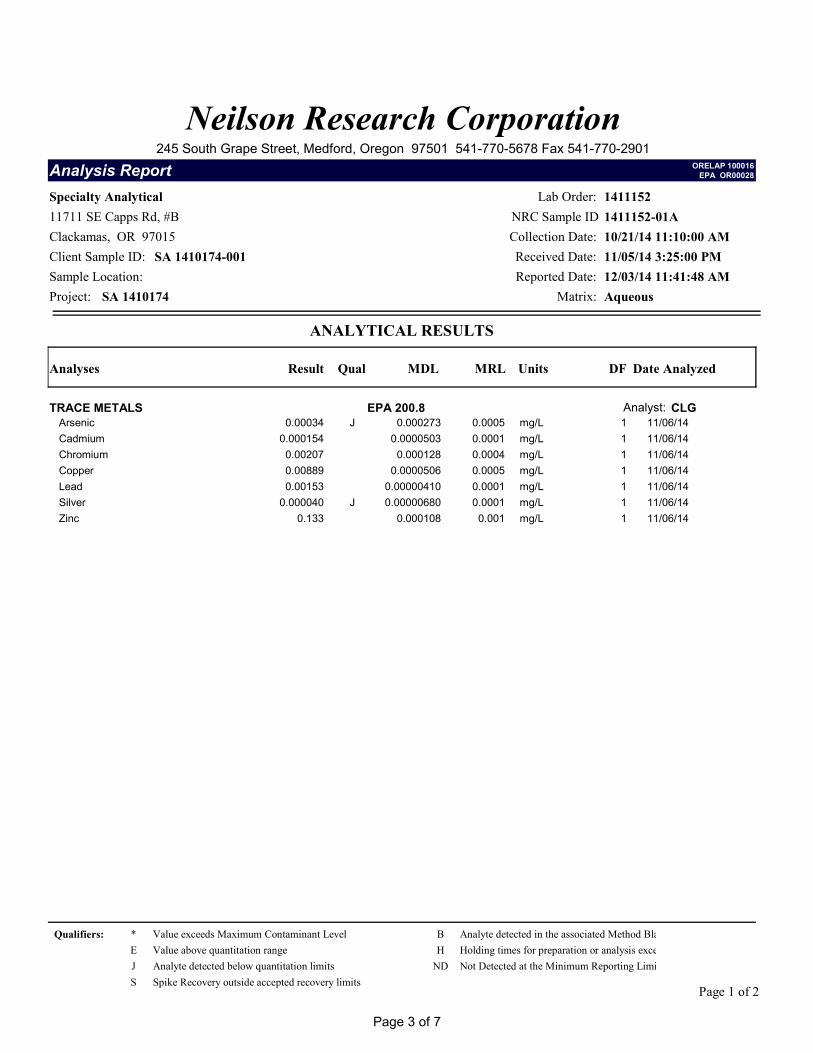
Analyses Result Qual Units Date AnalyzedMRL DFMDL
Project: SA 1410174
Collection Date: 10/21/14 11:10:00 AM
Specialty Analytical Lab Order: 1411152
Reported Date: 12/03/14 11:41:48 AM
ANALYTICAL RESULTS
Received Date: 11/05/14 3:25:00 PM
Matrix: Aqueous
Client Sample ID: SA 1410174-001
NRC Sample ID 1411152-01AClackamas, OR 97015
Sample Location:
11711 SE Capps Rd, #B
Neilson Research Corporation245 South Grape Street, Medford, Oregon 97501 541-770-5678 Fax 541-770-2901
Analysis Report ORELAP 100016EPA OR00028
TRACE METALS EPA 200.8 Analyst: CLGArsenic J 11/06/140.0005 mg/L 10.00034 0.000273Cadmium 11/06/140.0001 mg/L 10.000154 0.0000503Chromium 11/06/140.0004 mg/L 10.00207 0.000128Copper 11/06/140.0005 mg/L 10.00889 0.0000506Lead 11/06/140.0001 mg/L 10.00153 0.00000410Silver J 11/06/140.0001 mg/L 10.000040 0.00000680Zinc 11/06/140.001 mg/L 10.133 0.000108
Qualifiers:
Page 1 of 2
* Value exceeds Maximum Contaminant Level B Analyte detected in the associated Method BlankE Value above quantitation range H Holding times for preparation or analysis exceededJ Analyte detected below quantitation limits ND Not Detected at the Minimum Reporting LimitS Spike Recovery outside accepted recovery limits
Page 3 of 7

Analyses Result Qual Units Date AnalyzedMRL DFMDL
Project: SA 1410174
Collection Date: 10/21/14 11:45:00 AM
Specialty Analytical Lab Order: 1411152
Reported Date: 12/03/14 11:41:48 AM
ANALYTICAL RESULTS
Received Date: 11/05/14 3:25:00 PM
Matrix: Aqueous
Client Sample ID: SA 1410174-002
NRC Sample ID 1411152-02AClackamas, OR 97015
Sample Location:
11711 SE Capps Rd, #B
Neilson Research Corporation245 South Grape Street, Medford, Oregon 97501 541-770-5678 Fax 541-770-2901
Analysis Report ORELAP 100016EPA OR00028
TRACE METALS EPA 200.8 Analyst: CLGArsenic J 11/06/140.0005 mg/L 10.00048 0.000273Cadmium 11/06/140.0001 mg/L 10.000114 0.0000503Chromium 11/06/140.0004 mg/L 10.000925 0.000128Copper 11/06/140.0005 mg/L 10.0163 0.0000506Lead 11/06/140.0001 mg/L 10.00177 0.00000410Silver J 11/06/140.0001 mg/L 10.000012 0.00000680Zinc 11/06/140.001 mg/L 10.119 0.000108
Qualifiers:
Page 2 of 2
* Value exceeds Maximum Contaminant Level B Analyte detected in the associated Method BlankE Value above quantitation range H Holding times for preparation or analysis exceededJ Analyte detected below quantitation limits ND Not Detected at the Minimum Reporting LimitS Spike Recovery outside accepted recovery limits
Page 4 of 7

Project: SA 1410174
CLIENT: Specialty AnalyticalWork Order: 1411152
ANALYTICAL QC SUMMARY REPORTTestCode: ICPMS_200.8_W
03-Dec-14Date:Neilson Research Corporation
Sample ID MB-31251
Batch ID: 31251 TestNo: EPA 200.8 Analysis Date: 11/06/14
Prep Date: 11/06/14
Analyte Result SPK value SPK Ref Val %REC RPD Ref Val %RPDLowLimit HighLimit RPDLimit Qual
Units: mg/L
MRL
Client ID: ZZZZZ
RunNo: 76755
SeqNo: 1142344
MBLKSampType: TestCode: ICPMS_200.8
(EPA 200.8)
Arsenic 0.000500NDCadmium 0.000100NDChromium 0.000400NDCopper J0.0005000.00006148Lead J0.0001000.00001823Silver 0.000100NDZinc J0.001000.0007574
Sample ID LCS-31251
Batch ID: 31251 TestNo: EPA 200.8 Analysis Date: 11/06/14
Prep Date: 11/06/14
Analyte Result SPK value SPK Ref Val %REC RPD Ref Val %RPDLowLimit HighLimit RPDLimit Qual
Units: mg/L
MRL
Client ID: ZZZZZ
RunNo: 76755
SeqNo: 1142345
LCSSampType: TestCode: ICPMS_200.8
(EPA 200.8)
Arsenic 0.1 109 85 1150.000500 00.1093Cadmium 0.1 108 85 1150.000100 00.1085Chromium 0.1 107 85 1150.000400 00.1068Copper 0.1 108 85 1150.000500 0.000061480.1078Lead 0.1 109 85 1150.000100 0.000018230.1086Silver 0.1 105 85 1150.000100 00.1050Zinc 0.1 108 85 1150.00100 0.00075740.1086
Sample ID 1411159-01AMS
Batch ID: 31251 TestNo: EPA 200.8 Analysis Date: 11/06/14
Prep Date: 11/06/14
Analyte Result SPK value SPK Ref Val %REC RPD Ref Val %RPDLowLimit HighLimit RPDLimit Qual
Units: mg/L
MRL
Client ID: ZZZZZ
RunNo: 76755
SeqNo: 1142354
MSSampType: TestCode: ICPMS_200.8
(EPA 200.8)
Arsenic 0.1 103 70 1300.000500 0.0025050.1060Cadmium 0.1 99.8 70 1300.000100 00.09976Chromium 0.1 104 70 1300.000400 0.0002090.1047Copper 0.1 97.5 70 1300.000500 0.00040170.09793Lead 0.1 98.4 70 1300.000100 0.00006640.09851
Page 1 of 2
Qualifiers: E Value above quantitation range H Holding times for preparation or analysis exceeded J Analyte detected below quantitation limitsND Not Detected at the Minimum Reporting Limit R RPD outside accepted recovery limits S Spike Recovery outside accepted recovery limits
Page 5 of 7

Project: SA 1410174
CLIENT: Specialty AnalyticalWork Order: 1411152
ANALYTICAL QC SUMMARY REPORTTestCode: ICPMS_200.8_W
03-Dec-14Date:Neilson Research Corporation
Sample ID 1411159-01AMS
Batch ID: 31251 TestNo: EPA 200.8 Analysis Date: 11/06/14
Prep Date: 11/06/14
Analyte Result SPK value SPK Ref Val %REC RPD Ref Val %RPDLowLimit HighLimit RPDLimit Qual
Units: mg/L
MRL
Client ID: ZZZZZ
RunNo: 76755
SeqNo: 1142354
MSSampType: TestCode: ICPMS_200.8
(EPA 200.8)
Silver 0.1 95.7 70 1300.000100 00.09572Zinc 0.1 99.6 70 1300.00100 0.0047030.1043
Sample ID 1411159-01AMSD
Batch ID: 31251 TestNo: EPA 200.8 Analysis Date: 11/06/14
Prep Date: 11/06/14
Analyte Result SPK value SPK Ref Val %REC RPD Ref Val %RPDLowLimit HighLimit RPDLimit Qual
Units: mg/L
MRL
Client ID: ZZZZZ
RunNo: 76755
SeqNo: 1142355
MSDSampType: TestCode: ICPMS_200.8
(EPA 200.8)
Arsenic 0.1 104 70 130 200.000500 0.002505 0.106 0.7520.1068Cadmium 0.1 99.9 70 130 200.000100 0 0.09976 0.1000.09986Chromium 0.1 105 70 130 200.000400 0.000209 0.1047 0.7610.1055Copper 0.1 98.5 70 130 200.000500 0.0004017 0.09793 0.9550.09887Lead 0.1 99.2 70 130 200.000100 0.0000664 0.09851 0.8090.09931Silver 0.1 95.7 70 130 200.000100 0 0.09572 00.09572Zinc 0.1 100 70 130 200.00100 0.004703 0.1043 0.6690.1050
Page 2 of 2
Qualifiers: E Value above quantitation range H Holding times for preparation or analysis exceeded J Analyte detected below quantitation limitsND Not Detected at the Minimum Reporting Limit R RPD outside accepted recovery limits S Spike Recovery outside accepted recovery limits
Page 6 of 7
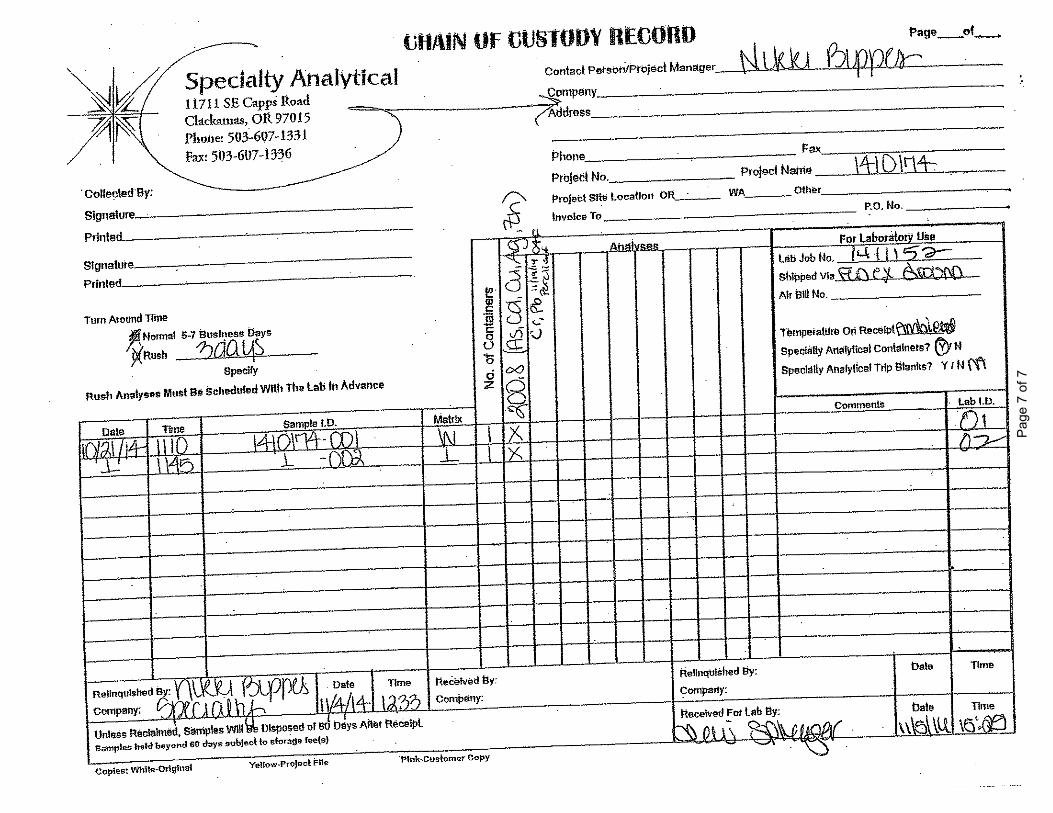
Page
7 o
f 7

245 S Grape St Medford, OR 97501 (541) 770-5678
400 SE G St, Suite B Grants Pass, OR 97526 (541) 479-4053
www.nrclabs.com
NEILSON RESEARCH CORPORATION
Environmental Testing Laboratory
Specialty AnalyticalNikki Bippes
Dear Nikki Bippes:
RE: SA 1410174Order No.: 1411341
FAX: 503-607-1336TEL: 503-607-1331
11711 SE Capps Rd, #BClackamas, OR 97015
11/17/2014
Neilson Research Corporation received 2 sample(s) on 11/11/2014 for the analyses presented in the following report.
Alec C Smith
The results relate only to the parameters tested or to the sample as received by the laboratory. This report shall not be reproduced except in full, without the written approval of Neilson Research Corporation. If you have any questions regarding these test results, please feel free to call.
Sincerely,Neilson Research Corporation
Project Manager
Page 1 of 8
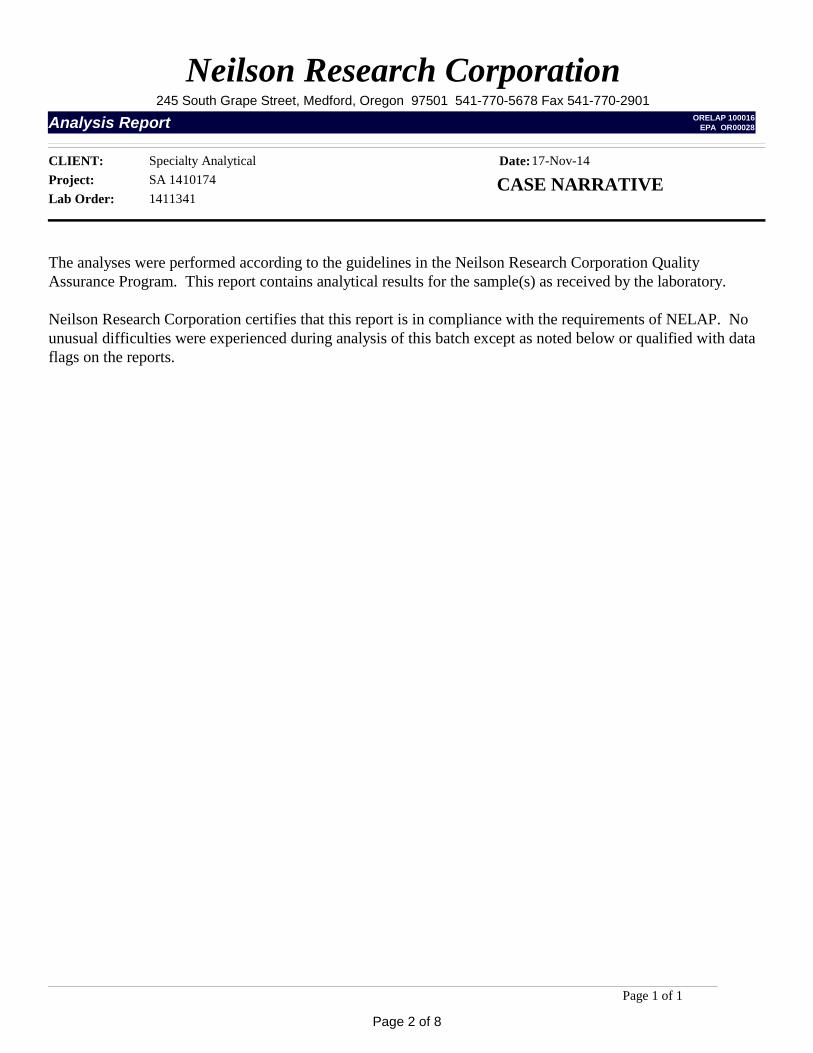
Neilson Research Corporation245 South Grape Street, Medford, Oregon 97501 541-770-5678 Fax 541-770-2901
Analysis Report ORELAP 100016EPA OR00028
Project: SA 1410174CLIENT: Specialty Analytical
Lab Order: 1411341CASE NARRATIVEDate:17-Nov-14
The analyses were performed according to the guidelines in the Neilson Research Corporation Quality Assurance Program. This report contains analytical results for the sample(s) as received by the laboratory.
Neilson Research Corporation certifies that this report is in compliance with the requirements of NELAP. No unusual difficulties were experienced during analysis of this batch except as noted below or qualified with data flags on the reports.
Page 1 of 1
Page 2 of 8

Analyses Result Qual Units Date AnalyzedMRL DFMDL
Project: SA 1410174
Collection Date: 10/21/2014 11:10:00 AM
Specialty Analytical Lab Order: 1411341
Reported Date: 11/17/2014 2:58:28 PM
ANALYTICAL RESULTS
Received Date: 11/11/2014 2:50:00 PM
Matrix: Aqueous
Client Sample ID: SA 1410174-001
NRC Sample ID 1411341-01AClackamas, OR 97015
Sample Location:
11711 SE Capps Rd, #B
Neilson Research Corporation245 South Grape Street, Medford, Oregon 97501 541-770-5678 Fax 541-770-2901
Analysis Report ORELAP 100016EPA OR00028
DISSOLVED TRACE METALS EPA 200.8 Analyst: CLGArsenic 11/12/20140.000515 mg/L 1ND 0.000281Cadmium 11/12/20140.000103 mg/L 1ND 0.0000518Chromium 11/12/20140.000412 mg/L 10.000703 0.000132Copper 11/12/20140.000515 mg/L 10.00489 0.0000521Lead 11/12/20140.000103 mg/L 10.000396 0.00000422Silver 11/12/20140.000103 mg/L 1ND 0.00000700Zinc 11/12/20140.00103 mg/L 10.0365 0.000111
Qualifiers:
Page 1 of 2
* Value exceeds Maximum Contaminant Level B Analyte detected in the associated Method BlankE Value above quantitation range H Holding times for preparation or analysis exceededJ Analyte detected below quantitation limits ND Not Detected at the Minimum Reporting LimitS Spike Recovery outside accepted recovery limits
Page 3 of 8

Analyses Result Qual Units Date AnalyzedMRL DFMDL
Project: SA 1410174
Collection Date: 10/21/2014 11:45:00 AM
Specialty Analytical Lab Order: 1411341
Reported Date: 11/17/2014 2:58:28 PM
ANALYTICAL RESULTS
Received Date: 11/11/2014 2:50:00 PM
Matrix: Aqueous
Client Sample ID: SA 1410174-002
NRC Sample ID 1411341-02AClackamas, OR 97015
Sample Location:
11711 SE Capps Rd, #B
Neilson Research Corporation245 South Grape Street, Medford, Oregon 97501 541-770-5678 Fax 541-770-2901
Analysis Report ORELAP 100016EPA OR00028
DISSOLVED TRACE METALS EPA 200.8 Analyst: CLGArsenic J 11/12/20140.000515 mg/L 10.00033 0.000281Cadmium 11/12/20140.000103 mg/L 1ND 0.0000518Chromium J 11/12/20140.000412 mg/L 10.00034 0.000132Copper 11/12/20140.000515 mg/L 10.0106 0.0000521Lead 11/12/20140.000103 mg/L 10.000373 0.00000422Silver 11/12/20140.000103 mg/L 1ND 0.00000700Zinc 11/12/20140.00103 mg/L 10.0704 0.000111
Qualifiers:
Page 2 of 2
* Value exceeds Maximum Contaminant Level B Analyte detected in the associated Method BlankE Value above quantitation range H Holding times for preparation or analysis exceededJ Analyte detected below quantitation limits ND Not Detected at the Minimum Reporting LimitS Spike Recovery outside accepted recovery limits
Page 4 of 8

NRC SOP QA-1104/AD-3100 Revision 1
Effective Date: 5/30/12
Neilson Research Corporation
DATA FLAGS
B Analyte detected in the associated method blank. BA BOD Alternative Calculation: The initial results performed by Standard Methods did not fall within parameters of the
Standard Methods calculation. An alternate approved calculation was performed using the HACH method and the value reported is an estimated concentration.
C Sample(s) does not meet NELAC/ORELAP sample acceptance criteria. See Case Narrative. C1 Sample(s) does not meet NELAC/ORELAP sample acceptance criteria for temperature. CF Results confirmed by re-analysis. CU Cleanup performed as specified by method. D1 The diesel elution pattern for the sample is not typical. D2 The sample appears to be a heavier hydrocarbon range than diesel. D3 The sample appears to be a lighter hydrocarbon range than diesel. D4 Detected hydrocarbons do not have pattern and range consistent with typical petroleum products and may be due to
biogenic interference. D5 Detected hydrocarbons in the diesel range appear to be weathered diesel. E Estimated value. ER Elevated reporting limit due to matrix. Report limits (MDLs, MRLs & PQLs) are adjusted based on variations in
sample preparation amounts, analytical dilutions, and percent solids, where applicable. FC Fecal Coliforms: Sample(s) received past 40 CFR Part 136 specified holding time. Results reported as estimated
values. G1 The gasoline elution pattern for the sample is not typical. G2 The sample appears to be a heavier hydrocarbon range than gasoline. G3 The sample appears to be a lighter hydrocarbon range than gasoline. G4 Detected hydrocarbons in the gasoline range appear to be weathered gasoline. HP Sample re-analysis performed outside of method specified holding time. HR Sample received outside of method specified holding time. HS Sample analyzed for volatile organics contained headspace. HT At the client’s request, the sample was analyzed outside of method specified holding time. H Analysis performed outside of method specified holding time. J Analyte detected below the Minimum Reporting Limit (MRL) and above the Method Detection Limit (MDL). The J
flag result is an estimated value and the user should be aware that this data is of limited reliability. MI Surrogate or Matrix Spike recovery is out of control limits due to matrix interference. Sample results may be biased. N See Case Narrative on page 2 of report. Q Closing continuing calibration verification (CCV) or laboratory control sample (LCS) exceeded high recovery limits,
but associated samples are non-detect and the sample results are not affected. Data meets EPA/NELAC requirements. R Relative percent difference (RPD) is outside of the accepted recovery limits. R1 Relative percent difference (RPD) is outside of the accepted recovery limits. However, analyses are not controlled on
RPD values for sample concentrations that are less than the reporting limit. R3 The relative percent difference (RPD) and/or percent recovery for the duplicate (DUP) or matrix spike (MS)/matrix
spike duplicate (MSD) cannot be accurately calculated due to the concentration of analyte already present in the sample.
R4 Duplicate analysis failed due to result being at or near method reporting limit. S Surrogate and/or matrix spike recovery is outside of the accepted recovery limits. Sample results may be biased. S1 Surrogate or matrix spike recovery is outside of control limits due to dilution necessary for analysis. SC Sub-contracted to another laboratory for analysis. T Toxicity Characteristic Leaching Procedure – Sample submitted contained < 0.5% solids. If the waste contains <0.5%
dry solids, the liquid portion of the waste, after filtration, is defined as the TCLP extract. # Value exceeds regulatory level for TCLP contaminant. X1 The motor oil elution pattern for the sample is not typical. X2 The sample appears to be a heavier hydrocarbon range than motor oil. X3 The sample appears to be a lighter hydrocarbon range than motor oil. * Value exceeds Maximum Contaminant Level or is outside the acceptable range.
Page 5 of 8

Project: SA 1410174
CLIENT: Specialty AnalyticalWork Order: 1411341
ANALYTICAL QC SUMMARY REPORTTestCode: ICPMS_200.8_DISS
17-Nov-14Date:Neilson Research Corporation
Sample ID: MB-31314
Batch ID: 31314 TestNo: EPA 200.8 Analysis Date: 11/12/2014
Prep Date: 11/12/2014
Analyte Result SPK value SPK Ref Val %REC RPD Ref Val %RPDLowLimit HighLimit RPDLimit Qual
Units: mg/L
MRL
Client ID: ZZZZZ
RunNo: 76895
SeqNo: 1144418
MBLKSampType: TestCode: ICPMS_200.8
(EPA 3005A)
Arsenic 0.000500NDCadmium 0.000100NDChromium 0.000400NDCopper 0.000500NDLead J0.0001000.00001060Silver 0.000100NDZinc 0.00100ND
Sample ID: LCS-31314
Batch ID: 31314 TestNo: EPA 200.8 Analysis Date: 11/12/2014
Prep Date: 11/12/2014
Analyte Result SPK value SPK Ref Val %REC RPD Ref Val %RPDLowLimit HighLimit RPDLimit Qual
Units: mg/L
MRL
Client ID: ZZZZZ
RunNo: 76895
SeqNo: 1144419
LCSSampType: TestCode: ICPMS_200.8
(EPA 3005A)
Arsenic 0.1 99.2 85 1150.000500 00.09915Cadmium 0.1 101 85 1150.000100 00.1013Chromium 0.1 104 85 1150.000400 00.1042Copper 0.1 102 85 1150.000500 00.1015Lead 0.1 99.2 85 1150.000100 0.00001060.09919Silver 0.1 97.5 85 1150.000100 00.09746Zinc 0.1 102 85 1150.00100 00.1024
Sample ID: LCSD-31314
Batch ID: 31314 TestNo: EPA 200.8 Analysis Date: 11/12/2014
Prep Date: 11/12/2014
Analyte Result SPK value SPK Ref Val %REC RPD Ref Val %RPDLowLimit HighLimit RPDLimit Qual
Units: mg/L
MRL
Client ID: ZZZZZ
RunNo: 76895
SeqNo: 1144420
LCSDSampType: TestCode: ICPMS_200.8
(EPA 3005A)
Arsenic 0.1 99.1 85 115 200.000500 0 0.09915 0.06050.09909Cadmium 0.1 102 85 115 200.000100 0 0.1013 0.1970.1015Chromium 0.1 104 85 115 200.000400 0 0.1042 0.3850.1038Copper 0.1 101 85 115 200.000500 0 0.1015 0.7910.1007Lead 0.1 98.9 85 115 200.000100 0.0000106 0.09919 0.2620.09893
Page 1 of 2
Qualifiers: E Value above quantitation range H Holding times for preparation or analysis exceeded J Analyte detected below quantitation limitsND Not Detected at the Minimum Reporting Limit R RPD outside accepted recovery limits S Spike Recovery outside accepted recovery limits
Page 6 of 8
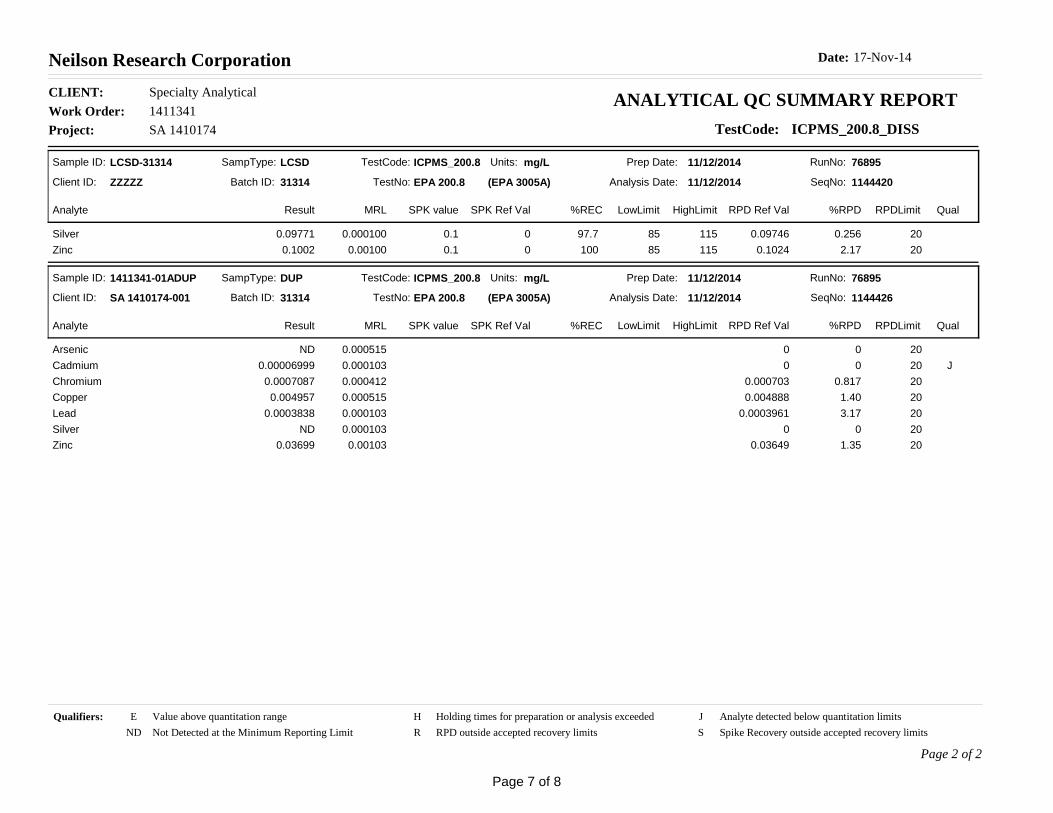
Project: SA 1410174
CLIENT: Specialty AnalyticalWork Order: 1411341
ANALYTICAL QC SUMMARY REPORTTestCode: ICPMS_200.8_DISS
17-Nov-14Date:Neilson Research Corporation
Sample ID: LCSD-31314
Batch ID: 31314 TestNo: EPA 200.8 Analysis Date: 11/12/2014
Prep Date: 11/12/2014
Analyte Result SPK value SPK Ref Val %REC RPD Ref Val %RPDLowLimit HighLimit RPDLimit Qual
Units: mg/L
MRL
Client ID: ZZZZZ
RunNo: 76895
SeqNo: 1144420
LCSDSampType: TestCode: ICPMS_200.8
(EPA 3005A)
Silver 0.1 97.7 85 115 200.000100 0 0.09746 0.2560.09771Zinc 0.1 100 85 115 200.00100 0 0.1024 2.170.1002
Sample ID: 1411341-01ADUP
Batch ID: 31314 TestNo: EPA 200.8 Analysis Date: 11/12/2014
Prep Date: 11/12/2014
Analyte Result SPK value SPK Ref Val %REC RPD Ref Val %RPDLowLimit HighLimit RPDLimit Qual
Units: mg/L
MRL
Client ID: SA 1410174-001
RunNo: 76895
SeqNo: 1144426
DUPSampType: TestCode: ICPMS_200.8
(EPA 3005A)
Arsenic 200.000515 0 0NDCadmium 20 J0.000103 0 00.00006999Chromium 200.000412 0.000703 0.8170.0007087Copper 200.000515 0.004888 1.400.004957Lead 200.000103 0.0003961 3.170.0003838Silver 200.000103 0 0NDZinc 200.00103 0.03649 1.350.03699
Page 2 of 2
Qualifiers: E Value above quantitation range H Holding times for preparation or analysis exceeded J Analyte detected below quantitation limitsND Not Detected at the Minimum Reporting Limit R RPD outside accepted recovery limits S Spike Recovery outside accepted recovery limits
Page 7 of 8
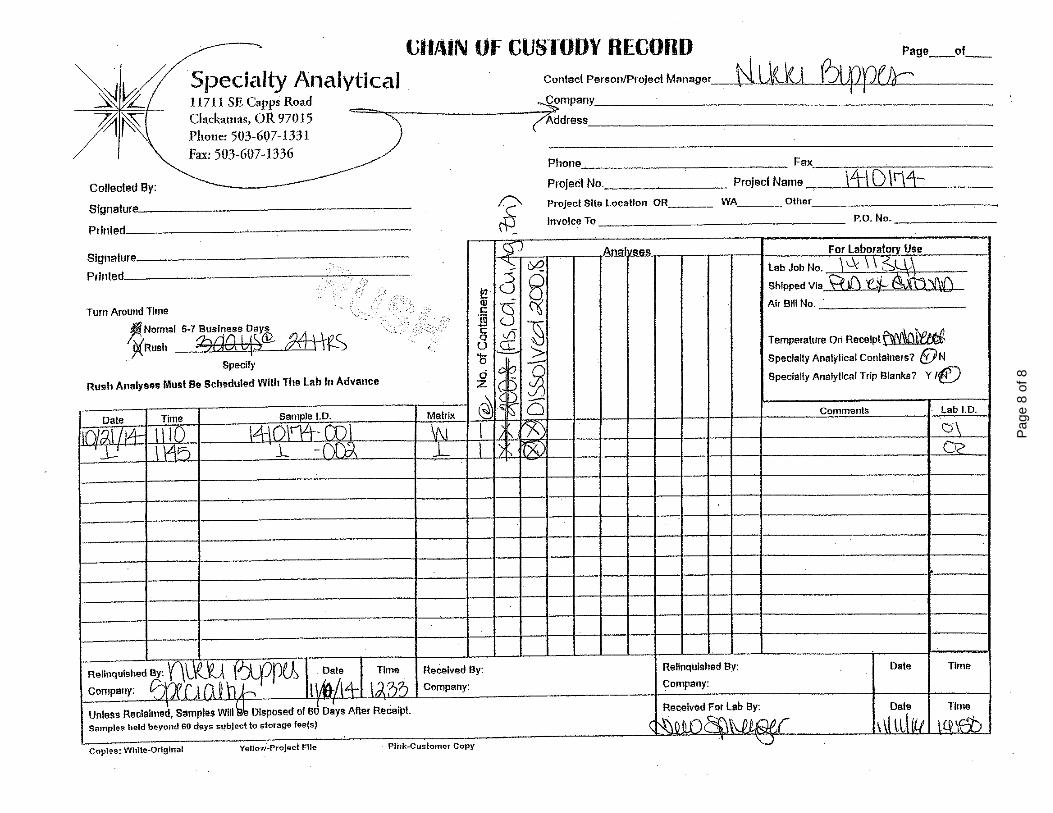
Pag
e 8
of 8

Jl F- Ana I yti cal Resou rces, I n co rpo rated
-/- Analvtical Chemists and ConsultantsIJ
24 November 2014
Nikki BippesSpecialty AnalyicalltTll SE Capps RoadClackamas, OR 97015
RE: Projects: 141017 4ll4l0l75lf 410089ARI Job No: ZK82
Dear Nikki:
Please find enclosed copies of the original chain of custody records and the final results forthe samples from the project referenced bbove. Analytical Resources, Inc. (ARI) originallyreceived these samples on October 17 and October 24, 2014. The samples were re-analyzed,for TBT as requested.
All samples were initially extracted on lllI9l14. The extract for sample 1410089-001 waslost before its extraction was complete. This sample was extracted a third time onIl/2ll14. The re-extraction proceeded without incident of note. The result for the lll2lll4extraction only has been submiued for this sample.
There were no fuither problems with these analyses.
A copy of these reports and all supporting data will remain on file with ARI. Please feelfree to contact me if you have any questions or require any additional information.
Respectfully,
ANALYTICAL RESOURCES. INC.I
\?,-t ,X'\ /1(r??WMaik D. Ha:ri$----Project Manager206/[email protected]
Enclosures
File ZK82
MDH/mdh
Page I of lg46'f 1 South 134th Place. Suite 100 r TukwilaWAg8l68 .2O6-695-6200 o 206-695-6201 fax

-,oCI
cn
=oa)otroe5ooa.o
'22otrcogrEE
€()FE
Tglla!o
|!.!a)oooaLau) a,
tD=to€5E;E*
5 ts
.)oG
C)
>@!oolrttoIotr43=E 39,
=cE;
pe-.Eit'83
aoIotr5IEooa-@!g
oo1E
oqrE
E4.9-30
EeF8F{'c)!a
c)
>s
R\
S+
=g- FE
Foota
ozod
lltltl|ltgtdiq*ll,F
otEIt)loIEIA
,oo,;)o
ooIIII_lIIIII
Eoto3)0o= g,3)ooA
o-c)oo-o-
oE'
t5o=t)oFLoooA(,oc0c)
I-FI-ta,-rJFIIrq--t)JJ,Lq-?IF-J
coq)oo6(,J&olrIo*q)ogFtDIo=?ott0
o(,6T'caaDE
F!t
€aoo3e!.t)
9a)o3ot-aoa>oco5g
!tll!lolglol('lqll\.
1
url.!F
IE
O0==
E)<
=F
IItIIIIIIItI
Jgd
E!o(:o0C)
iggg
]Euaq{-,aGF-brL,
tr0)nv)
9*.ltIf
PE
*" Se# : S
€a5ru#lffi -.1F

ARI Client: \40
COC i,lo(s):
Assigned ARI Job No:
tD Analytical Resources, Incorporated
a, Analytical Chemists and Consultants Cooler Receipt Form
Name: f4lo n<DeliverEd uy:@FupS Courier Hand Dellvered Other:-rreckins no, 7'7lb d894 147( ne
YES
@@*, ziot
@NO
NO
Were all botttes sealed in indivkluaf plastic bags? (G\ NO
Dd ail botfles anive in good condition (unbroken)? G', NoWere all botle labeb complete and legible? @ NO
Did the number of containers llsted on CoC match with the number of containers received? @ NoDid all bottte labels and tags agree with custody paper? llES '@
._.Were all botbE used conec{torlh€ requested analyses? (YED NO
Do any of the analyses (bottles) require preservation? (aftach preservation sheet, excluding VOCs)... @ YES NO
WereallVOo vialstree of airbubbles? @ YES NO
Was suftcient amount of sample s€nt in each bottle? .......... 1y?$ Nowas sutncreil amount or sampE 8€m an each botile? .......... ( yE$ NO,a \---lDate VOC Trip Blank was made at ARl... . ( rrAr
* Nottfy Pflect Uanager of dt*rqancies or concems n
Projecl
Prollmlnary Emmlnatlon Phate:
Were intad, prop€rly s(tned and dated custody seals attached to the outside of to cooler?
Were cBtody pap€c includ€d with the cooler?
Were custody papers ptoperly filled out (ink, signed, etc.) .............Temp€rstuG of Coole(s) ('C) (recommended 2.0$.0 'C for chemistry)Timc: _lf coohr temperature is out of complaance fil| oul fom 00070F
cooterAcceptedoy J y'h o.,"'
Log-ln Phase:
Was a temperature blank included in the cooler? YES
Whatkindofpad<ingmaterial wasused?... (BubbleWrair)fl*l{Gel Pad<siBaggiee FoamBlock Paper other:X-_-Z ---.-
{tY?$ffi \'--lv
Was Sample Spllt by ARI ' tG') YES Date/Time:- Eq.urpment- Sptit by:-
sampresLossedb$ - ..){\ "","' tUlZtJ 1t,J ,,^", I 173
Temp Gun lDf:
Samplo lD on Bottle samp|e lD on coc sample lD on BoHe Sample lD on GOC
l*1015-ror" l"t to /7 5-Dt4ton{-M7E t4bn>-oL
Addltqd Nolos, &scrqpaaclcs, C Resoludoas;
Bv: Dab:
rAlErlDdl*r ll Ht.s|..'-'&n ll arr-t
' .' ' li t^l-at-t
ElfiarltF Smell)t'sm'(<2mm)Pcabubblcc I -pb'( 2 to <4 mm )
Lrrgct"['(4to<6mm)Hcrdopacc)-hr'(>6mm)
0016F3r2no
EH.-#H : s-frS$ffr# *
Revision 014
Z"t-E&: #FG*;E*# i: r r- -ei, , *%.dSd"& f'6,t-.r
Cooler Receipt Form

aEotroe5t!oa.
,o
p-9e)cE
Ogro5e()FE
E(to=
=.>
5org
.!GC'
3'ooC
T, A
a, aD
:;TD
.BoE5
5_iggLl=
trooE
C)
;@.ltool!!.)':oa)oE
gF6*O
E!'ogo rts
E
fiEE?
g$EE
€3€.aooo=g=53
eo()l,EoEoooe!9org!o?aB
CaggEc)t
!+5EFoo
tc)
ozod
IIIII
gdflII
ooz,ttoEg.
IIIIIIIIcjz.C
)oPA
c,ooEE
xooL)
gooE
oor9I:u€t--at=
tLJ9lJeirF-;l:IOtoJEr3t)-)LI-2IaFtbJ
atoctoooIJ=orIog*o.ogIteoB'do0
o(tT!aaoFb!
DotE
l ttgt-
Ia3Do-ooO>-EotE
Ol
6tltlol.0lol6l61trlIDE
=E'
cr==
E>
(o
iggg
tu{-,rtF-i"(t.UonV,
I,EE= p{
i*E?o15o0ct
ffi${#S*: W
#ffi#*s

aL Analytical Resources, Incorporated
-4, Analytical Chemists and Consultants Gooler Receipt Form
ARI Cllcnt: \40
COC No(s):
Assigned ARI Job No:
Prullmlnary Enmln tlon Phae:
Wctc intad, propcdy slgned 8nd dated c$lody soels attachod to the outside of to cooler?
Wers custody papers Induded with tho cooler?
Were q.rgtody papec prcpedy lllled out (ink, eigned, €tc.) ........,....Temporetur€ ot Coob(s) ("C) (rscomtnsnded 2.0€.0 'C br chemistry)Time:_lf coolertgmpsrature F out of compllance
"lnKoooToF
,r1***,, l4(b fi4Deliwmd by,t6EFupS Couder Hand Delivercd oher:-rrackins no, 7-? lb O894 ..147(- xe
6c@No
t*rro"**. ffifmSZCoolerAcoepted by:
formsadatbch dl &,cumqrts
nWasatsmp€retureblankinduded inth€cooler? ..................,s.,''..i,.... YES (*!9|
wcre a[ botle8 seal€d in individual ptastic bags? .e No
Did all bottlec anive in good condition (unboken)? \try NO
were all botte labels complete and legible? @ No
Did the numbsrof contein€F listed on COC mdctr with the number of containers receiv€d? ................ @ NO
Dirl all bottte labeb and tra$ agree with custody papers? ................. YlS @wers all bottles used coned forthe requ,ested analyses? @ No
Do any of the analyses (bott€s) Bqulre pl€sawaton? (ettach pre€eilatlon sh€et, excluding VOCs),.. @ YES NO
Werc allVOC viab fise of air bubbles? @ YES No
Wassultlcieniamountof samplesent in each bottle? dO No-A V
Date VOC Trip Blank was made etARl,., '@Wessempl€sp|iibyAR|'1s)YEsDat€/Timo:-Equip'f€nt-Sp|itby:-
\-/t-
sampbsloggeoor, - .1i'h o "t, rclz4f t,/ rnnc' ll(6* Nofdfry Wod llanagcr ot il*rryhclg or concetns -
n^", f 100
*harkindorpad{ns"",";;;;;;;;:' 6ffi;ils';''*n* FoamBrock e"n", *"*l-I*\.\
Samole lD on gon|e Semple lD on coc samue ru on EoE|e ttample lD on COC
Li t6114-o|te i4!c tt4-re[- oll4 lo r-ztl- 6ozE t4 bt7.(42
A<onet ttotgs', rygcr€pettcteq & Resoludons.'
Bv: . lYn Dere: nlt'a ldFtrBrbtbr>4mm
oo-.&ttn
t.t],La ttxn
t. t.l
Smrll)"sn" (<2mm)Pcebubblcr I *pb" ( 2 to<tl mm )
Lrryc )'lg- ( 4 to<6 mm )
Herdrpacc)(hc" (>6mm)
0016F3t2110
HFq'#'E : ffi#ffiffiffi
Revision O14
Z."ij-* : Sr**ffi:3'ffi
Cooler Receipt Form

.sEotrgooJ|3oEI
E.o
';oE:Jotrc.!E
65eO
FE
To(,O
GccG
OE
398.a,
att
!i@=to=ECi-oYg
€tsloE()
@llo0a,L
=toEoEE
"$
E3
E3
E€
E=
8sorgE
gEE
-e€()g
>
--:AT
DEF
EF
E<
>
Td--
9E:.
BF
ggoc)c.o
d-odFoC'
Ec
ooIIIII
gIIII
Et
oEt6a)os(r,
6oEA
oEozC)
oEo-IIIIIIc;z.C
'ot
Eo.
L'0,CD
og6=ooE0-troIooC)
ocoo
I,I))Jar!:I-tD))h),_-(-I)0lT,*{J
CL
o(,oEootI:EAoEIoF!ri€I6oeI=aoCI
oo
oa,c61tsaa3=.>
!.E
Oole€vro
(,lDaoO=-aa!Fotr,3E
olGI
olilol3l!0lt-lr{)l
E*
s€
(f)tf|
gr-(.ir:rclr?N3ql'1 cog8=
xF
.F
r\g\od!iJIto(J
(!sane.(!Ov,N
-iiua-{-,-}(uF-l',.EU(uo.V
I
IEtot
;aItoao0o
Ets?*
1 L*h#**Fiil*
E *,"f* #,ffixiB
:#,
xoII
Hry{+
:ry r rywffi#5fii

tD Anatytical Resources, Incorporated
at Analytical Chemists and Consultants Gooler Receipt Form(1
nnre Ctl-CoCNo(s): t t
@Assigned ARf Job No: ?fr?t
Prcllmlnary Exarnlnation Phase:
Ir[fjJbB'* fc) (recommended 2 0'6'0 "crorchemistry)
lf cooler temperature is out of compliance fill out form 00070F
--- -Preiee'Name ' -/]4 \'UUQ---
Were intacl, properly sbned and dated custody seals attached to the outsHe of to cooler?
Were custody papers included with the coolef
Were custody papers properlyfilled out (tnk, signed, etc.) ,............
?.3
YES
(es>
@
coorerAcceprec oy: r4.,,/ o"t"' /:rl(1 /l t{ rime ICBSComptete custody fonns and at'€,ch att shiwtng documents
@NO
NO
Delivered Ov: qeO-pUeS Courier Hand Delivered Other.-rrackins no' ?1 t n)43Q 3a94 xn
-remp ^**'Wryryilfi
Log-ln Phase:
Was a temperature blank included in the cooler?
what kind of packing materialwas used? . {g@p wet lce @9!i Baggies Foam Block
Was suffcient ice used (if appropriate)? ...... ,,. ...... .
Were all bottles sealed in individual plastE bags?
Dd all bottlG arnve rn good condilion (unbroken)?
Were all bottb labels cornplete and legtble?
Did the number of containers hsted on COC match wrth the number of containers received? . .. ... . ....
Did all bottle labels and tags agree with custody papers?
Were all bottles used conect for the requested analyses?
Do any of the analyses (bottles) require preservation? (attach preservation sheet, excluding VOCs)...
Were all VOC vials free of arr bubbles?
Was sufficient amount of sample sent in each bottle?
Date VOC Trip Blank was made at ARl... .., ......
was sample Split by ARI , 8, YEs Dateffime:- Equrpment'
YES
Other:-YES
YES
(ts\-'.-:,(/Ec\5)'
HYES
YES
€e@ot
Papet
NA
@
@@NO
NO
NO
NO
NO
NO
NO
NO
Split by:
samples Lossed uv' A,/ on"' i}ln ft I -rine' /04O** Natify Prolect *lanager of dlscrepancies or concems n
Sample lD on Bofrle uamob tu on srJr, Sample lD on Bottle Sample lD on cOC
Addittonal lVotes, Dlscrepanci*, l3 Resolut ons.'
Bv' Date:
RGE*reubd€r
roaPa*ul*lrs' Small)*sm" (<2mm)
Pcabubbles ) 'pb" ( 2 1o < 4 mm )
Large)"lg"(4to<6mm)Hcedsprce)"hs" (>6mm)
0016F312,10
tr3'{#tr r ffi##ffi1F
Revision 014
;{Ff*:@ffi**$*ffi
Cooler Receipt Form
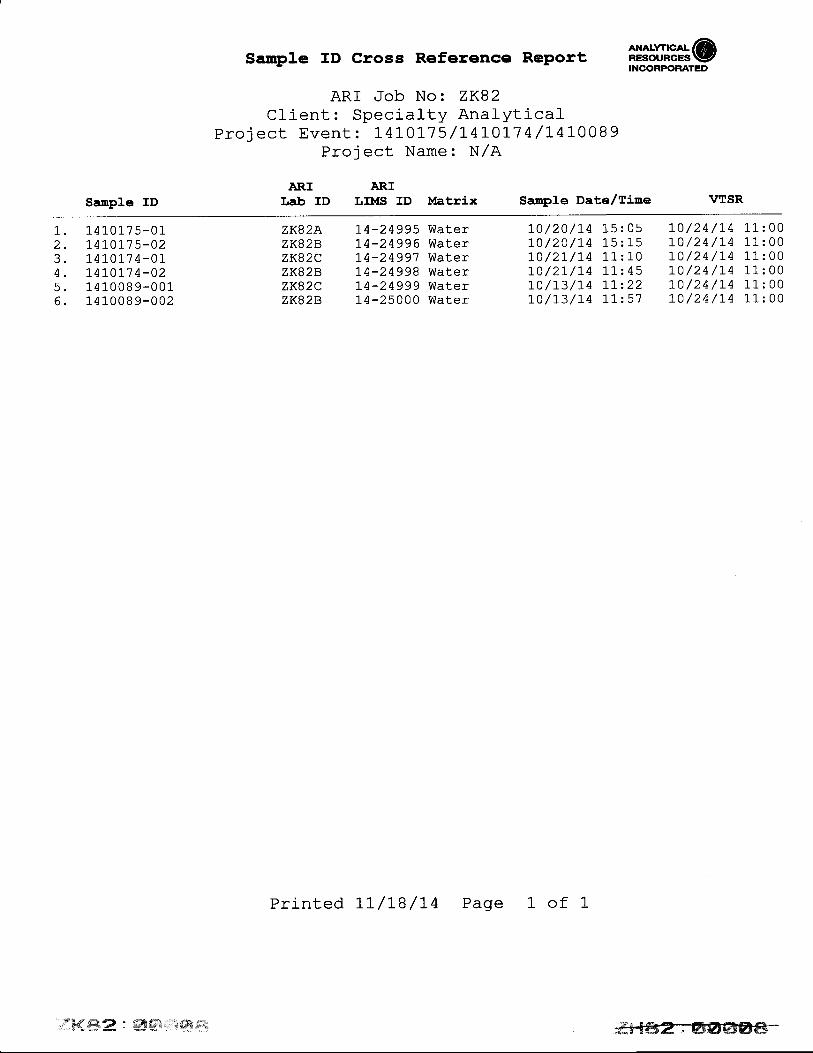
SampJ.e ID
sampre rD cross Reference Report iiiiqe+@INCORPORATED
ARI Job No: ZK82Cl-ient: Specialty Analytical
Pro j ect Event : 1,41017 5 /1-41017 4 /l'41008 9
Proiect Name: N/A
ARI ARILab ID LIMST ID t'tatrix Samp]-e Date,/Time VTSR
1. 1410175-012. r4r0l15-023. 14]0]7 4-0L4 . 1.41,017 4-025. 1410089-0016. 1410089-002
zK82A 1,4-24995 Water 10/20/I4 15:05 1'O/24/74 11:00ZK82B 14-24996 Water t0/20/L4 15:15 10/24/1'4 11:00zK82c 14-24997 Water 10/2L/74 11:10 I0/24/I4 11:00zK82B 1,4-24998 Water 10/2I/I4 l-l-:45 1'0/24/14 11:00zK82C t4-24999 Water 1'0/13/14 L1-:22 70/24/I4 11:00zK82B t4-25000 Water 1.0/13/L4 11:57 L0/24/14 1l-:00
HF4#E : ###trS3
Printed 7t/1,8/14 Page 1 of 1
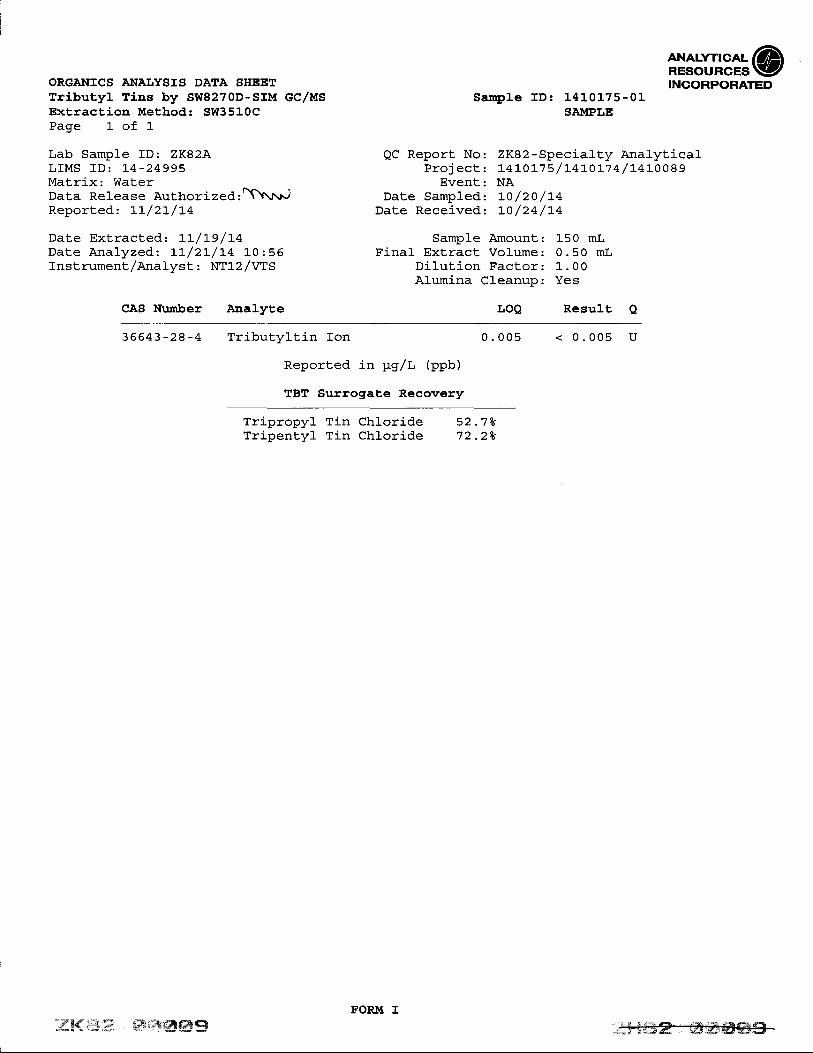
ORGAIVICS ANAIJYSIS DATA SHEETTributyl Tins by Sw8270D-SIM cclMsExtraction Method: SW3510CPage 1 of 1
Lab Sample ID: ZKa2ALIMS ID: L4-24995Matrix: WaterData Release Authorized:\\t:VReported: lL/21/t4
Dat.e Extracted: ll/19 /L4Date Analyzed: Ll/21,/L4 l-O:56Instrument/Anal-yst : NT12 /VTS
CAS Nurnber Analyte
ANALYTICALaiRESOURCES\7INCORPORATED
Sample ID: 1410175-01SAI{PLE
QC Report No: zK82-specialty Anal-yticalProj ect : l-41-0r-75 / 1,4LOL7 4 /l-410089
Event.: NADate Sampled: lO /20 /1-4
Date Received: lO/24/!4
Sample Amount: 150 mLFinal Extract. Volume: 0.50 mL
Dilution Factor: 1.00Afumina Cleanup: Yes
LOQ Result O
36643 *28 - 4 Tributyltin Ion U. UU5 < 0.005
Reported in pglr, (ppb)
TBT Suffogatse Recovery
Tripropyl Tin Chl-oride 52.72Tripentyl Tin Chloride 72.22
""f$sSeP: fe$&.#6frq;&FORM I
ffiF

AN,^rv?r.^^r la*=$l'#;;@ORGA}IICS AI{ALYSIS DATA SIIEET INCORPORATEDTributyl Tine by SW8270D-SIM GCIMS Sample ID: L4L0L75-02Extraction Method: SW3510C SAIfPLEPage L of 1-
Lab Sample ID: ZK82B QC Report No: ZK82-Specialty AnalyticalLrMS fD: t4-24995 Project: 14101-75 /1,41,01,74/ l-410089Matrix: Water \^ Event: NAData Release Authorized, \\rl Date Sampled: !0/20/1,4Reported: LL/2L/14 Date Received: 1,0/24/L4
Date Extracted: lL/1-9/L4 Sample Amount: 150 mLDate Analyzed:. LT/2L/I4 11:16 Final- Extract Volume: 0.50 mLTnstrument/Ana1yst: NT12/VTS Dilution Factor: l-.00
Al-umina Cleanup: Yes
CAS Number Arralyte LOQ Result O
36543-28-4 Tributyltin Ion 0.005 < 0.005 U
Reported in pglr, (ppb)
TBT Surogate Recovery
Tripropyl Tin Chloride 48.0?Tripentyl Tin Chloride 65.9t
?r4ds"€p : {frflftffiFF #tFORM I
ffi

ORGAIIICS AI{ALYSIS DATA SHEETTributyl Tins by SW8270D-SIM GCIMSExtraction Method: SW3510CPage 1 of l-
Lab Samp1e ID: ZK82CLIMS ID: L4-24997Matrix: WaterData Release Authorizedt\\WReported: 1,!/2L/L4
Date Extracted: 1,1,/L9/14Date Anafyzed: 11,/2L/a4 L]-t37Instrument/Analyst : NTI-2 /VTS
CAS Nurnber Analyte
ANALYnCAL(aRESOURCES \ZINCORPORATED
sample rD: 1410174-01SAI{PLE
QC Report No: ZK82-Specialty Anal-ytical-Projecr : 1410175 / r4L0L7 4 /l-410089
Event: NADate Sampled: lo/zt/t+
Date Received: lo /24/14
Sample Arnount: 150 mLFinal- Extract Volume: 0.50 mL
Dilution Factor: 1.00Al-umina Cleanurr: Yes
LOQ Result O
36643 -28 - 4 Tributyltin lon 0.005 < 0.005 u
Reported in pg/t (ppb)
TBT Surogate Recovery
TripropylTripentyl
Chloride 50.4?Ch]oride 72.2t
'1 an'L l_n

ixsbns*@INCORPORATEDORGAI{ICS AI{ALYSIS DATA SHEET
Tributyl Tins by SW8270D-SIM cClMSExtraction Method: SW3510CPage l- of L
Lab Sample ID: ZK82DLIMS ID: 1-4-24998Matrix: Water
iDaLa Release Authorized$\NJWReported t1/2L/La
Dat.e Extracted: 1,1- / 1,9 / 14Date Analyzed: LL/2L/L4 11:57Instrument/Analyst : NTI-2 /VTS
CAS Number Analyte
Sample ID: L LOL74-02SAI{PI.E
QC Report No:Proj ect:
Event:Date Sampled:
Date Received:
ZK82 -Specialty Analyticalt4tot7 s / t4!or7 4 / 1,410 0 I 9NAt0 /2!/t4L0/24/14
Sample Arnount: 150 mLFinal Extract VoLume: 0.50 mL
Diluti-on Factor: 1.00Alumina Cfeanup: Yes
LOQ Result O
35643 -28 -4 Tributyltin Ion 0.005
Reported in pg/L (ppb)
TBT Surrogate Recovery
< 0.005
TripropylTripentyl
Chloride 47.52Chloride 56.22
TinTin
trFf Se*P ' ffiSftffiq %F ,- r!!i r:, lll I r! !!! F ; I

Alsbffsrb@INCORPORATEDORGAIVICS AIVAI,YSIS DATA SHEET
Tributyl Tins by Sw8270D-SIM GCIMSExtraction Method: SW3510CPage l- of 1
Lab Samp1e ID: ZK82FLTMS ID:14-25000Matrix: WaterDat,a Release Authorized :'\nprReported: L1,/2L/L4
Date Extracted. 1,L/1,9/L4Date Analyzed: lL/2L/L4 12:I7Instrument/Analyst : NT12/VTS
CAS Nunber Arralyte
Sample ID: 1410089-002SAIVIPLE
QC Report No:Proj ect :
Event:Date Sampled:
Date Received:
ZK82 -Specialty AnalyticalaALOL1 5 / t4LOt7 4 / t4 r_0 08 9NAto/t3/1,4t0 /24 /1-4
Sample AmounL: 150 mLFinal Extract Volume: 0.50 mL
Di]ution FacLor: l- . 00Alumina Cleanup: Yes
LOQ Results
35643 -28-4 Tributvl-tin Ion 0.005 < 0.005 U
Reported in yg/L (ppb)
TBT Surrogate Recovery
Tripropyl TinTripentyl Tin
Chl-oride 55. 5?Chloride 78.2+
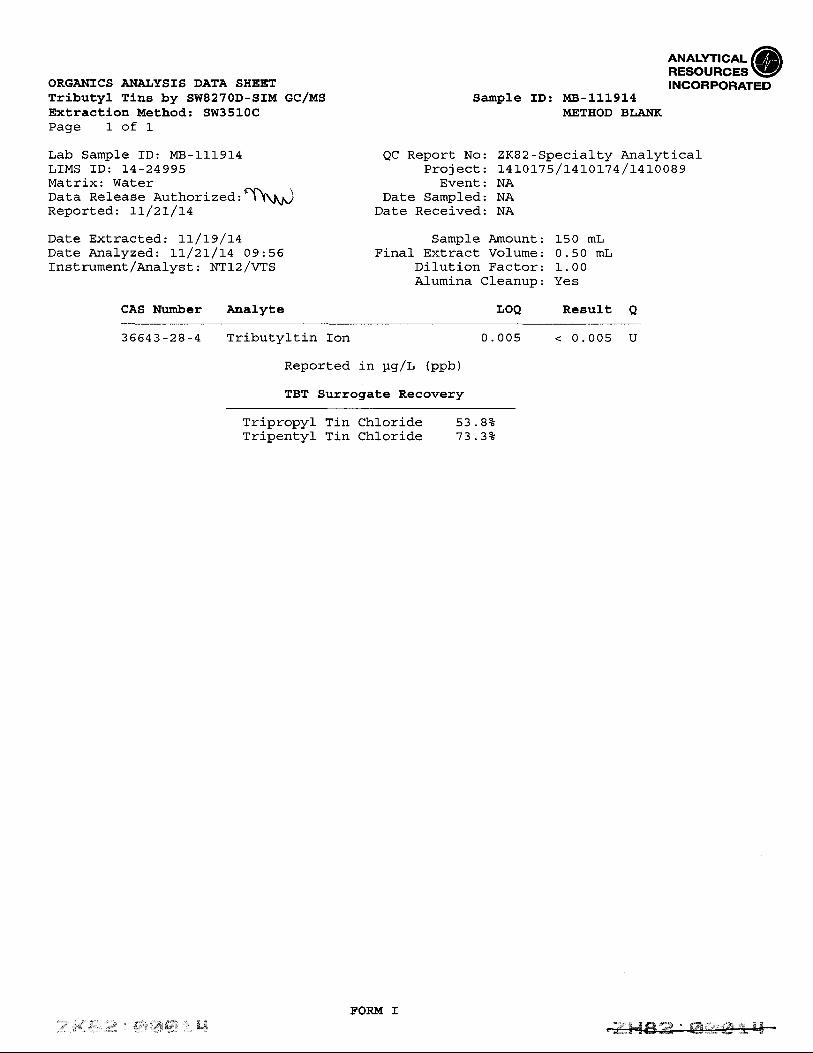
ORGAI{ICS AI{AI.YSIS DATA SHEETTributyl Tins by SW8270D-SIM GCIMSExtraction Method: SW3510CPage 1 of 1-
Lab Sample ID: MB-1L191-4LIMS ID:. 14-24995Matrix: WaterData Release Authorized.:^\jReported: LL/2L/1,4
Date Extracted : ll/19/1,4Date Analyzed: !!/21/14 09:56Instrument/.Anal-yst : NT12 /VTS
CAS Nurnber Arralyte
Sample ID: MB-111914METHOD BLA.I.IK
QC Report No: ZK82-Specialty AnalyticalProject : 141-0175 / L4tOt7 4 /1410089
Event: NADate Sampled: NA
Date Received: NA
Sample Arnount: 150 mLFinal Extract Volume: 0.50 mL
Dilution FacLor: l-.00Al-umina Cleanun: Yes
LOQ ReEult A
36643 -28 - 4 TribuLyltin Ion 0.005
Reported rn pg/t (ppb)
TBT Surrogate Recovery
Tripropyl Tin Chloride 53.8?Tripentyl Tin Chloride 73.3t
< 0.005
r9 & F9, F 4+'AiSgW&'t M ffi
ORGANICS ATiIALYSIS DATA SHEETTributyl Tine by SW8270D-SIM GCIMSPage l- of l-
Lab Sample ID: LCS-11191-4LIMS ID: L4-24995Matrix: Water
^\ IData Release Authorized:' 1\\JReport.ed: LL/21/14
Date Extracted LCS: !L/19/1,4
Date Analyzed LCS: ]-:-/Zt/t4 10:16r,csD: lL/2t/t4 10:36
InsLrument./.Analyst LCS : NTI-2/VTSLCSD: NT12/VTS
Analyte
ANALYTICAL II'ARESOUR;;;VINCORPORATED
Sample ID: LCS-111914I.AB CONTROL SAII'PLE
QC Report No: ZKB2-Specialty AnalyticalProject : 1410175 / LALOl',l 4 /141-0089
Date Sampled: NADate Received: NA
Sample Amount LCS: 150 mLLCSD: 150 mL
Final Extract Vol-ume LCS: 0.50 mLLCSD: 0.50 mL
Dilution Factor LCS: l-.00LCSD: 1.00
Alumina Cleanup: Yes
Sptke LCS spike LCSDLCS Added-LCS Recovery LCSD Added-LCSD Recovery RPD
Tributvltin lon 0.0s1 o.o74 68 .92
Reported in pgll (ppb)
RPD calculated using sampl-e concentrations per SW845.
TBT Surrogate Recovery
0.055 o.o74 7s.72 9.32
Tripropyl TinTripentyl Tin
ChlorideChloride
LCS LCSD52 .7t 60 .927L.5t 83.22

Arstilsrb@INCORPORATEDORGAI{ICS AI.IALYSIS DATA SHEET
Tributyl Tins by SW8270D-SIMExtraction Method: SW3510CPase 1 of 1
Lab Sample ID: ZK82ELIMS ID z 74-24999Matrix: WaterData Rel-ease Authorized:Reported: 7L / 24 / L4
Date Extracted z 1,1/ 2I / 1,4
Date Analyzedz 11,/22/14 L2:23Instrument/Analyst : NT12/VTS
CAS Nunber Anal-yte
,w
GClMS Sample ID: 1410089-001SAIVIPLE
A/- Pannrf NTn.
Proj ect :
Event:l-lrf a Qamnl od'
Date Received:
ZK82-Specialty Analyticalr 4L0r7 5 / 1 41,0L'7 4 / L 41,0 08 9NA70/13/14L0/24/14
Sample Amount: 150 mLFinal Extract Vol-ume: 0.50 mL
Di-lution Factor: 1.00Al-umina Cf eanup: Yes
LOQ Result A
36643-28-4 rrrluLJr 0.005 < 0.005
Ranarl-ad in rrnlT /nnl'r\!\EIrv! LEU rrl FrY / ! \Ilyy I
TBT Surrogate Recovery
L L Lt/L vuI L Chl-ori-deChloride
34.0%49 .02
f_+ " +*skFed s4j- F4 ;Fq i@ , (€-E ef$ Ai+E ' E g*e ffi-

ORGA}IICS AI{AI,YSIS DATA SHEETTributyl Tins by SW8270D-SIM cClMSExtraction Mettrod: SW3510CPage 1 of 1
Lab Sample f D: MB-71,27I4LIMS ID: I4-24ggg .n,Matrix: Water /nData Release Authorizedz y'"Reported: I1,/24/14
Date Extracted: lI/2I/14Date Analyzed: LL/22/14 1L:23Instrument/Analyst : NT12/VTS
CAS Nunber AnaLyte
ANALYTICA'@RESOURCES\ZINCORPORATED
SampJ-e ID: MB-112114METHOD BI,ANK
QC Report No: ZK82-Specialty Analytical-Prol ect : 14 10175 /I41,O1,7 4 /141,0089
Event: NAD:fc Semnlori . NA
Date Recei-ved: NA
SampJ-e Amount:Finaf Extract Volume:
Dil-ution Factor:Alumina Cleanup:
LOQ
1-50 mL0.50 mL1.00Yes
Result O
36643-28- 4 0.005 < 0. 005
Ranarl-arl in ttn/I /nnl-r\]\sl'v!Leu rrr FrYl! \yt/v,/
TBT Surrogate Recovery
'l'rl nr^h\r | 'l'r n
'l rl nant\, I I'r hChforideChl-oride
56.8%76.52
J:F{ !ffii.ff : #W# 5" T FORM I

ORGAr{ICS AI\IALYSIS DATA SHEETTributyJ- Tins by SDI8270D-SIM GCIMSPage 1 of 1
Lab Sample ID: LCS-1,I2IIALIMS ID:. 14-24999Matrix: WaterData Rel-ease Authorized:Renortecl:. 11 /24 /14
LCSD: IL/22/1,4 12t03lnstrument/Analyst LCS: NT12/VTS
LCSD: NT12/VTS
Ana]-yte
ANALYT|GA'(aRESOURCES \!ZINCORPORATED
Sample ID: LCS-112114LAB CONTROL SAI"IPLE
QC Report No: ZKB2-Specialty AnalyticalProj ect: 14 10175 /1-4L011 4 /I470O89
Date Sampled: NADate Received: NA
LCSD: 0.50 mLDi-lution Factor LCS: 1.00
LCSD: 1.00Afumina Cleanup: Yes
Spike LCS Spike LCSDLCS Added-LCS Recovery LCSD Added-LCSD Recovery RPD
Date Extracted LCS: LI/2I/14 a:mnl a amnrrn+ r /-$. 150 mLLCSD: 150 mL
Date Anal-yzed LCS:. 11 /22/14 1-1-:43 Final Extract Vofume LCS: 0.50 mL
Tril-rrr+,,r+i- ran 0.048 0.0.74 64.9% 0.045 0.0.1 4 60.89 6.59
Reported in p,g/L (ppb)
RPD cafcufated using sample concentrations per SW846.
TBT Surrogate Recovery
LCS LCSDn- j ^-^^..r mr ^ ^hloride 51,.42 50.'72rrflrrvvJ! rrrr vlTripentyl Tin Chloride 72.6eo 74.Oeo
tr&.fffi.:# : ffis*4ffi€ Sq
FORM III
'=ffi

Arssffsr!@INCORPORATED
TBT SI'RROGATE RECOVERY SI'MIIARY
Matrix: Water
/ TPRT'I :(TPNT) :
Client ID
A1- Pannrf Ir'Tn. 7.K9,2-Qnaa i r I f rr An: I rzf i ce I
Project : 14I0I7 5 /L4L01-7 4 / 1470089Event: NA
TPRT TPNT TOT OUT
MB-111914LCS-111914LCSD- 1I1.9I41410175-01L4L0L'7 5-021_4IOt1 4-0L7410]-7 4-02MB_TI2I1,4LCS-II2T1-4LCSD-1121141410089-0011410089-002
T-.i ^-^^.,1 nr 6 .hf Orider!fy!vy)/
Tri-'oentvl Tin Chloride
53.8? 13.3252.'le" 7r.5260. 9? 83.2252 .'7 e" '7 2 .2eo48.0? 65.9e"50.48 12.2241 .62 66.2256.8U 16.5251.42 72.6250.7? 7 4.0234.02 49.0%55.53 J8.2e"
000000000000
QC LIMITS(2r_L20)(22-1,20)
Prep Method: SW3510CAnalytical- Method: Low TBT (Hexyl) 8270D-SIM
Log Number Range: 14-24995 to 14-25000
9^na I f df / Kx /
--ks+A q4'-q " f*d%im d e%
FORM-II TBT
- r+!i-*'i-----4-.8-E++ry-j s*es vr{,futr {tdtu ' *J#-#A 6P

December 03, 2014
Bridgewater Group Inc.Anna St. John
Dear Anna St. John:
RE: TMP Stormwater
Order No.: 1410175
FAX (503) 675-1960TEL: (503) 675-5252
4500 SW Kruse WaySte 110Lake Oswego, OR 97035
Specialty Analytical11711 SE Capps Road, Ste B
Clackamas, Oregon 97015
Website: www.specialtyanalytical.comTEL: 503-607-1331 FAX: 503-607-1336
Specialty Analytical received 2 sample(s) on 10/22/2014 for the analyses presented in the following report.
Marty French
There were no problems with the analysis and all data for associated QC met EPA or laboratory specifications, except where noted in the Case Narrative, or as qualified with flags. Results apply only to the samples analyzed. Without approval of the laboratory, the reproduction of this report is only permitted in its entirety.
If you have any questions regarding these tests, please feel free to call.
Sincerely,
Lab Director

Project: TMP StormwaterCLIENT: Bridgewater Group Inc.
12/3/2014
Case Narrative1410175
Date:
WO#:
Specialty Analytical
Report Revision 1.
At the request of the client, chromium and lead were added to the original list of metals performed by the subcontracting lab by EPA Method 200.8.
Due to instrument issues, some or all of the metals on this report were sent to an outside lab. Any results from the subcontracted lab will be attached at the end of this report.
Project: TMP Stormwater
Client Sample ID: FAT-102014
Collection Date: 10/20/2014 3:05:00 AM
Matrix: WATER
CLIENT: Bridgewater Group Inc.
Lab ID: 1410175-001
03-Dec-14Specialty Analytical Date Reported:
Analyses Result Qual Unit Date AnalyzedDFMDL PQL
TOTAL MERCURY-AQUEOUS E245.2 Analyst: BW
Mercury 10/24/2014 8:59:42 AM0.0000160 mg/L 1ND 0.000100
DISSOLVED MERCURY-AQUEOUS E245.2 Analyst: BW
Mercury 10/24/2014 8:53:20 AM0.0000160 mg/L 1ND 0.000100
PAH BY EPA 625 E625 Analyst: bda
Acenaphthene J 10/27/2014 12:01:00 PM0.0019 µg/L 10.011 0.051
Acenaphthylene 10/27/2014 12:01:00 PM0.0055 µg/L 1ND 0.051
Anthracene 10/27/2014 12:01:00 PM0.0022 µg/L 1ND 0.051
Benz(a)anthracene J 10/27/2014 12:01:00 PM0.0025 µg/L 10.025 0.051
Benzo(a)pyrene J 10/27/2014 12:01:00 PM0.0017 µg/L 10.0037 0.051
Benzo(b)fluoranthene J 10/27/2014 12:01:00 PM0.0030 µg/L 10.017 0.051
Benzo(g,h,i)perylene J 10/27/2014 12:01:00 PM0.0015 µg/L 10.033 0.051
Benzo(k)fluoranthene J 10/27/2014 12:01:00 PM0.0015 µg/L 10.011 0.051
Chrysene J 10/27/2014 12:01:00 PM0.0021 µg/L 10.022 0.051
Dibenz(a,h)anthracene J 10/27/2014 12:01:00 PM0.0015 µg/L 10.0019 0.051
Fluoranthene J 10/27/2014 12:01:00 PM0.0031 µg/L 10.018 0.051
Fluorene J 10/27/2014 12:01:00 PM0.0022 µg/L 10.0043 0.051
Indeno(1,2,3-cd)pyrene 10/27/2014 12:01:00 PM0.0017 µg/L 1ND 0.051
Naphthalene J 10/27/2014 12:01:00 PM0.0069 µg/L 10.0088 0.051
Phenanthrene J 10/27/2014 12:01:00 PM0.0058 µg/L 10.035 0.051
Pyrene 10/27/2014 12:01:00 PM0.0029 µg/L 10.058 0.051
Surr: 2-Fluorobiphenyl 10/27/2014 12:01:00 PM%REC 158.9 18.6-106
Surr: 4-Terphenyl-d14 10/27/2014 12:01:00 PM%REC 167.3 39.6-131
Surr: Nitrobenzene-d5 10/27/2014 12:01:00 PM%REC 156.1 17-130
BASE/NEUTRALS/ACIDS E625 Analyst: bda
2,4,6-Trichlorophenol 10/27/2014 12:03:00 PM0.340 µg/L 1ND 1.07
2,4-Dichlorophenol 10/27/2014 12:03:00 PM0.311 µg/L 1ND 2.14
2,4-Dimethylphenol 10/27/2014 12:03:00 PM0.220 µg/L 1ND 1.07
2,4-Dinitrophenol 10/27/2014 12:03:00 PM0.237 µg/L 1ND 2.14
2-Chlorophenol 10/27/2014 12:03:00 PM0.186 µg/L 1ND 1.07
2-Methylphenol 10/27/2014 12:03:00 PM0.341 µg/L 1ND 2.14
2-Nitrophenol 10/27/2014 12:03:00 PM0.218 µg/L 1ND 1.07
3,4-Methylphenol 10/27/2014 12:03:00 PM0.346 µg/L 1ND 2.14
4-Bromophenyl phenyl ether 10/27/2014 12:03:00 PM0.208 µg/L 1ND 1.07
4-Chloro-3-methylphenol 10/27/2014 12:03:00 PM0.200 µg/L 1ND 1.07
Page 1 of 6

Project: TMP Stormwater
Client Sample ID: FAT-102014
Collection Date: 10/20/2014 3:05:00 AM
Matrix: WATER
CLIENT: Bridgewater Group Inc.
Lab ID: 1410175-001
03-Dec-14Specialty Analytical Date Reported:
Analyses Result Qual Unit Date AnalyzedDFMDL PQL
BASE/NEUTRALS/ACIDS E625 Analyst: bda
4-Nitrophenol 10/27/2014 12:03:00 PM1.07 µg/L 1ND 1.07
Bis(2-ethylhexyl)phthalate 10/27/2014 12:03:00 PM0.144 µg/L 13.56 1.07
Butyl benzyl phthalate 10/27/2014 12:03:00 PM0.168 µg/L 1ND 1.07
Diethyl phthalate 10/27/2014 12:03:00 PM0.128 µg/L 1ND 1.07
Dimethyl phthalate J 10/27/2014 12:03:00 PM0.116 µg/L 10.406 1.07
Di-n-butyl phthalate J 10/27/2014 12:03:00 PM0.112 µg/L 10.246 1.07
Di-n-octyl phthalate J 10/27/2014 12:03:00 PM0.0630 µg/L 10.203 1.07
Pentachlorophenol 10/27/2014 12:03:00 PM0.202 µg/L 1ND 2.14
Phenol 10/27/2014 12:03:00 PM0.207 µg/L 19.65 1.07
Surr: 2,4,6-Tribromophenol S 10/27/2014 12:03:00 PM%REC 1113 33.1-99.7
Surr: 2-Fluorobiphenyl 10/27/2014 12:03:00 PM%REC 194.2 33.1-96.2
Surr: 2-Fluorophenol 10/27/2014 12:03:00 PM%REC 146.7 13.4-57.1
Surr: 4-Terphenyl-d14 10/27/2014 12:03:00 PM%REC 1106 41-122
Surr: Nitrobenzene-d5 10/27/2014 12:03:00 PM%REC 184.1 28.9-99.9
Surr: Phenol-d5 10/27/2014 12:03:00 PM%REC 119.4 10.6-38.5
ORGANOCHLORINE PEST/PCB E608 Analyst: JRC
Aroclor 1016 10/28/2014 8:32:00 AM0.00396 µg/L 1ND 0.0101
Aroclor 1221 10/28/2014 8:32:00 AM0.00396 µg/L 1ND 0.0101
Aroclor 1232 10/28/2014 8:32:00 AM0.00396 µg/L 1ND 0.0101
Aroclor 1242 10/28/2014 8:32:00 AM0.00396 µg/L 1ND 0.0101
Aroclor 1248 10/28/2014 8:32:00 AM0.00396 µg/L 1ND 0.0101
Aroclor 1254 10/28/2014 8:32:00 AM0.00396 µg/L 1ND 0.0101
Aroclor 1260 10/28/2014 8:32:00 AM0.00396 µg/L 1ND 0.0101
Dieldrin 10/28/2014 8:32:00 AM0.00211 µg/L 1ND 0.00507
Surr: Decachlorobiphenyl 10/28/2014 8:32:00 AM%REC 1106 18.9-133
Surr: TCMX 10/28/2014 8:32:00 AM%REC 128.2 20.8-90.1
SUB CONTRACTING SUB_CONTRACTING Analyst: sub
Total Metals 11/6/2014 11:15:00 AM0 1See attached rpt 0
SUB CONTRACTING SUB_CONTRACTING Analyst: sub
Dissolved Metals 11/12/20140 1See attached rpt 0
SUB CONTRACTING SUB_CONTRACTING Analyst: sub
Tributyltin 10/30/2014 3:58:00 PM0 1See attached rpt 0
Page 2 of 6

Project: TMP Stormwater
Client Sample ID: FAT-102014
Collection Date: 10/20/2014 3:05:00 AM
Matrix: WATER
CLIENT: Bridgewater Group Inc.
Lab ID: 1410175-001
03-Dec-14Specialty Analytical Date Reported:
Analyses Result Qual Unit Date AnalyzedDFMDL PQL
TOTAL SUSPENDED SOLIDS M2540 D Analyst: BW
Total Suspended Solids 10/27/2014 9:53:19 AM1.10 mg/L 119.0 5.00
Page 3 of 6

Project: TMP Stormwater
Client Sample ID: ENS-102014
Collection Date: 10/20/2014 3:15:00 AM
Matrix: WATER
CLIENT: Bridgewater Group Inc.
Lab ID: 1410175-002
03-Dec-14Specialty Analytical Date Reported:
Analyses Result Qual Unit Date AnalyzedDFMDL PQL
TOTAL MERCURY-AQUEOUS E245.2 Analyst: BW
Mercury 10/24/2014 9:01:42 AM0.0000160 mg/L 1ND 0.000100
DISSOLVED MERCURY-AQUEOUS E245.2 Analyst: BW
Mercury 10/24/2014 8:55:20 AM0.0000160 mg/L 1ND 0.000100
PAH BY EPA 625 E625 Analyst: bda
Acenaphthene J 10/27/2014 12:26:00 PM0.0018 µg/L 10.0042 0.047
Acenaphthylene 10/27/2014 12:26:00 PM0.0050 µg/L 1ND 0.047
Anthracene J 10/27/2014 12:26:00 PM0.0021 µg/L 10.0031 0.047
Benz(a)anthracene J 10/27/2014 12:26:00 PM0.0023 µg/L 10.020 0.047
Benzo(a)pyrene J 10/27/2014 12:26:00 PM0.0016 µg/L 10.0042 0.047
Benzo(b)fluoranthene J 10/27/2014 12:26:00 PM0.0028 µg/L 10.0053 0.047
Benzo(g,h,i)perylene J 10/27/2014 12:26:00 PM0.0014 µg/L 10.010 0.047
Benzo(k)fluoranthene 10/27/2014 12:26:00 PM0.0014 µg/L 1ND 0.047
Chrysene J 10/27/2014 12:26:00 PM0.0019 µg/L 10.0054 0.047
Dibenz(a,h)anthracene J 10/27/2014 12:26:00 PM0.0014 µg/L 10.0050 0.047
Fluoranthene 10/27/2014 12:26:00 PM0.0028 µg/L 1ND 0.047
Fluorene 10/27/2014 12:26:00 PM0.0020 µg/L 1ND 0.047
Indeno(1,2,3-cd)pyrene J 10/27/2014 12:26:00 PM0.0016 µg/L 10.0042 0.047
Naphthalene 10/27/2014 12:26:00 PM0.0063 µg/L 1ND 0.047
Phenanthrene J 10/27/2014 12:26:00 PM0.0053 µg/L 10.0085 0.047
Pyrene J 10/27/2014 12:26:00 PM0.0027 µg/L 10.0090 0.047
Surr: 2-Fluorobiphenyl 10/27/2014 12:26:00 PM%REC 150.7 18.6-106
Surr: 4-Terphenyl-d14 10/27/2014 12:26:00 PM%REC 166.6 39.6-131
Surr: Nitrobenzene-d5 10/27/2014 12:26:00 PM%REC 154.0 17-130
BASE/NEUTRALS/ACIDS E625 Analyst: bda
2,4,6-Trichlorophenol 10/27/2014 12:32:00 PM0.314 µg/L 1ND 0.987
2,4-Dichlorophenol 10/27/2014 12:32:00 PM0.287 µg/L 1ND 1.97
2,4-Dimethylphenol 10/27/2014 12:32:00 PM0.203 µg/L 1ND 0.987
2,4-Dinitrophenol 10/27/2014 12:32:00 PM0.219 µg/L 1ND 1.97
2-Chlorophenol 10/27/2014 12:32:00 PM0.172 µg/L 1ND 0.987
2-Methylphenol 10/27/2014 12:32:00 PM0.315 µg/L 1ND 1.97
2-Nitrophenol 10/27/2014 12:32:00 PM0.201 µg/L 1ND 0.987
3,4-Methylphenol 10/27/2014 12:32:00 PM0.320 µg/L 1ND 1.97
4-Bromophenyl phenyl ether 10/27/2014 12:32:00 PM0.192 µg/L 1ND 0.987
4-Chloro-3-methylphenol 10/27/2014 12:32:00 PM0.185 µg/L 1ND 0.987
Page 4 of 6
Project: TMP Stormwater
Client Sample ID: ENS-102014
Collection Date: 10/20/2014 3:15:00 AM
Matrix: WATER
CLIENT: Bridgewater Group Inc.
Lab ID: 1410175-002
03-Dec-14Specialty Analytical Date Reported:
Analyses Result Qual Unit Date AnalyzedDFMDL PQL
BASE/NEUTRALS/ACIDS E625 Analyst: bda
4-Nitrophenol 10/27/2014 12:32:00 PM0.990 µg/L 1ND 0.987
Bis(2-ethylhexyl)phthalate J 10/27/2014 12:32:00 PM0.133 µg/L 10.405 0.987
Butyl benzyl phthalate 10/27/2014 12:32:00 PM0.155 µg/L 1ND 0.987
Diethyl phthalate 10/27/2014 12:32:00 PM0.118 µg/L 1ND 0.987
Dimethyl phthalate J 10/27/2014 12:32:00 PM0.108 µg/L 10.642 0.987
Di-n-butyl phthalate J 10/27/2014 12:32:00 PM0.104 µg/L 10.188 0.987
Di-n-octyl phthalate 10/27/2014 12:32:00 PM0.0582 µg/L 1ND 0.987
Pentachlorophenol J 10/27/2014 12:32:00 PM0.187 µg/L 10.197 1.97
Phenol 10/27/2014 12:32:00 PM0.192 µg/L 1ND 0.987
Surr: 2,4,6-Tribromophenol 10/27/2014 12:32:00 PM%REC 191.1 33.1-99.7
Surr: 2-Fluorobiphenyl S 10/27/2014 12:32:00 PM%REC 199.1 33.1-96.2
Surr: 2-Fluorophenol 10/27/2014 12:32:00 PM%REC 146.5 13.4-57.1
Surr: 4-Terphenyl-d14 10/27/2014 12:32:00 PM%REC 199.6 41-122
Surr: Nitrobenzene-d5 10/27/2014 12:32:00 PM%REC 179.9 28.9-99.9
Surr: Phenol-d5 10/27/2014 12:32:00 PM%REC 118.0 10.6-38.5
ORGANOCHLORINE PEST/PCB E608 Analyst: JRC
Aroclor 1016 10/28/2014 9:01:00 AM0.00372 µg/L 1ND 0.00953
Aroclor 1221 10/28/2014 9:01:00 AM0.00372 µg/L 1ND 0.00953
Aroclor 1232 10/28/2014 9:01:00 AM0.00372 µg/L 1ND 0.00953
Aroclor 1242 10/28/2014 9:01:00 AM0.00372 µg/L 1ND 0.00953
Aroclor 1248 10/28/2014 9:01:00 AM0.00372 µg/L 1ND 0.00953
Aroclor 1254 10/28/2014 9:01:00 AM0.00372 µg/L 1ND 0.00953
Aroclor 1260 10/28/2014 9:01:00 AM0.00372 µg/L 1ND 0.00953
Dieldrin 10/28/2014 9:01:00 AM0.00198 µg/L 1ND 0.00477
Surr: Decachlorobiphenyl 10/28/2014 9:01:00 AM%REC 1109 18.9-133
Surr: TCMX S 10/28/2014 9:01:00 AM%REC 115.5 20.8-90.1
SUB CONTRACTING SUB_CONTRACTING Analyst: sub
Total Metals 11/6/2014 11:35:00 AM0 1See attached rpt 0
SUB CONTRACTING SUB_CONTRACTING Analyst: sub
Dissolved Metals 11/12/20140 1See attached rpt 0
SUB CONTRACTING SUB_CONTRACTING Analyst: sub
Tributyltin 10/30/2014 4:11:00 PM0 1See attached rpt 0
Page 5 of 6

Project: TMP Stormwater
Client Sample ID: ENS-102014
Collection Date: 10/20/2014 3:15:00 AM
Matrix: WATER
CLIENT: Bridgewater Group Inc.
Lab ID: 1410175-002
03-Dec-14Specialty Analytical Date Reported:
Analyses Result Qual Unit Date AnalyzedDFMDL PQL
TOTAL SUSPENDED SOLIDS M2540 D Analyst: BW
Total Suspended Solids 10/27/2014 9:55:19 AM1.10 mg/L 15.00 5.00
Page 6 of 6

Project: TMP StormwaterClient: Bridgewater Group Inc.
TestCode: 608_W
03-Dec-14
QC SUMMARY REPORT1410175WO#:
Specialty Analytical
Sample ID: CCV@100
Batch ID: 8405 TestNo: E608 Analysis Date: 10/28/2014
Prep Date:
Analyte Result SPK value SPK Ref Val %REC RPD Ref Val %RPDLowLimit HighLimit RPDLimit Qual
Units: µg/L
PQL
Client ID: CCV
RunNo: 17497
SeqNo: 228962
CCVSampType: TestCode: 608_W
E608
Dieldrin 0.2000 97.7 85 1150.00500 00.195
Sample ID: MB-8405
Batch ID: 8405 TestNo: E608 Analysis Date: 10/28/2014
Prep Date: 10/24/2014
Analyte Result SPK value SPK Ref Val %REC RPD Ref Val %RPDLowLimit HighLimit RPDLimit Qual
Units: µg/L
PQL
Client ID: PBW
RunNo: 17497
SeqNo: 228963
MBLKSampType: TestCode: 608_W
E608
Aroclor 1016 0.0100ND
Aroclor 1221 0.0100ND
Aroclor 1232 0.0100ND
Aroclor 1242 0.0100ND
Aroclor 1248 0.0100ND
Aroclor 1254 0.0100ND
Aroclor 1260 0.0100ND
Dieldrin 0.00500ND
Surr: Decachlorobiphenyl 0.2000 93.9 18.9 1330.188
Surr: TCMX 0.2000 86.2 20.8 90.10.172
Sample ID: LCS-8405
Batch ID: 8405 TestNo: E608 Analysis Date: 10/28/2014
Prep Date: 10/24/2014
Analyte Result SPK value SPK Ref Val %REC RPD Ref Val %RPDLowLimit HighLimit RPDLimit Qual
Units: µg/L
PQL
Client ID: LCSW
RunNo: 17497
SeqNo: 228964
LCSSampType: TestCode: 608_W
E608
Dieldrin 0.2000 105 36 1460.00500 00.210
Qualifiers: Page 1 of 21B Analyte detected in the associated Method Blank H Holding times for preparation or analysis exceeded ND Not Detected at the Reporting LimitO RSD is greater than RSDlimit R RPD outside accepted recovery limits S Spike Recovery outside accepted recovery limits
Project: TMP StormwaterClient: Bridgewater Group Inc.
TestCode: 608_W
03-Dec-14
QC SUMMARY REPORT1410175WO#:
Specialty Analytical
Sample ID: LCSD-8405
Batch ID: 8405 TestNo: E608 Analysis Date: 10/28/2014
Prep Date: 10/24/2014
Analyte Result SPK value SPK Ref Val %REC RPD Ref Val %RPDLowLimit HighLimit RPDLimit Qual
Units: µg/L
PQL
Client ID: LCSS02
RunNo: 17497
SeqNo: 228965
LCSDSampType: TestCode: 608_W
E608
Dieldrin 0.2000 118 36 146 200.00500 0 0.2095 11.80.236
Sample ID: 1410174-001AMS
Batch ID: 8405 TestNo: E608 Analysis Date: 10/28/2014
Prep Date: 10/24/2014
Analyte Result SPK value SPK Ref Val %REC RPD Ref Val %RPDLowLimit HighLimit RPDLimit Qual
Units: µg/L
PQL
Client ID: ZZZZZZ
RunNo: 17497
SeqNo: 228967
MSSampType: TestCode: 608_W
E608
Dieldrin 0.2000 103 36 1460.00481 00.207
Sample ID: 1410174-002AMS
Batch ID: 8405 TestNo: E608 Analysis Date: 10/28/2014
Prep Date: 10/24/2014
Analyte Result SPK value SPK Ref Val %REC RPD Ref Val %RPDLowLimit HighLimit RPDLimit Qual
Units: µg/L
PQL
Client ID: ZZZZZZ
RunNo: 17497
SeqNo: 228969
MSSampType: TestCode: 608_W
E608
Dieldrin 0.2000 96.1 36 1460.00474 00.192
Sample ID: 1410175-001AMS
Batch ID: 8405 TestNo: E608 Analysis Date: 10/28/2014
Prep Date: 10/24/2014
Analyte Result SPK value SPK Ref Val %REC RPD Ref Val %RPDLowLimit HighLimit RPDLimit Qual
Units: µg/L
PQL
Client ID: FAT-102014
RunNo: 17497
SeqNo: 228971
MSSampType: TestCode: 608_W
E608
Dieldrin 0.2000 101 36 1460.00547 00.202
Qualifiers: Page 2 of 21B Analyte detected in the associated Method Blank H Holding times for preparation or analysis exceeded ND Not Detected at the Reporting LimitO RSD is greater than RSDlimit R RPD outside accepted recovery limits S Spike Recovery outside accepted recovery limits
Project: TMP StormwaterClient: Bridgewater Group Inc.
TestCode: 608_W
03-Dec-14
QC SUMMARY REPORT1410175WO#:
Specialty Analytical
Sample ID: CCV@100
Batch ID: 8405 TestNo: E608 Analysis Date: 10/28/2014
Prep Date:
Analyte Result SPK value SPK Ref Val %REC RPD Ref Val %RPDLowLimit HighLimit RPDLimit Qual
Units: µg/L
PQL
Client ID: CCV
RunNo: 17497
SeqNo: 228973
CCVSampType: TestCode: 608_W
E608
Dieldrin 0.2000 128 85 115 SC0.00500 00.257
Qualifiers: Page 3 of 21B Analyte detected in the associated Method Blank H Holding times for preparation or analysis exceeded ND Not Detected at the Reporting LimitO RSD is greater than RSDlimit R RPD outside accepted recovery limits S Spike Recovery outside accepted recovery limits

Project: TMP StormwaterClient: Bridgewater Group Inc.
TestCode: 625_PAH
03-Dec-14
QC SUMMARY REPORT1410175WO#:
Specialty Analytical
Sample ID: CCV-8406
Batch ID: 8406 TestNo: E625 Analysis Date: 10/27/2014
Prep Date:
Analyte Result SPK value SPK Ref Val %REC RPD Ref Val %RPDLowLimit HighLimit RPDLimit Qual
Units: µg/L
PQL
Client ID: CCV
RunNo: 17480
SeqNo: 228781
CCVSampType: TestCode: 625_PAH
E625-A
Acenaphthene 2.000 85.8 80 1200.050 01.7
Acenaphthylene 2.000 87.7 80 1200.050 01.8
Anthracene 2.000 84.1 80 1200.050 01.7
Benz(a)anthracene 2.000 86.5 80 1200.050 01.7
Benzo(a)pyrene 2.000 93.7 80 1200.050 01.9
Benzo(b)fluoranthene 2.000 91.5 80 1200.050 01.8
Benzo(g,h,i)perylene 2.000 87.1 80 1200.050 01.7
Benzo(k)fluoranthene 2.000 88.0 80 1200.050 01.8
Chrysene 2.000 85.1 80 1200.050 01.7
Dibenz(a,h)anthracene 2.000 90.5 80 1200.050 01.8
Fluoranthene 2.000 86.8 80 1200.050 01.7
Fluorene 2.000 87.9 80 1200.050 01.8
Indeno(1,2,3-cd)pyrene 2.000 90.2 80 1200.050 01.8
Naphthalene 2.000 85.6 80 1200.050 01.7
Phenanthrene 2.000 85.8 80 1200.050 01.7
Pyrene 2.000 86.7 80 1200.050 01.7
Sample ID: LCS-8406
Batch ID: 8406 TestNo: E625 Analysis Date: 10/27/2014
Prep Date: 10/24/2014
Analyte Result SPK value SPK Ref Val %REC RPD Ref Val %RPDLowLimit HighLimit RPDLimit Qual
Units: µg/L
PQL
Client ID: LCSW
RunNo: 17480
SeqNo: 228782
LCSSampType: TestCode: 625_PAH
E625-A
Acenaphthene 5.000 77.0 35.1 1000.050 03.9
Acenaphthylene 5.000 82.6 29 89.10.050 04.1
Anthracene 5.000 75.1 42 97.40.050 03.8
Qualifiers: Page 4 of 21B Analyte detected in the associated Method Blank H Holding times for preparation or analysis exceeded ND Not Detected at the Reporting LimitO RSD is greater than RSDlimit R RPD outside accepted recovery limits S Spike Recovery outside accepted recovery limits
Project: TMP StormwaterClient: Bridgewater Group Inc.
TestCode: 625_PAH
03-Dec-14
QC SUMMARY REPORT1410175WO#:
Specialty Analytical
Sample ID: LCS-8406
Batch ID: 8406 TestNo: E625 Analysis Date: 10/27/2014
Prep Date: 10/24/2014
Analyte Result SPK value SPK Ref Val %REC RPD Ref Val %RPDLowLimit HighLimit RPDLimit Qual
Units: µg/L
PQL
Client ID: LCSW
RunNo: 17480
SeqNo: 228782
LCSSampType: TestCode: 625_PAH
E625-A
Benz(a)anthracene 5.000 80.1 34.2 95.80.050 04.0
Benzo(a)pyrene 5.000 84.0 23.4 1030.050 04.2
Benzo(b)fluoranthene 5.000 84.8 36.6 99.50.050 04.2
Benzo(g,h,i)perylene 5.000 81.5 20.8 1200.050 04.1
Benzo(k)fluoranthene 5.000 74.3 39.7 93.40.050 03.7
Chrysene 5.000 72.8 39.1 1190.050 03.6
Dibenz(a,h)anthracene 5.000 85.0 5.05 890.050 04.3
Fluoranthene 5.000 80.6 42.4 95.90.050 04.0
Fluorene 5.000 81.3 37.4 88.40.050 04.1
Indeno(1,2,3-cd)pyrene 5.000 83.8 10.5 98.40.050 04.2
Naphthalene 5.000 69.4 25.6 1060.050 03.5
Phenanthrene 5.000 78.3 38.1 1060.050 03.9
Pyrene 5.000 80.9 41.3 1180.050 04.0
Sample ID: LCSD-8406
Batch ID: 8406 TestNo: E625 Analysis Date: 10/27/2014
Prep Date: 10/24/2014
Analyte Result SPK value SPK Ref Val %REC RPD Ref Val %RPDLowLimit HighLimit RPDLimit Qual
Units: µg/L
PQL
Client ID: LCSS02
RunNo: 17480
SeqNo: 228783
LCSDSampType: TestCode: 625_PAH
E625-A
Acenaphthene 5.000 70.6 35.1 100 200.050 0 3.852 8.723.5
Acenaphthylene 5.000 75.8 29 89.1 200.050 0 4.130 8.613.8
Anthracene 5.000 70.3 42 97.4 200.050 0 3.755 6.603.5
Benz(a)anthracene 5.000 73.5 34.2 95.8 200.050 0 4.006 8.643.7
Benzo(a)pyrene 5.000 76.7 23.4 103 200.050 0 4.201 9.103.8
Benzo(b)fluoranthene 5.000 76.1 36.6 99.5 200.050 0 4.241 10.93.8
Qualifiers: Page 5 of 21B Analyte detected in the associated Method Blank H Holding times for preparation or analysis exceeded ND Not Detected at the Reporting LimitO RSD is greater than RSDlimit R RPD outside accepted recovery limits S Spike Recovery outside accepted recovery limits
Project: TMP StormwaterClient: Bridgewater Group Inc.
TestCode: 625_PAH
03-Dec-14
QC SUMMARY REPORT1410175WO#:
Specialty Analytical
Sample ID: LCSD-8406
Batch ID: 8406 TestNo: E625 Analysis Date: 10/27/2014
Prep Date: 10/24/2014
Analyte Result SPK value SPK Ref Val %REC RPD Ref Val %RPDLowLimit HighLimit RPDLimit Qual
Units: µg/L
PQL
Client ID: LCSS02
RunNo: 17480
SeqNo: 228783
LCSDSampType: TestCode: 625_PAH
E625-A
Benzo(g,h,i)perylene 5.000 74.9 20.8 120 200.050 0 4.077 8.523.7
Benzo(k)fluoranthene 5.000 68.8 39.7 93.4 200.050 0 3.714 7.593.4
Chrysene 5.000 66.7 39.1 119 200.050 0 3.641 8.823.3
Dibenz(a,h)anthracene 5.000 78.2 5.05 89 200.050 0 4.251 8.323.9
Fluoranthene 5.000 75.1 42.4 95.9 200.050 0 4.029 7.103.8
Fluorene 5.000 74.5 37.4 88.4 200.050 0 4.063 8.673.7
Indeno(1,2,3-cd)pyrene 5.000 77.0 10.5 98.4 200.050 0 4.191 8.433.9
Naphthalene 5.000 64.0 25.6 106 200.050 0 3.471 8.133.2
Phenanthrene 5.000 72.2 38.1 106 200.050 0 3.917 8.093.6
Pyrene 5.000 74.2 41.3 118 200.050 0 4.043 8.623.7
Sample ID: MB-8406
Batch ID: 8406 TestNo: E625 Analysis Date: 10/27/2014
Prep Date: 10/24/2014
Analyte Result SPK value SPK Ref Val %REC RPD Ref Val %RPDLowLimit HighLimit RPDLimit Qual
Units: µg/L
PQL
Client ID: PBW
RunNo: 17480
SeqNo: 228784
MBLKSampType: TestCode: 625_PAH
E625-A
Acenaphthene J0.0500.0035
Acenaphthylene 0.050ND
Anthracene 0.050ND
Benz(a)anthracene J0.0500.012
Benzo(a)pyrene J0.0500.0062
Benzo(b)fluoranthene J0.0500.0047
Benzo(g,h,i)perylene J0.0500.0071
Benzo(k)fluoranthene J0.0500.0025
Chrysene J0.0500.0037
Qualifiers: Page 6 of 21B Analyte detected in the associated Method Blank H Holding times for preparation or analysis exceeded ND Not Detected at the Reporting LimitO RSD is greater than RSDlimit R RPD outside accepted recovery limits S Spike Recovery outside accepted recovery limits

Project: TMP StormwaterClient: Bridgewater Group Inc.
TestCode: 625_PAH
03-Dec-14
QC SUMMARY REPORT1410175WO#:
Specialty Analytical
Sample ID: MB-8406
Batch ID: 8406 TestNo: E625 Analysis Date: 10/27/2014
Prep Date: 10/24/2014
Analyte Result SPK value SPK Ref Val %REC RPD Ref Val %RPDLowLimit HighLimit RPDLimit Qual
Units: µg/L
PQL
Client ID: PBW
RunNo: 17480
SeqNo: 228784
MBLKSampType: TestCode: 625_PAH
E625-A
Dibenz(a,h)anthracene J0.0500.0041
Fluoranthene 0.050ND
Fluorene 0.050ND
Indeno(1,2,3-cd)pyrene J0.0500.0044
Naphthalene 0.050ND
Phenanthrene 0.050ND
Pyrene 0.050ND
Surr: 2-Fluorobiphenyl 0.1000 71.6 18.6 1060.072
Surr: 4-Terphenyl-d14 0.1000 78.2 39.6 1310.078
Surr: Nitrobenzene-d5 0.1000 69.1 17 1300.069
Sample ID: 1410174-001AMS
Batch ID: 8406 TestNo: E625 Analysis Date: 10/27/2014
Prep Date: 10/24/2014
Analyte Result SPK value SPK Ref Val %REC RPD Ref Val %RPDLowLimit HighLimit RPDLimit Qual
Units: µg/L
PQL
Client ID: ZZZZZZ
RunNo: 17480
SeqNo: 228789
MSSampType: TestCode: 625_PAH
E625-A
Acenaphthene 5.149 51.0 47 1450.051 0.014222.6
Acenaphthylene 5.149 55.3 33 1450.051 02.8
Anthracene 5.149 54.5 27 1330.051 0.0088922.8
Benz(a)anthracene 5.149 59.9 33 1430.051 0.017743.1
Benzo(a)pyrene 5.149 63.4 17 1630.051 0.010153.3
Benzo(b)fluoranthene 5.149 66.0 24 1590.051 0.0040403.4
Benzo(g,h,i)perylene 5.149 62.8 0.01 2190.051 0.0072873.2
Benzo(k)fluoranthene 5.149 56.6 11 1620.051 0.0031812.9
Chrysene 5.149 53.9 17 1680.051 0.0091602.8
Qualifiers: Page 7 of 21B Analyte detected in the associated Method Blank H Holding times for preparation or analysis exceeded ND Not Detected at the Reporting LimitO RSD is greater than RSDlimit R RPD outside accepted recovery limits S Spike Recovery outside accepted recovery limits
Project: TMP StormwaterClient: Bridgewater Group Inc.
TestCode: 625_PAH
03-Dec-14
QC SUMMARY REPORT1410175WO#:
Specialty Analytical
Sample ID: 1410174-001AMS
Batch ID: 8406 TestNo: E625 Analysis Date: 10/27/2014
Prep Date: 10/24/2014
Analyte Result SPK value SPK Ref Val %REC RPD Ref Val %RPDLowLimit HighLimit RPDLimit Qual
Units: µg/L
PQL
Client ID: ZZZZZZ
RunNo: 17480
SeqNo: 228789
MSSampType: TestCode: 625_PAH
E625-A
Dibenz(a,h)anthracene 5.149 65.8 0.01 2270.051 0.0076893.4
Fluoranthene 5.149 34.3 26 1370.051 0.022391.8
Fluorene 5.149 57.7 59 121 SMI0.051 0.017953.0
Indeno(1,2,3-cd)pyrene 5.149 64.5 0.01 1710.051 0.0053013.3
Naphthalene 5.149 38.4 21 1330.051 0.040602.0
Phenanthrene 5.149 60.4 54 1200.051 0.074143.2
Pyrene 5.149 57.9 52 1150.051 0.028313.0
Sample ID: 1410174-002AMS
Batch ID: 8406 TestNo: E625 Analysis Date: 10/27/2014
Prep Date: 10/24/2014
Analyte Result SPK value SPK Ref Val %REC RPD Ref Val %RPDLowLimit HighLimit RPDLimit Qual
Units: µg/L
PQL
Client ID: ZZZZZZ
RunNo: 17480
SeqNo: 228790
MSSampType: TestCode: 625_PAH
E625-A
Acenaphthene 5.118 63.0 47 1450.051 0.0045333.2
Acenaphthylene 5.118 68.4 33 1450.051 03.5
Anthracene 5.118 62.4 27 1330.051 0.0034893.2
Benz(a)anthracene 5.118 69.0 33 1430.051 0.019273.5
Benzo(a)pyrene 5.118 72.3 17 1630.051 0.0070083.7
Benzo(b)fluoranthene 5.118 74.7 24 1590.051 0.0078903.8
Benzo(g,h,i)perylene 5.118 73.9 0.01 2190.051 0.0055483.8
Benzo(k)fluoranthene 5.118 67.9 11 1620.051 0.0059033.5
Chrysene 5.118 62.3 17 1680.051 0.0068563.2
Dibenz(a,h)anthracene 5.118 79.0 0.01 2270.051 0.0024044.0
Fluoranthene 5.118 73.9 26 1370.051 0.0077993.8
Fluorene 5.118 68.8 59 1210.051 0.0023943.5
Qualifiers: Page 8 of 21B Analyte detected in the associated Method Blank H Holding times for preparation or analysis exceeded ND Not Detected at the Reporting LimitO RSD is greater than RSDlimit R RPD outside accepted recovery limits S Spike Recovery outside accepted recovery limits
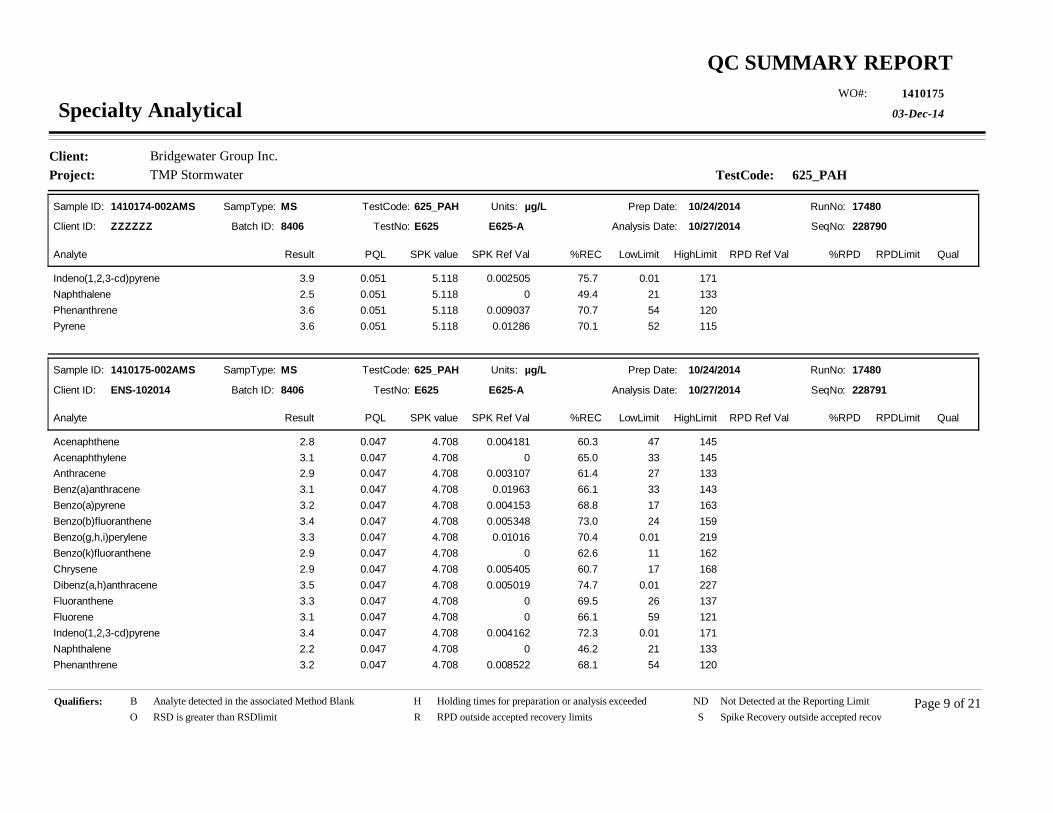
Project: TMP StormwaterClient: Bridgewater Group Inc.
TestCode: 625_PAH
03-Dec-14
QC SUMMARY REPORT1410175WO#:
Specialty Analytical
Sample ID: 1410174-002AMS
Batch ID: 8406 TestNo: E625 Analysis Date: 10/27/2014
Prep Date: 10/24/2014
Analyte Result SPK value SPK Ref Val %REC RPD Ref Val %RPDLowLimit HighLimit RPDLimit Qual
Units: µg/L
PQL
Client ID: ZZZZZZ
RunNo: 17480
SeqNo: 228790
MSSampType: TestCode: 625_PAH
E625-A
Indeno(1,2,3-cd)pyrene 5.118 75.7 0.01 1710.051 0.0025053.9
Naphthalene 5.118 49.4 21 1330.051 02.5
Phenanthrene 5.118 70.7 54 1200.051 0.0090373.6
Pyrene 5.118 70.1 52 1150.051 0.012863.6
Sample ID: 1410175-002AMS
Batch ID: 8406 TestNo: E625 Analysis Date: 10/27/2014
Prep Date: 10/24/2014
Analyte Result SPK value SPK Ref Val %REC RPD Ref Val %RPDLowLimit HighLimit RPDLimit Qual
Units: µg/L
PQL
Client ID: ENS-102014
RunNo: 17480
SeqNo: 228791
MSSampType: TestCode: 625_PAH
E625-A
Acenaphthene 4.708 60.3 47 1450.047 0.0041812.8
Acenaphthylene 4.708 65.0 33 1450.047 03.1
Anthracene 4.708 61.4 27 1330.047 0.0031072.9
Benz(a)anthracene 4.708 66.1 33 1430.047 0.019633.1
Benzo(a)pyrene 4.708 68.8 17 1630.047 0.0041533.2
Benzo(b)fluoranthene 4.708 73.0 24 1590.047 0.0053483.4
Benzo(g,h,i)perylene 4.708 70.4 0.01 2190.047 0.010163.3
Benzo(k)fluoranthene 4.708 62.6 11 1620.047 02.9
Chrysene 4.708 60.7 17 1680.047 0.0054052.9
Dibenz(a,h)anthracene 4.708 74.7 0.01 2270.047 0.0050193.5
Fluoranthene 4.708 69.5 26 1370.047 03.3
Fluorene 4.708 66.1 59 1210.047 03.1
Indeno(1,2,3-cd)pyrene 4.708 72.3 0.01 1710.047 0.0041623.4
Naphthalene 4.708 46.2 21 1330.047 02.2
Phenanthrene 4.708 68.1 54 1200.047 0.0085223.2
Qualifiers: Page 9 of 21B Analyte detected in the associated Method Blank H Holding times for preparation or analysis exceeded ND Not Detected at the Reporting LimitO RSD is greater than RSDlimit R RPD outside accepted recovery limits S Spike Recovery outside accepted recovery limits

Project: TMP StormwaterClient: Bridgewater Group Inc.
TestCode: 625_PAH
03-Dec-14
QC SUMMARY REPORT1410175WO#:
Specialty Analytical
Sample ID: 1410175-002AMS
Batch ID: 8406 TestNo: E625 Analysis Date: 10/27/2014
Prep Date: 10/24/2014
Analyte Result SPK value SPK Ref Val %REC RPD Ref Val %RPDLowLimit HighLimit RPDLimit Qual
Units: µg/L
PQL
Client ID: ENS-102014
RunNo: 17480
SeqNo: 228791
MSSampType: TestCode: 625_PAH
E625-A
Pyrene 4.708 66.3 52 1150.047 0.0090213.1
Qualifiers: Page 10 of 21B Analyte detected in the associated Method Blank H Holding times for preparation or analysis exceeded ND Not Detected at the Reporting LimitO RSD is greater than RSDlimit R RPD outside accepted recovery limits S Spike Recovery outside accepted recovery limits

Project: TMP StormwaterClient: Bridgewater Group Inc.
TestCode: 625X_W
03-Dec-14
QC SUMMARY REPORT1410175WO#:
Specialty Analytical
Sample ID: CCV-8407
Batch ID: 8407 TestNo: E625 Analysis Date: 10/27/2014
Prep Date:
Analyte Result SPK value SPK Ref Val %REC RPD Ref Val %RPDLowLimit HighLimit RPDLimit Qual
Units: µg/L
PQL
Client ID: CCV
RunNo: 17470
SeqNo: 228716
CCVSampType: TestCode: 625X_W
E625
2,4,6-Trichlorophenol 40.00 118 80 1201.00 047.4
2,4-Dichlorophenol 40.00 111 80 1202.00 044.4
2,4-Dimethylphenol 40.00 103 80 1201.00 041.2
2,4-Dinitrophenol 40.00 118 80 1202.00 047.2
2-Chlorophenol 40.00 104 80 1201.00 041.6
2-Methylphenol 40.00 82.6 80 1202.00 033.1
2-Nitrophenol 40.00 118 80 1201.00 047.1
3,4-Methylphenol 40.00 85.2 80 1202.00 034.1
4-Chloro-3-methylphenol 40.00 101 80 1201.00 040.3
4-Nitrophenol 40.00 80.1 80 1201.00 032.0
Bis(2-ethylhexyl)phthalate 40.00 116 80 1201.00 046.6
Butyl benzyl phthalate 40.00 94.4 80 1201.00 037.7
Diethyl phthalate 40.00 118 80 1201.00 047.0
Dimethyl phthalate 40.00 102 80 1201.00 040.7
Di-n-butyl phthalate 40.00 119 80 1201.00 047.4
Di-n-octyl phthalate 40.00 118 80 1201.00 047.4
Pentachlorophenol 40.00 120 80 1202.00 047.9
Phenol 40.00 86.9 80 1201.00 034.8
Sample ID: LCS-8407
Batch ID: 8407 TestNo: E625 Analysis Date: 10/27/2014
Prep Date: 10/24/2014
Analyte Result SPK value SPK Ref Val %REC RPD Ref Val %RPDLowLimit HighLimit RPDLimit Qual
Units: µg/L
PQL
Client ID: LCSW
RunNo: 17470
SeqNo: 228717
LCSSampType: TestCode: 625X_W
E625
2,4,6-Trichlorophenol 50.00 106 37 1441.00 053.2
Qualifiers: Page 11 of 21B Analyte detected in the associated Method Blank H Holding times for preparation or analysis exceeded ND Not Detected at the Reporting LimitO RSD is greater than RSDlimit R RPD outside accepted recovery limits S Spike Recovery outside accepted recovery limits
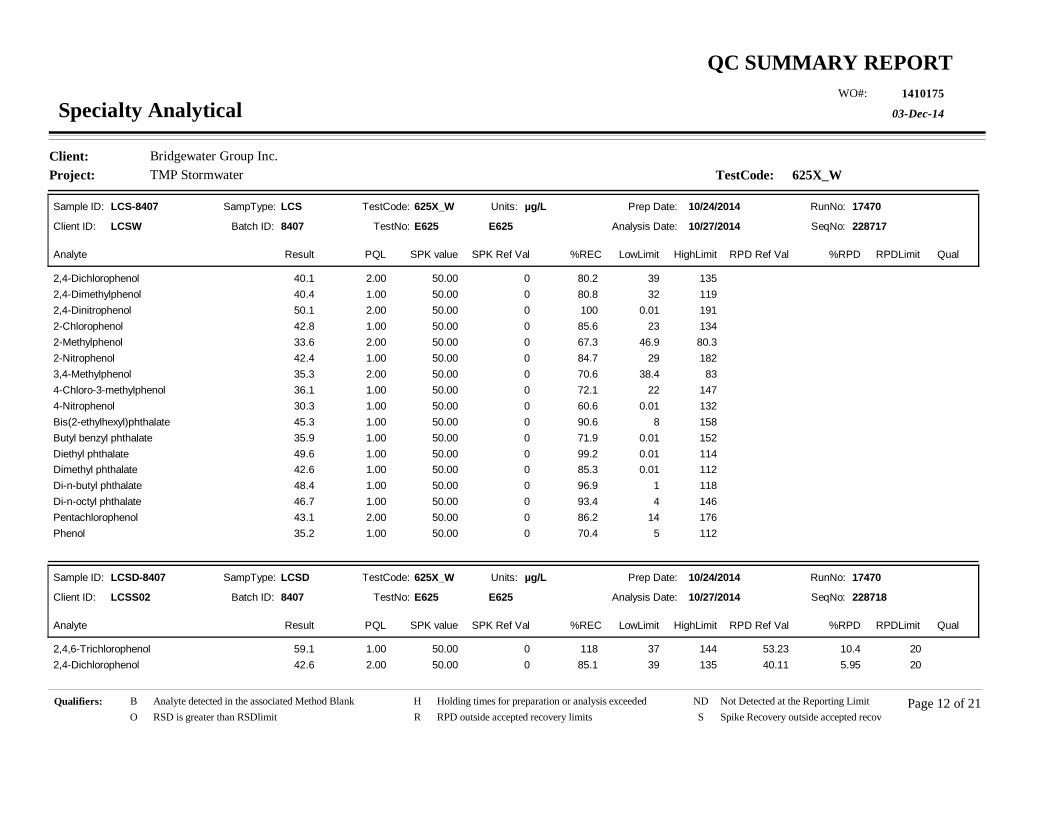
Project: TMP StormwaterClient: Bridgewater Group Inc.
TestCode: 625X_W
03-Dec-14
QC SUMMARY REPORT1410175WO#:
Specialty Analytical
Sample ID: LCS-8407
Batch ID: 8407 TestNo: E625 Analysis Date: 10/27/2014
Prep Date: 10/24/2014
Analyte Result SPK value SPK Ref Val %REC RPD Ref Val %RPDLowLimit HighLimit RPDLimit Qual
Units: µg/L
PQL
Client ID: LCSW
RunNo: 17470
SeqNo: 228717
LCSSampType: TestCode: 625X_W
E625
2,4-Dichlorophenol 50.00 80.2 39 1352.00 040.1
2,4-Dimethylphenol 50.00 80.8 32 1191.00 040.4
2,4-Dinitrophenol 50.00 100 0.01 1912.00 050.1
2-Chlorophenol 50.00 85.6 23 1341.00 042.8
2-Methylphenol 50.00 67.3 46.9 80.32.00 033.6
2-Nitrophenol 50.00 84.7 29 1821.00 042.4
3,4-Methylphenol 50.00 70.6 38.4 832.00 035.3
4-Chloro-3-methylphenol 50.00 72.1 22 1471.00 036.1
4-Nitrophenol 50.00 60.6 0.01 1321.00 030.3
Bis(2-ethylhexyl)phthalate 50.00 90.6 8 1581.00 045.3
Butyl benzyl phthalate 50.00 71.9 0.01 1521.00 035.9
Diethyl phthalate 50.00 99.2 0.01 1141.00 049.6
Dimethyl phthalate 50.00 85.3 0.01 1121.00 042.6
Di-n-butyl phthalate 50.00 96.9 1 1181.00 048.4
Di-n-octyl phthalate 50.00 93.4 4 1461.00 046.7
Pentachlorophenol 50.00 86.2 14 1762.00 043.1
Phenol 50.00 70.4 5 1121.00 035.2
Sample ID: LCSD-8407
Batch ID: 8407 TestNo: E625 Analysis Date: 10/27/2014
Prep Date: 10/24/2014
Analyte Result SPK value SPK Ref Val %REC RPD Ref Val %RPDLowLimit HighLimit RPDLimit Qual
Units: µg/L
PQL
Client ID: LCSS02
RunNo: 17470
SeqNo: 228718
LCSDSampType: TestCode: 625X_W
E625
2,4,6-Trichlorophenol 50.00 118 37 144 201.00 0 53.23 10.459.1
2,4-Dichlorophenol 50.00 85.1 39 135 202.00 0 40.11 5.9542.6
Qualifiers: Page 12 of 21B Analyte detected in the associated Method Blank H Holding times for preparation or analysis exceeded ND Not Detected at the Reporting LimitO RSD is greater than RSDlimit R RPD outside accepted recovery limits S Spike Recovery outside accepted recovery limits
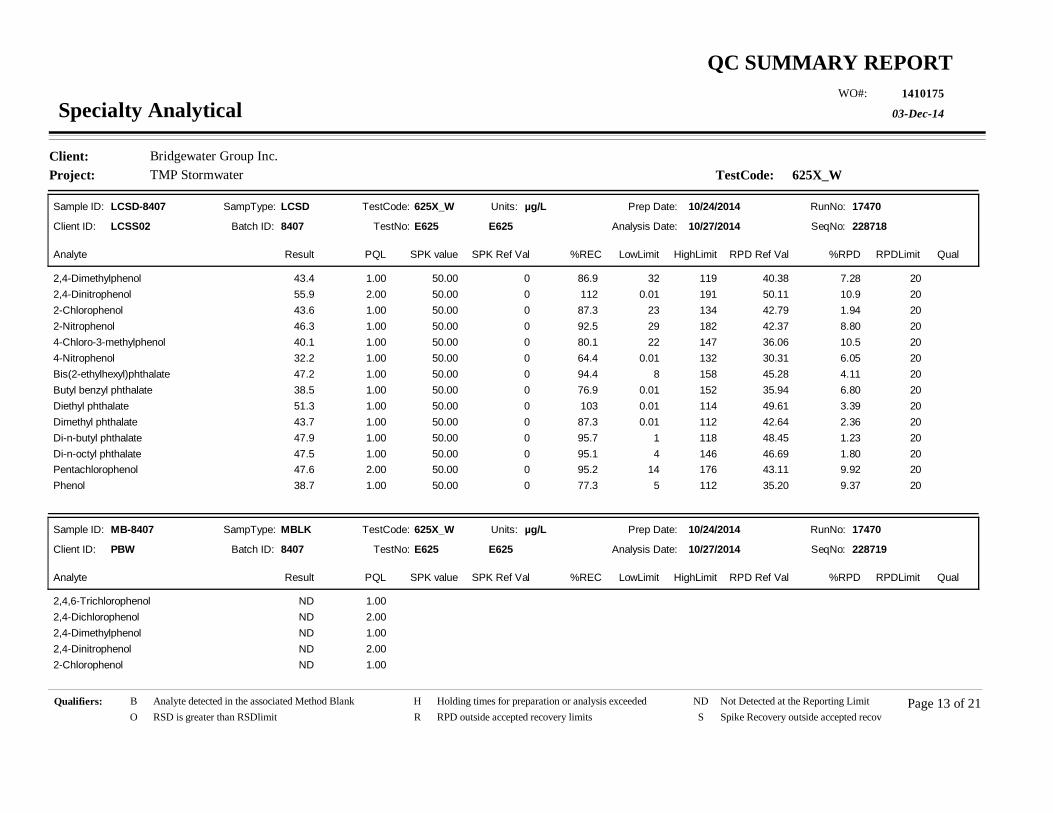
Project: TMP StormwaterClient: Bridgewater Group Inc.
TestCode: 625X_W
03-Dec-14
QC SUMMARY REPORT1410175WO#:
Specialty Analytical
Sample ID: LCSD-8407
Batch ID: 8407 TestNo: E625 Analysis Date: 10/27/2014
Prep Date: 10/24/2014
Analyte Result SPK value SPK Ref Val %REC RPD Ref Val %RPDLowLimit HighLimit RPDLimit Qual
Units: µg/L
PQL
Client ID: LCSS02
RunNo: 17470
SeqNo: 228718
LCSDSampType: TestCode: 625X_W
E625
2,4-Dimethylphenol 50.00 86.9 32 119 201.00 0 40.38 7.2843.4
2,4-Dinitrophenol 50.00 112 0.01 191 202.00 0 50.11 10.955.9
2-Chlorophenol 50.00 87.3 23 134 201.00 0 42.79 1.9443.6
2-Nitrophenol 50.00 92.5 29 182 201.00 0 42.37 8.8046.3
4-Chloro-3-methylphenol 50.00 80.1 22 147 201.00 0 36.06 10.540.1
4-Nitrophenol 50.00 64.4 0.01 132 201.00 0 30.31 6.0532.2
Bis(2-ethylhexyl)phthalate 50.00 94.4 8 158 201.00 0 45.28 4.1147.2
Butyl benzyl phthalate 50.00 76.9 0.01 152 201.00 0 35.94 6.8038.5
Diethyl phthalate 50.00 103 0.01 114 201.00 0 49.61 3.3951.3
Dimethyl phthalate 50.00 87.3 0.01 112 201.00 0 42.64 2.3643.7
Di-n-butyl phthalate 50.00 95.7 1 118 201.00 0 48.45 1.2347.9
Di-n-octyl phthalate 50.00 95.1 4 146 201.00 0 46.69 1.8047.5
Pentachlorophenol 50.00 95.2 14 176 202.00 0 43.11 9.9247.6
Phenol 50.00 77.3 5 112 201.00 0 35.20 9.3738.7
Sample ID: MB-8407
Batch ID: 8407 TestNo: E625 Analysis Date: 10/27/2014
Prep Date: 10/24/2014
Analyte Result SPK value SPK Ref Val %REC RPD Ref Val %RPDLowLimit HighLimit RPDLimit Qual
Units: µg/L
PQL
Client ID: PBW
RunNo: 17470
SeqNo: 228719
MBLKSampType: TestCode: 625X_W
E625
2,4,6-Trichlorophenol 1.00ND
2,4-Dichlorophenol 2.00ND
2,4-Dimethylphenol 1.00ND
2,4-Dinitrophenol 2.00ND
2-Chlorophenol 1.00ND
Qualifiers: Page 13 of 21B Analyte detected in the associated Method Blank H Holding times for preparation or analysis exceeded ND Not Detected at the Reporting LimitO RSD is greater than RSDlimit R RPD outside accepted recovery limits S Spike Recovery outside accepted recovery limits

Project: TMP StormwaterClient: Bridgewater Group Inc.
TestCode: 625X_W
03-Dec-14
QC SUMMARY REPORT1410175WO#:
Specialty Analytical
Sample ID: MB-8407
Batch ID: 8407 TestNo: E625 Analysis Date: 10/27/2014
Prep Date: 10/24/2014
Analyte Result SPK value SPK Ref Val %REC RPD Ref Val %RPDLowLimit HighLimit RPDLimit Qual
Units: µg/L
PQL
Client ID: PBW
RunNo: 17470
SeqNo: 228719
MBLKSampType: TestCode: 625X_W
E625
2-Methylphenol 2.00ND
2-Nitrophenol 1.00ND
3,4-Methylphenol 2.00ND
4-Chloro-3-methylphenol 1.00ND
4-Nitrophenol 1.00ND
Bis(2-ethylhexyl)phthalate 1.00ND
Butyl benzyl phthalate 1.00ND
Diethyl phthalate 1.00ND
Dimethyl phthalate 1.00ND
Di-n-butyl phthalate 1.00ND
Di-n-octyl phthalate 1.00ND
Pentachlorophenol 2.00ND
Phenol 1.00ND
Surr: 2,4,6-Tribromophenol 100.0 103 33.1 99.7 S103
Surr: 2-Fluorobiphenyl 100.0 119 33.1 96.2 S119
Surr: 2-Fluorophenol 100.0 88.0 13.4 57.1 S88.0
Surr: 4-Terphenyl-d14 100.0 118 41 122118
Surr: Nitrobenzene-d5 100.0 90.9 28.9 99.990.9
Surr: Phenol-d5 100.0 76.7 10.6 38.5 S76.7
Sample ID: 1410175-001AMS
Batch ID: 8407 TestNo: E625 Analysis Date: 10/27/2014
Prep Date: 10/24/2014
Analyte Result SPK value SPK Ref Val %REC RPD Ref Val %RPDLowLimit HighLimit RPDLimit Qual
Units: µg/L
PQL
Client ID: FAT-102014
RunNo: 17470
SeqNo: 228767
MSSampType: TestCode: 625X_W
E625
Qualifiers: Page 14 of 21B Analyte detected in the associated Method Blank H Holding times for preparation or analysis exceeded ND Not Detected at the Reporting LimitO RSD is greater than RSDlimit R RPD outside accepted recovery limits S Spike Recovery outside accepted recovery limits

Project: TMP StormwaterClient: Bridgewater Group Inc.
TestCode: 625X_W
03-Dec-14
QC SUMMARY REPORT1410175WO#:
Specialty Analytical
Sample ID: 1410175-001AMS
Batch ID: 8407 TestNo: E625 Analysis Date: 10/27/2014
Prep Date: 10/24/2014
Analyte Result SPK value SPK Ref Val %REC RPD Ref Val %RPDLowLimit HighLimit RPDLimit Qual
Units: µg/L
PQL
Client ID: FAT-102014
RunNo: 17470
SeqNo: 228767
MSSampType: TestCode: 625X_W
E625
2,4,6-Trichlorophenol 51.49 100 37 1441.03 051.5
2,4-Dichlorophenol 51.49 79.2 39 1352.06 040.8
2,4-Dimethylphenol 51.49 75.6 32 1191.03 038.9
2,4-Dinitrophenol 51.49 88.3 0.01 1912.06 045.5
2-Chlorophenol 51.49 73.5 23 1341.03 037.8
2-Methylphenol 51.49 53.8 55 126 SMI2.06 027.7
2-Nitrophenol 51.49 84.6 29 1821.03 043.5
3,4-Methylphenol 51.49 47.8 76 107 SMI2.06 024.6
4-Chloro-3-methylphenol 51.49 9.80 22 147 SMI1.03 05.05
4-Nitrophenol 51.49 90.2 0.01 1321.03 046.5
Bis(2-ethylhexyl)phthalate 51.49 73.6 8 1581.03 3.55841.5
Butyl benzyl phthalate 51.49 71.0 0.01 1521.03 036.6
Diethyl phthalate 51.49 103 0.01 1141.03 053.0
Dimethyl phthalate 51.49 78.7 0.01 1121.03 0.406040.9
Di-n-butyl phthalate 51.49 72.1 1 1181.03 0.245737.4
Di-n-octyl phthalate 51.49 82.0 4 1461.03 0.203042.4
Pentachlorophenol 51.49 105 14 1762.06 054.1
Phenol 51.49 12.0 5 1121.03 9.64715.8
Sample ID: 1410175-002AMS
Batch ID: 8407 TestNo: E625 Analysis Date: 10/27/2014
Prep Date: 10/24/2014
Analyte Result SPK value SPK Ref Val %REC RPD Ref Val %RPDLowLimit HighLimit RPDLimit Qual
Units: µg/L
PQL
Client ID: ENS-102014
RunNo: 17470
SeqNo: 228792
MSSampType: TestCode: 625X_W
E625
2,4,6-Trichlorophenol 47.21 88.7 37 1440.944 041.9
Qualifiers: Page 15 of 21B Analyte detected in the associated Method Blank H Holding times for preparation or analysis exceeded ND Not Detected at the Reporting LimitO RSD is greater than RSDlimit R RPD outside accepted recovery limits S Spike Recovery outside accepted recovery limits
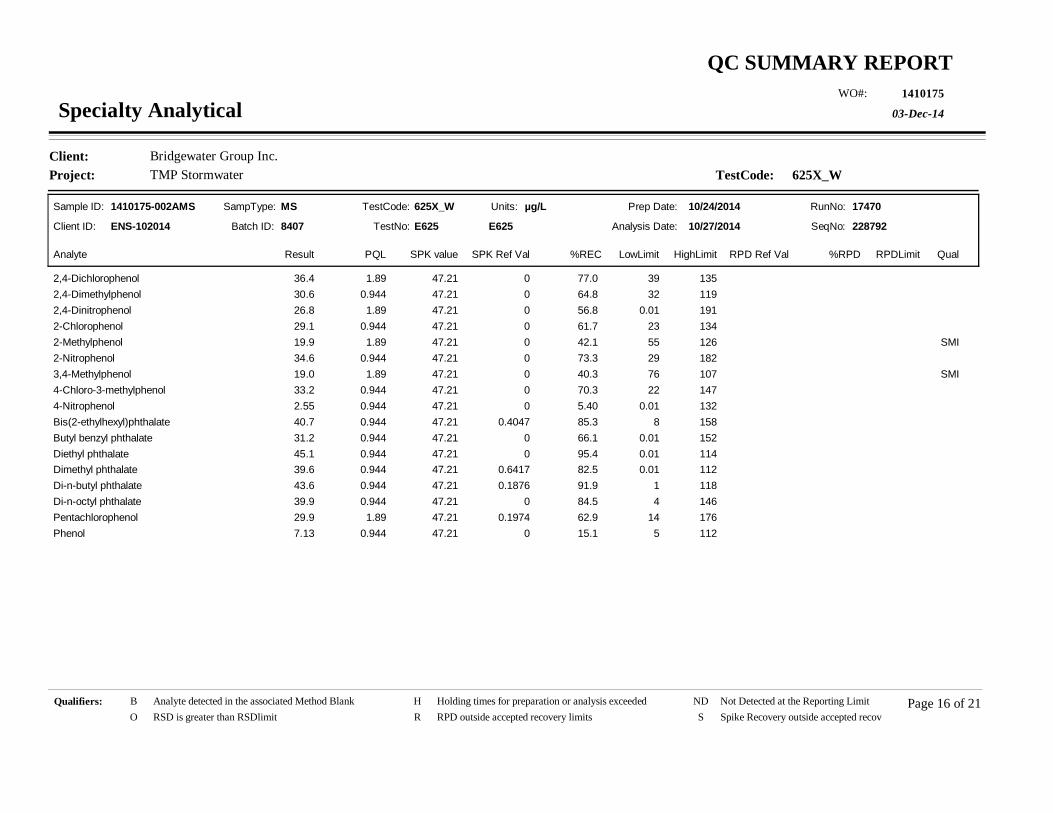
Project: TMP StormwaterClient: Bridgewater Group Inc.
TestCode: 625X_W
03-Dec-14
QC SUMMARY REPORT1410175WO#:
Specialty Analytical
Sample ID: 1410175-002AMS
Batch ID: 8407 TestNo: E625 Analysis Date: 10/27/2014
Prep Date: 10/24/2014
Analyte Result SPK value SPK Ref Val %REC RPD Ref Val %RPDLowLimit HighLimit RPDLimit Qual
Units: µg/L
PQL
Client ID: ENS-102014
RunNo: 17470
SeqNo: 228792
MSSampType: TestCode: 625X_W
E625
2,4-Dichlorophenol 47.21 77.0 39 1351.89 036.4
2,4-Dimethylphenol 47.21 64.8 32 1190.944 030.6
2,4-Dinitrophenol 47.21 56.8 0.01 1911.89 026.8
2-Chlorophenol 47.21 61.7 23 1340.944 029.1
2-Methylphenol 47.21 42.1 55 126 SMI1.89 019.9
2-Nitrophenol 47.21 73.3 29 1820.944 034.6
3,4-Methylphenol 47.21 40.3 76 107 SMI1.89 019.0
4-Chloro-3-methylphenol 47.21 70.3 22 1470.944 033.2
4-Nitrophenol 47.21 5.40 0.01 1320.944 02.55
Bis(2-ethylhexyl)phthalate 47.21 85.3 8 1580.944 0.404740.7
Butyl benzyl phthalate 47.21 66.1 0.01 1520.944 031.2
Diethyl phthalate 47.21 95.4 0.01 1140.944 045.1
Dimethyl phthalate 47.21 82.5 0.01 1120.944 0.641739.6
Di-n-butyl phthalate 47.21 91.9 1 1180.944 0.187643.6
Di-n-octyl phthalate 47.21 84.5 4 1460.944 039.9
Pentachlorophenol 47.21 62.9 14 1761.89 0.197429.9
Phenol 47.21 15.1 5 1120.944 07.13
Qualifiers: Page 16 of 21B Analyte detected in the associated Method Blank H Holding times for preparation or analysis exceeded ND Not Detected at the Reporting LimitO RSD is greater than RSDlimit R RPD outside accepted recovery limits S Spike Recovery outside accepted recovery limits

Project: TMP StormwaterClient: Bridgewater Group Inc.
TestCode: Hg_WW
03-Dec-14
QC SUMMARY REPORT1410175WO#:
Specialty Analytical
Sample ID: MB-8401
Batch ID: 8401 TestNo: E245.2 Analysis Date: 10/24/2014
Prep Date: 10/24/2014
Analyte Result SPK value SPK Ref Val %REC RPD Ref Val %RPDLowLimit HighLimit RPDLimit Qual
Units: mg/L
PQL
Client ID: PBW
RunNo: 17440
SeqNo: 228396
MBLKSampType: TestCode: Hg_WW
E245.1
Mercury 0.000100ND
Sample ID: LCS-8401
Batch ID: 8401 TestNo: E245.2 Analysis Date: 10/24/2014
Prep Date: 10/24/2014
Analyte Result SPK value SPK Ref Val %REC RPD Ref Val %RPDLowLimit HighLimit RPDLimit Qual
Units: mg/L
PQL
Client ID: LCSW
RunNo: 17440
SeqNo: 228397
LCSSampType: TestCode: Hg_WW
E245.1
Mercury 0.004000 99.5 80 1200.000100 00.00398
Sample ID: 1410174-001CDUP
Batch ID: 8401 TestNo: E245.2 Analysis Date: 10/24/2014
Prep Date: 10/24/2014
Analyte Result SPK value SPK Ref Val %REC RPD Ref Val %RPDLowLimit HighLimit RPDLimit Qual
Units: mg/L
PQL
Client ID: ZZZZZZ
RunNo: 17440
SeqNo: 228399
DUPSampType: TestCode: Hg_WW
E245.1
Mercury 200.000100 0 0ND
Sample ID: 1410174-001CMS
Batch ID: 8401 TestNo: E245.2 Analysis Date: 10/24/2014
Prep Date: 10/24/2014
Analyte Result SPK value SPK Ref Val %REC RPD Ref Val %RPDLowLimit HighLimit RPDLimit Qual
Units: mg/L
PQL
Client ID: ZZZZZZ
RunNo: 17440
SeqNo: 228400
MSSampType: TestCode: Hg_WW
E245.1
Mercury 0.004000 99.9 75 1250.000100 00.00399
Qualifiers: Page 17 of 21B Analyte detected in the associated Method Blank H Holding times for preparation or analysis exceeded ND Not Detected at the Reporting LimitO RSD is greater than RSDlimit R RPD outside accepted recovery limits S Spike Recovery outside accepted recovery limits
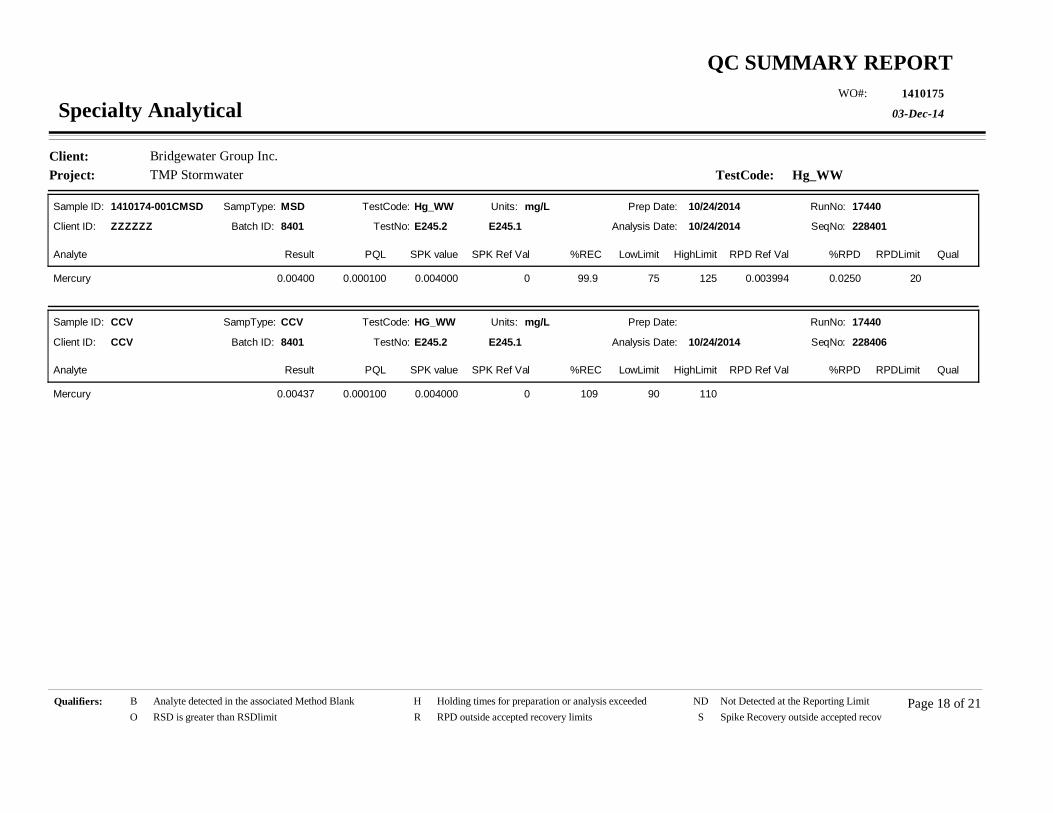
Project: TMP StormwaterClient: Bridgewater Group Inc.
TestCode: Hg_WW
03-Dec-14
QC SUMMARY REPORT1410175WO#:
Specialty Analytical
Sample ID: 1410174-001CMSD
Batch ID: 8401 TestNo: E245.2 Analysis Date: 10/24/2014
Prep Date: 10/24/2014
Analyte Result SPK value SPK Ref Val %REC RPD Ref Val %RPDLowLimit HighLimit RPDLimit Qual
Units: mg/L
PQL
Client ID: ZZZZZZ
RunNo: 17440
SeqNo: 228401
MSDSampType: TestCode: Hg_WW
E245.1
Mercury 0.004000 99.9 75 125 200.000100 0 0.003994 0.02500.00400
Sample ID: CCV
Batch ID: 8401 TestNo: E245.2 Analysis Date: 10/24/2014
Prep Date:
Analyte Result SPK value SPK Ref Val %REC RPD Ref Val %RPDLowLimit HighLimit RPDLimit Qual
Units: mg/L
PQL
Client ID: CCV
RunNo: 17440
SeqNo: 228406
CCVSampType: TestCode: HG_WW
E245.1
Mercury 0.004000 109 90 1100.000100 00.00437
Qualifiers: Page 18 of 21B Analyte detected in the associated Method Blank H Holding times for preparation or analysis exceeded ND Not Detected at the Reporting LimitO RSD is greater than RSDlimit R RPD outside accepted recovery limits S Spike Recovery outside accepted recovery limits

Project: TMP StormwaterClient: Bridgewater Group Inc.
TestCode: HGD_WW
03-Dec-14
QC SUMMARY REPORT1410175WO#:
Specialty Analytical
Sample ID: MB-8401
Batch ID: 8401 TestNo: E245.2 Analysis Date: 10/24/2014
Prep Date: 10/24/2014
Analyte Result SPK value SPK Ref Val %REC RPD Ref Val %RPDLowLimit HighLimit RPDLimit Qual
Units: mg/L
PQL
Client ID: PBW
RunNo: 17446
SeqNo: 228467
MBLKSampType: TestCode: HGD_WW
E245.1
Mercury 0.000100ND
Sample ID: LCS-8401
Batch ID: 8401 TestNo: E245.2 Analysis Date: 10/24/2014
Prep Date: 10/24/2014
Analyte Result SPK value SPK Ref Val %REC RPD Ref Val %RPDLowLimit HighLimit RPDLimit Qual
Units: mg/L
PQL
Client ID: LCSW
RunNo: 17446
SeqNo: 228468
LCSSampType: TestCode: HGD_WW
E245.1
Mercury 0.004000 99.5 85.4 1160.000100 00.00398
Sample ID: A1410174-001CDUP
Batch ID: 8401 TestNo: E245.2 Analysis Date: 10/24/2014
Prep Date:
Analyte Result SPK value SPK Ref Val %REC RPD Ref Val %RPDLowLimit HighLimit RPDLimit Qual
Units: mg/L
PQL
Client ID: ZZZZZZ
RunNo: 17446
SeqNo: 228475
DUPSampType: TestCode: HGD_WW
E245.1
Mercury 200.000100 0 0ND
Sample ID: A1410174-001CMS
Batch ID: 8401 TestNo: E245.2 Analysis Date: 10/24/2014
Prep Date:
Analyte Result SPK value SPK Ref Val %REC RPD Ref Val %RPDLowLimit HighLimit RPDLimit Qual
Units: mg/L
PQL
Client ID: ZZZZZZ
RunNo: 17446
SeqNo: 228476
MSSampType: TestCode: HGD_WW
E245.1
Mercury 0.004000 99.9 69.5 1250.000100 00.00399
Qualifiers: Page 19 of 21B Analyte detected in the associated Method Blank H Holding times for preparation or analysis exceeded ND Not Detected at the Reporting LimitO RSD is greater than RSDlimit R RPD outside accepted recovery limits S Spike Recovery outside accepted recovery limits

Project: TMP StormwaterClient: Bridgewater Group Inc.
TestCode: HGD_WW
03-Dec-14
QC SUMMARY REPORT1410175WO#:
Specialty Analytical
Sample ID: A1410174-001CMSD
Batch ID: 8401 TestNo: E245.2 Analysis Date: 10/24/2014
Prep Date:
Analyte Result SPK value SPK Ref Val %REC RPD Ref Val %RPDLowLimit HighLimit RPDLimit Qual
Units: mg/L
PQL
Client ID: ZZZZZZ
RunNo: 17446
SeqNo: 228477
MSDSampType: TestCode: HGD_WW
E245.1
Mercury 0.004000 99.9 69.5 125 200.000100 0 0.003994 0.02500.00400
Sample ID: CCV
Batch ID: 8401 TestNo: E245.2 Analysis Date: 10/24/2014
Prep Date:
Analyte Result SPK value SPK Ref Val %REC RPD Ref Val %RPDLowLimit HighLimit RPDLimit Qual
Units: mg/L
PQL
Client ID: CCV
RunNo: 17446
SeqNo: 228478
CCVSampType: TestCode: HGD_WW
E245.1
Mercury 0.004000 108 90 1100.000100 00.00431
Qualifiers: Page 20 of 21B Analyte detected in the associated Method Blank H Holding times for preparation or analysis exceeded ND Not Detected at the Reporting LimitO RSD is greater than RSDlimit R RPD outside accepted recovery limits S Spike Recovery outside accepted recovery limits
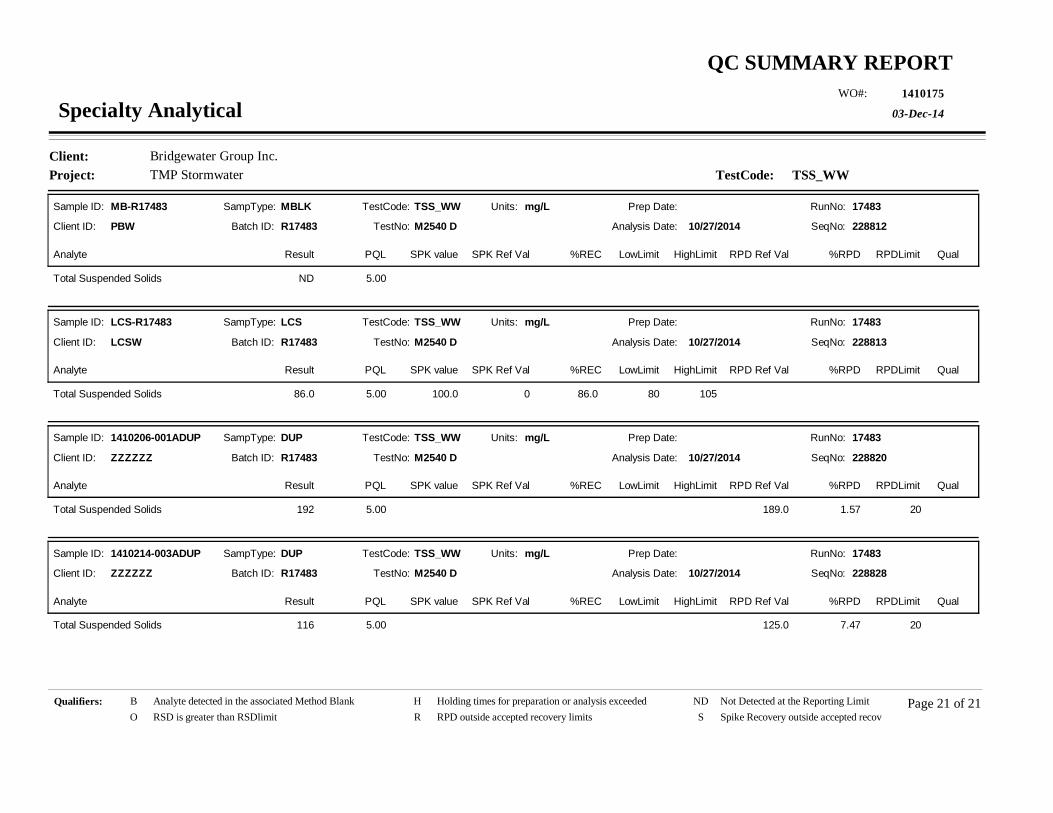
Project: TMP StormwaterClient: Bridgewater Group Inc.
TestCode: TSS_WW
03-Dec-14
QC SUMMARY REPORT1410175WO#:
Specialty Analytical
Sample ID: MB-R17483
Batch ID: R17483 TestNo: M2540 D Analysis Date: 10/27/2014
Prep Date:
Analyte Result SPK value SPK Ref Val %REC RPD Ref Val %RPDLowLimit HighLimit RPDLimit Qual
Units: mg/L
PQL
Client ID: PBW
RunNo: 17483
SeqNo: 228812
MBLKSampType: TestCode: TSS_WW
Total Suspended Solids 5.00ND
Sample ID: LCS-R17483
Batch ID: R17483 TestNo: M2540 D Analysis Date: 10/27/2014
Prep Date:
Analyte Result SPK value SPK Ref Val %REC RPD Ref Val %RPDLowLimit HighLimit RPDLimit Qual
Units: mg/L
PQL
Client ID: LCSW
RunNo: 17483
SeqNo: 228813
LCSSampType: TestCode: TSS_WW
Total Suspended Solids 100.0 86.0 80 1055.00 086.0
Sample ID: 1410206-001ADUP
Batch ID: R17483 TestNo: M2540 D Analysis Date: 10/27/2014
Prep Date:
Analyte Result SPK value SPK Ref Val %REC RPD Ref Val %RPDLowLimit HighLimit RPDLimit Qual
Units: mg/L
PQL
Client ID: ZZZZZZ
RunNo: 17483
SeqNo: 228820
DUPSampType: TestCode: TSS_WW
Total Suspended Solids 205.00 189.0 1.57192
Sample ID: 1410214-003ADUP
Batch ID: R17483 TestNo: M2540 D Analysis Date: 10/27/2014
Prep Date:
Analyte Result SPK value SPK Ref Val %REC RPD Ref Val %RPDLowLimit HighLimit RPDLimit Qual
Units: mg/L
PQL
Client ID: ZZZZZZ
RunNo: 17483
SeqNo: 228828
DUPSampType: TestCode: TSS_WW
Total Suspended Solids 205.00 125.0 7.47116
Qualifiers: Page 21 of 21B Analyte detected in the associated Method Blank H Holding times for preparation or analysis exceeded ND Not Detected at the Reporting LimitO RSD is greater than RSDlimit R RPD outside accepted recovery limits S Spike Recovery outside accepted recovery limits

KEY TO FLAGS Rev. May 12, 2010
A This sample contains a Gasoline Range Organic not identified as a specific hydrocarbon product. The result was quantifiedagainst gasoline calibration standards
A1 This sample contains a Diesel Range Organic not identified as a specific hydrocarbon product. The result was quantifiedagainst diesel calibration standards.
A2 This sample contains a Lube Oil Range Organic not identified as a specific hydrocarbon product. The result was quantifiedagainst a lube oil calibration standard.
A3 The result was determined to be Non-Detect based on hydrocarbon pattern recognition. The product was carry-over fromanother hydrocarbon type.
A4 The product appears to be aged or degraded diesel.
B The blank exhibited a positive result great than the reporting limit for this compound.
CN See Case Narrative.
D Result is based from a dilution.
E Result exceeds the calibration range for this compound. The result should be considered as estimate.
F The positive result for this hydrocarbon is due to single component contamination. The product does not match anyhydrocarbon in the fuels library.
G Result may be biased high due to biogenic interferences. Clean up is recommended.
H Sample was analyzed outside recommended holding time.
HT At clients request, samples was analyzed outside of recommended holding time.
J The result for this analyte is between the MDL and the PQL and should be considered as estimated concentration.
K Diesel result is biased high due to amount of Oil contained in the sample.
L Diesel result is biased high due to amount of Gasoline contained in the sample.
M Oil result is biased high due to amount of Diesel contained in the sample.
MC Sample concentration is greater than 4x the spiked value, the spiked value is considered insignificant.
MI Result is outside control limits due to matrix interference.
MSA Value determined by Method of Standard Addition.
O Laboratory Control Standard (LCS) exceeded laboratory control limits, but meets CCV criteria. Data meets EPArequirements.
Q Detection levels elevated due to sample matrix.
R RPD control limits were exceeded.
RF Duplicate failed due to result being at or near the method-reporting limit.
RP Matrix spike values exceed established QC limits; post digestion spike is in control.
S Recovery is outside control limits.
SC Closing CCV or LCS exceeded high recovery control limits, but associated samples are non-detect. Data meets EPArequirements.
* The result for this parameter was greater that the maximum contaminant level of the TCLP regulatory limit.


245 S Grape St Medford, OR 97501 (541) 770-5678
400 SE G St, Suite B Grants Pass, OR 97526 (541) 479-4053
www.nrclabs.com
NEILSON RESEARCH CORPORATION
Environmental Testing Laboratory
Specialty AnalyticalNikki Bippes
Dear Nikki Bippes:
RE: SA 1410175Order No.: 1411149
FAX 503-607-1336TEL: 503-607-1331
11711 SE Capps Rd, #BClackamas, OR 97015
11/14/2014
Neilson Research Corporation received 2 sample(s) on 11/5/2014 for the analyses presented in the following report.
Alec C Smith
The results relate only to the parameters tested or to the sample as received by the laboratory. This report shall not be reproduced except in full, without the written approval of Neilson Research Corporation. If you have any questions regarding these test results, please feel free to call.
Sincerely,Neilson Research Corporation
Project Manager
Page 1 of 8
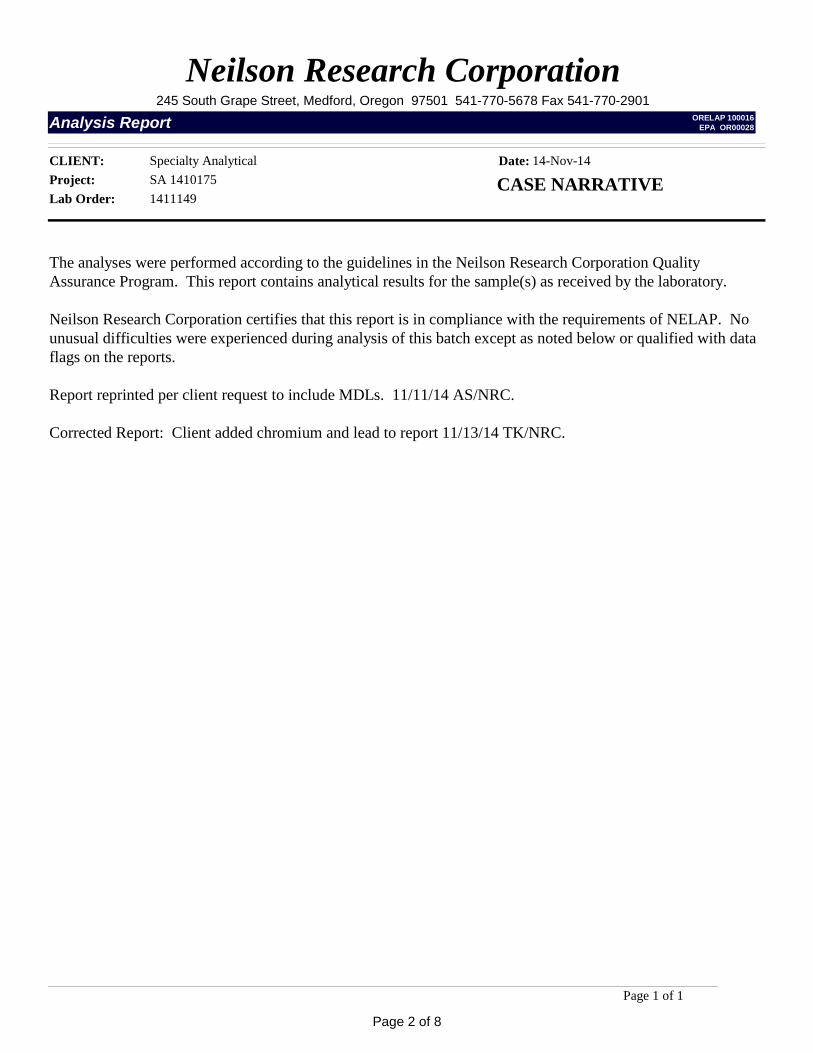
Neilson Research Corporation245 South Grape Street, Medford, Oregon 97501 541-770-5678 Fax 541-770-2901
Analysis Report ORELAP 100016EPA OR00028
Project: SA 1410175CLIENT: Specialty Analytical
Lab Order: 1411149CASE NARRATIVEDate: 14-Nov-14
The analyses were performed according to the guidelines in the Neilson Research Corporation Quality Assurance Program. This report contains analytical results for the sample(s) as received by the laboratory.
Neilson Research Corporation certifies that this report is in compliance with the requirements of NELAP. No unusual difficulties were experienced during analysis of this batch except as noted below or qualified with data flags on the reports.
Report reprinted per client request to include MDLs. 11/11/14 AS/NRC.
Corrected Report: Client added chromium and lead to report 11/13/14 TK/NRC.
Page 1 of 1
Page 2 of 8

Analyses Result Qual Units Date AnalyzedMRL DFMDL
Project: SA 1410175
Collection Date: 10/20/2014 3:05:00 PM
Specialty Analytical Lab Order: 1411149
Reported Date: 11/14/2014 4:30:03 PM
ANALYTICAL RESULTS
Received Date: 11/5/2014 3:25:00 PM
Matrix: Aqueous
Client Sample ID: SA 1410175-001
NRC Sample ID 1411149-01AClackamas, OR 97015
Sample Location:
11711 SE Capps Rd, #B
Neilson Research Corporation245 South Grape Street, Medford, Oregon 97501 541-770-5678 Fax 541-770-2901
Analysis Report ORELAP 100016EPA OR00028
TRACE METALS EPA 200.8 Analyst: CLGArsenic 11/6/20140.0005 mg/L 10.000740 0.000273Cadmium 11/6/20140.0001 mg/L 10.000421 0.0000503Chromium 11/6/20140.0004 mg/L 10.00264 0.000128Copper 11/6/20140.0005 mg/L 10.0409 0.0000506Lead 11/6/20140.0001 mg/L 10.00259 0.00000410Silver J 11/6/20140.0001 mg/L 10.000037 0.00000680Zinc 11/6/20140.001 mg/L 10.272 0.000108
Qualifiers:
Page 1 of 2
* Value exceeds Maximum Contaminant Level B Analyte detected in the associated Method BlankE Value above quantitation range H Holding times for preparation or analysis exceededJ Analyte detected below quantitation limits ND Not Detected at the Minimum Reporting LimitS Spike Recovery outside accepted recovery limits
Page 3 of 8

Analyses Result Qual Units Date AnalyzedMRL DFMDL
Project: SA 1410175
Collection Date: 10/20/2014 3:15:00 PM
Specialty Analytical Lab Order: 1411149
Reported Date: 11/14/2014 4:30:03 PM
ANALYTICAL RESULTS
Received Date: 11/5/2014 3:25:00 PM
Matrix: Aqueous
Client Sample ID: SA 1410175-002
NRC Sample ID 1411149-02AClackamas, OR 97015
Sample Location:
11711 SE Capps Rd, #B
Neilson Research Corporation245 South Grape Street, Medford, Oregon 97501 541-770-5678 Fax 541-770-2901
Analysis Report ORELAP 100016EPA OR00028
TRACE METALS EPA 200.8 Analyst: CLGArsenic 11/6/20140.0005 mg/L 1ND 0.000273Cadmium J 11/6/20140.0001 mg/L 10.000085 0.0000503Chromium 11/6/20140.0004 mg/L 10.000679 0.000128Copper 11/6/20140.0005 mg/L 10.0113 0.0000506Lead 11/6/20140.0001 mg/L 10.00190 0.00000410Silver J 11/6/20140.0001 mg/L 10.000010 0.00000680Zinc 11/6/20140.001 mg/L 10.0750 0.000108
Qualifiers:
Page 2 of 2
* Value exceeds Maximum Contaminant Level B Analyte detected in the associated Method BlankE Value above quantitation range H Holding times for preparation or analysis exceededJ Analyte detected below quantitation limits ND Not Detected at the Minimum Reporting LimitS Spike Recovery outside accepted recovery limits
Page 4 of 8
NRC SOP QA-1104/AD-3100 Revision 1
Effective Date: 5/30/12
Neilson Research Corporation
DATA FLAGS
B Analyte detected in the associated method blank. BA BOD Alternative Calculation: The initial results performed by Standard Methods did not fall within parameters of the
Standard Methods calculation. An alternate approved calculation was performed using the HACH method and the value reported is an estimated concentration.
C Sample(s) does not meet NELAC/ORELAP sample acceptance criteria. See Case Narrative. C1 Sample(s) does not meet NELAC/ORELAP sample acceptance criteria for temperature. CF Results confirmed by re-analysis. CU Cleanup performed as specified by method. D1 The diesel elution pattern for the sample is not typical. D2 The sample appears to be a heavier hydrocarbon range than diesel. D3 The sample appears to be a lighter hydrocarbon range than diesel. D4 Detected hydrocarbons do not have pattern and range consistent with typical petroleum products and may be due to
biogenic interference. D5 Detected hydrocarbons in the diesel range appear to be weathered diesel. E Estimated value. ER Elevated reporting limit due to matrix. Report limits (MDLs, MRLs & PQLs) are adjusted based on variations in
sample preparation amounts, analytical dilutions, and percent solids, where applicable. FC Fecal Coliforms: Sample(s) received past 40 CFR Part 136 specified holding time. Results reported as estimated
values. G1 The gasoline elution pattern for the sample is not typical. G2 The sample appears to be a heavier hydrocarbon range than gasoline. G3 The sample appears to be a lighter hydrocarbon range than gasoline. G4 Detected hydrocarbons in the gasoline range appear to be weathered gasoline. HP Sample re-analysis performed outside of method specified holding time. HR Sample received outside of method specified holding time. HS Sample analyzed for volatile organics contained headspace. HT At the client’s request, the sample was analyzed outside of method specified holding time. H Analysis performed outside of method specified holding time. J Analyte detected below the Minimum Reporting Limit (MRL) and above the Method Detection Limit (MDL). The J
flag result is an estimated value and the user should be aware that this data is of limited reliability. MI Surrogate or Matrix Spike recovery is out of control limits due to matrix interference. Sample results may be biased. N See Case Narrative on page 2 of report. Q Closing continuing calibration verification (CCV) or laboratory control sample (LCS) exceeded high recovery limits,
but associated samples are non-detect and the sample results are not affected. Data meets EPA/NELAC requirements. R Relative percent difference (RPD) is outside of the accepted recovery limits. R1 Relative percent difference (RPD) is outside of the accepted recovery limits. However, analyses are not controlled on
RPD values for sample concentrations that are less than the reporting limit. R3 The relative percent difference (RPD) and/or percent recovery for the duplicate (DUP) or matrix spike (MS)/matrix
spike duplicate (MSD) cannot be accurately calculated due to the concentration of analyte already present in the sample.
R4 Duplicate analysis failed due to result being at or near method reporting limit. S Surrogate and/or matrix spike recovery is outside of the accepted recovery limits. Sample results may be biased. S1 Surrogate or matrix spike recovery is outside of control limits due to dilution necessary for analysis. SC Sub-contracted to another laboratory for analysis. T Toxicity Characteristic Leaching Procedure – Sample submitted contained < 0.5% solids. If the waste contains <0.5%
dry solids, the liquid portion of the waste, after filtration, is defined as the TCLP extract. # Value exceeds regulatory level for TCLP contaminant. X1 The motor oil elution pattern for the sample is not typical. X2 The sample appears to be a heavier hydrocarbon range than motor oil. X3 The sample appears to be a lighter hydrocarbon range than motor oil. * Value exceeds Maximum Contaminant Level or is outside the acceptable range.
Page 5 of 8

Project: SA 1410175
CLIENT: Specialty AnalyticalWork Order: 1411149
ANALYTICAL QC SUMMARY REPORTTestCode: ICPMS_200.8_W
14-Nov-14Date:Neilson Research Corporation
Sample ID MB-31251
Batch ID: 31251 TestNo: EPA 200.8 Analysis Date: 11/6/2014
Prep Date: 11/6/2014
Analyte Result SPK value SPK Ref Val %REC RPD Ref Val %RPDLowLimit HighLimit RPDLimit Qual
Units: mg/L
MRL
Client ID: ZZZZZ
RunNo: 76755
SeqNo: 1142344
MBLKSampType: TestCode: ICPMS_200.8
(EPA 200.8)
Arsenic 0.000500NDCadmium 0.000100NDChromium 0.000400NDCopper J0.0005000.00006148Lead J0.0001000.00001823Silver 0.000100NDZinc J0.001000.0007574
Sample ID LCS-31251
Batch ID: 31251 TestNo: EPA 200.8 Analysis Date: 11/6/2014
Prep Date: 11/6/2014
Analyte Result SPK value SPK Ref Val %REC RPD Ref Val %RPDLowLimit HighLimit RPDLimit Qual
Units: mg/L
MRL
Client ID: ZZZZZ
RunNo: 76755
SeqNo: 1142345
LCSSampType: TestCode: ICPMS_200.8
(EPA 200.8)
Arsenic 0.1 109 85 1150.000500 00.1093Cadmium 0.1 108 85 1150.000100 00.1085Chromium 0.1 107 85 1150.000400 00.1068Copper 0.1 108 85 1150.000500 0.000061480.1078Lead 0.1 109 85 1150.000100 0.000018230.1086Silver 0.1 105 85 1150.000100 00.1050Zinc 0.1 108 85 1150.00100 0.00075740.1086
Sample ID 1411159-01AMS
Batch ID: 31251 TestNo: EPA 200.8 Analysis Date: 11/6/2014
Prep Date: 11/6/2014
Analyte Result SPK value SPK Ref Val %REC RPD Ref Val %RPDLowLimit HighLimit RPDLimit Qual
Units: mg/L
MRL
Client ID: ZZZZZ
RunNo: 76755
SeqNo: 1142354
MSSampType: TestCode: ICPMS_200.8
(EPA 200.8)
Arsenic 0.1 103 70 1300.000500 0.0025050.1060Cadmium 0.1 99.8 70 1300.000100 00.09976Chromium 0.1 104 70 1300.000400 0.0002090.1047Copper 0.1 97.5 70 1300.000500 0.00040170.09793Lead 0.1 98.4 70 1300.000100 0.00006640.09851
Page 1 of 2
Qualifiers: E Value above quantitation range H Holding times for preparation or analysis exceeded J Analyte detected below quantitation limitsND Not Detected at the Minimum Reporting Limit R RPD outside accepted recovery limits S Spike Recovery outside accepted recovery limits
Page 6 of 8
Project: SA 1410175
CLIENT: Specialty AnalyticalWork Order: 1411149
ANALYTICAL QC SUMMARY REPORTTestCode: ICPMS_200.8_W
14-Nov-14Date:Neilson Research Corporation
Sample ID 1411159-01AMS
Batch ID: 31251 TestNo: EPA 200.8 Analysis Date: 11/6/2014
Prep Date: 11/6/2014
Analyte Result SPK value SPK Ref Val %REC RPD Ref Val %RPDLowLimit HighLimit RPDLimit Qual
Units: mg/L
MRL
Client ID: ZZZZZ
RunNo: 76755
SeqNo: 1142354
MSSampType: TestCode: ICPMS_200.8
(EPA 200.8)
Silver 0.1 95.7 70 1300.000100 00.09572Zinc 0.1 99.6 70 1300.00100 0.0047030.1043
Sample ID 1411159-01AMSD
Batch ID: 31251 TestNo: EPA 200.8 Analysis Date: 11/6/2014
Prep Date: 11/6/2014
Analyte Result SPK value SPK Ref Val %REC RPD Ref Val %RPDLowLimit HighLimit RPDLimit Qual
Units: mg/L
MRL
Client ID: ZZZZZ
RunNo: 76755
SeqNo: 1142355
MSDSampType: TestCode: ICPMS_200.8
(EPA 200.8)
Arsenic 0.1 104 70 130 200.000500 0.002505 0.106 0.7520.1068Cadmium 0.1 99.9 70 130 200.000100 0 0.09976 0.1000.09986Chromium 0.1 105 70 130 200.000400 0.000209 0.1047 0.7610.1055Copper 0.1 98.5 70 130 200.000500 0.0004017 0.09793 0.9550.09887Lead 0.1 99.2 70 130 200.000100 0.0000664 0.09851 0.8090.09931Silver 0.1 95.7 70 130 200.000100 0 0.09572 00.09572Zinc 0.1 100 70 130 200.00100 0.004703 0.1043 0.6690.1050
Page 2 of 2
Qualifiers: E Value above quantitation range H Holding times for preparation or analysis exceeded J Analyte detected below quantitation limitsND Not Detected at the Minimum Reporting Limit R RPD outside accepted recovery limits S Spike Recovery outside accepted recovery limits
Page 7 of 8
Pag
e 8
of 8

Specialty AnalyticalNikki Bippes
Dear Nikki Bippes:
RE: SA 1410175Order No.: 1411339
FAX 503-607-1336TEL: 503-607-1331
11711 SE Capps Rd, #BClackamas, OR 97015
12/03/14
Neilson Research Corporation received 2 sample(s) on 11/11/14 for the analyses presented in the following report.
Alec C Smith
The results relate only to the parameters tested or to the sample as received by the laboratory. This report shall not be reproduced except in full, without the written approval of Neilson Research Corporation. If you have any questions regarding these test results, please feel free to call.
Sincerely,Neilson Research Corporation
Project Manager
Page 1 of 7

Neilson Research Corporation245 South Grape Street, Medford, Oregon 97501 541-770-5678 Fax 541-770-2901
Analysis Report ORELAP 100016EPA OR00028
Project: SA 1410175CLIENT: Specialty Analytical
Lab Order: 1411339CASE NARRATIVEDate: 03-Dec-14
The analyses were performed according to the guidelines in the Neilson Research Corporation Quality Assurance Program. This report contains analytical results for the sample(s) as received by the laboratory.
Neilson Research Corporation certifies that this report is in compliance with the requirements of NELAP. No unusual difficulties were experienced during analysis of this batch except as noted below or qualified with data flags on the reports.
Report reprinted to include Chromium, Lead, and MDL per client 11/19/14 CAF.
Page 1 of 1
Page 2 of 7
Analyses Result Qual Units Date AnalyzedMRL DFMDL
Project: SA 1410175
Collection Date: 10/20/14 3:05:00 PM
Specialty Analytical Lab Order: 1411339
Reported Date: 12/03/14 11:37:58 AM
ANALYTICAL RESULTS
Received Date: 11/11/14 2:50:00 PM
Matrix: Aqueous
Client Sample ID: SA 1410175-001
NRC Sample ID 1411339-01AClackamas, OR 97015
Sample Location:
11711 SE Capps Rd, #B
Neilson Research Corporation245 South Grape Street, Medford, Oregon 97501 541-770-5678 Fax 541-770-2901
Analysis Report ORELAP 100016EPA OR00028
DISSOLVED TRACE METALS EPA 200.8 Analyst: CLGArsenic 11/12/140.000515 mg/L 10.000645 0.000281Cadmium 11/12/140.000103 mg/L 10.000283 0.0000518Chromium 11/12/140.000412 mg/L 10.000666 0.000132Copper 11/12/140.000515 mg/L 10.0337 0.0000521Lead 11/12/140.000103 mg/L 10.000783 0.00000422Silver J 11/12/140.000103 mg/L 10.000017 0.00000700Zinc 11/12/140.00103 mg/L 10.302 0.000111
Qualifiers:
Page 1 of 2
* Value exceeds Maximum Contaminant Level B Analyte detected in the associated Method BlankE Value above quantitation range H Holding times for preparation or analysis exceededJ Analyte detected below quantitation limits ND Not Detected at the Minimum Reporting LimitS Spike Recovery outside accepted recovery limits
Page 3 of 7
Analyses Result Qual Units Date AnalyzedMRL DFMDL
Project: SA 1410175
Collection Date: 10/20/14 3:15:00 PM
Specialty Analytical Lab Order: 1411339
Reported Date: 12/03/14 11:37:58 AM
ANALYTICAL RESULTS
Received Date: 11/11/14 2:50:00 PM
Matrix: Aqueous
Client Sample ID: SA 1410175-002
NRC Sample ID 1411339-02AClackamas, OR 97015
Sample Location:
11711 SE Capps Rd, #B
Neilson Research Corporation245 South Grape Street, Medford, Oregon 97501 541-770-5678 Fax 541-770-2901
Analysis Report ORELAP 100016EPA OR00028
DISSOLVED TRACE METALS EPA 200.8 Analyst: CLGArsenic J 11/12/140.000515 mg/L 10.00041 0.000281Cadmium 11/12/140.000103 mg/L 1ND 0.0000518Chromium J 11/12/140.000412 mg/L 10.00036 0.000132Copper 11/12/140.000515 mg/L 10.00777 0.0000521Lead 11/12/140.000103 mg/L 10.000284 0.00000422Silver 11/12/140.000103 mg/L 1ND 0.00000700Zinc 11/12/140.00103 mg/L 10.0648 0.000111
Qualifiers:
Page 2 of 2
* Value exceeds Maximum Contaminant Level B Analyte detected in the associated Method BlankE Value above quantitation range H Holding times for preparation or analysis exceededJ Analyte detected below quantitation limits ND Not Detected at the Minimum Reporting LimitS Spike Recovery outside accepted recovery limits
Page 4 of 7

Project: SA 1410175
CLIENT: Specialty AnalyticalWork Order: 1411339
ANALYTICAL QC SUMMARY REPORTTestCode: ICPMS_200.8_DISS
03-Dec-14Date:Neilson Research Corporation
Sample ID MB-31314
Batch ID: 31314 TestNo: EPA 200.8 Analysis Date: 11/12/14
Prep Date: 11/12/14
Analyte Result SPK value SPK Ref Val %REC RPD Ref Val %RPDLowLimit HighLimit RPDLimit Qual
Units: mg/L
MRL
Client ID: ZZZZZ
RunNo: 76895
SeqNo: 1144418
MBLKSampType: TestCode: ICPMS_200.8
(EPA 3005A)
Arsenic 0.000500NDCadmium 0.000100NDChromium 0.000400NDCopper 0.000500NDLead J0.0001000.00001060Silver 0.000100NDZinc 0.00100ND
Sample ID LCS-31314
Batch ID: 31314 TestNo: EPA 200.8 Analysis Date: 11/12/14
Prep Date: 11/12/14
Analyte Result SPK value SPK Ref Val %REC RPD Ref Val %RPDLowLimit HighLimit RPDLimit Qual
Units: mg/L
MRL
Client ID: ZZZZZ
RunNo: 76895
SeqNo: 1144419
LCSSampType: TestCode: ICPMS_200.8
(EPA 3005A)
Arsenic 0.1 99.2 85 1150.000500 00.09915Cadmium 0.1 101 85 1150.000100 00.1013Chromium 0.1 104 85 1150.000400 00.1042Copper 0.1 102 85 1150.000500 00.1015Lead 0.1 99.2 85 1150.000100 0.00001060.09919Silver 0.1 97.5 85 1150.000100 00.09746Zinc 0.1 102 85 1150.00100 00.1024
Sample ID 1411341-01ADUP
Batch ID: 31314 TestNo: EPA 200.8 Analysis Date: 11/12/14
Prep Date: 11/12/14
Analyte Result SPK value SPK Ref Val %REC RPD Ref Val %RPDLowLimit HighLimit RPDLimit Qual
Units: mg/L
MRL
Client ID: ZZZZZ
RunNo: 76895
SeqNo: 1144426
DUPSampType: TestCode: ICPMS_200.8
(EPA 3005A)
Arsenic 200.000515 0 0NDCadmium 20 J0.000103 0 00.00006999Chromium 200.000412 0.000703 0.8170.0007087Copper 200.000515 0.004888 1.400.004957Lead 200.000103 0.0003961 3.170.0003838
Page 1 of 2
Qualifiers: E Value above quantitation range H Holding times for preparation or analysis exceeded J Analyte detected below quantitation limitsND Not Detected at the Minimum Reporting Limit R RPD outside accepted recovery limits S Spike Recovery outside accepted recovery limits
Page 5 of 7
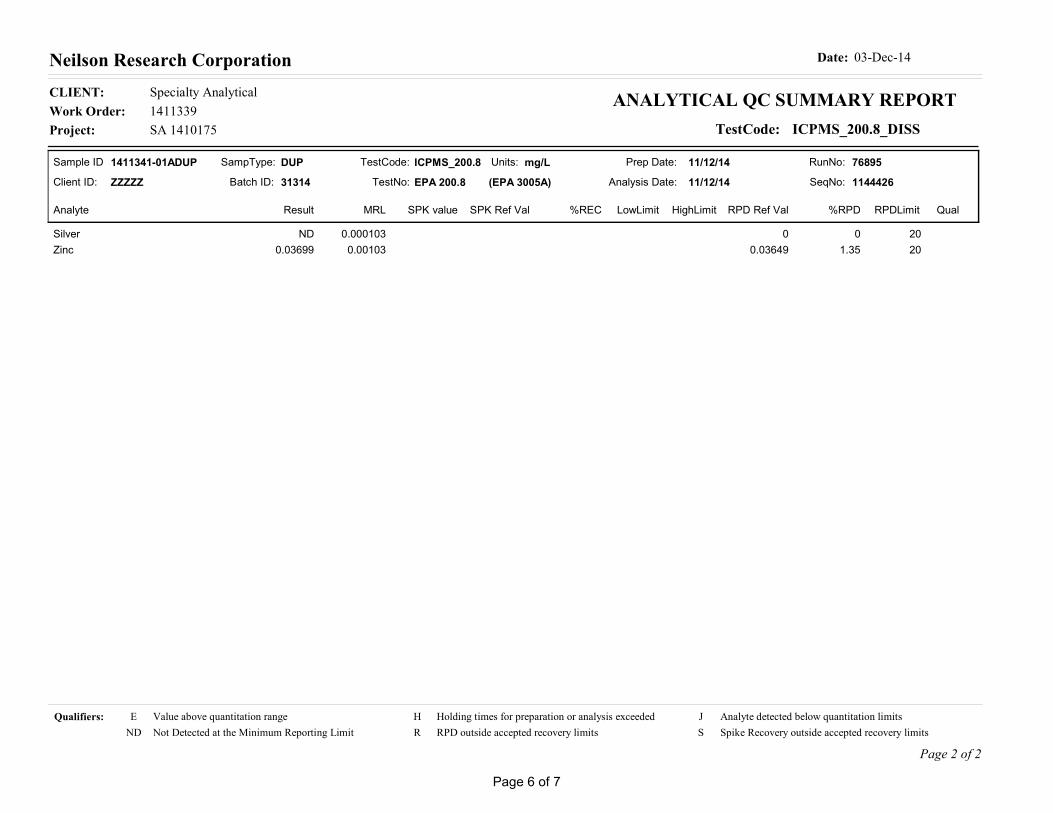
Project: SA 1410175
CLIENT: Specialty AnalyticalWork Order: 1411339
ANALYTICAL QC SUMMARY REPORTTestCode: ICPMS_200.8_DISS
03-Dec-14Date:Neilson Research Corporation
Sample ID 1411341-01ADUP
Batch ID: 31314 TestNo: EPA 200.8 Analysis Date: 11/12/14
Prep Date: 11/12/14
Analyte Result SPK value SPK Ref Val %REC RPD Ref Val %RPDLowLimit HighLimit RPDLimit Qual
Units: mg/L
MRL
Client ID: ZZZZZ
RunNo: 76895
SeqNo: 1144426
DUPSampType: TestCode: ICPMS_200.8
(EPA 3005A)
Silver 200.000103 0 0NDZinc 200.00103 0.03649 1.350.03699
Page 2 of 2
Qualifiers: E Value above quantitation range H Holding times for preparation or analysis exceeded J Analyte detected below quantitation limitsND Not Detected at the Minimum Reporting Limit R RPD outside accepted recovery limits S Spike Recovery outside accepted recovery limits
Page 6 of 7

Page
7 o
f 7

Jl F- Ana I yti cal Resou rces, I n co rpo rated
-/- Analvtical Chemists and ConsultantsIJ
24 November 2014
Nikki BippesSpecialty AnalyicalltTll SE Capps RoadClackamas, OR 97015
RE: Projects: 141017 4ll4l0l75lf 410089ARI Job No: ZK82
Dear Nikki:
Please find enclosed copies of the original chain of custody records and the final results forthe samples from the project referenced bbove. Analytical Resources, Inc. (ARI) originallyreceived these samples on October 17 and October 24, 2014. The samples were re-analyzed,for TBT as requested.
All samples were initially extracted on lllI9l14. The extract for sample 1410089-001 waslost before its extraction was complete. This sample was extracted a third time onIl/2ll14. The re-extraction proceeded without incident of note. The result for the lll2lll4extraction only has been submiued for this sample.
There were no fuither problems with these analyses.
A copy of these reports and all supporting data will remain on file with ARI. Please feelfree to contact me if you have any questions or require any additional information.
Respectfully,
ANALYTICAL RESOURCES. INC.I
\?,-t ,X'\ /1(r??WMaik D. Ha:ri$----Project Manager206/[email protected]
Enclosures
File ZK82
MDH/mdh
Page I of lg46'f 1 South 134th Place. Suite 100 r TukwilaWAg8l68 .2O6-695-6200 o 206-695-6201 fax
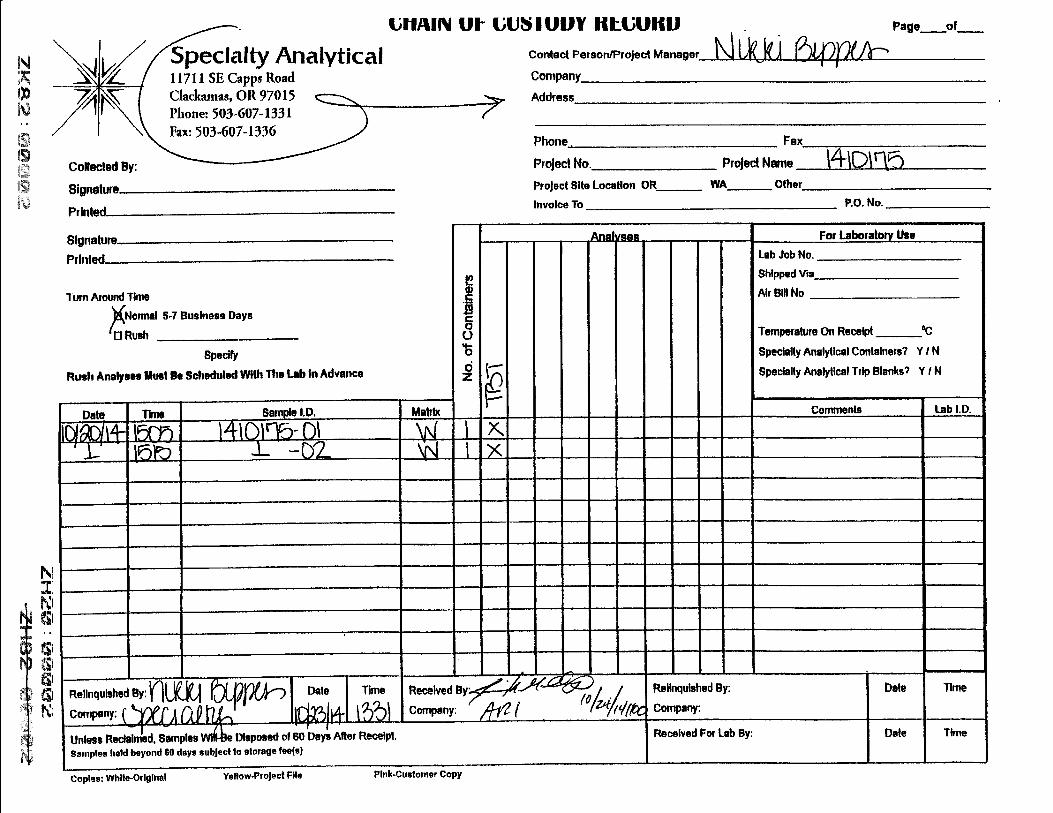
-,oCI
cn
=oa)otroe5ooa.o
'22otrcogrEE
€()FE
Tglla!o
|!.!a)oooaLau) a,
tD=to€5E;E*
5 ts
.)oG
C)
>@!oolrttoIotr43=E 39,
=cE;
pe-.Eit'83
aoIotr5IEooa-@!g
oo1E
oqrE
E4.9-30
EeF8F{'c)!a
c)
>s
R\
S+
=g- FE
Foota
ozod
lltltl|ltgtdiq*ll,F
otEIt)loIEIA
,oo,;)o
ooIIII_lIIIII
Eoto3)0o= g,3)ooA
o-c)oo-o-
oE'
t5o=t)oFLoooA(,oc0c)
I-FI-ta,-rJFIIrq--t)JJ,Lq-?IF-J
coq)oo6(,J&olrIo*q)ogFtDIo=?ott0
o(,6T'caaDE
F!t
€aoo3e!.t)
9a)o3ot-aoa>oco5g
!tll!lolglol('lqll\.
1
url.!F
IE
O0==
E)<
=F
IItIIIIIIItI
Jgd
E!o(:o0C)
iggg
]Euaq{-,aGF-brL,
tr0)nv)
9*.ltIf
PE
*" Se# : S
€a5ru#lffi -.1F

ARI Client: \40
COC i,lo(s):
Assigned ARI Job No:
tD Analytical Resources, Incorporated
a, Analytical Chemists and Consultants Cooler Receipt Form
Name: f4lo n<DeliverEd uy:@FupS Courier Hand Dellvered Other:-rreckins no, 7'7lb d894 147( ne
YES
@@*, ziot
@NO
NO
Were all botttes sealed in indivkluaf plastic bags? (G\ NO
Dd ail botfles anive in good condition (unbroken)? G', NoWere all botle labeb complete and legible? @ NO
Did the number of containers llsted on CoC match with the number of containers received? @ NoDid all bottte labels and tags agree with custody paper? llES '@
._.Were all botbE used conec{torlh€ requested analyses? (YED NO
Do any of the analyses (bottles) require preservation? (aftach preservation sheet, excluding VOCs)... @ YES NO
WereallVOo vialstree of airbubbles? @ YES NO
Was suftcient amount of sample s€nt in each bottle? .......... 1y?$ Nowas sutncreil amount or sampE 8€m an each botile? .......... ( yE$ NO,a \---lDate VOC Trip Blank was made at ARl... . ( rrAr
* Nottfy Pflect Uanager of dt*rqancies or concems n
Projecl
Prollmlnary Emmlnatlon Phate:
Were intad, prop€rly s(tned and dated custody seals attached to the outside of to cooler?
Were cBtody pap€c includ€d with the cooler?
Were custody papers ptoperly filled out (ink, signed, etc.) .............Temp€rstuG of Coole(s) ('C) (recommended 2.0$.0 'C for chemistry)Timc: _lf coohr temperature is out of complaance fil| oul fom 00070F
cooterAcceptedoy J y'h o.,"'
Log-ln Phase:
Was a temperature blank included in the cooler? YES
Whatkindofpad<ingmaterial wasused?... (BubbleWrair)fl*l{Gel Pad<siBaggiee FoamBlock Paper other:X-_-Z ---.-
{tY?$ffi \'--lv
Was Sample Spllt by ARI ' tG') YES Date/Time:- Eq.urpment- Sptit by:-
sampresLossedb$ - ..){\ "","' tUlZtJ 1t,J ,,^", I 173
Temp Gun lDf:
Samplo lD on Bottle samp|e lD on coc sample lD on BoHe Sample lD on GOC
l*1015-ror" l"t to /7 5-Dt4ton{-M7E t4bn>-oL
Addltqd Nolos, &scrqpaaclcs, C Resoludoas;
Bv: Dab:
rAlErlDdl*r ll Ht.s|..'-'&n ll arr-t
' .' ' li t^l-at-t
ElfiarltF Smell)t'sm'(<2mm)Pcabubblcc I -pb'( 2 to <4 mm )
Lrrgct"['(4to<6mm)Hcrdopacc)-hr'(>6mm)
0016F3r2no
EH.-#H : s-frS$ffr# *
Revision 014
Z"t-E&: #FG*;E*# i: r r- -ei, , *%.dSd"& f'6,t-.r
Cooler Receipt Form

aEotroe5t!oa.
,o
p-9e)cE
Ogro5e()FE
E(to=
=.>
5org
.!GC'
3'ooC
T, A
a, aD
:;TD
.BoE5
5_iggLl=
trooE
C)
;@.ltool!!.)':oa)oE
gF6*O
E!'ogo rts
E
fiEE?
g$EE
€3€.aooo=g=53
eo()l,EoEoooe!9org!o?aB
CaggEc)t
!+5EFoo
tc)
ozod
IIIII
gdflII
ooz,ttoEg.
IIIIIIIIcjz.C
)oPA
c,ooEE
xooL)
gooE
oor9I:u€t--at=
tLJ9lJeirF-;l:IOtoJEr3t)-)LI-2IaFtbJ
atoctoooIJ=orIog*o.ogIteoB'do0
o(tT!aaoFb!
DotE
l ttgt-
Ia3Do-ooO>-EotE
Ol
6tltlol.0lol6l61trlIDE
=E'
cr==
E>
(o
iggg
tu{-,rtF-i"(t.UonV,
I,EE= p{
i*E?o15o0ct
ffi${#S*: W
#ffi#*s
aL Analytical Resources, Incorporated
-4, Analytical Chemists and Consultants Gooler Receipt Form
ARI Cllcnt: \40
COC No(s):
Assigned ARI Job No:
Prullmlnary Enmln tlon Phae:
Wctc intad, propcdy slgned 8nd dated c$lody soels attachod to the outside of to cooler?
Wers custody papers Induded with tho cooler?
Were q.rgtody papec prcpedy lllled out (ink, eigned, €tc.) ........,....Temporetur€ ot Coob(s) ("C) (rscomtnsnded 2.0€.0 'C br chemistry)Time:_lf coolertgmpsrature F out of compllance
"lnKoooToF
,r1***,, l4(b fi4Deliwmd by,t6EFupS Couder Hand Delivercd oher:-rrackins no, 7-? lb O894 ..147(- xe
6c@No
t*rro"**. ffifmSZCoolerAcoepted by:
formsadatbch dl &,cumqrts
nWasatsmp€retureblankinduded inth€cooler? ..................,s.,''..i,.... YES (*!9|
wcre a[ botle8 seal€d in individual ptastic bags? .e No
Did all bottlec anive in good condition (unboken)? \try NO
were all botte labels complete and legible? @ No
Did the numbsrof contein€F listed on COC mdctr with the number of containers receiv€d? ................ @ NO
Dirl all bottte labeb and tra$ agree with custody papers? ................. YlS @wers all bottles used coned forthe requ,ested analyses? @ No
Do any of the analyses (bott€s) Bqulre pl€sawaton? (ettach pre€eilatlon sh€et, excluding VOCs),.. @ YES NO
Werc allVOC viab fise of air bubbles? @ YES No
Wassultlcieniamountof samplesent in each bottle? dO No-A V
Date VOC Trip Blank was made etARl,., '@Wessempl€sp|iibyAR|'1s)YEsDat€/Timo:-Equip'f€nt-Sp|itby:-
\-/t-
sampbsloggeoor, - .1i'h o "t, rclz4f t,/ rnnc' ll(6* Nofdfry Wod llanagcr ot il*rryhclg or concetns -
n^", f 100
*harkindorpad{ns"",";;;;;;;;:' 6ffi;ils';''*n* FoamBrock e"n", *"*l-I*\.\
Samole lD on gon|e Semple lD on coc samue ru on EoE|e ttample lD on COC
Li t6114-o|te i4!c tt4-re[- oll4 lo r-ztl- 6ozE t4 bt7.(42
A<onet ttotgs', rygcr€pettcteq & Resoludons.'
Bv: . lYn Dere: nlt'a ldFtrBrbtbr>4mm
oo-.&ttn
t.t],La ttxn
t. t.l
Smrll)"sn" (<2mm)Pcebubblcr I *pb" ( 2 to<tl mm )
Lrryc )'lg- ( 4 to<6 mm )
Herdrpacc)(hc" (>6mm)
0016F3t2110
HFq'#'E : ffi#ffiffiffi
Revision O14
Z."ij-* : Sr**ffi:3'ffi
Cooler Receipt Form

.sEotrgooJ|3oEI
E.o
';oE:Jotrc.!E
65eO
FE
To(,O
GccG
OE
398.a,
att
!i@=to=ECi-oYg
€tsloE()
@llo0a,L
=toEoEE
"$
E3
E3
E€
E=
8sorgE
gEE
-e€()g
>
--:AT
DEF
EF
E<
>
Td--
9E:.
BF
ggoc)c.o
d-odFoC'
Ec
ooIIIII
gIIII
Et
oEt6a)os(r,
6oEA
oEozC)
oEo-IIIIIIc;z.C
'ot
Eo.
L'0,CD
og6=ooE0-troIooC)
ocoo
I,I))Jar!:I-tD))h),_-(-I)0lT,*{J
CL
o(,oEootI:EAoEIoF!ri€I6oeI=aoCI
oo
oa,c61tsaa3=.>
!.E
Oole€vro
(,lDaoO=-aa!Fotr,3E
olGI
olilol3l!0lt-lr{)l
E*
s€
(f)tf|
gr-(.ir:rclr?N3ql'1 cog8=
xF
.F
r\g\od!iJIto(J
(!sane.(!Ov,N
-iiua-{-,-}(uF-l',.EU(uo.V
I
IEtot
;aItoao0o
Ets?*
1 L*h#**Fiil*
E *,"f* #,ffixiB
:#,
xoII
Hry{+
:ry r rywffi#5fii

tD Anatytical Resources, Incorporated
at Analytical Chemists and Consultants Gooler Receipt Form(1
nnre Ctl-CoCNo(s): t t
@Assigned ARf Job No: ?fr?t
Prcllmlnary Exarnlnation Phase:
Ir[fjJbB'* fc) (recommended 2 0'6'0 "crorchemistry)
lf cooler temperature is out of compliance fill out form 00070F
--- -Preiee'Name ' -/]4 \'UUQ---
Were intacl, properly sbned and dated custody seals attached to the outsHe of to cooler?
Were custody papers included with the coolef
Were custody papers properlyfilled out (tnk, signed, etc.) ,............
?.3
YES
(es>
@
coorerAcceprec oy: r4.,,/ o"t"' /:rl(1 /l t{ rime ICBSComptete custody fonns and at'€,ch att shiwtng documents
@NO
NO
Delivered Ov: qeO-pUeS Courier Hand Delivered Other.-rrackins no' ?1 t n)43Q 3a94 xn
-remp ^**'Wryryilfi
Log-ln Phase:
Was a temperature blank included in the cooler?
what kind of packing materialwas used? . {g@p wet lce @9!i Baggies Foam Block
Was suffcient ice used (if appropriate)? ...... ,,. ...... .
Were all bottles sealed in individual plastE bags?
Dd all bottlG arnve rn good condilion (unbroken)?
Were all bottb labels cornplete and legtble?
Did the number of containers hsted on COC match wrth the number of containers received? . .. ... . ....
Did all bottle labels and tags agree with custody papers?
Were all bottles used conect for the requested analyses?
Do any of the analyses (bottles) require preservation? (attach preservation sheet, excluding VOCs)...
Were all VOC vials free of arr bubbles?
Was sufficient amount of sample sent in each bottle?
Date VOC Trip Blank was made at ARl... .., ......
was sample Split by ARI , 8, YEs Dateffime:- Equrpment'
YES
Other:-YES
YES
(ts\-'.-:,(/Ec\5)'
HYES
YES
€e@ot
Papet
NA
@
@@NO
NO
NO
NO
NO
NO
NO
NO
Split by:
samples Lossed uv' A,/ on"' i}ln ft I -rine' /04O** Natify Prolect *lanager of dlscrepancies or concems n
Sample lD on Bofrle uamob tu on srJr, Sample lD on Bottle Sample lD on cOC
Addittonal lVotes, Dlscrepanci*, l3 Resolut ons.'
Bv' Date:
RGE*reubd€r
roaPa*ul*lrs' Small)*sm" (<2mm)
Pcabubbles ) 'pb" ( 2 1o < 4 mm )
Large)"lg"(4to<6mm)Hcedsprce)"hs" (>6mm)
0016F312,10
tr3'{#tr r ffi##ffi1F
Revision 014
;{Ff*:@ffi**$*ffi
Cooler Receipt Form

SampJ.e ID
sampre rD cross Reference Report iiiiqe+@INCORPORATED
ARI Job No: ZK82Cl-ient: Specialty Analytical
Pro j ect Event : 1,41017 5 /1-41017 4 /l'41008 9
Proiect Name: N/A
ARI ARILab ID LIMST ID t'tatrix Samp]-e Date,/Time VTSR
1. 1410175-012. r4r0l15-023. 14]0]7 4-0L4 . 1.41,017 4-025. 1410089-0016. 1410089-002
zK82A 1,4-24995 Water 10/20/I4 15:05 1'O/24/74 11:00ZK82B 14-24996 Water t0/20/L4 15:15 10/24/1'4 11:00zK82c 14-24997 Water 10/2L/74 11:10 I0/24/I4 11:00zK82B 1,4-24998 Water 10/2I/I4 l-l-:45 1'0/24/14 11:00zK82C t4-24999 Water 1'0/13/14 L1-:22 70/24/I4 11:00zK82B t4-25000 Water 1.0/13/L4 11:57 L0/24/14 1l-:00
HF4#E : ###trS3
Printed 7t/1,8/14 Page 1 of 1

ORGAIVICS ANAIJYSIS DATA SHEETTributyl Tins by Sw8270D-SIM cclMsExtraction Method: SW3510CPage 1 of 1
Lab Sample ID: ZKa2ALIMS ID: L4-24995Matrix: WaterData Release Authorized:\\t:VReported: lL/21/t4
Dat.e Extracted: ll/19 /L4Date Analyzed: Ll/21,/L4 l-O:56Instrument/Anal-yst : NT12 /VTS
CAS Nurnber Analyte
ANALYTICALaiRESOURCES\7INCORPORATED
Sample ID: 1410175-01SAI{PLE
QC Report No: zK82-specialty Anal-yticalProj ect : l-41-0r-75 / 1,4LOL7 4 /l-410089
Event.: NADate Sampled: lO /20 /1-4
Date Received: lO/24/!4
Sample Amount: 150 mLFinal Extract. Volume: 0.50 mL
Dilution Factor: 1.00Afumina Cleanup: Yes
LOQ Result O
36643 *28 - 4 Tributyltin Ion U. UU5 < 0.005
Reported in pglr, (ppb)
TBT Suffogatse Recovery
Tripropyl Tin Chl-oride 52.72Tripentyl Tin Chloride 72.22
""f$sSeP: fe$&.#6frq;&FORM I
ffiF

AN,^rv?r.^^r la*=$l'#;;@ORGA}IICS AI{ALYSIS DATA SIIEET INCORPORATEDTributyl Tine by SW8270D-SIM GCIMS Sample ID: L4L0L75-02Extraction Method: SW3510C SAIfPLEPage L of 1-
Lab Sample ID: ZK82B QC Report No: ZK82-Specialty AnalyticalLrMS fD: t4-24995 Project: 14101-75 /1,41,01,74/ l-410089Matrix: Water \^ Event: NAData Release Authorized, \\rl Date Sampled: !0/20/1,4Reported: LL/2L/14 Date Received: 1,0/24/L4
Date Extracted: lL/1-9/L4 Sample Amount: 150 mLDate Analyzed:. LT/2L/I4 11:16 Final- Extract Volume: 0.50 mLTnstrument/Ana1yst: NT12/VTS Dilution Factor: l-.00
Al-umina Cleanup: Yes
CAS Number Arralyte LOQ Result O
36543-28-4 Tributyltin Ion 0.005 < 0.005 U
Reported in pglr, (ppb)
TBT Surogate Recovery
Tripropyl Tin Chloride 48.0?Tripentyl Tin Chloride 65.9t
?r4ds"€p : {frflftffiFF #tFORM I
ffi

ORGAIIICS AI{ALYSIS DATA SHEETTributyl Tins by SW8270D-SIM GCIMSExtraction Method: SW3510CPage 1 of l-
Lab Samp1e ID: ZK82CLIMS ID: L4-24997Matrix: WaterData Release Authorizedt\\WReported: 1,!/2L/L4
Date Extracted: 1,1,/L9/14Date Anafyzed: 11,/2L/a4 L]-t37Instrument/Analyst : NTI-2 /VTS
CAS Nurnber Analyte
ANALYnCAL(aRESOURCES \ZINCORPORATED
sample rD: 1410174-01SAI{PLE
QC Report No: ZK82-Specialty Anal-ytical-Projecr : 1410175 / r4L0L7 4 /l-410089
Event: NADate Sampled: lo/zt/t+
Date Received: lo /24/14
Sample Arnount: 150 mLFinal- Extract Volume: 0.50 mL
Dilution Factor: 1.00Al-umina Cleanurr: Yes
LOQ Result O
36643 -28 - 4 Tributyltin lon 0.005 < 0.005 u
Reported in pg/t (ppb)
TBT Surogate Recovery
TripropylTripentyl
Chloride 50.4?Ch]oride 72.2t
'1 an'L l_n

ixsbns*@INCORPORATEDORGAI{ICS AI{ALYSIS DATA SHEET
Tributyl Tins by SW8270D-SIM cClMSExtraction Method: SW3510CPage l- of L
Lab Sample ID: ZK82DLIMS ID: 1-4-24998Matrix: Water
iDaLa Release Authorized$\NJWReported t1/2L/La
Dat.e Extracted: 1,1- / 1,9 / 14Date Analyzed: LL/2L/L4 11:57Instrument/Analyst : NTI-2 /VTS
CAS Number Analyte
Sample ID: L LOL74-02SAI{PI.E
QC Report No:Proj ect:
Event:Date Sampled:
Date Received:
ZK82 -Specialty Analyticalt4tot7 s / t4!or7 4 / 1,410 0 I 9NAt0 /2!/t4L0/24/14
Sample Arnount: 150 mLFinal Extract VoLume: 0.50 mL
Diluti-on Factor: 1.00Alumina Cfeanup: Yes
LOQ Result O
35643 -28 -4 Tributyltin Ion 0.005
Reported in pg/L (ppb)
TBT Surrogate Recovery
< 0.005
TripropylTripentyl
Chloride 47.52Chloride 56.22
TinTin
trFf Se*P ' ffiSftffiq %F ,- r!!i r:, lll I r! !!! F ; I

Alsbffsrb@INCORPORATEDORGAIVICS AIVAI,YSIS DATA SHEET
Tributyl Tins by Sw8270D-SIM GCIMSExtraction Method: SW3510CPage l- of 1
Lab Samp1e ID: ZK82FLTMS ID:14-25000Matrix: WaterDat,a Release Authorized :'\nprReported: L1,/2L/L4
Date Extracted. 1,L/1,9/L4Date Analyzed: lL/2L/L4 12:I7Instrument/Analyst : NT12/VTS
CAS Nunber Arralyte
Sample ID: 1410089-002SAIVIPLE
QC Report No:Proj ect :
Event:Date Sampled:
Date Received:
ZK82 -Specialty AnalyticalaALOL1 5 / t4LOt7 4 / t4 r_0 08 9NAto/t3/1,4t0 /24 /1-4
Sample AmounL: 150 mLFinal Extract Volume: 0.50 mL
Di]ution FacLor: l- . 00Alumina Cleanup: Yes
LOQ Results
35643 -28-4 Tributvl-tin Ion 0.005 < 0.005 U
Reported in yg/L (ppb)
TBT Surrogate Recovery
Tripropyl TinTripentyl Tin
Chl-oride 55. 5?Chloride 78.2+

ORGAI{ICS AI{AI.YSIS DATA SHEETTributyl Tins by SW8270D-SIM GCIMSExtraction Method: SW3510CPage 1 of 1-
Lab Sample ID: MB-1L191-4LIMS ID:. 14-24995Matrix: WaterData Release Authorized.:^\jReported: LL/2L/1,4
Date Extracted : ll/19/1,4Date Analyzed: !!/21/14 09:56Instrument/.Anal-yst : NT12 /VTS
CAS Nurnber Arralyte
Sample ID: MB-111914METHOD BLA.I.IK
QC Report No: ZK82-Specialty AnalyticalProject : 141-0175 / L4tOt7 4 /1410089
Event: NADate Sampled: NA
Date Received: NA
Sample Arnount: 150 mLFinal Extract Volume: 0.50 mL
Dilution FacLor: l-.00Al-umina Cleanun: Yes
LOQ ReEult A
36643 -28 - 4 TribuLyltin Ion 0.005
Reported rn pg/t (ppb)
TBT Surrogate Recovery
Tripropyl Tin Chloride 53.8?Tripentyl Tin Chloride 73.3t
< 0.005
r9 & F9, F 4+'AiSgW&'t M ffi

ORGANICS ATiIALYSIS DATA SHEETTributyl Tine by SW8270D-SIM GCIMSPage l- of l-
Lab Sample ID: LCS-11191-4LIMS ID: L4-24995Matrix: Water
^\ IData Release Authorized:' 1\\JReport.ed: LL/21/14
Date Extracted LCS: !L/19/1,4
Date Analyzed LCS: ]-:-/Zt/t4 10:16r,csD: lL/2t/t4 10:36
InsLrument./.Analyst LCS : NTI-2/VTSLCSD: NT12/VTS
Analyte
ANALYTICAL II'ARESOUR;;;VINCORPORATED
Sample ID: LCS-111914I.AB CONTROL SAII'PLE
QC Report No: ZKB2-Specialty AnalyticalProject : 1410175 / LALOl',l 4 /141-0089
Date Sampled: NADate Received: NA
Sample Amount LCS: 150 mLLCSD: 150 mL
Final Extract Vol-ume LCS: 0.50 mLLCSD: 0.50 mL
Dilution Factor LCS: l-.00LCSD: 1.00
Alumina Cleanup: Yes
Sptke LCS spike LCSDLCS Added-LCS Recovery LCSD Added-LCSD Recovery RPD
Tributvltin lon 0.0s1 o.o74 68 .92
Reported in pgll (ppb)
RPD calculated using sampl-e concentrations per SW845.
TBT Surrogate Recovery
0.055 o.o74 7s.72 9.32
Tripropyl TinTripentyl Tin
ChlorideChloride
LCS LCSD52 .7t 60 .927L.5t 83.22

Arstilsrb@INCORPORATEDORGAI{ICS AI.IALYSIS DATA SHEET
Tributyl Tins by SW8270D-SIMExtraction Method: SW3510CPase 1 of 1
Lab Sample ID: ZK82ELIMS ID z 74-24999Matrix: WaterData Rel-ease Authorized:Reported: 7L / 24 / L4
Date Extracted z 1,1/ 2I / 1,4
Date Analyzedz 11,/22/14 L2:23Instrument/Analyst : NT12/VTS
CAS Nunber Anal-yte
,w
GClMS Sample ID: 1410089-001SAIVIPLE
A/- Pannrf NTn.
Proj ect :
Event:l-lrf a Qamnl od'
Date Received:
ZK82-Specialty Analyticalr 4L0r7 5 / 1 41,0L'7 4 / L 41,0 08 9NA70/13/14L0/24/14
Sample Amount: 150 mLFinal Extract Vol-ume: 0.50 mL
Di-lution Factor: 1.00Al-umina Cf eanup: Yes
LOQ Result A
36643-28-4 rrrluLJr 0.005 < 0.005
Ranarl-ad in rrnlT /nnl'r\!\EIrv! LEU rrl FrY / ! \Ilyy I
TBT Surrogate Recovery
L L Lt/L vuI L Chl-ori-deChloride
34.0%49 .02
f_+ " +*skFed s4j- F4 ;Fq i@ , (€-E ef$ Ai+E ' E g*e ffi-

ORGA}IICS AI{AI,YSIS DATA SHEETTributyl Tins by SW8270D-SIM cClMSExtraction Mettrod: SW3510CPage 1 of 1
Lab Sample f D: MB-71,27I4LIMS ID: I4-24ggg .n,Matrix: Water /nData Release Authorizedz y'"Reported: I1,/24/14
Date Extracted: lI/2I/14Date Analyzed: LL/22/14 1L:23Instrument/Analyst : NT12/VTS
CAS Nunber AnaLyte
ANALYTICA'@RESOURCES\ZINCORPORATED
SampJ-e ID: MB-112114METHOD BI,ANK
QC Report No: ZK82-Specialty Analytical-Prol ect : 14 10175 /I41,O1,7 4 /141,0089
Event: NAD:fc Semnlori . NA
Date Recei-ved: NA
SampJ-e Amount:Finaf Extract Volume:
Dil-ution Factor:Alumina Cleanup:
LOQ
1-50 mL0.50 mL1.00Yes
Result O
36643-28- 4 0.005 < 0. 005
Ranarl-arl in ttn/I /nnl-r\]\sl'v!Leu rrr FrYl! \yt/v,/
TBT Surrogate Recovery
'l'rl nr^h\r | 'l'r n
'l rl nant\, I I'r hChforideChl-oride
56.8%76.52
J:F{ !ffii.ff : #W# 5" T FORM I
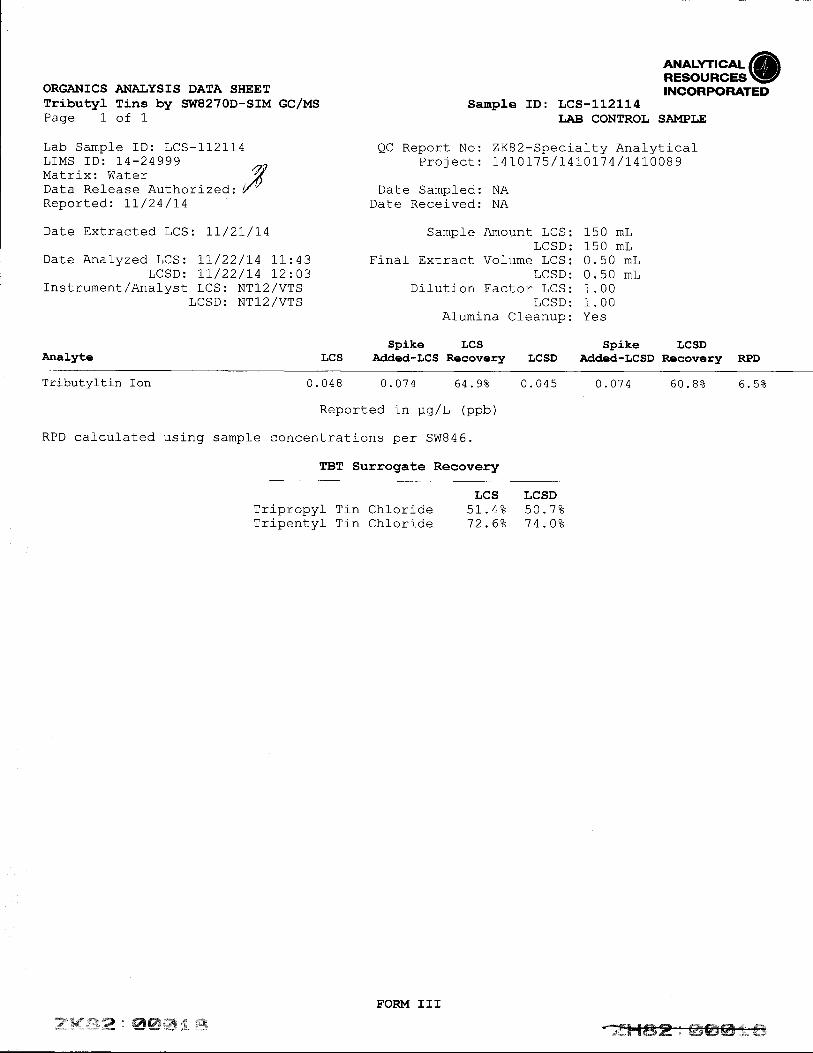
ORGAr{ICS AI\IALYSIS DATA SHEETTributyJ- Tins by SDI8270D-SIM GCIMSPage 1 of 1
Lab Sample ID: LCS-1,I2IIALIMS ID:. 14-24999Matrix: WaterData Rel-ease Authorized:Renortecl:. 11 /24 /14
LCSD: IL/22/1,4 12t03lnstrument/Analyst LCS: NT12/VTS
LCSD: NT12/VTS
Ana]-yte
ANALYT|GA'(aRESOURCES \!ZINCORPORATED
Sample ID: LCS-112114LAB CONTROL SAI"IPLE
QC Report No: ZKB2-Specialty AnalyticalProj ect: 14 10175 /1-4L011 4 /I470O89
Date Sampled: NADate Received: NA
LCSD: 0.50 mLDi-lution Factor LCS: 1.00
LCSD: 1.00Afumina Cleanup: Yes
Spike LCS Spike LCSDLCS Added-LCS Recovery LCSD Added-LCSD Recovery RPD
Date Extracted LCS: LI/2I/14 a:mnl a amnrrn+ r /-$. 150 mLLCSD: 150 mL
Date Anal-yzed LCS:. 11 /22/14 1-1-:43 Final Extract Vofume LCS: 0.50 mL
Tril-rrr+,,r+i- ran 0.048 0.0.74 64.9% 0.045 0.0.1 4 60.89 6.59
Reported in p,g/L (ppb)
RPD cafcufated using sample concentrations per SW846.
TBT Surrogate Recovery
LCS LCSDn- j ^-^^..r mr ^ ^hloride 51,.42 50.'72rrflrrvvJ! rrrr vlTripentyl Tin Chloride 72.6eo 74.Oeo
tr&.fffi.:# : ffis*4ffi€ Sq
FORM III
'=ffi
Arssffsr!@INCORPORATED
TBT SI'RROGATE RECOVERY SI'MIIARY
Matrix: Water
/ TPRT'I :(TPNT) :
Client ID
A1- Pannrf Ir'Tn. 7.K9,2-Qnaa i r I f rr An: I rzf i ce I
Project : 14I0I7 5 /L4L01-7 4 / 1470089Event: NA
TPRT TPNT TOT OUT
MB-111914LCS-111914LCSD- 1I1.9I41410175-01L4L0L'7 5-021_4IOt1 4-0L7410]-7 4-02MB_TI2I1,4LCS-II2T1-4LCSD-1121141410089-0011410089-002
T-.i ^-^^.,1 nr 6 .hf Orider!fy!vy)/
Tri-'oentvl Tin Chloride
53.8? 13.3252.'le" 7r.5260. 9? 83.2252 .'7 e" '7 2 .2eo48.0? 65.9e"50.48 12.2241 .62 66.2256.8U 16.5251.42 72.6250.7? 7 4.0234.02 49.0%55.53 J8.2e"
000000000000
QC LIMITS(2r_L20)(22-1,20)
Prep Method: SW3510CAnalytical- Method: Low TBT (Hexyl) 8270D-SIM
Log Number Range: 14-24995 to 14-25000
9^na I f df / Kx /
--ks+A q4'-q " f*d%im d e%
FORM-II TBT
- r+!i-*'i-----4-.8-E++ry-j s*es vr{,futr {tdtu ' *J#-#A 6P

Appendix D
October 2014 Video
Camera Surveys
Client: DTNA Job Number:
Project: Date:
Site: Field Staff:
Weather: Time In/Out:
SITE AND SAMPLING OBSERVATIONS
Sample ID: Media/matrix: Solid Sampling Time: 1741 Analytical Laboratory:
# Containers/Type Preservative Analysis/Method Field Filtered Filter Size MS/MSD Duplicate ID
NA NA NA NA
4. PAHs
FAT CUTOFF VALVE VAULT Specialty
2/8 oz jar NA 1. PCB Aroclors
2. Metals (Cd, Cr, Cu, Pb,
Zn)
3. Phthalates
LABORATORY SAMPLE DATA
EQUIPMENT AND SUPPLIES
PURPOSE AND SCOPE OF FIELD ACTIVITIES
Meet with Terra Hydr (TH) to collect solids samples from Fathom storm line between Fathom Cutoff Valve Vault and City manhole
AAJ831.
Lab-supplied 4 and 8 oz jars and labels. Decontaminated SS spoons wrapped in foil. New Nitrile gloves.
Samples collected on east and west sides of vault where materials had accumulated. Larger materials. Metal (washers), organics
(leaves and sticks) and paint chips. Estimated to be 1-2 inches of solids near the sides of the vault away from flow from Fathom
Outfall.
Sunny, clear 1600 - 1815
DTNA-001
SCE 10/10/2014
Western Star TMP ASJ/Terra Hydr

Client: DTNA Job Number:
Project: Date:
Site: Field Staff:
Weather: Time In/Out:
SITE AND SAMPLING OBSERVATIONS
Sample ID: Media/matrix: Solid Sampling Time: 1735 Analytical Laboratory:
# Containers/Type Preservative Analysis/Method Field Filtered Filter Size MS/MSD Duplicate ID
NA NA NA NA
4. PAHs
FAT-0-16 Specialty
1/8 oz jar NA 1. PCB Aroclors
2. Metals (Cd, Cr, Cu, Pb,
Zn)
3. Phthalates
LABORATORY SAMPLE DATA
EQUIPMENT AND SUPPLIES
PURPOSE AND SCOPE OF FIELD ACTIVITIES
Meet with Terra Hydr (TH) to collect solids samples from Fathom storm line between Fathom Cutoff Valve Vault and City manhole
AAJ831.
Lab-supplied 4 and 8 oz jars and labels. Decontaminated SS spoons wrapped in foil. New Nitrile gloves.
Sample collected between 0 and 16 feet downstream of Fathom cutoff valve vault. Fine sand-sized materials. Paint chips visible.
Estimated 1/2 inch thickness in pipe.
Sunny, clear 1600 - 1815
DTNA-001
SCE 10/10/2014
Western Star TMP ASJ/Terra Hydr
Client: DTNA Job Number:
Project: Date:
Site: Field Staff:
Weather: Time In/Out:
SITE AND SAMPLING OBSERVATIONS
Sample ID: Media/matrix: Solid Sampling Time: 1730 Analytical Laboratory:
# Containers/Type Preservative Analysis/Method Field Filtered Filter Size MS/MSD Duplicate ID
NA NA NA NA
4. PAHs
FAT-35-45 Specialty
1/8 oz jar NA 1. PCB Aroclors
2. Metals (Cd, Cr, Cu, Pb,
Zn)
3. Phthalates
LABORATORY SAMPLE DATA
EQUIPMENT AND SUPPLIES
PURPOSE AND SCOPE OF FIELD ACTIVITIES
Meet with Terra Hydr (TH) to collect solids samples from Fathom storm line between Fathom Cutoff Valve Vault and City manhole
AAJ831.
Lab-supplied 4 and 8 oz jars and labels. Decontaminated SS spoons wrapped in foil. New Nitrile gloves.
Sample collected between 35 and 45 feet downstream of Fathom cutoff valve vault. Black medium-coarse sand-sized materials.
Organics, paint chips visible. Estimated 1/2 inch thickness in pipe.
Sunny, clear 1600 - 1815
DTNA-001
SCE 10/10/2014
Western Star TMP ASJ/Terra Hydr
Client: DTNA Job Number:
Project: Date:
Site: Field Staff:
Weather: Time In/Out:
SITE AND SAMPLING OBSERVATIONS
Sample ID: Media/matrix: Solid Sampling Time: 1727 Analytical Laboratory:
# Containers/Type Preservative Analysis/Method Field Filtered Filter Size MS/MSD Duplicate ID
NA NA NA NA
Sunny, clear 1600 - 1815
DTNA-001
SCE 10/10/2014
Western Star TMP ASJ/Terra Hydr
LABORATORY SAMPLE DATA
EQUIPMENT AND SUPPLIES
PURPOSE AND SCOPE OF FIELD ACTIVITIES
Meet with Terra Hydr (TH) to collect solids samples from Fathom storm line between Fathom Cutoff Valve Vault and City manhole
AAJ831.
Lab-supplied 4 and 8 oz jars and labels. Decontaminated SS spoons wrapped in foil. New Nitrile gloves.
Sample collected between 45 and 63 feet downstream of Fathom cutoff valve vault. Black fine-coarse sand-sized materials.
Organics, paint chips visible. Estimated 1/2 inch thickness in pipe.
FAT-45-65 Specialty
2/4 oz jar NA 1. PCB Aroclors
2. Metals (Cd, Cr, Cu, Pb,
Zn)
3. Phthalates
4. PAHs
Client: DTNA Job Number:
Project: Date:
Site: Field Staff:
Weather: Time In/Out:
SITE AND SAMPLING OBSERVATIONS
Sample ID: Media/matrix: Solid Sampling Time: 1723 Analytical Laboratory:
# Containers/Type Preservative Analysis/Method Field Filtered Filter Size MS/MSD Duplicate ID
NA NA NA NA
4. PAHs
FAT-63-75 Specialty
1/8 oz jar NA 1. PCB Aroclors
2. Metals (Cd, Cr, Cu, Pb,
Zn)
3. Phthalates
LABORATORY SAMPLE DATA
EQUIPMENT AND SUPPLIES
PURPOSE AND SCOPE OF FIELD ACTIVITIES
Meet with Terra Hydr (TH) to collect solids samples from Fathom storm line between Fathom Cutoff Valve Vault and City manhole
AAJ831.
Lab-supplied 4 and 8 oz jars and labels. Decontaminated SS spoons wrapped in foil. New Nitrile gloves.
Sample collected between 63 and 75 feet downstream of Fathom cutoff valve vault. Black fine-coarse sand-sized materials.
Organics, paint chips visible. Estimated 3 inch thickness in pipe.
Sunny, clear 1600 - 1815
DTNA-001
SCE 10/10/2014
Western Star TMP ASJ/Terra Hydr
Client: DTNA Job Number:
Project: Date:
Site: Field Staff:
Weather: Time In/Out:
SITE AND SAMPLING OBSERVATIONS
Sample ID: Media/matrix: Solid Sampling Time: 1720 Analytical Laboratory:
# Containers/Type Preservative Analysis/Method Field Filtered Filter Size MS/MSD Duplicate ID
NA NA NA NA
Sunny, clear 1600 - 1815
DTNA-001
SCE 10/10/2014
Western Star TMP ASJ/Terra Hydr
LABORATORY SAMPLE DATA
EQUIPMENT AND SUPPLIES
PURPOSE AND SCOPE OF FIELD ACTIVITIES
Meet with Terra Hydr (TH) to collect solids samples from Fathom storm line between Fathom Cutoff Valve Vault and City manhole
AAJ831.
Lab-supplied 4 oz jars and labels. Decontaminated SS spoons wrapped in foil. New Nitrile gloves.
Sample collected between 75 and 90 feet downstream of Fathom cutoff valve vault. Black fine-coarse sand-sized materials.
Organics, paint chips visible. Estimated to be 2 inches in bottom of pipe.
FATHOM-75-90 Specialty
1/4 oz jar NA 1. PCB Aroclors
2. Metals (Cd, Cr, Cu, Pb,
Zn)
3. Phthalates
4. PAHs

Appendix E
Field Sampling Data Sheets for October 2014 Fathom Line
Solids Samples
DTNA-001-14Oct-QAQC-solids.doc PAGE 1
DATA QUALITY ASSURANCE/
QUALITY CONTROL REVIEW PROJECT NO. DTNA-001 | NOVEMBER 12, 2014 | DAIMLER TRUCKS NA
This report reviews the analytical results for six solids samples collected by the Bridgewater Group, Inc. for Daimler Trucks NA on October 10, 2014 in Portland, Oregon. All samples were transported under strict chain-of-custody procedures.
Specialty Analytical Labs (SA) in Clackamas, Oregon performed most analyses. SA sent samples to Neilson Research Corporation (NRC) in Medford, Oregon for USEPA SW6010B analysis. SA order number 1410091 and NRC order number 1410639 were reviewed. The analyses performed are listed below.
Analysis Reference
Metals USEPA SW6010B
Semi-Volatile Organics (Phthalates) USEPA SW8270D
Polycyclic Aromatic Hydrocarbons (PAHs) USEPA SW8270D
Polychlorinated Biphenyls (PCBs) USEPA SW8082A
USEPA = U.S. Environmental Protection Agency
DATA QUALIFICATIONS
Analytical results were evaluated according to applicable sections of USEPA procedures (USEPA, 2008, 2010) and appropriate laboratory and method-specific guidelines (SA, 2012; USEPA, 1986).
Four SW8270D phthalate non-detect results were Q qualified, indicating elevated detection levels due to sample matrix. SA also reported difficulty recovering surrogate and matrix spikes for SW8082A PCB analyses due to matrix interference. As detailed in this review, other quality control checks also point to inconsistent and possibly low measurements of PCBs.
The data are considered acceptable for their intended use, with the appropriate data qualifiers assigned.
HOLDING TIMES, PRESERVATION, AND SAMPLE STORAGE
Holding Times
Extractions and analyses were performed within the recommended holding time criteria.
Preservation and Sample Storage
The samples were preserved and stored appropriately.

DTNA-001-14Oct-QAQC-solids.doc PAGE 2
BLANKS
Method Blanks
Laboratory method blank analyses were performed at the required frequencies. No target analytes were detected above the reporting limits (RLs) in the method blanks.
Trip Blanks
Trip blanks were not required for this sampling event.
Field Blanks
Field blanks were not required for this sampling event.
Equipment Rinsate Blanks
Equipment rinsate blanks were not required for this sampling event, as all samples were collected using single-use equipment.
SURROGATE RECOVERY RESULTS
Samples were spiked with surrogate compounds to evaluate laboratory performance on individual samples. Surrogate recoveries fell outside control limits for all six PCB analyses due to matrix interference. Three recoveries were high, one was low, and two were zero. PCB measurements in samples were all non-detect, but these results might have been low due to matrix interference.
Of eighteen phthalate surrogate recoveries, three were above the upper control limit and six were below the lower control limit. One exceedance was attributed to matrix interference and the other two were still less than full recovery. The six low recoveries were all associated with diluted samples and attributed to matrix interference.
Associated batch quality assurance/quality control for samples with surrogate outliers was within acceptance limits. All remaining surrogate recoveries were within acceptance limits.
MATRIX SPIKE/MATRIX SPIKE DUPLICATE RESULTS
Matrix spike/matrix spike duplicates (MS/MSD) are field samples spiked with target analytes to provide information on laboratory precision and accuracy specific to the sample matrix. The MS/MSD samples were extracted and analyzed at the required frequency.
Recoveries of the SW8082A PCB matrix spikes were both above the upper control limit. The relative percent difference (RPD) for the MS/MSD pair also exceeded the limit, suggesting poor reproducibility of results due to the sample matrix.
Recoveries of 2 of 16 SW8270D PAH matrix spikes fell below lower control limits. RPDs for 2 of 16 MS/MSD pairs exceeded the limit by less than 4%. Associated quality assurance/quality control results for SW8270D were within acceptance limits and no degradation of data quality is suspected.

DTNA-001-14Oct-QAQC-solids.doc PAGE 3
Recoveries for SW6010B matrix spikes were within control limits except for one zinc MSD exceeding the upper control limit by 2% due to matrix interference. RPDs for SW6010B MS/MSD pairs were all within limits.
LABORATORY CONTROL SAMPLE/LABORATORY CONTROL
SAMPLE DUPLICATE RESULTS
Laboratory control sample/laboratory control sample duplicates (LCS/LCSD) are laboratory prepared samples spiked with target analytes to provide information on laboratory precision and accuracy independent of possible field sample matrix interference. LCS extractions and analyses were performed at the required frequency. All LCS analytes were within acceptance limits for percent recovery. LCSD analyses were not required for this sampling event.
FIELD DUPLICATE RESULTS
Field duplicates were not required for this sampling event.
REPORTING LIMITS
SA and NRC used routine reporting limits for non-detect results, with the exception of samples requiring dilutions because of high analyte concentrations and/or matrix interferences.
DATA PACKAGE
The data package was reviewed for transcription errors, omissions, and anomalies. None were found.
DTNA-001-14Oct-QAQC-solids.doc
REFERENCES
USEPA. 2008. USEPA contract laboratory program, national functional guidelines for
organics data review. EPA 540/R-08/01. U.S. Environmental Protection Agency, Office of Emergency and Remedial Response. June.
USEPA. 2010. USEPA contract laboratory program, national functional guidelines for inorganics data review. EPA 540/R-94/013. U.S. Environmental Protection Agency, Office of Superfund Remediation and Technology Innovation. January.
SA. 2012. Quality assurance manual. Specialty Analytical, Clackamas, Oregon.
USEPA. 1986. Test methods for evaluating solid waste: physical/chemical methods. EPA 530/SW-846. U.S. Environmental Protection Agency, Office of Solid Waste and Emergency Response. September (update 1, July 1992; update 2a, August 1993; update 2, September 1994; update 2b, January 1995).

October 23, 2014
Bridgewater Group Inc.Anna St. John
Dear Anna St. John:
RE: Fathom Post-Cleanout Solids Sampling / DTNA-001
Order No.: 1410091
FAX (503) 675-1960TEL: (503) 675-5252
4500 SW Kruse WaySte 110Lake Oswego, OR 97035
Specialty Analytical11711 SE Capps Road, Ste B
Clackamas, Oregon 97015
Website: www.specialtyanalytical.comTEL: 503-607-1331 FAX: 503-607-1336
Specialty Analytical received 6 sample(s) on 10/14/2014 for the analyses presented in the following report.
Marty French
There were no problems with the analysis and all data for associated QC met EPA or laboratory specifications, except where noted in the Case Narrative, or as qualified with flags. Results apply only to the samples analyzed. Without approval of the laboratory, the reproduction of this report is only permitted in its entirety.
If you have any questions regarding these tests, please feel free to call.
Sincerely,
Lab Director
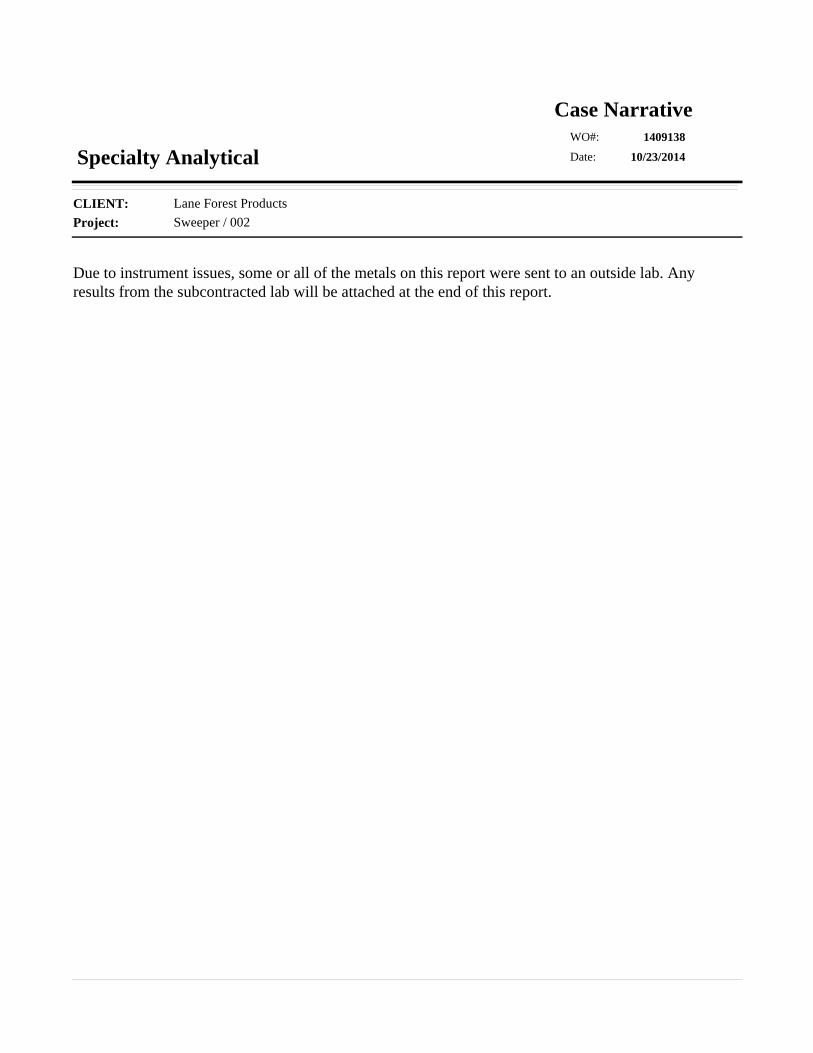
Project: Sweeper / 002CLIENT: Lane Forest Products
10/23/2014
Case Narrative1409138
Date:
WO#:
Specialty Analytical
Due to instrument issues, some or all of the metals on this report were sent to an outside lab. Any results from the subcontracted lab will be attached at the end of this report.

Project: Fathom Post-Cleanout Solids Sampling / DT
Client Sample ID: Fathom 75-90
Collection Date: 10/10/2014 5:20:00 PM
Matrix: SOLID
CLIENT: Bridgewater Group Inc.
Lab ID: 1410091-001
23-Oct-14Specialty Analytical Date Reported:
Analyses Result Qual Unit Date AnalyzedDFRL
ICP METALS- TOTAL RECOVERABLE SW6010C Analyst: sub
Cadmium 10/20/2014 12:00:00 PM0.851 mg/Kg 19.71
Chromium 10/20/2014 12:00:00 PM4.25 mg/Kg 1128
Copper 10/20/2014 12:00:00 PM0.851 mg/Kg 1143
Lead 10/20/2014 12:00:00 PM4.25 mg/Kg 142.0
Zinc 10/20/2014 12:00:00 PM4.25 mg/Kg 1502
SEMI-VOLATILE COMPOUNDS - BASE/NEUTRALSW8270D Analyst: bda
Bis(2-ethylhexyl)phthalate 10/21/2014 2:47:00 PM166 µg/Kg 514400
Butyl benzyl phthalate 10/21/2014 10:26:00 AM33.3 µg/Kg 1488
Diethyl phthalate 10/21/2014 10:26:00 AM33.3 µg/Kg 1ND
Dimethyl phthalate 10/21/2014 10:26:00 AM33.3 µg/Kg 1779
Di-n-butyl phthalate 10/21/2014 10:26:00 AM33.3 µg/Kg 1220
Di-n-octyl phthalate 10/21/2014 10:26:00 AM33.3 µg/Kg 1ND
Surr: 2-Fluorobiphenyl S 10/21/2014 10:26:00 AM52.6-93.2 %REC 197.4
Surr: 4-Terphenyl-d14 10/21/2014 10:26:00 AM49.8-118 %REC 1114
Surr: Nitrobenzene-d5 10/21/2014 10:26:00 AM44.8-103 %REC 173.2
PAH'S BY GC/MS - LOW LEVEL SW8270D Analyst: bda
Acenaphthene 10/16/2014 1:25:00 PM13.2 µg/Kg 1ND
Acenaphthylene 10/16/2014 1:25:00 PM13.2 µg/Kg 1ND
Anthracene 10/16/2014 1:25:00 PM13.2 µg/Kg 123.3
Benz(a)anthracene 10/16/2014 1:25:00 PM13.2 µg/Kg 182.6
Benzo(a)pyrene 10/16/2014 1:25:00 PM13.2 µg/Kg 1115
Benzo(b)fluoranthene 10/16/2014 1:25:00 PM13.2 µg/Kg 1156
Benzo(g,h,i)perylene 10/16/2014 1:25:00 PM13.2 µg/Kg 1128
Benzo(k)fluoranthene 10/16/2014 1:25:00 PM13.2 µg/Kg 148.7
Chrysene 10/16/2014 1:25:00 PM13.2 µg/Kg 1165
Dibenz(a,h)anthracene 10/16/2014 1:25:00 PM13.2 µg/Kg 122.0
Fluoranthene 10/16/2014 1:25:00 PM13.2 µg/Kg 1201
Fluorene 10/16/2014 1:25:00 PM13.2 µg/Kg 125.8
Indeno(1,2,3-cd)pyrene 10/16/2014 1:25:00 PM13.2 µg/Kg 186.6
Naphthalene 10/16/2014 1:25:00 PM13.2 µg/Kg 152.1
Phenanthrene 10/16/2014 1:25:00 PM13.2 µg/Kg 1140
Pyrene 10/16/2014 1:25:00 PM13.2 µg/Kg 1326
Surr: 2-Fluorobiphenyl 10/16/2014 1:25:00 PM42.6-128 %REC 180.2
Surr: Nitrobenzene-d5 10/16/2014 1:25:00 PM21.7-155 %REC 178.2
Surr: p-Terphenyl-d14 10/16/2014 1:25:00 PM44.9-155 %REC 197.4
PCB'S IN SOLIDS SW 8082A Analyst: JRC
Page 1 of 11

Project: Fathom Post-Cleanout Solids Sampling / DT
Client Sample ID: Fathom 75-90
Collection Date: 10/10/2014 5:20:00 PM
Matrix: SOLID
CLIENT: Bridgewater Group Inc.
Lab ID: 1410091-001
23-Oct-14Specialty Analytical Date Reported:
Analyses Result Qual Unit Date AnalyzedDFRL
PCB'S IN SOLIDS SW 8082A Analyst: JRC
Aroclor 1016 10/16/2014 6:14:00 PM0.333 µg/Kg 1ND
Aroclor 1221 10/16/2014 6:14:00 PM0.333 µg/Kg 1ND
Aroclor 1232 10/16/2014 6:14:00 PM0.333 µg/Kg 1ND
Aroclor 1242 10/16/2014 6:14:00 PM0.333 µg/Kg 1ND
Aroclor 1248 10/16/2014 6:14:00 PM0.333 µg/Kg 1ND
Aroclor 1254 10/16/2014 6:14:00 PM0.333 µg/Kg 1ND
Aroclor 1260 10/16/2014 6:14:00 PM0.333 µg/Kg 1ND
Aroclor 1262 10/16/2014 6:14:00 PM0.333 µg/Kg 1ND
Aroclor 1268 10/16/2014 6:14:00 PM0.333 µg/Kg 1ND
Surr: Decachlorobiphenyl SMI 10/16/2014 6:14:00 PM56.5-130 %REC 1663
Page 2 of 11
Project: Fathom Post-Cleanout Solids Sampling / DT
Client Sample ID: FAT 63-75
Collection Date: 10/10/2014 5:23:00 PM
Matrix: SOLID
CLIENT: Bridgewater Group Inc.
Lab ID: 1410091-002
23-Oct-14Specialty Analytical Date Reported:
Analyses Result Qual Unit Date AnalyzedDFRL
ICP METALS- TOTAL RECOVERABLE SW6010C Analyst: sub
Cadmium 10/20/2014 12:01:00 PM0.100 mg/Kg 12.59
Chromium 10/20/2014 12:01:00 PM0.500 mg/Kg 170.3
Copper 10/20/2014 12:01:00 PM1.00 mg/Kg 1108
Lead 10/20/2014 12:01:00 PM2.00 mg/Kg 124.1
Zinc 10/20/2014 12:01:00 PM1.00 mg/Kg 1419
SEMI-VOLATILE COMPOUNDS - BASE/NEUTRALSW8270D Analyst: bda
Bis(2-ethylhexyl)phthalate 10/21/2014 3:16:00 PM166 µg/Kg 58060
Butyl benzyl phthalate 10/21/2014 3:16:00 PM166 µg/Kg 51060
Diethyl phthalate Q 10/21/2014 3:16:00 PM166 µg/Kg 5ND
Dimethyl phthalate 10/21/2014 3:16:00 PM166 µg/Kg 5877
Di-n-butyl phthalate 10/21/2014 3:16:00 PM166 µg/Kg 5212
Di-n-octyl phthalate Q 10/21/2014 3:16:00 PM166 µg/Kg 5ND
Surr: 2-Fluorobiphenyl SMI 10/21/2014 3:16:00 PM52.6-93.2 %REC 524.6
Surr: 4-Terphenyl-d14 SMI 10/21/2014 3:16:00 PM49.8-118 %REC 541.0
Surr: Nitrobenzene-d5 10/21/2014 3:16:00 PM44.8-103 %REC 549.8
PAH'S BY GC/MS - LOW LEVEL SW8270D Analyst: bda
Acenaphthene 10/16/2014 1:49:00 PM13.2 µg/Kg 122.2
Acenaphthylene 10/16/2014 1:49:00 PM13.2 µg/Kg 1ND
Anthracene 10/16/2014 1:49:00 PM13.2 µg/Kg 124.6
Benz(a)anthracene 10/16/2014 1:49:00 PM13.2 µg/Kg 179.2
Benzo(a)pyrene 10/16/2014 1:49:00 PM13.2 µg/Kg 155.8
Benzo(b)fluoranthene 10/16/2014 1:49:00 PM13.2 µg/Kg 193.7
Benzo(g,h,i)perylene 10/16/2014 1:49:00 PM13.2 µg/Kg 183.7
Benzo(k)fluoranthene 10/16/2014 1:49:00 PM13.2 µg/Kg 127.6
Chrysene 10/16/2014 1:49:00 PM13.2 µg/Kg 1202
Dibenz(a,h)anthracene 10/16/2014 1:49:00 PM13.2 µg/Kg 122.4
Fluoranthene 10/16/2014 1:49:00 PM13.2 µg/Kg 1140
Fluorene 10/16/2014 1:49:00 PM13.2 µg/Kg 122.3
Indeno(1,2,3-cd)pyrene 10/16/2014 1:49:00 PM13.2 µg/Kg 146.4
Naphthalene 10/16/2014 1:49:00 PM13.2 µg/Kg 193.8
Phenanthrene 10/16/2014 1:49:00 PM13.2 µg/Kg 1170
Pyrene 10/16/2014 1:49:00 PM13.2 µg/Kg 1353
Surr: 2-Fluorobiphenyl 10/16/2014 1:49:00 PM42.6-128 %REC 164.2
Surr: Nitrobenzene-d5 10/16/2014 1:49:00 PM21.7-155 %REC 175.7
Surr: p-Terphenyl-d14 10/16/2014 1:49:00 PM44.9-155 %REC 181.2
PCB'S IN SOLIDS SW 8082A Analyst: JRC
Page 3 of 11

Project: Fathom Post-Cleanout Solids Sampling / DT
Client Sample ID: FAT 63-75
Collection Date: 10/10/2014 5:23:00 PM
Matrix: SOLID
CLIENT: Bridgewater Group Inc.
Lab ID: 1410091-002
23-Oct-14Specialty Analytical Date Reported:
Analyses Result Qual Unit Date AnalyzedDFRL
PCB'S IN SOLIDS SW 8082A Analyst: JRC
Aroclor 1016 10/16/2014 6:31:00 PM0.333 µg/Kg 1ND
Aroclor 1221 10/16/2014 6:31:00 PM0.333 µg/Kg 1ND
Aroclor 1232 10/16/2014 6:31:00 PM0.333 µg/Kg 1ND
Aroclor 1242 10/16/2014 6:31:00 PM0.333 µg/Kg 1ND
Aroclor 1248 10/16/2014 6:31:00 PM0.333 µg/Kg 1ND
Aroclor 1254 10/16/2014 6:31:00 PM0.333 µg/Kg 1ND
Aroclor 1260 10/16/2014 6:31:00 PM0.333 µg/Kg 1ND
Aroclor 1262 10/16/2014 6:31:00 PM0.333 µg/Kg 1ND
Aroclor 1268 10/16/2014 6:31:00 PM0.333 µg/Kg 1ND
Surr: Decachlorobiphenyl SMI 10/16/2014 6:31:00 PM56.5-130 %REC 10
Page 4 of 11

Project: Fathom Post-Cleanout Solids Sampling / DT
Client Sample ID: FAT 45-65
Collection Date: 10/10/2014 5:27:00 PM
Matrix: SOLID
CLIENT: Bridgewater Group Inc.
Lab ID: 1410091-003
23-Oct-14Specialty Analytical Date Reported:
Analyses Result Qual Unit Date AnalyzedDFRL
ICP METALS- TOTAL RECOVERABLE SW6010C Analyst: sub
Cadmium 10/20/2014 12:02:00 PM0.876 mg/Kg 18.94
Chromium 10/20/2014 12:02:00 PM4.38 mg/Kg 1316
Copper 10/20/2014 12:02:00 PM0.876 mg/Kg 1262
Lead 10/20/2014 12:02:00 PM4.38 mg/Kg 198.9
Zinc 10/20/2014 12:02:00 PM4.38 mg/Kg 1983
SEMI-VOLATILE COMPOUNDS - BASE/NEUTRALSW8270D Analyst: bda
Bis(2-ethylhexyl)phthalate 10/21/2014 4:14:00 PM166 µg/Kg 57570
Butyl benzyl phthalate 10/21/2014 11:53:00 AM33.3 µg/Kg 11050
Diethyl phthalate 10/21/2014 11:53:00 AM33.3 µg/Kg 1ND
Dimethyl phthalate 10/21/2014 11:53:00 AM33.3 µg/Kg 1860
Di-n-butyl phthalate 10/21/2014 11:53:00 AM33.3 µg/Kg 1114
Di-n-octyl phthalate 10/21/2014 11:53:00 AM33.3 µg/Kg 1ND
Surr: 2-Fluorobiphenyl 10/21/2014 11:53:00 AM52.6-93.2 %REC 158.0
Surr: 4-Terphenyl-d14 10/21/2014 11:53:00 AM49.8-118 %REC 1104
Surr: Nitrobenzene-d5 SMI 10/21/2014 11:53:00 AM44.8-103 %REC 143.8
PAH'S BY GC/MS - LOW LEVEL SW8270D Analyst: bda
Acenaphthene 10/16/2014 2:14:00 PM13.2 µg/Kg 1ND
Acenaphthylene 10/16/2014 2:14:00 PM13.2 µg/Kg 1ND
Anthracene 10/16/2014 2:14:00 PM13.2 µg/Kg 126.1
Benz(a)anthracene 10/16/2014 2:14:00 PM13.2 µg/Kg 147.6
Benzo(a)pyrene 10/16/2014 2:14:00 PM13.2 µg/Kg 155.3
Benzo(b)fluoranthene 10/16/2014 2:14:00 PM13.2 µg/Kg 194.4
Benzo(g,h,i)perylene 10/16/2014 2:14:00 PM13.2 µg/Kg 176.8
Benzo(k)fluoranthene 10/16/2014 2:14:00 PM13.2 µg/Kg 130.5
Chrysene 10/16/2014 2:14:00 PM13.2 µg/Kg 1120
Dibenz(a,h)anthracene 10/16/2014 2:14:00 PM13.2 µg/Kg 117.3
Fluoranthene 10/16/2014 2:14:00 PM13.2 µg/Kg 1121
Fluorene 10/16/2014 2:14:00 PM13.2 µg/Kg 122.8
Indeno(1,2,3-cd)pyrene 10/16/2014 2:14:00 PM13.2 µg/Kg 137.0
Naphthalene 10/16/2014 2:14:00 PM13.2 µg/Kg 153.3
Phenanthrene 10/16/2014 2:14:00 PM13.2 µg/Kg 1138
Pyrene 10/16/2014 2:14:00 PM13.2 µg/Kg 1235
Surr: 2-Fluorobiphenyl 10/16/2014 2:14:00 PM42.6-128 %REC 176.0
Surr: Nitrobenzene-d5 10/16/2014 2:14:00 PM21.7-155 %REC 179.9
Surr: p-Terphenyl-d14 10/16/2014 2:14:00 PM44.9-155 %REC 186.6
PCB'S IN SOLIDS SW 8082A Analyst: JRC
Page 5 of 11

Project: Fathom Post-Cleanout Solids Sampling / DT
Client Sample ID: FAT 45-65
Collection Date: 10/10/2014 5:27:00 PM
Matrix: SOLID
CLIENT: Bridgewater Group Inc.
Lab ID: 1410091-003
23-Oct-14Specialty Analytical Date Reported:
Analyses Result Qual Unit Date AnalyzedDFRL
PCB'S IN SOLIDS SW 8082A Analyst: JRC
Aroclor 1016 10/16/2014 7:21:00 PM0.333 µg/Kg 1ND
Aroclor 1221 10/16/2014 7:21:00 PM0.333 µg/Kg 1ND
Aroclor 1232 10/16/2014 7:21:00 PM0.333 µg/Kg 1ND
Aroclor 1242 10/16/2014 7:21:00 PM0.333 µg/Kg 1ND
Aroclor 1248 10/16/2014 7:21:00 PM0.333 µg/Kg 1ND
Aroclor 1254 10/16/2014 7:21:00 PM0.333 µg/Kg 1ND
Aroclor 1260 10/16/2014 7:21:00 PM0.333 µg/Kg 1ND
Aroclor 1262 10/16/2014 7:21:00 PM0.333 µg/Kg 1ND
Aroclor 1268 10/16/2014 7:21:00 PM0.333 µg/Kg 1ND
Surr: Decachlorobiphenyl SMI 10/16/2014 7:21:00 PM56.5-130 %REC 1296
Page 6 of 11
Project: Fathom Post-Cleanout Solids Sampling / DT
Client Sample ID: FAT 35-45
Collection Date: 10/10/2014 5:30:00 PM
Matrix: SOLID
CLIENT: Bridgewater Group Inc.
Lab ID: 1410091-004
23-Oct-14Specialty Analytical Date Reported:
Analyses Result Qual Unit Date AnalyzedDFRL
ICP METALS- TOTAL RECOVERABLE SW6010C Analyst: sub
Cadmium 10/20/2014 12:03:00 PM0.894 mg/Kg 18.38
Chromium 10/20/2014 12:03:00 PM4.47 mg/Kg 1193
Copper 10/20/2014 12:03:00 PM0.894 mg/Kg 1209
Lead 10/20/2014 12:03:00 PM4.47 mg/Kg 188.1
Zinc 10/20/2014 12:03:00 PM4.47 mg/Kg 1795
SEMI-VOLATILE COMPOUNDS - BASE/NEUTRALSW8270D Analyst: bda
Bis(2-ethylhexyl)phthalate 10/21/2014 4:43:00 PM166 µg/Kg 59830
Butyl benzyl phthalate 10/21/2014 12:22:00 PM33.3 µg/Kg 1811
Diethyl phthalate 10/21/2014 12:22:00 PM33.3 µg/Kg 1ND
Dimethyl phthalate 10/21/2014 12:22:00 PM33.3 µg/Kg 1891
Di-n-butyl phthalate 10/21/2014 12:22:00 PM33.3 µg/Kg 1126
Di-n-octyl phthalate 10/21/2014 12:22:00 PM33.3 µg/Kg 1ND
Surr: 2-Fluorobiphenyl S 10/21/2014 12:22:00 PM52.6-93.2 %REC 198.7
Surr: 4-Terphenyl-d14 SMI 10/21/2014 12:22:00 PM49.8-118 %REC 1137
Surr: Nitrobenzene-d5 10/21/2014 12:22:00 PM44.8-103 %REC 161.0
PAH'S BY GC/MS - LOW LEVEL SW8270D Analyst: bda
Acenaphthene 10/16/2014 2:38:00 PM13.2 µg/Kg 1ND
Acenaphthylene 10/16/2014 2:38:00 PM13.2 µg/Kg 1ND
Anthracene 10/16/2014 2:38:00 PM13.2 µg/Kg 122.6
Benz(a)anthracene 10/16/2014 2:38:00 PM13.2 µg/Kg 176.2
Benzo(a)pyrene 10/16/2014 2:38:00 PM13.2 µg/Kg 191.5
Benzo(b)fluoranthene 10/16/2014 2:38:00 PM13.2 µg/Kg 1151
Benzo(g,h,i)perylene 10/16/2014 2:38:00 PM13.2 µg/Kg 192.2
Benzo(k)fluoranthene 10/16/2014 2:38:00 PM13.2 µg/Kg 146.5
Chrysene 10/16/2014 2:38:00 PM13.2 µg/Kg 1153
Dibenz(a,h)anthracene 10/16/2014 2:38:00 PM13.2 µg/Kg 119.9
Fluoranthene 10/16/2014 2:38:00 PM13.2 µg/Kg 1210
Fluorene 10/16/2014 2:38:00 PM13.2 µg/Kg 116.1
Indeno(1,2,3-cd)pyrene 10/16/2014 2:38:00 PM13.2 µg/Kg 166.1
Naphthalene 10/16/2014 2:38:00 PM13.2 µg/Kg 127.2
Phenanthrene 10/16/2014 2:38:00 PM13.2 µg/Kg 1166
Pyrene 10/16/2014 2:38:00 PM13.2 µg/Kg 1284
Surr: 2-Fluorobiphenyl 10/16/2014 2:38:00 PM42.6-128 %REC 167.6
Surr: Nitrobenzene-d5 10/16/2014 2:38:00 PM21.7-155 %REC 173.0
Surr: p-Terphenyl-d14 10/16/2014 2:38:00 PM44.9-155 %REC 187.7
PCB'S IN SOLIDS SW 8082A Analyst: JRC
Page 7 of 11

Project: Fathom Post-Cleanout Solids Sampling / DT
Client Sample ID: FAT 35-45
Collection Date: 10/10/2014 5:30:00 PM
Matrix: SOLID
CLIENT: Bridgewater Group Inc.
Lab ID: 1410091-004
23-Oct-14Specialty Analytical Date Reported:
Analyses Result Qual Unit Date AnalyzedDFRL
PCB'S IN SOLIDS SW 8082A Analyst: JRC
Aroclor 1016 10/16/2014 7:38:00 PM0.333 µg/Kg 1ND
Aroclor 1221 10/16/2014 7:38:00 PM0.333 µg/Kg 1ND
Aroclor 1232 10/16/2014 7:38:00 PM0.333 µg/Kg 1ND
Aroclor 1242 10/16/2014 7:38:00 PM0.333 µg/Kg 1ND
Aroclor 1248 10/16/2014 7:38:00 PM0.333 µg/Kg 1ND
Aroclor 1254 10/16/2014 7:38:00 PM0.333 µg/Kg 1ND
Aroclor 1260 10/16/2014 7:38:00 PM0.333 µg/Kg 1ND
Aroclor 1262 10/16/2014 7:38:00 PM0.333 µg/Kg 1ND
Aroclor 1268 10/16/2014 7:38:00 PM0.333 µg/Kg 1ND
Surr: Decachlorobiphenyl SMI 10/16/2014 7:38:00 PM56.5-130 %REC 19.62
Page 8 of 11
Project: Fathom Post-Cleanout Solids Sampling / DT
Client Sample ID: FAT 0-16
Collection Date: 10/10/2014 5:35:00 PM
Matrix: SOLID
CLIENT: Bridgewater Group Inc.
Lab ID: 1410091-005
23-Oct-14Specialty Analytical Date Reported:
Analyses Result Qual Unit Date AnalyzedDFRL
ICP METALS- TOTAL RECOVERABLE SW6010C Analyst: sub
Cadmium 10/20/2014 12:04:00 PM0.890 mg/Kg 12.69
Chromium 10/20/2014 12:04:00 PM4.45 mg/Kg 1243
Copper 10/20/2014 12:04:00 PM0.890 mg/Kg 1109
Lead 10/20/2014 12:04:00 PM4.45 mg/Kg 154.9
Zinc 10/20/2014 12:04:00 PM4.45 mg/Kg 1673
SEMI-VOLATILE COMPOUNDS - BASE/NEUTRALSW8270D Analyst: bda
Bis(2-ethylhexyl)phthalate 10/21/2014 3:45:00 PM166 µg/Kg 59580
Butyl benzyl phthalate 10/21/2014 3:45:00 PM166 µg/Kg 51040
Diethyl phthalate Q 10/21/2014 3:45:00 PM166 µg/Kg 5ND
Dimethyl phthalate 10/21/2014 3:45:00 PM166 µg/Kg 53080
Di-n-butyl phthalate 10/21/2014 3:45:00 PM166 µg/Kg 5197
Di-n-octyl phthalate Q 10/21/2014 3:45:00 PM166 µg/Kg 5ND
Surr: 2-Fluorobiphenyl SMI 10/21/2014 3:45:00 PM52.6-93.2 %REC 519.1
Surr: 4-Terphenyl-d14 SMI 10/21/2014 3:45:00 PM49.8-118 %REC 530.1
Surr: Nitrobenzene-d5 10/21/2014 3:45:00 PM44.8-103 %REC 547.6
PCB'S IN SOLIDS SW 8082A Analyst: JRC
Aroclor 1016 10/16/2014 7:54:00 PM0.333 µg/Kg 1ND
Aroclor 1221 10/16/2014 7:54:00 PM0.333 µg/Kg 1ND
Aroclor 1232 10/16/2014 7:54:00 PM0.333 µg/Kg 1ND
Aroclor 1242 10/16/2014 7:54:00 PM0.333 µg/Kg 1ND
Aroclor 1248 10/16/2014 7:54:00 PM0.333 µg/Kg 1ND
Aroclor 1254 10/16/2014 7:54:00 PM0.333 µg/Kg 1ND
Aroclor 1260 10/16/2014 7:54:00 PM0.333 µg/Kg 1ND
Aroclor 1262 10/16/2014 7:54:00 PM0.333 µg/Kg 1ND
Aroclor 1268 10/16/2014 7:54:00 PM0.333 µg/Kg 1ND
Surr: Decachlorobiphenyl SMI 10/16/2014 7:54:00 PM56.5-130 %REC 10
Page 9 of 11
Project: Fathom Post-Cleanout Solids Sampling / DT
Client Sample ID: FAT Cutoff Valve Vault
Collection Date: 10/10/2014 5:41:00 PM
Matrix: SOLID
CLIENT: Bridgewater Group Inc.
Lab ID: 1410091-006
23-Oct-14Specialty Analytical Date Reported:
Analyses Result Qual Unit Date AnalyzedDFRL
ICP METALS- TOTAL RECOVERABLE SW6010C Analyst: sub
Cadmium 10/20/2014 12:05:00 PM0.887 mg/Kg 114.2
Chromium 10/20/2014 12:05:00 PM4.44 mg/Kg 11330
Copper 10/20/2014 12:05:00 PM0.887 mg/Kg 1292
Lead 10/20/2014 12:05:00 PM4.44 mg/Kg 1145
Zinc 10/20/2014 12:05:00 PM4.44 mg/Kg 11230
SEMI-VOLATILE COMPOUNDS - BASE/NEUTRALSW8270D Analyst: bda
Bis(2-ethylhexyl)phthalate 10/21/2014 1:20:00 PM33.3 µg/Kg 12120
Butyl benzyl phthalate 10/21/2014 1:20:00 PM33.3 µg/Kg 1264
Diethyl phthalate 10/21/2014 1:20:00 PM33.3 µg/Kg 1ND
Dimethyl phthalate 10/21/2014 1:20:00 PM33.3 µg/Kg 1183
Di-n-butyl phthalate 10/21/2014 1:20:00 PM33.3 µg/Kg 179.3
Di-n-octyl phthalate 10/21/2014 1:20:00 PM33.3 µg/Kg 1ND
Surr: 2-Fluorobiphenyl 10/21/2014 1:20:00 PM52.6-93.2 %REC 161.5
Surr: 4-Terphenyl-d14 10/21/2014 1:20:00 PM49.8-118 %REC 188.4
Surr: Nitrobenzene-d5 SMI 10/21/2014 1:20:00 PM44.8-103 %REC 142.8
PAH'S BY GC/MS - LOW LEVEL SW8270D Analyst: bda
Acenaphthene 10/16/2014 3:02:00 PM13.2 µg/Kg 1ND
Acenaphthylene 10/16/2014 3:02:00 PM13.2 µg/Kg 1ND
Anthracene 10/16/2014 3:02:00 PM13.2 µg/Kg 117.5
Benz(a)anthracene 10/16/2014 3:02:00 PM13.2 µg/Kg 120.4
Benzo(a)pyrene 10/16/2014 3:02:00 PM13.2 µg/Kg 129.1
Benzo(b)fluoranthene 10/16/2014 3:02:00 PM13.2 µg/Kg 159.2
Benzo(g,h,i)perylene 10/16/2014 3:02:00 PM13.2 µg/Kg 146.6
Benzo(k)fluoranthene 10/16/2014 3:02:00 PM13.2 µg/Kg 1ND
Chrysene 10/16/2014 3:02:00 PM13.2 µg/Kg 172.3
Dibenz(a,h)anthracene 10/16/2014 3:02:00 PM13.2 µg/Kg 1ND
Fluoranthene 10/16/2014 3:02:00 PM13.2 µg/Kg 172.5
Fluorene 10/16/2014 3:02:00 PM13.2 µg/Kg 115.3
Indeno(1,2,3-cd)pyrene 10/16/2014 3:02:00 PM13.2 µg/Kg 121.3
Naphthalene 10/16/2014 3:02:00 PM13.2 µg/Kg 135.2
Phenanthrene 10/16/2014 3:02:00 PM13.2 µg/Kg 173.2
Pyrene 10/16/2014 3:02:00 PM13.2 µg/Kg 1119
Surr: 2-Fluorobiphenyl 10/16/2014 3:02:00 PM42.6-128 %REC 177.0
Surr: Nitrobenzene-d5 10/16/2014 3:02:00 PM21.7-155 %REC 175.1
Surr: p-Terphenyl-d14 10/16/2014 3:02:00 PM44.9-155 %REC 192.2
PCB'S IN SOLIDS SW 8082A Analyst: JRC
Page 10 of 11
Project: Fathom Post-Cleanout Solids Sampling / DT
Client Sample ID: FAT Cutoff Valve Vault
Collection Date: 10/10/2014 5:41:00 PM
Matrix: SOLID
CLIENT: Bridgewater Group Inc.
Lab ID: 1410091-006
23-Oct-14Specialty Analytical Date Reported:
Analyses Result Qual Unit Date AnalyzedDFRL
PCB'S IN SOLIDS SW 8082A Analyst: JRC
Aroclor 1016 10/16/2014 8:11:00 PM0.333 µg/Kg 1ND
Aroclor 1221 10/16/2014 8:11:00 PM0.333 µg/Kg 1ND
Aroclor 1232 10/16/2014 8:11:00 PM0.333 µg/Kg 1ND
Aroclor 1242 10/16/2014 8:11:00 PM0.333 µg/Kg 1ND
Aroclor 1248 10/16/2014 8:11:00 PM0.333 µg/Kg 1ND
Aroclor 1254 10/16/2014 8:11:00 PM0.333 µg/Kg 1ND
Aroclor 1260 10/16/2014 8:11:00 PM0.333 µg/Kg 1ND
Aroclor 1262 10/16/2014 8:11:00 PM0.333 µg/Kg 1ND
Aroclor 1268 10/16/2014 8:11:00 PM0.333 µg/Kg 1ND
Surr: Decachlorobiphenyl SMI 10/16/2014 8:11:00 PM56.5-130 %REC 1728
Page 11 of 11
Project: Fathom Post-Cleanout Solids Sampling / DTNClient: Bridgewater Group Inc.
TestCode: 8082LL_S
23-Oct-14
QC SUMMARY REPORT1410091WO#:
Specialty Analytical
Sample ID: CCV 1016/1260@1
Batch ID: 8331 TestNo: SW 8082A Analysis Date: 10/16/2014
Prep Date:
Analyte Result SPK value SPK Ref Val %REC RPD Ref Val %RPDLowLimit HighLimit RPDLimit Qual
Units: µg/Kg
PQL
Client ID: CCV
RunNo: 17321
SeqNo: 227380
CCVSampType: TestCode: 8082LL_S
3545_8082LL
Aroclor 1016/1260 66.67 103 85 1150.333 068.6
Aroclor 1248 66.67 100 85 1150.333 066.7
Sample ID: MB-8331
Batch ID: 8331 TestNo: SW 8082A Analysis Date: 10/16/2014
Prep Date: 10/15/2014
Analyte Result SPK value SPK Ref Val %REC RPD Ref Val %RPDLowLimit HighLimit RPDLimit Qual
Units: µg/Kg
PQL
Client ID: PBS
RunNo: 17321
SeqNo: 227381
MBLKSampType: TestCode: 8082LL_S
3545_8082LL
Aroclor 1016 0.333ND
Aroclor 1221 0.333ND
Aroclor 1232 0.333ND
Aroclor 1242 0.333ND
Aroclor 1248 0.333ND
Aroclor 1254 0.333ND
Aroclor 1260 0.333ND
Aroclor 1262 0.333ND
Aroclor 1268 0.333ND
Surr: Decachlorobiphenyl 6667 74.2 56.5 1304950
Sample ID: LCS-8331
Batch ID: 8331 TestNo: SW 8082A Analysis Date: 10/16/2014
Prep Date: 10/15/2014
Analyte Result SPK value SPK Ref Val %REC RPD Ref Val %RPDLowLimit HighLimit RPDLimit Qual
Units: µg/Kg
PQL
Client ID: LCSS
RunNo: 17321
SeqNo: 227382
LCSSampType: TestCode: 8082LL_S
3545_8082LL
Aroclor 1016/1260 66.67 93.3 44.3 1370.333 062.2
Qualifiers: Page 1 of 8B Analyte detected in the associated Method Blank H Holding times for preparation or analysis exceeded ND Not Detected at the Reporting LimitO RSD is greater than RSDlimit R RPD outside accepted recovery limits S Spike Recovery outside accepted recovery limits
Project: Fathom Post-Cleanout Solids Sampling / DTNClient: Bridgewater Group Inc.
TestCode: 8082LL_S
23-Oct-14
QC SUMMARY REPORT1410091WO#:
Specialty Analytical
Sample ID: LCS-8331
Batch ID: 8331 TestNo: SW 8082A Analysis Date: 10/16/2014
Prep Date: 10/15/2014
Analyte Result SPK value SPK Ref Val %REC RPD Ref Val %RPDLowLimit HighLimit RPDLimit Qual
Units: µg/Kg
PQL
Client ID: LCSS
RunNo: 17321
SeqNo: 227382
LCSSampType: TestCode: 8082LL_S
3545_8082LL
Sample ID: CCV 1248@1
Batch ID: 8331 TestNo: SW 8082A Analysis Date: 10/17/2014
Prep Date:
Analyte Result SPK value SPK Ref Val %REC RPD Ref Val %RPDLowLimit HighLimit RPDLimit Qual
Units: µg/Kg
PQL
Client ID: CCV
RunNo: 17321
SeqNo: 227406
CCVSampType: TestCode: 8082LL_S
3545_8082LL
Aroclor 1248 66.67 96.0 85 1150.333 064.0
Sample ID: 1410091-002AMS
Batch ID: 8331 TestNo: SW 8082A Analysis Date: 10/16/2014
Prep Date: 10/15/2014
Analyte Result SPK value SPK Ref Val %REC RPD Ref Val %RPDLowLimit HighLimit RPDLimit Qual
Units: µg/Kg
PQL
Client ID: FAT 63-75
RunNo: 17321
SeqNo: 227434
MSSampType: TestCode: 8082LL_S
3545_8082LL
Aroclor 1016/1260 66.67 246 56.6 123 SMI0.333 0164
Sample ID: 1410091-002AMSD
Batch ID: 8331 TestNo: SW 8082A Analysis Date: 10/16/2014
Prep Date: 10/15/2014
Analyte Result SPK value SPK Ref Val %REC RPD Ref Val %RPDLowLimit HighLimit RPDLimit Qual
Units: µg/Kg
PQL
Client ID: FAT 63-75
RunNo: 17321
SeqNo: 227435
MSDSampType: TestCode: 8082LL_S
3545_8082LL
Aroclor 1016/1260 66.67 137 56.6 123 20 SRMI0.333 0 164.2 57.391.1
Qualifiers: Page 2 of 8B Analyte detected in the associated Method Blank H Holding times for preparation or analysis exceeded ND Not Detected at the Reporting LimitO RSD is greater than RSDlimit R RPD outside accepted recovery limits S Spike Recovery outside accepted recovery limits
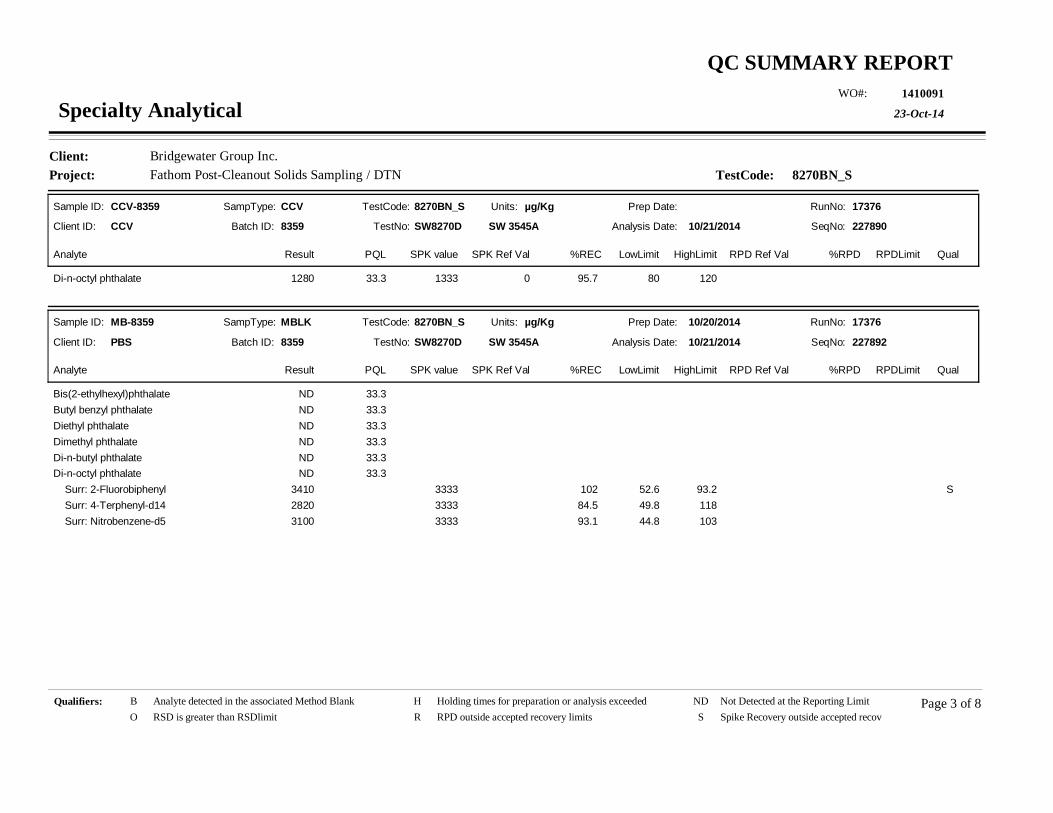
Project: Fathom Post-Cleanout Solids Sampling / DTNClient: Bridgewater Group Inc.
TestCode: 8270BN_S
23-Oct-14
QC SUMMARY REPORT1410091WO#:
Specialty Analytical
Sample ID: CCV-8359
Batch ID: 8359 TestNo: SW8270D Analysis Date: 10/21/2014
Prep Date:
Analyte Result SPK value SPK Ref Val %REC RPD Ref Val %RPDLowLimit HighLimit RPDLimit Qual
Units: µg/Kg
PQL
Client ID: CCV
RunNo: 17376
SeqNo: 227890
CCVSampType: TestCode: 8270BN_S
SW 3545A
Di-n-octyl phthalate 1333 95.7 80 12033.3 01280
Sample ID: MB-8359
Batch ID: 8359 TestNo: SW8270D Analysis Date: 10/21/2014
Prep Date: 10/20/2014
Analyte Result SPK value SPK Ref Val %REC RPD Ref Val %RPDLowLimit HighLimit RPDLimit Qual
Units: µg/Kg
PQL
Client ID: PBS
RunNo: 17376
SeqNo: 227892
MBLKSampType: TestCode: 8270BN_S
SW 3545A
Bis(2-ethylhexyl)phthalate 33.3ND
Butyl benzyl phthalate 33.3ND
Diethyl phthalate 33.3ND
Dimethyl phthalate 33.3ND
Di-n-butyl phthalate 33.3ND
Di-n-octyl phthalate 33.3ND
Surr: 2-Fluorobiphenyl 3333 102 52.6 93.2 S3410
Surr: 4-Terphenyl-d14 3333 84.5 49.8 1182820
Surr: Nitrobenzene-d5 3333 93.1 44.8 1033100
Qualifiers: Page 3 of 8B Analyte detected in the associated Method Blank H Holding times for preparation or analysis exceeded ND Not Detected at the Reporting LimitO RSD is greater than RSDlimit R RPD outside accepted recovery limits S Spike Recovery outside accepted recovery limits
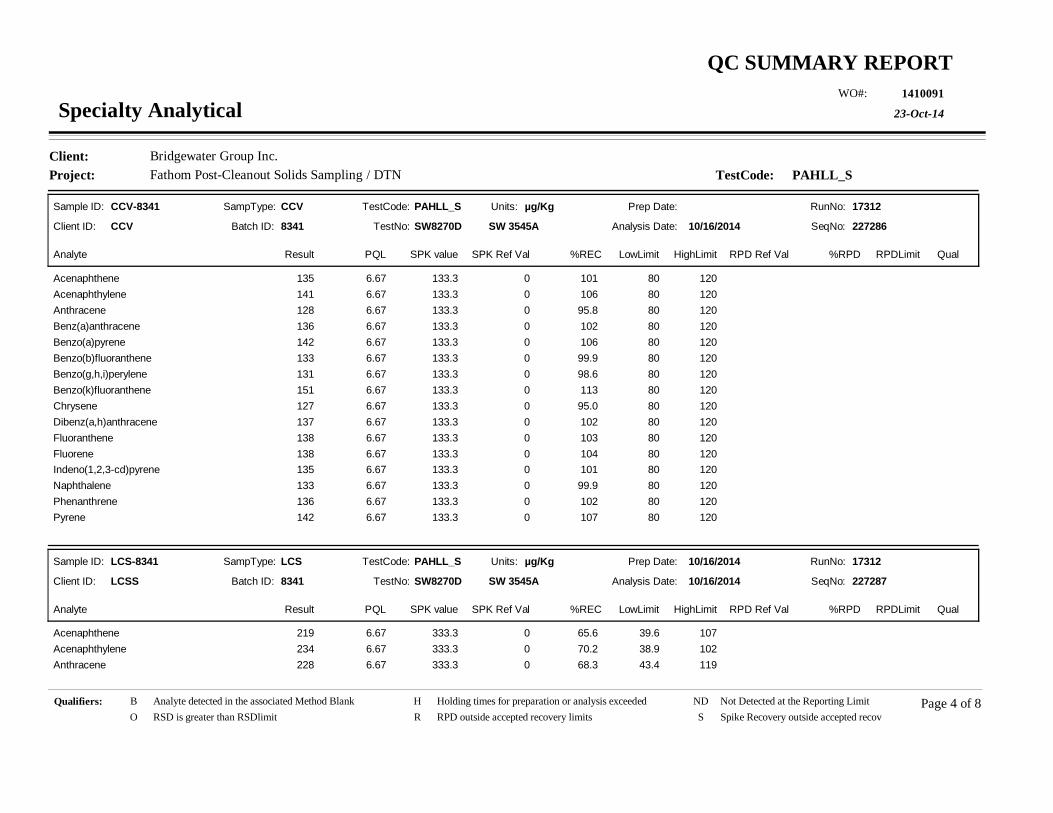
Project: Fathom Post-Cleanout Solids Sampling / DTNClient: Bridgewater Group Inc.
TestCode: PAHLL_S
23-Oct-14
QC SUMMARY REPORT1410091WO#:
Specialty Analytical
Sample ID: CCV-8341
Batch ID: 8341 TestNo: SW8270D Analysis Date: 10/16/2014
Prep Date:
Analyte Result SPK value SPK Ref Val %REC RPD Ref Val %RPDLowLimit HighLimit RPDLimit Qual
Units: µg/Kg
PQL
Client ID: CCV
RunNo: 17312
SeqNo: 227286
CCVSampType: TestCode: PAHLL_S
SW 3545A
Acenaphthene 133.3 101 80 1206.67 0135
Acenaphthylene 133.3 106 80 1206.67 0141
Anthracene 133.3 95.8 80 1206.67 0128
Benz(a)anthracene 133.3 102 80 1206.67 0136
Benzo(a)pyrene 133.3 106 80 1206.67 0142
Benzo(b)fluoranthene 133.3 99.9 80 1206.67 0133
Benzo(g,h,i)perylene 133.3 98.6 80 1206.67 0131
Benzo(k)fluoranthene 133.3 113 80 1206.67 0151
Chrysene 133.3 95.0 80 1206.67 0127
Dibenz(a,h)anthracene 133.3 102 80 1206.67 0137
Fluoranthene 133.3 103 80 1206.67 0138
Fluorene 133.3 104 80 1206.67 0138
Indeno(1,2,3-cd)pyrene 133.3 101 80 1206.67 0135
Naphthalene 133.3 99.9 80 1206.67 0133
Phenanthrene 133.3 102 80 1206.67 0136
Pyrene 133.3 107 80 1206.67 0142
Sample ID: LCS-8341
Batch ID: 8341 TestNo: SW8270D Analysis Date: 10/16/2014
Prep Date: 10/16/2014
Analyte Result SPK value SPK Ref Val %REC RPD Ref Val %RPDLowLimit HighLimit RPDLimit Qual
Units: µg/Kg
PQL
Client ID: LCSS
RunNo: 17312
SeqNo: 227287
LCSSampType: TestCode: PAHLL_S
SW 3545A
Acenaphthene 333.3 65.6 39.6 1076.67 0219
Acenaphthylene 333.3 70.2 38.9 1026.67 0234
Anthracene 333.3 68.3 43.4 1196.67 0228
Qualifiers: Page 4 of 8B Analyte detected in the associated Method Blank H Holding times for preparation or analysis exceeded ND Not Detected at the Reporting LimitO RSD is greater than RSDlimit R RPD outside accepted recovery limits S Spike Recovery outside accepted recovery limits
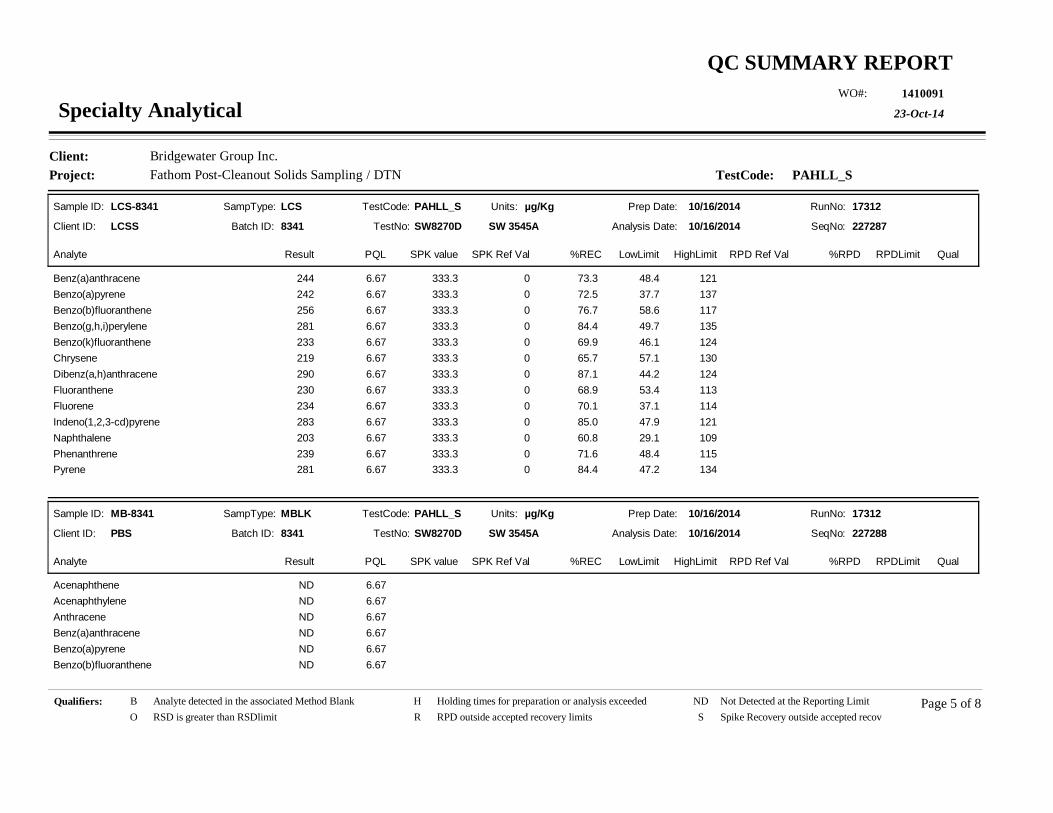
Project: Fathom Post-Cleanout Solids Sampling / DTNClient: Bridgewater Group Inc.
TestCode: PAHLL_S
23-Oct-14
QC SUMMARY REPORT1410091WO#:
Specialty Analytical
Sample ID: LCS-8341
Batch ID: 8341 TestNo: SW8270D Analysis Date: 10/16/2014
Prep Date: 10/16/2014
Analyte Result SPK value SPK Ref Val %REC RPD Ref Val %RPDLowLimit HighLimit RPDLimit Qual
Units: µg/Kg
PQL
Client ID: LCSS
RunNo: 17312
SeqNo: 227287
LCSSampType: TestCode: PAHLL_S
SW 3545A
Benz(a)anthracene 333.3 73.3 48.4 1216.67 0244
Benzo(a)pyrene 333.3 72.5 37.7 1376.67 0242
Benzo(b)fluoranthene 333.3 76.7 58.6 1176.67 0256
Benzo(g,h,i)perylene 333.3 84.4 49.7 1356.67 0281
Benzo(k)fluoranthene 333.3 69.9 46.1 1246.67 0233
Chrysene 333.3 65.7 57.1 1306.67 0219
Dibenz(a,h)anthracene 333.3 87.1 44.2 1246.67 0290
Fluoranthene 333.3 68.9 53.4 1136.67 0230
Fluorene 333.3 70.1 37.1 1146.67 0234
Indeno(1,2,3-cd)pyrene 333.3 85.0 47.9 1216.67 0283
Naphthalene 333.3 60.8 29.1 1096.67 0203
Phenanthrene 333.3 71.6 48.4 1156.67 0239
Pyrene 333.3 84.4 47.2 1346.67 0281
Sample ID: MB-8341
Batch ID: 8341 TestNo: SW8270D Analysis Date: 10/16/2014
Prep Date: 10/16/2014
Analyte Result SPK value SPK Ref Val %REC RPD Ref Val %RPDLowLimit HighLimit RPDLimit Qual
Units: µg/Kg
PQL
Client ID: PBS
RunNo: 17312
SeqNo: 227288
MBLKSampType: TestCode: PAHLL_S
SW 3545A
Acenaphthene 6.67ND
Acenaphthylene 6.67ND
Anthracene 6.67ND
Benz(a)anthracene 6.67ND
Benzo(a)pyrene 6.67ND
Benzo(b)fluoranthene 6.67ND
Qualifiers: Page 5 of 8B Analyte detected in the associated Method Blank H Holding times for preparation or analysis exceeded ND Not Detected at the Reporting LimitO RSD is greater than RSDlimit R RPD outside accepted recovery limits S Spike Recovery outside accepted recovery limits

Project: Fathom Post-Cleanout Solids Sampling / DTNClient: Bridgewater Group Inc.
TestCode: PAHLL_S
23-Oct-14
QC SUMMARY REPORT1410091WO#:
Specialty Analytical
Sample ID: MB-8341
Batch ID: 8341 TestNo: SW8270D Analysis Date: 10/16/2014
Prep Date: 10/16/2014
Analyte Result SPK value SPK Ref Val %REC RPD Ref Val %RPDLowLimit HighLimit RPDLimit Qual
Units: µg/Kg
PQL
Client ID: PBS
RunNo: 17312
SeqNo: 227288
MBLKSampType: TestCode: PAHLL_S
SW 3545A
Benzo(g,h,i)perylene 6.67ND
Benzo(k)fluoranthene 6.67ND
Chrysene 6.67ND
Dibenz(a,h)anthracene 6.67ND
Fluoranthene 6.67ND
Fluorene 6.67ND
Indeno(1,2,3-cd)pyrene 6.67ND
Naphthalene 6.67ND
Phenanthrene 6.67ND
Pyrene 6.67ND
Surr: 2-Fluorobiphenyl 6.667 79.4 42.6 1285.30
Surr: Nitrobenzene-d5 6.667 83.0 21.7 1555.53
Surr: p-Terphenyl-d14 6.667 103 44.9 1556.87
Sample ID: 1410091-004AMS
Batch ID: 8341 TestNo: SW8270D Analysis Date: 10/16/2014
Prep Date: 10/16/2014
Analyte Result SPK value SPK Ref Val %REC RPD Ref Val %RPDLowLimit HighLimit RPDLimit Qual
Units: µg/Kg
PQL
Client ID: FAT 35-45
RunNo: 17312
SeqNo: 227351
MSSampType: TestCode: PAHLL_S
SW 3545A
Acenaphthene 333.3 72.4 33.7 11133.2 7.719249
Acenaphthylene 333.3 74.6 32.3 12533.2 5.688254
Anthracene 333.3 72.1 42.7 12133.2 22.62263
Benz(a)anthracene 333.3 69.7 63.4 12133.2 76.18308
Benzo(a)pyrene 333.3 64.4 64.6 110 S33.2 91.45306
Benzo(b)fluoranthene 333.3 61.5 41.6 17233.2 150.7356
Qualifiers: Page 6 of 8B Analyte detected in the associated Method Blank H Holding times for preparation or analysis exceeded ND Not Detected at the Reporting LimitO RSD is greater than RSDlimit R RPD outside accepted recovery limits S Spike Recovery outside accepted recovery limits
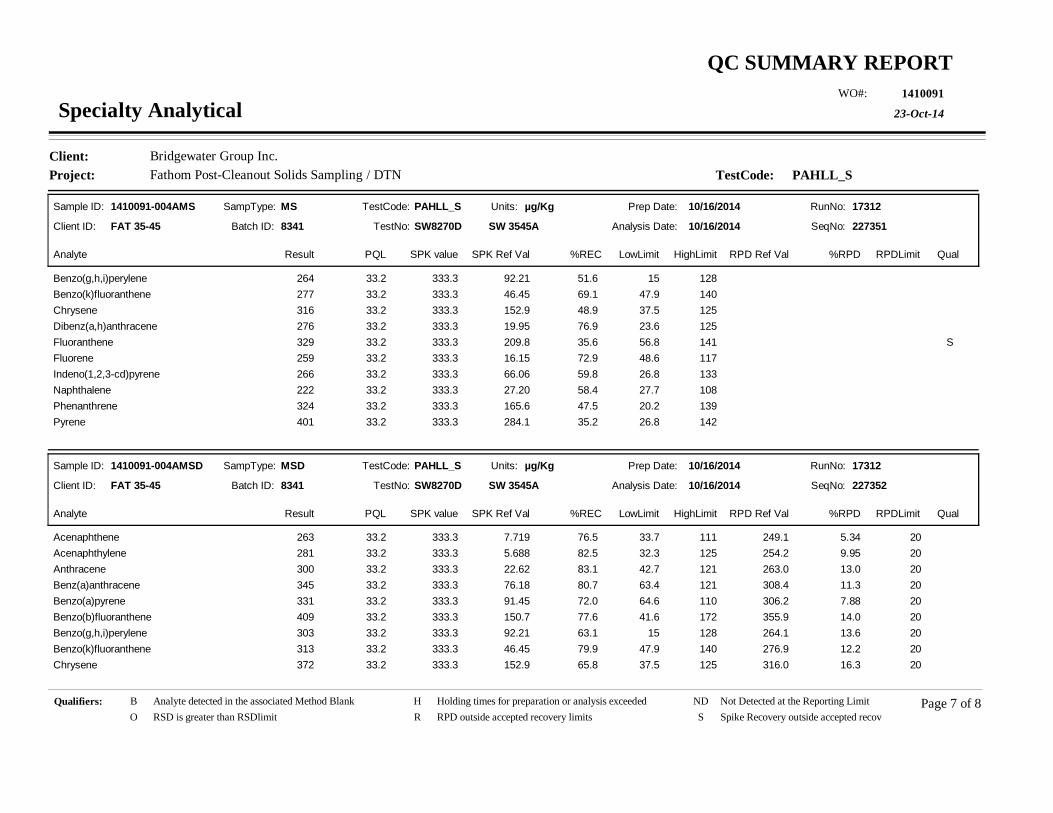
Project: Fathom Post-Cleanout Solids Sampling / DTNClient: Bridgewater Group Inc.
TestCode: PAHLL_S
23-Oct-14
QC SUMMARY REPORT1410091WO#:
Specialty Analytical
Sample ID: 1410091-004AMS
Batch ID: 8341 TestNo: SW8270D Analysis Date: 10/16/2014
Prep Date: 10/16/2014
Analyte Result SPK value SPK Ref Val %REC RPD Ref Val %RPDLowLimit HighLimit RPDLimit Qual
Units: µg/Kg
PQL
Client ID: FAT 35-45
RunNo: 17312
SeqNo: 227351
MSSampType: TestCode: PAHLL_S
SW 3545A
Benzo(g,h,i)perylene 333.3 51.6 15 12833.2 92.21264
Benzo(k)fluoranthene 333.3 69.1 47.9 14033.2 46.45277
Chrysene 333.3 48.9 37.5 12533.2 152.9316
Dibenz(a,h)anthracene 333.3 76.9 23.6 12533.2 19.95276
Fluoranthene 333.3 35.6 56.8 141 S33.2 209.8329
Fluorene 333.3 72.9 48.6 11733.2 16.15259
Indeno(1,2,3-cd)pyrene 333.3 59.8 26.8 13333.2 66.06266
Naphthalene 333.3 58.4 27.7 10833.2 27.20222
Phenanthrene 333.3 47.5 20.2 13933.2 165.6324
Pyrene 333.3 35.2 26.8 14233.2 284.1401
Sample ID: 1410091-004AMSD
Batch ID: 8341 TestNo: SW8270D Analysis Date: 10/16/2014
Prep Date: 10/16/2014
Analyte Result SPK value SPK Ref Val %REC RPD Ref Val %RPDLowLimit HighLimit RPDLimit Qual
Units: µg/Kg
PQL
Client ID: FAT 35-45
RunNo: 17312
SeqNo: 227352
MSDSampType: TestCode: PAHLL_S
SW 3545A
Acenaphthene 333.3 76.5 33.7 111 2033.2 7.719 249.1 5.34263
Acenaphthylene 333.3 82.5 32.3 125 2033.2 5.688 254.2 9.95281
Anthracene 333.3 83.1 42.7 121 2033.2 22.62 263.0 13.0300
Benz(a)anthracene 333.3 80.7 63.4 121 2033.2 76.18 308.4 11.3345
Benzo(a)pyrene 333.3 72.0 64.6 110 2033.2 91.45 306.2 7.88331
Benzo(b)fluoranthene 333.3 77.6 41.6 172 2033.2 150.7 355.9 14.0409
Benzo(g,h,i)perylene 333.3 63.1 15 128 2033.2 92.21 264.1 13.6303
Benzo(k)fluoranthene 333.3 79.9 47.9 140 2033.2 46.45 276.9 12.2313
Chrysene 333.3 65.8 37.5 125 2033.2 152.9 316.0 16.3372
Qualifiers: Page 7 of 8B Analyte detected in the associated Method Blank H Holding times for preparation or analysis exceeded ND Not Detected at the Reporting LimitO RSD is greater than RSDlimit R RPD outside accepted recovery limits S Spike Recovery outside accepted recovery limits
Project: Fathom Post-Cleanout Solids Sampling / DTNClient: Bridgewater Group Inc.
TestCode: PAHLL_S
23-Oct-14
QC SUMMARY REPORT1410091WO#:
Specialty Analytical
Sample ID: 1410091-004AMSD
Batch ID: 8341 TestNo: SW8270D Analysis Date: 10/16/2014
Prep Date: 10/16/2014
Analyte Result SPK value SPK Ref Val %REC RPD Ref Val %RPDLowLimit HighLimit RPDLimit Qual
Units: µg/Kg
PQL
Client ID: FAT 35-45
RunNo: 17312
SeqNo: 227352
MSDSampType: TestCode: PAHLL_S
SW 3545A
Dibenz(a,h)anthracene 333.3 81.1 23.6 125 2033.2 19.95 276.1 5.02290
Fluoranthene 333.3 59.1 56.8 141 20 R33.2 209.8 328.6 21.3407
Fluorene 333.3 81.8 48.6 117 2033.2 16.15 259.2 10.9289
Indeno(1,2,3-cd)pyrene 333.3 61.7 26.8 133 2033.2 66.06 265.5 2.26272
Naphthalene 333.3 72.7 27.7 108 2033.2 27.20 221.8 19.5270
Phenanthrene 333.3 67.7 20.2 139 2033.2 165.6 323.9 18.8391
Pyrene 333.3 66.7 26.8 142 20 R33.2 284.1 401.4 23.2507
Qualifiers: Page 8 of 8B Analyte detected in the associated Method Blank H Holding times for preparation or analysis exceeded ND Not Detected at the Reporting LimitO RSD is greater than RSDlimit R RPD outside accepted recovery limits S Spike Recovery outside accepted recovery limits

KEY TO FLAGS Rev. May 12, 2010
A This sample contains a Gasoline Range Organic not identified as a specific hydrocarbon product. The result was quantifiedagainst gasoline calibration standards
A1 This sample contains a Diesel Range Organic not identified as a specific hydrocarbon product. The result was quantifiedagainst diesel calibration standards.
A2 This sample contains a Lube Oil Range Organic not identified as a specific hydrocarbon product. The result was quantifiedagainst a lube oil calibration standard.
A3 The result was determined to be Non-Detect based on hydrocarbon pattern recognition. The product was carry-over fromanother hydrocarbon type.
A4 The product appears to be aged or degraded diesel.
B The blank exhibited a positive result great than the reporting limit for this compound.
CN See Case Narrative.
D Result is based from a dilution.
E Result exceeds the calibration range for this compound. The result should be considered as estimate.
F The positive result for this hydrocarbon is due to single component contamination. The product does not match anyhydrocarbon in the fuels library.
G Result may be biased high due to biogenic interferences. Clean up is recommended.
H Sample was analyzed outside recommended holding time.
HT At clients request, samples was analyzed outside of recommended holding time.
J The result for this analyte is between the MDL and the PQL and should be considered as estimated concentration.
K Diesel result is biased high due to amount of Oil contained in the sample.
L Diesel result is biased high due to amount of Gasoline contained in the sample.
M Oil result is biased high due to amount of Diesel contained in the sample.
MC Sample concentration is greater than 4x the spiked value, the spiked value is considered insignificant.
MI Result is outside control limits due to matrix interference.
MSA Value determined by Method of Standard Addition.
O Laboratory Control Standard (LCS) exceeded laboratory control limits, but meets CCV criteria. Data meets EPArequirements.
Q Detection levels elevated due to sample matrix.
R RPD control limits were exceeded.
RF Duplicate failed due to result being at or near the method-reporting limit.
RP Matrix spike values exceed established QC limits; post digestion spike is in control.
S Recovery is outside control limits.
SC Closing CCV or LCS exceeded high recovery control limits, but associated samples are non-detect. Data meets EPArequirements.
* The result for this parameter was greater that the maximum contaminant level of the TCLP regulatory limit.


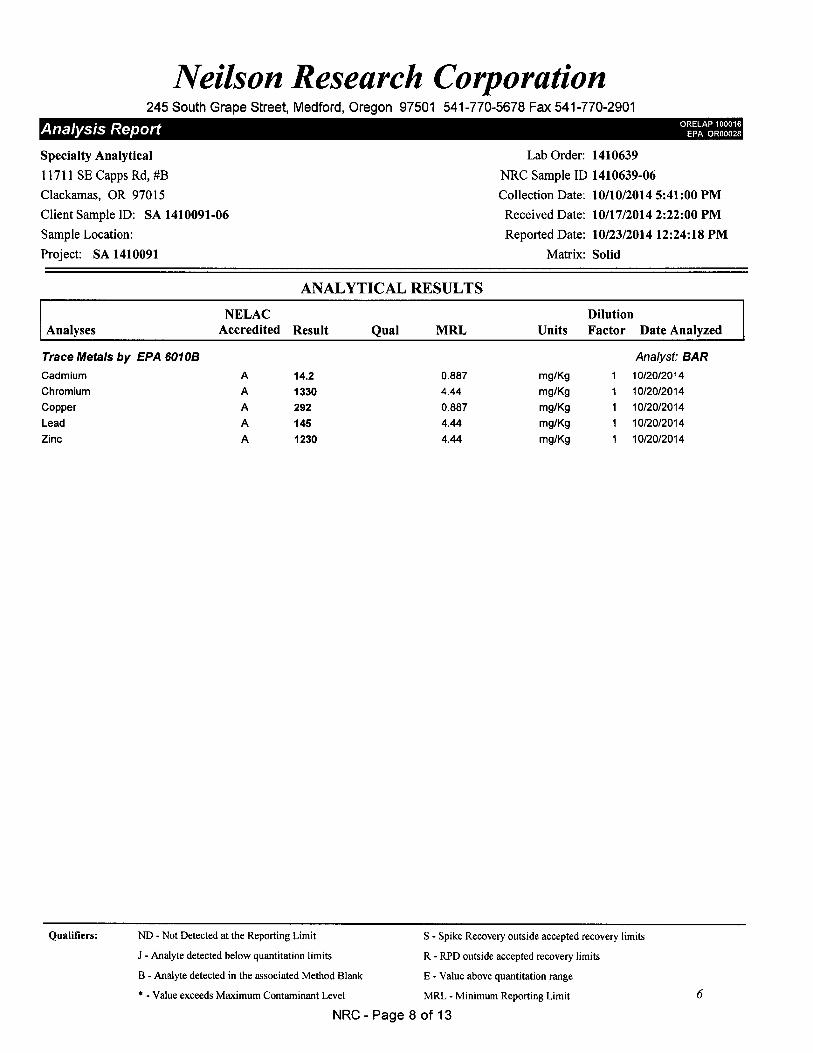

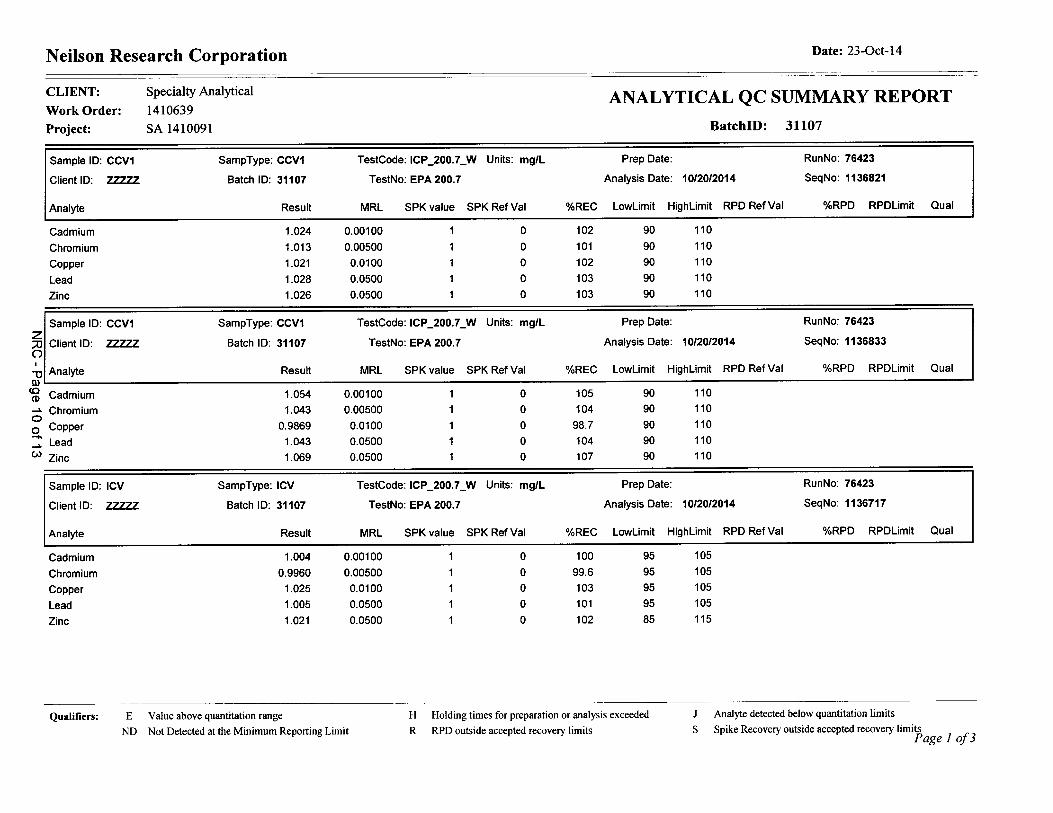
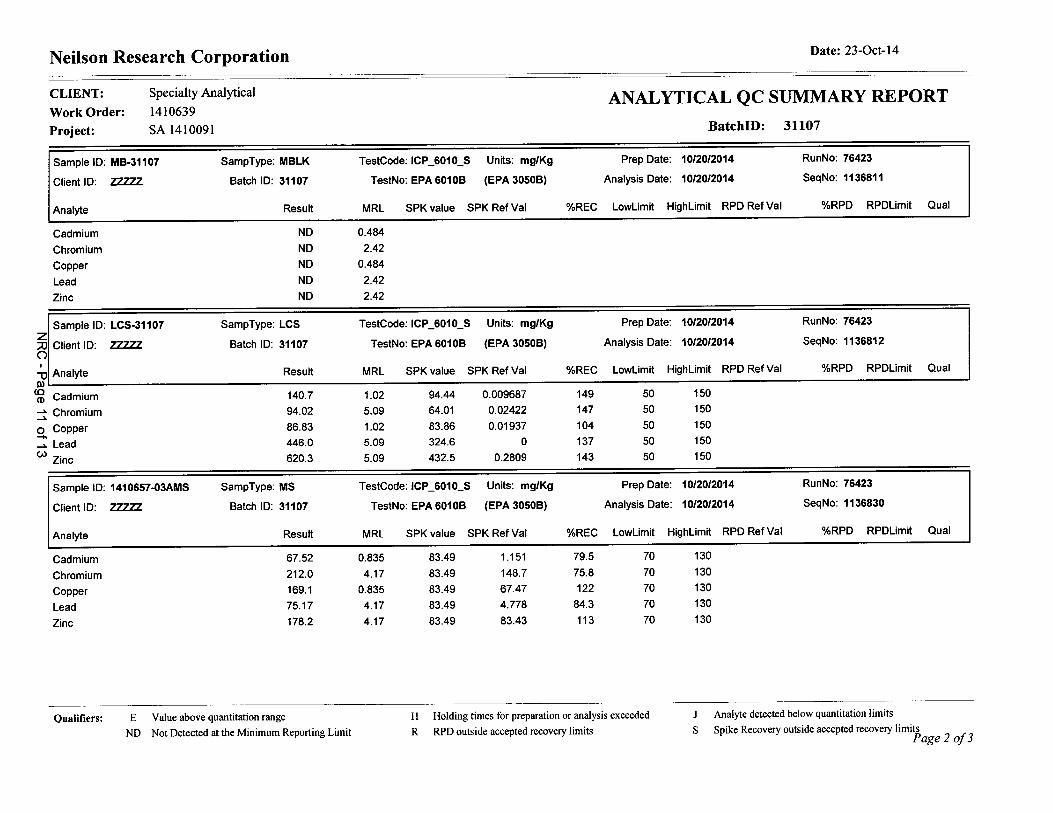
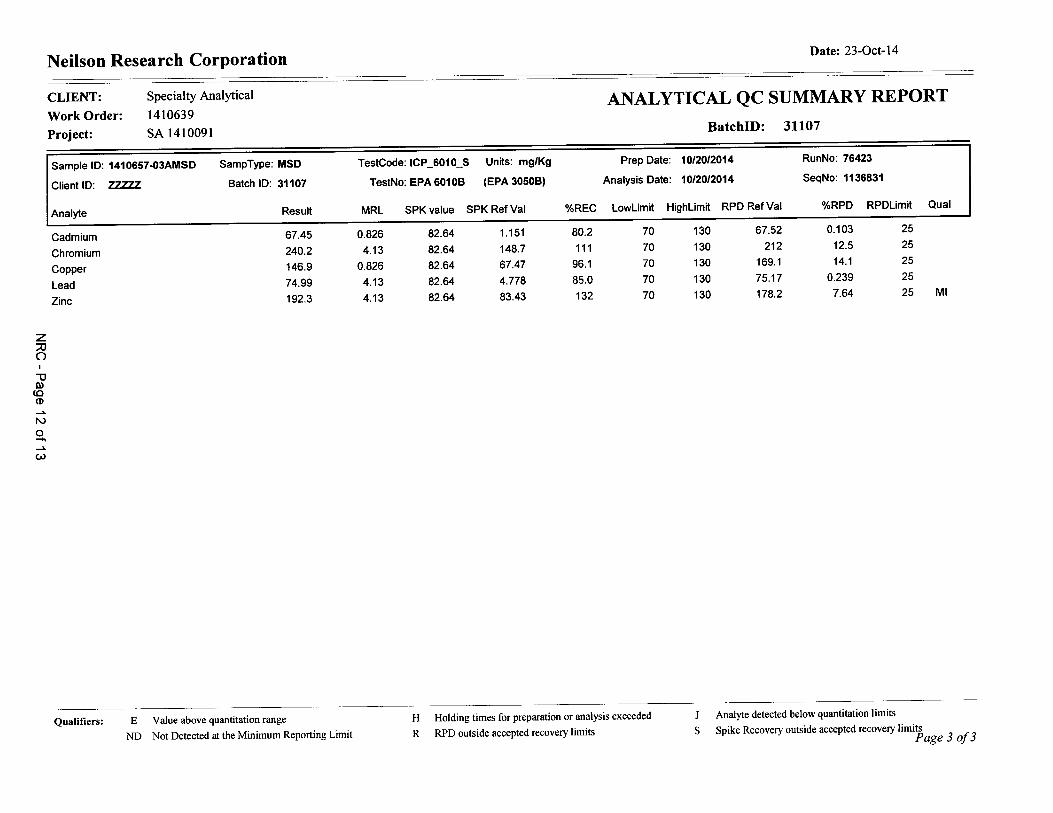
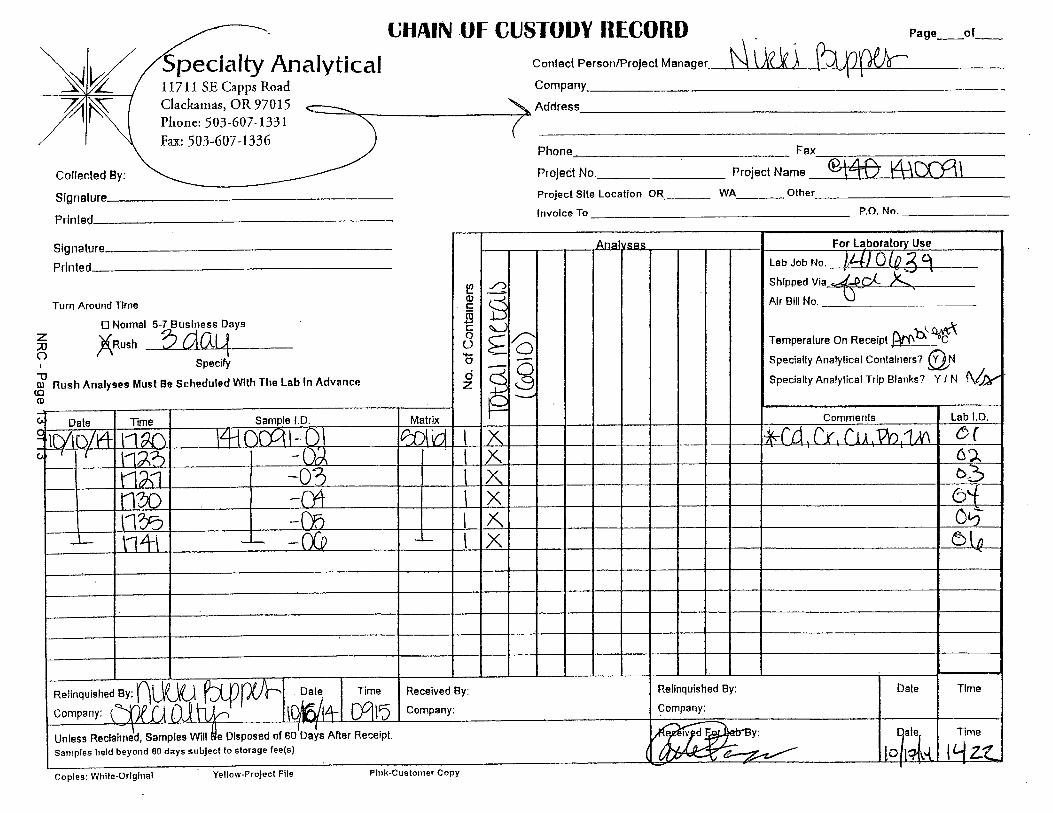

Ap
pe
nd
ix F
Lab
ora
tory
An
aly
tical R
ep
orts
an
d D
ata
Qu
ality
As
su
ran
ce/Q
uality
Co
ntro
l Me
mo
ran
du
m fo
r Oc
tob
er 2
014
Fath
om
Lin
e S
olid
s S
am
ple
s