Restaurant tipping: the impact of the ... - UvA Scripties
82
Restaurant tipping: the impact of the acknowledgment of gratitude on customer’s future intentions regarding revisit and word of mouth. Marion Holtkamp Student number: 10475443 January 31 st , 2015 MSc Business Studies, Marketing track Supervisor: Dr. K. Venetis
-
Upload
khangminh22 -
Category
Documents
-
view
0 -
download
0
Transcript of Restaurant tipping: the impact of the ... - UvA Scripties
Restaurant tipping: the impact of the acknowledgment of gratitude on customer’s future intentions regarding revisit and word of mouth.
Marion Holtkamp
Student number: 10475443
January 31st, 2015
MSc Business Studies, Marketing track
Supervisor: Dr. K. Venetis
2
Acknowledgements
This Master thesis is the final assignment for my Master Business Studies at the University of
Amsterdam. It explores the impact of the acknowledgment of gratitude on customer’s future
intentions in the context of restaurant tipping.
Completing my study and this thesis would not have been possible without the help of a number
of people. True to the subject of this thesis, I would like to express my feelings of gratitude for
their help.
I would first like to thank my thesis supervisor, Dr. Karin Venetis. Her guidance and critical view
gave me confidence and additional insight to write this thesis.
Furthermore I like to thank my study-buddy Tabitha Oostra-Brusse for her feedback, support
and talent to put things into perspective. Also, I like to say thanks to Nick Melis, my family and
Carien Verweij for their support and understanding.
Last but not least, I like to thank all my respondents for participating in this study!
Marion Holtkamp
Deventer, January 31st 2015
3
Abstract
Restaurant tipping: the impact of the acknowledgment of gratitude on customer’s future intentions regarding revisit and word of mouth.
Keywords: tipping; relationship marketing; consumer behavior; (expression and acknowledgment of) gratitude;
reciprocity; social norm and compliance
Tipping is a fascinating, dynamic and widely-adopted phenomenon, not only is it strongly
culturally determined, it also is an illustration of irrational consumer behavior as consumer
voluntarily increase the price of their restaurant visit. The majority of research into tipping has
been limited to the motivations and antecedents which drive tipping behavior; it neglects the
effect the practice has on the buyer-seller relationship.
This study uses the concept of gratitude in relationship marketing to explore the impact of
acknowledgement by the service provider, as a response to expressed gratitude (by means of a
tip), on future intentions by the customer, being word of mouth and revisit intentions.
As survey among 304 people in the Netherlands confirms the significant role gratitude plays in
relationship marketing. Our results suggest that respondents who expect and/or perceive to be
acknowledged for the expression of gratitude consider acknowledgment to be a hygiene factor.
This quantitative study contributes to earlier qualitative research by Raggio et al. (2014) and
confirms that a completed gratitude cycle enchances future intentions; as failing to do so has a
negative effect on revisit and word of mouth intnetions.We also identify that when consumers
make a voluntary financial contribution to express their gratitude, no threshold for overvaluing
this contribution exist.
Practically, this research provides hospitality service providers valuable insight in consumer
behavior related to tipping in the Netherlands. It stresses the importance of relationship
marketing investment, e.g. extra service and adaptations in policies, to make customers feel
grateful. As a result service providers benefit from an increased tip. To strengthen the
relationship-quality this study suggests that service providers should explicitly thank customers
for their tip. Consequently, people are more likely to speak positively about the restaurant and
revisit. The latter is of extra importance for service staff as this study shows that people who
visit the restaurant more frequently tip significantly higher.
4
Table of Content
1. Introduction ..................................................................................................................................... 6
2. Literature review.............................................................................................................................. 9
2.1 Tipping .......................................................................................................................................... 9
2.1.1 Tipping and social norm ........................................................................................................ 10
2.1.2 Tipping and gratitude ............................................................................................................ 11
2.1.3 Tipping – across countries .................................................................................................... 12
2.1.4 Effects of tipping ................................................................................................................... 13
2.2 Relationship marketing ................................................................................................................ 14
2.2.1 Relationship benefits ............................................................................................................ 15
2.2.2 Relationship quality .............................................................................................................. 16
2.2.3 Relationship marketing and gratitude .................................................................................... 16
2.3 Conceptual model ........................................................................................................................ 21
3. Research method .......................................................................................................................... 22
3.1 Data collection procedure ............................................................................................................ 22
3.2 Sample ........................................................................................................................................ 22
3.3 Measure development ................................................................................................................. 23
4. Results .......................................................................................................................................... 24
4.1 Descriptive data of sample ........................................................................................................... 24
4.2 Variables and measurements ...................................................................................................... 26
4.2.1 Reliability of scales ............................................................................................................... 26
4.2.2 Skewness and kurtosis ......................................................................................................... 26
4.2.3 Correlation Matrix ................................................................................................................. 27
4.2.4 Mean tip percentages – between groups............................................................................... 31

5
4.2.5 Tip percentage vs. perceived height of tip ............................................................................. 32
4.3 Hypothesis testing ....................................................................................................................... 33
5. Discussion and conclusions........................................................................................................... 44
5.1 Summery of the results ................................................................................................................ 44
5.2 Discussion and conclusions of the results .................................................................................... 47
5.3 Theoretical implications ............................................................................................................... 49
5.4 Managerial implications ............................................................................................................... 50
6. Limitations and further research .................................................................................................... 50
Bibliography .......................................................................................................................................... 53
Appendixes ........................................................................................................................................... 57
I Hardcopy invitation to participate in survey ...................................................................................... 57
II Relevant Marketing Scales: ............................................................................................................ 57
III Questionnaire ................................................................................................................................ 58
IV Multiple regression analyses (hypotheses 1, 2, and 3) ................................................................... 63
V Regression analyses (hypothesis 4) ............................................................................................... 67
VI Output moderation results (hypothesis 5) ...................................................................................... 73
VII Moderator values defining Johnson-Neyman significance region (hypothesis 5)............................ 75
VII ANOVA results (hypothesis 6) ...................................................................................................... 79

6
1. Introduction
Tipping is a fascinating, dynamic and widely-adopted phenomenon, not only is it strongly
culturally determined it also challenges the standard assumption of selfishness in the economic
exchange theory (Lynn, Zinkhan, & Harri, 1993). A tip, is paid after the service has been
received; the customer therefore intentionally increases the price he or she has to pay. This
irrational behavior stresses the importance of psychological reasons and social norms in
motivating economic behavior (Conlin, Lynn, & O'Donoghue, 2003; Azar, 2007) and presents
interesting insight into consumer behavior and the buyer-seller relationship.
Since 1977, in which Ben-Zion and Karni offered the first economic model for tipping, the
majority of research into tipping has been limited to the motivations and antecedents which drive
tipping behavior; it neglects the effect the practice has on the buyer-seller relationship. The little
interest of the effects on the buyer-seller relationship is remarkable as relationship marketing is
a much addressed topic in the service industry as regular/loyal customers contribute
significantly to high profit margin and revenue, positive referral and continuing customer
reciprocity (Morgan & Hunt, 1994; Ryu & Lee, 2013; Gummesson, 2014).
To understand the buyer-seller relationship better, insight into the motivation of the buyer to tip
and how certain antecedents can manipulate this behavior are essential. In an overview of
literature Azar (2007a) sums up service quality, patronage frequency (loyalty), bill size, service
quantity, group size/ composition, differences between countries, interpersonal connection with
the server and social norms as variables to tip. Later in 2011, Azar suggests that the two main
underlying reasons for tipping in restaurants are that tipping is a social norm and that customers
can use tipping to show their gratitude for the service they received.
The fast majority of articles on tipping however takes the social norm argument as a departure
point, and neglects gratitude (Azar, 2007a; Conlin et al. 2003; Kershnar, 2014). In general,
gratitude is a concept which has been overlooked by marketing scholars in the study of
commercial relationships (Raggio, Walz, Godbole, & Garretson Folse, 2014; Palmatier et al.,
2009).The social norm argument explains tipping behavior by means of an implicit contract
between the server and the customer (Bodvarsson & Gibson, 1994) and it is seen as form of
reciprocity which is aligned with a score-keeping mentality (Cropanzano & Mitchell, 2005).

7
Palmatier, Burke Jarvis, Bechkoff and Kardes (2009) however claim that emotional feelings in
response to a favor or benevolence received are different from the norm of reciprocity. Recent
research into relationship marketing has reinforced the importance of gratitude and stresses that
taking reciprocity (as a score-keeping mentality) as a departure point in research ignores the
underlying and important role of gratitude (Palmatier et al., 2009). Raggio et al. (2014) suggest
that gratitude is an important antecedent for trust and commitment, which are proven
precedents for loyalty and should therefore receive more attention.
According to Palmatier et al. (2009) gratitude is a key mediator in understanding how
relationship marketing investments increase e.g. (re)purchase intentions. In their qualitative
research of 2014 Raggio et al. build on the study of Palmatier et al. (2009) and claim that for
both parties to reap the full transformational effect of the expression of gratitude both parties
have to come to a mutal understanding that the gratitude cycle has been accomplished. The
steps of this cycle are ‘benefit – gratitude – expression – acknowledgement’ and is the initial
component of their theoretical model. In this cycle the beneficiary first has to recognize a benefit
which he then feels appreciation for (gratitude), when the beneficiary expresses his feelings of
gratitude a non-financial exchange takes place which the intitial benefactor has to acknowledge
to complete the cycle.
One of Raggio et al. (2014) observations therefore is that buyer and seller are both responsible
to express gratitude, but an asymmetry exists in which sellers are expected to show more
gratitude. The opposite seems to be the case in the concept of tipping, in which the buyer
voluntarely increases the price of the service to express gratitude. This observation will be
especially relevant in a context in which the social norm for tipping is less prevelant and
guidelines less explicit. In a cross-country study Lynn et al. (1993) suggest that this is the case
in countries with feminine values, in this context tipping emphasizes the social relationship. Most
insight into tipping behavior however applies to a North American context in which masculine
values prevail, here tipping stresses an economical relationship. Little academic research is
available related to tipping in countries where tipping is less prevalent and it’s rules of the
practice remain vague.
This study will be the first to explore the impact of acknowledgement by the service provider, as
a response to a tip, on future intentions by the customer, being word of mouth and revisit
intentions. It will test if the claim of Raggio et al. (2014) that the transformational power of

8
gratitude can only be achieved when both parties agree that the gratitude cycle has been
completed is correct. Additionally, this study will show if the evaluation of the ratio between the
level of acknowledgement and height of the tip by the customer has to be in accordance to have
an effect. In general, it will be valuable to explore if the expressed acknowledgment by the
service provider strengthens the relationship between customer and service provider and
consequently increases future intentions by the customers, and eventually business results.
The main research question has been defined as follows: what is the impact of acknowledgment
by the hospitality service supplier, in reaction to the expression of gratitude shown by the
customer in terms of tipping, on customer future intentions to revisit and of word of mouth?
In order to answer this question the literature review will answer the following sub-questions:
What is tipping and what motivate this behavior?
How do ‘social norm theory’ and feelings of gratitude’ affect tipping behavior?
What are cross-cultural differences in tipping behavior in relation to ‘social norm’ and
‘feelings of gratitude’?
What is relationship marketing?
What is the impact of gratitude in relationship marketing on buyer-seller relationships?
What are factors which make buyers (and sellers) grateful?
How do feelings and acknowledgement of gratitude impact customer reciprocity (revisit
intentions and word of mouth)?
The paper is organized in the following manner: firstly a review of literature provides insight in
the phenomenon of tipping related to social norm compliance and gratitude and the concept of
gratitude in relationship marketing. This overview will provide relevant insight in tipping behavior
and the importance of gratitude to the buyer-seller relationship which will likely result in positive
customer future intentions. Afterwards details about the quantitative research are provided.
Findings from the studies, as well as support from the literature are incorporated into a
theoretical model. Finally the consequences of the research are discussed and the academic
and managerial implications are addressed.
This research will make an academic and managerial contribution. Firstly, it will provide insight
into the impact of expressed gratitude which provides academic value regarding the role of
gratitude in (B2C) relationship marketing. Additionally it will provide more insight into the
consumer behavior related to tipping. Secondly, from a managerial perspective it will provide
9
guidance in anticipating on tipping behavior of customers by the service provider and
consequently improving the relationship quality, hence customer’s future intentions.
2. Literature review
2.1 Tipping
Tipping is a widespread custom governed by many and varied norms and motivations which
often leave customers uncertain about how much to tip, or even whether they should tip at all
(Lynn, Zinkhan & Harris, 1993). Tipping is a multi-billion-dollar phenomenon worldwide. To
illustrate: the custom accounts for up to $40 billion in the United States (Holland, 2009), and
approximately €425 million in the Netherlands (Versprille, 2014) a year.
The origin of the concept of tipping knows many stories dating as far back as the Middle Ages
when lords would throw coins at beggars to ensure a safe journey (Lynn et. al. 1993; Azar,
2007; Whaley et al., 2014). The origin of the word ‘tip’ is also debated. Lynn et al. (1993, p. 479)
sums up the following derivations: “(1) from the Latin word stips, meaning ‘gift’, (2) from the
Dutch word ‘tippen’, meaning ‘to tap’ (as in tapping a coin on a table to attract a server’s
attention), (3) the gypsy phrase ‘tipper me your money’, and (4) from the words ‘To Insure
Promptitude’ that were placed on collection boxes in eighteenth-century English coffee shops.”
In countries where tipping is custom an implicit contract dictates that good service is rewarded
by tipping. In general a custom disappears over time when it is costly to follow, however the
norm to tip has defied this observation. Azar (2007b) suggest that the custom survives due to
the fact that it is the most efficient way to monitor and reward the efforts of service workers.
Other research by Lynn (2001) however shows a weak correlation between the tip amount and
the quality of service. Better service increased the tip only by approximately 1.5%; if tipping was
aimed to reward or punish the quality of service Lynn claims that this increase would be too
small for waiter to notice. Conlin et al. (2003) present an alternative reason, they suggest that
the custom, although costly, does give a return as it takes away the negative effects of disutility
of not adhering to the social norm.

10
Since the late 70’s experts have theorized economic models of tipping. In the early days the
observation of Ben-Zion and Karni (1977) was that tips were consistent with self-interest
seeking behavior only for the case of repetitive customers to ensure the same level or better
service for their next visit. The motivations for tipping by one-time customers were left out of
their model. Ever since, tipping literature knows two dominant schools of thought (Whaley et al.,
2014), described as the employer-driven and customer-led. Segrave (1998) claims that from the
first perspective tipping behavior is driven by consumers who are sympathetic toward low-wage
servers and try to compensate for the irresponsible employers who cut on labor costs. The
customer-led view presents the idea that consumers like to reward (or not) the quality of service
received and show gratitude for the service received. In a review of tipping literature for
economic and psychological reasons to tip these two schools are recognized. Returning
motivations are: rewarding and responding to feelings of gratitude for good service while
simulatiously assuring future service delivery (Azar, 2007; Bodvarsson, Luksetich, & McDermott,
2003; Lynn, 2001, Whaley et al., 2014), out of empathy for the service staf (Azar, 2007; Lynn,
2001, Whaley et al., 2014) and need to comply to social norms and in relation the need for
social approval (Azar, 2007; Bodvarsson et al., 2003; Conlin et al., 2003; Lynn, 2001, Whaley et
al., 2014).
In a study by Azar in 2010 people were asked to indicate one or more out of seven potential
motivation for tipping. With 85% “tipping in restaurants in the social norm in the US” scored
highest, follow by “by tipping I can show the waiter my gratitude for his service” (68%).
2.1.1 Tipping and social norm
Kershnar (2014, p.247) suggests that “in contexts in which tipping is customary, there is a moral
duty to tip or explicitly tell the server that you will not be tipping”. He draws this conclusion after
researching both customers and server’s views on a scenario in which a customer is unable to
tip his server. The strong and apparent views from both parties illustrate a duty to tip which is
inherent in ordering food. This duty is dictated by an implicit contract which is governed by a
convention in the United States that customers tip their servers 15-20%. Conlin et al. (2003)
suggests that the main motivation of tipping is an internalized norm to support the social
(external) norm. When people violate this norm they are left with negative feelings caused by
less favorable social treatment from their peers. In their decision how much to tip, the customer

11
trades off material payoffs against the harmful effects. Additionally Azar (2007a) explains that
compliance with the social norm of tipping by stating that people derive benefits from tipping,
such as impressing others and improving their self-image. In another paper, also published in
2007, he states these reasons as the major motivations for tipping and labels these extrinsic
and intrinsic motivations as ‘social pressure’ and ‘fairness’.
Although the above research is all conducted in an American context which knows a strong
social tipping norm, the social norm theory most probably also apply to some extend in the
Dutch context, in which this research is conducted. Although the convention might be less
explicit and social norm less prevalent, the custom of tipping is commonly used. 9 out 10 Dutch
people indicate to regularly tip after a visit to a restaurant or bar (TNS Nipo/ RTL Nieuws, 2005).
This vast majority suggests that a sense of duty to tip is likely to exist, also in the Netherlands.
Consequently, the following is proposed:
H1 Feelings to comply to social norms related to tipping positively influence tipping behavior.
2.1.2 Tipping and gratitude
Although ‘gratitude’ is suggested to be one of the most prevalent motivations to tip, this
antecedent has received little isolated attention in tipping literature (Azar, 2007), neither has it in
marketing in general (Palmatier et al., 2009). A widely explored topic in tipping literature has
been the motivation driven by psychological utility to reciprocate feelings of satisfaction caused
by good service (Lynn & McCal , 2000). Little prior work exists about the relationship between
gratitude and satisfaction. In their theoretical framework Raggio et al. (2014) suggest that
gratitude precedes satisfaction, however their study offers mixed results, also suggesting that
satisfaction first has to be achieved before experiencing gratitude. They claim that the
constructs gratitude and satisfaction are independent and suggest that feelings of gratitude go
beyond feelings of satisfaction; feelings of gratitude are a response to an experience of
benevolence rather than offsetting the actual experience against the expected experience.
Regardless of the order, a strong relationship between the constructs satisfaction and gratitude
exist. Azar (2010) suggests that people who tip in reaction to feelings of gratitude are more
sensitive for the quality of service than those who tip to comply to social norm. In contrast,

12
people who indicate that social norm theory is their main reason for tipping do not think that it is
necessary to tip much more for excellent service than for poor service. Research by TNS Nipo/
RTL Nieuws (2005) shows that the vast majority (84%) of tippers in the Netherlands gives a tip
to show appreciation for the received service. If this appreciation is caused by feelings of
satisfaction or gratitude cannot be derived, however in light of this study we propose the
following hypothesis:
H2 Feelings of gratitude of the consumer towards the service experience positively influence
tipping behavior.
2.1.3 Tipping – across countries
Although wide-spread, the concept of tipping is strongly culturally determined. The variation in
tipping is considerable. In countries like the United States and Canada the principle is relatively
straight forward and the tip percentage high; the guideline for the percentage to tip in
restaurants is 15-20%. There are also countries, like Brazil, Turkey and Japan, where tipping is
not part of its culture and can even be taken as an insult. Other countries adopt a custom of a
moderate tip of 10% or less, is these countries (e.g. Germany, France, Argentina and China) the
practice remains vague, one person gives 10 cents, the other 10 percent (Bujisic et al., 2014;
Conlin et. al. 2003; Kershnar, 2014; Lynn et al., 1993). Conlin et. al. (2003) suggest two
possible answers for cross-country differences. Firstly, the extent to which the tipping norm is
related to possible benefical outcomes, these “efficiency benefits” differ across countries.
Secondly, the degree the norm for tipping is enforced by “internalized feelings of guilt and
shame”, the sensitivity for, and the effects of these feelings are experienced differently across
cultures.
Lynn et al. (1993) is the only researcher who has done extensive cross-country research to test
national differences in tipping practices and norms at a macrolevel across 30 countries. The
predictor variables used in his research are the cultural dimensions of Hofstede, power
distance, uncertainty avoidance, individualism and masculinity. He suggests that “tipping
appears to be more prevalent in countries with a high tolerance of status and power differences”
(p.483), “tipping was more prevalent the less tolerant countries were of uncertainty” (p.483),
suggesting tipping gives customers a sense of control. Another conclusion was that “tipping was
13
more prevalent in communalistic countries (p.484). Finally, “tipping appears to be less prevalent
in countries with feminine values” (p.484).
The Dutch score for masculinity is 14, in contrast to the US score of 62 (Hofstede, 2014), this
suggests that in general the Dutch national culture has a strong preference for feminine values.
In countries with feminine values service, interdependence and people are important; tipping in
this context emphasizes the social relationship. Most insight into tipping behavior however
applies to a North American context in which masculine values prevail, here tipping stresses an
economical relationship (Lynn et al.,1993).
Similar to Azar’s findings in his North American study in 2010, it is likely that social norm theory
and feelings of gratitude will positively relate to the tip amount in countries like the Netherlands,
like proposed in the hypotheses one and two. However, the final observation of the strong
preference for feminine values in relation to tipping behavior suggests that gratitude will have a
stronger effect on the tip amount than compliance to social norm in the Dutch context in which
this research is conducted; therefore hypothesis three is as follows:
H3 ‘Feelings of gratitude’ will have a stronger effect on tipping than ‘compliance to social norm’
in a country with a preference for feminine values, like the Netherlands.
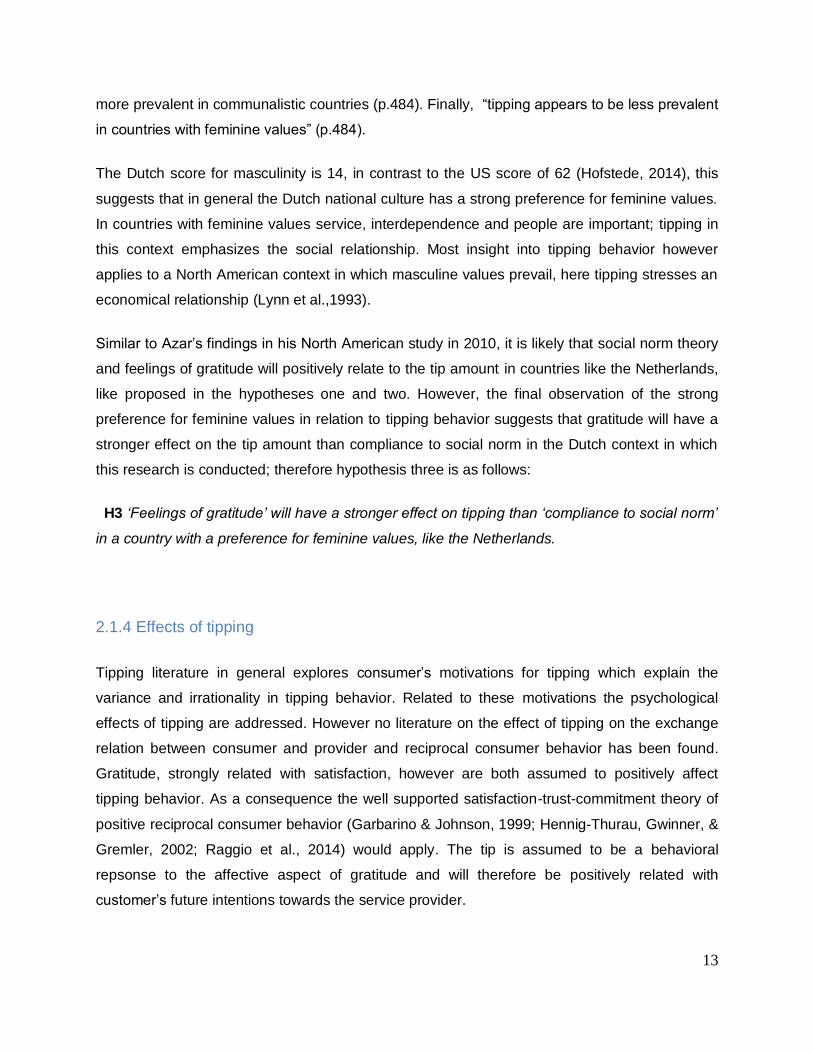
2.1.4 Effects of tipping
Tipping literature in general explores consumer’s motivations for tipping which explain the
variance and irrationality in tipping behavior. Related to these motivations the psychological
effects of tipping are addressed. However no literature on the effect of tipping on the exchange
relation between consumer and provider and reciprocal consumer behavior has been found.
Gratitude, strongly related with satisfaction, however are both assumed to positively affect
tipping behavior. As a consequence the well supported satisfaction-trust-commitment theory of
positive reciprocal consumer behavior (Garbarino & Johnson, 1999; Hennig-Thurau, Gwinner, &
Gremler, 2002; Raggio et al., 2014) would apply. The tip is assumed to be a behavioral
repsonse to the affective aspect of gratitude and will therefore be positively related with
customer’s future intentions towards the service provider.
14
Overall, restaurant visits are characterized by variety seeking behavior, which despite having
great potential for high commitment are also typified by low repeat behavior (Dick & Basu,
1994). This type of customers is described as ‘low relational’ by Garbarino and Johnson (1999)
and for this type of customers overall satisfaction (and gratitude) is the primary mediating
construct between attitudes and future intentions. Therefore we propose that if the tip amount
goes up as behavioral response to feelings of gratitude and satisfaction, the tip amount
consequently will have a predictive value for future intentions like revisit intentions and word of
mouth. This results in the following hypothesis:
H4 There is a positive relation between tipping behavior and customer’s future intentions.
2.2 Relationship marketing
Relationship marketing (RM) is defined as “all marketing activities directed toward establishing,
developing, and maintaining successful relational exchanges” (Morgan & Hunt, 1994, p. 22).
The objective of relationship marketing theory is understanding which key drivers have an
impact on important company results and obtaining better insight in the causal realtions
between these drivers and results (Hennig-Thurau et al., 2002). The increased emphasis on RM
is a reaction to the assumption that strong customer relationship result in “guest satisfaction,
positive word of mouth, business reeferrals, references and publicity” (Kim & Cha, 2002. p.321).
Gwinner, Gremler and Bitner (1998) claim that strong customer relationships are especially
important in the service industry because of it’s interpersonal focus and the relative lack of
objective measures for evaluating service quality. Research in both business-to-consumer and
business-to-business markets has established a well supported commitment-trust theory in RM
to achieve these strong customer relationships. Hence, RM investments are required to
enhance both commitment and trust, which in turn positively mediates customer behavior,
resulting in superior seller performance (Morgan & Hunt, 1994; Sirdeshmukh, Singh, & Sabol,
2002). A meta-analysis by Palmatier, Dant and Evans (2006), aimed to test the commitment-
trust theory in RM, however revealed that the direct effect of RM investments had a greater
effect on performance outcomes than could be explained by the mediating effect of commitment
and trust alone, suggesting a missing mediating mechanism. Three years later Palmatier et al.,
(2009) find support to believe that this missing construct is ‘gratitude’.
15
RM investments are essential to reap the benefits of RM. According to Palmatier et al., (2009)
these investments can vary from the delivery of extra service, adaptations in policies and
providing small favors or considerations. These initiatives create short term feelings of gratitude
(and in long term commitment and trust) with customers, which result in gratitude-based
reciprocal behaviors, which in turn lead to enhanced seller performance. Although there are
hospitality suppliers which have commited and trustworthy relationships with their customers,
most relationship between customers and suppliers will be clasified as ‘low relational’
(Garbarino & Johnson, 1999) due to the variety seeking attitude customers have towards the
service. This does not make relationship marketing investments less important, but it is
assumed to make the mediating short term effect of gratitude, versus commitment and trust,
more relevant.
In the past three decades two conceptual approaches have tried to explain the determinants of
succesfull relationship marketing outcomes, the relational benefits approach and the
relationship quality approach.
2.2.1 Relationship benefits
Research and experience have proven that strong consumer-supplier relations are beneficial for
the service provider, however Gwinner et al. (1998) claim that for a relationship to be long-term,
both parties will have to benefit. In this view they conducted research into the motivations of
consumers to be loyal to a company. These motivations were defined as relational benefits;
“benefits consumers receive above and beyond the core service performance, in return for their
enduring relationship with a service provider” (p. 102).
These relational benefits comprise of three dimensions, namely: social, confidence, and special
treatment benefits. Social benefits are psycho-social benefits and include emotions of personal
recognition, friendship and familiarity and result from personal connections. Confidence benefits
reduce perceived risk and builds trust. Special treatment benefits are economic incentive-based
preferential actions such as discounts, free upgrades and complimentary services (Ryu & Lee,
2013).
Gwinner et al. (1998) conclude that confidence benefits are most important in services, followed
by social and special treatment benefits. The confident benefit ensures that you know what you
can expect of your service provider and consequently reduces the perceived risk caused by the
16
intangible character of services. In relation to this study, confidence benefits of tipping could be
the predictability and insurance and of good service in the future.
2.2.2 Relationship quality
Relationship quality reflects the overall nature of the relationship between companies and
consumers. As relationship marketing has gained ground, so did the concept of relationship
quality. Over time the concept has known various component or dimensions including
cooperative norms (Baker, Simpson and Kelley, 1998) and customer orientation (Dorsch,
Swanson and Kelley, 1998; Palmer and Bejou, 1994). However, most researchers
conceptualize relationship quality as a “high-order construct composed of commitment,
satisfaction and trust” (De Wulf, Odekerken-Schroder, & Iacobucci, 2001; Hennig-Thurau et al.
2002; Ulaga & Eggert, 2006 p.314).
Relationship quality refers to relationship strength; Ryu and Lee (2013) claim it provides insight
into customer perceptions of the extent to which their expectations and desires are satisfied by
their relationship with services providers. A high relationship quality suggests that customers
trust and rely on the performance of service providers. In line, Kim and Cha (2002) refer to
relationship quality as the perceptions and evaluations of individual employee’s communication
and behavior, such as respect, courtesy, warmth, empathy and helpfulness.
In conclusion relationship quality focuses on the nature of the relationship and relational benefits
focus on the receipt of user-oriented benefits, both concepts view the fulfillment of customer
needs as central for relationship success (Hennig-Thurau et al., 2002). This study uses the
approach of relationship quality as it explores the role of gratitude in customer-supplier
interactions; relationship quality has proven to be a strong predictor of performance outcomes
like brand loyalty, (re)purchase intentions, share of wallet and positive word of mouth (Garbarino
& Johnson, 1999; Palmatier et al. 2009).
2.2.3 Relationship marketing and gratitude
Gratitude has always been an integral component in the study of social relationships but the
component has been overlooked by marketing scholars in the study of commercial relationships
(Raggio, Walz, Godbole, & Garretson Folse, 2014; Palmatier et al., 2009). This is remarkable as

17
gratitude shows potential to “transform transactional exchanges into relational ones” (Bolton,
Lemon, & Verhoef, 2004, p.272). The study of Palmatier et al., (2009) into RM reinforces the
importance of gratitude and stresses that taking reciprocity as a departure point in research
ignores the underlying and important role of gratitude.
To feel gratitude customers have to voluntarily appreciate and acknowledge certain given
benefits. The RM investment (the benefit) has to be perceived as genuine by the customer and
demonstrate the service provider is acting in the best interest of the customer. If this is the case
the benefit will be perceived as a benevolent act (Atuahene-Gima & Li, 2002; Fazal e Hasan,
Lings, & Mortimer, 2014). An actual benefit is not necessarily required to experience gratitude.
Only the intention or perceived intent to benefit the customer can already result in feelings of
gratitude and therefore good intentions can already be sufficient.
The ingrained psychological pressure to reciprocate after receiving a RM investment has been
recognized by researchers in different fields (Palmatier et al., 2009). Raggio et al. (2014) explain
reciprocity as closely aligned with a conditioned score-keeping mentality in which people seem
to be hardwired to repay others for what they receive, in a positive or negative sense. A
response related to feelings of gratitude however is not characterized by mindless behavior, nor
does the expresser expects something in return. In case of gratitude the beneficiary genuinely
appreciates and acknowledges certain given benefits. To experience feelings of gratitude “the
recipient must recognize that the benevolence is intentional and moreover, attribute good
intentions to the giver” (Palmatier et al., 2009. p.5). The recipient can then opt to keep these
feelings of gratitude to himself or express his feelings of gratitude (gratitude-based reciprocal
behavior) to the giver. In this sense gratitude is described as the emotional core of reciprocity.
Komter (2004) suggests that through this type of mutual giving, people become tied to what has
been described as a “web of feelings of gratitude” (p.203).
Although Palmatier et al. (2009) underpinned the importance of gratitude, they failed to
demonstrate how gratitude strenghtens customer-supplier relationships. To unraffle the “web of
feelings of gratitude” and shine light on the role of gratitude in commercial relationships Raggio
et al. (2014) conceptualized the web by introducing a gratitude cycle. In their model recognition
18
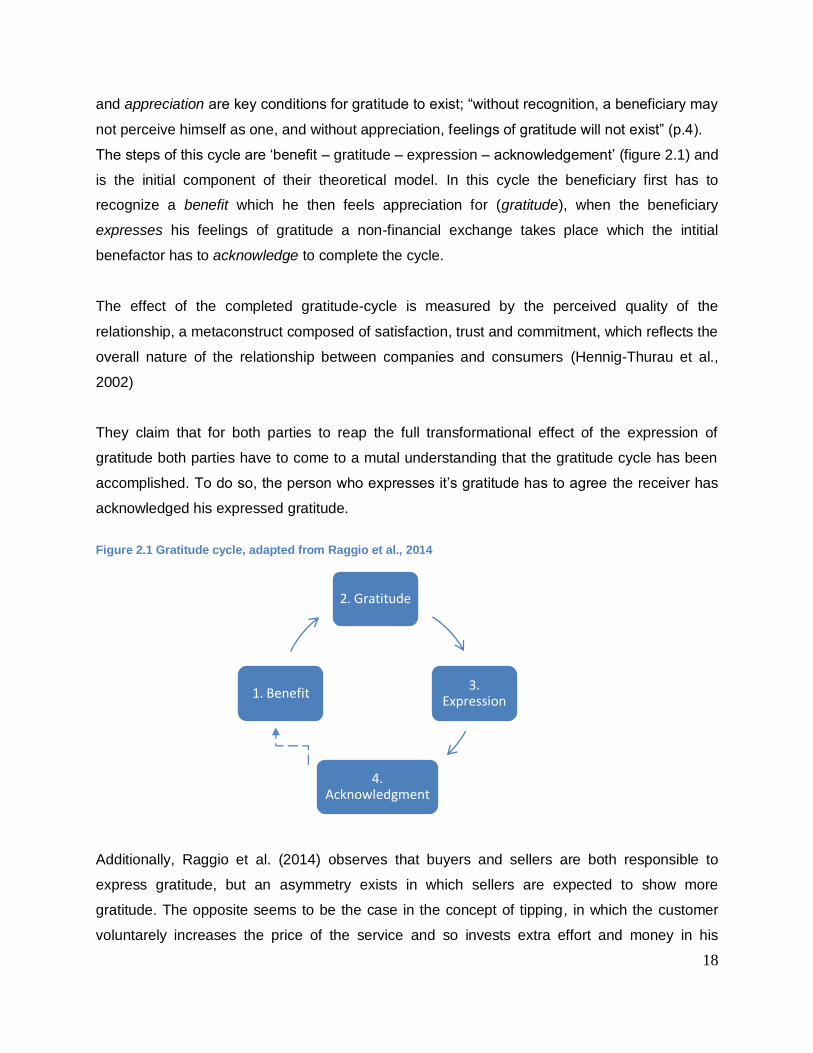
and appreciation are key conditions for gratitude to exist; “without recognition, a beneficiary may
not perceive himself as one, and without appreciation, feelings of gratitude will not exist” (p.4).
The steps of this cycle are ‘benefit – gratitude – expression – acknowledgement’ (figure 2.1) and
is the initial component of their theoretical model. In this cycle the beneficiary first has to
recognize a benefit which he then feels appreciation for (gratitude), when the beneficiary
expresses his feelings of gratitude a non-financial exchange takes place which the intitial
benefactor has to acknowledge to complete the cycle.
The effect of the completed gratitude-cycle is measured by the perceived quality of the
relationship, a metaconstruct composed of satisfaction, trust and commitment, which reflects the
overall nature of the relationship between companies and consumers (Hennig-Thurau et al.,
2002)
They claim that for both parties to reap the full transformational effect of the expression of
gratitude both parties have to come to a mutal understanding that the gratitude cycle has been
accomplished. To do so, the person who expresses it’s gratitude has to agree the receiver has
acknowledged his expressed gratitude.
Figure 2.1 Gratitude cycle, adapted from Raggio et al., 2014
Additionally, Raggio et al. (2014) observes that buyers and sellers are both responsible to
express gratitude, but an asymmetry exists in which sellers are expected to show more
gratitude. The opposite seems to be the case in the concept of tipping, in which the customer
voluntarely increases the price of the service and so invests extra effort and money in his
2. Gratitude
3. Expression
4. Acknowledgment
1. Benefit
19
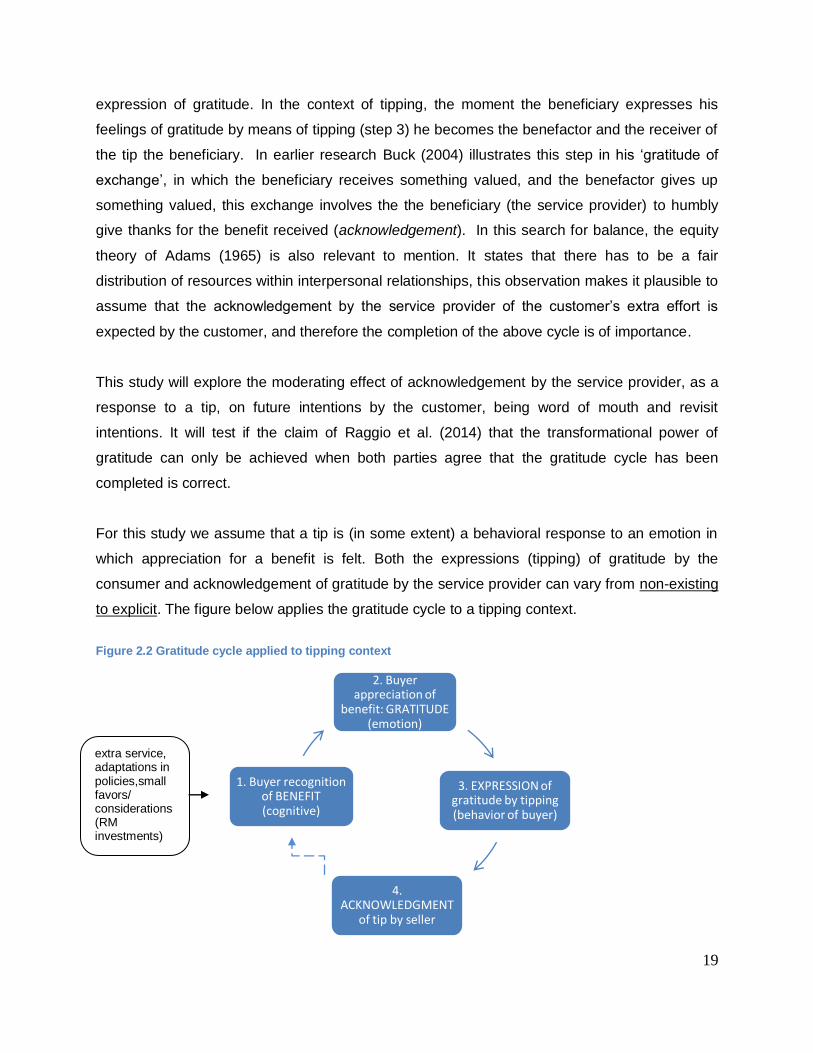
expression of gratitude. In the context of tipping, the moment the beneficiary expresses his
feelings of gratitude by means of tipping (step 3) he becomes the benefactor and the receiver of
the tip the beneficiary. In earlier research Buck (2004) illustrates this step in his ‘gratitude of
exchange’, in which the beneficiary receives something valued, and the benefactor gives up
something valued, this exchange involves the the beneficiary (the service provider) to humbly
give thanks for the benefit received (acknowledgement). In this search for balance, the equity
theory of Adams (1965) is also relevant to mention. It states that there has to be a fair
distribution of resources within interpersonal relationships, this observation makes it plausible to
assume that the acknowledgement by the service provider of the customer’s extra effort is
expected by the customer, and therefore the completion of the above cycle is of importance.
This study will explore the moderating effect of acknowledgement by the service provider, as a
response to a tip, on future intentions by the customer, being word of mouth and revisit
intentions. It will test if the claim of Raggio et al. (2014) that the transformational power of
gratitude can only be achieved when both parties agree that the gratitude cycle has been
completed is correct.
For this study we assume that a tip is (in some extent) a behavioral response to an emotion in
which appreciation for a benefit is felt. Both the expressions (tipping) of gratitude by the
consumer and acknowledgement of gratitude by the service provider can vary from non-existing
to explicit. The figure below applies the gratitude cycle to a tipping context.
Figure 2.2 Gratitude cycle applied to tipping context
2. Buyer appreciation of
benefit: GRATITUDE (emotion)
3. EXPRESSION of gratitude by tipping (behavior of buyer)
4. ACKNOWLEDGMENT
of tip by seller
1. Buyer recognition of BENEFIT (cognitive)
extra service, adaptations in policies,small favors/ considerations (RM investments)
20
The completion of these steps above should optimize the relationship between buyer and seller
according to Raggio et al. (2014). Therefore the following is proposed:
H5 The acknowledgement of the tip by the service provider moderates the impact of tipping
behavior on customer future intentions; when the acknowledgment is more explicit the tip will
have a stronger effect on revisit and word of mouth intentions.
In line with the gratitude cycle of Raggio et al. (2014) and the equity theory of (Adams, 1965) we
hypothesized that the acknowledgement of the tip has to be explicit to achieve a fair relational
exchange of gratitude. However, we also assume that it has to be in line with the perceived
height of the tip. This assumption is based on finding of Adams (1965) and Mayser and von
Wangenheim (2012) that individuals perceive distress when they feel that they are under or over
benefited. Although the threshold for making customer feel overvalued is higher than making
customers undervalued, both feelings result in feelings of discomfort, stress and guilt. The
reaction of the service supplier therefore can either be evaluated as fair or unfair by the
customer, according to their perception of the height of the tip. In case of a fair evaluation of the
equity ratio remains in balance, however an unfair evaluation leads to a feeling of inequity (Allen
& White, 2002) and research shows that in response the customer will act less favorable to
restore the equity ratio.
In this study the feeling of inequity is caused by either the undervalued or overvalued reaction in
response to the tip. In case the tip is perceived as low, an overenthusiastic thank-you reaction
(acknowledgement) might be considered inappropriate and embarrassing for the customer. In
contrast, when the customer believes to give a relatively high tip, the tip acknowledgement of
the tip might be expected to be stronger than when a moderate tip is given. We therefore
hypothesize that:
H6 The acknowledgement of the tip by the service provider has to be perceived as ‘in line’ with
the tip in order for customers to indicate future intentions as more likely.
21
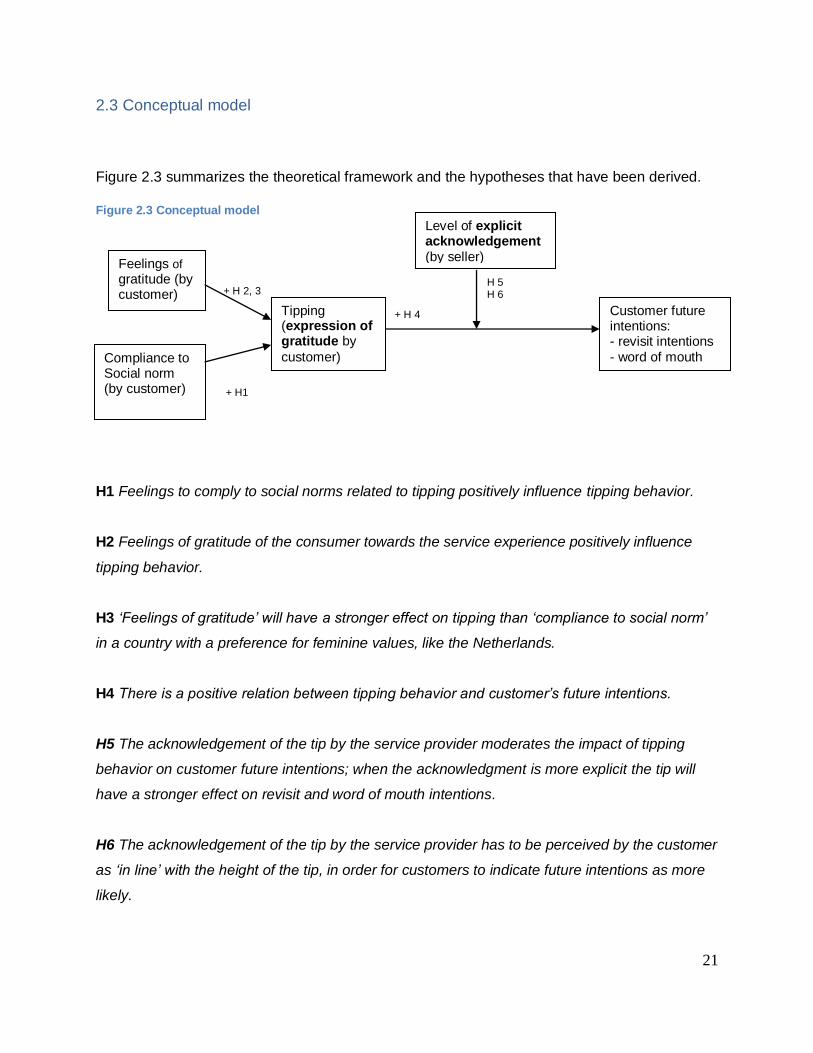
2.3 Conceptual model
Figure 2.3 summarizes the theoretical framework and the hypotheses that have been derived.
Figure 2.3 Conceptual model
H1 Feelings to comply to social norms related to tipping positively influence tipping behavior.
H2 Feelings of gratitude of the consumer towards the service experience positively influence
tipping behavior.
H3 ‘Feelings of gratitude’ will have a stronger effect on tipping than ‘compliance to social norm’
in a country with a preference for feminine values, like the Netherlands.
H4 There is a positive relation between tipping behavior and customer’s future intentions.
H5 The acknowledgement of the tip by the service provider moderates the impact of tipping
behavior on customer future intentions; when the acknowledgment is more explicit the tip will
have a stronger effect on revisit and word of mouth intentions.
H6 The acknowledgement of the tip by the service provider has to be perceived by the customer
as ‘in line’ with the height of the tip, in order for customers to indicate future intentions as more
likely.
H 5 H 6
+ H 2, 3
+ H 4
Compliance to Social norm (by customer)
Customer future intentions: - revisit intentions - word of mouth
Level of explicit acknowledgement (by seller)
Tipping (expression of gratitude by
customer)
Feelings of gratitude (by customer)
+ H1

22
3. Research method
3.1 Data collection procedure
In order to test the proposed hypotheses a descriptive research design was adopted. The study
used a cross-sectional survey approach to collect data related to consumer tipping behavior and
the effect acknowledgement of this tip has. Respondents were asked to recall the last time they
tipped in a restaurant context; this approach provided a personal, realistic and approachable
scenario for the respondent to relate the succeeding questions to. Firstly, the respondents were
asked to comment on the gratitude they felt towards the staff and their intentions to revisit and
participate in positive word of mouth. Next, the respondent was asked to indicate the amount of
the tip left behind and if he perceived the tip to be high or low and if the tip was acknowledged
by the service provider. Finally, questions were posed to test the level of compliance to social
norm related to tipping. The order of questions aimed to prevent socially desired answers from
the respondents related to the relation between the height of the tip, the perceived gratitude for
the received service and future intentions. To avoid any language barriers the questionnaire
was translated into Dutch.
The questionnaires were designed in Qualtrics, and distributed via the internet. SPSS was used
for descriptive statistics and analyses. Prior to issuing the questionnaires, a representative
group (in age and educational background) of eighteen respondents were asked to fill out the
survey and give feedback, small adjustments in the questionnaire were made accordingly.
3.2 Sample
Data was collected via convenience and self-selection sampling in the Netherlands. Care was
taken to achieve a sample which was representative for the Dutch population involved in tipping;
in gender, age (>18yrs) and geographically. Self-administrated, internet-mediated
questionnaires were distributed via the author’s network and invitations to participate in and
distribute the survey were posted on social media. Additionally, hardcopy invitations (appendix I)
were handed out to restaurant guests upon their departure of the restaurant. A total of 327
surveys were collected within 14 days of distribution. Of the 327 surveys, 2 respondents
indicated never to tip and 21 were incomplete, resulting in 304 valuable surveys. This type of
sample ensured a relatively diversified group of respondents, hence enhancing the external
validity of the study.
23
3.3 Measure development
To maximize the level of reliability and internal validity measures were borrowed from previous
studies, of which some were adapted to suit a restaurant setting. Participants responded to a
series of questions and multi-item Likert measures on a five-point scale, ranging from ‘strongly
disagree’ (1) to ‘strongly agree’(5).
The first set of questions was developed to set the scene. By asking the name of the restaurant,
the type, the amount of people dining, if the visit was for leisure or business, the respondent
was forced to recall the situation in which he last tipped. Additionally, the respondent was asked
when the visit took place and if he visited the restaurant before.
With respect to the customer reciprocity (revisit intentions and word of mouth) scales were taken
from the Marketing Scales Handbook (Bruner, 2009; 2013). The four item construct to test for
revisit intention (repatronage intention) originally was tested by Hess, Ganesan and Klein
(2003). As for the word of mouth construct a four item construct was originally composed and
tested by Bruggen, Foubert and Gremler (2011). In this section of the questionnaire, scales to
test for the level of gratitude were also included. These scales were adapted from Palmatier et
al. (2009). All three constructs present a satisfactory construct validity and reliability.
Next, the respondent was asked questions in relation to his tip. This study is conducted in a
context where guidelines for the tip percentage are vague. The Netherlands belong to the group
of countries in which tips can vary from 10% to ten cents. Therefore the perception of whether a
tip is high or low is very personal. To take this in consideration we suggest that not only the
absolute tip amount and the tip percentage will be of value but also the perception of height of
the tip by the consumer. The respondent was therefore asked to indicate the total amount of the
bill, the amount they tipped and if they perceived this tip to be low, a little low, not high/low, a
little high or high.
No existing scales to measure acknowledgement were found. The reciprocity construct
originally used in the research of Arnett, German and Hunt (2003) was able to measure a similar
effect and has been used to measure the level of acknowledgement by the service provider in
reaction to the given tip. The scale is composed of six, five-point Likert-type statements which
validly and reliably measure the degree to which a person believes that his support of a
particular organization is truly appreciated, three out of the six statements have been selected
24
and adapted to a tipping setting. Finally, the respondent was asked to indicate if the
acknowledgement of the tip by the service provider was in line with the height of their given tip.
To test for social compliance in relation to tipping, scales were borrowed from research into
tipping motivation scales by Whaley et al. (2014). Finally respondents were asked for several
demographical data, like gender, age, educational background and province of residence.
All previously mentioned scales have been borrowed from English academic papers and
translated to Dutch by conducting back-translation. Firstly, the English items were translated to
Dutch by the author, afterwards the translation was translated back to English by two academics
(English and Dutch) both fluent in English. These two translations were compared to the
original scales. The scales which differed from the origal scales were reassessed.
For detailed construct items, see appendix II. For the full questionnaire (in Dutch) see appendix
III.
4. Results
This chapter provides more insight in the descriptive data of the sample and correlations of the
variables of the hypothesized model.
4.1 Descriptive data of sample
The questionnaire has been completed by 327 respondents. Of the 327 surveys, 2 respondents
indicate never to tip and 21 were incomplete, resulting in 304 valuable surveys. The distribution
between men and women is very close to equal; 50.3% males; 49.7% female. The average age
is 41.7 years old and the vast majority of the respondents resides in the East of the Netherlands
(60%) and has a higher educational background (74%). The overrepresentation of the latter two
is most probably due to the self-selective nature of the data-collection and the networks used to
find respondents. The author addressed her own social and professional network to find
respondents, as she lives and works in Deventer at a University of Applied Science in the East
of the Netherlands. However, no literature has been found to suggest that people from the East
of the Netherlands or with a higher educational background tip significantly differently.
Additionally, note has to be taken regarding the authors network’s affinity with hospitality. Her

25
professional background in the hotel industry and the support on social media by hospitality
related accounts e.g. Nationale Horecagids, may enforced the self-selection of respondents who
are positively biased regarding the hospitality industry. For detailed distribution of the sample
data refer to table 4.1 below.
Table 4.1 Descriptive data of sample (N=304)
Freq. in %
Gender Male 154 50.3
Female 150 49.7
Age (years) M = 41.7, SD =14.8, Min 19, Max 81
<30 68 22.4
30 - 40 99 32.6
41 - 55 63 20.7
>55 74 24.3
Province of residence North (Fri, Dre, Gro, Fle) 16 5.3
East (Gel, Ove) 182 60.0
West (N-Hol, Z-Hol, Utr) 84 27.8
South (Zee, N-Bra, Lim) 22 7.2
Education Lower 80 26.3
Higher 224 73.7
Out of the 304 respondents the vast majority of respondents (74.3%) stated to tip nearly always
or even every time they visit a bar or restaurant (table 4.2). The respondents (N=2) who
indicated to never tip, and who have been excluded from the sample, are unlikely to be
representative for the population due to the self-selective approach of this study. People’s
interest to participate in the study was raised by asking them about the last time they dined out
and tipped, it is not likely that people who do not tip would feel addressed to participate in the
survey. Although 74.3% states to (almost) always tip, out of the 304 respondents only 47.2%
agree that tipping in restaurants is the social norm in the Netherlands, 23.8% disagrees with this
statement and 29% is indifferent (M = 3.22, SD =1.095).
26
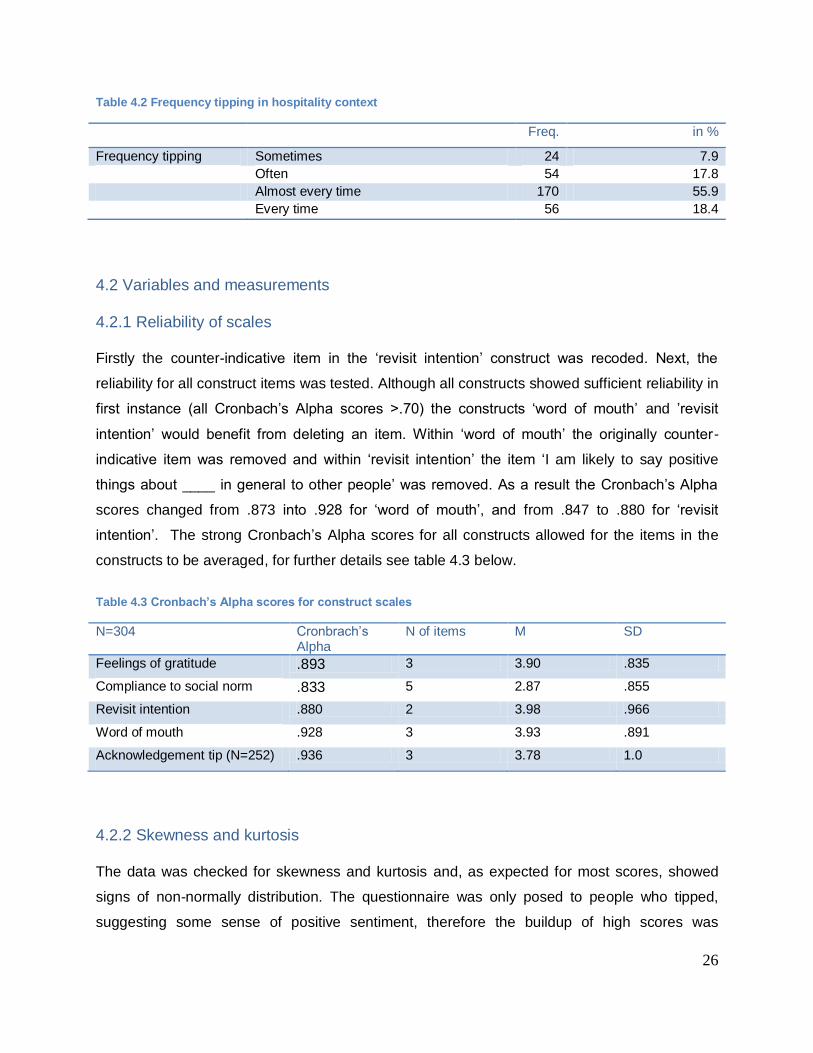
Table 4.2 Frequency tipping in hospitality context
Freq. in %
Frequency tipping Sometimes 24 7.9
Often 54 17.8
Almost every time 170 55.9
Every time 56 18.4
4.2 Variables and measurements
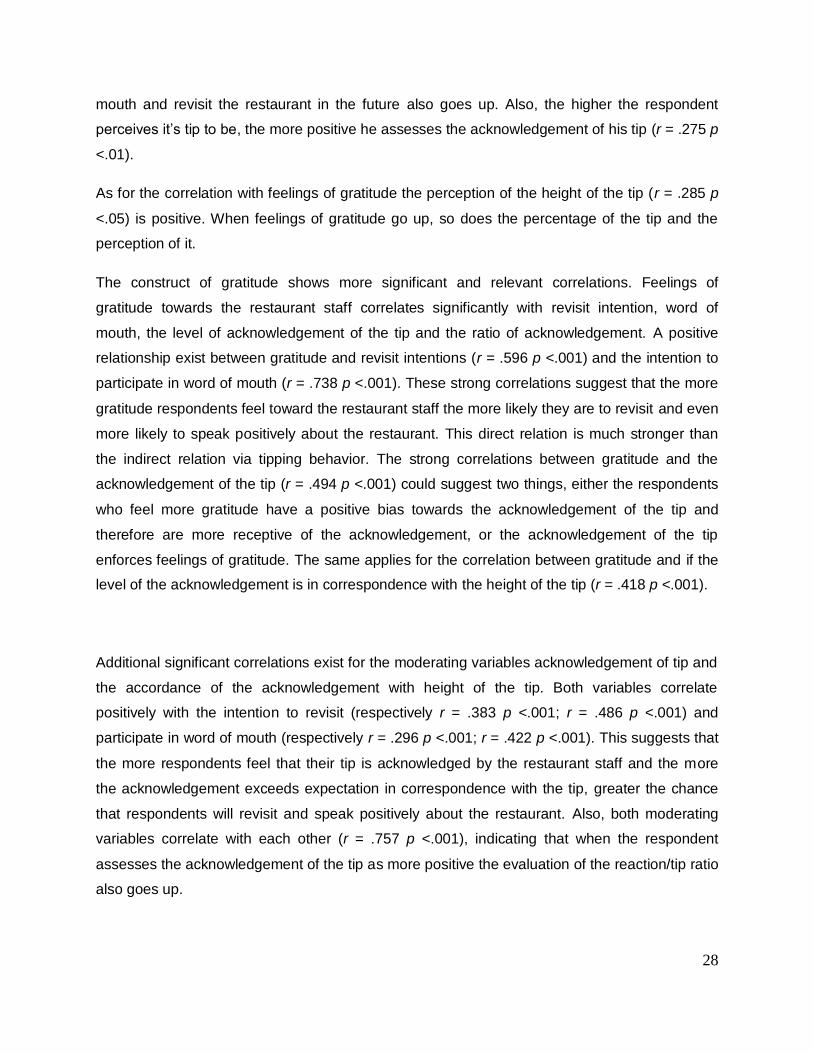
4.2.1 Reliability of scales
Firstly the counter-indicative item in the ‘revisit intention’ construct was recoded. Next, the
reliability for all construct items was tested. Although all constructs showed sufficient reliability in
first instance (all Cronbach’s Alpha scores >.70) the constructs ‘word of mouth’ and ’revisit
intention’ would benefit from deleting an item. Within ‘word of mouth’ the originally counter-
indicative item was removed and within ‘revisit intention’ the item ‘I am likely to say positive
things about ____ in general to other people’ was removed. As a result the Cronbach’s Alpha
scores changed from .873 into .928 for ‘word of mouth’, and from .847 to .880 for ‘revisit
intention’. The strong Cronbach’s Alpha scores for all constructs allowed for the items in the
constructs to be averaged, for further details see table 4.3 below.
Table 4.3 Cronbach’s Alpha scores for construct scales
N=304 Cronbrach’s Alpha
N of items M SD
Feelings of gratitude .893 3 3.90 .835
Compliance to social norm .833 5 2.87 .855
Revisit intention .880 2 3.98 .966
Word of mouth .928 3 3.93 .891
Acknowledgement tip (N=252) .936 3 3.78 1.0
4.2.2 Skewness and kurtosis
The data was checked for skewness and kurtosis and, as expected for most scores, showed
signs of non-normally distribution. The questionnaire was only posed to people who tipped,
suggesting some sense of positive sentiment, therefore the buildup of high scores was

27
expected. As a rule of thumb some researchers accept skewness and kurtosis values from -2 to
+2, more conservative views use a range from -1 to +1. As presented in table 4.4 most
constructs show evidence of negative skewness, with the exception of ‘tip percentage.
However, after inspecting the shapes of the distribution the values were assessed as
acceptable. Further support for this decision is the large sample (N=304), this could also cause
the rejection of normal distribution, therefore no further action to transform the variables was
taken (Tabachnick & Fidell, 2001).
Table 4.4 Skewness and kurtosis scores
N=304 Skewness Std. Error Kurtosis Std. Error
Feelings of gratitude -.994 .140 1.149 .279
Compliance to social norm -.138 .140 -.242 .279
Tip percentage 1.327 .140 4.073 .279
Tip – perception of height -.682 .139 2.335 .278
Revisit intention -1.074 .140 .708 .279
Word of mouth -1.030 .140 1.181 .279
Acknowledgement tip (N=252) -1.676 .153 2.709 .306
Acknowledgment – Tip ratio (N=252) -1.062 .153 2.256 .306
4.2.3 Correlation Matrix Table 4.5 presents the correlations between the variables. Included in this correlations matrix
are the independent variables (feelings of gratitude, compliance to social norm, tip percentage/
perception of height), the moderating variables (acknowledgement of tip/ ratio of
acknowledgement), the dependent variables (revisit intentions and word of mouth) and the
control variables (gender, age and education level). The analysis presents several significant
and relevant (r = higher or close to .3) correlations between certain independent, moderating
and dependent variables, these are described below.
The positive correlation between the tip percentage and the customers perception of the height
of their tip suggests that when the percentage goes up, so does the perception, however the
relationship is moderate (r = .354 p <.01). Only the perception of the height of the tip (not the
actual tip percentage) presents a close to moderate relationship with word of mouth intentions
and the intention to revisit (respectively r = .264 p <.01; r = .224 p <.01).This suggests that when
the perception of the height of the tip increases, respondent’s intention to participate in word of
28
mouth and revisit the restaurant in the future also goes up. Also, the higher the respondent
perceives it’s tip to be, the more positive he assesses the acknowledgement of his tip (r = .275 p
<.01).
As for the correlation with feelings of gratitude the perception of the height of the tip (r = .285 p
<.05) is positive. When feelings of gratitude go up, so does the percentage of the tip and the
perception of it.
The construct of gratitude shows more significant and relevant correlations. Feelings of
gratitude towards the restaurant staff correlates significantly with revisit intention, word of
mouth, the level of acknowledgement of the tip and the ratio of acknowledgement. A positive
relationship exist between gratitude and revisit intentions (r = .596 p <.001) and the intention to
participate in word of mouth (r = .738 p <.001). These strong correlations suggest that the more
gratitude respondents feel toward the restaurant staff the more likely they are to revisit and even
more likely to speak positively about the restaurant. This direct relation is much stronger than
the indirect relation via tipping behavior. The strong correlations between gratitude and the
acknowledgement of the tip (r = .494 p <.001) could suggest two things, either the respondents
who feel more gratitude have a positive bias towards the acknowledgement of the tip and
therefore are more receptive of the acknowledgement, or the acknowledgement of the tip
enforces feelings of gratitude. The same applies for the correlation between gratitude and if the
level of the acknowledgement is in correspondence with the height of the tip (r = .418 p <.001).
Additional significant correlations exist for the moderating variables acknowledgement of tip and
the accordance of the acknowledgement with height of the tip. Both variables correlate
positively with the intention to revisit (respectively r = .383 p <.001; r = .486 p <.001) and
participate in word of mouth (respectively r = .296 p <.001; r = .422 p <.001). This suggests that
the more respondents feel that their tip is acknowledged by the restaurant staff and the more
the acknowledgement exceeds expectation in correspondence with the tip, greater the chance
that respondents will revisit and speak positively about the restaurant. Also, both moderating
variables correlate with each other (r = .757 p <.001), indicating that when the respondent
assesses the acknowledgement of the tip as more positive the evaluation of the reaction/tip ratio
also goes up.

29
Both dependent variables revisit intentions and word of mouth correlate positively (r = .751 p
<.001), if respondents intent to speak more positively about the restaurant they are also more
likely to revisit the restaurant again.

30
Table 4.5 Correlation matrix
Variables M SD 1 2 3 4 5 6 7 8 9 10 11 12
1. Gender 1.51 0.5 -
2. Age 41.7 14.81 .373** -
3. Education level 0.73 0.444 -.163** -.354** -
4. Tip – absolute 6.95 8.34 .161** .12* -.175** -
5. Tip percentage 8.11 4.15 -.047 -.029 -.075 .081 -
6. Tip - perception height
3.01 0.682 .11 .06 .038 .146* .354** -
7. Feelings of gratitude
3.9 0.835 .09 .07 -.113* .15** .166** .285** (.89)
8. Compliance to social norm
2.87 0.86 -.119* -.059 -.058 .055 .08 .06 .06 (.83)
9. Revisit intention 3.98 0.966 .02 .004 -.062 .075 .11 .224** .596** .05 (.88)
10. Word of Mouth 3.93 0.891 .05 .018 -.081 .134* .122** .264** .738** .067 .751** (.928)
11. Acknowledge-ment of tip
3.78 1.002 .11 .096 -.12 .135* .108 .275** .494** .155* .383** .486** (.936)
12. Ratio acknow-ledgement tip
2.87 0.724 .09 .159* -.175** .13* .041 .113 .418** .052 .296** .422** .757**
-
**. Correlation is significant at the 0.01 level (2-tailed)
*. Correlation is significant at the 0.05 level (2-tailed)
31
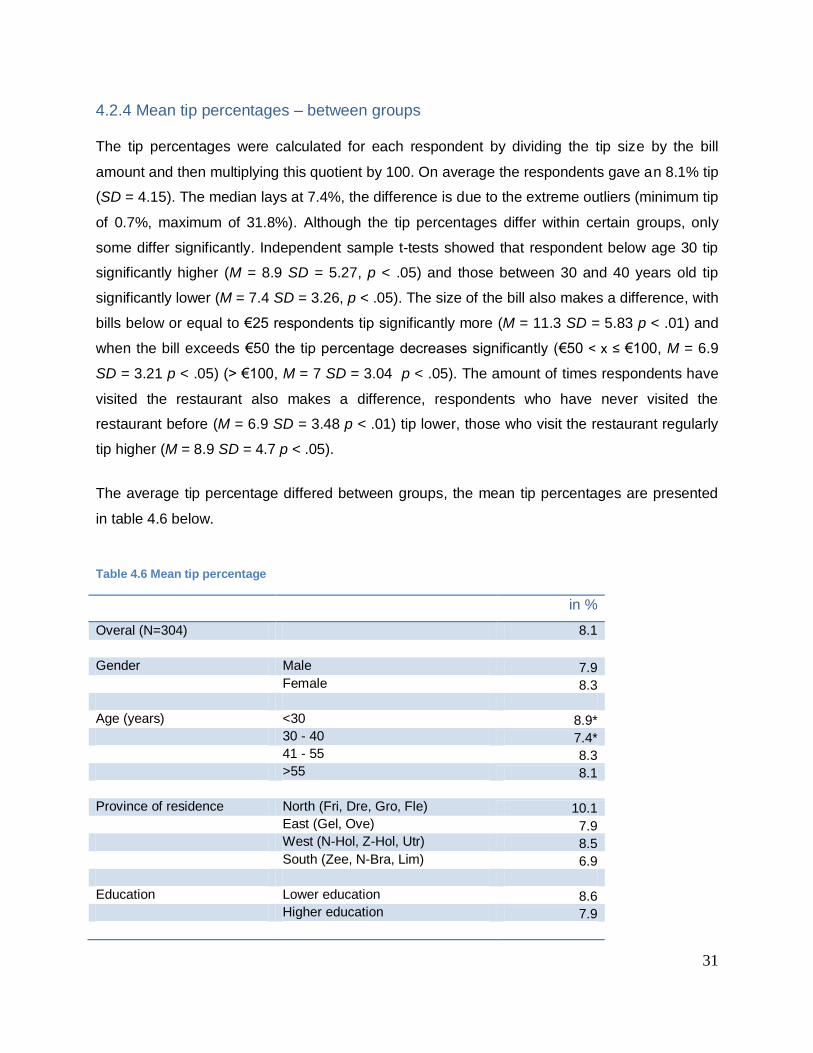
4.2.4 Mean tip percentages – between groups
The tip percentages were calculated for each respondent by dividing the tip size by the bill
amount and then multiplying this quotient by 100. On average the respondents gave an 8.1% tip
(SD = 4.15). The median lays at 7.4%, the difference is due to the extreme outliers (minimum tip
of 0.7%, maximum of 31.8%). Although the tip percentages differ within certain groups, only
some differ significantly. Independent sample t-tests showed that respondent below age 30 tip
significantly higher (M = 8.9 SD = 5.27, p < .05) and those between 30 and 40 years old tip
significantly lower (M = 7.4 SD = 3.26, p < .05). The size of the bill also makes a difference, with
bills below or equal to €25 respondents tip significantly more (M = 11.3 SD = 5.83 p < .01) and
when the bill exceeds €50 the tip percentage decreases significantly (€50 < x ≤ €100, M = 6.9
SD = 3.21 p < .05) (> €100, M = 7 SD = 3.04 p < .05). The amount of times respondents have
visited the restaurant also makes a difference, respondents who have never visited the
restaurant before (M = 6.9 SD = 3.48 p < .01) tip lower, those who visit the restaurant regularly
tip higher (M = 8.9 SD = 4.7 p < .05).
The average tip percentage differed between groups, the mean tip percentages are presented
in table 4.6 below.
Table 4.6 Mean tip percentage
in %
Overal (N=304) 8.1
Gender Male 7.9 Female 8.3
Age (years) <30 8.9* 30 - 40 7.4* 41 - 55 8.3 >55 8.1
Province of residence North (Fri, Dre, Gro, Fle) 10.1 East (Gel, Ove) 7.9 West (N-Hol, Z-Hol, Utr) 8.5 South (Zee, N-Bra, Lim) 6.9
Education Lower education 8.6 Higher education 7.9
32
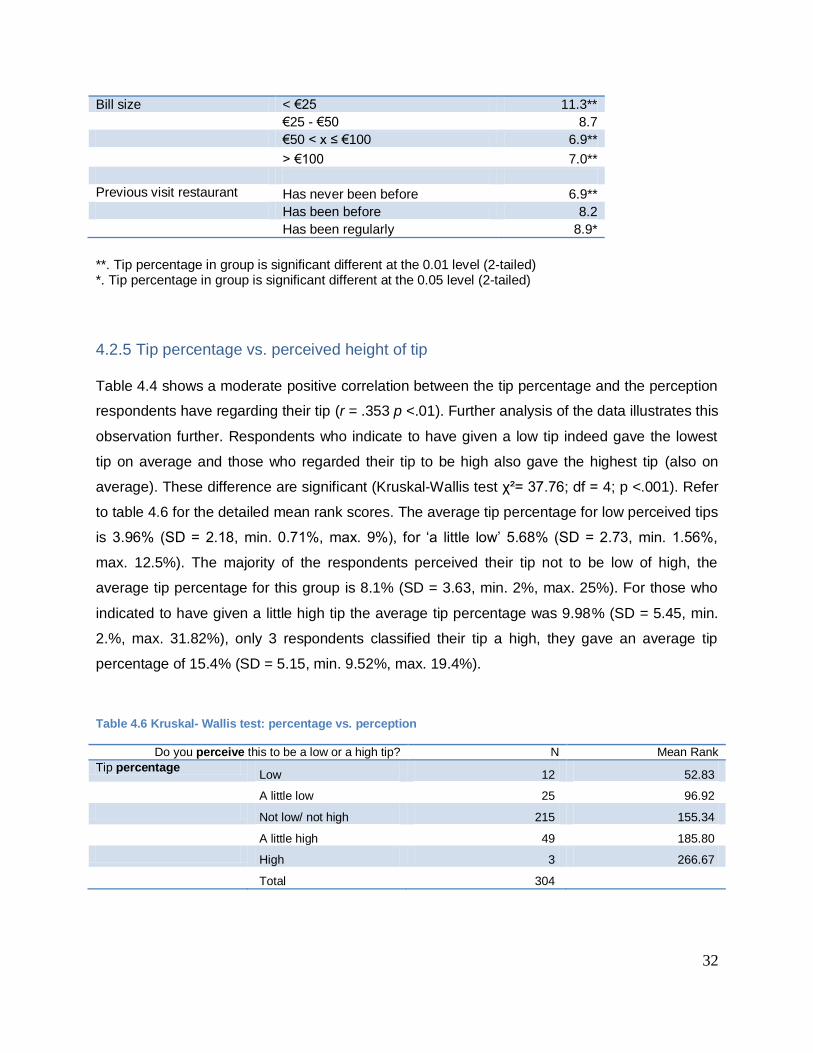
Bill size < €25 11.3** €25 - €50 8.7 €50 < x ≤ €100 6.9**
> €100 7.0** Previous visit restaurant Has never been before 6.9** Has been before 8.2 Has been regularly 8.9*
**. Tip percentage in group is significant different at the 0.01 level (2-tailed) *. Tip percentage in group is significant different at the 0.05 level (2-tailed)
4.2.5 Tip percentage vs. perceived height of tip
Table 4.4 shows a moderate positive correlation between the tip percentage and the perception
respondents have regarding their tip (r = .353 p <.01). Further analysis of the data illustrates this
observation further. Respondents who indicate to have given a low tip indeed gave the lowest
tip on average and those who regarded their tip to be high also gave the highest tip (also on
average). These difference are significant (Kruskal-Wallis test χ²= 37.76; df = 4; p <.001). Refer
to table 4.6 for the detailed mean rank scores. The average tip percentage for low perceived tips
is 3.96% (SD = 2.18, min. 0.71%, max. 9%), for ‘a little low’ 5.68% (SD = 2.73, min. 1.56%,
max. 12.5%). The majority of the respondents perceived their tip not to be low of high, the
average tip percentage for this group is 8.1% (SD = 3.63, min. 2%, max. 25%). For those who
indicated to have given a little high tip the average tip percentage was 9.98% (SD = 5.45, min.
2.%, max. 31.82%), only 3 respondents classified their tip a high, they gave an average tip
percentage of 15.4% (SD = 5.15, min. 9.52%, max. 19.4%).
Table 4.6 Kruskal- Wallis test: percentage vs. perception
Do you perceive this to be a low or a high tip? N Mean Rank
Tip percentage Low 12 52.83
A little low 25 96.92
Not low/ not high 215 155.34
A little high 49 185.80
High 3 266.67
Total 304
33
4.3 Hypothesis testing
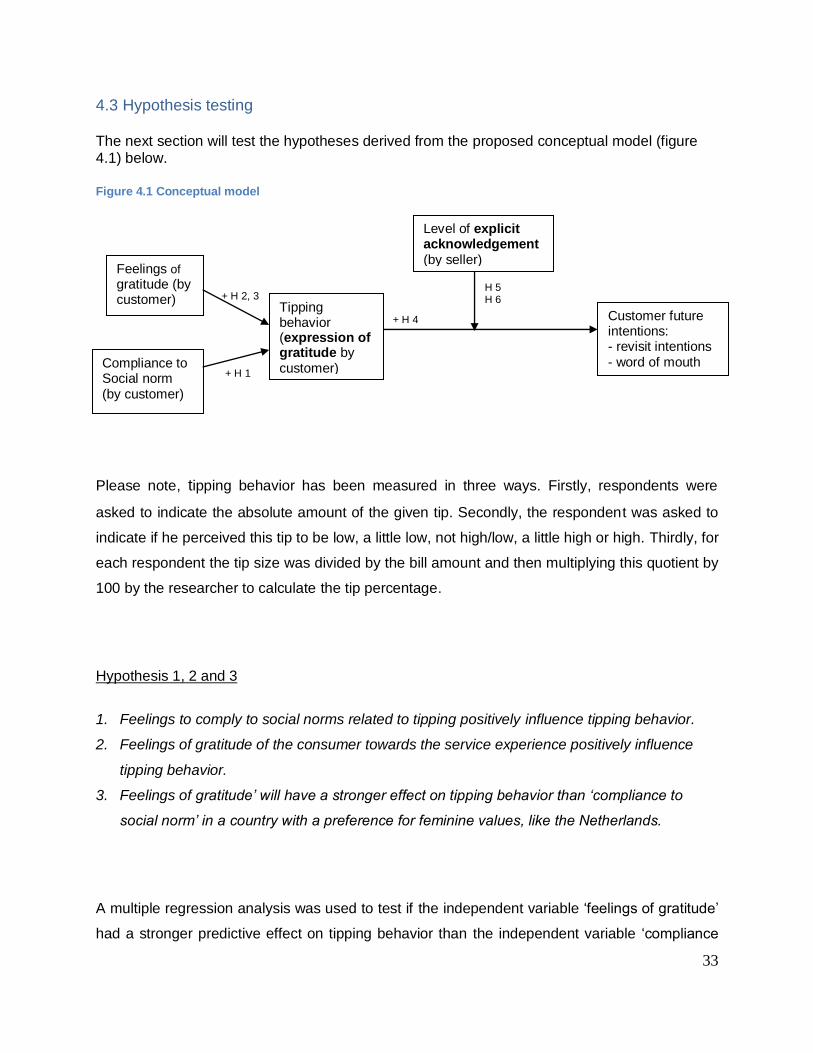
The next section will test the hypotheses derived from the proposed conceptual model (figure 4.1) below.
Figure 4.1 Conceptual model
Please note, tipping behavior has been measured in three ways. Firstly, respondents were
asked to indicate the absolute amount of the given tip. Secondly, the respondent was asked to
indicate if he perceived this tip to be low, a little low, not high/low, a little high or high. Thirdly, for
each respondent the tip size was divided by the bill amount and then multiplying this quotient by
100 by the researcher to calculate the tip percentage.
Hypothesis 1, 2 and 3
1. Feelings to comply to social norms related to tipping positively influence tipping behavior.
2. Feelings of gratitude of the consumer towards the service experience positively influence
tipping behavior.
3. Feelings of gratitude’ will have a stronger effect on tipping behavior than ‘compliance to
social norm’ in a country with a preference for feminine values, like the Netherlands.
A multiple regression analysis was used to test if the independent variable ‘feelings of gratitude’
had a stronger predictive effect on tipping behavior than the independent variable ‘compliance
H 5 H 6
+ H 2, 3
+ H 1
+ H 4
Compliance to Social norm (by customer)
Customer future intentions: - revisit intentions - word of mouth
Level of explicit acknowledgement (by seller)
Tipping behavior (expression of gratitude by customer)
Feelings of gratitude (by customer)

34
to social norm’, simultaneously illustrating the isolated effects of both independent variables. For
the absolute tip amount (table 4.7), the multiple regression indicated that the two predictors
explained 2.5% of the variance (R²=.025, F(2,300) = 3.858 p < .05). The two predictors
explained 3.4% of the variance in the tip percentage (R²=.034, F(2,300) = 5.358 p < .05 – table
4.8) and the analysis showed the two predictors explained 8,3% of the variance in the
perception of the tip (R²=.083, F(2,300) =13.616 p < .05 – table 4.9).
Table 4.7 Multiple regression model: tip – absolute amount
R R² R² change
B SE β t
Model 1 .158 .025* .019
Social Compliance .451 .558 .046 .807
Feelings of Gratitude 1.491 .572 .149** 2.605
* statistical significance: p < .05 ** statistical significance: p < .01
Table 4.8 Multiple regression: tip percentage
R R² R²
change
B SE β t
Model 1 .186 .034** .028
Social Compliance .338 .275 .070 1.227
Feelings of Gratitude .835 .282 .168** 2.955
** statistical significance: p < .01
Table 4.9 Multiple regression: tip – perception of height
R R² R²
change
B SE β t
Model 1 .288 .083*** .077
Social Compliance .030 .043 .039 .039
Feelings of Gratitude .226 .044 .284*** 2.955
*** statistical significance: p < .001
All three models (tip amount/ percentage and perception) showed that ‘feelings of gratitude’
significantly predicted tipping behavior: tip amount (β= .149, p < .01), tip percentage (β= .168, p
< .01) and perceived height of the tip (β= .284, p < .001).
35
In contrast, ‘compliance to social norm’ only showed insignificant values for tip amount (β= .046,
p = n.s.), tip percentage (β= .07, p = n.s.) and perceived height of the tip (β= .039, p = n.s.).
Further detailed testing related to compliance to social norm did show some significant
differences among certain groups. Respondents who left a tip after receiving a bill of €25 or
less, were significantly more sensitive to the social norm related to tipping (M = 2.88 SD =
1.014, p < .05) than those tipping for bills of €25 and up. Also, respondents who indicated to
have visited the restaurant before, both sometimes (M = 2.81 SD = .761, p < .05) and frequently
(M = 2.9 SD = 0.953, p < .05), tested significantly more sensitive to compliance to social norm
than those who had never visited the restaurant before. However, also for these more specific
groups the variable ‘compliance to social norm’ did not have a significant effect on tipping
behavior.
In summary, the findings of these multiple regression analyses suggest that when consumers
feel more gratitude for the service they receive, their tip will go up, both in amount, percentage
and perception, H2 is therefore supported. Although 47.2% of the respondents agree that
tipping in restaurants is the social norm in the Netherlands, no significant relation has been
found for ‘compliance to social norm’ in relation to tipping behavior, hence H1 is rejected.
Although the effect ‘gratitude’ has on tipping is significant, the explained variance by the model
is limited. However it does suggests that showing gratitude is the dominant reason for tipping in
the Netherlands when compared to compliance to social norm, therefore H3 is supported.
Detailed SPSS-output of the multiple regression analyses for H1, 2 and 3 can be found in
appendix IV.
Hypothesis 4
There is a positive relation between tipping behavior and customer’s future intentions.
In the preliminary exploration of the data (table 4.4) no to a negligible relation was found
between the independent variables ‘tip – absolute amount’ / ‘tip percentage’ and the dependent
variables ‘revisit intentions’ (r =.075 p = n.s.; r =.11 p = n.s.) and ‘word of mouth’ (r =.134 p =
<.05; r =.122 p = <.05). As for the independent variable ‘tip – perception of height’ and the
36
dependent variables ‘revisit intentions’ (r =.224 p < .05) and ‘word of mouth’ (r =.264 p = <.05) a
moderate positive relation was found.
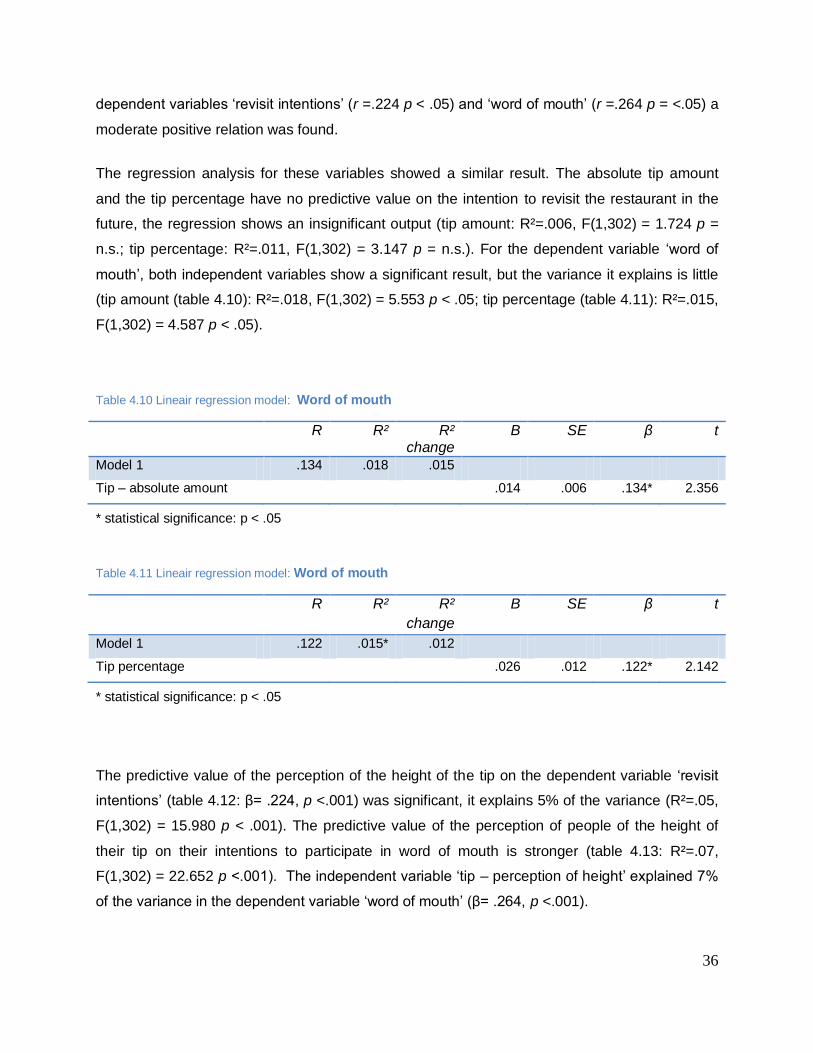
The regression analysis for these variables showed a similar result. The absolute tip amount
and the tip percentage have no predictive value on the intention to revisit the restaurant in the
future, the regression shows an insignificant output (tip amount: R²=.006, F(1,302) = 1.724 p =
n.s.; tip percentage: R²=.011, F(1,302) = 3.147 p = n.s.). For the dependent variable ‘word of
mouth’, both independent variables show a significant result, but the variance it explains is little
(tip amount (table 4.10): R²=.018, F(1,302) = 5.553 p < .05; tip percentage (table 4.11): R²=.015,
F(1,302) = 4.587 p < .05).
Table 4.10 Lineair regression model: Word of mouth
R R² R² change
B SE β t
Model 1 .134 .018 .015
Tip – absolute amount .014 .006 .134* 2.356
* statistical significance: p < .05
Table 4.11 Lineair regression model: Word of mouth
R R² R²
change
B SE β t
Model 1 .122 .015* .012
Tip percentage .026 .012 .122* 2.142
* statistical significance: p < .05
The predictive value of the perception of the height of the tip on the dependent variable ‘revisit
intentions’ (table 4.12: β= .224, p <.001) was significant, it explains 5% of the variance (R²=.05,
F(1,302) = 15.980 p < .001). The predictive value of the perception of people of the height of
their tip on their intentions to participate in word of mouth is stronger (table 4.13: R²=.07,
F(1,302) = 22.652 p <.001). The independent variable ‘tip – perception of height’ explained 7%
of the variance in the dependent variable ‘word of mouth’ (β= .264, p <.001).
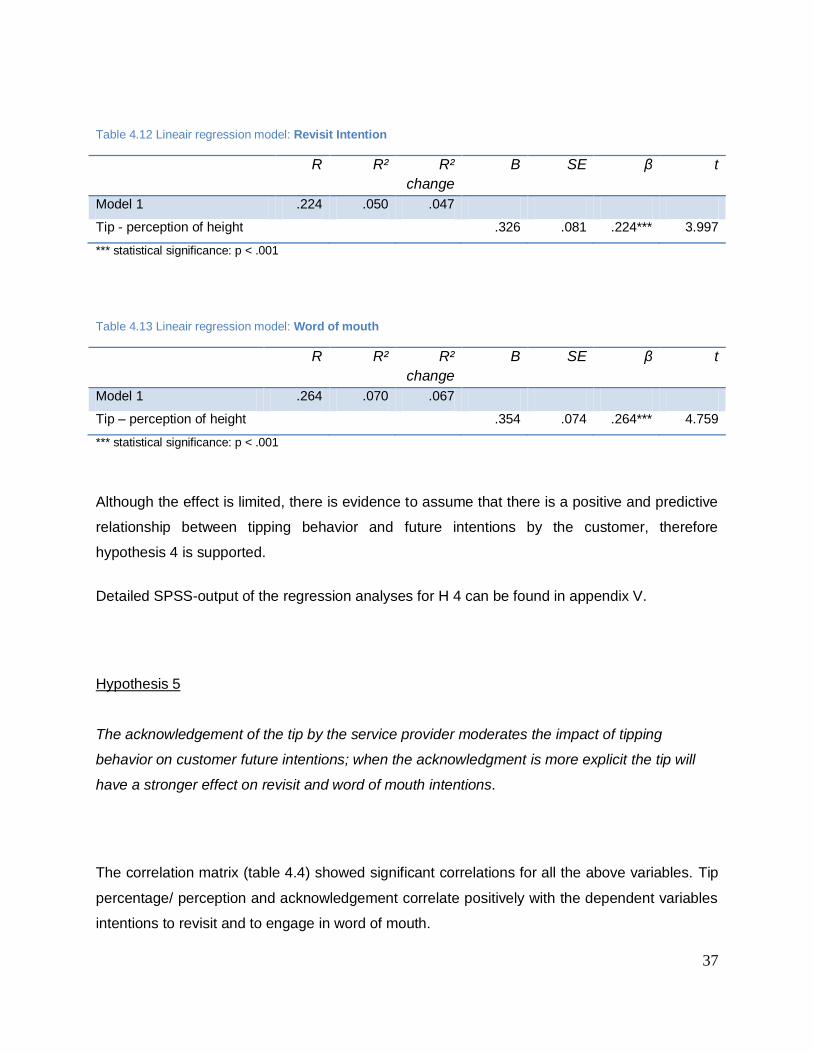
37
Table 4.12 Lineair regression model: Revisit Intention
R R² R²
change
B SE β t
Model 1 .224 .050 .047
Tip - perception of height .326 .081 .224*** 3.997
*** statistical significance: p < .001
Table 4.13 Lineair regression model: Word of mouth
R R² R²
change
B SE β t
Model 1 .264 .070 .067
Tip – perception of height .354 .074 .264*** 4.759
*** statistical significance: p < .001
Although the effect is limited, there is evidence to assume that there is a positive and predictive
relationship between tipping behavior and future intentions by the customer, therefore
hypothesis 4 is supported.
Detailed SPSS-output of the regression analyses for H 4 can be found in appendix V.
Hypothesis 5
The acknowledgement of the tip by the service provider moderates the impact of tipping
behavior on customer future intentions; when the acknowledgment is more explicit the tip will
have a stronger effect on revisit and word of mouth intentions.
The correlation matrix (table 4.4) showed significant correlations for all the above variables. Tip
percentage/ perception and acknowledgement correlate positively with the dependent variables
intentions to revisit and to engage in word of mouth.

38
The level of acknowledgement has been measured twofold. Firstly the respondents were asked
to indicate if they received a reaction (yes or no) from the service provider in response to their
tip. Out of the 304 respondents 72 answered they did not receive a reaction; the remaining 232
did receive a reaction.
Hypothesis 5 was first tested by examining the incremental contribution of ‘existing vs. non-
existing’ acknowledgement (moderator) between tipping behavior (independent variable) and
customer’s future intentions (dependent variables – revisit and word of mouth). To test this a
simple moderated regression analysis was performed using model 1 of PROCESS (Hayes,
2012).
Tipping behavior has been measured as the percentage of the tip and the perception of the
height of the tip by the customer. The moderated regression analyses were carried out for both
these measures.
For the tip percentage, the moderator showed an insignificant interaction with the dependent
variables ‘revisit intentions’ (ΔR2 = .0076, F(1, 300), p = .1198) ‘word of mouth’ (ΔR2 = .0111,
F(1, 300), p = .0577)
Also for the perceived height of the tip, the moderator showed an insignificant interaction with
the dependent variables ‘revisit intentions’ (ΔR2 = .0033, F(1, 300), p = .2979) ‘word of mouth’
(ΔR2 = .0056, F(1, 300), p = .1688)
Next in the questionnaire, the 232 respondents, who indicated to have received a reaction in
response to their tip, were asked to score three statements related to reciprocity used in the
research of Arnett et al. (2003) to evaluate the level of acknowledgement of the tip. The group of
72 respondents, who did not receive a reaction in response to their tip, included 20 respondents
who did wait for a response but did not receive one. As these 20 respondents did expect a
response but failed to receive one this study assumes they would fully disagree with the
reciprocity statements regarding the ‘acknowledgement of the tip’. To test hypothesis 5 we
therefore added these respondents (N=20) to this construct item as if they were dissatisfied with
the acknowledgement of their tip.

39
To further test hypothesis 5 the incremental contribution of the level of acknowledgement
(moderator) between the tipping behavior (independent variable) and customer’s future
intentions (dependent variables – revisit and word of mouth) was examined.
Again, a simple moderated regression analysis was performed using model 1 of PROCESS
(Hayes, 2012). The analysis shows whether the level of the acknowledgement of the tip by the
service provider interacts with tipping behavior and the customers’ intentions to revisit and
engage in word of mouth. If the interaction significantly increases the amount of variance in the
dependent variable then, despite the insignificant interaction for the existence vs. non-existence
of acknowledgement, the level of acknowledgement does serve as a moderator for the
relationship between tipping behavior and customer’s future intentions.
Tip percentage
We tested the above first for the tip percentage (independent variable), acknowledgement
(moderating variable) and word of mouth (dependent variable). The output (appendix VI) shows
significant evidence for moderation (β -.0278, p < .05) in which the interaction term
‘acknowledgement’ accounted for an additional 1.7% of the in variance in word of mouth.
The analysis for the dependent variable revisit intensions showed a similar result (appendix VI).
The result suggests significant evidence for moderation (β -.033, p < .05) in which the
interaction term ‘acknowledgement’ accounted for an additional 2.1% of the in variance in the
intention to revisit the restaurant.
The Johnson-Neyman technique was used to visualize the interaction and find the values for
‘acknowledgement’ which estimate the conditional affect the tip percentage has on word of
mouth and revisit intentions (for detailed results see appendix VII).
For respondents who scored the acknowledgement of their tip by the restaurant staff below 3.3
(mean scale of 1 to 5), an increase in the tip percentage had a negative effect on the evaluation
of their intentions to revisit the restaurant. As for the relationship between the independent
variable tip percentage and the dependent variable word of mouth, all scores for
acknowledgement below 3.02 (mean scale of 1 to 5) have a negative effect on the respondents
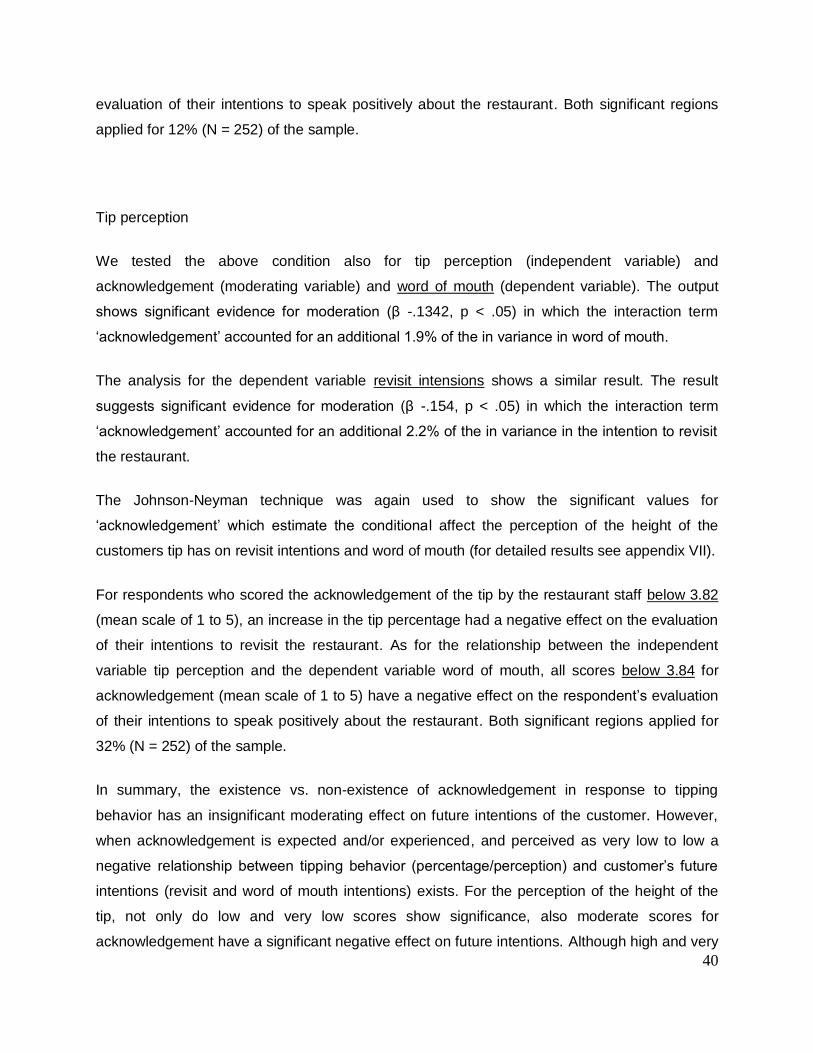
40
evaluation of their intentions to speak positively about the restaurant. Both significant regions
applied for 12% (N = 252) of the sample.
Tip perception
We tested the above condition also for tip perception (independent variable) and
acknowledgement (moderating variable) and word of mouth (dependent variable). The output
shows significant evidence for moderation (β -.1342, p < .05) in which the interaction term
‘acknowledgement’ accounted for an additional 1.9% of the in variance in word of mouth.
The analysis for the dependent variable revisit intensions shows a similar result. The result
suggests significant evidence for moderation (β -.154, p < .05) in which the interaction term
‘acknowledgement’ accounted for an additional 2.2% of the in variance in the intention to revisit
the restaurant.
The Johnson-Neyman technique was again used to show the significant values for
‘acknowledgement’ which estimate the conditional affect the perception of the height of the
customers tip has on revisit intentions and word of mouth (for detailed results see appendix VII).
For respondents who scored the acknowledgement of the tip by the restaurant staff below 3.82
(mean scale of 1 to 5), an increase in the tip percentage had a negative effect on the evaluation
of their intentions to revisit the restaurant. As for the relationship between the independent
variable tip perception and the dependent variable word of mouth, all scores below 3.84 for
acknowledgement (mean scale of 1 to 5) have a negative effect on the respondent’s evaluation
of their intentions to speak positively about the restaurant. Both significant regions applied for
32% (N = 252) of the sample.
In summary, the existence vs. non-existence of acknowledgement in response to tipping
behavior has an insignificant moderating effect on future intentions of the customer. However,
when acknowledgement is expected and/or experienced, and perceived as very low to low a
negative relationship between tipping behavior (percentage/perception) and customer’s future
intentions (revisit and word of mouth intentions) exists. For the perception of the height of the
tip, not only do low and very low scores show significance, also moderate scores for
acknowledgement have a significant negative effect on future intentions. Although high and very

41
high scores for the perception of acknowledgement do not show a positive significant
moderating effect between tipping behavior and customer’s future intentions, the result that very
low to moderate scores have a negative effect provides enough evidence to support hypothesis
5.
Hypothesis 6
The acknowledgement of the tip by the service provider has to be perceived as ‘in line’ with the
tip in order for customers to indicate future intentions as more likely.
To test this hypothesis, respondents were asked if the reaction received in response to their tip,
was in accordance with the height of their tip. Their answers were categorized in three different
groups: the reaction of the restaurant staff was either too little or too much compared to the
height of their tip, or the reaction was exactly in line with the height of their tip. For the 20
respondents who did expect a response but failed to receive one this study assumes they would
answer this question as follows: ‘the reaction was too little compared to the height of the tip’. To
test hypothesis 6 we therefore added these respondents (N=20) to this construct item.
The vast majority of respondents (74.6%) answered that the reaction they received was in line
with the tip they gave, 15.4% evaluated the reaction as too little and 9.9% as too much.
To test if the ‘reaction/tip ratio’ interacts with tipping behavior and customer’s future intentions, a
simple moderated regression analysis was performed using model 1 of PROCESS (Hayes,
2012).
For the perceived height of the tip, the moderator showed an insignificant interaction for both the
dependent variables ‘revisit intentions’ (ΔR2 = .012, F(1, 248), p = .0646) ‘word of mouth’ (ΔR2
= .0104, F(1, 248), p = .0656). These insignificant results suggest that the evaluation of whether
or not the reaction in response to the tip is considered appropriate does not strengthen nor
weaken the relation between tipping behavior and customer’s future intentions, therefore H6 is
rejected.
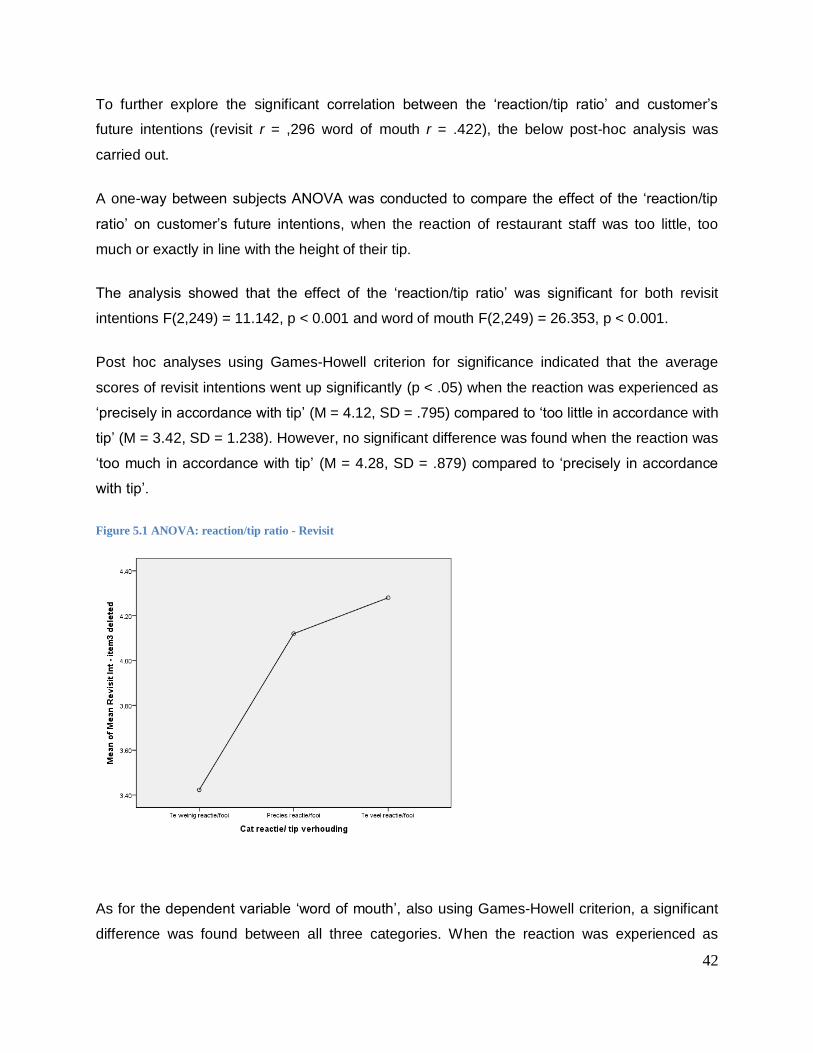
42
To further explore the significant correlation between the ‘reaction/tip ratio’ and customer’s
future intentions (revisit r = ,296 word of mouth r = .422), the below post-hoc analysis was
carried out.
A one-way between subjects ANOVA was conducted to compare the effect of the ‘reaction/tip
ratio’ on customer’s future intentions, when the reaction of restaurant staff was too little, too
much or exactly in line with the height of their tip.
The analysis showed that the effect of the ‘reaction/tip ratio’ was significant for both revisit
intentions F(2,249) = 11.142, p < 0.001 and word of mouth F(2,249) = 26.353, p < 0.001.
Post hoc analyses using Games-Howell criterion for significance indicated that the average
scores of revisit intentions went up significantly (p < .05) when the reaction was experienced as
‘precisely in accordance with tip’ (M = 4.12, SD = .795) compared to ‘too little in accordance with
tip’ (M = 3.42, SD = 1.238). However, no significant difference was found when the reaction was
‘too much in accordance with tip’ (M = 4.28, SD = .879) compared to ‘precisely in accordance
with tip’.
Figure 5.1 ANOVA: reaction/tip ratio - Revisit
As for the dependent variable ‘word of mouth’, also using Games-Howell criterion, a significant
difference was found between all three categories. When the reaction was experienced as

43
‘precisely in accordance with tip’ (M = 4.05, SD = .728) compared to ‘too little in accordance with
tip’ (M = 3.23, SD = 1.095) word of mouth went significantly up. In case the reaction was
experienced as ‘too much in accordance with tip’ (M = 4.6, SD = .593) compared to ‘precisely in
accordance with tip’, the intention to speak positively about the restaurant also went up
significantly.
Figure 5.2 ANOVA: reaction/tip ratio - WOM
We ran a final Kruskal-Wallis analysis (χ²= 71.558; df = 2; p <.001) to test if respondents who
assessed the reaction to their tip as too little, in line or too much in comparison to their tip have
corresponding scores for acknowledgement (low, average or high). The mean rank scores in
table 4.14 suggest that this is the case. Respondents who scored the reaction/tip ratio as too
little also on average assessed the acknowledgement of the tip lowest, those who assessed the
reaction/tip as too much also scored the level of acknowledgement as strongest.
Table 4.14 Kruskal-Wallis test Acknowledgment vs. reaction/tip ratio
Reaction/tip ratio N Mean Rank
Acknowledgment tip Too little reaction/ tip 39 45.90
Exactly in line/ tip 188 136.19
Too much reaction/ tip 25 179.36
Total 252
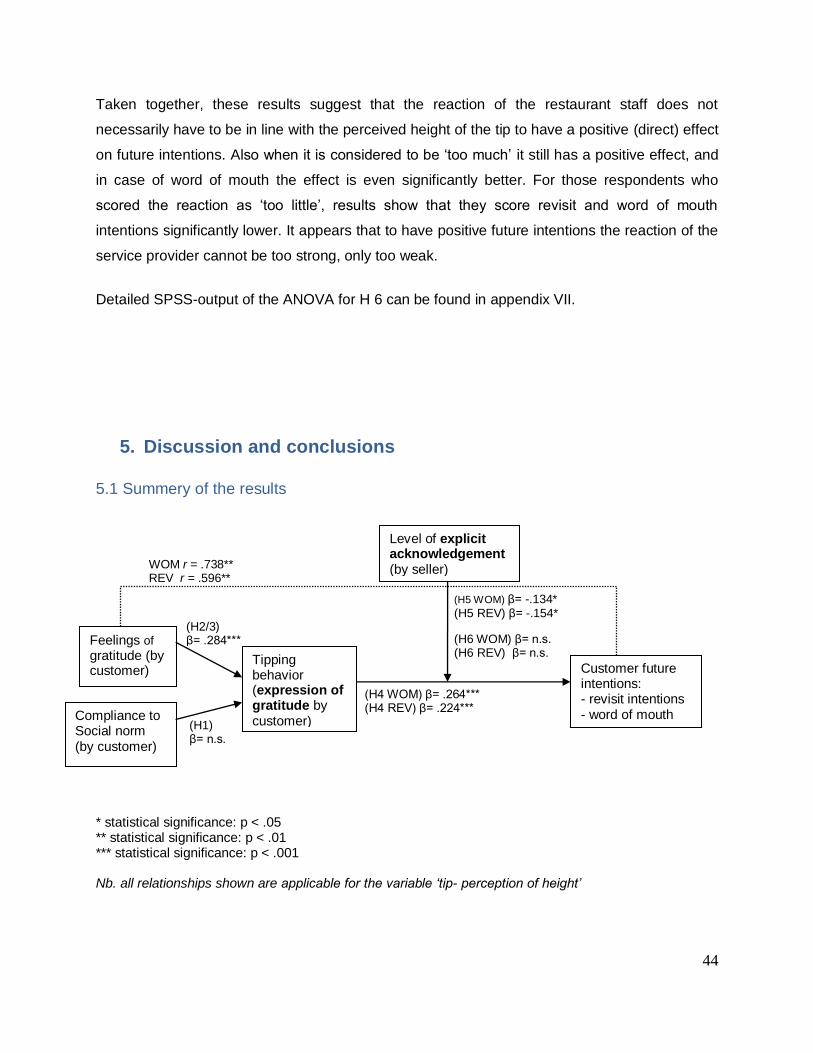
44
Taken together, these results suggest that the reaction of the restaurant staff does not
necessarily have to be in line with the perceived height of the tip to have a positive (direct) effect
on future intentions. Also when it is considered to be ‘too much’ it still has a positive effect, and
in case of word of mouth the effect is even significantly better. For those respondents who
scored the reaction as ‘too little’, results show that they score revisit and word of mouth
intentions significantly lower. It appears that to have positive future intentions the reaction of the
service provider cannot be too strong, only too weak.
Detailed SPSS-output of the ANOVA for H 6 can be found in appendix VII.
5. Discussion and conclusions
5.1 Summery of the results
* statistical significance: p < .05 ** statistical significance: p < .01 *** statistical significance: p < .001 Nb. all relationships shown are applicable for the variable ‘tip- perception of height’
WOM r = .738** REV r = .596**
(H1) β= n.s.
(H2/3) β= .284***
(H5 WOM) β= -.134* (H5 REV) β= -.154*
(H6 WOM) β= n.s. (H6 REV) β= n.s.
(H4 WOM) β= .264*** (H4 REV) β= .224***
Compliance to Social norm (by customer)
Customer future intentions: - revisit intentions - word of mouth
Level of explicit acknowledgement (by seller)
Tipping behavior (expression of gratitude by customer)
Feelings of gratitude (by customer)

45
H1 Feelings to comply to social norms related to tipping positively influence tipping
behavior.
Rejected
H2 Feelings of gratitude of the consumer towards the service experience
positively influence tipping behavior.
Supported
H3 Feelings of gratitude’ will have a stronger effect on tipping than ‘compliance to
social norm’ in a country with a preference for feminine values, like the
Netherlands.
Supported
H4 There is a positive relation between tipping behavior and customer’s future
intentions.
Supported
H5 The acknowledgement of the tip by the service provider moderates the impact
of tipping behavior on customer future intentions; when the acknowledgment is
more explicit the tip will have a stronger effect on revisit and word of mouth
intentions.
Supported
H6 The acknowledgement of the tip by the service provider has to be perceived by
the customer as ‘in line’ with the height of the tip, in order for customers to
indicate future intentions as more likely.
Rejected
H 1, 2 and 3
The findings of the multiple regression analyses suggest that when consumers feel more
gratitude for the service they receive, their tip will go up, both in amount (β= .149, p <.01),
percentage (β= .168, p <.01) and perception (β= .284, p <.001), H2 is therefore supported.
Although 47.2% of the respondents agree that tipping in restaurants is the social norm in the
Netherlands, no significant relation has been found for ‘compliance to social norm’ in relation to
tipping behavior, hence H1 is rejected. Although the effect ‘gratitude’ has on tipping is
significant, the explained variance by the model is limited. However it does suggests that
showing gratitude is the dominant reason for tipping in the Netherlands when compared to
compliance to social norm, therefore H3 is supported.
H 4
We found evidence to assume that there is a positive and predictive relationship between
tipping behavior and future intentions by the customer, therefore H4 is supported. The
predictive value of the perception of the height of the tip on the dependent variable ‘revisit
intentions’ (β= .224, p <.001) explains 5% of the variance. The predictive value of the perception
46
of people of the height of their tip on their intentions to participate in word of mouth explained
7% of the variance in the dependent variable ‘word of mouth’ (β= .264, p <.001).
H 5
The existence vs. non-existence of acknowledgement in response to tipping behavior has an
insignificant moderating effect on future intentions of the customer. However, when
acknowledgement is expected and/or experienced, and perceived as very low to low, a negative
relationship between tipping behavior and customer’s future intentions exists. In case of tip
percentage it presents a β= -.033 (p <.05) for revisit intentions and a β= -.0278 (p <.05) for word
of mouth. For the perception of the height of the tip, not only do low and very low scores show
significance, also moderate scores for acknowledgement have a significant negative effect on
future intentions (for revisit: β= -.154, p <.05; for WOM: β= -.134, p <.05). Although high and
very high scores for the perception of acknowledgement do not show a positive significant
moderating effect between tipping behavior and customer’s future intentions, the result that very
low to moderate scores have a negative effect provides enough evidence to support H5.
H 6
The insignificant results for H6 suggest that the evaluation of whether or not the reaction in
response to the tip is considered appropriate, does not strengthen nor weaken the relation
between tipping behavior and customer’s future intentions, therefore H6 is rejected. Post hoc
analysis for H6 suggests that the reaction of the restaurant staff does not necessarily have to be
in line with the perceived height of the tip to have a positive (direct) effect on future intentions.
When the acknowledgement is considered to be ‘too much’ it still has a positive effect, and in
case of word of mouth the effect is even significantly better. For those respondents who scored
the reaction as ‘too little’, results show that they score revisit and word of mouth intentions
significantly lower. It appears that to have positive future intentions the reaction of the service
provider cannot be too strong, only too weak.
47
5.2 Discussion and conclusions of the results
The findings of this study provide additional support that consumer behavior related to tipping is
irrational. It does so by showing that Dutch customers voluntarily increase the price of their
restaurant visit by an average of 8.1%, and also by demonstrating the inconsistency in their
tipping behavior. To illustrate, customers tip a significantly higher percentage when the bill is
below €25 (11.3%) then when the amount exceeds €50 (7%).
The inconsistency in tipping also explain the moderate correlation between the perception and
percentage of tip, hence the weak convention in the Dutch society regarding the appropriate tip
percentage. Although a detailed look suggests that on average the perception of the
respondent’s tip (low, not low/high or high) is in line with the tip percentage, the high standard
deviations suggest strong variance in what is considered to be the standard. While there is not
an exact consensus about the appropriate tip percentage, this study does show that people are
able to indicate if their tip is low, average or high. This awareness makes it possible for people
to perceive their tip as a way to punish bad or reward good service. This underlying awareness
might also increase the pressure to tip averagely or highly and so comply with social norm,
enhance self-image and/or avoid feelings of guilt, as suggested by Azar (2007).
Compliance to social norm is mentioned by Azar in 2010 as one of the two main drivers for
tipping. While awareness of the height of the tip might pressure people to give an average to
high tip, this study does not find significant support to suggest that compliance to social norm
has an effect on tipping behavior in the Netherlands. This is in line with the finding that less than
half of the respondents (47.2%) agree that tipping in restaurants is the social norm in the
Netherlands. However, this result is remarkable considering that 73.9% of the respondents
states to (almost) always tip. It is questionable if this frequency of tipping is always in response
to good service and gratitude and not due to compliance with social norm. Socially desired
answers might have manipulated the results of the questions regarding this construct. In line
with social norm, Azar (2010) also suggests ‘showing of’ as one of the motivations to tip,
however only 3 of the 304 respondents evaluated their tip as high, implying that this motivation
is insignificant for Dutch people.

48
The other main driver for tipping behavior according to Azar (2010) is the display of gratitude.
Although this study did find a significant relationship between the two variables, the predictive
value of gratitude on tipping is limited. This result might not support the findings of Azar (2010)
but it is consistent with research by Buck (2004), Fazal e Hasan et al. (2014) and Palmatier et
al. (2009) who suggest that gratitude may be felt but does not necesarely have to be expressed.
The conceptual distinction between affect and behavior is further supported by the stronger
relationship between the affective gratitude-construct and future intentions than the behavioral
tipping-construct and future intentions as tested in hypothesis 4.
The behavioral aspect of the expression of gratitude, in our study measured as tipping,
explained a significant amount of variance in customer’s future intention. We also assert a
moderating effect of the acknowledgement of the expression of gratitude. We found a negative
relationship between tipping behavior and future intentions for those respondents who perceived
the acknowledgement of their tip to be very low to moderate. This interacting effect however
only applies to respondents who expected and/ or experienced acknowledgement by the service
provider in response to their tip. The observation that a negative significant relationship has
been found for negative to moderate evaluations and no positive significant relationship for
positive evaluations of the moderator ‘acknowledgement’ suggest that this variable is a hygiene
factor. Lack of or little acknowledgement results in a more negative evaluation of future
intentions; however, explicit acknowledgement does not necessarily improve the evaluation.
This result confirms the importance of completing the gratitude cycle of Raggio et al. (2014) and
is consistent with gratitude of exchange theory by Buck (2004) and the equity theory of Adams
(1965) in which relational exchange partners are in search of a fair balance.
However, a relatively large number of respondents (17%) left the restaurant without waiting for a
reaction in response to their tip. According to Raggio et al. (2014) the gratitude cycle for this
group has not been completed and this should have negative consequences for the assessment
of the relationship quality, hence future intententions. Yet results for future intentions for this
group dismisses the claim by Raggio et al. (2014) as the results for the group who did not await
an reaction did not significantly differ from those who did receive a reaction. It is likely that this
group did not expect a reaction and therefore their evaluation for future intentions was not
affected by it. If this assumption is true an explanation for this observation can be found in the

49
expectancy-disconfirmation theory by Oliver (1980). This cognitive theory aims to explain post-
purchase satisfaction as a function of expectations, and disconfirmation of beliefs. Current
research concludes that amongst the respondents there is a group who expects an
acknowledgement of their tip, this acknowledgement is a hygiene factor and only has a negative
effect on future intentions if the service provider fails to thank the customer for the tip. There is
however another group who tip without the expectation of being acknowledged for it, in this case
the lack of acknowledgement has no effect on the overall evaluation of their intentions to revisit
or participate in positive word-of-mouth.
This study expected to find an interaction-effect for the reaction/tip-ratio between tipping
behavior and future intentions; however the moderating effect has proven to be insignificant.
Consequently, the evaluation by the respondents if the reaction was in or out of line with their
perceived height of the tip does not strengthen, neither weakens the evaluations of future
intentions. Overall, the vast majority of respondents (74.6%) assessed the reaction by the
service provider as in line with their tip, suggesting that either the extremes of under or over
appreciating the tip rarely happens, or that there is a high tolerance for the kind of reaction
which is perceived as acceptable and therefore in line with the tip. Adams (1965) suggest that
although the threshold to overvalue is higher than the threshold to undervalue, both conditions
cause discomfort. The result of this study is inconsistent with these findings. Although
respondents who feel that their tip is undervalued evaluate future intentions more negatively,
those respondents, who rate the reaction as too much, suggesting overvaluing, tend to be more
positive about future intention. Therefore we conclude that no threshold for overvaluing the tip,
as suggested by Adams (1965), has been found, implying that the reaction of the service
provider in response to the tip cannot be too strong, only too weak
5.3 Theoretical implications
This study explored the role of gratitude in relationship marketing. The goal of this study was to
explore the impact of the acknowledgement of expressed gratitude (by means of a tip), on future
intentions by the customer. This study finds additionally empirical evidence to confirm the
significant role of gratitude in relationship marketing, as originally suggested by Palmatier et al.
in 2006. Our results suggest that respondents who expect and/or perceive to be acknowledged
50
for the expression of gratitude consider acknowledgment to be a hygiene factor. The current
quantitative research contributes to earlier qualitative research by Raggio et al. (2014) and
confirms that a completed gratitude cycle enchances future intentions; as failing to do so has a
negative effect on revisit and word of mouth intnetions. We also identify that when consumers
make a voluntary financial contribution to express their gratitude, no threshold for overvaluing
this contribution exist, which is in contrast with earlier research by Adams (1965) and Mayser
and Von Wangenheim (2012).
5.4 Managerial implications
Practically, this research provides hospitality service providers valuable insight in consumer
behavior related to tipping in the Netherlands. It demonstrates the significant role of gratitude
and stresses the importance of relationship marketing investment, e.g. extra service,
adaptations in policies and small favors, to make customers feel grateful. As a result the tip
amount increases, which in return makes for more satisfied employees, which in return
reinforces service delivery. To strengthen the relationship-quality our research suggest that
service providers should thank customers for their tip and should not be embarrassed do this
explicitly. Result from our sample show that acknowledgement of a tip cannot be too strong,
only too weak. As a result people are more likely to speak positively about the restaurant and
revisit. The latter is of extra importance for service staff as this study shows that people who
visit the restaurant more frequently tip significantly higher.
6. Limitations and further research
On average, respondents evaluate the gratitude-construct, revisit intentions and word-of-mouth
as high to very high. These positive scores might suggest a high threshold for overall
satisfaction as a motivation to tip; it however may also be sign of a positive bias of the
respondents. The data collection via the author’s network can be considered to be a limitation.
Although effort has been made to avoid this by inviting random people to participate in the
survey after they left a restaurant, the author expects that the majority of questionnaires have
been filled out by people invited via her network. The affinity of this network with hospitality, as

51
well as the online distribution of questionnaire via hospitality-affiliated accounts on social media
might have resulted in a sample with an above average association with hospitality and
therefore probably a positive bias towards serving staff.
The insignificant relation between compliance to social norm and tipping behavior is
questionable. It is likely that these results have been manipulated by socially desired answers.
This study uses statements to test social norm which are specifically linked to tipping behavior,
a suggestion for further research is to test for general compliance with social norm to distance
respondents from the specific topic of tipping. Azar (2005) makes another suggestion to truly
measure if customers leave tip out of social compliance of fairness and so avoid socially desired
answers. His suggestion is that instead of leaving a tip at the table customers should be invited
into an isolated room. In this room the customer can put his tip in an enveloppe and drop this
annonymously in a safe which is opened once a week. To our knowledge this experiment has
not yet been done and would be an interesting topic for future research into consumer behavior.
In this case the social pressure is eliminated and the difference between the tips in the
experiment and the regular tips would illustrate the ratio between rewarding feelings of gratitude
and compliance to social norm, future service and embarrasment.
Also, this research recognizes the strong relationship between gratitude and satisfaction and
therefore assumes proven theories related to satisfaction to also be relevant for the gratitude-
construct. Future research should explore the relationship between these two constucts in more
depth; are feelings of gratitude an indication or result of satisfaction?
Another limitations it the lack of previously tested scales to measure acknowledgement (of
gratitude) and made it necessary to borrow from related literature. The reciprocity-scales used
by Arnett et al. (2003) have been able to measure if customers feel their tip has been
appreciated but it fails to measure by which means. A suggestion for further research is to see if
different types of acknowledgement (e.g. verbal or non-verbally) are differently evaluated and
which conditions are required to achieve a genuine feeling of benevolence. In line, an
experiment in which extreme reactions are simulated is also valuable, current research only
uses actual reaction which in the Dutch context are assumed to be moderate. Both suggestions
will also contribute to what type and level of reaction is perceived to be in line with a certain tip
and so avoid distress by over or under valueing the expression of gratitude (in tipping).
52
In line with this thought further research into expectations related to tipping is suggested,
because more insight into acknowledgment is only valuable if acknowledgment is expected. In
tipping literature (Azar, 2010; Lynn & McCall, 2000; Whaley et al., 2014) ‘future visit’ is
mentioned as one of the motivations of tipping. Our research has not taken this into account as
an isolated motivation to tip, this however might be a reason why some expect a reaction and
others do not. It will also be valuable to look into alternative conditions which determine the
(lack of) expectation for acknowledgement.
Prior to the step of acknowledgement in the gratitude cycle (Raggio et al., 2014), future
researchers should explore the determinants of the affective and behavioral aspects of
gratitude. This study does measure feelings of gratitude but fails to determine which reasons
are behind it are.
Due to the cross-sectional nature of this research, our study does not capture long-term feelings
of customer’s gratitude. Although we have suggested that the variety-seeking character of the
restaurant industry makes the short-term feeling of satisfaction a priority, future research should
reveal if feelings of gratitude are the key to turn these short-term feelings into long-term result.
In line with this, the perspective of the service provider on this matter is also valuable to explore
further.
Finally, our research leads us to suggest that the affective and behavioral aspects of gratitude
are a significant factor to consider when studying commercial relationships. When
acknowledgment is expected, the failure to do so by the service providers has negative
consequences for future intentions. Although we acknowledge that the completion of the
gratitude cycle is not the only way to enhance relationships, we do suggest it has a positive
influence on future relation exchanges.

53
Bibliography
Adams, J. S. (1965). Towards an understanding of inequity. Journal of Abnormal and Social Psychology , Vol 67(5) , 422-436.
Allen, R. S., & White, C. S. (2002). Equity Sensitivity Theory: A Test Of Responses To Two Types Of Under-Reward Situations. Journal of Managerial Issues , Vol 14(4) , 435-451.
Arnett, D. B., German, S. D., & Hunt, S. D. (2003). The Identity Salience Model of Relationship Marketing Success: The Case of Nonprofit Marketing. Journal of Marketing , Vol 67(2) , 89-105.
Atuahene-Gima, K., & Li, H. (2002). When Does Trust Matter? Antecedents and Contingent Effects of Supervisee Trust on Performance in Selling New Products in China and the United States. Journal of Marketing , Vol 66(3) , 61-81.
Azar, O. H. (2011). Business Strategy and the social norm of tipping. Journal of Economic Psychology , Vol 32(3) , 515-525.
Azar, O. H. (2007). The Social Norm of Tipping: A Review. Journal of Applied Social Psychology , Vol 37(2) , 380-402.
Azar, O. H. (2010). Tipping Motivations and Behavior in the U.S. and Israel. Journal of Applied Social Psychology , Vol 40(2) , 421-457.
Azar, O. H. (2005). Why pay extra? Tipping and the importance of social norms and feelings in economic theory. The journal of Socio-Economics , Vol 36(2) , 250-265.
Bodvarsson, O. B., & Gibson, W. A. (1994). Gratuities and customer appraisal of service: evidence from Minnesota restaurants. Journal of Socio-Economics , Vol 23(2) , 287-302.
Bodvarsson, O. B., Luksetich, W. A., & McDermott, S. (2003). Why do diners tip: rule-of-thumb or valuation of service. Applied Economics , Vol 35(15) , 1659-1665.
Bolton, S. A., Lemon, K. N., & Verhoef, P. C. (2004). The theoretical underpinnings of customer asset management: a framework and propositions for future research. Journal of the Academy of Marketing Science , Vol 17(9) , 271-292.
Bruggen, E. S., Foubert, B., & Gremler, D. D. (2011). Extreme Makeover: Short- and Long-Term Effects of a Remodeled Servicescape. Journal of Marketing , Vol 75(5) , 71-87.
Bruner, G. C. (2009). Marketing Scales Handbook : A Compilation of Multi-item Measures for Consumer Behavior and Advertising Research. Fort Worth, Texas: GCBII Productions.
Bruner, G. (2013). Marketing Scales Handbook : Multi-item Measures for Consumer Insight Research. Fort Worth, Texas: GCBII Productions.

54
Buck, R. (2004). The gratitude of exchange and the gratitude of caring: a developmental-interactionist perspective of moral emotion. In R. A. Emmons, & M. E. McCullough, The Psychology of Gratitude (pp. 100-122). New York: Oxford University Press.
Bujisic, M., Wu, L., Mattila, A., & Bilgihan, A. (2014). Not all smiles are created equal. International Journal of Contemporary Hospitality Management , Vol 26(2) , 293-306.
Conlin, M., Lynn, M., & O'Donoghue, T. (2003). The norm of restaurant tipping. Journal of Economic Behavior & Organisation , Vol 52(3) , 297-321.
Cropanzano, R., & Mitchell, M. S. (2005). Social Exchange Theory: An Interdisciplinary Review. Journal of Management , Vol 31(6) , 874-900.
De Wulf, K., Odekerken-Schroder, G., & Iacobucci, D. (2001). Investments in Consumer Relationships: A Cross-Country and Cross-Industry Exploration. Journal of Marketing , Vol 65(4)
, 33-50.
Dick, A. S., & Basu, K. (1994). Customer Loyalty: Toward an Integrated Conceptual Framework. Journal of the Academy of Marketing Science , Vol 22(2) , 99-113.
Fazal e Hasan, S., Lings, I., & Mortimer, G. (2014). The role of customer gratitude in making relationship marketing investments successful. Journal of Retailing and Consumer Services , Vol 21(5) , 788-796.
Garbarino, E., & Johnson, M. S. (1999). The Different Roles of Satisfaction, Trust, and Commitment in Customer Relationships. Journal of Marketing , Vol 63 , 70-87.
Gummesson, E. (2014). Productivity, quality and relationship marketing in service operations. International Journal of Contemporary Hospitality Management , Vol 10(1) , 656-662.
Gwinner, K. P., Gremler, D. D., & Bitner, M. J. (1998). Relational benefits in Services Industries: The Customer's Perspective. Journal of the Academy of Marketing Science , Vol 26(Spring) ,
101-114.
Hayes, A. F. (2012, January 16). PROCESS: A Versatile Computational Tool for Observed Variable Mediation, Moderation, and Conditional Process Modeling. Columbus, Ohio, United States of America.
Hennig-Thurau, T., Gwinner, K. P., & Gremler, D. D. (2002). Understanding Relationship Marketing Outcomes: An Integration of Relational Benefits and Relationship Quality. Journal of Service Research , Vol 4(3) , 230-247.
Hess, R. J., Ganesan, S., & Klein, N. M. (2003). Service Failure and Recovery: the Impact of Relationship Factors on Customer Satisfaction. JAMS , Vol 31(2) , 127-145.
Hofstede, G. (2014). The Hofstede Centre. Retrieved June 24, 2014, from geert-hofstede.com: http://geert-hofstede.com/dimensions.html
Holland, S. J. (2009). Tipping as risk sharing. Journal of Socio-Economics , Vol 38(4) , 641-647.

55
Jacob, C., & Gueguen, N. (2012). The Effect of Physical Distance Between Patrons and Servers on Tipping. Journal of Hospitality & Tourisma Research , 25-31.
Jung, M. H., Nelson, L. D., Gneezy, A., & Gneezy, U. (2013). Paying More When Paying for Others. Journal of Personality and Social Psychology (Forthcoming) .
Kershnar, S. (2014). A Promissory Theory of the Duty to Tip. Business and Society Review , Vol 119(2) 247-276.
Kim, J.-Y., Natter, M., & Spann, M. (2009). Pay What You Want: A New Participative Pricing Mechanism. Journal of Marketing , Vol 73(1) , 44-58.
Kim, W. G., & Cha, Y. (2002). Antecedents and consequences of relationship quality in hotel industry. International Journal of Hospitality Management , Vol 21(4) 321-338.
Kim, W. G., Lee, Y.-K., & Yoo, Y.-J. (2006). Predictors of relationship quality and relationship outcomes in luxury restaurants. Journal of Hospitality & Tourism Research , Vol 30(2) , 143-169.
Kinard, B. R., & Kinard, J. L. (2013). The effect of receipt personalization on tipping behavior. Journal of Consumer Behaviour , Vol 12(4) , 280-284.
Komter, A. E. (2004). Gratitude and gift exchange. (R. A. Emmons, & M. E. McCullough, Eds.) New York: Oxford University Press.
Lynn, M. (2001). Restaurant Tipping and Service Quality: A Tenuous Relationship. Cornell Hotel and Restaurant Administration Quarterly , (January) , 14-20.
Lynn, M., & McCall, M. (2000). Gratitude and gratuity: a meta-analysis of research on the service-tipping relationship. Journal of Socio-Economics , Vol 29(2) , 203-214.
Lynn, M., Zinkhan, G. M., & Harris, J. (1993). Consumer Tipping: A Cross-Country Study. Journal of Consumer Research , Vol 20(3) , 478-488.
Mayser, S., & Von Wangenheim, F. (2012). Perceived Fairness of Differential Customer Treatment: Consumers’ Understanding of Distributive Justice Really Matters. Journal of Service Research , Vol 16(1) , 99-113.
Morgan, R. M., & Hunt, S. D. (1994). The commitment-trust theory of relationship marketing. Journal of Marketing , Vol 58(3) , 20-38.
Oliver, R. L. (1999). Whence Consumer Loyalty? Journal of Marketing , Vol 63 ,33-44.
Palmatier, R. W., Burke Jarvis, C., Bechkoff, J. R., & Kardes, F. R. (2009). The Role of Customer Gratitude in Relationship Marketing. Journal of Marketing , Vol 73(9) , 1-18.
Palmatier, R. W., Dant, R. P., & Evans, K. R. (2006). Factors Influencing the Effectiveness of Relationship Marketing: A Meta-Analysis. Journal of Marketing , Vol 70(4) ,136-153.
56
Raggio, R. D., Walz, A. M., Godbole, M. B., & Garretson Folse, J. A. (2014). Gratitude in relationship marketing: theoretical development and directions for future research. European Journal of Marketing , Vol 48(1/2) , 2-24.
Ryu, K., & Lee, J.-S. (2013). Examination of Restaurant Quality, Relationship Benefits, and Customer Reciprocity From the Perspective of Relationship Marketing Investments. Journal of Hospitality & Tourism Research , 1-27.
Segrave, K. (1998). Tipping: An American Social History of Gratuities . Jefferson NC: McFarland & Company.
Sirdeshmukh, D., Singh, J., & Sabol, B. (2002). Consumer Trust, Value and Loyalty in Relational Exchanges. Journal of Marketing , Vol 66(1) ,15-37.
Tabachnick, B. G., & Fidell, L. S. (2001). Using multivariate statistics. Boston: Allyn & Bacon.
TNS NIPO/ RTL Nieuws. (2005, juni 24). TNS Nipo. Retrieved januari 9, 2014, from http://www.tns-nipo.com/nieuws/nieuwsberichten/fooi-moet-nog-steeds-verdiend-worden/
Ulaga, W., & Eggert, A. (2006). Relationship value and relationship quality, broadening the nomological network of business-to-business relationships. European Journal of Marketing , Vol
40(3/4) , 311-327.
Versprille, H. (2014, March 03). De zin en onzin van fooi. Het Parool .
Whaley, J. E., Douglas, A. C., & O'Neill, M. A. (2014). What's in a tip? The creation and refinement of a restaurant-tipping motivations scale: A consumer perspective. International Journal of Hospitality Management , Vol 37 , 121-130.
Wiggens Johnson, J., & Peng Cui, A. (2013). To influence or not to influence: External reference price strategies in pay-what-you-want pricing. Journal of Business Research , Vol 66(2) , 275-281.
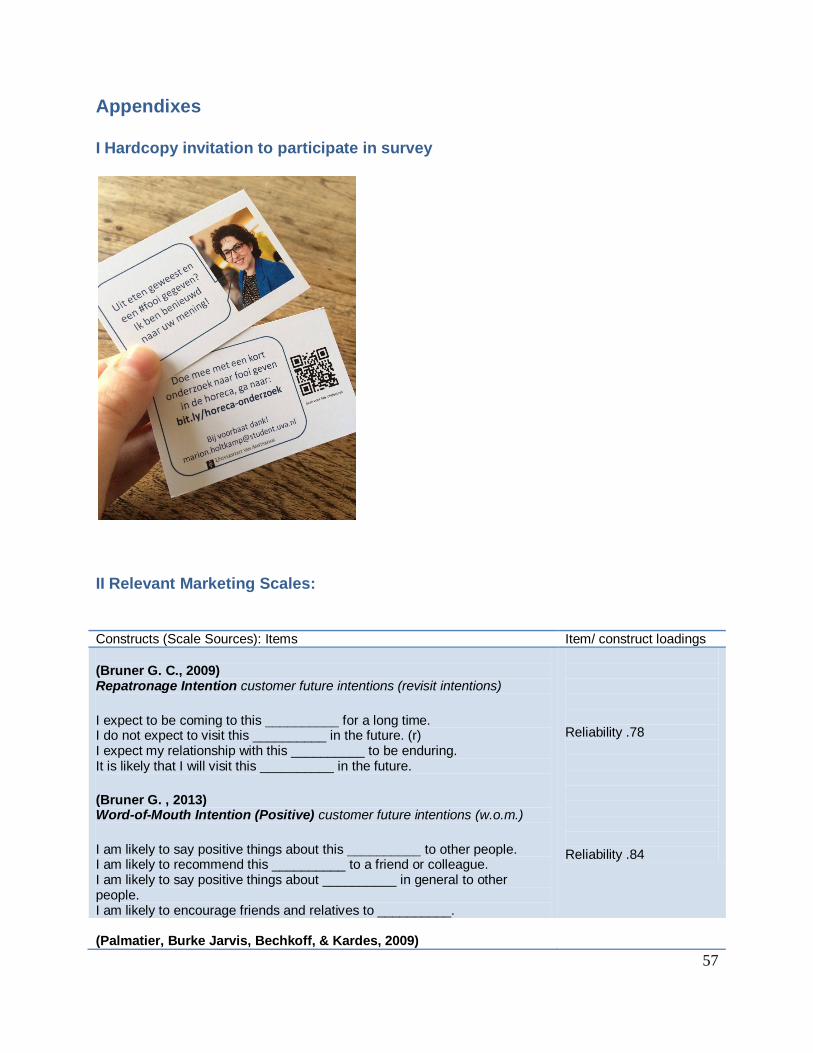
57
Appendixes
I Hardcopy invitation to participate in survey
II Relevant Marketing Scales:
Constructs (Scale Sources): Items Item/ construct loadings
(Bruner G. C., 2009) Repatronage Intention customer future intentions (revisit intentions)
I expect to be coming to this __________ for a long time. I do not expect to visit this __________ in the future. (r) I expect my relationship with this __________ to be enduring. It is likely that I will visit this __________ in the future.
(Bruner G. , 2013) Word-of-Mouth Intention (Positive) customer future intentions (w.o.m.)
I am likely to say positive things about this __________ to other people. I am likely to recommend this __________ to a friend or colleague. I am likely to say positive things about __________ in general to other people. I am likely to encourage friends and relatives to __________.
Reliability .78 Reliability .84
(Palmatier, Burke Jarvis, Bechkoff, & Kardes, 2009)
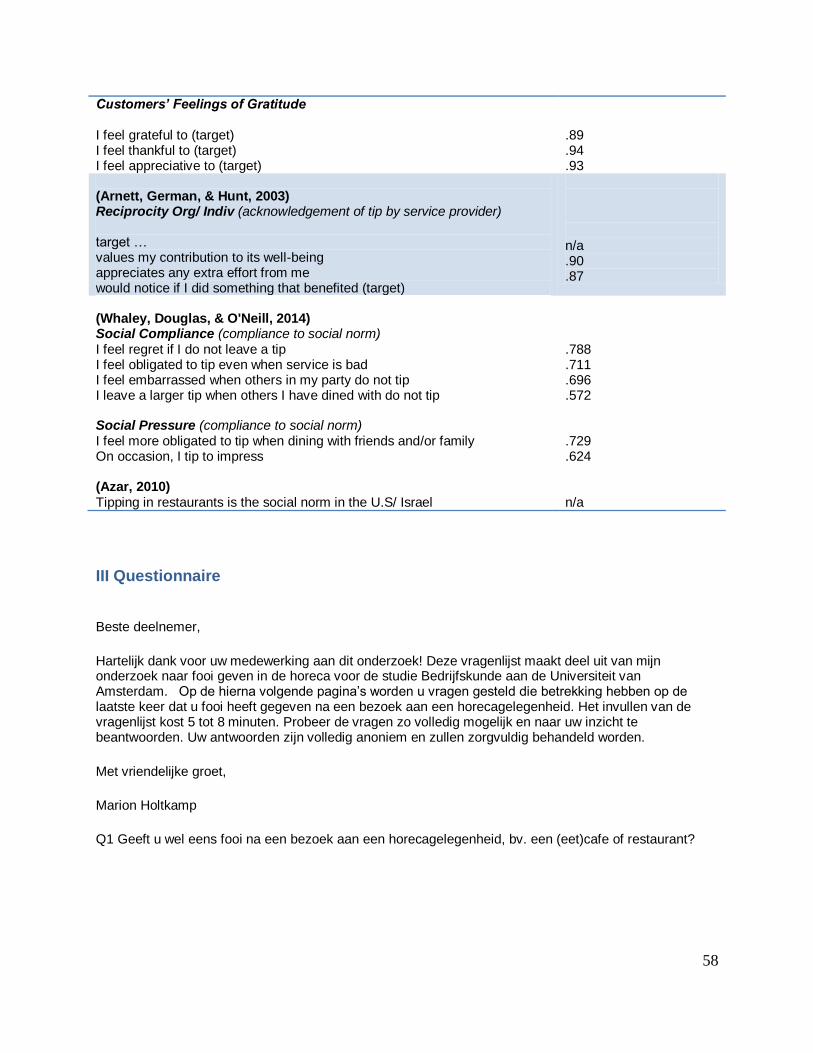
58
Customers’ Feelings of Gratitude I feel grateful to (target) I feel thankful to (target) I feel appreciative to (target)
.89 .94 .93
(Arnett, German, & Hunt, 2003) Reciprocity Org/ Indiv (acknowledgement of tip by service provider) target … values my contribution to its well-being appreciates any extra effort from me would notice if I did something that benefited (target)
n/a .90 .87
(Whaley, Douglas, & O'Neill, 2014) Social Compliance (compliance to social norm) I feel regret if I do not leave a tip I feel obligated to tip even when service is bad I feel embarrassed when others in my party do not tip I leave a larger tip when others I have dined with do not tip Social Pressure (compliance to social norm) I feel more obligated to tip when dining with friends and/or family On occasion, I tip to impress (Azar, 2010) Tipping in restaurants is the social norm in the U.S/ Israel
.788 .711 .696 .572 .729 .624 n/a
III Questionnaire
Beste deelnemer,
Hartelijk dank voor uw medewerking aan dit onderzoek! Deze vragenlijst maakt deel uit van mijn onderzoek naar fooi geven in de horeca voor de studie Bedrijfskunde aan de Universiteit van Amsterdam. Op de hierna volgende pagina’s worden u vragen gesteld die betrekking hebben op de laatste keer dat u fooi heeft gegeven na een bezoek aan een horecagelegenheid. Het invullen van de vragenlijst kost 5 tot 8 minuten. Probeer de vragen zo volledig mogelijk en naar uw inzicht te beantwoorden. Uw antwoorden zijn volledig anoniem en zullen zorgvuldig behandeld worden.
Met vriendelijke groet,
Marion Holtkamp
Q1 Geeft u wel eens fooi na een bezoek aan een horecagelegenheid, bv. een (eet)cafe of restaurant?

59
Ja
Nee
Q2 Hoe vaak geeft u fooi in de horeca? Soms
Regelmatig
Bijna altijd
Altijd
Denk terug aan de laatste keer dat u fooi heeft gegeven na een bezoek aan een horecagelegenheid. De volgende vragen hebben betrekking op deze situatie.
Q3 Wat was de naam van de horecagelegenheid?
Kunt u de naam van de horecagelegenheid niet herinneren? Vul dan 'xxx' in.
Q4 Wat voor type horecagelegenheid is dit volgens u? Cafetaria/ snackbar
Lunchroom
(Eet)cafe
Restaurant
Anders ____________________
Q5 Uit hoeveel personen bestond uw gezelschap? 1 persoon
2 personen
3 personen
4 personen
5 personen
6 personen
Meer dan 6 personen
Q6 Wat was de reden voor het bezoek? Prive
Zakelijk
Q7 Wanneer vond uw bezoek aan {TextEntryValue Q3} plaats? Vandaag
1 - 3 dagen geleden
4 - 7 dagen geleden
meer dan een week geleden
Q8 Heeft u {TextEntryValue Q3} vaker bezocht? Nog nooit
Ik ben wel eens eerder bij {TextEntryValue Q3} geweest
Ik bezoek {TextEntryValue Q3} regelmatig
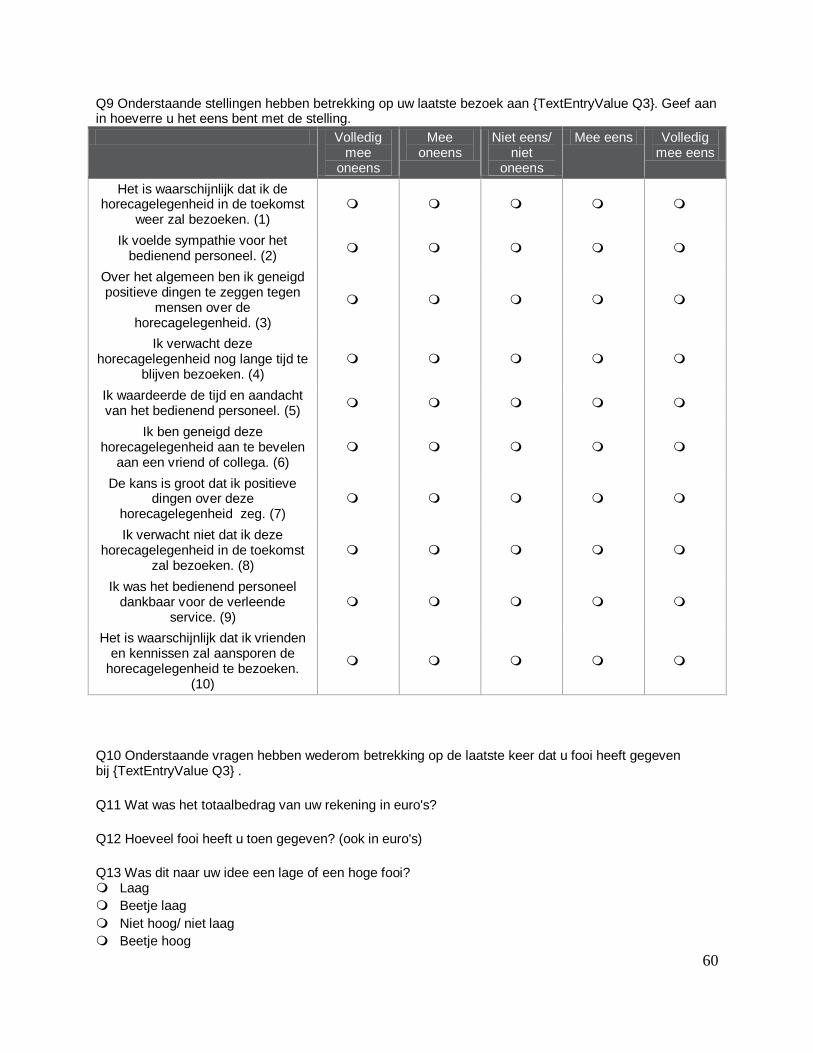
60
Q9 Onderstaande stellingen hebben betrekking op uw laatste bezoek aan {TextEntryValue Q3}. Geef aan in hoeverre u het eens bent met de stelling.
Volledig mee
oneens
Mee oneens
Niet eens/ niet
oneens
Mee eens Volledig mee eens
Het is waarschijnlijk dat ik de horecagelegenheid in de toekomst
weer zal bezoeken. (1)
Ik voelde sympathie voor het bedienend personeel. (2)
Over het algemeen ben ik geneigd positieve dingen te zeggen tegen
mensen over de horecagelegenheid. (3)
Ik verwacht deze horecagelegenheid nog lange tijd te
blijven bezoeken. (4)
Ik waardeerde de tijd en aandacht van het bedienend personeel. (5)
Ik ben geneigd deze horecagelegenheid aan te bevelen
aan een vriend of collega. (6)
De kans is groot dat ik positieve dingen over deze
horecagelegenheid zeg. (7)
Ik verwacht niet dat ik deze horecagelegenheid in de toekomst
zal bezoeken. (8)
Ik was het bedienend personeel dankbaar voor de verleende
service. (9)
Het is waarschijnlijk dat ik vrienden en kennissen zal aansporen de
horecagelegenheid te bezoeken. (10)
Q10 Onderstaande vragen hebben wederom betrekking op de laatste keer dat u fooi heeft gegeven bij {TextEntryValue Q3} .
Q11 Wat was het totaalbedrag van uw rekening in euro's?
Q12 Hoeveel fooi heeft u toen gegeven? (ook in euro's)
Q13 Was dit naar uw idee een lage of een hoge fooi? Laag
Beetje laag
Niet hoog/ niet laag
Beetje hoog

61
Hoog
Q14 Heeft het personeel van {TextEntryValue Q3}, op welke manier dan ook, gereageerd op uw fooi? Ja
Nee
Q15 Welke reden voor het ontbreken van een reactie op uw fooi heeft het meest betrekking op uw situatie. Ik heb de reactie van het personeel op mijn fooi (even) afgewacht, maar deze bleef uit.
Ik heb de fooi achtergelaten en de reactie van het personeel niet afgewacht
Q16 Onderstaande stellingen hebben betrekking op de reactie van het bedienend personeel op uw fooi. Geef aan in hoeverre u het eens bent met de stelling. Het personeel...
Volledig mee oneens
Oneens Niet eens/ niet oneens
Mee eens Volledig mee eens
merkte op dat ik iets deed in hun voordeel.
(1)
stelde mijn fooi op prijs. (2)
waardeerde mijn extra financiële
bijdrage. (3)
Q17 Stond de reactie van het personeel in verhouding met de hoogte van uw fooi? De reactie van het bedienend personeel was... te weinig in verhouding met mijn fooi.
minder in verhouding met mijn fooi.
precies in verhouding met mijn fooi
meer in verhouding met mijn fooi.
te veel in verhouding met mijn fooi.
Q18 Onderstaande stellingen hebben betrekking op fooi geven in het algemeen (uw antwoord hoeft dus geen directe betrekking te hebben op de voorgaande situatie). Geef aan in hoeverre u het eens bent met de stelling:
Volledig mee
oneens
Mee oneens
Niet eens/ niet oneens
Mee eens Volledig mee eens
Ik voel me bezwaard als ik geen fooi geef. (2)
Ik voel me bezwaard als andere mensen in mijn
gezelschap geen fooi geven. (4)
Ik voel me verplicht fooi te geven, ook als de service niet
zo goed is geweest. (3)
Ik laat een hogere fooi achter als anderen in mijn gezelschap
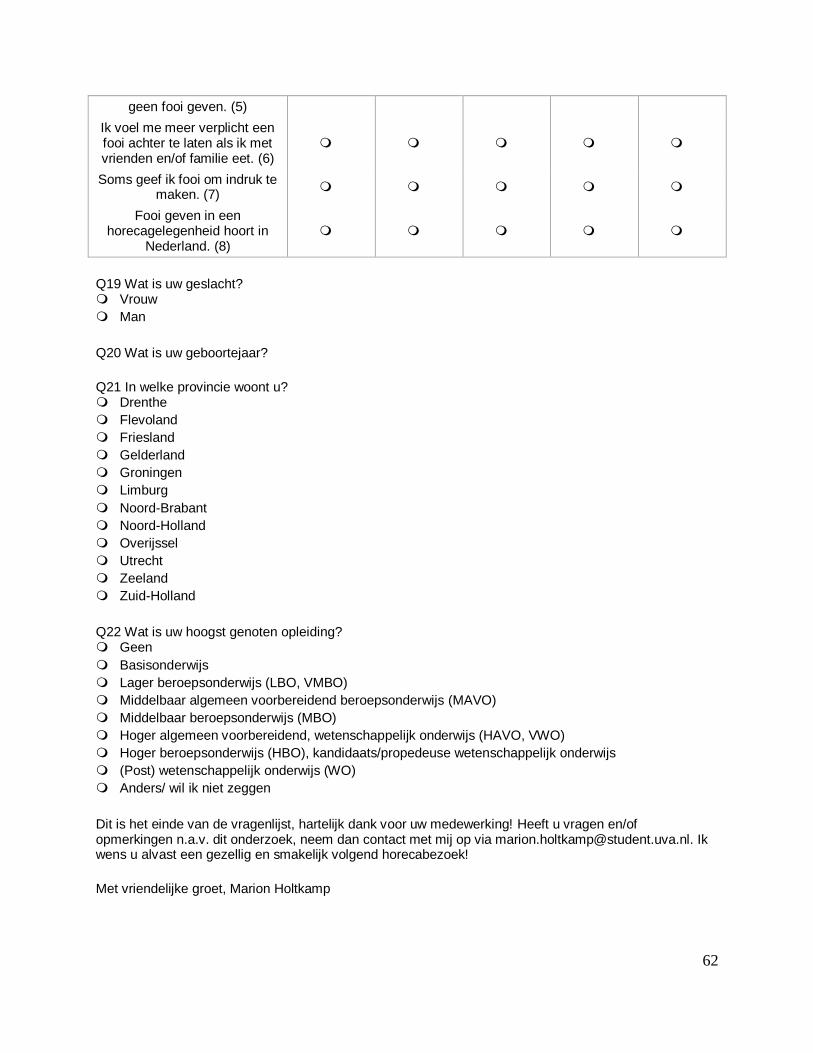
62
geen fooi geven. (5)
Ik voel me meer verplicht een fooi achter te laten als ik met vrienden en/of familie eet. (6)
Soms geef ik fooi om indruk te maken. (7)
Fooi geven in een horecagelegenheid hoort in
Nederland. (8)
Q19 Wat is uw geslacht? Vrouw
Man
Q20 Wat is uw geboortejaar?
Q21 In welke provincie woont u? Drenthe
Flevoland
Friesland
Gelderland
Groningen
Limburg
Noord-Brabant
Noord-Holland
Overijssel
Utrecht
Zeeland
Zuid-Holland
Q22 Wat is uw hoogst genoten opleiding? Geen
Basisonderwijs
Lager beroepsonderwijs (LBO, VMBO)
Middelbaar algemeen voorbereidend beroepsonderwijs (MAVO)
Middelbaar beroepsonderwijs (MBO)
Hoger algemeen voorbereidend, wetenschappelijk onderwijs (HAVO, VWO)
Hoger beroepsonderwijs (HBO), kandidaats/propedeuse wetenschappelijk onderwijs
(Post) wetenschappelijk onderwijs (WO)
Anders/ wil ik niet zeggen
Dit is het einde van de vragenlijst, hartelijk dank voor uw medewerking! Heeft u vragen en/of opmerkingen n.a.v. dit onderzoek, neem dan contact met mij op via [email protected]. Ik wens u alvast een gezellig en smakelijk volgend horecabezoek!
Met vriendelijke groet, Marion Holtkamp

63
IV Multiple regression analyses (hypotheses 1, 2, and 3)
Hypothesis 1 ‘Feelings to comply to social norms related to tipping positively influence tipping behavior. ’
Hypothesis 2 ‘Feelings of gratitude of the consumer towards the service experience positively influence tipping behavior. ’
Hypothesis 3 ‘Feelings of gratitude’ will have a stronger effect on tipping behavior than ‘compliance to social norm’ in a country with
a preference for feminine values, like the Netherlands.
Model Summary
Model R R Square
Adjusted R
Square
Std. Error of the
Estimate
Change Statistics
R Square
Change F Change df1 df2 Sig. F Change
1 .158a .025 .019 8.27834 .025 3.858 2 300 .022
a. Predictors: (Constant), MEAN Gratitude, MEAN SocComp
ANOVAa
Model Sum of Squares df Mean Square F Sig.
1 Regression 528.796 2 264.398 3.858 .022b
Residual 20559.277 300 68.531
Total 21088.073 302
a. Dependent Variable: Tip – absolute amount

64
b. Predictors: (Constant), MEAN Gratitude, MEAN SocComp
Coefficientsa
Model
Unstandardized Coefficients
Standardized
Coefficients
t Sig. B Std. Error Beta
1 (Constant) -.157 2.711 -.058 .954
MEAN SocComp .451 .558 .046 .807 .420
MEAN Gratitude 1.491 .572 .149 2.605 .010
a. Dependent Variable: Tip – absolute amount
Model Summaryb
Model R R Square
Adjusted R
Square
Std. Error of the
Estimate
Change Statistics
R Square
Change F Change df1 df2 Sig. F Change
1 .186a .034 .028 4.08473 .034 5.358 2 300 .005
a. Predictors: (Constant), MEAN Gratitude, MEAN SocComp
b. Dependent Variable: Tip percentage
ANOVAa
Model Sum of Squares df Mean Square F Sig.
1 Regression 178.780 2 89.390 5.358 .005b
Residual 5005.498 300 16.685
Total 5184.278 302
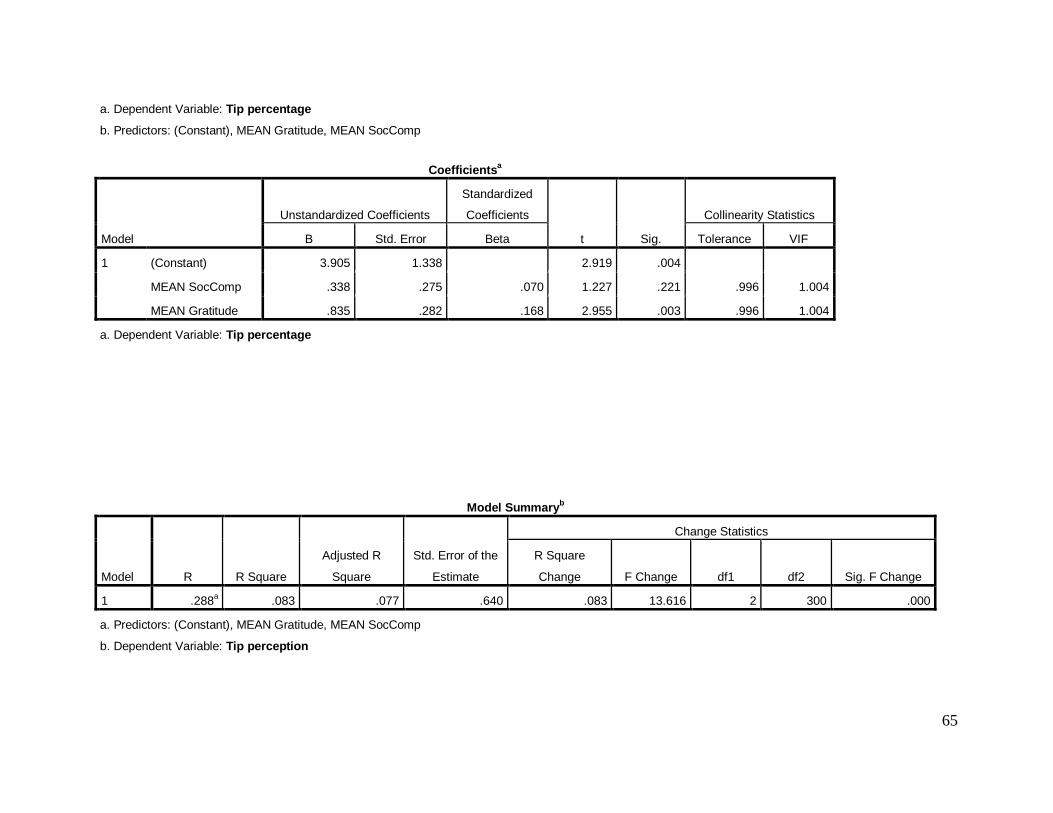
65
a. Dependent Variable: Tip percentage
b. Predictors: (Constant), MEAN Gratitude, MEAN SocComp
Coefficientsa
Model
Unstandardized Coefficients
Standardized
Coefficients
t Sig.
Collinearity Statistics
B Std. Error Beta Tolerance VIF
1 (Constant) 3.905 1.338 2.919 .004
MEAN SocComp .338 .275 .070 1.227 .221 .996 1.004
MEAN Gratitude .835 .282 .168 2.955 .003 .996 1.004
a. Dependent Variable: Tip percentage
Model Summaryb
Model R R Square
Adjusted R
Square
Std. Error of the
Estimate
Change Statistics
R Square
Change F Change df1 df2 Sig. F Change
1 .288a .083 .077 .640 .083 13.616 2 300 .000
a. Predictors: (Constant), MEAN Gratitude, MEAN SocComp
b. Dependent Variable: Tip perception

66
ANOVAa
Model Sum of Squares df Mean Square F Sig.
1 Regression 11.142 2 5.571 13.616 .000b
Residual 122.740 300 .409
Total 133.881 302
a. Dependent Variable: Tip perception
b. Predictors: (Constant), MEAN Gratitude, MEAN SocComp
Coefficientsa
Model
Unstandardized Coefficients
Standardized
Coefficients
t Sig. B Std. Error Beta
1 (Constant) 2.050 .209 9.787 .000
MEAN SocComp .030 .043 .039 .697 .486
MEAN Gratitude .226 .044 .284 5.120 .000
a. Dependent Variable: Tip perception
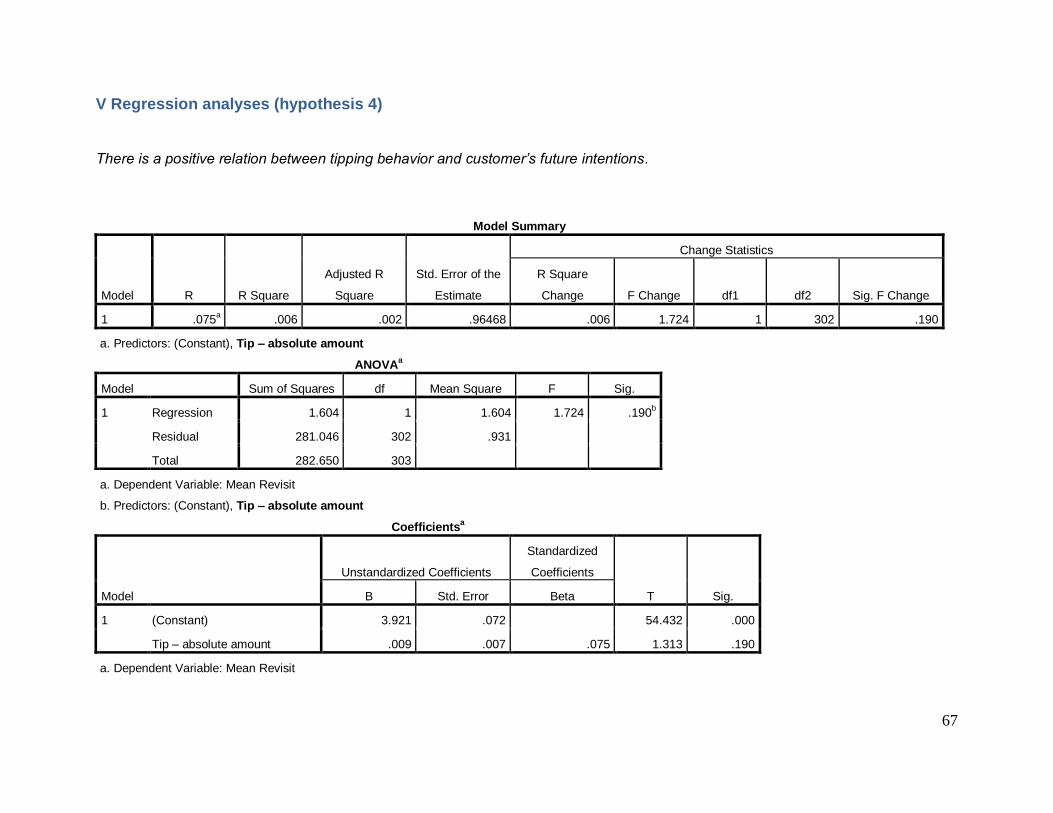
67
V Regression analyses (hypothesis 4)
There is a positive relation between tipping behavior and customer’s future intentions.
Model Summary
Model R R Square
Adjusted R
Square
Std. Error of the
Estimate
Change Statistics
R Square
Change F Change df1 df2 Sig. F Change
1 .075a .006 .002 .96468 .006 1.724 1 302 .190
a. Predictors: (Constant), Tip – absolute amount
ANOVAa
Model Sum of Squares df Mean Square F Sig.
1 Regression 1.604 1 1.604 1.724 .190b
Residual 281.046 302 .931
Total 282.650 303
a. Dependent Variable: Mean Revisit
b. Predictors: (Constant), Tip – absolute amount
Coefficientsa
Model
Unstandardized Coefficients
Standardized
Coefficients
T Sig. B Std. Error Beta
1 (Constant) 3.921 .072 54.432 .000
Tip – absolute amount .009 .007 .075 1.313 .190
a. Dependent Variable: Mean Revisit

68
Model Summary
Model R R Square
Adjusted R
Square
Std. Error of the
Estimate
Change Statistics
R Square
Change F Change df1 df2 Sig. F Change
1 .134a .018 .015 .884 .018 5.553 1 302 .019
a. Predictors: (Constant), Tip – absolute amount
ANOVAa
Model Sum of Squares df Mean Square F Sig.
1 Regression 4.341 1 4.341 5.553 .019b
Residual 236.121 302 .782
Total 240.462 303
a. Dependent Variable: Mean Word of Mouth
b. Predictors: (Constant), Tip – absolute amount
Coefficientsa
Model
Unstandardized Coefficients
Standardized
Coefficients
t Sig. B Std. Error Beta
1 (Constant) 3.835 .066 58.071 .000
Tip – absolute amount .014 .006 .134 2.356 .019
a. Dependent Variable: Mean Word of Mouth
Model Summary
Model R R Square Adjusted R Std. Error of the Change Statistics
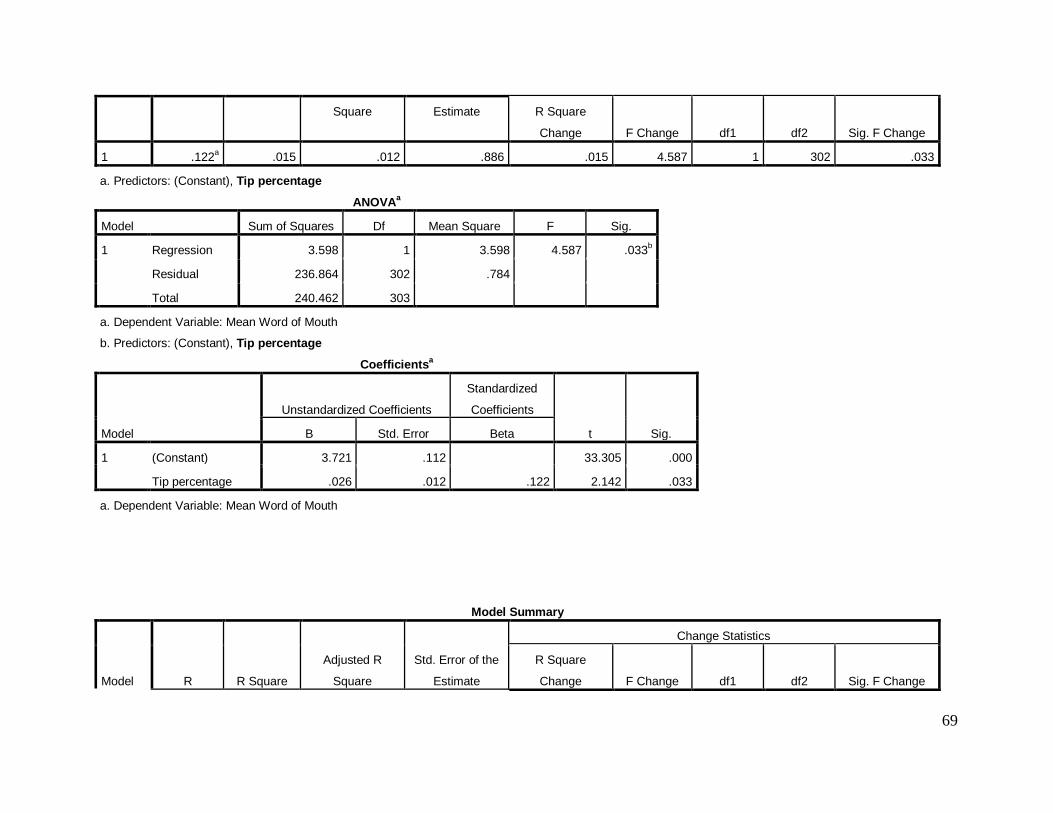
69
Square Estimate R Square
Change F Change df1 df2 Sig. F Change
1 .122a .015 .012 .886 .015 4.587 1 302 .033
a. Predictors: (Constant), Tip percentage
ANOVAa
Model Sum of Squares Df Mean Square F Sig.
1 Regression 3.598 1 3.598 4.587 .033b
Residual 236.864 302 .784
Total 240.462 303
a. Dependent Variable: Mean Word of Mouth
b. Predictors: (Constant), Tip percentage
Coefficientsa
Model
Unstandardized Coefficients
Standardized
Coefficients
t Sig. B Std. Error Beta
1 (Constant) 3.721 .112 33.305 .000
Tip percentage .026 .012 .122 2.142 .033
a. Dependent Variable: Mean Word of Mouth
Model Summary
Model R R Square
Adjusted R
Square
Std. Error of the
Estimate
Change Statistics
R Square
Change F Change df1 df2 Sig. F Change

70
1 .106a .011 .008 .962 .011 3.400 1 302 .066
a. Predictors: (Constant), Tip percentage
ANOVAa
Model Sum of Squares Df Mean Square F Sig.
1 Regression 3.147 1 3.147 3.400 .066b
Residual 279.504 302 .926
Total 282.650 303
a. Dependent Variable: Mean Revisit Int
b. Predictors: (Constant), Tip percentage
Coefficientsa
Model
Unstandardized Coefficients
Standardized
Coefficients
t Sig. B Std. Error Beta
1 (Constant) 3.783 .121 31.166 .000
TOTfooi/TOTrek .025 .013 .106 1.844 .066
a. Dependent Variable: Mean Revisit Int
Model Summary
Model R R Square
Adjusted R
Square
Std. Error of the
Estimate
Change Statistics
R Square
Change F Change df1 df2 Sig. F Change
1 .264a .070 .067 .861 .070 22.652 1 302 .000
a. Predictors: (Constant), Tip perception
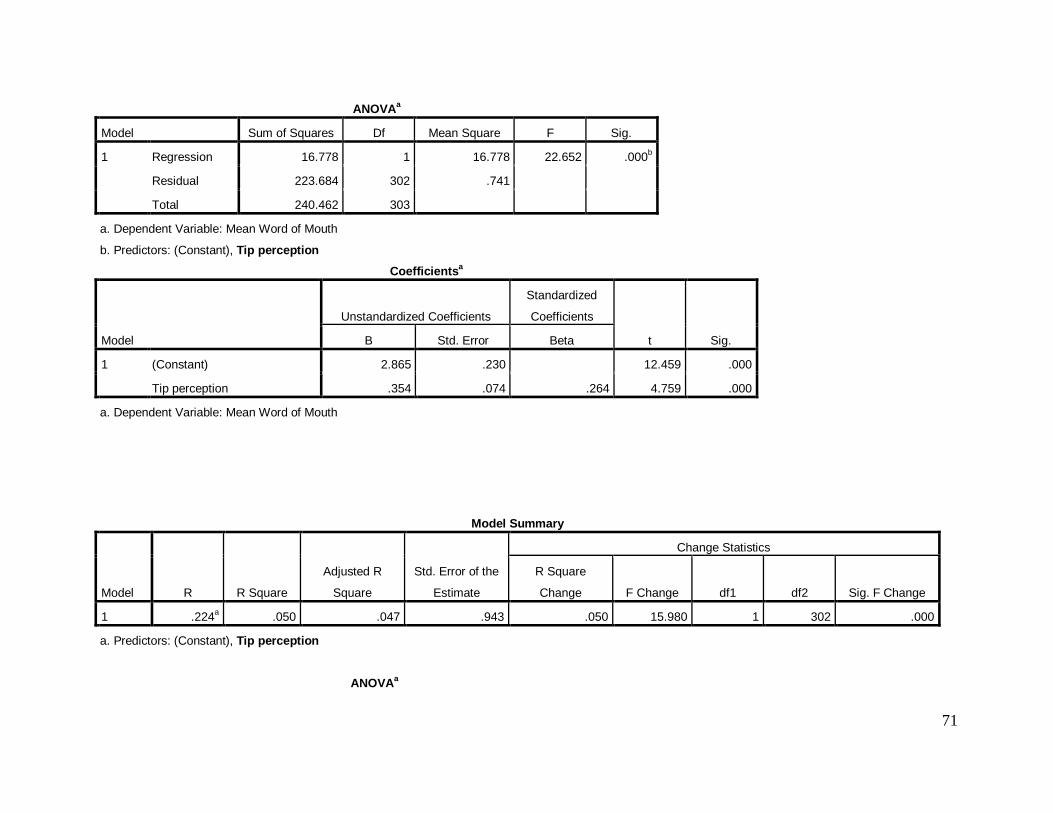
71
ANOVAa
Model Sum of Squares Df Mean Square F Sig.
1 Regression 16.778 1 16.778 22.652 .000b
Residual 223.684 302 .741
Total 240.462 303
a. Dependent Variable: Mean Word of Mouth
b. Predictors: (Constant), Tip perception
Coefficientsa
Model
Unstandardized Coefficients
Standardized
Coefficients
t Sig. B Std. Error Beta
1 (Constant) 2.865 .230 12.459 .000
Tip perception .354 .074 .264 4.759 .000
a. Dependent Variable: Mean Word of Mouth
Model Summary
Model R R Square
Adjusted R
Square
Std. Error of the
Estimate
Change Statistics
R Square
Change F Change df1 df2 Sig. F Change
1 .224a .050 .047 .943 .050 15.980 1 302 .000
a. Predictors: (Constant), Tip perception
ANOVAa
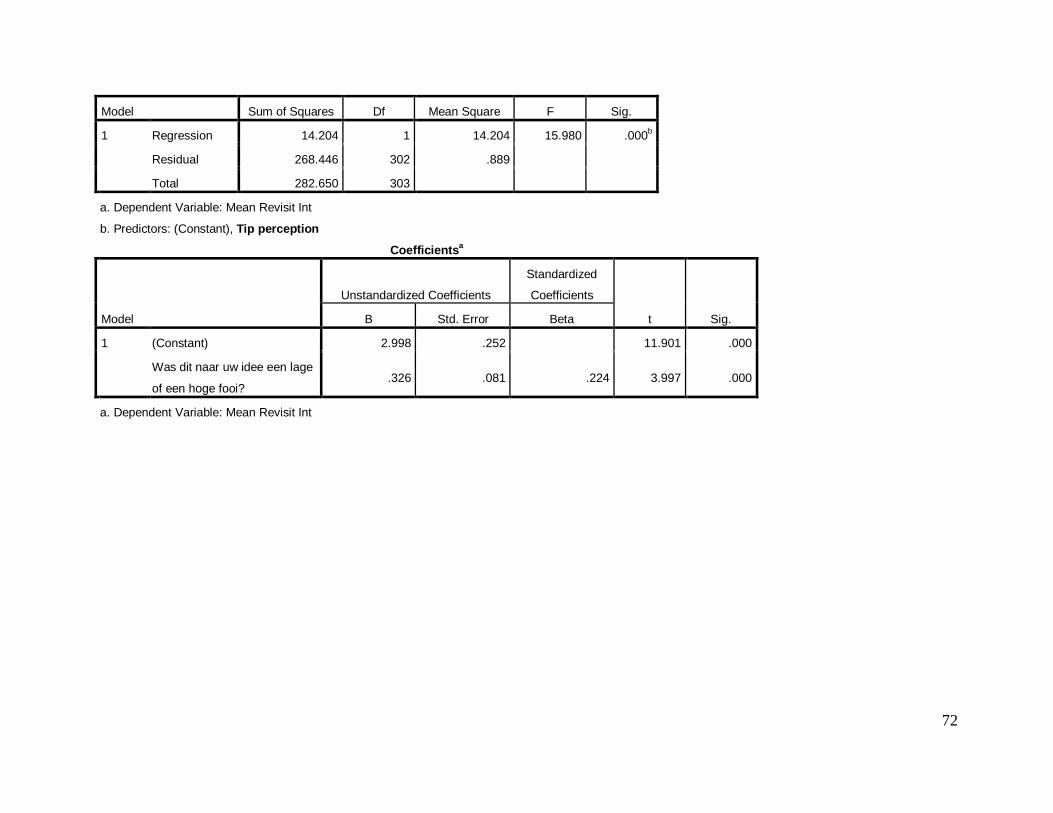
72
Model Sum of Squares Df Mean Square F Sig.
1 Regression 14.204 1 14.204 15.980 .000b
Residual 268.446 302 .889
Total 282.650 303
a. Dependent Variable: Mean Revisit Int
b. Predictors: (Constant), Tip perception
Coefficientsa
Model
Unstandardized Coefficients
Standardized
Coefficients
t Sig. B Std. Error Beta
1 (Constant) 2.998 .252 11.901 .000
Was dit naar uw idee een lage
of een hoge fooi? .326 .081 .224 3.997 .000
a. Dependent Variable: Mean Revisit Int
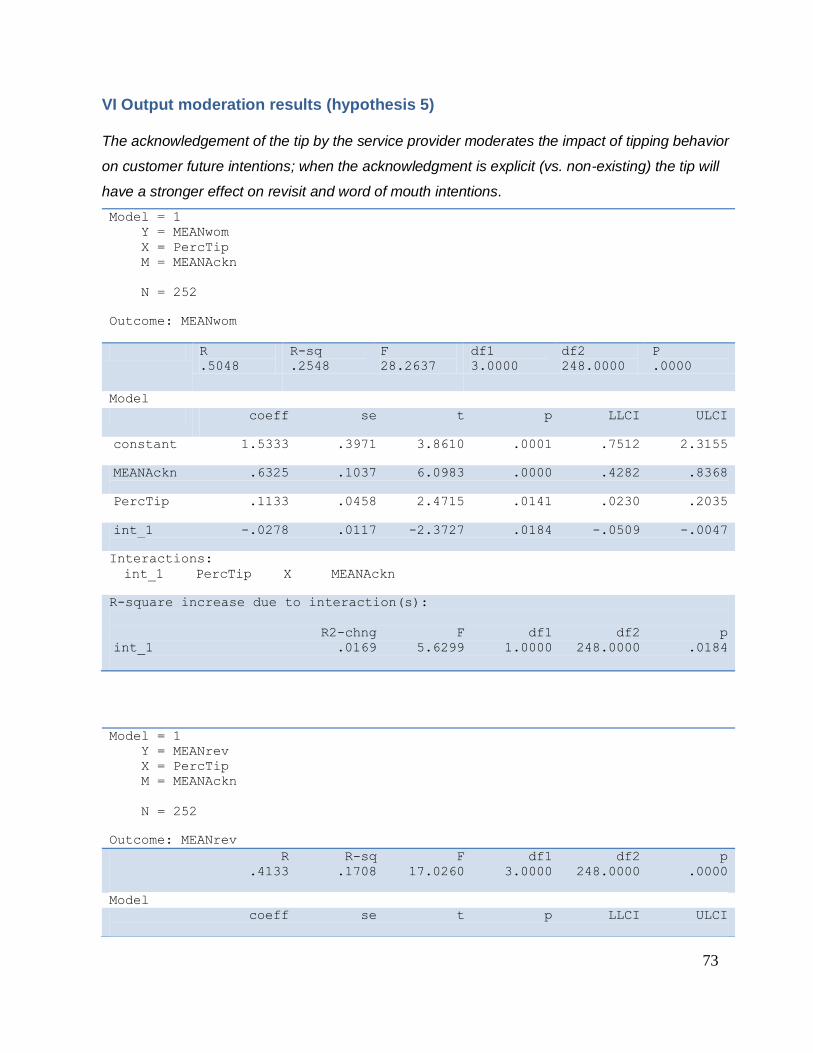
73
VI Output moderation results (hypothesis 5)
The acknowledgement of the tip by the service provider moderates the impact of tipping behavior
on customer future intentions; when the acknowledgment is explicit (vs. non-existing) the tip will
have a stronger effect on revisit and word of mouth intentions.
Model = 1
Y = MEANwom
X = PercTip
M = MEANAckn
N = 252
Outcome: MEANwom
R
.5048
R-sq
.2548
F
28.2637 df1
3.0000 df2
248.0000
P
.0000
Model coeff se t p LLCI ULCI
constant 1.5333 .3971 3.8610 .0001 .7512 2.3155
MEANAckn .6325 .1037 6.0983 .0000 .4282 .8368
PercTip .1133 .0458 2.4715 .0141 .0230 .2035
int_1 -.0278 .0117 -2.3727 .0184 -.0509 -.0047
Interactions:
int_1 PercTip X MEANAckn
R-square increase due to interaction(s):
R2-chng F df1 df2 p
int_1 .0169 5.6299 1.0000 248.0000 .0184
Model = 1
Y = MEANrev
X = PercTip
M = MEANAckn
N = 252
Outcome: MEANrev
R R-sq F df1 df2 p
.4133 .1708 17.0260 3.0000 248.0000 .0000
Model
coeff se t p LLCI ULCI
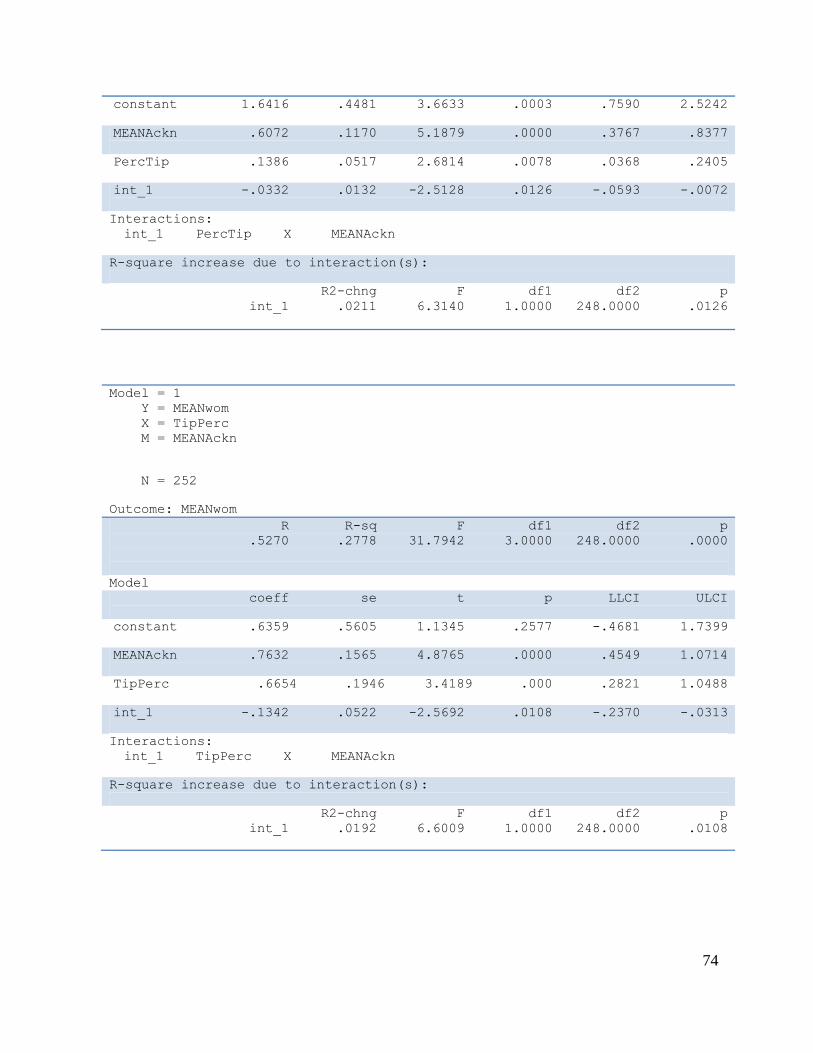
74
constant 1.6416 .4481 3.6633 .0003 .7590 2.5242
MEANAckn .6072 .1170 5.1879 .0000 .3767 .8377
PercTip .1386 .0517 2.6814 .0078 .0368 .2405
int_1 -.0332 .0132 -2.5128 .0126 -.0593 -.0072
Interactions:
int_1 PercTip X MEANAckn
R-square increase due to interaction(s):
R2-chng F df1 df2 p
int_1 .0211 6.3140 1.0000 248.0000 .0126
Model = 1
Y = MEANwom
X = TipPerc
M = MEANAckn
N = 252
Outcome: MEANwom
R R-sq F df1 df2 p
.5270 .2778 31.7942 3.0000 248.0000 .0000
Model
coeff se t p LLCI ULCI
constant .6359 .5605 1.1345 .2577 -.4681 1.7399
MEANAckn .7632 .1565 4.8765 .0000 .4549 1.0714
TipPerc .6654 .1946 3.4189 .000 .2821 1.0488
int_1 -.1342 .0522 -2.5692 .0108 -.2370 -.0313
Interactions:
int_1 TipPerc X MEANAckn
R-square increase due to interaction(s):
R2-chng F df1 df2 p
int_1 .0192 6.6009 1.0000 248.0000 .0108
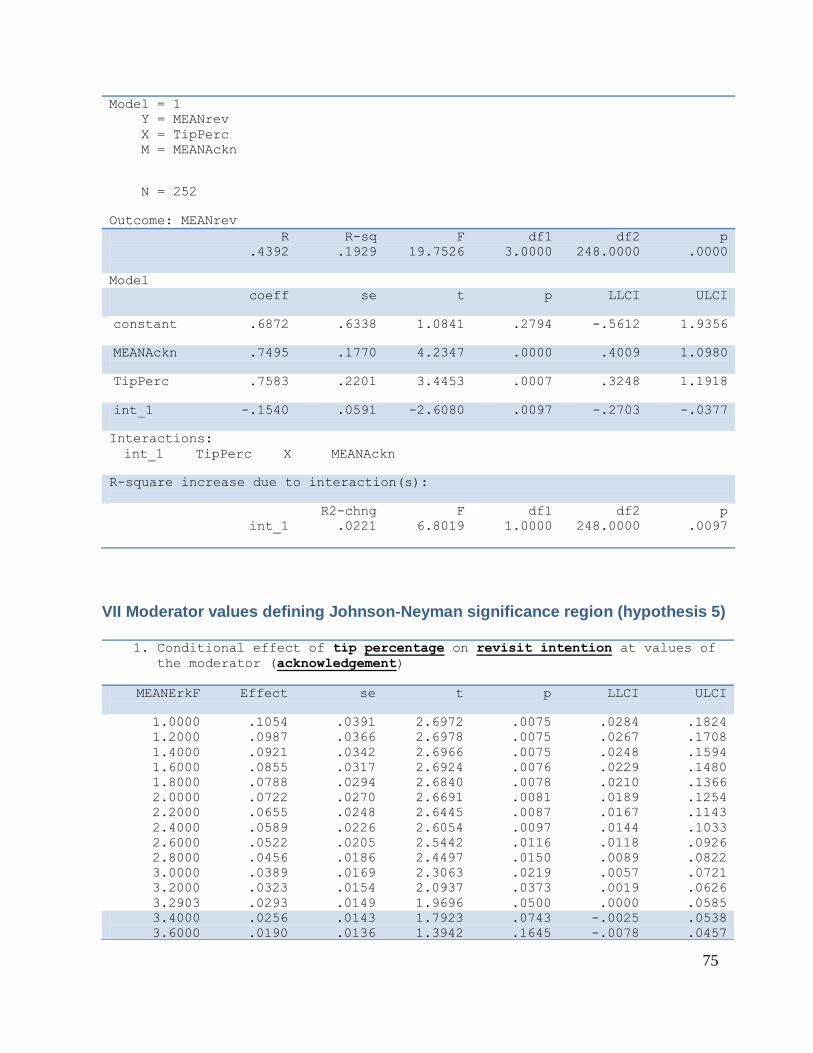
75
Model = 1
Y = MEANrev
X = TipPerc
M = MEANAckn
N = 252
Outcome: MEANrev
R R-sq F df1 df2 p
.4392 .1929 19.7526 3.0000 248.0000 .0000
Model
coeff se t p LLCI ULCI
constant .6872 .6338 1.0841 .2794 -.5612 1.9356
MEANAckn .7495 .1770 4.2347 .0000 .4009 1.0980
TipPerc .7583 .2201 3.4453 .0007 .3248 1.1918
int_1 -.1540 .0591 -2.6080 .0097 -.2703 -.0377
Interactions:
int_1 TipPerc X MEANAckn
R-square increase due to interaction(s):
R2-chng F df1 df2 p
int_1 .0221 6.8019 1.0000 248.0000 .0097
VII Moderator values defining Johnson-Neyman significance region (hypothesis 5)
1. Conditional effect of tip percentage on revisit intention at values of the moderator (acknowledgement)
MEANErkF Effect se t p LLCI ULCI
1.0000 .1054 .0391 2.6972 .0075 .0284 .1824
1.2000 .0987 .0366 2.6978 .0075 .0267 .1708
1.4000 .0921 .0342 2.6966 .0075 .0248 .1594
1.6000 .0855 .0317 2.6924 .0076 .0229 .1480
1.8000 .0788 .0294 2.6840 .0078 .0210 .1366
2.0000 .0722 .0270 2.6691 .0081 .0189 .1254
2.2000 .0655 .0248 2.6445 .0087 .0167 .1143
2.4000 .0589 .0226 2.6054 .0097 .0144 .1033
2.6000 .0522 .0205 2.5442 .0116 .0118 .0926
2.8000 .0456 .0186 2.4497 .0150 .0089 .0822
3.0000 .0389 .0169 2.3063 .0219 .0057 .0721
3.2000 .0323 .0154 2.0937 .0373 .0019 .0626
3.2903 .0293 .0149 1.9696 .0500 .0000 .0585
3.4000 .0256 .0143 1.7923 .0743 -.0025 .0538
3.6000 .0190 .0136 1.3942 .1645 -.0078 .0457
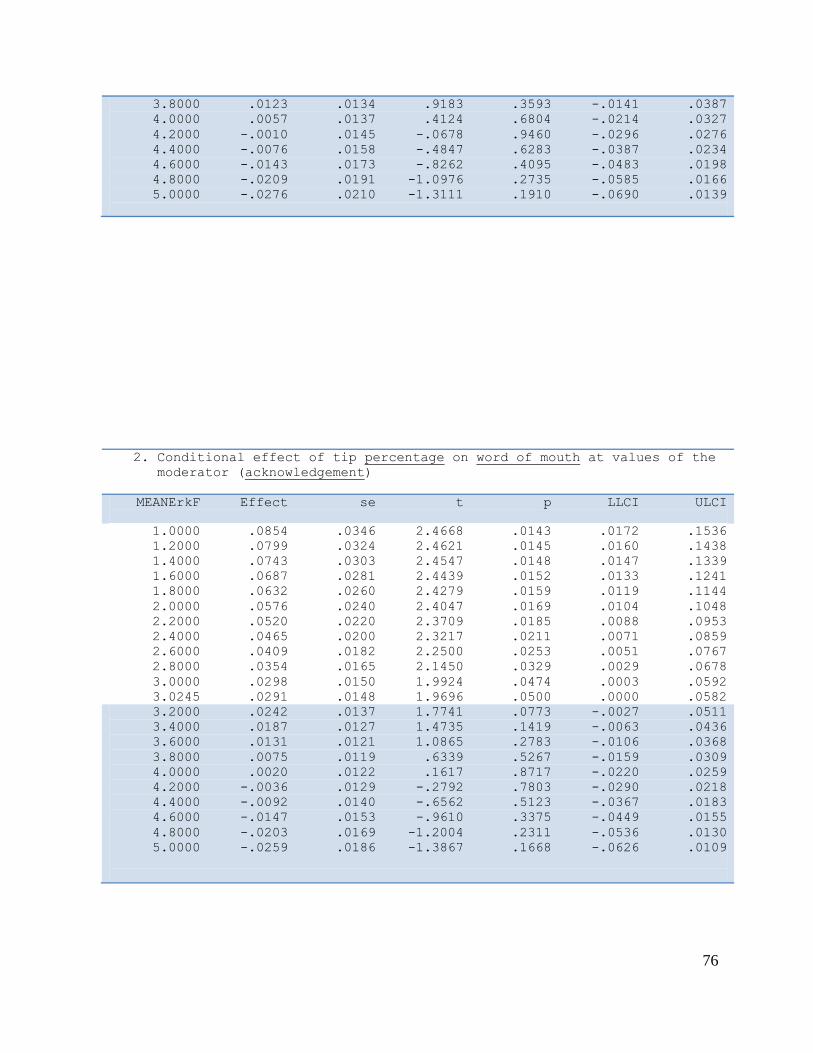
76
3.8000 .0123 .0134 .9183 .3593 -.0141 .0387
4.0000 .0057 .0137 .4124 .6804 -.0214 .0327
4.2000 -.0010 .0145 -.0678 .9460 -.0296 .0276
4.4000 -.0076 .0158 -.4847 .6283 -.0387 .0234
4.6000 -.0143 .0173 -.8262 .4095 -.0483 .0198
4.8000 -.0209 .0191 -1.0976 .2735 -.0585 .0166
5.0000 -.0276 .0210 -1.3111 .1910 -.0690 .0139
2. Conditional effect of tip percentage on word of mouth at values of the moderator (acknowledgement)
MEANErkF Effect se t p LLCI ULCI
1.0000 .0854 .0346 2.4668 .0143 .0172 .1536
1.2000 .0799 .0324 2.4621 .0145 .0160 .1438
1.4000 .0743 .0303 2.4547 .0148 .0147 .1339
1.6000 .0687 .0281 2.4439 .0152 .0133 .1241
1.8000 .0632 .0260 2.4279 .0159 .0119 .1144
2.0000 .0576 .0240 2.4047 .0169 .0104 .1048
2.2000 .0520 .0220 2.3709 .0185 .0088 .0953
2.4000 .0465 .0200 2.3217 .0211 .0071 .0859
2.6000 .0409 .0182 2.2500 .0253 .0051 .0767
2.8000 .0354 .0165 2.1450 .0329 .0029 .0678
3.0000 .0298 .0150 1.9924 .0474 .0003 .0592
3.0245 .0291 .0148 1.9696 .0500 .0000 .0582
3.2000 .0242 .0137 1.7741 .0773 -.0027 .0511
3.4000 .0187 .0127 1.4735 .1419 -.0063 .0436
3.6000 .0131 .0121 1.0865 .2783 -.0106 .0368
3.8000 .0075 .0119 .6339 .5267 -.0159 .0309
4.0000 .0020 .0122 .1617 .8717 -.0220 .0259
4.2000 -.0036 .0129 -.2792 .7803 -.0290 .0218
4.4000 -.0092 .0140 -.6562 .5123 -.0367 .0183
4.6000 -.0147 .0153 -.9610 .3375 -.0449 .0155
4.8000 -.0203 .0169 -1.2004 .2311 -.0536 .0130
5.0000 -.0259 .0186 -1.3867 .1668 -.0626 .0109

77
3. Conditional effect of tip perception on revisit intentions at values of the moderator (acknowledgement)
MEANErkF Effect se t p LLCI ULCI
1.0000 .6043 .1669 3.6207 .0004 .2756 .9330
1.2000 .5735 .1568 3.6584 .0003 .2647 .8822
1.4000 .5427 .1469 3.6949 .0003 .2534 .8320
1.6000 .5119 .1373 3.7284 .0002 .2415 .7823
1.8000 .4811 .1281 3.7560 .0002 .2288 .7333
2.0000 .4503 .1193 3.7733 .0002 .2152 .6853
2.2000 .4195 .1111 3.7740 .0002 .2006 .6384
2.4000 .3887 .1037 3.7492 .0002 .1845 .5928
2.6000 .3579 .0970 3.6874 .0003 .1667 .5490
2.8000 .3271 .0915 3.5750 .0004 .1469 .5072
3.0000 .2963 .0872 3.3984 .0008 .1246 .4680
3.2000 .2655 .0843 3.1485 .0018 .0994 .4315
3.4000 .2346 .0830 2.8256 .0051 .0711 .3982
3.6000 .2038 .0834 2.4429 .0153 .0395 .3682
3.8000 .1730 .0855 2.0240 .0440 .0047 .3414
3.8255 .1691 .0859 1.9696 .0500 .0000 .3382
4.0000 .1422 .0891 1.5969 .1116 -.0332 .3177
4.2000 .1114 .0940 1.1854 .2370 -.0737 .2966
4.4000 .0806 .1001 .8055 .4213 -.1165 .2778
4.6000 .0498 .1072 .4650 .6423 -.1612 .2609
4.8000 .0190 .1150 .1654 .8687 -.2075 .2455
5.0000 -.0118 .1235 -.0954 .9241 -.2550 .2314
4. Conditional effect of tip perception on word of mouth at values of the moderator (acknowledgement)
MEANErkF Effect se t p LLCI ULCI
1.0000 .5313 .1476 3.5997 .0004 .2406 .8220
1.2000 .5044 .1386 3.6389 .0003 .2314 .7775
1.4000 .4776 .1299 3.6773 .0003 .2218 .7334
1.6000 .4508 .1214 3.7129 .0003 .2117 .6899
1.8000 .4239 .1133 3.7430 .0002 .2009 .6470
2.0000 .3971 .1055 3.7632 .0002 .1893 .6049
2.2000 .3703 .0983 3.7672 .0002 .1767 .5639
2.4000 .3434 .0917 3.7464 .0002 .1629 .5240
2.6000 .3166 .0858 3.6891 .0003 .1476 .4856
2.8000 .2898 .0809 3.5818 .0004 .1304 .4491
3.0000 .2629 .0771 3.4108 .0008 .1111 .4148
3.2000 .2361 .0746 3.1667 .0017 .0893 .3829
3.4000 .2093 .0734 2.8496 .0047 .0646 .3539
3.6000 .1824 .0738 2.4722 .0141 .0371 .3278
3.8000 .1556 .0756 2.0581 .0406 .0067 .3045
3.8418 .1500 .0762 1.9696 .0500 .0000 .3000

78
4.0000 .1288 .0788 1.6347 .1034 -.0264 .2839
4.2000 .1019 .0831 1.2261 .2213 -.0618 .2657
4.4000 .0751 .0885 .8483 .3971 -.0993 .2494
4.6000 .0483 .0948 .5093 .6110 -.1384 .2349
4.8000 .0214 .1017 .2107 .8333 -.1789 .2217
5.0000 -.0054 .1092 -.0495 .9605 -.2204 .2096

79
VII ANOVA results (hypothesis 6)
The acknowledgement of the tip by the service provider has to be perceived as ‘in line’ with the tip in order for customers to evaluate
future intentions as more likely.
Descriptives
Mean Revisit Intentions
N Mean Std. Deviation Std. Error
95% Confidence Interval for Mean
Minimum Maximum Lower Bound Upper Bound
Te weinig reactie/fooi 39 3.4231 1.23831 .19829 3.0217 3.8245 1.00 5.00
Precies reactie/fooi 188 4.1197 .79456 .05795 4.0054 4.2340 1.00 5.00
Te veel reactie/fooi 25 4.2800 .87892 .17578 3.9172 4.6428 2.50 5.00
Total 252 4.0278 .91969 .05794 3.9137 4.1419 1.00 5.00
Test of Homogeneity of Variances
Mean Revisit Intentions
Levene Statistic df1 df2 Sig.
13.181 2 249 .000

80
ANOVA
Mean Revisit Intentions
Sum of Squares df Mean Square F Sig.
Between Groups 17.439 2 8.720 11.142 .000
Within Groups 194.866 249 .783
Total 212.306 251
Multiple Comparisons
Dependent Variable: Mean Revisit Intentions
Games-Howell
(I) Cat reactie/ tip verhouding (J) Cat reactie/ tip verhouding
Mean Difference
(I-J) Std. Error Sig.
95% Confidence Interval
Lower Bound Upper Bound
Te weinig reactie/fooi Precies reactie/fooi -.69660* .20658 .004 -1.1974 -.1958
Te veel reactie/fooi -.85692* .26499 .006 -1.4934 -.2204
Precies reactie/fooi Te weinig reactie/fooi .69660* .20658 .004 .1958 1.1974
Te veel reactie/fooi -.16032 .18509 .665 -.6170 .2964
Te veel reactie/fooi Te weinig reactie/fooi .85692* .26499 .006 .2204 1.4934
Precies reactie/fooi .16032 .18509 .665 -.2964 .6170
*. The mean difference is significant at the 0.05 level.
Descriptives
Mean Word of Mouth - items1 deleted
N Mean Std. Deviation Std. Error
95% Confidence Interval for Mean
Minimum Maximum Lower Bound Upper Bound
Te weinig reactie/fooi 39 3.23 1.095 .175 2.88 3.59 1 5
Precies reactie/fooi 188 4.05 .728 .053 3.94 4.15 1 5
Te veel reactie/fooi 25 4.60 .593 .119 4.36 4.84 3 5
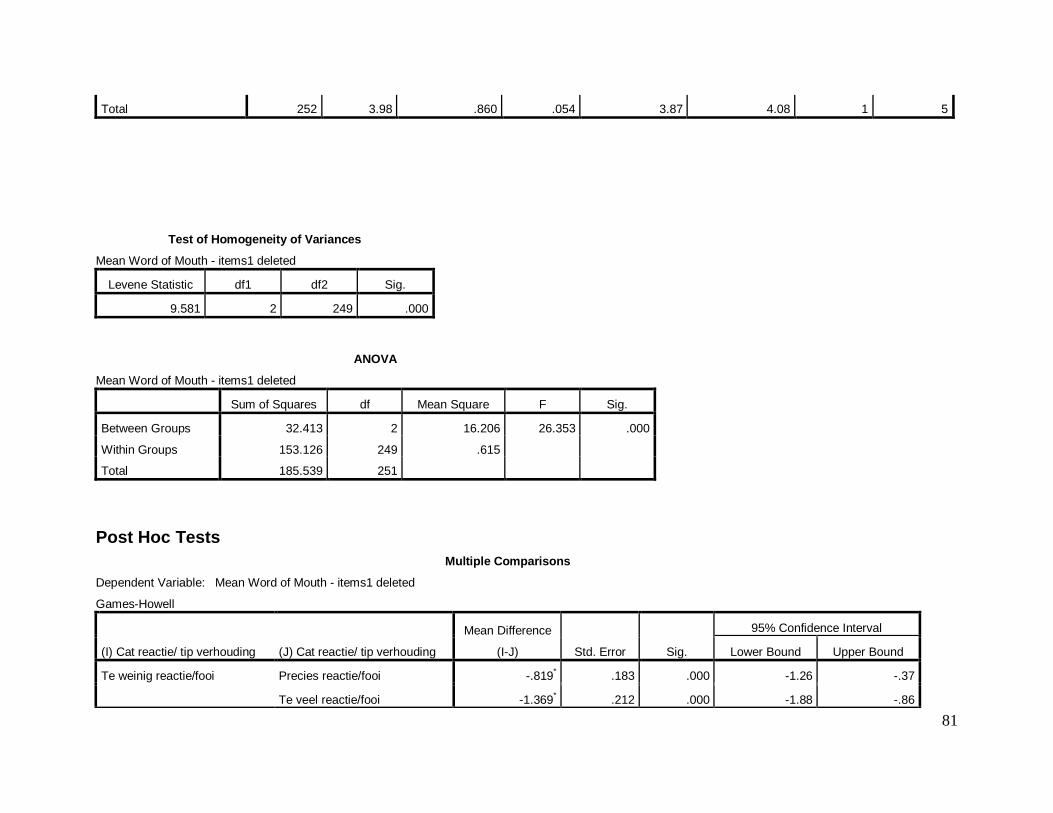
81
Total 252 3.98 .860 .054 3.87 4.08 1 5
Test of Homogeneity of Variances
Mean Word of Mouth - items1 deleted
Levene Statistic df1 df2 Sig.
9.581 2 249 .000
ANOVA
Mean Word of Mouth - items1 deleted
Sum of Squares df Mean Square F Sig.
Between Groups 32.413 2 16.206 26.353 .000
Within Groups 153.126 249 .615
Total 185.539 251
Post Hoc Tests
Multiple Comparisons
Dependent Variable: Mean Word of Mouth - items1 deleted
Games-Howell
(I) Cat reactie/ tip verhouding (J) Cat reactie/ tip verhouding
Mean Difference
(I-J) Std. Error Sig.
95% Confidence Interval
Lower Bound Upper Bound
Te weinig reactie/fooi Precies reactie/fooi -.819* .183 .000 -1.26 -.37
Te veel reactie/fooi -1.369* .212 .000 -1.88 -.86
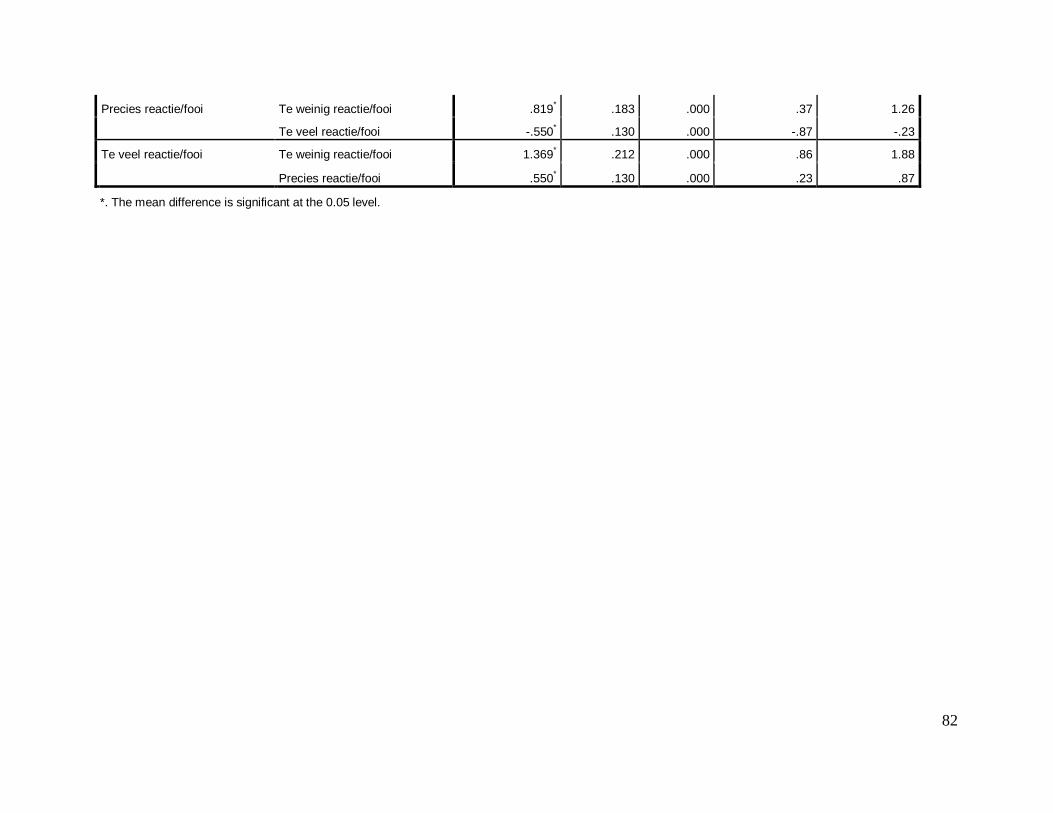
82
Precies reactie/fooi Te weinig reactie/fooi .819* .183 .000 .37 1.26
Te veel reactie/fooi -.550* .130 .000 -.87 -.23
Te veel reactie/fooi Te weinig reactie/fooi 1.369* .212 .000 .86 1.88
Precies reactie/fooi .550* .130 .000 .23 .87
*. The mean difference is significant at the 0.05 level.