RESTARTING THE HEMERDON TUNGSTEN MINE JUNE 2020
39
RESTARTING THE HEMERDON TUNGSTEN MINE JUNE 2020
-
Upload
khangminh22 -
Category
Documents
-
view
0 -
download
0
Transcript of RESTARTING THE HEMERDON TUNGSTEN MINE JUNE 2020

RESTARTING THE HEMERDON TUNGSTEN MINE JUNE 2020

The information contained in this document (the “Document”) is for introductory discussion purposes only and is strictly confidential. This Document is furnished to you on a confidential basis solely for
the purpose of evaluating your interest in this opportunity. By its acceptance hereof, each recipient agrees that neither it nor its agents, representatives, directors or employees will copy, reproduce or
distribute to others this Document, in whole or in part, at any time without the prior written consent of Tungsten West Limited (“Tungsten West” or the “Company”) and that it will keep confidential this
Document or any information otherwise obtained from the Company and will use this Document for the sole purpose of evaluating a possible investment in the Company.
This Document does not constitute an offer or solicitation to buy or sell any securities discussed herein in any jurisdiction where such would be prohibited. The information contained in this Document
does not and is not intended to constitute a "valuation," "formal valuation," "appraisal," "prior valuation," or a "report, statement or opinion of an expert" for purposes of any securities legislation in the
UK or elsewhere. We are not legal, tax or accounting experts and we express no opinion concerning any legal, tax or accounting matters or the sufficiency of this presentation for your purposes.
This Document is incomplete without reference to the discussion and any related written materials that supplement it.
The Document includes certain projections and forward-looking statements provided by the Company with respect to anticipated future performance. Such projections and forward-looking statements
reflect various assumptions of management concerning the future performance of the Company, which assumptions may or may not prove to be correct. The actual results may vary from the anticipated
results and such variations may be material. Factors that could cause such results to differ include the future price of commodities, results of exploration and development information, future costs,
availability of capital and other factors. Interested parties should use caution and consider these factors in evaluating any such forward-looking statements.
No representations or warranties are made as to the accuracy or reasonableness of any of the information contained in these materials including, without limiting the generality of the foregoing, any
assumptions or projections or forward-looking statements. Only those representations and warranties which may be made in a definitive written agreement relating to a transaction, when and if
executed, and subject to any limitations and restrictions as may be specified in such definitive agreement, shall have any legal effect.
Certain statements made in this Document, other than statements of historical fact, including, without limitation, those concerning the economic outlook for the mining industry, expectations regarding
metals prices, production, cash costs and other operating results, growth prospects and outlook of the Hemerdon mining project (“Hemerdon” or the “Project”), including the achievement of project
milestones, the completion and commencement of commercial operations and the completion of acquisitions and dispositions, liquidity and capital resources and capital expenditures and the outcome
and consequence of any potential or pending litigation or regulatory proceedings or environmental issues, are forward-looking statements regarding Tungsten West’s operations, economic performance
and financial condition. These forward-looking statements involve known and unknown risks, uncertainties and other factors that may cause Tungsten West’s actual results, performance or achievements
to differ materially from the anticipated results, performance or achievements expressed or implied in these forward-looking statements. Although Tungsten West believes that the expectations reflected
in such forward-looking statements are reasonable, no assurance can be given that such expectations will prove to have been correct. Accordingly, results could differ materially from those set out in the
forward-looking statements as a result of, among other factors, changes in economic, social, political and market conditions, success of business and operating initiatives, changes in the regulatory
environment and other government actions including environmental approvals and actions, fluctuations in metals prices and exchange rates, and business and operational risk management.
This Document may contain certain “Non-GAAP” financial measures. In addition, the presentation of these measures may not be comparable to similarly titled measures other companies may use. No
representations or warranties are made as to the accuracy or completeness of any of the information contained in these materials including, without limiting the generality of the foregoing, any
assumptions or projections or forward-looking statements. Only those representations and warranties which may be made in a definitive written agreement relating to a transaction, when and if
executed, and subject to any limitations and restrictions as may be specified in such definitive agreement, shall have any legal effect.
DISCLAIMER
2

3
A GREAT OPPORTUNITY FOR
INVESTORS
WORLD CLASS DEPOSIT OF A STRATEGIC METAL
PROJECT NPV OF £306m
IRR of 111%
RAISING £5m TO FINALISE DFS

KEY HIGHLIGHTSKEY HIGHLIGHTS
FIXING A WORLD CLASS TUNGSTEN MINE
>£200m sunk capital
WORLD’S 4th LARGEST TUNGSTEN RESOURCE
332 Mt @ 0.12% WO3
LOW CAPEX & QUICK PAYBACK
£35m Capex, est. £35m p.a. EBITDA
MINE LIFE OF 23 YEARS WITH POTENTIAL FOR +30
Post Tax NPV(5%): £306m
LOW OPEX & 3 REVENUE STREAMS
B/E WO3 PRICE: $134/mtu
DEFINITIVE FEASIBILITY STUDY ON TRACK FOR Q1 2021 WITH A PLANT REBUILD TIME OF 6 MONTHS
4
IMMEDIATE CASH FLOW FROM AGGREGATES
Sales into local market

£19m
£40m£35m
£74m
£78m
£199m£222m
£164m
£122m
£167m
£186m £185m
-£100m
-£50m
£0m
£50m
£100m
£150m
£200m
£250m
£300m
H1 2012 H2 2012 H1 2013 H2 2013 H1 2014 H2 2014 H1 2015 H2 2015 H1 2016 H2 2016 H1 2017 H2 2017
Tota
l En
terp
rise
Val
ue
(£m
)
Market Capitalization - Cash & Investments + Total Debt = Total Enterprise Value (TEV)
Peak Enterprise Value: £222m
VALUE PROPOSITION
MARKET CAP & ENTERPRISE VALUE
Pre-Production Mkt Cap: £200m
£5.6m Acquisition Price
£145m of Debt Prior to Receivership
Source: Capital IQ

ACHIEVEMENTS TO DATE
❑ Acquisition of the Hemerdon Mine Completed:
➢ Initial consideration of £5.6m, plus a £1.8m top-up payment into theRestoration Bond (increased to £13.2m)
➢ Deferred consideration of £1m per annum for 8 years, commencing 2022
❑ 10 year Mining Services Contract signed with Hargreaves Services:
➢ Life of contract average margin of 7.5%
❑ All historic property issues with neighbours and landlordsresolved
❑Major changes to the Minerals Lease:
➢ Landlords’ termination right upon mining cessation deferred until Dec2024
➢ Overall royalty reduced from 4.00% to 2.25%
➢ Option over Southern Extension
❑Management system under construction
➢ ISO 14001 – Environmental Management - Approved
➢ ISO 45001 – Health and Safety – pending
➢ ISO 39001 – Traffic Management - pending
➢ ISO 9001 – Quality Management – pending
➢ ISO 27001 – Information Technology – pending
➢ ISO 50001 – Energy Management – pending
➢ ISO 31001 – Risk Management - pending
❑ New Technical Reports:
➢ New Competent Persons Report (Wardell Armstrong)
➢ Updated JORC Resource (Mining Plus) plus further internal resource upgrade
➢ Grade increased by 12%
➢ New Optimised Pit Shell and Financial Model (Mining Plus and TWL)
➢ Multiple Metallurgical Test Work Reports:
➢ XRT Ore Sorting (Steinert and Tomra)
➢ Tailings classification analysis (Grinding Solutions)
➢ Ore and tailings magnetic separation characteristics (Eriez)
➢ WHIMS lab-scale testing on ore and tailings (Outotec)
➢ Gravity and magnetic separation (Wardell Armstrong)
➢ Concentrate dressing via leaching (Grinding solutions)
➢ Pilot Plant (GTK)
➢ Independent Metallurgical Reviews (Mike Halliwell and Doug Caffell)
➢ Project Review (Fairport Engineering)
❑ Trenching of the Southern Extension:
➢ 220m of trenching, including very high grade intercepts
❑ Aggregates:
➢ Characterisation and certification of aggregates (John Grimes Partnership)
❑ Core Technical Team Recruited:
➢ Technical Director, Geologists, Metallurgists, Sustainability Manager, ConsultantProject Manager, IT and Data Manager, Planning and Permitting Consultants
TECHNICALCORPORATE
6

FINANCIAL HIGHLIGHTS
DFS OPTIMISATIONASSUMPTIONS
7
FINANCIAL METRICS
CUMULATIVE CASH FLOW YEARS 1 to 3
Further upside to this Financial Model will comefrom:
➢ Drilling out the Southern Extension
➢ Drilling the Northern extension at depth
➢ Optimising / Steepening pit walls angle by 5 degrees
➢ Optimising overall recovery from granite (target +65%)
➢ Optimising killas metallurgy
➢ Hydrometallurgical and tailings retreatment test work
➢ Planning applications to increase pit dimensions
➢ Mine Waste Facility re-design.
Based on the Interim Technical Update the
project metrics are: (Mining Plus)
Source: TWL and Mining Plus
NPV(5%) £306m Post Tax
IRR 111%
LOM Cash Flow £526m Post Tax
Project Breakeven $134 / mtu APT Price
Total Revenue £1,595m
Total Opex £874m
Operating Margin 45%
-£40
-£30
-£20
-£10
£-
£10
£20
£30
-£15
-£10
-£5
£-
£5
£10
£15
Mar-20 Sep-20 Mar-21 Sep-21 Mar-22 Sep-22 Mar-23
Cu
mu
lati
ve F
CF
(£M
)
Op
erat
ing
& IN
vest
ing
Cas
hfl
ow
(£
M)
Operating Cashflow Investing Cashflow Cumulative Free Cashflow
WO3 Price Deck: $275 / mtu Years 1 - 5
$300 / mtu Years 5 - 10
$325 / mtu thereafter
Sn Price Deck $20,000 per tonne
WO3 Payability 78% of APT price
Mine Life 23 years
Capex £35m
Avg Granite Grade 0.18% WO3
0.03% Sn
Avg Killas Grade 0.11% WO3
0.02% Sn
Granite Ore Mined 59.9 Mt
Killas Ore Mined 17.8 Mt
Killas waste Mined 85 Mt
Strip Ratio 1.1 : 1
Recovery - Granite 58%
Recovery - Killas 44%
Total WO3 Recovered 72,000 tonnes
Total Sn Recovered 7,400 tonnes
Mining Cost £3.94 per bcm
Processing Cost £5.75 per mt
Royalty 2.25%
USD / GBP 1.25

EXPLORATION UPSIDE
8
10m at 0.54% WO3
12m at 0.63% WO3
13m at 2.28% WO3
12m at 0.67% WO3
12m at 0.99% WO3
12m at 0.51% WO3
13m at 0.34% WO3
12m at 0.67% WO3
13m at 0.35% WO3
12m at 0.75% WO3
11m at 0.44% WO3
WO3 %
0
0 – 0.05
0.05 – 0.10
0.10 – 0.15
0.15 – 0.20
0.20 – 0.25
0.25 – 0.30
>0.30
N
G10
Hemerdon Lateral Extension
G10 Granite boundary
G10
“The TWL plans for Hemerdon Processing Plant re-design are logical and make eminent sense.”M.P.Hallewell BSc, F.I.M.M.M., F.S.A.I.M.M., F.M.E.S., C.Eng Consulting Metallurgist
PROJECT OPTIMISATION
❑Crushing, Screening And XRT Ore Sorting:➢ Complete redesign of the front end crushing, sorting and screening circuit
➢ Inclusion of XRT Ore Sorting fundamentally changes the project economics
❑DMS Pre-concentration & Fine Gravity Circuit:➢ 17% increase in the feed to the Dense Media Separator
➢ Fines circuit recoveries are also improved by the addition of a WHIMS magnetic scavenger
❑Concentrate Dressing:➢ A new purpose built off-site leach plant will be a phase 2 upgrade option for the plant
➢ Test work has demonstrated a 98% stage recovery of WO3 from leaching, leading to a 67%final concentrate
❑Operational Efficiencies:➢ Maximising gravity flow to minimise pumping in order to minimise the production of fines
➢ Additional surge capacity throughout the system provides additional operational flexibility
➢ Technology added wherever possible
TWL Wolf
Ore Sorting ✓ ꭗ
Magnetic Separation ✓ ꭗ
Definitive Metallurgy ✓ ꭗ
Optimised Pit Design ✓ ꭗ
Minimised Pumping ✓ ꭗ
Optimised Crushing ✓ ꭗ
Resource Expansion ✓ ꭗ
Real Time Technology ✓ ꭗ
Near Mine Exploration ✓ ꭗ
MAJOR PROCESSING ROUTE CHANGES IN THE HEMERDON PLANT:
9

DIRECTORS & MANAGEMENT TEAM
Mark Thompson – Director & Executive Chairman
Mark holds a B.A. in Physics from Oxford University. He has 26 years of experience in financial
markets, commodity trading, minerals exploration and mine development. He has founded and
sat on the boards of several junior mining companies and has particular expertise in tin and
tungsten and in the South West of the UK. He consults widely within the metal derivatives and
mining industries and as an expert witness in metals and mining related commercial litigation.
Maximillian Denning – Director & CEO
Max holds a B.A. from the University of Leeds. He has over 10 years experience in the mining
sector mainly in commercial & finance, management consultancy and project delivery. He is on
the Investment Committee of Morebath Ltd, a family office that holds several investments in the
mining sector. He was formally GM Commercial & Finance of Pan African Minerals Ltd and
Deputy Country Manager at Hummingbird Resources Ltd.
Stephen Fabian – Non-Executive Director
Steve holds as B.E. (Min) from the University of New South Wales, Australia. He has
over 25 years experience in mining industry, as a fund manager and venture capitalist.
He is the Founder & Chairman of Brazil Tungsten Holdings and the CEO of Anglo
Saxony Mining.
Francis Johnstone – Non-Executive Director
Francis trained in corporate finance at Citibank before entering the mining business in
1989 with Cluff Resources where he became Group Projects and Operations Manager.
He has also previously held the position of Commercial Director at Ridge Mining plc.
He is currently an investment advisor to LSE listed Baker Steel Resources Trust and is a
NED of a number mining companies.
David Price – Chief Financial Officer
David Qualified as Chartered accountant with PwC and has since worked for 25 years in investment management and Private equity. His last two roles were at CD Capital a private equity
mining fund manager and AXA Rosenberg as European Finance director for Quantitative equity manager.
James McFarlane – Technical Director
James holds a MSc from the Camborne School of Mines in Mining Geology and has worked as both a production and exploration geologist in the UK, Ireland and Australia, and as a
principal mining consultant across a range of commodities globally. He was formerly Mining Technical Services Manager at Hemerdon under Wolf Minerals.
Jon Hsuan – Consultant Project Manager
Jon has over 40 years experience in senior management roles covering all aspects of project and mine activities. His expertise lie in geological studies, beneficiation test work and process
design, pilot plant programmes, plant technical and engineering work, EPCM contracts and project management. Since 2012, Jon has been a senior consultant of Behre-Dolbear.
BOARD OF DIRECTORS
MANAGEMENT TEAM AND CONSULTANTS
10

CAPITAL STRUCTURE AND CAPITAL RAISING
TOP 10 SHAREHOLDERS
CAPITAL RAISING
CORPORATE STRUCTURE
Fully diluted there are currently 84,871,889 shares in issuance
This consists of 52,148,489 shares, 1,678,400 warrants and 31,000,000 convertible loan notes:
➢ Convertible notes have a 3 year maturity from 29th November 2019 and pay 8% interest PIK
➢ Convertible at holders option at 30p per share
➢ Callable by TWL at 45p before 25th of May 2021 or at 60p before 25th October 2022
➢ Mandatory conversion upon qualifying IPO raising >£10.0m at +60p
Capital raised to date: £15.9m with £2.4m in treasury as of June 2020
The Founding Shareholders will earn 10% additional equity by hitting project milestones:
➢ 3.33% each upon: financial close for mine restart, declaring commercial production, and upon a liquidityevent through sale of the Company or IPO
TWL is currently raising £5.0m in order to complete and enhance thecurrent Definitive Feasibility Study, and to extend the corporaterunway to the end of 2021
This is by way of an equity offering
Use of Funds:
➢ General corporate purposes
➢ Southern Extension exploration drilling
➢ Tailings reprocessing feasibility study
➢ DFS optimisation studies
➢ Aggregates infrastructure
Fully Diluted Effective Interest:
Baker Steel Resources Trust 28.57%
Henry Maxey 16.50%
Denning Family 16.37%
David Lilley 10.73%
Eden Rock 6.29%
Ian Hannam 5.33%
Thompson Family 4.95%
Fabian Family 3.67%
Beth Korein 2.04%
South American Ferro Metals Ltd 1.16%
11

THE HEMERDON PROJECT

Mt Carbine (open pit)
Mt Carbine (stockpile)
Dolphin (mine)
O'Callaghans
Northern Dancer
Mactung
Sisson
Sangdong
Barruecopardo
La Parrilla
Hemerdon Mine
Hemerdon Mine (tailings)
-0.10
0.10
0.30
0.50
0.70
0.90
1.10
0 100 200 300 400 500 600 700
WO
3 /
%
Gross (Mt)
Source: TWL and Roskill
COMPARABLES
PEA 2011:CAPEX: $645m
IRR: 20% @$275/mtu
FS 2013: CAPEX: $579m
IRR: 16.3% @ $350/mtu
FS: 2016CAPEX: $69m
NPV5: $89m @$370/mtu
0
50000
100000
150000
200000
250000
Contained Tin (t) within Measured and Indicated Resources
INTERNAL 2020:CAPEX: $35m
IRR: 111% @$300/mtu
13
2020: MEASURED, INDICATED & INFERRED RESOURCES OF TUNGSTEN PROJECTS
Key
In Production
Underground
Pre-Production Open Pit

THE PROJECT
14

OVERVIEW OF THE HEMERDON TUNGSTEN MINE
❑ The Hemerdon Tungsten Mine is located 7 miles Northeast of Plymouth
➢ Discovered in 1867
➢ Mined during WW1, WW2 and then 2015-18 by Wolf Minerals
❑ Drilled by AMAX in the mid 1980’s:
➢ AMAX built and operated a pilot plant using this fresh ore demonstrating +65%recoveries
❑ Wolf Minerals’ invested +£200m into the project between 2007 and 2019
➢ Production commenced in 2015
➢ Poor plant design resulted in <50% recoveries
➢ Wolf Minerals (UK) Ltd entered receivership in October 2018
❑ Tungsten West completes acquisition of the Hemerdon assets inDecember 2019.
➢ 2.25% net smelter royalty
➢ £90k p.a. certain rent
➢ 40 year term from February 2014
➢ Comes with £13.2m of Restoration Bond and £1.8m of Environmental Bond cash
❑ Planning permission granted in 1986 and Modified in 2010:
➢ Remains in good standing until 2032
➢ 24/7 working
Source: TWL
HISTORY
15

CHINA CLAY PIT
ADJACENT
NORTHERN
EXTENSION
HEMERDON PIT
SOUTHERN
EXTENSION
MINE WASTE
FACILITY
NEW PUBLIC
LINK ROAD
PROCESSING
PLANT
Source: Google Earth
AGGREGATES
STOCKPILES
16

SUMMARY OF PLANT CHANGES
FRONT END CONCENTRATOR CONCENTRATE DRESSING
Old Configuration:
New Configuration:
❑ Primary And Secondary Hybrid Rolls Crushers
❑ Attrition Scrubber
❑ Low Frequency Noise Generating Screens
❑ 50% to Fines Circuit➢ Spirals
➢ Tables
❑ 50% to Coarse Circuit:➢ Primary Dense Media Separator
➢ Secondary Dense Media Separator
❑ Reduction Roast Kiln and Low Intensity Magnetic Separation Of Iron Minerals
❑ High Intensity Magnetic Separation Of Tin And Tungsten Products
❑ Single WO3 Concentrate Produced
❑ Phase1: Mobile Primary Jaw Crusher And
Secondary Cone Crusher
❑ Phase 2: Permanent Crushing Circuit In New
Building Adjacent To New Rom Pad
❑ XRT Ore Sorters Rejecting 70% Of Feed
❑ New, Smaller and Quieter Screens
❑ 67% to Coarse Circuit:➢ Primary Dense Media Separator
➢ Secondary Dense Media Separator
➢ Scavenger Dense Media Separator
❑ 33% to Fines Circuit
❑ Phase1: Spirals, Tables, new High Intensity
Magnetic Separator scavenger
❑ Phase2: Wet High Intensity Magnetic
Separator (WHIMS)
❑ Phase 1: Existing kiln
❑ Phase 2: New custom built hydrometallurgical
facility for alkali leaching
❑ Medium and High Grade WO3
concentrates produced
17

XRT ORE SORTING
18
Ore Type Test Wolf Tungsten West Variance
2018 2020
Granite W Recovery 74% 87% 13%
Mass pull 24% 30% 6%
Killas W Recovery 51% 70% 19%
Mass pull 8% 30% 22%
XRT PROVIDES SIGNIFICANT IMPROVEMENT IN TUNGSTEN RECOVERY
Photo Source: Tomra
XRT Ore Sorting is a pre-concentration method used to reject coarse, barren rock via laser and X-Rayscanning. Air jets kick each mineralised pebble off the feed belt and into a collection hopper
Rejecting ore prior to further processing significantly reducesdownstream processing costs and delivers to the concentrator plant ahigher grade feed with less contaminants
Optimised Pilot Plant Test Work has demonstrated:
87% WO3 Recovery
30% Mass Pull
TWL has undertaken test work at Steinert andTomra to optimise work on ore sortingundertaken by Wolf just prior to closure

GRAVITY SEPERATION
DMS CYCLONE
DESLIME AND FINE GRAVITY CIRCUIT
❑ The main recovery mechanism at Hemerdon is via gravity and theuse of Dense Media Separation
❑ Tungsten ore in a 0.8mm to 8mm size range is introduced to awater/magnetite/ferro-silicon slurry with a specific gravityseparation density of 2.70 g/cm3
❑ Light gangue minerals float and heavy minerals sink and arerecovered to a secondary cyclone with an SG of 3.50 g/cm3
❑ Major upgrades were made to the existing two stage DMS plant atHemerdon under Wolf Minerals, achieving +85% recovery at theend of operations to a 36% WO3 pre-concentrate
❑ Further minor modifications are required to this circuit to optimiseit including recommissioning the scavenger circuit
❑ -0.8mm crushed ore is fed to the fines circuits consisting of spirals,shaking tables and hydrosizers
❑ TWL is introducing a High Intensity Magnetic Separation scavengeron fine gravity tails, with a view that this may replace the finegravity circuit in due course
Source: Simscale
DYNAMIC DMS CYCLONE PRE-CONCENTRATION
19

PILOT PLANT
20Source: GTK
TRIALS AT GTK COMPLETED – RESULTS INTERPRETATION UNDERWAY
❑ GTK Mintec is owned and run by the Geological Survey of Finland.
❑ It is a leading European competence centre on the assessment and sustainable use of geological resources
❑ GTK has operated a pilot plant for TWL, processing 45 tonnes each of Hemerdon run of mine ore and ore sorter product
❑ Pilot Plant runs have been completed with the results from the program due imminently
❑ Initial indications show increased recoveries by using WHIMS in the fines circuit, and from the DMS by feeding at higher ore-sorted grades

AGGREGATES

❑ Aggregates background:➢ The Mine Waste Facility is built from an estimated 20Mt of pre-stripped
material from the pit (mainly killas) and coarse waste from the processing plant
➢ All of this “waste” has potential as saleable aggregates, ranging from fine sand
through to granite cobbles and Type 1A Fill
➢ Removing tonnes from site extends the MWF life and reduces future op-ex
❑ Quality Certification:➢ TWL has received certification of quality from the John Grimes Partnership for
the sale of multiple products
❑ Logistics:➢ Within the current planning permission TWL is allowed 50 lorry movements per
day or 150,000 tonnes per year
➢ A temporary increase to 120 movements per day (approx. 750,000t p.a.) has
been granted and formal planning application to increase this to 3 Mtpa is
being prepared.
➢ Export to the London market is possible in 15kt barges from the Port of
Plymouth – TWL is targeting +1Mtpa of sales into London
➢ A railway siding is 1.3km from mine site and studies are ongoing into rail
freight logistics options
UNLOCKING AGGREGATES FOR IMMEDIATE CASH FLOW
BACKGROUND
”Aggregate Sales to support both UK and global demands is extremely viable and lucrative secondary business model,
allowing financial support to the primary operation of mining Tungsten.” Panoptic Consultancy
22
Source: TWL

AGGREGATES STRATEGY
❑ TWL is working with the Duo Group to process stockpiles ofwaste and tailings and to produce 6 different aggregates:
➢ Type 1 A Fill
➢ 2 different types of sand
➢ 3 different sizes of gravel
❑ This is being approached on a phased basis with Phase 1already active and Phase 2 under way
➢ Phase 1 A – Mobile Crusher
➢ Phase 1 B – Mobile Wash Plant
➢ Phase 2 – Large Scale Mobile Wash Plant (+1Mtpa capacity)
➢ Phase 3 – Aggregates Production Integrated into Plant Rebuild
❑ Achievable local market share is estimated at 500kt per annum
❑ Achievable sales into London market are estimated as 1 – 2Mtpa in the medium term, barging from Plymouth to Tilbury
❑ Hemerdon would be a “Super Quarry” at this size
MARKETS
PHASED APPROACH
23
RAIL FREIGHT OPTION
❑ TWL is investigating the feasibility of stockpiling and selling aggregatesvia the Hemerdon rail siding that is located less then 1 mile from the site
Source: Google Earth and TWL

AGGREGATES
PHASE 1B - 55 tph MOBILE WASH PLANT ON SITE AT HEMERDON
24Source: TWL

RESOURCE AND EXPLORATION POTENTIAL
25
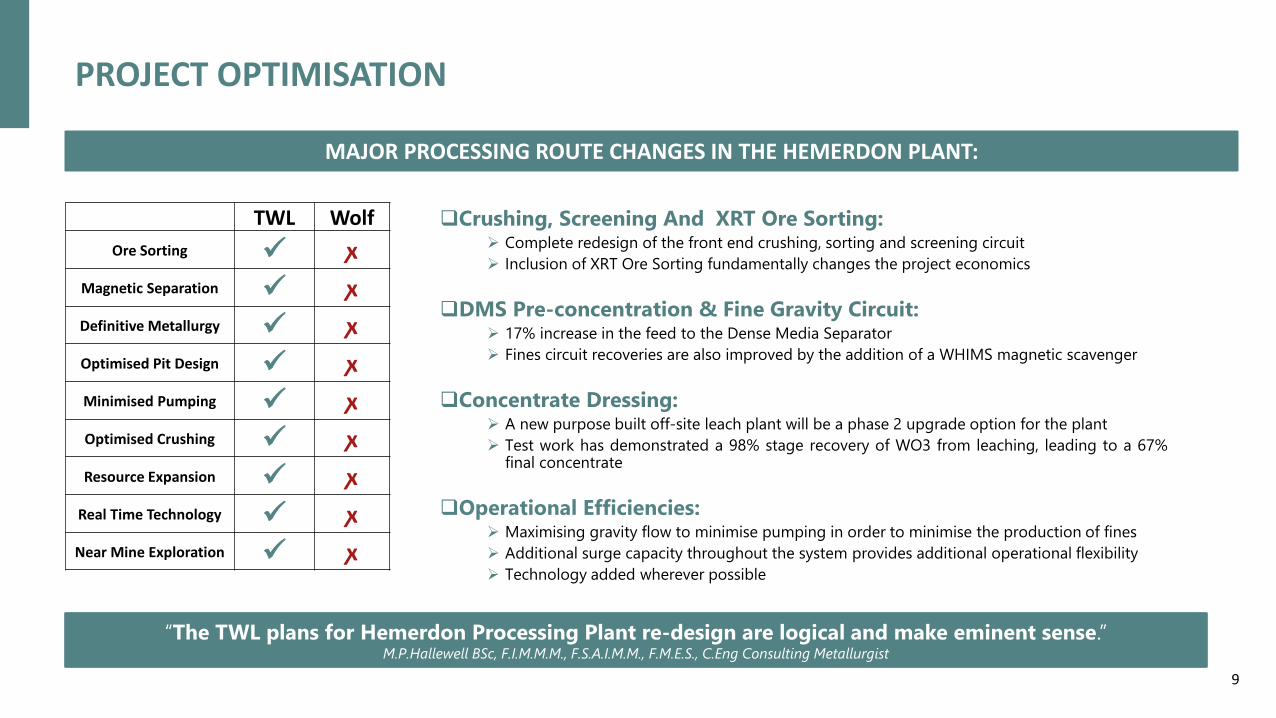
RESOURCE
❑ Tungsten West’s resource stands at 331.4 Mt @ 0.12% WO3 and 0.03% Sn
❑ 399kt contained WO3 and 80kt contained Sn
❑ In-pit mineral resource of 161.5 Mt for 211kt of WO3 and 44kt of Sn
❑ This new resource statement reconciles the 17.5% actual vs resource gradeincrease experienced by Wolf
➢ 0.17% WO3 resource grade vs an actually mined grade of 0.21% WO3
➢ Derives from the “nugget effect”
❑ Identified exploration upside is consistent with the potential for Hemerdonto become the largest tungsten resource in the World.
Notes:
❑ Mineral Resources reported at a cut-off grade of 0.04% WO3 in the granite and 0.06% WO3
in the killas
❑ In-pit mineral resource calculated basis a WO3 price of $500 per mtu and a pit boundary
outside the current permitted area
❑ Does not include either on surface granite stockpiles (0.9Mt at 0.18% WO3 and 0.05% Sn) or
tailings (3.3Mt at 0.19% WO3 and 0.03% Sn)
❑ Includes some tonnage in the Southern Extension in inferred category
2020 INTERNAL RESOURCE ESTIMATE
26
Category:Tonnes
(Mt)
WO3
Grade
WO3
Contained
(t)
Sn
Grade
Sn
Contained
(t)
Global Resource:Granite:
Measured 26.7 0.18% 49,323 0.03% 8,723
Indicated 48.6 0.16% 78,118 0.02% 10,941
Inferred 87.5 0.12% 101,882 0.02% 17,630
Killas:
Measured - - - -
Indicated 26.4 0.11% 28,835 0.03% 6,602
Inferred 142.2 0.10% 140,574 0.03% 35,616
Total 331.4 0.12% 398,732 0.03% 79,512
In Pit Mineral Resource:Granite:
Measured 26.7 0.18% 49,259 0.03% 8,688
Indicated 32.2 0.17% 55,153 0.02% 7,283
Inferred 1.7 0.11% 1,788 0.02% 290
Killas:
Measured - - - -
Indicated 26.3 0.11% 28,778 0.03% 8,016
Inferred 74.6 0.10% 77,014 0.03% 19,719
Total 161.5 0.13% 211,992 0.03% 43,996
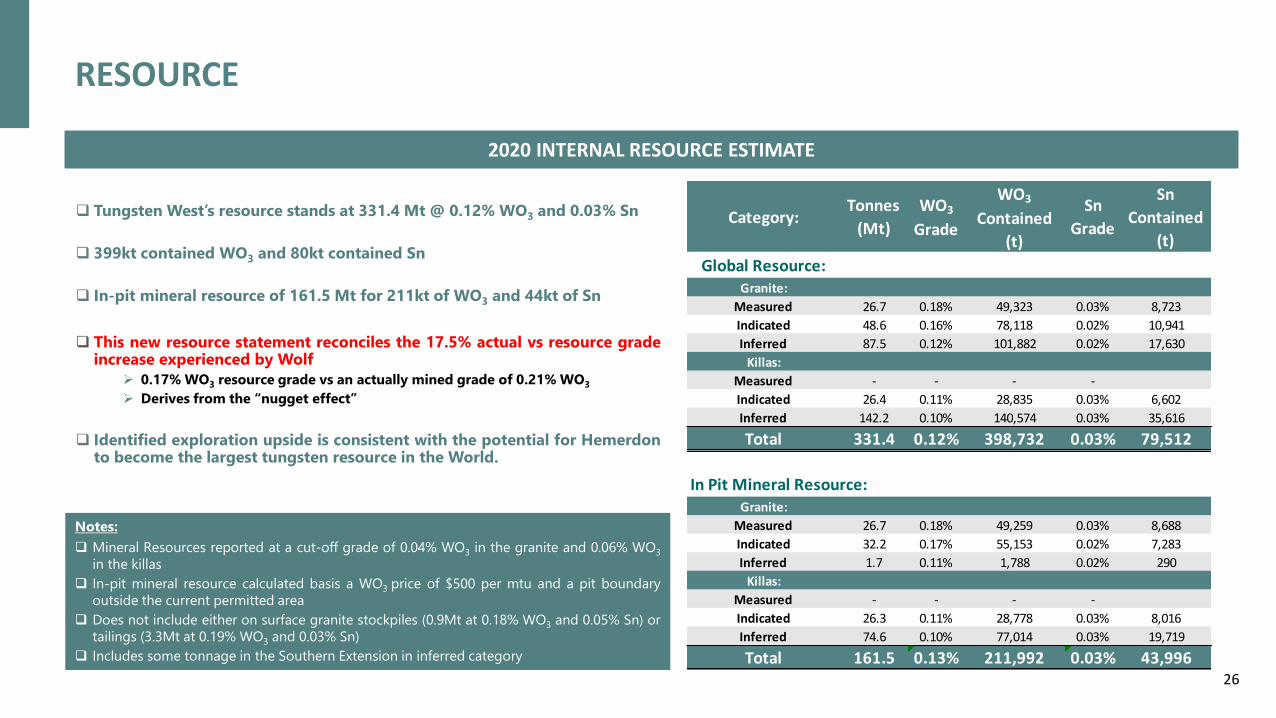
❑ Original Tungsten Discovery:
➢ Tungsten was first discovered at Hemerdon Ball in 1867 within the SouthernExtension where hard granite is found as little as 1m from surface
❑ Operating Mine During WW1 and WW2:
➢ During WW1 extraction began in 1916 on the northern weathered granite (currentpit) due to the existing technology and limited supply of explosives and thenmining recommenced during WW2 in the same pit
❑ AMAX Exploration Programme:
➢ Amax began exploring in 1979 they drilled out the northern area - this is nowshown to be on a dyke emanating from the main granite intrusion
❑Wolf Develops Project:
➢ Wolf undertook no investigations into the Southern Extension until 2018, when asoil sampling program took place - soil sampling and float assays are consideredexceptional and consistent with very significant resource potential
❑ TWL Trenching:
➢ TWL immediately recognised that the existing pit may not be coincident with themain ore-body and in September 2019 TWL undertook 210m of trenching as partof its due diligence process, achieving spectacular results
➢ Average trenching grade was circa 3x that of the in-pit resource grade
SOUTHERN EXTENSION
Current Pit
Dataset Averages:
WO3 - 418ppm
Sn - 221ppm
75% >500ppm WO3
SOUTHERN EXTENSION SOIL SURVEY 2018HISTORY OF EXPLORATION AT HEMERDON
27Source: Wolf Minerals

SOUTHERN EXTENSION
TRENCHING PHOTOS
28Source: TWL

ENVIRONMENTALSOCIAL ANDGOVERNANCE
29

ENVIROMENTAL, SOCIAL AND GOVERNANCE
BUSINESS PLAN FOUNDED ON ESG PRINCIPLES LOCAL REGION
Sources: Creacombe Solar Farm; Plymouth City Council
Environment:
➢ Licencing Requirements – Existing mining licence requires robust environmental compliance and commitment
➢ Carbon Neutral Target – TWL has set itself the challenging target of being carbon neutral by 2027
➢ Operating Efficiencies – Optimising energy usage and minimising environmental impacts
➢ Sustainability – Integrating aggregates production into a sustainability and restoration plan
➢ Restoration – A fully cash funded commitment to site restoration is in place with a £13.2m Restoration Bond
Social:
➢ Health and Safety – Striving to monitor, assess and mitigate all of the potential risks that could cause harm
➢ Community Engagement – Commitment to local stakeholder engagement
➢ Aggregates – Local construction industry benefits from a sustainable long term supply with a low carbon footprint
➢ Local Job Creation – Working with specialist recruitment consultants to recruit ex-military personnel
➢ Skills Training – Actively working with local tertiary education establishments for research projects
Governance:
➢ Business Practices – Strong business ethics, corporate responsibility, and codes of conduct in place
➢ Experienced Management – Extensive track record of financial competence and corporate governance
➢ Regulatory and Operating Environment – The South West of the UK is a very large current and historic
mining landscape regulated by the Mineral Planning Authority and the Environment Agency
30

CARBON FOOTPRINT
CARBON NEUTRAL STRATEGY
❑TWL is committed to minimising its carbon footprintand has set itself the ambitious target of being carbon-neutral by 2027.
Komatsu HD 605-7 converted by Kuhn to be an eDumper with a 65t capacity, running on a 600 kWh lithium ion packSource: autoblog.com
❑The mining industry is making great advances in moving awayfrom diesel vehicles, with all electric shovels currently available,and hydrogen and battery powered haul-trucks coming tomarket.
❑TWL is operating to ISO 50001 global standards on energy efficiency andmanagement.
❑Processing plant power consumption will be of the orderof 6.5 MW with grid power to be replaced by new-buildrenewables.
31
❑Energy consumption and efficiency for individual pieces ofplant and equipment is a key factor in the choice of suppliers

TECHNICAL INFORMATION
32

MINERALOGY
TYPICAL HEMERDON ORE DIFFERENCE BETWEEN FERBERITE AND WOLFRAMITE
❑ Hemerdon is a sheeted vein system of hundreds of thousands of quartz veinshosted within granite and killas
❑ Tungsten predominantly presents as millimetre to centimetre scale crystals offerberite, which is found within these quartz veins
❑ This makes Hemerdon ore particularly amenable to X-Ray Transmission OreSortingBlack ferberite crystals within quartz matrix
33
Source: TWL
Source: TWL

WHY WOLF FAILED: OVER PRODUCTION OF SLIMES
❑ Primary and secondary crushing fed to a rotary drum scrubber
designed to break down the clay fraction within the run of mine ore
➢ In the upper levels of the open pit clay levels were very high due tokaolinisation of the granite host rock
➢ Failure to sort ore by size fraction prior to scrubbing inadvertently resultedin significant attrition of the tungsten bearing minerals – ferberite andwolframite
➢ Both these minerals are soft and highly friable – i.e. amenable to breakageand attrition
❑ 32% of contained tungsten was lost to tails in the -38 micron fraction
post scrubbing: this is before any mineral separation had been
attempted.
➢ Significant use of pumps within the plant also contributed to further creation ofslimes and the underperformance of the concentrator circuit
➢ Poor choices in concentrate dressing equipment resulted in significant losses toLIMS tails and a low to medium grade final product
➢ Overall recoveries averaged between 20% and 40% only, versus a designexpectation of 65%
Source: TWL

TUNGSTEN MARKET
35

59.0%
19.5%
12.8%
8.6%
0%
10%
20%
30%
40%
50%
60%
70%
80%
90%
100%
Chemicals & Others
Mill Products
Steel & Alloy
Cemented Carbides
ABOUT TUNGSTEN
❑ Tungsten is a Transition Metal W that has extreme physical characteristics including:
➢ Highest tensile strength and melting point of any metal
➢ Hardest material other than diamonds
➢ Density of 19.3 (g/cm3) - comparable to Uranium and Gold
❑WO3 Concentrates are an intermediate product
➢ Further refined into Ammonium Paratungstate (”APT”) by metals processors
❑ Tungsten Concentrates are traded basis the APT price
➢ Typically 65% WO3 concentrate trades at 77%-82% of the APT price
TUNGSTEN RESOURCES BY COUNTRY 2018
Source: Roskill
BACKGROUND TO TUNGSTEN
STRATEGIC IMPORTANCE OF TUNGSTEN
❑ China Dominates the tungsten market
➢ China controls over 71% of global resources of tungsten
➢ Primary mine production accounted for 56.3% of Global tungsten production in 2018
❑ 51% of Tungsten demand was ex-China in 2018
➢ Global reliance on Chinese supply and processing
❑ Tungsten sits high on the EU and US list of critical minerals due to Chinese
domination of supply
71.5%
11.0%
6.0%3.3%
1.1%
1.0%
0.8%
0.5% 4.8%China
Russia
Canada
Australia
Vietnam
USA
Spain
UK
Others
Total Resources:11,273,000 (tW)
GLOBAL TUNGSTEN USES 2018
30.0%
17.0%
12.7%
11.8%
10.8%
6.0%5.0%6.7%
0%
10%
20%
30%
40%
50%
60%
70%
80%
90%
100%
Other apllications
Energy
Military / defence
Consumer Goods
Mining & Construction
Other Transposrt
Industrial Applications
Automotive
First Use End Use
Source: Roskill
36

TUNGSTEN SUPPLY / DEMAND
❑Mine Production slipped in 2018 to 82,000t despite demand growth of 5% YoY:
➢ Existing Chinese and international mines face depleting ore grades and reserves
❑ Demand growth forecasts robust and require additional sources of production
❑ Pre-development tungsten projects struggle to raise the required capital
➢ Very few large deposits – mainly small deposits that are unattractive investments
Source: Roskill
SUPPLY /DEMAND COMMENTARY GLOBAL TUNGSTEN SUPPLY BY REGION 2018
56.3%
5.6%2.4%
1.2%
1.2%
0.9%
0.9%
3.1%
28.4% China
Vietnam
Russia
Bolivia
N. Korea
Austria
UK
Other
Secondary
Total Supply:108,387 (tW)
Source: Roskill
GLOBAL TUNGSTEN DEMAND BY REGION
48.8%18.3%
13.6%
7.2%
12.1%
China
Europe
USA
Japan
Others
2018 Demand104,400 (tW)
SUPPLY AND DEMAND FORECAST 2011 TO 2028Source: Roskill
37

CASH COST, TUNGSTEN CONCENTRATES EX-CHINA
TUNGSTEN PRICE FORECAST
❑ The current spot price for APT (as of 16th June 2020) is quoted as US$215-225/mtu, down from a
pre-Covid level of US$250-270/mtu
❑ A good guide for long term commodity price outlook can be the cash-cost curve: a plot of production
of WO3 versus the cash cost of production - it is rare to see the price of any commodity below the
80th percentile of the cash cost of production for any sustained period of time.
❑ For Western World tungsten mine production this level would be at US$313/mtu (Roskill) but
Tungsten West is using a long-term average of US$300/mtu for financial modelling purposes
Source: Roskill and Bloomberg, 2019
100
150
200
250
300
350
400
450
500
20
11
20
12
20
13
20
14
20
15
20
16
20
17
20
18
20
19
20
20
20
21
20
22
20
23
20
24
20
25
20
26
20
27
20
28
20
29
AP
T (U
S$/m
tu)
APT - Historical APT - Low APT - Base APT - High
HISTORICAL AND FORECAST APT PRICE 2011-29 (US$/MTU)
MARKET PRICING DYNAMICS
❑ Roskill long term APT pricing
forecast: US$335/mtu
❑ At a project breakeven APT price
of $135 per mtu Hemerdon
would be a first quartile cash cost
producer
38