13th International Mine Water Association Congress
630
LAPPEENRANTA UNIVERSITY OF TECHNOLOGY LUT Scientific and Expertise Publications Research Reports – Proceedings, Volume 2 63 June 25–30, 2017 Lappeenranta, Finland 13th International Mine Water Association Congress – Mine Water & Circular Economy
-
Upload
khangminh22 -
Category
Documents
-
view
0 -
download
0
Transcript of 13th International Mine Water Association Congress
LAPPEENRANTA UNIVERSITY OF TECHNOLOGY
LUT Scientific and Expertise PublicationsResearch Reports – Proceedings, Volume 2 63
June 25–30, 2017Lappeenranta, Finland
13th International Mine Water Association Congress – Mine Water & Circular Economy
© IMWA – International Mine Water Association 2017
LUT Scientific and Expertise Publications
Name on publication: 13th International Mine Water Association Congress – Mine Water & Circular Economy
Editors: Christian Wolkersdorfer, Lotta Sartz, Mika Sillanpää, Antti Häkkinen
Tutkimusraportit – Research Reports, ISSN-L 2243-3376, ISSN 2243-3376
Serial number: 63
ISBN number, printed publication: 978-952-335-065-6ISBN number, electronic publication: 978-952-335-066-3
Print and layout: Bookcover Oy, Seinäjoki, Finland
Proceedings13th International Mine Water Association Congress
Volume 2
Lappeenranta – Finland25–30 June 2017
I
Table of Content – Volume 1
1 Tekes Projects
Underground Pumped-Storage Hydro Power Plants with Mine Water in Abandoned Coal Mines 6
Compositions of the Microbial Consortia Present in Biological Sulphate Reduction Processes During Mine Effluent Treatment 14
Online Water Flow, Level and Water Quality Monitoring Concept for Mines 22
Development and Application of Series Physical Simulation Test Equipment for Water Inrush in Coal Mine 28
Emergent membrane technologies for mine water purification 36
Synthesis of sorbents from industrial solid wastes by modification with atomic layer deposition (ALD) for mine water treatment 43
Valorisation of Separated Solids from Mine Water Treatment 55
Tailings Seepage Paths Mapped using Electric-Based Technology 64
Operational water balance model for Siilinjärvi mine 73
2 Regional
Assessment of the effects of mine closure activities to waste rock drainage quality at the Hitura Ni-Cu mine, Finland 80
Monitoring of mine water 88
Development and installation of an underground measurement technique at the pilot mine “Auguste Victoria” for a mid- to long-term monitoring of the mine water level rise 94
Mass Flow Reduction in Mining Water: Valuation of Measures with due regard to the requirements of the Water Framework Directive 101
Passive Mine Water Treatment with a full scale, containerized Vertical Flow Reactor at the abandoned Metsämonttu Mine Site, Finland 109
Exploration of Cambrian limestone groundwater runoff zones based on underground tracer tests 117
Similarities in Mine Water Management Challenges in Polar and Desert Climates: Two Case Studies 124
Mine Water Hydrodynamics, Stratification and Geochemistry for Mine Closure – The Metsämonttu Zn-Cu-Pb-Au-Ag-Mine, Finland 132
Leachate generation and nitrogen release from small-scale rock dumps at the Kiruna iron ore mine 140
Evaluation of mine water rebound processes in European Coal Mine Districts to enhance the understanding of hydraulic, hydrochemical and geomechanical processes 147
Pit Lake Modelling at the Aitik Mine (Northern Sweden): Importance of Site-Specific Model Inputs and Implications for Closure Planning 154
II
Coal mine flooding in the Lorraine-Saar basin: experience from the French mines 161
Sediment And Pore Water Properties Across The Chemocline Of A Mine Water-Impacted Boreal Lake During Winter Stagnation And Autumn Overturn 167
Mine water concept in detail – A case study of closing a German coal mine at Ruhr district 175
Mine Water Management in the Ruhr coalfield 183
Under Ice Treatment and Discharge Of A Tailings Impoundment – A Case Study From The Lupin Mine Nunavut, Canada 189
Large scale grouting to reconstruct groundwater barrier and its geoenvironmental impact 197
Independent investigation of reclamation at exploration drill holes at the remote Pebble copper prospect, Alaska 204
Environmental assessment of closeded coal mine territory using GIS analysis 212
Removal of Metals from Mining Wastewaters by Utilization of Natural and Modified Peat as Sorbent Materials 218
Towards minimum impact copper concentrator – The link between water and tailings 226
Hydrostratigraphy and 3D Modelling of a Bank Storage Affected Aquifer in a mineral exploration area in Sodankylä, Northern Finland 237
Facial and Paleogeografic Understanding of Tertiary Sediments as Basis to Predict their SpecificAMD Release 244
3 Physical Water Management
Capão Xavier Mine Water Drainage Management (Minas Gerais, Brazil) 254
Effect of operational parameters on the performance of an integrated semi- passive bioprocess. 262
Break Free from Your Inertia 269
Use of water from the WVII-16 leak in the Wieliczka Salt Mine (Poland) 276
Tailings Water Hydraulics Analyses for Risk Based Design 282
Water management in mining – Measuring and demonstrating value-impact of management strategies 288
Flooding of the uranium mine at Königstein/Saxony – current status and monitoring conducted 296
Integration of Solid Matter Coupled Contaminant Transport into the 3D Reactive Transport Boxmodel by the Example of PCB in German Hard Coal Mining 303
Mercury Accumulation and Bio-transportation in Wetlands Biota Affected by Gold Mining - Modelling and Remediation 312
Utilizing Geophysics As A Delineation Tool for Groundwater Flow Paths And Contaminants Along A Graben 320
Deep mining water control cooperative system based on 3-D directional drilling and controllable grouting techniques 328
III
Tracing mine water inflows, deriving dewatering measures for an open pit and a first trial to adapt the approach for underground mines 335
Tracer Test in Mine Water of the Abandoned Edendale Lead Mine, South Africa 342
Storage of arsenic-rich gold mine tailings as future resources 350
Integrating Climate Change into Water Management Design 358
Assessing Flood Hydrology in Data Scarce Tropical regions: a Congo (ROC) case study 365
Incorporating Climate Change Scenarios into Mine Design and Permitting Studies 373
Integrated removal of inorganic contaminants from Acid Mine Drainage using BOF Slag, Lime, Soda ash and Reverse Osmosis (RO): Implication for the Production of Drinking Water 381
Aquifer Reinjection Scheme for Excess Mine Water: Design Methodology and Outcomes 389
Important Characteristics of Membranes for Reliable Water and Wastewater Processes for Discharge and Re-use 396
Coal mine pitlakes in South Africa 403
Use of Geothermal Heat of Mine Waters in Upper Silesian Coal Basin, Southern Poland – Possibilities and Impediments 415
Dewatering Impacts of a South African Underground Coal Mine 422
Hydrochemical and isotopegeochemical evaluation of density stratification in mine water bodies of the Ruhr coalfield 430
Biophysical closure criteria without reference sites: Evaluating river diversions around mines 437
Water in Mining – Challenges for Reuse 445
Low-Cost Biological Treatment of Metal- and Sulphate-Contaminated Mine Waters 453
Managed Aquifer Recharge Integration Potentiality In Arid Climate Conditions In The Jordan Rift Valley 461
Mine Water – valued resource or missed opportunity? 469
Integrating water balance modelling in the economic feasibility analysis of metals mining 478
4 Modelling
Simulation of Mine Water Rebound in the Ostrava Basin – Part of the Upper Silesian Coal Basin 488
Waste Disposal In The Open Pits: The Hydrogeological Aspects And The Influence On the Environment (The South Urals, Russia) 489
Novel Approach to Acid Pit Lake Treatment and Management 495
Control of the remediation of anoxic AMD groundwater by sulphate reduction in a subsoil reactor 502
Finely Discretized Numerical Flow Model of Complex Multiple Open Pit Mine For Reliable Inflow and Pore Pressure Simulations – An African Perspective 510
3-dimensional geologic and groundwater flow modelling for coal mining areas as decision support tool - Iterative interaction workflow to establish a reliable groundwater model - 517
IV
Quantitative Evaluation Mining Impact on Unconsolidated Aquifers In Western China’s Inner Mongolia-Shaanxi mine Region 524
Reproduction of a Complex Tracer Test through Explicit Simulation of a Heterogeneous Aquifer using Bayesian Markov Chain Monte Carlo 532
Kittilä Gold Mine dewatering assessment: benefits of a new approach 540
The Application of Discrete Fracture Network Models to Mine Groundwater Studies 548
Posiva Flow Log (PFL), Tool for detection of groundwater flows in bedrock 556
Hydrogeological investigation of the Witbank, Ermelo and Highveld Coalfields: Implications for the subsurface transport and attenuation of acid mine drainage 564
Study on Evolution of Mining-induced Crack of Rock Mass Considering Hydromechanical Coupling Effects Based on Stabilized Nano CT Scan 572
Downstream geochemistry and proposed treatment – Bellvue Mine AMD, New Zealand 580
Restoration measures of an AMD polluted watershed based on mixing and geochemical models 588
Gas Flux Rates and the Linkage with Predicting AMD Loads in Waste Rock Dumps, and Designing Practical Engineering Solutions – Field Based Case Studies in Three Distinct Climates 595
Environmental Attributes and Resource Potential of Mill Tailings from Diverse Mineral Deposit Types 603
Progressive Management of AMD Risk During Construction of an Integrated Waste Storage Landform – A Case Study at Martabe Gold Mine, Indonesia 610
Development of a tool for efficient three dimensional reactive multicomponent transport modelling independent from the geohydraulic model system 618
A model-based study on the discharge of iron-rich groundwater into the Lusatian post-mining lake Lohsa, Germany 626
Appropriate Catchment Management can Improve the Profitability of a Mine: A Case Study from Dallol, Ethiopia 633
Geochemical Processes in a Column: Modeling Humidity Cell Test Results 642
Financial Modelling for Mine Discharge Treatment Options 649
Spring Flow Estimation After Mine Flooding in a Dolomitic Compartment 656
Comparison of thermodynamic equilibrium and kinetic approach in the predictive evaluation of waste rock seepage quality in Northern Finland. 664
How geochemical modelling helps understanding processes in mine water treatment plants – examples from former uranium mining sites in Germany 672
The need for improved representation of groundwater-surface water interaction and recharge in cold temperate – subarctic regions 680
Fractional and sequential recovery of inorganic contaminants from acid mine drainage using cryptocrystalline magnesite 689
Risk assessment of acidic drainage from waste rock piles using stochastic multicomponent reactive transport modeling 696
Requirements for numerical hydrogeological model implementation for predicting the environmental impact of the mine closure based on the example of the Zn/Pb mines in the Olkusz area 703
V
Table of Content – Volume 2
5 Geochemistry
Mineralogical Characterization of Weathered Outcrops as a Tool for Constraining Water Chemistry Predictions during Project Planning 712
Enrichment and Geoaccumulation of Pb, Zn, As, Cd and Cr in soils near New Union Gold Mine, Limpopo Province of South Africa 720
Thallium and other potentially toxic elements in surface waters contaminated by acid mine drainages in southern Apuan Alps (Tuscany) 728
The geochemistry of pore waters in riverbed sediments in a mining-impacted landscape: sources of potentially toxic elements 732
Sulfide Oxidation Kinetics in Low-Sulfide Tailings 737
The Whitehill Formation as a Potential Analogue to the Acid Mine Drainage Issues in the Witwatersrand, South Africa 745
Water quality of the abandoned sulfide mines of the Middle Urals (Russia) 753
Forecasting long term water quality after closure: Boliden Aitik Cu mine 761
Understanding groundwater composition at Kvarntorp, Sweden, from leaching tests and multivariate statistics 770
Water Quality in PGM Ore Flotation: The effect of Ionic Strength and pH 777
Mass transport of hydraulically stowed residues in adjacent aquifers in the Ruhr Area, Germany 785
Comparative Analysis of Waste Material Distribution between Remote Sensing Data and a Geochemical Map 793
Contamination trend at flooded mines: 20 y time-series at Casargiu, Sardinia 801
Delaying flooding of cemented paste backfill mixtures – Effect on the mobility of trace metals 806
Research on transformation characteristics of humic acid based on improved three-dimensional fluorescence regional integral 814
Developing closure plans using performance based closure objectives: Aitik Mine (Northern Sweden) 822
Kinetic Tests of Non-Amended and Cemented Paste Tailings Geochemistry in Subaqueous and Subaerial Settings 830
Behaviour of trace elements during evaporative salt precipitation from acid mine drainage (Agrio River, SW Spain) 836
Investigations on microbial reduction processes in a flooded underground mine 843
6 Valorisation
EU Raw Materials Information System and Raw Materials Scoreboard: addressing the data needs in support of the EU policies – an example for water use in mining 854
VI
Green liquor dregs from pulp and paper industry used in mining waste management: a symbiosis project (GLAD) between two Swedish base industries 862
Slag: What is it good for? Utilization of steelmaking slag to remove phosphate and neutralize acid 869
Valorization of pre-oxidized tailings as cover material for the reclamation of an old acid-generating mining site 877
Transformation of Reactive Spoil into Reusable Borrow Materials through Alkaline Waste Valorisation 884
Paperchain Project: Establishing a New Circular Economy Model between the Mining Sector and the Pulp & Paper Industry to Prevent Acid Mine Drainage 892
Ion Exchange by Zeolites and Peat-Based Sorption Media of Chilean Mine Water and their Potential for Secondary Mining 900
Integration of Heat Recovery and Renewables within a Mine Water Treatment Scheme: A UK Case Study 907Where there’s muck there’s brass: irrigated agriculture with mine impacted waters 915
Application of alkaline coal seam gas waters to remediate AMD from historical sulfide ore mining operation 923
The KaiHaMe project – increasing raw material value of exploited ores 931
Reduced Inorganic Sulfur Compounds of Simulated Mining Waters Support Bioelectrochemical and Electrochemical Current Generation 939
A Comparative Study on the Rare Earth Elements Recovery of Cross-linked Cellulose Adsorbentsand Capacitive Deionization with Cellulose Derived Carbon as Electrode Materials 947
Mine Waste Resource Assessment and Appraisal of Recovery via Mine Water 956
Mining waste as an exploration tool and secondary resource 964
Recovery of copper from low concentration waste waters by electrowinning 972
Hand-held X-ray fluorescence (hXRF) measurements as a useful tool in the environmental and mining sector – Comparative measurements and effects of water content 979
7 Constituents
Recycling bioremediated cyanidation tailings wastewater within the biooxidation circuit for gold recovery: impact on process performance and water management 990
Chemolithotrophic sulfide oxidizers in mine environment 998
Tracking Nitrate Sources at a Platinum Mine – Putting the puzzle together 1006
Quantification of diffuse iron discharge into surface waters in the Lusatian lignite mining district 1014
Characterization of Geo-Hydro-Ecological Factors Affecting the Distribution of Endangered Species in Viiankiaapa Mire, a Mineral Exploration Site 1022
VII
8 Treatment
Iron and Sulfate Removal in Highly Contaminated Acid Mine Drainage Using Passive Multi-Step Systems 1032
Simultaneous Treatment of Thiocyanates and Ammonia Nitrogen in Gold Mine Effluents Using Advanced Oxidation and Nitrification-Denitrification Processes 1039
Performance evaluation of membrane technology for removal of micro pollutants in Hartbeespoort dam water in South Africa 1048
A Novel Sorbents of Metal Ions Based on Thermally Activated, Acidic and Non-acidic Treated Dolomite 1055
Enhanced Mn Treatment in Mine Drainage Using Autocatalysis in a Steel Slag-Limestone Reactor 1063
Electrocoagulation treatment of real mining waters and solid-liquid separation of solids formed 1070
Pilot scale evaluation of the suitability of peat as sorbent filter material for metal removal from mining drainage water 1076
Removal of Dissolved Metals from Acid Wastewater Using Organic Polymer Hydrogels 1080
Field-scale denitrifying woodchip bioreactor treating high nitrate mine water at low temperatures 1087
Investigation of a Pit Lake Acting as a Large-scale Natural Treatment System for Diffuse Acid Mine Drainage 1095
Closed loop for AMD treatment waste 1103
A new approach to recover dissolved metals in AMD by two-step pH control on the neutralization method 1111
Biofouling of reverse osmosis membranes in a process water treatment system in a gold mine 1119
Treatment of historical mining waste using different incineration ashes 1125
Stimulation of Natural Attenuation of Metals in Acid Mine Drainage through Water and Sediment Management at Abandoned Copper Mines 1133
Challenges in Recovering Resources from Acid Mine Drainage 1138
Process development for complex mine water treatment 1147
Electromembrane Processes in Mine Water Treatment 1154
Compact Passive Treatment Process for Acid Mine Drainage, Utilizing Rice Husks and Rice Bran– Process Optimization 1162
Prevention of Sulfide Oxidation in Waste Rock using By-products and Industrial Remnants, a Suitability Study 1170
Assessment of Dewatering Process Using Flocculation and Self-filtration According to the Characteristics of Mine Drainage Sludge 1178
Changes in microbial community structure in response to changing oxygen stress in column tests of denitrification and selenium reduction 1185
Column Tests of Selenium Biomineralization in Support of Saturated Rockfill Design 1191
Enhancing mine drainage treatment by sulfate reducing bacteria using nutrient additives 1196
Are microcosms tiny pit lakes? 1204
VIII
Precipitation of metals and sulphate from mining waters: separation and stability analysis of the precipitates 1212
“SPOP”(Specific Product Oriented Precipitation): A new concept to recover metals from mining waste water avoiding hydroxide sludge? 1214
Isolation and application of siderophore producing bacteria from Finnish wetland samples for treatment of mining water effluents 1222
Removal of Iron from Dyffryn Adda, Parys Mountain, N. Wales, UK using Sono-electrochemistry(Electrolysis with assisted Power Ultrasound) 1228
9 Case Studies
Improving Resource Efficiency and Minimize Environmental Footprint – a case study preliminary results 1240
Mapping surface sources of acid mine drainage using remote sensing: case study of the Witbank,Ermelo and Highveld coalfields 1246
Reverse Osmosis Technology to Reduce Fresh Water Consumption –Case Study, Agnico Eagle Finland, Kittilä Mine 1254
Study of Sand Mining and Related Environmental Problems along the Nzhelele River in Limpopo Province of South Africa 1259
Recovery of Uranium using bisphosphonate modified nanoporous silicon 1267
Mining area disturbed by acid mine drainage – Acid Volatile Sulphur and Sequential Extraction studies 1268
Mineralogical and geochemical characteristics of tailings and waste rocks from a gold mine in northeastern Thailand 1277
Heritage of Mining in Sovereign Kyrgyzstan (Kyrgyzstan during the Soviet era and since independence acquisition) 1279
Thermal infrared remote sensing in assessing ground/surface water resources related to the Hannukainen mining development site, Northern Finland 1286
Case Study: Development of an underground depressurisation scheme in an operational mine with reduced pumping capacity 1293
Index
Authors 1302
Key Words 1315

5 Geochemistry
712
Lappeenranta, Finland IMWA 2017Mine Water and Circular Economy
Wolkersdorfer C, Sartz L, Sillanpää M, Häkkinen A (Editors)
Mineralogical Characterization of Weathered Outcrops as a Tool for Constraining Water Chemistry Predictions
during Project Planning
Tamara Diedrich1, Paul Fix2, and Andrea Foster3
1MineraLogic LLC, Duluth, MN; [email protected] of Minnesota Duluth; Duluth, MN
3U.S. Geological Survey, Menlo Park, CA; [email protected]
Abstract Weathered samples from naturally exposed outcrops of troctolite associated with a magmatic Ni-Cu sulphide deposit were characterized by synchrotron-based micro-X-ray fluorescence mapping (µ-XRF) and X-ray absorption spectroscopy (XAS), as well as by lab-based X-ray diffraction, electron microscopy, Raman spectroscopy and wet chemical methods. Metal mobility in weathered samples was assessed using a sequential leach procedure. Results are interpreted in the context of predictions for future mine water chemistry and used to refine the conceptual model for metal mobility following weathering of waste rock at a potential future mine site. Key words spectroscopy, XAS, XRF, EPMA, XRD, Raman, copper, weathering, alteration
Introduction
Water chemistry predictions used for mine planning and environmental review tend to rely heavily on geochemical characterization of relatively “fresh” rock samples. While these sam-ples may represent the condition of geologic materials as they will be excavated and initially managed during mining operations, they do not capture the evolution in mineral surfaces and formation of weathering products that occur as rock is exposed to surficial conditions over longer timescales. These weathering products attenuate dissolved metals through sorption or (co-)precipitation of secondary phases, and may release these stored metals should conditions change (for example, relocation to a subaqueous environment). There-fore, realistic prediction of mine impacted water chemistry at operational scales requires conceptual and geochemical models in which the weathering products and key reactions have been accurately identified.
This paper reports the characterization of weathering products associated with low sulphide outcrops of a magmatic copper (Cu) – nickel (Ni) sulphide deposit and the application of that characterization data as a tool for constraining pre-operational predictions of water chemistry. In this preliminary report, we characterize Cu-bearing, Fe (hydr)oxide weather-ing products at the micron scale, and use this information, along with results on copper re-lease from sequential leach tests, to refine a conceptual model for the release and potential mobility of copper following weathering of non-ore grade rock.
Geologic Context
Samples characterized for this study were collected from outcrops of the Duluth Complex, a large composite mafic intrusion located in northeastern Minnesota, USA. Basal portions
713
Lappeenranta, Finland IMWA 2017Mine Water and Circular Economy
Wolkersdorfer C, Sartz L, Sillanpää M, Häkkinen A (Editors)
of the complex contain copper-nickel-PGE magmatic sulphide deposits, hosted large-ly by troctolitic rocks (plagioclase + olivine +/- pyroxene; Miller et al. 2002; Severson and Hauck 2008). Multiple deposits in the Duluth Complex are currently being devel-oped as potential future copper-nickel-PGE mines. Sulphide mineralization consists of pyrrhotite, chalcopyrite, cubanite and pentlandite, generally occurring as disseminated grains among silicate phases in the troctolite, but also as veinlets, inclusions in silicates, intergrowths with hydrous minerals, and as rare massive sulphide segregations (Miller et al. 2002).
The geochemistry of Duluth Complex waste rock has been well studied by project propo-nents and by the research program at the Minnesota Department of Natural Resources. Sulphate, acidity, and metals are released through the oxidation of sulphide minerals, pri-marily pyrrhotite. The rock does not contain appreciable carbonate minerals; neutralization potential is provided by dissolution of abundant calcium-rich plagioclase and olivine. Due to the geometry of mineralization within the Duluth Complex (located along the base of in-trusions) deposits are associated with significant quantities of low sulphide, non-potentially acid generating, non-ore grade rock. However, even in the absence of acidic drainage, there is some potential for elevated concentrations of dissolved metals in contact water. There-fore, identifying the factors that control the mobility of metals is relevant to development of Duluth Complex projects.
Methods
Six samples from five visibly weathered outcrops at the site of a potential future copper-nick-el mine of a Duluth Complex deposit were sampled with the intent of capturing a represent-ative range of weathering products. Samples were collected as grab samples consisting of small clasts and rubble (typically less than 1 to 2 inches), and also larger (several inches in diameter) intact hand samples. The techniques used to characterize the mineralogy and chemistry of weathering products are described briefly below.
Thin section preparation. Samples were impregnated with low-trace element, low-tem-perature curing epoxy (EPOTEK-301-2FL), bonded to quartz slides. then cut and polished (under oil) to the standard 30 micron-thickness of petrographic sections.
X-ray Diffraction. Crystalline weathering products were identified in bulk material with a Phillips XPert MPD diffractometer at the University of Minnesota Duluth (USA) with a Cu Kα radiation source. Each sample was scanned between 5° and 65° 2θ at a scan rate of 0.05 deg. /min. Long collection times (~15 hrs.) were used to increase signal to noise ratios. Diffraction data were processed with X-Pert HighScore software and compared to mineral patterns in the International Centre for Diffraction Data database (ICDD 2007).
Sequential Leach. Grab samples were crushed, homogenized, and split into subsamples. One subsample from each was subjected to standard acid base accounting procedures, in-cluding analysis of the total sulphur content by LECO furnace combustion. Another sub-sample was subjected to six sequential extraction steps: particular focus in this paper is
714
Lappeenranta, Finland IMWA 2017Mine Water and Circular Economy
Wolkersdorfer C, Sartz L, Sillanpää M, Häkkinen A (Editors)
given to the amount of Cu released in the “oxidizable” and “reducible” steps [as defined by Chao and Zhou (1983) and Leinz and Sutley (2000), respectively].
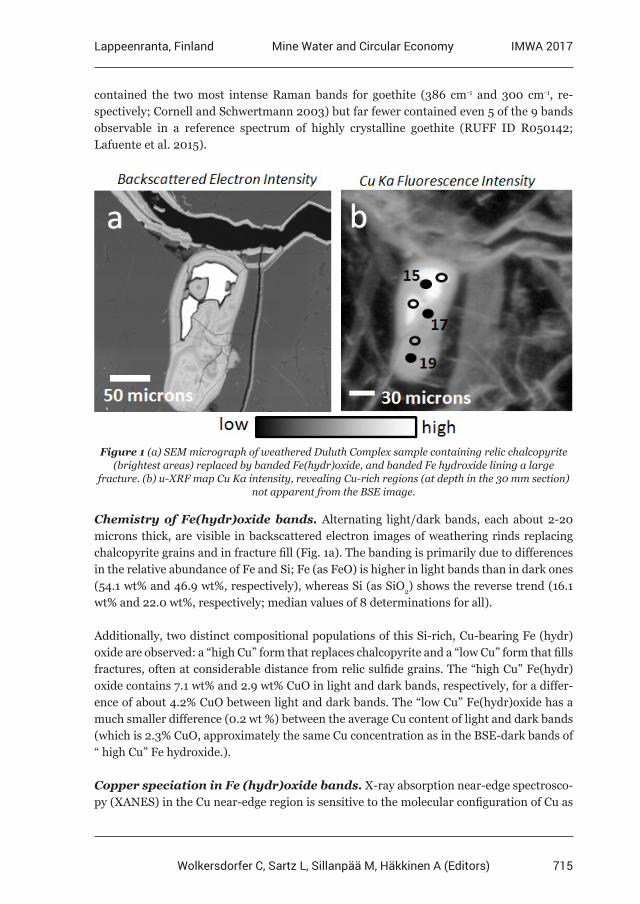
Scanning Electron Microscopy/Electron Microprobe. Images of average backs-catter electron intensity [e.g., fig. 1a] were collected using standard scanning electron mi-croscopes at U. Minnesota, Duluth, and the USGS in Menlo Park, CA, USA. Micron-scale compositional data were obtained on a JEOL JXA-8800L Superprobe at the USGS-Menlo Park from carbon-coated thin sections. The instrument was operated at 15 kV and 15 nA with an approximate incident beam spot of 1 mm diameter. Standard CITZAF corrections were applied to the data, which is expressed as weight % oxide, or as element %. Under these conditions, the detection limit for Cu was approximately 0.025 atom % (250 mg/kg), and the standard deviation of analyzed values was ~12%.
Raman Spectroscopy. Micro-Raman spectra were collected from uncoated thin sections using a Thermo Fisher DXR system at the USGS, Menlo Park, CA, USA. The system was equipped with a 532 nm laser, 50 cm-1 Rayleigh rejection filter, a grating with 900 lines per mm, and a Peltier-cooled 2048 pixel CCD detector. The collected spectra spanned the range 50-3399 cm-1 (3475 total points) with resolution of ± 5 cm-1.
Synchrotron µ-XRF/XAS. Micron-scale information on element distribution and cop-per speciation was obtained from coated or uncoated thin sections via µ-XRF mapping and XAS data collected at the Stanford Synchrotron Radiation Lightsource (Menlo Park, CA, USA; beamline II-3). The focusing optics produce a pseudo circular beam of ≈ 2 micron diameter. Beam energy was calibrated at 8984 eV using elemental Cu foil. The Cu Kα X-ray map shown in fig. 1b was produced by moving the sample over a region of interest in 2 mi-cron steps with a dwell time of 50 milliseconds per step. X-ray maps were processed and analyzed using MicroToolkit (version 1.1-1.2; Webb 2005).
X-ray absorption spectra at the Cu K-edge were collected from points of interest identified from µ-XRF maps. Spectra were collected over the energy range 8809-9365 eV, with ap-propriate count time and step size for the background, edge, and extended regions of the XAS spectrum (1 sec/10 eV, 1 sec/0.35 eV, and 2-5 sec/0.6-4 eV, respectively). Spectra were processed and analysed in the program SixPack (versions 1.2-1.4; Webb 2005). XAS spec-tra were fit over the energy range 8960-9160 eV using the “cycle fit” linear-combination, least-squares approach that minimizes overfitting of the data and has estimated error and detection limit of about 10% each (Kim et al. 2014).
Results and Discussion
Mineralogy of Fe(hydr)oxide bands. Characterization of weathering products via X-ray diffraction indicated the presence of the minerals rozenite, malachite, and goethite. Patterns from several samples displayed very broad peaks, roughly corresponding to peak positions of goethite and/or ferrihydrite, consistent with an interpretation that these prod-ucts are amorphous to poorly-crystalline hydrous iron oxide minerals. This conclusion was supported by MicroRaman spectroscopy, in which most spectra of banded Fe-hydroxide
715
Lappeenranta, Finland IMWA 2017Mine Water and Circular Economy
Wolkersdorfer C, Sartz L, Sillanpää M, Häkkinen A (Editors)
contained the two most intense Raman bands for goethite (386 cm-1 and 300 cm-1, re-spectively; Cornell and Schwertmann 2003) but far fewer contained even 5 of the 9 bands observable in a reference spectrum of highly crystalline goethite (RUFF ID R050142; Lafuente et al. 2015).
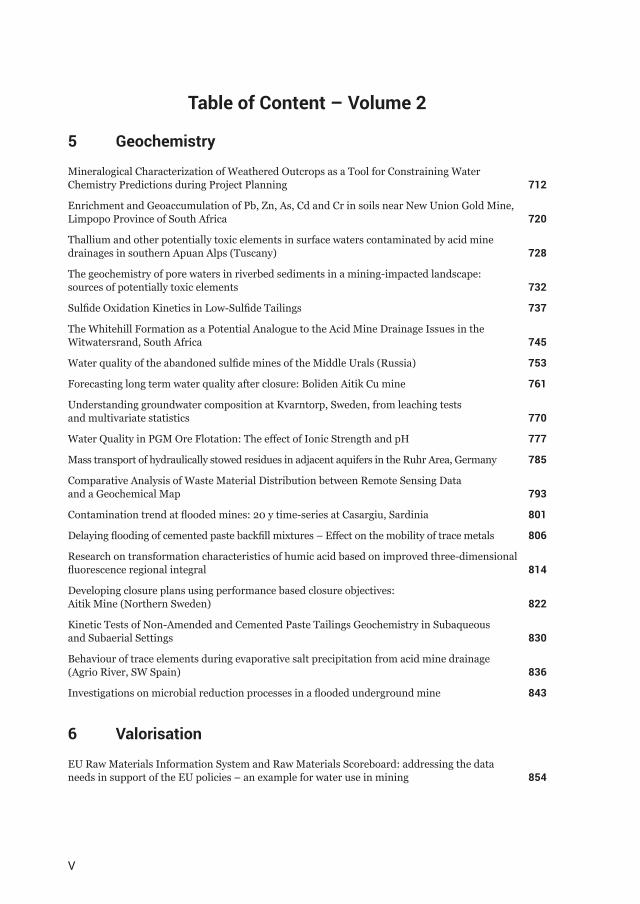
Figure 1 (a) SEM micrograph of weathered Duluth Complex sample containing relic chalcopyrite
(brightest areas) replaced by banded Fe(hydr)oxide, and banded Fe hydroxide lining a large fracture. (b) u-XRF map Cu Kα intensity, revealing Cu-rich regions (at depth in the 30 mm section)
not apparent from the BSE image.
Chemistry of Fe(hydr)oxide bands. Alternating light/dark bands, each about 2-20 microns thick, are visible in backscattered electron images of weathering rinds replacing chalcopyrite grains and in fracture fill (Fig. 1a). The banding is primarily due to differences in the relative abundance of Fe and Si; Fe (as FeO) is higher in light bands than in dark ones (54.1 wt% and 46.9 wt%, respectively), whereas Si (as SiO2) shows the reverse trend (16.1 wt% and 22.0 wt%, respectively; median values of 8 determinations for all).
Additionally, two distinct compositional populations of this Si-rich, Cu-bearing Fe (hydr)oxide are observed: a “high Cu” form that replaces chalcopyrite and a “low Cu” form that fills fractures, often at considerable distance from relic sulfide grains. The “high Cu” Fe(hydr)oxide contains 7.1 wt% and 2.9 wt% CuO in light and dark bands, respectively, for a differ-ence of about 4.2% CuO between light and dark bands. The “low Cu” Fe(hydr)oxide has a much smaller difference (0.2 wt %) between the average Cu content of light and dark bands (which is 2.3% CuO, approximately the same Cu concentration as in the BSE-dark bands of “ high Cu” Fe hydroxide.).
Copper speciation in Fe (hydr)oxide bands. X-ray absorption near-edge spectrosco-py (XANES) in the Cu near-edge region is sensitive to the molecular configuration of Cu as
716
Lappeenranta, Finland IMWA 2017Mine Water and Circular Economy
Wolkersdorfer C, Sartz L, Sillanpää M, Häkkinen A (Editors)
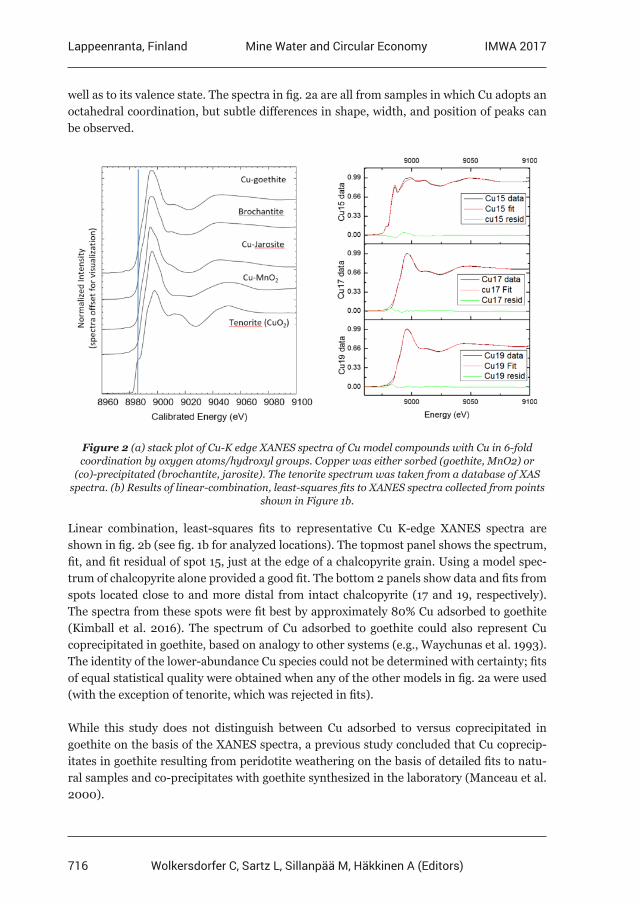
well as to its valence state. The spectra in fig. 2a are all from samples in which Cu adopts an octahedral coordination, but subtle differences in shape, width, and position of peaks can be observed.
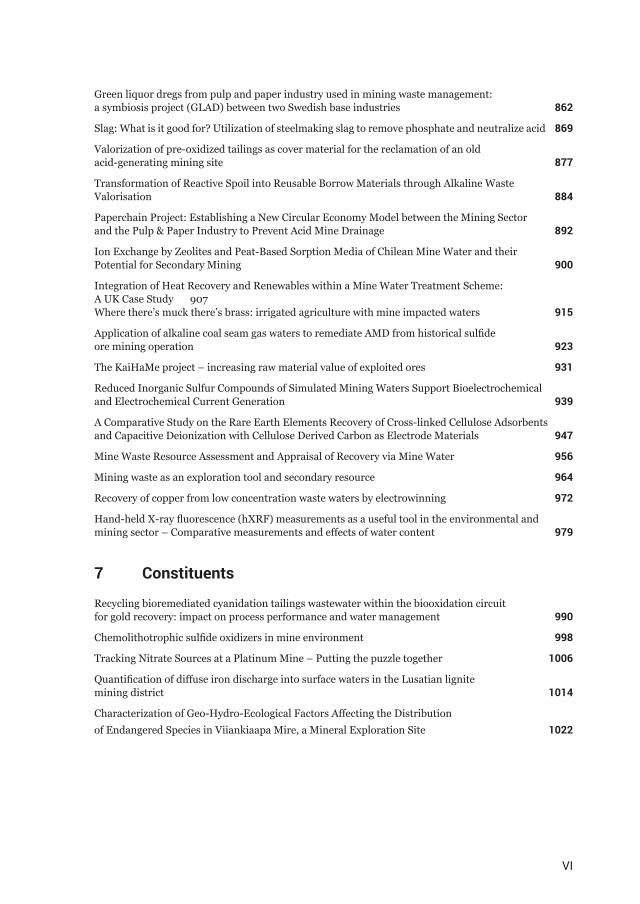
Figure 2 (a) stack plot of Cu-K edge XANES spectra of Cu model compounds with Cu in 6-fold coordination by oxygen atoms/hydroxyl groups. Copper was either sorbed (goethite, MnO2) or
(co)-precipitated (brochantite, jarosite). The tenorite spectrum was taken from a database of XAS spectra. (b) Results of linear-combination, least-squares fits to XANES spectra collected from points
shown in Figure 1b.
Linear combination, least-squares fits to representative Cu K-edge XANES spectra are shown in fig. 2b (see fig. 1b for analyzed locations). The topmost panel shows the spectrum, fit, and fit residual of spot 15, just at the edge of a chalcopyrite grain. Using a model spec-trum of chalcopyrite alone provided a good fit. The bottom 2 panels show data and fits from spots located close to and more distal from intact chalcopyrite (17 and 19, respectively). The spectra from these spots were fit best by approximately 80% Cu adsorbed to goethite (Kimball et al. 2016). The spectrum of Cu adsorbed to goethite could also represent Cu coprecipitated in goethite, based on analogy to other systems (e.g., Waychunas et al. 1993). The identity of the lower-abundance Cu species could not be determined with certainty; fits of equal statistical quality were obtained when any of the other models in fig. 2a were used (with the exception of tenorite, which was rejected in fits).
While this study does not distinguish between Cu adsorbed to versus coprecipitated in goethite on the basis of the XANES spectra, a previous study concluded that Cu coprecip-itates in goethite resulting from peridotite weathering on the basis of detailed fits to natu-ral samples and co-precipitates with goethite synthesized in the laboratory (Manceau et al. 2000).
717
Lappeenranta, Finland IMWA 2017Mine Water and Circular Economy
Wolkersdorfer C, Sartz L, Sillanpää M, Häkkinen A (Editors)
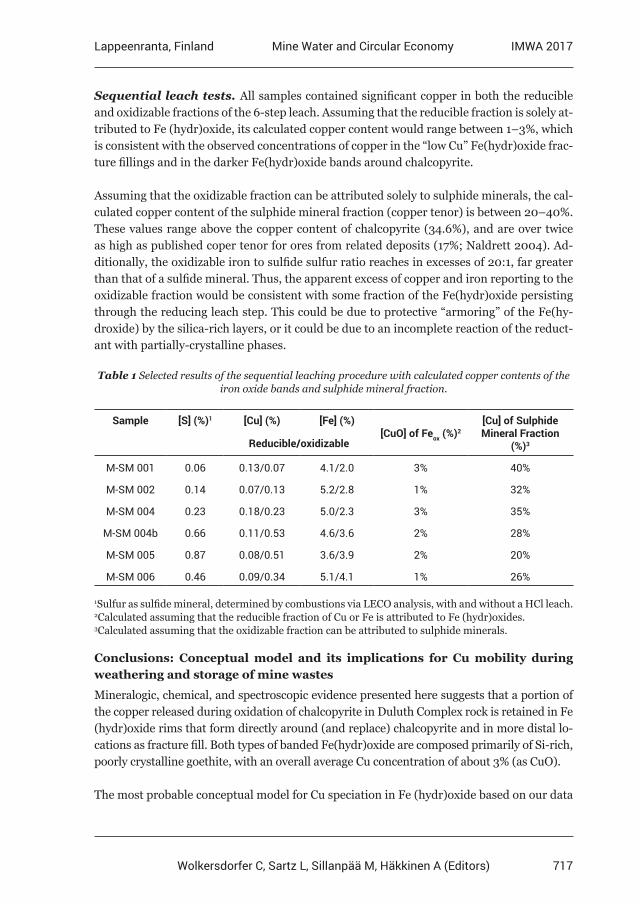
Sequential leach tests. All samples contained significant copper in both the reducible and oxidizable fractions of the 6-step leach. Assuming that the reducible fraction is solely at-tributed to Fe (hydr)oxide, its calculated copper content would range between 1–3%, which is consistent with the observed concentrations of copper in the “low Cu” Fe(hydr)oxide frac-ture fillings and in the darker Fe(hydr)oxide bands around chalcopyrite.
Assuming that the oxidizable fraction can be attributed solely to sulphide minerals, the cal-culated copper content of the sulphide mineral fraction (copper tenor) is between 20–40%. These values range above the copper content of chalcopyrite (34.6%), and are over twice as high as published coper tenor for ores from related deposits (17%; Naldrett 2004). Ad-ditionally, the oxidizable iron to sulfide sulfur ratio reaches in excesses of 20:1, far greater than that of a sulfide mineral. Thus, the apparent excess of copper and iron reporting to the oxidizable fraction would be consistent with some fraction of the Fe(hydr)oxide persisting through the reducing leach step. This could be due to protective “armoring” of the Fe(hy-droxide) by the silica-rich layers, or it could be due to an incomplete reaction of the reduct-ant with partially-crystalline phases.
Table 1 Selected results of the sequential leaching procedure with calculated copper contents of the iron oxide bands and sulphide mineral fraction.
Sample [S] (%)1 [Cu] (%) [Fe] (%)[CuO] of Feox (%)2
[Cu] of Sulphide Mineral Fraction
(%)3Reducible/oxidizable
M-SM 001 0.06 0.13/0.07 4.1/2.0 3% 40%
M-SM 002 0.14 0.07/0.13 5.2/2.8 1% 32%
M-SM 004 0.23 0.18/0.23 5.0/2.3 3% 35%
M-SM 004b 0.66 0.11/0.53 4.6/3.6 2% 28%
M-SM 005 0.87 0.08/0.51 3.6/3.9 2% 20%
M-SM 006 0.46 0.09/0.34 5.1/4.1 1% 26%
1Sulfur as sulfide mineral, determined by combustions via LECO analysis, with and without a HCl leach.2Calculated assuming that the reducible fraction of Cu or Fe is attributed to Fe (hydr)oxides.3Calculated assuming that the oxidizable fraction can be attributed to sulphide minerals.
Conclusions: Conceptual model and its implications for Cu mobility during weathering and storage of mine wastes
Mineralogic, chemical, and spectroscopic evidence presented here suggests that a portion of the copper released during oxidation of chalcopyrite in Duluth Complex rock is retained in Fe (hydr)oxide rims that form directly around (and replace) chalcopyrite and in more distal lo-cations as fracture fill. Both types of banded Fe(hydr)oxide are composed primarily of Si-rich, poorly crystalline goethite, with an overall average Cu concentration of about 3% (as CuO).
The most probable conceptual model for Cu speciation in Fe (hydr)oxide based on our data
718
Lappeenranta, Finland IMWA 2017Mine Water and Circular Economy
Wolkersdorfer C, Sartz L, Sillanpää M, Häkkinen A (Editors)
is on in which Cu occurs predominantly as a co-precipitate rather than adsorbed species, and, therefore, predictive models of copper concentration in mine contact water should in-clude terms to reflect the coprecipitation of copper with goethite. This distinction could have significant implications for water quality, based on experimental leach tests indicating that up to one order of magnitude less Cu is released from a Cu-Fe (hydr)oxide coprecipitate than from a Cu-Fe (hydr)oxide adsorption sample or even from Cu(OH)2 (pH range: 6-9; Karthikeyan et al. 1997).
Resistance of the Fe (hydr)oxide bands to the reducing leach step implies that these bands may be effective at sequestering Cu even if relocated to an environment depleted in oxygen, such as conditions typical of subaqueous disposal. However, the degree and time scales over which this attenuation could be expected to last would require further evaluation.
Acknowledgements
We gratefully acknowledge the support of Teck American Incorporated, insights and work of Steve Day and Chris Kennedy, and well as, Bronwen Forsyth, of SRK, who designed and oversaw the sequential leach test procedure. Use of the Stanford Synchrotron Radiation Lightsource, SLAC National Accelerator Laboratory, is supported by the U.S. Department of Energy, Office of Science, Office of Basic Energy Sciences under Contract No. DE-AC02-76SF00515. This research was conducted under SSRL proposal #4337.
References
Chao, TT, Zhou L (1983) Extraction techniques for selective dissolution of amorphous iron oxides from soils and sediments. Soil Sci Soc Am J 47:225–232.Karthikeyan KG, Elliott HA, Cannon FS (1997) Adsorption and coprecipitation of copper with the hydrous oxides of iron and aluminum. Environ Sci Technol 31:2721–2725. doi: 10.1021/ es9609009.Kim CS, Chi C, Miller SR, Rosales RA, Sugihara ES, Akau J, Rytuba JJ, Webb SM (2013) (Micro) spectroscopic analyses of particle size dependence on arsenic distribution and speciation in mine wastes. Environ Sci Technol 47: 8164-8171. doi: 10.1021/es4010653.Kimball BE, Foster AL, Seal RR, Piatak NM, Webb SM, Hammarstrom, JM (2016) Copper Speciation in Variably Toxic Sediments at the Ely Copper Mine, Vermont, United States. Environ Sci Technol 50: 1126-1136. doi: 10.1021/acs.est.5b04081.Lafuente B, Downs RT, Yang H, Stone N (2015) The power of databases: the RRUFF project, in: Danisi, T.A.a.R.M. (Ed.), Highlights in Mineralogical Crystallography. W. De Gruyter, Berlin, Germany, pp. 1-30.Leinz RW, Sutley SJ (2000) An investigation of the partitioning of metals in mine wastes using sequential extractions. 5th Int Conf Acid Rock Drain 1–11.Manceau A, Schlegel M, Musso M (2000) Crystal chemistry of trace elements in natural and synthetic goethite. Geochim Cosmochim Acta 64:3643–3661. doi: 10.1016/S0016-7037(00)00427-0.Miller JD, Jr, Green JC, Severson MJ, Chandler VW, Hauck SA, Peterson DM, Wahl TE (2002) Geology and mineral potential of the Duluth Complex and related rocks of northeastern Minnesota: Minnesota Geological Survey Report of Investigations 58. p 207.Naldrett AJ (2004) Magmatic sulfide deposits: geology, geochemistry and exploration. Springer Science & Business Media.Schwertmann, U, Cornell RM (2003) The Iron Oxides: Structure, Properties, Reactions, Occurences and Uses, Second Edition. Wiley-VCH GmbH & Co. KGaA, Weinheim.
719
Lappeenranta, Finland IMWA 2017Mine Water and Circular Economy
Wolkersdorfer C, Sartz L, Sillanpää M, Häkkinen A (Editors)
Severson, MJ, Hauck SA (2008) Finish Logging of Duluth Complex Drill Core (And a Reinterpretation of the Geology at the Mesaba (Babbitt) Deposit): University of Minnesota Duluth¸ Natural Resources Research Institute, Technical Report NRRI/TR-2008/17. Waychunas GA, Rea BA, Fuller CC, Davis JA (1993) Surface chemistry of ferrihydrite: part1. EXAFS studies of the geometry of coprecipitated and adsorbed arsenate. Geochim Cosmochim Acta 57: 2251- 2269.Webb SM (2005) Sixpack: A graphical user interface for XAS analysis using IFEFFIT. Physica Scripta, T1115: 1011-1014.Webb SM (2005) The MicroAnalysis Toolkit: X-ray Fluorescence Image Processing Software. AIP Conference Proceedings: 196-199.International Centre for Diffraction Data (ICDD), 2007.
720
Lappeenranta, Finland IMWA 2017Mine Water and Circular Economy
Wolkersdorfer C, Sartz L, Sillanpää M, Häkkinen A (Editors)
Enrichment and Geoaccumulation of Pb, Zn, As, Cd and Cr in soils near New Union Gold Mine, Limpopo Province
of South Africa
Confidence Muzerengi
Department of Mining and Environmental Geology, School of Environmental Sciences, University of Venda, Private Bag X5050, Thohoyandou 0950, South Africa, Tel: +27
159628645 or Cell: +27 732513012; Email: [email protected]
Abstract Geo-accumulation index, enrichment factor, contamination factor and pollution load indexes were employed to evaluate Pb, Zn, As, Cd and Cr in soils near New Union mine dump. Arsenic and Cd were graded as unpolluted to moderately polluted whilst, Pb, Zn and Cr indicated no contamination (Igeo ≤0) in the soil. The EF values for Pb, Zn and Cr where attributed natural processes with no evidence of anthropogenic source. Meanwhile, As and Cd showed significant contamination in soil with CF>4. The PLI values for 95% of the sample sites were ≥1.5, which consequently indicated deterioration of soil quality.
Key words Geo-accumulation index, enrichment factor, contamination factor and pollution load indexes.
Introduction
Mining is one of the most important sources of toxic metals into the environment and mine tailing disposal may result in acid mine drainage and the release of metals of toxic levels that impact on human health and the environment (Davies and Rice, 2001). Many studies such as Forstner (1985), Giller et al. (1988), Kozak (1991) and Grzebisz et al. (2002) have shown that metals are extremely persistent in the environment, non-biodegradable and readily accumulate to toxic levels. Contamination of soil is a constant danger due to pollution by toxic metals resulting in the infertility and unsuitability of the soil for plant growth and thus affecting the organisms in the food web (Marques et al. (2011). These metals can accumulate to phytotoxic levels, especially in low pH soils and subsequently reduce plant growth and enter the food chain when plants are consumed by humans and animals (Chaney, 1993).
According to Du Plessis (2011), Potgieter and De Villiers (1986), New Union mine operated from 1935 to 1998 in the Giyani greenstone belt under various mining companies such as Northfields Gold Pty Ltd, New Union Gold, Noorde and Offspring mines until exhaustion of the underground gold ore. The gold mined was associated with sulphides such as pyrrhotite (Fe1-XS), arsenopyrite (FeAsS), and (ZnS) sphelerite (Gan et al. 1986). A study by Mulugisi et al. (2009) and Mitileni et al. (2011) indicated elevated concentration of Pb, Cr, Cd, As and Zn at the mine tailings dump. Moreover, the tailings dam is thinly covered by vegetation and susceptible to water and wind erosion which may consequently enrich the surrounding environment with toxic metals. This study focused on the study of metal contamination (Ni, Cu, Pb, As, Cd and Cr) in the vicinity of New Union mine dump. The assessment of soil contamination was based on Geo-accumulation index (Igeo), enrichment factor (EF), contamination factor (CF) and pollution load indexes (PLI). The data on the distribution of
721
Lappeenranta, Finland IMWA 2017Mine Water and Circular Economy
Wolkersdorfer C, Sartz L, Sillanpää M, Häkkinen A (Editors)
these metals in soils near the mine dumb could provide valuable information on risk and exposure assessment of communities near the mine site.
Methods
Site Description
The area is located 10 km east of Malamulele town which lies between Giyani and Thohoy-andou towns and falls under Thulamela Municipality and Vhembe District in Limpopo Prov-ince. It is also located < 1 km east of Madonsi Village and climate of the area is subtropical with hot and rainy summers and short cool and very dry winters. Lowest rainfall of 3 mm oc-curs mainly in July and highest 139 mm in January with average midday temperature range of 23oC in June and 30.5oC in January (SAWS, 1980-2003). Lithological assemblages include mafic and ultramafic sequences such as chlorite schist, talc schist, tremolite-actinolite schist, and amphibolite schist which are rich in seperntinites and pyroxene (Potgieter and De Villi-ers, 1986). Meta-quartzite, banded ironstones, are also prominent throughout the area.
Soil sampling
Surface soils samples were collected from a depth of 10-30 cm around the tailings dam and the sample spacing being 100 m. At least 20 samples around the mine dumb whilst, an additional 2 were collected 10 km from the tailings dam to represent background metal concentration. In all, 22 samples of approximately 2 kg of each were collected using a steel spade and stored in sealed polythene bags and transported to the laboratory for pre-treatment and analyses.
Chemical Analysis
The samples were oven dried at 105-110°C, sieved to -2 mm and then milled to 85% -75 μm. Weights of 10 g were digested in 60 ml freshly prepared aqua regia (1:3 HNO3: HCl) on a hot plate for 2 hours. Standard stock solutions for all the elements were procured from Merck (Pty) Ltd South Africa and prepared in the laboratory for instrument calibration. The glassware used were thoroughly cleaned with deionised water and diluted nitric acid to remove any impurities. In addition, internal data quality control procedures were followed, that include in-cooperation of certified reference standards (CRMs) and blanks. The total concentrations of Ni, Cu, Pb, As, Cd and Cr were then determined using a Flame Atomic Absorption Spectrometer (AAS PerkinElmer Analyst 400).
Contamination Assessment Methods
Enrichment factor (EF) and Geoaccumulation index (Igeo) defined by Muller (1969) were used for assessment of soil contamination in the vicinity of the tailings dumb. Enrichment factor (EF) can be used to differentiate between the metals originating from anthropogenic activities and those from natural sources. Enrichment factor of the metals was calculated as the ratio of elemental concentration of sediment normalized to a reference Zr. The reference element is often the one characterized by low occurrence variability, such as the most com-monly used elements; Aluminum (Al), Zirconium (Zr), Titanium (Ti), Iron (Fe) and Scandium (Sc) as stated by Reiman and Decarital (2000), and Blaser et al. (2000). The enrichment factor was calculated using the formula originally introduced by Buat-Menard and Chesselet (1979)
722
Lappeenranta, Finland IMWA 2017Mine Water and Circular Economy
Wolkersdorfer C, Sartz L, Sillanpää M, Häkkinen A (Editors)
sampleBB
CEF
refx
refx c//=
(i)
where:
Cx = content of the examined element in the examined environment, Cref = content of the examined element in the reference environment, Bx = content of the reference element in the examined environment and Bref= content of the reference element in the reference en-vironment. Five contamination categories of EF were used in the study and a subsequent increase in EF values could correspond to the contributions of the anthropogenic origin of contamination (Sutherland, 2000) as foloows:
• EF < 2 is deficiency to minimal enrichment • EF 2-5 is moderate enrichment • EF 5-20 is significant enrichment • EF 20-40 is very high enrichment • EF > 40 is extremely high enrichment
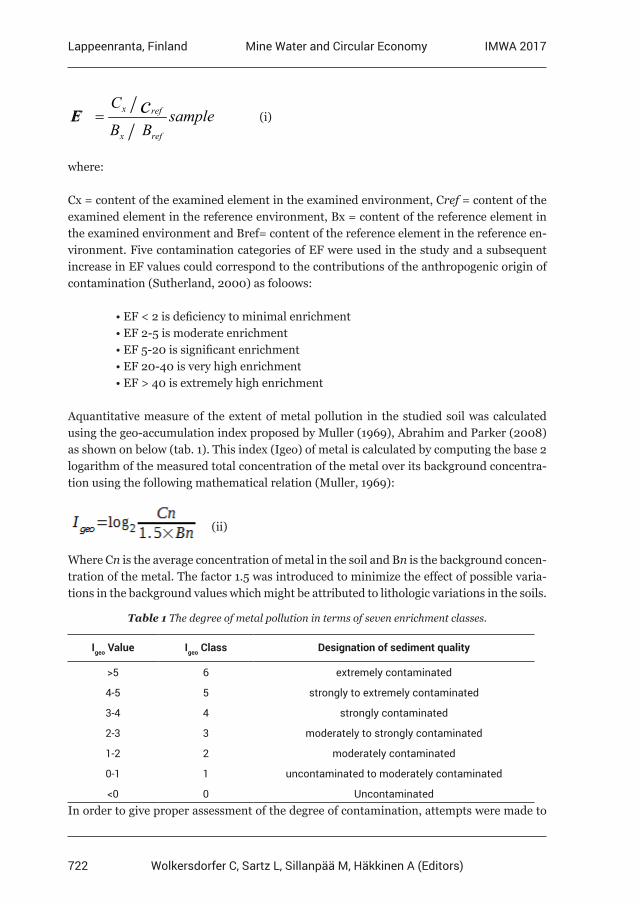
Aquantitative measure of the extent of metal pollution in the studied soil was calculated using the geo-accumulation index proposed by Muller (1969), Abrahim and Parker (2008) as shown on below (tab. 1). This index (Igeo) of metal is calculated by computing the base 2 logarithm of the measured total concentration of the metal over its background concentra-tion using the following mathematical relation (Muller, 1969):
(ii)
Where Cn is the average concentration of metal in the soil and Bn is the background concen-tration of the metal. The factor 1.5 was introduced to minimize the effect of possible varia-tions in the background values which might be attributed to lithologic variations in the soils.
Table 1 The degree of metal pollution in terms of seven enrichment classes.
Igeo Value Igeo Class Designation of sediment quality
>5 6 extremely contaminated
4-5 5 strongly to extremely contaminated
3-4 4 strongly contaminated
2-3 3 moderately to strongly contaminated
1-2 2 moderately contaminated
0-1 1 uncontaminated to moderately contaminated
<0 0 UncontaminatedIn order to give proper assessment of the degree of contamination, attempts were made to
723
Lappeenranta, Finland IMWA 2017Mine Water and Circular Economy
Wolkersdorfer C, Sartz L, Sillanpää M, Häkkinen A (Editors)
calculate the pollution load indexes (PLI) using the Thomilson et al. (1980) approach. The PLI represents the number of times by which the metal content in the soil exceeds the aver-age natural background concentration, and gives a summative indication of the overall level of metal toxicity in a particular sample. The control samples were taken to represent natural background. The PLI of the place are calculated by obtaining the n-root from the n-CFs that was obtained for all the metals as follows; (iii)
Where, n is the number of metals (n = 5 in this study). PLI<1 implies that the site is free from contamination whilst, PLI = 1 implies to base line level of pollution and PLI> 1 = dete-rioration of site quality. The CF represents the individual impact of each trace metal on the soils obtained using the equation;
(iv)
Where Cn represents metal concentration in the studies environment and Cref being the met-al concentration in the background environment.
Results and Discussion
Metal Concentrations
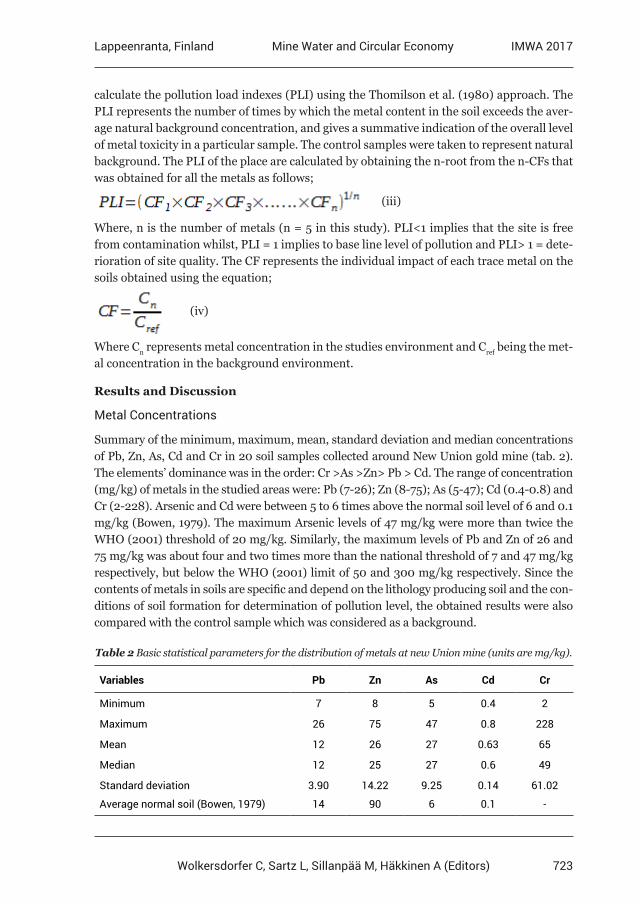
Summary of the minimum, maximum, mean, standard deviation and median concentrations of Pb, Zn, As, Cd and Cr in 20 soil samples collected around New Union gold mine (tab. 2). The elements’ dominance was in the order: Cr >As >Zn> Pb > Cd. The range of concentration (mg/kg) of metals in the studied areas were: Pb (7-26); Zn (8-75); As (5-47); Cd (0.4-0.8) and Cr (2-228). Arsenic and Cd were between 5 to 6 times above the normal soil level of 6 and 0.1 mg/kg (Bowen, 1979). The maximum Arsenic levels of 47 mg/kg were more than twice the WHO (2001) threshold of 20 mg/kg. Similarly, the maximum levels of Pb and Zn of 26 and 75 mg/kg was about four and two times more than the national threshold of 7 and 47 mg/kg respectively, but below the WHO (2001) limit of 50 and 300 mg/kg respectively. Since the contents of metals in soils are specific and depend on the lithology producing soil and the con-ditions of soil formation for determination of pollution level, the obtained results were also compared with the control sample which was considered as a background.
Table 2 Basic statistical parameters for the distribution of metals at new Union mine (units are mg/kg).
Variables Pb Zn As Cd Cr
Minimum 7 8 5 0.4 2
Maximum 26 75 47 0.8 228
Mean 12 26 27 0.63 65
Median 12 25 27 0.6 49
Standard deviation 3.90 14.22 9.25 0.14 61.02
Average normal soil (Bowen, 1979) 14 90 6 0.1 -
724
Lappeenranta, Finland IMWA 2017Mine Water and Circular Economy
Wolkersdorfer C, Sartz L, Sillanpää M, Häkkinen A (Editors)
Contamination Evaluation based on Geoaccumulation Index
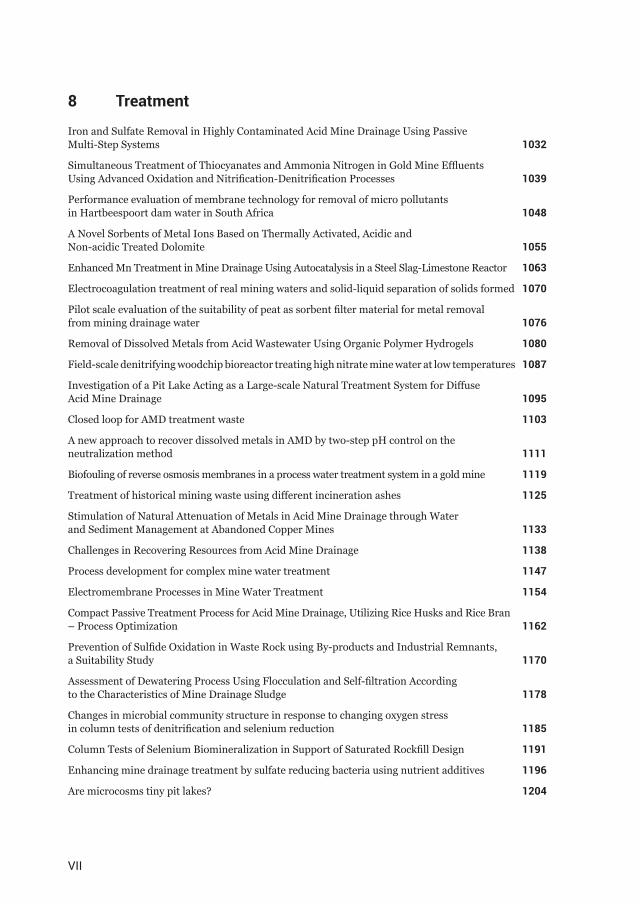
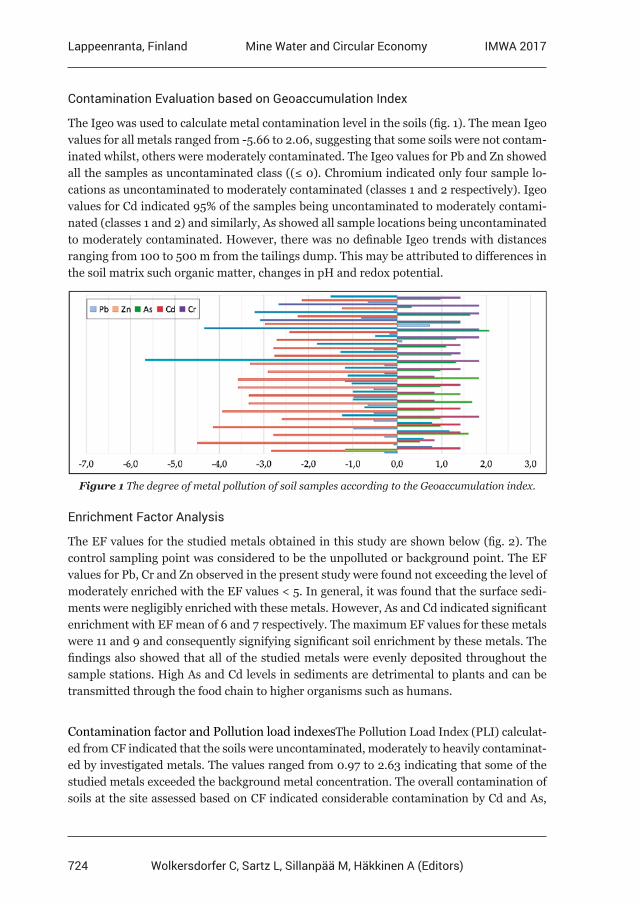
The Igeo was used to calculate metal contamination level in the soils (fig. 1). The mean Igeo values for all metals ranged from -5.66 to 2.06, suggesting that some soils were not contam-inated whilst, others were moderately contaminated. The Igeo values for Pb and Zn showed all the samples as uncontaminated class ((≤ 0). Chromium indicated only four sample lo-cations as uncontaminated to moderately contaminated (classes 1 and 2 respectively). Igeo values for Cd indicated 95% of the samples being uncontaminated to moderately contami-nated (classes 1 and 2) and similarly, As showed all sample locations being uncontaminated to moderately contaminated. However, there was no definable Igeo trends with distances ranging from 100 to 500 m from the tailings dump. This may be attributed to differences in the soil matrix such organic matter, changes in pH and redox potential.
Figure 1 The degree of metal pollution of soil samples according to the Geoaccumulation index.
Enrichment Factor Analysis
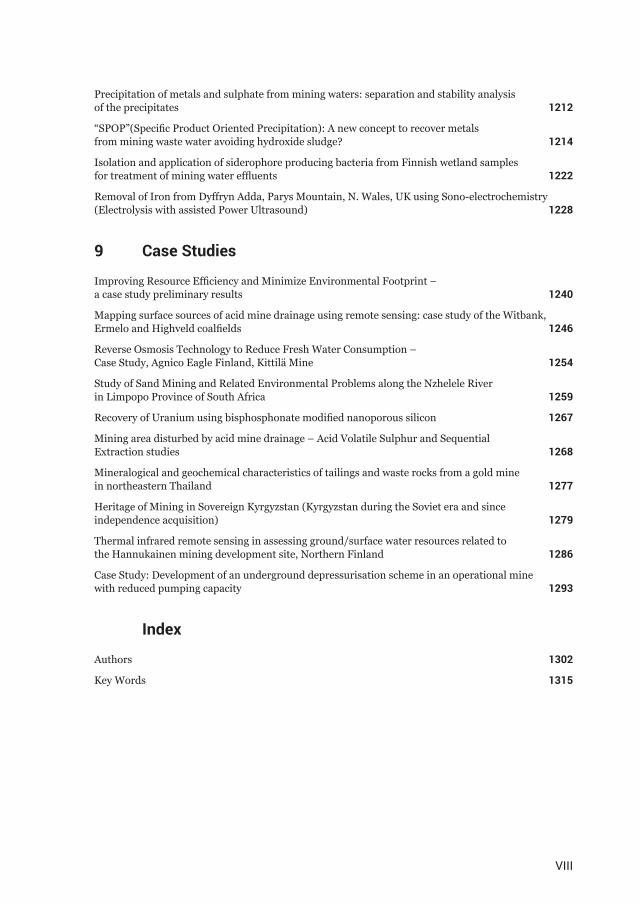
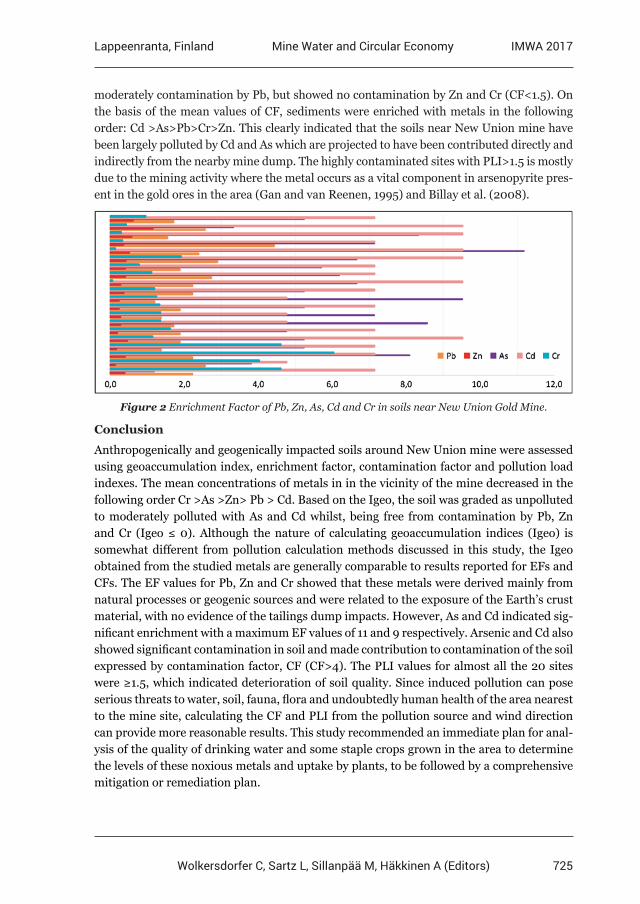
The EF values for the studied metals obtained in this study are shown below (fig. 2). The control sampling point was considered to be the unpolluted or background point. The EF values for Pb, Cr and Zn observed in the present study were found not exceeding the level of moderately enriched with the EF values < 5. In general, it was found that the surface sedi-ments were negligibly enriched with these metals. However, As and Cd indicated significant enrichment with EF mean of 6 and 7 respectively. The maximum EF values for these metals were 11 and 9 and consequently signifying significant soil enrichment by these metals. The findings also showed that all of the studied metals were evenly deposited throughout the sample stations. High As and Cd levels in sediments are detrimental to plants and can be transmitted through the food chain to higher organisms such as humans.
Contamination factor and Pollution load indexesThe Pollution Load Index (PLI) calculat-ed from CF indicated that the soils were uncontaminated, moderately to heavily contaminat-ed by investigated metals. The values ranged from 0.97 to 2.63 indicating that some of the studied metals exceeded the background metal concentration. The overall contamination of soils at the site assessed based on CF indicated considerable contamination by Cd and As,
725
Lappeenranta, Finland IMWA 2017Mine Water and Circular Economy
Wolkersdorfer C, Sartz L, Sillanpää M, Häkkinen A (Editors)
moderately contamination by Pb, but showed no contamination by Zn and Cr (CF<1.5). On the basis of the mean values of CF, sediments were enriched with metals in the following order: Cd >As>Pb>Cr>Zn. This clearly indicated that the soils near New Union mine have been largely polluted by Cd and As which are projected to have been contributed directly and indirectly from the nearby mine dump. The highly contaminated sites with PLI>1.5 is mostly due to the mining activity where the metal occurs as a vital component in arsenopyrite pres-ent in the gold ores in the area (Gan and van Reenen, 1995) and Billay et al. (2008).
Conclusion
Anthropogenically and geogenically impacted soils around New Union mine were assessed using geoaccumulation index, enrichment factor, contamination factor and pollution load indexes. The mean concentrations of metals in in the vicinity of the mine decreased in the following order Cr >As >Zn> Pb > Cd. Based on the Igeo, the soil was graded as unpolluted to moderately polluted with As and Cd whilst, being free from contamination by Pb, Zn and Cr (Igeo ≤ 0). Although the nature of calculating geoaccumulation indices (Igeo) is somewhat different from pollution calculation methods discussed in this study, the Igeo obtained from the studied metals are generally comparable to results reported for EFs and CFs. The EF values for Pb, Zn and Cr showed that these metals were derived mainly from natural processes or geogenic sources and were related to the exposure of the Earth’s crust material, with no evidence of the tailings dump impacts. However, As and Cd indicated sig-nificant enrichment with a maximum EF values of 11 and 9 respectively. Arsenic and Cd also showed significant contamination in soil and made contribution to contamination of the soil expressed by contamination factor, CF (CF>4). The PLI values for almost all the 20 sites were ≥1.5, which indicated deterioration of soil quality. Since induced pollution can pose serious threats to water, soil, fauna, flora and undoubtedly human health of the area nearest to the mine site, calculating the CF and PLI from the pollution source and wind direction can provide more reasonable results. This study recommended an immediate plan for anal-ysis of the quality of drinking water and some staple crops grown in the area to determine the levels of these noxious metals and uptake by plants, to be followed by a comprehensive mitigation or remediation plan.
Figure 2 Enrichment Factor of Pb, Zn, As, Cd and Cr in soils near New Union Gold Mine.
726
Lappeenranta, Finland IMWA 2017Mine Water and Circular Economy
Wolkersdorfer C, Sartz L, Sillanpää M, Häkkinen A (Editors)
Acknowledgements
The author is grateful to the sponsor, the University of Venda, South Africa and IMWA 2017, conference organisers for reviewing and publishing this paper.
References
Abrahim GMS, Parker PJ (2008) Assessment of Nigerian heavy metal enrichment factors and the degree of contamination in marine sediment from Tamaki Estaury. Auckland, New Zealand. Environ. Monit. Assess, 36:227-238Billay AY, Ngcofe L, Matshivha M (2008) GIS based Gold Prospectivity Mapping of the Giyani Greenstone Belt. Council for Geoscience, Pretoria, Project No. 200-0865, 42 ppBlaser P, Zimmermann S, Luster J, Shoty KW (2000) Critical Examination of Trace Element Enrichment and Depletions in Soils; As, Cr, Cu, Ni, Pb and Zn in Swiss Forest Soil. Science of the Total Environment, 249: 257-280 Bowen BJM (1979) Environmental chemistry of the elements. Academic Press, London, UK, 333 ppBuat-Menard RA, Chesselet R (1979) Variable influence of the atmospheric flux on the trace metal chemistry of oceanic suspended matter. J Earth Planet Sci Lett; 42:398-411Chaney RL (1993) Zinc phytotoxicity. In A.D. Robson (ed.) Zinc in Soils and Plants. Kluwer Academic Publ., Dordrecht: 135-150Davies MP, Rice S (2001) An alternative to conventional tailing management- “dry stack” filtered tailings, AMEC Earth and Environmental, Vancouver, Canada, 10:411-420Du Plessis GA (2011) National Instrument 43-101 Technical Report for the Madonsi Project, Limpopo Province, South Africa, 110 ppForstner U (1985) Chemical forms and Reactivity of Metals in Sediments. In: Chemical Methods for Assessing Bioavailability Metals in Sludges and Soils, Leschber R. (ed.). Elsevier, London, pp. 1-30Gan SB, McCourt S, Barton JM, Van Reenen, DD, Pretorius AI, Ehlers DL (1986) The Regional Geologic Setting of the Sutherland Belt, with particular reference to Gold Mineralization, Council for Geoscience, PretoriaGan SB, Van Reenen DD (1995) Geology of Gold Deposits in the Southern Marginal Zone of the Limpopo Belt and the adjacent Sutherland Greenstone Belt, South Africa. SA Journal of Geology, 98 (3): 263-275Giller KE, Witter E, McGrath, SP (1988) Toxicity of heavy metals to micro- organisms and microbial processes in agricultural soils. A review. Soil Biol. Biochem, 30:1389-1414Grzebisz, W, Ciesla L, Komisarek J, Potarzycki J (2002) Geochemical assessment of heavy metals pollution of urban soils. Polish J. Environ. Stud., 11(5):493-499Kozak J (1991) Heavy metals in soil. In: Cibulka J. et al.: Lead, Cadmium and Mercury transport in the biosphere. Academica, Praha, pp. 62-104Marques APGC, Rangel AOSS, Castro PM (2009) “Remediation of heavy metal contaminated soils: phytoremediation as a potentially promising clean-up technology,” Critical Reviews in Environmental Science and Technology, 39(8): 622-654Muller G (1969) Index of geoaccumulation in sediments of the Rhine River. Geojournal, 2, pp. 108-118Mulugisi G, Gumbo JR, Dacosta FA, Muzerengi C (2009) The Use of Indigenous Grass species as part of Rehabilitation of Mine Tailings: A Case study of New Union Gold Mine. Proceedings of the International Mine Water Conference, South Africa.Mitileni C, Gumbo JR, Muzerengi C, Dacosta FA (2011) The distribution of toxic metals in sediments: Case study of New Union Gold mine tailings, Limpopo, South Africa. Mine Water: Managing the Challenges IMWA, pp. 609-614Potgieter GA, De Veliers JPR (1986) Controls of Mineralization at the Fumani Gold Deposit, Sutherland Greenstone Belt. In C. R. Anhaeusser and S. Maske (eds.): Mineral deposits of Southern Africa, Geological Society of South Africa, 1:198-204
727
Lappeenranta, Finland IMWA 2017Mine Water and Circular Economy
Wolkersdorfer C, Sartz L, Sillanpää M, Häkkinen A (Editors)
Reiman C, Decarital P (2000) Intrinsic Flaws of Element Enrichment Factors (Efs) in Environmental Geochemistry. Environmental Science and Technology, 34:5084-5091South African Weather Service (1980-2003) Long-Term Climate of Giyani Data area. Pretoria,South Africa.www.weathersa.co.zaSteyn CE, Van Der Watt HVH, Claassens AS (1996) On the permissible Nickel concentration for South African soils. South African Journal of science, 92:359-363Sutherland RA (2000) Bed sediment-associated trace metals in an urban stream Oaho, Hawaii. Environ. Geol, 39: 611-637Tomlinson DL, Wilson JG, Harris CR, Jeffney DW (1980) Problems in the assessment of heavy metal levels in estuaries and the formation of pollution index, Helgol. Wiss. Meeresunters 33:566- 572 World Health Organization (2001) Codex Alimentarius Commission, Food additives and contaminants. WHO food standards Programme, ALINORM 10/12A:1-289.Fertilizer and their efficient use
728
Lappeenranta, Finland IMWA 2017Mine Water and Circular Economy
Wolkersdorfer C, Sartz L, Sillanpää M, Häkkinen A (Editors)
Thallium and other potentially toxic elements in surface waters contaminated by acid mine drainages in southern
Apuan Alps (Tuscany)
M. Perotti1*, L. Ghezzi1, R. Giannecchini1, M. D’Orazio1, S. Vezzoni1, R. Cidu2, R. Petrini1
1 Dipartimento di Scienze della Terra, Università di Pisa, Via S. Maria 53, 56126 Pisa, Italy 2 Dipartimento di Scienze Chimiche e Geologiche, Università di Cagliari, via Trentino 51,
09127 Cagliari, Italy
Abstract Geochemical surveys were carried out over three years in the mining area of Alta Versilia. The physico-chemical parameters and the concentrations of potentially toxic elements (PTE) were determined both in mine drainages and in waters of the Baccatoio Stream receiving AMD. AMD have an average pH of 2.2 and contain high concentrations of Al, Fe, Mn, Cu, Zn, As, Ni, Co, Se, Cd, Sb, Pb and Tl. The discharge of AMD into the stream results in a severe contamination. Downstream of the mines, the pH increases and most PTE are readily scavenged from the stream waters by precipitation and adsorption. On the contrary, Tl behaves almost conservatively, undergoing only dilution.
Key words Alta Versilia mine sites (Italy), mine drainage, potentially toxic elements, thallium
Introduction
Weathering of iron sulfide minerals is the primary source of the generation of acid mine drainages (AMD), which represent a major environmental problem in areas with many active and abandoned mine sites world-wide (Chen et al. 2007; Moore and Luoma 1990; Nordstrom et al. 2015). The southern sector of the Apuan Alps (northern Tuscany, Italy) is characterized by the occurrence of sulfide-bearing mineral deposits worked up to the begin-ning of 1990’s, and whose Tl-rich nature was recognized in the last years. Recent geological studies show Tl concentration levels up to 600 μg/g in the pyrite ores (D’Orazio et al. 2017). The mine sites of Pollone and Mt. Arsiccio are located in the catchment area of the Bacca-toio Stream (27.6 km2). Mine drainages directly discharge into the stream, that crosses the Valdicastello Carducci village and reaches the coastline flowing through a densely populated area. Despite the stream water has been used by local population to irrigate gardens and vegetable gardens, a detailed geochemical characterization of both AMD and their impact on the surface water quality has never been so far reported for this area.
In the present work the physico-chemical properties and major and trace element content were determined on acid mine drainages and superficial waters in the Baccatoio Stream catchment, with special reference to Tl.
Methods
Acid mine drainages, ground- and surface-waters were collected during repeated surveys from 2013 to 2016. Waters were filtered at the sampling stations using 0.45 µm nylon fil-ters, and stored into pre-cleaned high-density polyethylene bottles. Temperature, pH, redox potential (Eh), dissolved oxygen (DO), electrical conductivity (EC) and HCO3
- were deter
729
Lappeenranta, Finland IMWA 2017Mine Water and Circular Economy
Wolkersdorfer C, Sartz L, Sillanpää M, Häkkinen A (Editors)
mined in the field. Major anions and cations were determined by IC (Thermo-Dionex ICS-900) respectively on filtered and on filtered and acidified (using ultrapure HNO3) sample aliquots. Trace element analysis were performed on filtered and acidified samples by ICP-MS (PerkinElmer-NexION 300X) using 103Rh, 187Re and 209Bi as internal standards. The cer-tified reference solution IV-STOCK-1643 was used to evaluate analytical errors that were usually lower than 10%.
Results
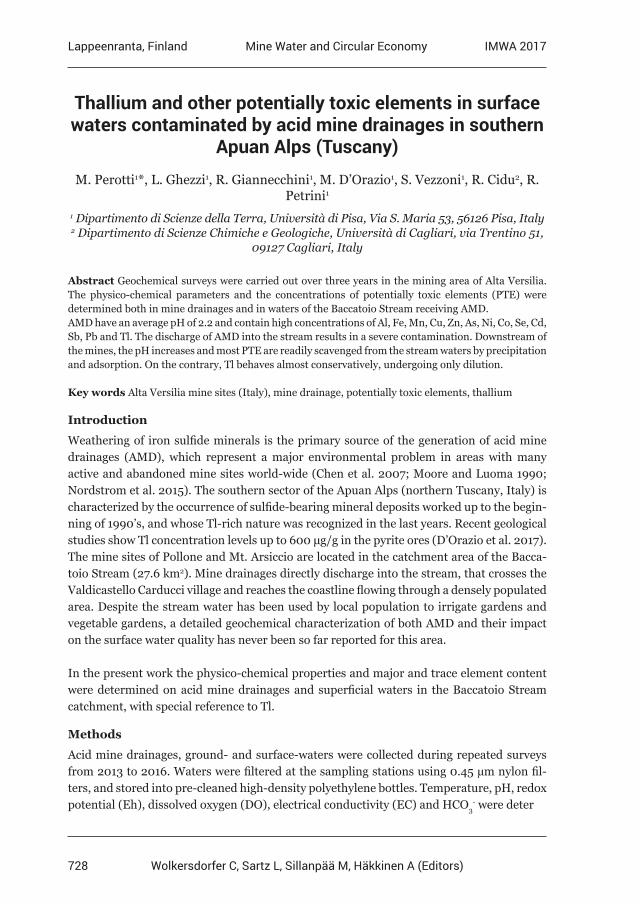
In AMD the pH, EC and DO range between 1.3 to 2.9; 1 mS/cm to 30 mS/cm and between 1.2 mg/L to 8.7 mg/L, respectively. The observed variability reflects the relative contribu-tion of sulfide oxidation and rainwater inputs in determining the dynamics of the processes inside the tunnels, and highlight the dependence on seasonality. AMD are also character-ized by high concentration of potentially toxic elements, as graphically shown in Figure 1, exceeding the Italian Regulation guidelines for groundwaters for Al, Fe, Mn, Cu, Zn, As, Ni, Co, Se, Cd, Sb, Tl and Pb.
Figure 1 Plots showing the elemental patterns (including PTE) in acid mine drainages from Pollone and Mt.Arsiccio mine sites. Note the high Tl concentration, in particular at the Mt. Arsiccio mining
area
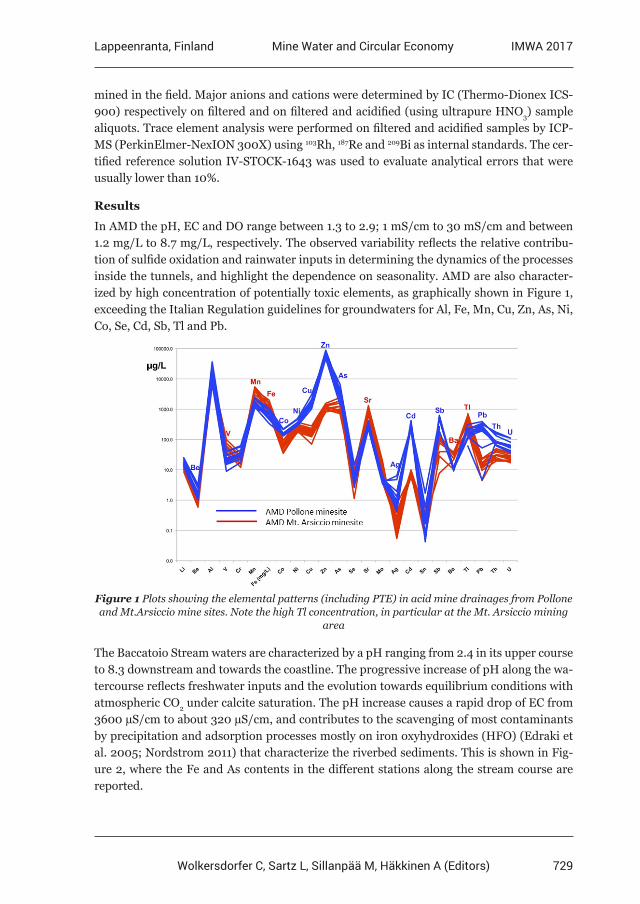
The Baccatoio Stream waters are characterized by a pH ranging from 2.4 in its upper course to 8.3 downstream and towards the coastline. The progressive increase of pH along the wa-tercourse reflects freshwater inputs and the evolution towards equilibrium conditions with atmospheric CO2 under calcite saturation. The pH increase causes a rapid drop of EC from 3600 µS/cm to about 320 µS/cm, and contributes to the scavenging of most contaminants by precipitation and adsorption processes mostly on iron oxyhydroxides (HFO) (Edraki et al. 2005; Nordstrom 2011) that characterize the riverbed sediments. This is shown in Fig-ure 2, where the Fe and As contents in the different stations along the stream course are reported.
730
Lappeenranta, Finland IMWA 2017Mine Water and Circular Economy
Wolkersdorfer C, Sartz L, Sillanpää M, Häkkinen A (Editors)
Figure 2 Fe and As distribution in different stations along the Baccatoio Stream, as an example of decreasing PTE concentration along the flowpath due to HFO precipitation. AMD are also superimposed (stars)
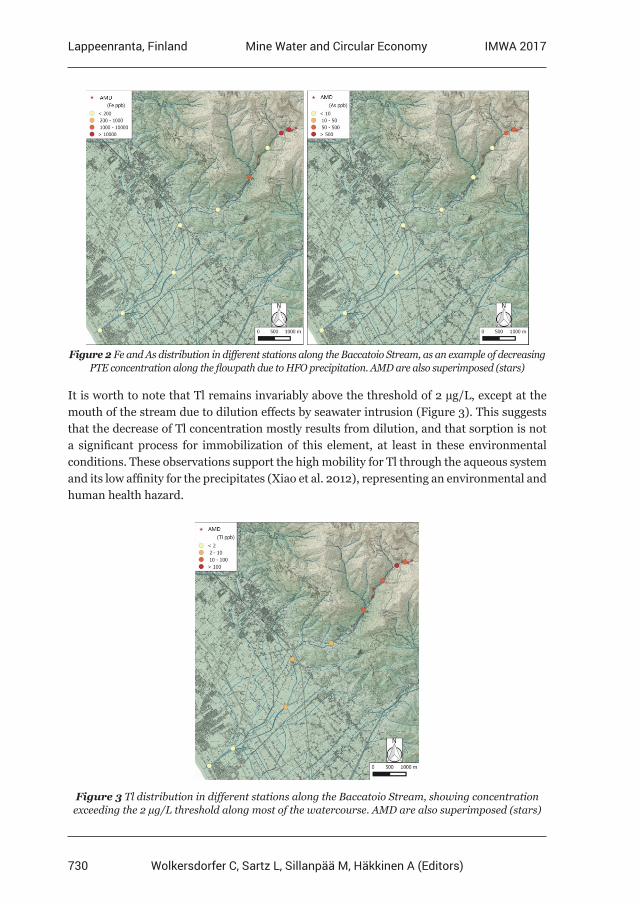
It is worth to note that Tl remains invariably above the threshold of 2 µg/L, except at the mouth of the stream due to dilution effects by seawater intrusion (Figure 3). This suggests that the decrease of Tl concentration mostly results from dilution, and that sorption is not a significant process for immobilization of this element, at least in these environmental conditions. These observations support the high mobility for Tl through the aqueous system and its low affinity for the precipitates (Xiao et al. 2012), representing an environmental and human health hazard.
Figure 3 Tl distribution in different stations along the Baccatoio Stream, showing concentration exceeding the 2 µg/L threshold along most of the watercourse. AMD are also superimposed (stars)
731
Lappeenranta, Finland IMWA 2017Mine Water and Circular Economy
Wolkersdorfer C, Sartz L, Sillanpää M, Häkkinen A (Editors)
Conclusions
High concentrations of PTE characterize the AMD from mine sites in the Baccatoio Stream catchment, in Alta Versilia (Tuscany, Italy), reflecting the large abundance of sulfides, in particular pyrite, in the ore bodies they drain. Drainages are characterized by high Tl con-tent, in particular the M. Arsiccio mine drainages, due to the Tl-rich nature of the pyrite ores occurring in this mine. AMDs impact the Baccatoio Stream water quality; however, most of the pollutants decrease in concentrations along the Baccatoio flowpath towards the coast-line due to dilution and HFO precipitation. Thallium migrates almost conservatively along the Baccatoio Stream maintaining concentrations above 2 µg/L. The use of the Baccatoio Stream as irrigation source may cause a Tl-contamination in agricultural soils, creating the conditions for environmental and human health hazards.
Acknowledgements
The authors thank the Regione Toscana for financial support.
References
Chen A, Lin C, Lu W, Wu Y, Ma Y, Li J, Zhu L (2007) Well water contaminated by acidic mine water from the Dabaoshan Mine, South China: Chemistry and toxicity. Chemosphere 70:248—255. doi: 10.1016/j.chemosphere.2007.06.041D’Orazio M, Biagioni C, Dini A, Vezzoni S (2017) Thallium-rich pyrite ores from the Apuan Alps, Tuscany, Italy: constraints for their origin and environmental concerns. Mineralium Deposita. doi: 10.1007/s00126-016-0697-1 (in press)Edraki M, Golding SD, Baublys KA, Lawrence MG (2005) Hydrochemistry, mineralogy and sulfur isotope geochemistry of acid mine drainage at the Mt. Morgan mine environment, Queensland, Australia. Applied Geochemistry 20:789—805Moore JN, Luoma SN (1990) Hazardous wastes from large-scale metal extraction. Environ Sci Technol 24:1278—1285Nordstrom DK (2011) Hydrogeochemical processes governing the origin, transport and fate of major and trace elements from mine wastes and mineralized rock to surface waters. Applied Geochemistry 26:1777—1791. doi: 10.1016/j.apgeochem.2011.06.002Nordstrom DK, Blowes DW, Ptacek CJ (2015) Hydrogeochemistry and microbiology of mine drainage: An update. Applied Geochemistry 57:3—16. doi: 10.1016/j.apgeochem.2015.02.008Xiao T, Guha J, Boyle D, Liu CQ, Zheng B, Wilson GC, Rouleau A, Chen J (2004) Naturally occurring thallium: a hidden geoenvironmental health hazard? Environment International 30:501— 507. doi: 10.1016/j.envint.2003.10.004
732
Lappeenranta, Finland IMWA 2017Mine Water and Circular Economy
Wolkersdorfer C, Sartz L, Sillanpää M, Häkkinen A (Editors)
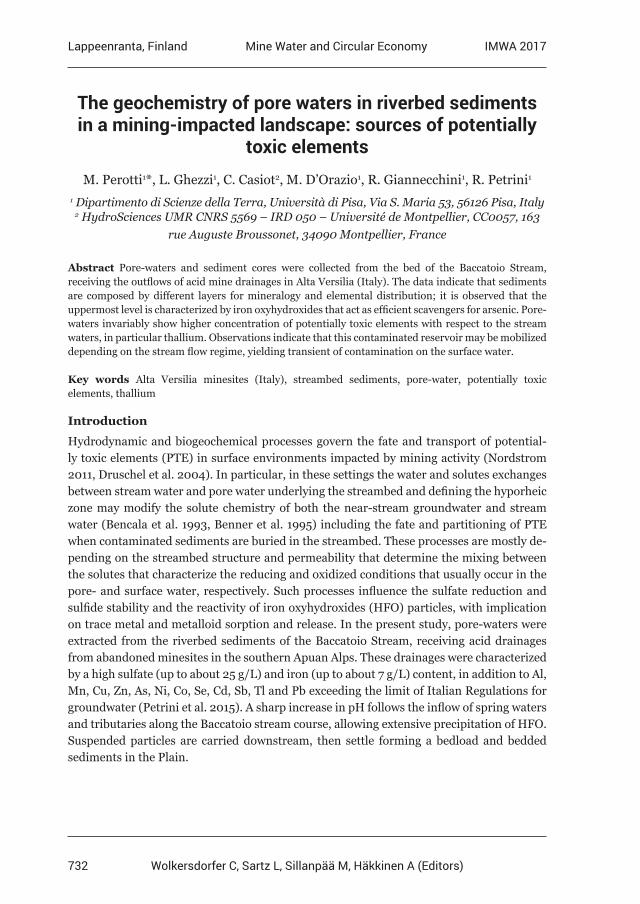
The geochemistry of pore waters in riverbed sediments in a mining-impacted landscape: sources of potentially
toxic elements
M. Perotti1*, L. Ghezzi1, C. Casiot2, M. D’Orazio1, R. Giannecchini1, R. Petrini1
1 Dipartimento di Scienze della Terra, Università di Pisa, Via S. Maria 53, 56126 Pisa, Italy 2 HydroSciences UMR CNRS 5569 – IRD 050 – Université de Montpellier, CC0057, 163
rue Auguste Broussonet, 34090 Montpellier, France
Abstract Pore-waters and sediment cores were collected from the bed of the Baccatoio Stream, receiving the outflows of acid mine drainages in Alta Versilia (Italy). The data indicate that sediments are composed by different layers for mineralogy and elemental distribution; it is observed that the uppermost level is characterized by iron oxyhydroxides that act as efficient scavengers for arsenic. Pore-waters invariably show higher concentration of potentially toxic elements with respect to the stream waters, in particular thallium. Observations indicate that this contaminated reservoir may be mobilized depending on the stream flow regime, yielding transient of contamination on the surface water.
Key words Alta Versilia minesites (Italy), streambed sediments, pore-water, potentially toxic elements, thallium
Introduction
Hydrodynamic and biogeochemical processes govern the fate and transport of potential-ly toxic elements (PTE) in surface environments impacted by mining activity (Nordstrom 2011, Druschel et al. 2004). In particular, in these settings the water and solutes exchanges between stream water and pore water underlying the streambed and defining the hyporheic zone may modify the solute chemistry of both the near-stream groundwater and stream water (Bencala et al. 1993, Benner et al. 1995) including the fate and partitioning of PTE when contaminated sediments are buried in the streambed. These processes are mostly de-pending on the streambed structure and permeability that determine the mixing between the solutes that characterize the reducing and oxidized conditions that usually occur in the pore- and surface water, respectively. Such processes influence the sulfate reduction and sulfide stability and the reactivity of iron oxyhydroxides (HFO) particles, with implication on trace metal and metalloid sorption and release. In the present study, pore-waters were extracted from the riverbed sediments of the Baccatoio Stream, receiving acid drainages from abandoned minesites in the southern Apuan Alps. These drainages were characterized by a high sulfate (up to about 25 g/L) and iron (up to about 7 g/L) content, in addition to Al, Mn, Cu, Zn, As, Ni, Co, Se, Cd, Sb, Tl and Pb exceeding the limit of Italian Regulations for groundwater (Petrini et al. 2015). A sharp increase in pH follows the inflow of spring waters and tributaries along the Baccatoio stream course, allowing extensive precipitation of HFO. Suspended particles are carried downstream, then settle forming a bedload and bedded sediments in the Plain.
733
Lappeenranta, Finland IMWA 2017Mine Water and Circular Economy
Wolkersdorfer C, Sartz L, Sillanpää M, Häkkinen A (Editors)
Methods
Pore-waters were collected in two stations along the stream course by a passive method us-ing a ceramic suction lysimeter at 15 cm depth in the riverbed. In one station waters were at both 15 and 40 cm and during low and high flow conditions. Waters were filtered in the field using 0.45 µm nylon filters, and stored into pre-cleaned high-density polyethylene bottles. Temperature, pH, redox potential (Eh), dissolved oxygen (DO), electrical conductivity (EC) and HCO3
- were determined immediately after sampling. Major anions and cations were determined by ion chromatography respectively on filtered and stabilized samples using ul-trapure HNO3. Trace elements, including PTE, were determined by ICP-MS using a Perkin-Elmer-NexION 300X. The certified reference standard IV-STOCK-1643 was used to evalu-ate analytical errors that were usually lower than 10% In one station were pore-water was collected riverbed sediments were also sampled to a depth of 40 cm using the piston coring technique. The sediment mineralogy was obtained by XRD using a Bruker D2 Phaser; the sediment chemistry was determined on the bulk by HHXRF using a NITON XL3t GOLDD+.
Results
Sediment core
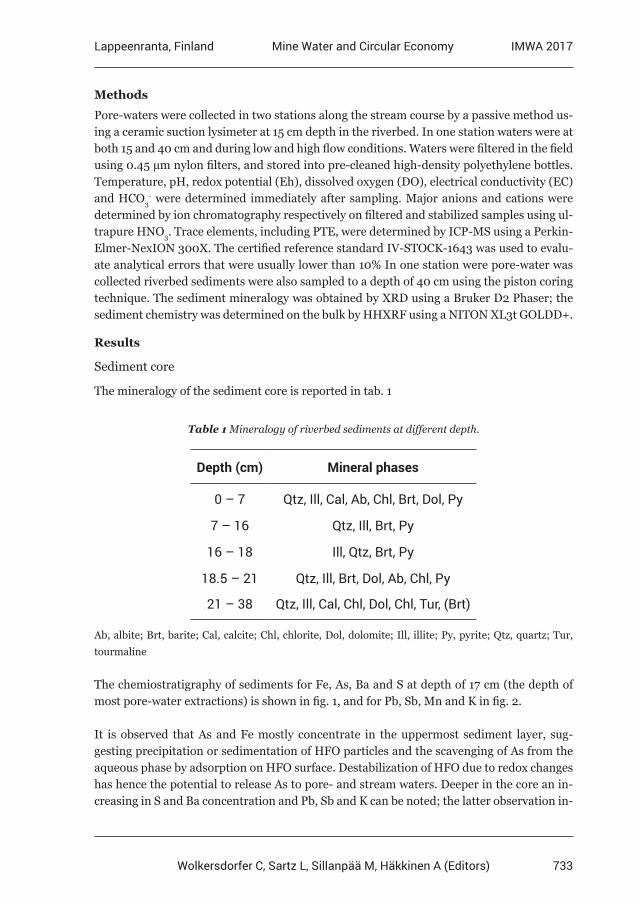
The mineralogy of the sediment core is reported in tab. 1
Table 1 Mineralogy of riverbed sediments at different depth.
Depth (cm) Mineral phases
0 – 7 Qtz, Ill, Cal, Ab, Chl, Brt, Dol, Py
7 – 16 Qtz, Ill, Brt, Py
16 – 18 Ill, Qtz, Brt, Py
18.5 – 21 Qtz, Ill, Brt, Dol, Ab, Chl, Py
21 – 38 Qtz, Ill, Cal, Chl, Dol, Chl, Tur, (Brt)
Ab, albite; Brt, barite; Cal, calcite; Chl, chlorite, Dol, dolomite; Ill, illite; Py, pyrite; Qtz, quartz; Tur, tourmaline
The chemiostratigraphy of sediments for Fe, As, Ba and S at depth of 17 cm (the depth of most pore-water extractions) is shown in fig. 1, and for Pb, Sb, Mn and K in fig. 2.
It is observed that As and Fe mostly concentrate in the uppermost sediment layer, sug-gesting precipitation or sedimentation of HFO particles and the scavenging of As from the aqueous phase by adsorption on HFO surface. Destabilization of HFO due to redox changes has hence the potential to release As to pore- and stream waters. Deeper in the core an in-creasing in S and Ba concentration and Pb, Sb and K can be noted; the latter observation in-
734
Lappeenranta, Finland IMWA 2017Mine Water and Circular Economy
Wolkersdorfer C, Sartz L, Sillanpää M, Häkkinen A (Editors)
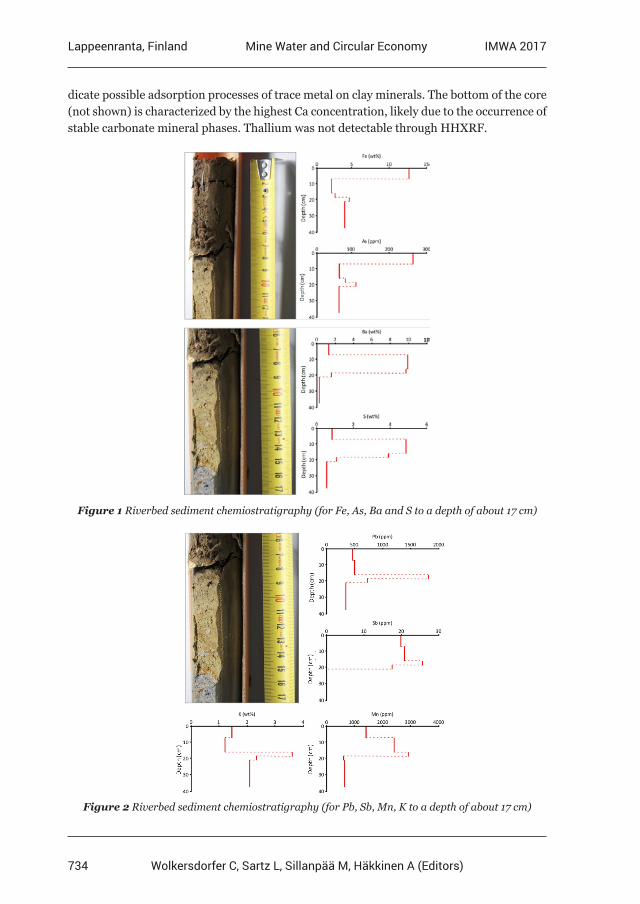
dicate possible adsorption processes of trace metal on clay minerals. The bottom of the core (not shown) is characterized by the highest Ca concentration, likely due to the occurrence of stable carbonate mineral phases. Thallium was not detectable through HHXRF.
Figure 1 Riverbed sediment chemiostratigraphy (for Fe, As, Ba and S to a depth of about 17 cm)
Figure 2 Riverbed sediment chemiostratigraphy (for Pb, Sb, Mn, K to a depth of about 17 cm)
735
Lappeenranta, Finland IMWA 2017Mine Water and Circular Economy
Wolkersdorfer C, Sartz L, Sillanpää M, Häkkinen A (Editors)
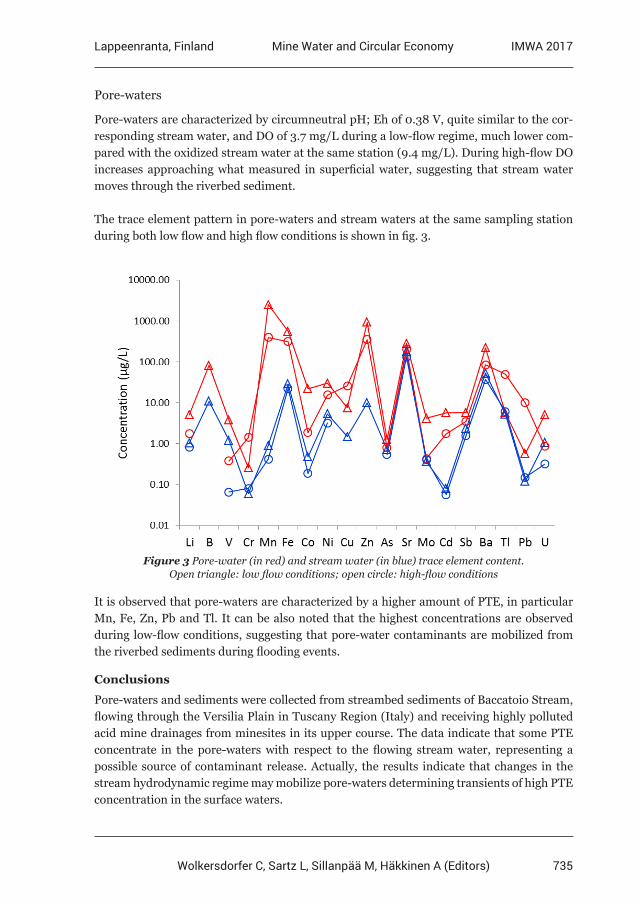
Pore-waters
Pore-waters are characterized by circumneutral pH; Eh of 0.38 V, quite similar to the cor-responding stream water, and DO of 3.7 mg/L during a low-flow regime, much lower com-pared with the oxidized stream water at the same station (9.4 mg/L). During high-flow DO increases approaching what measured in superficial water, suggesting that stream water moves through the riverbed sediment.
The trace element pattern in pore-waters and stream waters at the same sampling station during both low flow and high flow conditions is shown in fig. 3.
Figure 3 Pore-water (in red) and stream water (in blue) trace element content. Open triangle: low flow conditions; open circle: high-flow conditions
It is observed that pore-waters are characterized by a higher amount of PTE, in particular Mn, Fe, Zn, Pb and Tl. It can be also noted that the highest concentrations are observed during low-flow conditions, suggesting that pore-water contaminants are mobilized from the riverbed sediments during flooding events.
Conclusions
Pore-waters and sediments were collected from streambed sediments of Baccatoio Stream, flowing through the Versilia Plain in Tuscany Region (Italy) and receiving highly polluted acid mine drainages from minesites in its upper course. The data indicate that some PTE concentrate in the pore-waters with respect to the flowing stream water, representing a possible source of contaminant release. Actually, the results indicate that changes in the stream hydrodynamic regime may mobilize pore-waters determining transients of high PTE concentration in the surface waters.
736
Lappeenranta, Finland IMWA 2017Mine Water and Circular Economy
Wolkersdorfer C, Sartz L, Sillanpää M, Häkkinen A (Editors)
References
Bencala KE, Duff JH, Harvey JW, Jackman AP, Triska FJ (1993) Modeling within the stream-catchment continuum. In: Jakeman AJ, Beck MB and McAleer MJ eds. Modeling change in environmental systems. WileyBenner SGE, Smart E.W, Moore JN (1995) Metal behavior during surface-groundwater interaction, Silver Bow Creek, Montana. Environ. Sci. Technol. 29:1789—1795Nordstrom DK (2011) Hydrogeochemical processes governing the origin, transport and fate of major and trace elements from mine wastes and mineralized rock to surface waters. Applied Geochemistry 26:1777—1791. doi: 10.1016/j.apgeochem.2011.06.002Druschel GK, Baker BJ, Gihring TM, Banfield JF (2004) Acid mine drainage biogeochemistry at Iron Mountain, California Geochem. Trans. 5:13—31Petrini R, D’Orazio M, Giannecchini R, Bramanti E (2015) Thallium ecosystem diseases in dismissed mine sites as a threat for public health: the Valdicastello-Pietrasanta (Italy) case history. Congresso SIMP-SGI-SoGeI-AIV. Firenze, Italy. 2-4 Settembre 2015
737
Lappeenranta, Finland IMWA 2017Mine Water and Circular Economy
Wolkersdorfer C, Sartz L, Sillanpää M, Häkkinen A (Editors)
Sulfide Oxidation Kinetics in Low-Sulfide Tailings
L.E. Eary1, H. Gluski2, S, Mueller3, K. Duke4, M. Wickham5, D. Castendyk1
1Hatch, 4715 Innovation Drive, Fort Collins, Colorado, USA, [email protected] 2Resolution Copper, 102 Magma Heights, Superior, Arizona
3Boliden, Finnforsvägen 4, Boliden, Sweden 4Duke HydroChem, P.O. Box 41716, Tucson, Arizona
5Rio Tinto, 1440 8th St., #2105, Golden, Colorado
Abstract Oxidation kinetics of low sulfide tailings from two sources were measured in experimental tests in which surface areas of sulfide minerals determined by N2(g) adsorption. The surface areas were used to derive surface roughness factors based on particle size distributions. Using the surface area data, median rate constants ranged from 10-9.92 and 10-10.17 mol py/dm2/s for the kinetic tests conducted on two different types of low sulfide tailings. These rate constants are in reasonably good agreement with the value of 10-10.19 mol py/dm2/s reported by Williamson and Rimstidt (1994) for pyrite under water-saturated conditions.
Key words sulfide oxidation, kinetics, tailings, desulfurization
Introduction
Desulfurization technologies can reduce sulfide mineral contents in tailings to less than 1% and often less than 0.1-0.3%. This process produces a proportionately larger amount of low sulfide tailings and with the remainder of the sulfide content concentrated in a smaller amount of high sulfide tailings. While desulfurization can yield low sulfide contents, the potential still exists for acid generation for tailings with very low carbonate contents. Ti-tratable acidities may be very low in leachates from low-sulfide tailings, but the potential exists for metal leaching. The purpose of this paper is to present data on the reactivity of desulfurized tailings in terms of oxidative dissolution rates using the form of the kinetic rate expression developed for pyrite oxidation by Williamson and Rimstidt (1994). The rate data and interpretation presented here are meant to provide information that is characteristic of low-sulfide tailings with little or no carbonate neutralization content. This information can be used in the development of models of tailings leachate chemistry and in the associated design of reclamation covers for desulfurized tailings.
Methods
Samples
Experimental tests were conducted with low-sulfide tailings from two sources. One source was the Aitik Mine operated by Boliden AB. The second source was pilot plant metallurgical tests conducted in 2009 and 2014 for the Resolution Copper (RC) project.
Acid Base Accounting and Mineralogy
Samples of tailings used in kinetic tests were analyzed for acid base accounting (ABA) pa-rameters of: total S, sulfide-S, and neutralization potential. Carbonate neutralization poten-tial (CaNP) was determined from total inorganic carbon.
738
Lappeenranta, Finland IMWA 2017Mine Water and Circular Economy
Wolkersdorfer C, Sartz L, Sillanpää M, Häkkinen A (Editors)
Surface Area
Specific surface areas of four samples of high sulfide RC tailings were measured by N2(g) adsorption BET. The high sulfide tailings contained 20-25% sulfide-S. The specific surface areas measured for the high sulfide tailings are assumed to be representative of sulfide min-erals in low sulfide tailings. Prior to BET measurement, the sulfide mineral contents were enriched by dispersing them in an aqueous solution of lithium meta-tungstate (density = 2.95 g/cm3), followed by centrifugation to separate the float (silicates) and sink (sulfide) fractions. Total recoveries of the float and sink fractions were 92.3 to 99.9%.
The enriched fractions of the high sulfide tailings were analyzed for elemental contents. The total elemental contents averaged 97.5%. The remainder of 2.5% is thought to be mostly oxygen. The average elemental molar amounts for S and Fe, based on the weight % values were 1.56 and 0.77. These molar contents are equivalent to a ratio of S to Fe of 2.02:1.00, which is indicative of pyrite as the primary sulfide mineral in the samples.
Kinetic Testing
Laboratory Testing
Kinetic tests were conducted on low sulfide tailings samples from both RC and Aitik. These tests were conducted according to the humidity cell test (HCT) procedure described in ASTM 5744-96. The HCTs contained 0.5-1 kg of tailings and weekly application of 0.5-1 L of distilled water. The RC HCTs were run for 38-61 weeks. The Aitik HCTs were run for 96-199 weeks.
Leachates from humidity cell tests were analyzed for pH, acidity, alkalinity, conductivity, temperature, SO4, and volume on a weekly basis. Full suites of analytes were determined for weekly leachates for the first five weeks and thereafter every fifth week.
Field Barrel Tests
Field barrel tests were conducted with three samples of low sulfide tailings. The three bar-rels contained 69.7, 78.6, and 95.6 kg of tailings. The barrels collected water from direct pre-cipitation and were also irrigated on an approximate four-week cycle to generate sufficient leachate volumes for analyses.
Laboratory Oxygen Consumption Tests
Laboratory tests of oxidation consumption (“OxCon”) were conducted on six samples of RC tailings. Tailings samples with known moisture content were placed in sealed containers in which the decrease in O2 in the container atmosphered was monitored over time (Bourgeot et al. 2011). The decreases in O2 during were converted to sulfide oxidation rate, assuming that all O2 loss was due to oxidation of pyrite and all iron produced by oxidation was re-pre-cipitated as ferrihydrite.
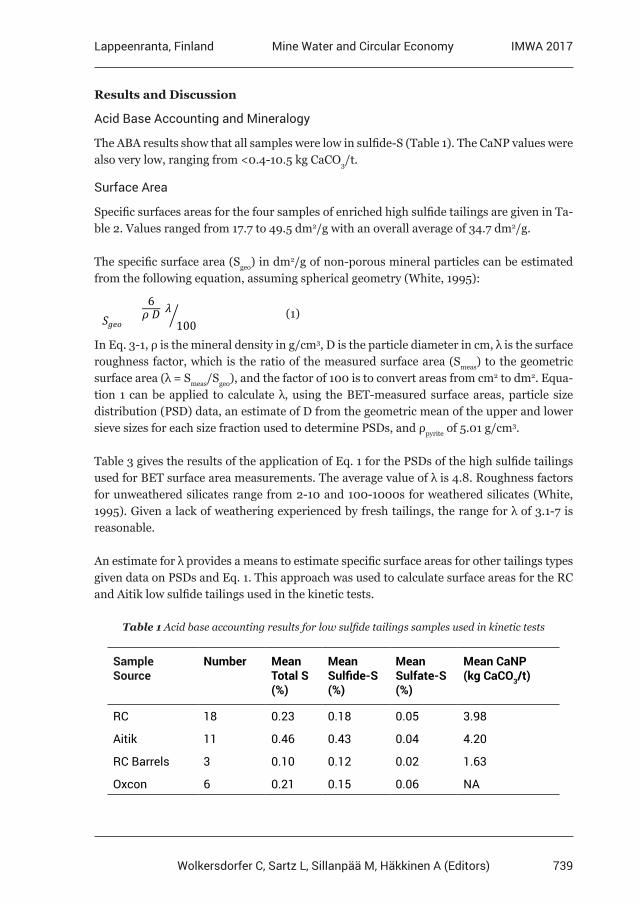
739
Lappeenranta, Finland IMWA 2017Mine Water and Circular Economy
Wolkersdorfer C, Sartz L, Sillanpää M, Häkkinen A (Editors)
Results and Discussion
Acid Base Accounting and Mineralogy
The ABA results show that all samples were low in sulfide-S (Table 1). The CaNP values were also very low, ranging from <0.4-10.5 kg CaCO3/t.
Surface Area
Specific surfaces areas for the four samples of enriched high sulfide tailings are given in Ta-ble 2. Values ranged from 17.7 to 49.5 dm2/g with an overall average of 34.7 dm2/g.
The specific surface area (Sgeo) in dm2/g of non-porous mineral particles can be estimated from the following equation, assuming spherical geometry (White, 1995):
𝑆𝑆𝑔𝑔𝑔𝑔𝑔𝑔 = 6𝜌𝜌 𝐷𝐷 𝜆𝜆
100
(1)
In Eq. 3-1, ρ is the mineral density in g/cm3, D is the particle diameter in cm, λ is the surface roughness factor, which is the ratio of the measured surface area (Smeas) to the geometric surface area (λ = Smeas/Sgeo), and the factor of 100 is to convert areas from cm2 to dm2. Equa-tion 1 can be applied to calculate λ, using the BET-measured surface areas, particle size distribution (PSD) data, an estimate of D from the geometric mean of the upper and lower sieve sizes for each size fraction used to determine PSDs, and ρpyrite of 5.01 g/cm3.
Table 3 gives the results of the application of Eq. 1 for the PSDs of the high sulfide tailings used for BET surface area measurements. The average value of λ is 4.8. Roughness factors for unweathered silicates range from 2-10 and 100-1000s for weathered silicates (White, 1995). Given a lack of weathering experienced by fresh tailings, the range for λ of 3.1-7 is reasonable.
An estimate for λ provides a means to estimate specific surface areas for other tailings types given data on PSDs and Eq. 1. This approach was used to calculate surface areas for the RC and Aitik low sulfide tailings used in the kinetic tests.
Table 1 Acid base accounting results for low sulfide tailings samples used in kinetic tests
Sample Source
Number Mean Total S (%)
Mean Sulfide-S (%)
Mean Sulfate-S (%)
Mean CaNP (kg CaCO3/t)
RC 18 0.23 0.18 0.05 3.98
Aitik 11 0.46 0.43 0.04 4.20
RC Barrels 3 0.10 0.12 0.02 1.63
Oxcon 6 0.21 0.15 0.06 NA
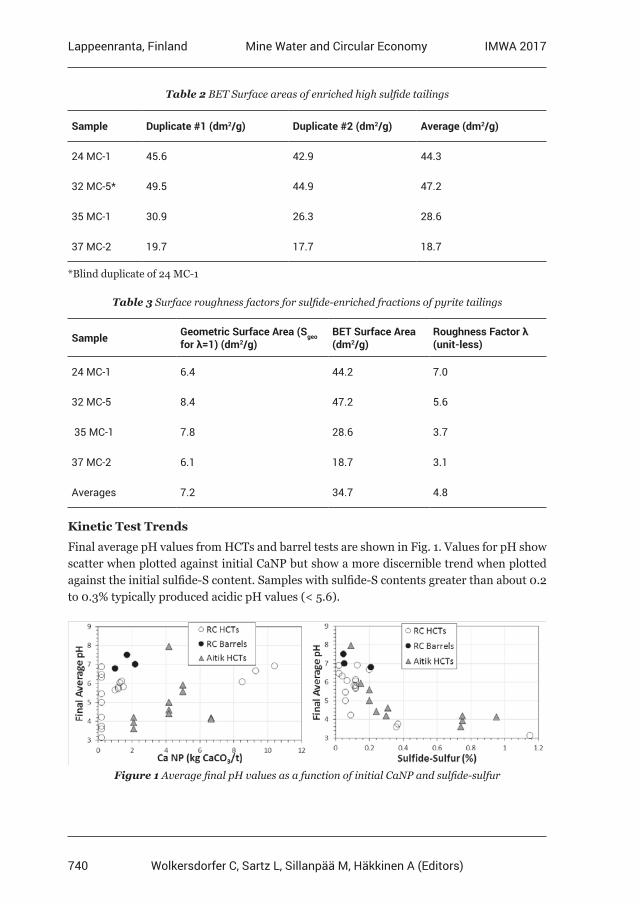
740
Lappeenranta, Finland IMWA 2017Mine Water and Circular Economy
Wolkersdorfer C, Sartz L, Sillanpää M, Häkkinen A (Editors)
Table 2 BET Surface areas of enriched high sulfide tailings
Sample Duplicate #1 (dm2/g) Duplicate #2 (dm2/g) Average (dm2/g)
24 MC-1 45.6 42.9 44.3
32 MC-5* 49.5 44.9 47.2
35 MC-1 30.9 26.3 28.6
37 MC-2 19.7 17.7 18.7
*Blind duplicate of 24 MC-1
Table 3 Surface roughness factors for sulfide-enriched fractions of pyrite tailings
Sample Geometric Surface Area (Sgeo for λ=1) (dm2/g)
BET Surface Area (dm2/g)
Roughness Factor λ (unit-less)
24 MC-1 6.4 44.2 7.0
32 MC-5 8.4 47.2 5.6
35 MC-1 7.8 28.6 3.7
37 MC-2 6.1 18.7 3.1
Averages 7.2 34.7 4.8
Kinetic Test Trends
Final average pH values from HCTs and barrel tests are shown in Fig. 1. Values for pH show scatter when plotted against initial CaNP but show a more discernible trend when plotted against the initial sulfide-S content. Samples with sulfide-S contents greater than about 0.2 to 0.3% typically produced acidic pH values (< 5.6).
Figure 1 Average final pH values as a function of initial CaNP and sulfide-sulfur
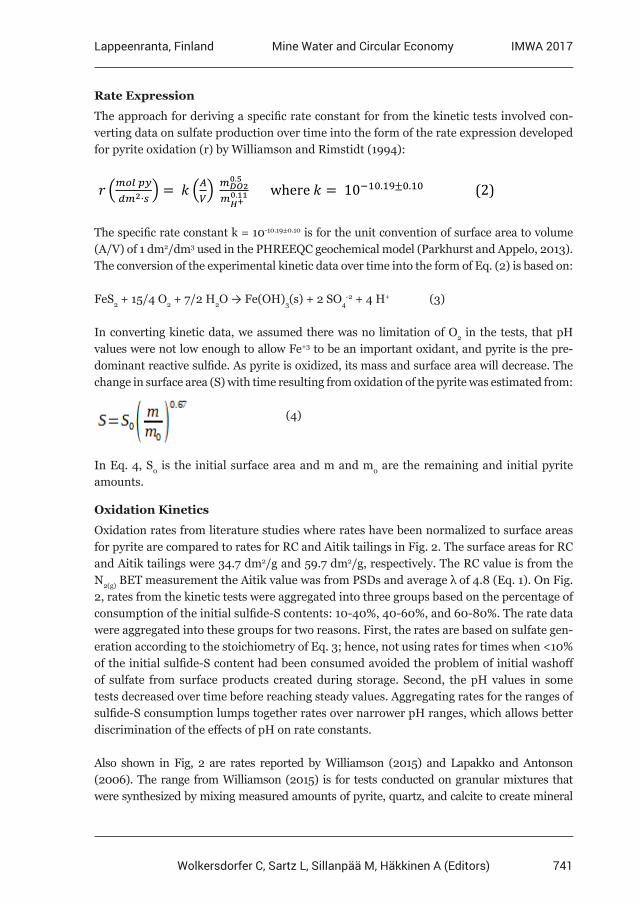
741
Lappeenranta, Finland IMWA 2017Mine Water and Circular Economy
Wolkersdorfer C, Sartz L, Sillanpää M, Häkkinen A (Editors)
Rate Expression
The approach for deriving a specific rate constant for from the kinetic tests involved con-verting data on sulfate production over time into the form of the rate expression developed for pyrite oxidation (r) by Williamson and Rimstidt (1994):
The specific rate constant k = 10-10.19±0.10 is for the unit convention of surface area to volume (A/V) of 1 dm2/dm3 used in the PHREEQC geochemical model (Parkhurst and Appelo, 2013). The conversion of the experimental kinetic data over time into the form of Eq. (2) is based on:
FeS2 + 15/4 O2 + 7/2 H2O → Fe(OH)3(s) + 2 SO4-2 + 4 H+ (3)
In converting kinetic data, we assumed there was no limitation of O2 in the tests, that pH values were not low enough to allow Fe+3 to be an important oxidant, and pyrite is the pre-dominant reactive sulfide. As pyrite is oxidized, its mass and surface area will decrease. The change in surface area (S) with time resulting from oxidation of the pyrite was estimated from:
(4)
In Eq. 4, S0 is the initial surface area and m and m0 are the remaining and initial pyrite amounts.
Oxidation Kinetics
Oxidation rates from literature studies where rates have been normalized to surface areas for pyrite are compared to rates for RC and Aitik tailings in Fig. 2. The surface areas for RC and Aitik tailings were 34.7 dm2/g and 59.7 dm2/g, respectively. The RC value is from the N2(g) BET measurement the Aitik value was from PSDs and average λ of 4.8 (Eq. 1). On Fig. 2, rates from the kinetic tests were aggregated into three groups based on the percentage of consumption of the initial sulfide-S contents: 10-40%, 40-60%, and 60-80%. The rate data were aggregated into these groups for two reasons. First, the rates are based on sulfate gen-eration according to the stoichiometry of Eq. 3; hence, not using rates for times when <10% of the initial sulfide-S content had been consumed avoided the problem of initial washoff of sulfate from surface products created during storage. Second, the pH values in some tests decreased over time before reaching steady values. Aggregating rates for the ranges of sulfide-S consumption lumps together rates over narrower pH ranges, which allows better discrimination of the effects of pH on rate constants.
Also shown in Fig, 2 are rates reported by Williamson (2015) and Lapakko and Antonson (2006). The range from Williamson (2015) is for tests conducted on granular mixtures that were synthesized by mixing measured amounts of pyrite, quartz, and calcite to create mineral
4
The approach for deriving a specific rate constant for from the kinetic tests involved converting data on sulfate production over time into the form of the rate expression developed for pyrite oxidation (r) by Williamson and Rimstidt (1994):
𝑟𝑟𝑟𝑟 𝑚𝑚𝑚𝑚𝑚𝑚𝑚𝑚𝑚𝑚𝑚𝑚 𝑝𝑝𝑝𝑝𝑝𝑝𝑝𝑝𝑑𝑑𝑑𝑑𝑚𝑚𝑚𝑚2∙𝑠𝑠𝑠𝑠
= 𝑘𝑘𝑘𝑘 𝐴𝐴𝐴𝐴𝑉𝑉𝑉𝑉 𝑚𝑚𝑚𝑚𝐷𝐷𝐷𝐷𝐷𝐷𝐷𝐷2
0.5
𝑚𝑚𝑚𝑚𝐻𝐻𝐻𝐻+0.11 where 𝑘𝑘𝑘𝑘 = 10−10.19±0.10 (2)
The specific rate constant k = 10-10.19±0.10 is for the unit convention of surface area to volume (A/V) of 1 dm2/dm3 used in the PHREEQC geochemical model (Parkhurst and Appelo, 2013). The conversion of the experimental kinetic data over time into the form of Eq. (2) is based on:
FeS2 + 15/4 O2 + 7/2 H2O → Fe(OH)3(s) + 2 SO4-2 + 4 H+ (3)
In converting kinetic data, we assumed there was no limitation of O2 in the tests, that pH values were not low enough to allow Fe+3 to be an important oxidant, and pyrite is the predominant reactive sulfide. As pyrite is oxidized, its mass and surface area will decrease. The change in surface area (S) with time resulting from oxidation of the pyrite was estimated from:
𝑆𝑆𝑆𝑆 = 𝑆𝑆𝑆𝑆0 𝑚𝑚𝑚𝑚𝑚𝑚𝑚𝑚00.67
(4)
In Eq. 4, S0 is the initial surface area and m and m0 are the remaining and initial pyrite amounts.
Oxidation Kinetics
Oxidation rates from literature studies where rates have been normalized to surface areas for pyrite are compared to rates for RC and Aitik tailings in Fig. 2. The surface areas for RC and Aitik tailings were 34.7 dm2/g and 59.7 dm2/g, respectively. The RC value is from the N2(g) BET measurement the Aitik value was from PSDs and average λ of 4.8 (Eq. 1). On Fig. 2, rates from the kinetic tests were aggregated into three groups based on the percentage of consumption of the initial sulfide-S contents: 10-40%, 40-60%, and 60-80%. The rate data were aggregated into these groups for two reasons. First, the rates are based on sulfate generation according to the stoichiometry of Eq. 3; hence, not using rates for times when <10% of the initial sulfide-S content had been consumed avoided the problem of initial washoff of sulfate from surface products created during storage. Second, the pH values in some tests decreased over time before reaching steady values. Aggregating rates for the ranges of sulfide-S consumption lumps together rates over narrower pH ranges, which allows better discrimination of the effects of pH on rate constants.
Also shown in Fig, 2 are rates reported by Williamson (2015) and Lapakko and Antonson (2006). The range from Williamson (2015) is for tests conducted on granular mixtures that were synthesized by mixing measured amounts of pyrite, quartz, and calcite to create mineral compositions with a high degree of characterization. The rates obtained by Williamson (2015) for these synthetic compositions overlap with many of those obtained from the low sulfide RC and Aitik tailings. The rates from Lapakko and Antonson (2006) were derived from tests on waste rock samples for which surface areas of the sulfide minerals were estimated. The majority of these rates are also in good agreement with the rates determined for the low sulfide tailings.
In general, the rates for the low sulfide RC and Aitik tailings range up to about 10 times higher than those calculated with the Williamson and Rimstidt (1994) rate expression for pH < ~6. At pH > 6, the rates for the RC and Aitik low sulfide tailings are in better agreement with the rate expression. Also shown in Fig. 3 are rates for oxidation by moist air from Jerz and Rimstidt (2004), Williamson (2013), and Williamson (2015). These rates overlap with those obtained from the OxCon tests on RC low sulfide tailings. The primary exceptions that deviate the other rates are those from the field barrel tests that are about 100 times slower than the laboratory tests. These slower rates are likely due to less access to O2 because of the closed sides and bottoms, leaving diffusion in to the top surface as the only route for O2 entry. Also, a high fraction of the leachate was observed to flow down the inside surfaces of the barrels rather than
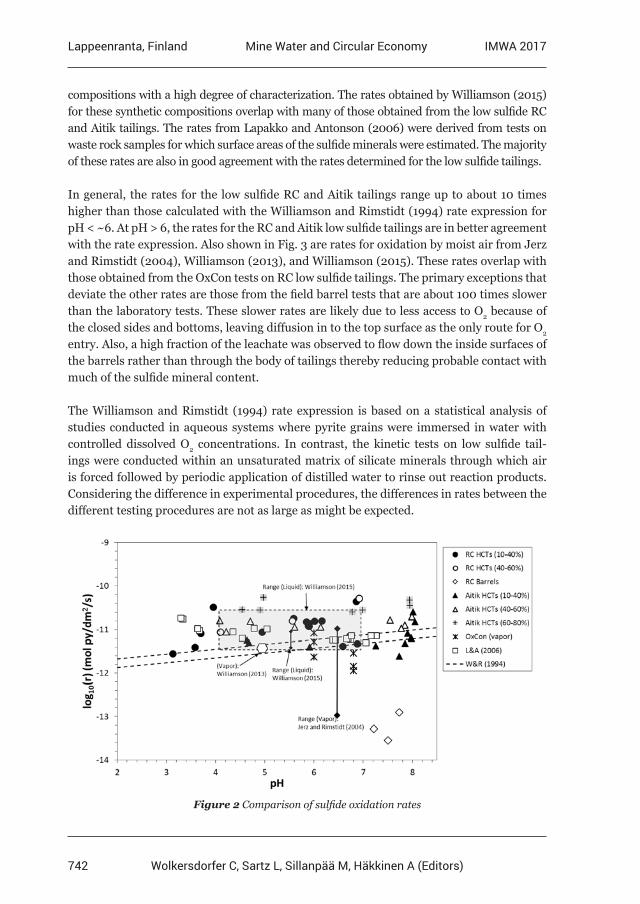
742
Lappeenranta, Finland IMWA 2017Mine Water and Circular Economy
Wolkersdorfer C, Sartz L, Sillanpää M, Häkkinen A (Editors)
compositions with a high degree of characterization. The rates obtained by Williamson (2015) for these synthetic compositions overlap with many of those obtained from the low sulfide RC and Aitik tailings. The rates from Lapakko and Antonson (2006) were derived from tests on waste rock samples for which surface areas of the sulfide minerals were estimated. The majority of these rates are also in good agreement with the rates determined for the low sulfide tailings.
In general, the rates for the low sulfide RC and Aitik tailings range up to about 10 times higher than those calculated with the Williamson and Rimstidt (1994) rate expression for pH < ~6. At pH > 6, the rates for the RC and Aitik low sulfide tailings are in better agreement with the rate expression. Also shown in Fig. 3 are rates for oxidation by moist air from Jerz and Rimstidt (2004), Williamson (2013), and Williamson (2015). These rates overlap with those obtained from the OxCon tests on RC low sulfide tailings. The primary exceptions that deviate the other rates are those from the field barrel tests that are about 100 times slower than the laboratory tests. These slower rates are likely due to less access to O2 because of the closed sides and bottoms, leaving diffusion in to the top surface as the only route for O2 entry. Also, a high fraction of the leachate was observed to flow down the inside surfaces of the barrels rather than through the body of tailings thereby reducing probable contact with much of the sulfide mineral content.
The Williamson and Rimstidt (1994) rate expression is based on a statistical analysis of studies conducted in aqueous systems where pyrite grains were immersed in water with controlled dissolved O2 concentrations. In contrast, the kinetic tests on low sulfide tail-ings were conducted within an unsaturated matrix of silicate minerals through which air is forced followed by periodic application of distilled water to rinse out reaction products. Considering the difference in experimental procedures, the differences in rates between the different testing procedures are not as large as might be expected.
Figure 2 Comparison of sulfide oxidation rates
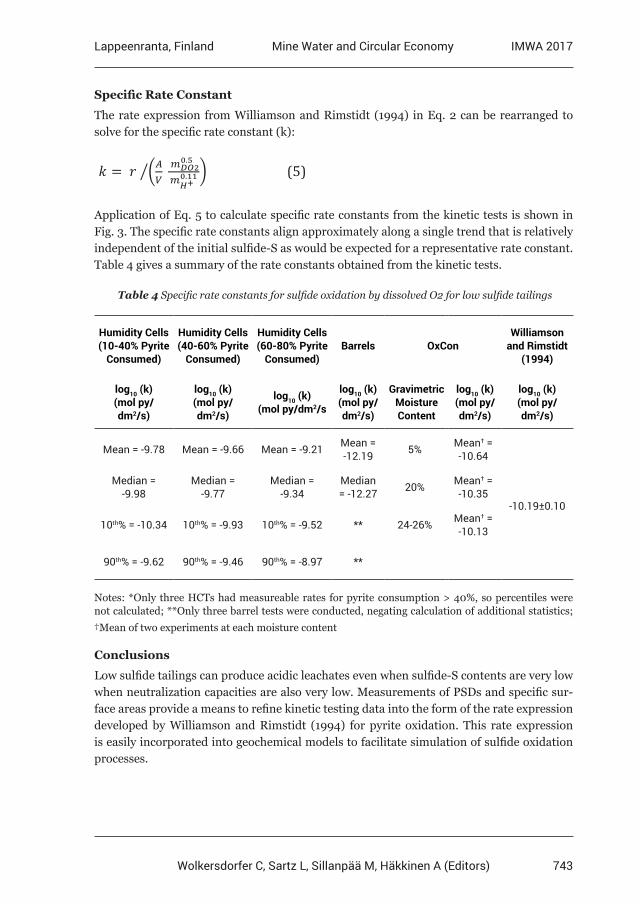
743
Lappeenranta, Finland IMWA 2017Mine Water and Circular Economy
Wolkersdorfer C, Sartz L, Sillanpää M, Häkkinen A (Editors)
Specific Rate Constant
The rate expression from Williamson and Rimstidt (1994) in Eq. 2 can be rearranged to solve for the specific rate constant (k):
Application of Eq. 5 to calculate specific rate constants from the kinetic tests is shown in Fig. 3. The specific rate constants align approximately along a single trend that is relatively independent of the initial sulfide-S as would be expected for a representative rate constant. Table 4 gives a summary of the rate constants obtained from the kinetic tests.
Table 4 Specific rate constants for sulfide oxidation by dissolved O2 for low sulfide tailings
Humidity Cells (10-40% Pyrite
Consumed)
Humidity Cells (40-60% Pyrite
Consumed)
Humidity Cells (60-80% Pyrite
Consumed)Barrels OxCon
Williamson and Rimstidt
(1994)
log10 (k)(mol py/dm2/s)
log10 (k)(mol py/dm2/s)
log10 (k)(mol py/dm2/s
log10 (k)(mol py/dm2/s)
Gravimetric Moisture Content
log10 (k)(mol py/dm2/s)
log10 (k) (mol py/dm2/s)
Mean = -9.78 Mean = -9.66 Mean = -9.21 Mean = -12.19 5% Mean† =
-10.64
-10.19±0.10
Median = -9.98
Median = -9.77
Median = -9.34
Median = -12.27 20% Mean† =
-10.35
10th% = -10.34 10th% = -9.93 10th% = -9.52 ** 24-26% Mean† = -10.13
90th% = -9.62 90th% = -9.46 90th% = -8.97 **
Notes: *Only three HCTs had measureable rates for pyrite consumption > 40%, so percentiles were not calculated; **Only three barrel tests were conducted, negating calculation of additional statistics; †Mean of two experiments at each moisture content
Conclusions
Low sulfide tailings can produce acidic leachates even when sulfide-S contents are very low when neutralization capacities are also very low. Measurements of PSDs and specific sur-face areas provide a means to refine kinetic testing data into the form of the rate expression developed by Williamson and Rimstidt (1994) for pyrite oxidation. This rate expression is easily incorporated into geochemical models to facilitate simulation of sulfide oxidation processes.
5
through the body of tailings thereby reducing probable contact with much of the sulfide mineral content.
The Williamson and Rimstidt (1994) rate expression is based on a statistical analysis of studies conducted in aqueous systems where pyrite grains were immersed in water with controlled dissolved O2 concentrations. In contrast, the kinetic tests on low sulfide tailings were conducted within an unsaturated matrix of silicate minerals through which air is forced followed by periodic application of distilled water to rinse out reaction products. Considering the difference in experimental procedures, the differences in rates between the different testing procedures are not as large as might be expected.
Figure 2 Comparison of sulfide oxidation rates
Specific Rate Constant
The rate expression from Williamson and Rimstidt (1994) in Eq. 2 can be rearranged to solve for the specific rate constant (k):
𝑘𝑘𝑘𝑘 = 𝑟𝑟𝑟𝑟 𝐴𝐴𝐴𝐴𝑉𝑉𝑉𝑉
𝑚𝑚𝑚𝑚𝐷𝐷𝐷𝐷𝐷𝐷𝐷𝐷20.5
𝑚𝑚𝑚𝑚𝐻𝐻𝐻𝐻+0.11 (5)
Application of Eq. 5 to calculate specific rate constants from the kinetic tests is shown in Fig. 3. The specific rate constants align approximately along a single trend that is relatively independent of the initial sulfide-S as would be expected for a representative rate constant. Table 4 gives a summary of the rate constants obtained from the kinetic tests.
Table 4 Specific rate constants for sulfide oxidation by dissolved O2 for low sulfide tailings Humidity Cells (10-40% Pyrite
Consumed)
Humidity Cells (40-60% Pyrite
Consumed)
Humidity Cells (60-80% Pyrite
Consumed) Barrels OxCon Williamson and
Rimstidt (1994)
log10 (k) (mol py/dm2/s)
log10 (k) (mol py/dm2/s)
log10 (k) (mol py/dm2/s log10 (k)
(mol py/dm2/s)
Gravimetric Moisture Content
log10 (k) (mol py/dm2/s)
log10 (k) (mol py/dm2/s)
Mean = -9.78 Mean = -9.66 Mean = -9.21 Mean = -12.19 5% Mean† = -10.64
-10.19±0.10 Median = -9.98 Median = -9.77 Median = -9.34 Median = -12.27 20% Mean† = -10.35 10th% = -10.34 10th% = -9.93 10th% = -9.52 ** 24-26% Mean† = -10.13 90th% = -9.62 90th% = -9.46 90th% = -8.97 **
Notes: *Only three HCTs had measureable rates for pyrite consumption > 40%, so percentiles were not calculated; **Only three barrel tests were conducted, negating calculation of additional statistics; †Mean of two experiments at each moisture content
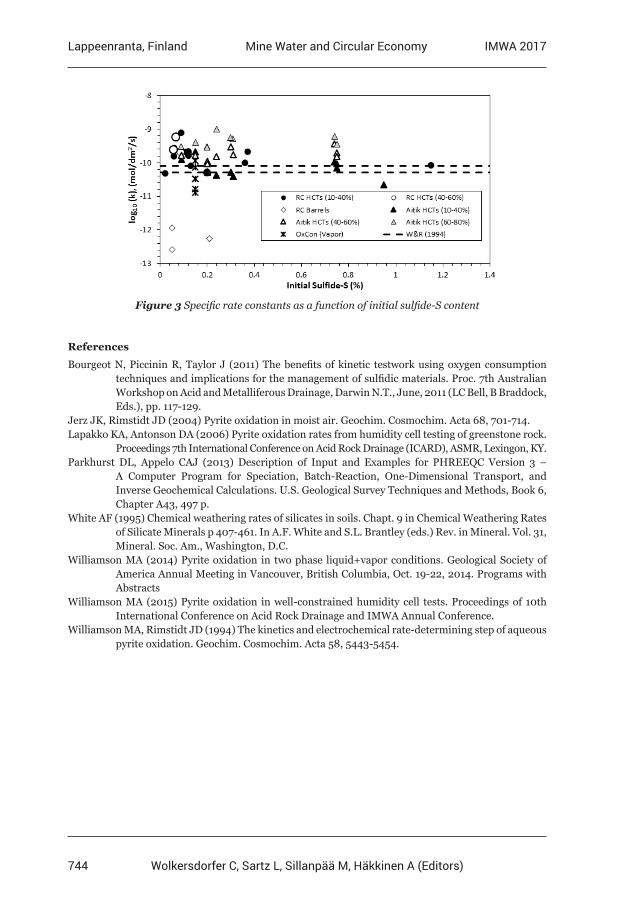
744
Lappeenranta, Finland IMWA 2017Mine Water and Circular Economy
Wolkersdorfer C, Sartz L, Sillanpää M, Häkkinen A (Editors)
References
Bourgeot N, Piccinin R, Taylor J (2011) The benefits of kinetic testwork using oxygen consumption techniques and implications for the management of sulfidic materials. Proc. 7th Australian Workshop on Acid and Metalliferous Drainage, Darwin N.T., June, 2011 (LC Bell, B Braddock, Eds.), pp. 117-129.Jerz JK, Rimstidt JD (2004) Pyrite oxidation in moist air. Geochim. Cosmochim. Acta 68, 701-714.Lapakko KA, Antonson DA (2006) Pyrite oxidation rates from humidity cell testing of greenstone rock. Proceedings 7th International Conference on Acid Rock Drainage (ICARD), ASMR, Lexingon, KY.Parkhurst DL, Appelo CAJ (2013) Description of Input and Examples for PHREEQC Version 3 – A Computer Program for Speciation, Batch-Reaction, One-Dimensional Transport, and Inverse Geochemical Calculations. U.S. Geological Survey Techniques and Methods, Book 6, Chapter A43, 497 p.White AF (1995) Chemical weathering rates of silicates in soils. Chapt. 9 in Chemical Weathering Rates of Silicate Minerals p 407-461. In A.F. White and S.L. Brantley (eds.) Rev. in Mineral. Vol. 31, Mineral. Soc. Am., Washington, D.C.Williamson MA (2014) Pyrite oxidation in two phase liquid+vapor conditions. Geological Society of America Annual Meeting in Vancouver, British Columbia, Oct. 19-22, 2014. Programs with AbstractsWilliamson MA (2015) Pyrite oxidation in well-constrained humidity cell tests. Proceedings of 10th International Conference on Acid Rock Drainage and IMWA Annual Conference.Williamson MA, Rimstidt JD (1994) The kinetics and electrochemical rate-determining step of aqueous pyrite oxidation. Geochim. Cosmochim. Acta 58, 5443-5454.
Figure 3 Specific rate constants as a function of initial sulfide-S content
745
Lappeenranta, Finland IMWA 2017Mine Water and Circular Economy
Wolkersdorfer C, Sartz L, Sillanpää M, Häkkinen A (Editors)
The Whitehill Formation as a Potential Analogue to the Acid Mine Drainage Issues in the Witwatersrand, South Africa
Dikeledi Tryphina Mashishi1, Christian Wolkersdorfer1,2
1Tshwane University of Technology (TUT), Department of Environmental, Water & Earth Sciences, Private Bag X680, Pretoria, 0001, South Africa
2Lappeenranta University of Technology, Laboratory of Green Chemistry, Sammonkatu 12, 50130 Mikkeli, Finland, [email protected]
Abstract Acid mine drainage issues have been a cause for worldwide concern. This study assessed the potential of the Whitehill Formation as an analogue to the acid mine drainage issues in the Witwatersrand, South Africa. Evaluation of the Whitehill Formation suggests that the outcrop of gypsum in the formation is derived from reaction of pyrite-bearing shale with calcite. In order to determine this, the geochemical, geological and palaeoclimatic setting and strata similar to the formation were investigated. In addition, chemical-thermodynamic modelling (PHREEQC) was used for simulations. The results of this study show that metals precipitated out of the rock-water solution to form various mineral phases.
Key words Acid mine drainage, Witwatersrand basin; natural analogue, Whitehill Formation; similar strata; geochemical modelling
Introduction
Environmental effects associated with mining often affect the natural water environment, thus resulting in acid mine drainage generation (AMD) (Younger & Wolkersdorfer 2004). Acid mine drainage is formed by the oxidation of pyrite in the presence of oxygen and water (Stumm & Morgan 1996). In South Africa, the rocks of the Witwatersrand Basin consist primarily of 70–90% quartz and 3–5% pyrite and the main reefs are situated underneath a dolomitic karst aquifer (Durand 2012). Mining activities in the Witwatersrand Basin have been in place for over 100 years, with some of the pyrite deposited on tailing dumps, thus resulting in the generation of acidic mine waters which discharge approximately 14.17 m3/h of mine water (Masindi et al. 2016; McCarthy 2011).
In order to reconstruct the occurrence of natural processes of over millions (Ma) to bil-lions (Ga) of years ago, this study uses a natural analogue, which has also been used else-where (Bruno et al. 2002). Throughout the entire Karoo Basin, the Whitehill Formation occurs and is overlain by the Collingham Formation and underlain by the Prince Albert Formation (Cole & Basson 1991). Deposition of the Whitehill Formation was about 275 Ma ago under deep marine anoxic conditions which prevailed until the deposition of the Coll-ingham Formation. In addition, the Whitehill Formation is predominantly comprised of pyrite-bearing shale, black carbonaceous mudstone, organic rich matter, dolomite, quartz and gypsum outcrops (Smithard et al. 2015; Branch 2007). According to Geel et al. (2015), the pyrite-bearing shale close to contact with the Whitehill Formation is framboidal pyrite which is its most reactive form as described by Nordstrom (1982).
In a natural environment, sulfate deposits are exposed to water through joints and fissures in order to generate sulfate solutions. When in contact with carbonates, sulfate solutions react with
746
Lappeenranta, Finland IMWA 2017Mine Water and Circular Economy
Wolkersdorfer C, Sartz L, Sillanpää M, Häkkinen A (Editors)
calcium to promote the precipitation of gypsum (CaSO4.2H2O) as associated with the distribution of Ca2+ and SO4
2−. This chemical process is given by the following equation (Lottermoser 2010):
CaCO3 + H2SO4 + H2O → CaSO4.2H2O + CO2 (1)
Strata similar to the Whitehill Formation are the Marcellus Formation (United States of America), Irati Black Shale Formation (Uruguay), Mangrullo Formation (Argentina, Par-aguay and Uruguay), Tacuary Formation (Paraguay), Barnett Shale Formation (United States of America), Kupferschiefer Shale Formation (Germany) and the Moenkopi Forma-tion (United States of America) (Geel et al. 2015, Stewart et al. 1972). All strata similar to the Whitehill Formation describe the precipitation of gypsum which formed as a result of acid rock drainage (ARD). In this study, we determine whether gypsum of the Whitehill Forma-tion is associated with ARD using geochemical modelling which comprises of the combina-tion of field and laboratory experiments in order to understand current AMD issues.
Methods
A total of seven rock samples were collected from the outcrops of the Whitehill Formation in Loeriesfontein, Calvinia and Laingsburg, South Africa (table 1). In order to determine the major and trace metals of the samples, X-ray fluorescence was used (PANalytical Axios X-ray fluorescence spectrometer: Council of Geoscience). In TUT’s mine water laboratory, batch tests with 400 mL of distilled water added to rock samples for analysis of the aqueous solution development were conducted. Furthermore, the parameters pH and electrical con-ductivity were determined over twelve weeks using Hach pHC201 and Hach CDC401 probes, connected to a Hach HQ40d. Also, at the end of the analysis, filtered samples were taken (0.45 µm nylon membrane syringe filters) and the residual water metal ion concentration were measured using inductively couple plasma-emission spectroscopy (9000 model ICP-OES at the Department of Chemical Engineering, in Tshwane University of Technology). In addition, ion chromatography (883 model: TUT Environmental and Analytical Chemistry Research laboratory) was used for anion analyses. Samples were measured in triplicate and results are reported as the mean. Results of the water quality parameters were verified by WaterLab. Moreover, results of aqueous solution were used in PHREEQC (WATEQ4F data-base) in order to calculate ion activities and saturation indices (SI) of mineral phases.
Principal component analysis (variance-covariance) was used to classify the seven samples (Past 3.15 from Øyvind Hammer).
Table 1 Geographical coordinates, WGS84
Sample Geodetic Datum
LF1 30°56′52″ S, 19°25′51″ E
LF2 30°56′35″ S, 19°25′59″ E
CV 31°29′20″ S, 19°28′48″ E
LB1 33°12′13″ S, 20°37′41″ E
LB2 33°10′58″ S, 20°49′03″ E
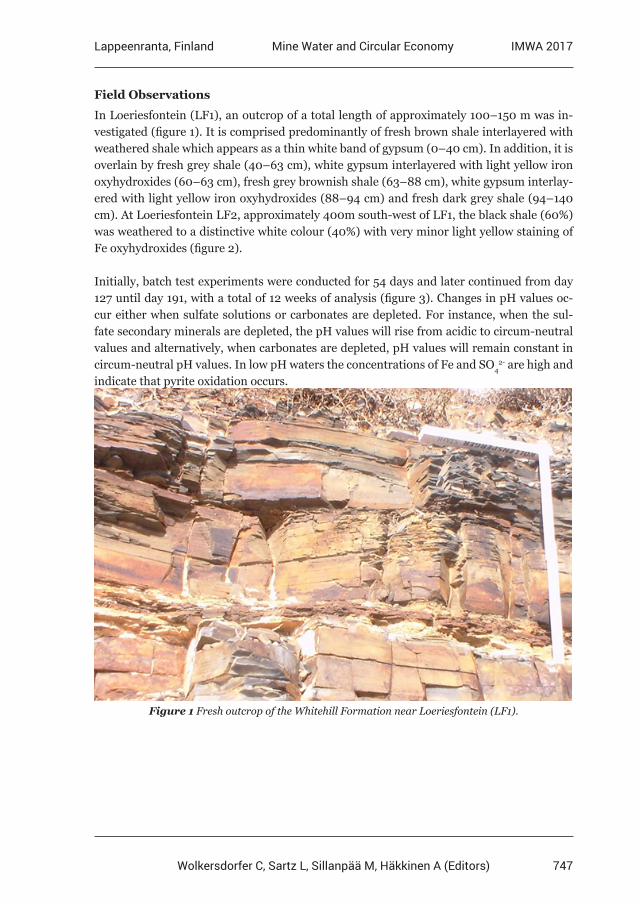
747
Lappeenranta, Finland IMWA 2017Mine Water and Circular Economy
Wolkersdorfer C, Sartz L, Sillanpää M, Häkkinen A (Editors)
Field Observations
In Loeriesfontein (LF1), an outcrop of a total length of approximately 100–150 m was in-vestigated (figure 1). It is comprised predominantly of fresh brown shale interlayered with weathered shale which appears as a thin white band of gypsum (0–40 cm). In addition, it is overlain by fresh grey shale (40–63 cm), white gypsum interlayered with light yellow iron oxyhydroxides (60–63 cm), fresh grey brownish shale (63–88 cm), white gypsum interlay-ered with light yellow iron oxyhydroxides (88–94 cm) and fresh dark grey shale (94–140 cm). At Loeriesfontein LF2, approximately 400m south-west of LF1, the black shale (60%) was weathered to a distinctive white colour (40%) with very minor light yellow staining of Fe oxyhydroxides (figure 2).
Initially, batch test experiments were conducted for 54 days and later continued from day 127 until day 191, with a total of 12 weeks of analysis (figure 3). Changes in pH values oc-cur either when sulfate solutions or carbonates are depleted. For instance, when the sul-fate secondary minerals are depleted, the pH values will rise from acidic to circum-neutral values and alternatively, when carbonates are depleted, pH values will remain constant in circum-neutral pH values. In low pH waters the concentrations of Fe and SO4
2- are high and indicate that pyrite oxidation occurs.
Figure 1 Fresh outcrop of the Whitehill Formation near Loeriesfontein (LF1).
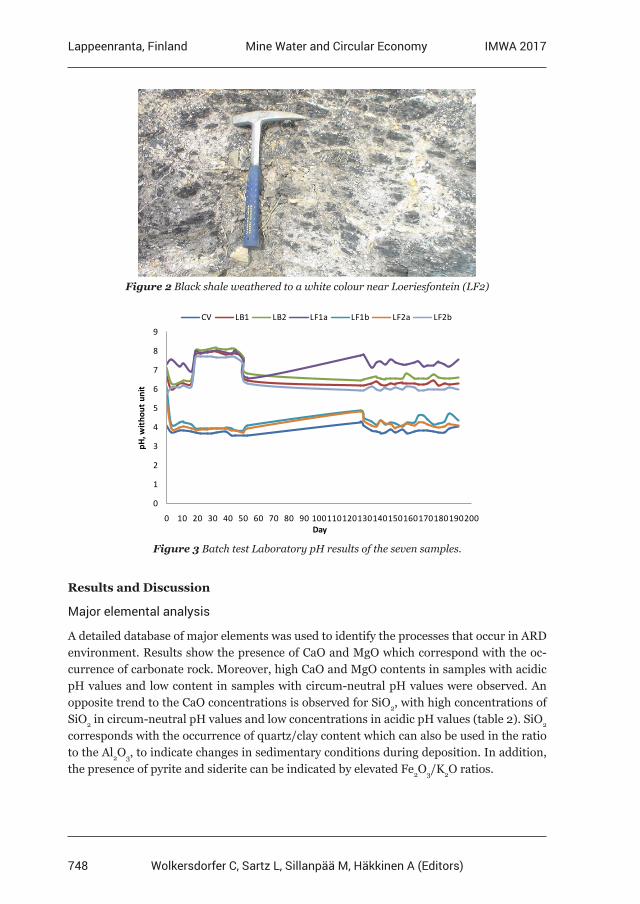
748
Lappeenranta, Finland IMWA 2017Mine Water and Circular Economy
Wolkersdorfer C, Sartz L, Sillanpää M, Häkkinen A (Editors)
Figure 2 Black shale weathered to a white colour near Loeriesfontein (LF2)
0
1
2
3
4
5
6
7
8
9
0 10 20 30 40 50 60 70 80 90 100110120130140150160170180190200
pH, w
ithou
t uni
t
Day
CV LB1 LB2 LF1a LF1b LF2a LF2b
Figure 3 Batch test Laboratory pH results of the seven samples.
Results and Discussion
Major elemental analysis
A detailed database of major elements was used to identify the processes that occur in ARD environment. Results show the presence of CaO and MgO which correspond with the oc-currence of carbonate rock. Moreover, high CaO and MgO contents in samples with acidic pH values and low content in samples with circum-neutral pH values were observed. An opposite trend to the CaO concentrations is observed for SiO2, with high concentrations of SiO2 in circum-neutral pH values and low concentrations in acidic pH values (table 2). SiO2 corresponds with the occurrence of quartz/clay content which can also be used in the ratio to the Al2O3, to indicate changes in sedimentary conditions during deposition. In addition, the presence of pyrite and siderite can be indicated by elevated Fe2O3/K2O ratios.
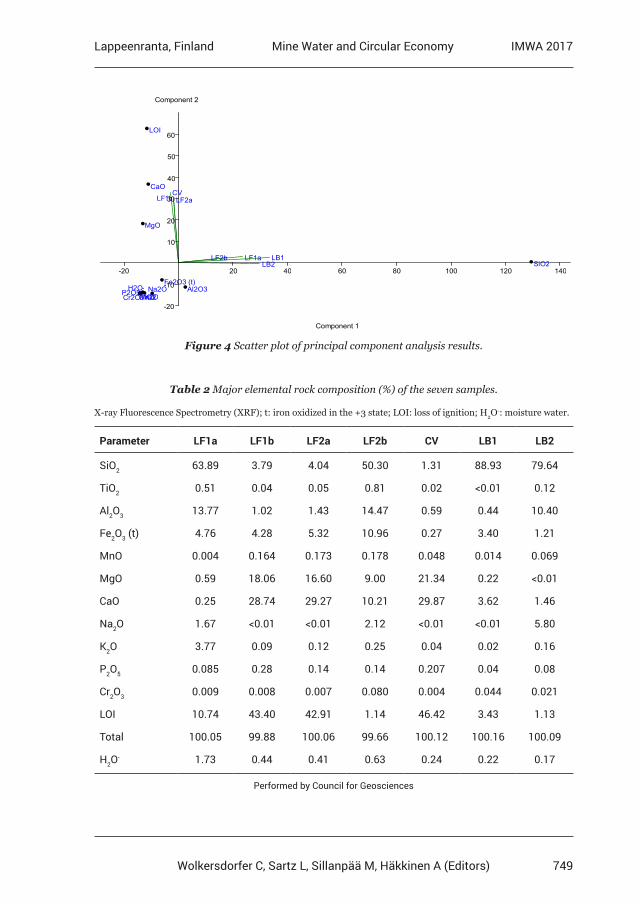
749
Lappeenranta, Finland IMWA 2017Mine Water and Circular Economy
Wolkersdorfer C, Sartz L, Sillanpää M, Häkkinen A (Editors)
LF1a
Cr2O 3 M T K i n O 2 O 2 O - 20
Component 1
LF 1 3 b 0 LF2a
LF2b
CV
LB1 LB2 SiO2
Al2O3 Fe2O3 (t)
MgO
50
40 CaO
Na2O P2O5
LOI
H2O - - 20 20 40 60 80 100 120 140
- 10
10
20
60
Component 2
Figure 4 Scatter plot of principal component analysis results.
Table 2 Major elemental rock composition (%) of the seven samples.
X-ray Fluorescence Spectrometry (XRF); t: iron oxidized in the +3 state; LOI: loss of ignition; H2O-: moisture water.
Parameter LF1a LF1b LF2a LF2b CV LB1 LB2
SiO2 63.89 3.79 4.04 50.30 1.31 88.93 79.64
TiO2 0.51 0.04 0.05 0.81 0.02 <0.01 0.12
Al2O3 13.77 1.02 1.43 14.47 0.59 0.44 10.40
Fe2O3 (t) 4.76 4.28 5.32 10.96 0.27 3.40 1.21
MnO 0.004 0.164 0.173 0.178 0.048 0.014 0.069
MgO 0.59 18.06 16.60 9.00 21.34 0.22 <0.01
CaO 0.25 28.74 29.27 10.21 29.87 3.62 1.46
Na2O 1.67 <0.01 <0.01 2.12 <0.01 <0.01 5.80
K2O 3.77 0.09 0.12 0.25 0.04 0.02 0.16
P2O5 0.085 0.28 0.14 0.14 0.207 0.04 0.08
Cr2O3 0.009 0.008 0.007 0.080 0.004 0.044 0.021
LOI 10.74 43.40 42.91 1.14 46.42 3.43 1.13
Total 100.05 99.88 100.06 99.66 100.12 100.16 100.09
H2O- 1.73 0.44 0.41 0.63 0.24 0.22 0.17
Performed by Council for Geosciences
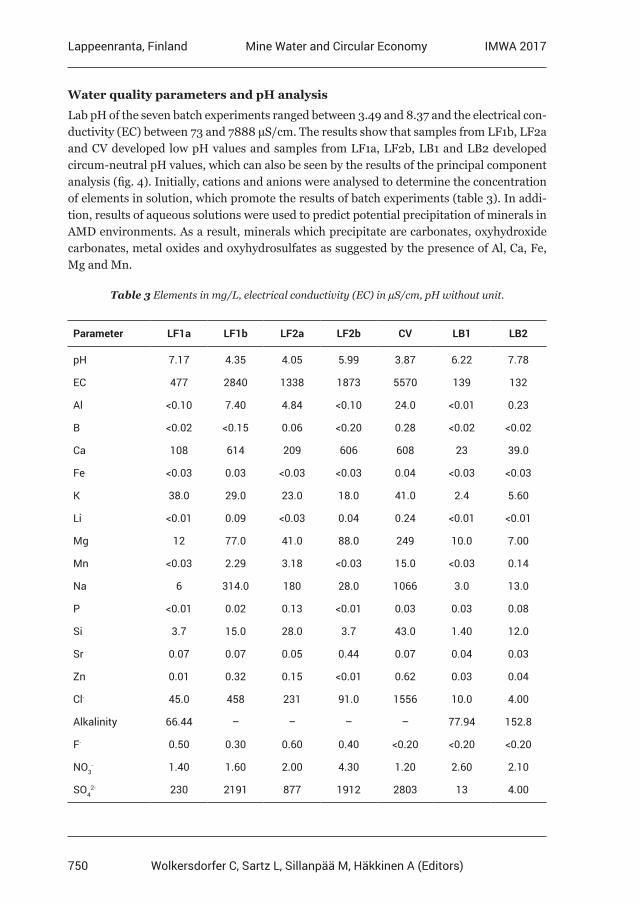
750
Lappeenranta, Finland IMWA 2017Mine Water and Circular Economy
Wolkersdorfer C, Sartz L, Sillanpää M, Häkkinen A (Editors)
Water quality parameters and pH analysis
Lab pH of the seven batch experiments ranged between 3.49 and 8.37 and the electrical con-ductivity (EC) between 73 and 7888 µS/cm. The results show that samples from LF1b, LF2a and CV developed low pH values and samples from LF1a, LF2b, LB1 and LB2 developed circum-neutral pH values, which can also be seen by the results of the principal component analysis (fig. 4). Initially, cations and anions were analysed to determine the concentration of elements in solution, which promote the results of batch experiments (table 3). In addi-tion, results of aqueous solutions were used to predict potential precipitation of minerals in AMD environments. As a result, minerals which precipitate are carbonates, oxyhydroxide carbonates, metal oxides and oxyhydrosulfates as suggested by the presence of Al, Ca, Fe, Mg and Mn.
Table 3 Elements in mg/L, electrical conductivity (EC) in µS/cm, pH without unit.
Parameter LF1a LF1b LF2a LF2b CV LB1 LB2
pH 7.17 4.35 4.05 5.99 3.87 6.22 7.78
EC 477 2840 1338 1873 5570 139 132
Al <0.10 7.40 4.84 <0.10 24.0 <0.01 0.23
B <0.02 <0.15 0.06 <0.20 0.28 <0.02 <0.02
Ca 108 614 209 606 608 23 39.0
Fe <0.03 0.03 <0.03 <0.03 0.04 <0.03 <0.03
K 38.0 29.0 23.0 18.0 41.0 2.4 5.60
Li <0.01 0.09 <0.03 0.04 0.24 <0.01 <0.01
Mg 12 77.0 41.0 88.0 249 10.0 7.00
Mn <0.03 2.29 3.18 <0.03 15.0 <0.03 0.14
Na 6 314.0 180 28.0 1066 3.0 13.0
P <0.01 0.02 0.13 <0.01 0.03 0.03 0.08
Si 3.7 15.0 28.0 3.7 43.0 1.40 12.0
Sr 0.07 0.07 0.05 0.44 0.07 0.04 0.03
Zn 0.01 0.32 0.15 <0.01 0.62 0.03 0.04
Cl- 45.0 458 231 91.0 1556 10.0 4.00
Alkalinity 66.44 – – – – 77.94 152.8
F- 0.50 0.30 0.60 0.40 <0.20 <0.20 <0.20
NO3- 1.40 1.60 2.00 4.30 1.20 2.60 2.10
SO42- 230 2191 877 1912 2803 13 4.00
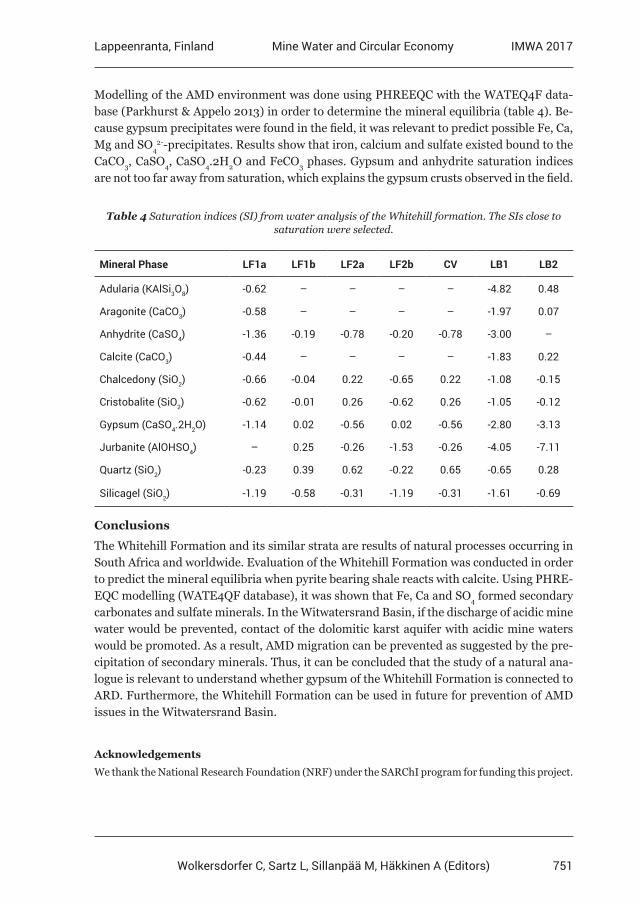
751
Lappeenranta, Finland IMWA 2017Mine Water and Circular Economy
Wolkersdorfer C, Sartz L, Sillanpää M, Häkkinen A (Editors)
Modelling of the AMD environment was done using PHREEQC with the WATEQ4F data-base (Parkhurst & Appelo 2013) in order to determine the mineral equilibria (table 4). Be-cause gypsum precipitates were found in the field, it was relevant to predict possible Fe, Ca, Mg and SO4
2--precipitates. Results show that iron, calcium and sulfate existed bound to the CaCO3, CaSO4, CaSO4.2H2O and FeCO3 phases. Gypsum and anhydrite saturation indices are not too far away from saturation, which explains the gypsum crusts observed in the field.
Table 4 Saturation indices (SI) from water analysis of the Whitehill formation. The SIs close to saturation were selected.
Mineral Phase LF1a LF1b LF2a LF2b CV LB1 LB2
Adularia (KAlSi3O8) -0.62 – – – – -4.82 0.48
Aragonite (CaCO3) -0.58 – – – – -1.97 0.07
Anhydrite (CaSO4) -1.36 -0.19 -0.78 -0.20 -0.78 -3.00 –
Calcite (CaCO3) -0.44 – – – – -1.83 0.22
Chalcedony (SiO2) -0.66 -0.04 0.22 -0.65 0.22 -1.08 -0.15
Cristobalite (SiO2) -0.62 -0.01 0.26 -0.62 0.26 -1.05 -0.12
Gypsum (CaSO4.2H2O) -1.14 0.02 -0.56 0.02 -0.56 -2.80 -3.13
Jurbanite (AlOHSO4) – 0.25 -0.26 -1.53 -0.26 -4.05 -7.11
Quartz (SiO2) -0.23 0.39 0.62 -0.22 0.65 -0.65 0.28
Silicagel (SiO2) -1.19 -0.58 -0.31 -1.19 -0.31 -1.61 -0.69
Conclusions
The Whitehill Formation and its similar strata are results of natural processes occurring in South Africa and worldwide. Evaluation of the Whitehill Formation was conducted in order to predict the mineral equilibria when pyrite bearing shale reacts with calcite. Using PHRE-EQC modelling (WATE4QF database), it was shown that Fe, Ca and SO4 formed secondary carbonates and sulfate minerals. In the Witwatersrand Basin, if the discharge of acidic mine water would be prevented, contact of the dolomitic karst aquifer with acidic mine waters would be promoted. As a result, AMD migration can be prevented as suggested by the pre-cipitation of secondary minerals. Thus, it can be concluded that the study of a natural ana-logue is relevant to understand whether gypsum of the Whitehill Formation is connected to ARD. Furthermore, the Whitehill Formation can be used in future for prevention of AMD issues in the Witwatersrand Basin.
Acknowledgements
We thank the National Research Foundation (NRF) under the SARChI program for funding this project.
752
Lappeenranta, Finland IMWA 2017Mine Water and Circular Economy
Wolkersdorfer C, Sartz L, Sillanpää M, Häkkinen A (Editors)
References
Branch T, Ritter O, Weckmann U, Sachsenhofer RF, Schilling F (2007) The Whitehill Formation: a high conductivity marker horizon in the Karoo Basin. S Afr J Geol 110(2–3):465–476, doi:10.2113/gssajg.110.2-3.465Bruno J, Duro L, Grivé M (2002) The applicability and limitations of thermodynamic geochemical models to simulate trace element behaviour in natural waters: Lessons learned from natural analogue studies. Chem Geol 190(1–4):371–393, doi:10.1016/S0009-2541(02)00126-2Cole DI, Basson WA (1991) Whitehill Formation. In: Johnson MR, Anhaeusser CR, Thomas RJ (Eds), 2006 The Geology of South Africa, Geological society of South Africa: Council for Geoscience, p 51–53Durand J (2012) The impact of gold mining of the Witwatersrand on the rivers and karst system of Gauteng and North West Province, South Africa. J Afr Earth Sci 68:24–43, doi:10.1016/j. jafrearsci.2012.03.013Geel L, De Wit M, Booth P, Schulz HM, Horsfield B (2015) Palaeo-Environment, diagenesis and characteristics of permian black shales in the lower Karoo Supergroup flanking the cape fold belt near Jansenville, Eastern Cape, South Africa: Implications for the shale gas potential of the Karoo Basin. S Afr J Geol 118(3):249–274, doi:10.2113/gssajg.118.3.249Lottermoser B (2010) Mine Wastes – Characterization, Treatment and Environmental Impacts, 3rd edn. Springer, HeidelbergMasindi V, Gitari MW, Tutu H, De Beer M (2016) Fate of inorganic contaminants post treatment of acid mine drainage by cryptocrystalline magnesite: Complimenting experimental results with a geochemical model. J Environ Chem Eng, 4(4):4846–4856, doi:10.1016/j.jece.2016.03.020McCarthy TS (2006) The Witwatersrand Supergroup. In: Johnson MR, Anhaeusser CR, Thomas RJ (Eds), 2006 The Geology of South Africa, Geological society of South Africa: Council for Geoscience, p 155-156McCarthy TS (2011) The impact of acid mine drainage in South Africa. J Afr Earth Sci 107(5/6):712– 718, doi:10.4102/sajs.v107i5/6.712Nordstrom DK (1982) Aqueous pyrite oxidation and the consequent formation of secondary iron minerals. In:Kittrick JA, Fanning DS, Hossner LR (Eds). Acid sulfate weathering. Soil Sci Soc Am Pub 37–56.Parkhurst DL, Appelo CAJ (2013) Description of Input and Examples for PHREEQC Version 3 – A Computer Program for Speciation, Batch-Reaction, One-Dimensional Transport, and Inverse Geochemical Calculations. US Geol Surv Tech Methods 6(A43):1–497 Smithard T, Bordy EM, Reid D (2015) The effect of dolerite intrusions on the hydrocarbon potential of the lower Permian Whitehill formation (Karoo Supergroup) in South Africa and Southern Namibia: A preliminary study. S Afr J Geol 118(4):489–510, doi:10.2113/gssajg.118.4.489Stewart JH, Poole FG, Wilson RF (1972) Stratigraphy and origin of the Triassic Moenkopi Formation and related strata in the Colorado Plateau region. United States Government Printing Office: Washington, 15-77 ppStumm W, Morgan JJ (1996) Aquatic chemistry – Chemical Equilibria and Rates in Natural Waters, 3rd edn. Wiley & Sons, New YorkWolkersdorfer C (2008) Water Management at Abandoned Flooded Underground Mines – Fundamentals, Tracer Tests, Modelling, Water Treatment. Heidelberg, Springer, 222 ppYounger PL, Wolkersdorfer C (2004) Mining Impacts on the Fresh Water Environment: Technical and Managerial Guidelines for Catchment Scale Management. Mine Water and the Environment (2004) 23: S2–S80
753
Lappeenranta, Finland IMWA 2017Mine Water and Circular Economy
Wolkersdorfer C, Sartz L, Sillanpää M, Häkkinen A (Editors)
Water quality of the abandoned sulfide mines of the Middle Urals (Russia)
Liudmila Rybnikova, Petr Rybnikov
The Institute of mining, Ural branch of the Russian Academy of Sciences, Ekaterinburg, Russia [email protected], [email protected]
Abstract Dozens of sulfide mines have been flooded in the Ural region. At Levikha mine (Sverdlovsk region), the discharge of acidic groundwater was formed after filling the depression cone. The reason for its formation is the dissolution of minerals in the collapse zone – the technogenic sulfuric acid weathering crust. Lateral flow from adjacent areas dilutes the solution in the collapse zone. The flow time here is 6-8 years, and during this period extremely high values of all constituents were observed. According to the inverse geochemical modeling, the composition of the rocks was determined. Their dissolution and precipitation produce the composition of the groundwater after flooding. The longevity of acidic waters formation was estimated in dozens of years.
Keywords AMD, copper-pyrite mines, dewatering, flooding, oxidation, geochemical and geofiltrational modeling
Introduction
The Urals ore region is one of the largest pyritic provinces in the world and is the leading mining center of Russia. The complex of former and current town attached the mine works traces the Greenstone lane – the regional province of massive sulfide deposits (Emlyn, 1991). Deposits of the Ural Paleozoic geosynclinal system were formed in the period from the late Cambrian – early Ordovician to early Carboniferous.
In recent decades, a large number of mines have been closed and flooded, including copper pyrite, one of the most dangerous in terms of the degree of influence on the hydrosphere. However, despite the mine abandonment and flooding, the formation of acid mine drainage in many of them continues. On the territory of Sverdlovsk region, the acid mine drainage of the flooded mines is one of the leading sources of contamination: 10% of the total amount of pollutants enters the river on the watershed, where such objects are located. Concentra-tions of components in groundwater and surface water significantly exceed the maximum permissible values.
The processes of oxidative weathering of pyrite and other sulfide minerals are the cause of increased acidity and the source of metals in mine waters. (Smirnov, 1951, Emlyn, 1991, Nordstrom and Alpers, 1999; Appelo and Postma, 2005). During the dewatering period (which lasted for several decades), secondary minerals were formed in the drained zone, which include efflorescent salts and Fe- and Al-hydroxy sulfate minerals (Hammarstrom et al, 2005, Belogub et al, 2009, Nordstrom, 2011). The unsteady nature of the change in the hydrochemical constituents was fixed in many closed mines and was called “first flush”, which lasts dozens of years (Younger, 1997; Wolkersdorfer, 2008).
754
Lappeenranta, Finland IMWA 2017Mine Water and Circular Economy
Wolkersdorfer C, Sartz L, Sillanpää M, Häkkinen A (Editors)
The aim of the work was to identify the regularities of hydrogeochemical processes leading to the formation of acid mine drainage in the copper pyrite mines of the Middle Urals. To achieve this goal the following tasks have been solved: 1) analysis of the processes of the for-mation of acid mine drainage at various stages of the mine development; 2) hydrogeochem-ical characteristic of groundwater types within disturbed areas; 3) assessment of trends in groundwater quality changes after flooding; 4) calculation of the degree of solutions satura-tion; 5) determination of the migration forms of dissolved components; 6) determination of the hydrodynamic balance of the flow in the zone of acid waters formation.
The hydrogeochemistry of groundwater and the features of its unsteady nature are consid-ered on the basis of the data obtained as a result of long-term observations at the flooded mines of the Levikha group of copper pyrite deposits (Sverdlovsk Region, Middle Urals, Russia).
Case study
The Levikha group of copper pyrite deposits is located 120 km to the north of Yekaterinburg. The mine was being worked out from 1927 to 2003. More than 10 million tons of copper ore have been extracted. The ore field has a length of 6 km. The ore-bearing formation reaches an apparent thickness of about 2 km. The geochemical type of Levikha deposits is copper-zinc. The main minerals are pyrite, chalcopyrite, sphalerite, bornite, fahlore, pyrrh-otite, magnetite, galena, chalcocite, covellite, native gold. A feature of the Levikha deposits is a large number of ore bodies (about 800, about 100 worked) and an abundance of dissem-inated ores that surround the bodies of massive pyrite. The copper content in sulfide ores varies considerably, ranging from sulfur ore without copper to ores with a copper content of 10-12%. The copper content in the disseminated ores does not exceed 1.5%.
According to the content of associated components, the ores are complex, they contain se-lenium, tellurium, indium, gold, silver, gallium, cadmium, germanium, arsenic and other elements. The main types of ore-bearing rocks are diabase (5%), albitophyre (10%), porphy-rites (10%), quartz-sericite and quartz-chlorite schists (75%). Rock-forming minerals are represented by plagioclase, albite, chlorite, sericite, quartz.
Mining operations were conducted both open (to a depth of 70 m) and underground (to a depth of 618 m) way. The upper horizons of up to 205 m had been worked out by 1960; the deposits were worked out with the collapse of overlapping strata of rocks (floor height 30-80 m). Within the mine field, extensive zones of displacement and collapse of rocks with funnel-shaped depressions of up to 30 m in depth have been formed. Zones are elongated in the meridional direction and have a total length of about 4 km and a width of 200 to 500 m. The length of the underground mine workings is about 100 km.While the deposit was being worked out, the amount of the dewatering varied from 34 to 66 l/s, accounting to 55 L/s in the normal year.
After the cessation of pumping in December 2003, there was a flooding of the mine work-ings, the water rose to a depth of about 20 – 40 m from the surface of the earth. The filling
755
Lappeenranta, Finland IMWA 2017Mine Water and Circular Economy
Wolkersdorfer C, Sartz L, Sillanpää M, Häkkinen A (Editors)
of the depression cone from a depth of 285 m had been lasting for 36 months. Since April 2007, the mine water has been discharged to the surface at the lowest point of the collapse zone in the Levikha-II mine area. A technogenic basin with a depth of about 20 m was formed here in the caving (collapse zone). Acid mine drainage is pumped over from the basin to the neutralization station, then after treatment with lime milk, it flows into the clarification pond and further, by gravity, through the old riverbed of the Levikha into the river Tagil (the valley of the river Tagil is 4 km East of the mine). The pumping rate varies from 15 L/s at a low water to 30 l/s at a high water (the average annual value is about 20 L/s, which is 2 times less than the value of the mine dewatering during working out).
As a rule, mining with roof caving goaf is usually used in the copper-mines of the Middle Urals. Cavings to a depth of 15-35 m and more, zones of collapse and subsidence of tens and hundreds of hectares are formed on the ground surface. These factors contribute to a more intensive penetration of infiltration water into the disturbed zone and active formation of anthropogenic sulfuric acid weathering crust. The hydrodynamic situation is determined by geomechanical processes, resulting in the formation of collapse and subsidence zones. Here the basic parameters of rock mass significantly differ from the background ones: infil-tration, coefficients of filtration and porosity of the collapse zones are one or two orders of magnitude greater than the parameters of the undisturbed rock mass. Both during working out and after flooding one of the main income items in the balance of dewatering is the up-take of atmospheric precipitation within the zones of collapse.
Testing and chemical analysis
The composition of groundwater in the area of the Levikha mine is analyzed on the basis of monitoring data for the period from the early 1950s to the present. Since the release of groundwater to the surface in April 2007, the pH, As2+, Cu2+, Fetot Mn2+, SO4
2-, Zn2+, TDS, suspended solids have been determined daily. In addition, since 2007 we have annually performed advanced laboratory studies of main and micro – component composition of wa-ter samples using methods of mass spectrometry with inductively coupled plasma ICP-MS.
To process the data obtained, statistical analysis methods were used, hydrodynamic and geochemical modeling was performed (using the Visual MINTEQ ver. 3.0/3.1 program code and MODFLOW, PMPATH software codes).
Hydrogeochemical conditions after flooding
After filling the depression cone, groundwater quality is characterized by the essentially non-sta-tionary hydrochemical regime: in the early years there is a sharp increase in the concentration of most of the components, then begins the gradual decline that can last for decades or more.
At the Levikha mine, the chemical composition indicators are up to now higher than when working out. The composition of groundwater in the zone of discharge is sulfate, hydro-carbonate ion is absent, chlorine is detected in the amount of 25-53 mg/L; among cations, aluminum, iron, and magnesium predominate (Table 1). Groundwater temperature is 10°C, Еh = 266 mV, Fe2+ = 1,209 mg/L, Fe3+ = 53 mg/L (sampling November 29, 2016).
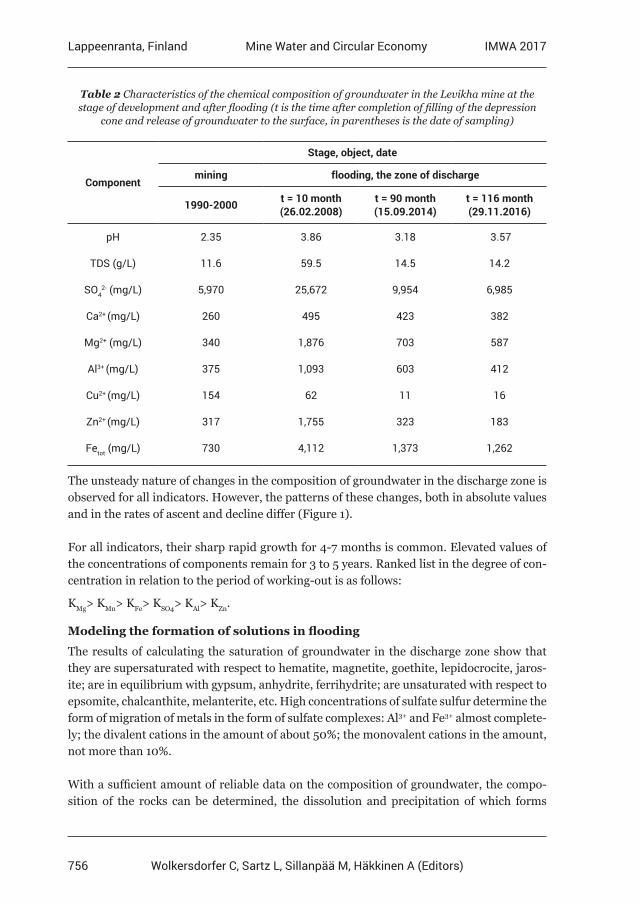
756
Lappeenranta, Finland IMWA 2017Mine Water and Circular Economy
Wolkersdorfer C, Sartz L, Sillanpää M, Häkkinen A (Editors)
Table 2 Characteristics of the chemical composition of groundwater in the Levikha mine at the stage of development and after flooding (t is the time after completion of filling of the depression
cone and release of groundwater to the surface, in parentheses is the date of sampling)
Component
Stage, object, date
mining flooding, the zone of discharge
1990-2000 t = 10 month (26.02.2008)
t = 90 month (15.09.2014)
t = 116 month (29.11.2016)
рН 2.35 3.86 3.18 3.57
TDS (g/L) 11.6 59.5 14.5 14.2
SO42- (mg/L) 5,970 25,672 9,954 6,985
Ca2+ (mg/L) 260 495 423 382
Mg2+ (mg/L) 340 1,876 703 587
Al3+ (mg/L) 375 1,093 603 412
Cu2+ (mg/L) 154 62 11 16
Zn2+ (mg/L) 317 1,755 323 183
Fetot (mg/L) 730 4,112 1,373 1,262
The unsteady nature of changes in the composition of groundwater in the discharge zone is observed for all indicators. However, the patterns of these changes, both in absolute values and in the rates of ascent and decline differ (Figure 1).
For all indicators, their sharp rapid growth for 4-7 months is common. Elevated values of the concentrations of components remain for 3 to 5 years. Ranked list in the degree of con-centration in relation to the period of working-out is as follows:
KMg> KMn> KFe> KSO4> KAl> KZn.
Modeling the formation of solutions in flooding
The results of calculating the saturation of groundwater in the discharge zone show that they are supersaturated with respect to hematite, magnetite, goethite, lepidocrocite, jaros-ite; are in equilibrium with gypsum, anhydrite, ferrihydrite; are unsaturated with respect to epsomite, chalcanthite, melanterite, etc. High concentrations of sulfate sulfur determine the form of migration of metals in the form of sulfate complexes: Al3+ and Fe3+ almost complete-ly; the divalent cations in the amount of about 50%; the monovalent cations in the amount, not more than 10%.
With a sufficient amount of reliable data on the composition of groundwater, the compo-sition of the rocks can be determined, the dissolution and precipitation of which forms
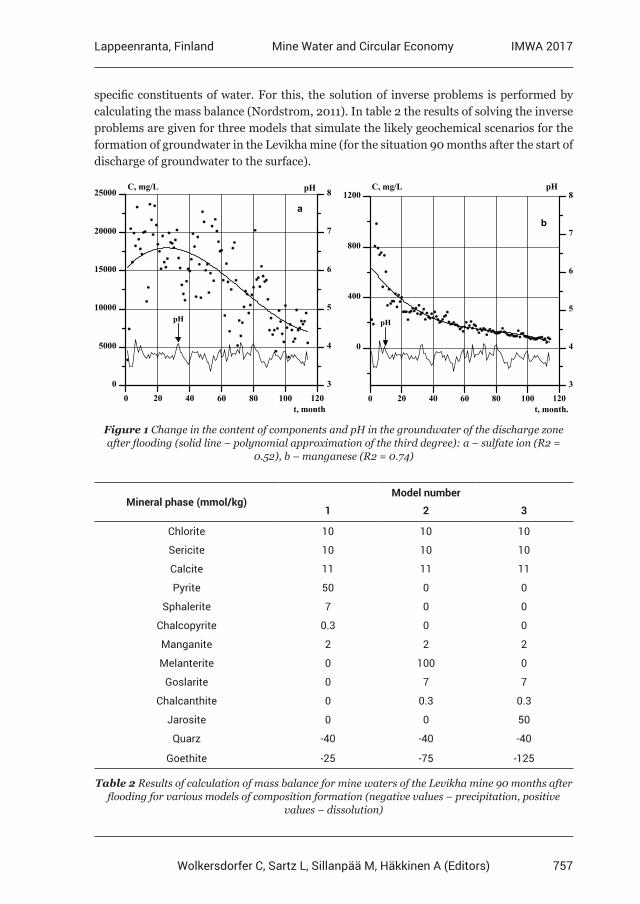
757
Lappeenranta, Finland IMWA 2017Mine Water and Circular Economy
Wolkersdorfer C, Sartz L, Sillanpää M, Häkkinen A (Editors)
specific constituents of water. For this, the solution of inverse problems is performed by calculating the mass balance (Nordstrom, 2011). In table 2 the results of solving the inverse problems are given for three models that simulate the likely geochemical scenarios for the formation of groundwater in the Levikha mine (for the situation 90 months after the start of discharge of groundwater to the surface).
0 20 40 60 80 100 120t, month
0
5000
10000
15000
20000
25000С, mg/L
3
4
5
6
7
8pH
pH
a
0 20 40 60 80 100 120t, month.
0
400
800
1200С, mg/L
3
4
5
6
7
8pH
pH
b
Figure 1 Change in the content of components and pH in the groundwater of the discharge zone after flooding (solid line – polynomial approximation of the third degree): a – sulfate ion (R2 =
0.52), b – manganese (R2 = 0.74)
Mineral phase (mmol/kg)Model number
1 2 3
Chlorite 10 10 10
Sericite 10 10 10
Calcite 11 11 11
Pyrite 50 0 0
Sphalerite 7 0 0
Chalcopyrite 0.3 0 0
Manganite 2 2 2
Melanterite 0 100 0
Goslarite 0 7 7
Chalcanthite 0 0.3 0.3
Jarosite 0 0 50
Quarz -40 -40 -40
Goethite -25 -75 -125
Table 2 Results of calculation of mass balance for mine waters of the Levikha mine 90 months after flooding for various models of composition formation (negative values – precipitation, positive
values – dissolution)
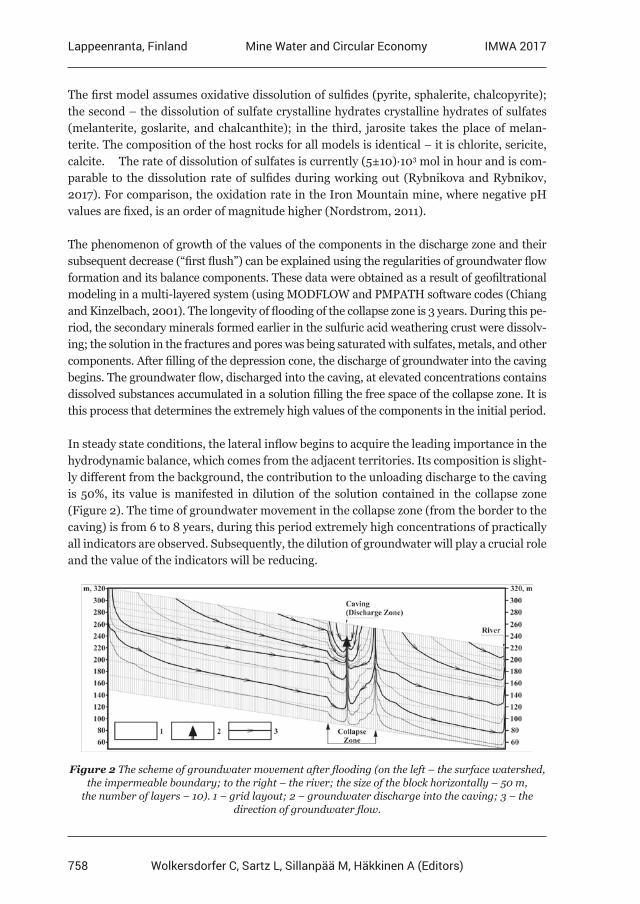
758
Lappeenranta, Finland IMWA 2017Mine Water and Circular Economy
Wolkersdorfer C, Sartz L, Sillanpää M, Häkkinen A (Editors)
The first model assumes oxidative dissolution of sulfides (pyrite, sphalerite, chalcopyrite); the second – the dissolution of sulfate crystalline hydrates crystalline hydrates of sulfates (melanterite, goslarite, and chalcanthite); in the third, jarosite takes the place of melan-terite. The composition of the host rocks for all models is identical – it is chlorite, sericite, calcite. The rate of dissolution of sulfates is currently (5±10)·103 mol in hour and is com-parable to the dissolution rate of sulfides during working out (Rybnikova and Rybnikov, 2017). For comparison, the oxidation rate in the Iron Mountain mine, where negative pH values are fixed, is an order of magnitude higher (Nordstrom, 2011).
The phenomenon of growth of the values of the components in the discharge zone and their subsequent decrease (“first flush”) can be explained using the regularities of groundwater flow formation and its balance components. These data were obtained as a result of geofiltrational modeling in a multi-layered system (using MODFLOW and PMPATH software codes (Chiang and Kinzelbach, 2001). The longevity of flooding of the collapse zone is 3 years. During this pe-riod, the secondary minerals formed earlier in the sulfuric acid weathering crust were dissolv-ing; the solution in the fractures and pores was being saturated with sulfates, metals, and other components. After filling of the depression cone, the discharge of groundwater into the caving begins. The groundwater flow, discharged into the caving, at elevated concentrations contains dissolved substances accumulated in a solution filling the free space of the collapse zone. It is this process that determines the extremely high values of the components in the initial period.
In steady state conditions, the lateral inflow begins to acquire the leading importance in the hydrodynamic balance, which comes from the adjacent territories. Its composition is slight-ly different from the background, the contribution to the unloading discharge to the caving is 50%, its value is manifested in dilution of the solution contained in the collapse zone (Figure 2). The time of groundwater movement in the collapse zone (from the border to the caving) is from 6 to 8 years, during this period extremely high concentrations of practically all indicators are observed. Subsequently, the dilution of groundwater will play a crucial role and the value of the indicators will be reducing.
Figure 2 The scheme of groundwater movement after flooding (on the left – the surface watershed, the impermeable boundary; to the right – the river; the size of the block horizontally – 50 m,
the number of layers – 10). 1 – grid layout; 2 – groundwater discharge into the caving; 3 – the direction of groundwater flow.
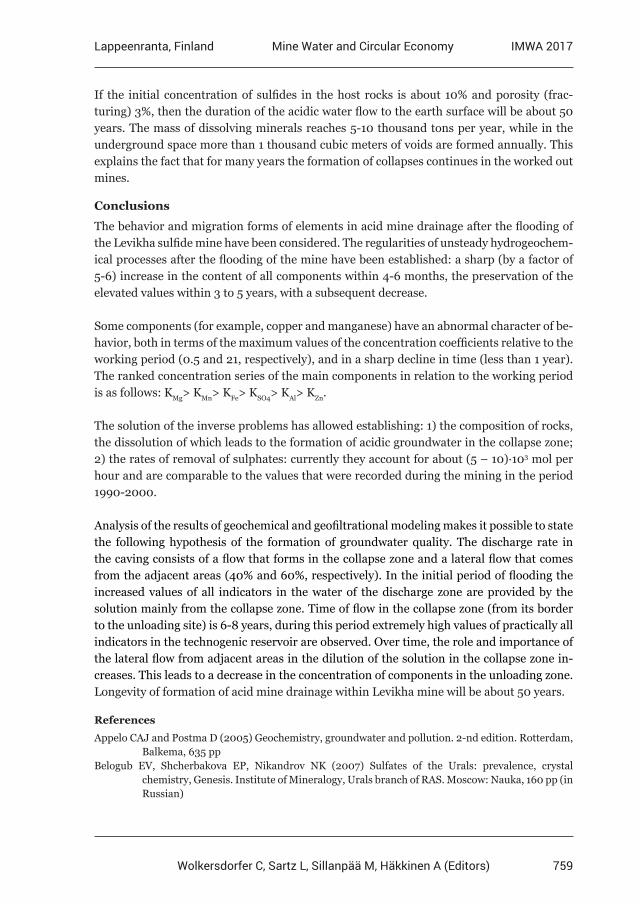
759
Lappeenranta, Finland IMWA 2017Mine Water and Circular Economy
Wolkersdorfer C, Sartz L, Sillanpää M, Häkkinen A (Editors)
If the initial concentration of sulfides in the host rocks is about 10% and porosity (frac-turing) 3%, then the duration of the acidic water flow to the earth surface will be about 50 years. The mass of dissolving minerals reaches 5-10 thousand tons per year, while in the underground space more than 1 thousand cubic meters of voids are formed annually. This explains the fact that for many years the formation of collapses continues in the worked out mines.
Conclusions
The behavior and migration forms of elements in acid mine drainage after the flooding of the Levikha sulfide mine have been considered. The regularities of unsteady hydrogeochem-ical processes after the flooding of the mine have been established: a sharp (by a factor of 5-6) increase in the content of all components within 4-6 months, the preservation of the elevated values within 3 to 5 years, with a subsequent decrease.
Some components (for example, copper and manganese) have an abnormal character of be-havior, both in terms of the maximum values of the concentration coefficients relative to the working period (0.5 and 21, respectively), and in a sharp decline in time (less than 1 year). The ranked concentration series of the main components in relation to the working period is as follows: KMg> KMn> KFe> KSO4> KAl> KZn.
The solution of the inverse problems has allowed establishing: 1) the composition of rocks, the dissolution of which leads to the formation of acidic groundwater in the collapse zone; 2) the rates of removal of sulphates: currently they account for about (5 – 10)·103 mol per hour and are comparable to the values that were recorded during the mining in the period 1990-2000.
Analysis of the results of geochemical and geofiltrational modeling makes it possible to state the following hypothesis of the formation of groundwater quality. The discharge rate in the caving consists of a flow that forms in the collapse zone and a lateral flow that comes from the adjacent areas (40% and 60%, respectively). In the initial period of flooding the increased values of all indicators in the water of the discharge zone are provided by the solution mainly from the collapse zone. Time of flow in the collapse zone (from its border to the unloading site) is 6-8 years, during this period extremely high values of practically all indicators in the technogenic reservoir are observed. Over time, the role and importance of the lateral flow from adjacent areas in the dilution of the solution in the collapse zone in-creases. This leads to a decrease in the concentration of components in the unloading zone.Longevity of formation of acid mine drainage within Levikha mine will be about 50 years.
References
Appelo CAJ and Postma D (2005) Geochemistry, groundwater and pollution. 2-nd edition. Rotterdam, Balkema, 635 pp Belogub EV, Shcherbakova EP, Nikandrov NK (2007) Sulfates of the Urals: prevalence, crystal chemistry, Genesis. Institute of Mineralogy, Urals branch of RAS. Moscow: Nauka, 160 pp (in Russian)
760
Lappeenranta, Finland IMWA 2017Mine Water and Circular Economy
Wolkersdorfer C, Sartz L, Sillanpää M, Häkkinen A (Editors)
Blowes DW, Ptacek CJ, Jambor JL, Weisener CG (2003) The Geochemistry of Acid Mine Drainage. Treatise on Geochemistry. Volume 9: Environmental Geochemistry. Oxford, Elsevier, p 149– 204Chiang WH and Kinzelbach W (2001) 3D-Groundwater Modeling with PMWIN. First edition. Springer- Verlag Berlin Heidelberg New York, 346 рpEmlin EF (1991) Technogenesis of pyrite deposits of the Urals. Sverdlovsk: Publication of Ural State University 256 pp (in Russian)Hammarstrom JM, Seal RR II, Meier AL and Kornfeld JM (2005) Secondary sulfate minerals associated with acid drainage in the eastern US: recycling of metals and acidity in surficial environments// Chemical Geology 215, p 407– 431Nordstrom DK and Alpers CN (1999) Negative pH, efflorescent mineralogy, and consequences for environmental restoration at the Iron Mountain Superfund site, California. Proc. Natl. Acad. Sci. USA 96, p 3455–3462Nordstrom DK (2011) Hydrogeochemical processes governing the origin, transport and fate of major and trace elements from mine wastes and mineralized rock to surface waters // Applied Geochemistry 26, p 1777–1791Rybnikova LS and Rybnikov PA (2017) Hydrogeochemistry of the abandoned sulfide mines of the Middle Urals (Russia) // Procedia Earth and Planetary Science 17C, p 849-852Smirnov SS (1951) The oxidation zone of sulfide deposits. M.: publishing house of the USSR Academy of Sciences, 334 pp (in Russian)Wolkersdorfer C (2008) Water management at abandoned flooded underground mines. Fundamentals. Tracer tests. Modelling. Water treatment. Springer, 465 ppYounger PL (1997) The longevity of mine water pollution: a basis for decision-making. Science of the Total Environment 194/195, p 457-466
761
Lappeenranta, Finland IMWA 2017Mine Water and Circular Economy
Wolkersdorfer C, Sartz L, Sillanpää M, Häkkinen A (Editors)
Forecasting long term water quality after closure: Boliden Aitik Cu mine
Matt McKeown1, Dave Christensen2, Seth Mueller3, Mike O’Kane4, Paul Weber5, Belinda Bird6
1O’Kane Consultants Inc. 112-112 Research Dr.Saskatoon,, Saskatchewan,,-Canada, [email protected]
2O’Kane Consultants Inc. 112-112 Research Dr.Saskatoon,, Saskatchewan,,-Canada, [email protected]
3Boliden Mineral AB. SE 936 81, Boliden, -Sweden [email protected] 4O’Kane Consultants Inc. 200-1121 Centre St NW, Calgary, Alberta,-Canada,
[email protected] 5O’Kane Consultants Inc. Unit 2, 2 McMillan St, Darfield, Canterbury,-New Zealand,
[email protected] 6New South Wales Minerals Council. PO Box H367, Australia Square, NSW 1215.
Abstract The Boliden Aitik Mine is located near Gällivare, northern Sweden. Since mining started in 1968, more than 500 Mt of waste rock have been deposited in storage facilities (WRSFs). This paper describes the approach to utilizing current hydrogeological and geochemical conditions for assessing contaminant loads emanating from the WRSFs. On the basis of this assessment, coupled with implementing closure management tools, and using modelling techniques, estimates for WRSF loading were developed. Modelling was used to estimate oxygen ingress and percolation rates for closure conditions based on inputs obtained from seven years of in situ cover system monitoring and field testing.
Key words Net percolation, oxygen ingress, long term water quality, geochemical modelling
Introduction
The Boliden Aitik Mine (Aitik) is a Cu-Au-Ag deposit situated in the Baltic shield near Gäll-ivare, northern Sweden. Host rocks consist primarily of muscovite schists, biotite gneisses, and amphibole-biotite gneisses of volcaniclastic origin (Boliden, 2015). The mine area in-cludes two open pits (Aitik and Salmijãrvi), service buildings, a tailings management facility (TMF), and WRSFs. (Eriksson, 2012). Since mining started in 1968, more than 500 Mt of waste rock have been deposited in WRSFs.
Waste rock is classified into PAF waste rock or Non Acid Forming (NAF) environmental waste rock. Environmental waste rock is described as waste rock that meets criteria render-ing it suitable for construction and rehabilitation activities; environmental waste rock is not considered capable of producing acid or metalliferous leachate. Waste rock that does not meet the environmental waste rock definition is considered PAF, although some rock would be considered NAF based on industry standard acid base accounting techniques.
The primary objective of this study was to understand long-term water quality of PAF WRSF basal seepage for the purpose of determining environmental risk to aquatic receptors downstream of the mine site at closure. Evaluating risk in terms of impacts on the aquatic
762
Lappeenranta, Finland IMWA 2017Mine Water and Circular Economy
Wolkersdorfer C, Sartz L, Sillanpää M, Häkkinen A (Editors)
receiving environment, required determination of both current and long-term water quality and quantity from the WRSFs. This paper focusses on determination of long term water quantity and quality emanating as basal and toe seepage from the WRSFs.
Methods
Geochemical Characterization:
The initial basis for the geochemical conceptual model was a literature review of waste rock mineralogy, which has been discussed in various papers including Strömberg (1997), Ström-berg and Banwart (1994; 1999) and Lindvall (2005). Additional field investigations were com-pleted in 2014 to provide further geochemical characterization of the waste rock. Field investi-gations included a WRSF test pit sampling program, and a seepage sampling program. Waste rock samples were collected from 27 test pits excavated in WRSFs, and three water samples were collected from seepage points emanating from PAF WRSFs. Industry standard acid base accounting (ABA) geochemical testing was undertaken to understand sources of acidity and alkalinity within the PAF WRSF, including potential sulfide acidity, stored acidic oxidation products, and acid neutralization potential. Field rinse pH data from samples collected demon-strated a range of pH values representing acid forming and non-acid forming waste rock, with older samples generally having lower pH values. Key mineralogy is presented in Table 1. Key sulfide oxidation reactions with the PAF WRSFs were identified as pyrite, chalcopyrite, and sphalerite. Melanterite- and jarosite- type minerals represent soluble- and sparingly soluble- stored acidity respectively; acidity contained in these minerals would be released as a function of pore-water flushing. Calcite and anorthite are the key acid neutralizing minerals.
At closure it was estimated that potential acidity associated with unoxidised pyrite within the PAF WRSF was 4.5 Mt CaCO3 eq. Stored soluble acidity associated with melanterite type minerals is ~61,000 tonnes CaCO3 eq. Stored sparingly soluble acidity associated with jarosite type minerals is ~497,000 tonnes CaCO3 eq. Potential acid neutralization capacity for the PAF WRSF was estimated to be ~1.4 million tonnes CaCO3 eq, based on measured calcite content. With such significant potential acidity, control of oxygen ingress and hence sulfide mineral oxidation is the key management tool required to control long term acid generation and seepage water quality from the PAF WRSF.
Table 1 Mineral composition of unoxidized waste rock (percentage by volume).
Mineral Strömberg and Banwart (1994)
Volume % (mean± 1 SD)
Strömberg and Banwart (1999)
Volume %
2014 WRSF sampling program (wt%)
(OKC, 2015)
Anorthite 6 4 3 – 9
Calcite 0.1 0.5 0.5
Pyrite 0.57 (0.08 – 1.7)
Chalcopyrite 0.09 (0.02 – 0.3)
Jarosite 0.41
Melanterite 0.02
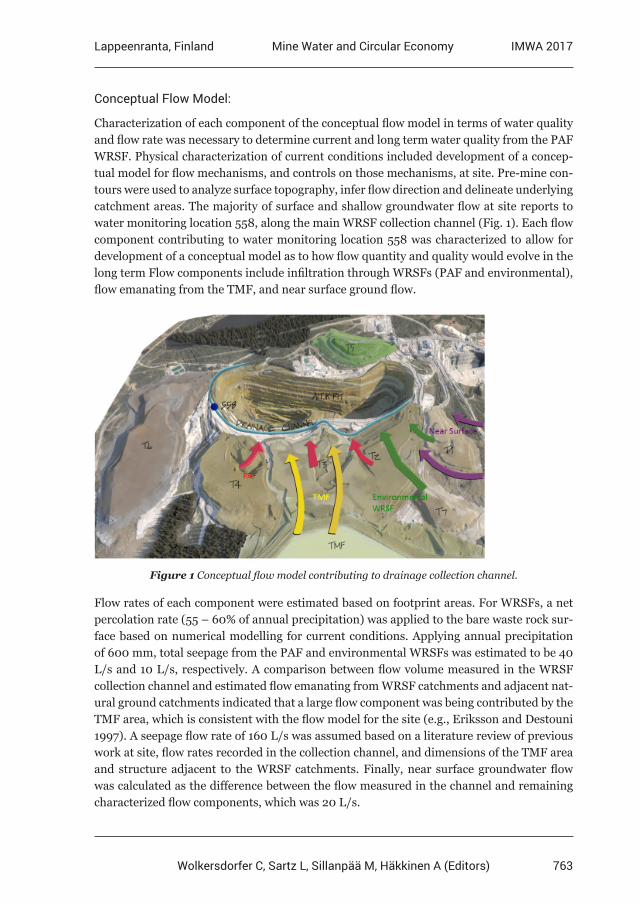
763
Lappeenranta, Finland IMWA 2017Mine Water and Circular Economy
Wolkersdorfer C, Sartz L, Sillanpää M, Häkkinen A (Editors)
Conceptual Flow Model:
Characterization of each component of the conceptual flow model in terms of water quality and flow rate was necessary to determine current and long term water quality from the PAF WRSF. Physical characterization of current conditions included development of a concep-tual model for flow mechanisms, and controls on those mechanisms, at site. Pre-mine con-tours were used to analyze surface topography, infer flow direction and delineate underlying catchment areas. The majority of surface and shallow groundwater flow at site reports to water monitoring location 558, along the main WRSF collection channel (Fig. 1). Each flow component contributing to water monitoring location 558 was characterized to allow for development of a conceptual model as to how flow quantity and quality would evolve in the long term Flow components include infiltration through WRSFs (PAF and environmental), flow emanating from the TMF, and near surface ground flow.
Figure 1 Conceptual flow model contributing to drainage collection channel.
Flow rates of each component were estimated based on footprint areas. For WRSFs, a net percolation rate (55 – 60% of annual precipitation) was applied to the bare waste rock sur-face based on numerical modelling for current conditions. Applying annual precipitation of 600 mm, total seepage from the PAF and environmental WRSFs was estimated to be 40 L/s and 10 L/s, respectively. A comparison between flow volume measured in the WRSF collection channel and estimated flow emanating from WRSF catchments and adjacent nat-ural ground catchments indicated that a large flow component was being contributed by the TMF area, which is consistent with the flow model for the site (e.g., Eriksson and Destouni 1997). A seepage flow rate of 160 L/s was assumed based on a literature review of previous work at site, flow rates recorded in the collection channel, and dimensions of the TMF area and structure adjacent to the WRSF catchments. Finally, near surface groundwater flow was calculated as the difference between the flow measured in the channel and remaining characterized flow components, which was 20 L/s.
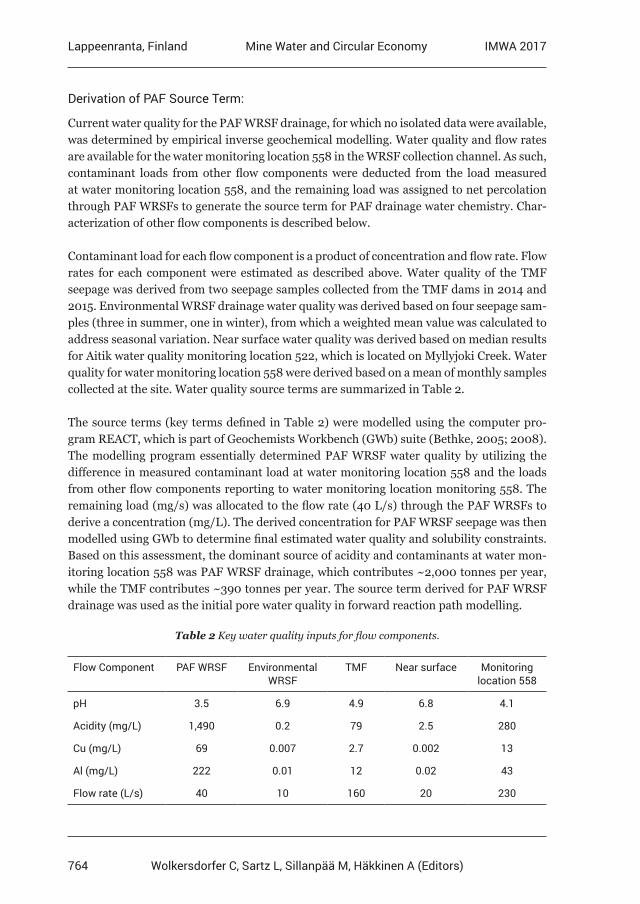
764
Lappeenranta, Finland IMWA 2017Mine Water and Circular Economy
Wolkersdorfer C, Sartz L, Sillanpää M, Häkkinen A (Editors)
Derivation of PAF Source Term:
Current water quality for the PAF WRSF drainage, for which no isolated data were available, was determined by empirical inverse geochemical modelling. Water quality and flow rates are available for the water monitoring location 558 in the WRSF collection channel. As such, contaminant loads from other flow components were deducted from the load measured at water monitoring location 558, and the remaining load was assigned to net percolation through PAF WRSFs to generate the source term for PAF drainage water chemistry. Char-acterization of other flow components is described below.
Contaminant load for each flow component is a product of concentration and flow rate. Flow rates for each component were estimated as described above. Water quality of the TMF seepage was derived from two seepage samples collected from the TMF dams in 2014 and 2015. Environmental WRSF drainage water quality was derived based on four seepage sam-ples (three in summer, one in winter), from which a weighted mean value was calculated to address seasonal variation. Near surface water quality was derived based on median results for Aitik water quality monitoring location 522, which is located on Myllyjoki Creek. Water quality for water monitoring location 558 were derived based on a mean of monthly samples collected at the site. Water quality source terms are summarized in Table 2.
The source terms (key terms defined in Table 2) were modelled using the computer pro-gram REACT, which is part of Geochemists Workbench (GWb) suite (Bethke, 2005; 2008). The modelling program essentially determined PAF WRSF water quality by utilizing the difference in measured contaminant load at water monitoring location 558 and the loads from other flow components reporting to water monitoring location monitoring 558. The remaining load (mg/s) was allocated to the flow rate (40 L/s) through the PAF WRSFs to derive a concentration (mg/L). The derived concentration for PAF WRSF seepage was then modelled using GWb to determine final estimated water quality and solubility constraints. Based on this assessment, the dominant source of acidity and contaminants at water mon-itoring location 558 was PAF WRSF drainage, which contributes ~2,000 tonnes per year, while the TMF contributes ~390 tonnes per year. The source term derived for PAF WRSF drainage was used as the initial pore water quality in forward reaction path modelling.
Table 2 Key water quality inputs for flow components.
Flow Component PAF WRSF Environmental WRSF
TMF Near surface Monitoring location 558
pH 3.5 6.9 4.9 6.8 4.1
Acidity (mg/L) 1,490 0.2 79 2.5 280
Cu (mg/L) 69 0.007 2.7 0.002 13
Al (mg/L) 222 0.01 12 0.02 43
Flow rate (L/s) 40 10 160 20 230
765
Lappeenranta, Finland IMWA 2017Mine Water and Circular Economy
Wolkersdorfer C, Sartz L, Sillanpää M, Häkkinen A (Editors)
Closure Cover System Design:
An engineered cover system will be implemented on the PAF WRSF as part of the mine clo-sure process with the primary objective of improving the long term quality of seepage waters and surface water from the reclaimed WRSFs by substantially reducing ingress of oxygen and meteoric waters into the facility. The PAF WRSF cover system design is based on field studies and numerical modelling processes as described by McKeown et al. (2015) and in-cludes a 0.3 m highly compacted till layer with an overlying 1.5 m of moderately compacted till and 0.3 m till and organic mix layer acting as a growth medium.
One dimensional soil-plant-atmosphere modelling was completed to simulate performance of the cover system over the long term and under selected sensitivity scenarios. Inputs to the modelling program included material properties obtained from field investigations, data obtained from cover system monitoring at site, and RCP4.5 climate change scenario gener-ated by the Swedish Meteorological and Hydrological Institute.
The key indicator of performance for the simulation was total oxygen ingress by diffusion, which previous performance monitoring had indicated was the dominant transport mech-anism for the PAF WRSFs. Results indicated that the cover system reduced oxygen ingress by diffusion from >2,000 g/m2/yr (bare waste rock) to an average of 32 g/m2/yr. Net per-colation rates decreased from between 55 – 60% of annual precipitation (bare waste rock) to between 27 – 32% of annual precipitation in the long term after cover system installation (noting that annual precipitation increases from ~600 mm/yr currently to 820 mm/yr by 2100 under the RCP4.5 climate change scenario).
In the long term, acidity and metal loading from the PAF WRSFs will be a function of oxygen ingress associated with oxygen diffusion through the cover system, and dissolved oxygen in net percolation. Numerical modelling determined that oxidation occurs predominantly in the upper 5 m of the PAF WRSF surface, indicating that the remaining WRSF profile remains in an anoxic condition. For GWb modelling, it was assumed that all oxygen is con-sumed by pyrite oxidation within this zone. Long term closure annual acidity loading was derived based on area of the PAF WRSFs at closure (540 ha), the amount of oxygen ingress over this area, and the assumption that all this oxygen reacted with pyrite to produce 4 moles of H+ ion per mole of pyrite oxidized. In current (bare) WRSF, the entire depth was assumed to be potentially oxidizing as oxygen moves freely within it as a result of advection and diffusion. Calculations for the WRSF after cover system construction (5 m oxidizing; 75 m anoxic) indicate that the system was non-acid forming from a conventional acid-base accounting perspective.
Basal Seepage Analysis
PAF WRSF draindown is important for forecasting long term water quality after closure as it controls the rate at which current water quality is replaced by a lower-acidity water type created by minimizing oxygen ingress to the WRSF. To determine draindown, one-dimen-sional seepage modelling was completed to simulate current conditions and long-term basal
766
Lappeenranta, Finland IMWA 2017Mine Water and Circular Economy
Wolkersdorfer C, Sartz L, Sillanpää M, Häkkinen A (Editors)
seepage from the WRSFs using SEEP/W, a software package designed to analyze ground-water seepage and pore-water pressure dissipation within porous materials. The seepage analysis was completed using a transient analysis of several 1D representative columns for both plateau and sloped areas of the WRSFs.
Results for current (bare waste rock) conditions indicate that the WRSFs are ‘wetted up’, there is no capacity for additional water storage within the WRSF profile. The response of the system is buffered due to the height of the WRSFs and the time required to percolate to the WRSF base, but water infiltrating into the top of the WRSF displaces seepage from the base of the facility. In the long term, construction of the cover system will reduce net percolation and ultimately basal seepage compared to the bare waste rock condition, but the magnitude of basal seepage volumes did not decrease dramatically, because long term annual precipitation is predicted to increase by 15 to 20% in the RCP4.5 climate change scenario.
Derivation of PAF Long Term Water Quality after Closure
Evolution of WRSF drainage water quality (prior to mixing with other flow components in the collection channel) was considered as three water quality phases, including current water quality, transition water quality, and long term water quality. Geochemical modelling performed with REACT estimated long term water quality and thus the risks associated with water quality after closure and after the installation of the cover system. Model inputs for forward path geochemical modelling were initial pore-water quality, mineralogy (based on field and laboratory data, company records), influent rainfall water quality, oxygen flux, and net percolation rates. Oxygen flux and percolation rates were determined by cover system modelling. Peer reviewed estimates were obtained for kinetic rate constants for dissolution of key initial waste rock components (pyrite, calcite, jarosite, anorthite) and precipitation of plausible secondary phases that might form from long term weathering. A numerical model was established to predict water quality during the transition period between current and long term water quality.
Modelling Approach
Current water quality is represented by the water-type derived from the inverse geochem-ical modelling process (e.g., PAF source term derived above). Duration of the current wa-ter quality phase was a function of the draindown phase, which was estimated to be 20 years based on seepage modelling. That is, it will take an estimated 20 years for the current pore-water near the top of the WRSF to percolate to the base and be replaced by the new lower acidity water-type. It was assumed that the acidity load reporting to the base of the WRSF is derived from the available stored soluble melanterite-type acidity load that is pres-ent within the WRSF, as oxygen is excluded due to the presence of the cover system.
Long term water quality was a function of sulfide oxidation (pyrite), jarosite dissolution, and neutralization of this acidity by minor calcite and abundant anorthite. Water quality was determined by GWb. It was assumed that long term water quality could not develop
767
Lappeenranta, Finland IMWA 2017Mine Water and Circular Economy
Wolkersdorfer C, Sartz L, Sillanpää M, Häkkinen A (Editors)
until all available reactive soluble melanterite-type acidity present in the WRSF was flushed out by net percolation.
It was assumed that not all the soluble melanterite-type acidity would be flushed from the WRSF during the transition period; one third of acidity (and contaminants) would remain in stagnant areas of the WRSF, being generally immobile (as noted by Eriksson and Destouni, 1997). Thus two thirds of the soluble melanterite-type acidity reports to the base of WRSF prior to transition to long term water quality. Sparingly soluble jarosite-type acidity was not considered in the numerical modelling of the transition phase as it was confirmed (in GWb geochemical modelling of the longer term water quality) that the calcite and anorthite present would also neutralize acidity from this source.
Evaluation of Risk
In the context of this project, risk represents an engineering tool for developing informed closure planning decisions. Risk can be controlled and managed through application of appropriate measures, and can be minimized by taking necessary precautions. These as-pects were developed through a top-down, expert-based risk process that assigned a set of probabilities for site specific conditions; namely, the Failure Modes and Effects Analysis, or process (FMEA).
A FMEA was completed to evaluate the closure design for Aitik site (Boliden, 2015), provid-ing a comprehensive review of the closure strategy for the Aitik site. Each failure mode was evaluated based on the potential water quality risk for adverse impacts to aquatic receptors downstream of the mine site where water quality is evaluated primarily in terms of spatial extent, magnitude, and frequency. The majority of failure modes and effects ranked a ‘low’ risk score, meaning that the long-term risk of occurrence and severity of effects is within the broadly acceptable range. Failure modes and effects ranking a risk score of ‘moderate’ or higher highlighted the requirement for carefully considered risk controls. Additional stud-ies been identified for completion to supplement available data and compare against the conceptual model for performance. In identifying mitigation measures, it was noted that regular maintenance in the initial stages of closure and monitoring are vital for managing risk at the site.
Conclusions
The WRSF evaluation involved desktop review and interrogation of previous studies com-pleted at Aitik, a field based geochemical assessment, and development of conceptual and numerically-driven models to characterize the hydrological components in regards to flow and quality. It was concluded that post-closure water quality from the PAF WRSF area will improve over time as the closure cover system begins to limit oxygen within the WRSF pro-file. Oxidation reactions will continue to occur, but at a much lower rate due to decreased oxygen availability following closure cover system construction (Fig 2). As stored acidity is flushed out and neutralization reactions occur within the WRSF profile, pH will increase and acidity loads will decrease with time. In approximately 50 years, circum-neutral pH drainage and associated low dissolved metals are predicted to emerge from the PAF WRSF.
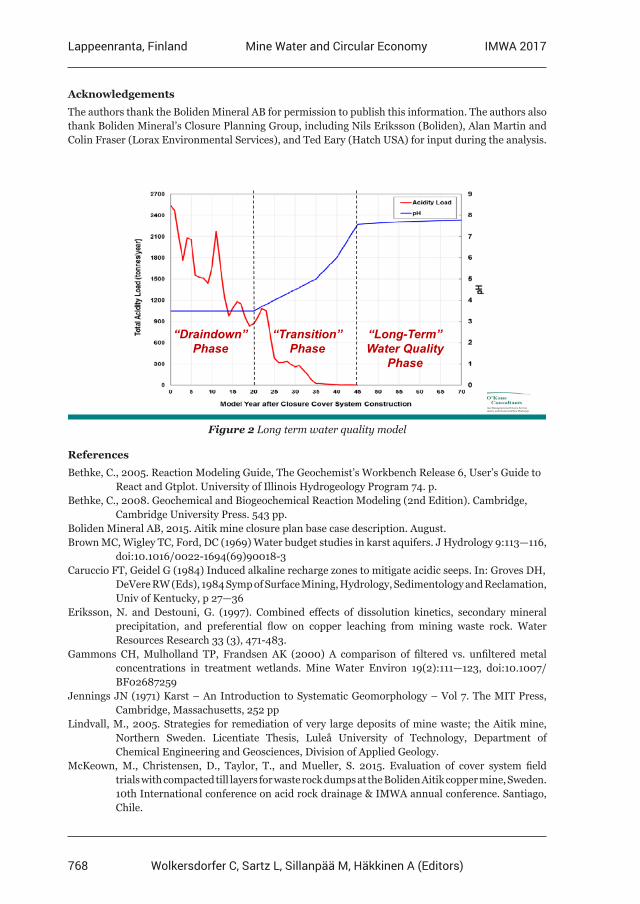
768
Lappeenranta, Finland IMWA 2017Mine Water and Circular Economy
Wolkersdorfer C, Sartz L, Sillanpää M, Häkkinen A (Editors)
Acknowledgements
The authors thank the Boliden Mineral AB for permission to publish this information. The authors also thank Boliden Mineral’s Closure Planning Group, including Nils Eriksson (Boliden), Alan Martin and Colin Fraser (Lorax Environmental Services), and Ted Eary (Hatch USA) for input during the analysis.
Integrated Mine Waste Management and Closure ServicesSpecialists in Geochemistry and Unsaturated Zone Hydrology
“Draindown”Phase
“Transition”Phase
“Long-Term”Water Quality
Phase
1
Figure 2 Long term water quality model
References
Bethke, C., 2005. Reaction Modeling Guide, The Geochemist’s Workbench Release 6, User’s Guide to React and Gtplot. University of Illinois Hydrogeology Program 74. p.Bethke, C., 2008. Geochemical and Biogeochemical Reaction Modeling (2nd Edition). Cambridge, Cambridge University Press. 543 pp.Boliden Mineral AB, 2015. Aitik mine closure plan base case description. August.Brown MC, Wigley TC, Ford, DC (1969) Water budget studies in karst aquifers. J Hydrology 9:113—116, doi:10.1016/0022-1694(69)90018-3Caruccio FT, Geidel G (1984) Induced alkaline recharge zones to mitigate acidic seeps. In: Groves DH, DeVere RW (Eds), 1984 Symp of Surface Mining, Hydrology, Sedimentology and Reclamation, Univ of Kentucky, p 27—36Eriksson, N. and Destouni, G. (1997). Combined effects of dissolution kinetics, secondary mineral precipitation, and preferential flow on copper leaching from mining waste rock. Water Resources Research 33 (3), 471-483.Gammons CH, Mulholland TP, Frandsen AK (2000) A comparison of filtered vs. unfiltered metal concentrations in treatment wetlands. Mine Water Environ 19(2):111—123, doi:10.1007/ BF02687259Jennings JN (1971) Karst – An Introduction to Systematic Geomorphology – Vol 7. The MIT Press, Cambridge, Massachusetts, 252 ppLindvall, M., 2005. Strategies for remediation of very large deposits of mine waste; the Aitik mine, Northern Sweden. Licentiate Thesis, Luleå University of Technology, Department of Chemical Engineering and Geosciences, Division of Applied Geology.McKeown, M., Christensen, D., Taylor, T., and Mueller, S. 2015. Evaluation of cover system field trials with compacted till layers for waste rock dumps at the Boliden Aitik copper mine, Sweden. 10th International conference on acid rock drainage & IMWA annual conference. Santiago, Chile.
769
Lappeenranta, Finland IMWA 2017Mine Water and Circular Economy
Wolkersdorfer C, Sartz L, Sillanpää M, Häkkinen A (Editors)
O’Kane Consultants Inc. (OKC). 2015. Boliden Aitik Project – Aitik mine closure project waste rock storage facility: cover system design, prediction of geochemistry and discharge water quality. Submitted to Boliden Mineral AB. September. Report no. 771/9-01.Strömberg B. 1997. Weathering kinetics of sulphidic mining waste. Ph.D. thesis. Department of Chemistry, Royal Institute of Technology, Stockholm, Sweden. TRITA-OOK-1043.Strömberg B and Banwart S., 1994. Kinetic modeling of geochemical processes in the Aitik mining waste rock site in northern Sweden. Applied Geochemistry, Vol. 9, pp.583-595.Strömberg B. and Banwart S., 1999. Experimental study of acid-consuming processes in mining waste rock: Some influences of mineralogy and particle size. Appl. Geochem. 14(1999)1-6.
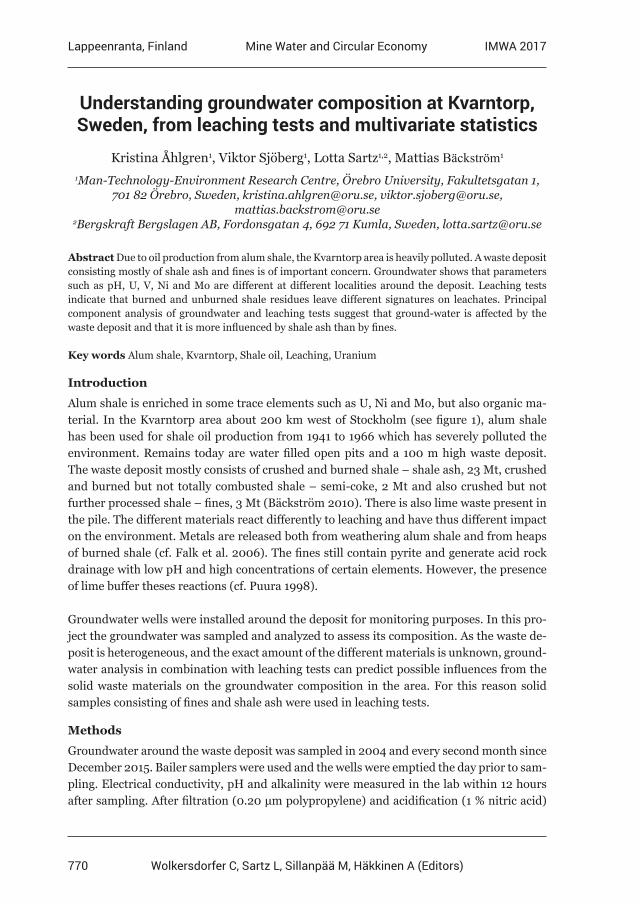
770
Lappeenranta, Finland IMWA 2017Mine Water and Circular Economy
Wolkersdorfer C, Sartz L, Sillanpää M, Häkkinen A (Editors)
Understanding groundwater composition at Kvarntorp, Sweden, from leaching tests and multivariate statistics
Kristina Åhlgren1, Viktor Sjöberg1, Lotta Sartz1,2, Mattias Bäckström1 1Man-Technology-Environment Research Centre, Örebro University, Fakultetsgatan 1,
701 82 Örebro, Sweden, [email protected], [email protected], [email protected]
2Bergskraft Bergslagen AB, Fordonsgatan 4, 692 71 Kumla, Sweden, [email protected]
Abstract Due to oil production from alum shale, the Kvarntorp area is heavily polluted. A waste deposit consisting mostly of shale ash and fines is of important concern. Groundwater shows that parameters such as pH, U, V, Ni and Mo are different at different localities around the deposit. Leaching tests indicate that burned and unburned shale residues leave different signatures on leachates. Principal component analysis of groundwater and leaching tests suggest that ground-water is affected by the waste deposit and that it is more influenced by shale ash than by fines.
Key words Alum shale, Kvarntorp, Shale oil, Leaching, Uranium
Introduction
Alum shale is enriched in some trace elements such as U, Ni and Mo, but also organic ma-terial. In the Kvarntorp area about 200 km west of Stockholm (see figure 1), alum shale has been used for shale oil production from 1941 to 1966 which has severely polluted the environment. Remains today are water filled open pits and a 100 m high waste deposit. The waste deposit mostly consists of crushed and burned shale – shale ash, 23 Mt, crushed and burned but not totally combusted shale – semi-coke, 2 Mt and also crushed but not further processed shale – fines, 3 Mt (Bäckström 2010). There is also lime waste present in the pile. The different materials react differently to leaching and have thus different impact on the environment. Metals are released both from weathering alum shale and from heaps of burned shale (cf. Falk et al. 2006). The fines still contain pyrite and generate acid rock drainage with low pH and high concentrations of certain elements. However, the presence of lime buffer theses reactions (cf. Puura 1998).
Groundwater wells were installed around the deposit for monitoring purposes. In this pro-ject the groundwater was sampled and analyzed to assess its composition. As the waste de-posit is heterogeneous, and the exact amount of the different materials is unknown, ground-water analysis in combination with leaching tests can predict possible influences from the solid waste materials on the groundwater composition in the area. For this reason solid samples consisting of fines and shale ash were used in leaching tests.
Methods
Groundwater around the waste deposit was sampled in 2004 and every second month since December 2015. Bailer samplers were used and the wells were emptied the day prior to sam-pling. Electrical conductivity, pH and alkalinity were measured in the lab within 12 hours after sampling. After filtration (0.20 μm polypropylene) and acidification (1 % nitric acid)
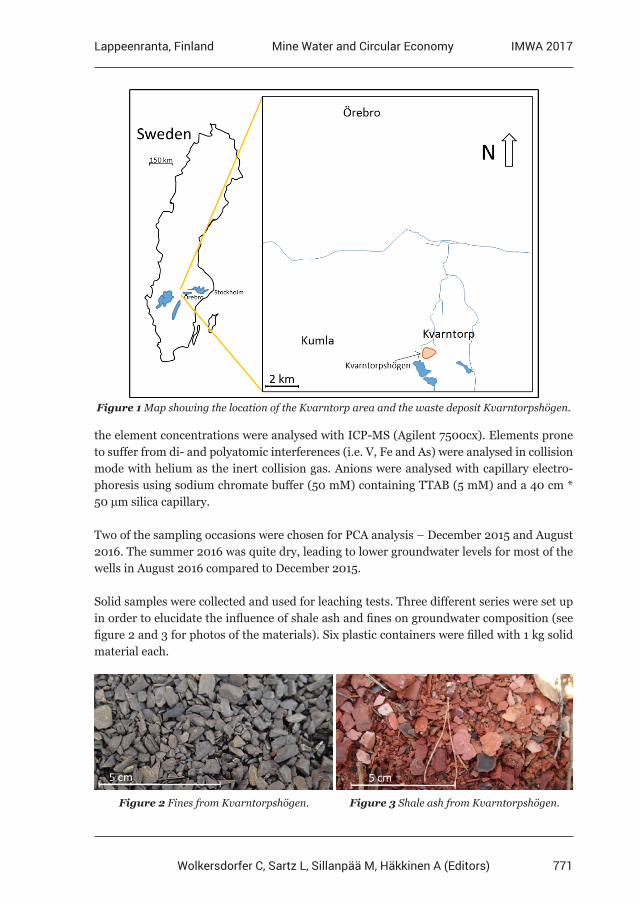
771
Lappeenranta, Finland IMWA 2017Mine Water and Circular Economy
Wolkersdorfer C, Sartz L, Sillanpää M, Häkkinen A (Editors)
Figure 1 Map showing the location of the Kvarntorp area and the waste deposit Kvarntorpshögen.
the element concentrations were analysed with ICP-MS (Agilent 7500cx). Elements prone to suffer from di- and polyatomic interferences (i.e. V, Fe and As) were analysed in collision mode with helium as the inert collision gas. Anions were analysed with capillary electro-phoresis using sodium chromate buffer (50 mM) containing TTAB (5 mM) and a 40 cm * 50 μm silica capillary.
Two of the sampling occasions were chosen for PCA analysis – December 2015 and August 2016. The summer 2016 was quite dry, leading to lower groundwater levels for most of the wells in August 2016 compared to December 2015. Solid samples were collected and used for leaching tests. Three different series were set up in order to elucidate the influence of shale ash and fines on groundwater composition (see figure 2 and 3 for photos of the materials). Six plastic containers were filled with 1 kg solid material each.
Figure 2 Fines from Kvarntorpshögen. Figure 3 Shale ash from Kvarntorpshögen.
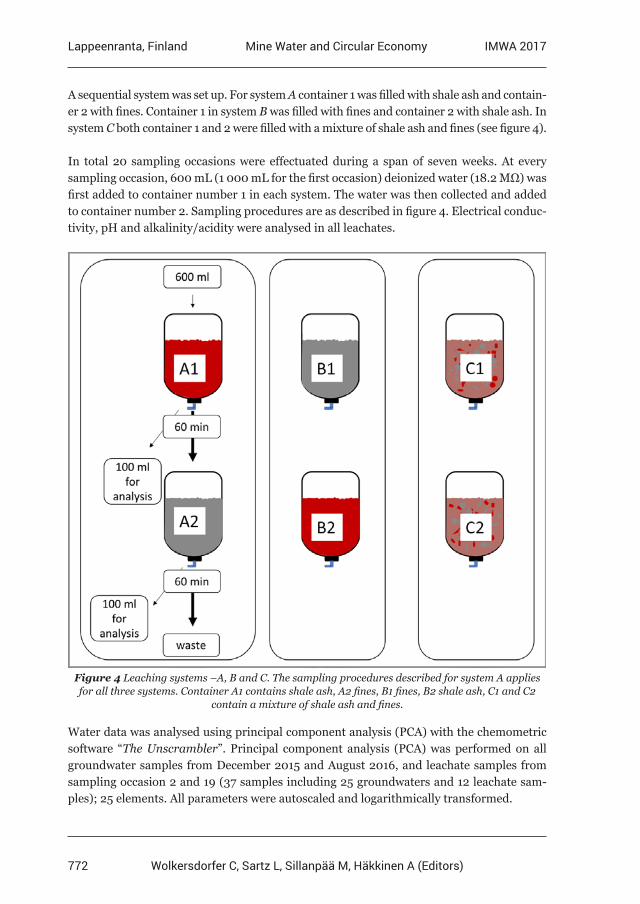
772
Lappeenranta, Finland IMWA 2017Mine Water and Circular Economy
Wolkersdorfer C, Sartz L, Sillanpää M, Häkkinen A (Editors)
A sequential system was set up. For system A container 1 was filled with shale ash and contain-er 2 with fines. Container 1 in system B was filled with fines and container 2 with shale ash. In system C both container 1 and 2 were filled with a mixture of shale ash and fines (see figure 4).
In total 20 sampling occasions were effectuated during a span of seven weeks. At every sampling occasion, 600 mL (1 000 mL for the first occasion) deionized water (18.2 MΩ) was first added to container number 1 in each system. The water was then collected and added to container number 2. Sampling procedures are as described in figure 4. Electrical conduc-tivity, pH and alkalinity/acidity were analysed in all leachates.
Figure 4 Leaching systems –A, B and C. The sampling procedures described for system A applies for all three systems. Container A1 contains shale ash, A2 fines, B1 fines, B2 shale ash, C1 and C2
contain a mixture of shale ash and fines.
Water data was analysed using principal component analysis (PCA) with the chemometric software “The Unscrambler”. Principal component analysis (PCA) was performed on all groundwater samples from December 2015 and August 2016, and leachate samples from sampling occasion 2 and 19 (37 samples including 25 groundwaters and 12 leachate sam-ples); 25 elements. All parameters were autoscaled and logarithmically transformed.
773
Lappeenranta, Finland IMWA 2017Mine Water and Circular Economy
Wolkersdorfer C, Sartz L, Sillanpää M, Häkkinen A (Editors)
Results and discussion
Groundwater
Analysis of the groundwater indicate that the wells display very different conditions. An example of the diversity of the composition is shown in table 1 where five wells are displayed regarding pH, U, V, Ni and Mo for water sampled in 2004 and in December 2015. It can be noted that well G7 has lower concentrations compared to the other wells. G7 is a deep well (31 m) that reaches all the way down to the sandstone aquifer, unlike the other wells in table 1 (SWECO VIAK 2005).
Burned lime is suspected to be the reason for high pH (10.64) in well G6. Well G1 has the lowest pH (3.97 and 3.2 in 2004) and quite high U concentration (350 ppb). Highest U con-centration is found in pH neutral G8 (1 230 ppb). It can be noted that the highest pH have decreased and the lowest increased from 2004 to 2015.
Table 1 pH and element concentrations for some of the groundwater sampled in 2004 (according to SWECO VIAK 2005) and in December 2015. Concentrations are in μg/L.
Well pH 2004
2015
U 2004
2015
V 2004
2015
Ni 2004
2015
Mo 2004
2015
G1 3.2 3.97 129 350 1.5 121 1190 1840 1 14.4
G3 3.6 5.92 16 52 1.8 16.6 235 278 8.2 423
G6 12.2 10.64 0.5 0.9 0.77 0.7 8.1 9.6 142 87.5
G7 10 7.88 0.01 0.01 2.0 0.24 0.5 1.58 2.0 0.90
G8 7.02 1760 1230 12 59.4 7.0 25.9 935 319
Leaching tests
With only shale ash (container A1) the leachates had higher pH (4.61-7.29) than leachates from fines (pH 2.24-6.8, container B1). With a mixture of both shale ash and fines the pH was found to be in between. Low pH tend to increase as the sampling occasions progress probably due to consumption of easily available acid forming minerals such as pyrite. Also the trace metals indicate a trend, as the concentrations in general are higher in the begin-ning of the sampling series and then decrease. Surface coating on the material is probably dissolved and washed out in connection to the early sampling occasions. Uranium shows lowest concentration for leachates from shale ash (A1) and highest for leachates where both shale ash and fines are involved (see figure 5). Differences in uranium concentrations are probably connected to pH.
Also for nickel, leachates from shale ash display the lowest concentrations (see figure 6). Lower concentrations for molybdenum (see figure 7) in B1 (fines) than in A1 (shale ash) is probably due to lower pH in B1. This is also a plausible reason for lower Mo concentrations in the leachate in A2 where the high concentration after passing A1 is lowered in A2 due to pH decrease. Also the groundwater indicates pH as the explanation for higher Mo concen-trations in G3 in 2015 (pH 5.92) than in 2004 (pH 3.6).

774
Lappeenranta, Finland IMWA 2017Mine Water and Circular Economy
Wolkersdorfer C, Sartz L, Sillanpää M, Häkkinen A (Editors)
Figure 5 Diagram showing the concentration of uranium in leachates.
Figure 6 Diagram showing the concentration of nickel in different leachates.
Figure 7 Diagram showing the concentration of molybdenum in different leachates.
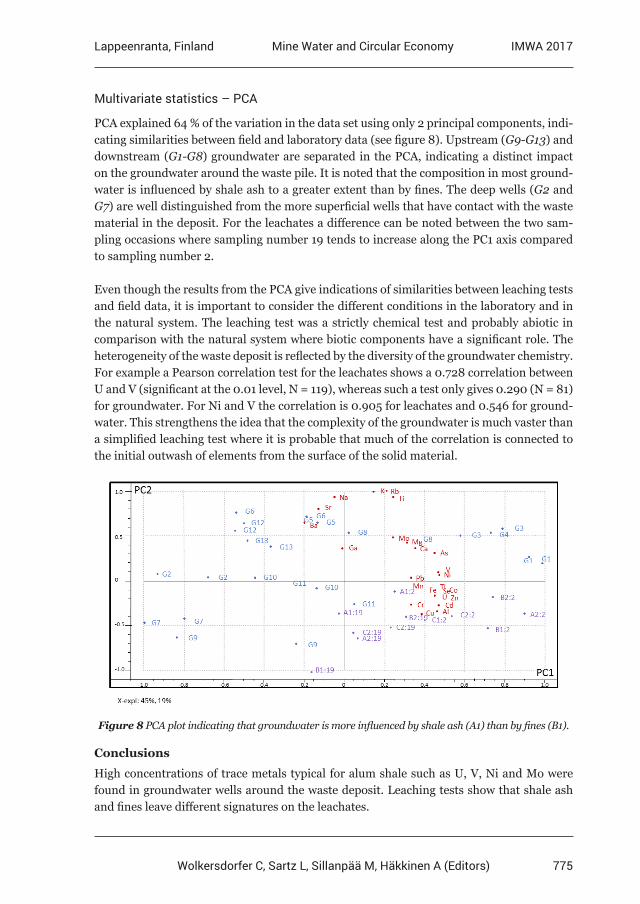
775
Lappeenranta, Finland IMWA 2017Mine Water and Circular Economy
Wolkersdorfer C, Sartz L, Sillanpää M, Häkkinen A (Editors)
Multivariate statistics – PCA
PCA explained 64 % of the variation in the data set using only 2 principal components, indi-cating similarities between field and laboratory data (see figure 8). Upstream (G9-G13) and downstream (G1-G8) groundwater are separated in the PCA, indicating a distinct impact on the groundwater around the waste pile. It is noted that the composition in most ground-water is influenced by shale ash to a greater extent than by fines. The deep wells (G2 and G7) are well distinguished from the more superficial wells that have contact with the waste material in the deposit. For the leachates a difference can be noted between the two sam-pling occasions where sampling number 19 tends to increase along the PC1 axis compared to sampling number 2.
Even though the results from the PCA give indications of similarities between leaching tests and field data, it is important to consider the different conditions in the laboratory and in the natural system. The leaching test was a strictly chemical test and probably abiotic in comparison with the natural system where biotic components have a significant role. The heterogeneity of the waste deposit is reflected by the diversity of the groundwater chemistry. For example a Pearson correlation test for the leachates shows a 0.728 correlation between U and V (significant at the 0.01 level, N = 119), whereas such a test only gives 0.290 (N = 81) for groundwater. For Ni and V the correlation is 0.905 for leachates and 0.546 for ground-water. This strengthens the idea that the complexity of the groundwater is much vaster than a simplified leaching test where it is probable that much of the correlation is connected to the initial outwash of elements from the surface of the solid material.
Figure 8 PCA plot indicating that groundwater is more influenced by shale ash (A1) than by fines (B1).
Conclusions
High concentrations of trace metals typical for alum shale such as U, V, Ni and Mo were found in groundwater wells around the waste deposit. Leaching tests show that shale ash and fines leave different signatures on the leachates.
776
Lappeenranta, Finland IMWA 2017Mine Water and Circular Economy
Wolkersdorfer C, Sartz L, Sillanpää M, Häkkinen A (Editors)
This study has shown that the combination of leaching experiments and principal compo-nent analysis can be used to understand the evolution of groundwater in a contaminated setting. As the Kvarntorp area is complex and different parameters covariate, further tests are needed to fully understand the processes and water chemistry.
Acknowledgements
The municipality of Kumla is acknowledged for giving access to the Kvarntorp area and permission to collect samples. Christian Källund and Andreas Källund are greatly acknowledged for performing the laboratory work with the leaching tests.
References
Bäckström M (2010) Environmental impact from an alum shale deposit, Kvarntorp, Sweden – present and future scenarios. In Wolkersdorfer & Freund (Eds.). International Mine Water Association (IMWA) 2010, Sydney, Canada, pp. 3-6.Falk H, Lavergren U, Bergbäck B (2006) Metal mobility in alum shale from Öland, Sweden. Journal of Geochemical Exploration 90:157-165.Källund C, Källund A (2011) Lakningsförsök av material från Kvarntorpshögen och Ljusnarsbergsfältet. Västerbergslagens utbildningscentrum [In Swedish].SWECO VIAK (2005) Sveriges Geologiska Undersökning. Kvarntorpsområdet. Studie av Kvarntorpshögen. SGU Project number 43032. SWECO project number 1310687 000.Puura E (1998) Weathering of mining waste rock containing alum shale and limestone: A case study of the Maardu dumps, Esonia. Department of Chemical Engineering and Technology, KTH, Stockholm, Sweden. PhD-thesis.
777
Lappeenranta, Finland IMWA 2017Mine Water and Circular Economy
Wolkersdorfer C, Sartz L, Sillanpää M, Häkkinen A (Editors)
Water Quality in PGM Ore Flotation: The effect of Ionic Strength and pH
M.S. Manono1, K. Matibidi2, C.K. Thubakgale2, K.C. Corin1, J.G. Wiese1
1Centre for Minerals Research, Department of Chemical Engineering, University of Cape Town, Private Bag X3, Rondebosch 7701, South Africa, [email protected]
2Department of Metallurgical Engineering, Vaal University of Technology, Potgieter BLVD, Vanderbijlpark, 1911, South Africa
Abstract Water and its chemistry are important variables in froth flotation. The presence of electrolytes in water may form either hydroxo species or precipitates in the flotation pulp when the process pH is altered. This may alter the chemical interactions that enable the process.This study investigates the interactive effect of plant water ionic strength and pH in the flotation of a sulphidic PGM bearing ore.Results suggest that water quality variations may have effects at both the air-water interface as well as the mineral air interface.
Key words Froth stability, Ionic strength, pH, Water quality, Water recovery
Introduction
The quest for a cleaner and safer environment with clean surface and ground water has led to increased recycling of process water within the minerals processing industry. Since the chemistry of process water is entirely different from fresh water and changes as water is recycled, there is a concern about the possible effects of its constituents (ion type, ionic strength etc.) on the efficiency of the flotation process (Rao and Finch, 1989). Studies have shown that recycled process water in mineral processing has a high salinity, contains po-tentially toxic metals ions, flotation reagents, organics and other pollutants (Slatter et al. 2009). Therefore, process water treatment and reuse has much academic and industrial relevance (Chen et al. 2008).
In response to the scarcity of fresh water, and the tight environmental legislation on wa-ter usage, PGM bearing ore flotation circuits make use of recycled process water. Howev-er, the chemistry of recycled process water may alter the performance of the flotation sys-tem. It is therefore required to understand the effects of these elements on the flotation process. Electrolytes in recycled process water can hinder the collector from adsorbing onto the mineral surface (Wang et al, 2014; Hancer et al. 2001). It has been reported that ions such as Ca2+, S2O3
2- and SO42- may activate pentlandite and pyrrhotite mineral sur-
faces at normal process pH 9 while S2O32- and Ca2+ compete with xanthate for adsorption
on pentlandite surfaces (Hodgson and Agar, 1989). Shackleton et al. (2003) stated that Ca2+ ions can chemisorb onto the pentlandite surface, replacing metal ions at the surface and possibly reducing particle surface hydrophobicity. Metal ions hydrolyze in alkaline pH and may deposit as hydrophilic metal hydroxides, sulphates or carbonates on the mineral surfaces (Fuerstenau et al. 1999). The reduction in mineral surface hydropho-bicity could compromise the efficiency of the particle – bubble attachment sub-process
778
Lappeenranta, Finland IMWA 2017Mine Water and Circular Economy
Wolkersdorfer C, Sartz L, Sillanpää M, Häkkinen A (Editors)
and consequently the performance of the flotation system (Koh et al. 2009, Schwarz and Grano, 2005). Ionic strength and the type of cations in solution can have an influence on the extent of activation. The presence of divalent cations in solution like Mg2+ or Fe2+ can compete with metal ions like Cu2+ on the mineral surface (Lascelles et al. 2001). Stud-ies by Parolis et al. (2008) and Shortridge et al. (2003) showed that the depression of naturally floatable gangue and the efficacy of carboxymethyl cellulose (CMC) were very much dependent upon the type and ionic strength of the electrolytes present in solution. They showed that when divalent cations (Ca2+ and Mg2+) were present, depression was greater than when monovalent cations were present (K+); and that increasing the ionic strength of the electrolytic conditions resulted in even greater depression of the naturally floatable gangue.
The presence of electrolytes can improve particle-bubble attachment efficiency through compressing the electric double layer and thus reducing the electrostatic repulsion be-tween particles and bubbles (Kurniawan et al. 2011). Electrolytes are favourable to the formation of smaller more stable bubbles due to the influence of electrolytes on gas dis-persion properties (bubble size, gas hold-up etc.). Smaller bubbles increase the parti-cle-bubble collision probability (Pugh et al. 1997; Bićak et al. 2012) and thereby improve particle-bubble attachment efficiency (Hewitt et al. 1994). An increase in electrolyte concentration increases the density of ions in the bulk solution resulting in counter-ion diffusion into the Stern layer, which increases attraction forces and decreases repulsion forces (Wang et al. 2014). The impact of ionic strength on bubble size is attributed to the fact that inorganic ions in water seem to slow inter-bubble drainage and thereby inhibit bubble coalescence and promote stability in the froth phase (Barker, 1986; Craig et al. 1993).
However, whether there is an interactive effect of ionic strength of plant water and pH is not well understood. In literature these two parameters have been studied individually. pH has been investigated mostly on single salt electrolytes in order to simplify the com-plex water chemistry. This approach does not truly represent the complex water chemis-try in flotation circuits and would not allow plant operators to predict the impact of ionic strength and pH when more than one hydroxo species, inorganic complex or precipitate is present in the system. Therefore, the purpose of this study is to investigate the inter-active effect of ionic strength and pH on the floatability of a PGM containing ore with a keen focus on the depression of gangue as well as froth stability.
Methods
1 kg ore samples were milled at 66% solids in synthetic plant water for 15 minutes in order to obtain a grind of 60% passing 75µm. The milled slurry was transferred into a 3L Denver flotation cell. The volume of the cell was made up to generate 35% solids using synthetic plant water (at the required ionic strength). The cell was fitted with a variable speed drive and the pulp level was controlled manually. The impeller speed was set at 1200 rpm. An air flow rate of 7 L/min was maintained for all flotation experiments and a constant froth height of 2 cm was sustained throughout. Reagents were dosed and
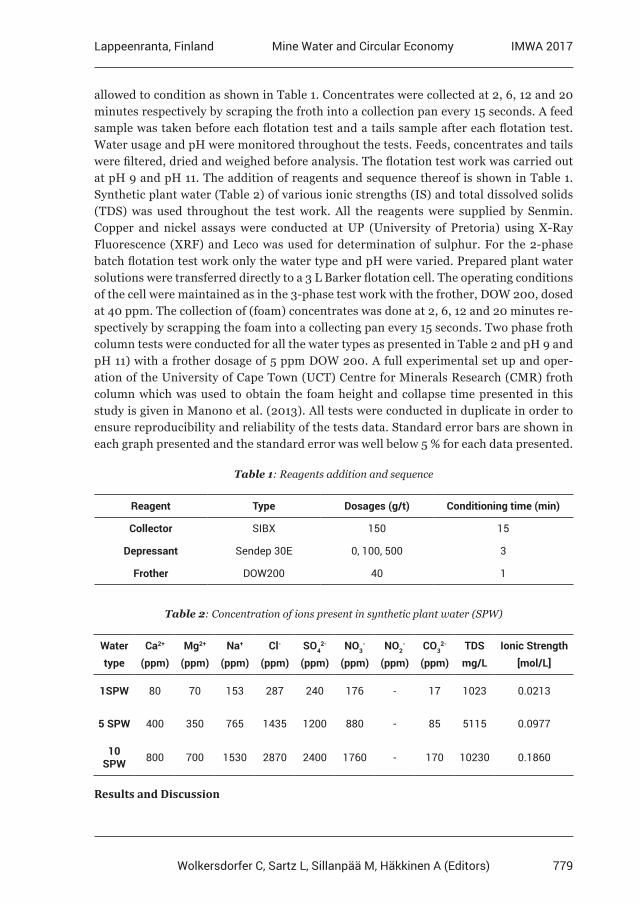
779
Lappeenranta, Finland IMWA 2017Mine Water and Circular Economy
Wolkersdorfer C, Sartz L, Sillanpää M, Häkkinen A (Editors)
allowed to condition as shown in Table 1. Concentrates were collected at 2, 6, 12 and 20 minutes respectively by scraping the froth into a collection pan every 15 seconds. A feed sample was taken before each flotation test and a tails sample after each flotation test. Water usage and pH were monitored throughout the tests. Feeds, concentrates and tails were filtered, dried and weighed before analysis. The flotation test work was carried out at pH 9 and pH 11. The addition of reagents and sequence thereof is shown in Table 1. Synthetic plant water (Table 2) of various ionic strengths (IS) and total dissolved solids (TDS) was used throughout the test work. All the reagents were supplied by Senmin. Copper and nickel assays were conducted at UP (University of Pretoria) using X-Ray Fluorescence (XRF) and Leco was used for determination of sulphur. For the 2-phase batch flotation test work only the water type and pH were varied. Prepared plant water solutions were transferred directly to a 3 L Barker flotation cell. The operating conditions of the cell were maintained as in the 3-phase test work with the frother, DOW 200, dosed at 40 ppm. The collection of (foam) concentrates was done at 2, 6, 12 and 20 minutes re-spectively by scrapping the foam into a collecting pan every 15 seconds. Two phase froth column tests were conducted for all the water types as presented in Table 2 and pH 9 and pH 11) with a frother dosage of 5 ppm DOW 200. A full experimental set up and oper-ation of the University of Cape Town (UCT) Centre for Minerals Research (CMR) froth column which was used to obtain the foam height and collapse time presented in this study is given in Manono et al. (2013). All tests were conducted in duplicate in order to ensure reproducibility and reliability of the tests data. Standard error bars are shown in each graph presented and the standard error was well below 5 % for each data presented.
Table 1: Reagents addition and sequence
Reagent Type Dosages (g/t) Conditioning time (min)
Collector SIBX 150 15
Depressant Sendep 30E 0, 100, 500 3
Frother DOW200 40 1
Table 2: Concentration of ions present in synthetic plant water (SPW)
Water type
Ca2+
(ppm)Mg2+
(ppm)Na+
(ppm)Cl-
(ppm)SO4
2-
(ppm)NO3
-
(ppm)NO2
-
(ppm)CO3
2-
(ppm)TDS
mg/LIonic Strength
[mol/L]
1SPW 80 70 153 287 240 176 - 17 1023 0.0213
5 SPW 400 350 765 1435 1200 880 - 85 5115 0.0977
10 SPW 800 700 1530 2870 2400 1760 - 170 10230 0.1860
Results and Discussion
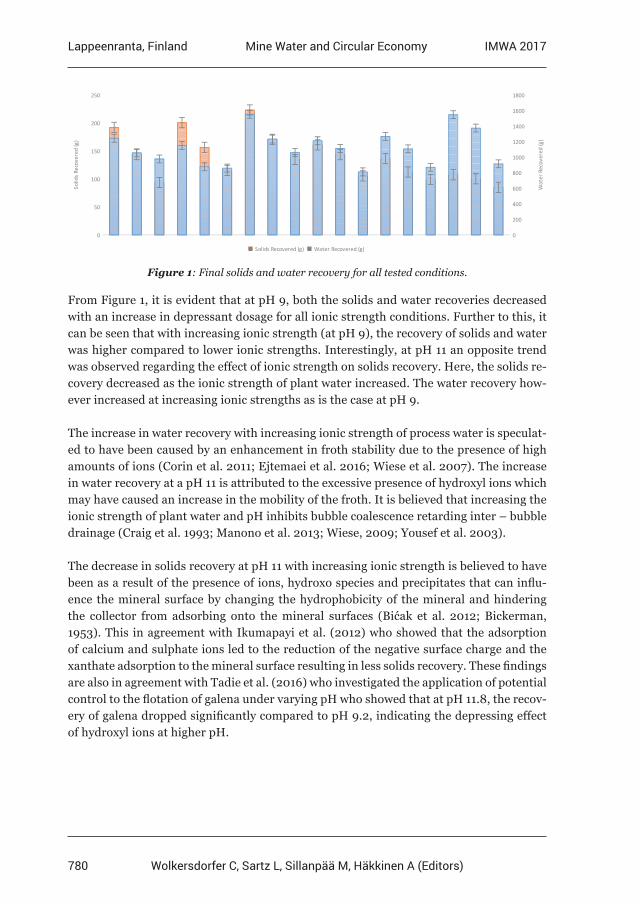
780
Lappeenranta, Finland IMWA 2017Mine Water and Circular Economy
Wolkersdorfer C, Sartz L, Sillanpää M, Häkkinen A (Editors)
0
50
100
150
200
250
0
200
400
600
800
1000
1200
1400
1600
1800
Solids Recovered (g) Water Recovered (g)
Solid
s Rec
over
ed (g
)
Wat
er R
ecov
ered
(g)
Figure 1: Final solids and water recovery for all tested conditions.
From Figure 1, it is evident that at pH 9, both the solids and water recoveries decreased with an increase in depressant dosage for all ionic strength conditions. Further to this, it can be seen that with increasing ionic strength (at pH 9), the recovery of solids and water was higher compared to lower ionic strengths. Interestingly, at pH 11 an opposite trend was observed regarding the effect of ionic strength on solids recovery. Here, the solids re-covery decreased as the ionic strength of plant water increased. The water recovery how-ever increased at increasing ionic strengths as is the case at pH 9.
The increase in water recovery with increasing ionic strength of process water is speculat-ed to have been caused by an enhancement in froth stability due to the presence of high amounts of ions (Corin et al. 2011; Ejtemaei et al. 2016; Wiese et al. 2007). The increase in water recovery at a pH 11 is attributed to the excessive presence of hydroxyl ions which may have caused an increase in the mobility of the froth. It is believed that increasing the ionic strength of plant water and pH inhibits bubble coalescence retarding inter – bubble drainage (Craig et al. 1993; Manono et al. 2013; Wiese, 2009; Yousef et al. 2003).
The decrease in solids recovery at pH 11 with increasing ionic strength is believed to have been as a result of the presence of ions, hydroxo species and precipitates that can influ-ence the mineral surface by changing the hydrophobicity of the mineral and hindering the collector from adsorbing onto the mineral surfaces (Bićak et al. 2012; Bickerman, 1953). This in agreement with Ikumapayi et al. (2012) who showed that the adsorption of calcium and sulphate ions led to the reduction of the negative surface charge and the xanthate adsorption to the mineral surface resulting in less solids recovery. These findings are also in agreement with Tadie et al. (2016) who investigated the application of potential control to the flotation of galena under varying pH who showed that at pH 11.8, the recov-ery of galena dropped significantly compared to pH 9.2, indicating the depressing effect of hydroxyl ions at higher pH.
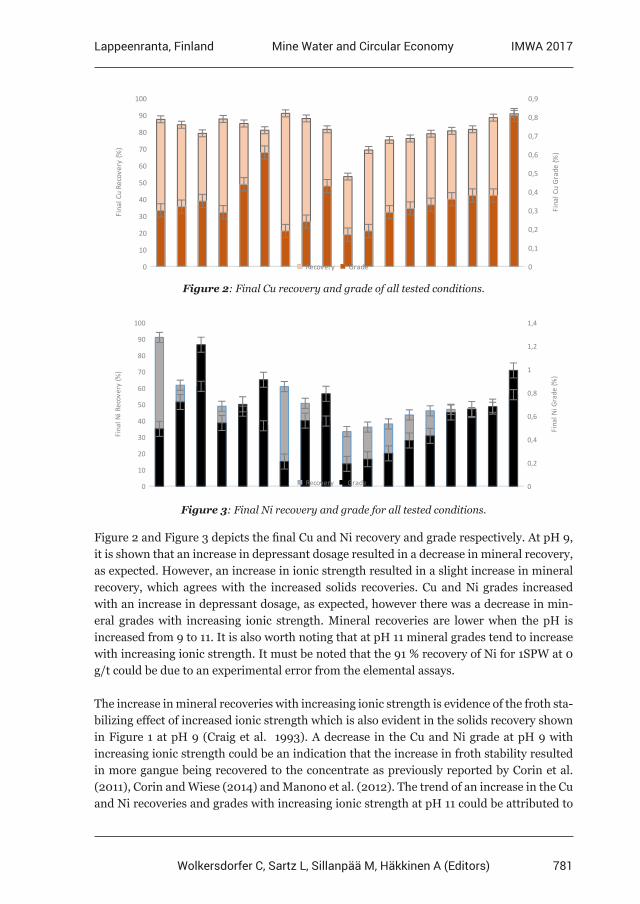
781
Lappeenranta, Finland IMWA 2017Mine Water and Circular Economy
Wolkersdorfer C, Sartz L, Sillanpää M, Häkkinen A (Editors)
0
10
20
30
40
50
60
70
80
90
100
0
0,1
0,2
0,3
0,4
0,5
0,6
0,7
0,8
0,9
Recovery Grade
Fina
l Cu
Reco
very
(%)
Fina
l Cu
Grad
e (%
)
Figure 2: Final Cu recovery and grade of all tested conditions.
0
10
20
30
40
50
60
70
80
90
100
0
0,2
0,4
0,6
0,8
1
1,2
1,4
Recovery Grade
Fina
l Ni R
ecov
ery
(%)
Fina
l Ni G
rade
(%)
Figure 3: Final Ni recovery and grade for all tested conditions.
Figure 2 and Figure 3 depicts the final Cu and Ni recovery and grade respectively. At pH 9, it is shown that an increase in depressant dosage resulted in a decrease in mineral recovery, as expected. However, an increase in ionic strength resulted in a slight increase in mineral recovery, which agrees with the increased solids recoveries. Cu and Ni grades increased with an increase in depressant dosage, as expected, however there was a decrease in min-eral grades with increasing ionic strength. Mineral recoveries are lower when the pH is increased from 9 to 11. It is also worth noting that at pH 11 mineral grades tend to increase with increasing ionic strength. It must be noted that the 91 % recovery of Ni for 1SPW at 0 g/t could be due to an experimental error from the elemental assays.
The increase in mineral recoveries with increasing ionic strength is evidence of the froth sta-bilizing effect of increased ionic strength which is also evident in the solids recovery shown in Figure 1 at pH 9 (Craig et al. 1993). A decrease in the Cu and Ni grade at pH 9 with increasing ionic strength could be an indication that the increase in froth stability resulted in more gangue being recovered to the concentrate as previously reported by Corin et al. (2011), Corin and Wiese (2014) and Manono et al. (2012). The trend of an increase in the Cu and Ni recoveries and grades with increasing ionic strength at pH 11 could be attributed to
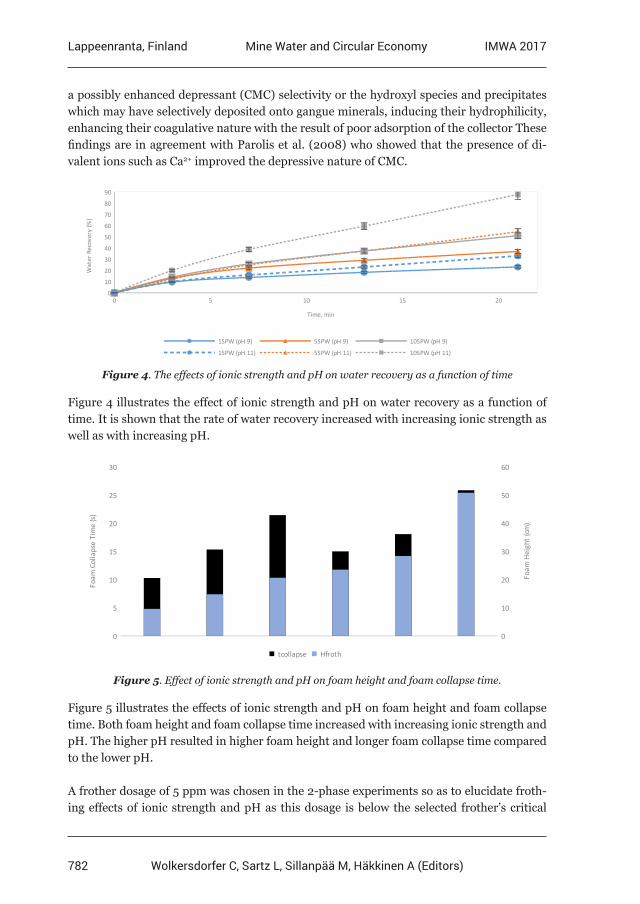
782
Lappeenranta, Finland IMWA 2017Mine Water and Circular Economy
Wolkersdorfer C, Sartz L, Sillanpää M, Häkkinen A (Editors)
a possibly enhanced depressant (CMC) selectivity or the hydroxyl species and precipitates which may have selectively deposited onto gangue minerals, inducing their hydrophilicity, enhancing their coagulative nature with the result of poor adsorption of the collector These findings are in agreement with Parolis et al. (2008) who showed that the presence of di-valent ions such as Ca2+ improved the depressive nature of CMC.
0 5 10 15 200
10
20
30
40
50
60
70
80
90
1SPW (pH 9) 5SPW (pH 9) 10SPW (pH 9)
1SPW (pH 11) 5SPW (pH 11) 10SPW (pH 11)
Time, min
Wat
er R
ecov
ery
(%)
Figure 4. The effects of ionic strength and pH on water recovery as a function of time
Figure 4 illustrates the effect of ionic strength and pH on water recovery as a function of time. It is shown that the rate of water recovery increased with increasing ionic strength as well as with increasing pH.
0
5
10
15
20
25
30
0
10
20
30
40
50
60
tcollapse Hfroth
Foam
Col
laps
e Ti
me
(s)
Foam
Hei
ght (
cm)
Figure 5. Effect of ionic strength and pH on foam height and foam collapse time.
Figure 5 illustrates the effects of ionic strength and pH on foam height and foam collapse time. Both foam height and foam collapse time increased with increasing ionic strength and pH. The higher pH resulted in higher foam height and longer foam collapse time compared to the lower pH.
A frother dosage of 5 ppm was chosen in the 2-phase experiments so as to elucidate froth-ing effects of ionic strength and pH as this dosage is below the selected frother’s critical
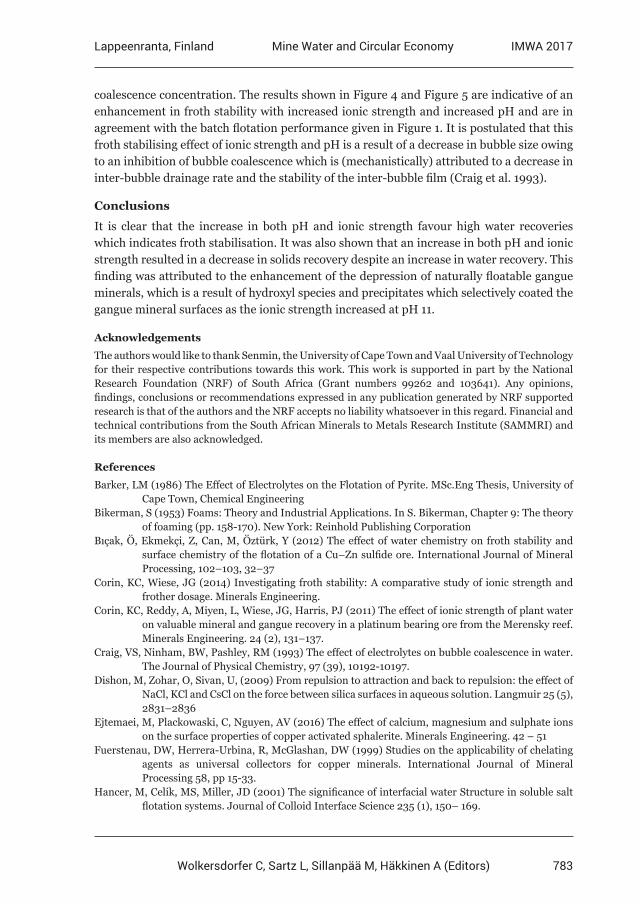
783
Lappeenranta, Finland IMWA 2017Mine Water and Circular Economy
Wolkersdorfer C, Sartz L, Sillanpää M, Häkkinen A (Editors)
coalescence concentration. The results shown in Figure 4 and Figure 5 are indicative of an enhancement in froth stability with increased ionic strength and increased pH and are in agreement with the batch flotation performance given in Figure 1. It is postulated that this froth stabilising effect of ionic strength and pH is a result of a decrease in bubble size owing to an inhibition of bubble coalescence which is (mechanistically) attributed to a decrease in inter-bubble drainage rate and the stability of the inter-bubble film (Craig et al. 1993).
Conclusions
It is clear that the increase in both pH and ionic strength favour high water recoveries which indicates froth stabilisation. It was also shown that an increase in both pH and ionic strength resulted in a decrease in solids recovery despite an increase in water recovery. This finding was attributed to the enhancement of the depression of naturally floatable gangue minerals, which is a result of hydroxyl species and precipitates which selectively coated the gangue mineral surfaces as the ionic strength increased at pH 11.
Acknowledgements
The authors would like to thank Senmin, the University of Cape Town and Vaal University of Technology for their respective contributions towards this work. This work is supported in part by the National Research Foundation (NRF) of South Africa (Grant numbers 99262 and 103641). Any opinions, findings, conclusions or recommendations expressed in any publication generated by NRF supported research is that of the authors and the NRF accepts no liability whatsoever in this regard. Financial and technical contributions from the South African Minerals to Metals Research Institute (SAMMRI) and its members are also acknowledged.
References
Barker, LM (1986) The Effect of Electrolytes on the Flotation of Pyrite. MSc.Eng Thesis, University of Cape Town, Chemical EngineeringBikerman, S (1953) Foams: Theory and Industrial Applications. In S. Bikerman, Chapter 9: The theory of foaming (pp. 158-170). New York: Reinhold Publishing CorporationBıçak, Ö, Ekmekçi, Z, Can, M, Öztürk, Y (2012) The effect of water chemistry on froth stability and surface chemistry of the flotation of a Cu–Zn sulfide ore. International Journal of Mineral Processing, 102–103, 32–37Corin, KC, Wiese, JG (2014) Investigating froth stability: A comparative study of ionic strength and frother dosage. Minerals Engineering.Corin, KC, Reddy, A, Miyen, L, Wiese, JG, Harris, PJ (2011) The effect of ionic strength of plant water on valuable mineral and gangue recovery in a platinum bearing ore from the Merensky reef. Minerals Engineering. 24 (2), 131–137.Craig, VS, Ninham, BW, Pashley, RM (1993) The effect of electrolytes on bubble coalescence in water. The Journal of Physical Chemistry, 97 (39), 10192-10197.Dishon, M, Zohar, O, Sivan, U, (2009) From repulsion to attraction and back to repulsion: the effect of NaCl, KCl and CsCl on the force between silica surfaces in aqueous solution. Langmuir 25 (5), 2831–2836Ejtemaei, M, Plackowaski, C, Nguyen, AV (2016) The effect of calcium, magnesium and sulphate ions on the surface properties of copper activated sphalerite. Minerals Engineering. 42 – 51Fuerstenau, DW, Herrera-Urbina, R, McGlashan, DW (1999) Studies on the applicability of chelating agents as universal collectors for copper minerals. International Journal of Mineral Processing 58, pp 15-33.Hancer, M, Celik, MS, Miller, JD (2001) The significance of interfacial water Structure in soluble salt flotation systems. Journal of Colloid Interface Science 235 (1), 150– 169.
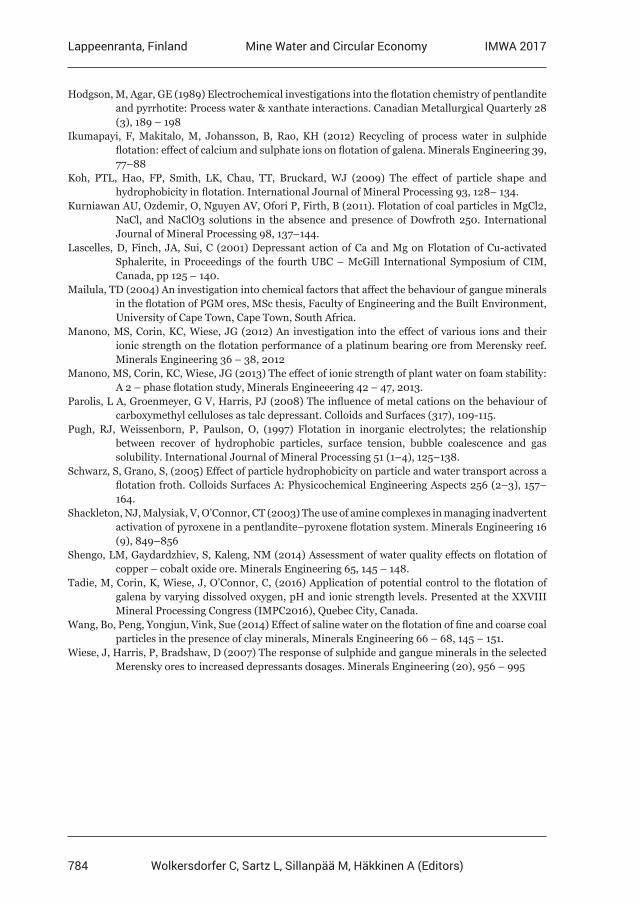
784
Lappeenranta, Finland IMWA 2017Mine Water and Circular Economy
Wolkersdorfer C, Sartz L, Sillanpää M, Häkkinen A (Editors)
Hodgson, M, Agar, GE (1989) Electrochemical investigations into the flotation chemistry of pentlandite and pyrrhotite: Process water & xanthate interactions. Canadian Metallurgical Quarterly 28 (3), 189 – 198Ikumapayi, F, Makitalo, M, Johansson, B, Rao, KH (2012) Recycling of process water in sulphide flotation: effect of calcium and sulphate ions on flotation of galena. Minerals Engineering 39, 77–88Koh, PTL, Hao, FP, Smith, LK, Chau, TT, Bruckard, WJ (2009) The effect of particle shape and hydrophobicity in flotation. International Journal of Mineral Processing 93, 128– 134.Kurniawan AU, Ozdemir, O, Nguyen AV, Ofori P, Firth, B (2011). Flotation of coal particles in MgCl2, NaCl, and NaClO3 solutions in the absence and presence of Dowfroth 250. International Journal of Mineral Processing 98, 137–144.Lascelles, D, Finch, JA, Sui, C (2001) Depressant action of Ca and Mg on Flotation of Cu-activated Sphalerite, in Proceedings of the fourth UBC – McGill International Symposium of CIM, Canada, pp 125 – 140.Mailula, TD (2004) An investigation into chemical factors that affect the behaviour of gangue minerals in the flotation of PGM ores, MSc thesis, Faculty of Engineering and the Built Environment, University of Cape Town, Cape Town, South Africa. Manono, MS, Corin, KC, Wiese, JG (2012) An investigation into the effect of various ions and their ionic strength on the flotation performance of a platinum bearing ore from Merensky reef. Minerals Engineering 36 – 38, 2012Manono, MS, Corin, KC, Wiese, JG (2013) The effect of ionic strength of plant water on foam stability: A 2 – phase flotation study, Minerals Engineeering 42 – 47, 2013.Parolis, L A, Groenmeyer, G V, Harris, PJ (2008) The influence of metal cations on the behaviour of carboxymethyl celluloses as talc depressant. Colloids and Surfaces (317), 109-115.Pugh, RJ, Weissenborn, P, Paulson, O, (1997) Flotation in inorganic electrolytes; the relationship between recover of hydrophobic particles, surface tension, bubble coalescence and gas solubility. International Journal of Mineral Processing 51 (1–4), 125–138.Schwarz, S, Grano, S, (2005) Effect of particle hydrophobicity on particle and water transport across a flotation froth. Colloids Surfaces A: Physicochemical Engineering Aspects 256 (2–3), 157– 164.Shackleton, NJ, Malysiak, V, O’Connor, CT (2003) The use of amine complexes in managing inadvertent activation of pyroxene in a pentlandite–pyroxene flotation system. Minerals Engineering 16 (9), 849–856Shengo, LM, Gaydardzhiev, S, Kaleng, NM (2014) Assessment of water quality effects on flotation of copper – cobalt oxide ore. Minerals Engineering 65, 145 – 148.Tadie, M, Corin, K, Wiese, J, O’Connor, C, (2016) Application of potential control to the flotation of galena by varying dissolved oxygen, pH and ionic strength levels. Presented at the XXVIII Mineral Processing Congress (IMPC2016), Quebec City, Canada.Wang, Bo, Peng, Yongjun, Vink, Sue (2014) Effect of saline water on the flotation of fine and coarse coal particles in the presence of clay minerals, Minerals Engineering 66 – 68, 145 – 151.Wiese, J, Harris, P, Bradshaw, D (2007) The response of sulphide and gangue minerals in the selected Merensky ores to increased depressants dosages. Minerals Engineering (20), 956 – 995
785
Lappeenranta, Finland IMWA 2017Mine Water and Circular Economy
Wolkersdorfer C, Sartz L, Sillanpää M, Häkkinen A (Editors)
Mass transport of hydraulically stowed residues in adjacent aquifers in the Ruhr Area, Germany
Timm Reisinger1, Thomas R. Rüde1
1RWTH Aachen University, Institute of Hydrogeology (LFH), Lochnerstr. 4-20, 52064 Aachen, Germany, [email protected]
Abstract Metal-containing residues were stowed in hard coal mines of the Ruhr Area. Induced by mine flooding highly mineralized groundwater can come into contact with these underground stowed residues. As known from laboratory tests – especially single fracture tests – the mobility of zinc, lead and cadmium increases when adding sodium chloride. In absence of sodium chloride, zinc has the highest mobility, followed by cadmium and lead. With addition of sodium chloride the mobility of cadmium enhanced and becomes higher than the mobility of zinc, this is due to the influence of chloro-complexation which is stronger for cadmium than for zinc. Moreover, it was ascertained that the mobility for oxyanions has an inverse behaviour.
Key words residues, mine flooding, metals, oxyanions, sodium chloride, single fracture experiments
Introduction
From the mid-1980s to 2006 large amounts of residues were used for stowing in hard coal mines of the Ruhr Area, Germany. A mixture of water and fine-grained residues were pumped directly into the goaf, i.e. into the collapsed material of the hanging wall beyond the shield. In case of a contaminant release of these residues the transport initially takes place via flow in fractures. The flow is orientated towards the next receiving level (e.g. nearest gate road). The distance from the stowed residues to the receiving level is at least 100 m in the investigated mining area. A flow through the goaf and country rocks takes place. A major challenge is to find out whether metals can be released from the stowed materials and, in case they were released, the country rocks are able to retard or even hinder their transport. Without retardation or barrier function of the country rocks there is a risk that pollutants reaching the surface via mine water drainage. For this purpose, laboratory tests such as column tests, single fracture experiments and flow cell experi-ments with typical country rock samples and waters of differing chemical composition were carried out.
Which components are the key players in this investigation of mass transport from the stowed residues?
It is necessary to assess the country rocks of the area of stowed residues, in order to make reliable statements on their barrier effect. The Ruhr Carbon depositions are characterised by a regular sequence of mudstone and sandstone as well as seams with an underclay. Es-pecially fine-grained rocks such as clay- and siltstones break in the cavities created by the mining of coal (goaf). Mainly due to the high rock load, the hydraulic permeability is very low. A Carboniferous Ruhr-Sandstone, which outcrops in a quarry in the city of Herdecke in the south of the Ruhr Area was used for laboratory tests. This so-called “Kaiserberg-Sand-
786
Lappeenranta, Finland IMWA 2017Mine Water and Circular Economy
Wolkersdorfer C, Sartz L, Sillanpää M, Häkkinen A (Editors)
stein” occurs as a country rock of the coal seams even in very large depths. The effective porosity is low (4.4 %). The mineralogical composition of the sandstone was determined by X-ray diffractometry: main components are 65 weight % quartz and 15 weight % feldspar. The calculated proportion of clay and mica minerals is 19.6 %.
Deep groundwater is water, which existed already in fractures and pores before coal mining started. While mining it still seeps into the mines and in long term, after flooding the mines, it will be the water which comes into contact with the stowed residues. This deep groundwater is always highly mineralized and in general mineralization increases with depth. The NaCl concentration for example already reaches in a depth of about 500 m below ground level the concentration of seawater (approx. 35 g L-1) and the concentration increas-es steadily to values of up to 200 g L-1 at depths of more than 1000 m (Jäger et al. 1990, Wedewardt 1995).
A total of approximately 1.6 million tons of residues were stowed; like residues from hard coal-, special waste-, household waste- and sewage sludge incineration, foundry sand and sludges from the chemical industry. Most residues were stowed at least 800 m deep in the underground. Before these residual substances were compressed into the goaf, they were mixed with cement-like additives and water. All data show that the mix-ture has hardened in the underground (AHU 2017). As seen from elution experiments, high pH-values were found in the case of a reactive contact with water (Jäger et al. 1990, RAG 1993-2004, Klinger 1993, Pass 1997). Since the metal compounds are usually nearly immobile at high pH values, their discharge is prevented. However, remobilization can occur with decreasing pH values and this will occur in the long run (centruries) by mineral transformation e.g. from ettringite to brucite and further mineral dissolution. Analysis of metals, present in filter dusts, showed that both zinc and lead are the dominant metals in a proportion of 80 weight % of the average total metal content. Cadmium has a proportion of approx. 1 weight % (AHU 2017). Due to the large proportions in the residues, due to the toxicity, and the large masses which can be eluted, these metals receive special attention in the risk assessment.
Experimental methods
All experiments were carried out with specimens of sandstone. They were flowed through with a solution of ultrapure water with a concentration of 2,5 * 10-4 mol L-1 of the metals lead, cadmium and zinc. The hydraulic gradient was kept constant. Reaching the breakthrough of the metals, the solution was enriched with 100 g L-1 sodium chloride. The concentration was analysed in the effluent. Additionally behaviour of oxyanions (vanadate, molybdate and arsenate), the effects of changes in pH and the flow in fractures per se were investigated. Specific electrical conductivity, oxygen content and pH, except the flow cell experiments (due to low flow rates), were measured continuously. In most of the cases the fluorescence tracer sodium naphthionate was used as a conservative tracer. Table 1 shows the boundary conditions for the various experimental setups.
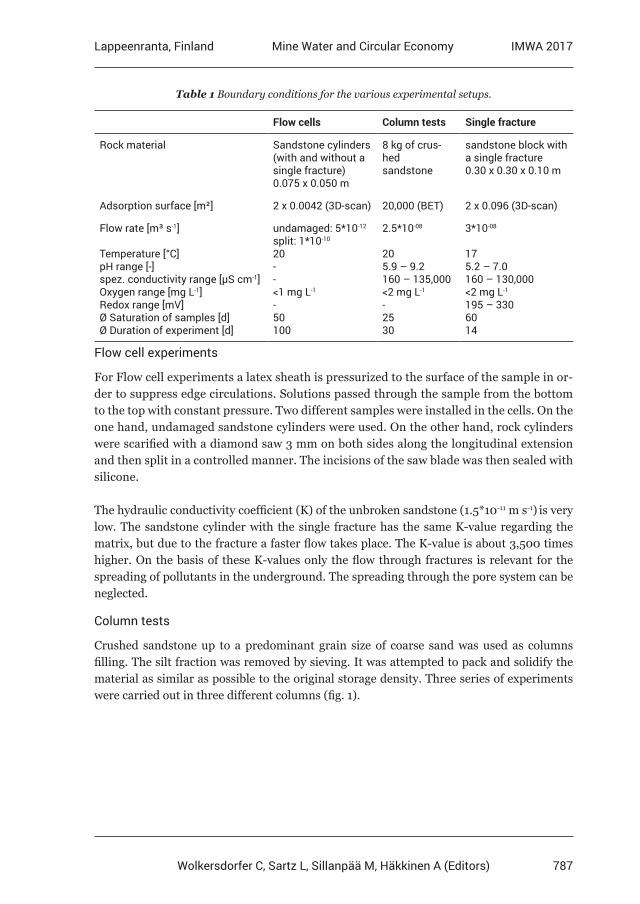
787
Lappeenranta, Finland IMWA 2017Mine Water and Circular Economy
Wolkersdorfer C, Sartz L, Sillanpää M, Häkkinen A (Editors)
Table 1 Boundary conditions for the various experimental setups.
Flow cells Column tests Single fracture
Rock material Sandstone cylinders (with and without a single fracture)0.075 x 0.050 m
8 kg of crus-hed sandstone
sandstone block with a single fracture0.30 x 0.30 x 0.10 m
Adsorption surface [m²] 2 x 0.0042 (3D-scan) 20,000 (BET) 2 x 0.096 (3D-scan)
Flow rate [m³ s-1]
Temperature [°C]pH range [-]spez. conductivity range [μS cm-1]Oxygen range [mg L-1]Redox range [mV]Ø Saturation of samples [d]Ø Duration of experiment [d]
undamaged: 5*10-12
split: 1*10-10
20--<1 mg L-1
-50100
2.5*10-08
205.9 – 9.2160 – 135,000<2 mg L-1
-2530
3*10-08
175.2 – 7.0160 – 130,000<2 mg L-1
195 – 3306014
Flow cell experiments
For Flow cell experiments a latex sheath is pressurized to the surface of the sample in or-der to suppress edge circulations. Solutions passed through the sample from the bottom to the top with constant pressure. Two different samples were installed in the cells. On the one hand, undamaged sandstone cylinders were used. On the other hand, rock cylinders were scarified with a diamond saw 3 mm on both sides along the longitudinal extension and then split in a controlled manner. The incisions of the saw blade was then sealed with silicone.
The hydraulic conductivity coefficient (K) of the unbroken sandstone (1.5*10-11 m s-1) is very low. The sandstone cylinder with the single fracture has the same K-value regarding the matrix, but due to the fracture a faster flow takes place. The K-value is about 3,500 times higher. On the basis of these K-values only the flow through fractures is relevant for the spreading of pollutants in the underground. The spreading through the pore system can be neglected.
Column tests
Crushed sandstone up to a predominant grain size of coarse sand was used as columns filling. The silt fraction was removed by sieving. It was attempted to pack and solidify the material as similar as possible to the original storage density. Three series of experiments were carried out in three different columns (fig. 1).
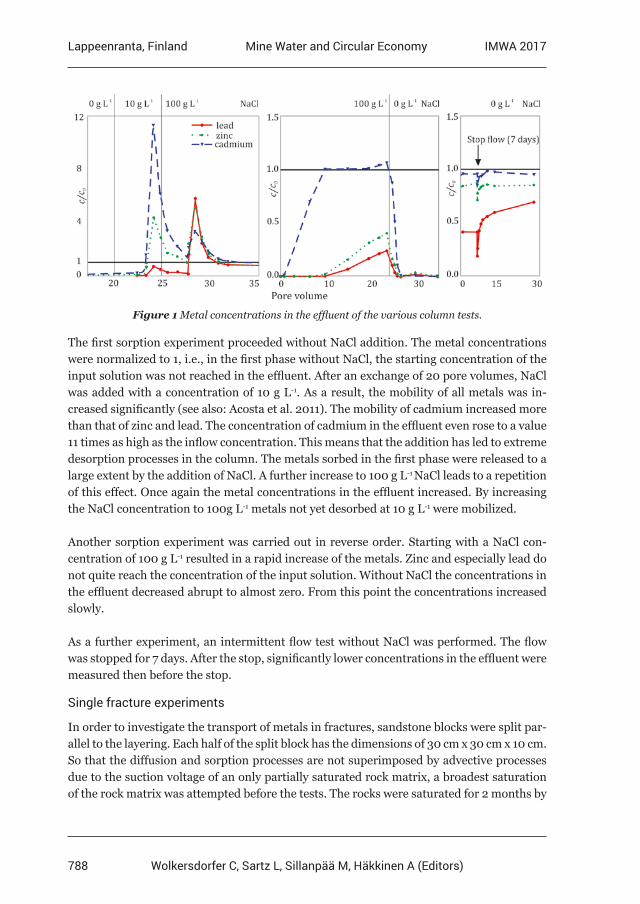
788
Lappeenranta, Finland IMWA 2017Mine Water and Circular Economy
Wolkersdorfer C, Sartz L, Sillanpää M, Häkkinen A (Editors)
Figure 1 Metal concentrations in the effluent of the various column tests.
The first sorption experiment proceeded without NaCl addition. The metal concentrations were normalized to 1, i.e., in the first phase without NaCl, the starting concentration of the input solution was not reached in the effluent. After an exchange of 20 pore volumes, NaCl was added with a concentration of 10 g L-1. As a result, the mobility of all metals was in-creased significantly (see also: Acosta et al. 2011). The mobility of cadmium increased more than that of zinc and lead. The concentration of cadmium in the effluent even rose to a value 11 times as high as the inflow concentration. This means that the addition has led to extreme desorption processes in the column. The metals sorbed in the first phase were released to a large extent by the addition of NaCl. A further increase to 100 g L-1 NaCl leads to a repetition of this effect. Once again the metal concentrations in the effluent increased. By increasing the NaCl concentration to 100g L-1 metals not yet desorbed at 10 g L-1 were mobilized.
Another sorption experiment was carried out in reverse order. Starting with a NaCl con-centration of 100 g L-1 resulted in a rapid increase of the metals. Zinc and especially lead do not quite reach the concentration of the input solution. Without NaCl the concentrations in the effluent decreased abrupt to almost zero. From this point the concentrations increased slowly.
As a further experiment, an intermittent flow test without NaCl was performed. The flow was stopped for 7 days. After the stop, significantly lower concentrations in the effluent were measured then before the stop.
Single fracture experiments
In order to investigate the transport of metals in fractures, sandstone blocks were split par-allel to the layering. Each half of the split block has the dimensions of 30 cm x 30 cm x 10 cm. So that the diffusion and sorption processes are not superimposed by advective processes due to the suction voltage of an only partially saturated rock matrix, a broadest saturation of the rock matrix was attempted before the tests. The rocks were saturated for 2 months by
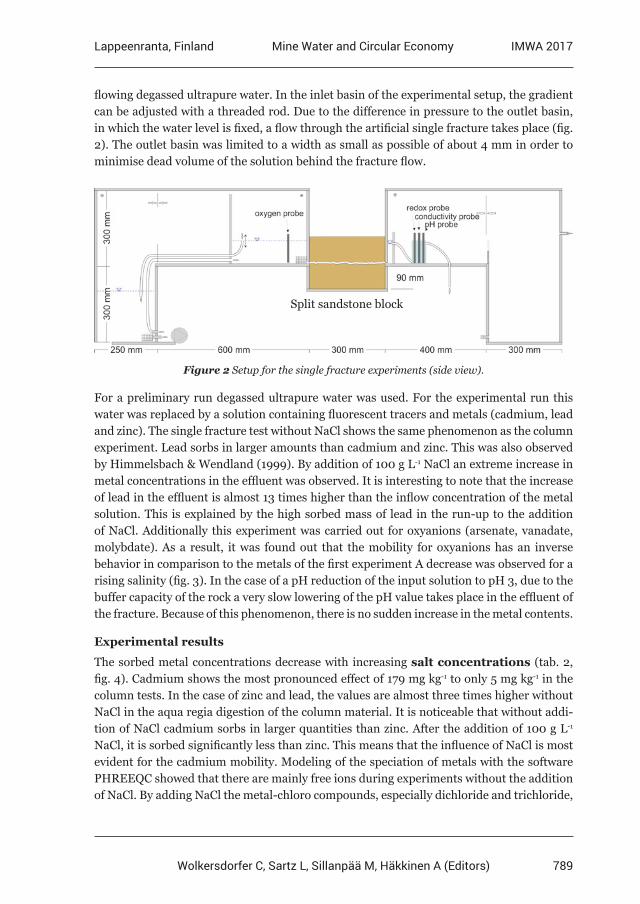
789
Lappeenranta, Finland IMWA 2017Mine Water and Circular Economy
Wolkersdorfer C, Sartz L, Sillanpää M, Häkkinen A (Editors)
flowing degassed ultrapure water. In the inlet basin of the experimental setup, the gradient can be adjusted with a threaded rod. Due to the difference in pressure to the outlet basin, in which the water level is fixed, a flow through the artificial single fracture takes place (fig. 2). The outlet basin was limited to a width as small as possible of about 4 mm in order to minimise dead volume of the solution behind the fracture flow.
Figure 2 Setup for the single fracture experiments (side view).
For a preliminary run degassed ultrapure water was used. For the experimental run this water was replaced by a solution containing fluorescent tracers and metals (cadmium, lead and zinc). The single fracture test without NaCl shows the same phenomenon as the column experiment. Lead sorbs in larger amounts than cadmium and zinc. This was also observed by Himmelsbach & Wendland (1999). By addition of 100 g L-1 NaCl an extreme increase in metal concentrations in the effluent was observed. It is interesting to note that the increase of lead in the effluent is almost 13 times higher than the inflow concentration of the metal solution. This is explained by the high sorbed mass of lead in the run-up to the addition of NaCl. Additionally this experiment was carried out for oxyanions (arsenate, vanadate, molybdate). As a result, it was found out that the mobility for oxyanions has an inverse behavior in comparison to the metals of the first experiment A decrease was observed for a rising salinity (fig. 3). In the case of a pH reduction of the input solution to pH 3, due to the buffer capacity of the rock a very slow lowering of the pH value takes place in the effluent of the fracture. Because of this phenomenon, there is no sudden increase in the metal contents.
Experimental results
The sorbed metal concentrations decrease with increasing salt concentrations (tab. 2, fig. 4). Cadmium shows the most pronounced effect of 179 mg kg-1 to only 5 mg kg-1 in the column tests. In the case of zinc and lead, the values are almost three times higher without NaCl in the aqua regia digestion of the column material. It is noticeable that without addi-tion of NaCl cadmium sorbs in larger quantities than zinc. After the addition of 100 g L-1 NaCl, it is sorbed significantly less than zinc. This means that the influence of NaCl is most evident for the cadmium mobility. Modeling of the speciation of metals with the software PHREEQC showed that there are mainly free ions during experiments without the addition of NaCl. By adding NaCl the metal-chloro compounds, especially dichloride and trichloride,
Split sandstone block
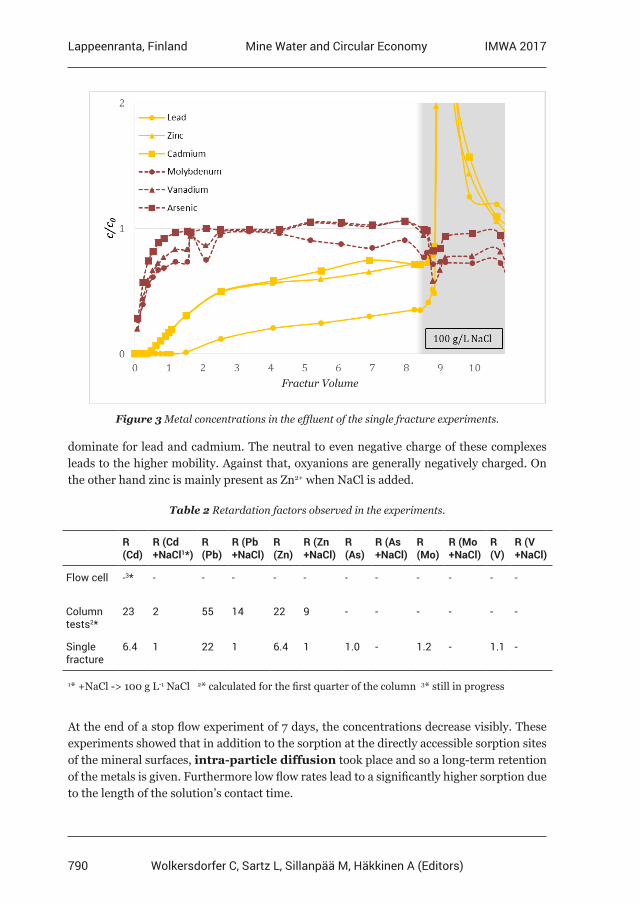
790
Lappeenranta, Finland IMWA 2017Mine Water and Circular Economy
Wolkersdorfer C, Sartz L, Sillanpää M, Häkkinen A (Editors)
Figure 3 Metal concentrations in the effluent of the single fracture experiments.
dominate for lead and cadmium. The neutral to even negative charge of these complexes leads to the higher mobility. Against that, oxyanions are generally negatively charged. On the other hand zinc is mainly present as Zn2+ when NaCl is added.
Table 2 Retardation factors observed in the experiments.
R (Cd)
R (Cd +NaCl1*)
R (Pb)
R (Pb +NaCl)
R (Zn)
R (Zn +NaCl)
R (As)
R (As +NaCl)
R (Mo)
R (Mo +NaCl)
R (V)
R (V +NaCl)
Flow cell -3* - - - - - - - - - - -
Column tests2*
23 2 55 14 22 9 - - - - - -
Single fracture
6.4 1 22 1 6.4 1 1.0 - 1.2 - 1.1 -
1* +NaCl -> 100 g L-1 NaCl 2* calculated for the first quarter of the column 3* still in progress
At the end of a stop flow experiment of 7 days, the concentrations decrease visibly. These experiments showed that in addition to the sorption at the directly accessible sorption sites of the mineral surfaces, intra-particle diffusion took place and so a long-term retention of the metals is given. Furthermore low flow rates lead to a significantly higher sorption due to the length of the solution’s contact time.
Fractur Volume
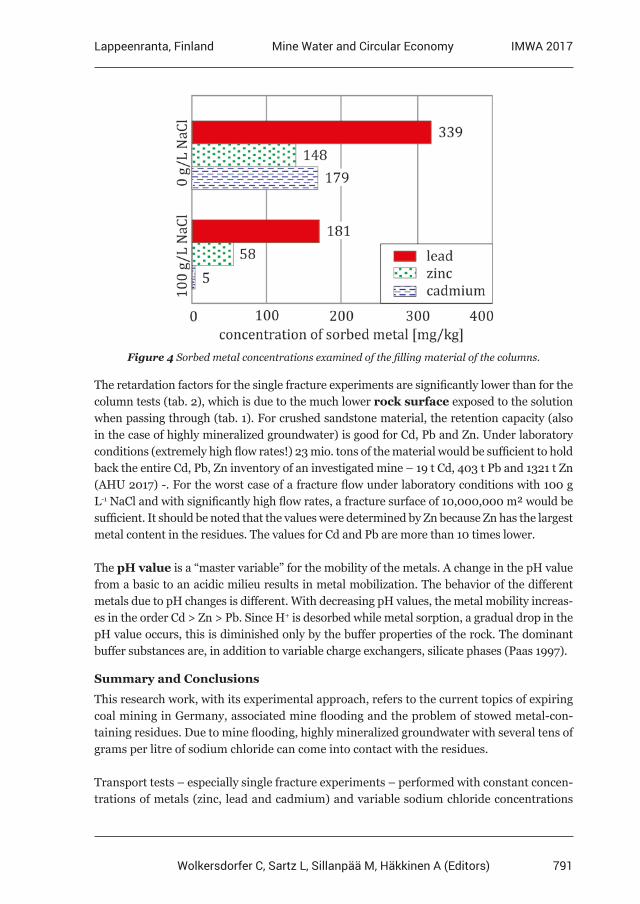
791
Lappeenranta, Finland IMWA 2017Mine Water and Circular Economy
Wolkersdorfer C, Sartz L, Sillanpää M, Häkkinen A (Editors)
Figure 4 Sorbed metal concentrations examined of the filling material of the columns.
The retardation factors for the single fracture experiments are significantly lower than for the column tests (tab. 2), which is due to the much lower rock surface exposed to the solution when passing through (tab. 1). For crushed sandstone material, the retention capacity (also in the case of highly mineralized groundwater) is good for Cd, Pb and Zn. Under laboratory conditions (extremely high flow rates!) 23 mio. tons of the material would be sufficient to hold back the entire Cd, Pb, Zn inventory of an investigated mine – 19 t Cd, 403 t Pb and 1321 t Zn (AHU 2017) -. For the worst case of a fracture flow under laboratory conditions with 100 g L-1 NaCl and with significantly high flow rates, a fracture surface of 10,000,000 m² would be sufficient. It should be noted that the values were determined by Zn because Zn has the largest metal content in the residues. The values for Cd and Pb are more than 10 times lower.
The pH value is a “master variable” for the mobility of the metals. A change in the pH value from a basic to an acidic milieu results in metal mobilization. The behavior of the different metals due to pH changes is different. With decreasing pH values, the metal mobility increas-es in the order Cd > Zn > Pb. Since H+ is desorbed while metal sorption, a gradual drop in the pH value occurs, this is diminished only by the buffer properties of the rock. The dominant buffer substances are, in addition to variable charge exchangers, silicate phases (Paas 1997).
Summary and Conclusions
This research work, with its experimental approach, refers to the current topics of expiring coal mining in Germany, associated mine flooding and the problem of stowed metal-con-taining residues. Due to mine flooding, highly mineralized groundwater with several tens of grams per litre of sodium chloride can come into contact with the residues.
Transport tests – especially single fracture experiments – performed with constant concen-trations of metals (zinc, lead and cadmium) and variable sodium chloride concentrations
792
Lappeenranta, Finland IMWA 2017Mine Water and Circular Economy
Wolkersdorfer C, Sartz L, Sillanpää M, Häkkinen A (Editors)
showed an increasing mobility of these metals influenced by high sodium chloride concen-trations. With the absence of sodium chloride, zinc has the highest mobility, followed by cadmium and lead. With addition of sodium chloride the mobility of cadmium is more en-hanced than the mobility of zinc as the influence of chloro-complexation is stronger for cad-mium than for zinc. Moreover, it was ascertained that the mobility for oxyanions (arsenate, molybdate and vanadate) has an inverse behaviour in comparison to these metals and a decrease was observed in the case of a rising salinity. Intermittent flow experiments showed that in addition to the sorption at the directly accessible sorption sites of the mineral surfac-es intra-particle diffusion also took place and so a long-term retention of the metals is given. With a higher mineralization of groundwater the viscosity is rising. Increasing viscosities cause lower flow rates and lower flow rates cause a higher sorption of metals.
Owing to the decreasing mobility of the oxyanions for high salt contents and the overall low content, no risk is likely. Due to a very low permeability, the spreading of zinc, lead and cad-mium through the pore system can be neglected. For country rocks, crushed in small pieces, in the goaf retardation and hinder capacity are very high, so spreading is also unlikely. For the fracture flow, a slight mass transport, to the at least 100 m away receiving level, can take place, because of a higher permeability and a lower amount of rock surfaces in contact with the solution. To enable reviews and predictions of mass transport into adjacent aquifers – based on the experimental results – a modelling of contaminant transport for a single fracture will be performed.
References
Acosta JA, Jansen B, Kalbitz K, Faz A, Martinez S (2011) Salinity increases mobility of heavy metals in soils. Chemosphere 2011; 85: 1318–1324AHU (2017) Gutachten zur Prüfung möglicher Umweltauswirkungen des Einsatzes von Abfall- und Reststoffen zur Bruch-Hohlraumverfüllung in Steinkohlenbergwerken in Nordrhein- Westfalen, Teil 1 Endbericht. http://www.umweltauswirkungen-utv.deHimmelsbach T, Wendland E (1999) Schwermetalltransport in Sandsteinen unter Bedingungen einer hochsalinaren Porenwasserlösung. Laborversuch und Modellierung. Grundwasser 3/4: 103 – 112Jäger B, Obermann P, Wilke FL (1990) Studie zur Eignung von Steinkohlenbergwerken im rechtsrheinischen Ruhrkohlenbezirk zur Untertageverbringung von Abfall- und Reststoffen. „Machbarkeitsstudie“, Bd. 1-4: 795 S., 55 Zeichnungen als Anlage; Düsseldorf (im Auftrag des Landesamtes für Wasser und Abfall NRW)Klinger C (1993) Mobilisationsverhalten von anorganischen Schadstoffen in der Umgebung von untertägigen Versatzbereichen am Beispiel von Reststoffen aus Müllverbrennungsanlagen im Steinkohlengebirge des Ruhrkarbons. Dissertation: 170 S., 78 Abb., 40 Tab.; Bonn (Rheinische Friedrich-Wilhelms-Universität Bonn)Paas N (1997) Untersuchungen zur Ermittlung der geochemischen Barriere von Gesteinen aus dem Umfeld untertägiger Versatzräume im Steinkohlenbergbau des Ruhrkarbons. Dissertation: 234 S., 105 Abb., 43 Tab.; Bonn (Rheinische Friedrich-Wilhelms-Universität Bonn)RAG (1993-2004) Quartals- und Abschlussberichte zu den Reststoffverbringungen in die Bergwerke Haus Aden Monopol, Hugo/Consolidation, Walsum. (unpublished); Herne (Ruhrkohle Bergbau AG)Wedewardt M (1995) Hydrochemie und Genese der Tiefenwässer im Ruhr-Revier. Dissertation: 250 S., 60 Abb., 10 Tab, 2 Anl.; Bonn (Rheinische Friedrich-Wilhelms-Universität Bonn)
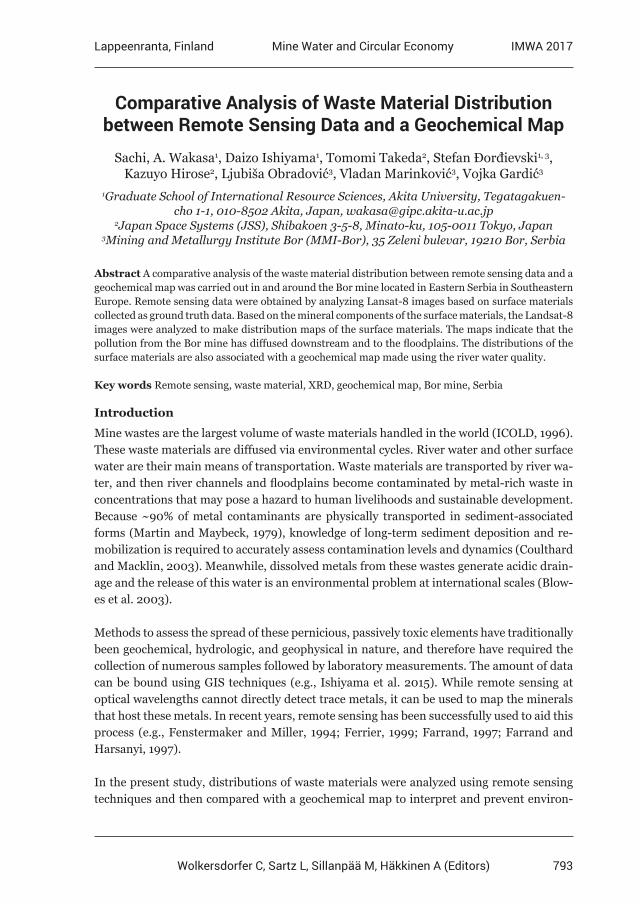
793
Lappeenranta, Finland IMWA 2017Mine Water and Circular Economy
Wolkersdorfer C, Sartz L, Sillanpää M, Häkkinen A (Editors)
Comparative Analysis of Waste Material Distribution between Remote Sensing Data and a Geochemical Map
Sachi, A. Wakasa1, Daizo Ishiyama1, Tomomi Takeda2, Stefan Ðorđievski1, 3, Kazuyo Hirose2, Ljubiša Obradović3, Vladan Marinković3, Vojka Gardić3
1Graduate School of International Resource Sciences, Akita University, Tegatagakuen-cho 1-1, 010-8502 Akita, Japan, [email protected]
2Japan Space Systems (JSS), Shibakoen 3-5-8, Minato-ku, 105-0011 Tokyo, Japan 3Mining and Metallurgy Institute Bor (MMI-Bor), 35 Zeleni bulevar, 19210 Bor, Serbia
Abstract A comparative analysis of the waste material distribution between remote sensing data and a geochemical map was carried out in and around the Bor mine located in Eastern Serbia in Southeastern Europe. Remote sensing data were obtained by analyzing Lansat-8 images based on surface materials collected as ground truth data. Based on the mineral components of the surface materials, the Landsat-8 images were analyzed to make distribution maps of the surface materials. The maps indicate that the pollution from the Bor mine has diffused downstream and to the floodplains. The distributions of the surface materials are also associated with a geochemical map made using the river water quality.
Key words Remote sensing, waste material, XRD, geochemical map, Bor mine, Serbia
Introduction
Mine wastes are the largest volume of waste materials handled in the world (ICOLD, 1996). These waste materials are diffused via environmental cycles. River water and other surface water are their main means of transportation. Waste materials are transported by river wa-ter, and then river channels and floodplains become contaminated by metal-rich waste in concentrations that may pose a hazard to human livelihoods and sustainable development. Because ~90% of metal contaminants are physically transported in sediment-associated forms (Martin and Maybeck, 1979), knowledge of long-term sediment deposition and re-mobilization is required to accurately assess contamination levels and dynamics (Coulthard and Macklin, 2003). Meanwhile, dissolved metals from these wastes generate acidic drain-age and the release of this water is an environmental problem at international scales (Blow-es et al. 2003).
Methods to assess the spread of these pernicious, passively toxic elements have traditionally been geochemical, hydrologic, and geophysical in nature, and therefore have required the collection of numerous samples followed by laboratory measurements. The amount of data can be bound using GIS techniques (e.g., Ishiyama et al. 2015). While remote sensing at optical wavelengths cannot directly detect trace metals, it can be used to map the minerals that host these metals. In recent years, remote sensing has been successfully used to aid this process (e.g., Fenstermaker and Miller, 1994; Ferrier, 1999; Farrand, 1997; Farrand and Harsanyi, 1997).
In the present study, distributions of waste materials were analyzed using remote sensing techniques and then compared with a geochemical map to interpret and prevent environ-
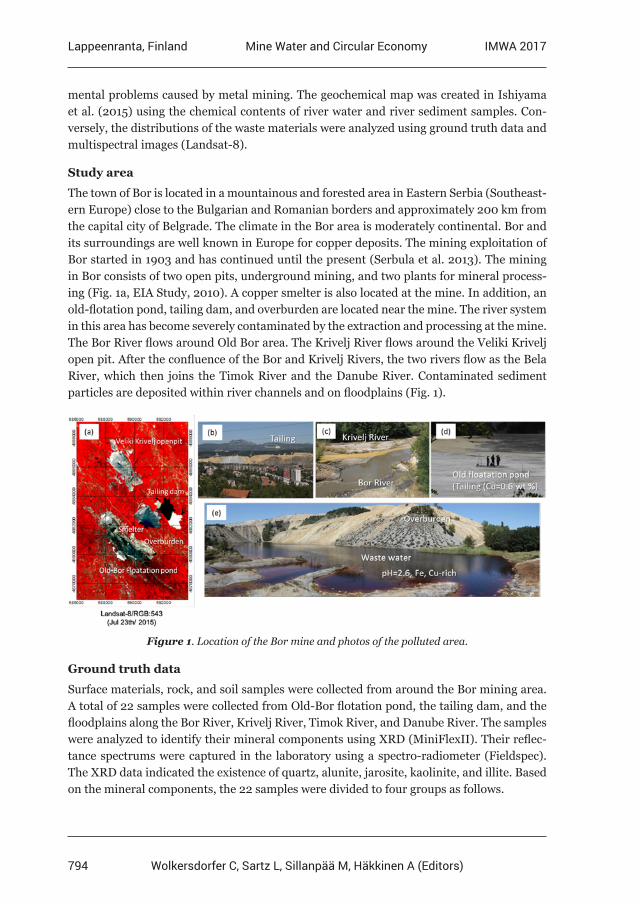
794
Lappeenranta, Finland IMWA 2017Mine Water and Circular Economy
Wolkersdorfer C, Sartz L, Sillanpää M, Häkkinen A (Editors)
mental problems caused by metal mining. The geochemical map was created in Ishiyama et al. (2015) using the chemical contents of river water and river sediment samples. Con-versely, the distributions of the waste materials were analyzed using ground truth data and multispectral images (Landsat-8).
Study area
The town of Bor is located in a mountainous and forested area in Eastern Serbia (Southeast-ern Europe) close to the Bulgarian and Romanian borders and approximately 200 km from the capital city of Belgrade. The climate in the Bor area is moderately continental. Bor and its surroundings are well known in Europe for copper deposits. The mining exploitation of Bor started in 1903 and has continued until the present (Serbula et al. 2013). The mining in Bor consists of two open pits, underground mining, and two plants for mineral process-ing (Fig. 1a, EIA Study, 2010). A copper smelter is also located at the mine. In addition, an old-flotation pond, tailing dam, and overburden are located near the mine. The river system in this area has become severely contaminated by the extraction and processing at the mine. The Bor River flows around Old Bor area. The Krivelj River flows around the Veliki Krivelj open pit. After the confluence of the Bor and Krivelj Rivers, the two rivers flow as the Bela River, which then joins the Timok River and the Danube River. Contaminated sediment particles are deposited within river channels and on floodplains (Fig. 1).
Figure 1. Location of the Bor mine and photos of the polluted area.
Ground truth data
Surface materials, rock, and soil samples were collected from around the Bor mining area. A total of 22 samples were collected from Old-Bor flotation pond, the tailing dam, and the floodplains along the Bor River, Krivelj River, Timok River, and Danube River. The samples were analyzed to identify their mineral components using XRD (MiniFlexII). Their reflec-tance spectrums were captured in the laboratory using a spectro-radiometer (Fieldspec). The XRD data indicated the existence of quartz, alunite, jarosite, kaolinite, and illite. Based on the mineral components, the 22 samples were divided to four groups as follows.
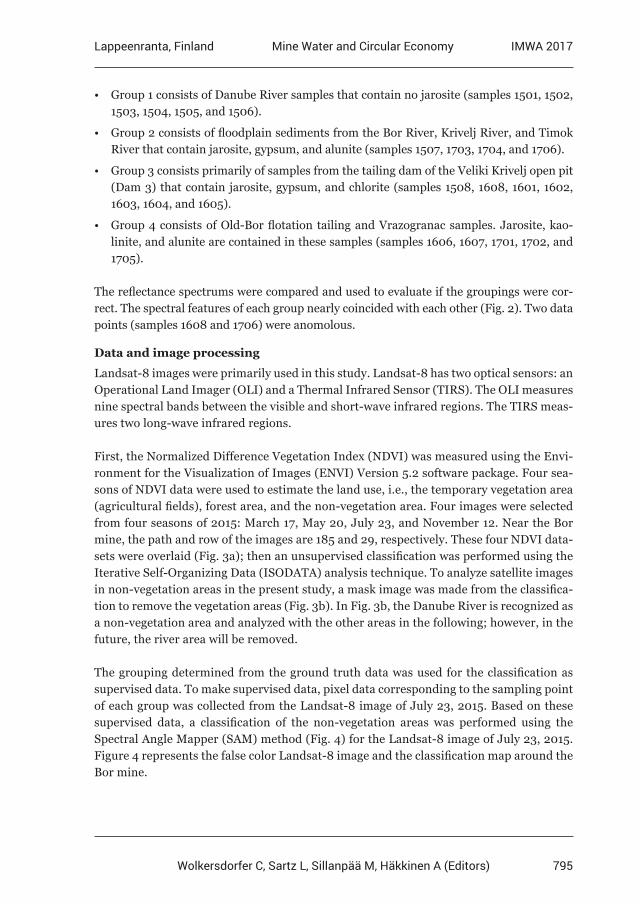
795
Lappeenranta, Finland IMWA 2017Mine Water and Circular Economy
Wolkersdorfer C, Sartz L, Sillanpää M, Häkkinen A (Editors)
• Group 1 consists of Danube River samples that contain no jarosite (samples 1501, 1502, 1503, 1504, 1505, and 1506).
• Group 2 consists of floodplain sediments from the Bor River, Krivelj River, and Timok River that contain jarosite, gypsum, and alunite (samples 1507, 1703, 1704, and 1706).
• Group 3 consists primarily of samples from the tailing dam of the Veliki Krivelj open pit (Dam 3) that contain jarosite, gypsum, and chlorite (samples 1508, 1608, 1601, 1602, 1603, 1604, and 1605).
• Group 4 consists of Old-Bor flotation tailing and Vrazogranac samples. Jarosite, kao-linite, and alunite are contained in these samples (samples 1606, 1607, 1701, 1702, and 1705).
The reflectance spectrums were compared and used to evaluate if the groupings were cor-rect. The spectral features of each group nearly coincided with each other (Fig. 2). Two data points (samples 1608 and 1706) were anomolous.
Data and image processing
Landsat-8 images were primarily used in this study. Landsat-8 has two optical sensors: an Operational Land Imager (OLI) and a Thermal Infrared Sensor (TIRS). The OLI measures nine spectral bands between the visible and short-wave infrared regions. The TIRS meas-ures two long-wave infrared regions.
First, the Normalized Difference Vegetation Index (NDVI) was measured using the Envi-ronment for the Visualization of Images (ENVI) Version 5.2 software package. Four sea-sons of NDVI data were used to estimate the land use, i.e., the temporary vegetation area (agricultural fields), forest area, and the non-vegetation area. Four images were selected from four seasons of 2015: March 17, May 20, July 23, and November 12. Near the Bor mine, the path and row of the images are 185 and 29, respectively. These four NDVI data-sets were overlaid (Fig. 3a); then an unsupervised classification was performed using the Iterative Self-Organizing Data (ISODATA) analysis technique. To analyze satellite images in non-vegetation areas in the present study, a mask image was made from the classifica-tion to remove the vegetation areas (Fig. 3b). In Fig. 3b, the Danube River is recognized as a non-vegetation area and analyzed with the other areas in the following; however, in the future, the river area will be removed.
The grouping determined from the ground truth data was used for the classification as supervised data. To make supervised data, pixel data corresponding to the sampling point of each group was collected from the Landsat-8 image of July 23, 2015. Based on these supervised data, a classification of the non-vegetation areas was performed using the Spectral Angle Mapper (SAM) method (Fig. 4) for the Landsat-8 image of July 23, 2015. Figure 4 represents the false color Landsat-8 image and the classification map around the Bor mine.
796
Lappeenranta, Finland IMWA 2017Mine Water and Circular Economy
Wolkersdorfer C, Sartz L, Sillanpää M, Häkkinen A (Editors)
Table 1. Mineral existence and groupings.
No. Location Alunite Calcite Chlorite Kaoli- nite
Dolo-mite
Gyp-sum
Jaro-site Illite Classifi-
cation
1501 Danube R.
Group 1
1502 Danube R.
1503 Danube R.
1504 Danube R.
1505 Danube R.
1506 Danube R.
1507 Timok R.
Group 21703 Vrazogra-
nac
1704 Krivelj R.
1706 Bor R.
1508 Timok R.
Group 3
1608 Old-Bor mine
1601 Dam3
1602 Dam3
1603 Dam3
1604 Dam3
1605 Dam3
1606 Old-Bor mine
Group 4
1607 Old-Bor mine
1701 Vrazogra-nac
1702 Vrazogra-nac
1705 Bor R.
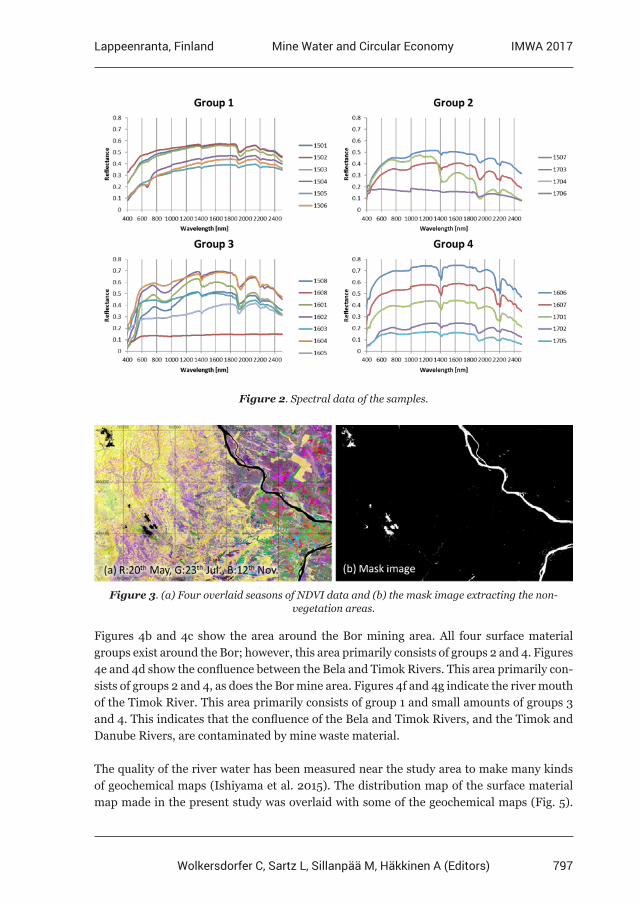
797
Lappeenranta, Finland IMWA 2017Mine Water and Circular Economy
Wolkersdorfer C, Sartz L, Sillanpää M, Häkkinen A (Editors)
Figure 2. Spectral data of the samples.
Figure 3. (a) Four overlaid seasons of NDVI data and (b) the mask image extracting the non-vegetation areas.
Figures 4b and 4c show the area around the Bor mining area. All four surface material groups exist around the Bor; however, this area primarily consists of groups 2 and 4. Figures 4e and 4d show the confluence between the Bela and Timok Rivers. This area primarily con-sists of groups 2 and 4, as does the Bor mine area. Figures 4f and 4g indicate the river mouth of the Timok River. This area primarily consists of group 1 and small amounts of groups 3 and 4. This indicates that the confluence of the Bela and Timok Rivers, and the Timok and Danube Rivers, are contaminated by mine waste material.
The quality of the river water has been measured near the study area to make many kinds of geochemical maps (Ishiyama et al. 2015). The distribution map of the surface material map made in the present study was overlaid with some of the geochemical maps (Fig. 5).
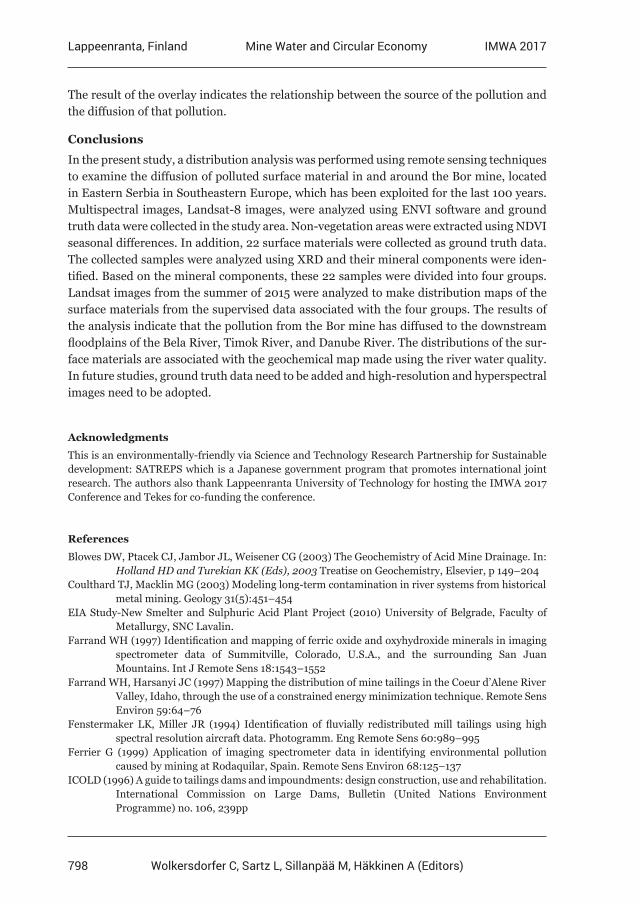
798
Lappeenranta, Finland IMWA 2017Mine Water and Circular Economy
Wolkersdorfer C, Sartz L, Sillanpää M, Häkkinen A (Editors)
The result of the overlay indicates the relationship between the source of the pollution and the diffusion of that pollution.
Conclusions
In the present study, a distribution analysis was performed using remote sensing techniques to examine the diffusion of polluted surface material in and around the Bor mine, located in Eastern Serbia in Southeastern Europe, which has been exploited for the last 100 years. Multispectral images, Landsat-8 images, were analyzed using ENVI software and ground truth data were collected in the study area. Non-vegetation areas were extracted using NDVI seasonal differences. In addition, 22 surface materials were collected as ground truth data. The collected samples were analyzed using XRD and their mineral components were iden-tified. Based on the mineral components, these 22 samples were divided into four groups. Landsat images from the summer of 2015 were analyzed to make distribution maps of the surface materials from the supervised data associated with the four groups. The results of the analysis indicate that the pollution from the Bor mine has diffused to the downstream floodplains of the Bela River, Timok River, and Danube River. The distributions of the sur-face materials are associated with the geochemical map made using the river water quality. In future studies, ground truth data need to be added and high-resolution and hyperspectral images need to be adopted.
Acknowledgments
This is an environmentally-friendly via Science and Technology Research Partnership for Sustainable development: SATREPS which is a Japanese government program that promotes international joint research. The authors also thank Lappeenranta University of Technology for hosting the IMWA 2017 Conference and Tekes for co-funding the conference.
References
Blowes DW, Ptacek CJ, Jambor JL, Weisener CG (2003) The Geochemistry of Acid Mine Drainage. In: Holland HD and Turekian KK (Eds), 2003 Treatise on Geochemistry, Elsevier, p 149–204Coulthard TJ, Macklin MG (2003) Modeling long-term contamination in river systems from historical metal mining. Geology 31(5):451–454EIA Study-New Smelter and Sulphuric Acid Plant Project (2010) University of Belgrade, Faculty of Metallurgy, SNC Lavalin.Farrand WH (1997) Identification and mapping of ferric oxide and oxyhydroxide minerals in imaging spectrometer data of Summitville, Colorado, U.S.A., and the surrounding San Juan Mountains. Int J Remote Sens 18:1543–1552Farrand WH, Harsanyi JC (1997) Mapping the distribution of mine tailings in the Coeur d’Alene River Valley, Idaho, through the use of a constrained energy minimization technique. Remote Sens Environ 59:64–76Fenstermaker LK, Miller JR (1994) Identification of fluvially redistributed mill tailings using high spectral resolution aircraft data. Photogramm. Eng Remote Sens 60:989–995Ferrier G (1999) Application of imaging spectrometer data in identifying environmental pollution caused by mining at Rodaquilar, Spain. Remote Sens Environ 68:125–137ICOLD (1996) A guide to tailings dams and impoundments: design construction, use and rehabilitation. International Commission on Large Dams, Bulletin (United Nations Environment Programme) no. 106, 239pp
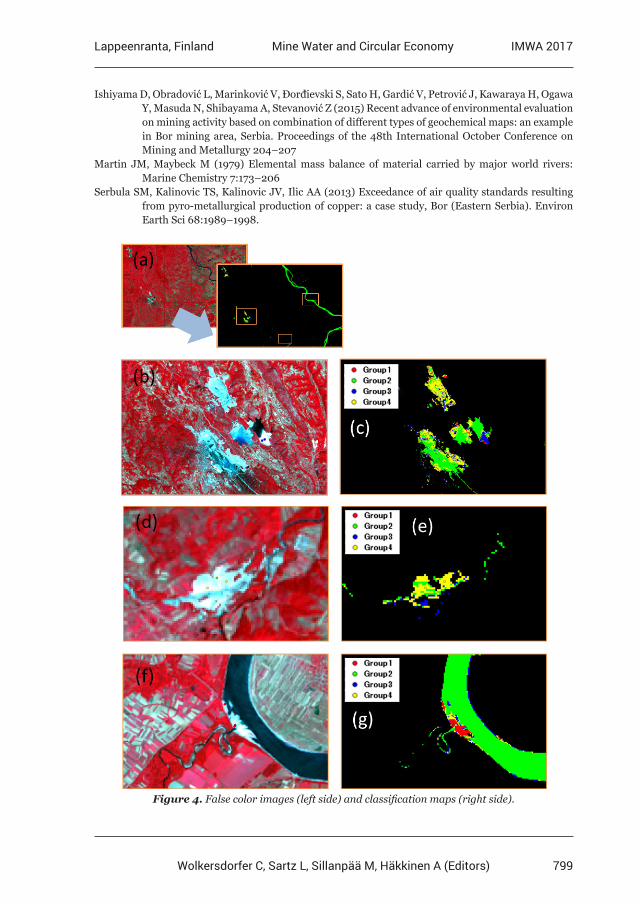
799
Lappeenranta, Finland IMWA 2017Mine Water and Circular Economy
Wolkersdorfer C, Sartz L, Sillanpää M, Häkkinen A (Editors)
Ishiyama D, Obradović L, Marinković V, Ðorđievski S, Sato H, Gardić V, Petrović J, Kawaraya H, Ogawa Y, Masuda N, Shibayama A, Stevanović Z (2015) Recent advance of environmental evaluation on mining activity based on combination of different types of geochemical maps: an example in Bor mining area, Serbia. Proceedings of the 48th International October Conference on Mining and Metallurgy 204–207Martin JM, Maybeck M (1979) Elemental mass balance of material carried by major world rivers: Marine Chemistry 7:173–206Serbula SM, Kalinovic TS, Kalinovic JV, Ilic AA (2013) Exceedance of air quality standards resulting from pyro-metallurgical production of copper: a case study, Bor (Eastern Serbia). Environ Earth Sci 68:1989–1998.
Figure 4. False color images (left side) and classification maps (right side).
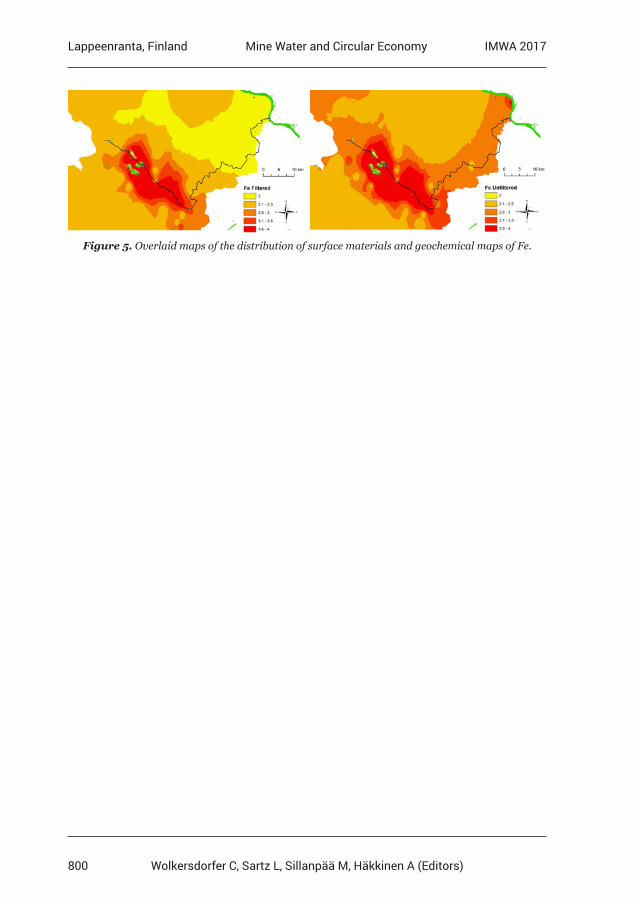
800
Lappeenranta, Finland IMWA 2017Mine Water and Circular Economy
Wolkersdorfer C, Sartz L, Sillanpää M, Häkkinen A (Editors)
Figure 5. Overlaid maps of the distribution of surface materials and geochemical maps of Fe.
801
Lappeenranta, Finland IMWA 2017Mine Water and Circular Economy
Wolkersdorfer C, Sartz L, Sillanpää M, Häkkinen A (Editors)
Contamination trend at flooded mines: 20 y time-series at Casargiu, Sardinia
Rosa Cidu1*, Franco Frau1, Riccardo Petrini2
1Dipartimento di Scienze Chimiche e Geologiche, Università di Cagliari, via Trentino 51, 09127 Cagliari, Italy, [email protected]
2Dipartimento di Scienze della Terra, Università di Pisa, Via S. Maria 53, 56126 Pisa, Italy
Abstract At Casargiu, Pb-Zn ores were exploited for a century. After mine closure, pumping systems were shut down allowing rebound. First outflow of contaminated water occurred in 1997. This study reports contamination trends based on 26 hydrogeochemical surveys carried out from 1997 to 2016. Results showed contamination peaks at the first flushing. After 20 y, concentrations of Ni and Co showed marked decreases, followed by Mn, sulfate, Pb, Zn and Cd. Although a decrease of contaminants has been occurring, high contamination persists at Casargiu. This suggests the need of remediation actions for preventing dispersion of contaminants downstream of abandoned mines.
Key words rebound, mine drainage, sulfate, metals, arsenic
Introduction
Outflow drainages following rebound at abandoned mines usually cause contamination in the aquatic system downstream of mine (Younger et al. 2005). Contamination peaks are often observed at the first flushing (Nordstrom 2009, Wolkersdorfer 2005), whereas con-centrations of contaminants generally decrease with increasing time since rebound (Cidu et al. 2005). However, long-time is usually to be expected for attaining levels of contaminants observed prior to rebound.
This paper is aimed at assessing contamination trends following rebound at the abandoned mine of Casargiu in SW Sardinia (Italy). Results of hydrogeochemical surveys carried out over 20 y are reported. At Casargiu, Pb-Zn sulfide veins were exploited for nearly a century until the 1980’s. After the cessation of mining operations, the pumping systems used to dry underground workings were shut down and the mine underwent flooding. Since the first outflow in 1997, the Casargiu drainage has been discharged directly into the Rio Irvi, a trib-utary of the Rio Piscinas that flows into the Mediterranean Sea, causing the deterioration of aquatic systems.
Methods
The water flowing out of the Casargiu shaft has been sampled and analyzed 26 times from 1997 to 2016. The main results of surveys carried out prior to the 2016 have been reported in previous studies (Cidu 2011, Cidu and Fanfani 2002, Cidu and Frau 2009, Frau et al. 2015). Temperature, pH, redox potential (Eh, Pt electrode, Orion), dissolved oxygen (DO), electrical conductivity (EC) and HCO3
- were determined on site. Immediately upon collec-tion, the water was filtered through 0.45 μm pore-size Nuclepore polycarbonate filters into pre-cleaned high-density polyethylene bottles. One filtered aliquot was used to analyze the anions by ion chromatography (IC, Dionex). One filtered aliquot was acidified on site with
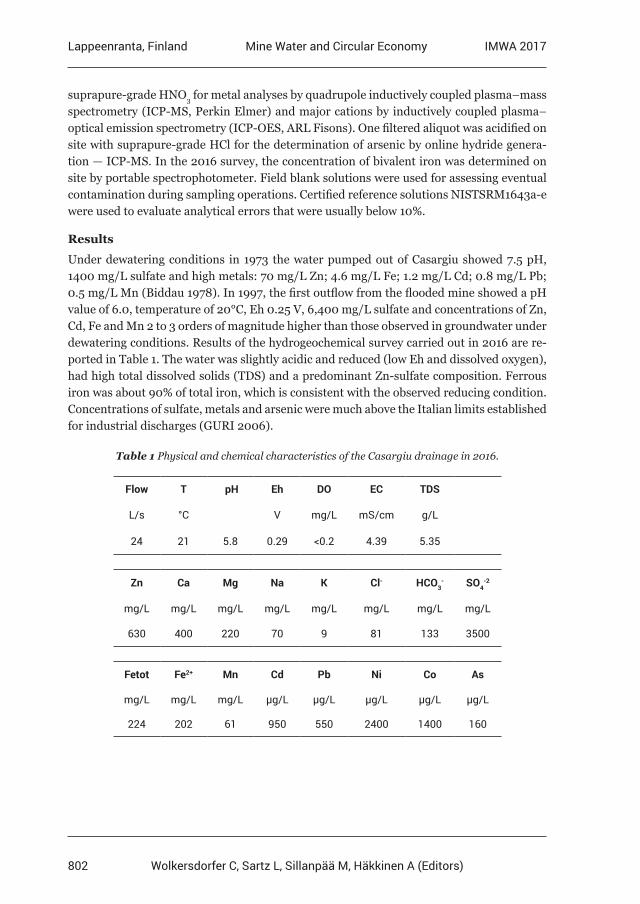
802
Lappeenranta, Finland IMWA 2017Mine Water and Circular Economy
Wolkersdorfer C, Sartz L, Sillanpää M, Häkkinen A (Editors)
suprapure-grade HNO3 for metal analyses by quadrupole inductively coupled plasma–mass spectrometry (ICP-MS, Perkin Elmer) and major cations by inductively coupled plasma–optical emission spectrometry (ICP-OES, ARL Fisons). One filtered aliquot was acidified on site with suprapure-grade HCl for the determination of arsenic by online hydride genera-tion — ICP-MS. In the 2016 survey, the concentration of bivalent iron was determined on site by portable spectrophotometer. Field blank solutions were used for assessing eventual contamination during sampling operations. Certified reference solutions NISTSRM1643a-e were used to evaluate analytical errors that were usually below 10%.
Results
Under dewatering conditions in 1973 the water pumped out of Casargiu showed 7.5 pH, 1400 mg/L sulfate and high metals: 70 mg/L Zn; 4.6 mg/L Fe; 1.2 mg/L Cd; 0.8 mg/L Pb; 0.5 mg/L Mn (Biddau 1978). In 1997, the first outflow from the flooded mine showed a pH value of 6.0, temperature of 20°C, Eh 0.25 V, 6,400 mg/L sulfate and concentrations of Zn, Cd, Fe and Mn 2 to 3 orders of magnitude higher than those observed in groundwater under dewatering conditions. Results of the hydrogeochemical survey carried out in 2016 are re-ported in Table 1. The water was slightly acidic and reduced (low Eh and dissolved oxygen), had high total dissolved solids (TDS) and a predominant Zn-sulfate composition. Ferrous iron was about 90% of total iron, which is consistent with the observed reducing condition. Concentrations of sulfate, metals and arsenic were much above the Italian limits established for industrial discharges (GURI 2006).
Table 1 Physical and chemical characteristics of the Casargiu drainage in 2016.
Flow T pH Eh DO EC TDS
L/s °C V mg/L mS/cm g/L
24 21 5.8 0.29 <0.2 4.39 5.35
Zn Ca Mg Na K Cl- HCO3- SO4
-2
mg/L mg/L mg/L mg/L mg/L mg/L mg/L mg/L
630 400 220 70 9 81 133 3500
Fetot Fe2+ Mn Cd Pb Ni Co As
mg/L mg/L mg/L µg/L µg/L µg/L µg/L µg/L
224 202 61 950 550 2400 1400 160
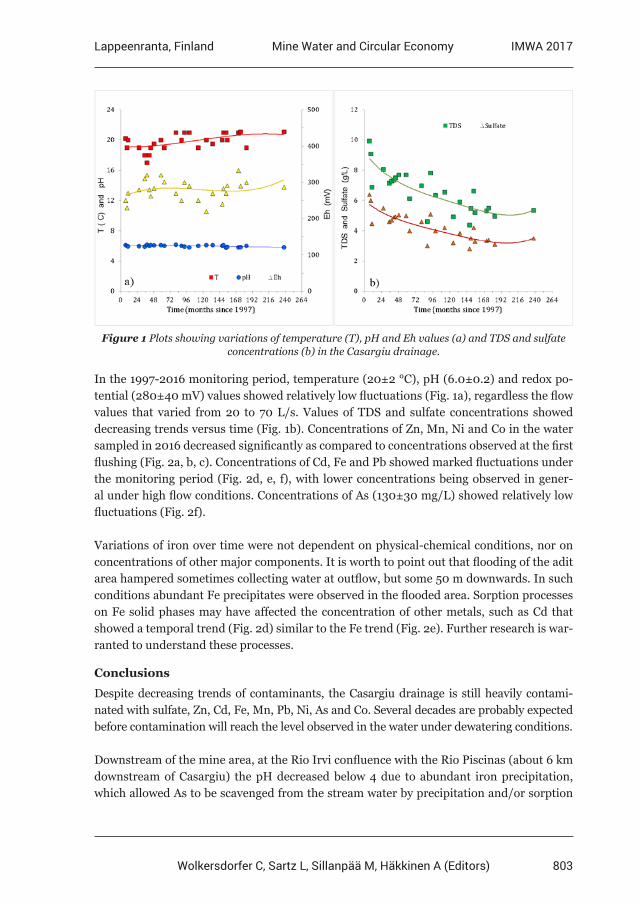
803
Lappeenranta, Finland IMWA 2017Mine Water and Circular Economy
Wolkersdorfer C, Sartz L, Sillanpää M, Häkkinen A (Editors)
Figure 1 Plots showing variations of temperature (T), pH and Eh values (a) and TDS and sulfate concentrations (b) in the Casargiu drainage.
In the 1997-2016 monitoring period, temperature (20±2 °C), pH (6.0±0.2) and redox po-tential (280±40 mV) values showed relatively low fluctuations (Fig. 1a), regardless the flow values that varied from 20 to 70 L/s. Values of TDS and sulfate concentrations showed decreasing trends versus time (Fig. 1b). Concentrations of Zn, Mn, Ni and Co in the water sampled in 2016 decreased significantly as compared to concentrations observed at the first flushing (Fig. 2a, b, c). Concentrations of Cd, Fe and Pb showed marked fluctuations under the monitoring period (Fig. 2d, e, f), with lower concentrations being observed in gener-al under high flow conditions. Concentrations of As (130±30 mg/L) showed relatively low fluctuations (Fig. 2f).
Variations of iron over time were not dependent on physical-chemical conditions, nor on concentrations of other major components. It is worth to point out that flooding of the adit area hampered sometimes collecting water at outflow, but some 50 m downwards. In such conditions abundant Fe precipitates were observed in the flooded area. Sorption processes on Fe solid phases may have affected the concentration of other metals, such as Cd that showed a temporal trend (Fig. 2d) similar to the Fe trend (Fig. 2e). Further research is war-ranted to understand these processes.
Conclusions
Despite decreasing trends of contaminants, the Casargiu drainage is still heavily contami-nated with sulfate, Zn, Cd, Fe, Mn, Pb, Ni, As and Co. Several decades are probably expected before contamination will reach the level observed in the water under dewatering conditions.
Downstream of the mine area, at the Rio Irvi confluence with the Rio Piscinas (about 6 km downstream of Casargiu) the pH decreased below 4 due to abundant iron precipitation, which allowed As to be scavenged from the stream water by precipitation and/or sorption
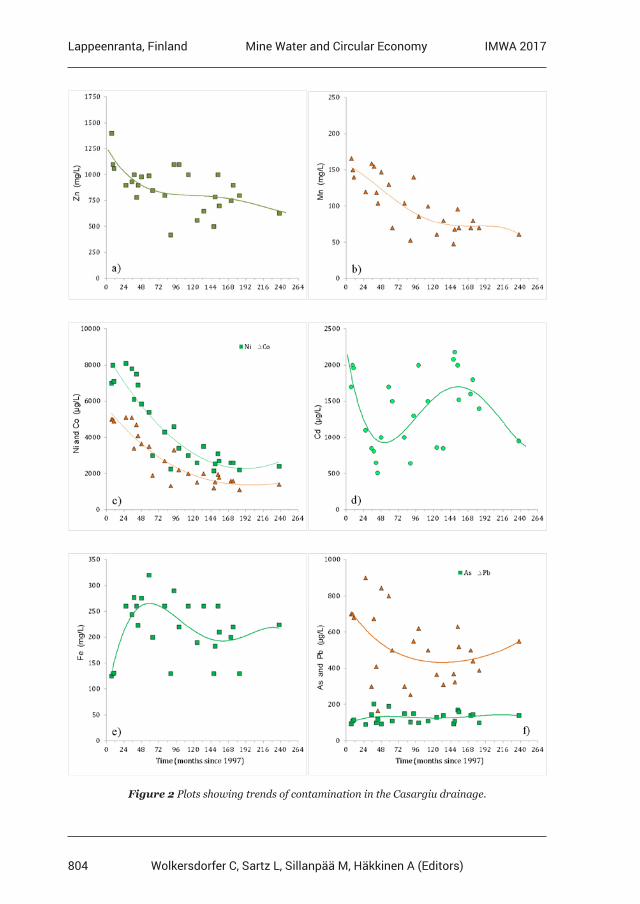
804
Lappeenranta, Finland IMWA 2017Mine Water and Circular Economy
Wolkersdorfer C, Sartz L, Sillanpää M, Häkkinen A (Editors)
Figure 2 Plots showing trends of contamination in the Casargiu drainage.
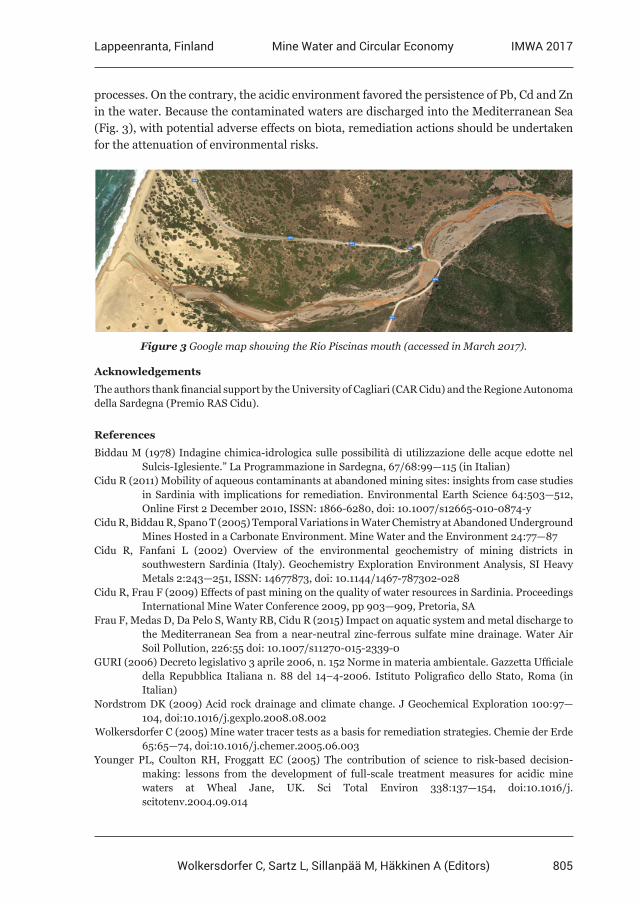
805
Lappeenranta, Finland IMWA 2017Mine Water and Circular Economy
Wolkersdorfer C, Sartz L, Sillanpää M, Häkkinen A (Editors)
processes. On the contrary, the acidic environment favored the persistence of Pb, Cd and Zn in the water. Because the contaminated waters are discharged into the Mediterranean Sea (Fig. 3), with potential adverse effects on biota, remediation actions should be undertaken for the attenuation of environmental risks.
Figure 3 Google map showing the Rio Piscinas mouth (accessed in March 2017).
Acknowledgements
The authors thank financial support by the University of Cagliari (CAR Cidu) and the Regione Autonoma della Sardegna (Premio RAS Cidu).
References
Biddau M (1978) Indagine chimica-idrologica sulle possibilità di utilizzazione delle acque edotte nel Sulcis-Iglesiente.” La Programmazione in Sardegna, 67/68:99—115 (in Italian)Cidu R (2011) Mobility of aqueous contaminants at abandoned mining sites: insights from case studies in Sardinia with implications for remediation. Environmental Earth Science 64:503—512, Online First 2 December 2010, ISSN: 1866-6280, doi: 10.1007/s12665-010-0874-yCidu R, Biddau R, Spano T (2005) Temporal Variations in Water Chemistry at Abandoned Underground Mines Hosted in a Carbonate Environment. Mine Water and the Environment 24:77—87 Cidu R, Fanfani L (2002) Overview of the environmental geochemistry of mining districts in southwestern Sardinia (Italy). Geochemistry Exploration Environment Analysis, SI Heavy Metals 2:243—251, ISSN: 14677873, doi: 10.1144/1467-787302-028Cidu R, Frau F (2009) Effects of past mining on the quality of water resources in Sardinia. Proceedings International Mine Water Conference 2009, pp 903—909, Pretoria, SAFrau F, Medas D, Da Pelo S, Wanty RB, Cidu R (2015) Impact on aquatic system and metal discharge to the Mediterranean Sea from a near-neutral zinc-ferrous sulfate mine drainage. Water Air Soil Pollution, 226:55 doi: 10.1007/s11270-015-2339-0GURI (2006) Decreto legislativo 3 aprile 2006, n. 152 Norme in materia ambientale. Gazzetta Ufficiale della Repubblica Italiana n. 88 del 14–4-2006. Istituto Poligrafico dello Stato, Roma (in Italian)Nordstrom DK (2009) Acid rock drainage and climate change. J Geochemical Exploration 100:97— 104, doi:10.1016/j.gexplo.2008.08.002Wolkersdorfer C (2005) Mine water tracer tests as a basis for remediation strategies. Chemie der Erde 65:65—74, doi:10.1016/j.chemer.2005.06.003Younger PL, Coulton RH, Froggatt EC (2005) The contribution of science to risk-based decision- making: lessons from the development of full-scale treatment measures for acidic mine waters at Wheal Jane, UK. Sci Total Environ 338:137—154, doi:10.1016/j. scitotenv.2004.09.014
806
Lappeenranta, Finland IMWA 2017Mine Water and Circular Economy
Wolkersdorfer C, Sartz L, Sillanpää M, Häkkinen A (Editors)
Delaying flooding of cemented paste backfill mixtures – Effect on the mobility of trace metals
Roger Hamberg1, Lena Alakangas1, Christian Maurice1, 1Luleå University of Technology, Division of Geosciences and Environmental
Engineering, 971 87 Luleå, Sweden, [email protected]
Abstract Flooding of cemented paste backfill (CPB) filled mine workings is, commonly, a slow process and its rate is important as a rapid flooding could limit sulphide oxidation and subsequent trace metal leaching. CPB-mixtures containing pyrrhotitic tailings with elevated concentrations of trace metals were flooded with different time delays. Delaying the flooding event increased trace metal leaching from CPB-mixtures, but except for copper, it was still lower compared to that in unmodified tailings. Regardless of time for flooding, sulphide oxidation in CPB-mixtures occurred, which poses an environmental risk, whereas a substantial proportion of trace metals was associated with acid-intolerant phases.
Key Words Cemented paste backfill, trace metals, flooding rate
Introduction
One way of managing tailings is by the use of a method called “cemented paste backfill” (CPB). In CPB, low proportions (3-7 wt %) of cementitious binders are mixed with tailings and backfilled into underground workings. Using CPB primarily aims to form a monolith that could act as a geotechnical support to underground mine cavities increasing opera-tional benefits for the mining industry. But using CPB could also prevent air intrusion into tailings and thereby lower sulphide oxidation rate.
The immobilization of trace metals in CPB has been assigned to a combination of a phys-ical encapsulation and chemical stabilisation. A physical encapsulation is largely depend-ent on the inherent strength of the CPB, which in turn is primarily due to the abundance of Calcium-Silicate-Hydrates (C-S-H) (Peyronnard and Benzaazoua, 2012). C-S-H is formed by the addition of calcium-rich binders that hydrate in solution. Factors governing the stability of C-S-H in a CPB are sulphide and sulphate content, curing time, and the type and proportion of binder material (Benzaazoua et al. 2004). Sulphide oxidation generates sulphates that dissolves the C-S-H (called a sulphate attack) forming expansive phases (i.e. gypsum and ettringite) that could reduce the inherent strength of the CPB. In sul-phide-rich CPB-materials, dissolution of C-S-H contributes to neutralization of the acid formed by the oxidation of sulphides. The hydroxyl anions from this process could react with trace metals forming hydroxides that could adsorb onto C-S-H (i.e. Pb and Zn) or be encapsulated within the C-S-H-structure (i.e. Ni and Cr) (Chen et al. 2009). However, introducing highly alkaline conditions (by the release of OH-) could also increase the mo-bility of some trace metals (i.e. Cr, Zn and Cu) (Kumpiene et al. 2008). Maintaining the stability of C-S-H is therefore of major importance concerning mobility of trace metals in the CPB.
807
Lappeenranta, Finland IMWA 2017Mine Water and Circular Economy
Wolkersdorfer C, Sartz L, Sillanpää M, Häkkinen A (Editors)
Curing times of 28 to90 days have been considered to be sufficient to reach the mechani-cal strength needed in a CPB-application (Benzaazoua et al. 2004, Kesimal et al. 2005). In these studies, the CPBs are to be flooded directly upon curing. In CPB, maintaining a high grade of water saturation will prevent sulphide oxidation and subsequent sulphate attack on the C-S-H. In field conditions, a CPB is typically flooded when mine operations are closed and the groundwater level recovers. Flooding of CPB could take a long time, and unsaturated zones could form within the monolith (Ouellet et al. 2006). This in turn will increase the risk for more extensive sulphide oxidation to occur within the CPB. Studies have shown that the strength in a CPB-material can be reduced by more than 50 % when curing times are prolonged to > 1 year (Kesimal et al. 2005), especially in a sulphide-rich CPB. Cruz and Bertrand (2001) have shown that low proportions of binders could be in-sufficient to suppress the generation of acid mine drainage. Information on the mobility of trace metals and iron sulphide minerals in CPB is essential for prediction/management of the contaminant release over a extended period of time. It is therefore important to investigate the chemical stability of trace metals in CPB-materials where iron sulphides are occurring. The objectives of this study were to:
- Evaluate the leaching behavior of trace metals in CPB-mixtures - Delaying a flooding event of CPB-mixtures for > 1 year and evaluate the effects on
trace metal leaching
Results from this study may add knowledge about the preparation of CPB-mixtures for use in excavated areas where the recovery of groundwater levels is slow.
Materials and Methods
Tailings from a cyanide leaching process (CT) were collected from a tailings pond at a gold mine in the north of Sweden. In the cyanide leaching process, lime and Fe(SO4)3 were added for the immobilization of trace metals by co-precipitation, cyanide destruction and increasing pH in outlet water. The cementitious binders tested for the preparation of various CPB-mixtures were: Portland cement (CE) and biofuel fly ash (FA). The ash was provided from a biofuel incineration plant located nearby the mine site. Elemental compositions of tailings, CE and FA are presented in table 1. Pyrrhotite was the main Fe-sulphide in CT (1 wt. %).
Preparation of CT-CPB-mixtures
CPB-Mixtures were selected to have a minimum strength of 200 kPa with a minimal pro-portion of binders (Table 2 for proportions). CPB-mixtures (CE and CE-FA) are based on cyanidation tailings (CT); the compositions are presented in table 2. CPB-mixtures of CE and CE-FA were cured for 31days or 446 days, hereafter named CE31, CE446, CE-FA31 and CE-FA446. CE31 and CE-FA31 were kept in humid conditions (70 % humidity), at room temperature, in dark conditions until the 31th day of curing. CE446 and CE-FA446 were kept in dark, room temperature conditions during a period of 446 days.
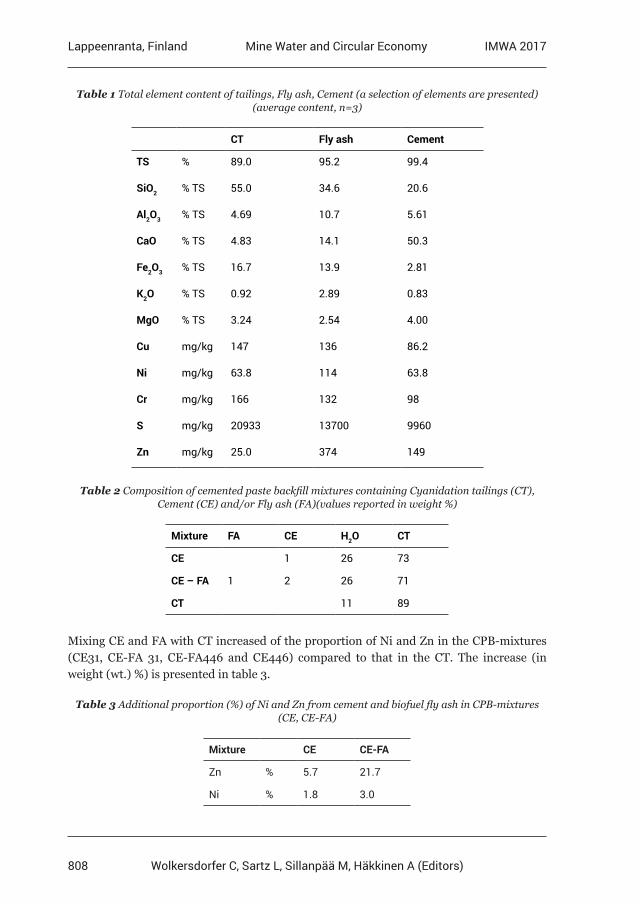
808
Lappeenranta, Finland IMWA 2017Mine Water and Circular Economy
Wolkersdorfer C, Sartz L, Sillanpää M, Häkkinen A (Editors)
Table 1 Total element content of tailings, Fly ash, Cement (a selection of elements are presented)(average content, n=3)
CT Fly ash Cement
TS % 89.0 95.2 99.4
SiO2 % TS 55.0 34.6 20.6
Al2O3 % TS 4.69 10.7 5.61
CaO % TS 4.83 14.1 50.3
Fe2O3 % TS 16.7 13.9 2.81
K2O % TS 0.92 2.89 0.83
MgO % TS 3.24 2.54 4.00
Cu mg/kg 147 136 86.2
Ni mg/kg 63.8 114 63.8
Cr mg/kg 166 132 98
S mg/kg 20933 13700 9960
Zn mg/kg 25.0 374 149
Table 2 Composition of cemented paste backfill mixtures containing Cyanidation tailings (CT), Cement (CE) and/or Fly ash (FA)(values reported in weight %)
Mixture FA CE H2O CT
CE 1 26 73
CE – FA 1 2 26 71
CT 11 89
Mixing CE and FA with CT increased of the proportion of Ni and Zn in the CPB-mixtures (CE31, CE-FA 31, CE-FA446 and CE446) compared to that in the CT. The increase (in weight (wt.) %) is presented in table 3.
Table 3 Additional proportion (%) of Ni and Zn from cement and biofuel fly ash in CPB-mixtures (CE, CE-FA)
Mixture CE CE-FA
Zn % 5.7 21.7
Ni % 1.8 3.0
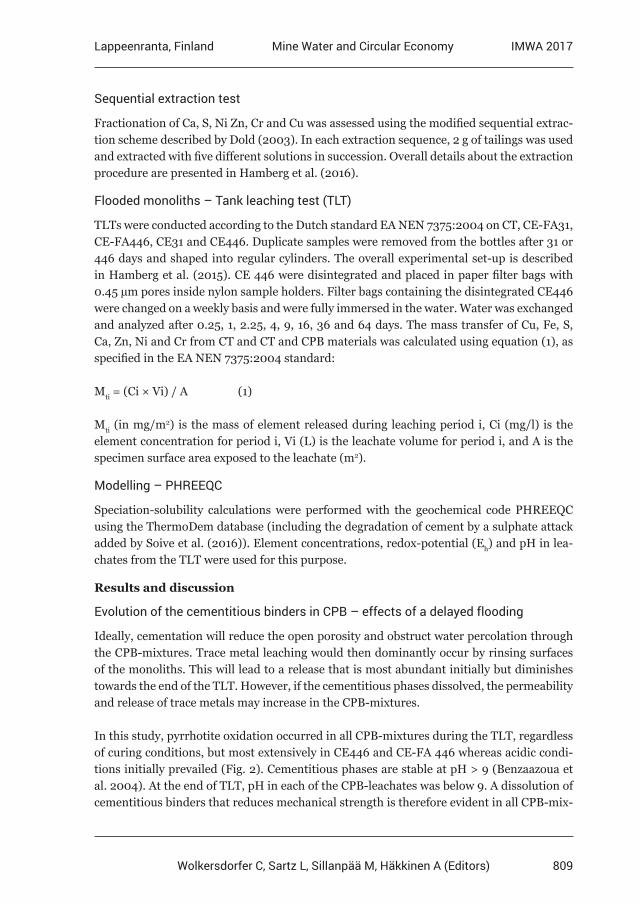
809
Lappeenranta, Finland IMWA 2017Mine Water and Circular Economy
Wolkersdorfer C, Sartz L, Sillanpää M, Häkkinen A (Editors)
Sequential extraction test
Fractionation of Ca, S, Ni Zn, Cr and Cu was assessed using the modified sequential extrac-tion scheme described by Dold (2003). In each extraction sequence, 2 g of tailings was used and extracted with five different solutions in succession. Overall details about the extraction procedure are presented in Hamberg et al. (2016).
Flooded monoliths – Tank leaching test (TLT)
TLTs were conducted according to the Dutch standard EA NEN 7375:2004 on CT, CE-FA31, CE-FA446, CE31 and CE446. Duplicate samples were removed from the bottles after 31 or 446 days and shaped into regular cylinders. The overall experimental set-up is described in Hamberg et al. (2015). CE 446 were disintegrated and placed in paper filter bags with 0.45 µm pores inside nylon sample holders. Filter bags containing the disintegrated CE446 were changed on a weekly basis and were fully immersed in the water. Water was exchanged and analyzed after 0.25, 1, 2.25, 4, 9, 16, 36 and 64 days. The mass transfer of Cu, Fe, S, Ca, Zn, Ni and Cr from CT and CT and CPB materials was calculated using equation (1), as specified in the EA NEN 7375:2004 standard:
Mti = (Ci × Vi) / A (1)
Mti (in mg/m2) is the mass of element released during leaching period i, Ci (mg/l) is the element concentration for period i, Vi (L) is the leachate volume for period i, and A is the specimen surface area exposed to the leachate (m2).
Modelling – PHREEQC
Speciation-solubility calculations were performed with the geochemical code PHREEQC using the ThermoDem database (including the degradation of cement by a sulphate attack added by Soive et al. (2016)). Element concentrations, redox-potential (Eh) and pH in lea-chates from the TLT were used for this purpose.
Results and discussion
Evolution of the cementitious binders in CPB – effects of a delayed flooding
Ideally, cementation will reduce the open porosity and obstruct water percolation through the CPB-mixtures. Trace metal leaching would then dominantly occur by rinsing surfaces of the monoliths. This will lead to a release that is most abundant initially but diminishes towards the end of the TLT. However, if the cementitious phases dissolved, the permeability and release of trace metals may increase in the CPB-mixtures.
In this study, pyrrhotite oxidation occurred in all CPB-mixtures during the TLT, regardless of curing conditions, but most extensively in CE446 and CE-FA 446 whereas acidic condi-tions initially prevailed (Fig. 2). Cementitious phases are stable at pH > 9 (Benzaazoua et al. 2004). At the end of TLT, pH in each of the CPB-leachates was below 9. A dissolution of cementitious binders that reduces mechanical strength is therefore evident in all CPB-mix-
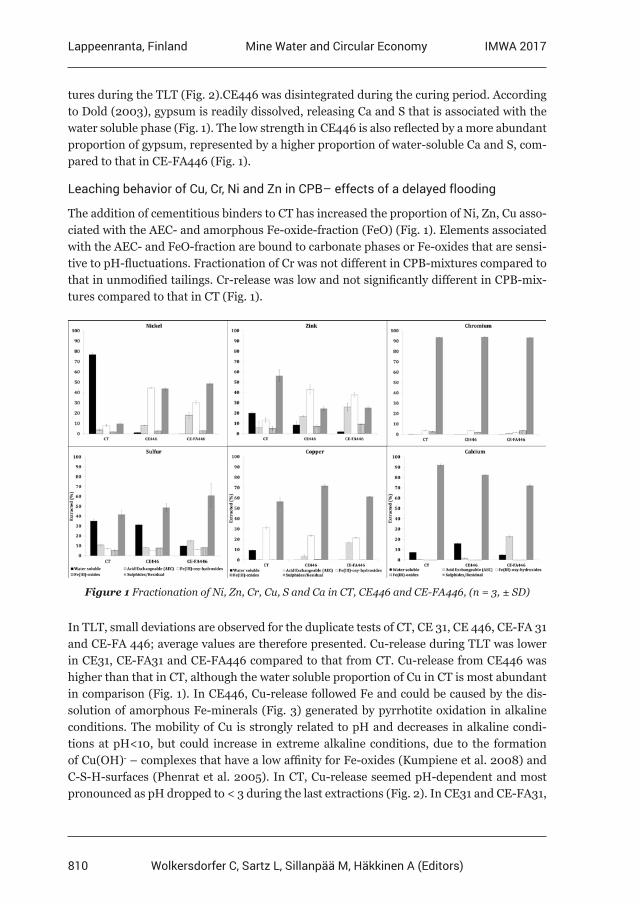
810
Lappeenranta, Finland IMWA 2017Mine Water and Circular Economy
Wolkersdorfer C, Sartz L, Sillanpää M, Häkkinen A (Editors)
tures during the TLT (Fig. 2).CE446 was disintegrated during the curing period. According to Dold (2003), gypsum is readily dissolved, releasing Ca and S that is associated with the water soluble phase (Fig. 1). The low strength in CE446 is also reflected by a more abundant proportion of gypsum, represented by a higher proportion of water-soluble Ca and S, com-pared to that in CE-FA446 (Fig. 1).
Leaching behavior of Cu, Cr, Ni and Zn in CPB– effects of a delayed flooding
The addition of cementitious binders to CT has increased the proportion of Ni, Zn, Cu asso-ciated with the AEC- and amorphous Fe-oxide-fraction (FeO) (Fig. 1). Elements associated with the AEC- and FeO-fraction are bound to carbonate phases or Fe-oxides that are sensi-tive to pH-fluctuations. Fractionation of Cr was not different in CPB-mixtures compared to that in unmodified tailings. Cr-release was low and not significantly different in CPB-mix-tures compared to that in CT (Fig. 1).
Figure 1 Fractionation of Ni, Zn, Cr, Cu, S and Ca in CT, CE446 and CE-FA446, (n = 3, ± SD)
In TLT, small deviations are observed for the duplicate tests of CT, CE 31, CE 446, CE-FA 31 and CE-FA 446; average values are therefore presented. Cu-release during TLT was lower in CE31, CE-FA31 and CE-FA446 compared to that from CT. Cu-release from CE446 was higher than that in CT, although the water soluble proportion of Cu in CT is most abundant in comparison (Fig. 1). In CE446, Cu-release followed Fe and could be caused by the dis-solution of amorphous Fe-minerals (Fig. 3) generated by pyrrhotite oxidation in alkaline conditions. The mobility of Cu is strongly related to pH and decreases in alkaline condi-tions at pH<10, but could increase in extreme alkaline conditions, due to the formation of Cu(OH)- – complexes that have a low affinity for Fe-oxides (Kumpiene et al. 2008) and C-S-H-surfaces (Phenrat et al. 2005). In CT, Cu-release seemed pH-dependent and most pronounced as pH dropped to < 3 during the last extractions (Fig. 2). In CE31 and CE-FA31,
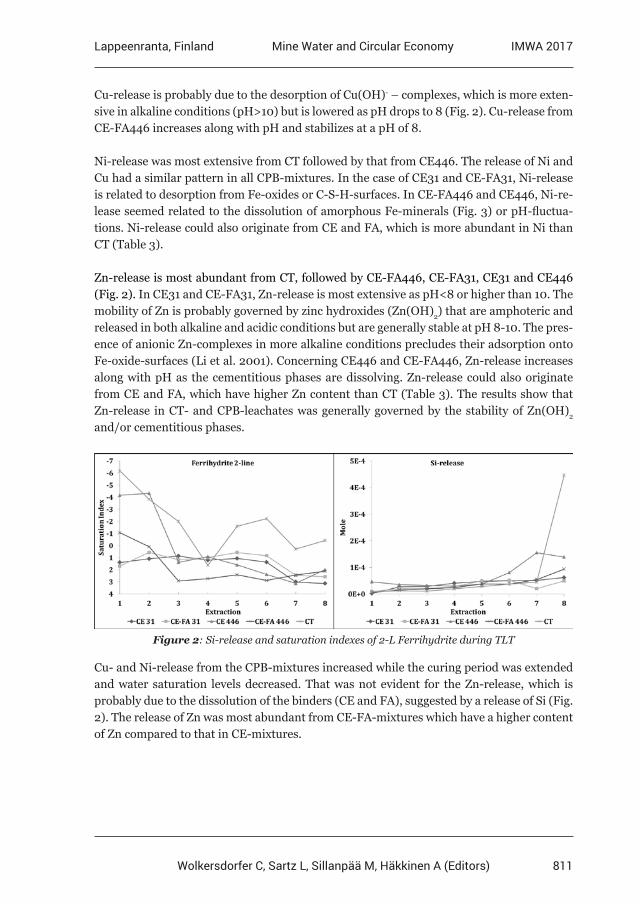
811
Lappeenranta, Finland IMWA 2017Mine Water and Circular Economy
Wolkersdorfer C, Sartz L, Sillanpää M, Häkkinen A (Editors)
Cu-release is probably due to the desorption of Cu(OH)- – complexes, which is more exten-sive in alkaline conditions (pH>10) but is lowered as pH drops to 8 (Fig. 2). Cu-release from CE-FA446 increases along with pH and stabilizes at a pH of 8.
Ni-release was most extensive from CT followed by that from CE446. The release of Ni and Cu had a similar pattern in all CPB-mixtures. In the case of CE31 and CE-FA31, Ni-release is related to desorption from Fe-oxides or C-S-H-surfaces. In CE-FA446 and CE446, Ni-re-lease seemed related to the dissolution of amorphous Fe-minerals (Fig. 3) or pH-fluctua-tions. Ni-release could also originate from CE and FA, which is more abundant in Ni than CT (Table 3).
Zn-release is most abundant from CT, followed by CE-FA446, CE-FA31, CE31 and CE446 (Fig. 2). In CE31 and CE-FA31, Zn-release is most extensive as pH<8 or higher than 10. The mobility of Zn is probably governed by zinc hydroxides (Zn(OH)2) that are amphoteric and released in both alkaline and acidic conditions but are generally stable at pH 8-10. The pres-ence of anionic Zn-complexes in more alkaline conditions precludes their adsorption onto Fe-oxide-surfaces (Li et al. 2001). Concerning CE446 and CE-FA446, Zn-release increases along with pH as the cementitious phases are dissolving. Zn-release could also originate from CE and FA, which have higher Zn content than CT (Table 3). The results show that Zn-release in CT- and CPB-leachates was generally governed by the stability of Zn(OH)2 and/or cementitious phases.
Figure 2: Si-release and saturation indexes of 2-L Ferrihydrite during TLT
Cu- and Ni-release from the CPB-mixtures increased while the curing period was extended and water saturation levels decreased. That was not evident for the Zn-release, which is probably due to the dissolution of the binders (CE and FA), suggested by a release of Si (Fig. 2). The release of Zn was most abundant from CE-FA-mixtures which have a higher content of Zn compared to that in CE-mixtures.
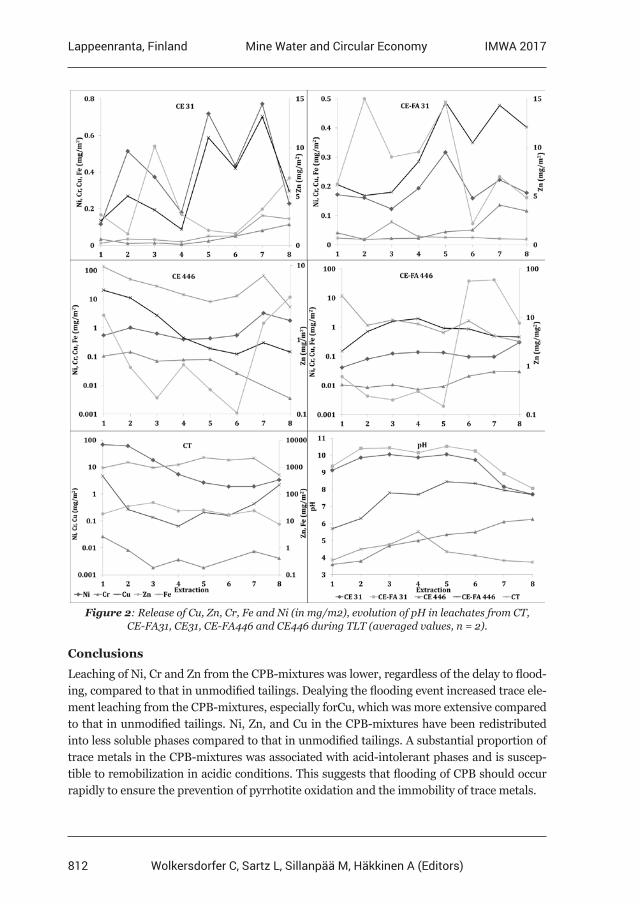
812
Lappeenranta, Finland IMWA 2017Mine Water and Circular Economy
Wolkersdorfer C, Sartz L, Sillanpää M, Häkkinen A (Editors)
Figure 2: Release of Cu, Zn, Cr, Fe and Ni (in mg/m2), evolution of pH in leachates from CT, CE-FA31, CE31, CE-FA446 and CE446 during TLT (averaged values, n = 2).
Conclusions
Leaching of Ni, Cr and Zn from the CPB-mixtures was lower, regardless of the delay to flood-ing, compared to that in unmodified tailings. Dealying the flooding event increased trace ele-ment leaching from the CPB-mixtures, especially forCu, which was more extensive compared to that in unmodified tailings. Ni, Zn, and Cu in the CPB-mixtures have been redistributed into less soluble phases compared to that in unmodified tailings. A substantial proportion of trace metals in the CPB-mixtures was associated with acid-intolerant phases and is suscep-tible to remobilization in acidic conditions. This suggests that flooding of CPB should occur rapidly to ensure the prevention of pyrrhotite oxidation and the immobility of trace metals.
813
Lappeenranta, Finland IMWA 2017Mine Water and Circular Economy
Wolkersdorfer C, Sartz L, Sillanpää M, Häkkinen A (Editors)
Acknowledgements
Financial support from Ramböll Sverige AB, Ramböll Foundation, SUSMIN – Tools for sustainable gold mining in EU, and the Center of Advanced Mining and Metallurgy (CAMM) at Luleå University of Technology is gratefully acknowledged. The personnel at Dragon Mining AB are also gratefully acknowledged for valuable information about the mining processes and for providing the tailings needed for this study
References
Benzaazoua M, Fall M., Belem, T (2004). A contribution to understanding the hardening process of cemented pastefill. Miner Eng, 17(2), 141-152.Chen QY, Tyrer M, Hills, CD (2009) Immobilisation of heavy metal in cement-based solidification/ stabilization: a review. Waste Manag 29, 390–403Cruz, R, Bertrand, V, Monroy, M, González, I (2001). Effect of sulfide impurities on the reactivity of pyrite and pyritic concentrates: A multi-tool approach. Appl Geochem, 16(7-8), 803-819.Dold B (2003). Speciation of the most soluble phases in a sequential extraction procedure adapted for geochemical studies of copper sulfide mine waste. J. Geochem. Explor. 80 (1), 55–68.EA NEN 7375:2004, Leaching characteristics of moulded or monolithic building and waste materials, Determination of leaching of inorganic components with the diffusion test, The tank test, 2004Hamberg R, Maurice C, Alakangas, L (2015). The use of low binder proportions in cemented paste backfill – effects on As-leaching. Miner Eng. 78, 74–82. doi:10.1016/j.mineng.2015.04.017.Hamberg R, Bark G, Maurice C, Alakangas, L (2016). Release of arsenic from cyanidation tailings. Miner Eng. 93, 57–64. doi:10.1016/j.mineng.2016.04.013.Kesimal, A, Yilmaz E, Ercikdi, B, Alp I, Deveci, H (2005). Effect of properties of tailings and binder on the short-and long-term strength and stability of cemented paste backfill. Mater Lett., 59 (28), 3703–3709. doi:10.1016/j.matlet.2005.06.042.Kumpiene J, Lagerkvist A, Maurice, C (2008). Stabilization of as, cr, cu, pb and zn in soil using amendments – A review. Waste Manag., 28(1), 215-225. doi:10.1016/j.wasman.2006.12.012Li, X D, Poon, C S, Sun, H, Lo, I M C, Kirk, D W (2001). Heavy metal speciation and leaching behaviors in cement based solidified/stabilized waste materials. J Hazard Mater., 82(3), 215-230. doi:10.1016/S0304-3894(00)00360-5Ouellet S, Bussière B, Mbonimpa M, Benzaazoua M, Aubertin, M (2006). Reactivity and mineralogical evolution of an underground mine sulphidic cemented paste backfill. Miner Eng., 19 (5), 407–419. doi:10.1016/j.mineng.2005.10.006.Peyronnard O, Benzaazoua, M (2012). Alternative by-product based binders for cemented mine backfill: Recipes optimisation using Taguchi method. Miner Eng. 29, 28–38. doi:10.1016/j. mineng.2011.12.010.Phenrat T, Marhaba T F, Rachakornkij, M (2005). A SEM and X-ray study for investigation of solidified/ stabilized arsenic-iron hydroxide sludge. J Hazard Mater, 118(1-3), 185-195.Soive, A., Roziere, E., Loukili, A. (2016). Parametrical study of the cementitious materials degradation under external sulfate attack through numerical modeling. Con Build Mat, 112, 267-275. doi:10.1016/j.conbuildmat.2016.02.187
814
Lappeenranta, Finland IMWA 2017Mine Water and Circular Economy
Wolkersdorfer C, Sartz L, Sillanpää M, Häkkinen A (Editors)
Research on transformation characteristics of humic acid based on improved three-dimensional fluorescence
regional integral
Tiantian Wang 1, Qi Wang 2, Xinyi Wang2,3
1Institute of Resources and Environment, Henan Polytechnic University, Jiaozuo, 454000, China
2School of Rescoures and Enviroment, North China University Of Water Resources And Electric Power, Zhengzhou, 450045, China
3Collaborative Innovation Center of Coalbed Methane and Shale Gas for Central Plains Economic Region, Henan Province, Jiaozuo 454000, China
Abstract This paper mainly studied transformation characteristics of humic acid in aqueous medium from coal-mining region of Pingdingshan. To achieve the research purpose, we carried out soil columns experiment. In this experiment, humic acid solution is used as water sample, meanwhile, marl rock are used as testing rock sample. Soon after the experiment, three-dimensional fluorescence technology was took to test humic acid. In order to improve precision of three-dimensional fluorescence, we applied the analytic hierarchy process (AHP) to the traditional regional integration method. Then the improved regional integral was utilized to analysis experiment result. The three-dimensional fluorescence regional integral results of marlstone show that from 192h to 600h, proportion of region V let up from 0.456 to 0.065, however, proportion of region IV added from 0.372 to 0.502. Apparently Humic acid has transformed in the marlstone. This kind of transformation is mainly degradation Humic acid was degraded into soluble metabolic products by microorganism. And for that the percentage of region V minished when the percentage of region IV added.
Key words Humic acid, 3DEEM, improved regional integral, marlstone
Introduction
Humic acid is a kind of polymer organic compound with fat and aromatic structure, which is made by carbon, hydrogen, oxygen, nitrogen, sulfur and other elements. Three-dimensional excitation-emission matrix(3DEEM) is a common technical means of humic acid research. At present, we mainly rely on the traditional peak position to identify humic acid qualita-tively. With the appearance of the regional integration method, it is quantitative for Three – dimensional fluorescence analysis. However, traditional integration method simply use the reciprocal of the region area as the balance weight, which is not completely consistent with the actual situation, and its accuracy still needs to be improved.
In this paper, the marl rock extracted from Pingdingshan coal field is used as the medium to carry out a simulation experiment. Then, three-dimensional fluorescence spectra of humic acid was detected in leaching solution. We introduced analytic hierarchy process(AHP) to improve Three-dimensional Fluorescence Region Integral Method, analyzing the spectral characteristics of three dimensional fluorescence quantitatively. The degradation charac-teristics of humic acid were studied, and this will lay the scientific foundation for the study of groundwater recharge, runoff and excretion mechanism in the water filled aquifer of coal mine.
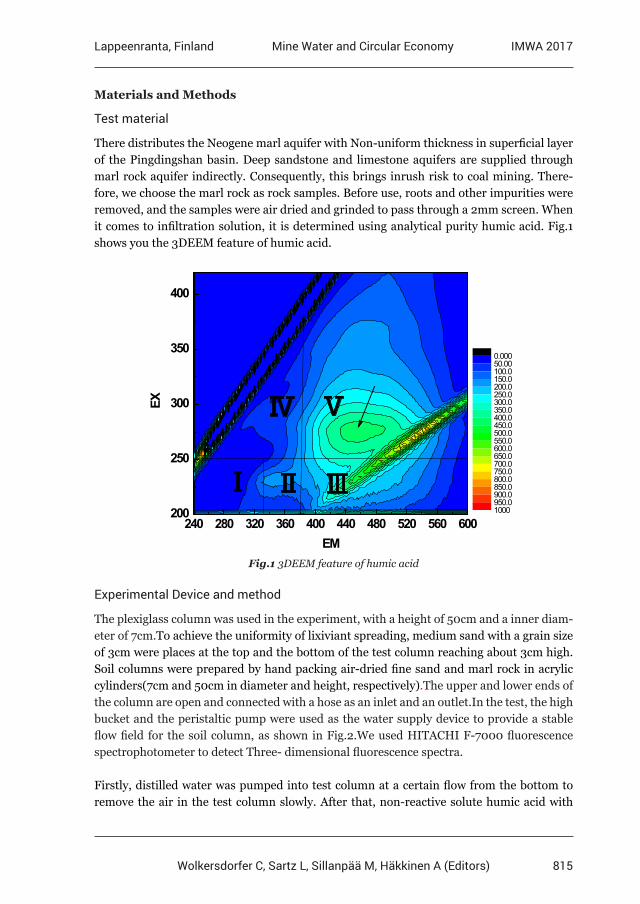
815
Lappeenranta, Finland IMWA 2017Mine Water and Circular Economy
Wolkersdorfer C, Sartz L, Sillanpää M, Häkkinen A (Editors)
Materials and Methods
Test material
There distributes the Neogene marl aquifer with Non-uniform thickness in superficial layer of the Pingdingshan basin. Deep sandstone and limestone aquifers are supplied through marl rock aquifer indirectly. Consequently, this brings inrush risk to coal mining. There-fore, we choose the marl rock as rock samples. Before use, roots and other impurities were removed, and the samples were air dried and grinded to pass through a 2mm screen. When it comes to infiltration solution, it is determined using analytical purity humic acid. Fig.1 shows you the 3DEEM feature of humic acid.
240 280 320 360 400 440 480 520 560 600200
250
300
350
400
ⅤⅣ
ⅢⅡⅠ
EM
EX
0.00050.00100.0150.0200.0250.0300.0350.0400.0450.0500.0550.0600.0650.0700.0750.0800.0850.0900.0950.01000
Fig.1 3DEEM feature of humic acid
Experimental Device and method
The plexiglass column was used in the experiment, with a height of 50cm and a inner diam-eter of 7cm.To achieve the uniformity of lixiviant spreading, medium sand with a grain size of 3cm were places at the top and the bottom of the test column reaching about 3cm high. Soil columns were prepared by hand packing air-dried fine sand and marl rock in acrylic cylinders(7cm and 50cm in diameter and height, respectively).The upper and lower ends of the column are open and connected with a hose as an inlet and an outlet.In the test, the high bucket and the peristaltic pump were used as the water supply device to provide a stable flow field for the soil column, as shown in Fig.2.We used HITACHI F-7000 fluorescence spectrophotometer to detect Three- dimensional fluorescence spectra.
Firstly, distilled water was pumped into test column at a certain flow from the bottom to remove the air in the test column slowly. After that, non-reactive solute humic acid with
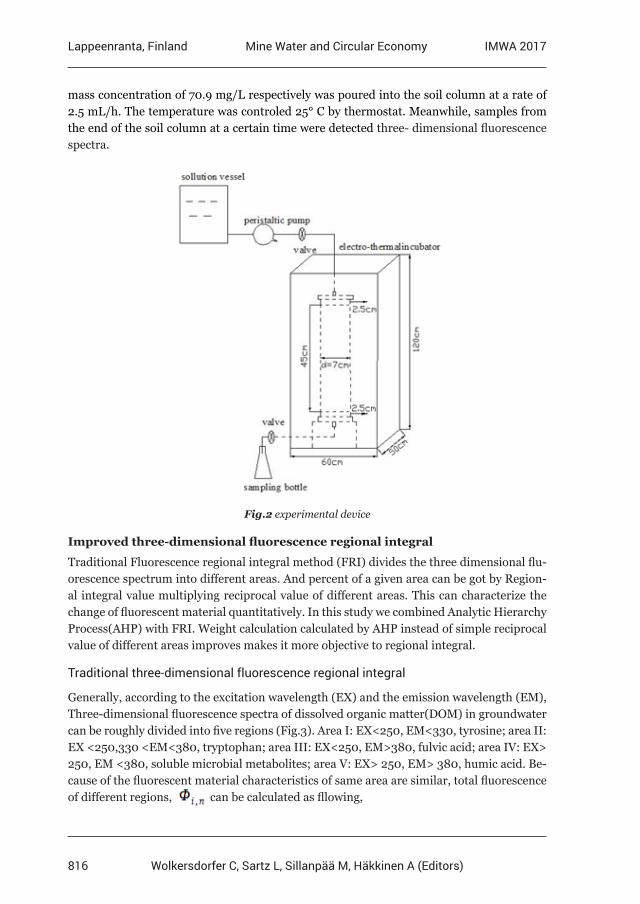
816
Lappeenranta, Finland IMWA 2017Mine Water and Circular Economy
Wolkersdorfer C, Sartz L, Sillanpää M, Häkkinen A (Editors)
mass concentration of 70.9 mg/L respectively was poured into the soil column at a rate of 2.5 mL/h. The temperature was controled 25° C by thermostat. Meanwhile, samples from the end of the soil column at a certain time were detected three- dimensional fluorescence spectra.
Fig.2 experimental device
Improved three-dimensional fluorescence regional integral
Traditional Fluorescence regional integral method (FRI) divides the three dimensional flu-orescence spectrum into different areas. And percent of a given area can be got by Region-al integral value multiplying reciprocal value of different areas. This can characterize the change of fluorescent material quantitatively. In this study we combined Analytic Hierarchy Process(AHP) with FRI. Weight calculation calculated by AHP instead of simple reciprocal value of different areas improves makes it more objective to regional integral.
Traditional three-dimensional fluorescence regional integral
Generally, according to the excitation wavelength (EX) and the emission wavelength (EM), Three-dimensional fluorescence spectra of dissolved organic matter(DOM) in groundwater can be roughly divided into five regions (Fig.3). Area I: EX<250, EM<330, tyrosine; area II: EX <250,330 <EM<380, tryptophan; area III: EX<250, EM>380, fulvic acid; area IV: EX> 250, EM <380, soluble microbial metabolites; area V: EX> 250, EM> 380, humic acid. Be-cause of the fluorescent material characteristics of same area are similar, total fluorescence of different regions, can be calculated as fllowing,
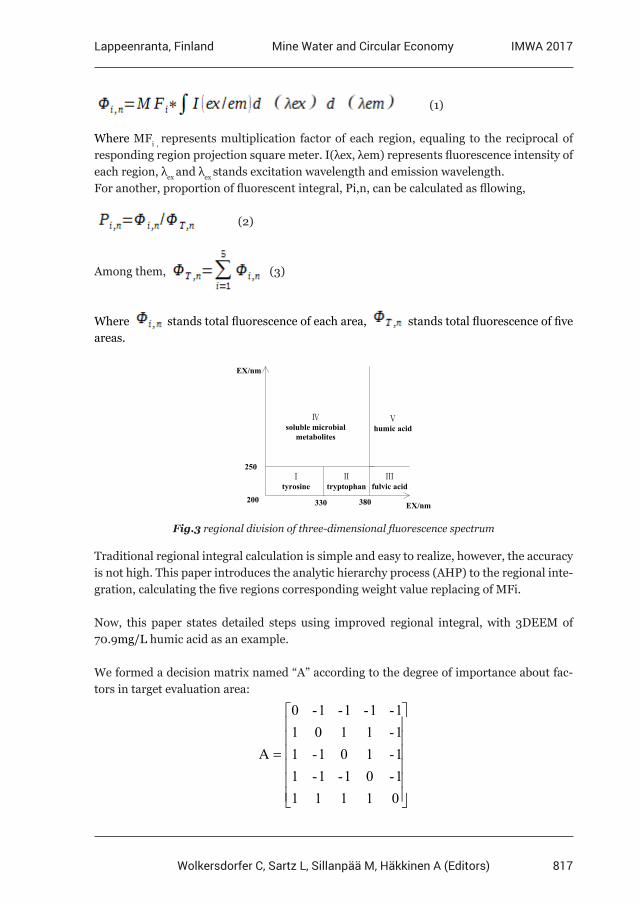
817
Lappeenranta, Finland IMWA 2017Mine Water and Circular Economy
Wolkersdorfer C, Sartz L, Sillanpää M, Häkkinen A (Editors)
(1)
Where MFi , represents multiplication factor of each region, equaling to the reciprocal of responding region projection square meter. I(λex, λem) represents fluorescence intensity of each region, λex and λex stands excitation wavelength and emission wavelength.For another, proportion of fluorescent integral, Pi,n, can be calculated as fllowing,
(2)
Among them, (3)
Where stands total fluorescence of each area, stands total fluorescence of five areas.
200
250
EX/nm
Ⅰtyrosine
Ⅱtryptophan
Ⅲ fulvic acid
Ⅴhumic acid
Ⅳ soluble microbial
metabolites
EX/nm 330 380
Fig.3 regional division of three-dimensional fluorescence spectrum
Traditional regional integral calculation is simple and easy to realize, however, the accuracy is not high. This paper introduces the analytic hierarchy process (AHP) to the regional inte-gration, calculating the five regions corresponding weight value replacing of MFi.
Now, this paper states detailed steps using improved regional integral, with 3DEEM of 70.9mg/L humic acid as an example.
We formed a decision matrix named “A” according to the degree of importance about fac-tors in target evaluation area:
=
011111-01-1-11-101-11-11011-1-1-1-0
A
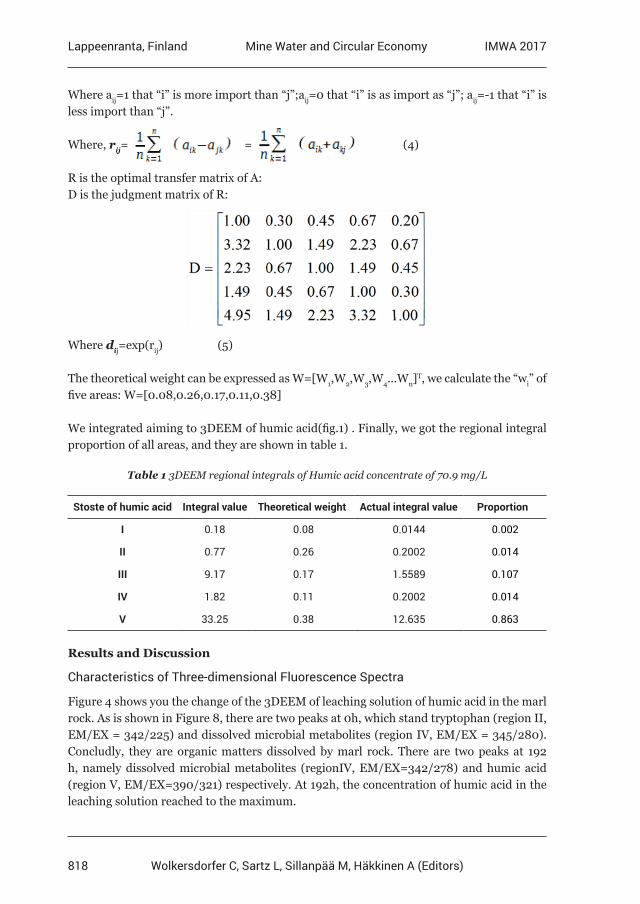
818
Lappeenranta, Finland IMWA 2017Mine Water and Circular Economy
Wolkersdorfer C, Sartz L, Sillanpää M, Häkkinen A (Editors)
Where aij=1 that “i” is more import than “j”;aij=0 that “i” is as import as “j”; aij=-1 that “i” is less import than “j”.
Where, rij= = (4)
R is the optimal transfer matrix of A:D is the judgment matrix of R:
Where dij=exp(rij) (5)
The theoretical weight can be expressed as W=[W1,W2,W3,W4...Wn]T, we calculate the “wi” of five areas: W=[0.08,0.26,0.17,0.11,0.38]
We integrated aiming to 3DEEM of humic acid(fig.1) . Finally, we got the regional integral proportion of all areas, and they are shown in table 1.
Table 1 3DEEM regional integrals of Humic acid concentrate of 70.9 mg/L
Stoste of humic acid Integral value Theoretical weight Actual integral value Proportion
I 0.18 0.08 0.0144 0.002
II 0.77 0.26 0.2002 0.014
III 9.17 0.17 1.5589 0.107
IV 1.82 0.11 0.2002 0.014
V 33.25 0.38 12.635 0.863
Results and Discussion
Characteristics of Three-dimensional Fluorescence Spectra
Figure 4 shows you the change of the 3DEEM of leaching solution of humic acid in the marl rock. As is shown in Figure 8, there are two peaks at 0h, which stand tryptophan (region II, EM/EX = 342/225) and dissolved microbial metabolites (region IV, EM/EX = 345/280). Concludly, they are organic matters dissolved by marl rock. There are two peaks at 192 h, namely dissolved microbial metabolites (regionIV, EM/EX=342/278) and humic acid (region V, EM/EX=390/321) respectively. At 192h, the concentration of humic acid in the leaching solution reached to the maximum.
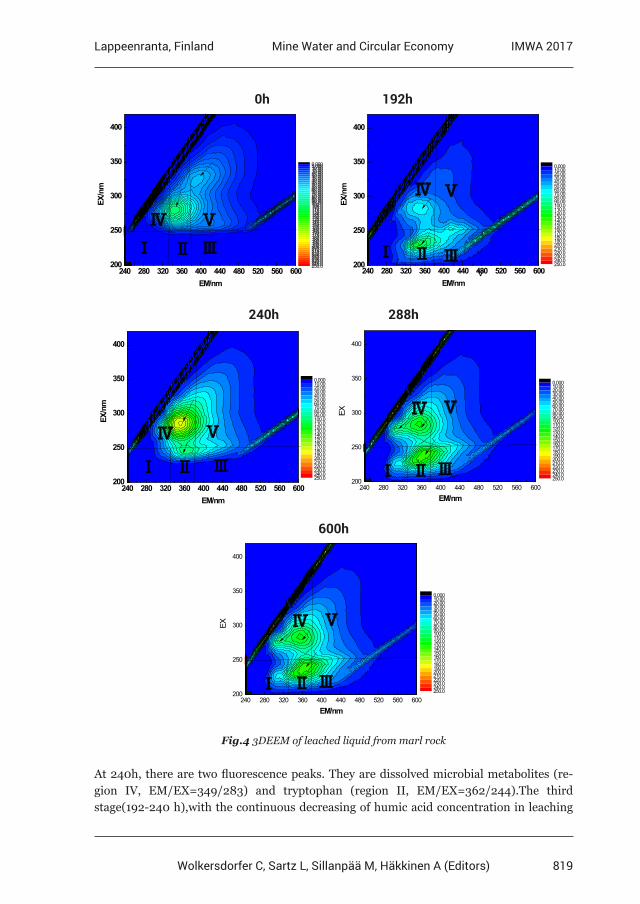
819
Lappeenranta, Finland IMWA 2017Mine Water and Circular Economy
Wolkersdorfer C, Sartz L, Sillanpää M, Häkkinen A (Editors)
At 240h, there are two fluorescence peaks. They are dissolved microbial metabolites (re-gion IV, EM/EX=349/283) and tryptophan (region II, EM/EX=362/244).The third stage(192-240 h),with the continuous decreasing of humic acid concentration in leaching
0h 192h
240h 288h
600h
240 280 320 360 400 440 480 520 560 600200
250
300
350
400
Ⅰ
EM/nm
EX/n
m
0.0005.00010.0015.0020.0025.0030.0035.0040.0045.0050.0055.0060.0065.0070.0075.0080.0085.0090.0095.00100.0105.0110.0115.0120.0125.0130.0135.0140.0145.0150.0155.0160.0165.0170.0175.0180.0185.0190.0195.0200.0205.0210.0215.0220.0225.0230.0235.0240.0245.0250.0
Ⅱ Ⅲ
Ⅳ Ⅴ
240 280 320 360 400 440 480 520 560 600200
250
300
350
400
EM/nm
EX/n
m
0.00010.0020.0030.0040.0050.0060.0070.0080.0090.00100.0110.0120.0130.0140.0150.0160.0170.0180.0190.0200.0210.0220.0230.0240.0250.0
Ⅴ
Ⅰ Ⅱ Ⅲ
Ⅳ Ⅴ
240 280 320 360 400 440 480 520 560 600200
250
300
350
400
EM/nm
EX/n
m
0.00010.0020.0030.0040.0050.0060.0070.0080.0090.00100.0110.0120.0130.0140.0150.0160.0170.0180.0190.0200.0210.0220.0230.0240.0250.0
ⅡⅠ Ⅲ
Ⅳ Ⅴ
240 280 320 360 400 440 480 520 560 600200
250
300
350
400
EM/nm
EX
0.00010.0020.0030.0040.0050.0060.0070.0080.0090.00100.0110.0120.0130.0140.0150.0160.0170.0180.0190.0200.0210.0220.0230.0240.0250.0
Ⅰ Ⅱ Ⅲ
Ⅳ Ⅴ
240 280 320 360 400 440 480 520 560 600200
250
300
350
400
EM/nm
EX
0.00010.0020.0030.0040.0050.0060.0070.0080.0090.00100.0110.0120.0130.0140.0150.0160.0170.0180.0190.0200.0210.0220.0230.0240.0250.0
Ⅰ Ⅱ Ⅲ
Ⅳ Ⅴ
Fig.4 3DEEM of leached liquid from marl rock
820
Lappeenranta, Finland IMWA 2017Mine Water and Circular Economy
Wolkersdorfer C, Sartz L, Sillanpää M, Häkkinen A (Editors)
solution (Figure 5), the peak value of region V disappear gradually, most of the humic acid is adsorbed by marl rock. At 288 h, there is only one peak in region II (EM/EX =370/242), at the same time, there appear two fluorescence peaks in area IV including IV1(EM/EX = 354/281) and IV2 (EM/EX = 305/275). Peak IV2 is a new fluorescence peak compared to previous two stages. The reason is that a new peak appeares when adsorbed humic acid by marl rock is degraded into dissolved microbial metabolites.
Characteristics of improved regional integral
We calculated the integral of three dimensional fluorescence spectra of leaching liquid from critical time, then we drew the regional integral columnar of three dimensional fluorescence spectra, and the figure6 show you that.
0.002 0.015 0.004 0.027 0.025
0.179
0.014
0.61
0.090.121 0.149
0.201
0.107
0.204
0.128 0.0510.059
0.051
0.014
0.052
0.3220.45
0.498
0.502
0.863
0.119
0.4560.351
0.265
0.065
原 0h 192h 240h 288h 600h0.0
0.2
0.4
0.6
0.8
1.0
proportion
Ⅴ Ⅳ Ⅲ Ⅱ Ⅰ
time
Fig.5 improved regional integrals of 3DEEM
From figure 8, we know that material leached from marlstone distribute in region II and region III. At 0h, the proportion of region II is 0.61 and that of III is 0.204.When at 192h, the proportion of region V reaches 0.61 getting to the maximum. With the time going, the proportion of region V decreases. From 192h to 600h, the proportion let up from 0.456 to 0.065. However, the proportion of IV increases from 0.322 to 0.502. we conclude that hu-mic acid has been transformed in the marlstone. And this transform mainly is degradation. Humic acid was degraded into soluble metabolic products by microorganism. Therfore, there appears a new fluorescence peak in IV zone, and the integral proportion increases.
Conclusion
(1) The three-dimensional fluorescence of humic acid from malm show that there appeas a new fluorescence peak IV2 at 288 h coming along with peak V disappearing at 240h.
821
Lappeenranta, Finland IMWA 2017Mine Water and Circular Economy
Wolkersdorfer C, Sartz L, Sillanpää M, Häkkinen A (Editors)
(2) The improved three-dimensional fluorescence regional integral show that from 192h to 600h, the proportion of region V decreases from 0.456 to 0.065.At the same time, the pro-portion of region V increases from 0.372 to 0.502, when there is mainly no change of other regions. It is obvious that humic acid has been degraded into soluble metabolic products by microorganism. Therfore, there appears a new fluorescence peak in IV zone, and the inte-gral proportion increases.
822
Lappeenranta, Finland IMWA 2017Mine Water and Circular Economy
Wolkersdorfer C, Sartz L, Sillanpää M, Häkkinen A (Editors)
Developing closure plans using performance based closure objectives: Aitik Mine (Northern Sweden)
Nils Eriksson1, Seth Mueller1, Anders Forsgren1, Åsa Sjöblom1, Alan Martin2, Mike O´Kane3, L.E. Eary4, Andreas Aronsson5
1Boliden Mineral AB, Boliden, Sweden 2Lorax Environmental Services Limited, Vancouver, BC, Canada
3O´Kane Consultants Inc., Saskatoon, Canada 4Hatch, Fort Collins, Colorado, US
5Sweco Environment AB, Sundsvall, Sweden
Abstract At Boliden’s Aitik Mine, closure planning has been ongoing over the last 25 years. Recently set national environmental quality standards (EQS) for surface waters, developed in relation to the implementation of the Water Framework Directive within the European Union, provide the opportunity to evaluate the overall requirements for the integrated closure of the mine. Based on site-specific information, a base-case closure scenario was developed fulfilling the water quality objectives in the recipient. Performance-based closure objectives showed to provide an efficient approach to optimise mine closure planning.
Introduction
Developing viable closure plans for large mines represents a significant challenge in the mining industry which relates to the complexity associated with scale, multiple sources and recipients as well as multiple closure objectives. In performance-based design, closure measures that make up the closure scenario are selected based on predictions of impact to the recipient environment. The relationship between closure measures and predicted im-pacts to the environment can be quantified by conducting numerical analysis. For example, quantification of the impacts of cover performance for waste rock, in the form of net perco-lation and oxygen ingress design criteria on recipient water quality, requires an integrated analysis of site-specific components including geochemical reactions, gas exchange as well as flow and transport processes occurring in the waste along the flow path. This approach provides an opportunity to develop site-specific performance-based design criteria based on quantification of the acceptable loadings to the recipient environment. A review of design approaches concludes that the process usually consists of the three steps: 1) Determine ac-ceptable recipient water quality standards; 2) Determine the maximum acceptable loading that can be discharged to the recipient without exceeding these water quality standards; and, 3) Select a closure system resulting in discharges less than this maximum.
Within the European Union (EU), the implementation of the Water Framework Directive has given the mining industry overall performance criteria in the form of environmental quality standards (EQS) for Priority Substances for receiving waters. When additional EQS for Specified Pollutants were introduced in Sweden in 2015 (HVMFS 2013:19), a full set of regulatory EQS became available to use as overall performance based closure objectives (tab. 1). The EQS provide increased clarity as to what is considered acceptable, not just from an eco-toxicological point of view, but that also includes a specified factor of safety.
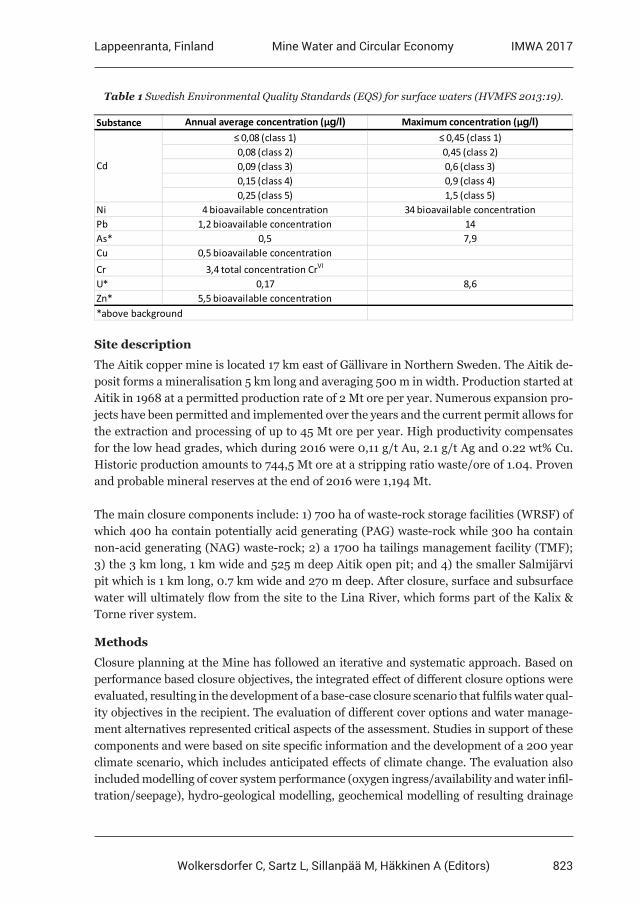
823
Lappeenranta, Finland IMWA 2017Mine Water and Circular Economy
Wolkersdorfer C, Sartz L, Sillanpää M, Häkkinen A (Editors)
Table 1 Swedish Environmental Quality Standards (EQS) for surface waters (HVMFS 2013:19).
Substance Annual average concentration (µg/l) Maximum concentration (µg/l)≤ 0,08 (class 1) ≤ 0,45 (class 1)0,08 (class 2) 0,45 (class 2)0,09 (class 3) 0,6 (class 3)0,15 (class 4) 0,9 (class 4)0,25 (class 5) 1,5 (class 5)
Ni 4 bioavailable concentration 34 bioavailable concentrationPb 1,2 bioavailable concentration 14As* 0,5 7,9Cu 0,5 bioavailable concentrationCr 3,4 total concentration CrVI
U* 0,17 8,6Zn* 5,5 bioavailable concentration*above background
Cd
Site description
The Aitik copper mine is located 17 km east of Gällivare in Northern Sweden. The Aitik de-posit forms a mineralisation 5 km long and averaging 500 m in width. Production started at Aitik in 1968 at a permitted production rate of 2 Mt ore per year. Numerous expansion pro-jects have been permitted and implemented over the years and the current permit allows for the extraction and processing of up to 45 Mt ore per year. High productivity compensates for the low head grades, which during 2016 were 0,11 g/t Au, 2.1 g/t Ag and 0.22 wt% Cu. Historic production amounts to 744,5 Mt ore at a stripping ratio waste/ore of 1.04. Proven and probable mineral reserves at the end of 2016 were 1,194 Mt.
The main closure components include: 1) 700 ha of waste-rock storage facilities (WRSF) of which 400 ha contain potentially acid generating (PAG) waste-rock while 300 ha contain non-acid generating (NAG) waste-rock; 2) a 1700 ha tailings management facility (TMF); 3) the 3 km long, 1 km wide and 525 m deep Aitik open pit; and 4) the smaller Salmijärvi pit which is 1 km long, 0.7 km wide and 270 m deep. After closure, surface and subsurface water will ultimately flow from the site to the Lina River, which forms part of the Kalix & Torne river system.
Methods
Closure planning at the Mine has followed an iterative and systematic approach. Based on performance based closure objectives, the integrated effect of different closure options were evaluated, resulting in the development of a base-case closure scenario that fulfils water qual-ity objectives in the recipient. The evaluation of different cover options and water manage-ment alternatives represented critical aspects of the assessment. Studies in support of these components and were based on site specific information and the development of a 200 year climate scenario, which includes anticipated effects of climate change. The evaluation also included modelling of cover system performance (oxygen ingress/availability and water infil-tration/seepage), hydro-geological modelling, geochemical modelling of resulting drainage
824
Lappeenranta, Finland IMWA 2017Mine Water and Circular Economy
Wolkersdorfer C, Sartz L, Sillanpää M, Häkkinen A (Editors)
composition from the TMF and WRSFs, pit lake modelling, recipient water quality modelling in downgradient river system, and modelling of bioavailable concentrations of constituents. Finally, a Failure Mode and Effect Analysis (FMEA) was developed by the multi-disciplinary project team to address and manage risk related to the base-case closure scenario.
In order to ensure consistency with respect to the climate variables used in the modelling, a common climate data set was developed that accounts for predictions of climate change for the local region (Lorax 2015a and Fraser et al. 2017). A daily climate dataset was created for the 2015-2100 period based on proceedings of IPCC Fifth Assessment Report and selecting Representative Concentration Pathway (RCP) 4.5 (RCP 4.5 assumes radiative forcing is stabi-lized at 4.5 W/m² by 2100). Data from 2025-2100 were looped to create at database to 2225. Corresponding flow rates for the recipients were obtained from the Swedish Meteorological and Hydrological Institute (SMHI) using the hydrological model S-HYPE which was driven by the same regional climate model used to represent future climatic conditions for the site.
O´Kane (2015a and b) modelled cover system performance (oxygen ingress/availability and water infiltration/seepage) for the WRSF and for the TMF using VADOSE/W, a two-dimen-sional (2-D) finite element model that predicts suction and temperature profiles for mate-rials in response to climatic forcing, such as evaporation, and lower boundary conditions. Based on these calculations, net percolation and gas movement are predicted. The modelling applied the common climate data set as well as site-specific material properties or functions derived from material characterisation and field trials. The results from the cover perfor-mance modelling were then used for the geochemical modelling of the WRSF and the TMF.
Geochemical modelling of the WRSF was performed by O´Kane (2015a) with the computer program REACT (Geochemist’s Workbench). Mineral dissolution and precipitation reac-tions were all assumed to occur following kinetic rate laws obtained from the peer-reviewed literature. At Aitik, the integrated WRSF seepage is a function of multiple sources that flow under the WRSF and into the drainage collection ditch. Source terms for the TMF, envi-ronmental waste rock drainage and near-surface natural drainage were estimated from the available dataset of water quality monitoring results. An inverse modelling process was un-dertaken to recreate current water quality and derive WRSF drainage water quality based on waste-rock characterisation results and the conceptual flow model. Forward reaction path modelling was then used to derive long term WRSF drainage water quality after clo-sure based on initial pore water quality, mineralogy, determined oxygen flux and net perco-lation through the final cover system. O´Kane (2015a) estimate the time frame for physical draining of the WRSF to transition from water quality after drain down to long term mod-elled water quality based on soluble acidity loads as represented by soluble melanterite-type available acidity.
Hatch (2015a) performed hydro-geological modelling of the closed TMF and geochemical modelling of resulting drainage composition from the different dams of the TMF. The ge-ochemical modelling calculations relied on the use of the PHREEQC geochemical model-
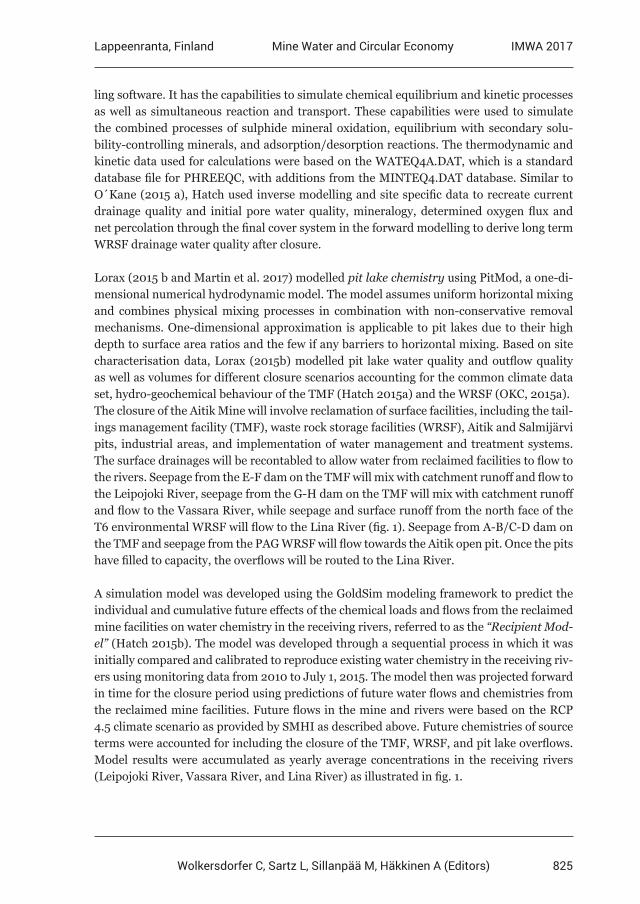
825
Lappeenranta, Finland IMWA 2017Mine Water and Circular Economy
Wolkersdorfer C, Sartz L, Sillanpää M, Häkkinen A (Editors)
ling software. It has the capabilities to simulate chemical equilibrium and kinetic processes as well as simultaneous reaction and transport. These capabilities were used to simulate the combined processes of sulphide mineral oxidation, equilibrium with secondary solu-bility-controlling minerals, and adsorption/desorption reactions. The thermodynamic and kinetic data used for calculations were based on the WATEQ4A.DAT, which is a standard database file for PHREEQC, with additions from the MINTEQ4.DAT database. Similar to O´Kane (2015 a), Hatch used inverse modelling and site specific data to recreate current drainage quality and initial pore water quality, mineralogy, determined oxygen flux and net percolation through the final cover system in the forward modelling to derive long term WRSF drainage water quality after closure.
Lorax (2015 b and Martin et al. 2017) modelled pit lake chemistry using PitMod, a one-di-mensional numerical hydrodynamic model. The model assumes uniform horizontal mixing and combines physical mixing processes in combination with non-conservative removal mechanisms. One-dimensional approximation is applicable to pit lakes due to their high depth to surface area ratios and the few if any barriers to horizontal mixing. Based on site characterisation data, Lorax (2015b) modelled pit lake water quality and outflow quality as well as volumes for different closure scenarios accounting for the common climate data set, hydro-geochemical behaviour of the TMF (Hatch 2015a) and the WRSF (OKC, 2015a).The closure of the Aitik Mine will involve reclamation of surface facilities, including the tail-ings management facility (TMF), waste rock storage facilities (WRSF), Aitik and Salmijärvi pits, industrial areas, and implementation of water management and treatment systems. The surface drainages will be recontabled to allow water from reclaimed facilities to flow to the rivers. Seepage from the E-F dam on the TMF will mix with catchment runoff and flow to the Leipojoki River, seepage from the G-H dam on the TMF will mix with catchment runoff and flow to the Vassara River, while seepage and surface runoff from the north face of the T6 environmental WRSF will flow to the Lina River (fig. 1). Seepage from A-B/C-D dam on the TMF and seepage from the PAG WRSF will flow towards the Aitik open pit. Once the pits have filled to capacity, the overflows will be routed to the Lina River.
A simulation model was developed using the GoldSim modeling framework to predict the individual and cumulative future effects of the chemical loads and flows from the reclaimed mine facilities on water chemistry in the receiving rivers, referred to as the “Recipient Mod-el” (Hatch 2015b). The model was developed through a sequential process in which it was initially compared and calibrated to reproduce existing water chemistry in the receiving riv-ers using monitoring data from 2010 to July 1, 2015. The model then was projected forward in time for the closure period using predictions of future water flows and chemistries from the reclaimed mine facilities. Future flows in the mine and rivers were based on the RCP 4.5 climate scenario as provided by SMHI as described above. Future chemistries of source terms were accounted for including the closure of the TMF, WRSF, and pit lake overflows. Model results were accumulated as yearly average concentrations in the receiving rivers (Leipojoki River, Vassara River, and Lina River) as illustrated in fig. 1.
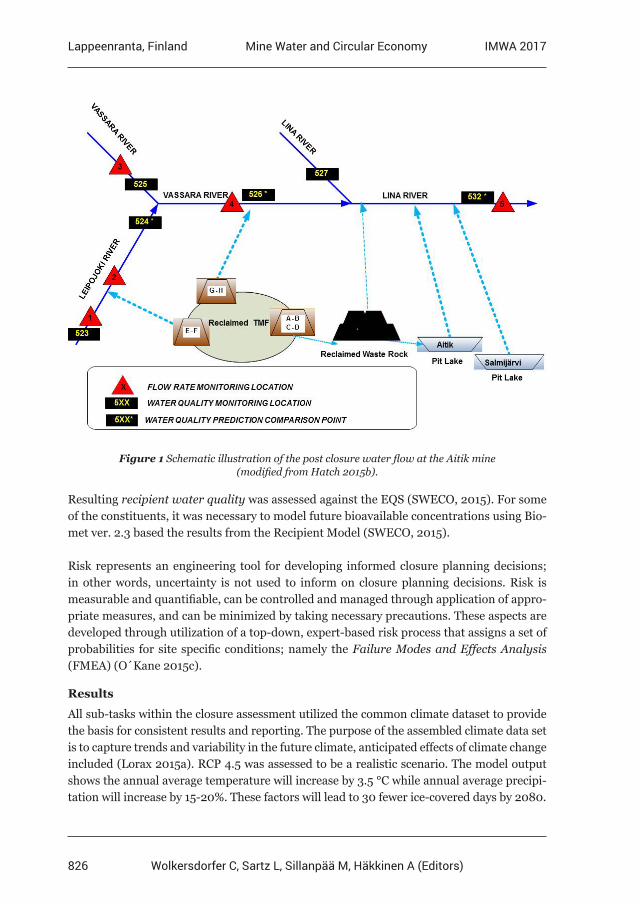
826
Lappeenranta, Finland IMWA 2017Mine Water and Circular Economy
Wolkersdorfer C, Sartz L, Sillanpää M, Häkkinen A (Editors)
Figure 1 Schematic illustration of the post closure water flow at the Aitik mine (modified from Hatch 2015b).
Resulting recipient water quality was assessed against the EQS (SWECO, 2015). For some of the constituents, it was necessary to model future bioavailable concentrations using Bio-met ver. 2.3 based the results from the Recipient Model (SWECO, 2015).
Risk represents an engineering tool for developing informed closure planning decisions; in other words, uncertainty is not used to inform on closure planning decisions. Risk is measurable and quantifiable, can be controlled and managed through application of appro-priate measures, and can be minimized by taking necessary precautions. These aspects are developed through utilization of a top-down, expert-based risk process that assigns a set of probabilities for site specific conditions; namely the Failure Modes and Effects Analysis (FMEA) (O´Kane 2015c).
Results
All sub-tasks within the closure assessment utilized the common climate dataset to provide the basis for consistent results and reporting. The purpose of the assembled climate data set is to capture trends and variability in the future climate, anticipated effects of climate change included (Lorax 2015a). RCP 4.5 was assessed to be a realistic scenario. The model output shows the annual average temperature will increase by 3.5 °C while annual average precipi-tation will increase by 15-20%. These factors will lead to 30 fewer ice-covered days by 2080.
827
Lappeenranta, Finland IMWA 2017Mine Water and Circular Economy
Wolkersdorfer C, Sartz L, Sillanpää M, Häkkinen A (Editors)
Modelling of the cover system performance for the PAF WRSF (O´Kane 2015a) shows that a cover of 0.3 m highly compacted till (ksat = 1 x 10⁻⁸ m/s), 1.5 m moderately compacted till and 0.3 m vegetated top soil results in an average annual oxygen ingress of 33 g/m2/yr for plateau areas and 37 g/m2/yr for sloping areas. Predicted net percolation was approximate-ly 32% and 27% for plateau and sloping areas, respectively. In the compacted till layer, a de-gree of saturation >85% is maintained during the simulation period. For the TMF (O´Kane 2015b), the same cover, but with ksat of the compacted till layer of 2.5 x 10⁻⁸ m/s, average annual oxygen ingress was 28 g/m2/yr if the water table is at 2.5 m or greater and decreased to <20 g/m2/yr if water table is at 1 m depth. Predicted net percolation was approximately 35% of annual precipitation and the compacted till layer maintains >85% degree of satura-tion, which is rule of thumb benchmark to control oxygen ingress.
Inverse geochemical modelling shows the PAF WRSF currently generates a low pH (pH 3.5) high acidity seepage with an acidity load of 2000 tonnes/year containing 80 tonnes/year of copper (O´Kane 2015a). Forward reaction path modelling indicates that after cover place-ment, there is a drain down period of approximately 20 years, where pH and contaminant load remains reasonably steady. This is followed by a transition period due to the flushing out of stored soluble acidity (mainly soluble melanterite-type acidity) of about 25 years, after which stable (long term) water quality conditions develop due to the limited oxygen and water transport through the cover. The long term seepage will be characterised by cir-cum-neutral pH where sulphide oxidation is limited, where remaining soluble and sparingly soluble acidity is neutralised by dissolution of alumina-silicate minerals, mainly anorthite (O´Kane 2015a).
In a similar way as for the WRSF, geochemical modelling of the TMF shows that seepage water quality from the dams is currently a mixture of process water and seepage from un-saturated zones close to the dams which are affected by sulphide oxidation (Hatch 2015a). After cover placement, the seepage water quality will evolve in a similar way as for the WRSF, resulting in circum-neutral long-term dam seepage water quality where acidity from limited sulphide oxidation is neutralised by dissolution of alumina-silicate minerals (mainly anorthite).
The Aitik pit lake model includes 34 inflow terms (Lorax, 2015b). During pit filling, the dom-inant flows are from the Clarification Pond (CP), runoff from WRSFs and natural ground, precipitation and pit wall runoff. Pit lake overflow occurs in Year 55 post closure, with an overall mean annual flow of 270 L/s. During the filling period, a gradual freshening over time in the surface layer results in the development of permanent stratification in the water column (meromixis). Acidic pH values (pH<5) are realized in the early stages of pit filling due to the input of low-pH seepage waters associated with WRSFs and TMF. Prior to pit lake overflow the results demonstrate the presence of circum-neutral pH conditions in lake surface waters. The modelling shows the improvement of the pit overflow can be accelerated by treating the WRSF seepage during pit filling (Martin et al. 2017). The Aitik pit overflow will discharge to the Lina River. Filling time for the Salmijärvi pit is 100 years and the evo-
828
Lappeenranta, Finland IMWA 2017Mine Water and Circular Economy
Wolkersdorfer C, Sartz L, Sillanpää M, Häkkinen A (Editors)
lution of the pit water quality follows a similar pattern to the Aitik pit; however, Salmijärvi does not receive any seepage from the WRSF or the TMF. The Salmijärvi pit overflow will discharge to the Myllyjoki Creek which flows into Lina River.
Recipient water quality modelling of downgradient river systems (Hatch 2015b) and model-ling of bioavailable concentrations of constituents followed by assessment against the overall objectives (Sweco 2015) shows that the highest impact will occur in the Lina River down-stream all Aitik discharges (monitoring point 532 in fig. 1). Further, the assessment high-lights that copper will be the critical parameter in order to comply with EQS (tab. 1), fig. 2.
0,00
0,05
0,10
0,15
0,20
0,25
0,30
0,35
0,40
0,45
0,50
2025 2035 2045 2055 2065 2075 2085 2095 2105 2115 2125 2135 2145 2155 2165 2175 2185 2195
Cu (µ
g/l b
ioav
aila
ble
frac
tion)
Year
Figure 2 Long term prediction of bioavailable copper concentration in the Lina River downstream the Aitik mine for the base-case closure scenario (modified from Sweco 2015).
A site wide base-case closure scenario was developed using this iterative systematic ap-proach. Results show that the EQS can be met in the recipient by applying a composite moraine cover system on the PAG WRSFs, as well as on the TMF embankments and unsatu-rated tailings zones of the TMF; remaining surface areas of the TMF will remain saturated. Non-PAG WRSFs will be covered with a simple moraine cover system and the pits will be flooded. Drainage from the WRSFs and the TWF will be diverted to the Aitik pit and treat-ed for approximately 55 years until the drainage water quality reaches steady state. The Aitik pit is predicted to fill in approximately 55 years, at which time the site-wide integrat-ed modelling illustrates the discharge will be suitable for direct discharge to the recipient. The FMEA identified technical, regulatory, societal, and economic risks to the the base-case closure scenario (O´Kane 2015c). Identification of these risks allowed for development of further studies, public consultation, and/or mitigation measures for each identified risk. Risks were prioritized based on whether being critical to the project meeting its objectives, to those having a limited effect on project success. All identified risks were assessed to be manageable within the closure scenario.
829
Lappeenranta, Finland IMWA 2017Mine Water and Circular Economy
Wolkersdorfer C, Sartz L, Sillanpää M, Häkkinen A (Editors)
Conclusions
A full set of regulatory environmental quality standards (EQS) for water bodies are available to use as overall performance-based closure objectives in Sweden. These EQS provide the opportunity to evaluate the overall requirements for the integrated closure of the Aitik mine.
An iterative and systematic approach was used to develop a base-case closure scenario that fulfils water quality objectives in the recipient. The assessment was based on site-specific in-formation and the development of a 200 year climate scenario, which includes anticipated effects of climate change, modelling of cover system performance, geochemical modelling of resulting drainage composition, hydro-geological modelling, pit lake modelling, and recip-ient water quality modelling and modelling of bioavailable concentrations of constituents.
Overall, the described approach provides an important case study in the area of developing methodologies used for optimising mine closure strategies at large base metal mines.
Acknowledgements
The authors wish to acknowledge Boliden Mineral AB for supporting the publication of this paper.
References
Martin A, Fraser C, Dunbar D, Mueller S and Eriksson N (2017). Pit Lake Modelling at the Aitik Mine (Northern Sweden): Importance of Site-Specific Model Inputs and Implications for Closure Planning. 13th Annual Mine Water Association Congress, Rauha-Lappeenranta, Finland, June 25-30, 2017.Hatch (2016a). Tailings Water Chemistry After Mine Closure. Report, September 23, 2016.Hatch (2016b). Recipient Model Description and Results. Report, September 23, 2016.HVMFS (2013:19). Swedish Environmental Quality Standards for surface water. Up-dated 2015-05-01.Fraser C, Martin A, Mueller S and Scott J (2017). Incorporating Climate Change Scenarios into Mine Design and Permitting Studies. 13th Annual Mine Water Association Congress, Rauha- Lappeenranta, Finland, June 25-30, 2017.Lorax (2015a). Synthetic Climate Record in Support of Waste Rock Storage Facility, Tailings Management Facility, Pit Lake and Recipient Water Quality Technical Assessments. August, 2015.Lorax (2015b). Predictive Modeling of Long-Term Pit Lake Water Quality and Discharge for the Aitik and Salmijärvi Pits, Aitik Mine, Sweden. Report, September, 2015.O’Kane (2015a). Aitik Mine Closure Project, Waste Rock Storage Facility Cover System Design and Prediction of Geochemistry and Discharge Water Quality. Report, September, 2015.O’Kane (2015b). Tailings Management Facility Soil-Plant-Atmosphere Numerical Modelling Program. Report, August, 2015.O´Kane (2015c). Boliden Aitik Project –Failure Modes and Effects Analysis (FMEA) Workshop for Evaluating Closure Conditions at the Boliden Aitik Site. Report, September 2015.SWECO (2015). Aitik discharge to the recipient after closure (in Swedish). November 2015.
830
Lappeenranta, Finland IMWA 2017Mine Water and Circular Economy
Wolkersdorfer C, Sartz L, Sillanpää M, Häkkinen A (Editors)
Kinetic Tests of Non-Amended and Cemented Paste Tailings Geochemistry in Subaqueous and Subaerial
Settings
Katharine S. Seipel, Damon L. Sheumaker, Lisa B. Kirk
Enviromin, Inc., 524 Professional Drive, Bozeman Montana 59715 United States, www.enviromininc.com
Abstract Addition of cement to paste tailings is increasingly used for tailings management. Enviromin investigated the geochemistry of various tailings management scenarios, using untreated and cemented paste tailings in standard and modified procedures. Kinetic geochemical tests included subaerial weathering of cemented paste tailings cylinders in modified humidity cell tests (HCTs, with 4% or 2% binders) and a saturated diffusion test (4% binders). Untreated tailings were weathered in conventional and saturated (modified) HCTs. Chemistries from these tests were used to predict operational and post-closure water quality, and clearly illustrate the benefit of reducing oxygen exposure and reactive surface area with cemented paste.
Key words paste tailings management, ASTM C1308, humidity cell test, Black Butte Copper Project
Introduction
Designing an economically and environmentally feasible tailings management facility is important to the permitting and financial success of mining operations. These facilities traditionally include tailings ponds, dry-stacked tailings, or subsurface placement of paste tailings as backfill. The addition of cement to paste tailings significantly reduces the reactive surface area of sulfidic minerals, thereby decreasing oxidation related impacts. While place-ment of paste tailings underground as backfill is common, application of this technology to create a non-flowable deposit with reduced reactivity in surface facilities is of increasing interest. Predicting the potential environmental impacts of these facilities remains a chal-lenge due to continuing evolution of this technology and relevant testing methods. Although numerous publications address the use of cemented paste tailings as backfill (e.g., Aldea and Cornelius 2010; Yilmaz et al. 2003), less has been published about the application of geochemical characterization methods in predictions of water quality (MEND 2006; Moran 2013), particularly in surface facilities. Here we describe how multiple methods of geochem-ical characterization (ASTM D5744-13, both unsaturated and saturated, and ASTM C1308) have been applied to assessment of these materials for management of sulfidic tailings.
Tintina Montana, Inc. proposes to mine and mill copper from two massive sulfide zones in underground workings at its Black Butte Copper Project (Project) in central Montana, USA. Approximately 45% of tailings will be placed as 4% cemented paste backfill for ground control in mined out stopes. Tintina has proposed a novel solution to management of the re-maining 55% of its tailings, involving placement of 0.5 to 2% cemented paste with non-flow-able characteristics in lifts within a double lined Cement Tailing Facility (CTF). This paste will weather subaerially when exposed to direct precipitation and runoff. All affected water will pass through a waste rock drain and receive reverse osmosis water treatment; no wa-
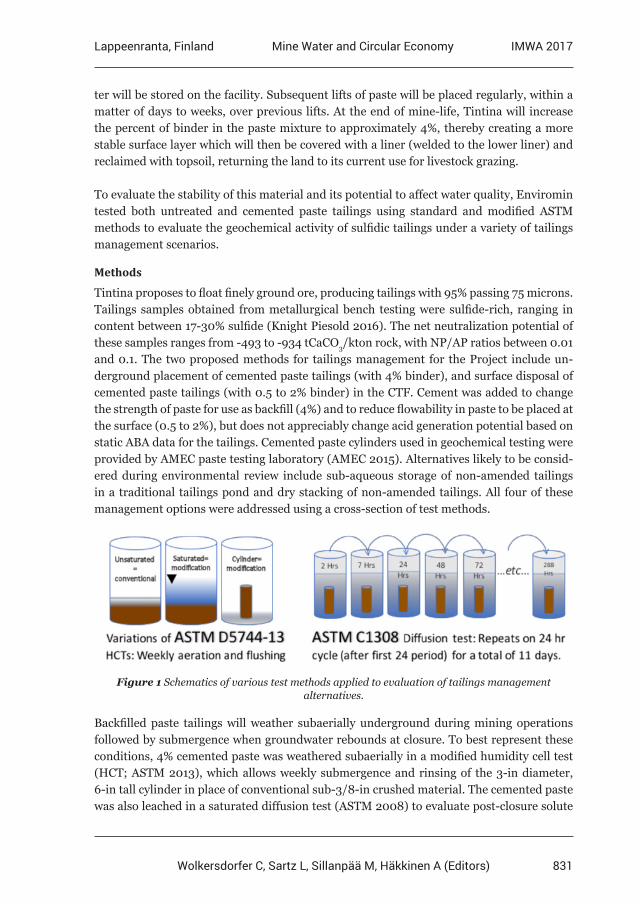
831
Lappeenranta, Finland IMWA 2017Mine Water and Circular Economy
Wolkersdorfer C, Sartz L, Sillanpää M, Häkkinen A (Editors)
ter will be stored on the facility. Subsequent lifts of paste will be placed regularly, within a matter of days to weeks, over previous lifts. At the end of mine-life, Tintina will increase the percent of binder in the paste mixture to approximately 4%, thereby creating a more stable surface layer which will then be covered with a liner (welded to the lower liner) and reclaimed with topsoil, returning the land to its current use for livestock grazing.
To evaluate the stability of this material and its potential to affect water quality, Enviromin tested both untreated and cemented paste tailings using standard and modified ASTM methods to evaluate the geochemical activity of sulfidic tailings under a variety of tailings management scenarios.
Methods
Tintina proposes to float finely ground ore, producing tailings with 95% passing 75 microns. Tailings samples obtained from metallurgical bench testing were sulfide-rich, ranging in content between 17-30% sulfide (Knight Piesold 2016). The net neutralization potential of these samples ranges from -493 to -934 tCaCO3/kton rock, with NP/AP ratios between 0.01 and 0.1. The two proposed methods for tailings management for the Project include un-derground placement of cemented paste tailings (with 4% binder), and surface disposal of cemented paste tailings (with 0.5 to 2% binder) in the CTF. Cement was added to change the strength of paste for use as backfill (4%) and to reduce flowability in paste to be placed at the surface (0.5 to 2%), but does not appreciably change acid generation potential based on static ABA data for the tailings. Cemented paste cylinders used in geochemical testing were provided by AMEC paste testing laboratory (AMEC 2015). Alternatives likely to be consid-ered during environmental review include sub-aqueous storage of non-amended tailings in a traditional tailings pond and dry stacking of non-amended tailings. All four of these management options were addressed using a cross-section of test methods.
Figure 1 Schematics of various test methods applied to evaluation of tailings management alternatives.
Backfilled paste tailings will weather subaerially underground during mining operations followed by submergence when groundwater rebounds at closure. To best represent these conditions, 4% cemented paste was weathered subaerially in a modified humidity cell test (HCT; ASTM 2013), which allows weekly submergence and rinsing of the 3-in diameter, 6-in tall cylinder in place of conventional sub-3/8-in crushed material. The cemented paste was also leached in a saturated diffusion test (ASTM 2008) to evaluate post-closure solute
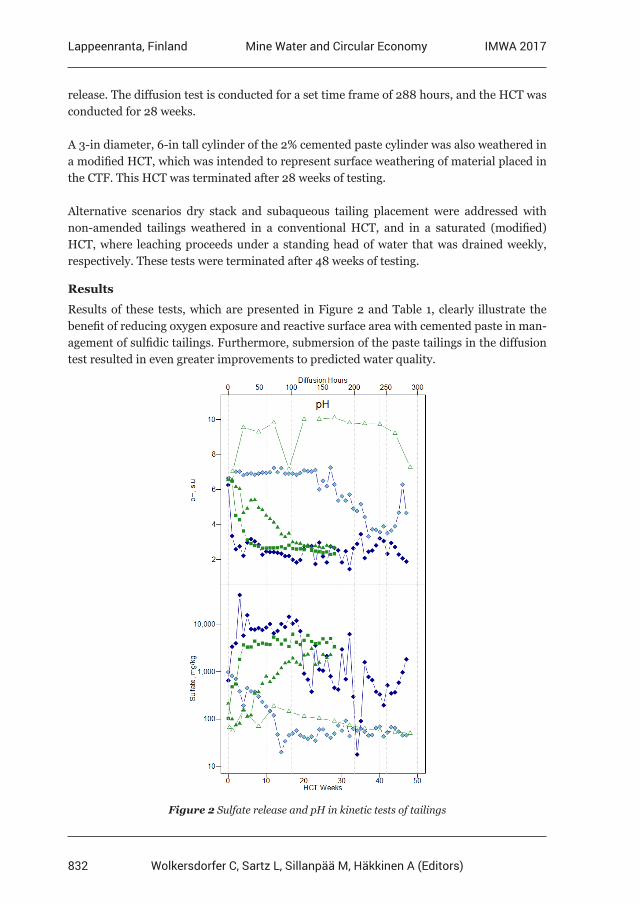
832
Lappeenranta, Finland IMWA 2017Mine Water and Circular Economy
Wolkersdorfer C, Sartz L, Sillanpää M, Häkkinen A (Editors)
release. The diffusion test is conducted for a set time frame of 288 hours, and the HCT was conducted for 28 weeks.
A 3-in diameter, 6-in tall cylinder of the 2% cemented paste cylinder was also weathered in a modified HCT, which was intended to represent surface weathering of material placed in the CTF. This HCT was terminated after 28 weeks of testing.
Alternative scenarios dry stack and subaqueous tailing placement were addressed with non-amended tailings weathered in a conventional HCT, and in a saturated (modified) HCT, where leaching proceeds under a standing head of water that was drained weekly, respectively. These tests were terminated after 48 weeks of testing.
Results
Results of these tests, which are presented in Figure 2 and Table 1, clearly illustrate the benefit of reducing oxygen exposure and reactive surface area with cemented paste in man-agement of sulfidic tailings. Furthermore, submersion of the paste tailings in the diffusion test resulted in even greater improvements to predicted water quality.
Figure 2 Sulfate release and pH in kinetic tests of tailings
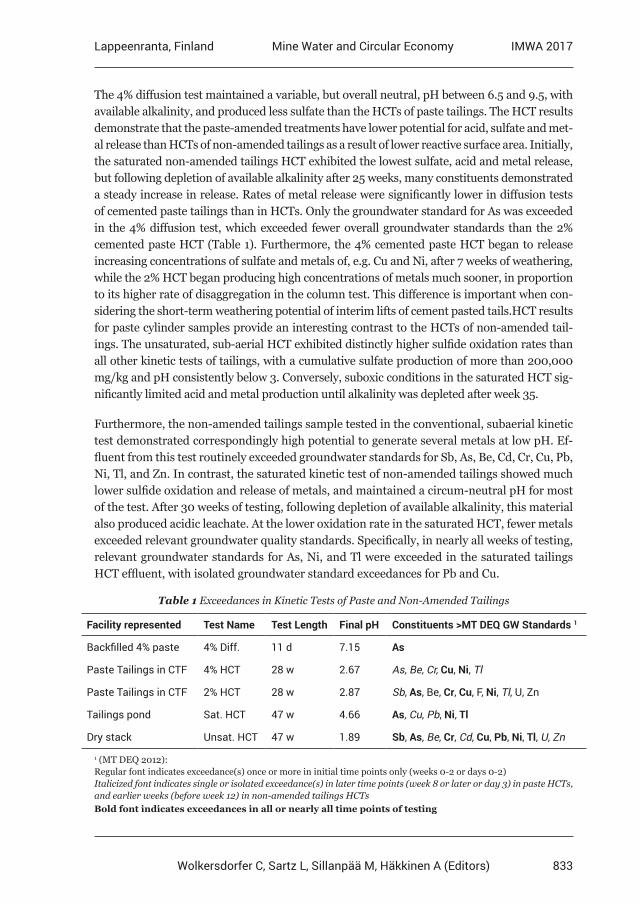
833
Lappeenranta, Finland IMWA 2017Mine Water and Circular Economy
Wolkersdorfer C, Sartz L, Sillanpää M, Häkkinen A (Editors)
The 4% diffusion test maintained a variable, but overall neutral, pH between 6.5 and 9.5, with available alkalinity, and produced less sulfate than the HCTs of paste tailings. The HCT results demonstrate that the paste-amended treatments have lower potential for acid, sulfate and met-al release than HCTs of non-amended tailings as a result of lower reactive surface area. Initially, the saturated non-amended tailings HCT exhibited the lowest sulfate, acid and metal release, but following depletion of available alkalinity after 25 weeks, many constituents demonstrated a steady increase in release. Rates of metal release were significantly lower in diffusion tests of cemented paste tailings than in HCTs. Only the groundwater standard for As was exceeded in the 4% diffusion test, which exceeded fewer overall groundwater standards than the 2% cemented paste HCT (Table 1). Furthermore, the 4% cemented paste HCT began to release increasing concentrations of sulfate and metals of, e.g. Cu and Ni, after 7 weeks of weathering, while the 2% HCT began producing high concentrations of metals much sooner, in proportion to its higher rate of disaggregation in the column test. This difference is important when con-sidering the short-term weathering potential of interim lifts of cement pasted tails.HCT results for paste cylinder samples provide an interesting contrast to the HCTs of non-amended tail-ings. The unsaturated, sub-aerial HCT exhibited distinctly higher sulfide oxidation rates than all other kinetic tests of tailings, with a cumulative sulfate production of more than 200,000 mg/kg and pH consistently below 3. Conversely, suboxic conditions in the saturated HCT sig-nificantly limited acid and metal production until alkalinity was depleted after week 35.
Furthermore, the non-amended tailings sample tested in the conventional, subaerial kinetic test demonstrated correspondingly high potential to generate several metals at low pH. Ef-fluent from this test routinely exceeded groundwater standards for Sb, As, Be, Cd, Cr, Cu, Pb, Ni, Tl, and Zn. In contrast, the saturated kinetic test of non-amended tailings showed much lower sulfide oxidation and release of metals, and maintained a circum-neutral pH for most of the test. After 30 weeks of testing, following depletion of available alkalinity, this material also produced acidic leachate. At the lower oxidation rate in the saturated HCT, fewer metals exceeded relevant groundwater quality standards. Specifically, in nearly all weeks of testing, relevant groundwater standards for As, Ni, and Tl were exceeded in the saturated tailings HCT effluent, with isolated groundwater standard exceedances for Pb and Cu.
Table 1 Exceedances in Kinetic Tests of Paste and Non-Amended Tailings
Facility represented Test Name Test Length Final pH Constituents >MT DEQ GW Standards 1
Backfilled 4% paste 4% Diff. 11 d 7.15 As
Paste Tailings in CTF 4% HCT 28 w 2.67 As, Be, Cr, Cu, Ni, Tl
Paste Tailings in CTF 2% HCT 28 w 2.87 Sb, As, Be, Cr, Cu, F, Ni, Tl, U, Zn
Tailings pond Sat. HCT 47 w 4.66 As, Cu, Pb, Ni, Tl
Dry stack Unsat. HCT 47 w 1.89 Sb, As, Be, Cr, Cd, Cu, Pb, Ni, Tl, U, Zn
1 (MT DEQ 2012):Regular font indicates exceedance(s) once or more in initial time points only (weeks 0-2 or days 0-2)Italicized font indicates single or isolated exceedance(s) in later time points (week 8 or later or day 3) in paste HCTs, and earlier weeks (before week 12) in non-amended tailings HCTsBold font indicates exceedances in all or nearly all time points of testing
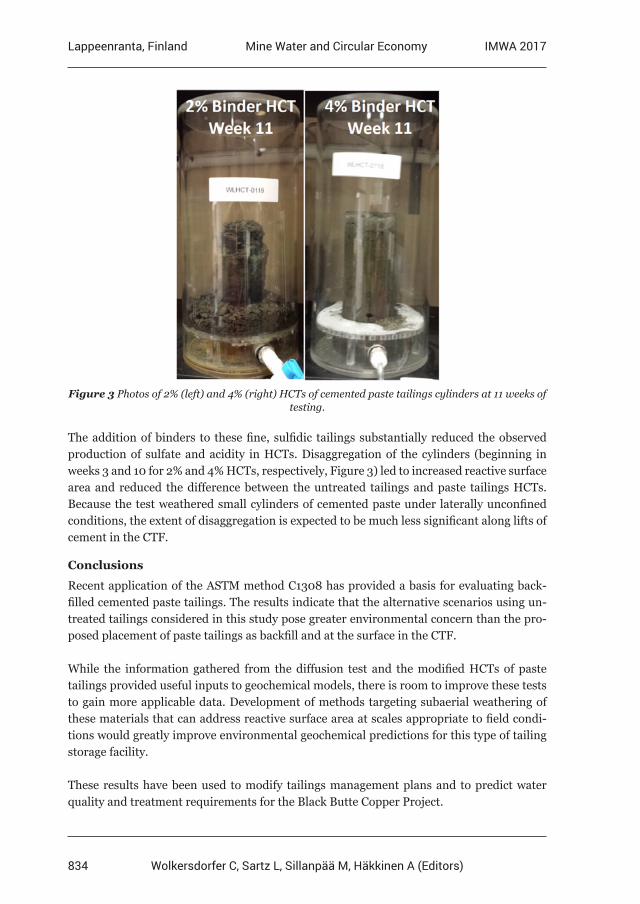
834
Lappeenranta, Finland IMWA 2017Mine Water and Circular Economy
Wolkersdorfer C, Sartz L, Sillanpää M, Häkkinen A (Editors)
The addition of binders to these fine, sulfidic tailings substantially reduced the observed production of sulfate and acidity in HCTs. Disaggregation of the cylinders (beginning in weeks 3 and 10 for 2% and 4% HCTs, respectively, Figure 3) led to increased reactive surface area and reduced the difference between the untreated tailings and paste tailings HCTs. Because the test weathered small cylinders of cemented paste under laterally unconfined conditions, the extent of disaggregation is expected to be much less significant along lifts of cement in the CTF.
Conclusions
Recent application of the ASTM method C1308 has provided a basis for evaluating back-filled cemented paste tailings. The results indicate that the alternative scenarios using un-treated tailings considered in this study pose greater environmental concern than the pro-posed placement of paste tailings as backfill and at the surface in the CTF.
While the information gathered from the diffusion test and the modified HCTs of paste tailings provided useful inputs to geochemical models, there is room to improve these tests to gain more applicable data. Development of methods targeting subaerial weathering of these materials that can address reactive surface area at scales appropriate to field condi-tions would greatly improve environmental geochemical predictions for this type of tailing storage facility.
These results have been used to modify tailings management plans and to predict water quality and treatment requirements for the Black Butte Copper Project.
Figure 3 Photos of 2% (left) and 4% (right) HCTs of cemented paste tailings cylinders at 11 weeks of testing.
835
Lappeenranta, Finland IMWA 2017Mine Water and Circular Economy
Wolkersdorfer C, Sartz L, Sillanpää M, Häkkinen A (Editors)
Acknowledgements
The authors appreciate Tintina’s permission to report these data and their continued commitment to creating a world class facility. We also thank AMEC and Knight Piesold for their support of this testing program. We also appreciate the contributions of McClelland Laboratories and Western Environmental Testing Laboratory (Sparks, Nevada, USA) in conducting these tests and providing guidance.
References
ASTM, 2008. C1308-08 Standard Test Method for Diffusive Releases from solidified Waste and a Computer Program to Model Diffusive, Fractional Leaching from Cylindrical Waste Forms. ASTM International, West Conshohocken, PA.ASTM, 2013. D5744-13 Standard Test Method for Laboratory Weathering of Solid Materials Using a Humidity Cell. ASTM International, West Conshohocken, PA.AMEC, 2015. Miscellaneous Laboratory Tests on binders, and Black Butte Copper Project cemented tailings paste. Hamilton, Ontario, Canada Lab. Knight Piesold, 2016. Waste and Water Management Design for MOP Application. Report prepared for Tintina Resources Inc. VA101-460/3-2 (Rev 5). July 20, 2016. Original report dated October 15, 2015. 162 p. MEND, 2006. Paste Backfill Geochemistry – Environmental Effects of Leaching and Weathering. Mine Environment Neutral Drainage (MEND) Program. Report Prepared By: Mehling Environmental Management Inc., Vancouver, BC. April. MT DEQ, 2012. Montana Circular Water Quality Standards (DEQ-7). October.Moran, P., L. Christoffersen, J. Gillow, M. Hay. 2013. Cemented Tailings Backfill – It’s Better, Now Prove It! SME Annual Meeting, Denver, CO. February 24 – 27.
836
Lappeenranta, Finland IMWA 2017Mine Water and Circular Economy
Wolkersdorfer C, Sartz L, Sillanpää M, Häkkinen A (Editors)
Behaviour of trace elements during evaporative salt precipitation from acid mine drainage
(Agrio River, SW Spain)
María Dolores Basallote, Manuel Olías, Rafael Pérez-López, Francisco Macías, Sergio Carrero, José Miguel Nieto
Department of Earth Sciences, University of Huelva, Campus El Carmen s/n, 21071 Huelva, Spain, [email protected]
Abstract Polluted by acid mine drainage (AMD), the Agrio River is the major input of pollutants to the Odiel River. To study the behaviour of dissolved elements, water collected directly from the Agrio stream was subjected to infrared light to total evaporation. The physicochemical parameters, monitored daily, showed electrical conductivity increased from 15.5 to 33.1 mS/cm and pH decreased from 2.3 to 1.3. The analysed elements (major and trace elements) showed different behaviour throughout the evaporation process, concluding that evaporative salts behave as temporary sink for many elements in rivers polluted by acid mine discharges, during the dry season.
Key words Iberian Pyrite Belt, acid river, evaporation, rare earth elements, toxic element
Introduction
The Iberian Pyrite Belt (IPB) is one of the largest polymetallic massive sulphide deposits in the world, which has been subjected to intense mining activity since prehistoric times (Nocete et al. 2005) but especially since the second half of the nineteen century (Olías and Nieto 2015). Because the Tinto and Odiel river basins (SW Spain) are located over the IPB materials, their waters have undergone a deep pollution by acid mine leachates from the oxidation of sulphide-rich mining wastes. Hence, these rivers present extreme acidic con-ditions as well as high concentration of toxic elements (i.e. metals and metalloids) (Sáinz et al. 2002; Sarmiento et al. 2009). The acid mine drainage (AMD) in this area is a huge environmental problem not only due to the contamination of the rivers but also to the toxic metal-polluted waters that are transported continuously to the Ría of Huelva estuary and the Gulf of Cádiz (Nieto et al. 2013).
Presenting a natural stream water quality at its upper part, the Odiel River collects acidic contributions from several sulphide mining areas distributed along its watershed. Never-theless, the main input of acid mine waters that causes its total deterioration is the Agrio River, which drain part of the Riotinto mines (Sarmiento et al. 2009). The Agrio waters present extreme contamination, with high concentrations of pollutants in solution and low pH values. Furthermore, the Mediterranean climate with almost non-existent rainfall dur-ing the dry season (from June to August) induces intense evaporation resulting in the su-persaturation and the subsequent precipitation of sulphate salts (Buckby et al. 2003). These soluble minerals act as sinks for acidity and toxics metals (Fe, Al, Cd, Co, Cu, Zn, etc.), but only temporary until the arrival of the first rainfalls, in the rainy season, when they are again released by dissolution (Hammarstrom et al. 2005; Nordstrom and Alpers 1999). For this reason, the aim of this work is focused on studying the behavior of trace elements from a
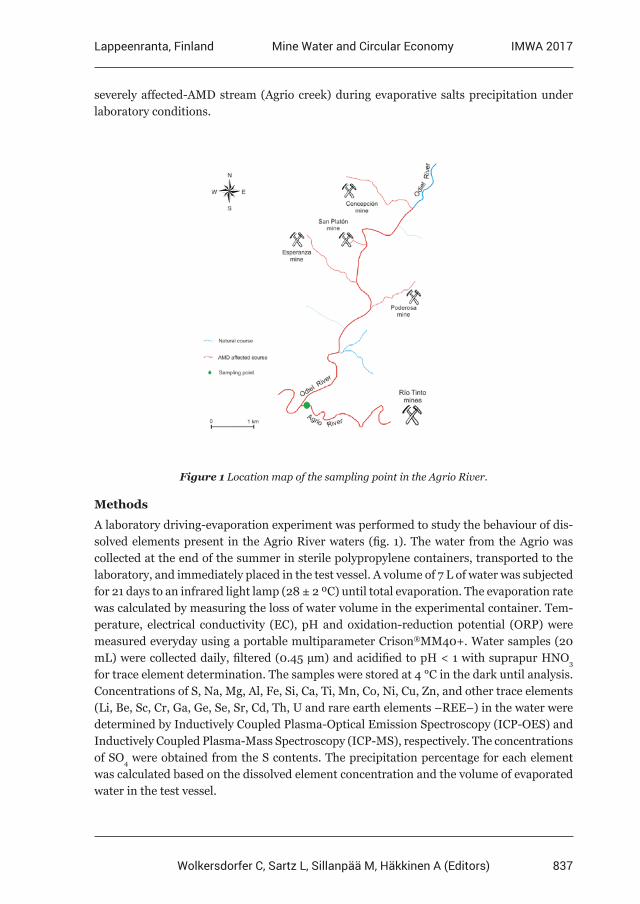
837
Lappeenranta, Finland IMWA 2017Mine Water and Circular Economy
Wolkersdorfer C, Sartz L, Sillanpää M, Häkkinen A (Editors)
severely affected-AMD stream (Agrio creek) during evaporative salts precipitation under laboratory conditions.
Figure 1 Location map of the sampling point in the Agrio River.
Methods
A laboratory driving-evaporation experiment was performed to study the behaviour of dis-solved elements present in the Agrio River waters (fig. 1). The water from the Agrio was collected at the end of the summer in sterile polypropylene containers, transported to the laboratory, and immediately placed in the test vessel. A volume of 7 L of water was subjected for 21 days to an infrared light lamp (28 ± 2 ºC) until total evaporation. The evaporation rate was calculated by measuring the loss of water volume in the experimental container. Tem-perature, electrical conductivity (EC), pH and oxidation-reduction potential (ORP) were measured everyday using a portable multiparameter Crison®MM40+. Water samples (20 mL) were collected daily, filtered (0.45 µm) and acidified to pH < 1 with suprapur HNO3 for trace element determination. The samples were stored at 4 °C in the dark until analysis. Concentrations of S, Na, Mg, Al, Fe, Si, Ca, Ti, Mn, Co, Ni, Cu, Zn, and other trace elements (Li, Be, Sc, Cr, Ga, Ge, Se, Sr, Cd, Th, U and rare earth elements –REE–) in the water were determined by Inductively Coupled Plasma-Optical Emission Spectroscopy (ICP-OES) and Inductively Coupled Plasma-Mass Spectroscopy (ICP-MS), respectively. The concentrations of SO4 were obtained from the S contents. The precipitation percentage for each element was calculated based on the dissolved element concentration and the volume of evaporated water in the test vessel.
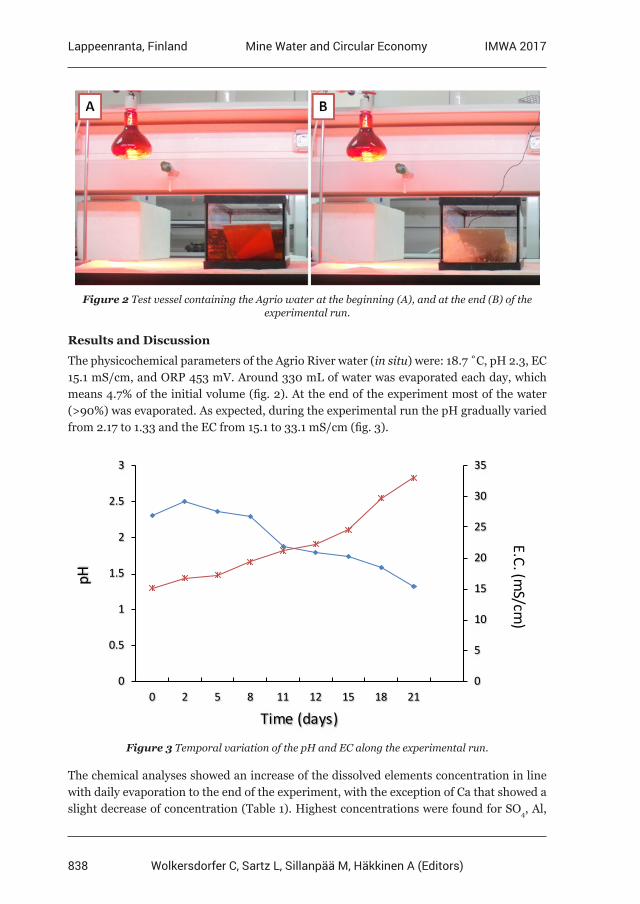
838
Lappeenranta, Finland IMWA 2017Mine Water and Circular Economy
Wolkersdorfer C, Sartz L, Sillanpää M, Häkkinen A (Editors)
Figure 2 Test vessel containing the Agrio water at the beginning (A), and at the end (B) of the experimental run.
Results and Discussion
The physicochemical parameters of the Agrio River water (in situ) were: 18.7 ˚C, pH 2.3, EC 15.1 mS/cm, and ORP 453 mV. Around 330 mL of water was evaporated each day, which means 4.7% of the initial volume (fig. 2). At the end of the experiment most of the water (>90%) was evaporated. As expected, during the experimental run the pH gradually varied from 2.17 to 1.33 and the EC from 15.1 to 33.1 mS/cm (fig. 3).
0
5
10
15
20
25
30
35
0
0.5
1
1.5
2
2.5
3
0 2 5 8 11 12 15 18 21
pH
Time (days)
E.C. (mS/cm
)
Figure 3 Temporal variation of the pH and EC along the experimental run.
The chemical analyses showed an increase of the dissolved elements concentration in line with daily evaporation to the end of the experiment, with the exception of Ca that showed a slight decrease of concentration (Table 1). Highest concentrations were found for SO4, Al,
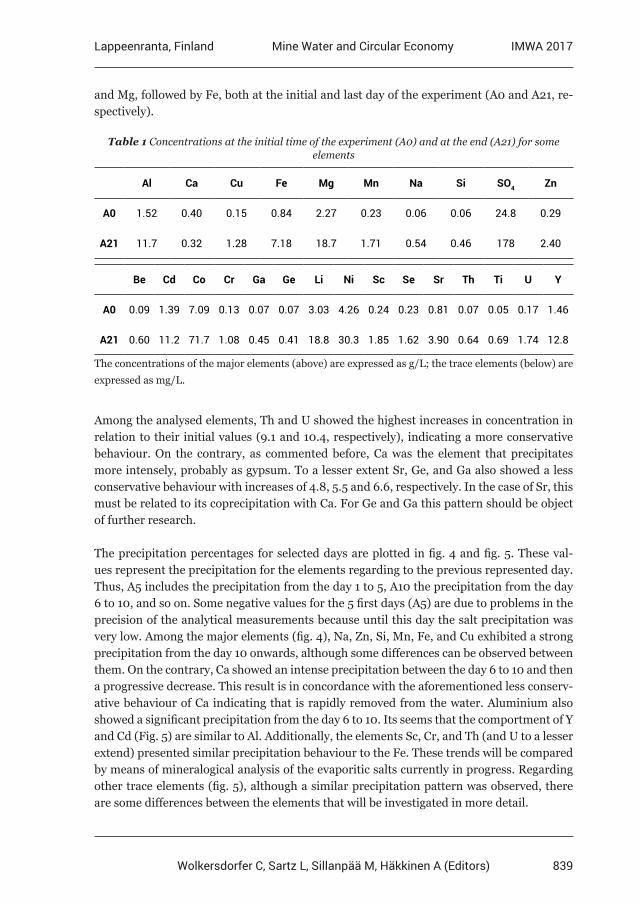
839
Lappeenranta, Finland IMWA 2017Mine Water and Circular Economy
Wolkersdorfer C, Sartz L, Sillanpää M, Häkkinen A (Editors)
and Mg, followed by Fe, both at the initial and last day of the experiment (A0 and A21, re-spectively).
Table 1 Concentrations at the initial time of the experiment (A0) and at the end (A21) for some elements
Al Ca Cu Fe Mg Mn Na Si SO4 Zn
A0 1.52 0.40 0.15 0.84 2.27 0.23 0.06 0.06 24.8 0.29
A21 11.7 0.32 1.28 7.18 18.7 1.71 0.54 0.46 178 2.40
Be Cd Co Cr Ga Ge Li Ni Sc Se Sr Th Ti U Y
A0 0.09 1.39 7.09 0.13 0.07 0.07 3.03 4.26 0.24 0.23 0.81 0.07 0.05 0.17 1.46
A21 0.60 11.2 71.7 1.08 0.45 0.41 18.8 30.3 1.85 1.62 3.90 0.64 0.69 1.74 12.8
The concentrations of the major elements (above) are expressed as g/L; the trace elements (below) are expressed as mg/L.
Among the analysed elements, Th and U showed the highest increases in concentration in relation to their initial values (9.1 and 10.4, respectively), indicating a more conservative behaviour. On the contrary, as commented before, Ca was the element that precipitates more intensely, probably as gypsum. To a lesser extent Sr, Ge, and Ga also showed a less conservative behaviour with increases of 4.8, 5.5 and 6.6, respectively. In the case of Sr, this must be related to its coprecipitation with Ca. For Ge and Ga this pattern should be object of further research.
The precipitation percentages for selected days are plotted in fig. 4 and fig. 5. These val-ues represent the precipitation for the elements regarding to the previous represented day. Thus, A5 includes the precipitation from the day 1 to 5, A10 the precipitation from the day 6 to 10, and so on. Some negative values for the 5 first days (A5) are due to problems in the precision of the analytical measurements because until this day the salt precipitation was very low. Among the major elements (fig. 4), Na, Zn, Si, Mn, Fe, and Cu exhibited a strong precipitation from the day 10 onwards, although some differences can be observed between them. On the contrary, Ca showed an intense precipitation between the day 6 to 10 and then a progressive decrease. This result is in concordance with the aforementioned less conserv-ative behaviour of Ca indicating that is rapidly removed from the water. Aluminium also showed a significant precipitation from the day 6 to 10. Its seems that the comportment of Y and Cd (Fig. 5) are similar to Al. Additionally, the elements Sc, Cr, and Th (and U to a lesser extend) presented similar precipitation behaviour to the Fe. These trends will be compared by means of mineralogical analysis of the evaporitic salts currently in progress. Regarding other trace elements (fig. 5), although a similar precipitation pattern was observed, there are some differences between the elements that will be investigated in more detail.
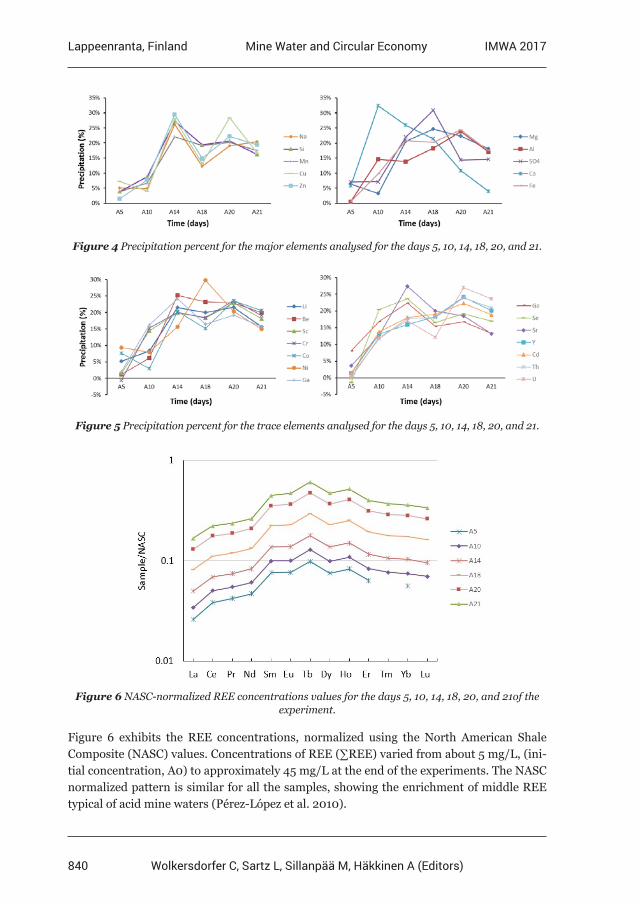
840
Lappeenranta, Finland IMWA 2017Mine Water and Circular Economy
Wolkersdorfer C, Sartz L, Sillanpää M, Häkkinen A (Editors)
Figure 4 Precipitation percent for the major elements analysed for the days 5, 10, 14, 18, 20, and 21.
Figure 5 Precipitation percent for the trace elements analysed for the days 5, 10, 14, 18, 20, and 21.
Figure 6 NASC-normalized REE concentrations values for the days 5, 10, 14, 18, 20, and 21of the experiment.
Figure 6 exhibits the REE concentrations, normalized using the North American Shale Composite (NASC) values. Concentrations of REE (∑REE) varied from about 5 mg/L, (ini-tial concentration, A0) to approximately 45 mg/L at the end of the experiments. The NASC normalized pattern is similar for all the samples, showing the enrichment of middle REE typical of acid mine waters (Pérez-López et al. 2010).
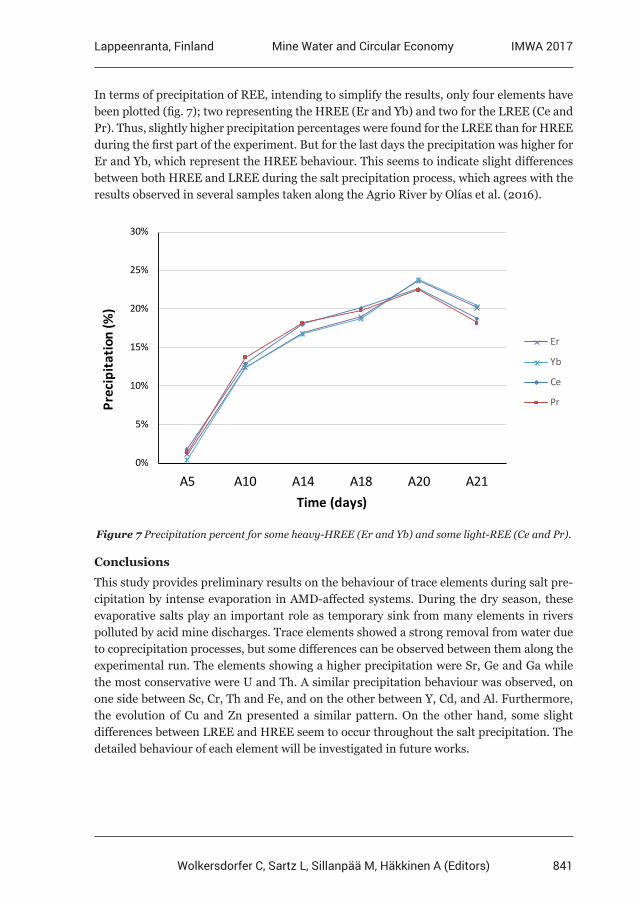
841
Lappeenranta, Finland IMWA 2017Mine Water and Circular Economy
Wolkersdorfer C, Sartz L, Sillanpää M, Häkkinen A (Editors)
In terms of precipitation of REE, intending to simplify the results, only four elements have been plotted (fig. 7); two representing the HREE (Er and Yb) and two for the LREE (Ce and Pr). Thus, slightly higher precipitation percentages were found for the LREE than for HREE during the first part of the experiment. But for the last days the precipitation was higher for Er and Yb, which represent the HREE behaviour. This seems to indicate slight differences between both HREE and LREE during the salt precipitation process, which agrees with the results observed in several samples taken along the Agrio River by Olías et al. (2016).
0%
5%
10%
15%
20%
25%
30%
A5 A10 A14 A18 A20 A21
Prec
ipita
tion
(%)
Time (days)
Er
Yb
Ce
Pr
Figure 7 Precipitation percent for some heavy-HREE (Er and Yb) and some light-REE (Ce and Pr).
Conclusions
This study provides preliminary results on the behaviour of trace elements during salt pre-cipitation by intense evaporation in AMD-affected systems. During the dry season, these evaporative salts play an important role as temporary sink from many elements in rivers polluted by acid mine discharges. Trace elements showed a strong removal from water due to coprecipitation processes, but some differences can be observed between them along the experimental run. The elements showing a higher precipitation were Sr, Ge and Ga while the most conservative were U and Th. A similar precipitation behaviour was observed, on one side between Sc, Cr, Th and Fe, and on the other between Y, Cd, and Al. Furthermore, the evolution of Cu and Zn presented a similar pattern. On the other hand, some slight differences between LREE and HREE seem to occur throughout the salt precipitation. The detailed behaviour of each element will be investigated in future works.
842
Lappeenranta, Finland IMWA 2017Mine Water and Circular Economy
Wolkersdorfer C, Sartz L, Sillanpää M, Häkkinen A (Editors)
Acknowledgements
The European Commission DG Environment partially supported the research work presented in this document, under grant reference LIFE12 ENV/ES/000250. The Spanish Ministry of Economic and Competitiveness also partially funded this work through the research projects CGL2016-78783-C2-1-R and ERAMIN PCIN2015-242. MD Basallote thanks the Spanish Ministry of Economy and Competitiveness for the Postdoctoral Fellowship granted under application reference FJCI-2015-24765. This is a contribution to the CEI·MAR series publications.
References
Buckby T, Black S, Coleman ML, Hodson ME (2003) Fe-sulphate-rich evaporative mineral precipitates from the Río Tinto, southwest Spain. Mineralogical Magazine 67(2):263-278 Hammarstrom JM, Seal Ii RR, Meier AL, Kornfeld JM (2005) Secondary sulfate minerals associated with acid drainage in the eastern US: recycling of metals and acidity in surficial environments. Chem. Geol. 215(1–4):407-431 Nieto JM, Sarmiento AM, Canovas CR, Olias M, Ayora C (2013) Acid mine drainage in the Iberian Pyrite Belt: 1. Hydrochemical characteristics and pollutant load of the Tinto and Odiel rivers. Environmental Science and Pollution Research 20(11):7509-7519Nocete F, Álex E, Nieto JM, Sáez R, Bayona MR (2005) An archaeological approach to regional environmental pollution in the south-western Iberian Peninsula related to Third millennium BC mining and metallurgy. Journal of Archaeological Science 32(10):1566-1576Nordstrom DK, Alpers CN (1999) Geochemistry of acid mine waters. In: Plumlee GS, Logson MJ, editors. The environmental geochemistry of mine waters. Rev Econ Geol; 6A: 133-160.,Olías M, Nieto JM (2015) Background conditions and mining pollution throughout history in the Río Tinto (SW Spain). Environments 2(3):295-316 Olías M, Cánovas CR, Pérez-López R, Macías F, Riera J, Nieto JM (2016) REE during evaporative precipitation in a severely affected AMD-creek (SW Spain). Proceedings IMWA 2016, Leipzig, Germany, 1336-1338.Pérez-López R, Delgado J, Nieto JM, Márquez-García B (2010) Rare earth element geochemistry of sulphide weathering in the São Domingos mine area (Iberian Pyrite Belt): a proxy for fluid–rock interaction and ancient mining pollution. Chem. Geol. 276(1):29-40Sáinz A, Grande JA, de la Torre ML, Sánchez-Rodas D (2002) Characterisation of sequential leachate discharges of mining waste rock dumps in the Tinto and Odiel rivers. J. Environ. Manage. 64(4):345-353 Sarmiento AM, Nieto JM, Olías M, Cánovas CR (2009) Hydrochemical characteristics and seasonal influence on the pollution by acid mine drainage in the Odiel river Basin (SW Spain). Appl. Geochem. 24(4):697-714
843
Lappeenranta, Finland IMWA 2017Mine Water and Circular Economy
Wolkersdorfer C, Sartz L, Sillanpää M, Häkkinen A (Editors)
Investigations on microbial reduction processes in a flooded underground mine
Corinne Wendler1, Nils Hoth1, Andrea Kassahun2, Michael Paul2
1Technische Universität Bergakademie Freiberg, Institute of Mining and Special Civil Engineering, Gustav-Zeuner-Straße 1A, 09599 Freiberg, Germany, [email protected]
2Wismut GmbH, Dept. Water Management, Jagdschänkenstraße 29, 09117 Chemnitz, Germany
Abstract This paper deals with the investigation of hydro-(bio-)geochemical processes in a flooded uranium underground mine in Germany. Processes were investigated by means of an extended sampling campaign. Focus was on the detection of microbial reduction processes. Achieved data was compared to the long-term monitoring data of the last decade(s).
Key words mine closure, flood water, uranium, microbial reduction, environmental parameters
Introduction
Wismut GmbH as the legal successor of the former mining company SDAG Wismut has been remediating its legacies in Central Germany since the closure of the former uranium mines by the end of 1990. The Wismut project is one of the most important environmental tasks in the German federal states of Saxony and Thuringia. One key aspect of the reme-diation activities is dedicated to the closure of several underground mines including mine flooding. At most of the mine sites, flooding is nowadays far progressed or already finished. Mine flooding in general causes an extensive change of hydrogeochemical conditions inside underground mines. In the beginning, soluble components are mobilized from altered and oxidized rock bodies. Later, mine water composition changes due to elution/dilution, min-eral reactions and redox-sensitive, microbially catalyzed processes. Therefore, water qual-ity and load predictions are essential for environmental impact assessment and mitigation planning, especially for mine water treatment.
Due to the existing environmental monitoring program of Wismut, a detailed description of mine water qualities and evolutions is available for a great amount of monitoring points over the last 25 years. At one particular Wismut mine site, where flooding was conduct-ed between 1998 and 2007, predictions based on pre-flooding data show a clear deviation for some contaminants compared to the long-term monitoring data. For example, uranium concentrations and concentrations of bicarbonate (HCO3
-) are characterized by stagnation or even increase instead of decrease over the last years. Aim of the study was to describe possible processes inside the flooded underground mine that allow an interpretation of the monitoring data. Therefore, required parameters for the detection of those processes during the mine water sampling and analysis are discussed.
Subject of Investigation
According to Younger et al. (2002), contaminant concentrations in a mine water pool should decrease over time after flooding is completed, mainly due to elution/dilution processes. At the investigated mine site, most of the parameters (including iron and other metals) fol-
844
Lappeenranta, Finland IMWA 2017Mine Water and Circular Economy
Wolkersdorfer C, Sartz L, Sillanpää M, Häkkinen A (Editors)
low this very general predictive trend, and a sufficient fit between predicted and measured monitoring data can be stated. However, two important parameters show a clear deviation between predicted and measured values: uranium and bicarbonate (HCO3
-). Both concen-trations are characterized by a stagnation or even increase instead of a decrease over the last years, approximately since the end of the flooding process (G.E.O.S. 2014).
There are different approaches for explaining these phenomena. Two potential explana-tions will be described by means of the following hypotheses:
• The surrounding rock body contains primary carbonates, such as dolomite (CaMg[-CO3]2), calcite (CaCO3), and siderite (FeCO3). During mine flooding, carbonates are dissolved and HCO3
- is increasing. In addition, iron and uranium are released during the dissolution process. There is also buffering due to the formation of secondary car-bonates.
• There are microbial reduction processes of organic matter, which cause iron reduc-tion. (Primary) Iron hydroxide phases are dissolved, so that elements that are bound to these phases are also released. Bicarbonate (HCO3
-) or rather carbon hydroxide (CO2) is a product of the microbial reduction of organic matter.
For the investigation of the two hypotheses, previous monitoring data was evaluated. It became obvious that for a clear distinction between carbonate dissolution and microbial processes, the existing data from routine monitoring was not sufficient, e.g. there was no in-formation about reduced species (ferrous iron, sulphide) in solution. Additional parameters needed to be determined during an extended sampling campaign.
Methods
An extended sampling campaign was carried out in order to realize additional measure-ments compared to the regular sampling of the long-term monitoring program. The addi-tional data was needed to provide further information e.g. about redox processes. As a first step, several existing sampling points (cased boreholes) were chosen to describe different areas of the flooded mine. The additional sampling was then carried out in parallel to a reg-ular sampling, so that it was possible to compare the obtained data. The main aspects of the sampling were the following:
• Determination of reduced species, which is necessary to characterize reduction pro-cesses inside the flooded mine. Therefore, Fe (II) and Fe-total, as well as sulfide and sulfate were analyzed by means of photometric measurements.
• Investigation of the formation of gas phases, such as H2S, CH4 and CO2, which are in-dicators of reduction processes. On the one hand, they were measured qualitatively by means of an on-site method, where mine water could degas in a closed bucket (filled with N2) and the developing gas phase was characterized (Fig. 1). On the other hand, samples were collected in closed exetainers for the quantitative measurement of dis-solved gas phases in an external laboratory (gas chromatography).
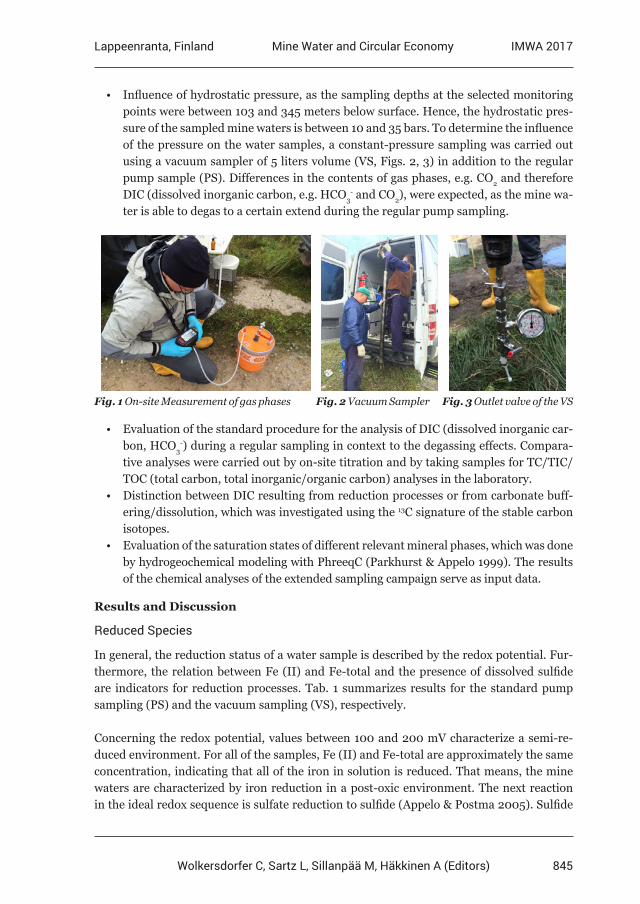
845
Lappeenranta, Finland IMWA 2017Mine Water and Circular Economy
Wolkersdorfer C, Sartz L, Sillanpää M, Häkkinen A (Editors)
• Influence of hydrostatic pressure, as the sampling depths at the selected monitoring points were between 103 and 345 meters below surface. Hence, the hydrostatic pres-sure of the sampled mine waters is between 10 and 35 bars. To determine the influence of the pressure on the water samples, a constant-pressure sampling was carried out using a vacuum sampler of 5 liters volume (VS, Figs. 2, 3) in addition to the regular pump sample (PS). Differences in the contents of gas phases, e.g. CO2 and therefore DIC (dissolved inorganic carbon, e.g. HCO3
- and CO2), were expected, as the mine wa-ter is able to degas to a certain extend during the regular pump sampling.
Fig. 1 On-site Measurement of gas phases Fig. 2 Vacuum Sampler Fig. 3 Outlet valve of the VS
• Evaluation of the standard procedure for the analysis of DIC (dissolved inorganic car-bon, HCO3
-) during a regular sampling in context to the degassing effects. Compara-tive analyses were carried out by on-site titration and by taking samples for TC/TIC/TOC (total carbon, total inorganic/organic carbon) analyses in the laboratory.
• Distinction between DIC resulting from reduction processes or from carbonate buff-ering/dissolution, which was investigated using the 13C signature of the stable carbon isotopes.
• Evaluation of the saturation states of different relevant mineral phases, which was done by hydrogeochemical modeling with PhreeqC (Parkhurst & Appelo 1999). The results of the chemical analyses of the extended sampling campaign serve as input data.
Results and Discussion
Reduced Species
In general, the reduction status of a water sample is described by the redox potential. Fur-thermore, the relation between Fe (II) and Fe-total and the presence of dissolved sulfide are indicators for reduction processes. Tab. 1 summarizes results for the standard pump sampling (PS) and the vacuum sampling (VS), respectively.
Concerning the redox potential, values between 100 and 200 mV characterize a semi-re-duced environment. For all of the samples, Fe (II) and Fe-total are approximately the same concentration, indicating that all of the iron in solution is reduced. That means, the mine waters are characterized by iron reduction in a post-oxic environment. The next reaction in the ideal redox sequence is sulfate reduction to sulfide (Appelo & Postma 2005). Sulfide
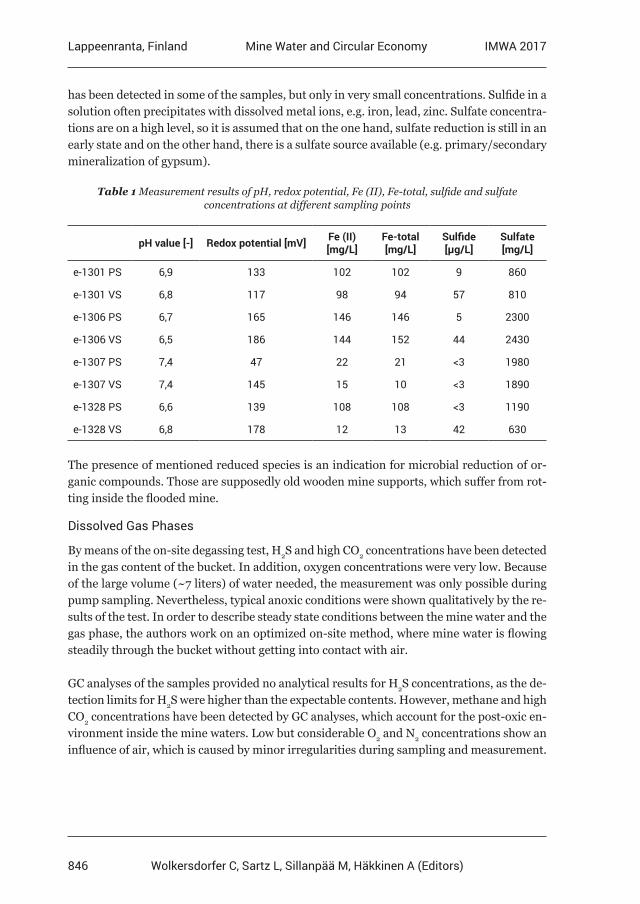
846
Lappeenranta, Finland IMWA 2017Mine Water and Circular Economy
Wolkersdorfer C, Sartz L, Sillanpää M, Häkkinen A (Editors)
has been detected in some of the samples, but only in very small concentrations. Sulfide in a solution often precipitates with dissolved metal ions, e.g. iron, lead, zinc. Sulfate concentra-tions are on a high level, so it is assumed that on the one hand, sulfate reduction is still in an early state and on the other hand, there is a sulfate source available (e.g. primary/secondary mineralization of gypsum).
Table 1 Measurement results of pH, redox potential, Fe (II), Fe-total, sulfide and sulfate concentrations at different sampling points
pH value [-] Redox potential [mV] Fe (II) [mg/L]
Fe-total [mg/L]
Sulfide [µg/L]
Sulfate [mg/L]
e-1301 PS 6,9 133 102 102 9 860
e-1301 VS 6,8 117 98 94 57 810
e-1306 PS 6,7 165 146 146 5 2300
e-1306 VS 6,5 186 144 152 44 2430
e-1307 PS 7,4 47 22 21 <3 1980
e-1307 VS 7,4 145 15 10 <3 1890
e-1328 PS 6,6 139 108 108 <3 1190
e-1328 VS 6,8 178 12 13 42 630
The presence of mentioned reduced species is an indication for microbial reduction of or-ganic compounds. Those are supposedly old wooden mine supports, which suffer from rot-ting inside the flooded mine.
Dissolved Gas Phases
By means of the on-site degassing test, H2S and high CO2 concentrations have been detected in the gas content of the bucket. In addition, oxygen concentrations were very low. Because of the large volume (~7 liters) of water needed, the measurement was only possible during pump sampling. Nevertheless, typical anoxic conditions were shown qualitatively by the re-sults of the test. In order to describe steady state conditions between the mine water and the gas phase, the authors work on an optimized on-site method, where mine water is flowing steadily through the bucket without getting into contact with air.
GC analyses of the samples provided no analytical results for H2S concentrations, as the de-tection limits for H2S were higher than the expectable contents. However, methane and high CO2 concentrations have been detected by GC analyses, which account for the post-oxic en-vironment inside the mine waters. Low but considerable O2 and N2 concentrations show an influence of air, which is caused by minor irregularities during sampling and measurement.
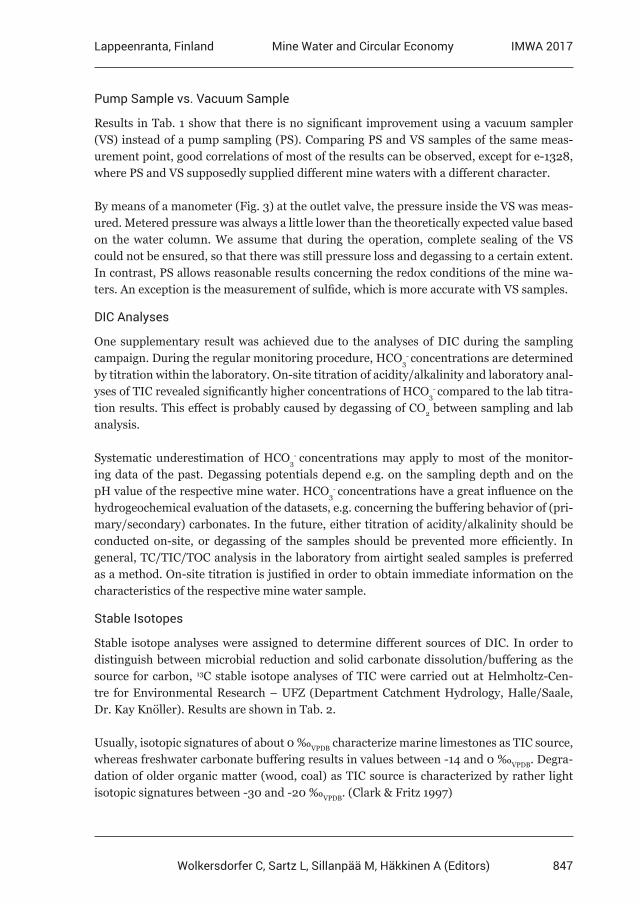
847
Lappeenranta, Finland IMWA 2017Mine Water and Circular Economy
Wolkersdorfer C, Sartz L, Sillanpää M, Häkkinen A (Editors)
Pump Sample vs. Vacuum Sample
Results in Tab. 1 show that there is no significant improvement using a vacuum sampler (VS) instead of a pump sampling (PS). Comparing PS and VS samples of the same meas-urement point, good correlations of most of the results can be observed, except for e-1328, where PS and VS supposedly supplied different mine waters with a different character.
By means of a manometer (Fig. 3) at the outlet valve, the pressure inside the VS was meas-ured. Metered pressure was always a little lower than the theoretically expected value based on the water column. We assume that during the operation, complete sealing of the VS could not be ensured, so that there was still pressure loss and degassing to a certain extent. In contrast, PS allows reasonable results concerning the redox conditions of the mine wa-ters. An exception is the measurement of sulfide, which is more accurate with VS samples.
DIC Analyses
One supplementary result was achieved due to the analyses of DIC during the sampling campaign. During the regular monitoring procedure, HCO3
- concentrations are determined by titration within the laboratory. On-site titration of acidity/alkalinity and laboratory anal-yses of TIC revealed significantly higher concentrations of HCO3
- compared to the lab titra-tion results. This effect is probably caused by degassing of CO2 between sampling and lab analysis.
Systematic underestimation of HCO3- concentrations may apply to most of the monitor-
ing data of the past. Degassing potentials depend e.g. on the sampling depth and on the pH value of the respective mine water. HCO3
- concentrations have a great influence on the hydrogeochemical evaluation of the datasets, e.g. concerning the buffering behavior of (pri-mary/secondary) carbonates. In the future, either titration of acidity/alkalinity should be conducted on-site, or degassing of the samples should be prevented more efficiently. In general, TC/TIC/TOC analysis in the laboratory from airtight sealed samples is preferred as a method. On-site titration is justified in order to obtain immediate information on the characteristics of the respective mine water sample.
Stable Isotopes
Stable isotope analyses were assigned to determine different sources of DIC. In order to distinguish between microbial reduction and solid carbonate dissolution/buffering as the source for carbon, 13C stable isotope analyses of TIC were carried out at Helmholtz-Cen-tre for Environmental Research – UFZ (Department Catchment Hydrology, Halle/Saale, Dr. Kay Knöller). Results are shown in Tab. 2.
Usually, isotopic signatures of about 0 ‰VPDB characterize marine limestones as TIC source, whereas freshwater carbonate buffering results in values between -14 and 0 ‰VPDB. Degra-dation of older organic matter (wood, coal) as TIC source is characterized by rather light isotopic signatures between -30 and -20 ‰VPDB. (Clark & Fritz 1997)
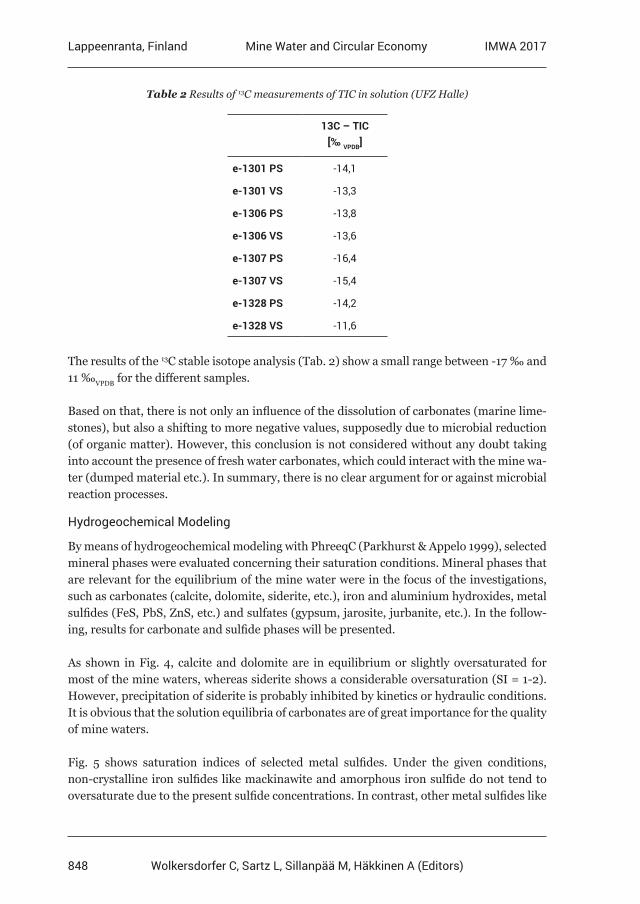
848
Lappeenranta, Finland IMWA 2017Mine Water and Circular Economy
Wolkersdorfer C, Sartz L, Sillanpää M, Häkkinen A (Editors)
Table 2 Results of 13C measurements of TIC in solution (UFZ Halle)
13C – TIC [‰ VPDB]
e-1301 PS -14,1
e-1301 VS -13,3
e-1306 PS -13,8
e-1306 VS -13,6
e-1307 PS -16,4
e-1307 VS -15,4
e-1328 PS -14,2
e-1328 VS -11,6
The results of the 13C stable isotope analysis (Tab. 2) show a small range between -17 ‰ and 11 ‰VPDB for the different samples.
Based on that, there is not only an influence of the dissolution of carbonates (marine lime-stones), but also a shifting to more negative values, supposedly due to microbial reduction (of organic matter). However, this conclusion is not considered without any doubt taking into account the presence of fresh water carbonates, which could interact with the mine wa-ter (dumped material etc.). In summary, there is no clear argument for or against microbial reaction processes.
Hydrogeochemical Modeling
By means of hydrogeochemical modeling with PhreeqC (Parkhurst & Appelo 1999), selected mineral phases were evaluated concerning their saturation conditions. Mineral phases that are relevant for the equilibrium of the mine water were in the focus of the investigations, such as carbonates (calcite, dolomite, siderite, etc.), iron and aluminium hydroxides, metal sulfides (FeS, PbS, ZnS, etc.) and sulfates (gypsum, jarosite, jurbanite, etc.). In the follow-ing, results for carbonate and sulfide phases will be presented.
As shown in Fig. 4, calcite and dolomite are in equilibrium or slightly oversaturated for most of the mine waters, whereas siderite shows a considerable oversaturation (SI = 1-2). However, precipitation of siderite is probably inhibited by kinetics or hydraulic conditions. It is obvious that the solution equilibria of carbonates are of great importance for the quality of mine waters.
Fig. 5 shows saturation indices of selected metal sulfides. Under the given conditions, non-crystalline iron sulfides like mackinawite and amorphous iron sulfide do not tend to oversaturate due to the present sulfide concentrations. In contrast, other metal sulfides like
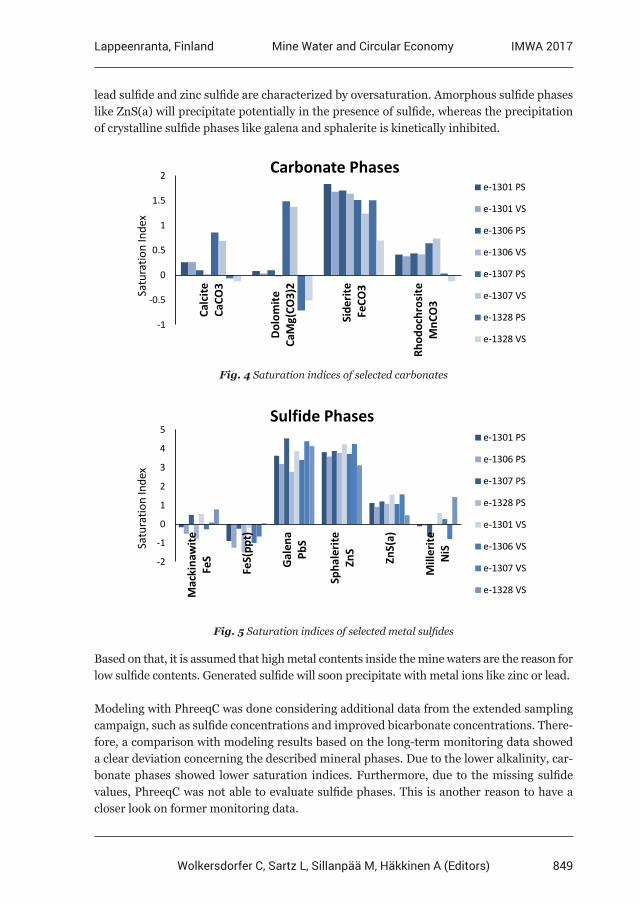
849
Lappeenranta, Finland IMWA 2017Mine Water and Circular Economy
Wolkersdorfer C, Sartz L, Sillanpää M, Häkkinen A (Editors)
lead sulfide and zinc sulfide are characterized by oversaturation. Amorphous sulfide phases like ZnS(a) will precipitate potentially in the presence of sulfide, whereas the precipitation of crystalline sulfide phases like galena and sphalerite is kinetically inhibited.
-1
-0.5
0
0.5
1
1.5
2
Calc
iteCa
CO3
Dol
omite
CaM
g(CO
3)2
Side
rite
FeC
O3
Rhod
ochr
osite
MnC
O3
Satu
ratio
n In
dex
Carbonate Phases e-1301 PS
e-1301 VS
e-1306 PS
e-1306 VS
e-1307 PS
e-1307 VS
e-1328 PS
e-1328 VS
Fig. 4 Saturation indices of selected carbonates
-2
-1
0
1
2
3
4
5
Mac
kina
wite
FeS
FeS(
ppt)
Gal
ena
PbS
Spha
lerit
eZn
S
ZnS(
a)
Mill
erite
NiSSa
tura
tion
Inde
x
Sulfide Phases e-1301 PS
e-1306 PS
e-1307 PS
e-1328 PS
e-1301 VS
e-1306 VS
e-1307 VS
e-1328 VS
Fig. 5 Saturation indices of selected metal sulfides
Based on that, it is assumed that high metal contents inside the mine waters are the reason for low sulfide contents. Generated sulfide will soon precipitate with metal ions like zinc or lead.
Modeling with PhreeqC was done considering additional data from the extended sampling campaign, such as sulfide concentrations and improved bicarbonate concentrations. There-fore, a comparison with modeling results based on the long-term monitoring data showed a clear deviation concerning the described mineral phases. Due to the lower alkalinity, car-bonate phases showed lower saturation indices. Furthermore, due to the missing sulfide values, PhreeqC was not able to evaluate sulfide phases. This is another reason to have a closer look on former monitoring data.
850
Lappeenranta, Finland IMWA 2017Mine Water and Circular Economy
Wolkersdorfer C, Sartz L, Sillanpää M, Häkkinen A (Editors)
Conclusions
The study leads to different conclusions. On the one hand, hydrogeochemical processes in-side the flooded mine were investigated by means of an extended sampling approach, so that additional parameters, such as reduced species, could be evaluated. On the other hand, extended data sets were compared to long-term monitoring data and some new aspects could be revealed.
Additional investigations during the extended sampling improved the understanding of key processes within the flooded mine. It is advised to include some of the methods used also during the regular monitoring procedure.
The investigations as a whole revealed that inside the flooded uranium mine there is not only one dominating process determining the long-term evolution of the mine water quali-ty. The combination of microbial reduction, carbonate dissolution and buffering by hydrox-ides, carbonates and gypsum leads to a very complex situation. Thus, prediction of the be-havior and development of the mine water quality needs sophisticated models that involve many process and reaction parameters.
Acknowledgements
The investigations were carried out as part of a framework agreement between Wismut GmbH and TU Bergakademie Freiberg.
References
Appelo CAJ, Postma D (2005) Geochemistry, groundwater and pollution. 2nd edition, Balkema, 649 ppClark ID, Fritz P (1997) Environmental Isotopes in Hydrogeology. Lewis Publishers, 328 ppG.E.O.S. (2014) Abschlussbericht: Analyse der Beschaffenheitsentwicklung des Flutungswassers Grube Ronneburg. G.E.O.S. Ingenieurgesellschaft mbH, Halsbrücke, Internal ReportParkhurst DL, Appelo CAJ (1999) User’s guide to PHREEQC 2. U.S. Geological Survey, Water Resources Investigations Report, 99-4259, Denver-ColoradoYounger PL, Banwart SA, Hedin RS (2002) Mine water Hydrology, Pollution, Remediation. Kluwer Academic Publishers, 442 pp


6 Valorisation
854
Lappeenranta, Finland IMWA 2017Mine Water and Circular Economy
Wolkersdorfer C, Sartz L, Sillanpää M, Häkkinen A (Editors)
EU Raw Materials Information System and Raw Materials Scoreboard: addressing the data needs in support of the
EU policies – an example for water use in mining
Beatriz Vidal-Legaz; Cynthia Latunussa; Gian Andrea Blengini; Tamas Hamor; Simone Manfredi, David Pennington
1European Commission – Joint Research Centre, Directorate D – Sustainable Resources, Unit D3 – Land Resources, Via E. Fermi 2749, 21027 Ispra (VA) Italy, beatriz.vidal-
Abstract The European Commission is developing the Raw Materials Information System (RMIS) and Scoreboard to count on a sound knowledge base for the support of the EU raw materials policy, covering the extraction of non-food, non-energy materials. Water is among the sustainability aspects that those developments will cover, given its paramount importance in the operation of mining and processing activities. This study surveyed water (use and pollution) data available at national/sub-national level to monitor the EU sector performance. Valuable, yet limited sources were found, which illustrates the challenges faced to provide sound data to support the EU raw materials policies.
Key words EU raw materials policy, sustainability, environmental performance, water use, water pollution
The EU Raw materials policy
Following the 2008 Raw Materials Initiative (RMI) (EC, 2008), the European Commission (EC) is committed to promoting the competitiveness of industries related to raw materials and securing their undistorted supply. This embraces the extraction and production of non-food, non-energy raw materials: abiotic materials such as metals, non-metallic minerals, and industrial minerals, and biotic materials such as wood or natural rubber. Of particular importance are materials considered as ‘critical’ (EC, 2014), i.e. they are very relevant to the economy while at the same time they show risk of supply disruption due to the conditions in supplying countries. Apart from securing materials supply, the RMI also promotes the ‘fair and sustainable supply of raw materials from global markets’, which embraces also social and environmental considerations, and the boosting of recycling.
Further, the Circular Economy Action Plan (EC, 2015) promotes the transition towards a circular economy, through the fostering of reuse and recycling, which will boost EU com-petitiveness and jobs generation, as well as fostering sustainability. This ambitious plan in-cludes measures and reviewed targets to increase recycling and prevent landfilling all along the production and consumption chain and until waste management and the market for secondary raw materials.
These policy actions to secure supply and boost sustainability require a solid and contin-uously updated knowledge base (data and information), covering the entire raw materials value chain. The environmental performance of all production stages becomes essential in-formation, where water plays a key role. To cover these needs, the EC is developing the Raw Materials Information System and the Raw Materials Scoreboard.
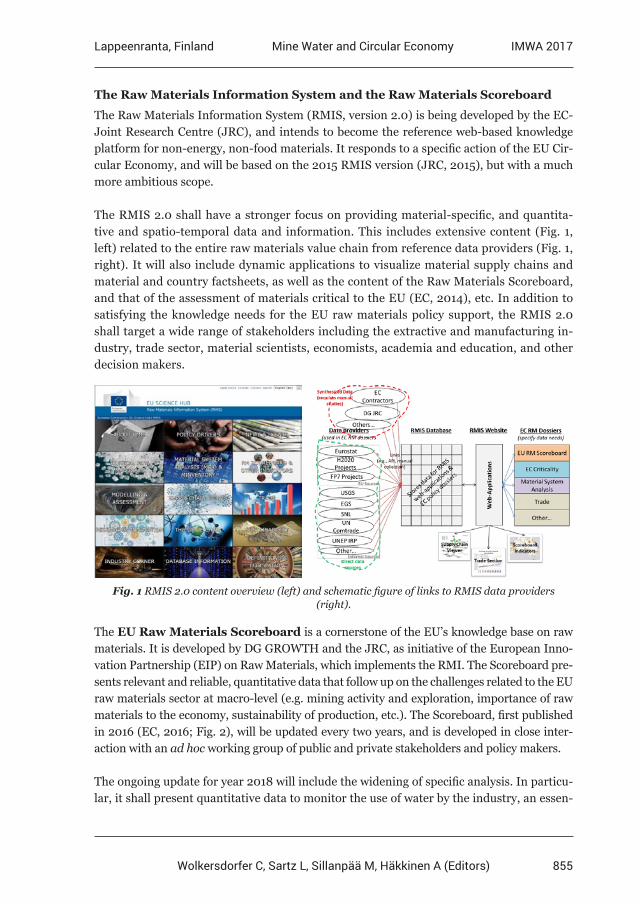
855
Lappeenranta, Finland IMWA 2017Mine Water and Circular Economy
Wolkersdorfer C, Sartz L, Sillanpää M, Häkkinen A (Editors)
The Raw Materials Information System and the Raw Materials Scoreboard
The Raw Materials Information System (RMIS, version 2.0) is being developed by the EC-Joint Research Centre (JRC), and intends to become the reference web-based knowledge platform for non-energy, non-food materials. It responds to a specific action of the EU Cir-cular Economy, and will be based on the 2015 RMIS version (JRC, 2015), but with a much more ambitious scope.
The RMIS 2.0 shall have a stronger focus on providing material-specific, and quantita-tive and spatio-temporal data and information. This includes extensive content (Fig. 1, left) related to the entire raw materials value chain from reference data providers (Fig. 1, right). It will also include dynamic applications to visualize material supply chains and material and country factsheets, as well as the content of the Raw Materials Scoreboard, and that of the assessment of materials critical to the EU (EC, 2014), etc. In addition to satisfying the knowledge needs for the EU raw materials policy support, the RMIS 2.0 shall target a wide range of stakeholders including the extractive and manufacturing in-dustry, trade sector, material scientists, economists, academia and education, and other decision makers.
Fig. 1 RMIS 2.0 content overview (left) and schematic figure of links to RMIS data providers (right).
The EU Raw Materials Scoreboard is a cornerstone of the EU’s knowledge base on raw materials. It is developed by DG GROWTH and the JRC, as initiative of the European Inno-vation Partnership (EIP) on Raw Materials, which implements the RMI. The Scoreboard pre-sents relevant and reliable, quantitative data that follow up on the challenges related to the EU raw materials sector at macro-level (e.g. mining activity and exploration, importance of raw materials to the economy, sustainability of production, etc.). The Scoreboard, first published in 2016 (EC, 2016; Fig. 2), will be updated every two years, and is developed in close inter-action with an ad hoc working group of public and private stakeholders and policy makers.
The ongoing update for year 2018 will include the widening of specific analysis. In particu-lar, it shall present quantitative data to monitor the use of water by the industry, an essen-
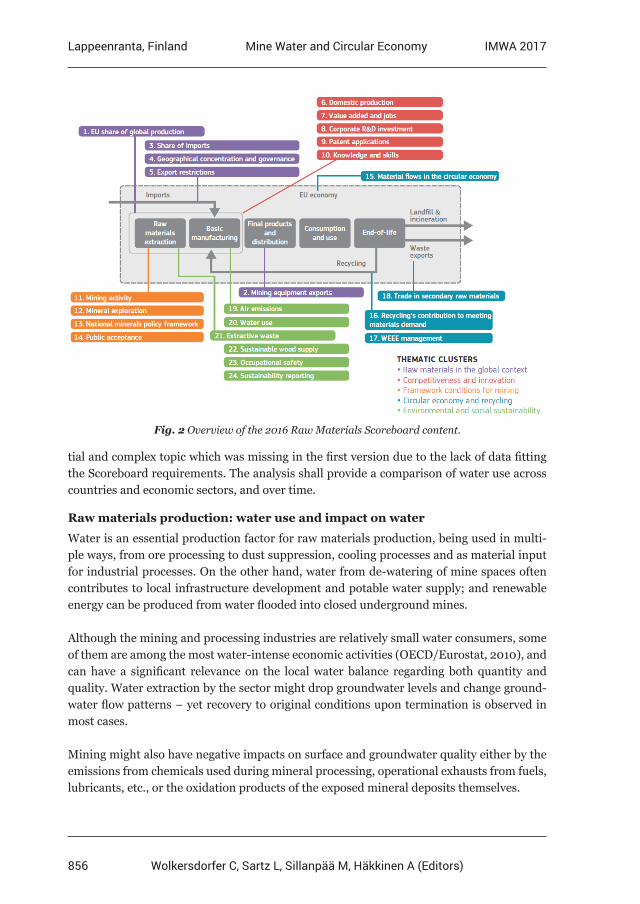
856
Lappeenranta, Finland IMWA 2017Mine Water and Circular Economy
Wolkersdorfer C, Sartz L, Sillanpää M, Häkkinen A (Editors)
tial and complex topic which was missing in the first version due to the lack of data fitting the Scoreboard requirements. The analysis shall provide a comparison of water use across countries and economic sectors, and over time.
Raw materials production: water use and impact on water
Water is an essential production factor for raw materials production, being used in multi-ple ways, from ore processing to dust suppression, cooling processes and as material input for industrial processes. On the other hand, water from de-watering of mine spaces often contributes to local infrastructure development and potable water supply; and renewable energy can be produced from water flooded into closed underground mines.
Although the mining and processing industries are relatively small water consumers, some of them are among the most water-intense economic activities (OECD/Eurostat, 2010), and can have a significant relevance on the local water balance regarding both quantity and quality. Water extraction by the sector might drop groundwater levels and change ground-water flow patterns − yet recovery to original conditions upon termination is observed in most cases.
Mining might also have negative impacts on surface and groundwater quality either by the emissions from chemicals used during mineral processing, operational exhausts from fuels, lubricants, etc., or the oxidation products of the exposed mineral deposits themselves.
Fig. 2 Overview of the 2016 Raw Materials Scoreboard content.
857
Lappeenranta, Finland IMWA 2017Mine Water and Circular Economy
Wolkersdorfer C, Sartz L, Sillanpää M, Häkkinen A (Editors)
Safeguarding water is specifically mentioned in the EU industry regulation and policy driv-ers. First, the deployment of the Industrial Emissions Directive (2010/75/EU), which cov-ers the largest installations producing metals and minerals, and requires the adoption of the so-called Best Available Techniques (BATs), has contributed to the improvement of water performance in the EU. BATs, specified in the BREFs (BATs reference documents), which are further promoted by the Circular Economy Action Plan, provide also standards for wa-ter use and water discharges of industrial processes. Several BREFs have been adopted by the EC, e.g. iron and steel (EC, 2012) and mining waste (EC, 2009). In addition, the min-ing waste directive (2006/21/EC) establishes requirements to promote safe operating sites (during exploration and operation, and after closure) which prevent/minimise leachate and water contamination, and also refers to the adoption of BAT technologies. Thus, the pre-vention and control of surface and groundwater contamination has become an important component of mine operation and closure.
Apart from the impact of the regulation on the water use and protection at mining sites, in-creasing water costs and limited water resources availability in e.g. dry environments have fostered the adoption of water saving technologies, e.g. wastewater reuse and recycling.
However, challenges persist. The potential of modern and old abandoned sites to pollute water can be high. Also, in a context of climate change, availability of water resources might threaten future mining water supply needs. Decreasing ore grades, which the subsequent increase of water demand, might further challenge improvements in mining water performance.
In this context, it becomes essential to count on sound data to monitor the EU sector water performance from both a quantitative and qualitative point of view. However, availability of industry water accounting data and official, comparable data records is limited. For instance, no data were found for a fair and accurate comparison of water use in the raw materials sec-tor that could be presented in the 2016 Raw Materials Scoreboard. This is partly due to the fact that the assessment of water use is very complex. First, water use is very industry-specif-ic, and it rather differs among operation sites. For instance, the extraction of precious metals, or the manufacturing of iron, steel, and paper are typically water-intensive activities. While the manufacturing of wood and non-metallic minerals are usually less demanding. Then, water supply and distribution networks are complex, often with both public authorities and private stakeholders involved. Water use is also very country-specific, with heterogeneous water availability conditions, and with different regulatory frameworks for water pricing, en-vironmental fees, scarcity issues, etc., which differently drive changes in water use efficiency. Particularly challenging is the sound assessment of water use by mining activities, where water use and water production, which can be used to cover self and other sectors’ demand, often co-exits (INE, 2013); where water consumption might strongly differ from water with-drawal and where several water sources with different quality levels might be used.
Methods
We underwent an assessment of available water-related data to improve the EU knowledge base, which included data provided at EU national or sub-national level on water withdraw-
858
Lappeenranta, Finland IMWA 2017Mine Water and Circular Economy
Wolkersdorfer C, Sartz L, Sillanpää M, Häkkinen A (Editors)
als, water use, water consumption, water intensity and water discharges. The scope covered the extraction and processing of non-food, non-energy raw materials. We first revisited the sources listed for potential future use in the 2016 Scoreboard (EC, 2016) and contacted experts on the diverse approaches. Based on that, we expanded the review of scientific and grey literature.
Results
This study identified valuable data sources which provide estimates following different methodologies, scales of analysis and water aspects (Tab.1).
Tab. 1 Overview of the most valuable data sources identified.
Option Description Indicators Coverage
Eurostat Harmonizes data by EU country and sector following Eurostat/OCDE (2010). Those are also used to estimate water intensity (related to the economic output). Poor data completeness.
Water withdrawal, water use and wastewater dis-charges.
- Countries: EU-28+
- Time: 1970-2014
- Sectors: B, C24 (only water use)
Member State data
(competent authorities and state agencies identified by Reynaud et al. 2016)
Data obtained directly from the EU Member States, generally more detailed and complete than those reported to Eurostat. No harmonization among countries, and in some cases indicators and methodologies differ. Data can be based on industry surveys or even measurements (from e.g. withdrawal permits, etc), but in most cases estimated from e.g. production volume.
Water withdrawal, water supply or water use (varying among countries).
- Countries: AU, BG, HR, DK, EE, DE, MT, PL, ES
- Time: Ranging from 1991 and 2015 (varying among countries)
- Sectors: B, B07, B08, C16, C17, C23, C24 (varying among countries)
Industry water disclosures
Water data from industry disclosures such as the Global Reporting Initiative (GRI) and CDP water (which comes from the Climate Disclosures Project).
GRI data has been used in several studies of water embodied in mineral commodities (e.g. Northey et al. 2013).
Water withdrawal by source, water discharge by quality and destination, water recycled and reused, and in some cases water intensity (GRI); water intensity (CDP).
- Countries: worldwide
- Time: 1999-2015 (GRI); 2010-2017 (CDP water)
- Sectors: construction materials, forest and paper products, metals products, mining
859
Lappeenranta, Finland IMWA 2017Mine Water and Circular Economy
Wolkersdorfer C, Sartz L, Sillanpää M, Häkkinen A (Editors)
Life Cycle Assessment
(LCA)
It considers not only direct water use onsite but all water used along the production chain (from extraction to transport, smelting, refining, etc). While focussing on the analysis of potential impacts of end-use products, it can also provide water estimates for commodities production.
Water inflows (water intake from different sources), pollutant and wastewater discharges.
- Countries: data from production process in specific countries (e.g. US, Switzerland, etc)
- Time: specific reference years
- Sectors: broad set of commodities
EE-IO
(e.g EXIOBASE)
They follow the flows of materials through the economy and estimate the inputs to production (e.g. water) as well as emissions associated to the production of a given sector, accounting also, as LCA does, for all the upstream value chains.
Water withdrawal, water consumption.
- Countries: EU-28 plus broad non-EU country coverage
- Time: 1995-2011
- Sectors: minerals and metals mining and production, metals re-processing
European Pollutant Release and Transfer Register
(E-PRTR)
Europe-wide register that provides data on emissions of a complete set of substances to water of a relevant share of EU industrial facilities. Limited data completeness.
Emission of pollutants to water.
- Countries: EU-28 +
- Time: 2007-2016
-Sectors: all NACE
Water indicators: Water withdrawal=water removed from any source, either permanently or tem-porarily. Mine water and drainage water are included. Water use=water actually used by end users, ex-cluding returned water. Water consumption=water use minus water discharged. Water intensity=wa-ter withdrawal or water use related to the output of the sector. Water discharges=water discharged after being used in, or produced by, industrial production processes (cooling water and surface runoff is ex-cluded). Countries: BG=Bulgaria, DE=Germany, DK=Denmark, EE=Estonia, ES=Spain, PL=Poland. EU-28+=EU-28 plus other European countries (e.g. Norway, Serbia or Switzerland). Sectors (follow-ing the NACE Rev.2 classification): B=mining and quarrying, B07=mining of metal ores, B08=other mining and quarrying, C16=manufacture of wood and wood products, C17=manufacture of paper and paper products, C23=manufacture of non-metallic minerals and C24=manufacture of basic metals.
EU countries official statistics on water use by sector resulted the most comprehensive data source to monitor trends over time and across countries and sectors. However, country and mining activities’ coverage were limited, and data harmonization among countries lacked. According to these data, focusing on the German dataset (Fig. 3, left), it can be noticed that total volumes of water used by the raw materials sector have been decreasing overall (yet patterns and trends are very heterogeneous when compared to other countries). Besides, significant decreasing trends in water intensity (Fig. 3, right) have been observed for ba-sic metals manufacturing, while mining (including also energy carriers) showed increasing trends.
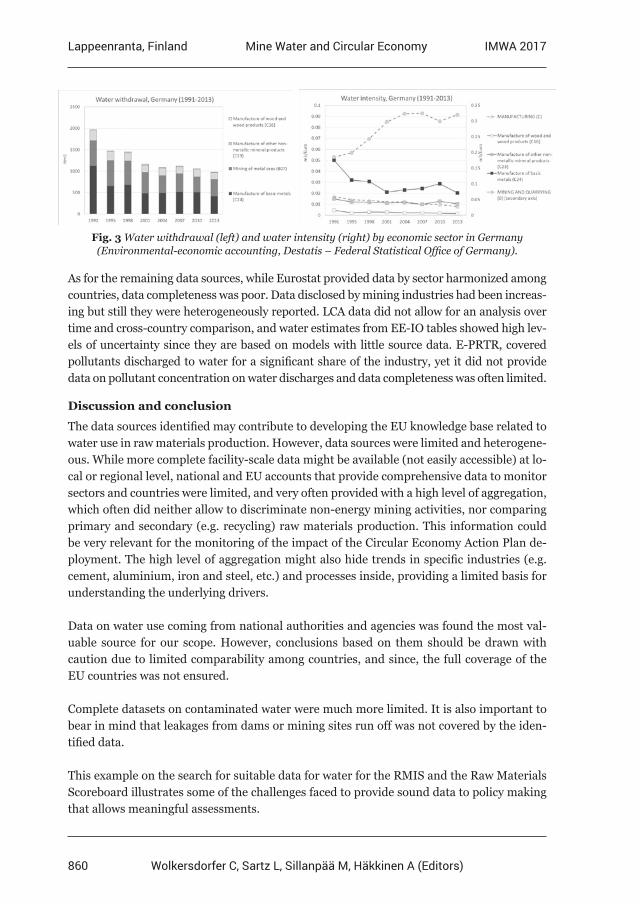
860
Lappeenranta, Finland IMWA 2017Mine Water and Circular Economy
Wolkersdorfer C, Sartz L, Sillanpää M, Häkkinen A (Editors)
Fig. 3 Water withdrawal (left) and water intensity (right) by economic sector in Germany (Environmental-economic accounting, Destatis – Federal Statistical Office of Germany).
As for the remaining data sources, while Eurostat provided data by sector harmonized among countries, data completeness was poor. Data disclosed by mining industries had been increas-ing but still they were heterogeneously reported. LCA data did not allow for an analysis over time and cross-country comparison, and water estimates from EE-IO tables showed high lev-els of uncertainty since they are based on models with little source data. E-PRTR, covered pollutants discharged to water for a significant share of the industry, yet it did not provide data on pollutant concentration on water discharges and data completeness was often limited.
Discussion and conclusion
The data sources identified may contribute to developing the EU knowledge base related to water use in raw materials production. However, data sources were limited and heterogene-ous. While more complete facility-scale data might be available (not easily accessible) at lo-cal or regional level, national and EU accounts that provide comprehensive data to monitor sectors and countries were limited, and very often provided with a high level of aggregation, which often did neither allow to discriminate non-energy mining activities, nor comparing primary and secondary (e.g. recycling) raw materials production. This information could be very relevant for the monitoring of the impact of the Circular Economy Action Plan de-ployment. The high level of aggregation might also hide trends in specific industries (e.g. cement, aluminium, iron and steel, etc.) and processes inside, providing a limited basis for understanding the underlying drivers.
Data on water use coming from national authorities and agencies was found the most val-uable source for our scope. However, conclusions based on them should be drawn with caution due to limited comparability among countries, and since, the full coverage of the EU countries was not ensured.
Complete datasets on contaminated water were much more limited. It is also important to bear in mind that leakages from dams or mining sites run off was not covered by the iden-tified data.
This example on the search for suitable data for water for the RMIS and the Raw Materials Scoreboard illustrates some of the challenges faced to provide sound data to policy making that allows meaningful assessments.
861
Lappeenranta, Finland IMWA 2017Mine Water and Circular Economy
Wolkersdorfer C, Sartz L, Sillanpää M, Häkkinen A (Editors)
Acknowledgements
The authors thank the experts interviewed during this study, who provided very valuable insight into the water-related data presented here: Arnaud Reynaud, Jeroen Bernhard, and Alberto Pistocchi (JRC Water and Marines Resources Unit); Stephan Pfister (ETH Zürich), Stefan Giljum (WU Vienna); Alexis Morgan and Susanne Schmitt (WWF), Elisa Vargas (DG Env), and Kevin Harding (Wits University). This work has been financed by the Administrative Arrangement SI2.738536 between DG GROWTH and DG JRC.
References
2006/21/EC Directive of the European Parliament and of the Council of 15 March 2006 on the management of waste from extractive industries and amending Directive 2004/35/EC2010/75/EU of the European Parliament and of the Council of 24 November 2010 on industrial emissions (integrated pollution prevention and control) (Recast)CDP water, https://www.cdp.net/en/waterEC (2008) Communication from the Commission to the European Parliament and the Council: The raw materials initiative – meeting our critical needs for growth and jobs in Europe, COM(2008) 699EC (2009) Best Available Techniques (BAT) Reference Document for the management of tailings and waste-rock in mining activitiesEC (2012) Best Available Techniques (BAT) Reference Document for Iron and Steel ProductionEC (2014) Report on critical raw materials for the EU, Ad hoc Working Group on defining critical raw materials), DG Enterprise and Industry (GROW) EC (2015) Communication from the Commission to the European Parliament, the Council, the European Economic and Social Committee and the Committee of the Regions: Closing the loop – An EU action plan for the Circular Economy, COM(2015)614 finalEC (2016) Raw Materials Scoreboard, http://bookshop.europa.eu/en/raw-materials-scoreboard- pbET0215541/E-PRTR (2017) European Pollutant Release and Transfer Register. Online tool to access and visualize the data http://prtr.ec.europa.eu/#/home; data download at the EEA portal, http://www. eea.europa.eu/data-and-maps/data/member-states-reporting-art-7-under-the-european- pollutant-release-and-transfer-register-e-prtr-regulation-13EXIOBASE version 2, http://www.exiobase.eu/ (version 3 provided by the authors, consulted December 2016)Global Reporting Initiative, https://www.globalreporting.org/Pages/default.aspxJRC (2015) Raw Materials Information System’ http://rmis.jrc.ec.europa.eu/Northey, SA, Haque, N, Lovel, R, and Cooksey, MA (2013), ‘Evaluating the application of water footprint methods to primary metal production systems’, Miner. Eng., 69, 65:80OCDE/Eurostat (2010) Data Collection Manual for the OECD/Eurostat Joint Questionnaire on Inland Waters Tables 1 – 7. Concepts, definitions, current practices, evaluations and recommendations, Version 2.3Reynaud, A (forthcoming) Use and value of water by industries in Europe: a cross-country analysis
862
Lappeenranta, Finland IMWA 2017Mine Water and Circular Economy
Wolkersdorfer C, Sartz L, Sillanpää M, Häkkinen A (Editors)
Green liquor dregs from pulp and paper industry used in mining waste management: a symbiosis project (GLAD)
between two Swedish base industries
Lotta Sartz1,5, Ian Hamilton2, Josef Mácsik3, Christian Maurice4, Stefan Sädbom5, Gunnar Westin6, Mattias Bäckström1,5
1Man-Technology-Environment Research Centre, Örebro University, Örebro, Sweden, [email protected]
2Econova Recycling AB, c/o Alfred Nobel Science Park, Örebro Sweden 3Ecoloop AB, Stockholm, Sweden
4Luleå University of Technology, Department of Civil, Environmental and Natural Resources Engineering, Luleå, Sweden
5Bergskraft Bergslagen AB, Kumla, Sweden 6RISE Processum AB, Örnsköldsvik, Sweden
Abstract Mining has been and still is an important industry in Sweden. Leaching from sulfidic mining waste is however a serious environmental issue that can bring acidity and metals in solution. Simultaneously, green liquor dreg (GLD) with potential to decrease oxygen transport to the waste and neutralize acid leachate, is generated by the pulp and paper industry and deposited in landfills. The aim of the project is to promote valorisation of GLD, identify hinders and create a database providing information about the material and its variability to enhance establishment of circular economy for the pulp and paper mill waste.
Key words Waste rock, alkaline by-product, sealing layer, injection
Introduction
Sweden is EU´s principal Fe producer and one of the main producers of Au, Pb, Ag, Zn and Cu. Thereby the Swedish mining industry is of utmost importance from a European per-spective. Mining operations may however have detrimental effects on soil, water and biota. Major long-term environmental effect is formation of acid mine drainage in sulfide-bearing mining waste. Simultaneously, Swedish paper and pulp industry – another important base industry, produces large amounts of alkaline residuals. Green liquor dreg (GLD) is the larg-est residual fraction, approximately 300 000 tonnes/yr is retrieved in the chemical recovery cycle at Swedish sulfate pulp mills. Today, GLD is exempted from taxes for disposal and there is no sustainable alternative for reutilization of GLD; the material is deposited or used to cap the mills´ own or municipal waste landfills.
Reclamation of mine waste
Today the most common method to prevent oxidization of sulfidic mining waste is to cover the waste material to prevent oxygen/water ingress. Today there are two main strategies used to prevent oxygen reaching the waste; 1) installing dry covers with a low permeability sealing layer or 2) disposing the waste under water. Both methods are based on the fact that oxygen diffusion is four orders of magnitude slower through water than through air. In Northern Europe climate conditions, the sealing layer method delay infiltration of oxygen through the cover by creating saturated condition (comparable to a suspended groundwater surface) in the sealing layer acting as an oxygen barrier. The second most common method
863
Lappeenranta, Finland IMWA 2017Mine Water and Circular Economy
Wolkersdorfer C, Sartz L, Sillanpää M, Häkkinen A (Editors)
is to dispose the mining waste below the water surface in a flooded open pit or in the tail-ings pond. Other approaches, which still are at the development level, aim at inhibiting the sulfide mineral to prevent the oxidation.
Sealing layer methods have limitations when the mining waste already has oxidized and when high concentrations of ferric iron is present. In such cases, the oxidation of the mining waste will continue, using ferric iron instead of oxygen and alkaline amendment is often used in order to increase pH and reduce trace element mobilization.
The 4-year GLAD project (2016-2020) (GLD vs ARD) was created around the hypothesis that GLD can be used as an effective agent in the remediation of acid generating mining waste. GLD consist of calcium carbonate, Na2CO3, Na2S and insoluble solids (Pöykiö et al. 2006; Martins et al. 2007; Nurmesniemi et al. 2005). Studies have shown that GLD typi-cally has low hydraulic conductivity (10-7-10-9 m/s) and is strongly alkaline (pH 11-13) (Nur-mesniemi et al. 2005). We agree with previous authors, that the properties suggest that GLD can be mixed together with natural materials, such as till, to construct sealing layers that will prevent oxygen from entering unoxidized mining waste. We also see a potential that GLD is a promising material to be used as neutralizer for already oxidized mining waste.
At the moment there are at least two new GLD-based methods that take advantage of dif-ferent properties of the GLD and are getting closer to commercial use. Mäkitalo (2015) de-scribes laboratory characterization and firmly established pilot experiments where GLD is mixed with coarse till. The GLD/till mixture fulfills the requirements for construction of sealing layers. In the application, the physical qualities (water retention capacity and low hydraulic conductivity) of the GLD is used and the buffering potential is merely a bonus that may affect the underlying waste. In another new application (Bäckström et al. 2011), GLD is injected into oxidized mining waste. Adhesive properties of the GLD decreases infiltration of water and the pH is increased which in turn reduces trace element mobility.
For acceptance of GLD, mining companies and authorities require production and quality control of critical factors over time. GLD is a residual material with generally negative mon-etary value for the producers and consequently, limited efforts have been made to monitor and control their quality. One key point in the GLAD project is to establish a GLD-property database with information about critical parameters for different types of applications. The database will make it easier for mining companies and “middle hands” (consultants and entrepreneurs) to compare and select materials for remediation. The database will also be a useful tool to guide the paper/pulp industry to target appropriate applications for the mate-rial and provide better knowledge of the quality criteria´s to be adhered to.
Methods
The GLAD Project
Project GLAD aims to fill the knowledge gap on production and quality requirements that currently is hindering the use of GLD for remediation of mine tailings and waste rock, and
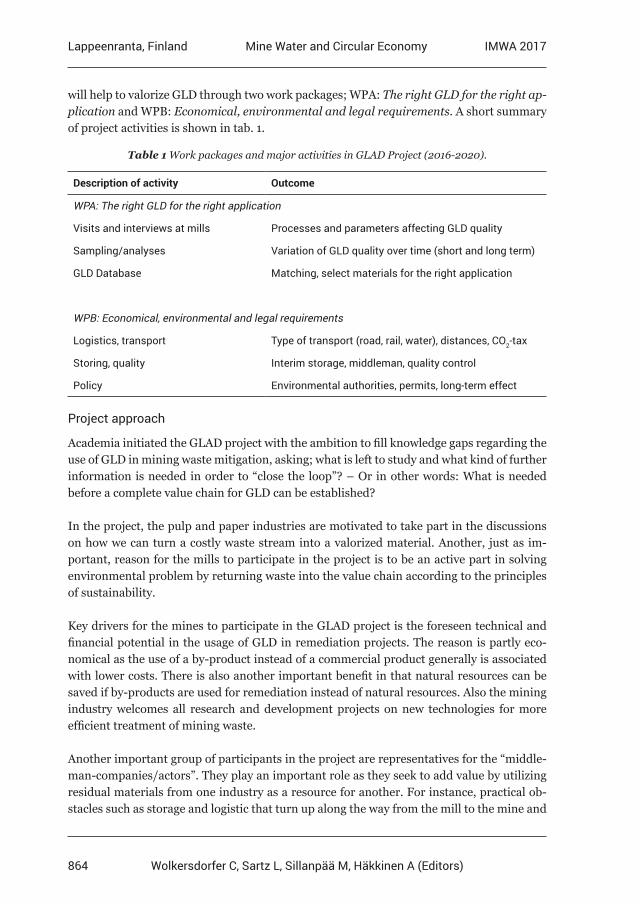
864
Lappeenranta, Finland IMWA 2017Mine Water and Circular Economy
Wolkersdorfer C, Sartz L, Sillanpää M, Häkkinen A (Editors)
will help to valorize GLD through two work packages; WPA: The right GLD for the right ap-plication and WPB: Economical, environmental and legal requirements. A short summary of project activities is shown in tab. 1.
Table 1 Work packages and major activities in GLAD Project (2016-2020).
Description of activity Outcome
WPA: The right GLD for the right application
Visits and interviews at mills Processes and parameters affecting GLD quality
Sampling/analyses Variation of GLD quality over time (short and long term)
GLD Database Matching, select materials for the right application
WPB: Economical, environmental and legal requirements
Logistics, transport Type of transport (road, rail, water), distances, CO2-tax
Storing, quality Interim storage, middleman, quality control
Policy Environmental authorities, permits, long-term effect
Project approach
Academia initiated the GLAD project with the ambition to fill knowledge gaps regarding the use of GLD in mining waste mitigation, asking; what is left to study and what kind of further information is needed in order to “close the loop”? – Or in other words: What is needed before a complete value chain for GLD can be established?
In the project, the pulp and paper industries are motivated to take part in the discussions on how we can turn a costly waste stream into a valorized material. Another, just as im-portant, reason for the mills to participate in the project is to be an active part in solving environmental problem by returning waste into the value chain according to the principles of sustainability.
Key drivers for the mines to participate in the GLAD project is the foreseen technical and financial potential in the usage of GLD in remediation projects. The reason is partly eco-nomical as the use of a by-product instead of a commercial product generally is associated with lower costs. There is also another important benefit in that natural resources can be saved if by-products are used for remediation instead of natural resources. Also the mining industry welcomes all research and development projects on new technologies for more efficient treatment of mining waste.
Another important group of participants in the project are representatives for the “middle-man-companies/actors”. They play an important role as they seek to add value by utilizing residual materials from one industry as a resource for another. For instance, practical ob-stacles such as storage and logistic that turn up along the way from the mill to the mine and
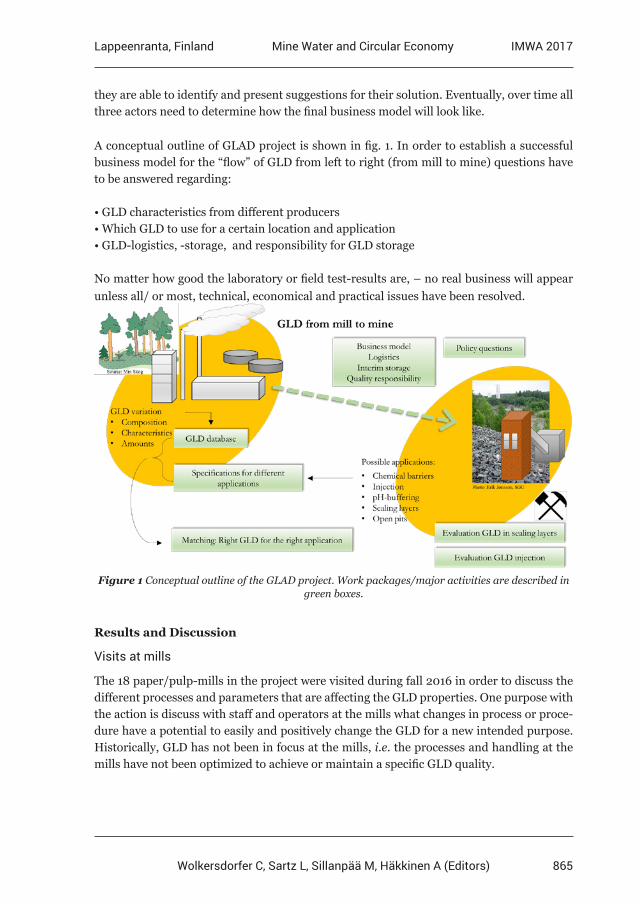
865
Lappeenranta, Finland IMWA 2017Mine Water and Circular Economy
Wolkersdorfer C, Sartz L, Sillanpää M, Häkkinen A (Editors)
they are able to identify and present suggestions for their solution. Eventually, over time all three actors need to determine how the final business model will look like.
A conceptual outline of GLAD project is shown in fig. 1. In order to establish a successful business model for the “flow” of GLD from left to right (from mill to mine) questions have to be answered regarding:
• GLD characteristics from different producers• Which GLD to use for a certain location and application• GLD-logistics, -storage, and responsibility for GLD storage
No matter how good the laboratory or field test-results are, – no real business will appear unless all/ or most, technical, economical and practical issues have been resolved.
Figure 1 Conceptual outline of the GLAD project. Work packages/major activities are described in green boxes.
Results and Discussion
Visits at mills
The 18 paper/pulp-mills in the project were visited during fall 2016 in order to discuss the different processes and parameters that are affecting the GLD properties. One purpose with the action is discuss with staff and operators at the mills what changes in process or proce-dure have a potential to easily and positively change the GLD for a new intended purpose. Historically, GLD has not been in focus at the mills, i.e. the processes and handling at the mills have not been optimized to achieve or maintain a specific GLD quality.
866
Lappeenranta, Finland IMWA 2017Mine Water and Circular Economy
Wolkersdorfer C, Sartz L, Sillanpää M, Häkkinen A (Editors)
Analyses of GLD
In order to determine the degree and character of variations in quality of GLD between different mills and different batches, GLD will be sampled at several mills at four occasions 2017 and 2018.
The investigated properties will be: Total element concentrations (by alkaline fusion and acid digestion followed by ICP-MS analysis), organic contaminants, cellulose derivates, mineralogy (XRD and SEM), water retention capacity (WR), hydraulic conductivity (HC), porosity, and organic content (determined as total organic content).
Leaching properties will be determined by standardized leaching tests (L/S 2, L/S 10) and sequential leaching test and leaching solutions will be analyzed for pH, redox potential, electrical conductivity, alkalinity, total organic content, sulfate, chloride, fluoride, nitrate, phosphate and element concentrations. Anions will be determined by capillary zone electro-phoresis or ion chromatography.
ATR-FTIR analysis: By analyzing all GLD samples with ATR-FTIR and relate the obtained spectra’s to the measured quality parameters (both chemical and physical) a multivariate model can be created using PCA and PLS. This model will be able to quickly determine both quality and changes with time for the same mill. The method and model can also be applied in a field situation to quickly determine the quality in different batches.
There are no records of eco toxic decomposition products of cellulose to GLD, but there is a potential risk which must be addressed. Samples of GLD from several different mills will be characterized with respect to human toxicity and eco toxicity: 1) simulated gastro intestine system leaching in order to determine toxicity when ingested, 2) skin exposure, inhalation etc., and 3) eco toxicity tests (fish and aquatic organisms).
Evaluation of the test results will show the industry and the environmental authorities that there are low risks in the handling, use and environmental application of GLD and that the application has no adverse effects on neither human health nor the environment (primarily the aquatic environment).
GLD Database
Characterization of the GLD as well as the relevant information about the process generat-ing the GLD will be compiled in an open database, where it is possible to compare different GLDs between different facilities, but also to compare with the requirements demanded by different reclamation methods. The database will be used to shift the view of GLD as “only a by-product” to a potential product and provide an incentive to slightly change the produc-tion in order to achieve a better GLD product. Reclamation projects will also have a new source of information that enables logistical planning and the selection of the “right” GLD material for their chosen method and remediation project.
867
Lappeenranta, Finland IMWA 2017Mine Water and Circular Economy
Wolkersdorfer C, Sartz L, Sillanpää M, Häkkinen A (Editors)
GLD quality varies depending on the production parameters and e.g. production incidents may lead to a batch with exceptional properties that should be separated for special purpos-es from the standard quality. There is also a need to develop a procedure for the operator at the mills to be aware of the quality of GLD, control it and ensure that different quality material do not impair the standard quality.
Criteria for quality control will be defined based on the use i.e. sealing layer, injection, etc. The aim is to identify key parameters that could be controlled by technicians at the paper mill and ensure that “different” material is not mixed with “standard” quality material.
GLD is expected to gain a higher degree of acceptance from authorities by becoming more transparent regarding what the benefits are using GLD, its content, properties and environ-mental impact.
Logistics and transport
The project will also study the logistical aspects connected to the application of GLD: vol-umes, transports, and interim/on-site storage.
Transportation costs may be a financial hurdle in many projects and therefore different solutions for transportation will be investigated including the possibility to use returning empty transports.
Storing and quality responsibility
Handling of GLD on the mining site and alternatives for temporary storing needs to be investigated. Possible GLD quality changes during aging also have an impact on the pos-sibility to store GLD either at a mining site prior to reclamation or at a mill site prior to transportation.
Arrangements where a “middleman”-company (consultant or entrepreneur) assigned for the project guarantees delivery of a certain volume with a certain quality (e.g. d.w.) are expected to be developed.
Policy questions
Market based instruments, e.g. deposit tax for GLD, affects how GLD will be seen in the future – as a cost-efficient, sustainable amendment for mine waste remediation, or as a by-product with limited, or no, area of application For the moment GLD is exempt from waste taxation (500 SEK/ton) but what will happen if the tax for depositing of waste also would include GLD?
In the GLAD project, two new approaches of using GLD for mine waste mitigation are eval-uated (GLD/till mixing and injection). Both trials have a background in experiences from trials that have been running for several years which gives a good starting point. The long-term based pilot scale tests are fundamental in the project. Results from “real world trials” are critical in proving to the authorities that our suggested use of GLD is a suitable, long-term treatment method of acid generating mining waste.
868
Lappeenranta, Finland IMWA 2017Mine Water and Circular Economy
Wolkersdorfer C, Sartz L, Sillanpää M, Häkkinen A (Editors)
Conclusions
Two major work packages have been identified in order to develop a successful, mar-ket-based business model for using GLD in mine waste applications. These are: 1) Estab-lishment of a robust database with information on volumes and quality of GLD at different mills and 2) Economical, environmental and legal requirements; all crucial parameters that more or less determine how the proposed new methods for GLD utilization will be accepted in practice.
Acknowledgements
The authors wish to thank The Swedish Foundation for Strategic Environmental Research for funding of the project within the Closing the Loop II programme. GLAD is a collaboration project between academia and the industry and the following partners are crucial for its realisation: BillerudKorsnäs Sweden AB, BillerudKorsnäs Skog & Industri AB, Smurfit Kappa Piteå, SCA Munksund AB, SCA Obbola AB, SCA Östrand AB, Aditya Birla Domsjö Fabriker AB, Mondi Dynäs AB, Holmen Iggesund Paperboard AB, Vallviks Bruk AB, Stora Enso Skutskär AB, Stora Enso Skoghall AB, Munksjö Paper AB Billingsfors, Ahlstrom-Munksjö Aspa Bruk AB, Södra Cell Mönsterås, Boliden Mineral AB, Ragn-Sells AB, RISE Processum AB, Zinkgruvan Mining AB, Econova AB, JRP Recycling Solutions AB, Swerecycling AB and Bergskraft Bergslagen AB.
References
Bäckström M, Sartz L, Larsson E, Karlsson S (2011) Properties of alkaline materials for injection into weathered mine waste piles – methods and initial pilot trials. In: Rüde RT, Freund A & Wolkersdorfer Ch; Mine Water – Managing the Challenges, p. 265—269; Aachen, GermanyMartins FM, Martins JM, Ferracin LC, da Cunha CJ (2007) Mineral phases of green liquor dregs, slaker grits, lime mud and wood ash of a Kraft pulp and paper mill. J Haz Mat 147:610—617, doi:10.1016 / j.jhazmat.2007.01.057 Mäkitalo M (2015) Green liquor dregs in sealing layers to prevent the formation of acid mine drainage – from characterization to implementation. Doctoral Dissertation, Luleå University of TechnologyNurmesniemi H, Pöykiö R, Perämäki P, Kuokkanen T (2005) The use of a sequential leaching procedure for heavy metal fractionation in green liquor dregs from a causticizing process at a pulp mill. Chem 61: 1475—1484, doi:10.1016 / j.chemosphere.2005.04.114Pöykiö R, Nurmesniemi H, Kuokkanen T, Perämäki P (2006) Green liquor dregs as an alternative neutralizing agent at a pulp mill. Environ Chem Lett 4:37—40, doi:10.1007/ s10311-005- 0031-0
869
Lappeenranta, Finland IMWA 2017Mine Water and Circular Economy
Wolkersdorfer C, Sartz L, Sillanpää M, Häkkinen A (Editors)
Slag: What is it good for? Utilization of steelmaking slag to remove phosphate and
neutralize acid
Nadine M. Piatak1, Robert R. Seal II1, Darryl A. Hoppe1, Carlin J. Green1, Paul M. Buszka2
1U.S. Geological Survey, 954 National Center, Reston, Virginia, USA, [email protected] 2U.S. Geological Survey, 5957 Lakeside Blvd., Indianapolis, Indiana, USA
Abstract Iron and steel slag has potential application in water treatment, beyond its current use in construction materials. Static and kinetic reactive test results using modern and legacy iron and steel slags from the Chicago-Gary area of Illinois and Indiana, USA, near Lake Michigan, demonstrated that slags are effective at removing phosphate from solutions, with modern air-cooled material being the most effective. Most slag samples additionally have high net neutralization potentials, some almost reaching that of calcite. These results indicate steelmaking slag may be a viable option for treating nutrient-rich or acidic waters.
Key words ferrous slag, nutrient removal, water treatment, neutralization potential, waste valorization
Introduction
Ferrous slag, a term that includes iron and steel slag, is the byproduct generated after smelt-ing iron ore in a blast furnace and making steel, most commonly in a Basic Oxygen Furnace (BOF) or Electric Arc Furnace. Ferrous slag is widely used in construction but vast amounts continue to be disposed of as waste. In the Chicago-Gary area of Illinois and Indiana, USA, slag infills lake-shore wetlands and generates alkaline drainage. Regional eutrophication and local acidification are concurrent problems in waterways in these states. Utilizing local-ly available steelmaking slag to treat nutrient-rich or acidic waters would be a higher value alternative than the use of slag in construction, potentially offsetting restoration costs to degraded legacy areas and decreasing steel manufacturers’ current waste footprint.
Samples and Methods
Slag from legacy sites and modern operating steelmaking facilities (tab. 1) is mostly vesic-ular and air-cooled, except for USSFegran, which is a granulated slag that consists of sand-sized glassy fragments. Several samples are fine grained, generally < 9.5 mm in diameter, and referred to as “C-fines.” C-fines are generally the size fraction remaining after steelmak-ers sort air-cooled slag to recover larger fragments to sell for use in construction. Coarse composites (30 – 50 subsamples) of air-cooled slag from legacy sites were crushed to < 9.5 mm. For column experiments, two slag samples (AMFeC and ILSS5) were further crushed to < 4.75 mm to ensure adequate flow within columns (inner diameters of 5 cm and length of 23.5 cm). Samples were also sieved to > 0.5 mm to remove fines to avoid clogging. In addition to slag, commercial-grade pulverized agricultural limestone (< 2.0 mm) was used in some tests for comparison to slag.
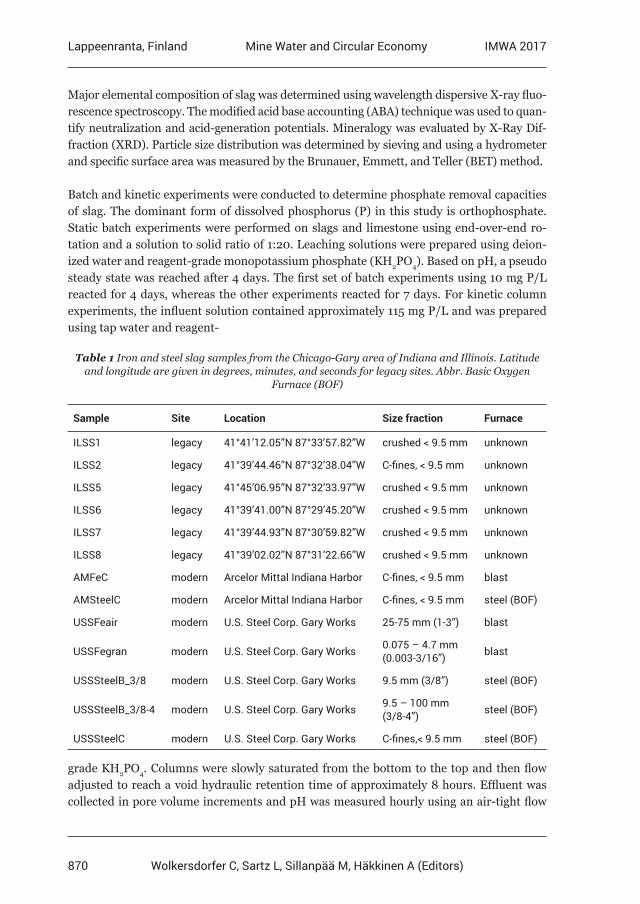
870
Lappeenranta, Finland IMWA 2017Mine Water and Circular Economy
Wolkersdorfer C, Sartz L, Sillanpää M, Häkkinen A (Editors)
Major elemental composition of slag was determined using wavelength dispersive X-ray fluo-rescence spectroscopy. The modified acid base accounting (ABA) technique was used to quan-tify neutralization and acid-generation potentials. Mineralogy was evaluated by X-Ray Dif-fraction (XRD). Particle size distribution was determined by sieving and using a hydrometer and specific surface area was measured by the Brunauer, Emmett, and Teller (BET) method.
Batch and kinetic experiments were conducted to determine phosphate removal capacities of slag. The dominant form of dissolved phosphorus (P) in this study is orthophosphate. Static batch experiments were performed on slags and limestone using end-over-end ro-tation and a solution to solid ratio of 1:20. Leaching solutions were prepared using deion-ized water and reagent-grade monopotassium phosphate (KH2PO4). Based on pH, a pseudo steady state was reached after 4 days. The first set of batch experiments using 10 mg P/L reacted for 4 days, whereas the other experiments reacted for 7 days. For kinetic column experiments, the influent solution contained approximately 115 mg P/L and was prepared using tap water and reagent-
Table 1 Iron and steel slag samples from the Chicago-Gary area of Indiana and Illinois. Latitude and longitude are given in degrees, minutes, and seconds for legacy sites. Abbr. Basic Oxygen
Furnace (BOF)
Sample Site Location Size fraction Furnace
ILSS1 legacy 41°41’12.05”N 87°33’57.82”W crushed < 9.5 mm unknown
ILSS2 legacy 41°39’44.46”N 87°32’38.04”W C-fines, < 9.5 mm unknown
ILSS5 legacy 41°45’06.95”N 87°32’33.97”W crushed < 9.5 mm unknown
ILSS6 legacy 41°39’41.00”N 87°29’45.20”W crushed < 9.5 mm unknown
ILSS7 legacy 41°39’44.93”N 87°30’59.82”W crushed < 9.5 mm unknown
ILSS8 legacy 41°39’02.02”N 87°31’22.66”W crushed < 9.5 mm unknown
AMFeC modern Arcelor Mittal Indiana Harbor C-fines, < 9.5 mm blast
AMSteelC modern Arcelor Mittal Indiana Harbor C-fines, < 9.5 mm steel (BOF)
USSFeair modern U.S. Steel Corp. Gary Works 25-75 mm (1-3”) blast
USSFegran modern U.S. Steel Corp. Gary Works 0.075 – 4.7 mm (0.003-3/16”) blast
USSSteelB_3/8 modern U.S. Steel Corp. Gary Works 9.5 mm (3/8”) steel (BOF)
USSSteelB_3/8-4 modern U.S. Steel Corp. Gary Works 9.5 – 100 mm (3/8-4”) steel (BOF)
USSSteelC modern U.S. Steel Corp. Gary Works C-fines,< 9.5 mm steel (BOF)
grade KH2PO4. Columns were slowly saturated from the bottom to the top and then flow adjusted to reach a void hydraulic retention time of approximately 8 hours. Effluent was collected in pore volume increments and pH was measured hourly using an air-tight flow
871
Lappeenranta, Finland IMWA 2017Mine Water and Circular Economy
Wolkersdorfer C, Sartz L, Sillanpää M, Häkkinen A (Editors)
through cell before effluent was exposed to the atmosphere (“initial pH”). The “final pH” of the pore volume, after exposure to the atmosphere, was as much as 1 pH unit lower than the initial pH because as the effluent equilibrated with CO2 in the atmosphere, calcite precipi-tated, generating hydrogen ions and resulting in a lower pH.
Reacted solutions from experiments were filtered (0.45 µm) and analyzed by inductively coupled plasma-atomic emission spectrometry, inductively coupled plasma-mass spec-trometry, and ion chromatography for major and trace elements. Phosphate was measured by spectrophotometry using the ascorbic acid method and alkalinity by titration. Geochem-ical modeling was performed using PHREEQC v. 3.3 and the minteq.v4 database.
Results and Discussion
Mineralogy and Chemistry
Modern and legacy slags (n = 13) generally have comparable chemical compositions with 10 – 44 wt. % CaO, 0.3 – 28 wt. % FeO, 10 – 44 wt. % SiO2, 1 – 15 wt. % Al2O3, 2 – 11 wt. % MgO, and 0.3 – 9 wt. % MnO. Modern iron and steel slags generally have higher concen-trations of Ca than legacy slag (fig. 1). Modern granulated and coarse air-cooled iron slags have the least amounts of Fe (1 wt. % FeO or less). Commonly identified mineral phases include: larnite, brownmillerite-srebrodolskite, melilite, wustite, spinel, calcite, quartz and cristobalite, and iron metal. The granulated iron slag is nearly all amorphous glass. Glass is less abundant, although likely present, in the other slag samples. The bulk chemistry and mineralogy of these samples are comparable to those reported for ferrous slag throughout the world (Piatak et al. 2015).
Neutralization Potential
Most slags produce alkaline paste pH values (pH 10 – 13) and have high net neutralization potentials (NNP) (400 – 830 kg CaCO3/t). The highest NNP values are equivalent to ap-proximately 80 % the neutralization potential of pure calcite or limestone (fig. 1). Samples with the highest NNP include modern iron granulated slag and the coarse-size fractions of modern, air-cooled iron and steel slags. Interestingly, two legacy samples offer comparable neutralization potentials to the modern materials (fig. 1). NNP correlates strongly with total Ca content (fig. 1). The Ca minerals in the slag (calcite, larnite, and rankinite) consume acid during hydrolysis, explaining this correlation. The slags with the highest NNP may be useful in treating acidic solutions such as acid-mine drainage from coal or base-metal operations as was reported by Simmons et al. (2002) who utilized ferrous slag as a filter in a leach bed that successfully neutralized acidic coal-mine drainage in West Virginia, USA.
Phosphate Removal Capacity
Batch experiments demonstrate efficient removal of phosphate from solutions with initial phosphate concentrations ranging from 10 to 1,085 mg P/L. At the lowest tested phosphate concentration of 10 mg P/L, 12 of the 13 slags removed essentially all of the phosphate from the solution (98 – 100 % retained in solid), with the lowest removal of 98 % measured for the coarse air-cooled blast-furnace slag (USSFeair), which had the lowest specific sur-
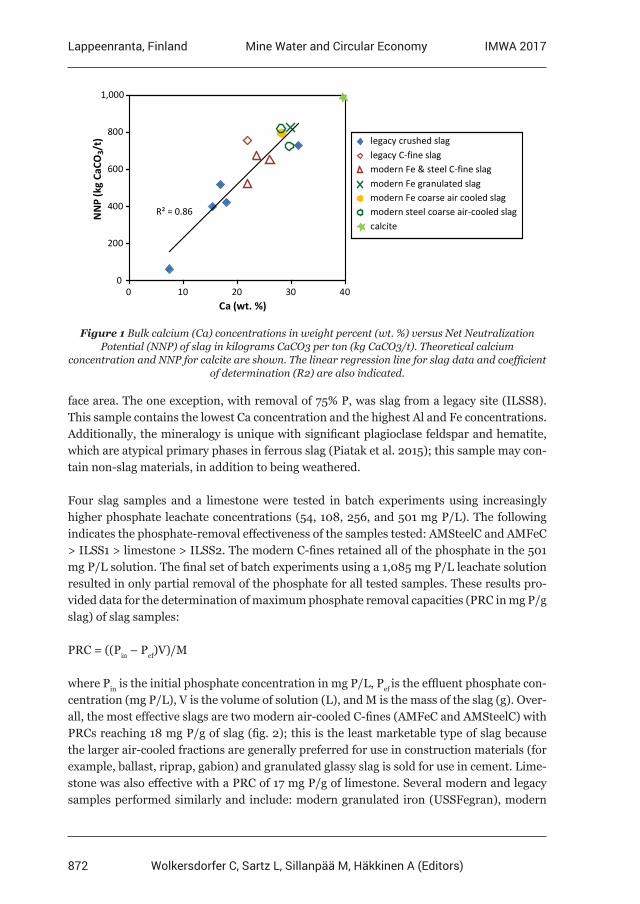
872
Lappeenranta, Finland IMWA 2017Mine Water and Circular Economy
Wolkersdorfer C, Sartz L, Sillanpää M, Häkkinen A (Editors)
R² = 0.86
0
200
400
600
800
1,000
0 10 20 30 40
NN
P(k
gCa
CO3/
t)
Ca (wt. %)
legacy crushed slaglegacy C-fine slagmodern Fe & steel C-fine slagmodern Fe granulated slagmodern Fe coarse air cooled slagmodern steel coarse air-cooled slagcalcite
Figure 1 Bulk calcium (Ca) concentrations in weight percent (wt. %) versus Net Neutralization Potential (NNP) of slag in kilograms CaCO3 per ton (kg CaCO3/t). Theoretical calcium
concentration and NNP for calcite are shown. The linear regression line for slag data and coefficient of determination (R2) are also indicated.
face area. The one exception, with removal of 75% P, was slag from a legacy site (ILSS8). This sample contains the lowest Ca concentration and the highest Al and Fe concentrations. Additionally, the mineralogy is unique with significant plagioclase feldspar and hematite, which are atypical primary phases in ferrous slag (Piatak et al. 2015); this sample may con-tain non-slag materials, in addition to being weathered.
Four slag samples and a limestone were tested in batch experiments using increasingly higher phosphate leachate concentrations (54, 108, 256, and 501 mg P/L). The following indicates the phosphate-removal effectiveness of the samples tested: AMSteelC and AMFeC > ILSS1 > limestone > ILSS2. The modern C-fines retained all of the phosphate in the 501 mg P/L solution. The final set of batch experiments using a 1,085 mg P/L leachate solution resulted in only partial removal of the phosphate for all tested samples. These results pro-vided data for the determination of maximum phosphate removal capacities (PRC in mg P/g slag) of slag samples:
PRC = ((Pin – Pef)V)/M
where Pin is the initial phosphate concentration in mg P/L, Pef is the effluent phosphate con-centration (mg P/L), V is the volume of solution (L), and M is the mass of the slag (g). Over-all, the most effective slags are two modern air-cooled C-fines (AMFeC and AMSteelC) with PRCs reaching 18 mg P/g of slag (fig. 2); this is the least marketable type of slag because the larger air-cooled fractions are generally preferred for use in construction materials (for example, ballast, riprap, gabion) and granulated glassy slag is sold for use in cement. Lime-stone was also effective with a PRC of 17 mg P/g of limestone. Several modern and legacy samples performed similarly and include: modern granulated iron (USSFegran), modern
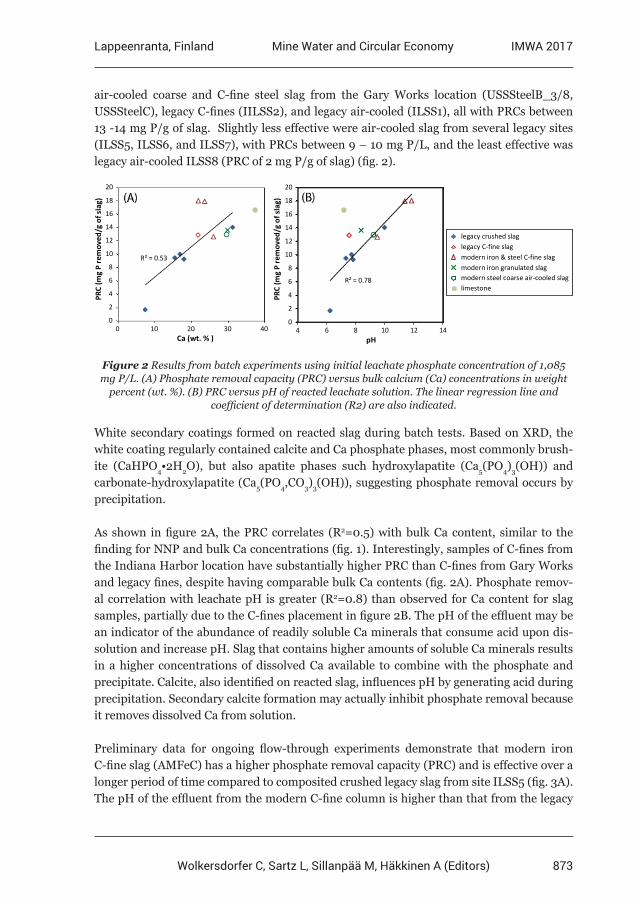
873
Lappeenranta, Finland IMWA 2017Mine Water and Circular Economy
Wolkersdorfer C, Sartz L, Sillanpää M, Häkkinen A (Editors)
air-cooled coarse and C-fine steel slag from the Gary Works location (USSSteelB_3/8, USSSteelC), legacy C-fines (IILSS2), and legacy air-cooled (ILSS1), all with PRCs between 13 -14 mg P/g of slag. Slightly less effective were air-cooled slag from several legacy sites (ILSS5, ILSS6, and ILSS7), with PRCs between 9 – 10 mg P/L, and the least effective was legacy air-cooled ILSS8 (PRC of 2 mg P/g of slag) (fig. 2).
(A) (B)
R² = 0.53
0
2
4
6
8
10
12
14
16
18
20
0 10 20 30 40
PRC
(mg
Pre
mov
ed/g
ofsl
ag)
Ca (wt. % )
R² = 0.78
0
2
4
6
8
10
12
14
16
18
20
4 6 8 10 12 14
PRC
(mg
Pre
mov
ed/g
ofsl
ag)
pH
legacy crushed slaglegacy C-fine slagmodern iron & steel C-fine slagmodern iron granulated slagmodern steel coarse air-cooled slaglimestone
Figure 2 Results from batch experiments using initial leachate phosphate concentration of 1,085 mg P/L. (A) Phosphate removal capacity (PRC) versus bulk calcium (Ca) concentrations in weight
percent (wt. %). (B) PRC versus pH of reacted leachate solution. The linear regression line and coefficient of determination (R2) are also indicated.
White secondary coatings formed on reacted slag during batch tests. Based on XRD, the white coating regularly contained calcite and Ca phosphate phases, most commonly brush-ite (CaHPO4•2H2O), but also apatite phases such hydroxylapatite (Ca5(PO4)3(OH)) and carbonate-hydroxylapatite (Ca5(PO4,CO3)3(OH)), suggesting phosphate removal occurs by precipitation.
As shown in figure 2A, the PRC correlates (R2=0.5) with bulk Ca content, similar to the finding for NNP and bulk Ca concentrations (fig. 1). Interestingly, samples of C-fines from the Indiana Harbor location have substantially higher PRC than C-fines from Gary Works and legacy fines, despite having comparable bulk Ca contents (fig. 2A). Phosphate remov-al correlation with leachate pH is greater (R2=0.8) than observed for Ca content for slag samples, partially due to the C-fines placement in figure 2B. The pH of the effluent may be an indicator of the abundance of readily soluble Ca minerals that consume acid upon dis-solution and increase pH. Slag that contains higher amounts of soluble Ca minerals results in a higher concentrations of dissolved Ca available to combine with the phosphate and precipitate. Calcite, also identified on reacted slag, influences pH by generating acid during precipitation. Secondary calcite formation may actually inhibit phosphate removal because it removes dissolved Ca from solution.
Preliminary data for ongoing flow-through experiments demonstrate that modern iron C-fine slag (AMFeC) has a higher phosphate removal capacity (PRC) and is effective over a longer period of time compared to composited crushed legacy slag from site ILSS5 (fig. 3A). The pH of the effluent from the modern C-fine column is higher than that from the legacy
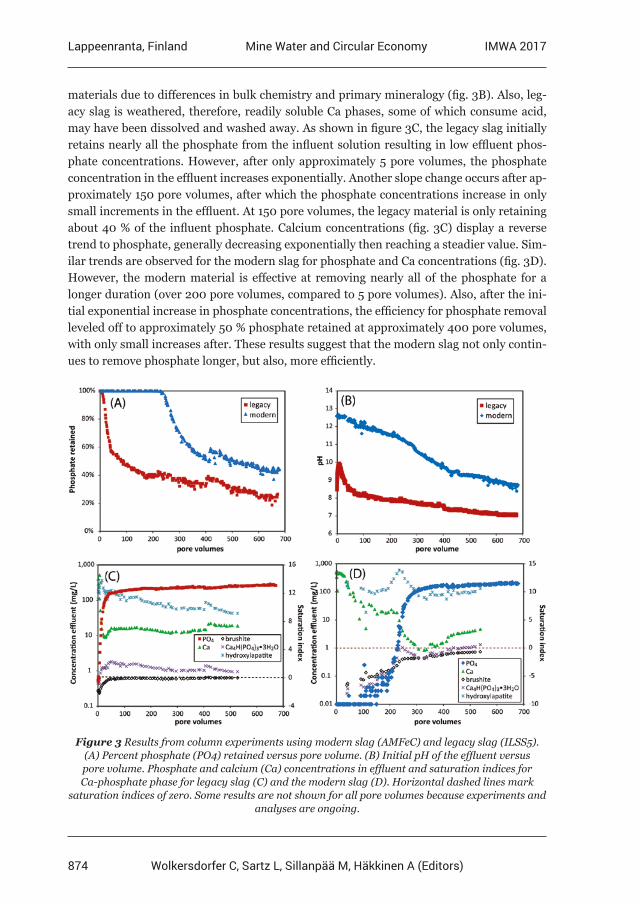
874
Lappeenranta, Finland IMWA 2017Mine Water and Circular Economy
Wolkersdorfer C, Sartz L, Sillanpää M, Häkkinen A (Editors)
materials due to differences in bulk chemistry and primary mineralogy (fig. 3B). Also, leg-acy slag is weathered, therefore, readily soluble Ca phases, some of which consume acid, may have been dissolved and washed away. As shown in figure 3C, the legacy slag initially retains nearly all the phosphate from the influent solution resulting in low effluent phos-phate concentrations. However, after only approximately 5 pore volumes, the phosphate concentration in the effluent increases exponentially. Another slope change occurs after ap-proximately 150 pore volumes, after which the phosphate concentrations increase in only small increments in the effluent. At 150 pore volumes, the legacy material is only retaining about 40 % of the influent phosphate. Calcium concentrations (fig. 3C) display a reverse trend to phosphate, generally decreasing exponentially then reaching a steadier value. Sim-ilar trends are observed for the modern slag for phosphate and Ca concentrations (fig. 3D). However, the modern material is effective at removing nearly all of the phosphate for a longer duration (over 200 pore volumes, compared to 5 pore volumes). Also, after the ini-tial exponential increase in phosphate concentrations, the efficiency for phosphate removal leveled off to approximately 50 % phosphate retained at approximately 400 pore volumes, with only small increases after. These results suggest that the modern slag not only contin-ues to remove phosphate longer, but also, more efficiently.
Figure 3 Results from column experiments using modern slag (AMFeC) and legacy slag (ILSS5). (A) Percent phosphate (PO4) retained versus pore volume. (B) Initial pH of the effluent versus pore volume. Phosphate and calcium (Ca) concentrations in effluent and saturation indices for Ca-phosphate phase for legacy slag (C) and the modern slag (D). Horizontal dashed lines mark
saturation indices of zero. Some results are not shown for all pore volumes because experiments and analyses are ongoing.
875
Lappeenranta, Finland IMWA 2017Mine Water and Circular Economy
Wolkersdorfer C, Sartz L, Sillanpää M, Häkkinen A (Editors)
The dissolution of Ca silicates and oxides in the slag likely increases Ca2+ and OH- concen-trations, which reacts with phosphate to form Ca phosphates. Under acidic to near neutral pH, brushite (CaHPO4•2H2O) is predicted to form from aqueous solutions, whereas under alkaline conditions, octacalcium phosphate (Ca8(HPO4)2(PO4)4•5H2O) may form before con-verting into Ca-deficient hydroxylapatite (Ca10-x(HPO4)x(PO4)6-x(OH)2-x (0 < x < 1)), which then may age to hydroxylapatite (Ca5(PO4)3(OH)), which is stable and insoluble (Dorozhkin 2016). Amorphous Ca phosphate has also been found to form before crystalizing to more stable forms. Bowden et al. (2009) reported a sequence of Ca-phosphate phases on reacted steel slag in column experiments from the most soluble brushite to octacalcium phosphate and hydroxylapatite over time. Interestingly, the legacy slag in this study generates an efflu-ent that, based on geochemical modeling, is oversaturated with respect to hydroxylapatite and octacalcium phosphate (represented in the geochemical database as Ca4H(PO4)3•3H2O) but after 40 pore volumes is approximately saturated with respect to brushite (saturation index ~ 0) (fig. 3C). Brushite was identified by XRD in precipitate that formed in the ef-fluent from this column, further supporting the hypothesis that precipitation of Ca phos-phate is a main removal mechanism. Geochemical modeling of Ca-phosphate phases for the modern slag column effluents results in saturation indices that are oversaturated for hydroxylapatite; however brushite and octacalcium phosphate saturation indices approach zero after approximately 250 pore volumes (fig. 3D). The formation of octacalcium phos-phate from more alkaline solutions reported by Dorozhkin (2016) may be consistent with its presence in the modern slag column with higher pH effluent. (Once the kinetic experi-ments are terminated, mineralogical identification of secondary precipitates formed within both columns will be conducted to compare to modeling results.) Some Ca phosphate phas-es such as brushite are more soluble at low and high pH (Dorozhkin 2016), therefore the higher pH conditions in the modern slag column compared to the legacy slag column (fig. 3B) may inhibit its initial precipitation. The mechanism that drives the phosphate removal previous to that requires further investigation. Precipitation of Fe phosphates may play a role. Also, calcite actively precipitated from effluent generated in the modern slag column for approximately the first 250 pore volumes, generally the same duration that brushite and octacalcium phosphate were undersaturated. During these initial pore volumes, primary Ca phases in the slag and secondary calcite may have provided sorption sites for phosphate. According to Bowden et al. (2009), absorbed phosphate on calcite may form nucleation sites from which precipitation of Ca phosphates may occur; however, limited sites are likely available on the calcite. Further, most of the secondary calcite began forming only after the effluent was exposed to atmospheric CO2. Iron phases in the slag (iron metal, wustite) may also provide sorption sites. However, sorption of phosphate would likely be limited under these high pH conditions. Additionally, phases not in the geochemical database such as amorphous Ca phosphate or Ca-deficient hydroxylapatite may be controlling Ca and phos-phate concentrations.
After the phosphate removal efficiency of both columns declines sharply, a much slower decline is observed and maintained for many pore volumes. Initially, the dissolution of the more soluble Ca-bearing minerals provides readily available Ca to combine with the phos-
876
Lappeenranta, Finland IMWA 2017Mine Water and Circular Economy
Wolkersdorfer C, Sartz L, Sillanpää M, Häkkinen A (Editors)
phate. The sharp decline may occur once the readily soluble Ca is exhausted and/or armor-ing by precipitates occurs on slag grains. Subsequently, the influent solutions become a significant source of Ca ions available for Ca-phosphate precipitation. Modeling indicates that the influent solution used is supersaturated with respect to brushite, and white pre-cipitates appeared to continue to accumulate in the column. Slag dissolution facilitated the initial nucleation of phosphate precipitation, which continues to occur due to a continuous supply of Ca in the influent. This effect was also observed by Bowden et al. (2009). This has interesting implications for water treatment scenarios such that phosphate removal may continue past predictions based on a slag’s PRC if the water to be treated is a source of Ca ions to the system. However, the precipitation of calcite and Ca phosphate may eventually decrease the hydraulic conductivity and dispersivity in treatment systems. To date, the cumulative PRC of the columns are 12 mg P/g of slag for legacy ILSS5 and 15 mg P/g of slag for modern C-fines (AMFeC).
Conclusions
Steelmaking slag may be a viable option for use in removing phosphate from municipal wastewaters or agricultural runoff or to treat acid solutions, such as acid-mine drainage. Because the bulk Ca content of the slags generally correlates with its effectiveness to remove phosphate and neutralize acid, determining Ca content maybe a useful initial assessment for identifying and ranking potential usable slag materials. Promoting the utilization of slag may reduce the amount disposed as waste at modern facilities, help offset restoration costs at legacy sites, and decrease the need to mine natural materials for water treatment appli-cations.
Acknowledgements
The authors thank Arcelor Mittal and U.S. Steel Corporation for providing modern steelmaking slags. Travis Cole and Robert Kay, of the U.S. Geological Survey, assisted in collecting slag samples at legacy sites. Jane Hammarstrom and Sarah Hayes, of the U.S. Geological Survey, provided helpful review comments that improved the text.
References
Bowden LI, Jarvis AP, Younger PL, Johnson KL (2009) Phosphorus removal from waste waters basic oxygen steel slag. Environ Sci Technol 43:2476-2481. doi:10.1021/es801626dDorozhkin SV (2016) Calcium orthophosphates (CaPO4): occurrence and properties. Prog Biomatter 5(1):9-70. doi:10.1007/s40204-015-0045-zPiatak NM, Parsons MB, Seal RR II (2015) Characteristics and environmental aspects of slag: A review. Appl Geochem 57:236-266. doi:10.1016/j.apgeochem.2014.04.009Simmons J, Ziemkiewicz P, Black DC (2002) Use of steel slag leach beds for the treatment of acid mine drainage. Mine Water Environ 21:91-99. doi:10.1007/s102300200024
877
Lappeenranta, Finland IMWA 2017Mine Water and Circular Economy
Wolkersdorfer C, Sartz L, Sillanpää M, Häkkinen A (Editors)
Valorization of pre-oxidized tailings as cover material for the reclamation of an old acid-generating mining site
Mari K. Tvedten1, Gijsbert D. Breedveld1, 2 and Thomas Pabst3
1University of Oslo, Department of Geosciences, Oslo, Norway 2Norwegian Geotechnical Institute (NGI), Oslo, Norway
3Polytechnique Montreal, Department of Civil, Geological and Mining Engineering, Montreal, Canada
Abstract Laboratory column tests were conducted to assess the performance of a cover with capillary barrier effects to control acid mine drainage generation from tailings at Folldal mine site (Norway). Results showed that the pre-oxidized tailings used as the moisture retaining layer remained at a high degree of saturation (Sr > 85%) throughout the tests, thus efficiently limiting oxygen diffusion to the reactive tailings. Valorization of pre-oxidized tailings could provide an alternative to cover materials that may not be readily available at mine sites.
Key words Acid mine drainage (AMD), Pre-oxidized tailings, Oxygen barrier, Cover with capillary barrier effects (CCBE)
Introduction
The area of Folldal in Hedmark, Norway, was extensively mined for copper, sulfur and zinc for over two hundred years. The mine is now closed, but waste rocks and tailings produced by the mining activities and disposed of at the surface were left unreclaimed and have been continuously generating acid mine drainage (AMD). AMD run-off has caused all life to dis-appear from the local river Folla, located a few hundred meters downstream the mine. The objective set by the Norwegian Environment Agency is to reduce copper concentrations in the river Folla from over 50 µg/L to less than 10 µg/L (NGI 2014). One of the selected reme-diation methods to achieve this objective is to cover the reactive tailings with a multilayer cover. AMD generation can indeed be reduced by preventing either water or oxygen from entering the reactive mine wastes (e.g. Bussière 2007). Several cover designs exist and have proven efficient to limit the generation of AMD, including water covers, monolayer or mul-tilayer covers (e.g. Aubertin et al. 2016). In a humid climate such as in Norway an oxygen barrier is usually considered the most efficient option for the reclamation of acid generat-ing mine sites. The water table is located several meters below the surface in Folldal, and a cover with capillary barrier effects (CCBE) was therefore assessed in this study. CCBEs have been successfully implemented at several mining sites like for example Les Terrains Aurifères – LTA (Ricard et al. 1997, Bussière et al. 2006,) or Lorraine (Dagenais et al. 2002, Dagenais 2005), both located in Quebec, Canada. A CCBE is typically made of three layers (e.g. Aubertin et al. 1999) and consists of a fine-grained moisture retaining layer (MRL) placed between two coarse-grained layers. The objective is to maintain a high degree of sat-uration in the MRL to limit the diffusion of oxygen to the underlying reactive mine wastes (oxygen diffusion is approximately 10 000 times slower in water than in air; e.g. Collin and Rasmuson 1988).
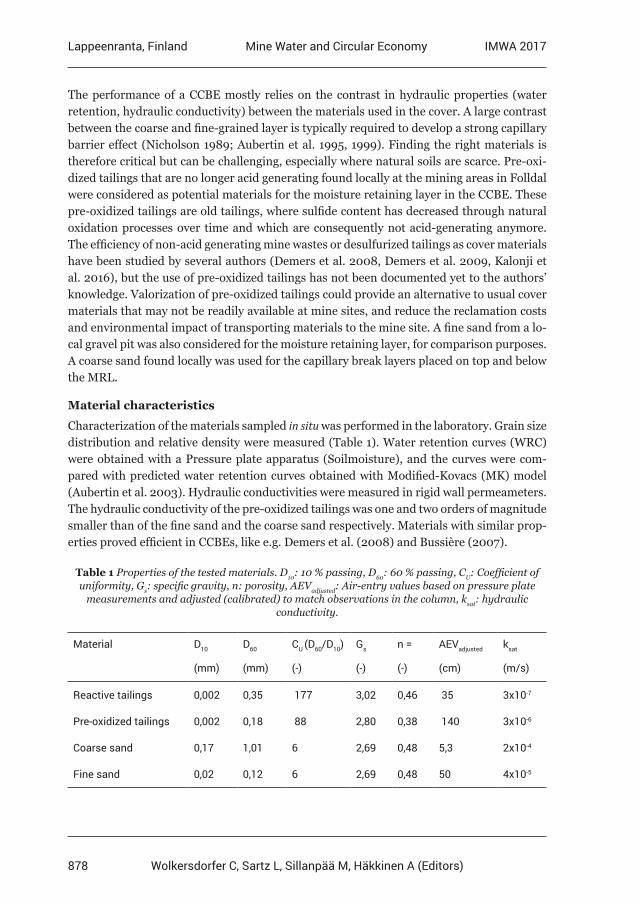
878
Lappeenranta, Finland IMWA 2017Mine Water and Circular Economy
Wolkersdorfer C, Sartz L, Sillanpää M, Häkkinen A (Editors)
The performance of a CCBE mostly relies on the contrast in hydraulic properties (water retention, hydraulic conductivity) between the materials used in the cover. A large contrast between the coarse and fine-grained layer is typically required to develop a strong capillary barrier effect (Nicholson 1989; Aubertin et al. 1995, 1999). Finding the right materials is therefore critical but can be challenging, especially where natural soils are scarce. Pre-oxi-dized tailings that are no longer acid generating found locally at the mining areas in Folldal were considered as potential materials for the moisture retaining layer in the CCBE. These pre-oxidized tailings are old tailings, where sulfide content has decreased through natural oxidation processes over time and which are consequently not acid-generating anymore. The efficiency of non-acid generating mine wastes or desulfurized tailings as cover materials have been studied by several authors (Demers et al. 2008, Demers et al. 2009, Kalonji et al. 2016), but the use of pre-oxidized tailings has not been documented yet to the authors’ knowledge. Valorization of pre-oxidized tailings could provide an alternative to usual cover materials that may not be readily available at mine sites, and reduce the reclamation costs and environmental impact of transporting materials to the mine site. A fine sand from a lo-cal gravel pit was also considered for the moisture retaining layer, for comparison purposes. A coarse sand found locally was used for the capillary break layers placed on top and below the MRL.
Material characteristics
Characterization of the materials sampled in situ was performed in the laboratory. Grain size distribution and relative density were measured (Table 1). Water retention curves (WRC) were obtained with a Pressure plate apparatus (Soilmoisture), and the curves were com-pared with predicted water retention curves obtained with Modified-Kovacs (MK) model (Aubertin et al. 2003). Hydraulic conductivities were measured in rigid wall permeameters. The hydraulic conductivity of the pre-oxidized tailings was one and two orders of magnitude smaller than of the fine sand and the coarse sand respectively. Materials with similar prop-erties proved efficient in CCBEs, like e.g. Demers et al. (2008) and Bussière (2007).
Table 1 Properties of the tested materials. D10: 10 % passing, D60: 60 % passing, CU: Coefficient of uniformity, Gs: specific gravity, n: porosity, AEVadjusted: Air-entry values based on pressure plate
measurements and adjusted (calibrated) to match observations in the column, ksat: hydraulic conductivity.
Material D10
(mm)
D60
(mm)
CU (D60/D10)
(-)
Gs
(-)
n =
(-)
AEVadjusted
(cm)
ksat
(m/s)
Reactive tailings 0,002 0,35 177 3,02 0,46 35 3x10⁻⁷
Pre-oxidized tailings 0,002 0,18 88 2,80 0,38 140 3x10⁻⁶
Coarse sand 0,17 1,01 6 2,69 0,48 5,3 2x10⁻⁴
Fine sand 0,02 0,12 6 2,69 0,48 50 4x10⁻⁵
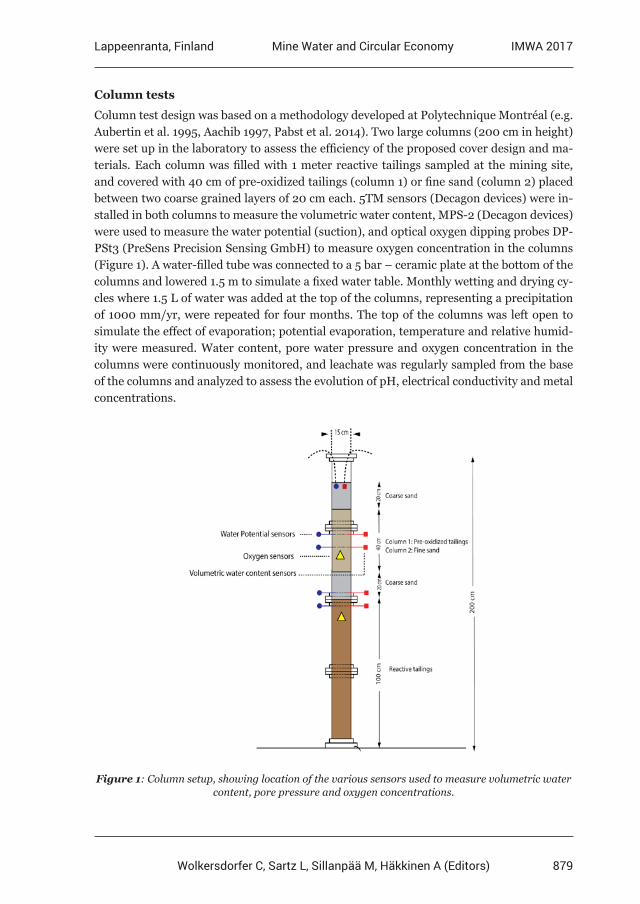
879
Lappeenranta, Finland IMWA 2017Mine Water and Circular Economy
Wolkersdorfer C, Sartz L, Sillanpää M, Häkkinen A (Editors)
Column tests
Column test design was based on a methodology developed at Polytechnique Montréal (e.g. Aubertin et al. 1995, Aachib 1997, Pabst et al. 2014). Two large columns (200 cm in height) were set up in the laboratory to assess the efficiency of the proposed cover design and ma-terials. Each column was filled with 1 meter reactive tailings sampled at the mining site, and covered with 40 cm of pre-oxidized tailings (column 1) or fine sand (column 2) placed between two coarse grained layers of 20 cm each. 5TM sensors (Decagon devices) were in-stalled in both columns to measure the volumetric water content, MPS-2 (Decagon devices) were used to measure the water potential (suction), and optical oxygen dipping probes DP-PSt3 (PreSens Precision Sensing GmbH) to measure oxygen concentration in the columns (Figure 1). A water-filled tube was connected to a 5 bar – ceramic plate at the bottom of the columns and lowered 1.5 m to simulate a fixed water table. Monthly wetting and drying cy-cles where 1.5 L of water was added at the top of the columns, representing a precipitation of 1000 mm/yr, were repeated for four months. The top of the columns was left open to simulate the effect of evaporation; potential evaporation, temperature and relative humid-ity were measured. Water content, pore water pressure and oxygen concentration in the columns were continuously monitored, and leachate was regularly sampled from the base of the columns and analyzed to assess the evolution of pH, electrical conductivity and metal concentrations.
Figure 1: Column setup, showing location of the various sensors used to measure volumetric water content, pore pressure and oxygen concentrations.
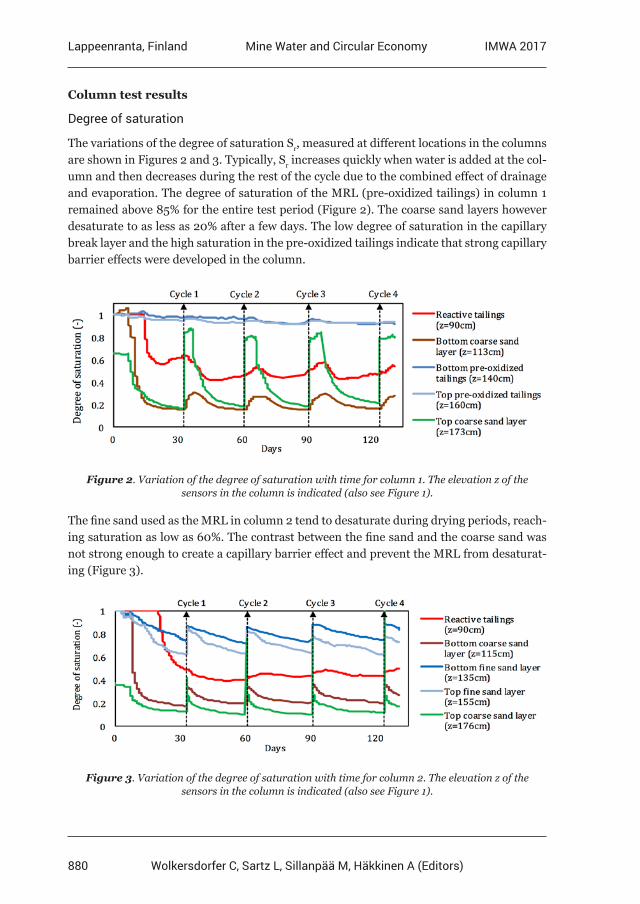
880
Lappeenranta, Finland IMWA 2017Mine Water and Circular Economy
Wolkersdorfer C, Sartz L, Sillanpää M, Häkkinen A (Editors)
Column test results
Degree of saturation
The variations of the degree of saturation Sr, measured at different locations in the columns are shown in Figures 2 and 3. Typically, Sr increases quickly when water is added at the col-umn and then decreases during the rest of the cycle due to the combined effect of drainage and evaporation. The degree of saturation of the MRL (pre-oxidized tailings) in column 1 remained above 85% for the entire test period (Figure 2). The coarse sand layers however desaturate to as less as 20% after a few days. The low degree of saturation in the capillary break layer and the high saturation in the pre-oxidized tailings indicate that strong capillary barrier effects were developed in the column.
Figure 2. Variation of the degree of saturation with time for column 1. The elevation z of the sensors in the column is indicated (also see Figure 1).
The fine sand used as the MRL in column 2 tend to desaturate during drying periods, reach-ing saturation as low as 60%. The contrast between the fine sand and the coarse sand was not strong enough to create a capillary barrier effect and prevent the MRL from desaturat-ing (Figure 3).
Figure 3. Variation of the degree of saturation with time for column 2. The elevation z of the sensors in the column is indicated (also see Figure 1).
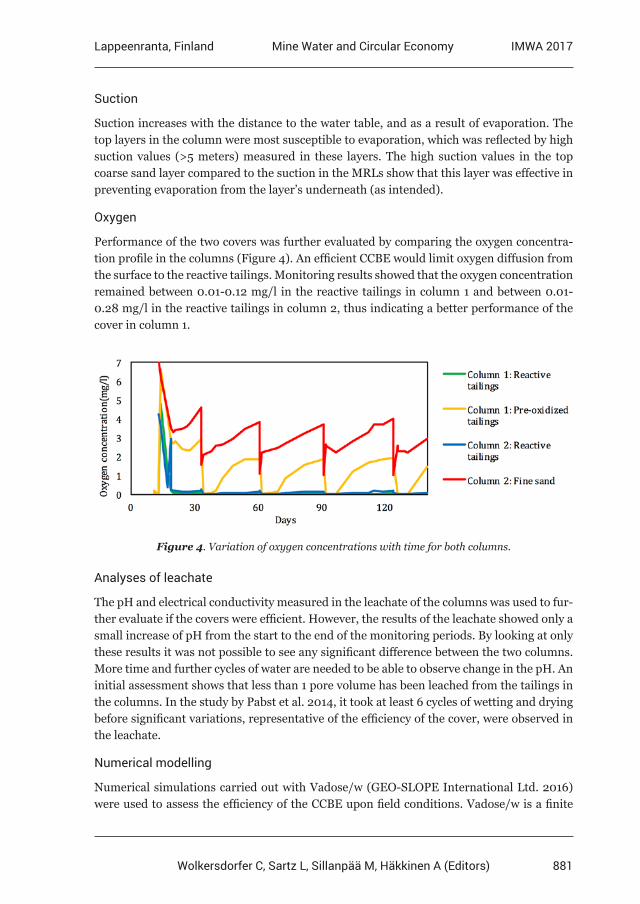
881
Lappeenranta, Finland IMWA 2017Mine Water and Circular Economy
Wolkersdorfer C, Sartz L, Sillanpää M, Häkkinen A (Editors)
Suction
Suction increases with the distance to the water table, and as a result of evaporation. The top layers in the column were most susceptible to evaporation, which was reflected by high suction values (>5 meters) measured in these layers. The high suction values in the top coarse sand layer compared to the suction in the MRLs show that this layer was effective in preventing evaporation from the layer’s underneath (as intended).
Oxygen
Performance of the two covers was further evaluated by comparing the oxygen concentra-tion profile in the columns (Figure 4). An efficient CCBE would limit oxygen diffusion from the surface to the reactive tailings. Monitoring results showed that the oxygen concentration remained between 0.01-0.12 mg/l in the reactive tailings in column 1 and between 0.01-0.28 mg/l in the reactive tailings in column 2, thus indicating a better performance of the cover in column 1.
Figure 4. Variation of oxygen concentrations with time for both columns.
Analyses of leachate
The pH and electrical conductivity measured in the leachate of the columns was used to fur-ther evaluate if the covers were efficient. However, the results of the leachate showed only a small increase of pH from the start to the end of the monitoring periods. By looking at only these results it was not possible to see any significant difference between the two columns. More time and further cycles of water are needed to be able to observe change in the pH. An initial assessment shows that less than 1 pore volume has been leached from the tailings in the columns. In the study by Pabst et al. 2014, it took at least 6 cycles of wetting and drying before significant variations, representative of the efficiency of the cover, were observed in the leachate.
Numerical modelling
Numerical simulations carried out with Vadose/w (GEO-SLOPE International Ltd. 2016) were used to assess the efficiency of the CCBE upon field conditions. Vadose/w is a finite
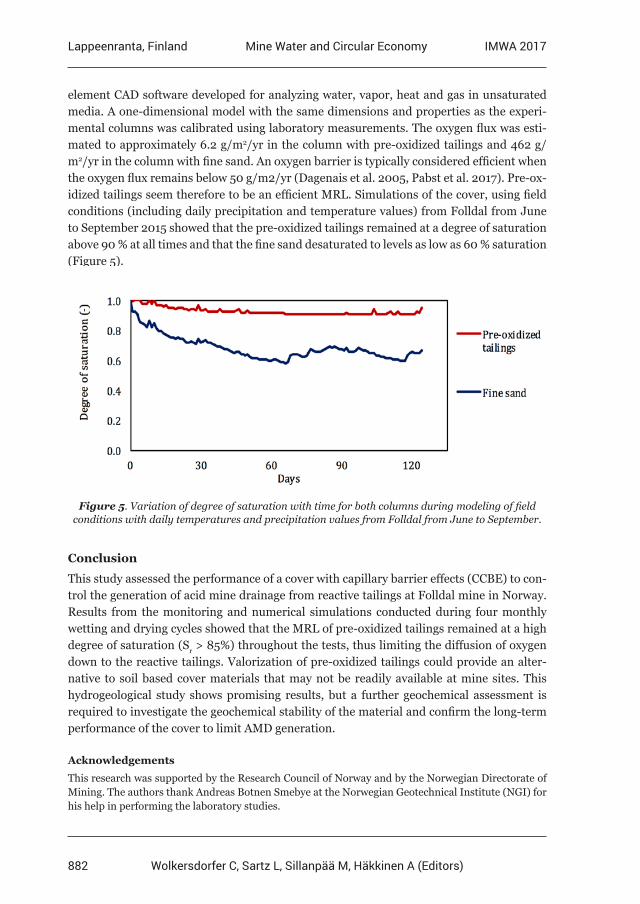
882
Lappeenranta, Finland IMWA 2017Mine Water and Circular Economy
Wolkersdorfer C, Sartz L, Sillanpää M, Häkkinen A (Editors)
element CAD software developed for analyzing water, vapor, heat and gas in unsaturated media. A one-dimensional model with the same dimensions and properties as the experi-mental columns was calibrated using laboratory measurements. The oxygen flux was esti-mated to approximately 6.2 g/m2/yr in the column with pre-oxidized tailings and 462 g/m2/yr in the column with fine sand. An oxygen barrier is typically considered efficient when the oxygen flux remains below 50 g/m2/yr (Dagenais et al. 2005, Pabst et al. 2017). Pre-ox-idized tailings seem therefore to be an efficient MRL. Simulations of the cover, using field conditions (including daily precipitation and temperature values) from Folldal from June to September 2015 showed that the pre-oxidized tailings remained at a degree of saturation above 90 % at all times and that the fine sand desaturated to levels as low as 60 % saturation (Figure 5).
Figure 5. Variation of degree of saturation with time for both columns during modeling of field conditions with daily temperatures and precipitation values from Folldal from June to September.
Conclusion
This study assessed the performance of a cover with capillary barrier effects (CCBE) to con-trol the generation of acid mine drainage from reactive tailings at Folldal mine in Norway. Results from the monitoring and numerical simulations conducted during four monthly wetting and drying cycles showed that the MRL of pre-oxidized tailings remained at a high degree of saturation (Sr > 85%) throughout the tests, thus limiting the diffusion of oxygen down to the reactive tailings. Valorization of pre-oxidized tailings could provide an alter-native to soil based cover materials that may not be readily available at mine sites. This hydrogeological study shows promising results, but a further geochemical assessment is required to investigate the geochemical stability of the material and confirm the long-term performance of the cover to limit AMD generation.
Acknowledgements
This research was supported by the Research Council of Norway and by the Norwegian Directorate of Mining. The authors thank Andreas Botnen Smebye at the Norwegian Geotechnical Institute (NGI) for his help in performing the laboratory studies.
883
Lappeenranta, Finland IMWA 2017Mine Water and Circular Economy
Wolkersdorfer C, Sartz L, Sillanpää M, Häkkinen A (Editors)
References
Aachib M (1997) Étude en laboratoire de la performance des barrières de recouvrement constituées de rejets miniers pour limiter le DMA, École polytechnique de Montréal. Département de génie minéral.Aubertin M, Chapuis R, Aachib M, Bussière B, Ricard J & Tremblay L (1995) Évaluation en laboratoire de barrières sèches construites à partir de résidus miniers. Mine Environment Neutral Drainage (MEND) Report, 2.Aubertin M, Aachib M, Monzon M, Joanes A, Bussière B & Chapuis R (1999) Étude de laboratoire sur l’efficacité de recouvrements construits à partir de résidus miniers. Rapport MEND/NEDEM, 2.Aubertin M, Mbonimpa M, Bussière B & Chapuis, R (2003) A model to predict the water retention curve from basic geotechnical properties. Canadian Geotechnical Journal, 40, p 1104-1122.Aubertin M, Bussière B, Pabst T, James M & Mbonimpa M (2016) Review of reclamation techniques for acid generating mine wastes upon closure of disposal sites. Proc. Geo-Chicago: Sustainability, Energy and the Geoenvironment, Chicago, August 14-18.Bussière B (2007) Colloquium 2004: Hydrogeotechnical properties of hard rock tailings from metal mines and emerging geoenvironmental disposal approaches. Canadian Geotechnical Journal, 44, p 1019-1052.Bussière B, Maqsoud A, Aubertin M, Martschuk J, McMullen J & Julien M (2006). Performance of the oxygen limiting cover at the LTA site, Malartic, Quebec. CIM Bulletin, 1(6), p 1-11.Collin M, Rasmuson A (1988) A comparison of gas diffusivity models for unsaturated porous media. Soil Science Society of America Journal, 52, p 1559-1565.Dagenais A-M (2005) Techniques de contrôle du drainage minier acide basées sur les effets capillaires. École polytechnique.Dagenais A-M, Aubertin M, Bussière B, Cyr J & Fontaine R (2002) Auscultation et suivi du recouvrement multicouche construit au site minier Lorraine, Latulipe, Québec. Défis & Perspectives: Symposium sur l’Environnement et les Mines, Rouyn-Noranda, p 3-5.Dagenais A-M, Aubertin M, Bussiere B & Martin, V (2005) Large scale applications of covers with capillary barrier effects to control the production of acid mine drainage. Proceedings of Post-Mining, 16-17.Demers I, Bussière B, Benzaazoua M, Mbonimpa M & Blier A (2008) Column test investigation on the performance of monolayer covers made of desulphurized tailings to prevent acid mine drainage. Minerals Engineering, 21, p 317-329.Demers I, Bussière B, Mbonimpa M & Benzaazoua, M (2009) Oxygen diffusion and consumption in low-sulphide tailings covers. Canadian Geotechnical Journal, 46, p 454-469.Demers I, Bussière B, Aachib M & Aubertin M (2011) Repeatability evaluation of instrumented column tests in cover efficiency evaluation for the prevention of acid mine drainage. Water, Air, & Soil Pollution, 219, p 113-128.Kalonji Kabambi A, Bussière B & Demers I (2017) Hydrogeological Behaviour of Covers with Capillary Barrier Effects Made of Mining Materials. Geotechnical and Geological Engineering, 1-22.NGI (2014) Folldal gruver. Vurdering av mulige tiltak mot avrenning fra tidligere gruvevirksomhet. http://www.dirmin.no/.Nicholson RV, Gillham RW, Cherry JA & Reardon EJ (1989) Reduction of acid generation in mine tailings through the use of moisture-retaining cover layers as oxygen barriers. Canadian Geotechnical Journal, 26, p 1-8.Pabst T, Aubertin M, Bussière B & Molson J (2014) Column Tests to Characterise the Hydrogeochemical Response of Pre-oxidised Acid-Generating Tailings with a Monolayer Cover. Water, Air, & Soil Pollution, 225, p 1-21.Pabst T, Molson J, Aubertin M & Bussière B (2017) Reactive transport modelling of the hydro- geochemical behaviour of partially oxidized acid-generating mine tailings with a monolayer cover. Applied Geochemistry, 78: 219-233.Ricard J, Aubertin M, Firlotte F, Knapp R, McMullen J & Julien, M (1997) Design and construction of a dry cover made of tailings for the closure of Les Terrains Aurifères site, Malartic, Québec, Canada. Proceedings of the 4th International Conference on Acid Rock Drainage, Vancouver, BC, p 1515-1530.
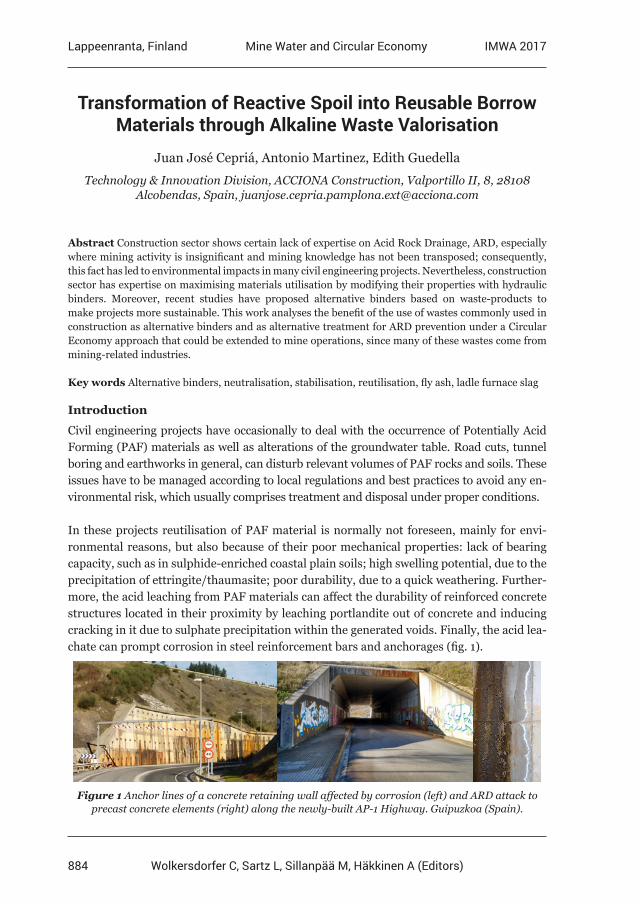
884
Lappeenranta, Finland IMWA 2017Mine Water and Circular Economy
Wolkersdorfer C, Sartz L, Sillanpää M, Häkkinen A (Editors)
Transformation of Reactive Spoil into Reusable Borrow Materials through Alkaline Waste Valorisation
Juan José Cepriá, Antonio Martinez, Edith Guedella
Technology & Innovation Division, ACCIONA Construction, Valportillo II, 8, 28108 Alcobendas, Spain, [email protected]
Abstract Construction sector shows certain lack of expertise on Acid Rock Drainage, ARD, especially where mining activity is insignificant and mining knowledge has not been transposed; consequently, this fact has led to environmental impacts in many civil engineering projects. Nevertheless, construction sector has expertise on maximising materials utilisation by modifying their properties with hydraulic binders. Moreover, recent studies have proposed alternative binders based on waste-products to make projects more sustainable. This work analyses the benefit of the use of wastes commonly used in construction as alternative binders and as alternative treatment for ARD prevention under a Circular Economy approach that could be extended to mine operations, since many of these wastes come from mining-related industries.
Key words Alternative binders, neutralisation, stabilisation, reutilisation, fly ash, ladle furnace slag
Introduction
Civil engineering projects have occasionally to deal with the occurrence of Potentially Acid Forming (PAF) materials as well as alterations of the groundwater table. Road cuts, tunnel boring and earthworks in general, can disturb relevant volumes of PAF rocks and soils. These issues have to be managed according to local regulations and best practices to avoid any en-vironmental risk, which usually comprises treatment and disposal under proper conditions.
In these projects reutilisation of PAF material is normally not foreseen, mainly for envi-ronmental reasons, but also because of their poor mechanical properties: lack of bearing capacity, such as in sulphide-enriched coastal plain soils; high swelling potential, due to the precipitation of ettringite/thaumasite; poor durability, due to a quick weathering. Further-more, the acid leaching from PAF materials can affect the durability of reinforced concrete structures located in their proximity by leaching portlandite out of concrete and inducing cracking in it due to sulphate precipitation within the generated voids. Finally, the acid lea-chate can prompt corrosion in steel reinforcement bars and anchorages (fig. 1).
Figure 1 Anchor lines of a concrete retaining wall affected by corrosion (left) and ARD attack to precast concrete elements (right) along the newly-built AP-1 Highway. Guipuzkoa (Spain).
885
Lappeenranta, Finland IMWA 2017Mine Water and Circular Economy
Wolkersdorfer C, Sartz L, Sillanpää M, Häkkinen A (Editors)
The ARD phenomenon in civil works is well covered by regulations in those countries where the mining sector is relevant for their economies (i.e. Canada, USA or Australia). In these coun-tries regulations limit the use of borrow materials containing sulphides up to certain threshold values and provide guidance along the project design and implementation. However, they do not usually include valorisation options, although innovative solutions can be accepted after conducting pilot trials (Dear et al. 2014; Ahern et al. 1998). Good examples of the reuse of ex-cavated materials through encapsulation in embankments can be found in Morin et al. 2003. Even so, several accidents have been reported in these countries, such as in the Halifax Airport, Canada (Hicks 2003) or along the I99 Highway, Pennsylvania, USA (Rose and Barns 2008).
These accidents have demonstrated the difficulties and high costs of treating leachates in non-planned and public areas as well as amending these materials with alkaline products to control acid drainage once the problem has appeared.
Soil stabilisation techniques using alkaline binders have been developed in road construc-tion projects along the last 25 years to take advantage of low quality materials excavated along the alignment, so avoiding landfilling and saving in additional borrow materials. The use of alkaline binders has been extended to road bases and subgrades with the aim of re-ducing their thickness, maintaining their bearing capacity. Consequently, more savings in materials can be achieved.
The main binders used in road construction projects are quick-lime and hydrated lime. Granulated Blast Furnace Slag (GBFS) or coal fly ash are usually combined with these to reduce the economic and environmental costs and to modify properties such as the setting time, hardening process or workability.
The latest research works in this field have been focused on finding alternative hydraulic binders based on alkaline wastes. Several studies have proved the potential of wastes such as paper sludge ash (Segui at al 2012), ladle furnace slag (Manso et al. 2013) and biomass fly ashes (Sarkkinen et al. 2016, Mácsik et al. 2012).
In a parallel way, over the last decade, in the mining sector different alkaline wastes (coal fly ash, different slags, cement kiln dust, green liquor dregs, red mud, construction and dem-olition waste, etc.) have been successfully used to treat ARD in reactive barriers (Banasiak et al. 2015), in leaching beds (Goetz and Riefler 2014), to directly amend rock waste (Lee et al. 2014) or as component of covers (Mäkitalo et al. 2015). These applications have led to several patents and commercial products, such as Ecotite™, Alkaloam® or Bauxol™. Unfortunately, little research exits on the possibility of valorising alkaline wastes to amend sulphide bearing spoil and reuse this as borrow materials in infrastructure projects. This re-search work focuses on the valorisation of low reactive spoil as core material for embankments after being amended through locally available alkaline waste (coal fly ash and ladle furnace slag). The mechanical stabilisation capacity of this technique is assessed to comply with con-struction requirements and durability commitments, from an integrating perspective.
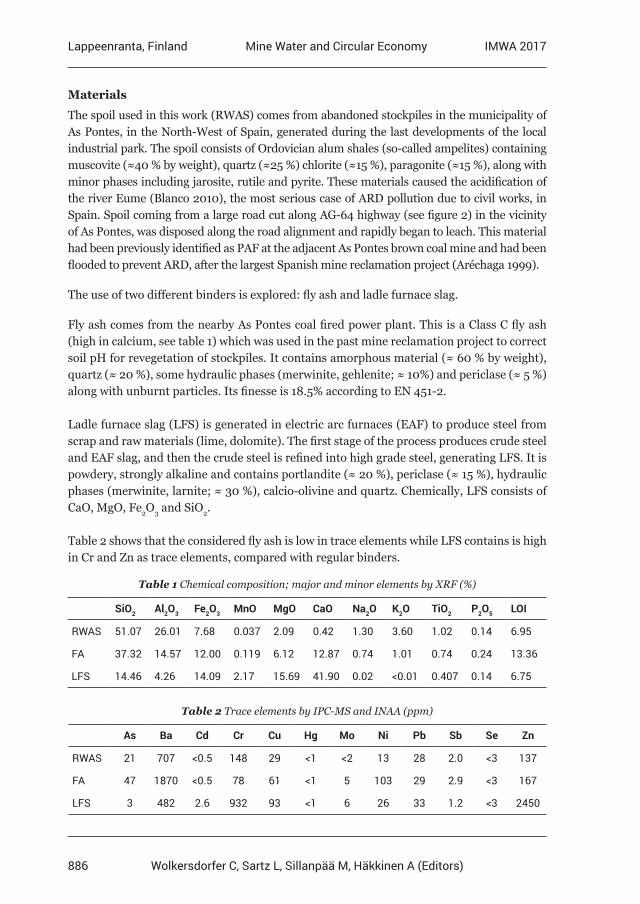
886
Lappeenranta, Finland IMWA 2017Mine Water and Circular Economy
Wolkersdorfer C, Sartz L, Sillanpää M, Häkkinen A (Editors)
Materials
The spoil used in this work (RWAS) comes from abandoned stockpiles in the municipality of As Pontes, in the North-West of Spain, generated during the last developments of the local industrial park. The spoil consists of Ordovician alum shales (so-called ampelites) containing muscovite (≈40 % by weight), quartz (≈25 %) chlorite (≈15 %), paragonite (≈15 %), along with minor phases including jarosite, rutile and pyrite. These materials caused the acidification of the river Eume (Blanco 2010), the most serious case of ARD pollution due to civil works, in Spain. Spoil coming from a large road cut along AG-64 highway (see figure 2) in the vicinity of As Pontes, was disposed along the road alignment and rapidly began to leach. This material had been previously identified as PAF at the adjacent As Pontes brown coal mine and had been flooded to prevent ARD, after the largest Spanish mine reclamation project (Aréchaga 1999).
The use of two different binders is explored: fly ash and ladle furnace slag.
Fly ash comes from the nearby As Pontes coal fired power plant. This is a Class C fly ash (high in calcium, see table 1) which was used in the past mine reclamation project to correct soil pH for revegetation of stockpiles. It contains amorphous material (≈ 60 % by weight), quartz (≈ 20 %), some hydraulic phases (merwinite, gehlenite; ≈ 10%) and periclase (≈ 5 %) along with unburnt particles. Its finesse is 18.5% according to EN 451-2.
Ladle furnace slag (LFS) is generated in electric arc furnaces (EAF) to produce steel from scrap and raw materials (lime, dolomite). The first stage of the process produces crude steel and EAF slag, and then the crude steel is refined into high grade steel, generating LFS. It is powdery, strongly alkaline and contains portlandite (≈ 20 %), periclase (≈ 15 %), hydraulic phases (merwinite, larnite; ≈ 30 %), calcio-olivine and quartz. Chemically, LFS consists of CaO, MgO, Fe2O3 and SiO2.
Table 2 shows that the considered fly ash is low in trace elements while LFS contains is high in Cr and Zn as trace elements, compared with regular binders.
Table 1 Chemical composition; major and minor elements by XRF (%)
SiO2 Al2O3 Fe2O3 MnO MgO CaO Na2O K2O TiO2 P2O5 LOI
RWAS 51.07 26.01 7.68 0.037 2.09 0.42 1.30 3.60 1.02 0.14 6.95
FA 37.32 14.57 12.00 0.119 6.12 12.87 0.74 1.01 0.74 0.24 13.36
LFS 14.46 4.26 14.09 2.17 15.69 41.90 0.02 <0.01 0.407 0.14 6.75
Table 2 Trace elements by IPC-MS and INAA (ppm)
As Ba Cd Cr Cu Hg Mo Ni Pb Sb Se Zn
RWAS 21 707 <0.5 148 29 <1 <2 13 28 2.0 <3 137
FA 47 1870 <0.5 78 61 <1 5 103 29 2.9 <3 167
LFS 3 482 2.6 932 93 <1 6 26 33 1.2 <3 2450
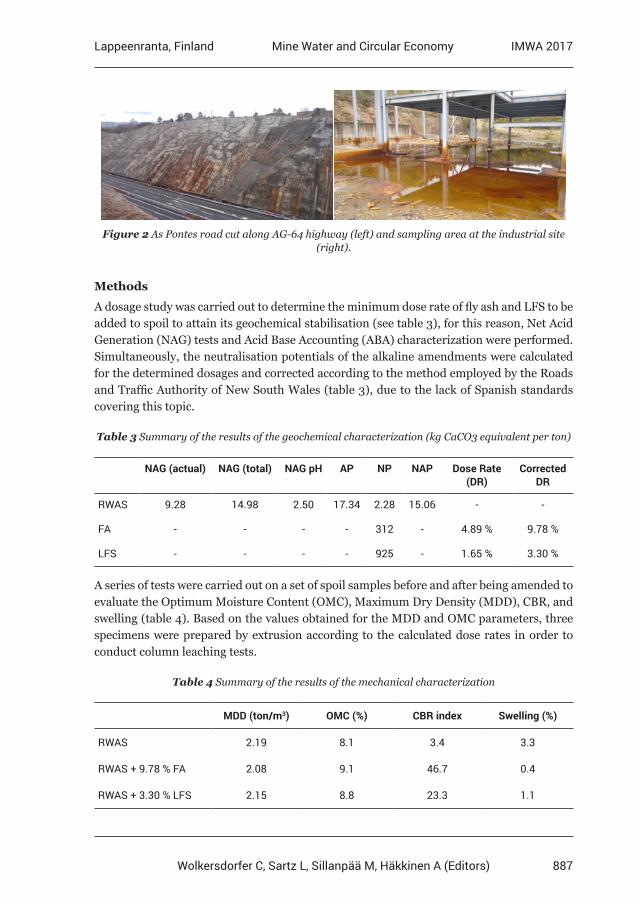
887
Lappeenranta, Finland IMWA 2017Mine Water and Circular Economy
Wolkersdorfer C, Sartz L, Sillanpää M, Häkkinen A (Editors)
Figure 2 As Pontes road cut along AG-64 highway (left) and sampling area at the industrial site (right).
Methods
A dosage study was carried out to determine the minimum dose rate of fly ash and LFS to be added to spoil to attain its geochemical stabilisation (see table 3), for this reason, Net Acid Generation (NAG) tests and Acid Base Accounting (ABA) characterization were performed. Simultaneously, the neutralisation potentials of the alkaline amendments were calculated for the determined dosages and corrected according to the method employed by the Roads and Traffic Authority of New South Wales (table 3), due to the lack of Spanish standards covering this topic.
Table 3 Summary of the results of the geochemical characterization (kg CaCO3 equivalent per ton)
NAG (actual) NAG (total) NAG pH AP NP NAP Dose Rate (DR)
Corrected DR
RWAS 9.28 14.98 2.50 17.34 2.28 15.06 - -
FA - - - - 312 - 4.89 % 9.78 %
LFS - - - - 925 - 1.65 % 3.30 %
A series of tests were carried out on a set of spoil samples before and after being amended to evaluate the Optimum Moisture Content (OMC), Maximum Dry Density (MDD), CBR, and swelling (table 4). Based on the values obtained for the MDD and OMC parameters, three specimens were prepared by extrusion according to the calculated dose rates in order to conduct column leaching tests.
Table 4 Summary of the results of the mechanical characterization
MDD (ton/m3) OMC (%) CBR index Swelling (%)
RWAS 2.19 8.1 3.4 3.3
RWAS + 9.78 % FA 2.08 9.1 46.7 0.4
RWAS + 3.30 % LFS 2.15 8.8 23.3 1.1
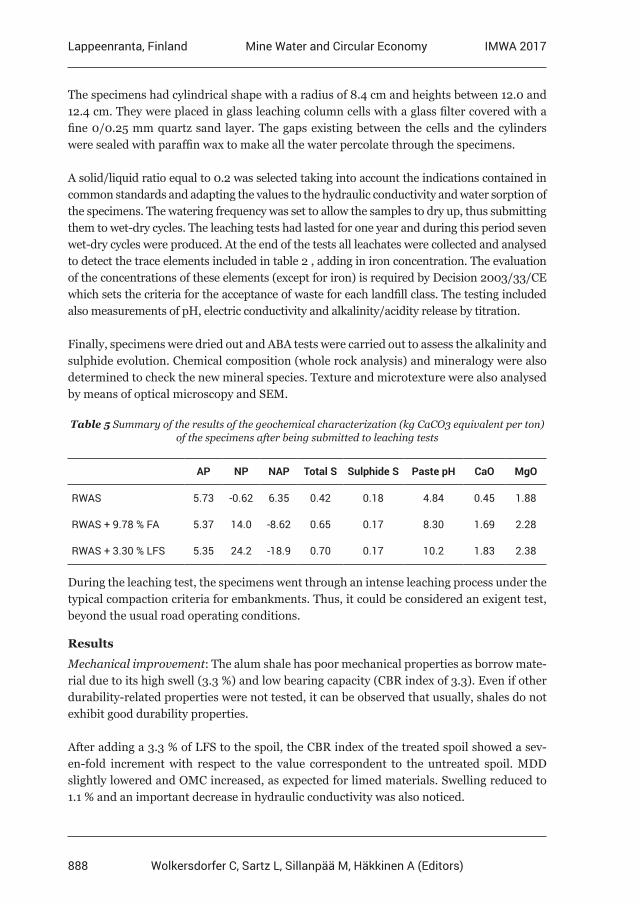
888
Lappeenranta, Finland IMWA 2017Mine Water and Circular Economy
Wolkersdorfer C, Sartz L, Sillanpää M, Häkkinen A (Editors)
The specimens had cylindrical shape with a radius of 8.4 cm and heights between 12.0 and 12.4 cm. They were placed in glass leaching column cells with a glass filter covered with a fine 0/0.25 mm quartz sand layer. The gaps existing between the cells and the cylinders were sealed with paraffin wax to make all the water percolate through the specimens.
A solid/liquid ratio equal to 0.2 was selected taking into account the indications contained in common standards and adapting the values to the hydraulic conductivity and water sorption of the specimens. The watering frequency was set to allow the samples to dry up, thus submitting them to wet-dry cycles. The leaching tests had lasted for one year and during this period seven wet-dry cycles were produced. At the end of the tests all leachates were collected and analysed to detect the trace elements included in table 2 , adding in iron concentration. The evaluation of the concentrations of these elements (except for iron) is required by Decision 2003/33/CE which sets the criteria for the acceptance of waste for each landfill class. The testing included also measurements of pH, electric conductivity and alkalinity/acidity release by titration.
Finally, specimens were dried out and ABA tests were carried out to assess the alkalinity and sulphide evolution. Chemical composition (whole rock analysis) and mineralogy were also determined to check the new mineral species. Texture and microtexture were also analysed by means of optical microscopy and SEM.
Table 5 Summary of the results of the geochemical characterization (kg CaCO3 equivalent per ton) of the specimens after being submitted to leaching tests
AP NP NAP Total S Sulphide S Paste pH CaO MgO
RWAS 5.73 -0.62 6.35 0.42 0.18 4.84 0.45 1.88
RWAS + 9.78 % FA 5.37 14.0 -8.62 0.65 0.17 8.30 1.69 2.28
RWAS + 3.30 % LFS 5.35 24.2 -18.9 0.70 0.17 10.2 1.83 2.38
During the leaching test, the specimens went through an intense leaching process under the typical compaction criteria for embankments. Thus, it could be considered an exigent test, beyond the usual road operating conditions.
Results
Mechanical improvement: The alum shale has poor mechanical properties as borrow mate-rial due to its high swell (3.3 %) and low bearing capacity (CBR index of 3.3). Even if other durability-related properties were not tested, it can be observed that usually, shales do not exhibit good durability properties.
After adding a 3.3 % of LFS to the spoil, the CBR index of the treated spoil showed a sev-en-fold increment with respect to the value correspondent to the untreated spoil. MDD slightly lowered and OMC increased, as expected for limed materials. Swelling reduced to 1.1 % and an important decrease in hydraulic conductivity was also noticed.
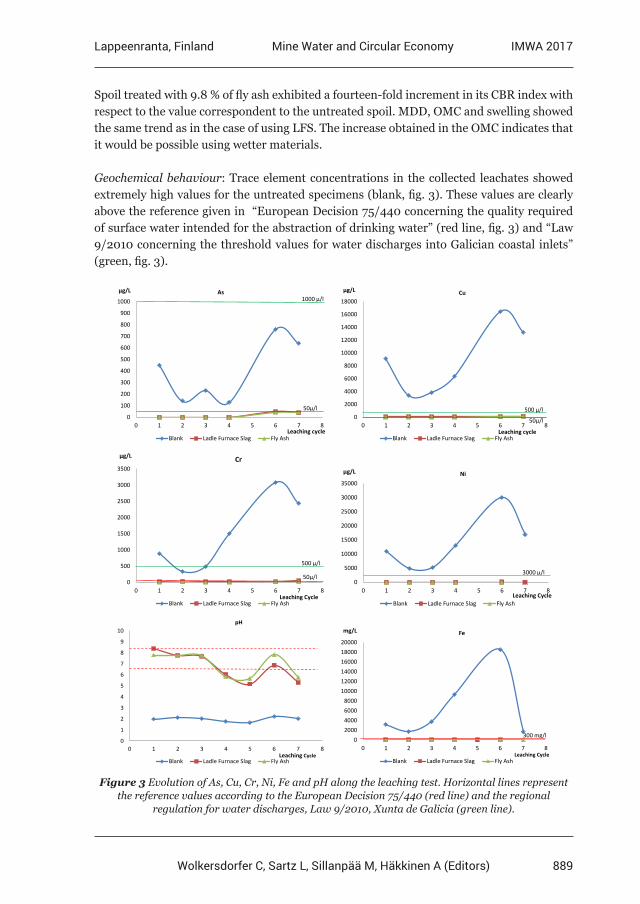
889
Lappeenranta, Finland IMWA 2017Mine Water and Circular Economy
Wolkersdorfer C, Sartz L, Sillanpää M, Häkkinen A (Editors)
Spoil treated with 9.8 % of fly ash exhibited a fourteen-fold increment in its CBR index with respect to the value correspondent to the untreated spoil. MDD, OMC and swelling showed the same trend as in the case of using LFS. The increase obtained in the OMC indicates that it would be possible using wetter materials.
Geochemical behaviour: Trace element concentrations in the collected leachates showed extremely high values for the untreated specimens (blank, fig. 3). These values are clearly above the reference given in “European Decision 75/440 concerning the quality required of surface water intended for the abstraction of drinking water” (red line, fig. 3) and “Law 9/2010 concerning the threshold values for water discharges into Galician coastal inlets” (green, fig. 3).
0
100
200
300
400
500
600
700
800
900
1000
0 1 2 3 4 5 6 7 8
As
Blank Ladle Furnace Slag Fly Ash
µg/L
Leaching cycle
1000 µ/l
50µ/l0
2000
4000
6000
8000
10000
12000
14000
16000
18000
0 1 2 3 4 5 6 7 8
Cu
Blank Ladle Furnace Slag Fly Ash
µg/L
Leaching cycle
500 µ/l
50µ/l
0
500
1000
1500
2000
2500
3000
3500
0 1 2 3 4 5 6 7 8
Cr
Blank Ladle Furnace Slag Fly Ash
µg/L
Leaching Cycle
50µ/l
500 µ/l
0
5000
10000
15000
20000
25000
30000
35000
0 1 2 3 4 5 6 7 8
Ni
Blank Ladle Furnace Slag Fly Ash
µg/L
Leaching Cycle
3000 µ/l
0
1
2
3
4
5
6
7
8
9
10
0 1 2 3 4 5 6 7 8
pH
Blank Ladle Furnace Slag Fly AshLeaching Cycle
02000400060008000
100001200014000160001800020000
0 1 2 3 4 5 6 7 8
Fe
Blank Ladle Furnace Slag Fly Ash
mg/L
Leaching Cycle
300 mg/l
Figure 3 Evolution of As, Cu, Cr, Ni, Fe and pH along the leaching test. Horizontal lines represent the reference values according to the European Decision 75/440 (red line) and the regional
regulation for water discharges, Law 9/2010, Xunta de Galicia (green line).
890
Lappeenranta, Finland IMWA 2017Mine Water and Circular Economy
Wolkersdorfer C, Sartz L, Sillanpää M, Häkkinen A (Editors)
For both treated specimens, the concentrations of the dangerous trace elements re-mained below the aforementioned threshold values. In general, leachates from both treated specimens showed similar concentrations, although the one treated with fly ash exhibit slightly lower values, except for Selenium. Concentrations of all analysed ele-ments in the LFS-treated specimen remained constant and close to till to the last cycle, when a minor rise for all the elements was observed. Leachates from fly ash-treated specimen showed the same minor rise but only in As and Cu. For both treated samples Fe remained close to zero and pH circumneutral up to cycle 4, while from this point on, available alkalinity showed signs of exhaustion, although, they continued having neutralisation capacity till the end of the leaching tests, especially in the case of LFS (table 5).
On the contrary, untreated specimens showed a continuous increase in the concentrations of all analysed elements up to the last cycle, indicating a weak depletion of metal mobility. Values of pH remained constant around 2 and Fe concentration greatly increased up to the last cycle, following the behaviour of the trace elements.
Conclusions
A sulphide bearing alum shale known to have caused ARD pollution in Galician rivers had been treated with two local wastes: fly ash and ladle furnace slag. Results demon-strate that feasible dose rates are able to neutralise acid generation and avoid metal mobility. As a consequence of the proposed treatments, mechanical properties were improved, suggesting that this treated material could be used in road subgrades in compliance with most of the international requirements. These results open the pos-sibility of using low reactive spoil in road embankments or general fills in mining op-erations following a circular economy approach which consists in the use of locally available amendments based on waste and by-products usually associated with mining activities.
Civil works could also benefit from this possibility when it is necessary to manage acid form-ing materials, adopting the characterization procedure of the mining sector when sectorial regulation and requirements lack.
References
Ahern CR, Stone Y, Blunden B (1998) Acid Sulfate Soils Assessment Guidelines. Acid Sulfate Soil Management Advisory Committee, Wollongbar, NSW. Australia, 63 pp.Aréchaga F (1999) Considerations upon mine voids based on dump recovering experience. Puentes mine case IMWA Proceedings.Banasiak L, Indraratna B, Lugg G, Pathirage U, McIntosh G, Rendell N (2015). Permeable reactive barrier rejuvenation by alkaline wastewater. Environmental Geotechnics, 2 (1), 45-55.Blanco R (2010) Centro de tratamiento de residuos industrials de Galicia. Situación actual y perspectivas de future. XVI Curso de Saude Ambiental, Baiona.Dear SE, Ahern CR, O’Brien LE, Dobos SK, McElnea AE, Moore NG, Watling KM (2014) Queensland Acid Sulfate Soil Technical Manual: Soil Management Guidelines. Brisbane: Department of Science, Information Technology, Innovation and the Arts, Queensland Government.
891
Lappeenranta, Finland IMWA 2017Mine Water and Circular Economy
Wolkersdorfer C, Sartz L, Sillanpää M, Häkkinen A (Editors)
Goetz ER, Riefler RG (2014) Performance of steel slag leach beds in acid mine drainage treatment. Chemical Engineering Journal, 240, 579-588.Hicks SA (2003) Acidic airport drainage, 20 years and $20 million worth of experience. Proceedings of the Sixth International Conference on Acid Rock Drainage, Cairns, Australia, p 14-17.Lee JK, Shang JQ, Wang H, Zhao C (2014) In-situ study of beneficial utilization of coal fly ash in reactive mine tailings. Journal of environmental management, 135, 73-80.Mácsik J, Edeskär T, Rogbeck Y, Ribbing C (2012) Stabilization of road structures with fly ash as binder component: through demo projects to full scale use, Ash Utilisation 2012, Stockholm, Sweden.Mäkitalo M, Mácsik J, Maurice C, Öhlander B (2015) Improving properties of sealing layers made of till by adding green liquor dregs to reduce oxidation of sulfidic mine waste. Geotechnical and Geological Engineering, 33(4), 1047-1054.Manso JM, Ortega-López V, Polanco JA, Setién J (2013) The use of ladle furnace slag in soil stabilization. Construction and Building Materials, 40, 126-134.Morin KA, Hutt NM, Coulter TS, Tekano WM (2003) Case study of non-mining prediction and control of acid rock drainage – the Vancouver Island Highway Project. Proceedings from the Sixth International Conference on Acid Rock Drainage, Cairns, Australia p 14-17.Rose AW, Barnes, HL (2008). Alkaline addition problems at the Skytop Interstate-99 site, central Pennsylvania. Proceedings America Society of Mining and Reclamation, p 927-949.Sarkkinen M, Kujala K, Kemppainen K, Gehör S. (2016) Effect of biomass fly ashes as road stabilisation binder. Road Materials and Pavement Design, 1-13.Segui P, Aubert JE, Husson B, Measson M (2012) Characterization of wastepaper sludge ash for its valorisation as a component of hydraulic binders. Applied Clay Science, 57, 79-85.
892
Lappeenranta, Finland IMWA 2017Mine Water and Circular Economy
Wolkersdorfer C, Sartz L, Sillanpää M, Häkkinen A (Editors)
Paperchain Project: Establishing a New Circular Eco-nomy Model between the Mining Sector and the Pulp &
Paper Industry to Prevent Acid Mine Drainage
Juan José Cepriá1, Edith Guedella1, Christian Maurice2, Gunnar Westin3
1Research & Development Technological Centre, ACCIONA Construction, Valportillo II, 8, 28108 Alcobendas, Spain, [email protected]; edith.guedella.
[email protected] 2Geovetenskap och Miljöteknik, Luleå University of Technology, 971 87 Luleå, Sweden, Christian.
[email protected] 3RISE Processum AB, Box 70, 891 22 Örnsköldsvik Sweden. [email protected]
Abstract European Pulp and Paper Industry (PPI) generates 11 million tonnes of waste yearly. Most of them are burnt for energy recovery or used for landspreading, but around 1.5 million tonnes are still disposed. If managed in a sustainable manner, they can become a valuable secondary raw material for other resource intensive industries. PAPERCHAIN, a research and innovation project funded by the European Commission, addresses this potential resource to demonstrate their technical, economic, social and environmental feasibility from the Circular Economy perspective. In detail, Green Liquor Dregs are presented as an example of cooperation between the PPI and the mining sector.
Key words waste valorisation, industrial symbiosis, alkaline amendments, covers
Introduction
According to the Confederation of EU Paper Industries (CEPI), Pulp and Paper Industry (PPI) waste streams have shown a great potential as feedstock for the production of high value products in other industries, paper (fibres) or energy conversion. Nowadays, 55% of this waste is burnt for energy production, land application accounts to 15%, and exploitation of residues in other industries to 10% (Deviatkin et al. 2015). However, 1.65 million tonnes of waste generated by the Pulp and Paper industry (15% of the total waste) are still disposed to landfills. In addition, the valorisation of this waste has also a direct impact in landfilling itself due to the generation of ashes. In fact, it triggers that most of the landfilled waste cor-respond with inorganic wastes (causticizing residuals and ashes) which are currently used as cement raw meal, and to a lesser extent, as amendment in forestry.
Furthermore, Europe is nowadays facing the challenge of resource scarcity and more effi-cient use. If managed in a sustainable manner, PPI waste can become a valuable raw mate-rial for other resource intensive industries such as the construction (i.e 5,4 billion tonnes of raw material consumption in Europe) or the chemical industry (1 billion tonnes). Moreover, mining industry waste generation is estimated at up to 20.000 million tons of solid waste yearly (Lottermoser 2007). A relevant part of this waste needs to be kept in environmental safety conditions, which in turn implies additional use of resources (e.g borrow materials).
A major potential long-term environmental effect of mining is the formation of acid rock drainage (ARD) in sulphide-bearing mine waste, which can last for hundreds or even thou-
893
Lappeenranta, Finland IMWA 2017Mine Water and Circular Economy
Wolkersdorfer C, Sartz L, Sillanpää M, Häkkinen A (Editors)
sands of years. The common ways to deal with ARD are either to prevent the oxidation of sulphide minerals or to mitigate the negative effect of ARD, buffering the acidity and im-mobilising metal ions. Waste rock is commonly disposed in large landfills in the vicinity of mines and a common method is to cover mine waste deposits to limit water and oxygen in-filtration to the waste or to lime the collected ARD in sedimentation ponds, generating huge amounts of potentially toxic sludge. When dry covers are constructed on the waste rock piles, they usually consist of engineered barriers designed also for dust and erosion control; contaminant release control and provision of a growth medium for vegetation. Engineered barriers consist usually multilayer constructions built of borrow materials available on site, mainly granular and clayey soils.
In the Nordic mining area, glacial till is the most common borrow material. Glacial till is granular, fine grained and has medium to low permeability. Clayey till has sufficient water retention capacity, which makes it useful for being used in mine covers in order to avoid oxygen infiltration, However, clayey till is a limited resource in the sub-arctic environment, implying often transport over long distances of huge amount of construction material. There is therefore an interest to improve material with high hydraulic conductivity. Alternatives to virgin earthen materials are quite scarce and mainly related with the modification of soil natural properties (clay, till, silt) by adding amendments to improve their waterproofing properties, their mechanical resistance or to provide additional ARD inhibition properties. Some amendments based on recycled waste have been tested in mining projects along the last two decades. Some examples include phosphate refuse to neutralize acidity, mixtures of high alkalinity waste (cement kiln dust, coal fly ash) with soils to produce high alkaline leachates and organic-based waste such as lignocellulosic-based materials (wood chips and wastes, sewage sludge, straw, paper mill sludge) for oxygen consuming barriers (SENES 1994; Haug and Pauls 2001).
Meanwhile, Green Liquor Dregs (GLDs) are the largest waste fraction retrieved in the chem-ical recovery cycle at the sulphate pulp mills. Approximately 240.000 tonnes are landfilled solely in Sweden each year because their only current relevant application is as final landfill cover layers.
The mining sector can benefit from GLDs as alternative material for covers to reduce raw material consumption in their reclamation projects (Maurice et al. 2010). GLD is a waste classified as non-hazardous which consists mainly of CaCO3, Na2CO3, Na2S and insoluble solids. They have a low hydraulic conductivity (10-7-10-9 m/s) and highly alkalinity (pH 11-13) which opens the possibility for their use as soil cover. Blending GLDs along with glacial till will produce a new engineered barrier with reduced thickness thanks to its improved sealing and water retention capacity, contributing to avoid water and oxygen ingress. Fur-thermore, the high alkalinity of GLDs provides this cover with an important reactivity to neutralize any acid leachate and to keep alkaline oxidation conditions, deploying three functions at the same time (Jia et al. 2016). Finally, GLDs could be also used to chemically neutralize ARD; Covers aim at preventing the formation of ARD but other strategies are
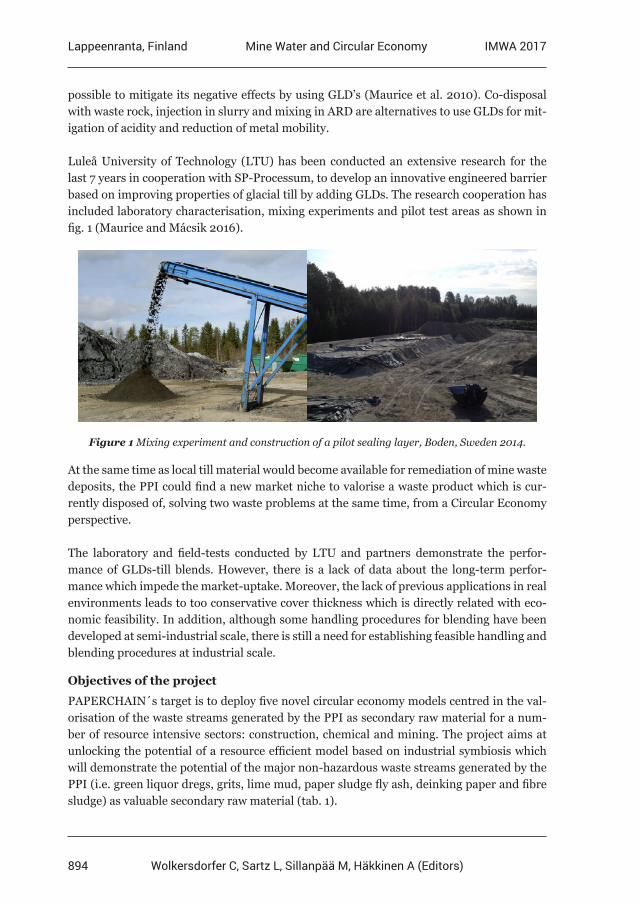
894
Lappeenranta, Finland IMWA 2017Mine Water and Circular Economy
Wolkersdorfer C, Sartz L, Sillanpää M, Häkkinen A (Editors)
possible to mitigate its negative effects by using GLD’s (Maurice et al. 2010). Co-disposal with waste rock, injection in slurry and mixing in ARD are alternatives to use GLDs for mit-igation of acidity and reduction of metal mobility.
Luleå University of Technology (LTU) has been conducted an extensive research for the last 7 years in cooperation with SP-Processum, to develop an innovative engineered barrier based on improving properties of glacial till by adding GLDs. The research cooperation has included laboratory characterisation, mixing experiments and pilot test areas as shown in fig. 1 (Maurice and Mácsik 2016).
Figure 1 Mixing experiment and construction of a pilot sealing layer, Boden, Sweden 2014.
At the same time as local till material would become available for remediation of mine waste deposits, the PPI could find a new market niche to valorise a waste product which is cur-rently disposed of, solving two waste problems at the same time, from a Circular Economy perspective.
The laboratory and field-tests conducted by LTU and partners demonstrate the perfor-mance of GLDs-till blends. However, there is a lack of data about the long-term perfor-mance which impede the market-uptake. Moreover, the lack of previous applications in real environments leads to too conservative cover thickness which is directly related with eco-nomic feasibility. In addition, although some handling procedures for blending have been developed at semi-industrial scale, there is still a need for establishing feasible handling and blending procedures at industrial scale.
Objectives of the project
PAPERCHAIN´s target is to deploy five novel circular economy models centred in the val-orisation of the waste streams generated by the PPI as secondary raw material for a num-ber of resource intensive sectors: construction, chemical and mining. The project aims at unlocking the potential of a resource efficient model based on industrial symbiosis which will demonstrate the potential of the major non-hazardous waste streams generated by the PPI (i.e. green liquor dregs, grits, lime mud, paper sludge fly ash, deinking paper and fibre sludge) as valuable secondary raw material (tab. 1).
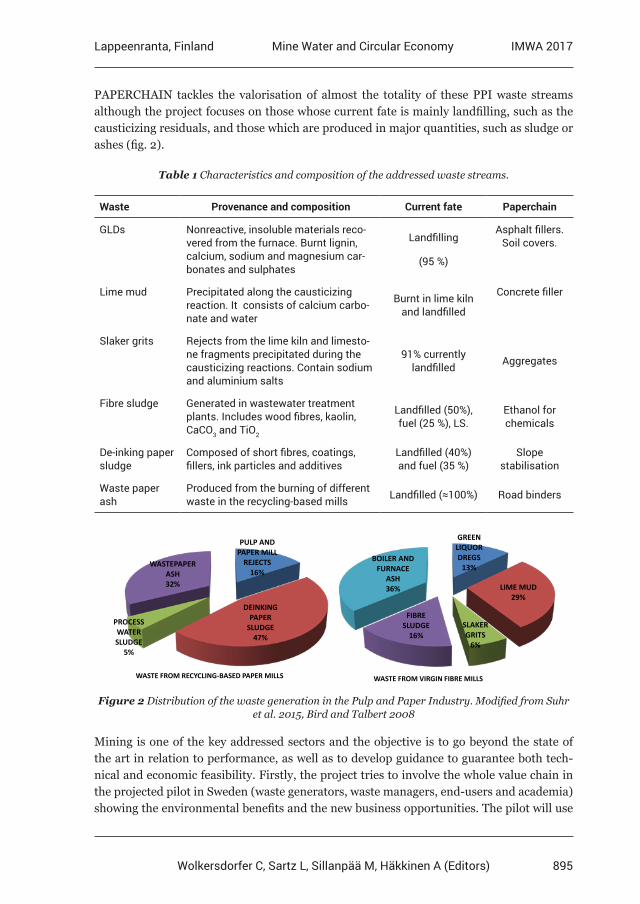
895
Lappeenranta, Finland IMWA 2017Mine Water and Circular Economy
Wolkersdorfer C, Sartz L, Sillanpää M, Häkkinen A (Editors)
PAPERCHAIN tackles the valorisation of almost the totality of these PPI waste streams although the project focuses on those whose current fate is mainly landfilling, such as the causticizing residuals, and those which are produced in major quantities, such as sludge or ashes (fig. 2).
Table 1 Characteristics and composition of the addressed waste streams.
Waste Provenance and composition Current fate Paperchain
GLDs Nonreactive, insoluble materials reco-vered from the furnace. Burnt lignin, calcium, sodium and magnesium car-bonates and sulphates
Landfilling
(95 %)
Asphalt fillers. Soil covers.
Lime mud Precipitated along the causticizing reaction. It consists of calcium carbo-nate and water
Burnt in lime kiln and landfilled
Concrete filler
Slaker grits Rejects from the lime kiln and limesto-ne fragments precipitated during the causticizing reactions. Contain sodium and aluminium salts
91% currently landfilled Aggregates
Fibre sludge Generated in wastewater treatment plants. Includes wood fibres, kaolin, CaCO3 and TiO2
Landfilled (50%), fuel (25 %), LS.
Ethanol for chemicals
De-inking paper sludge
Composed of short fibres, coatings, fillers, ink particles and additives
Landfilled (40%) and fuel (35 %)
Slope stabilisation
Waste paper ash
Produced from the burning of different waste in the recycling-based mills Landfilled (≈100%) Road binders
WASTE FROM RECYCLING-BASED PAPER MILLS WASTE FROM VIRGIN FIBRE MILLS
GREEN LIQUOR DREGS
13%
LIME MUD29%
SLAKER GRITS
6%
FIBRE SLUDGE
16%
BOILER AND FURNACE
ASH36%
PULP AND PAPER MILL
REJECTS16%
DEINKING PAPER
SLUDGE47%
PROCESS WATER SLUDGE
5%
WASTEPAPER ASH32%
Figure 2 Distribution of the waste generation in the Pulp and Paper Industry. Modified from Suhr et al. 2015, Bird and Talbert 2008
Mining is one of the key addressed sectors and the objective is to go beyond the state of the art in relation to performance, as well as to develop guidance to guarantee both tech-nical and economic feasibility. Firstly, the project tries to involve the whole value chain in the projected pilot in Sweden (waste generators, waste managers, end-users and academia) showing the environmental benefits and the new business opportunities. The pilot will use
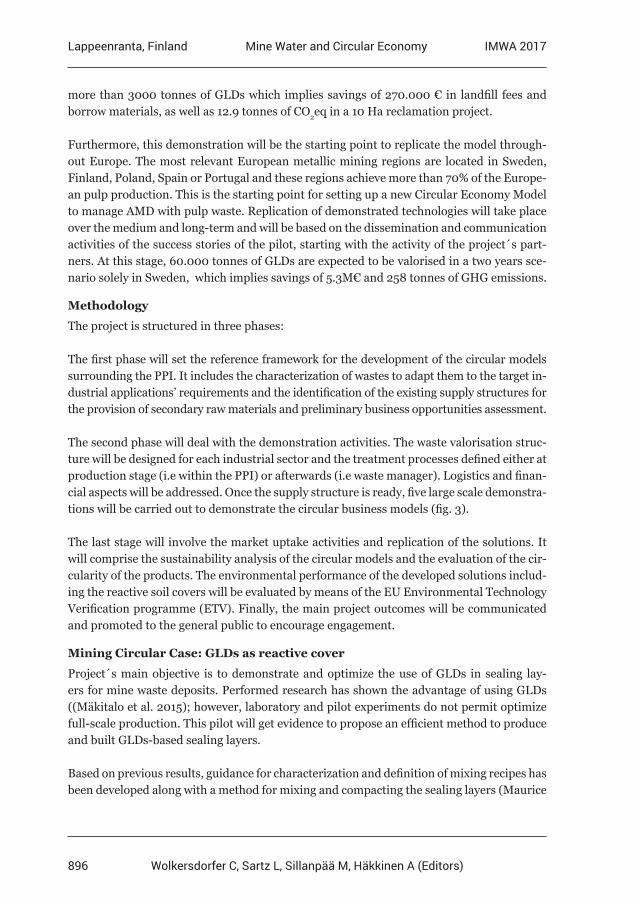
896
Lappeenranta, Finland IMWA 2017Mine Water and Circular Economy
Wolkersdorfer C, Sartz L, Sillanpää M, Häkkinen A (Editors)
more than 3000 tonnes of GLDs which implies savings of 270.000 € in landfill fees and borrow materials, as well as 12.9 tonnes of CO2eq in a 10 Ha reclamation project.
Furthermore, this demonstration will be the starting point to replicate the model through-out Europe. The most relevant European metallic mining regions are located in Sweden, Finland, Poland, Spain or Portugal and these regions achieve more than 70% of the Europe-an pulp production. This is the starting point for setting up a new Circular Economy Model to manage AMD with pulp waste. Replication of demonstrated technologies will take place over the medium and long-term and will be based on the dissemination and communication activities of the success stories of the pilot, starting with the activity of the project´s part-ners. At this stage, 60.000 tonnes of GLDs are expected to be valorised in a two years sce-nario solely in Sweden, which implies savings of 5.3M€ and 258 tonnes of GHG emissions.
Methodology
The project is structured in three phases:
The first phase will set the reference framework for the development of the circular models surrounding the PPI. It includes the characterization of wastes to adapt them to the target in-dustrial applications’ requirements and the identification of the existing supply structures for the provision of secondary raw materials and preliminary business opportunities assessment.
The second phase will deal with the demonstration activities. The waste valorisation struc-ture will be designed for each industrial sector and the treatment processes defined either at production stage (i.e within the PPI) or afterwards (i.e waste manager). Logistics and finan-cial aspects will be addressed. Once the supply structure is ready, five large scale demonstra-tions will be carried out to demonstrate the circular business models (fig. 3).
The last stage will involve the market uptake activities and replication of the solutions. It will comprise the sustainability analysis of the circular models and the evaluation of the cir-cularity of the products. The environmental performance of the developed solutions includ-ing the reactive soil covers will be evaluated by means of the EU Environmental Technology Verification programme (ETV). Finally, the main project outcomes will be communicated and promoted to the general public to encourage engagement.
Mining Circular Case: GLDs as reactive cover
Project´s main objective is to demonstrate and optimize the use of GLDs in sealing lay-ers for mine waste deposits. Performed research has shown the advantage of using GLDs ((Mäkitalo et al. 2015); however, laboratory and pilot experiments do not permit optimize full-scale production. This pilot will get evidence to propose an efficient method to produce and built GLDs-based sealing layers.
Based on previous results, guidance for characterization and definition of mixing recipes has been developed along with a method for mixing and compacting the sealing layers (Maurice
897
Lappeenranta, Finland IMWA 2017Mine Water and Circular Economy
Wolkersdorfer C, Sartz L, Sillanpää M, Häkkinen A (Editors)
Figure 3 Project concepts, proposed methodology and addressed topics.
and Mácsik 2016).. This guidance can be tested in a real environment, a 4.4 Ha waste rock landfill in Northern Sweden operated by Boliden to be carried out in summer of 2017.
Given its innovative character, no information is available on the robustness of the sealing layer for its sizing, so that, a large safety factor has been used for the construction work regarding the mixing process, the compaction, and the thickness, in order not to take any environmental risk. As a consequence, the solution is oversized and has to be optimized by reducing safety factors to reach the market. PAPERCHAIN project will carry out the follow-ing activities:
Pilot monitoring at the mine site provided by Boliden Mineral, where a GLDs/till mixture will be used as sealing layer. The effect of aging on the barrier function of the layer will be studied during the first two years of the project to identify uncertainties about the technolo-gy. The monitoring will result in the definition of new specifications for the demo, including the optimisation of the layer thickness.
Construction of 500 m2 demonstrator to optimise the cover construction. The demonstra-tion comprises three steps; i) optimisation of mixing using e.g. in-situ mixers, ii) compar-ison of different compactors and iii) assessment of the barrier function of sealing layers (0.2-0,5 m) and protective layer (0.3 – 1.5 m) with varying thickness.
898
Lappeenranta, Finland IMWA 2017Mine Water and Circular Economy
Wolkersdorfer C, Sartz L, Sillanpää M, Häkkinen A (Editors)
Assessment and follow-up of the demonstration site to measure, water content, oxygen transport and temperature within the layers. The effect of the leachate (percolating pre-cipitation) on the underlying mine waste and the recipient, monitoring those parameters (metals and anions) according to regional laws. The conclusions of the assessment will serve to update the guidance for construction of sealing layer for mine waste deposits.
Conclusions
The PPI is in the way of achieving the zero-waste target, although some waste streams are still disposed of, especially those inorganic fractions with no interest for energy recovery or agricultural beneficiation. The transformation of these wastes into valuable secondary raw material can be secured by the establishment of Circular Economy models with other sectors based on research and innovation projects along with the initial support of public authorities.
PAPERCHAIN project tries to develop and demonstrate the profit of PPI wastes for differ-ent resource intensive industries, including mining. Planned activities include the demon-stration of both, technical and environmental performance of GLDs in soil covers, and also the economic feasibility by means of assessing the quality, availability, logistics, workability and durability of this material and the projected solution.
Involvement of all the actors along the value chain with the support of academia and public authorities is a key aspect for the success of the project: Value creation, sustainability and replication. In this sense, the geographical correlation between PPI and main European mining districts as well as other mining relevant countries with forest industries, makes these technologies promisingly replicable.
Acknowledgements
This project has received funding from the European Union’s Horizon 2020 research and innovation programme under grant agreement N° 730305.
References
Bird M, Talbert J (2008) Waste stream reduction and re-use in the pulp and paper sector. Washington State Department of Ecology Industrial Footprint Project. Center for Sustainable Economy. www.sustainable-economy.org.Deviatkin I, Kujala A, Horttanainen M (2015) Deinking sludge utilization possibilities: technical, economic, and environmental assessments. LUT Scientific and Expertise Publications/ Research Reports.Haug MD, Pauls G (2001) A Review of non-traditional dry covers. The Mine Environment Neutral Drainage (MEND) Project. Report 2.21.3b. March 2002. Jia Y, Maurice C, Öhlander B (2016). Mobility of As, Cu, Cr, and Zn from tailings covered with sealing materials using alkaline industrial residues: a comparison between two leaching methods. Environmental Science and Pollution Research. 23, 1, s. 648-660 13 s. Lottermoser B (2007) Mine Waste, Characterisation, treatment and environmental impacts. Springer- Verlag Berlin Heidelberg.Maurice C, & Mácsik J (2016) Construction of sealing layer with till amended with GLD to reduce oxygen diffusion- Guidance (in Swedish).
899
Lappeenranta, Finland IMWA 2017Mine Water and Circular Economy
Wolkersdorfer C, Sartz L, Sillanpää M, Häkkinen A (Editors)
Maurice C, Mäkitalo, M, Villain L, Öhlander B (2010) Green liquor dregs for the amendment of tailings. Paste 2010, 13th International Seminar on Paste and Thickened Tailings Toronto, Canada, May 3-6, 2010. Mäkitalo M, Mácsik J, Maurice C, Öhlander B (2015) Improving properties of sealing layers made of till by adding green liquor dregs to reduce oxidation of sulfidic mine waste. Geotechnical and Geological Engineering, 33(4), 1047-1054.SENES Consultants Limited (1994) Evaluation of alternate dry covers for the inhibition of acid mine drainage from tailings. The Mine Environment Neutral Drainage (MEND) Project. Report 2.20.1. February 1994. Suhr M, Klein G, Kourti I, Gonzalo MR, Santonja GG, Roudier S, Sancho LD (2015) Best Available Techniques (Bat) Reference Document for the Production of Pulp, Paper and Board. European Commission.[verkkodokumentti]. Luxemburg.
900
Lappeenranta, Finland IMWA 2017Mine Water and Circular Economy
Wolkersdorfer C, Sartz L, Sillanpää M, Häkkinen A (Editors)
Ion Exchange by Zeolites and Peat-Based Sorption Media of Chilean Mine Water and their Potential for Secondary Mining
Juliane Günther, Maria Ussath, Nils Hoth, Carsten Drebenstedt1TU Bergakademie Freiberg, Germany, Gustav-Zeuner-Straße 1a, 09599 Freiberg,
Germany, [email protected], [email protected]
Abstract Acid mine drainage (AMD) is a common phenomenon in many mines all over the world. Ion exchange is a promising option for AMD treatment and has potential to be used for secondary mining approaches. In this paper, the results of column experiments with two ion exchange materials (peat-based sorption media and zeolite-containing andesite) in relation to Chilean mine waters are presented. Both materials treat the incoming water with mean copper concentrations of 350 mg/L over 15 to 42 exchanged pore volumes. With sequential extraction, it was possible to discharge the complete amount of attached copper from the materials.
Key words Mine water, Zeolite, APTsorb, copper retention, AMD treatment, secondary mining
Introduction
Chile is one of the largest copper producers worldwide with a long history of mining. Cop-per production always comes along with residual materials, which are deposited in large tailings facilities. These tailings still contain amounts of copper and other elements such as zinc, cobalt, manganese or aluminium. Due to the ore processing, the residual materials are often fine grained. This enhances acid mine drainage, which results in waters with low pH values and metals contamination being discharged into the environment in large volumes. To avoid the harmful effects of these waters on surrounding surface and subsurface waters, treatment is necessary. Except for the aforementioned problems, these residual bodies can also be seen as raw materials for secondary mining opportunities, because of their signifi-cant amounts of trace and minor elements (Ussath et al. 2015).
In the last decades, the interest in ion exchangers in mining has increased, because they are a promising option for AMD treatment (Younger et al. 2002). They also enable the reclama-tion of the attached elements by subsequent desorption. There is a large variety of materials, which can function as ion exchangers, e.g. clay, activated carbon, resins or fly ash (Babel and Kurniawan 2003). One promising ion exchange material, which is investigated in this paper, is zeolite. Zeolites are a large mineral group of micro-porous aluminium-silicates. Due to their structure, they have high exchange capacities for different elements e.g. Cu2+, Ni2+, or Pb2+. The pH value and particle size have a strong influence on the ion exchange capacity of zeo-lites, i.e. higher exchange capacities are reached at higher pH values and smaller particle sizes (Ok et al. 2007). Typical adsorption capacities for zeolite range between 1.64 and 5.10 mg/g (batch experiments) (Babel and Kurniawan 2003). Zeolites are reported to be reusable after discharging with NaNO3 (15 g/L) (Medvidović et al. 2006). Another common ion exchanger that is discussed in this paper is a peat-based sorption media. Peat can immobilise a variety of elements by complexation and chelation due to its structure and its carboxyl, phenol and hydroxyl groups (Ho et al. 1995). Ion exchange capacities of peat have already been tested for
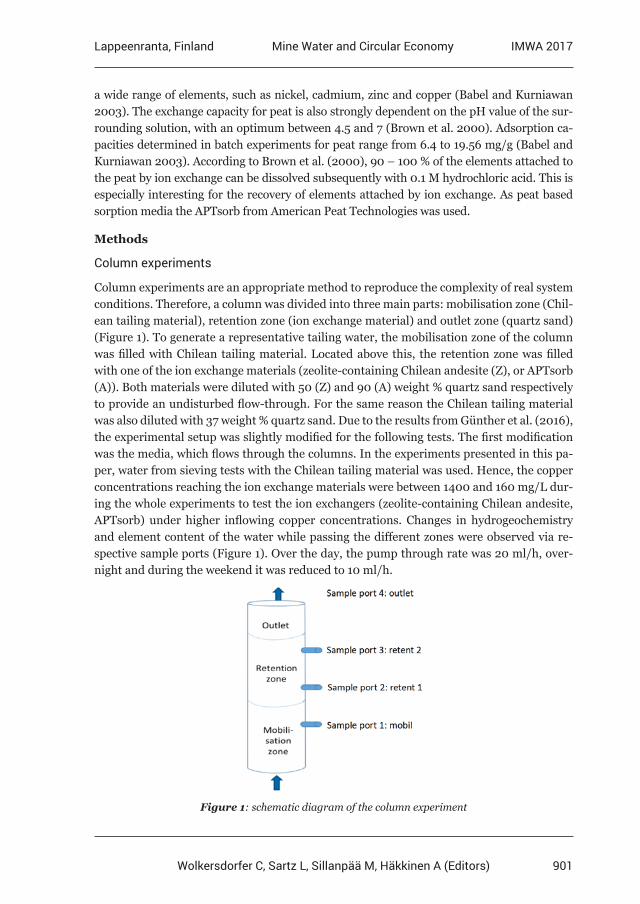
901
Lappeenranta, Finland IMWA 2017Mine Water and Circular Economy
Wolkersdorfer C, Sartz L, Sillanpää M, Häkkinen A (Editors)
a wide range of elements, such as nickel, cadmium, zinc and copper (Babel and Kurniawan 2003). The exchange capacity for peat is also strongly dependent on the pH value of the sur-rounding solution, with an optimum between 4.5 and 7 (Brown et al. 2000). Adsorption ca-pacities determined in batch experiments for peat range from 6.4 to 19.56 mg/g (Babel and Kurniawan 2003). According to Brown et al. (2000), 90 – 100 % of the elements attached to the peat by ion exchange can be dissolved subsequently with 0.1 M hydrochloric acid. This is especially interesting for the recovery of elements attached by ion exchange. As peat based sorption media the APTsorb from American Peat Technologies was used.
Methods
Column experiments
Column experiments are an appropriate method to reproduce the complexity of real system conditions. Therefore, a column was divided into three main parts: mobilisation zone (Chil-ean tailing material), retention zone (ion exchange material) and outlet zone (quartz sand) (Figure 1). To generate a representative tailing water, the mobilisation zone of the column was filled with Chilean tailing material. Located above this, the retention zone was filled with one of the ion exchange materials (zeolite-containing Chilean andesite (Z), or APTsorb (A)). Both materials were diluted with 50 (Z) and 90 (A) weight % quartz sand respectively to provide an undisturbed flow-through. For the same reason the Chilean tailing material was also diluted with 37 weight % quartz sand. Due to the results from Günther et al. (2016), the experimental setup was slightly modified for the following tests. The first modification was the media, which flows through the columns. In the experiments presented in this pa-per, water from sieving tests with the Chilean tailing material was used. Hence, the copper concentrations reaching the ion exchange materials were between 1400 and 160 mg/L dur-ing the whole experiments to test the ion exchangers (zeolite-containing Chilean andesite, APTsorb) under higher inflowing copper concentrations. Changes in hydrogeochemistry and element content of the water while passing the different zones were observed via re-spective sample ports (Figure 1). Over the day, the pump through rate was 20 ml/h, over-night and during the weekend it was reduced to 10 ml/h.
Figure 1: schematic diagram of the column experiment
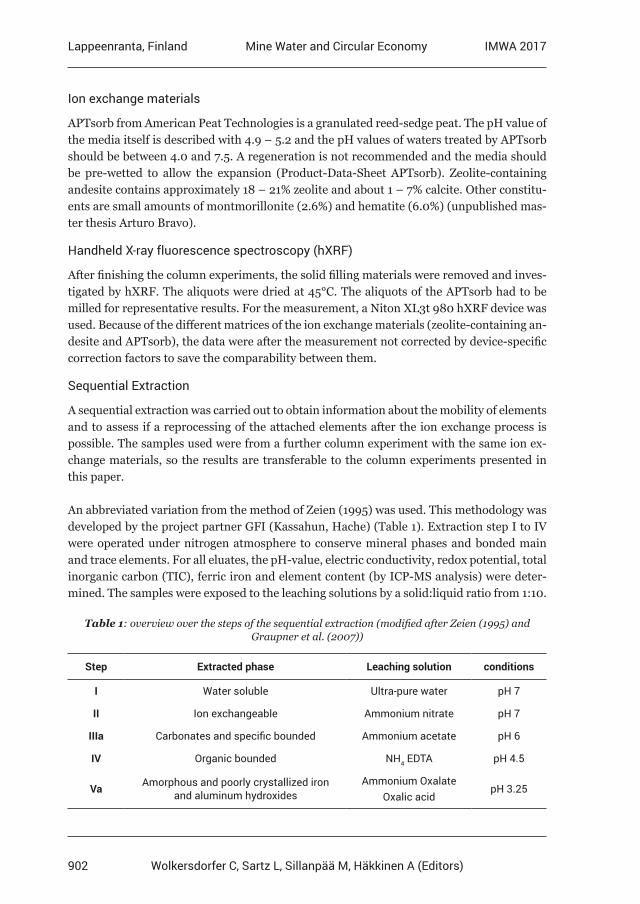
902
Lappeenranta, Finland IMWA 2017Mine Water and Circular Economy
Wolkersdorfer C, Sartz L, Sillanpää M, Häkkinen A (Editors)
Ion exchange materials
APTsorb from American Peat Technologies is a granulated reed-sedge peat. The pH value of the media itself is described with 4.9 – 5.2 and the pH values of waters treated by APTsorb should be between 4.0 and 7.5. A regeneration is not recommended and the media should be pre-wetted to allow the expansion (Product-Data-Sheet APTsorb). Zeolite-containing andesite contains approximately 18 – 21% zeolite and about 1 – 7% calcite. Other constitu-ents are small amounts of montmorillonite (2.6%) and hematite (6.0%) (unpublished mas-ter thesis Arturo Bravo).
Handheld X-ray fluorescence spectroscopy (hXRF)
After finishing the column experiments, the solid filling materials were removed and inves-tigated by hXRF. The aliquots were dried at 45°C. The aliquots of the APTsorb had to be milled for representative results. For the measurement, a Niton XL3t 980 hXRF device was used. Because of the different matrices of the ion exchange materials (zeolite-containing an-desite and APTsorb), the data were after the measurement not corrected by device-specific correction factors to save the comparability between them.
Sequential Extraction
A sequential extraction was carried out to obtain information about the mobility of elements and to assess if a reprocessing of the attached elements after the ion exchange process is possible. The samples used were from a further column experiment with the same ion ex-change materials, so the results are transferable to the column experiments presented in this paper.
An abbreviated variation from the method of Zeien (1995) was used. This methodology was developed by the project partner GFI (Kassahun, Hache) (Table 1). Extraction step I to IV were operated under nitrogen atmosphere to conserve mineral phases and bonded main and trace elements. For all eluates, the pH-value, electric conductivity, redox potential, total inorganic carbon (TIC), ferric iron and element content (by ICP-MS analysis) were deter-mined. The samples were exposed to the leaching solutions by a solid:liquid ratio from 1:10.
Table 1: overview over the steps of the sequential extraction (modified after Zeien (1995) and Graupner et al. (2007))
Step Extracted phase Leaching solution conditions
I Water soluble Ultra-pure water pH 7
II Ion exchangeable Ammonium nitrate pH 7
IIIa Carbonates and specific bounded Ammonium acetate pH 6
IV Organic bounded NH4 EDTA pH 4.5
Va Amorphous and poorly crystallized iron and aluminum hydroxides
Ammonium OxalateOxalic acid
pH 3.25
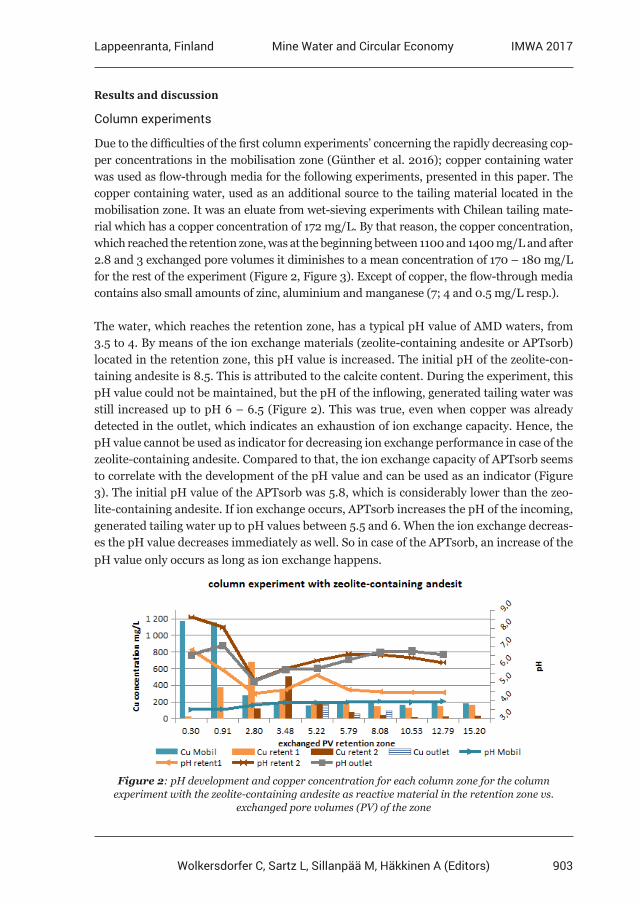
903
Lappeenranta, Finland IMWA 2017Mine Water and Circular Economy
Wolkersdorfer C, Sartz L, Sillanpää M, Häkkinen A (Editors)
Results and discussion
Column experiments
Due to the difficulties of the first column experiments’ concerning the rapidly decreasing cop-per concentrations in the mobilisation zone (Günther et al. 2016); copper containing water was used as flow-through media for the following experiments, presented in this paper. The copper containing water, used as an additional source to the tailing material located in the mobilisation zone. It was an eluate from wet-sieving experiments with Chilean tailing mate-rial which has a copper concentration of 172 mg/L. By that reason, the copper concentration, which reached the retention zone, was at the beginning between 1100 and 1400 mg/L and after 2.8 and 3 exchanged pore volumes it diminishes to a mean concentration of 170 – 180 mg/L for the rest of the experiment (Figure 2, Figure 3). Except of copper, the flow-through media contains also small amounts of zinc, aluminium and manganese (7; 4 and 0.5 mg/L resp.).
The water, which reaches the retention zone, has a typical pH value of AMD waters, from 3.5 to 4. By means of the ion exchange materials (zeolite-containing andesite or APTsorb) located in the retention zone, this pH value is increased. The initial pH of the zeolite-con-taining andesite is 8.5. This is attributed to the calcite content. During the experiment, this pH value could not be maintained, but the pH of the inflowing, generated tailing water was still increased up to pH 6 – 6.5 (Figure 2). This was true, even when copper was already detected in the outlet, which indicates an exhaustion of ion exchange capacity. Hence, the pH value cannot be used as indicator for decreasing ion exchange performance in case of the zeolite-containing andesite. Compared to that, the ion exchange capacity of APTsorb seems to correlate with the development of the pH value and can be used as an indicator (Figure 3). The initial pH value of the APTsorb was 5.8, which is considerably lower than the zeo-lite-containing andesite. If ion exchange occurs, APTsorb increases the pH of the incoming, generated tailing water up to pH values between 5.5 and 6. When the ion exchange decreas-es the pH value decreases immediately as well. So in case of the APTsorb, an increase of the pH value only occurs as long as ion exchange happens.
Figure 2: pH development and copper concentration for each column zone for the column experiment with the zeolite-containing andesite as reactive material in the retention zone vs.
exchanged pore volumes (PV) of the zone
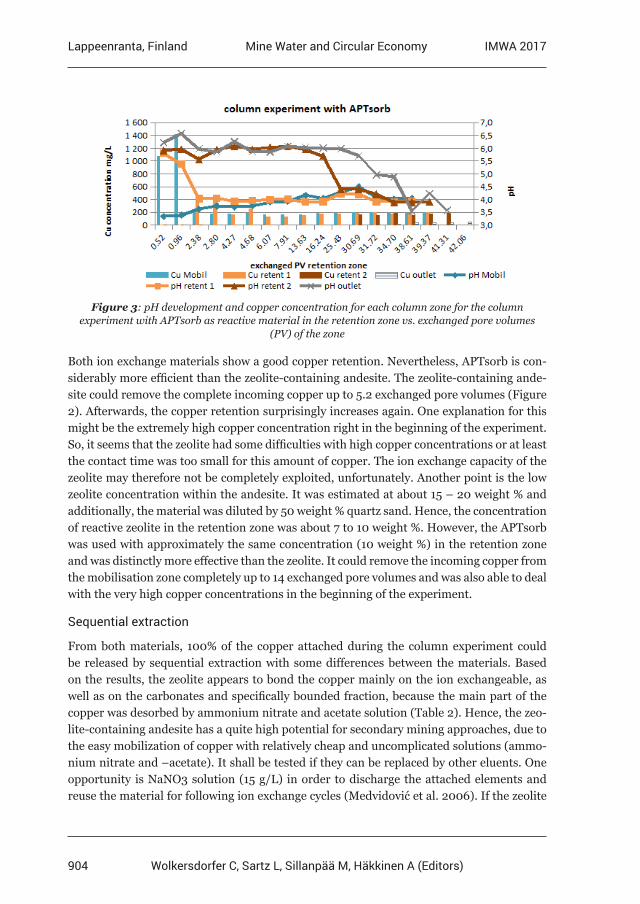
904
Lappeenranta, Finland IMWA 2017Mine Water and Circular Economy
Wolkersdorfer C, Sartz L, Sillanpää M, Häkkinen A (Editors)
Figure 3: pH development and copper concentration for each column zone for the column experiment with APTsorb as reactive material in the retention zone vs. exchanged pore volumes
(PV) of the zone
Both ion exchange materials show a good copper retention. Nevertheless, APTsorb is con-siderably more efficient than the zeolite-containing andesite. The zeolite-containing ande-site could remove the complete incoming copper up to 5.2 exchanged pore volumes (Figure 2). Afterwards, the copper retention surprisingly increases again. One explanation for this might be the extremely high copper concentration right in the beginning of the experiment. So, it seems that the zeolite had some difficulties with high copper concentrations or at least the contact time was too small for this amount of copper. The ion exchange capacity of the zeolite may therefore not be completely exploited, unfortunately. Another point is the low zeolite concentration within the andesite. It was estimated at about 15 – 20 weight % and additionally, the material was diluted by 50 weight % quartz sand. Hence, the concentration of reactive zeolite in the retention zone was about 7 to 10 weight %. However, the APTsorb was used with approximately the same concentration (10 weight %) in the retention zone and was distinctly more effective than the zeolite. It could remove the incoming copper from the mobilisation zone completely up to 14 exchanged pore volumes and was also able to deal with the very high copper concentrations in the beginning of the experiment.
Sequential extraction
From both materials, 100% of the copper attached during the column experiment could be released by sequential extraction with some differences between the materials. Based on the results, the zeolite appears to bond the copper mainly on the ion exchangeable, as well as on the carbonates and specifically bounded fraction, because the main part of the copper was desorbed by ammonium nitrate and acetate solution (Table 2). Hence, the zeo-lite-containing andesite has a quite high potential for secondary mining approaches, due to the easy mobilization of copper with relatively cheap and uncomplicated solutions (ammo-nium nitrate and –acetate). It shall be tested if they can be replaced by other eluents. One opportunity is NaNO3 solution (15 g/L) in order to discharge the attached elements and reuse the material for following ion exchange cycles (Medvidović et al. 2006). If the zeolite
905
Lappeenranta, Finland IMWA 2017Mine Water and Circular Economy
Wolkersdorfer C, Sartz L, Sillanpää M, Häkkinen A (Editors)
containing andesite used in the presented experiments is suitable for reuse the influence of the contained carbonates on ion exchange has to be clarified. In contrast to that stands the APTsorb. It bonds the adsorbed elements quite strongly to the organic fraction as the results show (Table 2). The main part of the adsorbed copper can only be released by EDTA solution (sequential extraction step IV). This is not suitable for secondary mining approach-es because EDTA is fairly expensive. By that reason, other extraction solutions should be tested. One option is HCl. Brown et al. (2000) reported that 90 – 100% of copper attached to the peat could be desorbed with a 0.1 M HCl solution. This could be a cheaper alternative to the expensive EDTA solution to unload the APTsorb. Since a reuse of APTsorb is not rec-ommended by the company American Peat Technology, the advantage of the higher copper retention can be compensated by the reuse of the zeolite-containing andesite.
Table 2: results of the sequential extraction of copper dissolution for both materials zeolite and APTsorb for each sequential extraction step (I – Va)
I II IIIa IV Va
Sample ppm % ppm % ppm % ppm % ppm %
Zeolite 0.0 0.0 620.2 76.6 217.4 26.9 55.2 6.8 19.9 2.5
APTsorb 13.3 0.8 21.3 1.3 93.6 5.9 1166.2 72.9 382.9 23.9
Conclusions
Both ion exchange materials were tested under challenging conditions with high incoming copper concentrations and a mixture of different elements compared to most of the men-tioned studies, which often consider only one element. Despite this, the zeolite-containing andesite and APTsorb show very good ion exchange capacities for copper. However, the APTsorb was considerably more effective in copper retention than the zeolite. Concerning the secondary mining potential, the zeolite-containing andesite seems to have advantages. Attached elements can be mobilised easier from the zeolite than from the APTsorb. In case of the zeolite, the regeneration solutions are considerably cheaper than the EDTA solution required for APTsorb. Nevertheless, the complete amount of copper attached to the ion exchange material in the column experiments can be dissolved by sequential extraction. To simplify the release of elements, the alternative solutions NaNO3 and HCl should be tested in future. Especially for the zeolite-containing andesite, it would be interesting if a reuse is possible after regeneration and if there is an effect on the ion exchange capacity for following cycles.
Acknowledgements
The project SecMinStratEl is funded by the German Federal Ministry of Education and Research (BMBF) as a part of the CLIENT-program “International Partnerships for Sustainable Technologies and Services for Climate Protection and the Environment” (grant no. (FKZ) 033R118A). The authors also thank American Peat Technologies for providing the APTsorb.
906
Lappeenranta, Finland IMWA 2017Mine Water and Circular Economy
Wolkersdorfer C, Sartz L, Sillanpää M, Häkkinen A (Editors)
References
Babel S, Kurniawan TA (2003) Low-cost adsorbents for heavy metals uptake from contaminated water. A review. J Hazard Mater 97 (1-3), S. 219–243Brown PA, Gill SA, Allen SJ (2000) Metal removal from wastewater using peat. Water Res 34 (16), S. 3907–3916. DOI: 10.1016/S0043-1354(00)00152-4Günther J, Ussath M, Hoth N, Drebenstedt C, (2016) Specific Retention of Copper and Strategic Elements from Chilean Mine Water with Zeolites and Peat-Based Sorption Media. – In: Drebenstedt, C. & Paul, M.: IMWA 2016 – Mining Meets Water – Conflicts and Solutions. – p. 1370 – 1375; Freiberg/Germany (TU Bergakademie Freiberg).Ho YS, John Wase DA, Forster CF (1995) Batch nickel removal from aqueous solution by sphagnum moss peat. Water Res 29 (5), S. 1327–1332.Medvidović N, Perić J, Trgo M (2006) Column performance in lead removal from aqueous solutions by fixed bed of natural zeolite–clinoptilolite. In: Separation and Purification Technology 49 (3), S. 237–244. DOI: 10.1016/j.seppur.2005.10.005 Ok YS, Yang JE, Zhang YS, Kim SJ, Chung DY (2007) Heavy metal adsorption by a formulated zeolite- Portland cement mixture. J Hazard Mater 147 (1-2), S. 91–96.Ussath M, Wendler C, Hoth N, Kelm U, Haubrich F, Hache M, Heide G, Grimmer M, Drebenstedt C (2015) Mobility of Strategic Elements in Chilean Tailings in the Context of Secondary Mining Processes – In: Agreeing on solutions for more sustainable mine water management – Proceedings of the 10th ICARD & IMWA Annual Conference; Santiago, Chile (GECAMIN).Younger PL Banwart SA, Hedin RS (2002) Mine water. Hydrology, pollution, remediation. Dordrecht: Kluwer Acad. Publ (Environmental pollution, 5).Product-Data-Sheet APTsorb from: http://americanpeattech.com/wp-lib/wp-content/uploads/2015/ 03/A3-APTsorb-Product-Data-Sheet.pdf (25.04.2017)
907
Lappeenranta, Finland IMWA 2017Mine Water and Circular Economy
Wolkersdorfer C, Sartz L, Sillanpää M, Häkkinen A (Editors)
Integration of Heat Recovery and Renewables within a Mine Water Treatment Scheme: A UK Case Study
Christopher J. Satterley1, Sinead Chamberlain1, Philip Broughton1
1The Coal Authority, Mansfield, United Kingdom, [email protected]
Abstract The Coal Authority has installed both mine water heat recovery and a solar array at its mine water treatment scheme at Dawdon, UK. Monitoring of these schemes indicates that savings in electricity costs could be around 30% (approximately 78,000 kWh) and CO2 savings of 54.7 tonnes per year combined. Pay back periods within 10 years are achieved, demonstrating that even small scale renewables have the potential to reduce energy costs and CO2 emission associated with mine water treatment. These installations are part of the Coal Authority’s ongoing programme to reduce costs associated with mine water treatment in the UK.
Key words Valorisation, Mine Water, Renewables, Heat Recovery, Low Carbon
Introduction
The Coal Authority operates over 75 mine water schemes across the UK with a new build programme of up to three new schemes per year. The Authority is funded by the United Kingdom Government to manage the legacy of historic coal mining in Britain. The Authority seeks to implement novel technologies and new ways of working that will deliver significant community and environment benefits and lead to the delivery of a treatment scheme pro-gramme without the need for continued Government funding.
To achieve this, the Authority is undertaking an extensive innovation, commercialisation, research and development programme. It seeks to create value from its assets and adopt a circular economy model, at a national and local level, that maximises its potential and real-ises sustainable benefits for the country.
Reducing the energy consumption and carbon intensity of mine water treatment are key requirements in order to ensure that such treatment is sustainable and cost effective in the long term. The Authority’s Innovation Programme includes investing in renewable genera-tion, heat recovery from mine water and seeking alternative uses for ochre produced from mine water treatment.
Recent developments at our Dawdon active treatment site in the North East of England to seek alternative energy sources to reduce costs and carbon emissions are an exemplar of the Authority’s overall approach. This paper will give details of the renewable energy generation technologies deployed at Dawdon, as well as how we have assessed their performance since deployment, lessons learned and our the future potential for these technologies within the Authority’s mine water treatment operations.
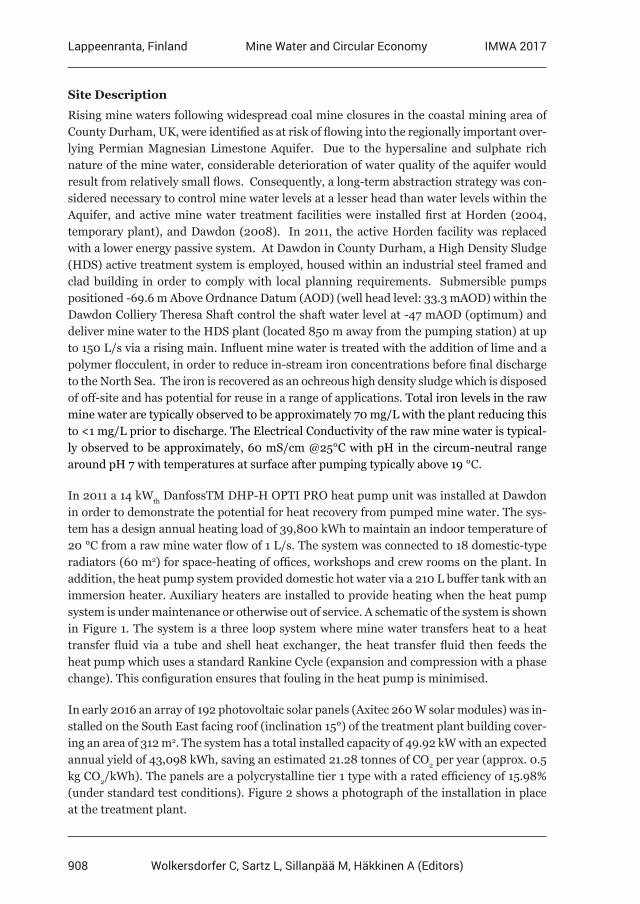
908
Lappeenranta, Finland IMWA 2017Mine Water and Circular Economy
Wolkersdorfer C, Sartz L, Sillanpää M, Häkkinen A (Editors)
Site Description
Rising mine waters following widespread coal mine closures in the coastal mining area of County Durham, UK, were identified as at risk of flowing into the regionally important over-lying Permian Magnesian Limestone Aquifer. Due to the hypersaline and sulphate rich nature of the mine water, considerable deterioration of water quality of the aquifer would result from relatively small flows. Consequently, a long-term abstraction strategy was con-sidered necessary to control mine water levels at a lesser head than water levels within the Aquifer, and active mine water treatment facilities were installed first at Horden (2004, temporary plant), and Dawdon (2008). In 2011, the active Horden facility was replaced with a lower energy passive system. At Dawdon in County Durham, a High Density Sludge (HDS) active treatment system is employed, housed within an industrial steel framed and clad building in order to comply with local planning requirements. Submersible pumps positioned -69.6 m Above Ordnance Datum (AOD) (well head level: 33.3 mAOD) within the Dawdon Colliery Theresa Shaft control the shaft water level at -47 mAOD (optimum) and deliver mine water to the HDS plant (located 850 m away from the pumping station) at up to 150 L/s via a rising main. Influent mine water is treated with the addition of lime and a polymer flocculent, in order to reduce in-stream iron concentrations before final discharge to the North Sea. The iron is recovered as an ochreous high density sludge which is disposed of off-site and has potential for reuse in a range of applications. Total iron levels in the raw mine water are typically observed to be approximately 70 mg/L with the plant reducing this to <1 mg/L prior to discharge. The Electrical Conductivity of the raw mine water is typical-ly observed to be approximately, 60 mS/cm @25°C with pH in the circum-neutral range around pH 7 with temperatures at surface after pumping typically above 19 °C.
In 2011 a 14 kWth DanfossTM DHP-H OPTI PRO heat pump unit was installed at Dawdon in order to demonstrate the potential for heat recovery from pumped mine water. The sys-tem has a design annual heating load of 39,800 kWh to maintain an indoor temperature of 20 °C from a raw mine water flow of 1 L/s. The system was connected to 18 domestic-type radiators (60 m2) for space-heating of offices, workshops and crew rooms on the plant. In addition, the heat pump system provided domestic hot water via a 210 L buffer tank with an immersion heater. Auxiliary heaters are installed to provide heating when the heat pump system is under maintenance or otherwise out of service. A schematic of the system is shown in Figure 1. The system is a three loop system where mine water transfers heat to a heat transfer fluid via a tube and shell heat exchanger, the heat transfer fluid then feeds the heat pump which uses a standard Rankine Cycle (expansion and compression with a phase change). This configuration ensures that fouling in the heat pump is minimised.
In early 2016 an array of 192 photovoltaic solar panels (Axitec 260 W solar modules) was in-stalled on the South East facing roof (inclination 15°) of the treatment plant building cover-ing an area of 312 m2. The system has a total installed capacity of 49.92 kW with an expected annual yield of 43,098 kWh, saving an estimated 21.28 tonnes of CO2 per year (approx. 0.5 kg CO2/kWh). The panels are a polycrystalline tier 1 type with a rated efficiency of 15.98% (under standard test conditions). Figure 2 shows a photograph of the installation in place at the treatment plant.
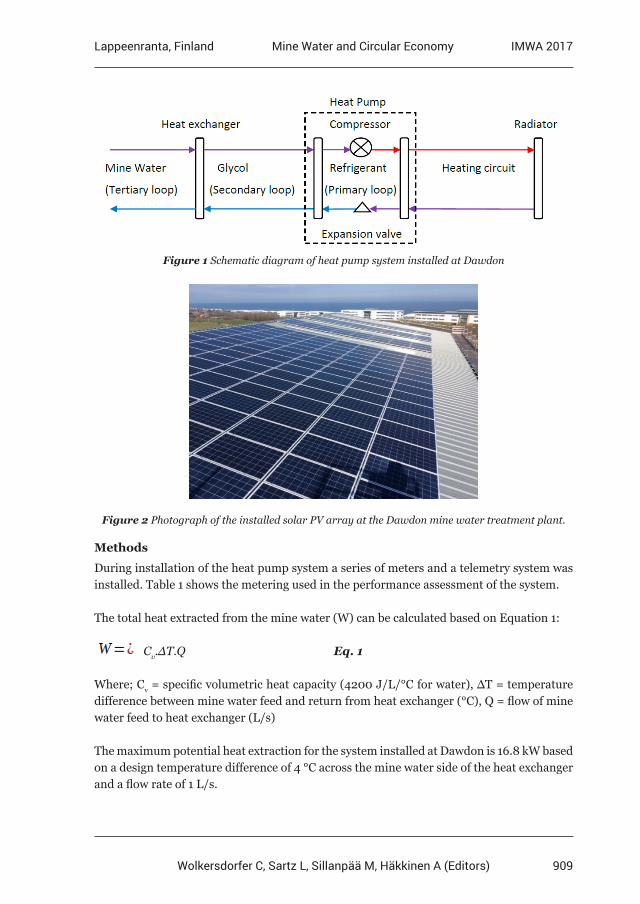
909
Lappeenranta, Finland IMWA 2017Mine Water and Circular Economy
Wolkersdorfer C, Sartz L, Sillanpää M, Häkkinen A (Editors)
Figure 1 Schematic diagram of heat pump system installed at Dawdon
Figure 2 Photograph of the installed solar PV array at the Dawdon mine water treatment plant.
Methods
During installation of the heat pump system a series of meters and a telemetry system was installed. Table 1 shows the metering used in the performance assessment of the system.
The total heat extracted from the mine water (W) can be calculated based on Equation 1:
Cv.ΔT.Q Eq. 1
Where; Cv = specific volumetric heat capacity (4200 J/L/°C for water), ΔT = temperature difference between mine water feed and return from heat exchanger (°C), Q = flow of mine water feed to heat exchanger (L/s)
The maximum potential heat extraction for the system installed at Dawdon is 16.8 kW based on a design temperature difference of 4 °C across the mine water side of the heat exchanger and a flow rate of 1 L/s.
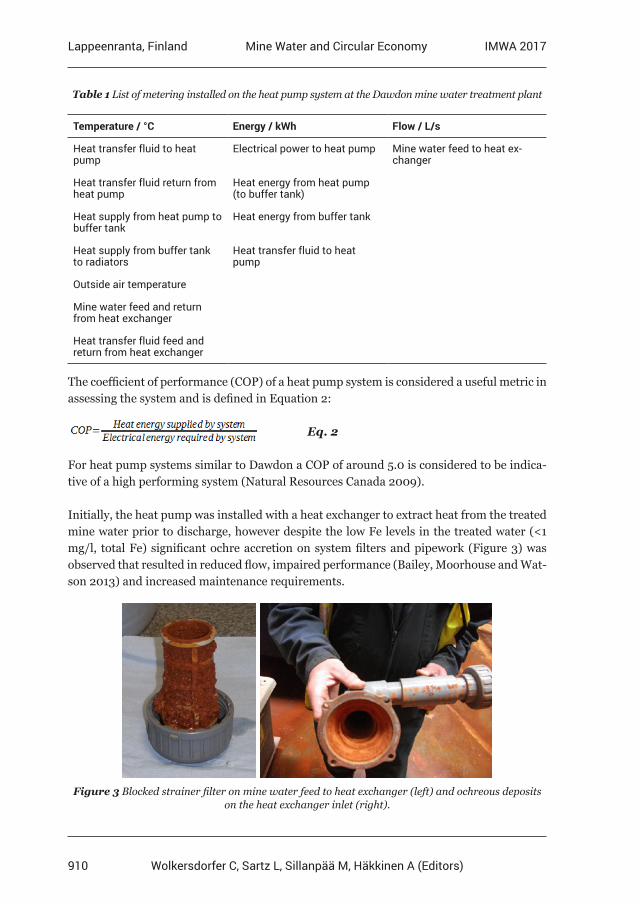
910
Lappeenranta, Finland IMWA 2017Mine Water and Circular Economy
Wolkersdorfer C, Sartz L, Sillanpää M, Häkkinen A (Editors)
Table 1 List of metering installed on the heat pump system at the Dawdon mine water treatment plant
Temperature / °C Energy / kWh Flow / L/s
Heat transfer fluid to heat pump
Electrical power to heat pump Mine water feed to heat ex-changer
Heat transfer fluid return from heat pump
Heat energy from heat pump (to buffer tank)
Heat supply from heat pump to buffer tank
Heat energy from buffer tank
Heat supply from buffer tank to radiators
Heat transfer fluid to heat pump
Outside air temperature
Mine water feed and return from heat exchanger
Heat transfer fluid feed and return from heat exchanger
The coefficient of performance (COP) of a heat pump system is considered a useful metric in assessing the system and is defined in Equation 2:
Eq. 2
For heat pump systems similar to Dawdon a COP of around 5.0 is considered to be indica-tive of a high performing system (Natural Resources Canada 2009).
Initially, the heat pump was installed with a heat exchanger to extract heat from the treated mine water prior to discharge, however despite the low Fe levels in the treated water (<1 mg/l, total Fe) significant ochre accretion on system filters and pipework (Figure 3) was observed that resulted in reduced flow, impaired performance (Bailey, Moorhouse and Wat-son 2013) and increased maintenance requirements.
Figure 3 Blocked strainer filter on mine water feed to heat exchanger (left) and ochreous deposits
on the heat exchanger inlet (right).
911
Lappeenranta, Finland IMWA 2017Mine Water and Circular Economy
Wolkersdorfer C, Sartz L, Sillanpää M, Häkkinen A (Editors)
In 2012, the system was reconfigured to extract heat from the raw ferruginous mine water, which is of relatively poor quality (>70 mg/l, total Fe). The reconfigured system showed sig-nificantly reduced fouling and negligible impact on performance. Following further reme-dial work in 2013 to calibrate all meters and correct heat transfer fluid leaks, a monitoring study was conducted between January and May 2014 to determine the performance of the system.
For the solar installation at Dawdon, all power generated by the array is monitored using a standard electricity meter (Landis+Gyr E230 residential/light commercial meter). The meter is telemetered directly into a web-based energy management tool allowing remote real-time monitoring of the solar panel performance, which is judged both in terms of en-ergy generated compared to expected output and contribution to the overall site energy consumption. Results presented are for the first full year of operation from April 2016 to March 2017.
Results & Discussion
During the heat pump test period between 17 January 2014 and 30 May 2014, the plant heating system was operational for a total of 679 hours. During this period a total of 18 peri-odic readings of the operational hours, heat produced and electricity consumed were taken to enable an estimation of COP for the heat pump. During this time, the pump went out of service on 3 occasions between readings, accounting for 134 hours of operation during which there were periods where auxiliary heat was the sole source of heating and calculat-ing a COP value for the heat pump would therefore be meaningless. As it is not possible to ascertain exactly when the heat pump was out of operation between these reading periods, the full 134 hours is excluded for the purposes of energy totals and COP calculation, leaving a test period of 545 hours. Table 2 shows the overall performance values for the test period.
Table 2 Overall performance values for the mine water heat pump at Dawdon during test period between January and May 2014.
Operational hours1
Total heat produced
/ kWh
Total electricity consumed /
kWh
COP1 Average mine water flow rate / L/s
Average indoor temperature / °C
Average outdoor temperature / °C
545 9,246 1,924 4.81 0.95 19.9 6.8
1 see text for further description
Over the test period considered, the heat pump was found to be operating very well with an average COP of 4.81, close to the high performance value of 5.00. Throughout the test period, the temperature of the indoor heated space was maintained at an average of 19.9 °C in compliance with the system design, even during winter months. Performance at this COP for the annual design heating load of 39,800 kWh creates and annual saving of approx. £2,670 (assuming £0.085 /kWh) and CO2 reduction of 15.7 tonnes CO2/year when com-pared with an electrical heating system supplying the same heat load. This annual saving results in a payback period of 9.2 years.
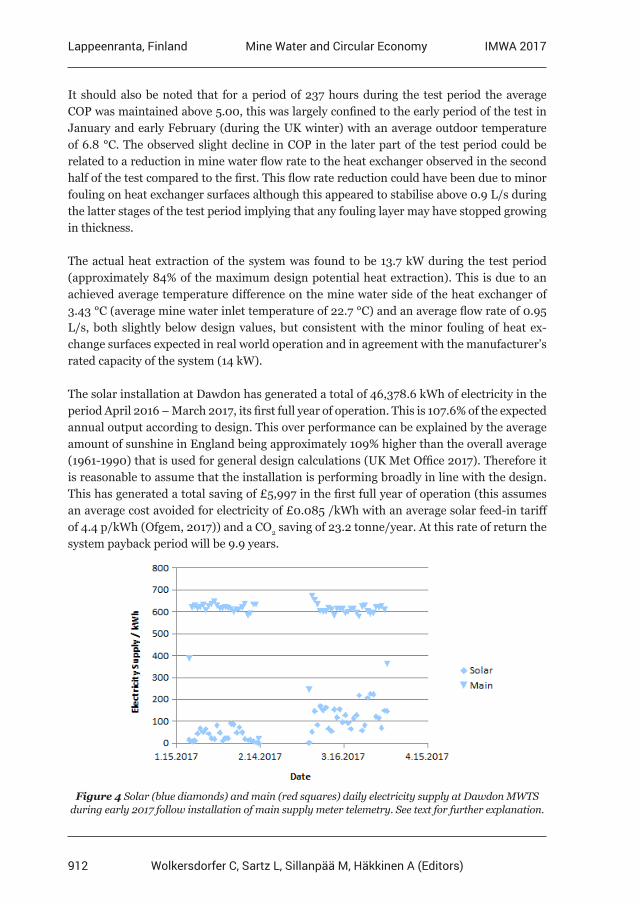
912
Lappeenranta, Finland IMWA 2017Mine Water and Circular Economy
Wolkersdorfer C, Sartz L, Sillanpää M, Häkkinen A (Editors)
It should also be noted that for a period of 237 hours during the test period the average COP was maintained above 5.00, this was largely confined to the early period of the test in January and early February (during the UK winter) with an average outdoor temperature of 6.8 °C. The observed slight decline in COP in the later part of the test period could be related to a reduction in mine water flow rate to the heat exchanger observed in the second half of the test compared to the first. This flow rate reduction could have been due to minor fouling on heat exchanger surfaces although this appeared to stabilise above 0.9 L/s during the latter stages of the test period implying that any fouling layer may have stopped growing in thickness.
The actual heat extraction of the system was found to be 13.7 kW during the test period (approximately 84% of the maximum design potential heat extraction). This is due to an achieved average temperature difference on the mine water side of the heat exchanger of 3.43 °C (average mine water inlet temperature of 22.7 °C) and an average flow rate of 0.95 L/s, both slightly below design values, but consistent with the minor fouling of heat ex-change surfaces expected in real world operation and in agreement with the manufacturer’s rated capacity of the system (14 kW).
The solar installation at Dawdon has generated a total of 46,378.6 kWh of electricity in the period April 2016 – March 2017, its first full year of operation. This is 107.6% of the expected annual output according to design. This over performance can be explained by the average amount of sunshine in England being approximately 109% higher than the overall average (1961-1990) that is used for general design calculations (UK Met Office 2017). Therefore it is reasonable to assume that the installation is performing broadly in line with the design. This has generated a total saving of £5,997 in the first full year of operation (this assumes an average cost avoided for electricity of £0.085 /kWh with an average solar feed-in tariff of 4.4 p/kWh (Ofgem, 2017)) and a CO2 saving of 23.2 tonne/year. At this rate of return the system payback period will be 9.9 years.
Figure 4 Solar (blue diamonds) and main (red squares) daily electricity supply at Dawdon MWTS during early 2017 follow installation of main supply meter telemetry. See text for further explanation.
913
Lappeenranta, Finland IMWA 2017Mine Water and Circular Economy
Wolkersdorfer C, Sartz L, Sillanpää M, Häkkinen A (Editors)
In January 2017 telemetry and data collection was also initialised on the main electricity supply meter, allowing regular comparative data to be collected for the overall electrical demand of the site as well as the solar PV production. The daily generation figures for the period between 19 January 2017 and 31 March 2017 where data is available is shown in Figure 4. It should be noted that the gap in data between 13 February and 3 March 2017 is due to a power fault on site that tripped the telemetry system requiring a manual reset, and therefore data is not available for that period.
The data collected in early 2017 show an average daily solar PV electricity supply of 81.5 kWh which is 13.8% of the overall average daily electrical demand of the site of 589.8 kWh, representing a significant contribution to the overall electrical demand of the site. Figure 4 also shows that as solar irradiance increases throughout March due to seasonal variation, which has a significant impact on the contribution of the system to the overall electrical de-mand. In the period before the loss of data in mid-February the average contribution of the solar PV system to the overall electrical demand was 5.7%, whereas after that period until the end of March the contribution rose significantly to 17.1%. Therefore to obtain a better representation of the overall performance of the system a full season of data is required.
Conclusion
Overall, the above results demonstrate that the deployment of renewable energy generation for both heating and electricity can achieve significant cost (potentially around 30%, 78,000 kWh) and CO2 savings (54.7 tonnes per year) on mine water treatment schemes, even at smaller scales. Both installations were able to retrieve pay back periods of approximately 10 years, in line with industry expectations. This study also highlights the benefits and challeng-es of implementing these technologies, include ensuring that for heat extraction, mine water is extracted before oxidation and for both technologies the need for accurate and available metering data in order to rapidly assess the performance and added value of renewables.
Future Work
The Coal Authority is actively pursuing an innovative programme of renewable generation deployment, mine water heat recovery and reuse of mine water treatment products such as ochre across their mine water treatment sites.
For reuse of ochre, options are currently being considered for the reuse of ochre which include within the land restoration sector (for immobilisation of contaminants such as arse-nic), phosphate reduction and industrial pigments.
Solar PV capacity also has further potential to be increased at the Dawdon site, utilising additional existing footprint on the site and solar PV capacity is already being installed at a number of other Coal Authority treatment sites.
In the future it will be important to monitor the performance of these continual improve-ments to assess the value gained against expectations and look for further opportunities for improvement.
914
Lappeenranta, Finland IMWA 2017Mine Water and Circular Economy
Wolkersdorfer C, Sartz L, Sillanpää M, Häkkinen A (Editors)
Acknowledgements
The Coal Authority would like to thank the UK Department for Business, Energy and Industrial Strategy for supporting their work.
References
Bailey, MT, Moorhouse, AML and Watson, IA (2013). Heat extraction from hypersaline mine water at the Dawdon mine water treatment site. Mine closure 2013: proceedings of the eighth international conference on mine closure. Australian Centre for Geomechanics, Perth, Tibbett, M., Fourie, A. B. and Digby, C., eds. ISBN 9780987093745.Natural Resources Canada (2009). Commercial earth energy systems: A buyer’s guide, Her Majesty the Queen in Right of Canada, ISBN 0-662-32808-6.Ofgem (2017). Feed-in Tariff (FIT): Generation & Export Payment Rate, available at: https://www. ofgem.gov.uk/publications-and-updates/feed-tariff-fit-generation-export-payment-rate- table-1-january-31-march-2017 [accessed 31 March 2017].UK Met Office (2017). UK temperature, rainfall and sunshine anomaly graphs, available at: http:// www.metoffice.gov.uk/climate/uk/summaries/anomalygraphs [accessed 31 March 2017].
915
Lappeenranta, Finland IMWA 2017Mine Water and Circular Economy
Wolkersdorfer C, Sartz L, Sillanpää M, Häkkinen A (Editors)
Where there’s muck there’s brass: irrigated agriculture with mine impacted waters
John Annandale1, Jo Burgess2, Phil Tanner1 1Department of Plant and Soil Sciences, University of Pretoria, Private Bag X20,
Hatfield, 0028, Pretoria, South Africa, [email protected] 2Water Research Commission, Private Bag X03, Gezina, 0031, Pretoria, South Africa
Abstract Investigations completed in 2009 and 2014 concluded that irrigation with coal and gold mine water was both feasible and desirable. Irrigated agriculture provides an opportunity to sequester up to 70% of salts contained in these waters by precipitation of gypsum within the soil profile, without adversely affecting soil condition or plant growth, while generating a revenue stream and providing sustainable employment. While the concept is feasible, large-scale implementation has lagged. The current project exposes the “irrigation with coal mine water” practice to a much larger reference group, and the principal factors delaying the adoption of this technology have been identified.
Keywords Mine water irrigation, risk and opportunity assessment, mine closure
Introduction
Coal and gold are the two largest mining sectors in South Africa – which is one of the world’s major resource locations. Both coal and gold have been mined for more than 150 years, with major intensification over the last 50. Both resources are associated with pyrite minerali-zation, and this results in operations generating substantial volumes of saline mine water. Disposal of this water has become a major issue over the last 20 years, particularly because many of the older operations are now closing. Current philosophy is to desalinate the wa-ter, largely by reverse osmosis (RO), but closure funds and the national exchequer cannot afford this requirement. Further, the energy demand of RO is prohibitive and the wastes generated (gypsum and brine) are problematic. Beneficial use through irrigated agriculture is an opportunity to sequester a significant proportion of the salts contained in many of these waters, to generate a revenue stream, to facilitate rural development and land tenure, and to provide sustainable employment opportunities in post-mining communities (van der Laan et al. 2014).
The National Planning Commission (NPC) identified the creation of a million jobs in ag-riculture and the development of integrated rural economies as key goals for achieving vi-sion 2030 of the National Development Plan (NDP) (NPC 2011). Taking into consideration the goals of the NDP, the proposed incorporation of irrigation with neutralised gypsifer-ous mine water as part of the growth path for expanding agriculture, both commercially and from an emerging famer perspective, is attractive. South Africa is a water-scarce coun-try, and irrigated agriculture has reached its threshold from a water allocation perspective (DWAF 2013). The opportunity exists for mine waters, which otherwise constitute a major “waste disposal problem” and which have not currently been allocated as a resource, to be used to support the NDP irrigation goals.
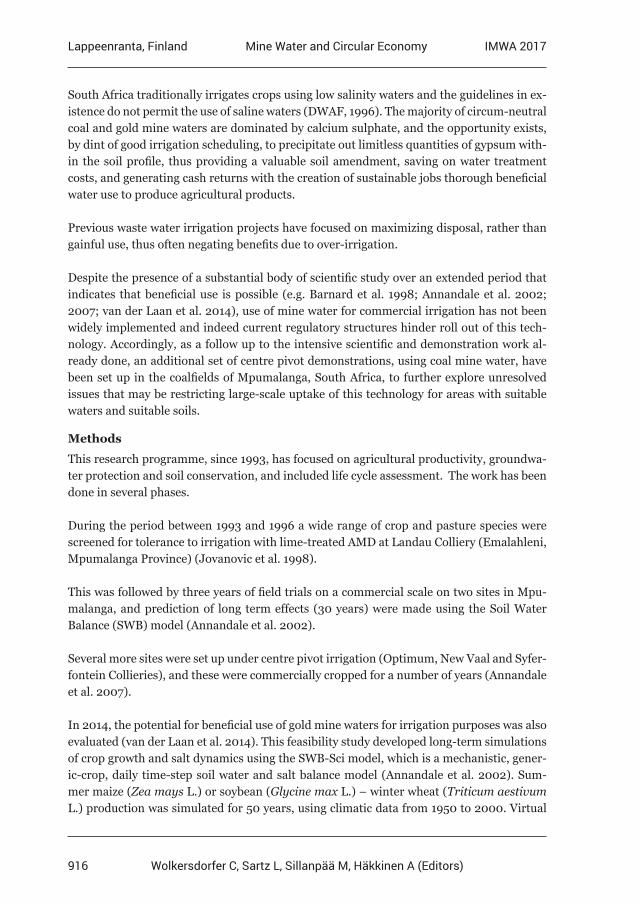
916
Lappeenranta, Finland IMWA 2017Mine Water and Circular Economy
Wolkersdorfer C, Sartz L, Sillanpää M, Häkkinen A (Editors)
South Africa traditionally irrigates crops using low salinity waters and the guidelines in ex-istence do not permit the use of saline waters (DWAF, 1996). The majority of circum-neutral coal and gold mine waters are dominated by calcium sulphate, and the opportunity exists, by dint of good irrigation scheduling, to precipitate out limitless quantities of gypsum with-in the soil profile, thus providing a valuable soil amendment, saving on water treatment costs, and generating cash returns with the creation of sustainable jobs thorough beneficial water use to produce agricultural products.
Previous waste water irrigation projects have focused on maximizing disposal, rather than gainful use, thus often negating benefits due to over-irrigation.
Despite the presence of a substantial body of scientific study over an extended period that indicates that beneficial use is possible (e.g. Barnard et al. 1998; Annandale et al. 2002; 2007; van der Laan et al. 2014), use of mine water for commercial irrigation has not been widely implemented and indeed current regulatory structures hinder roll out of this tech-nology. Accordingly, as a follow up to the intensive scientific and demonstration work al-ready done, an additional set of centre pivot demonstrations, using coal mine water, have been set up in the coalfields of Mpumalanga, South Africa, to further explore unresolved issues that may be restricting large-scale uptake of this technology for areas with suitable waters and suitable soils.
Methods
This research programme, since 1993, has focused on agricultural productivity, groundwa-ter protection and soil conservation, and included life cycle assessment. The work has been done in several phases.
During the period between 1993 and 1996 a wide range of crop and pasture species were screened for tolerance to irrigation with lime-treated AMD at Landau Colliery (Emalahleni, Mpumalanga Province) (Jovanovic et al. 1998).
This was followed by three years of field trials on a commercial scale on two sites in Mpu-malanga, and prediction of long term effects (30 years) were made using the Soil Water Balance (SWB) model (Annandale et al. 2002).
Several more sites were set up under centre pivot irrigation (Optimum, New Vaal and Syfer-fontein Collieries), and these were commercially cropped for a number of years (Annandale et al. 2007).
In 2014, the potential for beneficial use of gold mine waters for irrigation purposes was also evaluated (van der Laan et al. 2014). This feasibility study developed long-term simulations of crop growth and salt dynamics using the SWB-Sci model, which is a mechanistic, gener-ic-crop, daily time-step soil water and salt balance model (Annandale et al. 2002). Sum-mer maize (Zea mays L.) or soybean (Glycine max L.) – winter wheat (Triticum aestivum L.) production was simulated for 50 years, using climatic data from 1950 to 2000. Virtual
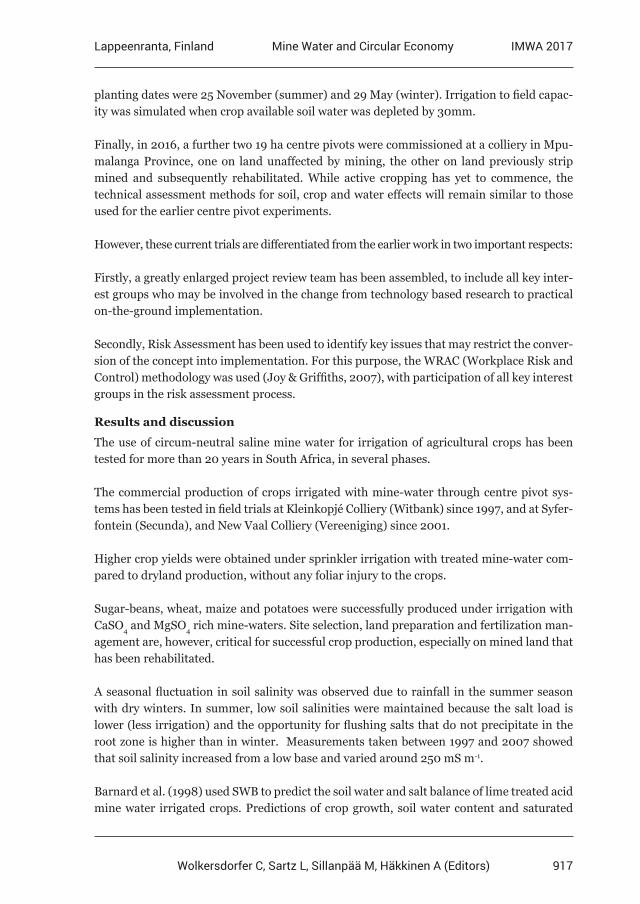
917
Lappeenranta, Finland IMWA 2017Mine Water and Circular Economy
Wolkersdorfer C, Sartz L, Sillanpää M, Häkkinen A (Editors)
planting dates were 25 November (summer) and 29 May (winter). Irrigation to field capac-ity was simulated when crop available soil water was depleted by 30mm.
Finally, in 2016, a further two 19 ha centre pivots were commissioned at a colliery in Mpu-malanga Province, one on land unaffected by mining, the other on land previously strip mined and subsequently rehabilitated. While active cropping has yet to commence, the technical assessment methods for soil, crop and water effects will remain similar to those used for the earlier centre pivot experiments.
However, these current trials are differentiated from the earlier work in two important respects:
Firstly, a greatly enlarged project review team has been assembled, to include all key inter-est groups who may be involved in the change from technology based research to practical on-the-ground implementation.
Secondly, Risk Assessment has been used to identify key issues that may restrict the conver-sion of the concept into implementation. For this purpose, the WRAC (Workplace Risk and Control) methodology was used (Joy & Griffiths, 2007), with participation of all key interest groups in the risk assessment process.
Results and discussion
The use of circum-neutral saline mine water for irrigation of agricultural crops has been tested for more than 20 years in South Africa, in several phases.
The commercial production of crops irrigated with mine-water through centre pivot sys-tems has been tested in field trials at Kleinkopjé Colliery (Witbank) since 1997, and at Syfer-fontein (Secunda), and New Vaal Colliery (Vereeniging) since 2001.
Higher crop yields were obtained under sprinkler irrigation with treated mine-water com-pared to dryland production, without any foliar injury to the crops.
Sugar-beans, wheat, maize and potatoes were successfully produced under irrigation with CaSO4 and MgSO4 rich mine-waters. Site selection, land preparation and fertilization man-agement are, however, critical for successful crop production, especially on mined land that has been rehabilitated.
A seasonal fluctuation in soil salinity was observed due to rainfall in the summer season with dry winters. In summer, low soil salinities were maintained because the salt load is lower (less irrigation) and the opportunity for flushing salts that do not precipitate in the root zone is higher than in winter. Measurements taken between 1997 and 2007 showed that soil salinity increased from a low base and varied around 250 mS m-1.
Barnard et al. (1998) used SWB to predict the soil water and salt balance of lime treated acid mine water irrigated crops. Predictions of crop growth, soil water content and saturated
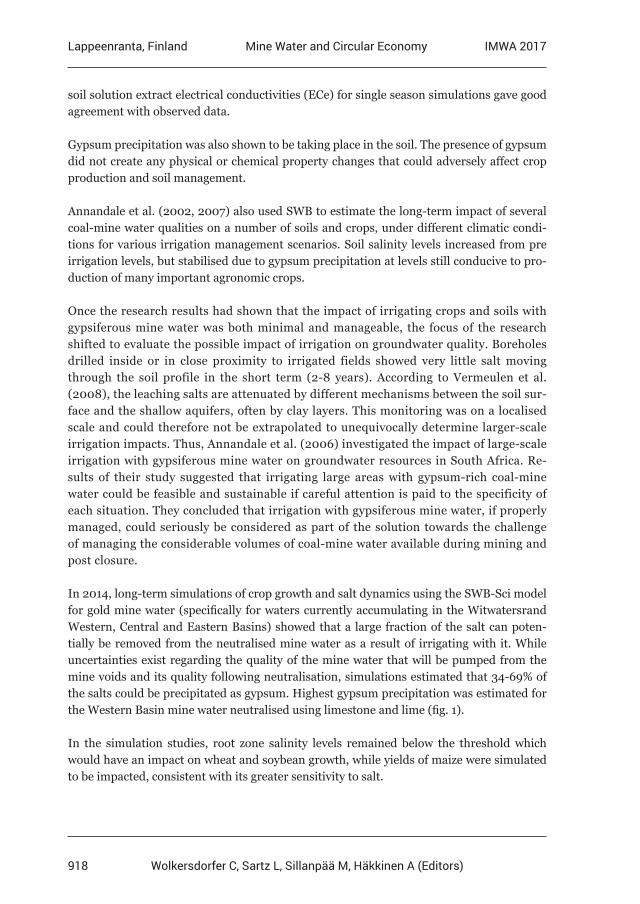
918
Lappeenranta, Finland IMWA 2017Mine Water and Circular Economy
Wolkersdorfer C, Sartz L, Sillanpää M, Häkkinen A (Editors)
soil solution extract electrical conductivities (ECe) for single season simulations gave good agreement with observed data.
Gypsum precipitation was also shown to be taking place in the soil. The presence of gypsum did not create any physical or chemical property changes that could adversely affect crop production and soil management.
Annandale et al. (2002, 2007) also used SWB to estimate the long-term impact of several coal-mine water qualities on a number of soils and crops, under different climatic condi-tions for various irrigation management scenarios. Soil salinity levels increased from pre irrigation levels, but stabilised due to gypsum precipitation at levels still conducive to pro-duction of many important agronomic crops.
Once the research results had shown that the impact of irrigating crops and soils with gypsiferous mine water was both minimal and manageable, the focus of the research shifted to evaluate the possible impact of irrigation on groundwater quality. Boreholes drilled inside or in close proximity to irrigated fields showed very little salt moving through the soil profile in the short term (2-8 years). According to Vermeulen et al. (2008), the leaching salts are attenuated by different mechanisms between the soil sur-face and the shallow aquifers, often by clay layers. This monitoring was on a localised scale and could therefore not be extrapolated to unequivocally determine larger-scale irrigation impacts. Thus, Annandale et al. (2006) investigated the impact of large-scale irrigation with gypsiferous mine water on groundwater resources in South Africa. Re-sults of their study suggested that irrigating large areas with gypsum-rich coal-mine water could be feasible and sustainable if careful attention is paid to the specificity of each situation. They concluded that irrigation with gypsiferous mine water, if properly managed, could seriously be considered as part of the solution towards the challenge of managing the considerable volumes of coal-mine water available during mining and post closure.
In 2014, long-term simulations of crop growth and salt dynamics using the SWB-Sci model for gold mine water (specifically for waters currently accumulating in the Witwatersrand Western, Central and Eastern Basins) showed that a large fraction of the salt can poten-tially be removed from the neutralised mine water as a result of irrigating with it. While uncertainties exist regarding the quality of the mine water that will be pumped from the mine voids and its quality following neutralisation, simulations estimated that 34-69% of the salts could be precipitated as gypsum. Highest gypsum precipitation was estimated for the Western Basin mine water neutralised using limestone and lime (fig. 1).
In the simulation studies, root zone salinity levels remained below the threshold which would have an impact on wheat and soybean growth, while yields of maize were simulated to be impacted, consistent with its greater sensitivity to salt.
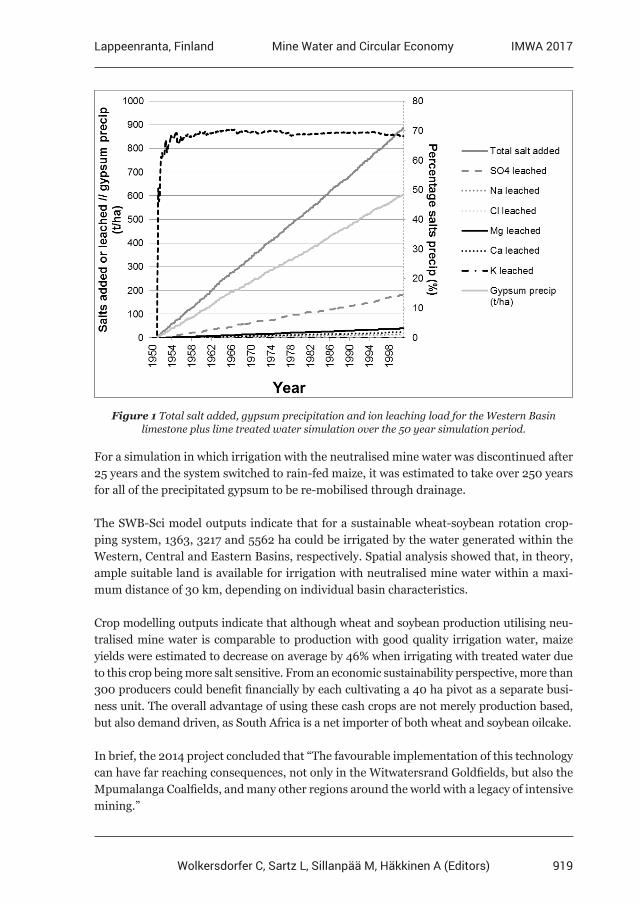
919
Lappeenranta, Finland IMWA 2017Mine Water and Circular Economy
Wolkersdorfer C, Sartz L, Sillanpää M, Häkkinen A (Editors)
Figure 1 Total salt added, gypsum precipitation and ion leaching load for the Western Basin limestone plus lime treated water simulation over the 50 year simulation period.
For a simulation in which irrigation with the neutralised mine water was discontinued after 25 years and the system switched to rain-fed maize, it was estimated to take over 250 years for all of the precipitated gypsum to be re-mobilised through drainage.
The SWB-Sci model outputs indicate that for a sustainable wheat-soybean rotation crop-ping system, 1363, 3217 and 5562 ha could be irrigated by the water generated within the Western, Central and Eastern Basins, respectively. Spatial analysis showed that, in theory, ample suitable land is available for irrigation with neutralised mine water within a maxi-mum distance of 30 km, depending on individual basin characteristics.
Crop modelling outputs indicate that although wheat and soybean production utilising neu-tralised mine water is comparable to production with good quality irrigation water, maize yields were estimated to decrease on average by 46% when irrigating with treated water due to this crop being more salt sensitive. From an economic sustainability perspective, more than 300 producers could benefit financially by each cultivating a 40 ha pivot as a separate busi-ness unit. The overall advantage of using these cash crops are not merely production based, but also demand driven, as South Africa is a net importer of both wheat and soybean oilcake.
In brief, the 2014 project concluded that “The favourable implementation of this technology can have far reaching consequences, not only in the Witwatersrand Goldfields, but also the Mpumalanga Coalfields, and many other regions around the world with a legacy of intensive mining.”
920
Lappeenranta, Finland IMWA 2017Mine Water and Circular Economy
Wolkersdorfer C, Sartz L, Sillanpää M, Häkkinen A (Editors)
It is clear that the technology holds great promise for management of one of mining’s great-est challenges; however, despite the lengthy research programme, no practical implemen-tation has occurred to date. Consequently, the current (2016 – 2020) project is establishing two pivots on an Mpumalanga coal mine, to be evaluated in the same manner as the previ-ous pivots, but with a greatly enlarged reference and control group, in order to ensure that concerns of key stakeholders are identified and addressed.
Risk assessment has identified the key “risks” that may prevent the conversion of the con-cept into large-scale reality. The risk assessment team included key participants from gov-ernment departments, NGOs, academia and mining companies.
The top risks that may hamper the practical implementation of the technology were identi-fied as follows:
• A legal framework that does not cater for the productive use of mine wastewater. Mine water should not cost the user more than freshwater.
• Use of mine water for irrigation attracts a waste discharge charge. (Irrigation not seen as a reuse option).
• Difficulty in aligning legislation requirements for different government departments in-volved in permitting irrigation with mine water results in delay in introduction of mine water use for agriculture.
• Lack of trained and motivated personnel to effectively manage schemes (this is particu-larly relevant for community farming, and would be a lesser issue with organised agri-culture).
• Failure to develop systems that make this an effective community-based activity; failure to provide appropriate incentives so that the community want to farm.
Addressing these risks and opportunities has become part of the current project.
Representatives of four key government departments (Environment, Water and Sanitation, Mineral Resources, and Agriculture) have participated in steering the project, together with relevant NGO representation; the project is currently recognized by the Department of Water and Sanitation as one of its flagship projects. It is expected that the strengthened regulators’ representation will greatly assist in defining the way to overcome current legislative hurdles.
It is intended that these centre pivot systems, over the four years of commercial irrigation, will play a key role as training centres for development of the necessary skills in appropriate communities. In addition, Best Practice Guidelines will be generated that address the key requirements of adequate technical controls to ensure correct irrigation methodology is ap-plied, and monitoring to ensure that any environmental impact is acceptable.
Conclusions
Use of mine impacted waters through irrigated agriculture provides an opportunity to se-quester a major portion of salts contained in many of these waters, while generating a reve-
921
Lappeenranta, Finland IMWA 2017Mine Water and Circular Economy
Wolkersdorfer C, Sartz L, Sillanpää M, Häkkinen A (Editors)
nue stream and providing sustainable employment in post-mining communities. Mines can obtain permission to close only if they specify and demonstrate sustainable post-closure land use. Our technique enables mines to defray the cost of pumping and actively treating mine-impacted water, and enables agriculture to occur in the post-mining landscape, even where no water is available from conventional sources.
Most of the coal- and gold-mine waters are dominated by calcium sulphate, and the se-questration occurs by precipitation of gypsum within the soil profile. Up to 70% of salts contained in these waters may be sequestered without adversely affecting soil condition or plant growth. Crop model simulations estimate that irrigating with neutralised mine water can result in wheat yields of approximately 9 t/ha and soybean yields of 5 t/ha when grown in rotation. Even under worst case scenarios in which farmers have to pay for the infrastruc-ture to deliver the mine water to their farms, a very respectable emerging farmer income of more than R240 000/year is predicted to be realised for a 40 ha farm. The Rand has been quite volatile, but at the time of writing the exchange rate was around R13-50 to the US$.
Two Water Research Commission projects, completed in 2009 and 2014 respectively, have concluded that irrigation with mine water is both feasible and desirable. Indeed, the con-cluding comment by van der Laan et al. (2014) was that “The favourable implementation of this technology can have far reaching consequences, not only in the Witwatersrand Gold-fields, but also the Mpumalanga Coalfields and many other regions around the world with a legacy of intensive mining.” Despite this glowing endorsement, this technique has not yet been adopted in South Africa.
A further project has now been initiated, which continues with the assessment of the im-pacts of irrigation using affected mine water in the Mpumalanga Coalfields. It again assess-es the viability of irrigation using mine-affected water with two commercially farmed centre pivots at a different coal mining location in Mpumalanga Province.
It is differentiated from earlier work by the inclusion of a greatly expanded reference group that includes both government and NGO representatives, and the inclusion of risk and op-portunity assessment as a tool to identify reasons for the failure of “this technology” to be adopted, and to devise appropriate controls to stimulate the implementation of this tech-nology.
There are major opportunities, worldwide, for agriculture to exploit the tremendous po-tential of suitable quality mining-impacted water to help solve the impending water-ener-gy-food crisis, without compromising soil and groundwater quality.
Acknowledgements
The authors would like to thank the Water Research Commission and the Strategic Water Partner Network for funding the running costs of this project, and Mafube Colliery for hosting and providing the necessary infrastructure to execute the research and demonstrate the concept to a wide audience. The contribution of Dr Michael van der Laan to the research done in the Goldfields is also greatly appreciated.
922
Lappeenranta, Finland IMWA 2017Mine Water and Circular Economy
Wolkersdorfer C, Sartz L, Sillanpää M, Häkkinen A (Editors)
References
Annandale JG, Beletse YG, De Jager PC, Jovanovic NZ, Steytler B, Benadé N, Lorentz SA, Hodgson FDI, Usher B, Vermeulen D, Aken ME (2007) Predicting the environmental impact and sustainability of irrigation with coal mine water. Research Report No. 1149/1/17, Water Research Commission, Pretoria, South AfricaAnnandale JG, Jovanovic NZ, Claassens AS (2002) The influence of irrigation with gypsiferous mine water on soil properties and drainage water. Research Report No. 858/1/02, Water Research Commission, Pretoria, South AfricaAnnandale JG, Jovanovic NZ, Hodgson FDI, Usher BH, ME Aken ME, van der Westhuizen AM, Bristow KL, Steyn JM (2006) Prediction of the environmental impact and sustainability of large-scale irrigation with gypsiferous mine-water on groundwater resources. Water SA 32(1):21-28Barnard RO, Rethman NFG, Annandale JG, Mentz WH, Jovanovic NZ (1998) The screening of crop, pasture and wetland species for tolerance of polluted water originating in coal mines. Research Report No. 582/1/98, Water Research Commission, Pretoria, South AfricaDWAF (1996) South African Water Quality Guidelines Volume 4: Agricultural Water Use: Irrigation, Second Edition. Department of Water and Sanitation (formerly Department of Water Affairs and Forestry), Pretoria, South AfricaDWAF (2013) Water for Growth and Development Framework. Version 7. Department of Water and Sanitation (formerly Department of Water Affairs and Forestry), Pretoria, South AfricaJovanovic NZ, Barnard RO, Rethman NFG, Annandale JG (1998) Crops can be irrigated with lime- treated acid mine drainage. Water SA Vol. 24 No. 2 April 1998 113-122Joy J, Griffiths D (2007) National minerals industry safety and health risk assessment. Version 6. Minerals Council of Australia (MCA), 164 ppNPC (2011) The National Development Plan: Vision for 2030. National Planning Commission. ISBN: 978-0-621-40475-3 RP270/2011Van der Laan M, Fey MV, van der Burgh G, de Jager PC, Annandale JG, du Plessis HM (2014) Feasibility study on the use of irrigation as part of a long-term acid mine water management strategy in the Vaal Basin. Research Report No. 2233/1/14, Water Research Commission, Pretoria, South AfricaVermeulen PD, Usher NH, van Tonder GJ (2008) Determination of the impact of coal mine water irrigation on groundwater resources. Research Report No. 1507/1/08, Water Research Commission, Pretoria, South Africa
923
Lappeenranta, Finland IMWA 2017Mine Water and Circular Economy
Wolkersdorfer C, Sartz L, Sillanpää M, Häkkinen A (Editors)
Application of alkaline coal seam gas waters to remediate AMD from historical sulfide ore mining
operation
Qian Chen1, David R. Cohen1, Martin S. Andersen2, Alan M. Robertson3,
David R. Jones4 and Ben Kelly5
1School of Biological, Earth and Environmental Sciences, University of New South Wales, Sydney, NSW 2052, Australia. Email: [email protected]
2School of Civil and Environmental Engineering and the Connected Waters Initiative Research Centre, University of New South Wales, Sydney, NSW 2052, Australia.
3RGS Environmental Pty Ltd, PO Box 3091, Sunnybank South, Qld 4109, Australia. 4DR Jones Environmental Excellence, 7 Edith St, Atherton, Qld 4883, Australia.
5Santos, Lvl 22, 32 Turbot Street, Brisbane, Qld 4000, Australia
Abstract Treatment of acid and metalliferous mine waters remains a major global environmental issue. Na2CO3/NaHCO3-rich brine concentrate produced by reverse osmosis treatment of co-produced water from coal seam gas extraction at Narrabri, Australia, has proven effective at neutralising and removing major and trace elements. pH-dependent removal of metals between this neutralant and the more conventional Ca(OH)2, NaOH and CaCO3 is similar. Laboratory experiments on the brine and a pilot field application of an analogue dilute Na2CO3 solution as neutralant are described in this paper. Whereas removal of Fe and Al is via precipitation of oxyhydroxides, removal of other trace metals appears largely controlled by adsorption on the Fe/Al-oxyhydroxides, though co-precipitation may also be a contributory factor.
Key words Acid and metalliferous drainage, solid precipitation, trace metal adsorption
Introduction
Production of gas from non-conventional sources such as coal seams and shale has exhibited exponential growth in the last two decades (Day 2009). It is typically necessary for CSG oper-ations to extract large volumes of co-produced water to facilitate gas production. The concen-tration and composition of salt in solution varies with geological characteristics of the basin from within which the gas is produced. The salinity of co-produced water typically exceeds concentrations that allow it to be used without treatment. Most commonly, reverse osmosis (RO) is used to reclaim water for on- or off-site beneficial uses. The salt concentration in the reject stream from RO treatment is a function of the recovery achieved in the RO processing. Concentrated brines can be further treated using thermal processing technologies to ultimate-ly produce crystallised salts. Industry is continuing to examine commercial uses for such salt products as opposed to disposal in regulated landfill sites which is relatively high cost.
The relatively high concentrations of CO32- and HCO3
- ions in co-produced water extracted in the Narrabri area renders them potentially beneficial in neutralising various acidic mate-rials, including remediation of acid and metalliferous drainage (AMD) at a range of opera-tional and legacy resource extraction sites (Commonwealth of Australia 2016; INAP 2009). This study compares the performance of Na carbonate-rich brine with more conventional neutralants in neutralising the acidity and removing metals from AMD.
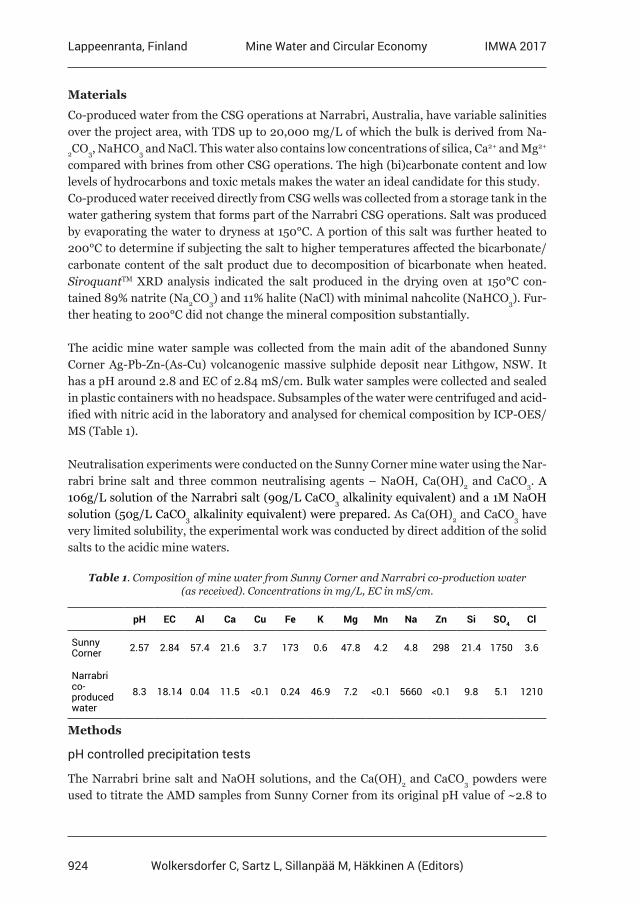
924
Lappeenranta, Finland IMWA 2017Mine Water and Circular Economy
Wolkersdorfer C, Sartz L, Sillanpää M, Häkkinen A (Editors)
Materials
Co-produced water from the CSG operations at Narrabri, Australia, have variable salinities over the project area, with TDS up to 20,000 mg/L of which the bulk is derived from Na-
2CO3, NaHCO3 and NaCl. This water also contains low concentrations of silica, Ca2+ and Mg2+ compared with brines from other CSG operations. The high (bi)carbonate content and low levels of hydrocarbons and toxic metals makes the water an ideal candidate for this study.Co-produced water received directly from CSG wells was collected from a storage tank in the water gathering system that forms part of the Narrabri CSG operations. Salt was produced by evaporating the water to dryness at 150°C. A portion of this salt was further heated to 200°C to determine if subjecting the salt to higher temperatures affected the bicarbonate/carbonate content of the salt product due to decomposition of bicarbonate when heated. SiroquantTM XRD analysis indicated the salt produced in the drying oven at 150°C con-tained 89% natrite (Na2CO3) and 11% halite (NaCl) with minimal nahcolite (NaHCO3). Fur-ther heating to 200°C did not change the mineral composition substantially.
The acidic mine water sample was collected from the main adit of the abandoned Sunny Corner Ag-Pb-Zn-(As-Cu) volcanogenic massive sulphide deposit near Lithgow, NSW. It has a pH around 2.8 and EC of 2.84 mS/cm. Bulk water samples were collected and sealed in plastic containers with no headspace. Subsamples of the water were centrifuged and acid-ified with nitric acid in the laboratory and analysed for chemical composition by ICP-OES/MS (Table 1).
Neutralisation experiments were conducted on the Sunny Corner mine water using the Nar-rabri brine salt and three common neutralising agents – NaOH, Ca(OH)2 and CaCO3. A 106g/L solution of the Narrabri salt (90g/L CaCO3 alkalinity equivalent) and a 1M NaOH solution (50g/L CaCO3 alkalinity equivalent) were prepared. As Ca(OH)2 and CaCO3 have very limited solubility, the experimental work was conducted by direct addition of the solid salts to the acidic mine waters.
Table 1. Composition of mine water from Sunny Corner and Narrabri co-production water (as received). Concentrations in mg/L, EC in mS/cm.
pH EC Al Ca Cu Fe K Mg Mn Na Zn Si SO4 Cl
Sunny Corner 2.57 2.84 57.4 21.6 3.7 173 0.6 47.8 4.2 4.8 298 21.4 1750 3.6
Narrabri co- produced water
8.3 18.14 0.04 11.5 <0.1 0.24 46.9 7.2 <0.1 5660 <0.1 9.8 5.1 1210
Methods
pH controlled precipitation tests
The Narrabri brine salt and NaOH solutions, and the Ca(OH)2 and CaCO3 powders were used to titrate the AMD samples from Sunny Corner from its original pH value of ~2.8 to
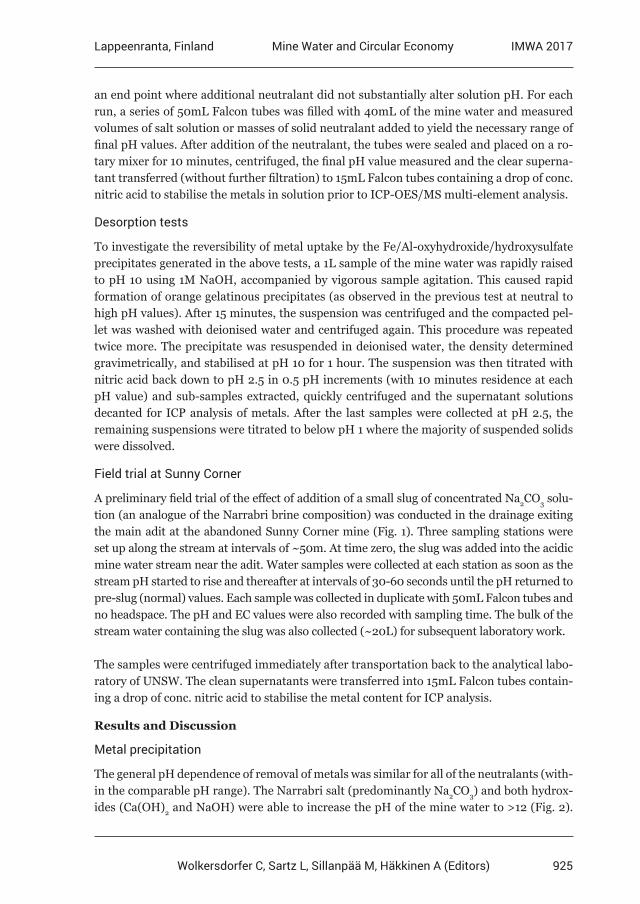
925
Lappeenranta, Finland IMWA 2017Mine Water and Circular Economy
Wolkersdorfer C, Sartz L, Sillanpää M, Häkkinen A (Editors)
an end point where additional neutralant did not substantially alter solution pH. For each run, a series of 50mL Falcon tubes was filled with 40mL of the mine water and measured volumes of salt solution or masses of solid neutralant added to yield the necessary range of final pH values. After addition of the neutralant, the tubes were sealed and placed on a ro-tary mixer for 10 minutes, centrifuged, the final pH value measured and the clear superna-tant transferred (without further filtration) to 15mL Falcon tubes containing a drop of conc. nitric acid to stabilise the metals in solution prior to ICP-OES/MS multi-element analysis.
Desorption tests
To investigate the reversibility of metal uptake by the Fe/Al-oxyhydroxide/hydroxysulfate precipitates generated in the above tests, a 1L sample of the mine water was rapidly raised to pH 10 using 1M NaOH, accompanied by vigorous sample agitation. This caused rapid formation of orange gelatinous precipitates (as observed in the previous test at neutral to high pH values). After 15 minutes, the suspension was centrifuged and the compacted pel-let was washed with deionised water and centrifuged again. This procedure was repeated twice more. The precipitate was resuspended in deionised water, the density determined gravimetrically, and stabilised at pH 10 for 1 hour. The suspension was then titrated with nitric acid back down to pH 2.5 in 0.5 pH increments (with 10 minutes residence at each pH value) and sub-samples extracted, quickly centrifuged and the supernatant solutions decanted for ICP analysis of metals. After the last samples were collected at pH 2.5, the remaining suspensions were titrated to below pH 1 where the majority of suspended solids were dissolved.
Field trial at Sunny Corner
A preliminary field trial of the effect of addition of a small slug of concentrated Na2CO3 solu-tion (an analogue of the Narrabri brine composition) was conducted in the drainage exiting the main adit at the abandoned Sunny Corner mine (Fig. 1). Three sampling stations were set up along the stream at intervals of ~50m. At time zero, the slug was added into the acidic mine water stream near the adit. Water samples were collected at each station as soon as the stream pH started to rise and thereafter at intervals of 30-60 seconds until the pH returned to pre-slug (normal) values. Each sample was collected in duplicate with 50mL Falcon tubes and no headspace. The pH and EC values were also recorded with sampling time. The bulk of the stream water containing the slug was also collected (~20L) for subsequent laboratory work.
The samples were centrifuged immediately after transportation back to the analytical labo-ratory of UNSW. The clean supernatants were transferred into 15mL Falcon tubes contain-ing a drop of conc. nitric acid to stabilise the metal content for ICP analysis.
Results and Discussion
Metal precipitation
The general pH dependence of removal of metals was similar for all of the neutralants (with-in the comparable pH range). The Narrabri salt (predominantly Na2CO3) and both hydrox-ides (Ca(OH)2 and NaOH) were able to increase the pH of the mine water to >12 (Fig. 2).
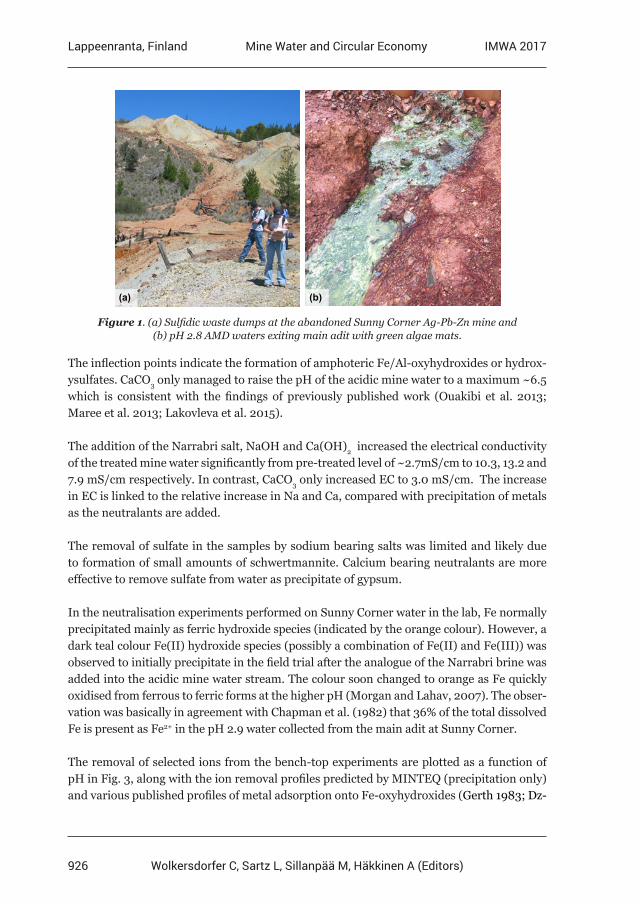
926
Lappeenranta, Finland IMWA 2017Mine Water and Circular Economy
Wolkersdorfer C, Sartz L, Sillanpää M, Häkkinen A (Editors)
(a) (b)
Figure 1. (a) Sulfidic waste dumps at the abandoned Sunny Corner Ag-Pb-Zn mine and (b) pH 2.8 AMD waters exiting main adit with green algae mats.
The inflection points indicate the formation of amphoteric Fe/Al-oxyhydroxides or hydrox-ysulfates. CaCO3 only managed to raise the pH of the acidic mine water to a maximum ~6.5 which is consistent with the findings of previously published work (Ouakibi et al. 2013; Maree et al. 2013; Lakovleva et al. 2015).
The addition of the Narrabri salt, NaOH and Ca(OH)2 increased the electrical conductivity of the treated mine water significantly from pre-treated level of ~2.7mS/cm to 10.3, 13.2 and 7.9 mS/cm respectively. In contrast, CaCO3 only increased EC to 3.0 mS/cm. The increase in EC is linked to the relative increase in Na and Ca, compared with precipitation of metals as the neutralants are added.
The removal of sulfate in the samples by sodium bearing salts was limited and likely due to formation of small amounts of schwertmannite. Calcium bearing neutralants are more effective to remove sulfate from water as precipitate of gypsum.
In the neutralisation experiments performed on Sunny Corner water in the lab, Fe normally precipitated mainly as ferric hydroxide species (indicated by the orange colour). However, a dark teal colour Fe(II) hydroxide species (possibly a combination of Fe(II) and Fe(III)) was observed to initially precipitate in the field trial after the analogue of the Narrabri brine was added into the acidic mine water stream. The colour soon changed to orange as Fe quickly oxidised from ferrous to ferric forms at the higher pH (Morgan and Lahav, 2007). The obser-vation was basically in agreement with Chapman et al. (1982) that 36% of the total dissolved Fe is present as Fe2+ in the pH 2.9 water collected from the main adit at Sunny Corner.
The removal of selected ions from the bench-top experiments are plotted as a function of pH in Fig. 3, along with the ion removal profiles predicted by MINTEQ (precipitation only) and various published profiles of metal adsorption onto Fe-oxyhydroxides (Gerth 1983; Dz-
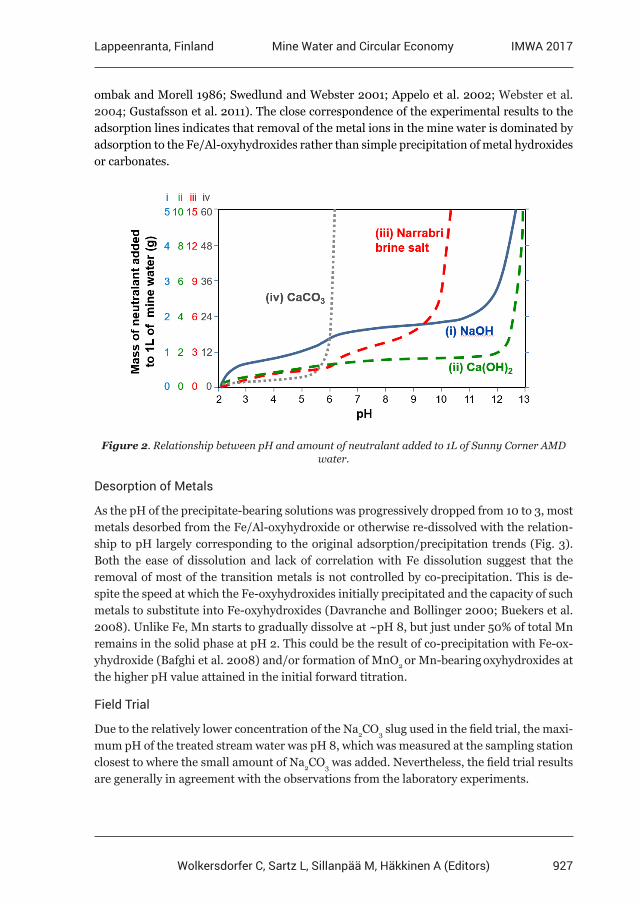
927
Lappeenranta, Finland IMWA 2017Mine Water and Circular Economy
Wolkersdorfer C, Sartz L, Sillanpää M, Häkkinen A (Editors)
ombak and Morell 1986; Swedlund and Webster 2001; Appelo et al. 2002; Webster et al. 2004; Gustafsson et al. 2011). The close correspondence of the experimental results to the adsorption lines indicates that removal of the metal ions in the mine water is dominated by adsorption to the Fe/Al-oxyhydroxides rather than simple precipitation of metal hydroxides or carbonates.
Figure 2. Relationship between pH and amount of neutralant added to 1L of Sunny Corner AMD water.
Desorption of Metals
As the pH of the precipitate-bearing solutions was progressively dropped from 10 to 3, most metals desorbed from the Fe/Al-oxyhydroxide or otherwise re-dissolved with the relation-ship to pH largely corresponding to the original adsorption/precipitation trends (Fig. 3). Both the ease of dissolution and lack of correlation with Fe dissolution suggest that the removal of most of the transition metals is not controlled by co-precipitation. This is de-spite the speed at which the Fe-oxyhydroxides initially precipitated and the capacity of such metals to substitute into Fe-oxyhydroxides (Davranche and Bollinger 2000; Buekers et al. 2008). Unlike Fe, Mn starts to gradually dissolve at ~pH 8, but just under 50% of total Mn remains in the solid phase at pH 2. This could be the result of co-precipitation with Fe-ox-yhydroxide (Bafghi et al. 2008) and/or formation of MnO2 or Mn-bearing oxyhydroxides at the higher pH value attained in the initial forward titration.
Field Trial
Due to the relatively lower concentration of the Na2CO3 slug used in the field trial, the maxi-mum pH of the treated stream water was pH 8, which was measured at the sampling station closest to where the small amount of Na2CO3 was added. Nevertheless, the field trial results are generally in agreement with the observations from the laboratory experiments.
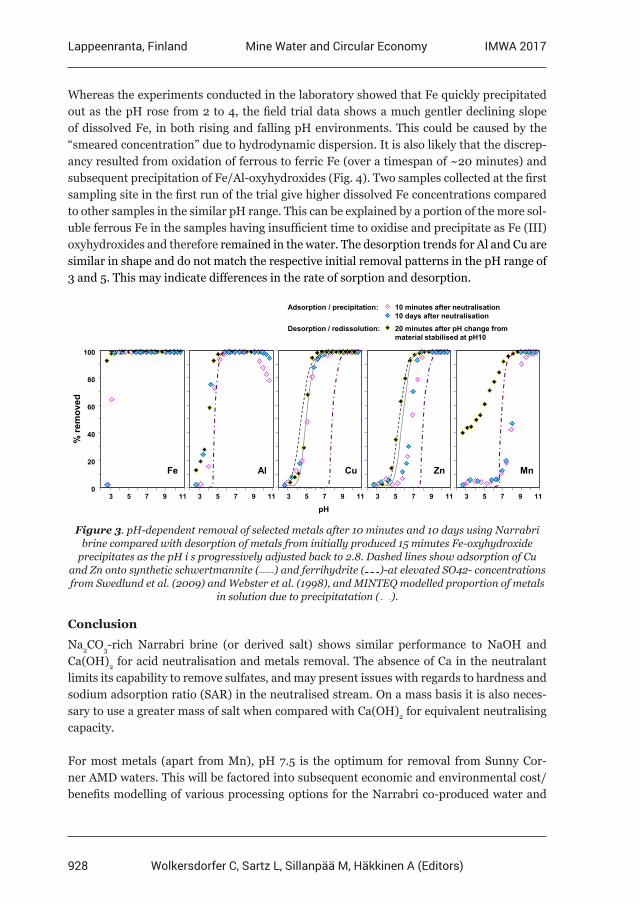
928
Lappeenranta, Finland IMWA 2017Mine Water and Circular Economy
Wolkersdorfer C, Sartz L, Sillanpää M, Häkkinen A (Editors)
Whereas the experiments conducted in the laboratory showed that Fe quickly precipitated out as the pH rose from 2 to 4, the field trial data shows a much gentler declining slope of dissolved Fe, in both rising and falling pH environments. This could be caused by the “smeared concentration” due to hydrodynamic dispersion. It is also likely that the discrep-ancy resulted from oxidation of ferrous to ferric Fe (over a timespan of ~20 minutes) and subsequent precipitation of Fe/Al-oxyhydroxides (Fig. 4). Two samples collected at the first sampling site in the first run of the trial give higher dissolved Fe concentrations compared to other samples in the similar pH range. This can be explained by a portion of the more sol-uble ferrous Fe in the samples having insufficient time to oxidise and precipitate as Fe (III) oxyhydroxides and therefore remained in the water. The desorption trends for Al and Cu are similar in shape and do not match the respective initial removal patterns in the pH range of 3 and 5. This may indicate differences in the rate of sorption and desorption.
0
Fe MnZnAl Cu
% r
emov
ed
pH
20
40
60
80
100
3 5 7 9 11
Adsorption / precipitation: 10 minutes after neutralisation10 days after neutralisation
Desorption / redissolution: 20 minutes after pH change frommaterial stabilised at pH10
3 5 7 9 113 5 7 9 113 5 7 9 11 3 5 7 9 11
Figure 3. pH-dependent removal of selected metals after 10 minutes and 10 days using Narrabri brine compared with desorption of metals from initially produced 15 minutes Fe-oxyhydroxide
precipitates as the pH i s progressively adjusted back to 2.8. Dashed lines show adsorption of Cu and Zn onto synthetic schwertmannite ( ) and ferrihydrite ( )-at elevated SO42- concentrations from Swedlund et al. (2009) and Webster et al. (1998), and MINTEQ modelled proportion of metals
in solution due to precipitatation ( ).
Conclusion
Na2CO3-rich Narrabri brine (or derived salt) shows similar performance to NaOH and Ca(OH)2 for acid neutralisation and metals removal. The absence of Ca in the neutralant limits its capability to remove sulfates, and may present issues with regards to hardness and sodium adsorption ratio (SAR) in the neutralised stream. On a mass basis it is also neces-sary to use a greater mass of salt when compared with Ca(OH)2 for equivalent neutralising capacity.
For most metals (apart from Mn), pH 7.5 is the optimum for removal from Sunny Cor-ner AMD waters. This will be factored into subsequent economic and environmental cost/benefits modelling of various processing options for the Narrabri co-produced water and
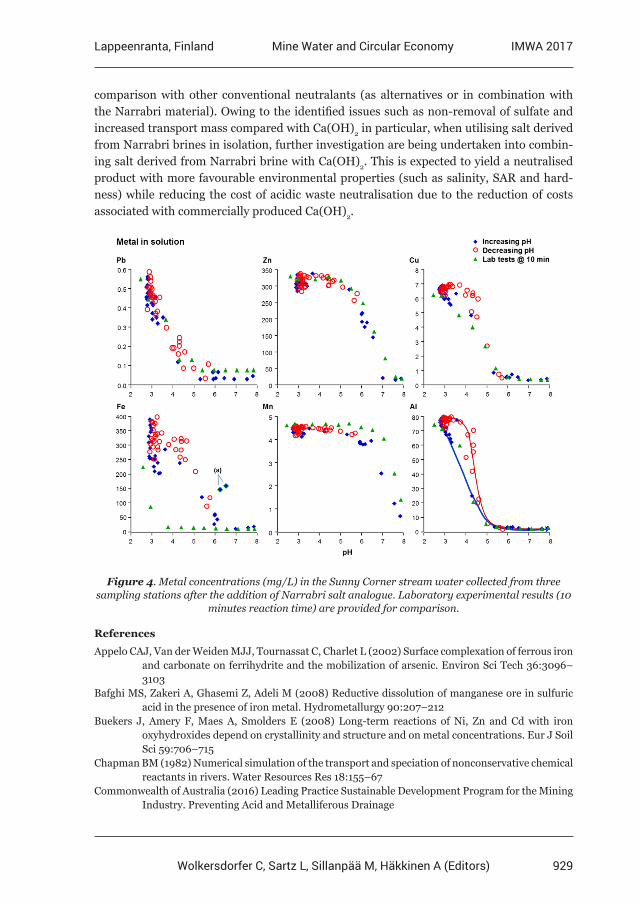
929
Lappeenranta, Finland IMWA 2017Mine Water and Circular Economy
Wolkersdorfer C, Sartz L, Sillanpää M, Häkkinen A (Editors)
comparison with other conventional neutralants (as alternatives or in combination with the Narrabri material). Owing to the identified issues such as non-removal of sulfate and increased transport mass compared with Ca(OH)2 in particular, when utilising salt derived from Narrabri brines in isolation, further investigation are being undertaken into combin-ing salt derived from Narrabri brine with Ca(OH)2. This is expected to yield a neutralised product with more favourable environmental properties (such as salinity, SAR and hard-ness) while reducing the cost of acidic waste neutralisation due to the reduction of costs associated with commercially produced Ca(OH)2.
Figure 4. Metal concentrations (mg/L) in the Sunny Corner stream water collected from three sampling stations after the addition of Narrabri salt analogue. Laboratory experimental results (10
minutes reaction time) are provided for comparison.
References
Appelo CAJ, Van der Weiden MJJ, Tournassat C, Charlet L (2002) Surface complexation of ferrous iron and carbonate on ferrihydrite and the mobilization of arsenic. Environ Sci Tech 36:3096– 3103Bafghi MS, Zakeri A, Ghasemi Z, Adeli M (2008) Reductive dissolution of manganese ore in sulfuric acid in the presence of iron metal. Hydrometallurgy 90:207–212Buekers J, Amery F, Maes A, Smolders E (2008) Long-term reactions of Ni, Zn and Cd with iron oxyhydroxides depend on crystallinity and structure and on metal concentrations. Eur J Soil Sci 59:706–715Chapman BM (1982) Numerical simulation of the transport and speciation of nonconservative chemical reactants in rivers. Water Resources Res 18:155–67Commonwealth of Australia (2016) Leading Practice Sustainable Development Program for the Mining Industry. Preventing Acid and Metalliferous Drainage
930
Lappeenranta, Finland IMWA 2017Mine Water and Circular Economy
Wolkersdorfer C, Sartz L, Sillanpää M, Häkkinen A (Editors)
Davranche M, Bollinger JC (2000) Release of metals from iron oxyhydroxides under reductive conditions: Effect of metal/solid interactions. J Col Inter Sci 232:165–173Day RW (2009) Coal seam gas booms in eastern Australia. Aust Resour Invest 3:42-47Dzombak DA, Morel FMM (1986) Adsorption of cadmium on hydrous ferric oxide at high sorbate/ sorbent ratios, equilibrium kinetics and modelling. J Col Inter Sci 112:588–597Gerth J, Brümmer GW, Tiller KG (1993) Retention of Ni, Zn and Cd by Si-associated goethite. Zeit Pflanz Boden 156:123–129Gustafsson JP, Tiberg T, Edkymish A, Kleja DB (2011) Modelling lead(II) sorption to ferrihydrite and soil organic matter. Environ Chem 8:485–492INAP (2009) Global Acid Rock Drainage Guide (GARD Guide). Document prepared by Golder Associates on behalf of the International Network on Acid Prevention (INAP) (http://www. inap.com.au/)Lakovleva E, Mäkilä E, Salonen J, Sitar M, Wang S, Sillanpää M (2015) Acid mine drainage (AMD) treatment: Neutralization and toxic elements removal with unmodified and modified limestone. Ecol Eng 81:30–40Maree JP, Mujuru M, Bologo V, Daniels N, Mpholoane D (2013) Neutralisation treatment of AMD at affordable cost. Water SA 39:245–250Morgan B, Lahav O (2007) The effect of pH on the kinetics of spontaneous Fe (II) oxidation by O 2 in aqueous solution–basic principles and a simple heuristic description. Chemosphere. 68(11):2080-4Ouakibi O, Loqman S, Hakkou R, Benzaazoua M (2013) The potential use of phosphatic limestone wastes in the passive treatment of AMD: A laboratory study. Mine Water Environ 32:266– 277Swedlund PJ, Webster JG (2001) Cu and Zn ternary surface complex formation with SO4 on ferrihydrite and schwertmannite. Appl Geochem 16:503–511.Swedlund PJ, Webster JG, Miskelly GM (2009) Goethite adsorption of Cu (II), Pb (II), Cd (II), and Zn (II) in the presence of sulfate: Properties of the ternary complex. Geochim. Cosmochim. Acta 73:1548–1562Webster JG, Swedlund PJ, Webster KS (1998). Trace metal adsorption onto an acid mine drainage iron (III) oxyhydroxy sulfate. Env. Sci. Tech. 32:1361–1368Webster TJ, Massa-Schlueter EA, Smith JL, Slamovich EB (2004) Osteoblast response to hydroxyapatite doped with divalent and trivalent cations. Biomaterials 25:2111–2121
931
Lappeenranta, Finland IMWA 2017Mine Water and Circular Economy
Wolkersdorfer C, Sartz L, Sillanpää M, Häkkinen A (Editors)
The KaiHaMe project – increasing raw material value of exploited ores
Päivi M. Kauppila1, Antti Taskinen2, Anna Tornivaara3, Neea Heino2,Marja Lehto-nen3, Mia Tiljander3, Teemu Karlsson1 and Tero Korhonen2
1Geological Survey of Finland, P.O. BOX 1237, FI-70211 Kuopio, Finland, [email protected] 2Geological Survey of Finland, Tutkijankatu 1, FI-83500 Outokumpu, Finland
3Geological Survey of Finland, P.O. BOX 96, FI-02151 Espoo, Finland
Abstract Mining generates large amounts of waste materials, since only a small part of excavated ores is usually utilized. Waste disposal requires large areas, is costly and may mean squander of natural resources, if only the most obvious commodities are utilized. The objective of the KaiHaMe project is to assess ways to increase raw material value of ores from gold deposits and to decrease the amount of disposed hazardous wastes. Based on the preliminary results, removal of harmful contaminants and minerals, in particular arsenic, from tailings through mineral processing seems to be a potential technique to achieve these goals.
Key words Mining waste, tailings, valorization, mineral processing, lysimeter tests
Introduction
Management of mining wastes is one of the primary challenges of sustainable mining due to their large amounts and potential long-term generation of low quality mine drainage. Only a small part of excavated ores can usually be utilized and the rest of the material is disposed as a waste, i.e. as waste rocks or tailings. This is especially true for the gold and base metal ore deposits, in which the ratio between generated wastes to the extracted valuable metals is particularly high. In these cases, the waste materials typically contain notable amounts of acid producing sulphide minerals and hazardous metals, and are prone to generate drainage waters with elevated metals and sulphate. Long-term management of these wastes in an environmentally and geotechnically acceptable manner is costly and requires large areas. Disposal of wastes may often also mean squander of natural resources, if only the most obvi-ous commodities are utilized from the ore. Thus, new methods and approaches to promote eco-efficient use of mineral resources are needed.
Consequently, various solutions have been developed during the last decades to increase valorization of mining wastes to decrease their environmental impacts. In addition, the ob-jective of the valorization has been to respond to the shortage of raw materials, growing costs to explore and mine new ore deposits, and a necessity to manage natural resourc-es in accordance with the sustainable development principles. The new solutions include, for instance, desulphurization of tailings (e.g. Benzaazoua & Kongolo 2003), production of glass-ceramics from tailings (e.g. Marabini et al. 1998), and recovery of precious metals from tailings using bioleaching (Liu et al. 2008) or chemical treatment (Lv et al. 2014).
The project “Mining waste management methods”, KaiHaMe, aims at increasing raw mate-rial value of excavated gold and base metal ore deposits and decreasing the amount of dis-
932
Lappeenranta, Finland IMWA 2017Mine Water and Circular Economy
Wolkersdorfer C, Sartz L, Sillanpää M, Häkkinen A (Editors)
posed hazardous wastes. This is done by modifying gold ore tailings with mineral processing techniques and by seeking new options for the use of waste rocks from base metal mining. The objective of the mineral processing is to generate tailings with lower levels of hazardous elements and minerals, especially As and sulphide minerals. The influence of the improved tailings composition on their leaching behaviour is further studied using mineralogical and geochemical characterization together with filled-in lysimeters measuring longer term be-haviour together with drainage quality in field conditions. The project started in 2015 and will continue until the beginning of 2018.
This paper focuses on the preliminary results from the beneficiation tests targeting at reduc-ing As and sulphide mineral content in gold ore tailings from the Kopsa ore deposit, and the filled-in tailings lysimeter tests to evaluate longer term performance of the modified tailings in field conditions. Initial results from waste rock studies are presented in a separate paper by Karlsson et al. (2017; these proceedings).
Study area and methods
Sample material for the beneficiation tests and filled-in lysimeters originated from the Kop-sa gold ore deposit, located in Western Finland (fig. 1). The Kopsa ore deposit is a porhyric Au-Cu mineralization, which is hosted by tonalite and mica schist. The major ore minerals in the deposit are arsenopyrite, chalcopyrite and pyrrhotite with accessory löllingite, marca-site, pyrite, sphalerite, gold, cubanite, bornite, stannite, bismuth and Bi-bearing sulphosalts (Gaál & Isohanni 1979). The estimated ore reserves are 13.6 Mt with 0.81 g/t Au, 0.15% Cu and 2.15 g/t Ag (SRK 2013). Elevated As contents are very typical for the mineralization, the As content varying between 0.1-1.2% in the deposit (Gaál & Isohanni 1979, Nurmi et al. 1991). Exploration has been carried out since the 1940s around the Kopsa deposit and the latest holder of the exploration claims, Belvedere Mining Oy, planned to open a mine but went bankrupt in 2015. Therefore, no tailings exist at the site yet, providing possibility for tailings optimization.
Beneficiation tests were carried out on the Kopsa ore to evaluate realistic ways to decrease As and sulphide mineral content in the tailings in order to decrease the amount of haz-ardous waste and to generate tailings that could be used as a cover material for mining waste facilities. In the flotation tests, influence of the grind size, flotation time, and flotation chemicals and their dosage was studied. Prior to the beneficiation tests, thorough miner-alogical analyses were carried out on the ore samples using a Mineral Liberation Analyser (MLA; MLA FEI Quanta 600) equipped with a scanning electron microscope, two energy dispersive spectrometers and the MLA software. The mineralogical phases, and liberation, association, and grain size distribution of the As bearing minerals were determined with the MLA. Electron probe microanalyser (Cameca SX100) was applied for more detailed identi-fication of the key mineral phases. The total chemical composition of the ore samples was measured using XRF, Au and Ag content by fire assay with FAAS, and total sulphur content using combustion technique (Eltra). Similar mineralogical and chemical characterizations were made on the beneficiation test products (i.e. concentrate and tailings) as for the ore sample to help to modify the process.
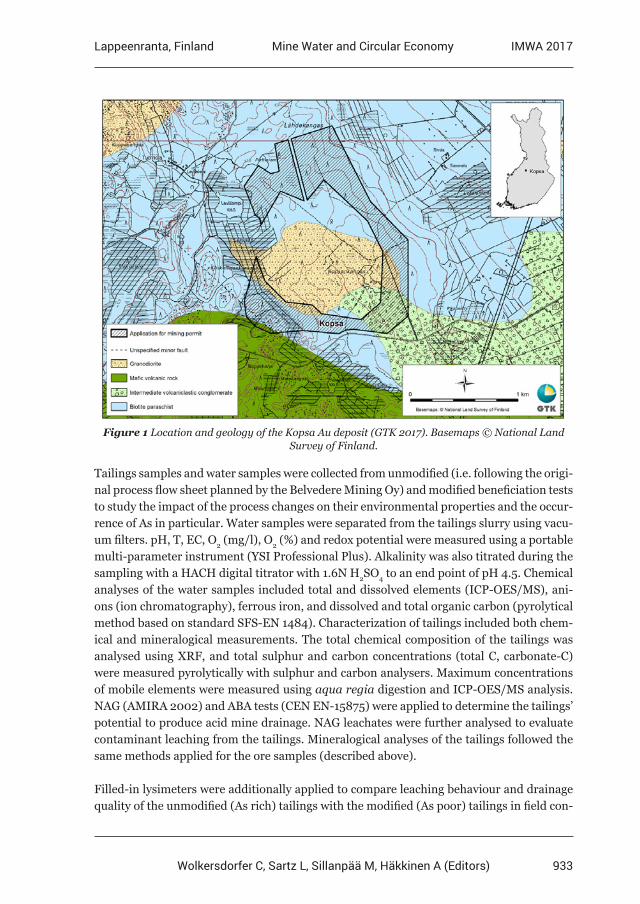
933
Lappeenranta, Finland IMWA 2017Mine Water and Circular Economy
Wolkersdorfer C, Sartz L, Sillanpää M, Häkkinen A (Editors)
Figure 1 Location and geology of the Kopsa Au deposit (GTK 2017). Basemaps © National Land Survey of Finland.
Tailings samples and water samples were collected from unmodified (i.e. following the origi-nal process flow sheet planned by the Belvedere Mining Oy) and modified beneficiation tests to study the impact of the process changes on their environmental properties and the occur-rence of As in particular. Water samples were separated from the tailings slurry using vacu-um filters. pH, T, EC, O2 (mg/l), O2 (%) and redox potential were measured using a portable multi-parameter instrument (YSI Professional Plus). Alkalinity was also titrated during the sampling with a HACH digital titrator with 1.6N H2SO4 to an end point of pH 4.5. Chemical analyses of the water samples included total and dissolved elements (ICP-OES/MS), ani-ons (ion chromatography), ferrous iron, and dissolved and total organic carbon (pyrolytical method based on standard SFS-EN 1484). Characterization of tailings included both chem-ical and mineralogical measurements. The total chemical composition of the tailings was analysed using XRF, and total sulphur and carbon concentrations (total C, carbonate-C) were measured pyrolytically with sulphur and carbon analysers. Maximum concentrations of mobile elements were measured using aqua regia digestion and ICP-OES/MS analysis. NAG (AMIRA 2002) and ABA tests (CEN EN-15875) were applied to determine the tailings’ potential to produce acid mine drainage. NAG leachates were further analysed to evaluate contaminant leaching from the tailings. Mineralogical analyses of the tailings followed the same methods applied for the ore samples (described above).
Filled-in lysimeters were additionally applied to compare leaching behaviour and drainage quality of the unmodified (As rich) tailings with the modified (As poor) tailings in field con-
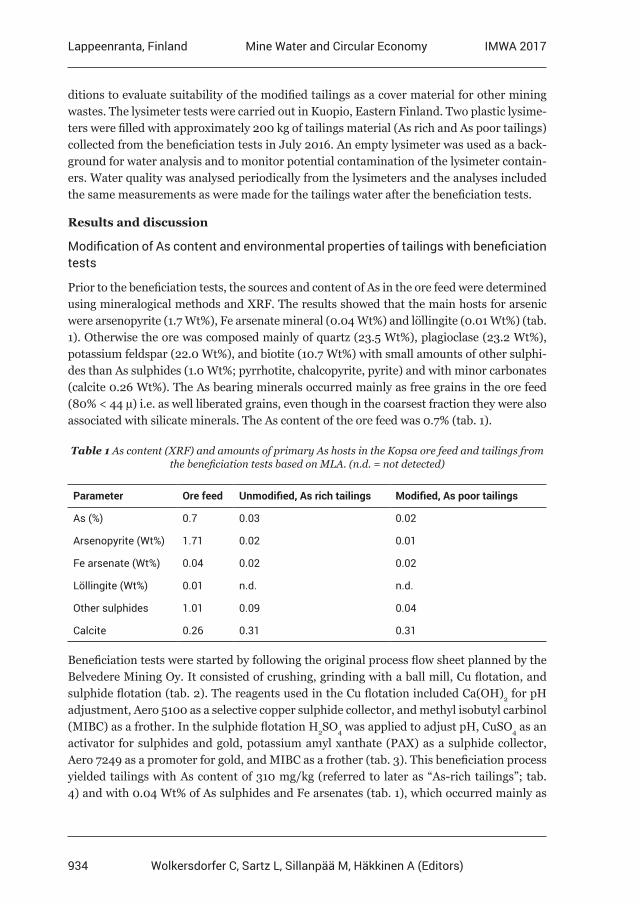
934
Lappeenranta, Finland IMWA 2017Mine Water and Circular Economy
Wolkersdorfer C, Sartz L, Sillanpää M, Häkkinen A (Editors)
ditions to evaluate suitability of the modified tailings as a cover material for other mining wastes. The lysimeter tests were carried out in Kuopio, Eastern Finland. Two plastic lysime-ters were filled with approximately 200 kg of tailings material (As rich and As poor tailings) collected from the beneficiation tests in July 2016. An empty lysimeter was used as a back-ground for water analysis and to monitor potential contamination of the lysimeter contain-ers. Water quality was analysed periodically from the lysimeters and the analyses included the same measurements as were made for the tailings water after the beneficiation tests.
Results and discussion
Modification of As content and environmental properties of tailings with beneficiation tests
Prior to the beneficiation tests, the sources and content of As in the ore feed were determined using mineralogical methods and XRF. The results showed that the main hosts for arsenic were arsenopyrite (1.7 Wt%), Fe arsenate mineral (0.04 Wt%) and löllingite (0.01 Wt%) (tab. 1). Otherwise the ore was composed mainly of quartz (23.5 Wt%), plagioclase (23.2 Wt%), potassium feldspar (22.0 Wt%), and biotite (10.7 Wt%) with small amounts of other sulphi-des than As sulphides (1.0 Wt%; pyrrhotite, chalcopyrite, pyrite) and with minor carbonates (calcite 0.26 Wt%). The As bearing minerals occurred mainly as free grains in the ore feed (80% < 44 µ) i.e. as well liberated grains, even though in the coarsest fraction they were also associated with silicate minerals. The As content of the ore feed was 0.7% (tab. 1).
Table 1 As content (XRF) and amounts of primary As hosts in the Kopsa ore feed and tailings from the beneficiation tests based on MLA. (n.d. = not detected)
Parameter Ore feed Unmodified, As rich tailings Modified, As poor tailings
As (%) 0.7 0.03 0.02
Arsenopyrite (Wt%) 1.71 0.02 0.01
Fe arsenate (Wt%) 0.04 0.02 0.02
Löllingite (Wt%) 0.01 n.d. n.d.
Other sulphides 1.01 0.09 0.04
Calcite 0.26 0.31 0.31
Beneficiation tests were started by following the original process flow sheet planned by the Belvedere Mining Oy. It consisted of crushing, grinding with a ball mill, Cu flotation, and sulphide flotation (tab. 2). The reagents used in the Cu flotation included Ca(OH)2 for pH adjustment, Aero 5100 as a selective copper sulphide collector, and methyl isobutyl carbinol (MIBC) as a frother. In the sulphide flotation H2SO4 was applied to adjust pH, CuSO4 as an activator for sulphides and gold, potassium amyl xanthate (PAX) as a sulphide collector, Aero 7249 as a promoter for gold, and MIBC as a frother (tab. 3). This beneficiation process yielded tailings with As content of 310 mg/kg (referred to later as “As-rich tailings”; tab. 4) and with 0.04 Wt% of As sulphides and Fe arsenates (tab. 1), which occurred mainly as
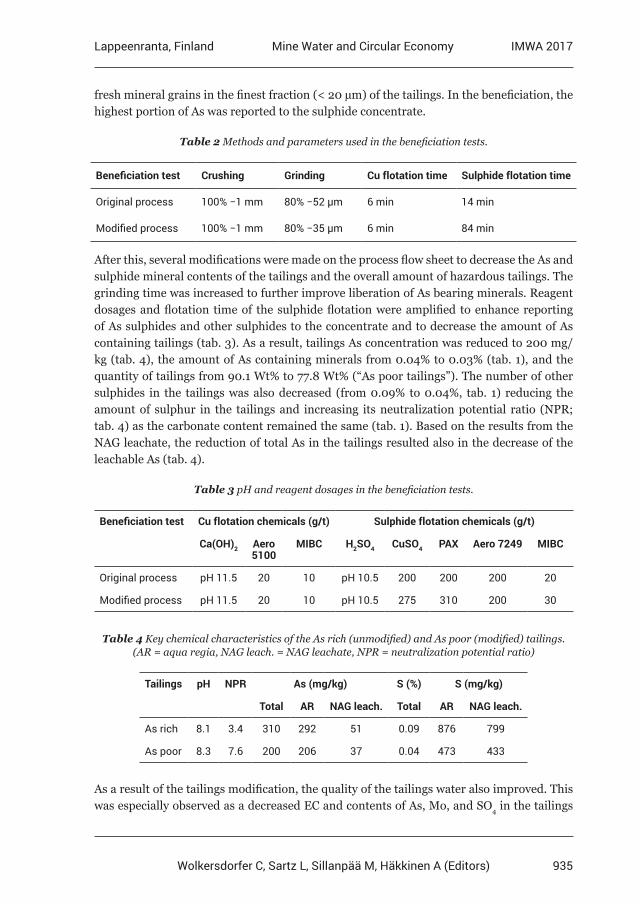
935
Lappeenranta, Finland IMWA 2017Mine Water and Circular Economy
Wolkersdorfer C, Sartz L, Sillanpää M, Häkkinen A (Editors)
fresh mineral grains in the finest fraction (< 20 µm) of the tailings. In the beneficiation, the highest portion of As was reported to the sulphide concentrate.
Table 2 Methods and parameters used in the beneficiation tests.
Beneficiation test Crushing Grinding Cu flotation time Sulphide flotation time
Original process 100% −1 mm 80% −52 µm 6 min 14 min
Modified process 100% −1 mm 80% −35 µm 6 min 84 min
After this, several modifications were made on the process flow sheet to decrease the As and sulphide mineral contents of the tailings and the overall amount of hazardous tailings. The grinding time was increased to further improve liberation of As bearing minerals. Reagent dosages and flotation time of the sulphide flotation were amplified to enhance reporting of As sulphides and other sulphides to the concentrate and to decrease the amount of As containing tailings (tab. 3). As a result, tailings As concentration was reduced to 200 mg/kg (tab. 4), the amount of As containing minerals from 0.04% to 0.03% (tab. 1), and the quantity of tailings from 90.1 Wt% to 77.8 Wt% (“As poor tailings”). The number of other sulphides in the tailings was also decreased (from 0.09% to 0.04%, tab. 1) reducing the amount of sulphur in the tailings and increasing its neutralization potential ratio (NPR; tab. 4) as the carbonate content remained the same (tab. 1). Based on the results from the NAG leachate, the reduction of total As in the tailings resulted also in the decrease of the leachable As (tab. 4).
Table 3 pH and reagent dosages in the beneficiation tests.
Beneficiation test Cu flotation chemicals (g/t) Sulphide flotation chemicals (g/t)
Ca(OH)2 Aero 5100
MIBC H2SO4 CuSO4 PAX Aero 7249 MIBC
Original process pH 11.5 20 10 pH 10.5 200 200 200 20
Modified process pH 11.5 20 10 pH 10.5 275 310 200 30
Table 4 Key chemical characteristics of the As rich (unmodified) and As poor (modified) tailings. (AR = aqua regia, NAG leach. = NAG leachate, NPR = neutralization potential ratio)
Tailings pH NPR As (mg/kg) S (%) S (mg/kg)
Total AR NAG leach. Total AR NAG leach.
As rich 8.1 3.4 310 292 51 0.09 876 799
As poor 8.3 7.6 200 206 37 0.04 473 433
As a result of the tailings modification, the quality of the tailings water also improved. This was especially observed as a decreased EC and contents of As, Mo, and SO4 in the tailings
936
Lappeenranta, Finland IMWA 2017Mine Water and Circular Economy
Wolkersdorfer C, Sartz L, Sillanpää M, Häkkinen A (Editors)
water of the As poor tailings compared with those of the As rich tailings (tab. 5). Both wa-ters were alkaline, as the beneficiation process was carried out at alkaline pH (tab. 3) and the tailings were fresh and unoxidized. The tailings water of the As poor tailings was less alkaline (pH 8.7) than the water from the As rich tailings (pH 10.1, tab. 5). This is probably because the modified enrichment process lasted longer than the original process leaving more time for the slurry pH to balance.
Table 5 Tailings water quality of the As rich (unmodified) and As poor (modified) tailings.
Tailings pH EC (mS/m) SO4 (mg/l) As (µg/l) Cu (µg/l) Mo (µg/l)
As rich 10.1 76 310 775 <0.5 55
As poor 8.7 57 220 174 <0.5 21
The results of the beneficiation tests and the subsequent characterization of tailings and tailings water suggest that it is possible to improve tailings environmental properties and contribute to the water quality in the enrichment process with reasonable adaptations of the beneficiation process. However, the feasibility of these adaptations with respect to the acquired benefits in the waste management requires further evaluation.
Evaluation of the performance of the modified tailings in field conditions using filled-in lysimeter
Lysimeter tests were started in July 2016 to study the performance of the modified As poor tailings generated in the beneficiation test as a cover material for other mining wastes in field conditions. Sampling from the lysimeters was made once in the autumn 2016 and it will continue once the lysimeters unfreeze after the winter period in Eastern Finland. Sum-maries of the mineralogy and key chemical characteristics of the tailings used in the lysim-eters are presented in tables 1 and 4.
Based on the preliminary results of the lysimeters, the seepage waters from both As rich and As poor tailings were alkaline (tab. 6) as expected based on the NPR. The main contam-inants in the seepages were As and Mo with minor Cu. Sulphate concentrations were also elevated suggesting minor sulphide oxidation, but as the sulphide content of the tailings was overall quite small and the sulphide mineral grains were unoxidized, most of the SO4 presumably originates from the H2SO4 and CuSO4 used in the ore processing.
Based on the results, the modification of the tailings has decreased leaching of metals from the tailings. Especially EC and concentrations of As, Cu, and Mn were smaller in the lysim-eter seepages of the modified As poor tailings than in the original As rich tailings (tab. 6). However, as the monitoring represents only one sampling event after the installation of the lysimeters, it is not expected that mineral weathering reactions have yet started. Instead, the current metal loading most likely results from the element leaching from the mineral edges broken during mineral processing. To observe the longer term changes in the water quality and to further evaluate the suitability of the As poor tailings for a cover material,
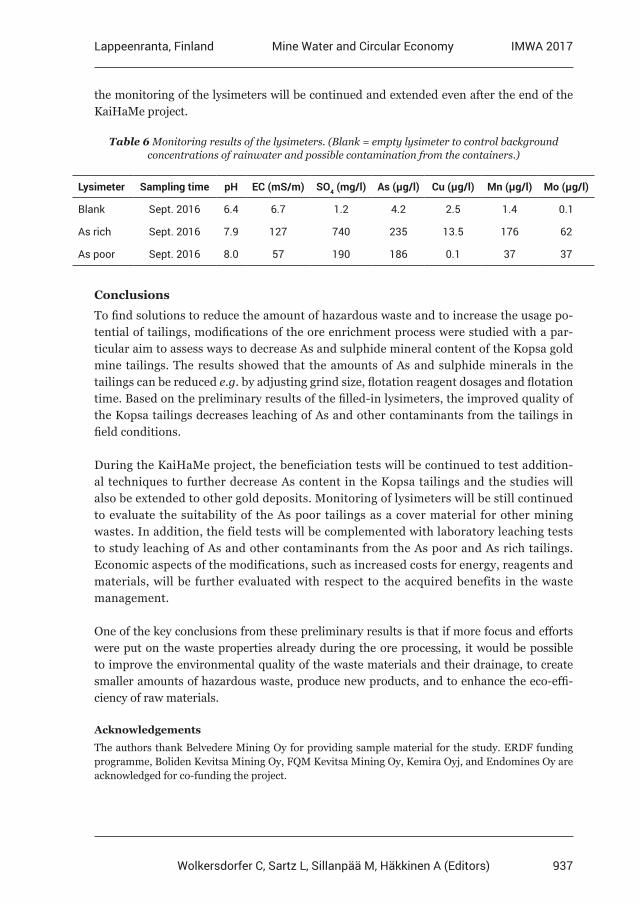
937
Lappeenranta, Finland IMWA 2017Mine Water and Circular Economy
Wolkersdorfer C, Sartz L, Sillanpää M, Häkkinen A (Editors)
the monitoring of the lysimeters will be continued and extended even after the end of the KaiHaMe project.
Table 6 Monitoring results of the lysimeters. (Blank = empty lysimeter to control background concentrations of rainwater and possible contamination from the containers.)
Lysimeter Sampling time pH EC (mS/m) SO4 (mg/l) As (µg/l) Cu (µg/l) Mn (µg/l) Mo (µg/l)
Blank Sept. 2016 6.4 6.7 1.2 4.2 2.5 1.4 0.1
As rich Sept. 2016 7.9 127 740 235 13.5 176 62
As poor Sept. 2016 8.0 57 190 186 0.1 37 37
Conclusions
To find solutions to reduce the amount of hazardous waste and to increase the usage po-tential of tailings, modifications of the ore enrichment process were studied with a par-ticular aim to assess ways to decrease As and sulphide mineral content of the Kopsa gold mine tailings. The results showed that the amounts of As and sulphide minerals in the tailings can be reduced e.g. by adjusting grind size, flotation reagent dosages and flotation time. Based on the preliminary results of the filled-in lysimeters, the improved quality of the Kopsa tailings decreases leaching of As and other contaminants from the tailings in field conditions.
During the KaiHaMe project, the beneficiation tests will be continued to test addition-al techniques to further decrease As content in the Kopsa tailings and the studies will also be extended to other gold deposits. Monitoring of lysimeters will be still continued to evaluate the suitability of the As poor tailings as a cover material for other mining wastes. In addition, the field tests will be complemented with laboratory leaching tests to study leaching of As and other contaminants from the As poor and As rich tailings. Economic aspects of the modifications, such as increased costs for energy, reagents and materials, will be further evaluated with respect to the acquired benefits in the waste management.
One of the key conclusions from these preliminary results is that if more focus and efforts were put on the waste properties already during the ore processing, it would be possible to improve the environmental quality of the waste materials and their drainage, to create smaller amounts of hazardous waste, produce new products, and to enhance the eco-effi-ciency of raw materials.
Acknowledgements
The authors thank Belvedere Mining Oy for providing sample material for the study. ERDF funding programme, Boliden Kevitsa Mining Oy, FQM Kevitsa Mining Oy, Kemira Oyj, and Endomines Oy are acknowledged for co-funding the project.
938
Lappeenranta, Finland IMWA 2017Mine Water and Circular Economy
Wolkersdorfer C, Sartz L, Sillanpää M, Häkkinen A (Editors)
References
AMIRA (2002) ARD Test Handbook. Project P387A Prediction & Kinetic Control of Acid Mine Drainage. AMIRA International LimitedBenzaazoua M, Kongolo M (2003) Physico-chemical properties of tailing slurries during environmental desulphurization by froth flotation. Int J Miner Process 69:221—234Gaál G, Isohanni M (1979) Characteristics of Igneous Intrusions and Various Wall Rocks in Some Precambrian Porphyry Copper-Molybdenum Deposits in Pohjanmaa, Finland. Econ Geol 74:1198—1210GTK 2017. Bedrock of Finland – DigiKP. Digital map database [Electronic resource]. Espoo: Geological Survey of Finland [referred 6th April 2017]. Version 1.0Karlsson T, Kauppila P, Lehtonen M (2017) Assessment of the effects of mine closure activities to waste rock drainage quality at the Hitura Ni-Cu mine, Finland. Submitted to the Proceedings of the 13th International Mine Water Association Congress – “Mine Water & Circular Economy – A Green Congress”Liu Y-G, Zhou M, Zeng G-M, Wang X, Li X, Fan T, Xu W-H (2008) Bioleaching of heavy metals from mine tailings by indigenous sulfur-oxidizing bacteria: Effects of substrate concentration. Bioresource Technol 99 (10):4124—4129Lv CC, Ding J, Qian P, Li QC, Ye SF, Chen YF (2015) Comprehensive recovery of metals from cyanidation tailing. Miner Eng 70:141—147Marabini AM, Plescia P, Maccari D, Burragato F, Pelino M (1998) New materials from industrial and mining wastes: glass-ceramics and glass- and rock-wool fibre. Int J Miner Process 53:121— 134Nurmi P (1991) Geological setting, history of discovery and exploration economics of Precambrian gold occurrences in Finland. J Geochem Explor 39:273—287SRK Consulting (2013) Preliminary economic assessment for the Kopsa copper-gold deposit, Finland. SRK Consulting (Sweden) AB, October 2013, 168 pp
939
Lappeenranta, Finland IMWA 2017Mine Water and Circular Economy
Wolkersdorfer C, Sartz L, Sillanpää M, Häkkinen A (Editors)
Reduced Inorganic Sulfur Compounds of Simulated Mining Waters Support Bioelectrochemical and
Electrochemical Current Generation
Mira Sulonen, Aino-Maija Lakaniemi, Marika Kokko, Jaakko Puhakka
Tampere University of Technology, Laboratory of Chemistry and Bioengineering, Korkeakoulunkatu 10, 33720 Tampere, Finland, [email protected]
Abstract Tetrathionate (S4O62-) was removed from simulated acidic mining water (pH<2.5) while
simultaneously generating electrical current in (bio)electrochemical systems. The current density in bioelectrochemical system was improved by optimizing the external resistance and the long-term stability was monitored for over 700 days. The electricity production efficiency improved over time and microbial cultures were dominated by Acidithiobacillus sp. and Ferroplasma sp. With bioelectrochemical systems, current was generated at lower anode potentials (≥0.3 V vs. Ag/AgCl) and tetrathionate was degraded at higher rate (≥110 mg L-1 d-1) than in the electrochemical system (≥0.5 V vs. Ag/AgCl and ≤35 mg L-1 d-1).
Keywords reduced inorganic sulphur compounds, tetrathionate, bioelectrochemical, electrochemical
Introduction
The processing of sulphide minerals often releases metals and reduced inorganic sulphur compounds, such as thiosulfate (S2O3
2-) and tetrathionate (S4O62-), to mining water streams.
In the environment, elevated metal concentrations can limit the growth of several organ-isms (Nies 1999). Sulphur-oxidizing microorganisms degrade RISCs producing sulphuric acid in the reaction (Johnson and Hallberg 2008). This causes acidification of the environ-ment and promotes the formation of acidic metal rich water known as acid mine drainage (AMD). Therefore, both RISCs and metals should be removed from mining water streams before their release to the environment.
In electrochemical systems, electrical current is produced via oxidation and reduction re-actions. A substrate is oxidized on an anode electrode and the electrons released in the ox-idation reaction flow through an electrical circuit to a cathode electrode, where an electron acceptor accepts the electrons and becomes reduced (Figure 1). The reduction potentials of the anodic electron donor and the cathodic electron acceptor define whether the system is spontaneously producing electrical energy or whether external energy is required to run the oxidation and reduction reactions. Electrochemical systems can be used, for example, to recover metals from water streams. Certain metal ions can be reduced on the cathode electrode and the metals will electrodeposit on the surface of the electrode, from where they can be recovered in pure elemental form (Modin et al. 2012, ter Heijne et al. 2010). The current required to run the electrochemical metal reduction is usually drawn from oxidation of water. The theoretical reduction potentials of metals are usually lower than the reduction potential of water (Table 1) and, therefore, external energy is required for combining water oxidation to metal reduction.
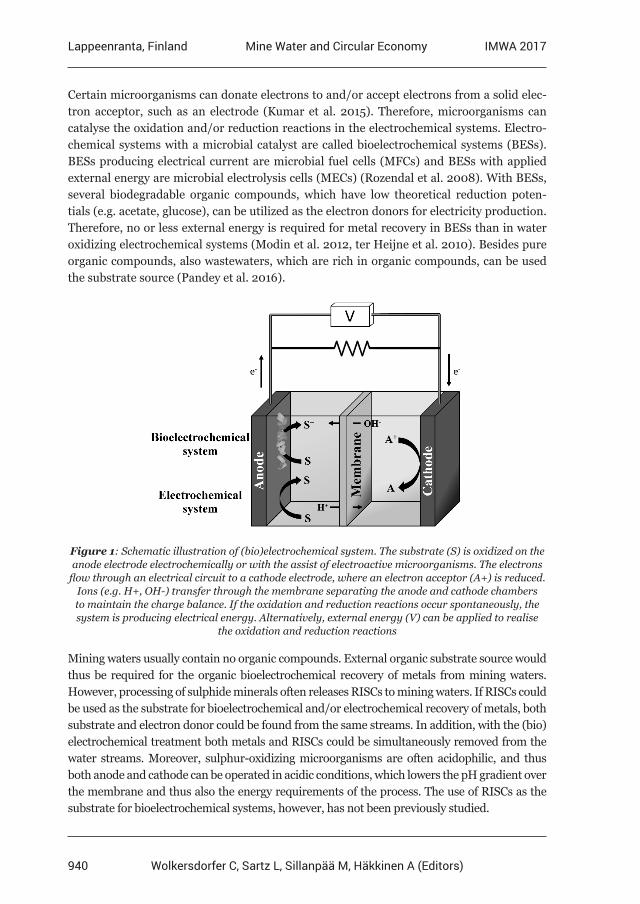
940
Lappeenranta, Finland IMWA 2017Mine Water and Circular Economy
Wolkersdorfer C, Sartz L, Sillanpää M, Häkkinen A (Editors)
Certain microorganisms can donate electrons to and/or accept electrons from a solid elec-tron acceptor, such as an electrode (Kumar et al. 2015). Therefore, microorganisms can catalyse the oxidation and/or reduction reactions in the electrochemical systems. Electro-chemical systems with a microbial catalyst are called bioelectrochemical systems (BESs). BESs producing electrical current are microbial fuel cells (MFCs) and BESs with applied external energy are microbial electrolysis cells (MECs) (Rozendal et al. 2008). With BESs, several biodegradable organic compounds, which have low theoretical reduction poten-tials (e.g. acetate, glucose), can be utilized as the electron donors for electricity production. Therefore, no or less external energy is required for metal recovery in BESs than in water oxidizing electrochemical systems (Modin et al. 2012, ter Heijne et al. 2010). Besides pure organic compounds, also wastewaters, which are rich in organic compounds, can be used the substrate source (Pandey et al. 2016).
Figure 1: Schematic illustration of (bio)electrochemical system. The substrate (S) is oxidized on the anode electrode electrochemically or with the assist of electroactive microorganisms. The electrons
flow through an electrical circuit to a cathode electrode, where an electron acceptor (A+) is reduced. Ions (e.g. H+, OH-) transfer through the membrane separating the anode and cathode chambers to maintain the charge balance. If the oxidation and reduction reactions occur spontaneously, the system is producing electrical energy. Alternatively, external energy (V) can be applied to realise
the oxidation and reduction reactions
Mining waters usually contain no organic compounds. External organic substrate source would thus be required for the organic bioelectrochemical recovery of metals from mining waters. However, processing of sulphide minerals often releases RISCs to mining waters. If RISCs could be used as the substrate for bioelectrochemical and/or electrochemical recovery of metals, both substrate and electron donor could be found from the same streams. In addition, with the (bio)electrochemical treatment both metals and RISCs could be simultaneously removed from the water streams. Moreover, sulphur-oxidizing microorganisms are often acidophilic, and thus both anode and cathode can be operated in acidic conditions, which lowers the pH gradient over the membrane and thus also the energy requirements of the process. The use of RISCs as the substrate for bioelectrochemical systems, however, has not been previously studied.
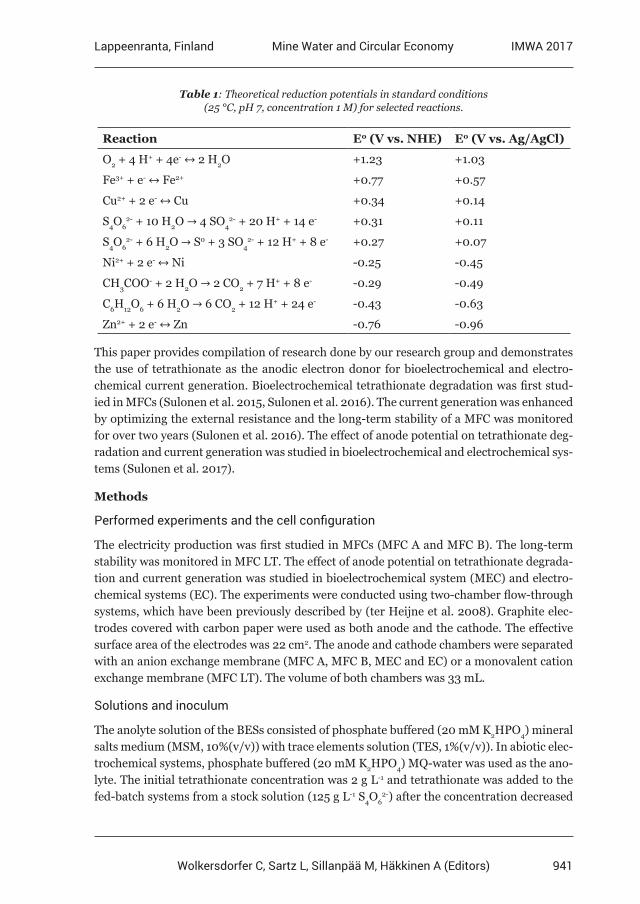
941
Lappeenranta, Finland IMWA 2017Mine Water and Circular Economy
Wolkersdorfer C, Sartz L, Sillanpää M, Häkkinen A (Editors)
Table 1: Theoretical reduction potentials in standard conditions (25 °C, pH 7, concentration 1 M) for selected reactions.
Reaction E0 (V vs. NHE) E0 (V vs. Ag/AgCl)
O2 + 4 H+ + 4e- ↔ 2 H2O +1.23 +1.03
Fe3+ + e- ↔ Fe2+ +0.77 +0.57
Cu2+ + 2 e- ↔ Cu +0.34 +0.14
S4O62- + 10 H2O → 4 SO4
2- + 20 H+ + 14 e- +0.31 +0.11
S4O62- + 6 H2O → S0 + 3 SO4
2- + 12 H+ + 8 e- +0.27 +0.07
Ni2+ + 2 e- ↔ Ni -0.25 -0.45
CH3COO- + 2 H2O → 2 CO2 + 7 H+ + 8 e- -0.29 -0.49
C6H12O6 + 6 H2O → 6 CO2 + 12 H+ + 24 e- -0.43 -0.63
Zn2+ + 2 e- ↔ Zn -0.76 -0.96
This paper provides compilation of research done by our research group and demonstrates the use of tetrathionate as the anodic electron donor for bioelectrochemical and electro-chemical current generation. Bioelectrochemical tetrathionate degradation was first stud-ied in MFCs (Sulonen et al. 2015, Sulonen et al. 2016). The current generation was enhanced by optimizing the external resistance and the long-term stability of a MFC was monitored for over two years (Sulonen et al. 2016). The effect of anode potential on tetrathionate deg-radation and current generation was studied in bioelectrochemical and electrochemical sys-tems (Sulonen et al. 2017).
Methods
Performed experiments and the cell configuration
The electricity production was first studied in MFCs (MFC A and MFC B). The long-term stability was monitored in MFC LT. The effect of anode potential on tetrathionate degrada-tion and current generation was studied in bioelectrochemical system (MEC) and electro-chemical systems (EC). The experiments were conducted using two-chamber flow-through systems, which have been previously described by (ter Heijne et al. 2008). Graphite elec-trodes covered with carbon paper were used as both anode and the cathode. The effective surface area of the electrodes was 22 cm2. The anode and cathode chambers were separated with an anion exchange membrane (MFC A, MFC B, MEC and EC) or a monovalent cation exchange membrane (MFC LT). The volume of both chambers was 33 mL.
Solutions and inoculum
The anolyte solution of the BESs consisted of phosphate buffered (20 mM K2HPO4) mineral salts medium (MSM, 10%(v/v)) with trace elements solution (TES, 1%(v/v)). In abiotic elec-trochemical systems, phosphate buffered (20 mM K2HPO4) MQ-water was used as the ano-lyte. The initial tetrathionate concentration was 2 g L-1 and tetrathionate was added to the fed-batch systems from a stock solution (125 g L-1 S4O6
2-) after the concentration decreased
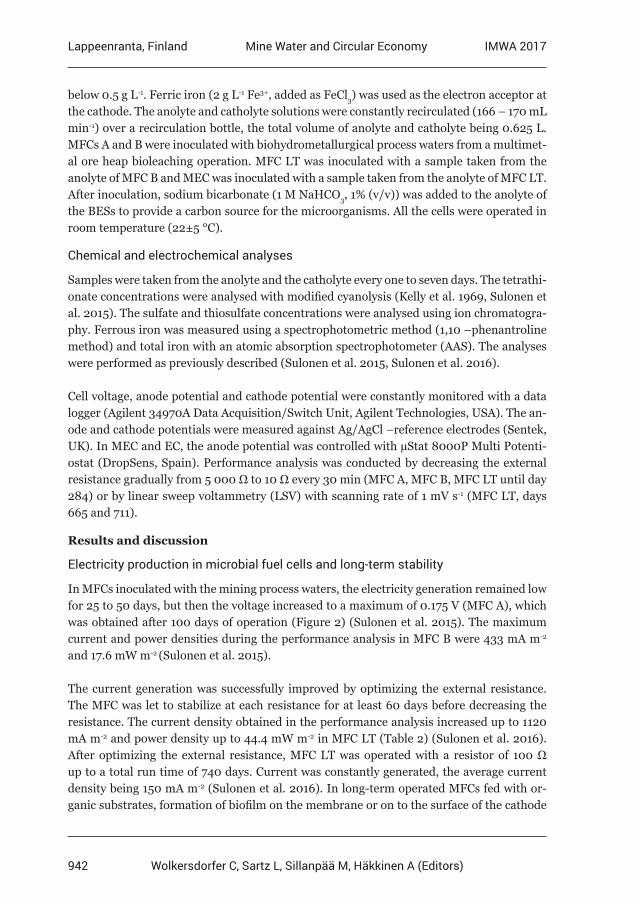
942
Lappeenranta, Finland IMWA 2017Mine Water and Circular Economy
Wolkersdorfer C, Sartz L, Sillanpää M, Häkkinen A (Editors)
below 0.5 g L-1. Ferric iron (2 g L-1 Fe3+, added as FeCl3) was used as the electron acceptor at the cathode. The anolyte and catholyte solutions were constantly recirculated (166 – 170 mL min-1) over a recirculation bottle, the total volume of anolyte and catholyte being 0.625 L. MFCs A and B were inoculated with biohydrometallurgical process waters from a multimet-al ore heap bioleaching operation. MFC LT was inoculated with a sample taken from the anolyte of MFC B and MEC was inoculated with a sample taken from the anolyte of MFC LT. After inoculation, sodium bicarbonate (1 M NaHCO3, 1% (v/v)) was added to the anolyte of the BESs to provide a carbon source for the microorganisms. All the cells were operated in room temperature (22±5 °C).
Chemical and electrochemical analyses
Samples were taken from the anolyte and the catholyte every one to seven days. The tetrathi-onate concentrations were analysed with modified cyanolysis (Kelly et al. 1969, Sulonen et al. 2015). The sulfate and thiosulfate concentrations were analysed using ion chromatogra-phy. Ferrous iron was measured using a spectrophotometric method (1,10 –phenantroline method) and total iron with an atomic absorption spectrophotometer (AAS). The analyses were performed as previously described (Sulonen et al. 2015, Sulonen et al. 2016).
Cell voltage, anode potential and cathode potential were constantly monitored with a data logger (Agilent 34970A Data Acquisition/Switch Unit, Agilent Technologies, USA). The an-ode and cathode potentials were measured against Ag/AgCl –reference electrodes (Sentek, UK). In MEC and EC, the anode potential was controlled with µStat 8000P Multi Potenti-ostat (DropSens, Spain). Performance analysis was conducted by decreasing the external resistance gradually from 5 000 Ω to 10 Ω every 30 min (MFC A, MFC B, MFC LT until day 284) or by linear sweep voltammetry (LSV) with scanning rate of 1 mV s-1 (MFC LT, days 665 and 711).
Results and discussion
Electricity production in microbial fuel cells and long-term stability
In MFCs inoculated with the mining process waters, the electricity generation remained low for 25 to 50 days, but then the voltage increased to a maximum of 0.175 V (MFC A), which was obtained after 100 days of operation (Figure 2) (Sulonen et al. 2015). The maximum current and power densities during the performance analysis in MFC B were 433 mA m-2 and 17.6 mW m-2 (Sulonen et al. 2015).
The current generation was successfully improved by optimizing the external resistance. The MFC was let to stabilize at each resistance for at least 60 days before decreasing the resistance. The current density obtained in the performance analysis increased up to 1120 mA m-2 and power density up to 44.4 mW m-2 in MFC LT (Table 2) (Sulonen et al. 2016). After optimizing the external resistance, MFC LT was operated with a resistor of 100 Ω up to a total run time of 740 days. Current was constantly generated, the average current density being 150 mA m-2 (Sulonen et al. 2016). In long-term operated MFCs fed with or-ganic substrates, formation of biofilm on the membrane or on to the surface of the cathode
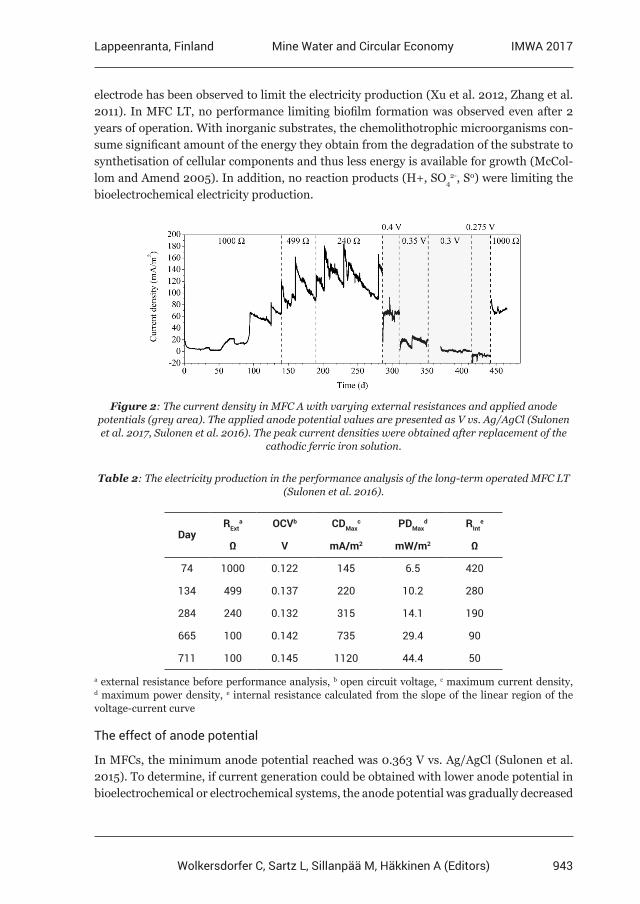
943
Lappeenranta, Finland IMWA 2017Mine Water and Circular Economy
Wolkersdorfer C, Sartz L, Sillanpää M, Häkkinen A (Editors)
electrode has been observed to limit the electricity production (Xu et al. 2012, Zhang et al. 2011). In MFC LT, no performance limiting biofilm formation was observed even after 2 years of operation. With inorganic substrates, the chemolithotrophic microorganisms con-sume significant amount of the energy they obtain from the degradation of the substrate to synthetisation of cellular components and thus less energy is available for growth (McCol-lom and Amend 2005). In addition, no reaction products (H+, SO4
2-, S0) were limiting the bioelectrochemical electricity production.
Figure 2: The current density in MFC A with varying external resistances and applied anode potentials (grey area). The applied anode potential values are presented as V vs. Ag/AgCl (Sulonen et al. 2017, Sulonen et al. 2016). The peak current densities were obtained after replacement of the
cathodic ferric iron solution.
Table 2: The electricity production in the performance analysis of the long-term operated MFC LT (Sulonen et al. 2016).
DayRExt
a OCVb CDMaxc PDMax
d RInte
Ω V mA/m2 mW/m2 Ω
74 1000 0.122 145 6.5 420
134 499 0.137 220 10.2 280
284 240 0.132 315 14.1 190
665 100 0.142 735 29.4 90
711 100 0.145 1120 44.4 50
a external resistance before performance analysis, b open circuit voltage, c maximum current density, d maximum power density, e internal resistance calculated from the slope of the linear region of the voltage-current curve
The effect of anode potential
In MFCs, the minimum anode potential reached was 0.363 V vs. Ag/AgCl (Sulonen et al. 2015). To determine, if current generation could be obtained with lower anode potential in bioelectrochemical or electrochemical systems, the anode potential was gradually decreased
944
Lappeenranta, Finland IMWA 2017Mine Water and Circular Economy
Wolkersdorfer C, Sartz L, Sillanpää M, Häkkinen A (Editors)
from 0.4 V vs. Ag/AgCl to 0.275 V vs. Ag/AgCl (Sulonen et al. 2017). Electricity was generat-ed in MEC with anode potential of 0.3 V vs. Ag/AgCl and above. In abiotic electrochemical systems, anode potential of 0.5 V vs. Ag/AgCl or above was required for current generation. Both tetrathionate-fed systems produced higher current density than the water oxidizing control reactor.
Tetrathionate degradation
In bioelectrochemical systems, the reaction products of tetrathionate degradation were sul-phate and elemental sulphur. The tetrathionate was, therefore, presumed to be degraded via disproportionation following Equation 1.
In electrochemical systems, the only observed reaction product was sulphate, suggesting that tetrathionate was degraded following Equation 2.
Higher tetrathionate degradation rates were obtained in the bioelectrochemical system (110 – 240 mg L-1 d-1) than in the abiotic electrochemical system (15 – 35 mg L-1 d-1). The coulom-bic efficiency – calculated as the relation of the electric charge generated in coulombs to the electric charge theoretically releasable from the degraded tetrathionate – remained higher in the electrochemical system (≤48%) than in the bioelectrochemical system (≤10%). The chemical energy was thus converted to electrical energy more efficiently in the electrochem-ical system than in the bioelectrochemical systems.
Microbial communities
Biometallurgical mining waters often contain several sulphur- and iron-oxidizing micro-organisms (Halinen et al. 2012, Sulonen et al. 2015). With mining process waters as the inoculum, the current generation improved after 100 days of operation. When the anolyte of a previously operated MFC was used as the inoculum, the electricity production started after one to 20 days of operation. The mining waters thus contained tetrathionate degrading microorganisms capable of electricity production. After enrichment, the microorganisms were able to start the electricity production quite rapidly.
The microbial communities were analysed from samples taken from the anolyte solution and from the surface of the anode electrode. The dominant genera in the anodic microbial communities inoculated with mining process waters were Acidithiobacillus sp. and Ferro-plasma sp (Sulonen et al. 2015). In the long-term operated MFC LT, which was inoculat-ed with the anolyte of MFC B, Acidithiobacillus was observed to dominate the microbial culture throughout the experiment (Sulonen et al. 2016). The low microbial variation pre-
5
𝑆𝑆𝑆𝑆4𝑂𝑂𝑂𝑂62− + 6 𝐻𝐻𝐻𝐻2𝑂𝑂𝑂𝑂 → 3 𝑆𝑆𝑆𝑆𝑂𝑂𝑂𝑂42− + 𝑆𝑆𝑆𝑆0 + 12 𝐻𝐻𝐻𝐻+ + 14 𝑒𝑒𝑒𝑒− (1)In electrochemical systems, the only observed reaction product was sulphate, suggesting that tetrathionate was degraded following Equation 2.
𝑆𝑆𝑆𝑆4𝑂𝑂𝑂𝑂62− + 10 𝐻𝐻𝐻𝐻2𝑂𝑂𝑂𝑂 → 4 𝑆𝑆𝑆𝑆𝑂𝑂𝑂𝑂42− + 20 𝐻𝐻𝐻𝐻+ + 14 𝑒𝑒𝑒𝑒− (2)Higher tetrathionate degradation rates were obtained in the bioelectrochemical system (110 – 240 mg L-1 d-1) than in the abiotic electrochemical system (15 – 35 mg L-1 d-1). The coulombic efficiency – calculated as the relation of the electric charge generated in coulombs to the electric charge theoretically releasable from the degraded tetrathionate – remained higher in the electrochemical system (≤48%) than in the bioelectrochemical system (≤10%). The chemical energy was thus converted to electrical energy more efficiently in the electrochemical system than in the bioelectrochemical systems.
Microbial communities
Biometallurgical mining waters often contain several sulphur- and iron-oxidizing microorganisms (Halinen et al. 2012, Sulonen et al. 2015). With mining process waters as the inoculum, the current generation improved after 100 days of operation. When the anolyte of a previously operated MFC was used as the inoculum, the electricity production started after one to 20 days of operation. The mining waters thus contained tetrathionate degrading microorganisms capable of electricity production. After enrichment, the microorganisms were able to start the electricity production quite rapidly.
The microbial communities were analysed from samples taken from the anolyte solution and from the surface of the anode electrode. The dominant genera in the anodic microbial communities inoculated with mining process waters were Acidithiobacillus sp. and Ferroplasma sp (Sulonen et al. 2015). In the long-term operated MFC LT, which was inoculated with the anolyte of MFC B, Acidithiobacillus was observed to dominate the microbial culture throughout the experiment (Sulonen et al. 2016). The low microbial variation presumably results from the extreme operation conditions; only sulphur-oxidizing mesophilic chemolithotrophs can grow in the used operational conditions (22±5 °C, pH ≤ 2.5, inorganic substrate).
Both Acidithiobacillus and Ferroplasma sp. are often found from mining environments. Acidithiobacillus sp. are acidophilic bacteria, some species of which are known to degrade sulphur compounds (Bobadilla Fazzini et al. 2013, Mangold et al. 2011, Osorio et al. 2013). Ferroplasma sp. are acidophilic archaea and the species have not been reported to degrade sulphur compounds (Dopson et al. 2004, Golyshina et al. 2000). Ferroplasma sp. was thus presumably growing by utilizing the excretes of other microorganisms as the source of energy.
Conclusions With (bio)electrochemical systems, the chemical energy stored in acidic mining waters can be converted to electrical energy while simultaneously removing reduced inorganic sulphur compounds from the mining waters. With bioelectrochemical systems, tetrathionate is degraded and electrical current is generated spontaneously with ferric iron as the cathodic electron acceptor. Biofouling or reaction product inhibition were not observed to limit the electricity production even after two years of operation. With electrochemical systems, an external power source is required and the tetrathionate was degraded with lower rate than in the bioelectrochemical systems, but the chemical energy was converted to electrical energy more efficiently. Tetrathionate is thus a promising substrate for both bioelectrochemical and electrochemical metal recovery.
Acknowledgements The research leading to these results has received funding from the European Union Seventh Framework Programme (FP7/2012-2016) under grant agreement n° 282970 (BioElectroMET).
945
Lappeenranta, Finland IMWA 2017Mine Water and Circular Economy
Wolkersdorfer C, Sartz L, Sillanpää M, Häkkinen A (Editors)
sumably results from the extreme operation conditions; only sulphur-oxidizing mesophilic chemolithotrophs can grow in the used operational conditions (22±5 °C, pH ≤ 2.5, inorgan-ic substrate).
Both Acidithiobacillus and Ferroplasma sp. are often found from mining environments. Acidithiobacillus sp. are acidophilic bacteria, some species of which are known to de-grade sulphur compounds (Bobadilla Fazzini et al. 2013, Mangold et al. 2011, Osorio et al. 2013). Ferroplasma sp. are acidophilic archaea and the species have not been reported to degrade sulphur compounds (Dopson et al. 2004, Golyshina et al. 2000). Ferroplasma sp. was thus presumably growing by utilizing the excretes of other microorganisms as the source of energy.
Conclusions
With (bio)electrochemical systems, the chemical energy stored in acidic mining waters can be converted to electrical energy while simultaneously removing reduced inorganic sulphur compounds from the mining waters. With bioelectrochemical systems, tetrathionate is de-graded and electrical current is generated spontaneously with ferric iron as the cathodic electron acceptor. Biofouling or reaction product inhibition were not observed to limit the electricity production even after two years of operation. With electrochemical systems, an external power source is required and the tetrathionate was degraded with lower rate than in the bioelectrochemical systems, but the chemical energy was converted to electrical ener-gy more efficiently. Tetrathionate is thus a promising substrate for both bioelectrochemical and electrochemical metal recovery.
Acknowledgements
The research leading to these results has received funding from the European Union Seventh Framework Programme (FP7/2012-2016) under grant agreement n° 282970 (BioElectroMET).
References
Bobadilla Fazzini RA, Cortés MP, Padilla L, Maturana D, Budinich M, Maass A, Parada P (2013) Stoichiometric modeling of oxidation of reduced inorganic sulfur compounds (Riscs) in Acidithiobacillus thiooxidans. Biotechnol Bioeng 110(8):2242-2251 Dopson M, Baker-Austin C, Hind A, Bowman JP, Bond PL (2004) Characterization of Ferroplasma isolates and Ferroplasma acidarmanus sp. nov., extreme acidophiles from Acid Mine Drainage and industrial bioleaching environments. Appl Environ Microbiol 70(4):2079- 2088 Golyshina OV, Pivovarova TA, Karavaiko GI, Kondratéva TF, Moore ER, Abraham WR, Lünsdorf H, Timmis KN, Yakimov MM, Golyshin PN (2000) Ferroplasma acidiphilum gen. nov., sp. nov., an acidophilic, autotrophic, ferrous-iron-oxidizing, cell-wall-lacking, mesophilic member of the Ferroplasmaceae fam. nov., comprising a distinct lineage of the Archaea. Int J Syst Evol Microbiol 50(3):997-1006 Halinen A, Beecroft NJ, Määttä K, Nurmi P, Laukkanen K, Kaksonen AH, Riekkola-Vanhanen M, Puhakka JA (2012) Microbial community dynamics during a demonstration-scale bioheap leaching operation. Hydrometallurgy 125–126:34-41 Johnson DB, Hallberg KB (2008) Carbon, iron and sulfur metabolism in acidophilic micro-organisms. Adv Microb Physiol 54:201-255
946
Lappeenranta, Finland IMWA 2017Mine Water and Circular Economy
Wolkersdorfer C, Sartz L, Sillanpää M, Häkkinen A (Editors)
Kelly DP, Chambers LA, Trudinger PA (1969) Cyanolysis and spectrophotometric estimation of trithionate in mixture with thiosulfate and tetrathionate. Anal Chem 41(7):898-901 Kumar R, Singh L, Wahid ZA, Din MFM (2015) Exoelectrogens in microbial fuel cells toward bioelectricity generation: a review. Int J Energy Res 39(8):1048-1067 Mangold S, Valdes J, Holmes DS, Dopson M (2011) Sulfur metabolism in the extreme acidophile Acidithiobacillus caldus. Front Microbiol 2:7-24 McCollom T, Amend J (2005) A thermodynamic assessment of energy requirements for biomass synthesis by chemolithoautotrophic micro-organisms in oxic and anoxic environments. Geobiology 3(2):135-144 Modin O, Wang X, Wu X, Rauch S, Fedje KK (2012) Bioelectrochemical recovery of Cu, Pb, Cd, and Zn from dilute solutions. J Hazard Mater 235–236:291-297 Nies DH (1999) Microbial heavy-metal resistance. Appl Microbiol Biotechnol 51(6):730-750 Osorio H, Mangold S, Denis Y, Ñancucheo I, Esparza M, Johnson DB, Bonnefoy V, Dopson M, Holmes DS (2013) Anaerobic sulfur metabolism coupled to dissimilatory iron reduction in the extremophile Acidithiobacillus ferrooxidans. Appl Environ Microbiol 79(7):2172-2181 Pandey P, Shinde VN, Deopurkar RL, Kale SP, Patil SA, Pant D (2016) Recent advances in the use of different substrates in microbial fuel cells toward wastewater treatment and simultaneous energy recovery. Appl Energy 168:706-723 Rozendal RA, Hamelers HVM, Rabaey K, Keller J, Buisman CJN (2008) Towards practical implementation of bioelectrochemical wastewater treatment. Trends Biotechnol 26(8):450- 459 Sulonen ML, Lakaniemi A, Kokko ME, Puhakka JA (2017) The effect of anode potential on bioelectrochemical and electrochemical tetrathionate degradation. Bioresour Technol 226:173-180 Sulonen MLK, Lakaniemi A, Kokko ME, Puhakka JA (2016) Long-term stability of bioelectricity generation coupled with tetrathionate disproportionation. Bioresour Technol 216:876-882 Sulonen MLK, Kokko ME, Lakaniemi A, Puhakka JA (2015) Electricity generation from tetrathionate in microbial fuel cells by acidophiles. J Hazard Mater 284:182-189 ter Heijne A, Liu F, van der Weijden R, Weijma J, Buisman CJN, Hamelers HVM (2010) Copper recovery combined with electricity production in a Microbial Fuel Cell. Environ Sci Technol 44(11):4376-4381 ter Heijne A, Hamelers HVM, Saakes M, Buisman CJN (2008) Performance of non-porous graphite and titanium-based anodes in microbial fuel cells. Electrochim Acta 53(18):5697-5703 Xu J, Sheng G, Luo H, Li W, Wang L, Yu H (2012) Fouling of proton exchange membrane (PEM) deteriorates the performance of microbial fuel cell. Water Res 46(6):1817-1824 Zhang F, Pant D, Logan BE (2011) Long-term performance of activated carbon air cathodes with different diffusion layer porosities in microbial fuel cells. Biosens Bioelectron 30(1):49-55
947
Lappeenranta, Finland IMWA 2017Mine Water and Circular Economy
Wolkersdorfer C, Sartz L, Sillanpää M, Häkkinen A (Editors)
A Comparative Study on the Rare Earth Elements Recovery of Cross-linked Cellulose Adsorbents and
Capacitive Deionization with Cellulose Derived Carbon as Electrode Materials
Feiping Zhao, Mika Sillanpää,
Laboratory of Green Chemistry, School of Engineering Science, Lappeenranta University of Technology, Sammonkatu 12, FI-50130 Mikkeli, Finland
Emails: [email protected]; [email protected]
Abstract The increasing demand for Rare Earth Elementals (REEs) due to their exponential use in various applications has stimulated research on the development of an efficient technology for the separation and recovery of REEs. Adsorption is one of the best and most typical methods, while capacitive deionization (CDI) is increasingly being considered as a promising solution for desalination and ions recovery. Cellulose, the most abundant and low-cost polysaccharides in the nature, has attracted great attention for its potential applications in adsorbent and energy storage fields, due to its excellent mechanical, abundant –OH functional groups, as well as the outstanding electronic and thermal properties after carbonization. With an objective to develop a cost-efficient and exceptional CDI electrode material with high specific surface area, low electrical resistance and durability, in this work, we developed a novel cellulose derived carbon electrode, and it was further applied for REEs recovery. The material exhibits the above-mentioned characteristics along with superior adsorption capability. As a comparison, a cellulose adsorbent was synthesized by crosslinking cellulose nanocrystal (CNC) with polyethylenimine (PEI). The adsorbent and electrode materials were characterized by Fourier Transform Infrared (FT-IR) spectroscopy, elemental analysis, Brunauer–Emmett–Teller (BET) analysis, Scanning Electron Microscope (SEM), Transmission Electron Microscopy (TEM). The electrochemical capacitive behavior of the electrode material was determined by cyclic voltammetry (CV). Their adsorption behaviors of the cellulose adsorbent for the removal of REEs by varying experimental conditions were investigated in bath. The CDI recovery performance was also studied using a laboratory CDI module, under varying voltage and REE concentrations. The REEs uptake ability, and the kinetics and isotherms of the both methods for REEs uptake were further compared. The REEs uptake mechanisms of the both methods were studied via FTIR and XPS as well. Such a comparison is not only useful for further understanding the fundamental of the traditional adsorption and electrosorption, but also for promoting the CDI application in water treatment.
Introduction
Rare Earth Elementals (REEs) have been applied in various advanced applications, includ-ing lasers, optics, super-magnets, catalysts, and batteries [1-3]. However, as the name sug-gests, the mining storage of REE is very limited and dispersed. The exponential use of REEs has skyrocketed the prices in the past decades due to the limited supply for “geopolitical” reasons. Therefore, the separation and recovery of REEs from residues and wastes would be crucial for both economical and sustainable reasons [4, 5]. In particular, the reproduction of REEs from diluted aqueous streams such as secondary resources and industrial wastewater has attracted great interest.
A number of methods have been employed for the recovery of REEs from aqueous solution, such as precipitation[6], solvent extraction [2], and ion-exchange [7]. However, most of
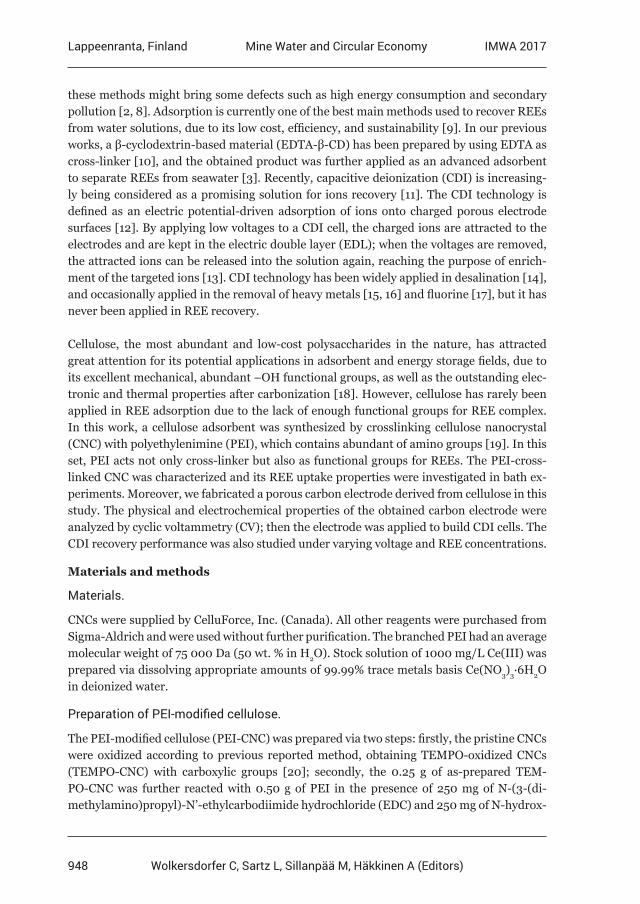
948
Lappeenranta, Finland IMWA 2017Mine Water and Circular Economy
Wolkersdorfer C, Sartz L, Sillanpää M, Häkkinen A (Editors)
these methods might bring some defects such as high energy consumption and secondary pollution [2, 8]. Adsorption is currently one of the best main methods used to recover REEs from water solutions, due to its low cost, efficiency, and sustainability [9]. In our previous works, a β-cyclodextrin-based material (EDTA-β-CD) has been prepared by using EDTA as cross-linker [10], and the obtained product was further applied as an advanced adsorbent to separate REEs from seawater [3]. Recently, capacitive deionization (CDI) is increasing-ly being considered as a promising solution for ions recovery [11]. The CDI technology is defined as an electric potential-driven adsorption of ions onto charged porous electrode surfaces [12]. By applying low voltages to a CDI cell, the charged ions are attracted to the electrodes and are kept in the electric double layer (EDL); when the voltages are removed, the attracted ions can be released into the solution again, reaching the purpose of enrich-ment of the targeted ions [13]. CDI technology has been widely applied in desalination [14], and occasionally applied in the removal of heavy metals [15, 16] and fluorine [17], but it has never been applied in REE recovery.
Cellulose, the most abundant and low-cost polysaccharides in the nature, has attracted great attention for its potential applications in adsorbent and energy storage fields, due to its excellent mechanical, abundant –OH functional groups, as well as the outstanding elec-tronic and thermal properties after carbonization [18]. However, cellulose has rarely been applied in REE adsorption due to the lack of enough functional groups for REE complex. In this work, a cellulose adsorbent was synthesized by crosslinking cellulose nanocrystal (CNC) with polyethylenimine (PEI), which contains abundant of amino groups [19]. In this set, PEI acts not only cross-linker but also as functional groups for REEs. The PEI-cross-linked CNC was characterized and its REE uptake properties were investigated in bath ex-periments. Moreover, we fabricated a porous carbon electrode derived from cellulose in this study. The physical and electrochemical properties of the obtained carbon electrode were analyzed by cyclic voltammetry (CV); then the electrode was applied to build CDI cells. The CDI recovery performance was also studied under varying voltage and REE concentrations.
Materials and methods
Materials.
CNCs were supplied by CelluForce, Inc. (Canada). All other reagents were purchased from Sigma-Aldrich and were used without further purification. The branched PEI had an average molecular weight of 75 000 Da (50 wt. % in H2O). Stock solution of 1000 mg/L Ce(III) was prepared via dissolving appropriate amounts of 99.99% trace metals basis Ce(NO3)3·6H2O in deionized water.
Preparation of PEI-modified cellulose.
The PEI-modified cellulose (PEI-CNC) was prepared via two steps: firstly, the pristine CNCs were oxidized according to previous reported method, obtaining TEMPO-oxidized CNCs (TEMPO-CNC) with carboxylic groups [20]; secondly, the 0.25 g of as-prepared TEM-PO-CNC was further reacted with 0.50 g of PEI in the presence of 250 mg of N-(3-(di-methylamino)propyl)-N’-ethylcarbodiimide hydrochloride (EDC) and 250 mg of N-hydrox-
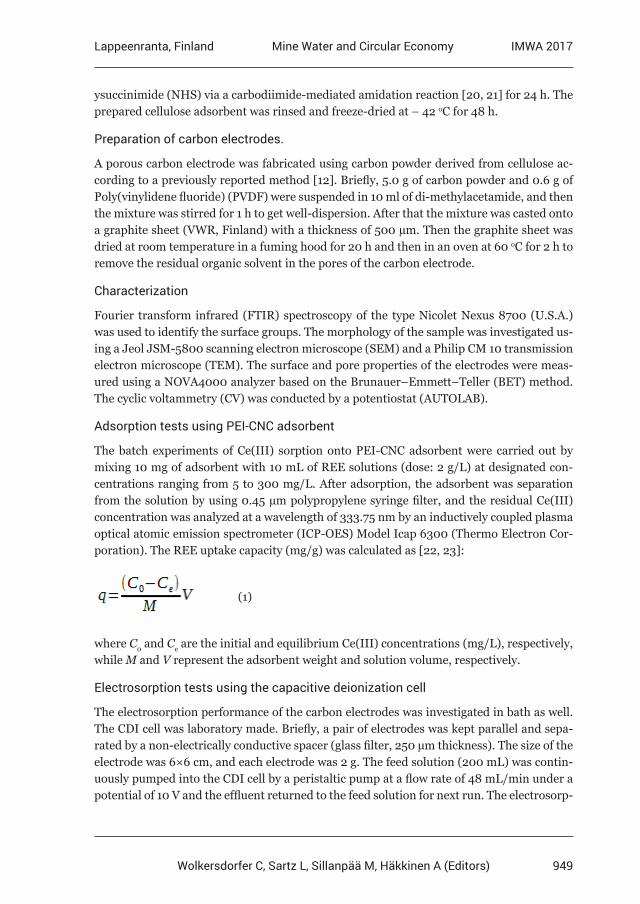
949
Lappeenranta, Finland IMWA 2017Mine Water and Circular Economy
Wolkersdorfer C, Sartz L, Sillanpää M, Häkkinen A (Editors)
ysuccinimide (NHS) via a carbodiimide-mediated amidation reaction [20, 21] for 24 h. The prepared cellulose adsorbent was rinsed and freeze-dried at – 42 oC for 48 h.
Preparation of carbon electrodes.
A porous carbon electrode was fabricated using carbon powder derived from cellulose ac-cording to a previously reported method [12]. Briefly, 5.0 g of carbon powder and 0.6 g of Poly(vinylidene fluoride) (PVDF) were suspended in 10 ml of di-methylacetamide, and then the mixture was stirred for 1 h to get well-dispersion. After that the mixture was casted onto a graphite sheet (VWR, Finland) with a thickness of 500 µm. Then the graphite sheet was dried at room temperature in a fuming hood for 20 h and then in an oven at 60 oC for 2 h to remove the residual organic solvent in the pores of the carbon electrode.
Characterization
Fourier transform infrared (FTIR) spectroscopy of the type Nicolet Nexus 8700 (U.S.A.) was used to identify the surface groups. The morphology of the sample was investigated us-ing a Jeol JSM-5800 scanning electron microscope (SEM) and a Philip CM 10 transmission electron microscope (TEM). The surface and pore properties of the electrodes were meas-ured using a NOVA4000 analyzer based on the Brunauer–Emmett–Teller (BET) method. The cyclic voltammetry (CV) was conducted by a potentiostat (AUTOLAB).
Adsorption tests using PEI-CNC adsorbent
The batch experiments of Ce(III) sorption onto PEI-CNC adsorbent were carried out by mixing 10 mg of adsorbent with 10 mL of REE solutions (dose: 2 g/L) at designated con-centrations ranging from 5 to 300 mg/L. After adsorption, the adsorbent was separation from the solution by using 0.45 µm polypropylene syringe filter, and the residual Ce(III) concentration was analyzed at a wavelength of 333.75 nm by an inductively coupled plasma optical atomic emission spectrometer (ICP-OES) Model Icap 6300 (Thermo Electron Cor-poration). The REE uptake capacity (mg/g) was calculated as [22, 23]:
(1)
where C0 and Ce are the initial and equilibrium Ce(III) concentrations (mg/L), respectively, while M and V represent the adsorbent weight and solution volume, respectively.
Electrosorption tests using the capacitive deionization cell
The electrosorption performance of the carbon electrodes was investigated in bath as well. The CDI cell was laboratory made. Briefly, a pair of electrodes was kept parallel and sepa-rated by a non-electrically conductive spacer (glass filter, 250 µm thickness). The size of the electrode was 6×6 cm, and each electrode was 2 g. The feed solution (200 mL) was contin-uously pumped into the CDI cell by a peristaltic pump at a flow rate of 48 mL/min under a potential of 10 V and the effluent returned to the feed solution for next run. The electrosorp-
950
Lappeenranta, Finland IMWA 2017Mine Water and Circular Economy
Wolkersdorfer C, Sartz L, Sillanpää M, Häkkinen A (Editors)
tion was repeated for 16 times. The Ce(III) concentrations before and after electrosorption using CDI were also analyzed by ICP-OES and conductivity meter (EC-500, SUNTEX).
Results and discussion
Characterization
The presence of additional functional groups on the surface of the cross-linked cellulose was studied by FT-IR. As shown in Figure 1a, the characteristic vibration peaks of the amino and amide groups were observed at 1642, 1561 and 1452 cm-1. The SEM image (Figure 1b) shows the pore structure and the pore wall could be assign to the cross-linked cellulose. The optical image in Figure 1c (Figure 1c) suggests the light weight of the material. In the TEM image (Figure 1d), it is easy to find the aggregation of the cellulose nanocrystals after cross-linking with PEI. This is beneficial for the practical application in water treatment.T
Figure 1. (a) FT-IR spectrum, (b) SEM, (c) optical image, and (d) TEM of the obtained cross-linked cellulose.
As shown in Figure 2a, the prepared carbon electrodes have a smooth surface and the car-bon were well-spread on the surface. Importantly, the carbon powders were binded firmly and no fracture was observed. Figure 2b shows the practical CDI cell and its inner structure
951
Lappeenranta, Finland IMWA 2017Mine Water and Circular Economy
Wolkersdorfer C, Sartz L, Sillanpää M, Häkkinen A (Editors)
was illustrated in Figure 2d. The parallel electrodes were separated by a 250 µm thickness of spacer and graphite sheets act as the current collector. Whole the CDI system was sealed in a Teflon house (10×10 cm). Figure 2c shows the CV curves of carbon electrode after three scans and the specific capacity was 86 F/g. All the CV curves were asymmetric, with two small peaks at 5.5 and 8.0 V. The specific surface area and the total pore volume of the ob-tained carbon electrodes were 39.48 m2/g and 0.117 cm3/g, respectively (Table 1). The good surface and pore properties resulted in the high specific capacity.
Figure 2. (a) the as-prepared carbon electrodes; (b) CDI cell; (c) Cyclic voltammograms of carbon electrode (blue, first scan; red, second scan; green, third scan); (d) schematic diagram of CDI cell.
Table 1. Surface and pore parameters of cellulose-derived carbon electrodes from nitrogen isotherms at -196 oC.
Parameter Value
SBET (m2/g) 39.48
Vtotal (cm3/g) 0.117
Dpore size (nm) 16.386
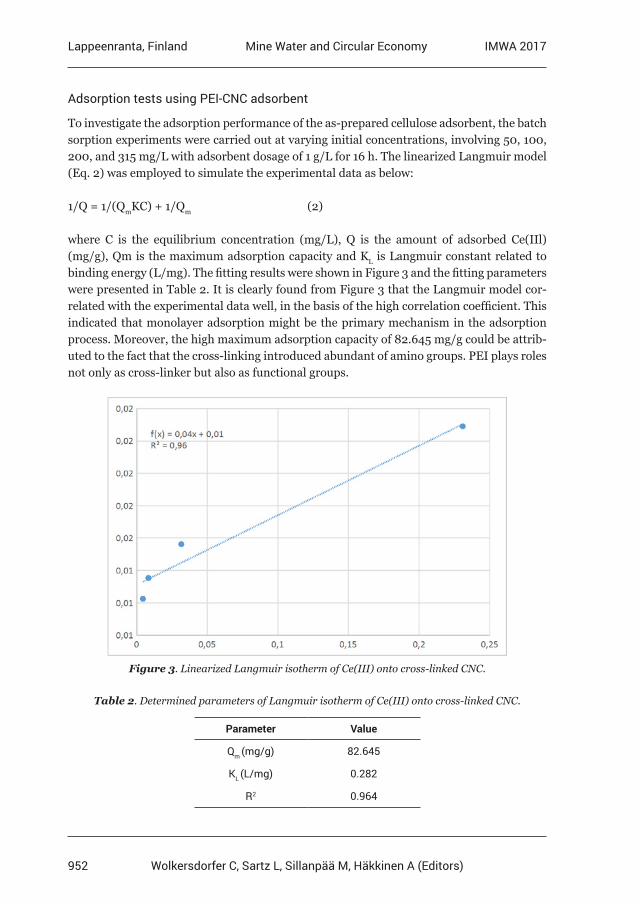
952
Lappeenranta, Finland IMWA 2017Mine Water and Circular Economy
Wolkersdorfer C, Sartz L, Sillanpää M, Häkkinen A (Editors)
Adsorption tests using PEI-CNC adsorbent
To investigate the adsorption performance of the as-prepared cellulose adsorbent, the batch sorption experiments were carried out at varying initial concentrations, involving 50, 100, 200, and 315 mg/L with adsorbent dosage of 1 g/L for 16 h. The linearized Langmuir model (Eq. 2) was employed to simulate the experimental data as below:
1/Q = 1/(QmKC) + 1/Qm (2)
where C is the equilibrium concentration (mg/L), Q is the amount of adsorbed Ce(IIl) (mg/g), Qm is the maximum adsorption capacity and KL is Langmuir constant related to binding energy (L/mg). The fitting results were shown in Figure 3 and the fitting parameters were presented in Table 2. It is clearly found from Figure 3 that the Langmuir model cor-related with the experimental data well, in the basis of the high correlation coefficient. This indicated that monolayer adsorption might be the primary mechanism in the adsorption process. Moreover, the high maximum adsorption capacity of 82.645 mg/g could be attrib-uted to the fact that the cross-linking introduced abundant of amino groups. PEI plays roles not only as cross-linker but also as functional groups.
Figure 3. Linearized Langmuir isotherm of Ce(III) onto cross-linked CNC.
Table 2. Determined parameters of Langmuir isotherm of Ce(III) onto cross-linked CNC.
Parameter Value
Qm (mg/g) 82.645
KL (L/mg) 0.282
R2 0.964
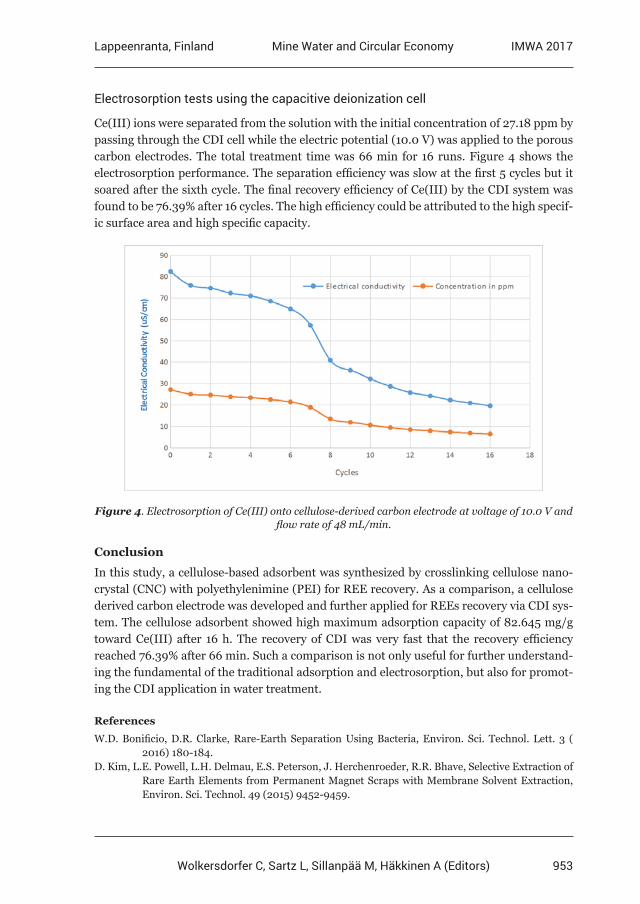
953
Lappeenranta, Finland IMWA 2017Mine Water and Circular Economy
Wolkersdorfer C, Sartz L, Sillanpää M, Häkkinen A (Editors)
Electrosorption tests using the capacitive deionization cell
Ce(III) ions were separated from the solution with the initial concentration of 27.18 ppm by passing through the CDI cell while the electric potential (10.0 V) was applied to the porous carbon electrodes. The total treatment time was 66 min for 16 runs. Figure 4 shows the electrosorption performance. The separation efficiency was slow at the first 5 cycles but it soared after the sixth cycle. The final recovery efficiency of Ce(III) by the CDI system was found to be 76.39% after 16 cycles. The high efficiency could be attributed to the high specif-ic surface area and high specific capacity.
Figure 4. Electrosorption of Ce(III) onto cellulose-derived carbon electrode at voltage of 10.0 V and flow rate of 48 mL/min.
Conclusion
In this study, a cellulose-based adsorbent was synthesized by crosslinking cellulose nano-crystal (CNC) with polyethylenimine (PEI) for REE recovery. As a comparison, a cellulose derived carbon electrode was developed and further applied for REEs recovery via CDI sys-tem. The cellulose adsorbent showed high maximum adsorption capacity of 82.645 mg/g toward Ce(III) after 16 h. The recovery of CDI was very fast that the recovery efficiency reached 76.39% after 66 min. Such a comparison is not only useful for further understand-ing the fundamental of the traditional adsorption and electrosorption, but also for promot-ing the CDI application in water treatment.
References
W.D. Bonificio, D.R. Clarke, Rare-Earth Separation Using Bacteria, Environ. Sci. Technol. Lett. 3 ( 2016) 180-184.D. Kim, L.E. Powell, L.H. Delmau, E.S. Peterson, J. Herchenroeder, R.R. Bhave, Selective Extraction of Rare Earth Elements from Permanent Magnet Scraps with Membrane Solvent Extraction, Environ. Sci. Technol. 49 (2015) 9452-9459.
954
Lappeenranta, Finland IMWA 2017Mine Water and Circular Economy
Wolkersdorfer C, Sartz L, Sillanpää M, Häkkinen A (Editors)
F. Zhao, E. Repo, Y. Meng, X. Wang, D. Yin, M. Sillanpää, An EDTA-β-cyclodextrin material for the adsorption of rare earth elements and its application in preconcentration of rare earth elements in seawater, J. Colloid Interface Sci. 465 (2016) 215-224.C. Li, Z. Zhuang, F. Huang, Z. Wu, Y. Hong, Z. Lin, Recycling rare earth elements from industrial wastewater with flowerlike nano-Mg(OH)(2), ACS applied materials & interfaces 5 (2013) 9719-9725.H. Moriwaki, R. Masuda, Y. Yamazaki, K. Horiuchi, M. Miyashita, J. Kasahara, T. Tanaka, H. Yamamoto, Application of Freeze-Dried Powders of Genetically Engineered Microbial Strains as Adsorbents for Rare Earth Metal Ions, ACS applied materials & interfaces 8 (2016) 26524- 26531.D. Dupont, K. Binnemans, Rare-earth recycling using a functionalized ionic liquid for the selective dissolution and revalorization of Y2O3: Eu3+ from lamp phosphor waste, Green Chem. 17 (2015) 856-868.G. Hong, M. Wang, X. Li, L. Shen, X. Wang, M. Zhu, B.S. Hsiao, Micro-nano structure nanofibrous p-sulfonatocalix[8]arene complex membranes for highly efficient and selective adsorption of lanthanum(III) ions in aqueous solution, RSC Adv. 5 (2015) 21178-21188.J.H. Rademaker, R. Kleijn, Y. Yang, Recycling as a Strategy against Rare Earth Element Criticality: A Systemic Evaluation of the Potential Yield of NdFeB Magnet Recycling, Environ. Sci. Technol. 47 (2013) 10129-10136.E. Repo, J.K. Warchoł, A. Bhatnagar, A. Mudhoo, M. Sillanpää, Aminopolycarboxylic acid functionalized adsorbents for heavy metals removal from water, Water Res. 47 (2013) 4812-4832.F. Zhao, E. Repo, D. Yin, Y. Meng, S. Jafari, M. Sillanpaa, EDTA-Cross-Linked beta-Cyclodextrin: An Environmentally Friendly Bifunctional Adsorbent for Simultaneous Adsorption of Metals and Cationic Dyes, Environ. Sci. Technol. 49 (2015) 10570-10580.N. Pugazhenthiran, S. Sen Gupta, A. Prabhath, M. Manikandan, J.R. Swathy, V.K. Raman, T. Pradeep, Cellulose Derived Graphenic Fibers for Capacitive Desalination of Brackish Water, ACS Appl. Mater. Interfaces 7 (2015) 20156-20163.Y.J. Kim, J.H. Choi, Improvement of desalination efficiency in capacitive deionization using a carbon electrode coated with an ion-exchange polymer, Water Res. 44 (2010) 990-996.K.B. Hatzell, M.C. Hatzell, K.M. Cook, M. Boota, G.M. Housel, A. McBride, E.C. Kumbur, Y. Gogotsi, Effect of oxidation of carbon material on suspension electrodes for flow electrode capacitive deionization, Environ. Sci. Technol. 49 (2015) 3040-3047.F.A. AlMarzooqi, A.A. Al Ghaferi, I. Saadat, N. Hilal, Application of Capacitive Deionisation in water desalination: A review, Desalination 342 (2014) 3-15.P. Xu, B. Elson, J.E. Drewes, Electrosorption of Heavy Metals with Capacitive Deionization: Water Reuse, Desalination and Resources Recovery, in: Desalination: Water from Water, John Wiley & Sons, Inc., 2014, pp. 521-548.X. Gu, Y. Yang, Y. Hu, M. Hu, C. Wang, Fabrication of Graphene-Based Xerogels for Removal of Heavy Metal Ions and Capacitive Deionization, ACS Sustainable Chem. Eng. 3 (2015) 1056-1065.W. Tang, P. Kovalsky, B. Cao, D. He, T.D. Waite, Fluoride Removal from Brackish Groundwaters by Constant Current Capacitive Deionization (CDI), Environ. Sci. Technol. 50 (2016) 10570- 10579.S. Hokkanen, A. Bhatnagar, M. Sillanpaa, A review on modification methods to cellulose-based adsorbents to improve adsorption capacity, Water research 91 (2016) 156-173.O. Boussif, F. Lezoualc’h, M.A. Zanta, M.D. Mergny, D. Scherman, B. Demeneix, J.P. Behr, A versatile vector for gene and oligonucleotide transfer into cells in culture and in vivo: polyethylenimine, PNAS 92 (1995) 7297-7301.L. Chen, W. Cao, P.J. Quinlan, R.M. Berry, K.C. Tam, Sustainable Catalysts from Gold-Loaded Polyamidoamine Dendrimer-Cellulose Nanocrystals, ACS Sustainable Chem. Eng. 3 (2015) 978-985.F. Zhao, E. Repo, D. Yin, M.E.T. Sillanpää, Adsorption of Cd(II) and Pb(II) by a novel EGTA-modified chitosan material: Kinetics and isotherms, J. Colloid Interface Sci. 409 (2013) 174-182.
955
Lappeenranta, Finland IMWA 2017Mine Water and Circular Economy
Wolkersdorfer C, Sartz L, Sillanpää M, Häkkinen A (Editors)
F. Zhao, W.Z. Tang, D. Zhao, Y. Meng, D. Yin, M. Sillanpää, Adsorption kinetics, isotherms and mechanisms of Cd(II), Pb(II), Co(II) and Ni(II) by a modified magnetic polyacrylamide microcomposite adsorbent, J. Water Process Eng. 4 (2014) 47-57.F. Zhao, E. Repo, M. Sillanpää, Y. Meng, D. Yin, W.Z. Tang, Green Synthesis of Magnetic EDTA- and/ or DTPA-Cross-Linked Chitosan Adsorbents for Highly Efficient Removal of Metals, Ind. Eng. Chem. Res. 54 (2015) 1271-1281.
956
Lappeenranta, Finland IMWA 2017Mine Water and Circular Economy
Wolkersdorfer C, Sartz L, Sillanpää M, Häkkinen A (Editors)
Mine Waste Resource Assessment and Appraisal of Recovery via Mine Water
Sapsford, D1, Brabham, P2, Crane, R1, Evans, D2, Statford, A2, Wright, A1 1Cardiff School of Engineering, Cardiff University; 2School of Earth and Ocean Sciences,
Cardiff University
Abstract In recent years, mine wastes have increasingly become targets for metals recovery. This paper discusses techniques to make preliminary resource value assessments and considers appropriate technology for metals recovery focussing on the passive cementation of copper on to zerovalent iron. The Parys Mountain legacycopper mine in the UK is used as an example where UAV photogrammetry, LiDAR and portable XRF were used to make volume and resource estimates. The cementation reaction is demonstrated to be capable or removing the majority of the Cu in an economically useful form from the mine water within a time period suitable for incorporation within a passive treatment/capture system.
Introduction
There are many reasons why metal mine wastes may be considered as suitable targets for metals recovery, some important examples are as follows: (i) Reworking of mine wastes and tailings where historic beneficiation processes were inefficient or metal prices have changed significantly such that that present-day reworking of the wastes is now economically viable; (ii) Reworking of mine wastes for metals which were not the original target of exploitation and are present at economic levels in the material. For example there has been recent in-terest in the so-called ‘‘E-tech’’ elements (Co, Te, Se, Nd, In, Ga, heavy rare earth elements) whose security of supply is an issue in addition to them being essential for current and future technologies. (iii) Site remediation and reclamation to prevent harm to human health and environment from historic mine wastes. It is very well known that many mine wastes can pose significant threats to the environment through AMD/ARD-ML (acid mine drainage, acid rock drainage and metal leaching) and/or airborne dust release. Drivers in the Europe-an Union include meeting the requirements of the Water Framework Directive (2000/60/EC) and the Mine Waste Directive (2006/21/EC). It is also noteworthy that recent econom-ic assessment frameworks which take into account damage to the provisioning of ecosys-tems services may provide additional incentives to ensure prevention of pollution from mine sites. (iv) There is potential for the current regulatory perspectives on the acceptability of long-term risk to environment posed by mine waste to change, such that current mine waste management practices e.g. cover/liner systems are considered to no longer provide sufficient protection of human health and the environment far enough into the future. This would mean that the removal of leachable metals from mine waste becomes a more favourable risk reduction strategy than containment. (v) That given long-term demand for metals and deple-tion of exisiting ores, what consitutes ecomonic grades continues to decline into the future such that, (i) above becomes viable for currently produced mine wastes.
All of these reasons point towards the importance of turning our attention to examining mine wastes as a resource. Thus some of the questions that follow on naturally from this are:
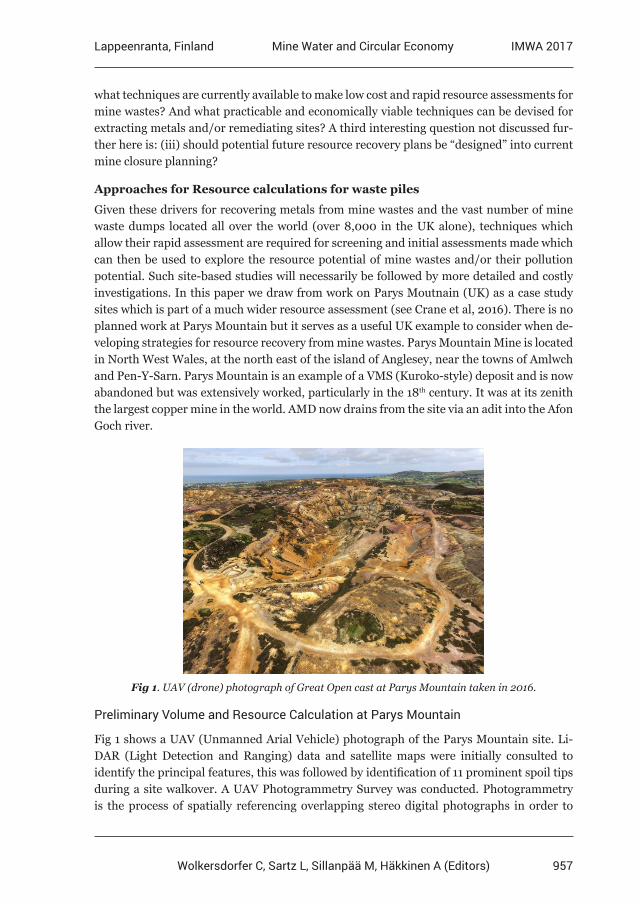
957
Lappeenranta, Finland IMWA 2017Mine Water and Circular Economy
Wolkersdorfer C, Sartz L, Sillanpää M, Häkkinen A (Editors)
what techniques are currently available to make low cost and rapid resource assessments for mine wastes? And what practicable and economically viable techniques can be devised for extracting metals and/or remediating sites? A third interesting question not discussed fur-ther here is: (iii) should potential future resource recovery plans be “designed” into current mine closure planning?
Approaches for Resource calculations for waste piles
Given these drivers for recovering metals from mine wastes and the vast number of mine waste dumps located all over the world (over 8,000 in the UK alone), techniques which allow their rapid assessment are required for screening and initial assessments made which can then be used to explore the resource potential of mine wastes and/or their pollution potential. Such site-based studies will necessarily be followed by more detailed and costly investigations. In this paper we draw from work on Parys Moutnain (UK) as a case study sites which is part of a much wider resource assessment (see Crane et al, 2016). There is no planned work at Parys Mountain but it serves as a useful UK example to consider when de-veloping strategies for resource recovery from mine wastes. Parys Mountain Mine is located in North West Wales, at the north east of the island of Anglesey, near the towns of Amlwch and Pen-Y-Sarn. Parys Mountain is an example of a VMS (Kuroko-style) deposit and is now abandoned but was extensively worked, particularly in the 18th century. It was at its zenith the largest copper mine in the world. AMD now drains from the site via an adit into the Afon Goch river.
Fig 1. UAV (drone) photograph of Great Open cast at Parys Mountain taken in 2016.
Preliminary Volume and Resource Calculation at Parys Mountain
Fig 1 shows a UAV (Unmanned Arial Vehicle) photograph of the Parys Mountain site. Li-DAR (Light Detection and Ranging) data and satellite maps were initially consulted to identify the principal features, this was followed by identification of 11 prominent spoil tips during a site walkover. A UAV Photogrammetry Survey was conducted. Photogrammetry is the process of spatially referencing overlapping stereo digital photographs in order to
958
Lappeenranta, Finland IMWA 2017Mine Water and Circular Economy
Wolkersdorfer C, Sartz L, Sillanpää M, Häkkinen A (Editors)
create 3D spatial data. The software used in this investigation was Photoscan (designed and licensed by Agisoft Ltd). The UAV used in this investigation was a Phantom 3 Professional, equipped with a 12 M pixel camera at fixed 20 mm focal length. Three basepoints across the site were established (one for each UAV flight) to allow optimum coverage of the area. The UAV flight time was approximately 15 minutes (due ot battery life). Each flight aimed to capture as many overlapping images of the site features from different angles and at dif-ferent elevations..
Following the UAV survey, software was used to first align photographs to requisite quality, and then from these produce a dense cloud of x,y,z points to build a mesh to create a height-field surface and a digital elevation model (DEM). Once a fully-meshed 3D model was com-pleted it was georeferenced. Whilst the software exports the camera location data, which is archived during the UAV survey, and provides an approximate georeference automatically during the photo alignment stage, a higher degree of accuracy is demanded when attempt-ing to calculate volume of features and structures. To increase accuracy, ground control points (GCPs) were taken. Agisoft recommends 9 to 10 GCPs in order to fulfil the georef-erencing task. In this instance, 7 sample points, determined by GPS, together with LiDAR data was used to determine the elevation and an additional 3 Ordnance Survey trig points were included which together provide the 10 GCP for an accurate georeferenced model. To determine the volume of a feature, it is necessary to remove all “secondary faces” using the “closed model volume” method, which automatically fills in hollow spaces to produce a base plane. This method does have limitations, for example, the base plane cannot be manual set to a referenced elevation, or a specific dip, but this process is possible with companion software to edit the mesh cloud.
From the UAV results with the Agisoft software a total volume of the 11 tips considered was determined to be 953,510m3 this is considered a conservative estimate because of the assumption is that the ‘close hole’ feature represents the correct planar surface underlying the spoil tip, because the exact depth to the base is unknown. Furthermore, the incomplete UAV coverage of the site resulted in modelling and scaling errors in Agisoft, primarily con-cerning tip two of the mine waste piles. The failure to acquire imagery of the South slope led to gaps in the dense cloud point. However, all other areas of the site had excellent coverage at different angles and elevations. The calculated total volume of 953,500 m³ was used with in situ density measurements to produces a conservative tonnage estimate of 1,935,600 tonnes. Alternative approaches were also used based on calculating volume from LiDAR or Satellite data for the 11 tips, assuming a base elevation and calculating a volume using either trapezoidal or Simpson’s rule to determine a volume from the measured area and LiDAR elevation data. The total spoil calculates to a volume of 3,200,000 m³ and satellite data 1,032,532 m3. The satellite and Agisoft volume estimates were surprisingly similar, despite employing a very different method to calculate volume. The variation in results be-tween photogrammetry and LiDAR is due in large part to the methods of calculating vol-ume where the method of determining the depth to base of each individual spoil tip. Some spoil tips were located on hillsides, with a sloping topography resulting in a non-linear base,
959
Lappeenranta, Finland IMWA 2017Mine Water and Circular Economy
Wolkersdorfer C, Sartz L, Sillanpää M, Häkkinen A (Editors)
the LiDAR volume calculations were based on the lowest point of elevation of the identi-fied boundary of the spoil tip and produced a horizontally-planar base for the model. The base plane likely intersects regolith and bedrock (beneath the waste pile) and therefore rep-resents an overestimate of the pile size.
For measuring the chemical composition of mine wastes XRF is useful for rapid in field screening has been assessed by numerous authors (e.g. Kalnikcy and Singhvi 2001; Kilbride et al. 2006; McComb et al. 2014). Based on 12 portable XRF readings the average copper concentration was 1,500 mg/kg and as such approximately 2,900 tonnes of Cu is estimat-ed to be present. Whilst not all of this could be recovered, if 30% recovery, expected from an inefficient dump leaching operation (e.g. Petersen, 2015) to 50% recovery gives 870 – 1450 tonnes which at current (April 2017) market value is worth within the region of £4-6M. Whilst these calculations are clearly very preliminary this is a very useful exercise as a means to get a first estimate of the mass of resources contained within mine wastes and can be used to immediately inform decisions regarding the economic viability of the recovery of such resources.
UAV photogrammetry is a rapidly improving technology and holds great promise in the surveying of large areas of mine wastes. But caution should be exercised because the accu-racy of volume estimation depends on the time taken in post-processing to edit mesh fields, produce high-quality dense point clouds and correctly align hundreds of images with the use of GCPs. The use of LiDAR data in GIS packages such as ArcGIS and Surfer 11 provides faster and easier estimations of volume but both techniques are also constrained by the re-quirement to determine an accurate determination of the topography of the mine waste pile floor. More recent sites may have accurate maps outlining the original surface but often with historic mines the original level of the base of the dump is lost to history. In such cases geo-physical surveys (such as Electrical Resistance Tomography and ground penetrating radar) can provide a cost effective means to accurately map the base of the dumps.
Metal Recovery
When considering metal recovery from low-grade material the boundary between what is feasible is controlled by what is technically achievable and the economically viability. Due to the thermodynamics of separation of chemical mixtures (Gutowski 2011; Valero et al 2015), an increase in the exergy cost for extraction is imposed as the target becomes more dilute within a mixture. This is reflected in the economics of ore processing and is why in situ mining and heap/dump leaching, which keep energy costs to a minimum by negating the large energy requirements of conventional mining and processing are favoured for low-grade ores (Sapsford et al 2016). There can also be other constraints which would curtail the use of physical “dig and process” remaining technology, for example in the UK a large num-ber of historic mines have protected designations e.g. Sites of Special Scientific Interest, or Scheduled Ancient Monuments which would heavily constrain or prevent invasive resource recovery practices (see Crane et al, 2016). For these reasons, metal recovery using in situ, or heap/dump leaching would be favourable technology to utilise if conducted at sufficiently high environmental standards. AMD/ARD-ML could be considered as a passive version of
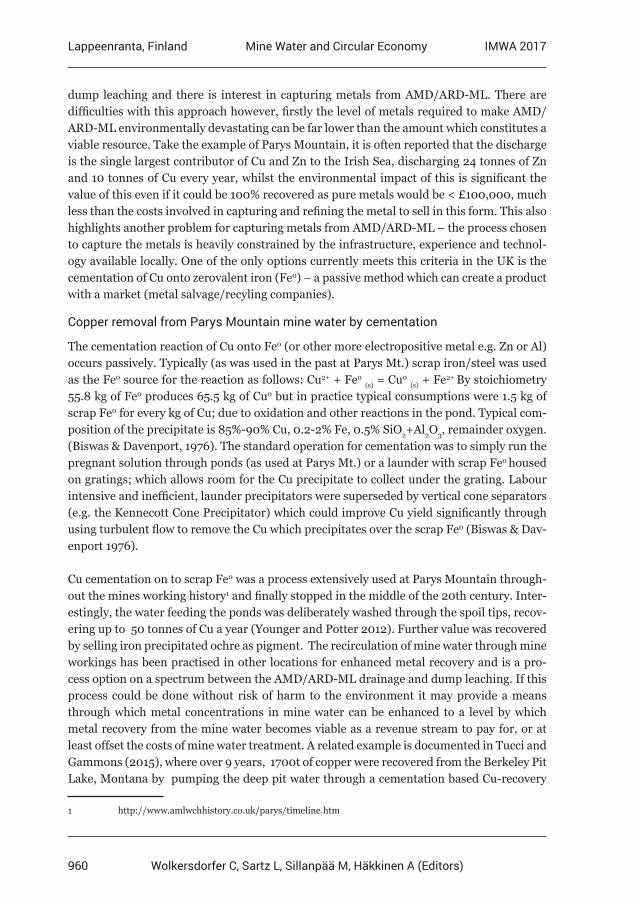
960
Lappeenranta, Finland IMWA 2017Mine Water and Circular Economy
Wolkersdorfer C, Sartz L, Sillanpää M, Häkkinen A (Editors)
dump leaching and there is interest in capturing metals from AMD/ARD-ML. There are difficulties with this approach however, firstly the level of metals required to make AMD/ARD-ML environmentally devastating can be far lower than the amount which constitutes a viable resource. Take the example of Parys Mountain, it is often reported that the discharge is the single largest contributor of Cu and Zn to the Irish Sea, discharging 24 tonnes of Zn and 10 tonnes of Cu every year, whilst the environmental impact of this is significant the value of this even if it could be 100% recovered as pure metals would be < £100,000, much less than the costs involved in capturing and refining the metal to sell in this form. This also highlights another problem for capturing metals from AMD/ARD-ML – the process chosen to capture the metals is heavily constrained by the infrastructure, experience and technol-ogy available locally. One of the only options currently meets this criteria in the UK is the cementation of Cu onto zerovalent iron (Fe0) – a passive method which can create a product with a market (metal salvage/recyling companies).
Copper removal from Parys Mountain mine water by cementation
The cementation reaction of Cu onto Fe0 (or other more electropositive metal e.g. Zn or Al) occurs passively. Typically (as was used in the past at Parys Mt.) scrap iron/steel was used as the Fe0 source for the reaction as follows: Cu2+ + Fe0 (s) = Cu0 (s) + Fe2+ By stoichiometry 55.8 kg of Fe0 produces 65.5 kg of Cu0 but in practice typical consumptions were 1.5 kg of scrap Fe0 for every kg of Cu; due to oxidation and other reactions in the pond. Typical com-position of the precipitate is 85%-90% Cu, 0.2-2% Fe, 0.5% SiO2+Al2O3, remainder oxygen. (Biswas & Davenport, 1976). The standard operation for cementation was to simply run the pregnant solution through ponds (as used at Parys Mt.) or a launder with scrap Fe0 housed on gratings; which allows room for the Cu precipitate to collect under the grating. Labour intensive and inefficient, launder precipitators were superseded by vertical cone separators (e.g. the Kennecott Cone Precipitator) which could improve Cu yield significantly through using turbulent flow to remove the Cu which precipitates over the scrap Fe0 (Biswas & Dav-enport 1976).
Cu cementation on to scrap Fe0 was a process extensively used at Parys Mountain through-out the mines working history1 and finally stopped in the middle of the 20th century. Inter-estingly, the water feeding the ponds was deliberately washed through the spoil tips, recov-ering up to 50 tonnes of Cu a year (Younger and Potter 2012). Further value was recovered by selling iron precipitated ochre as pigment. The recirculation of mine water through mine workings has been practised in other locations for enhanced metal recovery and is a pro-cess option on a spectrum between the AMD/ARD-ML drainage and dump leaching. If this process could be done without risk of harm to the environment it may provide a means through which metal concentrations in mine water can be enhanced to a level by which metal recovery from the mine water becomes viable as a revenue stream to pay for, or at least offset the costs of mine water treatment. A related example is documented in Tucci and Gammons (2015), where over 9 years, 1700t of copper were recovered from the Berkeley Pit Lake, Montana by pumping the deep pit water through a cementation based Cu-recovery
1 http://www.amlwchhistory.co.uk/parys/timeline.htm
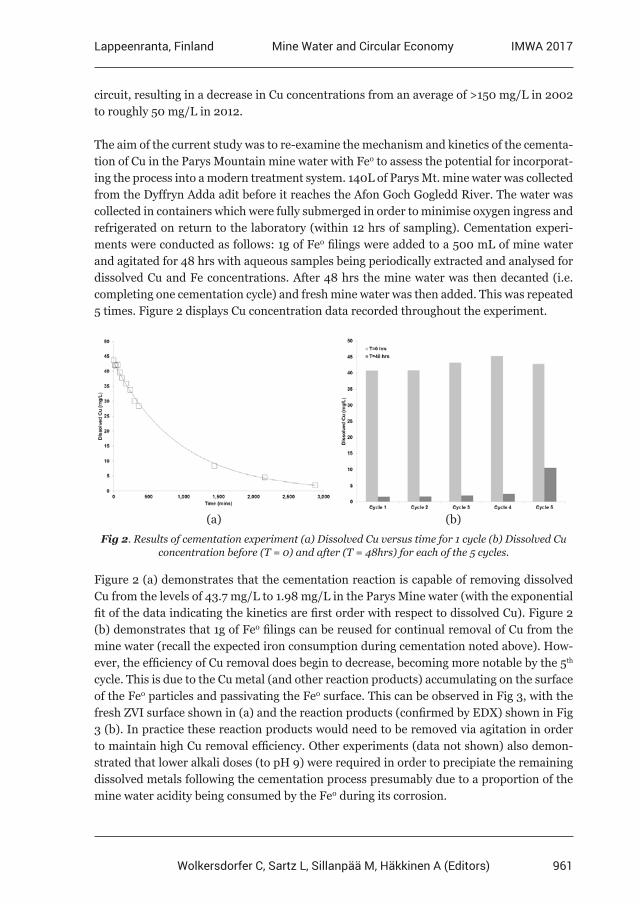
961
Lappeenranta, Finland IMWA 2017Mine Water and Circular Economy
Wolkersdorfer C, Sartz L, Sillanpää M, Häkkinen A (Editors)
circuit, resulting in a decrease in Cu concentrations from an average of >150 mg/L in 2002 to roughly 50 mg/L in 2012.
The aim of the current study was to re-examine the mechanism and kinetics of the cementa-tion of Cu in the Parys Mountain mine water with Fe0 to assess the potential for incorporat-ing the process into a modern treatment system. 140L of Parys Mt. mine water was collected from the Dyffryn Adda adit before it reaches the Afon Goch Gogledd River. The water was collected in containers which were fully submerged in order to minimise oxygen ingress and refrigerated on return to the laboratory (within 12 hrs of sampling). Cementation experi-ments were conducted as follows: 1g of Fe0 filings were added to a 500 mL of mine water and agitated for 48 hrs with aqueous samples being periodically extracted and analysed for dissolved Cu and Fe concentrations. After 48 hrs the mine water was then decanted (i.e. completing one cementation cycle) and fresh mine water was then added. This was repeated 5 times. Figure 2 displays Cu concentration data recorded throughout the experiment.
(a) (b)
Fig 2. Results of cementation experiment (a) Dissolved Cu versus time for 1 cycle (b) Dissolved Cu concentration before (T = 0) and after (T = 48hrs) for each of the 5 cycles.
Figure 2 (a) demonstrates that the cementation reaction is capable of removing dissolved Cu from the levels of 43.7 mg/L to 1.98 mg/L in the Parys Mine water (with the exponential fit of the data indicating the kinetics are first order with respect to dissolved Cu). Figure 2 (b) demonstrates that 1g of Fe0 filings can be reused for continual removal of Cu from the mine water (recall the expected iron consumption during cementation noted above). How-ever, the efficiency of Cu removal does begin to decrease, becoming more notable by the 5th cycle. This is due to the Cu metal (and other reaction products) accumulating on the surface of the Fe0 particles and passivating the Fe0 surface. This can be observed in Fig 3, with the fresh ZVI surface shown in (a) and the reaction products (confirmed by EDX) shown in Fig 3 (b). In practice these reaction products would need to be removed via agitation in order to maintain high Cu removal efficiency. Other experiments (data not shown) also demon-strated that lower alkali doses (to pH 9) were required in order to precipiate the remaining dissolved metals following the cementation process presumably due to a proportion of the mine water acidity being consumed by the Fe0 during its corrosion.
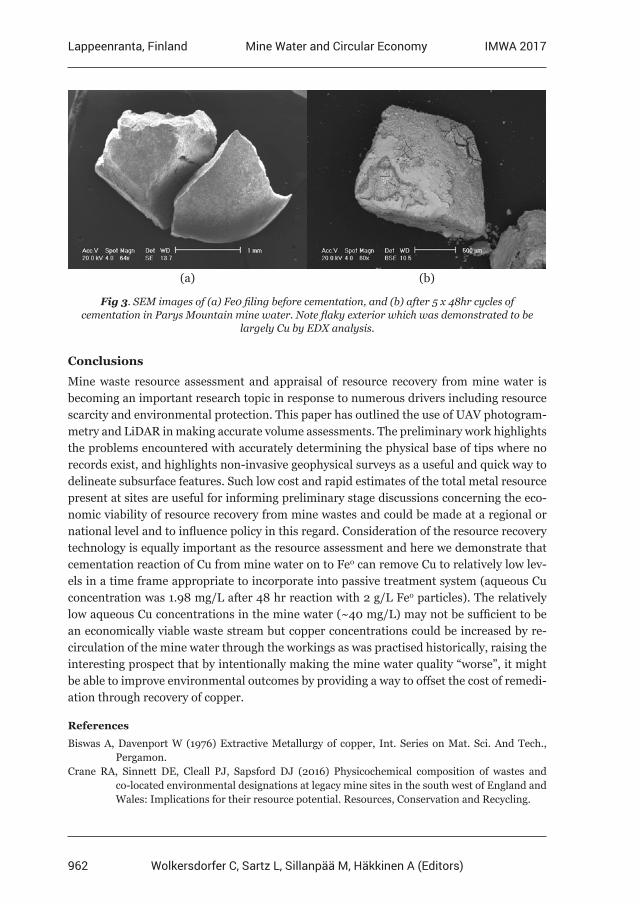
962
Lappeenranta, Finland IMWA 2017Mine Water and Circular Economy
Wolkersdorfer C, Sartz L, Sillanpää M, Häkkinen A (Editors)
(a) (b)
Fig 3. SEM images of (a) Fe0 filing before cementation, and (b) after 5 x 48hr cycles of cementation in Parys Mountain mine water. Note flaky exterior which was demonstrated to be
largely Cu by EDX analysis.
Conclusions
Mine waste resource assessment and appraisal of resource recovery from mine water is becoming an important research topic in response to numerous drivers including resource scarcity and environmental protection. This paper has outlined the use of UAV photogram-metry and LiDAR in making accurate volume assessments. The preliminary work highlights the problems encountered with accurately determining the physical base of tips where no records exist, and highlights non-invasive geophysical surveys as a useful and quick way to delineate subsurface features. Such low cost and rapid estimates of the total metal resource present at sites are useful for informing preliminary stage discussions concerning the eco-nomic viability of resource recovery from mine wastes and could be made at a regional or national level and to influence policy in this regard. Consideration of the resource recovery technology is equally important as the resource assessment and here we demonstrate that cementation reaction of Cu from mine water on to Fe0 can remove Cu to relatively low lev-els in a time frame appropriate to incorporate into passive treatment system (aqueous Cu concentration was 1.98 mg/L after 48 hr reaction with 2 g/L Fe0 particles). The relatively low aqueous Cu concentrations in the mine water (~40 mg/L) may not be sufficient to be an economically viable waste stream but copper concentrations could be increased by re-circulation of the mine water through the workings as was practised historically, raising the interesting prospect that by intentionally making the mine water quality “worse”, it might be able to improve environmental outcomes by providing a way to offset the cost of remedi-ation through recovery of copper.
References
Biswas A, Davenport W (1976) Extractive Metallurgy of copper, Int. Series on Mat. Sci. And Tech., Pergamon. Crane RA, Sinnett DE, Cleall PJ, Sapsford DJ (2016) Physicochemical composition of wastes and co-located environmental designations at legacy mine sites in the south west of England and Wales: Implications for their resource potential. Resources, Conservation and Recycling.
963
Lappeenranta, Finland IMWA 2017Mine Water and Circular Economy
Wolkersdorfer C, Sartz L, Sillanpää M, Häkkinen A (Editors)
Gutowski TG (2011) Materials separation and recycling. In:Thermodynamics and the destruction of resources, Cambridge University Press, Cambridge, 113–132Kalnicky, D. and Singhvi, R. (2001). Field portable XRF analysis of environmental samples. Journal of Hazardous Materials, 83(1-2), pp.93-122.Kilbride, C., Poole, J. and Hutchings, T. (2006). A comparison of Cu, Pb, As, Cd, Zn, Fe, Ni and Mn determined by acid extraction/ICP–OES and ex situ field portable X-ray fluorescence analyses. Environmental Pollution, 143(1), pp.16-23.McComb, J., Rogers, C., Han, F. and Tchounwou, P. (2014). Rapid Screening of Heavy Metals and Trace Elements in Environmental Samples Using Portable X-Ray Fluorescence Spectrometer, A Comparative Study. Water, Air, & Soil Pollution, 225(12).Petersen J (2016) Heap leaching as a key technology for recovery of values from low-grade ores–A brief overview. Hydrometallurgy. 2016 Oct 31;165:206-12.Sapsford D, Cleall P, Harbottle M (2016) In Situ Resource Recovery from Waste Repositories: Exploring the Potential for Mobilization and Capture of Metals from Anthropogenic Ores. Journal of Sustainable Metallurgy:1-8.Tucci NJ, Gammons CH. Influence of copper recovery on the water quality of the acidic Berkeley Pit Lake, Montana, USA. Environmental science & technology. 2015 Mar 12;49(7):4081-8.Valero A, Dominguez A, Valero A (2015) Exergy cost allocationof by-products in the mining and metallurgical industry. ResourConserv Recycl 102:128–142Younger P, Potter HA. Parys in springtime: hazard management and steps towards remediation of the UK’s most polluted acidic mine discharge.
964
Lappeenranta, Finland IMWA 2017Mine Water and Circular Economy
Wolkersdorfer C, Sartz L, Sillanpää M, Häkkinen A (Editors)
Mining waste as an exploration tool and secondary resource
Mattias Bäckström1, Lotta Sartz1,2, Stefan Sädbom2
1Man-Technology-Environment Research Centre, Örebro University, Fakultetsgatan 1, 701 82 Örebro, Sweden, [email protected]
2Bergskraft Bergslagen AB, Fordonsgatan 4, 692 71 Kumla, Sweden
Abstract There is today no overall information about how much mining waste there is in Sweden and what it contains. This project focused on samples from waste rock, tailings and slag from the historical mining region Bergslagen, Sweden. Modern dissolution and analytical methods were used in order to determine approximately 50 elements in the samples. Modern analytical data for the historical mining waste is useful as an exploration tool and can provide information about remaining or new resources underground. Results show that there is a potential for recovery of critical elements from mining waste as well as dealing with environmental problems.
Key words tailings, slag, trace elements, environment
Introduction
There is today no accurate information about how much mining waste there is in Sweden. Nor is there a clear idea about the content in the mining waste deposits. A lot of the waste was produced several hundred years ago and data about element content is scarce or of unknown quality. Some preliminary studies indicate, however, that there are very large vol-umes that potentially are available for recovery as a secondary resource. The mining waste is readily accessible above ground, thus saving a lot of energy compared to underground or open pit mining. This can in fact to some extent compensate for the lower metal concentra-tions in the mining waste compared to the ores.
Modern analytical data for the historical mining waste is also useful as an exploration tool and can provide information about remaining or new resources underground.
A major problem with historical mining waste is that it is often present in fairly small amounts in several locations. The geographical dispersion and the relatively small amount at each location together with the fact that the mining waste often has lower metal concen-trations than present ore makes an ordinary concentrator out of the question. However, a strategically located flexible concentrator could be a feasible solution. This type of concen-trator could also make it profitable to exploit smaller ores in the area. An alternative to a centralized concentrator is a mobile facility moving from mining waste site to mining waste site in order to extract elements from the waste.
A mobile facility could also be used for reclamation of mining waste where extraction of metals (for instance Ag) could add additional funds for the reclamation projects.
This project focused on collecting samples from waste rock, tailings and slag from the his-torical mining region Bergslagen, Sweden. Modern dissolution and analytical methods were
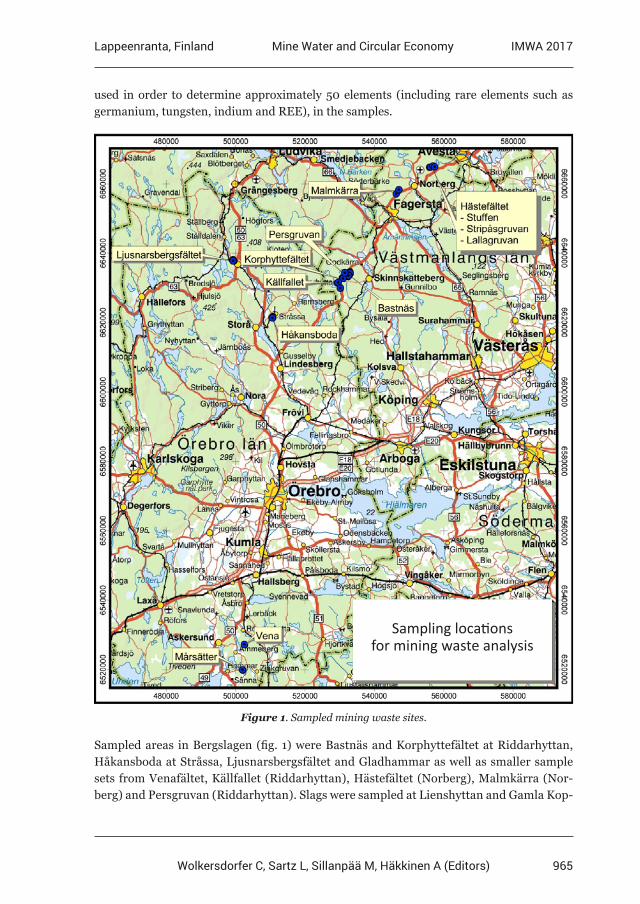
965
Lappeenranta, Finland IMWA 2017Mine Water and Circular Economy
Wolkersdorfer C, Sartz L, Sillanpää M, Häkkinen A (Editors)
used in order to determine approximately 50 elements (including rare elements such as germanium, tungsten, indium and REE), in the samples.
Figure 1. Sampled mining waste sites.
Sampled areas in Bergslagen (fig. 1) were Bastnäs and Korphyttefältet at Riddarhyttan, Håkansboda at Stråssa, Ljusnarsbergsfältet and Gladhammar as well as smaller sample sets from Venafältet, Källfallet (Riddarhyttan), Hästefältet (Norberg), Malmkärra (Nor-berg) and Persgruvan (Riddarhyttan). Slags were sampled at Lienshyttan and Gamla Kop-
Sampling locations for mining waste analysis
966
Lappeenranta, Finland IMWA 2017Mine Water and Circular Economy
Wolkersdorfer C, Sartz L, Sillanpää M, Häkkinen A (Editors)
parverket in Riddarhyttan and tailings were sampled at Persgruvan, Källfallet (Riddarhyt-tan) and Mårsätter.
Methods
Identification of objects for sampling
Each mining area has been divided into smaller objects prior to sampling. Care has been taken in order to divide the area into objects with roughly the same properties (with regards to origin, age, grain size, mineralogy, vegetation, age etc.).
Position has been determined for every object using hand held GPS (accuracy 3 m). Size of each object has been determined using a combination of GPS and on the ground measuring.
Waste rock sampling
Primary elemental distribution in the primary geological deposit have not been inves-tigated. From experience it is known that element distribution is uneven depending on primary geological features. One of the theories is that mining and transportation of the material to the waste pile has introduced “smearing” and blending of the elemental dis-tribution, meaning that sampling of waste in theory has a slightly higher possibility to indicate occurrence of interesting elements than sampling of primary rocks, from outcrop or drill core.
Sampling of waste rock was performed by “randomly” chipping pieces from waste rock piec-es using a hammer. For every sampling point at least 25 separate pieces were pooled into a sample. On average every sample was around 5 L (3.7 kg) containing around 35 pieces (n 213).
At some objects replicate samples have been collected in order to study the representative-ness of the sampling technique used.
Total amount of material in the sampled piles have been estimated to about 200 000 metric tons.
Slag sampling
It was assumed that historical slags are more homogenous in composition than the geo-logical material as even conditions during smelting was a prerequisite for good quality. Sampling of slag has been performed using a lower sampling density compared to waste rock. Focus has instead been to investigate whether elements have been enriched in the slag during the process. No chipping was performed; instead whole pieces of slag were collected directly from the waste deposit.
Total amount of material in the sampled slags have been estimated to about 150 000 metric tons.
967
Lappeenranta, Finland IMWA 2017Mine Water and Circular Economy
Wolkersdorfer C, Sartz L, Sillanpää M, Häkkinen A (Editors)
Tailings sampling
Tailings have been sampled at Källfallsgruvan, Mårsätter and at Vena. Samples have been retrieved using a small shovel or a hand held auger. Samples are from below the apparently oxidized upper layers of the tailings.
Average size for the tailings samples (n 21) were around 0.37 kg as they are considered to be more homogenous compared to the waste rock and slag samples.
Total amount of material in the sampled tailings have been estimated to about 75 000 met-ric tons.
Analytical methods
Samples were analysed for major and trace elements by MS Analytical. Sample pulps were fused by borate flux in a high temperature controlled muffle furnace and the resulting beads were dissolved in dilute mineral acids. Major oxides were determined by inductively cou-pled plasma-optical emission spectroscopy (ICP-OES) and refractory trace elements were determined by inductively coupled plasma-mass spectroscopy (ICP-MS). Other trace ele-ments were determined by inductively coupled plasma-optical emission spectroscopy (ICP-OES) following aqua regia digestion. Total sulphur and carbon were determined by a Leco Carbon and Sulphur analyser. Ore grade samples (Ag, Cu, Pb and Zn) were quantified by ICP-OES following 4-acid digestion. Analytical quality was monitored with method blanks, duplicates and certified reference materials and/or in-house verified reference materials.
Statistical methods
Principal component analysis (PCA) was performed on log-transformed and auto scaled data using the software The Unscrambler (Camo ASA).
Results and discussion
A lot of data has been produced during the project and this paper will only be able to pro-vide a small selection of data. Arsenic, gold, cerium and copper were chosen to illustrate the results. Table 1 and fig. 2 show the cumulative concentrations for the selected elements.
Table 1 Statistical distribution of the selected elements (mg/kg dw).
As Au Ce Cu
10th perc 0.60 0.005 37.8 6.30
25th perc 1.10 0.006 63.5 118
Median 4.40 0.020 153 1 590
75th perc 540 0.118 1 060 4 610
90th perc 4 800 0.409 3 070 7 900
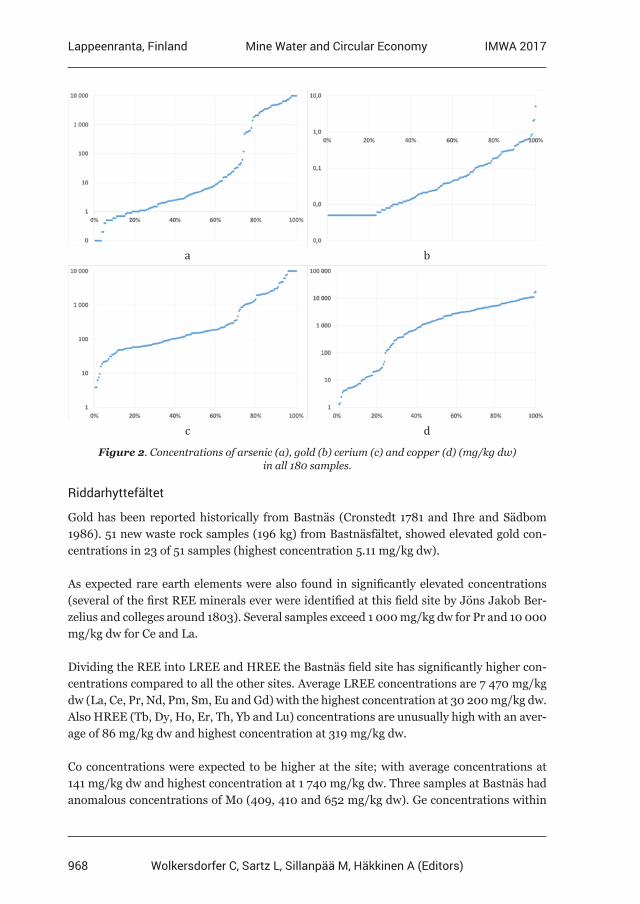
968
Lappeenranta, Finland IMWA 2017Mine Water and Circular Economy
Wolkersdorfer C, Sartz L, Sillanpää M, Häkkinen A (Editors)
a b
c d
Figure 2. Concentrations of arsenic (a), gold (b) cerium (c) and copper (d) (mg/kg dw) in all 180 samples.
Riddarhyttefältet
Gold has been reported historically from Bastnäs (Cronstedt 1781 and Ihre and Sädbom 1986). 51 new waste rock samples (196 kg) from Bastnäsfältet, showed elevated gold con-centrations in 23 of 51 samples (highest concentration 5.11 mg/kg dw).
As expected rare earth elements were also found in significantly elevated concentrations (several of the first REE minerals ever were identified at this field site by Jöns Jakob Ber-zelius and colleges around 1803). Several samples exceed 1 000 mg/kg dw for Pr and 10 000 mg/kg dw for Ce and La.
Dividing the REE into LREE and HREE the Bastnäs field site has significantly higher con-centrations compared to all the other sites. Average LREE concentrations are 7 470 mg/kg dw (La, Ce, Pr, Nd, Pm, Sm, Eu and Gd) with the highest concentration at 30 200 mg/kg dw. Also HREE (Tb, Dy, Ho, Er, Th, Yb and Lu) concentrations are unusually high with an aver-age of 86 mg/kg dw and highest concentration at 319 mg/kg dw.
Co concentrations were expected to be higher at the site; with average concentrations at 141 mg/kg dw and highest concentration at 1 740 mg/kg dw. Three samples at Bastnäs had anomalous concentrations of Mo (409, 410 and 652 mg/kg dw). Ge concentrations within
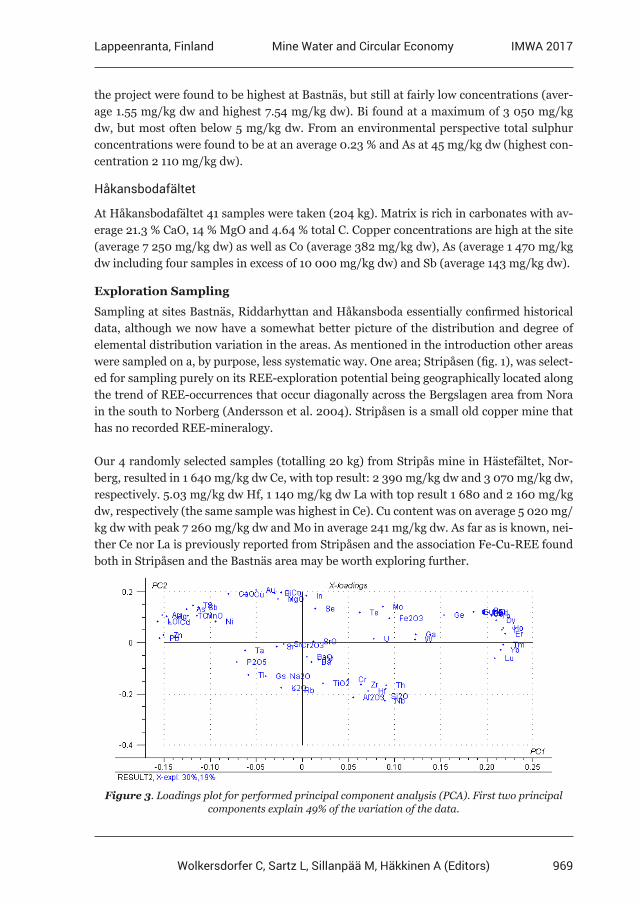
969
Lappeenranta, Finland IMWA 2017Mine Water and Circular Economy
Wolkersdorfer C, Sartz L, Sillanpää M, Häkkinen A (Editors)
the project were found to be highest at Bastnäs, but still at fairly low concentrations (aver-age 1.55 mg/kg dw and highest 7.54 mg/kg dw). Bi found at a maximum of 3 050 mg/kg dw, but most often below 5 mg/kg dw. From an environmental perspective total sulphur concentrations were found to be at an average 0.23 % and As at 45 mg/kg dw (highest con-centration 2 110 mg/kg dw).
Håkansbodafältet
At Håkansbodafältet 41 samples were taken (204 kg). Matrix is rich in carbonates with av-erage 21.3 % CaO, 14 % MgO and 4.64 % total C. Copper concentrations are high at the site (average 7 250 mg/kg dw) as well as Co (average 382 mg/kg dw), As (average 1 470 mg/kg dw including four samples in excess of 10 000 mg/kg dw) and Sb (average 143 mg/kg dw).
Exploration Sampling
Sampling at sites Bastnäs, Riddarhyttan and Håkansboda essentially confirmed historical data, although we now have a somewhat better picture of the distribution and degree of elemental distribution variation in the areas. As mentioned in the introduction other areas were sampled on a, by purpose, less systematic way. One area; Stripåsen (fig. 1), was select-ed for sampling purely on its REE-exploration potential being geographically located along the trend of REE-occurrences that occur diagonally across the Bergslagen area from Nora in the south to Norberg (Andersson et al. 2004). Stripåsen is a small old copper mine that has no recorded REE-mineralogy.
Our 4 randomly selected samples (totalling 20 kg) from Stripås mine in Hästefältet, Nor-berg, resulted in 1 640 mg/kg dw Ce, with top result: 2 390 mg/kg dw and 3 070 mg/kg dw, respectively. 5.03 mg/kg dw Hf, 1 140 mg/kg dw La with top result 1 680 and 2 160 mg/kg dw, respectively (the same sample was highest in Ce). Cu content was on average 5 020 mg/kg dw with peak 7 260 mg/kg dw and Mo in average 241 mg/kg dw. As far as is known, nei-ther Ce nor La is previously reported from Stripåsen and the association Fe-Cu-REE found both in Stripåsen and the Bastnäs area may be worth exploring further.
Figure 3. Loadings plot for performed principal component analysis (PCA). First two principal components explain 49% of the variation of the data.
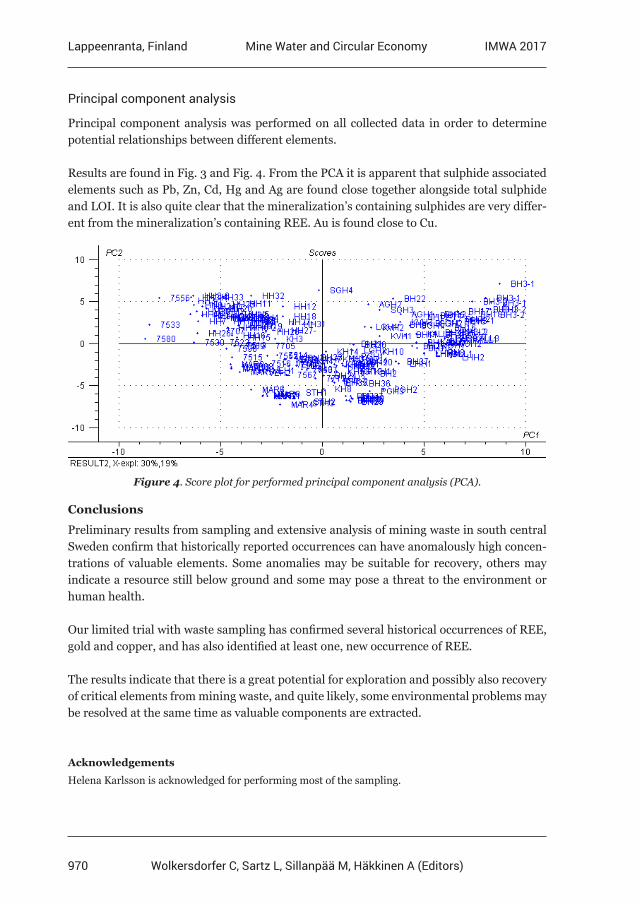
970
Lappeenranta, Finland IMWA 2017Mine Water and Circular Economy
Wolkersdorfer C, Sartz L, Sillanpää M, Häkkinen A (Editors)
Principal component analysis
Principal component analysis was performed on all collected data in order to determine potential relationships between different elements.
Results are found in Fig. 3 and Fig. 4. From the PCA it is apparent that sulphide associated elements such as Pb, Zn, Cd, Hg and Ag are found close together alongside total sulphide and LOI. It is also quite clear that the mineralization’s containing sulphides are very differ-ent from the mineralization’s containing REE. Au is found close to Cu.
Figure 4. Score plot for performed principal component analysis (PCA).
Conclusions
Preliminary results from sampling and extensive analysis of mining waste in south central Sweden confirm that historically reported occurrences can have anomalously high concen-trations of valuable elements. Some anomalies may be suitable for recovery, others may indicate a resource still below ground and some may pose a threat to the environment or human health.
Our limited trial with waste sampling has confirmed several historical occurrences of REE, gold and copper, and has also identified at least one, new occurrence of REE.
The results indicate that there is a great potential for exploration and possibly also recovery of critical elements from mining waste, and quite likely, some environmental problems may be resolved at the same time as valuable components are extracted.
Acknowledgements
Helena Karlsson is acknowledged for performing most of the sampling.
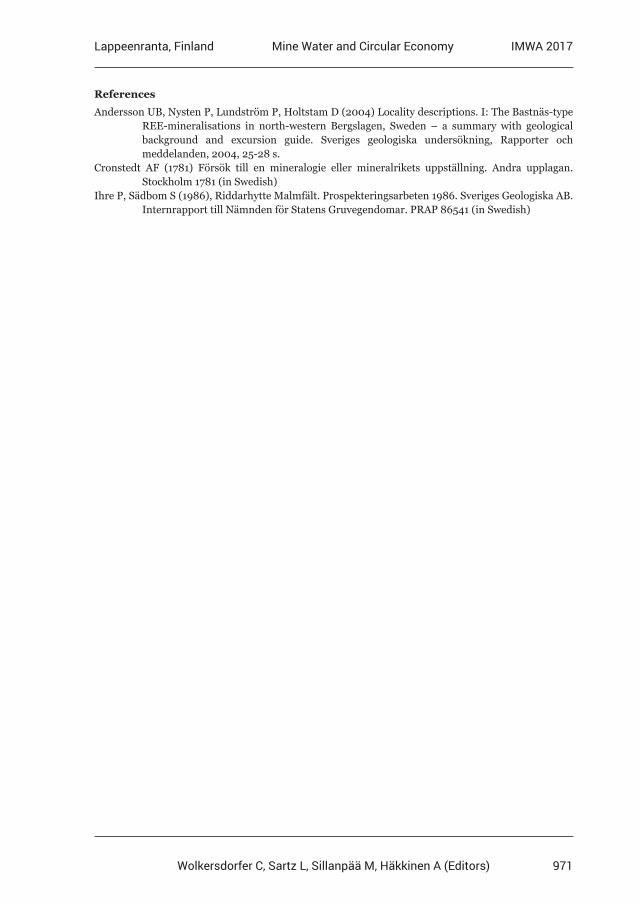
971
Lappeenranta, Finland IMWA 2017Mine Water and Circular Economy
Wolkersdorfer C, Sartz L, Sillanpää M, Häkkinen A (Editors)
References
Andersson UB, Nysten P, Lundström P, Holtstam D (2004) Locality descriptions. I: The Bastnäs-type REE-mineralisations in north-western Bergslagen, Sweden – a summary with geological background and excursion guide. Sveriges geologiska undersökning, Rapporter och meddelanden, 2004, 25-28 s.Cronstedt AF (1781) Försök till en mineralogie eller mineralrikets uppställning. Andra upplagan. Stockholm 1781 (in Swedish)Ihre P, Sädbom S (1986), Riddarhytte Malmfält. Prospekteringsarbeten 1986. Sveriges Geologiska AB. Internrapport till Nämnden för Statens Gruvegendomar. PRAP 86541 (in Swedish)
972
Lappeenranta, Finland IMWA 2017Mine Water and Circular Economy
Wolkersdorfer C, Sartz L, Sillanpää M, Häkkinen A (Editors)
Recovery of copper from low concentration waste waters by electrowinning
Pyry-Mikko Hannula1, Muhammad Kamran Khalid1, Sami Kinnunen1, Petteri Halli1, Dawid Janas2, Kirsi Yliniemi1, Mari Lundström1
1Aalto University, Department of Chemical and Metallurgical Engineering, School of Chemical Technology, Research group of hydrometallurgy and corrosion,
Vuorimiehentie 2, 02150 Espoo, Finland 2Silesian University of Technology, Department of Chemistry, B. Krzywoustego 4,
44-100 Gliwice, Poland
Abstract Metal pollution from mining operations has become a topic of concern due to the toxic nature of contaminated water. Potentially toxic metals do not degrade in the environment but accumulate in organisms while being toxic and carcinogenic. Typically, these waste waters contain low concentrations of metals which makes their recovery more difficult. In this research, the composition of waste water from various mining site and concentration plant locations were analysed. The recovery of copper from solutions by electrowinning on glassy carbon and carbon nanotube film was studied. The results show that waste water can be utilized to create novel composite structures energy efficiently.
Key words electrowinning, copper, carbon nanotube, waste water, low concentration
Introduction
Rapid development of heavy industries such as mining operations has led to serious en-vironmental issues caused by pollution. Potentially toxic metals do not degrade in the en-vironment but accumulate in organisms while being toxic and carcinogenic. For instance, there are over 1 million abandoned mines worldwide, and an even greater number of still operational mines and neutralization ponds, that are contaminated by metals such as cop-per, zinc, cadmium, lead, arsenic and iron (Fields 2003). As such, there is a growing de-mand for the removal of these metals from different waste streams and their potential reuse as secondary raw materials. As environmental regulations become more stringent and met-al prices increase the use of previously unemployed technologies may become possible for the removal and recovery of metals from different types of waste water streams.
There are many different techniques available for the recovery of low concentrations of met-als from waste waters, but typically the associated costs are high. Chemical precipitation is the most widely used waste water treatment technique due to its relative simplicity, but it requires the use of large amounts of chemicals that react with metal ions to form precipi-tates. These precipitates are then removed by sedimentation or filtration. Other potentially toxic metals removal techniques include ion exchange, adsorption, membrane filtration, coagulation and flocculation, flotation and electrochemical treatments.
Electrochemical methods for the recovery of low concentration of copper have so far been relatively understudied due to the required high capital investment and operating costs. However, as copper is more noble than other metals typically found in waste water streams,
973
Lappeenranta, Finland IMWA 2017Mine Water and Circular Economy
Wolkersdorfer C, Sartz L, Sillanpää M, Häkkinen A (Editors)
such as iron, nickel, lead, zinc and magnesium, it can be expected to be selectively recovered to create valuable high quality solid copper deposits. The competitive processes typically lead to some form of precipitated salts or increased concentration highlighting the poten-tial use of electrowinning as a recovery method. The possibility of utilizing industrial waste water as a source for high quality metal deposits by electrowinning offers an exciting new way of producing new materials in circular economy. Recently, carbon nanotube (CNT) – copper composite materials by electrochemical deposition of copper onto carbon nanotube materials have been explored for various electrical applications due to promising proper-ties, such as improved specific conductivity and ampacity (Subramaniam 2013), (Hannula 2016). However, until now these materials have been made from commercial chemicals, rather than waste waters. In addition, these synthetic solutions are free of any impurity metals that might compromise the quality of the resulting composite.
In this communication, we investigated the recovery process of high quality copper from low concentration and impure solutions by electrowinning onto carbon material. Commer-cial state-of-art glassy carbon and a novel carbon nanotube film were used to recover copper both from synthetic solutions as well as from an actual waste water sample collected from an industrial mine site.
Methods
Waste waters were obtained from various locations in Sweden, Finland and Australia and their composition was analysed by ICP-OES (inductively coupled plasma, optical emission spectroscopy, Perkin Elmer Optima 7100 DV, USA). Sample 14 is process waste water com-position before final neutralization and bleed out of the process.
The experimental work was carried out using a typical three electrode cell by a potentiostat (IviumStat, Netherlands) connected to a personal computer. The reference electrode was a standard calomel electrode (SCE, 0.244 V vs. SHE) by SI Analytics, Germany. Working electrode was a glassy carbon plate (GC, type 1, Alfa Aesar, America). A free-standing carbon nanotube film produced elsewhere (Janas, 2017) was also tested as the working electrode after removing an area of desired dimensions by surgical blade. The counter platinum elec-trode was 99.95 % purity produced by Kultakeskus, Finland. The impurities in the platinum were other PGMs, gold, silver, copper and base metals. The surface area of the working electrodes varied from 3 to 7 cm2.
A glass vessel with 200 cm3 volume was used as test cell and the distance between working and counter electrodes was kept constant at 2.5 ± 0.1 cm. Based on the actual waste water solution analysis (Table 1) the synthetic waste water composition was set as : 4 g/l of Fe and 0.1 g/l of Cu, while the solution pH was set to 2 by sulfuric acid additions. 0.5 M sodium sulfate was used as the background electrolyte to provide conductivity. The solution con-ductivity was approximately 70 mS/cm.
The synthetic solutions were prepared from analytical grade copper sulfate pentahydrate (CuSO4* 5H2O), iron sulfate heptahydrate (FeSO4*7H2O), sulfuric acid (H2SO4, 98 %), so-
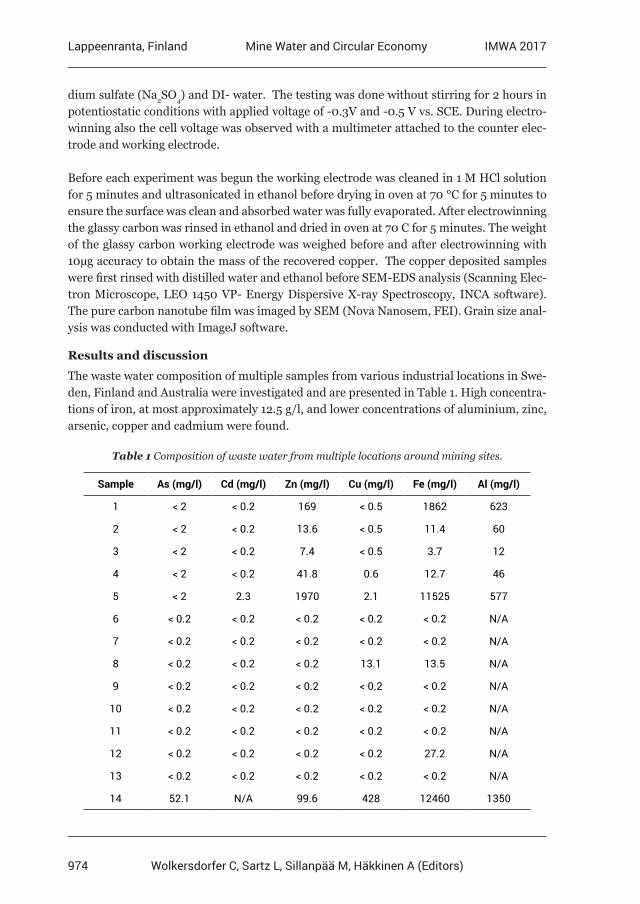
974
Lappeenranta, Finland IMWA 2017Mine Water and Circular Economy
Wolkersdorfer C, Sartz L, Sillanpää M, Häkkinen A (Editors)
dium sulfate (Na2SO4) and DI- water. The testing was done without stirring for 2 hours in potentiostatic conditions with applied voltage of -0.3V and -0.5 V vs. SCE. During electro-winning also the cell voltage was observed with a multimeter attached to the counter elec-trode and working electrode.
Before each experiment was begun the working electrode was cleaned in 1 M HCl solution for 5 minutes and ultrasonicated in ethanol before drying in oven at 70 °C for 5 minutes to ensure the surface was clean and absorbed water was fully evaporated. After electrowinning the glassy carbon was rinsed in ethanol and dried in oven at 70 C for 5 minutes. The weight of the glassy carbon working electrode was weighed before and after electrowinning with 10µg accuracy to obtain the mass of the recovered copper. The copper deposited samples were first rinsed with distilled water and ethanol before SEM-EDS analysis (Scanning Elec-tron Microscope, LEO 1450 VP- Energy Dispersive X-ray Spectroscopy, INCA software). The pure carbon nanotube film was imaged by SEM (Nova Nanosem, FEI). Grain size anal-ysis was conducted with ImageJ software.
Results and discussion
The waste water composition of multiple samples from various industrial locations in Swe-den, Finland and Australia were investigated and are presented in Table 1. High concentra-tions of iron, at most approximately 12.5 g/l, and lower concentrations of aluminium, zinc, arsenic, copper and cadmium were found.
Table 1 Composition of waste water from multiple locations around mining sites.
Sample As (mg/l) Cd (mg/l) Zn (mg/l) Cu (mg/l) Fe (mg/l) Al (mg/l)
1 < 2 < 0.2 169 < 0.5 1862 623
2 < 2 < 0.2 13.6 < 0.5 11.4 60
3 < 2 < 0.2 7.4 < 0.5 3.7 12
4 < 2 < 0.2 41.8 0.6 12.7 46
5 < 2 2.3 1970 2.1 11525 577
6 < 0.2 < 0.2 < 0.2 < 0.2 < 0.2 N/A
7 < 0.2 < 0.2 < 0.2 < 0.2 < 0.2 N/A
8 < 0.2 < 0.2 < 0.2 13.1 13.5 N/A
9 < 0.2 < 0.2 < 0.2 < 0.2 < 0.2 N/A
10 < 0.2 < 0.2 < 0.2 < 0.2 < 0.2 N/A
11 < 0.2 < 0.2 < 0.2 < 0.2 < 0.2 N/A
12 < 0.2 < 0.2 < 0.2 < 0.2 27.2 N/A
13 < 0.2 < 0.2 < 0.2 < 0.2 < 0.2 N/A
14 52.1 N/A 99.6 428 12460 1350
975
Lappeenranta, Finland IMWA 2017Mine Water and Circular Economy
Wolkersdorfer C, Sartz L, Sillanpää M, Häkkinen A (Editors)
In industrial electrowinning the typical operating conditions are at a cell voltage of 1.9- 2.5 V, copper ion concentration of ca 50 g/l, current density of 15-150 mA/cm2, temperature of 40-60 °C, a current efficiency 80-96 % and specific energy consumption of 1.9-2.5 kWh/kg of copper. Typically some form of solution movement (such as air sparging or forced circu-lation of electrolyte) is maintained to achieve faster and even mass transport. (Walsh 1990)
Typical time – current density graphs from electrowinning are shown in Figure 1. Here, synthetic waste water (100 ppm Cu, 4 g/l Fe, 0.5 M sodium sulfate at pH 2) and industrial waste water (sample 14) were used as the solution for copper electrowinning experiments with a carbon nanotube film and glassy carbon working electrode. The current was normal-ized with the apparent surface area of the samples. The glassy carbon surface is known to be smooth and homogenous, while the carbon nanotube film surface has a high surface area due to its porous nature (Figure 2a). Therefore, the actual current density is expected to be smaller than the value reported here.
Overall, the stable current densities are small, two orders of magnitude smaller than in industrial electrowinning, reflecting the small concentration and lack of agitation in the solution. However, even at lower polarization in the industrial waste water sample 14, the reaction rate is higher than in the synthetic solution. This result is attributed to the higher concentration of copper ions in the authentic waste water sample (428 ppm Cu) compared to the synthetic solution (100 ppm Cu).
The simplest way to increase the reaction rate would be to increase the overpotential. How-ever, this is expected to lead to unfavourable incorporation of less noble metals into the deposit and ruining the product purity. It can be reasonably assumed that the reaction rate could also be improved by improving the diffusion of copper ions i.e. mixing of the solution e.g. by a magnetic stirrer or by utilizing a more complex multi-cell structure. Another way to enhance the performance of this method is by increasing the electroactive area of the working electrode (Walsh 1990). In this respect, carbon nanotube films offer an exciting possibility through their highly porous surface area and tunable electrochemical activity through electro-oxidation (Hannula 2017).
Previously, we have shown smooth copper deposits on carbon nanotube films by electro-chemical deposition from industrial strength copper solutions, which contain no other met-als (Hannula 2017). In the current work, the as produced CNT-Cu samples showed a similar smooth morphology of deposits (Figure 2b-c) for both samples deposited in synthetic and waste water solutions.
Deposition from the synthetic solution yielded a copper layer with 0.3 µm thickness (area 6.8 cm2) with no contamination by iron from EDS analysis. However, the deposits from industrial waste water solutions (sample 14) were also found to be pure copper and no co-deposition of other metals could be identified with SEM-EDS. The copper layer from in-dustrial waste solution had thickness of 0.7 µm (area 3.1 cm2). The average grain size analy-
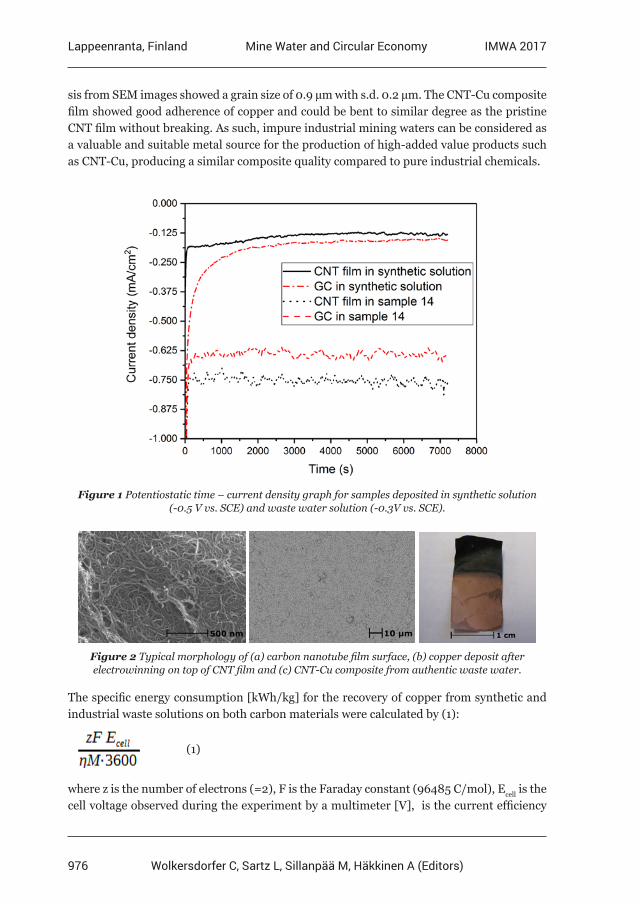
976
Lappeenranta, Finland IMWA 2017Mine Water and Circular Economy
Wolkersdorfer C, Sartz L, Sillanpää M, Häkkinen A (Editors)
sis from SEM images showed a grain size of 0.9 µm with s.d. 0.2 µm. The CNT-Cu composite film showed good adherence of copper and could be bent to similar degree as the pristine CNT film without breaking. As such, impure industrial mining waters can be considered as a valuable and suitable metal source for the production of high-added value products such as CNT-Cu, producing a similar composite quality compared to pure industrial chemicals.
Figure 1 Potentiostatic time – current density graph for samples deposited in synthetic solution (-0.5 V vs. SCE) and waste water solution (-0.3V vs. SCE).
Figure 2 Typical morphology of (a) carbon nanotube film surface, (b) copper deposit after electrowinning on top of CNT film and (c) CNT-Cu composite from authentic waste water.
The specific energy consumption [kWh/kg] for the recovery of copper from synthetic and industrial waste solutions on both carbon materials were calculated by (1):
(1)
where z is the number of electrons (=2), F is the Faraday constant (96485 C/mol), Ecell is the cell voltage observed during the experiment by a multimeter [V], is the current efficiency
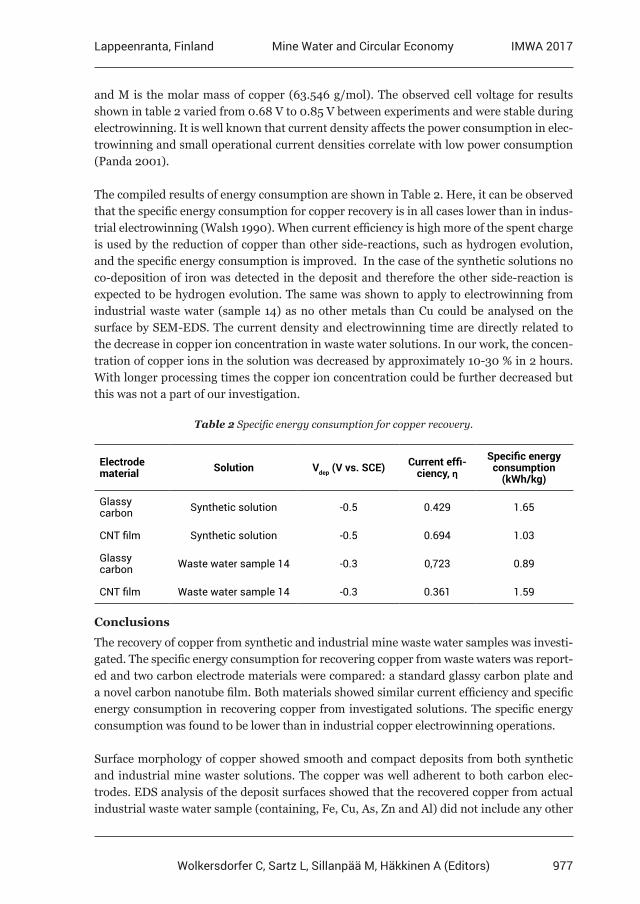
977
Lappeenranta, Finland IMWA 2017Mine Water and Circular Economy
Wolkersdorfer C, Sartz L, Sillanpää M, Häkkinen A (Editors)
and M is the molar mass of copper (63.546 g/mol). The observed cell voltage for results shown in table 2 varied from 0.68 V to 0.85 V between experiments and were stable during electrowinning. It is well known that current density affects the power consumption in elec-trowinning and small operational current densities correlate with low power consumption (Panda 2001).
The compiled results of energy consumption are shown in Table 2. Here, it can be observed that the specific energy consumption for copper recovery is in all cases lower than in indus-trial electrowinning (Walsh 1990). When current efficiency is high more of the spent charge is used by the reduction of copper than other side-reactions, such as hydrogen evolution, and the specific energy consumption is improved. In the case of the synthetic solutions no co-deposition of iron was detected in the deposit and therefore the other side-reaction is expected to be hydrogen evolution. The same was shown to apply to electrowinning from industrial waste water (sample 14) as no other metals than Cu could be analysed on the surface by SEM-EDS. The current density and electrowinning time are directly related to the decrease in copper ion concentration in waste water solutions. In our work, the concen-tration of copper ions in the solution was decreased by approximately 10-30 % in 2 hours. With longer processing times the copper ion concentration could be further decreased but this was not a part of our investigation.
Table 2 Specific energy consumption for copper recovery.
Electrode material Solution Vdep (V vs. SCE) Current effi-
ciency, ƞSpecific energy
consumption (kWh/kg)
Glassy carbon Synthetic solution -0.5 0.429 1.65
CNT film Synthetic solution -0.5 0.694 1.03
Glassy carbon Waste water sample 14 -0.3 0,723 0.89
CNT film Waste water sample 14 -0.3 0.361 1.59
Conclusions
The recovery of copper from synthetic and industrial mine waste water samples was investi-gated. The specific energy consumption for recovering copper from waste waters was report-ed and two carbon electrode materials were compared: a standard glassy carbon plate and a novel carbon nanotube film. Both materials showed similar current efficiency and specific energy consumption in recovering copper from investigated solutions. The specific energy consumption was found to be lower than in industrial copper electrowinning operations.
Surface morphology of copper showed smooth and compact deposits from both synthetic and industrial mine waster solutions. The copper was well adherent to both carbon elec-trodes. EDS analysis of the deposit surfaces showed that the recovered copper from actual industrial waste water sample (containing, Fe, Cu, As, Zn and Al) did not include any other
978
Lappeenranta, Finland IMWA 2017Mine Water and Circular Economy
Wolkersdorfer C, Sartz L, Sillanpää M, Häkkinen A (Editors)
metals as impurities. The biggest caveat in using electrowinning to produce high quality metal deposits from low concentration waste waters is the low reaction rate of the process – about two orders of magnitude smaller than in industrial electrowinning conditions. It is expected, however, that the kinetics of the process can be markedly improved by adding agitation to the system and this will be covered in future research.
Carbon nanotube – copper composite structures produced from industrial mine waste wa-ter showed similar morphology as previously published composites produced from synthet-ic solutions and commercial chemicals. The results show promise for the energy efficient recovery of copper on carbon materials from copper containing (ca 100-400 ppm Cu) mine waste waters. In addition, the results show promise in the production of high quality and high added-value composite materials based on carbon nanotube films and valueless mine waste waters.
Acknowledgements
This work has been financed by the Finnish Academy NoWaste project (grant nr. 297962) and Association of Finnish Steel and Metal producers METSEK project. RawMatTERS Finland Infrastructure (RAMI) supported by Academy of Finland is greatly acknowledged.
References
Fields, S. (2003) The earth’s open wounds: abandoned and orphaned mines Environmental health perspectives: 111(3): A154-61Hannula, P., Peltonen, A., Aromaa, J., Janas, D., Lundström, M., Wilson, B.P., Koziol, K. & Forsén, O. (2016) Carbon nanotube-copper composites by electrodeposition on carbon nanotube fibers. Carbon 107: 281-287, doi: 10.1016/j.carbon.2016.06.008Hannula, P., Aromaa, J., Wilson, B.P., Janas, D., Koziol, K., Forsén, O. & Lundström, M. (2017) Observations of copper deposition on functionalized carbon nanotube films. Electrochimica Acta 232:495-504, doi: 10.1016/j.electacta.2017.03.006Janas, D., Rdest, M. & Koziol, K.K.K. (2017) Free-standing films from chirality-controlled carbon nanotubes Materials & Design 121: 119—125, doi: 10.1016/j.matdes.2017.02.062Panda, B. & Das, S. (2001) Electrowinning of copper from sulfate electrolyte in presence of sulfurous acid Hydrometallurgy 59: 55-67, doi: 10.1016/S0304-386X(00)00140-7Subramaniam, C., Yamada, T., Kobashi, K., Sekiguchi, A., Futaba, D.N., Yumura, M. & Hata, K. (2013) One hundred fold increase in current carrying capacity in a carbon nanotube-copper composite. Nature communications 4, doi: 10.1038/ncomms3202Walsh, F.C. & Pletcher, D. (1990) Industrial electrochemistry Chapman Hall, London, 653 pp
979
Lappeenranta, Finland IMWA 2017Mine Water and Circular Economy
Wolkersdorfer C, Sartz L, Sillanpää M, Häkkinen A (Editors)
Hand-held X-ray fluorescence (hXRF) measurements as a useful tool in the environmental and mining sector –
Comparative measurements and effects of water content
Maria Ussath1, Marlies Grimmer1, Nils Hoth1, Juan Alcalde2
1Technische Universität Bergakademie Freiberg, Gustav-Zeuner-Straße 1A, 09599 Freiberg, Germany, [email protected]
2Universidad de Concepción, Instituto de Geología Aplicada, Chile
Abstract In this article, direct hXRF measurements on zinc-, arsenic- and lead-containing tailing material, which has been investigated with regard to its potential for re-mining, will be presented. Measurements on the original moist field material will be compared to measurements on dry material. In general, the evaluation of the hXRF data for the tailing material shows a good relative replication of the element contents determined (chemical analysis). This was not compulsory for such a heterogeneous material. In humid sediments, however, there are considerably large fluctuations in the element concentration.
Key words hand-held X-ray fluorescence spectrometer, hXRF, water content influence, tailings
Introduction
There are various applications of a hand-held XRF analyzer in fields related to mining, in the remediation sector and for environmental hazard analysis. In our research group, an hXRF device has been tested over the last 5 years in a variety of applications. During its application, the following materials were investigated: massive ore bodies, sediments and tailing material, but also composite materials and brown coal.
From the physical background of the XRF measuring principle, it is known that in addition to matrix and grain size effects the water content has a great influence on the results of XRF analysis (Kalnicky 2001). This has already been shown comparing field values with labora-tory values (Ussath 2015). The question is, how big is this effect and is it possible to correct the field-measured values?
For re-mining projects of old tailings and environmental assessment, the reliability of the quantification of valuable elements with field methods such as hXRF is important. Studies were carried out on various Chilean tailing materials. Some selected results of these investi-gations on material of a zinc-gold mine and a copper mine are presented.
Methods
X-ray fluorescence analysis and recalibration of raw data
The X-ray fluorescence (XRF) spectrometer is an instrument used for non-destructive detection of major elements and selected trace elements during the investigation of rocks, ores and soils. A hand-held X-ray fluorescence (hXRF) analyzer allows operating on-site for immediate analysis. For this study, an hXRF Niton XL3t980 analyzer equipped with an Ag-Anode 50 kV X-ray tube and Silicon-Drift-Detector 8 mm spot was used.
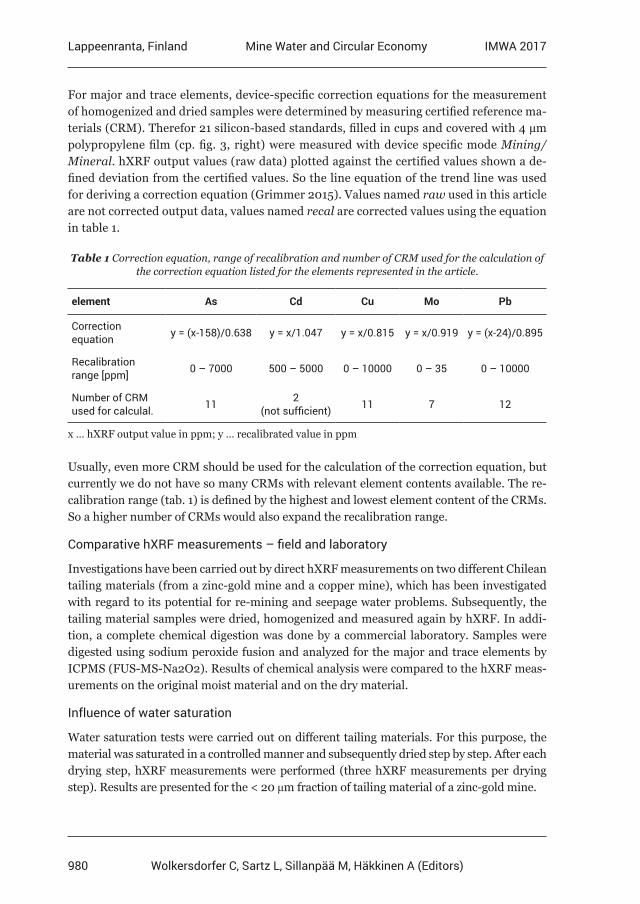
980
Lappeenranta, Finland IMWA 2017Mine Water and Circular Economy
Wolkersdorfer C, Sartz L, Sillanpää M, Häkkinen A (Editors)
For major and trace elements, device-specific correction equations for the measurement of homogenized and dried samples were determined by measuring certified reference ma-terials (CRM). Therefor 21 silicon-based standards, filled in cups and covered with 4 µm polypropylene film (cp. fig. 3, right) were measured with device specific mode Mining/Mineral. hXRF output values (raw data) plotted against the certified values shown a de-fined deviation from the certified values. So the line equation of the trend line was used for deriving a correction equation (Grimmer 2015). Values named raw used in this article are not corrected output data, values named recal are corrected values using the equation in table 1. Table 1 Correction equation, range of recalibration and number of CRM used for the calculation of
the correction equation listed for the elements represented in the article.
element As Cd Cu Mo Pb
Correction equation y = (x-158)/0.638 y = x/1.047 y = x/0.815 y = x/0.919 y = (x-24)/0.895
Recalibration range [ppm] 0 – 7000 500 – 5000 0 – 10000 0 – 35 0 – 10000
Number of CRM used for calculal. 11 2
(not sufficient) 11 7 12
x … hXRF output value in ppm; y … recalibrated value in ppm
Usually, even more CRM should be used for the calculation of the correction equation, but currently we do not have so many CRMs with relevant element contents available. The re-calibration range (tab. 1) is defined by the highest and lowest element content of the CRMs. So a higher number of CRMs would also expand the recalibration range.
Comparative hXRF measurements – field and laboratory
Investigations have been carried out by direct hXRF measurements on two different Chilean tailing materials (from a zinc-gold mine and a copper mine), which has been investigated with regard to its potential for re-mining and seepage water problems. Subsequently, the tailing material samples were dried, homogenized and measured again by hXRF. In addi-tion, a complete chemical digestion was done by a commercial laboratory. Samples were digested using sodium peroxide fusion and analyzed for the major and trace elements by ICPMS (FUS-MS-Na2O2). Results of chemical analysis were compared to the hXRF meas-urements on the original moist material and on the dry material.
Influence of water saturation
Water saturation tests were carried out on different tailing materials. For this purpose, the material was saturated in a controlled manner and subsequently dried step by step. After each drying step, hXRF measurements were performed (three hXRF measurements per drying step). Results are presented for the < 20 μm fraction of tailing material of a zinc-gold mine.
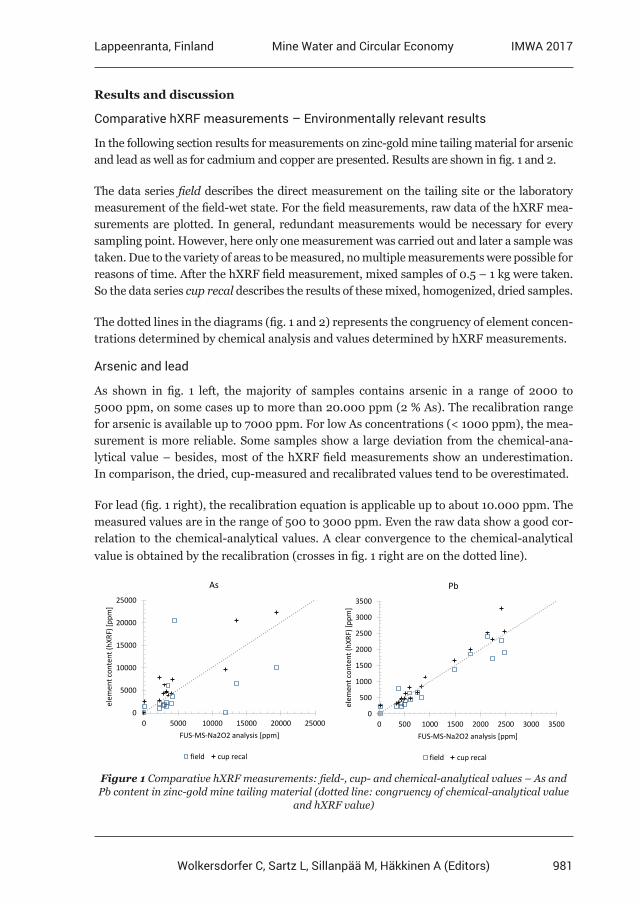
981
Lappeenranta, Finland IMWA 2017Mine Water and Circular Economy
Wolkersdorfer C, Sartz L, Sillanpää M, Häkkinen A (Editors)
Results and discussion
Comparative hXRF measurements – Environmentally relevant results
In the following section results for measurements on zinc-gold mine tailing material for arsenic and lead as well as for cadmium and copper are presented. Results are shown in fig. 1 and 2.
The data series field describes the direct measurement on the tailing site or the laboratory measurement of the field-wet state. For the field measurements, raw data of the hXRF mea-surements are plotted. In general, redundant measurements would be necessary for every sampling point. However, here only one measurement was carried out and later a sample was taken. Due to the variety of areas to be measured, no multiple measurements were possible for reasons of time. After the hXRF field measurement, mixed samples of 0.5 – 1 kg were taken. So the data series cup recal describes the results of these mixed, homogenized, dried samples.
The dotted lines in the diagrams (fig. 1 and 2) represents the congruency of element concen-trations determined by chemical analysis and values determined by hXRF measurements.
Arsenic and lead
As shown in fig. 1 left, the majority of samples contains arsenic in a range of 2000 to 5000 ppm, on some cases up to more than 20.000 ppm (2 % As). The recalibration range for arsenic is available up to 7000 ppm. For low As concentrations (< 1000 ppm), the mea-surement is more reliable. Some samples show a large deviation from the chemical-ana-lytical value – besides, most of the hXRF field measurements show an underestimation. In comparison, the dried, cup-measured and recalibrated values tend to be overestimated.
For lead (fig. 1 right), the recalibration equation is applicable up to about 10.000 ppm. The measured values are in the range of 500 to 3000 ppm. Even the raw data show a good cor-relation to the chemical-analytical values. A clear convergence to the chemical-analytical value is obtained by the recalibration (crosses in fig. 1 right are on the dotted line).
0
5000
10000
15000
20000
25000
0 5000 10000 15000 20000 25000
elem
ent c
onte
nt (h
XRF)
[ppm
]
FUS-MS-Na2O2 analysis [ppm]
As
field cup recal
0
500
1000
1500
2000
2500
3000
3500
0 500 1000 1500 2000 2500 3000 3500
elem
ent c
onte
nt (h
XRF)
[ppm
]
FUS-MS-Na2O2 analysis [ppm]
Pb
field cup recal
Figure 1 Comparative hXRF measurements: field-, cup- and chemical-analytical values – As and Pb content in zinc-gold mine tailing material (dotted line: congruency of chemical-analytical value
and hXRF value)
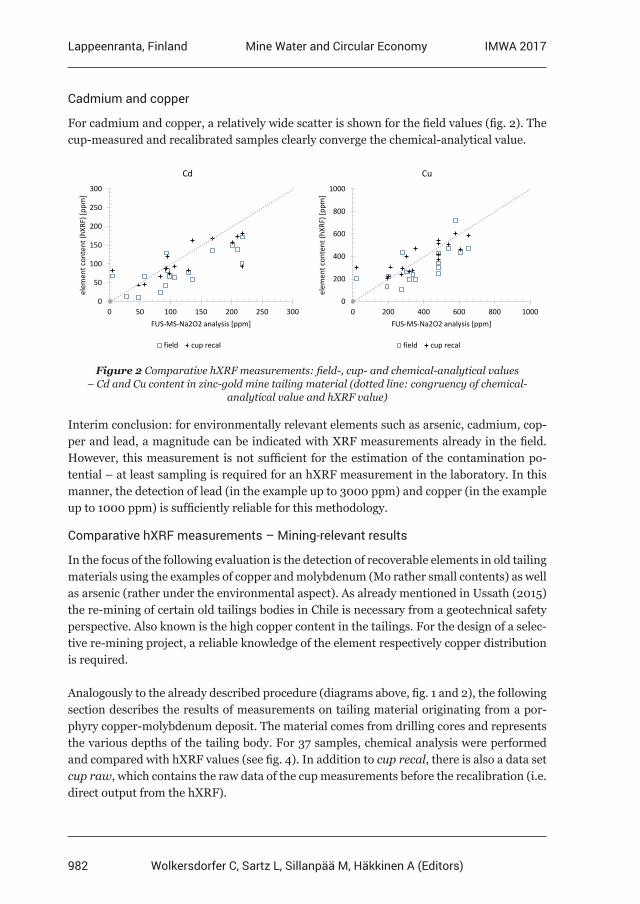
982
Lappeenranta, Finland IMWA 2017Mine Water and Circular Economy
Wolkersdorfer C, Sartz L, Sillanpää M, Häkkinen A (Editors)
Cadmium and copper
For cadmium and copper, a relatively wide scatter is shown for the field values (fig. 2). The cup-measured and recalibrated samples clearly converge the chemical-analytical value.
0
50
100
150
200
250
300
0 50 100 150 200 250 300
elem
ent c
onte
nt (h
XRF)
[ppm
]
FUS-MS-Na2O2 analysis [ppm]
Cd
field cup recal
0
200
400
600
800
1000
0 200 400 600 800 1000el
emen
t con
tent
(hXR
F) [p
pm]
FUS-MS-Na2O2 analysis [ppm]
Cu
field cup recal
Figure 2 Comparative hXRF measurements: field-, cup- and chemical-analytical values – Cd and Cu content in zinc-gold mine tailing material (dotted line: congruency of chemical-
analytical value and hXRF value)
Interim conclusion: for environmentally relevant elements such as arsenic, cadmium, cop-per and lead, a magnitude can be indicated with XRF measurements already in the field. However, this measurement is not sufficient for the estimation of the contamination po-tential – at least sampling is required for an hXRF measurement in the laboratory. In this manner, the detection of lead (in the example up to 3000 ppm) and copper (in the example up to 1000 ppm) is sufficiently reliable for this methodology.
Comparative hXRF measurements – Mining-relevant results
In the focus of the following evaluation is the detection of recoverable elements in old tailing materials using the examples of copper and molybdenum (Mo rather small contents) as well as arsenic (rather under the environmental aspect). As already mentioned in Ussath (2015) the re-mining of certain old tailings bodies in Chile is necessary from a geotechnical safety perspective. Also known is the high copper content in the tailings. For the design of a selec-tive re-mining project, a reliable knowledge of the element respectively copper distribution is required.
Analogously to the already described procedure (diagrams above, fig. 1 and 2), the following section describes the results of measurements on tailing material originating from a por-phyry copper-molybdenum deposit. The material comes from drilling cores and represents the various depths of the tailing body. For 37 samples, chemical analysis were performed and compared with hXRF values (see fig. 4). In addition to cup recal, there is also a data set cup raw, which contains the raw data of the cup measurements before the recalibration (i.e. direct output from the hXRF).
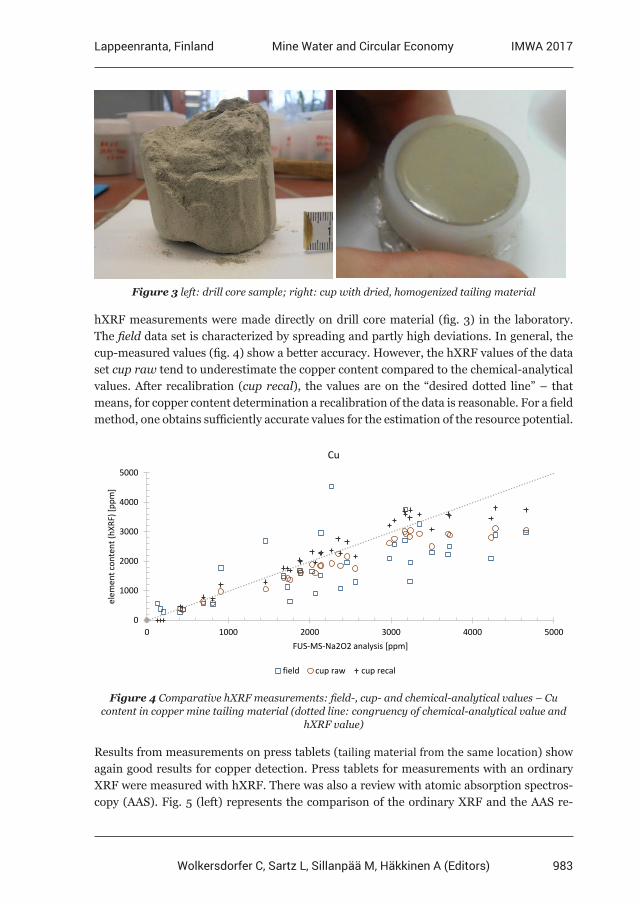
983
Lappeenranta, Finland IMWA 2017Mine Water and Circular Economy
Wolkersdorfer C, Sartz L, Sillanpää M, Häkkinen A (Editors)
Figure 3 left: drill core sample; right: cup with dried, homogenized tailing material
hXRF measurements were made directly on drill core material (fig. 3) in the laboratory. The field data set is characterized by spreading and partly high deviations. In general, the cup-measured values (fig. 4) show a better accuracy. However, the hXRF values of the data set cup raw tend to underestimate the copper content compared to the chemical-analytical values. After recalibration (cup recal), the values are on the “desired dotted line” – that means, for copper content determination a recalibration of the data is reasonable. For a field method, one obtains sufficiently accurate values for the estimation of the resource potential.
0
1000
2000
3000
4000
5000
0 1000 2000 3000 4000 5000
elem
ent c
onte
nt (h
XRF)
[ppm
]
FUS-MS-Na2O2 analysis [ppm]
Cu
field cup raw cup recal
Figure 4 Comparative hXRF measurements: field-, cup- and chemical-analytical values – Cu content in copper mine tailing material (dotted line: congruency of chemical-analytical value and
hXRF value)
Results from measurements on press tablets (tailing material from the same location) show again good results for copper detection. Press tablets for measurements with an ordinary XRF were measured with hXRF. There was also a review with atomic absorption spectros-copy (AAS). Fig. 5 (left) represents the comparison of the ordinary XRF and the AAS re-
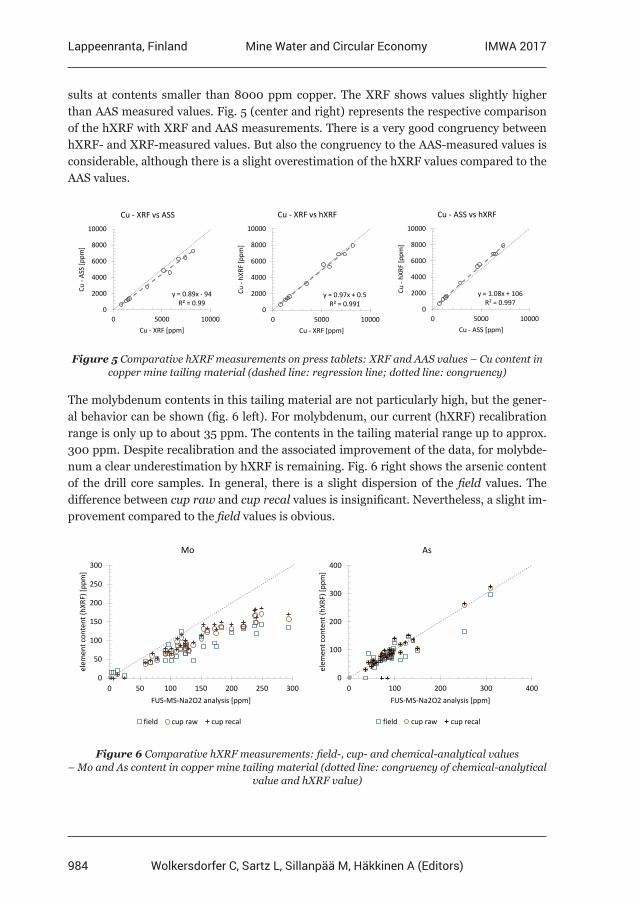
984
Lappeenranta, Finland IMWA 2017Mine Water and Circular Economy
Wolkersdorfer C, Sartz L, Sillanpää M, Häkkinen A (Editors)
sults at contents smaller than 8000 ppm copper. The XRF shows values slightly higher than AAS measured values. Fig. 5 (center and right) represents the respective comparison of the hXRF with XRF and AAS measurements. There is a very good congruency between hXRF- and XRF-measured values. But also the congruency to the AAS-measured values is considerable, although there is a slight overestimation of the hXRF values compared to the AAS values.
y = 0.89x - 94R² = 0.99
0
2000
4000
6000
8000
10000
0 5000 10000
Cu -
ASS
[ppm
]
Cu - XRF [ppm]
Cu - XRF vs ASS
y = 0.97x + 0.5R² = 0.991
0
2000
4000
6000
8000
10000
0 5000 10000
Cu -
hXRF
[ppm
]
Cu - XRF [ppm]
Cu - XRF vs hXRF
y = 1.08x + 106R² = 0.997
0
2000
4000
6000
8000
10000
0 5000 10000
Cu -
hXRF
[ppm
]
Cu - ASS [ppm]
Cu - ASS vs hXRF
Figure 5 Comparative hXRF measurements on press tablets: XRF and AAS values – Cu content in copper mine tailing material (dashed line: regression line; dotted line: congruency)
The molybdenum contents in this tailing material are not particularly high, but the gener-al behavior can be shown (fig. 6 left). For molybdenum, our current (hXRF) recalibration range is only up to about 35 ppm. The contents in the tailing material range up to approx. 300 ppm. Despite recalibration and the associated improvement of the data, for molybde-num a clear underestimation by hXRF is remaining. Fig. 6 right shows the arsenic content of the drill core samples. In general, there is a slight dispersion of the field values. The difference between cup raw and cup recal values is insignificant. Nevertheless, a slight im-provement compared to the field values is obvious.
0
50
100
150
200
250
300
0 50 100 150 200 250 300
elem
ent c
onte
nt (h
XRF)
[ppm
]
FUS-MS-Na2O2 analysis [ppm]
Mo
field cup raw cup recal
0
100
200
300
400
0 100 200 300 400
elem
ent c
onte
nt (h
XRF)
[ppm
]
FUS-MS-Na2O2 analysis [ppm]
As
field cup raw cup recal
Figure 6 Comparative hXRF measurements: field-, cup- and chemical-analytical values – Mo and As content in copper mine tailing material (dotted line: congruency of chemical-analytical
value and hXRF value)
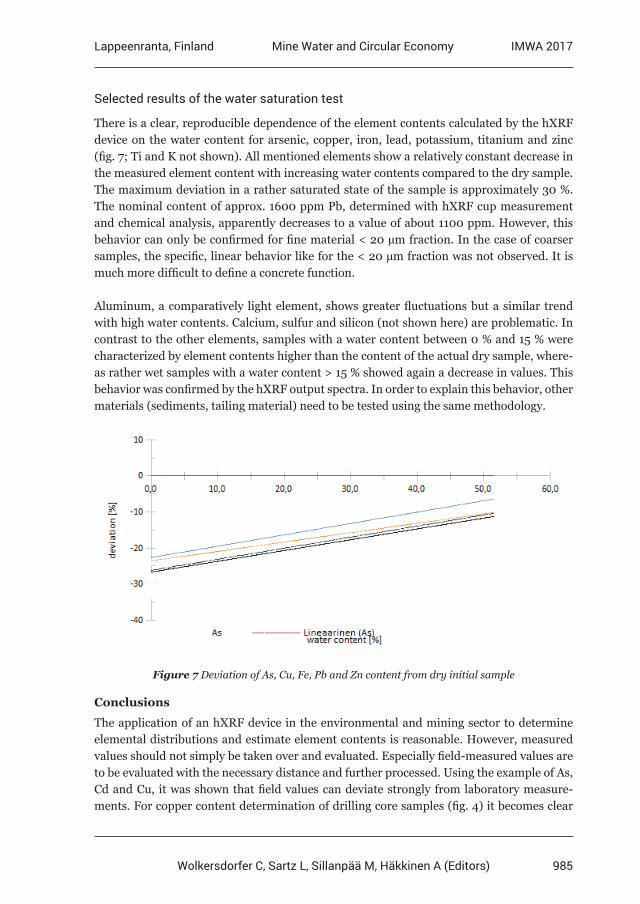
985
Lappeenranta, Finland IMWA 2017Mine Water and Circular Economy
Wolkersdorfer C, Sartz L, Sillanpää M, Häkkinen A (Editors)
Selected results of the water saturation test
There is a clear, reproducible dependence of the element contents calculated by the hXRF device on the water content for arsenic, copper, iron, lead, potassium, titanium and zinc (fig. 7; Ti and K not shown). All mentioned elements show a relatively constant decrease in the measured element content with increasing water contents compared to the dry sample. The maximum deviation in a rather saturated state of the sample is approximately 30 %. The nominal content of approx. 1600 ppm Pb, determined with hXRF cup measurement and chemical analysis, apparently decreases to a value of about 1100 ppm. However, this behavior can only be confirmed for fine material < 20 µm fraction. In the case of coarser samples, the specific, linear behavior like for the < 20 µm fraction was not observed. It is much more difficult to define a concrete function.
Aluminum, a comparatively light element, shows greater fluctuations but a similar trend with high water contents. Calcium, sulfur and silicon (not shown here) are problematic. In contrast to the other elements, samples with a water content between 0 % and 15 % were characterized by element contents higher than the content of the actual dry sample, where-as rather wet samples with a water content > 15 % showed again a decrease in values. This behavior was confirmed by the hXRF output spectra. In order to explain this behavior, other materials (sediments, tailing material) need to be tested using the same methodology.
Figure 7 Deviation of As, Cu, Fe, Pb and Zn content from dry initial sample
Conclusions
The application of an hXRF device in the environmental and mining sector to determine elemental distributions and estimate element contents is reasonable. However, measured values should not simply be taken over and evaluated. Especially field-measured values are to be evaluated with the necessary distance and further processed. Using the example of As, Cd and Cu, it was shown that field values can deviate strongly from laboratory measure-ments. For copper content determination of drilling core samples (fig. 4) it becomes clear
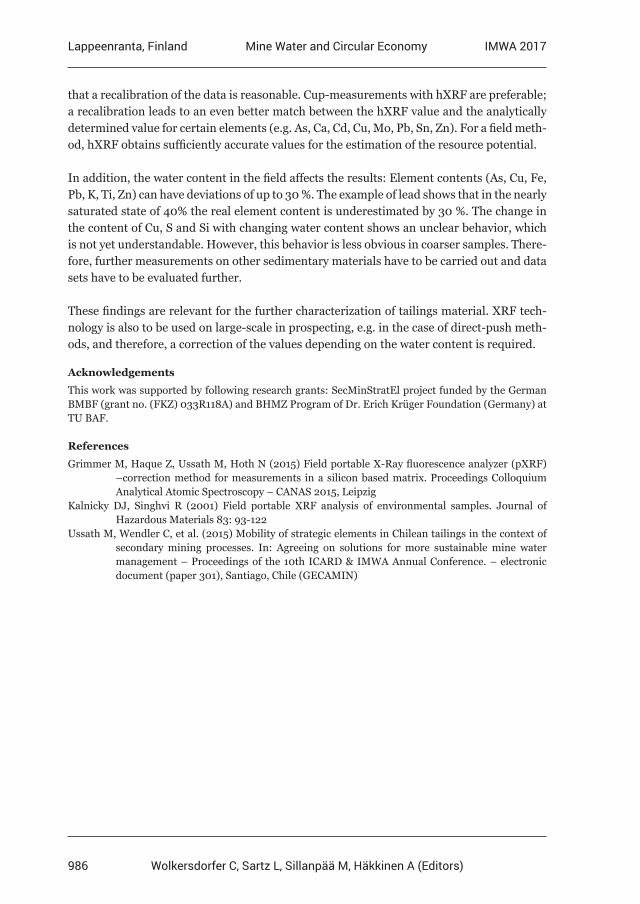
986
Lappeenranta, Finland IMWA 2017Mine Water and Circular Economy
Wolkersdorfer C, Sartz L, Sillanpää M, Häkkinen A (Editors)
that a recalibration of the data is reasonable. Cup-measurements with hXRF are preferable; a recalibration leads to an even better match between the hXRF value and the analytically determined value for certain elements (e.g. As, Ca, Cd, Cu, Mo, Pb, Sn, Zn). For a field meth-od, hXRF obtains sufficiently accurate values for the estimation of the resource potential.
In addition, the water content in the field affects the results: Element contents (As, Cu, Fe, Pb, K, Ti, Zn) can have deviations of up to 30 %. The example of lead shows that in the nearly saturated state of 40% the real element content is underestimated by 30 %. The change in the content of Cu, S and Si with changing water content shows an unclear behavior, which is not yet understandable. However, this behavior is less obvious in coarser samples. There-fore, further measurements on other sedimentary materials have to be carried out and data sets have to be evaluated further.
These findings are relevant for the further characterization of tailings material. XRF tech-nology is also to be used on large-scale in prospecting, e.g. in the case of direct-push meth-ods, and therefore, a correction of the values depending on the water content is required.
Acknowledgements
This work was supported by following research grants: SecMinStratEl project funded by the German BMBF (grant no. (FKZ) 033R118A) and BHMZ Program of Dr. Erich Krüger Foundation (Germany) at TU BAF.
References
Grimmer M, Haque Z, Ussath M, Hoth N (2015) Field portable X-Ray fluorescence analyzer (pXRF) –correction method for measurements in a silicon based matrix. Proceedings Colloquium Analytical Atomic Spectroscopy – CANAS 2015, LeipzigKalnicky DJ, Singhvi R (2001) Field portable XRF analysis of environmental samples. Journal of Hazardous Materials 83: 93-122Ussath M, Wendler C, et al. (2015) Mobility of strategic elements in Chilean tailings in the context of secondary mining processes. In: Agreeing on solutions for more sustainable mine water management – Proceedings of the 10th ICARD & IMWA Annual Conference. – electronic document (paper 301), Santiago, Chile (GECAMIN)


7 Constituents
990
Lappeenranta, Finland IMWA 2017Mine Water and Circular Economy
Wolkersdorfer C, Sartz L, Sillanpää M, Häkkinen A (Editors)
Recycling bioremediated cyanidation tailings wastewater within the biooxidation circuit for gold recovery: impact
on process performance and water management
Catherine J. Edward, Mariette Smart and Susan T. L. Harrison
Centre for Bioprocess Engineering Research (CeBER), Department of Chemical Engineering, University of Cape Town, South Africa.
Abstract Small scale batch experiments were conducted to assess potential to recycle bioremediated cyanidation tailings water (ASTER™ water) within the biooxidation circuit and reduce nutrient demand of biooxidation operations. Cultures grown in 0K medium or ASTER™ water with and without nutrient supplementation were compared. The microbial community was challenged with thiocyanate (SCN). ASTER™ water cannot provide sufficient nutrients to sustain growth and metabolic activity of the culture. Supplemented ASTER™ water promoted growth and activity comparable to cultures grown in 0 K media. Elevated thiocyanate concentrations (5 mg/L) altered community structure, resulting in loss of iron-oxidising bacterium L. ferriphilum, affecting process performance.
Key words Wastewater recycling, thiocyanate, iron oxidation, sulphur oxidation, mixed biooxidation community
Introduction
Biohydrometallurgical processing schemes are highly dependent on water quality for op-timum function, therefore water recycling within these operations has been limited (Stott et al. 2001). The current trend towards integrated, sustainable mining practices within commercial operations and toward ‘zero-waste’ systems has prompted re-evaluation of plant-wide water management (Mudd 2007; Mudd 2008). Biohydrometallurgical process routes for gold recovery from sulphidic concentrates have typically not recycled cyanida-tion wastewater due to historical process upsets and the apparent sensitivity of the bioo-xidation organisms to low levels of thiocyanate (SCN-) (Adams 2013). The ‘rule-of-thumb’ exposure limit has been proposed as 1 mg/L SCN- (van Aswegen et al. 2007); however, data from rigorous study is not yet presented. Cyanidation bioremediation processes such as the Activated Sludge Tailings Effluent Remediation (ASTER™) process have been suc-cessful in reducing high levels of SCN- (± 1500 mg/L) to concentrations of 0.025 and 0.1 mg/L (van Buuren 2014). This suggests potential to close the water cycle within the biooxidation circuit. SCN- is metabolised by various organisms via reactions (1) to (3) to generate ammonium, sulphate and bicarbonate (Makhotla et al. 2010). These ions, specif-ically NH4
+, may contribute to the nutrient requirements of the biooxidation culture that predominantly depend on nitrogen, phosphate and potassium supplemented in the form of sulphate salts (van Aswegen et al. 2007).
1
Recycling bioremediated cyanidation tailings wastewater within the biooxidation circuit for gold recovery: impact on process
performance and water managementCatherine J. Edward, Mariette Smart and Susan T. L. Harrison
Centre for Bioprocess Engineering Research (CeBER), Department of Chemical Engineering, University of Cape Town, South Africa.
Abstract Small scale batch experiments were conducted to assess potential to recycle bioremediated cyanidation tailings water (ASTER™ water) within the biooxidation circuit and reduce nutrient demand of biooxidation operations. Cultures grown in 0K medium or ASTER™ water with and without nutrient supplementation were compared. The microbial community was challenged with thiocyanate (SCN-). ASTER™ water cannot provide sufficient nutrients to sustain growth and metabolic activity of the culture. Supplemented ASTER™ water promoted growth and activity comparable to cultures grown in 0 K media. Elevated thiocyanate concentrations (5 mg/l) altered community structure, resulting in loss of iron-oxidising bacterium L. ferriphilum, affecting process performance. Key words: Wastewater recycling, thiocyanate, iron oxidation, sulphur oxidation, mixed biooxidation community
Introduction Biohydrometallurgical processing schemes are highly dependent on water quality for optimum function, therefore water recycling within these operations has been limited (Stott et al. 2001). The current trend towards integrated, sustainable mining practices within commercial operations and toward ‘zero-waste’ systems has prompted re-evaluation of plant-wide water management (Mudd 2007; Mudd 2008). Biohydrometallurgical process routes for gold recovery from sulphidic concentrates have typically not recycled cyanidation wastewater due to historical process upsets and the apparent sensitivity of the biooxidation organisms to low levels of thiocyanate (SCN-) (Adams 2013). The ‘rule-of-thumb’ exposure limit has been proposed as 1 mg/l SCN- (van Aswegen et al. 2007); however, data from rigorous study is not yet presented. Cyanidation bioremediation processes such as the Activated Sludge Tailings Effluent Remediation (ASTER™) process have been successful in reducing high levels of SCN- (± 1500 mg/l) to concentrations of 0.025 and 0.1 mg/l (van Buuren 2014). This suggests potential to close the water cycle within the biooxidation circuit. SCN- is metabolised by various organisms via reactions (1) to (3) to generate ammonium, sulphate and bicarbonate (Makhotla et al. 2010). These ions, specifically NH4+, may contribute to the nutrient requirements of the biooxidation culture that predominantly depend on nitrogen, phosphate and potassium supplemented in the form of sulphate salts (van Aswegen et al. 2007).
𝑆𝑆𝑆𝑆𝑆𝑆𝑆𝑆𝑆𝑆𝑆𝑆− + 𝐻𝐻𝐻𝐻2𝑂𝑂𝑂𝑂 → 𝐻𝐻𝐻𝐻𝑆𝑆𝑆𝑆𝑆𝑆𝑆𝑆𝑂𝑂𝑂𝑂 + 𝐻𝐻𝐻𝐻𝑆𝑆𝑆𝑆− (1)
𝐻𝐻𝐻𝐻𝑆𝑆𝑆𝑆𝑆𝑆𝑆𝑆𝑂𝑂𝑂𝑂 + 2𝐻𝐻𝐻𝐻2𝑂𝑂𝑂𝑂 → 𝑆𝑆𝑆𝑆𝐻𝐻𝐻𝐻4+ + 𝐻𝐻𝐻𝐻𝑆𝑆𝑆𝑆𝑂𝑂𝑂𝑂3− (2)
𝑆𝑆𝑆𝑆𝐻𝐻𝐻𝐻− + 2𝑂𝑂𝑂𝑂2 → 𝑆𝑆𝑆𝑆𝑂𝑂𝑂𝑂42− + 𝐻𝐻𝐻𝐻+ (3)
Biooxidation cultures are typically dominated by three species: Acidithiobacillus caldus, Leptospirillum ferriphilum and Acidiplasma cupricumulans. These microorganisms provide leach agents to facilitate the degradation of the mineral concentrate encapsulating the gold metal, making it available for recovery via cyanidation. In this research, the feasibility of recycling
991
Lappeenranta, Finland IMWA 2017Mine Water and Circular Economy
Wolkersdorfer C, Sartz L, Sillanpää M, Häkkinen A (Editors)
Biooxidation cultures are typically dominated by three species: Acidithiobacillus caldus, Leptospirillum ferriphilum and Acidiplasma cupricumulans. These microorganisms pro-vide leach agents to facilitate the degradation of the mineral concentrate encapsulating the gold metal, making it available for recovery via cyanidation. In this research, the feasibility of recycling ASTER™ treated cyanidation wastewater within the biooxidation circuit is ex-plored through quantifying resilience of the mixed microbial community used in biooxida-tion process to SCN-.
Materials and methods
Microbial culture and growth medium: A mixed moderately thermophilic biooxidation cul-ture, originating from commercial gold biooxidation leaching tanks, was maintained in an aerated 1 L stirred reactor at 45°C and pH 1.3. The culture was maintained at a 15 % w/v solids loading of arsenopyrite/pyrite mineral concentrate in 0 K medium. The reactor was operated in ‘draw-and-fill’ mode at a residence time of 5 days. The bacterially-dominated culture was comprised of At. caldus (42.4%), L. ferriphilum (25.8%), other bacteria (29.4%) and Ac. cupricumulans (2.4%).
Experimental design: Batch experiments were conducted in multiwell plates (MWPs) using Greiner Bio-one CELLSTAR® 12 Well Suspension Culture Plates (4 ml volume per well). One MWP was used to investigate the effect of thiocyanate (SCN-) on cell growth, and ferrous and sulphur oxidation activity under SCN- loadings of 0 mg/L, 0.1 mg/L, 1 mg/L and 5 mg/L using 0 K nutrient medium. The second MWP was set up to investigate the po-tential for utilizing ASTER™ water as a nutrient solution in place of 0 K medium. ASTER™ water was obtained from a 1 L stirred tank reactor run at similar conditions to that of the commercial ASTER™ operations (Kantor et al. 2015). The continuous ASTER™ reactor was fed 750 mg/L SCN-, supplemented with molasses and phosphate to give a residence time of 12 hours and an effluent SCN- concentration of 0.4 mg/L. The ASTER™ water was clarified through a 0.22 µm filter to remove cells associated with SCN- degradation before use. SCN- concentrations of 0.4 mg/L, 1 mg/L and 5 mg/L were evaluated. Biooxidation rates in 0 K supplemented ASTER™ water at a SCN- loading of 1 mg/L were also read.
Each well was charged with the specified nutrient matrix (0 K medium, ASTER™ water or 0 K supplemented ASTER™ water), 5 g/L each of ferrous and ferric iron, 0.5 % (w/v) tyndalised elemental sulphur and the designated volume of SCN- stock solution (20 mg/L). The wells were inoculated with biooxidation culture at 1 x 10⁷ cells/ml. A total working volume of 3 ml at starting pH 1.7 was used. To mitigate evaporative losses, each MWP was fitted with an AeraSeal™ film and placed in a humidified container. The MWPs were incu-bated in a shaking incubator at 45°C and 140 rpm. During the experiment, 20 µl samples
1
Recycling bioremediated cyanidation tailings wastewater within the biooxidation circuit for gold recovery: impact on process
performance and water managementCatherine J. Edward, Mariette Smart and Susan T. L. Harrison
Centre for Bioprocess Engineering Research (CeBER), Department of Chemical Engineering, University of Cape Town, South Africa.
Abstract Small scale batch experiments were conducted to assess potential to recycle bioremediated cyanidation tailings water (ASTER™ water) within the biooxidation circuit and reduce nutrient demand of biooxidation operations. Cultures grown in 0K medium or ASTER™ water with and without nutrient supplementation were compared. The microbial community was challenged with thiocyanate (SCN-). ASTER™ water cannot provide sufficient nutrients to sustain growth and metabolic activity of the culture. Supplemented ASTER™ water promoted growth and activity comparable to cultures grown in 0 K media. Elevated thiocyanate concentrations (5 mg/l) altered community structure, resulting in loss of iron-oxidising bacterium L. ferriphilum, affecting process performance. Key words: Wastewater recycling, thiocyanate, iron oxidation, sulphur oxidation, mixed biooxidation community
Introduction Biohydrometallurgical processing schemes are highly dependent on water quality for optimum function, therefore water recycling within these operations has been limited (Stott et al. 2001). The current trend towards integrated, sustainable mining practices within commercial operations and toward ‘zero-waste’ systems has prompted re-evaluation of plant-wide water management (Mudd 2007; Mudd 2008). Biohydrometallurgical process routes for gold recovery from sulphidic concentrates have typically not recycled cyanidation wastewater due to historical process upsets and the apparent sensitivity of the biooxidation organisms to low levels of thiocyanate (SCN-) (Adams 2013). The ‘rule-of-thumb’ exposure limit has been proposed as 1 mg/l SCN- (van Aswegen et al. 2007); however, data from rigorous study is not yet presented. Cyanidation bioremediation processes such as the Activated Sludge Tailings Effluent Remediation (ASTER™) process have been successful in reducing high levels of SCN- (± 1500 mg/l) to concentrations of 0.025 and 0.1 mg/l (van Buuren 2014). This suggests potential to close the water cycle within the biooxidation circuit. SCN- is metabolised by various organisms via reactions (1) to (3) to generate ammonium, sulphate and bicarbonate (Makhotla et al. 2010). These ions, specifically NH4+, may contribute to the nutrient requirements of the biooxidation culture that predominantly depend on nitrogen, phosphate and potassium supplemented in the form of sulphate salts (van Aswegen et al. 2007).
𝑆𝑆𝑆𝑆𝑆𝑆𝑆𝑆𝑆𝑆𝑆𝑆− + 𝐻𝐻𝐻𝐻2𝑂𝑂𝑂𝑂 → 𝐻𝐻𝐻𝐻𝑆𝑆𝑆𝑆𝑆𝑆𝑆𝑆𝑂𝑂𝑂𝑂 + 𝐻𝐻𝐻𝐻𝑆𝑆𝑆𝑆− (1)
𝐻𝐻𝐻𝐻𝑆𝑆𝑆𝑆𝑆𝑆𝑆𝑆𝑂𝑂𝑂𝑂 + 2𝐻𝐻𝐻𝐻2𝑂𝑂𝑂𝑂 → 𝑆𝑆𝑆𝑆𝐻𝐻𝐻𝐻4+ + 𝐻𝐻𝐻𝐻𝑆𝑆𝑆𝑆𝑂𝑂𝑂𝑂3− (2)
𝑆𝑆𝑆𝑆𝐻𝐻𝐻𝐻− + 2𝑂𝑂𝑂𝑂2 → 𝑆𝑆𝑆𝑆𝑂𝑂𝑂𝑂42− + 𝐻𝐻𝐻𝐻+ (3)
Biooxidation cultures are typically dominated by three species: Acidithiobacillus caldus, Leptospirillum ferriphilum and Acidiplasma cupricumulans. These microorganisms provide leach agents to facilitate the degradation of the mineral concentrate encapsulating the gold metal, making it available for recovery via cyanidation. In this research, the feasibility of recycling
992
Lappeenranta, Finland IMWA 2017Mine Water and Circular Economy
Wolkersdorfer C, Sartz L, Sillanpää M, Häkkinen A (Editors)
were withdrawn at regular intervals to analyze ferrous iron concentrations using the 1-10 phenanthroline colorimetric assay. Sulphur oxidation was quantified at the start and end of experiment by ion chromatography. Cell numbers were measured twice daily under phase contrast microscopy and 1000x magnification.
The completion of the experiment was marked by depletion of ferrous iron in the experi-ments in 0 K medium supplemented with 0, 0.1 and 1 mg/L SCN- and also the 0 K supple-mented ASTER process water with 1 mg/L SCN- loading. For final cell numbers in excess of 108 cells/ml (SCN- supplemented 0 K medium studies and 0 K and 1 mg/L SCN- supple-mented ASTER™ water study), a 2 ml aliquot from each well was centrifuged at 14, 000 × g for 5 min to pellet cells. For the remaining samples (<108 cells/ml), the triplicate wells were combined and centrifuged as described to ensure a sufficient number of cells were harvest-ed for DNA extraction. Cell pellets were washed twice with 10 mM citrate buffer (9.88 mM citric acid anhydrous, 0.22 mM sodium citrate dihydrate, pH 2) to remove soluble iron and neutralised by washing twice with TE buffer (10 mM Tris-Cl, 1 mM EDTA, pH 8), cen-trifuging at 14, 000 x g for 5 min between washes. Pellets were stored at -20°C until DNA was extracted using the High Pure PCR Template Preparation Kit (Roche) with a modified extraction protocol. Cells were re-suspended in 200 µl tissue lysis buffer with the inclusion of 50 µg lysozyme and 2 µg RNaseA and incubated at 37°C for 30 min. Following incubation, proteinase K was added as per manufacturer’s description and the protocol described for the isolation of DNA from bacteria and yeast followed from this point. DNA extracted was quantified using a Nanodrop® ND2000 spectrophotometer and 10 ng/µl working concen-trations prepared for quantitative real-time polymerase chain reaction (qPCR). The qPCR analysis was performed as described using the UniBact, L. ferriphilum, At. caldus, UniArch and Ac. cupricumulans specific primer sets.
Results and discussion
The first set of experiments were designed to assess microbial performance and growth when exposed to a range of SCN- concentrations characteristically associated with ASTER™ water. A SCN- concentration of 0.1 mg/L was investigated as it is the typical concentra-tion of residual SCN- reported in commercial ASTER™ wastewaters (van Buuren 2014). In addition, a SCN- concentration of 1 mg/L was investigated as it has been suggested as the maximum tolerable concentration for biooxidation organisms (van Aswegen et al. 2007). Furthermore, the impact of potential perturbations in the post-cyanidation bioremediation circuit was evaluated by monitoring oxidation performance when exposed to 5 mg/L SCN-.
Table 1 illustrates that the maximum specific growth rate (µmax), lag time and maximum cell numbers achieved in the microbial culture in 0 K medium was unaffected by the presence of increasing concentrations of SCN- up to 1 mg/L. Potentially the µmax was marginally in-creased at 5 mg/L. Most notably, at 5 mg/L SCN- the lag time was markedly increased (~2 fold) relative to the cultures with lower SCN- loadings and the maximum cell concentration achieved at termination of the experiment of the culture exposed to 5 mg/L SCN- was less than half that of the control culture exposed to 0 mg/L SCN-. The reduced cell concentration may have been responsible for the negligible ferrous oxidation activity seen at 5 mg/L SCN
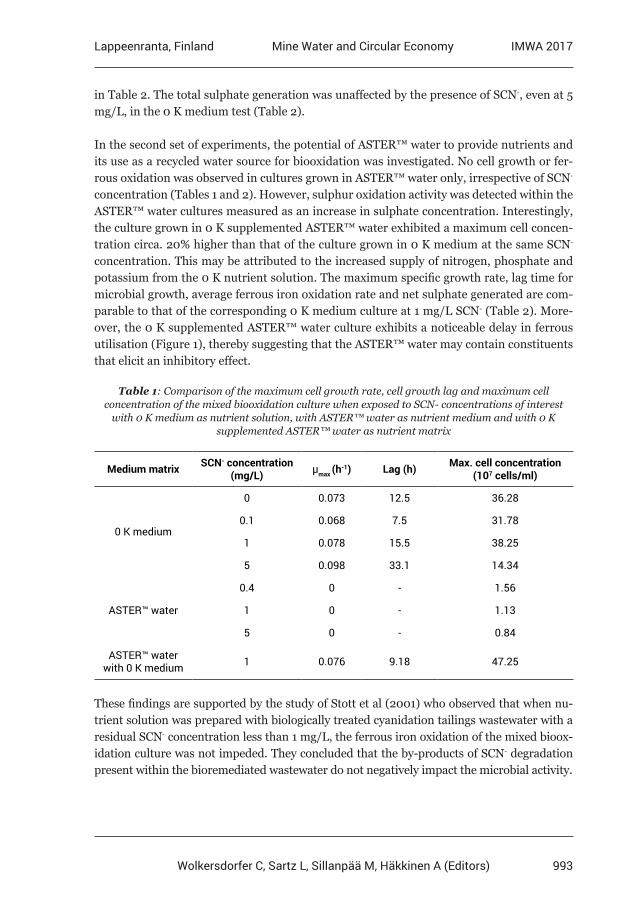
993
Lappeenranta, Finland IMWA 2017Mine Water and Circular Economy
Wolkersdorfer C, Sartz L, Sillanpää M, Häkkinen A (Editors)
in Table 2. The total sulphate generation was unaffected by the presence of SCN-, even at 5 mg/L, in the 0 K medium test (Table 2).
In the second set of experiments, the potential of ASTER™ water to provide nutrients and its use as a recycled water source for biooxidation was investigated. No cell growth or fer-rous oxidation was observed in cultures grown in ASTER™ water only, irrespective of SCN- concentration (Tables 1 and 2). However, sulphur oxidation activity was detected within the ASTER™ water cultures measured as an increase in sulphate concentration. Interestingly, the culture grown in 0 K supplemented ASTER™ water exhibited a maximum cell concen-tration circa. 20% higher than that of the culture grown in 0 K medium at the same SCN- concentration. This may be attributed to the increased supply of nitrogen, phosphate and potassium from the 0 K nutrient solution. The maximum specific growth rate, lag time for microbial growth, average ferrous iron oxidation rate and net sulphate generated are com-parable to that of the corresponding 0 K medium culture at 1 mg/L SCN- (Table 2). More-over, the 0 K supplemented ASTER™ water culture exhibits a noticeable delay in ferrous utilisation (Figure 1), thereby suggesting that the ASTER™ water may contain constituents that elicit an inhibitory effect.
Table 1: Comparison of the maximum cell growth rate, cell growth lag and maximum cell concentration of the mixed biooxidation culture when exposed to SCN- concentrations of interest
with 0 K medium as nutrient solution, with ASTER™ water as nutrient medium and with 0 K supplemented ASTER™ water as nutrient matrix
Medium matrix SCN- concentration (mg/L) µmax (h-1) Lag (h) Max. cell concentration
(107 cells/ml)
0 K medium
0 0.073 12.5 36.28
0.1 0.068 7.5 31.78
1 0.078 15.5 38.25
5 0.098 33.1 14.34
ASTER™ water
0.4 0 - 1.56
1 0 - 1.13
5 0 - 0.84
ASTER™ water with 0 K medium 1 0.076 9.18 47.25
These findings are supported by the study of Stott et al (2001) who observed that when nu-trient solution was prepared with biologically treated cyanidation tailings wastewater with a residual SCN- concentration less than 1 mg/L, the ferrous iron oxidation of the mixed bioox-idation culture was not impeded. They concluded that the by-products of SCN- degradation present within the bioremediated wastewater do not negatively impact the microbial activity.
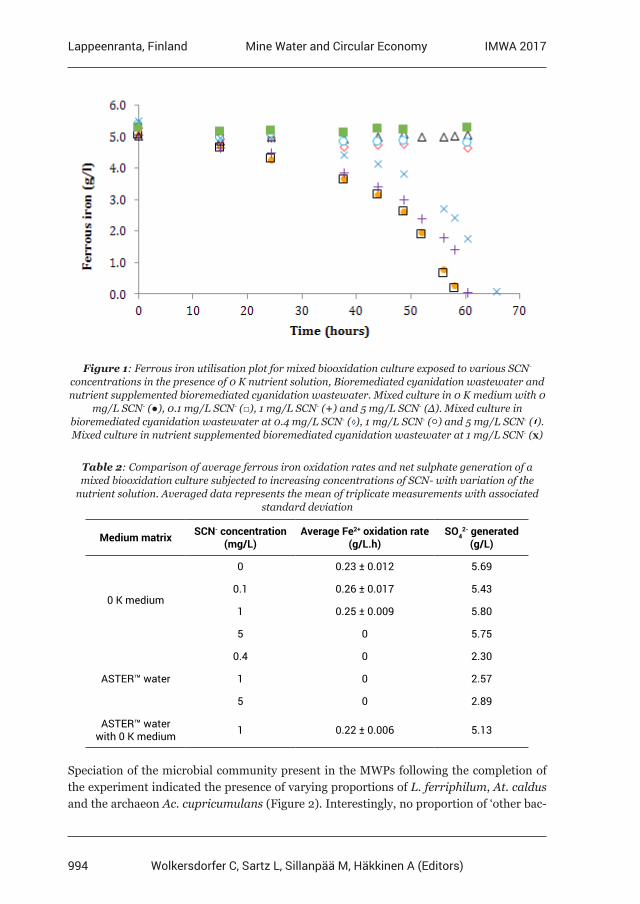
994
Lappeenranta, Finland IMWA 2017Mine Water and Circular Economy
Wolkersdorfer C, Sartz L, Sillanpää M, Häkkinen A (Editors)
Figure 1: Ferrous iron utilisation plot for mixed biooxidation culture exposed to various SCN- concentrations in the presence of 0 K nutrient solution, Bioremediated cyanidation wastewater and nutrient supplemented bioremediated cyanidation wastewater. Mixed culture in 0 K medium with 0
mg/L SCN- (), 0.1 mg/L SCN- (), 1 mg/L SCN- (+) and 5 mg/L SCN- (Δ). Mixed culture in bioremediated cyanidation wastewater at 0.4 mg/L SCN- ( ), 1 mg/L SCN- () and 5 mg/L SCN- ( ). Mixed culture in nutrient supplemented bioremediated cyanidation wastewater at 1 mg/L SCN- (x)
Table 2: Comparison of average ferrous iron oxidation rates and net sulphate generation of a mixed biooxidation culture subjected to increasing concentrations of SCN- with variation of the
nutrient solution. Averaged data represents the mean of triplicate measurements with associated standard deviation
Medium matrix SCN- concentration (mg/L)
Average Fe2+ oxidation rate (g/L.h)
SO42- generated
(g/L)
0 K medium
0 0.23 ± 0.012 5.69
0.1 0.26 ± 0.017 5.43
1 0.25 ± 0.009 5.80
5 0 5.75
ASTER™ water
0.4 0 2.30
1 0 2.57
5 0 2.89
ASTER™ water with 0 K medium 1 0.22 ± 0.006 5.13
Speciation of the microbial community present in the MWPs following the completion of the experiment indicated the presence of varying proportions of L. ferriphilum, At. caldus and the archaeon Ac. cupricumulans (Figure 2). Interestingly, no proportion of ‘other bac-
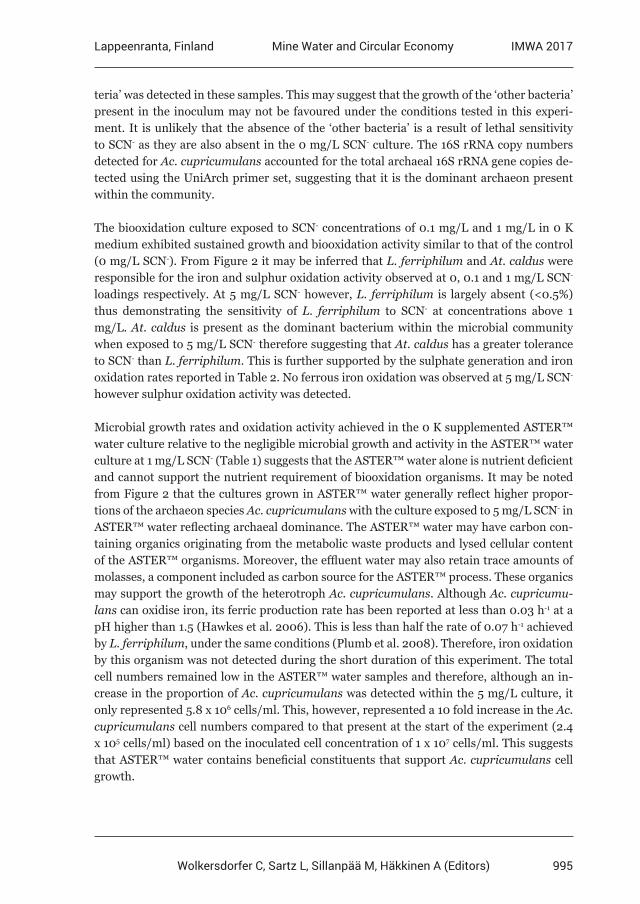
995
Lappeenranta, Finland IMWA 2017Mine Water and Circular Economy
Wolkersdorfer C, Sartz L, Sillanpää M, Häkkinen A (Editors)
teria’ was detected in these samples. This may suggest that the growth of the ‘other bacteria’ present in the inoculum may not be favoured under the conditions tested in this experi-ment. It is unlikely that the absence of the ‘other bacteria’ is a result of lethal sensitivity to SCN- as they are also absent in the 0 mg/L SCN- culture. The 16S rRNA copy numbers detected for Ac. cupricumulans accounted for the total archaeal 16S rRNA gene copies de-tected using the UniArch primer set, suggesting that it is the dominant archaeon present within the community.
The biooxidation culture exposed to SCN- concentrations of 0.1 mg/L and 1 mg/L in 0 K medium exhibited sustained growth and biooxidation activity similar to that of the control (0 mg/L SCN-). From Figure 2 it may be inferred that L. ferriphilum and At. caldus were responsible for the iron and sulphur oxidation activity observed at 0, 0.1 and 1 mg/L SCN- loadings respectively. At 5 mg/L SCN- however, L. ferriphilum is largely absent (<0.5%) thus demonstrating the sensitivity of L. ferriphilum to SCN- at concentrations above 1 mg/L. At. caldus is present as the dominant bacterium within the microbial community when exposed to 5 mg/L SCN- therefore suggesting that At. caldus has a greater tolerance to SCN- than L. ferriphilum. This is further supported by the sulphate generation and iron oxidation rates reported in Table 2. No ferrous iron oxidation was observed at 5 mg/L SCN- however sulphur oxidation activity was detected.
Microbial growth rates and oxidation activity achieved in the 0 K supplemented ASTER™ water culture relative to the negligible microbial growth and activity in the ASTER™ water culture at 1 mg/L SCN- (Table 1) suggests that the ASTER™ water alone is nutrient deficient and cannot support the nutrient requirement of biooxidation organisms. It may be noted from Figure 2 that the cultures grown in ASTER™ water generally reflect higher propor-tions of the archaeon species Ac. cupricumulans with the culture exposed to 5 mg/L SCN- in ASTER™ water reflecting archaeal dominance. The ASTER™ water may have carbon con-taining organics originating from the metabolic waste products and lysed cellular content of the ASTER™ organisms. Moreover, the effluent water may also retain trace amounts of molasses, a component included as carbon source for the ASTER™ process. These organics may support the growth of the heterotroph Ac. cupricumulans. Although Ac. cupricumu-lans can oxidise iron, its ferric production rate has been reported at less than 0.03 h-1 at a pH higher than 1.5 (Hawkes et al. 2006). This is less than half the rate of 0.07 h-1 achieved by L. ferriphilum, under the same conditions (Plumb et al. 2008). Therefore, iron oxidation by this organism was not detected during the short duration of this experiment. The total cell numbers remained low in the ASTER™ water samples and therefore, although an in-crease in the proportion of Ac. cupricumulans was detected within the 5 mg/L culture, it only represented 5.8 x 10⁶ cells/ml. This, however, represented a 10 fold increase in the Ac. cupricumulans cell numbers compared to that present at the start of the experiment (2.4 x 10⁵ cells/ml) based on the inoculated cell concentration of 1 x 10⁷ cells/ml. This suggests that ASTER™ water contains beneficial constituents that support Ac. cupricumulans cell growth.
996
Lappeenranta, Finland IMWA 2017Mine Water and Circular Economy
Wolkersdorfer C, Sartz L, Sillanpää M, Häkkinen A (Editors)
Figure 2: Graphical representation of the percentage species abundance of a biooxidation culture exposed to various SCN- concentrations in the presence of 0 K medium, ASTER water or 0 K
supplemented ASTER water. Bars indicate the average abundance of L. ferriphilum ( ), At. caldus ( ), other bacteria ( ) and Ac. cupricumulans ( ). Error bars indicate standard error for samples
where three biological replicates were available due to high cell numbers.
Conclusions
The current study suggests the presence of inhibitors in the ASTER™ water, as the microbi-al iron utilisation in nutrient supplemented ASTER™ water was delayed relative to the con-trol experiment grown in 0 K medium at the corresponding SCN- concentration of 1 mg/L. This study further details the shift in the microbial ecology as a function of SCN- concentra-tion within a biooxidation culture, linked to both the iron oxidation and sulphate generation and thus providing comprehensive insight into the possibility of recycling ASTER™ water within the biooxidation circuit.
Furthermore, it was found that ASTER™ water does not contain a sufficient nutrient profile to sustain microbial growth and activity without supplementation. Nutrient supplemented ASTER™ water, however, was shown to reflect adequate and similar cell growth, ferrous iron oxidation and sulphur oxidation, despite the presence of SCN- at a concentration of 1 mg/L. A further elevated concentration of SCN- (5 mg/L) was shown to affect the biooxida-tion performance and community structure significantly. The microbial cultures exposed to 5 mg/L SCN- were found to have a negligible proportion of L. ferriphilum within the population, consequently resulting in no iron oxidation and reduced overall cell numbers. These results illustrate that ASTER™ water may be recycled successfully within biooxida-tion circuits, provided the water is appropriately supplemented with nutrients to support microbial growth and that SCN- concentration does not exceed tolerable limits. Recycling of treated cyanidation wastewater has potential to reduce the water demand associated with the biooxidation operations and to improve water management. Further work is required to assess the feasibility of recycling ASTER™ water through quantifying the impact of pro-longed SCN- exposure on process efficiency, microbial community and its resilience.
997
Lappeenranta, Finland IMWA 2017Mine Water and Circular Economy
Wolkersdorfer C, Sartz L, Sillanpää M, Häkkinen A (Editors)
Acknowledgements
The authors gratefully acknowledge the National Research Foundation South African Research Chair initiative funding for the national SARChI chair in Bioprocess Engineering (GUN 64778).
References
Adams MD, (2013) Impact of recycling cyanide and its reaction products on upstream unit operations. Miner Eng 53:241-255Hawkes RB, Franzmann P D, O’hara G, Plumb JJ (2006) Ferroplasma cupricumulans sp. nov., a novel moderately thermophilic, acidophilic archaeon isolated from an industrial-scale chalcocite bioleach heap. Extremophiles 10(6): 525-530Kantor RS, van Zyl AW, van Hille RP, Thomas BC, Harrison STL, Banfield J (2015) Bioreactor microbial ecosystems for thiocyanate and cyanide degradation unravelled with genome-resolved metagenomics. Environ Microbiol 17(12): 4929-4941Makhotla N, van Buuren C, Olivier JW (2010) The ASTER process: Technology development through to piloting, demonstration and commercialization. 236-253Mudd GM (2007) Global trends in gold mining: Towards quantifying environmental and resource sustainablility? Resour Policy 32: 42-56.Mudd GM (2008) Sustainability Reporting and Water Resources: a Preliminary Assessment of Embodied Water and Sustainable Mining. Mine Water Environ 27: 136-144.Plumb JJ, Muddle R, Franzmann PD (2007). Effect of pH on rates of iron and sulfur oxidation by bioleaching organisms. Miner Eng (21): 76-82Stott MB, Franzmann PD, Zappia LR, Watling HR, Quan LP, Clark BJ, Houchin MR, Miller PC, Williams TL (2001) Thiocyanate removal from saline CIP process water by a rotating biological contactor, with reuse of the water for bioleaching. Hydrometallurgy 62: 93–105van Aswegen P, van Niekerk J, Olivier W (2007) The BIOX™ Process for the Treatment of Refractory Gold Concentrates, in: Rawlings D, Johnson B (Eds), Biomining, Springer-Verlag, Berlin, p 1-32van Buuren, C. 2014. Biomin’s Novel Integrated Technologies for Optimising Refractory Gold Processing Solutions.1-25
998
Lappeenranta, Finland IMWA 2017Mine Water and Circular Economy
Wolkersdorfer C, Sartz L, Sillanpää M, Häkkinen A (Editors)
Chemolithotrophic sulfide oxidizers in mine environment
Anu Kettunen1, Maija Vidqvist1
1Teollisuuden Vesi, Moreenikatu 2B, 04600 Mäntsälä, Finland, [email protected]
Abstract Microbial communities in waste rock waters from Mine A were compared to process water sample microbial communities from Mines B and C, with special attention to microbes active in sulfur and iron cycling. It turned out that in Mine A waste rock waters, neutrophilic, psychrotolerant proteobacteria represented the majority of sulfur oxidizers while in Mine B and C process samples, acidophilic sulfur oxidizers dominated. Data presented in this paper emphasize the interaction between environmental conditions and microbial clusters.
Key words chemolithotrophic microbes, molecular techniques, waste rock and process waters, sulfur and iron oxidation and reduction, bioleaching, NRD and ARD
Introduction
Sulfide minerals are exposed to both physicochemical and microbiological oxidation, re-leasing sulfate and metals from the ore (Nordstrom & Southam 1997, Lindsay et al. 2009). This process is desirable in bioleaching processes and neutral in traditional mining, but represents a challenge when occurring in waste rock piles. Depending on the neutralization capacity of the waste rock, microbial bioleaching results in Neutral Rock Drainage (NRD) or Acid Rock Drainage (ARD) (Singer & Stumm 1970, Blowes et al. 2003).
Molecular microbiological techniques enable the characterization of microbial communi-ties, especially sulfur oxidizing microbes, and analysis of the effect of environmental condi-tions on microbial community structure and vice versa.
Methods
Mines A, B and C are Finnish operational mines, Mine A representing a copper and nickel mine in Lapland province, Mine B a zinc and copper mine in Oulu province and Mine C a zinc mine in Oulu province.
Altogether 57 individual waste rock water samples were collected at two locations (WR120 and WR118) from Mine A in December 2015 (winter) and July-September 2016 (sum-mer). Average values for the two locations are shown in Tables 1a and 2a while Fig. 1a-1b represent averages of the two locations. In addition, one process water sample (PL7) from Mine A was collected in December 2015. Waste rock water microbial communities are compared to process samples taken from Mines B and C. From Mine B, one process water sample (PL1), one filament sample (PF1) and one solid rock (PS1) sample were collected in December 2014 (winter). From Mine C, process water samples were collected from two locations (P318 and PE1) in February 2013 (winter) and two locations (PKP1 and PKP2) in July 2016 (summer).
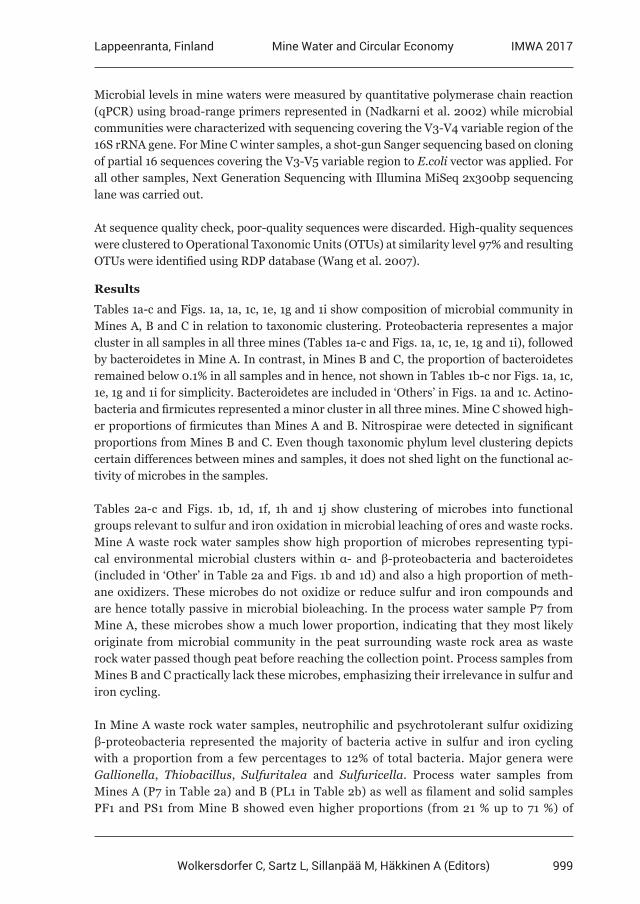
999
Lappeenranta, Finland IMWA 2017Mine Water and Circular Economy
Wolkersdorfer C, Sartz L, Sillanpää M, Häkkinen A (Editors)
Microbial levels in mine waters were measured by quantitative polymerase chain reaction (qPCR) using broad-range primers represented in (Nadkarni et al. 2002) while microbial communities were characterized with sequencing covering the V3-V4 variable region of the 16S rRNA gene. For Mine C winter samples, a shot-gun Sanger sequencing based on cloning of partial 16 sequences covering the V3-V5 variable region to E.coli vector was applied. For all other samples, Next Generation Sequencing with Illumina MiSeq 2x300bp sequencing lane was carried out.
At sequence quality check, poor-quality sequences were discarded. High-quality sequences were clustered to Operational Taxonomic Units (OTUs) at similarity level 97% and resulting OTUs were identified using RDP database (Wang et al. 2007).
Results
Tables 1a-c and Figs. 1a, 1a, 1c, 1e, 1g and 1i show composition of microbial community in Mines A, B and C in relation to taxonomic clustering. Proteobacteria representes a major cluster in all samples in all three mines (Tables 1a-c and Figs. 1a, 1c, 1e, 1g and 1i), followed by bacteroidetes in Mine A. In contrast, in Mines B and C, the proportion of bacteroidetes remained below 0.1% in all samples and in hence, not shown in Tables 1b-c nor Figs. 1a, 1c, 1e, 1g and 1i for simplicity. Bacteroidetes are included in ‘Others’ in Figs. 1a and 1c. Actino-bacteria and firmicutes represented a minor cluster in all three mines. Mine C showed high-er proportions of firmicutes than Mines A and B. Nitrospirae were detected in significant proportions from Mines B and C. Even though taxonomic phylum level clustering depicts certain differences between mines and samples, it does not shed light on the functional ac-tivity of microbes in the samples.
Tables 2a-c and Figs. 1b, 1d, 1f, 1h and 1j show clustering of microbes into functional groups relevant to sulfur and iron oxidation in microbial leaching of ores and waste rocks. Mine A waste rock water samples show high proportion of microbes representing typi-cal environmental microbial clusters within α- and β-proteobacteria and bacteroidetes (included in ‘Other’ in Table 2a and Figs. 1b and 1d) and also a high proportion of meth-ane oxidizers. These microbes do not oxidize or reduce sulfur and iron compounds and are hence totally passive in microbial bioleaching. In the process water sample P7 from Mine A, these microbes show a much lower proportion, indicating that they most likely originate from microbial community in the peat surrounding waste rock area as waste rock water passed though peat before reaching the collection point. Process samples from Mines B and C practically lack these microbes, emphasizing their irrelevance in sulfur and iron cycling.
In Mine A waste rock water samples, neutrophilic and psychrotolerant sulfur oxidizing β-proteobacteria represented the majority of bacteria active in sulfur and iron cycling with a proportion from a few percentages to 12% of total bacteria. Major genera were Gallionella, Thiobacillus, Sulfuritalea and Sulfuricella. Process water samples from Mines A (P7 in Table 2a) and B (PL1 in Table 2b) as well as filament and solid samples PF1 and PS1 from Mine B showed even higher proportions (from 21 % up to 71 %) of
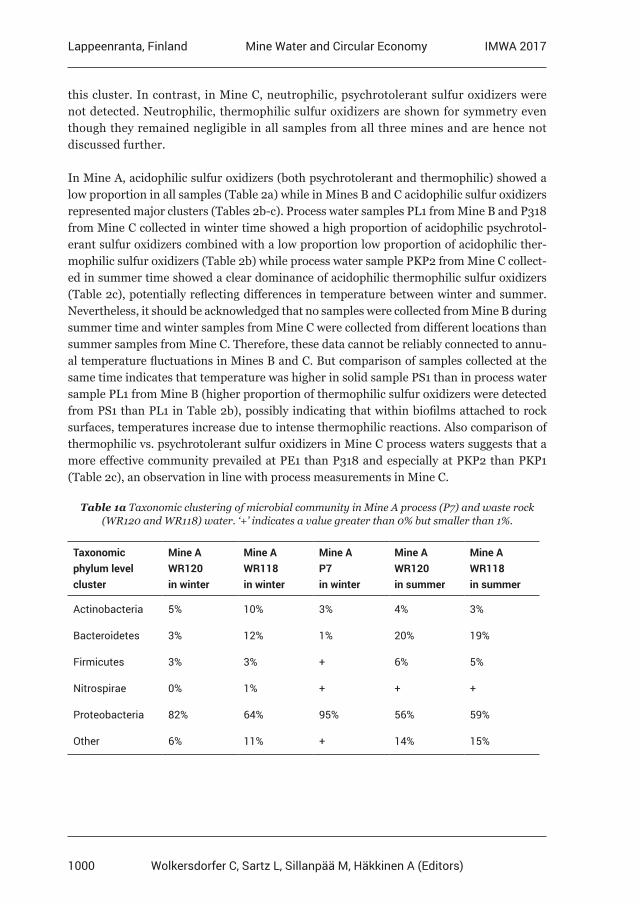
1000
Lappeenranta, Finland IMWA 2017Mine Water and Circular Economy
Wolkersdorfer C, Sartz L, Sillanpää M, Häkkinen A (Editors)
this cluster. In contrast, in Mine C, neutrophilic, psychrotolerant sulfur oxidizers were not detected. Neutrophilic, thermophilic sulfur oxidizers are shown for symmetry even though they remained negligible in all samples from all three mines and are hence not discussed further.
In Mine A, acidophilic sulfur oxidizers (both psychrotolerant and thermophilic) showed a low proportion in all samples (Table 2a) while in Mines B and C acidophilic sulfur oxidizers represented major clusters (Tables 2b-c). Process water samples PL1 from Mine B and P318 from Mine C collected in winter time showed a high proportion of acidophilic psychrotol-erant sulfur oxidizers combined with a low proportion low proportion of acidophilic ther-mophilic sulfur oxidizers (Table 2b) while process water sample PKP2 from Mine C collect-ed in summer time showed a clear dominance of acidophilic thermophilic sulfur oxidizers (Table 2c), potentially reflecting differences in temperature between winter and summer. Nevertheless, it should be acknowledged that no samples were collected from Mine B during summer time and winter samples from Mine C were collected from different locations than summer samples from Mine C. Therefore, these data cannot be reliably connected to annu-al temperature fluctuations in Mines B and C. But comparison of samples collected at the same time indicates that temperature was higher in solid sample PS1 than in process water sample PL1 from Mine B (higher proportion of thermophilic sulfur oxidizers were detected from PS1 than PL1 in Table 2b), possibly indicating that within biofilms attached to rock surfaces, temperatures increase due to intense thermophilic reactions. Also comparison of thermophilic vs. psychrotolerant sulfur oxidizers in Mine C process waters suggests that a more effective community prevailed at PE1 than P318 and especially at PKP2 than PKP1 (Table 2c), an observation in line with process measurements in Mine C.
Table 1a Taxonomic clustering of microbial community in Mine A process (P7) and waste rock (WR120 and WR118) water. ‘+’ indicates a value greater than 0% but smaller than 1%.
Taxonomic phylum level cluster
Mine A WR120 in winter
Mine A WR118 in winter
Mine A P7 in winter
Mine A WR120 in summer
Mine A WR118 in summer
Actinobacteria 5% 10% 3% 4% 3%
Bacteroidetes 3% 12% 1% 20% 19%
Firmicutes 3% 3% + 6% 5%
Nitrospirae 0% 1% + + +
Proteobacteria 82% 64% 95% 56% 59%
Other 6% 11% + 14% 15%
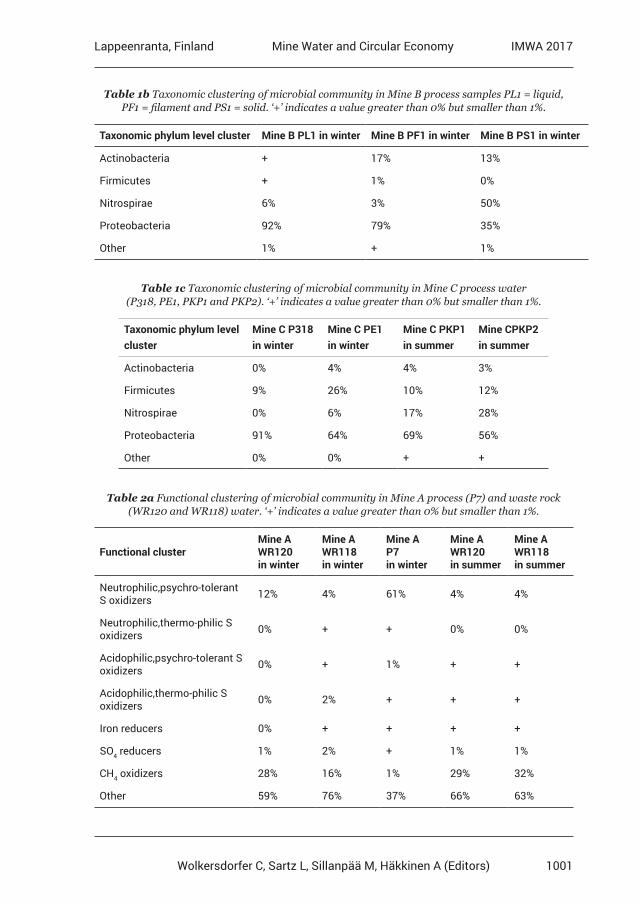
1001
Lappeenranta, Finland IMWA 2017Mine Water and Circular Economy
Wolkersdorfer C, Sartz L, Sillanpää M, Häkkinen A (Editors)
Table 1b Taxonomic clustering of microbial community in Mine B process samples PL1 = liquid, PF1 = filament and PS1 = solid. ‘+’ indicates a value greater than 0% but smaller than 1%.
Taxonomic phylum level cluster Mine B PL1 in winter Mine B PF1 in winter Mine B PS1 in winter
Actinobacteria + 17% 13%
Firmicutes + 1% 0%
Nitrospirae 6% 3% 50%
Proteobacteria 92% 79% 35%
Other 1% + 1%
Table 1c Taxonomic clustering of microbial community in Mine C process water (P318, PE1, PKP1 and PKP2). ‘+’ indicates a value greater than 0% but smaller than 1%.
Taxonomic phylum level cluster
Mine C P318 in winter
Mine C PE1 in winter
Mine C PKP1 in summer
Mine CPKP2 in summer
Actinobacteria 0% 4% 4% 3%
Firmicutes 9% 26% 10% 12%
Nitrospirae 0% 6% 17% 28%
Proteobacteria 91% 64% 69% 56%
Other 0% 0% + +
Table 2a Functional clustering of microbial community in Mine A process (P7) and waste rock (WR120 and WR118) water. ‘+’ indicates a value greater than 0% but smaller than 1%.
Functional clusterMine A WR120 in winter
Mine A WR118 in winter
Mine A P7 in winter
Mine A WR120 in summer
Mine A WR118 in summer
Neutrophilic,psychro-tolerant S oxidizers 12% 4% 61% 4% 4%
Neutrophilic,thermo-philic S oxidizers 0% + + 0% 0%
Acidophilic,psychro-tolerant S oxidizers 0% + 1% + +
Acidophilic,thermo-philic S oxidizers 0% 2% + + +
Iron reducers 0% + + + +
SO4 reducers 1% 2% + 1% 1%
CH4 oxidizers 28% 16% 1% 29% 32%
Other 59% 76% 37% 66% 63%
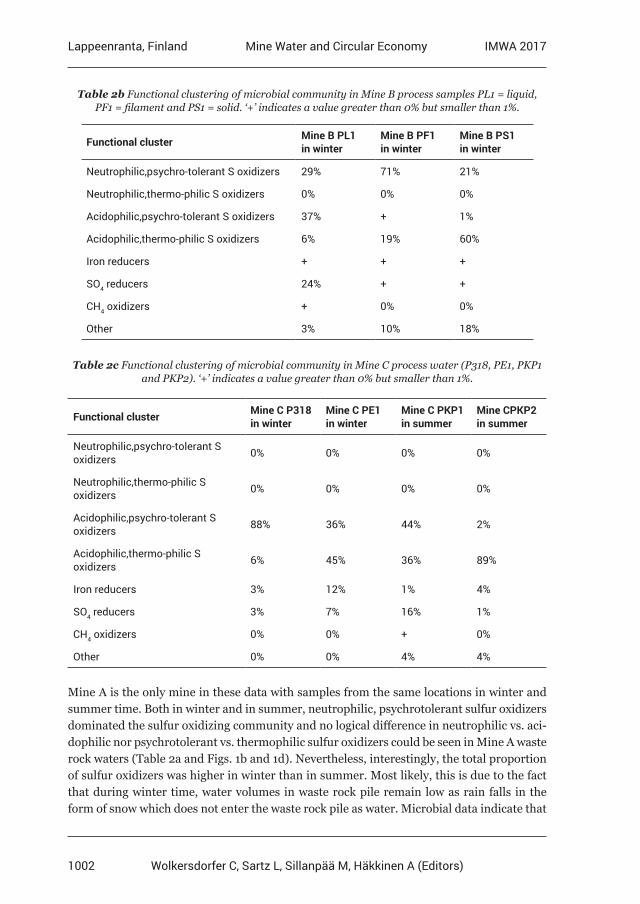
1002
Lappeenranta, Finland IMWA 2017Mine Water and Circular Economy
Wolkersdorfer C, Sartz L, Sillanpää M, Häkkinen A (Editors)
Table 2b Functional clustering of microbial community in Mine B process samples PL1 = liquid, PF1 = filament and PS1 = solid. ‘+’ indicates a value greater than 0% but smaller than 1%.
Functional cluster Mine B PL1 in winter
Mine B PF1 in winter
Mine B PS1 in winter
Neutrophilic,psychro-tolerant S oxidizers 29% 71% 21%
Neutrophilic,thermo-philic S oxidizers 0% 0% 0%
Acidophilic,psychro-tolerant S oxidizers 37% + 1%
Acidophilic,thermo-philic S oxidizers 6% 19% 60%
Iron reducers + + +
SO4 reducers 24% + +
CH4 oxidizers + 0% 0%
Other 3% 10% 18%
Table 2c Functional clustering of microbial community in Mine C process water (P318, PE1, PKP1 and PKP2). ‘+’ indicates a value greater than 0% but smaller than 1%.
Functional cluster Mine C P318 in winter
Mine C PE1 in winter
Mine C PKP1 in summer
Mine CPKP2 in summer
Neutrophilic,psychro-tolerant S oxidizers 0% 0% 0% 0%
Neutrophilic,thermo-philic S oxidizers 0% 0% 0% 0%
Acidophilic,psychro-tolerant S oxidizers 88% 36% 44% 2%
Acidophilic,thermo-philic S oxidizers 6% 45% 36% 89%
Iron reducers 3% 12% 1% 4%
SO4 reducers 3% 7% 16% 1%
CH4 oxidizers 0% 0% + 0%
Other 0% 0% 4% 4%
Mine A is the only mine in these data with samples from the same locations in winter and summer time. Both in winter and in summer, neutrophilic, psychrotolerant sulfur oxidizers dominated the sulfur oxidizing community and no logical difference in neutrophilic vs. aci-dophilic nor psychrotolerant vs. thermophilic sulfur oxidizers could be seen in Mine A waste rock waters (Table 2a and Figs. 1b and 1d). Nevertheless, interestingly, the total proportion of sulfur oxidizers was higher in winter than in summer. Most likely, this is due to the fact that during winter time, water volumes in waste rock pile remain low as rain falls in the form of snow which does not enter the waste rock pile as water. Microbial data indicate that
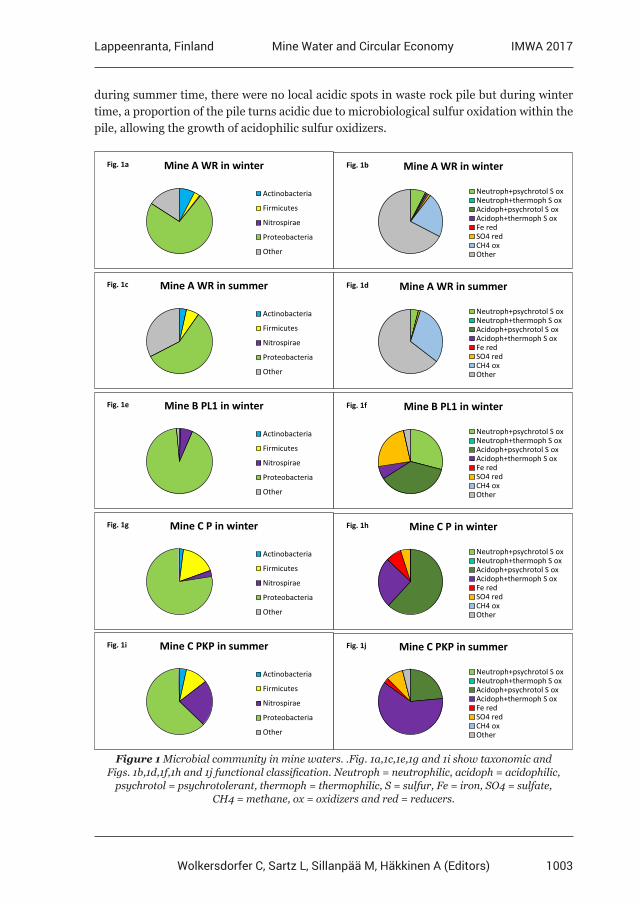
1003
Lappeenranta, Finland IMWA 2017Mine Water and Circular Economy
Wolkersdorfer C, Sartz L, Sillanpää M, Häkkinen A (Editors)
during summer time, there were no local acidic spots in waste rock pile but during winter time, a proportion of the pile turns acidic due to microbiological sulfur oxidation within the pile, allowing the growth of acidophilic sulfur oxidizers.
Mine A WR in winter
Actinobacteria
Firmicutes
Nitrospirae
Proteobacteria
Other
Fig. 1a Mine A WR in winter
Neutroph+psychrotol S oxNeutroph+thermoph S oxAcidoph+psychrotol S oxAcidoph+thermoph S oxFe redSO4 redCH4 oxOther
Fig. 1b
Mine A WR in summer
Actinobacteria
Firmicutes
Nitrospirae
Proteobacteria
Other
Fig. 1c Mine A WR in summer
Neutroph+psychrotol S oxNeutroph+thermoph S oxAcidoph+psychrotol S oxAcidoph+thermoph S oxFe redSO4 redCH4 oxOther
Fig. 1d
Mine B PL1 in winter
Actinobacteria
Firmicutes
Nitrospirae
Proteobacteria
Other
Fig. 1e Mine B PL1 in winter
Neutroph+psychrotol S oxNeutroph+thermoph S oxAcidoph+psychrotol S oxAcidoph+thermoph S oxFe redSO4 redCH4 oxOther
Fig. 1f
Mine C P in winter
Actinobacteria
Firmicutes
Nitrospirae
Proteobacteria
Other
Fig. 1g Mine C P in winter
Neutroph+psychrotol S oxNeutroph+thermoph S oxAcidoph+psychrotol S oxAcidoph+thermoph S oxFe redSO4 redCH4 oxOther
Fig. 1h
Mine C PKP in summer
Actinobacteria
Firmicutes
Nitrospirae
Proteobacteria
Other
Fig. 1i Mine C PKP in summer
Neutroph+psychrotol S oxNeutroph+thermoph S oxAcidoph+psychrotol S oxAcidoph+thermoph S oxFe redSO4 redCH4 oxOther
Fig. 1j
Figure 1 Microbial community in mine waters. .Fig. 1a,1c,1e,1g and 1i show taxonomic and Figs. 1b,1d,1f,1h and 1j functional classification. Neutroph = neutrophilic, acidoph = acidophilic,
psychrotol = psychrotolerant, thermoph = thermophilic, S = sulfur, Fe = iron, SO4 = sulfate, CH4 = methane, ox = oxidizers and red = reducers.
1004
Lappeenranta, Finland IMWA 2017Mine Water and Circular Economy
Wolkersdorfer C, Sartz L, Sillanpää M, Häkkinen A (Editors)
The opposite reactions to oxidation of sulfur/sulfide and iron are reduction of sulfate and ferric ion. The proportion of iron and sulfate reducers hence is an indirect indication of the intensity of sulfur and iron oxidation as the latter provides the former with substrates, namely ferric iron and sulfate. In Mine A, sulfur oxidizers represented a smaller propor-tion of the microbial community (Table 2a) than in Mines B and C (Tables 2b and 2c) and consistently, also iron and sulfate reducers showed a lower proportion in Mine A waste rock water than in Mine B and C process water samples. In Mine B, process water sample PL1 showed a significant proportion of sulfate reducers while in filament and solid samples PF1 and PS1, only hints of sulfate and iron reducers could be detected (Table 2b). In Mine C, all process water samples showed both iron and sulfate reducers. Direct comparison of sulfur and iron oxidation vs. sulfate and iron reduction suggests a higher overall efficiency of sulfur oxidation for P318 (94% vs. 6%) than PE1 (81% vs. 19%) and for PKP2 (91% vs. 4%) than PKP1 (80% vs. 17%) for Mine C. It should, however, be noticed that such comparison is oversimplified as different sulfur oxidizers show different reaction kinetics and differ in relation to RedOx requirements (strict aerobes vs. facultative anaerobes) and carbon me-tabolism (obligate autotrophs vs. autotrophs/heterotrophs vs. obligate heterotrophs). Clas-sification of microbial community taking into account also these factors results in more a complicated, but also a complex picture. It appears that strict aerobes, such as Alicycloba-cillus spp. and Leptospirillum spp., occur mainly in conditions where external, mechanical aeration is provided, i.e. in mining processes based on bioleaching. Another observation is that obligate heterotrophs (e.g. Ferrimicrobium/Ferrithrix spp.) are detected when a ma-ture biofilm providing organic carbon is present. A more detailed analysis of these factors, however, is not possible within the scope of this paper.
Conclusions
Sulfur and iron oxidizing microbes prevail whenever suitable substrates, such as sulfides in ores, are available. Nevertheless, in waste rock piles, the intensity of sulfur oxidation remains low resulting in only a moderate decrease in pH. The circumneutral pH does not allow growth of acidophilic microbes with potentially more efficient sulfur oxidizing capaci-ty. Mine A has a lower ore sulfur content than Mine B and C ores, which further explains the observed differences in microbial communities between waste rock waters from Mine A and process waters from Mines B and C.
One motivation for this work was to evaluate the risk that Mine A waste rock area turns into ARD. Microbial data combined with chemical measurements, estimated dissolution rates, ore composition and acid-base balance calculations indeed indicated that ARD is not likely in Mine A conditions, but the main challenge probably is to manage elevated sulfate and metal concentrations in drainage water.
Acknowledgements
The authors thank Alan Delaney, Ville Heikkinen, Mikael Korte and Ulla Syrjälä for reviewing the text and providing constructive critique and suggestions to improve.
1005
Lappeenranta, Finland IMWA 2017Mine Water and Circular Economy
Wolkersdorfer C, Sartz L, Sillanpää M, Häkkinen A (Editors)
References
Blowes DW, Ptacek CJ, Jambor JL, Weisener CG (2003) The geochemistry of acid mine drainage. Treatise Geochem. 2003, 9, 149–204. Lindsay MBJ, CondonPD, Jambor JL, Lear KG, Blowes DW, Ptacek CJ (2009) Mineralogical, geochemical, and microbial investigation of a sulfiderich tailings deposit characterized by neutral drainage. Appl. Geochem. 24: 2212–2221. Nadkarni MA, Martin FE, Jacques NA, Hunter N (2002) Determination of bacterial load ty real-time PCR using a broad-range (universal probe and primers set. Microbiol 148: 257-266Nordstrom, D.K.; Southam, G. Geomicrobiology of sulfide mineral oxidation. Rev. Mineral. 1997, 35, 361–390. Singer PC, Stumm W (1970) Acidic mine drainage: The rate determining step. Science: 167, 1121–1123. Wang QG, Garrity M, Tiedje JM, Cole JR (2007) Naïve Bayesian Classifier for Rapid Assignment of rRNA Sequences into the New Bacterial Taxonomy. Appl Environ Microbiol. 73(16):5261- 5267; doi: 10.1128/AEM.00062-07 [PMID: 17586664]
1006
Lappeenranta, Finland IMWA 2017Mine Water and Circular Economy
Wolkersdorfer C, Sartz L, Sillanpää M, Häkkinen A (Editors)
Tracking Nitrate Sources at a Platinum Mine – Putting the puzzle together
Sarah J.W. Skinner1
1SRK Consulting, 265 Oxford Road, Illovo, South Africa, [email protected]
Abstract Elevated nitrate may be associated with mining activities but can also be attributed to the application of fertilizers, human and animal waste and other sources. Nitrogen readily undergoes biologically mediated reactions. This transformation and the mixing and evaporation processes that occur with reuse of water underground renders distinguishing between the origins of the nitrate in water a complex task. This case study from a platinum mine in South Africa demonstrates how the hydrochemistry and the hydrogeological evidence, combined with evidence from stable isotope analysis, allowed for the identification of the source areas contributing to elevated nitrate in the water resources.
Key words Hydrochemistry, nitrate contamination, nitrogen isotopes, source identification
Introduction
Nitrate concentrations can typically vary from <1 to >45 mg/L as N in groundwater in the northern provinces of South Africa where the study area is located (Tredoux et.al 2009). Local nitrate concentrations can therefore exceed the South African drinking water quality standard of 11 mg/L as N (SANS 241- 2015). Although there is some debate as to the appro-priateness in linking illness rates with nitrate levels in drinking water (Fewtrell 2004); the nitrate concentration standard was established as a conservative quality limit to reduce the risk of methaemoglobinaemia from drinking water in babies under 1 year of age (DWAF 1996).
Nitrate sources
According to Brochu 2009 and Degnan et al. 2015, nitrate can be introduced into the groundwater resources through the incomplete ignition of explosive compounds such as ammonium nitrate, the injection of nitrogenous gases during blasting, and nitrification (ox-idation) of reduced nitrogen components of explosives. Additional sources of nitrate in the mining environment can include the leaching of blasting residues from waste rock, tailings and/or dirty water impoundments, inadequate control of sewage and the dissolution of am-monium nitrate explosives or waste explosives due to poor handling, storage and loading. The interaction of the chemicals used in metallurgical plants (nitric acid, hydrochloric acid, iron chloride, ammonium chloride, sodium bromide and ammonium hydroxide) can also contribute to increased ammonia, nitrate and chloride concentrations in the groundwater by Bosman 2009.
Nitrate may also be naturally present as a result of soil nitrification processes from the min-eralization and mobilization of nitrate from natural soil or host rock lithologies, (DWAF 1996; Tredoux 2009, Bosman, 2009). Other possible sources of nitrogen in the water re-sources (ammonia and/or nitrate) unrelated to mining activities can also include sewage
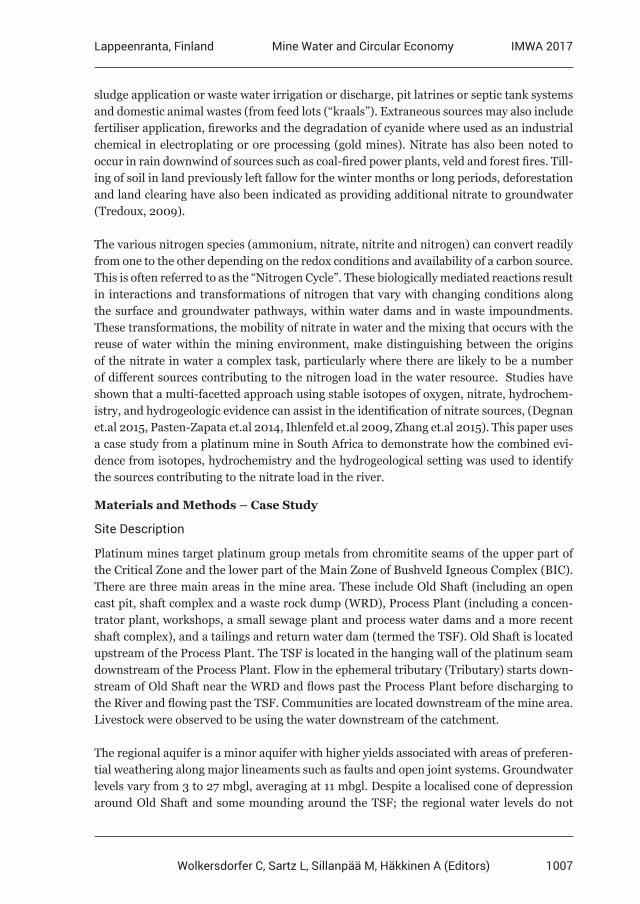
1007
Lappeenranta, Finland IMWA 2017Mine Water and Circular Economy
Wolkersdorfer C, Sartz L, Sillanpää M, Häkkinen A (Editors)
sludge application or waste water irrigation or discharge, pit latrines or septic tank systems and domestic animal wastes (from feed lots (“kraals”). Extraneous sources may also include fertiliser application, fireworks and the degradation of cyanide where used as an industrial chemical in electroplating or ore processing (gold mines). Nitrate has also been noted to occur in rain downwind of sources such as coal-fired power plants, veld and forest fires. Till-ing of soil in land previously left fallow for the winter months or long periods, deforestation and land clearing have also been indicated as providing additional nitrate to groundwater (Tredoux, 2009).
The various nitrogen species (ammonium, nitrate, nitrite and nitrogen) can convert readily from one to the other depending on the redox conditions and availability of a carbon source. This is often referred to as the “Nitrogen Cycle”. These biologically mediated reactions result in interactions and transformations of nitrogen that vary with changing conditions along the surface and groundwater pathways, within water dams and in waste impoundments. These transformations, the mobility of nitrate in water and the mixing that occurs with the reuse of water within the mining environment, make distinguishing between the origins of the nitrate in water a complex task, particularly where there are likely to be a number of different sources contributing to the nitrogen load in the water resource. Studies have shown that a multi-facetted approach using stable isotopes of oxygen, nitrate, hydrochem-istry, and hydrogeologic evidence can assist in the identification of nitrate sources, (Degnan et.al 2015, Pasten-Zapata et.al 2014, Ihlenfeld et.al 2009, Zhang et.al 2015). This paper uses a case study from a platinum mine in South Africa to demonstrate how the combined evi-dence from isotopes, hydrochemistry and the hydrogeological setting was used to identify the sources contributing to the nitrate load in the river.
Materials and Methods – Case Study
Site Description
Platinum mines target platinum group metals from chromitite seams of the upper part of the Critical Zone and the lower part of the Main Zone of Bushveld Igneous Complex (BIC). There are three main areas in the mine area. These include Old Shaft (including an open cast pit, shaft complex and a waste rock dump (WRD), Process Plant (including a concen-trator plant, workshops, a small sewage plant and process water dams and a more recent shaft complex), and a tailings and return water dam (termed the TSF). Old Shaft is located upstream of the Process Plant. The TSF is located in the hanging wall of the platinum seam downstream of the Process Plant. Flow in the ephemeral tributary (Tributary) starts down-stream of Old Shaft near the WRD and flows past the Process Plant before discharging to the River and flowing past the TSF. Communities are located downstream of the mine area. Livestock were observed to be using the water downstream of the catchment.
The regional aquifer is a minor aquifer with higher yields associated with areas of preferen-tial weathering along major lineaments such as faults and open joint systems. Groundwater levels vary from 3 to 27 mbgl, averaging at 11 mbgl. Despite a localised cone of depression around Old Shaft and some mounding around the TSF; the regional water levels do not
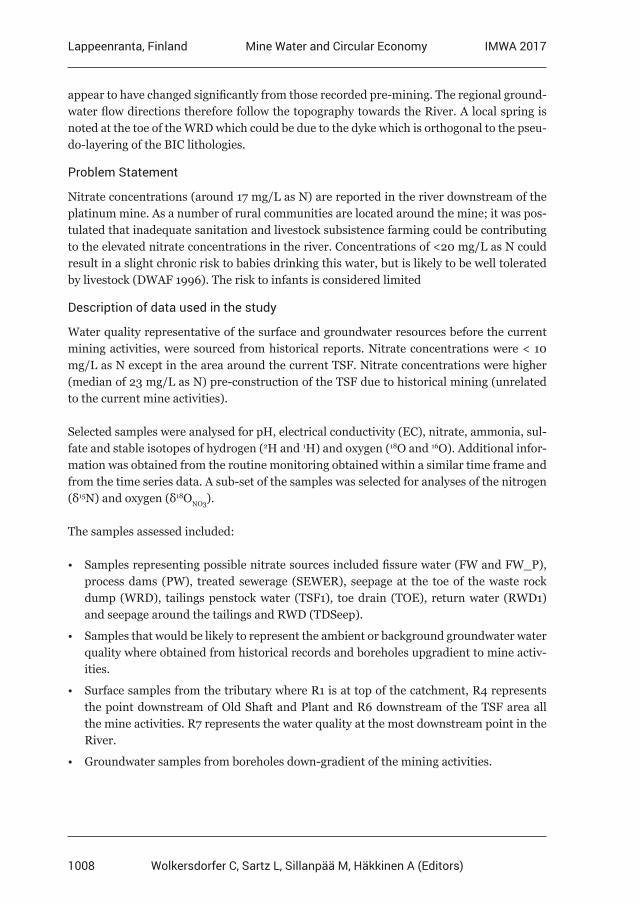
1008
Lappeenranta, Finland IMWA 2017Mine Water and Circular Economy
Wolkersdorfer C, Sartz L, Sillanpää M, Häkkinen A (Editors)
appear to have changed significantly from those recorded pre-mining. The regional ground-water flow directions therefore follow the topography towards the River. A local spring is noted at the toe of the WRD which could be due to the dyke which is orthogonal to the pseu-do-layering of the BIC lithologies.
Problem Statement
Nitrate concentrations (around 17 mg/L as N) are reported in the river downstream of the platinum mine. As a number of rural communities are located around the mine; it was pos-tulated that inadequate sanitation and livestock subsistence farming could be contributing to the elevated nitrate concentrations in the river. Concentrations of <20 mg/L as N could result in a slight chronic risk to babies drinking this water, but is likely to be well tolerated by livestock (DWAF 1996). The risk to infants is considered limited
Description of data used in the study
Water quality representative of the surface and groundwater resources before the current mining activities, were sourced from historical reports. Nitrate concentrations were < 10 mg/L as N except in the area around the current TSF. Nitrate concentrations were higher (median of 23 mg/L as N) pre-construction of the TSF due to historical mining (unrelated to the current mine activities).
Selected samples were analysed for pH, electrical conductivity (EC), nitrate, ammonia, sul-fate and stable isotopes of hydrogen (2H and 1H) and oxygen (18O and 16O). Additional infor-mation was obtained from the routine monitoring obtained within a similar time frame and from the time series data. A sub-set of the samples was selected for analyses of the nitrogen (δ15N) and oxygen (δ18ONO3).
The samples assessed included:
• Samples representing possible nitrate sources included fissure water (FW and FW_P), process dams (PW), treated sewerage (SEWER), seepage at the toe of the waste rock dump (WRD), tailings penstock water (TSF1), toe drain (TOE), return water (RWD1) and seepage around the tailings and RWD (TDSeep).
• Samples that would be likely to represent the ambient or background groundwater water quality where obtained from historical records and boreholes upgradient to mine activ-ities.
• Surface samples from the tributary where R1 is at top of the catchment, R4 represents the point downstream of Old Shaft and Plant and R6 downstream of the TSF area all the mine activities. R7 represents the water quality at the most downstream point in the River.
• Groundwater samples from boreholes down-gradient of the mining activities.
1009
Lappeenranta, Finland IMWA 2017Mine Water and Circular Economy
Wolkersdorfer C, Sartz L, Sillanpää M, Häkkinen A (Editors)
Discussion and Results
Nitrate distribution
Surface water profiling (fig 1) demonstrates that the nitrate concentrations are highest) at the top of the catchment near the Old Plant (R2 and R3) and are assimilated downstream (R4 to R7). Sodium and chloride concentrations increase downstream of the Process Plant (R4). Nitrate, sodium and chloride concentrations remain within a similar order down-stream of the TSF (R6 and R7). This implies that the main source of nitrate is near the Old Shaft but there is an additional source of salinity from the Process Plant to the river. Nitrate concentrations in the sources and boreholes located around Old Shaft are similarly higher than around the Plant and TSF areas. Higher concentrations of sodium and chloride (salini-ty) are observed in the sources and boreholes around the Plant and TSF. A local distribution of higher nitrate is observed in the boreholes downstream of the RWD. These boreholes are located within a similar area adjacent to a dry drainage line. The higher concentrations may be associated with seepage from the RWD along a preferential flow path where the baseline pre-construction was already elevated.
0
10
20
30
40
50
60
70
80
90
100
PDFW
1PI
TW
RD PWFW
_P SWSE
WER
TD1
RWD1 TO
ETD
1 se
epTD
2 se
ep R1 R2 R3 R4 R5 R6 R7
BH3
BH33
BH10
BH4
BH27
BH28
BH21
BH25
BH23
BH31
BH32
BH22
BH20
BH30
BH5
BH26
BH6
BH11
BH7
BH1
TBH3
BH14
BH13
TBH2
STB
H2D
BH2
TBH1 BH
8BH
12
Conc
entr
atio
ns (m
g/l a
s N)
Sample IDNitrate m(g/l as N) Chloride (mg/l)
River Profile
Groundwater
AREASBackgroundOld ShaftPlantTSFTSF - ds of RWDDirection of flow
SANS 241-2015(11 mg/l as N)
Sources
R1, interpolated from historical records as sample point was dry at time of study.
Figure 1. Bar chart presenting concentrations of nitrate (as N), chloride and sodium in the Study area
Oxygen and Deuterium Isotopes
The results for the samples analysed for the environmentally stable isotopes for hydrogen (2H and 1H) and oxygen (18O and 16O) are presented in the figure below (fig 2). According to Mook 2000, fractionation of oxygen and hydrogen in water during various processes often results in the development of a unique isotopic composition in the water. The relative abun-dance of these isotopes (expressed as a ratio relative to a standard) is used as an indicator of the source of the water, or the processes which it has undergone. The hydrologic connection between two samples, if found along a flow path, can therefore be proved if the samples are
1010
Lappeenranta, Finland IMWA 2017Mine Water and Circular Economy
Wolkersdorfer C, Sartz L, Sillanpää M, Häkkinen A (Editors)
isotopically similar or if the results plot along a mixing line between two isotopically distinct source waters (otherwise termed endmembers). The background groundwater samples plot in the lower negative quadrant, as is typical of groundwater, whilst the TSF provides an evaporative endmember in the positive top quadrant. A distinct mixing line is indicated between the TSF and groundwater samples confirming the impact of the TSF on the ground-water. Of note, is the similar grouping of the samples near Old Shaft (WRD, FW1 (fissure water), adjacent boreholes and stream samples (R2 and R3) which shares similar isotopic characteristics to the groundwater. This implies that the water at the toe of the WRD and water in the river is probably recharged by groundwater.
Gaye, 2001 suggests that a plot of relationship between δ18O and salinity (TDS) can also be used to identify different salinization pathways. The TDS was estimated from the electrical conductivity reported for the samples and plotted against δ18O (fig 3). The hydrochemical grouping identified around the WRD and groundwater is once again shown in the plot as is the mixing between the TSF sources and the groundwater.
R2R3
R4
R6
R7
BH3
BH33
BH10
SEWER
PD
FW1
PIT
WRD
FW_P
TD1
RWD1
TOE
TD1 seep
TD2 seep
BH25 BH31BH32
BH20
BH5
BH11
BH1
BH14
TBH2STBH2D
BH2
TBH1
BH12
-20
-15
-10
-5
0
5
10
15
20
-5.0 -4.0 -3.0 -2.0 -1.0 0.0 1.0 2.0 3.0 4.0 5.0
δ2H
(o/ o
o)
δ18O (o/oo)
R2R3R4R6R7BH3BH33BH10SEWERPDFW1PITWRDFW_PTD1RWD1TOETD1 seepTD2 seepBH25BH31BH32BH20BH5BH11BH1BH14TBH2STBH2DBH2TBH1BH12
Marker colour by AreaOld ShaftPlantTSF area
f
Fissure water, WRD Boreholes group
Possible Rainfall influence(Surface waterimpoundments, Pit and Sewer)
Groundwater
River samples
BackgroundBoreholes
Sources
Boreholes
Figure 2 Plot of ∂2H versus δ18O
Nitrogen Isotopes
The relative abundance of nitrogen isotopes in water can be compared to reference values obtained from literature, to identify the likely water source. Kendall 1998 provides typical ranges of nitrate isotopes of δ15N and δ18O of the nitrate ion, plotted in comparison to the study results (fig 4). The results from the study again show a similar grouping between the water in the tributary, the WRD seep, fissure water (FW) and groundwater boreholes located within the same area. These samples all plot within the range typical of a source re-lating to blasting activities. The stream samples T2 and T1 are also located within this area. The information further supports the observation that WRD seep is recharged by leachate
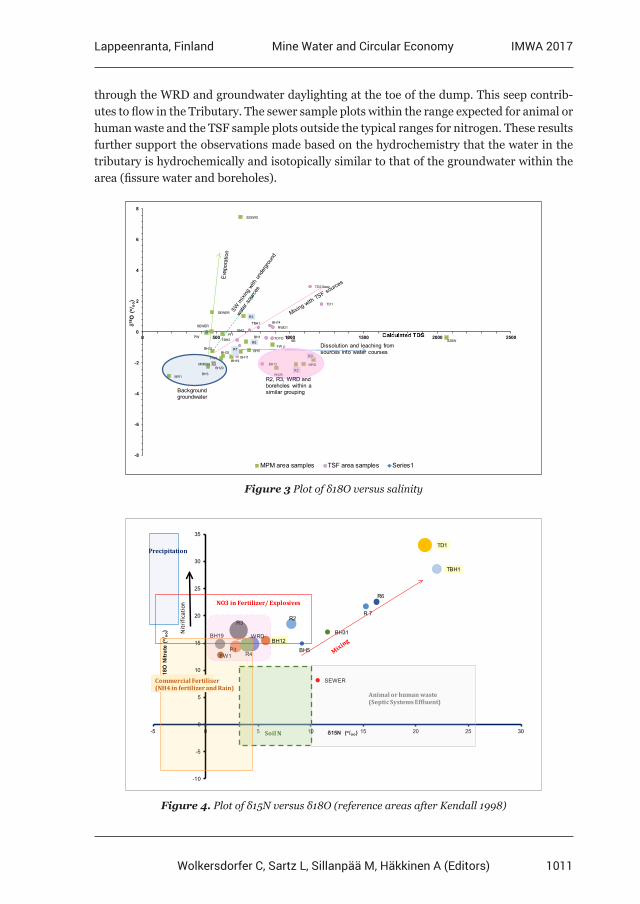
1011
Lappeenranta, Finland IMWA 2017Mine Water and Circular Economy
Wolkersdorfer C, Sartz L, Sillanpää M, Häkkinen A (Editors)
through the WRD and groundwater daylighting at the toe of the dump. This seep contrib-utes to flow in the Tributary. The sewer sample plots within the range expected for animal or human waste and the TSF sample plots outside the typical ranges for nitrogen. These results further support the observations made based on the hydrochemistry that the water in the tributary is hydrochemically and isotopically similar to that of the groundwater within the area (fissure water and boreholes).
PW
FW1
FW_p
PIT
WRD
SEWER
SEWER
SSSWD
S2SW
R2
R3
R3
R5
R7
BH3MR1
BH19
BH25
BH32BH31
MMB10
BH5
BH20
BH11
BH1
BH14
TBH2
BH2
TBH1
BH12
TD1
RWD1
TDTDSB
TD2 Seep
-8
-6
-4
-2
0
2
4
6
8
0 500 1000 1500 2000 2500
δ18 O
(o/ o
o)
MPM area samples TSF area samples Series1
R2, R3, WRD and boreholes within a similar grouping
Dissolution and leaching from sources into water courses
Background groundwater
Figure 3 Plot of δ18O versus salinity
SEWER
FW1
R3
R6
BH31
R 7
BH12BH19
BH5R4
R2
Pit
TD1
WRD
TBH1
-10
-5
0
5
10
15
20
25
30
35
-5 0 5 10 15 20 25 30
δ18O
Nitr
ate
(o/ o
o)
δ15N (o/oo)
Nitr
ifica
tion
Commercial Fertiliser (NH4 in fertilizer and Rain)
Animal or human waste (Septic Systems Effluent)
Precipitation
Soil N
NO3 in Fertilizer/ Explosives
Figure 4. Plot of δ15N versus δ18O (reference areas after Kendall 1998)
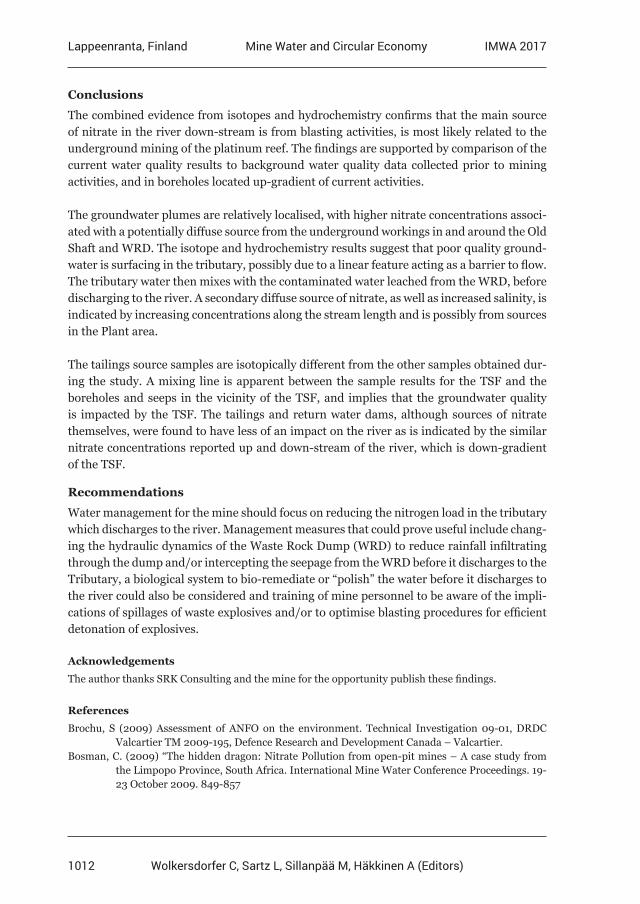
1012
Lappeenranta, Finland IMWA 2017Mine Water and Circular Economy
Wolkersdorfer C, Sartz L, Sillanpää M, Häkkinen A (Editors)
Conclusions
The combined evidence from isotopes and hydrochemistry confirms that the main source of nitrate in the river down-stream is from blasting activities, is most likely related to the underground mining of the platinum reef. The findings are supported by comparison of the current water quality results to background water quality data collected prior to mining activities, and in boreholes located up-gradient of current activities.
The groundwater plumes are relatively localised, with higher nitrate concentrations associ-ated with a potentially diffuse source from the underground workings in and around the Old Shaft and WRD. The isotope and hydrochemistry results suggest that poor quality ground-water is surfacing in the tributary, possibly due to a linear feature acting as a barrier to flow. The tributary water then mixes with the contaminated water leached from the WRD, before discharging to the river. A secondary diffuse source of nitrate, as well as increased salinity, is indicated by increasing concentrations along the stream length and is possibly from sources in the Plant area.
The tailings source samples are isotopically different from the other samples obtained dur-ing the study. A mixing line is apparent between the sample results for the TSF and the boreholes and seeps in the vicinity of the TSF, and implies that the groundwater quality is impacted by the TSF. The tailings and return water dams, although sources of nitrate themselves, were found to have less of an impact on the river as is indicated by the similar nitrate concentrations reported up and down-stream of the river, which is down-gradient of the TSF.
Recommendations
Water management for the mine should focus on reducing the nitrogen load in the tributary which discharges to the river. Management measures that could prove useful include chang-ing the hydraulic dynamics of the Waste Rock Dump (WRD) to reduce rainfall infiltrating through the dump and/or intercepting the seepage from the WRD before it discharges to the Tributary, a biological system to bio-remediate or “polish” the water before it discharges to the river could also be considered and training of mine personnel to be aware of the impli-cations of spillages of waste explosives and/or to optimise blasting procedures for efficient detonation of explosives.
Acknowledgements
The author thanks SRK Consulting and the mine for the opportunity publish these findings.
References
Brochu, S (2009) Assessment of ANFO on the environment. Technical Investigation 09-01, DRDC Valcartier TM 2009-195, Defence Research and Development Canada – Valcartier.Bosman, C. (2009) “The hidden dragon: Nitrate Pollution from open-pit mines – A case study from the Limpopo Province, South Africa. International Mine Water Conference Proceedings. 19- 23 October 2009. 849-857
1013
Lappeenranta, Finland IMWA 2017Mine Water and Circular Economy
Wolkersdorfer C, Sartz L, Sillanpää M, Häkkinen A (Editors)
Department of Water Affairs and Forestry, (1996) South African Water Quality Guidelines. Volume 1-4: Domestic Use; Agriculture Irrigation & Industrial Use. CSIR Environmental Services.Degnan, J.R., Bohlke, J.K., Pelham, K., Langlais, D.M., Walsh, J.G. (2015) Identification of Groundwater Nitrate Contamination from Explosives Used in Road Construction: Isotopic, Chemical, and Hydrologic Evidence. Environmental Science and Technology. ACS Publications.Gaye C.B. (2001), “Isotope techniques for monitoring groundwater salinization”, First International Conference on Salt Water Intrusion and Coastal Aquifers—Monitoring, Modeling, and Management. Esaouira, Morocco, April 23-25, 2001.Fewtrell, L, (2004) “Drinking-Water Nitrate, Methaemoglobinaemia, and Global Burden of Disease: A Discussion”, Environmental Health Perspectives. Volume 112, number 14, 1370-1373Ihlenfeld, C., Oates, C.J., Bullock, S. and Van Zyl, R. (2009) Isotopic Fingerprinting of Groundwater Nitrate Sources around Anglo American’s RPM Mogalakwena Operation (Limpopo Province, South Africa). International Mine Water Conference, 19th – 23rd October 2009, Pretoria, South Africa. 882-891.Kendall, C. (1998) Tracing nitrogen sources and cycling in catchments: Chapter 16 in Kendall, C. and McDonnell, J.J. (eds) Isotope Tracers in Catchment Hydrology. Elsevier.Mook, W.G. 2000. Natural Isotopes of Elements other than H, C, O. Chapter 12 in Mook, W.G. (ed) Volume I: Introduction. Theory Methods Review. UNESCO/IAEA Series on: Environmental Isotopes in the Hydrological Cycle Principles and Applications.Pasten-Zapata, E, Ledesma-Ruiz, Harter, T; Ramirez, A.I. and Mahlknecht, J (2014) Assessment of sources and fate of nitrate in shallow groundwater of an agricultural area by using a multi- tracer approach. Science of the Total Environment. Volume 470-171. 855-864. South African Bureau of Standards (2015), SANS 241 Drinking water quality standardTredoux, G, Engelbrecht, P and Israel, S (2009) Nitrate in Groundwater. Why is it a hazard and how to control it? Report to the Water Research commission, WRC Report No TT 410/09.Zhang Y, Zhou, J, Cenfu, C, Hesheng, C, Yunde, L and Xu, W (2015) Evaluating the Sources and Fate of Nitrate in the Alluvial Aquifers in the Shijiazhuang Rural and Suburban Area, China: Hydrochemical and Multi-Isotopic Approaches. Water 2015, 7, 1515-1537.
1014
Lappeenranta, Finland IMWA 2017Mine Water and Circular Economy
Wolkersdorfer C, Sartz L, Sillanpää M, Häkkinen A (Editors)
Quantification of diffuse iron discharge into surface waters in the Lusatian lignite mining district
Wilfried Uhlmann1, Yvonne Lindig1, Thomas Claus1, Sven Radigk2, Volkmar Zarach2
1Institut für Wasser und Boden Dr. Uhlmann, Lungkwitzer Str. 12, 01259 Dresden, Germany, [email protected]
2Lausitzer und Mitteldeutsche Bergbau-Verwaltungsgesellschaft mbH, Knappenstr. 1, 01968 Senftenberg, Germany
Abstract Lignite mining affects the water balance and the water quality of surface water and groundwater on a large scale. The interactions between surface water and groundwater play an important role in the different stages of active mining, remediation mining and post-mining. A current problem of the remediation mining is the diffuse discharge of contaminated groundwater into surface water. This results in acidification and iron hydroxide precipitation in the surface water.This paper shows two case studies where it was possible to quantify diffuse discharges of groundwater into surface waters in a reliable way and with an appropriate measurement effort.
Key words: diffuse discharge, iron hydroxide precipitation, streams
Introduction
Lignite mining affects the water balance as well as the water quality of surface and ground-water on a large scale. The interactions between surface water and groundwater play an im-portant and changing role in the different stages of active mining, remediation mining and post-mining. A current problem of the remediation mining are diffuse discharges of con-taminated groundwater into surface water in the regions of groundwater rising. This results in acidification and iron hydroxide precipitation in the surface water (Benthaus et al. 2015).
Knowledge of discharge volumes, concentrations and loads are necessary to plan suitable measures to prevent the inflow of iron rich groundwater into surface water. A methodo-logical problem to localize groundwater inflow is that discharge volume and loads are not directly measurable. The determination of discharge volume of groundwater inflow by dif-ferential measurement of discharge in watercourses does not provide the required accuracy and spatial resolution. Observation wells nearby surface waters only provide point informa-tion about hydraulic potentials and hydrochemistry. Geohydraulic models are often limited in their accuracy (Uhlmann et al. 2014).
The present paper shows two case studies where it was possible to quantify diffuse dis-charges of groundwater into surface waters in a reliable way and with an appropriate meas-urement effort. Essential prerequisites were a good knowledge of the investigation area, synthesis of measurement and evaluation concept as well as the reasonable using of a geo-hydraulic model.
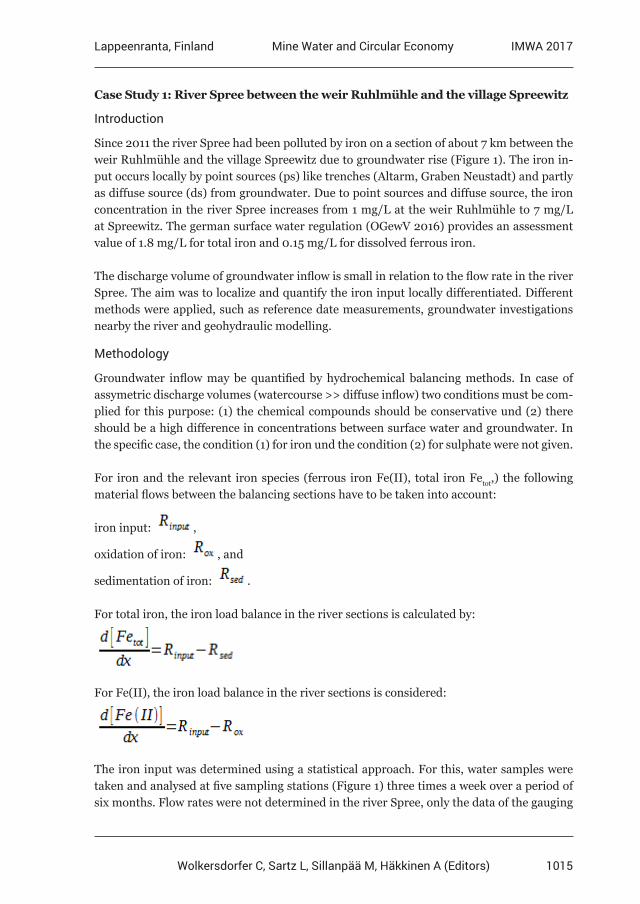
1015
Lappeenranta, Finland IMWA 2017Mine Water and Circular Economy
Wolkersdorfer C, Sartz L, Sillanpää M, Häkkinen A (Editors)
Case Study 1: River Spree between the weir Ruhlmühle and the village Spreewitz
Introduction
Since 2011 the river Spree had been polluted by iron on a section of about 7 km between the weir Ruhlmühle and the village Spreewitz due to groundwater rise (Figure 1). The iron in-put occurs locally by point sources (ps) like trenches (Altarm, Graben Neustadt) and partly as diffuse source (ds) from groundwater. Due to point sources and diffuse source, the iron concentration in the river Spree increases from 1 mg/L at the weir Ruhlmühle to 7 mg/L at Spreewitz. The german surface water regulation (OGewV 2016) provides an assessment value of 1.8 mg/L for total iron and 0.15 mg/L for dissolved ferrous iron.
The discharge volume of groundwater inflow is small in relation to the flow rate in the river Spree. The aim was to localize and quantify the iron input locally differentiated. Different methods were applied, such as reference date measurements, groundwater investigations nearby the river and geohydraulic modelling.
Methodology
Groundwater inflow may be quantified by hydrochemical balancing methods. In case of assymetric discharge volumes (watercourse >> diffuse inflow) two conditions must be com-plied for this purpose: (1) the chemical compounds should be conservative und (2) there should be a high difference in concentrations between surface water and groundwater. In the specific case, the condition (1) for iron und the condition (2) for sulphate were not given.
For iron and the relevant iron species (ferrous iron Fe(II), total iron Fetot,) the following material flows between the balancing sections have to be taken into account:
iron input: ,
oxidation of iron: , and
sedimentation of iron: .
For total iron, the iron load balance in the river sections is calculated by:
For Fe(II), the iron load balance in the river sections is considered:
The iron input was determined using a statistical approach. For this, water samples were taken and analysed at five sampling stations (Figure 1) three times a week over a period of six months. Flow rates were not determined in the river Spree, only the data of the gauging
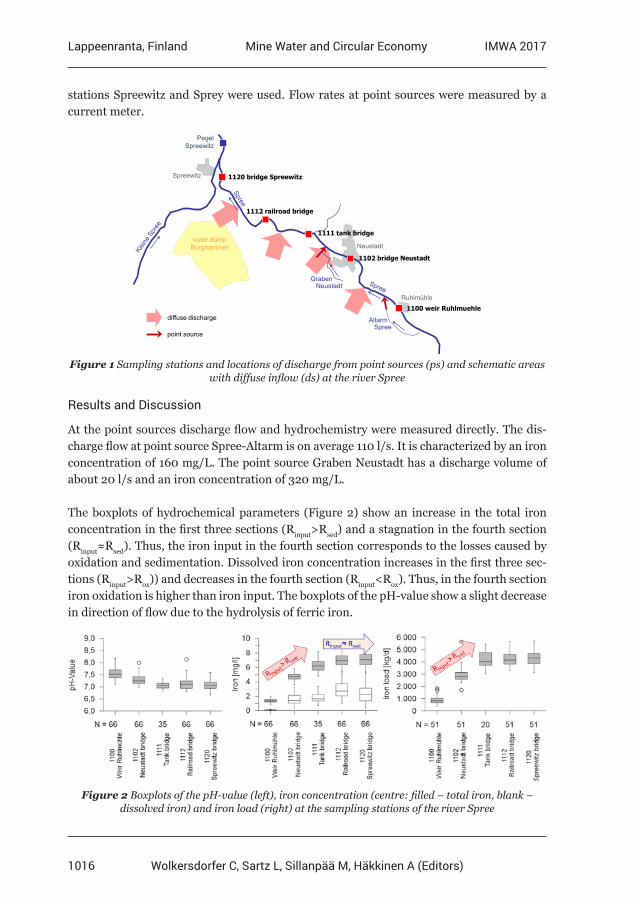
1016
Lappeenranta, Finland IMWA 2017Mine Water and Circular Economy
Wolkersdorfer C, Sartz L, Sillanpää M, Häkkinen A (Editors)
stations Spreewitz and Sprey were used. Flow rates at point sources were measured by a current meter.
Neustadt
Ruhlmühle
AltarmSpree
Spreewitz
outer dumpBurghammer
GrabenNeustadt
PegelSpreewitz
1100 weir Ruhlmuehle
1120 bridge Spreewitz
1112 railroad bridge
1102 bridge Neustadt
1111 tank bridge
diffuse discharge
point source
Figure 1 Sampling stations and locations of discharge from point sources (ps) and schematic areas with diffuse inflow (ds) at the river Spree
Results and Discussion
At the point sources discharge flow and hydrochemistry were measured directly. The dis-charge flow at point source Spree-Altarm is on average 110 l/s. It is characterized by an iron concentration of 160 mg/L. The point source Graben Neustadt has a discharge volume of about 20 l/s and an iron concentration of 320 mg/L.
The boxplots of hydrochemical parameters (Figure 2) show an increase in the total iron concentration in the first three sections (Rinput>Rsed) and a stagnation in the fourth section (Rinput≈Rsed). Thus, the iron input in the fourth section corresponds to the losses caused by oxidation and sedimentation. Dissolved iron concentration increases in the first three sec-tions (Rinput>Rox)) and decreases in the fourth section (Rinput<Rox). Thus, in the fourth section iron oxidation is higher than iron input. The boxplots of the pH-value show a slight decrease in direction of flow due to the hydrolysis of ferric iron.
Figure 2 Boxplots of the pH-value (left), iron concentration (centre: filled – total iron, blank – dissolved iron) and iron load (right) at the sampling stations of the river Spree
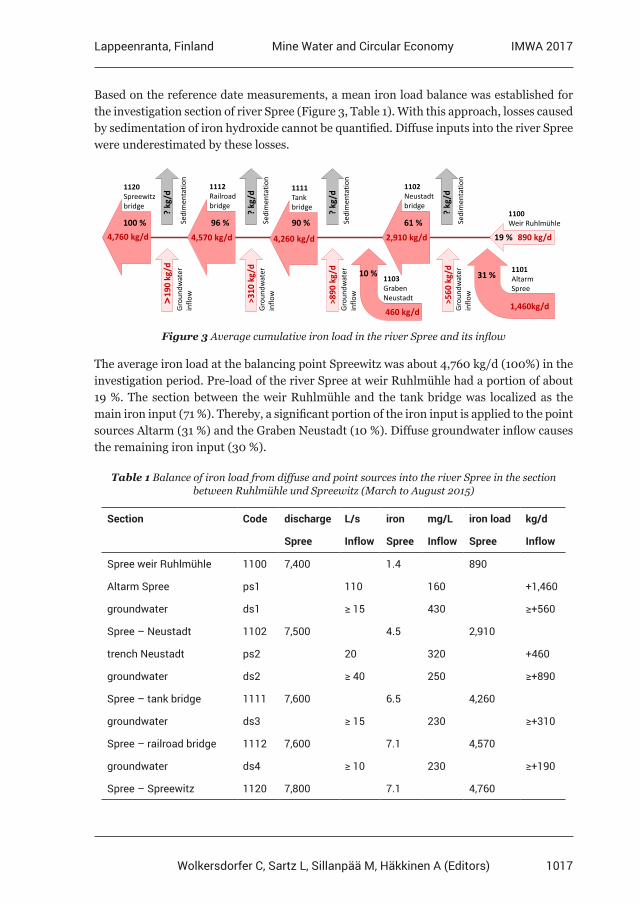
1017
Lappeenranta, Finland IMWA 2017Mine Water and Circular Economy
Wolkersdorfer C, Sartz L, Sillanpää M, Häkkinen A (Editors)
Based on the reference date measurements, a mean iron load balance was established for the investigation section of river Spree (Figure 3, Table 1). With this approach, losses caused by sedimentation of iron hydroxide cannot be quantified. Diffuse inputs into the river Spree were underestimated by these losses.
890 kg/d
1100Weir Ruhlmühle
1,460kg/d
1101AltarmSpree
4,570 kg/d
1112Railroadbridge
460 kg/d
1103Graben Neustadt
4,760 kg/d
1120Spreewitzbridge
Grou
ndw
ater
inflo
w
>19
0 kg
/d
Grou
ndw
ater
inflo
w
>310
kg/
d4,260 kg/d
1111Tankbridge
Grou
ndw
ater
inflo
w
>890
kg/
d
2,910 kg/d
1102Neustadtbridge
Grou
ndw
ater
inflo
w
>560
kg/
d
100 %19 %
61 %90 %96 %
? kg
/d
Sedi
men
tatio
n
? kg
/dSe
dim
enta
tion
? kg
/dSe
dim
enta
tion
31 %10 %
? kg
/dSe
dim
enta
tion
Figure 3 Average cumulative iron load in the river Spree and its inflow
The average iron load at the balancing point Spreewitz was about 4,760 kg/d (100%) in the investigation period. Pre-load of the river Spree at weir Ruhlmühle had a portion of about 19 %. The section between the weir Ruhlmühle and the tank bridge was localized as the main iron input (71 %). Thereby, a significant portion of the iron input is applied to the point sources Altarm (31 %) and the Graben Neustadt (10 %). Diffuse groundwater inflow causes the remaining iron input (30 %).
Table 1 Balance of iron load from diffuse and point sources into the river Spree in the section between Ruhlmühle und Spreewitz (March to August 2015)
Section Code discharge L/s iron mg/L iron load kg/d
Spree Inflow Spree Inflow Spree Inflow
Spree weir Ruhlmühle 1100 7,400 1.4 890
Altarm Spree ps1 110 160 +1,460
groundwater ds1 ≥ 15 430 ≥+560
Spree – Neustadt 1102 7,500 4.5 2,910
trench Neustadt ps2 20 320 +460
groundwater ds2 ≥ 40 250 ≥+890
Spree – tank bridge 1111 7,600 6.5 4,260
groundwater ds3 ≥ 15 230 ≥+310
Spree – railroad bridge 1112 7,600 7.1 4,570
groundwater ds4 ≥ 10 230 ≥+190
Spree – Spreewitz 1120 7,800 7.1 4,760
1018
Lappeenranta, Finland IMWA 2017Mine Water and Circular Economy
Wolkersdorfer C, Sartz L, Sillanpää M, Häkkinen A (Editors)
Groundwater sampling from 11 observation wells nearby the river complements the inves-tigations and confirmed the existence of hot spots with local iron concentrations up to over 400 mg/L. Based on the results of groundwater modelling, groundwater investigations and measurement campaigns, the iron load could be quantified as shown in Table 1. The balance shows that the capture and treatment of the point sources can substantially reduce the iron input. Treatment measures of diffuse inputs are only economical in sections between weir Ruhlmühle and the tank bridge (ds1, ds2).
Case Study 2: Lower course of the river Kleine Spree
Introduction
Since 2008 the river Kleine Spree is contaminated by iron on a section of about 4.5 km be-tween the outlet of the Burghammer reservoir and the mouth of the river Spree (Figure 4). The reason for this is also the exfiltration of iron-rich groundwater as a result of the ground-water rising. Between 0.2 and 75 mg/L iron were measured in the river Kleine Spree (Uhl-mann et al. 2012). The aim of the investigations was to localize and quantify the iron input.
The investigation area of the river Kleine Spree is characterized by a special feature. Up-stream of the input area, the reservoir Burghammer discharges into the river. Burghammer is a post-mining lake. It is acidified and has to be chemically neutralized regularly. Discharge from the reservoir Burghammer occurs discontinuously. In the reservoir Burghammer, the sulphate concentration is also increased. Since the discharge in the river Kleine Spree is naturally low (MQ ≈ 1 m³/s), the periods with a discharge from the reservoir Burghammer can be used as a tracer signal.
Methodology
Between Burg and Spreewitz seven measuring points were installed in the river Kleine Spree to localize hot spots of iron input (Figure 4). At the sampling stations, measurements of the flow rate and hydrochemistry were conducted. Due to the predominantly low flow rates in the river, the discharge of the groundwater inflow could be estimated by difference meas-urements. However, the measurement error is too high for planning technical measures.
Observation wells nearby the river Kleine Spree were sampled. The range of the hydrochem-ical parameters is widely spread. It can only be characterized statistically. Based on the flow rates and investigations of the water chemistry the groundwater inflow and the groundwa-ter chemistry were estimated using a mass balance model. Thereby, especially the tracer signal of the outlet from the reservoir Burghammer was useful.
Results
Since the measurement campaigns were carried out at different discharge conditions, the range of hydrochemical findings is very large. On the basis of the median values of the iron and sulphate concentrations, however, a successive substance input with the groundwater can be detected in the longitudinal profile of the river Kleine Spree (Figure 5). Two hot spots of the substance input can be documented on the basis of the concentration change: (1)
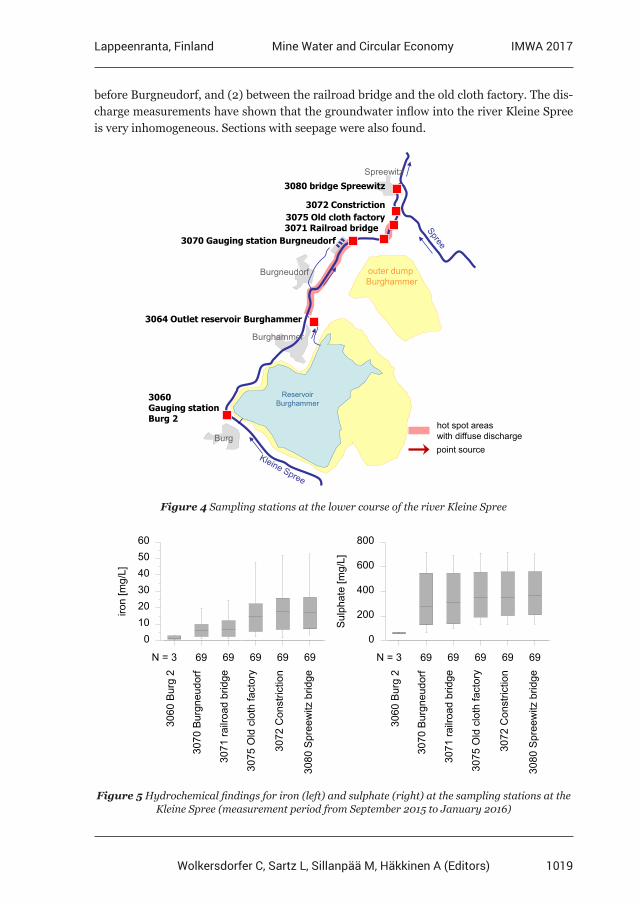
1019
Lappeenranta, Finland IMWA 2017Mine Water and Circular Economy
Wolkersdorfer C, Sartz L, Sillanpää M, Häkkinen A (Editors)
before Burgneudorf, and (2) between the railroad bridge and the old cloth factory. The dis-charge measurements have shown that the groundwater inflow into the river Kleine Spree is very inhomogeneous. Sections with seepage were also found.
ReservoirBurghammer
Burg
Burghammer
Burgneudorf
Spreewitz
outer dumpBurghammer
3060 Gauging stationBurg 2
3070 Gauging station Burgneudorf 3071 Railroad bridge
3072 Constriction3075 Old cloth factory
3080 bridge Spreewitz
3064 Outlet reservoir Burghammer
hot spot areaswith diffuse dischargepoint source
Figure 4 Sampling stations at the lower course of the river Kleine Spree
0102030405060
iron
[mg/
L]
3060
Bur
g 2
3070
Bur
gneu
dorf
3071
railr
oad
brid
ge
3075
Old
clo
th fa
ctor
y
3072
Con
stric
tion
3080
Spr
eew
itz b
ridge
6969696969N = 3
0
200
400
600
800
Sul
phat
e [m
g/L]
3060
Bur
g 2
3070
Bur
gneu
dorf
3071
railr
oad
brid
ge
3075
Old
clo
th fa
ctor
y
3072
Con
stric
tion
3080
Spr
eew
itz b
ridge
6969696969N = 3
Figure 5 Hydrochemical findings for iron (left) and sulphate (right) at the sampling stations at the Kleine Spree (measurement period from September 2015 to January 2016)
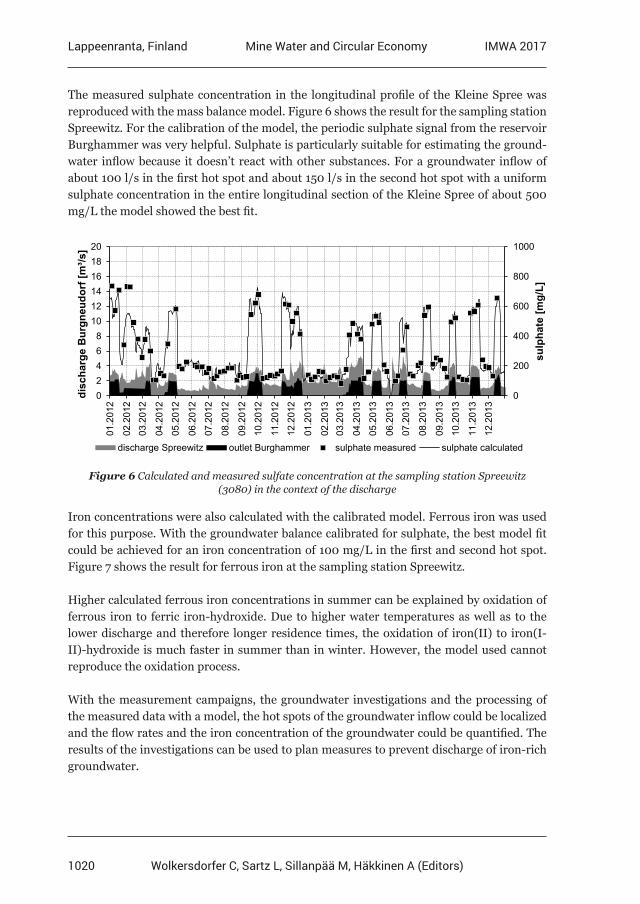
1020
Lappeenranta, Finland IMWA 2017Mine Water and Circular Economy
Wolkersdorfer C, Sartz L, Sillanpää M, Häkkinen A (Editors)
The measured sulphate concentration in the longitudinal profile of the Kleine Spree was reproduced with the mass balance model. Figure 6 shows the result for the sampling station Spreewitz. For the calibration of the model, the periodic sulphate signal from the reservoir Burghammer was very helpful. Sulphate is particularly suitable for estimating the ground-water inflow because it doesn’t react with other substances. For a groundwater inflow of about 100 l/s in the first hot spot and about 150 l/s in the second hot spot with a uniform sulphate concentration in the entire longitudinal section of the Kleine Spree of about 500 mg/L the model showed the best fit.
0
200
400
600
800
1000
02468
101214161820
01.2
012
02.2
012
03.2
012
04.2
012
05.2
012
06.2
012
07.2
012
08.2
012
09.2
012
10.2
012
11.2
012
12.2
012
01.2
013
02.2
013
03.2
013
04.2
013
05.2
013
06.2
013
07.2
013
08.2
013
09.2
013
10.2
013
11.2
013
12.2
013
sulp
hate
[mg/
L]
disc
harg
e B
urgn
eudo
rf [m
³/s]
discharge Spreewitz outlet Burghammer sulphate measured sulphate calculated
Figure 6 Calculated and measured sulfate concentration at the sampling station Spreewitz (3080) in the context of the discharge
Iron concentrations were also calculated with the calibrated model. Ferrous iron was used for this purpose. With the groundwater balance calibrated for sulphate, the best model fit could be achieved for an iron concentration of 100 mg/L in the first and second hot spot. Figure 7 shows the result for ferrous iron at the sampling station Spreewitz.
Higher calculated ferrous iron concentrations in summer can be explained by oxidation of ferrous iron to ferric iron-hydroxide. Due to higher water temperatures as well as to the lower discharge and therefore longer residence times, the oxidation of iron(II) to iron(I-II)-hydroxide is much faster in summer than in winter. However, the model used cannot reproduce the oxidation process.
With the measurement campaigns, the groundwater investigations and the processing of the measured data with a model, the hot spots of the groundwater inflow could be localized and the flow rates and the iron concentration of the groundwater could be quantified. The results of the investigations can be used to plan measures to prevent discharge of iron-rich groundwater.
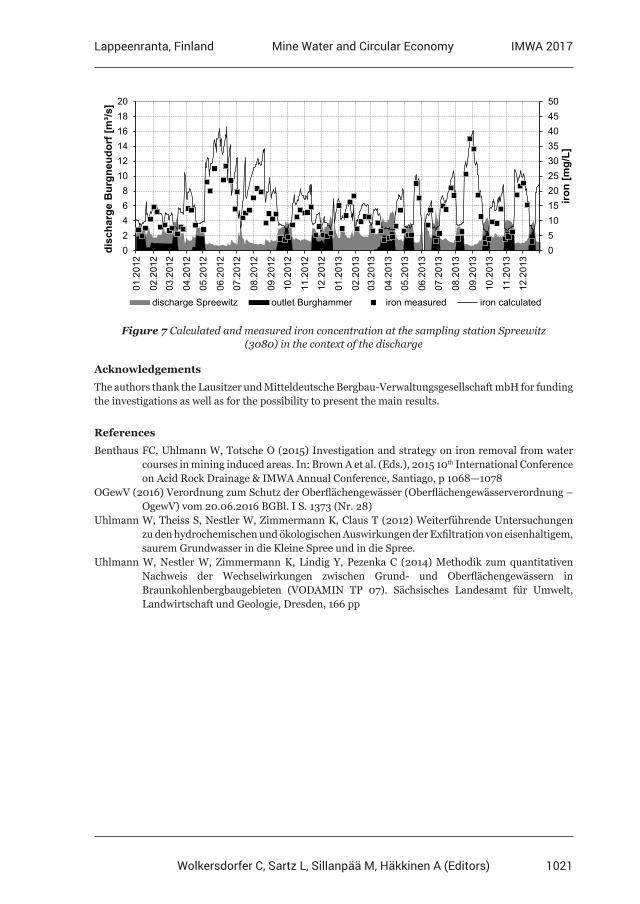
1021
Lappeenranta, Finland IMWA 2017Mine Water and Circular Economy
Wolkersdorfer C, Sartz L, Sillanpää M, Häkkinen A (Editors)
05101520253035404550
02468
101214161820
01.2
012
02.2
012
03.2
012
04.2
012
05.2
012
06.2
012
07.2
012
08.2
012
09.2
012
10.2
012
11.2
012
12.2
012
01.2
013
02.2
013
03.2
013
04.2
013
05.2
013
06.2
013
07.2
013
08.2
013
09.2
013
10.2
013
11.2
013
12.2
013
iron
[mg/
L]
disc
harg
e B
urgn
eudo
rf [m
³/s]
discharge Spreewitz outlet Burghammer iron measured iron calculated
Figure 7 Calculated and measured iron concentration at the sampling station Spreewitz (3080) in the context of the discharge
Acknowledgements
The authors thank the Lausitzer und Mitteldeutsche Bergbau-Verwaltungsgesellschaft mbH for funding the investigations as well as for the possibility to present the main results.
References
Benthaus FC, Uhlmann W, Totsche O (2015) Investigation and strategy on iron removal from water courses in mining induced areas. In: Brown A et al. (Eds.), 2015 10th International Conference on Acid Rock Drainage & IMWA Annual Conference, Santiago, p 1068—1078OGewV (2016) Verordnung zum Schutz der Oberflächengewässer (Oberflächengewässerverordnung – OgewV) vom 20.06.2016 BGBl. I S. 1373 (Nr. 28)Uhlmann W, Theiss S, Nestler W, Zimmermann K, Claus T (2012) Weiterführende Untersuchungen zu den hydrochemischen und ökologischen Auswirkungen der Exfiltration von eisenhaltigem, saurem Grundwasser in die Kleine Spree und in die Spree. Uhlmann W, Nestler W, Zimmermann K, Lindig Y, Pezenka C (2014) Methodik zum quantitativen Nachweis der Wechselwirkungen zwischen Grund- und Oberflächengewässern in Braunkohlenbergbaugebieten (VODAMIN TP 07). Sächsisches Landesamt für Umwelt, Landwirtschaft und Geologie, Dresden, 166 pp
1022
Lappeenranta, Finland IMWA 2017Mine Water and Circular Economy
Wolkersdorfer C, Sartz L, Sillanpää M, Häkkinen A (Editors)
Characterization of Geo-Hydro-Ecological Factors Affecting the Distribution of Endangered Species in
Viiankiaapa Mire, a Mineral Exploration Site
Kirsti Korkka-Niemi, Anne Rautio, Paula Bigler, Susanne Åberg
University of Helsinki, Department of Geosciences and Geography, P.O. Box 64, FI-00014 Helsinki, FINLAND, [email protected]
Abstract A prominent Cu-Ni-PGE sulphide discovery named Sakatti has been discovered below the Natura 2000 protected Viiankiaapa mire. A thermal infrared survey using an unmanned aerial vehicle was combined with field observations and hydrogeochemical analysis of pore water in the peatland to assess whether endangered species (especially Hamatocaulis vericosus) prefer areas influenced by groundwater or certain geochemical environments. Before planning of the intensive exploration and possible mining activities, it is important to understand the possible association of the mire vegetation with groundwater–surface water interactions, as well as the geochemical features of the local bedrock.
Key words mire, endangered species, hydrogeochemistry, thermal infrared, unmanned aerial vehicle
Introduction
A Cu-Ni-PGE sulphide mineralization has been discovered in Sodankylä, Northern Finland (Brownscombe et al. 2015), located beneath the Natura 2000 protected Viiankiaapa mire close to the River Kitinen (fig. 1). It is important to understand the hydrology of the aapa mire and the possible association of the mire vegetation with the groundwater–surface wa-ter interactions, as well as the geochemical features of the local bedrock (fig. 2).
Although it is widely known that the plant cover and water quality of bog waters are related to the surrounding groundwater flow systems, the whole geo-hydro-ecological system of aapa mires is usually inadequately understood. Fraser (2001) concluded that the mixing of meteoric water and deeper groundwater controls the geochemical profiles of pore water in peatlands, being important to their biogeochemical functioning. Laitinen et al. (2005) sum-marized that mire hydrology, and especially its relationship with groundwater recharge–discharge patterns, is crucial for mire vegetation, but has seldom been studied in Finland.
In Viiankiaapa mire, based on present understanding of the surface and groundwater flow pat-terns and hydrogeochemical features of the surface and groundwaters (Salonen et al. 2016), as well as the distribution of endangered species (fig. 1), we assume that the hydrological pattern can provide an explanation for the distribution of these special habitats. Because water is able to transfer essential nutrients and trace elements for the certain types of vegetation, it is impor-tant to understand the geo-hydro-ecological system of the mire complex and its surroundings.
In this study, a thermal infrared (TIR) survey using an unmanned aerial vehicle (UAV) was combined with field observations and hydrogeochemical analysis of pore water in the peat-land to assess whether endangered species (especially Hamatocaulis vermicosus, fig. 1) prefer groundwater-influenced habitats or certain geochemical environments.
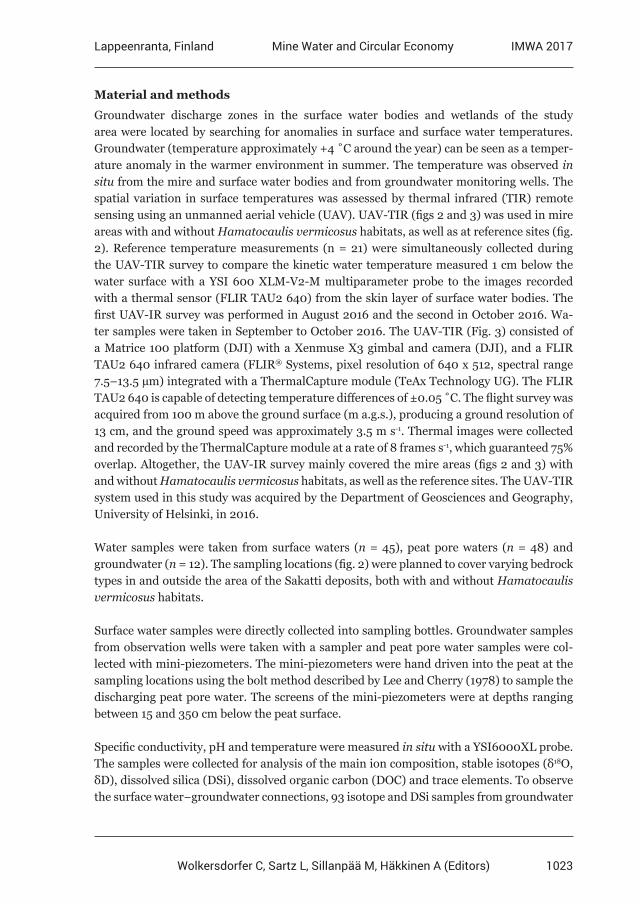
1023
Lappeenranta, Finland IMWA 2017Mine Water and Circular Economy
Wolkersdorfer C, Sartz L, Sillanpää M, Häkkinen A (Editors)
Material and methods
Groundwater discharge zones in the surface water bodies and wetlands of the study area were located by searching for anomalies in surface and surface water temperatures. Groundwater (temperature approximately +4 ˚C around the year) can be seen as a temper-ature anomaly in the warmer environment in summer. The temperature was observed in situ from the mire and surface water bodies and from groundwater monitoring wells. The spatial variation in surface temperatures was assessed by thermal infrared (TIR) remote sensing using an unmanned aerial vehicle (UAV). UAV-TIR (figs 2 and 3) was used in mire areas with and without Hamatocaulis vermicosus habitats, as well as at reference sites (fig. 2). Reference temperature measurements (n = 21) were simultaneously collected during the UAV-TIR survey to compare the kinetic water temperature measured 1 cm below the water surface with a YSI 600 XLM-V2-M multiparameter probe to the images recorded with a thermal sensor (FLIR TAU2 640) from the skin layer of surface water bodies. The first UAV-IR survey was performed in August 2016 and the second in October 2016. Wa-ter samples were taken in September to October 2016. The UAV-TIR (Fig. 3) consisted of a Matrice 100 platform (DJI) with a Xenmuse X3 gimbal and camera (DJI), and a FLIR TAU2 640 infrared camera (FLIR® Systems, pixel resolution of 640 x 512, spectral range 7.5–13.5 µm) integrated with a ThermalCapture module (TeAx Technology UG). The FLIR TAU2 640 is capable of detecting temperature differences of ±0.05 C. The flight survey was acquired from 100 m above the ground surface (m a.g.s.), producing a ground resolution of 13 cm, and the ground speed was approximately 3.5 m s-1. Thermal images were collected and recorded by the ThermalCapture module at a rate of 8 frames s-1, which guaranteed 75% overlap. Altogether, the UAV-IR survey mainly covered the mire areas (figs 2 and 3) with and without Hamatocaulis vermicosus habitats, as well as the reference sites. The UAV-TIR system used in this study was acquired by the Department of Geosciences and Geography, University of Helsinki, in 2016.
Water samples were taken from surface waters (n = 45), peat pore waters (n = 48) and groundwater (n = 12). The sampling locations (fig. 2) were planned to cover varying bedrock types in and outside the area of the Sakatti deposits, both with and without Hamatocaulis vermicosus habitats.
Surface water samples were directly collected into sampling bottles. Groundwater samples from observation wells were taken with a sampler and peat pore water samples were col-lected with mini-piezometers. The mini-piezometers were hand driven into the peat at the sampling locations using the bolt method described by Lee and Cherry (1978) to sample the discharging peat pore water. The screens of the mini-piezometers were at depths ranging between 15 and 350 cm below the peat surface.
Specific conductivity, pH and temperature were measured in situ with a YSI6000XL probe. The samples were collected for analysis of the main ion composition, stable isotopes (δ18O, δD), dissolved silica (DSi), dissolved organic carbon (DOC) and trace elements. To observe the surface water−groundwater connections, 93 isotope and DSi samples from groundwater
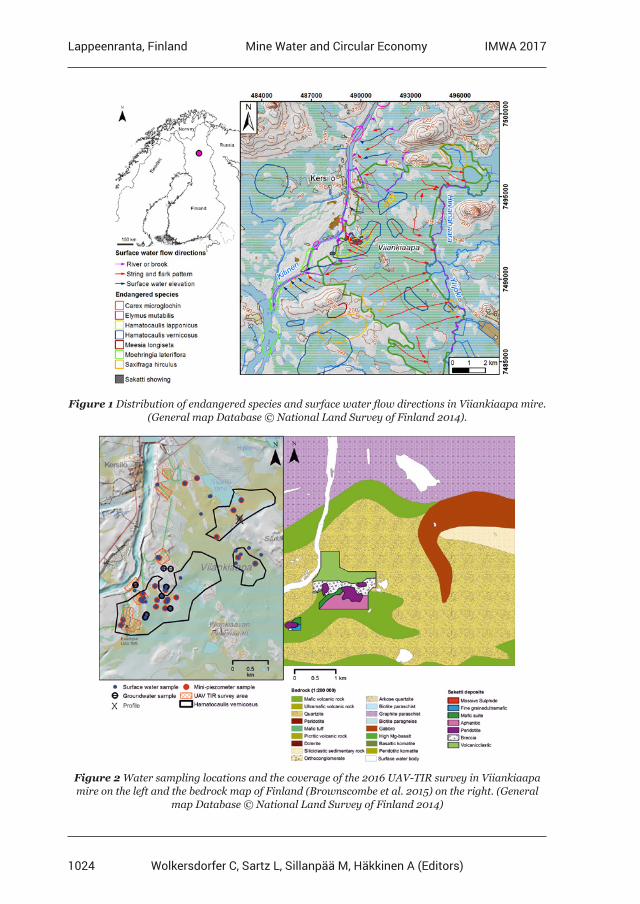
1024
Lappeenranta, Finland IMWA 2017Mine Water and Circular Economy
Wolkersdorfer C, Sartz L, Sillanpää M, Häkkinen A (Editors)
Figure 1 Distribution of endangered species and surface water flow directions in Viiankiaapa mire. (General map Database © National Land Survey of Finland 2014).
Figure 2 Water sampling locations and the coverage of the 2016 UAV-TIR survey in Viiankiaapa mire on the left and the bedrock map of Finland (Brownscombe et al. 2015) on the right. (General
map Database © National Land Survey of Finland 2014)
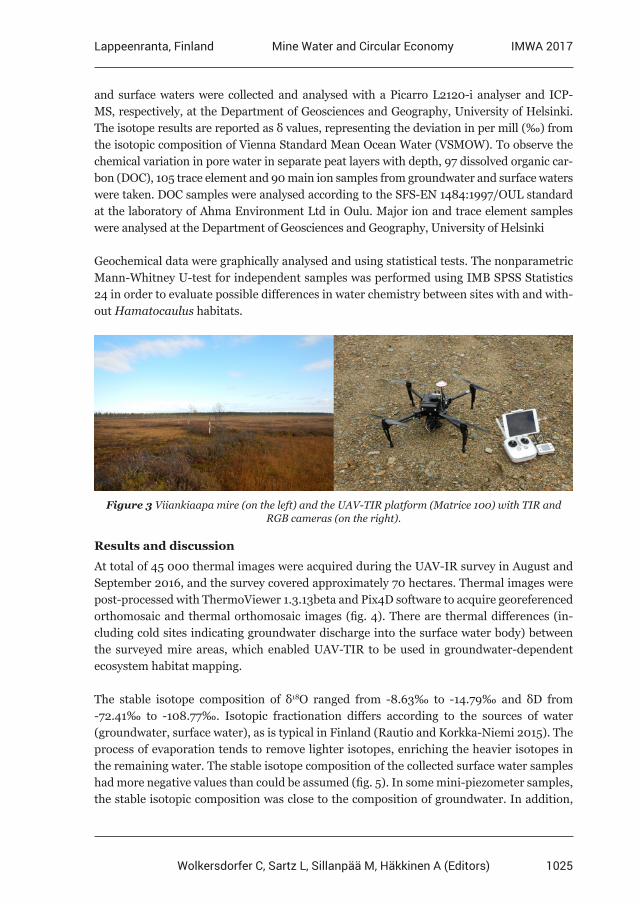
1025
Lappeenranta, Finland IMWA 2017Mine Water and Circular Economy
Wolkersdorfer C, Sartz L, Sillanpää M, Häkkinen A (Editors)
and surface waters were collected and analysed with a Picarro L2120-i analyser and ICP-MS, respectively, at the Department of Geosciences and Geography, University of Helsinki. The isotope results are reported as δ values, representing the deviation in per mill (‰) from the isotopic composition of Vienna Standard Mean Ocean Water (VSMOW). To observe the chemical variation in pore water in separate peat layers with depth, 97 dissolved organic car-bon (DOC), 105 trace element and 90 main ion samples from groundwater and surface waters were taken. DOC samples were analysed according to the SFS-EN 1484:1997/OUL standard at the laboratory of Ahma Environment Ltd in Oulu. Major ion and trace element samples were analysed at the Department of Geosciences and Geography, University of Helsinki
Geochemical data were graphically analysed and using statistical tests. The nonparametric Mann-Whitney U-test for independent samples was performed using IMB SPSS Statistics 24 in order to evaluate possible differences in water chemistry between sites with and with-out Hamatocaulus habitats.
Figure 3 Viiankiaapa mire (on the left) and the UAV-TIR platform (Matrice 100) with TIR and RGB cameras (on the right).
Results and discussion
At total of 45 000 thermal images were acquired during the UAV-IR survey in August and September 2016, and the survey covered approximately 70 hectares. Thermal images were post-processed with ThermoViewer 1.3.13beta and Pix4D software to acquire georeferenced orthomosaic and thermal orthomosaic images (fig. 4). There are thermal differences (in-cluding cold sites indicating groundwater discharge into the surface water body) between the surveyed mire areas, which enabled UAV-TIR to be used in groundwater-dependent ecosystem habitat mapping.
The stable isotope composition of δ18O ranged from -8.63‰ to -14.79‰ and δD from -72.41‰ to -108.77‰. Isotopic fractionation differs according to the sources of water (groundwater, surface water), as is typical in Finland (Rautio and Korkka-Niemi 2015). The process of evaporation tends to remove lighter isotopes, enriching the heavier isotopes in the remaining water. The stable isotope composition of the collected surface water samples had more negative values than could be assumed (fig. 5). In some mini-piezometer samples, the stable isotopic composition was close to the composition of groundwater. In addition,
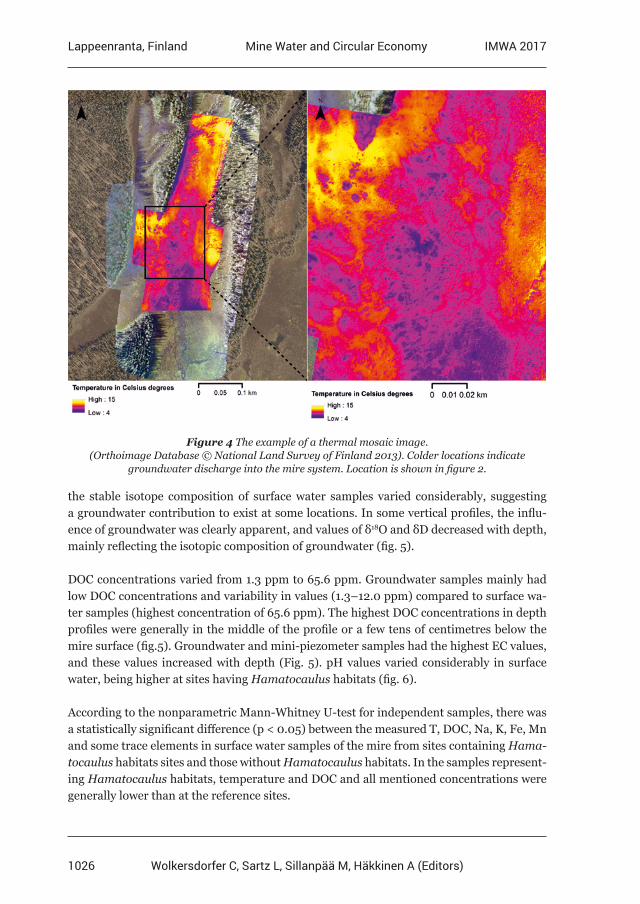
1026
Lappeenranta, Finland IMWA 2017Mine Water and Circular Economy
Wolkersdorfer C, Sartz L, Sillanpää M, Häkkinen A (Editors)
Figure 4 The example of a thermal mosaic image. (Orthoimage Database © National Land Survey of Finland 2013). Colder locations indicate
groundwater discharge into the mire system. Location is shown in figure 2.
the stable isotope composition of surface water samples varied considerably, suggesting a groundwater contribution to exist at some locations. In some vertical profiles, the influ-ence of groundwater was clearly apparent, and values of δ18O and δD decreased with depth, mainly reflecting the isotopic composition of groundwater (fig. 5).
DOC concentrations varied from 1.3 ppm to 65.6 ppm. Groundwater samples mainly had low DOC concentrations and variability in values (1.3–12.0 ppm) compared to surface wa-ter samples (highest concentration of 65.6 ppm). The highest DOC concentrations in depth profiles were generally in the middle of the profile or a few tens of centimetres below the mire surface (fig.5). Groundwater and mini-piezometer samples had the highest EC values, and these values increased with depth (Fig. 5). pH values varied considerably in surface water, being higher at sites having Hamatocaulus habitats (fig. 6).
According to the nonparametric Mann-Whitney U-test for independent samples, there was a statistically significant difference (p < 0.05) between the measured T, DOC, Na, K, Fe, Mn and some trace elements in surface water samples of the mire from sites containing Hama-tocaulus habitats sites and those without Hamatocaulus habitats. In the samples represent-ing Hamatocaulus habitats, temperature and DOC and all mentioned concentrations were generally lower than at the reference sites.
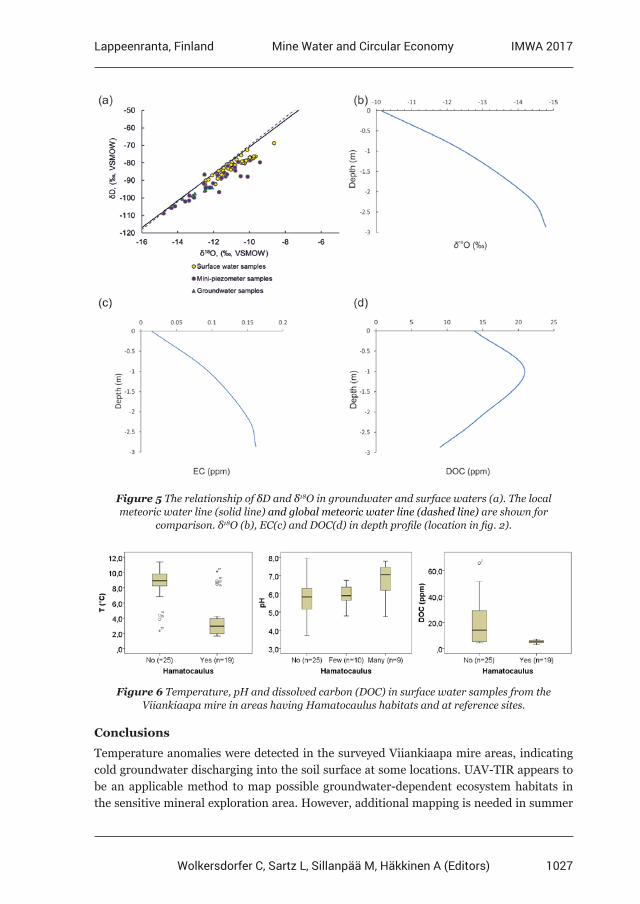
1027
Lappeenranta, Finland IMWA 2017Mine Water and Circular Economy
Wolkersdorfer C, Sartz L, Sillanpää M, Häkkinen A (Editors)
Figure 5 The relationship of δD and δ18O in groundwater and surface waters (a). The local meteoric water line (solid line) and global meteoric water line (dashed line) are shown for
comparison. δ18O (b), EC(c) and DOC(d) in depth profile (location in fig. 2).
Figure 6 Temperature, pH and dissolved carbon (DOC) in surface water samples from the Viiankiaapa mire in areas having Hamatocaulus habitats and at reference sites.
Conclusions
Temperature anomalies were detected in the surveyed Viiankiaapa mire areas, indicating cold groundwater discharging into the soil surface at some locations. UAV-TIR appears to be an applicable method to map possible groundwater-dependent ecosystem habitats in the sensitive mineral exploration area. However, additional mapping is needed in summer
1028
Lappeenranta, Finland IMWA 2017Mine Water and Circular Economy
Wolkersdorfer C, Sartz L, Sillanpää M, Häkkinen A (Editors)
during the more optimal TIR imagery conditions. The temperature, DOC, Na, K, Mn and Fe, as well as some trace element contents of surface water in the peatland were lower at locations having Hamatocaulus habitats than at reference sites. In some vertical profiles, the influence of groundwater was clearly evident, and values of δ18O, δD, DSi and DOC de-creased with the depth, reflecting the composition of groundwater. Moreover, further analy-sis of vertical piezometric levels in the peat layers should be conducted in order to verify the groundwater flow patterns, especially at sites having Hamatocaulus habitats.
Acknowledgements
We thank Jukka Jokela and Joanna Kuntonen van’t-Riet from AA Sakatti Mining Oy for their valuable support and cooperation in making this research possible, K.H. Renlund Foundation and the foundation Maa- ja Vesitekniikan Tuki for financial support, as well as Veli-Pekka Salonen for his distinguished contribution.
References
Brownscombe W, Ihlenfeld C, Coppard J, Hartshorne C, Klatt S, Siikaluoma JK, Herrington RJ (2015) Chapter 3.7 The Sakatti Cu-Ni-PGE Sulfide Deposit in Northern Finland. In: O’Brien WDML (ed.), Mineral Deposits of Finland, Elsevier, p 211–252Fraser C, Roulet NT, Lafleur M (2001) Groundwater flow patterns in a large peatland. J of Hydrology 246(1–4):142–154Laitinen J, Rehell S, Huttunen A (2005) Vegetation-related hydrotopographic and hydrologic classification for aapa mires (Hirvisuo, Finland). Ann. Bot.Fennici 42:107–121 Lee D, Cherry J (1978) A field exercise on groundwater flow using seepage meters and minipiezometers. J. Geological Education 27: 6–20Rautio A, Kivimäki A-L, Korkka-Niemi K, Nygård M, Salonen V-P, Lahti K, Vahtera H (2015) Vulnerability of groundwater resources to interaction with river water in a boreal catchment, Hydrol. Earth Syst. Sci. 19(7):3015−3032, doi 10.5194/hess-19-3015-2015Rautio A, Korkka-Niemi K (2011) Characterization of groundwater– lake water interactions at Lake Pyhäjärvi, SW Finland. Boreal Environ. Res. 16:363–380Rautio A, Korkka-Niemi K (2015) Chemical and isotopic tracers indicating groundwater/surface-water interaction within a boreal lake catchment in Finland, Hydrogeol. J. 23(4):687–705, doi 10.1007/s10040-015-1234-5Salonen V-P, Korkka-Niemi K, Rautio A, Koivisto E, Åberg A, Åberg S, Laakso J, Lahtinen T & Suonperä E (2016) Sakatti geoenvironments. A baseline study on Quaternary sediments, hydrogeological conditions and groundwater – surface water interactions in Kersilö area, Sodankylä. AA Sakatti Mines OY, Report, University of Helsinki, Department of Geosciences and geography


8 Treatment
1032
Lappeenranta, Finland IMWA 2017Mine Water and Circular Economy
Wolkersdorfer C, Sartz L, Sillanpää M, Häkkinen A (Editors)
Iron and Sulfate Removal in Highly Contaminated Acid Mine Drainage Using Passive Multi-Step Systems
Tsiverihasina V. Rakotonimaro1, Carmen M. Neculita1, Bruno Bussière1, Thomas Genty1, Gérald J. Zagury2
1Research Institute on Mines and Environment (RIME), University of Quebec in Abitibi-Temiscamingue (UQAT), 445 Boul. de l’Université, Rouyn-Noranda, QC, Canada, J9X5E4
2RIME- Polytechnique Montréal, Department of Civil, Geological, and Mining Engineering, Polytechnique Montréal, Montreal, QC, Canada, H3C 3A7
Abstract Remediation of high Fe and SO42−acid mine drainage (AMD) with passive multi-step systems
is less prone to clogging, but could show variable efficiency. Hence, four scenarios (MS1 to MS4) of passive multi-step treatment systems were tested. The system (MS3) composed of two pretreatment units of dispersed alkaline substrate reactors and one unit of passive biochemical reactor was found the most efficient (Fe and SO4
2− removal of 99% and 77%, respectively). Clogging issues were not encountered in all reactors. Nonetheless, further studies on the treatment of highly contaminated Fe and SO4
2− AMD with other dissolved metals should be undertaken.
Key words acid mine drainage, passive biochemical reactor, multi-step systems, dispersed alkaline substrate, wood ash
Introduction
Treatment of highly contaminated acid mine drainage (AMD) often involve passive multi-step systems because they are less subjected to clogging and/or passivation. Their design includes pretreatment, principal and polishing units, which can be aerobic and anaerobic, chemical, and biological. Some types may involve the combination in series of dispersed alkaline substrate (DAS – mixture of coarse (wood chips) and neutralizing materials (cal-cite or magnesia)) units with cascade aeration (Rötting et al. 2008) or decantation ponds (Caraballo et al. 2011; Macías et al. 2012). Passive biochemical reactors (PBRs) were com-bined with anoxic limestone drains (ALD) (Figueroa et al. 2007; Prasad and Henry 2009) or with peat biofilters (Clyde et al. 2016). However, a multi-step treatment has variable efficiency (in terms of Fe and SO4
2− removal) depending on the water quality, and on the type and number of units composing the system. The DAS-based multi-step systems could remove up to 99.9% of Fe in AMD, at initial Fe concentrations <0.5 g/L, whereas at higher concentrations (0.5−1 g/L), the efficiency decreased to as low as 20% (Rötting et al. 2008; Caraballo et al. 2009, 2011). In addition, the SO4
2− was marginally removed (Rötting et al. 2008; Caraballo et al. 2011; Macìas et al. 2012). PBRs-based multi-step treatment could remove up to 99.7% of Fe and 53% of SO4
2-, at initial concentrations <0.5 g/L and 0.3−3 g/L, respectively (Figueroa et al. 2007; Prasad and Henry 2009). Oppositely, Fe and SO4
2-
removal was found around 78% and 55%, at initial Fe and SO42- concentrations of 1.8 g/L
and 4.7 g/L, respectively (Genty et al. 2016). However, AMD originating from abandoned mines and tailings can be characterized by extremely high concentrations of dissolved Fe (up to 141 g/L) and SO4
2- (up to 760 g/L) (Nordstrom et al. 2000). Hence, an optimization of the performance of multi-step systems to allow treating an AMD of such quality is still
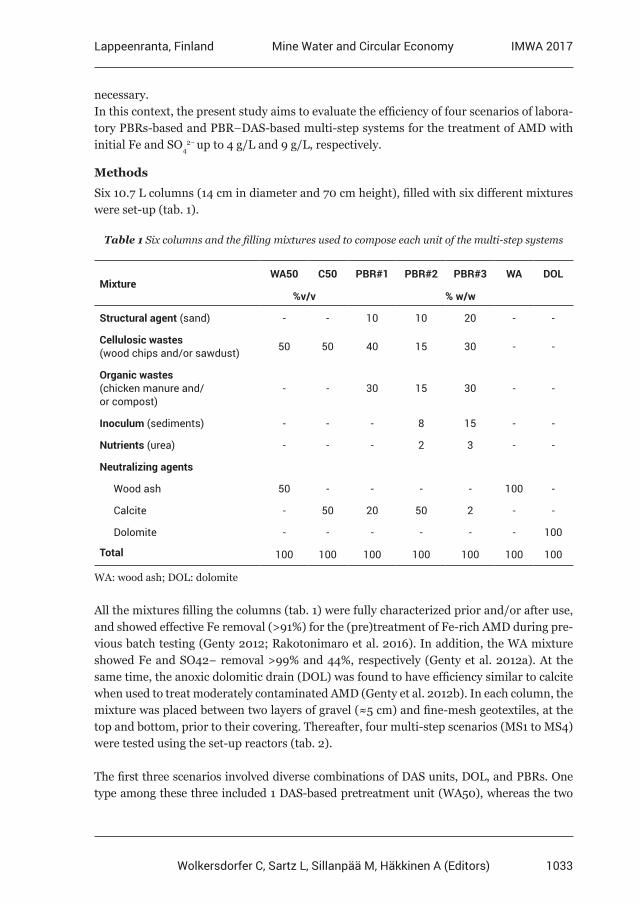
1033
Lappeenranta, Finland IMWA 2017Mine Water and Circular Economy
Wolkersdorfer C, Sartz L, Sillanpää M, Häkkinen A (Editors)
necessary. In this context, the present study aims to evaluate the efficiency of four scenarios of labora-tory PBRs-based and PBR−DAS-based multi-step systems for the treatment of AMD with initial Fe and SO4
2− up to 4 g/L and 9 g/L, respectively.
Methods
Six 10.7 L columns (14 cm in diameter and 70 cm height), filled with six different mixtures were set-up (tab. 1).
Table 1 Six columns and the filling mixtures used to compose each unit of the multi-step systems
MixtureWA50 C50 PBR#1 PBR#2 PBR#3 WA DOL
%v/v % w/w
Structural agent (sand) - - 10 10 20 - -
Cellulosic wastes (wood chips and/or sawdust) 50 50 40 15 30 - -
Organic wastes (chicken manure and/ or compost)
- - 30 15 30 - -
Inoculum (sediments) - - - 8 15 - -
Nutrients (urea) - - - 2 3 - -
Neutralizing agents
Wood ash 50 - - - - 100 -
Calcite - 50 20 50 2 - -
Dolomite - - - - - - 100
Total 100 100 100 100 100 100 100
WA: wood ash; DOL: dolomite
All the mixtures filling the columns (tab. 1) were fully characterized prior and/or after use, and showed effective Fe removal (>91%) for the (pre)treatment of Fe-rich AMD during pre-vious batch testing (Genty 2012; Rakotonimaro et al. 2016). In addition, the WA mixture showed Fe and SO42− removal >99% and 44%, respectively (Genty et al. 2012a). At the same time, the anoxic dolomitic drain (DOL) was found to have efficiency similar to calcite when used to treat moderately contaminated AMD (Genty et al. 2012b). In each column, the mixture was placed between two layers of gravel (≈5 cm) and fine-mesh geotextiles, at the top and bottom, prior to their covering. Thereafter, four multi-step scenarios (MS1 to MS4) were tested using the set-up reactors (tab. 2).
The first three scenarios involved diverse combinations of DAS units, DOL, and PBRs. One type among these three included 1 DAS-based pretreatment unit (WA50), whereas the two
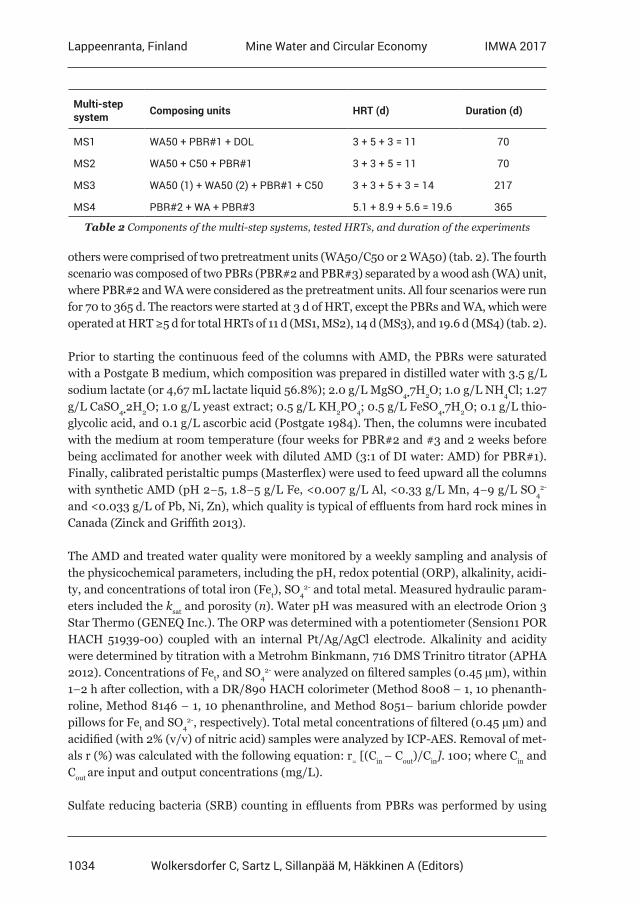
1034
Lappeenranta, Finland IMWA 2017Mine Water and Circular Economy
Wolkersdorfer C, Sartz L, Sillanpää M, Häkkinen A (Editors)
others were comprised of two pretreatment units (WA50/C50 or 2 WA50) (tab. 2). The fourth scenario was composed of two PBRs (PBR#2 and PBR#3) separated by a wood ash (WA) unit, where PBR#2 and WA were considered as the pretreatment units. All four scenarios were run for 70 to 365 d. The reactors were started at 3 d of HRT, except the PBRs and WA, which were operated at HRT ≥5 d for total HRTs of 11 d (MS1, MS2), 14 d (MS3), and 19.6 d (MS4) (tab. 2).
Prior to starting the continuous feed of the columns with AMD, the PBRs were saturated with a Postgate B medium, which composition was prepared in distilled water with 3.5 g/L sodium lactate (or 4,67 mL lactate liquid 56.8%); 2.0 g/L MgSO4•7H2O; 1.0 g/L NH4Cl; 1.27 g/L CaSO4•2H2O; 1.0 g/L yeast extract; 0.5 g/L KH2PO4; 0.5 g/L FeSO4•7H2O; 0.1 g/L thio-glycolic acid, and 0.1 g/L ascorbic acid (Postgate 1984). Then, the columns were incubated with the medium at room temperature (four weeks for PBR#2 and #3 and 2 weeks before being acclimated for another week with diluted AMD (3:1 of DI water: AMD) for PBR#1). Finally, calibrated peristaltic pumps (Masterflex) were used to feed upward all the columns with synthetic AMD (pH 2−5, 1.8−5 g/L Fe, <0.007 g/L Al, <0.33 g/L Mn, 4−9 g/L SO4
2- and <0.033 g/L of Pb, Ni, Zn), which quality is typical of effluents from hard rock mines in Canada (Zinck and Griffith 2013).
The AMD and treated water quality were monitored by a weekly sampling and analysis of the physicochemical parameters, including the pH, redox potential (ORP), alkalinity, acidi-ty, and concentrations of total iron (Fet), SO4
2- and total metal. Measured hydraulic param-eters included the ksat and porosity (n). Water pH was measured with an electrode Orion 3 Star Thermo (GENEQ Inc.). The ORP was determined with a potentiometer (Sension1 POR HACH 51939-00) coupled with an internal Pt/Ag/AgCl electrode. Alkalinity and acidity were determined by titration with a Metrohm Binkmann, 716 DMS Trinitro titrator (APHA 2012). Concentrations of Fet, and SO4
2- were analyzed on filtered samples (0.45 µm), within 1–2 h after collection, with a DR/890 HACH colorimeter (Method 8008 – 1, 10 phenanth-roline, Method 8146 – 1, 10 phenanthroline, and Method 8051– barium chloride powder pillows for Fet and SO4
2-, respectively). Total metal concentrations of filtered (0.45 µm) and acidified (with 2% (v/v) of nitric acid) samples were analyzed by ICP-AES. Removal of met-als r (%) was calculated with the following equation: r= [(Cin – Cout)/Cin]. 100; where Cin and Cout are input and output concentrations (mg/L).
Sulfate reducing bacteria (SRB) counting in effluents from PBRs was performed by using
Table 2 Components of the multi-step systems, tested HRTs, and duration of the experiments
Multi-step system Composing units HRT (d) Duration (d)
MS1 WA50 + PBR#1 + DOL 3 + 5 + 3 = 11 70
MS2 WA50 + C50 + PBR#1 3 + 3 + 5 = 11 70
MS3 WA50 (1) + WA50 (2) + PBR#1 + C50 3 + 3 + 5 + 3 = 14 217
MS4 PBR#2 + WA + PBR#3 5.1 + 8.9 + 5.6 = 19.6 365
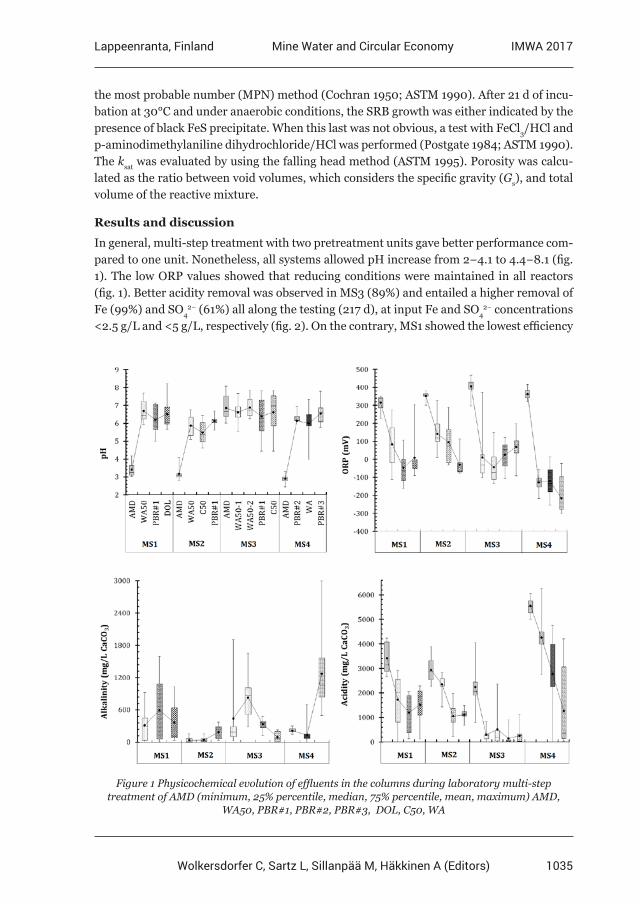
1035
Lappeenranta, Finland IMWA 2017Mine Water and Circular Economy
Wolkersdorfer C, Sartz L, Sillanpää M, Häkkinen A (Editors)
the most probable number (MPN) method (Cochran 1950; ASTM 1990). After 21 d of incu-bation at 30°C and under anaerobic conditions, the SRB growth was either indicated by the presence of black FeS precipitate. When this last was not obvious, a test with FeCl3/HCl and p-aminodimethylaniline dihydrochloride/HCl was performed (Postgate 1984; ASTM 1990). The ksat was evaluated by using the falling head method (ASTM 1995). Porosity was calcu-lated as the ratio between void volumes, which considers the specific gravity (Gs), and total volume of the reactive mixture.
Results and discussion
In general, multi-step treatment with two pretreatment units gave better performance com-pared to one unit. Nonetheless, all systems allowed pH increase from 2−4.1 to 4.4−8.1 (fig. 1). The low ORP values showed that reducing conditions were maintained in all reactors (fig. 1). Better acidity removal was observed in MS3 (89%) and entailed a higher removal of Fe (99%) and SO4
2− (61%) all along the testing (217 d), at input Fe and SO42− concentrations
<2.5 g/L and <5 g/L, respectively (fig. 2). On the contrary, MS1 showed the lowest efficiency
Figure 1 Physicochemical evolution of effluents in the columns during laboratory multi-step treatment of AMD (minimum, 25% percentile, median, 75% percentile, mean, maximum) AMD,
WA50, PBR#1, PBR#2, PBR#3, DOL, C50, WA
1036
Lappeenranta, Finland IMWA 2017Mine Water and Circular Economy
Wolkersdorfer C, Sartz L, Sillanpää M, Häkkinen A (Editors)
(acid, Fe and SO42− removal of 51, 53 and 29%, respectively) (tab. 3). Over time (after 139
d), the effectiveness of MS4 decreased to half fold, probably due to WA unit saturation as well as a decrease of alkalinity (down to 73%). Hence, Fe and SO4
2− removal dropped, re-spectively from 99% to 45% and from 49% to 13%. Moreover, only half of the acidity was neutralized (45%).
The performance of a multi-step treatment appears to be dependent on the effectiveness of the pretreatment units as well as on the initial Fe and SO4
2− concentrations. Higher efficien-cy was found with two WA50 pretreatment units in MS3 (removal of up to 96% of Fe; load of 427 g Fe/m3/d and 58% of SO4
2−). Subsequently, the following PBR#1 could treat 4−73 g Fe/m3/d. At the same time, a possible oxidation of sulfur/sulfide from the PBR#1 could have
Figure 2 Relative removal of Fe and SO42− (minimum, 25% percentile, median, 75% percentile,
maximum, mean) during multi-step treatment of AMD
MS1 MS2 MS3 MS4
pH 5−8.21 4.73−6.68 4.44−8.09 5.78−7.79
ORP (mV) -18 -29 81 -65−101
Fet removal (%)* 53 76 99 31−100
SO42- removal (%)** 29 61 65 -16−83
Acid removal (%) 51 78 89 -27−100
Alkalinity (mg CaCO3/L) 26−1597 3−630 7−1905 500−3000
Table 3 Efficiency of the different multi-step systems
*Input concentrations in MS1, MS2, and MS3: 2.5±0.4 g/L and 4±0.4 g/L in MS4
** Input concentrations in MS1, MS2, and MS3: 5±0.6 g/L and 9±1.2 g/L in MS4
1037
Lappeenranta, Finland IMWA 2017Mine Water and Circular Economy
Wolkersdorfer C, Sartz L, Sillanpää M, Häkkinen A (Editors)
increased SO42− concentration in the last unit (i.e. C50) of the system (fig. 2).
Even when exposed to higher acidity as well as Fe and SO42− concentrations, the first pre-
treatment unit in MS4 (i.e. PBR#2) showed a steady acidity and Fe removal (23% and 12% or equivalent to 13 g Fe/m3 substrate/d, respectively) all along the testing. In addition, the produced alkalinity was also maintained (around 214 mg/L as CaCO3; fig. 1). However, this alkalinity was not sufficient enough to allow SRB to thrive. Accordingly, the SRB counts did not exceed 200 cells/100 mL, which may explain the negligible SO4
2− removal. Nevertheless, the following WA unit presented a better efficiency (Fe removal of 40%, and 32% of SO4
2−) during the first 125 d and subsequently the last unit (PBR#3) could remove 98% of Fe and 33% of SO4
2− (fig. 2).
Additionally, all the tested multi-step systems could decrease up to 98% of Al, Ni, Pb and Zn concentrations. These metals were removed early in the pre-treatment units (>72%). The most significant Zn removal (94%) in PBR#1 during MS2 was possibly promoted by its adsorption onto Fe and Al (oxy) hydroxides. Up to 99.4% of Mn was also removed during the first phase of the pretreatment unit(s) in MS1 to MS3 because of the high pH value (>8). On the contrary, higher Mn removal (83%) was found in the last unit of MS4 before day 132, when Fe concentration was lowered before WA saturation (Fe/Mn ratio <1).
Little change of the overall ksat in all reactors (from the initial value 7.7 x 10⁻³− 1.4 x 10⁻² cm/s to an order of 10-4−10-3 cm/s) suggested that clogging issues and short circuiting did not occur during the experiments. Hence, mixtures with ksat>10-3cm/s are recommended for an efficient multi-step treatment composed of DAS and PBR units.
Conclusions
Amongst the four tested multi-step treatment systems, MS3, composed of two pretreatment units (WA50) and one PBR, was the most efficient in Fe and SO4
2− removal from highly con-taminated AMD. MS4 (consisting of two PBRs separated by a WA unit) showed a higher efficiency (Fe and SO4
2−removal of 99% and 50%, respectively) before WA saturation (i.e. during the first 132 d). A PBR-based pretreatment unit could be an efficient Fe-pretreatment (even at a low load; around 13 g/m3/d) at initial Fe concentrations up to 2.5 g/L, providing that enough alkalinity can ensure acid neutralization and microbial activity. Even though clogging was not observed during testing and the ksat was relatively stable (10-3−10-4 cm/s) in all multi-step systems, the use of mixture with ksat>10-3cm/s is recommended when using DAS and PBR units. Further studies on passive multi-step treatment of AMD with high Fe, SO4
2− and other dissolved metals need to be carried out.
Acknowledgements
The authors thank the NSERC (Natural Sciences and Engineering Research Council of Canada), the MERN (Ministère de l’Énergie et des Ressources Naturelles – Québec’s Ministry of Energy and Natural Resources), and the industrial partners of the RIME UQAT-Polytechnique Montreal, including Agnico Eagle, Canadian Malartic Mine, Iamgold, Raglan Mine-Glencore, and Rio Tinto. The authors want also to thank Marc Paquin, Mélanie Bélanger, Patrick Bernèche, Joël Beauregard and Alain Perreault for
1038
Lappeenranta, Finland IMWA 2017Mine Water and Circular Economy
Wolkersdorfer C, Sartz L, Sillanpää M, Häkkinen A (Editors)
technical assistance during the laboratory experiments.References
APHA (American Public Health Association) (2012) Alkalinity titration, standard methods for the examination of water and wastewater, 22nd ed. Greenberg A (Eds), Washington DC, USAASTM (American Society for Testing and Materials) (1995) Standard test method for permeability of granular soils. Annual book of ASTM Standards.08. D 2434 – 68, Philadelphia, PA, USAASTM (American Society for Testing and Materials) (1990) Standard methods for sulphate reducing bacteria in water and water-formed deposit. In: Annual book of ASTM Standards, vol. 04.08. Section D 4412—84, Washington, DC, pp. 533–535.Caraballo MA., Rötting TS., Macías F, Nieto JM, Ayora C (2009) Field multi-step limestone and MgO passive system to treat acid mine drainage with high metal concentrations. Appl Geochem 24: 2301—2311 Caraballo MA, Macías F, Rötting TS, Nieto JM, Ayora C (2011) Long term remediation of highly polluted acid mine drainage: A sustainable approach to restore the environmental quality of the Odiel river basin. Environ Pollut 159: 3613—3619Cochran, WG (1950) Estimation of bacterial densities by means of the most probable number. Biometrics 6, 105—116Clyde EJ, Champagne P, Jamieson HE, Gorman C, Sourial J (2016) The use of passive treatment for the mitigation of acid mine drainage at the Williams Brothers Mine (California): Pilot-scale study. J Clean Prod 130: 116—125Figueroa L, Miller A, Zaluski M, Bless D (2007) Evaluation of a two-stage passive treatment approach for mining influenced waters. In: Proc. of the American Society of Mining and Reclamation (ASMR). June 2-7, Lexington, KY, USA. pp. 238—247Genty T, Bussière B, Paradie M, Neculita CM (2016) Passive biochemical treatment of ferriferous mine drainage: Lorraine mine site, Northern Quebec, Canada. In: Proc. of the International Mine Water Association (MWA). July 11-15, Leipzig, GermanyGenty T, Bussière B, Potvin R, Benzaazoua M, Zagury GJ (2012a) Capacity of wood ash filters to remove iron from acid mine drainage: Assessment of retention mechanism, Mine Water Environ. 31 (4): 273—286Genty T, Bussière B, Potvin R, Benzaazoua M, Zagury GJ (2012b) Dissolution of calcitic marble and dolomitic rock in high iron concentrated acid mine drainage: Application to anoxic limestone drains, Environ Earth Sci 66: 2387—2401Genty, T (2012) Comportement hydro-bio-géo-chimique de systèmes passifs de traitement du drainage minier acide fortement contaminé en fer. PhD dissertation. Applied Sciences, UQAT, Rouyn- Noranda, QC, Canada, 270p Macías F, Caraballo MA, Rötting TS, Pérez-López R, Nieto JM, Ayora C (2012) From highly polluted Zn-rich acid mine drainage to non-metallic waters: Implementation of a multi-step alkaline passive treatment system to remediate metal pollution. Sci Tot Environ 433: 323—330Nordstrom DK, Alpers CN, Ptacek CJ, Blowes DW (2000) Negative pH and extremely acidic mine waters from Iron Mountain, California. Environ Sci Technol 34: 254—258Postgate JR (1984) The sulfate-reducing bacteria. 2nd ed. Cambridge University Press: CambridgePrasad D, Henry JG (2009) Removal of sulphates, acidity and iron form from acid mine drainage in a bench scale biochemical system. Environ Technol 30 (2): 151—160Rakotonimaro TV, Neculita CM, Bussière B, Zagury GJ (2016) Effectiveness of various dispersed alkaline substrates for the pretreatment of ferriferous acid mine drainage. Appl Geochem 73: 13—23 Rötting TS, Caraballo MA, Serrano JA, Ayora C, Carrera J (2008) Field application of calcite Dispersed Alkaline Substrate (calcite-DAS) for passive treatment of acid mine drainage with high Al and metal concentrations. Appl Geochem 23: 1660—1674Zinck J, Griffith W (2013) Review of acidic drainage treatment and sludge management operations, MEND Report 3.43.1. CANMET-MMSL, 101p
1039
Lappeenranta, Finland IMWA 2017Mine Water and Circular Economy
Wolkersdorfer C, Sartz L, Sillanpää M, Häkkinen A (Editors)
Simultaneous Treatment of Thiocyanates and Ammonia Nitrogen in Gold Mine Effluents Using Advanced
Oxidation and Nitrification-Denitrification Processes
Carolina Gonzalez-Merchan1,2, Rayen Tanabene1,2, Thomas Genty2,3, Bruno Bus-sière1, Robin Potvin2,4, Mathieu Allaire2, Carmen M. Neculita1
1 Research Institute on Mines and Environment (RIME), University of Québec in Abitibi-Témiscamingue (UQAT), 445 Boul. de l’Université, Rouyn-Noranda, QC, Canada, J9X5E4 2 Technology Center for Industrial Waste (Centre Technologique des Résidus Industriels
– CTRI), 433, Boul. du Collège, Rouyn-Noranda, QC, Canada, J9X5E5 3 Agnico Eagle Mines Limited, 10 200, route de Preissac, Rouyn-Noranda, QC, Canada,
J0Y1C0 4 College of Abitibi-Témiscamingue (CEGEP-AT), 425, Boul. du Collège, Rouyn-Noranda,
QC, Canada, J9X5E5
Abstract Efficient treatment of gold mine effluents, with simultaneous removal of cyanides (CN-) and their derivatives, including thiocyanates (SCN-) and ammonia nitrogen (NH3-N), remains a challenge. The present study assessed the removal efficiency of SCN- and NH3-N in gold mine effluents using an advanced oxidation process (ferrates) and a biological nitrification-denitrification (nit-denit) process. Results showed almost complete removal of SCN- (>97%) using the two processes together. However, ferrates rapidly removed the SCN-, NH3-N concentrations increased up to 117 mg/L. Consequently, ferrate treatment alone was found inadequate to completely remove NH3-N, which required a nit-denit process with a longer reaction time.
Keywords Ammonia nitrogen, ferrates, gold mine effluents, nitrification-denitrification, thiocyanates.
Introduction
Gold and silver extraction methods generate effluents that are contaminated with cyanides (CN-), as well as with thiocyanates (SCN-) (in sulfidic ores and at high alkalinity). Effective treatment technologies to remove CN- are available, but they cannot simultaneously remove SCN-. They also produce toxic by-products, such as ammonia nitrogen (NH3-N) (Botz et al. 2005; Gould et al. 2012). Although SCN-, NH3-N, and nitrates (NO3
-) are less toxic than CN-, they are difficult to treat and environmentally persistent (Gould et al. 2012). Furthermore, excesses of NH3-N and NO3
- in receiving water can lead to eutrophication and acidification, thus resulting in subsequent toxic effects in aquatic ecosystems. Complementary treatment is therefore required after CN- removal.
Recent findings indicate that advanced oxidation and biological processes transform SCN- into sulfates (SO4
2-) and intermediate by-products, such as NH3-N, which is subsequently oxidized into NO3
- (Gould et al. 2012; Oulego et al. 2015; Villemur et al. 2015). The advanced oxidation process uses strong oxidants, such as ferrate [Fe(VI)], which is also a coagulant, and is widely used to treat drinking water and wastewater (Yates et al. 2014; Goodwill et al. 2016). Recent studies showed that Fe(VI) is also an advantageous alternative for mine efflu-ent treatment because it is environmentally friendly when transformed into Fe(III), which
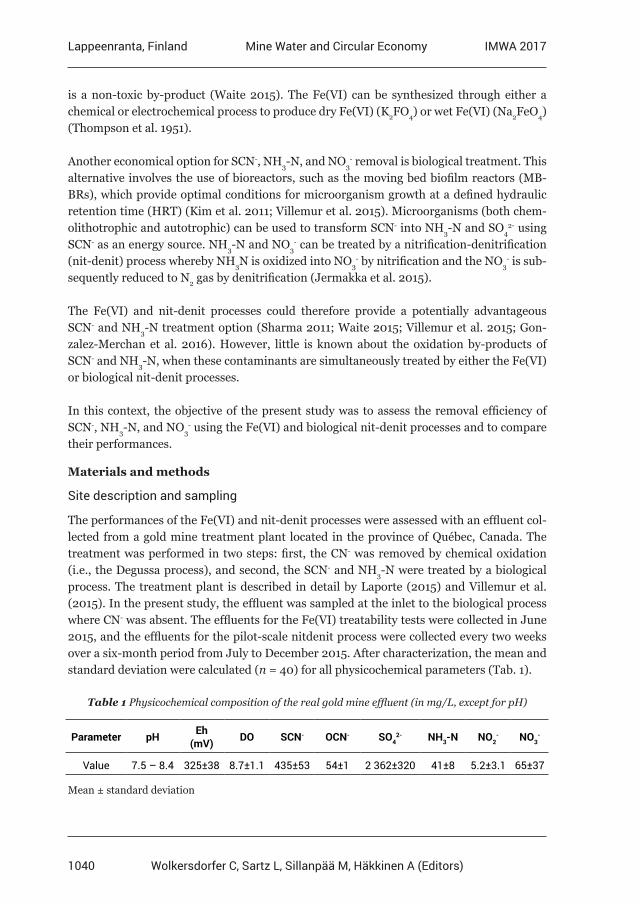
1040
Lappeenranta, Finland IMWA 2017Mine Water and Circular Economy
Wolkersdorfer C, Sartz L, Sillanpää M, Häkkinen A (Editors)
is a non-toxic by-product (Waite 2015). The Fe(VI) can be synthesized through either a chemical or electrochemical process to produce dry Fe(VI) (K2FO4) or wet Fe(VI) (Na2FeO4) (Thompson et al. 1951).
Another economical option for SCN-, NH3-N, and NO3- removal is biological treatment. This
alternative involves the use of bioreactors, such as the moving bed biofilm reactors (MB-BRs), which provide optimal conditions for microorganism growth at a defined hydraulic retention time (HRT) (Kim et al. 2011; Villemur et al. 2015). Microorganisms (both chem-olithotrophic and autotrophic) can be used to transform SCN- into NH3-N and SO4
2- using SCN- as an energy source. NH3-N and NO3
- can be treated by a nitrification-denitrification (nit-denit) process whereby NH3N is oxidized into NO3
- by nitrification and the NO3- is sub-
sequently reduced to N2 gas by denitrification (Jermakka et al. 2015).
The Fe(VI) and nit-denit processes could therefore provide a potentially advantageous SCN- and NH3-N treatment option (Sharma 2011; Waite 2015; Villemur et al. 2015; Gon-zalez-Merchan et al. 2016). However, little is known about the oxidation by-products of SCN- and NH3-N, when these contaminants are simultaneously treated by either the Fe(VI) or biological nit-denit processes.
In this context, the objective of the present study was to assess the removal efficiency of SCN-, NH3-N, and NO3
- using the Fe(VI) and biological nit-denit processes and to compare their performances.
Materials and methods
Site description and sampling
The performances of the Fe(VI) and nit-denit processes were assessed with an effluent col-lected from a gold mine treatment plant located in the province of Québec, Canada. The treatment was performed in two steps: first, the CN- was removed by chemical oxidation (i.e., the Degussa process), and second, the SCN- and NH3-N were treated by a biological process. The treatment plant is described in detail by Laporte (2015) and Villemur et al. (2015). In the present study, the effluent was sampled at the inlet to the biological process where CN- was absent. The effluents for the Fe(VI) treatability tests were collected in June 2015, and the effluents for the pilot-scale nitdenit process were collected every two weeks over a six-month period from July to December 2015. After characterization, the mean and standard deviation were calculated (n = 40) for all physicochemical parameters (Tab. 1).
Table 1 Physicochemical composition of the real gold mine effluent (in mg/L, except for pH)
Parameter pH Eh (mV) DO SCN- OCN- SO4
2- NH3-N NO2- NO3
-
Value 7.5 – 8.4 325±38 8.7±1.1 435±53 54±1 2 362±320 41±8 5.2±3.1 65±37
Mean ± standard deviation
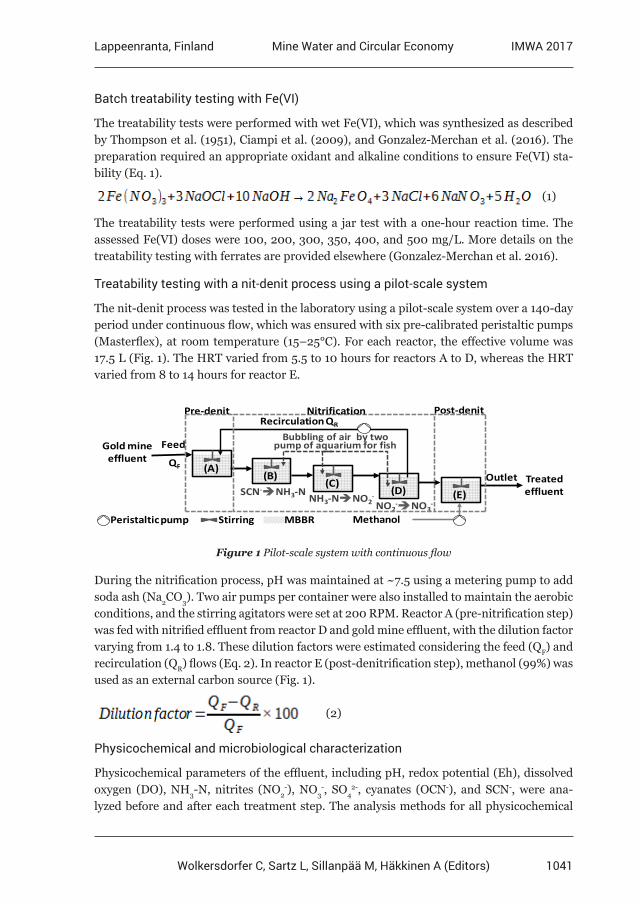
1041
Lappeenranta, Finland IMWA 2017Mine Water and Circular Economy
Wolkersdorfer C, Sartz L, Sillanpää M, Häkkinen A (Editors)
Batch treatability testing with Fe(VI)
The treatability tests were performed with wet Fe(VI), which was synthesized as described by Thompson et al. (1951), Ciampi et al. (2009), and Gonzalez-Merchan et al. (2016). The preparation required an appropriate oxidant and alkaline conditions to ensure Fe(VI) sta-bility (Eq. 1). (1)
The treatability tests were performed using a jar test with a one-hour reaction time. The assessed Fe(VI) doses were 100, 200, 300, 350, 400, and 500 mg/L. More details on the treatability testing with ferrates are provided elsewhere (Gonzalez-Merchan et al. 2016).
Treatability testing with a nit-denit process using a pilot-scale system
The nit-denit process was tested in the laboratory using a pilot-scale system over a 140-day period under continuous flow, which was ensured with six pre-calibrated peristaltic pumps (Masterflex), at room temperature (15–25°C). For each reactor, the effective volume was 17.5 L (Fig. 1). The HRT varied from 5.5 to 10 hours for reactors A to D, whereas the HRT varied from 8 to 14 hours for reactor E.
(D)
(A)
MBBR
Gold mine effluent
Treatedeffluent
Peristalticpump
Recirculation QR
MethanolStirring
Feed
Outlet
Bubbling of air by two pump of aquarium for fish
SCN-NH3-N NH3-NNO2-NO2
-NO3-
Pre-denit Nitrification Post-denit
(B)(C)
(E)
QF
Figure 1 Pilot-scale system with continuous flow
During the nitrification process, pH was maintained at ~7.5 using a metering pump to add soda ash (Na2CO3). Two air pumps per container were also installed to maintain the aerobic conditions, and the stirring agitators were set at 200 RPM. Reactor A (pre-nitrification step) was fed with nitrified effluent from reactor D and gold mine effluent, with the dilution factor varying from 1.4 to 1.8. These dilution factors were estimated considering the feed (QF) and recirculation (QR) flows (Eq. 2). In reactor E (post-denitrification step), methanol (99%) was used as an external carbon source (Fig. 1).
(2)
Physicochemical and microbiological characterization
Physicochemical parameters of the effluent, including pH, redox potential (Eh), dissolved oxygen (DO), NH3-N, nitrites (NO2
-), NO3-, SO4
2-, cyanates (OCN-), and SCN-, were ana-lyzed before and after each treatment step. The analysis methods for all physicochemical
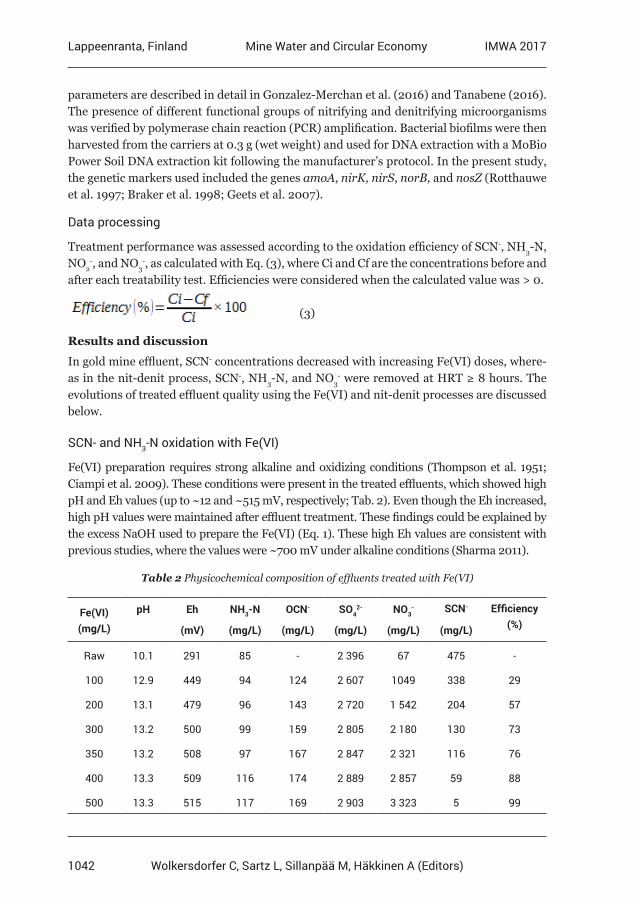
1042
Lappeenranta, Finland IMWA 2017Mine Water and Circular Economy
Wolkersdorfer C, Sartz L, Sillanpää M, Häkkinen A (Editors)
parameters are described in detail in Gonzalez-Merchan et al. (2016) and Tanabene (2016). The presence of different functional groups of nitrifying and denitrifying microorganisms was verified by polymerase chain reaction (PCR) amplification. Bacterial biofilms were then harvested from the carriers at 0.3 g (wet weight) and used for DNA extraction with a MoBio Power Soil DNA extraction kit following the manufacturer’s protocol. In the present study, the genetic markers used included the genes amoA, nirK, nirS, norB, and nosZ (Rotthauwe et al. 1997; Braker et al. 1998; Geets et al. 2007).
Data processing
Treatment performance was assessed according to the oxidation efficiency of SCN-, NH3-N, NO2
-, and NO3-, as calculated with Eq. (3), where Ci and Cf are the concentrations before and
after each treatability test. Efficiencies were considered when the calculated value was > 0.
(3)
Results and discussion
In gold mine effluent, SCN- concentrations decreased with increasing Fe(VI) doses, where-as in the nit-denit process, SCN-, NH3-N, and NO3
- were removed at HRT ≥ 8 hours. The evolutions of treated effluent quality using the Fe(VI) and nit-denit processes are discussed below.
SCN- and NH3-N oxidation with Fe(VI)
Fe(VI) preparation requires strong alkaline and oxidizing conditions (Thompson et al. 1951; Ciampi et al. 2009). These conditions were present in the treated effluents, which showed high pH and Eh values (up to ~12 and ~515 mV, respectively; Tab. 2). Even though the Eh increased, high pH values were maintained after effluent treatment. These findings could be explained by the excess NaOH used to prepare the Fe(VI) (Eq. 1). These high Eh values are consistent with previous studies, where the values were ~700 mV under alkaline conditions (Sharma 2011).
Fe(VI) (mg/L)
pH Eh NH3-N OCN- SO42- NO3
- SCN- Efficiency (%)(mV) (mg/L) (mg/L) (mg/L) (mg/L) (mg/L)
Raw 10.1 291 85 - 2 396 67 475 -
100 12.9 449 94 124 2 607 1049 338 29
200 13.1 479 96 143 2 720 1 542 204 57
300 13.2 500 99 159 2 805 2 180 130 73
350 13.2 508 97 167 2 847 2 321 116 76
400 13.3 509 116 174 2 889 2 857 59 88
500 13.3 515 117 169 2 903 3 323 5 99
Table 2 Physicochemical composition of effluents treated with Fe(VI)
1043
Lappeenranta, Finland IMWA 2017Mine Water and Circular Economy
Wolkersdorfer C, Sartz L, Sillanpää M, Häkkinen A (Editors)
The strongly oxidizing conditions of the Fe(VI) treatment decreased the initial SCN- (475 mg/L) concentrations, whereas SO4
2- increased with increasing Fe(VI) doses. The final SO4
2- concentration was 1.2 times higher in the treated vs. the raw effluent. This result was interpreted in the sense that SCN- was transformed into SO4
2-, as corroborated by previous findings (Sharma et al. 2002).
In addition, SCN- oxidation (~99%) was confirmed by the formation of NH3-N and NO3-,
with concentrations increasing from 85 to 117 mg/L and from 67 to 3 323 mg/L, respective-ly. At the same time, OCN- concentrations rose to 174 mg/L, whereas NO2
- concentrations were below the detection limit. The absence of NO2
- indicates that in the presence of a strong oxidant, such as Fe(VI), the NO2
- was rapidly transformed into NO3-, as demonstrated pre-
viously by Sharma et al. (1998). Consequently, the SCN- oxidation produced intermediate by-products, such as OCN-, which was hydrolyzed into NH3-N, and subsequently oxidized into NO3
- (Sharma et al. 2002; Oulego et al. 2014). In the present study, the very high NO3-
concentrations could be related to NH3-N oxidation as well as the Fe(NO3-) that was used
as the Fe(III) source for Fe(VI) preparation (Eq. 1). Although the SCN- was successfully treated, these results indicate that the reaction time was too short to allow complete NH3-N removal. This can be attributed to the slow oxidation kinetics of NH3-N in the presence of SCN- (Sharma et al. 1998; Gonzalez-Merchan et al. 2016).
These results justify the need for new processes in Fe(VI) treatment for NH3-N and NO3-.
Removal efficiency of SCN-, NH3-N and NO3- using the biological nit-denit process
A pilot-scale system was used to assess the nit-denit process, in which the concentrations of SCN, NH3-N, and NO3
- decreased with increasing dilution factor and HRT duration (Tab. 3). In the pre- and post-denit steps, the conditions were anoxic, as confirmed by the low DO concentrations (< 0.5 mg/L), and the pH values varied from 6.4 to 9.2. In contrast, for the nitrification process, conditions were aerobic (as reflected by DO > 5 mg/L), with consistent alkaline pH values of 7.5 due to the presence of bubbling air and the Na2CO3 which was add-ed to control the pH. In this nitrification process, the activity of microorganisms requires the presence of DO as well as pH regulation (Lay-Son et al. 2008; Kim et al. 2011). These results are also related to the Eh values, which were higher for the nitrification than for the pre- and post-denitrification steps (> 70 mV vs. < -50 mV). Thus, the aerobic conditions during the nitrification process could be appropriate for SCN-, NH3-N, and NO2
- oxidation, whereas during the pre- and post-denitrification processes, the anoxic conditions could have contributed to the NO3
- reduction, as indicated by previous findings (Kim et al. 2011; Lay-Son et al. 2008; Villemur et al. 2015).
In the present study, the biological nit-denit process was performed in three main steps:First, in reactor A (pre-denitrification), at HRT ≥ 8 hours, the initial SCN- concentrations were removed (> 53%) at all dilution factors. However, at HRT = 5.5 hours, SCN- removal was significantly related to the dilution factor (Tab. 3). For example, at dilution factors of 1.5 and 1.6, the removal efficiency increased from 37 to 54%. Despite these differences, the SCN- concentrations were on average ~1.6 times higher in the feed than in reactor A at a dilution
1044
Lappeenranta, Finland IMWA 2017Mine Water and Circular Economy
Wolkersdorfer C, Sartz L, Sillanpää M, Häkkinen A (Editors)
factor of 1.5. Moreover, the increasing NH3-N concentrations (from 41 to 83 mg/L) reflected the SCN- oxidation in reactor A. These results confirmed that the contaminants were di-luted and that SCN- can be oxidized with high HRT and dilution factors. Consequently, as shown by Kim et al. (2011), pre-denitrification contributes mainly to reducing contaminant concentrations. However, in reactor A, NO3
- concentrations were only slightly diminished (< 20%), and the concentrations actually increased at a dilution factor of 1.8, because the recycled effluent (from reactor D; Fig. 1) produced strong concentrations (up to 450 mg/L).Second, the nitrification process involved the oxidation of SCN-, NH3-N, and NO2
- in reac-tors B, C, and D, respectively. In reactor B, SCN- was efficiently removed (> 77%) at HRT ≥ 8 hours, whereas the removal efficiency for SCN- was very low at 5.5 hours HRT (~37%). Nevertheless, at the end of nitrification (reactor D), SCN- concentrations were lower than 11 mg/L for all conditions. The low concentrations of SCN- were due to the oxidation of SCN- to SO4
2-, thus increasing SO42- concentrations up to a maximum of 3 250 mg/L. Hence, in
reactor B, the microorganisms used SCN- as an energy source to transform SCN- into SO42-,
which was confirmed by the functional groups of nitrifying bacteria detected in the MBBRs, in agreement with previous findings (Villemur et al. 2015). In contrast, the NH3-N oxidation in reactor C was adversely affected by the short reaction time, with an HRT of 5.5 hours, and low dilution factors. For example, the removal efficiencies for NH3-N were lower at 5.5 hours HRT than at ≥ 8 hours HRT (< 15% vs. > 60%). In fact, at low HRT, the slow oxida-tion kinetics for the NH3-N oxidation resulted in the accumulation of this contaminant, with NH3-N concentrations exceeding 83 mg/L. These high NH3-N concentrations could have caused an inhibitory effect, as previously demonstrated by Lay-Son et al. (2008). However, the NO2
- concentration was 1.2 times higher in reactor C compared to reactor B, confirming that NH3-N was transformed into NO2
- in the presence of aerobic conditions. In reactor C, the microorganisms’ activity was confirmed by the presence of ammonia monooxygenase genes. Afterwards, in reactor D, NO2
- was oxidized into NO3-. The NO3
- concentrations were 1.5 times higher in reactor D than in reactor C, when NO2
- decreased (Tab. 3), except at a low HRT (5.5 hours) and dilution factor (1.5) in which case NO2
- increased. Despite these differences, the results clearly indicated that nitration was achieved, because the NO2
- was efficiently oxidized into NO3
- (> 69%). In addition, the presence of nitrite reductase genes explains the NO2
- oxidation.
Finally, in the post-denitrification step, NO3- was satisfactorily removed (> 80%) under all
dilution factors and HRTs. Thus, the denitrification process was successful, as confirmed by the presence of N2O reductase (nosZ) in the MBBRs. Although the reaction time was longer in the nit-denit process than in the Fe(VI) process (8 hours vs. 1 hour), NH3-N and NO3
- were efficiently removed.
Conclusion
For the simultaneous treatment of SCN- and NH3-N, the performances of the Fe(VI) and nit-denit processes were assessed and compared. Results showed that the coupling of both pro-cesses almost completely removed the SCN- (> 97%). Nevertheless, in effluents treated with Fe(VI), the NO3
- and NH3-N concentrations increased (from 67 to 3 323 mg/L and from 85 to 117 mg/L, respectively). The nit-denit process successfully transformed the NH3-N and
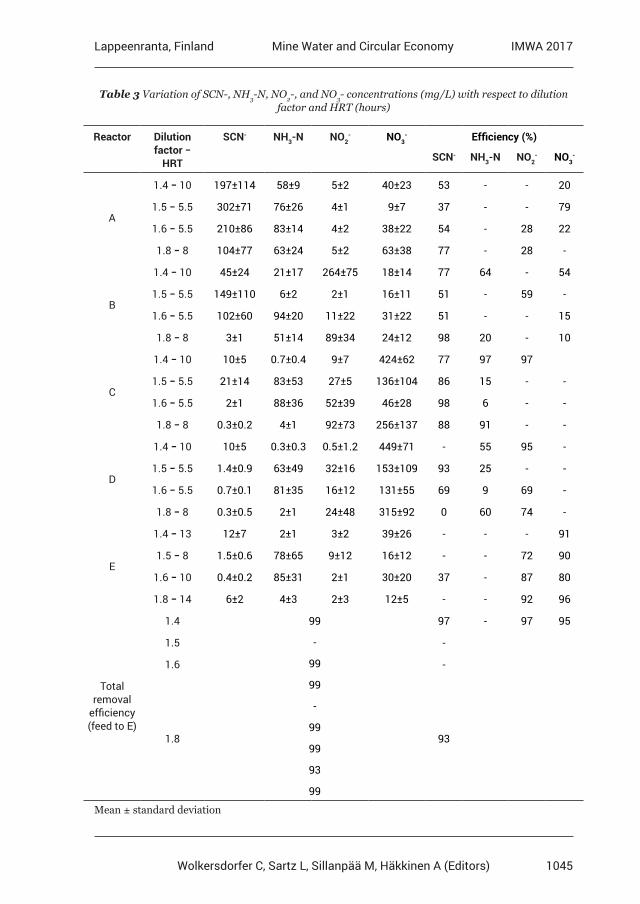
1045
Lappeenranta, Finland IMWA 2017Mine Water and Circular Economy
Wolkersdorfer C, Sartz L, Sillanpää M, Häkkinen A (Editors)
Reactor Dilution factor −
HRT
SCN- NH3-N NO2- NO3
- Efficiency (%)
SCN- NH3-N NO2- NO3
-
A
1.4 − 10 197±114 58±9 5±2 40±23 53 - - 20
1.5 − 5.5 302±71 76±26 4±1 9±7 37 - - 79
1.6 − 5.5 210±86 83±14 4±2 38±22 54 - 28 22
1.8 − 8 104±77 63±24 5±2 63±38 77 - 28 -
B
1.4 − 10 45±24 21±17 264±75 18±14 77 64 - 54
1.5 − 5.5 149±110 6±2 2±1 16±11 51 - 59 -
1.6 − 5.5 102±60 94±20 11±22 31±22 51 - - 15
1.8 − 8 3±1 51±14 89±34 24±12 98 20 - 10
C
1.4 − 10 10±5 0.7±0.4 9±7 424±62 77 97 97
1.5 − 5.5 21±14 83±53 27±5 136±104 86 15 - -
1.6 − 5.5 2±1 88±36 52±39 46±28 98 6 - -
1.8 − 8 0.3±0.2 4±1 92±73 256±137 88 91 - -
D
1.4 − 10 10±5 0.3±0.3 0.5±1.2 449±71 - 55 95 -
1.5 − 5.5 1.4±0.9 63±49 32±16 153±109 93 25 - -
1.6 − 5.5 0.7±0.1 81±35 16±12 131±55 69 9 69 -
1.8 − 8 0.3±0.5 2±1 24±48 315±92 0 60 74 -
E
1.4 − 13 12±7 2±1 3±2 39±26 - - - 91
1.5 − 8 1.5±0.6 78±65 9±12 16±12 - - 72 90
1.6 − 10 0.4±0.2 85±31 2±1 30±20 37 - 87 80
1.8 − 14 6±2 4±3 2±3 12±5 - - 92 96
Total removal
efficiency (feed to E)
1.4 99
-
99
99
-
99
99
93
99
97 - 97 95
1.5 -
1.6 -
1.8 93
Mean ± standard deviation
Table 3 Variation of SCN-, NH3-N, NO2-, and NO3- concentrations (mg/L) with respect to dilution factor and HRT (hours)
1046
Lappeenranta, Finland IMWA 2017Mine Water and Circular Economy
Wolkersdorfer C, Sartz L, Sillanpää M, Häkkinen A (Editors)
NO3-, as confirmed by the detection of ammonia-oxidizing bacteria. While a 1-hour reaction
time was required for almost complete SCN- removal using Fe(VI), optimal removal with the nit-denit process was achieved in 8 hours. NH3-N and NO3
- were efficiently removed using the nit-denit process, although the process required a lengthy reaction time. Finally, in the presence of Fe(VI), NH3-N oxidation was incomplete and NO3
- could not be removed, while effluents treated with Fe(VI) needed additional pH adjustment.
Acknowledgements
This study was funded by the Natural Sciences and Engineering Research Council of Canada (NSERC), the industrial partners of RIME UQAT-Polytechnique (Agnico Eagle, Canadian Malartic Mine, Iamgold Corporation, Raglan Mine-Glencore, and Rio Tinto), and Mabarex. The authors gratefully acknowledge the assistance of Marc Paquin during the experimental procedures.
References
Botz MM, Mudder TI, Akcil AU (2005). Cyanide treatment: Physical, chemical and biological process. Dev. Miner. Process. 15, 672-702.Braker G, Fesefeldt A, Witzel KP (1998). Development of PCR primer systems for amplification of nitrite reductase genes (nirK and nirS) to detect denitrifying bacteria in environmental samples. Appl. Environ. Microbiol. 64(10), 3769-3775.Ciampi LE, Daly LJ (2009). Methods of synthesizing a ferrate oxidant and its use in ballast water. Patent US7476342B2.Geets J, de Cooman M, Wittebolle L, Heylen K, Vanparys B, De Vos P, Verstraete W, Boon N (2007). Real-time PCR assay for the simultaneous quantification of nitrifying and denitrifying bacteria in activated sludge. Appl. Microbiol. Biotechnol. 75, 211-221.Gonzalez-Merchan C, Genty T, Bussière B, Potvin R, Paquin M, Benhammadi M, Neculita CM (2016). Ferrate performance in thiocyanates and ammonia degradation in gold mine effluents. Miner. Eng. 95, 124-130.Goodwill JE, Jiang Y, Reckhow DA, Tobiason JE (2016). Laboratory assessment of ferrate for drinking water treatment. AWWA J. 108: 3.Gould DW, King M, Mohapatra BR, Cameron RA, Kapoor A, Koren DW (2012). A critical review on destruction of thiocyanate in mining effluents. Miner. Eng. 34, 38-47.Jermakka J, Wendling L, Sohlberg E, Heinonen H, Vikman M (2015). Potential technologies for the removal and recovery of nitrogen compounds from mine and quarry waters in subarctic conditions. Crit. Rev. Env. Sci. Tec. 45, 703-748.Kim YM, Cho HU, Lee DS, Park C, Park D, Park JM (2011). Response of nitrifying bacterial communities to the increased thiocyanate concentration in pre-denitrification process. Bioresour. Technol. 102, 913-922.Laporte P (2015). Évolution à la mine Laronde du traitement biologique du thiocyanate (In French). Symposium Mines and the Environment, Rouyn-Noranda, QC, Canada, June 14-17.Lay-Son M, Drakies C (2008). New approach to optimize operational conditions for the biological treatment of high-strength thiocyanate and ammonium waste: pH as key factor. Water Res. 42, 774-780.Oulego P, Collado S, Laca Díaz AM (2014). Simultaneous oxidation of cyanide and thiocyanate at high pressure and temperature. J. Hazard. Mater. 280, 570-578.Rotthauwe JH, Witzel KP, Liesack W (1997). The ammonia monooxygenase structural gene amoA as a functional marker: molecular fine-scale analysis of natural ammonia-oxidizing populations. Appl. Environ. Microbiol. 63(12), 4704-4712.Sharma VK (2011). Oxidation of inorganic contaminants by ferrates (VI, V, and IV)-kinetics and mechanisms: A review. J. Environ. Manage. 92, 1051-1073.Sharma VK, Bloom JT, Joshi VN (1998). Oxidation of ammonia by ferrate(VI). J. Environ. Sci. Health A 33, 635-650.
1047
Lappeenranta, Finland IMWA 2017Mine Water and Circular Economy
Wolkersdorfer C, Sartz L, Sillanpää M, Häkkinen A (Editors)
Sharma VK, Burnett CR, O’Connor DB, Cabelli DE (2002). Iron(VI) and iron(V) oxidation of thiocyanate. Environ. Sci. Technol. 36, 4182-4186.Tanabene R (2016). Développement d’une approche biologique de dénitrification des effluents des mines d’or à l’échelle de laboratoire (Doctoral dissertation, Université du Québec en Abitibi- Témiscamingue).Thompson GW, Ockerman LT, Schreyer JM (1951). Preparation and purification of potassium ferrate (VI). J. Chem. Soc. 73, 1379-1381.Yates BJ, Zboril R, Sharma VK (2014). Engineering aspects of ferrate in water and wastewater treatment – a review. J. Environ. Sci. Health A 49, 1603-1614.Villemur R, Juteau P, Bougie V, Ménard J, Déziel E (2015). Development of four-stage moving bed biofilm reactor train with a pre-denitrification configuration for the removal of thiocyanate and cyanate. Bioresour. Technol. 181, 254-262.Waite T (2015). Treatment of mine wastewaters for cyanide destruction and thiocyanate removal with ferrate(VI), Symposium Mines and the Environment, Rouyn-Noranda, QC, Canada, June 14-17.
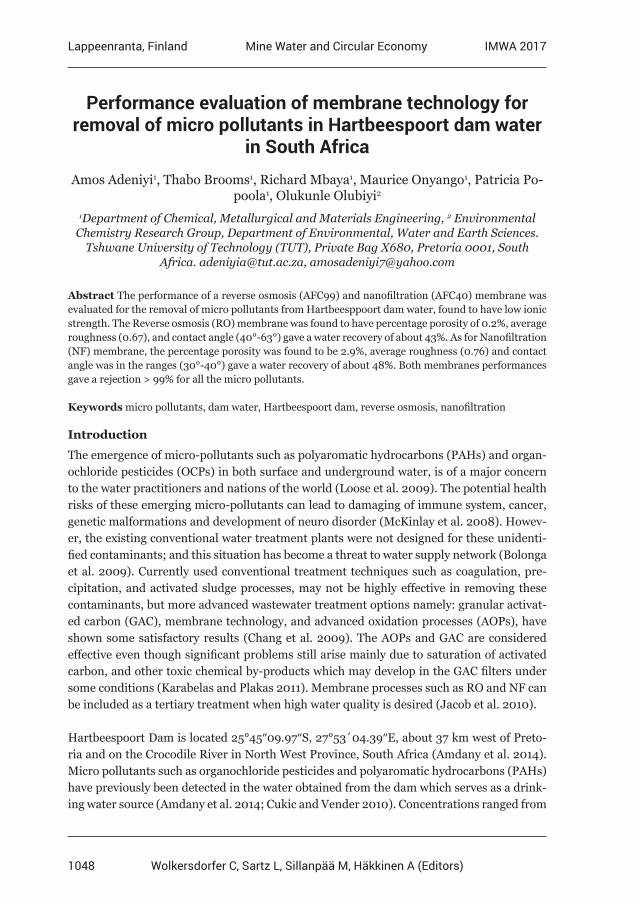
1048
Lappeenranta, Finland IMWA 2017Mine Water and Circular Economy
Wolkersdorfer C, Sartz L, Sillanpää M, Häkkinen A (Editors)
Performance evaluation of membrane technology for removal of micro pollutants in Hartbeespoort dam water
in South Africa
Amos Adeniyi1, Thabo Brooms1, Richard Mbaya1, Maurice Onyango1, Patricia Po-poola1, Olukunle Olubiyi2
1Department of Chemical, Metallurgical and Materials Engineering, 2 Environmental Chemistry Research Group, Department of Environmental, Water and Earth Sciences.
Tshwane University of Technology (TUT), Private Bag X680, Pretoria 0001, South Africa. [email protected], [email protected]
Abstract The performance of a reverse osmosis (AFC99) and nanofiltration (AFC40) membrane was evaluated for the removal of micro pollutants from Hartbeesppoort dam water, found to have low ionic strength. The Reverse osmosis (RO) membrane was found to have percentage porosity of 0.2%, average roughness (0.67), and contact angle (40°-63°) gave a water recovery of about 43%. As for Nanofiltration (NF) membrane, the percentage porosity was found to be 2.9%, average roughness (0.76) and contact angle was in the ranges (30°-40°) gave a water recovery of about 48%. Both membranes performances gave a rejection > 99% for all the micro pollutants.
Keywords micro pollutants, dam water, Hartbeespoort dam, reverse osmosis, nanofiltration
Introduction
The emergence of micro-pollutants such as polyaromatic hydrocarbons (PAHs) and organ-ochloride pesticides (OCPs) in both surface and underground water, is of a major concern to the water practitioners and nations of the world (Loose et al. 2009). The potential health risks of these emerging micro-pollutants can lead to damaging of immune system, cancer, genetic malformations and development of neuro disorder (McKinlay et al. 2008). Howev-er, the existing conventional water treatment plants were not designed for these unidenti-fied contaminants; and this situation has become a threat to water supply network (Bolonga et al. 2009). Currently used conventional treatment techniques such as coagulation, pre-cipitation, and activated sludge processes, may not be highly effective in removing these contaminants, but more advanced wastewater treatment options namely: granular activat-ed carbon (GAC), membrane technology, and advanced oxidation processes (AOPs), have shown some satisfactory results (Chang et al. 2009). The AOPs and GAC are considered effective even though significant problems still arise mainly due to saturation of activated carbon, and other toxic chemical by-products which may develop in the GAC filters under some conditions (Karabelas and Plakas 2011). Membrane processes such as RO and NF can be included as a tertiary treatment when high water quality is desired (Jacob et al. 2010).
Hartbeespoort Dam is located 25°45ʺ09.97ʺS, 27°53´04.39ʺE, about 37 km west of Preto-ria and on the Crocodile River in North West Province, South Africa (Amdany et al. 2014). Micro pollutants such as organochloride pesticides and polyaromatic hydrocarbons (PAHs) have previously been detected in the water obtained from the dam which serves as a drink-ing water source (Amdany et al. 2014; Cukic and Vender 2010). Concentrations ranged from
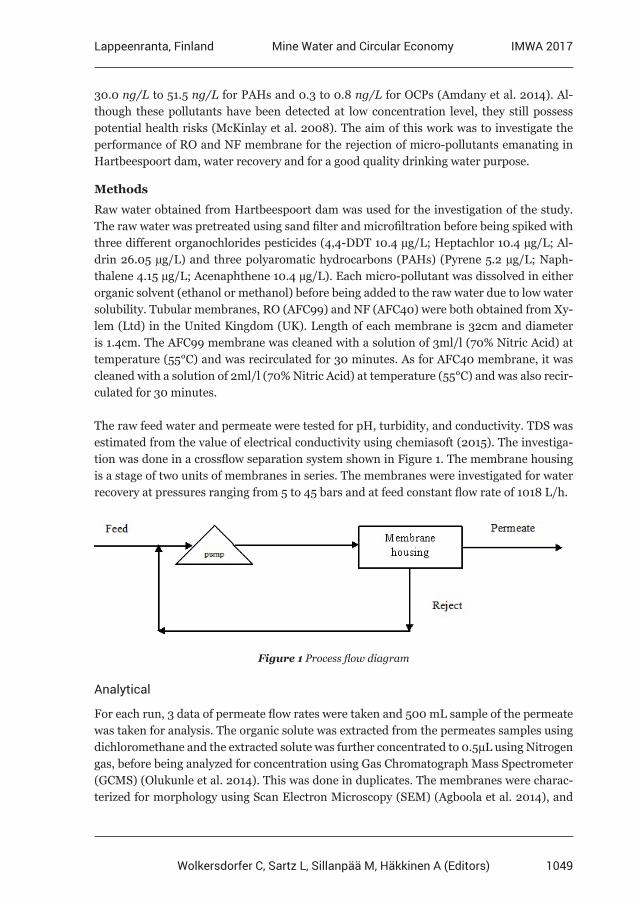
1049
Lappeenranta, Finland IMWA 2017Mine Water and Circular Economy
Wolkersdorfer C, Sartz L, Sillanpää M, Häkkinen A (Editors)
30.0 ng/L to 51.5 ng/L for PAHs and 0.3 to 0.8 ng/L for OCPs (Amdany et al. 2014). Al-though these pollutants have been detected at low concentration level, they still possess potential health risks (McKinlay et al. 2008). The aim of this work was to investigate the performance of RO and NF membrane for the rejection of micro-pollutants emanating in Hartbeespoort dam, water recovery and for a good quality drinking water purpose.
Methods
Raw water obtained from Hartbeespoort dam was used for the investigation of the study. The raw water was pretreated using sand filter and microfiltration before being spiked with three different organochlorides pesticides (4,4-DDT 10.4 µg/L; Heptachlor 10.4 µg/L; Al-drin 26.05 µg/L) and three polyaromatic hydrocarbons (PAHs) (Pyrene 5.2 µg/L; Naph-thalene 4.15 µg/L; Acenaphthene 10.4 µg/L). Each micro-pollutant was dissolved in either organic solvent (ethanol or methanol) before being added to the raw water due to low water solubility. Tubular membranes, RO (AFC99) and NF (AFC40) were both obtained from Xy-lem (Ltd) in the United Kingdom (UK). Length of each membrane is 32cm and diameter is 1.4cm. The AFC99 membrane was cleaned with a solution of 3ml/l (70% Nitric Acid) at temperature (55°C) and was recirculated for 30 minutes. As for AFC40 membrane, it was cleaned with a solution of 2ml/l (70% Nitric Acid) at temperature (55°C) and was also recir-culated for 30 minutes.
The raw feed water and permeate were tested for pH, turbidity, and conductivity. TDS was estimated from the value of electrical conductivity using chemiasoft (2015). The investiga-tion was done in a crossflow separation system shown in Figure 1. The membrane housing is a stage of two units of membranes in series. The membranes were investigated for water recovery at pressures ranging from 5 to 45 bars and at feed constant flow rate of 1018 L/h.
Figure 1 Process flow diagram
Analytical
For each run, 3 data of permeate flow rates were taken and 500 mL sample of the permeate was taken for analysis. The organic solute was extracted from the permeates samples using dichloromethane and the extracted solute was further concentrated to 0.5µL using Nitrogen gas, before being analyzed for concentration using Gas Chromatograph Mass Spectrometer (GCMS) (Olukunle et al. 2014). This was done in duplicates. The membranes were charac-terized for morphology using Scan Electron Microscopy (SEM) (Agboola et al. 2014), and
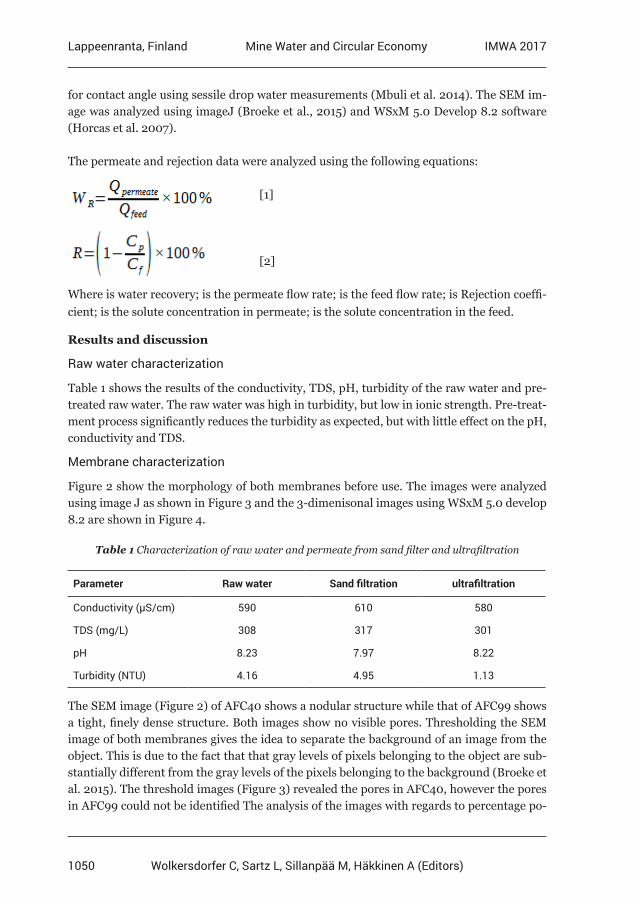
1050
Lappeenranta, Finland IMWA 2017Mine Water and Circular Economy
Wolkersdorfer C, Sartz L, Sillanpää M, Häkkinen A (Editors)
for contact angle using sessile drop water measurements (Mbuli et al. 2014). The SEM im-age was analyzed using imageJ (Broeke et al., 2015) and WSxM 5.0 Develop 8.2 software (Horcas et al. 2007).
The permeate and rejection data were analyzed using the following equations:
[1]
[2]
Where is water recovery; is the permeate flow rate; is the feed flow rate; is Rejection coeffi-cient; is the solute concentration in permeate; is the solute concentration in the feed.
Results and discussion
Raw water characterization
Table 1 shows the results of the conductivity, TDS, pH, turbidity of the raw water and pre-treated raw water. The raw water was high in turbidity, but low in ionic strength. Pre-treat-ment process significantly reduces the turbidity as expected, but with little effect on the pH, conductivity and TDS.
Membrane characterization
Figure 2 show the morphology of both membranes before use. The images were analyzed using image J as shown in Figure 3 and the 3-dimenisonal images using WSxM 5.0 develop 8.2 are shown in Figure 4.
Table 1 Characterization of raw water and permeate from sand filter and ultrafiltration
Parameter Raw water Sand filtration ultrafiltration
Conductivity (μS/cm) 590 610 580
TDS (mg/L) 308 317 301
pH 8.23 7.97 8.22
Turbidity (NTU) 4.16 4.95 1.13
The SEM image (Figure 2) of AFC40 shows a nodular structure while that of AFC99 shows a tight, finely dense structure. Both images show no visible pores. Thresholding the SEM image of both membranes gives the idea to separate the background of an image from the object. This is due to the fact that that gray levels of pixels belonging to the object are sub-stantially different from the gray levels of the pixels belonging to the background (Broeke et al. 2015). The threshold images (Figure 3) revealed the pores in AFC40, however the pores in AFC99 could not be identified The analysis of the images with regards to percentage po-
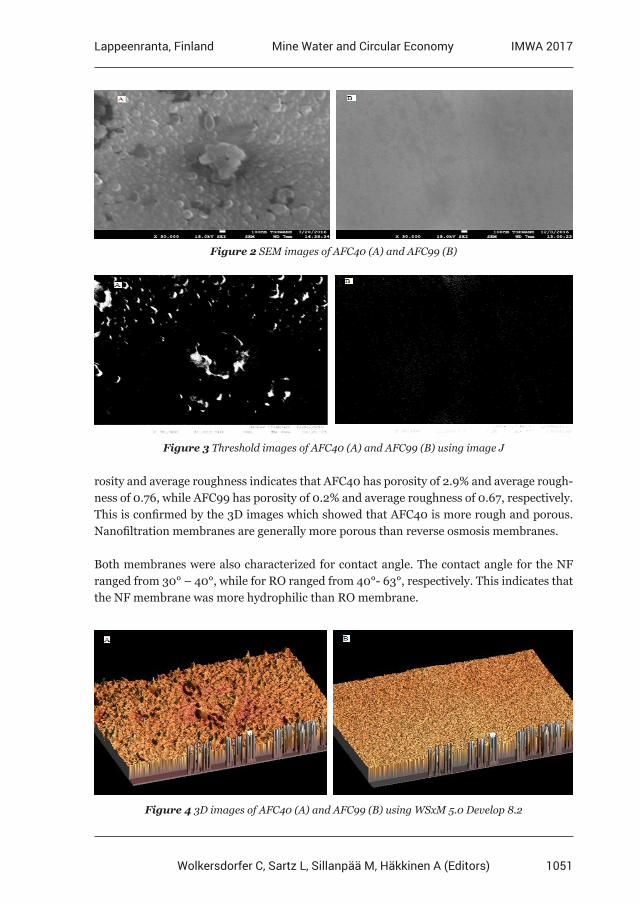
1051
Lappeenranta, Finland IMWA 2017Mine Water and Circular Economy
Wolkersdorfer C, Sartz L, Sillanpää M, Häkkinen A (Editors)
rosity and average roughness indicates that AFC40 has porosity of 2.9% and average rough-ness of 0.76, while AFC99 has porosity of 0.2% and average roughness of 0.67, respectively. This is confirmed by the 3D images which showed that AFC40 is more rough and porous. Nanofiltration membranes are generally more porous than reverse osmosis membranes.
Both membranes were also characterized for contact angle. The contact angle for the NF ranged from 30° – 40°, while for RO ranged from 40°- 63°, respectively. This indicates that the NF membrane was more hydrophilic than RO membrane.
Figure 4 3D images of AFC40 (A) and AFC99 (B) using WSxM 5.0 Develop 8.2
Figure 2 SEM images of AFC40 (A) and AFC99 (B)
Figure 3 Threshold images of AFC40 (A) and AFC99 (B) using image J
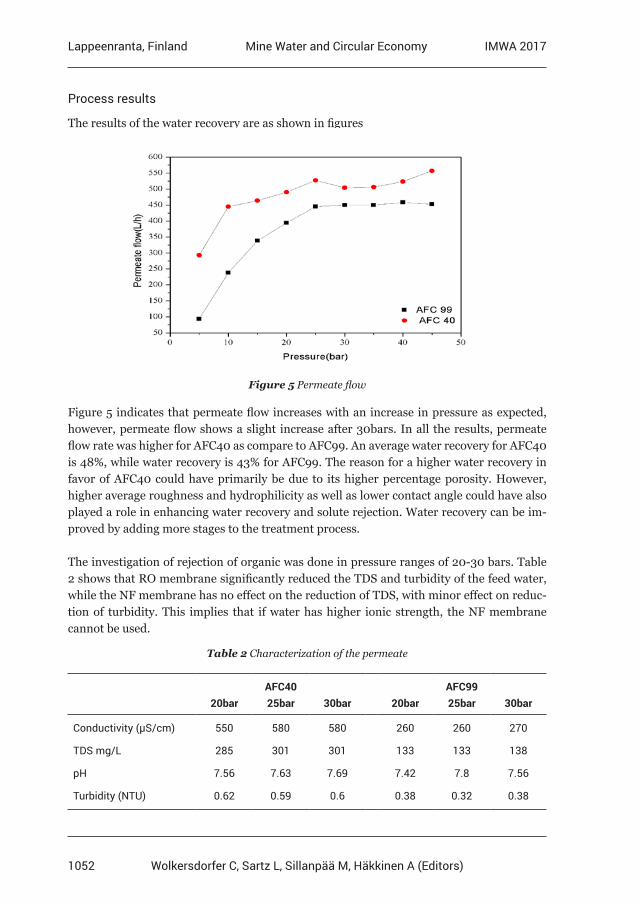
1052
Lappeenranta, Finland IMWA 2017Mine Water and Circular Economy
Wolkersdorfer C, Sartz L, Sillanpää M, Häkkinen A (Editors)
Process results
The results of the water recovery are as shown in figures
Figure 5 Permeate flow
Figure 5 indicates that permeate flow increases with an increase in pressure as expected, however, permeate flow shows a slight increase after 30bars. In all the results, permeate flow rate was higher for AFC40 as compare to AFC99. An average water recovery for AFC40 is 48%, while water recovery is 43% for AFC99. The reason for a higher water recovery in favor of AFC40 could have primarily be due to its higher percentage porosity. However, higher average roughness and hydrophilicity as well as lower contact angle could have also played a role in enhancing water recovery and solute rejection. Water recovery can be im-proved by adding more stages to the treatment process.
The investigation of rejection of organic was done in pressure ranges of 20-30 bars. Table 2 shows that RO membrane significantly reduced the TDS and turbidity of the feed water, while the NF membrane has no effect on the reduction of TDS, with minor effect on reduc-tion of turbidity. This implies that if water has higher ionic strength, the NF membrane cannot be used.
Table 2 Characterization of the permeate
AFC40 AFC9920bar 25bar 30bar 20bar 25bar 30bar
Conductivity (μS/cm) 550 580 580 260 260 270
TDS mg/L 285 301 301 133 133 138
pH 7.56 7.63 7.69 7.42 7.8 7.56
Turbidity (NTU) 0.62 0.59 0.6 0.38 0.32 0.38
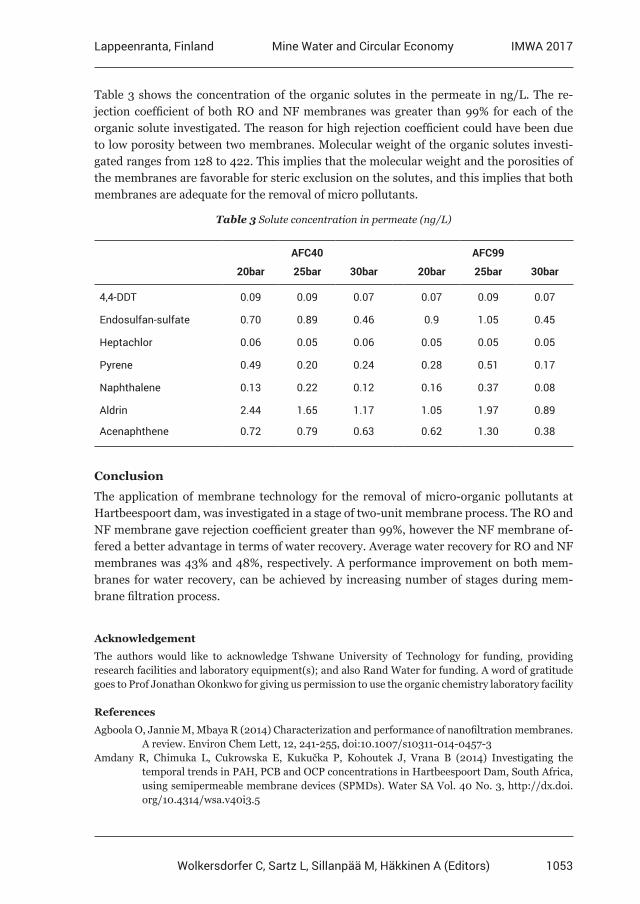
1053
Lappeenranta, Finland IMWA 2017Mine Water and Circular Economy
Wolkersdorfer C, Sartz L, Sillanpää M, Häkkinen A (Editors)
Table 3 shows the concentration of the organic solutes in the permeate in ng/L. The re-jection coefficient of both RO and NF membranes was greater than 99% for each of the organic solute investigated. The reason for high rejection coefficient could have been due to low porosity between two membranes. Molecular weight of the organic solutes investi-gated ranges from 128 to 422. This implies that the molecular weight and the porosities of the membranes are favorable for steric exclusion on the solutes, and this implies that both membranes are adequate for the removal of micro pollutants.
Table 3 Solute concentration in permeate (ng/L)
AFC40 AFC99
20bar 25bar 30bar 20bar 25bar 30bar
4,4-DDT 0.09 0.09 0.07 0.07 0.09 0.07
Endosulfan-sulfate 0.70 0.89 0.46 0.9 1.05 0.45
Heptachlor 0.06 0.05 0.06 0.05 0.05 0.05
Pyrene 0.49 0.20 0.24 0.28 0.51 0.17
Naphthalene 0.13 0.22 0.12 0.16 0.37 0.08
Aldrin 2.44 1.65 1.17 1.05 1.97 0.89
Acenaphthene 0.72 0.79 0.63 0.62 1.30 0.38
Conclusion
The application of membrane technology for the removal of micro-organic pollutants at Hartbeespoort dam, was investigated in a stage of two-unit membrane process. The RO and NF membrane gave rejection coefficient greater than 99%, however the NF membrane of-fered a better advantage in terms of water recovery. Average water recovery for RO and NF membranes was 43% and 48%, respectively. A performance improvement on both mem-branes for water recovery, can be achieved by increasing number of stages during mem-brane filtration process.
Acknowledgement
The authors would like to acknowledge Tshwane University of Technology for funding, providing research facilities and laboratory equipment(s); and also Rand Water for funding. A word of gratitude goes to Prof Jonathan Okonkwo for giving us permission to use the organic chemistry laboratory facility
References
Agboola O, Jannie M, Mbaya R (2014) Characterization and performance of nanofiltration membranes. A review. Environ Chem Lett, 12, 241-255, doi:10.1007/s10311-014-0457-3Amdany R, Chimuka L, Cukrowska E, Kukučka P, Kohoutek J, Vrana B (2014) Investigating the temporal trends in PAH, PCB and OCP concentrations in Hartbeespoort Dam, South Africa, using semipermeable membrane devices (SPMDs). Water SA Vol. 40 No. 3, http://dx.doi. org/10.4314/wsa.v40i3.5
1054
Lappeenranta, Finland IMWA 2017Mine Water and Circular Economy
Wolkersdorfer C, Sartz L, Sillanpää M, Häkkinen A (Editors)
Bolong N, Ismail AF, Salim MR, Matsuura T (2009) A review of the effects of emerging contaminants in wastewater and options for their removal. Des 239, 229–246, https://doi.org/10.1016/j. desal.2008.03.020Broeke J, Pérez JMM, Pascau J (2015) Image Processing with ImageJ. Second Edition. Packt Publishing. Chang H, Choo K, Lee B, Choi S (2009) The methods of identification, analysis, and removal of endocrine disrupting compounds (EDCs) in water. JHM 172, 1–12, doi: 10.1016/j. jhazmat.2009.06.135.Cukic Z, Venter P (2010) Characterization and managing of internal nutrient load (sediments) of hartbeespoort dam. www.ewisa.co.za/literature/files/339_265%20Cukic.pdf (accessed:10-05-2015)Horcas I, Fernandez R., Gomez-Rodriguez JM, Colchero J, Gomez-Herrero J, Baro AM (2007) WSXM: A software for scanning probe microscopy. Sci. Instrum., 78, 1, doi: 10.1063/1.2432410http://www.chemiasoft.com/chemd/TDS (accessed: 03:08:2015)Jacob M, Guigui C, Cabassud C, Darras H, Lavison G, Moulin L (2010) Performances of RO and NF processes for wastewater reuse: Tertiary treatment after a conventional activated sludge or a membrane bioreactor. Des 250, 833–839, doi: 10.1016/j.desal.2008.11.052 Karabelas A, Plakas K (2011) Membrane Treatment of Potable Water for Pesticides Removal, Herbicides, Theory and Applications, Prof. Marcelo Larramendy (Ed.), ISBN: 978-953-307-975-2.Loos R, Gawlik BM, Locoro G, Rimaviciute E, Contini S, Bidoglio G (2009) EU-wide survey of polar organic persistent pollutants in European river waters. Environ Pollut, Vol. 157, pp. 561–568, doi: 10.1016/j.envpol.2008.09.020. Mbuli BS, Nxumalo EN, Mhlanga SD, Krause RW, Pillay VL, Oren Y, Linder C, Mamba BB (2014) Development of Antifouling Polyamide Thin-Film Composite Membranes Modified with Amino-Cyclodextrins and Diethylamino-Cyclodextrins for Water Treatment. J. Appl. Polym. Sci., doi: 10.1002/APP.40109, doi: 10.1002/app.40109McKinlay R., Plant JA, Bell JNB, Voulvoulis N (2008) Endocrine disrupting pesticides: Implications for risk assessment. Environ Intl, Vol. 34, No. 2, pp. 168–183, ISSN 0160-4120. Olukunle OI, Sibiya IV, Okonkwo OJ, Odusanya AO (2014) Influence of physicochemical and chemical parameters on polybrominated diphenyl ethers in selected landfill leachates, sediments and river sediments from Gauteng, South Africa. Environ Sci Pollut Res, doi:10.1007/s11356- 014-3443-1.Sharpe RM, Irvine DS (2004) How strong is the evidence of a link between environmental chemicals and adverse effects on human health? Brit. Med. J., 328, 447–451, doi: 10.1136/ bmj.328.7437.447
1055
Lappeenranta, Finland IMWA 2017Mine Water and Circular Economy
Wolkersdorfer C, Sartz L, Sillanpää M, Häkkinen A (Editors)
A Novel Sorbents of Metal Ions Based on Thermally Activated, Acidic and Non-acidic Treated Dolomite
Andrei Ivanets1, Natalia Kitikova1, Irina Shashkova1, Mika Silanpää2,3
1Institute of General and Inorganic Chemistry, National Academy of Sciences of Belarus, Surganova St. 9/1, Minsk 220072, Belarus, [email protected]
2Lappeenranta University of Technology, Laboratory of Green Chemistry, Sammonkatu 12, 50130 Mikkeli, Finland
3Department of Civil and Environmental Engineering, Florida International University, Miami, FL-33174, USA
Abstract The development of a novel sorbents for the removal of toxic metal ions from wastewaters is an important task for the research community. In this study, the different approaches of physical-chemical modification (thermal activation, acidic and non-acidic treatment) of natural dolomite were proposed in order to synthesize highly effective sorption materials. The effect of dolomite modification conditions on sorption properties of prepared sorbents was studied. It was shown that these sorbents could find practical applications for the sorptive purification of mine water from metal ions.
Key words sorption, metal ions, mine water, waste water, dolomite
Introduction
At near feature the principals of green chemistry and zero waste technologies will be in the focus of industrial and mining enterprises. So, the development of a novel sorbents for the removal of toxic metal ions from wastewaters is an important task for the research commu-nity (Fu 2010). Natural materials (zeolites and clays, phosphate rocks and carbonate-con-taining minerals) are attractive candidates for the development of highly effective sorbents for metal ions. It is well known that in a native form these materials have a low effectiveness and do not fit for the practical use (Babel 2003).
Recently, the different approaches of physical-chemical modification (thermal activation, acidic and non-acidic treatment) of natural dolomite were proposed in order to synthesize highly effective sorption materials. The aim of this work was to study the effect of dolomite modification conditions on sorption properties of prepared sorbents towards metal ions.
Methods
Preparation of sorbents and solutions
Dolomite from the Ruba deposit with the following chemical composition (in wt %): SiO2 1.1, Fe2O3 0.4, Al2O3 0.5, CaO 30.3, MgO 20.0, SO3 0.4, K2O 0.2, Na2O 0.1 and calcination loss 47.0 was used. The heat treatment of the samples was performed in a SNOL 7.2/1300 electrical resistance furnace in the temperature range of 700–900 °С, with keeping at the fi-nal temperature for 5 h. The heating rate was fixed at 5 °С/min. For the synthesis of sorbent with a high content of calcium and magnesium phosphates and high sorption properties, it was previously suggested to activate the natural dolomite by calcination at 800 °C.
1056
Lappeenranta, Finland IMWA 2017Mine Water and Circular Economy
Wolkersdorfer C, Sartz L, Sillanpää M, Häkkinen A (Editors)
The sorbent PD-1 was obtained after 24 h of stirring dolomite with 20% phosphoric acid at a dolomite to phosphoric acid weight ratio of 1 : 3. To prepare the sorbent PD-2, activated dolomite was dissolved in concentrated nitric acid, and thereafter Ca and Mg phosphates were precipitated at pH 10 using ammonium phosphate. Details can be found elsewhere. In contrast to previous work, the synthesis was conducted by slow controlled titration (5 mL·s1), and, after total addition of the ammonium phosphate solution, the suspension was created within 24 h. After aging and washing with distilled water, the precipitate of Ca-Mg phosphate was rinsed with ethanol. Replacement of intermicellar liquid (water with ethanol) yields a sorbent with a more developed mesoporous structure, because ethanol has a lower surface tension than water. By this means, sorbent PD-1 represents a mixture of Ca-Mg hydrogen phosphates with the approximate composition (Mg,Ca)HPO4·xH2O. PD-2 represents a mix-ture of Ca-Mg tertiary phosphates with the total formula (Mg,Ca)3(PO4)2·yH2O.
Sample PD-3 was obtained using soft non-acid method, after 16 h of stirring dolomite with 0.2 M NaH2PO4 at a dolomite to NaH2PO4 ratio of 1.4 : 33 g∙mL-1. Theoretical calculations suggest that this quantity is enough for full interaction between magnesium oxide and so-dium phosphates.
Aqueous solutions of M(II) ions were prepared by dissolving a weighed mass of analytical grade salts M(NO3)2 (Sigma-Aldrich). Strong HCl or HNO3 acids were used for washing out the laboratory glassware. Distilled water was used for all experiments.
Analytical methods
XRD patterns were collected on an ADVANCED D8 powder diffractometer (CuKα radiation, 2Theta = 10−60 deg., Brucker, Germany). Phase identification of the samples was carried out using XRD standard base JCPDS PDF2. The file number is shown in brackets in the figure captions. Low temperature (77 K) nitrogen physisorption–desorption was studied by a static volume method using a surface/porosity analyzer (Micromeritics ASAP 2020 MP, USA).
For elemental composition analysis, the sorbents were dissolved in 6 M nitric acid. Total calcium and magnesium concentration was determined using complexometric EDTA ti-tration, while magnesium concentration was determined using an atomic-absorption tech-nique. The concentration of PO4
3- was defined spectrophotometrically as phosphovanado-molybdate complex at λ = 440 nm.
The concentration of M(II) ions present in the model solutions in the course of the sorption experiments was measured using an atomic absorption spectrometer (Contr AAS 300, An-alytic Jena, Germany).
Sorption study
The adsorption capacity was calculated using the following equation:
( )mVCCq t0t −=
(1)
1057
Lappeenranta, Finland IMWA 2017Mine Water and Circular Economy
Wolkersdorfer C, Sartz L, Sillanpää M, Häkkinen A (Editors)
where C0 and Ct (mmol·L-1) are the initial concentration and the concentration of M(II) at contact time t (min), V (L) is the solution volume and m (g) is the sorbent mass.
The influence of initial concentration of M(II) solutions on the sorption capacity of the syn-thesized sorbents was determined by varying metal concentration in the range from 0.5 to 25 mmol·L-1. For this study, 0.2 g of a sorbent was mixed with 50 mL of model solution at room temperature for the contact time of 24 h. The data obtained in these experiments were used to create sorption isotherms and these were fitted to the Langmuir, Freundlich, Redlich-Peterson and Sips isotherm models, which are most often used to describe the ad-sorption of one component (Foo 2010).
For dynamic sorption in case of PD-3 the multicomponent aqueous solution of Pb2+, Zn2+, Cu2+, Cd2+, Ni2+, Sr2+ and Co2+ ions was prepared by dissolving nitrate salts in distilled water at a concentration of 5.0 mg∙L-1 of each metal. The sorption experiments were carried out in dynamic mode. Sorbents were placed in glass column with diameter 1.0 cm, the high of sorbent was 5.0 cm. The linear rate of filtration was 10 m∙h-1 (the contact time was 47±3 sec.).
The removal efficiency was calculated using the following equation:
%1000
0 ×−
=Ñ
ÑÑ åα (2)
where α is removal efficiency in %, C0 and Ce are concentration before and after sorp-tion, mg∙L1.
Results and discussion
Characterization of sorbents
Samples of natural dolomite D-700, D-800, and D-900 thermally activated at 700, 800, and 900°C, respectively were tested as sorbents. According XRD data, the sample D-700 is complex in composition containing both the original dolomite and calcium carbonate doped with magnesium oxide. The D-800 sample contains predominantly calcium carbonate and magnesium oxide, while D-900 sample is a mixture of calcium and magnesium oxides with a small calcium carbonate admixture. According to the XRD data (fig. 1) and chemical analysis (Table 1), the PD-1 sample is a mix-ture of calcium and magnesium hydrogen phosphates with the gross composition Ca2Mg(H-PO4)3·8.7H2O. Sorbent PD-2 is composed of calcium, magnesium and magnesium-ammoni-um secondary phosphates, and can be described by the formula CaMg1.5(NH4)(PO4)2·12.5H2O. PD-3 is a mixture of calcium and magnesium tertiary and hydrogen phosphates, calci-um carbonate and magnesium oxide, with the composition Ca0.6Mgx(PO4)y(HPO4)1.6-y(-CaCO3)4.7(MgO)5.1-x·7.8H2O. Due to the fact that calcium and magnesium tertiary phosphates obtained by precipitation are amorphous compounds, their reflexes are absent from the dif-fraction pattern of the PD-2 sorbent. In contrast, magnesium-ammonium phosphate is char-acterized by a high degree of crystallinity, which is confirmed by clearly visible reflexes.
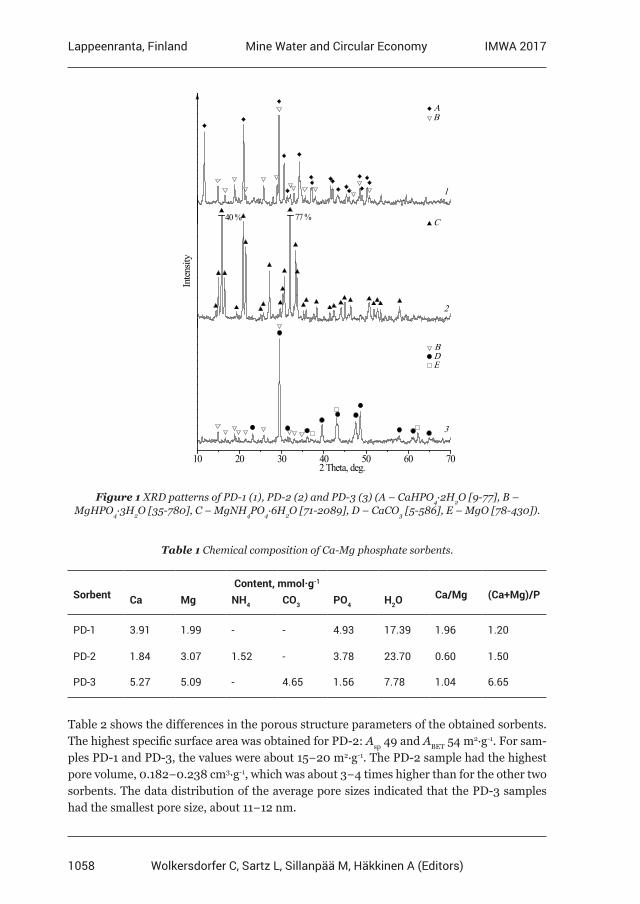
1058
Lappeenranta, Finland IMWA 2017Mine Water and Circular Economy
Wolkersdorfer C, Sartz L, Sillanpää M, Häkkinen A (Editors)
10 20 30 40 50 60 70
C
BA
1
2
77 %40 %
Inte
nsity
B
ED
3
2 Theta, deg.
Figure 1 XRD patterns of PD-1 (1), PD-2 (2) and PD-3 (3) (А – CaHPO4·2H2O [9-77], B – MgHPO4·3H2O [35-780], C – MgNH4PO4·6H2O [71-2089], D – CaCO3 [5-586], E – MgO [78-430]).
Table 1 Chemical composition of Ca-Mg phosphate sorbents.
SorbentContent, mmol·g-1
Ca/Mg (Ca+Mg)/PCa Mg NH4 CO3 PO4 H2O
PD-1 3.91 1.99 - - 4.93 17.39 1.96 1.20
PD-2 1.84 3.07 1.52 - 3.78 23.70 0.60 1.50
PD-3 5.27 5.09 - 4.65 1.56 7.78 1.04 6.65
Table 2 shows the differences in the porous structure parameters of the obtained sorbents. The highest specific surface area was obtained for PD-2: Asp 49 and ABET 54 m2·g-1. For sam-ples PD-1 and PD-3, the values were about 15−20 m2∙g-1. The PD-2 sample had the highest pore volume, 0.182−0.238 cm3∙g-1, which was about 3−4 times higher than for the other two sorbents. The data distribution of the average pore sizes indicated that the PD-3 samples had the smallest pore size, about 11−12 nm.
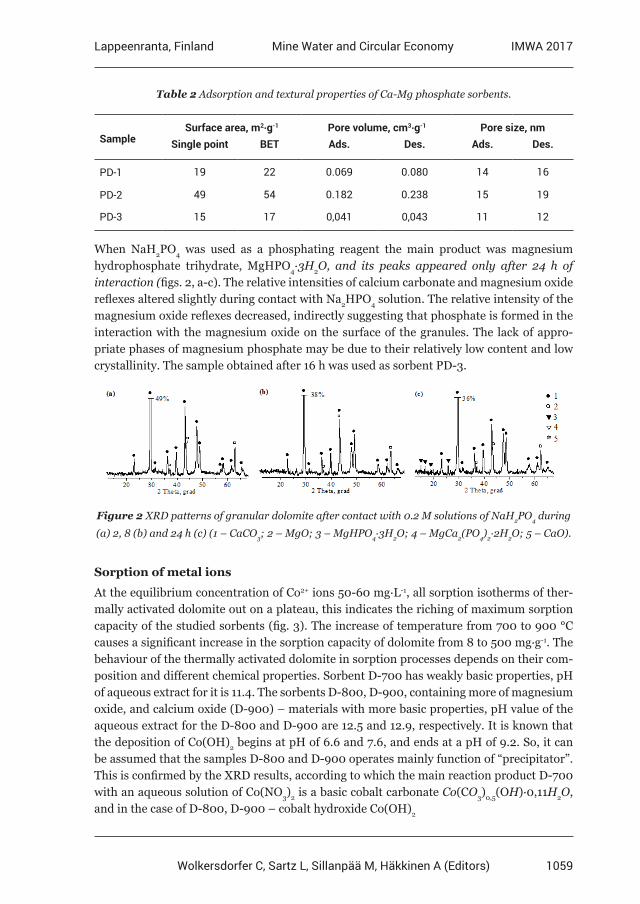
1059
Lappeenranta, Finland IMWA 2017Mine Water and Circular Economy
Wolkersdorfer C, Sartz L, Sillanpää M, Häkkinen A (Editors)
Table 2 Adsorption and textural properties of Ca-Mg phosphate sorbents.
SampleSurface area, m2∙g-1 Pore volume, cm3∙g-1 Pore size, nm
Single point BET Ads. Des. Ads. Des.
PD-1 19 22 0.069 0.080 14 16
PD-2 49 54 0.182 0.238 15 19
PD-3 15 17 0,041 0,043 11 12
When NaH2PO4 was used as a phosphating reagent the main product was magnesium hydrophosphate trihydrate, MgHPO4·3Н2О, and its peaks appeared only after 24 h of interaction (figs. 2, a-c). The relative intensities of calcium carbonate and magnesium oxide reflexes altered slightly during contact with Na2HPO4 solution. The relative intensity of the magnesium oxide reflexes decreased, indirectly suggesting that phosphate is formed in the interaction with the magnesium oxide on the surface of the granules. The lack of appro-priate phases of magnesium phosphate may be due to their relatively low content and low crystallinity. The sample obtained after 16 h was used as sorbent PD-3.
Figure 2 XRD patterns of granular dolomite after contact with 0.2 M solutions of NaH2PO4 during
(a) 2, 8 (b) and 24 h (c) (1 – СаСО3; 2 – MgO; 3 – MgHPO4·3H2O; 4 – MgCa2(PO4)2·2H2O; 5 – CaO).
Sorption of metal ions
At the equilibrium concentration of Co2+ ions 50-60 mg∙L-1, all sorption isotherms of ther-mally activated dolomite out on a plateau, this indicates the riching of maximum sorption capacity of the studied sorbents (fig. 3). The increase of temperature from 700 to 900 °C causes a significant increase in the sorption capacity of dolomite from 8 to 500 mg∙g-1. The behaviour of the thermally activated dolomite in sorption processes depends on their com-position and different chemical properties. Sorbent D-700 has weakly basic properties, pH of aqueous extract for it is 11.4. The sorbents D-800, D-900, containing more of magnesium oxide, and calcium oxide (D-900) – materials with more basic properties, pH value of the aqueous extract for the D-800 and D-900 are 12.5 and 12.9, respectively. It is known that the deposition of Co(OH)2 begins at pH of 6.6 and 7.6, and ends at a pH of 9.2. So, it can be assumed that the samples D-800 and D-900 operates mainly function of “precipitator”. This is confirmed by the XRD results, according to which the main reaction product D-700 with an aqueous solution of Co(NO3)2 is a basic cobalt carbonate Со(CО3)0,5(OН)·0,11Н2О, and in the case of D-800, D-900 – cobalt hydroxide Co(OH)2
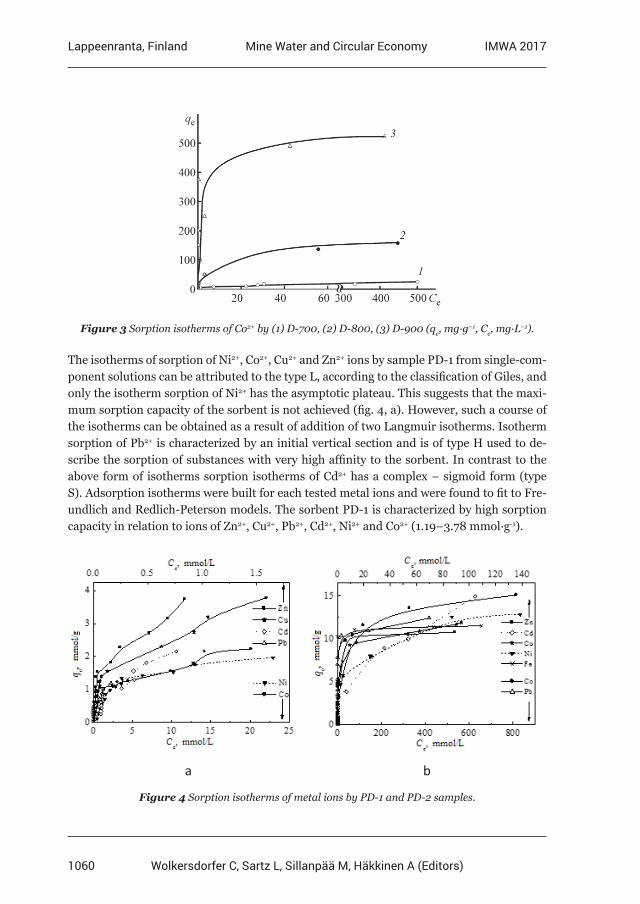
1060
Lappeenranta, Finland IMWA 2017Mine Water and Circular Economy
Wolkersdorfer C, Sartz L, Sillanpää M, Häkkinen A (Editors)
Figure 3 Sorption isotherms of Co2+ by (1) D-700, (2) D-800, (3) D-900 (qе, mg∙g–1, Се, mg∙L–1).
The isotherms of sorption of Ni2+, Co2+, Cu2+ and Zn2+ ions by sample PD-1 from single-com-ponent solutions can be attributed to the type L, according to the classification of Giles, and only the isotherm sorption of Ni2+ has the asymptotic plateau. This suggests that the maxi-mum sorption capacity of the sorbent is not achieved (fig. 4, a). However, such a course of the isotherms can be obtained as a result of addition of two Langmuir isotherms. Isotherm sorption of Pb2+ is characterized by an initial vertical section and is of type H used to de-scribe the sorption of substances with very high affinity to the sorbent. In contrast to the above form of isotherms sorption isotherms of Cd2+ has a complex − sigmoid form (type S). Adsorption isotherms were built for each tested metal ions and were found to fit to Fre-undlich and Redlich-Peterson models. The sorbent PD-1 is characterized by high sorption capacity in relation to ions of Zn2+, Cu2+, Pb2+, Cd2+, Ni2+ and Co2+ (1.19−3.78 mmol∙g-1).
a b
Figure 4 Sorption isotherms of metal ions by PD-1 and PD-2 samples.
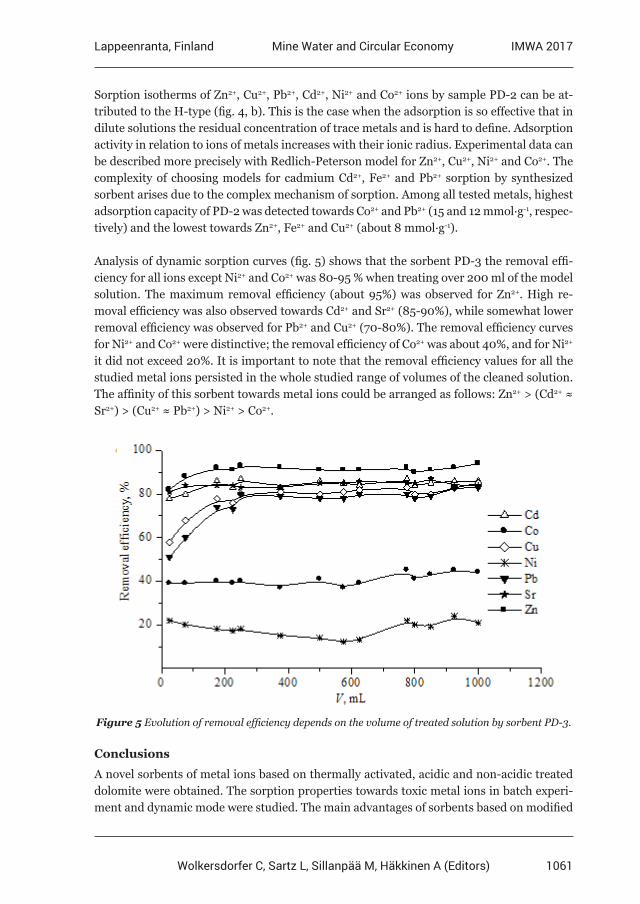
1061
Lappeenranta, Finland IMWA 2017Mine Water and Circular Economy
Wolkersdorfer C, Sartz L, Sillanpää M, Häkkinen A (Editors)
Sorption isotherms of Zn2+, Cu2+, Pb2+, Cd2+, Ni2+ and Co2+ ions by sample PD-2 can be at-tributed to the H-type (fig. 4, b). This is the case when the adsorption is so effective that in dilute solutions the residual concentration of trace metals and is hard to define. Adsorption activity in relation to ions of metals increases with their ionic radius. Experimental data can be described more precisely with Redlich-Peterson model for Zn2+, Cu2+, Ni2+ and Co2+. The complexity of choosing models for cadmium Cd2+, Fe2+ and Pb2+ sorption by synthesized sorbent arises due to the complex mechanism of sorption. Among all tested metals, highest adsorption capacity of PD-2 was detected towards Co2+ and Pb2+ (15 and 12 mmol∙g-1, respec-tively) and the lowest towards Zn2+, Fe2+ and Cu2+ (about 8 mmol∙g-1).
Analysis of dynamic sorption curves (fig. 5) shows that the sorbent PD-3 the removal effi-ciency for all ions except Ni2+ and Co2+ was 80-95 % when treating over 200 ml of the model solution. The maximum removal efficiency (about 95%) was observed for Zn2+. High re-moval efficiency was also observed towards Cd2+ and Sr2+ (85-90%), while somewhat lower removal efficiency was observed for Pb2+ and Cu2+ (70-80%). The removal efficiency curves for Ni2+ and Co2+ were distinctive; the removal efficiency of Co2+ was about 40%, and for Ni2+ it did not exceed 20%. It is important to note that the removal efficiency values for all the studied metal ions persisted in the whole studied range of volumes of the cleaned solution. The affinity of this sorbent towards metal ions could be arranged as follows: Zn2+ > (Cd2+ ≈ Sr2+) > (Cu2+ ≈ Pb2+) > Ni2+ > Co2+.
Figure 5 Evolution of removal efficiency depends on the volume of treated solution by sorbent PD-3.
Conclusions
A novel sorbents of metal ions based on thermally activated, acidic and non-acidic treated dolomite were obtained. The sorption properties towards toxic metal ions in batch experi-ment and dynamic mode were studied. The main advantages of sorbents based on modified
1062
Lappeenranta, Finland IMWA 2017Mine Water and Circular Economy
Wolkersdorfer C, Sartz L, Sillanpää M, Häkkinen A (Editors)
dolomite are high sorption capacity and kinetic parameters, low cost and possibility for the re-use of utilized sorbents, e.g. as a pigment for production of building materials. It indi-cates that these sorbents could find practical applications for the sorptive purification of mine water from metal ions.
Acknowledgements
The authors thank Belarusian Republican Foundation for Fundamental Research for financially support this work (grant # X17MC006).
References
S. Babel, T.A. Kurniawan (2003) Low-cost adsorbents for heavy metals uptake from contaminated water: a review, J. Hazard. Mater. 97: 219–243, doi:10.1016/S0304-3894(02)00263-7K.Y. Foo, B.H. Hameed (2010) Insights into the modeling of adsorption isotherm systems, Chem. Eng. J. 156: 2−10, doi: 10.1016/j.cej.2009.09.013F. Fu, Qi Wang (2011) Removal of heavy metal ions from wastewaters: A review, J. Environ. Manag. 92: 407-418, doi: 10.1016/j.jenvman.2010.11.011
1063
Lappeenranta, Finland IMWA 2017Mine Water and Circular Economy
Wolkersdorfer C, Sartz L, Sillanpää M, Häkkinen A (Editors)
Enhanced Mn Treatment in Mine Drainage Using Autocatalysis in a Steel Slag-Limestone Reactor
Duk-Min Kim, Hyun-Sung Park, Dong-Kwan Kim, Sang-Hwan Lee
MIRECO (Korea Mine Reclamation Corporation), Segye-ro 2, Wonju, 26464, South Korea, [email protected]
Abstract Modified steel slag and Mn sand reactors were operated for one year to remove Mn. The steel slag reactor showed the lowest Mn, below 0.2 mg/L, but Mn increased above 2.7 mg/L at only 4.5 mg/L of Fe. In contrast, a reactor consisting of steel slag and limestone, after accumulating autocatalytic Mn (hydr)oxides for 160 bed volumes, brought Mn to below 2 mg/L from an initial concentration of 30—50 mg/L, and produced outflow with the lowest pH of 7—9. The reactor also maintained Mn below 3.0 mg/L, even when loaded with 17.7 mg/L of Fe.
Key words Manganese, Autocatalysis, Steel slag, Birm, Passive Treatment
Introduction
Passive Mn treatment is challenging because precipitation of (hydr)oxides requires high pH (usually >9.0) and the existence of Fe can inhibit Mn removal because Fe is precipitated prior to Mn (Nairn and Hedin 1993). The slag leach bed (SLB) method has recently been applied due to fewer Fe interaction and clogging effects (Ziemkiewicz 1998; Hamilton et al. 2007; Skousen et al. 2017). In this method, freshwater reacts with the steel slag and flows into a pH adjustment pond. However, it is generally difficult to control the flow rate of the alkaline water from the SLB and efficiently maintain good water quality at discharge (Goetz and Riefler, 2014).
The surfaces of manganese (hydr)oxides can act as an autocatalyst for the oxidation of dis-solved Mn2+ ions. The proposed mechanism for the destabilization of Mn2+ ion symmetry is the exchange of H2O ligands between hydrated Mn2+ ions and the surfaces of manganese (hydr)oxides (Morgan 2000). Therefore, the Mn2+ oxidation rate generally increases in the presence of manganese (hydr)oxides (Coughlin and Matsui 1976; Barloková and Ilavský 2009; Younger et al. 2002).
The application of a slag reactor could be cost-effective, while maintaining a stable and low Mn concentration and pH, if it is tolerant to Fe and removes Mn efficiently at pH <9.0. Therefore, the objective of this study is to evaluate modified slag reactors that use autocatal-ysis, are Fe tolerant, and maintain a relatively low pH discharge.
Methods
Five reactors were chosen to remove Mn, three were filled with alkaline media (steel slag, steel slag+limestone, and steel slag+Mn-coated gravel), one was filled with catalytic media (Mn-coated sand), and the last was a control, filled with filter agent (Table 1; Fig. 1). The three reactors with alkaline media had an upward flow, while the other two reactors had a downward flow. Retention time was calculated by dividing the effective pore volume by flow
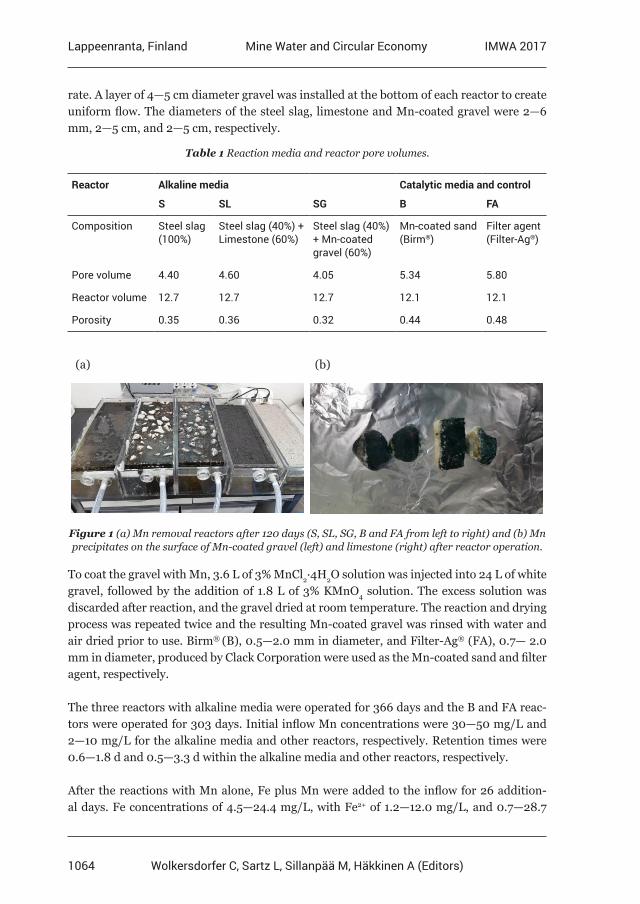
1064
Lappeenranta, Finland IMWA 2017Mine Water and Circular Economy
Wolkersdorfer C, Sartz L, Sillanpää M, Häkkinen A (Editors)
rate. A layer of 4—5 cm diameter gravel was installed at the bottom of each reactor to create uniform flow. The diameters of the steel slag, limestone and Mn-coated gravel were 2—6 mm, 2—5 cm, and 2—5 cm, respectively.
Table 1 Reaction media and reactor pore volumes.
Reactor Alkaline media Catalytic media and control
S SL SG B FA
Composition Steel slag (100%)
Steel slag (40%) + Limestone (60%)
Steel slag (40%) + Mn-coated gravel (60%)
Mn-coated sand (Birm®)
Filter agent (Filter-Ag®)
Pore volume 4.40 4.60 4.05 5.34 5.80
Reactor volume 12.7 12.7 12.7 12.1 12.1
Porosity 0.35 0.36 0.32 0.44 0.48
(a) (b)
Figure 1 (a) Mn removal reactors after 120 days (S, SL, SG, B and FA from left to right) and (b) Mn precipitates on the surface of Mn-coated gravel (left) and limestone (right) after reactor operation.
To coat the gravel with Mn, 3.6 L of 3% MnCl2·4H2O solution was injected into 24 L of white gravel, followed by the addition of 1.8 L of 3% KMnO4 solution. The excess solution was discarded after reaction, and the gravel dried at room temperature. The reaction and drying process was repeated twice and the resulting Mn-coated gravel was rinsed with water and air dried prior to use. Birm® (B), 0.5—2.0 mm in diameter, and Filter-Ag® (FA), 0.7— 2.0 mm in diameter, produced by Clack Corporation were used as the Mn-coated sand and filter agent, respectively.
The three reactors with alkaline media were operated for 366 days and the B and FA reac-tors were operated for 303 days. Initial inflow Mn concentrations were 30—50 mg/L and 2—10 mg/L for the alkaline media and other reactors, respectively. Retention times were 0.6—1.8 d and 0.5—3.3 d within the alkaline media and other reactors, respectively.
After the reactions with Mn alone, Fe plus Mn were added to the inflow for 26 addition-al days. Fe concentrations of 4.5—24.4 mg/L, with Fe2+ of 1.2—12.0 mg/L, and 0.7—28.7
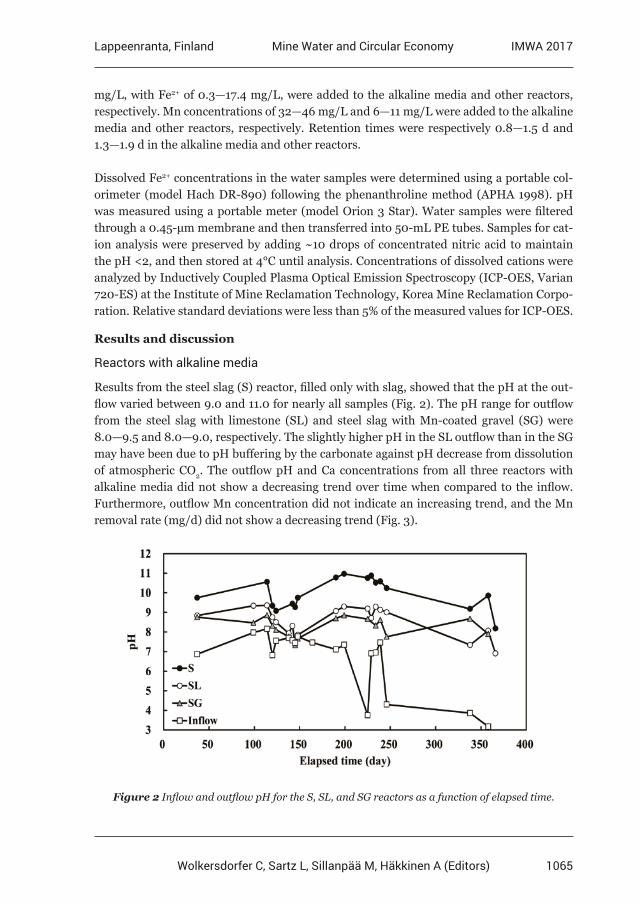
1065
Lappeenranta, Finland IMWA 2017Mine Water and Circular Economy
Wolkersdorfer C, Sartz L, Sillanpää M, Häkkinen A (Editors)
mg/L, with Fe2+ of 0.3—17.4 mg/L, were added to the alkaline media and other reactors, respectively. Mn concentrations of 32—46 mg/L and 6—11 mg/L were added to the alkaline media and other reactors, respectively. Retention times were respectively 0.8—1.5 d and 1.3—1.9 d in the alkaline media and other reactors.
Dissolved Fe2+ concentrations in the water samples were determined using a portable col-orimeter (model Hach DR-890) following the phenanthroline method (APHA 1998). pH was measured using a portable meter (model Orion 3 Star). Water samples were filtered through a 0.45-μm membrane and then transferred into 50-mL PE tubes. Samples for cat-ion analysis were preserved by adding ~10 drops of concentrated nitric acid to maintain the pH <2, and then stored at 4°C until analysis. Concentrations of dissolved cations were analyzed by Inductively Coupled Plasma Optical Emission Spectroscopy (ICP-OES, Varian 720-ES) at the Institute of Mine Reclamation Technology, Korea Mine Reclamation Corpo-ration. Relative standard deviations were less than 5% of the measured values for ICP-OES.
Results and discussion
Reactors with alkaline media
Results from the steel slag (S) reactor, filled only with slag, showed that the pH at the out-flow varied between 9.0 and 11.0 for nearly all samples (Fig. 2). The pH range for outflow from the steel slag with limestone (SL) and steel slag with Mn-coated gravel (SG) were 8.0—9.5 and 8.0—9.0, respectively. The slightly higher pH in the SL outflow than in the SG may have been due to pH buffering by the carbonate against pH decrease from dissolution of atmospheric CO2. The outflow pH and Ca concentrations from all three reactors with alkaline media did not show a decreasing trend over time when compared to the inflow. Furthermore, outflow Mn concentration did not indicate an increasing trend, and the Mn removal rate (mg/d) did not show a decreasing trend (Fig. 3).
Figure 2 Inflow and outflow pH for the S, SL, and SG reactors as a function of elapsed time.
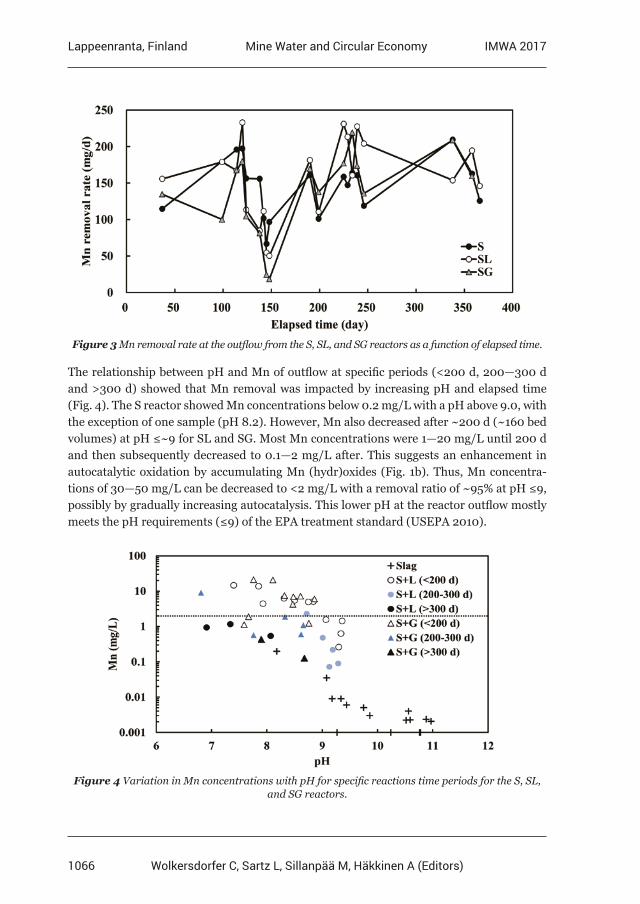
1066
Lappeenranta, Finland IMWA 2017Mine Water and Circular Economy
Wolkersdorfer C, Sartz L, Sillanpää M, Häkkinen A (Editors)
Figure 3 Mn removal rate at the outflow from the S, SL, and SG reactors as a function of elapsed time.
The relationship between pH and Mn of outflow at specific periods (<200 d, 200—300 d and >300 d) showed that Mn removal was impacted by increasing pH and elapsed time (Fig. 4). The S reactor showed Mn concentrations below 0.2 mg/L with a pH above 9.0, with the exception of one sample (pH 8.2). However, Mn also decreased after ~200 d (~160 bed volumes) at pH ≤~9 for SL and SG. Most Mn concentrations were 1—20 mg/L until 200 d and then subsequently decreased to 0.1—2 mg/L after. This suggests an enhancement in autocatalytic oxidation by accumulating Mn (hydr)oxides (Fig. 1b). Thus, Mn concentra-tions of 30—50 mg/L can be decreased to <2 mg/L with a removal ratio of ~95% at pH ≤9, possibly by gradually increasing autocatalysis. This lower pH at the reactor outflow mostly meets the pH requirements (≤9) of the EPA treatment standard (USEPA 2010).
Figure 4 Variation in Mn concentrations with pH for specific reactions time periods for the S, SL, and SG reactors.
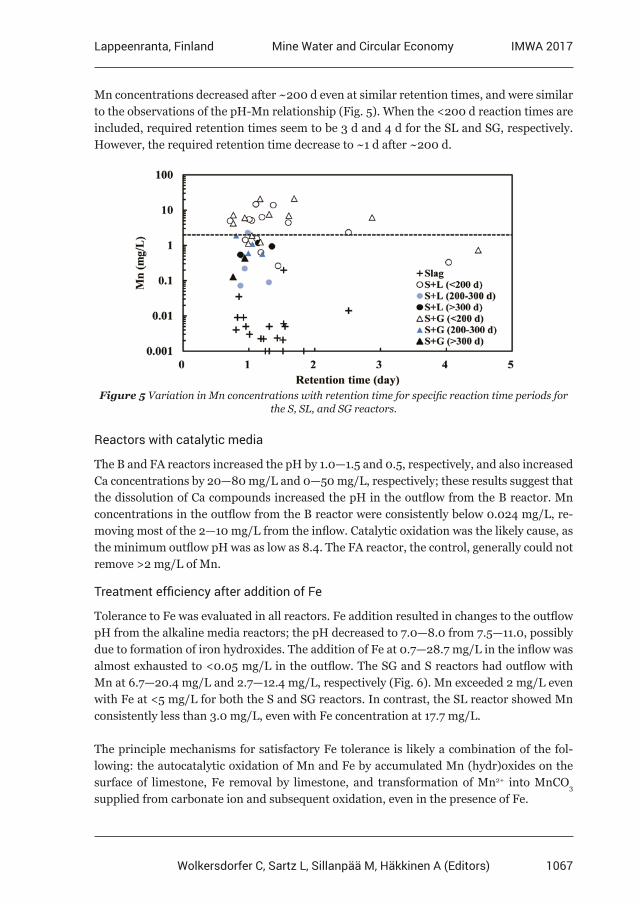
1067
Lappeenranta, Finland IMWA 2017Mine Water and Circular Economy
Wolkersdorfer C, Sartz L, Sillanpää M, Häkkinen A (Editors)
Mn concentrations decreased after ~200 d even at similar retention times, and were similar to the observations of the pH-Mn relationship (Fig. 5). When the <200 d reaction times are included, required retention times seem to be 3 d and 4 d for the SL and SG, respectively. However, the required retention time decrease to ~1 d after ~200 d.
Figure 5 Variation in Mn concentrations with retention time for specific reaction time periods for the S, SL, and SG reactors.
Reactors with catalytic media
The B and FA reactors increased the pH by 1.0—1.5 and 0.5, respectively, and also increased Ca concentrations by 20—80 mg/L and 0—50 mg/L, respectively; these results suggest that the dissolution of Ca compounds increased the pH in the outflow from the B reactor. Mn concentrations in the outflow from the B reactor were consistently below 0.024 mg/L, re-moving most of the 2—10 mg/L from the inflow. Catalytic oxidation was the likely cause, as the minimum outflow pH was as low as 8.4. The FA reactor, the control, generally could not remove >2 mg/L of Mn.
Treatment efficiency after addition of Fe
Tolerance to Fe was evaluated in all reactors. Fe addition resulted in changes to the outflow pH from the alkaline media reactors; the pH decreased to 7.0—8.0 from 7.5—11.0, possibly due to formation of iron hydroxides. The addition of Fe at 0.7—28.7 mg/L in the inflow was almost exhausted to <0.05 mg/L in the outflow. The SG and S reactors had outflow with Mn at 6.7—20.4 mg/L and 2.7—12.4 mg/L, respectively (Fig. 6). Mn exceeded 2 mg/L even with Fe at <5 mg/L for both the S and SG reactors. In contrast, the SL reactor showed Mn consistently less than 3.0 mg/L, even with Fe concentration at 17.7 mg/L.
The principle mechanisms for satisfactory Fe tolerance is likely a combination of the fol-lowing: the autocatalytic oxidation of Mn and Fe by accumulated Mn (hydr)oxides on the surface of limestone, Fe removal by limestone, and transformation of Mn2+ into MnCO3 supplied from carbonate ion and subsequent oxidation, even in the presence of Fe.
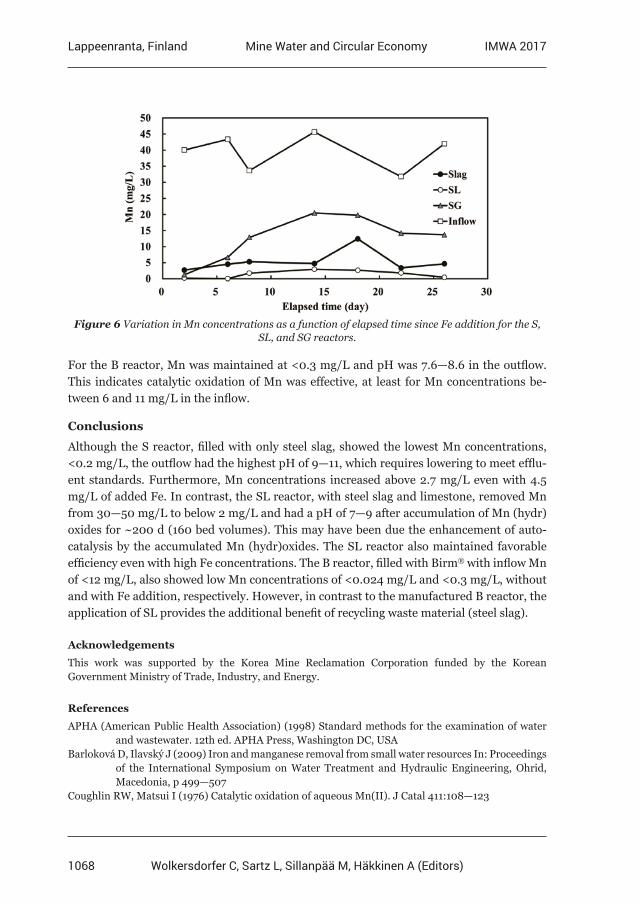
1068
Lappeenranta, Finland IMWA 2017Mine Water and Circular Economy
Wolkersdorfer C, Sartz L, Sillanpää M, Häkkinen A (Editors)
Figure 6 Variation in Mn concentrations as a function of elapsed time since Fe addition for the S, SL, and SG reactors.
For the B reactor, Mn was maintained at <0.3 mg/L and pH was 7.6—8.6 in the outflow. This indicates catalytic oxidation of Mn was effective, at least for Mn concentrations be-tween 6 and 11 mg/L in the inflow.
Conclusions
Although the S reactor, filled with only steel slag, showed the lowest Mn concentrations, <0.2 mg/L, the outflow had the highest pH of 9—11, which requires lowering to meet efflu-ent standards. Furthermore, Mn concentrations increased above 2.7 mg/L even with 4.5 mg/L of added Fe. In contrast, the SL reactor, with steel slag and limestone, removed Mn from 30—50 mg/L to below 2 mg/L and had a pH of 7—9 after accumulation of Mn (hydr)oxides for ~200 d (160 bed volumes). This may have been due the enhancement of auto-catalysis by the accumulated Mn (hydr)oxides. The SL reactor also maintained favorable efficiency even with high Fe concentrations. The B reactor, filled with Birm® with inflow Mn of <12 mg/L, also showed low Mn concentrations of <0.024 mg/L and <0.3 mg/L, without and with Fe addition, respectively. However, in contrast to the manufactured B reactor, the application of SL provides the additional benefit of recycling waste material (steel slag).
Acknowledgements
This work was supported by the Korea Mine Reclamation Corporation funded by the Korean Government Ministry of Trade, Industry, and Energy.
References
APHA (American Public Health Association) (1998) Standard methods for the examination of water and wastewater. 12th ed. APHA Press, Washington DC, USABarloková D, Ilavský J (2009) Iron and manganese removal from small water resources In: Proceedings of the International Symposium on Water Treatment and Hydraulic Engineering, Ohrid, Macedonia, p 499—507Coughlin RW, Matsui I (1976) Catalytic oxidation of aqueous Mn(II). J Catal 411:108—123
1069
Lappeenranta, Finland IMWA 2017Mine Water and Circular Economy
Wolkersdorfer C, Sartz L, Sillanpää M, Häkkinen A (Editors)
Goetz ER, Riefler RG (2014) Performance of steel slag leach beds in acid mine drainage treatment. Chem Eng J 240:579—588Hamilton J, Gue J, Socotch C (2007) The use of steel slag in passive treatment design for AMD discharge in the Huff Run watershed restoration. In: Proceedings of the 24th ASMR, Gillette, WY, p 272—282Morgan JJ (2000) Manganese in natural waters and earth’s crust: its availability to organisms. Met Ions Biol Syst 37:1—34Nairn RW, Hedin RS (1993) Contaminant removal capabilities of wetlands constructed to treat coal mine drainage. In: Moshiri GA (Ed), Constructed wetlands for water quality improvement. Lewis publishers, Boca Raton, FL, USA, p 187—195Skousen J, Zipper CE, Rose A, Ziemkiewicz PF, Nairn R, McDonald LM, Kleinmann RL (2017) Review of Passive Systems for Acid Mine Drainage Treatment. Mine Water Environ 36:133—153, doi:10.1007/s10230-016-0417-1USEPA (U.S. Environmental Protection Agency) (2010) NPDES Permit Writer’s Manual. EPA- 833-K-10-001, U.S. Environmental Protection Agency, Office of Water, Washington DC, USA, p 5-2Ziemkiewicz PF (1998) Steel slag: applications for AMD control. In: Proceedings of the 1998 conference on hazardous waste research, Snowbird, UT, p 44—62
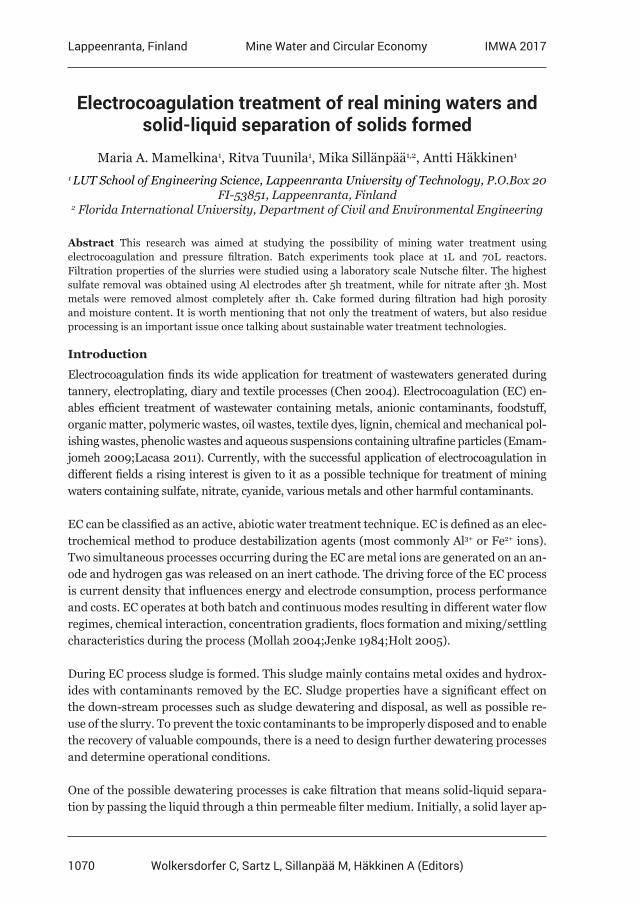
1070
Lappeenranta, Finland IMWA 2017Mine Water and Circular Economy
Wolkersdorfer C, Sartz L, Sillanpää M, Häkkinen A (Editors)
Electrocoagulation treatment of real mining waters and solid-liquid separation of solids formed
Maria A. Mamelkina1, Ritva Tuunila1, Mika Sillänpää1,2, Antti Häkkinen1
1 LUT School of Engineering Science, Lappeenranta University of Technology, P.O.Box 20 FI-53851, Lappeenranta, Finland
2 Florida International University, Department of Civil and Environmental Engineering
Abstract This research was aimed at studying the possibility of mining water treatment using electrocoagulation and pressure filtration. Batch experiments took place at 1L and 70L reactors. Filtration properties of the slurries were studied using a laboratory scale Nutsche filter. The highest sulfate removal was obtained using Al electrodes after 5h treatment, while for nitrate after 3h. Most metals were removed almost completely after 1h. Cake formed during filtration had high porosity and moisture content. It is worth mentioning that not only the treatment of waters, but also residue processing is an important issue once talking about sustainable water treatment technologies.
Introduction
Electrocoagulation finds its wide application for treatment of wastewaters generated during tannery, electroplating, diary and textile processes (Chen 2004). Electrocoagulation (EC) en-ables efficient treatment of wastewater containing metals, anionic contaminants, foodstuff, organic matter, polymeric wastes, oil wastes, textile dyes, lignin, chemical and mechanical pol-ishing wastes, phenolic wastes and aqueous suspensions containing ultrafine particles (Emam-jomeh 2009;Lacasa 2011). Currently, with the successful application of electrocoagulation in different fields a rising interest is given to it as a possible technique for treatment of mining waters containing sulfate, nitrate, cyanide, various metals and other harmful contaminants.
EC can be classified as an active, abiotic water treatment technique. EC is defined as an elec-trochemical method to produce destabilization agents (most commonly Al3+ or Fe2+ ions). Two simultaneous processes occurring during the EC are metal ions are generated on an an-ode and hydrogen gas was released on an inert cathode. The driving force of the EC process is current density that influences energy and electrode consumption, process performance and costs. EC operates at both batch and continuous modes resulting in different water flow regimes, chemical interaction, concentration gradients, flocs formation and mixing/settling characteristics during the process (Mollah 2004;Jenke 1984;Holt 2005).
During EC process sludge is formed. This sludge mainly contains metal oxides and hydrox-ides with contaminants removed by the EC. Sludge properties have a significant effect on the down-stream processes such as sludge dewatering and disposal, as well as possible re-use of the slurry. To prevent the toxic contaminants to be improperly disposed and to enable the recovery of valuable compounds, there is a need to design further dewatering processes and determine operational conditions.
One of the possible dewatering processes is cake filtration that means solid-liquid separa-tion by passing the liquid through a thin permeable filter medium. Initially, a solid layer ap-
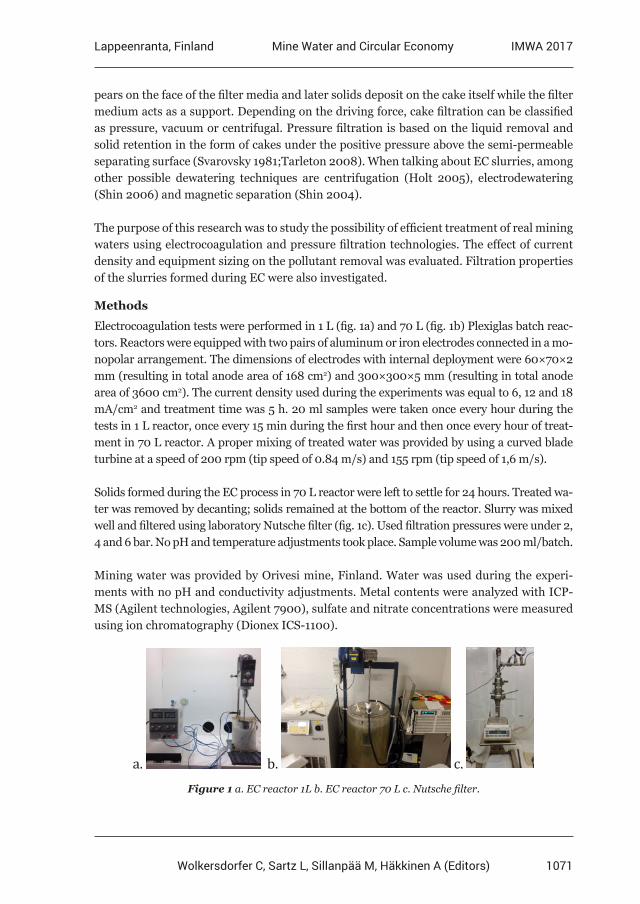
1071
Lappeenranta, Finland IMWA 2017Mine Water and Circular Economy
Wolkersdorfer C, Sartz L, Sillanpää M, Häkkinen A (Editors)
pears on the face of the filter media and later solids deposit on the cake itself while the filter medium acts as a support. Depending on the driving force, cake filtration can be classified as pressure, vacuum or centrifugal. Pressure filtration is based on the liquid removal and solid retention in the form of cakes under the positive pressure above the semi-permeable separating surface (Svarovsky 1981;Tarleton 2008). When talking about EC slurries, among other possible dewatering techniques are centrifugation (Holt 2005), electrodewatering (Shin 2006) and magnetic separation (Shin 2004).
The purpose of this research was to study the possibility of efficient treatment of real mining waters using electrocoagulation and pressure filtration technologies. The effect of current density and equipment sizing on the pollutant removal was evaluated. Filtration properties of the slurries formed during EC were also investigated.
Methods
Electrocoagulation tests were performed in 1 L (fig. 1a) and 70 L (fig. 1b) Plexiglas batch reac-tors. Reactors were equipped with two pairs of aluminum or iron electrodes connected in a mo-nopolar arrangement. The dimensions of electrodes with internal deployment were 60×70×2 mm (resulting in total anode area of 168 cm2) and 300×300×5 mm (resulting in total anode area of 3600 cm2). The current density used during the experiments was equal to 6, 12 and 18 mA/cm2 and treatment time was 5 h. 20 ml samples were taken once every hour during the tests in 1 L reactor, once every 15 min during the first hour and then once every hour of treat-ment in 70 L reactor. A proper mixing of treated water was provided by using a curved blade turbine at a speed of 200 rpm (tip speed of 0.84 m/s) and 155 rpm (tip speed of 1,6 m/s).
Solids formed during the EC process in 70 L reactor were left to settle for 24 hours. Treated wa-ter was removed by decanting; solids remained at the bottom of the reactor. Slurry was mixed well and filtered using laboratory Nutsche filter (fig. 1c). Used filtration pressures were under 2, 4 and 6 bar. No pH and temperature adjustments took place. Sample volume was 200 ml/batch.
Mining water was provided by Orivesi mine, Finland. Water was used during the experi-ments with no pH and conductivity adjustments. Metal contents were analyzed with ICP-MS (Agilent technologies, Agilent 7900), sulfate and nitrate concentrations were measured using ion chromatography (Dionex ICS-1100).
a. b. c. Figure 1 a. EC reactor 1L b. EC reactor 70 L c. Nutsche filter.
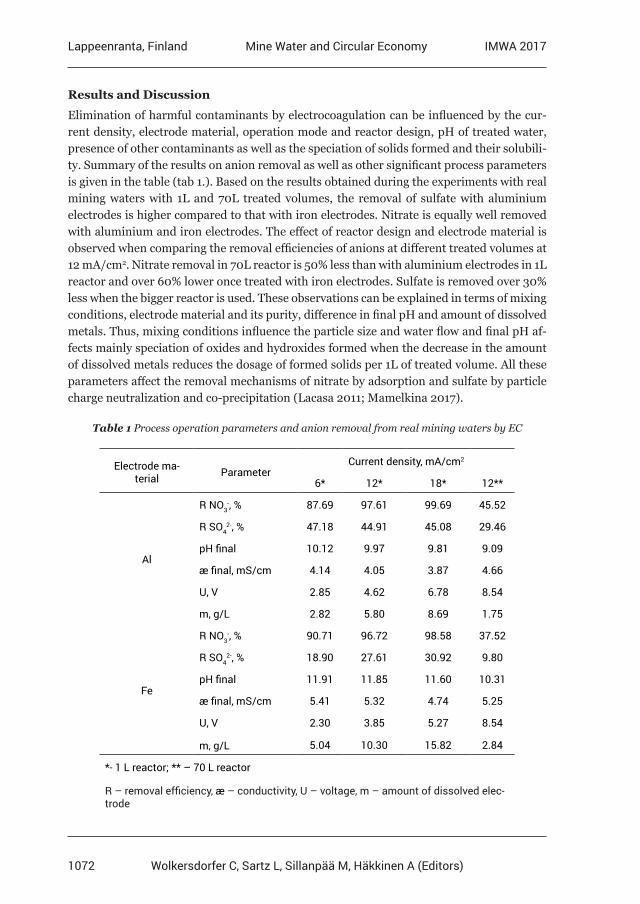
1072
Lappeenranta, Finland IMWA 2017Mine Water and Circular Economy
Wolkersdorfer C, Sartz L, Sillanpää M, Häkkinen A (Editors)
Results and Discussion
Elimination of harmful contaminants by electrocoagulation can be influenced by the cur-rent density, electrode material, operation mode and reactor design, pH of treated water, presence of other contaminants as well as the speciation of solids formed and their solubili-ty. Summary of the results on anion removal as well as other significant process parameters is given in the table (tab 1.). Based on the results obtained during the experiments with real mining waters with 1L and 70L treated volumes, the removal of sulfate with aluminium electrodes is higher compared to that with iron electrodes. Nitrate is equally well removed with aluminium and iron electrodes. The effect of reactor design and electrode material is observed when comparing the removal efficiencies of anions at different treated volumes at 12 mA/cm2. Nitrate removal in 70L reactor is 50% less than with aluminium electrodes in 1L reactor and over 60% lower once treated with iron electrodes. Sulfate is removed over 30% less when the bigger reactor is used. These observations can be explained in terms of mixing conditions, electrode material and its purity, difference in final pH and amount of dissolved metals. Thus, mixing conditions influence the particle size and water flow and final pH af-fects mainly speciation of oxides and hydroxides formed when the decrease in the amount of dissolved metals reduces the dosage of formed solids per 1L of treated volume. All these parameters affect the removal mechanisms of nitrate by adsorption and sulfate by particle charge neutralization and co-precipitation (Lacasa 2011; Mamelkina 2017).
Table 1 Process operation parameters and anion removal from real mining waters by EC
Electrode ma-terial Parameter
Current density, mA/cm2
6* 12* 18* 12**
Al
R NO3-, % 87.69 97.61 99.69 45.52
R SO42-, % 47.18 44.91 45.08 29.46
pH final 10.12 9.97 9.81 9.09
æ final, mS/cm 4.14 4.05 3.87 4.66
U, V 2.85 4.62 6.78 8.54
m, g/L 2.82 5.80 8.69 1.75
Fe
R NO3-, % 90.71 96.72 98.58 37.52
R SO42-, % 18.90 27.61 30.92 9.80
pH final 11.91 11.85 11.60 10.31
æ final, mS/cm 5.41 5.32 4.74 5.25
U, V 2.30 3.85 5.27 8.54
m, g/L 5.04 10.30 15.82 2.84
*- 1 L reactor; ** – 70 L reactor
R – removal efficiency, æ – conductivity, U – voltage, m – amount of dissolved elec-trode
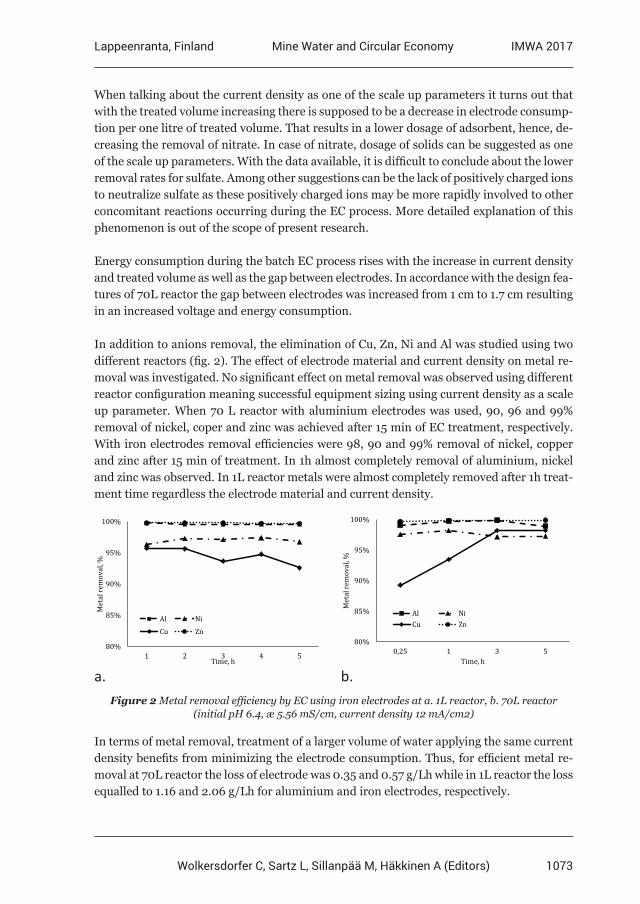
1073
Lappeenranta, Finland IMWA 2017Mine Water and Circular Economy
Wolkersdorfer C, Sartz L, Sillanpää M, Häkkinen A (Editors)
When talking about the current density as one of the scale up parameters it turns out that with the treated volume increasing there is supposed to be a decrease in electrode consump-tion per one litre of treated volume. That results in a lower dosage of adsorbent, hence, de-creasing the removal of nitrate. In case of nitrate, dosage of solids can be suggested as one of the scale up parameters. With the data available, it is difficult to conclude about the lower removal rates for sulfate. Among other suggestions can be the lack of positively charged ions to neutralize sulfate as these positively charged ions may be more rapidly involved to other concomitant reactions occurring during the EC process. More detailed explanation of this phenomenon is out of the scope of present research.
Energy consumption during the batch EC process rises with the increase in current density and treated volume as well as the gap between electrodes. In accordance with the design fea-tures of 70L reactor the gap between electrodes was increased from 1 cm to 1.7 cm resulting in an increased voltage and energy consumption.
In addition to anions removal, the elimination of Cu, Zn, Ni and Al was studied using two different reactors (fig. 2). The effect of electrode material and current density on metal re-moval was investigated. No significant effect on metal removal was observed using different reactor configuration meaning successful equipment sizing using current density as a scale up parameter. When 70 L reactor with aluminium electrodes was used, 90, 96 and 99% removal of nickel, coper and zinc was achieved after 15 min of EC treatment, respectively. With iron electrodes removal efficiencies were 98, 90 and 99% removal of nickel, copper and zinc after 15 min of treatment. In 1h almost completely removal of aluminium, nickel and zinc was observed. In 1L reactor metals were almost completely removed after 1h treat-ment time regardless the electrode material and current density.
Figure 2 Metal removal efficiency by EC using iron electrodes at a. 1L reactor, b. 70L reactor (initial pH 6.4, æ 5.56 mS/cm, current density 12 mA/cm2)
In terms of metal removal, treatment of a larger volume of water applying the same current density benefits from minimizing the electrode consumption. Thus, for efficient metal re-moval at 70L reactor the loss of electrode was 0.35 and 0.57 g/Lh while in 1L reactor the loss equalled to 1.16 and 2.06 g/Lh for aluminium and iron electrodes, respectively.
80%
85%
90%
95%
100%
1 2 3 4 5
Met
al re
mov
al, %
Time, h
Al Ni
Cu Zn80%
85%
90%
95%
100%
0,25 1 3 5
Met
al re
mov
al, %
Time, h
Al NiCu Zn
a. b.
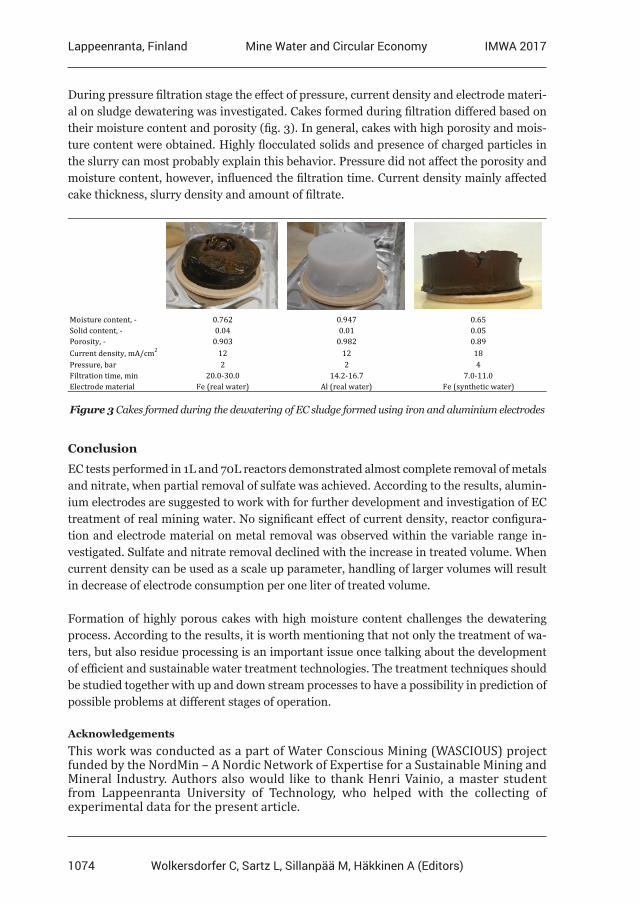
1074
Lappeenranta, Finland IMWA 2017Mine Water and Circular Economy
Wolkersdorfer C, Sartz L, Sillanpää M, Häkkinen A (Editors)
During pressure filtration stage the effect of pressure, current density and electrode materi-al on sludge dewatering was investigated. Cakes formed during filtration differed based on their moisture content and porosity (fig. 3). In general, cakes with high porosity and mois-ture content were obtained. Highly flocculated solids and presence of charged particles in the slurry can most probably explain this behavior. Pressure did not affect the porosity and moisture content, however, influenced the filtration time. Current density mainly affected cake thickness, slurry density and amount of filtrate.
Moisture content, - 0.762 0.947 0.65Solid content, - 0.04 0.01 0.05Porosity, - 0.903 0.982 0.89Current density, mA/cm2 12 12 18Pressure, bar 2 2 4Filtration time, min 20.0-30.0 14.2-16.7 7.0-11.0Electrode material Fe (real water) Al (real water) Fe (synthetic water)
Figure 3 Cakes formed during the dewatering of EC sludge formed using iron and aluminium electrodes
Conclusion
EC tests performed in 1L and 70L reactors demonstrated almost complete removal of metals and nitrate, when partial removal of sulfate was achieved. According to the results, alumin-ium electrodes are suggested to work with for further development and investigation of EC treatment of real mining water. No significant effect of current density, reactor configura-tion and electrode material on metal removal was observed within the variable range in-vestigated. Sulfate and nitrate removal declined with the increase in treated volume. When current density can be used as a scale up parameter, handling of larger volumes will result in decrease of electrode consumption per one liter of treated volume.
Formation of highly porous cakes with high moisture content challenges the dewatering process. According to the results, it is worth mentioning that not only the treatment of wa-ters, but also residue processing is an important issue once talking about the development of efficient and sustainable water treatment technologies. The treatment techniques should be studied together with up and down stream processes to have a possibility in prediction of possible problems at different stages of operation.
Acknowledgements
This work was conducted as a part of Water Conscious Mining (WASCIOUS) project funded by the NordMin – A Nordic Network of Expertise for a Sustainable Mining and Mineral Industry. Authors also would like to thank Henri Vainio, a master student from Lappeenranta University of Technology, who helped with the collecting of experimental data for the present article.
1075
Lappeenranta, Finland IMWA 2017Mine Water and Circular Economy
Wolkersdorfer C, Sartz L, Sillanpää M, Häkkinen A (Editors)
References
Chen G (2004) Electrochemical technologies in wastewater treatment. Sep. Purif. Technol. 38: 11-41.Emamjomeh ME, Sivakumar M (2009) Review of pollutants removed by electrocoagulation and electrocoagulation/flotation processes. J. Environ. Manage. 90: 1663-1679.Holt PK, Barton GW, Mitchell CA (2005) The future for electrocoagulation as a localised water treatment technology. Chemosphere 59: 355-367.Jenke DR, Diebold FE (1984) Electroprecipitation treatment of acid mine wastewater. Water Res. 18 (7): 855-859.Lacasa E, Cañizares P, Sáez C, Fernández FJ, Rodrigo MA (2011) Electrochemical phosphates removal using iron and aluminium electrodes. Chem. Eng. J. 172 (1): 137-143.Mamelkina MA, Cotillas S, Lacasa E, Sáez C, Tuunila R, Sillanpää M, Häkkinen A, Rodrigo MA (2017) Removal of sulfate from mining waters by electrocoagulation. Sep. Purif. Technol. 182: 87-93Mollah MYA, Morkovsky P, Gomes JAG, Kesmez M, Parga J, Cocke DL (2004) Fundamentals, present and future perspectives of electrocoagulation. J. Hazard. Mater. B114: 199-210.Shin H, Lee J, (2006) Performance evaluation of electrocoagulation and electrodewatering system for reduction of water content in sewage sludge. Korean J. Chem. Eng. 23 (2): 188-193.Shin S, Kim Y, Jung S, Suh K, Kang S, Jeong S, Kim H (2004) Combined performance of electrocoagulation and magnetic separation processes for treatment of dye wastewater. Korean J. Chem. Eng. 21 (4): 806-810.Svarovsky L (1981) Solid-liquid separation. Butterworth & Co Ltd.Tarleton S, Wakeman R (2008) Dictionary of filtration and separation. Filtration Solution, Exeter, UK.
1076
Lappeenranta, Finland IMWA 2017Mine Water and Circular Economy
Wolkersdorfer C, Sartz L, Sillanpää M, Häkkinen A (Editors)
Pilot scale evaluation of the suitability of peat as sorbent filter material for metal removal from mining drainage water
Elisangela Heiderscheidt1, Heini Postila1, Anna-Kaisa Ronkanen1, Felipe Campos1, Harshita Gogoi2, Tiina Leiviskä2
1Water Resources and Environmental Engineering, University of Oulu, 90014 University of Oulu, Oulu -Finland
2Chemical Process Engineering, University of Oulu, 90014 University of Oulu, Oulu –Finland
Abstract Peat is an inexpensive and biodegradable sorbent material with good capacity to sorb cationic ions such as metals and metalloids. The aim of this study was to evaluate metal removal efficiency of natural and chemically treated (HCl) peat when applied as sorbent media in small scale pilot filter systems. Based on the results obtained, purification efficiency e.g., removal of nickel and arsenic, was good but decreased with time. Leaching of aluminium and iron occurred in both pilots, but residual concentrations of leaching elements were mainly lower than the Finnish drinking water quality recommendations.
Key words peat, pilot, metal removal, sorption, filter
Introduction
Peat is an inexpensive, biodegradable and widely available biomaterial that is mostly com-posed of lingocellulosic constituents which are associated with good capacity to sorb cat-ionic ions such as metals and metalloids (Brown et al. 2000). Peat can also be modified (e.g., chemically treated) to increase its sorption capacity (Bulgariu et al. 2011). A number of studies have reported substantial potential of natural or modified peat for mining water purification (Brown et al. 2000, Bulgariu et al. 2011). However, there is a lack of pilot and real scale demonstrations which can attest to the suitability of peat as sorbent material for mining water purification in real purification systems.
The research work conducted under the Min-North project (Development, Evaluation and Optimization of Measures to Reduce the Impact on the Environment from Mining Activities in Northern Regions–Interreg Nord, EU) aimed to bridge the gap on the available knowl-edge by assessing in pilot scale the suitability of natural and modified peat as sorbent media for horizontal flow filter systems. The objective was to evaluate the purification efficiency (removal of selected metals) achieved by natural and chemically treated peat and the feasi-bility of using it as sorbent media in filter systems.
Material and methods
Natural peat, normally used in energy production, was used and based on literature review as well as previous studies an acid treatment (HCl) was selected as the modification meth-od. The peat modification process applied is fully described in Gogoi (2016). Natural and modified peat (particle size 90-250 µm) were placed into two identical compartmentalized horizontal flow filter systems (fig. 1). Characterization of natural and modified peat mate-
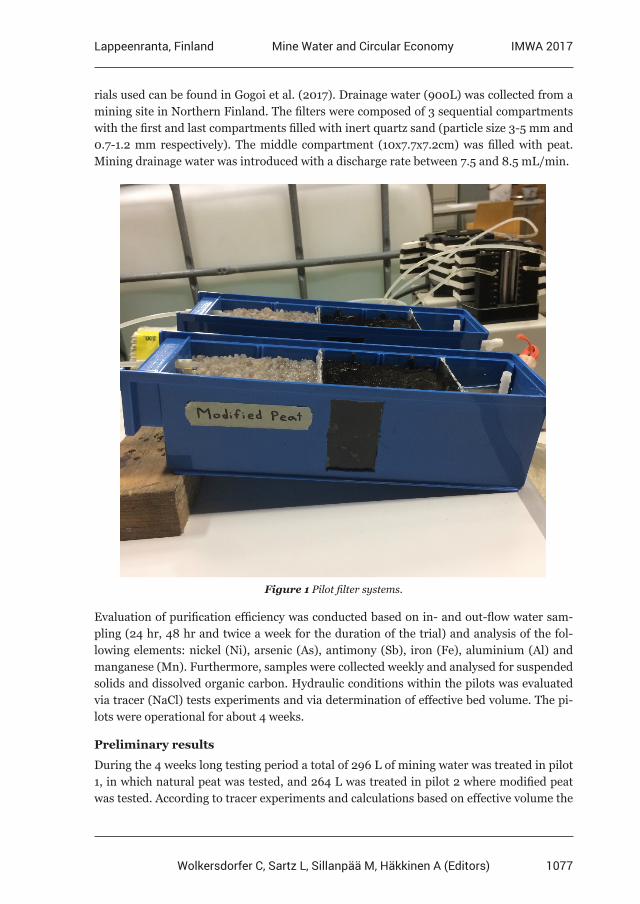
1077
Lappeenranta, Finland IMWA 2017Mine Water and Circular Economy
Wolkersdorfer C, Sartz L, Sillanpää M, Häkkinen A (Editors)
rials used can be found in Gogoi et al. (2017). Drainage water (900L) was collected from a mining site in Northern Finland. The filters were composed of 3 sequential compartments with the first and last compartments filled with inert quartz sand (particle size 3-5 mm and 0.7-1.2 mm respectively). The middle compartment (10x7.7x7.2cm) was filled with peat. Mining drainage water was introduced with a discharge rate between 7.5 and 8.5 mL/min.
Figure 1 Pilot filter systems.
Evaluation of purification efficiency was conducted based on in- and out-flow water sam-pling (24 hr, 48 hr and twice a week for the duration of the trial) and analysis of the fol-lowing elements: nickel (Ni), arsenic (As), antimony (Sb), iron (Fe), aluminium (Al) and manganese (Mn). Furthermore, samples were collected weekly and analysed for suspended solids and dissolved organic carbon. Hydraulic conditions within the pilots was evaluated via tracer (NaCl) tests experiments and via determination of effective bed volume. The pi-lots were operational for about 4 weeks.
Preliminary results
During the 4 weeks long testing period a total of 296 L of mining water was treated in pilot 1, in which natural peat was tested, and 264 L was treated in pilot 2 where modified peat was tested. According to tracer experiments and calculations based on effective volume the
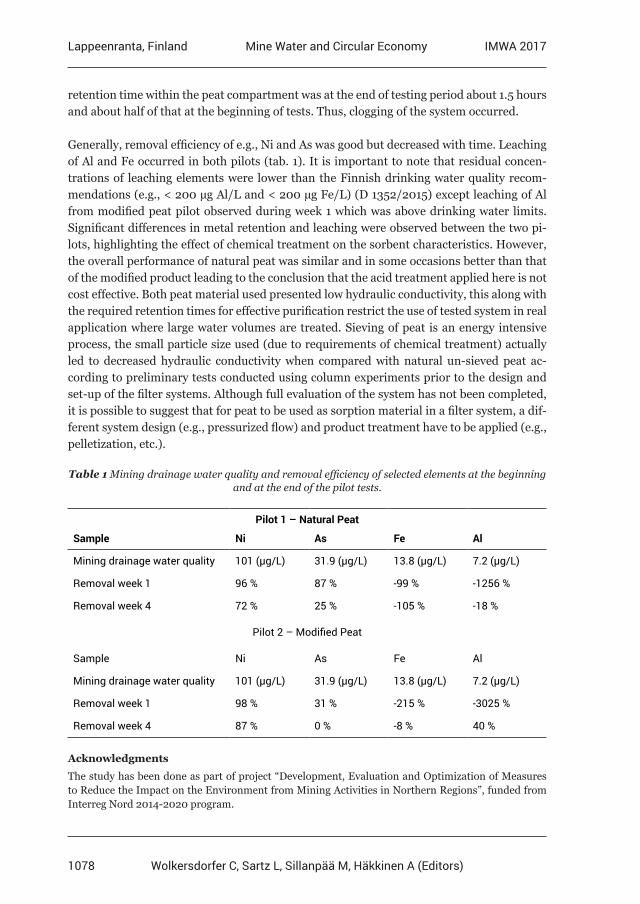
1078
Lappeenranta, Finland IMWA 2017Mine Water and Circular Economy
Wolkersdorfer C, Sartz L, Sillanpää M, Häkkinen A (Editors)
retention time within the peat compartment was at the end of testing period about 1.5 hours and about half of that at the beginning of tests. Thus, clogging of the system occurred.
Generally, removal efficiency of e.g., Ni and As was good but decreased with time. Leaching of Al and Fe occurred in both pilots (tab. 1). It is important to note that residual concen-trations of leaching elements were lower than the Finnish drinking water quality recom-mendations (e.g., < 200 µg Al/L and < 200 µg Fe/L) (D 1352/2015) except leaching of Al from modified peat pilot observed during week 1 which was above drinking water limits. Significant differences in metal retention and leaching were observed between the two pi-lots, highlighting the effect of chemical treatment on the sorbent characteristics. However, the overall performance of natural peat was similar and in some occasions better than that of the modified product leading to the conclusion that the acid treatment applied here is not cost effective. Both peat material used presented low hydraulic conductivity, this along with the required retention times for effective purification restrict the use of tested system in real application where large water volumes are treated. Sieving of peat is an energy intensive process, the small particle size used (due to requirements of chemical treatment) actually led to decreased hydraulic conductivity when compared with natural un-sieved peat ac-cording to preliminary tests conducted using column experiments prior to the design and set-up of the filter systems. Although full evaluation of the system has not been completed, it is possible to suggest that for peat to be used as sorption material in a filter system, a dif-ferent system design (e.g., pressurized flow) and product treatment have to be applied (e.g., pelletization, etc.).
Table 1 Mining drainage water quality and removal efficiency of selected elements at the beginning and at the end of the pilot tests.
Pilot 1 – Natural Peat
Sample Ni As Fe Al
Mining drainage water quality 101 (µg/L) 31.9 (µg/L) 13.8 (µg/L) 7.2 (µg/L)
Removal week 1 96 % 87 % -99 % -1256 %
Removal week 4 72 % 25 % -105 % -18 %
Pilot 2 – Modified Peat
Sample Ni As Fe Al
Mining drainage water quality 101 (µg/L) 31.9 (µg/L) 13.8 (µg/L) 7.2 (µg/L)
Removal week 1 98 % 31 % -215 % -3025 %
Removal week 4 87 % 0 % -8 % 40 %
Acknowledgments
The study has been done as part of project “Development, Evaluation and Optimization of Measures to Reduce the Impact on the Environment from Mining Activities in Northern Regions”, funded from Interreg Nord 2014-2020 program.
1079
Lappeenranta, Finland IMWA 2017Mine Water and Circular Economy
Wolkersdorfer C, Sartz L, Sillanpää M, Häkkinen A (Editors)
References
Brown PA, Gill SA, Allen SJ (2000) Metal removal from wastewater using peat. Water Research 34(16), 3907-3916.Bulgariu L, Bulgariu D, Macoveanu M (2011) Adsorptive Performance of Alkaline Treated Peat for Heavy Metal Removal. Separation Science and Technology 46, 1023-1033.D 1352/2015 (2015) Sosiaali- ja terveysministeriön asetus talousveden laatuvaatimuksista ja valvontatutkimuksista (In unofficial English translation: The Ministry of Social Affairs And Health Degree of drinking water quality standards and monitoring studies)Gogoi H (2016) Removal of heavy metals from industrial wastewaters and urban run-off using modified biomass and mineral based sorbents. University of Oulu, Master thesis.Gogoi H, Leiviskä T, Heiderscheidt E, Postila H, Tanskanen J (2017) Removal of Metals from Mining Wastewaters by Utilization of Natural and Modified Peat as Sorbent Materials. 13th International Mine Water Association Congress, IMWA 2017.25-30 June, Lappeenranta, Finland.
1080
Lappeenranta, Finland IMWA 2017Mine Water and Circular Economy
Wolkersdorfer C, Sartz L, Sillanpää M, Häkkinen A (Editors)
Removal of Dissolved Metals from Acid Wastewater Using Organic Polymer Hydrogels
Masahiko Bessho1, 2, Radmila Markovic3, Tatjana Apostolovski Trujic3, Dragana Bozic3, Nobuyuki Masuda2, Zoran Stevanovic3
1 International Center for Research and Education on Mineral Engineering and Resources, Akita University, 1-1 Tegata Gakuen-machi, Akita, 010-8502, Japan,
[email protected] 2 Graduate School of International Resource Sciences, Akita University, 1-1 Tegata
Gakuen-machi, Akita, 010-8502, Japan 3 Mining and Metallurgy Institute Bor, Zeleni bulevar 35, 19210 Bor, Serbia
Abstract The possibility of using different type of cross-linked gelatin hydrogels for recovery and removal of metals from acidic wastewater by adsorption was investigated. Acid extraction (Type A) and alkaline extraction (Type B) gelatin hydrogels were cross-linked by glutaraldehyde. This gave sufficient cross-linking to both types of gelatin hydrogels. Copper recovery test revealed that the cross-linked Type B gelatin hydrogels could recover more Cu than the Type A gelatin ones and that Cu recovery by Type B gelatin was dependent on pH. Recovery was mainly affected by carboxyl groups on the side chains of gelatin molecules in hydrogels.
Key words acid mine drainage, adsorption, hydrogel, gelatin
Introduction
Acid mine drainage (AMD) is a serious environmental pollution issue in the mining in-dustry. AMD is caused by the oxidation of sulfides such as pyrite, chalcopyrite, galena or sphalerite by surface or ground water (Gissinger et al. 1998; Zhang et al. 1998). It can have an extremely acidic pH and contain various metal ions (Fe, Cu, Pb, Zn, etc.). The ecological threat posed by AMD continues after mining ceases, since AMD can also be formed when rain water passes through tailings or mine wastes in repository sites. In Japan, there are nu-merous closed mines, such as the former Matsuo mine. Generally, neutralizing agents such as CaCO3 have been added to AMD for pH adjustment and precipitation of metal ions as hydroxides in order to prevent degradation of the surrounding environment. However, pre-cipitation of metal hydroxides disturbs efficient recycling of the potentially valuable metal ions contained in the AMD. Thus, to use AMD as a resource, the separation of metals as well as their removal from AMD is required. A way to purify AMD that would lead to recycling of major or minor metal elements is desirable.
Adsorption is an effective technique for recovery of metal ions from water. Recovery and separation of metals by adsorption can achieve both purification of the AMD and metal recovery. This study aims to develop a novel adsorbent for recovery of cationic metal ions from AMD, using natural organic polymers. In this study, organic polymer hydrogels for adsorbents were prepared with gelatin. First, cross-linking of the gelatin hydrogels was in-vestigated because they dissolve in warm water and decompose in acidic water. We also in-vestigated the basic adsorption behavior of metal ions to the cross-linked gelatin hydrogels. Copper was used as a model substance, for it is a common AMD metal.
1081
Lappeenranta, Finland IMWA 2017Mine Water and Circular Economy
Wolkersdorfer C, Sartz L, Sillanpää M, Häkkinen A (Editors)
Methods
Materials
As an adsorbent material for metal recovery, gelatins isolated from a porcine skin by an acid process (Type A) and a bovine skin by an alkaline process (Type B), were purchased from Sigma-Aldrich Japan Co., Japan. Type A and Type B gelatins had an isoelectric point (IEP) of 8-9 and 4-5, respectively.
Preparation and cross-linking of gelatin hydrogels
The gelatins were dissolved in distilled water at 50 ºC. Prescribed volumes of 25% glutaral-dehyde solution (Wako Pure Chemical Industries, Ltd., Japan) were added as a cross-linker to 50 mL of gelatin solutions. Immediately, they were introduced to 8 cm square plastic dishes. They were eventually transformed into hydrogels by storage at room temperature. The cross-linked gelatin hydrogels were 5 mm thick. The cross-linked gelatin hydrogels were then immersed in distilled water, and totally swelled for 72 h at room temperature. The distilled water for swelling was exchanged every 24 h.
Specific water content of cross-linked gelatin hydrogels
The extent of cross-linking was estimated via the specific water content. The wet weight (Ww) of the cross-linked gelatin hydrogels was measured after swelling and the dry weight (Wd) after freeze-drying. The specific water content was calculated according to the follow-ing equation:
Specific water content = (Ww-Wd ) / Wd
Adsorption test of metal into cross-linked gelatin hydrogels
Recovery tests for a metal using gelatin hydrogels were performed in an aqueous solution containing 2 mM of Cu at different pHs. The copper solutions were prepared from copper sulfate pentahydrate (CuSO4.5H2O; Wako Pure Chemical Industries, Ltd., Japan), and the solutions were adjusted to various pH values by H2SO4 solutions (Wako Pure Chemical Industries). For the adsorption test, a cross-linked hydrogel sheet (2 cm-square shape) was cut out, and incubated in 10 mL of aqueous copper solution at room temperature for 24 h.
Quantitative analysis of Cu in solutions
After the recovery tests, the cross-linked gelatin hydrogel sheets were removed from the solutions. Copper concentrations in these solutions were measured by inductively-coupled plasma optical emission spectrometry (ICP-OES, SPS 5510, Seiko Instruments Inc., Japan). And then, recovery rate of copper from the solution was calculated.
Results and discussion
Glutaraldehyde-induced-cross-linking of gelatin hydrogels
Figure 1 shows the gelation time of Type A and Type B gelatin hydrogels with or without the cross-linker (glutaraldehyde solution) at room temperature. Without cross-linker, 25 mg/
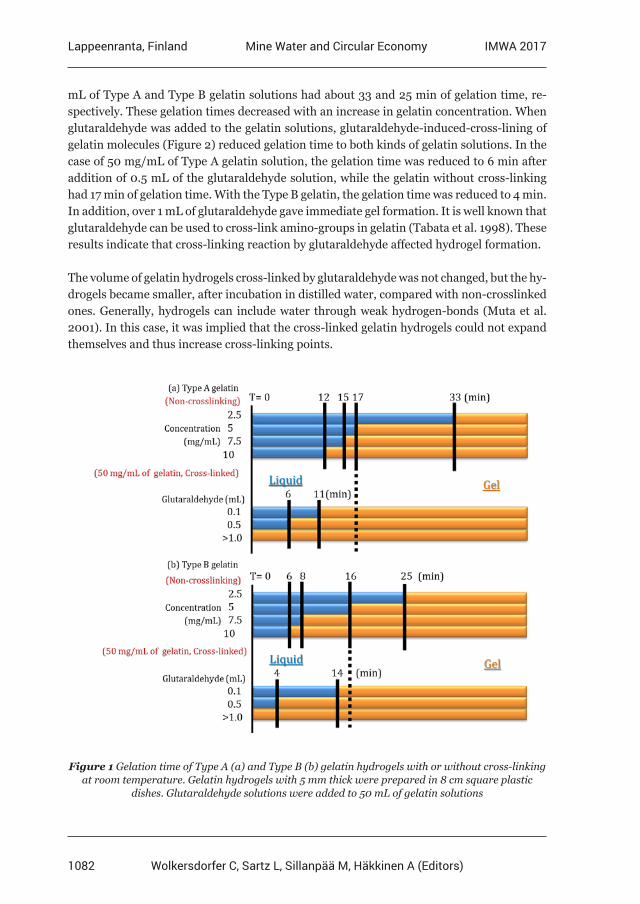
1082
Lappeenranta, Finland IMWA 2017Mine Water and Circular Economy
Wolkersdorfer C, Sartz L, Sillanpää M, Häkkinen A (Editors)
mL of Type A and Type B gelatin solutions had about 33 and 25 min of gelation time, re-spectively. These gelation times decreased with an increase in gelatin concentration. When glutaraldehyde was added to the gelatin solutions, glutaraldehyde-induced-cross-lining of gelatin molecules (Figure 2) reduced gelation time to both kinds of gelatin solutions. In the case of 50 mg/mL of Type A gelatin solution, the gelation time was reduced to 6 min after addition of 0.5 mL of the glutaraldehyde solution, while the gelatin without cross-linking had 17 min of gelation time. With the Type B gelatin, the gelation time was reduced to 4 min. In addition, over 1 mL of glutaraldehyde gave immediate gel formation. It is well known that glutaraldehyde can be used to cross-link amino-groups in gelatin (Tabata et al. 1998). These results indicate that cross-linking reaction by glutaraldehyde affected hydrogel formation.
The volume of gelatin hydrogels cross-linked by glutaraldehyde was not changed, but the hy-drogels became smaller, after incubation in distilled water, compared with non-crosslinked ones. Generally, hydrogels can include water through weak hydrogen-bonds (Muta et al. 2001). In this case, it was implied that the cross-linked gelatin hydrogels could not expand themselves and thus increase cross-linking points.
Figure 1 Gelation time of Type A (a) and Type B (b) gelatin hydrogels with or without cross-linking at room temperature. Gelatin hydrogels with 5 mm thick were prepared in 8 cm square plastic
dishes. Glutaraldehyde solutions were added to 50 mL of gelatin solutions
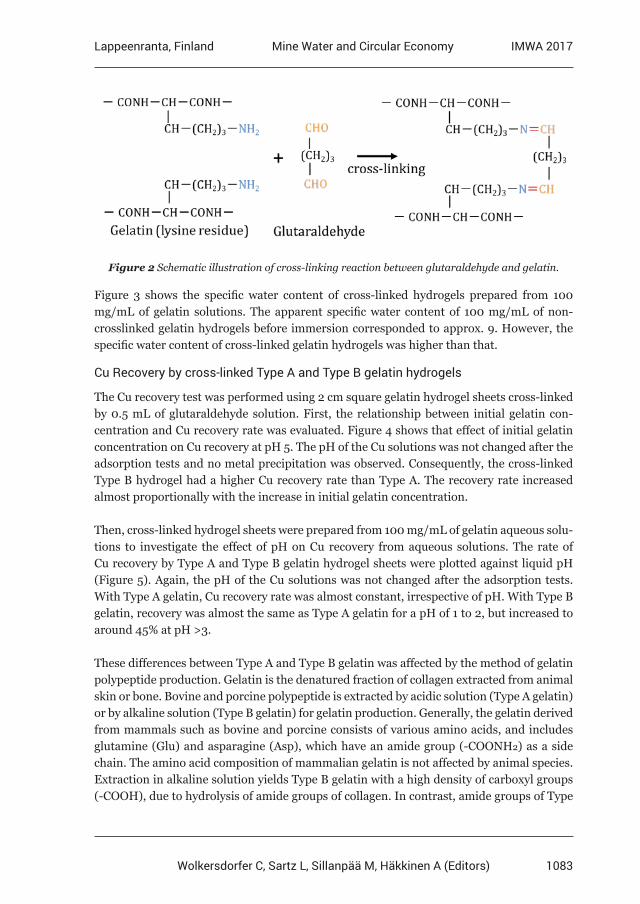
1083
Lappeenranta, Finland IMWA 2017Mine Water and Circular Economy
Wolkersdorfer C, Sartz L, Sillanpää M, Häkkinen A (Editors)
Figure 2 Schematic illustration of cross-linking reaction between glutaraldehyde and gelatin.
Figure 3 shows the specific water content of cross-linked hydrogels prepared from 100 mg/mL of gelatin solutions. The apparent specific water content of 100 mg/mL of non-crosslinked gelatin hydrogels before immersion corresponded to approx. 9. However, the specific water content of cross-linked gelatin hydrogels was higher than that.
Cu Recovery by cross-linked Type A and Type B gelatin hydrogels
The Cu recovery test was performed using 2 cm square gelatin hydrogel sheets cross-linked by 0.5 mL of glutaraldehyde solution. First, the relationship between initial gelatin con-centration and Cu recovery rate was evaluated. Figure 4 shows that effect of initial gelatin concentration on Cu recovery at pH 5. The pH of the Cu solutions was not changed after the adsorption tests and no metal precipitation was observed. Consequently, the cross-linked Type B hydrogel had a higher Cu recovery rate than Type A. The recovery rate increased almost proportionally with the increase in initial gelatin concentration.
Then, cross-linked hydrogel sheets were prepared from 100 mg/mL of gelatin aqueous solu-tions to investigate the effect of pH on Cu recovery from aqueous solutions. The rate of Cu recovery by Type A and Type B gelatin hydrogel sheets were plotted against liquid pH (Figure 5). Again, the pH of the Cu solutions was not changed after the adsorption tests. With Type A gelatin, Cu recovery rate was almost constant, irrespective of pH. With Type B gelatin, recovery was almost the same as Type A gelatin for a pH of 1 to 2, but increased to around 45% at pH >3.
These differences between Type A and Type B gelatin was affected by the method of gelatin polypeptide production. Gelatin is the denatured fraction of collagen extracted from animal skin or bone. Bovine and porcine polypeptide is extracted by acidic solution (Type A gelatin) or by alkaline solution (Type B gelatin) for gelatin production. Generally, the gelatin derived from mammals such as bovine and porcine consists of various amino acids, and includes glutamine (Glu) and asparagine (Asp), which have an amide group (-COONH2) as a side chain. The amino acid composition of mammalian gelatin is not affected by animal species. Extraction in alkaline solution yields Type B gelatin with a high density of carboxyl groups (-COOH), due to hydrolysis of amide groups of collagen. In contrast, amide groups of Type
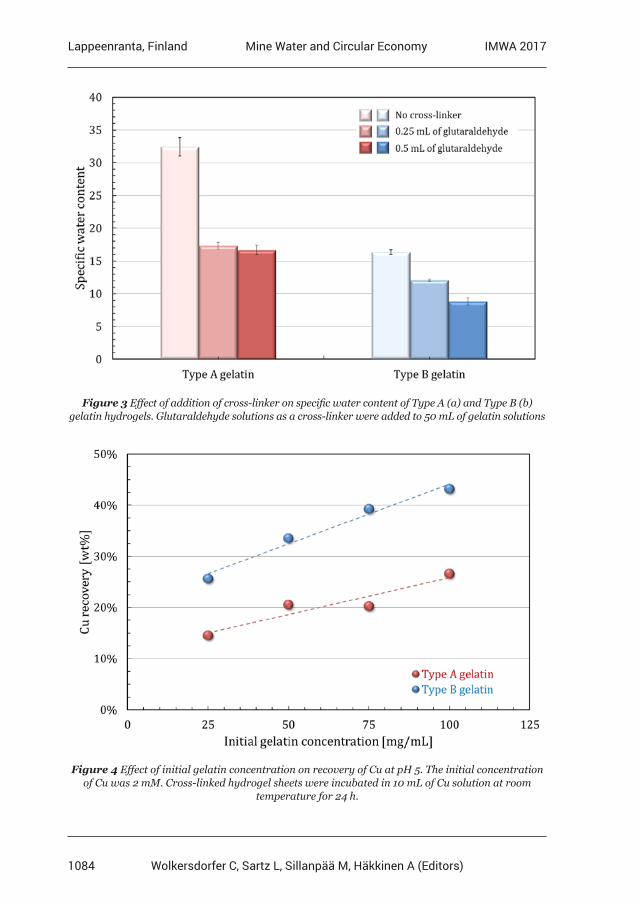
1084
Lappeenranta, Finland IMWA 2017Mine Water and Circular Economy
Wolkersdorfer C, Sartz L, Sillanpää M, Häkkinen A (Editors)
Figure 3 Effect of addition of cross-linker on specific water content of Type A (a) and Type B (b) gelatin hydrogels. Glutaraldehyde solutions as a cross-linker were added to 50 mL of gelatin solutions
Figure 4 Effect of initial gelatin concentration on recovery of Cu at pH 5. The initial concentration of Cu was 2 mM. Cross-linked hydrogel sheets were incubated in 10 mL of Cu solution at room
temperature for 24 h.
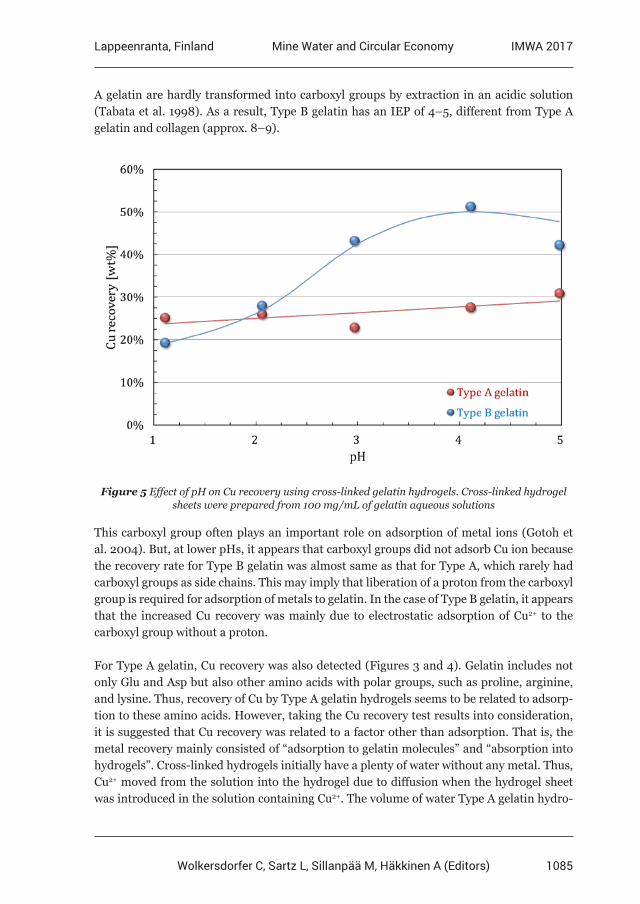
1085
Lappeenranta, Finland IMWA 2017Mine Water and Circular Economy
Wolkersdorfer C, Sartz L, Sillanpää M, Häkkinen A (Editors)
A gelatin are hardly transformed into carboxyl groups by extraction in an acidic solution (Tabata et al. 1998). As a result, Type B gelatin has an IEP of 4–5, different from Type A gelatin and collagen (approx. 8–9).
Figure 5 Effect of pH on Cu recovery using cross-linked gelatin hydrogels. Cross-linked hydrogel sheets were prepared from 100 mg/mL of gelatin aqueous solutions
This carboxyl group often plays an important role on adsorption of metal ions (Gotoh et al. 2004). But, at lower pHs, it appears that carboxyl groups did not adsorb Cu ion because the recovery rate for Type B gelatin was almost same as that for Type A, which rarely had carboxyl groups as side chains. This may imply that liberation of a proton from the carboxyl group is required for adsorption of metals to gelatin. In the case of Type B gelatin, it appears that the increased Cu recovery was mainly due to electrostatic adsorption of Cu2+ to the carboxyl group without a proton.
For Type A gelatin, Cu recovery was also detected (Figures 3 and 4). Gelatin includes not only Glu and Asp but also other amino acids with polar groups, such as proline, arginine, and lysine. Thus, recovery of Cu by Type A gelatin hydrogels seems to be related to adsorp-tion to these amino acids. However, taking the Cu recovery test results into consideration, it is suggested that Cu recovery was related to a factor other than adsorption. That is, the metal recovery mainly consisted of “adsorption to gelatin molecules” and “absorption into hydrogels”. Cross-linked hydrogels initially have a plenty of water without any metal. Thus, Cu2+ moved from the solution into the hydrogel due to diffusion when the hydrogel sheet was introduced in the solution containing Cu2+. The volume of water Type A gelatin hydro-
1086
Lappeenranta, Finland IMWA 2017Mine Water and Circular Economy
Wolkersdorfer C, Sartz L, Sillanpää M, Häkkinen A (Editors)
gels contain supports that almost all of the recovery was caused by absorption of Cu into them. It is possible that the Type B gelatin hydrogels also recovered Cu by absorption. But, at higher pH, adsorption surely contributed to Cu recovery. Therefore, it appears that Type B gelatin is a more suitable adsorbent material to recover cationic metal ions.
Conclusions
In order to develop a novel adsorbent for recovery of cationic metal ions from AMD, organic polymer hydrogels were prepared with two kinds of gelatin. Cross-linking of the gelatin hy-drogels was evaluated and then we investigated basic adsorption behavior of metal ions to cross-linked gelatin hydrogels using copper solutions.
Glutaraldehyde was used for cross-linking of Type A and Type B gelatin hydrogels. It gave sufficient cross-linking to both types of gelatin hydrogels, and the gelation time at room temperature was remarkably reduced. The relative decrease in specific water content of the Type A and Type B hydrogels with the addition of glutaraldehyde supported the promotion of the cross-linking reaction.
The cross-linked Type B gelatin hydrogels recovered more Cu than the Type A gelatin. Re-covery by Type B gelatin hydrogels was dependent on pH. Metal recovery by gelatin hy-drogels mainly consisted of adsorption to gelatin molecules and absorption into hydrogels. Adsorption was rarely detected with Type A gelatin. In contrast, Cu recovery using Type B gelatin hydrogels was mainly affected by carboxyl groups on side chains of gelatin molecules in hydrogels at higher pH.
Acknowledgements
This research was carried out as a part of a project entitled ”Research on the integration system of spatial environment analyses and advanced metal recovery to ensure sustainable resource development” planned for 2015 to 2019, which is being carried out by Akita University, Japan Space System, and Mitsui Mineral Development Engineering Co., Ltd., together with the Mining and Metallurgical Institute of Bor, funding by JST (Japan Science and Technology Agency) and JICA (Japan International Cooperative Agency).
References
Gissinger PB, Alnot M, Ehrhardt JJ, Behra P (1998) Surface oxidation of pyrite as a function of pH. Environ SciTechnol 32: 2839—2845Gotoh T, Matsushima K, Kikuchi K (2004) Adsorption of Cu and Mn on covalently cross-linked alginate gel beads. Chemosphere 55: 57—64.Muta H, Miwa M, Satoh M (2001) Ion-specific swelling of hydrophilic polymer gels. Polymer 42(14): 6313—6316.Tabata Y, Ikada Y (1998) Protein release from gelatin matrices. Adv Drug Delivery Rev 31(3): 287—301.Zhang YL, Evangelou VP (1998) Formation of ferric hydroxide–silica coatings on pyrite and its oxidation behavior. Soil Sci. 163: 53—62.
1087
Lappeenranta, Finland IMWA 2017Mine Water and Circular Economy
Wolkersdorfer C, Sartz L, Sillanpää M, Häkkinen A (Editors)
Field-scale denitrifying woodchip bioreactor treating high nitrate mine water at low temperatures
Albin Nordström1, Roger Herbert1
1Department of Earth Sciences, Uppsala University, Villavägen 16, 75236, Uppsala, Sweden [email protected]
Abstract A field-scale woodchip bioreactor was installed at the Kiruna iron ore mine (northern Sweden) for the removal of NO3
- in mine and process water originating from the use of ammonium nitrate based explosives. Over a period of two years, the woodchip bioreactor removed an average incoming NO3
- concentration of 22.0±0.3 mg N L-1 to below detection limits (0.06 mg N L-1) at bioreactor temperatures above 5°C and hydraulic residence times between 1.9-2.6 days. As the hydraulic residence time in the system was decreased to 1 day and/or the bioreactor temperature decreased to below 5°C, NO3
- removal was incomplete. The bioreactor acted as an overall sink and source of NO2
- and NH4
+, respectively, with low level ammonium production (< l mg N L-1) observed during the test period. The direct application of a woodchip bioreactor for the removal of NO3
- in leachate produced from waste rock deposits in subarctic climates is limited by the variability and timing of leachate production.
Key words Woodchip bioreactor, nitrate removal, neutral mine drainage, low temperatures
Introduction
A substantial amount of the ammonium nitrate-based explosives used in mining never det-onate; a study of the explosives used in Swedish mines (Lindeström 2012) indicates that the amount of undetonated explosives reaches 10-20% of the total explosives used. Ammonium nitrate residues are retained on waste rock masses and are highly soluble in water. Follow-ing the deposition of the waste rock masses on the ground surface, nitrogen compounds are leached as the undetonated explosive residues come into contact with percolating rainwa-ter and/or snowmelt. Consequently, waste rock piles are sources of nitrogen (N) primarily in the form of nitrate (NO3
-), with less amounts of ammonium (NH4+) and nitrite (NO2
-) (Lindeström 2012). Excess release of NO3
- to aquatic ecosystems may lead to the eutro-phication of water bodies. In addition, ammonia (NH3) is toxic to aquatic ecosystem when present at high concentrations.
Denitrification, the sequential reduction of NO3- to nitrogen gas (N2) via the intermediate
species NO2-, NO, and N2O, is together with anaerobic ammonium oxidation (ANAMMOX)
the only process that may serve as an environmental sink for NO3-. Denitrification is exem-
plified with glucose as the carbon substrate/electron donor in reaction (1):
Compared to ionized species of nitrogen, N2 is inert and largely unavailable as a source of nitrogen for the majority of living organisms. Bioreactors containing organic carbon and promoting heterotrophic denitrification are low maintenance and low cost techniques for
1
Field-scale denitrifying woodchip bioreactor treating high nitrate mine water at low temperatures
Albin Nordström1, Roger Herbert1
1Department of Earth Sciences, Uppsala University, Villavägen 16, 75236, Uppsala, Sweden [email protected]
Abstract A field-scale woodchip bioreactor was installed at the Kiruna iron ore mine (northern Sweden) for the removal of NO3- in mine and process water originating from the use of ammonium nitrate based explosives. Over a period of two years, the woodchip bioreactor removed an average incoming NO3- concentration of 22.0 mg N L-1 to below detection limits (0.06 mg N L-1) at bioreactor temperatures above 5°C and hydraulic residence times between 1.9-2.6 days. Low level ammonium production (< l mg N L-1) was observed during this period. Key words: Woodchip bioreactor, nitrate removal, neutral mine drainage, low temperatures
Introduction A substantial amount of the ammonium nitrate-based explosives used in mining never detonate; a study of the explosives used in Swedish mines (Lindeström 2012) indicates that the amount of undetonated explosives reaches 10-20%. Ammonium nitrate residues are retained on waste rock masses and are highly soluble in water. Following the deposition of the waste rock masses on the ground surface, nitrogen compounds are leached as the undetonated explosive residues come into contact with percolating rainwater and/or snowmelt. Consequently, waste rock piles are sources of nitrogen (N) primarily in the form of nitrate (NO3-), with less amounts of ammonium (NH4+) and nitrite (NO2-) (Lindeström 2012). Excess release of NO3- to aquatic ecosystems may lead to the eutrophication of water bodies. In addition, ammonia (NH3) is toxic to aquatic ecosystem when present at high concentrations.
Denitrification, the sequential reduction of NO3- to nitrogen gas (N2) via the intermediate species NO2-, NO, and N2O, is together with anaerobic ammonium oxidation (ANAMMOX) the only process that may serve as an environmental sink for NO3-. Denitrification is exemplified with glucose as the carbon substrate/electron donor in reaction (1):
𝑁𝑁𝑁𝑁𝑁𝑁𝑁𝑁3− + 524𝐶𝐶𝐶𝐶6𝐻𝐻𝐻𝐻12𝑁𝑁𝑁𝑁6 → 12𝑁𝑁𝑁𝑁2 + 𝐻𝐻𝐻𝐻𝐶𝐶𝐶𝐶𝑁𝑁𝑁𝑁3− + 1
4𝐻𝐻𝐻𝐻2𝐶𝐶𝐶𝐶𝑁𝑁𝑁𝑁3 + 12𝐻𝐻𝐻𝐻2𝑁𝑁𝑁𝑁 (1)
Compared to ionized species of nitrogen, N2 is inert and largely unavailable as a source of nitrogen for the majority of living organisms. Bioreactors containing organic carbon and promoting heterotrophic denitrification are low maintenance and low cost techniques for NO3- removal that have been applied to various NO3- contamination settings (e.g. Woli et al. 2010, Warneke et al. 2011). However, most of the studies have been performed at relatively high temperatures not relevant in climates where temperatures may be close to, or below, 0°C for extended periods. In addition, few have been applied to mine settings. In this study, a field-scale denitrifying woodchip bioreactor constructed in the subarctic climate at the Kiruna mine (northern Sweden) was installed for the removal of NO3- from mine drainage and process water. The objective of the study was to determine the potential of a denitrifying woodchip bioreactor as a treatment method for the removal NO3- from waste rock leachate at temperatures expected in a subarctic climate. For an overview of the denitrifying bioreactor technology, the reader is referred to Schipper et al. (2010).
Methods The bioreactor was constructed at the Kiruna iron ore mine (northern Sweden) in close proximity to a clarification pond at the mine site. Construction of the bioreactor took place in May and June 2015.
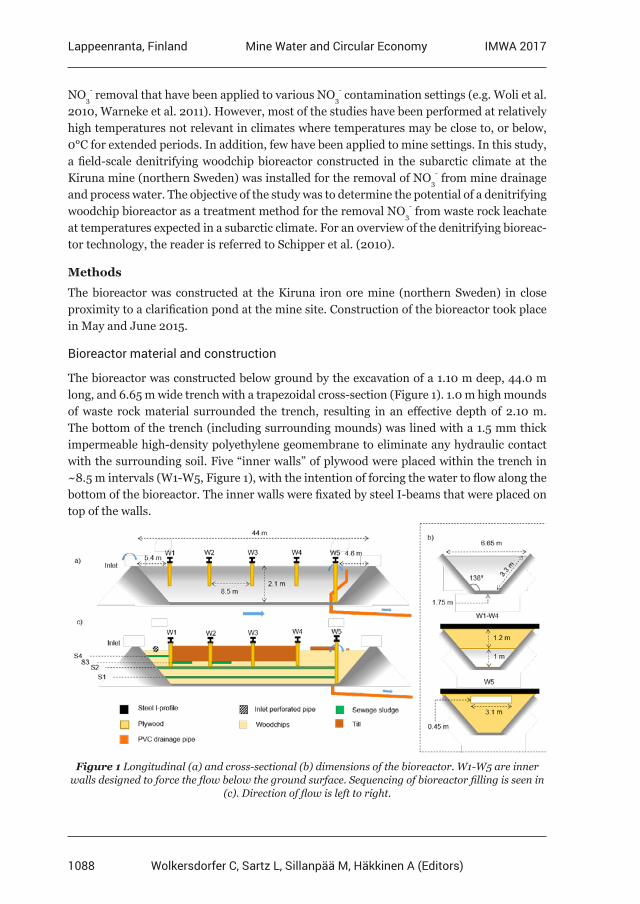
1088
Lappeenranta, Finland IMWA 2017Mine Water and Circular Economy
Wolkersdorfer C, Sartz L, Sillanpää M, Häkkinen A (Editors)
NO3- removal that have been applied to various NO3
- contamination settings (e.g. Woli et al. 2010, Warneke et al. 2011). However, most of the studies have been performed at relatively high temperatures not relevant in climates where temperatures may be close to, or below, 0°C for extended periods. In addition, few have been applied to mine settings. In this study, a field-scale denitrifying woodchip bioreactor constructed in the subarctic climate at the Kiruna mine (northern Sweden) was installed for the removal of NO3
- from mine drainage and process water. The objective of the study was to determine the potential of a denitrifying woodchip bioreactor as a treatment method for the removal NO3
- from waste rock leachate at temperatures expected in a subarctic climate. For an overview of the denitrifying bioreac-tor technology, the reader is referred to Schipper et al. (2010).
Methods
The bioreactor was constructed at the Kiruna iron ore mine (northern Sweden) in close proximity to a clarification pond at the mine site. Construction of the bioreactor took place in May and June 2015.
Bioreactor material and construction
The bioreactor was constructed below ground by the excavation of a 1.10 m deep, 44.0 m long, and 6.65 m wide trench with a trapezoidal cross-section (Figure 1). 1.0 m high mounds of waste rock material surrounded the trench, resulting in an effective depth of 2.10 m. The bottom of the trench (including surrounding mounds) was lined with a 1.5 mm thick impermeable high-density polyethylene geomembrane to eliminate any hydraulic contact with the surrounding soil. Five “inner walls” of plywood were placed within the trench in ~8.5 m intervals (W1-W5, Figure 1), with the intention of forcing the water to flow along the bottom of the bioreactor. The inner walls were fixated by steel I-beams that were placed on top of the walls.
Figure 1 Longitudinal (a) and cross-sectional (b) dimensions of the bioreactor. W1-W5 are inner walls designed to force the flow below the ground surface. Sequencing of bioreactor filling is seen in
(c). Direction of flow is left to right.
1089
Lappeenranta, Finland IMWA 2017Mine Water and Circular Economy
Wolkersdorfer C, Sartz L, Sillanpää M, Häkkinen A (Editors)
W5 covered the entire cross-section of the bioreactor (Figure 1b) and featured an adjustable rectangular weir intended for controlling the water level in the bioreactor. The inlet was constructed using a perforated pipe that was placed perpendicular to the direction of flow in the bioreactor. The bioreactor was drained at the outlet using polyvinyl chloride (PVC) pipes emerging at the surface (Figure 1c). The inlet and outlet was designed to spread the flow of water in the bioreactor, reducing advection velocities, which have been shown to promote higher NO3
- removal rates (see Herbert and Nordström 2016).
The bioreactor was filled with pine woodchips (porosity 0.54) and digested sewage sludge at a sludge:woodchip ratio of 1:84 on a volume basis. Woodchips were purchased at a local lumber mill, and served as the carbon source for (heterotrophic) denitrification (see reac-tion 1). Woodchip sized fragments (approximately 0.5 cm x 1 cm x 3 cm w/b/l) were used as they provided a high permeability environment in comparison to smaller sized fragments, e.g. sawdust, minimizing the risk of clogging pores and bypassing of flow, and in addition enabling a high process volume. The sewage sludge was shipped from the Uddebo waste water plant in Luleå (northern Sweden) and was used as an initial source of denitrifying mi-croorganisms catalyzing reaction 1. The digested sewage sludge was mixed with water (1:10 on a volume basis) in a slurry, and added in layers at 50 cm and 100 cm above the geomem-brane (S1 and S2 in Figure 1c). In addition, sewage sludge (not slurry) was (partially) added to the top surface of the woodchips in the first ~20 m of the bioreactor (S3 and S4 in Figure 1c). Geotextile was used to cover the top surface of the woodchips, and was partially covered by a layer of glacial till (primarily silty-sand, but also with larger cobbles <300 mm, and with detrital organic matter) as seen in Figure 1c. The geotextile was used as to prevent the till material from migrating into the woodchips, while the glacial till served three purposes: (1) minimizing the atmospheric contact with the bioreactor interior, (2) forcing water to flow in the more permeable woodchip material along the bottom of the bioreactor, and (3) decreasing the infiltration of precipitation to the bioreactor interior which would have a dilutive effect. Additionally, temperature probes (Campbell Scientific T107, 16 in total) were embedded within the mixture of woodchips and sewage sludge during construction.
The bioreactor was fed with water from the outlet of the clarification pond using a submerg-ible pump, and a ball valve was used to adjust the input flow rate to the bioreactor. The abil-ity to adjust the input flow rate allowed for controlling the hydraulic residence time (HRT) of the system. During the emplacement of the glacial till, the bioreactor was saturated with water from the clarification pond. Pore water was then slowly recirculated for 10 days (cf. Nordström and Herbert 2016) to allow the denitrifying microbial community to develop, before the bioreactor outlet was opened and through-flow commenced.
Bioreactor operation
The bioreactor test period extended for the duration of two field seasons, referred to as the first and second operational year, respectively. The first operational year extended between the 22nd of June 2015 following the completion of the bioreactor, and the 20th of November 2015. Between the 20th of November 2015 and the 9th of May 2016, referred to as the winter intermission, there was no flow through the bioreactor. Temperature measurements did,
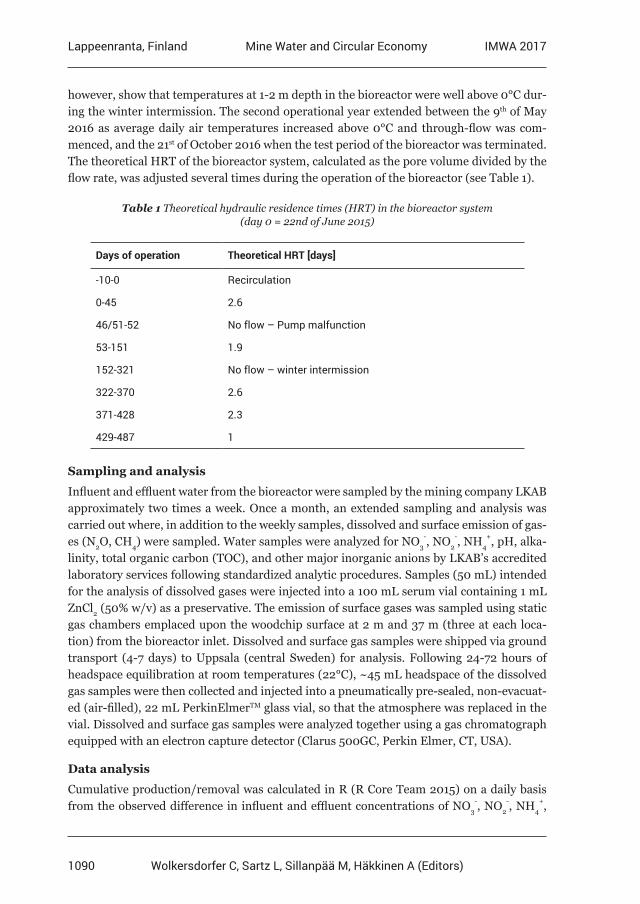
1090
Lappeenranta, Finland IMWA 2017Mine Water and Circular Economy
Wolkersdorfer C, Sartz L, Sillanpää M, Häkkinen A (Editors)
however, show that temperatures at 1-2 m depth in the bioreactor were well above 0°C dur-ing the winter intermission. The second operational year extended between the 9th of May 2016 as average daily air temperatures increased above 0°C and through-flow was com-menced, and the 21st of October 2016 when the test period of the bioreactor was terminated. The theoretical HRT of the bioreactor system, calculated as the pore volume divided by the flow rate, was adjusted several times during the operation of the bioreactor (see Table 1).
Table 1 Theoretical hydraulic residence times (HRT) in the bioreactor system (day 0 = 22nd of June 2015)
Days of operation Theoretical HRT [days]
-10-0 Recirculation
0-45 2.6
46/51-52 No flow – Pump malfunction
53-151 1.9
152-321 No flow – winter intermission
322-370 2.6
371-428 2.3
429-487 1
Sampling and analysis
Influent and effluent water from the bioreactor were sampled by the mining company LKAB approximately two times a week. Once a month, an extended sampling and analysis was carried out where, in addition to the weekly samples, dissolved and surface emission of gas-es (N2O, CH4) were sampled. Water samples were analyzed for NO3
-, NO2-, NH4
+, pH, alka-linity, total organic carbon (TOC), and other major inorganic anions by LKAB’s accredited laboratory services following standardized analytic procedures. Samples (50 mL) intended for the analysis of dissolved gases were injected into a 100 mL serum vial containing 1 mL ZnCl2 (50% w/v) as a preservative. The emission of surface gases was sampled using static gas chambers emplaced upon the woodchip surface at 2 m and 37 m (three at each loca-tion) from the bioreactor inlet. Dissolved and surface gas samples were shipped via ground transport (4-7 days) to Uppsala (central Sweden) for analysis. Following 24-72 hours of headspace equilibration at room temperatures (22°C), ~45 mL headspace of the dissolved gas samples were then collected and injected into a pneumatically pre-sealed, non-evacuat-ed (air-filled), 22 mL PerkinElmerTM glass vial, so that the atmosphere was replaced in the vial. Dissolved and surface gas samples were analyzed together using a gas chromatograph equipped with an electron capture detector (Clarus 500GC, Perkin Elmer, CT, USA).
Data analysis
Cumulative production/removal was calculated in R (R Core Team 2015) on a daily basis from the observed difference in influent and effluent concentrations of NO3
-, NO2-, NH4
+,
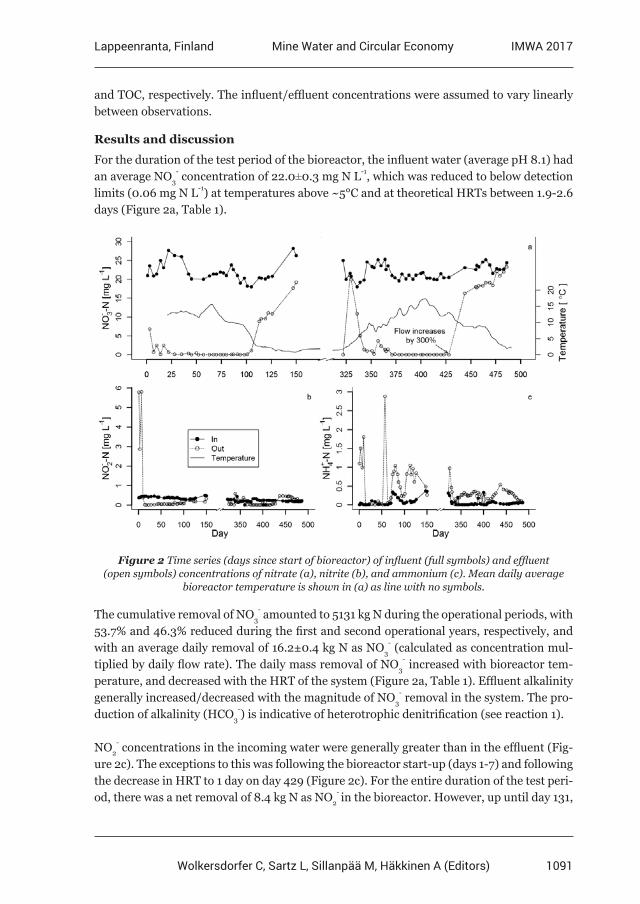
1091
Lappeenranta, Finland IMWA 2017Mine Water and Circular Economy
Wolkersdorfer C, Sartz L, Sillanpää M, Häkkinen A (Editors)
and TOC, respectively. The influent/effluent concentrations were assumed to vary linearly between observations.
Results and discussion
For the duration of the test period of the bioreactor, the influent water (average pH 8.1) had an average NO3
- concentration of 22.0±0.3 mg N L-1, which was reduced to below detection limits (0.06 mg N L-1) at temperatures above ~5°C and at theoretical HRTs between 1.9-2.6 days (Figure 2a, Table 1).
Figure 2 Time series (days since start of bioreactor) of influent (full symbols) and effluent (open symbols) concentrations of nitrate (a), nitrite (b), and ammonium (c). Mean daily average
bioreactor temperature is shown in (a) as line with no symbols.
The cumulative removal of NO3- amounted to 5131 kg N during the operational periods, with
53.7% and 46.3% reduced during the first and second operational years, respectively, and with an average daily removal of 16.2±0.4 kg N as NO3
- (calculated as concentration mul-tiplied by daily flow rate). The daily mass removal of NO3
- increased with bioreactor tem-perature, and decreased with the HRT of the system (Figure 2a, Table 1). Effluent alkalinity generally increased/decreased with the magnitude of NO3
- removal in the system. The pro-duction of alkalinity (HCO3
-) is indicative of heterotrophic denitrification (see reaction 1).
NO2- concentrations in the incoming water were generally greater than in the effluent (Fig-
ure 2c). The exceptions to this was following the bioreactor start-up (days 1-7) and following the decrease in HRT to 1 day on day 429 (Figure 2c). For the entire duration of the test peri-od, there was a net removal of 8.4 kg N as NO2
- in the bioreactor. However, up until day 131,
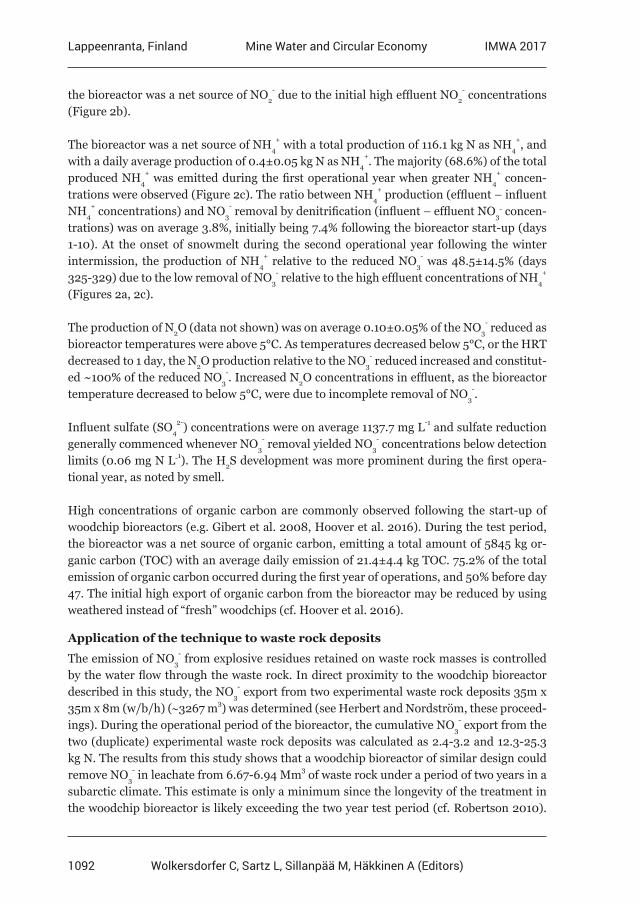
1092
Lappeenranta, Finland IMWA 2017Mine Water and Circular Economy
Wolkersdorfer C, Sartz L, Sillanpää M, Häkkinen A (Editors)
the bioreactor was a net source of NO2- due to the initial high effluent NO2
- concentrations (Figure 2b).
The bioreactor was a net source of NH4+ with a total production of 116.1 kg N as NH4
+, and with a daily average production of 0.4±0.05 kg N as NH4
+. The majority (68.6%) of the total produced NH4
+ was emitted during the first operational year when greater NH4+ concen-
trations were observed (Figure 2c). The ratio between NH4+ production (effluent – influent
NH4+ concentrations) and NO3
- removal by denitrification (influent – effluent NO3- concen-
trations) was on average 3.8%, initially being 7.4% following the bioreactor start-up (days 1-10). At the onset of snowmelt during the second operational year following the winter intermission, the production of NH4
+ relative to the reduced NO3- was 48.5±14.5% (days
325-329) due to the low removal of NO3- relative to the high effluent concentrations of NH4
+ (Figures 2a, 2c).
The production of N2O (data not shown) was on average 0.10±0.05% of the NO3- reduced as
bioreactor temperatures were above 5°C. As temperatures decreased below 5°C, or the HRT decreased to 1 day, the N2O production relative to the NO3
- reduced increased and constitut-ed ~100% of the reduced NO3
-. Increased N2O concentrations in effluent, as the bioreactor temperature decreased to below 5°C, were due to incomplete removal of NO3
-.
Influent sulfate (SO42-) concentrations were on average 1137.7 mg L-1 and sulfate reduction
generally commenced whenever NO3- removal yielded NO3
- concentrations below detection limits (0.06 mg N L-1). The H2S development was more prominent during the first opera-tional year, as noted by smell.
High concentrations of organic carbon are commonly observed following the start-up of woodchip bioreactors (e.g. Gibert et al. 2008, Hoover et al. 2016). During the test period, the bioreactor was a net source of organic carbon, emitting a total amount of 5845 kg or-ganic carbon (TOC) with an average daily emission of 21.4±4.4 kg TOC. 75.2% of the total emission of organic carbon occurred during the first year of operations, and 50% before day 47. The initial high export of organic carbon from the bioreactor may be reduced by using weathered instead of “fresh” woodchips (cf. Hoover et al. 2016).
Application of the technique to waste rock deposits
The emission of NO3- from explosive residues retained on waste rock masses is controlled
by the water flow through the waste rock. In direct proximity to the woodchip bioreactor described in this study, the NO3
- export from two experimental waste rock deposits 35m x 35m x 8m (w/b/h) (∼3267 m3) was determined (see Herbert and Nordström, these proceed-ings). During the operational period of the bioreactor, the cumulative NO3
- export from the two (duplicate) experimental waste rock deposits was calculated as 2.4-3.2 and 12.3-25.3 kg N. The results from this study shows that a woodchip bioreactor of similar design could remove NO3
- in leachate from 6.67-6.94 Mm3 of waste rock under a period of two years in a subarctic climate. This estimate is only a minimum since the longevity of the treatment in the woodchip bioreactor is likely exceeding the two year test period (cf. Robertson 2010).
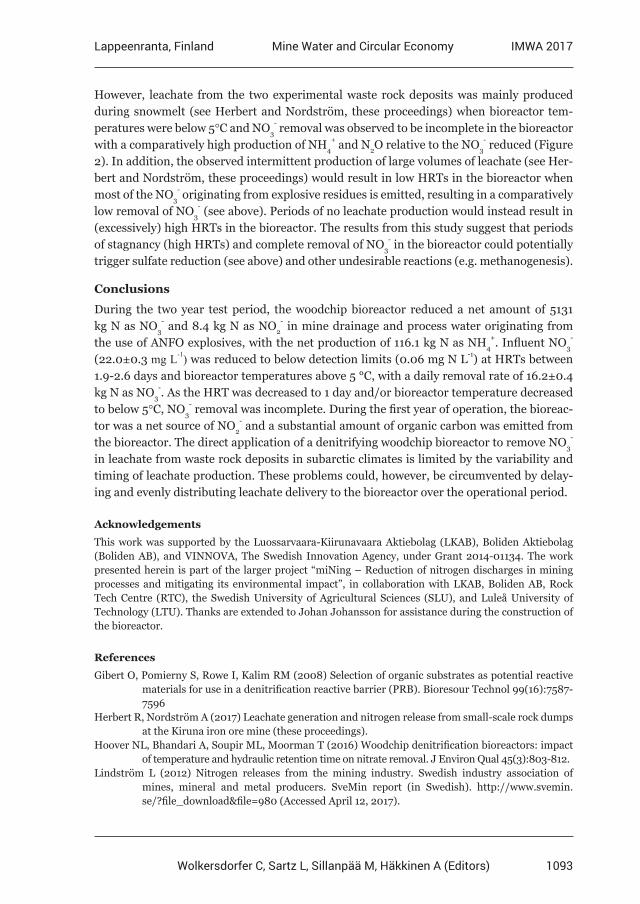
1093
Lappeenranta, Finland IMWA 2017Mine Water and Circular Economy
Wolkersdorfer C, Sartz L, Sillanpää M, Häkkinen A (Editors)
However, leachate from the two experimental waste rock deposits was mainly produced during snowmelt (see Herbert and Nordström, these proceedings) when bioreactor tem-peratures were below 5°C and NO3
- removal was observed to be incomplete in the bioreactor with a comparatively high production of NH4
+ and N2O relative to the NO3- reduced (Figure
2). In addition, the observed intermittent production of large volumes of leachate (see Her-bert and Nordström, these proceedings) would result in low HRTs in the bioreactor when most of the NO3
- originating from explosive residues is emitted, resulting in a comparatively low removal of NO3
- (see above). Periods of no leachate production would instead result in (excessively) high HRTs in the bioreactor. The results from this study suggest that periods of stagnancy (high HRTs) and complete removal of NO3
- in the bioreactor could potentially trigger sulfate reduction (see above) and other undesirable reactions (e.g. methanogenesis).
Conclusions
During the two year test period, the woodchip bioreactor reduced a net amount of 5131 kg N as NO3
- and 8.4 kg N as NO2- in mine drainage and process water originating from
the use of ANFO explosives, with the net production of 116.1 kg N as NH4+. Influent NO3
- (22.0±0.3 mg L-1) was reduced to below detection limits (0.06 mg N L-1) at HRTs between 1.9-2.6 days and bioreactor temperatures above 5 °C, with a daily removal rate of 16.2±0.4 kg N as NO3
-. As the HRT was decreased to 1 day and/or bioreactor temperature decreased to below 5°C, NO3
- removal was incomplete. During the first year of operation, the bioreac-tor was a net source of NO2
- and a substantial amount of organic carbon was emitted from the bioreactor. The direct application of a denitrifying woodchip bioreactor to remove NO3
- in leachate from waste rock deposits in subarctic climates is limited by the variability and timing of leachate production. These problems could, however, be circumvented by delay-ing and evenly distributing leachate delivery to the bioreactor over the operational period.
Acknowledgements
This work was supported by the Luossarvaara-Kiirunavaara Aktiebolag (LKAB), Boliden Aktiebolag (Boliden AB), and VINNOVA, The Swedish Innovation Agency, under Grant 2014-01134. The work presented herein is part of the larger project “miNing – Reduction of nitrogen discharges in mining processes and mitigating its environmental impact”, in collaboration with LKAB, Boliden AB, Rock Tech Centre (RTC), the Swedish University of Agricultural Sciences (SLU), and Luleå University of Technology (LTU). Thanks are extended to Johan Johansson for assistance during the construction of the bioreactor.
References
Gibert O, Pomierny S, Rowe I, Kalim RM (2008) Selection of organic substrates as potential reactive materials for use in a denitrification reactive barrier (PRB). Bioresour Technol 99(16):7587- 7596Herbert R, Nordström A (2017) Leachate generation and nitrogen release from small-scale rock dumps at the Kiruna iron ore mine (these proceedings).Hoover NL, Bhandari A, Soupir ML, Moorman T (2016) Woodchip denitrification bioreactors: impact of temperature and hydraulic retention time on nitrate removal. J Environ Qual 45(3):803-812.Lindström L (2012) Nitrogen releases from the mining industry. Swedish industry association of mines, mineral and metal producers. SveMin report (in Swedish). http://www.svemin. se/?file_download&file=980 (Accessed April 12, 2017).
1094
Lappeenranta, Finland IMWA 2017Mine Water and Circular Economy
Wolkersdorfer C, Sartz L, Sillanpää M, Häkkinen A (Editors)
Nordström A, Herbert R (2016) Denitrification in a low-temperature bioreactor system at two different hydraulic residence times: laboratory column studies. Environ Technol doi:10.1080/095933 30.2016.1228699R Core Team (2015) R: A language and environment for statistical computing. R Foundation for Statistical Computing, Vienna, Austria. URL https://www.R-project.org/.Robertson WD (2010) Nitrate removal rates in woodchip media of varying age. Ecol Eng 36:1581-1587Schipper LA, Robertson WD, Gold AJ, Jaynes DB, Cameron SC (2010) Denitrifying bioreactors – An approach for reducing nitrate loads to receiving waters. Ecol Eng 36:1532-1543.Warneke S, Schipper LA, Bruesewitz DA, McDonald I, Cameron S (2011) Rates, controls and potential adverse effects of nitrate removal in a denitrification bed. Ecol Eng 37:511-512.Woli KP, David MB, Cooke RA, McIsaac GF, Mitchell CA (2010) Nitrogen balance in and export from agricultural fields associated with controlled drainage sysems and denitrifying bioreactors. Ecol Eng 36:1558-1566.
1095
Lappeenranta, Finland IMWA 2017Mine Water and Circular Economy
Wolkersdorfer C, Sartz L, Sillanpää M, Häkkinen A (Editors)
Investigation of a Pit Lake Acting as a Large-scale Natural Treatment System for Diffuse Acid Mine Drainage
Joscha Opitz1, Matthias Alte1, Martin Bauer1, Wolfgang Schäfer2, Thomas Söll3
1BASE TECHNOLOGIES GmbH, Josef-Felder-Straße 53, 81241 Munich, Germany, [email protected]
2Steinbeis Transfer Center for Groundwater Modeling, Wiesloch, Germany 3Büro für geohydraulische Modellrechnungen, Schwäbisch Gmünd, Germany
Abstract Natural anaerobic biochemical processes used for passive treatment of AMD were observed in the extensive shallow water zone of a pit lake in the former German lignite district of Upper Palatinate. Although continuously fed by acidic metalliferous groundwater, lake-pH increased from 3.5 to circum-neutral over a 15-year-period. The natural attenuation processes were studied and quantified using a regional groundwater flow model linked with geochemical calculations and sediment core analysis. The results indicate that full-scale pit lakes could be used for passive treatment of both diffuse and point source AMD on a much larger scale if the determining environmental conditions were identified.
Key words Acid Mine Drainage, pit lake, passive treatment, diffuse pollution, NAPA
Introduction
Mining activities, especially open-pit coal and lignite mining, are usually associated with the extensive formation of Acid Mine Drainage (AMD). Diffuse AMD is predominantly gen-erated by contact of sulphide-bearing minerals with oxygen and water below the surface. The resulting acidic and metalliferous groundwater can cause extensive pollution and en-vironmental impairment downstream of the actual pollution source. Although there is still a great knowledge gap, studies by Mayes et al. (2008) indicate that diffuse contamination can account for as much as 50 % up to nearly 100 % of surface water pollution and influx of potentially toxic metals depending on mine and catchment characteristics. Whereas point source AMD can easily be collected and treated, the effective control and treatment of dif-fuse AMD is considered to be almost impossible. Consequently, diffuse AMD is often the main cause for both surface- and groundwater pollution.
It is well known that natural biochemical processes such as microbially mediated sulphate and iron reduction can lead to de-acidification and metal immobilisation (Geller et al. 2009). Sulphate reducing bacteria (SRB) require anoxic conditions, absence of ferric iron, a sulphate concentration > 100 mg/L, a carbon source and thrive under circum-neutral pH (Younger et al. 2002):
4FeOOH + 16H+ + 8SO42- + 15CH2O → 4FeS2 +25H2O + 15CO2
Microbial sulphate reduction was observed to contribute to the overall water quality of nat-ural wetlands and small pit lakes (e.g. in the German lignite district of Lusatia). The process is emulated in passive treatment systems such as anaerobic wetlands and Successive Alka-linity Producing Systems (SAPS) (Skousen et al. 2017; Younger et al. 2002). Furthermore,
1096
Lappeenranta, Finland IMWA 2017Mine Water and Circular Economy
Wolkersdorfer C, Sartz L, Sillanpää M, Häkkinen A (Editors)
laboratory- and field-scale experiments were conducted to actively induce sulphate reduc-ing processes by introducing external sources of alkalinity and carbon (e.g. lime and straw) into acidic pit lakes (e.g. Fyson & Nixdorf 2006; Geller et al. 2009; Koschorreck et al. 2011). However, to date there is no report of a full-scale pit lake self-neutralising predominantly induced by natural biochemical processes and hence attendant decreasing of the relevant contaminations. The study at hand describes a formerly acidic pit lake which self-neutral-ised over the course of 10 to 15 years. Furthermore, the study addresses potential perspec-tives as well as challenges and limitations regarding technical adaptation of pit lakes for mine water management.
Background and Site Description
Lake Knappensee is a pit lake in the former lignite mining district of Upper Palatinate in southeast Germany. The lake is the upstream link in a cascade of two pit lakes surrounded by former opencast segments and overburden dumps. Flooding of the 550,000-m² pit lake ended in 1982. Most of the formerly 50 m deep pit was backfilled, resulting in an unusu-ally shallow, polymictic pit lake with a maximal depth of only 9 m (avg. 5 m). As a natural consequence, the northern part of lake Knappensee represents an extensive shallow water zone of approximately 250,000 m², which is densely vegetated by submerged bulbous rush (Juncus bulbosus). Additionally, the western and northern shores are lined with reed and cattail belts (Phragmites australis, Typha latifolia). In 1995, a mine water treatment plant was installed in close vicinity to lake Knappensee for chemical treatment of seepage water from an adjacent former pit by adding lime slurry and flocculants. The treated water is dis-charged into lake Knappensee at its north-western end.
Methods
Investigation of lake Knappensee included, but was not limited to: 1. Continuous monitoring of inflow and outflow volume and water quality as well
as monitoring of surrounding groundwater observations wells; 2. Limnological and environmental investigation (vegetation, stratification, depth
profiles); 3. Investigation of the regional geology, mining history and mined land morpholo-
gy with a special focus on waste rock mineralogy and consequential acidification potential;
4. Development of a regional groundwater flow model; 5. Geochemical modelling of regional acid generating and neutralising processes
(spatial Acid Base Accounting); 6. Sampling of 15 sediment cores and analysis in a glove box lab under anoxic con-
ditions.
By combining the results, especially of (4) and (5), a regional transport model was devel-oped which was used for the quantification of acidity fluxes to and from lake Knappensee (Schäfer et al. 2016). The sediment cores were analysed for typical mine water contaminants and different sulphur compounds to investigate contaminant and acidity deposition in the sediment of lake Knappensee (Schäfer et al. 2016).
1097
Lappeenranta, Finland IMWA 2017Mine Water and Circular Economy
Wolkersdorfer C, Sartz L, Sillanpää M, Häkkinen A (Editors)
Results and Evaluation
Lake Knappensee is well characterised in terms of water balance and quality since the end of flooding. Additional monitoring of groundwater observation wells shows that up to the present day most of the mined and backfilled land is heavily affected by pyrite oxidation, resulting in highly acidic (acidity up to 48 mmol/l) and metalliferous (total Fe up to 1,500 mg/L) groundwater discharging to lake Knappensee. Nevertheless, between 1999 and 2012 the initially acidic pH of lake Knappensee increased from about 3.5 to circum-neutral. Si-multaneously acidity as well as iron and aluminium concentrations decreased substantially from peaks in 1992 and 2001 at up to 1.4 mmol/l and up to 7.0 mg/L respectively to +/- 0 mmol/l and < 0.5 mg/L (fig. 1).
Since 2010 lake Knappensee displays circum-neutral pH and a stable acid-base equilibrium. Only groundwater leakage and lake water in very confined areas directly adjacent to pits and dumps display acidic pH of 2.5 – 4.0. In addition, contamination of lake Knappensee by influent diffuse AMD is still apparent in elevated sulphate (+/- 1,000 mg/L, fig. 1) and manganese (+/- 1 mg/L) concentrations.
Quantitative monitoring and modelling of inflow and outflow show that the total through-flow of lake Knappensee (avg. 1 Mio. m³/year) can be divided into three categories: 1. Rainwater (ca. 50 %): Surface runoff, ditch influx, floodway, precipitation on
lake surface less evapotranspiration of lake surface; 2. Discharge from the active-chemical seepage treatment plant of an adjacent
landfill for lignite ashes (ca. 25 %); 3. Net-groundwater inflow (ca. 25%): Groundwater inflow from surrounding pits
and dumps less groundwater outflow.
A rough qualitative and quantitative water balance of lake Knappensee is outlined in table 1. The first category is of little interest as it is predominantly comprised of unaffected rain-water. As stated above, groundwater discharge to lake Knappensee from surrounding pits and dumps is still highly acidic (Schäfer et al. 2016). In contrast, the effluent of an adjacent chemical treatment plant is circum-neutral and buffered due to addition of lime slurry.
Table 1 Rough water balance of lake Knappensee
Category Water quality Mean net acidity App. Volume
1. Rainwater Neutral, low salinity +/– 0 mmol/l 500,000 m³/a
2. Treatment plant discharge
Neutral pH, net-alkaline, low Fe/Al, high Mn/SO4
– 2 mmol/l 250,000 m³/a
3. Net-groundwater inflow
Low pH, high acidity, high Fe/Al/Mn/SO4
> 6 mmol/l 250,000 m³/a
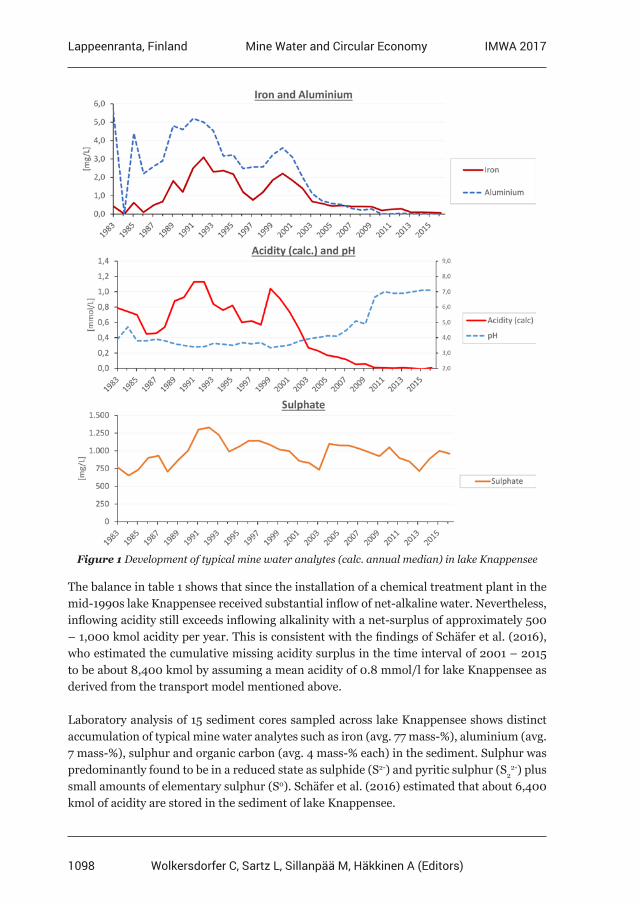
1098
Lappeenranta, Finland IMWA 2017Mine Water and Circular Economy
Wolkersdorfer C, Sartz L, Sillanpää M, Häkkinen A (Editors)
Figure 1 Development of typical mine water analytes (calc. annual median) in lake Knappensee
The balance in table 1 shows that since the installation of a chemical treatment plant in the mid-1990s lake Knappensee received substantial inflow of net-alkaline water. Nevertheless, inflowing acidity still exceeds inflowing alkalinity with a net-surplus of approximately 500 – 1,000 kmol acidity per year. This is consistent with the findings of Schäfer et al. (2016), who estimated the cumulative missing acidity surplus in the time interval of 2001 – 2015 to be about 8,400 kmol by assuming a mean acidity of 0.8 mmol/l for lake Knappensee as derived from the transport model mentioned above.
Laboratory analysis of 15 sediment cores sampled across lake Knappensee shows distinct accumulation of typical mine water analytes such as iron (avg. 77 mass-%), aluminium (avg. 7 mass-%), sulphur and organic carbon (avg. 4 mass-% each) in the sediment. Sulphur was predominantly found to be in a reduced state as sulphide (S2-) and pyritic sulphur (S2
2-) plus small amounts of elementary sulphur (S0). Schäfer et al. (2016) estimated that about 6,400 kmol of acidity are stored in the sediment of lake Knappensee.
1099
Lappeenranta, Finland IMWA 2017Mine Water and Circular Economy
Wolkersdorfer C, Sartz L, Sillanpää M, Häkkinen A (Editors)
Discussion
Firstly, a rough water balance of lake Knappensee shows that there is a large acidity sur-plus missing in the pit lake. Secondly, sediment core analysis shows that plenty of acidity is stored in (iron-) sulphides in the sediment of lake Knappensee. As both estimations for the relevant time interval from 1999 to 2012 are roughly in the same order of magnitude, the results of this study strongly indicate, that well-known geochemical mechanisms such as natural microbial reduction processes are the driving force of in-lake neutralisation of lake Knappensee.
Furthermore, there is a good cause to believe that continuous discharge of net-alkaline wa-ter to lake Knappensee since the mid-1990s might have been a vital trigger and/or prerequi-site by creating a local environment suitable for growth and distribution of both hygrophil-ous plants and SRB. In this case increasing accumulation of dead plant material provided a continuous carbon source whilst living plants stabilised and covered the sediment. Limiting access of oxygen or oxidants to the sediment is a vital prerequisite for the development of a reducing and circum-neutral environment ideal for SRBs (Geller et al. 2009; Younger et al. 2002).
This hypothesis is supported by the fact that the discharge point of the chemical treatment plant at the shallow northern end of the pit lake coincides with the highest intensity of hydrophytes. Presumably over time continual dissimilatory sulphate reduction in the litto-ral and shallow water zone of lake Knappensee resulted in increasing acidity consumption and eventually in full neutralisation of the pit lake. However, the precise nature and scope of influent alkalinity and hydrophyte distribution as a trigger for biogenic de-acidification remains uncertain and is a subject of follow-up investigations. Additional contribution of further processes is possible but less likely and unverifiable (Schäfer et al. 2016).
Lake Knappensee covers a groundwater drainage area of approximately 3 – 4 km², which corresponds to roughly 50 % of the mining district’s diffuse AMD. In addition to extensive acidity consumption, sediment core analysis shows that the sediment of the pit lake is a nat-ural sink for typical mine water contaminants such as sulphate and iron. Since dissimilatory sulphate reduction and subsequent precipitation of iron sulphides developed naturally in an artificial post-mining environment because of advantageous circumstances, major parts of lake Knappensee can be regarded as a large-scale anaerobic passive treatment system or “Natural Attenuating Pit lake Area” (NAPA).
Prospects
Both dissimilatory microbial sulphate reduction and discharge of river water have been in-vestigated in terms of their potential as a tool to manage water quality in acidic pit lakes (e.g. Fyson et al. 2006; Geller et al. 2009; Schultze et al. 2005, 2009), yet no stable and self-sus-taining system was discovered or created so far. Previous studies show that a multitude of factors affect the development of acidic pit lakes:
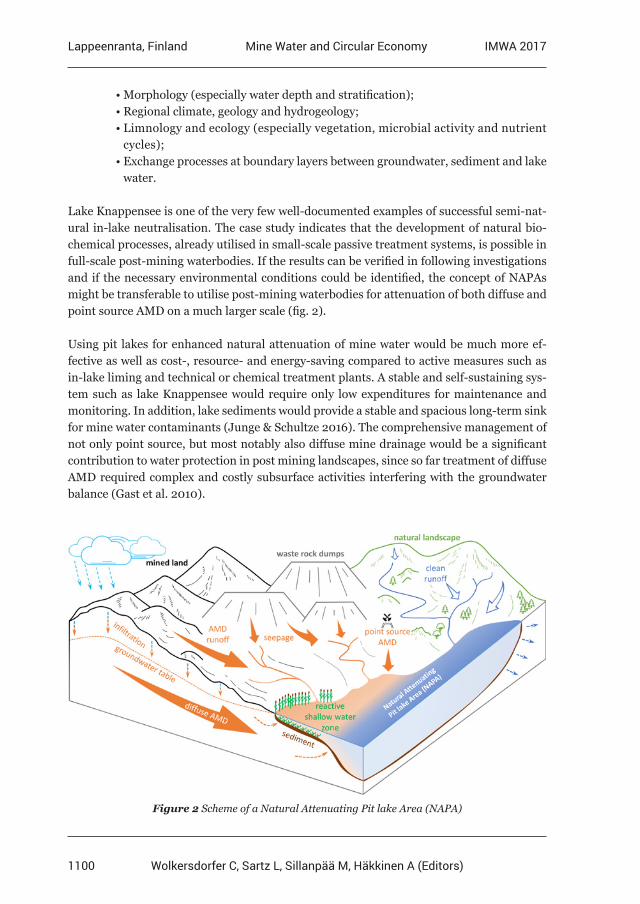
1100
Lappeenranta, Finland IMWA 2017Mine Water and Circular Economy
Wolkersdorfer C, Sartz L, Sillanpää M, Häkkinen A (Editors)
• Morphology (especially water depth and stratification); • Regional climate, geology and hydrogeology; • Limnology and ecology (especially vegetation, microbial activity and nutrient
cycles); • Exchange processes at boundary layers between groundwater, sediment and lake
water.
Lake Knappensee is one of the very few well-documented examples of successful semi-nat-ural in-lake neutralisation. The case study indicates that the development of natural bio-chemical processes, already utilised in small-scale passive treatment systems, is possible in full-scale post-mining waterbodies. If the results can be verified in following investigations and if the necessary environmental conditions could be identified, the concept of NAPAs might be transferable to utilise post-mining waterbodies for attenuation of both diffuse and point source AMD on a much larger scale (fig. 2).
Using pit lakes for enhanced natural attenuation of mine water would be much more ef-fective as well as cost-, resource- and energy-saving compared to active measures such as in-lake liming and technical or chemical treatment plants. A stable and self-sustaining sys-tem such as lake Knappensee would require only low expenditures for maintenance and monitoring. In addition, lake sediments would provide a stable and spacious long-term sink for mine water contaminants (Junge & Schultze 2016). The comprehensive management of not only point source, but most notably also diffuse mine drainage would be a significant contribution to water protection in post mining landscapes, since so far treatment of diffuse AMD required complex and costly subsurface activities interfering with the groundwater balance (Gast et al. 2010).
Figure 2 Scheme of a Natural Attenuating Pit lake Area (NAPA)
1101
Lappeenranta, Finland IMWA 2017Mine Water and Circular Economy
Wolkersdorfer C, Sartz L, Sillanpää M, Häkkinen A (Editors)
Emulating and augmenting natural attenuation processes in NAPAs could take passive mine water treatment to a new level with great potential regarding water pollution control and cost saving as well as conservation of resources and energy.
Challenges and Limitations
Various studies and experiments, especially in the lignite fields of Eastern Germany, have tried to determine and/or reproduce the environmental conditions necessary for natural in-lake neutralisation. Although lake Knappensee makes a difference in this regard, the identification and sizing of the essential environmental factors and boundary conditions remains the major challenge before artificial reproduction is conceivable. Implementing a NAPA only works as a long-term measure, since in contrast to normal-scale passive treat-ment plants it takes years or decades until the respective processes get fully established in full-scale. Consequently, appropriate strategies are needed for both short-term pollution control and long-term developments such as water level fluctuations and sediment accumu-lation. Moreover, research should focus on ways to initiate and accelerate the determining biochemical processes, especially if water authorities are to accept the principle of sacrific-ing a pit lake for pollution control.
Using pit lakes as large-scale treatment systems for diffuse AMD is only feasible in hydroge-ological settings where most of the groundwater discharges to a central void. Furthermore, the results of this study indicate, that extensive shallow water zones are necessary. Since pit lakes are usually created due to the lack of backfill, creating shallow pit lakes contradicts the original purpose.
In summary, as in all cases where natural systems are adapted for technical purposes, sev-eral challenges must be met and the exact outcome and chance of success is virtually un-predictable.
Conclusions
• Spatial Acid Base Accounting based on a groundwater model was successfully used for the prediction of geohydrological conditions, yet caution must be taken using geochemical models such as PHREEQ-C for pit lakes, as vital biochemical processes such as microbial sulphate reduction are not considered unless respec-tive kinetics are specially (pre-)defined.
• Lake Knappensee is the first case of natural in-lake neutralisation, although fol-low-up investigations are necessary to identify and quantify the decisive prereq-uisites, boundary conditions, sizing criteria and limitations as a basis for poten-tial artificial emulation.
• Contrary to numerous studies postulating a deep meromictic or holomictic pit lake as prerequisite for stable immobilisation of acidity in the anoxic moni-molimnion or hypolimnion, lake Knappensee is an example of a very shallow polymictic lake where acidity is immobilised in the epilimnion, presumably due to dense vegetation covering and stabilising the sediment.
1102
Lappeenranta, Finland IMWA 2017Mine Water and Circular Economy
Wolkersdorfer C, Sartz L, Sillanpää M, Häkkinen A (Editors)
• In a best-case scenario, the adaptation of pit lakes for AMD attenuation (especial-ly diffuse AMD) could revolutionise mine water management in opencast mining, away from active or end-of-pipe treatment to integrated, sustainable large-scale NAPAs.
• Demand for novel approaches is evident from the large number of acidic pit lakes worldwide.
• Since the basic principle has already been proven in small-scale anaerobic wet-lands, the next step is the adaptation of pit lakes for passive treatment purposes in a large-scale field trial to reproduce the environmental conditions already ob-served in lake Knappensee.
Acknowledgements
The project was supported by Uniper Kraftwerke GmbH, Düsseldorf (formerly E.ON Kraftwerke GmbH).
References
Fyson A, Nixdorf B, Kalin M (2006) The acidic lignite pit lakes of Germany – Microcosm experiments on acidity removal through controlled eutrophication. Ecological Engineering 28(3), p 288- 295Gast M, Schöpke R, Walko M, Benthaus FC (2010) In situ aquifer treatment by microbial sulfate reduction. In: Proceedings of the IMWA Symposium 2010, Sydney (Canada), p 119-123 Geller W, Koschorreck M, Wendt-Potthoff K, Bozau K, Herzsprung P, Büttner O, Schultze M (2009) A pilot-scale field experiment for the microbial neutralization of a holomictic acidic pit lake. Journal of Geochemical Exploration 100(2-3), p 153-159Junge FW, Schultze M (2016) Open cast mines as river sediment and pollutant sinks – The example Mulde Reservoir (East Germany). In: Proceedings of the IMWA Conference 2016, Leipzig, p 159-166Koschorreck M, Boehrer B, Friese K, Geller W, Schultze M, Wendt-Potthoff K (2011) Oxygen depletion induced by adding whey to an enclosure in an acidic mine pit lake. Ecological Engineering 37(12), p 1983-1989Mayes WM, Gozzard E, Potter HAB, Jarvis AP (2008) Quantifying the importance of diffuse minewater pollution in a historically heavily coal mined catchment. Environmental Pollution 151(1), p 165-175Schäfer W, Alte M, Bauer M, Söll T, Peiffer S (2016) Quantification of Acidity Deposition in the Sediment of a former lignite mining lake in the Wackersdorf Mining District (Eastern Bavaria). In: Proceedings of the IMWA Conference 2016, Leipzig, p 236-243Schultze M, Boehrer B, Duffek A, Herzsprung P, Geller W (2005) Introduction of river water as a tool to manage water quality in pit lakes. In: Proceedings of the IMWA Congress 2005, Oviedo, p 273-279Schultze M, Geller W, Wendt-Potthoff K, Benthaus, FC (2009) Management of water quality in German pit lakes. In: Proceedings of the 8th ICARD 2009, Skellefteå (Sweden), p 273-279Skousen J, Zipper CE, Rose A, Ziemkiewicz P, Nairn R, McDonald LM, Kleinmann RL (2017) Review of passive systems for Acid Mine Drainage Treatment. Mine Water and the Environment 36(1), p 133-153Younger PL, Banwart SA, Hedin RS (2002) Mine Water – Hydrology, Pollution, Remediation. Springer- Science+Busniss Media Dordrecht, DOI 10.1007/978-94-010-0610-1, 442 pp.
1103
Lappeenranta, Finland IMWA 2017Mine Water and Circular Economy
Wolkersdorfer C, Sartz L, Sillanpää M, Häkkinen A (Editors)
Closed loop for AMD treatment waste
Kendra Zamzow1, Glenn Miller2
1Center for Science in Public Participation, PO Box 1250 Chickaloon, AK 99674 US [email protected]
2Department of Natural Resources and Environmental Science, MS 199, University of Nevada, Reno 89557
Abstract At the abandoned Leviathan copper mine, acid mine water is treated with an alcohol-based bioreactor. The bioreactor system has been successfully operating since 2003, treating 11.4 to 15.1 million liters of AMD annually. Biodiesel, produced at a nearby agricultural farm, has a manufacturing waste product rich in alcohols. This biodiesel waste can feed the mine bioreactor, and the waste sludge from mine water treatment could be used as a soil supplement at the farm.
Key words: acid drainage, biodiesel, bioreactor, glycerol, micronutrients, soil supplement, SRB
Introduction
The products left over from manufacturing biodiesel fuel and, entirely unrelated, the sludge from acid mine drainage treatment are both waste products. Biodiesel is manufactured by adding methanol and sodium- or potassium-hydroxide to vegetable oil, including waste cooking oil, resulting in trans-esterification of fatty acids to form biodiesel. The waste frac-tion contains glycerol and methanol, carbons that sulfate-reducing bacteria (SRB) can uti-lize, and hydroxides that raise pH. In laboratory columns, SRB were able to treat simulated acid mine drainage (AMD) by utilizing biodiesel waste (Zamzow et al. 2006). AMD treat-ment with SRB results in a metal-sulfide sludge waste. The loop of sharing waste products is discussed here.
Site location
Leviathan is a former copper and sulfur mine in the Sierra Nevada mountains (US). Under-ground mining was conducted from 1863 to 1872 for copper sulfate. From 1954-1962 open pit mining generated 20 million tonnes of waste rock. Aspen Creek runs through waste rock piles and forms the acid seep that is treated by the bioreactors. The site is at an elevation of 2135 m. Heavy snow can be expected from October to May, with significant variability. Elec-tricity is provided by a diesel generator and solar panel arrays. Snow-melt generally occurs from April through July, significantly increasing flow into the bioreactor from an average of 20 L/min to 90 L/min (US EPA 2006).
Bioreactors
Compost-free bioreactors provide a carbon source SRB can directly utilize, such as ethanol, methanol, or ethylene glycol (Tsukamoto and Miller 1999; Luo 2004). Compost-free biore-actors at Leviathan were constructed as four open ponds. The first two (Pond 1, Pond 2) are the location of microbial activity and contain rock substrate for SRB attachment (Fig. 1). Downstream ponds (Pond 3, Pond 4) contain no rock and are for the precipitation of sulfide sludge. Influent into bioreactors is acidic (pH 2.5 to 3.2) and contains elevated metals, with
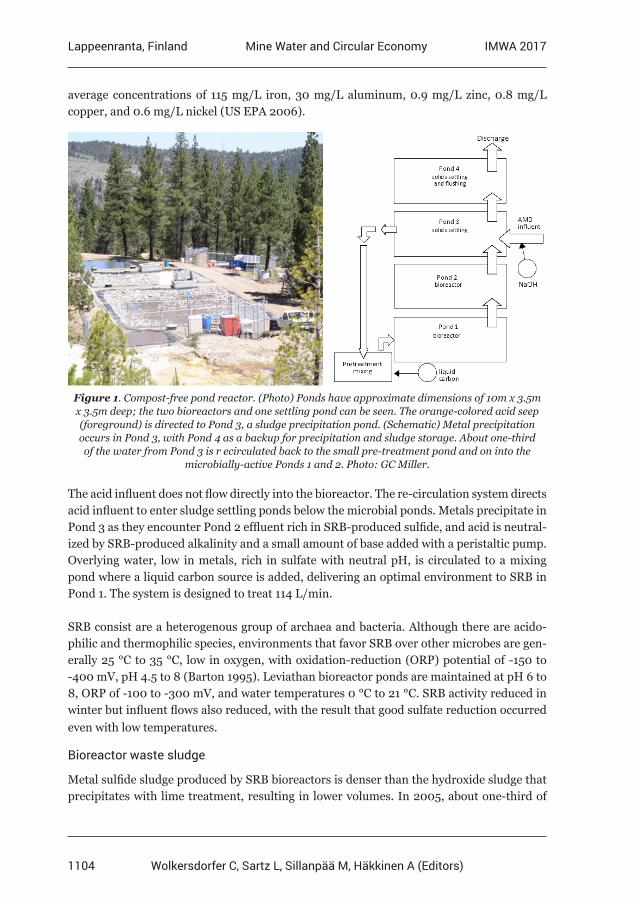
1104
Lappeenranta, Finland IMWA 2017Mine Water and Circular Economy
Wolkersdorfer C, Sartz L, Sillanpää M, Häkkinen A (Editors)
average concentrations of 115 mg/L iron, 30 mg/L aluminum, 0.9 mg/L zinc, 0.8 mg/L copper, and 0.6 mg/L nickel (US EPA 2006).
The acid influent does not flow directly into the bioreactor. The re-circulation system directs acid influent to enter sludge settling ponds below the microbial ponds. Metals precipitate in Pond 3 as they encounter Pond 2 effluent rich in SRB-produced sulfide, and acid is neutral-ized by SRB-produced alkalinity and a small amount of base added with a peristaltic pump. Overlying water, low in metals, rich in sulfate with neutral pH, is circulated to a mixing pond where a liquid carbon source is added, delivering an optimal environment to SRB in Pond 1. The system is designed to treat 114 L/min. SRB consist are a heterogenous group of archaea and bacteria. Although there are acido-philic and thermophilic species, environments that favor SRB over other microbes are gen-erally 25 °C to 35 °C, low in oxygen, with oxidation-reduction (ORP) potential of -150 to -400 mV, pH 4.5 to 8 (Barton 1995). Leviathan bioreactor ponds are maintained at pH 6 to 8, ORP of -100 to -300 mV, and water temperatures 0 °C to 21 °C. SRB activity reduced in winter but influent flows also reduced, with the result that good sulfate reduction occurred even with low temperatures.
Bioreactor waste sludge
Metal sulfide sludge produced by SRB bioreactors is denser than the hydroxide sludge that precipitates with lime treatment, resulting in lower volumes. In 2005, about one-third of
Figure 1. Compost-free pond reactor. (Photo) Ponds have approximate dimensions of 10m x 3.5m x 3.5m deep; the two bioreactors and one settling pond can be seen. The orange-colored acid seep (foreground) is directed to Pond 3, a sludge precipitation pond. (Schematic) Metal precipitation occurs in Pond 3, with Pond 4 as a backup for precipitation and sludge storage. About one-third of the water from Pond 3 is r ecirculated back to the small pre-treatment pond and on into the
microbially-active Ponds 1 and 2. Photo: GC Miller.
1105
Lappeenranta, Finland IMWA 2017Mine Water and Circular Economy
Wolkersdorfer C, Sartz L, Sillanpää M, Häkkinen A (Editors)
the sludge in Pond 3 (5,000 kg) was pumped out of the pond and into filter bags (3 m x 4.6 m). From November 2003 to July 2005, an estimated 12,900 kg dry weight of sludge was produced (3,900 kg per million liters of AMD treated) with moisture content of 80% in filter bag solids. Sludge samples were collected from the pre-treatment pond, Pond 3, Pond 4, and the filter bags for analysis.
Biodiesel waste source
Bently Agrodynamics in Minden, Nevada, 20 miles from the mine site, is an agricultural operation that produces biodiesel for their farm vehicles and provides limited biodiesel fuel to the community. Employees collect used oil from restaurants and react it with potassium hydroxide in heated stainless steel tanks. Biodiesel waste (BD waste) fluid was supplied to us in 208 L drums.
Methods
Raw water samples (500 ml) were collected from the AMD influent, pond effluents, and from the final discharge and analyzed weekly or biweekly for sulfate, alcohols, and total and dissolved metals. Duplicate samples (125 ml) were acidified with nitric acid to pH < 1.5 for total metals and alcohol concentrations. Biodiesel waste varies in composition between batches. Fourteen samples taken from the Minden, Nevada plant showed glycerol at 8% to 30% and methanol 10% to 20%. During the field experiment, samples of BD waste were ana-lyzed on a regular basis. Drums of methanol were occasionally added to the tote containing BD waste providing additional variability (Zamzow 2007).
Biodiesel waste feed
At the mine site, BD waste was pumped from drums to a 1,100 liter tote. From November 2005-June 2006, BD waste supplemented the ethanol feed to acclimate the microbial pop-ulation. Feed was through a gravity drip system which, due to the glycerol and fat content, was highly temperature dependent. In June 2006, a solar-powered peristaltic pump was installed for more consistent BD waste feed control. In August 2006 the ethanol feed was stopped and the bioreactor operated solely on BD waste until October 2006. Based on the assumption that BD waste averaged 20% glycerol and 15% methanol, the goal was to pro-vide a flow of 130-140 ml/min in order to reduce 100% of the sulfate, with sulfate at 1900-2000 mg/L (Zamzow 2007).
Analysis of bioreactor water
Sulfate removal and metal removal were indicators of bioreactor treatment effectiveness. Concentrations of Fe, Ni, and Zn were analyzed regularly with occasionally analysis of Cu and Mn. Analysis was conducted on a Perkin-Elmer 5000 flame atomic absorption spectro-photometer. Sulfate concentration was determined by standard gravimetric analysis using barium sulfate precipitation (Clesceri et al. 1998). Alcohols were analyzed by HPLC (HP 1050) equipped with an Aminex HPX-87H column heated to 60 °C, using 0.001M H2SO4 eluent. Refractive index and UV detectors were run in sequence. A Waters 510 HPLC was used to pump the eluent through the RID reference cell. The limits of detection were 15 mg/L (glycerol) and 20 mg/L (methanol) (Zamzow et al. 2006).
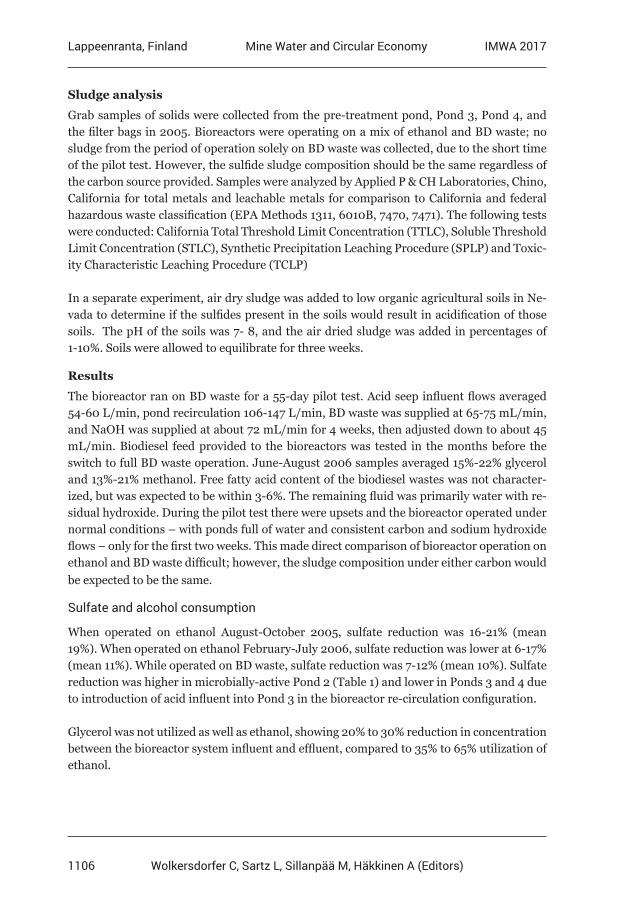
1106
Lappeenranta, Finland IMWA 2017Mine Water and Circular Economy
Wolkersdorfer C, Sartz L, Sillanpää M, Häkkinen A (Editors)
Sludge analysis
Grab samples of solids were collected from the pre-treatment pond, Pond 3, Pond 4, and the filter bags in 2005. Bioreactors were operating on a mix of ethanol and BD waste; no sludge from the period of operation solely on BD waste was collected, due to the short time of the pilot test. However, the sulfide sludge composition should be the same regardless of the carbon source provided. Samples were analyzed by Applied P & CH Laboratories, Chino, California for total metals and leachable metals for comparison to California and federal hazardous waste classification (EPA Methods 1311, 6010B, 7470, 7471). The following tests were conducted: California Total Threshold Limit Concentration (TTLC), Soluble Threshold Limit Concentration (STLC), Synthetic Precipitation Leaching Procedure (SPLP) and Toxic-ity Characteristic Leaching Procedure (TCLP)
In a separate experiment, air dry sludge was added to low organic agricultural soils in Ne-vada to determine if the sulfides present in the soils would result in acidification of those soils. The pH of the soils was 7- 8, and the air dried sludge was added in percentages of 1-10%. Soils were allowed to equilibrate for three weeks.
Results
The bioreactor ran on BD waste for a 55-day pilot test. Acid seep influent flows averaged 54-60 L/min, pond recirculation 106-147 L/min, BD waste was supplied at 65-75 mL/min, and NaOH was supplied at about 72 mL/min for 4 weeks, then adjusted down to about 45 mL/min. Biodiesel feed provided to the bioreactors was tested in the months before the switch to full BD waste operation. June-August 2006 samples averaged 15%-22% glycerol and 13%-21% methanol. Free fatty acid content of the biodiesel wastes was not character-ized, but was expected to be within 3-6%. The remaining fluid was primarily water with re-sidual hydroxide. During the pilot test there were upsets and the bioreactor operated under normal conditions – with ponds full of water and consistent carbon and sodium hydroxide flows – only for the first two weeks. This made direct comparison of bioreactor operation on ethanol and BD waste difficult; however, the sludge composition under either carbon would be expected to be the same.
Sulfate and alcohol consumption
When operated on ethanol August-October 2005, sulfate reduction was 16-21% (mean 19%). When operated on ethanol February-July 2006, sulfate reduction was lower at 6-17% (mean 11%). While operated on BD waste, sulfate reduction was 7-12% (mean 10%). Sulfate reduction was higher in microbially-active Pond 2 (Table 1) and lower in Ponds 3 and 4 due to introduction of acid influent into Pond 3 in the bioreactor re-circulation configuration.
Glycerol was not utilized as well as ethanol, showing 20% to 30% reduction in concentration between the bioreactor system influent and effluent, compared to 35% to 65% utilization of ethanol.
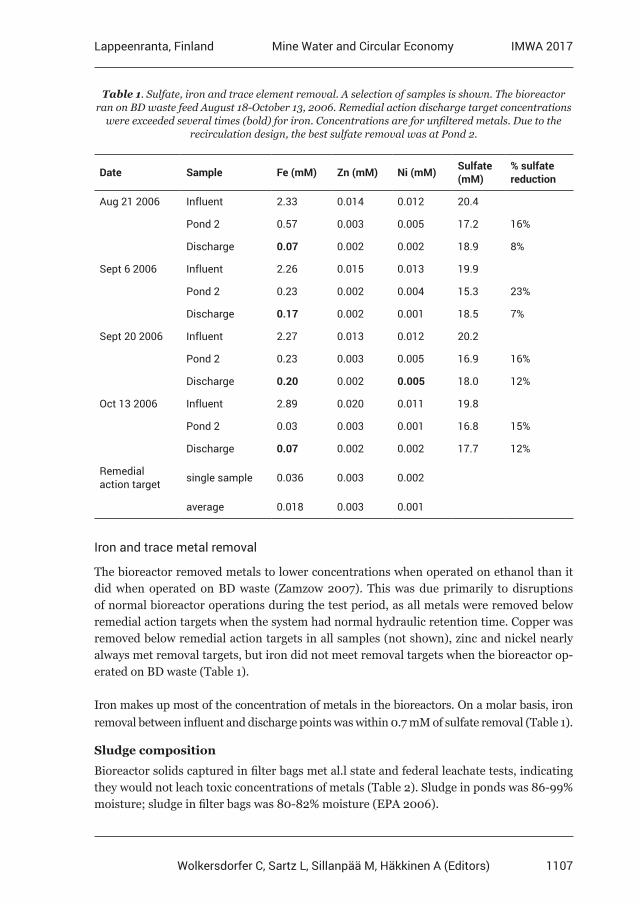
1107
Lappeenranta, Finland IMWA 2017Mine Water and Circular Economy
Wolkersdorfer C, Sartz L, Sillanpää M, Häkkinen A (Editors)
Table 1. Sulfate, iron and trace element removal. A selection of samples is shown. The bioreactor ran on BD waste feed August 18-October 13, 2006. Remedial action discharge target concentrations
were exceeded several times (bold) for iron. Concentrations are for unfiltered metals. Due to the recirculation design, the best sulfate removal was at Pond 2.
Date Sample Fe (mM) Zn (mM) Ni (mM) Sulfate (mM)
% sulfate reduction
Aug 21 2006 Influent 2.33 0.014 0.012 20.4
Pond 2 0.57 0.003 0.005 17.2 16%
Discharge 0.07 0.002 0.002 18.9 8%
Sept 6 2006 Influent 2.26 0.015 0.013 19.9
Pond 2 0.23 0.002 0.004 15.3 23%
Discharge 0.17 0.002 0.001 18.5 7%
Sept 20 2006 Influent 2.27 0.013 0.012 20.2
Pond 2 0.23 0.003 0.005 16.9 16%
Discharge 0.20 0.002 0.005 18.0 12%
Oct 13 2006 Influent 2.89 0.020 0.011 19.8
Pond 2 0.03 0.003 0.001 16.8 15%
Discharge 0.07 0.002 0.002 17.7 12%
Remedial action target single sample 0.036 0.003 0.002
average 0.018 0.003 0.001
Iron and trace metal removal
The bioreactor removed metals to lower concentrations when operated on ethanol than it did when operated on BD waste (Zamzow 2007). This was due primarily to disruptions of normal bioreactor operations during the test period, as all metals were removed below remedial action targets when the system had normal hydraulic retention time. Copper was removed below remedial action targets in all samples (not shown), zinc and nickel nearly always met removal targets, but iron did not meet removal targets when the bioreactor op-erated on BD waste (Table 1).
Iron makes up most of the concentration of metals in the bioreactors. On a molar basis, iron removal between influent and discharge points was within 0.7 mM of sulfate removal (Table 1).
Sludge composition
Bioreactor solids captured in filter bags met al.l state and federal leachate tests, indicating they would not leach toxic concentrations of metals (Table 2). Sludge in ponds was 86-99% moisture; sludge in filter bags was 80-82% moisture (EPA 2006).
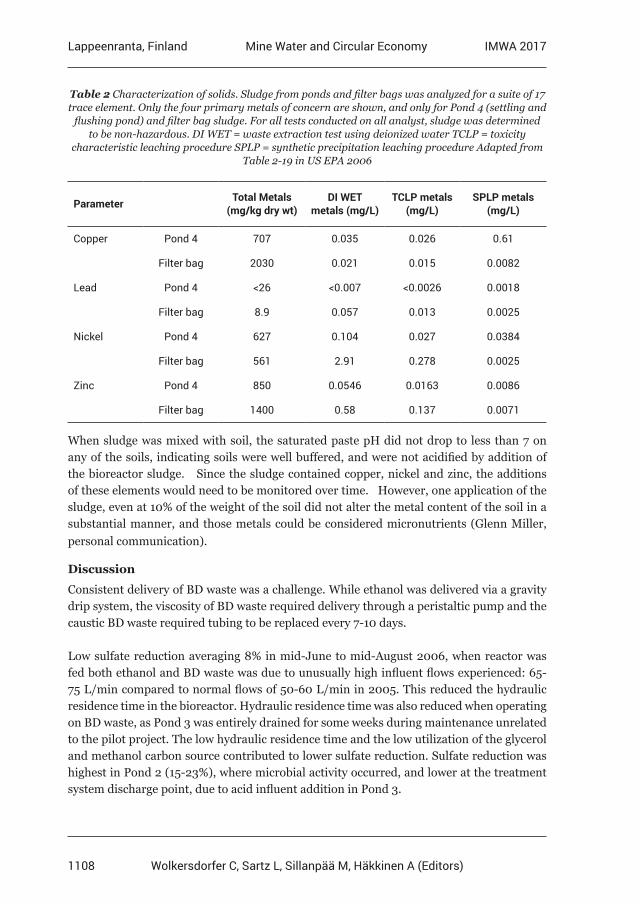
1108
Lappeenranta, Finland IMWA 2017Mine Water and Circular Economy
Wolkersdorfer C, Sartz L, Sillanpää M, Häkkinen A (Editors)
Table 2 Characterization of solids. Sludge from ponds and filter bags was analyzed for a suite of 17 trace element. Only the four primary metals of concern are shown, and only for Pond 4 (settling and
flushing pond) and filter bag sludge. For all tests conducted on all analyst, sludge was determined to be non-hazardous. DI WET = waste extraction test using deionized water TCLP = toxicity
characteristic leaching procedure SPLP = synthetic precipitation leaching procedure Adapted from Table 2-19 in US EPA 2006
Parameter Total Metals (mg/kg dry wt)
DI WET metals (mg/L)
TCLP metals (mg/L)
SPLP metals (mg/L)
Copper Pond 4 707 0.035 0.026 0.61
Filter bag 2030 0.021 0.015 0.0082
Lead Pond 4 <26 <0.007 <0.0026 0.0018
Filter bag 8.9 0.057 0.013 0.0025
Nickel Pond 4 627 0.104 0.027 0.0384
Filter bag 561 2.91 0.278 0.0025
Zinc Pond 4 850 0.0546 0.0163 0.0086
Filter bag 1400 0.58 0.137 0.0071
When sludge was mixed with soil, the saturated paste pH did not drop to less than 7 on any of the soils, indicating soils were well buffered, and were not acidified by addition of the bioreactor sludge. Since the sludge contained copper, nickel and zinc, the additions of these elements would need to be monitored over time. However, one application of the sludge, even at 10% of the weight of the soil did not alter the metal content of the soil in a substantial manner, and those metals could be considered micronutrients (Glenn Miller, personal communication).
Discussion
Consistent delivery of BD waste was a challenge. While ethanol was delivered via a gravity drip system, the viscosity of BD waste required delivery through a peristaltic pump and the caustic BD waste required tubing to be replaced every 7-10 days.
Low sulfate reduction averaging 8% in mid-June to mid-August 2006, when reactor was fed both ethanol and BD waste was due to unusually high influent flows experienced: 65-75 L/min compared to normal flows of 50-60 L/min in 2005. This reduced the hydraulic residence time in the bioreactor. Hydraulic residence time was also reduced when operating on BD waste, as Pond 3 was entirely drained for some weeks during maintenance unrelated to the pilot project. The low hydraulic residence time and the low utilization of the glycerol and methanol carbon source contributed to lower sulfate reduction. Sulfate reduction was highest in Pond 2 (15-23%), where microbial activity occurred, and lower at the treatment system discharge point, due to acid influent addition in Pond 3.
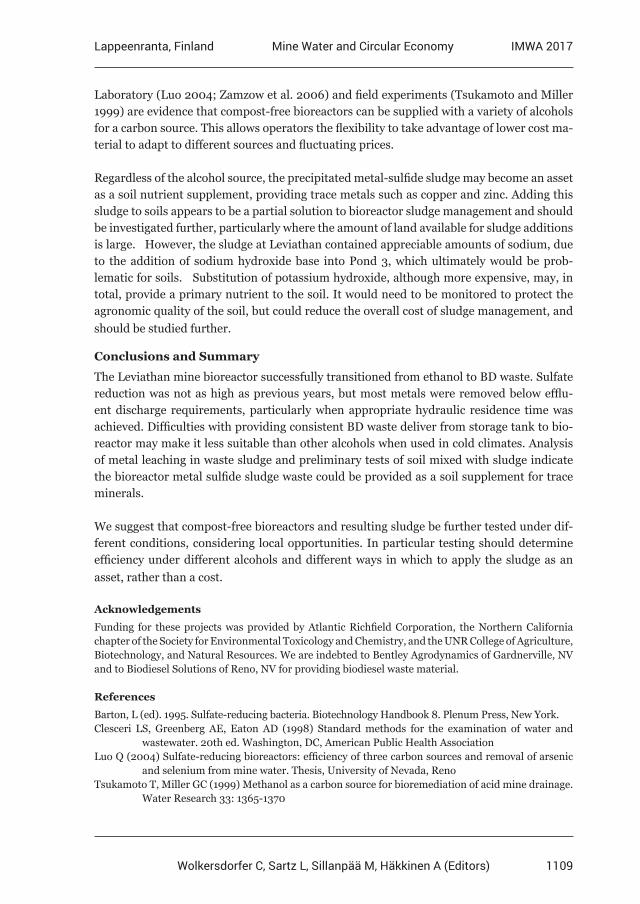
1109
Lappeenranta, Finland IMWA 2017Mine Water and Circular Economy
Wolkersdorfer C, Sartz L, Sillanpää M, Häkkinen A (Editors)
Laboratory (Luo 2004; Zamzow et al. 2006) and field experiments (Tsukamoto and Miller 1999) are evidence that compost-free bioreactors can be supplied with a variety of alcohols for a carbon source. This allows operators the flexibility to take advantage of lower cost ma-terial to adapt to different sources and fluctuating prices.
Regardless of the alcohol source, the precipitated metal-sulfide sludge may become an asset as a soil nutrient supplement, providing trace metals such as copper and zinc. Adding this sludge to soils appears to be a partial solution to bioreactor sludge management and should be investigated further, particularly where the amount of land available for sludge additions is large. However, the sludge at Leviathan contained appreciable amounts of sodium, due to the addition of sodium hydroxide base into Pond 3, which ultimately would be prob-lematic for soils. Substitution of potassium hydroxide, although more expensive, may, in total, provide a primary nutrient to the soil. It would need to be monitored to protect the agronomic quality of the soil, but could reduce the overall cost of sludge management, and should be studied further.
Conclusions and Summary
The Leviathan mine bioreactor successfully transitioned from ethanol to BD waste. Sulfate reduction was not as high as previous years, but most metals were removed below efflu-ent discharge requirements, particularly when appropriate hydraulic residence time was achieved. Difficulties with providing consistent BD waste deliver from storage tank to bio-reactor may make it less suitable than other alcohols when used in cold climates. Analysis of metal leaching in waste sludge and preliminary tests of soil mixed with sludge indicate the bioreactor metal sulfide sludge waste could be provided as a soil supplement for trace minerals.
We suggest that compost-free bioreactors and resulting sludge be further tested under dif-ferent conditions, considering local opportunities. In particular testing should determine efficiency under different alcohols and different ways in which to apply the sludge as an asset, rather than a cost.
Acknowledgements
Funding for these projects was provided by Atlantic Richfield Corporation, the Northern California chapter of the Society for Environmental Toxicology and Chemistry, and the UNR College of Agriculture, Biotechnology, and Natural Resources. We are indebted to Bentley Agrodynamics of Gardnerville, NV and to Biodiesel Solutions of Reno, NV for providing biodiesel waste material.
References
Barton, L (ed). 1995. Sulfate-reducing bacteria. Biotechnology Handbook 8. Plenum Press, New York.Clesceri LS, Greenberg AE, Eaton AD (1998) Standard methods for the examination of water and wastewater. 20th ed. Washington, DC, American Public Health AssociationLuo Q (2004) Sulfate-reducing bioreactors: efficiency of three carbon sources and removal of arsenic and selenium from mine water. Thesis, University of Nevada, RenoTsukamoto T, Miller GC (1999) Methanol as a carbon source for bioremediation of acid mine drainage. Water Research 33: 1365-1370
1110
Lappeenranta, Finland IMWA 2017Mine Water and Circular Economy
Wolkersdorfer C, Sartz L, Sillanpää M, Häkkinen A (Editors)
Tsukamoto T, Miller GC (2006) Data summary report for bioreactors at the Leviathan mine Aspen Seep, 2006. University of Nevada, Reno. Prepared for Atlantic Richfield CoUS EPA (2006) Compost-free bioreactor treatment of acid rock drainage, Leviathan mine, California. Innovative Technology Evaluation Report. EPA/540/R-06/009., US Environmental Protection AgencyZamzow K, Tsukamoto T, Miller GC (2006) Waste from biodiesel manufacturing as an inexpensive carbon source for bioreactors treating acid mine drainage. Mine Water Environ 25: 163-170Zamzow K (2007) Microbial communities utilizing biodiesel waste and ethanol in treatment of acid mine drainage. Dissertation. University of Nevada, Reno
1111
Lappeenranta, Finland IMWA 2017Mine Water and Circular Economy
Wolkersdorfer C, Sartz L, Sillanpää M, Häkkinen A (Editors)
A new approach to recover dissolved metals in AMD by two-step pH control on the neutralization method
Nobuyuki Masuda 1, Radmila Markovic 2, Masahiko Bessho 1, Dragana Bozic 2, Ljubisa Obradovic 2, Vladan Marinkovic 2, Daizo Ishiyama, 1, Zoran Stevanovic 2
1 Akita University, Graduate School of International Sciences, 1-1 Tegata Gakuen-cho, Akita City, Japan, 010-8502, Japan, [email protected]
2Mining and Metallurgy Institute Bor, 35 Zeleni Bulevar, 19210 Bor, Republic of Serbia
Abstract A new approach is proposed to recover iron and copper separately by controlling the pH using a two-step neutralization process. Iron sludge and copper sludge can be recovered separately. It is expected that copper sludge will dissolve in sulfuric acid to feed to solvent extraction process or feed directly to an existing copper smelter. Effluents from wastes and river water samplings were carried out several times from 2015 and three point’s AMDs were selected to treat and recover the metals in Bor mine area in Serbia. The experiment results suggested the proposed process is promising.
Key words AMD, neutralization, metal recovery, copper mine, pH control
Introduction
AMD treatment is a serious matter for mining industry especially for mines that have been abandoned or operating long-term. Substances such as accumulated waste materials, flo-tation tailings and underground cavities generate AMD which contains various metal el-ements. Such AMD should be treated by removing the contained hazardous metals before they flow out of the mine area. However, the cost for such treatment has long been a heavy burden on the mining industry.
Bor mining complex is located 230km south-east of Beograd, Serbia. The mine drainage water in the area is released to the downstream without any treatment through tributaries of Danube River. It is suggested that the mine drainage water in Bor mining area gives en-vironmental impact to the river water of Danube River (UNEP 2002).
There are two major mines and copper smelter/refinery. The Bor underground mine has a history of more than 100 years, and Bor open-pit mining opened in 1923. The total amount of ore mined from the open-pit was approximately 100million tons with the waste of ap-proximately 170 million tons. There are other mines which are the Veliki Krivelj open-pit mine and the Cerovo open-pit mine. Waste rocks, low grade ores and flotation tailings are left in surrounding areas, causing environmental problems. The mining influenced water including waste water from the copper smelter and refinery plant flow into Krivelj and Bor Rivers, then down to Danube. Not only the Serbian government and municipal people but also international organizations have strong concern to such environmental situation (JICA 2008, S.Stojadinovic et al. 2011).
Previous research conducted between 2011 and 2013, financed by Japan International Co-operation Agency (JICA) and Japan Society for the Promotion of Science (JSPS), showed
1112
Lappeenranta, Finland IMWA 2017Mine Water and Circular Economy
Wolkersdorfer C, Sartz L, Sillanpää M, Häkkinen A (Editors)
that the environmental impacts to the river water of River Danube caused by the mine drainage and various mine wastes are not clear. However, serious environmental impacts were recognized in Bor mining area to the downstream basin by 30 km along Bela River. There exists flotation tailings, waste rocks and AMD with relatively high content of copper in the mine area(N.Masuda et al. 2012). In this research, a new approach is proposed to treat the AMD effectively by recovering toxic but valuable metals.
This research is a part of the project “Research on the integration system of spatial environ-ment analyses and advanced metal recovery to ensure sustainable resource development”, planned from 2015 to 2019, conducted by Akita University, Japan Space System and Mit-sui Mineral Development Engineering Co., Ltd. together with the Mining and Metallurgy Institute of Bor, funded by JST (Japan Science and Technology Agency) and JICA (Japan International Cooperative Agency).
Methods
Sampling and chemical analysis
Fig. shows a schematic map of the river system in the Bor area, explaining the mine facil-ities along the river which may be affecting the water quality. P-[number] s are the sam-pling points of the river water. The 11 bold numbers (red) are the sampling points in this research. Other points (black) were sampled in previous research. Previous research has shown that the water in these 11 sampling points contain copper exceeding 10mg/L. Points of the P-[number] in boxes were selected as target AMD for this research to treat and recov-er copper and iron. The river flows from left to right and up to River Danube, shown at the upper right corner.
Tab.1 shows the example results of chemical analysis of the 11 points samples, taken in August 2016. Samples were collected and analysed four times in 2016. The pH and metal contents differ each time, depending on the time of sampling; however, the tendency is clear that the water with higher content of metals always derived from the same sampling points.
P-1 is the most up-stream sampling point in Veriki Krivelj River, and the sampled water is not contaminated. P-2 is the branch of the Veriki Krivelj River, located down-stream of over burden damp site. The over burden contains oxidized copper minerals as well as pyrite. This suggests that the seepage water from the dump contains copper. Tab.1 shows that more than 90mg/L of copper and 30mg/t of iron are contained at this specific point. P-3 is a sample of pumped-up water from the underground mine operation site, which also flow down to Veriki Krivelj River. It is low in pH and contains more than 100mg/L of copper, 361mg/L of iron, 23mg/L of manganese and more than 0.1mg/L of arsenic. P-6-1 is very low in pH and the highest content of iron, copper, zinc and arsenic in all the sampling points. However, all this water runs down from the metallurgical plants, such as smelter and refinery of the mine, and flows down to Bor River. It is possible that the plants release the waste water directly into the drainage channel without any treatment in their operation. P-11 also has higher content of metals; more than 500mg/L of iron, 50mg/L of copper, and the content
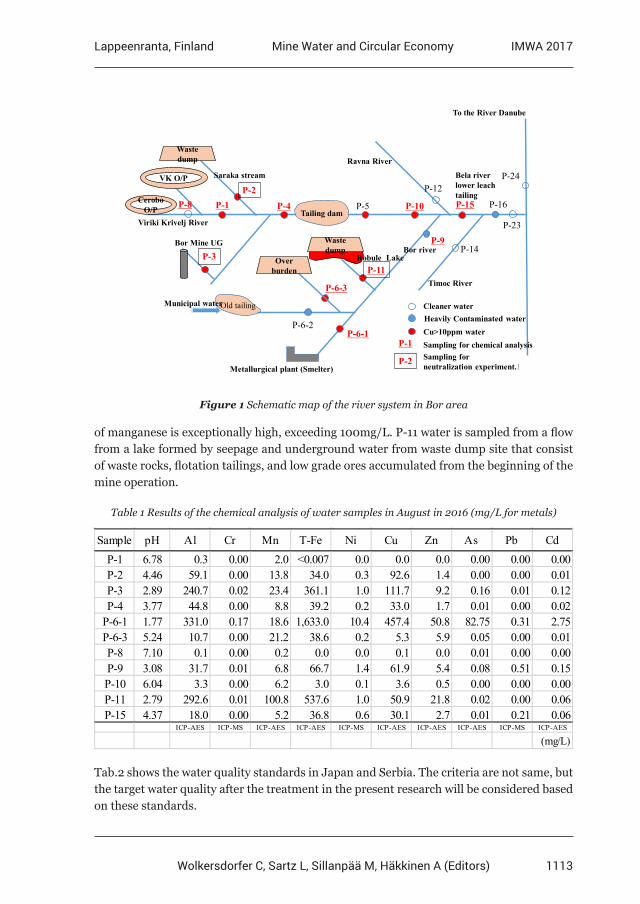
1113
Lappeenranta, Finland IMWA 2017Mine Water and Circular Economy
Wolkersdorfer C, Sartz L, Sillanpää M, Häkkinen A (Editors)
1
Old tailing
Tailing dam
Waste dump
Over burden
Waste dump
Bor Mine UG
Robule Lake
VK O/P
Metallurgical plant (Smelter)P-2
P-1P-8 P-5
P-11
P-4
P-3
P-12
P-6-3
P-10
P-9
P-6-2P-6-1
P-15
P-14
P-16
P-23
P-24
To the River Danube
Timoc River
Viriki Krivelj River
Ravna River
Bor river
Municipal water
Saraka stream Bela river lower leach tailing
Heavily Contaminated waterCleaner water
Cu>10ppm water
P-2
Sampling for neutralization experiment.
CeroboO/P
P-1 Sampling for chemical analysis
Figure 1 Schematic map of the river system in Bor area
of manganese is exceptionally high, exceeding 100mg/L. P-11 water is sampled from a flow from a lake formed by seepage and underground water from waste dump site that consist of waste rocks, flotation tailings, and low grade ores accumulated from the beginning of the mine operation.
Table 1 Results of the chemical analysis of water samples in August in 2016 (mg/L for metals)
Sample pH Al Cr Mn T-Fe Ni Cu Zn As Pb CdP-1 6.78 0.3 0.00 2.0 <0.007 0.0 0.0 0.0 0.00 0.00 0.00P-2 4.46 59.1 0.00 13.8 34.0 0.3 92.6 1.4 0.00 0.00 0.01P-3 2.89 240.7 0.02 23.4 361.1 1.0 111.7 9.2 0.16 0.01 0.12P-4 3.77 44.8 0.00 8.8 39.2 0.2 33.0 1.7 0.01 0.00 0.02
P-6-1 1.77 331.0 0.17 18.6 1,633.0 10.4 457.4 50.8 82.75 0.31 2.75P-6-3 5.24 10.7 0.00 21.2 38.6 0.2 5.3 5.9 0.05 0.00 0.01P-8 7.10 0.1 0.00 0.2 0.0 0.0 0.1 0.0 0.01 0.00 0.00P-9 3.08 31.7 0.01 6.8 66.7 1.4 61.9 5.4 0.08 0.51 0.15P-10 6.04 3.3 0.00 6.2 3.0 0.1 3.6 0.5 0.00 0.00 0.00P-11 2.79 292.6 0.01 100.8 537.6 1.0 50.9 21.8 0.02 0.00 0.06P-15 4.37 18.0 0.00 5.2 36.8 0.6 30.1 2.7 0.01 0.21 0.06
ICP-AES ICP-MS ICP-AES ICP-AES ICP-MS ICP-AES ICP-AES ICP-AES ICP-MS ICP-AES
(mg/L)
Tab.2 shows the water quality standards in Japan and Serbia. The criteria are not same, but the target water quality after the treatment in the present research will be considered based on these standards.
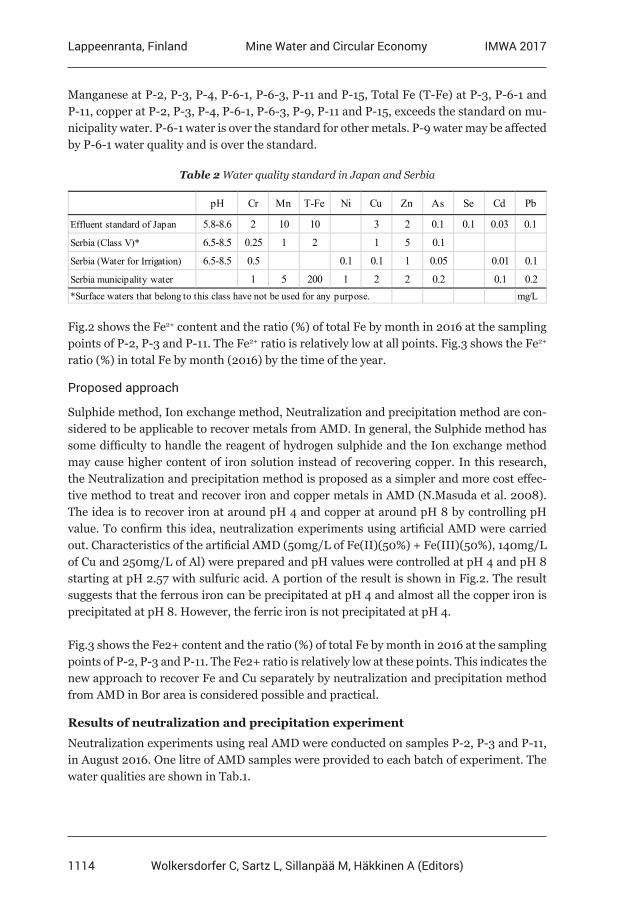
1114
Lappeenranta, Finland IMWA 2017Mine Water and Circular Economy
Wolkersdorfer C, Sartz L, Sillanpää M, Häkkinen A (Editors)
Manganese at P-2, P-3, P-4, P-6-1, P-6-3, P-11 and P-15, Total Fe (T-Fe) at P-3, P-6-1 and P-11, copper at P-2, P-3, P-4, P-6-1, P-6-3, P-9, P-11 and P-15, exceeds the standard on mu-nicipality water. P-6-1 water is over the standard for other metals. P-9 water may be affected by P-6-1 water quality and is over the standard.
Table 2 Water quality standard in Japan and Serbia
pH Cr Mn T-Fe Ni Cu Zn As Se Cd Pb
Effluent standard of Japan 5.8-8.6 2 10 10 3 2 0.1 0.1 0.03 0.1
Serbia (Class V)* 6.5-8.5 0.25 1 2 1 5 0.1
Serbia (Water for Irrigation) 6.5-8.5 0.5 0.1 0.1 1 0.05 0.01 0.1
Serbia municipality water 1 5 200 1 2 2 0.2 0.1 0.2*Surface waters that belong to this class have not be used for any purpose. mg/L
Fig.2 shows the Fe2+ content and the ratio (%) of total Fe by month in 2016 at the sampling points of P-2, P-3 and P-11. The Fe2+ ratio is relatively low at all points. Fig.3 shows the Fe2+ ratio (%) in total Fe by month (2016) by the time of the year.
Proposed approach
Sulphide method, Ion exchange method, Neutralization and precipitation method are con-sidered to be applicable to recover metals from AMD. In general, the Sulphide method has some difficulty to handle the reagent of hydrogen sulphide and the Ion exchange method may cause higher content of iron solution instead of recovering copper. In this research, the Neutralization and precipitation method is proposed as a simpler and more cost effec-tive method to treat and recover iron and copper metals in AMD (N.Masuda et al. 2008). The idea is to recover iron at around pH 4 and copper at around pH 8 by controlling pH value. To confirm this idea, neutralization experiments using artificial AMD were carried out. Characteristics of the artificial AMD (50mg/L of Fe(II)(50%) + Fe(III)(50%), 140mg/L of Cu and 250mg/L of Al) were prepared and pH values were controlled at pH 4 and pH 8 starting at pH 2.57 with sulfuric acid. A portion of the result is shown in Fig.2. The result suggests that the ferrous iron can be precipitated at pH 4 and almost all the copper iron is precipitated at pH 8. However, the ferric iron is not precipitated at pH 4.
Fig.3 shows the Fe2+ content and the ratio (%) of total Fe by month in 2016 at the sampling points of P-2, P-3 and P-11. The Fe2+ ratio is relatively low at these points. This indicates the new approach to recover Fe and Cu separately by neutralization and precipitation method from AMD in Bor area is considered possible and practical.
Results of neutralization and precipitation experiment
Neutralization experiments using real AMD were conducted on samples P-2, P-3 and P-11, in August 2016. One litre of AMD samples were provided to each batch of experiment. The water qualities are shown in Tab.1.
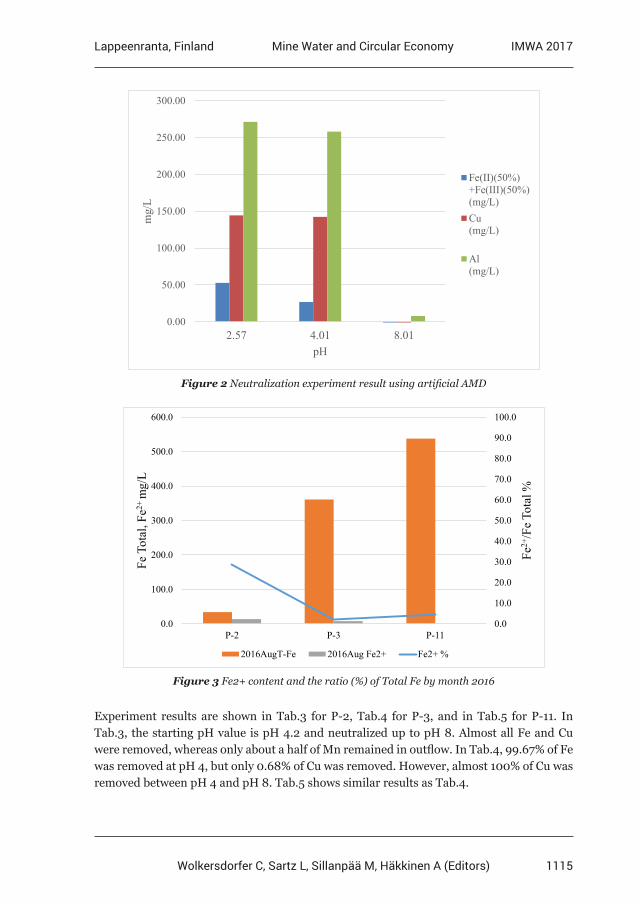
1115
Lappeenranta, Finland IMWA 2017Mine Water and Circular Economy
Wolkersdorfer C, Sartz L, Sillanpää M, Häkkinen A (Editors)
0.00
50.00
100.00
150.00
200.00
250.00
300.00
2.57 4.01 8.01
mg/
L
pH
Fe(II)(50%)+Fe(III)(50%)(mg/L)Cu(mg/L)
Al(mg/L)
Figure 2 Neutralization experiment result using artificial AMD
0.0
10.0
20.0
30.0
40.0
50.0
60.0
70.0
80.0
90.0
100.0
0.0
100.0
200.0
300.0
400.0
500.0
600.0
P-2 P-3 P-11
Fe2+
/Fe
Tota
l %
Fe T
otal
, Fe2+
mg/
L
2016AugT-Fe 2016Aug Fe2+ Fe2+ %
Figure 3 Fe2+ content and the ratio (%) of Total Fe by month 2016
Experiment results are shown in Tab.3 for P-2, Tab.4 for P-3, and in Tab.5 for P-11. In Tab.3, the starting pH value is pH 4.2 and neutralized up to pH 8. Almost all Fe and Cu were removed, whereas only about a half of Mn remained in outflow. In Tab.4, 99.67% of Fe was removed at pH 4, but only 0.68% of Cu was removed. However, almost 100% of Cu was removed between pH 4 and pH 8. Tab.5 shows similar results as Tab.4.
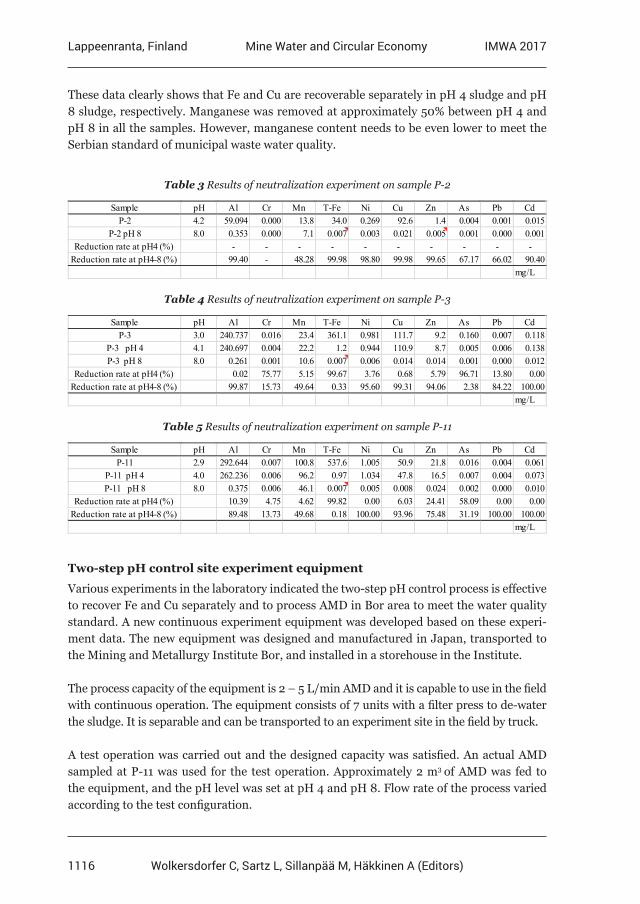
1116
Lappeenranta, Finland IMWA 2017Mine Water and Circular Economy
Wolkersdorfer C, Sartz L, Sillanpää M, Häkkinen A (Editors)
These data clearly shows that Fe and Cu are recoverable separately in pH 4 sludge and pH 8 sludge, respectively. Manganese was removed at approximately 50% between pH 4 and pH 8 in all the samples. However, manganese content needs to be even lower to meet the Serbian standard of municipal waste water quality.
Table 3 Results of neutralization experiment on sample P-2
Sample pH Al Cr Mn T-Fe Ni Cu Zn As Pb CdP-2 4.2 59.094 0.000 13.8 34.0 0.269 92.6 1.4 0.004 0.001 0.015
P-2 pH 8 8.0 0.353 0.000 7.1 0.007 0.003 0.021 0.005 0.001 0.000 0.001Reduction rate at pH4 (%) - - - - - - - - - -
Reduction rate at pH4-8 (%) 99.40 - 48.28 99.98 98.80 99.98 99.65 67.17 66.02 90.40mg/L
Table 4 Results of neutralization experiment on sample P-3
Sample pH Al Cr Mn T-Fe Ni Cu Zn As Pb CdP-3 3.0 240.737 0.016 23.4 361.1 0.981 111.7 9.2 0.160 0.007 0.118
P-3 pH 4 4.1 240.697 0.004 22.2 1.2 0.944 110.9 8.7 0.005 0.006 0.138P-3 pH 8 8.0 0.261 0.001 10.6 0.007 0.006 0.014 0.014 0.001 0.000 0.012
Reduction rate at pH4 (%) 0.02 75.77 5.15 99.67 3.76 0.68 5.79 96.71 13.80 0.00Reduction rate at pH4-8 (%) 99.87 15.73 49.64 0.33 95.60 99.31 94.06 2.38 84.22 100.00
mg/L
Table 5 Results of neutralization experiment on sample P-11
Sample pH Al Cr Mn T-Fe Ni Cu Zn As Pb CdP-11 2.9 292.644 0.007 100.8 537.6 1.005 50.9 21.8 0.016 0.004 0.061
P-11 pH 4 4.0 262.236 0.006 96.2 0.97 1.034 47.8 16.5 0.007 0.004 0.073P-11 pH 8 8.0 0.375 0.006 46.1 0.007 0.005 0.008 0.024 0.002 0.000 0.010
Reduction rate at pH4 (%) 10.39 4.75 4.62 99.82 0.00 6.03 24.41 58.09 0.00 0.00Reduction rate at pH4-8 (%) 89.48 13.73 49.68 0.18 100.00 93.96 75.48 31.19 100.00 100.00
mg/L
Two-step pH control site experiment equipment
Various experiments in the laboratory indicated the two-step pH control process is effective to recover Fe and Cu separately and to process AMD in Bor area to meet the water quality standard. A new continuous experiment equipment was developed based on these experi-ment data. The new equipment was designed and manufactured in Japan, transported to the Mining and Metallurgy Institute Bor, and installed in a storehouse in the Institute.
The process capacity of the equipment is 2 – 5 L/min AMD and it is capable to use in the field with continuous operation. The equipment consists of 7 units with a filter press to de-water the sludge. It is separable and can be transported to an experiment site in the field by truck.
A test operation was carried out and the designed capacity was satisfied. An actual AMD sampled at P-11 was used for the test operation. Approximately 2 m3 of AMD was fed to the equipment, and the pH level was set at pH 4 and pH 8. Flow rate of the process varied according to the test configuration.
1117
Lappeenranta, Finland IMWA 2017Mine Water and Circular Economy
Wolkersdorfer C, Sartz L, Sillanpää M, Häkkinen A (Editors)
Sludge, recovered on the newly developed two-step pH control experiment equipment, was analysed. Preliminary results are shown in Tab. 6. The results indicate that the sludge is clearly separated into two; one rich in iron and the other rich in copper. The concentration of Cu 1.1% in the sludge at pH 8 is comparable to the copper ore in other copper mines around the world. The copper content of 0.29% in the sludge at pH 4 is reduced and it is possible to move to the sludge at pH 8 by optimizing the two-step pH value and controlling the pH more carefully. As is distributed in the sludge at pH 4 and 8.
Table 6 Preliminary results of sludge analysis
Element pH 4 pH 8Fe (%) 23.43 1.32 ICP-AESCu (%) 0.29 1.1 ICP-AES
As (mg/kg) 12 8 ICP-MS
Conclusions
The experiment results suggest that the two-step pH control neutralization and precipita-tion method is effective to recover iron and copper separately in the sludge generated along the process and is reliable in processing the water quality to a requited level.
It was expected the copper concentration in the sludge recovered by the proposed process will be comparable to present-day copper ore in other operating mines around the world.
To optimize the two-step, pH is important to increase recovery ratio of copper at the second step. Laboratory experiments play an important role in finding the optimum conditions, which may vary by AMD quality, and site by site.
More precise and practical data will be acquired and confirmed by continuous experiments using the newly developed on-site experiment equipment.
Water sampling and analyses will continue to investigate whether water quality changes by factors such as season, weather and mine operation conditions.
Manganese reduction process should be considered on top of this two-step pH control pro-cess.
Acknowledgements
This research is carried out as a part of the project titled ”Research on the integration system of spatial environment analyses and advanced metal recovery to ensure sustainable resource development” planned from 2015 to 2019, conducted by Akita University, Japan Space System and Mitsui Mineral Development Engineering Co., Ltd. together with the Mining and Metallurgy Institute of Bor, funded by JST (Japan Science and Technology Agency) and JICA (Japan International Cooperative Agency). Authors appreciate the researchers and technicians in the Mining and Metallurgy Bor for their supportive works on sampling, analysis and various kinds of experiments done in the field and the Institute.
1118
Lappeenranta, Finland IMWA 2017Mine Water and Circular Economy
Wolkersdorfer C, Sartz L, Sillanpää M, Häkkinen A (Editors)
References
UNEP/Post-Conflict Assessment Unit (2002) Assessment of Environmental Monitoring Capacities in Bor Mission ReportJICA (2008) Final Report of the Master Plan for Mining Promotion in Republic of SerbiaN.Masuda, K.Hashimoto, H.Asano, E.Matsushima, S.Yamaguchi (2008) Test results of a newly proposed neutralization process to reduce and utilize the sludge, Minerals Engineering Vol.21:310-316Sasa Stojadinovic, Miodrag Zikic, Radoje Pantovic (2011) RTB Bor: The Comeback of Serbian Copper. Engineering and Mining Journal Vol 212, No.8:102-107N.Masuda, D.Ishiyama, A.Shibayama, Y.Takasaki, H.Kawaraya, H.Sato, Z.Stevanovic, L.Obradovic (2012) Study on the mining influenced water and a possibility to extract copper metal from tailings deposition in Bor, Serbia, IMWA2012 Proceedings pp 637-642N.Masuda, D.Ishiyama, A.Shibayama, M.Bessho, K.Haga, S.Wakasa (2016) An International cooperative research project to solve environmental problems by integrating multiple disciplines in copper mining areas in Serbia, Copper 2016, Kobe, Japan
1119
Lappeenranta, Finland IMWA 2017Mine Water and Circular Economy
Wolkersdorfer C, Sartz L, Sillanpää M, Häkkinen A (Editors)
Biofouling of reverse osmosis membranes in a process water treatment system in a gold mine
Minna Pihlajakuja1, Ville Rantanen1, and Maija Vidqvist1
Industrial Water ltd., Moreenikatu 2 B, 04600 Mäntsälä, Finland
Abstract Bacterial biofilms commonly cause biofouling in reverse osmosis (RO) membranes. The biofilm confers a protective environment to the bacteria, improving their tolerance against stress factors. In this study, bacterial biofouling was studied in a full-scale RO system, producing process water for a Finnish gold mine. Raw water bacterial levels corresponded to levels in natural waters. During normal RO operation, bacteria attached to the membrane did not detach to the concentrate water. In contrast, during washing, a high bacterial disperse from the membrane biofilm was observed. Bacterial community analysis suggests a dominant bacterium to be a biofouling indicator in this RO system.
Key words biofilm, mine water treatment, reverse osmosis
Introduction
Reverse osmosis (RO) and nano filtration (NF) are emerging techniques in mining for treat-ment of waste waters and recycling of process waters (Acheampong 2010). Nevertheless, fouling is a typical problem in RO systems. Salt precipitation, mainly of CaSO4 and CaCO2, on RO membranes is commonly considered as a fouling mechanism. Various water analyses and modelling software are used to estimate and avoid inorganic scaling conditions. Anti-scalant, a chemical that prevents calcium precipitation, may also be added to the feed water to prevent the effects of scaling (Jiang 2017).
Biofouling differs from calcium precipitation. The risk of biofouling cannot be exactly cal-culated. It is mainly caused by bacteria which multiply, implying that a single bacterium is able to cause biofouling. The RO membrane is a favourable surface for bacterial growth; first, nutrient concentration is higher near the membrane due to concentration polarization. Second, water flow in the spiral membrane module is laminar and thus no high shear forces occur. Third, water flow continuously brings new nutrients for the bacteria to feed on. Anti-scalants are usually based on phosphorous, which is often the limiting nutrient for bacteria in waters (Vrouwenvelder 2000).
Bacteria form slimy, complex communities called biofilms, onto surfaces. The slime com-poses of extracellular polymeric substances (EPS) excreted by the bacteria. EPS consists predominantly of extracellular polysaccharides, and to a lesser extent of proteins, lipids, and DNA (Flemming 2010). The cell density is high in biofilms, in which the bacteria are covered by EPS. Bacteria tolerate various stress factors substantially better in biofilms than as planktonic, free-swimming cells. For instance, bacteria living in biofilms may withstand biocides, toxic compounds, nutrient deprivation, as well as fluctuation in temperature and pH, among others (Garrett 2008).
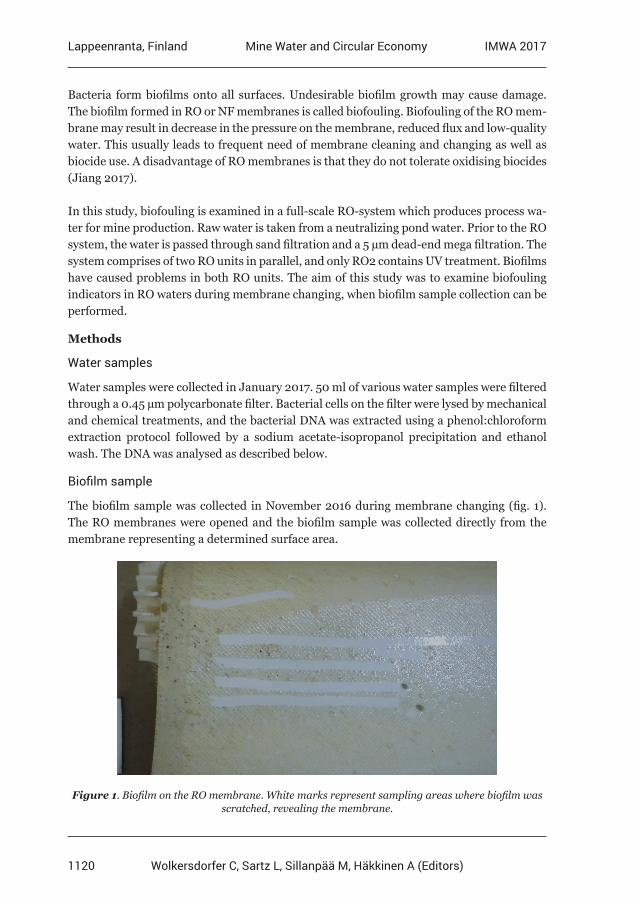
1120
Lappeenranta, Finland IMWA 2017Mine Water and Circular Economy
Wolkersdorfer C, Sartz L, Sillanpää M, Häkkinen A (Editors)
Bacteria form biofilms onto all surfaces. Undesirable biofilm growth may cause damage. The biofilm formed in RO or NF membranes is called biofouling. Biofouling of the RO mem-brane may result in decrease in the pressure on the membrane, reduced flux and low-quality water. This usually leads to frequent need of membrane cleaning and changing as well as biocide use. A disadvantage of RO membranes is that they do not tolerate oxidising biocides (Jiang 2017).
In this study, biofouling is examined in a full-scale RO-system which produces process wa-ter for mine production. Raw water is taken from a neutralizing pond water. Prior to the RO system, the water is passed through sand filtration and a 5 µm dead-end mega filtration. The system comprises of two RO units in parallel, and only RO2 contains UV treatment. Biofilms have caused problems in both RO units. The aim of this study was to examine biofouling indicators in RO waters during membrane changing, when biofilm sample collection can be performed.
Methods
Water samples
Water samples were collected in January 2017. 50 ml of various water samples were filtered through a 0.45 µm polycarbonate filter. Bacterial cells on the filter were lysed by mechanical and chemical treatments, and the bacterial DNA was extracted using a phenol:chloroform extraction protocol followed by a sodium acetate-isopropanol precipitation and ethanol wash. The DNA was analysed as described below.
Biofilm sample
The biofilm sample was collected in November 2016 during membrane changing (fig. 1). The RO membranes were opened and the biofilm sample was collected directly from the membrane representing a determined surface area.
Figure 1. Biofilm on the RO membrane. White marks represent sampling areas where biofilm was scratched, revealing the membrane.
1121
Lappeenranta, Finland IMWA 2017Mine Water and Circular Economy
Wolkersdorfer C, Sartz L, Sillanpää M, Häkkinen A (Editors)
Total bacterial levels were measured by quantitative polymerase chain reaction (qPCR) us-ing broad range primers developed by Nadkarni et al. (2002). The bacterial community was studied by next-generation sequencing (NGS) covering the variable V3-V4 region of the 16S rRNA gene (StarSEQ GmbH). In addition, the biofilm samples were sequenced from V1-V8 covering the entire 16S gene (GATC Biotech). The NGS data was processed with the USEARCH program. A 97 % similarity levels for operational taxonomic units (OTUs) were used for clustering by the UPARSE-OTU algorithm (Edgar 2013). Identification of the OTUs was based on the RDB pipeline classification (Wang et al. 2007).
Results
Raw water quality is presented in Table 1. Raw water have huge amount of nitrogen. Both RO system use antiscalant containing phosphate. Phosphorus in raw water remained below detection, but RO concentrate had 1 mg/L phosphorus. Before the antiscalant feed phos-phorus is a limiting nutrient and after the antiscalant feed, carbon (TOC) is the limiting nutrient.
Table 1 Nutrients in raw water.
pH 8.4
TOC 12 mg/L
NO3-N 10 mg/L
NH4-N 20 mg/L
P <0.02 mg/L
Total bacterial levels measured by qPCR broad range primers are presented in figure 2. The bacterial levels of the raw water corresponded to typical bacterial concentrations in Finn-ish lakes and rivers. Sand filtration decreased bacterial levels below 1∙106 cells/ml. Mega filtration did not affect the concentration of bacteria. No change in the bacterial levels was observed in the pipe between the mega filter and the RO1 inlet, while the bacterial concen-tration decreased below 3∙104 cells/ml in the RO2 water line due to UV treatment.
When operating with a 50 % recovery, bacterial levels should multiply by factor of 2 from RO inlets to RO concentrates. As bacteria levels increased only by factor of 2, bacteria at-tached to the membrane did not detach from the membrane to the concentrate water during normal RO operation. In contrast, after permeate reverse direction cleaning, bacterial levels reached almost 1∙108 cells/ml, which implies that high concentrations of bacteria dispersed from the RO membrane biofilm to the permeate water. In the permeate water before reverse direction cleaning bacterial levels remained below 1∙104 cells/ml.
Figure 3 shows the bacterial community analysis by NGS of the waters and biofilms of the RO-system. The raw water community was dominated by four bacterial genera: Lutibac-ter within Flavobacteria, Thiobacillus within β-proteobacteria and Azotobacter and Pseu-domonas within γ-proteobacteria. Flavobacterium within Flavobacteria was detected in raw water at a 0.03 % proportion. The filtrations and RO membrane did not significantly
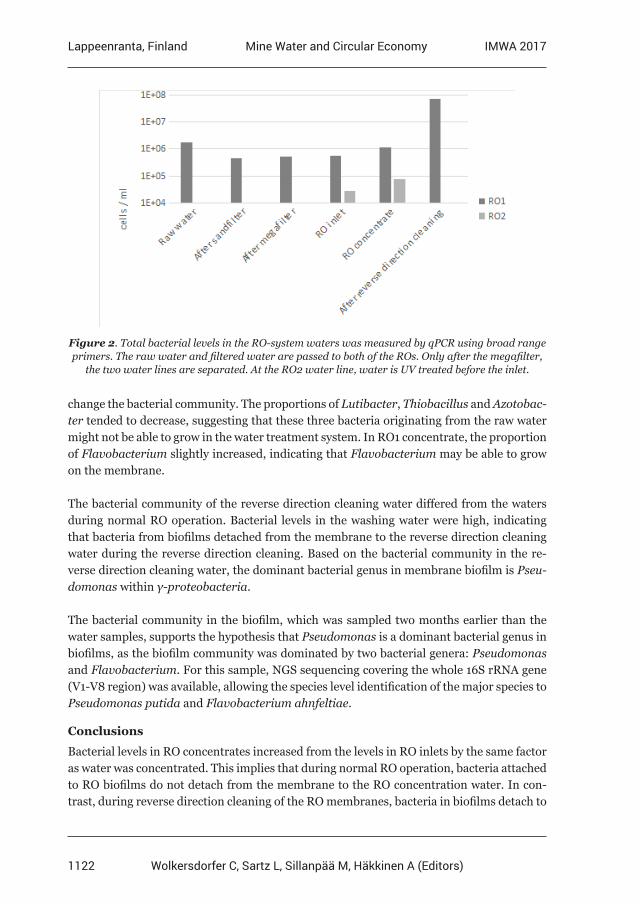
1122
Lappeenranta, Finland IMWA 2017Mine Water and Circular Economy
Wolkersdorfer C, Sartz L, Sillanpää M, Häkkinen A (Editors)
change the bacterial community. The proportions of Lutibacter, Thiobacillus and Azotobac-ter tended to decrease, suggesting that these three bacteria originating from the raw water might not be able to grow in the water treatment system. In RO1 concentrate, the proportion of Flavobacterium slightly increased, indicating that Flavobacterium may be able to grow on the membrane.
The bacterial community of the reverse direction cleaning water differed from the waters during normal RO operation. Bacterial levels in the washing water were high, indicating that bacteria from biofilms detached from the membrane to the reverse direction cleaning water during the reverse direction cleaning. Based on the bacterial community in the re-verse direction cleaning water, the dominant bacterial genus in membrane biofilm is Pseu-domonas within γ-proteobacteria.
The bacterial community in the biofilm, which was sampled two months earlier than the water samples, supports the hypothesis that Pseudomonas is a dominant bacterial genus in biofilms, as the biofilm community was dominated by two bacterial genera: Pseudomonas and Flavobacterium. For this sample, NGS sequencing covering the whole 16S rRNA gene (V1-V8 region) was available, allowing the species level identification of the major species to Pseudomonas putida and Flavobacterium ahnfeltiae.
Conclusions
Bacterial levels in RO concentrates increased from the levels in RO inlets by the same factor as water was concentrated. This implies that during normal RO operation, bacteria attached to RO biofilms do not detach from the membrane to the RO concentration water. In con-trast, during reverse direction cleaning of the RO membranes, bacteria in biofilms detach to
Figure 2. Total bacterial levels in the RO-system waters was measured by qPCR using broad range primers. The raw water and filtered water are passed to both of the ROs. Only after the megafilter,
the two water lines are separated. At the RO2 water line, water is UV treated before the inlet.
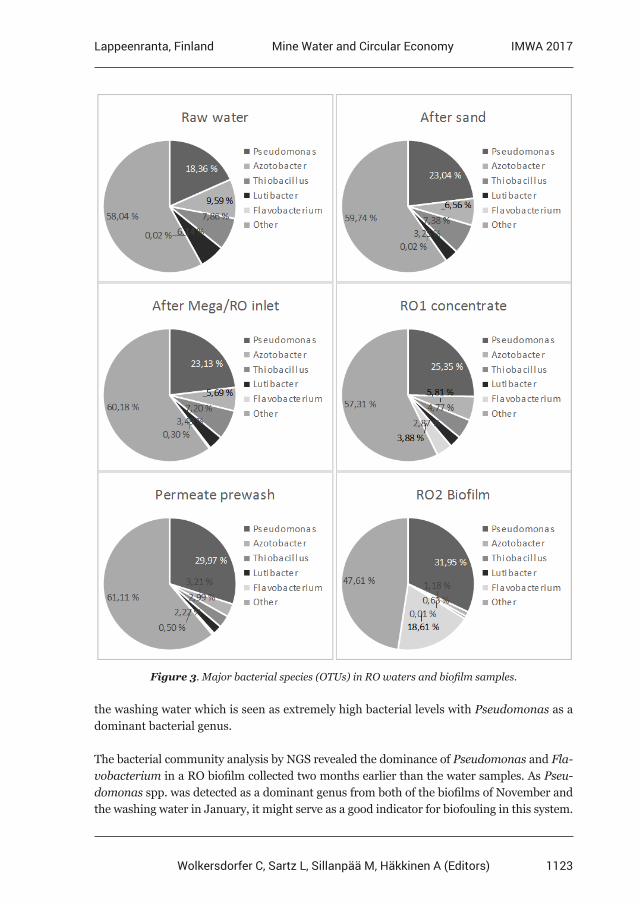
1123
Lappeenranta, Finland IMWA 2017Mine Water and Circular Economy
Wolkersdorfer C, Sartz L, Sillanpää M, Häkkinen A (Editors)
the washing water which is seen as extremely high bacterial levels with Pseudomonas as a dominant bacterial genus.
The bacterial community analysis by NGS revealed the dominance of Pseudomonas and Fla-vobacterium in a RO biofilm collected two months earlier than the water samples. As Pseu-domonas spp. was detected as a dominant genus from both of the biofilms of November and the washing water in January, it might serve as a good indicator for biofouling in this system.
Figure 3. Major bacterial species (OTUs) in RO waters and biofilm samples.
1124
Lappeenranta, Finland IMWA 2017Mine Water and Circular Economy
Wolkersdorfer C, Sartz L, Sillanpää M, Häkkinen A (Editors)
References
Acheampong MA, Meulepas RJW, Lens PNL (2010) Removal of heavy metals and cyanidefrom gold mine wastewater. Journal of chemical technology and biotechnology 85(5):590–613, doi: 10.1002/jctb.2358Edgar RC (2013) UPARSE: Highly accurate OTU sequences from microbial amplicon reads. Nature Methods 10(10):996-8. doi: 10.1038/nmeth.2604,Flemming HC, Wingender J (2010) The biofilm matrix. Nature reviews Microbiology 8:623-633Garrett TR, Bhakoo M, Zhang Z (2008) Bacterial adhesion and biofilms on surfaces. Progress in Natural Science 18:1049–1056, doi:10.1016/j.pnsc.2008.04.001Jiang S, Li Y, Ladewig BP (2017) A review of reverse osmosis membrane fouling and control strategies. Science of the Total Environment 595:567–583Nadkarni MA, Martin FE, Jacques JA, Hunter (2002) Determination of bacterial load by real- time PCR using a broad-range (universal) probe and primers set. Microbiology 148:257–266, doi: 10.1099/00221287-148-1-257Vrouwenvelder JS, Manolarakis SA, Veenendaal HR, van der Kooij D (2000) Biofouling potential of chemicals used for scale control in RO and NF membranes. Desalination 132:1-10, doi: 10.1016/S0011-9164(00)00129-6Wang Q, Garrity GM, Tiedje JM, Cole JR (2007) Naïve Bayesian Classifier for Rapid Assignment of rRNA Sequences into the New Bacterial Taxonomy. Appl Environ Microbiol. 73(16):5261- 5267; doi: 10.1128/AEM.00062-07
1125
Lappeenranta, Finland IMWA 2017Mine Water and Circular Economy
Wolkersdorfer C, Sartz L, Sillanpää M, Häkkinen A (Editors)
Treatment of historical mining waste using different incineration ashes
Sanna Ekblom1, Lotta Sartz1,2, Mattias Bäckström1
1Man-Technology-Environment Research Centre, Örebro University, Fakultetsgatan 1, 701 82 Örebro, Sweden, [email protected]
2Bergskraft Bergslagen AB, Fordonsgatan 4, 692 71 Kumla, Sweden, [email protected]
Abstract ARD from historical mining sites in Sweden is a major source for trace elements to surface waters. In order to be able to treat a large portion of these sites cost effective reclamation methods is necessary. Incineration ashes were used in leaching tests to study their effect on a highly weathered mining waste in order to neutralize acidity and immobilize trace elements.This study shows that ashes can be used to increase pH and decrease trace element mobility from oxidized mining waste. Increased leaching of Cl, Mo and Sb, however, needs to be considered for waste fuel ashes before use.
Key words Antimony, molybdenum, chloride, leaching
Introduction
Mining has been ongoing for centuries in mid Sweden and has had an impact on the envi-ronment. Waste deposits with historic sulphidic mining waste are highly weathered, gener-ating acid rock drainage (ARD) with high concentrations of trace elements such as Cu, Zn, Pb and Cd.
Mainly two processes generate acidity and trace elements: (1) sulphide mineral oxidation and (2) hydrolysis of Fe3+, Al3+ and Mn2+ (Akcil and Koldas 2006). Pyrite (FeS2) is the main acid producing sulphide mineral. Oxidation occurs when pyrite reacts with dissolved oxy-gen producing acidity as well as dissolved ferrous and sulphate ions. When pH drops, oxi-dation of ferrous iron to ferric iron is accelerated by microbiological activity. Ferric iron will cause oxidation of pyrite to proceed during anaerobic conditions.
Other common sulphide minerals in mining waste are galena (PbS) and sphalerite (ZnS). Both galena and sphalerite are characterized as non-acid producing minerals, but oxidation and dissolution in acidic conditions will mobilize trace elements.
Neutralisation of ARD with alkaline additives would result in reduced mobility of trace elements (Pb, Zn, Cu, Cd). Major elements such as Fe and Al, frequently found dissolved in the acidic water, play an important role in metal immobilization. When pH increas-es, formation of iron- and aluminium hydroxide, hydroxysulphate and hydroxycarbonate minerals are favoured, which will act as sorbents for cationic metals (Bigham et al. 2000). Commercial materials such as limestone, slaked lime or sodium carbonate have been used as neutralizing agents with good results but it is rather costly and consumes natural re-sources. By reusing alkaline by-products, the cost would rapidly decrease and two envi-ronmental problems could be solved at the same time. Many studies have been performed
1126
Lappeenranta, Finland IMWA 2017Mine Water and Circular Economy
Wolkersdorfer C, Sartz L, Sillanpää M, Häkkinen A (Editors)
where various alkaline by-products were used, including e.g. residues from pulp and pa-per industries (Sartz 2010; Jia et al. 2014) and fly ash from coal combustion (Park et al. 2014) with good results.
This paper includes six ashes (fly and bottom ash) from incinerator facilities using three different fuel sources, including household/industrial, contaminated and non-contami-nated wood chips. Ashes were mixed with historic sulphide-rich mining waste from Berg-slagen, mid Sweden.
The aim is to study alkaline by-products ability to neutralize and stabilize acidic metal-rich mining waste without adding new contaminants to the system and thus reduce the impact on the environment.
Methods
The mining waste was highly weathered and collected from Ljusnarsbergsfältet in Kop-parberg, Sweden (Sartz 2010). The ore field was discovered in 1624 and was last operat-ed in 1975 before being closed down. Mining focused primarily on copper (chalcopyrite, CuFeS2) and secondary on iron ore, and later also sphalerite (ZnS) and galena (PbS). Prior to sampling, waste rock aggregates were crushed and sieved into fractions < 13 mm (Sartz 2010).
The study included six ashes originating from different incineration facilities in Sweden (tab. 1).
Table 1 Summary of BFB ashes used in this study (Saqib and Bäckström 2015).
Alkaline material Abbr. Waste fuel (%) Additives
Lidköping bottom LBHousehold + Industrial (70:30) Ammonia, slaked lime and
activated carbonLidköping fly LF
Nynäshamn bottom NBContaminated wood chips (100) Ammonia, lime and activated
carbonNynäshamn fly NF
Eskilstuna bottom EBWood chips (100) Ammonia
Eskilstuna fly EF
Distribution of trace elements as well as the chloride content (%) of the ashes were deter-mined in a previous study and can be found in tab. 2 (Saqib and Bäckström 2015). Leached concentration of trace elements in the ashes at liquid/solid ratio (L/S) 2 and 10 can be found in tab. 3 (Saqib and Bäckström 2015).
1127
Lappeenranta, Finland IMWA 2017Mine Water and Circular Economy
Wolkersdorfer C, Sartz L, Sillanpää M, Häkkinen A (Editors)
Table 2 Concentration of trace elements (mg/kg dw) and chloride (%) in the ashes (Saqib and Bäckström 2015).
Location Ash Zn Cu Pb Cd Mo Sb Cl
Eskilstuna Fly 1 290 74 140 12 <6 2 0.6
Bottom 821 36.7 12 0.3 <6 0.5 <0.1
Lidköping Fly 8 120 16 400 6 920 97 28 538 21.4
Bottom 2 490 3 550 563 1.5 24 321 0.5
Nynäshamn Fly 12 100 864 1 900 21 7 64 4
Bottom 5 760 1 890 1 730 0.4 <6 22 <0.1
Table 3 Leachable concentrations (µg/L) of trace elements from the ashes at L/S 2 and L/S 10 with 18.2 MΩ water (Saqib and Bäckström 2015). Bdl: below detection limit.
Location Ash L/S Zn Cu Pb Cd Mo Sb
Eskilstuna Fly 2 280 10 570 Bdl 300 Bdl
10 110 35 230 Bdl 38 0.23
Bottom 2 27 110 16 Bdl 6.70 Bdl
10 100 29 230 Bdl 7.40 0.32
Lidköping Fly 2 44 000 830 000 1 300 000 12 1 200 1.7
10 2 600 3 100 67 000 Bdl 330 0.38
Bottom 2 19.0 12.0 1.8 Bdl 220 50
10 22 6.6 15.0 Bdl 31 100
Nynäshamn Fly 2 3 600 270 30 000 Bdl 200 0.29
10 2 800 81 12 000 Bdl 80 0.23
Bottom 2 50 15 52 3.8 54 34
10 11 6.6 10 Bdl 5.4 16
A 2.5 L container was prepared for each ash by adding 180 g mining waste and 20 g ash (90:10). A reference sample was prepared with 200 g mining waste to achieve the same L/S as the other samples. An addition of 20 g of 18.2 MΩ water was made to the containers giving a starting L/S of 0.1 followed by cumulative L/S of 0.5, 1, 2, 5, 10 and 20. After ad-dition of water the containers were shaken and the liquid phase was removed and filtered (0.40 µm) for analysis every second day. After sampling, electrical conductivity and pH were measured immediately followed by acidity/alkalinity and inorganic anions (chloride and sulphate). For major and trace element analysis samples were acidified with HNO3 fol-lowed by analysis using ICP-MS.
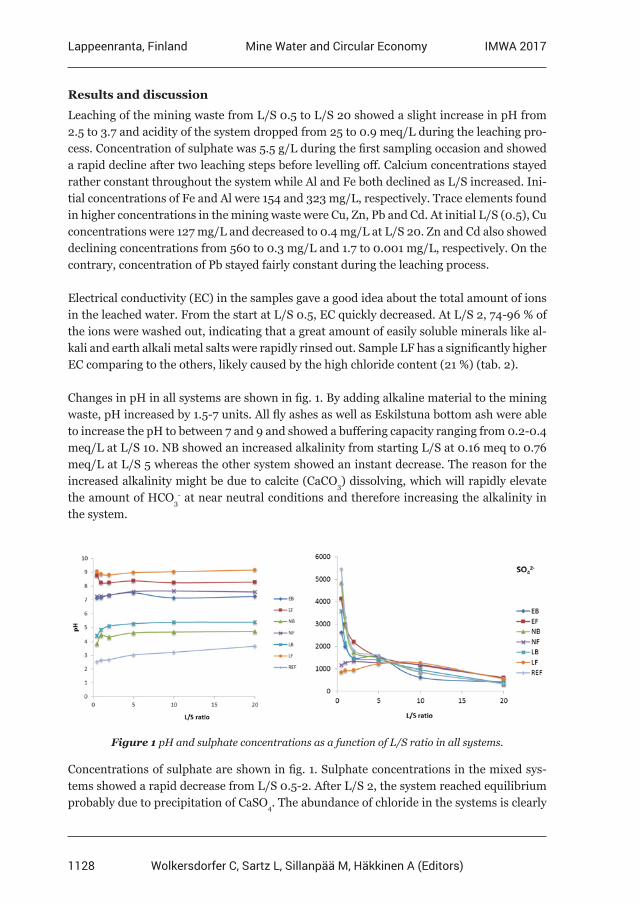
1128
Lappeenranta, Finland IMWA 2017Mine Water and Circular Economy
Wolkersdorfer C, Sartz L, Sillanpää M, Häkkinen A (Editors)
Results and discussion
Leaching of the mining waste from L/S 0.5 to L/S 20 showed a slight increase in pH from 2.5 to 3.7 and acidity of the system dropped from 25 to 0.9 meq/L during the leaching pro-cess. Concentration of sulphate was 5.5 g/L during the first sampling occasion and showed a rapid decline after two leaching steps before levelling off. Calcium concentrations stayed rather constant throughout the system while Al and Fe both declined as L/S increased. Ini-tial concentrations of Fe and Al were 154 and 323 mg/L, respectively. Trace elements found in higher concentrations in the mining waste were Cu, Zn, Pb and Cd. At initial L/S (0.5), Cu concentrations were 127 mg/L and decreased to 0.4 mg/L at L/S 20. Zn and Cd also showed declining concentrations from 560 to 0.3 mg/L and 1.7 to 0.001 mg/L, respectively. On the contrary, concentration of Pb stayed fairly constant during the leaching process.
Electrical conductivity (EC) in the samples gave a good idea about the total amount of ions in the leached water. From the start at L/S 0.5, EC quickly decreased. At L/S 2, 74-96 % of the ions were washed out, indicating that a great amount of easily soluble minerals like al-kali and earth alkali metal salts were rapidly rinsed out. Sample LF has a significantly higher EC comparing to the others, likely caused by the high chloride content (21 %) (tab. 2).
Changes in pH in all systems are shown in fig. 1. By adding alkaline material to the mining waste, pH increased by 1.5-7 units. All fly ashes as well as Eskilstuna bottom ash were able to increase the pH to between 7 and 9 and showed a buffering capacity ranging from 0.2-0.4 meq/L at L/S 10. NB showed an increased alkalinity from starting L/S at 0.16 meq to 0.76 meq/L at L/S 5 whereas the other system showed an instant decrease. The reason for the increased alkalinity might be due to calcite (CaCO3) dissolving, which will rapidly elevate the amount of HCO3
- at near neutral conditions and therefore increasing the alkalinity in the system.
Figure 1 pH and sulphate concentrations as a function of L/S ratio in all systems.
Concentrations of sulphate are shown in fig. 1. Sulphate concentrations in the mixed sys-tems showed a rapid decrease from L/S 0.5-2. After L/S 2, the system reached equilibrium probably due to precipitation of CaSO4. The abundance of chloride in the systems is clearly
1129
Lappeenranta, Finland IMWA 2017Mine Water and Circular Economy
Wolkersdorfer C, Sartz L, Sillanpää M, Häkkinen A (Editors)
connected to the ashes since the reference system contained 73 mg/L during the first sam-pling occasion. Chloride concentrations in several of the mixed systems was diluted to below limit of detection. LF showed an exceptionally high chloride concentration of 28 g/L at L/S 0.5, which can be associated with the high chloride content of the fuel. NF also showed a high chloride concentration at 3 g/L. Chloride concentrations were much lower in the bot-tom ashes.
Concentrations of calcium in LF and NF were the highest at the initial sampling occasion with 9.6 g/L and 1.8 g/L, respectively, and showed a rapid decrease until L/S 2 where the concentrations leveled out. Addition of lime/quicklime for flue gas treatment is a likely cause of the elevated calcium levels in Lidköping and Nynäshamn fly ashes. The rapid de-cline in LF and NF is probably due to dissolution of Ca(OH)2,whereas gypsum (CaSO4) are at equilibrium causing stabilization of all systems (Gitari et al. 2010).
High concentrations of Al and Fe could be found in the reference system. All mixed sys-tems showed an almost quantitative removal of Fe during the first sampling occasion. Al concentrations in NB and LB (pH ~4-5) were high indicating that precipitation of Al was unsuccessful for the systems were pH did not exceed 5.5.
Trace element immobilization was successful in several systems. Concentrations of Cd and Sb can be seen in fig. 2 and a comparison of the concentrations of Zn, Cu, Pb, Cd at L/S 10 in the reference and the mixed systems are shown in tab. 4. The trace metal concentration shows a decrease by 83.5-100 % at L/S 10 in four of the systems, including all fly ashes and Eskilstuna bottom ash (EB). The remaining systems (NB and LB) showed an increase of over 100 % for Zn and Cd compared to the reference. With pH of 4.7 (NB) and 5.4 (LB) at L/S 10, the systems were not able to immobilize these elements and the elevated concen-trations of metals are likely caused by additional concentrations of these elements being released from the ashes. At pH 4.7, the Nynäshamn bottom ash (NB) was partly able to immobilize Cu and Pb from the leachate (around 60-70 %) and Lidköping bottom ash (LB) 5.4 showed a decrease of 90 %. This indicates that a lower pH is required to immobilize Pb and Cu compared to Zn and Cd.
Mo and Sb are trace elements frequently found in ashes as can be seen in tab. 2 and 3. Leached amounts of these elements are higher from the fly ashes compared to the bottom ashes contrary to the other trace elements. It should be noted that the content of these el-ements are higher in fly ashes in general (tab. 2). For Sb, all system shows at least a 250 % increase in concentration compared to the reference. LF showed the highest increase of al-most 200 000 %. Concentrations of Mo from the bottom ashes decreased 11 to 51 % whereas the concentrations increased with around 450 to 2 700 % from the fly ashes. In a previous study it was found that Mo has a higher sorption at low pH compared to high pH as it acts as an anion (Bäckström and Sartz 2011), which might be the case here as well.
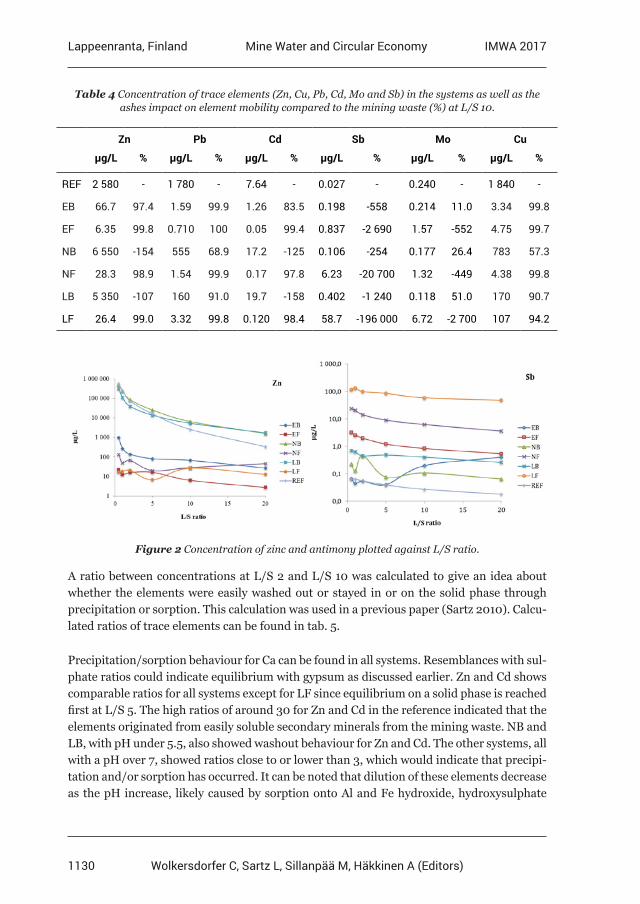
1130
Lappeenranta, Finland IMWA 2017Mine Water and Circular Economy
Wolkersdorfer C, Sartz L, Sillanpää M, Häkkinen A (Editors)
Table 4 Concentration of trace elements (Zn, Cu, Pb, Cd, Mo and Sb) in the systems as well as the ashes impact on element mobility compared to the mining waste (%) at L/S 10.
Zn Pb Cd Sb Mo Cu
µg/L % µg/L % µg/L % µg/L % µg/L % µg/L %
REF 2 580 - 1 780 - 7.64 - 0.027 - 0.240 - 1 840 -
EB 66.7 97.4 1.59 99.9 1.26 83.5 0.198 -558 0.214 11.0 3.34 99.8
EF 6.35 99.8 0.710 100 0.05 99.4 0.837 -2 690 1.57 -552 4.75 99.7
NB 6 550 -154 555 68.9 17.2 -125 0.106 -254 0.177 26.4 783 57.3
NF 28.3 98.9 1.54 99.9 0.17 97.8 6.23 -20 700 1.32 -449 4.38 99.8
LB 5 350 -107 160 91.0 19.7 -158 0.402 -1 240 0.118 51.0 170 90.7
LF 26.4 99.0 3.32 99.8 0.120 98.4 58.7 -196 000 6.72 -2 700 107 94.2
Figure 2 Concentration of zinc and antimony plotted against L/S ratio.
A ratio between concentrations at L/S 2 and L/S 10 was calculated to give an idea about whether the elements were easily washed out or stayed in or on the solid phase through precipitation or sorption. This calculation was used in a previous paper (Sartz 2010). Calcu-lated ratios of trace elements can be found in tab. 5.
Precipitation/sorption behaviour for Ca can be found in all systems. Resemblances with sul-phate ratios could indicate equilibrium with gypsum as discussed earlier. Zn and Cd shows comparable ratios for all systems except for LF since equilibrium on a solid phase is reached first at L/S 5. The high ratios of around 30 for Zn and Cd in the reference indicated that the elements originated from easily soluble secondary minerals from the mining waste. NB and LB, with pH under 5.5, also showed washout behaviour for Zn and Cd. The other systems, all with a pH over 7, showed ratios close to or lower than 3, which would indicate that precipi-tation and/or sorption has occurred. It can be noted that dilution of these elements decrease as the pH increase, likely caused by sorption onto Al and Fe hydroxide, hydroxysulphate
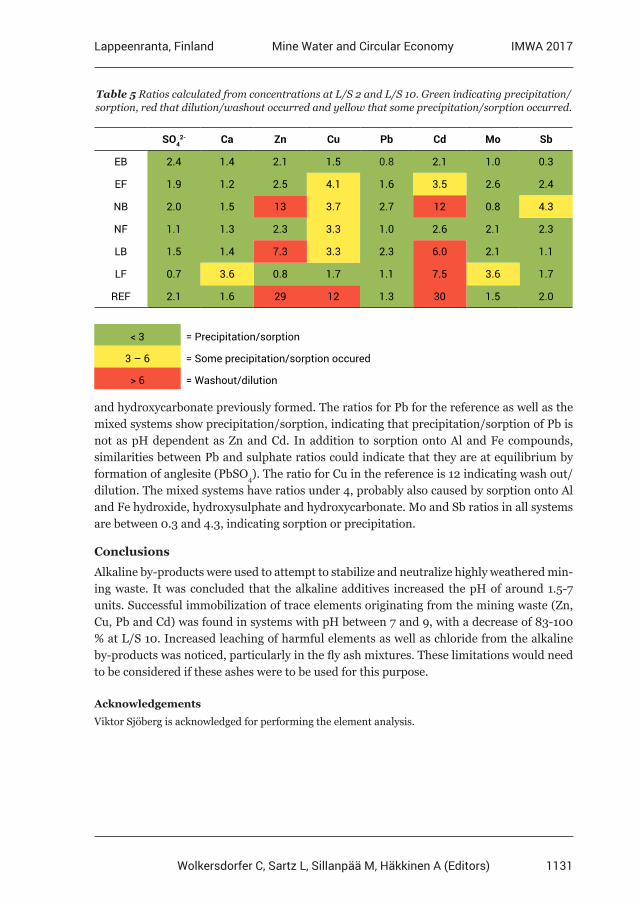
1131
Lappeenranta, Finland IMWA 2017Mine Water and Circular Economy
Wolkersdorfer C, Sartz L, Sillanpää M, Häkkinen A (Editors)
Table 5 Ratios calculated from concentrations at L/S 2 and L/S 10. Green indicating precipitation/sorption, red that dilution/washout occurred and yellow that some precipitation/sorption occurred.
SO42- Ca Zn Cu Pb Cd Mo Sb
EB 2.4 1.4 2.1 1.5 0.8 2.1 1.0 0.3
EF 1.9 1.2 2.5 4.1 1.6 3.5 2.6 2.4
NB 2.0 1.5 13 3.7 2.7 12 0.8 4.3
NF 1.1 1.3 2.3 3.3 1.0 2.6 2.1 2.3
LB 1.5 1.4 7.3 3.3 2.3 6.0 2.1 1.1
LF 0.7 3.6 0.8 1.7 1.1 7.5 3.6 1.7
REF 2.1 1.6 29 12 1.3 30 1.5 2.0
< 3 = Precipitation/sorption
3 – 6 = Some precipitation/sorption occured
> 6 = Washout/dilution
and hydroxycarbonate previously formed. The ratios for Pb for the reference as well as the mixed systems show precipitation/sorption, indicating that precipitation/sorption of Pb is not as pH dependent as Zn and Cd. In addition to sorption onto Al and Fe compounds, similarities between Pb and sulphate ratios could indicate that they are at equilibrium by formation of anglesite (PbSO4). The ratio for Cu in the reference is 12 indicating wash out/dilution. The mixed systems have ratios under 4, probably also caused by sorption onto Al and Fe hydroxide, hydroxysulphate and hydroxycarbonate. Mo and Sb ratios in all systems are between 0.3 and 4.3, indicating sorption or precipitation.
Conclusions
Alkaline by-products were used to attempt to stabilize and neutralize highly weathered min-ing waste. It was concluded that the alkaline additives increased the pH of around 1.5-7 units. Successful immobilization of trace elements originating from the mining waste (Zn, Cu, Pb and Cd) was found in systems with pH between 7 and 9, with a decrease of 83-100 % at L/S 10. Increased leaching of harmful elements as well as chloride from the alkaline by-products was noticed, particularly in the fly ash mixtures. These limitations would need to be considered if these ashes were to be used for this purpose.
Acknowledgements
Viktor Sjöberg is acknowledged for performing the element analysis.
1132
Lappeenranta, Finland IMWA 2017Mine Water and Circular Economy
Wolkersdorfer C, Sartz L, Sillanpää M, Häkkinen A (Editors)
References
Akcil A, Koldas S (2006) Acid Mine Drainage (AMD): causes, treatment and case studies. J Clean Prod 14(12): 1139-1145Bigham JM, Nordstrom DK (2000) Iron and aluminum hydroxysulfates from acid sulfate waters. Rev Min Geochem 40: 351–403Bäckström M, Sartz L (2011) Mixing of Acid Rock Drainage with Alkaline Ash Leachates—Fate and Immobilisation of Trace Elements. Water Air Soil Pollut 222(1): 377-389Dold B (2014) Evolution of Acid Mine Drainage Formation in Sulphidic Mine Tailings. Minerals 4(3): 621-641Gitari WM, Petrik LF, Key DL, Okujeni C (2010) Partitioning of major and trace inorganic contaminants in fly ash acid mine drainage derived solid residues. Int J Environ Sci Tech 7(3): 519-534Jia Y, Maurice C, Öhlander B (2014) Effect of the alkaline industrial residues fly ash, green liquor dregs, and lime mud on mine tailings oxidation when used as covering material. Environ Earth Sci 72(2): 319-334Park J, Edraki M, Mulligan D, Jang H (2014) The application of coal combustion by-products in mine site rehabilitation. J clean prod 84(1): 761-772Saqib N, Bäckström M (2015) Distribution and leaching characteristics of trace elements in ashes as a function of different waste fuels and incineration technologies. J environ sci 36(10): 9-21Sartz L (2010) Alkaline by-products as amendments for remediation of historic mine sites. Örebro Studies in Environmental Science 15, Dissertation, Örebro University, SwedenSartz L, Bäckström M, Karlsson S, Allard B (2016) Mixing of acid rock drainage with alkaline leachates: Formation of solid precipitates and pH-buffering. Mine Water Environ 35(1): 64-76
1133
Lappeenranta, Finland IMWA 2017Mine Water and Circular Economy
Wolkersdorfer C, Sartz L, Sillanpää M, Häkkinen A (Editors)
Stimulation of Natural Attenuation of Metals in Acid Mine Drainage through Water and Sediment
Management at Abandoned Copper Mines
Gijsbert D. Breedveld1,2, Franziska Klimpel2, Marianne Kvennås1, Gudny Okkenhaug1,3
11Norwegian Geotechnical Institute (NGI), Department of Environmental Engineering, P.O. Box 3930 Ullevaal Stadion, 0806 Oslo, Norway, [email protected]
2Department of Geosciences, University of Oslo, P.O. Box 1047 Blindern, 0316 Oslo, Norway 3Department of Environmental Sciences, Norwegian University of Life Sciences, P.O. Box
5003 NMBU 1432 Aas, Norway
Abstract Abandoned mining sites represent a substantial environmental challenge especially when acid mine drainage (AMD) is affecting surface water (Nordstrom 2011). Comparison of abandoned copper mines in Norway shows a clear difference in the environmental impact as indicated by the fish population in the receiving waters. Local hydrological and geochemical conditions were investigated to address the environmental fate of the copper release and the influence on the available copper fraction. Remedial solutions are designed based on stimulating the natural on-going attenuation processes. Management of hydrological and sedimentary processes can give an immediate improvement while long-term solutions for source removal are implemented.
Key words acid mine drainage, natural attenuation, water quality, aluminium, copper
Introduction
Sulitjelma is an abandoned copper mining area located in Northern Norway. A total of 26 million tons of ore have been extracted between 1887 and 1991 from several mines in the area. Drainage from the mine and exposed tailings has resulted in severe contamination of the local lake Langevatn (fig. 1). Langevatn is composed of 3 natural basins draining from east to west, covering a total area of 5.5 km2 and 150 mill m3 of water. The main run-off from the mines flows into the first basin. The Norwegian Environment Agency has imposed a reg-ulatory limit of 10 µg Cu/L at the western outlet of the lake to protect the ecological quality of the watercourse downstream of the lake. The study aims at understanding the on-going attenuation processes in the lake and finding ways to improve them.
Methods
Water and sediment samples were collected in the field to study the geochemical changes in the lake system and the contributory rivers and streams. Large volumes of water were collected from the mine (Grunnstollen), the surface water leaving the primary lake basin (Langvatn) and the Lomi river. Dilution series of the mine water with respectively lake wa-ter and river water were composed for detailed studies of the complexation and precipita-tion processes under laboratory conditions. Lake water was sampled at different depth in addition to sediment samples to study the sedimentary processes.
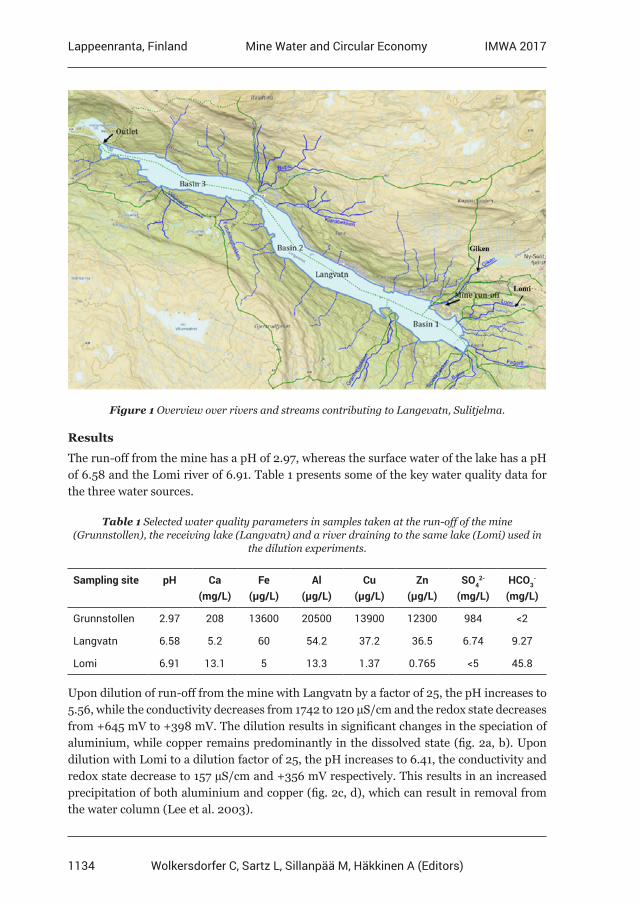
1134
Lappeenranta, Finland IMWA 2017Mine Water and Circular Economy
Wolkersdorfer C, Sartz L, Sillanpää M, Häkkinen A (Editors)
Figure 1 Overview over rivers and streams contributing to Langevatn, Sulitjelma.
Results
The run-off from the mine has a pH of 2.97, whereas the surface water of the lake has a pH of 6.58 and the Lomi river of 6.91. Table 1 presents some of the key water quality data for the three water sources.
Table 1 Selected water quality parameters in samples taken at the run-off of the mine (Grunnstollen), the receiving lake (Langvatn) and a river draining to the same lake (Lomi) used in
the dilution experiments.
Sampling site pH Ca (mg/L)
Fe (µg/L)
Al (µg/L)
Cu (µg/L)
Zn (µg/L)
SO42-
(mg/L)HCO3
- (mg/L)
Grunnstollen 2.97 208 13600 20500 13900 12300 984 <2
Langvatn 6.58 5.2 60 54.2 37.2 36.5 6.74 9.27
Lomi 6.91 13.1 5 13.3 1.37 0.765 <5 45.8
Upon dilution of run-off from the mine with Langvatn by a factor of 25, the pH increases to 5.56, while the conductivity decreases from 1742 to 120 µS/cm and the redox state decreases from +645 mV to +398 mV. The dilution results in significant changes in the speciation of aluminium, while copper remains predominantly in the dissolved state (fig. 2a, b). Upon dilution with Lomi to a dilution factor of 25, the pH increases to 6.41, the conductivity and redox state decrease to 157 µS/cm and +356 mV respectively. This results in an increased precipitation of both aluminium and copper (fig. 2c, d), which can result in removal from the water column (Lee et al. 2003).
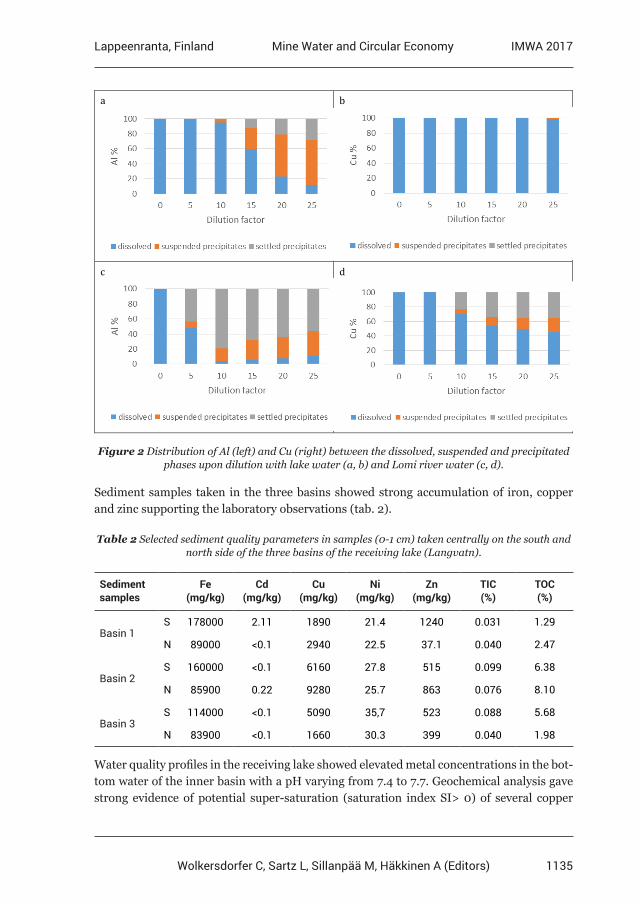
1135
Lappeenranta, Finland IMWA 2017Mine Water and Circular Economy
Wolkersdorfer C, Sartz L, Sillanpää M, Häkkinen A (Editors)
a b
c d
Figure 2 Distribution of Al (left) and Cu (right) between the dissolved, suspended and precipitated
phases upon dilution with lake water (a, b) and Lomi river water (c, d).
Sediment samples taken in the three basins showed strong accumulation of iron, copper and zinc supporting the laboratory observations (tab. 2).
Table 2 Selected sediment quality parameters in samples (0-1 cm) taken centrally on the south and north side of the three basins of the receiving lake (Langvatn).
Sediment samples
Fe (mg/kg)
Cd (mg/kg)
Cu (mg/kg)
Ni (mg/kg)
Zn (mg/kg)
TIC (%)
TOC (%)
Basin 1S 178000 2.11 1890 21.4 1240 0.031 1.29
N 89000 <0.1 2940 22.5 37.1 0.040 2.47
Basin 2 S 160000 <0.1 6160 27.8 515 0.099 6.38
N 85900 0.22 9280 25.7 863 0.076 8.10
Basin 3S 114000 <0.1 5090 35,7 523 0.088 5.68
N 83900 <0.1 1660 30.3 399 0.040 1.98
Water quality profiles in the receiving lake showed elevated metal concentrations in the bot-tom water of the inner basin with a pH varying from 7.4 to 7.7. Geochemical analysis gave strong evidence of potential super-saturation (saturation index SI> 0) of several copper
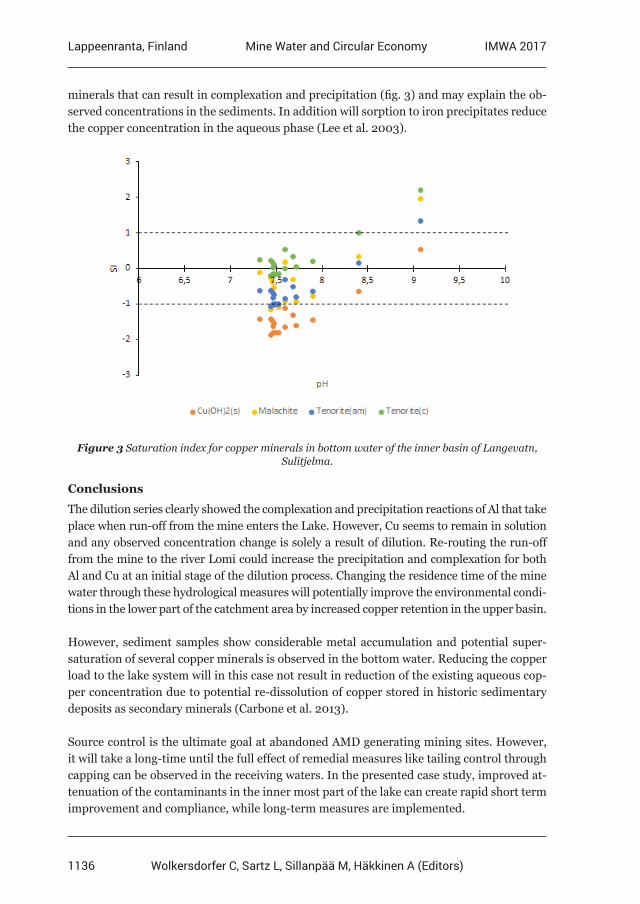
1136
Lappeenranta, Finland IMWA 2017Mine Water and Circular Economy
Wolkersdorfer C, Sartz L, Sillanpää M, Häkkinen A (Editors)
minerals that can result in complexation and precipitation (fig. 3) and may explain the ob-served concentrations in the sediments. In addition will sorption to iron precipitates reduce the copper concentration in the aqueous phase (Lee et al. 2003).
Figure 3 Saturation index for copper minerals in bottom water of the inner basin of Langevatn, Sulitjelma.
Conclusions
The dilution series clearly showed the complexation and precipitation reactions of Al that take place when run-off from the mine enters the Lake. However, Cu seems to remain in solution and any observed concentration change is solely a result of dilution. Re-routing the run-off from the mine to the river Lomi could increase the precipitation and complexation for both Al and Cu at an initial stage of the dilution process. Changing the residence time of the mine water through these hydrological measures will potentially improve the environmental condi-tions in the lower part of the catchment area by increased copper retention in the upper basin.
However, sediment samples show considerable metal accumulation and potential super-saturation of several copper minerals is observed in the bottom water. Reducing the copper load to the lake system will in this case not result in reduction of the existing aqueous cop-per concentration due to potential re-dissolution of copper stored in historic sedimentary deposits as secondary minerals (Carbone et al. 2013).
Source control is the ultimate goal at abandoned AMD generating mining sites. However, it will take a long-time until the full effect of remedial measures like tailing control through capping can be observed in the receiving waters. In the presented case study, improved at-tenuation of the contaminants in the inner most part of the lake can create rapid short term improvement and compliance, while long-term measures are implemented.
1137
Lappeenranta, Finland IMWA 2017Mine Water and Circular Economy
Wolkersdorfer C, Sartz L, Sillanpää M, Häkkinen A (Editors)
Acknowledgements
The authors thank Siri Simonsen and Mufak Said Naoroz at the department of Geosciences, University of Oslo for their support with the chemical analyses. This research was supported by the Research Council of Norway and the Norwegian Directorate of Mining.
References
Carbone C, Dinelli E, Marescotti P, Gasparotto G, Lucchetti G (2013) The role of AMD secondary minerals in controlling environmental pollution: Indications from bulk leaching tests. J Geochem Explor 132: 188—200, doi:10.1016/j.gexplo.2013.07.001Lee G, Bigham JM, Faure G (2002) Removal of trace metals by coprecipitation with Fe, Al and Mn from natural waters contaminated with acid mine drainage in the Ducktown Mining District, Tennessee. Appl Geochem 17: 569—581, doi:10.1016/S0883-2927(01)00125-1Nordstrom DK (2011) Hydrogeochemical processes governing the origin, transport and fate of major and trace elements from mine wastes and mineralized rock to surface waters. Appl Geochem 26: 1777—1791, doi:10.1016/j.apgeochem.2011.06.002
1138
Lappeenranta, Finland IMWA 2017Mine Water and Circular Economy
Wolkersdorfer C, Sartz L, Sillanpää M, Häkkinen A (Editors)
Challenges in Recovering Resources from Acid Mine Drainage
D. Kirk Nordstrom1, Robert J. Bowell2, Kate M. Campbell1, Charles N. Alpers3
1 U.S. Geological Survey, Boulder, CO, 80303 USA, [email protected], [email protected] 2 SRK Consulting, CF102HH, Cardiff, Wales, UK, [email protected]
3 U.S. Geological Survey, Sacramento, CA, 95819 USA, [email protected]
Abstract Metal recovery from mine waters and effluents is not a new approach but one that has occurred largely opportunistically over the last four millennia. Due to the need for low-cost resources and increasingly stringent environmental conditions, mine waters are being considered in a fresh light with a designed, deliberate approach to resource recovery often as part of a larger water treatment evaluation. Mine water chemistry is highly dependent on many factors including geology, ore deposit composition and mineralogy, mining methods, climate, site hydrology, and others. Mine waters are typically Ca-Mg-SO4±Al±Fe with a broad range in pH and metal content. The main issue in recovering components of these waters having potential economic value, such as base metals or rare earth elements, is the separation of these from more reactive metals such as Fe and Al.Broad categories of methods for separating and extracting substances from acidic mine drainage are chemical and biological. Chemical methods include solution, physicochemical, and electrochemical technologies. Advances in membrane techniques such as reverse osmosis have been substantial and the technique is both physical and chemical. Biological methods may be further divided into microbiological and macrobiological, but only the former is considered here as a recovery method, as the latter is typically used as a passive form of water treatment.
Key words mine wastes, acid mine drainage, recoverable resources
Introduction
The demand for copper, during the Bronze age for tools and weapons and then later for fiscal instruments, was a driving force in the early exploitation of copper (Markoe, 2000; López, 2015). Such demand led to the application of copper cementation in the processing of mine waters in Spain and Sardinia as early as 3000 BC by Phoenicians. Copper cemen-tation was adopted later by Roman miners and subsequently spread to become common in the recovery of copper from mine waters and acid leaching until the advent of solvent ex-traction (Audsley et al., 1961; Lewis and Jones, 1970; Jones and Bird, 1972; Markoe, 2000; Bowell et al., 2013; Ávila, 2015; López, 2015).
The combination of high mining costs, increasingly stringent environmental obligations, and exhaustion of historically important metal sources has led to re-assessment of alterna-tive sources of metals (Hsu and Harrison, 1994; Vegliò et al., 2003; Bowell, 2004a; Gaikwad et al., 2010). During the last two decades, interest has increased for recovering marketable products from acid mine drainage (AMD), raffinates, and other forms of solid and liquid wastes from mining and mineral processing activities. Lottermoser (2010) cites more than a dozen examples of the reuse or recycling of mine wastes. Macaskie et al. (2009) mention the potential for environmental bionanotechnology for AMD in an article entitled “Today’s wastes, tomorrow’s materials for environmental protection.” Michalková et al. (2013) dis-
1139
Lappeenranta, Finland IMWA 2017Mine Water and Circular Economy
Wolkersdorfer C, Sartz L, Sillanpää M, Häkkinen A (Editors)
cuss the production of ferrites and hematite from AMD. Tamaura et al. (1991) demonstrated the production of ferrites from AMD more than 25 years ago. A Japanese group demonstrat-ed the feasibility of combining sulfid(iz)ation with neutralization for selective extraction of Cu, Zn, and Fe from AMD (Wang et al., 2013).
The two main components of AMD, Fe and Al, are observed to be removed naturally in downstream drainage during oxidation and increase in pH (Nordstrom, 2011). An engi-neering study demonstrated separation resulting in high purity of Fe and Al from coal mine drainage (Wei et al., 2005) including magnetic nanoparticles (Wei and Viadero, 2007). The main challenge is not so much finding or studying possible technologies, but rather adopt-ing the best “stream” of technologies for a particular site given the composition of the water, the target recovery product(s), the cost and ease of transportation, and the distance to a potential buyer.
This paper is a preliminary review of the numerous types of chemical, electrochemical, and microbiological methods that have been, or could be, investigated to selectively extract po-tentially marketable products from AMD. The review describes some of the inherent advan-tages, limitations, and challenges associated with various resource recovery methods.
General types of separation methods
Methods for separating and extracting substances from AMD can be classified in two broad categories: chemical and biological. Chemical methods include solution, physicochemical, and electrochemical technologies. Advances in membrane techniques such as reverse os-mosis have been substantial and the technique is both physical and chemical. Biological methods may be further divided into microbiological and macrobiological, but the macrobi-ological (mostly phytoremediation and wetlands) will not be considered here because these are predominantly passive remediation techniques, not generally used as recovery methods. Chemical methods, along with evaporation, represent some of the more attractive options for resource recovery from acid mine waters.
Chemical methods can be subdivided into • Oxidative precipitation (primarily to precipitate hydrous ferric oxides) • Metal reduction methods such as Cu cementation • Solvent extraction (SX) • Sulfide precipitation (SP)
Physicochemical methods include • Reverse osmosis (RO) • Evaporation • Ion exchange (IX)
Electrochemical methods include • Electrowinning/electroplating • Electrocoagulation
1140
Lappeenranta, Finland IMWA 2017Mine Water and Circular Economy
Wolkersdorfer C, Sartz L, Sillanpää M, Häkkinen A (Editors)
• Hydrolysis and H2 production • Electrodialysis • Electrokinetics
Microbiological methods include • Sulfate reduction • Fe reduction • Metal reduction (in addition to Fe and Cu) • H2 production
Combinations of these methods, for example • Electrochemical cells with semi-permeable membrane • Bioelectrochemical systems such as microbial fuel cells or microbial electrolysis
cells for metal reduction and H2 production • Electrowinning with solvent extraction or ion exchange • Solvent extraction with ion exchange • Sulfide precipitation with alkali neutralization
Potentially recoverable products
In addition to the obvious metal products that may be recovered such as Cu, Pb, Zn, and Cd, both the high concentrations of SO4
2- and the resulting “clean or useable” water itself should be considered as potential products. Many of today’s mines are located in arid re-gions where water is in high demand and SO4
2- can contaminate water supplies. If most of the metal contaminants and sulfate are removed, then the only remaining concern typically would be for elevated concentrations of salt components such as sodium, chloride, fluoride, or highly conservative constituents such as nitrate.
AMD chemistry
Decisions on evaluating these methods for practical applications require an understanding of the types of AMD that might be encountered. Although it would be impossible to ade-quately represent all types of mine water compositions, a few generalizations can be made. Water compositions for AMD can be associated with coal mines, non-radioactive metal mines (hydrothermal deposits of Cu, Pb, Zn, Cd, Au, Ag, As, Sb, Co, and Ni), and radioactive mines (deposits of U, V, Ra, and Th, which will not be considered here).
Coal mines do not typically contain dissolved concentrations of “potentially economic” met-als such as Cu, Pb, Zn, Cd, Ag, and Au high enough to consider for extraction. When they produce acid drainage, concentrations of Fe and Al predominate with occasional contami-nation from As, Co, Mn, Ni, and Se (Cravotta, 2008).
Mine (metal) water chemistry is highly dependent on many factors including geology, ore deposit composition and mineralogy, mining methods, climate and many others. Mine waters are typically classified as Ca-Mg-SO4±Al±Fe with a broad range in pH and metal content. In many cases, these waters contain metals that approach similar grades to those
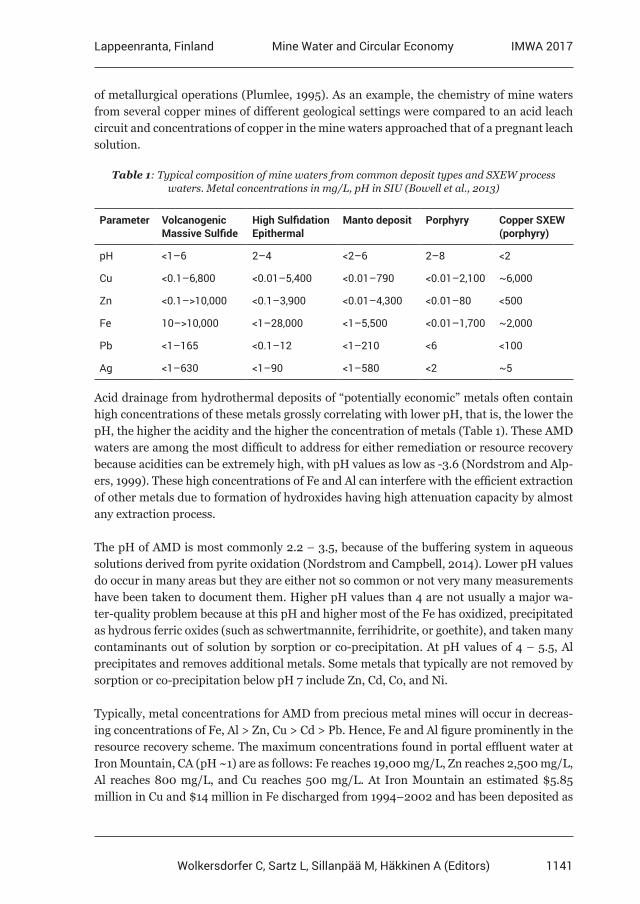
1141
Lappeenranta, Finland IMWA 2017Mine Water and Circular Economy
Wolkersdorfer C, Sartz L, Sillanpää M, Häkkinen A (Editors)
of metallurgical operations (Plumlee, 1995). As an example, the chemistry of mine waters from several copper mines of different geological settings were compared to an acid leach circuit and concentrations of copper in the mine waters approached that of a pregnant leach solution.
Table 1: Typical composition of mine waters from common deposit types and SXEW process waters. Metal concentrations in mg/L, pH in SIU (Bowell et al., 2013)
Parameter Volcanogenic Massive Sulfide
High Sulfidation Epithermal
Manto deposit Porphyry Copper SXEW (porphyry)
pH <1–6 2–4 <2–6 2–8 <2
Cu <0.1–6,800 <0.01–5,400 <0.01–790 <0.01–2,100 ~6,000
Zn <0.1–>10,000 <0.1–3,900 <0.01–4,300 <0.01–80 <500
Fe 10–>10,000 <1–28,000 <1–5,500 <0.01–1,700 ~2,000
Pb <1–165 <0.1–12 <1–210 <6 <100
Ag <1–630 <1–90 <1–580 <2 ~5
Acid drainage from hydrothermal deposits of “potentially economic” metals often contain high concentrations of these metals grossly correlating with lower pH, that is, the lower the pH, the higher the acidity and the higher the concentration of metals (Table 1). These AMD waters are among the most difficult to address for either remediation or resource recovery because acidities can be extremely high, with pH values as low as -3.6 (Nordstrom and Alp-ers, 1999). These high concentrations of Fe and Al can interfere with the efficient extraction of other metals due to formation of hydroxides having high attenuation capacity by almost any extraction process.
The pH of AMD is most commonly 2.2 – 3.5, because of the buffering system in aqueous solutions derived from pyrite oxidation (Nordstrom and Campbell, 2014). Lower pH values do occur in many areas but they are either not so common or not very many measurements have been taken to document them. Higher pH values than 4 are not usually a major wa-ter-quality problem because at this pH and higher most of the Fe has oxidized, precipitated as hydrous ferric oxides (such as schwertmannite, ferrihidrite, or goethite), and taken many contaminants out of solution by sorption or co-precipitation. At pH values of 4 – 5.5, Al precipitates and removes additional metals. Some metals that typically are not removed by sorption or co-precipitation below pH 7 include Zn, Cd, Co, and Ni.
Typically, metal concentrations for AMD from precious metal mines will occur in decreas-ing concentrations of Fe, Al > Zn, Cu > Cd > Pb. Hence, Fe and Al figure prominently in the resource recovery scheme. The maximum concentrations found in portal effluent water at Iron Mountain, CA (pH ~1) are as follows: Fe reaches 19,000 mg/L, Zn reaches 2,500 mg/L, Al reaches 800 mg/L, and Cu reaches 500 mg/L. At Iron Mountain an estimated $5.85 million in Cu and $14 million in Fe discharged from 1994–2002 and has been deposited as
1142
Lappeenranta, Finland IMWA 2017Mine Water and Circular Economy
Wolkersdorfer C, Sartz L, Sillanpää M, Häkkinen A (Editors)
sludge in the open pit, the disposal site for lime-neutralized AMD (D.K. Nordstrom, USGS, unpublished data). Furthermore, the mine is estimated to continue discharging concentrat-ed AMD for approximately 3,000 years based on current weathering rates and the known reserves of pyrite and other sulfides remaining underground (Nordstrom and Alpers, 1999).
Methods of separating or controlling Fe concentrations
Because Fe can occur in the dissolved state in either a reduced ferrous iron form (Fe(II)), or an oxidized ferric iron form (Fe(III)), there is an opportunity to control the redox species to separate or control Fe concentrations. Fe(II) is highly soluble, whereas Fe(III) is highly insoluble above pH 3 and is less soluble than Fe(II) even at low pH values. If the dissolved Fe is kept reduced as Fe(II) it could be kept in solution until other metals are separated and then it could be oxidized by microbes, air, or hydrogen peroxide to precipitate it as Fe(III). Alternatively, if most of the metals and other contaminants are removed, the result would be a ferrous-sulfate solution that could be evaporated. Ammonium could be added to in-crease the stability of the final product, for which a market al.ready exists.
Precipitation of dissolved Fe(III) at pH values of 2 – 4 will typically produce schwertman-nite, microcrystalline goethite, and/or ferrihydrite. Lower pH values may produce jarosite group minerals, which are not a desirable product because of the potential for containing high concentrations of contaminants such as Pb and As (Dutrizac and Jambor, 2000). Schwertmannite and goethite will also sorb these and other contaminants. A better product because of its purity would be hematite. However, hematite requires higher temperatures (generally > 100°C).
Metal recovery
Electrowinning for Cu is generally not done on AMD because concentrations of nearly 1,000 mg/L are necessary. One historical method that has worked well for Cu removal is Cu ce-mentation. This method has a long tradition, as discussed above. At Parys Mountain in North Wales the process was applied throughout the nineteenth and early twentieth cen-tury in the production of Cu from mine water (Audsley et al., 1961). In these cells, roasted goethite-rich boulders (pig-iron ore) were placed and then diverted copper-rich mine water flowed through the pits to precipitate copper by the reaction:
Cu2+ (in mine water) + Fe0 (scrap iron) Fe2+ (in solution) +Cu0 (metal)
However, this reaction does increase the ratio Fe(II)/Fe(III) in solution until hydrolysis removes the hydroxide. At Iron Mountain, CA, Cu cementation was used for many decades and observations show that influent Cu concentrations of 100 – 300 mg/L were reduced by 80 to 95% (Alpers et al., 2003). This efficiency may have been a function of pH, which was typically around 1 (Nordstrom and Alpers, 1999).
Biological methods of metal leaching as well as metal recovery through sulfur reduction and formation of sulfides has been evaluated (Peters and Ku, 1985; Barrett et al., 1993; Hsu and Harrison, 1995; Nodwell and Kratochvil, 2012). Reduction of SO4 by microbial bioreactors
1143
Lappeenranta, Finland IMWA 2017Mine Water and Circular Economy
Wolkersdorfer C, Sartz L, Sillanpää M, Häkkinen A (Editors)
removes metals by sulfide precipitation. Commercially, native sulfur is used as a feedstock for the process (Nodwell and Kratochvil, 2012).
In recent years, a number of companies such as Paques in the Netherlands and BioteQ in North America have developed mine water treatment plants that reduce metal loadings by reacting sulfide gas with the mine water to form metal sulfides. The basic principle behind this process is the production of hydrogen sulfide (H2S) from elemental sulfur via the action of anaerobic bacteria. The H2S is reacted with a solution containing target metals and the metals precipitate from solution as insoluble sulfides. Dependent upon the solution chem-istry and the target metals, pH adjustment of the solution may be required. In the case of copper, CuS will form over a wide pH range so typically no pH adjustment is required for this, although modification maybe required to remove competing ions.
Sulfide precipitation plants have been installed in several places around the world including the BioteQ plants at the Caribou and Raglan mines in Canada, Mount Wellington in Colo-rado, and the Bisbee mine in Arizona (Lopez et al., 2009; Nodwell and Kratochvil, 2012). In these locations, the produced metal-sulfide precipitate can be processed by conventional smelting operations; metals that would otherwise be lost are recovered, and the operations typically generate positive cash flows. However, the economics are adversely affected by the presence of Fe(II) that will also precipitate as a metal sulfide and consume sulfide, increas-ing costs (both capital and operational). These costs may be offset if the Fe(II) is oxidized to Fe(III), as ferric hydroxide precipitates may prove to be a commodity that can be reused in cements and construction materials. In microbial systems, additional reagents (nutrients, C source) and an optimal temperature range, typically within 20 – 35°C for sulfur reducers (Johnson and Hallberg, 2007).
At the Bisbee project, southern Arizona, the BioteQ plant had a design capacity of 10,900 m3/day with a solution composition of: Cu = 350 mg/L; Fe(III) = 550 mg/L. The project capital costs were about US $2.5 million and operating costs were US$0.20/lb Cu recovered, plus US$0.18/lb transport/smelting costs (based on 2008 information). Costs increased later in the project as Cu grades declined (E. Wieland, BioteQ, written commun., 2017). Metal re-covery from mine waters represents a potential source of revenue to offset water-treatment costs and in some places may even represent an economic gain in its own right.
The clean separation of metals such as Cu, Zn, and Cd by sulfide precipitation is dependent upon careful control of pH as it is adjusted upwards. Once the pH has reached 4 to 5, Al (± Si) will precipitate as a fairly pure hydroxysulfate (such as basaluminite). Rare earth ele-ments (REE), if present, will precipitate with Al. Therefore, REE should be extracted either through ion exchange or solvent extraction to separate from the Al (before or after the Al precipitation). A similar approach is applied in the processing of clay-rich ores (Jordens et al., 2013). The Fe and Al also have potential for producing sulfate chemicals that are com-mon coagulants in water treatment such as the ettringite process (Reinsel, 1999; Bowell, 2004b). The more soluble metals like Zn, Cd, Ni, and Co could be concentrated and sepa-
1144
Lappeenranta, Finland IMWA 2017Mine Water and Circular Economy
Wolkersdorfer C, Sartz L, Sillanpää M, Häkkinen A (Editors)
rated through ion exchange or solvent extraction processes (Veglió et al., 2003; Gaikwad et al., 2010). Ion exchange is proven technology for removing the remaining Ca and SO4. Other components like Li can similarly recovered (Bowell et al., 2013).
Summary
The recovery of metals from mine waters and effluents is not new, but over time, as re-covery has gone from opportunistic to designed, the application of process technology has improved, making this approach a potentially viable option at more mine sites. The closure and abandonment of mining areas is rarely caused by complete consumption of a resource but rather is typically associated with diminishing financial returns based on metal values, or social, political, and environmental restrictions that lead to an uneconomic scenario for a resource unit. With regard to legacy mine sites, such as Iron Mountain, California, the re-moval and concentration of metals is a logical step in improving environmental water qual-ity and in producing saleable products that can assist in offsetting water treatment costs. Each mine site requires a site-specific evaluation of the hydrogeochemistry and hydrology to determine the potential for recovering metals and to identify suitable technologies.
A caveat exists to applying these methods: even if the “resource potential” can be proven and the technology is shown to recover economic amounts of metal, there may still be little incentive to “re-mine” many legacy mining districts. New mining ventures may be held re-sponsible for all past mining legacy issues, as well as any new disturbance, so a site-specific analysis is prudent to assess potential legal action from property owners or bankruptcy trus-tees who could lay claim to any recovered value.
References
Alpers CN, Nordstrom DK, Spitzley J (2003) Extreme acid mine drainage from a pyritic massive sulfide deposit: The Iron Mountain end-member. In: Jambor JL, Blowes DW, Ritchie AIM (eds), Environmental Aspects of Mine Wastes. Mineralogical Association of Canada Short- Course, 31: 407-430.Audsley A, Daborn GR, Pearson D (1961) Recovery of copper from mine water at Parys Mountain Copper Mines, Anglesey. NCL, Teddington. 25 p.Ávila JJ (2015) Phoenician Bronzes in Spain. A western metalworking. In: Ávila JJ (ed), Phoenician Bronzes in Mediterranean: Bibliotheca Archaeologica Hispana, 45. Madrid, Real Academia de la Historia. 395-442.Barrett J, Hughes MN, Karavaiko GI, Spencer PA (1993) Metal Extraction by Bacterial Oxidation of Minerals. Ellis Horwood, Sussex, 191 p.Bowell RJ (2004a) A different kind of ore. Explore 125: 1-5.Bowell RJ (2004b) A review of sulphate removal options for mine waters. In: Jarvis AP, Dudgeon BA, Younger PL (eds): Mine water 2004 – Proceedings International Mine Water Association Symposium Newcastle upon Tyne (University of Newcastle), 2: 75-91.Bowell RJ, Dey BM, Sapsford DJ, Williams C, Williams KP (2013) Geochemical assessment of legacy mine sites: assigning values and seeking new opportunities. In: Tibbet M, Fourie AB, Dinby C (eds), Mine Closure 2013. Australian Center for Geomechanics, Perth, 583-596.Cravotta III CA (2008) Dissolved metals and associated constituents in abandoned coal-mine discharges, Pennsylvania, USA. Part 1: Constituent quantities and correlations. Applied Geochemistry, 23: 166-202.
1145
Lappeenranta, Finland IMWA 2017Mine Water and Circular Economy
Wolkersdorfer C, Sartz L, Sillanpää M, Häkkinen A (Editors)
Dutrizac J, Jambor JL (2000) Jarosites and their application in hydrometallurgy. In: Alpers CN, Jambor JL, Nordstrom DK (eds), Reviews in Mineralogy and Geochemistry, v. 40, Sulfate Minerals – Crystallography, Geochemistry, and Environmental Significance, Mineralogical Society of America, Washington, D.C., 405-452.Gaikwad RW, Sapkai RS and Sapkai VS (2010) Removal of Cu from AMD using ion exchange techniques. J. Water Resource and Protection, 2: 948-989.Hsu CH, Harrison RG (1995) Bacterial leaching of zinc and copper from mining wastes. Hydrometallurgy, 37: 169-179.Johnson DB, Hallberg KB (2007) Techniques for detecting and identifying acidophilic mineral- oxidizing microorganisms. In: Rawlings DE, Johnson DB (eds) Biomining. Berlin: Springer- Verlag, 237–261.Jones RFJ, Bird DG (1972) Roman gold-mining in north-west Spain, II: Workings on the Rio Duerna. Journal of Roman Studies 62: 59-74. Jordens A, Cheng YP, Waters KE (2013) A review of the beneficiation of rare earth element bearing minerals. Min Eng, 41: 97-114.Lewis PR, Jones RFJ (1970) Roman gold-mining in north-west Spain. Journal of Roman Studies 60: 169-85.López JAZ (2015) Bronze and Metallurgy in Phoenician Sources. In: Alviá, JJ (ed) Phoenician Bronzes In the Mediterranean: Bibliotheca Archaeologica Hispana, 45. Madrid, Real Academia de la Historia, 29-46.Lopez O, Sanguinetti, D, Bratty M, Kratochvil D (2009) Green technologies for sulphate and metal removal in mining and metallurgical effluents. Proceedings Environmine’09, Santiago.Lottermoser BG (2010) Mine Wastes: Characterization, Treatment and Environmental Impacts. 3rd edition, Springer, Berlin, 401 pp. Macaskie LE, Mikheenko IP, Yong P, Deplanche K, Murray AJ, Paterson-Beedle M, Coker VS, Pearce CI, Pattrick RAD, Vaughan D, van der Laan G, Lloyd JR (2009) Today’s wastes, tomorrow’s materials for environmental protection. Adv Mater Res 71-73: 541-548. Markoe GE (2000) Peoples of the Past: Phoenicians. Berkeley: University of California Press. ISBN 0-520-22614-3.Michalková E, Schwarz M, Pulišová P, Máša B, Sudovský P (2013) Metals recovery from acid mine drainage and possibilities for their utilization. Pol J Environ Stud 22(4): 1111-1118.Nodwell M, Kratochvil D (2012) Sulphide precipitation and ion exchange technologies to treat acid mine drainage. ICARD 2012, Skelletea, Sweden. Nordstrom DK (2011) Hydrogeochemical processes governing the origin, transport and fate of major and trace elements from mine wastes and mineralized rock to surface waters. Appl Geochem 26: 1777-1791.Nordstrom DK, Alpers CN (1999) Negative pH, efflorescent mineralogy, and consequences for environmental restoration at the Iron Mountain Superfund site, California. Proc Nat’l Acad Sci 96: 3455-3462.Nordstrom DK, Campbell KM (2014) Modeling low-temperature geochemical processes: In Drever JI (ed), Surface and Ground Water, Weathering, and Soils, Treatise on Geochemistry, v. 7, Holland HD, Turekian KK (ex eds), Elsevier, Amsterdam, 27-68.Peters RW, Ku Y (1985) Batch precipitation studies for heavy metal removal by sulfide precipitation. AIChE Symposium series. Separation of Heavy Metals 81: 9-27.Plumlee G (1995) Mine-drainage waters as potential economic resources. Society of Economic Geologists (SEG) Newsletter 22: 6-7.Reinsel, MA (1999) A new process for sulfate removal from industrial waters. Proceedings 16th Annual National Meeting of the American Society for Surface Mining and Reclamation. August 13 – 19, 1999. Scottsdale, Arizona.Tamaura Y, Katsura T, Rojarayanont S, Yoshida T, Abe H (1991) Ferrite process; Heavy metal ions treatment system. Water Sci Technol 23(10-12): 1893-1900.
1146
Lappeenranta, Finland IMWA 2017Mine Water and Circular Economy
Wolkersdorfer C, Sartz L, Sillanpää M, Häkkinen A (Editors)
Vegliò F, Quaresima R, Fornari P, Ubaldini S (2003) Recovery of valuable metals from electronic and galvanic industrial wastes by leaching and electrowinning. Waste Management, 23: 245-252.Wang LP, Ponou J, Matsuo S, Okaya K, Dodbiba G, Nazuka T, Fujita T (2013) Integrating sulfidization with neutralization treatment for selective recovery of copper and zinc over iron from acid mine drainage. Miner Eng 45: 100-107. Wei X, Viadero Jr RC (2007) Synthesis of magnetite nanoparticles with ferric iron recovered from acid mine drainage: Implications for environmental engineering. Coll Surf A: Physicochem Eng Aspects 294(1-3): 280-286.Wei X, Viadero Jr RC, Buzby KM (2005) Recovery of iron and aluminium from acid mine drainage by selective precipitation. Environ Eng Sci 22(6): 745-755.
1147
Lappeenranta, Finland IMWA 2017Mine Water and Circular Economy
Wolkersdorfer C, Sartz L, Sillanpää M, Häkkinen A (Editors)
Process development for complex mine water treatment
Tim Aubel1,Eberhard Janneck1,Robin Kalanchey2
1G.E.O.S. Ingenieurgesellschaft mbH, Schwarze Kiefern 2, 09633 Halsbrücke, Germany [email protected]
2 Eldorado Gold Corporation, 1188 Bentall 5 550 Burrard Street Vancouver, BC V6C 2B5, Canada
Abstract In this paper a process development for a complex mine water treatment is presented. Based on hypothetical specifications for process water /discharge quality after treatment and hypothetical assumptions for water compositions before treatment, a treatment strategy was developed. This desktop-based flowsheet was tested on a lab scale for all stages of unit processes and showed a full compliance with all discharge limits. The process development includes different options for varying water qualities, cost estimation for CAPEX and OPEX and a basic design for a full scale water treatment plant.
Key words Mine water, active treatment, reverse osmosis, nanofiltration, process water, zero liquid discharge, re-use
Preliminary considerations
The phenomenon of so-called “preg-robbing” by carbonaceous materials present in the ore is a well-known problem in the gold/silver mining industry (Miller 2005). Preg-robbing can be exacerbated by soluble chloride in process water, as it can contribute to dissolution of gold and then precipitation (reduction) of the dissolved gold during pressure oxidation and thus increase adverse effects of preg-robbing carbonaceous materials due to potential loss of gold. Chloride concentrations of as low as 50 to 100 mg/L can result in significant gold losses in some cases. For example, gold recoveries were decreased from 95% to about 90% at 15 mg/L chloride concentration in the process water.
The presence of organic carbon (carbonaceous material) in the ore and chloride in the pro-cess water can render processing strategies economically unattractive and this prevent the development of selected mine projects. How to mitigate the effects of chloride in the process water presents a unique challenge of treating the process water to meet multiple objectives:
• operate the ore processing plant with a minimum amount of fresh water make-up;• recycle the reclaimed water from a tailing management facility (TMF) for ore processing;• remove chloride from the reclaimed TMF water to a targeted concentration of less
than 10 mg/L and• meet al.l government discharge limits on occasions when discharge of treated wa-
ter to the environment is required (Beyond metals the sulphate may be subject to discharge limits between 250 and 2000 mg/L depending on national regulations and site specific conditions (for example: Peru, Brazil: 250 mg/L , Chile: 1,000 mg/L )).
When discharge to the environment is required the process water will be treated to meet
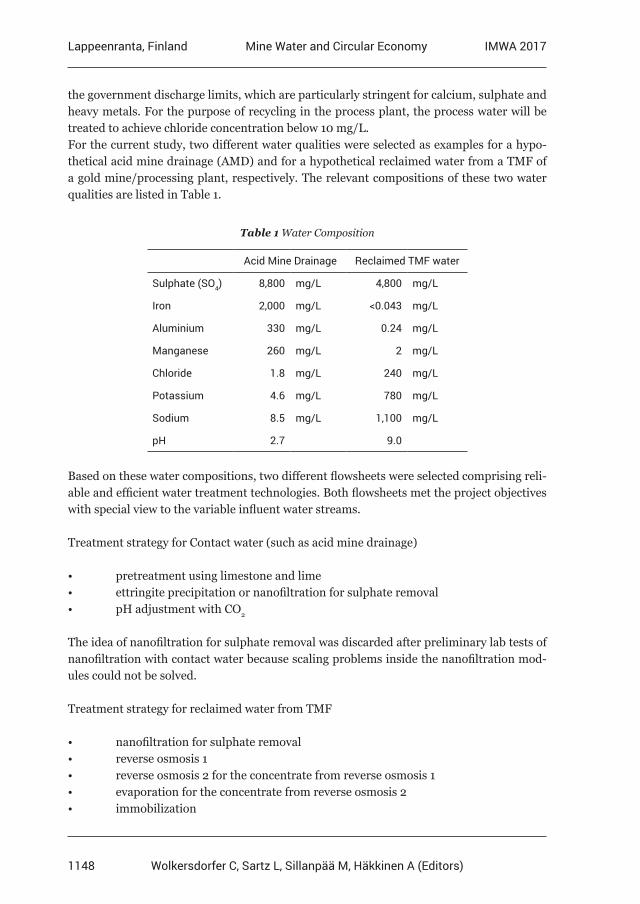
1148
Lappeenranta, Finland IMWA 2017Mine Water and Circular Economy
Wolkersdorfer C, Sartz L, Sillanpää M, Häkkinen A (Editors)
the government discharge limits, which are particularly stringent for calcium, sulphate and heavy metals. For the purpose of recycling in the process plant, the process water will be treated to achieve chloride concentration below 10 mg/L.For the current study, two different water qualities were selected as examples for a hypo-thetical acid mine drainage (AMD) and for a hypothetical reclaimed water from a TMF of a gold mine/processing plant, respectively. The relevant compositions of these two water qualities are listed in Table 1.
Table 1 Water Composition
Acid Mine Drainage Reclaimed TMF water
Sulphate (SO4) 8,800 mg/L 4,800 mg/L
Iron 2,000 mg/L <0.043 mg/L
Aluminium 330 mg/L 0.24 mg/L
Manganese 260 mg/L 2 mg/L
Chloride 1.8 mg/L 240 mg/L
Potassium 4.6 mg/L 780 mg/L
Sodium 8.5 mg/L 1,100 mg/L
pH 2.7 9.0
Based on these water compositions, two different flowsheets were selected comprising reli-able and efficient water treatment technologies. Both flowsheets met the project objectives with special view to the variable influent water streams.
Treatment strategy for Contact water (such as acid mine drainage)
• pretreatment using limestone and lime• ettringite precipitation or nanofiltration for sulphate removal• pH adjustment with CO2
The idea of nanofiltration for sulphate removal was discarded after preliminary lab tests of nanofiltration with contact water because scaling problems inside the nanofiltration mod-ules could not be solved.
Treatment strategy for reclaimed water from TMF
• nanofiltration for sulphate removal• reverse osmosis 1• reverse osmosis 2 for the concentrate from reverse osmosis 1• evaporation for the concentrate from reverse osmosis 2• immobilization
1149
Lappeenranta, Finland IMWA 2017Mine Water and Circular Economy
Wolkersdorfer C, Sartz L, Sillanpää M, Häkkinen A (Editors)
Results
Contact water (acid mine drainage)
For the treatment of a hypothetical contact water composition, different types of limestone and lime were tested for pH adjustment.
For the pH adjustment with limestone and lime, the following test parameters showed the best results and were suggested for the basic design:
• dosage of limestone: 6 kg/m³ contact water• quality: fine ground limestone, 95% passing 90 µm, 90% CaCO3 • reaction time: 15 min• air sparging during limestone addition• pH around 2.7 in the beginning, pH 4.3 in the end
followed by
• dosage of hydrated lime: 5.65 kg/m³• lime milk 10-20 wt-% of Ca(OH)2
• reaction time: 30 min with continuous stirring• pH adjustment: 10.5• flocculant type: A130 (anionic)• flocculant dosage: 1 g/m³• sedimentation time of the sludge : 2 h
After pH adjustment using limestone and lime, TDS, sulphate, calcium and aluminium did not meet the government discharge limits. Therefore, additional treatment steps including ettringite precipitation and pH adjustment with CO2 were necessary.
The following test parameters for the ettringite precipitation were elaborated and suggested for the basic design:
• set-point pH during ettringite precipitation: ≥ 11.5 • lime consumption to maintain pH ≥ 11.5: 1.35 kg/m³ • specific dosage for sulphate removal: 1.8 g ISTRA50 cement per g SO4 to remove• reaction time: 2 hours with continuous stirring• flocculant type: C248 (cationic)• flocculant dosage: 20 g/m³• sedimentation time of the sludge : 2 h
followed by the final pH-adjustment with CO2:• set-point pH: 7.5 – 8.0
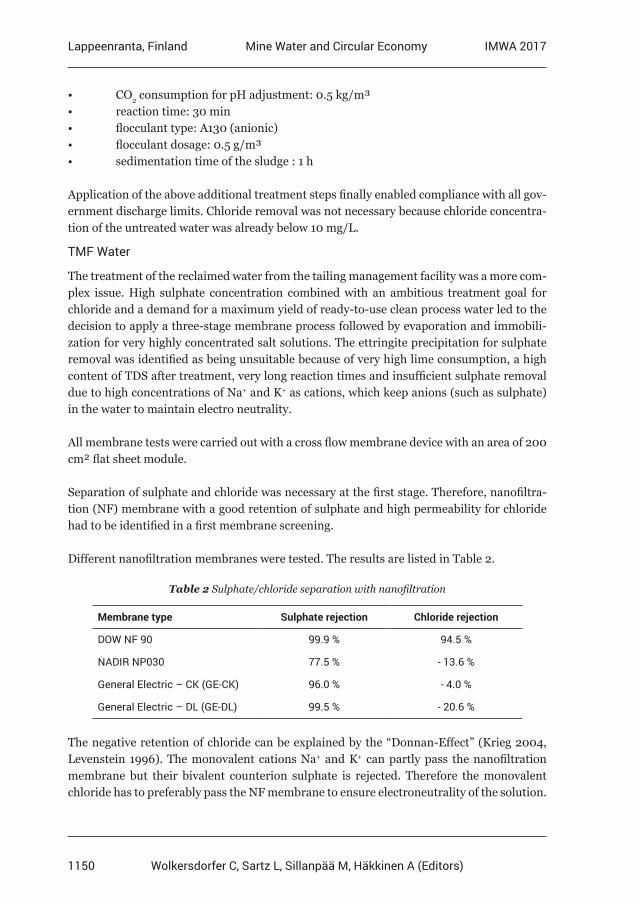
1150
Lappeenranta, Finland IMWA 2017Mine Water and Circular Economy
Wolkersdorfer C, Sartz L, Sillanpää M, Häkkinen A (Editors)
• CO2 consumption for pH adjustment: 0.5 kg/m³ • reaction time: 30 min• flocculant type: A130 (anionic)• flocculant dosage: 0.5 g/m³• sedimentation time of the sludge : 1 h
Application of the above additional treatment steps finally enabled compliance with all gov-ernment discharge limits. Chloride removal was not necessary because chloride concentra-tion of the untreated water was already below 10 mg/L.
TMF Water
The treatment of the reclaimed water from the tailing management facility was a more com-plex issue. High sulphate concentration combined with an ambitious treatment goal for chloride and a demand for a maximum yield of ready-to-use clean process water led to the decision to apply a three-stage membrane process followed by evaporation and immobili-zation for very highly concentrated salt solutions. The ettringite precipitation for sulphate removal was identified as being unsuitable because of very high lime consumption, a high content of TDS after treatment, very long reaction times and insufficient sulphate removal due to high concentrations of Na+ and K+ as cations, which keep anions (such as sulphate) in the water to maintain electro neutrality.
All membrane tests were carried out with a cross flow membrane device with an area of 200 cm² flat sheet module.
Separation of sulphate and chloride was necessary at the first stage. Therefore, nanofiltra-tion (NF) membrane with a good retention of sulphate and high permeability for chloride had to be identified in a first membrane screening.
Different nanofiltration membranes were tested. The results are listed in Table 2.
Table 2 Sulphate/chloride separation with nanofiltration
Membrane type Sulphate rejection Chloride rejection
DOW NF 90 99.9 % 94.5 %
NADIR NP030 77.5 % - 13.6 %
General Electric – CK (GE-CK) 96.0 % - 4.0 %
General Electric – DL (GE-DL) 99.5 % - 20.6 %
The negative retention of chloride can be explained by the “Donnan-Effect” (Krieg 2004, Levenstein 1996). The monovalent cations Na+ and K+ can partly pass the nanofiltration membrane but their bivalent counterion sulphate is rejected. Therefore the monovalent chloride has to preferably pass the NF membrane to ensure electroneutrality of the solution.
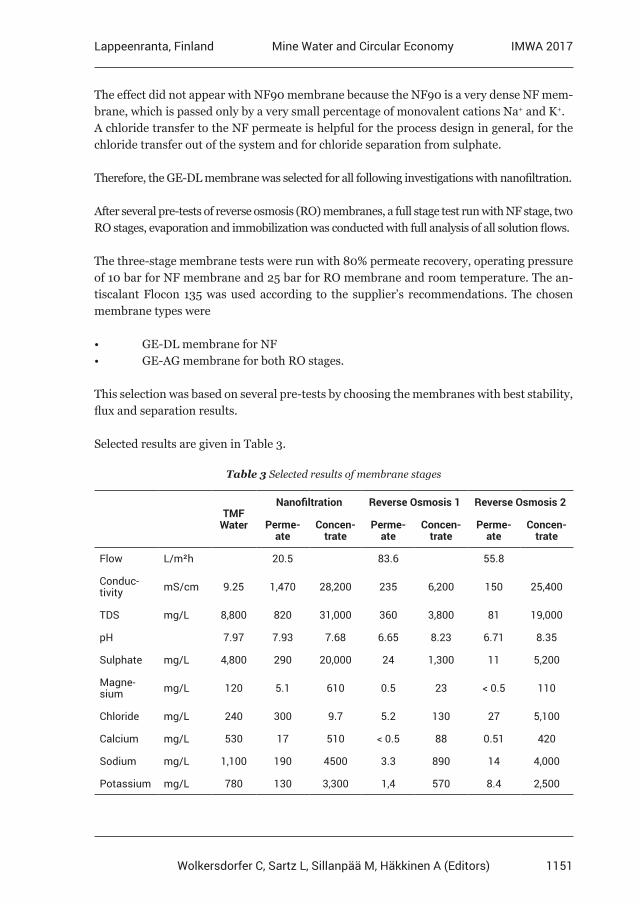
1151
Lappeenranta, Finland IMWA 2017Mine Water and Circular Economy
Wolkersdorfer C, Sartz L, Sillanpää M, Häkkinen A (Editors)
The effect did not appear with NF90 membrane because the NF90 is a very dense NF mem-brane, which is passed only by a very small percentage of monovalent cations Na+ and K+.A chloride transfer to the NF permeate is helpful for the process design in general, for the chloride transfer out of the system and for chloride separation from sulphate.
Therefore, the GE-DL membrane was selected for all following investigations with nanofiltration.
After several pre-tests of reverse osmosis (RO) membranes, a full stage test run with NF stage, two RO stages, evaporation and immobilization was conducted with full analysis of all solution flows.
The three-stage membrane tests were run with 80% permeate recovery, operating pressure of 10 bar for NF membrane and 25 bar for RO membrane and room temperature. The an-tiscalant Flocon 135 was used according to the supplier’s recommendations. The chosen membrane types were
• GE-DL membrane for NF• GE-AG membrane for both RO stages.
This selection was based on several pre-tests by choosing the membranes with best stability, flux and separation results.
Selected results are given in Table 3.
Table 3 Selected results of membrane stages
TMF Water
Nanofiltration Reverse Osmosis 1 Reverse Osmosis 2
Perme-ate
Concen-trate
Perme-ate
Concen-trate
Perme-ate
Concen-trate
Flow L/m²h 20.5 83.6 55.8
Conduc-tivity mS/cm 9.25 1,470 28,200 235 6,200 150 25,400
TDS mg/L 8,800 820 31,000 360 3,800 81 19,000
pH 7.97 7.93 7.68 6.65 8.23 6.71 8.35
Sulphate mg/L 4,800 290 20,000 24 1,300 11 5,200
Magne-sium mg/L 120 5.1 610 0.5 23 < 0.5 110
Chloride mg/L 240 300 9.7 5.2 130 27 5,100
Calcium mg/L 530 17 510 < 0.5 88 0.51 420
Sodium mg/L 1,100 190 4500 3.3 890 14 4,000
Potassium mg/L 780 130 3,300 1,4 570 8.4 2,500
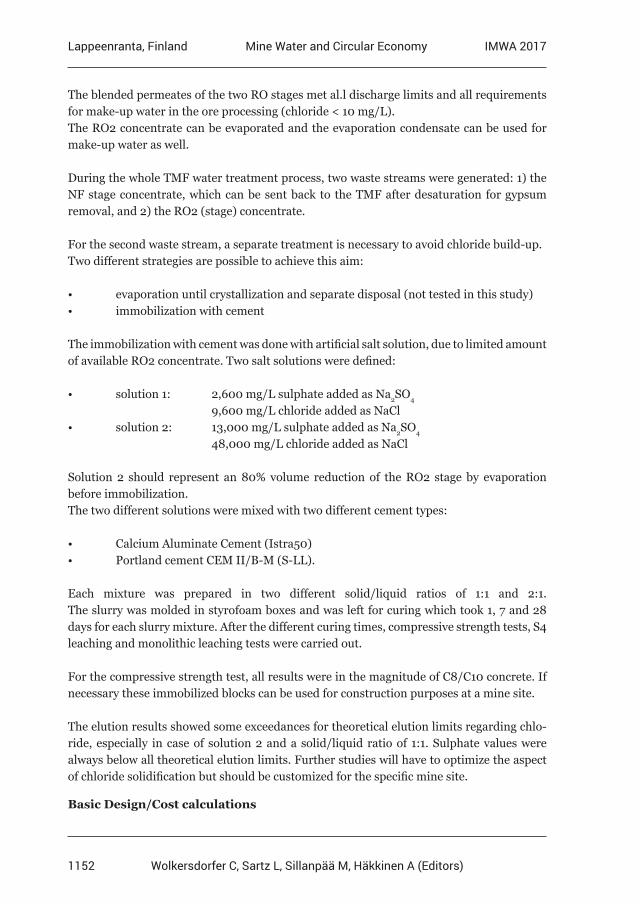
1152
Lappeenranta, Finland IMWA 2017Mine Water and Circular Economy
Wolkersdorfer C, Sartz L, Sillanpää M, Häkkinen A (Editors)
The blended permeates of the two RO stages met al.l discharge limits and all requirements for make-up water in the ore processing (chloride < 10 mg/L).The RO2 concentrate can be evaporated and the evaporation condensate can be used for make-up water as well.
During the whole TMF water treatment process, two waste streams were generated: 1) the NF stage concentrate, which can be sent back to the TMF after desaturation for gypsum removal, and 2) the RO2 (stage) concentrate.
For the second waste stream, a separate treatment is necessary to avoid chloride build-up. Two different strategies are possible to achieve this aim:
• evaporation until crystallization and separate disposal (not tested in this study)• immobilization with cement
The immobilization with cement was done with artificial salt solution, due to limited amount of available RO2 concentrate. Two salt solutions were defined:
• solution 1: 2,600 mg/L sulphate added as Na2SO4
9,600 mg/L chloride added as NaCl• solution 2: 13,000 mg/L sulphate added as Na2SO4
48,000 mg/L chloride added as NaCl
Solution 2 should represent an 80% volume reduction of the RO2 stage by evaporation before immobilization.The two different solutions were mixed with two different cement types:
• Calcium Aluminate Cement (Istra50)• Portland cement CEM II/B-M (S-LL).
Each mixture was prepared in two different solid/liquid ratios of 1:1 and 2:1. The slurry was molded in styrofoam boxes and was left for curing which took 1, 7 and 28 days for each slurry mixture. After the different curing times, compressive strength tests, S4 leaching and monolithic leaching tests were carried out.
For the compressive strength test, all results were in the magnitude of C8/C10 concrete. If necessary these immobilized blocks can be used for construction purposes at a mine site.
The elution results showed some exceedances for theoretical elution limits regarding chlo-ride, especially in case of solution 2 and a solid/liquid ratio of 1:1. Sulphate values were always below all theoretical elution limits. Further studies will have to optimize the aspect of chloride solidification but should be customized for the specific mine site.
Basic Design/Cost calculations
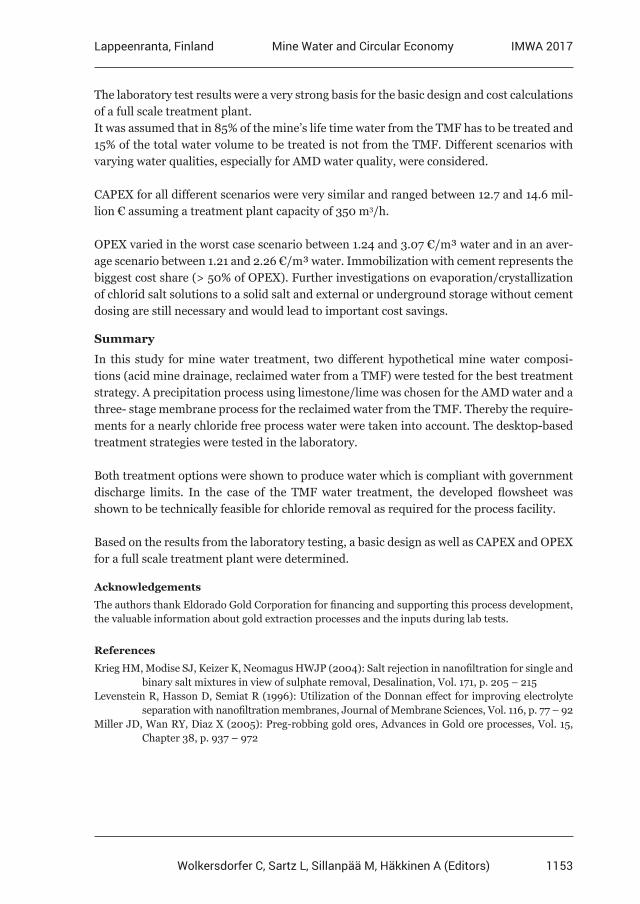
1153
Lappeenranta, Finland IMWA 2017Mine Water and Circular Economy
Wolkersdorfer C, Sartz L, Sillanpää M, Häkkinen A (Editors)
The laboratory test results were a very strong basis for the basic design and cost calculations of a full scale treatment plant.It was assumed that in 85% of the mine’s life time water from the TMF has to be treated and 15% of the total water volume to be treated is not from the TMF. Different scenarios with varying water qualities, especially for AMD water quality, were considered.
CAPEX for all different scenarios were very similar and ranged between 12.7 and 14.6 mil-lion € assuming a treatment plant capacity of 350 m3/h.
OPEX varied in the worst case scenario between 1.24 and 3.07 €/m³ water and in an aver-age scenario between 1.21 and 2.26 €/m³ water. Immobilization with cement represents the biggest cost share (> 50% of OPEX). Further investigations on evaporation/crystallization of chlorid salt solutions to a solid salt and external or underground storage without cement dosing are still necessary and would lead to important cost savings.
Summary
In this study for mine water treatment, two different hypothetical mine water composi-tions (acid mine drainage, reclaimed water from a TMF) were tested for the best treatment strategy. A precipitation process using limestone/lime was chosen for the AMD water and a three- stage membrane process for the reclaimed water from the TMF. Thereby the require-ments for a nearly chloride free process water were taken into account. The desktop-based treatment strategies were tested in the laboratory.
Both treatment options were shown to produce water which is compliant with government discharge limits. In the case of the TMF water treatment, the developed flowsheet was shown to be technically feasible for chloride removal as required for the process facility.
Based on the results from the laboratory testing, a basic design as well as CAPEX and OPEX for a full scale treatment plant were determined.
Acknowledgements
The authors thank Eldorado Gold Corporation for financing and supporting this process development, the valuable information about gold extraction processes and the inputs during lab tests.
References
Krieg HM, Modise SJ, Keizer K, Neomagus HWJP (2004): Salt rejection in nanofiltration for single and binary salt mixtures in view of sulphate removal, Desalination, Vol. 171, p. 205 – 215Levenstein R, Hasson D, Semiat R (1996): Utilization of the Donnan effect for improving electrolyte separation with nanofiltration membranes, Journal of Membrane Sciences, Vol. 116, p. 77 – 92Miller JD, Wan RY, Diaz X (2005): Preg-robbing gold ores, Advances in Gold ore processes, Vol. 15, Chapter 38, p. 937 – 972
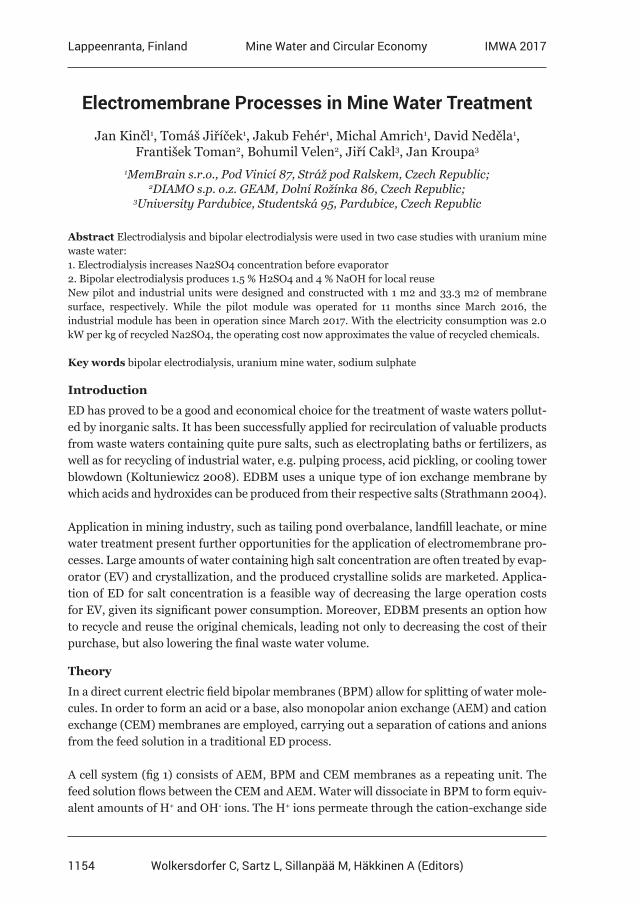
1154
Lappeenranta, Finland IMWA 2017Mine Water and Circular Economy
Wolkersdorfer C, Sartz L, Sillanpää M, Häkkinen A (Editors)
Electromembrane Processes in Mine Water Treatment
Jan Kinčl1, Tomáš Jiříček1, Jakub Fehér1, Michal Amrich1, David Neděla1, František Toman2, Bohumil Velen2, Jiří Cakl3, Jan Kroupa3
1MemBrain s.r.o., Pod Vinicí 87, Stráž pod Ralskem, Czech Republic; 2DIAMO s.p. o.z. GEAM, Dolní Rožínka 86, Czech Republic;
3University Pardubice, Studentská 95, Pardubice, Czech Republic
Abstract Electrodialysis and bipolar electrodialysis were used in two case studies with uranium mine waste water: 1. Electrodialysis increases Na2SO4 concentration before evaporator2. Bipolar electrodialysis produces 1.5 % H2SO4 and 4 % NaOH for local reuse New pilot and industrial units were designed and constructed with 1 m2 and 33.3 m2 of membrane surface, respectively. While the pilot module was operated for 11 months since March 2016, the industrial module has been in operation since March 2017. With the electricity consumption was 2.0 kW per kg of recycled Na2SO4, the operating cost now approximates the value of recycled chemicals.
Key words bipolar electrodialysis, uranium mine water, sodium sulphate
Introduction
ED has proved to be a good and economical choice for the treatment of waste waters pollut-ed by inorganic salts. It has been successfully applied for recirculation of valuable products from waste waters containing quite pure salts, such as electroplating baths or fertilizers, as well as for recycling of industrial water, e.g. pulping process, acid pickling, or cooling tower blowdown (Koltuniewicz 2008). EDBM uses a unique type of ion exchange membrane by which acids and hydroxides can be produced from their respective salts (Strathmann 2004).
Application in mining industry, such as tailing pond overbalance, landfill leachate, or mine water treatment present further opportunities for the application of electromembrane pro-cesses. Large amounts of water containing high salt concentration are often treated by evap-orator (EV) and crystallization, and the produced crystalline solids are marketed. Applica-tion of ED for salt concentration is a feasible way of decreasing the large operation costs for EV, given its significant power consumption. Moreover, EDBM presents an option how to recycle and reuse the original chemicals, leading not only to decreasing the cost of their purchase, but also lowering the final waste water volume.
Theory
In a direct current electric field bipolar membranes (BPM) allow for splitting of water mole-cules. In order to form an acid or a base, also monopolar anion exchange (AEM) and cation exchange (CEM) membranes are employed, carrying out a separation of cations and anions from the feed solution in a traditional ED process.
A cell system (fig 1) consists of AEM, BPM and CEM membranes as a repeating unit. The feed solution flows between the CEM and AEM. Water will dissociate in BPM to form equiv-alent amounts of H+ and OH- ions. The H+ ions permeate through the cation-exchange side
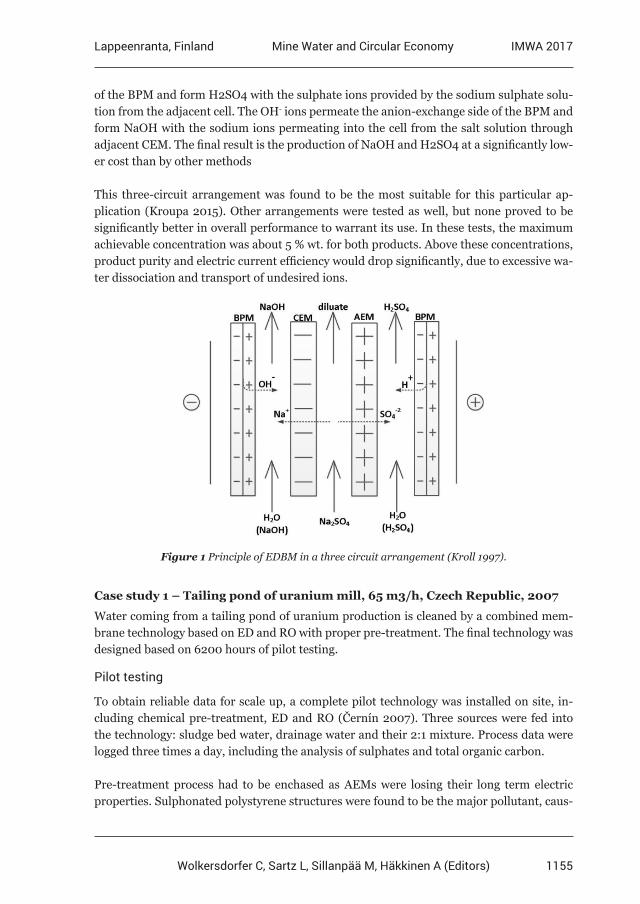
1155
Lappeenranta, Finland IMWA 2017Mine Water and Circular Economy
Wolkersdorfer C, Sartz L, Sillanpää M, Häkkinen A (Editors)
of the BPM and form H2SO4 with the sulphate ions provided by the sodium sulphate solu-tion from the adjacent cell. The OH- ions permeate the anion-exchange side of the BPM and form NaOH with the sodium ions permeating into the cell from the salt solution through adjacent CEM. The final result is the production of NaOH and H2SO4 at a significantly low-er cost than by other methods
This three-circuit arrangement was found to be the most suitable for this particular ap-plication (Kroupa 2015). Other arrangements were tested as well, but none proved to be significantly better in overall performance to warrant its use. In these tests, the maximum achievable concentration was about 5 % wt. for both products. Above these concentrations, product purity and electric current efficiency would drop significantly, due to excessive wa-ter dissociation and transport of undesired ions.
Figure 1 Principle of EDBM in a three circuit arrangement (Kroll 1997).
Case study 1 – Tailing pond of uranium mill, 65 m3/h, Czech Republic, 2007
Water coming from a tailing pond of uranium production is cleaned by a combined mem-brane technology based on ED and RO with proper pre-treatment. The final technology was designed based on 6200 hours of pilot testing.
Pilot testing
To obtain reliable data for scale up, a complete pilot technology was installed on site, in-cluding chemical pre-treatment, ED and RO (Černín 2007). Three sources were fed into the technology: sludge bed water, drainage water and their 2:1 mixture. Process data were logged three times a day, including the analysis of sulphates and total organic carbon.
Pre-treatment process had to be enchased as AEMs were losing their long term electric properties. Sulphonated polystyrene structures were found to be the major pollutant, caus-
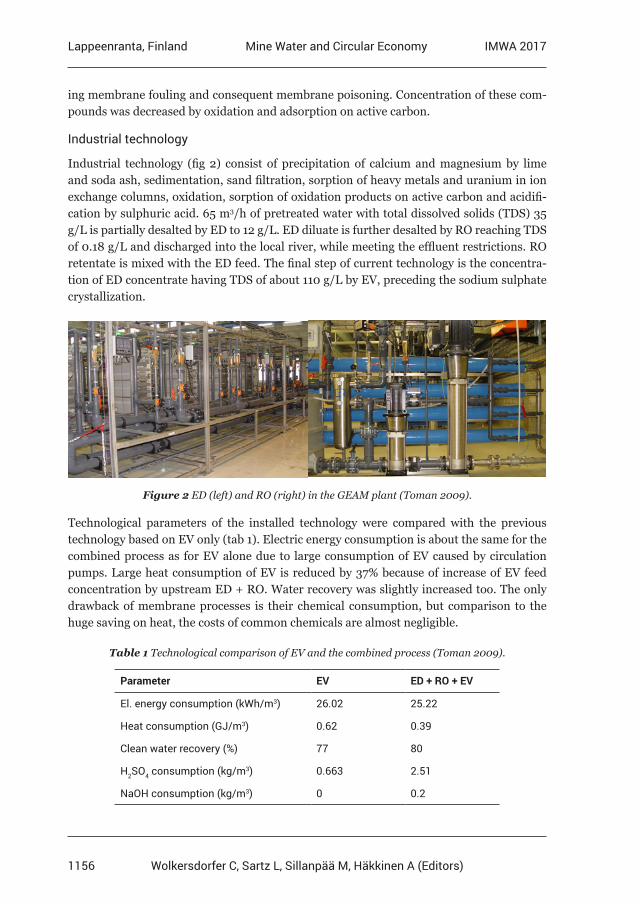
1156
Lappeenranta, Finland IMWA 2017Mine Water and Circular Economy
Wolkersdorfer C, Sartz L, Sillanpää M, Häkkinen A (Editors)
ing membrane fouling and consequent membrane poisoning. Concentration of these com-pounds was decreased by oxidation and adsorption on active carbon.
Industrial technology
Industrial technology (fig 2) consist of precipitation of calcium and magnesium by lime and soda ash, sedimentation, sand filtration, sorption of heavy metals and uranium in ion exchange columns, oxidation, sorption of oxidation products on active carbon and acidifi-cation by sulphuric acid. 65 m3/h of pretreated water with total dissolved solids (TDS) 35 g/L is partially desalted by ED to 12 g/L. ED diluate is further desalted by RO reaching TDS of 0.18 g/L and discharged into the local river, while meeting the effluent restrictions. RO retentate is mixed with the ED feed. The final step of current technology is the concentra-tion of ED concentrate having TDS of about 110 g/L by EV, preceding the sodium sulphate crystallization.
Figure 2 ED (left) and RO (right) in the GEAM plant (Toman 2009).
Technological parameters of the installed technology were compared with the previous technology based on EV only (tab 1). Electric energy consumption is about the same for the combined process as for EV alone due to large consumption of EV caused by circulation pumps. Large heat consumption of EV is reduced by 37% because of increase of EV feed concentration by upstream ED + RO. Water recovery was slightly increased too. The only drawback of membrane processes is their chemical consumption, but comparison to the huge saving on heat, the costs of common chemicals are almost negligible.
Table 1 Technological comparison of EV and the combined process (Toman 2009).
Parameter EV ED + RO + EV
El. energy consumption (kWh/m3) 26.02 25.22
Heat consumption (GJ/m3) 0.62 0.39
Clean water recovery (%) 77 80
H2SO4 consumption (kg/m3) 0.663 2.51
NaOH consumption (kg/m3) 0 0.2
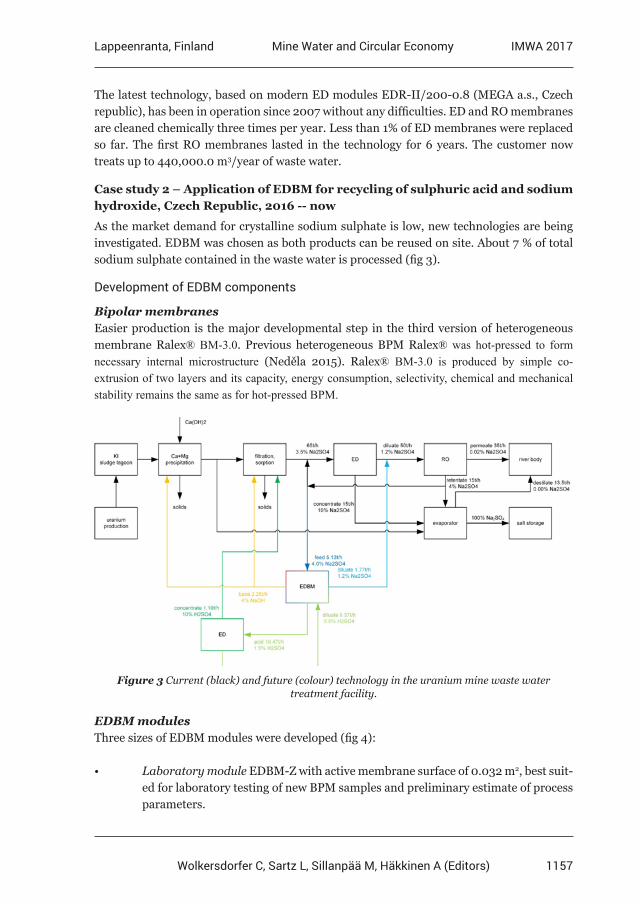
1157
Lappeenranta, Finland IMWA 2017Mine Water and Circular Economy
Wolkersdorfer C, Sartz L, Sillanpää M, Häkkinen A (Editors)
The latest technology, based on modern ED modules EDR-II/200-0.8 (MEGA a.s., Czech republic), has been in operation since 2007 without any difficulties. ED and RO membranes are cleaned chemically three times per year. Less than 1% of ED membranes were replaced so far. The first RO membranes lasted in the technology for 6 years. The customer now treats up to 440,000.0 m3/year of waste water.
Case study 2 – Application of EDBM for recycling of sulphuric acid and sodium hydroxide, Czech Republic, 2016 -- now
As the market demand for crystalline sodium sulphate is low, new technologies are being investigated. EDBM was chosen as both products can be reused on site. About 7 % of total sodium sulphate contained in the waste water is processed (fig 3).
Development of EDBM components
Bipolar membranesEasier production is the major developmental step in the third version of heterogeneous membrane Ralex® BM-3.0. Previous heterogeneous BPM Ralex® was hot-pressed to form necessary internal microstructure (Neděla 2015). Ralex® BM-3.0 is produced by simple co-extrusion of two layers and its capacity, energy consumption, selectivity, chemical and mechanical stability remains the same as for hot-pressed BPM.
Figure 3 Current (black) and future (colour) technology in the uranium mine waste water treatment facility.
EDBM modulesThree sizes of EDBM modules were developed (fig 4):
• Laboratory module EDBM-Z with active membrane surface of 0.032 m2, best suit-ed for laboratory testing of new BPM samples and preliminary estimate of process parameters.
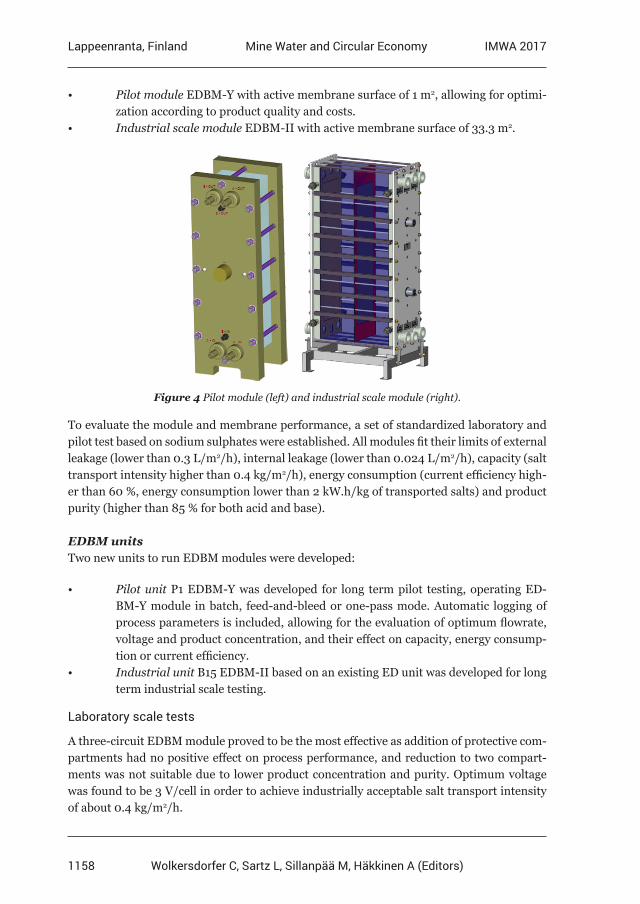
1158
Lappeenranta, Finland IMWA 2017Mine Water and Circular Economy
Wolkersdorfer C, Sartz L, Sillanpää M, Häkkinen A (Editors)
• Pilot module EDBM-Y with active membrane surface of 1 m2, allowing for optimi-zation according to product quality and costs.
• Industrial scale module EDBM-II with active membrane surface of 33.3 m2.
Figure 4 Pilot module (left) and industrial scale module (right).
To evaluate the module and membrane performance, a set of standardized laboratory and pilot test based on sodium sulphates were established. All modules fit their limits of external leakage (lower than 0.3 L/m2/h), internal leakage (lower than 0.024 L/m2/h), capacity (salt transport intensity higher than 0.4 kg/m2/h), energy consumption (current efficiency high-er than 60 %, energy consumption lower than 2 kW.h/kg of transported salts) and product purity (higher than 85 % for both acid and base).
EDBM unitsTwo new units to run EDBM modules were developed:
• Pilot unit P1 EDBM-Y was developed for long term pilot testing, operating ED-BM-Y module in batch, feed-and-bleed or one-pass mode. Automatic logging of process parameters is included, allowing for the evaluation of optimum flowrate, voltage and product concentration, and their effect on capacity, energy consump-tion or current efficiency.
• Industrial unit B15 EDBM-II based on an existing ED unit was developed for long term industrial scale testing.
Laboratory scale tests
A three-circuit EDBM module proved to be the most effective as addition of protective com-partments had no positive effect on process performance, and reduction to two compart-ments was not suitable due to lower product concentration and purity. Optimum voltage was found to be 3 V/cell in order to achieve industrially acceptable salt transport intensity of about 0.4 kg/m2/h.
1159
Lappeenranta, Finland IMWA 2017Mine Water and Circular Economy
Wolkersdorfer C, Sartz L, Sillanpää M, Häkkinen A (Editors)
The largest possible flowrate is favourable for EDBM operation, given that (i) the pump energy consumption is by an order of magnitude lower than that of ion transport, and (ii) the boundary layer, where slow diffusion prevails, is less developed at increased flowrates. Flowrate is only limited by the pressure drop of industrial EDBM module and should be kept below 0.5 bar, typically occurring at linear velocities of around 0.07 m/s.
4.0 % wt. hydroxide and 1.5 % wt. acid were found to be optimum product concentrations, while providing acceptable purity and current efficiency. The base can be reused at site di-rectly; the acid requires further concentration on existing ED technology to reach to 10 % wt.
Pilot tests
During 11 months of pilot testing the unit has been in stable operation, producing the required product concentrations and approaching purities of 80 %. Compared to the laboratory tests, the pilot unit was operated at lower current densities of about 350 A/m2 with current efficien-cy of about 62 %. Energy consumption of 2.0 kWh/kg of transported sodium sulphate could not be compared to previous studies as the operating conditions differed considerably.
Industrial scale tests
Industrial production started in March 2017 on the newly developed B15 unit with one ED-BM-II module. As the data cover less than one month of operation it is still early to publish any results. However, before the end of 2017 a feasibility study based on industrial scale data will be completed.
Operation costs
In the projected application of EDBM into existing technology (fig 3), the feed is 5.13 t/h of RO retentate with 4.0 % sodium sulphate. EDBM products are 1.77 t/h diluate with 1.2 % sodium sulphate, which is used as RO feed, 2.25 t/h of 4.0 % NaOH, which is used directly on site, and 10.47 t/h of 1.5 % H2SO4, which is concentrated in existing ED to 1.10 t/h of 10 % H2SO4, while 9.37 t/h ED diluate with 0.5 % H2SO4 is recycled back to EDBM for acid solu-tion make-up. Exiting ED capacity should remain approximately constant. Time needed for H2SO4 concentration should be freed by decreasing salt amount for desalination by feeding a part of 4 % sodium sulphate solution into EDBM.
The estimate of operation costs (tab 2) is based on 11 month of pilot testing, given the electric energy price (0.064 €/kWh) and 300 workdays in a year. Electrical energy is 88 % of total operation costs, remaining 12 % are spare parts, such as membranes, spacers, and electrodes.
Current price of produced acids and bases is 317,034 €/year at given chemical prices (210 €/t 50 % NaOH and 55 €/t 94 % H2SO4). That is much more than operation costs of 223,358 €/year, operating profit is 119,410 €/year only by reduced chemicals purchase. EDBM technology brings more flexibility to the water treatment on site. Large EV with large operation expenses does not have to run permanently and crystalline sodium sulphate is not produced when capacity demand is low such as during a low rainfall winter period.
1160
Lappeenranta, Finland IMWA 2017Mine Water and Circular Economy
Wolkersdorfer C, Sartz L, Sillanpää M, Häkkinen A (Editors)
Table 2 Operation costs of EDBM.
Operation cost (€/year) Operation cost (%)
Electric energy 195,970 88
Chemicals 62 0
Spare parts 27,326 12
Total operation costs 223,358 100
Conclusions
Combination of desalination and concentration technologies proved to be the most compet-itive when compared to using each technology separately. Combined technology of ED, RO and thermal concentration (EV, crystallizer) decreases both investment and operation costs of waste water treatment and brings us closer to zero liquid discharge. In this combination:
- Thermal step is used for production of solid salts and reduction of salt discharge into water bodies.
- ED is used for decreasing both investment and operating costs of the thermal step. Concentration of the EV feed up to 18 % wt. brings significant heat consumption sav-ings. Total costs are lower with membrane processes despite the need of larger chem-ical and mechanical pre-treatment.
- RO is used for meeting strict water discharge limits while RO retentate is pumped back into ED without any additional costs.
- Long membrane lifetime of both RO and ED is achievable with proper pre-treatment.
New heterogeneous BM-3.0 used in new laboratory and pilot scale modules was used for pro-duction of sulphuric acid and sodium hydroxide from sodium sulphate, with salt transport intensity 0.45 kg/m2/h, 62 % current efficiency and energy consumption 2.0 kWh per kg of transported salt. Application of EDBM technology on DIAMO s.p., division GEAM is econom-ically feasible because of the eliminated costs for the recycled chemicals. EDBM brings also higher flexibility for changing capacity needs in case an unusual weather change occurs.
Acknowledgements
This work has been supported by the Technology Agency of the Czech Republic under the project no. TH10131077 „Production of NaOH and H2SO4 from waste Na2SO4 by electrodialysis with bipolar membrane“ within the framework of Project no. LO1418 “Progressive Development of Membrane Innovation Centre” supported by the program NPU I of Ministry of Education, Youth and Sports of the Czech Republic, using the infrastructure Membrane Innovation Centre.
References
Černín A, Kysela V, Mejta V (2007) Zpracování multikomponentních odpadních vod elektrodialýzou v uranovém průmyslu, Book of abstracts CHISA Conference, PragueKoltuniewicz AB, Drioli E (2008) Membranes in Clean Technologies, Wiley – VCH Verlag GmbH & Co. KGaA
1161
Lappeenranta, Finland IMWA 2017Mine Water and Circular Economy
Wolkersdorfer C, Sartz L, Sillanpää M, Häkkinen A (Editors)
Kroll JJ (1997) Monopolar and bipolar ion exchange membranes mass transport limitations. Enschede: Dept. of Chem. Eng., University of Twente.Kroupa J, Cakl J, Kinčl J, (2015) Increasing the concentration of products from electrodialysis with heterogeneous bipolar membrane, Innovative remediation technologies – research and experience, 8.Neděla D, Křivčík J, Válek R, Stránská E (2015) Influence of water content on properties of a heterogeneous bipolar membrane, Desal. Wat. Treat. 56, 3269–3272Strathmann H (2004) Ion-exchange membrane separation processes, Boston: Elsevier. Toman F (2009) Membrane processes in a water treatment at the uranium chemical mill, Book of abstracts PERMEA, Prague
1162
Lappeenranta, Finland IMWA 2017Mine Water and Circular Economy
Wolkersdorfer C, Sartz L, Sillanpää M, Häkkinen A (Editors)
Compact Passive Treatment Process for Acid Mine Drainage, Utilizing Rice Husks and Rice Bran
– Process Optimization
Takaya Hamai1, Yuki Sato1, Kazuhiro Kojima1, Takao Miura2, Kentaro Hayashi2, Taisuke Sakakibara2, Kazunori Hatsuya2, Mikio Kobayashi2, Nobuyuki Masuda2,
Kousuke Takamoto2, Masahiro Sowanaka2, Takeshi Sakata2, Tomoyuki Hori3, Atsushi Ogata3, Tomo Aoyagi3, Hiroshi Habe3
1Metals Technology Center, Japan Oil, Gas and Metals National Corporation, Furudate 9-3, Kosaka-kouzan, Kosaka, Akita, Japan, [email protected]
2Metals Environment Management Department, Japan Oil, Gas and Metals National Corporation, Toranomon 2-10-1, Minato-ku, Tokyo, Japan
3Advanced Industrial Science and Technology, Umezono 1-1-1, Tsukuba, Ibaraki, Japan
Abstract A biological passive mine water treatment system, which is environment-friendly and energy saving, has been developed by JOGMEC (Japan Oil, Gas and Metals National Corporation). In this “JOGMEC process”, contaminated mine water is treated in a vertical-flow anaerobic bioreactor that utilizes sulfate reducing bacteria (SRB). It is necessary to introduce compact passive treatment system with a higher flow rate (shorter hydraulic retention time (HRT)). Based on column tests, required HRT could be substantially shortened down to 6 hours with above neutralization process.
Key words AMD, Passive Treatment, Sulfate Reducing Bacteria
Introduction
Japan Oil, Gas and Metals National Corporation (JOGMEC) has been conducting survey research on passive treatment since 2007 and has focused on treatment methods to remove metals contained in acid mine drainage as sulfide by utilizing of sulfate reducing bacteria (SRB).
Field tests have been conducted with anaerobic reactors filled with “rice bran” in addition to “rice husk” for acid mine drainage since 2014. Continuous removal of metals for more than 300 days has been confirmed with the hydraulic retention time (HRT) of 50 hours under the conditions close to natural environment that the temperature in the winter drops to around -10 degrees. Besides, continuous removal for more than one year has been confirmed with the HRT of 25 hours 1), 2).
As described above, it is becoming clear that acid mine drainage can be treated for a long period under the condition of the HRT of about 50 hours or 25 hours using the “JOGMEC process”, a process of removing metal in mine drainage as sulfide by utilizing SRB, with an anaerobic bioreactor filled with rice bran and rice husk. In addition, the analyses on metal precipitates, bacterial flora, and so on, in the bioreactor have revealed various aspects of the reaction mechanisms related to removal of metal ions with hydrogen sulfide ions orig-inated by the reduction with SRB3), 4). Water flow condition such as the HRT of 25 hours is notably short comparing to other tests in other countries, so that the scale of required
1163
Lappeenranta, Finland IMWA 2017Mine Water and Circular Economy
Wolkersdorfer C, Sartz L, Sillanpää M, Häkkinen A (Editors)
equipment may be smaller for treatment per a unit. Yet, further efficiency and optimization of the process is necessary to come into widespread adoption in Japanese acid mine drain-age systems.
Therefore, the test (acceleration test) had be carried out to investigate how much the estab-lished process can treat mine drainage in this short HRT to evaluate capability of treatment.
Methods
Purpose of experiments
This is the test to investigate how the JOGMEC process established to show can treat mine drainage in a short HRT. This is the test to investigate the shortest HRT for the drainage treatment with the current JOGMEC capability. More specifically, the purpose is to inves-tigate the condition of the shortest possible HRT by SRB of sulfate ion reduction with the HRT being decreased gradually from 50 hours (i.e., increase in water flow per unit) that used to be confirmed for drain treatment.
In the previous case, acid mine drainage was directly introduced to the bioreactor. When raw water contained iron, the drainage was introduced into the anaerobic bioreactor after iron removal process. However, new process was introduced to this test: increasing pH of the drainage to the level of 5 ~ 6 before the conveyance into the bioreactor. In general, SRB is known as reducing sulfate ion actively under neutral pH. In the previous process, the limestone, filled in the anaerobic bioreactor, principally adjusted pH to SRB activity, but it was predicted that the limestone was dissolving as days passing, eventually leading to lower pH. In fact, the pH was confirmed to be decreased significantly around upper part of reactor conducted after 800 days from the beginning. The limestone also played a key role as a structural material of an anaerobic bioreactor; was filled in the whole bioreactor; hence, frequent refilling might not be practical. Therefore, as a new process a “pH controlling tank” filled with limestone was designed before the anaerobic bioreactor.
In this test, two processes were conducted: like previous tests, process for introducing raw water directly into the anaerobic reactors represents as acid condition (hereafter referred to as A-condition); newly designed process for introducing drainage into the anaerobic reactor after adjusting pH 5~6 represents as neutral condition (hereafter referred to as N-condi-tion). This test is to determine how the shortest possible HRT for two processes differed from each other.
Structure and Contents of reactor
Column with a diameter of 25 cm and a height of 110 cm was used for the bioreactor, which had a structure that allowed water to be sampled at four levels. Water sampling ports were set at the heights of 40 cm, 65 cm, 90 cm, and 110 cm from the top of the bioreactor. The port nearest to the input was called “the first port” and the port nearest to the output was called “the fourth port.”
1164
Lappeenranta, Finland IMWA 2017Mine Water and Circular Economy
Wolkersdorfer C, Sartz L, Sillanpää M, Häkkinen A (Editors)
The anaerobic bioreactor was filled with the contents as shown below. As a “source of bacte-ria” related to sulfate ion reduction including SRB, soil collected from the surrounding mine site was used. Rice husk was used as “substrate” of the bioreactor and “nutrient source” for bacteria. Rice bran was also used as “easily degradable organic matter” which was easily decomposed than rice husk by bacteria. Limestone (3 to 20 mm) was used as “structural material” for securing air gap and pH buffering. Each initial filling weight was 4.7 kg of rice husk, 4.5 kg of rice bran, 17.5 g of soil and about 20 kg of limestone. The rice husk, lime-stones and soil were evenly stirred to achieve homogeneous dispersion, and were filled in the bioreactor. The rice bran was intensively filled on top of the bioreactor. After filling of these contents, the bioreactor was filled with raw water, mine drainage to be treated; the amount was 35 L. The weight of the contents and filling compositions were the same for A-condition and N-condition.
Condition of Experiments
Quality of Raw WaterFigure 1 shows the quality of the raw water to be treated in this test. As described above, the raw water contained iron. Thus, the raw water of the A-condition was the water that passed through the iron oxidation and removal process, and the raw water of the N-condition was the water that passed through the pH controlling tank. Although the pH of the raw water rose to around six in the N-condition, the concentration of the metal such as copper and zinc was almost the same as the raw water of the A-condition.
Table 1 Average Quality of Treated Water (Unit : mg/L)
pH T-Fe Zn Cu Cd SO42-
Drainage 3.5 36.5 15.4 4.9 0.06 310
A-condition 3.0 8.0 15.4 4.9 0.06 310
N-condition 6.2 2.7 14.6 3.3 0.06 316
Analysis of itemsThe raw water to be treated and the water after treatment were periodically sampled and analyzed. Items for testing were temperature, pH, Oxidation-Reduction Potential (ORP), metal concentrations (such as iron, copper, zinc, and cadmium), sulfate ion concentration, sulfide ion concentration (hydrogen sulfide, hydrogen sulfide ion, and other sulfide ion were fixed as sulfide ion in strong alkaline condition, and analyzed with a spectrophotometric method using methylene blue), and chemical oxygen demand (COD).
Water Flow rateA-ConditionRaw water was pumped by a liquid feed pump into the bioreactor from the upper side to increase the water flow rate gradually. The HRT of the bioreactor was adjusted to 50 hours (about 12 mL/min), 25 hours (about 24 mL/min), 20 hours (about 30 mL/min), 12 hours
1165
Lappeenranta, Finland IMWA 2017Mine Water and Circular Economy
Wolkersdorfer C, Sartz L, Sillanpää M, Häkkinen A (Editors)
(about 50 mL/min), 8 hours (about 72 mL/min), 7 hours (83 mL/min). It allowed at least 10 days for each water flow period. The water flow rate was increased at the stage where the system was thought to stabilized to some extent in terms of, for example, the level of pH, ORP, and sulfate ion concentration. This test was conducted in winter beginning from December 4, 2015 and ending on April 26, 2016 to examine the processing capacity at low temperature. On February 26, 2016 which was 84th day from the beginning of the test, be-cause clogging inside the bioreactor prevented water from passing temporarily, a part of the rice bran which caused the clogging was removed. Then water flowing was resumed.
N-conditionWater passing through the pH adjustment tank was used as raw water for passing through the bioreactor from the top using pump in the same way as A-condition. The HRT of the bioreactor was set to 25 hours, 20 hours, 12 hours, 8 hours, 6 hours (about 100 mL/min) to 5 hours (about 120 mL/min.) This test began on January 28, 2016 and ended on June 2 of the same year. Table 2 shows conducted days for each HRT for both A- and N-conditions.
Table 2 Conducted Schedule
HRT 50 hours 25 hours 20 hours 12 hours 8 hours 7 hours 6 hours 5 hours
A-condition 12days 28 days 15days 50days 18days 21days - -
N-condition - 13days 26 days 11 days 25 days - 14 days 37 days
Results
(1) pH, ORP, the Concentration of sulfate concentration under A-Condition
Figure 1, Figure 2 and Figure 3 shows the change in pH, ORP and the concentration of sul-fate ion-respectively under A-Condition.
According to these results, it was found that in the A-condition, the pH of the first port greatly decreased at the HRT of 12 hours, and the ORP increased and showed a positive value. Those values were rather stable at each port at the HRT of 20 hours, but in the latter half of the 12 hour, the pH was low and the ORP showed a high value. The sulfate ion con-centration decreased greatly in the bioreactor up to the middle of the 12 hour of HRT but it decreased only by about 30 mg/L in the latter half of the HRT of 12 hours. The sulfate ion concentration did not decrease almost all the time in the HRT of 8 hours and no decrease was confirmed at the HRT of 7 hours.
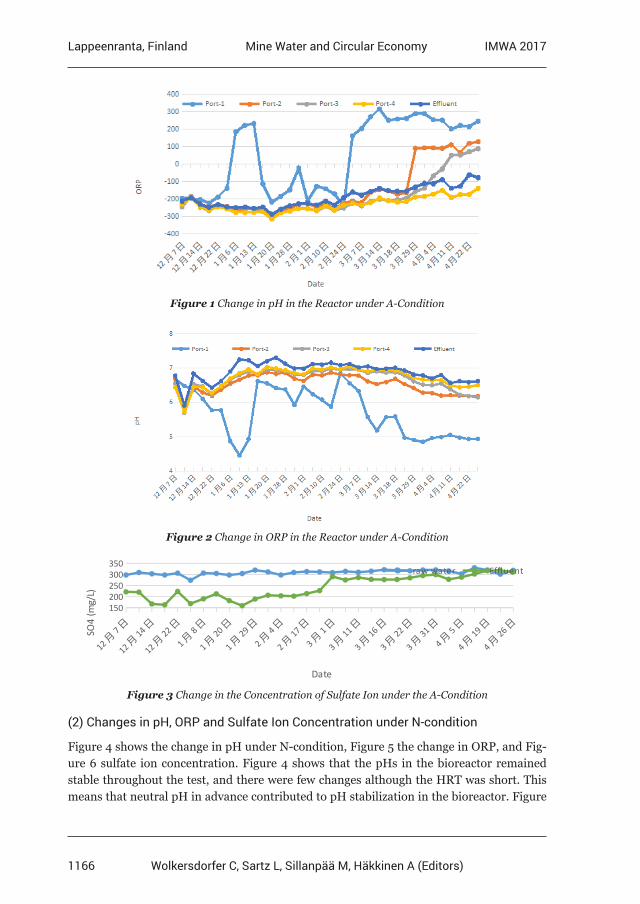
1166
Lappeenranta, Finland IMWA 2017Mine Water and Circular Economy
Wolkersdorfer C, Sartz L, Sillanpää M, Häkkinen A (Editors)
Figure 1 Change in pH in the Reactor under A-Condition
Figure 2 Change in ORP in the Reactor under A-Condition
12 月7 日
12 月14 日
12 月22 日
1 月8 日
1 月20 日
1 月29 日
2 月4 日
2 月17 日
3 月1 日
3 月11 日
3 月16 日
3 月22 日
3 月31 日
4 月5 日
4 月19 日
4 月26 日
150200250300350
raw water Effluent
Date
SO4
(mg/
L)
Figure 3 Change in the Concentration of Sulfate Ion under the A-Condition
(2) Changes in pH, ORP and Sulfate Ion Concentration under N-condition
Figure 4 shows the change in pH under N-condition, Figure 5 the change in ORP, and Fig-ure 6 sulfate ion concentration. Figure 4 shows that the pHs in the bioreactor remained stable throughout the test, and there were few changes although the HRT was short. This means that neutral pH in advance contributed to pH stabilization in the bioreactor. Figure
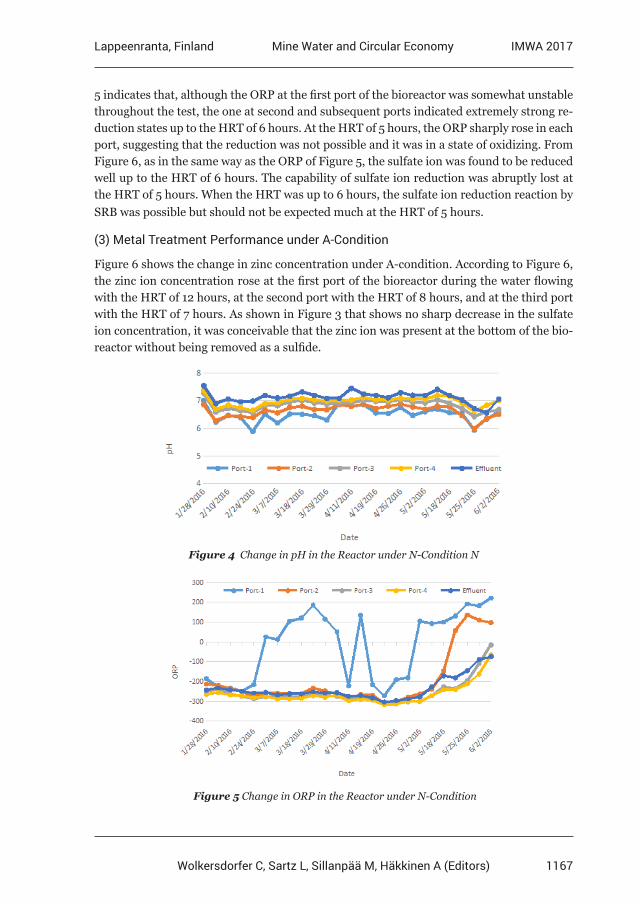
1167
Lappeenranta, Finland IMWA 2017Mine Water and Circular Economy
Wolkersdorfer C, Sartz L, Sillanpää M, Häkkinen A (Editors)
5 indicates that, although the ORP at the first port of the bioreactor was somewhat unstable throughout the test, the one at second and subsequent ports indicated extremely strong re-duction states up to the HRT of 6 hours. At the HRT of 5 hours, the ORP sharply rose in each port, suggesting that the reduction was not possible and it was in a state of oxidizing. From Figure 6, as in the same way as the ORP of Figure 5, the sulfate ion was found to be reduced well up to the HRT of 6 hours. The capability of sulfate ion reduction was abruptly lost at the HRT of 5 hours. When the HRT was up to 6 hours, the sulfate ion reduction reaction by SRB was possible but should not be expected much at the HRT of 5 hours.
(3) Metal Treatment Performance under A-Condition
Figure 6 shows the change in zinc concentration under A-condition. According to Figure 6, the zinc ion concentration rose at the first port of the bioreactor during the water flowing with the HRT of 12 hours, at the second port with the HRT of 8 hours, and at the third port with the HRT of 7 hours. As shown in Figure 3 that shows no sharp decrease in the sulfate ion concentration, it was conceivable that the zinc ion was present at the bottom of the bio-reactor without being removed as a sulfide.
Figure 4 Change in pH in the Reactor under N-Condition N
Figure 5 Change in ORP in the Reactor under N-Condition
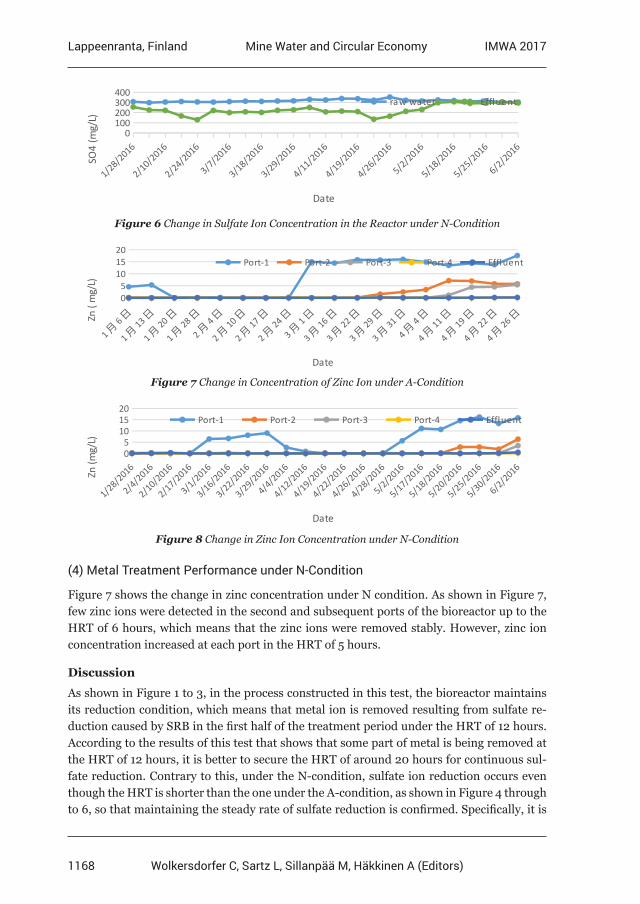
1168
Lappeenranta, Finland IMWA 2017Mine Water and Circular Economy
Wolkersdorfer C, Sartz L, Sillanpää M, Häkkinen A (Editors)
1/28/2
016
2/10/2
016
2/24/2
016
3/7/2
016
3/18/2
016
3/29/2
016
4/11/2
016
4/19/2
016
4/26/2
016
5/2/2
016
5/18/2
016
5/25/2
016
6/2/2
0160
100200300400
raw water Effluent
Date
SO4
(mg/
L)
Figure 6 Change in Sulfate Ion Concentration in the Reactor under N-Condition
1 月6 日
1 月13 日
1 月20 日
1 月28 日
2 月4 日
2 月10 日
2 月17 日
2 月24 日
3 月1 日
3 月16 日
3 月22 日
3 月29 日
3 月31 日
4 月4 日
4 月11 日
4 月19 日
4 月22 日
4 月26 日
05
101520
Port-1 Port-2 Port-3 Port-4 Effluent
Date
Zn (
mg/
L)
Figure 7 Change in Concentration of Zinc Ion under A-Condition
1/28/2
016
2/4/2
016
2/10/2
016
2/17/2
016
3/1/2
016
3/16/2
016
3/22/2
016
3/29/2
016
4/4/2
016
4/12/2
016
4/19/2
016
4/22/2
016
4/26/2
016
4/28/2
016
5/2/2
016
5/17/2
016
5/18/2
016
5/20/2
016
5/25/2
016
5/30/2
016
6/2/2
01605
101520
Port-1 Port-2 Port-3 Port-4 Effluent
Date
Zn (m
g/L)
Figure 8 Change in Zinc Ion Concentration under N-Condition
(4) Metal Treatment Performance under N-Condition
Figure 7 shows the change in zinc concentration under N condition. As shown in Figure 7, few zinc ions were detected in the second and subsequent ports of the bioreactor up to the HRT of 6 hours, which means that the zinc ions were removed stably. However, zinc ion concentration increased at each port in the HRT of 5 hours.
Discussion
As shown in Figure 1 to 3, in the process constructed in this test, the bioreactor maintains its reduction condition, which means that metal ion is removed resulting from sulfate re-duction caused by SRB in the first half of the treatment period under the HRT of 12 hours. According to the results of this test that shows that some part of metal is being removed at the HRT of 12 hours, it is better to secure the HRT of around 20 hours for continuous sul-fate reduction. Contrary to this, under the N-condition, sulfate ion reduction occurs even though the HRT is shorter than the one under the A-condition, as shown in Figure 4 through to 6, so that maintaining the steady rate of sulfate reduction is confirmed. Specifically, it is
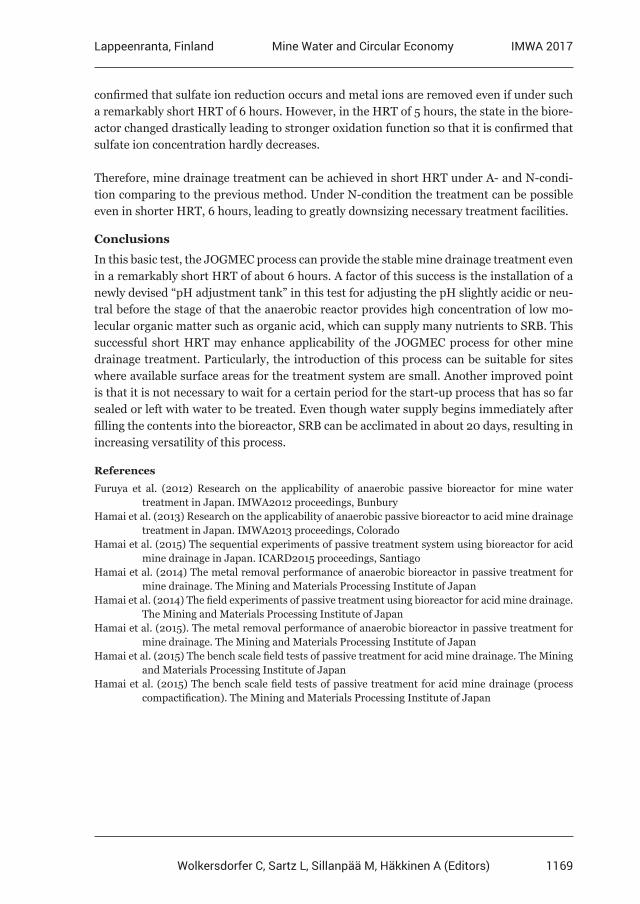
1169
Lappeenranta, Finland IMWA 2017Mine Water and Circular Economy
Wolkersdorfer C, Sartz L, Sillanpää M, Häkkinen A (Editors)
confirmed that sulfate ion reduction occurs and metal ions are removed even if under such a remarkably short HRT of 6 hours. However, in the HRT of 5 hours, the state in the biore-actor changed drastically leading to stronger oxidation function so that it is confirmed that sulfate ion concentration hardly decreases.
Therefore, mine drainage treatment can be achieved in short HRT under A- and N-condi-tion comparing to the previous method. Under N-condition the treatment can be possible even in shorter HRT, 6 hours, leading to greatly downsizing necessary treatment facilities.
Conclusions
In this basic test, the JOGMEC process can provide the stable mine drainage treatment even in a remarkably short HRT of about 6 hours. A factor of this success is the installation of a newly devised “pH adjustment tank” in this test for adjusting the pH slightly acidic or neu-tral before the stage of that the anaerobic reactor provides high concentration of low mo-lecular organic matter such as organic acid, which can supply many nutrients to SRB. This successful short HRT may enhance applicability of the JOGMEC process for other mine drainage treatment. Particularly, the introduction of this process can be suitable for sites where available surface areas for the treatment system are small. Another improved point is that it is not necessary to wait for a certain period for the start-up process that has so far sealed or left with water to be treated. Even though water supply begins immediately after filling the contents into the bioreactor, SRB can be acclimated in about 20 days, resulting in increasing versatility of this process.
References
Furuya et al. (2012) Research on the applicability of anaerobic passive bioreactor for mine water treatment in Japan. IMWA2012 proceedings, BunburyHamai et al. (2013) Research on the applicability of anaerobic passive bioreactor to acid mine drainage treatment in Japan. IMWA2013 proceedings, ColoradoHamai et al. (2015) The sequential experiments of passive treatment system using bioreactor for acid mine drainage in Japan. ICARD2015 proceedings, SantiagoHamai et al. (2014) The metal removal performance of anaerobic bioreactor in passive treatment for mine drainage. The Mining and Materials Processing Institute of JapanHamai et al. (2014) The field experiments of passive treatment using bioreactor for acid mine drainage. The Mining and Materials Processing Institute of JapanHamai et al. (2015). The metal removal performance of anaerobic bioreactor in passive treatment for mine drainage. The Mining and Materials Processing Institute of JapanHamai et al. (2015) The bench scale field tests of passive treatment for acid mine drainage. The Mining and Materials Processing Institute of JapanHamai et al. (2015) The bench scale field tests of passive treatment for acid mine drainage (process compactification). The Mining and Materials Processing Institute of Japan
1170
Lappeenranta, Finland IMWA 2017Mine Water and Circular Economy
Wolkersdorfer C, Sartz L, Sillanpää M, Häkkinen A (Editors)
Prevention of Sulfide Oxidation in Waste Rock using By-products and Industrial Remnants, a Suitability Study
Elsa Nyström1, Hanna Kaasalainen1, Lena Alakangas1
1Luleå University of Technology, Division of Geosciences and Environmental Engineering, 971 87 Luleå, Sweden, [email protected]
Abstract Prevention and mitigation of acid rock drainage from mining are decisive for limiting environmental impact. Five by-products and industrial remnants (lime kiln dust, blast furnace slag, granulated blast furnace slag, cement kiln dust and fly ash) were investigated for their suitability to prevent acidity and metal(loid)s during leaching from highly sulfidic (50wt%, sulfide) waste rock in small scale laboratory test cells. Variations in pH and electrical conductivity in leachate allowed differentiation between the different materials. Lime kiln dust (5wt%) and fly ash (1 and 2.5wt%) were observed to be the most suitable materials to prevent acidity and metal(loid)s leaching.
Keywords Prevention measures, metal leaching, waste rock management, by-product, industrial remnant
Introduction
In Sweden, the most common way for treatment of acid rock drainage (ARD) generated by waste rock heaps during operation is active treatment through the addition of alkaline ma-terials in an attempt to raise the pH and attenuate metals of drainage waters. This approach generally includes alkaline reagents with subsequent sludge formation as a result of precip-itation of e.g. Me-oxides and gypsum. An alternative would be the treatment of the waste rock in order to mitigate the generation of ARD and thereby reduce the lime consumption and sludge formation during operation. Studies have shown that sulfide oxidation at near neutral pH in the presence of sufficient alkalinity will promote precipitation of secondary minerals such as Fe- oxides on the sulfide surface which with time grow thicker and there-by prevents the sulfides from further oxidation (Huminicki and Rimstidt 2009). Several materials (organic and inorganic) studied were either too expensive or potentially harmful to the environment (Sahoo et al. 2013). In recent years, the focus has shifted towards the use of alternative materials such as by-products and industrial remnants (BPIR) in order to minimize costs. A mapping of BPIRs in Sweden (Alakangas et al. 2014) identified materials with potential to promote secondary mineral formation and/or stabilization/solidification through pozzolanic properties. The materials were further investigated and the results are presented in this paper. The aim of the study was to investigate the suitability of different BPIR to prevent acidity generated by the oxidation of sulfidic waste rock and to immobilize metal(loid)s.
Materials and methods
Highly sulfidic waste rock (50wt% sulfide) from an open pit mine (Zn, Cu, Au, and Ag) cur-rently in operation in the Skellefte field, northern Sweden was used in the study. Waste rock with high sulfide content not typical for all waste rock at the site was used in the study. Min-eral characterization showed that pyrite and quartz are the dominating minerals with traces
1171
Lappeenranta, Finland IMWA 2017Mine Water and Circular Economy
Wolkersdorfer C, Sartz L, Sillanpää M, Häkkinen A (Editors)
of muscovite, chlorite and calcite. Other sulfides found are chalcopyrite, bournonite, sphaler-ite and arsenopyrite (unpubl. data). A more detailed characterization is on-going in order to identify the distribution of trace metals in minerals. Acid Base Accounting test (Swedish standard SS-EN 15875:2011) showed that the waste rock is acid producing with a net neu-tralization potential (NNP) of -946±167. The total element composition of the waste rock was determined with the EPA-methods (modified) 200.7 with ICP-AES (Perkin Elmer Optima DV 5300) and 200.8 with ICP-SFMS (Thermo Scientific Element) by the SVEDAC-accred-ited ALS Scandinavia laboratory in Luleå, Sweden. For analyses of As, Cu, S, and Zn, the samples were dried at 50 °C and digested with 7 M nitric acid in closed teflon vessels in a microwave oven. The other elements were determined after fusion with lithium metaborate followed by dissolution in diluted nitric acid. Five different materials were used as additives to waste rock with the aim to reduce the generation of acid and metal(loid)s during opera-tion. Lime kiln dust (LKD), originating from combustion gasses flowing through the kiln in the production of quicklime by Nordkalk consists of partially calcined material mixed with finely crushed limestone. LKD primarily consists of finely crushed calcium carbonate in com-bination with quicklime and traces of portlandite and gypsum. Cement kiln dust (CKD) from Cementa AB is a fine-grained caustic material originating from combustion gasses flowing through the cement kiln in the production of cement clinker. The main minerals are calcite and quicklime with traces of ettringite, gypsum, and portlandite. Blast furnace slag from Merox AB is produced parallel with iron in the blast furnace. It can be either air cooled (BFS) or water granulated (GBFS) depending on desired material characteristics. The mineralogy of BFS primarily consists of monticellite and akermanite. The minerals in GBFS are undeter-mined as it is considered amorphous; it does, however, resemble hercynite (personal com-munication with Merox AB). Fly ash (FA) from the paper mill industry, BillerudKorsnäs, is a fine-grained remnant from the separation of combustion gasses in the incineration of biofuels. The mineralogy mainly consists of calcite, quartz, and hydroxides.
Kinetic leaching
Kinetic testing was conducted using free-draining column leach test methods in HDPE small scale test cells (10L) lined with geotextile at the bottom to avoid clogging. Partly ox-idized sulfide-rich waste rock crushed and sieved to a size of 5-30mm and 30-60mm was used (Table 1). Each test cell was irrigated with 600ml of MilliQ water on a weekly basis (based on average annual precipitation in the area). Each cell was leached for several weeks before addition of BPIRs to ensure reasonable similarity regarding pH, EC and metal(loid) concentrations in the different test cells. The alkaline material was added on top of the waste rock in accordance with Table 1 and Figure 1. The amounts of BPIRs added were based on estimated costs for material and transportation (Alakangas et al. 2014). One test cell was kept as a reference. CKD was added to (G)BFS in order to activate (hydrate) the (G)BFS for making use of the materials pozzolanic properties as it has been suggested to bind S in a more stable form than gypsum (Tariq and Yanful 2013).
Leachate was collected at the bottom on a weekly basis the day after irrigation. pH and elec-trical conductivity (EC) were determined immediately in closed containers to limit oxygen
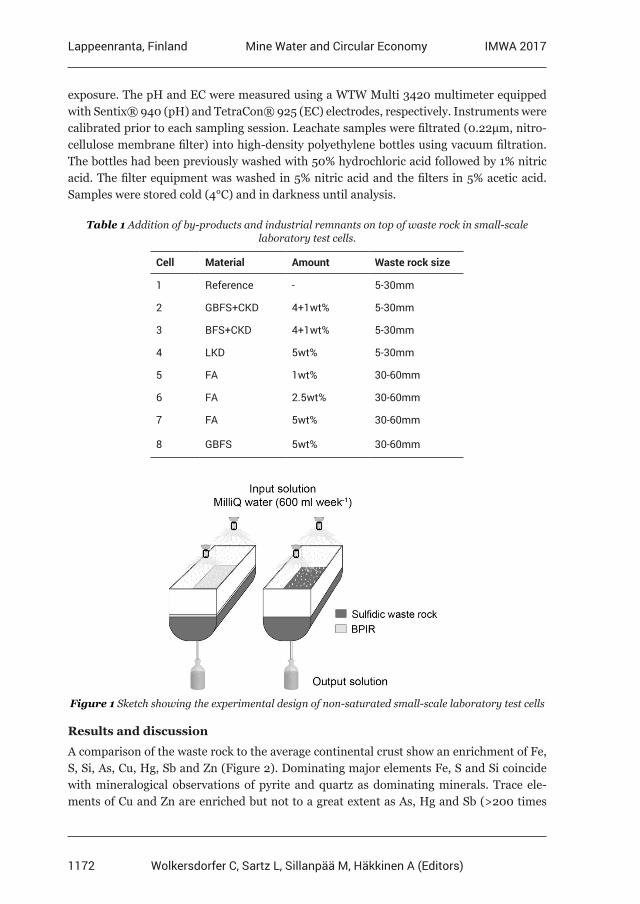
1172
Lappeenranta, Finland IMWA 2017Mine Water and Circular Economy
Wolkersdorfer C, Sartz L, Sillanpää M, Häkkinen A (Editors)
exposure. The pH and EC were measured using a WTW Multi 3420 multimeter equipped with Sentix® 940 (pH) and TetraCon® 925 (EC) electrodes, respectively. Instruments were calibrated prior to each sampling session. Leachate samples were filtrated (0.22μm, nitro-cellulose membrane filter) into high-density polyethylene bottles using vacuum filtration. The bottles had been previously washed with 50% hydrochloric acid followed by 1% nitric acid. The filter equipment was washed in 5% nitric acid and the filters in 5% acetic acid. Samples were stored cold (4°C) and in darkness until analysis.
Table 1 Addition of by-products and industrial remnants on top of waste rock in small-scale laboratory test cells.
Cell Material Amount Waste rock size
1 Reference - 5-30mm
2 GBFS+CKD 4+1wt% 5-30mm
3 BFS+CKD 4+1wt% 5-30mm
4 LKD 5wt% 5-30mm
5 FA 1wt% 30-60mm
6 FA 2.5wt% 30-60mm
7 FA 5wt% 30-60mm
8 GBFS 5wt% 30-60mm
Figure 1 Sketch showing the experimental design of non-saturated small-scale laboratory test cells
Results and discussion
A comparison of the waste rock to the average continental crust show an enrichment of Fe, S, Si, As, Cu, Hg, Sb and Zn (Figure 2). Dominating major elements Fe, S and Si coincide with mineralogical observations of pyrite and quartz as dominating minerals. Trace ele-ments of Cu and Zn are enriched but not to a great extent as As, Hg and Sb (>200 times
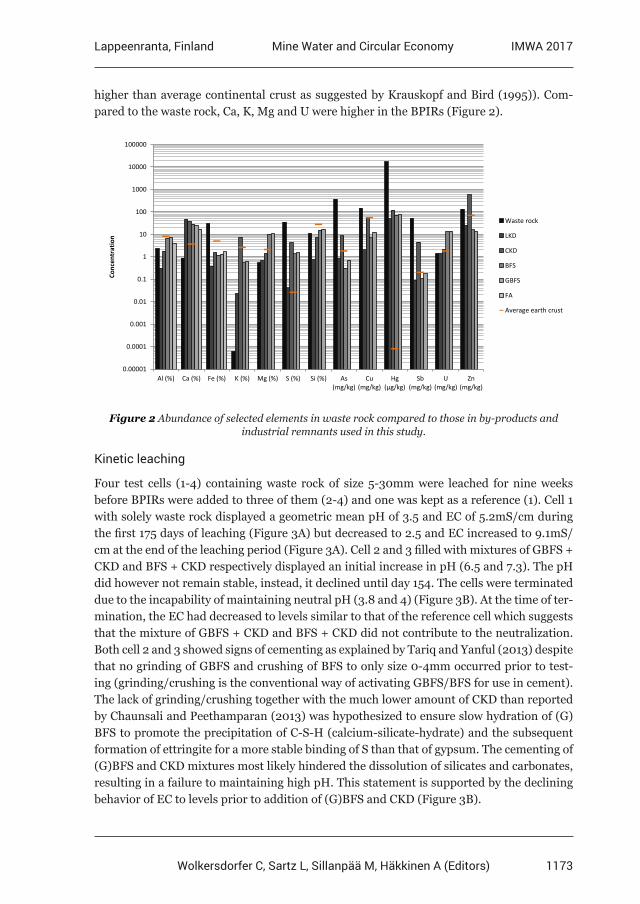
1173
Lappeenranta, Finland IMWA 2017Mine Water and Circular Economy
Wolkersdorfer C, Sartz L, Sillanpää M, Häkkinen A (Editors)
higher than average continental crust as suggested by Krauskopf and Bird (1995)). Com-pared to the waste rock, Ca, K, Mg and U were higher in the BPIRs (Figure 2).
0.00001
0.0001
0.001
0.01
0.1
1
10
100
1000
10000
100000
Al (%) Ca (%) Fe (%) K (%) Mg (%) S (%) Si (%) As(mg/kg)
Cu(mg/kg)
Hg (μg/kg)
Sb(mg/kg)
U(mg/kg)
Zn(mg/kg)
Conc
entr
atio
n
Waste rock
LKD
CKD
BFS
GBFS
FA
Average earth crust
Figure 2 Abundance of selected elements in waste rock compared to those in by-products and industrial remnants used in this study.
Kinetic leaching
Four test cells (1-4) containing waste rock of size 5-30mm were leached for nine weeks before BPIRs were added to three of them (2-4) and one was kept as a reference (1). Cell 1 with solely waste rock displayed a geometric mean pH of 3.5 and EC of 5.2mS/cm during the first 175 days of leaching (Figure 3A) but decreased to 2.5 and EC increased to 9.1mS/cm at the end of the leaching period (Figure 3A). Cell 2 and 3 filled with mixtures of GBFS + CKD and BFS + CKD respectively displayed an initial increase in pH (6.5 and 7.3). The pH did however not remain stable, instead, it declined until day 154. The cells were terminated due to the incapability of maintaining neutral pH (3.8 and 4) (Figure 3B). At the time of ter-mination, the EC had decreased to levels similar to that of the reference cell which suggests that the mixture of GBFS + CKD and BFS + CKD did not contribute to the neutralization. Both cell 2 and 3 showed signs of cementing as explained by Tariq and Yanful (2013) despite that no grinding of GBFS and crushing of BFS to only size 0-4mm occurred prior to test-ing (grinding/crushing is the conventional way of activating GBFS/BFS for use in cement). The lack of grinding/crushing together with the much lower amount of CKD than reported by Chaunsali and Peethamparan (2013) was hypothesized to ensure slow hydration of (G)BFS to promote the precipitation of C-S-H (calcium-silicate-hydrate) and the subsequent formation of ettringite for a more stable binding of S than that of gypsum. The cementing of (G)BFS and CKD mixtures most likely hindered the dissolution of silicates and carbonates, resulting in a failure to maintaining high pH. This statement is supported by the declining behavior of EC to levels prior to addition of (G)BFS and CKD (Figure 3B).
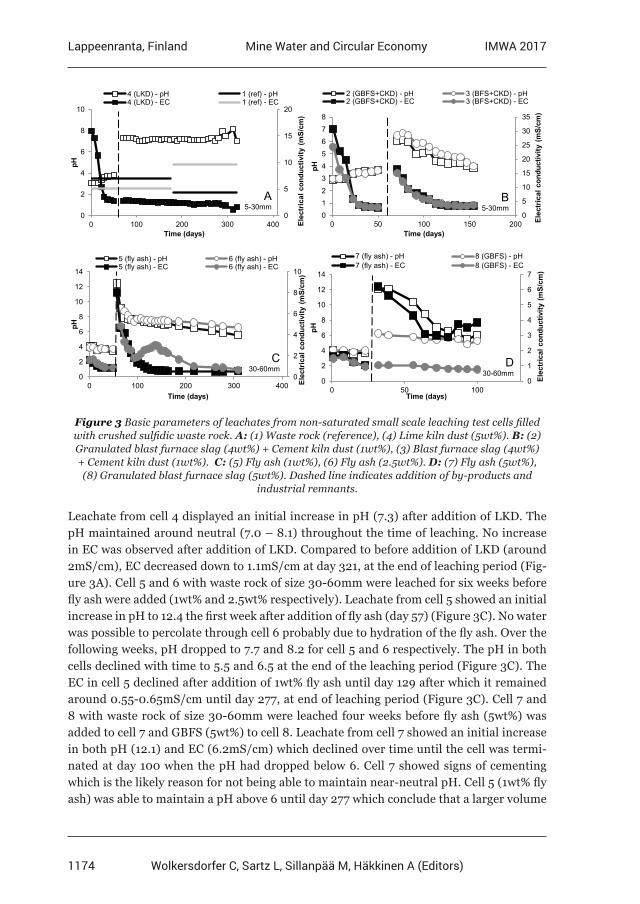
1174
Lappeenranta, Finland IMWA 2017Mine Water and Circular Economy
Wolkersdorfer C, Sartz L, Sillanpää M, Häkkinen A (Editors)
0
5
10
15
20
0
2
4
6
8
10
0 100 200 300 400 Elec
tric
al c
ondu
ctiv
ity (m
S/cm
)
pH
Time (days)
4 (LKD) - pH 1 (ref) - pH4 (LKD) - EC 1 (ref) - EC
A5-30mm
0
5
10
15
20
25
30
35
0
1
2
3
4
5
6
7
8
0 50 100 150 200 Elec
tric
al c
ondu
ctiv
ity (m
S/cm
)
pH
Time (days)
2 (GBFS+CKD) - pH 3 (BFS+CKD) - pH2 (GBFS+CKD) - EC 3 (BFS+CKD) - EC
B5-30mm
0
2
4
6
8
10
0
2
4
6
8
10
12
14
0 100 200 300 400 Elec
tric
al c
ondu
ctiv
ity (m
S/cm
)
pH
Time (days)
5 (fly ash) - pH 6 (fly ash) - pH5 (fly ash) - EC 6 (fly ash) - EC
C30-60mm
0
1
2
3
4
5
6
7
0
2
4
6
8
10
12
14
0 50 100
Elec
tric
al c
ondu
ctiv
ity (m
S/cm
)
pH
Time (days)
7 (fly ash) - pH 8 (GBFS) - pH7 (fly ash) - EC 8 (GBFS) - EC
D30-60mm
Figure 3 Basic parameters of leachates from non-saturated small scale leaching test cells filled with crushed sulfidic waste rock. A: (1) Waste rock (reference), (4) Lime kiln dust (5wt%). B: (2) Granulated blast furnace slag (4wt%) + Cement kiln dust (1wt%), (3) Blast furnace slag (4wt%) + Cement kiln dust (1wt%). C: (5) Fly ash (1wt%), (6) Fly ash (2.5wt%). D: (7) Fly ash (5wt%), (8) Granulated blast furnace slag (5wt%). Dashed line indicates addition of by-products and
industrial remnants.
Leachate from cell 4 displayed an initial increase in pH (7.3) after addition of LKD. The pH maintained around neutral (7.0 – 8.1) throughout the time of leaching. No increase in EC was observed after addition of LKD. Compared to before addition of LKD (around 2mS/cm), EC decreased down to 1.1mS/cm at day 321, at the end of leaching period (Fig-ure 3A). Cell 5 and 6 with waste rock of size 30-60mm were leached for six weeks before fly ash were added (1wt% and 2.5wt% respectively). Leachate from cell 5 showed an initial increase in pH to 12.4 the first week after addition of fly ash (day 57) (Figure 3C). No water was possible to percolate through cell 6 probably due to hydration of the fly ash. Over the following weeks, pH dropped to 7.7 and 8.2 for cell 5 and 6 respectively. The pH in both cells declined with time to 5.5 and 6.5 at the end of the leaching period (Figure 3C). The EC in cell 5 declined after addition of 1wt% fly ash until day 129 after which it remained around 0.55-0.65mS/cm until day 277, at end of leaching period (Figure 3C). Cell 7 and 8 with waste rock of size 30-60mm were leached four weeks before fly ash (5wt%) was added to cell 7 and GBFS (5wt%) to cell 8. Leachate from cell 7 showed an initial increase in both pH (12.1) and EC (6.2mS/cm) which declined over time until the cell was termi-nated at day 100 when the pH had dropped below 6. Cell 7 showed signs of cementing which is the likely reason for not being able to maintain near-neutral pH. Cell 5 (1wt% fly ash) was able to maintain a pH above 6 until day 277 which conclude that a larger volume
1175
Lappeenranta, Finland IMWA 2017Mine Water and Circular Economy
Wolkersdorfer C, Sartz L, Sillanpää M, Häkkinen A (Editors)
fly ash will not necessarily generate better results. Regarding fly ash, it is evident that application (thickness, compaction etc.) may be proven important to avoid cementation. Leachate from cell 8 showed an increase in pH (6.2) after addition of GBFS (5wt%) but no signs of increased EC were found. The pH declined during the time of leaching (4.7 at day 93). Cell 8 showed signs of carbonation. Through personal communication with Merox, it is implied that solely GBFS may require a greater water volume to dissolve than used in this study. The need of excess water was supported by the modified batch leach tests performed prior to the setup of columns for leaching (Swedish standard SS-EN 12457-2) for estimation of easily soluble metal(loid)s in the respective by-product or industrial remnant (unpubl.data).
An initial wash-out of oxidation products and soluble secondary minerals was shown for all cells which reflected the pH (Figure 3A-D). Similar pH, EC, and metal(loid) concentrations were observed for cell 1-4 and 5-8 prior to the addition of BPIRs. The Fe:S molar ratio in the leachate of cell 4 was stabilized around 0.5 after 219 days confirming pyrite oxidation as the primary source of Fe and S, and an indication of accelerated sulfide oxidation (Figure 3A). The increasing sulfide oxidation was accompanied by release of high concentrations of metal(loid)s to the leachate. Release of Cu (19.7mg/L) and Zn (23mg/L) displayed high leachability at day 219, compared to its presence in the waste rock (147mg/kg and 133mg/kg respectively), if similar release rate as day 219 continue all Cu and Zn would be depleted in less than five years. The time until accelerating sulfide oxidation is long considering the high sulfide content in the waste rock (50wt% sulfide) as well as the particle size. The high release rate of metal(loid)s are due to the likely high concentration of ferric ions and bacteria due to the low pH, which both together accelerate the oxidation rate of pyrite (Nordstrom and Southam 1997). In such acidic environment recovery of metal(loid)s could have been an option.
Cell 4, 5 and 6 were those that showed best results in pH and EC development throughout the time of leaching. The average concentration of metal(loid)s in cell 1 (solely waste rock) after day 219 suggest that the sulfide oxidation occurring is significant (Table 2). The ad-dition of LKD shows a significant decrease of metal(loid) concentrations corresponding to >99.9% for As, Fe, U, and Zn. Concentrations of S and Sb are decreased by 94.7 and 98.3% respectively, while Hg shows a decrease of 88.1%. Due to differences in waste rock size, a direct comparison between cell 1 (reference) and cell 5- 6 is not applicable. When the dominant mineral present (pyrite) is acid generating, a particle size reduction can re-sult in lower pH when subjected to column leaching (Lapakko 2006). The size difference between cell 1 and cell 5-6, therefore, suggest that observations in pH in cell 1 are over-estimated compared to that of a hypothetical reference corresponding to size 30-60mm. Whether or not the addition of fly ash to cell 5-6 is comparable to that of the reference cell, it can through a comparison of figure 2 and table 3 be concluded that although fly ash is enriched in metal(loid)s it is not necessarily reflected in the chemical composition of the leachate.
1176
Lappeenranta, Finland IMWA 2017Mine Water and Circular Economy
Wolkersdorfer C, Sartz L, Sillanpää M, Häkkinen A (Editors)
Table 3 Concentrations of metal(loid)s in leachate from solely waste rock and from waste rock with the addition of by-products and industrial remnants. 1: Waste rock (reference), 4: Lime kiln
dust (5wt%), 5: Fly ash (1wt%), 6: Fly ash (2.5wt%).
Cell As (μg/L) Cu (μg/L) Fe (mg/L) Hg (μg/L) S (mg/L) Sb (μg/L) U (μg/L) Zn (μg/L)
11 10708 11358 7040 0.42 5902 182 228 14532
42 0.22 <0.1 0.0004 0.05 315 3.1 0.28 1.84
53 0.13 0.80 0.63 <0.002 95 1.7 1.1 76
63 0.53 0.28 0.27 <0.002 156 4.0 1.8 45
1 Average concentration of 102 days of leaching (day 219-321) 2 Concentration at day 321 3 Concentration at day 277
In general, a materials suitability for application cannot be determined only by examining the total chemical composition or its leachability in a batch test (unpubl.data) but rather has to be put in context (in this case application to waste rock) before any major conclusions can be made. In this case, it can be concluded that addition of BPIRs that fail to maintain pH during the first 200 days is not suitable for this application.
Conclusion
• Despite high sulfide content in waste rock (50wt%), the sulfide oxidation did not accel-erate until 219 days of leaching.
• An increase in the amount of by-products and industrial remnants do not necessarily increase the quality of leachate.
• The most promising industrial remnants are LKD due to the ability to remain pH, EC and lower the metal(loid) concentrations over a longer period of time.
Acknowledgements
Boliden Minerals AB and Strategic Innovation Programme for the Swedish Mining and Metal Producing Industry are gratefully acknowledged for their financial support. Boliden Minerals AB, Billerud-Korsnäs, Cementa, Merox, and Nordkalk are acknowledged for providing materials and taking part of discussions about the remnants behavior. Dr. Fredrik Engström is most appreciated for his material knowledge and contribution to the discussion.
References
Alakangas L, Maurice C, Mácsik J, Nyström E, Sandström N, Andersson-Wikström A, Hällström L (2014) Kartläggning av restprodukter för efterbehandling och inhibering av gruvavfall: funktion tillgång och logistik, Luleå, Luleå university of technology (in swedish)Chaunsali P, & Peethamparan S (2013) Novel cementitious binder incorporating cement kiln dust: Strength and durability. ACI Materials Journal, 110(3): 297-304Huminicki D, Rimstidt D (2009) Iron oxyhydroxide coating of pyrite for acid mine drainage control. Applied Geochemistry 24: 1626-1634, doi: 10.1016/j.apgeochem.2009.04.032Krauskopf K.B, Bird D.K (1995) Introduction to Geochemistry. MacGraw-Hill, 647Lapakko K.A, Engstrom J.N, Antonson D.A (2006) Effect on particle size on drainage quality from three lithologies, In: 7th International Conference on Acid Rock Drainage (ICARD), Montana, US
1177
Lappeenranta, Finland IMWA 2017Mine Water and Circular Economy
Wolkersdorfer C, Sartz L, Sillanpää M, Häkkinen A (Editors)
Nordstrom D.K and Southam G (1997) Geomicrobiology of sulfide mineral oxidation. In Mineralogical Society of America Reviews in Mineralogy 35: 361-382Sahoo PK, Kim K, Equeenuddin Sk. Md, Powell MA (2013) Current Approaches for Mitigating Acid Mine Drainage, Reviews of Environmental Contamination and Toxicology 226:1-32, doi: 10.1007/978-1-4614-6898-1Swedish standard SS-EN 12457-2. Characterization of waste – Leaching – Compliance test for leaching of granular waste materials and sludges – Part 2: One stage batch test at a liquid to solid ratio of 10l/kg for materials with particle size below 4 mm (without size reduction). Approved 2003-01-10Swedish standard SS-EN 15875:2011. Characterization of waste – Static test for determination of acid potential and neutralization potential of sulfidic waste. Approved 2011-11-07Tariq A, and Yanful E (2013) A review of binders used in cemented paste tailings for underground and surface disposal practices, Journal of Environmental Management 13: 138-149, doi: 10.1016/j.jenvman.2013.09.039
1178
Lappeenranta, Finland IMWA 2017Mine Water and Circular Economy
Wolkersdorfer C, Sartz L, Sillanpää M, Häkkinen A (Editors)
Assessment of Dewatering Process Using Flocculation and Self-filtration According to the Characteristics of
Mine Drainage Sludge
Duk-Min Kim, Dong-Kwan Kim
MIRECO (Korea Mine Reclamation Corporation), Segye-ro 2, Wonju 26464, South Korea, [email protected]
Abstract Geotextile tubes, geotextile bags, and gunny bags were used to dewater sludge via flocculation and self-filtration at passive and semi-active mine drainage treatment facilities. The relationship between the discharge rate in one day and the initial volume of the sludge indicated dewaterability of sludge regardless of the dewatering material and its shape. The water content of sludge from the passive treatment facilities decreased to <80% in one day. The effects of oxidation and precipitation on the particle surface increasing the particle size and decreasing the in situ water content might have enhanced the dewaterability at the passive treatment facilities.
Key words Mine drainage sludge, Geotextile, Self-filtration, Dewatering, Water content
Introduction
Accumulation of sludge is inevitable at mine drainage treatment facilities due to metal precipitation. For example, Fe hydroxides accumulate during vertical flow at successive alkalinity-producing systems (SAPS) (Kepler and McCleary 1994), and OH-, supplied by added chemicals, reacts with dissolved metals such as Fe, Mn, and Zn to generate flocs at (semi-)active treatment facilities. Semi-active treatment systems generally accumulate sludge over a long period in rectangular settling ponds with horizontal flow, while active treatment systems continuously treat sludge. Developing a simple and efficient method to treat accumulated sludge is needed for both passive and semi-active treatment sys-tems.
Geotextile is a polymerized textile material used for sand, soil, or gravel during construc-tion, which may be woven or non-woven (Jeon et al. 2014). Furthermore, it is used as a filter material to reduce the water content of sludge and sediment. Flocculation and self-filtration using geotextile or other materials simplifies the operation and required machinery compared with sludge dehydrators. Several studies and field applications have assessed the use of geotextile tubes for dewatering (Fowler et al. 2000; Mastin et al. 2008; Howard et al. 2009; Kaye 2016). However, there are few studies on the differences in dewatering efficiency according to the characteristics of the treatment facilities and sludge.
Therefore, the objectives of this study were to elucidate the principal factors affecting the dewatering efficiency of mine drainage sludge, including physical differences in sludge be-tween passive and semi-active treatment facilities and the material or shape of dewatering tubes or bags.
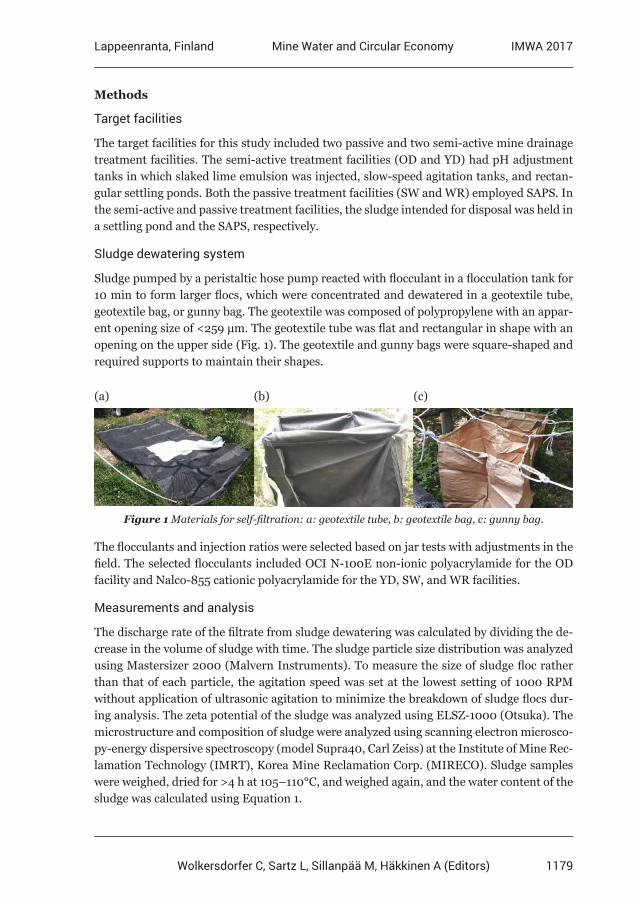
1179
Lappeenranta, Finland IMWA 2017Mine Water and Circular Economy
Wolkersdorfer C, Sartz L, Sillanpää M, Häkkinen A (Editors)
Methods
Target facilities
The target facilities for this study included two passive and two semi-active mine drainage treatment facilities. The semi-active treatment facilities (OD and YD) had pH adjustment tanks in which slaked lime emulsion was injected, slow-speed agitation tanks, and rectan-gular settling ponds. Both the passive treatment facilities (SW and WR) employed SAPS. In the semi-active and passive treatment facilities, the sludge intended for disposal was held in a settling pond and the SAPS, respectively.
Sludge dewatering system
Sludge pumped by a peristaltic hose pump reacted with flocculant in a flocculation tank for 10 min to form larger flocs, which were concentrated and dewatered in a geotextile tube, geotextile bag, or gunny bag. The geotextile was composed of polypropylene with an appar-ent opening size of <259 μm. The geotextile tube was flat and rectangular in shape with an opening on the upper side (Fig. 1). The geotextile and gunny bags were square-shaped and required supports to maintain their shapes.
(a) (b) (c)
Figure 1 Materials for self-filtration: a: geotextile tube, b: geotextile bag, c: gunny bag.
The flocculants and injection ratios were selected based on jar tests with adjustments in the field. The selected flocculants included OCI N-100E non-ionic polyacrylamide for the OD facility and Nalco-855 cationic polyacrylamide for the YD, SW, and WR facilities.
Measurements and analysis
The discharge rate of the filtrate from sludge dewatering was calculated by dividing the de-crease in the volume of sludge with time. The sludge particle size distribution was analyzed using Mastersizer 2000 (Malvern Instruments). To measure the size of sludge floc rather than that of each particle, the agitation speed was set at the lowest setting of 1000 RPM without application of ultrasonic agitation to minimize the breakdown of sludge flocs dur-ing analysis. The zeta potential of the sludge was analyzed using ELSZ-1000 (Otsuka). The microstructure and composition of sludge were analyzed using scanning electron microsco-py-energy dispersive spectroscopy (model Supra40, Carl Zeiss) at the Institute of Mine Rec-lamation Technology (IMRT), Korea Mine Reclamation Corp. (MIRECO). Sludge samples were weighed, dried for >4 h at 105–110°C, and weighed again, and the water content of the sludge was calculated using Equation 1.
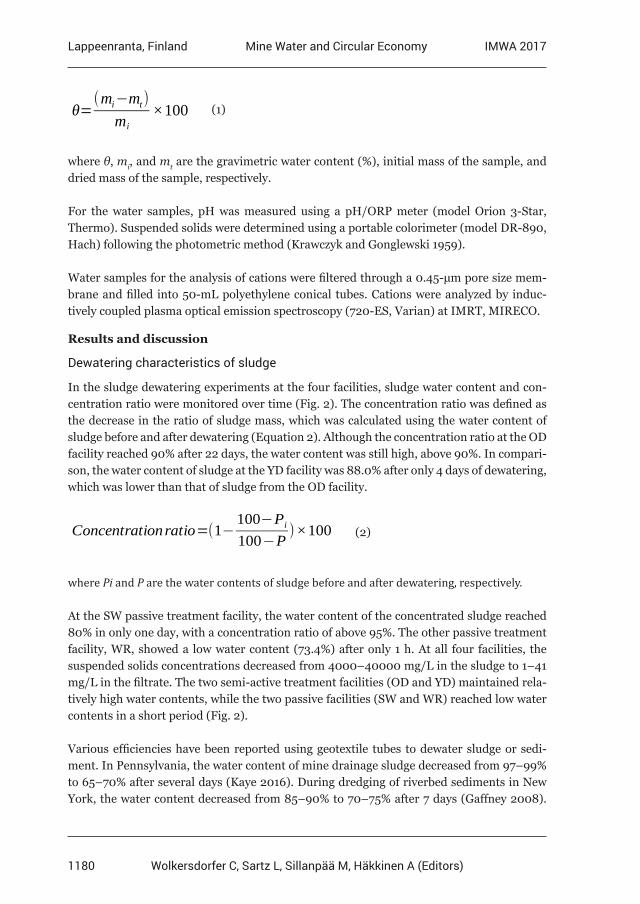
1180
Lappeenranta, Finland IMWA 2017Mine Water and Circular Economy
Wolkersdorfer C, Sartz L, Sillanpää M, Häkkinen A (Editors)
θ=(mi−mt)
mi×100
(1)
where θ, mi, and mt are the gravimetric water content (%), initial mass of the sample, and dried mass of the sample, respectively.
For the water samples, pH was measured using a pH/ORP meter (model Orion 3-Star, Thermo). Suspended solids were determined using a portable colorimeter (model DR-890, Hach) following the photometric method (Krawczyk and Gonglewski 1959).
Water samples for the analysis of cations were filtered through a 0.45-μm pore size mem-brane and filled into 50-mL polyethylene conical tubes. Cations were analyzed by induc-tively coupled plasma optical emission spectroscopy (720-ES, Varian) at IMRT, MIRECO.
Results and discussion
Dewatering characteristics of sludge
In the sludge dewatering experiments at the four facilities, sludge water content and con-centration ratio were monitored over time (Fig. 2). The concentration ratio was defined as the decrease in the ratio of sludge mass, which was calculated using the water content of sludge before and after dewatering (Equation 2). Although the concentration ratio at the OD facility reached 90% after 22 days, the water content was still high, above 90%. In compari-son, the water content of sludge at the YD facility was 88.0% after only 4 days of dewatering, which was lower than that of sludge from the OD facility.
Concentrationratio=(1−100−Pi
100−P)×100
(2)
where Pi and P are the water contents of sludge before and after dewatering, respectively.
At the SW passive treatment facility, the water content of the concentrated sludge reached 80% in only one day, with a concentration ratio of above 95%. The other passive treatment facility, WR, showed a low water content (73.4%) after only 1 h. At all four facilities, the suspended solids concentrations decreased from 4000–40000 mg/L in the sludge to 1–41 mg/L in the filtrate. The two semi-active treatment facilities (OD and YD) maintained rela-tively high water contents, while the two passive facilities (SW and WR) reached low water contents in a short period (Fig. 2).
Various efficiencies have been reported using geotextile tubes to dewater sludge or sedi-ment. In Pennsylvania, the water content of mine drainage sludge decreased from 97–99% to 65–70% after several days (Kaye 2016). During dredging of riverbed sediments in New York, the water content decreased from 85–90% to 70–75% after 7 days (Gaffney 2008).
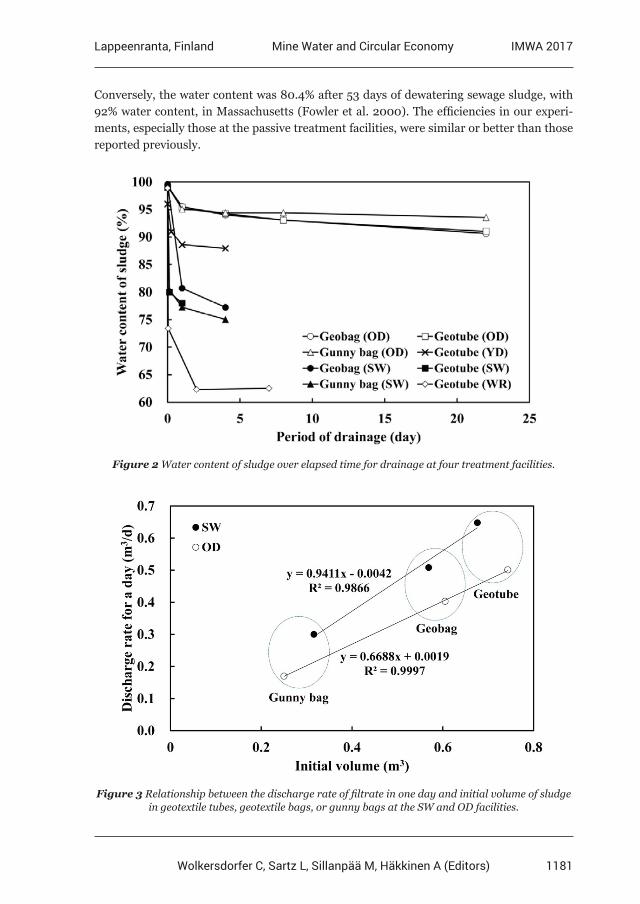
1181
Lappeenranta, Finland IMWA 2017Mine Water and Circular Economy
Wolkersdorfer C, Sartz L, Sillanpää M, Häkkinen A (Editors)
Conversely, the water content was 80.4% after 53 days of dewatering sewage sludge, with 92% water content, in Massachusetts (Fowler et al. 2000). The efficiencies in our experi-ments, especially those at the passive treatment facilities, were similar or better than those reported previously.
Figure 2 Water content of sludge over elapsed time for drainage at four treatment facilities.
Figure 3 Relationship between the discharge rate of filtrate in one day and initial volume of sludge in geotextile tubes, geotextile bags, or gunny bags at the SW and OD facilities.
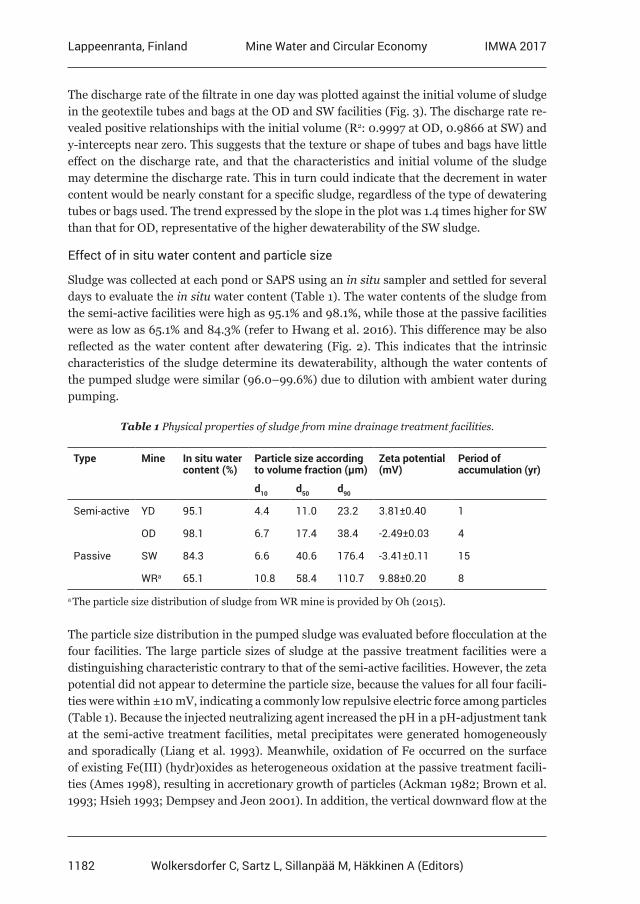
1182
Lappeenranta, Finland IMWA 2017Mine Water and Circular Economy
Wolkersdorfer C, Sartz L, Sillanpää M, Häkkinen A (Editors)
The discharge rate of the filtrate in one day was plotted against the initial volume of sludge in the geotextile tubes and bags at the OD and SW facilities (Fig. 3). The discharge rate re-vealed positive relationships with the initial volume (R2: 0.9997 at OD, 0.9866 at SW) and y-intercepts near zero. This suggests that the texture or shape of tubes and bags have little effect on the discharge rate, and that the characteristics and initial volume of the sludge may determine the discharge rate. This in turn could indicate that the decrement in water content would be nearly constant for a specific sludge, regardless of the type of dewatering tubes or bags used. The trend expressed by the slope in the plot was 1.4 times higher for SW than that for OD, representative of the higher dewaterability of the SW sludge.
Effect of in situ water content and particle size
Sludge was collected at each pond or SAPS using an in situ sampler and settled for several days to evaluate the in situ water content (Table 1). The water contents of the sludge from the semi-active facilities were high as 95.1% and 98.1%, while those at the passive facilities were as low as 65.1% and 84.3% (refer to Hwang et al. 2016). This difference may be also reflected as the water content after dewatering (Fig. 2). This indicates that the intrinsic characteristics of the sludge determine its dewaterability, although the water contents of the pumped sludge were similar (96.0–99.6%) due to dilution with ambient water during pumping.
Table 1 Physical properties of sludge from mine drainage treatment facilities.
Type Mine In situ water content (%)
Particle size according to volume fraction (μm)
Zeta potential (mV)
Period of accumulation (yr)
d10 d50 d90
Semi-active YD 95.1 4.4 11.0 23.2 3.81±0.40 1
OD 98.1 6.7 17.4 38.4 -2.49±0.03 4
Passive SW 84.3 6.6 40.6 176.4 -3.41±0.11 15
WRa 65.1 10.8 58.4 110.7 9.88±0.20 8
a The particle size distribution of sludge from WR mine is provided by Oh (2015).
The particle size distribution in the pumped sludge was evaluated before flocculation at the four facilities. The large particle sizes of sludge at the passive treatment facilities were a distinguishing characteristic contrary to that of the semi-active facilities. However, the zeta potential did not appear to determine the particle size, because the values for all four facili-ties were within ±10 mV, indicating a commonly low repulsive electric force among particles (Table 1). Because the injected neutralizing agent increased the pH in a pH-adjustment tank at the semi-active treatment facilities, metal precipitates were generated homogeneously and sporadically (Liang et al. 1993). Meanwhile, oxidation of Fe occurred on the surface of existing Fe(III) (hydr)oxides as heterogeneous oxidation at the passive treatment facili-ties (Ames 1998), resulting in accretionary growth of particles (Ackman 1982; Brown et al. 1993; Hsieh 1993; Dempsey and Jeon 2001). In addition, the vertical downward flow at the
1183
Lappeenranta, Finland IMWA 2017Mine Water and Circular Economy
Wolkersdorfer C, Sartz L, Sillanpää M, Häkkinen A (Editors)
SAPS may have contributed to compaction, resulting in enlarged particles, as reported by MIRECO (2016).
Media with large particle sizes have high hydraulic conductivities for drainage (Hazen 1911; Shepherd 1989). Although polymers also bind flocs from the sludge at the semi-active treat-ment facilities, the low discharge rate of the sludge suggests that the intrinsic characteristics of sludge are more important than polymerization. Moreover, intrinsic characteristics such as specific resistance to filtration and viscosity are considered to be high for sludge from (semi-)active treatment facilities, as reported by Dentel and Abu-Orf (1995) and Dempsey and Jeon (2001).
Conclusions
The positive relationship between the discharge rate for one day and the initial sludge volume suggests that the intrinsic characteristic of sludge is a more important determi-nant of dewaterability than the texture or shape of dewatering tubes or bags. The slope of the relationship can be used as a parameter to assess sludge dewaterability. Accretionary growth of particles and compaction during vertical flow at the SAPS of the passive treat-ment facilities could have resulted in the large flocs, with 50% particle size distribution (d50) values of 40.6–58.4 μm, and low in situ water contents. Thus, the water content of the sludge could be effectively reduced to <80% using flocculation and self-filtration after ~1 day at the passive treatment facilities, even though the water content was ~99% in the pumped sludge.
Acknowledgements
This work was supported by the Korea Mine Reclamation Corporation funded by the Korean Government Ministry of Trade, Industry, and Energy.
References
Ackman TE (1982) Sludge disposal from acid mine drainage treatment. Bureau of Mines Report of Investigations RI 8672, USAAmes RP (1998) Iron oxidation, gas transfer, and solids formation in passive treatment systems for mine drainage. Dissertation, The Pennsylvania State University, USABrown H, Skousen J, Renton J (1993) Floc generation by chemical neutralization of acid mine drainage. Green Lands 23:44—51Dempsey BA, Jeon BH (2001) Characteristics of sludge produced from passive treatment of mine drainage. Geochem-Explor Env A 1:89—94Dentel SK, Abu-Orf MM (1995) Laboratory and full-scale studies of liquid stream viscosity and streaming current for characterization & monitoring of dewaterability. Water Resour 291:2663—2672Fowler J, Bagby RM, Trainer E (2000) Dewatering sewage sludge with geotextile tubes. In: Pederson J, Adams EE (Eds), Dredged Material Management – Options and Environmental Considerations, Proc. of a conference, MIT Sea Grant College Program, p 80—83Gaffney DA (2008) Use of poor quality geo-material in geotextile tubes for structural applications. In: Proc. 2008 Geotextile Tubes Workshop, Mississippi State University, Starkville, MS, USAHazen A (1911) Discussion: Dams on sand foundations. T Am Soc Civ Eng 73:199Howard IL, Smith M, Saucier CL, White TD (2009) Geotextile Tubes Workshop, SERRI Report 70015- 002, USA
1184
Lappeenranta, Finland IMWA 2017Mine Water and Circular Economy
Wolkersdorfer C, Sartz L, Sillanpää M, Häkkinen A (Editors)
Hsieh Y (1993) Effect of ion adsorption with various hydrolysis characteristics on the dewaterability of Fe2O3 sludge. Water Sci Technol 28(7):23—30Hwang WJ, Oh TG, Lee JU, Kim DM, Cha J (2016) Characteristic research of sludges in passive mine water treatment system of Waryong, Donghae (6th adit) and Honam mine. J Korean Soc Miner Energy Resour Eng 53(5):489—497Jeon HY, Jang YC, Jang JW, Jeong YI, Park YM (2014) Geosynthetics design and construction. CIR Press, KoreaKaye P (2016) Successful dewatering of acid mine drainage materials. http://www.bishopwater.ca/ case-studies.php. Accessed 15 March 2017Kepler DA, McCleary EC (1994) Successive alkalinity-producing systems (VFW) for the treatment of acidic mine drainage. In: Proc. International Land Reclamation and Mine Drainage Conference. USDI, Bureau of Mines SP 06A-94, Pittsburgh, PA, USAKrawczyk D, Gonglewski N (1959) Determining suspended solids using a spectrophotometer. Sew Ind Wastes 31:1159—1164Liang L, McNabb JA, Paulk JM, Gu B, McCarthy JF (1993) Kinetics of Fe(II) oxygenation at low partial pressure of oxygen in the presence of natural organic matter. Environ Sci Technol 27:1864— 1870Mastin BJ, Lebster GE, Salley JR (2008) Use of Geotube® dewatering containers in environmental dredging. In: GeoAmericas Conference Proceedings 2008, p 1467—1486MIRECO (Korea Mine Reclamation Corp.) (2016) Development of technology for removing sludge and scales around mine drainage treatment facilities. Report 2015-041, MIRECO, Wonju, Korea, p 161—172Oh TG (2015) A study on turbidity improvement and precipitation characteristic of mine drainage using coagulant. Dissertation, Dong-A University, Busan, KoreaShepherd RG (1989) Correlations of permeability and grain size. Ground Water 27:633—638
1185
Lappeenranta, Finland IMWA 2017Mine Water and Circular Economy
Wolkersdorfer C, Sartz L, Sillanpää M, Häkkinen A (Editors)
Changes in microbial community structure in response to changing oxygen stress in column tests of denitrification
and selenium reduction
Chiachi Hwang1, Lisa Bithell Kirk2, Brent Peyton1
1Montana State University, Center for Biofilm Engineering. United States of America; 2Enviromin, Inc., United States of America
Abstract Microbial community structure in nitrate and selenium-reducing biofilm from saturated waste rock backfill was described using 16S rRNA sequencing. Microaerophilic biofilm contained sequences highly similar to nitrate-reducing, iron-oxidizing Thiobacillus and iron-reducing Albidiferax, with most sequences similar to the hydrocarbon-degrading genus Polaromonas. Less abundant sulfate-reducing Desulfosporosinus was observed with the sulfur-oxidizing genera Sulfuritalea, especially in suboxic columns. Methylotenera were common in methanol-fed columns. Abundance of Se-reducing bacteria such as Dechloromonas, Anaeromyxobacter, and Acidovorax increased as oxygen decreased. The Se-reducing genera were less abundant than iron, nitrate and sulfur-cycling genera, which represent more of the energy and mass cycled in mined environments.
Key words reduction, selenium, microbial, column tests
Introduction
Metal-microbe interactions, such as microbial respiration of metals for metabolic purposes or metal detoxification mechanisms, e.g. metal sequestration to microbial biofilms, are in-creasingly recognized as a valid strategy to stabilize and/or remove metals in a sustainable and cost-effective manner. Reduction of selenium (Se), for instance, capitalizes on the ca-pability of microbes to alter selenium speciation to less mobile forms such as using selenate (SeO4
2-) as the terminal electron acceptor during respiratory processes. For biological Se-re-duction to proceed efficiently, however, competing electron acceptors such as oxygen (O2) or nitrate (NO3
-) need to be removed first.
In this study, bench-scale column laboratory experiments were conducted to evaluate the influence of O2 on biological NO3
- and Se-reduction by indigenous microorganisms (i.e. those native in groundwater and waste rock) in saturated rock fills (SRF). Columns were fed with site groundwater from a saturated waste rock backfill at a coal mine. Columns were amend-ed with either methanol or glycerol to stimulate microbial growth. Controls without carbon amendment were also carried out to evaluate intrinsic rates of NO3
- and Se reduction. The performance of the column reactors was compared by monitoring physicochemical param-eters during operation and microbial communities were analyzed using high throughput Illumina sequencing at the end of each experiment.
Methods
Column reactors. For each oxygen stress experiment, dissolved oxygen in the influent groundwater was monitored to achieve oxic or microaerophilic and anoxic conditions by sparging with nitrogen gas. Each experiment was set up with a total of six 3.7 L column
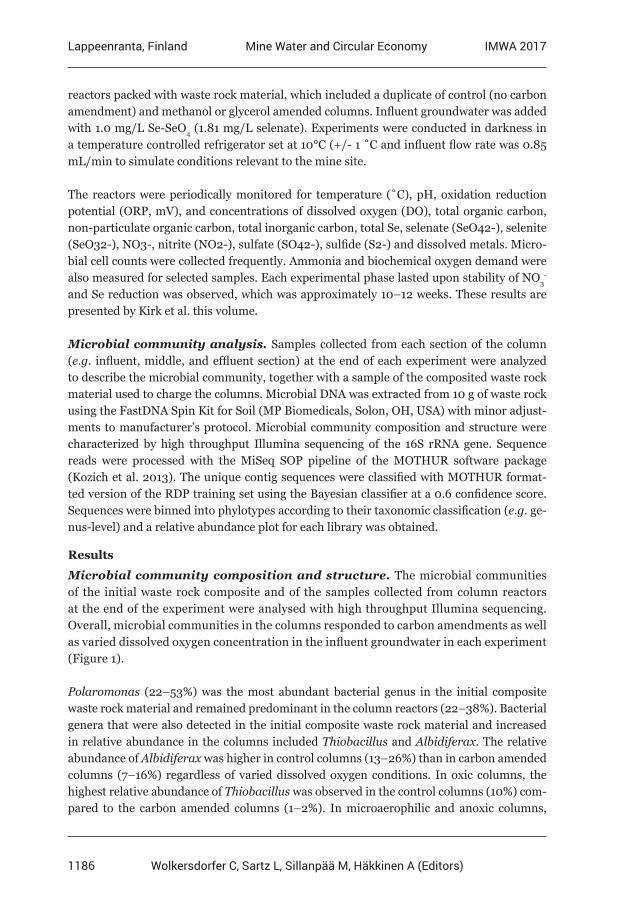
1186
Lappeenranta, Finland IMWA 2017Mine Water and Circular Economy
Wolkersdorfer C, Sartz L, Sillanpää M, Häkkinen A (Editors)
reactors packed with waste rock material, which included a duplicate of control (no carbon amendment) and methanol or glycerol amended columns. Influent groundwater was added with 1.0 mg/L Se-SeO4 (1.81 mg/L selenate). Experiments were conducted in darkness in a temperature controlled refrigerator set at 10°C (+/- 1 ˚C and influent flow rate was 0.85 mL/min to simulate conditions relevant to the mine site.
The reactors were periodically monitored for temperature (˚C), pH, oxidation reduction potential (ORP, mV), and concentrations of dissolved oxygen (DO), total organic carbon, non-particulate organic carbon, total inorganic carbon, total Se, selenate (SeO42-), selenite (SeO32-), NO3-, nitrite (NO2-), sulfate (SO42-), sulfide (S2-) and dissolved metals. Micro-bial cell counts were collected frequently. Ammonia and biochemical oxygen demand were also measured for selected samples. Each experimental phase lasted upon stability of NO3
- and Se reduction was observed, which was approximately 10–12 weeks. These results are presented by Kirk et al. this volume.
Microbial community analysis. Samples collected from each section of the column (e.g. influent, middle, and effluent section) at the end of each experiment were analyzed to describe the microbial community, together with a sample of the composited waste rock material used to charge the columns. Microbial DNA was extracted from 10 g of waste rock using the FastDNA Spin Kit for Soil (MP Biomedicals, Solon, OH, USA) with minor adjust-ments to manufacturer’s protocol. Microbial community composition and structure were characterized by high throughput Illumina sequencing of the 16S rRNA gene. Sequence reads were processed with the MiSeq SOP pipeline of the MOTHUR software package (Kozich et al. 2013). The unique contig sequences were classified with MOTHUR format-ted version of the RDP training set using the Bayesian classifier at a 0.6 confidence score. Sequences were binned into phylotypes according to their taxonomic classification (e.g. ge-nus-level) and a relative abundance plot for each library was obtained.
Results
Microbial community composition and structure. The microbial communities of the initial waste rock composite and of the samples collected from column reactors at the end of the experiment were analysed with high throughput Illumina sequencing. Overall, microbial communities in the columns responded to carbon amendments as well as varied dissolved oxygen concentration in the influent groundwater in each experiment (Figure 1).
Polaromonas (22–53%) was the most abundant bacterial genus in the initial composite waste rock material and remained predominant in the column reactors (22–38%). Bacterial genera that were also detected in the initial composite waste rock material and increased in relative abundance in the columns included Thiobacillus and Albidiferax. The relative abundance of Albidiferax was higher in control columns (13–26%) than in carbon amended columns (7–16%) regardless of varied dissolved oxygen conditions. In oxic columns, the highest relative abundance of Thiobacillus was observed in the control columns (10%) com-pared to the carbon amended columns (1–2%). In microaerophilic and anoxic columns,
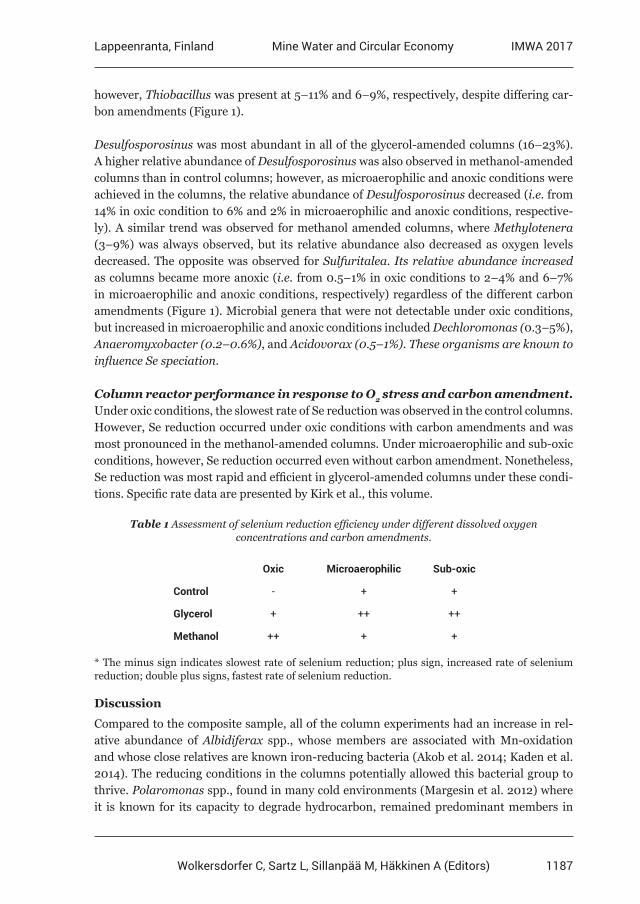
1187
Lappeenranta, Finland IMWA 2017Mine Water and Circular Economy
Wolkersdorfer C, Sartz L, Sillanpää M, Häkkinen A (Editors)
however, Thiobacillus was present at 5–11% and 6–9%, respectively, despite differing car-bon amendments (Figure 1).
Desulfosporosinus was most abundant in all of the glycerol-amended columns (16–23%). A higher relative abundance of Desulfosporosinus was also observed in methanol-amended columns than in control columns; however, as microaerophilic and anoxic conditions were achieved in the columns, the relative abundance of Desulfosporosinus decreased (i.e. from 14% in oxic condition to 6% and 2% in microaerophilic and anoxic conditions, respective-ly). A similar trend was observed for methanol amended columns, where Methylotenera (3–9%) was always observed, but its relative abundance also decreased as oxygen levels decreased. The opposite was observed for Sulfuritalea. Its relative abundance increased as columns became more anoxic (i.e. from 0.5–1% in oxic conditions to 2–4% and 6–7% in microaerophilic and anoxic conditions, respectively) regardless of the different carbon amendments (Figure 1). Microbial genera that were not detectable under oxic conditions, but increased in microaerophilic and anoxic conditions included Dechloromonas (0.3–5%), Anaeromyxobacter (0.2–0.6%), and Acidovorax (0.5–1%). These organisms are known to influence Se speciation.
Column reactor performance in response to O2 stress and carbon amendment. Under oxic conditions, the slowest rate of Se reduction was observed in the control columns. However, Se reduction occurred under oxic conditions with carbon amendments and was most pronounced in the methanol-amended columns. Under microaerophilic and sub-oxic conditions, however, Se reduction occurred even without carbon amendment. Nonetheless, Se reduction was most rapid and efficient in glycerol-amended columns under these condi-tions. Specific rate data are presented by Kirk et al., this volume.
Table 1 Assessment of selenium reduction efficiency under different dissolved oxygen concentrations and carbon amendments.
Oxic Microaerophilic Sub-oxic
Control - + +
Glycerol + ++ ++
Methanol ++ + +
* The minus sign indicates slowest rate of selenium reduction; plus sign, increased rate of selenium reduction; double plus signs, fastest rate of selenium reduction.
Discussion
Compared to the composite sample, all of the column experiments had an increase in rel-ative abundance of Albidiferax spp., whose members are associated with Mn-oxidation and whose close relatives are known iron-reducing bacteria (Akob et al. 2014; Kaden et al. 2014). The reducing conditions in the columns potentially allowed this bacterial group to thrive. Polaromonas spp., found in many cold environments (Margesin et al. 2012) where it is known for its capacity to degrade hydrocarbon, remained predominant members in
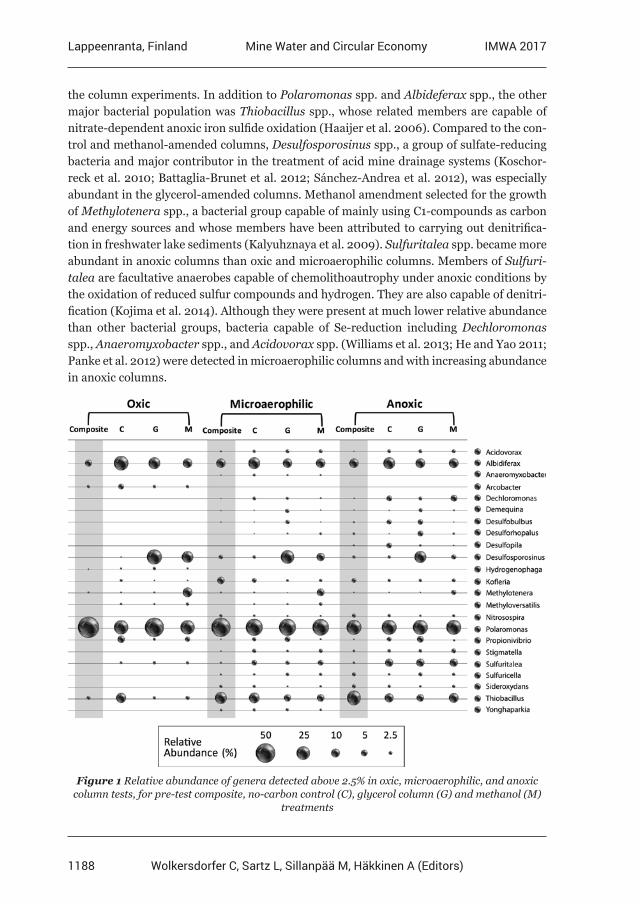
1188
Lappeenranta, Finland IMWA 2017Mine Water and Circular Economy
Wolkersdorfer C, Sartz L, Sillanpää M, Häkkinen A (Editors)
the column experiments. In addition to Polaromonas spp. and Albideferax spp., the other major bacterial population was Thiobacillus spp., whose related members are capable of nitrate-dependent anoxic iron sulfide oxidation (Haaijer et al. 2006). Compared to the con-trol and methanol-amended columns, Desulfosporosinus spp., a group of sulfate-reducing bacteria and major contributor in the treatment of acid mine drainage systems (Koschor-reck et al. 2010; Battaglia-Brunet et al. 2012; Sánchez-Andrea et al. 2012), was especially abundant in the glycerol-amended columns. Methanol amendment selected for the growth of Methylotenera spp., a bacterial group capable of mainly using C1-compounds as carbon and energy sources and whose members have been attributed to carrying out denitrifica-tion in freshwater lake sediments (Kalyuhznaya et al. 2009). Sulfuritalea spp. became more abundant in anoxic columns than oxic and microaerophilic columns. Members of Sulfuri-talea are facultative anaerobes capable of chemolithoautrophy under anoxic conditions by the oxidation of reduced sulfur compounds and hydrogen. They are also capable of denitri-fication (Kojima et al. 2014). Although they were present at much lower relative abundance than other bacterial groups, bacteria capable of Se-reduction including Dechloromonas spp., Anaeromyxobacter spp., and Acidovorax spp. (Williams et al. 2013; He and Yao 2011; Panke et al. 2012) were detected in microaerophilic columns and with increasing abundance in anoxic columns.
Figure 1 Relative abundance of genera detected above 2.5% in oxic, microaerophilic, and anoxic column tests, for pre-test composite, no-carbon control (C), glycerol column (G) and methanol (M)
treatments
1189
Lappeenranta, Finland IMWA 2017Mine Water and Circular Economy
Wolkersdorfer C, Sartz L, Sillanpää M, Häkkinen A (Editors)
Conclusion
The study showed that Se attenuation can be promoted through carbon amendment in sat-urated rock fills. As the results indicated, methanol-amended columns performed the best under oxic condition, but glycerol-amended columns performed the best in microaerophilic and anoxic conditions. This was also a reflection of substrate requirements for growth of microbes in the deeper subsurface. Although reduction was observed in amended columns in spite of the presence of oxygen, and even without amendment under suboxic conditions, the choice of carbon substrate did influence the microbial community structure.
References
Akob DM, Bohu T, Beyer A, Schäffner F, Händel M, Johnson CA, Merten D, Büchel G, Totsche KU, Küsel K (2014) Identification of Mn(II)-oxidizing bacteria from a low-pH contaminated former uranium mine. Appl Environ Microbiol. 80:5086-97. doi:10.1128/AEM.01296–14Battaglia-Brunet F, Crouzet C, Burnol A, Coulon S, Morin D, Joulian C (2012) Precipitation of arsenic sulphide from acidic water in a fixed-film bioreactor. Water Res. 46:3923–33. doi:10.1016/j.watres.2012.04.035Haaijer SC, Van der Welle ME, Schmid MC, Lamers LP, Jetten MS, Op den Camp HJ (2006) Evidence for the involvement of betaproteobacterial Thiobacilli in the nitrate-dependent oxidation of iron sulfide minerals. FEMS Microbiol Ecol. 58:439–548. DOI:10.1111/j.1574-6941.2006. 00178.xHe Q and Yao K (2010) Impact of alternative electron acceptors on selenium(IV) reduction by Anaeromyxobacter dehalogenans. Bioresour Technol. 102:3578–3580. doi:10.1016/j. biortech.2010.10.046Kalyuhznaya MG, Martens-Habbena W, Wang T, Hackett M, Stolyar SM, Stahl DA, Lidstrom ME, Chistoserdova L (2009) Methylophilaceae link methanol oxidation to denitrification in freshwater lake sediment as suggested by stable isotope probing and pure culture analysis. Environ Microbiol Rep. 1:385–92. doi:10.1111/j.1758-2229.2009.00046.xKaden R, Spröer C, Beyer D, Krolla-Sidenstein P (2014) Rhodoferax saidenbachensis sp. nov., a psychrotolerant, very slowly growing bacterium within the family Comamonadaceae, proposal of appropriate taxonomic position of Albidiferax ferrireducens strain T118T in the genus Rhodoferax and emended description of the genus Rhodoferax. Int J Syst Evol Microbiol. 64:1186–1193. doi:10.1099/ijs.0.054031-0Kirk L, Hwang C, Ertuna C, Kennedy C, Peyton B, (2017) Column Tests of Selenium Biomineralization in Support of Saturated Rockfill Design. This volume.Kojima H, Watanabe T, Iwata T, Fukui M (2014) Identification of major planktonic sulfur oxidizers in stratified freshwater lake. PLoS One. 9(4):e93877. doi:10.1371/journal.pone.0093877Koschorreck M, Geller W, Neu T, Kleinsteuber S, Kunze T, Trosiener A, Wendt-Potthoff K (2010) Structure and function of the microbial community in an in situ reactor to treat an acidic mine pit lake. FEMS Microbiol Ecol. 73:385–95. doi:10.1111/j.1574-6941.2010.00886.x. Kozich JJ, Westcott SL, Baxter NT, Highlander SK, Schloss PD (2013) Development of a dual-index sequencing strategy and curation pipeline for analyzing amplicon sequence data on the MiSeq Illumina sequencing platform. Applied and Environmental Microbiology 79:5112– 5120. DOI:10.1128/AEM.01043-13Margesin R, Spröer C, Zhang DC, Busse HJ (2012) Polaromonas glacialis sp. nov. and Polaromonas cryoconiti sp. nov., isolated from alpine glacier cryoconite. Int J Syst Evol Microbiol. 62:2662–2668. doi:10.1099/ijs.0.037556-0Panke C, Obst M, Benzerara K, Morin G, Ona-Nguema G, Dippon U, Kappler A (2012) Green rust formation during Fe(II) oxidation by the nitrate-reducing Acidovorax sp. Strain BoFeN1. Environ Sci Technol. 46:1439–1446. doi::10.1021/es2016457
1190
Lappeenranta, Finland IMWA 2017Mine Water and Circular Economy
Wolkersdorfer C, Sartz L, Sillanpää M, Häkkinen A (Editors)
Sánchez-Andrea I, Triana D, Sanz JL 2012. Bioremediation of acid mine drainage coupled with domestic wastewater treatment. Water Sci Technol. 66:2425–31. doi:10.2166/wst.2012.477Williams KH, Wilkins MJ, N’Guessan AL, Arey B, Dodova E, Dohnalkova A, Holmes D, Lovley DR, Long P (2013) Field evidence of selenium bioreduction in a uranium-contaminated aquifer. Environ Microbiol Rep. 5:444–52. doi:10.1111/1758-2229.12032
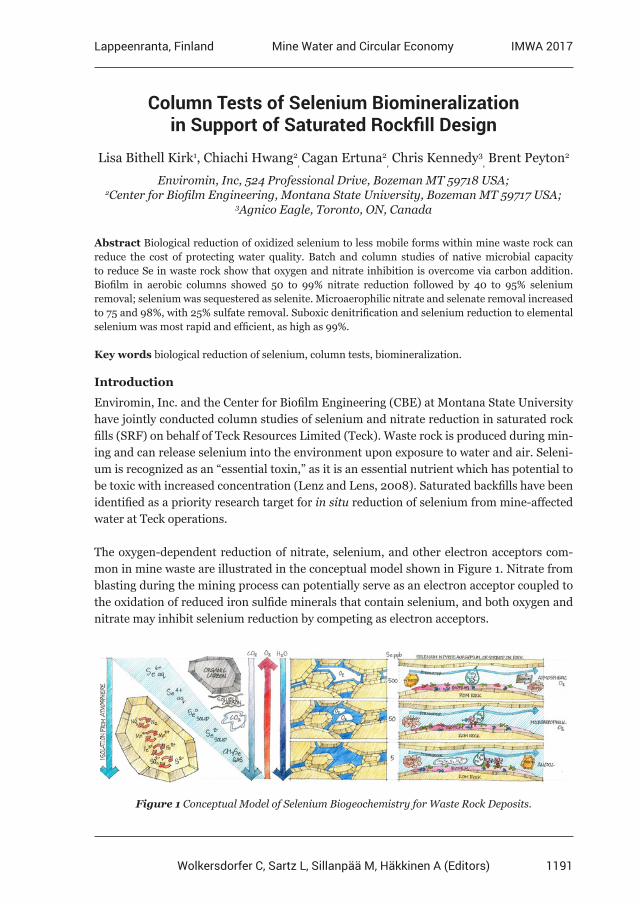
1191
Lappeenranta, Finland IMWA 2017Mine Water and Circular Economy
Wolkersdorfer C, Sartz L, Sillanpää M, Häkkinen A (Editors)
Column Tests of Selenium Biomineralization in Support of Saturated Rockfill Design
Lisa Bithell Kirk1, Chiachi Hwang2, Cagan Ertuna2
, Chris Kennedy3, Brent Peyton2
Enviromin, Inc, 524 Professional Drive, Bozeman MT 59718 USA; 2Center for Biofilm Engineering, Montana State University, Bozeman MT 59717 USA;
3Agnico Eagle, Toronto, ON, Canada
Abstract Biological reduction of oxidized selenium to less mobile forms within mine waste rock can reduce the cost of protecting water quality. Batch and column studies of native microbial capacity to reduce Se in waste rock show that oxygen and nitrate inhibition is overcome via carbon addition. Biofilm in aerobic columns showed 50 to 99% nitrate reduction followed by 40 to 95% selenium removal; selenium was sequestered as selenite. Microaerophilic nitrate and selenate removal increased to 75 and 98%, with 25% sulfate removal. Suboxic denitrification and selenium reduction to elemental selenium was most rapid and efficient, as high as 99%.
Key words biological reduction of selenium, column tests, biomineralization.
Introduction
Enviromin, Inc. and the Center for Biofilm Engineering (CBE) at Montana State University have jointly conducted column studies of selenium and nitrate reduction in saturated rock fills (SRF) on behalf of Teck Resources Limited (Teck). Waste rock is produced during min-ing and can release selenium into the environment upon exposure to water and air. Seleni-um is recognized as an “essential toxin,” as it is an essential nutrient which has potential to be toxic with increased concentration (Lenz and Lens, 2008). Saturated backfills have been identified as a priority research target for in situ reduction of selenium from mine-affected water at Teck operations.
The oxygen-dependent reduction of nitrate, selenium, and other electron acceptors com-mon in mine waste are illustrated in the conceptual model shown in Figure 1. Nitrate from blasting during the mining process can potentially serve as an electron acceptor coupled to the oxidation of reduced iron sulfide minerals that contain selenium, and both oxygen and nitrate may inhibit selenium reduction by competing as electron acceptors.
Figure 1 Conceptual Model of Selenium Biogeochemistry for Waste Rock Deposits.
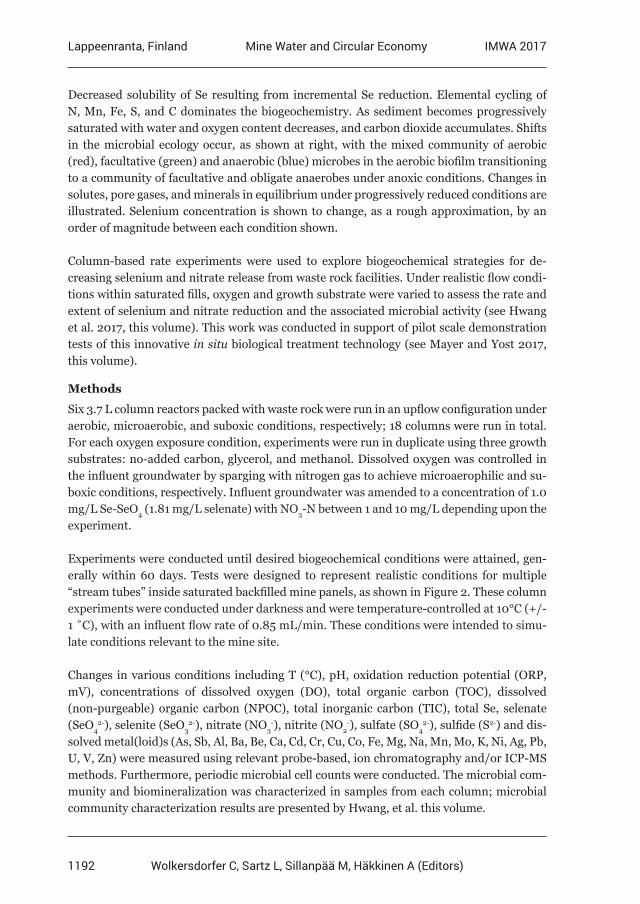
1192
Lappeenranta, Finland IMWA 2017Mine Water and Circular Economy
Wolkersdorfer C, Sartz L, Sillanpää M, Häkkinen A (Editors)
Decreased solubility of Se resulting from incremental Se reduction. Elemental cycling of N, Mn, Fe, S, and C dominates the biogeochemistry. As sediment becomes progressively saturated with water and oxygen content decreases, and carbon dioxide accumulates. Shifts in the microbial ecology occur, as shown at right, with the mixed community of aerobic (red), facultative (green) and anaerobic (blue) microbes in the aerobic biofilm transitioning to a community of facultative and obligate anaerobes under anoxic conditions. Changes in solutes, pore gases, and minerals in equilibrium under progressively reduced conditions are illustrated. Selenium concentration is shown to change, as a rough approximation, by an order of magnitude between each condition shown.
Column-based rate experiments were used to explore biogeochemical strategies for de-creasing selenium and nitrate release from waste rock facilities. Under realistic flow condi-tions within saturated fills, oxygen and growth substrate were varied to assess the rate and extent of selenium and nitrate reduction and the associated microbial activity (see Hwang et al. 2017, this volume). This work was conducted in support of pilot scale demonstration tests of this innovative in situ biological treatment technology (see Mayer and Yost 2017, this volume).
Methods
Six 3.7 L column reactors packed with waste rock were run in an upflow configuration under aerobic, microaerobic, and suboxic conditions, respectively; 18 columns were run in total. For each oxygen exposure condition, experiments were run in duplicate using three growth substrates: no-added carbon, glycerol, and methanol. Dissolved oxygen was controlled in the influent groundwater by sparging with nitrogen gas to achieve microaerophilic and su-boxic conditions, respectively. Influent groundwater was amended to a concentration of 1.0 mg/L Se-SeO4 (1.81 mg/L selenate) with NO3-N between 1 and 10 mg/L depending upon the experiment.
Experiments were conducted until desired biogeochemical conditions were attained, gen-erally within 60 days. Tests were designed to represent realistic conditions for multiple “stream tubes” inside saturated backfilled mine panels, as shown in Figure 2. These column experiments were conducted under darkness and were temperature-controlled at 10°C (+/- 1 ˚C), with an influent flow rate of 0.85 mL/min. These conditions were intended to simu-late conditions relevant to the mine site.
Changes in various conditions including T (°C), pH, oxidation reduction potential (ORP, mV), concentrations of dissolved oxygen (DO), total organic carbon (TOC), dissolved (non-purgeable) organic carbon (NPOC), total inorganic carbon (TIC), total Se, selenate (SeO4
2-), selenite (SeO32-), nitrate (NO3
-), nitrite (NO2-), sulfate (SO4
2-), sulfide (S2-) and dis-solved metal(loid)s (As, Sb, Al, Ba, Be, Ca, Cd, Cr, Cu, Co, Fe, Mg, Na, Mn, Mo, K, Ni, Ag, Pb, U, V, Zn) were measured using relevant probe-based, ion chromatography and/or ICP-MS methods. Furthermore, periodic microbial cell counts were conducted. The microbial com-munity and biomineralization was characterized in samples from each column; microbial community characterization results are presented by Hwang, et al. this volume.
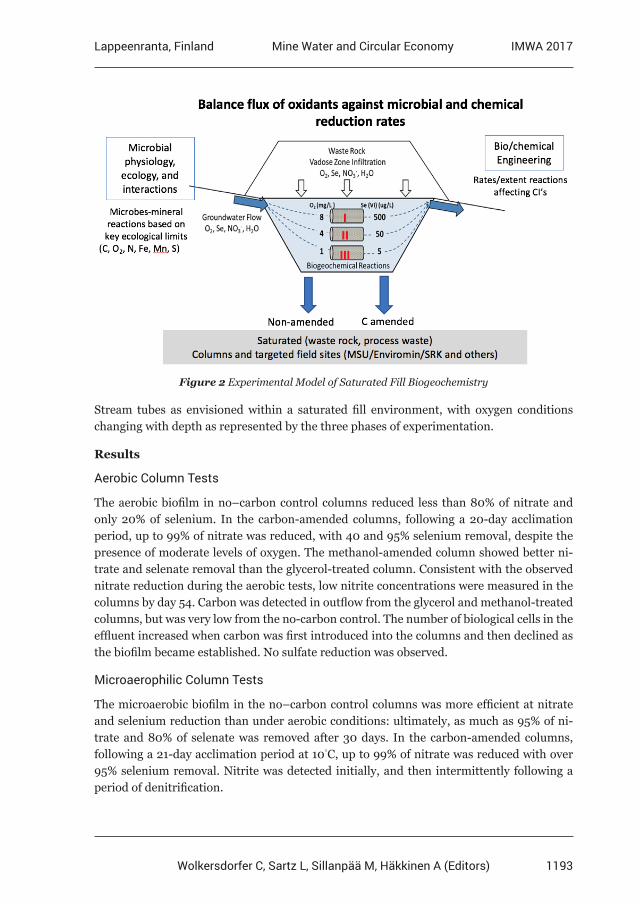
1193
Lappeenranta, Finland IMWA 2017Mine Water and Circular Economy
Wolkersdorfer C, Sartz L, Sillanpää M, Häkkinen A (Editors)
Figure 2 Experimental Model of Saturated Fill Biogeochemistry
Stream tubes as envisioned within a saturated fill environment, with oxygen conditions changing with depth as represented by the three phases of experimentation.
Results
Aerobic Column Tests
The aerobic biofilm in no–carbon control columns reduced less than 80% of nitrate and only 20% of selenium. In the carbon-amended columns, following a 20-day acclimation period, up to 99% of nitrate was reduced, with 40 and 95% selenium removal, despite the presence of moderate levels of oxygen. The methanol-amended column showed better ni-trate and selenate removal than the glycerol-treated column. Consistent with the observed nitrate reduction during the aerobic tests, low nitrite concentrations were measured in the columns by day 54. Carbon was detected in outflow from the glycerol and methanol-treated columns, but was very low from the no-carbon control. The number of biological cells in the effluent increased when carbon was first introduced into the columns and then declined as the biofilm became established. No sulfate reduction was observed.
Microaerophilic Column Tests
The microaerobic biofilm in the no–carbon control columns was more efficient at nitrate and selenium reduction than under aerobic conditions: ultimately, as much as 95% of ni-trate and 80% of selenate was removed after 30 days. In the carbon-amended columns, following a 21-day acclimation period at 10°C, up to 99% of nitrate was reduced with over 95% selenium removal. Nitrite was detected initially, and then intermittently following a period of denitrification.
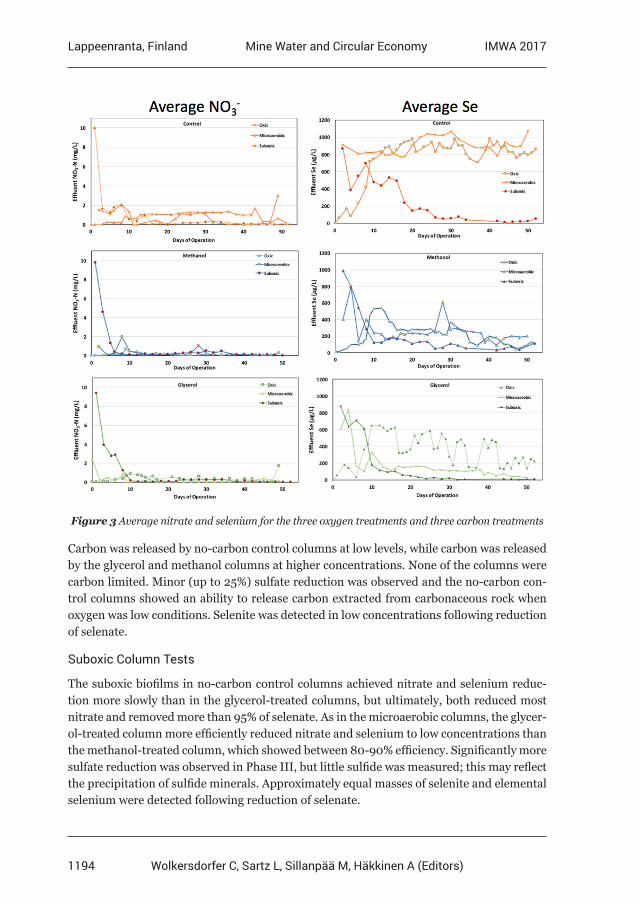
1194
Lappeenranta, Finland IMWA 2017Mine Water and Circular Economy
Wolkersdorfer C, Sartz L, Sillanpää M, Häkkinen A (Editors)
Figure 3 Average nitrate and selenium for the three oxygen treatments and three carbon treatments
Carbon was released by no-carbon control columns at low levels, while carbon was released by the glycerol and methanol columns at higher concentrations. None of the columns were carbon limited. Minor (up to 25%) sulfate reduction was observed and the no-carbon con-trol columns showed an ability to release carbon extracted from carbonaceous rock when oxygen was low conditions. Selenite was detected in low concentrations following reduction of selenate.
Suboxic Column Tests
The suboxic biofilms in no-carbon control columns achieved nitrate and selenium reduc-tion more slowly than in the glycerol-treated columns, but ultimately, both reduced most nitrate and removed more than 95% of selenate. As in the microaerobic columns, the glycer-ol-treated column more efficiently reduced nitrate and selenium to low concentrations than the methanol-treated column, which showed between 80-90% efficiency. Significantly more sulfate reduction was observed in Phase III, but little sulfide was measured; this may reflect the precipitation of sulfide minerals. Approximately equal masses of selenite and elemental selenium were detected following reduction of selenate.
1195
Lappeenranta, Finland IMWA 2017Mine Water and Circular Economy
Wolkersdorfer C, Sartz L, Sillanpää M, Häkkinen A (Editors)
Conclusions
This study characterized the conditions under which native microbial communities promote nitrate and selenium reduction/attenuation in saturated column flow reactors. Results are summarized in Figure 3. The microbial communities associated with biomineralization of N, Fe, Se and S have been identified and vary in rate and efficiency in response to changes in oxygen, nitrate, and carbon availability (see Hwang et al. this volume). These results were used to address the following two questions that inform the design and operation of pilot and full scale SRF facilities.
1. How do varied dissolved oxygen levels influence selenium reduction rates? As dissolved oxygen drops and becomes more consistent, nitrate and selenium reduction is initiated more rapidly and becomes more efficient in removing mass from solution. Review of Figure 3 shows that denitrification happens more readily than selenium reduc-tion. Both processes were relatively noisier in the no-carbon control column, but could reach efficient removal at steady state for water with a 16-hour residence time under su-boxic conditions, following a period of biofilm growth on the order of weeks. Reduction was more efficient in methanol-treated biofilms when oxygen was present, and in glyc-erol-treated biofilms when oxygen was low. Reducing conditions were established most quickly, and were most stable, when oxygen was low.
2. Is carbon amendment necessary? Can coal from waste rocks provide enough carbon for selenium reduction? Under suboxic conditions, no-carbon control col-umns were able to release carbon into solution, presumably through biological degra-dation of the carbonaceous waste rock. Under microaerophilic and suboxic conditions, the available native carbon appears to be sufficient to drive reduction with adequate res-idence time. This may not be true during upset conditions, however, such as seasonal spikes in oxygen or nitrate.
Acknowledgements
The authors gratefully acknowledge the support of Teck Coal and the contributions of the Teck Resources Applied Research and Development team.
References
Mayer, J.M. and R. Yost (2017) Reproduction of a Complex Tracer Test through Explicit Simulation of a Heterogeneous Aquifer using Bayesian Markov Chain Monte Carlo. This volume.Hwang, C., Lisa Bithell Kirk and B. Peyton (2017) Changes in microbial community structure in response to changing oxygen stress in column tests of denitrification and selenium reduction. This volume. Lenz, M. and P.N.L. Lens (2008) The essential toxin: The changing perception of selenium in environmental sciences. Sci Tot Env, 407(12):3620-33.
1196
Lappeenranta, Finland IMWA 2017Mine Water and Circular Economy
Wolkersdorfer C, Sartz L, Sillanpää M, Häkkinen A (Editors)
Enhancing mine drainage treatment by sulfate reducing bacteria using nutrient additives
H. Christenson1, P. Weber2, J. Pope1, N. Newman1, W. Olds2, D. Trumm1
1CRL Energy Ltd, 97 Nazareth Ave, Christchurch, [email protected] 2O’Kane Consultants (NZ) Ltd, Unit 2, 2 McMillan Street, Darfield.
Abstract The metabolism of sulfate reducing bacteria provides a useful pathway for treatment of mine influenced water (MIW) in passive sulfate reducing bioreactor treatment systems. However, the performance of these bioreactors can be unpredictable, with full scale systems often not reaching their design specifications. In this experiment, traditional sulfate reducing bioreactors have been fed additional nutrients, and the effect on effluent sulfate concentrations has been measured as an indication of sulfate reducing bacteria (SRB) activity. Nutrient addition led to a more than 15 fold improvement to the amount of sulfate removed from mine influenced water relative to the control systems. This extends the capacity of SRB technologies to treat MIW discharges.
Introduction
Sulfate reducing bacteria (SRB) can obtain energy by oxidizing organic compounds while reducing sulfate to hydrogen sulfide:
(1)
SRB activity consumes SO42-, and the metabolic products HCO3
- and H2S can neutralise acidity, and precipitate metals as sulfides respectively, presenting an attractive option for MIW treatment.
Passive MIW treatment systems that utilise SRB have been implemented in many systems. They take advantage of a variety of carbon sources, and alkalinity sources where applicable (DiLoreto et al., 2016; Gusek, 2002; McCauley et al., 2009). Active treatment systems have also taken advantage of SRB metabolism, and a variety of water soluble organic carbon com-pounds have been used in such systems (Hao et al., 2014; Zagury et al., 2006; Zamzow et al., 2006). The effectiveness of bioreactors to treat MIW depends on operating conditions, environmental conditions, the MIW chemistry, and the desired water quality outcomes.
Success of passive treatment systems relies on the success of an entire ecosystem within the bioreactor. In passive sulfate reducing bioreactors, fermenting bacteria breakdown the organic material present and release labile carbon compounds that SRB can metabolise. When the growth conditions for fermenting bacteria are compromised, this can reduce SRB activity and whether treatment goal posts are achieved. For example, the rate of breakdown of organic material can slow at low temperatures, and this can reduce the bioreactor effi-ciency. The use of these systems is also limited to relatively low flow drainages because often a long hydraulic retention time (HRT) is required for successful treatment.In this study an experiment was designed to test whether addition of nutrients to passive SRB bioreactors lead to improved removal of sulfate from MIW. Influent MIW was dosed
Enhancing mine drainage treatment by sulfate reducing bacteria using nutrient additives
H. Christenson1, P. Weber2, J. Pope1, N. Newman1, W. Olds2, D. Trumm1
1CRL Energy Ltd, 97 Nazareth Ave, Christchurch, [email protected] 2O'Kane Consultants (NZ) Ltd, Unit 2, 2 McMillan Street, Darfield.
Abstract The metabolism of sulfate reducing bacteria provides a useful pathway for treatment of mine influenced water (MIW) in passive sulfate reducing bioreactor treatment systems. However, the performance of these bioreactors can be unpredictable, with full scale systems often not reaching their design specifications. In this experiment, traditional sulfate reducing bioreactors have been fed additional nutrients, and the effect on effluent sulfate concentrations has been measured as an indication of sulfate reducing bacteria (SRB) activity. Nutrient addition led to a more than 15 fold improvement to the amount of sulfate removed from mine influenced water relative to the control systems. This extends the capacity of SRB technologies to treat MIW discharges.
Introduction Sulfate reducing bacteria (SRB) can obtain energy by oxidizing organic compounds while reducing sulfate to hydrogen sulfide:
SO42− + 2CH2O
SRB⎯2HCO3
− + H2S
SRB activity consumes SO42-, and the metabolic products HCO3- and H2S can neutralise acidity, and precipitate metals as sulfides respectively, presenting an attractive option for MIW treatment.
Passive MIW treatment systems that utilise SRB have been implemented in many systems. They take advantage of a variety of carbon sources, and alkalinity sources where applicable (DiLoreto et al., 2016; Gusek, 2002; McCauley et al., 2009). Active treatment systems have also taken advantage of SRB metabolism, and a variety of water soluble organic carbon compounds have been used in such systems (Hao et al., 2014; Zagury et al., 2006; Zamzow et al., 2006). The effectiveness of bioreactors to treat MIW depends on operating conditions, environmental conditions, the MIW chemistry, and the desired water quality outcomes.
Success of passive treatment systems relies on the success of an entire ecosystem within the bioreactor. In passive sulfate reducing bioreactors, fermenting bacteria breakdown the organic material present and release labile carbon compounds that SRB can metabolise. When the growth conditions for fermenting bacteria are compromised, this can reduce SRB activity and whether treatment goal posts are achieved. For example, the rate of breakdown of organic material can slow at low temperatures, and this can reduce the bioreactor efficiency. The use of these systems is also limited to relatively low flow drainages because often a long hydraulic retention time (HRT) is required for successful treatment.
In this study an experiment was designed to test whether addition of nutrients to passive SRB bioreactors lead to improved removal of sulfate from MIW. Influent MIW was dosed with two nutrient additives, providing additional nourishment to the SRB. Sulfate was used as an indicator of any improvements to treatment efficiency during optimisation trials.
Methods
Mine water collection and characterisation Acidic MIW was collected from an opencast sub-bituminous coal mine located near Coalgate on New Zealand's South Island. Three cubic meters of water was collected on the 22nd December
1197
Lappeenranta, Finland IMWA 2017Mine Water and Circular Economy
Wolkersdorfer C, Sartz L, Sillanpää M, Häkkinen A (Editors)
with two nutrient additives, providing additional nourishment to the SRB. Sulfate was used as an indicator of any improvements to treatment efficiency during optimisation trials.
Methods
Mine water collection and characterisation
Acidic MIW was collected from an opencast sub-bituminous coal mine located near Coalgate on New Zealand’s South Island. Three cubic meters of water was collected on the 22nd De-cember 2015, and stored in polyethylene containers prior to use. A 20 L sample of mud was also collected from a wetland that received drainage water from the mine. The mud had black zones with an H2S smell, and these were stored at 16 °C in a polypropylene bucket prior to the start of the experiment.
Experimental setup
Twelve cylindrical up-flow reactors were built using polyvinyl chloride pipes (Fig. 1). The re-actors were filled with 300 g of quartz chips, then packed with a mixture of limestone, bark, bark mulch, and compost in a 3:3:2:2 volume ratio. A small proportion of the reduced mud (1 % of the mixture volume) was mixed through to inoculate the system with SRB.
Reactors were kept in a 16 °C temperature controlled room, and batch fed once per day with MIW. Control reactors received only MIW, and the two nutrient mixtures PX1.0 and PX1.5 were added to the MIW in the experimental reactors. PX 1.0 and PX 1.5 differed in their car-bon compound compositions. An application for intellectual property rights to the nutrient mixture compositions may be filed, and their composition is not described in this paper.
At the start of the experiment, the reactors were filled with a mixture of 50 % MIW and 50 % municipal drinking water, and left for 48 hours. They were then dosed with MIW to gener-ate an HRT of 10 days. After 3 weeks, the HRT was reduced to 5 days and nutrient addition of PX1.0 and PX1.5 to the MIW feeds for 4 reactors commenced. Nutrients were applied such that the chemical oxygen demand (COD):SO4 ratio was 3; a COD:SO4 ratio between 2.4 and 5 is suggested to achieve the maximum sulfate reduction rates (Hao et al., 2014). The effluent water chemistry was monitored, and periodically the nutrient addition rates and HRTs were altered according to Table 1.
Chemical analysis
Each week pH, ORP, conductivity and temperature were measured for the MIW and the reactor effluent, and samples were collected for alkalinity, Ca, and SO4 analysis. Meters used for measurements were calibrated on the day of use. At the beginning of the experiment trace metals in the MIW were also analysed. Alkalinity was analysed by titration with 0.1 M HCl, Dissolved metals were analysed by ICP-MS using the APHA method 3125 B. Sul-fate was analysed using the APHA ion chromatography method 4110 B, and the QuikChem flow injection analysis method 10-116-10-1-A. Total sulfide concentrations were periodical-ly analysed in reactor effluent according to the HACH spectrophotometric methylene blue method 8131.
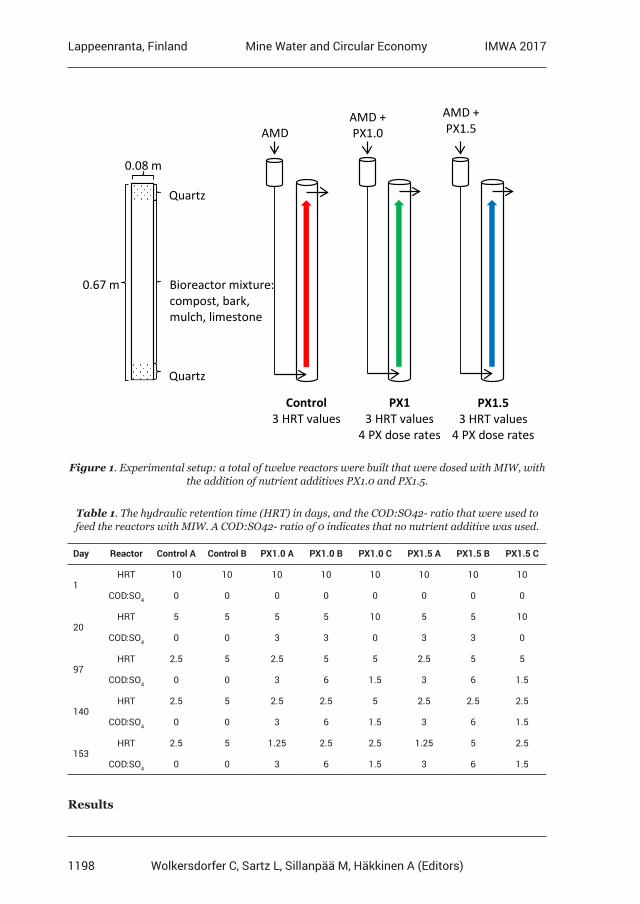
1198
Lappeenranta, Finland IMWA 2017Mine Water and Circular Economy
Wolkersdorfer C, Sartz L, Sillanpää M, Häkkinen A (Editors)
Quartz
Bioreactor mixture: compost, bark, mulch, limestone
Quartz
0.67 m
0.08 m
AMD
Control 3 HRT values
AMD + PX1.0
PX1 3 HRT values
4 PX dose rates
AMD + PX1.5
PX1.5 3 HRT values
4 PX dose rates
Figure 1. Experimental setup: a total of twelve reactors were built that were dosed with MIW, with the addition of nutrient additives PX1.0 and PX1.5.
Table 1. The hydraulic retention time (HRT) in days, and the COD:SO42- ratio that were used to feed the reactors with MIW. A COD:SO42- ratio of 0 indicates that no nutrient additive was used.
Day Reactor Control A Control B PX1.0 A PX1.0 B PX1.0 C PX1.5 A PX1.5 B PX1.5 C
1HRT 10 10 10 10 10 10 10 10
COD:SO4 0 0 0 0 0 0 0 0
20HRT 5 5 5 5 10 5 5 10
COD:SO4 0 0 3 3 0 3 3 0
97HRT 2.5 5 2.5 5 5 2.5 5 5
COD:SO4 0 0 3 6 1.5 3 6 1.5
140HRT 2.5 5 2.5 2.5 5 2.5 2.5 2.5
COD:SO4 0 0 3 6 1.5 3 6 1.5
153HRT 2.5 5 1.25 2.5 2.5 1.25 5 2.5
COD:SO4 0 0 3 6 1.5 3 6 1.5
Results
1199
Lappeenranta, Finland IMWA 2017Mine Water and Circular Economy
Wolkersdorfer C, Sartz L, Sillanpää M, Häkkinen A (Editors)
Mine water chemistry
The MIW used for the experiment had pH 3.4 and conductivity of 1.66 mS/cm. Concentra-tions of metals typically enriched in New Zealand coal mine drainage were below 6 mg/L (Table 2). The Ca concentration was 250 mg/L, and SO4 concentrations ranged from 1290-1370 mg/L throughout the experiment.
Table 2. Metal concentrations in the MIW used in the experiment
Metal Al Mn Fe Ni Zn
Concentration (mg/L) 5.4 5.2 0.7 0.2 0.7
Treated effluent from the reactors had circum-neutral pH, and alkalinity of more than 100 mg/L CaCO3 (Table 3). The effluent from the nutrient-dosed reactors had 3 or more times the alkalinity that was measured in the control reactors. The reactors dosed with PX1.5 had effluent with lower pH, yet higher alkalinity than that from the PX1.0 dosed reactors. The PX1.5 reactors also had effluent with higher conductivity than the influent MIW, in contrast to the control and PX1.0 reactors that consistently reduced the MIW conductivity by a small amount.
Table 3. Indicative water chemistry of MIW and reactor effluents
Water type Control effluent PX1.0 effluent PX1.5 effluent Influent MIW
pH 7.2 7.3 6.6 3.4
Alkalinity (mg/L CaCO3) 170 500 840 -
Conductivity (mS/cm) 1.60 1.64 2.18 1.66
Sulfate removal
Sulfate was removed from solution in the control reactors, and in the reactors dosed with nutrients (Fig 2). At the beginning of the experiment (day 21), the reactors had similar ef-fluent sulfate concentrations close to 1200 mg/L. Between 21 and 50 days of operation, the concentration of sulfate in the nutrient dosed reactors decreased by approximately half, to around 600 mg/L, whilst the control reactors remained close to 1200 mg/L. Throughout the experiment, the nutrient dosed reactors released water that was compliant with the New Zealand stock water quality guideline (1,000 mg/L).
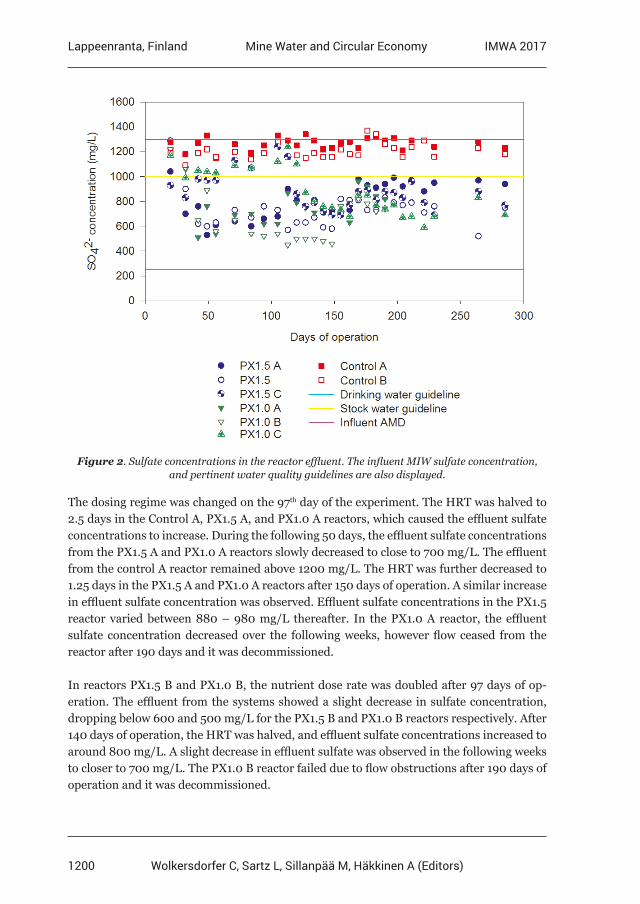
1200
Lappeenranta, Finland IMWA 2017Mine Water and Circular Economy
Wolkersdorfer C, Sartz L, Sillanpää M, Häkkinen A (Editors)
Figure 2. Sulfate concentrations in the reactor effluent. The influent MIW sulfate concentration, and pertinent water quality guidelines are also displayed.
The dosing regime was changed on the 97th day of the experiment. The HRT was halved to 2.5 days in the Control A, PX1.5 A, and PX1.0 A reactors, which caused the effluent sulfate concentrations to increase. During the following 50 days, the effluent sulfate concentrations from the PX1.5 A and PX1.0 A reactors slowly decreased to close to 700 mg/L. The effluent from the control A reactor remained above 1200 mg/L. The HRT was further decreased to 1.25 days in the PX1.5 A and PX1.0 A reactors after 150 days of operation. A similar increase in effluent sulfate concentration was observed. Effluent sulfate concentrations in the PX1.5 reactor varied between 880 – 980 mg/L thereafter. In the PX1.0 A reactor, the effluent sulfate concentration decreased over the following weeks, however flow ceased from the reactor after 190 days and it was decommissioned.
In reactors PX1.5 B and PX1.0 B, the nutrient dose rate was doubled after 97 days of op-eration. The effluent from the systems showed a slight decrease in sulfate concentration, dropping below 600 and 500 mg/L for the PX1.5 B and PX1.0 B reactors respectively. After 140 days of operation, the HRT was halved, and effluent sulfate concentrations increased to around 800 mg/L. A slight decrease in effluent sulfate was observed in the following weeks to closer to 700 mg/L. The PX1.0 B reactor failed due to flow obstructions after 190 days of operation and it was decommissioned.
1201
Lappeenranta, Finland IMWA 2017Mine Water and Circular Economy
Wolkersdorfer C, Sartz L, Sillanpää M, Häkkinen A (Editors)
Nutrient dosing of the PX1.5 C and PX1.0 C reactors began after 97 days of operation. The nutrients were dosed to achieve a COD:SO4
2- ratio of 1.5. Effluent sulfate concentrations de-creased in both reactors to approximately 700 mg/L by 150 days of operation. At this stage the HRT was decreased to 2.5 days, and the effluent sulfate concentrations increased to close to 900 mg/L following the change. Over the subsequent weeks the sulfate concentra-tions decreased to close to 600 mg/L in the PX1.0 C reactor, however in the PX1.5 C reactor, sulfate concentrations remained between 690 and 880 mg/L.
Discussion
Addition of nutrients to MIW treated by sulfate reducing bioreactors delivers lower efflu-ent sulfate concentrations than those not treated with nutrient (Fig. 2). At the start of the experiment, the reactors that were fed nutrients had effluent sulfate concentrations that decreased over a six week period to stabilise at around 600 mg/L. The decrease in sulfate concentration is attributed to SRB, and the change over time is likely due to an increasing population of the bacteria in response to the available nutrients. Decreasing the HRT in-creased the SO4 load to the system, and the populations present in the reactors were unable to consume the increased SO4 load. Over a six week period, it appears that the SRB pop-ulation responds to the new conditions, and effluent sulfate concentrations decrease and seem to stabilise. Although SO4 and COD were present in the same ratio in each reactor, the minimum concentration of SO4 seemed to be achieved at greater HRT. Despite this, the higher load at low HRT meant the sulfate removal rate (and therefore net sulfate removal) was greater at low HRT (Fig. 3).
When the rate of nutrient application to the PX1.5 B and PX1.0B reactors was doubled, a slight decrease in the effluent sulfate concentration was observed. The decrease was not proportional to the rate of nutrient application. This was also observed when a COD:SO4 ratio of 1.5 was used. At low nutrient applications in reactors PX1.5 C and PX1.0 C, sulfate concentrations below 700 mg/L could still be achieved. Although an excess of COD:SO4 was supplied to the reactors, complete sulfate reduction was not achieved. Soluble sulfide compounds can inhibit SRB activity. The measured total sulfide concentrations ranged up to 250 mg/L. This is lower than documented concentrations where sulfide toxicity to SRB has been documented (477 – 617 mg/L)(Neculita et al., 2007). Removal of sulfide from the system is being investigated as a way to identify if sulfide concentrations may limit the rate of sulfate removal by SRB.
The rate of sulfate reduction in the control reactors was close to 20 mg/L/day (Fig. 3). This was similar in Control A and Control B at 5 and 2.5 day HRT respectively. Nutrient addition led to significantly increased sulfate reduction rates. At a 5 day HRT the PX1.5 and PX1.0 reactors removed close to 120 mg/L/day of sulfate from the MIW. Decreasing the reactor HRT was the factor that led to the best improvements in sulfate reduction rates. At a 1.25 day HRT the PX1.5 reactor removed close to 300 mg/L/day of sulfate; a 15 fold increase relative to the control reactor.
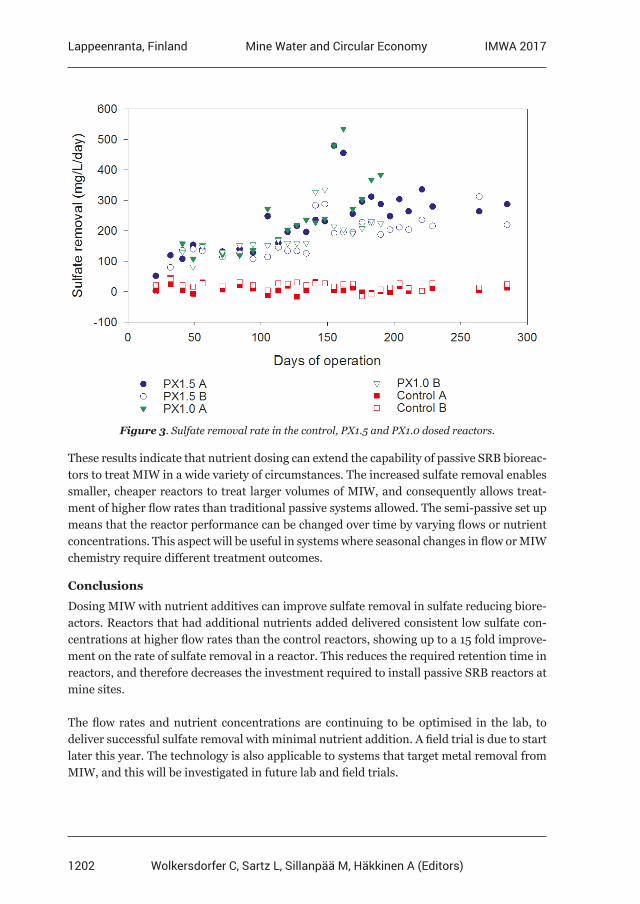
1202
Lappeenranta, Finland IMWA 2017Mine Water and Circular Economy
Wolkersdorfer C, Sartz L, Sillanpää M, Häkkinen A (Editors)
Figure 3. Sulfate removal rate in the control, PX1.5 and PX1.0 dosed reactors.
These results indicate that nutrient dosing can extend the capability of passive SRB bioreac-tors to treat MIW in a wide variety of circumstances. The increased sulfate removal enables smaller, cheaper reactors to treat larger volumes of MIW, and consequently allows treat-ment of higher flow rates than traditional passive systems allowed. The semi-passive set up means that the reactor performance can be changed over time by varying flows or nutrient concentrations. This aspect will be useful in systems where seasonal changes in flow or MIW chemistry require different treatment outcomes.
Conclusions
Dosing MIW with nutrient additives can improve sulfate removal in sulfate reducing biore-actors. Reactors that had additional nutrients added delivered consistent low sulfate con-centrations at higher flow rates than the control reactors, showing up to a 15 fold improve-ment on the rate of sulfate removal in a reactor. This reduces the required retention time in reactors, and therefore decreases the investment required to install passive SRB reactors at mine sites.
The flow rates and nutrient concentrations are continuing to be optimised in the lab, to deliver successful sulfate removal with minimal nutrient addition. A field trial is due to start later this year. The technology is also applicable to systems that target metal removal from MIW, and this will be investigated in future lab and field trials.
1203
Lappeenranta, Finland IMWA 2017Mine Water and Circular Economy
Wolkersdorfer C, Sartz L, Sillanpää M, Häkkinen A (Editors)
References
DiLoreto, Z. A., Weber, P. A., Olds, W., Pope, J., Trumm, D., Chaganti, S. R., Heath, D. D., and Weisener, C. G., 2016, Novel cost effective full scale mussel shell bioreactors for metal removal and acid neutralization: Journal of Environmental Management, v. 183, p. 601-612.Gusek, J. J., Sulfate-Reducing Bioreactor Design and Operating Issues : is this passive treatment technology for your mine drainage?, in Proceedings National Association of Abandoned Mine Land Programs Annual Conference, Park City, Utah., 2002, p. 14.Hao, T.-w., Xiang, P.-y., Mackey, H. R., Chi, K., Lu, H., Chui, H.-k., van Loosdrecht, M. C., and Chen, G.-H., 2014, A review of biological sulfate conversions in wastewater treatment: Water research, v. 65, p. 1-21.McCauley, C. A., O‘Sullivan, A. D., Milke, M. W., Weber, P. A., and Trumm, D. A., 2009, Sulfate and Metal Removal in Bioreactors Treating Acid Mine Drainage Dominated with Iron and Aluminum: Water Research, v. 43, p. 961-970.Neculita, C., Zagury, G., and Bussiere, B., 2007, passive treatment of acid mine drainage in bioreactors using sulphate reducing bacteria: Journal of Environmental Quality, v. 36, p. 1-16.Zagury, G. J., Kulnieks, V. I., and Neculita, C. M., 2006, Characterization and reactivity assessment of organic substrates for sulphate-reducing bacteria in acid mine drainage treatment: Chemosphere, v. 64, no. 6, p. 944-954.Zamzow, K., Tsukamoto, T., and Miller, G., 2006, Waste from biodiesel manufacturing as an inexpensive carbon source for bioreactors treating acid mine drainage: Mine Water and the Environment, v. 25, no. 3, p. 163-170.
1204
Lappeenranta, Finland IMWA 2017Mine Water and Circular Economy
Wolkersdorfer C, Sartz L, Sillanpää M, Häkkinen A (Editors)
Are microcosms tiny pit lakes?
Mark A. Lund1, Melanie L. Blanchette1, Jahir Gonzalez-Pinto1, Rosalind Green2, Caroline Mather2, Christopher Kleiber2, Steven Lee2
1Mine Water and Environment Research Centre, Edith Cowan University, 270 Joondalup Drive, Joondalup, WA 6027, Australia, [email protected]
2Rio Tinto Iron Ore, 152-156 St Georges Terrace, Perth, WA 6000
Abstract Microcosm experiments are frequent precursors to field trials for the treatment of acidic pit lakes using organic matter. We conducted field and microcosm experiments to test the effectiveness of hay to remediate two small, shallow acidic pit lakes. ‘West’ Lake was treated with 19 t of hay and ‘East’ Lake was untreated. Microcosms mimicked key lake trends in water quality, increasing pH and reducing metal concentrations to a greater extent and faster than the field trial. However, microcosms are not tiny pit lakes because they provide an overly optimistic picture of remediation efficacy.
Key words Mine pit lakes, remediation, organic matter, AMD
Introduction
Acidic pit lakes present challenges for successful closure due to water quality issues that impact on beneficial end uses. The only established technological solution to pit lake acidity is the use of chemical neutralisation (see Geller et al. 2013), although it is typically an expen-sive and temporary solution. Treating acid mine drainage (AMD) in mine discharges using organic materials has proven effective at metal removal and increasing pH (Skousen et al. 2017). Adding organic matter to pit lakes is potentially an economical way to stimulate sul-phate reducing bacterial (SRB) reduction of acidity and metal contamination (Frömmichen et al. 2003). Therefore, when carbon inputs exceed loss in pit lakes, natural processes may improve water quality (Blanchette and Lund 2016).
The use of organic matter to improve pit lakes in situ has been rarely attempted at full scale and treatment effectiveness has varied (McCullough et al. 2008); iron cycling in the pit lakes can even work against effective treatment (Koschorreck et al. 2007). However, numerous small-scale laboratory experiments (microcosms) have demonstrated effective treatment of acidic pit lake waters with a wide variety of organic materials (e.g. Kumar et al. 2011a). We propose that there is still much to be learned from field-scale trials that cannot be anticipated or designed for in smaller experiments.
Previous microcosm experiments (MiWER, unpublished) tested the use of sewage for reme-diation of pit lakes in the Pilbara region of Western Australia. However, limited availability of bulk organic materials (Kumar et al. 2011b) and pit lakes have prevented in situ testing. Recently, the availability of spoilt hay and two small pit lakes provided an opportunity for a field test using organic matter for acidity remediation. A microcosm experiment (measuring water quality parameters) was run concurrently examining the effects of hay additions on water sourced from both the lakes. This paper focuses on how well microcosms represent processes observed in the field.
1205
Lappeenranta, Finland IMWA 2017Mine Water and Circular Economy
Wolkersdorfer C, Sartz L, Sillanpää M, Häkkinen A (Editors)
Methods
Study site – The climate in the Pilbara region of northern Western Australia is semi-arid to arid with hot summers and mild winters. Mean maximum temperatures range from 35.9-38.3 oC in summer (Dec.-Feb.) and 23-25.5 oC in winter (Jun.-Aug.). Rainfall is highly vari-able and characterised by periodic high intensity rainfall events occurring predominantly in summer months, followed by extended periods of drought. Mean annual rainfall is 399 mm and evaporation is generally >3000 mm annually. The field study occurred in two small temporary pit lakes less than 0.5 km apart (West Lake, 0.3 ha, max. depth 9.5 m; and East Lake, 1.5 ha, max. depth 8 m) that filled in 2010 with ground and rain water.
At the start of the microcosm experiment West Lake water was more acidic (pH 2.92 vs 4.69) and saline (11.8 mS cm-1 vs 9.9 mS cm-1) than East Lake water (Hydrolab Quanta). Al-though many metal concentrations were similar between the lakes, Al, Co, Cr, Fe, K and Zn were higher in West Lake and Se and Cd were higher in East Lake (Table 1; ECU Analytical Chemistry Laboratory).
Table 1 Select physico-chemical parameters measured in lake water used in the start of the microcosm experiment, where there were large differences between lakes.
pH EC Al Cd Co Cr Fe K Se Zn SO4
mS/cm mg/L µg/L mg/L µg/L mg/L mg/L µg/L µg/L g/L
East 4.69 9.932 28.1 0.78 1.2 <0.1 0.7 26 29 539 9.0
West 2.92 11.83 55.9 0.48 1.7 1.4 5.4 43 9 942 11.1
In situ full-scale trial – In September 2015, 27 bales of water-spoiled locally-grown hay (~19 t fresh weight) was added to West Lake using a telescopic handler. Floating hay naturally dispersed across the lake, with the majority sinking by October and final traces disappear-ing from the surface in January 2016. The aim was to create a benthic layer approximately 0.3 m deep (~6 kg m-2). Hay was analysed for select chemical concentrations (such as Cl). Both lakes were monitored (at 30 min intervals) for stratification using thermistor chains, with dissolved oxygen (DO; bottom only) and conductivity (EC; bottom and surface) loggers (Hobo, Onset). An autonomous logging probe (Hanna HI9829) was used to measure pH and oxidation reduction potential (ORP) in West Lake at hourly intervals (located at the surface until 11/11/2015 and then 4 m). Water was collected on 10 occasions (Nov. 2014-March 2016), 12 samples from West Lake (n surface = 10, n bottom = 2), 10 surface samples from East Lake. Bottom samples were collected using a low-flow bladder pump QED MP50, after 15 min of purging the line. Samples were analysed for pH, EC, select metals and metal-loids, sulfate, chloride, acidity and dissolved organic carbon (DOC). The field trial finished in March 2016 due to backfill of the void.
Microcosm trial – Twelve tubular acrylic microcosms (0.6 m long, 0.12 m dia.) were sealed at the bottom using a rubber bung and left open to allow ambient gas exchange (Fig. 1). Sediment (50 mm depth) followed by water (220 mm height, ~1.5 L), was added to each
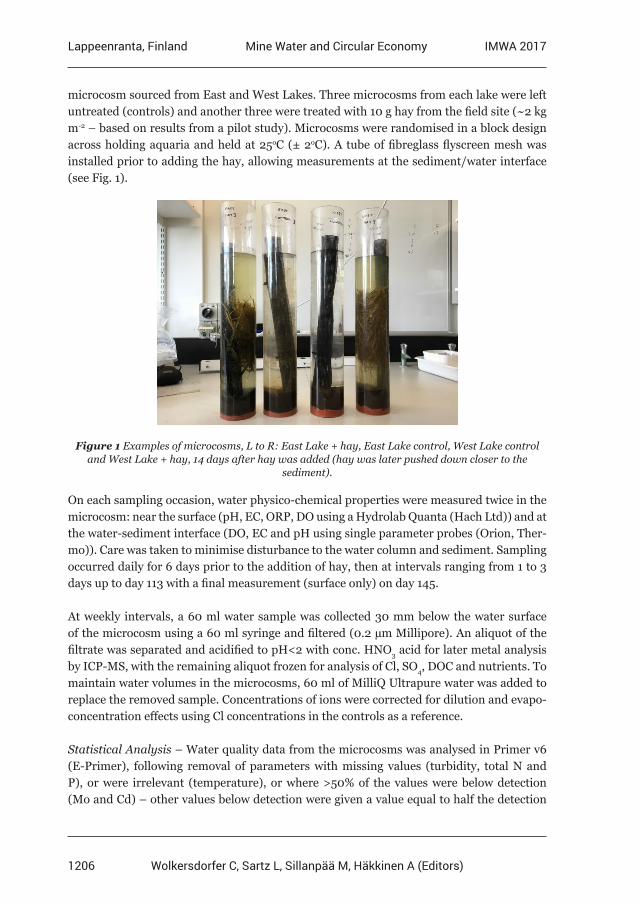
1206
Lappeenranta, Finland IMWA 2017Mine Water and Circular Economy
Wolkersdorfer C, Sartz L, Sillanpää M, Häkkinen A (Editors)
microcosm sourced from East and West Lakes. Three microcosms from each lake were left untreated (controls) and another three were treated with 10 g hay from the field site (~2 kg m-2 – based on results from a pilot study). Microcosms were randomised in a block design across holding aquaria and held at 25oC (± 2oC). A tube of fibreglass flyscreen mesh was installed prior to adding the hay, allowing measurements at the sediment/water interface (see Fig. 1).
Figure 1 Examples of microcosms, L to R: East Lake + hay, East Lake control, West Lake control and West Lake + hay, 14 days after hay was added (hay was later pushed down closer to the
sediment).
On each sampling occasion, water physico-chemical properties were measured twice in the microcosm: near the surface (pH, EC, ORP, DO using a Hydrolab Quanta (Hach Ltd)) and at the water-sediment interface (DO, EC and pH using single parameter probes (Orion, Ther-mo)). Care was taken to minimise disturbance to the water column and sediment. Sampling occurred daily for 6 days prior to the addition of hay, then at intervals ranging from 1 to 3 days up to day 113 with a final measurement (surface only) on day 145.
At weekly intervals, a 60 ml water sample was collected 30 mm below the water surface of the microcosm using a 60 ml syringe and filtered (0.2 µm Millipore). An aliquot of the filtrate was separated and acidified to pH<2 with conc. HNO3 acid for later metal analysis by ICP-MS, with the remaining aliquot frozen for analysis of Cl, SO4, DOC and nutrients. To maintain water volumes in the microcosms, 60 ml of MilliQ Ultrapure water was added to replace the removed sample. Concentrations of ions were corrected for dilution and evapo-concentration effects using Cl concentrations in the controls as a reference.
Statistical Analysis – Water quality data from the microcosms was analysed in Primer v6 (E-Primer), following removal of parameters with missing values (turbidity, total N and P), or were irrelevant (temperature), or where >50% of the values were below detection (Mo and Cd) – other values below detection were given a value equal to half the detection
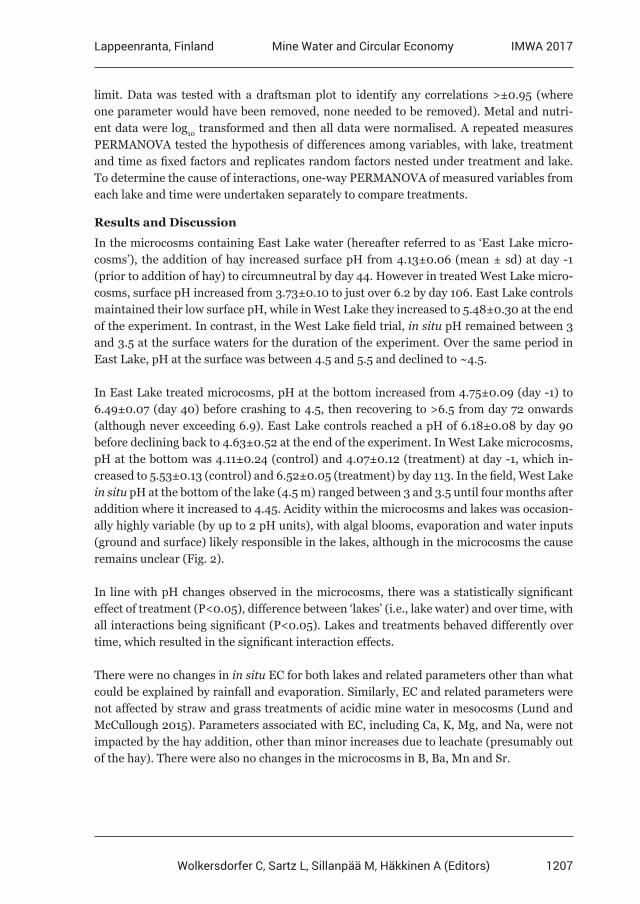
1207
Lappeenranta, Finland IMWA 2017Mine Water and Circular Economy
Wolkersdorfer C, Sartz L, Sillanpää M, Häkkinen A (Editors)
limit. Data was tested with a draftsman plot to identify any correlations >±0.95 (where one parameter would have been removed, none needed to be removed). Metal and nutri-ent data were log10 transformed and then all data were normalised. A repeated measures PERMANOVA tested the hypothesis of differences among variables, with lake, treatment and time as fixed factors and replicates random factors nested under treatment and lake. To determine the cause of interactions, one-way PERMANOVA of measured variables from each lake and time were undertaken separately to compare treatments.
Results and Discussion
In the microcosms containing East Lake water (hereafter referred to as ‘East Lake micro-cosms’), the addition of hay increased surface pH from 4.13±0.06 (mean ± sd) at day -1 (prior to addition of hay) to circumneutral by day 44. However in treated West Lake micro-cosms, surface pH increased from 3.73±0.10 to just over 6.2 by day 106. East Lake controls maintained their low surface pH, while in West Lake they increased to 5.48±0.30 at the end of the experiment. In contrast, in the West Lake field trial, in situ pH remained between 3 and 3.5 at the surface waters for the duration of the experiment. Over the same period in East Lake, pH at the surface was between 4.5 and 5.5 and declined to ~4.5.
In East Lake treated microcosms, pH at the bottom increased from 4.75±0.09 (day -1) to 6.49±0.07 (day 40) before crashing to 4.5, then recovering to >6.5 from day 72 onwards (although never exceeding 6.9). East Lake controls reached a pH of 6.18±0.08 by day 90 before declining back to 4.63±0.52 at the end of the experiment. In West Lake microcosms, pH at the bottom was 4.11±0.24 (control) and 4.07±0.12 (treatment) at day -1, which in-creased to 5.53±0.13 (control) and 6.52±0.05 (treatment) by day 113. In the field, West Lake in situ pH at the bottom of the lake (4.5 m) ranged between 3 and 3.5 until four months after addition where it increased to 4.45. Acidity within the microcosms and lakes was occasion-ally highly variable (by up to 2 pH units), with algal blooms, evaporation and water inputs (ground and surface) likely responsible in the lakes, although in the microcosms the cause remains unclear (Fig. 2).
In line with pH changes observed in the microcosms, there was a statistically significant effect of treatment (P<0.05), difference between ‘lakes’ (i.e., lake water) and over time, with all interactions being significant (P<0.05). Lakes and treatments behaved differently over time, which resulted in the significant interaction effects.
There were no changes in in situ EC for both lakes and related parameters other than what could be explained by rainfall and evaporation. Similarly, EC and related parameters were not affected by straw and grass treatments of acidic mine water in mesocosms (Lund and McCullough 2015). Parameters associated with EC, including Ca, K, Mg, and Na, were not impacted by the hay addition, other than minor increases due to leachate (presumably out of the hay). There were also no changes in the microcosms in B, Ba, Mn and Sr.
1208
Lappeenranta, Finland IMWA 2017Mine Water and Circular Economy
Wolkersdorfer C, Sartz L, Sillanpää M, Häkkinen A (Editors)
a) East Lake Microcosm
3
4
5
6
7
8
9
-10 10 30 50 70 90 110 130 150
pH
Days
Control
Treatment
b) West Lake Microcosm
3
4
5
6
7
8
9
-10 10 30 50 70 90 110 130 150
pH
Days
c) West Lake
Figure 2 pH changes in surface waters of a) East Lake microcosm, b) West Lake microcosm and c) West Lake (note probe moved from surface to ~4.5 m during experiment).
In both lake microcosms, hay reliably drove DO to hypoxia (often anoxia) at the bottom, compared to only occasionally hypoxic conditions in the controls. ORP was consistently lower at the surface of the microcosms in the treatments compared to the controls, dropping frequently below -200 mV in the East Lake replicates, but only after day 90 nearly reaching -200 mV in the West Lake replicates. There was a significant (P<0.05) inverse correlation (r>0.68) between ORP and pH within treatments for each lake.
In the field, both lakes were thermally stratified with differences of 3-4 oC over 5 m, and a hypoliminion formed at 5 m in West Lake and 7 m in East Lake. However, temperature stratification disappeared in both lakes within 24 h of rainfall events of >20mm. Mixing in West Lake did not increase dissolved oxygen in the hypoliminion – in East Lake high rain-fall in January 2016 appeared to trigger a decline in DO from ~8 mg L-1 to ~2 mg L-1 before recovering back to ~8 mg L-1 two months after the rain event. Logger data did not indicate salinity stratification, however the January rain event may have created a freshwater lens over the lakes resulting in a halocline, which when combined with groundwater inflows may account for the decline in benthic oxygen observed in East Lake following the mixing event. Lake turnover can re-oxidize reduced sulphides by effectively reversing positive improve-ments made by the treatment (Koschorreck et al. 2007). As apparent in West Lake and in a previous field trial at Collinsville (Qld), turnover failed to sufficiently alter conditions in
1209
Lappeenranta, Finland IMWA 2017Mine Water and Circular Economy
Wolkersdorfer C, Sartz L, Sillanpää M, Häkkinen A (Editors)
the hypoliminion to prevent a rapid return to improving water quality. The microcosms were not thermally stratified, but after day 44, the bottom waters (regardless of treatment or ‘lake’) became salinity stratified with a 1000 to 1500 mS cm-1 difference in the controls and ~2000 mS cm-1 in the treatments. These differences were likely due to the replacement of sampled water with low EC MilliQ water. The salinity stratification had virtually disap-peared in the controls by day 106, and was decreasing in the treatments as evapoconcentra-tion countered the dilution following the patterns seen for Cl. The addition of replacement sample water in the microcosms appeared to mimic the effects of rainfall observed in the field trial.
Sulphate concentrations over the microcosm experiment suggest that there was no signif-icant SRB activity due to similarities between treatment and controls. However, visual in-spection indicated the likely presence of iron monosulfide under the hay. It was expected that SRB activity would be the main mechanism for increasing the pH – water quality sam-ples of bottom waters might have been useful to determine whether sulphate reduction was occurring beneath the hay. In the field trial, sulphate (adjusted for Cl) remained unchanged in East Lake but decreased by approximately 2000 mg L-1 in West Lake at the benthos but not at the surface (changes in Cl at the surface and bottom suggest that there was a halocline present at the time). The reduction in sulphate is indicative of sulphate reduction although there is only very limited benthic data.
In the microcosms, Al decreased from 28 mg L-1 (East) and 56 mg L-1 (West) to <5 mg L-1
in both treatments (although more rapidly in East; day 28 vs day 54 for West, and this de-crease was observed in the controls between 10-20 mg L-1 and by day 68). Removal of Al in the hypoxic microcosms was most likely due to binding to the organic matter. Cobalt, Be and Zn also declined similarly to Al, with large decreases (10 to 100 times) in the hay treat-ments by day 28 (although for Co and Be in the West treatments, this did not occur until day 68) and smaller declines (<5 times) in the controls. Removal of Co and Zn typically occurs through formation of metal sulphides. Despite the lack of obvious sulphate reduction, the relatively small quantities of sulphide required to form precipitates would not noticeably alter the overall sulphate concentrations. Selenium remained unchanged in the controls but declined to <3 µg L-1 (from 28 µg L-1 in the East microcosms and 9.2 µg L-1 in the West micro-cosms) by day 28 in the East and day 68 in the West. In the field trial, Zn declined soon after hay addition from 2 mg L-1 to 0.05 mg L-1 in the bottom waters and dropped by ~0.5 mg L-1 at the surface and remained unchanged in East Lake. Cobalt and Ni concentrations were not impacted by the treatment, and increased slightly in both lakes (surface) and at the bottom of West Lake. Copper followed the trend observed for Zn (although concentrations were typically low (<0.5 mg L-1)). Large reductions in Al, Co and Zn, with both straw and grass treatments were also noted by Lund and McCullough (2015), highlighting a commonality of removal processes regardless of initial water qualities.
Manganese did not appear to be impacted by the hay treatment in the field or microcosms. In the microcosms, regardless of the treatment, there was an increase (~50% in East and
1210
Lappeenranta, Finland IMWA 2017Mine Water and Circular Economy
Wolkersdorfer C, Sartz L, Sillanpää M, Häkkinen A (Editors)
~100% in the West) in concentrations of Mn at day 1, likely released from the sediments. Manganese is removed from waters primarily by bacterially-catalysed oxidation in circum-neutral waters, which may explain the lack of removal in the acidic microcosms (Skousen et al. 2017). Iron concentrations were largely unchanged in the surface waters of both lakes in the field, but increased by 10 fold in bottom waters of the treated West Lake. In the surface of the microcosms, Fe concentrations were generally low but on occasion increased up to 10 fold compared to the start of the experiment – these increases were often short lived and only seen in some of the replicates. There was no apparent relationships between ORP, DO (% sat) and Fe concentrations in the microcosms. As suggested for sulphate, there might be an oxidation/reduction cycle for Fe occurring within the lakes and microcosms that main-tains the status quo in terms of concentrations where small changes in DO and ORP result in the short-term peaks of ferrous iron.
In the microcosms, NH3 increased in the East Lake control at day 1 (~10 fold; presumably released from the sediments), which did not occur in West Lake microcosms. Ammonia concentrations after day 1 remained largely unchanged in the controls until the end of the experiment. Adding hay increased NH3 concentrations in the water of both ‘lakes,’ although there was a high degree of variability among replicates. Concentrations of NH3 in the treated microcosms returned to baseline levels after day 40 for East Lake and day 68 for the West Lake. The low pH inhibits nitrification (Jeschke et al. 2013) and NOx concentrations de-clined to <20 µg L-1 by day 40 in all treatments and lakes presumably due to denitrification. The addition of hay caused release of FRP in both ‘lake’ microcosms which peaked on day 1, although by day 9 had returned to low levels. Hay maintained FRP concentrations 4-5 times higher than measured in the controls, which may be due to maintenance of low DO and ORP conditions preventing binding to Al or Fe (Kafper 1998). Hay increased DOC concentrations by about 100 mg L-1 initially and then maintained them at concentrations about 5 times higher than the controls.
Conclusions
Microcosms containing hay had higher pH levels which was reflected in the field trial, con-trasting with the findings of Lund and McCullough (2015) where straw failed to increase pH but grass did (in mesocosm trials only). This suggests that the hay used in this exper-iment had more labile carbon than the straw and was likely a better material for pit lake remediation. West Lake microcosms responded more slowly and less dramatically to hay treatment than East Lake microcosms, which may explain the limited responses observed in the field trial. The lower initial pH and higher levels of many metals would probably have made it more difficult for SRB activity to activate, slowing down remediation. Our micro-cosms reproduced many of the major trends measured in the field trial. Unfortunately, the field trial was too short and sampling (replication) too limited by operational constraints to demonstrate the long-term effectiveness of the hay addition. However, there were positive signs of water quality improvement that suggest further trials are warranted. More detailed sampling of the microcosm waters at the sediment/water interface would have aided in-terpretation of potential Fe and sulphate cycles. We have microbial community (16S RNA) data for the microcosms and lakes that will be evaluated in subsequent publications. This
1211
Lappeenranta, Finland IMWA 2017Mine Water and Circular Economy
Wolkersdorfer C, Sartz L, Sillanpää M, Häkkinen A (Editors)
research suggests that microcosms paint an overly optimistic picture of remediation effi-cacy. Therefore we contend that field trials are the ultimate scale for experimentation and therefore all opportunities to conduct experiments at field level enhance our understanding of these approaches to remediation.
Acknowledgements
The authors thank Rio Tinto Iron Ore for their financial and field support for the project. Thanks to Adam Kemp and Mark Bannister of Edith Cowan University for assistance with the microcosm experiment and chemical analysis. Edith Cowan University provided infrastructural and administrative support.
References
Blanchette ML, Lund MA (2016) Pit lakes are a global legacy of mining: an integrated approach to achieving sustainable ecosystems and value for communities Current Opinion in Environmental Sustainability 23:28-34Frömmichen R, Kellner S, Friese K (2003) Sediment conditioning with organic and/or inorganic carbon sources as a first step in alkalinity generation of acid mine pit lake water (pH 2-3) Environmental Science and Technology 37:1414-1421Geller W, Schultze M, Kleinmann R, Wolkersdorfer CE (2013) Acidic Mining Lakes: The Legacy of coal and metal surface mines. Springer, BerlinJeschke C, Falagán C, Knoeller K, Schultze M, Koschorreck M (2013) No nitrification in lakes below pH 3 Environmental Science & Technology 47:14018-14023 doi:10.1021/es402179vKafper M (1998) Assessment of the colonization and primary production of microphytobenthos in the littoral of acidic mining lakes in Lusatia (Germany) Water, Air and Soil Pollution 108:331- 340Koschorreck M, Bozau E, Frömmichen R, Geller W, Herzsprung P, Wendt-Potthoff K (2007) Processes at the sediment water interface after addition of organic matter and lime to an acid mine pit lake mesocosm Environmental science & technology 41:1608-1614Kumar RN, McCullough CD, Lund MA (2011a) How does storage affect the quality and quantity of organic carbon in sewage for use in the bioremediation of acidic mine waters? Ecological Engineering 37:1205-1213 doi:10.1016/j.ecoleng.2011.02.021Kumar RN, McCullough CD, Lund MA, Newport M (2011b) Sourcing Organic Materials for Pit Lake Bioremediation in Remote Mining Regions Mine Water and the Environment 30:296-301 doi:10.1007/s10230-011-0144-6Lund MA, McCullough CD (2015) Addition of bulk organic matter to acidic pit lakes may facilitate closure. Paper presented at the 10th ICARD | IMWA 2015 Conference – Agreeing on solutions for more sustainable mine water management, Sanitago, Chile, McCullough CD, Lund MA, May JM Field scale trials treating acidity in coal pit lakes using sewage and green waste. In: Rapantova N, Hrkal Z (eds) Proceedings of the 10th International Mine Water Association (IMWA) Congress, Karlovy Vary, Czech Republic, 2008. pp 599-602Skousen J, Zipper CE, Rose A, Ziemkiewicz PF, Nairn R, McDonald LM, Kleinmann RL (2017) Review of Passive Systems for Acid Mine Drainage Treatment Mine Water and the Environment 36:133-153 doi:10.1007/s10230-016-0417-1
1212
Lappeenranta, Finland IMWA 2017Mine Water and Circular Economy
Wolkersdorfer C, Sartz L, Sillanpää M, Häkkinen A (Editors)
Precipitation of metals and sulphate from mining waters: separation and stability analysis of the precipitates
Kaj Jansson1, Janne Kauppi2, Mikko Huhtanen3, Antti Häkkinen3
1Outotec, Rauhalanpuisto 9, 02230, Espoo, Finland 2Outotec, Tukkikatu 1, 53100, Lappeenranta, Finland
3LUT School of Engineering Science, Lappeenranta University of Technology, P.O.Box 20, FI-53851, Lappeenranta, Finland, [email protected]
Extended Abstract
This paper introduces an experimental study that was carried out to demonstrate and com-pare the performance of different chemical precipitation methods for removal of soluble metals and sulphate from mining waters. In addition to this, the separation characteristics of the precipitates formed were determined and the environmental acceptability of the final solids was evaluated. The goal of the study was on the other hand to generate stable solids that can be easily separated from the recycled water, and on the other hand, to investigate if some suitable solid fractions could be successfully separated and utilized as secondary raw material resources. This was achieved by performing the precipitation processes in sever-al steps and by separating the precipitates formed during different stages into individual fractions. Analysis of the products formed enabled detailed evaluation of the most suitable precipitation conditions in order to optimize the precipitation steps and to compare the alternative methods for solid residue treatment.
The experiments performed in this study were made with laboratory-scale equipment by using mining water samples obtained from an industrial process. The water used in the experiments had a relatively high concentration of sulphate (> 2500 mg/dm3) and also significant quantities of various metals (Fe, Ni, Cu, Zn, etc.). The precipitation ex-periments were performed as simple batch tests where the precipitation conditions were varied in order to detect the most important process variables and to find the practical limits of the method. Solubility data existing in the literature was utilized for selecting the pH-range for each precipitation step. The composition of the water sample was inves-tigated carefully before and during the tests and pH and redox potential of the solution were continuously monitored in order to detect the conditions were the main reactions occurred. The solids formed during the different precipitation steps were separated from the solution by performing filtration tests with a laboratory-scale pressure filter. The data collected during these tests enabled calculation of the theoretical filtration parameters that can be used for further process development. All the solid fractions were also an-alysed to determine their chemical compositions, particle sizes and stability according to standardized procedures. Different process configurations were suggested in order to maximize the overall performance of the treatment process and to evaluate the economics of alternative processes.
1213
Lappeenranta, Finland IMWA 2017Mine Water and Circular Economy
Wolkersdorfer C, Sartz L, Sillanpää M, Häkkinen A (Editors)
It was shown that the precipitation methods considered in this study could be used for removal of most metals from the water samples and also sulphate could be successfully removed to achieve acceptable levels in the treated water. The overall results of this study are promising and suggest that stable metal precipitates can be generated in a cost effective way and that the composition of the precipitates can be reliably controlled by careful selec-tion of the precipitation conditions. Splitting the precipitation process into several subse-quent steps opens up some new possibilities to utilize certain fractions of the precipitates as secondary raw materials. Separation of all precipitates could be successfully performed by applying pressure filtration and the results from this part of the study can be further used for selecting the most suitable separation equipment for each step of the overall process.
Key words precipitation, sulphate, metals, separation, stability
1214
Lappeenranta, Finland IMWA 2017Mine Water and Circular Economy
Wolkersdorfer C, Sartz L, Sillanpää M, Häkkinen A (Editors)
“SPOP”(Specific Product Oriented Precipitation): A new concept to recover metals from mining waste
water avoiding hydroxide sludge?
John, M. and Heuss-Aßbichler, S.
Ludwig-Maximilians-Universität München, Theresienstr. 41, 80333 München, Germany, [email protected]
Abstract Environmental pollution is a non-negligible issue for most mines and becomes an urgent task when acidic and metal loaded waters are created. “SPOP” is an environmentally friendly low-energy concept to protect water as a resource: the purified water can either be reused in various processing steps or discharged without environmental impact. The solid residues consist of precipitated oxides and native metals. This makes SPOP to a powerful method for secondary mining due to the economically attractive recovery of metals dissolved in aqueous solutions.
Key words water purification, metal recovery, secondary mining
Introduction
Water pollution in mining industry is caused by acid mine drainage (AMD), effluents after mineral processing and from mill tailings as well as seepage from the impoundments. There are plenty of different physical, chemical or biological methods to treat metal (M) loaded mining waste water. They are categorized in active and passive treatment technologies, as for example membrane technology, and hydroxide precipitation using lime (e.g. Johnson & Hallberg 2005, Sheoran & Sheoran 2006, Simate & Ndlovu 2014). However, all state-of-the-art-techniques have well-known problems: For example, there is almost no membrane without fouling and what to do with the metal-bearing, partially toxic and highly volumi-nous hydroxide sludges? In general, these treatment technologies effect new waste streams (Simate & Ndlovu 2014). As for instance, dewatering of the secondary waste is costly and their deposit may harm the environment (Rakotonimaro et al. 2017). The potential of the metal resources hidden in mining waste water are mostly neglected (Gutiérrez et al. 2016, Rakotonimaro et al. 2017). Furthermore, water use is a critical issue in mining sites, in particular in arid climate zones. Hence, possible strategies for recovery of metals and water is becoming a more acute development task (Simate & Ndlovu, 2014, Nguyen et al. 2017).
“SPOP”: A procedure to recover transition and noble metals from industrial waste water
During the last years our research group worked on an innovative procedure to generate hydroxide free residues from different metal loaded aqueous solutions, called “SPOP” (Spe-cific Product Oriented Precipitation). The basic principle of our method implies the pres-ence or addition of variable amounts of Fe2+ ions to a metal loaded solution and subsequent alkalization with focus on prevention of voluminous hydroxides. The achieved recovery rates are very high, with ≥ 99.99 % for Cu, Ni, Fe, Zn, Cr, Ag, Au and Mn. After treatment, the metal concentrations in waste water are in compliance with the limit values for direct dischargers in Germany.
1215
Lappeenranta, Finland IMWA 2017Mine Water and Circular Economy
Wolkersdorfer C, Sartz L, Sillanpää M, Häkkinen A (Editors)
All residues consist exclusively of M-Oxides, M-Fe-Oxides or metallic phases (M0). The composition of the residues is controlled by the reaction conditions (e.g. temperature, pH, redox state, kinetics) and in some cases ageing procedures. By optimizing these parameters, it is possible to gain directly from metal loaded waste water M-Oxides as ZnO, CuO, Cu2O (Heuss-Aßbichler et al. 2016a+b, John 2016, John et al. 2016a+b), delafossite as CuFeO2, CuFe1-xMnxO2 or AgFeO2 (John et al. 2016c, John 2016), M-ferrite, composite nanoparti-cles consisting of magnetite (Fe3O4), M-ferrite (MxFe3-xO4) and delafossite (MFeO2) or pure zero-valent metals M0, e.g. as foils (Ag0), or as nm to µm sized powders (Cu0, Au0) (Heu-ss-Aßbichler et al. 2016b, John 2016, John et al. 2016a). Our results clearly show that or-ganic components or chelating agents, commonly present in industrial waste water do not harm the process. Due to the low volume and high metal content of the residues, the method can be an economic alternative for metalworking industries and helps to avoid dissipation of precious elements (Huber et al. 2016). Currently, a mobile pilot plant station (100l/h throughput) is constructed with the aim to upscale the laboratory experiments.
“SPOP”: A suitable concept to treat mining waste water?
Our method was originally developed and successfully tested to purify waste water from metalworking industries (Heuss-Aßbichler et al. 2016a, John 2016, John et al. 2016a-c). It combines efficient water purification with effective recovery of metals. Now, we adapted “SPOP” to treat mining waste waters. Our first results on synthetic mining waste waters at lab-scale are promising.
Experimental setup and methods
The experimental setup contains of a reaction vessel (volume: 500 ml) which is equipped with a valve and a filter on the bottom of it. Both, valve and filter can be operated separate-ly. First, the waste water was heated up to its natural elevated temperature (40 and 45 °C) using a heating plate and controlled by a thermocouple. Next, the solution was alkalized with NaOH. During this period the valve and the filter on the bottom of the vessel was kept closed. Once pH 8.5 was reached, the valve was opened to pass the purified waste water through the filter media. In the meanwhile NaOH was further added to achieve a pH be-tween 9 and 10 for further 5 minutes in the reaction vessel. The pH was kept constant for at least 5 minutes. A fresh aliquot was taken, and the residual precipitates were aged 24 h under humid conditions. Afterwards, the precipitates were washed with water (µS/cm) to remove the remaining co-precipitated salts and then dried at room temperature.
All residues are analysed using XRD and FTIR. Additionally samples were analysed using SEM, TEM and magnetic measurements (VFTB). Phase identification was performed by X-ray powder diffraction using a GE diffractometer 3003 TT. Samples were measured using Cu Kα1 radiation on a zero-background quartz holder. To gain better counting statistics, the holder was rotated during data collection. Each sample were measured 3 times at 0.013° 2 θ steps for an exposure time of 100 sec/count and summed to increase the signal/noise ratio. FTIR was applied to identify phases with low crystallinity. Therefore, an EQUINOX55 spectrometer from Bruker was used. The measuring conditions were: 64 scans, from 360 –
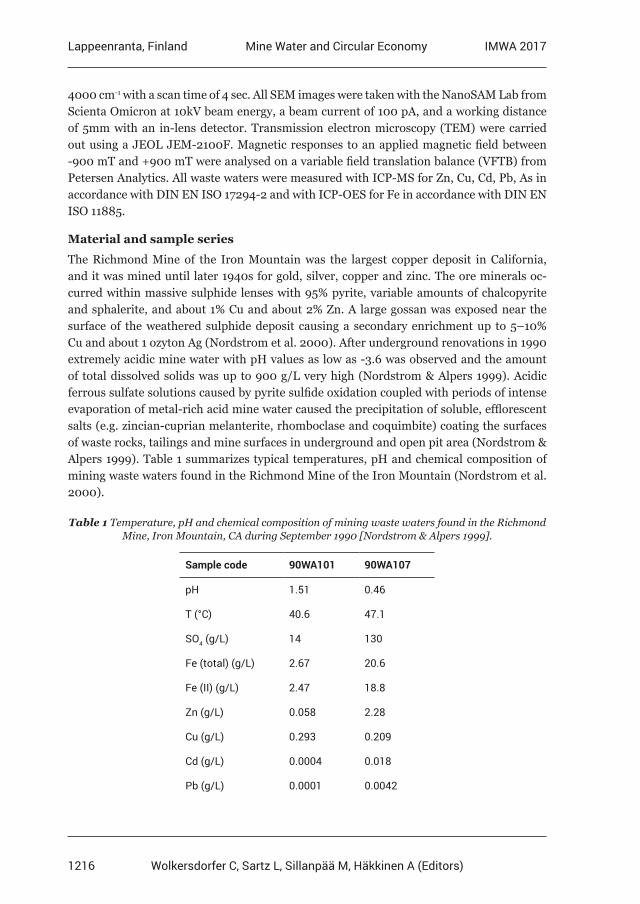
1216
Lappeenranta, Finland IMWA 2017Mine Water and Circular Economy
Wolkersdorfer C, Sartz L, Sillanpää M, Häkkinen A (Editors)
4000 cm-1 with a scan time of 4 sec. All SEM images were taken with the NanoSAM Lab from Scienta Omicron at 10kV beam energy, a beam current of 100 pA, and a working distance of 5mm with an in-lens detector. Transmission electron microscopy (TEM) were carried out using a JEOL JEM-2100F. Magnetic responses to an applied magnetic field between -900 mT and +900 mT were analysed on a variable field translation balance (VFTB) from Petersen Analytics. All waste waters were measured with ICP-MS for Zn, Cu, Cd, Pb, As in accordance with DIN EN ISO 17294-2 and with ICP-OES for Fe in accordance with DIN EN ISO 11885.
Material and sample series
The Richmond Mine of the Iron Mountain was the largest copper deposit in California, and it was mined until later 1940s for gold, silver, copper and zinc. The ore minerals oc-curred within massive sulphide lenses with 95% pyrite, variable amounts of chalcopyrite and sphalerite, and about 1% Cu and about 2% Zn. A large gossan was exposed near the surface of the weathered sulphide deposit causing a secondary enrichment up to 5–10% Cu and about 1 ozyton Ag (Nordstrom et al. 2000). After underground renovations in 1990 extremely acidic mine water with pH values as low as -3.6 was observed and the amount of total dissolved solids was up to 900 g/L very high (Nordstrom & Alpers 1999). Acidic ferrous sulfate solutions caused by pyrite sulfide oxidation coupled with periods of intense evaporation of metal-rich acid mine water caused the precipitation of soluble, efflorescent salts (e.g. zincian-cuprian melanterite, rhomboclase and coquimbite) coating the surfaces of waste rocks, tailings and mine surfaces in underground and open pit area (Nordstrom & Alpers 1999). Table 1 summarizes typical temperatures, pH and chemical composition of mining waste waters found in the Richmond Mine of the Iron Mountain (Nordstrom et al. 2000).
Table 1 Temperature, pH and chemical composition of mining waste waters found in the Richmond Mine, Iron Mountain, CA during September 1990 [Nordstrom & Alpers 1999].
Sample code 90WA101 90WA107
pH 1.51 0.46
T (°C) 40.6 47.1
SO4 (g/L) 14 130
Fe (total) (g/L) 2.67 20.6
Fe (II) (g/L) 2.47 18.8
Zn (g/L) 0.058 2.28
Cu (g/L) 0.293 0.209
Cd (g/L) 0.0004 0.018
Pb (g/L) 0.0001 0.0042
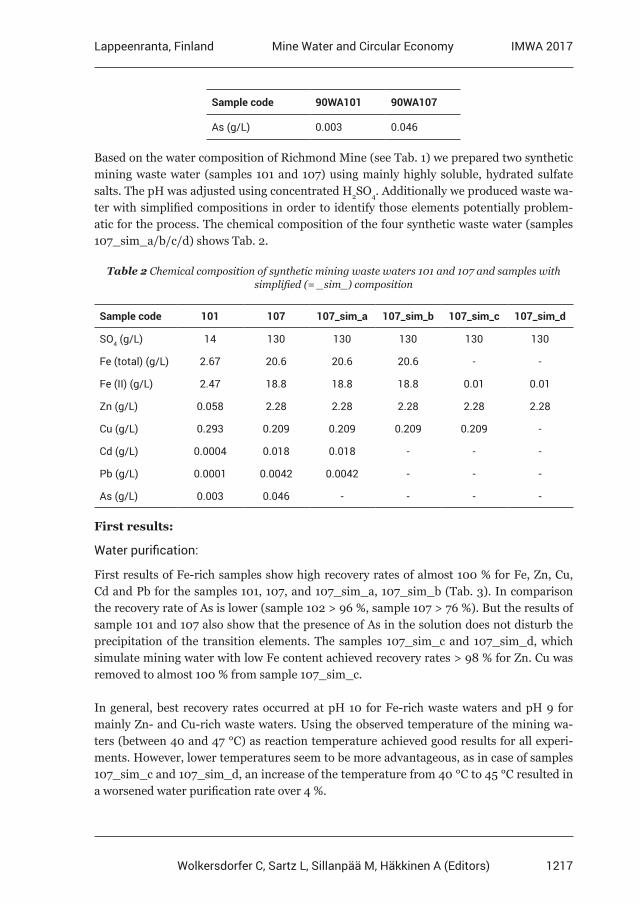
1217
Lappeenranta, Finland IMWA 2017Mine Water and Circular Economy
Wolkersdorfer C, Sartz L, Sillanpää M, Häkkinen A (Editors)
Sample code 90WA101 90WA107
As (g/L) 0.003 0.046
Based on the water composition of Richmond Mine (see Tab. 1) we prepared two synthetic mining waste water (samples 101 and 107) using mainly highly soluble, hydrated sulfate salts. The pH was adjusted using concentrated H2SO4. Additionally we produced waste wa-ter with simplified compositions in order to identify those elements potentially problem-atic for the process. The chemical composition of the four synthetic waste water (samples 107_sim_a/b/c/d) shows Tab. 2.
Table 2 Chemical composition of synthetic mining waste waters 101 and 107 and samples with simplified (= _sim_) composition
Sample code 101 107 107_sim_a 107_sim_b 107_sim_c 107_sim_d
SO4 (g/L) 14 130 130 130 130 130
Fe (total) (g/L) 2.67 20.6 20.6 20.6 - -
Fe (II) (g/L) 2.47 18.8 18.8 18.8 0.01 0.01
Zn (g/L) 0.058 2.28 2.28 2.28 2.28 2.28
Cu (g/L) 0.293 0.209 0.209 0.209 0.209 -
Cd (g/L) 0.0004 0.018 0.018 - - -
Pb (g/L) 0.0001 0.0042 0.0042 - - -
As (g/L) 0.003 0.046 - - - -
First results:
Water purification:
First results of Fe-rich samples show high recovery rates of almost 100 % for Fe, Zn, Cu, Cd and Pb for the samples 101, 107, and 107_sim_a, 107_sim_b (Tab. 3). In comparison the recovery rate of As is lower (sample 102 > 96 %, sample 107 > 76 %). But the results of sample 101 and 107 also show that the presence of As in the solution does not disturb the precipitation of the transition elements. The samples 107_sim_c and 107_sim_d, which simulate mining water with low Fe content achieved recovery rates > 98 % for Zn. Cu was removed to almost 100 % from sample 107_sim_c.
In general, best recovery rates occurred at pH 10 for Fe-rich waste waters and pH 9 for mainly Zn- and Cu-rich waste waters. Using the observed temperature of the mining wa-ters (between 40 and 47 °C) as reaction temperature achieved good results for all experi-ments. However, lower temperatures seem to be more advantageous, as in case of samples 107_sim_c and 107_sim_d, an increase of the temperature from 40 °C to 45 °C resulted in a worsened water purification rate over 4 %.
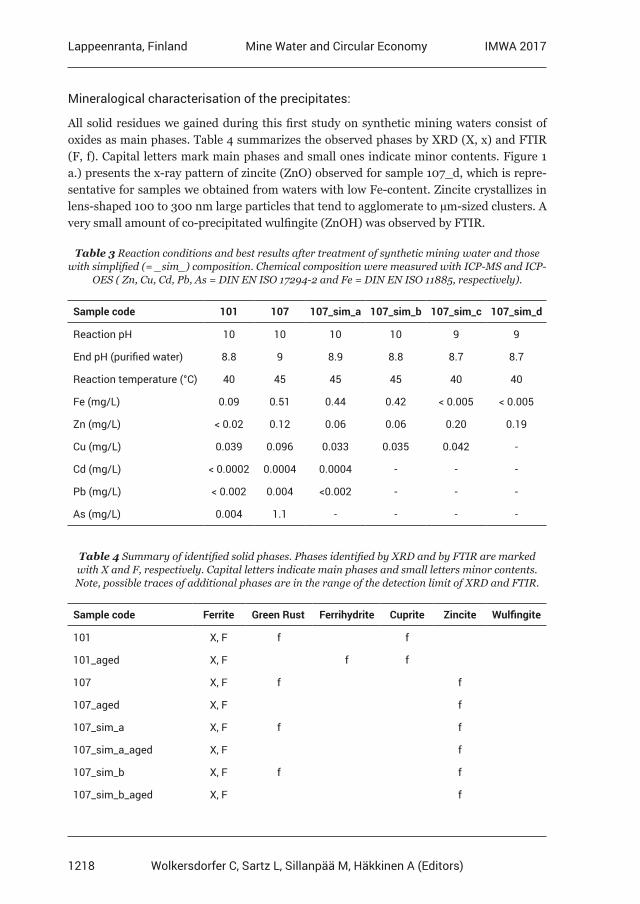
1218
Lappeenranta, Finland IMWA 2017Mine Water and Circular Economy
Wolkersdorfer C, Sartz L, Sillanpää M, Häkkinen A (Editors)
Mineralogical characterisation of the precipitates:
All solid residues we gained during this first study on synthetic mining waters consist of oxides as main phases. Table 4 summarizes the observed phases by XRD (X, x) and FTIR (F, f). Capital letters mark main phases and small ones indicate minor contents. Figure 1 a.) presents the x-ray pattern of zincite (ZnO) observed for sample 107_d, which is repre-sentative for samples we obtained from waters with low Fe-content. Zincite crystallizes in lens-shaped 100 to 300 nm large particles that tend to agglomerate to µm-sized clusters. A very small amount of co-precipitated wulfingite (ZnOH) was observed by FTIR.
Table 3 Reaction conditions and best results after treatment of synthetic mining water and those with simplified (= _sim_) composition. Chemical composition were measured with ICP-MS and ICP-
OES ( Zn, Cu, Cd, Pb, As = DIN EN ISO 17294-2 and Fe = DIN EN ISO 11885, respectively).
Sample code 101 107 107_sim_a 107_sim_b 107_sim_c 107_sim_d
Reaction pH 10 10 10 10 9 9
End pH (purified water) 8.8 9 8.9 8.8 8.7 8.7
Reaction temperature (°C) 40 45 45 45 40 40
Fe (mg/L) 0.09 0.51 0.44 0.42 < 0.005 < 0.005
Zn (mg/L) < 0.02 0.12 0.06 0.06 0.20 0.19
Cu (mg/L) 0.039 0.096 0.033 0.035 0.042 -
Cd (mg/L) < 0.0002 0.0004 0.0004 - - -
Pb (mg/L) < 0.002 0.004 <0.002 - - -
As (mg/L) 0.004 1.1 - - - -
Table 4 Summary of identified solid phases. Phases identified by XRD and by FTIR are marked with X and F, respectively. Capital letters indicate main phases and small letters minor contents. Note, possible traces of additional phases are in the range of the detection limit of XRD and FTIR.
Sample code Ferrite Green Rust Ferrihydrite Cuprite Zincite Wulfingite
101 X, F f f
101_aged X, F f f
107 X, F f f
107_aged X, F f
107_sim_a X, F f f
107_sim_a_aged X, F f
107_sim_b X, F f f
107_sim_b_aged X, F f
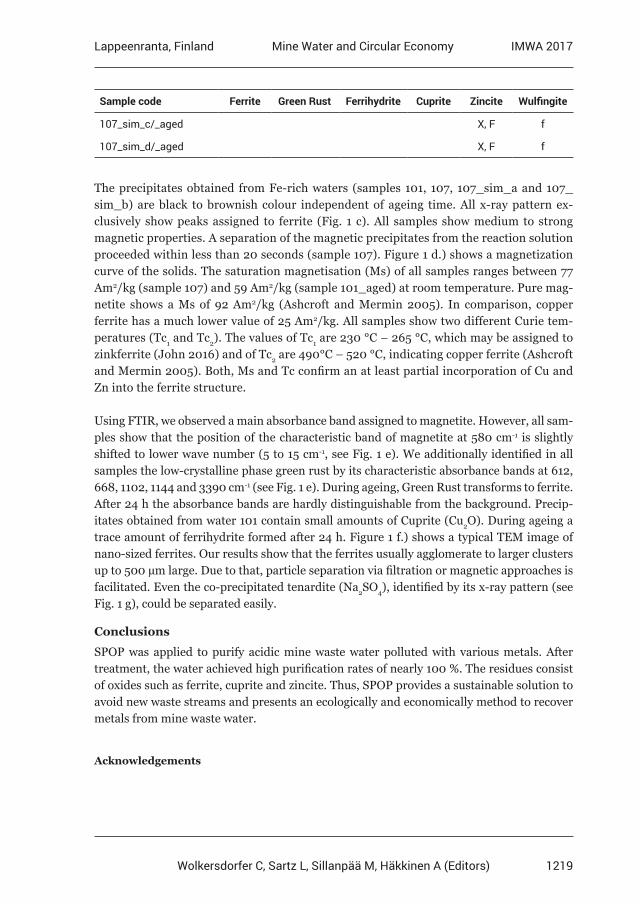
1219
Lappeenranta, Finland IMWA 2017Mine Water and Circular Economy
Wolkersdorfer C, Sartz L, Sillanpää M, Häkkinen A (Editors)
Sample code Ferrite Green Rust Ferrihydrite Cuprite Zincite Wulfingite
107_sim_c/_aged X, F f
107_sim_d/_aged X, F f
The precipitates obtained from Fe-rich waters (samples 101, 107, 107_sim_a and 107_sim_b) are black to brownish colour independent of ageing time. All x-ray pattern ex-clusively show peaks assigned to ferrite (Fig. 1 c). All samples show medium to strong magnetic properties. A separation of the magnetic precipitates from the reaction solution proceeded within less than 20 seconds (sample 107). Figure 1 d.) shows a magnetization curve of the solids. The saturation magnetisation (Ms) of all samples ranges between 77 Am2/kg (sample 107) and 59 Am2/kg (sample 101_aged) at room temperature. Pure mag-netite shows a Ms of 92 Am2/kg (Ashcroft and Mermin 2005). In comparison, copper ferrite has a much lower value of 25 Am2/kg. All samples show two different Curie tem-peratures (Tc1 and Tc2). The values of Tc1 are 230 °C – 265 °C, which may be assigned to zinkferrite (John 2016) and of Tc2 are 490°C – 520 °C, indicating copper ferrite (Ashcroft and Mermin 2005). Both, Ms and Tc confirm an at least partial incorporation of Cu and Zn into the ferrite structure.
Using FTIR, we observed a main absorbance band assigned to magnetite. However, all sam-ples show that the position of the characteristic band of magnetite at 580 cm-1 is slightly shifted to lower wave number (5 to 15 cm-1, see Fig. 1 e). We additionally identified in all samples the low-crystalline phase green rust by its characteristic absorbance bands at 612, 668, 1102, 1144 and 3390 cm-1 (see Fig. 1 e). During ageing, Green Rust transforms to ferrite. After 24 h the absorbance bands are hardly distinguishable from the background. Precip-itates obtained from water 101 contain small amounts of Cuprite (Cu2O). During ageing a trace amount of ferrihydrite formed after 24 h. Figure 1 f.) shows a typical TEM image of nano-sized ferrites. Our results show that the ferrites usually agglomerate to larger clusters up to 500 µm large. Due to that, particle separation via filtration or magnetic approaches is facilitated. Even the co-precipitated tenardite (Na2SO4), identified by its x-ray pattern (see Fig. 1 g), could be separated easily.
Conclusions
SPOP was applied to purify acidic mine waste water polluted with various metals. After treatment, the water achieved high purification rates of nearly 100 %. The residues consist of oxides such as ferrite, cuprite and zincite. Thus, SPOP provides a sustainable solution to avoid new waste streams and presents an ecologically and economically method to recover metals from mine waste water.
Acknowledgements
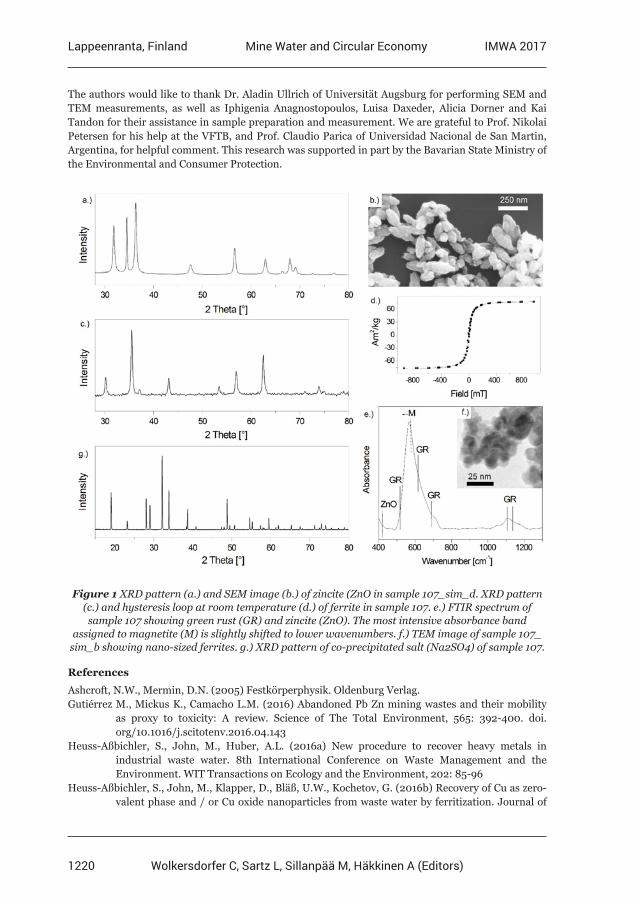
1220
Lappeenranta, Finland IMWA 2017Mine Water and Circular Economy
Wolkersdorfer C, Sartz L, Sillanpää M, Häkkinen A (Editors)
The authors would like to thank Dr. Aladin Ullrich of Universität Augsburg for performing SEM and TEM measurements, as well as Iphigenia Anagnostopoulos, Luisa Daxeder, Alicia Dorner and Kai Tandon for their assistance in sample preparation and measurement. We are grateful to Prof. Nikolai Petersen for his help at the VFTB, and Prof. Claudio Parica of Universidad Nacional de San Martin, Argentina, for helpful comment. This research was supported in part by the Bavarian State Ministry of the Environmental and Consumer Protection.
Figure 1 XRD pattern (a.) and SEM image (b.) of zincite (ZnO in sample 107_sim_d. XRD pattern (c.) and hysteresis loop at room temperature (d.) of ferrite in sample 107. e.) FTIR spectrum of sample 107 showing green rust (GR) and zincite (ZnO). The most intensive absorbance band
assigned to magnetite (M) is slightly shifted to lower wavenumbers. f.) TEM image of sample 107_sim_b showing nano-sized ferrites. g.) XRD pattern of co-precipitated salt (Na2SO4) of sample 107.
References
Ashcroft, N.W., Mermin, D.N. (2005) Festkörperphysik. Oldenburg Verlag. Gutiérrez M., Mickus K., Camacho L.M. (2016) Abandoned Pb Zn mining wastes and their mobility as proxy to toxicity: A review. Science of The Total Environment, 565: 392-400. doi. org/10.1016/j.scitotenv.2016.04.143Heuss-Aßbichler, S., John, M., Huber, A.L. (2016a) New procedure to recover heavy metals in industrial waste water. 8th International Conference on Waste Management and the Environment. WIT Transactions on Ecology and the Environment, 202: 85-96Heuss-Aßbichler, S., John, M., Klapper, D., Bläß, U.W., Kochetov, G. (2016b) Recovery of Cu as zero- valent phase and / or Cu oxide nanoparticles from waste water by ferritization. Journal of
1221
Lappeenranta, Finland IMWA 2017Mine Water and Circular Economy
Wolkersdorfer C, Sartz L, Sillanpää M, Häkkinen A (Editors)
Environmental Management 181: 1-7Huber, A.L., Heuss-Aßbichler, S., John, M. (2016) Is an effective recovery of heavy metals from industrial effluents feasible? in Pomberger, R. et al. (Ed.) 2016. Abfallverwertungstechnik und Abfallwirtschaft Eigenverlag / Montanuniversität Leoben, Leoben, Austria, p 721-724John, M. (2016) Low temperature synthesis of nano crystalline zero-valent phases and (doped) metal oxides as AxB3-xO4 (ferrite), ABO2 (delafossite), A2O and AO. A new process to treat industrial waste waters?John, M., Heuss-Aßbichler, S., Huber, A.L. (2016a) A new concept to recover heavy metals from industrial waste water. in Pomberger, R. et al. (Ed.) 2016. Abfallverwertungstechnik und Abfallwirtschaft Eigenverlag / Montanuniversität Leoben, Leoben, Austria, p 115-120John, M., Heuss-Aßbichler S., Ullrich, A. (2016b) Purification of waste water form zinc plating industry by precipitation of (doped) ZnO nanoparticles. International Journal of Environmental Science and Technology. 1735-1472John, M., Heuss-Aßbichler, S., Ullrich A, Rettenwander, D. (2016c) Purification of heavy metal loaded waste water from electroplating industry under synthesis of delafossite (ABO2) by “Lt- delafossite process”. Water Research 100, 98 – 104Johnson, D. B., & Hallberg, K. B. (2005) Acid mine drainage remediation options: a review. Science of the total environment, 338(1): 3-14.Nguyen, M.T., Vink, S., Ziemski, M., Barrett, D.J. (2014) Water and energy synergy and trade-off potentials in mine water management. Journal of Cleaner Production, 84, 629-638. doi. org/10.1016/j.jclepro.2014.01.063Nordstrom, D.K., Alpers, C.N. (1999) Negative pH, efflorescent mineralogy, and consequences for environmental restoration at the Iron Mountain Superfund site, California. Proceedings of the National Academy of Sciences, 96(7): 3455-3462.Nordstrom, D.K., Alpers, C.N., Ptacek, C.J., Blowes, D.W. (2000) Negative pH and extremely acidic mine waters from Iron Mountain, California. Environmental Science & Technology, 34(2), 254-258.Rakotonimaro, T.V., Neculita, C.M., Bussière, B., Benzaazoua, M., Zagury, G.J. (2017) Recovery and reuse of sludge from active and passive treatment of mine drainage-impacted waters: a review. Environ Sci Pollut Res 24(1): 73-91. doi:10.1007/s11356-016-7733-7Sheoran, A.S., Sheoran, V. (2006) Heavy metal removal mechanism of acid mine drainage in wetlands: a critical review. Minerals engineering, 19(2): 105-116. doi:10.1016/j.mineng.2005.08.006Simate, G.S., Ndlovu, S. (2014) Acid mine drainage: Challenges and opportunities. Journal of Environmental Chemical Engineering, 2(3): 1785-1803. doi.org/10.1016/j.jece.2014.07.021
1222
Lappeenranta, Finland IMWA 2017Mine Water and Circular Economy
Wolkersdorfer C, Sartz L, Sillanpää M, Häkkinen A (Editors)
Isolation and application of siderophore producing bacteria from Finnish wetland samples for treatment of
mining water effluents
Sanna Taskila1, Michal Banasik2, Harshita Gogoi1, Tiina Leiviskä1, Juha Tanskanen1
1University of Oulu, Chemical Process Engineering, PO Box 4300, 90014 Oulu, Finland, [email protected]
2Gdańsk University of Technology, Department of Molecular Biotechnology and Microbiology, ul. Narutowicza 11/12, 80-233 Gdańsk, Poland
Abstract Microbial bioremediation is used for the treatment of mining wastewaters via binding of metals with extracellular siderophore molecules or via precipitation of metals by reducing sulfate to sulfides. In the present research wetland samples were screened for microbes that possess useful traits regarding such applications. Two isolates, identified as Pseudomonas sp., were investigated regarding their capacity for growth and siderophore production under various substrates. The isolates were immobilized on sawdust, and tested for the binding of nickel from aqueous solutions in batch experiments. Further research is addressed for the characterization and improvement of immobilization and metal binding mechanisms.
Key words bioremediation, mining effluent, wastewater treatment, biosorption, siderophore
Introduction
Metals belong to the most problematic pollutants released by the mining industry, causing a wide variety of health and environmental problems (Amini et al. 2008). Conventional methods for metal removal from mining effluents, such as chemical precipitation, electro-chemical treatment, membrane separation, and adsorption on activated carbon are availa-ble. These methods often fail in treatment of large amounts of mining wastewaters with very low concentrations of pollutants. Further problems such as production of large amounts of demanding secondary pollutants and by-products whose further processing generates high costs are encountered.
Microbial bioremediation is one option to substitute or complement existing wastewater treatment technologies. Microbial cells may be used for direct binding or complexing of soluble metals. Complexing owes to specific low molecular weight (500–1500 Da) com-pounds excreted into surrounding environment by microbes, referred to as siderophores, exhibiting an extremely high affinity towards iron (Kf>1030) (Hider and Kong 2010). As the concentration of bioavailable iron is very low in nature, siderophores have been evolved to fulfill the need for soluble iron critical for vital metabolic processes (Neilands 1981), and are therefore produced by majority of microbes (Hider and Kong 2010, Nejlands et al. 1987). Siderophores has been successfully used for bioremediation of contaminated soils by solubilizing metals (Ahmed and Holmström 2014). In wastewater treatment applica-tions, complexes could be removed by solid liquid separation after binding or complexing the metal.
1223
Lappeenranta, Finland IMWA 2017Mine Water and Circular Economy
Wolkersdorfer C, Sartz L, Sillanpää M, Häkkinen A (Editors)
The removal of metals from solution may be enhanced by stimulating the siderophore pro-duction by applied microbes. This may be achieved via control of soluble iron, pH, tempera-ture, nature of carbon and nitrogen source, availability of phosphorus and oxygen transfer (Villegas 2007). As the cultivation media affects largely the costs of microbial processes, it is especially advisable to seek for suitable inexpensive carbon and nitrogen sources.
The purpose of the research presented herein was to find efficient siderophore-producing microorganisms whose siderophores might be applicable in biosorption of metal-contain-ing wastewaters. The aim was to isolate and characterize bacterial strains, and to assess their capability to produce siderophores under various carbon and nitrogen sources. More-over, the applicability of isolated bacteria for bioremediation purposes was addressed in initial investigation of their immobilization on an inert carrier (sawdust) and use of the immobilized bacteria for removal of nickel from aqueous solution.
Methods
The soil samples were taken nearby Lake Pyykösjärvi, Oulu, Finland (coordinates 65.048533, 25.491656) in November 2016. Portion of soil was taken into an aseptic con-tainer and stored at +4 °C prior use. Approximately 1 g of soil was transferred to 10 mL of sterile 0.9% NaCl solution and the sample was shaken on the rotary shaker at the room temperature for 2 hours. The soil suspension was decanted to remove solid particles and 1 mL of solution was transferred to the aseptic Eppendorf – type tube. Subsequently, serial dilutions in 0.9% NaCl solution (100 µL of dilutions 10-5–10-8) of the sample were applied onto the Petri dishes containing SCA medium (Starch Casein Agar: 10.0 g soluble starch, 0.3 g casein, 2.0 g KNO3, 0.05 g MgSO4·7H2O, 2.0 g K2HPO4, 2.0 g NaCl, 0.02 g CaCO3, 0.01 g FeSO4·7H2O, 18.0 g agar L-1 H2O) supplemented with 50 µg mL-1 nystatin to prevent growth of fungi and incubated at 27˚C for 1 week. Finally two colonies were picked (referred later on to as Strains 1 and 2) for further research.
The strains were characterized by metagenome sequencing. A portion of the 16S small-sub-unit ribosomal gene was amplified with primers F519 (5-CAGCMGCCGCGGTAATWC-3) and R926 (5-CCGTCAATTCCTTTRAGTTT-3). The F519 primer contained an Ion Torrent adapter sequence A, a 9-bp unique barcode sequence, and one nucleotide linker. R926 primer contained an Ion Torrent adapter trP1 sequence. Polymerase chain reaction (PCR) assays were performed in 25-μL reactions in two replicates, each containing 1 × Phusion GC master mix (Thermo Scientific, Espoo, Finland), 0.4 μM of forward and reverse primers and 20 ng of genomic DNA as the template. After an initial 3 min denaturation at 98 °C, the following cycling conditions were used: 28 cycles of 98 °C, 10 s; 64 °C, 20 s; 72 °C, 20 s. After PCR amplification reactions were purified using the AMPure XP reagent (Agen-court Bioscience, CA, USA). Amplicon concentration of purified samples was measured on a Bioanalyzer DNA-1000 chip (Agilent Technologies, CA, USA) and individual samples were pooled in equivalent amounts. A pooled sample was further purified with Ampure XP and sequencing was performed with Ion Torrent PGM on a 316 chip using Ion View chemistry (ThermoFisher Scientific, USA).
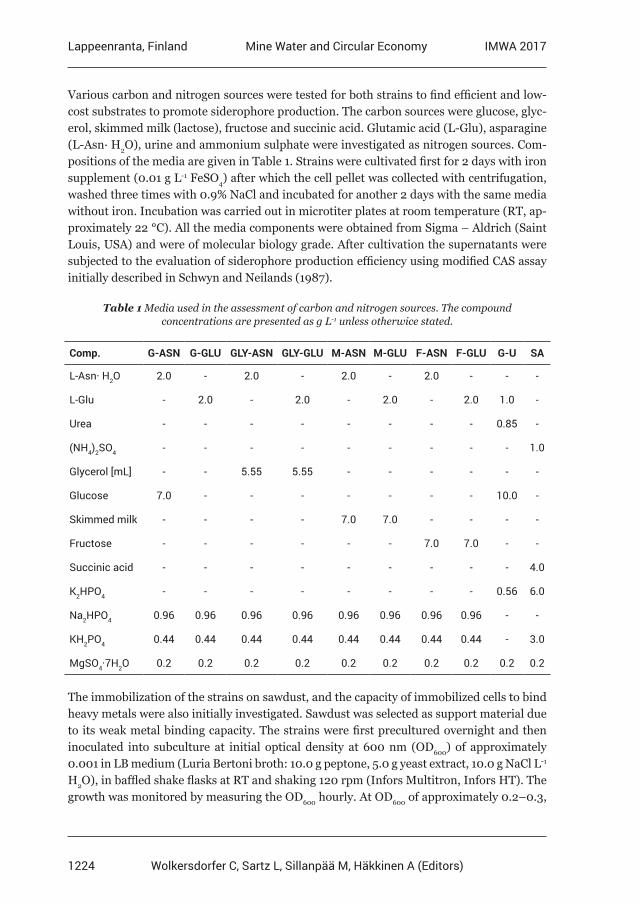
1224
Lappeenranta, Finland IMWA 2017Mine Water and Circular Economy
Wolkersdorfer C, Sartz L, Sillanpää M, Häkkinen A (Editors)
Various carbon and nitrogen sources were tested for both strains to find efficient and low-cost substrates to promote siderophore production. The carbon sources were glucose, glyc-erol, skimmed milk (lactose), fructose and succinic acid. Glutamic acid (L-Glu), asparagine (L-Asn· H2O), urine and ammonium sulphate were investigated as nitrogen sources. Com-positions of the media are given in Table 1. Strains were cultivated first for 2 days with iron supplement (0.01 g L-1 FeSO4) after which the cell pellet was collected with centrifugation, washed three times with 0.9% NaCl and incubated for another 2 days with the same media without iron. Incubation was carried out in microtiter plates at room temperature (RT, ap-proximately 22 °C). All the media components were obtained from Sigma – Aldrich (Saint Louis, USA) and were of molecular biology grade. After cultivation the supernatants were subjected to the evaluation of siderophore production efficiency using modified CAS assay initially described in Schwyn and Neilands (1987).
Table 1 Media used in the assessment of carbon and nitrogen sources. The compound concentrations are presented as g L-1 unless otherwice stated.
Comp. G-ASN G-GLU GLY-ASN GLY-GLU M-ASN M-GLU F-ASN F-GLU G-U SA
L-Asn· H2O
L-Glu
Urea
(NH4)2SO4
Glycerol [mL]
Glucose
Skimmed milk
Fructose
Succinic acid
K2HPO4
Na2HPO4
KH2PO4
MgSO4·7H2O
2.0
-
-
-
-
7.0
-
-
-
-
0.96
0.44
0.2
-
2.0
-
-
-
-
-
-
-
-
0.96
0.44
0.2
2.0
-
-
-
5.55
-
-
-
-
-
0.96
0.44
0.2
-
2.0
-
-
5.55
-
-
-
-
-
0.96
0.44
0.2
2.0
-
-
-
-
-
7.0
-
-
-
0.96
0.44
0.2
-
2.0
-
-
-
-
7.0
-
-
-
0.96
0.44
0.2
2.0
-
-
-
-
-
-
7.0
-
-
0.96
0.44
0.2
-
2.0
-
-
-
-
-
7.0
-
-
0.96
0.44
0.2
-
1.0
0.85
-
-
10.0
-
-
-
0.56
-
-
0.2
-
-
-
1.0
-
-
-
-
4.0
6.0
-
3.0
0.2
The immobilization of the strains on sawdust, and the capacity of immobilized cells to bind heavy metals were also initially investigated. Sawdust was selected as support material due to its weak metal binding capacity. The strains were first precultured overnight and then inoculated into subculture at initial optical density at 600 nm (OD600) of approximately 0.001 in LB medium (Luria Bertoni broth: 10.0 g peptone, 5.0 g yeast extract, 10.0 g NaCl L-1 H2O), in baffled shake flasks at RT and shaking 120 rpm (Infors Multitron, Infors HT). The growth was monitored by measuring the OD600 hourly. At OD600 of approximately 0.2–0.3,
1225
Lappeenranta, Finland IMWA 2017Mine Water and Circular Economy
Wolkersdorfer C, Sartz L, Sillanpää M, Häkkinen A (Editors)
i.e. at early exponential growth phase, a 100 mL portion of each subculture was transferred to a 0.05 g (0.5 g L-1 dosage) portion of autoclaved Scots pine (Pinus sylvestris) sawdust (a size fraction of 90–250 µm) and incubated at RT for 20 hrs. The adsorption of cells was as-sessed based on the OD600 of the supernatant before and after immobilization. The capacity of immobilized cells to bind nickel was studied by incubation of the suspension in presence of nickel at pH 6.1 (5 mg L-1, prepared from Ni(NO3)2) at RT and 100 rpm shaking for 24 hours. The nickel reduction was analysed by inductively coupled plasma mass spectrometry (ICP-MS) according to standardized method SFS-EN ISO 17294-2:2005.
Results
Based on the sequencing results both strains represent Pseudomonas sp. which are com-mon soil bacteria found in various ecological niches. They are especially known as adaptive bacteria with high diversity of iron uptake systems (Lin et al. 2002), which is a positive indication of their applicability for biosorption purposes.
Both strains were able to grow in all tested media, although differences were observed in the turbidity of cultures after 2 days of cultivation. However, it is known that medium ap-propriate for microorganism growth is not always the one in which siderophores production efficiency is the highest, and thus the interpretation of data was focused on the last men-tioned (fig. 1). Regarding the production efficiency of siderophores, Strain 1 was superior as it was able to synthesize at least a low amount of siderophores in each media. However, large variations in siderophore production were observed between the provided carbon and nitrogen sources (tab. 1).
The highest siderophore productivity for Strain 1 was observed in media G-ASN, with glu-cose and asparagine as sole carbon and nitrogen sources, respectively. This is in line with previously reported observations (e.g. Duffy and Defago 1999), suggesting that glucose is a proper choice as carbon source for the purpose. It is, however, a relatively expensive sub-strate for any low-cost applications. Skimmed milk (lactose) was another well suitable car-bon source. This finding is in line with our previous experience (data not published), and would be advantageous for the process economy. Based on literature fructose and succinic acid should also stimulate siderophore production by Pseudomonas sp. (Duffy and Defago 1999, Rachid and Ahmed 2005). This was not confirmed in the present research, although moderate siderophore production was observed by Strain 2 on fructose. Regarding the ni-trogen sources, asparagine and glutamate were the most suitable substrates. It is unsurpris-ing as amino acids generally stimulate siderophores biosynthesis. Siderophores synthesis was clearly weaker when other nitrogen sources were applied.
The possibility for successful immobilization of the cells is an important aspect for any bioremediation application of the isolated strains. Therefore, the immobilization of the strains was investigated using sawdust as carrier material, which is an inert and abundant lignocellulosic side stream, well suitable for the purpose (Obuekwe and Al-Muttawa 2001). In the initial experiments it was observed that after the sawdust addition the turbidity of the supernatants did not grow exponentially, as would be expected under exponential growth
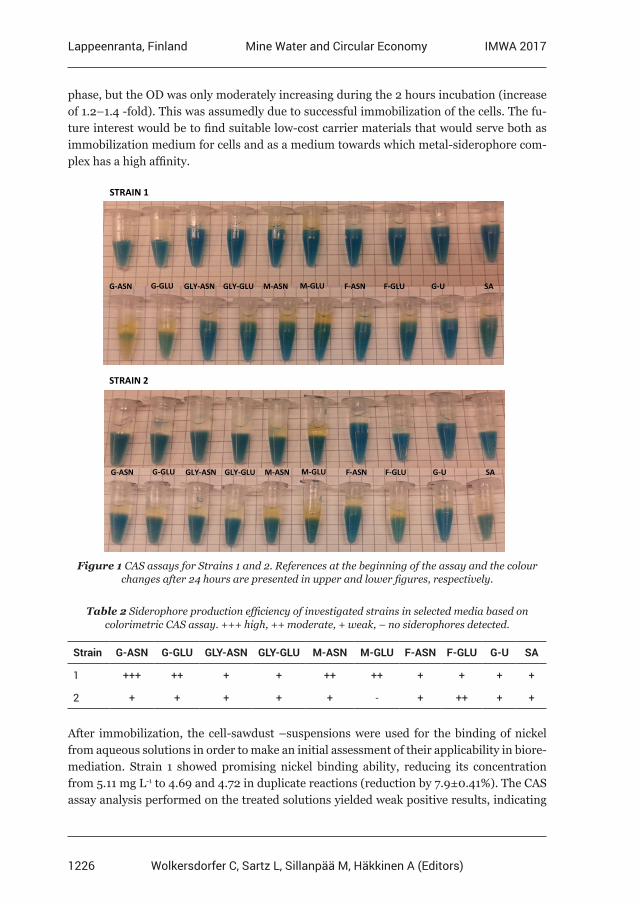
1226
Lappeenranta, Finland IMWA 2017Mine Water and Circular Economy
Wolkersdorfer C, Sartz L, Sillanpää M, Häkkinen A (Editors)
phase, but the OD was only moderately increasing during the 2 hours incubation (increase of 1.2–1.4 -fold). This was assumedly due to successful immobilization of the cells. The fu-ture interest would be to find suitable low-cost carrier materials that would serve both as immobilization medium for cells and as a medium towards which metal-siderophore com-plex has a high affinity.
G-ASN G-GLU GLY-GLU F-ASN G-U SAF-GLUM-GLUM-ASNGLY-ASN
G-ASN G-GLU GLY-GLU F-ASN G-U SAF-GLUM-GLUM-ASNGLY-ASN
STRAIN 1
STRAIN 2
Figure 1 CAS assays for Strains 1 and 2. References at the beginning of the assay and the colour changes after 24 hours are presented in upper and lower figures, respectively.
Table 2 Siderophore production efficiency of investigated strains in selected media based on colorimetric CAS assay. +++ high, ++ moderate, + weak, – no siderophores detected.
Strain G-ASN G-GLU GLY-ASN GLY-GLU M-ASN M-GLU F-ASN F-GLU G-U SA
1 +++ ++ + + ++ ++ + + + +
2 + + + + + - + ++ + +
After immobilization, the cell-sawdust –suspensions were used for the binding of nickel from aqueous solutions in order to make an initial assessment of their applicability in biore-mediation. Strain 1 showed promising nickel binding ability, reducing its concentration from 5.11 mg L-1 to 4.69 and 4.72 in duplicate reactions (reduction by 7.9±0.41%). The CAS assay analysis performed on the treated solutions yielded weak positive results, indicating
1227
Lappeenranta, Finland IMWA 2017Mine Water and Circular Economy
Wolkersdorfer C, Sartz L, Sillanpää M, Häkkinen A (Editors)
the formation of metal-siderophore complexes in the treatment solution (data not shown). The sorption of metal-siderophore complexes is highly dependent on the pH and the medi-um used. For example, Karimzadeh et al. 2013 showed that the metal (Pb, Zn, Cd) sorption on zeolite was increased in the presence of siderophores under slightly acidic to neutral con-ditions. The future aim is to optimize the system and study the mechanism of nickel uptake.
Conclusions
The isolated Pseudomonas strains were able to grow and produce siderophores under var-ious substrates. Regarding the siderophore production, the most promising results were achieved with Strain 1 when cultivated on glucose and asparagine as carbon and nitrogen sources, respectively. This result was confirmed in initial metal binding experiments, using Strain 1 cells immobilized on Scots pine sawdust for the removal of nickel from aqueous solution. The present results indicate potential of Strain 1 for the bioremediation purpos-es. Further development is focused on understanding and improvement of metal binding mechanisms in this system, to find the most suitable solid carrier material, evaluate proper dosages for the bacteria and carrier, and to develop feasible post-treatment method after metal binding.
Acknowledgements
The authors acknowledge financing by the European Research Development Fund and the North Ostrobothnia Centre for Economic Development, Transport and the Environment (project A71699 Sustainable refining of peatland biomasses to valuable products).
References
Ahmed E, Holmström SJM (2014) Siderophores in environmental research: roles and applications. Microb Biotechnol. 7(3): 196–208.Amini M, Younesi H, Bahramifar N, Lorestani AAZ, Ghorbani F, Daneshi A, Sharifzadeh M (2008) Application of response surface methodology for optimization of lead biosorption in an aqueous solution by Aspergillus niger. J Hazardous Materials 154(1-3):694–702 Duffy BK, Défago G (1999) Environmental factors modulating antibiotic and siderophore biosynthesis by Pseudomonas fluorescens biocontrol strains. Appl Environ Microbiol 65(6):2429–2438 Hider RC, Kong X (2010) Chemistry and biology of siderophores. Nat Prod Rep 27(5):637–57Karimzadeh L, Nair S, Merkel BJ (2013) Effect of microbial siderophore DFOB on Pb, Zn, and Cd sorption onto zeolite. Aquat Geochem 19:25–37Lin J, Huang S, Zhang Q (2002) Outer membrane proteins: key players for bacterial adaptation in host niches. Microbes and Infection 4(3):325–331Neilands JB (1981) Iron absorption and transport in microorganisms. Annu Rev Nutr 1:27–46Neilands JB, Konopka K, Schwyn B, Coy M, Francis RT, Paw BH, Bagg A (1987) In: Winkelmann G, van der Helm D, Neilands JB (Eds), Iron Transport in Microbes, Plants and Animals. VCH Press, Weinheim p 3–33 Obuekwe and Al-Muttawa (2001) Self-immobilized bacterial cultures with potential for application as ready-to-use seeds for petroleum bioremediation. Biotechnol Lett 23(13):1025–1032Rachid D, Ahmed B (2005) Effect of iron and growth inhibitors on siderophores production by Pseudomonas fluorescens. African Journal of Biotechnology 4(7):697–702Schwyn B, Neilands JB (1987) Universal chemical assay for the detection and determination of siderophores. Anal Biochem 160(1):47–56.Villegas MED (2007) In: Varma A and Chincholkar SB (Eds), Microbial siderophores, vol. 12. Springer, Berlin p 219–231
1228
Lappeenranta, Finland IMWA 2017Mine Water and Circular Economy
Wolkersdorfer C, Sartz L, Sillanpää M, Häkkinen A (Editors)
Removal of Iron from Dyffryn Adda, Parys Mountain, N. Wales, UK using Sono-electrochemistry
(Electrolysis with assisted Power Ultrasound)
Sarah A Morgan1, Zoe N Matthews1, Philip G Morgan1 and Peter Stanley2
1KP2M Ltd., C10 Ashmount Business Park, Swansea, SA6 8QR, UK [email protected]
2Natural Resources Wales, TŶ Cambria, Newport Rd., Cardiff, CF24 0TP, UK [email protected]
Abstract The Dyffryn Adda from Parys Mountain, N. Wales is one of the most polluting mine waters in the UK releasing c. 10 tonnes of copper per annum and 24 tonnes of zinc per annum into the Irish Sea. The Metal Mines Strategy for Wales has ranked it first. An acid, iron rich mine water visible by its ochreous staining along 3 km of the Afon Goch Amlwch to its coastal discharge at Porth Offeiriad (Priest Port) has a negative impact on both river and coastal water quality and local businesses and communities. Several investigations using Active, Passive and Hybrid treatment processes employing conventional treatment technologies as well as Pump to sea have been considered, however successful treatment has not proven to be cost beneficial to date. This study shows that sono-electrochemical treatment (combined electrolysis and power ultrasound) to produce magnesium hydroxide can raise the pH of the water, precipitate iron as insoluble iron hydroxide [Fe(OH)2] and has the potential to preferentially precipitate other metals in their stable hydroxide forms. Extrapolating the laboratory results and methods to full scale treatment (12 l sec-1 flow rate) indicates that it is a viable Active treatment process compared to other treatment options being considered and can aid failing water bodies achieve compliance with the EU Water Framework Directive.
Introduction
Parys Mountain, N. Wales is one of the most polluting mine waters in the UK, discharging more metals into the Irish Sea than the River Mersey despite having less than 0.3% of the flow of the River Mersey. Parys has a number of discrete discharges of which Dyffryn Adda is considered the most challenging water chemistry being more acidic and metal rich than most surface water discharges in the UK. The Dyffryn Adda pollutes 3 km of the Afon Goch Amlwch before discharging into the sea at Port Offeiriad causing ochreous staining and depositing copper (≈ 10 t a-1), zinc (≈ 24 t a-1) and cadmium (~45 kg annum-1) into the Irish Sea. The discharge chemistry also includes other contaminants (Table 1).
A ‘Parys Mountain Treatment Options Report’ was commissioned in 2012 by Natural Re-sources Wales (formerly Environment Agency Wales) (URS 2012) to review treatment op-tions to ameliorate the environmental impact of Parys Mountain on the economic and well being benefits to local and national communities. In further discussions it was considered that the first stage of amelioration would be to reduce the total iron discharged from Dy-ffryn Adda to <1.0 mgl-1 and to reduce the ochreous visual impact discharge in the Afon Goch Amlwch and into the sea, now the North Anglesey Marine possible Special Area of Conservation.
1229
Lappeenranta, Finland IMWA 2017Mine Water and Circular Economy
Wolkersdorfer C, Sartz L, Sillanpää M, Häkkinen A (Editors)
Table 1. Dyffryn Adda – Flow Concentrations (12 L s-1 [1040 m3 day-1])
Total (µgl-1) Minimum Mean Maximum
Acidity (as CaCO3) 1,194 1,743 2,210
pH 2 3 3
Iron 453,000 599,000 708,000
Copper 30,600 38,130 52,600
Zinc 55,900 65,311 92,900
Manganese 14,300 20,470 30,400
Aluminium 4 63,571 87,800
Sulphate 1,940,000 2,534,000 3,020,000
Cadmium 153 175 196
Arsenic 129 360 662
Nickel 154 189 240
Lead 19 28 46
The releases of iron, sulphate and high levels of acidity are primarily a result of pyrite oxi-dation catalyzed by sulphur oxidizing bacteria (Barbes et al., 1968):
4FeS2 + 15O2 + 14H2O = 4Fe(OH)3 + 8H2SO4 (Sulphuric acid)
Traditional treatment methods for Mine water can generally be divided into 2 techniques:-
1. Active treatment which require ongoing mechanical / electrical operations and manual maintenance e.g. aeration, liquid chemical pH neutralization, chemical cationic coagu-lants and precipitation; membrane processes; ion exchange and chemical and / or biolog-ical sulphate removal;
2. Passive treatment typically refers to processes that do not require human intervention, operation, or maintenance, use gravity flow for water movement and promote the growth of natural vegetation e.g. reed bed systems.
Given the high concentrations of metals and low pH passive treatment at Parys Mountain is broadly accepted as being impractical and technically unfeasible. Active treatment compris-ing of High Density Sludge (HDS) with pH adjustment using lime is however widely used for treating acid mine drainage (AMD) water. In addition some success has been achieved using sulphide reduction (addition of sodium sulphide) after pH adjustment (caustic soda dosing) as a potential treatment option. In some circumstances hybrid active/passive systems may be employed e.g. semi-passive iron removal with targeted removal of other metals by sul-
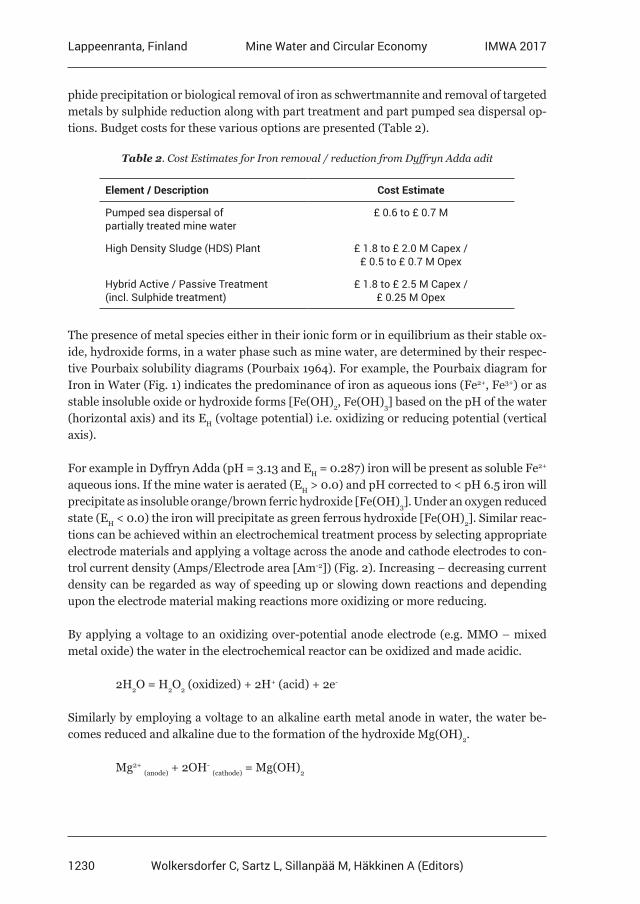
1230
Lappeenranta, Finland IMWA 2017Mine Water and Circular Economy
Wolkersdorfer C, Sartz L, Sillanpää M, Häkkinen A (Editors)
phide precipitation or biological removal of iron as schwertmannite and removal of targeted metals by sulphide reduction along with part treatment and part pumped sea dispersal op-tions. Budget costs for these various options are presented (Table 2).
Table 2. Cost Estimates for Iron removal / reduction from Dyffryn Adda adit
Element / Description Cost Estimate
Pumped sea dispersal of partially treated mine water
£ 0.6 to £ 0.7 M
High Density Sludge (HDS) Plant £ 1.8 to £ 2.0 M Capex / £ 0.5 to £ 0.7 M Opex
Hybrid Active / Passive Treatment (incl. Sulphide treatment)
£ 1.8 to £ 2.5 M Capex / £ 0.25 M Opex
The presence of metal species either in their ionic form or in equilibrium as their stable ox-ide, hydroxide forms, in a water phase such as mine water, are determined by their respec-tive Pourbaix solubility diagrams (Pourbaix 1964). For example, the Pourbaix diagram for Iron in Water (Fig. 1) indicates the predominance of iron as aqueous ions (Fe2+, Fe3+) or as stable insoluble oxide or hydroxide forms [Fe(OH)2, Fe(OH)3] based on the pH of the water (horizontal axis) and its EH (voltage potential) i.e. oxidizing or reducing potential (vertical axis).
For example in Dyffryn Adda (pH = 3.13 and EH = 0.287) iron will be present as soluble Fe2+ aqueous ions. If the mine water is aerated (EH > 0.0) and pH corrected to < pH 6.5 iron will precipitate as insoluble orange/brown ferric hydroxide [Fe(OH)3]. Under an oxygen reduced state (EH < 0.0) the iron will precipitate as green ferrous hydroxide [Fe(OH)2]. Similar reac-tions can be achieved within an electrochemical treatment process by selecting appropriate electrode materials and applying a voltage across the anode and cathode electrodes to con-trol current density (Amps/Electrode area [Am-2]) (Fig. 2). Increasing – decreasing current density can be regarded as way of speeding up or slowing down reactions and depending upon the electrode material making reactions more oxidizing or more reducing.
By applying a voltage to an oxidizing over-potential anode electrode (e.g. MMO – mixed metal oxide) the water in the electrochemical reactor can be oxidized and made acidic.
2H2O = H2O2 (oxidized) + 2H+ (acid) + 2e-
Similarly by employing a voltage to an alkaline earth metal anode in water, the water be-comes reduced and alkaline due to the formation of the hydroxide Mg(OH)2.
Mg2+ (anode) + 2OH- (cathode) = Mg(OH)2
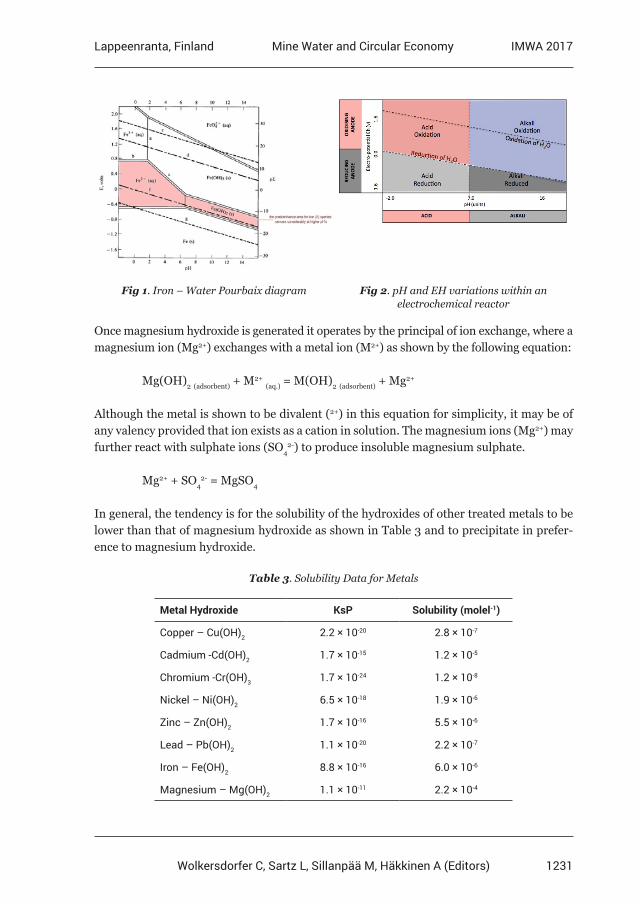
1231
Lappeenranta, Finland IMWA 2017Mine Water and Circular Economy
Wolkersdorfer C, Sartz L, Sillanpää M, Häkkinen A (Editors)
Fig 1. Iron – Water Pourbaix diagram Fig 2. pH and EH variations within an electrochemical reactor
Once magnesium hydroxide is generated it operates by the principal of ion exchange, where a magnesium ion (Mg2+) exchanges with a metal ion (M2+) as shown by the following equation:
Mg(OH)2 (adsorbent) + M2+ (aq.) = M(OH)2 (adsorbent) + Mg2+
Although the metal is shown to be divalent (2+) in this equation for simplicity, it may be of any valency provided that ion exists as a cation in solution. The magnesium ions (Mg2+) may further react with sulphate ions (SO4
2-) to produce insoluble magnesium sulphate.
Mg2+ + SO42- = MgSO4
In general, the tendency is for the solubility of the hydroxides of other treated metals to be lower than that of magnesium hydroxide as shown in Table 3 and to precipitate in prefer-ence to magnesium hydroxide.
Table 3. Solubility Data for Metals
Metal Hydroxide KsP Solubility (molel-1)
Copper – Cu(OH)2 2.2 × 10⁻²⁰ 2.8 × 10⁻⁷
Cadmium -Cd(OH)2 1.7 × 10⁻¹⁵ 1.2 × 10⁻⁵
Chromium -Cr(OH)3 1.7 × 10⁻²⁴ 1.2 × 10⁻⁸
Nickel – Ni(OH)2 6.5 × 10⁻¹⁸ 1.9 × 10⁻⁶
Zinc – Zn(OH)2 1.7 × 10⁻¹⁶ 5.5 × 10⁻⁶
Lead – Pb(OH)2 1.1 × 10⁻²⁰ 2.2 × 10⁻⁷
Iron – Fe(OH)2 8.8 × 10⁻¹⁶ 6.0 × 10⁻⁶
Magnesium – Mg(OH)2 1.1 × 10⁻¹¹ 2.2 × 10⁻⁴
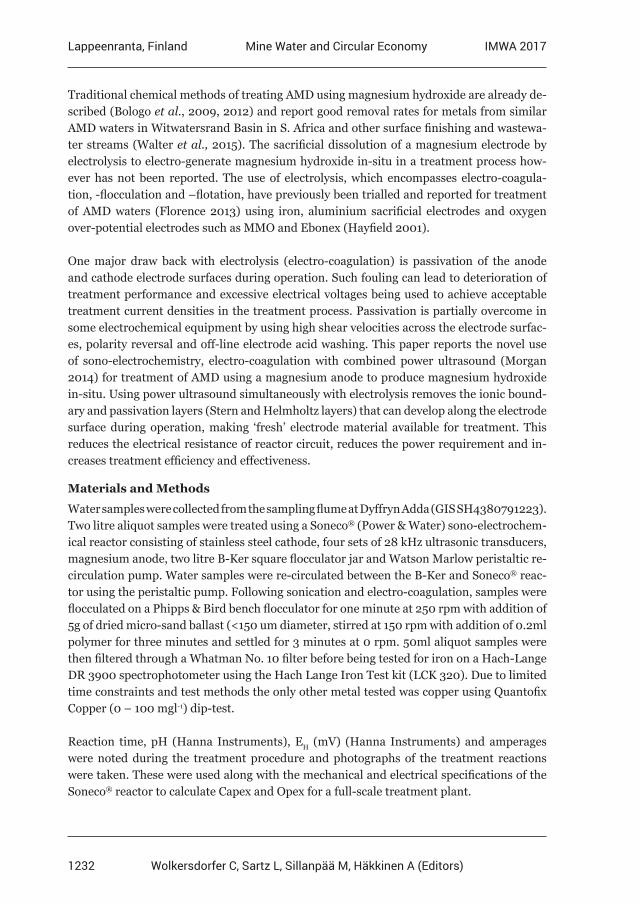
1232
Lappeenranta, Finland IMWA 2017Mine Water and Circular Economy
Wolkersdorfer C, Sartz L, Sillanpää M, Häkkinen A (Editors)
Traditional chemical methods of treating AMD using magnesium hydroxide are already de-scribed (Bologo et al., 2009, 2012) and report good removal rates for metals from similar AMD waters in Witwatersrand Basin in S. Africa and other surface finishing and wastewa-ter streams (Walter et al., 2015). The sacrificial dissolution of a magnesium electrode by electrolysis to electro-generate magnesium hydroxide in-situ in a treatment process how-ever has not been reported. The use of electrolysis, which encompasses electro-coagula-tion, -flocculation and –flotation, have previously been trialled and reported for treatment of AMD waters (Florence 2013) using iron, aluminium sacrificial electrodes and oxygen over-potential electrodes such as MMO and Ebonex (Hayfield 2001).
One major draw back with electrolysis (electro-coagulation) is passivation of the anode and cathode electrode surfaces during operation. Such fouling can lead to deterioration of treatment performance and excessive electrical voltages being used to achieve acceptable treatment current densities in the treatment process. Passivation is partially overcome in some electrochemical equipment by using high shear velocities across the electrode surfac-es, polarity reversal and off-line electrode acid washing. This paper reports the novel use of sono-electrochemistry, electro-coagulation with combined power ultrasound (Morgan 2014) for treatment of AMD using a magnesium anode to produce magnesium hydroxide in-situ. Using power ultrasound simultaneously with electrolysis removes the ionic bound-ary and passivation layers (Stern and Helmholtz layers) that can develop along the electrode surface during operation, making ‘fresh’ electrode material available for treatment. This reduces the electrical resistance of reactor circuit, reduces the power requirement and in-creases treatment efficiency and effectiveness.
Materials and Methods
Water samples were collected from the sampling flume at Dyffryn Adda (GIS SH4380791223). Two litre aliquot samples were treated using a Soneco® (Power & Water) sono-electrochem-ical reactor consisting of stainless steel cathode, four sets of 28 kHz ultrasonic transducers, magnesium anode, two litre B-Ker square flocculator jar and Watson Marlow peristaltic re-circulation pump. Water samples were re-circulated between the B-Ker and Soneco® reac-tor using the peristaltic pump. Following sonication and electro-coagulation, samples were flocculated on a Phipps & Bird bench flocculator for one minute at 250 rpm with addition of 5g of dried micro-sand ballast (<150 um diameter, stirred at 150 rpm with addition of 0.2ml polymer for three minutes and settled for 3 minutes at 0 rpm. 50ml aliquot samples were then filtered through a Whatman No. 10 filter before being tested for iron on a Hach-Lange DR 3900 spectrophotometer using the Hach Lange Iron Test kit (LCK 320). Due to limited time constraints and test methods the only other metal tested was copper using Quantofix Copper (0 – 100 mgl-1) dip-test.
Reaction time, pH (Hanna Instruments), EH (mV) (Hanna Instruments) and amperages were noted during the treatment procedure and photographs of the treatment reactions were taken. These were used along with the mechanical and electrical specifications of the Soneco® reactor to calculate Capex and Opex for a full-scale treatment plant.
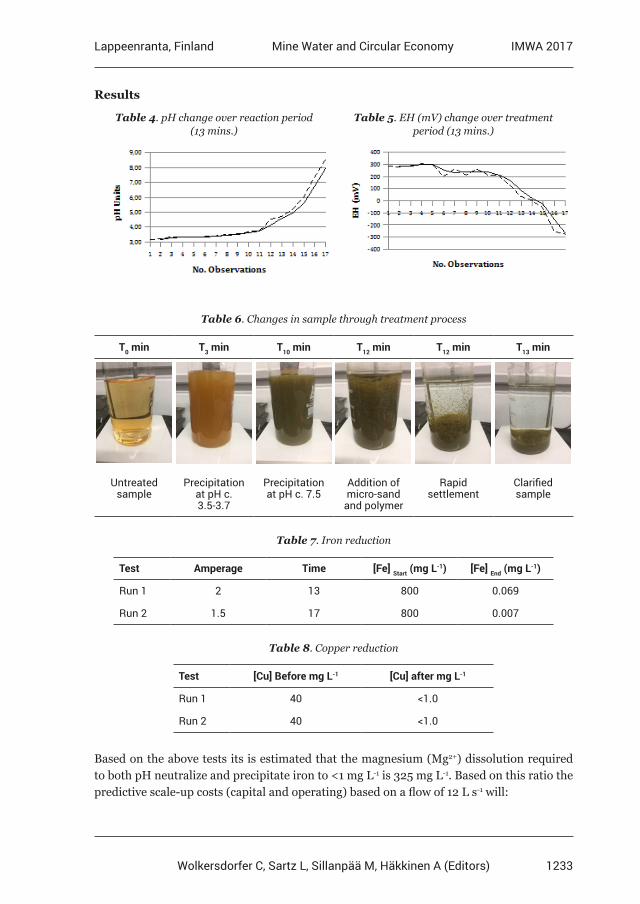
1233
Lappeenranta, Finland IMWA 2017Mine Water and Circular Economy
Wolkersdorfer C, Sartz L, Sillanpää M, Häkkinen A (Editors)
Results
Table 4. pH change over reaction period (13 mins.)
Table 5. EH (mV) change over treatment period (13 mins.)
Table 6. Changes in sample through treatment process
T0 min T3 min T10 min T12 min T12 min T13 min
Untreated sample
Precipitation at pH c. 3.5-3.7
Precipitation at pH c. 7.5
Addition of micro-sand
and polymer
Rapid settlement
Clarified sample
Table 7. Iron reduction
Test Amperage Time [Fe] Start (mg L-1) [Fe] End (mg L-1)
Run 1 2 13 800 0.069
Run 2 1.5 17 800 0.007
Table 8. Copper reduction
Test [Cu] Before mg L-1 [Cu] after mg L-1
Run 1 40 <1.0
Run 2 40 <1.0
Based on the above tests its is estimated that the magnesium (Mg2+) dissolution required to both pH neutralize and precipitate iron to <1 mg L-1 is 325 mg L-1. Based on this ratio the predictive scale-up costs (capital and operating) based on a flow of 12 L s-1 will:
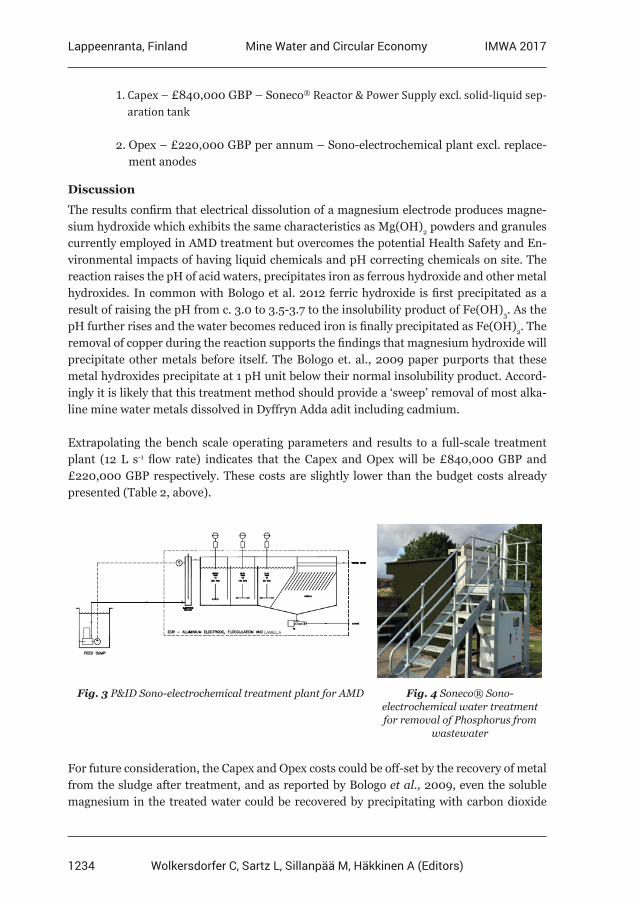
1234
Lappeenranta, Finland IMWA 2017Mine Water and Circular Economy
Wolkersdorfer C, Sartz L, Sillanpää M, Häkkinen A (Editors)
1. Capex – £840,000 GBP – Soneco® Reactor & Power Supply excl. solid-liquid sep-aration tank
2. Opex – £220,000 GBP per annum – Sono-electrochemical plant excl. replace-ment anodes
Discussion
The results confirm that electrical dissolution of a magnesium electrode produces magne-sium hydroxide which exhibits the same characteristics as Mg(OH)2 powders and granules currently employed in AMD treatment but overcomes the potential Health Safety and En-vironmental impacts of having liquid chemicals and pH correcting chemicals on site. The reaction raises the pH of acid waters, precipitates iron as ferrous hydroxide and other metal hydroxides. In common with Bologo et al. 2012 ferric hydroxide is first precipitated as a result of raising the pH from c. 3.0 to 3.5-3.7 to the insolubility product of Fe(OH)3. As the pH further rises and the water becomes reduced iron is finally precipitated as Fe(OH)2. The removal of copper during the reaction supports the findings that magnesium hydroxide will precipitate other metals before itself. The Bologo et. al., 2009 paper purports that these metal hydroxides precipitate at 1 pH unit below their normal insolubility product. Accord-ingly it is likely that this treatment method should provide a ‘sweep’ removal of most alka-line mine water metals dissolved in Dyffryn Adda adit including cadmium.
Extrapolating the bench scale operating parameters and results to a full-scale treatment plant (12 L s-1 flow rate) indicates that the Capex and Opex will be £840,000 GBP and £220,000 GBP respectively. These costs are slightly lower than the budget costs already presented (Table 2, above).
Fig. 3 P&ID Sono-electrochemical treatment plant for AMD Fig. 4 Soneco® Sono-electrochemical water treatment for removal of Phosphorus from
wastewater
For future consideration, the Capex and Opex costs could be off-set by the recovery of metal from the sludge after treatment, and as reported by Bologo et al., 2009, even the soluble magnesium in the treated water could be recovered by precipitating with carbon dioxide
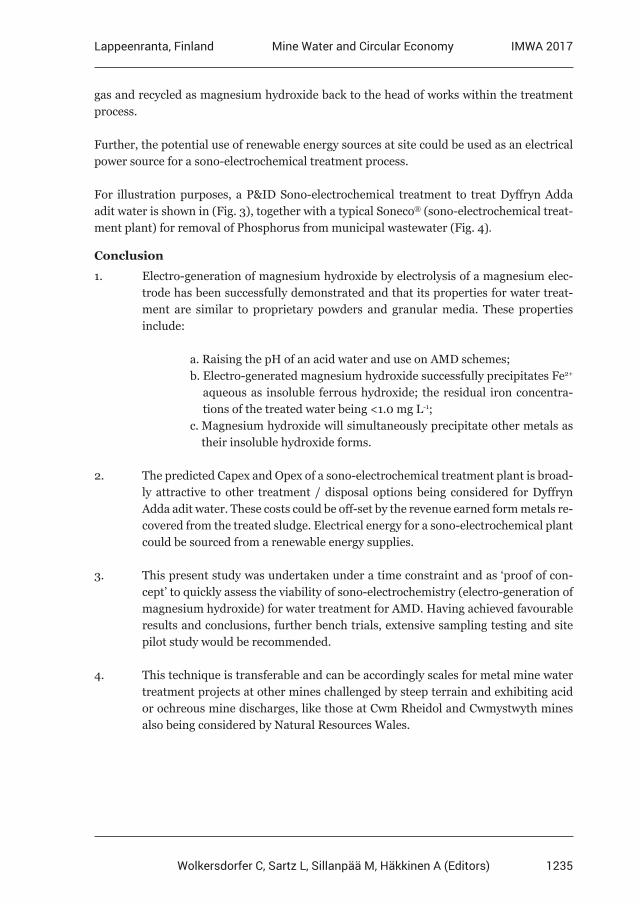
1235
Lappeenranta, Finland IMWA 2017Mine Water and Circular Economy
Wolkersdorfer C, Sartz L, Sillanpää M, Häkkinen A (Editors)
gas and recycled as magnesium hydroxide back to the head of works within the treatment process.
Further, the potential use of renewable energy sources at site could be used as an electrical power source for a sono-electrochemical treatment process.
For illustration purposes, a P&ID Sono-electrochemical treatment to treat Dyffryn Adda adit water is shown in (Fig. 3), together with a typical Soneco® (sono-electrochemical treat-ment plant) for removal of Phosphorus from municipal wastewater (Fig. 4).
Conclusion
1. Electro-generation of magnesium hydroxide by electrolysis of a magnesium elec-trode has been successfully demonstrated and that its properties for water treat-ment are similar to proprietary powders and granular media. These properties include:
a. Raising the pH of an acid water and use on AMD schemes; b. Electro-generated magnesium hydroxide successfully precipitates Fe2+
aqueous as insoluble ferrous hydroxide; the residual iron concentra-tions of the treated water being <1.0 mg L-1;
c. Magnesium hydroxide will simultaneously precipitate other metals as their insoluble hydroxide forms.
2. The predicted Capex and Opex of a sono-electrochemical treatment plant is broad-ly attractive to other treatment / disposal options being considered for Dyffryn Adda adit water. These costs could be off-set by the revenue earned form metals re-covered from the treated sludge. Electrical energy for a sono-electrochemical plant could be sourced from a renewable energy supplies.
3. This present study was undertaken under a time constraint and as ‘proof of con-cept’ to quickly assess the viability of sono-electrochemistry (electro-generation of magnesium hydroxide) for water treatment for AMD. Having achieved favourable results and conclusions, further bench trials, extensive sampling testing and site pilot study would be recommended.
4. This technique is transferable and can be accordingly scales for metal mine water treatment projects at other mines challenged by steep terrain and exhibiting acid or ochreous mine discharges, like those at Cwm Rheidol and Cwmystwyth mines also being considered by Natural Resources Wales.
1236
Lappeenranta, Finland IMWA 2017Mine Water and Circular Economy
Wolkersdorfer C, Sartz L, Sillanpää M, Häkkinen A (Editors)
References
URS (2012). Parys Mountain – Treatment Options Report. Draft 30 March 2012., Environment Agency Wales. Project Reference 46399817/MARP002.Barbes, H.J. and Romberger, S.B. (1968). Chemical Aspects of Acid Mine Drainage. J. Water Poll. Contr. Fed. 40 (3) 371 – 384.Pourbaix, M. (1964). Atlas of Electrochemical Equilibrium in Aqueous Solutions. Published by National Association of Corrosion (1974). ISBN 10: 0915567989.Bologo, V., Maree, J.P. and Zvinowanda, C.M. (2009). Treatment of Acid Mine Drainage Using Magnesium Hydroxide. Abstracts of the International Mine Water Conference, Proceedings ISBN No. 878-0-9802623-5-3, 19th-23rd October 2009, Pretoria, South Africa.Bologo, V., Maree, J.P., and Carlsson, F. (2012). Application of Magnesium Hydroxide and Barium Hydroxide for the removal of Metals and Sulphate from Mine Water. Water SA vol. 38 n.1 Pretoria.Walter, M.D., Witkowski, J.T., and Gibson, A. (2015). Removal of Metals from Metal Finishing Waste Water Using a Granular, Magnesium-Based Adsorbent. Martin Marietta Magnesia Specialties, LLC. 8140 Corporate Drive, Suite 220, Baltimore, Maryland 21236 USA.Florence, K.M, and Morgan, P.G. (2013). A novel electrochemical process for aqueous oxidation of acid mine drainage using advanced power electronics and real time control. IMWA Conference “Reliable Mine Water Technology” IMWA 31st May 2013, Golden CO; USA.Hayfield, P.C.S. (2001). Development of a New Monolithic Ti4O7 Ebonex Ceramic. Published by Royal Society of Chemistry. ISBN 10: 0854049844.Morgan, P.G. (2014). British Patent No. GB 1503638.7 – Method and apparatus for decontamination of fluids (Soneco). International Patent PCT/GB2016/050692 – Method and apparatus for decontamination of fluids.


9 Case Studies
1240
Lappeenranta, Finland IMWA 2017Mine Water and Circular Economy
Wolkersdorfer C, Sartz L, Sillanpää M, Häkkinen A (Editors)
Improving Resource Efficiency and MinimizeEnvironmental Footprint – a case study preliminary results
Albuquerque, MTD1,2, Antunes IMHR2,3; Dinis, ML2; Futuro, A2.; Gois, J2; Leite, A.2; Vila, C2; Figueiredo, J2; Fiúza, A2
1 Instituto Politécnico de Castelo Branco, Av. Pedro Álvares Cabral, nº 12, 6000-084 Castelo Branco, Portugal, Teresa Albuquerque ([email protected])
2 FEUP, CERENA, Portugal 3 Centro de Ciências da Terra da Universidade do Minho
Abstract Panasqueira Mine (Portugal) has been mainly exploited for wolframite, cassiterite and chalcopyrite (W, Sn, Cu). Through the detailed and careful characterization of tailings with different mineralogy, new invaluable insights into the weathering characteristics of many different minerals will be received, making possible proper risk assessments, and predict which type of tailings might pose severe future environmental risk namely to the Zêzere river. The Zêzere River is an important river and is under the Cabeço do Pião tailings influence. The knowledge and methods acquired will lead to a conceptual model working as guidance to a more sustainable mining in the hereafter.
Key words Panasqueira mine; Cabeço do Pião; Risk assessment; guidance
Introduction
The worldwide demand for metals and minerals is rapidly rising, driven by economic growth. Europe delivers a huge trade deficit for metallic minerals, and thus needs to evoke more of its own resources to reduce this dependence. Mining is still the primary method of metals extraction so it is of crucial importance to identify new processing methods and process design, as well as risk assessment for the remaining residuals.
Since 1898, Panasqueira Mine in Portugal was exploited for wolframite, cassiterite and chalcopyrite (W, Sn Cu), the latter two as by-products. Until 1912 the mining scale was mi-nor, but increased by 1928 and ultimately got a large development. One, of seven areas is the Cabeço do Pião (Fig.1) where tailings have been displaced from 1927 and 90 years ahead. The tailings deposit has an average height between 30 and 40 m and slopes around 35º. The estimated volume of the tailings is 731 034 m3. An ore processing plant was constructed at that site using gravity, electromagnetic separations, and flotation. The grain size of the material is variable. The tailings have average grades around 4000 ppm of W, 6800 ppm of Zn, 2494 ppm of Cu, but also contain 76350 ppm of As. The geochemistry and mineralogy of the tailings have been thoroughly studied as well as the acid mine drainage impact. The tailings are nowadays property of the municipality of Fundão and they are not included in the National Program for Mine Rehabilitation.
Material and Methods
Sampling of the tailings was performed in two different dates: in December 2016 and Jan-uary 2017. It was used an excavator (Fig.2) to gather 33 superficial (50 to 60 cm of depth) mineral waste samples. The sampling was performed on a rectangular grid of 40 x 20 m and a Global Position System (GPS) allowed to georeferenced all with UTM system.
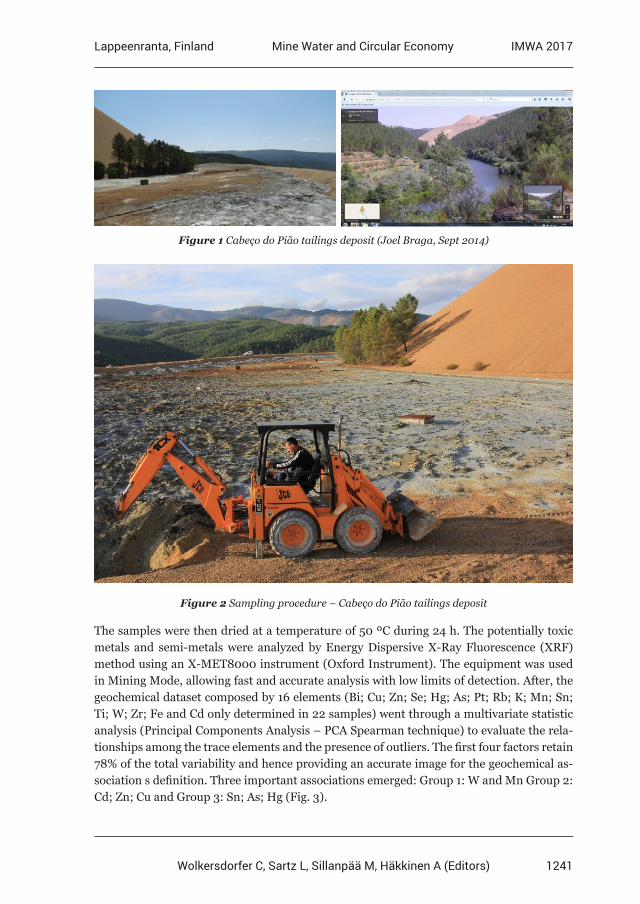
1241
Lappeenranta, Finland IMWA 2017Mine Water and Circular Economy
Wolkersdorfer C, Sartz L, Sillanpää M, Häkkinen A (Editors)
Figure 1 Cabeço do Pião tailings deposit (Joel Braga, Sept 2014)
Figure 2 Sampling procedure – Cabeço do Pião tailings deposit
The samples were then dried at a temperature of 50 ºC during 24 h. The potentially toxic metals and semi-metals were analyzed by Energy Dispersive X-Ray Fluorescence (XRF) method using an X-MET8000 instrument (Oxford Instrument). The equipment was used in Mining Mode, allowing fast and accurate analysis with low limits of detection. After, the geochemical dataset composed by 16 elements (Bi; Cu; Zn; Se; Hg; As; Pt; Rb; K; Mn; Sn; Ti; W; Zr; Fe and Cd only determined in 22 samples) went through a multivariate statistic analysis (Principal Components Analysis – PCA Spearman technique) to evaluate the rela-tionships among the trace elements and the presence of outliers. The first four factors retain 78% of the total variability and hence providing an accurate image for the geochemical as-sociation s definition. Three important associations emerged: Group 1: W and Mn Group 2: Cd; Zn; Cu and Group 3: Sn; As; Hg (Fig. 3).
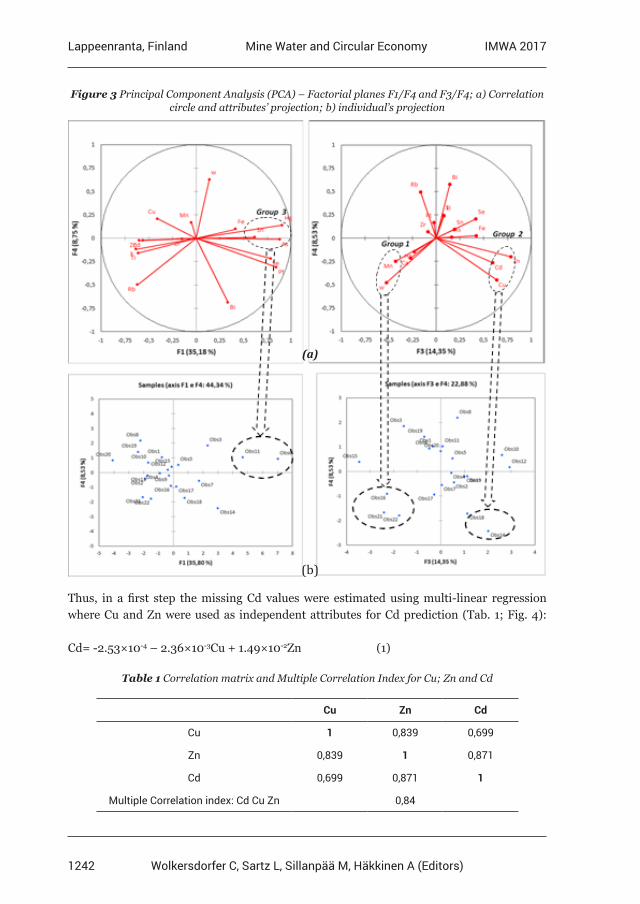
1242
Lappeenranta, Finland IMWA 2017Mine Water and Circular Economy
Wolkersdorfer C, Sartz L, Sillanpää M, Häkkinen A (Editors)
Figure 3 Principal Component Analysis (PCA) – Factorial planes F1/F4 and F3/F4; a) Correlation circle and attributes’ projection; b) individual’s projection
(a)
(b)
Thus, in a first step the missing Cd values were estimated using multi-linear regression where Cu and Zn were used as independent attributes for Cd prediction (Tab. 1; Fig. 4):
Cd= -2.53×10⁻⁴ – 2.36×10⁻³Cu + 1.49×10⁻²Zn (1)
Table 1 Correlation matrix and Multiple Correlation Index for Cu; Zn and Cd
Cu Zn Cd
Cu 1 0,839 0,699
Zn 0,839 1 0,871
Cd 0,699 0,871 1
Multiple Correlation index: Cd Cu Zn 0,84
Figure 4 Linear regression: training and validation sets
In a second step a geostatistical approach was used to accomplish the construction of ele-ments’ concentration patterns.
Geostatistical techniques are founded along the theory of regionalized variables (Matheron, 1971) which says that variables within an area show both random and spatially structured properties (Journel and Huijbregts, 1978). Experimental variograms must be estimated and modelled to quantify the spatial variability of random variables as a function of their sep-aration lag (Antunes et al. 2013). When forecasting the risk of contamination (e.g. months ahead), it is mandatory to stress the importance of the future estimated values to exceed the maximum admissible values. The delineation of enriched zones requires the interpolation of content values to the nodes of a regular grid where a prediction model will work as guid-ance to a more sustainable mining management.
The new variables (F1 and F3) obtained by PCA are defined as regionalized variables and are additive by construction. Therefore, a two-step geostatistical modelling methodology was used as follows:
1) Selected attributes (F1 and F3) went through structural analysis, and experimental vari-ograms were computed (Fig. 5);
1
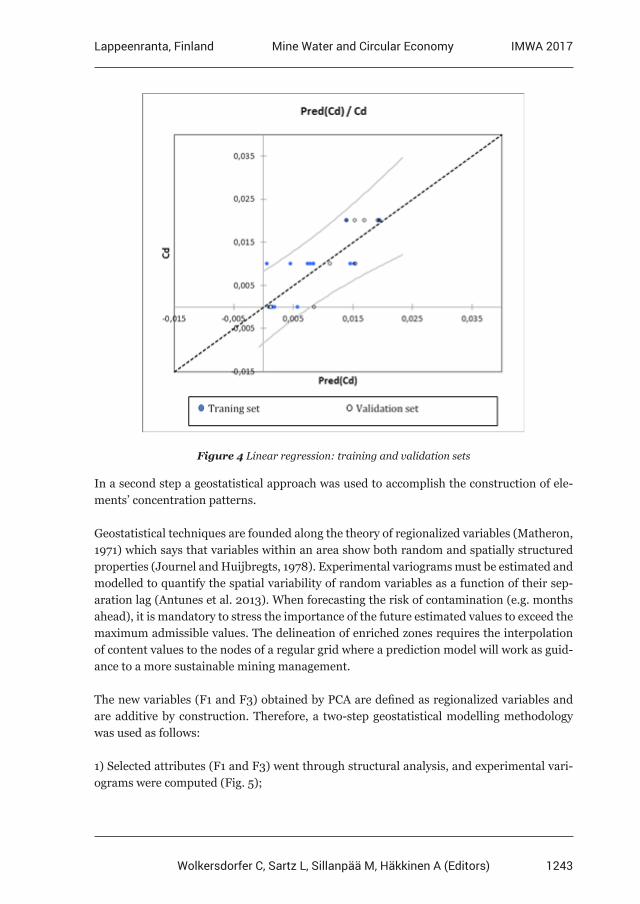
1243
Lappeenranta, Finland IMWA 2017Mine Water and Circular Economy
Wolkersdorfer C, Sartz L, Sillanpää M, Häkkinen A (Editors)
Figure 4 Linear regression: training and validation sets
In a second step a geostatistical approach was used to accomplish the construction of ele-ments’ concentration patterns.
Geostatistical techniques are founded along the theory of regionalized variables (Matheron, 1971) which says that variables within an area show both random and spatially structured properties (Journel and Huijbregts, 1978). Experimental variograms must be estimated and modelled to quantify the spatial variability of random variables as a function of their sep-aration lag (Antunes et al. 2013). When forecasting the risk of contamination (e.g. months ahead), it is mandatory to stress the importance of the future estimated values to exceed the maximum admissible values. The delineation of enriched zones requires the interpolation of content values to the nodes of a regular grid where a prediction model will work as guid-ance to a more sustainable mining management.
The new variables (F1 and F3) obtained by PCA are defined as regionalized variables and are additive by construction. Therefore, a two-step geostatistical modelling methodology was used as follows:
1) Selected attributes (F1 and F3) went through structural analysis, and experimental vari-ograms were computed (Fig. 5);
1
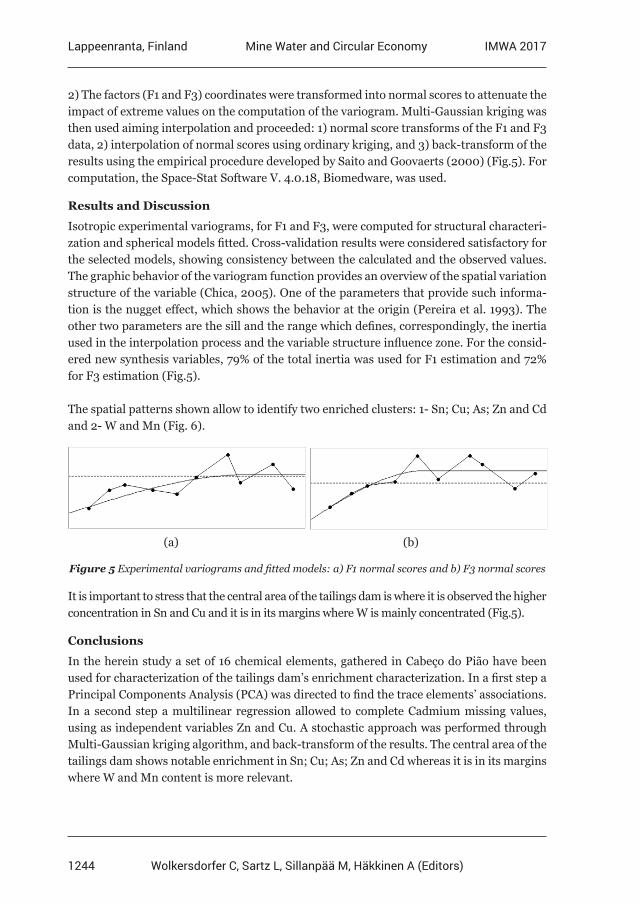
1244
Lappeenranta, Finland IMWA 2017Mine Water and Circular Economy
Wolkersdorfer C, Sartz L, Sillanpää M, Häkkinen A (Editors)
2) The factors (F1 and F3) coordinates were transformed into normal scores to attenuate the impact of extreme values on the computation of the variogram. Multi-Gaussian kriging was then used aiming interpolation and proceeded: 1) normal score transforms of the F1 and F3 data, 2) interpolation of normal scores using ordinary kriging, and 3) back-transform of the results using the empirical procedure developed by Saito and Goovaerts (2000) (Fig.5). For computation, the Space-Stat Software V. 4.0.18, Biomedware, was used.
Results and Discussion
Isotropic experimental variograms, for F1 and F3, were computed for structural characteri-zation and spherical models fitted. Cross-validation results were considered satisfactory for the selected models, showing consistency between the calculated and the observed values. The graphic behavior of the variogram function provides an overview of the spatial variation structure of the variable (Chica, 2005). One of the parameters that provide such informa-tion is the nugget effect, which shows the behavior at the origin (Pereira et al. 1993). The other two parameters are the sill and the range which defines, correspondingly, the inertia used in the interpolation process and the variable structure influence zone. For the consid-ered new synthesis variables, 79% of the total inertia was used for F1 estimation and 72% for F3 estimation (Fig.5).
The spatial patterns shown allow to identify two enriched clusters: 1- Sn; Cu; As; Zn and Cd and 2- W and Mn (Fig. 6).
(a) (b)
Figure 5 Experimental variograms and fitted models: a) F1 normal scores and b) F3 normal scores
It is important to stress that the central area of the tailings dam is where it is observed the higher concentration in Sn and Cu and it is in its margins where W is mainly concentrated (Fig.5).
Conclusions
In the herein study a set of 16 chemical elements, gathered in Cabeço do Pião have been used for characterization of the tailings dam’s enrichment characterization. In a first step a Principal Components Analysis (PCA) was directed to find the trace elements’ associations. In a second step a multilinear regression allowed to complete Cadmium missing values, using as independent variables Zn and Cu. A stochastic approach was performed through Multi-Gaussian kriging algorithm, and back-transform of the results. The central area of the tailings dam shows notable enrichment in Sn; Cu; As; Zn and Cd whereas it is in its margins where W and Mn content is more relevant.
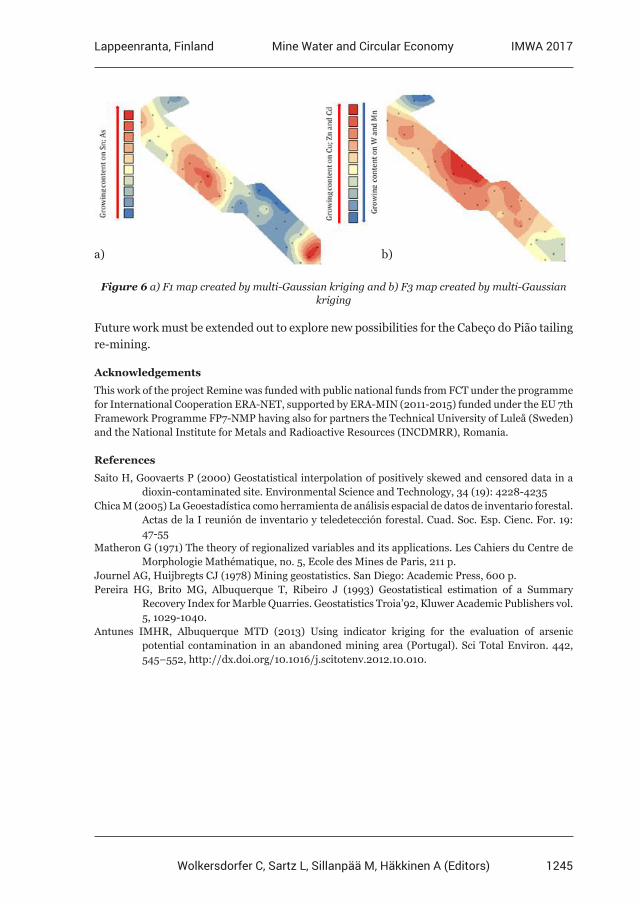
1245
Lappeenranta, Finland IMWA 2017Mine Water and Circular Economy
Wolkersdorfer C, Sartz L, Sillanpää M, Häkkinen A (Editors)
a) b)
Figure 6 a) F1 map created by multi-Gaussian kriging and b) F3 map created by multi-Gaussian kriging
Future work must be extended out to explore new possibilities for the Cabeço do Pião tailing re-mining.
Acknowledgements
This work of the project Remine was funded with public national funds from FCT under the programme for International Cooperation ERA-NET, supported by ERA-MIN (2011-2015) funded under the EU 7th Framework Programme FP7-NMP having also for partners the Technical University of Luleå (Sweden) and the National Institute for Metals and Radioactive Resources (INCDMRR), Romania.
References
Saito H, Goovaerts P (2000) Geostatistical interpolation of positively skewed and censored data in a dioxin-contaminated site. Environmental Science and Technology, 34 (19): 4228-4235Chica M (2005) La Geoestadística como herramienta de análisis espacial de datos de inventario forestal. Actas de la I reunión de inventario y teledetección forestal. Cuad. Soc. Esp. Cienc. For. 19: 47-55Matheron G (1971) The theory of regionalized variables and its applications. Les Cahiers du Centre de Morphologie Mathématique, no. 5, Ecole des Mines de Paris, 211 p.Journel AG, Huijbregts CJ (1978) Mining geostatistics. San Diego: Academic Press, 600 p.Pereira HG, Brito MG, Albuquerque T, Ribeiro J (1993) Geostatistical estimation of a Summary Recovery Index for Marble Quarries. Geostatistics Troia’92, Kluwer Academic Publishers vol. 5, 1029-1040.Antunes IMHR, Albuquerque MTD (2013) Using indicator kriging for the evaluation of arsenic potential contamination in an abandoned mining area (Portugal). Sci Total Environ. 442, 545–552, http://dx.doi.org/10.1016/j.scitotenv.2012.10.010.
1246
Lappeenranta, Finland IMWA 2017Mine Water and Circular Economy
Wolkersdorfer C, Sartz L, Sillanpää M, Häkkinen A (Editors)
Mapping surface sources of acid mine drainage using remote sensing: case study of the Witbank, Ermelo and
Highveld coalfields
Emmanuel Sakala1,2, Francois Fourie2, Modreck Gomo2, Henk Coetzee1
1Council for Geoscience, Private Bag X112, Pretoria, 0001, South Africa, [email protected]
2Institute of Groundwater Studies, University of the Free State, PO Box 339, Bloemfontein, 9300, South Africa
Abstract The research involves formulating a methodology to automatically map surface acid mine drainage pollutant sources using remote sensing in support of environmental and coal discard management in the Witbank, Ermelo and Highveld coalfields. The spectral uniqueness of acid mine drainage-generated secondary iron-bearing minerals is used to build a decision tree for differentiating these from other minerals depicted from Landsat 8 data. Previously known acid mine drainage-generating coal discard dumps coincide with the remote sensing mapped minerals (jarosite and haematite). The mapped acid mine drainage sources can be used to plan management and mitigation strategies for the protection of water resources.
Key words Acid mine drainage, coalfield, remote sensing, mineral, pollutant source
Introduction
Acid mine drainage (AMD) is formed when sulfide minerals (pyrite and marcasite) ema-nating from coal mining operations or orebodies are oxidised by water in the presence of oxygen to form an acidic solution (Pinetown et al.. 2007). The AMD formed is characterised by low pH values, high concentrations of sulfate and total dissolved solids (TDS), and ele-vated concentrations of heavy metals, such as iron, aluminium and manganese, which are remobilised by the acidic environment (Bell et al.. 2001). Elevated concentrations of these substances in water resources cause a deterioration of the water quality, adversely affecting aquatic life and posing serious health concerns to humans and animals. The deposition of various secondary iron minerals (Fe-bearing) is also typically associated with AMD (Bell et al.. 2001). Sources of AMD range from surface exposed sources (mine discards, tailing dumps, coal loading bays, coal washing plants) to sources buried within the subsurface (coal orebodies). The potential AMD sources in the subsurface are usually starved of oxygen (a key ingredient in AMD generation) and therefore pose little risk as AMD sources. This paper proposes a cost-effective methodology to map surface AMD sources over large areas (coal-field or catchment scale) using remote sensing data.
There are nineteen coalfields in South Africa, with the current mining activities largely tak-ing place in the Witbank, Ermelo and Highveld coalfields located in the Mpumalanga Prov-ince of South Africa (Banks et al.. 2011). These coalfields are located between latitude 25o30′ to 27o45′ south and longitude 28o30′ and 30o30′ east, covering an area of approximately 23 315 km2 (fig. 1). The area receives an average long-term rainfall of between 600 and 1 100 mm (SAWS 2016). The winters are typically dry and cold with occasional frost, while the
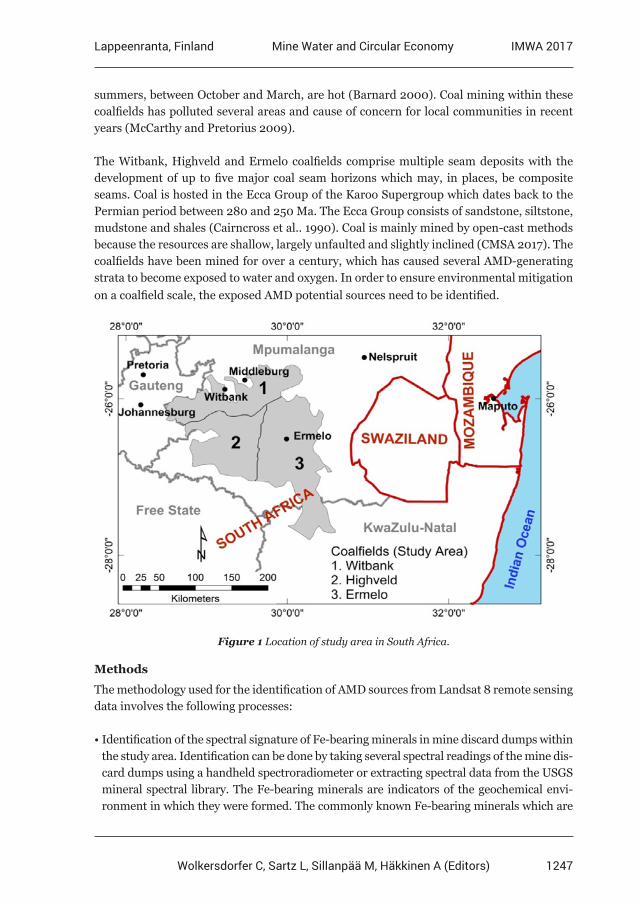
1247
Lappeenranta, Finland IMWA 2017Mine Water and Circular Economy
Wolkersdorfer C, Sartz L, Sillanpää M, Häkkinen A (Editors)
summers, between October and March, are hot (Barnard 2000). Coal mining within these coalfields has polluted several areas and cause of concern for local communities in recent years (McCarthy and Pretorius 2009).
The Witbank, Highveld and Ermelo coalfields comprise multiple seam deposits with the development of up to five major coal seam horizons which may, in places, be composite seams. Coal is hosted in the Ecca Group of the Karoo Supergroup which dates back to the Permian period between 280 and 250 Ma. The Ecca Group consists of sandstone, siltstone, mudstone and shales (Cairncross et al.. 1990). Coal is mainly mined by open-cast methods because the resources are shallow, largely unfaulted and slightly inclined (CMSA 2017). The coalfields have been mined for over a century, which has caused several AMD-generating strata to become exposed to water and oxygen. In order to ensure environmental mitigation on a coalfield scale, the exposed AMD potential sources need to be identified.
Figure 1 Location of study area in South Africa.
Methods
The methodology used for the identification of AMD sources from Landsat 8 remote sensing data involves the following processes:
• Identification of the spectral signature of Fe-bearing minerals in mine discard dumps within the study area. Identification can be done by taking several spectral readings of the mine dis-card dumps using a handheld spectroradiometer or extracting spectral data from the USGS mineral spectral library. The Fe-bearing minerals are indicators of the geochemical envi-ronment in which they were formed. The commonly known Fe-bearing minerals which are
1248
Lappeenranta, Finland IMWA 2017Mine Water and Circular Economy
Wolkersdorfer C, Sartz L, Sillanpää M, Häkkinen A (Editors)
sensitive indicators of pH, Eh, relative humidity, degree of oxidation and other environmen-tal conditions are copiapite (Fe+2 Fe4
+3(SO4)6(OH)2∙20(H2O)), jarosite (KFe3+3)(SO4)2(OH)6),
schwertnannite (Fe16+3)O16(SO4)2 (OH)12∙nH2O(n~10 to 12)), ferrihydrite (5Fe2O3∙9H2O),
goethite (Fe+3O(OH)) and haematite (Fe2O3) (Swayze et al.. 2000; Crowley et al.. 2003). Within the study area, the Fe-bearing minerals which form in abundance are haematite and jarosite, according to a study by Cole et al.. (2015). The spectral uniqueness of these Fe-bear-ing minerals makes it possible to identify them from orbital and airborne imaging data.
• Resampling of the mineral spectral data to Landsat 8 bandwidth sizes.
• Comparison of various bands and identification of the reflectance value differences to be used in order to differentiate between the AMD indicator minerals and the other minerals present.
• Developing a decision tree for differentiating various minerals using their reflectance re-sponses at various bandwidths. The decision tree is then applied to the Landsat 8 data to produce a map showing the distribution of the AMD indicator minerals.
• Verification of the results by follow-up ground investigations over the identified AMD sources.
In this paper, free Landsat 8 data downloaded for from the USGS website were used to iden-tify secondary Fe-bearing minerals. Landsat 8 data comprise nine bands in the visible and near-infrared (VNIR) and short-wave infrared (SWIR) ranges (Band 8 is the panchromatic band and Band 9 is a cloud detection band) and two bands in the thermal infrared (TIR) range (table 1).
Table 1 Properties of Landsat 8 data used (Cole et al.. 2015).
Range Band Wavelength range (nm) Spatial resolution (m)
VNIR 1 433–453 30
2 450–515 30
3 525–600 30
4 630–680 30
5 845–885 30
8 500–680 15
SWIR 6 1 560–1 660 30
7 2 100–2 300 30
9 1 360–1 390 30
TIR 10 10 600–11 200 100
11 11 500–12 500 100
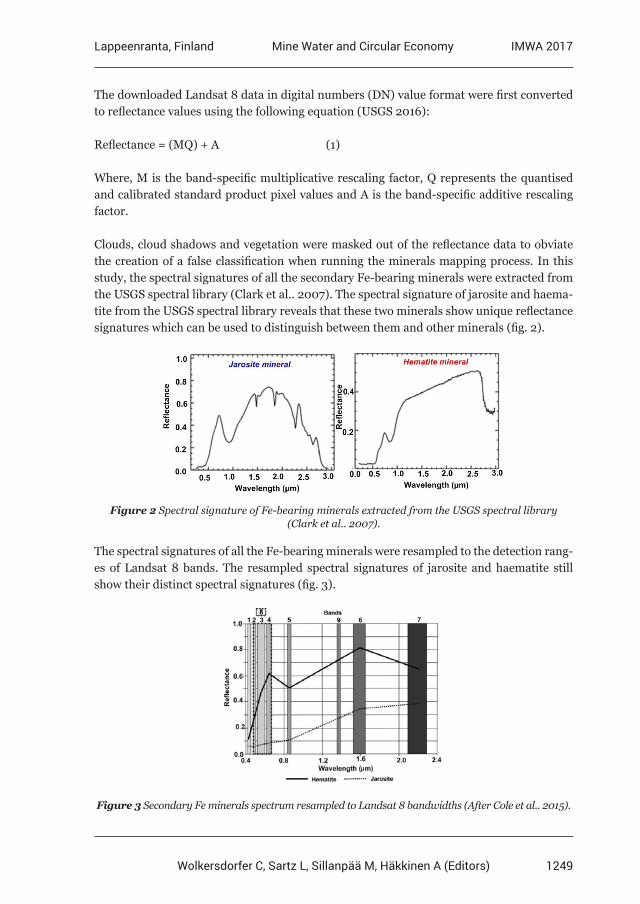
1249
Lappeenranta, Finland IMWA 2017Mine Water and Circular Economy
Wolkersdorfer C, Sartz L, Sillanpää M, Häkkinen A (Editors)
The downloaded Landsat 8 data in digital numbers (DN) value format were first converted to reflectance values using the following equation (USGS 2016):
Reflectance = (MQ) + A (1)
Where, M is the band-specific multiplicative rescaling factor, Q represents the quantised and calibrated standard product pixel values and A is the band-specific additive rescaling factor.
Clouds, cloud shadows and vegetation were masked out of the reflectance data to obviate the creation of a false classification when running the minerals mapping process. In this study, the spectral signatures of all the secondary Fe-bearing minerals were extracted from the USGS spectral library (Clark et al.. 2007). The spectral signature of jarosite and haema-tite from the USGS spectral library reveals that these two minerals show unique reflectance signatures which can be used to distinguish between them and other minerals (fig. 2).
Figure 2 Spectral signature of Fe-bearing minerals extracted from the USGS spectral library (Clark et al.. 2007).
The spectral signatures of all the Fe-bearing minerals were resampled to the detection rang-es of Landsat 8 bands. The resampled spectral signatures of jarosite and haematite still show their distinct spectral signatures (fig. 3).
Figure 3 Secondary Fe minerals spectrum resampled to Landsat 8 bandwidths (After Cole et al.. 2015).
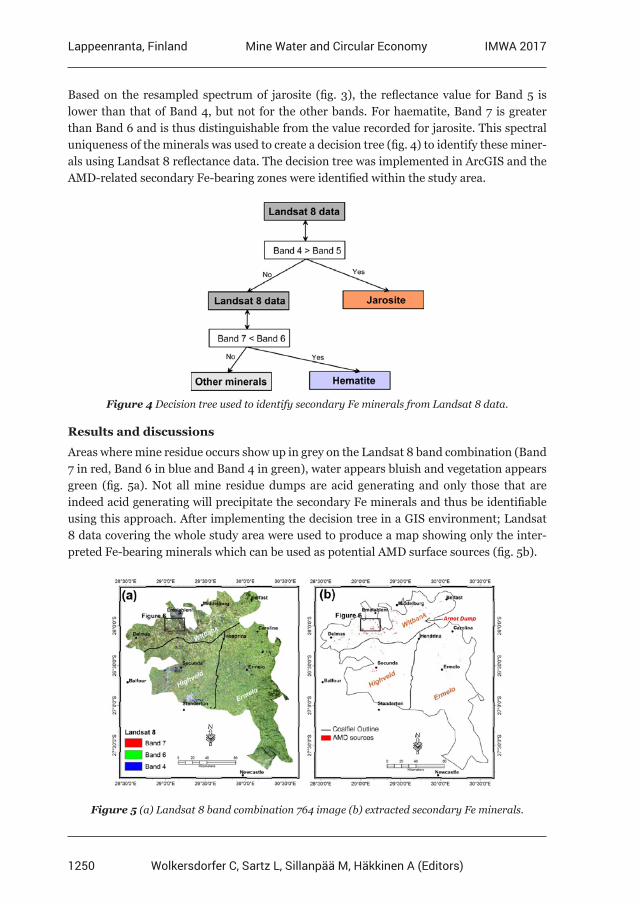
1250
Lappeenranta, Finland IMWA 2017Mine Water and Circular Economy
Wolkersdorfer C, Sartz L, Sillanpää M, Häkkinen A (Editors)
Based on the resampled spectrum of jarosite (fig. 3), the reflectance value for Band 5 is lower than that of Band 4, but not for the other bands. For haematite, Band 7 is greater than Band 6 and is thus distinguishable from the value recorded for jarosite. This spectral uniqueness of the minerals was used to create a decision tree (fig. 4) to identify these miner-als using Landsat 8 reflectance data. The decision tree was implemented in ArcGIS and the AMD-related secondary Fe-bearing zones were identified within the study area.
Figure 4 Decision tree used to identify secondary Fe minerals from Landsat 8 data.
Results and discussions
Areas where mine residue occurs show up in grey on the Landsat 8 band combination (Band 7 in red, Band 6 in blue and Band 4 in green), water appears bluish and vegetation appears green (fig. 5a). Not all mine residue dumps are acid generating and only those that are indeed acid generating will precipitate the secondary Fe minerals and thus be identifiable using this approach. After implementing the decision tree in a GIS environment; Landsat 8 data covering the whole study area were used to produce a map showing only the inter-preted Fe-bearing minerals which can be used as potential AMD surface sources (fig. 5b).
Figure 5 (a) Landsat 8 band combination 764 image (b) extracted secondary Fe minerals.
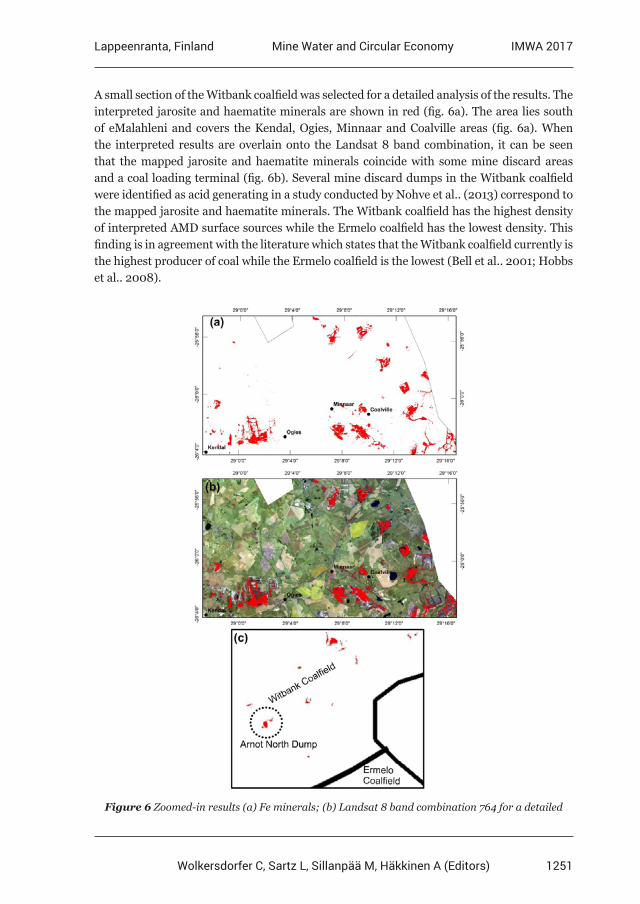
1251
Lappeenranta, Finland IMWA 2017Mine Water and Circular Economy
Wolkersdorfer C, Sartz L, Sillanpää M, Häkkinen A (Editors)
A small section of the Witbank coalfield was selected for a detailed analysis of the results. The interpreted jarosite and haematite minerals are shown in red (fig. 6a). The area lies south of eMalahleni and covers the Kendal, Ogies, Minnaar and Coalville areas (fig. 6a). When the interpreted results are overlain onto the Landsat 8 band combination, it can be seen that the mapped jarosite and haematite minerals coincide with some mine discard areas and a coal loading terminal (fig. 6b). Several mine discard dumps in the Witbank coalfield were identified as acid generating in a study conducted by Nohve et al.. (2013) correspond to the mapped jarosite and haematite minerals. The Witbank coalfield has the highest density of interpreted AMD surface sources while the Ermelo coalfield has the lowest density. This finding is in agreement with the literature which states that the Witbank coalfield currently is the highest producer of coal while the Ermelo coalfield is the lowest (Bell et al.. 2001; Hobbs et al.. 2008).
Figure 6 Zoomed-in results (a) Fe minerals; (b) Landsat 8 band combination 764 for a detailed
1252
Lappeenranta, Finland IMWA 2017Mine Water and Circular Economy
Wolkersdorfer C, Sartz L, Sillanpää M, Häkkinen A (Editors)
analysis of interpreted secondary Fe minerals; (c) Arnot North discard mine dump.
To test the validity of the identified AMD sources, the mine discard dumps classified as AMD sources in this paper were compared with the dumps identified as acid generating by Novhe et al.. (2013). Novhe et al.. (2013) had used static tests including paste pH, a neutralisation analysis, acid potential determination and kinetic tests (column leach tests) to identify AMD generating mine discard dumps in the Witbank coalfield. Consequently, the Arnot North mine discard dump was identified as acid generating. Moreover, the site is characterised by high secondary Fe-bearing minerals (fig. 6c). The results from the remote sensing technique are in agreement with laboratory tests, thus increasing confidence in the usage of remote sensing data.
Conclusions
The paper describes the application of a remote sensing technique which can be used by environmental agencies to quickly select potential AMD generating mine discard dumps thereby improving decision making in respect of the implementation of mitigation meas-ures. Selection of secondary Fe-bearing minerals from aerial Landsat 8 aerial data ensured that most of these minerals occurring in waste rocks and mine dumps and those that have been transported and deposited on roads, railway lines, loading bays, wetlands and river banks are all mapped at a 30 m resolution. The mapped AMD pollutant sources can be used by mining authorities and environmental agencies to plan management and mitigation measures to prevent the AMD from reaching water resources. The approach can be extend-ed to other high resolution aerial remote sensing data to increase the spatial resolution once the data becomes accessible freely or at lower cost.
References
Banks VJ, Palumbo-Roe, Van Tonder DB, Davies J, Fleming C and Chevrel S (2011) Conceptual models of the Witbank coalfield, South Africa. Earth observation for monitoring and observing environmental and societal impacts of mineral resources exploration and exploitation, cEC FP7 Project EO-MINERS, Deliverable D3. 1–2, 107.Barnard HC (2000) An explanation of the 1:500 000 general hydrogeological map-Johannesburg 2526, Department of Water and Sanitation. Bell FG, Bullock SET, Halbich TFJ and Lindsay P (2001) Environmental impacts associated with an abandoned mine in the Witbank coalfield, South Africa. International Journal of Coal Geology 45, 195–216. Cairncross B, Hart RJ and Willis JP (1990) Geochemistry and sedimentology of coal seams from the Permian Witbank Coalfield, South Africa: a means of identification. International Journal of Coal Geology, 16, 309–325.Chamber of Mines of South Africa (CMSA) (2017) Mining in SA: Coal <http://www.chamberofmines. org.za/sa-mining/coal> Accessed: 09 April 2017.Clark RN, Swayze GA, Wise R, Livo E, Hoefen T, Kokaly R and Sutley SJ (2007) USGS digital spectral library splib06a: U.S. Geological Survey, Digital Data Series 231, <http://speclab.cr.usgs. gov/spectral.lib06>Cole J, Cole P, Yibas B, Vadapalli V, Novhe O and Netshitungulwana R (2015) A holistic approach towards best management of mine pollution impacts on water resources of South Africa
1253
Lappeenranta, Finland IMWA 2017Mine Water and Circular Economy
Wolkersdorfer C, Sartz L, Sillanpää M, Häkkinen A (Editors)
using river catchment strategy: Report on remote sensing for mining pollution & AMD, Council for Geoscience, unpublished report No 2015-0092.Crowley JK Williams DE, Hammarstrom JM, Piatak N, Chou IM and Mars JC (2003) Spectral reflectance properties (0.4–2.5 m) of secondary Fe-oxide, Fe-hydroxide, and Fe-sulphate- hydrate minerals associated with sulphide-bearing mine wastes. Geochemistry: Exploration, Environment and Analysis 3(3), 219–228.Hobbs P, Oelofse S, Rascher J (2008) Management of environmental impacts from coal mining in the Upper Olifants River Catchment as a function of age and scale. Water Resources Development, 24(3), 417–431.McCarthy TS and Pretorius K (2009) Coal mining on the Highveld and its implications for future water quality in the Vaal river system. International Mine Water Conference Proceedings, Pretoria, South Africa, p 56–65.Novhe NO, Maree J, Ogola JS (2013) Characterization of potential acid leachate from raw coal, discard coal and slimes from a colliery in the Witbank Coalfield, Mpumalanga Province, South Africa. International Mine Water Conference Proceedings, Golden CO, United States, 875–880.Pinetown KL, Ward CR and van der Westhuizen WA (2007) Quantitative evaluation of minerals in cola deposits in the Witbank and Highveld coalfields, and the potential impact on acid mine drainage. International Journal of Coal Geology 70, 166–183.South African Weather Service (SAWS) (2016) Historical Rain Maps, <http://www.weathersa.co.za/ climate/historical-rain-maps> Accessed: 23 March 2016.Swayze GA, Smith KS, Clark RN, Sutley SJ, Pearson RM, Vance JS, Hageman PL, Briggs PH, Meier AL, Singleton MJ and Roth S (2000) Using imaging spectroscopy to map acidic mine waste, Environmental Science and Technology 34, 47–54.United State Geological Survey (USGS) (2016) Earth Explorer-Landsat 8, <www.earthexplorer.usgs. gov>, Accessed: 30 March 2016.
1254
Lappeenranta, Finland IMWA 2017Mine Water and Circular Economy
Wolkersdorfer C, Sartz L, Sillanpää M, Häkkinen A (Editors)
Reverse Osmosis Technology to Reduce Fresh Water Consumption – Case Study, Agnico Eagle Finland,
Kittilä Mine
Karri Aunola1, Anni Aho2, Maija Vidqvist1, Vesa Pieskä2
1Teollisuuden Vesi Oy (Industrial Water Ltd.), Moreenikatu 2 B, FI-04600 Mäntsälä, Finland 2Agnico Eagle Finland, Kittilä Mine, Pokantie 541, FI-99250 Kiistala, Finland
Abstract Mines require large volumes of water in their processes. Therefore, the recycling of process waters is desirable. With improved water recycling, freshwater intake can be reduced while simultaneously decreasing water discharge.Reverse osmosis (RO) is acknowledged as the key technology for the recycling of process waters. In this study, the RO pilot operated in Agnico Eagle Finland Kittilä Mine with a slightly over-saturated gypsum solution with the silt density index permanently near or above 5.0. Based on this near full-scale pilot operated for more than a year, we recommend RO technology for process water recycling.
Key words IMWA 2017, Agnico Eagle, Mine Water Treatment, Water Recycling, Reverse Osmosis
Introduction
Agnico Eagle Finland Kittilä Mine is a gold mine situated in Northern Finland. The objective of Kittilä Mine is to increase water recycling per ton of ore processed. In addition to increasing the water recycling efficiency of the mine, it may be possible to decrease fresh water intake.
Reverse osmosis (RO) is typically used in desalination processes, and the technique is ap-plied in the major number of the world’s desalination plants (Greenlee et al.. 2009). Fur-thermore, RO is a key technology in the recycling of process waters.
Although RO is widely used in other industries, the harsh conditions in mining environ-ments result in specific challenges for RO operation. Pretreatment is extremely important for the reliable functioning of the RO, as various compounds may cause fouling or scaling of the membranes (Andes et al.. 2013). Typical RO membrane fouling and/or scaling factors include total suspended solids (TSS), iron, manganese, organic compounds, hardness, and microbiological growth (Vidqvist 2005). The main objective for this pilot is to gain knowl-edge about the technical usability of RO technology in Kittilä mine.
Methods
The water recycling pilot was begun at the end of 2015 and has since been operating at Kittilä mine. The feed water for the pilot is neutralizing pond water that is slightly over-sat-urated with gypsum solution with a silt density index, a typical fouling indicator for RO membranes, permanently near or above 5.0. The RO has the capacity to produce approxi-mately 20 m3/h of low salinity permeate with a recovery rate of 50 %. The RO permeate is used as the process water.
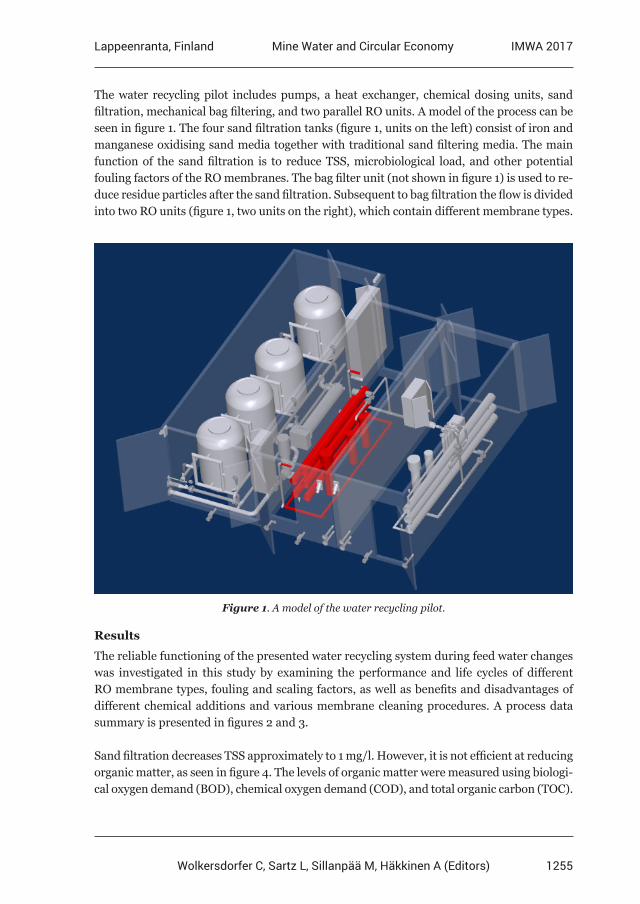
1255
Lappeenranta, Finland IMWA 2017Mine Water and Circular Economy
Wolkersdorfer C, Sartz L, Sillanpää M, Häkkinen A (Editors)
The water recycling pilot includes pumps, a heat exchanger, chemical dosing units, sand filtration, mechanical bag filtering, and two parallel RO units. A model of the process can be seen in figure 1. The four sand filtration tanks (figure 1, units on the left) consist of iron and manganese oxidising sand media together with traditional sand filtering media. The main function of the sand filtration is to reduce TSS, microbiological load, and other potential fouling factors of the RO membranes. The bag filter unit (not shown in figure 1) is used to re-duce residue particles after the sand filtration. Subsequent to bag filtration the flow is divided into two RO units (figure 1, two units on the right), which contain different membrane types.
Figure 1. A model of the water recycling pilot.
Results
The reliable functioning of the presented water recycling system during feed water changes was investigated in this study by examining the performance and life cycles of different RO membrane types, fouling and scaling factors, as well as benefits and disadvantages of different chemical additions and various membrane cleaning procedures. A process data summary is presented in figures 2 and 3.
Sand filtration decreases TSS approximately to 1 mg/l. However, it is not efficient at reducing organic matter, as seen in figure 4. The levels of organic matter were measured using biologi-cal oxygen demand (BOD), chemical oxygen demand (COD), and total organic carbon (TOC).
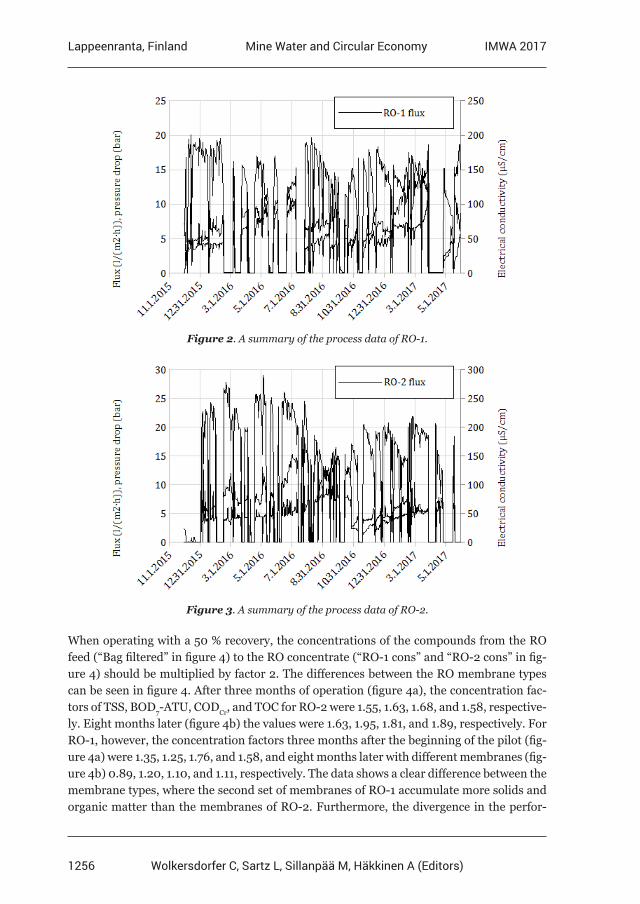
1256
Lappeenranta, Finland IMWA 2017Mine Water and Circular Economy
Wolkersdorfer C, Sartz L, Sillanpää M, Häkkinen A (Editors)
When operating with a 50 % recovery, the concentrations of the compounds from the RO feed (“Bag filtered” in figure 4) to the RO concentrate (“RO-1 cons” and “RO-2 cons” in fig-ure 4) should be multiplied by factor 2. The differences between the RO membrane types can be seen in figure 4. After three months of operation (figure 4a), the concentration fac-tors of TSS, BOD7-ATU, CODCr, and TOC for RO-2 were 1.55, 1.63, 1.68, and 1.58, respective-ly. Eight months later (figure 4b) the values were 1.63, 1.95, 1.81, and 1.89, respectively. For RO-1, however, the concentration factors three months after the beginning of the pilot (fig-ure 4a) were 1.35, 1.25, 1.76, and 1.58, and eight months later with different membranes (fig-ure 4b) 0.89, 1.20, 1.10, and 1.11, respectively. The data shows a clear difference between the membrane types, where the second set of membranes of RO-1 accumulate more solids and organic matter than the membranes of RO-2. Furthermore, the divergence in the perfor-
Figure 2. A summary of the process data of RO-1.
Figure 3. A summary of the process data of RO-2.
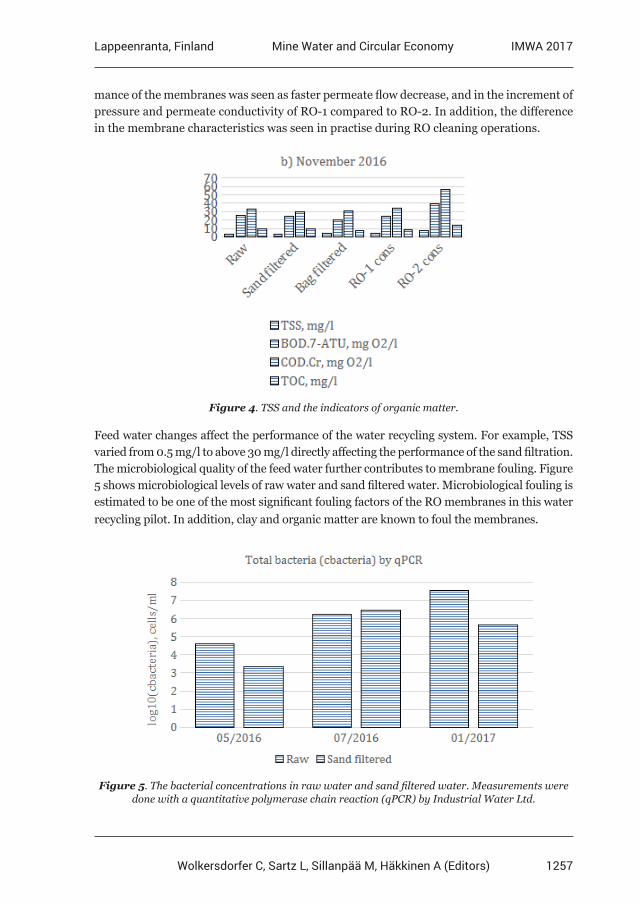
1257
Lappeenranta, Finland IMWA 2017Mine Water and Circular Economy
Wolkersdorfer C, Sartz L, Sillanpää M, Häkkinen A (Editors)
mance of the membranes was seen as faster permeate flow decrease, and in the increment of pressure and permeate conductivity of RO-1 compared to RO-2. In addition, the difference in the membrane characteristics was seen in practise during RO cleaning operations.
Figure 4. TSS and the indicators of organic matter.
Feed water changes affect the performance of the water recycling system. For example, TSS varied from 0.5 mg/l to above 30 mg/l directly affecting the performance of the sand filtration. The microbiological quality of the feed water further contributes to membrane fouling. Figure 5 shows microbiological levels of raw water and sand filtered water. Microbiological fouling is estimated to be one of the most significant fouling factors of the RO membranes in this water recycling pilot. In addition, clay and organic matter are known to foul the membranes.
Figure 5. The bacterial concentrations in raw water and sand filtered water. Measurements were done with a quantitative polymerase chain reaction (qPCR) by Industrial Water Ltd.
1258
Lappeenranta, Finland IMWA 2017Mine Water and Circular Economy
Wolkersdorfer C, Sartz L, Sillanpää M, Häkkinen A (Editors)
Conclusions
The Agnico Eagle Finland Kittilä Mine case study showed the RO technology to be an effi-cient system for mine water treatment, as the water recycling within the mine was increased and the permeate quality was shown to be consistent. The most challenging factor in the use of RO technology is membrane fouling. Therefore, different membrane types and enhanced pretreatment methods need to be studied to in-crease the RO production cycle time between RO membrane cleaning operations.
In this study, regular process observation alongside RO cleaning procedure development were done to ensure the functioning of the water recycling pilot. Due to the importance of microbiological fouling, systematic and regular microbial monitoring was additionally conducted.
Improved water recycling is not only technically useful for the mining industry, but is also capable of decreasing environmental impact of any industrial branch. Water recycling is also a prerequisite for the goal of zero liquid discharge in any process.
Acknowledgements
The authors would like to thank M. Pihlajakuja for microbiological tests and analyses.
References
Andes K., Bartels C. R., Liu E., Sheely N. (2013) Methods for Enhanced Cleaning of Fouled RO Elements. The International Desalination Association (IDA) World Congress on Desalination and Water Reuse, 13 pp, REF: IDAWC/TIAN13- 094Greenlee L. F., Lawler D. F., Freeman B. D., Marrot B., Moulin P. (2009) Reverse osmosis desalination: Water sources, technology, and today’s challenges. Water Research 43:2317–2348, doi:10.1016/j.watres.2009.03.010Vidqvist M. (2005) Käänteisosmoosilla puhdasta vettä. Kunnossapito 5:41–45
1259
Lappeenranta, Finland IMWA 2017Mine Water and Circular Economy
Wolkersdorfer C, Sartz L, Sillanpää M, Häkkinen A (Editors)
Study of Sand Mining and Related Environmental Problems along the Nzhelele River in Limpopo Province
of South Africa
Francis Amponsah-Dacosta1 and Humphrey Mathada2
1Department of Mining and Environmental Geology, University of Venda, P/Bag X5050, Thohoyandou, 0950, South Africa, [email protected] and [email protected]
2Department of Geography and Geo-information Sciences, University of Venda, [email protected]
Abstract The purpose of this study was to determine the relevance of South African regulatory framework to sand mining; map locations of sand mining activities along the Nzhelele River; assess the environmental impacts; and suggest strategies for mitigating the major impacts. The research approach involved review of legislations, mapping of sand mining activities, visual observation, and river bank erosion assessment. The study showed that improper sand mining causes degradation of the Nzhelele River and its floodplains. It emerged that lack of clear-cut guidelines constrain efforts of legislation enforcement and that strategies be developed to discourage indiscriminate extraction of sand.
Keywords sand mining, environmental impacts, legislation and regulatory framework, mapping of sand mining sites, management strategies
Introduction
Sand mining is a common practice in many rivers and floodplains across South Africa. The demand for sand is escalating at an alarming rate as a result of ever-increasing building construction projects and other infrastructural development. This has contributed to in-discriminate sand mining and severe environmental impacts such as habitat destruction, degradation of the aesthetic beauty of the surroundings, deforestation of floodplains, and modified stream structure and functionality (Hayer & Irwin 2008 and Kondolf 1997).
There is paucity of information on the impact of sand mining in the Limpopo Province in general and the Nzhelele River valley in particular. In view of the high demand of sand, mushrooming of sand mining activities and the associated environmental degradation, it is important that a study is conducted to address the environmental impacts of sand mining along Nzhelele River. In this regard a study was conducted to examine the South African legislative environment for sand mining activities, map the locations of sand mining sites along the Nzhelele River, assess the environmental impacts of sand mining along the river, and come up with strategies for preventing, controlling and mitigating the environmental impacts of sand mining.
Background of the Study Area
The Nzhelele River is a major watercourse in Limpopo Province of South Africa. The river’s catchment area comprises 2,436 km2. This river meanders in a northeastward direction across a wide plain that contains considerable biodiversity, including numerous large mammals such as girraffes, white rhinos and blue wildebeests. Cultivation closer to the source of the river and
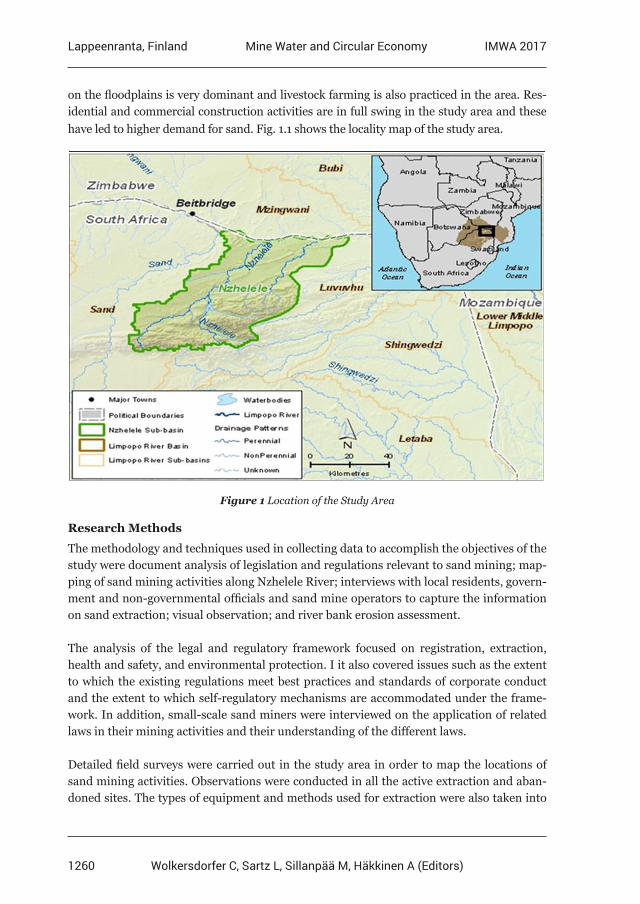
1260
Lappeenranta, Finland IMWA 2017Mine Water and Circular Economy
Wolkersdorfer C, Sartz L, Sillanpää M, Häkkinen A (Editors)
on the floodplains is very dominant and livestock farming is also practiced in the area. Res-idential and commercial construction activities are in full swing in the study area and these have led to higher demand for sand. Fig. 1.1 shows the locality map of the study area.
Figure 1 Location of the Study Area
Research Methods
The methodology and techniques used in collecting data to accomplish the objectives of the study were document analysis of legislation and regulations relevant to sand mining; map-ping of sand mining activities along Nzhelele River; interviews with local residents, govern-ment and non-governmental officials and sand mine operators to capture the information on sand extraction; visual observation; and river bank erosion assessment.
The analysis of the legal and regulatory framework focused on registration, extraction, health and safety, and environmental protection. I it also covered issues such as the extent to which the existing regulations meet best practices and standards of corporate conduct and the extent to which self-regulatory mechanisms are accommodated under the frame-work. In addition, small-scale sand miners were interviewed on the application of related laws in their mining activities and their understanding of the different laws.
Detailed field surveys were carried out in the study area in order to map the locations of sand mining activities. Observations were conducted in all the active extraction and aban-doned sites. The types of equipment and methods used for extraction were also taken into
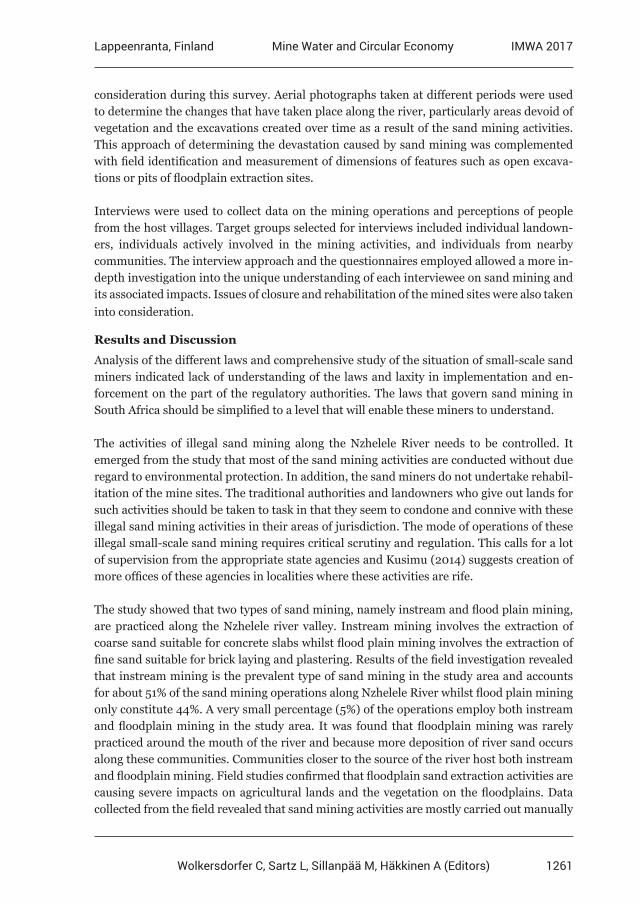
1261
Lappeenranta, Finland IMWA 2017Mine Water and Circular Economy
Wolkersdorfer C, Sartz L, Sillanpää M, Häkkinen A (Editors)
consideration during this survey. Aerial photographs taken at different periods were used to determine the changes that have taken place along the river, particularly areas devoid of vegetation and the excavations created over time as a result of the sand mining activities. This approach of determining the devastation caused by sand mining was complemented with field identification and measurement of dimensions of features such as open excava-tions or pits of floodplain extraction sites.
Interviews were used to collect data on the mining operations and perceptions of people from the host villages. Target groups selected for interviews included individual landown-ers, individuals actively involved in the mining activities, and individuals from nearby communities. The interview approach and the questionnaires employed allowed a more in-depth investigation into the unique understanding of each interviewee on sand mining and its associated impacts. Issues of closure and rehabilitation of the mined sites were also taken into consideration.
Results and Discussion
Analysis of the different laws and comprehensive study of the situation of small-scale sand miners indicated lack of understanding of the laws and laxity in implementation and en-forcement on the part of the regulatory authorities. The laws that govern sand mining in South Africa should be simplified to a level that will enable these miners to understand.
The activities of illegal sand mining along the Nzhelele River needs to be controlled. It emerged from the study that most of the sand mining activities are conducted without due regard to environmental protection. In addition, the sand miners do not undertake rehabil-itation of the mine sites. The traditional authorities and landowners who give out lands for such activities should be taken to task in that they seem to condone and connive with these illegal sand mining activities in their areas of jurisdiction. The mode of operations of these illegal small-scale sand mining requires critical scrutiny and regulation. This calls for a lot of supervision from the appropriate state agencies and Kusimu (2014) suggests creation of more offices of these agencies in localities where these activities are rife.
The study showed that two types of sand mining, namely instream and flood plain mining, are practiced along the Nzhelele river valley. Instream mining involves the extraction of coarse sand suitable for concrete slabs whilst flood plain mining involves the extraction of fine sand suitable for brick laying and plastering. Results of the field investigation revealed that instream mining is the prevalent type of sand mining in the study area and accounts for about 51% of the sand mining operations along Nzhelele River whilst flood plain mining only constitute 44%. A very small percentage (5%) of the operations employ both instream and floodplain mining in the study area. It was found that floodplain mining was rarely practiced around the mouth of the river and because more deposition of river sand occurs along these communities. Communities closer to the source of the river host both instream and floodplain mining. Field studies confirmed that floodplain sand extraction activities are causing severe impacts on agricultural lands and the vegetation on the floodplains. Data collected from the field revealed that sand mining activities are mostly carried out manually
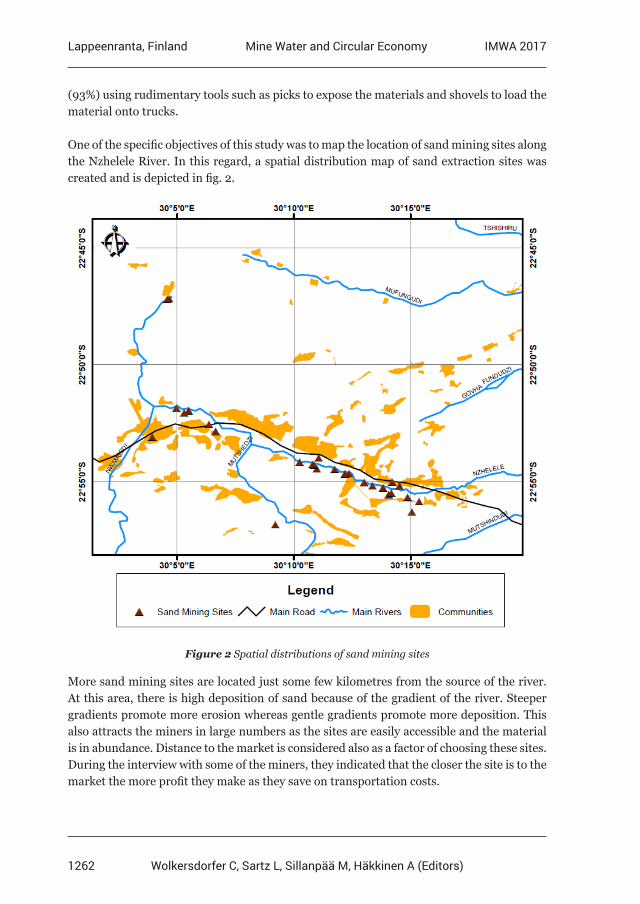
1262
Lappeenranta, Finland IMWA 2017Mine Water and Circular Economy
Wolkersdorfer C, Sartz L, Sillanpää M, Häkkinen A (Editors)
(93%) using rudimentary tools such as picks to expose the materials and shovels to load the material onto trucks.
One of the specific objectives of this study was to map the location of sand mining sites along the Nzhelele River. In this regard, a spatial distribution map of sand extraction sites was created and is depicted in fig. 2.
Figure 2 Spatial distributions of sand mining sites
More sand mining sites are located just some few kilometres from the source of the river. At this area, there is high deposition of sand because of the gradient of the river. Steeper gradients promote more erosion whereas gentle gradients promote more deposition. This also attracts the miners in large numbers as the sites are easily accessible and the material is in abundance. Distance to the market is considered also as a factor of choosing these sites. During the interview with some of the miners, they indicated that the closer the site is to the market the more profit they make as they save on transportation costs.
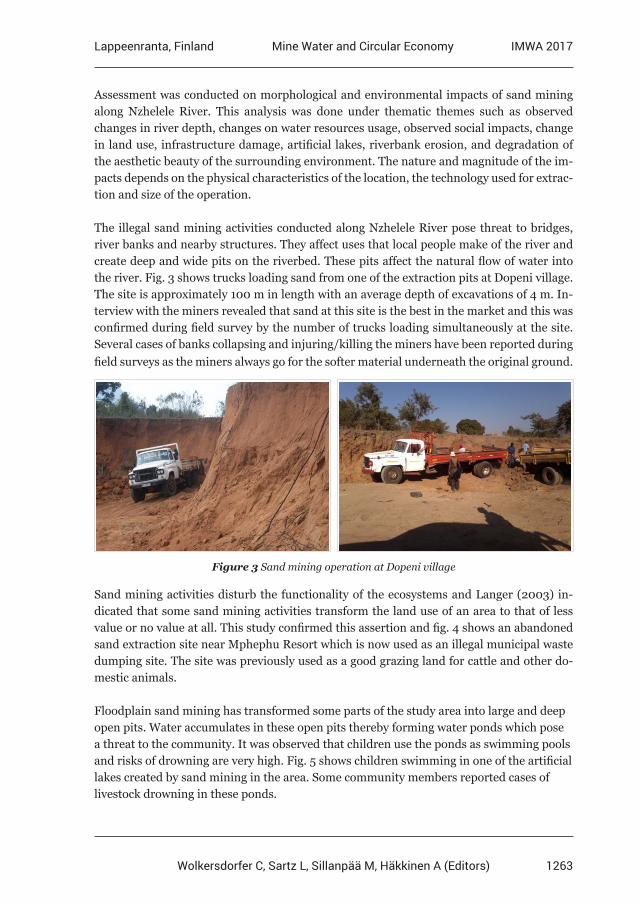
1263
Lappeenranta, Finland IMWA 2017Mine Water and Circular Economy
Wolkersdorfer C, Sartz L, Sillanpää M, Häkkinen A (Editors)
Assessment was conducted on morphological and environmental impacts of sand mining along Nzhelele River. This analysis was done under thematic themes such as observed changes in river depth, changes on water resources usage, observed social impacts, change in land use, infrastructure damage, artificial lakes, riverbank erosion, and degradation of the aesthetic beauty of the surrounding environment. The nature and magnitude of the im-pacts depends on the physical characteristics of the location, the technology used for extrac-tion and size of the operation.
The illegal sand mining activities conducted along Nzhelele River pose threat to bridges, river banks and nearby structures. They affect uses that local people make of the river and create deep and wide pits on the riverbed. These pits affect the natural flow of water into the river. Fig. 3 shows trucks loading sand from one of the extraction pits at Dopeni village. The site is approximately 100 m in length with an average depth of excavations of 4 m. In-terview with the miners revealed that sand at this site is the best in the market and this was confirmed during field survey by the number of trucks loading simultaneously at the site. Several cases of banks collapsing and injuring/killing the miners have been reported during field surveys as the miners always go for the softer material underneath the original ground.
Figure 3 Sand mining operation at Dopeni village
Sand mining activities disturb the functionality of the ecosystems and Langer (2003) in-dicated that some sand mining activities transform the land use of an area to that of less value or no value at all. This study confirmed this assertion and fig. 4 shows an abandoned sand extraction site near Mphephu Resort which is now used as an illegal municipal waste dumping site. The site was previously used as a good grazing land for cattle and other do-mestic animals.
Floodplain sand mining has transformed some parts of the study area into large and deep open pits. Water accumulates in these open pits thereby forming water ponds which pose a threat to the community. It was observed that children use the ponds as swimming pools and risks of drowning are very high. Fig. 5 shows children swimming in one of the artificial lakes created by sand mining in the area. Some community members reported cases of livestock drowning in these ponds.
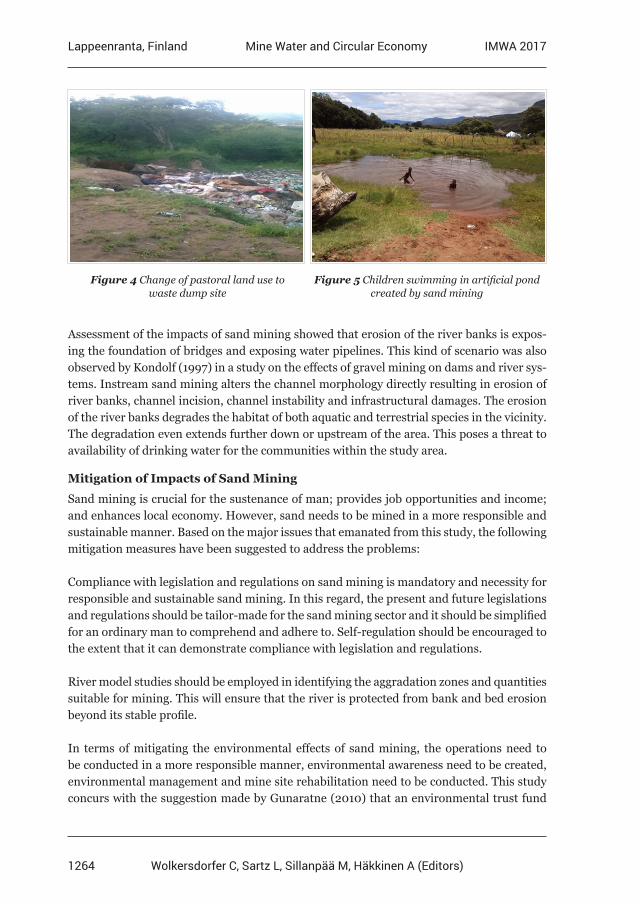
1264
Lappeenranta, Finland IMWA 2017Mine Water and Circular Economy
Wolkersdorfer C, Sartz L, Sillanpää M, Häkkinen A (Editors)
Assessment of the impacts of sand mining showed that erosion of the river banks is expos-ing the foundation of bridges and exposing water pipelines. This kind of scenario was also observed by Kondolf (1997) in a study on the effects of gravel mining on dams and river sys-tems. Instream sand mining alters the channel morphology directly resulting in erosion of river banks, channel incision, channel instability and infrastructural damages. The erosion of the river banks degrades the habitat of both aquatic and terrestrial species in the vicinity. The degradation even extends further down or upstream of the area. This poses a threat to availability of drinking water for the communities within the study area.
Mitigation of Impacts of Sand Mining
Sand mining is crucial for the sustenance of man; provides job opportunities and income; and enhances local economy. However, sand needs to be mined in a more responsible and sustainable manner. Based on the major issues that emanated from this study, the following mitigation measures have been suggested to address the problems:
Compliance with legislation and regulations on sand mining is mandatory and necessity for responsible and sustainable sand mining. In this regard, the present and future legislations and regulations should be tailor-made for the sand mining sector and it should be simplified for an ordinary man to comprehend and adhere to. Self-regulation should be encouraged to the extent that it can demonstrate compliance with legislation and regulations.
River model studies should be employed in identifying the aggradation zones and quantities suitable for mining. This will ensure that the river is protected from bank and bed erosion beyond its stable profile.
In terms of mitigating the environmental effects of sand mining, the operations need to be conducted in a more responsible manner, environmental awareness need to be created, environmental management and mine site rehabilitation need to be conducted. This study concurs with the suggestion made by Gunaratne (2010) that an environmental trust fund
Figure 5 Children swimming in artificial pond created by sand mining
Figure 4 Change of pastoral land use to waste dump site
1265
Lappeenranta, Finland IMWA 2017Mine Water and Circular Economy
Wolkersdorfer C, Sartz L, Sillanpää M, Häkkinen A (Editors)
needs to be established to pay for environmental restoration and the community should play a significant role in effective management of this resource.
Monitoring plans are to be designed to provide data on profile changes and sediment trans-port capacity to enable the authorities to evaluate the long-term effect of the mining activi-ties both upstream and downstream of sand extraction sites.
A policy guideline needs to be developed to provide criteria for sustainable in-stream and off-channel extraction of sand. Implementation of the principles and processes of this guideline will limit the negative externalities of sand mining by restricting mining activities in terms of number, location and production rate.
Conclusion
Sand mining contributes to construction of buildings and infrastructure development and provides both economic and social benefits. However, intensive sand mining with disre-gard to environmental protection significantly erodes these gains and creates a series of socio-economic and environmental problems.
The legislation and regulatory agenda for sand mining activities is vague and passive and these make enforcement difficult and complicated. Lack of clear and precise guidelines for dealing with sand mining operations coupled with inability of the regulatory authorities and other stakeholders to monitor these uncontrolled activities and employing effective enforce-ment principles means not much attention is being directed to curbing unscrupulous sand mining activities and concomitant environmental degradation.
There are so many sand mining sites along the Nzhelele River due to easy access to the mate-rials. Over exploitation of river sand threatens the very existence of the river and leads to sig-nificant environmental degradation and ecological disorders. Sand mining has degraded and altered Nzhelele River and its floodplain at an alarming rate. These impacts have affected many people in host communities. The major impacts of sand mining in the study area were found to be alteration of the water table, change in land use, infrastructure damage and col-lapsing of river banks. The most deplorable legacy of unregulated sand mining in the study is the life threatening artificial lakes formed by accumulation of water in open excavations.
Even though there are no specific guidelines on sand mining operations, it is suggested that local municipalities come up with bylaws to help preserve the ecological beauty of their areas. Environmental awareness training should be conducted for the communities in the vicinity of the extraction sites. This will help in monitoring and enforcement of the bylaws. Studies focusing on the impacts of sand mining on water quality should be conducted. This will help the community and the government authorities to know and understand the na-ture and severity of impacts of sand mining on water quality in the area.
Findings and recommendations of this study will help create public awareness on the eco-logical and social economic values of rivers, guide the concerned regulatory authorities for
1266
Lappeenranta, Finland IMWA 2017Mine Water and Circular Economy
Wolkersdorfer C, Sartz L, Sillanpää M, Häkkinen A (Editors)
more serious consideration of the potential long term consequences of widespread sand mining, and contribute to formulation of policies to protect and conserve the river and river valleys from destruction by sand mining. This study can also be replicated for other rivers that are threatened by irresponsible sand mining.
Acknowledgement
The authors are very grateful to University of Venda and National Research Foundation for providing funds for undertaking the field work and meeting the costs of field data analysis. We are particularly thankful to Mr. S. E. Mhlongo for his contribution during the field work. Our heartfelt appreciation goes to all those who contributed in diverse ways in acquisition of data for completion of this project.
References
Guaratne LPH (2010) Policy Options for Sustainable River Sand Mining in Sri Lanka, Published by the Economy and Environment Program for Southeast Asia (EEPSEA), Singapore, ISBN: 978-981-08-7709-5.Hayer C and Irwin ER (2008) Influence of gravel mining and other factors on detection probabilities of coastal plain fishes in the mobile river basin, Alabama. DOI: 10.1577/T07-153.1Kondolf GM (1997) Hungry water: effects of dams and gravel mining on river channels. Environmental Management 21: 533–551. Kusimi JM (2014) Sediment Yield and Bank Erosion Assessment of Pra River Basin, PhD. Thesis, University of Ghana, Legon, pp. 158.Langer WH (2003) A general overview of the technology of in-stream mining of sand and gravel resources, associated potential environmental impacts, and methods to control potential impacts, USGS Open-File Report OF-02-153.
1267
Lappeenranta, Finland IMWA 2017Mine Water and Circular Economy
Wolkersdorfer C, Sartz L, Sillanpää M, Häkkinen A (Editors)
Recovery of Uranium using bisphosphonate modified nanoporous silicon
Rinez Thapa, Tuomo Nissinen, Joakim Riikonen, Vesa Pekka Lehto
University of Eastern Finland, Finland
Abstract Uranium is a highly toxic metal which can cause, for example acute kidney failure. Therefore, effective removal of uranium from mineral resources and mine waters is important. Furthermore, uranium-bearing polymetallic deposits are also enriched in precious rare earth elements of high demand e.g. scandium. Commercial recovery of uranium as a by-product is also an option in exploitation of uraniferous resources. Standardized use of uranium offers the long-term green fuel supply for nuclear power plants.
Keywords removal of uranium, nanoporous silicon, bisphosphonates
The present study focuses on development of a reliable and cost-effective method for puri-fication of uraniferous waters, even at low concentrations. The method is based on bisphos-phonate (BP) modified porous silicon (PSi) hybrid material. PSi, prepared by electrochemi-cal etching of Si wafers, contains a large number of small nanopores, ca. 10 nm in diameter and a large surface area (ca. 200 m2/g). The particle size and porous structure of PSi is tuned to optimize the metal adsorption process regarding the rate and quantity of the ad-sorption. Large surface area enables grafting of large number of bisphosphonate molecules on the surface. Bisphosphonates are able to reversibly and selectively chelate metals from dilute solutions. Hence, BP grafted PSi facilitates i) reversible chelation of the metal cations ii) large surface area to adsorb high amount of the metal and iii) relatively large pore size allowing suitable diffusion kinetics of the metal solution.
We have shown that BP-PSi was able to reversibly chelate and release metals from aqueous solutions for at least 50 consecutive times without major reduction of its capacity. Prelim-inary results show that the maximum capacity of BP-PSi filter for uranium was 13 mg/g in an aqueous solution at pH 1. The material was also able to release ca. 70 % of uranium in 1M sulphuric acid. Optimal parameters and conditions such as pH influence, ion selectivity and kinetics of the material in adsorbing and desorbing uranium will be investigated.
The work shows that it is possible to extract uranium form aqueous solutions with BP-PSi. However, at this point the cost of the material is too high for industrial applications. Further work will aim to reduce the cost of the material by employing alternative methods, such as using quartz sand or biogenic silica to produce porous silicon. The low cost BP modified PSi would be a promising material in terms of novelty and ecoefficiency for removal of uranium from contaminated water streams as chelation/adsorption is highly energy efficient process.
1268
Lappeenranta, Finland IMWA 2017Mine Water and Circular Economy
Wolkersdorfer C, Sartz L, Sillanpää M, Häkkinen A (Editors)
Mining area disturbed by acid mine drainage – Acid Vola-tile Sulphur and Sequential Extraction studies
Lívia Ribeiro de Souza, Ana Cláudia Queiroz Ladeira
Center for the Development of Nuclear Technology, CDTN, Av. Antonio Carlos 2627, Campus UFMG, Pampulha, Belo Horizonte, Brazil, CEP 31270901,
[email protected]; [email protected]
Abstract This study investigated the sulfate bacterial reduction process in sediments from a water reservoir (Águas Claras) and the Antas creek contaminated by metals from acid mine drainage (AMD). The Acid Volatile Sulphur indicated that the bacterial reduction is a relevant process in the natural attenuation of the contamination in the reservoir. However, biological adverse effects are expected for sample S1 inside the reservoir, that is likely to be toxic whilst for the sediment S4 in the river, the toxicity is uncertain. The extraction procedure (mBCR) indicated that the predominance of the U (0.4%) in the labile fraction as well as the high concentrations of Zn (0.5%) and Mn (0.7%) inside the reservoir raise concerns regarding their availability to the environment. It was observed that the contamination is concentrated in Águas Claras reservoir.
Key words AVS, sulphate reduction, BCRm, sediments, uranium, zinc, manganese
Introduction
In Brazil, acid mine drainage (AMD) occurs in a former uranium mine at Poços de Caldas Plateau and contains radionuclides and other elements, which are precipitated from the acid water by liming. However, there are two important concerns related to the AMD treat-ment: i) the removal of contaminants by liming is not so effective and ii) significant amounts of precipitate escapes from the settling tanks from the Water Treatment Unit ending up at Águas Claras reservoir. The incorporation of this material into the sediments is a key issue to determine whether the contamination will reach the Antas creek and spread to the envi-ronment.
The bioavailability of contaminants in sediments can be predicted by understanding in which mineral phases they are incorporated and in which chemical form they are presented. The occurrence of the contaminants as a metal sulphides as well as their adsorption on iron and manganese oxides are important facts that leads to a more stable sediment. Therefore, the quantification of the sulphide phases simultaneously with sequential extraction meth-ods are powerful to tools provide information about distribution, mobility and potential of migration of the contaminants to the environment (Morillo et al.. 2008; Charriau et al.. 2011; Larios et al.. 2012; Byrne et al.. 2010; Sarmiento et al.. 2009; Delgado et al.. 2011).
This study investigated the occurrence of bacterial reduction process in superficial sedi-ments from Águas Claras reservoir and Antas Creek by determining the Acid Volatile Sul-phur (AVS). In addition, the availability of the contaminants was assessed by sequential extraction tests. The sediments were characterized chemically and mineralogical and clas-sified according to their toxicity based on international criteria. It is important to stress
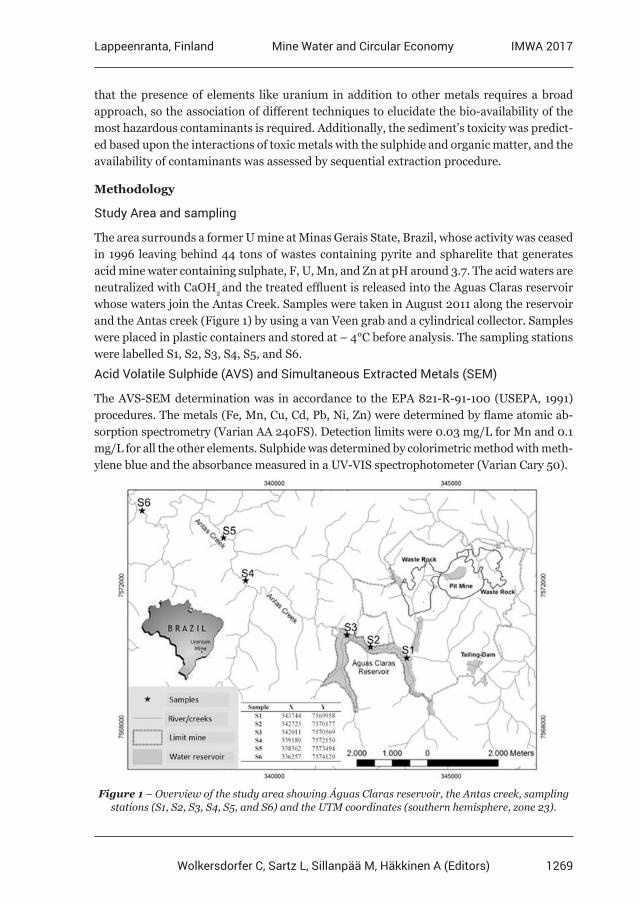
1269
Lappeenranta, Finland IMWA 2017Mine Water and Circular Economy
Wolkersdorfer C, Sartz L, Sillanpää M, Häkkinen A (Editors)
that the presence of elements like uranium in addition to other metals requires a broad approach, so the association of different techniques to elucidate the bio-availability of the most hazardous contaminants is required. Additionally, the sediment’s toxicity was predict-ed based upon the interactions of toxic metals with the sulphide and organic matter, and the availability of contaminants was assessed by sequential extraction procedure.
Methodology
Study Area and sampling
The area surrounds a former U mine at Minas Gerais State, Brazil, whose activity was ceased in 1996 leaving behind 44 tons of wastes containing pyrite and spharelite that generates acid mine water containing sulphate, F, U, Mn, and Zn at pH around 3.7. The acid waters are neutralized with CaOH2 and the treated effluent is released into the Aguas Claras reservoir whose waters join the Antas Creek. Samples were taken in August 2011 along the reservoir and the Antas creek (Figure 1) by using a van Veen grab and a cylindrical collector. Samples were placed in plastic containers and stored at – 4°C before analysis. The sampling stations were labelled S1, S2, S3, S4, S5, and S6.
Acid Volatile Sulphide (AVS) and Simultaneous Extracted Metals (SEM)
The AVS-SEM determination was in accordance to the EPA 821-R-91-100 (USEPA, 1991) procedures. The metals (Fe, Mn, Cu, Cd, Pb, Ni, Zn) were determined by flame atomic ab-sorption spectrometry (Varian AA 240FS). Detection limits were 0.03 mg/L for Mn and 0.1 mg/L for all the other elements. Sulphide was determined by colorimetric method with meth-ylene blue and the absorbance measured in a UV-VIS spectrophotometer (Varian Cary 50).
Figure 1 – Overview of the study area showing Águas Claras reservoir, the Antas creek, sampling stations (S1, S2, S3, S4, S5, and S6) and the UTM coordinates (southern hemisphere, zone 23).
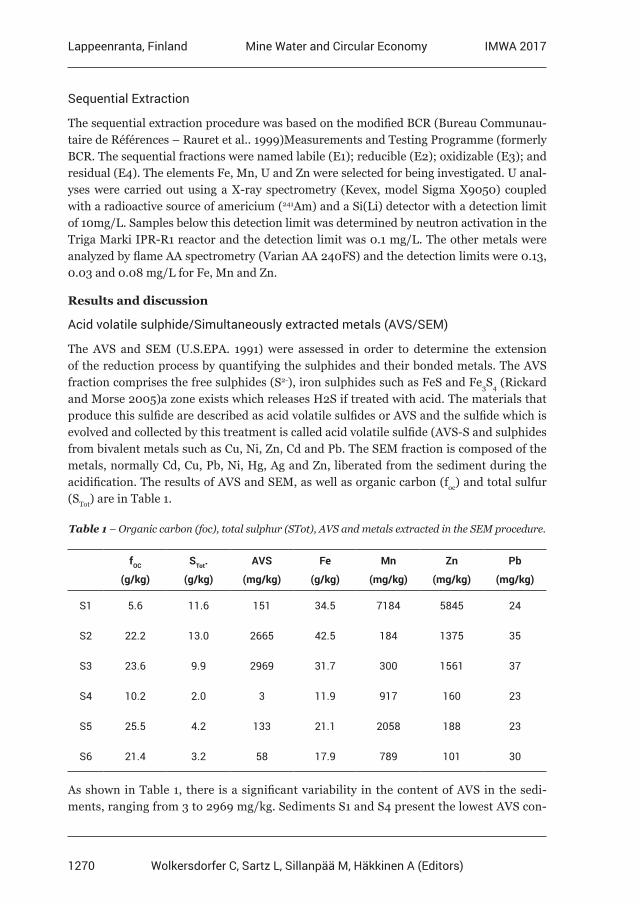
1270
Lappeenranta, Finland IMWA 2017Mine Water and Circular Economy
Wolkersdorfer C, Sartz L, Sillanpää M, Häkkinen A (Editors)
Sequential Extraction
The sequential extraction procedure was based on the modified BCR (Bureau Communau-taire de Références – Rauret et al.. 1999)Measurements and Testing Programme (formerly BCR. The sequential fractions were named labile (E1); reducible (E2); oxidizable (E3); and residual (E4). The elements Fe, Mn, U and Zn were selected for being investigated. U anal-yses were carried out using a X-ray spectrometry (Kevex, model Sigma X9050) coupled with a radioactive source of americium (241Am) and a Si(Li) detector with a detection limit of 10mg/L. Samples below this detection limit was determined by neutron activation in the Triga Marki IPR-R1 reactor and the detection limit was 0.1 mg/L. The other metals were analyzed by flame AA spectrometry (Varian AA 240FS) and the detection limits were 0.13, 0.03 and 0.08 mg/L for Fe, Mn and Zn.
Results and discussion
Acid volatile sulphide/Simultaneously extracted metals (AVS/SEM)
The AVS and SEM (U.S.EPA. 1991) were assessed in order to determine the extension of the reduction process by quantifying the sulphides and their bonded metals. The AVS fraction comprises the free sulphides (S2-), iron sulphides such as FeS and Fe3S4 (Rickard and Morse 2005)a zone exists which releases H2S if treated with acid. The materials that produce this sulfide are described as acid volatile sulfides or AVS and the sulfide which is evolved and collected by this treatment is called acid volatile sulfide (AVS-S and sulphides from bivalent metals such as Cu, Ni, Zn, Cd and Pb. The SEM fraction is composed of the metals, normally Cd, Cu, Pb, Ni, Hg, Ag and Zn, liberated from the sediment during the acidification. The results of AVS and SEM, as well as organic carbon (foc) and total sulfur (STot) are in Table 1.
Table 1 – Organic carbon (foc), total sulphur (STot), AVS and metals extracted in the SEM procedure.
fOC
(g/kg)
STot.
(g/kg)
AVS
(mg/kg)
Fe
(g/kg)
Mn
(mg/kg)
Zn
(mg/kg)
Pb
(mg/kg)
S1 5.6 11.6 151 34.5 7184 5845 24
S2 22.2 13.0 2665 42.5 184 1375 35
S3 23.6 9.9 2969 31.7 300 1561 37
S4 10.2 2.0 3 11.9 917 160 23
S5 25.5 4.2 133 21.1 2058 188 23
S6 21.4 3.2 58 17.9 789 101 30
As shown in Table 1, there is a significant variability in the content of AVS in the sedi-ments, ranging from 3 to 2969 mg/kg. Sediments S1 and S4 present the lowest AVS con-
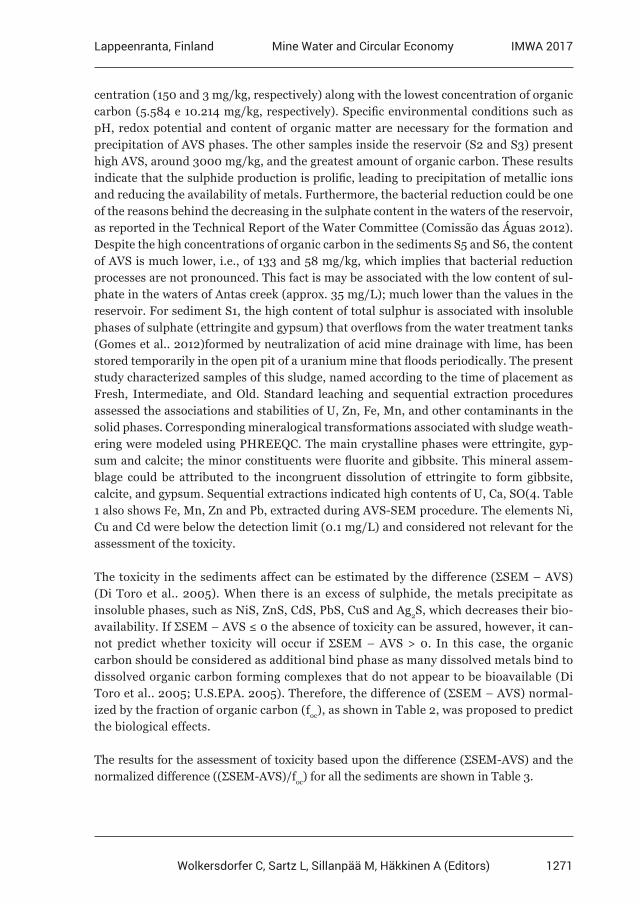
1271
Lappeenranta, Finland IMWA 2017Mine Water and Circular Economy
Wolkersdorfer C, Sartz L, Sillanpää M, Häkkinen A (Editors)
centration (150 and 3 mg/kg, respectively) along with the lowest concentration of organic carbon (5.584 e 10.214 mg/kg, respectively). Specific environmental conditions such as pH, redox potential and content of organic matter are necessary for the formation and precipitation of AVS phases. The other samples inside the reservoir (S2 and S3) present high AVS, around 3000 mg/kg, and the greatest amount of organic carbon. These results indicate that the sulphide production is prolific, leading to precipitation of metallic ions and reducing the availability of metals. Furthermore, the bacterial reduction could be one of the reasons behind the decreasing in the sulphate content in the waters of the reservoir, as reported in the Technical Report of the Water Committee (Comissão das Águas 2012). Despite the high concentrations of organic carbon in the sediments S5 and S6, the content of AVS is much lower, i.e., of 133 and 58 mg/kg, which implies that bacterial reduction processes are not pronounced. This fact is may be associated with the low content of sul-phate in the waters of Antas creek (approx. 35 mg/L); much lower than the values in the reservoir. For sediment S1, the high content of total sulphur is associated with insoluble phases of sulphate (ettringite and gypsum) that overflows from the water treatment tanks (Gomes et al.. 2012)formed by neutralization of acid mine drainage with lime, has been stored temporarily in the open pit of a uranium mine that floods periodically. The present study characterized samples of this sludge, named according to the time of placement as Fresh, Intermediate, and Old. Standard leaching and sequential extraction procedures assessed the associations and stabilities of U, Zn, Fe, Mn, and other contaminants in the solid phases. Corresponding mineralogical transformations associated with sludge weath-ering were modeled using PHREEQC. The main crystalline phases were ettringite, gyp-sum and calcite; the minor constituents were fluorite and gibbsite. This mineral assem-blage could be attributed to the incongruent dissolution of ettringite to form gibbsite, calcite, and gypsum. Sequential extractions indicated high contents of U, Ca, SO(4. Table 1 also shows Fe, Mn, Zn and Pb, extracted during AVS-SEM procedure. The elements Ni, Cu and Cd were below the detection limit (0.1 mg/L) and considered not relevant for the assessment of the toxicity.
The toxicity in the sediments affect can be estimated by the difference (ΣSEM – AVS) (Di Toro et al.. 2005). When there is an excess of sulphide, the metals precipitate as insoluble phases, such as NiS, ZnS, CdS, PbS, CuS and Ag2S, which decreases their bio-availability. If ΣSEM – AVS ≤ 0 the absence of toxicity can be assured, however, it can-not predict whether toxicity will occur if ΣSEM – AVS > 0. In this case, the organic carbon should be considered as additional bind phase as many dissolved metals bind to dissolved organic carbon forming complexes that do not appear to be bioavailable (Di Toro et al.. 2005; U.S.EPA. 2005). Therefore, the difference of (ΣSEM – AVS) normal-ized by the fraction of organic carbon (foc), as shown in Table 2, was proposed to predict the biological effects.
The results for the assessment of toxicity based upon the difference (ΣSEM-AVS) and the normalized difference ((ΣSEM-AVS)/foc) for all the sediments are shown in Table 3.
1272
Lappeenranta, Finland IMWA 2017Mine Water and Circular Economy
Wolkersdorfer C, Sartz L, Sillanpää M, Häkkinen A (Editors)
Table 3 – Results of sediment toxicity based upon the difference (ΣSEM-AVS) and the normalized difference (ΣSEM-AVS)/foc).
Sample AVS ΣSEM fOC (ΣSEM-AVS) (ΣSEM-AVS)/fOC
µmol/g µmol/g gOC/g µmol/g µmol/gOC
S1 4.70 89.40 0.006 84.70 15168
S2 83.11 21.20 0.022 - 61.91 - 2785
S3 92.58 24.05 0.024 - 68.53 - 2913
S4 0.10 2.56 0.010 2.46 241
S5 4.15 2.98 0.025 - 1.17 - 46
S6 1.82 1.70 0.021 - 0.13 - 6
gOC = gram of organic carbon
According to Table 3, the sediments S2 and S3, inside the Águas Claras reservoir, and the sediments S5 and S6 in the river were classified as non-toxic, since the difference of ΣSEM-AVS were negative. On the other hand, the sediments S1 and S4 presented positive value, i.e. (ΣSEM-AVS) > 0, and were normalized by the fraction of organic carbon (foc). According to these criteria, the sample S4 presented uncertain toxicity once the value of ΣSEM-AVS)/fOC is between 130 and 3000 µmol gOC
-1. The sediment S1 presented (ΣSEM-AVS)/fOC greater than 3000 µmol gOC
-1, which implies high risk of adverse biological effects mainly due to the high content of Zn. In general, the results show that the sulphate from the reservoir under-goes bacterial reduction producing highly insoluble sulphide, markedly the zinc, which de-crease the metals availability to the environment. Therefore, despite the high levels of total metals in most sediments, samples S2, S3, S5 and S6 were assessed as non-toxic. However,
Table 2 – Toxicity criteria for sediments based on AVS, SEM and fOC. (Adapted from USEPA, 2005).
Limit values in (µmol/goc) Predicted biological effect
ΣSEM-AVS ≤ 0 Sediment is Non-toxic
< 130 Sediment Toxicity is not likely to be caused by Cd, Cu, Pb, Ni, Ag and Zn
130 < < 3,000 Sediment Toxicity is uncertain due to Cd, Cu, Pb, Ni, Ag and Zn
> 3,000 Sediment Toxicity is likely to be caused by Cd, Cu, Pb, Ni, Ag and Zn
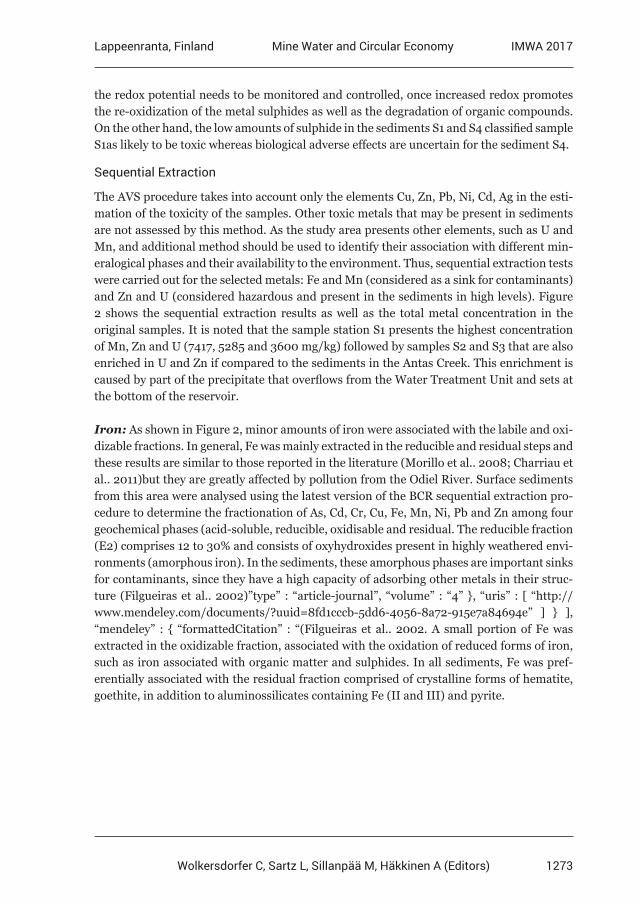
1273
Lappeenranta, Finland IMWA 2017Mine Water and Circular Economy
Wolkersdorfer C, Sartz L, Sillanpää M, Häkkinen A (Editors)
the redox potential needs to be monitored and controlled, once increased redox promotes the re-oxidization of the metal sulphides as well as the degradation of organic compounds. On the other hand, the low amounts of sulphide in the sediments S1 and S4 classified sample S1as likely to be toxic whereas biological adverse effects are uncertain for the sediment S4.
Sequential Extraction
The AVS procedure takes into account only the elements Cu, Zn, Pb, Ni, Cd, Ag in the esti-mation of the toxicity of the samples. Other toxic metals that may be present in sediments are not assessed by this method. As the study area presents other elements, such as U and Mn, and additional method should be used to identify their association with different min-eralogical phases and their availability to the environment. Thus, sequential extraction tests were carried out for the selected metals: Fe and Mn (considered as a sink for contaminants) and Zn and U (considered hazardous and present in the sediments in high levels). Figure 2 shows the sequential extraction results as well as the total metal concentration in the original samples. It is noted that the sample station S1 presents the highest concentration of Mn, Zn and U (7417, 5285 and 3600 mg/kg) followed by samples S2 and S3 that are also enriched in U and Zn if compared to the sediments in the Antas Creek. This enrichment is caused by part of the precipitate that overflows from the Water Treatment Unit and sets at the bottom of the reservoir.
Iron: As shown in Figure 2, minor amounts of iron were associated with the labile and oxi-dizable fractions. In general, Fe was mainly extracted in the reducible and residual steps and these results are similar to those reported in the literature (Morillo et al.. 2008; Charriau et al.. 2011)but they are greatly affected by pollution from the Odiel River. Surface sediments from this area were analysed using the latest version of the BCR sequential extraction pro-cedure to determine the fractionation of As, Cd, Cr, Cu, Fe, Mn, Ni, Pb and Zn among four geochemical phases (acid-soluble, reducible, oxidisable and residual. The reducible fraction (E2) comprises 12 to 30% and consists of oxyhydroxides present in highly weathered envi-ronments (amorphous iron). In the sediments, these amorphous phases are important sinks for contaminants, since they have a high capacity of adsorbing other metals in their struc-ture (Filgueiras et al.. 2002)”type” : “article-journal”, “volume” : “4” , “uris” : [ “http://www.mendeley.com/documents/?uuid=8fd1cccb-5dd6-4056-8a72-915e7a84694e” ] ], “mendeley” : “formattedCitation” : “(Filgueiras et al.. 2002. A small portion of Fe was extracted in the oxidizable fraction, associated with the oxidation of reduced forms of iron, such as iron associated with organic matter and sulphides. In all sediments, Fe was pref-erentially associated with the residual fraction comprised of crystalline forms of hematite, goethite, in addition to aluminossilicates containing Fe (II and III) and pyrite.
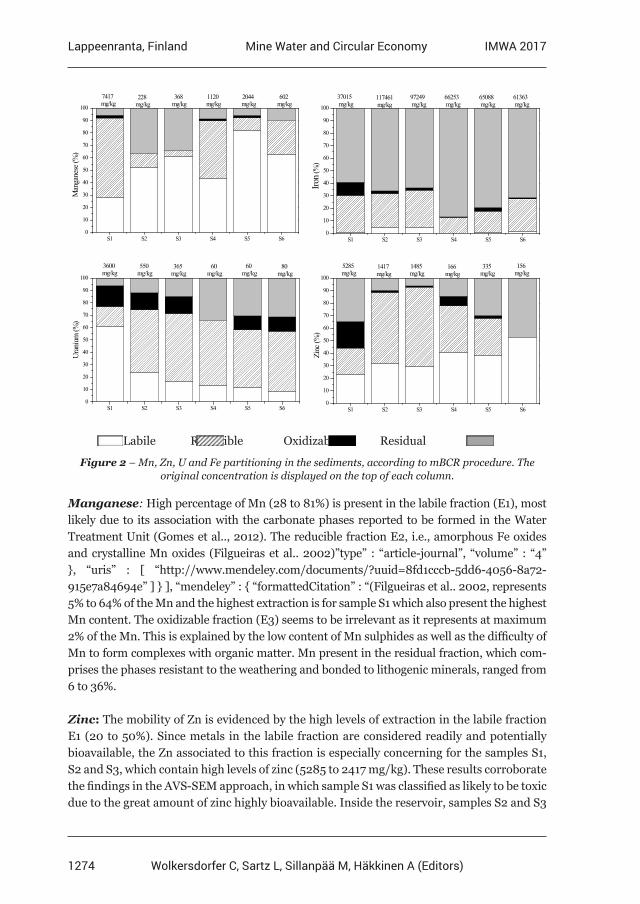
1274
Lappeenranta, Finland IMWA 2017Mine Water and Circular Economy
Wolkersdorfer C, Sartz L, Sillanpää M, Häkkinen A (Editors)
Labile Reducible Oxidizable Residual
Figure 2 – Mn, Zn, U and Fe partitioning in the sediments, according to mBCR procedure. The original concentration is displayed on the top of each column.
Manganese: High percentage of Mn (28 to 81%) is present in the labile fraction (E1), most likely due to its association with the carbonate phases reported to be formed in the Water Treatment Unit (Gomes et al.., 2012). The reducible fraction E2, i.e., amorphous Fe oxides and crystalline Mn oxides (Filgueiras et al.. 2002)”type” : “article-journal”, “volume” : “4” , “uris” : [ “http://www.mendeley.com/documents/?uuid=8fd1cccb-5dd6-4056-8a72-915e7a84694e” ] ], “mendeley” : “formattedCitation” : “(Filgueiras et al.. 2002, represents 5% to 64% of the Mn and the highest extraction is for sample S1 which also present the highest Mn content. The oxidizable fraction (E3) seems to be irrelevant as it represents at maximum 2% of the Mn. This is explained by the low content of Mn sulphides as well as the difficulty of Mn to form complexes with organic matter. Mn present in the residual fraction, which com-prises the phases resistant to the weathering and bonded to lithogenic minerals, ranged from 6 to 36%.
Zinc: The mobility of Zn is evidenced by the high levels of extraction in the labile fraction E1 (20 to 50%). Since metals in the labile fraction are considered readily and potentially bioavailable, the Zn associated to this fraction is especially concerning for the samples S1, S2 and S3, which contain high levels of zinc (5285 to 2417 mg/kg). These results corroborate the findings in the AVS-SEM approach, in which sample S1 was classified as likely to be toxic due to the great amount of zinc highly bioavailable. Inside the reservoir, samples S2 and S3
S1 S2 S3 S4 S5 S60
10
20
30
40
50
60
70
80
90
100
602 mg/kg
2044 mg/kg
1120 mg/kg
368 mg/kg
228 mg/kg
7417 mg/kg
Man
gane
se (%
)
S1 S2 S3 S4 S5 S60
10
20
30
40
50
60
70
80
90
100
61363 mg/kg
65088 mg/kg
66253 mg/kg
97249 mg/kg
117461 mg/kg
37015 mg/kg
Iron (
%)
S1 S2 S3 S4 S5 S60
10
20
30
40
50
60
70
80
90
100
80 mg/kg
60 mg/kg
60 mg/kg
365 mg/kg
550 mg/kg
3600 mg/kg
Uran
ium
(%)
S1 S2 S3 S4 S5 S60
10
20
30
40
50
60
70
80
90
100
156 mg/kg
335 mg/kg
166 mg/kg
1485 mg/kg
1417 mg/kg
5285 mg/kg
Zinc
(%)
1275
Lappeenranta, Finland IMWA 2017Mine Water and Circular Economy
Wolkersdorfer C, Sartz L, Sillanpää M, Häkkinen A (Editors)
have around 60% of total zinc extracted in the reducible fraction, mainly in the form of zinc oxide and/or adsorbed in Fe oxyhydroxides. The association of Zn in Fe–Mn oxides/hy-droxides confirms the known ability of this phase to scavenge zinc from the aqueous phase, and these phases are completely extracted during the AVS/SEM procedure. The sediment S1 is the only one to present significant amount of Zn associated with the oxidizable fraction. Since this sediment presented low content of organic matter and sulphides, Zn is probably associated with other oxidizable phases such as CRS-Fe. Despite the elevated content of organic matter in the other samples, only 2% of total zinc was extracted in the oxidizable fraction, indicating that it is not significant as binding phase. Zinc extracted in the residual fraction indicate the presence of spharelite ZnS.
Uranium: The sample S1 presented the highest extraction of U in the labile fraction, ap-prox. 60%, most likely due to the presence of calcium diuranate (CaU2O7) that overflowed from the Water Treatment Unit and settled down in the bottom of the lake (Gomes et al.. 2012)formed by neutralization of acid mine drainage with lime, has been stored temporarily in the open pit of a uranium mine that floods periodically. The present study characterized samples of this sludge, named according to the time of placement as Fresh, Intermediate, and Old. Standard leaching and sequential extraction procedures assessed the associations and stabilities of U, Zn, Fe, Mn, and other contaminants in the solid phases. Correspond-ing mineralogical transformations associated with sludge weathering were modeled using PHREEQC. The main crystalline phases were ettringite, gypsum and calcite; the minor constituents were fluorite and gibbsite. This mineral assemblage could be attributed to the incongruent dissolution of ettringite to form gibbsite, calcite, and gypsum. Sequential ex-tractions indicated high contents of U, Ca, SO(4. Minor amounts of U were extracted in the labile fraction in the other sediments, ranging from 2 to 23%. For these samples, U can be non-specifically adsorbed on the surface of clays or on Fe and Mn oxyhydroxides. The presence of the U in the labile fraction is particularly worrying as its high concentration – 3600 mg/kg in sample S1, for instance – can pose risks to the environment. However, it is interesting to note that the U content in the labile fraction decreases with distance from upstream to downstream the lake, i.e., from sample S1 to S6. In all samples except S1, most of the U is associated with the Mn and Fe oxydydroxides (step E2), most likely due to the sorption or occlusion of U in hematite (Fe2O3) and goethite (Fe3O4) (Duff et al.. 2002). The lower extraction of U in step E2 for sample S1, near 15%, is related to the low content of Fe in this sample. The U in the oxidizable fraction E3 is approx. 15%, and represents the U sorbed in the organic matter (Duff et al.. 2002) and/or the U reduced into crystalline oxides (e.g., uraninite) in an effective mechanism of bioremediation. Sample S4, the only one without U in the oxidizable fraction, is also the one that presents the lowest level of total sulfur and organic matter. Significant contents of U in the residual fraction in sediments S4, S5 and S6; around 30% is probably due to its inclusion in the crystalline iron oxides, silicates and gibbsite or as uraninite; all of them typical minerals of the region.
Conclusion
According to the AVS-SEM analyses, the formation of sulphides result in the unlikely tox-icity of the sediments S2 and S3 inside the reservoir, despite the high levels of Zn. Sequen-
1276
Lappeenranta, Finland IMWA 2017Mine Water and Circular Economy
Wolkersdorfer C, Sartz L, Sillanpää M, Häkkinen A (Editors)
tial extraction procedure indicates the presence of Zn mainly in the labile and reducible fractions. Similarly, the U was extracted mainly in the labile and reducible phases. The metals extracted in the labile fraction are the main cause of concern once they can be read-ily released in a acidic environment typical of AMD. In the light of these findings, we see that the precipitate that overflow from the Water Treatment Unit results in the enrichment of metals in the sediments of the Aguas Claras reservoir. Furthermore, the environmen-tal impact is mostly restricted to the reservoir, where the concentration and bioavailability of metals in the sediments decreases downstream. However, although it was observed the decreases their bioavailability, in order to prevent later mobilization of the metals the sed-iments should remain in anoxic conditions, thus hindering the re-dissolution of the metal sulphides. The investigation of the bioremediation process as well as the definition of the chemical availability of the contaminants can support the decision making process on the best remediation plan for the reservoir, e.g., removing the sediments or improving/moni-toring the bioremediation process.
Acknowledgement
The authors thank CAPES, FAPEMIG and CNPq – INCT-Acqua, PPM, CT Mineral- for the financial support.
References
Charriau A, Lesven L, Gao Y, Leermakers M, Baeyens W, Ouddane B, Billon, G. (2011) Trace metal behaviour in riverine sediments: Role of organic matter and sulfides. Appl Geochemistry 26:80–90. Comissão das Águas (2012) Avaliação da qualidade das águas e sedimentos das microbacias do Ribeirão das Antas e do Ribeirão de Caldas no Planalto de Poços de Caldas – Relatório Técnico da Comissão das Águas. Available at: pocosdecaldas.mg.leg.br/index.php?download=52. Accessed 25 Sep 2015Di Toro DM, McGrath JA, Hansen DJ, Berry WJ, Paquin PR, Mathew R, Wu KB, Santore, RC (2005) Predicting sediment metal toxicity using a sediment biotic ligand model: methodology and initial application. Environ Toxicol Chem 24:2410. doi: 10.1897/04-413R.1Duff MC, Coughlin JU, Hunter DB (2002) Uranium co-precipitation with iron oxide minerals. Geochim Cosmochim Acta 66:3533–3547. Filgueiras A V., Lavilla I, Bendicho C (2002) Chemical sequential extraction for metal partitioning in environmental solid samples. J Environ Monit 4:823–857. Gomes AFS, Lopez DL, Ladeira ACQ (2012) Characterization and assessment of chemical modifications of metal-bearing sludges arising from unsuitable disposal. J Hazard Mater 199-200:418–25. Rauret G, López-Sánchez JF, Sahuquillo A, Rubio R, Davidson C, Ure AM, Quevauviller P. (1999) Improvement of the BCR three step sequential extraction procedure prior to the certification of new sediment and soil reference materials. J Environ Monit 1:57–61.Sarmiento AM, Olías M, Nieto JM, Cánovas CR, Delgado J (2009) Natural attenuation processes in two water reservoirs receiving acid mine drainage. Sci Total Environ 407:2051–62. U.S.EPA. (1991) Draft Analytical Method for Determination of Acid Volatile Sulfide and Selected Simultaneously Extractable Metals in Sediment. EPA-821-R-91-100. Washigton, DC.
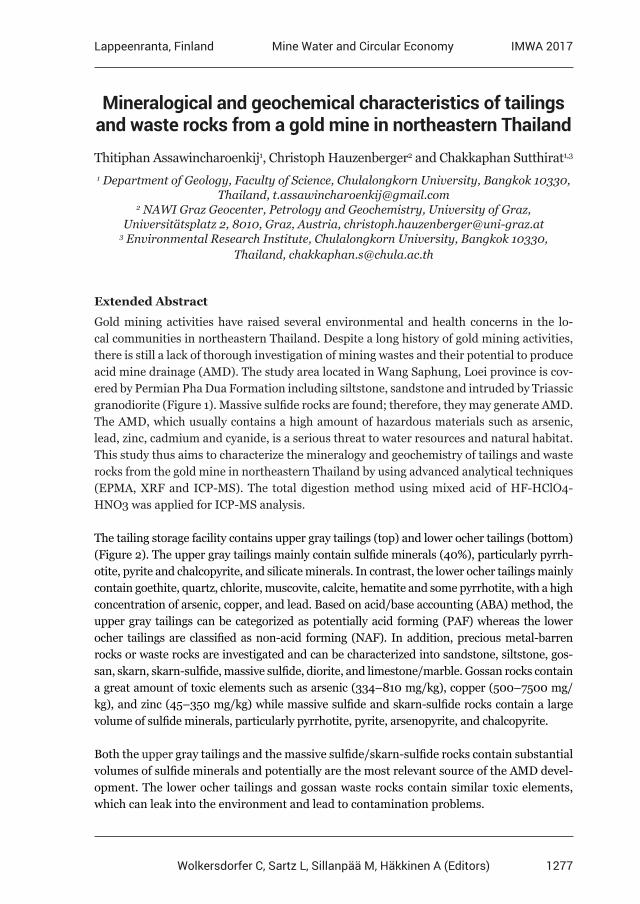
1277
Lappeenranta, Finland IMWA 2017Mine Water and Circular Economy
Wolkersdorfer C, Sartz L, Sillanpää M, Häkkinen A (Editors)
Mineralogical and geochemical characteristics of tailings and waste rocks from a gold mine in northeastern Thailand
Thitiphan Assawincharoenkij1, Christoph Hauzenberger2 and Chakkaphan Sutthirat1,3 1 Department of Geology, Faculty of Science, Chulalongkorn University, Bangkok 10330,
Thailand, [email protected] 2 NAWI Graz Geocenter, Petrology and Geochemistry, University of Graz,
Universitätsplatz 2, 8010, Graz, Austria, [email protected] 3 Environmental Research Institute, Chulalongkorn University, Bangkok 10330,
Thailand, [email protected]
Extended Abstract
Gold mining activities have raised several environmental and health concerns in the lo-cal communities in northeastern Thailand. Despite a long history of gold mining activities, there is still a lack of thorough investigation of mining wastes and their potential to produce acid mine drainage (AMD). The study area located in Wang Saphung, Loei province is cov-ered by Permian Pha Dua Formation including siltstone, sandstone and intruded by Triassic granodiorite (Figure 1). Massive sulfide rocks are found; therefore, they may generate AMD. The AMD, which usually contains a high amount of hazardous materials such as arsenic, lead, zinc, cadmium and cyanide, is a serious threat to water resources and natural habitat. This study thus aims to characterize the mineralogy and geochemistry of tailings and waste rocks from the gold mine in northeastern Thailand by using advanced analytical techniques (EPMA, XRF and ICP-MS). The total digestion method using mixed acid of HF-HClO4-HNO3 was applied for ICP-MS analysis.
The tailing storage facility contains upper gray tailings (top) and lower ocher tailings (bottom) (Figure 2). The upper gray tailings mainly contain sulfide minerals (40%), particularly pyrrh-otite, pyrite and chalcopyrite, and silicate minerals. In contrast, the lower ocher tailings mainly contain goethite, quartz, chlorite, muscovite, calcite, hematite and some pyrrhotite, with a high concentration of arsenic, copper, and lead. Based on acid/base accounting (ABA) method, the upper gray tailings can be categorized as potentially acid forming (PAF) whereas the lower ocher tailings are classified as non-acid forming (NAF). In addition, precious metal-barren rocks or waste rocks are investigated and can be characterized into sandstone, siltstone, gos-san, skarn, skarn-sulfide, massive sulfide, diorite, and limestone/marble. Gossan rocks contain a great amount of toxic elements such as arsenic (334–810 mg/kg), copper (500–7500 mg/kg), and zinc (45–350 mg/kg) while massive sulfide and skarn-sulfide rocks contain a large volume of sulfide minerals, particularly pyrrhotite, pyrite, arsenopyrite, and chalcopyrite.
Both the upper gray tailings and the massive sulfide/skarn-sulfide rocks contain substantial volumes of sulfide minerals and potentially are the most relevant source of the AMD devel-opment. The lower ocher tailings and gossan waste rocks contain similar toxic elements, which can leak into the environment and lead to contamination problems.
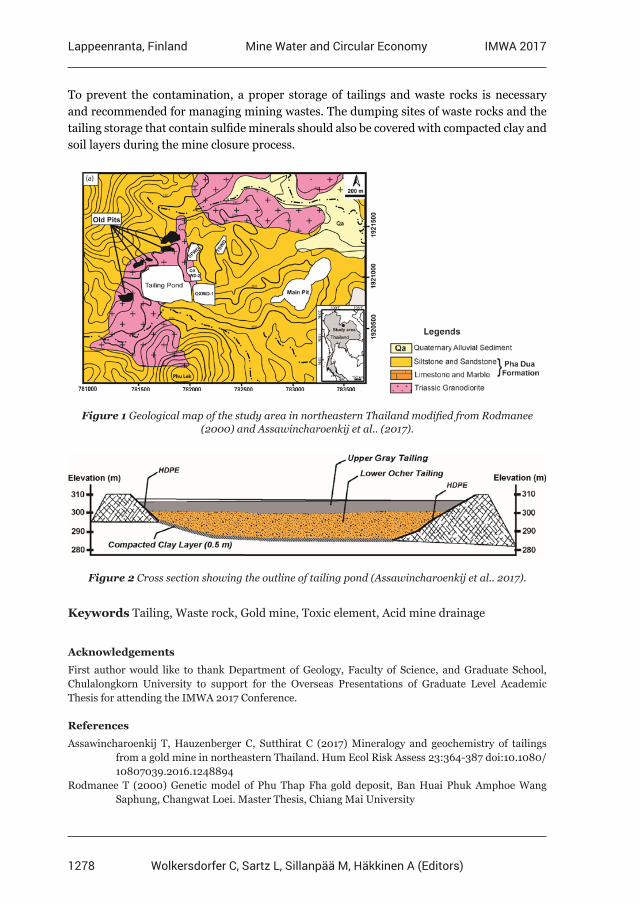
1278
Lappeenranta, Finland IMWA 2017Mine Water and Circular Economy
Wolkersdorfer C, Sartz L, Sillanpää M, Häkkinen A (Editors)
To prevent the contamination, a proper storage of tailings and waste rocks is necessary and recommended for managing mining wastes. The dumping sites of waste rocks and the tailing storage that contain sulfide minerals should also be covered with compacted clay and soil layers during the mine closure process.
Figure 1 Geological map of the study area in northeastern Thailand modified from Rodmanee (2000) and Assawincharoenkij et al.. (2017).
Figure 2 Cross section showing the outline of tailing pond (Assawincharoenkij et al.. 2017).
Keywords Tailing, Waste rock, Gold mine, Toxic element, Acid mine drainage
Acknowledgements
First author would like to thank Department of Geology, Faculty of Science, and Graduate School, Chulalongkorn University to support for the Overseas Presentations of Graduate Level Academic Thesis for attending the IMWA 2017 Conference.
References
Assawincharoenkij T, Hauzenberger C, Sutthirat C (2017) Mineralogy and geochemistry of tailings from a gold mine in northeastern Thailand. Hum Ecol Risk Assess 23:364-387 doi:10.1080/ 10807039.2016.1248894Rodmanee T (2000) Genetic model of Phu Thap Fha gold deposit, Ban Huai Phuk Amphoe Wang Saphung, Changwat Loei. Master Thesis, Chiang Mai University
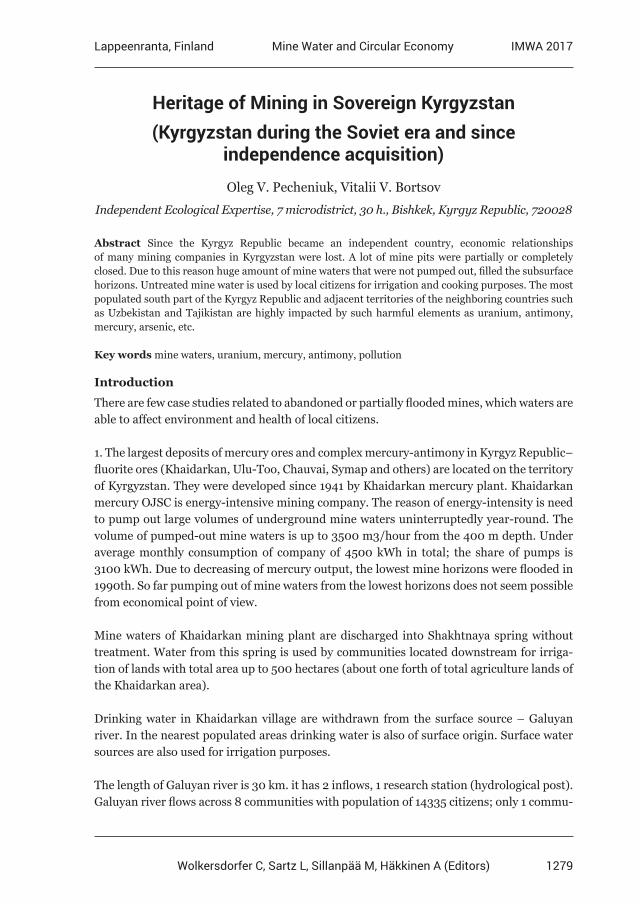
1279
Lappeenranta, Finland IMWA 2017Mine Water and Circular Economy
Wolkersdorfer C, Sartz L, Sillanpää M, Häkkinen A (Editors)
Heritage of Mining in Sovereign Kyrgyzstan (Kyrgyzstan during the Soviet era and since
independence acquisition)
Oleg V. Pecheniuk, Vitalii V. Bortsov
Independent Ecological Expertise, 7 microdistrict, 30 h., Bishkek, Kyrgyz Republic, 720028
Abstract Since the Kyrgyz Republic became an independent country, economic relationships of many mining companies in Kyrgyzstan were lost. A lot of mine pits were partially or completely closed. Due to this reason huge amount of mine waters that were not pumped out, filled the subsurface horizons. Untreated mine water is used by local citizens for irrigation and cooking purposes. The most populated south part of the Kyrgyz Republic and adjacent territories of the neighboring countries such as Uzbekistan and Tajikistan are highly impacted by such harmful elements as uranium, antimony, mercury, arsenic, etc.
Key words mine waters, uranium, mercury, antimony, pollution
Introduction
There are few case studies related to abandoned or partially flooded mines, which waters are able to affect environment and health of local citizens.
1. The largest deposits of mercury ores and complex mercury-antimony in Kyrgyz Republic– fluorite ores (Khaidarkan, Ulu-Too, Chauvai, Symap and others) are located on the territory of Kyrgyzstan. They were developed since 1941 by Khaidarkan mercury plant. Khaidarkan mercury OJSC is energy-intensive mining company. The reason of energy-intensity is need to pump out large volumes of underground mine waters uninterruptedly year-round. The volume of pumped-out mine waters is up to 3500 m3/hour from the 400 m depth. Under average monthly consumption of company of 4500 kWh in total; the share of pumps is 3100 kWh. Due to decreasing of mercury output, the lowest mine horizons were flooded in 1990th. So far pumping out of mine waters from the lowest horizons does not seem possible from economical point of view.
Mine waters of Khaidarkan mining plant are discharged into Shakhtnaya spring without treatment. Water from this spring is used by communities located downstream for irriga-tion of lands with total area up to 500 hectares (about one forth of total agriculture lands of the Khaidarkan area).
Drinking water in Khaidarkan village are withdrawn from the surface source – Galuyan river. In the nearest populated areas drinking water is also of surface origin. Surface water sources are also used for irrigation purposes.
The length of Galuyan river is 30 km. it has 2 inflows, 1 research station (hydrological post). Galuyan river flows across 8 communities with population of 14335 citizens; only 1 commu-
1280
Lappeenranta, Finland IMWA 2017Mine Water and Circular Economy
Wolkersdorfer C, Sartz L, Sillanpää M, Häkkinen A (Editors)
nity has water supply system. There is no long-term data on river flow. Water of Galuyan river is the source of water intake for Khaidarkan village water supply pipeline. Mercury concentrations in the soil of Galuyan river basin on the area of the rural water supply facili-ties (and below at the distance from 2 to 10 km) are as follows:
Figure 1 Mine waters, Jalalabad Oblast, Kyrgyzstan
Table 1 Water quality analyses (Galuyan river)
Concentration in samples analyzed (Hg) Average value (Hg) MAC (KR) (water supply)(Hg)
0,057 – 0,1 µg/l 0,058 µg/l 0,0005 mg/l or 0,50 µg/l
Table 2 Soil quality analyses (Galuyan river basin)
Concentration in samples analyzed(Hg)
Average value (Hg)
Background values for soil of studied area (Hg)
0,11 – 0,85 mg/kg 0,39 mg/kg 0,39 mg/kg
Table 3 Water quality analyses (random sampling points on the sites of Khaidarkan mercury plant)
Concentration in samples analyzed(Hg)
MAC (KR) overlimits(Hg)
Background values for Galuyan river(Hg)
0,27 – 5,58 µg/l exceeds 5,4 – 111,6 times 0,058 µg/l
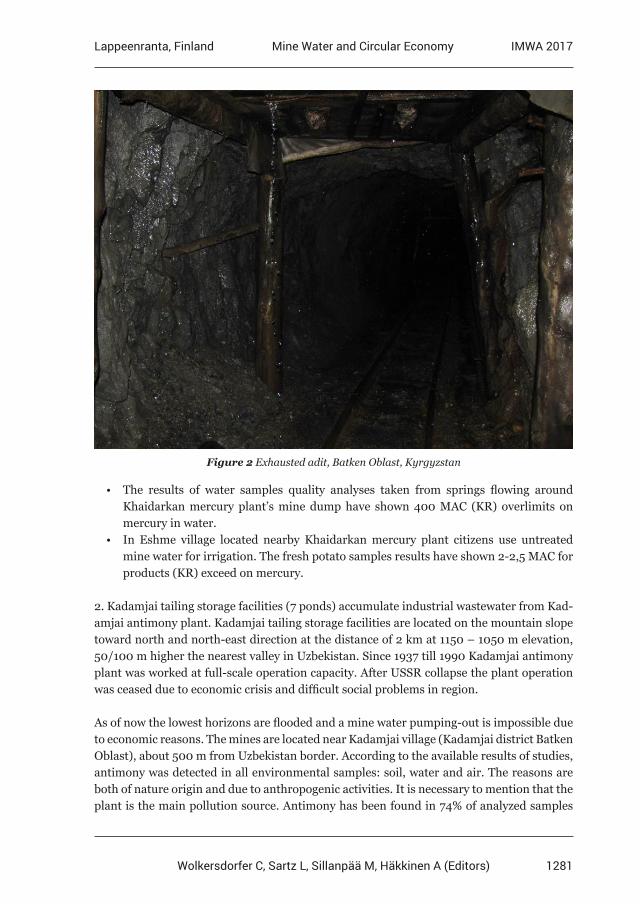
1281
Lappeenranta, Finland IMWA 2017Mine Water and Circular Economy
Wolkersdorfer C, Sartz L, Sillanpää M, Häkkinen A (Editors)
Figure 2 Exhausted adit, Batken Oblast, Kyrgyzstan
• The results of water samples quality analyses taken from springs flowing around Khaidarkan mercury plant’s mine dump have shown 400 MAC (KR) overlimits on mercury in water.
• In Eshme village located nearby Khaidarkan mercury plant citizens use untreated mine water for irrigation. The fresh potato samples results have shown 2-2,5 MAC for products (KR) exceed on mercury.
2. Kadamjai tailing storage facilities (7 ponds) accumulate industrial wastewater from Kad-amjai antimony plant. Kadamjai tailing storage facilities are located on the mountain slope toward north and north-east direction at the distance of 2 km at 1150 – 1050 m elevation, 50/100 m higher the nearest valley in Uzbekistan. Since 1937 till 1990 Kadamjai antimony plant was worked at full-scale operation capacity. After USSR collapse the plant operation was ceased due to economic crisis and difficult social problems in region.
As of now the lowest horizons are flooded and a mine water pumping-out is impossible due to economic reasons. The mines are located near Kadamjai village (Kadamjai district Batken Oblast), about 500 m from Uzbekistan border. According to the available results of studies, antimony was detected in all environmental samples: soil, water and air. The reasons are both of nature origin and due to anthropogenic activities. It is necessary to mention that the plant is the main pollution source. Antimony has been found in 74% of analyzed samples
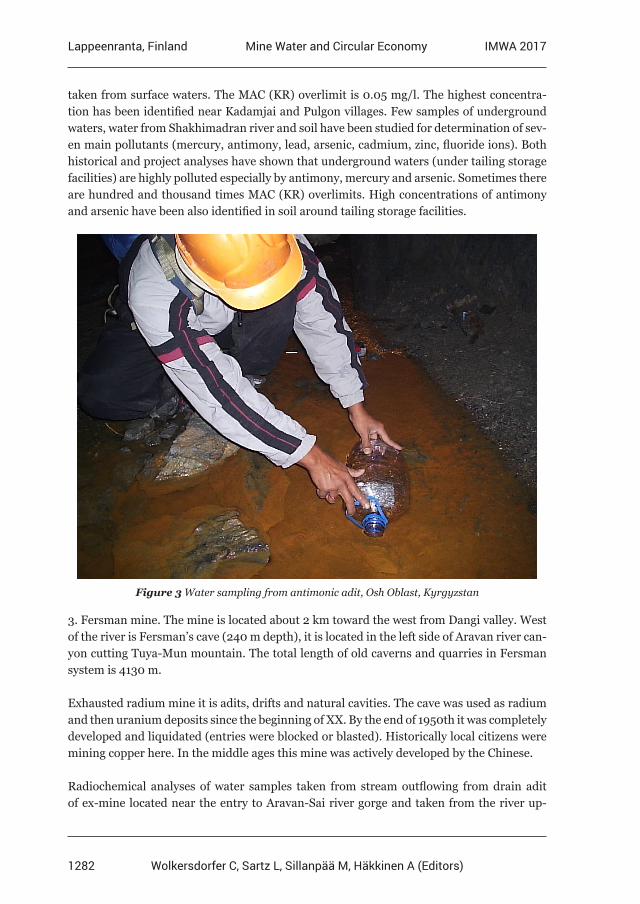
1282
Lappeenranta, Finland IMWA 2017Mine Water and Circular Economy
Wolkersdorfer C, Sartz L, Sillanpää M, Häkkinen A (Editors)
taken from surface waters. The MAC (KR) overlimit is 0.05 mg/l. The highest concentra-tion has been identified near Kadamjai and Pulgon villages. Few samples of underground waters, water from Shakhimadran river and soil have been studied for determination of sev-en main pollutants (mercury, antimony, lead, arsenic, cadmium, zinc, fluoride ions). Both historical and project analyses have shown that underground waters (under tailing storage facilities) are highly polluted especially by antimony, mercury and arsenic. Sometimes there are hundred and thousand times MAC (KR) overlimits. High concentrations of antimony and arsenic have been also identified in soil around tailing storage facilities.
Figure 3 Water sampling from antimonic adit, Osh Oblast, Kyrgyzstan
3. Fersman mine. The mine is located about 2 km toward the west from Dangi valley. West of the river is Fersman’s cave (240 m depth), it is located in the left side of Aravan river can-yon cutting Tuya-Mun mountain. The total length of old caverns and quarries in Fersman system is 4130 m.
Exhausted radium mine it is adits, drifts and natural cavities. The cave was used as radium and then uranium deposits since the beginning of XX. By the end of 1950th it was completely developed and liquidated (entries were blocked or blasted). Historically local citizens were mining copper here. In the middle ages this mine was actively developed by the Chinese.
Radiochemical analyses of water samples taken from stream outflowing from drain adit of ex-mine located near the entry to Aravan-Sai river gorge and taken from the river up-
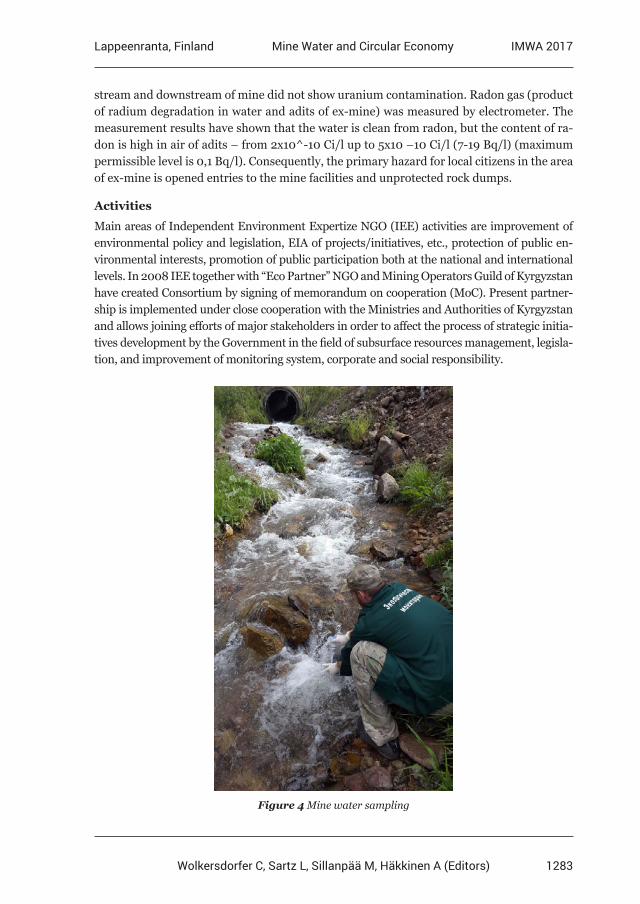
1283
Lappeenranta, Finland IMWA 2017Mine Water and Circular Economy
Wolkersdorfer C, Sartz L, Sillanpää M, Häkkinen A (Editors)
stream and downstream of mine did not show uranium contamination. Radon gas (product of radium degradation in water and adits of ex-mine) was measured by electrometer. The measurement results have shown that the water is clean from radon, but the content of ra-don is high in air of adits – from 2х10^-10 Ci/l up to 5х10 –10 Ci/l (7-19 Bq/l) (maximum permissible level is 0,1 Bq/l). Consequently, the primary hazard for local citizens in the area of ex-mine is opened entries to the mine facilities and unprotected rock dumps.
Activities
Main areas of Independent Environment Expertize NGO (IEE) activities are improvement of environmental policy and legislation, EIA of projects/initiatives, etc., protection of public en-vironmental interests, promotion of public participation both at the national and international levels. In 2008 IEE together with “Eco Partner” NGO and Mining Operators Guild of Kyrgyzstan have created Consortium by signing of memorandum on cooperation (MoC). Present partner-ship is implemented under close cooperation with the Ministries and Authorities of Kyrgyzstan and allows joining efforts of major stakeholders in order to affect the process of strategic initia-tives development by the Government in the field of subsurface resources management, legisla-tion, and improvement of monitoring system, corporate and social responsibility.
Figure 4 Mine water sampling
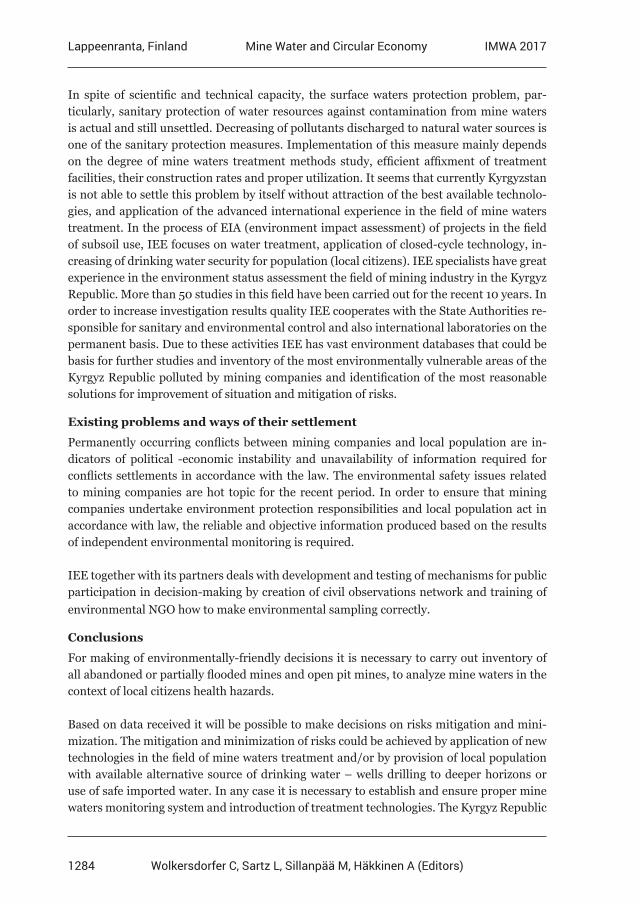
1284
Lappeenranta, Finland IMWA 2017Mine Water and Circular Economy
Wolkersdorfer C, Sartz L, Sillanpää M, Häkkinen A (Editors)
In spite of scientific and technical capacity, the surface waters protection problem, par-ticularly, sanitary protection of water resources against contamination from mine waters is actual and still unsettled. Decreasing of pollutants discharged to natural water sources is one of the sanitary protection measures. Implementation of this measure mainly depends on the degree of mine waters treatment methods study, efficient affixment of treatment facilities, their construction rates and proper utilization. It seems that currently Kyrgyzstan is not able to settle this problem by itself without attraction of the best available technolo-gies, and application of the advanced international experience in the field of mine waters treatment. In the process of EIA (environment impact assessment) of projects in the field of subsoil use, IEE focuses on water treatment, application of closed-cycle technology, in-creasing of drinking water security for population (local citizens). IEE specialists have great experience in the environment status assessment the field of mining industry in the Kyrgyz Republic. More than 50 studies in this field have been carried out for the recent 10 years. In order to increase investigation results quality IEE cooperates with the State Authorities re-sponsible for sanitary and environmental control and also international laboratories on the permanent basis. Due to these activities IEE has vast environment databases that could be basis for further studies and inventory of the most environmentally vulnerable areas of the Kyrgyz Republic polluted by mining companies and identification of the most reasonable solutions for improvement of situation and mitigation of risks.
Existing problems and ways of their settlement
Permanently occurring conflicts between mining companies and local population are in-dicators of political -economic instability and unavailability of information required for conflicts settlements in accordance with the law. The environmental safety issues related to mining companies are hot topic for the recent period. In order to ensure that mining companies undertake environment protection responsibilities and local population act in accordance with law, the reliable and objective information produced based on the results of independent environmental monitoring is required.
IEE together with its partners deals with development and testing of mechanisms for public participation in decision-making by creation of civil observations network and training of environmental NGO how to make environmental sampling correctly.
Conclusions
For making of environmentally-friendly decisions it is necessary to carry out inventory of all abandoned or partially flooded mines and open pit mines, to analyze mine waters in the context of local citizens health hazards.
Based on data received it will be possible to make decisions on risks mitigation and mini-mization. The mitigation and minimization of risks could be achieved by application of new technologies in the field of mine waters treatment and/or by provision of local population with available alternative source of drinking water – wells drilling to deeper horizons or use of safe imported water. In any case it is necessary to establish and ensure proper mine waters monitoring system and introduction of treatment technologies. The Kyrgyz Republic
1285
Lappeenranta, Finland IMWA 2017Mine Water and Circular Economy
Wolkersdorfer C, Sartz L, Sillanpää M, Häkkinen A (Editors)
needs in an attraction of the best available technologies and we are ready to provide plat-form for pilot projects on mine waters treatment for ensuring of environmental security.
Acknowledgements
Hereby authors thank the Finnish Environment Institute for support in preparation of present material and participation in IMWA 2017.
References
The State Agency of Environment Protection and Forestry under the Government of the Kyrgyz Republic, (2009) Social and Economic Assessment of Primary Mercury Production at Khaidarkan mercury plantPogodin S.A., Libman E.P, (1971) “How Soviet Radium was Developed”. Moscow, AtomisdatA.M. Djusmamatov, M.T. Omurzakov, I.I. Karavshkin. Osh Oblast center of the State sanitary and Epidemiological Supervision Center. (2016) Radium mine Tuya-Muyun on the south of Kyrgyzstan. History and nowadays
1286
Lappeenranta, Finland IMWA 2017Mine Water and Circular Economy
Wolkersdorfer C, Sartz L, Sillanpää M, Häkkinen A (Editors)
Thermal infrared remote sensing in assessing ground/surface water resources related to the Hannukainen
mining development site, Northern Finland
Anne Rautio, Kirsti Korkka-Niemi, Veli-Pekka Salonen
Department of Geosciences and Geography, P.O. Box 64, University of Helsinki, FI-00014, Helsinki, Finland, [email protected]
Abstract The potential impacts of mining activities are often connected with groundwater and surface water systems, as well as their interactions, which may be inadequately understood. Thermal infrared remote sensing was found to be a highly applicable method to indicate the active connections of groundwater and surface water resources in our study area, and could be an applicable method for use both in baseline studies and later in environmental monitoring. This research provided new insights into water management in subarctic environments, and the results could be used to locate mining infrastructure in areas with special concerns over water related issues.
Key words thermal infrared (TIR), groundwater, surface water, interactions, mining activities
Introduction
Environmental issues are playing an increasingly important role in planning large-scale mining activities, where potential impacts are often related to water management and wa-ter-related issues. This is especially the case in areas where the mining development sites host complicated aquifer systems with notable connections to natural surface water bodies.
Hannukainen is an old mining area in Northern Finland, and there are plans to restart the mining of iron oxide copper gold (IOCG) ore deposits within the next couple of years. The preliminary plans include a processing plant and tailings management facility (TMF) for housing 11.1 Mt of tailings with a high sulphur grade having the potential to produce acid mine drainage (AMD) (SRK 2014). One of the alternative areas for the new mining activities, option (1A), is surrounded by three valuable and vulnerable rivers (Valkeajoki, Äkäsjoki and Kuerjoki) and three brooks (Kivivuopionoja W, Kivivuopionoja N and Laurinoja) (fig. 1). The Quaternary sediments are exceptionally thick and permeable, hosting large groundwa-ter reserves with complex groundwater flow conditions (Salonen et al.. 2014a, b). Therefore, it is essential to understand the interactions between surface water and groundwater for the proactive design and planning of mining activities in the sensitive study area.
Low-altitude helicopter-based thermal infrared (TIR) imagery has proved to be a useful and applicable tool to locate groundwater discharging into terrestrial and aquatic environments at different scales (local, watershed) under favourable imagery conditions, i.e. when a suffi-cient temperature contrast exists between the groundwater and soil surface or surface water (Torgersen et al.. 2001, Dugdale et al.. 2013, Rautio et al.. 2015). The technical develop-ments of TIR cameras and unmanned aerial vehicles (UAVs), as well as lowered acquisition costs, have increasingly enabled their utilization in research.
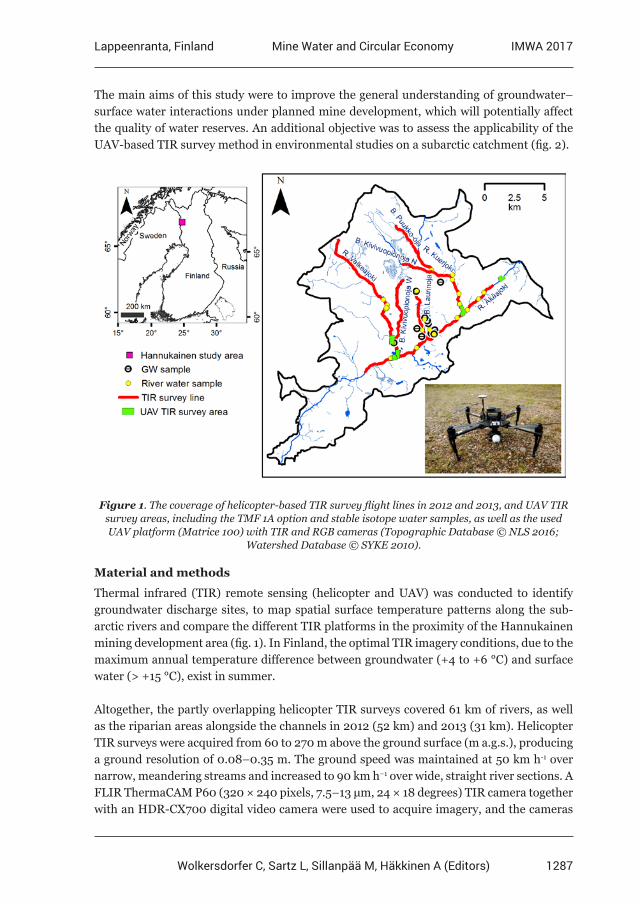
1287
Lappeenranta, Finland IMWA 2017Mine Water and Circular Economy
Wolkersdorfer C, Sartz L, Sillanpää M, Häkkinen A (Editors)
The main aims of this study were to improve the general understanding of groundwater–surface water interactions under planned mine development, which will potentially affect the quality of water reserves. An additional objective was to assess the applicability of the UAV-based TIR survey method in environmental studies on a subarctic catchment (fig. 2).
Figure 1. The coverage of helicopter-based TIR survey flight lines in 2012 and 2013, and UAV TIR survey areas, including the TMF 1A option and stable isotope water samples, as well as the used UAV platform (Matrice 100) with TIR and RGB cameras (Topographic Database © NLS 2016;
Watershed Database © SYKE 2010).
Material and methods
Thermal infrared (TIR) remote sensing (helicopter and UAV) was conducted to identify groundwater discharge sites, to map spatial surface temperature patterns along the sub-arctic rivers and compare the different TIR platforms in the proximity of the Hannukainen mining development area (fig. 1). In Finland, the optimal TIR imagery conditions, due to the maximum annual temperature difference between groundwater (+4 to +6 °C) and surface water (> +15 °C), exist in summer.
Altogether, the partly overlapping helicopter TIR surveys covered 61 km of rivers, as well as the riparian areas alongside the channels in 2012 (52 km) and 2013 (31 km). Helicopter TIR surveys were acquired from 60 to 270 m above the ground surface (m a.g.s.), producing a ground resolution of 0.08–0.35 m. The ground speed was maintained at 50 km h-1 over narrow, meandering streams and increased to 90 km h−1 over wide, straight river sections. A FLIR ThermaCAM P60 (320 × 240 pixels, 7.5–13 μm, 24 × 18 degrees) TIR camera together with an HDR-CX700 digital video camera were used to acquire imagery, and the cameras
1288
Lappeenranta, Finland IMWA 2017Mine Water and Circular Economy
Wolkersdorfer C, Sartz L, Sillanpää M, Häkkinen A (Editors)
were held in a near-vertical position on the side of the helicopter. The acquisition time and the position were tagged into the digital image files from a built-in GPS. The data collection of thermal and digital video cameras was synchronized to the nearest second to correlate the thermal and visible band imagery during post-flight image processing. The FLIR Ther-maCAM P60 was capable of detecting temperature differences of 0.08 ˚C with an accuracy of ±2.0 ˚C or ±2.0% of the reading.
UAV-TIR (fig. 1) consisted of a Matrice 100 platform (DJI) with a Xenmuse X3 gimbal and camera (DJI) and a FLIR TAU2 640 TIR camera integrated with a ThermalCapture module (TeAx Technology UG). The FLIR TAU2 640 has a pixel resolution of 640 x 512, a spec-tral range of 7.5–13.5 µm and a field of view of 45° x 37°. The FLIR TAU2 640 is capable of detecting temperature differences of ±0.05 ˚C with an accuracy of ±5.0 ˚C or 5.0% of the reading, as reported by the manufacturer. An UAV-TIR survey was acquired from 100 m above the ground surface (m a.g.s.) and the ground speed was approximately 3.5 m s-1 following premeditated flight route points. Thermal images were collected digitally and re-corded from the sensor to the ThermalCapture at a rate of 8 frames s-1, which guaranteed 75% overlap between the image frames. The thermal image frames were mosaicked and georeferenced with Pix4D software in post-processing of the survey data. The flight altitude of 100 m a.g.s. produced a ground resolution of 13 cm and the UAV-TIR survey covered the river and wetland areas of approximately 1.6 km2 (fig. 1). In addition, the stable isotopic compositions (δD, δ18O) were used as tracers to verify the observed groundwater discharge into the river system. When the end members differ suf-ficiently, the stable isotopic composition can be applied in groundwater−surface water in-teraction studies (Rautio and Korkka-Niemi 2015; Rautio et al.. 2015). The δ18O and δD compositions were analysed from a total of 33 samples collected during the field campaigns in 2011, 2012 and 2013 (fig. 1). The samples were analysed with a Picarro L2120-i analyser at the University of Helsinki.
Results
Based on low temperature anomalies detected in the helicopter TIR survey, more than 500 groundwater discharge sites were located along the studied river and brooks. Moreover, the longitudinal minimum radiant temperature (Tminr) patterns of the studied rivers were highly variable. The River Valkeajoki and the brook Kivivuopionoja W were cold tributaries (approximately 10 ˚C average Tminr), suggesting a strong groundwater influence and a hy-draulic connection with underlying aquifers. The River Kuerjoki also had a relatively cool stream (approximately 13 C average Tminr), suggesting some groundwater component in the river flow. The δ18O and δD compositions revealed differences between the studied rivers and supported the TIR results concerning the groundwater component in the studied rivers (Fig. 2). The UAV-TIR revealed low temperature anomalies in the same locations as the helicopter TIR surveys, but in more detail.
Thermal anomalies were classified into three categories: (1) discrete anomalies, (2) cold creeks and tributaries discharging into a main brook/river channel, and (3) diffuse anoma-
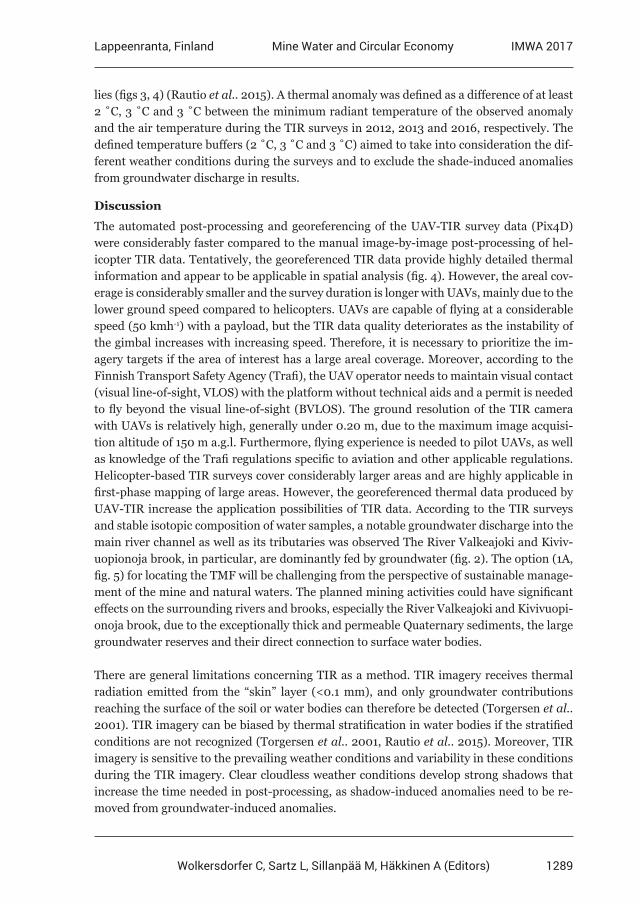
1289
Lappeenranta, Finland IMWA 2017Mine Water and Circular Economy
Wolkersdorfer C, Sartz L, Sillanpää M, Häkkinen A (Editors)
lies (figs 3, 4) (Rautio et al.. 2015). A thermal anomaly was defined as a difference of at least 2 ˚C, 3 ˚C and 3 ˚C between the minimum radiant temperature of the observed anomaly and the air temperature during the TIR surveys in 2012, 2013 and 2016, respectively. The defined temperature buffers (2 ˚C, 3 ˚C and 3 ˚C) aimed to take into consideration the dif-ferent weather conditions during the surveys and to exclude the shade-induced anomalies from groundwater discharge in results.
Discussion
The automated post-processing and georeferencing of the UAV-TIR survey data (Pix4D) were considerably faster compared to the manual image-by-image post-processing of hel-icopter TIR data. Tentatively, the georeferenced TIR data provide highly detailed thermal information and appear to be applicable in spatial analysis (fig. 4). However, the areal cov-erage is considerably smaller and the survey duration is longer with UAVs, mainly due to the lower ground speed compared to helicopters. UAVs are capable of flying at a considerable speed (50 kmh-1) with a payload, but the TIR data quality deteriorates as the instability of the gimbal increases with increasing speed. Therefore, it is necessary to prioritize the im-agery targets if the area of interest has a large areal coverage. Moreover, according to the Finnish Transport Safety Agency (Trafi), the UAV operator needs to maintain visual contact (visual line-of-sight, VLOS) with the platform without technical aids and a permit is needed to fly beyond the visual line-of-sight (BVLOS). The ground resolution of the TIR camera with UAVs is relatively high, generally under 0.20 m, due to the maximum image acquisi-tion altitude of 150 m a.g.l. Furthermore, flying experience is needed to pilot UAVs, as well as knowledge of the Trafi regulations specific to aviation and other applicable regulations. Helicopter-based TIR surveys cover considerably larger areas and are highly applicable in first-phase mapping of large areas. However, the georeferenced thermal data produced by UAV-TIR increase the application possibilities of TIR data. According to the TIR surveys and stable isotopic composition of water samples, a notable groundwater discharge into the main river channel as well as its tributaries was observed The River Valkeajoki and Kiviv-uopionoja brook, in particular, are dominantly fed by groundwater (fig. 2). The option (1A, fig. 5) for locating the TMF will be challenging from the perspective of sustainable manage-ment of the mine and natural waters. The planned mining activities could have significant effects on the surrounding rivers and brooks, especially the River Valkeajoki and Kivivuopi-onoja brook, due to the exceptionally thick and permeable Quaternary sediments, the large groundwater reserves and their direct connection to surface water bodies.
There are general limitations concerning TIR as a method. TIR imagery receives thermal radiation emitted from the “skin” layer (<0.1 mm), and only groundwater contributions reaching the surface of the soil or water bodies can therefore be detected (Torgersen et al.. 2001). TIR imagery can be biased by thermal stratification in water bodies if the stratified conditions are not recognized (Torgersen et al.. 2001, Rautio et al.. 2015). Moreover, TIR imagery is sensitive to the prevailing weather conditions and variability in these conditions during the TIR imagery. Clear cloudless weather conditions develop strong shadows that increase the time needed in post-processing, as shadow-induced anomalies need to be re-moved from groundwater-induced anomalies.
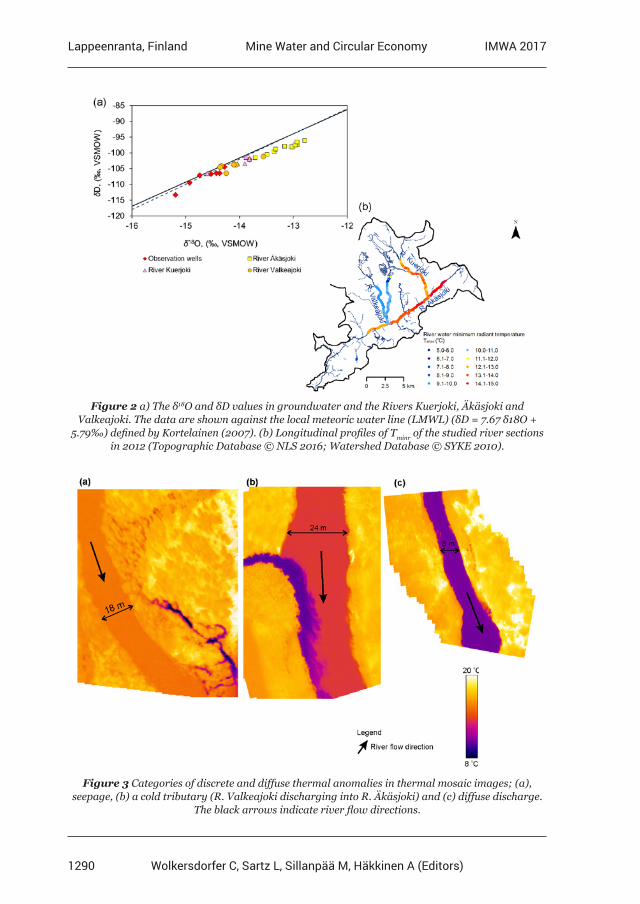
1290
Lappeenranta, Finland IMWA 2017Mine Water and Circular Economy
Wolkersdorfer C, Sartz L, Sillanpää M, Häkkinen A (Editors)
Figure 2 a) The δ18O and δD values in groundwater and the Rivers Kuerjoki, Äkäsjoki and Valkeajoki. The data are shown against the local meteoric water line (LMWL) (δD = 7.67 δ18O +
5.79‰) defined by Kortelainen (2007). (b) Longitudinal profiles of Tminr of the studied river sections in 2012 (Topographic Database © NLS 2016; Watershed Database © SYKE 2010).
Figure 3 Categories of discrete and diffuse thermal anomalies in thermal mosaic images; (a), seepage, (b) a cold tributary (R. Valkeajoki discharging into R. Äkäsjoki) and (c) diffuse discharge.
The black arrows indicate river flow directions.
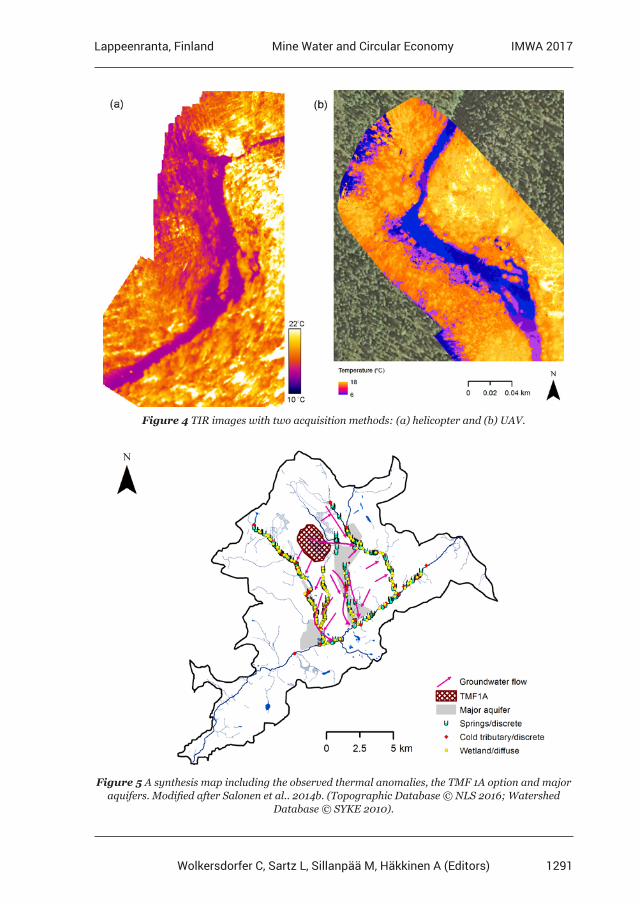
1291
Lappeenranta, Finland IMWA 2017Mine Water and Circular Economy
Wolkersdorfer C, Sartz L, Sillanpää M, Häkkinen A (Editors)
Figure 4 TIR images with two acquisition methods: (a) helicopter and (b) UAV.
Figure 5 A synthesis map including the observed thermal anomalies, the TMF 1A option and major aquifers. Modified after Salonen et al.. 2014b. (Topographic Database © NLS 2016; Watershed
Database © SYKE 2010).
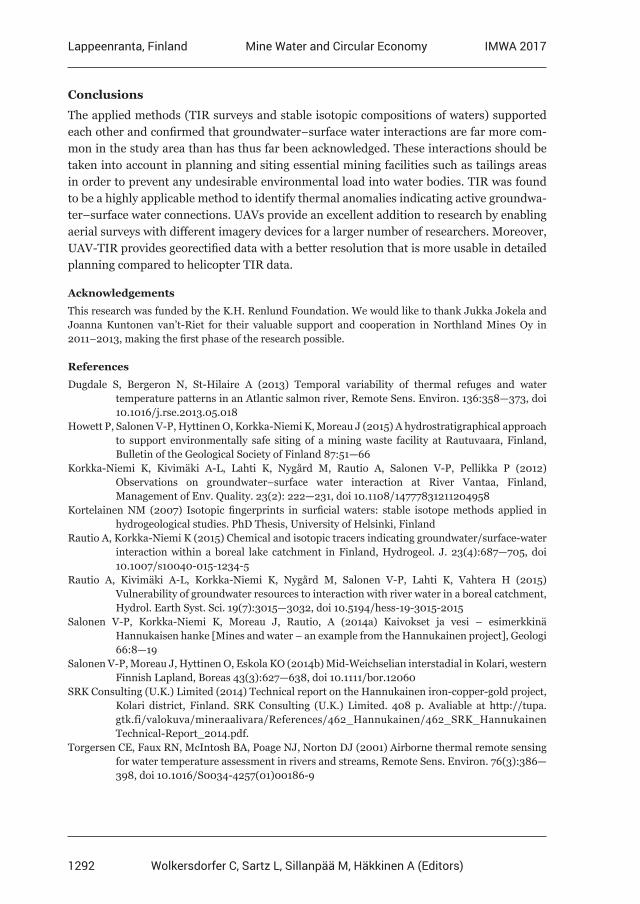
1292
Lappeenranta, Finland IMWA 2017Mine Water and Circular Economy
Wolkersdorfer C, Sartz L, Sillanpää M, Häkkinen A (Editors)
Conclusions
The applied methods (TIR surveys and stable isotopic compositions of waters) supported each other and confirmed that groundwater−surface water interactions are far more com-mon in the study area than has thus far been acknowledged. These interactions should be taken into account in planning and siting essential mining facilities such as tailings areas in order to prevent any undesirable environmental load into water bodies. TIR was found to be a highly applicable method to identify thermal anomalies indicating active groundwa-ter–surface water connections. UAVs provide an excellent addition to research by enabling aerial surveys with different imagery devices for a larger number of researchers. Moreover, UAV-TIR provides georectified data with a better resolution that is more usable in detailed planning compared to helicopter TIR data.
Acknowledgements
This research was funded by the K.H. Renlund Foundation. We would like to thank Jukka Jokela and Joanna Kuntonen van’t-Riet for their valuable support and cooperation in Northland Mines Oy in 2011–2013, making the first phase of the research possible.
References
Dugdale S, Bergeron N, St-Hilaire A (2013) Temporal variability of thermal refuges and water temperature patterns in an Atlantic salmon river, Remote Sens. Environ. 136:358—373, doi 10.1016/j.rse.2013.05.018Howett P, Salonen V-P, Hyttinen O, Korkka-Niemi K, Moreau J (2015) A hydrostratigraphical approach to support environmentally safe siting of a mining waste facility at Rautuvaara, Finland, Bulletin of the Geological Society of Finland 87:51—66Korkka-Niemi K, Kivimäki A-L, Lahti K, Nygård M, Rautio A, Salonen V-P, Pellikka P (2012) Observations on groundwater–surface water interaction at River Vantaa, Finland, Management of Env. Quality. 23(2): 222—231, doi 10.1108/14777831211204958Kortelainen NM (2007) Isotopic fingerprints in surficial waters: stable isotope methods applied in hydrogeological studies. PhD Thesis, University of Helsinki, FinlandRautio A, Korkka-Niemi K (2015) Chemical and isotopic tracers indicating groundwater/surface-water interaction within a boreal lake catchment in Finland, Hydrogeol. J. 23(4):687—705, doi 10.1007/s10040-015-1234-5Rautio A, Kivimäki A-L, Korkka-Niemi K, Nygård M, Salonen V-P, Lahti K, Vahtera H (2015) Vulnerability of groundwater resources to interaction with river water in a boreal catchment, Hydrol. Earth Syst. Sci. 19(7):3015—3032, doi 10.5194/hess-19-3015-2015Salonen V-P, Korkka-Niemi K, Moreau J, Rautio, A (2014a) Kaivokset ja vesi – esimerkkinä Hannukaisen hanke [Mines and water – an example from the Hannukainen project], Geologi 66:8—19Salonen V-P, Moreau J, Hyttinen O, Eskola KO (2014b) Mid-Weichselian interstadial in Kolari, western Finnish Lapland, Boreas 43(3):627—638, doi 10.1111/bor.12060SRK Consulting (U.K.) Limited (2014) Technical report on the Hannukainen iron-copper-gold project, Kolari district, Finland. SRK Consulting (U.K.) Limited. 408 p. Avaliable at http://tupa. gtk.fi/valokuva/mineraalivara/References/462_Hannukainen/462_SRK_Hannukainen Technical-Report_2014.pdf.Torgersen CE, Faux RN, McIntosh BA, Poage NJ, Norton DJ (2001) Airborne thermal remote sensing for water temperature assessment in rivers and streams, Remote Sens. Environ. 76(3):386— 398, doi 10.1016/S0034-4257(01)00186-9
1293
Lappeenranta, Finland IMWA 2017Mine Water and Circular Economy
Wolkersdorfer C, Sartz L, Sillanpää M, Häkkinen A (Editors)
Case Study: Development of an underground depressurisation scheme in an operational mine with
reduced pumping capacity
Alastair Black1, Mark Raynor1, Thierry Kalonga2, Laurent Kabiku2
1SRK Consulting (UK) Ltd, Churchill House, Cardiff CF10 2HH, [email protected] 2Kibali Gold Mines, Doko, Province Orientale, DRC
Abstract Groundwater pressure and inflow responses to the systematic opening of underground drain holes in a deep shaft at the Kibali Gold Mine is presented. The hydraulic tests were undertaken when the mine was advancing into areas with higher inflow potential, prior to the construction of the main pump-station. The aim was to estimate the sustained inflow rate from permeable structures and determine the optimum method to reduce flooding risk. Proven connections between drain-holes were reconciled with modelled geological bodies which contain greater water volumes. These analyses were used to advise immediate grouting requirements and determine optimal drain holes to open to aid in depressurization of near term developments.
Key words depressurization, underground, dewatering, hydraulic, testing
Introduction
The procedure described herein was applied at the Kibali underground mine in the DRC. A 750m deep vertical shaft and multi-level off-shaft areas were in active development at the time. Three levels at 530, 685 and 725m below ground were considered within the testing. The geological setting is hard competent rock, with multiple brittle fractures that are typi-cally associated with ironstones and doleritic dykes. A comprehensive description of the site can be found in Randgold (2017), Bird (2016) and Vargas et al.. (2014)
Short term pumping requirements and the expectation of increased inflows was a challenge for the mine as an interim pumping station with a low capacity of 16 l/s was in place pending the development of the full pumping station in excess of 200l/s. The capacity utilised to control seepage at the time of testing was approximately 10l/s with drain holes all closed or ‘shut-in’.
The testing in this case study was required to:
• identify areas of higher risk which warranted cover grouting; • reconcile proven hydrogeological connections with modelled geological bodies antici-
pated to store larger volumes of water; • advise on the underground drains to open, fully utilising the 16l/s and which holes
would optimally depressurize areas where drilling and blasting was planned; and, • improve upon the understanding of the rate of flow reduction when drains are opened
or features intercepted.
The procedures undertaken utilised basic equipment available at all underground mine sites and the duration of the testing in this case study was 4 days.
1294
Lappeenranta, Finland IMWA 2017Mine Water and Circular Economy
Wolkersdorfer C, Sartz L, Sillanpää M, Häkkinen A (Editors)
High Level test description
The core of the test involved the systematic opening of drain holes while monitoring pres-sure response in other drain holes within the off-shaft area and monitoring vibrating wire piezometers (VWP) pressure changes around the mine site. As each drain hole is opened the flow rate is recorded and in most, but not all cases, noted to reduce during the duration of the test. These readings collectively are the primary datasets for syn- and post-test analysis.
Ordering of the holes to be opened, and duration to remain open was planned prior to the test. The procedure allows for changes to the timings that holes are open during the test in response to the data being recorded. Such changes would be to maximise the useful data gleaned within the period.
In general the order of holes to be opened was defined from lowest anticipated inflow rates to highest. This permitted the review of the smaller inflows pressure responses which would have otherwise been masked by the overriding signals of the higher yielding drains.
Holes were opened for the maximum duration possible in an attempt to induce pressure responses at greater distances from the drain. The limiting factor for drains to be open was water levels in local sumps and/or the requirement to close all drain holes prior to egress for blasting which in this mine occurs every 12 hours.
Monitoring of all sump levels during the test and a comprehensive understanding of the un-derground water management system is paramount and maximum permissible levels were defined for each sump. When these level limits were encountered the test was stopped and sumps were allowed to be pumped down. The duration of the test is therefore in part de-fined by the volume of water storage which is acceptable in areas of the underground mine.Analysis of results considers the rate of reduction in flows over time and the lag and attenua-tion of the on/off drain hole signals across the monitored locations. Through these analyses the efficiency of connections and rate of potential inflows can be estimated.
General procedure and considerations
Pre Test
Prior to the test an underground survey was conducted to provide input to a site specific procedures document and assist in the preparation of hardware required to fit hoses and gauges or install loggers.
The survey includes (non exclusive list):
• Confirmation of hole names and reconciliation with holes in the geological model • Note on diameter, thread and whether adapters are required for pressure gauges/hoses; • Note on whether valves can be opened and closed easily • Requirements for hoses and their lengths for drain holes which are not plumbed to sumps • Sump locations, pump types and each pumps operational triggers
1295
Lappeenranta, Finland IMWA 2017Mine Water and Circular Economy
Wolkersdorfer C, Sartz L, Sillanpää M, Häkkinen A (Editors)
• Levels of permanent electrics, generators, rigs and other features which may affect decision on permissible levels for water storage at sumps
• Confirmation of linkages in underground pumping system, rating of pumps and iden-tification of reservoirs which are used as overflows if pumping to surface is exceeded.
• Telemetered alarms for reservoirs • Details of flow and pressure monitoring which currently exists • Other local issues e.g. ground conditions and potential for washout / transport of fines
to sumps.
The logging interval on all existing VWP installations was reduced from 2 hours to 5 min-utes approximately 2 days before the start of the test. The loggers remained at this frequen-cy for the duration of the testing.
Site specific procedures were developed and communicated to all parties operating under-ground. Shut-in trigger limits for each sump were discussed and agreed with the mining contractors such that the test did not significantly interfere with ongoing activities. The test results in substantially wetter conditions underground than would be tolerated under normal conditions. The written procedure was discussed and circulated during morning meetings to ensure that all stakeholders clearly understood what was planned.
The procedure included stage volume calculations for each of the sumps and basic model-ling of how the overall pumping system would respond to elevated water levels relative to normally operations. A basic spreadsheet model was used to identify areas requiring addi-tional pumps and key overflow reservoirs were noted such that hardware could be put in place in advance. This had the effect of reducing impacts to others, permitting the test to run for a longer duration, providing better quality data and reducing the amount of time to drain down sumps after the permitted storage volumes had been used. Procedures could be updated each day with any revised plans, and re-issued to all stake-holders to aid communication of the unusual activities.
In every planned test the procedure to follow included: • Morning briefing and confirmation from shaft managers that the tests could proceed
as planned • Start test and continue until specified time in procedures has elapsed. • If any sump level limit reaches the permissible limit before that time
-> shut-in prematurely • If any individual requests for the test to stop or pause -> shut-in prematurely • Always shut-in when all egress for blasting even if the sumps are fully managing cur-
rent requirements. • Basic analysis of data to inform the subsequent shifts test
Syn- test
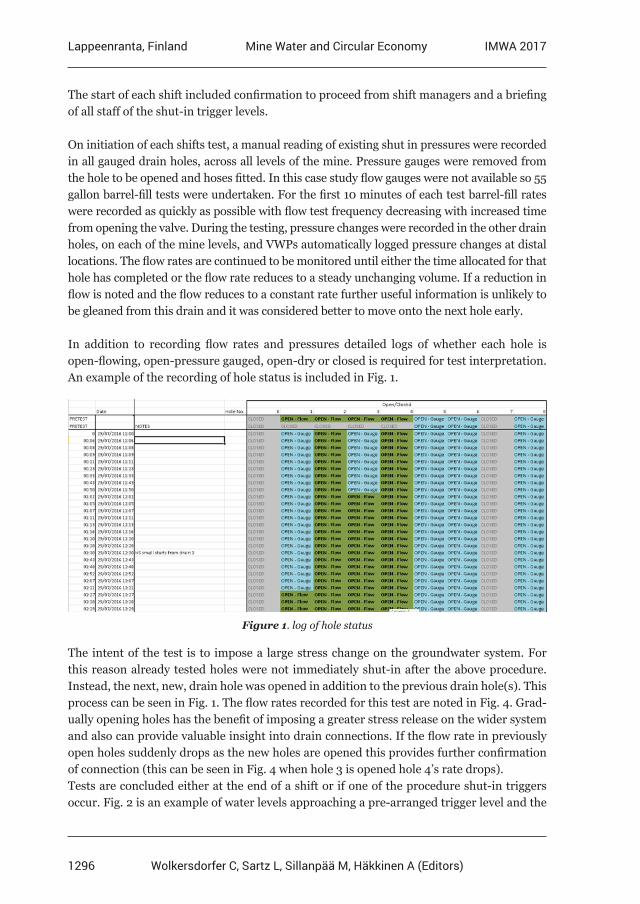
1296
Lappeenranta, Finland IMWA 2017Mine Water and Circular Economy
Wolkersdorfer C, Sartz L, Sillanpää M, Häkkinen A (Editors)
The start of each shift included confirmation to proceed from shift managers and a briefing of all staff of the shut-in trigger levels.
On initiation of each shifts test, a manual reading of existing shut in pressures were recorded in all gauged drain holes, across all levels of the mine. Pressure gauges were removed from the hole to be opened and hoses fitted. In this case study flow gauges were not available so 55 gallon barrel-fill tests were undertaken. For the first 10 minutes of each test barrel-fill rates were recorded as quickly as possible with flow test frequency decreasing with increased time from opening the valve. During the testing, pressure changes were recorded in the other drain holes, on each of the mine levels, and VWPs automatically logged pressure changes at distal locations. The flow rates are continued to be monitored until either the time allocated for that hole has completed or the flow rate reduces to a steady unchanging volume. If a reduction in flow is noted and the flow reduces to a constant rate further useful information is unlikely to be gleaned from this drain and it was considered better to move onto the next hole early.
In addition to recording flow rates and pressures detailed logs of whether each hole is open-flowing, open-pressure gauged, open-dry or closed is required for test interpretation. An example of the recording of hole status is included in Fig. 1.
Figure 1. log of hole status
The intent of the test is to impose a large stress change on the groundwater system. For this reason already tested holes were not immediately shut-in after the above procedure. Instead, the next, new, drain hole was opened in addition to the previous drain hole(s). This process can be seen in Fig. 1. The flow rates recorded for this test are noted in Fig. 4. Grad-ually opening holes has the benefit of imposing a greater stress release on the wider system and also can provide valuable insight into drain connections. If the flow rate in previously open holes suddenly drops as the new holes are opened this provides further confirmation of connection (this can be seen in Fig. 4 when hole 3 is opened hole 4’s rate drops).Tests are concluded either at the end of a shift or if one of the procedure shut-in triggers occur. Fig. 2 is an example of water levels approaching a pre-arranged trigger level and the
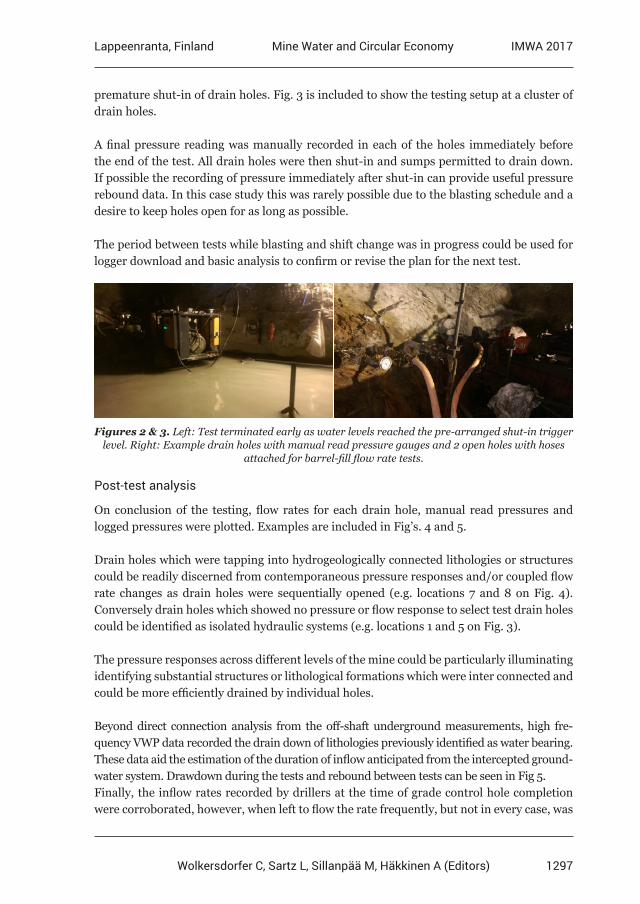
1297
Lappeenranta, Finland IMWA 2017Mine Water and Circular Economy
Wolkersdorfer C, Sartz L, Sillanpää M, Häkkinen A (Editors)
premature shut-in of drain holes. Fig. 3 is included to show the testing setup at a cluster of drain holes.
A final pressure reading was manually recorded in each of the holes immediately before the end of the test. All drain holes were then shut-in and sumps permitted to drain down. If possible the recording of pressure immediately after shut-in can provide useful pressure rebound data. In this case study this was rarely possible due to the blasting schedule and a desire to keep holes open for as long as possible.
The period between tests while blasting and shift change was in progress could be used for logger download and basic analysis to confirm or revise the plan for the next test.
Figures 2 & 3. Left: Test terminated early as water levels reached the pre-arranged shut-in trigger level. Right: Example drain holes with manual read pressure gauges and 2 open holes with hoses
attached for barrel-fill flow rate tests.
Post-test analysis
On conclusion of the testing, flow rates for each drain hole, manual read pressures and logged pressures were plotted. Examples are included in Fig’s. 4 and 5.
Drain holes which were tapping into hydrogeologically connected lithologies or structures could be readily discerned from contemporaneous pressure responses and/or coupled flow rate changes as drain holes were sequentially opened (e.g. locations 7 and 8 on Fig. 4). Conversely drain holes which showed no pressure or flow response to select test drain holes could be identified as isolated hydraulic systems (e.g. locations 1 and 5 on Fig. 3).
The pressure responses across different levels of the mine could be particularly illuminating identifying substantial structures or lithological formations which were inter connected and could be more efficiently drained by individual holes.
Beyond direct connection analysis from the off-shaft underground measurements, high fre-quency VWP data recorded the drain down of lithologies previously identified as water bearing. These data aid the estimation of the duration of inflow anticipated from the intercepted ground-water system. Drawdown during the tests and rebound between tests can be seen in Fig 5.Finally, the inflow rates recorded by drillers at the time of grade control hole completion were corroborated, however, when left to flow the rate frequently, but not in every case, was
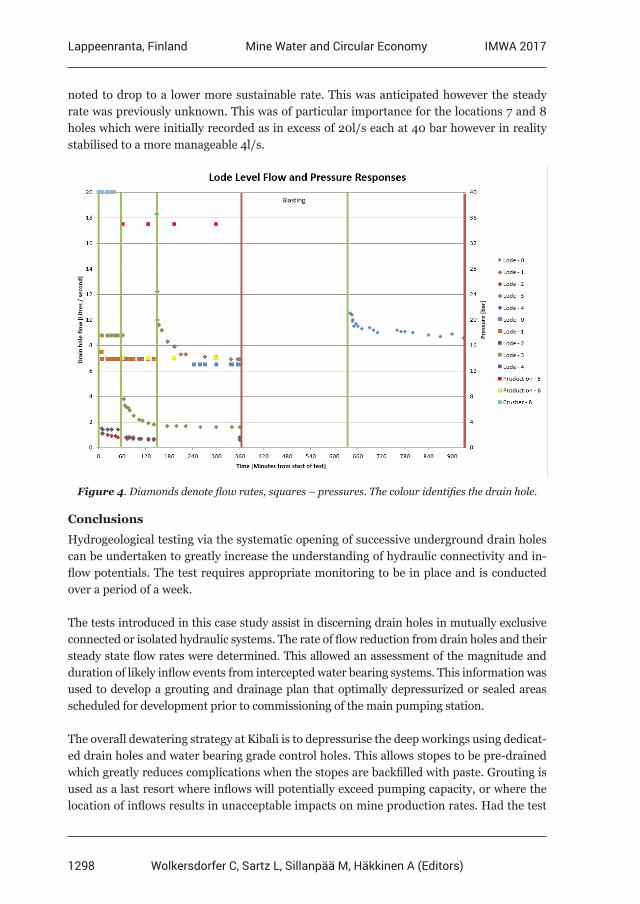
1298
Lappeenranta, Finland IMWA 2017Mine Water and Circular Economy
Wolkersdorfer C, Sartz L, Sillanpää M, Häkkinen A (Editors)
noted to drop to a lower more sustainable rate. This was anticipated however the steady rate was previously unknown. This was of particular importance for the locations 7 and 8 holes which were initially recorded as in excess of 20l/s each at 40 bar however in reality stabilised to a more manageable 4l/s.
Figure 4. Diamonds denote flow rates, squares – pressures. The colour identifies the drain hole.
Conclusions
Hydrogeological testing via the systematic opening of successive underground drain holes can be undertaken to greatly increase the understanding of hydraulic connectivity and in-flow potentials. The test requires appropriate monitoring to be in place and is conducted over a period of a week.
The tests introduced in this case study assist in discerning drain holes in mutually exclusive connected or isolated hydraulic systems. The rate of flow reduction from drain holes and their steady state flow rates were determined. This allowed an assessment of the magnitude and duration of likely inflow events from intercepted water bearing systems. This information was used to develop a grouting and drainage plan that optimally depressurized or sealed areas scheduled for development prior to commissioning of the main pumping station.
The overall dewatering strategy at Kibali is to depressurise the deep workings using dedicat-ed drain holes and water bearing grade control holes. This allows stopes to be pre-drained which greatly reduces complications when the stopes are backfilled with paste. Grouting is used as a last resort where inflows will potentially exceed pumping capacity, or where the location of inflows results in unacceptable impacts on mine production rates. Had the test
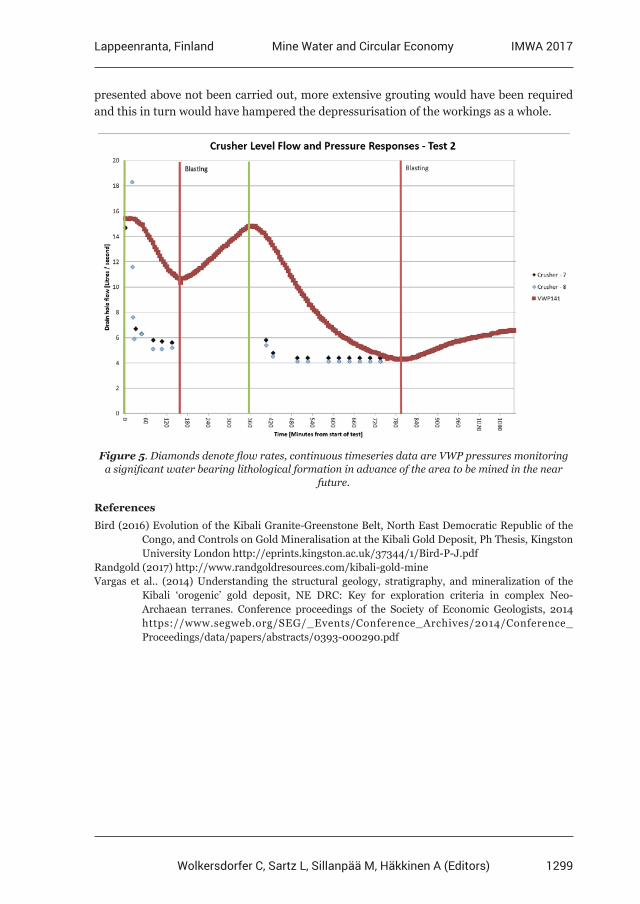
1299
Lappeenranta, Finland IMWA 2017Mine Water and Circular Economy
Wolkersdorfer C, Sartz L, Sillanpää M, Häkkinen A (Editors)
presented above not been carried out, more extensive grouting would have been required and this in turn would have hampered the depressurisation of the workings as a whole.
Figure 5. Diamonds denote flow rates, continuous timeseries data are VWP pressures monitoring a significant water bearing lithological formation in advance of the area to be mined in the near
future.
References
Bird (2016) Evolution of the Kibali Granite-Greenstone Belt, North East Democratic Republic of the Congo, and Controls on Gold Mineralisation at the Kibali Gold Deposit, Ph Thesis, Kingston University London http://eprints.kingston.ac.uk/37344/1/Bird-P-J.pdfRandgold (2017) http://www.randgoldresources.com/kibali-gold-mineVargas et al.. (2014) Understanding the structural geology, stratigraphy, and mineralization of the Kibali ‘orogenic’ gold deposit, NE DRC: Key for exploration criteria in complex Neo- Archaean terranes. Conference proceedings of the Society of Economic Geologists, 2014 https://www.segweb.org/SEG/_Events/Conference_Archives/2014/Conference_ Proceedings/data/papers/abstracts/0393-000290.pdf


Index
1302
Lappeenranta, Finland IMWA 2017Mine Water and Circular Economy
Wolkersdorfer C, Sartz L, Sillanpää M, Häkkinen A (Editors)
AuthorsA
Åberg, Annika Katarina 237Åberg, Susanne Charlotta 237Adeniyi, Amos 1048Åhlgren, Kristina Maria 770Aho, Anni 1258Alakangas, Lena 806, 1170Albuquerque, M Teresa D 1244Alcalde, Juan 979Allaire, Mathieu 1039Alpers, Charles N. 1138Alte, Matthias 1095Amponsah-Dacosta, Francis 1263Amrich, Michal 1154Andersen, Martin 923Anderson, Malcolm 633Andrade, Lucas Santos 445Annandale, John George 915António, Fiúza 1244Antunes, I. Margarida Horta R. 1244Aoyagi, Tomo 1162Apostolovski-Trujic, Tatjana 1080Arnold, Mona 14, 55Aronsson, Andreas 822Assawincharoenkij, Thitiphan 1281Aubel, Tim 1147Aunola, Karri 1258Austin, Edward 389
B
Bäckström, Mattias 770, 862, 964, 1125Balzer, Isabelle 175, 183Banasik, Michal 1222Barnes, Andrew 664Barteaux, Mitchell 595, 610Basallote, M Dolores 836Bauer, Martin 1095Beckie, Roger 696Bendrat, Michael 94Bessho, Masahiko 1080, 1111Bigler, Paula 1022
1303
Lappeenranta, Finland IMWA 2017Mine Water and Circular Economy
Wolkersdorfer C, Sartz L, Sillanpää M, Häkkinen A (Editors)
Birch, Joanna 389Black, Alastair 680, 1297Blanchette, Melanie 437, 1204Bomberg, Malin 14Bortsov, Vitalii 1283Bowell, Rob 664, 1138Bowie, Andrea Josephine 189Bozic, Dragana 1080, 1111Brabham, Peter 956Bräutigam, Bernd 101Bredenkamp, Brendon John 510Breedveld, Gijsbert D. 877, 1133Brooms, Thabo 1048Broughton, Philip 907Brückner, Friedemann 517Bultiauw, Jan 396Burgess, Jo 915Bussière, Bruno 1032, 1039Buszka, Paul M. 869
C
Cakl, Jiří 1154Campbell, Kate M. 1138Campos Lopez, Felipe 1076Carrero, Sergio 836Carruth, David 365Casiot, Corinne 732Castendyk, Devin 737Cepriá, Juan 884, 892Chamberlain, Sinead 907Chambers, Dave 204Charles, Jessica Claire 664Chen, Qian 923Chimuka, Luke 312Christensen, Dave 761Christenson, Hana Kirsten 1196Cidu, Rosa 728, 801Claus, Thomas 618, 626, 1014Coetzee, Henk 564, 1250Cohen, David R 923Collan, Mikael 478Corbel, Soazig 161Corcoran, Flann 389
1304
Lappeenranta, Finland IMWA 2017Mine Water and Circular Economy
Wolkersdorfer C, Sartz L, Sillanpää M, Häkkinen A (Editors)
Corin, K.C. 777Cottrell, Mark 548Crane, Richard 956Craw, David 350Croall, Jacob Grant 495Cukrowska, Ewa Maria 312Czop, Mariusz 703
D
Declercq, Julien 664Dennis, Ingrid 649, 656Dennis, Rainier 649, 656Diedrich, Tamara 712Digges La Touche, Gareth 548Dinis, Maria de Lurdes 1244Djordjievski, Stefan 793d’Obyrn, Kajetan 276Dogan, Tansel 147Dong, Shuning 328D’Orazio, Massimo 728, 732Drebenstedt, Carsten 244, 900Drobniewski, Michael 88, 183Du, Wenfeng 572Duke, Kate 737Dunbar, Donald 154
E
Eary, L.E. 737, 822Eckart, Michael 303Edward, Catherine Joanna 990Ekblom, Sanna 1125El idrysy, Houcyne 124Eriksson, Nils 154, 822Ertuna, Cagan 1191Eulenberger, Sven 296Evans, Dylan 956
F
Fehér, Jakub 1154Feng, Feisheng 572Fernandez, Jesus Manuel 6Fernández-Rubio, Rafael 254Fix, Paul 712
1305
Lappeenranta, Finland IMWA 2017Mine Water and Circular Economy
Wolkersdorfer C, Sartz L, Sillanpää M, Häkkinen A (Editors)
Forsgren, Anders 822Foster, Andrea 712Fourie, Francois 564, 1250França, Silvia Cristina Alves 445Frankenhoff, Hagen 175, 183Fraser, Colin 154, 373Frau, Franco 801Futuro, Aurora 1244
G
Galdo, Monica 6Gardić, Vojka 793Genty, Thomas 1032, 1039Gericke, Mariekie 14, 453Ghanem, Marwan 461Ghezzi, Lisa 728, 732Giannecchini, Roberto 728, 732Głodniok, Marcin 415Gluski, Heather 737Goerke-Mallet, Peter 147Gogoi, Harshita 218, 1076, 1222Góis, Joaquim 1244Gomo, Modreck 564, 1250Gonzalez Pinto, Jahir 1204Gonzalez-Merchan, Carolina 1039Goode, Tomas 633Grandchamp, César 254Green, Carlin J. 869Grewar, Tamsyn 14Grimmer, Marlies 979Grohs, Ken 610Grönroos, Antti 36Grycz, David 488Guedella, Edith 884, 892Günther, Juliane 900Guo, Weijia 28Gzyl, Grzegorz 415
H
Habe, Hiroshi 1162Hagedorn, David 335Häkkinen, Antti 1070, 1206Halli, Petteri 972
1306
Lappeenranta, Finland IMWA 2017Mine Water and Circular Economy
Wolkersdorfer C, Sartz L, Sillanpää M, Häkkinen A (Editors)
Hamai, Takaya 1162Hamberg, Roger 806Hamilton, Ian 862Hannula, Pyry-Mikko 972Harpke, Birgit 101Harrison, Susan Therese Largier 262, 990Hatsuya, Kazunori 1162Hauzenberger, Christoph 1281Hayashi, Kentaro 1162Heiderscheidt, Elisangela 218, 1076Heikkinen, Eero 540Heikkinen, Juha 36Heino, Neea 931Heise, Klaus 101Henkel, Laura 430Herbert, Roger 140, 1087Hertrijana, Janjan 610Heuss-Aßbichler, Soraya 1214Hiljanen, Risto 22Hirose, Kazuyo 793Hoppe, Darryl A. 869Hori, Tomoyuki 1162Hoth, Nils 244, 335, 843, 900, 979Hu, Rongjie 197Hu, Weiyue 524Huddy, Robert John 262Hughes, Andy 64Huhtanen, Mikko 1206Huttunen, Markus 73Hwang, Chiachi 1185, 1191
I
Iakovleva, Evgenia 43Ishiyama, Daizo 793, 1111Ivanets, Andrei 1055
J
Jakkila, Juho 73Janas, Dawid 972Janneck, Eberhard 1147Janson, Ewa 415Jansson, Kaj 226, 1206Järvelä, Eliisa 36
1307
Lappeenranta, Finland IMWA 2017Mine Water and Circular Economy
Wolkersdorfer C, Sartz L, Sillanpää M, Häkkinen A (Editors)
Jenk, Ulf 296Jin, Dewu 524Jiříček, Tomáš 1154John, Melanie 1214Johnstone, Andrew Clifford 403Jones, David R 923
K
Kaartinen, Tommi 55Kaasalainen, Hanna 1170Kaiser, Joël 161Kalanchey, Robin 1147Kamwilaisak, Khanita 43Kangas, Petteri 55Karlsson, Teemu 80, 931Karvonen, Tuomo 540Kassahun, Andrea 672, 843Kauppi, Janne 226, 1206Kauppila, Päivi 80, 931Kauppila, Tommi 167Kelly, Ben 923Kennedy, Chris 1191Kennedy, Lizel 403Kerr, Gemma 350Kettunen, Anu 998, 1119Khalid, Muhammad Kamran 972Khan, Shoaib 43Khayrulina, Elena 212Kim, Dong-Kwan 1063, 1178Kim, Duk-Min 1063, 1178Kinčl, Jan 1154Kinnunen, Sami 972Kirk, Lisa Bithell 830, 1185, 1191Kitikova, Natalia 1055Klimpel, Franziska 1133Klinger, Christoph 303Kobayashi, Mikio 1162Koch, Thomas 618Kojima, Kazuhiro 1162Kokko, Marika E. 939Kolhinen, Vesa 73Komulainen, Jere Johannes 556Korhonen, Tero 931
1308
Lappeenranta, Finland IMWA 2017Mine Water and Circular Economy
Wolkersdorfer C, Sartz L, Sillanpää M, Häkkinen A (Editors)
Korkka-Niemi, Kirsti 237, 1022, 1290Korppoo, Marie 73Kotiranta, Tuukka 226Kret, Ewa 703Kroupa, Jan 1154Kruse, Steffen 94Kvennås, Marianne 1133Kyllönen, Hanna 36
L
Lakaniemi, Aino-Maija 939Lee, Sang-Hwan 1063Lehto, Vesa Pekka 1271Lehtonen, Marja 80, 931Leite, Alexandre 1244Leiviskä, Tiina 218, 1076, 1222Lena, Zahn 502Levay, Eric 510Lilley, Tim 396Lindig, Yvonne 1014Liu, Qisheng 328Liu, Zaibin 328Loayza, Pamela Elizabeth Velarde 445Lobo de Razende, Mauro 54Löchte, Joachim 303Lorca Fernández, David 254Loredo, Jorge 6Lorentz, Simon Antony 282Lourens, Paul Joel 422Lund, Mark 437, 1204Lundström, Mari 972Luukka, Pasi 478
M
Macias, Francisco 588, 836Mácsik, Josef 862Maest, Ann 642Mäkinen, Jari 167Malloch, Kirstine 350Malucha, Pavel 488Mamelkina, Maria 1070Mandrla, Vladimir 488Manja, Walko 502
1309
Lappeenranta, Finland IMWA 2017Mine Water and Circular Economy
Wolkersdorfer C, Sartz L, Sillanpää M, Häkkinen A (Editors)
Manono, Malibongwe Shadrach 777Mansel, Holger 517Marais, Alkie 510Marais, Tynan Steven 262Marincović, Vladan 793Marinkovic, Vladan 1111Markovic, Radmila 1080, 1111Markowska, Małgorzata 415Martin, Alan 154, 373, 822Martinez, Antonio 884Mashishi, Dikeledi Tryphina 745Masindi, Vhahangwele 381, 689Masuda, Nobuyuki 1080, 1111, 1162Mathada, Humphrey 1263Matibidi, K. 777Matthews, Zoe N 1228Maurice, Christian 806, 862, 892Mayer, John Markus 532Mayer, K.Ulrich 696Mbanga, Odwa 312Mbaya, Richard 1048McLachlan, Christine 350Melchers, Christian 94, 147, 430Menendez, Javier 6Miller, Glenn 1103Miura, Takao 1162Mix, Sebastian 626Mokone, Mpho Penelope 342Molitor, Norbert 101Mollehuara Canales, Raul 288Morgan, Philip G 1228Morgan, Sarah A 1228Mueller, Seth 154, 373, 737, 822Mühlbauer, Ritva 453Muller, Heinrich Hagspihl 453Munoz Saavedra, Victor A. 269, 358Muzerengi, Confidence 720
N
Nan, Shenghui 328Ndiritu, John 689Neale, John William 453Neculita, Carmen Mihaela 1032, 1039
1310
Lappeenranta, Finland IMWA 2017Mine Water and Circular Economy
Wolkersdorfer C, Sartz L, Sillanpää M, Häkkinen A (Editors)
Neděla, David 1154Nickolay, Maksimovich 212Nieto, José Miguel 836Nikupeteri, Lea 22Nissinen, Tuomo 1271Nordström, Albin 140, 1087Nordstrom, D. Kirk 642, 1138Nugraha, Candra 610Nyström, Elsa 1170
O
O´Kane, Mike 822Obradovic, Ljubisa 1111Obradović, Ljubiša 793Ogata, Atsushi 1162Okkenhaug, Gudny 1133Olds, William 1196Olias, Manuel 588, 836Oliver, Totsche 502Olubiyi, Olukunle 1048Onyango, Maurice Stephen 1048Opitz, Joscha 1095Orr, Matthew 610Osman, Muhammad Suhail 381
P
Pabst, Thomas 877Park, Hyun-Sung 1063Paul, Michael 296, 843Pearce, Steven Richard 595, 610Pecehniuk, Oleg 1283Pedretti, Daniele 696Peng, Suping 572Pérez López, Rafael 588Pérez-López, Rafael 836Perotti, Martina 728, 732Petrini, Riccardo 728, 732, 801Peyton, Brent 1185, 1191Philipp, Wieland 517Piatak, Nadine M 603, 869Picken, Päivi 540Pieskä, Vesa 1258Pietrucin, Dorota 703
1311
Lappeenranta, Finland IMWA 2017Mine Water and Circular Economy
Wolkersdorfer C, Sartz L, Sillanpää M, Häkkinen A (Editors)
Pihlajakuja, Minna 1119Połeć, Marzena 276Pope, James 580, 1196Popoola, Patricia 1048Postawa, Adam 276Postila, Heini 218, 1076Potvin, Robin 1039Preene, Martin 389Puhakka, Jaakko A. 939Purnamasari, Henny 610
Q
Qonya, Busisiwe 109Queiroz Ladeira, Ana Claudia 1272
R
Radigk, Sven 1014Rakotonimaro, Tsiverihasina Vavaka 1032Rantanen, Ville 1119Rapantova, Nada 488Rascher, Jochen 244Rautio, Anne 1022, 1290Reisinger, Timm 785Reker, Bastian 147Ribeiro de Souza, Livia 1272Riikonen, Joakim 1271Robertson, Alan M 923Ronkanen, Anna-Kaisa 1076Rüde, Thomas R. 785Rüger, Michael 517Ruiz Cánovas, Carlos 588Rybnikov, Petr 489, 753Rybnikova, Liudmila 489, 753Rykaart, Maritz 358
S
Sädbom, Stefan 862, 964Sakakibara, Taisuke 1162Sakala, Emmanuel 564, 1250Sakata, Takeshi 1162Salo, Marja 14Salonen, Veli-Pekka 237, 1290Sapsford, Devin 956
1312
Lappeenranta, Finland IMWA 2017Mine Water and Circular Economy
Wolkersdorfer C, Sartz L, Sillanpää M, Häkkinen A (Editors)
Sartz, Lotta 770, 862, 964, 1125Sato, Yuki 1162Satterley, Christopher James 907Saukkoriipi, Jaakko 540Savolainen, Jyrki 478Saxby, Tim 469Schäfer, Wolfgang 1095Schöpke, Ralph 502Scott, James 373Seal, Robert R 603, 869Seepei, Lerato 14Seipel, Katharine Schultz 830Seppä, Ville-Matti 540Seppälä, Jaakko 22Sergey, Pyankov 212Shapka-Fels, Tia 358Shashkova, Irina 1055Sheumaker, Damon Lee 830Silänpää, Mika 43, 947, 1055, 1070Simon, Andre 244Sinche-Gonzalez, Maria 288Sjöberg, Viktor 770Sjöblom, Åsa 822Skinner, Sarah Jane Wolfe 1006Smart, Mariette 990Smith, Francis Peter 365Solismaa, Lauri 167Söll, Thomas 1095Sowanaka, Masahiro 1162Stanley, Peter 1228Stearman, Arlene 189Stevanovic, Zoran 1080, 1111Stratford, Alexander 956Sui, Wanghua 197Sulonen, Mira L. K. 939Sun, Wenbin 28Sutthirat, Chakkaphan 1281Suvio, Piia 226
T
Takamoto, Kousuke 1162Takeda, Tomomi 793Tanabene, Rayen 1039
1313
Lappeenranta, Finland IMWA 2017Mine Water and Circular Economy
Wolkersdorfer C, Sartz L, Sillanpää M, Häkkinen A (Editors)
Tang, Walter Z. 43Tanner, Phillip D 915Tanskanen, Juha 218, 1222Taskila, Sanna Katariina 1222Taskinen, Antti 931Thapa, Rinez 1271Thubakgale, C.K. 777Thürmer, Konrad 502Tiljander, Mia 931Tom, Sharp 189Toman, František 1154Tornivaara, Anna 931Totsche, Oliver 626Trampus, Bruna Camara 445Trumm, Dave 580, 1196Tutu, Hlanganani 312Tuunila, Ritva 1070Tvedten, Mari Katrine 877
U
Uhlmann, Wilfried 618, 626, 1014Urlich, Cecil 64Ussath, Maria 900, 979
V
Vaittinen, Tiina 540van Hille, Robert Paul 262Vasconcelos Caldas, Fabiana 254Vehviläinen, Bertel 73Velen, Bohumil 1154Vento, Tiia 73Vermeulen, Danie 320, 422Vezzoni, Simone 728Vicentin, Serge 161Vidal-Legaz, Beatriz 854Vidqvist, Maija 998, 1258Vila, Cristina 1244Volker, Preuß 502vom Berg, Bernd 94
W
Wakasa, Sachi, A. 793Wang, Qi 117, 814
1314
Lappeenranta, Finland IMWA 2017Mine Water and Circular Economy
Wolkersdorfer C, Sartz L, Sillanpää M, Häkkinen A (Editors)
Wang, Shaobin 43Wang, Tiantian 117, 814Wang, Wenke 328Wang, Xinyi 117, 814Warrender, Ruth 664Weber, Anne 672Weber, Paul 580, 1196Wendler, Corinne 843West, Rae 580Westermann, Sebastian 147Westin, Gunnar 862, 892Wickham, Matt 737Wiese, J.G. 777Witthaus, Holger 88, 94, 175, 183Wolkersdorfer, Christian 109, 132, 147, 342, 745Wright, Amelia 956
X
Xing, Zhen-guo 572
Y
Yang, Binbin 197Yliniemi, Kirsi 972Yost, Ray 532Yungwirth, Grace 389
Z
Zagury, Gérald J. 1032Zamzow, Kendra 204, 1103Zarach, Volkmar 1014Zhang, Shichuan 28Zhao, Chunhu 524Zhao, Feiping 947Zheng, Shitian 197Zielke-Olivier, Josepha Simone Doris Renate 320Zimmermann, Kai 618, 626
1315
Lappeenranta, Finland IMWA 2017Mine Water and Circular Economy
Wolkersdorfer C, Sartz L, Sillanpää M, Häkkinen A (Editors)
Key Words3
3-D directional drilling 3283DEEM 814
A
Aapa mire 1022abandoned mine 101, 109, 342acid drainage 1103Acid mine drainage 244, 381, 564, 580, 595, 689, 696, 728, 745, 877, 900, 923, 1032, 1080, 1095, 1111, 1133, 1162, 1204, 1228, 1250, 1281acid mine drainages 732acid mine water 212acid rock drainage 862, 998, 1170acidity ingress 495active treatment 1147, 1228Adaptive Monitoring 189adsorption 43, 947, 1080agriculture 469alkaline amendments 892alkaline 1125Alternative binders 884Alum shale 770amendment 1125ammonia nitrogen 1039antimicrobial treatment 1119antimony 1283Applied Engineering 358APTsorb 900Apuan Alps 728arsenic 350, 801arsenolite 350arsenopyrite 350artificial neural network 564Asenic 672attenuation 564Autocatalysis 1063AVS 1272
1316
Lappeenranta, Finland IMWA 2017Mine Water and Circular Economy
Wolkersdorfer C, Sartz L, Sillanpää M, Häkkinen A (Editors)
B
Baccatoio Stream catchment 728backfill 806Bayesian 532BCRm 1272Bedrock 556bioavailability 1133biodiesel 1103bioelectrochemical 939biofouling 1119bioleaching 998biological sulphate reduction 262biological 453biomineralization 1191Biooxidation 990bioreactor 14, 1103biota 312biotransportation 312bipolar membrane 1154Birm 1063bisphosphonates 1271borehole yield 422Brazil 254
C
Cabeço do Pião 1244Cambrian limestone groundwater 117Capacitive Deionization 947CAPEX 226carbon nanotube 972case study 822catchment water management 633Cellolose 947cementation 956Cemented Paste Tailings 830chemolitrotrophic microbes 998circular economy 854Climate change 358, 373climate 469closed coal mine 212closure planning 373closure 437coal mine flooding 517
1317
Lappeenranta, Finland IMWA 2017Mine Water and Circular Economy
Wolkersdorfer C, Sartz L, Sillanpää M, Häkkinen A (Editors)
coal mining 6coalfield 1250cold 680colum test 1191column tests 1185connections 1297Connectivity test 117constructed 140contamination 720copper mine 1111copper retention 900copper 972Cover Design 595cover systems 761Cover with capillary barrier effects (CCBE) 877covers 892critical elements 964cryptocrystalline magnesite 689current 939Cut and fill 335
D
Dams 64data analysis 269data logging system 94data monitoring 28deep mining 328Denitrification 1087depressurisation 1297Desert 124design 1191desulphurization 737dewatering 254, 335, 422, 445, 1178, 1297DFN 548DIC 843diffuse discharge 1014diffuse pollution 1095discrete fracture network 548dispersed alkaline substrate 1032dissolution of the secondary minerals 753diversion well 580dolomite 1055dolomitic compartment 656
1318
Lappeenranta, Finland IMWA 2017Mine Water and Circular Economy
Wolkersdorfer C, Sartz L, Sillanpää M, Häkkinen A (Editors)
dump 140
E
economics 469ecosystem 437Electrical Resistivity Tomography 320electrochemical 939electrocoagulation 1070, 1228electrodialysis 1154Electromagnetics 320electrowinning 972enrichment factor 720environment 288, 603environmental assessment 212Environmental impact 204Environmental pollution 793environmental problems 1263evaporitic salts 836Evolution of Mining-induced Crack 572Exploration 204Extreme Climate 124extreme rainfall 365
F
FEFLOW 488ferrates 1039filter 1076Financial modelling 649fine discretization 510fine sand and marlstone 814Finland 109, 132first flush 753flood hydrology 365flooded mines 753flooding 132flow path interpretation 335fly ash 884Forward osmosis 36FracMan 548fractured zone 524free 680Froth stability 777full-scale operation 1258
1319
Lappeenranta, Finland IMWA 2017Mine Water and Circular Economy
Wolkersdorfer C, Sartz L, Sillanpää M, Häkkinen A (Editors)
G
gas flux 595, 610GCC 358gelatin 1080Geochemical characterization 642Geochemical Map 793Geochemical modeling 642, 672geochemistry 132, 761geological structure 28Geostatistics 532Geotextile 1178Geothermal heat 415GIS analysis 212gold mine effluents 1039Gold mine 1281Graben 320ground/surface water resources 1290Groundwater Contamination 320groundwater dependent ecoosystem 1022groundwater discharge 626groundwater flow 556groundwater inflow 510groundwater investigations 633groundwater level 489Groundwater 237, 296, 389, 502, 524grouting 197, 328guidance 1244gypsum precipitation 915Gypsum 745
H
hand-held X-ray fluorescence spectrometer 979hard coal mining 88, 147, 161, 175, 183, 430Hard rock open pit 335Hartbeespoort dam 1048HCT 664hdyrodynamic modeling 703Heat Recovery 907heterogeneity 696Humic acid 814Humidity-cell test 642hXRF 979Hydrocarbonate 843
1320
Lappeenranta, Finland IMWA 2017Mine Water and Circular Economy
Wolkersdorfer C, Sartz L, Sillanpää M, Häkkinen A (Editors)
hydrocencus 422hydrodynamic 342Hydroelectricity 6hydrogel 1080hydrogeochemistry 1022hydrogeological environment 197hydrogeology 540, 556hydrological management 1133Hydrology 269, 358Hydromechanical Coupling Effects 572
I
improved regional integral 814index of geoaccumulation 720industrial residue 1170industrial symbiosis 892information system 854injection 862Intensive runoff zone 117Ionic strength 777iron hydroxide precipitation 1014iron open pit 254iron ore 140iron-rich 626Irrigation 915isotopes 1006
J
job creation 915Jordan Rift Valley 461
K
Kinetic Test Methods 830kinetics 737Königstein mine 296Kvarntorp 770Kyrgyzstan 1283
L
ladle furnace slag 884leaching 770legislation and regulatory framework 1263Lime 189
1321
Lappeenranta, Finland IMWA 2017Mine Water and Circular Economy
Wolkersdorfer C, Sartz L, Sillanpää M, Häkkinen A (Editors)
limestone aquifers 197local hydrogeology 335long-term 761loose aquifer 524Low Carbon 907low concentration 972low temperature 1087lysimeter tests 931lysimeter 80
M
managed aquifer recharge 389management 288, 1006manganese 1063, 1272mapping of sand mining sites 1263MAR of carbonate and alluvial aquifer 461mass-flow reduction 101massive energy storage 6maximum major stress 572Membrane distillation 36Membranes 396, 1048mercury 312, 1283meromixis 154, 167metal ions removal 43metal ions 1055metal oxides coating 43metal recovery 689, 1111, 1214metal 1076metalloids 396metals 218, 785, 801, 836, 1206Metsämonttu 109, 132microbes 437, 1204microbial communities 14Microbial Reduction Processes 843microbial 1185microcosms 1204micronutrients 1103micropollutants 1048Mine Closure 147, 154, 175, 415, 703, 822, 843mine dewatering 540mine discharge 649mine drainage 801Mine Flooding 161, 296, 303, 656, 785, 843
1322
Lappeenranta, Finland IMWA 2017Mine Water and Circular Economy
Wolkersdorfer C, Sartz L, Sillanpää M, Häkkinen A (Editors)
mine process waters 1258mine water control cooperative system 328mine water level rise 94Mine water management 124, 183Mine water monitoring 88mine water rebound 147, 488mine water treatment 14mineral characterization 712mineral deposits 603mineral processing 931minerals 1250mining costs 633Mining Environment 237Mining waste 931mining wastewater 218mining water treatment 1070Mire Hydrology 237mixing model 588modelling 154, 237, 303, 365, 373, 488, 495, 502, 540, 580, 588, 626, 664, 680, 703modification 218modified 1076Moisture retaining layer 877molecular microbiology 1119monitoring network 489monitoring 296multi-step systems 1032mussel shells 580
N
nanofiltration 1048, 1147nanoporous silicon 1271NAPA 1095natural attenuation 1133natural lakes 167negative and positive effect 197neutralisation 884neutralization potential 869neutralization 189, 1111NGO 1283nitrate 1006, 1087nitrification-denitrification 1039
1323
Lappeenranta, Finland IMWA 2017Mine Water and Circular Economy
Wolkersdorfer C, Sartz L, Sillanpää M, Häkkinen A (Editors)
Nitrogen 140non-hydrophilic material 28Novel 1228NRD 998numerical flow model 510numerical simulation 524nutrient 1196
O
Olkusz area 703Online environmental monitoring 22open pit 489, 510operational data 1119operational forecast model water balance 73Operational 1297OPEX 226optimisation 689Oxygen barrier 877
P
Panasqueira mine 1244partial sulphide oxidation 262Particle Transport 303passive biochemical reactor 1032Passive Treatment 109, 580, 588, 1063, 1095, 1162passive 453Paste thickening 445Paste 806PCB 303peak flow 365peat 218, 1076Pebble 204performance based closure objectives 822Permafrost 124pH control 1111pH 777phosphate 869PHREEQC 588, 664, 689physical simulation 28pilot unit 1258pit lakes 154, 495, 517, 1095, 1204pollutant sources 1250Pollution 720
1324
Lappeenranta, Finland IMWA 2017Mine Water and Circular Economy
Wolkersdorfer C, Sartz L, Sillanpää M, Häkkinen A (Editors)
pore waters 732Posiva Flow Log 556post-mining lake 626Post-mining water management 88, 175, 183Potentially toxic elements 720, 732precipitation 1206prediction 642, 761Predictive Numerical Calculations 664Pre-oxidized tailings 877preventive in advance drainage 254process water 1147Profitability 478progressive mine closure 610pump test 422pumped storage 6pumping rate 489purification efficiency 1076Purification 36
Q
quality 288quantitative evaluation 524
R
R 269Rare Earth Elements 947raw materials 854Reactive Mass Transport 303reactive multicomponent transport modelling 618rebound 801recharge 680reclamation 204, 964recovery 55, 964Recycling 990, 1154reduced inorganic sulphur compounds 939reduction 453, 1185REE 836reference sites 437regulation 469Reinjection 389remediation 312, 489, 502, 1125, 1138remote control 1290remote sensing 793, 1250
1325
Lappeenranta, Finland IMWA 2017Mine Water and Circular Economy
Wolkersdorfer C, Sartz L, Sillanpää M, Häkkinen A (Editors)
Renewables 907representative values and the rock seepage discharge 572reprocessing 350residue 1206resource recovery 1138resource 603Reuse of water 445re-use 1147reutilisation 884reverse osmosis 36, 381, 1048, 1147, 1258Risk assessment 696, 1244risk based approach 288risk based design 282river diversion 437riverbed sediments 732RO membranes 1119Ruhr area 147, 430
S
Safety 64sampling 1283sand mining 1263Saturated Volume Fluctuation 656scoreboard 854sealing layers 862seasonality 167secondary mining 900, 1214sediments 167, 1272selective treatment 495selenium 1185, 1191Self-filtration 1178semi-passive process 262separation 1138Shale oil 770siderophore producing bacteria 1222Similar Strata 745Simulation 478slag 869sludge 1178sodium chloride 785soil 564solid precipitation 923solid-liquid separation 1070
1326
Lappeenranta, Finland IMWA 2017Mine Water and Circular Economy
Wolkersdorfer C, Sartz L, Sillanpää M, Häkkinen A (Editors)
sonoelectrochemistry 1228sorption 218, 1055sound management strategies 1263source apportionment 649source 1006South African coal mine pit lakes 403SPLP 603Spring flow recovery 656SRB 1103stabilisation 884stability 64, 806stabilized Nano CT scan 572stable isotopes 430, 1022static tests 80static 342Steel slag 1063stratification 403, 430streams 1014sulphate ions removal 43sulphate reducing bacteria 1162, 1196sulphate reduction 502, 1272sulphate removal 14, 55, 1070sulphate 396, 453, 801, 1196, 1206sulphate-reducing bacteria 14sulphide oxidation 737, 1170sulphides 753Sunny Corner 923surface water 237, 680Surficial deposits 237Sustainability 389, 445sustainable mine closure 403System dynamic modelling 478
T
tailings 64, 226, 282, 350, 445, 603, 737, 793, 931, 979, 1281Technologies 64tetrathionate 939Thailand 1281Thallium 728Thermal infrared 1290Thiocyanate 990thiocyanates 1039
1327
Lappeenranta, Finland IMWA 2017Mine Water and Circular Economy
Wolkersdorfer C, Sartz L, Sillanpää M, Häkkinen A (Editors)
Toxic element 1281trace metals 806, 923Tracer Test 342, 532Transmissivity 556transport 564treatment options 649treatment 189, 396, 869, 1196Trona 495tropical regions 365
U
UAV photogrammetry 956UAV 1290uncertainty 696Under Ice 189underground measurement 94Underground mining 335Upper Silesian Coal Basin 488uranium removal 1271uranium 296, 672, 770, 1154, 1272use of salt water 276
V
vadose zone 564valorization 55, 907, 931vertical flow reactor 109
W
waste materials 785Waste Rock Dump Instrumentation 595waste rock utilization 80Waste rock 532, 664, 862, 998, 1170, 1281waste rocks 696waste valorisation 892, 956Waste water distribution 793waste water 972, 1055wastewater re-use 396Water balance 478water circulation 1258water content influence 979Water content 1178Water Framework Directive 101water hazard 276
1328
Lappeenranta, Finland IMWA 2017Mine Water and Circular Economy
Wolkersdorfer C, Sartz L, Sillanpää M, Häkkinen A (Editors)
water inrush phenomenon 28Water Management 226, 254, 358, 990water purification 1214Water quality 161, 403, 761, 777, 830water recovery 777, 1048Water Supply 124water-energy-food nexus 915weathering 712wetlands 312 Whitehill Formation 745Wieliczka Salt Mine 276Witwatersrand Basin 745wood ash 1032woodchip bioreactor 1087
X
XAS 712
Z
Zeolite 900zero liquid discharge 1147zinc 1272Zeolite 900zero liquid discharge 1147zinc 1272

Lappeenranta University of TechnologyResearch Reports
ISSN-L 2243-3376 ISSN 2243-3376
These proceedings of the 13th International Mine Water Association Congress in Lappeenranta, Finland, contain 176 oral and poster presentations about mine water related issues. More than 600 authors from 37 nations present papers covering all relevant mine water aspects. Their themes include Finnish Mine Water Issues, Arctic Environment, Mine Closure, Mine Flooding, Mine Water and Exploration, Pit Lakes, Hydrogeology, Geochemistry, Metals & Semi- Metals, Circular Economy & Valorisation, Active & Passive Treatment as well as Case Studies. Currently, these proceedings volume can be considered the most comprehensive compilation of leading, worldwide mine water research and development.