
Indian Engineering Congress - IEI
430
Theme Engineers for Viable Technology and $ 5 Trillion Economy Technical Volume Indian Engineering Congress th 36 December 26-28, 2021
-
Upload
khangminh22 -
Category
Documents
-
view
1 -
download
0
Transcript of Indian Engineering Congress - IEI

Theme
Engineers for Viable Technologyand $ 5 Trillion Economy
Tec
hn
ica
l V
olu
me
IndianEngineering Congress
th36
December 26-28, 2021

Tech
nic
al
Volu
me
36th
Indian Engineering CongressDecember 26-28, 2021
The Institution of Engineers (India)
Theme
Engineers for Viable Technology and $5 Trillion Economy


Composed by
Published by
Publisher
Technical Department
The Institution of Engineers (India)
Maj Gen MJS Syali, VSM (Retd)
The Institution of Engineers (India)8 Gokhale Road, Kolkata 700020
8 Gokhale Road, Kolkata 700020
Secretary and Director General for The Institution of Engineers (India)
8 Gokhale Road, Kolkata
Editorial Team
Technical Department, IEIDr N Sengupta, Dr S Chakraborty, Mr K Sen, Mr T Chakraborty, Ms A Dutta,
Ms H Roy, Mr S Bagchi, Mr P Chakraborty, Ms P Nath, Mr S K Misra
President
Chairman, Technical Committee
Secretary & Director General
Er Narendra Singh
Prof Swapan Bhaumik
Maj Gen MJS Syali, VSM (Retd)

Copyright Information
For Authors
For Readers
As soon as an article is accepted for publication, authors will be requested to assign copyright of the article (or to grant exclusive publication and dissemination rights) to the organizer. This will ensure the widest possible protection and dissemination of information under copyright laws. More information about copyright regulations for this Technical volume is available at: www.ieindia.org
While the advice and information in this Technical Volume is believed to be true and accurate at the date of its publications, neither the authors, the editors nor the publisher can accept any legal responsibility for any errors or omissions that may have been made. The publisher/ organizer make no warranty, express or implied, with respect to the material contained herein. All articles published in this Technical Volume are protected by copyright, which covers the exclusive rights to reproduce and distribute the article (e.g, as offprint), as well as all translation rights. No material published in this Technical Volume may be reproduced photographically or stored on microfilm, in electronic data bases, on video disks, etc, without first obtaining written permission from the organizer (respective the copyright owner). The use of general description names, trade names, trademarks, etc, in this publication, even if not specifically identified, does not imply that these names are not protected by the relevant laws and regulations. For permission for reuse our content please send request addressed to: The Director (Technical), The Institution of Engineers (India), 8 Gokhale Road, Kolkata 700020 (Telephone: 033-40106213 or Email: [email protected])
As per By-Law 115, Copyright of each paper published in the Institution-Journals or Proceedings in full or in abstract at its Centres shall lie with the Institution.
The Institution of Engineers (India) has exclusive rights and license to publish and distribute the print as well as online edition of proceeding worldwide. The views expressed in this publication do not necessarily reflect those of the Institution. All rights reserved. No part of this publication may be reproduced, stored in a retrieval system or transmitted in any form or by any means, without prior written permission of The Institution of Engineers (India).
Copyright
© The Institution of Engineers (India) 2021

Er Narendra Singh, FIEPresidentThe Institution of Engineers (India)
The Institution of Engineers (India)AN ISO 9001 : 2015 CERTIFIED ORGANISATION
(ESTABLISHED 1920, INCORPORATED BY ROYAL CHARTER 1935)
8 Gokhale Road, Kolkata 700 020
A Century of Service to the Nation
( )Narendra Singh
MessageIt gives me great pleasure to note that Technical Volume is being published on the occasion of the 36th Indian Engineering Congress held during 26-28 December 2021 at Vigyan Bhavan, New Delhi on the theme “Engineers for Viable Technology and USD 5 Trillion Economy”.
The technical session was organized in online mode during December 15-16, 2021. During these two days, 55 papers were presented in 12 Technical sessions. The program was attended by 268 participants. Due to the unprecedented situation worldwide arising out of COVID-19 pandemic, we were compelled to organize the 35th Indian Engineering Congress last year in virtual mode. But with the gradual return of the normalcy we are fortunate enough to organize it in hybrid mode this year in which the Technical Session was organized in online mode and the main function of the Congress was organized in physical mode. I am overwhelmed by the response received from the authors and participants during the Technical Sessions.
I take this opportunity to congratulate and thank all those who have taken the initiative and put all effort to bring out this Technical Volume through meticulous planning comprising articles by eminent engineers.
I am sure that the articles in this technical volume will benefit scientist, engineers, technologists, policy makers, academicians and all concerned.
Telephone : 4010 6299, +91 33-2223 8311 / 14 / 15 / 16 *** Web : http://www.ieindia.org


Prof (Dr) Swapan Bhaumik, FIEChairmanCommittee for Advancement of Technology and EngineeringThe Institution of Engineers (India)
The Institution of Engineers (India)AN ISO 9001 : 2015 CERTIFIED ORGANISATION
(ESTABLISHED 1920, INCORPORATED BY ROYAL CHARTER 1935)
8 Gokhale Road, Kolkata 700 020
A Century of Service to the Nation
(Swapan Bhaumik)
Message
On behalf of the Technical Committee, I am honoured and delighted to present the prestigious Technical Volume of the 36th Indian Engineering Congress, which was held in hybrid mode during 26-28 December 2021 on the theme ‘Engineers for Viable Technology and $5 Trillion Economy”. The Technical Session was organized during 15-16 December 2021 in online mode and the main program of the Congress was organized during 26-28 December 2021.
On the occasion of this Prestigious Event of IEI during the two days of the Technical Session held during 15-16 December 2021. Out of 58 papers scheduled for presentation 55 were presented in 12 technical sessions. Total 76 papers were received out of which 73 were accepted after review and fulfilling the criteria for plagiarism. Finally authors of 58 papers registered for presentation.
We are thankful to the Reviewers for their kind evaluation of the papers received for 36th IEC, Session Chair and Co Chair of all technical sessions for their relentless effort to conduct the sessions successfully.
I also thank Director (Technical) of The Institution of Engineers (India) and his team for their dedicated effort to make the event successful and bringing out this Technical Volume.
Telephone : 4010 6299, +91 33-2223 8311 / 14 / 15 / 16 *** Web : http://www.ieindia.org


Contents Agricultural Engineering
En
gin
eers
fo
r V
iab
le T
ech
no
logy
an
d $
5 T
rill
ion
Eco
no
my
AG_050_02_183
Comparison of Data Driven Modelling Techniques for Rainfall Runoff Modelling of Kosi River Nikhil Jadhav, Pankaj Kumar and Abhinav Kumar Singh
15
AG_075_04
Power Characteristics of BLDC Motor for Design of e-Powered Agricultural Machine S P Singh, Utpal Ekka, M K Singh, A K Jain and Pradip Basak
21
Architectural Engineering
AR_068_01_252
Preparing Architectural Education for Atmanirbhar Bharat Tessy Varkey, Binumol Tom and Biju Augustine
35
Chemical Engineering
CH_016_02_197
Scientometric Analysis on Utilization of Agricultural Waste for Board and Panel Preparation Prerna Sharma and V R Prasathkumar
43
Civil Engineering
CV_001_01_158 Conceptual Model of Quality Management based on Blockchain in Construction Industry Atul Kumar Singh and V R Prasath Kumar
63
CV_008_03_169
Evaluation of Energy-Efficient Office Building through Glass Thermal Properties, Shading Devices and Window-wall Ratio Kshitija S Penta and Ashwini R Patil
71
CV_020_04_209
Applications of Geo-textiles for the Stabilization of Soil: A Review Saurabh Kumar, Utkarsh Pandey and Sneha Gupta
79
CV_021_05_204
Consequence of Removal of Arbitration Clause from Engineering Contracts A Discussion Pronoy RoyChowdhury
89
CV_022_06_191
Comparative Study of Concrete made using Rice Husk Ash, Rice Straw Ash and Bamboo Leaf Ash Rajiv Sharma Leihaothabam and Khwairakpam Sachidananda
95
CV_023_07_180
Challenges in Respect to Skill Development Initiatives for 5 Trillion Dollar Economy by 2025 A Case of Construction Sector K R Ramana and K Srinivas
103
CV_051_11_199
Study of Methodology for Removal of Arsenic Contamination from Public Water Supply Projects West Bengal Perspective Pronoy Roy Chowdhury
111
CV_056_12_224 Advantages of use of Tubular/Hollow Sections over Conventional Open Sections in Hydro-Carbon Industry Structures Amresh Kumar, Papia Mandal and Anurag Sinha
117
CV_057_13_225
Effective Utilization of Rolled Sections in Hydrocarbon Plant Structures Papia Mandal, K Madhavilatha and Anurag Sinha
129
CV_060_15_153 Tomographic Image based Pavement Condition Assessment using Machine Learning Approach Aradhana Rajeshkumar Chavan, Sunil Pimplikar and Ashlesha Deshmukh
137
CV_064_17_240
Optimum Size of Radius of Curvature for a Trapezoidal Channel to Minimise Hydraulic Loss M R Goyal and N K Jain
149

Contents Computer Engineering
En
gin
eers
fo
r V
iab
le T
ech
no
logy
an
d $
5 T
rill
ion
Eco
no
my
CP_018_03_203 Engineering Collaborations for Accessing Hidden Web Resources Manpreet Singh Sehgal
159
CP_019_04_194
A Machine Learning Approach for Predicting Heart Disease using Efficient Algorithm Anuradha T and Priyanka Vutkur
165
CP_041_07_196 A Smart Phone Application to Evaluate Candle Flame Characteristics Abhay Chatterjee and Thangaraja Jeyaseelan
173
Electrical Engineering
EL_025_02_215
Supraharmonics in the Electric Power Grid: Detection and Measurement in Textile Industry Y Dhayaneswaran, A Amudha and L Ashokkumar
181
EL_028_05_210
Electric Vehicle Charging Landscape Aiming for Self Reliant India Priyabrata Pradhan
187
EL_029_06_198 Solar based Bi-Directional Electric Vehicle Charger Sampathraja Natarajan, Ashok Kumar Loganathan and Jishnu Viswanathan
193
EL_030_07_192
Analysis of the Pivotal Role of Entrepreneurship in the Solar Energy Sector of India A Focus on the Indian Renewable Market Ale Imran, Mohd Rihan and Rahul Pachauri
209
Electronics and Telecommunication Engineering
ET_003_01_146
On Some Findings on Micro-strip Patch Antenna for Bio-medical Applications Arpita Santra, Arnima Das, Maitreyi Ray Kanjilal and Moumita Mukherjee
219
ET_013_02_175
Integrated Maritime Domain Information Awareness TWW Leelarathna, Ruwan Bolongho and Sumali S Morapitiya
223
ET_032_03_181
Point-of-care Diagnostic Device in Healthcare: A Literature Review Ramya D and Ashok Kumar L
231
ET_034_05_179
Radar Cross Section Estimation for a Complex Shaped Objects using SPSG and PO Methods Swathi Nambari, Gottapu Sasi Bhushana Rao, Raj Kumar Goswami and Kolluri Sri Ranga Rao
237
ET_046_06_178
Two Applications of FBG Temperature Sensor for Environmental Safety Sagupha Parween and Aruna Tripathy
247
Environmental Engineering
EN_070_04
Sustainable Ash Management in Thermal Power Plants in Parity with COP26’s Mission of Phasing Down of Coal for Empowerment of India’s Economy Case of the Country’s First Multipurpose Project
Shiv Shyam and Binoy K Choudhury
257
Mechanical Engineering
MC_005_01_149
Preliminary Prototype and Analysis of a Customized Handle for Winding Machine using Fused Filament Fabrication Sreekanth M P
275
MC_039_05_207
Comparison of Properties of SA 213 T 12 Tube Weldments by GTAW, ATIG, P-GMAW and Alternating Shielding Gas GMAW N Rajasekaran, A Santhakumari and A Raja
297

Contents MC_038_04_216
Integration of AI & ML with High-speed Compression Ignition Engine being used on Diesel Locos of Indian Railways Narendra Kumar Verma
281
En
gin
eers
fo
r V
iab
le T
ech
no
logy
an
d $
5 T
rill
ion
Eco
no
my
MC_040_06_201
Contribution of Engineers in Reaching $5 Trilion Economy Vinayak Hegde
305
MC_054_11_222
Challenges in Design of Positive Isolation System for Large Diameter Gas Piping in Steel Plants Anirban Datta and Pranab Kumar Bhattacharya
311
MC_071_14_237
Experience of Belt Jump and Sway in a Short Belt Conveyor Bhaskar Dutta and Anirban Datta
323
MC_076_15_258
Overview of Wet Flue Gas Desulphurisation System and Condensate Flow Study in View of New Stringent Environment Regulations for Fossil Fuel based Power Plants in India Pradeep Kumar Sharma and Rahul Singh
331
Materials and Metallurgical Engineering
MM_059_02_235
Optimization of Annealing Cycle and Microstructural Characterization of Cold Rolled Titanium-stabilized Interstitial Free Steel Santosh Kumar, M Deepa, Janak Lal, K K Singh, N Mondal and Vinod Kumar
343
Mining Engineering
MN_036_01_214
Prediction of Roof Falls and induced Caving in Continuous Miner Panel using Machine Learning D Laxmi Narayana and M S Venkataramayya
353
Production Engineering
PR_062_01_231
The Sustainable Development in Madurai Jewellery Cluster E Bhaskaran
363
Textile Engineering
TX_066_01
Modelling Multi-phase Machine Repairable System for a Textile Industry S Karpagam
377
Interdisciplinary
ID_010_01_167 Atmanirbhar Bharat: Indigenization for Defence Forces Ashok Kumar Panda
393
ID_063_02_241 Expertise Collaboration and Data Integration in Industries Anuj Kumar
399
ID_072_03_255 Opportunity for Made in India Medical Devices in Global Markets: Role of Quality Balram Sankaran and Shiyas C R
403
ID_048_09_186 Drastic Change in Technical Education in India Arun Chandra Sawhney
407
ID_049_10_182 Basic Engineering Considerations for Engineers and Entreprenures Arun Chandra Sawhney
415


En
gin
eers
fo
r V
iab
le T
ech
no
log
y a
nd
$5
Tri
llio
n E
con
om
y
Agricultural
Engineering


Engineers for Viable Technology and $5 Trillion Economy
15 Technical Volume of 36th Indian Engineering Congress, December 26-28, 2021
ISBN 978-81-955500-1-2
Comparison of Data Driven Modelling Techniques for Rainfall
Runoff Modelling of Kosi River
Nikhil Jadhav*, Pankaj Kumar and Abhinav Kumar Singh
Department of Soil and Water Conservation Engineering, Govind Ballabh Pant University Agriculture &
Technology, Pantnagar, Uttarakhand
*email: [email protected]
Abstract: In the recent past, use of various machine learning techniques in predicting runoff from the catchment has
become very popular. In this study, three empirical rainfall runoff models are employed to predict the discharge of
the Kosi River for 11 years (2005-2015). The machine learning techniques such as support vector regression (SVR),
multivariate adaptive regression splines (MARS) and random forest (RF) are employed for rainfall runoff modelling
of Kosi watershed. The performances of all three prediction models have been successfully compared. Daily
rainfall-runoff data for the period of 2005 to 2015 was collected for the Kosi River at Ramnagar barrage. It was
seen that RF model outperformed over other two models. The gamma test was successfully applied in determination
of the best input variables. The performance of the models is evaluated in terms of efficiency measures such as
coefficient of determination (R2), root mean squared error (RMSE) and Nash Sutcliffe Efficiency (NSE). The results
revealed that random forest with R2 value 0.95 in testing phase performed superior than other two models. The
performance of MARS model was satisfactory while SVR model resulted very poor values. Therefore, RF model can
be considered as most accurate model for prediction of discharge.
Keywords: Rainfall-runoff Model; Gamma Test; SVR; MARS; RF
INTRODUCTION
Rainfall-runoff models develop relationship between rainfall and runoff. The rainfall-runoff relationship is one of
the most intricate hydrologic phenomena to comprehend due to its immense spatial and temporal variability of
watershed characteristics and precipitation patterns, and the number of variables involved in the modelling of the
physical process. For the decision makers, rainfall-runoff modelling produces a means of quantitative prediction.
Modelling runoff helps to gain a better understanding of hydrologic phenomena and how changes affect the
hydrological cycle (Xu, 2002). Modelling surface runoff can be difficult, as per as complex calculation is concerned
and contain number of interconnected variables. The model add general components such as inputs, governing
equations, boundary conditions or parameters, model processes, and outputs (Singh, 1995). The results of surface
runoff modelling helps to understand catchment yields and response, estimate water availability, changes over time
and forecasting.
Of the various models available, empirical or black box type models develop empirically identified statistical
relationships between rainfall and runoff, without attempting to define and understand the physical processes
invoked in the transformation. Empirical models are data driven models and are simple to use.These type of models
do not consider physical processes involved in the system. The precision of model predictions is greatly subject to
user‟s ability, knowledge, and understanding of the model and of the watershed characteristics.
Machine learning based models are capable of providing a useful alternative to deal with the multivariate and
complicated nature of the phenomena of rainfall and runoff.

Engineers for Viable Technology and $5 Trillion Economy
16 Technical Volume of 36th Indian Engineering Congress, December 26-28, 2021 ISBN 978-81-955500-1-2
Support Vector Regression (SVM)
Support Vector Regression technique was firstly made known by Vapnik in 1992. Support Vector Regression (SVR)
is a nonlinear regression method based on Support Vector Machines (SVM). It can be said as a sub part of Support
Vector Machines (SVM). Support Vector Regression maps the data lower dimensional data into a higher
dimensional feature space using various kernel functions and then attempts to solve a linear regression problem in
the newly developed higher dimensional space. The SVR algorithm works with the goal to create the best line that
can segregate n- dimensional space into classes.
Multivariate Adaptive Regression Spline (MARS)
Multivariate adaptive regression spline (MARS) model is a newer non-parametric regression method. It is a non-
linear regression method that was first established by Friedman in 1991. The model records the nonlinear response
between the inputs and the output of a system by constructing several splines and creates a number of knots between
these splines (Friedman 1991). It works in two stages viz. forward stage and backward stage. In forward stage,
MARS algorithm take the whole data and then takes the sub sample from the dataset and tries to fit linear regression
line on those sample data set. When these lines are getting fitted on those sample data set, the algorithm just try to
connect all those linear regression lines fitted by the algorithm. Thereafter, the algorithm joins all those regression
line with knot. A knot marks the end of one region of data and the beginning of another. Number of knots are
selected randomly in the model. These knots occurs in pairs and are called as basis function. In backward stage, the
algorithm removes the basis function which does not contribute to model accuracy or removes the model error.
Random Forest (RF)
Random forest is very popular ensemble machine learning technique. It was systematically developed by Breiman in
2001. The algorithm of Random Forest are very stable, straightforward and flexible. Random forest classifier or
regressor is basically a bagging technique. Number of models called as based learners or decision trees are created
using some samples of rows and features from the complete dataset. Sampling with replacement method is used
while performing sampling. Decision tree have two properties viz. low bias and high variance. Each decision tree
gets trained on the particular dataset used thereby becoming able to give accuracy or prediction. In case of
classifying problems, majority of votes given by various decision trees are considered as outputs. Whereas, in case
of regression problems, mean of the outputs given by various decision trees is considered as output. Mean of the
outputs of all decision tree causes conversion of high variance possessed by individual decision tree into low
variance in overall decision trees.
This paper illuminates application of SVM, MARS and RF in rainfall runoff modelling. The purpose of this study is
to evaluate the performance of machine learning techniques viz. SVM, MARS and RF in modelling the runoff using
statistical indices such as root mean square error (RMSE), coefficient of determination (R2) and Nash Sutcliffe
efficiency (NSE) etc. for the Kosi watershed. Also, this paper compares values of statistical analysis. On the basis of
values computed, the study puts forward the best model to use in rainfall runoff modelling among these three
empirical models.
MATERIAL AND METHODS
Description of the Study Area and Data
The study area is located on the Kosi River, a Himalayan river which originates at Rudradhari in Almora district of
Uttarakhand state. It confluences to river Ramganga river near village Chamraul (Uttar Pradesh). The study area
spatially lies between 33°21′54′′N to 34°27′52′′ N latitude and 74°24′08′′ E to 75°35′ 36′′ E longitude with a total
area of 3420 sq. km. It covers almost all the physiographic divisions of the Kashmir Valley and is drained by the
most important tributaries of river Jhelum. The rainfall and runoff data at Ramnagar barrage gauging station from
2005 to 2015 was procured, comprising of 4013 days. The data sets for the years 2005 to 2013 were used for
training the models and these models were validated for various data sets achieved for 2013 to 2015. The whole
dataset were work out in Gamma test software for best input selection. Gamma test creates different models with

Engineers for Viable Technology and $5 Trillion Economy
17 Technical Volume of 36th Indian Engineering Congress, December 26-28, 2021
ISBN 978-81-955500-1-2
combination of different inputs. Then it calculates gamma value for each model. The model having least gamma
value is selected as best input model. The best inputs illustrated by gamma test were further used for modelling.
Support Vector Regression
The Support Vector Machine (SVM) is a nonlinear generalization algorithm used for classification and regression
problems, introduced by Vapnik (1992). The rainfall-runoff phenomenon is itself non-linear in nature, thus creating
non-linearly separable points in space. The regression model can be constructed by mapping non-linear mapping
function. The nonlinearly separable problem can be converted into linearly separable by mapping the original input
data into higher dimensional space. The goal of the SVR algorithm is to construct a function y = f(x) which
represents the dependence of the output yi on the input xi. The form of this function is
y = ωT
Φ (x) + b (1)
Where, ω is weight vector and b is bias and Φ(x) is non-linear mapping function of inputs
Multivariate Adaptive Regression Splines (MARS)
Multivariate adaptive regression spline (MARS) models the nonlinear response between the inputs and the output of
a system by constructing several splines and creates a number of knots between these splines. A knot marks the end
of one region of data and the beginning of another. In a MARS model, there is no need for any specific assumption
about the underlying functional relationship between the inputs and the output.
GCV = MSE
1− f+1 +pf
n 2 (2)
Where, MSE= mean squared error, f = number of basis functions, p = basis function penalty and n = number of
observations.
Random Forest (RF)
Random Forest model is a decision tree model which handle complex relationships of independent and dependent
varaiable without any assumption. The algorithm deals well with overfitting of the data and they can operate in
parallel computing mode (Dayal el al. 2021). Considering a training set X = x1, x2, . . ., xn, responses Y = y1, y2, . . .,
yn, and B times repeated bagging, a random sample (Xb,Yb) is selected replacing the training set, which is fitted to a
regression tree (fb), for b = 1, 2, . . ., B. After training, the unseen samples (say, x‟) can be predicted by averaging all
the individual regression trees‟ predictions on x‟ as:
ƒˆ =
1
B fB
b=1 b (x‟) (3)
RESULTS AND DISCUSSION
The least gamma value was found for the combination of seven inputs as following: R, R(t-1), R(t-2), Q(t-3), Q(t-2), Q(t-1)
and Q where R and Q are the rainfall and runoff data calculated from tth
day. (t-1), (t-2) and (t-3) represents the
lagging done from one, two and three days before tth
day, respectively. Minimum gamma value was computed to be
0.0959. These input variables were further used in SVM, MARS and RF model. The complete dataset were divided
into two parts. First 80 % data i.e. for the period of 2005 to 2013 were used for training of the models and remaining
20 % dataset i.e. for the period of 2013 to 2015 were used for testing of the models. The maximum discharge for the
Kosi River was recorded to be 2180.341 cumec. The values of statistical indices such as minimum, maximum,
mean, first quartile, and third quartile of the training, testing, and the complete dataset is given in Table 1.
In case of SVR model, the value of Root Mean Square Error (RMSE) for training and testing phase was found to be
58.28 and 33.28, respectively. Also, NSE values were -1.28 and 0.00 for training and testing phase respectively.

Engineers for Viable Technology and $5 Trillion Economy
18 Technical Volume of 36th Indian Engineering Congress, December 26-28, 2021 ISBN 978-81-955500-1-2
Coefficient of determination (R2) of 0.66 was observed for testing phase. Overall, the performance of SVR model
was poor as compared to MARS and RF model. The agreement between observed and predicted discharge is
unsatisfactory.
The MARS model resulted better values than conventional SVR model. Root Mean Square Error (RMSE) value was
47.36 for training and 17.96 for testing phase. The NSE and coefficient of determination between observed and
simulated discharge was found to be in the range of 0.49 to 0.88 and 0.66 to 0.89, respectively. Thus, big hike
observed in R2 value in testing phase. The performance of MARS model is intermediate between SVR and RF
model.
Random forest model came up with superior values among all three models. The model performance during training
and testing period is found to be very good. RMSE value for training and testing phase was found to be 28.52 and
12.98, whereas NSE value was found to be 0.81 and 0.92, respectively. Highest coefficient of determination is
obtained by RF model is 0.95. The agreement between observed and predicted discharge is very satisfactory.
Table 1 Values of statistical parameters of training, testing and complete daily dataset R, R(t-1), R(t-2), Q(t-3), Q(t-2), Q(t-
1) and Q of the study area. Xmin, Xmax, Xmean, 1st
Q, 3rd
Q are minimum value, maximum value, mean, first quartile,
and third quartile
Statistical
Parameters
Input Variables
R
(mm)
R(t-1)
(mm)
R(t-2)
(mm)
Q(t-3)
(cumec)
Q(t-2)
(cumec)
Q(t-1)
(cumec)
Q
(cumec)
Training (2005-2013)
Xmin 0.00 0.00 0.00 0.00 0.00 0.00 0.00
Xmax 140.00 140.00 140.00 2180.341 2180.341 2180.341 2180.341
Xmean 3.012 3.012 3.012 27.864 27.868 27.872 27.876
Median 0.00 0.00 0.00 6.966 6.966 6.980 6.994
1st Q 0.00 0.00 0.00 3.709 3.709 3.709 3.709
3nd
Q 0.00 0.00 0.00 21.606 21.606 21.606 21.606
Testing (2013 - 2015)
Xmin 0.00 0.00 0.00 2.379 2.379 2.379 2.379
Xmax 142.400 142.400 142.400 731.198 731.198 731.198 731.198
Xmean 2.472 2.472 2.472 27.776 27.759 27.743 27.726
Median 0.00 0.00 0.00 11.383 11.383 11.355 11.298
1st Q 0.00 0.00 0.00 6.173 6.159 6.145 6.131
3nd
Q 0.00 0.00 0.00 22.101 22.101 22.101 22.101
Complete Data (2005-2015)
Xmin 0.00 0.00 0.00 0.00 0.00 0.00 0.00
Xmax 142.400 142.400 142.400 2180.341 2180.341 2180.341 2180.341
Xmean 2.958 2.958 2.958 27.846 27.846 27.846 27.846
Median 0.00 0.00 0.00 7.929 7.929 7.929 7.929
1st Q 0.00 0.00 0.00 4.247 4.247 4.247 4.247
3nd
Q 0.00 0.00 0.00 21.634 21.634 21.634 21.634
Comparison of the performance values of RMSE, NSE and R2 for both the models is shown in Table 2. From the
comparison, it is clear that Random Forest model outperformed than SVR and MARS model.

Engineers for Viable Technology and $5 Trillion Economy
19 Technical Volume of 36th Indian Engineering Congress, December 26-28, 2021
ISBN 978-81-955500-1-2
Table 2 Comparison of SVM, MARS and RF model using statistical indices
Models Training Testing
RMSE NSE R2
RMSE NSE R2
SVM 58.28 -1.28 0.57 33.28 0.00 0.66
MARS 47.36 0.49 0.66 17.96 0.88 0.89
RF 28.52 0.81 0.90 12.98 0.92 0.95
CONCLUSION
In this study, comparison of three empirical rainfall-runoff models have been successfully done. Random forest
model outperformed the other two model and thus, it is best suited for the prediction of runoff. Decision trees
present in random forest model learns better from the data, thereby creating good correlation between observed and
predicted values. Due to tremendous variation in the data, regression line has limitation to fit well. It causes SVR
and MARS model to perform in the range of poor to satisfactory.
REFERENCES
1. Deen Dayal, Praveen K. Gupta and Ashish Pandey (2021). Streamflow estimation using satellite-retrieved water
fluxes and machine learning technique over monsoon-dominated catchments of India. Hydrological Sciences
Journal, 66:4, 656-671.
2. Maity Rajib, Bhagwat Parag and Bhatnagar Ashish (2010). Potential of support vector regression for prediction
of monthly streamflow using endogenous property. Hydrological Processes, 24, 917–923.
3. Zhenliang Yin, Qifeng, Xiaohu Wen, Ravinesh C. Deo, Linshan Yang, Jianhua Si, Zhibin He (2018). Design and
evaluation of SVR, MARS and M5Tree models for 1, 2 and 3-day lead time forecasting of river flow data in a
semiarid mountainous catchment. Stochastic Environmental Research and Risk Assessment.
4. Dinh Tuan Vu, Xuan Linh Tran, Minh-Tu Cao, Thien Cuong Tran, Nhat-Duc Hoang (2020). Machine Learning
Based Soil Erosion Susceptibility Prediction Using Social Spider Algorithm Optimized Multivariate Adaptive
Regression Spline.
5. Joshi Jignesh, Patel Vinod M (2011). Rainfall-Runoff Modeling Using Artificial Neural Network. National
Conference on Recent Trends in Engineering & Technology
6. J.H. Friedman, C.B. Roosen (1995). An Introduction to Multivariate Adaptive Regression Splines, Statistical
Methods in Medical Research, 4 197-217
7. J.H. Friedman, Multivariate Adaptive Regression Splines (1991). The Annals of Statistics, 19 1-67
8. Hsu K Gao X, Sorooshain S., and Gupta H.V. (1995). Artificial Neural Network Modelling of the Rainfall-
runoff Process Water Resources, 3, 2517-2530.
9. Keith Beven (2012). Rainfall-Runoff Modelling The Primer. 1-5
10. Xiao M, Zhang Q, Singh VP, Chen X (2017). Probabilistic forecasting of seasonal drought behaviors in the Huai
river basin, China. Theor Appl Climatol 128:667–677. https://doi.org/10.1007/ s00704-016-1733-x
11. Seth Richa, Singh Prashant, Manindra Mohan, Singh Rakesh, Gupta Vinod K., Uniyal D.P., Dobhal Rajendra
and Gupta Sanjay (2013). Assessment of Water Quality of Kosi River, Almora, Uttarakhand (India) for Drinking
and Irrigation Purposes, TACL 3 (4), 287 – 297
12. Zhaoli Wang, Chengguang Lai, Xiaohong Chen, Bing Yang, Shiwei Zhao and Xiaoyan Bai (2015). Flood hazard
risk assessment model based on random forest. Journal of Hydrology 527, 1130-1141.


Engineers for Viable Technology and $5 Trillion Economy
21 Technical Volume of 36th Indian Engineering Congress, December 26-28, 2021
ISBN 978-81-955500-1-2
75_04
Power Characteristics of BLDC Motor for Design of e-Powered
Agricultural Machine
S P Singh1*
, Utpal Ekka1, M K Singh
2, A K Jain
3 and Pradip Basak
4
1Division of Agricultural Engineering, ICAR-Indian Agricultural Research Institute, Pusa, New Delhi
2Indian Agricultural Research Institute Regional Research Station, Karnal
3Department of Electrical Engineering, Indian Institute of Technology Delhi, New Delhi
4ICAR-Indian Agricultural Statistics Research Institute, New Delhi
*e-mail: [email protected]
Abstract: Marginal and small farmers, having less than 2 ha land and size of plots, in India depend on animate
power for various agricultural operations. There is a need of such prime movers in India to provide a clean source
of power for light to medium farm operations which require power of 576 W to 1080 W. Power characteristics on
various loads with two power packs was analyzed using frictional resistance mechanism. A 48 V BLDC 1.5 kW
motor was studied for voltage and current drawn characteristics at varying loads (gradual and fixed load) with 24
Ah and 48 Ah capacities of deep rechargeable batteries power packs. It is observed from laboratory study that
higher battery capacity (48 Ah) power pack provided stability in voltage and current drawn at varying loading
condition. The maximum and sustainable power obtained from 1500 W BLDC motor suggests to have maximum
speed of 5 km/h for designing a walk-behind electric prime mover as an electrimate source of power in agriculture.
Optimum power was derived of 844 W at speed of 0.42 m/s for operation of having 700 mm operational width for
designing small walkbehind electrical agricultural prime mover. Use of electrical energy through battery have great
capability in reducing burden of global emissions in terms of 41.8 kg CO2/ ha for one operation in a single pass.
Keywords: Electrimate Source of Power; Smf Lead Acid Battery; Battery Power Pack; Power Characteristics;
Electric Agricultural Prime Mover; Clean Technology
INTRODUCTION
Agricultural machines are mostly operated in hard/loose soils for performing various mobile farm operations in the
field. The soil condition affectspulling ability of traction device. At present the mobile farm operations are mostly
performed byhuman beings, animate power (human and animal) and mechanical (tractor, power tiller and combine
harvester) power source. There is very confined output withhuman beings and animate power in farm operation.
Therefore, the share of mechanical power in farm operations increased to a tune of 86% (Mehta et al. 2019). Diesel
is the main source of fuel for mechanical power. The power obtained with diesel fuelis considered as one of the
largest contributors to environmental pollution due to exhaust emissions. This is also responsible for several health
problems as well (Reşitoğlu et al. 2015). Exposure to pollution from fossil fuels also leads to around 490 million
days of work absence due to illness (NDTV 2020; Farrow et al. 2020). The Automotive Industry Standards (AIS)
suggested for reducing pollution with a viable option of electric vehicles and providing incentives to farmers
(Pushkar 2019).World Health Organization also suggested the reduction in fossil fuel in India that can be achieved
with liquid petroleum gas and electricity, along with biogas and ethanol, as these are the clean energy alternatives
(WHO 2016). Considering these suggestions, attempt has been made to use electric power in mobile agricultural
operations for primary and secondary tillage, furrow/ridge making, planking, sowing, interculture, spraying,
harvesting and plucking.
The use of electric power using battery as energy storage system is being studied globally for its potentiality in
mobile farm operations with tractor, solar powered electric tractor, orchard tractors, autonomous or self-drive
agricultural machines, agricultural robots, precision agriculture, walk-behind electric machine for tillage,
Engineers for Viable Technology and $5 Trillion Economy
22 Technical Volume of 36th Indian Engineering Congress, December 26-28, 2021
ISBN 978-81-955500-1-2
sowing/planting and plant care, interculture, harvesting, etc (Kiranet al. 2017; Shinde and Awati 2017; Mathan et al.
2019; Rycroft 2019; Singh et al. 2020; Singh et al.2019a &b; Sahoo and Raheman 2020). Electric vehicles were
found better-quality than internal combustion engines with respect to its efficiency, endurance, durability,
acceleration capability and simplicity (Juan 2010).
Brushless direct current (BLDC) motor or direct current (DC) motor was used to drive the agricultural machines for
indented function at farm. Lead acid batteries are mostly used in these devices due to economy and low maintenance
i.e.,less expensive than other energystorage alternatives (Juan 2010). It also adds weight to machine for better
traction. Study has also been made to charge the batteries through solar for running battery power weeder
(Govardhini and Reddy 2017). Peukert model of battery behavior described the drop of voltage at increased load and
same time current drawn was also increased (Buchmann 2001; NPTEL).There is very limited information available
on the use of electric power characteristics at various loads on low rpm as most of the work is for high-speed battery
electric vehicle (Grunditz 2016). Electric motors used in electric vehicles are providing high torque at the time of
initial acceleration and low power consumption (Hayrettin 2020). The important characteristics of wide available
range of motor speed and torque provides a workable zone for operation in various fields (Yimin and Mehrdad
2006). BLDC motors are more advantageous in terms of usage compared to other electric motors with regards to
high torque (Gökozan and Taştan 2019) because of its high magnetic rotor. Hence brushless DC motors has
potential in designing the agricultural farm traction vehicle under electric vehicle (EV) impetus framework (Nanda
and Kar 2006).
In Indian agriculture, small farmers are dependent on manual and bullock power for various farm operations. There
is need to have electrimate source of power (human being and electric power obtained from battery, account for the
bulk of the power used in agriculture particularly among small and marginal farmers) for them. Keeping this in
view, study is planned to assess design parameters for electric powered agriculturemachine to increase their
productivity.
MATERIALS AND METHODS
Laboratory Experiments
A frictional resistance mechanism was designed and developed for assessing characteristics of 1500W BLDC motor.
Frictionalsurface was considered to load the BLDC motor through a flywheel using Prony brake dynamometer
principle. A flywheel was coupled with a three-phase BLDC motor through a 1: 9 gear reduction unit. Motor
wasdriven by 48 V sealed maintenance free (SMF) battery controlled by motor controller. Two battery power packs
were used in the study. A 12 V 24 Ah valve regulated lead acid (VRLA) battery having 350 cycles was taken to
make 48 V as per requirement of BLDC motor. For making 48 Ah, pack of 4 batteries were used in parallel. The
weight of 24 Ah and 48 Ah battery power packs was 28 kg and 56 kg, respectively. Motor controller has provision
to vary the speed in three levels i.ethe speed at transmission level of 1, 2 and 3 was 2000, 2550 and 3100 rpm,
respectively. An energy meter wasconnected to the power transmission circuit for measuringreal time voltage and
current during operation. The flywheel was loaded through a canvas belt. Belt was fixed at one end and other end
was attached with a 998 N spring balance. The idle weight was 21.58N. Required load was provided by tightening
nut and bolt on the setup. A 736 N S-type tension and compression load cell was attached with fixed end of belt to
recorded tangential force on flywheel (Figure 2). Excitation power was provided to the load meter through 12 V 12
Ah lead acid batteries.
Total five experiments were conducted in laboratory in the Division of Agricultural Engineering, ICAR-Indian
Agricultural Research Institute, New Delhi, India during the period July 2020 to December 2020. Tangential force
on flywheel under static condition was recorded at no applied load condition, 49 N, 98 N, 147 N, 196 N, 245 N, 294
N, 343 N, 392 N, 441 N, 491 N, 540 N and 589 N applied load at T1 side and was also recorded during dynamic
condition at selected speed. The experiment was conducted at first transmission level of speed of motor. Out of five,
two experiments were conducted for five minutes of experiment duration with both power packs. During first
experiment, the flywheel was run at 397 N load (tangential force) and gradually load was decreased at the rate of 49
N applied load till no load condition. Second experiment was conducted at increased loads at similar load
increments pattern from no load condition up to 397 N.In the first two experiments speed were allowed to change

Engineers for Viable Technology and $5 Trillion Economy
23 Technical Volume of 36th Indian Engineering Congress, December 26-28, 2021
ISBN 978-81-955500-1-2
due to loading and unloading force. Third experiment was conducted at gradual increased load from no load
condition by maintaining constant speed at 24Ah power pack. With same power pack, fourth experiment was also
conducted at constant applied load of 245 N at speed of 100 rpm for analyzing battery discharge rate with voltage
and current drawn behavior. Fifth experiment was conducted to evaluate the effect of online charging the 48 Ah
battery power pack with solar power. Three solar panels (17.87 V of each panel) were attached in series to get 48 V
and 6.06 current. Power was provided through maximum power point tracking (MPPT) controller to power pack.
The flywheel was loaded at 232 N tangential forces at speed of 102 ± 2 rpm for 37 minute duration. The power
characteristics was compared with and without charging power pack also on similar flywheel load (221 N) at speed
of 100 ± 2 rpm.
Multi meter was also used to compare the voltage reading obtained from energy meter before start of experiment.
Speed on flywheel was measured by a tachometer. Data obtained with these experiments were analyzed for power
characteristics during different loading conditions. Power was calculated using a formula of multiplication of
voltage and current. Whereas torque applied to the motor was calculated as,
T =P x 60
2πN
Where, T = torque [Nm] P = power at tangential force on flywheel [W] and N= flywheel speed [rpm]
Data recorded during each experiment were analyzed and correlations are shown in Figures 5 to 10. Two tailed t-
test were used to compare the data of voltage, current, power, torque and speed with both power packs.
Operational Parameter Optimization
The power requirement in selected farm operations lies between 0.0072 to 0.018 W/mm2 based on the power
requirement with human and animate power (Table 1). From this table,the power requirement for small prime
mover of size 700 mm was analysed to a range of 576W to 1080 W for 800 mm width of cultivator In secondary
tillage operation to 400 mm plough for primary tillage operation. The size of land with the marginal and small
farmers are generally varying from 100 m2 to 2000 m
2. Therefore, the requirements of machine is light weight and
compact which enable to perform multi operation.
Table 1 Force requi1rement in different type of farm operations.
Power source Farm operations Equipment Width
[mm]
Depth/
Dia [mm]
Draft
[N]
Speed
[m/s]
Power
[W/sq. mm
or W]
Animal
(Sharma and
Mukesh 2013)
Tillage Desi plough 120 150 588.6 0.55 0.018
Secondary tillage Tyne
cultivator
450 100 588.6 0.55 0.0072
Sowing 3 row seed
drill
660 75 588.6 0.55 0.00654
Manual Seeding (Sharma
and Mukesh
2013)
Hand drill 200 50 196.2 0.55 0.0108
Weeding (Singh
et al. 2016)
Wheel hoe 150 40 147.2 0.55 0.0135
Multi-objective genetic algorithmic technique was employed in R software using “nsga2R” package for optimizing
depth of operation and draft requirements with respect to electric power availability at pre-determined working
width. Considering a multi-objective optimisation problem, the objective functions along with the constraints are
given below

Engineers for Viable Technology and $5 Trillion Economy
24 Technical Volume of 36th Indian Engineering Congress, December 26-28, 2021
ISBN 978-81-955500-1-2
Maximize 1 1 2 3( ) ,f x x x x and
Minimize2 1 2 3 4( ) ,f x x x x x
subject to 20 200x and
40.42 0.97x
where, 1( )f x = draft, N;
2 ( )f x = power requirement, W; 1x = operating width of the machine, mm;
2x = depth,
mm; 3x = resistance force, N/mm
2, and
4x = speed, m/s. The operating width of the machine 1x was fixed at 700
mm keeping in view of the row to row spacing at the field condition. The resistance force, 3x was fixed at 0.02
N/mm2 as it remains constant at the 0-200 mm depth of the soil.
RESULTS AND DISCUSSIONS
Effect of Loads on Power Characteristics of BLDC Motor
The study carried out on frictional resistance mechanism setup to decide the variables for designing a small walk-
behind electric prime mover in agriculture were analyzed in terms of tangential load, power and torque
characteristics, and speed with load, battery performance and solar charging during operation at different type of
loading conditions. The results are discussed in appropriate sections.
Effect of Gradual Decreased Load on Speed, Voltage and Current
A power pack of 48 Ah and 24 Ah battery charging capacities was used to observe the voltage and current for
decreasing trend of tangential force (Figure 1(a)) on flywheel. Correspondingly flywheel speed was 85 and 66 rpm
by setting acceleratorposition for the experiment. It was found that 1500 W BLDC motor could not be accelerated at
initial load of 490.5 N with both power packs. The voltage of 48 Ah and 24 Ah power packs was 52.62 V and 52.71,
respectively before start of experiments. In 48 Ah power pack, voltage was dropped from initial level to 48.5 V at
load of 397 N tangential force. Voltage drop continued up to 172 N load on flywheel. While it was dropped from
initial charge level to 47.6 V at 397 N tangential force with 24 Ah battery capacity and continued up to 217 N.
Voltage was in increasing order after 124 N load of tangential force and continued till No Load condition with 48
Ah battery capacity of power pack while it was observed from 217 N load onwards with 24 Ah battery capacity. The
decreasing and increasing of volatile voltage during run were due to requirement of varied current at reducing loads.
This might be due to battery‟s internal resistance. The drop of voltage during run was 19.9 to 42% more with 24 Ah
battery capacity of power pack than 48 Ah battery capacity of power pack. Two tailed paired t-test reveals the
significant difference at p < 0.05 with 13.77964 value of t and < 0.00001 value of p. The drop of voltage may be
called battery drop at varied current drawn depending on load. More stability in voltage drop during run was
observed with higher Ah capacity of power pack. The voltage (stabilized) was 49.69 V and 48.75 V after experiment
with 48 Ah and 24 Ah battery capacity, respectively. The current drawn was 26.85 A at flywheel load of 397 N with
48 Ah battery capacity of power pack while the current drawn of 23.4 A with 24 Ah battery capacity. Current drawn
was in reducing trend with reduced load of flywheel at both power packs. T-test analysis reveals the significant
difference at p<0.05 between current drawn at both power packs with t-value of 8.861187 at value of p of <0.00001.
The significant difference between voltage and current drawn clearly indicates better stability with higher capacity
power pack under this condition.
The power obtained with 48 Ah and 24 Ah battery capacity of power pack was 1302 to 200 W and 1114 to 139 W,
respectively under reduced loading conditions at fixed accelerator positions (Figure 1(b)). Power reduction was
higher (8.04 times) with 24 Ah battery power pack as compared to 6.52 times with 48 Ah battery power pack.
Decreasing trend of power requirement was observed with both power packs at different loading conditions. The
speed was increased 3.03 times (66 rpm and 200 rpm) from initial speed with 24 Ah battery power pack as
compared to speed increment of 2.55 times (85 rpm and 218 rpm) with 48 Ah battery power pack at fixed
accelerator position. The significant difference was observed in power and speed obtained with both power packs at

Engineers for Viable Technology and $5 Trillion Economy
25 Technical Volume of 36th Indian Engineering Congress, December 26-28, 2021
ISBN 978-81-955500-1-2
p < 0.05 with t-value of 8.934273 and p-value of 0.00001, and t-value of 6.421683 and value of p as 0.00012,
respectively. It is clear from figure that 48 Ah battery power pack provides better stability during decreased flywheel
loading conditions. From Figure 1 (b), it is clear that a sharp decline in power was observed for 129.07 Nm torque
and 119.43 Nm torque for 48 Ah and 24 Ah battery capacity of power pack, respectively and thereafter stability was
observed. It suggests for use of 24 Ah battery power pack for 980 W power with 94 Nm torque while 1248 W power
at 113.6 Nm was with 48 Ah battery capacity.
a. Reduced force in contrast to voltage and current
Load at 22Ah 161.24 119.43 93.64 84.33 70.31 53.89 40.96 29.40 18.30 6.62
Load at 48Ah 146.37 129.07 113.56 98.35 83.30 64.56 45.57 34.84 21.96 8.75
b. Torque in contrast to power and speed at gradual decreased loading condition
Figure 1 Correlations between voltage, current, torque, speed at gradual decreasing load with 48 Ah and 24 Ah
battery power packs.
Effect of Gradual Increased Load on Speed, Voltage and Current
The correlation between tangential force and current drawn clearly indicated the increasing trend with increasing
tangential force on flywheel (Figure 2(a)) with both power packs. The initial charge level of 48 Ah and 24 Ah
battery capacity power packs was 52.71 V and 49.96 V, respectively. The increase of load was up to 447 N with 48
Ah battery power pack at flywheel speed of 29 rpm while it was up to 349 N at flywheel speed of 39 rpm with 24

Engineers for Viable Technology and $5 Trillion Economy
26 Technical Volume of 36th Indian Engineering Congress, December 26-28, 2021
ISBN 978-81-955500-1-2
Ah battery capacity of power pack. Regarding loading of flywheel, it is observed that flywheel is loaded at 417 N
tangential force when gradually increased loading condition while initial loading condition motor could not be
accelerated at 397 N (Figure 1(a)). The voltage drop with 48 Ah and 24 Ah battery power capacities was 0.71 V
from initial level of 52.71 V during idle condition at flywheel speed of 207 rpm and 1.46 V drop in voltage from
initial charge at flywheel speed of 161 rpm. The voltage drop followed decreasing trend with increase in load on
flywheel with both power packs. The current drawn followed increasing trend at increased load with both power
packs. This follows similar trend of voltage drop and increase in current drawn with varying (speed) load
(Buchmann 2001 and NPTEL). Consistency in voltage and current drawn was observed with 48 Ah battery capacity
of power pack.
a. Tangential force in contrast to Voltage and Current drawn at gradual increasing loads
Load at 24Ah 15.16 20.55 27.73 43.82 62.74 83.41 111.58 148.66 221.29 - -
Load at 48Ah 8.16 19.55 30.51 43.83 58.23 76.30 96.38 127.52 185.79 243.93 365.23
b. Torque in contrast to Power and Flywheel Speed at gradual increasing loads
Figure 2 Correlations between torque, speed, voltage and current drawn at gradual increasing load with 48 Ah and
24 Ah battery power packs

Engineers for Viable Technology and $5 Trillion Economy
27 Technical Volume of 36th Indian Engineering Congress, December 26-28, 2021
ISBN 978-81-955500-1-2
Power obtained with both power packs showed increasing trend with increase in load (torque) on flywheel at fixed
position of accelerator (Figure 2(b)). Power varied from 177 W to 1109 W at 8.16 Nm to 365.23 Nm torque on
flywheel with 48 Ah battery capacity of power pack while it was 255 W to 903 W at torque of 15.16 Nm to 221.29
Nm. The flywheel speed follows decreasing trend at both power packs with increasing load on flywheel. The speed
was reduced from 207 to 29 rpm at minimum to maximum applied torque with 48 Ah battery capacity of power
pack while it was reduced from 161 rpm to 39 rpm with 24 Ah battery capacity of power pack. The torque-power
characteristics curve indicates fragmented linearity of power at varied torque with 24 Ah battery capacity of power
pack. However linear power was observed up to 838 W at 83 Nm torque and speed of 96 rpm
Effect of Constant Speed on Voltage and Current at Increasing Loads
The speed obtained (96 rpm) during gradual increase loading condition (Figure 2(b)) was assessed at constant load
for power assessment. Voltage and current drawn at different torque levels at flywheel speed of 105 ± 5 rpm was
presented in Figure 3. The drop of voltage was 1.7 V at No applied load condition (8.8 Nm torque) from initial
charge level (51.2 V) of a 24 Ah battery power pack. The voltage was dropped to 46 V during run at torque of 198.1
Nm. Total voltage drop during the experiment was 6.9 V from its initial charge level. Current drawn at low torque
(8.8 Nm) was 2.07 A and follow increasing trend with increase in torque at flywheel. The current drawn was found
46.15 A which was maximum with this battery pack. This study at constant rpm of 105 rpm clearly indicates the
optimum obtainable torque of 112.9 Nm at power of 1241 W with 1.5 kW BLDC motor when voltage during run
was 48.45 V and current drawn was 25.62 A. The study suggests utilizing maximum 82.7% of motor power.
Figure 3 Correlations between voltage drop and current drawn with increasing torque at 105± 4.6 rpm with 24 Ah
battery power pack.
Effect of Constant Load and Speed on Voltage and Current with Time
The speed obtained (96 rpm) during gradual increase loading condition (Figure 3(b)) was assessed at constant load for battery
discharge rate. A graph was presented between voltage and current drawn behavior when the flywheel was loaded at constant
load of 217 N at a flywheel speed of 101 ± 6 rpm with a 24 Ah battery power pack (Figure 4(a)). The voltage was dropped to
49.4 V at load of 217 N from initial charge level of 53.12 V. The voltage varied from 49.14 V to 41.2 V during 72 min run. After
65 minutes of run at this load, current drawn was 17-17.4 A at voltage of 42.6 to 41.2 V. The current drawn was 15.9 A to 16.6 A
up to 60 minute when voltage was 49.4 to 43.4 V. This battery power pack completely exhausted in 72 minute under the
condition. Battery performance at constant load and speed is analyzed and presented in Figure 4(b). This will help in assessing
the battery level at a time and also to finalize the storage battery capacity for the prime mover to be designed.
Effect of Solar Charging on Battery Power Pack at Load
Voltage and current drawn characteristics during with and without online solar charging of 48 Ah battery power
pack was shown in Figure 5. Average tangential force was 232 N and 221 N with online solar charging and without

Engineers for Viable Technology and $5 Trillion Economy
28 Technical Volume of 36th Indian Engineering Congress, December 26-28, 2021
ISBN 978-81-955500-1-2
charging at flywheel speed of 102 rpm and 100 rpm, respectively. Voltage was dropped from initial 53.8 V to 49.42
V at 232 N load and voltage varied around 48.81 V to 50.04 V during the experiment when power pack was attached
with online solar charging with 3 panels of 100W 6A attached in series. While voltage was dropped from initial
53.11 V to 50.37 V at 221 N load and voltage remained between 48.65 V to 50.73 V when the experiment was run
with battery power pack only. After experiment the voltage was 51.5 V and 51.25 V of the power pack with and
without online solar charging. No significant difference was observed in voltage drop during the experiment at p <
0.05 with t-value of -1.604853 and p-value of 0.12061. The current drawn at 232 N load was 20.93 A and varied
between 17.71 A to 21.49 A during the experiment at average flywheel speed of 102 ±2 rpm with power pack
attached with online solar charging. The current drawn at 221 N load was 18.51 A and it varied between 18.36 A to
20.58 A at average flywheel of 100 + 2 rpm with battery power pack only.
a. Voltage and current drawn
b. Discharge cycle of 24Ah battery at constant load and speed
Figure 4 Correlations between voltage and current drawn at load of 217N at 101±6 rpm with time through 24 Ah
battery power pack
A significant difference was observed in current drawn at load of 232 N and 221 N at p < 0.05 with t-value of
3.497525 and p-value of 0.00185. The torque generated varied between 80.01 Nm to 101.98 Nm during online- solar
charged power pack while it varied from 88.04 Nm to 98.6 Nm with battery power pack only. The power and torque

Engineers for Viable Technology and $5 Trillion Economy
29 Technical Volume of 36th Indian Engineering Congress, December 26-28, 2021
ISBN 978-81-955500-1-2
obtained during experiment without charging the power pack was significantly higher (t-value of 3.625291and p-
value of 0.00135, and t-value of 4.365496 and p-value of 0.00021) as compared to online charging the power pack
with solar. This may be due to high requirement of current at this load while charging through solar might be
fluctuating with maximum 6A current. This experiment clearly indicates more stability in voltage drop during run
with power pack charged solar online while 21.5 % variation in torque was also observed with online solar charged
power pack as compared to 10.71 % torque variation with battery power pack at 232 and 221 N loads. The study
suggests increasing the current drawn by solar which may affect significantly during run at load.
Figure 5 Voltage and current drawn characteristics with and without solar charging the power pack of 48 Ah
Comparative Performance of Battery Power Packs on Power, Torque and Speed
Power, torque and speed relationship with reference to tangential force on flywheel was presented in Figure 6. The
load and power graph clearly indicates sustainability of power with increase in load on flywheel at full accelerator
position for 48 Ah power pack as compared to 24 Ah power pack. The maximum power obtained with 48 Ah and 24
Ah battery capacity power packs was 74.9 % and 71.7 % of 1500 W BLDC motor, respectively. Linearity of power
was obtained up to 853 W (56.8% of motor power) with 48 Ah battery capacity power pack at 58.2 Nm torque.
There is no significant difference (t-value of 1.410095 and p-value of 0.19212 and t-value of 0.315063 and p-value
of 0.7599) at p < 0.05 between torque and speed with both power packs but significantly higher power was obtained
with 48 Ah power pack as compared to 24 Ah battery pack at t-value of 5.867323 and p-value of 0.00024. The
results obtained with the experiment gave a clear-cut finding of power versus speed reduction. The speed reduction
was 5.4 and 4.7 at power ratio of 6.32 and 6.35 with torque ratio of 30 to 34 for studied battery power packs. This
reveals for having speed reduction of about 5 to get desired level of power and torque.
Optimization of Depth and Power
Multi-objective genetic algorithmic technique was employed in R software using “nsga2R” package to optimize the
output of machine at minimum power consumption. In case of the secondary tillage operation, it is carried out at
around 100-130 mm depth of the soil. Therefore, 102, 121 and 153 mm depth of soil are chosen as the optimal
solution points in the Pareto front (Figure 7). These optimal solution points are marked as cyan, black and red
coloured squared points, respectively. At thesedepths, the operating speed of machine is determined as 0.42 m/s. The
draft and power requirement of the machine at 102 mm, 121 mm and 153 mm operational depth were found as 1424
N and 597.92 W, 1689 N and 709.43 W, and 2141 N and 899.19W, respectively. A set of optimal solutions, known
as the Pareto front solutions is obtained from a set of non-dominated solutions, being chosen as optimal without
sacrificing at least one other objective function. In case of multi objective optimization, the trade-off was identified
since it gave multiple solutions across the Pareto front.

Engineers for Viable Technology and $5 Trillion Economy
30 Technical Volume of 36th Indian Engineering Congress, December 26-28, 2021
ISBN 978-81-955500-1-2
The results obtained from Figure 8 was matching with the optimization result given in Figure 7. The findings
suggest to operate the machine at 144 mm depth for getting optimal performance with the equipment having 700mm
operational width. The power requirement was observed to 844W at speed of 0.42m/s.
Figure 6 Power and torque characteristics with two different power packs at gradual increased load
Figure 10 Optimization of operating depth and power for design of e-prime mover in agriculture
A 48 Ah battery capacity power pack is suitable for about 3 h duration at continuous current drawn of 16 Ah (800
W). Considering the speed reduction ratio obtained from Figure 6, the maximum speed of 5 km/h may be kept for
walk-behind electric prime mover to achieve desired power and torque. This also confirms the finding of Grunditz
(2016) about the time to accelerate can be achieved with various combinations of initial maximum force and
maximum power. This small prime mover has potential to save 15.6 liter diesel per ha as compared to power tiller
operation at 75% field efficiency for one operation in a single pass (Tewari et al. 1997). Hence, this prime mover
would reduce burden of global emissions in terms of 41.8 kg CO2/ ha. Use of electrical energy through battery may
have great potential in mobile and stationary farm operations in developing and under-developed countries.

Engineers for Viable Technology and $5 Trillion Economy
31 Technical Volume of 36th Indian Engineering Congress, December 26-28, 2021
ISBN 978-81-955500-1-2
CONCLUSIONS
Based on laboratory experiment conducted on frictional resistance mechanism setup with 1500 W three-phase
BLDC motor, following significant conclusions are drawn,
1. 1500 W BLDC motor can develop power to sustain initially maximum tangential force of 397 N (441 N applied
load) on flywheel shaft.
2. Online solar charging at varying loads on fixed accelerator position with both power packs have some effect on
voltage stability.
3. Higher battery capacity (48 Ah) power pack provided stability in voltage and current drawn at varying loading
condition.
4. The maximum and sustainable power from 1500 W BLDC motor was 75 % (1125W) and 56.8 % (853W) of its
capacity with speed reduction of 1.47 and 4.7, respectively.
5. The study suggests to have maximum speed of 5km/h for designing a walk-behind electric prime mover as an
electrimate source of powerin agriculture.
6. Optimization technic also suggested to have optimum power of 844 W at speed of 0.42 m/s for operation of
having 700 mm operational width.
ACKNOWLEDGEMENT
Authors thankfully acknowledge the Technology Development and Transfer, Department of Science and
Technology, Ministry of Science and Technology, Government of India, New Delhi for funding the project on
„Development of Smart Mobile E-power Unit withMatching Implements for Small Farmers”.
REFERENCES
1. Buchmann, I. 2001. Batteries in a portable world - A handbook on rechargeable batteries for non-engineers. 2nd
edition, Cadex Electronics Inc. Canada.
2. Farrow, A., K. A.Miller and L.Myllyvirta. 2020. Toxic air: The price of fossil fuels. Seoul: Greenpeace
Southeast Asia, February, 2020.
3. Gökozan, H. and M.Taştan. 2019. Autonomous road vehicles and electrical-electronic equipment. Research
and Review in Engineering Summer: 261.
4. Govardhini, M. K. and K. H. Reddy. 2017. Design and fabrication of solar powered multi-crop weeder.
International Journal of Technical Innovation in Modern Engineering & Science,3:78-82.
5. Grunditz, Emma Arfa.2016. Design and Assessment of Battery Electric Vehicle Powertrain, with Respect to
Performance, Energy Consumption and Electric Motor Thermal Capability”. Ph. D. Thesis. Department of
Energy and Environment, Division of Electric Power Engineering, Chalmers University of Technology,
Göteborg, Sweden.
6. Hayrettin, G. 2020. Traction motors and motor drivers used in electric vehicles. European Journal of Science
and Technology 19: 105-111.
7. Juan, Dixon. 2010. Energy Storage for Electric Vehicles. IEEE International Conference on Industrial
Technology, March 14-17, 2010.https://ieeexplore.ieee.org/xpl/conhome/5465897/proceeding
8. Kiran, I.,M. A. Kaes, Md. Abdul and Md. Rostom Ali. 2017. Development and performance evaluation of a
battery-operated small-scale reaper. Agricultural Engineering International: CIGR Journal 19(2): 217–223.
9. Mathan, M., Kumaraan, B.Sathish., T. Selvam., Babu P.Yuvarajan and G. Yogesh. 2019. Design and analysis
of battery powered weeder. International Journal of Engineering Science and Computing 9 (3): 21073-21076.

Engineers for Viable Technology and $5 Trillion Economy
32 Technical Volume of 36th Indian Engineering Congress, December 26-28, 2021
ISBN 978-81-955500-1-2
10. Mehta, C. R., N. S.Chandel andP. C.Jena. 2019. Indian agriculture counting on farm mechanization.
Agricultural Mechanization in Asia, Africa and Latin America 50(1): 84-89.
11. NDTV. 2020. Air pollution from fossil fuels costs India USD 150 Billion annually, reveals A new report.
NDTV- India News, 2020; February 07. https://swachhindia.ndtv.com/air-pollution-from-fossil-fuels-costs-
india-usd-150-billion-annually-reveals-a-new-report-41704/
12. NPTEL. – Electrical Engineering – Introduction to Hybrid and Electric Vehicles.
https://nptel.ac.in/content/storage2/courses/108103009/download/M9.pdf dated 12.3.21 at 16:31h
13. Nanda, G. and Narayan C. Kar. 2006. A survey and comparison of characteristics of motor drives used in
electric vehicles. Canadian Conference on Electrical and Computer Engineering,
May.http://dx.doi.org/10.1109/CCECE.2006.277736
14. Pushkar, B. 2019. Agricultural pollution in India. The Sunday Standard, The New Indian Express, July 07,
2019.
15. Reşitoğlu, İbrahim Aslan., Kemal Altinişik and AliKeskin. 2015. The pollutant emissions from diesel-engine
vehicles and exhaust after treatment systems”. Clean Technologies and Environmental Policy 17: 15-27.
16. Rycroft, Mike. 2019. Electric powered farm vehicles set to revolutionise agriculture sector. ee Publisher Feb
27, https://www.ee.co.za/article/electric-powered-farm-vehicles-set-to-revolutionise-agriculture-sector.html
dated 12.3.21 at 12:26h
17. Sahoo, A. U. and H. Raheman. 2020. Development of an electric reaper: a clean harvesting machine for cereal
crops. Clean Technologies and Environmental Policy 22: 955-964.
18. Sharma, S.and S.Mukesh. 2013. Farm machinery design: Principles and problems. 3rd Edition. New Delhi,
India:Jain Brothers.
19. Shinde, T. A. and J. S. Awati. 2017. Design and development of automatic seed sowing machine. International
Journal of Electronics and Communication Engineering April: 40-44.
20. Singh, M. K. 2020. Design and development of battery-operated planter for seed spices. Un-published Ph. D.
Thesis. 2020; MPUAT, Udaipur, India.
21. Singh, M. K., S. P. Singh., M. K. Singh and U. Ekka. 2019a. Battery assisted four-wheel weeder for reducing
drudgery of farmers. Indian Journal of Agricultural Sciences 89(9): 66-70.
22. Singh, S. P., A. Kumar and H. L. Kushwaha. 2020. Sugar cane canopy spraying: A perspective solution with
ergonomics and mechatronics approach. Sugar Tech, 22 (2): 203-207, https://doi.org/10.1007/s12355-019-
00766-1
23. Singh, S. P., M. K. Singh., U. Ekka and M. K. Singh. 2019b. E-powered multi-purpose two-row seeder for
smallholders. Indian Journal of Agricultural Sciences89 (12): 2091–2095.
24. Singh, S. P., M. K. Singh and R. C. Solanki. 2016. Design and development of four-wheel weeder for wide-
row crops. Indian Journal of Agricultural Sciences 86(1): 42-49.
25. Tiwari, P. S., A. C. Varshney and C. R. Mehta. 1997. Field evaluation of power tiller rotavator with seating
attachment. Indian Journal of Agricultural Sciences 67(9): 414-417.
26. WHO. 2016. India takes steps to curb air pollution. Bulletin of the World Health Organization, 2016; 94: 487-
488. doi: http://dx.doi.org/10.2471/BLT.16.020716
27. Yimin, G. andE. Mehrdad. 2006. A torque and speed coupling hybrid drivetrain, architecture, control and
simulation. IEEE Transactions on Power Electronics 21(3): 741.

En
gin
eers
fo
r V
iab
le T
ech
no
log
y a
nd
$5
Tri
llio
n E
con
om
y
Architectural
Engineering


Engineers for Viable Technology and $5 Trillion Economy
35 Technical Volume of 36th Indian Engineering Congress, December 26-28, 2021
ISBN 978-81-955500-1-2
AR_068_01_252
Preparing Architectural Education for Atmanirbhar Bharat
Tessy Varkey1*
, Binumol Tom1 and Biju Augustine
2
1Department of Architecture, Rajiv Gandhi Institute of Technology, Kottayam, Kerala
2Department of Mechanical Engineering, Government Engineering College, Wayanad, Kerala
*email: [email protected]
Abstract: India is urbanizing at a rapid rate. This rapid urbanization is essential for the growth of economic
opportunities but the built-environment is facing crucial challenges. Atmanirbhar Bharat Abhiyan coupled with the
creative spirits of good architects will help to realize the true potential of urbanization for a sustainable and
prosperous future for India. Architecture education and practice should transform and develop to accommodate the
needs of an Atmanirbhar Bharat. Institutions in India should have reciprocal arrangements with other countries and
thus expand the opportunities of the student to gain a broader experience in an increasingly globalized profession.
Architecture education should also be internationally validated with direct evidence of student learning. There
should be a paradigm shift in the design of Education towards developing professionals with the ability to
understand and use local knowledge, traditional knowledge, and emerging technologies while being cognizant of
critical issues such a climate change. Architectural practice requires becoming financially competitive and
technologically challenging to keep up with the international standards of design and delivery.
Keywords: Atmanirbhar Bharat; Architecture; Education; OBE; Practice
INTRODUCTION
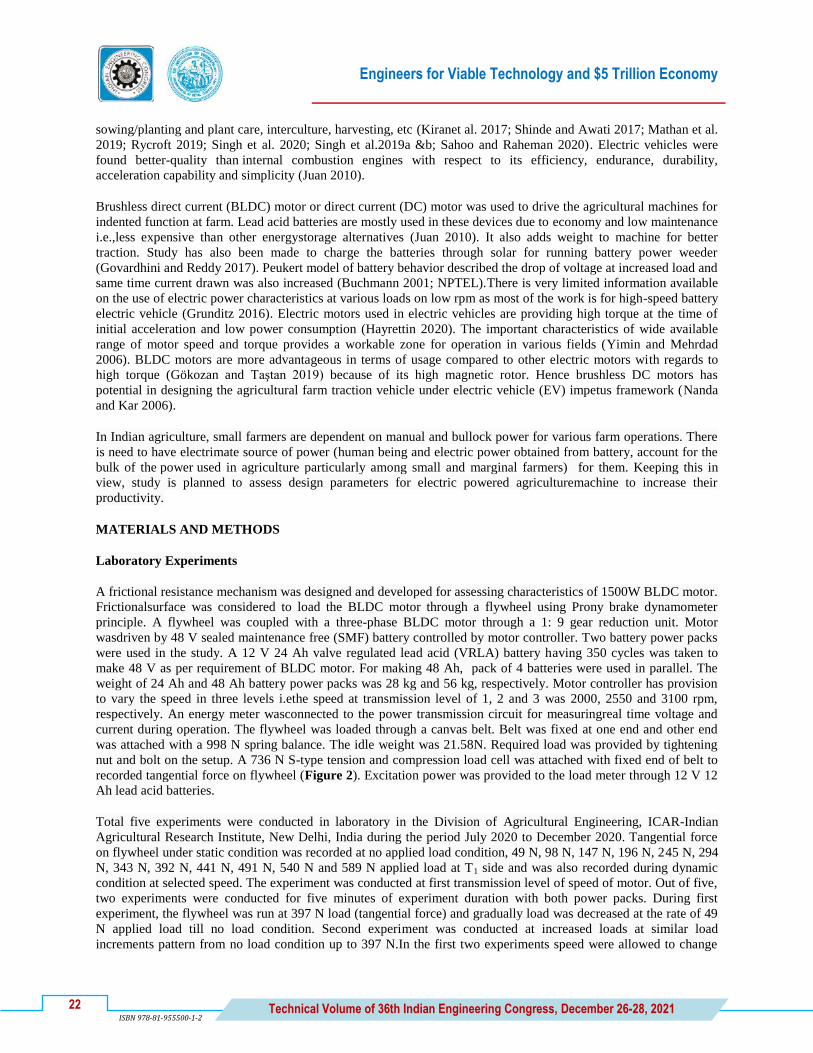
India has a population of 1.34 billion which is growing at a rate of 1.17% with an urbanization rate of 2.28%[1].
India‟s urban population has grown five-fold in the last half century to approximately 430 million inhabitants in
2015 and the number is expected to rise to 600 million by 2030, accounting for 40% of India‟s population[2] . 5 of
the top 20 emerging cities in the world, namely, New Delhi, Mumbai, Bangalore, Kolkata and Chennai are in India
[1]. This rapid urbanization is essential for the growth of economic opportunities but the built environment is facing
important challenges such as outdated building regulations, poor spatial planning, urban sprawl, poor public
transport, lack of investment in infrastructure and affordable housing, land shortage, and climate change. The New
Urban Agenda, Habitat III, Ecuador, 2016 calls for government to ensure sustainable and inclusive urban economies
by leveraging the agglomeration benefits of well-planned urbanization.
Atmanirbhar Bharat Abhiyan coupled with the creative spirits of good architects will help to realize the true
potential of urbanization for a sustainable and prosperous future and will support in making India “a bigger and
more important part of the global economy.” The main goal of Atmanirbhar Bharat is for India to become self-
sufficient though not a self-centered system. It will aid in pursuing policies that are efficient, competitive and
resilient, thus making India a self-sustaining and self-generating country. An Atmanirbhar Bharat is necessary to
fulfill the dream of making the 21st century an Indian century, i.e. a century dominated by India. It will help in
creating an eco-system that will allow Indian companies to become competitive in the global market. It aims to
make the country and its citizens independent and self-reliant in all senses. The five pillars of Atmanirbhar Bharat
are Economy, Infrastructure, Systems, Vibrant Demography, and Demand. This will require research and
development, and mindset to make a creative, innovative and learning society[3]. Architecture education and
practice should transform and develop to accommodate the needs of the strong foundation for an Atmanirbhar
Bharat.

Engineers for Viable Technology and $5 Trillion Economy
36 Technical Volume of 36th Indian Engineering Congress, December 26-28, 2021
ISBN 978-81-955500-1-2
ARCHITECTURE
Architecture is a profession which has to be embraced very carefully as it allows the architect to transform the
environment, built and un-built. It deals with everything that surrounds us, the Panchabhootas, the air, water, fire,
earth and light.Architects in association with planners and engineers have an important role in the design of well-
planned cities which can contribute to the economic, socio-cultural, civic, and environmental development of a
nation[2]. The Guidelines for the UIA Accord on Recommended International standards of Professionalism in
Architecture Practice Policy on Ethics and Conduct defines architecture as a liberal profession and architects being
obligated to the highest standards of independence, impartiality, professional confidentiality, integrity, competence
and professionalism and committed to provide the highest possible quality of design, and other deliverables. It also
states that architects must bring to the society special and unique knowledge, professional skills, and aptitudes
essential to the development of the built environment and to those societies and cultures in which such development
take place” [4].
Architects such as Charles Correa, BV Doshi, Joseph Allen Stein, and Laurie Baker rose to become masters
achieving international recognition, designing in a language which is modern yet rooted to the Indian context. An
architecture which celebrates the spirit of India while competing globally will lead the way to an Atmanirbhar Indian
Architecture.
Architecture Education
The UNESCO-UIA Charter for Architectural Education states that Architectural Education constitutes some of the
most significant environmental and professional challenges of the contemporary world and that the educators must
prepare architects to formulate new solutions for the present and the future.Social and functional degradation of
many human settlements will create severe and complex problems[5]. Architectural education is not just a simple
matter of information dissipation but it deals with the entire life and living of man and his societies, continuing
traditions and his developmental progress[6]. Architectural education is an amalgamation of a myriad of studies,
extending from materials, climatology, drafting, sketching, design, and services to history, sociology, and
philosophy. An education which is embedded in the true Indian heritages and inculcates the need of the 21st century
can pave a way forward.
A. Current state of Architecture Education in India
The Council of Architecture (CoA)is bestowed with the responsibility to regulate the education and the practice of
the profession of architecture throughout India.There are 471 institutions imparting education in Architecture in
India. The standards of education being imparted in these institutions is currently governed by the Council of
Architecture‟s Minimum standards of Architectural education Regulations, 2020, which set forth the minimum
requirements of eligibility for admission, course duration, standards of staff and accommodation, course content,
examination, etc [7]. The significant increase in the number of architectural schools during the late 2000‟s without
upholding the Council of Architecture‟s Minimum standards of Architectural education has lowered the overall
quality of architectural education.
Table 1 shows the unprecedented increase in the number of new institutions and the consequent increase in the
number of institutions closed/ put on zero intake. Figure 1 shows the percentage of seats that are vacant in various
institutions together. The Perspective Plan for Growth of Architecture Education approved and adopted by the
Council of Architecture (2020) proposes only a check on the allotment of new institutions based on categories of
states created on the basis of the average ratio of architects to inhabitants [8].
Very few institutions in India have reciprocal arrangements with other countries and thus limit the opportunities of
the student to gain a broader experience in an increasingly globalised profession. Although a student can apply to
study overseas for architecture education, but the tuition fees are very expensive and thus can be afforded only by
the rich and prosperous.
Engineers for Viable Technology and $5 Trillion Economy
37 Technical Volume of 36th Indian Engineering Congress, December 26-28, 2021
ISBN 978-81-955500-1-2
Table 1 Status of Institutions
Year Number of
Institution
New Institution
Approved
Institutions Closed/ Zero
Intake/ Restored
Total
Number
2006-07 127 10 0 137
2007-08 137 4 2 139
2008-09 139 7 13 133
2009-10 133 25 6 152
2010-11 152 27 -7 186
2011-12 186 60 12 234
2012-13 234 67 -1 302
2013-14 302 35 0 337
2014-15 337 52 10 379
2015-16 379 64 20 423
2016-17 423 33 -2 458
2017-18 458 22 12 468
2018-19 468 20 11 477
2019-20 477 15 29 463
Source – Perspective Plan for growth of Architectural Education in India, Council of Architecture
Figure 1 Percentage of seats vacant (Source – Perspective plan for growth of Architectural Education in India, COA)
B. International Validation / Accreditation
The Council of Architecture (CoA) oversees the maintenance of the architecture education standards for about 500
institutions in India, periodically by way of conducting inspections through committees of peer experts against a
checklist prescribed by the document „Minimum Standards of Architectural Education.‟ Even though the works of
the students are also evaluated by the peer experts in addition to the checklist as prescribed by the Council of
Architecture, there is no direct evidence of student learning and these need to be included for transparency and
quality assurance but the methodology does not have an international recognition /validation. The Commonwealth
Association of Architects (CAA) is a membership organisation for professional bodies representing architects in
Commonwealth countries[10]. The association sets procedures for the validation of courses in architecture against

Engineers for Viable Technology and $5 Trillion Economy
38 Technical Volume of 36th Indian Engineering Congress, December 26-28, 2021
ISBN 978-81-955500-1-2
set criteria. But neither the Indian Institute of Architects (IIA) or the Council of Architecture (CoA) is a member
currently.
The UNESCO-UIA Charter for Architectural Education, the UIA Accord on Recommended International standards
on Professionalism in Architectural Practice and the Canberra Accord on Architectural Education are documents
employed by various accreditation/validation agencies in architectural education. The National Board of
Accreditation, India, the only body which accredits programmes is only a signatory to the Washington accord
responsible for accrediting undergraduate engineering programs. The various international accreditation agencies
such as the National Architectural Accrediting Board in USA, the Canadian Architectural Certification Board, Royal
Institute of British Architects, the Architects Accreditation Council of Australia, and the Korean Architectural
Accrediting Board have various Performances Criteria for both the program and the student. Each accreditation
agency has a formal evaluation process for assessment of student achievement, which is based primarily on the
concept of outcomes based education. All agencies have a framework for the documentation and demonstration of
the results of the assessment.India‟s demographic dividend will be a key for its growth in the future. This can only
be utilized effectively by the students of architecture if the B.Arch course is adept to the 21st Century skills, and is
validated to international standards also.
C. National Education Policy (NEP) 2020
The aim of education in ancient India was not just the acquisition of knowledge as preparation for life in the world
but for the complete realization and liberation of the self. The rich heritage of ancient and eternal Indian knowledge
and thought has been the guiding light for the National Education Policy (NEP) 2020. The preparation of
professionals must involve an education in the ethics and importance of public purpose, an education in the
discipline, and an education for practice. It must centrally involve critical and interdisciplinary thinking, discussion,
debate, research, and innovation [12].
The National Education Policy calls for a paradigm shift in the design of Education towards developing
professionals with the ability to understand and use local knowledge, traditional knowledge, and emerging
technologies while being cognizant of critical issues such a climate change for our rowing population. It needs to be
competitive globally, adopting best practices and embracing new and appropriate technologies for wider access. It
must reflect socio-cultural contexts in an evidence based manner. It should be re-envisioned to match the varied
roles that an architect needs to address in the society. Indian Knowledge Systems, including indigenous and
traditional systems are to be included.
D. The Way Forward
There needs to be a significant paradigm shift in the traditional output based education system. The traditional
uniformity that was part of learning doesn‟t any longer have the same power or sense of purpose. It won‟t work
effectively in order to educate people to their potential or enable them to be useful in society. But the current times
require a new Learning, a Reflexive and Transformative pedagogy for the networked knowledge society[14]. The
new learning needs to be dynamic with greater emphasis on learner engagement, with leaners acknowledged as
knowledge constructors and as active knowledge makers. It should be passion driven. The society needs the students
to understand about Knowledge, Skills, and Attitudes / Sensibilities. Architecture education should instill various
skills and abilities such as creativity, critical thinking, collaboration, problem solving, leadership, cross-cultural
communication, information management, and technology advancements. The diverse representation in classrooms,
the students‟ unique educational, cultural, linguistic and social backgrounds, and their multiple perspectives should
help in the proliferation of Intercultural Competence. Cultural self-awareness, empathy, and openness can bridge the
gap. All learners should be understood in their differences, in their own sense of identity, and the orientations that
they bring to learning.
Outcome Based Education (OBE) begins with the end in mind with clearly defined educational goals or outcomes
set for each course and program thatis aligned to the Graduate Attributes. The basic characteristics of OBE being
remediation and enrichment for students would give every opportunity available to master the content, irrespective
of their differences, and to meet the absolute standards. The design of the curriculum, learning strategies, and

Engineers for Viable Technology and $5 Trillion Economy
39 Technical Volume of 36th Indian Engineering Congress, December 26-28, 2021
ISBN 978-81-955500-1-2
learning opportunities should be such as to ensure the achievement of the learning outcomes and to enhance student
learning.
Architecture Practice
India is in a stage of development wherein huge amounts of investment are pouring into the building industry and
opportunities of growth are increasing. Architectural practice requires becoming financially competitive and
technologically challenging to keep up with the international standards of design and delivery[13]. Figure 2 shows
the ratio of inhabitants to architects. Very few States and Union Territories have low ratios, i.e. less than 10,000
persons/architect. The state with the highest ratio is Bihar, with 201792 persons/architect, which is also a backward
state in terms of economic development. In developed economies such as the USA and the UK, the ratios are much
lower, i.e. lesser than 2000 persons/architect. India is urbanizing rapidly with vulnerable issues. The lack of
educational, institutional and professional capacity has important consequences such as weak policies, unsustainable
development, unhealthy and ill-designed spaces, and loss of identity and cultural values.
Figure 2 Ratio of inhabitants to architects (Source – Perspective plan for growth of Architectural Education in India, COA)
The architectural profession faces many challenges such as lack of respect, establishing standards of design,
insufficient opportunities, outdated building regulations, corruption, poor enforcement of existing building codes
and schedule of fees, and the understatement of the role of the architect in the community. Continuing Professional
Development is essential as architects develop their career and need to be abreast with technological advancements,
material innovations, and to learn new skills for higher expertise. But are our institutions equipped enough to take up
this challenge and additional burden.
CONCLUSIONS
The profession of Architecture can only realize it's true potential for the development of the country when both the
education and the practice are aligned towards the need of delivering international quality architecture that
rejuvenates the essence of the varied culture and heritage of the sub-continent. There should be a proper connect
between academic education and professional context. This transformation is fundamental for achieving full human
potential for a diverse, equitable, and inclusive society and for the nation‟s development. The minimum standards
made mandate by the Council of Architecture, the apex body of the controlling the education scenario in the country
is only the minimum bench mark to be attained by an institution to continue with education. While most of the
institutions in India maintain only these minimum standards for obtaining extension of approval by the Council of

Engineers for Viable Technology and $5 Trillion Economy
40 Technical Volume of 36th Indian Engineering Congress, December 26-28, 2021
ISBN 978-81-955500-1-2
Architecture, without exploring ways and means to go ahead of this minimum bench mark. New ways and means
are to be discovered so that Minimum standards 2020 can embrace NEP2020 and take Architecture Education ahead
to meet the global standards and thus attain the standards to meet the settings of Atmanirbhar Bharat.
ACKNOWLEDGMENT
We are highly thankful to the TEQIP-II Research Seed Money fund provided by Rajiv Gandhi Institute of
Technology, Government Engineering College, Kottayam, Kerala for the partial financial assistance for carrying out
this research.
REFERENCES
1. The Commonwealth Association of Architects, Planning for Rapid Urbanization, Survey of the Architectural
Profession in the Commonwealth (2018).
2. Mirae Asset Global Investments (India), Housing for all by 2022: A big opportunity in the making, LENS issue
9 (2018).
3. AatmaNirbhar Bharat Abhiyan, My Gov, https://aatmanirbharbharat.mygov.in/ Accessed on 26 Nov 2021.
4. International Union of Architects, Guidelines for the UIA Accord on Recommended International standards of
Professionalism in Architecture Practice Policy on ethics and conduct (2017).
5. International Union of Architects, Charter – UNESCO/UIA for Architectural Education (2017).
6. Himanshu D. Chhaya, Architectural Education in a Holistic Framework. In Symposium on New Directions of
Architectural Education - the necessity of a cultural paradigm responsive to the majority. GREHA. Delhi,
India: Greha, 1999.
7. Council of Archiecture, About us, https://www.coa.gov.in/ Accessed 27 No 2021.
8. Perspective plan for growth of architectural education, Council of Architecture (2020).
9. Canberra Accord on Architectural Education, Rules and Procedures (2014).
10. International Union of Architects, The UNESCO-UIA Validation System Procedures Manual for study
programmes and systems (2017).
11. Commonwealth Association of Architects, Overview, https://www.comarchitect.org/overview/ Accessed 27
November 2021
12. National Education Policy, 2020.
13. Dr. Deepti Gupta, Gaps between Professional Readiness and Education of Architecture, Journal of Indian
Institute of Architects. Volume 86, Issue 10 (2021).
14. Mary Kalantzis and Bill Cope, Learner differences in theory and practice, Open Review of Educational
Research, 3:1, 85-132, DOI: 10.1080/23265507.2016.1164616 (2016).

En
gin
eers
fo
r V
iab
le T
ech
no
log
y a
nd
$5
Tri
llio
n E
con
om
y
Chemical
Engineering

Engineers for Viable Technology and $5 Trillion Economy
43 Technical Volume of 36th Indian Engineering Congress, December 26-28, 2021
ISBN 978-81-955500-1-2
Scientometric Analysis on Utilization of Agricultural Waste for
Board and Panel Preparation
Prerna Sharma and V R Prasathkumar*
Department of Civil Engineering, Faculty of Engineering and Technology, SRM Institute of Science and
Technology, Kattankulathur, Tamil Nadu
*e-mail: [email protected]
Abstract: Agricultural wastes are widely distributed in the environment, creating a health and environmental risk.
Because of their environmental and health benefits, natural insulating materials are becoming increasingly popular.
The goal of this research is to provide a precise method for measuring science and technology development trends
in agricultural waste panel and board production, with sustainability as the most important factor. The papers were
gathered using a bibliographic approach based on the Scopus database. Using scientometric analysis, researchers
can look at the trends in these articles, including keywords, journals, countries, and authors. The use of waste in
energy-efficient architecture is an emerging research topic. The filter is applied based on the paper’s keyword of
panel and board, and the observed properties are detailed in the study. The research is being carried out to gain a
practical understanding of the various materials that have been used in the preparation of boards and panels, as
well as the tests that will be carried out, such as modulus of rupture, elasticity, thermal conductivity, energy
analysis, small hot box test, and life cycle assessment to assess energy usage and CO2 emissions. The future scope
has alsobeen added in the conclusion.
Keywords: Agricultural Waste, Board, Panel, Insulation, Thermal Conductivity
INTRODUCTION
Many countries are now debating the use of organic residual biomass from urban, agricultural, and industrial
sources. Dumping materials in landfills adds to the production of greenhouse gases, of which paper and cardboard
account for a significant portion[1]. Agriculture produces trash, which is currently mismanaged in terms of both
environmental and economic considerations[2]. Agricultural waste has the potential to play a key role as a
sustainable alternative building material in the construction industry. New alternative sustainable insulating
construction products, on the other hand, have been at the forefront of societal concerns[3]. Buildings use a lot of
energy and have a lot of severe environmental effects. A structure's facade is a structural component that can help
save energy while also mitigating negative environmental effects[4]. Pyrolysis is one of the processes that might be
used to transform biomass into higher-value goods [5]. Nonetheless, administrations are passing regulations to
prohibit the use of asbestos in a wide range of items due to a variety of health issues. Other advanced technologies
are currently searching for more resistant and long-lasting materials[6]. The demand for energy is high, as are the
prices of heating and cooling in the winter and summer, respectively. Building insulation, which is becoming
increasingly popular, may help save money on these charges. The creation of acceptable materials has become
equally important as a result of the rising use[7]. Manufacturing particleboards with agricultural waste as raw
materials is a cost-effective and intriguing solution. Natural particleboards with low thermal conductivity might be
used in a variety of applications, including ceiling and wall insulation. Furthermore, manufacturers, restaurants, and
the food industry create a large number of agricultural peels each year, which are frequently discarded as trash[8].
Particleboard makers are now obliged to search for new, inexpensive, and readily available raw material sources. At
the same time, the construction industry has concentrated on using healthier, safer, and ecologically friendly
materials[9]. Particleboard is indeed an engineered wood-based panel made by heating and pressing wood particles
with an appropriate adhesive. The major main material in the particleboard business is wood [10].
Vermicomposting, which uses worms to stabilize and modify compost into useable end-products, has been
recommended as an alternate treatment strategy for high-moisture-content organic wastes from agricultural,

Engineers for Viable Technology and $5 Trillion Economy
44 Technical Volume of 36th Indian Engineering Congress, December 26-28, 2021
ISBN 978-81-955500-1-2
industrial, and municipal sources[11]. A large research community has been paying attention to the ongoing search
for better sustainable and cost-effective processing solutions throughout the world. Emissions CO2 of to the
environment, energy, and water usage are just a few of the variables that play a role in this scenario. Some
approaches that have shown favorable outcomes in this context include reusing, employing green construction
materials (which has to be sustainable, regional, and accessible), retrofitting, and adopting low-tech tools and
approaches[12]. Concrete manufacturing has become one of the primary environmental problems in the construction
sector because to the related emissions and contributing to natural resource depletion [13].
Using diverse types of agricultural waste for the board can help reduce CO2 emissions while also being beneficial
for soundproofing, insulation, and artificial ceilings[14]. Cork oak are long-lived trees (up to 200 to 250 years), and
various life cycle assessments on cork material have highlighted the forest's sustainable environmental benefits,
especially in terms of avoiding destruction in dry regions and long-term CO2reduction[15].Buildings' environmental
effect has been analyzed not just in terms of the energy used in their usage, but also in terms of the energy materials
used in their construction. The prevalence of "sick building syndrome" is rising. The primary investigation was
chemical contaminants from indoor sources such as building materials, poor ventilation, excessive use of heating,
ventilation, and air conditioning, and volatile organic compounds[16]. Not only has the utilization of agricultural
waste proven beneficial in terms of insulation, but so has bacterial farming, it is 20% stronger and has a larger
density, a greensulate panel offers better structural qualities than a foam panel. It is less flammable than foam and
can sustain fire for longer. It also creates no hazardous emissions when burned and may be broken down into little
pieces and dispersed on the ground to give nutrients[17].The basic thermophysical characteristics used to describe
the thermal behaviour of insulating materials are thermal conductivity, specific heat capacity, and density[18].
Sustainable development asks for lower-impact technology in all aspects of human existence; a circular economy
approach attempts to keep a product's value by returning it to the manufacturing process at the end of its lifespan,
reducing material intake, waste creation, and energy usage [19]. Waste management is the most essential issue in
environmental preservation and natural resource protection.The fundamental causes of the numerous processes of
deterioration that have harmed our planet's ecosystem, including the creation of municipal solid waste, are changes
in the environment and population increase[20]. The increasing need for high thermal performance and "near-zero-
energy" buildings, as well as present rising problems and possibilities in the domains of green manufacturing and
low environmental effect, necessitate the use of organic relevant items rather than traditional methods [21].Thermal
insulation is a low-cost, widely available, and well-proven method that saves energy and money while also
decreasing emissions as soon as it is implemented. The originality of this research derives from the analysis done,
which included a cross-comparative study capable of picking the best article from the scopus data source linked to
panel and board preparation, as well as experimental investigations in terms of thermal performance and
environmental effect.By merging VOS mapping technology with upgraded viewer software, the VOS viewer
application was born. The VOS viewer works with almost any hardware and operating system. It may also be
launched directly from a web page on the internet [22].
The utilization of agricultural waste will be focused in this study. Agricultural waste is a good building material
since it is renewable, inexpensive, lightweight, and has a high specific strength and stiffness.
METHODOLOGY
While document structure is important in many fields, it is especially important in information inspection.
Bibliometrics is the study of document structure via the use of tools, goals, frequency classification, ranking, and
reference analysis.The details about the various level done to carry out the review study is represented in the
Figure 1 that consisting of six levels.
Data Analysis
Bibliometric analysis, a methodology for mapping identified published records, is now widely recognized as a new
way to evaluate academically complex themes in library and information science [23-24]. VOS viewer is a publicly
accessible computer software for creating and viewing bibliometric maps. The VOS viewer is used to produce co-
citation maps of authors or journals, as well as co-occurrence maps of keywords[25].

Engineers for Viable Technology and $5 Trillion Economy
45 Technical Volume of 36th Indian Engineering Congress, December 26-28, 2021
ISBN 978-81-955500-1-2
Figure 1 Levels for analytical study
Data Retrieval
The Scopus database was used as it gives users access to journal articles as well as the references in those papers
allowing them to go back and forth in time. The database may be used for both research and collection development
[26]. A total of 675 articles were used to do research on board made from farm waste.
PUBLICATIONS
Annual Publication using Agricultural Waste
Agricultural waste utilization is one of the important topics to be analyzed as it creating a disturbing impact on the
environment. From 1974 to 2021, Figrue 2 shows publications published on the subject of "agricultural waste
utilized in civil engineering" for construction applications.
Figure 2 Chronological order of agricultural waste publication
From the above figure, it is observed that the study on agricultural waste has been done from early years but from
2010, the study has been increased exponentially each year. In 2020 it has reached the highest and it continuous
increasing in 2021.
TYPES OF PUBLICATION
The publication is divided into three areas, document type, language, and publication access. Figure 3 shows the
number of different sorts of publications over the same period (1974 to July 2021). The language in which the

Engineers for Viable Technology and $5 Trillion Economy
46 Technical Volume of 36th Indian Engineering Congress, December 26-28, 2021
ISBN 978-81-955500-1-2
publications were published is shown in Figure 4. The graph clearly shows that more than 63% of papers were
written in the English language. Figure 5 depicts the paper’s publishing access where 75% of the papers are
published in the paid journal.
Figure 3 Publication based on document type
Figure 4 Publication based on language
Figure 5 Publication based on access
Keyword Analysis
The review of the paper is on the area related to agricultural waste and the most prevalent keywords linked with
agricultural waste in the building were analyzed. The minimal number of keyword co-occurrences has been kept at
five. Using these conditions as a guide, 72 out of 1640 met the requirements. Following that, the mapping was used
to document the co-occurrences of terms, total occurrences, and total bond strength. Figure 6 depicts a keyword-
based collaborative network. The clusters of the keyword that has been taken in various studies are shown in
Table 1.
Source Analysis
Readers may receive the finest information available and quickly choose the ideal journal for publishing by
assessing the influence of journals in a given subject. Figure 7 shows the source occurrences map using the
bibliography as an analysis tool. The minimum number of documents of a source given was 8 and out of 331
sources, 15 meets the threshold. The clusters of the source that has been taken in various studies are shown in Table
2. A cluster is a collection of nodes that are linked in some way. In a network, each node is allocated to a single
cluster.

Engineers for Viable Technology and $5 Trillion Economy
47 Technical Volume of 36th Indian Engineering Congress, December 26-28, 2021
ISBN 978-81-955500-1-2
Figure 6 Occurrences map of keywords
Table 1Clusters of keywords
Cluster no Keywords
1 Agricultural by- products, agricultural wastes, biomass, building materials, porosity,
recycling, rice husk, self-compacting concrete, sustainable, sustainable concrete,
sustainable developer, sustainable materials, thermal conductivity, waste management,
Waste material waste recycling.
2 Agriculture waste, agricultural waste materials, environmental impact, green concrete, life
cycle assessment, pozzolanic activity, rice husk ash, rice straw, thermal insulation,
workability.
3 Characterization, coconut shell, lightweight aggregate, lightweight concrete, mechanical
properties solid waste.
4 Agricultural residues, cement replacement, concrete, durability, microstructure, mortar,
strength, sustainability, wastes.
5 Compressive strength, density, flexural strength, foamed concrete, rice husk ash, sorptivity,
split tensile strength, water absorption.
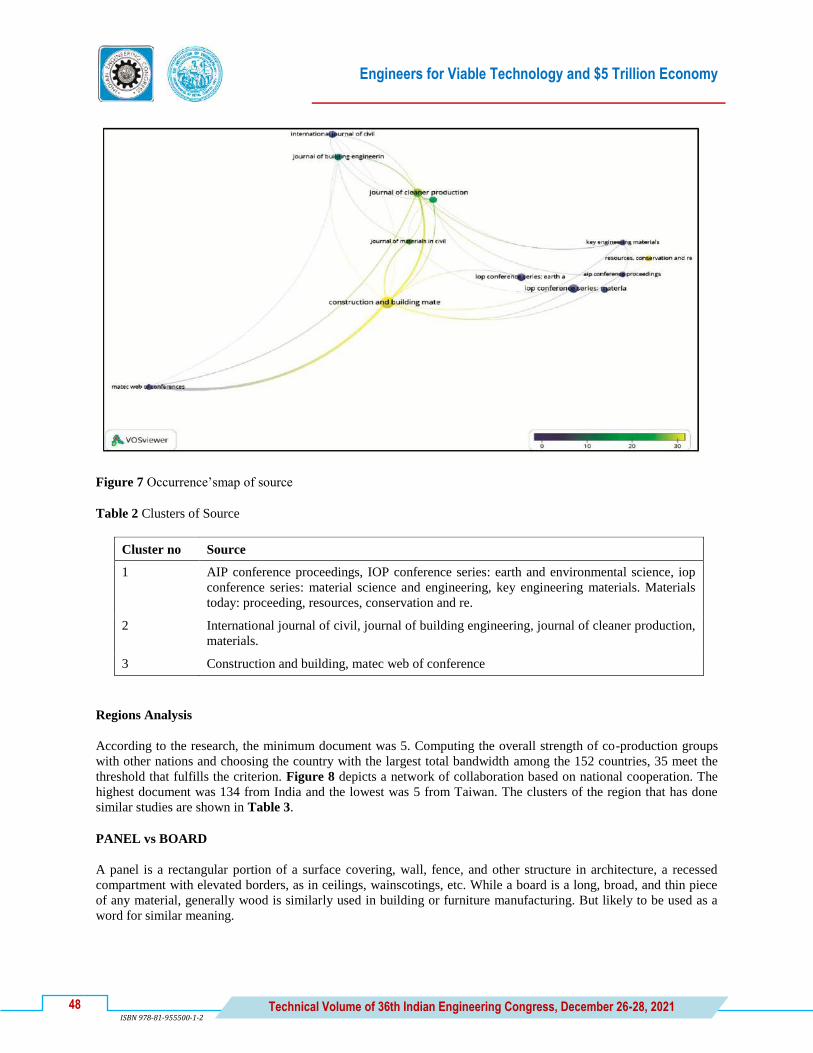
Engineers for Viable Technology and $5 Trillion Economy
48 Technical Volume of 36th Indian Engineering Congress, December 26-28, 2021
ISBN 978-81-955500-1-2
Figure 7 Occurrence’smap of source
Table 2 Clusters of Source
Cluster no Source
1 AIP conference proceedings, IOP conference series: earth and environmental science, iop
conference series: material science and engineering, key engineering materials. Materials
today: proceeding, resources, conservation and re.
2 International journal of civil, journal of building engineering, journal of cleaner production,
materials.
3 Construction and building, matec web of conference
Regions Analysis
According to the research, the minimum document was 5. Computing the overall strength of co-production groups
with other nations and choosing the country with the largest total bandwidth among the 152 countries, 35 meet the
threshold that fulfills the criterion. Figure 8 depicts a network of collaboration based on national cooperation. The
highest document was 134 from India and the lowest was 5 from Taiwan. The clusters of the region that has done
similar studies are shown in Table 3.
PANEL vs BOARD
A panel is a rectangular portion of a surface covering, wall, fence, and other structure in architecture, a recessed
compartment with elevated borders, as in ceilings, wainscotings, etc. While a board is a long, broad, and thin piece
of any material, generally wood is similarly used in building or furniture manufacturing. But likely to be used as a
word for similar meaning.

Engineers for Viable Technology and $5 Trillion Economy
49 Technical Volume of 36th Indian Engineering Congress, December 26-28, 2021
ISBN 978-81-955500-1-2
Figure 8 Occurrence’smap of country
Tables 3 Clusters of country
Cluster no Country
1 Australia, Canada, France, Nigeria, Spain, United States
2 India, Indonesia, Iran, Malaysia, Mexico, Singapore
3 Brazil, Egypt, Germany, Pakistan, South Africa, Thailand
4 Italy, Netherlands, South Korea, Vietnam
5 China, japan, Turkey, United Kingdom
6 Portugal, Taiwan
7 Czech republic
Study on the Board Preparation using the Farm Waste
The data collected for the research on agricultural waste was further separated, and then the studies prepared on the
board were taken. Corn curbs, agriculture debris, rice husk, and coconut husk, have high insulating properties. The
filtering procedure in the title of the article using boards as a search phrase was used to separate the 675 articles.
Figure 9 depicts the article about the board that was published each year. It can be observed that the study in the
area of board preparation for insulation has been increasing from 2020.
Study on the Panel Preparation using the Farm Waste
The data gathered for the agricultural waste study was divided further, and the studies prepared on the panel were
then taken. Mostly used waste for the study was cork, granulated tires, rice husk, coffee chaff, wood shavings, straw,
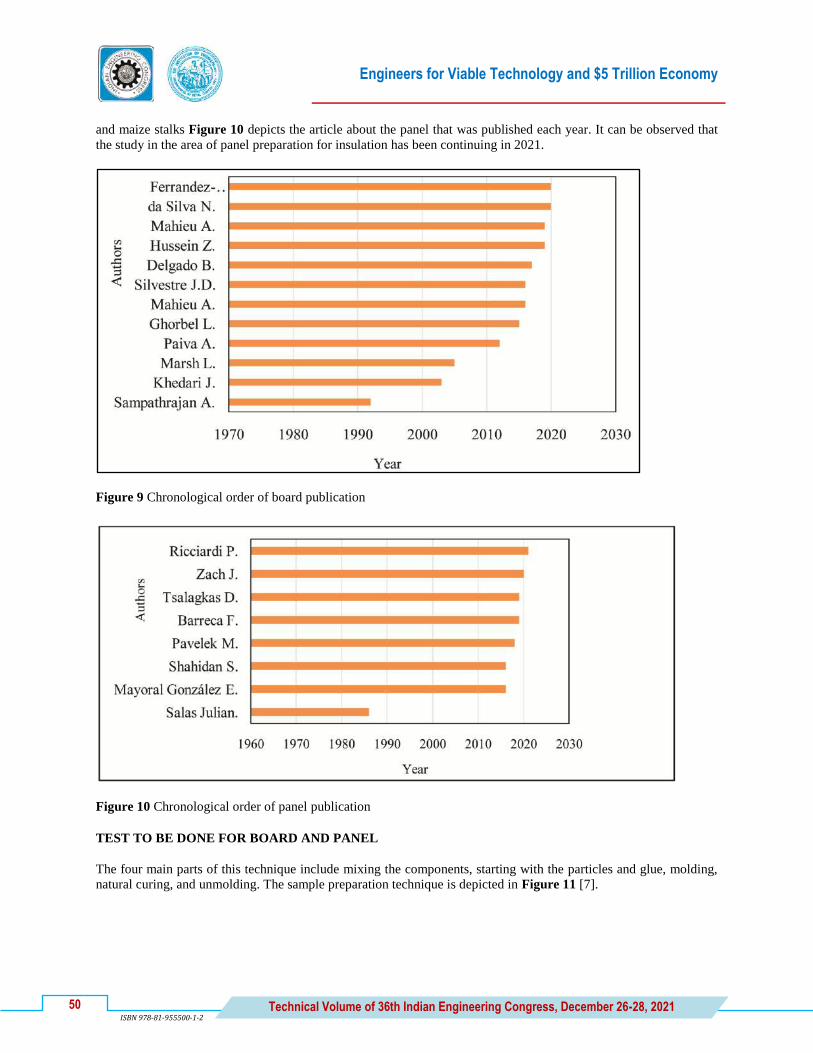
Engineers for Viable Technology and $5 Trillion Economy
50 Technical Volume of 36th Indian Engineering Congress, December 26-28, 2021
ISBN 978-81-955500-1-2
and maize stalks Figure 10 depicts the article about the panel that was published each year. It can be observed that
the study in the area of panel preparation for insulation has been continuing in 2021.
Figure 9 Chronological order of board publication
Figure 10 Chronological order of panel publication
TEST TO BE DONE FOR BOARD AND PANEL
The four main parts of this technique include mixing the components, starting with the particles and glue, molding,
natural curing, and unmolding. The sample preparation technique is depicted in Figure 11 [7].

Engineers for Viable Technology and $5 Trillion Economy
51 Technical Volume of 36th Indian Engineering Congress, December 26-28, 2021
ISBN 978-81-955500-1-2
Figure 11 Particleboard production process
Classification of Board
Particleboards are divided into seven categories based on their characteristics. The SFS-EN 312 [27] standard is
used to define the characteristics of particle board classes across Europe. Particleboard classes are denoted by the
letter 'P' followed by a number from 1 to 7 [28]. Table 4 shows the classification of board grades.
Table 4 Board grade and its uses
GRADE USES
P1 Boards for interior construction
P2 Interior usage furniture boards
P3 Non-load-bearing usage
P4 Interior-use boards that can endure stress
P5 board that withstands moisture better, that must tolerate tension
P6 For internal usage, floor boards that can resist a lot of pressure
P7 For applications that must bear a lot of pressure
Flexural Strength
Flexural parameters such as modulus of rupture (MOR) and modulus of elasticity will be evaluated using static
bending tests (MOE) section 9 of ASTM D1037-06[20] is used for the samples that are subjected to static bending
testing [7]. The results are shown in Table 5 for various materials.

Engineers for Viable Technology and $5 Trillion Economy
52 Technical Volume of 36th Indian Engineering Congress, December 26-28, 2021
ISBN 978-81-955500-1-2
Table 5 MOR and MOE of board from various farm waste materials [2,7,9,10,14]
Material MOR (MPa) MOE (MPa)
Vine pruning 6.58- 16.5. 743 – 1810
Flax 13.85 1722
Durian particleboards 25.177 28.407
Rubber wood Medium Density 3776.100 2947.234
Tea oil camellia shell 13.4 1840
Maize husk 427 5.2
Paddy straw 193 4.9
Coconut Pith 282 5.8
Groundnut shell 523 6.3
Most common boards used for studies are grade P1-P4 and the values of MOR and MOE of those grades are shows
in the Figure 12.
Figure 12 MOR and MOE of Grade P1-P2
Thickness Swelling and Water Absorption
According to European rules, particleboards certified as Grade P3 must have a maximum thickness swelling value of
17% after 24 hours in water. The findings of the thickness swelling values and water absorption values using natural
fiber are shown in Figure 13 [2].
Water absorption can be assessed with a precision of 0.1 mg by weighing the samples before and after immersion.
To get an accurate average, the measurements must be repeated five times for each particleboard[9].
Sound Insulation
Boards with thicknesses of 3, 2, and 4 cm are utilized for sound insulation boards made from natural waste. Impact
sound insulation tests must be carried out following NP EN ISO 140 [30], and impact sound insulation ratings were
determined following ISO 717-2 [31]. The equipment to measure sound insulation is shown in Figure 14. The basic
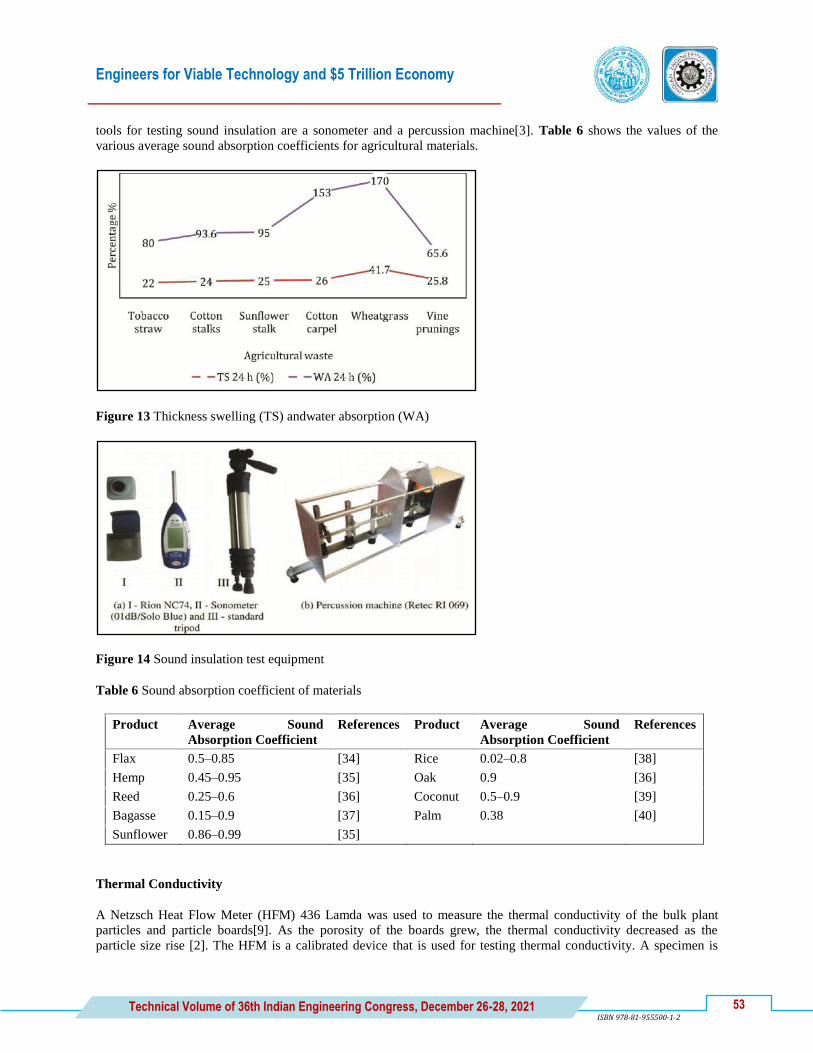
Engineers for Viable Technology and $5 Trillion Economy
53 Technical Volume of 36th Indian Engineering Congress, December 26-28, 2021
ISBN 978-81-955500-1-2
tools for testing sound insulation are a sonometer and a percussion machine[3]. Table 6 shows the values of the
various average sound absorption coefficients for agricultural materials.
Figure 13 Thickness swelling (TS) andwater absorption (WA)
Figure 14 Sound insulation test equipment
Table 6 Sound absorption coefficient of materials
Product Average Sound
Absorption Coefficient
References Product Average Sound
Absorption Coefficient
References
Flax 0.5–0.85 [34] Rice 0.02–0.8 [38]
Hemp 0.45–0.95 [35] Oak 0.9 [36]
Reed 0.25–0.6 [36] Coconut 0.5–0.9 [39]
Bagasse 0.15–0.9 [37] Palm 0.38 [40]
Sunflower 0.86–0.99 [35]
Thermal Conductivity
A Netzsch Heat Flow Meter (HFM) 436 Lamda was used to measure the thermal conductivity of the bulk plant
particles and particle boards[9]. As the porosity of the boards grew, the thermal conductivity decreased as the
particle size rise [2]. The HFM is a calibrated device that is used for testing thermal conductivity. A specimen is

Engineers for Viable Technology and $5 Trillion Economy
54 Technical Volume of 36th Indian Engineering Congress, December 26-28, 2021
ISBN 978-81-955500-1-2
placed between two plates, one hot and the other cold, and the heat flow induced by the temperature differential is
measured using a heat flux sensor[32]. The schematic diagram is shown in Figure 15 and the thermal conductivity
(λ) value for various materials is shown in Table 7.
Figure 15 Schematic of thermal conductivity test [6]
Table 7 Thermal conductivity coefficients of different organic fibers [2]
Material Thermal Conductivity λ (W/m K)
Hemp
0.111
0.040 to 0.094
0.038 to 0.075
Flax 0.042
Cotton 0.040 to 0.069
Date palm rachis 0.083
Rice straw 0.076 to 0.091
Sisal 0.070
Sugarcane bagasse 0.079 to 0.098
Wood particleboards 0.070 to 0.180
Wood fiberboards 0.050 to 0.140
Vine prunings 0.064 to 0.068
The hot box design is the method that was used by Milos Pavelek and Paola Ricciardi to measure the thermal
conductivities. Figure 16 shows the apparatus of the small hot-box [19].
Figrue 16 The small hot box apparatus

Engineers for Viable Technology and $5 Trillion Economy
55 Technical Volume of 36th Indian Engineering Congress, December 26-28, 2021
ISBN 978-81-955500-1-2
The specimen is sandwiched between two compartments, one for metering and the other for environmental
conditions [42]. The climatic chamber represents the outside climate (cold side), whereas the metering chamber
represents the inside environment (hot side). The panel thermal resistance is estimated using the observed heat flow
from the metering chamber side to the climatic chamber side passing through the specimen, as well as the recorded
temperature differential between the hot and cold sides [41].
Energy Analysis
The software mostly used is ―energy plus‖. This activity includes the physical or chemical processing of materials,
as well as the transfer and conversion of energy.The innovative panels in giant reed for buildings with the ―chimney
effect‖ and the cork were used to make the panel in the wall the panel was compared with the normal brick wall for
the energy analysis of heating and cooling. For heating and cooling, the predicted CO2 emissions for brick walls
were 2517 kg, 623 kg for agglomerated cork walls, and 1905 kg for giant reed walls [16].
Figrue 17 Energy Analysis for Autodesk Revit
As shown in Figure 17, Energy Analysis for Revit is a tool that allows users to execute a cloud-based whole-
building evaluation using Autodesk® Green Building Studio® (GBS) directly from Revit.Revit now provides an
integrated Energy Analysis workflow that incorporates both Architectural Building elements such as walls, roofs,
floors, and windows, as well as Conceptual Massing components formerly known as Conceptual Energy Analysis.
Figure 18 Detailed life cycle stages of building materials [15]

Engineers for Viable Technology and $5 Trillion Economy
56 Technical Volume of 36th Indian Engineering Congress, December 26-28, 2021
ISBN 978-81-955500-1-2
Life Cycle Assessment (LCA)
The analysis and valuation of a given item's natural impacts is known as a life cycle assessment [1]. An LCA
investigation of a building material or collection can be classified as cradle-to-grave (the extraction and handling of
raw materials and creation), cradle-to-cradle (vehicle cost, appropriation, and assembly, use, upkeep, and final
removal), or cradle-to-cradle (reuse, recovery, and recycling). The details of 4 stages (A, B, C and D) considered in
LCA are discussed in Figure 18.
The importance of conducting a life cycle assessment of particleboard production is that it provides information on
critical parameters such as fossil fuel based primary energy consumption, renewable primary energy consumption,
Eutrophication potential, climate impact over a period of 100 years, depletion of the ozone layer.
CONCLUSION
The monetization of these agricultural byproducts could thus give farmers with a new source of income.It
contributes to the removal of agricultural waste from the environment in such a way that even waste is turned
into a commodity.
Applying water repellent chemicals during the board's manufacture would improve these metrics significantly
if the thickness swelling and water absorption values were very high.
When compared to cork and granulated tyres, rice husk and coffee chaff have the lowest global warming
potential and cumulative energy requirement, especially when considering thermal studies.
Coconut shells can withstand temperatures of up to 800°C while losing just a small percentage of compressive
strength. Less than 10% was the ideal proportion to use as an admixture or replacement. The thermal
characterization can be done using the small hot box apparatus.
Cork, rice husk, and coffee chaff were some of the finest sustainable panels discovered, with similar thermal
conductivities of 0.063–0.068 W/mK and reduced environmental effects.
As the agricultural waste is used on the panel and board preparation the binding agent must be used and binder
types urea-formaldehyde, phenol-formaldehyde resins, isocyanate.
Consequently, particleboards manufactured from agricultural waste are feasible choices to employ in building
insulation walls and ceilings, even for the improved aesthetic features making it affordable and also decrease in
CO2 emission and the problem of waste disposal.
The greater the value of the average sound insulation capacity, the better the sound insulating capability.
This review paper would help in understanding the different test values of agricultural waste as well as the
experimental procedure for the thermal conductivity test. Making it useful for the researcher.
The study of life cycle assessment aids in analyzing the environmental consequences of practical boards and
panels' manufacture, usage, and end-of-life processing. This aids in the reduction of toxic waste utilization as
well as pollution in the environment.
FUTURE SCOPE
Future studies on the impact of various binding material ratios for thermal and mechanical characteristics can be
done. Furthermore, most of the studies are done using the hot-pressing process, and fewer binders are used, further
research on the binder and alternative agricultural waste for the sustainable solution can be an intriguing and better
approach in the construction of sustainable solutions.
DECLARATION OF COMPETING INTEREST
There are no conflicts of interest declared by the authors.

Engineers for Viable Technology and $5 Trillion Economy
57 Technical Volume of 36th Indian Engineering Congress, December 26-28, 2021
ISBN 978-81-955500-1-2
REFERENCES
1. B. Delgado, D. Lopez Gonzalez, S.Godbout, R. Lagace, A. Giroir-Fendler, A. Avalos Ramirez, A study of
torrefied cardboard characterization and applications: Composition, oxidation kinetics and methane adsorption,
Science of the Total Environment 10 (2017)593–594.
2. Manuel Ferrandez-Villena, Clara Eugenia Ferrandez-Garcia, Teresa Garcia-Ortuno, Antonio Ferrandez-
Garcia,Maria Teresa Ferrandez-Garcia, Analysis of the Thermal Insulation and Fire- Resistance Capacity of
Particleboards Made from Vine (Vitis vinifera L.) Pruning, Polymers12 (2020)2-11.
3. Jorge Faustino,Luos Pereira, Salviano Soares,Daniel Cruz,Anabela Paiva, Humberto Varum,Joso Ferreira,
Jorge Pinto, Impact sound insulation technique using corn cob particleboard, Construction and Building
Materials 37 (2012) 153-159.
4. Amirhossein Balali, Alireza Valipour, Identification and selection of building façade's smart materials
according to sustainable development goals, Sustainable Materials and Technologies 26 (2020) 1-20.
5. L. Ghorbel, T. Rouissi, S. K. Brar, D. Lopez-Gonzlebz, A. A. Ramirez, S. Godbout,Value-added performance
of processed cardboard and farm breeding compost by pyrolysis, Waste Management (2015) 1-10.
6. Daniel Fernando Hincapi Rojas, Posidia Pineda-Gomez, John Fredy Guapacha-Flores, Effect of silica
nanoparticles on the mechanical and physical properties of fibercement boards, Journal of Building
Engineering 31 (2020) 1-7.
7. 7.Zakia Hussein, Taha Ashour, Mervat Khalil, Adel Bahnasawy, Samir Ali, Jutta Hollands, Azra Korjenic,
Rice straw and flax fiber particleboards as a product of agricultural waste: An evaluation of technical
properties, Applied Science 9 (2019) 1-20.
8. 8.Joseph Khedari,SarochaCharoenvai,JongjitHirunlabh, New insulating particleboards from durian peel and
coconut coir, Building and Environment 38 (2003) 435 – 441.
9. A. Mahieua, S. Alixb, N. Leblanca, Properties of particleboards made of agricultural by-products with a
classical binder or self-bound, Industrial Crops & Products 130 (2019) 371-379.
10. Kamran Choupani Chaydarreh, Xiuyi Lin, Litao Guan, Hong Yun, Jin Gu,Chuanshuang Hu, Utilization of tea
oil camellia (Camellia oleifera Abel.) shells as alternative raw materials for manufacturing particleboard,
Industrial Crops & Products 161 (2021) 1-9.
11. Lori Marsh, Scott Subler, Sudanshu Mishra, Michele Marini, Suitability of aquaculture effluent solids mixed
with cardboard as a feedstock for vermicomposting, Bio resource Technology 96 (2005) 413–418.
12. Anabela Paiva, Sandra Pereira, Ana Sa, Daniel Cruz, Humberto Varum, Jorge Pinto, A contribution to the
thermal insulation performance characterization of corn cob particleboards, Energy and Buildings 45(2012)
274–279.
13. Malindu Sandanayake , Chamila Gunasekara, David Law, Guomin Zhang, Sujeeva Setunge, Dennis Wanijuru,
Sustainable criterion selection framework for green building materials – An optimization based study of fly-ash
Geopolymer concrete, Sustainable Materials and Technologies 25 (2020) 1-10.
14. A. Sampathrajan, N. C. Vijayaraghavan, K. R. Swaminathan, Mechanical and thermal properties of particle
boards made from farm residues, Bioresource Technology 40 (1992) 249-251.
15. Jose D. Silvestre, Nuno Pargana, Jorge de Brito, Manuel D. Pinheiro,Vera Durao, Insulation Cork Boards—
Environmental Life Cycle Assessment of an OrganicConstruction Material, Material (2016)91-16.
16. Francesco Barreca, Antonio Martinez Gabarron, Jose A. Flores Yepes, Joaquin J Pastor Perezb, Innovative use
of giant reed and cork residues for panels of buildings in Mediterranean area, Resources Conservation &
Recycling 140(2019) 259–266.
17. Mayoral Gonzalez, Eduardo,Gonzalez Diez, Isabel, Bacterial induced cementation processes and mycelium
panel growth from agricultural waste, Key Engineering Materials 663 (2015) 42-49.

Engineers for Viable Technology and $5 Trillion Economy
58 Technical Volume of 36th Indian Engineering Congress, December 26-28, 2021
ISBN 978-81-955500-1-2
18. Milos Pavelek, Marek Prajer, Kamil Trgala, Static and dynamic thermal characterization of timber frame/wheat
(triticumaestivum) chaff thermal insulation panel for sustainable building construction, Sustainability10 (2018)
1-19.
19. Paola Ricciardi, Elisa Belloni, Francesca Merli,Cinzia Buratti, Sustainable Panels Made with Industrial and
Agricultural Waste: Thermal and Environmental Critical Analysis of the Experimental Results, Applied science
11(2021) 1-14.
20. Shahiron Shahidan, Alif Syazani Leman, Mohamad Syamir Senin, Nurul Izzati Raihan Ramzi Hannan,
Suitability of Coconut Shell Concrete for Precast Cool Wall Panel A Review, MATEC Web of Conferences
87 (2016) 1-10.
21. Dimitrios Tsalagkas, Zoltan Borcsok, Zoltan Pasztory, Thermal, physical and mechanical properties of surface
overlaid bark‑based insulation panels, European Journal of Wood and Wood Products 77 (2019) 721–730
22. https://www.vosviewer.com
23. Zhang Ying, Pu Shengyan, Lv Xue, Gao Ya, Ge Long, Global trends and prospects in microplastics research: A
bibliometric Analysi, Journal of Hazardous Materials (2020)1-18.
24. Antonino Marvuglia, LisanneHavinga, Oliver Heidrich, Jimeno Fonseca, Niki Gaitani, Diana Reckien,
Advances and challenges in assessing urban sustainability: an advanced bibliometric review, Renewable and
Sustainable Energy Reviews 124 (2020)1-12.
25. Nees Jan van Eck, Ludo Waltman, VOS viewer: A computer program for bibliometric mapping, ERIM report
series research in management Erasmus Research Institute of Management 84 (2009) 1-22.
26. Judy F Burnham, Scopus database: a review Biomedical Digital Libraries, 2006,1-8
27. https://www.scribd.com/doc/262489054/BS-EN-312
28. https://www.woodproducts.fi/content/particle-board
29. American Society of Testing and Materials. Standard Test Methods for Evaluating Properties of Wood-Base
Fiberand Particle Panel Materials, D1037-06 Section 9, 11, 12, American Society of Testing and Materials:
WestConshohocken, PA, USA, 2006.
30. NP EN ISO 140-7. do isolamentosonoro de e de elementos de – Parte 7: in situ, do isolamentosonoro de
pavimentos a sons de (in Portuguese), Instituto da Qualidade (IPQ), 2008.
31. ISO 717-2. Acoustics: rating of sound insulation in buildings and of building elements – Part 2: impact sound
insulation. International Organization for Standardization (ISO); 1996.
32. https://autodesk.typepad.com/bpa/2013/03/revit-2014-release-news-new-buildingperformance-analysis-
features.html
33. HFM_436_Lambda_brochure.pdf
34. Nemr El Hajja,∗, Brice Mboumba-Mamboundoua, Rose-Marie Dheillya, Zoheir Abourab, Malek Benzeggaghb,
MichΦle Queneudeca, Development of thermal insulating and sound absorbing agro-sourced materials from
auto linked flax-tows, Industrial Crops and Products 34 (2011) 921– 928.
35. P.A. Chabriac, E. Gourdon, P. Gle b, A. Fabbri a, H. Lenormand, Agricultural by-products for building
insulation: Acoustical characterization and modeling to predict micro-structural parameters, Construction and
Building Materials 112 (2016) 158–167.
36. Berardi U and Iannace G, Acoustic characterization of natural fibers for soundabsorption applications, Building
and Environment (2015) 1-42.
37. Kazem Doost-hoseini a, Hamid Reza Taghiyari, Abdollah Elyasi, Correlation between sound absorption
coefficients with physical and mechanical properties of insulation boards made from sugar cane bagasse,
Composites: Part B 58 (2014) 10–15.

Engineers for Viable Technology and $5 Trillion Economy
59 Technical Volume of 36th Indian Engineering Congress, December 26-28, 2021
ISBN 978-81-955500-1-2
38. DT Liu, KF Xia, RD Yang, J Li, K F Chen and M M Nazhad, Manufacturing of a biocomposite with both
thermal and acoustic properties, Journal of Composite Materials 46(9) 1011–1020
39. Zahra Balador, Morten Gjerde, Nigel Isaacs, and Marzieh Imani ―Thermal and Acoustic Building Insulations
from Agricultural Wastes‖ Springer International Publishing AG 2018.
40. Changjie Chen, You Zhang, Guangxiang Sun, Jiayi Wang and Guohe Wang, Windmill Palm Fiber / Polyvinyl
Alcohol Coated Nonwoven Mats with Sound Absorption Characteristics, BioResources11,(2016) 4212-4225.
41. American Society for Testing and Materials. ASTM C 518-85 Standard Test Method for Steady-State Heat
Flux Measurements and Thermal Transmission by Means of the Heat Flow Meter Apparatus; American Society
for Testing and Materials: West Conshohocken, PA, USA, 1989.
42. Xinrui Lu, Ali M. Memari,Comparative study of Hot Box Test Method using laboratory evaluation of thermal
properties of a given building envelope system type, Energy & Buildings, 178 (2018) 130–139.


En
gin
eers
fo
r V
iab
le T
ech
no
log
y a
nd
$5
Tri
llio
n E
con
om
y
Civil
Engineering


Engineers for Viable Technology and $5 Trillion Economy
63 Technical Volume of 36th Indian Engineering Congress, December 26-28, 2021
ISBN 978-81-955500-1-2
Conceptual Model of Quality Management based on Blockchain
in Construction Industry
Atul Kumar Singh and V R Prasath Kumar*
Department of Civil Engineering, Faculty of Engineering and Technology, SRM Institute of Science and
Technology, Kattankulathur, Tamil Nadu
*e-mail: [email protected]
Abstract: Poor quality in construction could lead to the cash flow disruption, project delays, profit loss in projects
due to rework, and some time to the property damage or human loss due to accidents. In order to ensure the quality
of work, quality control (QC) departments inspect the construction work compliance with best practices, defined
procedures, and specifications. These inspections rely on manual procedures, post-construction evaluation,
document-based, and are carried out through a supervisory manner approach from top-down. However, this
topdown control-oriented approach does not provide enough motivation for quality control managers, operators,
and workers to voluntarily follow quality procedures and specifications. Besides, document-based quality
specification compliance assessments have limitations that are difficult to determine whether the required
specifications have actually been implemented and are not reliable to measure their real performance as well. In
this regard, this study proposes a conceptual framework for Blockchain-based quality management at construction
sites, which could ensure security and reliability of information generated through while implementing quality-
related specification and procedures by managers and workers using Distributed Ledger Technologies (DLT) and
also to encourage them by establishing a compensation structure through performance assessment for activities of
each task. The Block chained quality management approach would greatly help shift the traditional top-down and
passive quality control process to bottom-up and voluntary manner. It might open a new innovative value-chain
structure in the construction quality domain which provides securing reliability of activities required for quality
assurance procedures and specification implementation.
Keywords: Blockchain; Distributed Ledger Technologies (DLT); Construction Quality; Defect Management
INTRODUCTION
Rework of poor-quality construction work is regarded as a non-value adding activity that is utterly affecting the
productivity and performance in construction projects that spend inessential enormous costs, materials, time, and
manpower [1]. Many researches have extensively focused on construction defect management to enhance the poor
quality in construction. Previous studies revealed that 5% to 15% of costs in construction projects are caused due to
poor-quality work [2].
The rework does not only costs but might charge additional expenses due to delay in the project, and sometimes
consume those resources which are allocated to other parts of the project. Poor quality does not only affect costs but
also severe accidents. In the case of Korea, accidents due to poor quality of construction work have been reported in
many projects such as the collapse of Pyenogtaek international bridge and the fall of the exterior wall of the National
University Museum, both of which cause many deaths. Also, the number of dispute related to defects in apartment
buildings are increased from 69 cases in 2010 to 3,880 cases in 2016.
Generally, in construction, to make sure the quality of work and prevent defects, the manager inspects the completed
work, identify the defects if any, and records them with information of drawings and locations or in the form of
documents such as checklist and punchlist. After identifying defects in the field, they discuss the quality of work
with the subcontractors and instruct them for actions such as repair or rework. This cycle of rework and quality
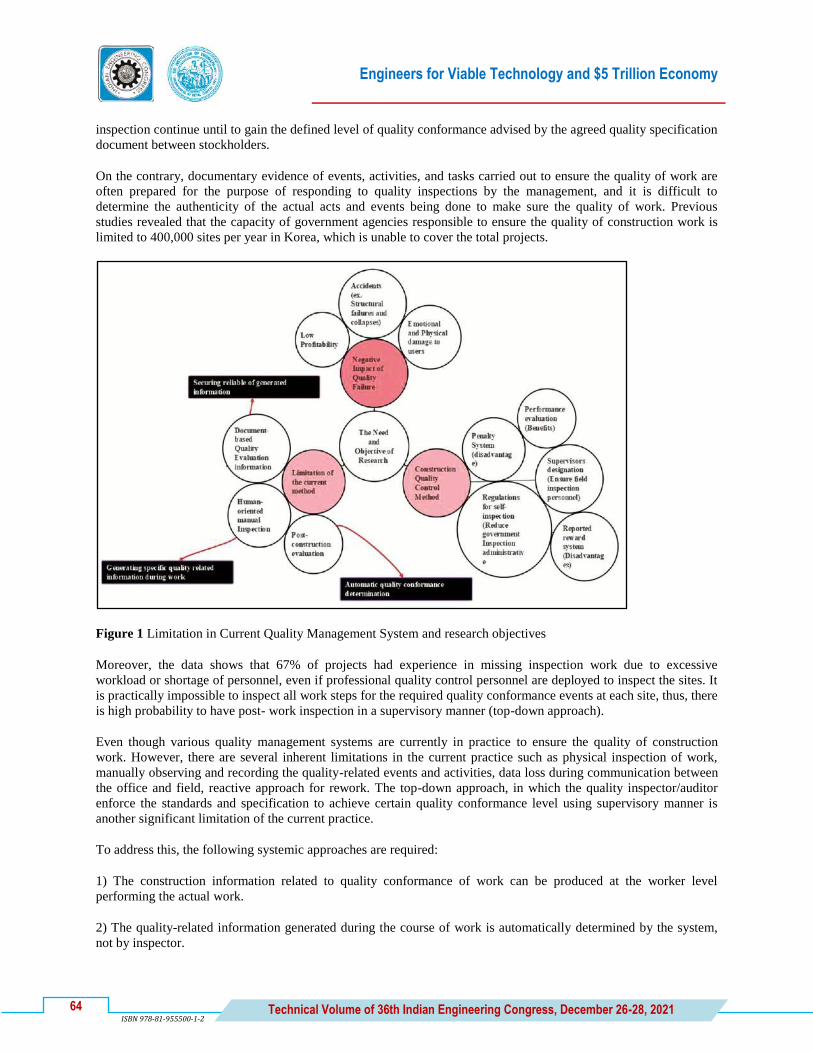
Engineers for Viable Technology and $5 Trillion Economy
64 Technical Volume of 36th Indian Engineering Congress, December 26-28, 2021
ISBN 978-81-955500-1-2
inspection continue until to gain the defined level of quality conformance advised by the agreed quality specification
document between stockholders.
On the contrary, documentary evidence of events, activities, and tasks carried out to ensure the quality of work are
often prepared for the purpose of responding to quality inspections by the management, and it is difficult to
determine the authenticity of the actual acts and events being done to make sure the quality of work. Previous
studies revealed that the capacity of government agencies responsible to ensure the quality of construction work is
limited to 400,000 sites per year in Korea, which is unable to cover the total projects.
Figure 1 Limitation in Current Quality Management System and research objectives
Moreover, the data shows that 67% of projects had experience in missing inspection work due to excessive
workload or shortage of personnel, even if professional quality control personnel are deployed to inspect the sites. It
is practically impossible to inspect all work steps for the required quality conformance events at each site, thus, there
is high probability to have post- work inspection in a supervisory manner (top-down approach).
Even though various quality management systems are currently in practice to ensure the quality of construction
work. However, there are several inherent limitations in the current practice such as physical inspection of work,
manually observing and recording the quality-related events and activities, data loss during communication between
the office and field, reactive approach for rework. The top-down approach, in which the quality inspector/auditor
enforce the standards and specification to achieve certain quality conformance level using supervisory manner is
another significant limitation of the current practice.
To address this, the following systemic approaches are required:
1) The construction information related to quality conformance of work can be produced at the worker level
performing the actual work.
2) The quality-related information generated during the course of work is automatically determined by the system,
not by inspector.

Engineers for Viable Technology and $5 Trillion Economy
65 Technical Volume of 36th Indian Engineering Congress, December 26-28, 2021
ISBN 978-81-955500-1-2
3) The reliability of the generated information can be secured at the same time. Therefore, this study aims to propose
an innovative quality management system model that utilizes blockchain technology, which has a lot of interest in
the construction field.
Issues in Current Quality Management Systems
One of the critical components in a successful construction project management is quality management [3]. In
construction, the occurrence of quality non-conformance is comparatively high and can negatively affect the firm's
profit and its competitiveness [4]. Poor quality is the consequence of non-conformance to the quality standards and
specifications during construction work, which results in additional time and cost to all in a project [5].
In order to sort out the issue, this area is being extensively studied by many researchers. However, the problem of
data loss, reactive approach, and substantial workload still exist. For instance, the process of manual observation and
recording the non-conformance or defect information at the site and re-putting to the computer in the office for
discussion is cumbersome and could be less accurate due high chance of data errors, omission and miswrite [6].
Quality conformance inspection consumes a major portion of construction manger's work efforts, which is
accounted for around 38 percent of their total work [7]. To reduce the workload of the construction managers in
checking quality conformance, radio frequency (RF) technology [8], personal digital assistant (PDA) [9] and laser
scanner [10] have been developed. However, these systems work with reactive approaches after non-conformance
already been happened, and it is vital to control and apply all the required events and activities for quality
conformance during the construction process so that to ensure the specified quality before the defect occurs.
Over the last decade, many researchers have devoted vital attention to enhance the quality management system in
construction. Several concepts and their enabling technologies such as building information modeling (BIM) and
augmented reality (AR) have been investigated for proactive and automatic quality inspection during the
construction work. The augmented virtuality (AV) based tele-inspection system for non-conformance detection has
been developed by Wang and Chen [11]. Similarly, Dong et al proposed a mobile-based telematic digital workbench
system for construction quality management that integrates the location of visual information on the job site with the
3D model [12]. However, a categoric, transparent, and reliable approach is inevitable to solve the before mentioned
issues in the current quality management system.
Blockchain Technology Applications in Construction
Blockchain technology also known as distributed ledger technology (DLT) is considered to be capable of
transforming many global industries, and the construction has no exception. Blockchain was introduced in 2008 as
an underpinning technology for the verification tool of world's first cryptocurrency (bitcoin) transactions[13].
The significant features of block chain technology are:
(i) immutability (once blocks are chained then cannot be modified);
(ii) a peer-to-peer network made up nodes (computers) for decentralized operation;
(iii) reliability (all nodes have an same copy of the same blockchain in all nodes which is verified through an
algorithm for any anomalies;
(iv) authentication (a Proof-of-Work mechanism validate transactions in the Blockchain) [14].
Previous research already been carried out to explore blockchain technology for multiple domains can be classified
in seven use-categories:

Engineers for Viable Technology and $5 Trillion Economy
66 Technical Volume of 36th Indian Engineering Congress, December 26-28, 2021
ISBN 978-81-955500-1-2
Figure 2 Previous research on blockchain technology for multiple domain
The scope of the derived literature in this paper is limited to the previous efforts related to the buildings, energy and
construction. Currently, many researchers are focusing on the applications of Blockchain technology in various
construction industry areas such as energy transactions using distributed fields, Integration of IoT technologies with
blockchain, BIM and blockchain-based approaches, and resolution of delayed payment to subcontractors' problems
through a smart contract. Castellanos investigated the energy transactions generated from wind or solar sources
using distributed ledger technology (DLT)[15]. To measure the inside temperature in the building using IoT based
smart home devices, a hybrid approach of BIM and blockchain technology is applied for energy management and
saving [16]. Wang proposed a smart contract-based blockchain method to solve the problem of wage payment to the
construction worker [17]. Previous efforts regarding the blockchain in the construction domain revealed that most of
the research was focused on smart contracts to enhance the transactions of payments. However, some web articles
have focussed on the conceptual adoption of blockchain in safety compliance and quality conformance in
construction.
Blockchain-based Quality Management System Framework
This study intends to develop an innovative system framework that utilizes blockchain technology for effective
construction quality management. The main functions and utilization effects of this system includes three main
attributes: (1) Implementing text mining, computer vision, internet of things (IoT), and augmented reality (AR)
technology to determine the appropriate information generated by quality conformance activities, (2) Leveraging
Distributed Ledger Technologies (DLT) in blockchain to ensure security and reliability of information generated
during the specific quality-related events, tasks, and activities (3) Based on the report of on-site quality conformance
activities being done by worker level, granting the contractor/partner quality conformance level assessment.
The proposed framework enables the categoric generation of construction information related to the quality of work
at the bottom worker level that performs the actual work. However, the system instead of the person automatically
determines the generated information and controls the reliability of the generated information.
The quality management-related stakeholders in a construction project can be grouped into four classes. Quality
conformance events and activity information produced during the construction work is mainly generated by
contractors and suppliers, and the generated information is stored in the quality management events and activities

Engineers for Viable Technology and $5 Trillion Economy
67 Technical Volume of 36th Indian Engineering Congress, December 26-28, 2021
ISBN 978-81-955500-1-2
database (DB). The verification of the quality conformance of the stored information is evaluate d in rules-based or
algorithm-based systems. To allow access of relevant participants to the project's information, the proposed system
framework would adopt licensed blockchain protocols to only allow authorized participants to the network.
In the process of creating quality conformance events and activities information, checking and verifying the ledger,
Hyperledger consensus algorithm can be used to check the author or viewer's authority to ensure the reliability of
stored data and prevent unauthorized users from accessing the ledger. Unlike, other specific platforms to a
particularbusiness- models, Hyperledger can be universally adopted in several fields of industries. The Hyperledger
is an open-source community of Linux foundation project focused on developing tools and libraries for blockchain
deployments.
These tools and libraries are open source and can be written or modified based on requirements using common
programming languages such as Java, Golang, Node.js, and could be further integrated with construction industry
tools for BIM such as Revit, dynamo, grasshopper, as well as to other technologies such as IOT, image recognition,
and text-mapping. The configurable module structure allows users to easily select and replace the functions they
want to fit the business model of the desired company. In order to reduce data overload in a Blockchain network, the
raw data in large amount with more size such as images, BIM files, sensor data, etc. could be stored in a separate
database outside the blockchain, however, the generated hash and URL against each transactions would be recorded
in a distributed ledger. Through channel separation and MSP (Membership Service Provider) function in
Hyperledger, general contractor can access the ledger of subcontractor‟s CH.2, but sub-contractor cannot be
accessed by general contractor‟s CH.1.
In addition, the audit agency, and supervisor can grant the participation access to CH.1 and CH.2 for reviewing the
quality conformance level of construction companies recorded on the blockchain.
Figure 3 Process of proposed Blockchain-based quality management model

Engineers for Viable Technology and $5 Trillion Economy
68 Technical Volume of 36th Indian Engineering Congress, December 26-28, 2021
ISBN 978-81-955500-1-2
IMPLEMENTATION SCENARIOS
In order to ensure quality of work, the quality conformance events and activities needs to be checked for each work
step, and the generated information during each step is automatically checked by the system, not the person, for
compliance with quality-related regulations and procedures.
To further elaborate the idea of the study, four case scenarios are selected and detailed as under. Missing struts when
install shoring system: For instance, inspecting the struts when installing the shoring or shielding system in an
excavated site, the manger takes images of each job-step during work progress. The augment reality (AR) based
image matching techniques check the installation status and accuracy of the struts, any discrepancies could be
recorded and sent to the database.
The blockchain system could generate a hash for each generated record and will save on the server. Checking
waterproofing work procedures: In waterproofing work, there are various layers of different materials to be painted
and finished on the surface with specific time intervals. The manger captures the images after finishing the primary
layer and before starting the second layer, the rule-based engine analyzes the images with corresponding time
reference and record the hash against each transaction in the blockchain.
Testing Compressive Strength of Concrete: Calculating compressive strength of concrete is very critical in
construction of structural works. Initially, the quality inspector in the lab take image of concrete molds during curing
under water. Then the inspector captures the compressive strength results after 3, 7 and 28 days by doing experiment
on universal testing machine (UTM). The system can then generate the hash against both the images and will be
saved in the block chain, other data such as images or documents will be stored in the external database.
Figure 4 Implementation scenarios for the proposed Quality Management Model

Engineers for Viable Technology and $5 Trillion Economy
69 Technical Volume of 36th Indian Engineering Congress, December 26-28, 2021
ISBN 978-81-955500-1-2
Material test report Registration: Similarly, equipment or machinery fitness and material quality is also significant to
ensure quality of work. In order to have reliable quality and fitness to use information, the document certificate
made against each particular inspection for the concerned equipment or materials could be uploaded to the
blockchain system.
The images of the documents can be converted to the text using optical character recognition technology (OCR) or
text mining, then the required relevant important information such as date, time, location and fitness etc. can be
extracted, and their corresponding hash along with URL could be stored in the blockchain.
DISCUSSION ON EXPECTED RESULTS
The core intention of the study is to develop a framework for a system that automatically evaluate and examine the
quality conformance events and activities grading level based on the information generated during the process of
performing quality control events, activities and tasks by the manager or workers. The system based on the proposed
framework is expected to be beneficial and alternate for Inspection agencies and prospective users or occupants
(considering apartments case), as it provides reliable, transparent, and verified information required for quality
conformance, without even physically visiting the site.
The rules for quality conformance can be defined from quality management regulations and quality inspection cases.
The integration of advance technologies with blockchain such as image recognition, image matching and IoT based
sensors could determine the accurate and secure information pertaining to quality conformance. In addition, the
determined qualityrelated information and verification data can be recorded on the blockchain to gain security and
reliability, and using channel-specific access rights, users can be provided with reliable quality management activity
information at any time.
Additionally, this study proposed a quality management process innovation for shifting the traditional quality
management process from top-down approach to bottom-Up approach that can efficiently measure the quality
conformance level during the actual work (proactively) before the failure occurs, rather than detecting the defect
after the completion of entire work, which is reactive approach.
CONCLUSION
To ensure the quality of work in construction, the quality control (QC) departments inspect the work compliance
with best practices, defined procedures, and specifications. These inspections rely on post-construction evaluation,
document-based, and are carried out through a supervisory manner approach from top-down.
Apart from that, the traditional quality management system is unable to acquire the job step events/activities
information pertaining to the standard and best practices required to produce a qualitative work. To address this
issue, this research proposed a conceptual framework for Blockchain-based construction quality management
system.
This proposed framework utilizes Hyperledger fabric protocols to store key information of quality related events and
activities using blockchain technology. It also proposed the application of various technologies, including image
recognition, image matching, text mining, and IOT sensors, to verify the suitability of safety activities. It is expected
that the Block chained quality management approach will contribute to shift the traditional top-down to passive
quality control process to bottom-up and voluntary manner. It might open a new innovative value-chain structure in
the construction quality domain which provides securing reliability of activities required for quality assurance
procedures and specification implementation.
REFERENCES
1. S. Alwi, K. Hampson, S. Mohamed, Non Value-Adding Activities: A Comparative Study of Indonesian and
Australian Construction Projects, Proc. 10th Conf. Int. Gr. Lean Constr. (2002).

Engineers for Viable Technology and $5 Trillion Economy
70 Technical Volume of 36th Indian Engineering Congress, December 26-28, 2021
ISBN 978-81-955500-1-2
2. P. Netscher, The true costs of poor quality construction | LinkedIn, (n.d.). https://www.linkedin.com/pulse/true-
costs-poor-quality-construction-paul-netscher/ (accessed June 22, 2020).
3. H. Abdul-Rahman, Some observations on the issues of quality cost in construction, Int. J. Qual. Reliab. Manag.
14 (1997) 464–481. https://doi.org/10.1108/02656719710170693.
4. H. Abdul-Rahman, P.A. Thompson, I. L. Whyte, Capturing the cost of nonconformance on construction sites:
An application of the quality cost matrix, Int. J. Qual. Reliab. Manag. 13 (1996) 48–60.
https://doi.org/10.1108/02656719610108314.
5. Y.A. Olawale, M. Sun, Cost and time control of construction projects: Inhibiting factors and mitigating
measures in practice, Constr. Manag. Econ. 28 (2010) 509–526. https://doi.org/10.1080/01446191003674519.
6. C.S. Park, D.Y. Lee, O.S. Kwon, X. Wang, A framework for proactive construction defect management using
BIM, augmented reality and ontology-based data collection template, Autom. Constr. 33 (2013) 61–71.
https://doi.org/10.1016/j.autcon.2012.09.010.
7. J.Y. Lee, O.S. Kwon, J.S. Choi, C.S. Park, A study on construction defect management using augmented
reality technology, 2012 Int. Conf. Inf. Sci. Appl. ICISA 2012. (2012).
https://doi.org/10.1109/ICISA.2012.6220933.
8. L.C. Wang, Enhancing construction quality inspection and management using RFID technology, Autom.
Constr. 17 (2008) 467–479. https://doi.org/10.1016/j.autcon.2007.08.005.
9. Y.S. Kim, S.W. Oh, Y.K. Cho, J.W. Seo, A PDA and wireless web-integrated system for quality inspection
and defect management of apartment housing projects, Autom. Constr. 17 (2008) 163–179.
https://doi.org/10.1016/j.autcon.2007.03.006.
10. S.N. Yu, J.H. Jang, C.S. Han, Auto inspection system using a mobile robot for detecting concrete cracks in a
tunnel, Autom. Constr. 16 (2007) 255–261. https://doi.org/10.1016/j.autcon.2006.05.003.
11. X. Wang, R. Chen, An Empirical Study on Augmented Virtuality Space for TeleInspection of Built
Environments, Tsinghua Sci. Technol. 13 (2008) 286–291. https://doi.org/10.1016/S1007-0214(08)70163-9.
12. A. Dong, M. Lou Maher, M.J. Kim, N. Gu, X. Wang, Construction defect management using a telematic
digital workbench, Autom. Constr. 18 (2009) 814–824. https://doi.org/10.1016/j.autcon.2009.03.005.
13. D. Vujičić, D. Jagodić, S. Randić, Blockchain technology, bitcoin, and Ethereum: A brief overview, in: 2018
17th Int. Symp. INFOTEH-JAHORINA, INFOTEH 2018 - Proc., Institute of Electrical and Electronics
Engineers Inc., 2018: pp. 1–6. https://doi.org/10.1109/INFOTEH.2018.8345547.
14. J. Li, D. Greenwood, M. Kassem, Blockchain in the built environment and construction industry: A systematic
review, conceptual models and practical use cases, Autom. Constr. 102 (2019) 288–307.
https://doi.org/10.1016/j.autcon.2019.02.005.
15. J.A.F. Castellanos, D. Coll-Mayor, J.A. Notholt, Cryptocurrency as guarantees of origin: Simulating a green
certificate market with the Ethereum Blockchain, in: 2017 5th IEEE Int. Conf. Smart Energy Grid Eng. SEGE
2017, Institute of Electrical and Electronics Engineers Inc., 2017: pp. 367–372.
https://doi.org/10.1109/SEGE.2017.8052827.
16. A. Dorri, S.S. Kanhere, R. Jurdak, Towards an optimized blockchain for IoT, in: Proc. - 2017 IEEE/ACM 2nd
Int. Conf. Internet-of-Things Des. Implementation, IoTDI 2017 (Part CPS Week), Association for Computing
Machinery, Inc, 2017: pp. 173–178. https://doi.org/10.1145/3054977.3055003.
17. J. Wang, P. Wu, X. Wang, W. Shou, The outlook of blockchain technology for construction engineering
management, Front. Eng. Manag. 4 (2017) 67. https://doi.org/10.15302/j-fem-2017006.

Engineers for Viable Technology and $5 Trillion Economy
71 Technical Volume of 36th Indian Engineering Congress, December 26-28, 2021
ISBN 978-81-955500-1-2
CV_008_03_169
Evaluation of Energy-Efficient Office Building through Glass
Thermal Properties, Shading Devices and Window-wall Ratio
Kshitija S Penta and Ashwini R Patil*
D Y Patil College of Engineering, Akurdi, Pune, Maharashtra
*e-mail: [email protected]
Abstract: Sustainable development is a more concerning topic due to rapid urbanization, population growth, and
comfort in building services. As India is a developing country it consumes almost 30% of energy in lighting, cooling,
and heating form, in the commercial building sector. By implementation or adopting energy-efficient codes could
provide lead to a sustainable future. In India, BEE has introduced ECBC (Energy Conservation Building Code)
2017 to optimize energy use by using passive strategies and providing comfort levels to occupants in a commercial
building. This paper will present the energy performance of the building, for developing process data needed for
modeling a new commercial office building was collected from past research related to energy-efficient building. By
adopting ECBC prescriptive compliance approaches the reference office building was model through simulation
software Design Builder along with the Energy Pulse engine. Using energy-efficient code as a guideline further
evaluation of the same building is done by changing 3 building parameters via window glass with increase WWR
and shading devices. After simulating the model the results were analyzed for annual total energy consumption and
all summer energy consumption. Making use of ECBC's prescriptive compliance approach and simulation software
will help in easy implementation and imposing. The use of such codes will lead to a reduction in future barriers and
using software will lead to a reduction of manual calculation barriers. After that lastly, the Discount payback period
analysis was done for 10% and 6% rates.
Keywords: ECBC 2017; Glazing; Shading Devices; WWR; Design Builder
INTRODUCTION
India consumes almost 30% of energy in the commercial building sector [5, 12]. The primary energy consumes in
form of heating, cooling, ventilation, lighting, and equipment‟s and the secondary energy is consumed by domestic
hot water and other loads [15]. A previous study observed that windows help save energy consumption by using
glass as a major material and using glass with its thermal properties as lower U-value and high solar heat gain
coefficient for passive solar heating applications [10]. The building window design is the major part that affects the
received natural light across the building, so for this reason the window must be designed in such a manner that it
allows most of the natural sunlight to enter with the required amount into the building and it should balance the light
need and heat gain inside the building. So this will help to achieve balance in heat gain and natural daylighting[14].
Among the building envelope glass is the main element that influences the thermal performance of the building,
therefore it is essential to study the thermal behavior of the glass for balancing the day lighting and heat gain inside
[5]. However, the glazing technologies can help provide sufficient daylight to the building and save energy
Moreover, it also enhances the architectural appearance of the building [9]. Using a glass of different types such as
single, double, and triple and also affect the energy performance of the building. Shading devices can also contribute
to the energy performance of the building, using shades for the facades with large portions glazed. As the provision
of glaze is to provide natural lighting and aesthetic appearance to the building but providing glass at large portion
can cause heat gain inside the building which would lead to occupant/employee discomfort to overcome this
property of glass the application of shades would help provide better energy performance of the building. There are
different shading elements such as fixed and movable shading devices that are used to improve the energy
performance of the building [6]. The shading design impact and its control on building energy performance are not
taken into account at the design stage, eventually, the cooling and lighting energy balance between fenestration

Engineers for Viable Technology and $5 Trillion Economy
72 Technical Volume of 36th Indian Engineering Congress, December 26-28, 2021
ISBN 978-81-955500-1-2
design and lighting are to be identified [16]. BEE (Bureau of Energy Efficiency), a government body of India with
United States AID, has done a study based on the actual performance of the building for conditioned and non-
conditioned buildings for all commercial building sectors. The ECBC (Energy Conservation Building Code) was
developed for the same aspect by BEE; on 27th May 2007, ECBC was launched for the first time to design or to
construct new commercial buildings with minimum efficiency standards. The ECBC in June 2017 was updated
which introduced additional new requirements, lighting, HVAC, electrical, building envelopes, and renewable
systems [12,15]. In this paper evaluation of the model would be done with ECBC guidelines by using DesignBuilder
version 7.0.0.093 along with EnergyPluse Engine 9.4 and then changing three parameters such as different types of
glass, WWR, and shading devices for the same ECBC model to make energy performance better and the results
were analyzed for annual total energy consumption in kWh/m2, and all summer energy consumption in kWh/m
2.
Then lastly a simple discount payback period analysis was performed for 10% and 6% for providing guidelines for
selecting the project [11].
METHODOLOGY
In this evaluation, the office building is simulated for energy usage which is in form of heating, cooling, and lighting
energy loads, by using the simulation tool Design Builder. The use of the software will help in easy analysis of
the model at the initial design stage and with an excuse for any manual calculation. The reference building is a
model by using ECBC as a guideline [12]. The glass mandatory value is inputted, then by replacing three glass
types-single, double and triple glass are consider with it four different shades are coupled with a 60% increase in
WWR [19].
Design of Reference Building is Developed Which Complaints to ECBC 2017
The building is a commercial office building with a rectangular shape [17] with a two-story office building and the
design of the building complaints to ECBC 2017. By assumption of the building are done from the previous study,
such as 2-story building, the shape of the building is kept rectangular, lighting controls are on and are LED lighting,
cooling appliances are to be 5-star rating, remaining data is prescriptive values from the code.
Table I Base building details summary
Activity template
Occupancy Schedule Working Profile (days in
a week)
Metabolic Factor
8:00 – 16:00 6 0.90
Construction template
External wall (u-value) Roof (u-value) Floor (u-value) Infiltration in air change
0.4 0.33 2.16 0.5ac/h
Opening template (ECBC)
Glazing (u-value) SHGC VLT WWR
3.3 0.27 0.561 40%
Lighting template
Lighting Lighting Controls LPD
LED On 9.5 w/m2
HVAC
Mechanical vent Heating Cooling DHW
On On On Off
Design of Proposed Building is Developed by Altering Glass Type, Shades and 60% WWR
For making the office building energy-efficient, alternate glass types were selected concerning its thermal
properties, shading devices and 60% WWR selected from past research studies and were used for evaluation and
they were considered for the same ECBC model. Further evaluation was carried concerning alternate 3 building
parameters.

Engineers for Viable Technology and $5 Trillion Economy
73 Technical Volume of 36th Indian Engineering Congress, December 26-28, 2021
ISBN 978-81-955500-1-2
Table 2 Glazing types
Sr. No. Types of Glass
1 Sgl. LoE (e2=.2) Clr. 6mm
3 Dbl. LoE SPEC. SEL. Tint 6/13 Argon
5 Dbl. LoE Spec. Selc. Clr. 3/13/6 Arg.
6 Dbl. Sage glass Climaplus Green No Tint
7 Dbl. SGG XT 60-28 6/16/4
9 Trp. LoE Film (66) Br. 6/13 Air
10 Trp. Sage Glass Climatop Green No Tint
Table 3 Shading devices
Sr. No. Types of Shading Devices Dimensions
1 Overhang, Sidefins 1.5 m
2 Overhang, Sidefins, Louvre 0.5 m
3 Louver 1 m
4 Sidefins 0.5 m
RESULT AND DISCUSSION
Calculation of Annual and All Summer Energy Consumption for Reference Model
Simulating the office building in the DesignBuilder software the following results were obtained, the model was
simulated for annual total energy consumption in kWh/m2and all summer energy consumption in kWh/m
2. From
Table 4 it is observed the building consumes 72.7 kWh/m2 of energy annually and 47.4 kWh/m
2 of energy all
summer. This value would be used as a benchmark for the project and alternate glass; shades would be used to make
the energy performance of the building best.
Table 4 Results ECBC Model
Results ECBC Model
Annual total energy Consumption kWh/m2 All Summer energy Consumption kWh/m
2
72.7 47.4
Calculation of Annual and All Summer Energy Consumption for Propose Model
Results for Annual Total Energy Consumption of Office Building
As the simulation of the reference model is carried on, the same building would be used for further evaluation with
different glass types, shading elements, and WWR. So after simulating the building with alternate parameters
following results are obtained. From Table 5 it is observed that evaluation of building is done for single, double, and
triple glass type with four different shading devices.
The single glass shows a poor performance than that of double and triple glass types. Double layer saint global glass
along with overhang + sidefins show more efficient performance than ECBC mode. As for annually, the office
building consumes 63.23 kWh/m2 of energy, and all the triple glass shows the best energy performance of 61.86
kWh/m2 annually. And so on it is observed that overhang+ sidefines 1.5 are more energy-efficient shading devices

Engineers for Viable Technology and $5 Trillion Economy
74 Technical Volume of 36th Indian Engineering Congress, December 26-28, 2021
ISBN 978-81-955500-1-2
that save more energy than that of outer shades. Figure 1 helps in understanding the energy performance of the
building through various parameters consider for the building.
Table 5 Annual total energy consumption kWh/m2 of proposed building
Description Overhang
+Sidefins 1.5
Overhang, Sidefins,
Louvre 0.5
Louver
1
Sidefins
0.5
No
Shade
Case 0 ECBC Glaze - - - - 72.7
Case 1 SglLoE (e2=.2) Clr
6mm
91.52 97.29 181.0 132.97 -
Case 2 DblLoE Spec Sel Tint
6/13mm Argon
67.95 70.64 80.93 84.89 -
Case 3 DblLoE Spec SelClr
6/13mm Arg
72.49 76.15 77.41 97.64 -
Case 4 Dbl. LoE Spec. Slec.
Clr 3/13/6mm Argon
72.82 76.33 77.46 98.35 -
Case 5 Dbl. Sage glass
Climaplus Green No
Tint
64.37 66.78 75.6 80.39 -
Case 6 Dbl. SGG XT 60-28
6/16/4
63.23 65.57 70.21 79.44 -
Case 7 Trp. LoE Film (66) Br.
6/13 Air
69.69 72.41 85.06 84.97
Case 8 Trp. Sage Glass
Climatop Green No
Tint
61.86 63.98 74.98 74.72
Figure 1 Graphical presentation of annual consumption in kWh/m2
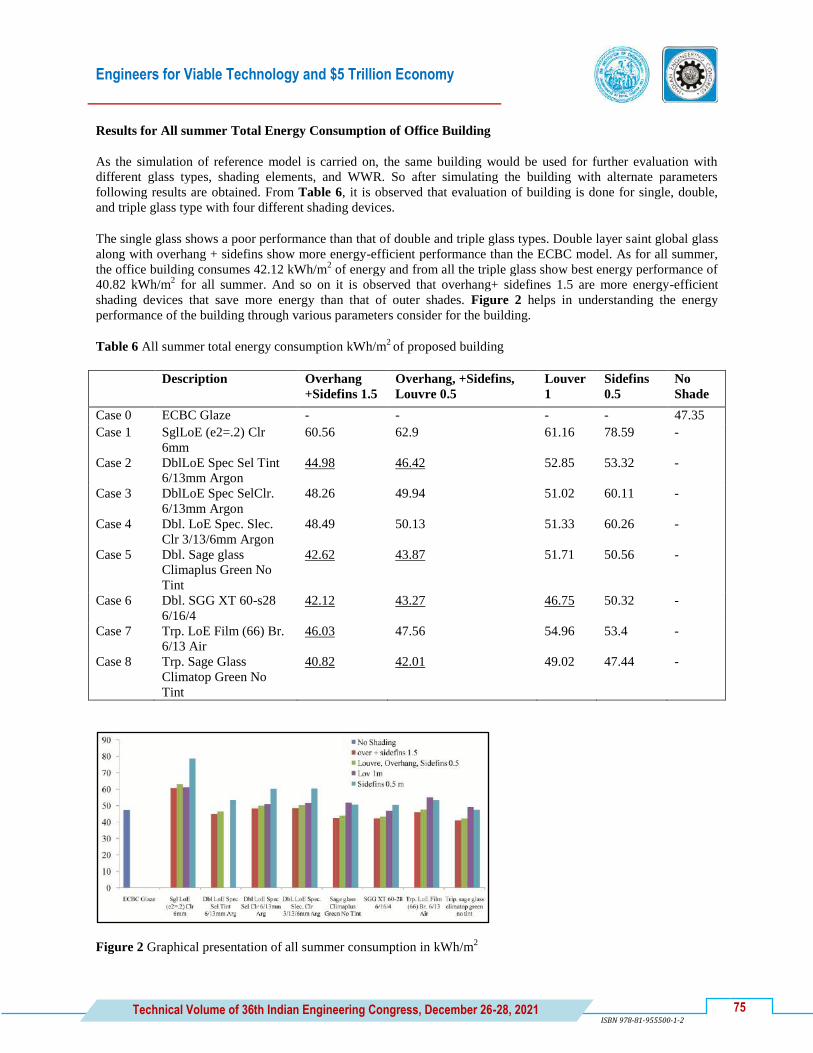
Engineers for Viable Technology and $5 Trillion Economy
75 Technical Volume of 36th Indian Engineering Congress, December 26-28, 2021
ISBN 978-81-955500-1-2
Results for All summer Total Energy Consumption of Office Building
As the simulation of reference model is carried on, the same building would be used for further evaluation with
different glass types, shading elements, and WWR. So after simulating the building with alternate parameters
following results are obtained. From Table 6, it is observed that evaluation of building is done for single, double,
and triple glass type with four different shading devices.
The single glass shows a poor performance than that of double and triple glass types. Double layer saint global glass
along with overhang + sidefins show more energy-efficient performance than the ECBC model. As for all summer,
the office building consumes 42.12 kWh/m2 of energy and from all the triple glass show best energy performance of
40.82 kWh/m2 for all summer. And so on it is observed that overhang+ sidefines 1.5 are more energy-efficient
shading devices that save more energy than that of outer shades. Figure 2 helps in understanding the energy
performance of the building through various parameters consider for the building.
Table 6 All summer total energy consumption kWh/m2 of proposed building
Description Overhang
+Sidefins 1.5
Overhang, +Sidefins,
Louvre 0.5
Louver
1
Sidefins
0.5
No
Shade
Case 0 ECBC Glaze - - - - 47.35
Case 1 SglLoE (e2=.2) Clr
6mm
60.56 62.9 61.16 78.59 -
Case 2 DblLoE Spec Sel Tint
6/13mm Argon
44.98 46.42 52.85 53.32 -
Case 3 DblLoE Spec SelClr.
6/13mm Argon
48.26 49.94 51.02 60.11 -
Case 4 Dbl. LoE Spec. Slec.
Clr 3/13/6mm Argon
48.49 50.13 51.33 60.26 -
Case 5 Dbl. Sage glass
Climaplus Green No
Tint
42.62 43.87 51.71 50.56 -
Case 6 Dbl. SGG XT 60-s28
6/16/4
42.12 43.27 46.75 50.32 -
Case 7 Trp. LoE Film (66) Br.
6/13 Air
46.03 47.56 54.96 53.4 -
Case 8 Trp. Sage Glass
Climatop Green No
Tint
40.82 42.01 49.02 47.44 -
Figure 2 Graphical presentation of all summer consumption in kWh/m2
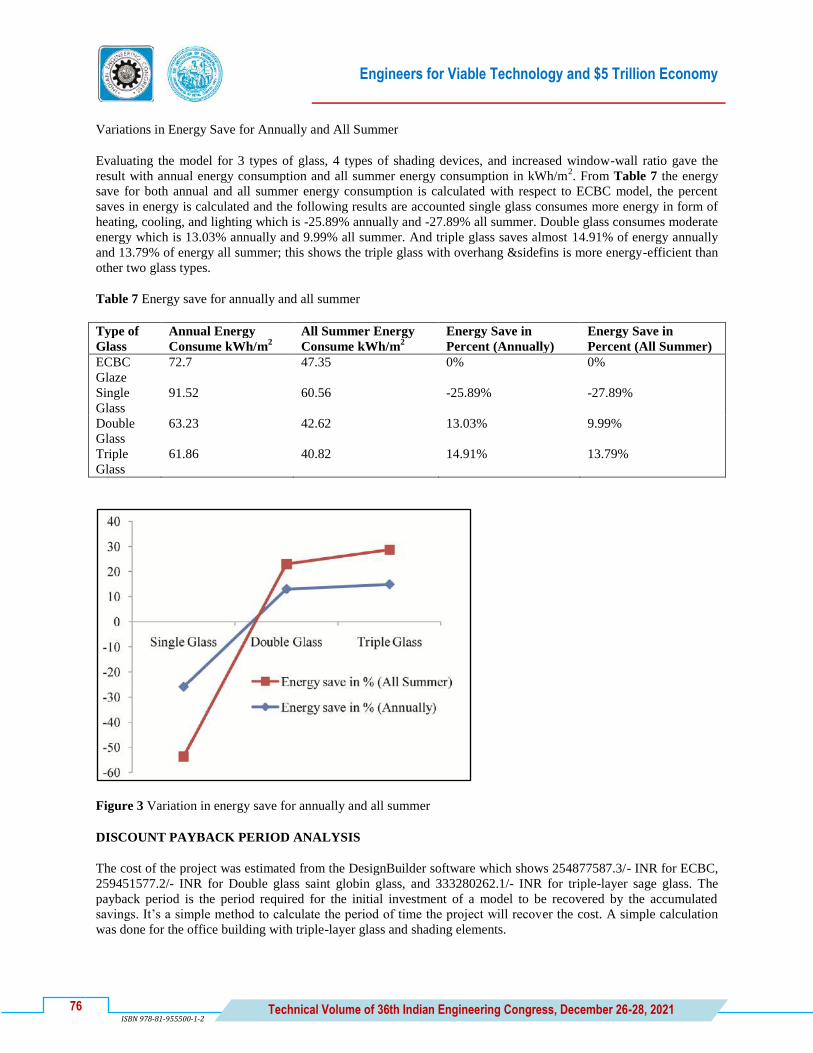
Engineers for Viable Technology and $5 Trillion Economy
76 Technical Volume of 36th Indian Engineering Congress, December 26-28, 2021
ISBN 978-81-955500-1-2
Variations in Energy Save for Annually and All Summer
Evaluating the model for 3 types of glass, 4 types of shading devices, and increased window-wall ratio gave the
result with annual energy consumption and all summer energy consumption in kWh/m2. From Table 7 the energy
save for both annual and all summer energy consumption is calculated with respect to ECBC model, the percent
saves in energy is calculated and the following results are accounted single glass consumes more energy in form of
heating, cooling, and lighting which is -25.89% annually and -27.89% all summer. Double glass consumes moderate
energy which is 13.03% annually and 9.99% all summer. And triple glass saves almost 14.91% of energy annually
and 13.79% of energy all summer; this shows the triple glass with overhang &sidefins is more energy-efficient than
other two glass types.
Table 7 Energy save for annually and all summer
Type of
Glass
Annual Energy
Consume kWh/m2
All Summer Energy
Consume kWh/m2
Energy Save in
Percent (Annually)
Energy Save in
Percent (All Summer)
ECBC
Glaze
72.7 47.35 0% 0%
Single
Glass
91.52 60.56 -25.89% -27.89%
Double
Glass
63.23 42.62 13.03% 9.99%
Triple
Glass
61.86 40.82 14.91% 13.79%
Figure 3 Variation in energy save for annually and all summer
DISCOUNT PAYBACK PERIOD ANALYSIS
The cost of the project was estimated from the DesignBuilder software which shows 254877587.3/- INR for ECBC,
259451577.2/- INR for Double glass saint globin glass, and 333280262.1/- INR for triple-layer sage glass. The
payback period is the period required for the initial investment of a model to be recovered by the accumulated
savings. It‟s a simple method to calculate the period of time the project will recover the cost. A simple calculation
was done for the office building with triple-layer glass and shading elements.
Engineers for Viable Technology and $5 Trillion Economy
77 Technical Volume of 36th Indian Engineering Congress, December 26-28, 2021
ISBN 978-81-955500-1-2
The discount payback period was calculated for triple glass as this glass shows more energy-efficient performance
of the building. The discount rates were assumed to be 10% and 6% [11]. It was taking 4.86 years for a 10%
discount rate and 4.32% for a 6% discount rate. This simple calculation will help to select the project at its initial
stage.
CONCLUSIONS
In the present paper, the ECBC model is as reference model 3 parameters are changed to evaluate the energy
performance of the building, single, double and triple types of glass with different thermal properties and different
gap gas, 4 types of shading elements are used which are of fixed type and increased window-wall ratio of 60% is
used.
From the results conclusion are made:
Case 0- ECBC model is provided as a benchmark for minimizing energy standard and it consumes 72.7
kWh/m2 of energy for annual total energy and 47.35 kWh/m
2 of energy for all summer consumption by an
office building.
Case 1- Single glass shows poor energy performance even after coupling with shading elements as its least
energy consumption is 91.52 kWh/m2 for annual total and 60.56 kWh/m
2 for all summer.
Case 2, 3, 4, 5, and 6- Shows the performance of double glass type with all 4 different shading elements out of
which Saint Globin Glass shows good energy performance with overhang &sidefins 1.5 shading element i.e.
63.23 kWh/m2 for annual total energy consumption and 42.12 kWh/m
2 for all summer energy consumption.
Case 7 and 8- Triple glass-sage shows best energy performance than the rest of the glass with overhang
&sidefins shading element and 60% WWR.
Triple glass when coupled with overhang &sidefins, and 60% WWR, it performs better than other glass as it
saves 14.91% of energy annually. The single clear glass performs the worst with -25.89% of energy annually;
negative sign represents the overuse of energy concerning the ECBC model. The double glass shows moderate
performs as compare to all of 13.03% save in energy annually.
By performing simple calculation as discount payback period analysis, this helps as a guideline for selecting
the project at the initial stage it is not accurate, more variations can be performed but this is a simple
calculation for roughly analyzing the project budget. So the calculation for 10% discount rate 4.86 years is
observed and 6% discount rate 4.32 years is observed.
ACKNOWLEDGMENT
Authors would like to thanks all officials of D.Y. Patil College of Engineering for supporting and encouraging.
REFERENCES
1. Jian Yao, An investigation into the impact of movable solar shades on energy, indoor thermal and visual
comfort improvements. Building and Environment 71, pp 24-32 (2013)
2. Anh-Tuan Nguyen, A review on simulation-based optimization methods applied to building performance
analysis. Applied Energy 113, pp 1043-1058 (2014)
3. Alex Nutkiewicz, Rishee K. Jain, Ronita Bardhan, Energy modeling of urban informal settlement
redevelopment: Exploring design parameters for optimal thermal comfort in Dharavi, Mumbai, India. Applied
Energy 231, pp 433-445 (2018)

Engineers for Viable Technology and $5 Trillion Economy
78 Technical Volume of 36th Indian Engineering Congress, December 26-28, 2021
ISBN 978-81-955500-1-2
4. Mona Doctor-Pingel, Vishnu Vardhan, Sanyogita Manu, Gail Brager, Rajan Rawa, A study of indoor thermal
parameters for naturally ventilated occupied buildings in the warm-humid climate of southern India. Building
and Environment 151, pp 1-14 (2019)
5. Kiran Kumar Gorantla, Effect of Different Double Glazing Window Combinations on Heat gain in Buildings
for Passive Cooling in Various Climatic Regions of India. Materials Today: Proceedings 4, pp 1910–1916
(2017)
6. Ayca Kirimtat, Basak Kundak, Review of simulation modeling for shading devices in buildings. Renewable
and Sustainable Energy Reviews 54, pp 23-49 (2016)
7. Abdelsalam Aldawoud, Conventional fixed shading devices in comparison to an electrochromic glazing system
in a hot, dry climate. Energy and Buildings 59, pp 104-110 (2013)
8. Guohui Feng: Study on the Influence of Window-wall Ratio on the Energy Consumption of Nearly Zero
Energy Buildings. Procedia Engineering 205, pp 730–737 (2017)
9. W. J. He: The role of window glazing on daylighting and energy saving in buildings. Renewable and
Sustainable Energy Reviews 42, pp 323-343 (2015)
10. Suresh B., Passive building energy savings: A review of building envelope components. Renewable and
Sustainable Energy Reviews 15, pp 3617-3631 (2011)
11. Mingzhe Liu, Control strategies for intelligent glazed facade and their influence on energy and comfort
performance of office buildings in Denmark. Applied Energy 145, pp 43-51 (2015)
12. ECBC (Energy Conversation Building Code) 2017, https://www.beeindia.gov.in/hi/download/3087/
BEE_ECBC%202017.pdf
13. I. L. Wong, P. C. Eames, R. S. Perera, A review of transparent insulation systems and the evaluation of
payback period for building applications. Solar Energy 81, pp 1058–1071 (2007)
14. Ali Heydari, Seyed Esmaeil Sadati, Mohammad Reza Gharib, Effects of Different Window Configurations on
Energy Consumption in Building: Optimization and Economic Analysis. JOBE 102099 (2020)
15. Mayank Bhatnagara, Jyotirmay Mathur, Vishal Garg, Development of reference building models for India.
Journal of Building Engineering 21, pp 267-277 (2019)
16. Athanassios Tzempelikos, Andreas K. Athienitis, The impact of shading design and control on building
cooling and lighting demand. Solar Energy 81, pp 369–382 (2007)
17. Shakila Pathirana, Asanka Rodrigo, Rangika Halwatura, Effect of building shape, orientation, window to wall
ratios and zones on energy effciency and thermal comfort of naturally ventilated houses in tropical climate.
International Journal of Energy and Environmental Engineering 10, pp 107–120 (2019)
18. Nurdil Eskin, Hamdi Turkmen, Analysis of annual heating and cooling energy requirements for office
buildings in different climates in Turkey. Energy and Buildings 40, pp 763–773 (2008)
19. Guohui Feng, Study on the Influence of Window-wall Ratio on the Energy Consumption of Nearly Zero
Energy Buildings. Procedia Engineering 205, pp 730–737 (2017)
20. Abdelsalam Aldawoud: Conventional fixed shading devices in comparison to an electrochromic glazing system
in hot, dry climate. Energy and Buildings 59, pp 104-110 (2013)

Engineers for Viable Technology and $5 Trillion Economy
79 Technical Volume of 36th Indian Engineering Congress, December 26-28, 2021
ISBN 978-81-955500-1-2
CV_020_04_209
Applications of Geo-textiles for the Stabilization of Soil: A
Review
Saurabh Kumar*,Utkarsh Pandey and Sneha Gupta
Madan Mohan Malaviya University of Technology, Gorakhpur, Uttar Pradesh
*e-mail: [email protected]
Abstract: Soil serves as a support for the construction and effectively distributes load. If the soil is unable to bear
load effectively, the structure fails in a variety of ways, including settlement, fractures, and other types of structural
collapse. If soil is not properly stable, it sometimes creates a lot of problems for construction engineers, mostly due
to the lower bearing capacity of the soil and its high compressibility. Therefore, to increase the load bearing
capacity and engineering properties of subsoil (known as Soil Stabilization), a wide range of methods and
reinforcing materials are available, such as: geo-textile sheets, geo-grid, metal strips, bar mats, etc. The strength
and stability of soil mass can be improved and increased with the help of the stabilization process, and the
settlement of structures built on it is reduced. Geo-textile (Geo-synthetic) is a reinforcing material made of thin
permeable sheets of synthetic fibres that are widely used in modern engineering practice to strengthen foundations,
slopes, crushed stone columns, road pavements, etc. From the various studies done by many researchers in recent
years, it is determined that the geo-textile used in all the projects or research work has a significant impact on the
properties of the soil. In this paper, before and after putting in the geo-textile, dry density, shear strength,
permeability, and CBR values have been compared, and an effort has been made to collect information about soil
stabilization using geo-textiles, which includes a brief summary of their procedure and their applications and
identifies the different areas that need further attention or improvement.
Keywords: Soil Stabilization; Geo-textile; Reinforcement; Sub-grade; Geotechnical Tests
INTRODUCTION
In olden times, a substantial role in the development of structural engineering was made possible only by parallel
developments in building material technology. For the construction of large and elaborate structures, man initially
used wood, then limestone, and then cement concrete, reinforced cement concrete, and more recently, pre-stressed
reinforced concrete. Whereas, soil and rock are commonly used as geotechnical materials. Whereas, soil and rock
are commonly used as geotechnical materials. It is difficult to expect a similar development in geotechnical
construction. In geotechnical engineering, a variety of materials are taken to improve the quality of the soil, one of
which is geosynthetics (Geotextiles). The use of geotextiles has been described through this research paper. Use of
geotextiles increased the tensile resistance capacity of soils. Due to this, the load-carrying capacity of the soil and
stability of the soil increased [1].
The soil which has contained silt and clay particles exhibits significant distress signs, including shrinkage and
strength loss during the rainy seasons throughout the summer. Because of its expansive behavior, black cotton soil
loses its strength during the rainy season. The following are some of the issues with soil expansion (N.B.O. 1962).
When soil is saturated, expansive soils exhibit high plasticity and are compressible. These soils have a high dry
strength but become mushy after being saturated. Filling pores and cracks with water accelerates the softening
process, reducing shear strength and resulting in limited bearing capacity

Engineers for Viable Technology and $5 Trillion Economy
80 Technical Volume of 36th Indian Engineering Congress, December 26-28, 2021 ISBN 978-81-955500-1-2
Differential heaving of structures created in the dry season as an outcome of soil swelling throughout the subsequent
wet season. Swelling restrictions create swelling pressure, which makes the structures unstable. As a result of the
formation of fractures, structures supported on soil lift up. During the dry season, structures constructed at the end of
the rainy seasons, when high natural water content, display shrinkage cracks and settlements. Through skin friction,
shrinkage causes downward pressure on the foundation, increasing the foundation pressure [2].
Because of these factors, expansive soils must be treated before being used as an engineering material. Soil
modification and soil stabilization are the two processes that these treatments are grouped into. The technique of
blending and combining things with soils to enhance the specific features of soils is termed "soil stabilization".
Blending soils with commercially existing admixtures which affect the texture, stage, or plasticity, or function as the
binder of soil cementation, may be part of the process (IRC: SP: 89-2010). Soil modification is a stabilizing
procedure by which a change in one or more soil properties occurs without a considerable gain in soil strength or
durability.
Various soil stabilization and modification procedures can modify soil qualities such as strength of the soil,
compressibility features, its workability, swelling potential, and tendencies to volume change.
Thermal, mechanical, chemical, and electrical methods are used to achieve stabilization. Because thermal and
electrical energy are rarely used, there is less information available on them. The use of mechanical energy to
densify soil is known as mechanical stabilization or compaction. Densification causes air to be evacuated from soil
cavities without any significant changes in the moisture content. This technique can be used to stabilize soils with
low cohesion where the compaction energy can promote particle interlocking and the rearrangement. However, if
soil is exposed to considerable moistness fluctuations, then procedures are ineffective. Efficiency of compaction
might be reduced if the fine content of the soil (fraction less than 75 micron) increases. Because of interparticle
connection and rearrangement during compaction, this is the case. For the fine-grained soil to change the physio-
chemical properties, chemical stabilization, rather than densification, is a more effective way. Chemical stabilization
of the non-cohesive and coarse-grain soil by more than 50% by weight at a grain size greater than 75 microns can be
profitable if a significant stabilization response is accomplished in the soil (Dallas and Syam 2009)[2].
Therefore, Geotextiles are expected to be cost-effective, long-lasting, and simple to use. Geotextiles are becoming
increasingly important in geotechnical engineering. In this review paper a brief summary of the research work done
on soil stabilization using geo-textile.
Geo-synthetic materials are made up of synthetic fiber and polymers used as geotextiles such as polypropylene,
polyethylene terephthalate, polyethylene, polyamide etc. Synthetic fibres are utilised in contact with soil, rock, or
other geotechnical materials to improve soil engineering properties. Geo-textile, geo-grid, geo-cell, geo-net, geo-
membrane, erosion control mat, geo-synthetic clay liner, and geo-composite are some of the most common geo-
synthetics [1]. The most extensively utilized geo-synthetics are geo-textiles. The nylon bags filled with sand
employed in the Dutch Delta Works in 1956 can be regarded as the first known application of geo-textiles.
For the past 60 years, geotextiles have been frequently utilized in geotechnical engineering. Geotextiles can help
with separation, filtration, drainage, reinforcement and stabilization, barrier, and erosion protection in geotechnical
engineering [3].
Every year, more than 1.4 billion square metres of geotextiles are utilized, and this tendency is expected to continue.
Approximately 98 percent of geotextiles are made of non-biodegradable polymers from the polyester, polyolefin, or
polyamide families. Long-term use of geo-textiles may result in the breakup of synthetic polymer, results in the form
of accumulation of microplastics in the surrounding environment, due to a variety of environmental conditions such
as friction, wind, moisture, and UV radiation.
Furthermore, when geotextiles are used in geotechnical engineering, they raises the performance requirements of
geotextiles [3].

Engineers for Viable Technology and $5 Trillion Economy
81 Technical Volume of 36th Indian Engineering Congress, December 26-28, 2021
ISBN 978-81-955500-1-2
As a result, geo-textiles are thought to be cost-effective, long-lasting, and simple to utilize. Geotextiles are becoming
increasingly important in the field of geotechnical engineering. The main objective of paper is to deliver a quick
overview of the research on soil stabilization using geotextiles which have been done by many researchers.
MATERIAL AND METHODOLOGY
Materials and methodology for „Application of Geotextiles for the stabilization of soil‟ used by different researchers
are given below-
Talal o. AI-Refeai (1999) worked to understand the resilient behavior of a weak subgrade soil with the geotextile
reinforcement which is laid on the soil subgrade. The effect of deviator stress and confining stress on the resilient
behavior of a base subgrade arrangement provided with a nonwoven geotextile reinforcement layer has received
special attention. They studied the influence of nonwoven geo-textile on the resilient and plastic behavior of a sub-
grade geo-textile base system by conducting a series of cyclic triaxial tests on two different soils (coarse sand as a
base material and clayey silty sand as a sub-grade material) [5].
E.A. Subaida et al. (2010) conducted an experimental investigation to determine the benefits of using fabricated
coir geotextiles in place of reinforcing material in the pavement section. A robust circular plate in acres was used to
put on monotonic and consistent loads on both the reinforced laboratory road sections and unreinforced road
sections. The impacts of estimated geotextile position and stiffness were examined with the help of using dual base
courses and 2 types of woven coir geotextiles[12].
Abhijith R.P. (2015) The natural coir fibers' importance on approved roads is presented through an experimental
study. The coir fibres provide a reinforcing action on the subgrade soils. Coir fibre is a natural material derived from
coconut husk. Coir fibre is commonly found in many places in India. Use of coir fibre improves the strength of sub
grade soil. Coir fibres of varying lengths from 0.5 to 3 cm and 2 to 8 per cent of the total soil weight are mixed and a
correlation is made by the CBR test. As a result, the introduction of soil at two-thirds of the depth appears to be
more effective. Reinforcement action is necessary during the initial phase; thereafter, reinforcement action is
achieved by consolidation of subgrade soil [13].
Sugandini and Madhuri (2017) worked on soil geo-synthetics (including geo-textile) interaction properties for four
types of soils (Red laterite, Marine clay, Black Cotton Soil, and Sandy soils) were used with the geo-composite
reinforcing materials and CBR tests were conducted to find out the density of the soil samples and the mechanical
strength of the sub-grade soil. The main objective of the work is to study the effect of the strength of the soil after
the application of geo-synthetics [8].
D.A. Ogundare et al. (2018) explored the use of non-woven geotextiles in sub-grade material as a road building
reinforcement. They assessed two soil samples for sub-grade suitability based on their geotechnical qualities.
According to the AASHTO, virgin soil samples A and B, which are classified as A – 7 – 5 and A – 7 – 6,
respectively, are weak sub-grade materials.
Compaction experiments were conducted by using a hard metal mould with a height of 175 mm and an interior
diameter of 150 mm for this experiment. Soil samples were compacted into three layers, each with 25 blows of a 2.5
kg rammer falling from a height of 310 mm.
The CBR tests were carried out in a single layer of soil (compressed soil) in unsoaked conditions without
reinforcement and placed at a depth h/4 from the top surface and base surfaces of the soil sample in a mould with
reinforced non-woven geotextiles. Load values corresponding to the results were noted at 0.25, 0.5, 1.5, 2.0, 2.5, 3.0,
4.0, 5.0, 6.0, 7.5 and 8.00 (all values in millimetre) [4].
Vivek et al. (2018) stabilized the soil by using coir geo-textile and described its use, which provides knowledge
about the enhancement of soil properties with the results of CBR and shear tests carried out before and after the
treatment [7].

Engineers for Viable Technology and $5 Trillion Economy
82 Technical Volume of 36th Indian Engineering Congress, December 26-28, 2021
ISBN 978-81-955500-1-2
Prasad and Satyanarayana (2018) In his study examined, to improve the soft marine clay, silica-manganese slag
mixed with sand was used as stone column material, and geo-textile material was employed to support the stone
columns as reinforcement. This geo-textile was cut into circular discs and placed horizontally within the stone
column at a 50 mm interval (equivalent to the stone column's diameter "D").
Marine clay, Silica-Manganese slag, Sand and Geo-textile were used in his study. For the preparation of the geo-
textile reinforced stone column, after the clay bed was prepared to a depth of 100 mm at the bottom, a PVC pipe of
5cm in outer diameter and 1mm thick was located at the centre of the tank, and the clay bed was prepared to the
outside of the pipe in 50 mm layers up to the remaining height of 200 mm, which is prepared similar to the
procedure used to prepare the plain stone column. The reinforced stone column was constructed for different
reinforcement lengths and was prepared in two stages, i.e., the unreinforced and reinforced portions. To construct
the fully reinforced (D) stone columns, the geo-textile discs were placed at specified intervals of "D" within the
stone column trial and the compaction was done similar to the unreinforced column. To construct the partially
reinforced stone column (D/2D/3D), the bottom unreinforced portion was constructed similar to the unreinforced
portion and the upper reinforced portion.
After completion of the stone column, it was kept for 24 hours for moisture equalization and to improve the bonding
between the aggregates and the clay bed. After the load tests were conducted for the clay bed, unreinforced and
reinforced stone columns, load settlement graphs were drawn and the ultimate load and corresponding settlements
were determined by drawing double tangent method [9].
G.G. Janakiraman et al. (2019) focused on better understanding of natural and artificial geo-textiles for
strengthening of subgrade soil and evaluated the effect of reinforcement of geo-textiles on subgrade soil. For this,
they took five dissimilar geo-textiles (composite geo-textile, Geo-bag geo-textile, Hot Bound geo-textile, Coir geo-
textile, non-Woven geo-textile) and the load-penetration performance of granular soil reinforced with geotextiles
was examined in the laboratory by the California Bearing Ratio test. Granular soil specimens of various gradings are
selected and tested for lack of reinforcement.
A field CBR test was conducted on soil filled with a ground grid in test pits. Test pits of a size of 0.5 m × 0.5 m ×
0.5 m were excavated and filled with moisture-retaining soils having moisture content and density. In order to
ensure the density and moisture after filling, the core cutter test is carried out on the loaded soil.
The field density and moisture content have been measured. The soil filling with and without geogrid was subjected
to a CBR test. For all testing on geo-grid reinforced soil beds, a single layer of geo-grid is laid at the mid-height of
the soil in the pit. The experiment is repeated with different geo-grids and soil fill levels. The load is applied via the
response loading technique, which is aided by the truck [11].
Tanvi Singh et. al. (2020) examined the strength enhancement with the help of experimental investigation. The
main objective of their investigation was to decrease the pavement thickness and to rise the strength of pavement
structures by using geo-textile as reinforcement material and in their experiments they also included the study on the
effect of type of geo-textile used for reinforcement, effect of position of reinforcement layer, effect of number of
layer of reinforcement, prediction of CBR values using ANN and M5P, Prediction for woven geo-textile, prediction
for non-woven geo-textile [6].
RESULTS AND DISCUSSIONS
Based on the above materials and methodology used by researchers, they came to results as given below:
Talal o. AI-Refeai (1999) according to the results of the experimental investigations, the resilient modulus of the
sub-grade geo-textile base system increases as the confining stress grows and drops as the deviator stress increases.
In contrast to the very little influence of geo-textile inclusion on k3, the influence of geo-textile on k2 is significant,
implying that the relative sensitivity of the sub-grade geo-textile-base system to changes in deviator stress is lower
than that of the sub-grade base system.

Engineers for Viable Technology and $5 Trillion Economy
83 Technical Volume of 36th Indian Engineering Congress, December 26-28, 2021
ISBN 978-81-955500-1-2
Behavior of Geo-textile Reinforced Sand on WeakSub-grade231. Because of confining and deviator stresses, the
AASHTO models (equations 1 and 2) may be unable to predict the change in resilient modulus of sub-grade
geotextile-base systems. The addition of nonwoven geotextile to the sub-grade geotextile base system resulted in
just a minor increase in the system's resilience modulus of around 14%. The presence of geotextile improved the
plastic behaviour of the sub-grade geotextile-base system and reduced permanent deformation by almost 50%.
The findings indicate that the use of the geotextile had no significant effect on the resilient modulus (increase of
only 14 percent). Permanent deformation, on the other hand, was significantly reduced (by 50%). [5].
E.A. Subaida et al (2010) By use of coir geotextiles improved the bearing capacity of thin sections, according to E.
A. Subaida et al. The load-carrying capability of geotextile applied at the interface of the subgrade and base course
was significantly increased during major deformations. When coir geo-textile placed within the base path at all
stages of deformations, there was a significant increase in bearing capacity. The coir geotextile was developed to be
installed one-third of the plate diameter under the surface in the base course. [12]
Abhijith R.P (2015) The results of Abhijith R.P (2015) concluded that introducing Geo-textiles at a depth of two-
thirds from the bottom was more successful. The initial reinforcing activity is required, and later reinforcing action
is produced through the consolidation of subgrade soil. [13]
D.A. Ogundare et. al. (2018) It is observed that when the two soil samples were reinforced with non-woven geo-
textile, there was an increase in their CBR values in unsoaked condition (15% and 21%) than when equated with
their CBR values (4% and 7%) without reinforcement which shows that the soil sample reinforced with nonwoven
geo-textile are suitable for sub-grade as established under the specification of the Federal Ministry of Works (1997)
criteria for sub-grade soils.
Table 1 Summary of preliminary test results
Classification (BIS) G M G C G W
Liquid-limit (%) 35.50 43.50 23.00
Plastic-limit (%) 20.20 29.40 -
Plasticity-index (%) 15.30 14.10 -
Specific-gravity (g) 2.70 2.63 1.98
Table 2 CBR values under Soaked Condition
Soil
samples
Without nonwoven
geotextile
C B R value
(%)
With nonwoven
geotextile
C B R value
(%)
2.5mm 5.0mm 2.5mm 5.0mm
Samples A 2.8 3.2 3.2 9.6 9.7 10.0
Samples B 5.2 6.0 6.0 15.8 13.8 16.0
Samples C 1.4 1.5 2.0 2.8 2.6 3.0
According to their experimental data, the application of non-woven geo-textile at various depths, as measured by the
California Bearing Ratio (CBR), generally increases the strength of the sub-grade soil, irrespective of the level at
which the non-woven geo-textile is installed within the thickness of the sub-grade.
Prasad and Satyanarayana (2018) from their study, following conclusions were derived-
Load carrying capacity of the soft clay can be increased by introducing the stone column and also by adding the
sand to the stone column by minimizing the voids between the aggregates. Load carrying capacities are increased to

Engineers for Viable Technology and $5 Trillion Economy
84 Technical Volume of 36th Indian Engineering Congress, December 26-28, 2021
ISBN 978-81-955500-1-2
32% and 43% by improving the soil with the Slag column and Slag Sand column respectively. Stone column
performance can be increased by introducing the lateral geotextile discs within the column.
Load carrying capacity can be increased by increasing the embedment length of reinforcement.
Settlements can be reduced by improving the soil with stone column and also with the reinforcement length.
Settlement of the clay bed was reduced from 10 mm to 4.0 mm by reinforcing the soil with the reinforcement length
of 4D. Bulging of the stone column can be reduced by introducing the reinforcement and also with the reinforcement
length. Bulging of the plain stone column was reduced from 7.5 mm to 5.5 mm by reinforcing with geo-textile to a
length of 4D. The maximum bulging for the unreinforced stone column was found at the middle of the column.
Whereas for the reinforced columns, the maximum bulging found below the end of thereinforcement. The results
indicate that the soft soil can be improved with the stone column and can be further stabilized with the geo-textile
reinforcement [9].
Graph 1 Source- Prasad and Satyanarayana, 2018
BULGING ANALYSIS OF STONE COLUMNS
After the load testing, the slag aggregates were removed, and the hole created in the clay bed was filled with plaster
of Paris paste and allowed to set for one day before the surrounding clay was removed to get the deformed shape.
The bulging behaviour of the columns was investigated after measuring deformations at 2.5cm intervals throughout
the length of the stone columns. The column's depth vs bulging is displayed on a graph.
Graph 2 depicts the bulging curves of unreinforced and reinforced stone columns with different reinforcing depths.
The core of the stone columns that were not reinforced had the largest bulging of 10 mm. The maximum bulging of
the stone column was reduced to 8.1 mm using slag+sand. The addition of reinforcement lowered this even more,
resulting in maximum bulging of 7.0 mm, 6.5 mm, 6.0 mm, and 4.0 mm for reinforcement lengths of D, 2D, 3D, and
4D, respectively.

Engineers for Viable Technology and $5 Trillion Economy
85 Technical Volume of 36th Indian Engineering Congress, December 26-28, 2021
ISBN 978-81-955500-1-2
Graph 2 Source- Prasad and Satyanarayana, 2018
G.G. Janakiraman et. al. (2019) from their study, following conclusions were derived-
Soil that has been reinforced with geo-synthetics (natural or synthetic geotextiles) becomes stronger and stiffer than
soil that has not been reinforced. Placing geotextile material in soil enhances the soil's bearing ability and load
carrying capacity, extending the pavement's service life. Experimental tests revealed a significant increase in
subgrade strength, verifying the theoretical aspects. When geo-synthetics are utilized in pavements, they provide a
variety of purposes such as strengthening, separation, drainage, and filtering. Grain size analysis, Atterberg,
compaction, and the California bearing ratio test were all recognized as geotechnical tests. To determine the strength
of the soil, CBR tests were carried out by inserting geo-grids at varied depths and in a single layer under unsoaked
conditions. As a result of incorporating geo-grids into the soil, the strength of the subgrade has also been
significantly increased. It was discovered that geo-grids located 3/5 of the way from the base had a higher CBR
value than those placed 2/5 and 4/5 of the way from the base. As the number of layers of geo-grids increases,
changes in the behavior of the soil under unsoaked conditions emerge. It has showed a significant effect of
improvement as a subgrade stabilizer. It has a quick preservation time, is corrosion resistant, and extends the road
pavement's service life. The results of these studies show that adding geotextile to reinforced granular soils raises the
bearing ratio. As a result, geotextile should be used as a more current approach of enhancing road construction on
weak subgrade materials.[11].
Tanvi Singh et. al. (2020) were examined the effect of reinforcing woven and non-woven geo- textile at different
depth of reinforcement in single and double layer in terms of CBR value in their research work. Further for
prediction of CBR, ANN and M5P modeling approaches were used. Vital outcomes of their research are listed
below: Strength of sub-grade soil was enhancing upon reinforcement with both woven and non- woven geo- textile.
Rise in strength with reference to parent soil was noticed from 19.79% to 188.23% depending on the position of
reinforcement, type of geo-textile laid and number of layers ofreinforcement.
Sub-grade soil reinforced with woven geo-textile gives better result when reinforced with to nonwoven geo- textile
for all position of reinforcement and for both single and doublelayer. Optimum benefit of reinforcement was marked
only if position of reinforcement of geo- textile layer is at M/3 and M/2 for both woven and non-wovengeo-textile.

Engineers for Viable Technology and $5 Trillion Economy
86 Technical Volume of 36th Indian Engineering Congress, December 26-28, 2021
ISBN 978-81-955500-1-2
Increment ratio of double layer of reinforcement for both woven and non-woven was greater than of respective
single layer. Performance of M5P predicts the CBR value for woven was better thanANN. Performance of ANN to
predict the CBR value for non-woven was betterthanM5P.
S. Ramjiram Thakur et. al. (2021) In the laboratory, they performed California bearing ratio (CBR) tests and came to
the following conclusions- The addition of nonwoven geotextile materials to soils improves CBR and, as a result,
soil strength. In many earthen structures, geotextile-reinforced soils will perform unreinforced soils, increasing load-
carrying capacity.
CONCLUSIONS
Different articles and journals reviewed above tell us about the different properties and uses of geo-textiles when
used in different fields and areas of civil work. It is concluded that the geo-textile used in all the research work or
projects has an important impact on the enhancement of soil properties.
Shear strength, permeability, dry density, and CBR were determined before and after the geotextile was installed.
Shear strength, dry density, and CBR enhanced by the addition of geotextiles, whereas permeability and penetration
(check for settlement) decreased, indicating a significant improvement in engineering behaviour. As a result, geo-
textiles serve a critical role in improving soil qualities by lowering compressibility and boosting strength. Because
the future of geotextiles is very dynamic and will be motivated by different aspects such as cost, performance, and
resource availability, there is a lot of need for more research in this area. Today, there are various competing
philosophies in the field of geotextile use. On the one hand, there is an increasing demand for environmentally
acceptable geotextiles, and on the other hand, there is a continuing need to make use of natural resources. The
following is a list of potential research topics for future work.
The current study could be expanded to include other types of geotextiles and soils. More advanced technology,
precise application procedures, and maintenance can be used in investigations including soft soil reinforcement.
Field tests can be conducted to obtain more useful results. Degradation aspects and their impacts are frequently
addressed in studies.
REFERENCES
1. Ramjiram Thakur, S., Naveen, B.P. &Tegar, J.P.: Improvement in CBR value of soil reinforced with
nonwoven geotextile sheets. International journal of Geo-Engineering 12(8), pp,(2021).
2. Santosh Dhakar, S.K. Jain Index Copernicus Value. Stabilization of Soil A Review. International journal of
science and research(2015)
3. Wu, Hao& Yao, Chongkai & Li, Chenghan & Miao, Miao & Zhong, Yujian & Lu, Yuquan & Liu,
Tong.:Review of Application and Innovation of Geotextiles in Geotechnical Engineering. Materials. National
library of medicine 13. 1774.10.3390/ma13071774 (2020).
4. Ogundare, Damilola & Familusi, Ayokunle & Osunkunle, A.B. & Olusami, Joel: Utilization of Geotextile For
Soil Stabilization. American Journal of Engineering Research (AJER) 7(8), 224-231(2018).
5. Al-Refeai, Talal.: Behavior of Geotextile Reinforced Sandon Weak Subgrade. Journal of King Saud University
- Engineering Sciences 12[2] 219-232 (2000).
6. Tanvi Singh, Yash Goyal,Suresh Kumar.: Predicting The Strength Enhancement of Subgrade Soil Reinforced
eith Geotextile Using Artificial Neural Network and M5P Model Tree, European Journal of Molecular &
Clinical Medicine, 7(8), pp 2728-2737 (2020)
7. Vivek, Harish, Simran Kapoor, Savita Rangra, Nisha Thakur, Vikash, Rajat, Pallavi Bansal, Himani Thkur,
Rohit Chaudhary, Romani Chaudhary. Soil Stabilisation Using By Geotextiles. International Journal of Core
Engineering & Management Volume 4, Issue 10, ISSN No: 2348-9510 (2018).

Engineers for Viable Technology and $5 Trillion Economy
87 Technical Volume of 36th Indian Engineering Congress, December 26-28, 2021
ISBN 978-81-955500-1-2
8. S.Sugandini, M.Madhuri.:Stabilization of Soils using Geosynthetics. International Journal of Advance
Research and Innovative Ideas In Education Volume 3 Issue 6 pp1118- 1132(2017).
9. Suvvari, Sivagowriprasad and Satyanarayana, Model Tests on Soft Soil Stabilized with Geotextile
Reinforcement. IOSR Journal of Engineering, 8,12-16(2018).
10. Ansari, Abdullah and Daigavane, Prashant and Pathan, Shahrukhakhan and Shaikh, Naseer Shaikh, Firoj. Use
of Geotextiles in Roads Over Weak Subgrades.10.1007/978-981-33-6466-0_34.(2021).
11. Janakiraman, G & Paramaguru, Pasupathi &Thangaraj, Pratheep, Stabilization of Subgrade Using
Geosynthetics. Journal of Advanced Research in Dynamical and Control Systems (2019).
12. E.A. Subaida, S. Chandhrakaran, N. Shankar, Laboratory performance of unpaved roads reinforced with woven
coir geotextiles. International Journal of Geotechnical Engineering 27[3], 204-210 (2010).
13. Abhijith R.P, Effect of Natural Coir fibers on CBR strength of soil subgrade. International Journal of Scientific
and research publication volume 5 pp 94-107(2015).


Engineers for Viable Technology and $5 Trillion Economy
89 Technical Volume of 36th Indian Engineering Congress, December 26-28, 2021 ISBN 978-81-955500-1-2
CV_021_05_204
Consequence of Removal of Arbitration Clause from
Engineering Contracts A Discussion
Pronoy RoyChowdhury
Public Health Engineering Department, Government of West Bengal
email: [email protected]
Abstract: The arbitration clause which was an integral part of the Engineering Contract in India is presently a
matter of considerable debate. This is because of the obvious reason that there are many instances where abuse of
the arbitration clause in the Engineering contract has been made. There is an well-established legal system in India
and any plaintiff who is a party to Engineering contract can bring a suit to a court of law if he feels that injustice
has been performed and contractual clauses has not been adhered to. The legal system is very formal and
substantial time is consumed before the issue is settled through the intervention of the court of law. As time being the
essence of contract, especially engineering contract where delayed decision for contractual dispute resolution may
actually affect infrastructural development and overall well being of the citizen of the country, alternative dispute
resolution system through an arbitral mechanism is preferable practise. However some long drawn and costly
arbitration proceedings for dispute resolution of Engineering contract has become one of the major reason for
discouraging arbitration in engineering contracts. To facilitate arbitration, an arbitration agreement should
executed between the contracting parties. The agreement is generally in the form of an arbitration clause in the
Engineering contract. But various Government and Semi Government Engineering departments who invite tenders
for large Engineering projects has either done with the arbitration clause by introducing departmental dispute
resolution committee or have issued conditional arbitration clause fixing financial ceiling of tender amount for
taking arbitration proceedings. In this article it is proposed to discuss the consequences which shall fall due to
discouraging or removal of arbitration clause from engineering contracts.
Keywords: Engineering Contract; Contract Act; Engineering Arbitration; Alternative Dispute Resolution
INTRODUCTION
The first major mile stone in the professional Engineering field of India was the formation of the largest professional
body of Engineers called the Institution of Engineers (India) (IEI) way back in 1921, which was subsequently
incorporated by a Royal charter issued by the British crown in 1935, granted by King George –V. The institution
was formed with the intention “to promote and advance the science, practice and business of Engineering in all its
branches in India”. As per provisions of clause no. 2(i) of the Royal Charter reads “to arrange and promote the
adoption of equitable forms of contracts and other documents used in the Engineering and settlement of disputes by
arbitration and to act as or nominate arbitrators and umpires on such terms and in such cases as may seem
expedient”. The Royal charter awarded to the IEI the only Engineering institution of the Indian Engineers even
before independence of India clearly reflected the intention of the Indian engineering community to resolve matters
of disputes arising in Engineering Contract through process of arbitration rather than going to the Civil court for
disposal of the issue. It is beyond doubt that the rationale for adopting arbitration process for resolving disputes
relating to Engineering contracts provides a cheap and quick final settlement of the dispute of civil nature without
direct intervention of the court. Building and Engineering contracts usually involve various technical points which
can be speedily resolved by appointing competent and experienced arbitrators who have Engineering background
and have retired from higher capacity such as that of Superintending Engineer or Chief Engineer of various works
department of Government. Arbitration proceedings also have the added advantage of privacy and a less formal
atmosphere then a Court of Law. The efficacy of arbitration provision over the general legal procedure may be

Engineers for Viable Technology and $5 Trillion Economy
90 Technical Volume of 36th Indian Engineering Congress, December 26-28, 2021 ISBN 978-81-955500-1-2
categorised into (i) less time consuming (ii) less costly than proceeding through law courts (iii) more convenient
method of disposal of disputes in Engineering Contracts. Time being the essence of Contract, if the contract is
delayed due to dispute between client and the contractor or the client and the consultant, then the progress of the
Engineering project is adversely affected. Arbitration here acts as an effective vehicle for delivery of speedy,
effective and less formal form of dispute resolution mechanism. But it is often reported that the effective instrument
of alternative dispute resolution, is not effectively applied and arbitration proceedings takes long time to conclude
sometimes even for years together making it costly and frustrating the very objective for adopting arbitration for
dispute resolution. It is also observed that certain arbitration minded contractors has the sole purpose to misuse the
provisions of arbitration agreement in the contract document to extract more financial benefit from the client (often
Government client) without actually executing the desired performance embodied within the engineering contract in
terms of work specification. Such incidents have raised much questions about the actual benefits obtained out of
arbitration. But inspite of some stray incidents of misuse of arbitration provision the overall benefit of arbitration in
dispute resolution in engineering contract is manifold and cannot be undermined in any way.
SUITABILITY OF ARBITRATION FOR ENGINEERING CONTRACTS
(i) The procedure of a Civil suit in a Court of law is very formal (guided by provisions of Civil Procedure
Code1908 with amendment 2002). Every fact will have to be pleaded in the plaint or the written statement.
This makes the written statement very voluminous. However there are certain obvious facts in Engineering
which need not be specifically stated. For example reinforced concrete work cannot be cast without shuttering
or reinforcement. Again excavation below the ground cannot be done without dewatering arrangement. But
even these obvious facts are required to be clearly stated in the statement of facts. This would require a proper
and effective co-ordination between the Engineer and the advocate while preparing the legal document. Any
omission of terminology in the written statement shall provide benefit to the unscrupulous and litigious
document. Thus the case may be lost merely due to weakness of technical representation in written statement.
However if the arbitrator is from Engineering background obvious technical facts may not be required to be
stated explicitly as the individual is well acquainted with the technicalities due to wide experience in the
concerned field.
(ii) During arbitration the time and place of sitting is habitually settled through mutual consent. The civil court will
not permit such freedom. Thus if a Superintending Engineer failed to attend the court for oral evidence because
the Chief Engineer had called for an urgent meeting the court may take “adverse presumption”. The
honourable Court may interpret that had the Superintending Engineer appeared before the Court the evidence
may not have gone in favour of the Government or the Government official is not co-operating with the Court
in the matter of the legal proceedings. Thus the court may issue a punishment order against the Government
official. But such problems could be avoided in case of an arbitration.
(iii) If there is provision for arbitration in an engineering contract it shall be possible to argue about various issues
before an experienced Engineer arbitrator in a relatively informal ambience.
(iv) In many of the Engineering contracts related matters if the disputes are directly brought to the honourable
Court sometimes there are possibilities that miscarriage of justice may happen due to want of proper
interpretation of technical terminologies. In such case it is the honourable Justice may invite the opinion of a
technical expert. Thus the judgement is much influenced by the conclusion drawn by the technical expert.
Engineering is a practical subject, the interpretation given by a technical expert would actually be limited to the
expertise of the individual in the particular field of Engineering. It is often difficult to obtain an expert with
exact technical knowhow. Such as it is well known that in deep excavation it is required to provide earth
retaining structure to prevent the caving in of the deep excavation. Earth retaining structure may be of various
forms, such as sheet pile, brick retaining wall, Cantilever retaining wall, Reinforced Concrete diaphragm wall
etc. Now the type of the retaining wall to be provided at the site depends on the design consideration and
nature of the site. An expert may be experienced with deep excavation, but the technology used for execution
of sheet pile work is quite different from that required for the work of diaphragm wall. Although the basic
function of both this type of earth retaining structure is the same but the utility of the particular type of
construction is site specific. Hence the expert testimony of an individual having experience with sheet pile wall

Engineers for Viable Technology and $5 Trillion Economy
91 Technical Volume of 36th Indian Engineering Congress, December 26-28, 2021 ISBN 978-81-955500-1-2
construction may not be at all useful it the work actually requires diaphragm wall construction. However if the
arbitrator is a civil engineer himself with wide experience and professional knowledge then it would not be
difficult for him to enquire into the exact technicalities of the Engineering work to be executed. The stated
example highlights the efficiency and beauty of the arbitration process for efficient dispute resolution in
engineering contracts.
IMPLICATION OF REMOVAL OF ARBITRATION CLAUSE
Any valid Engineering contract in India should be defined as per provisions of the Indian Contract Act 1872. As per
section 28 of the Indian Contract act any contract agreement to be valid should not contain any restrictive clause or
provision which shall prevent any party involved in the agreement from suing the other party if the party feels that
he has been deprived as per provisions of the agreement. Removal of arbitration clause in a way restricts the parties
involved in the contract agreement to avail the instrument of dispute resolution through arbitration. Time being the
essence of any engineering contract long drawn trials at the court in many cases virtually hampers the progress of
the Engineering projects.
MODIFICATION IN ARBITRATION PROVISION IN GOVERNMENT CONTRACTS
Understanding the fact that the arbitration clause in the tender documents of Engineering works, especially in
Government departments has been misused many a times by ligation minded contractors, authorities of many works
department of the Government across the country has decided to cause removal of the clause or have placed
restriction in tenders before taking recourse to arbitration. We may state as an example the standard bid document of
the Kerala PWD[1]for works of value above Rs. 5.0 Crores, which under clause no. 79.1 reads “Arbitration shall not
be a means of settlement of any dispute or claim out of this contract. All disputes and differences arising out of the
contract may be resolved through discussion between the employer and the contractor within the preview of the
contract agreement. If such discussions are not fruitful the disputes shall be settled only by the civil court in whose
jurisdiction the work covered by the contract is situated or in whose jurisdiction the contract was entered into in case
the work extended to the jurisdiction of more than one court”. The above paragraph clearly indicated that the Kerala
PWD has totally done with the arbitration clause in tender documents.
The CPWD in the clause number 25 of the contract agreement provides for settlement of contractual dispute through
arbitration. But clause 25 of CPWD contract agreement[2] provides for conditional arbitration. As per provision the
aggrieved contractor/agency should first approach the Superintending Engineer of the concerned Circle for
redressing the dispute. If the Superintending Engineer fails to give decision within 15 days from receipt of the prayer
concerned the contractor should now approach the Chief Engineer concerned who shall give decision within 30 days
of receipt of the prayer, failing which the contractor may appeal to the dispute redressal committee for redressal of
the dispute. If the dispute redressal committee fails to give decision then the aggrieved party may within a period of
30 days give notice to the Chief Engineer for appointment of arbitrator in the prescribed form. Thus the terms of
contract clearly indicates that the aggrieved contractor should exhaust the entire mechanism of settlement of
claims/disputes prior to invoking arbitration. Hence in other words arbitration is critically observed.
In the similar line the Maharastra PWD[3] vide section 3, clause number 24 of the standard bidding document
requires for referring the contractual dispute to the departmental dispute review expert within 14 days of notification
of the Engineer‟s decision, if such decision appears to be wrongly taken as per provisions of the contract agreement.
The Departmental review expert in this case has been defined as the Superintending Engineer of the Circle whose
decision shall be binding. However if the aggrieved contractor is unhappy with decision given by the Superintending
Engineer, the contractor may appeal to the Chief Engineer within thirty days. If the contractor is not satisfied with
the order passed by the Chief Engineer, he may again appeal within 30 days of receipt of such order to the Secretary
of PWD. If he is convinced prima facie that there is substance in the claim of the contractor and that the claim
rejected by the Superintending Engineer and The Chief Engineer is not frivolous the matter shall be put upto the
standing committee of the Government for suitable decision. For works of value above Rs 5.0 Crores the procedure
for arbitration shall be as per Government rules and procedure drawn up by the law and judiciary department of
Government of Maharastra regarding “Institutional Arbitration Policy”.

Engineers for Viable Technology and $5 Trillion Economy
92 Technical Volume of 36th Indian Engineering Congress, December 26-28, 2021 ISBN 978-81-955500-1-2
In the state of Bihar[4], arbitration for engineering contracts are under the preview of the Bihar Public works
contracts dispute arbitration tribunal Act 2008. The act provides for the constitution of a tribunal to arbitrate into
disputes arising from works contracts to which the state Government or public sector undertaking is a party. The
tribunal was formed in the interest of expeditious dispute resolution for speedy execution of projects. The tribunal
consisted of a Chairman and such number of members who may be appointed by the State Government. The
Chairman should be a judge of the High court or a District Judge with atleast 5 years of experience. The member
should be or have been either a secretary to the Government of Bihar for atleast 3 years or Engineer-in-Chief or
Chief Engineer for atleast 2 years of Superintending Engineer for atleast 3 years. The tenure of Chairman and
members are renewed after every 3 years. The tribunal is vested with the powers of a civil court.
As per provisions of notification no. 558/SPW dated 13/12/2011[5] the PWD West Bengal has omitted the
arbitration clause i.e clause no. 25 from the tender forms of contract. The Government in the said notification
indicated that “Whereas the matter of dispensing with the resolution, through arbitration, of disputes arising out of
the contracts entered into by this department with the contractors for the purpose of carrying out execution of public
works has been under active consideration of the Government for some time past in order to get rid of the
complicacies being encountered in the process;
Now, therefore the Governor after careful consideration of the matter is pleased hereby to say that there shall
henceforth be no provision for arbitration for resolution of disputes that may arise out of the contracts to be entered
into by this department with the contractors for the purpose of carrying out execution of Public Works and hence the
West Bengal Form no. 2911/2911(i)/2911(ii) shall stand amended in the following manner:-
Clause 25 of the Conditions of Contract of the West Bengal Form No. 2911/2911(i)/2911(ii) shall be omitted”. The
tender forms have been subsequently modifiedin PWD WB[6] by formation of dispute redressal committee vide
provisions of Government G.O.No.8182-F(y) dated 26/9/2012 of the Finance Department. The clause number 25
reads “Except where otherwise provided in the contract. All questions and disputes relating to the meaning of
specifications, designs, drawings and instructions, herein before mentioned and as to the quality of workmanship of
materials used on the work or as to any other question, claim, right, matter or thing whatsoever, in any way arising
out of relating to contracts, designs, drawings, specifications, estimates, instructions, orders or these conditions or
otherwise concerning the works, or the executions or failure to execute the same, whether arising during the progress
of the work, or after the completion or abandonment thereof shall be dealt with as mentioned hereinafter: If the
contractor considers any work demanded of him/her to be outside the requirement of the contract, or disputes any
drawing , record or decision given in writing the Engineer-in-charge or any matter in connection with or arising out
of the contract or carrying out of the work to be unacceptable, he/she shall promptly within 15 days request the
chairman of the Departmental dispute redressal committee formed by the Government, in written for written
instruction or decision. Thereupon, the Dispute redressal committee shall give its written instruction or decision
within a period of three months from the date of receipt of the contractor‟s letter. Above provisions will be
applicable irrespective of the value of the works to which the dispute may relate.” The Dispute redressal committee
in the works department shall be constituted with the following officials as members:-
(i) Additional Chief Secretary/ Principal secretary/ Secretary of the Department concerned as Chairman,
(ii) Engineer-in-Chief/Chief Engineer or any officer of the equivalent rank of the Department as member,
(iii) One designated Chief Engineer/Engineer of the Department to be nominated by the Department as Member
Secretary and Convenor,
(iv) One representative of the Finance Department of the Government not below the rank of Joint Secretary or
Financial advisor in Case of works department as member.
This clause has been introduced by replacing the previous version of the clause 25 which runs as, “Except where
otherwise provided in the contract. All questions and disputes relating to the meaning of specifications, designs,
drawings and instructions, herein before mentioned and as to the quality of workmanship of materials used on the
work or as to any other question, claim, right, matter or thing whatsoever, in any way arising out of relating to
contracts, designs, drawings, specifications, estimates, instructions, orders or these conditions or otherwise

Engineers for Viable Technology and $5 Trillion Economy
93 Technical Volume of 36th Indian Engineering Congress, December 26-28, 2021 ISBN 978-81-955500-1-2
concerning the works, or the executions or failure to execute the same, whether arising during the progress of the
work, or after the completion or abandonment thereof shall be referred to the sole arbitration of the Chief Engineer
of the department. Should the Chief Engineer be for any reason unwilling or unable to act as such arbitrator, such
questions and disputes shall be referred to an arbitrator to be appointed by the Chief Engineer. The award of the
arbitrator shall be final conclusive and binding on all the parties to this contract. The award shall be a speaking one,
i.e the arbitrator shall recite facts and reasons arising in support of the award after discussing fully the claims and
conditions of the parties.” The above clause was valid only for works of value above Rs 100 Lakhs.
AMENDMENT TO ARBITRATION AND CONCILIATION ACT 1996
The Arbitration and Conciliation act 1996 which is the principal act has been recently amended recently twice once
in 2015 and again in 2019. The amendment act has brought various significant changes to the 1996 act. The
amendment act seeks to establish and incorporate under section 43A[7] Arbitration Council of India. The council
has been defined as a body corporate having perpetual succession and common seal. The council shall be established
by the Central Government through notification in the official gazette.
As defined under clause 43C(i) (a)[7] the council shall consist of a chairperson who has been a Judge of the
Supreme Court of India, Chief Justice of a High Court or a Judge of the High court or an eminent person having
specialized knowledge in the administration of arbitration. A member who shall be an eminent practitioner of
arbitration and an eminent academician having experience in research and teaching of arbitration and alternative
dispute resolution system. The Chairperson shall be appointed by the Central Government in consultation with the
Chief justice of India. The member shall be nominated by the Central Government. An eminent academician shall be
appointed by the Central Government in consultation with the Chairperson. Beside this there shall be ex-office
members from the Ministry of law and Justice, Ministry of Finance department of Expenditure not below the rank of
joint Secretary, and one part time member from recognised body of commerce and industry on rotational basis to be
chosen by the Central Government. The Chief Executive Officer shall be the ex-officio Member Secretary. The
Chairperson, Member of the council shall hold office for a term of three years only.
The duty of the council as defined under section 43D(1)[7] shall be to promote and encourage arbitration, mediation
and conciliation or other alternative dispute resolution mechanism the council shall also frame policy and guideline
for establishment of professional standard for arbitration. The duties of the Arbitration Council of India (refer
section 43 D(2)[7]) includes the following:-
Framing policy for grading of arbitration institutions;
Recognition of professional institutions for accreditation of arbitrators;
To promote institutional arbitration;
To hold training, workshops and courses in arbitration in collaboration with law firms and institutes;
To conduct examinations on various subjects related to arbitration;
To make recommendations to the Central Government in the matters of arbitration; and several such other
important functions.
The 1996 version of the Act specifies that the minimum required qualification of a person to be an arbitrator should
be one who is competent to contract provided that the person should be of sound mind and shall not have any
relationship with the parties involved in arbitration. However the amendment act specifically indicates and binds the
qualification of the arbitrators. As per provisions of section 43J[7] of the amendment act the qualification,
experience and norms for accreditation of arbitrators are mentioned under the eight schedule. The person shall not
be qualified as an arbitrator unless he is an advocate or Chartered accountant or Cost Accountant or Company
Secretary with ten years of experience or an Officer of Indian legal service or Government officer working in
Government or Autonomous body or Public Sector Undertaking or at Senior level managerial position with ten
years of experience with Law degree or Government officer working in Government or Autonomous body or Public
Sector Undertaking or at Senior level managerial position with ten years of experience with Engineering degree or

Engineers for Viable Technology and $5 Trillion Economy
94 Technical Volume of 36th Indian Engineering Congress, December 26-28, 2021 ISBN 978-81-955500-1-2
self-employed or an officer having administrative experience in Central or State Government. Above all the
Arbitrator should have general reputation as an honourable individual with integrity and impartiality.
Model fee for the arbitrator depending on the money value of the claim which has risen the dispute has also been
fixed in the amendment Act of 2015 as per provisions laid down in the fourth schedule[8] of the act.
CONCLUSION
Arbitration is a powerful methodology of alternative dispute resolution without the direct involvement of Civil Court
of law. But certain incidents of long drawn and expensive arbitration process especially in Engineering contracts has
led many government bodies to drop the arbitration clause or adopt conditional arbitration. Now in engineering
contracts arbitration process is being replaced by empowered departmental dispute resolution committees. Finally
when all the channels of dispute resolution committee are closed the aggrieved contractor has no other means left
but to take recourse to the Civil Court for dispute resolution through formal trial as per civil procedure code, which
is formal and hence time taking. However realising the obvious difficulties the Indian legislature has amended the
principal act for good. The new amendments in the principal act of 1996 shall go a long way to encourage the
process of adopting arbitration for speedy disposal of disputes in engineering contracts.
REFERENCES
1. Standard Bid Document for e-Tendering (for works costing above Rs. 5 Crores) of the Kerala PWD, (2017), pp
82.
2. General Conditions of Contract, Central Public Works Department, Government of India (2011),pp 60, 61.
3. Standard Bidding Document, Procurement of Civil Works, Part-I, Maharashtra PWD, (2017), pp 35.
4. Bihar Public Works Contracts Disputes Arbitration Tribunal Act, (2008), sec- 3, part-2.
5. Notification No. 558/SPW dated 13/12/2011, of the Principal Secretary, P.W Dept. Govt. of WB.
6. Government order related to, modification of clause relating to settlement of disputes under the conditions of
contract, .No.8182-F(y) dated 26/9/2012 of the Finance Department, Govt. of WB.
7. The arbitration and conciliation (amendment) act, (2019), PRT-IA, pp 4, 5,7,8 & 11.
Engineers for Viable Technology and $5 Trillion Economy
95 Technical Volume of 36th Indian Engineering Congress, December 26-28, 2021 ISBN 978-81-955500-1-2
CV_022_06_191
Comparative Study of Concrete made using Rice Husk Ash,
Rice Straw Ash and Bamboo Leaf Ash
Rajiv Sharma Leihaothabam* and Khwairakpam Sachidananda
Department of Civil Engineering, National Institute of Technology Manipur, Langol, Imphal
*e-mail: [email protected]
Abstract: In order to negate the effect of cement production, many researchers are studying the use of different
industrial and agricultural wastes to develop sustainable concrete. Among them, Rice husk ash (RSA), Rice straw
ash (RSA) and Bamboo leaf ash (BLA) are used for partial cement replacement. This paper gives the comparative
study of the specific gravity, chemical compositions, compressive strength, tensile strength and sorptivity of concrete
made using RHA, RSA and BLA. A few papers have been referred where the cement contents in concrete have been
replaced by 5%, 10%, 15% and 20% of its total weight by RHA, RSA and BLA. The values of compressive strength,
tensile strength and sorptivity developed at 28 days of curing are used for this study. Highest value of compressive
strength is observed when 15% of the total weight of cement is replaced by RHA, followed by 10% BLA concrete
and then by 5% BLA concrete. Highest value of tensile strength is observed at 15% RHA concrete, followed by 15%
RSAconcrete and then by 10% BLA concrete. Lowest value of sorptivity is observed when 15% of the total weight
ofcement is replaced by BLA.
Keywords: Concrete; Rice Husk; Rice Straw; Bamboo Leaf Ashes.
INTRODUCTION
Cement production is one of the main contributors of environmental pollution. The process of cement production
leads to the emission of greenhouse gases. It also requires a lot of energy for fuel consumption. Even by changing
the typical process of fuel consumption, cost of production can be reduced significantly and it can also help in
reducing the negative effects of cement production. Therefore, different industrial and agricultural waste materials
should be adopted for fuel in cement production [1].
Rice husk ash, rice straw ash and bamboo leaf ash are the residues of burning rice husk, rice straw and bamboo leaf
respectively. The energy produced while burning can also be used as fuels in cement production. The residues can
also be used as partial replacement of cement in concrete. This will greatly help in the environment by saving energy
and lowering the carbon footprint.
Rice husk, which is one of the most common agricultural wastes, is a by-product left during rice milling process. It
is the outer, non-edible part removed from the rice grain. It is mostly produced in rural areas of developing countries
like India. When rice husk is burned, the ash left behind is known as rice husk ash. RSA is around 20% of the total
weight of rice husk. This RSA contains high amount of silica, which makes it a suitable pozzolanic material for
cement replacement [2].
Rice straw is also one of the most abundantly available agricultural wastes. It is produced during the process of
harvesting paddy. This waste is usually disposed and burnt. It gives negative impacts to the environment.
Rice straw is burnt to give rice straw ash. This residue is a pozzolanic material which is suitable for partial cement
replacement. The energy produced from burning rice straw can also be used as a fuel for cement production [3].
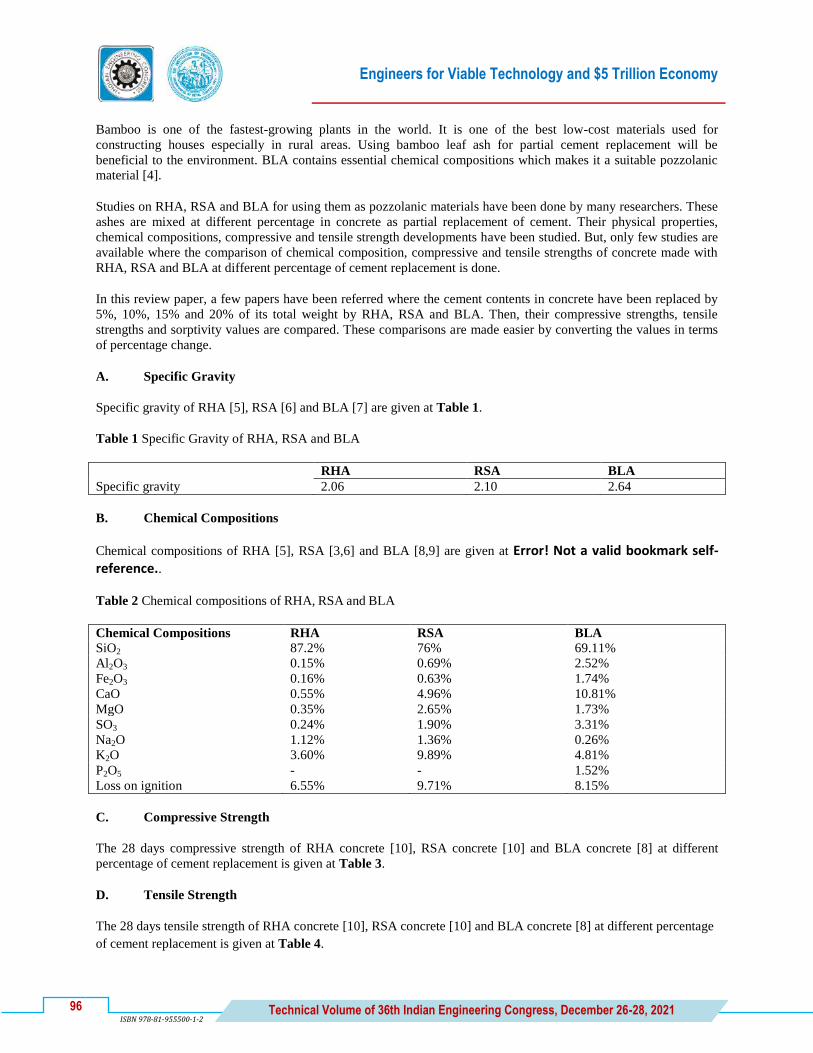
Engineers for Viable Technology and $5 Trillion Economy
96 Technical Volume of 36th Indian Engineering Congress, December 26-28, 2021 ISBN 978-81-955500-1-2
Bamboo is one of the fastest-growing plants in the world. It is one of the best low-cost materials used for
constructing houses especially in rural areas. Using bamboo leaf ash for partial cement replacement will be
beneficial to the environment. BLA contains essential chemical compositions which makes it a suitable pozzolanic
material [4].
Studies on RHA, RSA and BLA for using them as pozzolanic materials have been done by many researchers. These
ashes are mixed at different percentage in concrete as partial replacement of cement. Their physical properties,
chemical compositions, compressive and tensile strength developments have been studied. But, only few studies are
available where the comparison of chemical composition, compressive and tensile strengths of concrete made with
RHA, RSA and BLA at different percentage of cement replacement is done.
In this review paper, a few papers have been referred where the cement contents in concrete have been replaced by
5%, 10%, 15% and 20% of its total weight by RHA, RSA and BLA. Then, their compressive strengths, tensile
strengths and sorptivity values are compared. These comparisons are made easier by converting the values in terms
of percentage change.
A. Specific Gravity
Specific gravity of RHA [5], RSA [6] and BLA [7] are given at Table 1.
Table 1 Specific Gravity of RHA, RSA and BLA
RHA RSA BLA
Specific gravity 2.06 2.10 2.64
B. Chemical Compositions
Chemical compositions of RHA [5], RSA [3,6] and BLA [8,9] are given at Error! Not a valid bookmark self-reference..
Table 2 Chemical compositions of RHA, RSA and BLA
Chemical Compositions RHA RSA BLA
SiO2 87.2% 76% 69.11%
Al2O3 0.15% 0.69% 2.52%
Fe2O3 0.16% 0.63% 1.74%
CaO 0.55% 4.96% 10.81%
MgO 0.35% 2.65% 1.73%
SO3 0.24% 1.90% 3.31%
Na2O 1.12% 1.36% 0.26%
K2O 3.60% 9.89% 4.81%
P2O5 - - 1.52%
Loss on ignition 6.55% 9.71% 8.15%
C. Compressive Strength
The 28 days compressive strength of RHA concrete [10], RSA concrete [10] and BLA concrete [8] at different
percentage of cement replacement is given at Table 3.
D. Tensile Strength
The 28 days tensile strength of RHA concrete [10], RSA concrete [10] and BLA concrete [8] at different percentage
of cement replacement is given at Table 4.

Engineers for Viable Technology and $5 Trillion Economy
97 Technical Volume of 36th Indian Engineering Congress, December 26-28, 2021 ISBN 978-81-955500-1-2
Table 3 Compressive strength of RHA, RSA and BLA concrete at different % content for 28 days of curing
% Content Compressive strength (N/mm
2)
RHA Concrete RSA Concrete BLA Concrete
0% 38.88 38.88 26.90
5% 36.36 31.42 27.60
10% 37.80 33.37 28.50
15% 42.80 38.63 25.50
20% 38.47 34.35 24.10
Table 4 Tensile strength of RHA, RSA and BLA concrete at different % content for 28 days of curing
% Content Tensile strength (N/mm
2)
RHA Concrete RSA Concrete BLA Concrete
0% 2.62 2.62 2.46
5% 2.24 2.32 2.67
10% 2.66 2.63 2.76
15% 2.90 2.85 2.41
20% 1.98 1.93 2.18
E. Sorptivity
Sorptivity in concrete is its ability to absorb and transmit water through it via capillary action. It determines the
permeability, durability and water resistance of concrete [9].
For RHA and RSA concrete, the test was done using a plastic container with steel bar of diameter 18 mm kept on the
bottom of the container. After the concrete cubes were oven-dried at 105°C for 24 hours and wetted, the test was
carried out. The sorptivity values given at 120 minutes were considered [10]. For BLA concrete, the sampled cubes
were oven-dried for 24 hours at 110°C, tarried for 72 hours at 50°C and then kept airtight for 15 days. Five faces of
each of the cubes were coated and the other side was kept open to the water. Then, the samples were submerged in
water [8]. Sorptivity values were taken after 28 days of curing.
RESULTS AND DISCUSSION
Compressive Strength
To compare the compressive strengths of RHA concrete, RSA concrete and BLA concrete at different percentage of
cement replacement, the percentage change in their compressive strengths are calculated and given at Table 5. The
comparison is done for 28 days of curing. Illustration of this change is also given at Figure 1.
The compressive strength of RHA concrete decreases at 5% RHA content, then it increases when cement is replaced
by 10% and 15% of its weight by RHA. Then, it again decreases at 20% RHA content. The compressive strength of
the concrete at 15% RHA content is higher than the normal concrete i.e. when the RHA content is 0%.
The pattern of percentage change in compressive strength of RSA concrete for its different percentage is almost
similar to that of RHA concrete. But, the compressive strengths of RSA concrete at different percentage content of
cement replacement are lower than the normal concrete i.e. when the RSA content is 0%.
For BLA concrete, the compressive strength increases till 10% BLA content and then decreases. The compressive
strength of the concrete at 10% and 5% BLA content is higher than the normal concrete i.e. when the BLA content is
0%.
Engineers for Viable Technology and $5 Trillion Economy
98 Technical Volume of 36th Indian Engineering Congress, December 26-28, 2021 ISBN 978-81-955500-1-2
Table 5 Percentage change in compressive strength of RHA, RSA and BLA concrete at different % content
% Content Percentage Change in Compressive Strength
RHA Concrete RSA Concrete BLA Concrete
0% 0 0 0
5% -0.94672 -2.86344 0.1883
10% -0.388 -2.10684 0.4304
15% 1.552 -0.06596 -0.3766
20% -0.12804 -1.7266 -0.7532
Figure 1 Percentage change in compressive strength of RHA, RSA and BLA concrete at different % content
From Figure 1, it is observed that the compressive strength of RHA concrete with 15% content is the highest. It is
followed by 10% BLA concrete and then by 5% BLA concrete. Other mixes give the compressive strengths lower
than that of the normal concrete mix.
Tensile Strength
To compare the tensile strengths of RHA concrete, RSA concrete and BLA concrete at different percentage of
cement replacement, the percentage change in their tensile strengths are calculated and given at Table 6. The
comparison is done for 28 days of curing. Illustration of this change is also given at Figure 2.
The tensile strength of RHA concrete decreases at 5% RHA content, then it increases when cement is replaced by
10% and 15% of its weight by RHA. Then, it again decreases at 20% RHA content. The tensile strength of the
concrete at 15% RHA content is higher than the normal concrete i.e. when the RHA content is 0%. The pattern of
percentage change in tensile strength of RSA concrete for its different percentage content is also similar to that of
RHA concrete.

Engineers for Viable Technology and $5 Trillion Economy
99 Technical Volume of 36th Indian Engineering Congress, December 26-28, 2021 ISBN 978-81-955500-1-2
Similarly, the tensile strength of RSA concrete decreases at 5% RSA content and then increases till 15% RSA
content.
Table 6 Percentage change in tensile strength of RHA, RSA and BLA concrete at different % content
% Content Percentage Change in Tensile Strength
RHA Concrete RSA Concrete BLA Concrete
0% 0 0 0
5% -0.14744 -0.1164 0.05649
10% 0.01552 0.00388 0.0807
15% 0.10864 0.08924 -0.01345
20% -0.24832 -0.26772 -0.07532
Figure 2 Percentage change in tensile strength of RHA, RSA and BLA concrete at different % content
It again decreases at 20% RSA content. The tensile strength of the concrete at 15% RSA content is higher than the
normal concrete i.e. when the RSA content is 0%. It is also observed that the tensile strengths of 10% RHA concrete
and 10% RSA concrete are slightly higher than that of the normal concrete mix.
For BLA concrete, the tensile strength increases till 10% BLA content and then decreases. The tensile strength of
the concrete at 10% and 5% BLA content is higher than the normal concrete i.e. when the BLA content is 0%. This
pattern is similar to its percentage change in its compressive strength.
From Figure 2, it is observed that the tensile strength of RHA concrete with 15% content is the highest, followed by
15% RSA concrete and then by 10% BLA concrete.
Sorptivity
To compare the sorptivity of RHA concrete, RSA concrete and BLA concrete at different percentage of cement
replacement, the percentage change in their sorptivity values are calculated and given at Table 7. Illustration of this
change is also given at Figure 3.

Engineers for Viable Technology and $5 Trillion Economy
100 Technical Volume of 36th Indian Engineering Congress, December 26-28, 2021 ISBN 978-81-955500-1-2
The sorptivity value of RHA concrete decreases till 10% RHA content. It then slightly decreases and then increases
Table 7 Percentage change in sorptivity value of RHA, RSA and BLA concrete at different % content
% Content Percentage Change in Sorptivity Value
RHA Concrete RSA Concrete BLA Concrete
0% 0 0 0
5% -0.01402 -0.03079 -0.03623
10% -0.03079 -0.03639 -0.03643
15% -0.03079 -0.01782 -0.03722
20% -0.02911 -0.00832 -0.03564
Figure 3 Percentage change in sorptivity value of RHA, RSA and BLA concrete at different % content till 20%
RHA content.
For RSA concrete, the sorptivity value decreases till 10% RSA content and then it increases till 20% RSA content.
The sorptivity value of BLA concrete decreases at 5% BLA content and then it slightly decreases and then increases
till 10% BLA content. This value decreases at 15% content and then increases again at 20% BLA content.
Compared to the normal concrete, sorptivity decreases for all of the different mixes of RHA, RSA and BLA. From
Figure 3, sorptivity of BLA concrete at 15% of its content is the lowest.
CONCLUSIONS
Based of this study, following conclusions can be drawn:
1. The compressive strength of concrete replaced with 15% RHA content is higher than the rest of the concrete with
different percentage of RHA, RSA and BLA. It is followed by 10% BLA concrete and then by 5% BLA
concrete. Other mixes give the compressive strengths lower than that of the normal concrete mix.
2. The tensile strength of concrete replaced with 15% RHA content is higher than the rest of the concrete with
different percentage of RHA, RSA and BLA. It is followed by 15% RSA concrete and then by 10% BLA
concrete.

Engineers for Viable Technology and $5 Trillion Economy
101 Technical Volume of 36th Indian Engineering Congress, December 26-28, 2021 ISBN 978-81-955500-1-2
3. The sorptivity value of concrete replaced with 15% BLA content is lower than the rest of the concrete with
different percentage of RHA, RSA and BLA.
REFERENCES
1. N. Zainudeen and J. Jeyamathan, “Cement and its effect to the environment: A case study in SriLanka,”
Proc. from Int. Conf. Build. Educ. Res. , pp. 1408–1416, 2008, [Online]. Available:
http://www.irbnet.de/daten/iconda/CIB11336.pdf.
2. D. D. Bui, “Rice Husk Ash as a Mineral Admixture for High Performance Concrete.” p. 122, 2001.
3. M. A. El-Sayed and T. M. El-Samni, “Physical and Chemical Properties of Rice Straw Ash and Its Effect
on the Cement Paste Produced from Different Cement Types,” J. King Saud Univ. - Eng. Sci., vol. 19, no.
1, pp. 21–29, 2006, doi: 10.1016/S1018-3639(18)30845-6.
4. P. Asha, A. Salman, and R. A. Kumar, “Experimental Study on Concrete with Bamboo Leaf Ash,” Int. J.
Eng. Adv. Technol., no. 6, pp. 2249–8958, 2014.
5. G. Rodríguez De Sensale, “Strength development of concrete with rice-husk ash,” Cem. Concr. Compos.,
vol. 28, no. 2, pp. 158–160, 2006, doi: 10.1016/j.cemconcomp.2005.09.005.
6. S. Munshi and R. P. Sharma, “Experimental Investigation on Strength and Water Permeability of Mortar
Incorporate with Rice Straw Ash,” Adv. Mater. Sci. Eng., vol. 2016, 2016, doi: 10.1155/2016/9696505.
7. A. A. Umoh and A. O. Ujene, “Empirical Study on Effect of Bamboo Leaf Ash in Concrete,” J. Eng.
Technol., vol. 5, no. 2, pp. 71–82, 2014.
8. O. Onikeku, S. M. Shitote, J. Mwero, and A. A. Adedeji, “Evaluation of Characteristics of Concrete Mixed
with Bamboo Leaf Ash,” Open Constr. Build. Technol. J., vol. 13, no. 1, pp. 67–80, 2019, doi:
10.2174/1874836801913010067.
9. G. Dhinakaran and G. H. Chandana, “Compressive strength and durability of bamboo leaf ash concrete,”
Jordan J. Civ. Eng., vol. 10, no. 3, pp. 279–289, 2016, doi: 10.14525/jjce.10.3.3601.
10. M. T. Ibrahim, G. A. Hamdy, R. M. Abdel-naby, and T. A. El-sayed, “Study of Properties of Concrete
Containing Recycled Rice Straw and Rice Husk,” vol. 1, no. 40, pp. 87–101, 2019.


Engineers for Viable Technology and $5 Trillion Economy
103 Technical Volume of 36th Indian Engineering Congress, December 26-28, 2021
ISBN 978-81-955500-1-2
CV_023_07_180
Challenges in Respect to Skill Development Initiatives for 5
Trillion Dollar Economy by 2025 A Case of Construction
Sector
K R Ramana1* and K Srinivas
2
1C S I Institute of Technology (CSIIT), Hyderabad, Telangana State
2Jawaharlal Nehru University of Fine Arts & Architecture, Masab Tank, Hyderabad, Telangana State
*e-mail : [email protected]
Abstract: In the development of an economy, skill development occupies a dominant place and appropriate policies
are required for the same. Performance of an economy is dependent on its human resources. The parameters driving
the economic growth and socioeconomic stability of any country are skills and education. In the short term policy,
reducing unemployment forms the basis the framing of the skills issue and in the long term policy, skill requirement
are broadly seen whether the skilled and trained work force for a given Industry meets the requirement with the
demand imposed in a particular sector of the economy based on the economic growth which is projected to be 5
trillion dollars by 2025 for India. The trend that is visible today and is expected to last atleast for another 2 decades
is that the proportion of the workforce in the working age group is well in excess of those dependent on them.
Acceleration of economic growth can be achieved by way of huge labour workforce through skill development
thereby making the best use of the demographic dividend. The accelerated economic growth has fuelled the demand
for skilled manpower which has resulted in woeful shortage of skilled manpower in the country in general and
construction sector in particular. Based on the path for a 5 trillion dollar growth by 2025, will India be able to
match or slip this growth considering a humble 5% contribution of the construction sector to the GDP Growth and
where India could stand in an accelerated growth path. The paper also provides suggestion to meet the challenges
of construction Industry needs for skilled man power with an attempt to meet the skills demand in Indian
Construction sector.
Keywords: Socioeconomic Stability; Demographic Dividend; Accelerated Economic Growth; Key Drivers
INTRODUCTION
Overall effectiveness and empowering of an individual for working more efficiently can be achieved by skill
Development. This results in economy becoming more productive, innovative and competitive by way of having
skilled human potential. Globalization and technological changes has provided both challenges and growing
opportunities for economic expansion and job creation. Countries which have higher and better levels of human
skills get adjusted more effectively to the changes that are taking place at a rapid pace. Apart from access to
vocational and technical education, access to secondary and tertiary education is also equally important. Attention
should also be focussed on informal learning on the job, structured apprenticeships and other enterprise based
training, along with government and non-governmental training programs.
Skills development is a much broader concept involving a diverse community and as a result it is quite difficult to
monitor this development. Skills development in construction sector is a good example and difficult to monitor and
update the numbers being skilled at a given level due a diverse agency involved in skills training and updating the
statistics is also difficulty as only those training being done under NSDC franchise for Construction sector skills
centre and available within a reasonable accurate figure. There are a number of informal bodies providing skills
training in construction trades and these are restricted to only the company employees and the details of trained
workers are not publicly shared.

Engineers for Viable Technology and $5 Trillion Economy
104 Technical Volume of 36th Indian Engineering Congress, December 26-28, 2021
ISBN 978-81-955500-1-2
CONSTRUCTION SECTOR SIZE AND MANPOWER
Construction is an important activity that drives emerging economies like India, which are yet to develop large
network of Infrastructure and Real Estate Assets. The estimated size of construction industry is about Indian rupees
2.1 trillion in the year 2008. After agriculture sector in India the construction sector second largest contributing to
the economic activity and it is providing employment opportunity to around 33 million workforces. The
Compounded Annual Growth Rate (CAGR) of India‟s Construction industry has risen to around 11.1% in eight
years (from 2001 to 2008). This is the result of increased housing demand and massive investment in infrastructure.
The infrastructure sectors spending in Projects like Roads, Ports, power plants, Airports is projected at more than Rs
2.5 trillion on annual basis for the next six years, and will demand 92 million hours of labour.
Construction sector accounts for investment of around 53% of the Gross Fixed Capital Formation in the country.
This has resulted in immense development of the economy and ensured that the supply chain movement goes at a
brisk pace. The construction sector is linked to various industries like steel, cement, paints, chemicals, tiles, fixtures,
accessories and fittings. In the short term this my have serve as a demand booster, while in the long term it has
contributed to boosting the infrastructure capacity (NSDC 2012), Table 1 shows the size and growth of the
construction sector GDP in India.
Table 1 Growth and size of Construction Industry in terms of GDP at constant prices(Indian Rupees in Billions)
S.No Year GDP Growth (Indian Rupees in Billions)
1 2001 1,084
2 2002 1,127
3 2003 1,217
4 2004 1,362
5 2005 1.500
6 2006 1,839
7 2007 2.055
8 2008 2,263
Average CAGR is 11.1%
Source: Economic survey 2008-2009 and IMaCS Analysis 2
A broad Classification of The Construction sector can be depicted into two segments (NSDC 2012). Infrastructure
[Transportation, Urban Development, Utilities] and Real Estate [Residential, commercial, Industrial and Special
Economic Zones (SIZ‟s)]
Figure 1 Landscape of Indian Construction Industry
The Real Estate sector contributes to around 24% of the Construction Gross Domestic Product of country where as
the Infrastructure sector contributes to about 76%. Depending on the expected growth in the Real Estate sector and

Engineers for Viable Technology and $5 Trillion Economy
105 Technical Volume of 36th Indian Engineering Congress, December 26-28, 2021
ISBN 978-81-955500-1-2
Infrastructure sectors, it is anticipated that about 83 million people would be engaged in the Construction sector by
the year 2022. The increment construction workforce demand between the year 2008 and 2022 is projected to
around 47 million. The composition sector wise is as follows:
Table 2 Projected Human Resources Required
Const Industry 2008 2012 2018 2022
Increment (in 000s)
Infrastruture 25177 33868 48280 5,289 33,111
Real Estate 10790 14515 20692 24981 14,191
Total 35968 48383 68972 83270 47,302
Source: IMaCs Analysis
Figure 2 Projected figures in Billions of Rupees from2008 to 2022 with a Cumulative Aggregate growth rate of 9.5
to 10%
Projected Real GDP of Construction Sector (in Billion Indian Rupees)
Table 3 India: GDP in Current Prices
S.No Year GDP (billion USD)
1 1986 252.75
2 1990 326.61
3 1995 399.79
4 2000 466.84
5 2005 834.25
6 2010 1300
7 2015 2000
8 2020 2500
9 2022 3312.95
10 2024 3884.73
11 2026 4534.34
Source: STATISTA, Economics & Politics- International
Table 4 Segmentation of Work Force in Construction Industry

Engineers for Viable Technology and $5 Trillion Economy
106 Technical Volume of 36th Indian Engineering Congress, December 26-28, 2021
ISBN 978-81-955500-1-2
S.No Occupation % (Percentage)
1 Engineers 2.65
2 Technicians and foremen 1.80
3 Clerical 2.50
4 Skilled workers 10
5 Unskilled worker 83.1
TOTAL 100
SIGNIFICANCE OF STUDY
This paper is intended to highlight the proportion of skilled worker in relation to total manpower in the construction
sector. Going by the present way the skilled worker is inducted despite having skill council for construction,
adequate skilled and trained worker are not being generated to meet the demand going by the various studies made
by study groups based on the secondary data collected. The man power projected by 2025 will be around 90 million
and the skilled man power would be around 9 million. With the existing skilled man power generation we can hardly
reach 0.5 million per year. Hence there is going to be a mismatch between availability and requirement by end of
2025 when our economy will be reaching a 5 trillion US Dollars.
LITERATURE REVIEW
Rubvita Chadha et al (2014)
“Industry‟s requirement for employability of Management students in Present scenario”. The study has suggested
and concluded that skill development can be achieved by way of offering more practical training, developing
conversational skills, improving employability skills, organizing frequent personality development workshops and
encouraging academia-industry interaction.
Hari Prasad. N et al (2014)
In his study titled “alarming employability skills deficiency a month budding engineering graduates and Diploma
holders” – a study on Engineering and Diploma holds in Chittoor district” has concluded that in developing skills,
impact of peer group and personal experiences play key role. Quick employment can be attained by focussing on
group discussions and professional networking. Answering updated questionnaires related to technical aspect and
continuous interview attempts a helps to sustain corporate employment.
FICCI skill report by Ernst and Young (2012)
In this research paper on “Skill Development in Construction Industry in India” development of skill wass one of the
prime agenda of the Government of India for the 12th
Five Year Plan. ( 2012-2017). This is very much highlighted in
a research paper titled “Skill development in construction industry in India”. The government plans to prepare
standards required for training programs by setting up sector skills councils. Skills Development is a important
initiative for achieving India‟s ambitious growth targets as envisaged by captains of industry and it was decided to
work with dedication by involving stakeholders, namely the industry, government and academia to develop
sustainable and scalable skills propositions which will promote the youth of the country from different sections of
the society. The industry is attempting to reduce the skill gap by taking proactive measures to partner with the
government. One example of this initiative is the Establishment of Rural Development and Self-Employment
Training Institutes.The government as a incentive measure is exempting payment of service tax for all skills training
institutes who are involved in vocational education training there by making skills training more affordable to public
in large. Companies like L&T, Hindustan construction Corporation ( HCC) etc have taken the following initiatives
in enhancing the skills of construction workers.
A Report of the Working Group on Construction for the Eleventh Five Year Plan (for the Period-2007 to
2012)by BMTPC

Engineers for Viable Technology and $5 Trillion Economy
107 Technical Volume of 36th Indian Engineering Congress, December 26-28, 2021
ISBN 978-81-955500-1-2
The size of Construction Industry is estimated at Rs.310,000 crores (includes Private & Public stakes), providing an
employment standing at 31 million man-years per year of which unskilled category at 82.45 % occupies the major
share. The manpower in construction industry is growing at a constant pace of 8 to 9 % resulting into annual
addition of about 25 lakh individuals in addition to existing manpower. This is a huge task given that they required
to be trained in order to have quality, safe and durable structures.
With the advent of innovative building materials, advancement in technology and the need for construction of
disaster resistant structures to diffuse the effect of natural disasters, it is very imperative that working professionals
update their knowledge and understanding of subjects periodically. Understanding need for capacity building,
BMTPC is organizes structured training programmes for working professionals for updating their skills and
knowledge in areas of Green Construction Practices, Sustainable Construction, Earthquake Resistant Design and
Construction etc
OBJECTIVES OF THE STUDY
To study about the proportion of skilled workforce over the total work force deployed in the construction
industry.
The present level of the total work force in the construction industry.
Projected work force up to 2022 for the industry.
Whether Indian construction industry would be able to meet the requirement of skilled workforce by 2025
when GDP is projected for a 5 Trillion US Dollar economy and suggested measures to be taken.
PRESENT STATUS OF SKILL DEVELOPMENT IN CONSTRUCTION INDUSTRY AND THE
CHALLENGES FACED
The construction industry in India which is the index of country's progress and its economic development has a
huge task in that efforts should be stepped up for training and upskilling its workforce thereby unlocking the
growth opportunities in the construction sector and contributing to the nation's development in an optimal manner.
In this fast paced era, the Indian construction industry needs more skills to be imbibed by an individual. Around 60
million people are employed in construction industry in India and 9% of the country's GDP is contributed by this
sector. This sector also creates more than 45 million jobs either directly or indirectly. By 2022, the Indian
construction sector will become the largest employer by employing around 76 million people. This means jobs for
an additional 16 million people in the coming years. Notwithstanding the rosy predictions,, the construction industry
is bogged down by poor productivity relative to other sectors as it is handicapped by intractable problems. Labour-
productivity growth globally in construction has averaged only 1% annually in the past two decades as against 2.8%
and 3.6% per year growth of the world economy and manufacturing respectively.
According to the McKinsey Global Institute's Construction Productivity Survey and Report, 2017, severe
underperformance of the construction sector is attributed to high amount of regulation, dependence on public-sector
demand and fragmented, cyclical nature of the industry.
The percentage of service-cost to the overall project-cost is 12-15%, whereas the global standard is higher at more
than 40%. Indian companies face the problem of tough competition and lack of recognition for quality work.
Constant changes brought about by technology upgradation and rising workplace expectations have fuelled the
demand for a skilled work by appreciating safety regulations, working at optimum efficiency and at the same
excelling in their trade. Concentrating on multi-skilling their workforce and improving the working environment at
project sites for attracting the bright talents in this sector is the need of hour for countries like India if it is to catch
with rest of the world.
CHALLENGES TO MEET THE FUTURE NEED

Engineers for Viable Technology and $5 Trillion Economy
108 Technical Volume of 36th Indian Engineering Congress, December 26-28, 2021
ISBN 978-81-955500-1-2
Construction workers in India continue to be trained by the traditional master craftsmen owing to lack of an
institutional mechanism for skill development. Absence of utilisation of new technologies or work methods in
traditional methods has made the situation quite challenging as it is necessary that the next generation of workers
need consistent and continual upskilling and not just confined to training by giving sustainable value to the entire
ecosystem.
A remarkable example of how governments across the world can contribute to training future construction workers
is shown by Government of United Kingdom by setting up the Construction Skills Fund (CSF), in 2018.The £22
million CSF is funded by the Department for Education aims to provide training to individuals looking to get into
the construction industry through the Construction Industry Training Board for filling the skill gaps and make more
people 'site ready'. by enhancing their skills. It has endeavoured to provide training to unemployed and those
planning to have a change their career, for entering into construction sector. Similar initiatives are also taken by
Construction Industry Development Council in India to for improving the productivity of construction workers. The
construction industry too on its part has stepped up its efforts for increasing the sustainability of the sector.
However, much more needs to be done by the sector if it is to t capitalise on the growth opportunities in future
Based on the fore going the challenges faced by the construction industry are:
Changing market environment, technological progress besides disruptive entrants have triggered industry
overhaul
Value being added by multiple interventions from multiple stakeholders is at stake as they differ in objectivity,
focus and framework
Transformations have taken time but COVID is accelerating the same
Industry has to prepare itself for new normal
SUGGESTIONS FOR ENHANCING THE CAPACITY OF SKILLED MANPOWER IN CONSTRUCTION
INDUSTRY FOR MEETING THE DEMAND
1. Various ministries under Government of India dealing with housing, labour employment, skill development,
rural development will have to amend changes appropriately to facilitate skill development.
2. Private players should be given incentives by the government to provide training to the construction workers. At
the same time, the industry must collaborate on a massive scale for use of scarce capital resources for skill
training
3. Skilling, Re-skilling and Up- skilling is required to endeavour to the needs of future
4. Offering of variety of diploma and vocational programmes and strengthening the industry-academia interaction.
5. There exists already more than 500 Pradhan Mantri Kaushal Kendra in addition to the training centres being run
by the industry. The need is to realign and integrate all of them to collectively deliver in uni-direction which
would make a paradigm shift in the way the industry conducts itself.
6. There is complete absence of primary research in the industry. There exists no mapping of demand clusters,
supply clusters and traditional clusters which needs to be done
7. Move the entire workforce from „Informal‟ to „Formal‟ as being part of „Formal‟ drives lot of inherent
advantages.
8. Deploy and ensure that „Recognition of Prior Learning‟ (RPL) becomes a mandatory part of the industry before
construction workers moves in to a construction site.
All this can be expedited with the right kind of technology which will be vitalto the success. In short, numbers can
be achieved but provided the right framework, delivery mechanism and technological support are present.

Engineers for Viable Technology and $5 Trillion Economy
109 Technical Volume of 36th Indian Engineering Congress, December 26-28, 2021
ISBN 978-81-955500-1-2
REFERENCES
1. Mehrotra, AG. and Sahoo and BK,(2013). Estimating India‟s Skill Gap on Realistic Basis for 2022, Economic
and Political Weekly of India, Vol. 48, No.13, pp.102–111.
2. GoI, (2009) National Skill Development Policy, New Delhi: Government of India.
(http://www.skilldevelopment.gov.in/sites/default/files/resource/ NationalSkillDevelopmentPolicyMarch09.pdf).
3. IMaCS (2012): A report of the working group in construction for the 11th
five-year plan, Planning commission,
Government of India and ICRA Management Consulting services Limited (IMaCS). pp. 4-7, India.
4. Ramana KR and Ramakrishna N, (2013). Skill Development in Construction Sector: The Need and Evaluation,
Paper Presented at SKILLS 2013, 2nd International Conference on Life Skills and Livelihood Skills, Challenges
for International Cooperation, pp. 12–14 December 2013 at NAC, Hyderabad (Discussion paper on Asia Pacific
Dialogue. Organized by REEDS, supported by Government of Andhra Pradesh and Government of India).
5. India Today, New Delhi, Issue 13th
February, 2020 – Challenges faced by Indian Construction Industry.

Engineers for Viable Technology and $5 Trillion Economy
111 Technical Volume of 36th Indian Engineering Congress, December 26-28, 2021
ISBN 978-81-955500-1-2
CV_051_11_199
Study of Methodology for Removal of Arsenic Contamination
from Public Water Supply Projects West Bengal Perspective
Pronoy Roy Chowdhury
Public Health Engineering Directorate, Governement of West Bengal
*email: [email protected]
Abstract: Water supply projects utilize surface water, sub-surface water and ground water as sources. The most
economical alternative is to use ground water as source, because it will not require construction of water treatment
plant for surface or sub-surface based water supply schemes, which involves high capital cost. However for areas
which are far away from the river, it is not viable to utilize river water for source for such areas ground water is the
only preferable source to feed the water supply scheme. If the area receives substantial rainfall throughout the year
the ground water reserve in the aquifer is easily replenished and hence abstraction of ground water through
production tubewell shall be a sustainable approach to provide drinking water supply to the population. As ground
water is generally abstracted from confined aquifer, the water quality of ground water is free bacteriological
contamination. However the main evil in ground water is chemical contamination. One of the most significant
chemical contaminant in ground water is Arsenic, which is a cumulative poison in human system. Prolonged intake
of arsenic laden water in relatively higher concentration, results in manifestation of toxic effects of arsenic in
human body, various health related problems develop due to arsenic poisoning which is broadly termed as
“Arsenicosis”. Arsenic contamination in ground water is observed across the globe, the problem is very wide
spread in West Bengal. In this paper a time tested methodology for effective removal of arsenic from drinking water
is discussed. The methodology incorporates oxidation followed by coagulant assisted precipitation, and finally
applying adsorption technique using polishing agent for removal of residual arsenic so that the treated water has
arsenic below detectable limit. The method is easily implemented at the field and the operation and maintenance of
the plant is less. The process has been indigenously developed for field application for public water supply schemes
and provides potable water to the population in reliable quality.
Keyword: Arsenic Removal; Ground Water; Aarsenic Contamination; Water Quality
INTRODUCTION
Arsenic contamination in ground water is observed widely across the globe. The problem is prevalent in India and is
very significantly observed in the state of West Bengal. As per assessment arsenic contamination is most prominent
in the 8 districts of West Bengal including North 24 Parganas, South 24 Parganas, Hooghly (part), PurbaBurdwan
(part), Nadia, Murshidabad, Maldah and only few scattered villages of Howrah (Figure 1). In these 8 districts about
84 blocks, 3319 villages and 8153 habitations are affected from arsenic infestation in ground water and about 16.5
million rural population of West Bengal are at risk due to this arsenic contamination. All the 84 blocks are located
by the bank of the river Hooghly and its adjoining areas. The analysis of ground water sample in this areas indicated
higher arsenic concentration in ground water. The contamination is mostly observed at a depth of 20m-80m below
G.L. prolonged ingestion of arsenic through food and drinking water causes accumulation in the human body,
arsenic can be traced in hair, nail, urine and other body parts. Due to the toxic effect of arsenic lesions develop in the
palms and the foot (Figure 2). Diarrhea and other abdominal problems may occur, in severe cases kidney may be
affected and cancer may develop. If the problem is detected at an early stage and the patient is removed to a location
where drinking water is free from arsenic contamination, thepatient is found to improve in health, due to flushing
out of accumulated arsenic from the system. It has been found that the effect of arsenic toxicity is manifested
significantly in case of individuals suffering from malnutrition i.e. among the poor people. In the late 1980s water
testing reports revealed higher concentration of arsenic in water beyond the tolerable limit of 0.05mg/l in shallow

Engineers for Viable Technology and $5 Trillion Economy
112 Technical Volume of 36th Indian Engineering Congress, December 26-28, 2021
ISBN 978-81-955500-1-2
tubewells. Later arsenic in higher concentration was also observed in India Mark-II head fitted deep water pump
type tubewell. Initially it was thought that stray cases of arsenic contamination was due to the activity of the farmers
who spray fertilizers of arsenic based compounds to the crops, but later on realizing the huge extent of the problem it
was concluded that detection of higher level of arsenic is possibly due to geological causes. So far the reason for
extensive infestation of arsenic contamination is unknown. The question of delivery of arsenic free drinking water to
the population was a very compelling question to the water supply Engineer of West Bengal. The issue was a big
concern which led to the formation of arsenic Task force in 2005 by the Govt. of West Bengal a technical committee
with the terms of reference to explore and give approval to such technologies for arsenic removal after appropriate
evaluation and proper pilot study at the site. The Public Health Engineering Department, Govt. of West Bengal, has
taken the most significant initiative in the aspect of provision of Arsenic free drinking water to the population of the
state. The initiative has involved construction of Mega piped water supply projects with Surface and Sub-Surface
water, from the major rivers in West Bengal (mainly river Hooghly) for the areas which are located near the river
bank and for the other areas where it is difficult to transport raw water of river due to relatively greater distance from
the river, through sinking of big diameter deep tubewellto deeper aquifer free from arsenic and in areas where the
aquifers are infested with arsenic contamination use of Arsenic-Cum-Iron removal plant has water to the been made
to ensure Arsenic free drinking water to the population. A elaborate system of water testing laboratories both of
PHED and NGO driven labs were established to ensure efficient testing of water samples across the state.
Figure 1 The map showing groundwater pollution by Arsenic, in the inter-fluvial region of the Bhagirathi-Hoogli
and the Jalangi-Ichamatirivers lying mostly in the eastern part of the Bhagirathi-Hoogliriver of West Bengal. The
Arsenic contamination in ground water beyond 0.05 mg/l has been found within the shallow aquifer (20-80m below
ground level) (obtained from official website of PHED WB).

Engineers for Viable Technology and $5 Trillion Economy
113 Technical Volume of 36th Indian Engineering Congress, December 26-28, 2021
ISBN 978-81-955500-1-2
Figure 2 Showing the skin lesions developed in the palms and foot of Arsenic affected patient
REMOVAL TECHNOLOGY
Arsenic is a metalloid, it is found in ground water and usually exists as inorganic arsenic in both trivalent (As (III))
and Pentavalent (As(V)) species. As(III) has relatively higher level of toxicity in comparison with As(V). Various
technologies are available for removal of Arsenic from ground water. The technologies are based on following
principals:-
(a) Coagulation/co-precipitation,
(b) Adsorption,
(c) Sedimentation,
(d) Ion exchange,
(e) Membrane/Reverse Osmosis,
(f) Biological treatment,
(g) Nano technology based process etc.
All the above technologies have case specific advantages and disadvantages.
The removal of arsenic from water depends on the type of arsenic species present is water. As an example
coagulation/co-precipitation method using iron or aluminum salts yield better result for Arsenic (V) species rather
than arsenic (III). Thus to enhance the process of removal at first oxidation of the raw water is required so that all
As(III) species is oxidized to As(V) and then the removal is done by coagulation/co-precipitation. The sedimentation
process is adopted following coagulation/co-precipitation for effective removal of Arsenic species from solution.
The mostly widely used Arsenic cum iron removal plant (AIRP) is based on the methodology of oxidation followed
by co-precipitation through coagulation, flocculation, clarification and finally filtration (either through rapid sand
filter or pressure filter) and then adsorption using activated alumina. The process finally yields water with arsenic
within acceptable limit as per BIS guidelines. As per the current BIS code of practice IS-10500-2012 [1]with
amendment, vide table 3 sl no. X, the acceptable limit for Arsenic is 0.01 mg/l and there is “no relaxation” to this
quality standard. This method is capable of removing the arsenic and iron content from ground water so that water is
fit for human consumption only with disinfection by chlorination. The process of coagulation is achieved with the
addition of metal based coagulant such as Ferric chloride (FeCl3), the coagulant hydrolyses in water forming
positively charged Ferric Hydroxide (Fe(OH)3). However the process to work effectively Arsenic must be oxidized
to As(V) state.
PROCESS FLOW
The process flow for Arsenic –Cum-Iron removal plant with oxidation, co-precipitation and polishing method is
depicted below for clarity of understanding.

Engineers for Viable Technology and $5 Trillion Economy
114 Technical Volume of 36th Indian Engineering Congress, December 26-28, 2021
ISBN 978-81-955500-1-2
Effective performance of the above type of AIRP is much dependent on coagulation and sedimentation of the
Arsenic present in the water. For ensuring removal of the arsenic species as As(V) the coagulant FeCl3 is mixed at
first violently in the mechanically operated flash mixer for uniform mixing. This operation is termed as rapid
mixing. The water is then gently stirred and circulated in the baffles of the baffle flocculator to keep the colloidal
particles in suspension and to promote collision between the colloidal particles so as to ensure effective formation of
floc to assist in sedimentation. This type of AIRP may be economically constructed for ground water based piped
water supply scheme with capacity varying from 30 CuM/hr to 180 CuM/hr. The AIRP can be fitted for rural piped
water supply schemes with population varying from 15000 to 20000 souls. The structure is constructed with M30
grade R.C.C and Steel reinforcement providing adequate cover to the reinforcement a required vide provision of IS
456-2000 [2] and IS-3370 (part-2) 2009 [3] for water retaining structures. Flow in the different units of the plant is
maintained through gravity. Proper assessment of the natural slope of the site is essential for laying out the plant.
The oxidation chamber should be designed for 30 minutes detention period to ensure proper oxidation of As(III) to
As(V) for proper functioning of the unit. As the process flow is based on gravity system least use of electro-
mechanical instruments are done, the energy cost and the operation maintenance cost of the scheme is relatively less.
Arsenic removal efficiency of the plant has been assessed between 92-95%. A significant difficulty associated with
the plant is disposal of sludge generated at the sedimentation tank of the AIRP. The sludge has high concentration of
Arsenic. The sludge cannot be disposed of by burying in the ground, as it will cause leaching of Arsenic in the
shallow depth water table aquifer and shall further aggravate contamination in the locality. However as the
concentration of arsenic in ground water is generally found in the range of 1 mg/l to 0.05 mg/l (however higher
concentrations are also encountered) it takes considerable time to accumulate substantial thickness of sludge layer
and hence sludge disposal is not required at frequent intervals. Researchers have established that sludge may be
effectively disposed by mixing with clay for brick manufacturing or mixing with concrete in controlled ratio. Details
of the process of sludge disposal is available elsewhere in literature[4].
CONCLUSION
Supply of potable drinking water to the population in proper quality and adequate quantity is the mandate for a
progressive society. Nature has posed a challenge to humanity in the form of arsenic toxicity in ground water which
is a major impediment for providing wholesome drinking water to the population. This hazard can be combatted
with three fold approach (a) using surface or Sub-surface water as source for water supply, (b) using ground water

Engineers for Viable Technology and $5 Trillion Economy
115 Technical Volume of 36th Indian Engineering Congress, December 26-28, 2021
ISBN 978-81-955500-1-2
from deeper aquifers which is not contaminated with arsenic & (iii) using ground water source with Arsenic –cum –
Iron removal plant. Where surface and sub-surface water from major rivers are available mega water supply project
can be developed by construction of Water treatment Plant (WTP) at huge capital cost and recurring operation and
maintenance cost. The cost of acquiring land for WTP is also substantially large which also adds to the capital cost.
As an alternative ground water based water supply scheme is a preferable alternative. Thus Ground water based
water supply scheme with exploitation of ground water in deeper aquifer and fitted with AIRP is a popular
alternative. In areas where ground water in deeper aquifer is free from arsenic AIRP may be installed because with
overexploitation of ground water leaching of arsenic may take place form shallow aquifer to deeper aquifer, and the
arsenic free layer may develop contamination in near future. Among the various technology for removal of arsenic
available the one with oxidation followed by co-precipitation and then activated alumina polishing unit with gravity
flow model is the most economic and practical approach for arsenic removal for public water supply schemes, hence
it is discussed in this paper and is suggested for adoption for arsenic removal in water supply schemes.
REFERENCES
1. IS 10500-2012, “Indian Standard Drinking water Specification”, Bureau of Indian Standards, New Delhi.
2. IS 456 – 2000, “Plain and Reinforced Concrete-Code of Practice”, Bureau of Indian Standards, New Delhi.
3. IS 3370 (Part-2) 2009, “Code of Practice Concrete Structures for Storage of Liquids, Part 2: Reinforced
Concrete Structures”, Bureau of Indian Standards, NewDelhi.
4. P.Mandal et.al. 2016, “Disposal Problem of Arsenic Sludge Generated During Arsenic Removal from Drinking
Water”, International Conference on Solid Waste Management, 2015, Science Direct, Elsevier, pp 943-949.


Engineers for Viable Technology and $5 Trillion Economy
117 Technical Volume of 36th Indian Engineering Congress, December 26-28, 2021
ISBN 978-81-955500-1-2
CV_056_12_224
Advantages of use of Tubular/Hollow Sections over
Conventional Open Sections in Hydro-Carbon Industry
Structures
Amresh Kumar*, Papia Mandal and Anurag Sinha
Structural Division, Engineers India Limited, Gurugram Complex, Gurugram Haryana
*email: [email protected]
Abstract: Tubular/ Hollow sections are gaining popularity in recent times, due to its higher strength-to-weight ratio
than conventional open sections as well as for the reason that, hollow sections create lightweight and visually
attractive structures. Due to their cross sectional configuration, such sections have inherent advantage in torsional
buckling resistance capacity and axial load carrying capacity. Thus, its usage is continuously being increased in the
hydrocarbon sector as well. Tubular/ hollow sections have been successfully used in many components of the
structures, in which traditionally MC boxed sections were used due to its reduced requirement of welding, as
compared to MC boxed sections. Therefore, it is imperative to analyze hollow sections and open rolled sections
considering design strength and steel quantity requirements, to enable the designers to select the appropriate
section, fitting the functional requirements and economics of the project. This study presents the comparative
benefits of using hollow sections instead of open sections by presenting a theoretical comparison as well as a case
study of three categories of industrial structures in hydrocarbon industry. Further it presents a detailed account of
limitations in use of hollow sections on large scale in industrial structures of hydro carbon sector.
Keywords: Hollow Sections; Lateral Torsional Strength; Yield Strength; IS 4923; Industrial Structures; Weight-to-
strength Ratio
INTRODUCTION
The excellent properties of the tubular shape have been recognized for a long time; there are examples of bridges
etc. made of tubular sections as long back as last century. However, in the absence of readymade hollow sections,
large tubular sections have been prepared by welding open sections such as channels or angles.
Hollow sections are gaining popularity in recent times, due to its higher strength-to-weight ratio than conventional
sections as well as for the reason that, hollow sections create lightweight and visually attractive structures. Many
examples in nature show the excellent properties of the tubular shape with regard to loading in compression, torsion
and bending in all directions. For examples, tall slender plants such as bamboo tree or small weeds etc. Thus, use of
hollow sections is in a way a nature inspired choice. Due to geometric configuration, such sections have inherent
advantage in torsional buckling resistance capacity and axial load carrying capacity.
Even though predominant use of hollow section has been observed in infrastructure projects only, yet its usage is
continuously increasing in the hydrocarbon sector as well. In the recent projects, tubular/ hollow sections have been
successfully used in various structures, such as pipe supports, operating platforms and trusses in the shed or other
structures, small pipe racks, or structural components such as vertical and plan bracings, longitudinal/ tie members
of pipe racks and other structures etc. Many components of the structures, in which traditionally MC boxed sections
were used, have been grossly taken over by hollow sections, due to its reduced requirement of welding, as compared
to boxed sections fabricated from channels/angles.

Engineers for Viable Technology and $5 Trillion Economy
118 Technical Volume of 36th Indian Engineering Congress, December 26-28, 2021
ISBN 978-81-955500-1-2
BENEFITS OF USING HOLLOW SECTION OVER CONVENTIONAL OPEN SECTIONS-
Following has been the main reasons for increasing use of hollows sections-
I. Aesthetic Reasons
Due to aesthetic reasons, hollow sections have been the first choice for buildings where structural members are
exposed such as in airports, malls, exhibition centers and other amenity buildings. In structural members, as the
length of member increases, their axial capacity decreases. The decrease in capacity is very less for hollow sections
as compared to open sections. This makes hollow sections preferable choice for members of large span trusses.
Thus, hollow sections are valuable in providing long span structures having a feel of openness and aesthetics which
have always been an architect‟s delight.
II. Design Benefits
Hollow sections are made of similar steel as used for open steel sections, thus in principle there is no difference as
long as mechanical and chemical properties are concerned. However, distribution of mass on cross sectional plane
plays an important role in determining the strength-to-weight ratios of structural section. The more mass is placed
away from the centroid of cross-sectional area, the more strength section has against Euler buckling and lateral-
torsional buckling, which is required for a section to be loaded to its full compressive or bending strength. In this
aspect, hollow sections (by having total mass placed away from centroid) have a major advantage over conventional
I-sections, channels and angles, which have most of the mass placed near centroid or along axes passing though
centroid (Figure 1).
Figure 1 Centroid (intersection of x- and y-axis) and mass distribution around centroid for different types of
structural steel sections
Further, Tables 1 and 2 below show a comparison of unit weights of members required for a given Bending moment
and Axial compression capacity. The percentage reduction in material is calculated and highlighted wherever there
is a saving. Effective lengths of the members have been considered as 0 m (fully restraint), 4 m & 8 m for bending
as well as for axial compression to incorporate the effect of slenderness on member capacity.
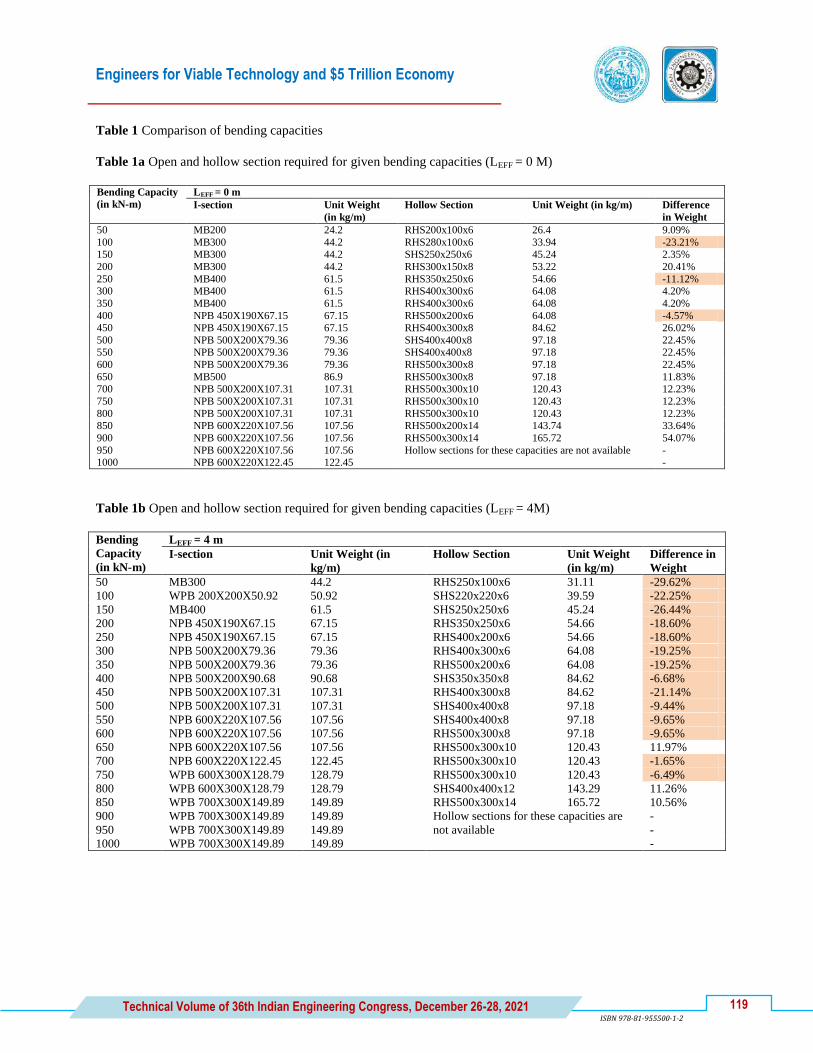
Engineers for Viable Technology and $5 Trillion Economy
119 Technical Volume of 36th Indian Engineering Congress, December 26-28, 2021
ISBN 978-81-955500-1-2
Table 1 Comparison of bending capacities
Table 1a Open and hollow section required for given bending capacities (LEFF = 0 M)
Bending Capacity
(in kN-m)
LEFF = 0 m
I-section Unit Weight
(in kg/m)
Hollow Section Unit Weight (in kg/m) Difference
in Weight
50 MB200 24.2 RHS200x100x6 26.4 9.09%
100 MB300 44.2 RHS280x100x6 33.94 -23.21% 150 MB300 44.2 SHS250x250x6 45.24 2.35%
200 MB300 44.2 RHS300x150x8 53.22 20.41%
250 MB400 61.5 RHS350x250x6 54.66 -11.12% 300 MB400 61.5 RHS400x300x6 64.08 4.20%
350 MB400 61.5 RHS400x300x6 64.08 4.20%
400 NPB 450X190X67.15 67.15 RHS500x200x6 64.08 -4.57%
450 NPB 450X190X67.15 67.15 RHS400x300x8 84.62 26.02%
500 NPB 500X200X79.36 79.36 SHS400x400x8 97.18 22.45% 550 NPB 500X200X79.36 79.36 SHS400x400x8 97.18 22.45%
600 NPB 500X200X79.36 79.36 RHS500x300x8 97.18 22.45%
650 MB500 86.9 RHS500x300x8 97.18 11.83% 700 NPB 500X200X107.31 107.31 RHS500x300x10 120.43 12.23%
750 NPB 500X200X107.31 107.31 RHS500x300x10 120.43 12.23%
800 NPB 500X200X107.31 107.31 RHS500x300x10 120.43 12.23% 850 NPB 600X220X107.56 107.56 RHS500x200x14 143.74 33.64%
900 NPB 600X220X107.56 107.56 RHS500x300x14 165.72 54.07%
950 NPB 600X220X107.56 107.56 Hollow sections for these capacities are not available - 1000 NPB 600X220X122.45 122.45 -
Table 1b Open and hollow section required for given bending capacities (LEFF = 4M)
Bending
Capacity
(in kN-m)
LEFF = 4 m
I-section Unit Weight (in
kg/m)
Hollow Section Unit Weight
(in kg/m)
Difference in
Weight
50 MB300 44.2 RHS250x100x6 31.11 -29.62%
100 WPB 200X200X50.92 50.92 SHS220x220x6 39.59 -22.25%
150 MB400 61.5 SHS250x250x6 45.24 -26.44%
200 NPB 450X190X67.15 67.15 RHS350x250x6 54.66 -18.60%
250 NPB 450X190X67.15 67.15 RHS400x200x6 54.66 -18.60%
300 NPB 500X200X79.36 79.36 RHS400x300x6 64.08 -19.25%
350 NPB 500X200X79.36 79.36 RHS500x200x6 64.08 -19.25%
400 NPB 500X200X90.68 90.68 SHS350x350x8 84.62 -6.68%
450 NPB 500X200X107.31 107.31 RHS400x300x8 84.62 -21.14%
500 NPB 500X200X107.31 107.31 SHS400x400x8 97.18 -9.44%
550 NPB 600X220X107.56 107.56 SHS400x400x8 97.18 -9.65%
600 NPB 600X220X107.56 107.56 RHS500x300x8 97.18 -9.65%
650 NPB 600X220X107.56 107.56 RHS500x300x10 120.43 11.97%
700 NPB 600X220X122.45 122.45 RHS500x300x10 120.43 -1.65%
750 WPB 600X300X128.79 128.79 RHS500x300x10 120.43 -6.49%
800 WPB 600X300X128.79 128.79 SHS400x400x12 143.29 11.26%
850 WPB 700X300X149.89 149.89 RHS500x300x14 165.72 10.56%
900 WPB 700X300X149.89 149.89 Hollow sections for these capacities are
not available
-
950 WPB 700X300X149.89 149.89 -
1000 WPB 700X300X149.89 149.89 -
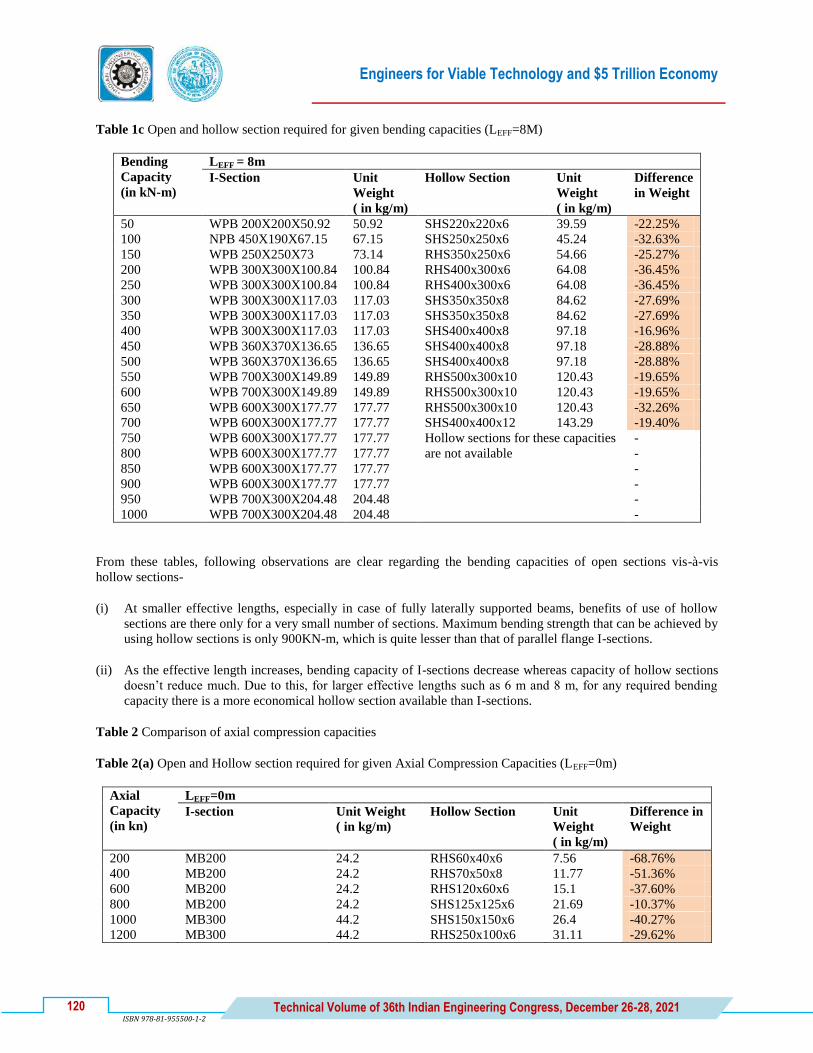
Engineers for Viable Technology and $5 Trillion Economy
120 Technical Volume of 36th Indian Engineering Congress, December 26-28, 2021
ISBN 978-81-955500-1-2
Table 1c Open and hollow section required for given bending capacities (LEFF=8M)
Bending
Capacity
(in kN-m)
LEFF = 8m
I-Section
Unit
Weight
( in kg/m)
Hollow Section
Unit
Weight
( in kg/m)
Difference
in Weight
50 WPB 200X200X50.92 50.92 SHS220x220x6 39.59 -22.25%
100 NPB 450X190X67.15 67.15 SHS250x250x6 45.24 -32.63%
150 WPB 250X250X73 73.14 RHS350x250x6 54.66 -25.27%
200 WPB 300X300X100.84 100.84 RHS400x300x6 64.08 -36.45%
250 WPB 300X300X100.84 100.84 RHS400x300x6 64.08 -36.45%
300 WPB 300X300X117.03 117.03 SHS350x350x8 84.62 -27.69%
350 WPB 300X300X117.03 117.03 SHS350x350x8 84.62 -27.69%
400 WPB 300X300X117.03 117.03 SHS400x400x8 97.18 -16.96%
450 WPB 360X370X136.65 136.65 SHS400x400x8 97.18 -28.88%
500 WPB 360X370X136.65 136.65 SHS400x400x8 97.18 -28.88%
550 WPB 700X300X149.89 149.89 RHS500x300x10 120.43 -19.65%
600 WPB 700X300X149.89 149.89 RHS500x300x10 120.43 -19.65%
650 WPB 600X300X177.77 177.77 RHS500x300x10 120.43 -32.26%
700 WPB 600X300X177.77 177.77 SHS400x400x12 143.29 -19.40%
750 WPB 600X300X177.77 177.77 Hollow sections for these capacities
are not available
-
800 WPB 600X300X177.77 177.77 -
850 WPB 600X300X177.77 177.77 -
900 WPB 600X300X177.77 177.77 -
950 WPB 700X300X204.48 204.48 -
1000 WPB 700X300X204.48 204.48 -
From these tables, following observations are clear regarding the bending capacities of open sections vis-à-vis
hollow sections-
(i) At smaller effective lengths, especially in case of fully laterally supported beams, benefits of use of hollow
sections are there only for a very small number of sections. Maximum bending strength that can be achieved by
using hollow sections is only 900KN-m, which is quite lesser than that of parallel flange I-sections.
(ii) As the effective length increases, bending capacity of I-sections decrease whereas capacity of hollow sections
doesn‟t reduce much. Due to this, for larger effective lengths such as 6 m and 8 m, for any required bending
capacity there is a more economical hollow section available than I-sections.
Table 2 Comparison of axial compression capacities
Table 2(a) Open and Hollow section required for given Axial Compression Capacities (LEFF=0m)
Axial
Capacity
(in kn)
LEFF=0m
I-section
Unit Weight
( in kg/m)
Hollow Section
Unit
Weight
( in kg/m)
Difference in
Weight
200 MB200 24.2 RHS60x40x6 7.56 -68.76%
400 MB200 24.2 RHS70x50x8 11.77 -51.36%
600 MB200 24.2 RHS120x60x6 15.1 -37.60%
800 MB200 24.2 SHS125x125x6 21.69 -10.37%
1000 MB300 44.2 SHS150x150x6 26.4 -40.27%
1200 MB300 44.2 RHS250x100x6 31.11 -29.62%

Engineers for Viable Technology and $5 Trillion Economy
121 Technical Volume of 36th Indian Engineering Congress, December 26-28, 2021
ISBN 978-81-955500-1-2
1400 MB300 44.2 RHS250x150x6 35.82 -18.96%
1600 MB300 44.2 SHS220x220x6 39.59 -10.43%
1800 WPB 200X200X50.92 50.92 SHS250x250x6 45.24 -11.15%
2000 WPB 200X200X50.92 50.92 SHS220x220x8 51.96 2.04%
2200 MB400 61.5 RHS350x250x6 54.66 -11.12%
2400 MB400 61.5 RHS300x200x8 59.5 -3.25%
2600 NPB 450X190X67.15 67.15 RHS300x150x10 65.48 -2.49%
2800 MB450 72.4 RHS400x200x8 72.06 -0.47%
3000 NPB 400X180X75.66 75.66 SHS220x220x12 75.46 -0.26%
3200 NPB 500X200X79.36 79.36 RHS500x200x8 84.62 6.63%
3400 MB500 86.9 RHS500x200x8 84.62 -2.62%
3600 NPB 500X200X90.68 90.68 RHS350x250x10 89.03 -1.82%
3800 WPB 300X300X100.84 100.84 SHS400x400x8 97.18 -3.63%
4000 WPB 300X300X100.84 100.84 RHS300x200x14 99.78 -1.05%
4200 NPB 500X200X107.31 107.31 RHS500x200x10 104.73 -2.40%
4400 WPB 300X300X117.03 117.03 RHS500x300x10 120.43 2.91%
4600 WPB 300X300X117.03 117.03 RHS500x300x10 120.43 2.91%
4800 NPB 600X220X122.45 122.45 RHS500x300x10 120.43 -1.65%
5000 WPB 600X300X128.79 128.79 RHS400x300x12 124.45 -3.37%
5200 WPB 600X300X128.79 128.79 RHS500x300x12 143.29 11.26%
5400 WPB 360X370X136.65 136.65 RHS500x300x12 143.29 4.86%
5600 WPB 700X300X149.89 149.89 RHS500x300x12 143.29 -4.40%
5800 WPB 700X300X149.89 149.89 RHS500x300x12 143.29 -4.40%
6000 WPB 700X300X149.89 149.89 RHS500x300x14 165.72 10.56%
6200 WPB 600X300X177.77 177.77 RHS500x300x14 165.72 -6.78%
6400 WPB 600X300X177.77 177.77 RHS500x300x14 165.72 -6.78%
6600 WPB 600X300X177.77 177.77 RHS500x300x14 165.72 -6.78%
6800 WPB 360X370X182.01 182.01 Hollow sections for these
capacities are not available
-
7000 WPB 360X370X197.65 197.65 -
7200 WPB 360X370X197.65 197.65 -
7400 WPB 360X370X197.65 197.65 -
7600 WPB 700X300X204.48 204.48 -
7800 WPB 700X300X204.48 204.48 -
8000 WPB 600X300X211.92 211.92 -
Table 2b Open and Hollow section required for given Axial Compression Capacities (LEFF=4m)
Axial
Capacity
(in kn)
LEFF = 4m
I-section
Unit Weight
( in kg/m)
Hollow Section
Unit
Weight
( in kg/m)
Difference
in Weight
200 MB300 44.2 SHS100x100x6 16.98 -61.58%
400 MB300 44.2 SHS125x125x6 21.69 -50.93%
600 WPB 200X200X50.92 50.92 SHS150x150x6 26.4 -48.15%
800 WPB 200X200X50.92 50.92 RHS240x120x6 32.05 -37.06%
1000 WPB 200X200X50.92 50.92 RHS250x150x6 35.82 -29.65%
1200 NPB 450X190X67.15 67.15 SHS220x220x6 39.59 -41.04%
1400 WPB 250X250X73 73.14 SHS250x250x6 45.24 -38.15%
1600 WPB 250X250X73 73.14 RHS300x200x6 45.24 -38.15%
1800 WPB 250X250X73 73.14 RHS350x250x6 54.66 -25.27%
2000 WPB 250X250X73 73.14 RHS350x250x6 54.66 -25.27%
2200 WPB 300X300X100.84 100.84 RHS400x300x6 64.08 -36.45%
2400 WPB 300X300X100.84 100.84 RHS400x300x6 64.08 -36.45%
2600 WPB 300X300X100.84 100.84 SHS300x300x8 72.06 -28.54%
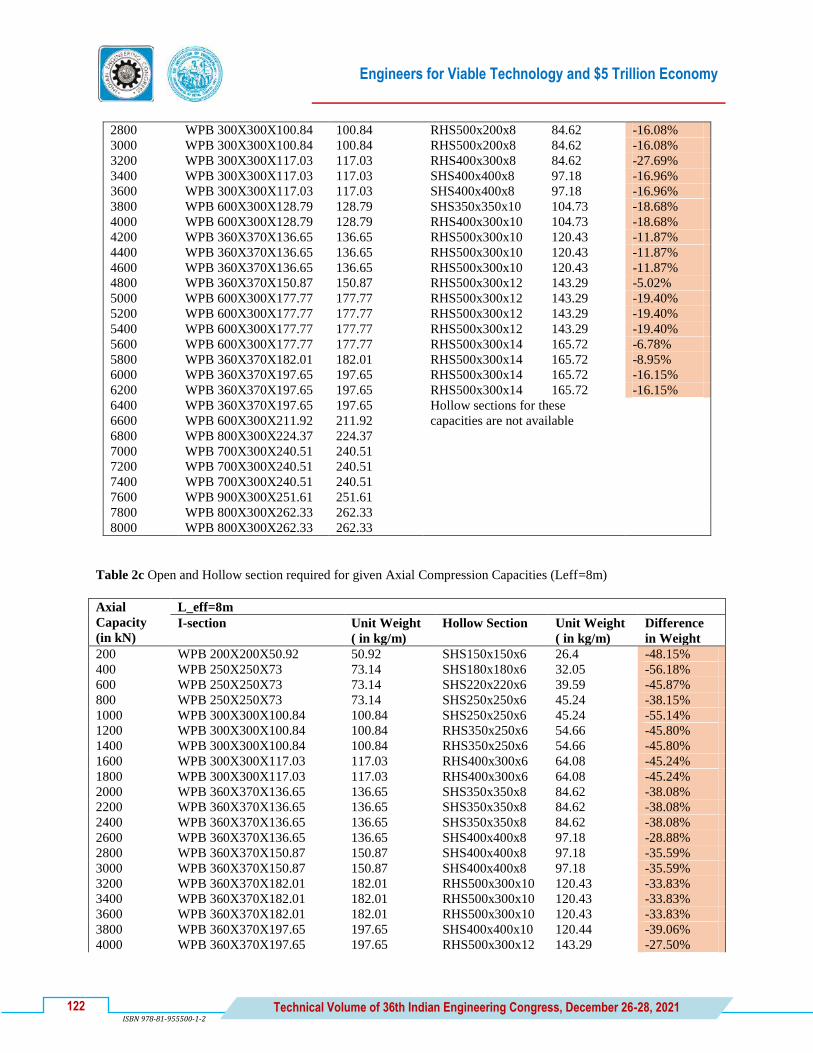
Engineers for Viable Technology and $5 Trillion Economy
122 Technical Volume of 36th Indian Engineering Congress, December 26-28, 2021
ISBN 978-81-955500-1-2
2800 WPB 300X300X100.84 100.84 RHS500x200x8 84.62 -16.08%
3000 WPB 300X300X100.84 100.84 RHS500x200x8 84.62 -16.08%
3200 WPB 300X300X117.03 117.03 RHS400x300x8 84.62 -27.69%
3400 WPB 300X300X117.03 117.03 SHS400x400x8 97.18 -16.96%
3600 WPB 300X300X117.03 117.03 SHS400x400x8 97.18 -16.96%
3800 WPB 600X300X128.79 128.79 SHS350x350x10 104.73 -18.68%
4000 WPB 600X300X128.79 128.79 RHS400x300x10 104.73 -18.68%
4200 WPB 360X370X136.65 136.65 RHS500x300x10 120.43 -11.87%
4400 WPB 360X370X136.65 136.65 RHS500x300x10 120.43 -11.87%
4600 WPB 360X370X136.65 136.65 RHS500x300x10 120.43 -11.87%
4800 WPB 360X370X150.87 150.87 RHS500x300x12 143.29 -5.02%
5000 WPB 600X300X177.77 177.77 RHS500x300x12 143.29 -19.40%
5200 WPB 600X300X177.77 177.77 RHS500x300x12 143.29 -19.40%
5400 WPB 600X300X177.77 177.77 RHS500x300x12 143.29 -19.40%
5600 WPB 600X300X177.77 177.77 RHS500x300x14 165.72 -6.78%
5800 WPB 360X370X182.01 182.01 RHS500x300x14 165.72 -8.95%
6000 WPB 360X370X197.65 197.65 RHS500x300x14 165.72 -16.15%
6200 WPB 360X370X197.65 197.65 RHS500x300x14 165.72 -16.15%
6400 WPB 360X370X197.65 197.65 Hollow sections for these
capacities are not available
6600 WPB 600X300X211.92 211.92
6800 WPB 800X300X224.37 224.37
7000 WPB 700X300X240.51 240.51
7200 WPB 700X300X240.51 240.51
7400 WPB 700X300X240.51 240.51
7600 WPB 900X300X251.61 251.61
7800 WPB 800X300X262.33 262.33
8000 WPB 800X300X262.33 262.33
Table 2c Open and Hollow section required for given Axial Compression Capacities (Leff=8m)
Axial
Capacity
(in kN)
L_eff=8m
I-section
Unit Weight
( in kg/m)
Hollow Section
Unit Weight
( in kg/m)
Difference
in Weight
200 WPB 200X200X50.92 50.92 SHS150x150x6 26.4 -48.15%
400 WPB 250X250X73 73.14 SHS180x180x6 32.05 -56.18%
600 WPB 250X250X73 73.14 SHS220x220x6 39.59 -45.87%
800 WPB 250X250X73 73.14 SHS250x250x6 45.24 -38.15%
1000 WPB 300X300X100.84 100.84 SHS250x250x6 45.24 -55.14%
1200 WPB 300X300X100.84 100.84 RHS350x250x6 54.66 -45.80%
1400 WPB 300X300X100.84 100.84 RHS350x250x6 54.66 -45.80%
1600 WPB 300X300X117.03 117.03 RHS400x300x6 64.08 -45.24%
1800 WPB 300X300X117.03 117.03 RHS400x300x6 64.08 -45.24%
2000 WPB 360X370X136.65 136.65 SHS350x350x8 84.62 -38.08%
2200 WPB 360X370X136.65 136.65 SHS350x350x8 84.62 -38.08%
2400 WPB 360X370X136.65 136.65 SHS350x350x8 84.62 -38.08%
2600 WPB 360X370X136.65 136.65 SHS400x400x8 97.18 -28.88%
2800 WPB 360X370X150.87 150.87 SHS400x400x8 97.18 -35.59%
3000 WPB 360X370X150.87 150.87 SHS400x400x8 97.18 -35.59%
3200 WPB 360X370X182.01 182.01 RHS500x300x10 120.43 -33.83%
3400 WPB 360X370X182.01 182.01 RHS500x300x10 120.43 -33.83%
3600 WPB 360X370X182.01 182.01 RHS500x300x10 120.43 -33.83%
3800 WPB 360X370X197.65 197.65 SHS400x400x10 120.44 -39.06%
4000 WPB 360X370X197.65 197.65 RHS500x300x12 143.29 -27.50%

Engineers for Viable Technology and $5 Trillion Economy
123 Technical Volume of 36th Indian Engineering Congress, December 26-28, 2021
ISBN 978-81-955500-1-2
4200 WPB 600X300X285.47 285.47 RHS500x300x12 143.29 -49.81%
4400 I-sections for these capacities are not available RHS500x300x12 143.29 -
4600 SHS400x400x12 143.29 -
4800 RHS500x300x14 165.72 -
5000 RHS500x300x14 165.72 -
From the tables above, following observations can be made regarding axial compression capacities of hollow section
in comparison to that of I-sections-
(i) At smaller effective lengths, benefits of use of hollow sections are there only for a very small number of
sections. Maximum Axial compressive strength that can be achieved by using hollow sections is only 6600 kN,
which is quite lesser than that of parallel flange I-sections.
(ii) As the effective length increases, compressive strength of I-sections decreases whereas capacity of hollow
sections doesn‟t reduce much. Due to this, for larger effective lengths such as 6m and 8m, for any required
bending capacity there is a more economical hollow section available than I-sections.
As per a study [2], comparison between the required mass of open and hollow sections for a given load and for a
buckling length of 3 m, is presented in Figure 2. It shows that in those cases where loads are small, leading to
lighter (and hence relatively slender) sections from stress point of view, hollow sections provide a great advantage
(considerably lower use of material). However, if loads are heavier, resulting in requirement of heavy sections from
stress considerations, the advantage (in %) will be lower. This is due to the fact that heavier open sections, similar to
hollow sections, have inherently better design properties about minor axis than lighter sections. It means that for a
given length, heavier open sections have lesser slenderness and thus higher allowable strength ratio than lighter open
sections. Thus, if hollow sections are used in place of lighter open sections (e.g., MB200, MB250, MB300 etc.),
reduction in strength due to slenderness can be avoided but same may not be the case for heavy open sections such
as WPB600x300x128 or higher.
Figure 2 Mass required for Open and Hollow Sections for a given load

Engineers for Viable Technology and $5 Trillion Economy
124 Technical Volume of 36th Indian Engineering Congress, December 26-28, 2021
ISBN 978-81-955500-1-2
III. Lesser Requirement of Corrosion Protection
The closed shape without sharp corners reduces the area to be protected and extends the corrosion protection life.
Figure 3 below shows surfaces requiring painting or other corrosion protect in hollow and open sections.
IV. Material and Cost Savings
As explained above, due to better utilization of mass hollow sections exhibit higher strength as compared to open
section of same weight and same effective length and hence result in significant savings in material and cost.
Figure 3 Surfaces requiring painting in hollow and open sections
Although the manufacturing costs of hollow sections are higher than for other sections, leading to higher unit
material cost, but reduction in overall quantity of steel required have resulted in lower overall cost for structure.
In order to establish the actual savings in different types of structure sample design have been performed for T-
supports, Pipe rack and Technological structures; first using conventional open sections or built-up box sections and
then using standard hollow sections. The results of this comparative study are presented below-
T-supports
Comparison presented in Table 3 shows that there is approximately 2.78-11.23% savings in material if hollow
sections are used in place of built-up channel box sections for design of T-supports of various width and height
(Figure 3a)
Pipe Rack
A comparison of Structural steel MTO for a sample Pipe rack (Figure 3b) designed with two above mentioned
section categories is presented in Table 4. It shows that there is approximately 6.27% savings in material if hollow
sections are used in place of conventional open sections.
Technological Structure
A comparison of Structural steel MTO for a sample Technological Structure (Figure 3c) designed with two above
mentioned section categories is presented in Table 5. It shows that there is approximately 14.67% savings in
material if hollow sections are used in place of conventional open sections.

Engineers for Viable Technology and $5 Trillion Economy
125 Technical Volume of 36th Indian Engineering Congress, December 26-28, 2021
ISBN 978-81-955500-1-2
Figure 3 Sample industrial structures selected for study
Table 3 Reduction in MTO for t-supports
T-support details Standard T-support using MC [ ]
section
Standard T-support using
SHS/RHS section
%age
reduction in
weight
Type Width
(mm)
Height
(mm)
Member Total
weight
(kg)
Member
type
Member Total weight
(kg)
A 750 2000 ISMC150[] 92.40 RHS RHS220X140X6 88.28 4.46%
SHS SHS180X180X6 88.22 4.52%
B 750 3000 ISMC200[] 167.25 RHS RHS260X180X6 148.50 11.21%
SHS SHS220X220X6 148.46 11.23%
C 750 4000 ISMC250[] 290.70 RHS RHS300x200x8 280.73 3.43%
SHS SHS250X250X8 282.63 2.78%
D 1500 1500 ISMC150[] 100.80 RHS RHS220X140X6 96.30 4.46%
SHS SHS180X180X6 96.24 4.52%
E 1500 2300 ISMC200[] 169.48 RHS RHS260X180X6 150.48 11.21%
SHS SHS220X220X6 150.44 11.23%
F 1500 3000 ISMC250[] 275.40 RHS RHS300x200x8 265.95 3.43%
SHS SHS250X250X8 267.75 2.78%

Engineers for Viable Technology and $5 Trillion Economy
126 Technical Volume of 36th Indian Engineering Congress, December 26-28, 2021
ISBN 978-81-955500-1-2
Table 4 Reduction in MTO for sample pipe rack
Section Type used in sample pipe rack Steel MTO (in MT) Reduction due to use of hollow sections
Conventional Open sections 104.25 6.27%
Hollow sections 98.16
Table 5 Reduction in MTO for sample technological structure
Section Type used in sample
Technological structure
Steel MTO (in MT) Reduction due to use of hollow sections
Conventional Open sections 210.81 14.67%
Hollow sections 179.90
PROBLEMS IN USE OF HOLLOW SECTIONS
In spite of the benefits listed above, use of hollow sections in industrial structures has been limited by various
factors which are being overtaken by manufacturers and designers both with advancement of technology and domain
knowledge.
Limitations on Availability
Hollow sections are manufactured (and used) in accordance with IS: 4923 (Hollow Steel Sections for Structural
Use), by either Seamless or Hot finished welded or Electric resistance or induction welded process. So far hollow
sections in India have been available for very small sections sizes. Reason being that use of hollow section for
structural purposes is governed by IS 4923 which included structural properties of members up to 108 mm x 180
mm and 172 mm x 92 mm only. With new IS 4923-2017, hollow section up to 400 mm x 400 mm and 500 mm x
300 mm size have been incorporated and large hollow section sizes are now being manufactured. Still, there is need
for even larger sections as heavy industrial structures in hydrocarbon sector require the rolled sections even up to
WPB 900 x 300 x 291, in order to support large equipments and to satisfy stringent design criteria applicable to
them.
Other aspect of availability limitation is that even though hollow sections are being manufactured in a larger
spectrum of sizes but the same are not available in market very easily especially if the quantity required for a
particular section size is small. However, this is being taken care of by manufactures by establishing manufacturing
units all across the country, strengthening distribution network and upgrading rolling process to ensure easy changes
in process for producing any section size as per order. Further designers are also ensuring to limit the number of
sections used in design to the minimum to avoid generating demand for large number of sections with small
quantities.
Limitation on Bending Capacity
Though axial capacities of SHS or RHS are substantial, flexural capacities of these sections are not so impressive,
resulting in hindrance of its global usage in all structures, which is required for heavily loaded elements for strength
& serviceability requirements.
Limitation on Use for Certain Type of Members Only
Hollow sections (especially SHS sections) have similar properties about both the axis. This property is useful for
members carrying axial and bending stresses. However in case of purely bending members, such as beams of
operating floors etc, minor axis strength is not that much of importance due to presence plane bracing. In such cases,
SHS sections usually are in fact a wrong choice of section type. RHS section can be a better choice for such
members depending on the unsupported length of compression flange.

Engineers for Viable Technology and $5 Trillion Economy
127 Technical Volume of 36th Indian Engineering Congress, December 26-28, 2021
ISBN 978-81-955500-1-2
Limitation due to Connection Detailing
These sections being closed from all sides, application of stiffener plates, at the point of stress concentration, such as
beam-column junctions (Figure 4a), equipment supporting members etc. are not possible. There are studies being
done to use external stiffeners at stress concentration points (Figure 4b) however this makes connection very
cumbersome and unaesthetic. This discourages the usage of these sections for such applications.
Figure 4 Connection in hollow sections
CONCLUSION
So far, use of hollow sections in large industrial structures has been limited to bracing and tie members only and
thus percentage of hollow sections in total weight of steel used in structures is approximately 7-10% only. Major
limitation in using hollow sections as main members is the scarcity of connection detailing for hollow sections when
used as beams and columns especially in a moment frames. Based on feedback from industry, prominent hollow
section manufacturers have started joint efforts with educational and research institutes for development of standard
details for various type of connections used in hydrocarbon industry. Once such details are finalized and
successfully adopted, use of hollow sections is expected to rise rapidly.
REFERENCES
1. https://skyciv.com/technical/benefits-of-different-steel-sections/
2. Hollow sections in Structural applications by Prof. Dr. J. Wardenier, Delft University of Technology,
Netherlands.


Engineers for Viable Technology and $5 Trillion Economy
129 Technical Volume of 36th Indian Engineering Congress, December 26-28, 2021
ISBN 978-81-955500-1-2
CV_057_13_225
Effective Utilization of Rolled Sections in Hydrocarbon Plant
Structures
Papia Mandal*, K Madhavilatha and Anurag Sinha
Structural Division, Engineers India Limited, Gurugram Complex, Gurugram, Haryana
*email: [email protected]
Abstract: “Make in Steel” strategy is one of the core contributor to take India towards $5-trillion economy goal.
Hydrocarbon industry is one of the major sectors, where structural steel consumption is substantial. Along with the
growth of the nation, capacities of refineries and petrochemicals are also growing noticeably and thereby
demanding variety of structural steel rolled sections in huge quantity. Age-old vicious cycle of demand-supply is
continuing to be unbeatable for rolled sections as well. In past few years, manufacturers have geared up to produce
more variety of sections. Though it is fascinating for the structural engineers to have more options, tradeoff between
various sections becomes difficult; moreover ordering process and inventory management get more stringent for
both of the contractors and manufacturers. Various structural components have a particular pattern of axial force
and bending moment carrying mechanism; by deep understanding of the same and mapping certain types of rolled
sections along with a specific types of structural components, sections can be effectively utilized and variety of
sections can be reduced thereof. This paper aims at reducing variety of structural steel rolled sections, by effective
utilization of axial and bending capacities of the sections, particularly for structures associated with hydrocarbon
industry.
Keywords: Structural Steel; Rolled Section; Axial Capacity; Bending Capacity; Hydrocarbon Industry
INTRODUCTION
Steel has a crucial role in India‟s growth and the journey towards $5-trillion economy goal. Structural steel being a
subset of total steel consumption of the nation, increase of its usage is equally important. Major component of
Refinery and petrochemical plants are built in structural steel, thereby hydrocarbon industries are significant
contributors towards economic growth of India.
Structural steel rolled sections are primarily used in the structures of hydrocarbon plants. Leading steel
manufacturers are evolving continuously in terms of introducing variety of rolled sections and also structural steel
grades to expand its base and facilitate its usage. Though enlistment of numerous sections and their huge variety in
the manufacturer‟s catalogue fascinates structural engineers, tradeoff between various sections sizes becomes
precarious decision. Moreover, too many varieties of sections cause bottlenecking of the ordering process and
inventory management down the line.Certain rolled sections perform well under axial load than under bending
moment; whereas the other set of sections show better performance against bending moment than axial load. Also,
various components of a structure have a particular pattern in terms of their load transferring mechanism. Rolled
sections can be effectively utilized when these two aspects namely section‟s predominant capacity and structural
component‟s load transferring pattern are mapped properly. Thus, reducing the variety of sections for usage in
structures associated with hydrocarbon industry. Though there isa paper available onselection of parameter for I-
beam [1], abovementioned aspects is not covered in the study.
The aim of this paper is to reduce the variety of rolled steel sections by shortlisting them on the basis of their
predominant axial and bending capacity and by effective utilization in various structural components.

Engineers for Viable Technology and $5 Trillion Economy
130 Technical Volume of 36th Indian Engineering Congress, December 26-28, 2021
ISBN 978-81-955500-1-2
STUDY DESIGN
Process units of refinery and petrochemical plantsprimarily have three types of major structures.Depending on the
capacity of the process units, size of the below mentioned structures may vary; however, configuration remains the
same.
Type-I: Pipe racks are the structures that carry all process and utility pipes throughout the process units. Various
components (Figure 1) of a pipe rack are (a) column, (b) portal beam, (c) longitudinal beam and (d)
horizontal/vertical bracing.
Portal beams and columns are connected through moment connections whereaslongitudinal beams and the
vertical bracings are connected to the columns through shear connections. All the pipes are supported
over the portal beams.
Type-II: Technological structures are the structures that support various equipments, pipes, valves and
occasionally air-fin coolers.Various components (Figure 1) of technological structures are (a) column, (b)
portal beam, (c)longitudinal beam, (d) equipment supporting beam, (e) horizontal/vertical bracing.
Grating supporting beams being nominal in quantities shall not form part of this study.
Type-III: Compressor sheds, as the name suggest are for housing compressors along with EOT cranes for removal
of part of the motors. Various components (Figure 1) of compressor sheds are (a) laced twin column, (b)
portal column, (c) portal beam, (d) longitudinal beam-1 (with moment connection at the level of twin
column) (e) longitudinal beam-2 (with shear connection at the level of portal column, (f)
horizontal/vertical bracing. (g) Crane girder.
Percentage utilization in axial and bending for the abovementioned components of various structures are
tabulated (Table 1) and the percentages are mentioned against utilization factor. Range of rolled
structural steel sections namely NPB and WPB are selected for detailed study of their axial and bending
capacities. Bending capacities,maximum and corresponding to lateral torsional buckling(LTB) length of
1.5 m, 3 m and 4m for the selected NPB and WPB sections aretabulated (Table 2); maximum and
minimum (LTB length=4m) bending capacities are plotted for NPB400 to NPB600 and WBP200 to
WPB360 against weight (Figure 2); bending capacities for WPB600 to WPB900 are plotted (Figure 3)
separately. Similarly, axial capacities for the selected NPB and WPB sections are tabulated (Table 3)
andplotted for NPB400 to NPB600 and WBP200 to WPB360 against weight (Figure 4); axial capacities
for WPB600 to WPB900 are plotted (Figure 5) separately.
RESULT AND DISCUSSION
A: Structural Component Wise Axial & Bending Capacity Utilization Factor
From the utilization factors mentioned in Table 1, it is evident that some of the components predominantly behave
as bending members; e.g. portal beams of pipe racks; portal beams and equipment supporting beams of
technological structures; portal columns, portal beams, longitudinal beams-1 of compressor sheds etc. Similarly
some of the components predominantly behave as axial members; e.g. longitudinal beams, horizontal/vertical
bracing of pipe racks; longitudinal beams, horizontal/vertical bracing of technological structures; individual section
of laced twin columns, longitudinal beams-2, horizontal/vertical bracing of compressor sheds etc. Few of the
components such as columns behave as combined bending and axial members.
Refer Table 2, maximum bending capacities to weight ratio for NPB sections (67.2-154.5kg/m) varies from 0.5-0.7
(T-m)/(kg/m), whereas for WPB sections with similar weight (50.9-197.7kg/m) varies from 0.2-0.4. Refer Fig. 2,
maximum bending capacities of NPB sections (67.2–154.5kg/m)vs. weight is represented in Curve-IA and WPB
sections (50.9– 197.7kg/m) is represented in Curve-IB. Slope of the best fit line of Curve-IA is steeper than that of
curve-IB. From the slope of the best fit lines of these two curves, it is evident that, for same weight, NPB sections
give more bending capacities than WPB sections, or NPB sections are more effective in bending than WPB sections
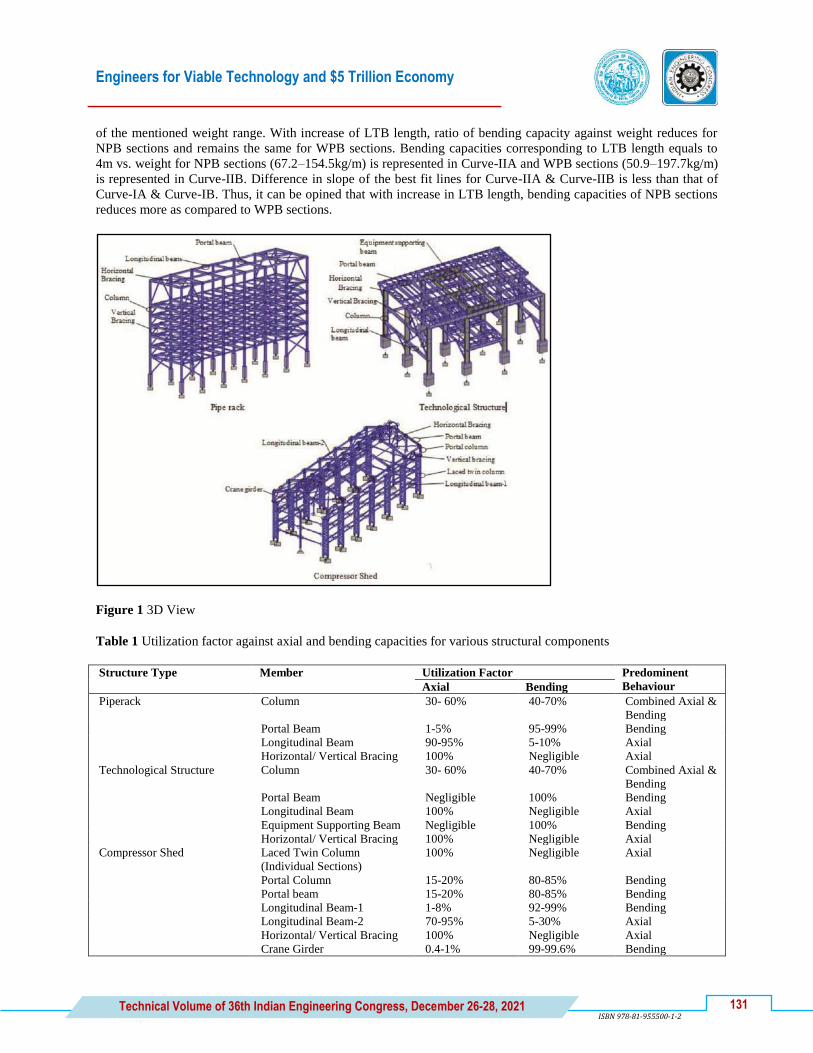
Engineers for Viable Technology and $5 Trillion Economy
131 Technical Volume of 36th Indian Engineering Congress, December 26-28, 2021
ISBN 978-81-955500-1-2
of the mentioned weight range. With increase of LTB length, ratio of bending capacity against weight reduces for
NPB sections and remains the same for WPB sections. Bending capacities corresponding to LTB length equals to
4m vs. weight for NPB sections (67.2–154.5kg/m) is represented in Curve-IIA and WPB sections (50.9–197.7kg/m)
is represented in Curve-IIB. Difference in slope of the best fit lines for Curve-IIA & Curve-IIB is less than that of
Curve-IA & Curve-IB. Thus, it can be opined that with increase in LTB length, bending capacities of NPB sections
reduces more as compared to WPB sections.
Figure 1 3D View
Table 1 Utilization factor against axial and bending capacities for various structural components
Structure Type Member Utilization Factor Predominent
Behaviour Axial Bending
Piperack Column 30- 60% 40-70% Combined Axial &
Bending
Portal Beam 1-5% 95-99% Bending
Longitudinal Beam 90-95% 5-10% Axial
Horizontal/ Vertical Bracing 100% Negligible Axial
Technological Structure Column 30- 60% 40-70% Combined Axial &
Bending
Portal Beam Negligible 100% Bending
Longitudinal Beam 100% Negligible Axial
Equipment Supporting Beam Negligible 100% Bending
Horizontal/ Vertical Bracing 100% Negligible Axial
Compressor Shed Laced Twin Column
(Individual Sections)
100% Negligible Axial
Portal Column 15-20% 80-85% Bending
Portal beam 15-20% 80-85% Bending
Longitudinal Beam-1 1-8% 92-99% Bending
Longitudinal Beam-2 70-95% 5-30% Axial
Horizontal/ Vertical Bracing 100% Negligible Axial
Crane Girder 0.4-1% 99-99.6% Bending

Engineers for Viable Technology and $5 Trillion Economy
132 Technical Volume of 36th Indian Engineering Congress, December 26-28, 2021
ISBN 978-81-955500-1-2
Table 2 Bending capacities vs. weight for NPB & WPB sections
Section Names WT.
kg/m
Md_max
T-m
Md/
Wt.
Md_1.5m
T-m
Md_1.5m/
Wt.
Md_3m
T-m
Md_3m/
Wt.
Md_4m
kN-m
Md_4m/
Wt.
NPB450X190X67.2 (a) 67.2 34.0 0.5 32.5 0.5 28.3 0.4 24.0 0.4
NPB400X180X75.7 (b) 75.7 34.1 0.5 32.6 0.4 28.5 0.4 24.6 0.3
NPB500X200X79.4 (c) 79.4 44.2 0.6 42.6 0.5 37.5 0.5 32.3 0.4
NPB500X200X90.7 (d) 90.7 49.9 0.5 47.9 0.5 42.2 0.5 36.5 0.4
NPB450X190X92.4 (e) 92.4 46.5 0.5 44.6 0.5 39.4 0.4 34.5 0.4
NPB500X200X107.3 (f) 107.3 59.4 0.6 57.2 0.5 50.9 0.5 44.9 0.4
NPB600X220X107.6 (g) 107.6 71.4 0.7 69.2 0.6 62.2 0.6 55.1 0.5
NPB600X220X122.5 (h) 122.5 79.8 0.7 77.3 0.6 69.2 0.6 61.3 0.5
NPB600X220X154.5 (i) 154.5 101.6 0.7 98.6 0.6 89.4 0.6 80.9 0.5
WPB200X200X50.9 (j) 50.9 11.9 0.2 11.6 0.2 10.8 0.2 10.1 0.2
WPB250X250X73 (k) 73.1 22.2 0.3 21.9 0.3 20.7 0.3 19.7 0.3
WPB250X250X103.9 (l) 103.9 32.6 0.3 32.3 0.3 30.7 0.3 29.7 0.3
WPB300X300X100.8 (m) 100.8 36.0 0.4 35.9 0.4 34.3 0.3 33.1 0.3
WPB300X300X117.0 (n) 117.0 42.5 0.4 42.4 0.4 40.5 0.3 39.2 0.3
WPB360X370X136.7 (o) 136.7 59.2 0.4 59.2 0.4 57.4 0.4 55.8 0.4
WPB360X370X150.9 (p) 150.9 66.0 0.4 66.0 0.4 64.0 0.4 62.4 0.4
WPB300X300X182.0 (q) 182.0 80.4 0.4 80.4 0.4 78.1 0.4 76.2 0.4
WPB360X370X197.7 (r) 197.7 87.7 0.4 87.7 0.4 85.3 0.4 83.3 0.4
WPB600X300X128.8 (a‟) 128.8 82.3 0.6 81.5 0.6 76.5 0.6 72.1 0.6
WPB700X300X149.9 (b‟) 149.9 110.0 0.7 108.7 0.7 101.7 0.7 95.4 0.6
WPB600X300X177.8 (c‟) 177.8 121.6 0.7 120.9 0.7 114.6 0.6 109.6 0.6
WPB700X300X204.5 (d‟) 204.5 159.8 0.8 158.7 0.8 149.9 0.7 142.9 0.7
WPB600X300X211.9 (e‟) 211.9 146.0 0.7 145.3 0.7 138.0 0.7 132.4 0.6
WPB800X300X224.4 (f‟) 224.4 197.7 0.9 196.0 0.9 184.6 0.8 175.1 0.8
WPB700X300X240.5 (g‟) 240.5 189.3 0.8 188.6 0.8 178.0 0.7 170.2 0.7
WPB900X300X251.6 (h‟) 251.6 245.7 1.0 243.2 1.0 228.6 0.9 216.1 0.9
WPB800X300X262.3 (i‟) 262.3 232.5 0.9 230.5 0.9 217.5 0.8 207.1 0.8
WPB600X300X285.5 (j‟) 285.5 199.4 0.7 198.6 0.7 189.5 0.7 183.1 0.6
WPB900X300X291.5 (k‟) 291.5 286.0 1.0 283.2 1.0 266.6 0.9 252.9 0.9
WPB700X300X300.7 (l‟) 300.7 239.5 0.8 238.2 0.8 226.4 0.8 217.7 0.7
WPB800X300X317.4 (m‟) 317.4 283.8 0.9 281.7 0.9 266.8 0.8 255.2 0.8
Figure 2 Weight vs. Bending Capacity for NPB400-600 & WPB200-360
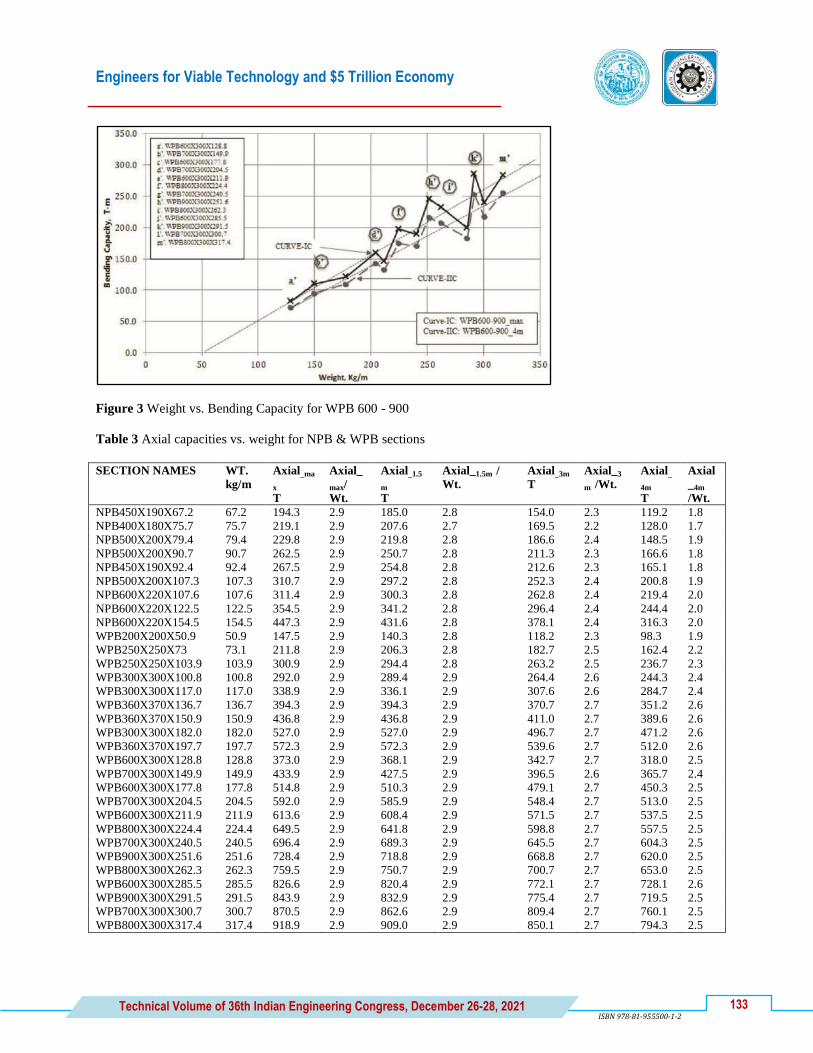
Engineers for Viable Technology and $5 Trillion Economy
133 Technical Volume of 36th Indian Engineering Congress, December 26-28, 2021
ISBN 978-81-955500-1-2
Figure 3 Weight vs. Bending Capacity for WPB 600 - 900
Table 3 Axial capacities vs. weight for NPB & WPB sections
SECTION NAMES WT.
kg/m
Axial_ma
x
T
Axial_
max/
Wt.
Axial_1.5
m
T
Axial_1.5m /
Wt.
Axial_3m
T
Axial_3
m /Wt.
Axial_
4m
T
Axial
_4m
/Wt.
NPB450X190X67.2 67.2 194.3 2.9 185.0 2.8 154.0 2.3 119.2 1.8
NPB400X180X75.7 75.7 219.1 2.9 207.6 2.7 169.5 2.2 128.0 1.7
NPB500X200X79.4 79.4 229.8 2.9 219.8 2.8 186.6 2.4 148.5 1.9
NPB500X200X90.7 90.7 262.5 2.9 250.7 2.8 211.3 2.3 166.6 1.8
NPB450X190X92.4 92.4 267.5 2.9 254.8 2.8 212.6 2.3 165.1 1.8
NPB500X200X107.3 107.3 310.7 2.9 297.2 2.8 252.3 2.4 200.8 1.9
NPB600X220X107.6 107.6 311.4 2.9 300.3 2.8 262.8 2.4 219.4 2.0
NPB600X220X122.5 122.5 354.5 2.9 341.2 2.8 296.4 2.4 244.4 2.0
NPB600X220X154.5 154.5 447.3 2.9 431.6 2.8 378.1 2.4 316.3 2.0
WPB200X200X50.9 50.9 147.5 2.9 140.3 2.8 118.2 2.3 98.3 1.9
WPB250X250X73 73.1 211.8 2.9 206.3 2.8 182.7 2.5 162.4 2.2
WPB250X250X103.9 103.9 300.9 2.9 294.4 2.8 263.2 2.5 236.7 2.3
WPB300X300X100.8 100.8 292.0 2.9 289.4 2.9 264.4 2.6 244.3 2.4
WPB300X300X117.0 117.0 338.9 2.9 336.1 2.9 307.6 2.6 284.7 2.4
WPB360X370X136.7 136.7 394.3 2.9 394.3 2.9 370.7 2.7 351.2 2.6
WPB360X370X150.9 150.9 436.8 2.9 436.8 2.9 411.0 2.7 389.6 2.6
WPB300X300X182.0 182.0 527.0 2.9 527.0 2.9 496.7 2.7 471.2 2.6
WPB360X370X197.7 197.7 572.3 2.9 572.3 2.9 539.6 2.7 512.0 2.6
WPB600X300X128.8 128.8 373.0 2.9 368.1 2.9 342.7 2.7 318.0 2.5
WPB700X300X149.9 149.9 433.9 2.9 427.5 2.9 396.5 2.6 365.7 2.4
WPB600X300X177.8 177.8 514.8 2.9 510.3 2.9 479.1 2.7 450.3 2.5
WPB700X300X204.5 204.5 592.0 2.9 585.9 2.9 548.4 2.7 513.0 2.5
WPB600X300X211.9 211.9 613.6 2.9 608.4 2.9 571.5 2.7 537.5 2.5
WPB800X300X224.4 224.4 649.5 2.9 641.8 2.9 598.8 2.7 557.5 2.5
WPB700X300X240.5 240.5 696.4 2.9 689.3 2.9 645.5 2.7 604.3 2.5
WPB900X300X251.6 251.6 728.4 2.9 718.8 2.9 668.8 2.7 620.0 2.5
WPB800X300X262.3 262.3 759.5 2.9 750.7 2.9 700.7 2.7 653.0 2.5
WPB600X300X285.5 285.5 826.6 2.9 820.4 2.9 772.1 2.7 728.1 2.6
WPB900X300X291.5 291.5 843.9 2.9 832.9 2.9 775.4 2.7 719.5 2.5
WPB700X300X300.7 300.7 870.5 2.9 862.6 2.9 809.4 2.7 760.1 2.5
WPB800X300X317.4 317.4 918.9 2.9 909.0 2.9 850.1 2.7 794.3 2.5

Engineers for Viable Technology and $5 Trillion Economy
134 Technical Volume of 36th Indian Engineering Congress, December 26-28, 2021
ISBN 978-81-955500-1-2
Figure 4 Weight vs. Axial Capacity for NPB 400 – 600 & WPB 200 - 360
Figure 5 Weight vs. Axial Capacity for WPB 600 - 900
B: Bending Capacities of NPB & WPB Sections - Maximum and against Various LTB Lengths
Refer Curve-IA of Figure 2, sections above best fit line, as represented by point “a”, “c”, “g” and “h” have better
bending capacity to weight ratio than rest of the sections. Sections represented by points “d” and “i” are lying over
the best fit line, ratio of maximum bending capacity to weight ratio of NPB500x200x90.7, represented by point “d”
is 0.5 (T-m)/(kg/m), whereas the same ratio of NPB500x200x79.4, represented by point “c” is 0.6 (T-m)/(kg/m); so
for the same depth 500 mm and same flange width 200mm, utilization of NPB500x200x79.4 in bending capacity is
better than that of NPB500x200x90.7.However, from Curve-IB, WPB sections represented by points are near to the
best fit line, so in this range most of the WPB sections are more or less similar in terms of utilization.

Engineers for Viable Technology and $5 Trillion Economy
135 Technical Volume of 36th Indian Engineering Congress, December 26-28, 2021
ISBN 978-81-955500-1-2
In reference to Curve-IC of Figure 3, WPB sections represented by points b‟, d‟, f‟, h‟, i‟, k‟ are lying above the
best fit line, and therefore, they are utilized better than the rest of the sections in terms of bending capacity
w.r.t.weight. WPB 900x300x291.5, represented by point k‟ is having more bending capacity as compared to WPB
800x300x317.4, though the weight of earlier section is less than that of the later. Thus, WPB 800x300x317.4 is not
effective in terms of its utilization in bending capacity. Also, slopes of the best fit lines of the Curves-IC & IIC are
almost similar; therefore, it is clear that bending capacities of this range of WPB sections do not reduce much as
compared to their maximum capacities up to LTB length of 4m and thus the sections are well utilized for this length.
For higher LTB lengths further study can be done to understand the utilization.
C: Axial capacities of NPB & WPB Sections - Maximum and against Various Unsupported Lengths
Refer Table 3, though maximum axial capacities for NPB400 to 600 sections and WPB200 to 360 sections with
similar weight rangevaries, axial capacities of NPB sections for higher unsupported length, say 4m are quite less
than that of WPB sections. Thus, it is evident that, WPB sections are better for axial members than NPB sections.
Refer Figure 4, difference in slope of Curve-IIIA and IVA is much more than that of Curve-IIIB and IVB.
Therefore, it is evident that utilization of WPB sections against axial capacity is much better than NPB sections.
Figure 5 also depicts similar pattern for WPB600 to 900 sections.
However, in case of axial capacity, all the sections of NPB and WPB for the mentioned range of weights have
uniform efficiency in terms of axial capacity w.r.t. weight.
CONCLUSION
On the concluding note, findings from the present study can be summarized as below –
1. NPB400 to 600 sections (67.2-154.5kg/m) are more efficient as bending member than as axial member,
especially for LTB length up to 3 to 4m. Thus, they may be better utilized as portal beams of lightweight pipe
racks,portal beams and equipment supporting beams of lightweight technological structures; portal beams,
columns, and longitudinal beams at twin column level.
2. WPB200 to 360 sections (50.9-197.7kg/m) are more efficient as axial member than as bending member.Thus,
they may be better utilized as longitudinal beams in braced frame directions for pipe racks, technological
structures and compressor sheds. These sections are also effective as bending members for LTB length more
than 4m; thus they may also be effectively used for beams where the same cannot be laterally restraint up to
4m.
3. For column of lightly loaded piperack or technological structures, any of the abovementioned sections may be
used based on actual predominant behavior either axial or bending. Laced twin column of the compressor
sheds being almost restraint against LTB, any of the NPB or WPB section based on actual requirement of axial
capacity may be used.
4. WPB600 to 900sections (128.8-317.4kg/m)are efficient as bending as well as axial member; thus may be
effectively used as portal beams, columns, equipment supporting beams etc.
5. For horizontal/vertical bracings, some small sizes of WPB sections may be used, though angle sections and
square hollow sections (SHS) are more effective for the same. However, angle and SHS sections are not in the
purview of this paper, separate study may be carried out in similar line for these sections.
6. Few sections are more efficient in terms of their utilization in bending or axial capacities w.r.t.weight than
other sections, those sections may be shortlisted at the onset of any projects based on nature and size of process
units, so as facilitate ordering and inventory management by means of reduction in variety.

Engineers for Viable Technology and $5 Trillion Economy
136 Technical Volume of 36th Indian Engineering Congress, December 26-28, 2021
ISBN 978-81-955500-1-2
This study, thus suggests a concept, which may be adopted for other industries as well. However, values mentioned
here are relevant for this case study only and the same should not be used for otherareas withoutanalytical backup.
REFERENCES
1. Alexander R. Tusnina, Milan Prokica, “Selection of parameters for I-beam experimental model subjected to
bending and torsion” - XXIV R-S-P seminar, Theoretical Foundation of Civil Engineering (24RSP) (TFoCE
2015)

Engineers for Viable Technology and $5 Trillion Economy
137 Technical Volume of 36th Indian Engineering Congress, December 26-28, 2021 ISBN 978-81-955500-1-2
CV_060_15_153
Tomographic Image based Pavement Condition Assessment
using Machine Learning Approach
Aradhana Rajeshkumar Chavan, Sunil Pimplikar and Ashlesha Deshmukh*
Department of Civil Engineering, MIT World Peace University, Kothrud, Pune, Maharashtra
*email: [email protected]
Abstract: Tomography is a new nondestructive concrete pavement diagnostic tool that may be utilized for better
quality assurance and control during construction as well as to aid in rehabilitation decision-making. Pavement
condition evaluation gives data that may be used to economical judgments about its maintenance. Surveys are
carried out with the help of high-end vehicles or on-the-ground processes to calculate distress on pavement. As this
system is man-dependent, it tends to be dangerous, less efficient and costly. Photos of road to be used for
determining distress is yet a challenge to be solved. Researchers have been able to construct strong techniques for
evaluating pavement tomographic pictures with remarkable accuracies because to recent advances in machine
learning. Machine learning algorithms, on the other hand, require a large ground truth dataset, which is typically
unavailable in the pavement field. Pictures from the Mumbai-Pune highway and Dehu road were manually removed
and tagged for categorization, resulting in a large number of Google street-view images. The model was then
trained using the labelled dataset of Indian roads using the YOLO (you only look once) machine learning
framework. The model is used in this study to categorize the distresses and estimate their intensity at the same time.
Indicators for determining pavement conditions are created for distress categorization segmentation and distress
densification utilizing the YOLO machine learning framework using machine learning techniques. These outcomes
are used to create a complete tool for pavement monitoring that assigns a score to each pavement Tomographic
picture based on the kind and intensity of the distressed part. Thus, human intervention is restricted. This study
might be useful in evaluating pavement conditions over time and assisting in making informed judgments for road
restoration or rebuilding at the appropriate time.
Keywords: Tomographic Images; Pavement Condition; Machine Learning; YOLO; Accuracy Index1.
INTRODUCTION
In the construction sector, quality may endeavor to meet different consumer expectations despite shifting dynamics
[1]. As the consumers become conscious regarding the quality, the construction firms are aggressively seeking to
adopt high quality to ensure long-term viability [2]. Quality assurance (QA) is usedalong with total quality
management (TQM) in construction business for quality management systems (QMS) according to Lau and Tang
[3]. TQM is a culture that prioritizes customer satisfaction above constant improvement and innovation across the
whole company process [4]. TQM make it possible to improve the satisfaction levels of the customer, enhances
productivity and qualityand healthy environment for competition according to Jaeger and Adair [5].
The building sector has long struggled to achieve acceptable quality standards. Each year, lot of resources are
wasted due to lack of good quality management methods. TQM ideas, originally employed in Japan and more
recently in the USA, have improved productivity, reduced the cost, and improved dependability in the
manufacturing business. These ideas may be used to the building business as well. During the 1970s, for example,
Japanese construction businesses began applying TQM, based on the experiences of Japanese manufacturers.
Despite the fact that building is a creative, once-in-a-lifetime activity, the Japanese construction sector adopted
TQM ideals that some believed were only applicable to mass manufacturing.

Engineers for Viable Technology and $5 Trillion Economy
138 Technical Volume of 36th Indian Engineering Congress, December 26-28, 2021
ISBN 978-81-955500-1-2
Figure 1 Quality Control Evolution
Definition of Quality
The quality of a project is described as meetings its functions and legal standards along with its aesthetics. The
project requirements are expressed based on expectations from it. Quality is said to be good if the work carried out
meets these expectations.
An efficient pavement management system (PMS) can be developed by identifying the distress on the pavement
which gives in-depth analysis of its condition. Thus, economical and constructive decisions may be taken for its
management. As the system for distress identification is man-dependent, it tends to be dangerous, less efficient and
costly.
Benefits of TQM using Pavements model in the construction industry:Benefits of TQM in construction business are:
Achievement of consistency throughout project.
Enhanced control over all processes.
Reduced cycle time for construction.
Less losses.
The time it takes to get to the location has been cut in half.
Chemical spillage is reduced.
Increased performance measurement and improved consumer views of the business.
Gives the predication of unnecessary incident.
LITERARURE REVIEW
Following section discuss the overall review of related work related to TQM,
Arash Hosseini, et al, 2019, This paper deals with different Quality control indicators for long-term performance of
pavements. Geo-relational data base of in-service pavement is created and then linked with quality indicators and
long-term performance. Methodology adopted is 1. Data collection, 2. Production quality data, 3. A dataset of 30
projects for about two hundred miles is used for performance analysis. The segments used are: alligator, transverse
Engineers for Viable Technology and $5 Trillion Economy
139 Technical Volume of 36th Indian Engineering Congress, December 26-28, 2021 ISBN 978-81-955500-1-2
and rutting types of cracks along with longitudinal cracking. And to quantify this DI (Deterioration index) is
calculated (DI=416.1X^0.02875-383.7).
The goal of this study is to link pavement performance at a specific area to individual data points collected during
the mix manufacture and building stages. A total of 30 pavements were used to create 101 test sections. The
resistance of HMA mixtures containing 12.5mm NMAS to rutting and alligator cracking is investigated.
Abhay Tawalare, et al 2016, This paper deals with PPI for rural roads which is useful for further development of
rural areas. Because funding resources for rural road maintenance are limited, there is always a decision-making
tool. Many parameters are considered in this paper which will be useful for PMGSY field engineers.In totality,
twenty-two PD parameters were identified and out of which only necessary parameters were selected through expert
opinions and these experts were having more than 25years of experience in rural road construction. A questionnaire
was created to determine the severity of each characteristic contributing to rural road deterioration on a scale of 10
to 100 percent, and it was delivered to all district officials. 117 responses were received. And this data was analyzed
and weightage of each was used to find PPI i.e Pavement Performance Index and validation was done.
The model is built on a priority ranking model, and it is the result of multiplying each degrading parameter's rating
and weightage. A distress survey may be used to establish a rating for each. Validation revealed a PPI of 3.746,
indicating that pavement performance in April 2015 was satisfactory. PMGSY field engineers will benefit greatly
from this concept. PPI may also be used to generate a priority list of rural roads in need of repair and upkeep.
Aman A et al,2016, A Hidden Markov Model (HMM) based framework for dealing with expectations of customers
is formed in this paper. It utilizes house of quality for generating future requirements. The QFD make the decisions
for pavement maintenance based on HMM. Data was collected and was in the form of pie charts and this data was
marked in three categories namely High with 5, Medium with 3, and Low with 1 weightage. Socio-economic, safety,
maintenance efficiency and environment are considered the main parameters.Further non-stationary hidden Markov
model can be used for improvement, along with this uncertainties model can also be prepared. Also, advanced
modelling techniques will be required for vast amount of computer programming and simulation.
Umesh Sahoo et al; 2014, This report is on rural roads, specifically 19 rural roadtest-sections are considered for
performance study.Roughness and rutting are considered as main factors in varying traffic conditions. Here
conditions used were tenth was kept shorter for better results considering minimum length limit upto 200m
suggested by Cundil(1996) for roughness measurement. Herea NDT method of FWD(falling head deflectometer) is
commonly used. The defection data is used to back calculate the layer moduli. Other parameters considered are as
suggested in the previous study like rutting, raveling and cracking which form potholes and depressions. Pavement
layer composition were also studied.
Research Problem
• The conventional method of evaluating project bids, which places the most focus on price and gives less
weight to prior expertise, present workload, and reputation for quality.
• Determining the state of a pavement is critical in determining the type and scope of repairs that should be made
to the road in order to provide the necessary level of service to vehicle traffic.
• Efficient design and preservation of drains is necessary for main road especially in the mountains and heavy
rain areas.
• TQM implementation for long term, particularly in the construction sector, causes a big issue.
• A lack of understanding and information on TQM.
• Heavy traffic, axle load, and a water-logged location are the main causes of distress.
• The occurrence of the pavement condition under evaluation in the Critical PCI Range does not require its
immediate restoration.

Engineers for Viable Technology and $5 Trillion Economy
140 Technical Volume of 36th Indian Engineering Congress, December 26-28, 2021
ISBN 978-81-955500-1-2
• There is no way to measure the quality of building procedures.
Objective I: To Analyze existing method control statements used in pavement construction processes
Method Statement for Chandani Chowk Flyover Project:
Granular sub base (GSB)
The scope of this job is to lay and compress well-graded GSB material on a prepared and authorized subgrade in line
with MORT&H standard Article 401.
Quality Control
• At the job site, the gradation of the material must be managed by making required modifications.
• At a rate of one test per 1000 sq.m., the compacted surface will be examined for field density. When evaluated
according to IS: 2720, the degree of compaction should not be less than 98 percent (Part-28).
• The surface must be examined for levels at MORTH intervals longitudinally and transversely, and the difference
must be less than 10mm.
Subgrade:
Scope:
Construction of sub grade with approved borrow material as per MoRTH.
Construction of sub grade with approved suitable material available from the roadway excavation or any other
excavation
Quality Control:
Compaction control: The compaction control shall be done by comparing the field dry density with the laboratory
Maximum Dry Density for achieving 97% of compaction at the OMC +1% to -2%. Control shall be exercised on
each layer to meet the required degree of compaction before going to the subsequent layer.
Dense Bitumen Macadam:
Scope:
• The work will consist of a double course of 135mm in two stages of construction. On a previously prepared non-
bituminous / existing bituminous surface, the thickness of pavement the required as per specification. The
purpose of this methodology is to outline the guideline for laying of Dense Bituminous Macadam At site
• Asphalt Batch mix plant (120 TPH) : 1 No
• Sensor Paver: 1 No
• Smooth Wheel tandem vibratory roller : 1 No
• Truck Mounted Bitumen Sprayer: 1 No
• Tippers : As per site requirement
• Thermometer for Measuring Temperature : 1 N of Mix.

Engineers for Viable Technology and $5 Trillion Economy
141 Technical Volume of 36th Indian Engineering Congress, December 26-28, 2021 ISBN 978-81-955500-1-2
Wet Mix Macadam Construction:
Material Specifications :
Los Angeles Abrasion Value Max 40%
Aggregate Impact Value Max 30%
Combined Flakiness and Elongation Index Max 35%
Plasticity index Max 6
Gradation Confirming to 400-13
Compaction 1 set for 1000Sq.m
Questionnaire :
• From IRC 57 2000, Table (E-2)-1 for Quality Grading for Concrete construction the following Questions were
considered to know the acceptable quality of concrete.
• This Questions were asked to the Expert from NCC (Nagarjuna Construction Company) by physical visiting on
site (Chandni Chowk Flyover Project).
Outcome of Questionnaire Survey for
Chandani Chowk Project :
• W.c ratio, Workability, Testing, Target Strength are used as per the MORTH Specifications and IS 456.
• Various Factors/ Items from the table are properly followed and maintained as per the given information so we
can conclude that acceptable Quality work is done.

Engineers for Viable Technology and $5 Trillion Economy
142 Technical Volume of 36th Indian Engineering Congress, December 26-28, 2021
ISBN 978-81-955500-1-2
MCS by Ajwani Infrastructure Pvt. Ltd for Development of road (concrete road) at sector No. 16 Rajeshivajinagar in
prabhag No. 2”
METHOD STATEMENT FOR EXCAVATION OF ROAD IN SOIL / ROCK.
• Compaction at OMC to achieve min. of 95% / 97% of MDD for the given case
• The cut formation, which serves as sub grade if found suitable, then the same shall be checked for its relative
compaction as per table 300.2, and if fails then the same shall be loosened and compacted in layers in the
specified manner.
Stemming:
• Stemming may be used if required, of free dry running material, which passes through a 2.8mm sieve and
retained on 1.2mm sieve by 90%.
METHOD STATEMENT FOR EARTHWORK IN EMBANKMENT (FILLING)
The following types of materials are not appropriate for embankment.
a. Plants found in swamps, marshes, and bogs.
b. Peat, log stumps, and perishable materials any soil classified as OL, OI, OH, or Pt. by IS: 1498.
c. Materials that can spontaneously combust.
d. Materials that have been frozen.
e. Clay with a liquid limit more than 50 and a plasticity index greater than 25.
f. Materials containing salts cause leaching in the embankment.
Acceptance Criteria :
• Field Dry Density Shall be greater than 95% of MDD.
• Optimum moisture content shall be +1% to -2% during the time of compaction
METHOD STATEMENT FOR EARTHWORK IN SUBGRADE (FILLING)
• The material that have LL less than 50%,PI less than 25%,Free swell Index Less than 50% shall be used for Sub
grade construction. The material which is having Lab MDD of min.
• For sub grade, clods and hard lumps of soil will be broken down to a maximum size of 50mm.
Acceptance Criteria:
• Field Dry Density Shall be equal to or greater than 97% of MDD.
• Layer thickness tolerance shall be+ 20 mm.
• Optimum moisture content shall be +1%to -2% during the time of compaction.
METHODOLOGY FOR GRANULAR SUB BASE
• Rolling shall be continued for giving sufficient number of pass to achieve field density in excess of 98 % of
M.D.D. as per Lab.

Engineers for Viable Technology and $5 Trillion Economy
143 Technical Volume of 36th Indian Engineering Congress, December 26-28, 2021 ISBN 978-81-955500-1-2
METHODOLOGY OF CONSTRUCTION PAVEMENT QUALITY CONCRETE
• MORT&H specification clause No. 602 IRC 15 – 2011 and technical specification of contract.
MCS By Ajwani Infrastructure Pvt. Ltd. For “Widening and construction of road and Nalla on the land Transferred
by Agriculture Department from Wadhmukhwadi Fata To Chavisawadi Fata on Pune
METHODOLOGY FOR BITUMINOUS MACADAM / DENSE BITUMINOUS MACADAM /
BITUMINOUS CONCRETE
• Bituminous concrete of 5.4% (Vg30) provides hot-laid and mixed bitumen of bituminous concrete by the total
mixed weight per MORTH Clause 509.
• Bituminous‟ Macadam concrete of 4.5% (Vg30) provides hot-laid and mixed bitumen of bituminous concrete by
the total mixed weight per MORTH Clause 507.
• Bituminous‟ Macadam concrete of 4.5% (Vg30) provides hot-laid and mixed bitumen of bituminous concrete by
the total mixed weight per MORTH Clause 507.
Quality Control
• All materials and workmanship must meet the requirements of section 900 of the MORTH, IRC, I.S., or the
Tender QAP.
Objective II:To perform Tomographic image analysis on constructed and operated pavements, determine pavement
condition index(PCI)
Proposed Methodology:
In this project, we are attempting to use a python code written to extract photos from Google street-view utilizing
the Google Application Programming Interface (API). Pavement specialists analyzed the images by hand,
considering nine various levels of discomfort. After then, the data set's performance was evaluated using You Look
Only Once, a well-known deep learning framework (YOLO v2). YOLO's proposed model, on the other hand, did
not quantify the fracture density. Hence, we studied the U-net type of model and developed it to evaluate the signals
of distress density. Decisively, the conditional indices of the proposed developed models of YOLO and U-Net based
ML predictive models were used to propose the distress conditional detection of the pavements of concrete or
asphalt using the deep learning based predictive models. The key to verify the variety, quantity and quality of the
utilization of the data is promptly noted.Because of the labeled datasets developed for the conditional rigid pavement
author Majidifard et. al. represented the tomo-graphical image of pavement datasets. The extracted images consists
of 7237 types of images which are considered as the datasets amongst 22 different sectionized pavements including
the ones with interstate-wise routes and highways. Illustrated Figure 2 summaries the major contributory part of the
study.
Automated Detection, Segmentation and Classification Methods gor Cracks
First, we presented a one-of-a-kind dataset annotated for PD categorization and densification at the same time. The
data comes from Google Street View, as well as manually collected photographs of the Mumbai Pune highway and
Dehu Road, which provide us a diversity of camera perspectives to help the recognize severity of distinct types of
fracturs and cracks.
Secondly, implementation of the delineating boundries of various abnormal conditions like critical shadow and non-
cracked objects like trees, cars, etc. is segmented model to model as per the distress signals. Overcoming intelligent
models with high-end architectural designing are envisaged by accepting the challenge.

Engineers for Viable Technology and $5 Trillion Economy
144 Technical Volume of 36th Indian Engineering Congress, December 26-28, 2021
ISBN 978-81-955500-1-2
Figure 2 Proposed Work flowchart
Contemporary conditional pavements based on cracked YOLO classifier, hybrid-ML and U-Net density model is
used to detect the distress signals.
The tomographic process of segmenting one picture into many parts is known as image segmentation. Classification
of lines and curves in the images under conceptual image segmentation is performed. Considering the background
areas of the objects in the image, its segmentation is nothing but the extraction of edge-detection.Semantic objects
like humans, cars or buildings in the tomographic and videos associates computer vision and image-processing
copes for detecting object-based classification. In the ML and AI based development, the object-based classification
and segmentation under both the image processing techniques carryout precisely. The segmentation of the classifier
related to the objects in a single image is possibly used for grouping and categorizing into a single class. During
segmentation, each object in an image belonging to a single class is highlighted with distinct hues in order for
computer vision to recognise them. The degree of the distresses can be detected in crack segmentation, but there is
no way to divide them into different categories. On the other hand, the distresses can be grouped into distinct
categories in the classification techniques, but the severity cannot be quantified.
Thresholding and edge detection are the two most used segmentation methods. In automatic PD systems, threshold-
based segmentation is often used. Edge detection is another common image processing approach. The quick
reduction of picture data to useful information is a key advantage of edge detection. Various edge detectors like
Roberts, LOG, Prewitt and Sobel detectors are used to carry-out the process.Nevertheless, problems under edge-
detection corresponds to characterization under spatial scale is tiresome to be detected. Because of the many features
at various scales, it is recognized that working with Pavement Tomographic pictures in the process of PD is difficult.
Wavelet-based edge identification at many scales has been prominent in pavement image processing during the last
decade. Various hindrances of sudden lighting and shadows in the pavement images are introduced automatically
with new technical challenges in the distressed signaling schemes.Here, we're attempting to create a new PCI using
data from a crack categorization model and machine learning models.
Research carried by Majidifard et. al. on comprehensive development of the deep learning algorithms from the
pavement-based data-set‟s distress signals have inspired this work.This section focuses on their work and how it
relates to the present research. After evaluating several studies, the researchers classified and documented nine
categories of the most essential distresses that impact pavement condition. Huge, distress database of pavement from
22 various US based areas are distributed section ally using python code in which communication between the API
is carried-out with the google view street.In addition to this, the images acquired from the google view street is
predefined as per the distress classifier signals, which is illustrated in the Figure-3. It offers an instant annotation of
the 9 distinct types of categorical paving types. Therefore, from the figure illustrated, the blocking of cracks,
selective reflection, sealed and lane based longitudinal cracks are amongst the highest boundaries in the boxes that
are founded in the paving datasets.
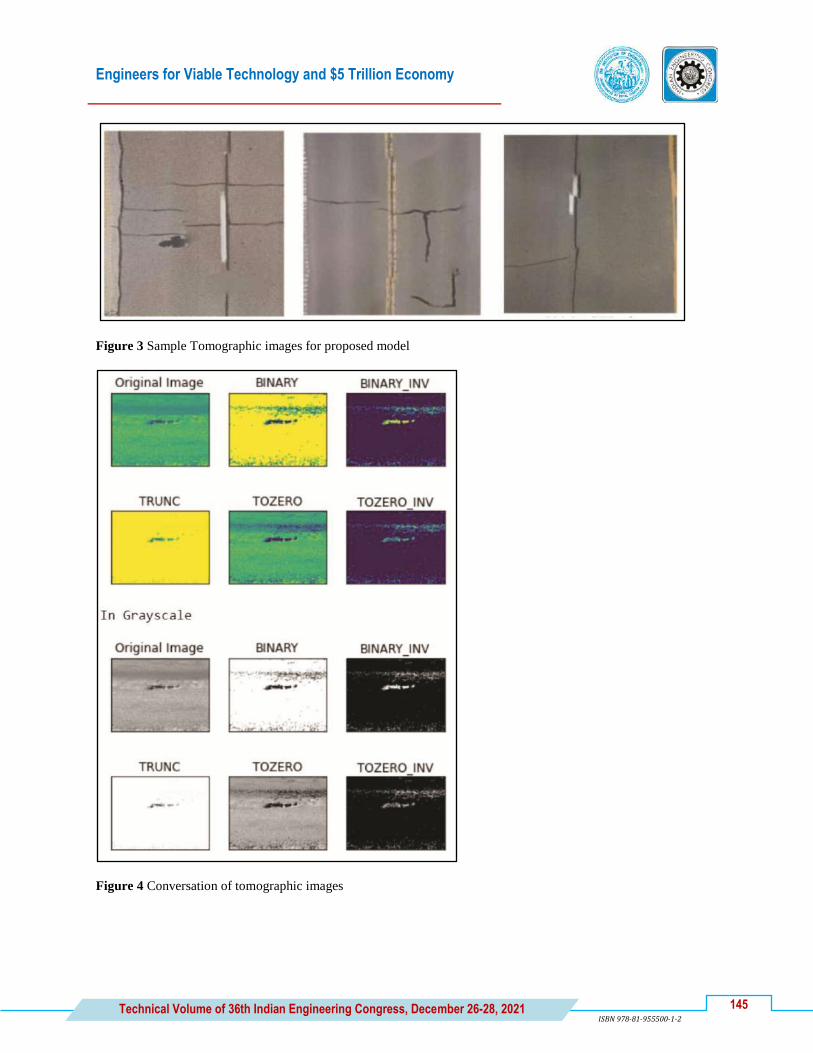
Engineers for Viable Technology and $5 Trillion Economy
145 Technical Volume of 36th Indian Engineering Congress, December 26-28, 2021 ISBN 978-81-955500-1-2
Figure 3 Sample Tomographic images for proposed model
Figure 4 Conversation of tomographic images

Engineers for Viable Technology and $5 Trillion Economy
146 Technical Volume of 36th Indian Engineering Congress, December 26-28, 2021
ISBN 978-81-955500-1-2
Figure 5 Obtain Result using proposed model
CONCLUSION
A deep machine learning technique was used in this work to forecast road-way pavement quality.The models were
trained using a large dataset of road conditions derived from Google Street View. Bounding boxes with nine distinct
PD were added to the photographs. A cutting-edge deep learning system was used to automatically identify
andcategorize the PD. Moreover, 9 segments were formed for PDI. The density of the distresses was calculated
using a pre-trained model approach.A U-Net based algorithm was used for this purpose. Road photos obtained
manually in a range of atmospheric circumstances were used to fine-tune the pre-trained model. The proposed
algorithm can distinguish characteristics such as automobiles, shadowsand PD with accuracy.
The suggested algorithm has certain benefits over other deep-learning based algorithms. First, this technology
reduced PASER's reliance on human judgement and improved its accuracy. Furthermore, this research is a
trailblazer in terms of producing a PCI prediction after PDI. Second, the algorithms were trained with freely
available Google street-view pictures of roads. In future we will try to work on comparative analysis of different
models with number of input images for more accurate analysis
REFERENCES
1. Arash Hosseini, Ahmed Faheem, Hans Titi, Scot Schwandt, Evaluation of the long-term performance of
flexible pavements with respect to production and construction quality control indicators, 2019
2. Christina Plati, Sustainability factors in pavement materials, design, and preservation strategies: A literature
review ,by 2019
3. Abhishek Jindal, G.D. Ransinchung R. N., Behavioural study of pavement quality concrete containing
construction, industrial and agricultural wastes, 2018
4. Michael Tarimo, PaulosWondimu, James Odeck, JardaLohne, Ola Laedre Sustainable roads in Serengeti
National Park: gravel roads construction and maintenance, 2017.
5. Gueta, L. B. and A. Sato (2017). Classifying road surface conditions using vibration signals. Asia-Pacific
Signal and Information Processing Association Annual Summit and Conference (APSIPA ASC), 2017, IEEE.
6. Alqudah, Y. A. and B. H. Sababha (2017). On the analysis of road surface conditions using embedded mobile
phone sensors, IEEE: 177.

Engineers for Viable Technology and $5 Trillion Economy
147 Technical Volume of 36th Indian Engineering Congress, December 26-28, 2021 ISBN 978-81-955500-1-2
7. Abhay Tawalare, K.Vasudeva Raju, Pavement Performance Index for Indian rural roads, 2016.
8. Aman A Bolar, Solomon Tesfamariam, Rehan Sadiq, Framework for prioritising infrastructure user
expectations using Quality Function Deployment(QFD), 2017
9. Shibin Lin, Jeramy Ashlock, R Christopher Williams, Nondestructive quality assessment of asphalt pavements
based on dynamic modulus, 2016
10. P. Forsythe, "Construction service quality and satisfaction for a targeted housing customer", Engineering,
Construction and Architectural Management, vol. 23, no. 3, pp. 323-348, 2016
11. M. Jaeger and D. Adair, "Perception of TQM benefits, practices and obstacles", The TQM Journal, vol. 28, no.
2, pp. 317-336, 2016.
12. R. N. Lussier, C. Bandara and S. Marom, “Entrepreneurship success investigation in Sri Lanka”, The World
Journal of Entrepreneurship, Management and Sustainable Development, vol. 12, no. 3, pp. 102-112. 2016.
13. L. Oyedele, B. Jaiyeoba, K. Kadiri, S. Folagbade, I. Tijani and R. Salami, "Critical factors affecting
construction quality in Nigeria: evidence from industry professionals", International Journal of Sustainable
Building Technology and Urban Development, vol. 6, no. 2, pp. 103-113, 2015.
14. Xu, J., K. Yang and Y. M. Shao (2018). "Ride Comfort of Passenger Cars on Two-Lane Mountain Highways
Based on Tri-axial Acceleration from Field Driving Tests." International Journal of Civil Engineering 16(3):
335-351.
15. Han, D., V. Renaudin and M. Ortiz (2015). Mobile phone Based Gait Analysis Using STFT and Wavelet for
Indoor Navigation. International Conference on Indoor Positioning & Indoor Navigation.
16. W. T. A. Lau, A study of the prospects of evolution from quality assurance to total quality management for the
Hong Kong construction industry (Doctoral dissertation), 2015.
17. M. Kamal and R. Flanagan, “Key Characteristics of Rural Construction SMEs”, Journal of Construction in
Developing Countries, vol. 19, no. 2, pp.1-13. 2014.
18. Umesh Sahoo, Sarfaraz Ahmed and K. S. Reddy, Long Term Performance Evaluation of Rural Road
Pavements in India, 2014.
19. SireeshSaride, Deepti A T Someshwar Rao, Sarath Prasad, R DayakarBabu, Evaluation of Fly-Ash treated
Reclaimed Asphalt Pavement For Design Of Sustainable Pavement Bases- An Indian Perspective, 2014
20. A.L.Simpson, G.R.Rada, B.A.Visintine, J.L.Groeger, N. Saadatymand, Condition Assessment Using Ride
Quality, 2014.
21. Nuria Forcada, Gerard Rusinol, Marcel MacArulla and Peter.E.D.Love, Reowrk in Highway Projects,2014
22. Linda M Pierce, Quality Management for Pavement Condition Data Collection, 2014
23. Piotr Radziszewski, Karol J Kowalski, Jan B Król. Michal Sarnowski, Jerzy Pilat, Quality Assessment of
Bituminous Binders Based on the Viscoelastic Properties: Polish Experince, 2013.


Engineers for Viable Technology and $5 Trillion Economy
149 Technical Volume of 36th Indian Engineering Congress, December 26-28, 2021 ISBN 978-81-955500-1-2
CV_064_17_240
Optimum Size of Radius of Curvature for a Trapezoidal Channel
to Minimise Hydraulic Loss
M R Goyal1 and N K Jain
2*
1Chairman, Board of Consultants, Ranjit Sagar Dam and Shahpurkandi Dam Project
2Hydel Projects, Punjab Water Resources Department, Chandigarh
*email: [email protected]
Abstract: Optimum value of the radius of curvature to be provided to join the bed of a trapezoidal channel with side
slopes has been worked out, to minimize the head loss in the channel. It has been found to be equal to 0.4 R, where
R is the mean hydraulic radius of the channel, for all values of side slopes. Provision of curves with a radius equal
to the depth of the channel has been found to increase the head loss instead of decreasing it, thus defeating the very
purpose for which it is provided.
Keywords: Hydraulic Loss; Trapezoidal Channel; Radius of Curvature
INTRODUCTION
In lined canals and hydel channels with trapezoidal cross-section, usually circular curves are provided to join the bed
with the side slopes. The objective of these curves is to smooth the flow of water and hence reduce the hydraulic
head loss in the channel. The radius of the curves is fixed on ad-hoc basis. In India, for more than a century, the
practice is to provide a radius equal to the water depth in the channel. In this paper, the optimum value of the radius
of curvature has been worked out, to minimize the hydraulic head loss in the channel. This optimization becomes of
paramount importance in the case of hydel channels and tail race channels of hydro power plants, as each millimeter
of head saved, can result in thousands of more units of power generation. It has been found that the century old
practice of providing curves equal to the water depth of the channel, actually increases the head loss, instead of
decreasing it, thus defeating the very purpose for which it is provided.
DERIVATION OF MATHEMATICAL RELATION
Consider a trapezoidal channel of width B and depth D with inclination angle of the sides to the base of the channel
as {Zl and having a curve of radius r at the bottom 2 corners

Engineers for Viable Technology and $5 Trillion Economy
150 Technical Volume of 36th Indian Engineering Congress, December 26-28, 2021
ISBN 978-81-955500-1-2
Area (A) of trapezoidal channel A = BD+D2cotØ
Wetted perimeter (P) of trapezoidal channel P =B+ 2D(1+cot2Ø)
1/2
=B+2DcosecØ

Engineers for Viable Technology and $5 Trillion Economy
151
Technical Volume of 36th Indian Engineering Congress, December 26-28, 2021 ISBN 978-81-955500-1-2

Engineers for Viable Technology and $5 Trillion Economy
152 Technical Volume of 36th Indian Engineering Congress, December 26-28, 2021
ISBN 978-81-955500-1-2

Engineers for Viable Technology and $5 Trillion Economy
153 Technical Volume of 36th Indian Engineering Congress, December 26-28, 2021
ISBN 978-81-955500-1-2

Engineers for Viable Technology and $5 Trillion Economy
154 Technical Volume of 36th Indian Engineering Congress, December 26-28, 2021
ISBN 978-81-955500-1-2

Engineers for Viable Technology and $5 Trillion Economy
155 Technical Volume of 36th Indian Engineering Congress, December 26-28, 2021
ISBN 978-81-955500-1-2
CONCLUSION
It has been found that the optimum radius of curvature to minimize the hydraulic head loss, is equal to 0.4 R
where R is the hydraulic mean radius of the channel, for all values of side slopes. It has also been found that
provision of a radius equal to the water depth in the channel, actually increases the head loss, instead of decreasing
it, and thus defeats the very purpose for which it is provided. The practice of providing a radius equal to the depth
of the channel must be discontinued forthwith, and instead, a radius equal to 0.4 R should be provided. Provision of
a curve with radius equal to 0.4R becomes of paramount importance in the case of Hydel channels and tail race
channel of power plants, as each millimeter of head saved can result in thousands of more units of power production.


En
gin
eers
fo
r V
iab
le T
ech
no
log
y a
nd
$5
Tri
llio
n E
con
om
y
Computer
Engineering


Engineers for Viable Technology and $5 Trillion Economy
159 Technical Volume of 36th Indian Engineering Congress, December 26-28, 2021
ISBN 978-81-955500-1-2
Engineering Collaborations for Accessing Hidden Web
Resources
Manpreet Singh Sehgal
Department of Computer Science and Engineering, ApeejayStya University, Sohna, Gurugram
e-mail: [email protected]
Abstract: The world wide web has always been a research platform for information and data scientists. The value of
information is generally seen as a proportional to the depth of the world wide web. While the surface web is being
taken good care of by the search engines at a great length, It is the deep web that posed challenges to the
information and data scientists. A lot of research has been expended in the direction of extracting information from
the deep web resources. Many researchers have studied the problem statement in their perspective and devise
solutions to address their formulated problem statements. Individually these efforts showed promising results.
However, there has been a gap of the joint effort to bring these individual efforts together to reap the collective
fruits to address the much larger and more sensible problem statement. This paper highlights the different problem
statements of different researchersand suggests the collaborative approach to bring out one common problem
statement to envisage one big problem and its probable solution.
Keywords: Collaborative Approach; Hidden Web; Deep Web; Information Retrieval
INTRODUCTION
World Wide Web (WWW) scores high when it comes to the ranking of information resources to satisfy the
information need. There is a plethora of information (organized, unorganized, validated and invalidated) available in
the WWW that needs to get tapped and validated before it gets consumed. Various validating organizations certify
the correctness and validity of the information prevalent on the WWW. However, such validated information resides
in the databases of the validating organizations which can only be accessed by presenting queries to these databases.
For automating queries, organizations design search interfaces which need to be filled up to form queries and fetch
information from the databases [1]. The information residing in databases is categorized as hidden web resource
since it is hidden behind search interfaces into the databases. Traditional search engines can extract the information
present in the documents but they are not able to extract data from the databases of validating organizations.
However, many researchers have extended their resources and efforts to tap this area of information extraction and
have been successful as well. But there is a research gap of collaborative efforts to completely address the problem
in a way it should have been addressed. This paper firstly presents the related work in the direction of hidden web
data extraction followed by the examination of the efforts which are potential candidates for collaboration. The
anticipated results that will be probably achieved in the light of collaboration are discussed at the end of the paper.
RELATED WORK
There are two parts to the World Wide Web (WWW). One part is exposed to the search engines so is easy to
navigate, while the other is hidden in the databases, unlinked, non-textual form and hence out of reach of the
traditional search engines thereby is hard to tap. The irony of the matter is that the later part of the WWW is 99% of
the WWW implying the fact that what traditional search engines are capable to tap is just 1% of the entire WWW
[2-5].

Engineers for Viable Technology and $5 Trillion Economy
160 Technical Volume of 36th Indian Engineering Congress, December 26-28, 2021
ISBN 978-81-955500-1-2
A lot of work has been done to study the techniques to extract the hidden data. Khurana and Chandak [6] surveyed
methodologies to select deep web source to extract the data hidden underneath. The problem statement of their
research is to highlight the fact that “among multitudes of information available in the deep web, the quality of data
should derive its selection measure to keep less relevant and redundant information from getting unnecessarily
processed”. Singh and Anuradha [7] proposed a methodology of sponger and squeezer to extract (Sponge) data from
the hidden web page and after analyzing and processing it, pouring it (Squeeze) to the local repository for the future
analysis by knowledge experts. Their problem statement is to “detect the type of data in the hidden web pages to
guide the correct extraction of tabular information presented in HTML page onto the local repository”.
Singh and Prasad in [8], suggested an ontology-based approach to extract the hidden web data for automatically
filling up the query interface form after fetching the domain specific values from the built ontology of the specific
domain. In their research, they also mentioned the need of ontology builder, in case there is no ontology for the
subject being investigated. Their problem statement is to “design a unique system to uncover hidden web using
existing ontologies”. In the related research [9], Singh and Prasad proposed the replacement of ontology with that of
database indexed by search engines, to gain the advantage of the existing WWW repositories containing virtually
any domain information, thereby eliminating the need of Ontology Builder asked for in the earlier research [9].
Their problem statement is “overcoming the need to design ontology builder by replacing ontologies with the
indexed databases of traditional search engines as they are there for virtually any domain”. In [10] Y. Wang and
J.Hu proposed a machine learning approach to sense the presence of tables on the hidden web pages. Their problem
statement is to investigate the web pages for the presence of relational data so as to categorize the pages as
relevant/irrelevant.” B. Liu et. al in [11] proposed the effective strategy to mine the contiguous and non-contiguous
data records to extract important information out of them. Their problem statement is to “address the issues present
in exiting data mining approaches to bring out more accurate data mining approach”. On the lines of extracting and
processing data at the large scale in a collaborative manner Felix, Biswanath and Mirek introduced Web Lab
Collaboration Server [12]. The underlying problem statement is to “recognize the fact that despite latest advances in
data extraction and processing technologies, the users from non-technical background find it difficult to deal with
the tools to fetch the relevant data for various applications and build an abstract model that presents easy to use
interface for inputs to extract and process data to the non-technical users”.
The approaches mentioned can be categorized as the improvements of the existing methods to make the life of
application users easy. The author has envisaged the need to engineer the collective efforts of some of the above-
mentioned techniques to achieve a larger objective. The following section throws light on the potential candidates of
collaboration.
PROPOSED WORK
In this paper, the different individual approaches to extract hidden web data are selected and viewed from a larger
perspective for collaboration to extract hidden web data using the goodness of the collaborating approaches.
Figure 1 represents the collaborated technologies proposed in the current research. D and SD in Figure 1 represent
the domain and statement of domain as two inputs to the UDDWE [9]. UDDWE initially fetches the documents
from WWW for the corresponding D (Domain) and SD (Statement of Domain). At the later stage of UDDWE
processing the hidden web pages from the fetched documents are fetched. Two categories of hidden web pages
(Structured and Unstructured) are identified by UDDWE [9]. White colored documents are the pages which
represent unstructured information, whereas the red colored blocks the hidden documents with the structured
information. This mixed set of documents is passed to the data mining approach suggested by [11] and Machine
learning approach proposed by [10] at the same time. Both [10] and [11] are designed to identify the documents with
and without table tag. The output of Machine learning approach [10] is the set of documents with the tabular
structures whereas Data mining approach [11] provides the mined data out of non-tabular unstructured documents.
This mined data is stored in the local repository LR1 The tabular structured documents are parsed by HWPDE [7] as
a result of which the data types of the columns of the tables are detected, the data present in the data cells of the
table is sponged (extracted) and filled (squeezed) in the local repository LR2. The data from LR1 and LR2 is fed to
the agent-based system for Data Integration suggested by [14]. The agent-based system introduced at the end
collects the data from LR1 and LR2 and stores in its local repository LR3. LR3 is the considered as the data rich
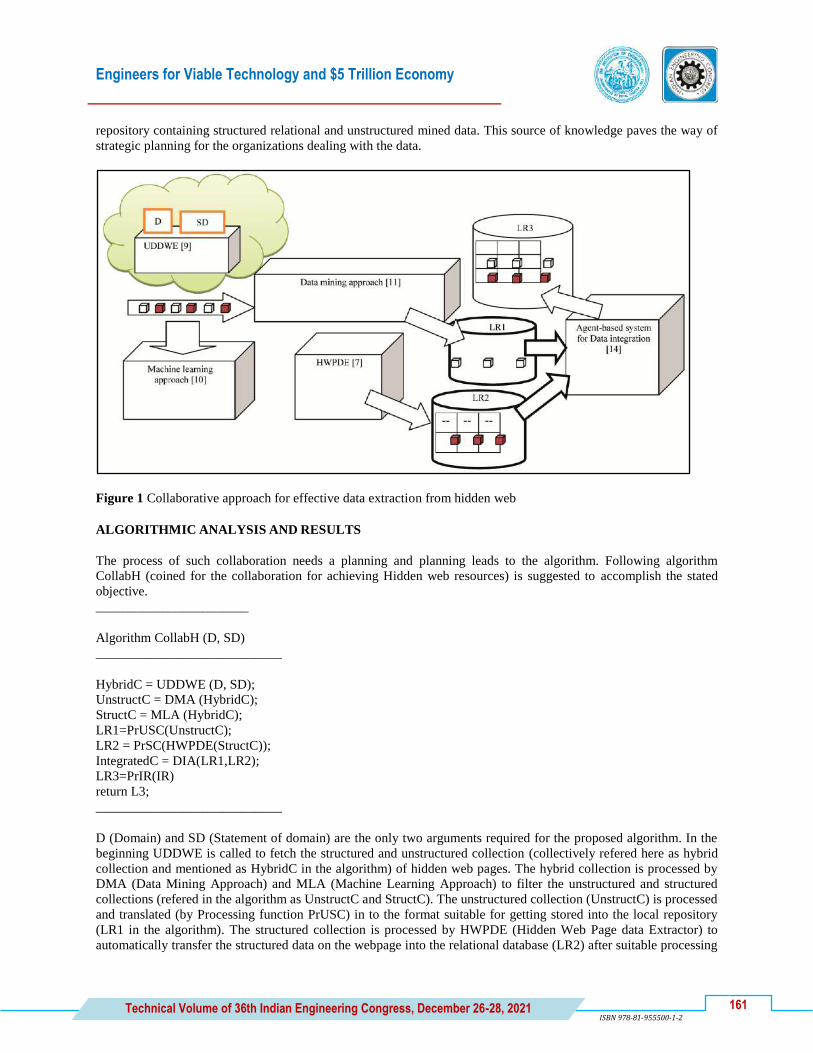
Engineers for Viable Technology and $5 Trillion Economy
161 Technical Volume of 36th Indian Engineering Congress, December 26-28, 2021
ISBN 978-81-955500-1-2
repository containing structured relational and unstructured mined data. This source of knowledge paves the way of
strategic planning for the organizations dealing with the data.
Figure 1 Collaborative approach for effective data extraction from hidden web
ALGORITHMIC ANALYSIS AND RESULTS
The process of such collaboration needs a planning and planning leads to the algorithm. Following algorithm
CollabH (coined for the collaboration for achieving Hidden web resources) is suggested to accomplish the stated
objective.
_______________________
Algorithm CollabH (D, SD)
____________________________
HybridC = UDDWE (D, SD);
UnstructC = DMA (HybridC);
StructC = MLA (HybridC);
LR1=PrUSC(UnstructC);
LR2 = PrSC(HWPDE(StructC));
IntegratedC = DIA(LR1,LR2);
LR3=PrIR(IR)
return L3;
____________________________
D (Domain) and SD (Statement of domain) are the only two arguments required for the proposed algorithm. In the
beginning UDDWE is called to fetch the structured and unstructured collection (collectively refered here as hybrid
collection and mentioned as HybridC in the algorithm) of hidden web pages. The hybrid collection is processed by
DMA (Data Mining Approach) and MLA (Machine Learning Approach) to filter the unstructured and structured
collections (refered in the algorithm as UnstructC and StructC). The unstructured collection (UnstructC) is processed
and translated (by Processing function PrUSC) in to the format suitable for getting stored into the local repository
(LR1 in the algorithm). The structured collection is processed by HWPDE (Hidden Web Page data Extractor) to
automatically transfer the structured data on the webpage into the relational database (LR2) after suitable processing

Engineers for Viable Technology and $5 Trillion Economy
162 Technical Volume of 36th Indian Engineering Congress, December 26-28, 2021
ISBN 978-81-955500-1-2
by the processing function PrSC (identification of data types, checking if the repository is being built for the first
time etc). Finally, the DIA (Data Integrator Agent) picks up the contents of the local repositories LR1 and LR2 and
integrates the repositories in the collection IntegratedC. This Integrated Collection is stored in Local repository LR3
which is returned as the output. The difference in HybricdC and IntegratedC is in their format. HybridC is the
collection of Webpages both structured and unstructured, whereas IntegratedC is the collection of the relevant and
the focused data extracted from the webpages.
The experiments were carried out on sample domains (D) and statement of domains (SD) depicted in Table 1.
Table 1 Domains and Statement of domains for collaborative analysis.
Sr. No Domain Statement of Domain (Query)
1 Cricket Orange Cap award in IPL 2019
ICC World Cup history
2 Food Order from Swiggy: One Masala Dosa, Two Cokes and one small
French Fries
I want to buy pedigree animal food for my Labrador dog.
3 Civilization The Egyptian civilization
The culture and civilization of Sindh
UDDWE brings out the hidden web entry points and consequently enable fetching of hidden web data (both
unstructured and structured) corresponding to each statement of domain for the corresponding domain mention in
Table I. The result of UDDWE on the information present in Table 1 is represented in Table 2. The fetched pages
by UDDWE are from the WWW, which are processed further in UDDWE for the presence of hidden web entry
point signature (Search query interface form). After the firing of queries by UDDWE and human intervention two
categories of documents (Structured and Unstructured) are fetched. Data mining approach identifies unstructured
data and pour in in the local repository, whereas machine learning approach identifies structured data and passes it to
HWPDE for sponging and squeezing processes. HWPDE automatically detects the data types of the columns of
structured data stored in HTML table, and creates the local repository with the detected type information before
storing the information in it. Finally, both structured and unstructured information repositories are merged together
using agent-based approach for data integration.
Table 2 UDDWE Results
Sr. No Domain Statement of Domain Fetched Pages
(K)
Relevant
Pages(R)
Identified Hidden
Web Entry Points(H)
1 DM1: Cricket Orange Cap award in
IPL 2019
12 8 1 (Relevant)
ICC World Cup
history
27 23 17 (Relevant)
2 DM2: Food Order from Swiggy:
One Masala Dosa,
Two Cokes and one
small French Fries
15 11 0
I want to buy pedigree
animal food for my
Labrador dog.
22 18 4 (Relevant)
3 DM3:
Civilization
The Egyptian
civilization
26 22 13 (Relevant)
The culture and
civilization of Sindh
17 13 9 (Relevant)

Engineers for Viable Technology and $5 Trillion Economy
163 Technical Volume of 36th Indian Engineering Congress, December 26-28, 2021
ISBN 978-81-955500-1-2
CONCLUSION AND FUTURE SCOPE
The collaborative approach depicted in the research promises the combined goodness of the individual research
efforts. The final repository shown in the proposed work serves as the backbone of the data analysis and proves
helpful in effective decision making for the stakeholders involved. Though the approaches discussed in the
collaboration effort are separated apart in the time domain, however such efforts will always be welcome in future as
by using collaborative approach, system designers don‟t need to re-invent the wheel for designing a subsystem if the
similar subsystem is already in place by other researchers. The paradigm shift to collaborative efforts will ensure the
greater emphasis on solving bigger problems with the solutions of the smaller sub problems which are already
solved for specific applications.
ACKNOWLEDGMENT
Author would like to acknowledge the research facilities of J.C Bose University of Science and Technology,
Faridabad, MVN University, Palwal and ApeejayStya University, Sohna for the help in the proposed research.
REFERENCES
1. A. Ntoulas, P. Zerfos, J.Cho., “Downloading Textual Hidden Web Content Through Keyword Queries,” in
Proceedings of the 5th ACM/IEEE-CS Joint Conference on Digital Libraries, JCDL'05, Denver, USA, Jun
2005 IEEE , pp. 100-109.
2. The size of the World Wide Web (The Internet) [Online], Available: https://www.worldwidewebsize.com/,
Accessed on 10 June 2019.
3. Bergman and M.K, “The Deep Web: Surfacing hidden value,” Journal of Electronic Publishing, vol. 7, no.1,
pp. 1-17, 2001.
4. S. Lawrence and C.L. Giles, “Searching the World Wide Web,” Science, International Journal of Science, vol.
280 no.5360, pp. 98–100, 1998.
5. S. Lawrence and C.L. Giles, “Accessibility of information on the web,” Nature, International Journal of
Science, vol. 400, no. 107. https://doi.org/10.1038/21987, 1999.
6. K.Khurana and M.B Chandak, “Survey of Techniques for Deep Web Source Selection and Surfacing the
Hidden Web Content”, International Journal of Advanced Computer Science and Applications, Vol 7, No.5,
pp. 409-418, 2016.
7. M. Singh and Anuradha, “HWPDE: Novel approach for data extraction from structured web pages,”
International Journal of Computer Applications, vol. 50, no. 8, pp. 22-27, July 2012.
8. M. Singh and J.S. Prasad, “All Domain Hidden Web Exposer Ontologies: A Unified approach for excavating
the web to unhide deep web,” in Proceedings of International Conference on Smart Innovations in
Communication and Computational Sciences, Indore, India, Ed. by Springer, Singapore, pp. 423-431, 2018.
9. M. Singh and J.S. Prasad. “UDDWE: Universal Domain Deep Web Exposer,” International Journal of
Engineering and Technology (UAE), vol. 7 no.4 pp 4398-4404, 2018.
10. Y. Wang and J. Hu, “A machine learning based approach for table detection on the web,” in Proceedings of the
11th international conference on World Wide Web, New York, NY, USA, ACM Press, pp. 242–250, 2002.
11. B. Liu, R. Grossman, and Y. Zhai, “Mining data records in web pages,” In Proceedings of the ninth ACM
SIGKDD International Conference on Knowledge discovery and data mining, New York, NY, USA, ACM
Press, pp. 601–606, 2003.
12. Felix Weigel, Biswanath Panda, and Mirek Riedewald, “Large-Scale Collaborative Analysis and Extraction of
Web Data”, VLDB endowment, pp. 1476-1479, 2008
13. Baker Ross Inspiring Creativity, Available Online at https://www.bakerross.co.uk/wooden-jigsaw-puzzles,
Accessed on August 24, 2019.

Engineers for Viable Technology and $5 Trillion Economy
164 Technical Volume of 36th Indian Engineering Congress, December 26-28, 2021
ISBN 978-81-955500-1-2
14. J.T. McDonald, M.L. Talbert, and S.A. DeLoach, “Heterogeneous database integration using agent-oriented
information systems,” in Proceedings of the International Conference on Artificial Intelligence (IC-AI‟ 2000),
Monte Carlo Resort, Las Vegas, Nevada, CSREA Press, vol. 3, pp. 1359-1365, June 26–29, 2000

Engineers for Viable Technology and $5 Trillion Economy
165 Technical Volume of 36th Indian Engineering Congress, December 26-28, 2021
ISBN 978-81-955500-1-2
CP_019_04_194
A Machine Learning Approach for Predicting Heart Disease
using Efficient Algorithm
Anuradha T1* and Priyanka Vutkur
2
1Computer Science and Engineering Department, PDA College of Engineering, Kalaburagi
2Computer Science and Engineering Department, SLN College of Engineering, Raichur
*e-mail: [email protected]
Abstract: In our country, there is a high increase in death due to heart disease cases. It’s very important to predict
such cases beforehand. It is a primary concern as its necessity to safeguard the people to live their lives in secured
way so as to take precautions. In modern medical research they have concluded that the over rate of heart disease is
because of extreme levels of exercise, i.e peoples mind set is that doing jogging, bodybuilding, running, and
exercises leads to good fitness but medical researchers have proved that they may lead to the sudden death of a
person at the very early age. It's difficult to predict manually whether a person is undergoing heart disease or not.
So to overcome this difficulty we proposed a heart disease prediction system based on the medical history of
patients. In this paper, we mainly focus on proving how best the machine learning models can be built to predict
even at the worst case to overcome the early death of a patient. In this paper, a novel method that identifies the
disease in heart the proposed algorithm by name, Gradient Boosting Classifier algorithm. Our proposed Gradient
Boosting Classifier is used to corporate with machine learning models so has to improve the performance of
Prediction system by reducing the complexity. The simulated results of the proposed algorithm are compared with
that of KNN algorithm. It is observed that the proposed Gradient Boosting Algorithm shows better performance as
compared to KNN in terms of Learning rate and decision tree model.
Keywords: Heart Disease; Confusion Matrix; Machine Learning; KNN; Gradient Boosting Classifier
INTRODUCTION
Data science is a study that combines domain knowledge, programming skills, mathematical and statistical skills to
extract meaningful information from data, data can be either in the table format, text, image, audio or video.
Machine learning algorithms can be applied to all these types of data to produce artificial intelligence systems to
perform a given task. In turn, these systems analyse the task into tangible business values. A heart attack occurs
when one or more of your arteries become blocked. India has the highest rate of heart disease worldwide.
LITERATURE SURVEY
There are few researchers who have worked on prediction of disease in heart. In [1], the authors have studied that
yearly the number of deaths in India has been a rise from 3 million in 1990 to 5 million in 2020. In the rural
population it has ranged from 1.6% to 7.4% of Indian population is discussed in [2]. Abdominal obesity,
hypertension, tobacco, lack of physical activity, and higher diabetes, are the risk factors of causing CVD, at very
young age, than among other ethnic groups [3]. The rates of CVD risk factors have been rapidly rising in Indian
urban communities over 25 years is studied in [4].In [5], authors have analyzed heart disease prediction using more
input attributes. Till now the researchers have used 13 input attributes for predicting heart diseases, in this paper,
the authors have two added attributes i.esmoking and obesity. Using this dataset they have applied a Decision tree
algorithm and KNN achieved the highest accuracy of 87.5%. In [6], they built an intelligent classifier that predicts
the heart disease problem this diagnosis component is integrated with the mobile applications with the real-time
monitoring component and raises an alarm whenever an emergency occurs. Results of their proposed methods have
achieved the highest accuracy of 85% for SVC and Naive Bayes. In [7], researchers used 13 input attributes and 1

Engineers for Viable Technology and $5 Trillion Economy
166 Technical Volume of 36th Indian Engineering Congress, December 26-28, 2021
ISBN 978-81-955500-1-2
output attribute and applied Naive Bayes machine learning algorithms, achieving 86% accuracy. In [8], the authors
have reduced 2 input attributes from 13 attributes. The authors used three classifiers like Naive Bayes, J48 Decision
Tree, and Bagging algorithm, which has achieved 85% for the bagging classifier algorithm. In [9] they used Naive
Bayes classifier for pre-existing data and achieved 74% accuracy. In [10], in this paper experiments have been
performed using UIC machine learning dataset and evaluated for all the methodologies, they have used Naive Bayes
accuracy of 81% and SVM accuracy of 90 %. It is observed that the authors in [11], achieved 80% using KNN,
SVM as 82% and ANN as 84%KNN. It is studied in [12], the authors have achieved 90% using KNN and 88.1%
using Navie Bayes.
Table 1 Prediction of disease in heart with different Algorithms in terms of Accuracy
Authors Accuracy Techniques
Danger Chaitrali S [5] 87.5 % KNN
OtoomAF[6] 84.5 %
84.5 %
SVM
Naive Bayes
VembandasamyK[7] 86.4 % Naive Bayes
ChaurasiaV[8] 84 %
85.03 %
J48
Bagging
Parthiban G[9] 74 % Naive Bayes
Deepika K[10] 81 %
90%
Naive Bayes
SVM
Dwivedi AK [11] 80%
82%
84%
KNN
SVM
ANN
Devansh Shah1[12] 90%
88.1 %
KNN
Naive Bayes
Proposed models 91%
92.9%
KNN
GradientBoostingClassifier
The analysis is carried out using publicly available data for heart disease in kegel. The dataset holds 303 instants
with 14 attributes from [13], such as thalach, slope, age, thal, thena, gender, cp, trestbps, chol, fbs, restecg, exang,
oldpeak, ca, target, dataset is analyzed with visualization tools, preprocessing, and Machine Learning Algorithms.
It is observed from Table 2, represents the attribute name and its description for each attribute taken from [13]. The
data classification is shown from Figure 1 we can classify the data into „Qualitative‟ is again classified as Nominal
and Ordinal data where as the„Quantitative‟ data classified as Discrete and Continuous data.
PROPOSED METHODOLOGY
The proposed methodology employs Gradient Boosting Classifier Algorithm for prediction of heart disease in terms
of Learning Rate and Decision Trees. In this paper we will discuss two supervised machine learning algorithms,
namely, „K Nearest Neighbor Classifier‟ (K-NN) and Gradient Boosting Classifier.
‘K’ Nearest Neighbour Classifier
This algorithm is quite a simple and very powerful Machine Learning model, representation of the field is done
using the training dataset. The predictions of the output values are calculated by checking the complete dataset for K
data nodes with the same values, and using the Euclidean number to determine the resulting values. Such a dataset
can require lots of space to store and process the data, when there are multiple attributes and have to be constantly
curated . However, they very accurately, and efficiently at finding the needed values in a large dataset. The K value
indicates the count of the nearest neighbours.

Engineers for Viable Technology and $5 Trillion Economy
167 Technical Volume of 36th Indian Engineering Congress, December 26-28, 2021
ISBN 978-81-955500-1-2
Table 2 List of Various Attributes Used [13]
Sl
No
Observations of Attributes Description Values
1. Age Age in years Continuous
2. Sex Sex of Subject Male/Female
3. CP Chest Pain Four Types
4. Trestbps Resting Blood Pressure Continuous
5. Chol Serum Cholesterol Continuous
6. FBS Fasting Blood Sugar <, or >120 mg/dl
7. Restecg Resting Electrocardiograph Five values
8. Thalach Maximum Heart Rate Achieved Continuous
9. Exang Exercise Induced Angina Yes/No
10 Oldpeak ST Depression when Workout compared to the
Amount of Rest Taken
Continuous
11. Slope Slope of Peak Exercise ST Segment Up/Flat/Down
12. Ca Gives the number of Major vessels Coloured by
Fluroscopy
0-3
13. Thal Defect Type Reversible/Fixed/Normal
14. Num(Disorder) Heart Disease Not present/ present in
the four major types
Figure 1 Data Classification
We need to compute the distance between the trained and tested labels. There is no mathematically or statically pre-
defined way to find the K value. Initialize a random K value and start computing. Choose the K value which has the
minimum error rate. Before applying any machine learning algorithm, split the data into training and testing. Split
the dataset into X and Y, where X will be all the attributes present in the dataset leaving the answer key attribute, Y
will only answer key attribute. 10% of data is used for testing and the remaining 90% of data is used for training,
KNN Algorithm for different K values:
Step 1: Load the training and testing data set.
Step 2: Now, we need to fix a K value for calculating the distance for the whole dataset, K value must be integer.

Engineers for Viable Technology and $5 Trillion Economy
168 Technical Volume of 36th Indian Engineering Congress, December 26-28, 2021
ISBN 978-81-955500-1-2
Step 3: Perform the following steps for each point in the test data:
3.1- using the euclidean approach, calculate the distance between the value of the testing data and each row of the
training data.
3.2- Sort the calculated values in ascending order based on the distance between them.
3.3- choose the top K rows from the sorted array
3.4- Assign a class to the test points based on the most commonly categorised rows.
Step 4: Evaluate the KNN module using a confusion matrix.
Step 4: Evaluate the KNN module using Matrix of Perplexity
Step 5: END
Gradient Boosting Classifier
As the name implies, this method is one of the machine learning algorithms used for categorization. The goal of this
approach, Gradient Boosting, is to boost the algorithm's strength by tweaking a poor learning algorithm. PAC is the
foundation for this type of learning (Probability Approximately Correct Learning). Gradient Boosting Classifiers
apply a similar notion in this learning method, which tells the machine learning problem how complicated it is.The
logarithmic loss is frequently used in the gradient boosting process.
Gradient Boosting algorithms frequently use logarithmic loss; however, there is no need to develop a new loss
function every time the method is implemented; instead, any differentiable loss function can be applied to the model.
There are two parts to the boosting systems: an additive component and a weak learner. In gradient boosting,
decision trees are used to deal with weak learning. The additive components of this technique are gradually
introduced to the model, and as a result, previous trees cannot be changed and their values remain fixed. By taking
the computed loss and applying gradient descent, the error of the provided parameters can be minimised; tree
parameters are updated to reduce the loss.The new tree's output is added to the output of the preceding trees in the
model. This process is repeated until the loss falls below a particular level. Gradient Boosting Classifier is a useful
technique for determining whether or not a patient is sick. There are 303 instances and 14 attributes in the collection.
When the k value is 5, the first iteration of the KNN algorithm achieves 83 percent accuracy. When the number of
instances is increased from 303 to 918 in the second iteration, we achieve 91 percent accuracy for the same K value.
And after 918 instances of experimenting with the Gradient Boosting Classifier method, we were able to reach a 93
percent accuracy.
Gradient Boosting Classifier Algorithm
Step1:Compute the average of the target attribute.
Step2:Compute the residuals.
Step3:Construct a decision tree.
Step 4: Using all of the trees existing in the ensemble, predict the goal value.
Step 5: Subtract the old residuals from the new residuals.
Step 6: Repeat steps 3–5 until the total number of estimators equals the total number of estimators.
Step 7: Once the trees have been trained, make a final forecast using all of the trees in the ensemble.
EXPERIMENTAL RESULTS AND CONVERSATIONS
The suggested algorithm's simulation experiments are carried out with the Jupyter notebook python 3 simulators and
the simulation parameters specified in the proposed technique. When compared to the K nearest neighbours
classifier, the proposed Gradient Boosting Classifier produced better results. Before proceeding to the experimental

Engineers for Viable Technology and $5 Trillion Economy
169 Technical Volume of 36th Indian Engineering Congress, December 26-28, 2021
ISBN 978-81-955500-1-2
results of machine learning algorithms, one of the most essential concepts in machine learning, the confusion matrix,
should be discussed.
Matrix of Perplexity
The confusion matrix is also known as the 'error matrix' in machine learning and statistical classifications, and it is
specifically in the form of a table arrangement that permits visualisation of an algorithm's performance as illustrated
inbelow Figure 6.
Figure 6 Matrix of Perplexity
If we plot the predicted values against actual values we get the matrix as shown in the above table.
The matrix depicted in the above table is obtained by plotting anticipated values against actual values.
Let's define 'True positive,' 'False positive,' 'True negative,' and 'False negative,' respectively.
True Positive (TP) data points are those in which the projected values were positive and the actual values were
positive as well.
True Negative (TN): These are data points with negative actual values and similarly negative forecasted values.
False Positive (FP): These are data points whose actual values were negative but which were wrongly identified by
the algorithm.
False Negative (FN): These are data points whose true values were positive but were misidentified as negative by
the algorithm.
Now let's look at the findings of the algorithm and see which one is the best.
K Nearest Neighbour Classifier
Applying the KNN algorithm as mentioned in proposed method it has achieved an accuracy of 83% when the k
value is 5 for 303 instances and 14 attributes. As it is less accurate, and tried to improve the better accuracy by
increasing the number of instances from 303 to 918 and 14 attributes have drastically increased the accuracy to 91%
for the same k value.
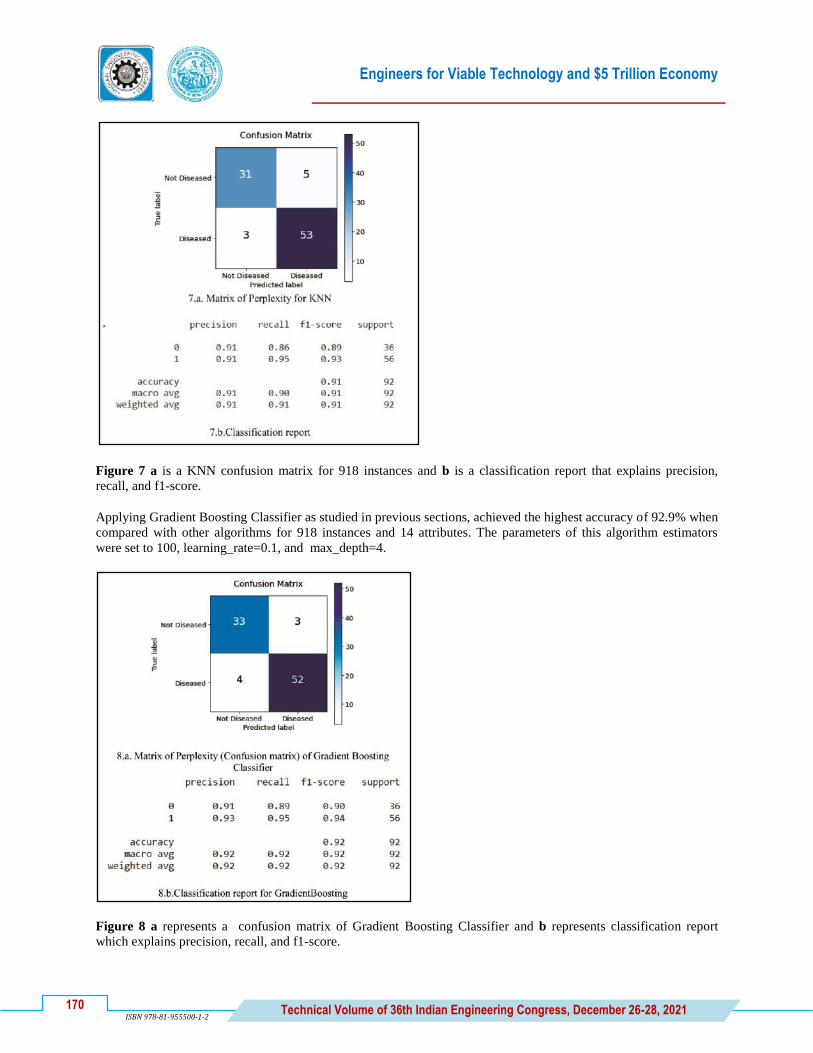
Engineers for Viable Technology and $5 Trillion Economy
170 Technical Volume of 36th Indian Engineering Congress, December 26-28, 2021
ISBN 978-81-955500-1-2
Figure 7 a is a KNN confusion matrix for 918 instances and b is a classification report that explains precision,
recall, and f1-score.
Applying Gradient Boosting Classifier as studied in previous sections, achieved the highest accuracy of 92.9% when
compared with other algorithms for 918 instances and 14 attributes. The parameters of this algorithm estimators
were set to 100, learning_rate=0.1, and max_depth=4.
Figure 8 a represents a confusion matrix of Gradient Boosting Classifier and b represents classification report
which explains precision, recall, and f1-score.

Engineers for Viable Technology and $5 Trillion Economy
171 Technical Volume of 36th Indian Engineering Congress, December 26-28, 2021
ISBN 978-81-955500-1-2
Figure 9 Comparison between KNN and Gradient Boosting classifier
It is observed from Figure 9 we can conclude that Gradient Boosting Classifier has achieved the highest accuracy
compared to KNN algorithm. So we prefer the Gradient Boosting Classifier model in terms of Learning rate and
Decision tree for prediction of heart disease that gives 93% of accuracy compared to KNN.
CONCLUSION
In this paper, we used Machine Learning algorithmsto predict whether a person is suffering from heart disease.
After importing the data, we analyzed it using histogram plot, barplot for target and age, barplot for grouped data i.e
gender versus age concerning the target. We then generated dummy variables for nominal data and ordinal data
features and scaled other features. We then split the data for training 90% and 10 % for testing. Then applied
Machine Learning algorithms, K Neighbour Classifier for different K values, Gradient Boosting
Classifier(parameters with estimators, learning rate, and depth), then varied dataset across each model to improve
their scores. In the end, GradientBoosting Classifier achieved the highest score of 92.9% when the estimator value is
100 in terms of learning rate and decision trees.
REFERENCES
1. Murray CJ, Lopez AD, “Alternative projections of mortality and disability by cause 1990–2020: Global Burden
of Disease Study. Lancet. 1997;349:1, pp.498–504.
2. Gupta R, Joshi P, Mohan V, Reddy KS, Yusuf S. “Epidemiology and causation of coronary heart disease and
stroke in India”,.Heart. 2008;94:, pp.16–26.
3. Yusuf S, Hawken S, Ounpuu S, et al. “Effect of potentially modifiable risk factors associated with myocardial
infarction in 52 countries (the INTERHEART study): a case-control study”, Lancet. 2004, pp.37–52.
4. World Health Organization (WHO) India [Accessed April 29, 2010]; National cardiovascular disease database.,
. Bhargava SK, Sachdev HS, Fall CH, et al. Relation of serial changes in childhood body-mass index to
impaired glucose tolerance in young adulthood. N Engl J Med. 2004;350:8, pp.65–75.
5. Dangare, Chaitrali S and Sulabha S Apte. "Improved study of heart disease prediction system using data mining
classification techniques." International Journal of Computer Applications 47.10 (2012): 44-8.
6. Ahmed Fawzi Otoom, Emad E. Abdallah, Yousef Kilani, Ahmed Kefaye, and Mohammad Ashour “Effective
Diagnosis and Monitoring of Heart Disease”
7. Vembandasamy K, Sasipriya R, Deepa E. Heart diseases detection using Naive Bayes algorithm. Int J Innov Sci
Eng Technol. 2015;2(9):441–4.
8. Chaurasia V, Pal S. Data mining approach to detect heart diseases. Int J Adv Comput Sci Inf Technol
(IJACSIT). 2014;2:56–66.

Engineers for Viable Technology and $5 Trillion Economy
172 Technical Volume of 36th Indian Engineering Congress, December 26-28, 2021
ISBN 978-81-955500-1-2
9. G. Parthiban, S. Srivatsa. Applying machine learning methods in diagnosing heart disease for diabetic patients.
Published 2012.
10. Deepika K, Seema S. Predictive analytics to prevent and control chronic diseases. In: 2016 2nd international
conference on applied and theoretical computing and communication technology (iCATccT). IEEE. p. 381–86.
11. Dwivedi AK. Performance evaluation of different machine learning techniques for prediction of heart disease.
Neural Comput Appl. 2018;29(10):685–693.
12. Devansh Shah1 · Samir Patel1 · Santosh Kumar Bharti1. Heart Disease Prediction using Machine Learning
Techniques
13. Kaggle.com for dataset.

Engineers for Viable Technology and $5 Trillion Economy
173 Technical Volume of 36th Indian Engineering Congress, December 26-28, 2021
ISBN 978-81-955500-1-2
CP_041_07_196
A Smart Phone Application to Evaluate Candle Flame
Characteristics
Abhay Chatterjee and Thangaraja Jeyaseelan*
School of Mechanical Engineering, Vellore Institute of Technology, Vellore
*email:[email protected]
Abstract: Today, smartphones are used for a variety of applications it is not limited to calling and receiving, and
sending text messages, they have a variety of features such as a camera, torch, games, social media, news, and so
on. This paper aims to utilize the device for yet another application that is capturing the flame height, wick width,
and flame width using a smartphone camera. The experimental setup is quite trivial; the camera should be as close
as possible to the flame, the reference length has to be measured to have an idea about the total length captured
which aids to calculate the pixel length of the image. Further, the change in height and width with respect to time is
also recorded.
Keywords: Image Processing; Candle Flame; Smart Phone; Python
INTRODUCTION
A smartphone is used for various applications in today‟s world. A smartphone is a very common device that is used
by almost everyone these days. It is already used for various applications such as maintaining the caloric balance in
the human body [1]. Furthermore, there are applications such as ithleteTM
which determine ultra-short-term heart
rate variability [2]. Covid-19 pandemic has made a huge impact on each one of us in some way or the other, mental
health of the youth being one of the major issues, but a smartphone application on assessment and management of
youth mental health could help in reducing the anxiety and depression cases among youths [3,4]. GeoTools is
another android application that aids to do tasks in the area of geology, such as being a pocket compass [5].
According to the literature, there are about 76% of undergraduate students use smartphones for educational purposes
[6]. Some studies aim to incorporate learning via smartphones Supadi et al. recorded a positive impact when
smartphone application was used for mathematics learning [7]. A feedback survey on undergraduate students for
academic library applications was taken and it suggested that students were willing to utilize the applications [8].
The candle flame dimensions can help us to understand diffusion flame characteristics, help to facilitate industrial
design, and help in understanding ignition potential. The flame height characteristics also help in the
characterization of the soot formation [9]. Sunderland et al. developed a model to predict flame width and heights by
capturing the length and width of the wick with a high-resolution camera and utilizing the Rayleigh number and
Nusselt number for their model [10]. This paper aims to provide a simple methodology and a basic setup to capture
the wick width, flame height, and flame width. The model suggested in this paper facilitates that a common person
without any laboratory equipment can capture the flame dimensions and process it with an open-source language
python. Subsequently, the variation in these parameters are noted which could give us an insight into how much
wax is burned in a candle flame in every frame.

Engineers for Viable Technology and $5 Trillion Economy
174 Technical Volume of 36th Indian Engineering Congress, December 26-28, 2021
ISBN 978-81-955500-1-2
METHODOLOGY
Experimental Setup
The candle has to be placed as near as possible to the reference length. Reference length is the pre-measured length,
the length should include the whole flame height, for example, if the flame height is about 40mm the references
length should be at least 50 mm. The camera should be as near as possible to the flame, if we increase the distance
of the camera the measurement error would increase.
Model
The model was made utilizing OpenCV library from an open-source language python. The image as captured on the
phone is now ready for further processing. The noise is reduced using medianblur (appropriate Kernel size has to be
selected) as this blurring preserves edges that are in our interest for the calculation of flame height and flame width.
After that use canny (using appropriate threshold values) to get the edges. After that number of pixels between the
edges is counted and the pixel length is multiplied to get the appropriate results. This is repeated for the various
frames and the variation in height and width can be observed.
RESULTS AND DISCUSSION
The candle was kept close to the white paper which was 63mm in length (reference length, that is the height of
Figure 1). The camera was placed in such a way that the whole length just fit in the frame and the lens was as close
as possible. The video was captured with a Nokia 7 plus phone, with 30fps. Then the frames were extracted using
the OpenCV library in python, as shown in Figure 1. After getting the frames noise reduction is done using
medianblur, we can use the same or different kernel size for detecting appropriate height and width which depends
majorly on the lighting and the background of the taken image. In this case for the height calculation, the kernel size
is 23, the wick width the kernel size is 81, and for the width calculation, the kernel size is 121. The built-in function
of OpenCV, cv2.canny is used to get the edges with appropriate thresholds of the in as shown in Figure 2.
Figure 1 A sample Frame from the video of the candle
burning
Figure 2 Image showing edges for the height calculation
Now the pixel length has to be calculated as 63mm = 3840 pixels, which results in 1 pixel= 0.0164mm. Further, the
using various kernel sizes and appropriate thresholds, the result which is shown in Figure 3 is obtained.
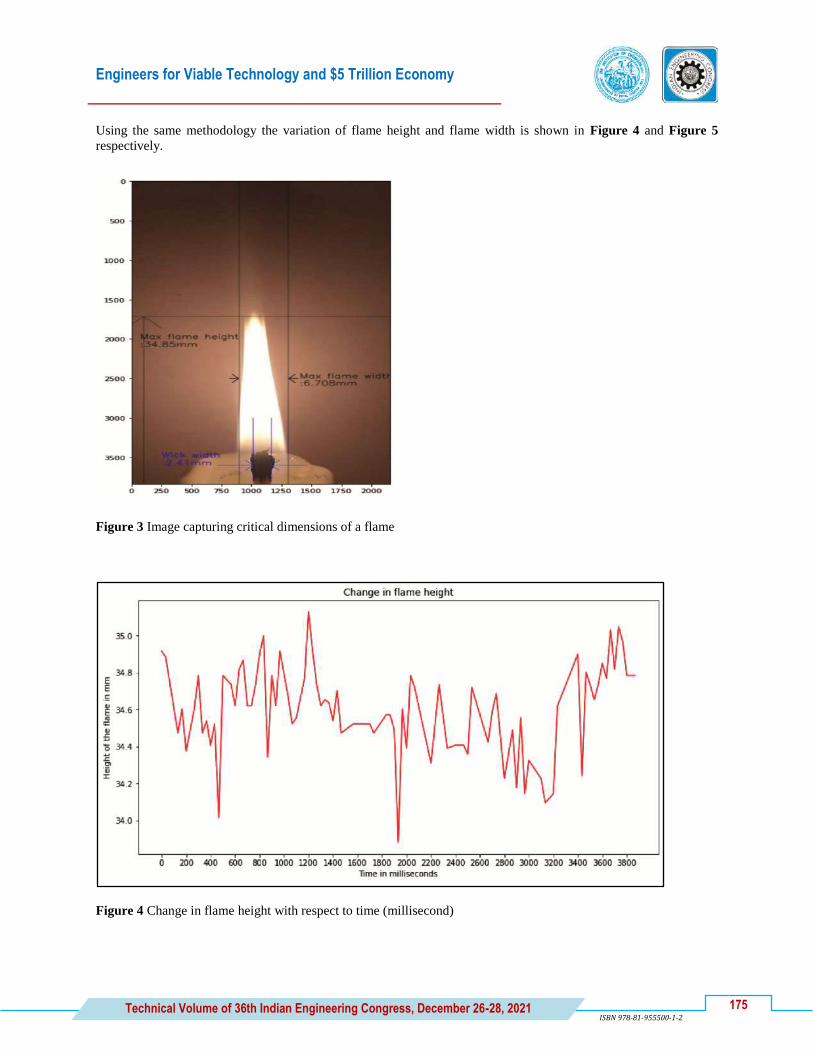
Engineers for Viable Technology and $5 Trillion Economy
175 Technical Volume of 36th Indian Engineering Congress, December 26-28, 2021
ISBN 978-81-955500-1-2
Using the same methodology the variation of flame height and flame width is shown in Figure 4 and Figure 5
respectively.
Figure 3 Image capturing critical dimensions of a flame
Figure 4 Change in flame height with respect to time (millisecond)

Engineers for Viable Technology and $5 Trillion Economy
176 Technical Volume of 36th Indian Engineering Congress, December 26-28, 2021 ISBN 978-81-955500-1-2
Figure 5 Change in flame width with respect to time (milliseconds)
Image processing helps to easily identify the changes of critical dimensions with respect to time. The variation of the
flame height and flame width can be will help in calculating various other parameters such as how much wax is
burnt every frame, and other parameters similar to it. The average height recorded was 34.6 mm and the width
average was 6.7 mm.
CONCLUSION
A model was put forward which is simple to perform using open source language like python and doesn‟t require
any laboratory equipment, just a smartphone. The wick width, flame height, and its variation, and flame width and
its variation are measured by this model. Which further can give us ways to calculate different factors affecting it.
Further the average flame height of 34.6 mm and width of 6.7 mm was also recorded.
REFERENCES
1. Tsai, C. C., Lee, G., Raab, F., Norman, G. J., Sohn, T., Griswold, W. G., & Patrick, K. (2007). Usability and
feasibility of PmEB: a mobile phone application for monitoring real time caloric balance. Mobile networks and
applications, 12(2), 173-184.
2. Flatt, A. A., &Esco, M. R. (2013). Validity of the ithlete™ smart phone application for determining ultra-short-
term heart rate variability. Journal of human kinetics, 39, 85.
3. https://www.unicef.org/lac/en/impact-covid-19-mental-health-adolescents-and-youth accessed at 5-11-2021
4. Reid, S. C., Kauer, S. D., Hearps, S. J., Crooke, A. H., Khor, A. S., Sanci, L. A., & Patton, G. C. (2013). A
mobile phone application for the assessment and management of youth mental health problems in primary
care: health service outcomes from a randomised controlled trial of mobiletype. BMC family practice, 14(1), 1-
9.
5. Weng, Y. H., Sun, F. S., & Grigsby, J. D. (2012). GeoTools: An android phone application in
geology. Computers & Geosciences, 44, 24-30.
6. Bomhold, C. R. (2013). Educational use of smart phone technology: A survey of mobile phone application use
by undergraduate university students. Program.

Engineers for Viable Technology and $5 Trillion Economy
177 Technical Volume of 36th Indian Engineering Congress, December 26-28, 2021
ISBN 978-81-955500-1-2
7. Ariyanto, L., Kusumaningsih, W., &Aini, A. N. (2018, March). Mobile phone application for mathematics
learning. In Journal of Physics: Conference Series (Vol. 983, No. 1, p. 012106). IOP Publishing.
8. Karim, N. S. A., Darus, S. H., &Hussin, R. (2006). Mobile phone applications in academic library services: a
students' feedback survey. Campus-Wide Information Systems
9. Thomsen, M. C., Fuentes, A., Demarco, R., Volkwein, C., Consalvi, J. L., &Reszka, P. (2017). Soot
measurements in candle flames. Experimental Thermal and Fluid Science, 82, 116-123.
10. Sunderland, P. B., Quintiere, J. G., Tabaka, G. A., Lian, D., & Chiu, C. W. (2011). Analysis and measurement
of candle flame shapes. Proceedings of the Combustion Institute, 33(2), 2489-2496.


En
gin
eers
fo
r V
iab
le T
ech
no
log
y a
nd
$5
Tri
llio
n E
con
om
y
Electrical
Engineering


Engineers for Viable Technology and $5 Trillion Economy
181
181
Technical Volume of 36th Indian Engineering Congress, December 26-28, 2021 ISBN 978-81-955500-1-2
EL_025_02_215
Supraharmonics in the Electric Power Grid: Detection and
Measurement in Textile Industry
Y Dhayaneswaran 1*, A Amudha
1 and L Ashokkumar
2
1Department of Electrical and Electronics Engineering, Karpagam Academy of Higher Education, Coimbatore
2Department of Electrical and Electronics Engineering, P S G College of Technology, Coimbatore
*e-mail: [email protected]
Abstract: Solar and wind energy technologies, as well as smart grids, have gotten a lot of attention lately in the
electric power distribution system. With the help of power electronics equipment, it is possible to convert energy
from natural power sources into electrical power. The electronics technologies have resulted in the discovery of new
emissions that occur between frequency 2 and 150 kHz, which is outside of the conventional power quality
frequency range. Supraharmonics is the term used to describe these emissions, which are found all over the planet
(SH). As a result, these emissions have a significant negative influence on the power quality and lifespan of the
electrical distribution system.In the textile business, inverters are used to modernise the machines in accordance
with the process requirements. In the home, inverters are being used in air conditioners, refrigerators, and ceiling
fans to reduce power usage. In addition, solar panels are becoming increasingly popular as a means of
transitioning to a more environmentally friendly energy source, with inverters being used to convert the DC voltage
to the alternating current. Due to these factors, conductive emission occurs in the frequency range of 2 kHz to 150
kHz, which is referred to as Supraharmonics. Interference sources, victims, and consequences are addressed in
detail.
Keywords: Harmonics; EMI; Supra Harmonics; 2.5 to 150 kH
INTRODUCTION
Grids are changing due to (1) increased incorporation of sustainable power sources including solar photovoltaic and
wind power, (2) the electrification of automobiles demanding battery recharging techniques, (3) the approaching
decentralized energy management trend and (4) the use of electrical machines. Power electronics offers the
technological solutions to CO2 challenges listed above. All of these new technologies contribute to grid concerns by
generating emissions in the conventional power quality frequency band of 0–2 kHz.
Supraharmonics are a distinct sort of emission that happens between 2 and 150 kHz and can be distinguished from
other types of emission. Several power converters, including rectifiers diode, dc to dc converters, Inverters, are used
extensively in these technologies. Their integration into power networks results in serious power quality issues,
notably with regard to sulphur dioxide emissions. Changing Harmonic Emission levels are a relatively new
occurrence in the electrical grid that is associated with the use of renewable energy sources such as solar and wind.
Furthermore, the SH emission range is significantly depend on the quantity of power electronics equipment
connected to a power grid [1]. As more renewable energy sources are integrated into the electricity system, SH
emissions are injected. So, in recent years, several studies have been carried out to identify, measure, and minimise
this new high-frequency phenomenon [2]. Recently, many problems like as household equipment failures, capacitor
overheating, and electromagnetic incompatibility have been reported due to strong SH emission. As a result of
increased thermal stress induced by SH emissions, the life of electrical appliances is reduced.
A growing number of fully automated processes necessitates power electronic devices like variable frequency drives
and servo drives. However, by emitting in the 0–2 kHz range, these new technologies cause grid issues.
Supraharmonic emissions (between 2–150 kHz) have also emerged as power electronics converter switching

Engineers for Viable Technology and $5 Trillion Economy
182 Technical Volume of 36th Indian Engineering Congress, December 26-28, 2021 ISBN 978-81-955500-1-2
frequencies increase to produce more compact and efficient equipment. All these technologies rely on power
converters such as inverters and rectifiers. Integration into electrical grids causes significant power quality issues,
particularly supraharmonic emission.
Pollution and noise have caused a labour shortage in the textile industry. Because the textile industry is nonstop,
technicians must maintain their power electrical devices. If any of the gadgets fail, substantial profits are lost. Thus,
the technician must take all precautions to avoid component failure. Technicians currently know about 0-2kHz
harmonics and their mitigation, but not supraharmonics. Supraharmonics research and study is now popular in
research institutes.The textile mill's main goal is to turn cotton into yarn, a six-stage process. These are discussed
briefly for benefit of understanding. Textile mills are classified as card, combed, and ring spun. The card sliver
system cleans raw cotton and card it into thick yarn (sliver). It has draw frame and comber machines to ensure
consistent sliver thickness and remove short fibres. This method of turning sliver into yarn utilises speed frames and
ring frames (thin thread).
The definition of Supraharmonics is highlighted in this study. The findings of a practical experiment done in textile
mills are discussed in this paper.
SUPRAHARMONICS
The harmonics were in the range of 0–2 kHz in frequency. Many modern gadgets, particularly those powered by
renewable energy (RE), raise worries about high levels of noise exceeding 2 kHz, which is a concern for many
people. All kind of current and voltage waveforms disruption occurring between the spectrum range of 2 to 150 kHz
is referred to as SH [12], and it is used to depict this distortion. When electronic switching technologies slice the
voltage sinusoidal waveform between the cutoff and conducting states, they generate extremely large harmonics
such as SH.Circuits such as inverter circuits, for example, are known to produce harmonics. Electrical device
breakdown, especially touchscreen technologies, mechanical resonant frequency noise, and thermal expansion stress
are all possible consequences of these massive harmonics, which might shorten the equipment's lifespan. PLCs and
power-electronic converters [14] are the most significant producers of SH on the grid.To understand SH creation, it
is necessary to first understand harmonics. When dealing with constant loads, the voltage quality has an impact on
the demand current, which in turn has an impact on the utility grid. The voltage waveform deviation results in a
current waveform deviation, which in turn induces the voltage waveform to be affected [15]. Even though the input
voltage is virtually sinusoidal, the load consumes a disordered amount of current. As a result, a sine input voltage
results in a quasi-load voltage if applied.
Fortunately, modern power-electronic technology, such as controlled power supplies and energy transformation
devices, has brought the problem back to life. Switched mode power supply (SMPS) have progressed from using
transformers operating at 50 or 60 Hz to adopting high frequency transformers. Apart from the magnetic flux
current, which is negligible when compared to the practically sinusoidal load current, transformers were essentially
linear devices. SCRs with non-sinusoidal characteristics are extensively used in modern power supplies.As a result,
Fourier analysis detects its waveform as a frequency range of fundamental frequencies and harmonic components.
Every time the current distortion is measured, it is discovered that the voltage deformation at some of these
frequencies is the maximum [12] and [18]. A significant amount of influence is exerted on power systems by the
harmonic content of such non - sinusoidal current waveform. As a result of the high frequency operation of power
electronics interface converters, they produce increased harmonic distortions [19–21]. Because there is less iron
core, there is less weight, mass, and expenditure. The disruption of frequencies that are higher than the low-
frequency harmonic spectrum receives very little attention in the scientific community. This was most likely due to
low levels of disruption in previous years.
SUPRAHARMONIC IMPLICATIONS AND CHARACTERISTICS
SH has recently gained increased attention [21] because of the potential impact on other networked devices.
Increased capacitive current may damage the power supply, will result in increased safety hazards because of the use
of the SH.In addition, it may consequence in (a) obvious faults through sense of touch technician modules and
lightbulb duller, (b) decrease the operating period of Lighting systems, (c) contact errors (PLC communication

Engineers for Viable Technology and $5 Trillion Economy
183
183
Technical Volume of 36th Indian Engineering Congress, December 26-28, 2021 ISBN 978-81-955500-1-2
systems), (d) getting too hot of transformers and static var compensators, (f) failure of safety protection equipment,
(g) failure of communication among smart meters, and (h) malfunction of household components, medical
equipment, and surveillance systems, as well as road transport controls..Additionally, the SH distortions generated
by non - linear loads would result in significant energy wastage, which would have a severe influence on electricity
transmission systems and their components. Furthermore, it has been demonstrated that SH has an impact on
network instability in poorly built networks with hybrid renewable energy inverters, resulting in bogus inverter
activation [4] and [21] in badly designed networks with renewable energy system inverters. Unless the dangers of
SH are identified and addressed, it is reasonable to believe that they are potentially harmful.
The desire to improve power-factor and reduce harmonic interference in inverter at low-frequency output current
used in grid connected equipment has resulted in an increase in SH emissions [21]. In this case, the
Supraharmonics is created by the power electronic switches of IGBT switching frequency of the inverter and can be
exported to the grid. If the inverter does not function or does not provide output, the unit is classified as a SH basin
[22]. The main grid's RE sources, which use inverters as output interfaces, have the potential to generate significant
Supraharmonics.A current is driven by two driving forces that are generated by a connection between an inverter
and the grid, as depicted in Figure 1. Primary emission is a quantity of the current generated by power electronics or
any other electrical equipment that is either ordinary or supraharmonic in nature. Secondary emission, on the other
hand, is a regular or supraharmonic portion of current caused by sources external to the device (e.g., from a power
source).
Figure 1 Equivalent circuit for emission of primary & secondary
THE ANALYSIS OF SUPRAHARMONICS BASED ON REAL-TIME MEASUREMENTS
SH is conducted in a textile mill in Tamilnadu, India, where the Supraharmonics measurements are taken. Even
though there are numerous PQ measuring devices available on the market today, the manufacturer Powerside
https://powerside.com is developing the P Qube 3 metre, which measures the Supraharmonics in the power quality
frequency band between 2.5 and 150 kHz to quantify the power quality frequency band. This instrument has been
approved for Class A PQ permitting in accordance with IEC 61000-4-30 [2]. Dranetz also manufactures the PQ
metre, which is used to measure harmonics (https://www.dranetz.com). However, it is possible that another
manufacturer has that feature, which will be investigated further. The Pqube 3 metre has been installed in the Textile
mill for the purpose of collecting data for the study. At the textile mill, the instrument is fixed on a weekly basis, for
a total of one week. Every one second, the data is gathered, and it captures every power quality event that occurs.
Figure 2 depicts a single line diagram of load sharing and the capability of the shared load system.
The industry's sanctioned demand for electricity at this location is 1250 KVA, according to the utility. There are
nonlinear loads on the machines, which are fed by a frequency converter that provides power to the motors. The
total installed power of a single machine ranges between 45kW and 55 kW, depending on the model. The Pqube 3
meter is linked to the load side, and data is collected for a period of one week in continuous operation. The data is
collected on a day-to-day basis. The Supraharmonics level is observed in different frequency spectrums, and the
voltage peak at 2kHz is measured to be 30Vpk.

Engineers for Viable Technology and $5 Trillion Economy
184 Technical Volume of 36th Indian Engineering Congress, December 26-28, 2021 ISBN 978-81-955500-1-2
Figure 2 Power line diagram of Textile mill
Figure 3 Real time graph on Supraharmonics taken through Pqube meter for one day.
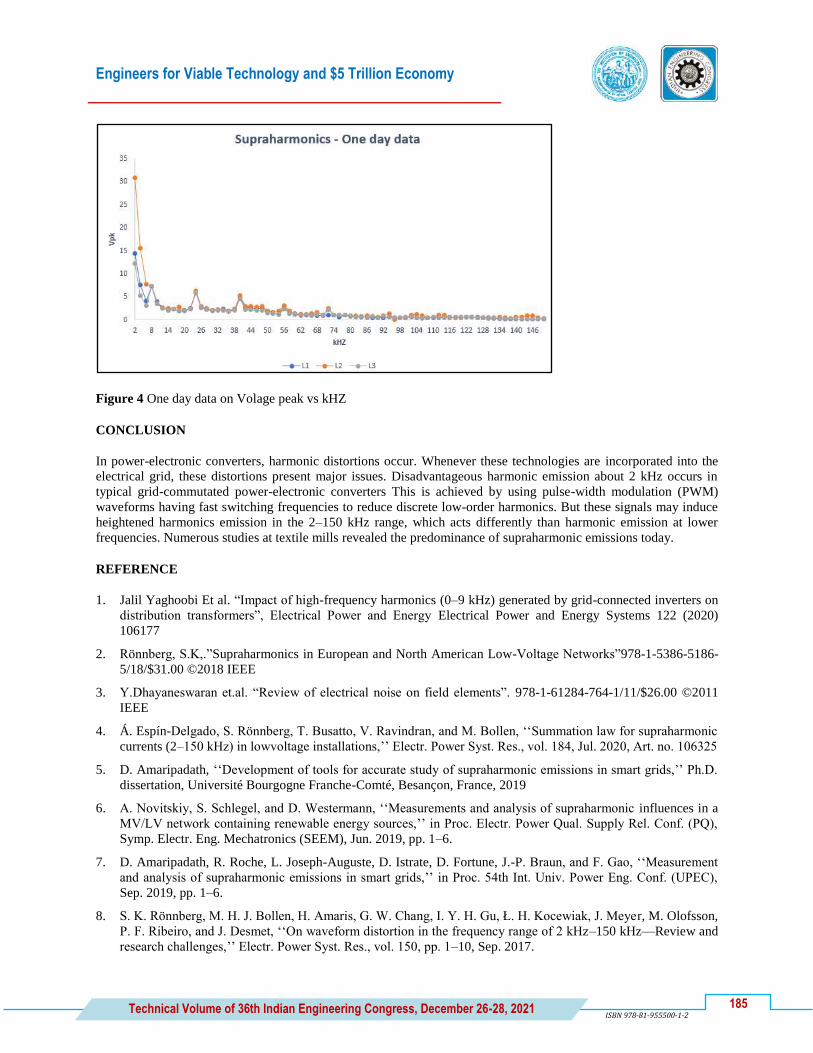
Engineers for Viable Technology and $5 Trillion Economy
185
185
Technical Volume of 36th Indian Engineering Congress, December 26-28, 2021 ISBN 978-81-955500-1-2
Figure 4 One day data on Volage peak vs kHZ
CONCLUSION
In power-electronic converters, harmonic distortions occur. Whenever these technologies are incorporated into the
electrical grid, these distortions present major issues. Disadvantageous harmonic emission about 2 kHz occurs in
typical grid-commutated power-electronic converters This is achieved by using pulse-width modulation (PWM)
waveforms having fast switching frequencies to reduce discrete low-order harmonics. But these signals may induce
heightened harmonics emission in the 2–150 kHz range, which acts differently than harmonic emission at lower
frequencies. Numerous studies at textile mills revealed the predominance of supraharmonic emissions today.
REFERENCE
1. Jalil Yaghoobi Et al. ―Impact of high-frequency harmonics (0–9 kHz) generated by grid-connected inverters on
distribution transformers‖, Electrical Power and Energy Electrical Power and Energy Systems 122 (2020)
106177
2. Rönnberg, S.K,.‖Supraharmonics in European and North American Low-Voltage Networks‖978-1-5386-5186-
5/18/$31.00 ©2018 IEEE
3. Y.Dhayaneswaran et.al. ―Review of electrical noise on field elements‖. 978-1-61284-764-1/11/$26.00 ©2011
IEEE
4. Á. Espín-Delgado, S. Rönnberg, T. Busatto, V. Ravindran, and M. Bollen, ‗‗Summation law for supraharmonic
currents (2–150 kHz) in lowvoltage installations,‘‘ Electr. Power Syst. Res., vol. 184, Jul. 2020, Art. no. 106325
5. D. Amaripadath, ‗‗Development of tools for accurate study of supraharmonic emissions in smart grids,‘‘ Ph.D.
dissertation, Université Bourgogne Franche-Comté, Besançon, France, 2019
6. A. Novitskiy, S. Schlegel, and D. Westermann, ‗‗Measurements and analysis of supraharmonic influences in a
MV/LV network containing renewable energy sources,‘‘ in Proc. Electr. Power Qual. Supply Rel. Conf. (PQ),
Symp. Electr. Eng. Mechatronics (SEEM), Jun. 2019, pp. 1–6.
7. D. Amaripadath, R. Roche, L. Joseph-Auguste, D. Istrate, D. Fortune, J.-P. Braun, and F. Gao, ‗‗Measurement
and analysis of supraharmonic emissions in smart grids,‘‘ in Proc. 54th Int. Univ. Power Eng. Conf. (UPEC),
Sep. 2019, pp. 1–6.
8. S. K. Rönnberg, M. H. J. Bollen, H. Amaris, G. W. Chang, I. Y. H. Gu, Ł. H. Kocewiak, J. Meyer, M. Olofsson,
P. F. Ribeiro, and J. Desmet, ‗‗On waveform distortion in the frequency range of 2 kHz–150 kHz—Review and
research challenges,‘‘ Electr. Power Syst. Res., vol. 150, pp. 1–10, Sep. 2017.

Engineers for Viable Technology and $5 Trillion Economy
186 Technical Volume of 36th Indian Engineering Congress, December 26-28, 2021 ISBN 978-81-955500-1-2
9. Specification for Radio Disturbance and Immunity Measuring Apparatus and Methods—Part 1-4: Radio
Disturbance and Immunity Measuring Apparatus—Antennas and Test Sites for Radiated Disturbance
Measurements, Standard CISPR 16-1-4, 2019.
10. T. M. Mendes, C. A. Duque, L. R. M. Silva, D. D. Ferreira, and J. Meyer, ‗‗Supraharmonic analysis by filter
bank and compressive sensing,‘‘ Electr. Power Syst. Res., vol. 169, pp. 105–114, Apr. 2019.
11. J. Huang and H. Shi, ‗‗Suppression of the peak harmonics from loads by using a variable capacitance filter in
low-voltage DC/DC converters,‘‘ IEEE Trans. Electromagn. Compat., vol. 58, no. 4, pp. 1217–1227, Aug.
2016.
12. M. Bollen, M. Olofsson, A. Larsson, S. Rönnberg, and M. Lundmark, ‗‗Standards for supraharmonics (2 to 150
kHz),‘‘ IEEE Electromagn. Compat. Mag., vol. 3, no. 1, pp. 114–119, Apr. 2014.
13. V. Khokhlov, J. Meyer, A. Grevener, T. Busatto, and S. Ronnberg, ‗‗Comparison of measurement methods for
the frequency range 2–150 kHz (supraharmonics) based on the present standards framework,‘‘ IEEE Access,
vol. 8, pp. 77618–77630, 2020.
14. J. C. Hernández, M. J. Ortega, J. De la Cruz, and D. Vera, ‗‗Guidelines for the technical assessment of
harmonic, flicker and unbalance emission limits for PV-distributed generation,‘‘ Electr. Power Syst. Res., vol.
81, no. 7, pp. 1247–1257, Jul. 2011.
15. M. Z. M. Radzi, M. M. Azizan, and B. Ismail, ‗‗Observatory case study on total harmonic distortion in current
at laboratory and office building,‘‘ J. Phys., Conf. Ser., vol. 1432, Jan. 2020, Art. no. 012008.
16. N. Cho, H. Lee, R. Bhat, and K. Heo, ‗‗Analysis of harmonic hosting capacity of IEEE Std. 519 with IEC
61000-3-6 in distribution systems,‘‘ in Proc. IEEE PES GTD Grand Int. Conf. Expo. Asia (GTD Asia), Mar.
2019, pp. 730–734.
17. EEE Draft Standard for Interconnecting Distributed Resources With Electric Power Systems—Amendment 1,
Standard IEEE P1547a/D3, Mar. 2014, pp. 1–12.
18. A. Moreno-Munoz, A. Gil-de-Castro, S. Rönnberg, M. Bollen, and E. Romero-Cadval, ‗‗Ongoing work in
CIGRE working groups on supraharmonics from power-electronic converters,‘‘ in Proc. Int. Conf. Exhib.
Electr. Distrib., Jun. 2015, pp. 1–5.
19. T. Yalcin, M. Özdemir, P. Kostyla, and Z. Leonowicz, ‗‗Analysis of supraharmonics in smart grids,‘‘ in Proc.
IEEE Int. Conf. Environ. Electr. Eng., IEEE Ind. Commercial Power Syst. Eur. (EEEIC/I&CPS Europe), Jun.
2017, pp. 1–4.
20. ctromagnetic Compatibility (EMC)—Part 4-19: Testing and Measurement Techniques—Test for Immunity to
Conducted, Differential Mode Disturbances and Signaling in the Frequency Range 2 kHz to 150 kHz at A.C.
Power Ports, Standard IEC 61000-4-19:2014, 2014.
21. Y. Wang, D. Luo, and X. Xiao, ‗‗Evaluation of supraharmonic emission levels of multiple grid-connected
VSCs,‘‘ IET Gener., Transmiss. Distrib., vol. 13, no. 24, pp. 5597–5604, Dec. 2019.
22. G. Anne, M. Jan, and R. Sarah, ‗‗Comparison of measurement methods for the frequency range 2–150 kHz
(supraharmonics),‘‘ in Proc. IEEE 9th Int. Workshop Appl. Meas. Power Syst. (AMPS), Sep. 2018, pp. 1–6.

Engineers for Viable Technology and $5 Trillion Economy
187
187
Technical Volume of 36th Indian Engineering Congress, December 26-28, 2021 ISBN 978-81-955500-1-2
EL_028_05_210
Electric Vehicle Charging Landscape Aiming for Self Reliant
India
Priyabrata Pradhan
Hindustan Petroleum Corporation Limited
email: [email protected]
Abstract: One of the revolutionizing global strategies for the de-carbonization of the transport sector is the
transition to electric mobility. India is amongst the few countries that propagate the globalEV30@30 campaign,
targeting to have at least 30% new electric vehicles by the year 2030. An essential pre-requisite to achieve this
ambitious transition comprises of accessible and robust network of electric vehicle (EV) charging infrastructure for
which the Government of India has enabled various policies to promote the development of the charging network.
However, in view of the present scenario of this new infrastructure type, there is a need for customizing to the
Indian transport system along with building capacity among stakeholders to support the on-ground expansion. This
paper aims at giving the efficient and timely implementation of electric vehicle charging structure ensuring proper
integration of transportation and supply networks.
Keywords: Electric Vehicle; Battery Swapping; Rating
INTRODUCTION
With the rising demand for electric vehicle it can eventually lead to replacement of conventionalvehicles. Thepaper
aims for understanding the Electric vehicle charging structure along with the introduction to concepts (technical) of
EV equipment‘s, AC/DC charging, power ratings & charging standards. It also focuses on supply of electricity for
charging structure along with the financial viability for the same.
EV CHARGING STRUCTURE
The basic unit of EV charging structurecomprises of the Electric vehicle supply equipment (EVSE). This accesses
power from theelectricity supply and makes usage of a control system & wired connection to safely charge Electric
Vehicles. An Electric vehicle supply equipment control system enables many different functions such as
authentication of user, charging prior to authorization, recording of information & exchange of network
management along with ensuring data privacy &security. It is advised to use Electric vehicle supply equipment with
least basic control & and management functions for all purposes related to charging. Conductive charging or plug-in
charging, is the main charging technology in practice.
EV charging depends on the specification of Electric Vehicle batteries, as power needs to be supplied to the battery
at the exact right voltage & levels of current to give permission for charging. In India, in view of the EVs, transport
electrification is expected to be driven by light electric vehicle which primarily comprises of two-wheelers and
three-wheelers. Moreover, Cars and light commercial vehiclesare the other vehicle segments being electrified.
Electric Vehicle charging requirements primarily depend on specifications of batteries of EV. The voltage &
capacity of Electric Vehiclebatteries differ amongst the various EV segments, as shown in Table 1.
It is evident that low-voltage batteries are able to power the E-2Ws and e-3Ws. The lowvoltage batteries were the
ones to power the first generation of e-cars. The 2nd
generation of e-cars can be seen in the future e-car models which

Engineers for Viable Technology and $5 Trillion Economy
188 Technical Volume of 36th Indian Engineering Congress, December 26-28, 2021 ISBN 978-81-955500-1-2
are powered from high-voltage batteries. Electric Light Commercial Vehicles will comprise of both low-voltage and
high-voltage vehicles, depending on their load-carrying capacity.
Table 1 Voltage & Capacity of EV vehicles
CHARGING METHODS & POWER RATINGS
The charging method comprises of supply of direct current to the battery pack. Aconverter is required to provide
(DC) power to the battery, as the electrical distribution system supplies (AC) alternate current. Conductive charging
can be both Alternating Current and Direct Current. In the case of an AC electric vehicle supply equipment, the
Alternating Current power is delivered to the on-board charger of the Electric Vehicle whichresults in conversion
into Direct Current. A Direct Current electric vehicle supply equipmentresults in external conversion of the power
and supplying the Direct Current power directly to the battery and thus bypassing the on-board charger.
As per depiction in Figure 1, AC &DC charging are classified into charging modes of four types with AC charging
depicted by Modes 1-3 & DC charging shown by Mode 4.
As per Figure 1, modes 1 &2 are applicable for connecting an Electric vehicle to a socket outlet of standard type
which utilizes a cable and plug. The typical Mode 1 which is also known as dumb charging, allows nil
communication between the EV & EVSE and thus is not recommended. The portable cable that is used in Mode 2
has an inbuilt protection &control capability. It is typically used for home charging. Modes 3 & 4 provide a separate
charger device to give power to the Electric vehicle. They have improvised control systems &are primarily used for
commercial & public charging[1].
POWER RATINGS
Electric vehicle supply equipment have various ratings of power or levels based on charging requirements, which
determine the power requirements for charging structure. The Table 2 depicts the categorization of electric vehicle
charging by power level along with the normal power charging. The normal power charging goes up to 22kW,
whereas the highpower charging goes upto 200kW.

Engineers for Viable Technology and $5 Trillion Economy
189
189
Technical Volume of 36th Indian Engineering Congress, December 26-28, 2021 ISBN 978-81-955500-1-2
Figure 1 Classification of AC & DC Charging
Table 2 Normal & high power charging
Supply equipment‘s with ratings up to 500kW are available globally, however they are mainly applicable for heavy
vehicles like trucks or buses. Primarily normal power Alternating current charging is sufficient for e-3Ws, e-2Ws, &
e-cars. Normal power DC charging is specific to India, due to the commonness of Light EVs & the usage of low-
voltage batteries in e-cars.
Single-phase AC chargers which have a capacity of maximum power rating of 7kW, are adequate for Light Electric
Vehicles & cars with single phase chargers which are available on-board Moreover, 3-phase Alternating Current
(AC) chargers having a power rating up to 22 kW, are required for cars havinglarger on-board chargers. Most
importantly, input power supply for the normal power charging can be provided from the standard electricity
distribution network. For e-cars having battery capacities between 30-80kWh (high-voltage), high-power DC
charging of capacity 50kW is used. The power level of DC chargers in the market ranges between 25kW and 60kW.
High-power DC charging takes less time for e-cars. However, it requires electricity supply higher along with with

Engineers for Viable Technology and $5 Trillion Economy
190 Technical Volume of 36th Indian Engineering Congress, December 26-28, 2021 ISBN 978-81-955500-1-2
additional structure. Thus, normal power charging points are sufficient for charging requirements primarily,
including overnight or slow charging of cars.
BATTERY SWAPPING
An alternative recharging method for the battery that is receiving attention globally is battery swapping. The process
includes removal of the depleted EV battery and corresponding replacement with a fully charged one. The
technology is under trial phase for various Electric vehicle segments which includes the e-2Ws, e-3Ws, e-cars &
even e-buses.
The types of battery swapping includes:
a) Manual: The battery swapping station consists of a standalone device, in which batteries are placed &removed
manually from the individual slots. Manual swapping stations are modular & take a minimum amount of space.
These are used for 2W & 3W battery, as the battery pack size are much smaller & the weight can be handled by one
person.
b) Autonomous: A robotic arm is to be used in autonomous type of swapping stations with the swapping process
being semi/fully automated. Robotic swapping is primarily used for 4W & e-bus applications. The battery packs are
larger and heavier, and require much mechanical assistance. In addition to the above, these swapping stations are
more expensive and have a higher land requirement.
EV CHARGING STANDARDS
Standards ensure compatibility of any Electric vehicle supply equipment‘s with all Electric Vehicles [2]. The (BIS)
Bureau of Indian Standard is primarily responsible for formulating Electric vehicle standards for the charging in
India. It is to be noted that Indian standards for ElectricVehicle charging are compliant with global standards,
however climate & the variations in available vehicle types necessitate modifications which are specifically
applicable to India.
INDIAN STANDARDS FOR AC CHARGING
IS 17017 (key EV charging standard) comprises of three parts & six sections. IS-17017- Part-1 details of the basic
features of all electric vehicles charging systems. An AC Electric vehicle supply equipment must adhere to this
standard & specific to Alternating Current connector standards in the IS-17017-Part-2[3]. Both Alternating Current
and Direct Current Electric vehicle supply equipment need to confirm to the standards IS-17017-Parts 21 & 22.
Additional Indian standards for Alternating Current Electric vehicle supply equipment s have been approved for
light EVs and e-cars.
INDIAN STANDARDS FOR DC CHARGING
IS-17017-Part-23 gives the requirements for Direct Current charging stations, with power output ranging from
50kW to 200kW. Above this, high power charging standards are required which cater to buses and other heavy
vehicles [3].
FROM CHARGING STATIONS TO CHARGING POINTS
Charging stations refer to high-power Electric vehicle supply equipmentoften referring to the multiple charging
guns. Charging points also refer to normal power electric vehicle supply equipment that can be accessed by a
portable charging cable. While the initial deployment of public charging structure in India focused on charging
stations, it is increasingly evident that most public charging needs can be served by a densely distributed network of
charging points.

Engineers for Viable Technology and $5 Trillion Economy
191
191
Technical Volume of 36th Indian Engineering Congress, December 26-28, 2021 ISBN 978-81-955500-1-2
An Electric vehicle charging network comprises of many normalpowered charging points. This is preferable to one
with high-power charging stations in limited number. For Electric vehicles, anywhere parking location where the
vehicle is stationary& having access to an EV charging point can have access to recharge the battery of the vehicle
battery. This is popularly known as destination charging, as against the ―onthe-go charging‖. In the latter, vehicles
rapidly top up their battery charge so as to drive to their destinations. Thus, EV charging structure should be
provided where vehicles are parked on a regular basis, rather than finding out new locations as hubs for EV
charging. This approach eventually leads to a charging structure implementation which promotes a distributed
network of Electric vehicle. It enables charging points to the users at various locations - at apartments, office, malls,
railway stations, bus depot etc. Such network approaches which are distributed have multiple advantages for users &
operator and range from ease of access to financial viability.
ARRANGING FOR ELECTRICITY SUPPLY FOR CHARGING
The 1ststep in arranging for the electricity supply for Electric Vehicle charging is to estimate the demand for
required power in kilowatts. Precisely, this is equivalent to the summation of the rated input requirement of all the
points for charging. In case of a system comprising of battery charging, this would be equal to the power for
simultaneous charging of the total number of. As soon as the total power demand is known, an Electric Vehicle
owner may choose of the 3 options for provision of electricity for the Electric vehicle chargingstructure which
comprise of (i) Drawing electricity from the existing power connection (ii) Arranging a new electricity connection
(iii) Using a renewable energy generation system.
CONCLUSION
Electric Vehicles represent a revolution for both the power and transportation sectors, with having the potential to
move ahead in the reduction of carbonization in both sectors by coupling them. Though the transportation sector has
a very low share of renewable energy, it is presently undergoing a revolutionizing change, specifically in the vehicle
segment on plying on the roads where the EVs are ready to rule the roads.In view of the new infrastructure type,
there is aneed for customizing to the Indian transport system along with building capacity among stakeholders to
support the on-ground expansion. This paper describes upon giving the efficientimplementation of electric vehicle
charging structure along with ensuring proper integration of transportation & supply networks.
REFERENCES
1. Chan,C.C. (2013),―The rise &fall of electric vehicles in 1828-1932: Lessonslearned‖, Proceedings of the IEEE,
Vol. 101 No. 1
2. Yan, Q.& Kezunovic, M.‗‗Impact analysis of electric vehicle charging on distributionsystem,‘‘ in Proc. North
Amer. Power Symp. (NAPS), Sep. 2012
3. Status quo analysis of various segments ofelectric mobility and low carbon passengerroad transport in India by
NITI Aayog.


Engineers for Viable Technology and $5 Trillion Economy
193 Technical Volume of 36th Indian Engineering Congress, December 26-28, 2021 ISBN 978-81-955500-1-2
EL_029_06_198
Solar based Bi-Directional Electric Vehicle Charger
Sampathraja Natarajan*, Ashok Kumar Loganathan and Jishnu Viswanathan
Department of Electrical and Electronics Engineering, PSG College of Technology, Peelamedu, Coimbatore
*e-mail: [email protected]
Abstract: Electric vehicle is an emerging as a solution for the problems caused by the vehicles which are powered
by fossil fuels. The adaptability of Electric Vehicle (EV) depends on the charging infrastructure. This paper
proposes a solar based bidirectional electric vehicle charger is designed which integrates the solar array directly
on the DC bus of the charger. It is a two stage charger which consists of a bidirectional AC-DC converter followed
by a bidirectional DC-DC converter. The EV battery gets charged using the solar power or grid power. The solar or
the battery power is also feed to the grid. The charger works in both G2V and V2G mode. In this charger both the
converters shares a common DC link capacitor. The bidirectional AC-DC converter acts as a rectifier in G2V mode
and as an inverter in V2G mode. The DC-DC converter acts as a buck converter in G2V mode. During the V2G
mode the DC-DC converter acts as a boost converter to raise the voltage of the battery to the sufficient DC link
voltage. DQ control is implemented for bidirectional AC-DC converter and PI controller is used to control the
bidirectional DC-DC converter. The charger is designed for a single phase 230 V, 50 Hz supply and for a load of
300 V, 66 Ah. The charger is designed and simulated using MATLAB simulink software. The results of the
simulation are used to validate the design and control of the proposed charger.
Keywords: Electric Vehicle; Bi-directional Charger; Solar Array; G2V; V2G
INTRODUCTION
The increase in population, shrinkage of resources like fossil fuels and the growing concern for reduce the
environment pollution has made the automobile industries to think of an alternative approach of propulsion. Due to
this electric vehicle is an emerging as a solution for the problems caused by the vehicles which are powered by fossil
fuels. The adaptability of Electric Vehicle (EV) depends on the charging infrastructure. However, charging of
electric vehicle require a large amount of electrical energy. Most of the electrical energy comes from thermal power
plants which use coal and gas. Thus electric vehicle can be a clean and green alternative way of transportation when
the energy required for charging the vehicle comes from renewable energy sources. Renewable energies such as
solar and wind based grid connected system can be used for charging the EVs. This requires revamping of
transmission lines for carrying more power. A solar based energy generating station produces electric supply that
can be used on-site. The advantage of this charging station is that the power is generated locally and used locally.
Thus, the transmission line does not have to be upgraded for high power and power does not have to been drawn
from the grid to charge the vehicle when the cost of energy is high. The used of solar based charging station
minimizes the cost of charging and avoids overloading of grid.The solar PV power output is intermittent in nature
and discontinuous. Energy storage devices like battery can be combined with solar panels to provide continuous
power. The operation of Electric Vehicle and solar array reduces the impacts of solar generation. Electric Vehicles
are parked for 90% of the time due to which their batteries store a large amount of energy. This energy can be used
in V2G (Vehicle to Grid) mode. Vehicle to grid mode provides voltage support and reactive power compensation to
the grid.
The synchronous reference frame conversion is used to implement a current control for the bidirectional AC-DC
converter. With proportional integral (PI) controllers, active power and the reactive power outputs of the inverter is
controlled in the dq reference frame. Using a Phase-Locked Loop, the grid current and grid voltage are used to
produce an orthogonal signal pair. PLL is used to push the injected grid current to be in phase with the grid voltage.

Engineers for Viable Technology and $5 Trillion Economy
194 Technical Volume of 36th Indian Engineering Congress, December 26-28, 2021 ISBN 978-81-955500-1-2
―Mohamed O. Badawy, Y. Sozer‖ presents an optimal power flow technique of a solarbattery powered Electric
Vehicle (EV) charging station to minimize the operational cost. The objective of the technique is to help penetration
of power from the solar and battery system to the grid. This also supports the growing need for the fast electric
vehicle charging rates. This can be achieved by continuously reducing the running cost of the system while
considering both the battery degradation cost and the grid traffics. An optimization algorithm is formulated along
with the constraints which is required. The cost of operation is chosen as a combination of both the battery
degradation cost and the grid prices. The battery degradation cost model accounts for the cycle DOD, average SOC
and the operating temperature. Particle Swarm Optimization (PSO) is used as a predictive optimization tool for
setting the SOC limits of the battery according to the solar PV power, grid prices and the load forecast [1].
―H.N. de Melo, J. P. F. Trovao, P. G. Pereirinha, H. M. Jorge‖ proposes a functional and a simple bidirectional plug-
in electric vehicle charger topology which is capable of making interaction with an autonomous EMS (Energy
Management System) in a residential setting. The EMS achieves potential benefits like energy exchange between
the consumer and grid with the help of bidirectional electric vehicle charger. A suitable controller charger design is
presented which includes the size of all passive elements and controllers. The charger can be adjusted for booth
charging and discharging mode using the power level which is provided by the energy management system. The
power of the charger is bidirectional and flexible, thus it allows charging and discharging operation at various power
levels which is beneficial with integrating the power allocated and for scheduling the power among all the
residential loads [2].
―Anjeet Verma, B. Singh‖ proposes an electric vehicle (EV) charger which operates in all the four quadrants of the
reactive and active power (P-Q) plane. The charger consists of a full bridge AC-DC converter and a bi-directional
DC-DC converter. The charger operates in both Grid to Vehicle (G2V) and Vehicle to Grid (V2G) modes. The
bidirectional charger is capable of exchanging both reactive and active power. The batteries state of charge is also
been preserved during the reactive power flow. The charger is designed to operate in a single phase 230V, 50Hz
supply [3].
―L. Albiol Tendillo, E. Vidal Idiarte, J.Maixé Altés, J.M. Bosque Moncusí, H. Valderrama Blaví‖ presents the
design and the control of bidirectional DC-DC converter for electric vehicles charging application. The DC-DC
converter topology uses sliding mode control which uses only one surface. The bidirectional operation of the
converter allows the permanent magnet synchronous motor (PMSM) to work either as a generator or motor. During
motoring mode, the current flow is from the battery to the motor and the converter acts as a boost converter. During
braking mode, the current flows from the PMSM to the battery and the converter acts as a buck converter. The
sliding mode surface successfully controls the DC-DC converter in both the motoring and regenerative braking
mode of the machine [5].
―Liwen Pan, Chengning Zhang‖ presents a high power density SIC based bidirectional AC-DC and DC-DC
converter for electric vehicle charging application. The on board vehicle charger is multifunctional it transfers
energy between the battery and the electric traction system and as an AC-DC battery charger. The converter control
is developed for the motor drive system and for the battery charging system. It consists of a power pulsation
reducing circuit. The improved control is designed to achieve better performance than the DCM control used in AC-
DC converter in the battery charging mode [6].
Problem Statement
The electric vehicle can be a clean and green alternative way of transportation if the energy required for charging
comes from renewable energy sources. The renewable energy based charger must be able to transfer power in both
V2G and G2V mode based on a power management strategy and must also aim in minimizing the utility grid
dependency.
The rest of this paper is organized as follows. In Section II, system configuration is provided. In Section
IIIexplainsthe control algorithm of the proposed charger. Section IVexplains the bidirectional AC-DC converter
control for both grid to vehicle and vehicle to grid mode.Section V briefly explains the design of the proposed

Engineers for Viable Technology and $5 Trillion Economy
195 Technical Volume of 36th Indian Engineering Congress, December 26-28, 2021 ISBN 978-81-955500-1-2
system. In Section VI the MATLAB modelling of the proposed charger is given. In Section VII the results of the
simulation work is discussed. Finally, Section VIII concludes this paper.
SYSTEM CONFIGURATION
Figure 1 shows the block diagram of proposed charger. The charger consists of a bidirectional AC-DC converter
followed by a bidirectional DC-DC converter. The EV battery gets charged using the solar power or grid power. The
solar or the battery power is also feed to the grid. The charger works in both G2V and V2G mode.
GRID
230 Vrms,
50 Hz
BIDIRECTIONAL
AC – DC
CONVERTER
BIDIRECTIONAL
DC-DC
CONVERTER
EV
BATTERY
300 V,60 Ah
SOLAR
PANEL
400 V
400 V
Figure 1 Block diagram of the solar based EV charger
Figure 2 shows the circuit diagram of the proposed charger. Two converters share a common DC capacitor in this
proposed charger. One converter connects to the grid, while the other connects to the battery. During G2V mode the
bidirectional AC-DC converter acts as a rectifier. It converts AC voltage into DC voltage for charging the battery.
The power is transferred to the battery through the DC link capacitor. A bi-directional DC-DC converter is
necessary to interface the battery. It acts as a buck converter for the control of charging voltage and current during
grid-to-vehicle mode.During the V2G mode the DC-DC converter acts as a boost converter to raise the voltage of
the battery to the sufficient DC link voltage. The AC-DC converter acts as an inverter. It converts the DC voltage to
AC voltage for feeding the solar power and battery power to the grid. The coupling inductor (Lc) is used to connect
the charger to the grid. The coupling inductor eliminates the harmonics and smoothen the grid current.
Bidirectional AC-DC
Converter
Bidirectional DC-DC
converter
Cb
Lb
Cdc
S5
S6
S1
S2
S3
S4
PV array
230V,50Hz
Single Phase
Supply
Ls Lc
CfBattery
Figure 2 Circuit Topology of Solar Based Bi-Directional battery charger
CONTROL ALGORITHM

Engineers for Viable Technology and $5 Trillion Economy
196 Technical Volume of 36th Indian Engineering Congress, December 26-28, 2021 ISBN 978-81-955500-1-2
The control Algorithm of the proposed charger is shown in Figure 3. The solar based electric vehicle charger
operates in two modes. The two modes of operation are grid to vehicle and vehicle to grid mode. Each mode of
operation depends on the solar power generated and the state of charge (SOC) of the battery. When the SOC of the
battery is less than 20% the battery gets charged. The battery gets charged from the solar power when the PV power
generated is greater than the battery power. When the PV power generated is less the battery gets charged from the
grid power until the SOC of the battery reaches 80%.
START
Calculate PPV and PB
Calculate SOC %
SOC < 20 20 < SOC < 80 SOC > 80
CHARGE /
DISCHARGE
CHARGE DISCHARGE
SOC < 80 PPV > 0
Stop
Charging
Feed PPV
and PB
power to
the grid
SOC > 20
Stop
discharging
Feed PB
power to the
grid
Battery
gets
charged
still
SOCMAX
using
power
from grid
Battery
gets
charged
still
SOCMAX
using
power
from PV
PPV > PB
NOYES
YES
NO
YES
YES
NO
NO
Figure 3 Control Algorithm
The charger operates in vehicle to grid mode when the SOC of the battery is greater than 80%. When the PV power
generated is more than zero both the solar power and the battery power is fed to the grid. When no power is
generated from the PV array only the battery power is fed to the grid. When the SOC of the battery reaches 20% the
battery stops discharging.
BIDIRECTIONAL AC-DC CONVERTER CONTROL
Grid to Vehicle Mode
The Grid to vehicle control block diagram is shown in Figure 4. In the G2V mode the bidirectional AC-DC
converter acts as a rectifier. For this control, the grid voltage, grid current and the output DC voltage are sensed at
the inverter side. The error between the actual DC voltage and the reference voltage is found which is then fed to a
PI controller. The output of the PI controller is then multiplied with cos(wt) to get the value of reference current.
Cos(wt) is the unit vector generated by PLL and this is aligned in phase with the grid voltage. The block diagram of
PLL is shown in Figure 5. The reference current is then compared with the inverter current to find the error. The
error is then fed to a PIController. The output of the PI controller is then added with the grid voltage to get the
reference voltage value. The obtained reference voltage is fed to the PWM generation block. In the PWM generation
block, the reference voltage is compared with triangular carrier waves to generate PWM pulses. The output of each
comparator is inverted using NOT gate. The generated PWM is connected to the respective switches of the
bidirectional converter. The PWM generation block diagram is given in Figure 6.

Engineers for Viable Technology and $5 Trillion Economy
197 Technical Volume of 36th Indian Engineering Congress, December 26-28, 2021 ISBN 978-81-955500-1-2
error+
VDC
VDC ref
-
PI Controller prod
uct
cos wt
Iref
+
Iinv-
error
PI Controller
+
+Vgrid
Vref
VgridPLL
cos wt
sine wt
Vgrid
Iinv
VDCL
OA
D
Figure 4 G2V Controller Block Diagram
d-q
ALPHA
BETA ALPHA-BETA
d
q
-+
q ref = 0
PI
integrator
wtSINE
COSINE
SINE wt
COS wt
ʃ
wt
COS wt – Active current reference
SINE wt – Reactive current reference
Figure 5 Phase Locked Loop (PLL) Block Diagram
Vref
carrier COMPARATOR
COMPARATOR
NOT
NOT
-Vref
PWM1
PWM2
PWM3
PWM4
Figure 6 PWM Generation Block Diagram
Vehicle to Grid Mode
The vehicle to grid control block diagram is given in Figure 7. In V2G mode the bidirectional converter acts as an
inverter. The switching pulse of the inverter is controlled using dq control. The grid voltage is sensed and it is
transformed into αβ frame. The alpha (α) and beat (β) voltages is given to the PLL to get wt. The αβ voltages are
converted into dq voltages. Similar to the grid voltage, the inverter current is also sensed and transformed into dq
frame. Id and Iq are compared with its reference values and the output is given to the PI controller. The output of the
PI controller is added with Vq+LwId and Vd-LwIq respectively. The added values are then transformed back to the
αβ frame. The beta voltage is multiplied with 1/VDC and given to the PWM generation block[7].

Engineers for Viable Technology and $5 Trillion Economy
198 Technical Volume of 36th Indian Engineering Congress, December 26-28, 2021 ISBN 978-81-955500-1-2
1 / VDC
PWM
αβ
dq
Vq + LwId +
+
+
+
Current
Controller
( PI )
Vd - LwIq
+
Idref
Id- -
+
Iq
Iqref
Single
phase αβ
generation
Iα Iβ
Single
phase αβ
generation
Vg
Vα Vβ
Vd Vq
wt
PLLwt
GRID
VDC
Bidirectional
AC-DC
Converter
αβ
dq
wt
αβ
dq
Beta
Figure 7 V2G Controller Block Diagram
DESIGN OF PROPOSED SYSTEM
The bidirectional AC-DC converter is designed for a power of 3kW. The DC link voltage which is required for
power transfer to the battery is 325V. Therefore, for design of DC link capacitor a voltage of 400V is considered.
Cdc =Idc
2 ∗ ω ∗ ΔVdc
= Pdc /Vdc
2 ∗ ω ∗ ΔVdc
=3000/400
2 ∗ 314 ∗ 0.015 ∗ 400= 1990.4 µF
The value of the DC link capacitor is rounded off and considered as 2000 µF.
The switching frequency considered for the design of the coupling inductor is 20 kHz. The fundamental supply
current peak value is 20A. 3% of the fundamental supply current is taken as the current ripple.
Lc = mVdc
6 ∗ fs ∗ h ∗ Δic
= 400
6 ∗ 20 ∗ 103 ∗ 1.2 ∗ 20 ∗ 0.03= 4.62 mH
The inductor value is rounded off to 5 mH for simulation.
There will be harmonics injected from the grid. To prevent this inductive and capacitive filter is designed.
Cf = Ipeak
ωL Vpeak
tan(θ)
=20 2/230
314 ∗ 230 2tan 1 = 318 nF

Engineers for Viable Technology and $5 Trillion Economy
199 Technical Volume of 36th Indian Engineering Congress, December 26-28, 2021 ISBN 978-81-955500-1-2
A filter capacitor value of 330 nF is considered.
The filter inductor is designed as
Ls = 1
2πfs ∗ Ig
Vg ∗ 1 −
2πfs 2
2πfres 2
= 7.35 mH
The filter inductor in the dc side is designed for a switching frequency of 10 kHz. The duty ratio is considered as
0.75.
Lb = Vdc k(1 − k)
fΔIb
=400 ∗ 0.75 ∗ 0.25
32 ∗ 1000 ∗ 10 ∗ 0.05= 4.68 mH
Thus, by rounding off the obtained value 5 mH is selected as the inductor value.
Table 1 AC-DC Converter Specification
S.No Name Rating
1 Supply Voltage 230 V
2 Supply Current 20 A
3 Switching Frequency 20 kHz
4 Output Voltage 400 V
5 Output Current 13 A
6 Filter Circuit Inductor 7.35 mH
7 Filter Circuit Capacitor 330 nF
8 Coupling Inductor 5 mH
Table 2 DC-DC Converter Specification
S.No Name Rating
1 Input Voltage 400 V
2 Switching Frequency 10 kHz
3 Output Voltage 325 V
4 Output Current 10 A
5 Modulation Index 0.8
6 DC Link Capacitor 2000 µF
7 Filter Inductor 5 mH
8 Filter Capacitor 700 µF
Table 3 Battery Specification
S.No Name Rating
1 Battery Voltage 300 V
2 Rated Capacity 60Ah
3 Type li-ion
Table 4 PV Module Specification
S.No Name Rating
1 No. Of Modules 60
2 Cell per Module 60
3 Open Circuit Voltage 36.3 V
4 Short Circuit Current 7.84 A
5 Output Current 13 A
6 Maximum Power 213 W
7 Output Voltage 400 V
MATLAB MODELING
MATLAB Block – Grid to Vehicle Mode
In Figure 8 the electric vehicle charger is simulated in grid to vehicle mode. An AC supply of 325 V is given at the
supply. The bidirectional AC - DC converter is controlled using dq control. The AC supply is converted to DC
source and a DC voltage of 400V is obtained across the DC link capacitor. A solar panel is connected after the
bidirectional AC – DC converter. A voltage of 400V is obtained from the solar panel. The DC – DC converter acts

Engineers for Viable Technology and $5 Trillion Economy
200 Technical Volume of 36th Indian Engineering Congress, December 26-28, 2021 ISBN 978-81-955500-1-2
as a buck converter in grid to vehicle mode. The 400V DC supply is reduced to 300V. A battery of 300V, 66Ah is
connected at the load. The battery gets charged during this mode.
Figure 8 Grid to Vehicle Mode
MATLAB Block –Grid to Vehicle Control
The grid to vehicle control simulation block is shown in figure 9. The grid voltage is sensed and is converted from
alpha beta to dq frame. The error between the actual DC voltage and the reference voltage is found which is then fed
to a PI controller. The output of the PI controller is then multiplied with cos(wt) to get the value of reference current.
The error between the actual and the reference current is fed to the PI controller. The controller output is then given
to the pulse generation block.
Figure 9 Grid to Vehicle Control

Engineers for Viable Technology and $5 Trillion Economy
201 Technical Volume of 36th Indian Engineering Congress, December 26-28, 2021 ISBN 978-81-955500-1-2
MATLAB Block – Vehicle to Grid Mode
Figure 10 Vehicle to Grid Mode
In Figure 10 the electric vehicle charger is simulated in vehicle to grid mode. A battery of 300V, 66Ah is connected
at the supply. The bidirectional DC – DC converter act as a boost converter in this mode. The 316V battery voltage
is converted to 400V. A solar panel is connected after the bidirectional AC – DC converter. A voltage of 400V is
obtained from the solar panel. The bidirectional AC - DC converter is controlled using dq control. The DC supply is
converted to AC source and an AC voltage of 240 V and 10 A current is obtained at the output of the converter.
MATLAB Block – Vehicle to Grid Control
The vehicle to grid control simulation block is shown in Figure 11. The grid voltage and current is sensed and
transformed form alpha beta to dq frame. The Id and Iq are compared with its reference values and the given to the
PI controller. The output of the PI controller is transformed to alpha beta frame. The beta voltage is given to the
PWM generation block.
Figure 11 Vehicle to Grid Control

Engineers for Viable Technology and $5 Trillion Economy
202 Technical Volume of 36th Indian Engineering Congress, December 26-28, 2021 ISBN 978-81-955500-1-2
RESULTS AND DISCUSSION
Grid to Vehicle Mode
The grid voltage and current is shown in Figure 12. A grid voltage of 325V and 50Hz is given to the converter. The
grid current is 10A.
Figure 12 Input Grid Voltage and Current
The output DC voltage of the bidirectional AC-DC converter is shown in Figure 13. DC link capacitor is boosting
the voltage 1.5 times of the input supply voltage. The DC voltage obtained is 400V.
Figure 13 DC link voltage
The output DC voltage of the solar panel is shown in Figure 14. The DC voltage of 425V is obtained from the PV
array.

Engineers for Viable Technology and $5 Trillion Economy
203 Technical Volume of 36th Indian Engineering Congress, December 26-28, 2021 ISBN 978-81-955500-1-2
Figure 14 Solar PV Output Voltage
Figure 15 PWM Pulse to the Bidirectional DC – DC Converter
The battery state of charge is shown in Figure 16. The SOC % increases as the battery is getting charged.
Figure 16 Battery SOC

Engineers for Viable Technology and $5 Trillion Economy
204 Technical Volume of 36th Indian Engineering Congress, December 26-28, 2021 ISBN 978-81-955500-1-2
The waveform in Figure 17 shows the battery voltage when it is getting charged. The battery voltage obtained is
316 V.
Figure 17 Battery Voltage
The waveform in Figure 18 shows the battery current. The battery current obtained is -10 A. The obtained current
is in negative polarity as the battery is getting charged.
Figure 18 Battery Current
Vehicle to Grid Mode
This waveform shown in Figure 19 is the battery voltage when it is getting discharged. The battery voltage obtained
is 316 V.
Figure 19 Battery Voltage

Engineers for Viable Technology and $5 Trillion Economy
205 Technical Volume of 36th Indian Engineering Congress, December 26-28, 2021 ISBN 978-81-955500-1-2
The battery state of charge is shown in Figure 20. The SOC % decreases as the battery is getting discharged.
Figure 20 Battery SOC %
The battery current waveform is shown in Figure 21. The battery current obtained when the battery is getting
discharged is 10 A.
Figure 21 Battery Current
PWM pulses given to the switch 2 of the DC – DC converter is shown in Figure 22. The switching frequency is 10
kHz.
Figure 22 Gate Pulse

Engineers for Viable Technology and $5 Trillion Economy
206 Technical Volume of 36th Indian Engineering Congress, December 26-28, 2021 ISBN 978-81-955500-1-2
The output DC voltage of the bidirectional DC-DC converter is shown in Figure 23. The DC-DC converter act as a
boost converter and a voltage of 425V is obtained.
Figure 23 Output Voltage of DC-DC Converter
The output DC voltage of the solar panel is shown in Figure 24. The DC voltage of 425V is obtained from the PV
array.
Figure 24 Solar Panel Voltage
PWM pulses given to the switches of the bidirectional AC – DC converter is shown in Figure 25. The switching
frequency is 20 kHz.
Figure 25 PWM Pulse to the AC – DC Converter

Engineers for Viable Technology and $5 Trillion Economy
207 Technical Volume of 36th Indian Engineering Congress, December 26-28, 2021 ISBN 978-81-955500-1-2
The obtained AC voltage and current is shown in Figure 26. AC voltage of 240 V and 10 A current is obtained at
the output of the converter.
Figure 26 Output AC Voltage and Current
CONCLUSION
In this papera solar based electric vehicle charger which has a bidirectional AC – DC converter and a bidirectional
DC – DC converter along with the solar panel has been designed and simulated. The electric vehicle charger has the
capability of working in both the grid to vehicle and vehicle to grid mode. The charger is controlled based on the
control algorithm. The proposed system is modelled and simulated using MATLAB software.Thesimulation
resultsobtainedindicates that the operation of the charger is achieved as per the control algorithm in both the modes.
The proposed system also minimizes the utility grid dependency.
REFERENCES
1. M. O. Badawy and Y. Sozer, "Power Flow Management of a Grid Tied PV-Battery System for Electric
Vehicles Charging," in IEEETransactions on Industry Applications, vol. 53, no. 2, pp. 1347-1357, March-April
2017.
2. H. N. de Melo, J. P. F. Trovão, P. G. Pereirinha, H. M. Jorge and C. H. Antunes, ―A Controllable Bidirectional
Battery Charger for Electric Vehicles with Vehicle toGrid Capability,‖ IEEE Trans. Veh. Technol., vol. 67, no.
1, pp. 114-123, Jan. 2018.
3. Sumathi S, Ashok Kumar L, Surekha P (2015) Solar PV and wind energy conversion system. Springer.
4. A. Verma and B. Singh, ―Bi-directional charger for electric vehicle with four quadrant capabilities,‖ in IEEE
7th Power India Int. Conf. (PIICON), Bikaner, 2016, pp. 1-6.
5. H. Kydd, J. R. Anstrom, P. D. Heitmann, K. J. Komara and M. E. Crouse, ―VehicleSolar-Grid Integration:
Concept and Construction,‖ IEEE Power and Energy Technol. Sys. J., vol. 3, no. 3, pp. 81-88, Sept. 2016.
6. L. Albiol-Tendillo, E. Vidal-Idiarte, J. Maixé-Altés, J.M. Bosque-Moncusí and H. Valderrama-Blaví, ―Design
and Control of a Bidirectional DC/DC Converter for an Electric Vehicle,‖15th International Power Electronics
and Motion Control Conference, March 2012.
7. Liwen Pan and Chengning Zhang, ‖ An Integrated Multifunctional Bidirectional AC/DC and DC/DC
Converter for Electric Vehicles Applications,‖ IEEE Power and Energy Technol. Sys. J., vol. 3, no. 3, pp. 81-
88, June 2016.

Engineers for Viable Technology and $5 Trillion Economy
208 Technical Volume of 36th Indian Engineering Congress, December 26-28, 2021 ISBN 978-81-955500-1-2
8. I. Jayathilaka et al., "DQ Transform Based Current Controller for Single-Phase Grid Connected Inverter," 2018
2nd International Conference On ElectricalEngineering (EECon), Colombo, Sri Lanka, 2018, pp. 32-37.
9. A. M. Mnider, D. J. Atkinson, M. Dahidah and M. Armstrong, "A simplified DQ controller for single-phase
grid-connected PV inverters," 2016 7th International Renewable Energy Congress (IREC), Hammamet,
Tunisia, 2016, pp. 1-6.
10. Ashok Kumar L, Albert Alexander S, Madhuvanthani Rajendran (2020) Power Electronics Converters for
Solar Photovoltaic Systems. Academic Press, Elsevier, USA.
11. Sampathraja N, Ashok Kumar L, Saravanakumar R, MadeWartana I (2016) Solar Power Forecasting using
Adaptive Curve Fitting Algorithm. International Conference on Artificial intelligence, Smart Grid and Smart
Applications: 227-236.

Engineers for Viable Technology and $5 Trillion Economy
209 Technical Volume of 36th Indian Engineering Congress, December 26-28, 2021 ISBN 978-81-955500-1-2
EL_030_07_192
Analysis of the Pivotal Role of Entrepreneurship in the Solar
Energy Sector of India A Focus on the Indian Renewable
Market
Ale Imran1*, Mohd Rihan
1 and Rahul Pachauri
2
1Department of Electrical Engineering, Aligarh Muslim University, Aligarh
2National Institute of Solar Energy, Ministry of New and Renewable Energy, Gurugram
*e-mail: [email protected]
Abstract: Renewable Energy, is considered to be the need of the hour, as the world is grappling with issues of
climatic change, energy poverty and un-employability. In a developing country like India, solar energy holds the key
to aforementioned challenges as it is abundantly available and free of cost. The solar energy market of India, in the
last decade has been growing at an unprecedented pace, with rapid developments being made in both on-grid and
offgrid sector. This study highlights the pivotal role of entrepreneurship in the solar energy sector of India. The
topic of research being inter-disciplinary takes into consideration the aspects of entrepreneurial theory and the
current trends in renewable energy. The quintessential role of entrepreneurship in promoting the cause of solar
energy, has been analyzed using three different parameters i.e. Number of starts-up or entrepreneurial ventures
conceived, the investments made in the solar energy sector and the policy incentives by the Government of India.
This study also characterizes the current status of the solar start-ups into ideation, validation, traction and scale-up
stages. It is expected that growth of the solar energy sector, catalyzed by the innovative actions of entrepreneurs will
help in achieving the sustainable development along with the future energy needs.
Keywords: Renewable Energy; Solar Energy; Entrepreneurship; Start-ups; Policy Incentives
INTRODUCTION
The CoVID-19 pandemic has shown how fragile the world is. A microscopic virus has brought the entire humanity
on the knees. Millions of lives and livelihood have been threatened and lost. In-fact today, also happens to be the
time, when we need to introspect the future we want to build and the planet we want to leave for the upcoming
generations. The last 18 months of the pandemic has shown that the humans can adapt to evolving circumstances
and indeed have enormous capacity to change the way they live, work and organize themselves. On 25 September,
2015, the members the United Nations, signed up for the 17 sustainable development goals, a set of solution to the
biggest problems the world faces. Many of these problems are interlinked and interconnected. Climate change
happens to be one of them and quintessentially a critical one [1]. According to the latest reports by NASA on
climate change 2010-2019 was the warmest decade, indicating the fact that climate change is real and happening [2].
Today as the globe confronts the verity of climate change, these warmer temperatures further aid in the fueling of a
host of natural calamities resulting in further degradation of the natural habitat and environment. Carbon dioxide
(CO2) and other greenhouse gas emissions are considered to be the major sources of continued global warming. As a
matter of fact, the CO2 concentration in the atmosphere has increased by up to 48% since 1850, when compared to
the pre-industrialized era and the continuous usage of fossil fuels has played the major part in it. [3]
Affordable and Clean Energy is one of the seventeen goals adopted by the UN. One of the many objectives that is
meant to be achieved through this goal is to considerably enhance the percentage share of renewable energy in the
overall global energy scenario. According to IRENA (International Renewable Energy Agency) by the beginning of
the year 2021, the international energy generation by renewable means reached 2799 GW, superseding the previous
year by 10.3%. The maximum increase occurred in Solar Energy, which increased by 22% (+127GW) closely

Engineers for Viable Technology and $5 Trillion Economy
210 Technical Volume of 36th Indian Engineering Congress, December 26-28, 2021 ISBN 978-81-955500-1-2
followed by wind energy at 18% (+111GW) [4]. Figure 1 depicts the distribution of the global renewable energy
generation by energy source in the beginning of 2021. In terms of the continental distribution, Asia (in particularly
China) played a pivotal role in enhancing the renewable energy generation by a staggering 64%, followed by the
North American & European markets, where an increase of 8.2% and 6% was witnessed respectively. India too has
made its make on the international scene, with the rapid generation and deployment of the renewables, specifically
the solar power. It‘s in fact among the top 5 nations of the world in photovoltaic power programs. Today, the
aggregate capacity of installed solar PV in the country is nearly 40 GW as compared to 161 MW in 2010. This
includes both the roof-top solar and ground-mounted solar along with the off-grid solar power.
Figure 1 Distribution of Energy sources in Renewable Energy generation
The surge of the usage of renewables serves dual purpose:
1) It is considered to be an imperative action for reducing the impact of the climatic change in agreement to the Paris
Accord, besides
2) the goal of providing universal clean, affordable and reliable energy to everyone becomes more enabled.
According to 2019 Energy Progress Report by IEA (International Energy Agency), IRENA, UN Statistics Division,
World Bank & WHO (World Health Organization) even today, 12-14 percent of the world‘s population haven‘t got
any access to modern electricity and more than 2.9 billion inhabitants have no ingress to clean cooking and heating
[5]. Renewable energy is not only close to local communities but also possess the potential to create a difference in
the lives of millions.
Today, there‘s no denying the fact that innovation and entrepreneurship are critical for the further development and
deeper penetration of the renewable energy. Multiple opportunities exist for entrepreneurs to identify the gap in the
existing renewable energy market, deploy creative and innovative solutions with scalable business models, procure
liberal benefits and create an impact. Many entrepreneurs are focusing their ventures along the different aspects of
renewable energy entrepreneurship like consultation, installation, financing and maintenance. Globally green energy
investments are expected to be at least half of the total investments in the entire energy sector in 2020. Start-Ups
across the globe, are being conceived in the energy industry with solar energy, wind energy, hydro energy and
biomass being the prominent fronts in the area of renewable energy. Furthermore, besides the conventional
mainstream energy market, ample possibilities do exist in the off-grid energy sector as well with social enterprises
like SELCO Solar, Urja Unlimited, Pollinate Energy etc having made a mark for themselves by working at the BOP
(Base of Pyramid) in developing countries like India. [6]-[7]
In this paper, the importance of entrepreneurship in promoting the growth of solar energy in a developing country
like India is highlighted. The paper is structured as follows: After the introduction in section I, a review of
renewable energy entrepreneurship, both on and off grid is presented in section II. Section III explores and studies
the role of entrepreneurship in the solar energy sector of India in terms of number of start-ups conceived and

Engineers for Viable Technology and $5 Trillion Economy
211 Technical Volume of 36th Indian Engineering Congress, December 26-28, 2021 ISBN 978-81-955500-1-2
investments made by government, private and public-private networks. The start-ups conceived has also been
characterized on the basis of their stages in this work. The paper also highlights the new governmental policies and
regulatory frameworks of the recent past introduced to promote/support the same. Section IV concludes the paper.
ENTREPRENEURSHIP IN THE RENEWABLE ENERGY SECTOR
With the ever increasing demand for energy in our daily lives, from the household needs to commercial obligations,
the role of renewable energy is gaining more prominence. According to IRENA Global Energy Transformation: A
Roadmap to 2050 report, the intended target for the next three decades is to create a renewable energy dominated
market for creating a sustainable energy future. In order to achieve the same and to ensure that the targets are met,
both the market incumbents and new ventures, created by Renewable energy entrepreneurs have a significant role to
play [8]. Traditionally, the incumbents had an upper hand when it came to government energy policies, regulations,
market share and dynamics; however, with the changing times, the role of start-ups in the renewable energy sector is
gaining prominence. The new entrepreneurial ventures or start-ups in the renewable energy sector are usually
associated with disruptive innovation, (when compared to the incremental innovation followed by the incumbents);
as well as being more sustainable [9]. As a matter of fact, the literature suggests that pressures of sustainable
development have resulted in ample opportunities being created for new entrants, who tend to follow a value based
approach in creating products, processes or services with the aim to create a more social and environmental impact.
[10]
Another aspect that‘s important from the economics point of view and is fundamental to entrepreneurship, in
general, is the creation of jobs. The Renewable sector has generated about 11.5 million jobs in year 2019, with the
solar photovoltaic (PV) leading among the renewable energy technologies (RETs). It accounted for every 1 out of 3
jobs created in this sector. However, the lack of skilled labor that could deal with the specific necessities of the job-
at-hand like installation, maintenance, consultation, repair work etc does at times impede, the brisk pace of the
renewables especially in developing countries of South Asia and South East Asia. Questions have also been raised in
the past, regarding the need to introduce new specialized programs in Higher Educational Institutes (HEIs) that deals
with imparting technical skills required in the 21st century renewable energy sector. The authors on researching
found out that in India, out of 54 central universities, about 26 universities offer a specialized course in renewables
at the Master‘s level, whereas the number is comparatively very less at the Bachelor‘s level. Furthermore, out of 31
National Institute of Technology (NITs) ,23 institutes offer renewable related courses at postgraduate level, but
similar to central universities here also, the figure for the under-graduate courses remains comparatively low. Does
this hinder, up to an extent the prospects of interested future taskforce of renewables? Could the launch of vocational
training course specific to the needs and requirements be introduced? These questions do intrigue a thinking process
that could help by creating a future task force in the renewable sector.
Renewable Energy Entrepreneurship is an inclusive domain, with the research being carried out, broadly segmented
into two different areas i.e. entrepreneurship and renewable energy. Renewable Energy Entrepreneurship (REE) can
be defined as the ―starting-up, running and potentially growth of a new business venture that focuses on the
development, design, production and distribution of renewable energy as well as renewable energy systems and
technologies including all aspects of the renewable energy value chain, comprising of planning, consulting,
financing, installation, maintenance and end of life management or disposal‖ [11]-[12]. The development and
execution of technological feasibility along with sustainable business model are critically important from the
renewable energy entrepreneur‘s perspective for the success of any venture. Furthermore, their significance from the
investors perspective is no less and it also aids the governments in formulating policies and regulations that helps in
supporting new innovations. As a matter of fact, new ventures and start-ups with creative business models are on the
rise, with numerous new entrants trying to create an impact. The major funding of the renewable energy sector
comes from the private investments, which according to an estimate accounts for more than 80% in the last decade.
Off-grid renewable energy also represents an equally important domain, that presents magnitude of opportunities in
terms of new entrepreneurial ventures, that could create interventions which could benefit millions of people who
have no access to the grid connected modern energy. Tailored approaches in terms of technology innovative
solutions, creative financial and business models, cross sector linkages and capacity building programs have proved
to be game changers in numerous circumstances, across the continents of Asia, Africa & South America. Besides,

Engineers for Viable Technology and $5 Trillion Economy
212 Technical Volume of 36th Indian Engineering Congress, December 26-28, 2021 ISBN 978-81-955500-1-2
the conventional venture and start-ups, social entrepreneurs have also played an important role in reaching out to the
underprivileged masses and improving their daily lives by helping to increase the work hours, providing light for
children‘s study and other household chores (especially during evening, after the natural light is no longer present).
[13]-[14] The concept of iterative learning and empathizing with the end user are central to many of these
initiatives. Moreover, they tend to engage the local rural population by providing them with training and easier
payment mechanisms. .Selco Solar in India, Grameen Shakti in Bangladesh, Solar Sister in Tanzania, Sistemas de
Technologia Adequada Agroeletro (STA) in Brazil are few examples of social enterprises that has helped millions of
rural people who suffer from energy crisis, across the globe.
ANALYSIS OF ENTREPRENEURSHIP IN THE GROWTH OF SOLAR SECTOR IN INDIA
The Indian economy has grown in the last many years and is considered one of the key drivers for the pursuit of
renewable energy along with the needs of energy security and reduced carbon footprints. As of 2021, India stands
tall among the top five countries of the world having the largest installed capacity of 95.66 G-Watts renewable
energy, with Solar and Wind constituting the major stake, as shown in Figure 2. The country further intends to
reach a target of 40% generation through renewables by the year 2030 to meet it‘s growing domestic, commercial
and industrial demands and has taken a lot of policy measures and regulatory frameworks, both at the Central and
State levels to achieve the same. Among the renewable technologies, the solar power has witnessed tremendous
growth in the last decade. The Govt. of India launched National Solar Mission, a three phased project in 2010 with
the intention to streamline the diffusion of solar energy across India. Various subsidies and incentives were given as
a part of the scheme to enhance the adoption of solar based products like solar lanterns solar pumps etc. Among the
various objectives outlined to be achieved, focus was also given on promotion and conceptualization of start-ups and
entrepreneurship in the solar energy sector by leveraging financial assistance, mentoring and networking to the
upcoming entrepreneurs interested in the domain. The state of Telangana, for example established an Incubation
center in association with Texas University, United States of America to nurture and support new ventures in the
area of solar energy for promoting the cause
Figure 2 The Installed All India power capacity of renewables
This section of the paper, investigates the pivotal role of entrepreneurship in the growth of the solar energy sector of
India. The number of start-ups conceived in the last 10 years, the investments made by private players along with
governmental offerings & policy incentives and regulatory frameworks have been chosen as the parameters of
assessment. Content based analysis has been used for carrying out this research by studying data in a methodological
and organized manner. Important keywords related to the solar energy sector and entrepreneurship were targeted for
carrying out this search
Start-Ups & Entrepreneurial Ventures in the Solar Sector of Indian Market
Under the Jawaharlal Nehru National Solar Mission, numerous incentives were taken to promote the spirit of
entrepreneurship in the solar energy sector by providing subsidies, rebates and tax benefits to the energy
entrepreneurs venturing in the solar sector. Furthermore, the Start-Up India initiative introduced by Govt. of India in
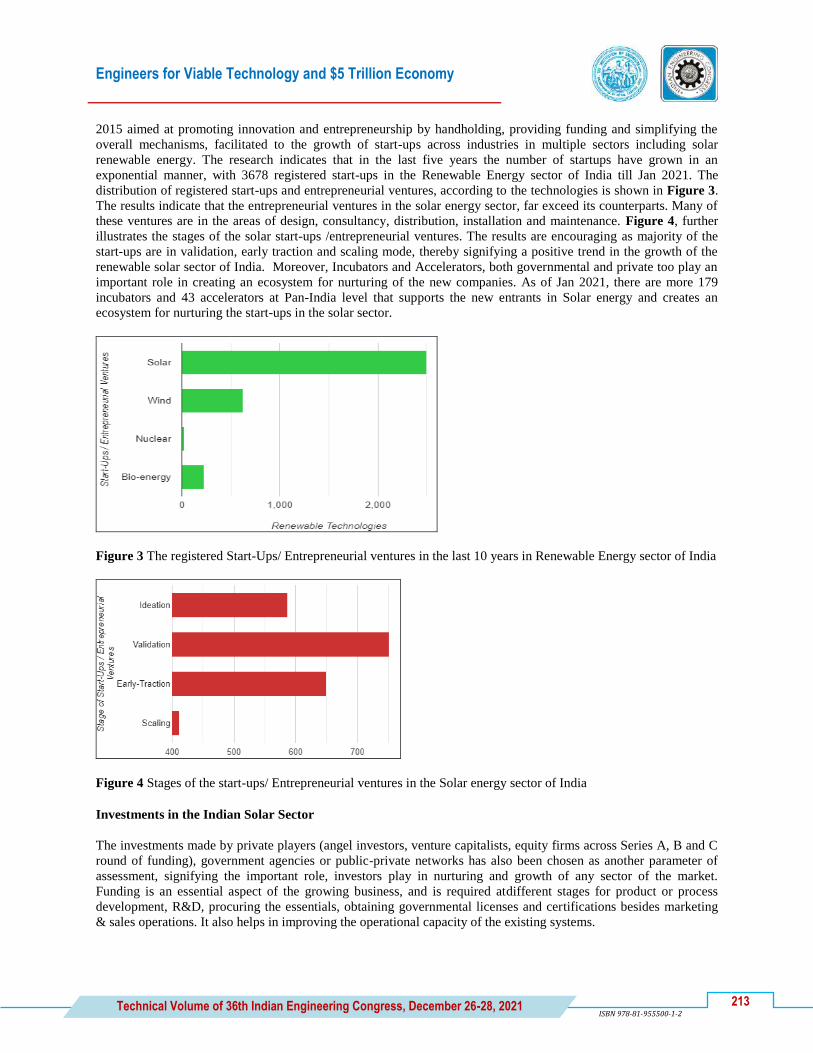
Engineers for Viable Technology and $5 Trillion Economy
213 Technical Volume of 36th Indian Engineering Congress, December 26-28, 2021 ISBN 978-81-955500-1-2
2015 aimed at promoting innovation and entrepreneurship by handholding, providing funding and simplifying the
overall mechanisms, facilitated to the growth of start-ups across industries in multiple sectors including solar
renewable energy. The research indicates that in the last five years the number of startups have grown in an
exponential manner, with 3678 registered start-ups in the Renewable Energy sector of India till Jan 2021. The
distribution of registered start-ups and entrepreneurial ventures, according to the technologies is shown in Figure 3.
The results indicate that the entrepreneurial ventures in the solar energy sector, far exceed its counterparts. Many of
these ventures are in the areas of design, consultancy, distribution, installation and maintenance. Figure 4, further
illustrates the stages of the solar start-ups /entrepreneurial ventures. The results are encouraging as majority of the
start-ups are in validation, early traction and scaling mode, thereby signifying a positive trend in the growth of the
renewable solar sector of India. Moreover, Incubators and Accelerators, both governmental and private too play an
important role in creating an ecosystem for nurturing of the new companies. As of Jan 2021, there are more 179
incubators and 43 accelerators at Pan-India level that supports the new entrants in Solar energy and creates an
ecosystem for nurturing the start-ups in the solar sector.
Figure 3 The registered Start-Ups/ Entrepreneurial ventures in the last 10 years in Renewable Energy sector of India
Figure 4 Stages of the start-ups/ Entrepreneurial ventures in the Solar energy sector of India
Investments in the Indian Solar Sector
The investments made by private players (angel investors, venture capitalists, equity firms across Series A, B and C
round of funding), government agencies or public-private networks has also been chosen as another parameter of
assessment, signifying the important role, investors play in nurturing and growth of any sector of the market.
Funding is an essential aspect of the growing business, and is required atdifferent stages for product or process
development, R&D, procuring the essentials, obtaining governmental licenses and certifications besides marketing
& sales operations. It also helps in improving the operational capacity of the existing systems.

Engineers for Viable Technology and $5 Trillion Economy
214 Technical Volume of 36th Indian Engineering Congress, December 26-28, 2021 ISBN 978-81-955500-1-2
Furthermore, India has a 100 per cent FDI policy for the renewable energy sector under automatic route, thereby
making the Indian market an attractive proposition for both national and international investors. The key findings
illustrate that in the last seven years since 2014, 69 Billion $ have been invested in the Indian renewable market,
with more than 55 percent of these investments being made in the solar energy sector. In-fact the net investment in
the last one-year financial time frame i.e. 2020-21 exceeds 10 Billion $. The key research however suggest that the
country further requires an investment of 500 Billion $ by year 2030, to reach its capacity target. Recently in June
2021, Reliance Industries, an incumbent and a major player of the fossil fuel industry, pledged 10 Billion $ over the
next three years for manufacturing and generation of green energy, with solar energy being one of the prime areas of
focus as it intends to achieve a production of 100 G-Watt in the next 10 years.
Policy Incentives & Regulatory Frameworks
Inadequate policy support by the government or policymakers has been cited as one of the major constraints that
hinders the diffusion of renewable energy at a decent pace in developing countries. It‘s of immense importance to
create a positive outlook among incumbents and new entrants by creating, designing and implementing policy
incentives and regulatory frameworks that brings an optimistic attitude as a general sentiment. The policymakers
and the Govt. of India have taken a lot of initiatives under various schemes of different ministries and departments
to promote the cause of clean and green energy, to limit the bureaucratic disruptions and to promote the spirit of
entrepreneurship and start-ups in the solar energy sector. Some of the latest initiatives, by the government and
highlighted as a part of this study are as follows:
1. Though the ―Make in India‖ initiative, the Central Govt. intends to promote the manufacturing and production
process in the renewable solar sector like for example Solar PV‘s, solar charging infrastructures, batteries etc. The
scheme, besides reducing the dependability on other countries for procuring the raw materials and equipment‘s is
also expected to provide a boost to the solar industry of the country by promoting innovation and entrepreneurship at
both the local and national level. It could further help the economy of the country, with the increased exports as
there‘s always a possibility of becoming a major production hub.
2. Production linked incentives (PLI) scheme ―National program on High Efficiency on Solar PV Modules‖
endorsed by Ministry of New and Renewable Energy (MNRE) has recently been approved in November 2020. An
estimated 4500 Crores has been allocated for the next 5 years, specifically to upgrade the production capability of
High efficiency solar PV modules. The scheme also promotes entrepreneurship at both manufacturing and
integration capacity, as both new entrants and incumbents are eligible for the bidding process.
3. Approved List of Models and Manufacturers i.e. ALMM of Solar photovoltaic modules is yet another initiative
by the Ministry of New and Renewable Energy (MNRE) to safeguard long term energy interests of the country, by
assuring that the quality and reliability of the solar PV modules and cells used is in accordance to the BIS
compliances. The scheme was launched in January 2019 and gives boost to local and national entrepreneurial efforts
in regards to the manufacturing of the components at the domestic level.
4. Indian Renewable Dashboard, launched in April 2021 is a joint initiative by Central Electricity Authority (CEA)
and CEEW‘s Centre for Energy Finance, to provide a single platform for providing information regarding the
upcoming and ongoing renewable energy projects in the country.
However, in-spite of the aforementioned there are still issues to be tackled and challenges to be faced, in order to
achieve the goals of energy security and sustainability. Infrastructure related issues in the remote parts of the
country, the shortage of the skilled technical manpower and hindrances in obtaining the finance in a systematic and
synchronized manner are those matters which needs to be looked into for further strengthening the roots of
entrepreneurship in the solar sector.
CONCLUSION
In this working paper, the pivotal role of entrepreneurship in the growing solar energy sector of India is presented.
The number of start-ups or entrepreneurial ventures conceived, investments made by private-public institutions and

Engineers for Viable Technology and $5 Trillion Economy
215 Technical Volume of 36th Indian Engineering Congress, December 26-28, 2021 ISBN 978-81-955500-1-2
favorable policy incentives by the government have been chosen as the parameters of assessment. The renewable
energy sector, in general offers ample opportunities of employment as well. The sector in the last five years has
created 0.8 million full time jobs at different designation, based on the possessed skillset. The basic aim of providing
clean and green energy to everyone, along with the motivations to reduce the carbon footprints does gain momentum
with the enhanced coverage of renewable technology, for which the new entrants, start-ups and entrepreneurial
ventures do play a critical and quintessential role.
REFERENCES
1. United Nations, ―Goal 13 : Take urgent action to combat climate change and its impact‖ United Nations, Oct
2015, Accessed on June 15,2021[Online] Available https://www.un.org/sustainabledevelopment/climate-
change
2. T.Greene, P.Jacobs, ―2020 tied for warmest year on record‖ NASA, Jan 2021, Accessed on June 16, 2021
[Online] , Available https://www.nasa.gov/press-release/2020-tied-for-warmest-year-on-record-nasa-analysis-
shows
3. NASA, ―Global Climate Change :Facts‖ NASA, May 2021, Accessed on June 16, 2021 [Online], Available
https://climate.nasa.gov/vital-signs/carbon-dioxide/
4. Press Release IRENA ―World Adds Record new renewable energy capacity in 2020‖ IRENA, April 2021,
Accessed on June 20, 2021 [Online], Available
https://www.irena.org/newsroom/pressreleases/2021/Apr/World-Adds-Record-New-Renewable-Energy-
Capacity-in-2020
5. IEA, ―Tracking SDG7 :The energy progress report 2019‖ IEA, May 2019, Accessed on June 20, 2021
[Online], Available https://www.iea.org/reports/tracking-sdg7-the-energy-progress-report-2019
6. Rick M, Boidurjo ― Keep your Clients Close, and Your Suppliers Closer: Institutional Partnerships for
Activising Solar Energy Entrepreneurs in Rural India‖ International Journal of Development Research, Vol 10,
Issue 1,2020, pp 33238-33248.
7. Jolly, S., Raven, R. & Romijn, H. ―Upscaling of business model experiments in off-grid PV solar energy in
India‖. Sustain Science Springer 7, 199–212 2012
8. K.Hockerts, R.Wustenhagen ― Greening Goliaths vs Emerging Davids-Theorizing about the role of incumbents
and new entrants in entrepreneurship ― Journal of Business Venturing, Elsevier, Vol 25, pp 481-492, 2009
9. M.Loock ―Going beyond best technology and lowest price : on renewable energy investors preference for
service driven business models ― Energy Policy, Elsevier, Vol 40, pp 21-27, 2012
10. J.Hall, G.Daneke, M.Lenox ― Sustainable Development and entrepreneurship : Past contributions and future
directions‖ Journal of Business Venturing, Elsevier, Vol 25, pp 439-448, 2010
11. C.Gabriel, J.Kirkwood, S.Walton, E.Rose ― How do developing country constraints affect renewable energy
entrepreneurs‖ Energy for Sustainable Development, Elsevier, Vol 35, pp 52-66, 2016
12. C.Gabriel ― What is challenging renewable energy entrepreneurs in developing countries ― Renewable and
sustainable energy Reviews, Elsevier, Vol 64, pp 362-371, 2016
13. D. Horst ―Social enterprise and renewable energy : emerging initiatives and communitites of practise‖ Social
enterprise journal, Emerald, Vol 4, No 3, pp 171-185, 2008
14. Sören Becker, Conrad Kunze, Mihaela Vancea ―Community energy and social entrepreneurship: Addressing
purpose, organisation and embeddedness of renewable energy projects‖ Journal of Cleaner Production,Volume
147,2017,Pages 25-36.


En
gin
eers
fo
r V
iab
le T
ech
no
log
y a
nd
$5
Tri
llio
n E
con
om
y
Electronics
and
Telecommunication
Engineering


Engineers for Viable Technology and $5 Trillion Economy
219 Technical Volume of 36th Indian Engineering Congress, December 26-28, 2021
ISBN 978-81-955500-1-2
ET_003_01_146
On Some Findings on Micro-strip Patch Antenna for Biomedical
Applications
Arpita Santra1*
, Arnima Das1, Maitreyi Ray Kanjilal
1 and Moumita Mukherjee
2
1Department of Electronics and Communication Engineering, Narula Institute of Technology, Agarpara, Kolkata
2Department of Physics, Adamas University, Adamas Knowledge City, 24 Parganas (North), Kolkata
*email: [email protected]
Abstract: The author aims to find the possibilities of using Micro-strip Patch antenna in the fields of Bio-Medical
applications. Due to the advancements in the medical technologies the requirements of miniaturized and compact
devices has been increasing which leads to the technological developments in this area. The work is dedicated for
finding the gateway of antenna technology in this field. The simulations are carried over by the HFSS software.
Keywords: Micro-strip; Bio-medical; Radiation Pattern
INTRODUCTION
The microwave/ millimeter wave [5,6] signal generation, detection and radiation by the antenna has become an
interesting application area. The applications include the spectroscopy, secure communication, bio-medical
engineering, wireless communication etc. As it is known that the silicon technology offers its applications in the
high-density signal processing with its scaling capacity consisting of the diverse size variations. The recent
developments are finding way to the silicon-on chip products worldwide. Due to the increase in high level of
integration the size reduction become noticeable.
A. Micro-strip Patch Antenna
The micro-strip patch antenna is having a lot of applications in the field of transmission, detection/sensing and
radiation with its wide variety of usage as per the selection of frequency [7]. The author here tries to find the
application in the field of bi-medical engineering. The simulated results also confirm the capability of the proposed
antenna in the mentioned field [8].
B. Proximity Coupled Feeding
The Micro-strip patch antenna may contain different type of feeding by which the excitation is applied to the
antenna. The author has taken the Proximity coupling method for the feeding to the antenna. The Figure 1 here
represents a proximity coupling technique.
RESULTS
The simulation has been carried out in HFSS software and the following results have been noted. The Figure 2
shows the simulated antenna in the software.
The S11 plot is shown in the Figure 3 where the results show a considerable response of the antenna for the Bio-
medical applications. The radiation pattern is shown in the Figure 4 where the results also show the response to be
taken for the Bio-medical applications.

Engineers for Viable Technology and $5 Trillion Economy
220 Technical Volume of 36th Indian Engineering Congress, December 26-28, 2021 ISBN 978-81-955500-1-2
Figure 1 Proximity coupling technique in Micro-strip patch antenna
Figure 2 Simulated antenna in HFSS software
Figure 3 S11 plot

Engineers for Viable Technology and $5 Trillion Economy
221 Technical Volume of 36th Indian Engineering Congress, December 26-28, 2021
ISBN 978-81-955500-1-2
Figure 4 Radiation Pattern of the simulated antenna
CONCLUSION
The simulated results show that the proposed antenna can be considered for Bio-medical applications. The
frequency response, radiation pattern is compatible with the Bio-medical environments.
REFERENCES
1. Constantine A, Balanis, 'Antenna Theory-Analysis and Design', Second Edition, John Wiley and Sons,Inc.,1997.
2. J.R. James, P.S. Hall. Handbook of microstrip antennas, I.E.E. Electromagnetic Waves Series 28- Peter
Pereginus LTD, 1989.
3. R.J. Mailloux, J.F. Mcllvenna and N.P. Kemweis-Microstrip Array Technology IEEE Transactions on Antennas
and Propagation,Vol.29,No.1,January 1981 .
4. H. Pues, A. Van de capelle, Accurate transmission line model for the rectangular microstrip antenna, IEEE
Microwave, Antenna and Propagation Proceedings, Vol.131,Pt.December 1984.
5. Ansoft Corporation, HFSS User's Guide, version 10 &12,Ansoft Corporation,Pittsburgh,CA,20
6. Mahdi Ali, Abdennacer Kachouri and Mounir Samet "Novel method for planar microstrip antenna matching
impedance", Journal of Telecommunications, May 2010.
7. Garg, R and Ittipiboon, A; “Micro strip Antenna Design Handbook”, Artech House, 2001.
8. D.M. Pozar, ―Microstrip Antennas‖, Proc.IEEE, vol.80, No.1, January 1992.


Engineers for Viable Technology and $5 Trillion Economy
223 Technical Volume of 36th Indian Engineering Congress, December 26-28, 2021 ISBN 978-81-955500-1-2
Integrated Maritime Domain Information Awareness
TWW Leelarathna1, Ruwan Bolongho
2 and Sumali S Morapitiya
3*
1Directorate of Electrical and Electronics Engineering, Sri Lanka Navy, Colombo, Sri Lanka
2Sri Lanka Navy, Colombo, Sri Lanka
3Department of Electrical, Electronics and Telecommunication Engineering, General Sir John Kotelawala Defence
University, Sri Lanka
*email: [email protected]
Abstract: The centralized maritime domain awareness information system is the most important and effective factor
to the country covered by the sea. This paper presents detailed information on the implemented Automatic
Identification System (AIS) network is used to collect the data using the central point as well as the selected 13
points in the whole over the country. Further, using this system collecting the ships and crafts plying the waters
around the island can be viewed through a single interface. There are 14 outputs of the AIS system and can grab all
details from 13 points to the central point. The implemented system is low cost and reduces the complexity of
collecting information at a central point. The implemented system is more beneficial to the naval parties and the
port authority.
Keywords: Automatic Identification System; Integrated Maritime Domain System (IMDS); Serial to Ethernet
Converter
INTRODUCTION
Sri Lanka is called the pearl of the Indian ocean and it is covered by Indian seawater. Due to the geographical
situation of the country, the centralized maritime information system is more important to the day to day life.
Further, the maritime information system is useful to harbour needs, fisheries as well as security departments in Sri
Lanka. The AIS provides the navigational data of the ships and seaboard. Also, location details, identification details
were received from AIS [1].
Using a Wide Area Aerial Surveillance (WAAS) system facilitate awareness of the large area of the sea with high-
resolution images [2]. The system of e-navigation contributes to the planning and implementation of integrated
information to distribute the static and dynamic information to the vessels [3]. The traffic system was implemented
to the aware traffic information for the sea travellers. Moreover, it gives the information of the whole journey of the
travellers [4]. The human resource for maritime activities creates many difficulties in the day to day life. Therefore,
introduced An integrated maritime reasoning and monitoring system for maritime shipping and port activities [5].
The Integrated Maritime System (IMS) is a chart plotting software, was designed by the new design cell for
visualizing the vessels sailing around the island which was gathered by the 13 automatic identification system
stations. All Ships and crafts must transmit their ship details through the AIS system and the receiving station can
receive the ship details using their receiver. The 13 numbers receiving stations are established for the IMDS around
Sri Lanka. The proposed system consists of 4 stages such as IMS, serial to Internet Protocol (IP) converter, network
and integrated software interface.
The remainder of the paper is organized as follows: In section A, include the system model with AIS, serial to
parallel converter, integrated software interface and the configurations. In section B, includes results and discussion.
Finally, Section C concludes the whole paperwork.

Engineers for Viable Technology and $5 Trillion Economy
224 Technical Volume of 36th Indian Engineering Congress, December 26-28, 2021
ISBN 978-81-955500-1-2
System Model
The AIS system has been used the track the vessels and it is an automated system. Further, it is operating in the Very
High Frequency (VHF) mobile maritime band. Moreover, it is connecting with the ships and able to identify using
navigational marks.
Figure 1 shows the proposed overall system model of the integrated maritime awareness system.
Figure 1 Proposed system model
AIS
The AIS system has two types of classes as class A and class B. Class A contains passenger ships and all vessels 300
GT on international voyages. There are limited functional in class B and non-SOLAS vessel are class B. The
161.975 MHz 161.975 MHz VHF frequency is used for simplex ship to ship communication and the 162.025 MHz
frequency is used for duplex ship to shore communication. Also, it is used Self-organizing Time Division Multiple
Access (STDMA) technology and it has 40 miles line of sight limitation. AIS is transmitting static information,
dynamic information and voyage related information. Static details are MMSI number, IMO number, name and call
sign, length and beam, type of ship, location of position fixing antenna. Dynamic details are ship‟s position with
accuracy indication, position timestamp (in UTC), Course Over Ground (COG). Voyage related details are ship‟s
draught, type of cargo, destination and ETA, route plan (waypoints).
Figure 2 shows the proposed locations of the AIS network in Sri Lanka.
AIS Data Format
Transmitter transmit the information in RS232 format in NMEA standard. The sample data format is as follows.
!AIVDM,2,1,3,B,55P5TL01VIaAL@7WKO@mBplU@<PDhh000000001S;AJ::4A80?4i@E53,0*3E
!AIVDM,2,2,3,B,1@0000000000000,2*55
Figure 3 shows the AIS data in the software interface and it is in NMEA standard.

Engineers for Viable Technology and $5 Trillion Economy
225 Technical Volume of 36th Indian Engineering Congress, December 26-28, 2021
ISBN 978-81-955500-1-2
Figure 2 Proposed AIS network locations.
Figure 3 AIS data in the software interface.

Engineers for Viable Technology and $5 Trillion Economy
226 Technical Volume of 36th Indian Engineering Congress, December 26-28, 2021
ISBN 978-81-955500-1-2
Serial to IP Converter
The remote access, control and manage serial devices using serial to IP converter through IP network and internet.
The asynchronous data transfer over an RS232, RS422, or RS485 port to TCP/IP or UDP packets. Further, it is
connected with a direct cable connection or over Ethernet.
There are 3 types of Serial to IP converters that have been used for this system.
1. PortServer® TS by DIGI
2. USR-TCP232-302
3. Hi-Link USR-TCP232-30
Configuration of Serial to IP Converter
There is the same configuration procedure that will be followed for the above three types of converters.
1. First, the device must be powered with the help of a designated power supply.
2. The data output of the AIS unit has to be connected to the serial data input of the converter unit.
3. Ethernet cable has to be connected to the ethernet port of the converter and the PC.
4. Each device has its default IP address and it can be found by referring user manual of each device.
5. IP address, subnet mask and the gateway address of the PC must be changed according to the default IP range of
the converter unit.
6. After configuration, log in to the web interface of the converter using a web browser by entering the user name
and the password of the converter unit.
7. In the web interface, several sub-pages can be adjusted according to our device.
8. Most AIS transponder‟s output their data at a 38400 bps baud rate. Therefore, the serial configuration has to be
changed (baud rate, number of bits, start bits, stop bits, parity bits) according to the AIS unit.
9. The port settings have to be changed according to the cloud network. IP addresses of the converter have to be
assigned according to the Network.
10. After finished configuration, the network cable can be plugged into the network switch
Figure 3 Details of computer interfaces.

Engineers for Viable Technology and $5 Trillion Economy
227 Technical Volume of 36th Indian Engineering Congress, December 26-28, 2021
ISBN 978-81-955500-1-2
Table 1 shows the 13 AIS locations of the network with the IP address and port details.
Table 1 Network details of the AIS locations
S.No. Station IP Address Port
01 Station A 192.168.1.1 2001
02 Station B 192.168.1.2 2001
03 Station C 192.168.1.3 2001
04 Station D 192.168.1.4 2002
05 Station E 192.168.1.5 2002
06 Station F 192.168.1.6 2002
07 Station G 192.168.1.7 10001
08 Station H 192.168.1.8 10001
09 Station I 192.168.1.9 10003
10 Station J 192.168.1.10 8080
11 Station K 192.168.1.11 8080
12 Station L 192.168.1.12 2001
13 Station M 192.168.1.13 2002
Integrated Software Interface
A concise chart plotter software called “Integrated Maritime Surveillance System” is used to decode the AIS data
and visualize it on a single interface. This software was designed using free open-source software called “OPEN
CPN”.
This software was written by C/C++ programming languages.
Software Configuration
The software has to be configured before use,
1. A suitable chart has to be added to the software interface using add chart menu.
2. Network settings (IP address and Port) has to be entered using add connection menu.
3. Display settings have to be changed according to the user requirements.
4. After configuration vessels begin to appear on the display.
5. Clicking on the vessel icon will allow viewing the vessel data.
Figure 4 Adding the interface.

Engineers for Viable Technology and $5 Trillion Economy
228 Technical Volume of 36th Indian Engineering Congress, December 26-28, 2021
ISBN 978-81-955500-1-2
Figure 5 Adding new connection.
Figure 6 Display options.
RESULTS AND DISCUSSION
There are 3 inputs for the software interfaces such as chart, IP addresses of the converters and ports of the
converters. Also, there are 14 outputs such as MMSI number, Call Sign, IMO number, class, navigational status,
type of the vessel, size, destination, estimate time to arrive, course, speed, heading, rate of turn, range and bearing to
receiving station and position data.
Figure 7 Vessel details

Engineers for Viable Technology and $5 Trillion Economy
229 Technical Volume of 36th Indian Engineering Congress, December 26-28, 2021
ISBN 978-81-955500-1-2
Figure 8 Software interface after adding all AIS stations
CONCLUSION
The integrated maritime domain information awareness system is more advantages in many ways. All the AIS
stations around the island are networked so that the details of all ships and crafts plying the waters around the island
can be viewed through a single interface. Ability to view a wide range of data as all systems are networked. Ability
to easily trace the location of the vessel as it maps the current location. Ability to easily analyze the data of the
vessel by viewing the data of the vessel on a screen at the same time. Vessels that are capable of being captured by
the AIS system are divided into different categories, with the ability to easily observe vessels belonging to these
categories by representing those vessels in different colours and icons. One system failure is covered by another
nearby system so that the failure of one AIS doesn‟t affect the entire system.
Serial to IP Converters can now be purchased at a relatively low price in the market, making it possible to make new
connections at a very low cost. Increase the ability to expand the network as the number of systems that can be
included is unlimited. There are a few limitations of the system such as Since the system performance depends on
the performance and the speed of the network, a system failure can occur during a network crash. Problems with
data storage due to unavailability of centralized sever system. Inability to analyze past data due to inability to record.
Due to the shortage of serial to IP converters in the local market, it takes a long time to repair a breakdown. Some
Serial to IP converters has limited access to the number of users that can be accessed, reducing the ability to monitor
from a large number of monitoring stations.
REFERENCES
1. Series, M. Technical Characteristics for an Automatic Identification System Using Time-Division Multiple
Access in the VHF Maritime Mobile Band; Recommendation ITU: Geneva, Switzerland, 2014, pp. 1371–1375.
2. U. M. Leloglu and E. Tunali, "Wide-area spaceborne maritime surveillance system," 2017 8th International
Conference on Recent Advances in Space Technologies (RAST), 2017, pp. 507-511, doi:
10.1109/RAST.2017.8002930.
3. N. Ward, "Turning maritime data into information," 2015 International Association of Institutes of Navigation
World Congress (IAIN), 2015, pp. 1-5, doi: 10.1109/IAIN.2015.7352243.
4. M. Vujic, B. Mandzuka and P. Skorput, "Multimodal traveler information systems in maritime
environment," 2016 International Symposium ELMAR, 2016, pp. 89-92, doi: 10.1109/ELMAR.2016.7731761.
5. K. S. O. Tan and S. S. Tng, "An integrated maritime reasoning and monitoring system," 2012 15th International
Conference on Information Fusion, 2012, pp. 1345-1350.


Engineers for Viable Technology and $5 Trillion Economy
231 Technical Volume of 36th Indian Engineering Congress, December 26-28, 2021
ISBN 978-81-955500-1-2
T_032_03_181
Point-of-care Diagnostic Device in Healthcare: A Literature
Review
Ramya D* and Ashok Kumar L
Department of Electrical and Electronics Engineering, PSG College of Technology, Coimbatore
*e-mail: [email protected]
Abstract: Point-of-care (POC) device is an in-vitro diagnostic device utilized by medical professionals near
patients, bedside or extra laboratory testing to obtain results quickly and simply and improve the patient care. POC
device alert only the crucial data to clinicians or medical professionals. In addition to patient health monitoring,
POC devices can be used for cancer, diabetes, and cardiovascular diseases diagnosis (rule-in or rule-out) and
management especially in emergency departments, physician office, paramedicine, and mobile units. This review
aims to illustrates the use of POC devices for diabetes and cardiovascular management.
Keywords: Point-of-care; In-vitro Diagnostic; Cancer; Diabetes; Cardiovascular Disease; Emergency.
INTRODUCTION
Health care is the organized provision of diagnose, treatment, prevention and management of diseases or illness and
improve the quality of patient. Fast evolving healthcare industry has led to numerous innovations in diagnostic
devices to treat patients quickly and accurately to assess and treat more patients in emergency, primary care. Health
care is becoming transformative in identifying the onset of disease at an early stage and in some cases health care
prevents even before the onset of diseases. One of the best ways to achieve is patient centered and near patient
testing for faster triaging and treatment. The Point-of-care (POC) devices also known as near- patient testing
typically placed near the patient or bedside and obtain quicker results. As the need for faster test results growing,
diagnostic devices like easy to use, portable, miniaturized devices have evolved.
A. Applications of POC
1) Diabetes Management
Diabetes is a highly prevalent diseases in development of several other diseases are cardiovascular or renal disease.
Based on International Diabetes Federation (IDF) Diabetes Atlas, in 2030 diabetes incidence is projected to increase
to 552 million [35]. In emergency clinics, hypoglycemia and hyperglycemia are related with higher death and length
of stay. Hence, bed-side glucose monitoring with rapid, accurate and high turnaround time (TAT) was in demand.
However, central laboratory testing (CLT) is the reference testing of plasma glucose. Various lab tests are prescribed
in the detection of patients with diabetes. The initial stated use of POC is observed in early documents from 1550
B.C, in which physicians used ants to measure sugar in the blood [39]. After enormous research, the breakthrough
came in 1965 by an Ernie Adams tram develop primary stick, a Dextrostix, stick that used oxidoreductase enzymes.
Further followed by advancement in quantitative blood glucose result by Ames team and developed Ames
Reflectance meter in 1970 [38].
Immediate results obtained from POC device are crucial in reducing the diagnosis time and initiate the treatment for
patients. Some of the POC devices available in the market are tabulated below (Table I).

Engineers for Viable Technology and $5 Trillion Economy
232 Technical Volume of 36th Indian Engineering Congress, December 26-28, 2021
ISBN 978-81-955500-1-2
Table 1 POC devices in Diabetes Management
POC Device Company Purpose
Accu-Chek Aviva Plus Roche Glucose meter
Accu-Chek Nano Roche Glucose Meter
ReliOn Prime ReliOn Glucose meter
OneTouch VerioIQ LifeScan Glucose Meter
Nova Max Nova Glucose meter
FreeStyle Lite Abbott Glucose meter
Afinion HbA1C Dx Assay Abbott HbA1C testing
HemoCue HbA1c 501 system HemoCue HbA1C testing
2) Cardiovascular Diseases
Cardiovascular diseases are one of the life-threatening and early diagnosing is first and foremost. Cardiac Markers
can be effectively used not only for the treatment of cardiovascular diseases but also early diagnosis.
a) History of Cardiac Markers
Ladue et al (1954) proposed the first cardiac biomarker aspartate aminotransferase (AST) released from cardiac
muscle cells experiencing cell death would be beneficial in identifying severe myocardial infarction (MI) using
paper-based chromatography [4]. At present, AST has been ruled-out due to lack of specificity for diagnosing AMI.
AST levels elevate in hepatic disease, pulmonary embolism. Wroblewski and Ladue found a change in lactate
dehydrogenase (LDH) activity in AMI patients. But Ulmer et al. corroborated this finding. Schmiechen et al (1997)
proposed another crucial biomarker lactate dehydrogenase (LDH) for detecting myocardial ischemia. LDH peaksin
6 to 12 hours after an AMI [6]. It is also specific for non-cardiac diseases like erythrocyte haemolysis and testicular
germ cell tumour markers.
Dreyfus et al (1960) proved creatine kinase (CK) activity in the detection of myocardial infarction. Although various
studies and experiments observed higher sensitivity of CK during diagnosis of AMI, it highly lacks its specificity as
a biomarker [7]. Wroblewski proposed that the measurement of specific isoenzymes (CK-MB) provide a reliable
result and increase the specificity of cardiac enzyme biomarkers [8]. Gilkeson et al (1978) developed the earlier
method to detect serum myoglobin using radioimmunoassay (RIA) but late discontinued for STAT analysis due to
time consuming process [10].
In 1985, mass assays to estimate the protein concentration for CK-MB were developed by Chan et al. [11]. Later in
1986, Vaidya et al, created the first monoclonal antibody to CK-MBand at present all automated immunoassay
instrumentation are used [13]. In 1963, after several studies Professor Setsuro Ebashi proved that a new troponin
compound is responsible for the muscle regulation [14].Various studies showed the two mutated human cardiac
troponin (cTn) components, cTnI and cTnT are the main cause of cardiomyopathies. In 1987, Cummins established
the effective primary RIA for the measurements of cTnI in serum [15]. Over the past 30 years, several research
groups continuously optimizing cTnI immunoassay and have analytical sensitivity is almost 100-folder higher than
experimental assays that were initially described.
In 1989, Katus et al developed the first-generation immunoassay based on enzyme linked immunosorbent assay
(ELISA) with two antibodies [16]. Cross reactivity was the major problem and resulted in the introduction of
second-generation assay in 1997. In 1999, the linearity is improvised in third-generation troponin T assay. In 2007,
the fourth-generation assay using fragment antigen-binding (FAB) of two cTnT antibodies is developed. The new
high-sensitivity cTn assay is the improvised fourth-generation assay with the sample amountupto 50 µL and buffer
optimization through background noise cancellation.
Heart-type fatty acid binding protein (H-FABP), a responsive cardiac biosignature was discovered in 1988
byProfessor Jan Glatz for the detection of myocardial within one to three hours of pain. Vupputuri et al (2015) and

Engineers for Viable Technology and $5 Trillion Economy
233 Technical Volume of 36th Indian Engineering Congress, December 26-28, 2021
ISBN 978-81-955500-1-2
other research groups studied and evaluated in accordance with which heart type protein could remain used whilst
early diagnostic quantitative marker in heart attack patients [17]. The simultaneous measurement of cTnI and C-
reactive protein (CRP) was achieved by developing an electrochemical immunoassay by Zhou et al (2010) based on
microfluidic chips [18] and the carbon fibre electrode was surface modified to increase the assay performance.
Lee et al (2012) developed a polyaniline (PANI) nanowire biosensor with greater biosensing ability, good
biocompatibility to monoclonal antibodies by integrating with microfluidic microchannels for the detection of
myoglobin (Myo),CK-MB, cTnI, and b-type natriuretic peptide (BNP) [20]. Philips Minicare I-20 point-of-care
(POC) system could care by testingin the patient vicinity for people enduring chest pain when they turn up at the
hospital or health care. Minicare work through blending ofnovel materials in the blood sample, and the sensor can
perceive and compute the amount of a given cTnI biomarker [21]. The biggest challenge in POC is doctor‟s
confidence level and reliability.
Jasper et al, studied the clinical execution of high-sensitive cardiac troponin I assay in POC device in people with
myocardial infarction and compared with central laboratory assays and resulted high diagnostic accuracy in early
detection. Though the higher efficiency of the POC-hs-cTnI resulted direct triage toward rule-out or rule-in without
the need of serial sampling, there has been lack inoverall performance of central laboratory testing i.e.., higher
number of analytically false-positive results. Table II list the currently available POC devices.
DISCUSSION
Throughout the course of this review, it has been very evident that research and vast advancement of diagnostic
technology and delivery of health care services has resulted in an increase in the demand of POC devices especially
in primary care, emergency care and urban health centers. With recent advancement, POC can lead to increased and
improved patient outcomes. But it can replace the conventional laboratory testing if the result is accurate and
authenticate. But that not true. The POC devices can act as better substitution in diagnosing. The major advantages
or purpose of using POC are reduced time to obtain results of diagnostic testing, decline in pre and post analytical
mistakes such as mishandling/ mislabeling of patient specimen, delayed reporting of critical results, clinicians‟
convenience, lessen the patient visiting time and finally the best patient outcome. The major drawback of POC
devices is diagnostic accuracy in terms sensitivity and specificity due to low concentration sample. Human errors are
also included due to sampling inaccuracy, lack of knowledge. A device with quick, accurate, authenticate, user
friendly, small, easy-to-use, pre-analytical error proof should be designed for wide implementation in all the health
centers and reduce the overall cost of the diagnostic devices.
Table 2 POC devices for detecting cardiac markers
Manufacturer & Device Device Type Cardiac Biomarkers
Alere, Triage Cardiac Panel Portable type CK-MB, Myoglobin, Troponin I
Abbott, i-STAT Handheld device cTnI, CK-MB, BNP
Trinity, Meritas Portable hs-cTnI
Response Biomedical, RAMP Benchtop analyser D-Dimer, NT-proBNP, Troponin I, Myo, CK-MB
Siemens Stratus, CS Benchtop analyzer Troponin I, D-Dimer, NT-proBNP, hsCRP, beta-
HCG, CK-MB, Myo
bioMerieux, Vidas Ultra Benchtop analyzer hs-cTnI, CK-MB, Myo
Roche, Cardiac T Quantitative Handheld device cTnT
Cobas h 232 POC system Handheld device Troponin T, NT-proBNP, D-Dimer, CK-MB
Minicare I-20 Handheld device cTnI
CONCLUSION

Engineers for Viable Technology and $5 Trillion Economy
234 Technical Volume of 36th Indian Engineering Congress, December 26-28, 2021
ISBN 978-81-955500-1-2
Diabetes Mellitus and cardiovascular diseases were one of the major contributing sectors for the research and
growth of POC diagnostic devices. Over population and under-staff in the emergency department is a serious barrier
to provide the best health service. The POC devices reduce the pressure or crowd on emergency departments, faster
triaging and better rule-in/ rule-out decision making and fulfill the healthcare development goals of „no one left
behind‟ in terms of effective health services, efficient health systems, better patient outcome and faster discharging
rates. Testing near the patient bed-side, has grown drastically. POC have been more efficient and effective for early
detection and treatment, and faster field triage. Successful innovation and development of new devices which
makes POC as near-future.
REFERENCE
1. A. Sreeniwas Kumar, Nakul Sinha, Cardiovascular disease in India: A 360-degree overview, Medical Journal of
Armed Forces India, 76(2020) 1-3.
2. Vedika Rathore, Neelima Singh, Roshan Kumar Mahat, Risk Factors for Acute Myocardial Infarction: A
Review, Eurasian Journal of Medical Investigation 2018; 2(1); 1-7.
3. Kristian Thygesen, Joseph S. Alpert, Allan S. Jaffe, Bernard R. Chaitman, Jeroen J. Bax, David A. Morrow,
Harvey D. White, Fourth Universal Definition of Myocardial Infarction (2018), Circulation, Volume 138, Issue
20, 13 November 2018; Pages e618-e651.
4. J S Ladue, F Wroblewski, A Karmen, Serum glutamic oxaloacetic transaminase activity in human acute
transmural myocardial infarction, 1954 Sep 24;120(3117):497-9.
5. HILL BR, LEVI C. Elevation of a serum component in neoplastic disease, in Cancer Research 1954
Aug;14(7):513-5. PMID: 13190533.
6. N J Schmiechen, C Han, D P Milzman, ED use of rapid lactate to evaluate patients with acute chest pain, Annals
of Emergency medicine, 1997 Nov;30(5);571-7
7. Burton E. Sobel, Gerald F. Bresnahan, William E. Shell, Richard D. Yoder, Estimation of Infarct size in Man
and its relation to prognosis, in Circulation 1972;46:640-8.
8. Wroblewski F. Serum enzyme and isoenzyme alterations in myocardial infarction, Progress in Cardiovascular
Diseases, 1963 Jul; 6:63-83.
9. Bruns DE, Chitwood J, Koller K, et al., Creatine kinaseMB activity: clinical and laboratory studies of specific
immunochemical technique with optimized enzymatic assay, Annals of Clinical and Laboratory Science 1983;
13:59-66.
10. Gilkeson G, Stone MJ, Waterman M, et al., Detection of myoglobin by radioimmunoassay in human sera: its
usefulness and limitations as an emergency room screening test for acute myocardial infarction, American Heart
Journal 1978; 95:70-7.
11. Chan DW, Taylor E, Frye T, et al. Immunoenzymatically assay for creatine kinase MB with subunit specific
monoclonal antibodies compared with an immunochemical method and electrophoresis, in Clinical Chemistry
1985; 31:465-9.
12. Alan H.B. Wu, Cardiac Markers: From Enzymes to Proteins, diagnosis to Prognosis, Laboratory to Bedside,
Annals of Clinical and Laboratory Science, Vol 29, No. 1, 1999
13. Vaidya HC, Maynard Y, Dietzler DN, et al., Direct measurement of creatine kinase-MB activity in serum after
extraction with a monoclonal antibody specific to the MB isoenzyme, Clinical Chemistry 1986; 32:657-63.
14. Ebashi S, Kodama A, A new protein factor promoting aggregation of tropomyosin, Journal of Biochemistry
1965; 58:107-8
15. Cummins B, Auckland ML, Cummins P., Cardiac-specific troponin-I radioimmunoassay in the diagnosis of
acute myocardial infarction, American Heart Journal 1987; 113:1333-44.

Engineers for Viable Technology and $5 Trillion Economy
235 Technical Volume of 36th Indian Engineering Congress, December 26-28, 2021
ISBN 978-81-955500-1-2
16. Katus HA, Remppis A, Looser S, et al., Enzyme-linked immunoassay of cardiac troponin T for the detection of
acute myocardial infarction in patients, Journal of Molecular Cell Cardiology 1989; 21:1349-53. 10.1016/0022-
2828(89)90680-9.
17. Katus HA, Looser S, Hallermeyer K, et al., Development and in vitro characterization of a new immunoassay of
cardiac troponin T, Clinical Chemistry 1992;38:386-93.
18. Lippi G, Cervellin G., Genetic polymorphisms of human cardiac troponins as an unrecognized challenge for
diagnosing myocardial injury, International Journal of Cardiology 2014; 171:467-70.
19. Anjith Vupputuri, Saritha Sekhar, Sajitha Krishnan, K. Venugoplan, K.U. Natarajan, Heart-type fatty acid-
binding protein (H-FABP) as an early diagnostic biomarker in patients with acute chest pain, Indian Heart
Journal 67 (2015), 538-42.
20. Sibtain Ahmed, Lena Jafri, Performance of cardiac Troponin I: A comparison between the Point of Care testing
(POCT) AQT90 Flex and the Siemens Advia Centaur Analyzer in an emergency setting, 2019, Cureus 11(3):
e4231.
21. Fang Zhou, Min Lu, Wei Wang, Zhi-Ping Bian, Jian-Rong Zhang, Jun-Jie Zhu, Electrochemical Immunosensor
for Simultaneous Detection of dual cardiac markers based on a Poly (Dimethylsiloxane)- Gold Nanoparticles
Composite Microfluidic chip: A proof of principle, Clinical Chemistry 56:11 (2010).
22. Sibtain Ahmed, Lena Jafri, Ahmed Raheem, Shahid Shakeel, Imran Siddigui, Performance Evaluation of Cardiac
Troponin I Assay: A comparison between the Point -of-care Testing Radiometer AQT90 FLEX and the Central
Laboratory Siemens, Advia Centaur Analyzer, Cureus, March 2019; 11(3): e4231.
23. Innam Lee, Xiliang Luo, Jiyong Huang, Xinyan Tracy Cui, Minhee Yun, Detection of cardiac Biomarkers using
Single Polyaniline Nanowire-based conductometric Biosensors, Biosensors 2012, 2 205-220.
24. Jasper Boeddinghaus, Thomas Nestelberger, Luca Koechlin, Desiree Wussler et al, Early diagnosis of
Myocardial infarction with point-of-care High-Sensitivity Cardiac Troponin I, Journal of the American college
of cardiology Vol. 75, No. 10, 2020.
25. Michelle L.O‟Donoghue, David A. Morrow, Christopher P. Cannon, Petr Jarolim, Nihar R. Desai, Matthew W.
Sherwood, Sabina A. Murphy, Robert E. Gerszten and Marc S. Sabatine, Multimarker risk stratification in
patients with Acute Myocardial Infarction, Journal of the American Heart Association, 2016, Vol. 5, No. 5.
26. Christiana Schernthaner, Michael Lichtenauer, Bernhard Wernly, Vera Paar, Rudin Pistulli, Ilonka Rohm,
Christian Jung, Hans-Reiner Figulla, Attila Yilmaz, Janne Cadamuro, Elisabeth Haschke-Becher. John Pernow,
Paul Christian Schulze, Uta C. Hoppe, Daniel Kretzschmar, Multibiomarker analysis in patients with acute
myocardial infarction, European Journal of Clinical Investigation Vol 47, 2017.
27. Kaige Zhao, Min Tang, Huaisheng Wang, Zhenxian Zhou, Yafeng Wu, Songqin Liu,, Simultaneous detection of
three biomarkers related to acute myocardial infarction based on immunosensing biochip, Biosensors and
Bioelectronics 126(2019) 767-772.
28. Anouk van Hooij, Elisa M. Tjon Kon Fat, Danielle de Jong, Marufa Khatun, Santosh Soren, Abu Sufian
Chowdhury, Johan Chandra Roy, Khorshed Alam, Jong-Pill Kim, Jan Hendrik Richardus, Annemieke Geluk,
Paul L.A.M. Corstjens, Prototype multi-biomarker test for point-of-care leprosy diagnostics, iScience 24,
102006, January 22, 2021.
29. Can Dincer, Richard Bruch, Andre Kling, Petra S. Dittrich, Gerald A. Urban, Multiplexed Point-of-care –
xPOCT, Trends Biotechnology, 2017 Aug; 35(8): 728-742.
30. 8. Singer AJ, Ardise J, Gulla J, Cangro J. Point-of-care testing reduces length of stay in emergency department
chest pain patients, Annal Emergency of Medicine 2005; 45:587–91.
31. Apple FS, Chung AY, Kogut ME, Bubany S, Murakami MAM. Decreased patient charges following
implementation of point-of-care cardiac troponin monitoring in acute coronary syndrome patients in a
community hospital cardiology unit, Clinical Chimica Acta 2006; 370:191–5.

Engineers for Viable Technology and $5 Trillion Economy
236 Technical Volume of 36th Indian Engineering Congress, December 26-28, 2021
ISBN 978-81-955500-1-2
32. Pickering JW, Young JM, George PM, et al., Validity of a novel point-of-care troponin assay for single-test rule-
out of acute myocardial infarction, JAMA Cardiology 2018; 3:1108–12.
33. Santanu Guha, Rishi Sethi, Saumithra Ray, Vinay K Bahl, S. Shanmugasundaram, Prafula Kerkar,
Sivasubramanian Ramakrishnan, Rakesh Yadav, Gaurav Chaudary et al, Cardiological society of India: Position
statement for the management of ST elevation myocardial infarction in India, Journal of Indian Heart 2017 Apr;
69 (Suppl 1): S63 – S97.
34. Francesca di serio, Marco Captuto, Martina Zaninotto, Cosmino Ottomano, Evaluation of analytical performance
of the PATHFAST cardiac troponin, Clinical Chemistry and Laboratory Medicine, June 2009; 47(7); 829-833.
35. David R. Whiting, Lenor Guriguata, Clara Weil, Jonathan Shaw, IDF Diabetes Atlas: Global estimates of the
prevalence of diabetes for 2011 and 2030, Diabetes Research and Clinical Practice, Volume 94, Issue 3,
December 2011, Pages 311-321.
36. Kost GJ. Goals, guidelines, and principles for point of care testing. In: Kost GJ, ed. Principles and practice of
point of care testing, Philadelphia, PA: Lippincott Williams and Wilkins; 2002.
37. Nichols J., Point of Care Testing – Performance Improvement and Evidence Based Outcomes, New York, NY:
Marcel Decker, Inc.; 2003.
38. Clarke SF, Foster JR., A history of blood glucose meters and their role in self-monitoring of diabetes
mellitus, British Journal of Biomedical Science 2012;69(2):83-93.
39. Johnson G., Clinical lecture on the various modes of testing for sugar in the urine. British Medical Journal
1884;1(1201):1-4.
40. Benedict SR., A reagent for the detection of reducing sugars 1908. Journal of Biological Chemistry
2002;277(16): e5.
41. Free AH, Adams EC, Kercher ML, Free HM, Cook MH., Simple specific test for urine glucose, Clinical
Chemistry 1957;3(3):163-168.
42. Kohn J., A rapid method of estimating blood-glucose ranges, Lancet. 1957;273(6986):119-121.
43. Free AH, Free HM., Self-testing, an emerging component of clinical chemistry, Clinical Chemistry
1984;30(6):829-838.
44. Mendosa D , History of blood glucose meters: transcripts of interviews 2006, Available
at: http://www.mendosa.com/history.htm.
45. BCCResearch. Point of Care Diagnostics (Report code HLC043C) BCC Research; 2012. Available
t: http://www.bccresearch.com/market-research/healthcare/point-of-care-diagnostics-market-hlc043c.html

Engineers for Viable Technology and $5 Trillion Economy
237 Technical Volume of 36th Indian Engineering Congress, December 26-28, 2021
ISBN 978-81-955500-1-2
ET_034_05_179
Radar Cross Section Estimation for a Complex Shaped Objects
using SPSG and PO Methods
Swathi Nambari1*, Gottapu Sasi Bhushana Rao
2, Raj Kumar Goswami
3 and
Kolluri Sri Ranga Rao4
1Department of Electronics and Communication Engineering, Gayatri Vidya Parishad College for Degree and PG
Courses(A), Visakhapatnam, Andhra Pradesh 2Department of Electronics and Communication Engineering, Andhra University College of Engineering,
Visakhapatnam, Andhra Pradesh 3Department of Electronics and Communication Engineering, Gayatri Vidya Parishad College of Engineering For
Women, Visakhapatnam, Andhra Pradesh 4Naval Science and Technological Laboratory (NSTL), DRDO, Visakhapatnam, Andhra Pradesh
*e-mail: [email protected]
Abstract: Radar plays a crucial role in the present war scenario and defence applications. RCS is an important
parameter that defines the target cross sectional area. The higher the RCS value, the greater the target detection
capability of the Radar. RCS estimation mainly depends on the size, shape, orientation of the object towards the
Radar, and also the material of which the object is made. Among these, the size, shape, and orientation of the object
are considered to be the most significant features in RCS estimation process. RCS determination is an important
task for identifying or classifying the objects as either friend or foe. Accurate estimation of Radar Cross Section
(RCS) at high frequencies and reduction of radar perceivability at different frequencies is a challenging task. An
efficient algorithm is required that can run on a standard PC which provides RCS predictions within a short time. In
this paper, Spherical Polar Scattering Geometry (SPSG) and Physical Optics (PO) based algorithms are proposed
to estimate RCS of complex structured objects.
Keywords: Radar Cross Section (RCS); Spherical Polar Scattering Geometry (SPSG); Physical Optics (PO);
Frequency; Dimension; Wavelength
INTRODUCTION
The Radar Cross Section of an object accepts a fundamental part in disclosure by radar. Redesign or decreasing of
RCS of object which is being recognized by radar needs control dependent upon the applications. A thorough
perception of the electromagnetic scattering characteristics of an object is essential for productive execution of
needed control of its RCS. In military applications, decrease the RCS of air targets like rockets, flying machines, and
spy satellites. Correspondingly, ground vehicles and rocket launchers ought to be arranged with the objective that
they have least RCS. For testing of radars and searchers, counterfeit targets are required. These fake targets are to be
expected for required RCS and sometimes, redesign the RCS to meet the range and testing conditions. [1-5].
A. RCS CONTROL
RCS Increase: A few applications require improvement of the RCS. Getting ready planes require persevering after
and along these lines for dependable following their RCS is extended. Fabricated airborne objects are used for
rocket execution evaluation and these targets are followed by radars. The RCS of these airborne targets is improved.
Customary practice is to use Luneburg focal points, corner reflectors and moreover transponders with enhancers. It
depends on the application.

Engineers for Viable Technology and $5 Trillion Economy
238 Technical Volume of 36th Indian Engineering Congress, December 26-28, 2021
ISBN 978-81-955500-1-2
RCS Decrease: Diminishing the RCS of a ship proposes its late recognizable proof, which is basic to surprise and
movement. The RCS of an oceanic boat is moreover essential since most present day weapons have presented radar
for use in the midst of the last commitment stage. This is by virtue of a ship with a lower RCS would be recognized
later, just as would endure better in a hostile area. As such, the RCS of an oceanic boat has changed into a basic
arrangement factor for secrecy to achieve awe, movement, and survivability. Accordingly, accurate RCS affirmation
and RCS decreasing are matters of phenomenal importance for oceanic boats [6-9].
RCS reduction strategies incorporate passive cancellation or impedance loading, active cancellation or active
loading, radar absorbing materials (RAMs), and shaping. Shaping and radar absorbing materials are the two
essentially utilized RCS diminishment strategies on maritime ships
B. RCS EVALUATION
The performance of the objects is evaluated using RCS prediction methodologies and RCS full scale measurements.
Standard spheres that undergo calibration test with the dimensions 3”, 7” and 11” radius the RCS obtained are -
17.44 dBsm, -10 dBsm and 6.10 dBsm considered for comparison. From Figure 1 it is observed that RCS can be
evaluated using techniques like full scale measurements, scaled model measurements, RCS theoretical prediction
software tools [10-15].
Figure 1 Techniques to RCS analysis and evaluation
RCS Simulation of Sphere:
Figure 2 RCS (dBsm) vs. frequency (GHz) for diameters of sphere
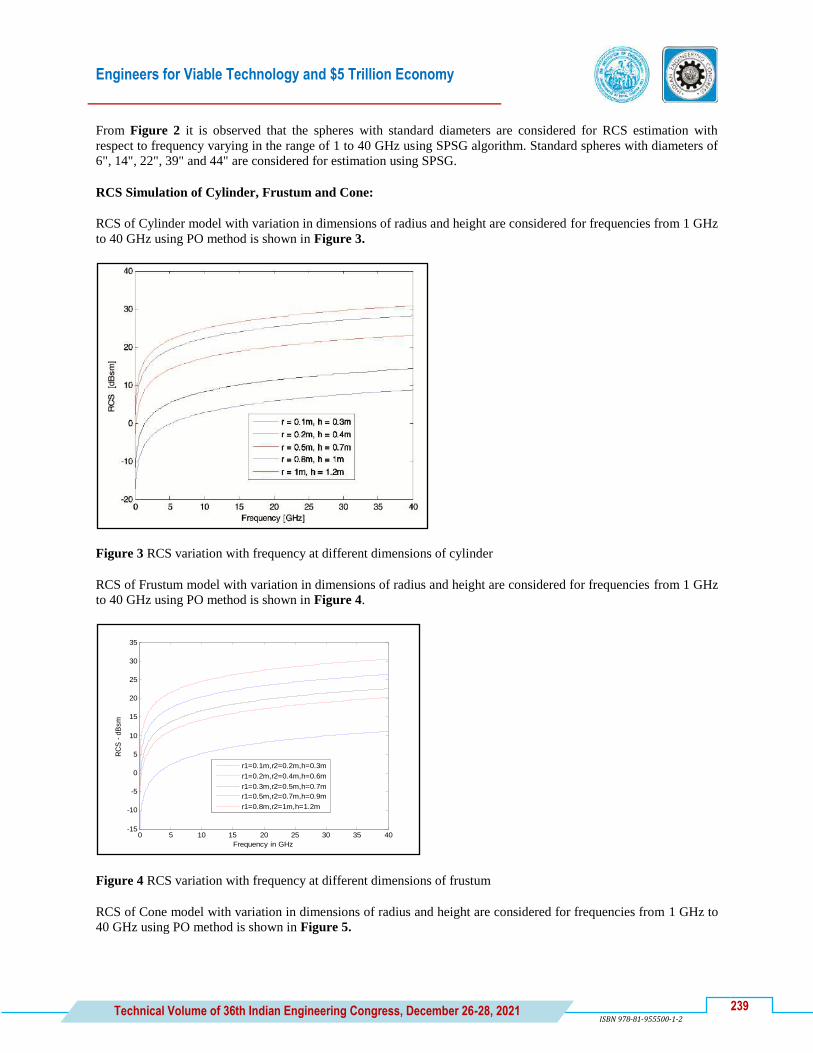
Engineers for Viable Technology and $5 Trillion Economy
239 Technical Volume of 36th Indian Engineering Congress, December 26-28, 2021
ISBN 978-81-955500-1-2
From Figure 2 it is observed that the spheres with standard diameters are considered for RCS estimation with
respect to frequency varying in the range of 1 to 40 GHz using SPSG algorithm. Standard spheres with diameters of
6", 14", 22", 39" and 44" are considered for estimation using SPSG.
RCS Simulation of Cylinder, Frustum and Cone:
RCS of Cylinder model with variation in dimensions of radius and height are considered for frequencies from 1 GHz
to 40 GHz using PO method is shown in Figure 3.
Figure 3 RCS variation with frequency at different dimensions of cylinder
RCS of Frustum model with variation in dimensions of radius and height are considered for frequencies from 1 GHz
to 40 GHz using PO method is shown in Figure 4.
Figure 4 RCS variation with frequency at different dimensions of frustum
RCS of Cone model with variation in dimensions of radius and height are considered for frequencies from 1 GHz to
40 GHz using PO method is shown in Figure 5.
0 5 10 15 20 25 30 35 40-15
-10
-5
0
5
10
15
20
25
30
35
Frequency in GHz
RC
S -
dB
sm
r1=0.1m,r2=0.2m,h=0.3m
r1=0.2m,r2=0.4m,h=0.6m
r1=0.3m,r2=0.5m,h=0.7m
r1=0.5m,r2=0.7m,h=0.9m
r1=0.8m,r2=1m,h=1.2m

Engineers for Viable Technology and $5 Trillion Economy
240 Technical Volume of 36th Indian Engineering Congress, December 26-28, 2021
ISBN 978-81-955500-1-2
Figure 5 RCS variation with frequency at different dimensions of cone
RCS of Cylinder model with radius and height dimensions are considered for aspect variation 0 to 180 degrees using
PO method is shown in Figure 6. Peak RCS occurs at 90 degrees.
Figure 6 RCS variation with aspect angle at r = 0.1m, h = 0.3m
RCS of Frustum model with radius and height dimensions are considered for aspect variation 0 to 180 degrees using
PO method is shown in Figure 7. Peak RCS occurs at 90 + α degrees.
Figure 7 RCS with aspect angle at r1 = 0.1m, r2 = 0.2m, h = 0.3m
0 5 10 15 20 25 30 35 40-20
-10
0
10
20
30
40
Frequency in GHz
RC
S -
dB
sm
r1 = 0m, r2 = 0.2m, h = 0.3m
r1 = 0m, r2 = 0.4m, h = 0.6m
r1 = 0m, r2 = 0.5m, h = 0.7m
r1 = 0m, r2 = 0.7m, h = 0.9m
r1 = 0m, r2 = 1m, h = 1.2m
0 20 40 60 80 100 120 140 160 180-50
-40
-30
-20
-10
0
10
Aspect angle - degrees
RC
S -
dB
sm
Frequency = 10GHz (X-Band)
0 20 40 60 80 100 120 140 160 180-60
-50
-40
-30
-20
-10
0
10
Apsect angle - degrees
RC
S -
dB
sm
frequency= 10GHz (X-Band)
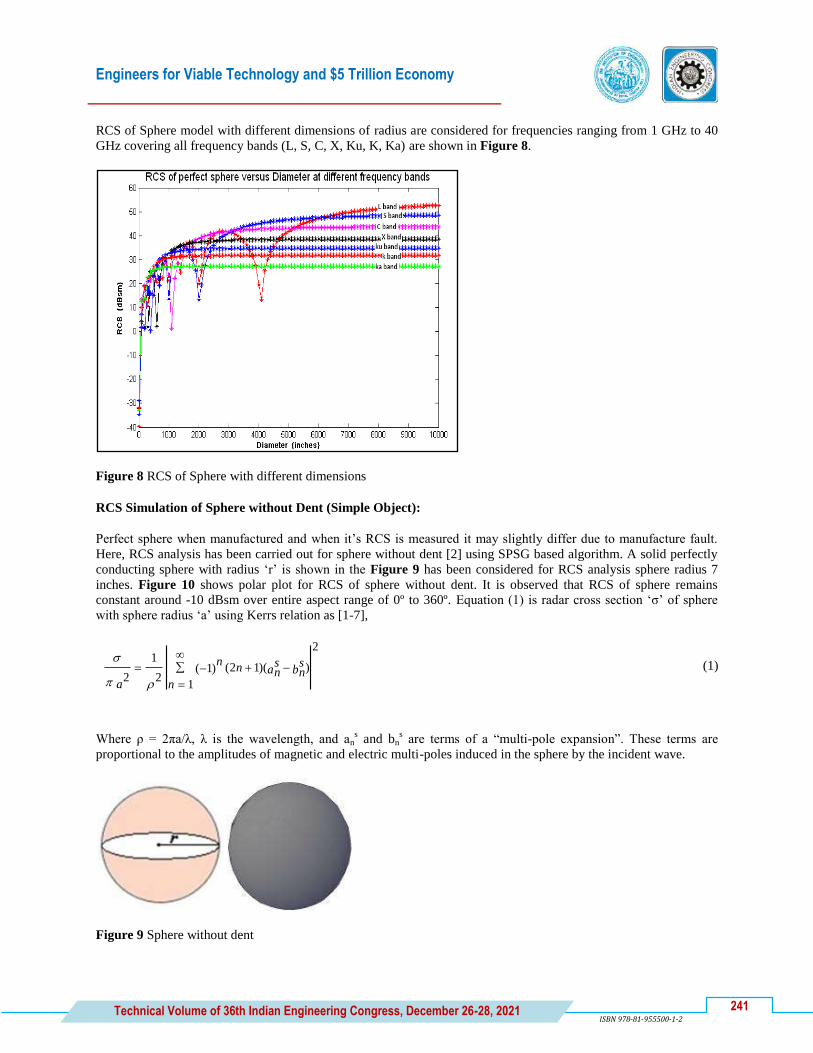
Engineers for Viable Technology and $5 Trillion Economy
241 Technical Volume of 36th Indian Engineering Congress, December 26-28, 2021
ISBN 978-81-955500-1-2
RCS of Sphere model with different dimensions of radius are considered for frequencies ranging from 1 GHz to 40
GHz covering all frequency bands (L, S, C, X, Ku, K, Ka) are shown in Figure 8.
Figure 8 RCS of Sphere with different dimensions
RCS Simulation of Sphere without Dent (Simple Object):
Perfect sphere when manufactured and when it‟s RCS is measured it may slightly differ due to manufacture fault.
Here, RCS analysis has been carried out for sphere without dent [2] using SPSG based algorithm. A solid perfectly
conducting sphere with radius „r‟ is shown in the Figure 9 has been considered for RCS analysis sphere radius 7
inches. Figure 10 shows polar plot for RCS of sphere without dent. It is observed that RCS of sphere remains
constant around -10 dBsm over entire aspect range of 0º to 360º. Equation (1) is radar cross section „σ‟ of sphere
with sphere radius „a‟ using Kerrs relation as [1-7],
(1)
Where ρ = 2πa/λ, λ is the wavelength, and ans and bn
s are terms of a “multi-pole expansion”. These terms are
proportional to the amplitudes of magnetic and electric multi-poles induced in the sphere by the incident wave.
Figure 9 Sphere without dent
)
1
)(12()1(
2
2
1
2b
sn
n
asnn
n
a
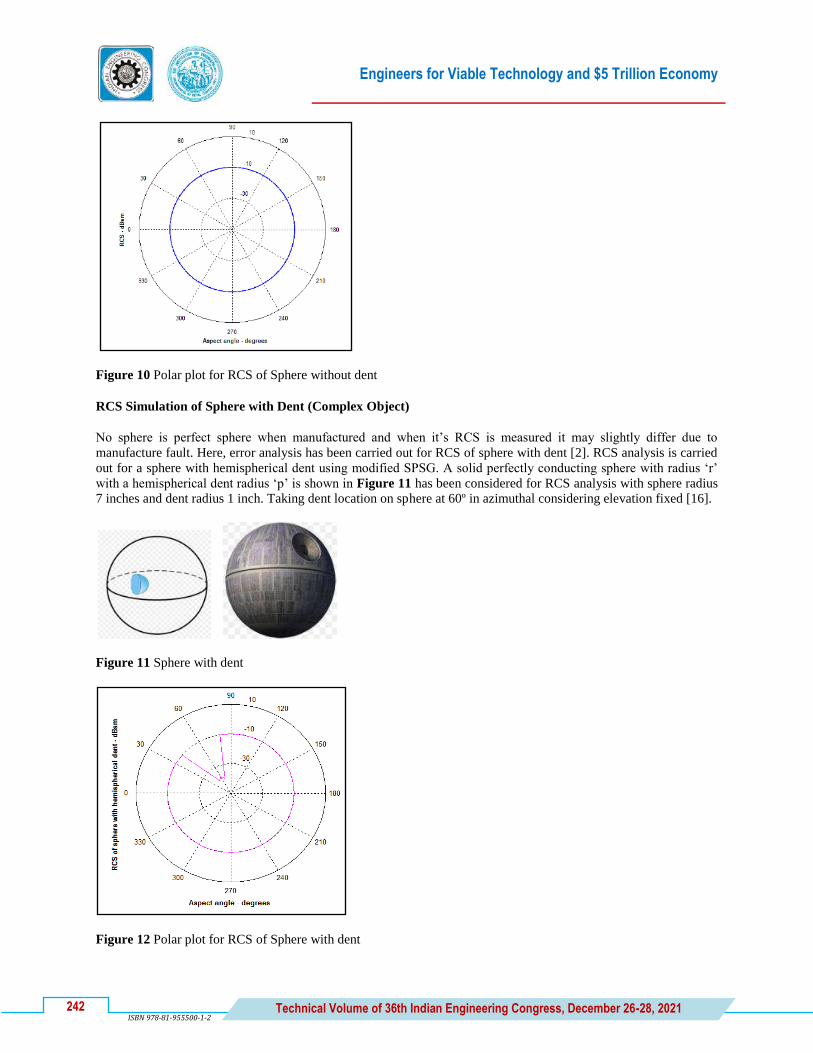
Engineers for Viable Technology and $5 Trillion Economy
242 Technical Volume of 36th Indian Engineering Congress, December 26-28, 2021
ISBN 978-81-955500-1-2
Figure 10 Polar plot for RCS of Sphere without dent
RCS Simulation of Sphere with Dent (Complex Object)
No sphere is perfect sphere when manufactured and when it‟s RCS is measured it may slightly differ due to
manufacture fault. Here, error analysis has been carried out for RCS of sphere with dent [2]. RCS analysis is carried
out for a sphere with hemispherical dent using modified SPSG. A solid perfectly conducting sphere with radius „r‟
with a hemispherical dent radius „p‟ is shown in Figure 11 has been considered for RCS analysis with sphere radius
7 inches and dent radius 1 inch. Taking dent location on sphere at 60º in azimuthal considering elevation fixed [16].
Figure 11 Sphere with dent
Figure 12 Polar plot for RCS of Sphere with dent

Engineers for Viable Technology and $5 Trillion Economy
243 Technical Volume of 36th Indian Engineering Congress, December 26-28, 2021
ISBN 978-81-955500-1-2
It is observed from Figure 12 that dent RCS is around -38 decibels in squaremeter or dBsm at 60º whereas RCS of
sphere is around -10 dBsm in remaining aspects of 0º to 360º.
Table 1 Error analysis for RCS of sphere with and without Dent
Sphere RCS Dent RCS
-10 dBsm -38 dBsm
RCS values of sphere values with and without dent are given in Table 1.
RCS of Plasma Sphere (Complex Object)
Plasma stealth is known as active stealth technology and the plasma is the fourth state of substance. It is a mixture of
electrons, ions, and neutral particles and is electrically neutral. Because the charged particles can interact with the
electric and the magnetic field of the em wave, the em wave will be scattered, refracted and/or absorbed when it
strikes the plasma [10,12].
Figure 13 Plasma sphere
The Plasma sphere is shown in Figure 13. Standard spheres that undergo calibration tests with the dimension 7”
Radius with RCS value of 0.1 m2
or -10.0 dBsm is considered for comparison with the results simulated for RCS of
plasma sphere and RCS of metal sphere. Plasma based SPSG is developed to simulate plasma RCS. Equation (2) is
radar cross section of plasma sphere, letting n=n1+jn2, according to Mie's theory, RCS of the plasma sphere is given
by „σ‟ as [1]-[10],
1
))(12()1(
2
))(12()1(
2
2l
blialil
lblr
il
alrl
l
k
(2)
Where the subscripts „r‟ and „i‟ represent the real and imaginary part of a complex respectively, al and bl are factors
from Mie‟s theory. Equation (3) is a propagation constant „k‟ given by [4] and [5-10],
2
2
100
pk (3)
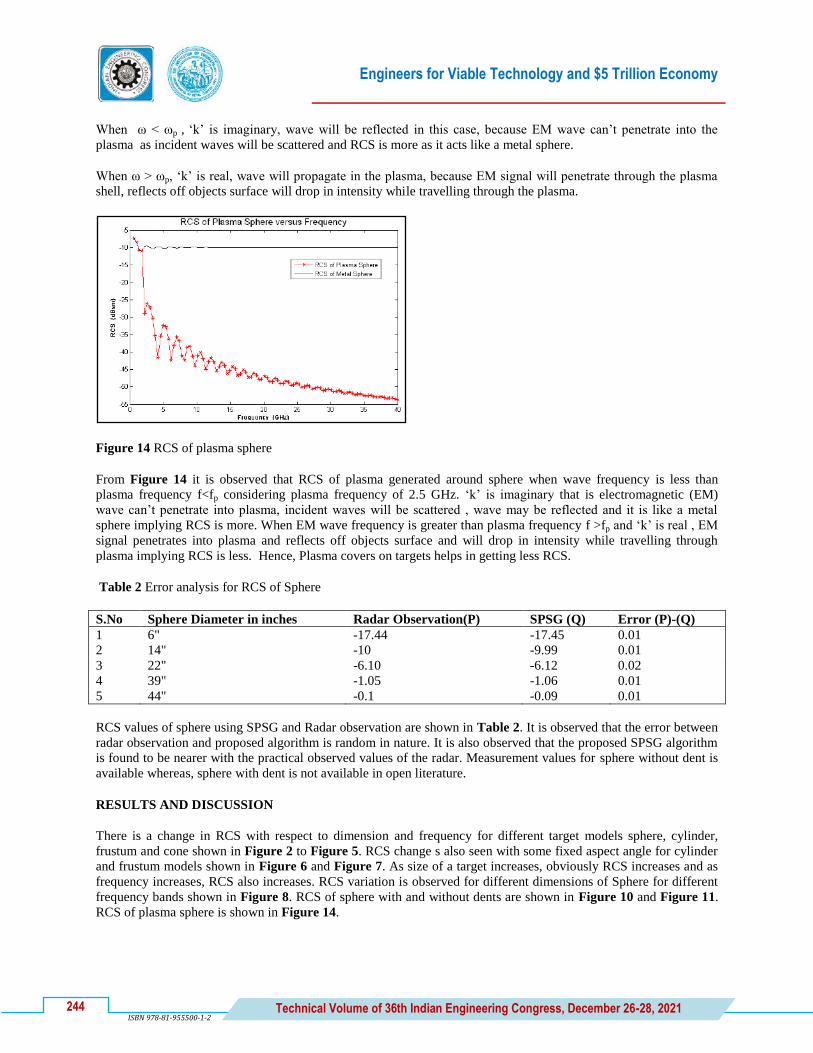
Engineers for Viable Technology and $5 Trillion Economy
244 Technical Volume of 36th Indian Engineering Congress, December 26-28, 2021
ISBN 978-81-955500-1-2
When ω < ωp , „k‟ is imaginary, wave will be reflected in this case, because EM wave can‟t penetrate into the
plasma as incident waves will be scattered and RCS is more as it acts like a metal sphere.
When ω > ωp, „k‟ is real, wave will propagate in the plasma, because EM signal will penetrate through the plasma
shell, reflects off objects surface will drop in intensity while travelling through the plasma.
Figure 14 RCS of plasma sphere
From Figure 14 it is observed that RCS of plasma generated around sphere when wave frequency is less than
plasma frequency f<fp considering plasma frequency of 2.5 GHz. „k‟ is imaginary that is electromagnetic (EM)
wave can‟t penetrate into plasma, incident waves will be scattered , wave may be reflected and it is like a metal
sphere implying RCS is more. When EM wave frequency is greater than plasma frequency f >fp and „k‟ is real , EM
signal penetrates into plasma and reflects off objects surface and will drop in intensity while travelling through
plasma implying RCS is less. Hence, Plasma covers on targets helps in getting less RCS.
Table 2 Error analysis for RCS of Sphere
S.No Sphere Diameter in inches Radar Observation(P) SPSG (Q) Error (P)-(Q)
1 6" -17.44 -17.45 0.01
2 14" -10 -9.99 0.01
3 22" -6.10 -6.12 0.02
4 39" -1.05 -1.06 0.01
5 44" -0.1 -0.09 0.01
RCS values of sphere using SPSG and Radar observation are shown in Table 2. It is observed that the error between
radar observation and proposed algorithm is random in nature. It is also observed that the proposed SPSG algorithm
is found to be nearer with the practical observed values of the radar. Measurement values for sphere without dent is
available whereas, sphere with dent is not available in open literature.
RESULTS AND DISCUSSION
There is a change in RCS with respect to dimension and frequency for different target models sphere, cylinder,
frustum and cone shown in Figure 2 to Figure 5. RCS change s also seen with some fixed aspect angle for cylinder
and frustum models shown in Figure 6 and Figure 7. As size of a target increases, obviously RCS increases and as
frequency increases, RCS also increases. RCS variation is observed for different dimensions of Sphere for different
frequency bands shown in Figure 8. RCS of sphere with and without dents are shown in Figure 10 and Figure 11.
RCS of plasma sphere is shown in Figure 14.

Engineers for Viable Technology and $5 Trillion Economy
245 Technical Volume of 36th Indian Engineering Congress, December 26-28, 2021
ISBN 978-81-955500-1-2
CONCLUSION
It is concluded that radar cross section was computed for curved shaped objects like sphere, cylinder, frustum and
cone. The backscattered RCS for these objects were estimated using RCS prediction methodology called Physical
Optics. The far field monostatic RCS for these objects has been computed at various dimensions and at some
specified Radar frequencies ranging from 1 GHz to 40 GHz. In this plots are obtained for RCS verses frequency for
various dimensions for the given objects and the plots are also obtained for various frequencies for RCS verses
aspect angle for the given objects. RCS enhancement is seen with respect to size and frequency. Using SPSG, RCS
versus frequency plots are obtained for different diameters of sphere which are highly impractical with radar
measurements and also with RCS prediction software tools. The proposed algorithms are easy to use with
mathematical modeling for RCS estimation of objects in the absence of radar measurements due to system
complexity and cost effective with hardware and software.
ACKNOWLEDGEMENT
Authors would like to thank the RCS Division Team, Naval Science and Technological Laboratory (NSTL), DRDO,
Visakhapatnam, Dept of ECE, Andhra University College of Engineering, Visakhapatnam, Gayathri Vidya Parishad
Group of Institutions (GVPCDPGC and GVPCEW), Visakhapatnam, and also Anil Neerukonda Institute of
Technology and Sciences, Visakhapatnam for the present research work.
REFERENCES
1. Kerr.D.E., “Propagation of Short Radio Waves”, Radiation Laboratory Series Vol. 13, Chapter 6, McGraw-
Hill, Newyork, 1951.
2. Blake.L.V., “Calculation of the Radar Cross Section of a Perfectly Conducting Sphere”, Naval Research
Laboratory(NRL), Washington DC, July,1972.
3. E.F Knott, “Radar Cross Section,” Second Edition,Archtech House, 1993.
4. Skolnik.M.I., “Introduction to Radar Systems”, Second Edition, p.41, McGraw- Hill,Newyork, 1962.
5. Skolnik.M.I., “Radar Handbook”, Second Edition, Chapter 11,p.11.1, McGraw-Hill, New York, 1990.
6. Simon Kingsley, “Understanding Radar Systems,” Second Edition.
7. Bassem R.Mahafza, “Radar system Analysis and Design using Matlab,” Second edition , pp.100-102, Jan
2000.
8. Nicholas C.Currie, “Techniques of Radar Reflectivity Measurement”, p.27, Archtech House, 1984.
9. Jenn.D.C, “Radar and Laser Cross Section Engineering” Naval Postgraduate School, California, 2005.
10. Y Gao, J Shi, J Wang, “The calculation of backscattering radar cross section of plasma spheres,” Institute of
Electronic Engineering, Hefei, IEEE, 2000.
11. Sasibhushana Rao Gottapu “Monostatic RCS estimation of missile shaped model using PO method” in
International conference on Advanced Materials Technologies (ICAMT-2016), 27th
-28th
Dec 2016.
12. Swathi Nambari “Estimation of RCS for a perfectly Conducting and plasma spheres” , Springer India, 2016
13. Swathi Nambari “Radar RCS estimation of a perfectly conducting sphere obtained from a Spherical Polar
Scattering Geometry” IEEE 2015.
14. Swathi Nambari “RCS Computation of Shapes Obtained by Cascading Simple Objects Using PO Method and
Results Obtained Using Matlab Simulation Software” in International Journal of Electronics and
Communication Technology (IJECT), Vol 4 Issue 2, Apr-Jun 2013.
15. Swathi Nambari “Development of Algorithm for RCS estimation of a perfectly conducting sphere using
spherical polar scattering geometry” in International Journal of Applied Engineering Research, Vol 12, No
11,pp-2656-2661, 2017.

Engineers for Viable Technology and $5 Trillion Economy
246 Technical Volume of 36th Indian Engineering Congress, December 26-28, 2021
ISBN 978-81-955500-1-2
16. Kolluri Sri Ranga Rao, Gottapu Sasibhushana Rao, Swathi Nambari “RCS Estimation of Sphere with Dent
using SPSG including Error Analysis in Stealth Technology”, IEEE International Conference on Range
Technology (ICORT-2019), Integrated Test Range (ITR), Defence Research and Development Organization
(DRDO), Chandipur, Odisha, India, 15th
- 17th
February 2019.

Engineers for Viable Technology and $5 Trillion Economy
247 Technical Volume of 36th Indian Engineering Congress, December 26-28, 2021
ISBN 978-81-955500-1-2
ET_046_06_178
Two Applications of FBG Temperature Sensor for
Environmental Safety
Sagupha Parween and Aruna Tripathy*
Department of Electronics and Instrumentation Engineering, College of Engineering and Technology, Ghataikia,
Maha LaxmiVihar, Techno Campus, Bhubaneswar
*email: [email protected]
Abstract: Detection and monitoring of temperature in fire sensitive areas, high temperature zones such as
underground coal mines and smelting plant applications is a crucial requirement in order to ensure safety of
working personnel and to avoid unnecessary damage to life and infrastructure. Smoldering combustion is most often
responsible for underground coal mine fire. A commonly used method for detection of underground fire can be done
through temperature gradient. Similarly smelting plants as mandated in various stages of aluminium production
starting from the mixing stage typically having 160°C-180°C to the alumina electrolysis process that is
characterized by about 1000°C. Therefore, detection and subsequent monitoring of temperature change in
underground coal mines as well as smelting plants is an important concern. A four channel FBG temperature sensor
based system is proposed in this paper that demonstrates multiple FBG sensors. These four sensors sense different
temperatures and a single channel making use of wavelength division multiplexing (WDM) is used thereafter to send
the sensed data. The originally transmitted signal is retrieved at the receiver by a WDM demultiplexer. Three
different channels such as Optical fiber cable (OFC), Free Space Optics (FSO) and Optical Wireless
communication (OWC) channels have been simulated here to assess and compare the performance of the proposed
WDM-FBG sensor system.
Keywords: FBG; Optical Sensor; Temperature; OFC; FSO; OWC
INTRODUCTION
Temperature sensing is an important concern for the environmental safety. Detection of increase in temperature
before any exposure is required. Accurate timely temperature detection prevents any life loss and industrial damage
in areas where in temperatures can go beyond some safety limits due to a slew of reasons. Conventional temperature
sensors like Thermocouple, resistance temperature detector (RTD)s, pyrometers and thermistors do exist to sense
temperature in different applications. Although theseare in practice, however different temperature ranges mandate
the use of different temperature sensors and may not lead to multiplexing easily. An optical Fiber Bragg Grating
(FBG) sensor is better than these electrical sensors from the point of view of electromagnetic interferences, electric
sparks. Also an FBG can be used in a multiplexed configuration to sense temperature at several locations and
sensing mechanism is optical in nature avoiding the need for expensive electrical isolation. Such sensors are immune
to environmental changes and passive in nature. It is with these constraints that we make use of an optical Fiber
Bragg Grating (FBG) sensor to detect different changes in temperature [1-2] as point sensors. The same type of
sensor can be used to detect different temperature ranges with different thermo-optic coefficients and the system
designer need not worry about different sensors for a host of temperature ranges. Besides offering immunity to
electromagnetic interference that is widespread in industrial applications and ease of deployment in inflammable,
hazardous areas such aluminium smelting plant and underground coal mines, these sensors are also easily amenable
to multiplexing. Typically the Hall-Héroult process [3] is used for aluminium smelting in the process of extracting
aluminium from its oxide, alumina. This is done in many stages with particular temperature scaling. During
aluminium production, temperature sensing is required in various stages [4]. A temperature in the range of 160-
180°C [4-5] is required in the mixingstage. After the mixing stage, the green paste comes out of the mixer which has
to be cooled to about 110-120°C temperature before it is fed into the block press in the Block Forming stage. This is

Engineers for Viable Technology and $5 Trillion Economy
248 Technical Volume of 36th Indian Engineering Congress, December 26-28, 2021
ISBN 978-81-955500-1-2
done in order for the finished blocks to retain their shape [5]. For baking of green blocks, the furnace is slowly
heated up to the range of 1100 – 1120°C and then slowly cools down again [5-6]. Baking of the green blocks is
carried out above 1000ºC [5-6]. An exothermic reaction resulting due to the natural oxidization of coal over time
leads to underground coal mine fire [7]. This is one of the terrible hazards that must be taken care of without or as
less as possible human intervention. Exothermic internal reactions arising out of self-heating due to an increase in
temperature paves way for smouldering combustion that leads to explosion subsequently. A gradual rise in
temperature results inthe forthcoming mine fire.Due to the change in temperature, heat is produced which defines
the energy transmission between the coal and its surrounding[8-9]. The heat produced leads to coal mine fire which
is a risky hazard in underground coal mines.
In both the applications, it is criticalto sense and maintainanaccurate temperature change to avoid the losses of
precious lives as well as infrastructure damage. Multiple FBG sensors are proposed to be distributed in the area of
concern to detect the temperature change and to multiplexthe sensed data to be sent over a common channel to some
remote monitoring unit. Wavelength Division Multiplexing (WDM) is used to multiplex temperature as coming
from several sources distributed over a given area [10-11]. The number of components and installation cost within a
sensor network is reduced through multiplexing several channels. The sensed information is transmitted and
subsequently received over an analog communication link. The communication links in this work makes use of
Optical Fiber Cable (OFC), Free Space Optic (FSO) and Optical Wireless Communication (OWC) as the channel.
An FSO channel is used to transmit the sensed measurand to the receiver. However, in all these, FBG sensor was
used as a point sensor over OFC or FSO in a multiplexed configuration. The capability of a multiplexed sensor over
an OWC is yet to be explored and the resulting performance needs to be compared with those obtained over OFC
and FSO. This particular issue is addressed in the present work. The primary difference between an FSO and an
OFC lies in the fact that free space is used as the transmission medium in case of FSO while it is an optical cable in
OFC [12-13]. The OWC is not much different from the FSO except the difference is in the propagation medium.
OWC is considered for outer surface where it is assumed to be free from atmospheric attenuation factor [14]. In the
receiver a WDM Demultiplexer is used to separate the sensed data that has been transmitted from each FBG sensor.
Section II describes the proposed FBG sensor over the three different transmission media. The experimental layouts
for proposed WDM-FBG system are shown in Section III. Section IV compares the results and analysis of
experimental arrangements. Section V provides a conclusion of the experimental results.
SYSTEM MODEL
A shift in thewavelength of an optical source from its centre wavelength due to a change in temperature forms the
basic principle of FBG sensors in the measurement of temperature. An FBG sensor reflects only one particular
wavelength while transmitting the remaining wavelengths for white light from an optical white light source (WLS)
being shoneonto it. The particular wavelength which is reflected off satisfies the Bragg condition and the
corresponding wavelength is called the Bragg wavelength given as [15-16],
effB n2 (1)
where effn is the effective refractive index of FBG sensor, Λ is the grating period, and B is the Bragg wavelength.
The wavelength shift with respect to any change in the reference temperature is given as [17]:
TBB )1( (2)
where, B is the change inwavelength B is the centre Bragg wavelength, ξ is the thermo-optic coefficient and ΔT
is the change in temperature. The FBG sensor responds by shifting the centre wavelength for any change in
temperature other than the set reference temperature.
PROPOSED SENSOR LAYOUT
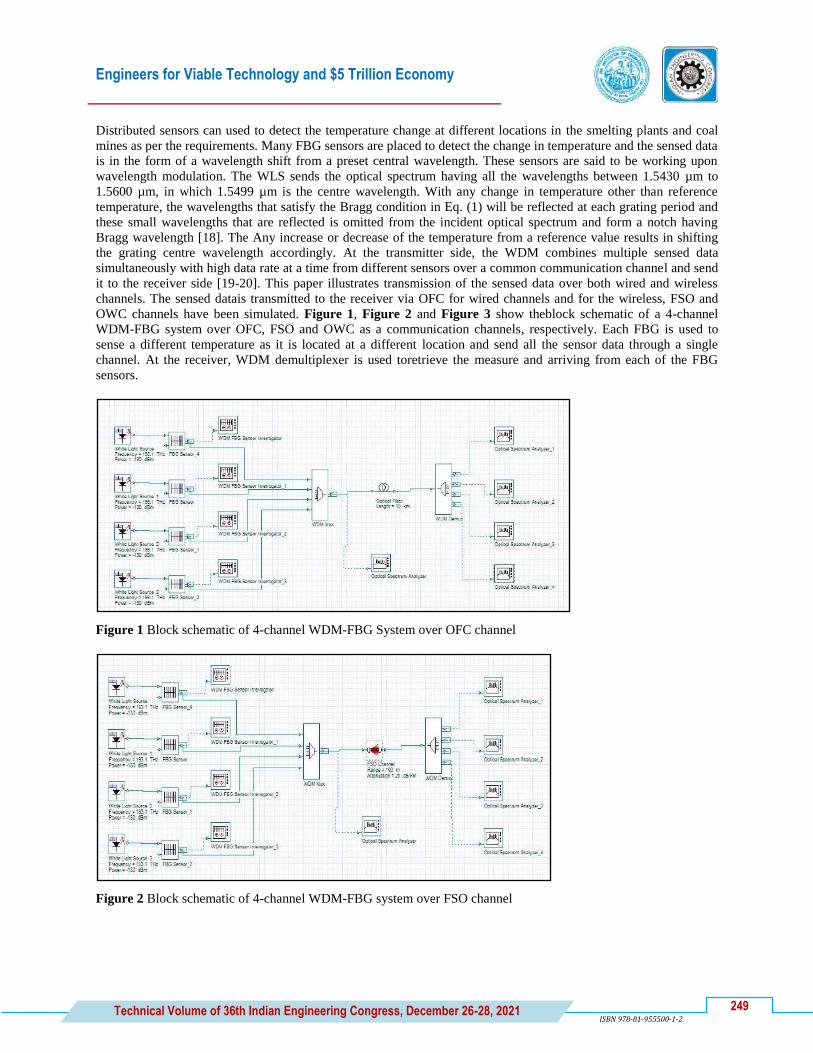
Engineers for Viable Technology and $5 Trillion Economy
249 Technical Volume of 36th Indian Engineering Congress, December 26-28, 2021
ISBN 978-81-955500-1-2
Distributed sensors can used to detect the temperature change at different locations in the smelting plants and coal
mines as per the requirements. Many FBG sensors are placed to detect the change in temperature and the sensed data
is in the form of a wavelength shift from a preset central wavelength. These sensors are said to be working upon
wavelength modulation. The WLS sends the optical spectrum having all the wavelengths between 1.5430 µm to
1.5600 µm, in which 1.5499 µm is the centre wavelength. With any change in temperature other than reference
temperature, the wavelengths that satisfy the Bragg condition in Eq. (1) will be reflected at each grating period and
these small wavelengths that are reflected is omitted from the incident optical spectrum and form a notch having
Bragg wavelength [18]. The Any increase or decrease of the temperature from a reference value results in shifting
the grating centre wavelength accordingly. At the transmitter side, the WDM combines multiple sensed data
simultaneously with high data rate at a time from different sensors over a common communication channel and send
it to the receiver side [19-20]. This paper illustrates transmission of the sensed data over both wired and wireless
channels. The sensed datais transmitted to the receiver via OFC for wired channels and for the wireless, FSO and
OWC channels have been simulated. Figure 1, Figure 2 and Figure 3 show theblock schematic of a 4-channel
WDM-FBG system over OFC, FSO and OWC as a communication channels, respectively. Each FBG is used to
sense a different temperature as it is located at a different location and send all the sensor data through a single
channel. At the receiver, WDM demultiplexer is used toretrieve the measure and arriving from each of the FBG
sensors.
Figure 1 Block schematic of 4-channel WDM-FBG System over OFC channel
Figure 2 Block schematic of 4-channel WDM-FBG system over FSO channel

Engineers for Viable Technology and $5 Trillion Economy
250 Technical Volume of 36th Indian Engineering Congress, December 26-28, 2021
ISBN 978-81-955500-1-2
Figure 3 Block schematic of 4-channel WDM-FBG System over OWC channel
RESULTS AND ANALYSIS
Opti System 16.0 software has been used here to perform all the simulations. The graphs are obtained using
MATLAB R2016b. In 4-Channel WDM-FBG system, four number of FBG sensors are used to sense 4 different
temperature ranges, i.e. between 200oC, 350
oC, 600
oC and 1000
oC with respect to a reference temperature of 0
oC
that has a centre Bragg wavelength 1.54999 nm. The thermo-optic coefficient ξ used for temperature sensing of
200oC and 350
oC is10
-4/oC and for 600
oC and 1000
oC the ξ value is 10
-5/ oC. The change in temperature will shift the
centre 1.5499 µm wavelength into four different wavelengths for four different temperatures; these wavelengths are
multiplexed using WDM which is shown in Figure 4 and passed through a 1 km OFC that has a 0.2 dB/km of
typical channel attenuation.
Figure 4 4 x1 WDM Mux output OFC channel
AWDM demultiplexer is used to retrieve the data from each transmitter at the receiver side. We have assessed the
capability of FSO and OWC channel to send out and receive the multiplexed data in as to be used in these two
applications also. An FSO channel is 100 m range with 25 dB/km attenuation and OWC with arange of is 1Km with
25dB/Km has been used in the schematic. The Bragg wavelength shift according to the change in temperature as
transmitted through OFC, FSO, and OWC channels is compared in Table 1.

Engineers for Viable Technology and $5 Trillion Economy
251 Technical Volume of 36th Indian Engineering Congress, December 26-28, 2021
ISBN 978-81-955500-1-2
Table 1 Bragg wavelengths shift vs.Temperaturechange over OFC, FSO and OWC
Temperature
(oC)
Bragg Wavelength over OFC
(µm)
Bragg Wavelength over FSO
(µm)
Bragg Wavelength over OWC
(µm)
200 1.55304 1.55309 1.55301
350 1.55539 1.5556 1.55536
600 1.55096 1.55097 1.55094
1000 1.55151 1.55149 1.55147
We have considered the centre Bragg wavelength as 1.54999 µm in obtaining Table 1. Table 2 shows the difference
in Bragg wavelength shift for OFC, FSO, and OWC communication channels as a function of temperature as
obtained by using Eq. (2). Here, we have taken the reference temperature as 0oC and effn is considered to be 1.45.
Table 2 Difference between Bragg wavelengths shift and centre Bragg wavelength
Temperature
(oC)
Theoretical
(ΔλB) (nm)
Simulated (ΔλB)
(nm) in OFC
Simulated (ΔλB)
(nm) in FSO
Simulated (ΔλB)
(nm) in OWC
200 30.1 31.06 31.061 31.0602
350 54.24 54.43 54.44 54.43
600 92.1 93.05 93.058 93.056
1000 154.1 155.15 155.14 155.147
A look at Table 2 clearly shows that thesimulated temperature shifts over the three different channels follow the
theoretical shifts closely. The comparative plot of temperature vs. both theoretical and simulated Bragg wavelength
shifts as a function of the ambient temperature asobserved over OFC, FSO and OWC channels are compared in
Figure 5. All the results show the detection and sensing capability of the proposed scheme over three different
channels as the same result is observed to be obtained in each case.
Figure 5 Graph depicting Temperature as a function of Bragg wavelength shift observed over OFC, FSO and OWC
communication channels
The FBG sensor can reliably transmit the sensed temperature up to a certain range through the OFC, FSO and OWC
communication channels. Table 3 shows the reliable distance to detect the sensed temperature at the receiver. All
the three channels are assumed to have an attenuation of 0.2 dB/Km.

Engineers for Viable Technology and $5 Trillion Economy
252 Technical Volume of 36th Indian Engineering Congress, December 26-28, 2021
ISBN 978-81-955500-1-2
Table 3 Communication range overOFC, FSO and OWC channel for the 4 channel WDM FBG Sensor
Communication Channel Range
OFC 75 km
FSO 520 m
OWC 30m
CONCLUSIONS
Two applications of FBG sensor in fire related hazardous areas like underground coal mines and smelting plant
applications are presented through computer simulations that demonstrate the multiplexing capability offered by
fibre based temperature sensing and subsequent monitoring. The maximum range is observed to be obtained for
OFC which is 75 km while OWC is pretty restricted in its range to 520 m for a temperature range of 200C to
1000C. Results obtained show promise for the use of such sensors in avoiding mishapsdue to unmonitored sharp
temperature changesas well as providing environmental safety in both of the areas.
REFERENCES
1. S Parween, A Tripathy, “Remote Monitoring of Temperature Using Optical Fiber Bragg Grating Sensor”,
Springer Lecture Notes on Communications in Computer and Information Science book series (CCIS, volume
1372, pp.36-47, May 2021.
2. S.P Ugale, Dr. V Mishra, “Fiber Bragg Grating Modeling, Characterization and Optimization with different,
index profiles”, International Journal of Engineering Science and Technology, vol. 2, pp. 4463-4468,
September 2010.
3. Aluminium Production Process, [online] Available:http://www.balcoindia.com/operations/pdf/Aluminium-
Production-Process.pdf.
4. S Parween, ATripathy: “An Optical Fibre Bragg Grating Temperature Sensor for Smelting Plant Application”,
Souvenir-International Conference on Innovations in Aluminium Technology (INALT 2020), February 2020.
5. H Kuvande, “The Aluminum Smelting Process”, Article in Journal of Occupational and Environmental
Medicine, vol.56, May 2014.
6. H Alamdari, “Aluminium Production Process: Challenges and Opportunities”, Article in Metals-Open Access
Metallurgy Journal, vol.7, April 2017.
7. G Qi, D Wang, et al., “Smoldering combustion of coal under forced air flow: experimental investigation”,
Journal of Fire Sciences, vol. 34, pp. 267-288, April 2016.
8. M Onifade, B Genc, “Spontaneous combustion liability of coal and coal-shale: a review of prediction
methods”, In. Journal of Coal Science & Technology, vol. 6, pp. 151–168, March 2019.
9. S Parween, A Tripathy, “Distributed FBG Temperature Sensor for Coal Mine Fire Detection”, Springer
Lecture Notes on Networks and Systems (LNSS) (In Press),vol.321, Ch34, 2021
10. B.A. Ahmed, O Aghzout, et.al,“Transmission Performance Analysis of WDM Radio over Fiber Technology
for Next Generation Long-Haul Optical Networks”, Research Article in International Journal of Optics, vol.1,
pp.1-9, February 2019.
11. M. Chakkour, A. Hajaji, O. Aghzout, F. Chaoui, M. el yakhloufi, “EDFA-WDM Optical Network Design and
Development using OptiSystem Simulator”, Conference in Optical Fibre Communication, January 2019.
12. A Jaiswal, M.R Bhatnagar, V.K Jain, “Performance evaluation of space shift keying in free-space optical
communication”, Journal of Optical Communications and Networking, vol.9, pp.149-160, February 2017

Engineers for Viable Technology and $5 Trillion Economy
253 Technical Volume of 36th Indian Engineering Congress, December 26-28, 2021
ISBN 978-81-955500-1-2
13. H.A Willebrand, B.S Ghuman, “Fibre optics without fibre”, IEEE Spectrum, vol.38, no.8, pp.40-45,August
2017.
14. A.M Hammadi, E.M Zghair, “Transmission performance Analysis of Three Different Channels in Optical
Communication Systems”, International Journal of Scientific & Engineering Research (IJSER), vol.5, February
2014.
15. C.E Campanella, A Cuccovillo, C Campanella, A Yurt, V.M.N Passaro,“Fibre Bragg Grating Based Strain
Sensors: Review of Technology and Applications”, Article in Multidisciplinary Digital Publishing Institute
(MDPI) journals , vol.18, pp.1-27, September 2018.
16. J Cong, X Zhang, K Chen, J Xu, “ Fiber optic Bragg grating based on hydrogels for measuring salinity”, article
in Sensors and Actuators B:Chemicals, vol.87, pp.487-490, July 2002.
17. R.P Khare, “Fiber optics and optoelectronics”, Oxford University Press, 2004.
18. K O Hill, G Meltz, “Fiber Bragg grating technology fundamentals and overview” In: Journal of Lightwave
Technology, vol.15, pp.1263-1276, August 1997.
19. B.A Ahmed, O Aghzout, M Chakkour, et al., “Transmission Performance Analysis of WDM Radio over Fiber
Technology for Next Generation Long-Haul Optical Networks”, Research Article in International Journal of
Optics, vol. 1, pp.1-9, January 2019.
20. D Rajan, “Analysis of 8 Channel WDM Network With EDFA”, In: International Journal of Scientific &
Engineering Research, vol. 7, pp. 1446-1449, December 2016.


En
gin
eers
fo
r V
iab
le T
ech
no
log
y a
nd
$5
Tri
llio
n E
con
om
y
Environmental
Engineering


Engineers for Viable Technology and $5 Trillion Economy
257 Technical Volume of 36th Indian Engineering Congress, December 26-28, 2021
ISBN 978-81-955500-1-2
EN_070_04
Sustainable Ash Management in Thermal Power Plants in Parity
with COP26‟s Mission of Phasing Down of Coal for
Empowerment of India‟s Economy Case of the Country‟s
First Multipurpose Project
Shiv Shyam and Binoy K Choudhury*
Department of Energy Management, Indian Institute of Social Welfare & Business Management, College Square
West, Kolkata
*e-mail: [email protected]
Abstract: Almost 70% of electricity produced in India come from coal for economic reasons. However this is a great
challenge for the country in view of coal phase down policy adopted in COP26 as the ash percentage of domestic
coal supply has exceeded 40% and it is still increasing. The Government of India and Thermal Power Plants
demonstrated a number of cases of turning waste into wealth by productive use of ash from thermal power plants in
brick manufacturing, land filling for highway, cement manufacturing and so on, showing an upward trend of some
utilization of ash from mere 10% in 1996-97 to 79% in the first-half of 2021-21. A great opportunity exists to
optimize, replicate and coordinate the productive utilization of ash in 281 thermal power plants in the country
operational in both public and private sectors. As per the data received from 199 thermal power plants, 313 million
tons of coal was consumed producing 106 million tons of ash in the first half-year of 2020-21 only. Out of this, more
than 22 million tons of ash not utilized while the rest may be better utilized. A case of large thermal power station of
India’s first multipurpose project viz. Damodar Valley Corporation (DVC) has been studied and multiple
alternatives for economic as well as environmental benefits has been presented with details of factual information in
four scenarios in the present paper. We have used Analytical Hierarchy Process (AHP) for ranking all the identified
hindrances in the ash transportation and dumping process. After identifying all the hindrances, we have proposed
different feasible and suitable scenarios for overcoming these hindrances. AHP application also revealed that
prioritization amongst these alternative scenarios including solar photovoltaic power generation would be
subjective issues for the large number of thermal power plants in India and effective for optimization towards
attaining SDGs, according to local conditions and sustainability in the long run during the phase down process.
Besides emission reduction from power sector, which is also the largest CO2 emitter among all economic sectors of
India, some of the scenarios presented here have been found to have simple payback period of less than three
months.
Keywords: Sustainability; Sustainable Ash Management; Waste to Wealth; Phasing Down on Coal; India’s
Economic Empowerment Tools
1. INTRODUCTION
Since India has more reserves of coal than any other fossil fuels, thermal power plants are producing more than 70%
of total electricity produced in India (Central Electric Authority, 2021). Since India has huge reserves of coal,
thermal power plants are the major source of electricity production. As energy demands are increasing by many
folds, new thermal power plants were being installed in the country as the most economical solution until recently
when due to commitments at COPs and environmental issues, India decided to stop building new thermal power
plants by 2022 (Mathiesen, 2021). The large numbers of existing power plants use poor coal quality coal which
generate lots of ash as a by-product which are dumped in ash pond/dyke/mines. The dumping of ash is a serious
concern which adversely affects our environment. However, a good number of success stories in India and abroad

Engineers for Viable Technology and $5 Trillion Economy
258 Technical Volume of 36th Indian Engineering Congress, December 26-28, 2021 ISBN 978-81-955500-1-2
are there to turn this waste into wealth (Council of Scientific and Industrial Research, 2020). Ash is also used
sometimes to fill the mines/quarries which are now devoid of minerals/stones. Such initiatives for productive
utilization of ash is going to also help fulfil the mission of the Government of India to turn into a five trillion
economy by 2025 (Press Information Bureau, 2018). In most of DVC owned thermal power plants, ash is being
dumped in vacant quarries/mines of West Bengal (WB) and Jharkhand (JH). Damodar Valley Corporation (DVC),
India‟s first multi-purpose project (Damodar valley Corporation, n.d.) owned Koderma Thermal Power Station
(KTPS) at Koderma, JH which is one such thermal power plant out of total 8 presently operating in DVC. The ash
generated at KTPS, Koderma is being dumped in stone quarries of Dhab and Domchanch areas of Koderma district
of Jharkhand. HYVAs are being used to transport ash on daily basis from thermal power plant to the stone quarries.
These HYVAs are generally covered by Tarpaulin sheets to minimize air pollution. The transportation through
HYVAs isn‟t nuisance free. DVC contracts generally demand of nuisance free transportation. There are lots of daily
hindrances in transportation of ash from power plants to quarries. These hindrances are sometimes natural and
sometimes man-made. These hindrances seriously affect the work and hence earnings and also attract penalty due to
less quantity of ash transported in such cases The fuel is used in transportation of ash from HYVAs which suck a lot
of fuel in the process which sometimes become a serious concern. The cost of fuel becomes a burden when the
targeted quantity of ash to be handled annually or monthly isn‟t met and penalty is imposed by DVC or other
government organizations. The fuel becomes a very critical commodity as rate of Diesel at which ash transportation
work has been contracted isn‟t the same when work is actually started. There are several parameters which can
affect fuel consumption in ash transportation. This analysis is a sincere effort towards analyzing, understanding and
validating the fuel consumption trends and ash transportation work which helps us to understand in depth the excess
fuel consumption at each step and potential for saving fuel cost at those steps. Various tools like sensitivity analysis,
Analytical Hierarchy process, cost-benefit analysis etc have been used for proper in-depth analysis of hindrances in
ash transportation. The cost incurred due to fuel consumed is a serious concern for the company as the fuel costs
were to the tune of 2501300/- INR for the year April 2020 to April 2021. There are several areas where fuel is being
consumed but transportation plays one of the biggest roles in increasing fuel bills. This study analyses the
transportation work and corresponding costs incurred etc due to ash transportation from ash pond to abandoned
stone quarries.
LITERATURE REVIEW
Ash Generation
In our country, more than 60% of the electricity is still being produced by thermal power plants (Hannan, 2015).
Since we have abundant coal reserves in our country, they are the major source of power generation (Tropical Forest
Research Institute, 2017). In a coal-fired boiler, bottom ash constitutes of total ash and rest constitutes fly ash
(Indian Audit and Accounts Department, 2015). The quality of coal found in India produces 35-45% of ash on
average basis (Indian Audit and Accounts Department, 2015). One of the biggest concerns with Indian coal quality
is that the burning of such coal produces ample amount of ash (bottom ash and fly ash) (Chouhan, et al., 2016).
(Chouhan, et al., 2016) further states that such produced ash has low utilization potential and cause huge
environmental problems. Chimneys of the thermal power plants capture fly ash (Ahmad, et al., 2014). Earlier
practices of disposing off fly ash directly into the atmosphere has been curbed by pollution control board (Ahmad, et
al., 2014). Now, fly ash must be captured before releasing into the atmosphere (Ahmad, et al., 2014).
Ash Transportation
One of the most important concern regarding on fly ash is certainly is its disposal (Tropical Forest Research
Institute, 2017). According to the current practices, ash in its slurry form is released in the ash pond (Central
Pollution Control Board, 2013). The overflow from the ash pond from natural or man-made reasons used to
discharged in the nearby water bodies which used to create huge problem of environmental problems (Central
Pollution Control Board, 2013). Sometimes, fly ash is transported and dumped in abandoned mines or sone quarries
(Tropical Forest Research Institute, 2017).

Engineers for Viable Technology and $5 Trillion Economy
259 Technical Volume of 36th Indian Engineering Congress, December 26-28, 2021 ISBN 978-81-955500-1-2
Ash Disposal
(Lopes, 2021) quotes from an April 22nd
notification of the central government that Coal and lignite-based thermal
power plants should ensure 100% utilisation of ash generated by it in an eco-friendly manner. “Since last two
decades, government is issuing notifications regarding proper disposal and utilization of fly ash (Lopes, 2021). Also,
according to other notifications, fly ash should be used in building materials and backfilling of abandoned mines and
quarries (Lopes, 2021). In our country main utilization of fly ash is in cement industries, backfilling mines and
quarries, low lying areas, construction of roads, embankments, ash-based bricks etc (Indian Audit and Accounts
Department, 2015). This slurry disposal generally requires huge area of land (“usually 350 acres or 0.35 acre / MW
for 2 X 500 MW TPP”) for creating ash pond and also ample amount of water, both of which are sparse now a days
in current scenario (Indian Audit and Accounts Department, 2015). One major drawback of the wet disposal process
is that it reduces the "lime reactivity" in ash which is an important property of fly ash to be used in cement
manufacturing process (Indian Audit and Accounts Department, 2015).
Ash Recycling
Innovative methods of using fly ash is in vogue since many years as many companies around the world are engaged
in finding new methods for using this material (Carpenter, 1997). Also, these days, companies are marketing fly ash
for finding better prospects (Carpenter, 1997). A technique has been devised and patented for converting fly ash into
Flashag™ which is made by heating fly ash until it crystallizes (National Institute of Environmental Health
Sciences, 2007) Flashag™ is an aggregate that can be mixed with sand, water, and Portland cement to make
concrete.(National Institute of Environmental Health Sciences, 2007). In a presentation at the April 2005 World of
Coal Ash Conference, the process of manufacturing Flashag™ was shown to deliver strength in concrete with 25%
more compressive strength than concrete made with fly ash pellets (National Institute of Environmental Health
Sciences, 2007). Burnt clay brick is still the most basic building material for construction of houses in our country in
most of the states (Gadling & Varma, 2017).
OBJECTIVES & METHODOLOGY
Materials
Study Area
Figure 1 Study Area Map
Engineers for Viable Technology and $5 Trillion Economy
260 Technical Volume of 36th Indian Engineering Congress, December 26-28, 2021 ISBN 978-81-955500-1-2
Methods
Data Collection
Primary Data - Data regarding hindrances in ash transporting work, ratings for those hindrances, data regarding
different aspects of fixed and portable cantilever shed like price, size, strength, dimension etc, data needed for
knowing different usages of ashetc have been collected after survey
Secondary Data - Data regarding daily ash trips and quantity, dataregarding monthly rainfall in Koderma, regarding
rake details, freight charges of BTAP and BOXN rakes, distance slab applicable etc, solar panels efficiency,
electricity production from panels, size of panels and cost of the panels have been collected from various sources
Methodology used for objectives:
Aim I: To identify the issues and factors that affect variation in Diesel consumption in ash transportation
Methodology: To fulfil this aim, the data regarding ash transportation work will be plotted against each month.
The fuel consumption per MT-km trend of ash transportation for each datewill be plotted and minimum monthly
value in the trend will be verified with the help of „Hindrance register‟ available at the site. The data will again
be verified with the help of monthly rainfall data.
Aim II: To assess the savings potential in Diesel consumption in ash transportation work
Methodology: The monthly minimum value of fuel consumption per MT-km will be compared with the
minimum fuel consumptionper MT-km value for each month to assess the potential of cost savings for each
month.
Aim III: To analyze theoretically all the hindrances involved in ash handling and transporting work for assessing
their weights for finding an ideal investment weightage factor
Methodology: All the hindrancesin ash transportation workwill be been ranked using Analytical Hierarchy
Process. The weighted hindrances will be used for finding best possible alternatives for the hindrances. The
weighted hindrances will also be used to find out the investments required in minimizing the hindrances.
Aim IV: To maximize the benefits of fuel saving assessed for improving the ash transportation work
Methodology: The alternatives for reducing the negative impact of the hindrances will be maximized using
sensitivity analysis and return on investment method.Product Matrix will be used for assessing quotations of
possible scenarios and finding best possible scenarios for the hindrances
Aim V: To calculate quantitively the impact of fuel savings potential in terms of reduced carbon footprint
Methodology: The fuel savings potential will be used to calculate reduced Diesel consumption. This extra actual
Diesel consumed can be used to find the extra cost incurred and extra CO2 generated.
Instrument and Software Used
Analytical Hierarchy Process (AHP) will be used for finding weights of the hindrances. Sensitivity analysis will
be used on weighted hindrances after applying AHP. SPSS v 26.0 and Excel 2019 have been used for analysis.
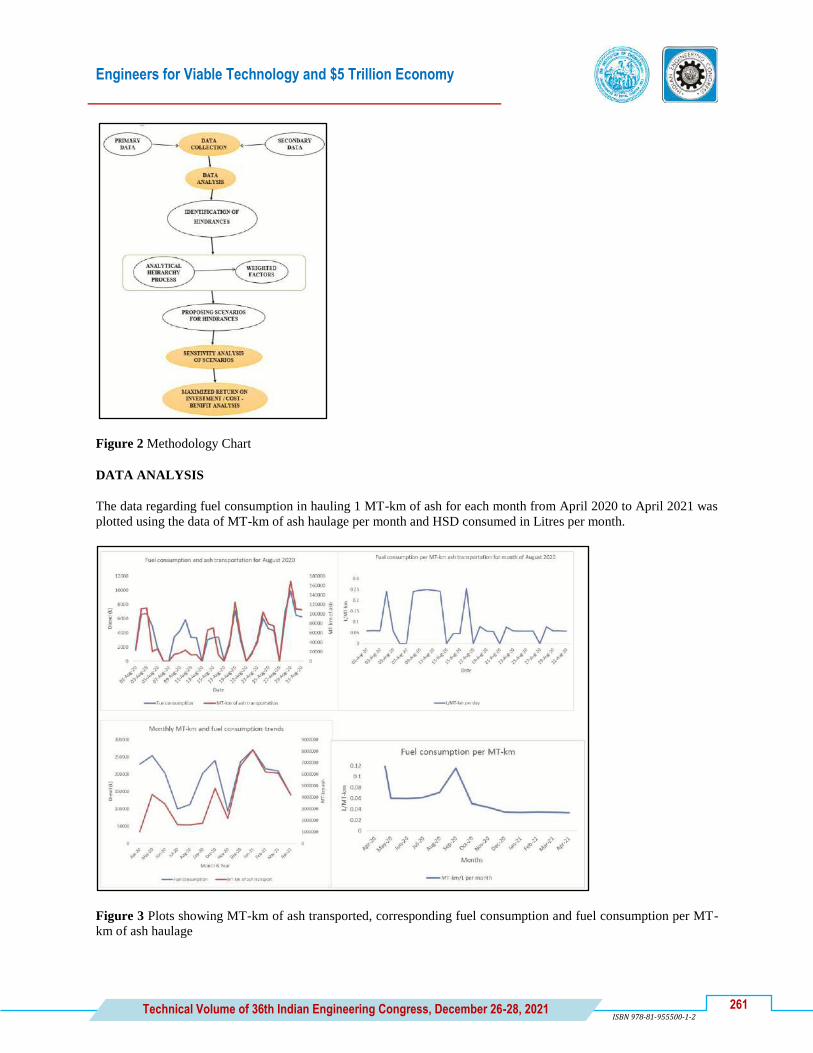
Engineers for Viable Technology and $5 Trillion Economy
261 Technical Volume of 36th Indian Engineering Congress, December 26-28, 2021 ISBN 978-81-955500-1-2
Figure 2 Methodology Chart
DATA ANALYSIS
The data regarding fuel consumption in hauling 1 MT-km of ash for each month from April 2020 to April 2021 was
plotted using the data of MT-km of ash haulage per month and HSD consumed in Litres per month.
Figure 3 Plots showing MT-km of ash transported, corresponding fuel consumption and fuel consumption per MT-
km of ash haulage
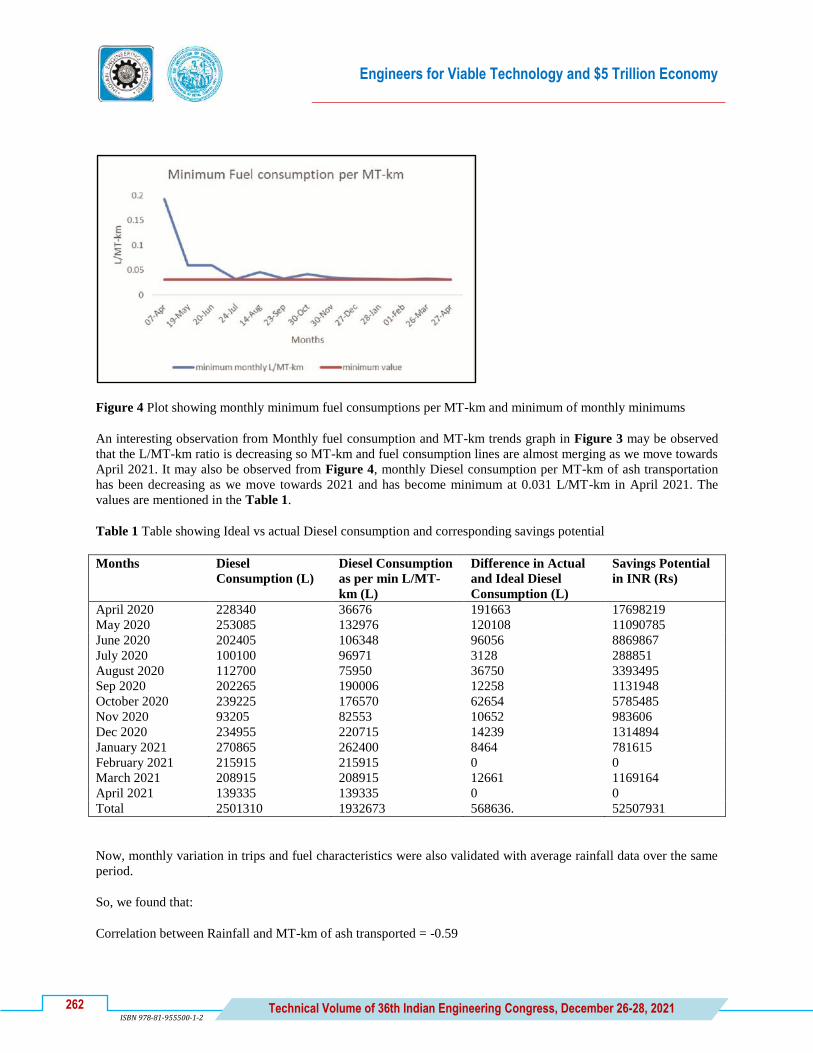
Engineers for Viable Technology and $5 Trillion Economy
262 Technical Volume of 36th Indian Engineering Congress, December 26-28, 2021 ISBN 978-81-955500-1-2
Figure 4 Plot showing monthly minimum fuel consumptions per MT-km and minimum of monthly minimums
An interesting observation from Monthly fuel consumption and MT-km trends graph in Figure 3 may be observed
that the L/MT-km ratio is decreasing so MT-km and fuel consumption lines are almost merging as we move towards
April 2021. It may also be observed from Figure 4, monthly Diesel consumption per MT-km of ash transportation
has been decreasing as we move towards 2021 and has become minimum at 0.031 L/MT-km in April 2021. The
values are mentioned in the Table 1.
Table 1 Table showing Ideal vs actual Diesel consumption and corresponding savings potential
Months Diesel
Consumption (L)
Diesel Consumption
as per min L/MT-
km (L)
Difference in Actual
and Ideal Diesel
Consumption (L)
Savings Potential
in INR (Rs)
April 2020 228340 36676 191663 17698219
May 2020 253085 132976 120108 11090785
June 2020 202405 106348 96056 8869867
July 2020 100100 96971 3128 288851
August 2020 112700 75950 36750 3393495
Sep 2020 202265 190006 12258 1131948
October 2020 239225 176570 62654 5785485
Nov 2020 93205 82553 10652 983606
Dec 2020 234955 220715 14239 1314894
January 2021 270865 262400 8464 781615
February 2021 215915 215915 0 0
March 2021 208915 208915 12661 1169164
April 2021 139335 139335 0 0
Total 2501310 1932673 568636. 52507931
Now, monthly variation in trips and fuel characteristics were also validated with average rainfall data over the same
period.
So, we found that:
Correlation between Rainfall and MT-km of ash transported = -0.59

Engineers for Viable Technology and $5 Trillion Economy
263 Technical Volume of 36th Indian Engineering Congress, December 26-28, 2021 ISBN 978-81-955500-1-2
Correlation between Rainfall and MT-km of Diesel consumed = -0.48
There is not good correlation in both the cases as there are other hindrances also apart from rainfall in transporting
of ash from ash pond to ash dumping sites. Those other hindrances have been determined using Analytical
Hierarchy Process. After using AHP, we had our results as:
Table 2 Criteria weights of different hindrances
Now, we propose different scenarios to overcome these hindrances for bringing Fuel consumption in 1 MT-km of
ash haulage to the minimum value of 0.031 L/MT-km
Figure 5 Satellite Image showing ash pond of KTPS, Koderma, JH
SCENARIO I: Ash Bricks Manufacturing Plant
A normal brick manufacturing plant using ash can cost around Rs 3,00,000 INR/- and covers around ½ acre to 1 acre
(4046.86 m2) of land. Also, it can produce around 12000 bricks per day. It also requires water which is also readily
available. About 1/3rd
area, i.e., 192700 m2
of the ash pond area can be used in brick manufacturing. If all produced
ash is consumed here then no transportation would be required which is a serious burden for any thermal power
plant.
The selected area in the figure above is around 19500 m2 area which doesn‟t fetch too much of the ash pond area
and suitable for one brick manufacturing plant.
If we install 4 such manufacturing units in the available land, then we will require Rs 12,00,000 which will produce
48,000 fly ash bricks per day.

Engineers for Viable Technology and $5 Trillion Economy
264 Technical Volume of 36th Indian Engineering Congress, December 26-28, 2021 ISBN 978-81-955500-1-2
Figure 6 Satellite image showing selected area in yellow border which might be an apt location for setting up fly
ash brick manufacturing unit
SCENARIO II: Portable Cantilever Shed
A cantilever prefabricated portable shed can be constructed at the edges of the ash pond. A mild cantilever fixed
shed 10-20 feet high, 50 m in length and10 m in width spanning both sides of the support and having thickness of
10-15 mm and made of mild steel costs around Rs 220 per square feet. The rooftop is color coated. The rooftop can
also be covered with solar panels. The portable pre-fabricated roof shed costs around Rs 1200 per square feet.
Figure 7 Satellite image showing highlighted edge in yellow which might be an apt location for installation of
portable shed
The portable prefabricated shed of 100 m can be placed on the edge of the ash pond as shown in the figure above.
As can be seen, the ash isn‟t being currently excavated from the left edge of the pond, so ash can be stored here
under the roof shed.

Engineers for Viable Technology and $5 Trillion Economy
265 Technical Volume of 36th Indian Engineering Congress, December 26-28, 2021 ISBN 978-81-955500-1-2
Size of portable shed = 5381.96 feet2
So, the portable shed can cost around Rs 64,58,352
Cost of installation of 1 kW solar panel = Rs 98,000i
Area required by 1 kW solar panel = 9.29 m2 ii
So, almost 50 solar panels can be installed on our shed.
Cost of installation of 50 solar panels of 1 kW = Rs 4,90,00,00
1kW solar panel is sufficient to produce around 3.75 units (average of 3 units and 4.5 units) of electricity per day on
a normal sunny day and 112.5 units of electricity in a month and hence 1350 units of electricity in a year. iii
So, 50 such solar panels can produce around 187.5 kWh units of electricity every day.
So, total cost of installation of shed with solar panels = Rs 1,13,58,352
i. 1https://www.loomsolar.com/blogs/pricelist/1kw-solar-system-price-in-india
ii. 1https://letsavelectricity.com/how-many-solar-panels-i-can-install-in-100-sq-ft-area/
iii. 1https://letsavelectricity.com/how-much-electricity-does-one-solar-panel-produce-in-a-day/
Payback Period
We have average/normal fuel consumption per MT-km of ash transportation for April 2020 to April 2021 = 0.05
L/MT-km
Also, we have average L/MT-km for the month of August 2020 when rain was maximum at 352.7 mm = 0.09
L/MT-km
So, difference of average/normal L/MT-km and L/MT-km value of August 2020 = 0.04 L/MT-km which comes out
to be 63851.45 L of Diesel.
So, Ideal Diesel consumption = Actual Consumption – Difference = 48848.55 L
For the rate of 1 L of Diesel = Rs 92.34, we get Rs 4510675.1
Also, 187.5 units of electricity can be generated per day which can be converted to Rs 796.87
For a month of 31 days = Rs 24703
So, Total Benefit = Rs 24703 + 4510675 = Rs 4535378
If we spend Rs 1,13,58,352 on the installation of shed with solar panel as well, then we can save Rs 4519436.
So, Payback period = Rs 1,13,58,352 / Rs 4535378= 2.5 months
SCENARIO III: Ash Transportation by Rail
Koderma Thermal Power plant is having proper facility for unloading of coal using BOXN rakes through rail
transport. The same BOXN wagons can be used to transport ash to 100 kms to any cement plant or any other
industry which might consume ash in proper quantity as per norms laid down by Central Pollution Control Board.
So, while transporting ash using BOXN wagons, proper tarpaulin sheets should be used for covering the wagons. In
case of BTAP wagons, no sheets are required to cover the wagons. There might be 2 cases in transporting of ash
using railways: AKA Logistics is already purchasing Diesel from various petrol pumps situated on Ranchi – Patna
NH 20 near Koderma town. So, purchasing our own Diesel might be a better idea. Also, when Diesel purchased is to
the tune of 1 Lakh Litres, then petrol pump owners provide concession also on per Litre of Diesel purchased.

Engineers for Viable Technology and $5 Trillion Economy
266 Technical Volume of 36th Indian Engineering Congress, December 26-28, 2021 ISBN 978-81-955500-1-2
Figure 8 Satellite Image showing railway infrastructure facility inside KTPS, Koderma, JH
Also, train load is always beneficial and considering the size of the ash pond, it would be apt to use whole rake of
BTAP wagons.
BTAP wagons cost less to the transporter, so these might be a better option for transportation considering the fact
that it should be made readily available by railways
So, considering all the scenarios, we have:
Table 31 Different scenarios of BOXN/BTAP wagons based on load and diesel purchased for successfully
transporting 1 rake
BOXN wagons
(train load)
BTAP wagons
(wagon load)
BOXN wagons
(wagon load)
BTAP wagons
(train load)
Diesel purchased Rs7,39,721 Rs7,69,446 Rs7,91,781 Rs7,19,427
Diesel not purchased Rs7,57,560 Rs7,87,285 Rs8,09,620 Rs7,37,266
So, benefits in BOXN wagons are intangible benefits which might be quite evident in long run considering the fact
that BOXN wagons frequent the power plant already while BTAP wagons might be difficult or expensive to get in
intangible terms as its rake placement due to nature of rakes which are more common in Dhanbad – Gaya stretch of
Delhi – Howrah route might not be easy. Also, conventional loading and unloading methods won‟t work in case of
BTAP wagons which need special arrangement in both the cases and unloading occurs only via closed pipe system
connected directly to fly ash silos for which minimum pressure should be 2 barsiv.So, after proper scrutiny, we can
choose train load of BOXN/BTAP wagons with Diesel purchased which are most suitable among all scenarios.
1https://www.youtube.com/watch?v=K43_lnYL01k
Payback Period
We have average rate per ton as per workorder for placing 1 rake = Rs 100 per tonne (since the rate is based on
transportation, so per tonne rate will be same for coal/ash)
Also, Quantity in BOXN wagons = 3800 MT
So, we will earnRs 3,80,000 in placing 1 rake
Now, we have Rs 3,597,21 in loss for placing and transporting 1 BOXN rake of ash from KTPS, JH and loss of Rs
2,54,327 in case of placing 1 BTAP wagon

Engineers for Viable Technology and $5 Trillion Economy
267 Technical Volume of 36th Indian Engineering Congress, December 26-28, 2021 ISBN 978-81-955500-1-2
This loss doesn‟t include social benefits which will be having due to reduced traffic, reduction in no of accidents,
reduced pollution, reduction in local issues and many more which isn‟t in the scope of current study to quantify in
monetary terms to achieve at the true loss or gain.
Scenario IV: Setting up SPV Power Plant
SPV power plant consists of PV systems arranged in an array of SPV modules and associated components.In this
power plant, DC form of electricity is produced. SPV power plant can be installed to produce electricity as well as
supply storage area for dry ash. The SPV can be set up around the edges of the ash pond or in the vicinity of the
pond.
Figure 9 Satellite image showingarea around the vicinity of the ash pond
For setting 1 kW solar PV power plant, area required is 10 m2.
Almost, 600 m2 area is required for setting up a 100 kW solar PV plant.
Electricity generated = 12000 units/month = 400 units/day
Costs required = Rs 3,00,000 to Rs 5,00,000
This area covered by solar PV plant can be quite useful in storing dry ash which has to be transported in 3-4 days
approx.
FINDINGS & DISCUSSION
Minimum fuel consumption per MT-km of ash transportation for the period of April 2020 to April 2021 at
Koderma Thermal power plant site came out to be 0.031 L/MT-km.
Total Diesel consumption for the period April 2020 to April 2021 was 2501310 L of Diesel
Total Diesel costs due to ash transportation was Rs 23,09,70,965 for the year April 2020 to April 2021.
If our fuel consumption per MT-km of ash transported was ideal which in our case is 0.031 L/MT-km, then
Diesel consumption would have been 1932673 L of Diesel for the period April 2020 to April 2021
The savings potential in terms of Diesel quantity came out to be more than 5,60,000 L of Diesel for the period
April 2020 to April 2021

Engineers for Viable Technology and $5 Trillion Economy
268 Technical Volume of 36th Indian Engineering Congress, December 26-28, 2021 ISBN 978-81-955500-1-2
We found that there are 7 most important hindrances in ash transportation work from ash pond to ash dumping
sites.
The ash transportation through HYVAs cause lot of pollution to the environment, increase in accidents on the
road, traffic jam situations, decline in road conditions, breakdown etc
Heavy rains came out to be the biggest hindrance factor in our study.
We found 4 most appropriate and apt ways of reducing the hindrances in the transportation by trying to use the
fly ash generated in situ, by making arrangements for keeping ash to be transported dry and transporting ash to
nearby cement plants or any other suitable industry in the range of 100 kms
1/3rd
area of the ash pond is still not in use and can be used for brick manufacturing plant or shed construction
Sheds can be constructed at the edges of the ash pond to that side where ash excavation isn‟t being executed
currently.
The movable shed will felicitate that we can change the location of the shed as per the need and the area
available for ash storage around ash pond.
Solar panels can be installed on the roof of the sheds though proper arrangements need to be done for keeping
the panels clean from the ash dust as in a study it was found that ash dust can reduce its efficiency by around 30
percent
Solar panels can‟t be installed on the ash surface, only feasible placement is above the roof of the sheds.
100 kW Solar PV plants if installed at the edge or in the suitable vicinity of the ash pond will require around 600
m2 area of land and will cost Rs 3 lacs to Rs 5 lacs.
100 kW Solar PV plants if installed at the edge or in the suitable vicinity of the ash pond can be used to provide
storage of ash which have to be used in 3-4 days and will also produce 14,4000 units of electricity per year
approx.
15,23,946 kg of CO2 emission can be avoided per year if we can reduce our fuel consumption per MT-km of ash
transportation to 0.031 L/MT-km
67,03,510 kg of CO2 emission can be avoided per year if we can completely stop our ash transportation and can
consume in situ by making brick manufacturing units
The calculations show that we may have to suffer Rs 3,597,21 in loss for placing and transporting 1 BOXN rake
of ash from KTPS, JH while loss of Rs 2,54,327 in case of placing 1 BTAP wagon. But this loss doesn‟t include
social benefits which will be having due to reduced traffic, reduction in no of accidents, reduced pollution,
reduction in local issues and many more which isn‟t in the scope of current study to quantify in monetary terms
to achieve at the true loss or gain.
The payback period of using shed with solar panels on-board at the ash pond came to be 2.5 months which is
quite encouraging.
CONCLUSION
Diesel consumption is one of the biggest contributors of expenses to the company in ash transportation at KTPS,
Koderma, JH
7 major hindrances are involved in the ash transportation at KTPS site from ash pond to the ash dumping sites
These hindrances have been tried to overcome with the help of 3 scenarios presented in our report.
Total Diesel costs due to ash transportation was Rs 23,09,70,965 for the year April 2020 to April 2021 which can
be overcome by our 3 scenarios proposed.

Engineers for Viable Technology and $5 Trillion Economy
269 Technical Volume of 36th Indian Engineering Congress, December 26-28, 2021 ISBN 978-81-955500-1-2
Setting of fly ash manufacturing units in the available land in the ash pond or in the vicinity of the ash pond will
cost around Rs 12,00,000 while our ash transportation costs per month comes around Rs 1,92,47,580 on an
average basis.
Establishing portable shed at one of the edges of the ash pond with solar panels installed on the roof costs around
Rs 4,90,00,00 and it also has the potential of producing 187.5 units of electricity every day, 5625 units of
electricity every month and 67500 units of electricity every year which can be beneficial in long term.
A 100 kW Solar PV plants if installed at the edge or in the suitable vicinity of the ash pond will require around
600 m2 area of land which will cost Rs 3 lacs to Rs 5 lacs and can be used as storage of dry ash and can produce
1,44,000 units of electricity per year.
Transporting ash by rail to any cement plant or any other suitable industry can cost around Rs 7,00,000 to Rs
8,00,000 per rake using BOXN wagons and BTAP wagons
A single full BTAP rake can carry 3561 MT of ash and a full BOXN wagon can carry 3800 MT of ash.
Currently, 6000 MT to 7000 MT of ash transporting is being done in whole day by HYVAs from ash pond to
dumping site. Only 2 such rakes (BOXN and BTAP) can load more than 7000 MT of ash per day.
Also, KTPS, Koderma is connected to Dhanbad – Gaya section of Delhi – Howrah route and also all the railway
routes in 100 km range are electrified, so there won‟t be any use of diesel locos for transportation of ash.
The reduced hindrances with minimum damage to the environment, human lives, road traffic, roads etc can‟t
always be compared in monetary terms and the results are far-fetched.
15,23,946 kg of CO2 can be generated less if we can reduce our fuel consumption per MT-km of ash
transportation to 0.031 L/MT-km and 67,03,510 kg of CO2 can be generated less if we can completely stop our
ash transportation and can consume in situ by making brick manufacturing units
The calculations show that we may have to suffer Rs 3,597,21 in loss for placing and transporting 1 BOXN rake
of ash from KTPS, JH while loss of Rs 2,54,327 in case of placing 1 BTAP wagon. But this loss doesn‟t include
social benefits which will be having due to reduced traffic, reduction in no of accidents, reduced pollution,
reduction in local issues and many more which isn‟t in the scope of current study to quantify in monetary terms
to achieve at the true loss or gain.
The payback period of using shed with solar panels on-board at the ash pond came to be 2.5 months which is
quite encouraging.
LIMITATIONS AND WAY FORWARD
There were limited number of people available for data collection. If we can extend the study to several thermal
power plants having almost the same issues, then we can extend our study and get more data leading to greater
accuracy.
Average Diesel consumed in each trip has been taken same for each trip but in certain situations fuel consumed
is more than the average due to some unavoidable circumstances. If we can coordinate with the concerned site
regarding exact data for each and every trip, then we can achieve greater accuracy.
Underload and Punitive Overload charges have not been taken into account while calculating freight in case of
ash transportation by rail. We can consider taking into account RR copy of ash transported by NTPC or any other
thermal power plant entity to include approx. underload and punitive overload charges also.
Prices of portable sheds considered is as per quoted from vendors in different cities in Jharkhand. We can survey
through a greater number of vendors to achieve on an average price of the required shed.
The shed construction site at the edge of ash pond has been considered as per the suitability and current
excavation area from ash pond. Due to constraints which were not in our control, we couldn‟t visit ash pond. If
more time is provided, then we can arrange to visit ash pond at different sites to understand the site for
installation of portable shed better.

Engineers for Viable Technology and $5 Trillion Economy
270 Technical Volume of 36th Indian Engineering Congress, December 26-28, 2021 ISBN 978-81-955500-1-2
The wind direction, soil and other factors hasn‟t been considered in deciding the area at the edge for shed
construction. We need more time and authority to receive all the data regarding different parameters of
environment at the ash pond.
Solar panels have been found to have efficiency reduced due to dust particles. Hence, they would need to have
proper cleaning system on periodic basis. More studies are needed to develop such system or panels which can
counter the effects of ash dust on solar panels.
The price of brick manufacturing unit has been taken as per the quoted prices received from different vendors
from different cities in Jharkhand. We can survey through a greater number of vendors to achieve on an average
price of the required brick manufacturing unit
The dimension of the shed has been taken as per the feedback received from different vendors from different
cities in Jharkhand. We can survey through a greater number of vendors to achieve on an average price of the
required brick manufacturing unit
Exact area of the ash pond isn‟t available. Due to constraints which were not in our control, we couldn‟t visit ash
pond. If more time is provided, then we can arrange to visit ash pond at different sites to understand the site for
installation of portable shed better.
The area of the ash pond and its different sections have been taken through the satellite image. Due to constraints
which were not in our control, we couldn‟t visit ash pond. If more time is provided, then we can arrange to visit
ash pond at different sites to understand the site for installation of portable shed better.
The payback period achieved for transporting ash via rail using BOXN rakes instead of road is based on some of
the available variables quantifiable. As per the scope of the study, it wasn‟t possible to take into account all the
variables and quantify them for arriving at true loss or gain data.
REFERENCES
Ahmad, A. M., Ali, Z. & Haque, M. E., 2014. Fly ash Slurry transportation: Indian Scenario. Waste
Technology (WasTech), Volume 2(1)2014:1-7, p. 1.
Burele, S. & Khan, A., 2014. Pond Ash bricks. Journal of Emerging Technologies and Innovative Research,
8(11), pp. 445-446.
Carpenter, M., 1997. Recycling Fly Ash And Sludge For Profit. [Online] ; Available at:
https://www.waste360.com/mag/waste_recycling_fly_ash [Accessed 16 November 2021].
Central Electric Authority, 2021. Dashboard. [Online] Available at: https://cea.nic.in/dashboard/?lang=en
[Accessed 30 November 2021].
Central Electricity Authority, 2020. Report On Fly Ash Generation At Coal / Lignite Based Thermal Power
Stations And It's Utilization In The Country For Year 2019-20, New Delhi: Ministry of Power, Govt of India.
Central Pollution Control Board, 2013. Guidelines for loading, unloading and nuisance free transportation of
all types of flyash, including bottom ash etc. generated by thermal power stations, New Delhi: s.n.
Chouhan, G. S., Kumar, S. & Singh, K. M., 2016. Environmental impact assessment of ash disposal system of
a thermal power plant. International Journal of Hydrogen Energy, pp. 2-4.
Council of Scientific and Industrial Research, 2020. Researchers turn fly ash waste into mineral wealth.
[Online] Available at: https://www.csir.res.in/slider/researchers-turn-fly-ash-waste-mineral-wealth [Accessed
30 November 2021].
Damodar valley Corporation, n.d. Evolution. [Online] Available at:
https://www.dvc.gov.in/dvcwebsite_new1/evolution-
timeline/#:~:text=7th%20July%2C%201948,Act%20of%20the%20Central%20Legislature\ [Accessed 30
November 2021].

Engineers for Viable Technology and $5 Trillion Economy
271 Technical Volume of 36th Indian Engineering Congress, December 26-28, 2021 ISBN 978-81-955500-1-2
Gadling, P. P. & Varma, M. B., 2017. A review of ecofriendly bricks using flyaash. Jornal of construction
Engineering, Tehnology and management, 7(2), pp. 35-40.
Hannan, J., 2015. Chemical Makeup of Fly and Bottom Ash Varies Significantly; Must Be Analyzed Before
Recycled. [Online] Available at: https://www.thermofisher.com/blog/mining/chemical-makeup-of-fly-and-
bottom-ash-varies-significantly-must-be-analyzed-before-recycled/[Accessed 2 June 2021].
Indian Audit and Accounts Department, 2015. Issues in utilization of ash by Thermal Power Plants in the
country. Journal of Goverment Audits & Accounts.
Karthikeyan, K., Nagarajan, N. & Sivaprakasam, S., 2019. Study on Innovative Building Materials Used in
Flyash Bricks Manufacturing with vaiuos mix proportions. IRE Journals, 2(9), pp. 68-71.
Lopes, F., 2021. India‟s new directives on sustainable disposal of fly ash may do more harm than good.
[Online] Available at: https://scroll.in/article/1003328/indias-new-directives-on-sustainable-disposal-of-fly-
ash-may-do-more-harm-than-good [Accessed 7 November 2021].
Mahod, S., 2020. Fly ash transportation boosting Indian Railways‟ revenue. [Online] Available at:
https://www.thehitavada.com/Encyc/2020/12/28/Fly-ash-transportation-boosting-Indian-Railways-revenue-
.amp.html[Accessed 16 November 2021].
Mathiesen, K., 2021. India needs no to halt building new coal plants in 2022. [Online] Available at:
https://www.climatechangenews.com/2016/12/16/india-to-halt-building-new-coal-plants-in-2022/[Accessed 30
November 2021].
Mathiesen, K., 2021. India to halt building new coal plants in 2022. [Online] Available at:
https://www.climatechangenews.com/2016/12/16/india-to-halt-building-new-coal-plants-in-2022/[Accessed 30
November 2021].
Ministry of power, 2021. Power Sector at a Glance ALL INDIA. [Online] Available at:
https://powermin.gov.in/en/content/power-sector-glance-all-india[Accessed 3 July 2021].
Mu, E. & Pereyra-Rojas, M., n.d. [Online] Available at:
https://www.springer.com/cda/content/document/cda.../9783319338606-c2.pdf?...[Accessed 7 August 2018].
National Institute of Environmental Health Sciences, 2007. Recycling: Building on Fly Ash Waste.
Environmental health Perspectives, Volume 115.
NTPC, 2015. Ash Utilization. [Online] Available at: https://www.ntpc.co.in/en/environment/ash-
utilisation[Accessed 6 November 2021].
Pichery, C., 2014. Encyclopedia of Toxicology (Third Edition). ScienceDirect, pp. 236-237.
Press Information Bureau, 2018. Vision of a USD 5 Trillion Indian Economy. [Online] Available at:
https://pib.gov.in/Pressreleaseshare.aspx?PRID=1549454[Accessed 30 November 2021].
Priya, A. S. & Muruganandam, D., 2018. Work-life balance of employees working in power sectors of
krishnagiri district. April.
Rao, V. K., 2020. Railways' first fly-ash train from Andhra Pradesh to Karnataka flagged off in Vizag. [Online]
Available at: https://timesofindia.indiatimes.com/city/visakhapatnam/railways-first-fly-ash-train-from-andhra-
pradesh-to-karnataka-flagged-off-in-vizag/articleshow/80046534.cms[Accessed 16 November 2021].
Tropical Forest Research Institute, 2017. Flyash: Characteristics, Problems and Possible Utilization. Pelagia
Research Library, pp. 32-33.
V. & Viana, R., 2010. Using the analytic hierarchy process (ahp) to select and prioritize projects in a portfolio.
Washington DC, Project Manament Institute.
iiiiiii
https ://www. loomsolar.com/blogs /pricelis t/1kw-so lar-sy stem-price-in-india iiii
https ://letsavelectricity .com/how-many -solar-panels-i-can-install-in-100-sq-ft-area/ iii
https ://letsavelectricity .com/how-much-electricity -does-one-solar-panel-produce-in-a-day /


En
gin
eers
fo
r V
iab
le T
ech
no
log
y a
nd
$5
Tri
llio
n E
con
om
y
Mechanical
Engineering

Engineers for Viable Technology and $5 Trillion Economy
275 Technical Volume of 36th Indian Engineering Congress, December 26-28, 2021 ISBN 978-81-955500-1-2
MC_005_01_149
Preliminary Prototype and Analysis of a Customized Handle for
Winding Machine using Fused Filament Fabrication
Sreekanth M P*
Department of Mechanical Engineering, Vimal Jyothi Engineering College, Chemperi, Kannur, Kerala
*email: [email protected]
Abstract: Additive manufacturing transformed the prospect of product development. Customized and individualized
product development never be so effortless. In this context, aim here is to develop a preliminary prototype of
customized handle for winding machine using in handloom industry. Design of the handle is completed according to
the hand anthropometric data of workers. CATIA V5R20 is used for 3D modeling and Analysis. Polylactic Acid
(PLA) used as material and Flash Forge Dreamer Additive Manufacturing (AM) machine, which works based Fused
Filament Fabrication (FFF) is employed for prototyping. Analysis confirms that the design using PLA material is
safe as maximum von Moses stress obtained (6.57 × 10⁴ N/m2) is less than the yield strength of PLA material
(4.9×10⁷ N/m2).
Keywords: Prototype; Customization; Fused Filament Fabrication; Handle; Hand Anthropometry; Additive
Manufacturing
INTRODUCTION
By eliminating tool and reducing wastage of material, Additive Manufacturing (AM) or 3D Printing (3DP) can be
considered as one of the most noteworthy development in manufacturing in recent years, which directly prints from
Computer Aided Design (CAD) data layer – by – layer [1]. It helps the technology to be a potential player in
Industry 4.0 [2]. Fused Filament Fabrication (FFF) or Fused Deposition Modeling (FDM) is an AM technology
which usually fabricate the objects layer-by-layer by extruding material through a nozzle [3, 4]. FFF parts can be
used in wide variety of applications from unarmed aerial vehicles to 3D Printers [5].
Parry et al. developed a customized crutch grip using 3D scanner, Autodesk Fusion 360, and Stereolithography
(SLA) additive manufacturing and recommended that AM is a worthwhile method for fabricating customized Daily
Living Aids (DLA) [6]. Additionally, using reverse engineering and FDM additive manufacturing technology, a
customized helmet is developed with enhanced comfort. The researchers concluded from the study that the method
is suitable for rapid product development and to address the needs of the customer individually [7].
A customized hand orthosis is developed using 3D Scanner and FDM AM machine with a printing time of about 11
hours and lead time of about 1 day, which will be useful for patients [8].In addition to this, individually customized
wrist orthosis was designed using the 3D scanned data of a patient and fabricated by employing FDM technology
withupper layer of the orthosis was made of ABS and inner layer was made using TPU (Thermoplastic
Polyurethane) [9]. TPU has considerable elasticity and research proved that the flexible inner layer increases the
comfort of user [9].
Furthermore, customized orthosis is fabricated using Autodesk Inventor 3D modeling software, 3D scanner,
MeshLab software for creating an automated algorithm of 3D scan data, and Raise 3D Pro FDM AM machine [10].
The study concluded that Polylactic Acid (PLA) is strong when compared to other materials used such as
Acrylonitrile Butadiene Styrene (ABS), High impact Polystyrene (HIPS), and Polyamide 12 (PA12 – nylon)
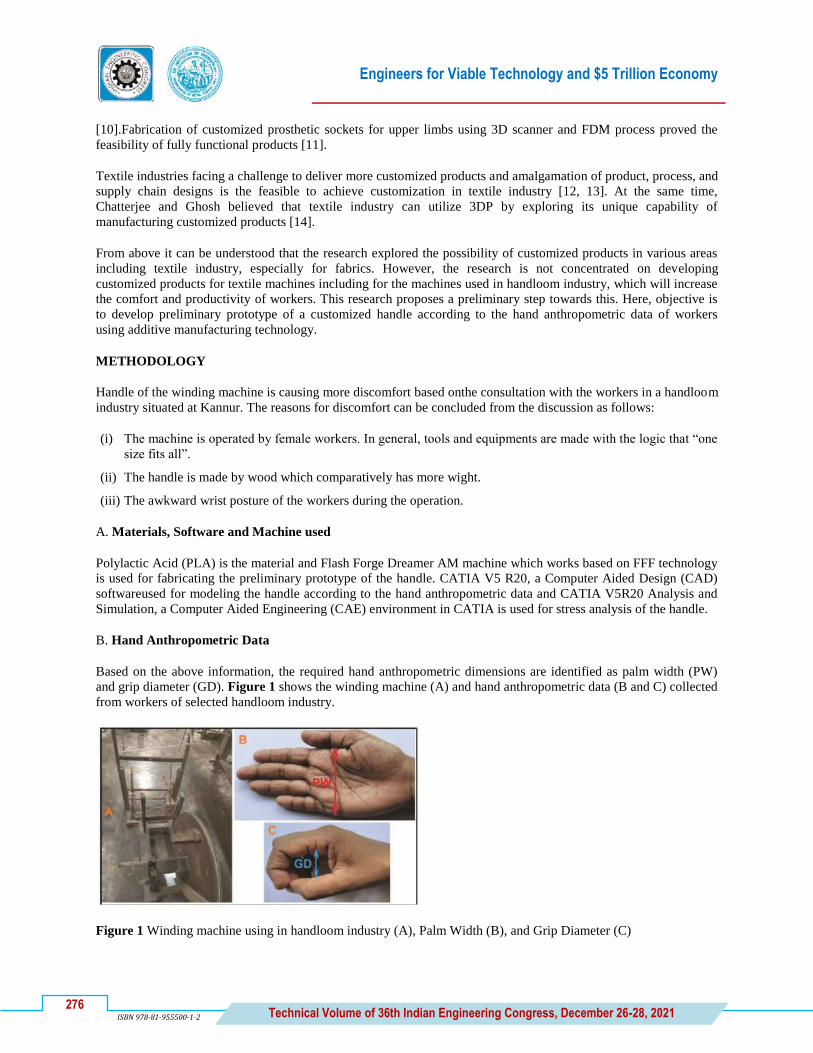
Engineers for Viable Technology and $5 Trillion Economy
276 Technical Volume of 36th Indian Engineering Congress, December 26-28, 2021 ISBN 978-81-955500-1-2
[10].Fabrication of customized prosthetic sockets for upper limbs using 3D scanner and FDM process proved the
feasibility of fully functional products [11].
Textile industries facing a challenge to deliver more customized products and amalgamation of product, process, and
supply chain designs is the feasible to achieve customization in textile industry [12, 13]. At the same time,
Chatterjee and Ghosh believed that textile industry can utilize 3DP by exploring its unique capability of
manufacturing customized products [14].
From above it can be understood that the research explored the possibility of customized products in various areas
including textile industry, especially for fabrics. However, the research is not concentrated on developing
customized products for textile machines including for the machines used in handloom industry, which will increase
the comfort and productivity of workers. This research proposes a preliminary step towards this. Here, objective is
to develop preliminary prototype of a customized handle according to the hand anthropometric data of workers
using additive manufacturing technology.
METHODOLOGY
Handle of the winding machine is causing more discomfort based onthe consultation with the workers in a handloom
industry situated at Kannur. The reasons for discomfort can be concluded from the discussion as follows:
(i) The machine is operated by female workers. In general, tools and equipments are made with the logic that “one
size fits all”.
(ii) The handle is made by wood which comparatively has more wight.
(iii) The awkward wrist posture of the workers during the operation.
A. Materials, Software and Machine used
Polylactic Acid (PLA) is the material and Flash Forge Dreamer AM machine which works based on FFF technology
is used for fabricating the preliminary prototype of the handle. CATIA V5 R20, a Computer Aided Design (CAD)
softwareused for modeling the handle according to the hand anthropometric data and CATIA V5R20 Analysis and
Simulation, a Computer Aided Engineering (CAE) environment in CATIA is used for stress analysis of the handle.
B. Hand Anthropometric Data
Based on the above information, the required hand anthropometric dimensions are identified as palm width (PW)
and grip diameter (GD). Figure 1 shows the winding machine (A) and hand anthropometric data (B and C) collected
from workers of selected handloom industry.
Figure 1 Winding machine using in handloom industry (A), Palm Width (B), and Grip Diameter (C)
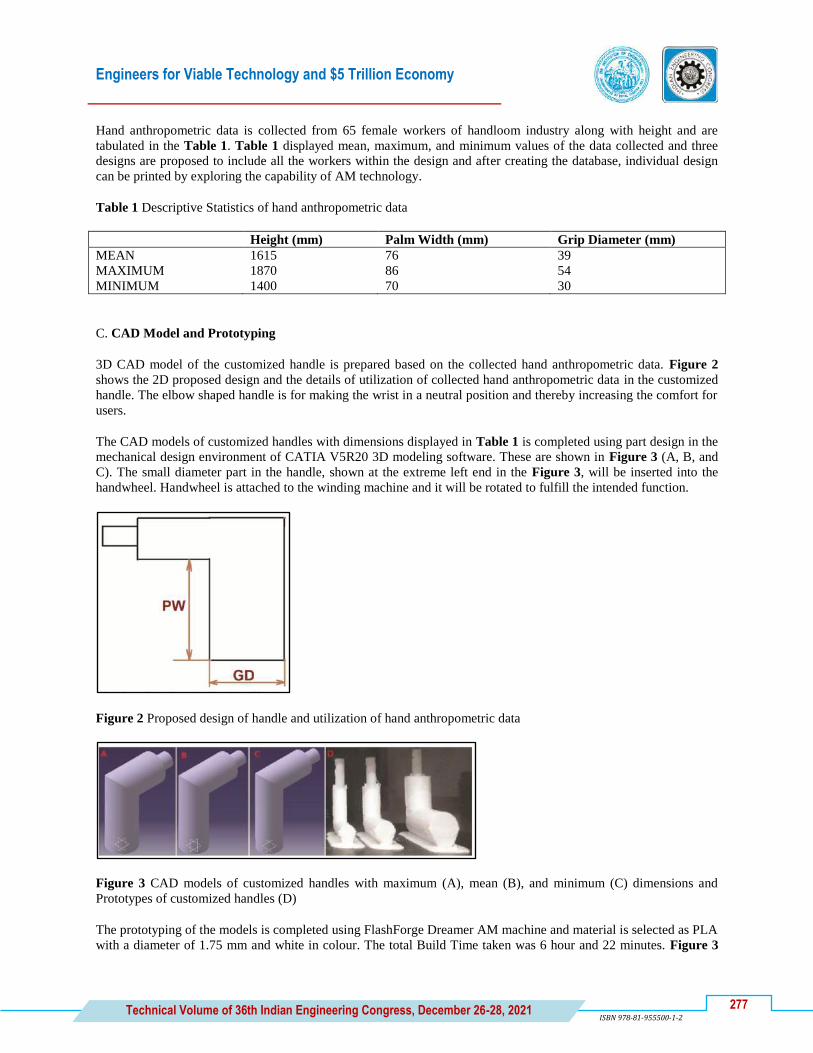
Engineers for Viable Technology and $5 Trillion Economy
277 Technical Volume of 36th Indian Engineering Congress, December 26-28, 2021 ISBN 978-81-955500-1-2
Hand anthropometric data is collected from 65 female workers of handloom industry along with height and are
tabulated in the Table 1. Table 1 displayed mean, maximum, and minimum values of the data collected and three
designs are proposed to include all the workers within the design and after creating the database, individual design
can be printed by exploring the capability of AM technology.
Table 1 Descriptive Statistics of hand anthropometric data
Height (mm) Palm Width (mm) Grip Diameter (mm)
MEAN 1615 76 39
MAXIMUM 1870 86 54
MINIMUM 1400 70 30
C. CAD Model and Prototyping
3D CAD model of the customized handle is prepared based on the collected hand anthropometric data. Figure 2
shows the 2D proposed design and the details of utilization of collected hand anthropometric data in the customized
handle. The elbow shaped handle is for making the wrist in a neutral position and thereby increasing the comfort for
users.
The CAD models of customized handles with dimensions displayed in Table 1 is completed using part design in the
mechanical design environment of CATIA V5R20 3D modeling software. These are shown in Figure 3 (A, B, and
C). The small diameter part in the handle, shown at the extreme left end in the Figure 3, will be inserted into the
handwheel. Handwheel is attached to the winding machine and it will be rotated to fulfill the intended function.
Figure 2 Proposed design of handle and utilization of hand anthropometric data
Figure 3 CAD models of customized handles with maximum (A), mean (B), and minimum (C) dimensions and
Prototypes of customized handles (D)
The prototyping of the models is completed using FlashForge Dreamer AM machine and material is selected as PLA
with a diameter of 1.75 mm and white in colour. The total Build Time taken was 6 hour and 22 minutes. Figure 3

Engineers for Viable Technology and $5 Trillion Economy
278 Technical Volume of 36th Indian Engineering Congress, December 26-28, 2021 ISBN 978-81-955500-1-2
(D) displayed the prototypes with minimum, mean, and maximum hand dimensions in the build chamber of the
machine surrounded by support material.
ANALYSIS AND DISCUSSION
The stress analysis of handle is accomplished by generative structural analysis in the analysis and simulation
environment of CATIA V5R20.The handle designed according to the minimum hand anthropometric dimensions
(palm width = 70 mm and grip diameter = 30 mm) was used for analysis. It was based on the assumption that the
handles with median and maximum dimensions will withstand the same load.
The grip force, 336 N, was identified from research by Koley and Melton [15]. The research reported the grip
strength of Indian males and females. Highest value of grip strength was selected for the analysis in this project.
This force was converted to pressure force as this was acting throughout the handle surface. By dividing by surface
area, 6597.34 mm2, found that 0.051 N/mm
2 will be acting on the entire surface of the handle. When converted to
N/m2, 0.051 N/mm
2will be 51000 N/m
2. This is the value used for analysis and is applied on the handle surface. The
properties of PLA are tabulated in the Table 2.
Table 2 Properties of PLA
Parameter Value
Elastic or Young‟s Modulus 3.6 × 10⁹ N/m
2
Poisson‟s Ratio 0.3
Yield Strength 4.9 × 10⁷ N/m
2
Figure 4 (A) shows the constraints and pressure force on the surface of the handle and Figure 4 (B) illustrates the
von Mises stress developed on the handle by applying the above-mentioned pressure force on the handle surface.
The maximum von Mises stress attained is 6.57 × 10⁴ N/m
2. The design of the handle is validated based on the von
Mises stress criterion of failure. This states that the von Mises stress obtained from analysis should be less than the
yield strength of the material [16]. Here the maximum von Mises stress obtainedis 6.57 × 10⁴ N/m
2 and yield
strength of PLA material is 4.9 × 10⁷ N/m
2 obtained from Matweb 2021 [17]. Obtained maximum von Mises stress
is less than the yield strength of PLA. This proved that the design by using PLA material is safe for handles using in
winding machine in the handloom industry.
Figure 4 Constraints and pressure applied on the handle (A) and von Mises Stress (B)
When using hand tools, it is necessary to have a neutral arm and wrist posture for improving the comfort of users
[18]. The customized design of handles presented in this research considered this aspect. Refer the figure shown in
Figure 5 which illustrated the wrist posture of existing wooden and customized handles (used representative images,
not in the real environment). This confirms that customized handles are bringing the wrist in a neutral position and
in turn enhance the comfort of workers who uses the winding machine. Another contributing factor to the comfort is
the reduced weight of customized handle (PLA) when compared to the wooden handle.

Engineers for Viable Technology and $5 Trillion Economy
279 Technical Volume of 36th Indian Engineering Congress, December 26-28, 2021 ISBN 978-81-955500-1-2
RECOMMENDATIONS
Design and fabrication of handles based on minimum, mean, and maximum hand anthropometric data are
completed. However, individual customization can be done through necessary alterations with respect to
individual‟s palm width and grip diameter in the existing CAD models. By exploring the possibility of AM
technology, product can be delivered within a short span of time.
Figure 5 Wrist postures of existing and modified handles
CONCLUSIONS AND LIMITATIONS
A customized handle using for winding machine according to the hand anthropometric data of workers from
handloom industry is developed. Palm width and grip diameter of 65 female workers are collected. By adopting AM
technology, customized products can be developed within a reasonable time.Similar strategy can be applied to
similar hand tools for enhancing comfort of users. Preliminary prototype is developed in this research and the hand
anthropometric data can be collected from more workers and the accuracy of data can be enhanced.
ACKNOWLEDGMENT
Would like to express my sincere gratitude to Athul Pradeep T, Vishnu K, Akshay P, and Akshay E P who are 2017
– 21 batch UG students in the Department of Mechanical Engineering, Vimal Jyothi Engineering College,
Chemperi, Kannur. Would like to thank management and staff of Kanhirode Weavers, Kannur for allowing to
conduct the study and anthropometric survey among workers. Grateful to the management and staff of Vimal Jyothi
Engineering College for the opportunity.
REFERENCES
1. B. Brenken, E. Barocio, AFavaloro, V Kunc, and R. B. Pipes, “Fused Filament Fabrication of Fiber-Reinforced
Polymers: A Review”, Additive Manufacturing, vol. 21, pp. 1-16, May 2018.
2. U. M. Dilberoglu, B. Gharehpapagh, U. Yaman, and M. Dolen, “The role of additive manufacturing in the era
of Industry 4.0”, Procedia Manufacturing, vol. 11, pp. 545-554, 2017.
3. A. R. Zanjanijam, I. Major, J. G. Lyons, U. Lafont, and D. M.Devine, “Fused Filament Fabrication of PEEK: A
Review ofProcess-Structure-Property Relationships”, Polymers, vol. 12, no. 8, 1665, 2020.
4. A. V. Healy, C. Waldron, L. M. Geever, D. M. Devine, and J. G. Lyons, “Degradable Nanocomposites for
Fused FilamentFabrication Applications”, Journal of Manufacturing and Materials Processing, vol. 2, no. 2, 29,
2018.
5. E. Cuan-Urquizo, E. Barocio, V. Tejada-Ortigoza, R. B. Pipes,C. A. Rodriguez, and A. Roman-Flores,
“Characterization of the Mechanical Properties of FFFStructures andMaterials: A Review on theExperimental,
Computational andTheoreticalApproaches”, Materials, vol. 12, no. 6, 895, 2019.

Engineers for Viable Technology and $5 Trillion Economy
280 Technical Volume of 36th Indian Engineering Congress, December 26-28, 2021 ISBN 978-81-955500-1-2
6. E. J. Parry, J. M. Best, and C. E. Banks, “Three-dimensional (3D) scanning and additive manufacturing (AM)
allows the fabrication of customized crutch grips”,Materials Today Communications, vol. 25, 2020.
7. P. Wang, J. Yang, Y. Hu, J. Huo, and X. Feng, “Innovative design of a helmet based on reverse engineering and
3D printing”, Alexandria Engineering Journal, vol. 60, no. 3, pp. 3445-3453, 2021.
8. G. Baronio, S. Harran, and A. Signoroni, “A Critical Analysis of a Hand Orthosis Reverse Engineering and 3D
Printing Process”,Applied Bionics and Biomechanics – Recent Advances in Biomedical Applications, Article
ID 8347478, 2016.
9. F. Górski, W. Kuczko, W Weiss, R Wichniarek,M Zukowska, “Prototyping of an Individualized Multi-Material
Wrist Orthosis Using Fused Deposition Modelling”,Advances in Science and Technology Research Journal,
vol. 13, no. 4, pp. 39-47, 2019.
10. F. Górski, R. Wichniarek, W. Kuczko, M. Zukowska, M. Lulkiewicz, and P. Zawadzki, “Experimental Studies
on 3D Printing of Automatically Designed Customized Wrist-Hand Orthoses”, Materials, vol. 13, no. 18, 4091,
2020.
11. F. Górski, R. Wichniarek, W. Kuczko, and M. Zukowska, “Study on Properties of Automatically Designed 3D-
Printed Customized Prosthetic Sockets”, Materials, vol. 14, no. 18, 5240, 2021.
12. R. Gebhardt, L. Grafmüller, M. Barteld, and T. Mosig,“Mass Customized Technical Textiles Challenges to The
Textile Industry for Tomorrow”, Vlakna a Textil, vol. 23, pp. 76-85, 2016.
13. N. J. Vandaele, and C. J. Decouttere, “The Multiple Faces of Mass Customization: Product Design, Process
Design and Supply Chain Design”, In: C.Emmanouilidis, M.Taisch, and D.Kiritsis (eds),“Advances in
Production Management Systems, Competitive Manufacturing for Innovative Products and Services (APMS
2012)”,IFIP Advances in Information and Communication Technology, vol. 397, Springer, Berlin, Heidelberg,
2013.
14. K. Chatterjee, and T. K. Ghosh, “3D Printing of Textiles: Potential Roadmap to Printingwith Fibers”, Advanced
Materials, vol. 32, no. 4, 1902086, 2020.
15. S. Koley, and S. Melton, “Age-related Changes in Handgrip Strength among Healthy Indian Males and Females
Aged 6-25 years”, Journal of Life Sciences, vol. 2, no. 2, pp. 73-80, 2010.
16. T. R. Chandrupatla, and A. D. Belegundu, Introduction to Finite Elements in Engineering (Third Edition), New
Jersey: Prentice Hall Inc., 2002.
17. Matweb 2021, “Overview of materials for Polylacticacid (PLA) Biopolymer”, Available from:
http://www.matweb.com/search/DataSheet.aspx?MatGUID=ab96a4c0655c4018a8785ac4031b9278&ckck=1
[24 April 2021].
18. EHS Today 2005, “Ergonomic Guidelines for Selecting Hand and Power Tools”,Available from:
https://www.ehstoday.com/health/article/21908634/ergonomic-guidelines-for-selecting-hand-and-power-tools
[18 October 2021].

Engineers for Viable Technology and $5 Trillion Economy
281 Technical Volume of 36th Indian Engineering Congress, December 26-28, 2021 ISBN 978-81-955500-1-2
MC_038_04_216
Integration of AI & ML with High-speed Compression Ignition
Engine being used on Diesel Locos of Indian Railways
Narendra Kumar Verma
Retired IRSME/Ex Dy. Chief Mechanical Engineer, N Rly /Principal Supervisors Training Centre, Charbagh,
Lucknow (Earlier STS), Lucknow, Uttar Pradesh
e-mail: [email protected]
Abstract: India has proved itself to be the major economy having the fastest growth the world over. By 2025, India's
target is to the tune of $5 trillion economy. The target is still more challenging due to the Pandemic COVID19
period. Currently, India's GDP is about $2.78 trillion. India's nominal GDP, estimated at about $2.74 trillion in
FY20 has presently shrunk to $2.66 trillion in FY21.
In particular, the focus on “Make in India” are directly influenced by the strength of India's infrastructure. The way
India has handled the COVID19 vaccination project indigenously for its 1.3 billion people is commendable and this
is in line with the initiative of the Government for “Atmanirbhar Bharat”. The services sector has adversely suffered
during Covid-19 pandemic. But the software services sector, an unexpected beneficiary, gained from the pandemic
situation is the surging global demand for digital services, reviving client additions, top line growth and most
important, hiring. India has certain SDGs mapped by NITI (National Institution for Transforming India) Aayog
based on various defined indicators responding to national needs. The Government is committed to ensuring “Sabka
Saath, Sabka Vikas, Sabka Vishwas” in the spirit of the Sustainable Development Goals' motto of “Leaving No One
Behind”.
Indian Railways is one of the largest networks for train operation and it is the fourth largest in the world. Since
Railways are mainly concerned with train operation carrying passengers as well as freight services. As on 1st April
2021, the national rail network consists of 123,542 track km over a defined route of 64689 km with 7,325 stations.
For efficient train operation, Railways have to maintain a large fleet of rolling stocks hence importance of
locomotive cannot be ignored.
These mainline diesel electric locomotives have definitely an impact on overall performance of the train operation.
In view of above, the efforts are made to integrate the functioning of high-speed compression ignition engines
installed on high horse power locomotives working over Indian railways. This integration has been made possible
with the help of Artificial Intelligence (AI) & Machine learning (ML) the latest technological approach. By using
this technology, the railways are also capable to maintain punctuality of trains & reduce failures of locomotive to
the extent possible.
Internal combustion engines have powered our civilization since the second industrial revolution. Today, Internal
combustion engines stand at a critical intersection, seeking immediate breakthrough technologies to produce
highpowerand achieving near-zero carbon emissions targets.
Artificial intelligence (AI), particularly with the advances in machine learning (ML) and deep learning, outperforms
humans in solving many highly complex real-world problems. In recent years, AI has revolutionized a huge number
of disciplines. Internal combustion engine is a complicated system that involves combustion, heat transfer, fluid
dynamics, system control, and design, among other mechanisms, and thus provides a perfect yet challenging
platform for AI applications. Testing and simulations of engine operations generate a huge amount of data that can

Engineers for Viable Technology and $5 Trillion Economy
282 Technical Volume of 36th Indian Engineering Congress, December 26-28, 2021 ISBN 978-81-955500-1-2
be utilized to train AI models. Meanwhile, applications of AI models in model development, engine
design/optimization, and control are still in their growing up stage. Interdisciplinary research on AI for internal
combustion engines is needed to close this gap.
Here the emphasis is laid on the introduction of Microprocessor based Locomotive Control System along with the
MCBG /Microcontroller based governor which not only reduces /avoids engine failure but increases the operational
efficiency of the locomotives in actual service.
Keywords: Artificial Intelligence; Machine Learning; SDGs; Heat Transfer; Fluid Dynamics; Microprocessor;
MCBG; Efficiency; Engine Failures
INTRODUCTION
Before going ahead, it would be better to throw some light on Artificial intelligence.
Artificial Intelligence
Basically, artificial intelligence is the broad science of imitating human abilities, machine learning is a specific
subset of AI that trains a machine how to learn.AI focusses with a promise of genuine human to machine interaction.
When machine behaves like an intelligent person, request can be easily understood, data points connected easily and
conclusions can be judiciously drawn. It can reason, observe & plan. We are at a new level of cognition in the AI
field that has taken birth to be truly fruitful in our lives.
In other words, Artificial intelligence is a field of computer science which makes a computer system that can imitate
human intelligence. AI system need not be pre-programmed. On the basis of capabilities, it can be further sub-
divided into three types:
Weak AI
General AI
Strong AI
Presently, AI has a great focus on various disciplines. The future of AI is strong. It is said that strong AI will be
intelligent than humans.
Intelligent machines, can be created with a larger concept of AI, that can stimulate human capability, thinking and
behaviour, whereas, ML is an application of AI which allows machines to learn from data without being absolutely
programmed.
AI, ML & deep learning are corelated and are integrated at some level. The field of AI has a long history having
with military science & statistics, along with contributions from psychology, philosophy, maths & cognitive science.
AI initially set out to make computers more beneficial and capable of independent reasoning.
AI has originated from the Dartmouth Research project in 1956 that has explored the topics like solving problems
and symbolic methods. The defence department of U.S had taken keen initiative (during 1960s) in this type of work
and increased the focus on training computers in order to imitate reasonings of human beings., Defence Advanced
Research Projects Agency (DARPA) completed street mapping projects in 1970s and produced intelligent personal
assistants in 2003, long before Google, Amazon or Microsoft tackled similar projects in this area.
It has paved the route for the present automation and formal reasoning that we all observe in computers in this
modern world. AI is on the path of changing the world. Actually, it already has our ability to consume and act on
data is because of advancement in computing, complex algorithms and intelligent analytical output.

Engineers for Viable Technology and $5 Trillion Economy
283 Technical Volume of 36th Indian Engineering Congress, December 26-28, 2021 ISBN 978-81-955500-1-2
Machine Learning
It is about extraction of knowledge from the data. It can be defined as,
“Machine learning is a subfield of AI, that makes the machines possible to learn from past data or experiences
without being absolutely programmed”.
Machine learning makes a computer system possible to make predictions for taking some decisions using historical
data without being absolutely programmed. A large amount of structured and semi-structured data is used so that a
machine learning model can generate accurate result or confirm the actual output based on that data.
Machine learning works on algorithm and uses her own historical data to learn. It works only for specific domains
such as if we are creating a machine learning model to detect pictures of dogs, it will only give result for dog
images, but if a new data is provided like image of a cat, then it will become unresponsive. Machine learning is
being used in various places such as for online recommender system, for Google search algorithms, Facebook Auto
friend tagging suggestion, Email spam filter etc.
It can be divided into three types:
Supervised learning
Reinforcement learning
Unsupervised learning
Difference between AI & ML
S.No Artificial Intelligence Machine learning
1 Artificial intelligence is a technology which
enables a machine to simulate human behaviour.
Machine learning is a subset of AI which allows a
machine to automatically learn from past data without
programming explicitly.
2 The goal of AI is to make a smart computer
system like humans to solve complex problems.
The aim of ML is to permit machines to learn from
data so that they can give correct output.
3 In AI, we make intelligent systems to perform any
task like a human
In ML, we teach machines with data to perform a
particular task and give an accurate result.
4 Machine learning and deep learning are the two
main subsets of AI
Deep learning is a main subset of machine learning.
5 AI has a very wide range of scope. Machine learning has a limited scope.
6 AI is working to create an intelligent system which
can perform various complex tasks.
Machine learning system is meant to create machines
which can perform specific tasks for which they are
trained.
7 AI system is concerned about maximizing the
chances of success.
ML is specifically concerned about accuracy and
patterns.
8 The main applications of AI are Siri, customer
support using catboats, Expert System, Online
game playing, intelligent humanoid robot, etc.
Machine learning is being used in various places such
as for online recommender system, for Facebook Auto
friend tagging suggestion, Email spam filter, Google
search algorithms, etc.
9 On the basis of capabilities, AI can be divided into
three types, which are, Weak AI, General AI,
and Strong AI.
It is of three kinds e.g.; Reinforcement
learning, Supervised learning, Unsupervised learning
etc.
10 It includes learning, reasoning, and self-correction. In case of new data, it only includes learning and self-
correction.
11 AI completely deals with Structured, semi-
structured, and unstructured data
Machine learning deals with Structured and semi-
structured data.

Engineers for Viable Technology and $5 Trillion Economy
284 Technical Volume of 36th Indian Engineering Congress, December 26-28, 2021 ISBN 978-81-955500-1-2
Internal Combustion Engines
Internal combustion engines have powered on human interface since the second industrial revolution. Presently I.C
Engines are near critical path and there is an immediate requirement of specialised technologies to produce HHP in
addition to fulfil the near Zero carbon emissions targets. It is one of the biggest challenges for the engine industry
around the world.
Artificial intelligence (AI), particularly with the advances in machine learning and deep learning, out-performs
humans in solving many highly complex real-world problems as indicated above. The Internal combustion engines
is a complicated system that involves fluid dynamics, combustion, heat transfer, catalysis, system control, and
design, among other mechanisms, and thus provides a perfect yet challenging platform for AI applications. Testing
and simulations of engine operations have generated a large amount of data that can be utilized to train AI models.
Focus on the applications of AI in the field of internal combustion engines are of prime importance which include,
but are not limited to:
• AI in engine design, including the combustion system, fuel and lubricant system, and after treatment system
• Development of data-driven operational performance for Internal combustion engines
• AI in fuel injection & heat transfer, etc
• AI in optimizations of internal combustion engines
• AI in engine speed control & other important aspects.
Micro Controller-based Governor MEG -601 [MCBG]
MCBG-MEG-601 has been developed conforming to RDSO Spec. No. MP.0.17.00.01 dated March 2002 (Rev-01)
amendment 02 (June 2002).
Salient features of MCBG are enumerated as follows;
The basic function of the governor is to control the speed of engine based on corresponding handle position
(Notch) of the throttle. A micro controller-controlled DC stepper motor is used to control the fuel rack of diesel
engine of the locomotive through a control linkage.
A second function is load control through an interface with E-type excitation system, for maintaining a pre-set
constant horsepower at each notch.
The equipment also maintains air manifold pressure (air inlet pressure) bias fuel limiting to maintain air: fuel
ratio.
Third function is low lube oil pressure shut down. It is done through an OPS (oil pressure switch). OPS is set for
drop out & pic up pressures.
Necessary provision for reduction of excitation during wheel slip is also incorporated which can be done through
user settable parameters.
Vacuum Fluorescent Display (VFD) is continuously used to display status of various engine parameters.
Configurations of system through user settable parameters and reading of error log can be managed on line on the
locomotive itself by using a laptop PC, even while the engine is running. The equipment is modular in construction
and it has functionally separated plug-in modules for ease of servicing.
MCBG consists of two sub-assemblies namely:
(i) Control Unit (ii) Actuator Unit.

Engineers for Viable Technology and $5 Trillion Economy
285 Technical Volume of 36th Indian Engineering Congress, December 26-28, 2021 ISBN 978-81-955500-1-2
Control Unit
It is mounted on the short hood side wall just below the existing location of lube oil, fuel oil & booster air pressure
gauges in the driver‟s cabin, or any other suitable location as per design features of loco. Control unit accommodates
all necessary electronic circuits for functioning of governor. Plug in modules of control unit are as under,
(a) Control Card
It is consisting of a 16-bit micro controller; its peripheral ICs and necessary system software for governor control.
All other cards in the system are integrated with control card.
(b) Input Card
Utilized for monitoring,
Engine speed signal from tacho generator.
Position & pressure signals from the actuator unit.
Notch input signals from throttle handle.
All other high voltage input signals.
All the input signals are optically isolated surge protected and reverse polarity protected.
(c) Motor Control Card
It drives the stepper motor in actuator unit. Two identical cards are being used for this purpose.
(d) Load & Clutch Control
Meant for driving the clutch in the actuator unit and it also provides excitation voltage output for load control
through an interface with E-type excitation system.
(e) Display Control Card
Main attribute of the card is to display the data on Vacuum Fluorescent Display in 20-character x 4 line
receivedfrom micro controller. The card has its own micro controller to communicate with control card through
serial communication.
(f) Power Supply Card
This card is suitable for converting 72 V locomotive battery voltage to different low voltage supplies required by the
system. Switches for various functions like over speed test, Reset/start operation & booster air pressure bypass.
Actuator Unit
Location of Actuator Unit is exactly on the same engine base as in case of already existing mechanical Governors.
The Governor controls the engine speed, based on throttle handle position (known as notch), position of notches
is controlled & selected by the Loco pilot on the control Desk.
Tachogenerator or speed sensor is mounted on the Engine to indicate relevant engine RPM.
Digital PID* control is used to calculate desired fuel rack position dynamically, based on the selected notch on
throttle handle and measured Engine RPM.

Engineers for Viable Technology and $5 Trillion Economy
286 Technical Volume of 36th Indian Engineering Congress, December 26-28, 2021 ISBN 978-81-955500-1-2
[*A PID controller is an instrument used in industrial control applications to regulate temperature, flow,
pressure, speed and other process variables. PID (proportional integral derivative) controllers use a control loop
feedback mechanism to control process variables and are the most accurate and stable controller. PID control
uses closed-loop control feedback to keep the actual output from a process as close to the target or setpoint
output as possible.]
Fuel rack of Diesel Engine is controlled by a stepper motor drive equipped in the actuator unit. Load on the
engine is controlled by the governor electrically through an electrical interface with the excitation system of
Locomotive. Thus H.P at each notch is monitored at a pre set level.
A pressure sensor is mounted in the air manifold for measurement of booster (Turbo) air pressure. Movement of
fuel rack is limited as a function of this pressure to prevent incomplete combustion of fuel, black smoke,
excessive engine temperature, fuel wastage etc caused by lack of air to burn the fuel.
Monitoring of engine lube oil pressure is continuously ensured. If the lube oil pressure is less than the specified
pressure at each notch, engine is automatically shut down. Thus, consequential damages to the engine, due to
malfunction of lube oil pump, are avoided.
Vacuum Fluorescent Display continuously shows the status of various engine parameters.
Built in fault diagnostic facility takes appropriate action immediately and displays relevant fault message on the
display board for information to the loco pilot. It also records the fault with date and time stamp, to help the
maintenance crew /staff later for analysis of the root cause.
The Governor has number of user programmable parameters, which permits the system to be used on various
types of engines/locomotives.
Configuration of the system through user settable parameters for fine tuning of operation and reading fault
messages of Error Log can be done, on-line on the locomotive, using a laptop PC, even while the engine is
running.
The equipment is modular in construction and has functionally separated plug-in modules for ease of repair and
maintenance.
Figure 1 Rotary output of actuator connected to fuel linkage (for EMD Locomotives)

Engineers for Viable Technology and $5 Trillion Economy
287 Technical Volume of 36th Indian Engineering Congress, December 26-28, 2021 ISBN 978-81-955500-1-2
Figure 2 Linear output of actuator connected to fuel linkage (for GE/Alco type Locomotives)
Principle of Operation
The micro controller in control unit continuously measures the frequency signal from the existing Tacho- generator
on loco.
(a) Engine RPM is calculated from this frequency signal. Desired engine RPM is determined from the selected notch
on throttle handle. Comparing these two RPMs in a PID control loop the micro controller drives fuel rack of the
engine through the actuator unit, so as to adjust the engine RPM equal to the set RPM for the given notch. PID
parameters can optimised for each class of engines through user settable parameters using a laptop PC, so as to
maintain stable engine RPM free from hunting.
(b) B.A. P is measured through a pressure sensor to limit the movement of fuel rack as a function of BAP.Thus
supply of fuel to engine proportional to available air pressure is ensured which is helpful in preventing,
(i) Incomplete combustion
(ii) Smoky exhaust gases
(iii) Excessive engine temperature
(iv) Fuel wastage.

Engineers for Viable Technology and $5 Trillion Economy
288 Technical Volume of 36th Indian Engineering Congress, December 26-28, 2021 ISBN 978-81-955500-1-2
A toggle switch is equipped on control unit to bypass this feature. In case of bypass, speed variation between
different notches is linearly based on acceleration and retardation rates specified in user settable parameters.
(c) Load control output is provided to maintain constant horse power output of the engine at each notch. Load
control js done by changing the generator field excitation, from maximum to minimum or vice versa at a rate
specified in user suitable parameters. BAP linked load control facility is also available.
(d) Lube Oil Pressure (L.O.P) is continuously monitored. Provision of sensing wheel slip and reduction of excitation
to minimum is available which may be managed through a user settable parameter.
(e) Over Speed Trip assembly:
A 3- position key switch is provided to ensure testing of over speed trip.
Ist position on key switch: Selects a built-in feature of MCBG to test electronic overspeed trip RPM< mechanical
OST.
In this case engine RPM is gradually increased above 8th
notch RPM, when engine RPM reaches a set RPM for
electronic OST, the system shuts down the engine with proper display.
Second Position: Selects Mechanical OST where governor gradually increases engine RPM to maximum set limit
and waits for a specified time. By this time mechanical OST device should operate & trip, even if it does not trip due
to any reason- engine RPM reduces to idle. Display further indicates whether the test was successful/fail or needs
adjustment.
(f) In addition to above, actuator unit is equipped with an electromagnetic clutch, which turns off automatically
during loss of power and fuel rack is brought to no fuel position. It also gets deactivated in case of malfunctioning of
the system. This will close fuel rack and engine will shut down.
A built-in fault diagnostic system continuously monitors the health of various peripherals.
In case of major faults, the engine is shut down automatically and displayed on display board with message. Fault is
registered with time & date in error log for further maintenance /servicing. This aspect is of vital importance for
preventing the engine with heavy detrimental damages.
User Settable Parameters
Different parameters of the MCBG are user settable by using a laptop computer. The software displays the range and
default value for any parameter that is selected for any minor modification. These values differ from loco to loco
depending on the design features. Laptop interfaces with MCBG through an RS 232 serial port. These parameters
can be set while the engine is running, which is very useful for initial turning of engine. List of parameters that are
user settable is as follows;
Notch wise engine speed.
Notch wise minimum LOP for loco shut down.
Maximum permissible fuel rack at each notch.
Fuel rack limit- BAP wise
Setting of OST RPM
Rates of engine acceleration & deacceleration.
Load control minimum and maximum voltage & responsive time.
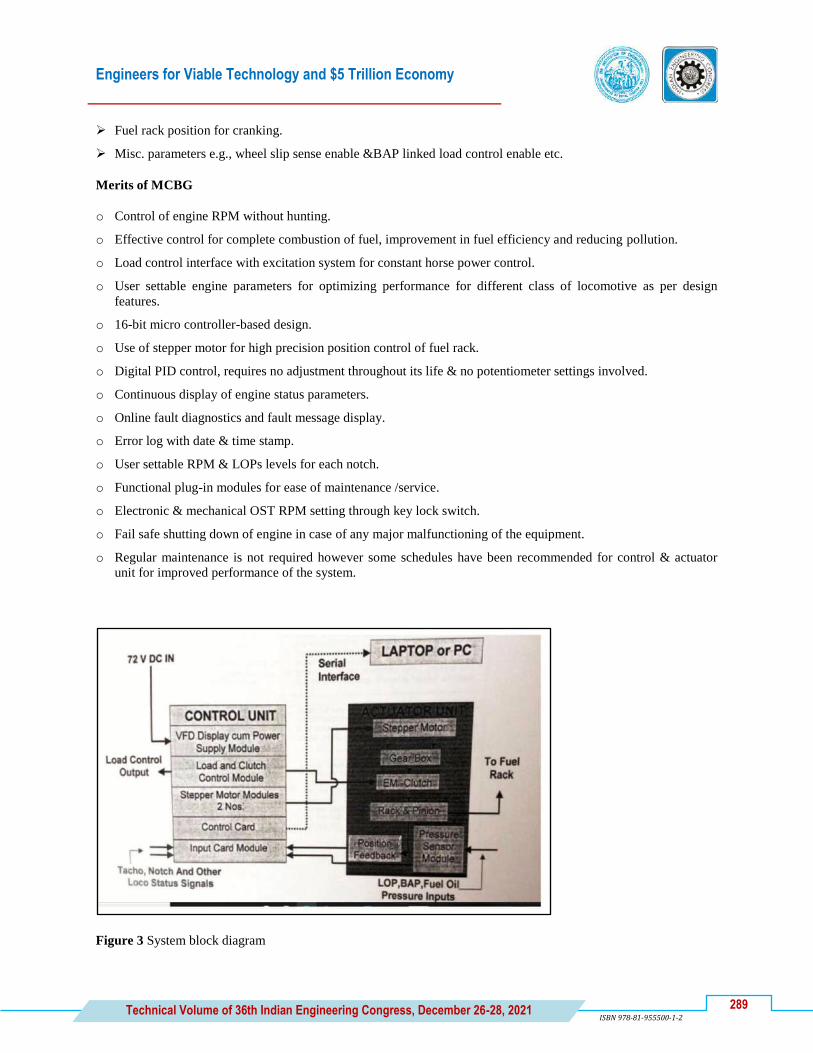
Engineers for Viable Technology and $5 Trillion Economy
289 Technical Volume of 36th Indian Engineering Congress, December 26-28, 2021 ISBN 978-81-955500-1-2
Fuel rack position for cranking.
Misc. parameters e.g., wheel slip sense enable &BAP linked load control enable etc.
Merits of MCBG
o Control of engine RPM without hunting.
o Effective control for complete combustion of fuel, improvement in fuel efficiency and reducing pollution.
o Load control interface with excitation system for constant horse power control.
o User settable engine parameters for optimizing performance for different class of locomotive as per design
features.
o 16-bit micro controller-based design.
o Use of stepper motor for high precision position control of fuel rack.
o Digital PID control, requires no adjustment throughout its life & no potentiometer settings involved.
o Continuous display of engine status parameters.
o Online fault diagnostics and fault message display.
o Error log with date & time stamp.
o User settable RPM & LOPs levels for each notch.
o Functional plug-in modules for ease of maintenance /service.
o Electronic & mechanical OST RPM setting through key lock switch.
o Fail safe shutting down of engine in case of any major malfunctioning of the equipment.
o Regular maintenance is not required however some schedules have been recommended for control & actuator
unit for improved performance of the system.
Figure 3 System block diagram

Engineers for Viable Technology and $5 Trillion Economy
290 Technical Volume of 36th Indian Engineering Congress, December 26-28, 2021 ISBN 978-81-955500-1-2
Maintenance Schedule of MCBG
Sch. Control Unit Actuator Unit
Trip (20 days) 1.Check & ensure tightness of couplers available
on back panel of control unit.
2.Visual inspection of wire shoes & connections
on MCBG terminal board at CP backside for any
looser disconnected wires. Ensure tightness of
these connections as normal procedure.
1. Check & ensure tightness of couplers
provided on the actuator unit.
2.Ensure any possible leakage from the
pressure sensor pipeline.
3.Ensure availability of external spring
provided on fuel control shaft arm, if missing
provide new one.
M4 1.Conduct rack calibration test as per the annex-I
available in MCBG operation & maintenance
manual to ensure free movement of racks. If any
racks are found sticky, re-test after lubrication of
racks.
1.check for any damage to the rubber bellow
provided on the output shaft.
2.If so replace the bellow to avoid dust entry
on to the output shaft.
M24 1.Remove, clean and refit the unit. Replace
(MCB MB gasket) if found on simulator set up.
Damaged.
1.Unload, clean & refit the unit. Replace the
following items if found damaged.
(i)Actuator main cover gasket (ii)PRS box
cover gasket (iii)Bellow AU
(iv)Flange gasket (v) AU Mat-GB (vi) AU
Mat-RP
M48 1.Remove, clean the control unit.
2.Visually inspect the individual modules for any
damaged components.
3.Replace circuit breaker.
4.Replace gaskets as per companies guide lines.
5.Test the unit along with the actuator on
simulator set up.
1.Unload the actuator unit and clean.
2. Check & fill the grease.
3.Clean the clutch plates with thin cloth
soaked with isopropyl alcohol.
4.Replace the gasket as per standard practice.
5.Check calibration of pressure sensors.
Replace sensors if damaged /deviated.
M96 1.Replace all interconnecting cables with
couplers and loco connecting cables.
2.Replace all pressure sensors.
3. Replace OSTA test key assembly.
4.Replace all push buttons (Reset/Start and
Acknowledge.)
NOTE: (a) Schedule attention listed here is telescopic type hence all lower schedules have to be followed along with a higher
sch. (b)I case of any control unit and actuator unit are interchanged, auto fuel rack sensor calibration has to be carried out as
per procedure laid down in governor maintenance manual for efficient control of fuel racks. (C)M2 & M12 Sch. Are not shown
as these are covered with next higher schedules.
MICROPROCESSOR CONTROLLER UNIT
Medha‟s* Microprocessor based Loco Control System Type MEP 660 (Proprietary item of M/s Medha) being
usedfor controlling diesel electric locomotives. This is an alternative to the E-type excitation system being used on
WDM3 & other types of locomotives working over IR. This system is equipped for Excitation Control, Propulsion
Control, Dynamic Braking Control, Wheel Slip Control, and Auxiliary Generator Control with digital PID controls.

Engineers for Viable Technology and $5 Trillion Economy
291 Technical Volume of 36th Indian Engineering Congress, December 26-28, 2021 ISBN 978-81-955500-1-2
Pic 1 MEP660- Display
*Medha Servo Drives Pvt. Ltd. is focused on rail transportation. It is known for the product range, domain knowledge, design
expertise, and manufacturing capabilities. Medha has proved to be a world leader in railway products and it has specialised in
three areas, Control Electronics, Power Electronics and safety critical Signalling. They have designed and manufactured various
high-tech electronics products for application on locomotives, coaches, railway stations and yards. Medha R&D Centre has all
the infrastructure required for developing sophisticated products
Microprocessor MEP- 660 (Ver2.0) WDM3A & WDM3G Locomotives
Microprocessor based control system have been introduced on Diesel Electric Locomotives.
Microprocessor Technology is new to our engineers/operating staff and, therefore, it is necessary that proper
knowledge about troubles which everyone faces during service of locomotives should be disseminated properly.
Microprocessor Control System is the vital part of Diesel electric locomotive. The system is recently introduced on
Indian Railways for ensuring higher reliability & better availability of locomotives.
Proper knowledge of system and troubleshooting is necessary to ensure reliability & availability of locomotive in
sheds as well as on line.
Introduction of Excitation Control System
Excitation control system regulates the exciter field current through a transistor switch operated by the pulse width
modulator basically a magnetic amplifier. The average current is decided by „ON‟ to „OF‟ ratio of PWM which is
controlled by the mixer reference network basically a resister network with two saturable reactors and rectifiers. The
mixer reference network receives proportionate feedback signals from TA voltage, TA current and engine speed.
Based on the input signal levels, it sends a controlling signal to PWM, which controls the exciter field current and its
output. The exciter output is directly connected to alternator field through GF contactor which is again controlled by
propulsion control system. The traction alternator power is controlled to the required constant horse power at each
notch.
INTRODUCTION OF MICROPROCESSOR BASED CONTROL SYSTEM (VER2.0) FOR
WDM3A/WDM3G LOCOMOTIVES
The MEP-660 is a complete locomotive control system consisting of engine cranking, loco propulsion control,
excitation control., auxiliary generator control & continuous monitoring of safety devices on the locomotives. Some
of the improved features are the self-load test of the locomotives and inbuilt event recorder designed and developed
as per RDSO specifications. MEP-660 loco control system is designed to replace the existing propulsion & E-type

Engineers for Viable Technology and $5 Trillion Economy
292 Technical Volume of 36th Indian Engineering Congress, December 26-28, 2021 ISBN 978-81-955500-1-2
Excitation system. MEP-660 control system eliminates mechanical interlocking (sequential /timing) and uses
microprocessor to control the locomotive through software logic.
Figure 4 Excitation control system
Salient Features of Microprocessor Based control system (MBCS)
(a) Fault Diagnostics: Microprocessor based system has the fault diagnostics capabilities. The system continuously
monitors various operational parameters and checks for abnormalities in the functioning of various traction
equipment.
The fault is displayed on the display unit along with restrictions imposed because of the fault, for information of
the loco pilot. Fault code along with real time & date stamp is logged in the Error Log Memory.
(b) Self-Diagnostics: This system keeps on monitoring its own modules and sensors, continuously for their
healthiness.
(c) Fault Tolerance: Fault tolerance capabilities are existing in this system for certain faults. In such cases the
operation of the locomotive continues in the normal way and the fault is logged in error log with data pack for
later analysis.
(d) Automatic fault recovery
(e) Short Term rating of traction motors
(f) Self-test to digital input and output
(g) Self: Load Box test
(h) Event Recorder
(I) In the short-term memory - Various data are recorded in one second interval and latest 45 hrs data is available
at any time to download.
(II) In the long-term memory - Only speed and distance along with date and time are recorded in 20 secs interval
and Latest 225 days data is available at any time to download.
(i) Multi reset vigilance control device.
(j) Auto flasher light.
(k) Auto emergency brake system.
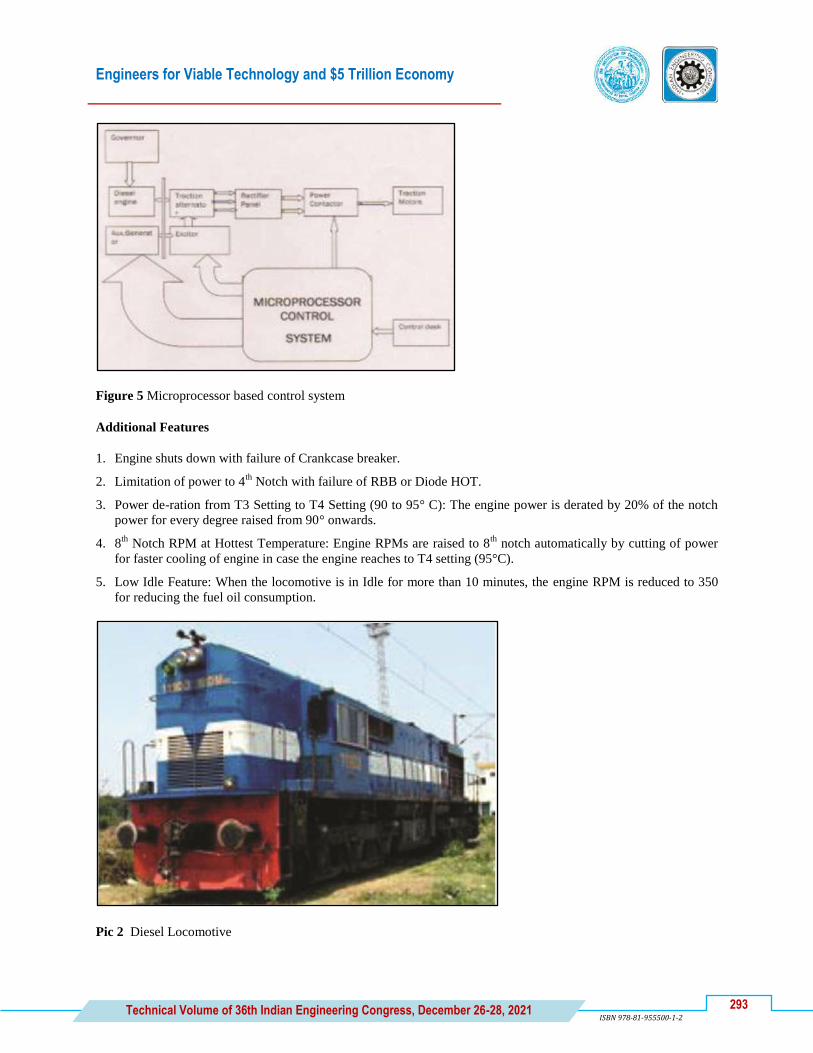
Engineers for Viable Technology and $5 Trillion Economy
293 Technical Volume of 36th Indian Engineering Congress, December 26-28, 2021 ISBN 978-81-955500-1-2
Figure 5 Microprocessor based control system
Additional Features
1. Engine shuts down with failure of Crankcase breaker.
2. Limitation of power to 4th
Notch with failure of RBB or Diode HOT.
3. Power de-ration from T3 Setting to T4 Setting (90 to 95° C): The engine power is derated by 20% of the notch
power for every degree raised from 90° onwards.
4. 8th
Notch RPM at Hottest Temperature: Engine RPMs are raised to 8th
notch automatically by cutting of power
for faster cooling of engine in case the engine reaches to T4 setting (95°C).
5. Low Idle Feature: When the locomotive is in Idle for more than 10 minutes, the engine RPM is reduced to 350
for reducing the fuel oil consumption.
Pic 2 Diesel Locomotive

Engineers for Viable Technology and $5 Trillion Economy
294 Technical Volume of 36th Indian Engineering Congress, December 26-28, 2021 ISBN 978-81-955500-1-2
Brief Details of Engine
Alco 251-C, 16 cylinder, 3,300 hp (2,500 kW) (2,430 hp or 1,810 kW site rating) with GE/ABB turbo supercharged
engine. 1,050 rpm max, 400 rpm idle; 228 mm × 266 mm (8.98 in × 10.47 in) bore x stroke; compression ratio
12.5:1. Direct fuel injection, centrifugal pump cooling system (2,457 L/min (540 imp gal/min; 649 US gal/min) at
1,000 rpm), fan driven by eddy current clutch (86 hp or 64 kW at 1,000 rpm)
Conclusion: Thus, it is concluded that there is definitely the application of AI & ML with close integration with
Microprocessor control based locomotive and Micro controller based governor with modified high horse power
(HHP) turbo-superchargers because these system definitely contribute in reducing fuel consumption, maintaining
proper air: fuel ratio, avoiding severe damages to engine power pack due to operation of over speed trip assy.
electronically or otherwise by mechanical means, reducing exhaust emission by controlling incomplete combustion.
These microprocessors governors & microprocessor control-based locomotive are supported by the design
consideration and following points,
Durability, reliability and fuel economy(i.e specific fuel consumption) are the main considerations that limit the
degree of supercharging of an engine.
Because of the excessive heat generation and heat transfer,the valve overlap is usually designed greater in
supercharged engines . The valve overlap may vary from approximately 80° to 160° of crank travel.
Increased valve overlap permits greater time during which cooler air will flow past the valves and the piston
crown. This cools the exhaust valve seat , the exhaust valves and the piston crown.Thus the thermal loading of
cylinder head valves, valve seat & the piston crown is reduced to the extent possible.
When inlet air is compressed, it becomes hot. When air charge leaves the compressor, it is at much higher
temperature than ambient air. During supercharging, the temperature of air increases from 60° to 95° C. When
air is heated, it expands and thereby density reduces. Because of this the mass of air entering the cylinder
becomes lesser. This reduces availabilty of oxygen in the cylinder for combustion.Further supply of hot air to
engine may increase engine operating temperature. As such charge is cooled by way of aftercooling to overcome
this problem. In double discharge turbo of GE make, two aftercoolers are provided for cooling the charged air.
However, it adds to the complexity of the system. It has been proved that HHP locomotives engines are having
improved BAP by 46.8 % say 47 % or more aas compared to conventioinal TSCs of ALCO make.
The turbocharger may also be used to increase fuel efficiency without any attempt to increase power. It does this by
recovering waste energy in the exhaust and feeding it back into the engine intake. By using this otherwise waste
energy to increase the mass of air it becomnes easier to ensure that all fuel is burnt before being vented at the start
of the exhaust stage.
The power of the engine can be increased by increasing the mean effctive pressure, this is being done by
turbocharging.
Volumetric efficiency of the engine is increased by 1.5% using turbochargiung compared to natural aspiration.
Mechanical efficiency of the engine is increased by 12 % using turbocharger as compared to natural aspiration.
Specific fuel consumption can be reduced by .020 Kg/KWH by providing turbocharging compared to natural
aspiration.
Turbocharging is economically better than the natural aspiration, because turbocharger can be driven by utilizing
the exhaust gases. Air : fuel ratio is high in turbocharging as compared to natural aspiration. Diesel knocking is
reduced by providing TSC. All the aboce parameters can be improved by extensive research in the relevant field.
Design of turbosupercharger is basically based on following performance parameters
(i) Increased gas loading and thermal stresses, enhanced booster air pressure.

Engineers for Viable Technology and $5 Trillion Economy
295 Technical Volume of 36th Indian Engineering Congress, December 26-28, 2021 ISBN 978-81-955500-1-2
(ii) Durability, reliability anf fuel economy (i.e specific fuel consumption) .
(iii) The valve overlap may vary from approximately 80° to 160° of crank travel. Thermal loading of cylinder
head valves, valve seat & the piston crown is reduced to the extent possible.
(iv) During supercharging, the temperature of air increases from 60° to 95° C.
(v) Reduced exhaust emission, better torque characteristics, tractive effort is iomproved.
REFERENCES
1. M/s Medha Servo Drives Pvt Ltd, Hyderabad
2. Automating Analytics with Artificial intelligencehttps://www.brighttalk.com/webcast/10755/285493/
automating-analytics
3. https://250.dartmouth.edu/highlights/artificial-intelligence-ai-coined-dartmouth
4. History of artificial intelligence - Wikipedia
5. https://www.javapoint.com
6. Internal Combustion Engines by V. Ganesan
7. Alco Engines Div. USA & Diesel loco modernisation Workshops, Patiala. (Pb), India.
8. Diesel Loco works, Varanasi, India.
9. Internal combustion engines by M.L. Mathur & R.P Sharma.
10. Rolling Stock Workshops, Charbagh, Lucknow
11. IEI technical webinars on various topics.


Engineers for Viable Technology and $5 Trillion Economy
297 Technical Volume of 36th Indian Engineering Congress, December 26-28, 2021 ISBN 978-81-955500-1-2
MC_039_05_207
Comparison of Properties of SA213 T12 Tube Weldments by
GTAW, ATIG, P-GMAW and Alternating Shielding Gas
GMAW
N Rajasekaran1*, A Santhakumari
1 and A Raja
2
1 Bharat Heavy Electricals Limited, Tiruchirappalli
2 Welding Research Institute, Tiruchirappalli
*email: [email protected]
Abstract: The composition Sa213 T12 chrome moly alloy steel Tubes make it ideal for use in power plants,
refineries, Petro-chemical plants, and oil field services where fluids and gases are transported at extremely high
temperatures and pressures. These tubes offer the advantages like Consistent Workability, Preferred Fabrication
and better Mechanical Properties. These tubes are often used in the water wall tubes, reheater tubes and super
heater tubes of super critical and ultra-super critical boilers. Conventionally, Pulsed Gas Metal Arc Welding (P-
GMAW) and Gas Tungsten Arc Welding (GTAW) processes are used to join these tubes. Activated TIG (ATIG) and
Alternating Shielding Gas GMAW (A – GMAW) are the emerging processes for higher quality and productivity. This
paper compares the properties of weldments of SA213 T12 tubes welded by the above processes.
Keywords: T12; P GMAW; ATIG; GMAW; Alternating Shielding Gas; Power Plants
INTRODUCTION
SA213 T12, the ferritic and austenitic alloy steel tubes are widely used in water walls, reheaters, heat exchangers,
and condensers of power plants, marine application, refineries, paper pulping, petrochemical applications, pressure
vessels and general engineering applications.
For boiler applications, these tubes are welded with Pulsed GMAW (P-GMAW) and Gas Tungsten Arc Welding
(GTAW) processes to meet the requirements of higher quality and productivity. Activated TIG (ATIG) and GMAW
with Alternate Shielding Gas (A-GMAW) are the new high productive processes with improved quality, reduced
processing time, savings in energy and consumables, reduced arc time weldment, etc.
Butt joining of the tubes were carried out with optimized parameters and the mechanical and metallurgical
properties are compared.
A. Alternating Shielding Gas GMAW (A-GMAW)
The operating point in GMAW process depends on the shielding gas used; besides the wire feed speed [current] and
voltage settings [1]. However, the stable operating point for each shielding gas viz. Argon and CO2 is located
differently on the parametric window. By use of alternating shielding gases wherein two different shielding gases
are alternatingly supplied to the torch for effectively protecting the weld pool from the atmospheric contamination.
The arc dynamics changes alternately in tune with the alternating shielding gas supply. The frequently changing arc
dynamics positively influences the weld pool thereby the incidence of defects like porosity and crack are decreased.
Besides, it also results in improved weld metal mechanical properties in steel. Other factors such as flat bead profile

Engineers for Viable Technology and $5 Trillion Economy
298 Technical Volume of 36th Indian Engineering Congress, December 26-28, 2021
ISBN 978-81-955500-1-2
and smooth weld metal transfer are considered to be beneficial aspects of gas pulsing in GMAW process. GMAW
with alternating shielding gases is characterized by the switching of the transfer mode from spray to short circuiting
type, which produces reliable fusion and penetration. Gas pulsing frequency and procedures have to be established
to meet the quality requirements of tube butt joints. Figure 1 shows the Principle of operation of Alternating
Shielding gases GMAW.
Figure 1 Principle of Operation of Alternating Shielding gases GMAW [1]
B. Activated TIG (ATIG)
The increased weld penetration in ATIG welding is attributed to reverse Marangoni effect. Marangoni effect is one
of the penetration mechanisms which refer to the convective flow within the weld pool due to the surface tension
gradient on weld pool surface. During TIG welding the surface tension gradient is negative and the convection
movements are centrifugal leading to shallow penetration. The addition of activated flux induces an inversion of the
convection currents changing the sign of the surface tension gradient, resulting convection movements changed to
centripetal. Hence, the penetration depth increases [2].
EXPERIMENTAL WORK
The SA 213 T 12 tubes have been edge prepared by the facility available as per the requirement. Square butt edge
preparation was carried out for TIG process and for other processes 70°V groove.
Number of experiments to optimize the parameters and the optimized parameters were used for welding trials.
Preheating has been done as per requirement using LP gas before welding. After welding, the samples were
subjected to Post Weld Heat Treatment (PWHT) also as per ASME code requirement. After PWHT, the joints were
subjected to Radiographic Tests (RT). Transverse tensile and impact specimens have been extracted from the
welded tubes and tested as per AWS standard. Microstructural studies have been observed in the base metal and
weld metals. During welding of samples, the voltage and current waveforms were also recorded by using Analysator
Hannover.
The surfaces of the tubes to be joined are cleaned to remove oxide films, oil coatings, etc. prior to welding. Día 0.8
mm ER 80 S B2 filler wire was used for all welding trials.

Engineers for Viable Technology and $5 Trillion Economy
299 Technical Volume of 36th Indian Engineering Congress, December 26-28, 2021 ISBN 978-81-955500-1-2
Welded joints with GTAW process were carried out in orbital GTAW machines using Dia. 54 × 4 mm SA213 T12
tubes with 100% argon as shielding gas. The welding was completed in 3 passes.
Welding trials with P-GMAW process were carried out in the automated tube butt welding machines using Dia.
57.15 × 14.3 mm tubes with 95% argon and 5% CO2 mixed gas, as shielding gas. The welding was completed in 5
passes.
C. ATIG Processes
After ensuring, right fit up of the square edge prepared tube joints, the activated flux paste (mixture prepared with
flux powder and acetone) was applied on the joint area by using a smooth brush. The flux that was applied had
major elements such as Silica, Titanium, Al, Fe, Calcium, Manganese, Nickel, Chromium and Copper. On applying
the flux on the joint area, shielding gas, suitable welding current, welding voltage, welding speed, wire feed rate, gas
flow rate, torch angle, torch position, polarity were set appropriate so that full penetration is obtained in a single
pass.
D. Alternating Shielding Gas GMAW (A-GMAW)
Dia. 57.15 × 14.3 mm SA213 tubes were welded by using alternating shield gas GMAW process. The shielding
gases argon and CO2 are alternatingly fed into the weld pool through the gas alternator at the frequency of 0.02 sec
and 0.04 sec respectively.
Figure 2 shows the welding set up for ATIG and A-GMAW processes.
Figure 2 Set up & Weld Joint for A-GMAW process and ATIG processes
RESULTS AND DISCUSSIONS
The mechanical properties of welds deposited by all the four types have been studied and compared.
E. Radiography Test (RT)
The welded samples were subjected to Radiography (RT) test to ensure the soundness of the joint. All the joints met
the RT requirement as per ASME.

Engineers for Viable Technology and $5 Trillion Economy
300 Technical Volume of 36th Indian Engineering Congress, December 26-28, 2021
ISBN 978-81-955500-1-2
F. Tensile Test
The tensile strength of the welds were determined by using UTM 600 kN. The transverse tensile test specimen is
prepared as per the standard AWS B 4.0.
Table 1 shows the transverse tensile test results for SA213 T12 tube welds and compared with parent / base
Material.
Table 1 Tensile test results
Description UTS MPa Position of Fracture
GTAW 474, 481 Base Metal
ATIG 491, 511 Base Metal
P-GMAW 467, 470 Base Metal
A-GMAW 470, 473 Base Metal
Parent Material 415 As per Literature
From Table 1 it could be observed that the UTS values of all the four methods are above the minimum value of base
material i.e., 415 MPa. The UTS values of ATIG welds are much higher than other processes. The A-GMAW also
results in better UTS value than P-GMAW.
G. Guided Bend Test
The welds were subjected to guided bend tests and test coupons were prepared as per AWS B 4.0. Both transverse
face and root bend tests were carried out for GTAW and ATIG and side bend test for P-GMAW and A-GMAW, to
evaluate both the ductility and soundness of the weldments. 180° bend tests with mandrel diameter equal to 4 t were
carried out on all welded samples. Both the specifications were tested and the results are tabulated in Table 2. All
samples passed the test without any discontinuitywhich ensures the ductility of the weld.
Table 2 Guided bend test results
Description Face Root Side
GTAW Passed Passed -
ATIG Passed Passed -
P-GMAW - - Passed
A-GMAW - - Passed
H. Macrograph& HAZ
The macrograph of the joints and with of Heat Affected Zone (HAZ) are compared as detailed below.
Figure 3 Macrographs

Engineers for Viable Technology and $5 Trillion Economy
301 Technical Volume of 36th Indian Engineering Congress, December 26-28, 2021 ISBN 978-81-955500-1-2
Figure 3A shows the bead profile of GTAW, B shows the ATIG profile, C the P-GMAW and D the A-GMAW.
Comparing the bead profiles ATIG produces deeper penetration and lesser bead width in single pass. The bead
width of gas alternator is also uniform and lesser comparing with P-GMAW and A-GMAW. Further, it could be
observed that the width of HAZ is 5.29 mm is for the weld with A-GMAW against 5.56 mm for P-GMAW and this
may be due to the low heat input in A-GMAW to the weld pool.
I. Microstructure
The microstructural study was done under the optical microscope under proper illumination condition in the desired
region, under 500X magnification for P-GMAW and A-GMAW joints.
The microstructure of base materials, HAZ and weld metal for SA213 T12 tube are shown in Figure 4.
Figure 4 Micrographs of Welds
Equal amount of polygonal ferrite and bainite was seen in base metal. Hard martensitic phase was observed at the
HAZ; also prior austenite grain boundary is seen.
It can be seen that the bainite structure is formed at the weld metal region in both gas mixer and gas alternator The
coarse polygonal ferrite was noticed together with bainitic phase at middle and bottom of the weld metal of gas
mixer when compared to gas alternator.

Engineers for Viable Technology and $5 Trillion Economy
302 Technical Volume of 36th Indian Engineering Congress, December 26-28, 2021
ISBN 978-81-955500-1-2
J. Arc Characteristics
During the welding trials, the current and voltagesignatures were captured using the Analysator Hannover system,
developed by Late Prof. Dr. Ing. Rehfeldt of Germany. The current and voltage transient signatures are shown in
Figure 5 and analyzed.
Figure 5 Current & Voltage Characteristics
From Figure 5 A and B, It will be interesting to note that comparing to GTAW, in ATIG process, the arc voltage
increases significantly. Further, the arc voltage is much more stable comparatively.
While comparing Figure 5 C and D it can be observed that Combination of argon and CO2 in A-GMAW for a
shorter duration generate more pulses which enhance the metal deposition with reduced heat input, also enables to
increase the welding speed during welding.
In the case of P-GMAW the occurrence of lesser peak current for a longer duration will drastically increase the
instantaneous heat input.

Engineers for Viable Technology and $5 Trillion Economy
303 Technical Volume of 36th Indian Engineering Congress, December 26-28, 2021 ISBN 978-81-955500-1-2
CONCLUSIONS
The weld metal deposited by all the methods is found to meet all mechanical properties viz. tensile and bend, as per
ASME standards. ATIG and A-GMAW produces much better results than conventional processes.
• In ATIG process, the welding has been completed in single pass, whereas in other process it is multipass welds.
• The productivity of tube joints is increased by three times per shift in ATIG welding compared to GTAW
method.
• The consumption of power, shielding gas, consumable wire came down to approx. 50% for ATIG.
• The gas consumption in A-GMAW is lesser comparing to P-GMAW.
• The current and voltage signature analysis proves that ATIG process results in more stable voltage.
• The A-GMAW produces more pulses and higher peak current which enable the process to increase the speed as
well with reduced heat input.
• The bead profile of ATIG and A-GMAW are better than GTAW and P-GMAW.
• The microstructure of A-GMAW is better than P-GMAW.
REFERENCES
1. C. Balamurugan, Dr. A. Raja, Dr. K. L. Rohira, Dr. Ashfaq. “Tube butt welding using GMAW with alternating
shielding gases”. IIW Annual Assembly, 2011
2. P V D Ramesh, N Rajasekaran, A. Santhakumari & Dr A Raja. “Establishment of Activated TIG Welding
Technology for Tube to Tube Joining Applications”.Seminar on „Roadmap for Excellence in Welding”, 19-20
November 2010 by IWS at New Delhi


Engineers for Viable Technology and $5 Trillion Economy
305 Technical Volume of 36th Indian Engineering Congress, December 26-28, 2021 ISBN 978-81-955500-1-2
MC_040_06_201
Contribution of Engineers in Reaching $5trilion Economy
Vinayak Hegde
Balance of Plant Department, Adani Power Mundra Ltd, Tunda and Siracha, Kutch, Gujarat
email: [email protected]
Abstract: Contribution of engineers in creating the nation‟s GDP is key to the technology centric activities of all
sectors of economy in rapidly changing world economic scenarios. The VUCA world situations in the recent
conditions created by onslaught of pandemic has made the this aspect more significant. Indian economy is no
exception to this as economy is growing at a rapid pace with the policy impetus to the economic environment as
envisioned by the government. Actualization of the policies into the real world economic scenarios to achieve the
targeted results through the engineering skills and technological efforts are entrusted to the engineers of the nation.
The opportunities available for contribution by the engineers in the three main sectors of the economy in the current
economic environment is discussed in this paper. Engineering innovation to the existing practices and technological
up gradation potential in the identified sectors are enormous for bringing the Gross Value Addition n the short
period of time ahead. The present work identifies key drivers for GDP growth, includes critical analysis of sector
wise financial investments that have impact on value addition and introduces scope on possible technological
developmental strategies further implementation.
Keywords: Productivity; Innovation; Technology.
INTRODUCTION
India has set a ambitious goal to become USD 5 Trillion economy by the end of FY2025 and envisioned to
become third largest economy in the world. The Government has several ongoing initiatives across sectors focused
on growth and the role of Engineers in achieving these initiatives is significant and challenging after the
lockdown imposed halted economic activities to prevent the spread of COVID-19. A faster rate of growth is
required to be achieved after relaxation of restrictions imposed in lock downs to overcome the losses happened in
output during previous two years. According to the recent trends to achieve the set targets, Engineers as nation
builders must contribute as catalysts to initiate the basis for loss compensated faster growth during this year only.
This can happen in the identified economic sectors by connecting growth aspirations with the skills of the
engineers and by the development of improved technologies and further use them as fulcrum to leapfrog.
CONNECT GROWTH ASPIRATIONS WITH ENGINEERING SKILLS AND TECHNOLOGY
The focus on growth aspirations laid by economic policies in three broad segments of the economy- Agriculture and
its related activities, Manufacturing in Industries and the Services need impetus by efforts of engineering skills in
the forms of innovations and technological improvements in the existing practices. The typical compositions of the
three sectors characterizing the economies in varying degrees for three countries is provided in Chart 1 which
indicates dominance of service sector in large GDP nations.
Service sector itself involves gross value additions done by core innovation and technological activities and it is the
key for economic growth. Technological Innovation comes with the core feature of productivity growth which is
“doing more with less”. Growth in productivity improves the citizens‟ standard of living as greater number of
services and products are generated by less production inputs compared to inputs required in the past. Activities
done with productivity obviously bring greater value additions within a short time.

Engineers for Viable Technology and $5 Trillion Economy
306 Technical Volume of 36th Indian Engineering Congress, December 26-28, 2021 ISBN 978-81-955500-1-2
Chart 1 Distribution of the GDP across economic sectors-2018
Agriculture and Allied Activities
In the Indian economy labor force participation in agriculture sector is comparatively highest to the other sectors
than that of India which indicate that enormous scope exists for use of innovations in the activities to improve
productivity. It is also clear by the results that the main food grains contribution of in terms of acreage is 15
percent, while their contribution in production is less than 9 percent.
For Americans, agriculture was once a leading form of employment but now it is only a less than 2% of the
population is engaged in activities of farming, even when output by Agricultural activities have increased. This is
evident in the Chart 2. This also freed the major chunk of the labor community to search for other areas of
production in manufacturing and services sector.
Chart 2 Distribution of the workforce across economic sectors-2019
Ways to Improve Productivity in Agriculture
Improving productivity requires engineers to adopt innovation throughfounding of start-ups in Agricultural
activities. Start-ups with potential of human capital and intellects is the right approach for economic growth in the
current Indian scenario comprising requirement of multi pronged approach solutionsfor creating the agricultural
value chain and value addition. A key element in the improving competitiveness is the efficient use of this

Engineers for Viable Technology and $5 Trillion Economy
307 Technical Volume of 36th Indian Engineering Congress, December 26-28, 2021 ISBN 978-81-955500-1-2
innovation led talents. In order to achieve the results faster, clear objectives to be set by use of technology
collaborations and participation of stakeholders.
In India, agricultural start-ups are still at beginning stage and are started by some aspiring „agripreneurs‟ with a aim
to solve multiple problems inherent in the ecosystem of Indian agribusiness. The potential for scaling up and
opportunity of disrupting the technologies is an advantage. In the global investments arena, during 2019, agri-tech
start-ups from India contributed around $400 which is less than 10%. Technological interventions required in value
chains in the knowledge areas of agricultural sciences like mobile apps for weather forecast, decision support
systems for crops selling prices, soil management solutions, sowing techniques involving artificial intelligence and
crop pest control systems. Educating farmers and get accustomed to the new technologies is also an area for policy
reforms in adult education schemes which will benefit the farming community.Governmental policy frameworks to
be revived through farm Co-operative sectors for promoting such educations to the majority of needy farmers
community who are having technological generations gap issues.
Engineering Development of equipment and devices related to crop management, harvest management and transport
is another area like Mobile controlled motor, UAVs for pest control spray, Drone services for crops management,
technologies in irrigation systems for drip and sprinkler, GPS powered driverless tractors, Counting Machines for
crop produces, algorithms usingMachine-learning to identify weeds, Imaging technologies to sorting crops based
on size, type, colour, etc.
Development of marketing support based solutions for crops and producesdistribution, support on packaging
technology and handling is in the urgent need looking to India‟s vast imbalance territorial geographies for crops
and seasonal changes to cropping.Also, a mobile applications to sell agricultural products, price forecasting models
on controlling inflation, dynamic mechanisms on product pricing can be a game changer for vast Indian agriculture
produces.
Success Story Models of Early Starters
On a market study of agriculture start-ups, a many of new start-ups have already embraced the innovation and
technological route to solve climate change challenges of Indian farmers. One such start-up, Skymet Weather
Services offers weather monitoring and predictingaimed at tackling the risks in farming. These solutions offer
village level measurements and predictions on yield for any crop with accuracy and weather forecasting at local
level in time ranges of short, medium, and long duration. Another start-up Ecozen Solutions is offering
indigenously developed solar based products for crop irrigation and harvest storage for regions having issues of
disruptions in electrical supply. Crop protection methods are offered by Barrix Agro Sciences with eco-friendly
features like preventing water and soil contamination which are caused by use of chemicals to tackle damages by
pests and diseases.
In an effort to connect marginal Indian farmers on value chain stake holders, online and mobile based solutions are
provided by eKutir Global. They offer services to connect farmers with service providers for farm soil-testing ,
seeds and fertilizers supply, information on banks, food-processing centres,exporters and retailers. They offer a
one-stop solution with field partners for training farmers to even use mobile applications.
Some ventures initially ventured as start-ups are now turned out as medium-scale businesses owing to innovative
solutions. One such company is EM3 AgriServices, which was started in 2014, has opted the farming-as-a-service
business model. They offer machines on a pay-for-use basis to farm activities through their techno service centres
called „Samadhan‟.
These are the some examples of innovation and technology collaborations that are eventually turning out the
business to successful ventures and making impact on economical landscape development. Indian agriculture has
potential to replicate and improvise further on these business models to garner greater share in economy as it is
characterised by vast variety of agricultural produces with varying geographically and climatically changing
conditions.

Engineers for Viable Technology and $5 Trillion Economy
308 Technical Volume of 36th Indian Engineering Congress, December 26-28, 2021 ISBN 978-81-955500-1-2
Industrial Manufacturing
Dan Scheinman, Former Senior Vice President of Cisco Systems‟ Media Solutions Group once said, “We originally
came to India for the [low] cost. We stayed because of the quality, and now we‟re investing because of the
innovation”. Focus on existing high impact sectors in manufacturing is the key to achieve the target with advantages
in cost, quality and scope for innovation.
Indian Industrial Sectors Requiring Engineering Skills
Defence sector in India is having 2nd largest standing military and its spending is fifth largest in the world. Almost
60% of defence requirements are met through imports and is largest spending of 30% of total budget for importing
conventional defence equipment.Forging industry-academia-R&D lab collaborations is the opportunity in this sector
which is open arena for the engineers and entrepreneurs. Some Indian private business houses like Adani have
started their venture in defence and aerospace with encouraging government policy of indigenous manufacturing of
defence equipment. These have come up with defence collaboration in technology with foreign companies.
The engineering sector accounts about 27% of total factories in the industrial sectors and comprises 63% of the
foreign collaborations. Investment in infrastructure and industrial production over recent years made India‟s
engineering sector witnessing a remarkable growth.It is associated with the manufacturing and infrastructure sectors
which makes it a important contributor in India‟s economy mix and having advantage of 100% FDI approvals.
Make In India initiative by the government has attractive support schemes for new technology absorption which
needs to be fully utilised by the Indian engineers and industrialists.
Electronics System, Design & Manufacturing (ESDM) sector in India is the focus area for the engineers owing to
its demand met by exports. More than 60 per cent of the products under total domestic demand for electronics and
70 per cent of the components demands are met by imports. This share of imports in this sector is further rising over
the years to around 75% which is a indication of huge potential for development of electronic goods sectors in
India.
A sizeable Automobile industry exists in India, contributing to more than 7 per cent of India‟s GDP. Indian auto
industry is the sixth largest by production in the world but India‟s share in exports of auto-components is around 4
per cent and in exports of overall automotive sector share is about 1 per cent. This indicates there is a lot of scope
for further integration with Global Value Chains. Its employment creation potential is also huge and currently
provides direct employment to 1.5 million people and indirect employment of same quantity.
Apart from the above, there are 8 emerging sectors in the manufacturing which are expected contribute significantly
where Indian engineers have to upscale their skills through academic involvement to meet the opportunities of
promising technologies. Namely in the areas of Robotics, Unmanned Aerial Vehicles, Biotechnology, electric
mobility are at nascent stage in India offering tremendous potential in the areas of employment generation and
significant share in GDP. The renewed commitments of India during recently concludedclimate change conference
COP26 has also opened vistas in large scale technology changes for Indian energy and environment industry.
The Services
In India‟s GDP, the services sector contribution being the dominant and attracting major foreign investments. It
contributed significantly to exports and it is a source of large scale employment. It covers economic activities of real
estate, construction, insurance, transport, personal and social related activities, hotel business and computer software
and hardware development and testing. Service sector‟s share in economy has been steadily increased to 54 percent
and almost 80 percent of FDIs are coming into service sector.
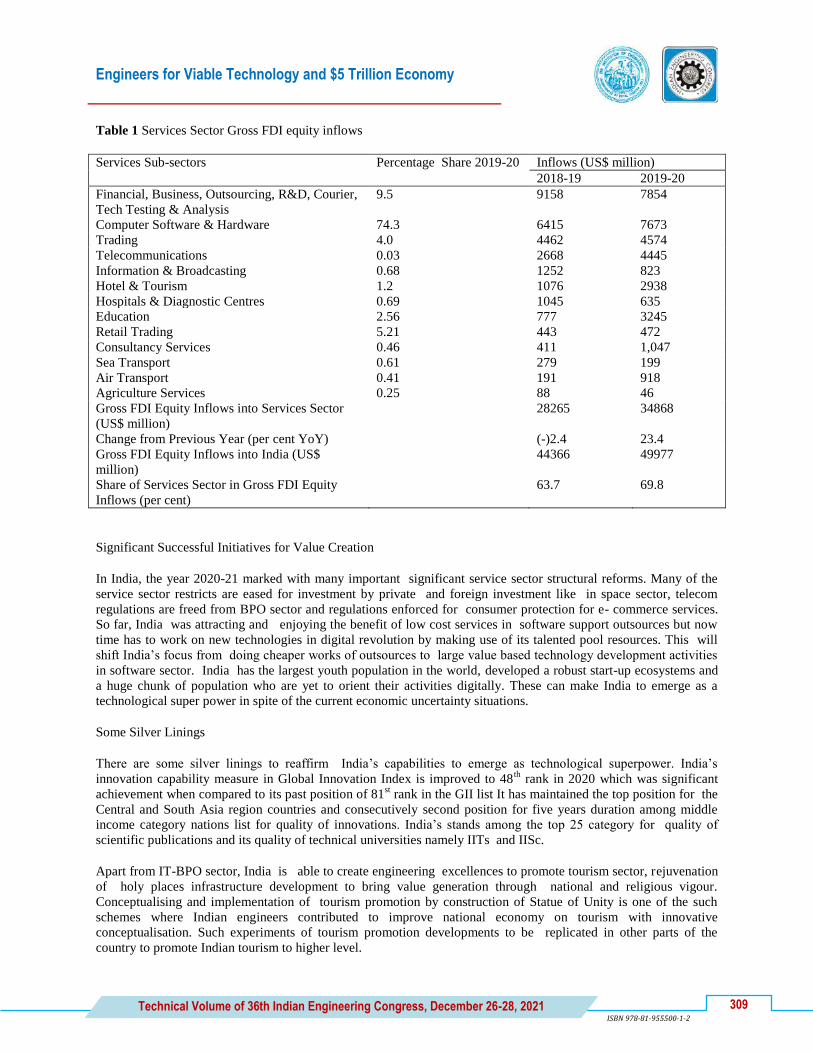
Engineers for Viable Technology and $5 Trillion Economy
309 Technical Volume of 36th Indian Engineering Congress, December 26-28, 2021 ISBN 978-81-955500-1-2
Table 1 Services Sector Gross FDI equity inflows
Services Sub-sectors Percentage Share 2019-20 Inflows (US$ million)
2018-19 2019-20
Financial, Business, Outsourcing, R&D, Courier,
Tech Testing & Analysis
9.5 9158 7854
Computer Software & Hardware 74.3 6415 7673
Trading 4.0 4462 4574
Telecommunications 0.03 2668 4445
Information & Broadcasting 0.68 1252 823
Hotel & Tourism 1.2 1076 2938
Hospitals & Diagnostic Centres 0.69 1045 635
Education 2.56 777 3245
Retail Trading 5.21 443 472
Consultancy Services 0.46 411 1,047
Sea Transport 0.61 279 199
Air Transport 0.41 191 918
Agriculture Services 0.25 88 46
Gross FDI Equity Inflows into Services Sector
(US$ million)
28265 34868
Change from Previous Year (per cent YoY) (-)2.4 23.4
Gross FDI Equity Inflows into India (US$
million)
44366 49977
Share of Services Sector in Gross FDI Equity
Inflows (per cent)
63.7 69.8
Significant Successful Initiatives for Value Creation
In India, the year 2020-21 marked with many important significant service sector structural reforms. Many of the
service sector restricts are eased for investment by private and foreign investment like in space sector, telecom
regulations are freed from BPO sector and regulations enforced for consumer protection for e- commerce services.
So far, India was attracting and enjoying the benefit of low cost services in software support outsources but now
time has to work on new technologies in digital revolution by making use of its talented pool resources. This will
shift India‟s focus from doing cheaper works of outsources to large value based technology development activities
in software sector. India has the largest youth population in the world, developed a robust start-up ecosystems and
a huge chunk of population who are yet to orient their activities digitally. These can make India to emerge as a
technological super power in spite of the current economic uncertainty situations.
Some Silver Linings
There are some silver linings to reaffirm India‟s capabilities to emerge as technological superpower. India‟s
innovation capability measure in Global Innovation Index is improved to 48th
rank in 2020 which was significant
achievement when compared to its past position of 81st rank in the GII list It has maintained the top position for the
Central and South Asia region countries and consecutively second position for five years duration among middle
income category nations list for quality of innovations. India‟s stands among the top 25 category for quality of
scientific publications and its quality of technical universities namely IITs and IISc.
Apart from IT-BPO sector, India is able to create engineering excellences to promote tourism sector, rejuvenation
of holy places infrastructure development to bring value generation through national and religious vigour.
Conceptualising and implementation of tourism promotion by construction of Statue of Unity is one of the such
schemes where Indian engineers contributed to improve national economy on tourism with innovative
conceptualisation. Such experiments of tourism promotion developments to be replicated in other parts of the
country to promote Indian tourism to higher level.

Engineers for Viable Technology and $5 Trillion Economy
310 Technical Volume of 36th Indian Engineering Congress, December 26-28, 2021 ISBN 978-81-955500-1-2
In efficiency improvement of goods handled for import and exports at Indian ports, there is significant reduction of
the turnaround time to 2.62 days in the year 2020 from 4.6 days in year 2011. This will add efficiency and cost
reduction to import and export activities of the nation.
In the start-up front, $28Bn has been raised till September 2021 for the 9 months and more number of start ups are
entering the unicorn club. Start-up ecosystem unicorns comprised health-tech, social commerce and e-pharmacy
making the total counts to 75 numbers in the unicorn club which is a encouraging sign in the service sector. With
this rate of growth, there will be around 100 unicorns by end of 2023.Service sector in India is attracting more
investments through start-up routes and companies are seeing good valuations for the growing demand in spite of
the second Covid wave during this year. The service sector is expected further revival with the ongoing vaccination
drive and ease of restrictions in contact intensive activities.
CONCLUSION
Connecting economic aspirations with engineering skills and technologies is the key factor for target achievement.
Today engineering skills and technology bringing disruptions in all walks of the life. With the start of digital
revolution, India is in forefront with its vast fraternity of young talented engineers who can make the dream come
true in every sector of economy. The start-up hubs by the young engineers are making huge disruptions in the
technology and digital landscape. They are changing the way of doing business in all sectors of the economy
through e-commerce route. In agriculture they are providing real time data inputs on soil quality, weather status for
increasing the productivity. Start-ups in health, education are processing information and data through artificial
intelligence and machine learning to get better outcomes. The blend of government‟s economy oriented policy
measures, schemes on business promotion initiatives are helping the engineers to realise the ease of doing business
and make full utilisation their skills. The nations engineer fraternity is fully equipped to bring positive turnaround in
economy in spite of pandemic challenges created in the last two years through its vast skill base and innovative
spirit.
REFERENCES
1. www.indiabudget.gov.in/economicsurvey/doc/vol2chapter/echap09_vol2.pdf. Page 310.
2. Jan 2019, Final report working group Department Industrial Policy and Promotion, Ministry of Commerce and
Industry, Govt. of India.
3. Press Publication on August 14, 2021, Press Information Bureau Ministry of Commerce & Industry, Govt. of
India.
4. News Article by Shailender Kumar,Regional Managing Director, Oracle India
5. Anil Nair1 &OrhunGuldiken& Stav Fainshmidt& Amir Pezeshkan, Innovation in India: A review of past
research and future directions Published online: 9 November 2015
6. https://www.statista.com/statistics, Published by Aaron O'Neill Jul 22, 2021.
7. News articles, Media and Press releases of Government of India

Engineers for Viable Technology and $5 Trillion Economy
311 Technical Volume of 36th Indian Engineering Congress, December 26-28, 2021 ISBN 978-81-955500-1-2
MC_054_11_222
Challenges in Design of Positive Isolation System for Large
Diameter Gas Piping in Steel Plants
Anirban Datta* and Pranab Kumar Bhattacharya
MESCIA Engineers, Salt Lake City, Kolkata, West Bengal
*e-mail: [email protected]
Abstract: In this era of heading to 5 trillion dollar economy, „Safety‟ remains prime concern for any industrial
establishment; steel plant is no exception. During reduction of iron ore, the blast furnace produces blast furnace
gas, having considerable calorific value. The gas, however, is not only poisonous, but has potential to form
explosive mixture. Apart from blast furnace gas, there are other hazardous gases such coke oven gas, mixed gas etc.
which also run through piping system in steel plants. After utilizing optimum heat value of the gas in various
shops/units inside the plant, it is often required to release unused/excess gas through flare system. While
maintaining the line pressure, the process calls for extreme safety measures against any hazard. „Water-seal‟ is a
conventional requirement at the upstream of branch-out connections or flare stack, which avoids any accidental
propagation of fire caused by ingress of air from top of the stack, or from any other source of leakage. In addition,
„positive isolation‟ during maintenance necessitates either U-seal (requiring considerable plant space) or a Goggle
Valve (a costlier proposition), in lieu. Designing of the positive isolation for repair/maintenance in large diameter
gas piping mains connected to different units/shops/equipment often possess a challenge to the consulting engineer.
This paper articulates on those challenges and focuses on a cost-effective, efficient and innovative safety device for
flare stack, which can be called „Water-Seal-cum-Lock‟
Keywords: Steel; Gas; Flare; Water-seal; Positive-isolation; Safety
INTRODUCTION
Firstly, the recommended/normative basic safety requirements in handling fuel gases such as Blast Furnace Gas
(BFG), Coke Oven gas (COG), and LD gas (LDG) & their mixtures (MG) and Liquid Petroleum Gas (LPG) are
discussed in this paper. It focuses briefly the precautions to be taken, safety appliances to be available and their use
in working with above gas lines to prevent from their main hazards of fire, explosion & gas poisoning, within and
outside iron & steel making sector.[1]
HAZARDS OF BY-PRODUCT GASES
Following Table 1 indicates the hazardous properties of various by-product gases produced/used from/in various
shops/units, shown in Safety Code for Iron & Steel Sector, published by Ministry of Steel, Govt. of India, Doc. No:
SC/21: [1]
A. Effect of Carbon Monoxide (CO) on Respiratory System
Carbon monoxide when inhaled along with air is absorbed in blood and reduces the oxygen carrying capacity in
blood, and forms carboxy-hemoglobin in place of oxy-hemoglobin, causing body tissues to suffer from anoximia
(lack of oxygen), with symptoms such as Headache, Nausea, Vomiting, Feeling of giddiness, difficulty in breathing.
[2]

Engineers for Viable Technology and $5 Trillion Economy
312 Technical Volume of 36th Indian Engineering Congress, December 26-28, 2021 ISBN 978-81-955500-1-2
B. Effect of Carbon Monoxide (CO) in Blood
Following Table 2 indicates the effect of different percentage levels of CO when absorbed in blood, shown in Safety
Code for Iron & Steel Sector, published by Ministry of Steel, Govt. of India, Doc. No: SC/21:[1]
Table 1 Hazards of by-product gases
Limit BFG COG LDG MG
Toxicity Highly toxic Toxic Extremely toxic Highly toxic
Flammability
Inflammable
Inflammable Inflammable Inflammable
Carbon Monoxide percentage
by volume
23 - 27 6 - 10 60 - 70 10 - 60
Explosiveness Explosive Explosive Explosive Explosive
Lower Explosive Limit (LEL) 35% in air 6% in air 15% in air
10 - 30% Depending on
composition
Higher Explosive Limit
(HEL)
73.5% in air 31% in air 72% in air 35 - 70% Depending on
composition
Identification of gases (by
smells)
Odourless Burning tar
Rotten egg or
rotten fish
Odourless Odourless
Table 2 Effect of Various percentages of CO in blood
CO Percentage in Blood Effects
0 – 10 Shortness of breath on exertion
10 – 20
Increase in shortness of breath and slight headache
20 – 30 Headache is more pronounced, irritable, judgment impaired, vomiting
30 – 40 Becomes confused, faint
40 – 50 Above symptoms are intensified with increased pulse rate respiration
50 – 60 Unconsciousness
60 – 70 Respiration may fail, death may occur
C. Fire and Explosion Hazards
1) Due to presence of leakage in gas piping and presence of ignition source in near vicinity:
In case there is any ignition source such as gas cutting/ welding spatters, sparking due electrical short circuit as well
as from tools and tackles, or thunder etc. in the vicinity of gas conveying piping/pipeline, and there is any event of
leakage through flanged joint(s) of valve(s) or expansion/dismantling joint(s), severe fire and explosion can occur.
2) Spontaneous ignition of coke oven gas (COG):
Sometimes, in a steel plant, spontaneous ignition is experienced in coke oven gas (COG) deposits either on ground
or inside piping running on overhead pipe-rack, in the form of white smoke or fire, particularly during shutdowns
when COG piping/pipelines are opened for inspection or maintenance. Reason of this is the presence of pyrophoric
iron sulfide (PIS), which is formed by the conversion of iron oxide (rust or corrosion deposits) into iron sulfide in an
environment which is free from oxygen and/or where hydrogen sulfide gas is present with concentration more than
oxygen. PIS, when exposed to the atmospheric air, oxidizes exothermically, resulting in the formation of excessive
heat oxidation which can ignite nearby flammable material, substances or fuel-air mixtures.

Engineers for Viable Technology and $5 Trillion Economy
313 Technical Volume of 36th Indian Engineering Congress, December 26-28, 2021 ISBN 978-81-955500-1-2
PREVENTIVE MEASURES & POSITIVE ISOLATION OF GAS MAINS
Fire occurred due to PIS can be avoided by preventing PIS from contacting air, by maintaining a continuous layer of
liquid or inert gas between the by-product gas and the air, through following precautionary measures:
a) Always purging the gas piping/pipeline, preferably with nitrogen or steam, before dismantling it for
maintenance.
b) Covering the open ends thoroughly immediately after dismantling the pipes, to prevent air ingress inside the
pipe.
c) Keeping the deposits inside the pipe submerged in water, if capping of end is not possible.
d) Maintaining a positive pressure inside the pipe, if possible, preferably with nitrogen supply.
Due to the hazardous characteristics/features of by-product gases indicated in Table 1, it is an absolute „safety-
necessity‟ to provide a positive isolation in gas piping during shut-down/maintenance.
In steel plants, there are three conventional ways of achieving positive isolation of gas lines:
1. Water Seal (U Seal/ Quick Dump Seal
2. Blanking
3. Goggle Valve
Figure 1 shows means of positive isolation of gas piping main with both U Seal and Goggle Valve.
Figure 1 Positive isolation of gas main with U-seal / Goggle Valve.

Engineers for Viable Technology and $5 Trillion Economy
314 Technical Volume of 36th Indian Engineering Congress, December 26-28, 2021 ISBN 978-81-955500-1-2
Figure 2 Typical installation of Goggle Valve in gas piping main.
Figure 3 Typical installation of U Seal in gas piping main.
ISOLATION WITH WATER SEALS
Water Sealing (Figure 4):
a) First, the Gas isolating valve „1‟ is to be closed.
b) Next, the drain valves „4‟& „5‟ are to be closed and a blank is to be put additionally below the valve „4‟.
c) It is to be ensured that there is sufficient water pressure in the water inlet line.
d) Then, water inlet valves „2‟ and „3‟ are to be opened.
e) Next, water overflow valve „6‟ is to be opened.

Engineers for Viable Technology and $5 Trillion Economy
315 Technical Volume of 36th Indian Engineering Congress, December 26-28, 2021 ISBN 978-81-955500-1-2
f) As soon as water starts coming from overflow line, water inlet valve „2‟ is to be adjusted in order to ensure
continuous trickling through water overflow line.
g) Now, water sealing of U Seal is done.
h) From time to time the flow of water trickling from overflow line is to be kept under watch.
Figure 4 Scheme of U Seal in gas piping main.[2]
Purging of Gas Line with Inert Gas (Figure 5):
a) The gas incoming line valve, if provided, is to be closed.
b) The outlet gas line valve at consumer‟s side, if provided, is to be closed.
c) Water sealing in incoming line is to be done as per Figure 4.
d) Water sealing in outlet line (consumer side) is to be done as per Figure 4.
e) Bleeder/vent valve, just before first isolation device (valve or U seal) of downstream line of all consumers is to
be opened, to depressurize the gas line and it is to be ensured that the line is completely depressurized before
purging preferably with nitrogen.
f) During purging process, no personnel is to be allowed to stay near the vicinity of end bleeders due to presence of
high concentrations of nitrogen.
g) Purging valve nearest to the isolation point is to be opened.
h) Line pressure is to be monitored and controlled by installing a manometer in one of the drip pots. This
manometer should not be fixed very near to purge in and vent out point, in order to ensure accurate monitoring.
Pressure in the gas line is to be controlled by throttling either purge-in or vent-out valves. Drip pot where
manometer is placed must not be used as vent-out for controlling the line pressure.
i) For COG, purging is to be continued till carbon monoxide concentration at bleeder becomes less than 50 ppm.
During checking of carbon monoxide concentration at bleeder, suitable gas mask must be used.
j) When carbon monoxide concentration at bleeder becomes less than 50 ppm, nitrogen purging valve is to be
closed. Purging is now over and gas line work to be carried out from outside; however, personnel entry inside
gas line must be prohibited still.
k) If any work which require entry of personnel inside the gas line, gas line is to be purged out with air (with
suitable mechanical equipment (e.g. portable compressor or exhaust fan) till oxygen level goes above 20%,
especially for BFG & LDG lines, as per the stipulations of confined space safety standard.

Engineers for Viable Technology and $5 Trillion Economy
316 Technical Volume of 36th Indian Engineering Congress, December 26-28, 2021 ISBN 978-81-955500-1-2
l) In no case any personnel should enter inside COG line.
Figure 5 Purging of gas main with nitrogen.[2]
Water Seal Breaking (after necessary purging of gas line) (Figure 4):
a) Water inlet valves „2‟ and „3‟ are to be closed.
b) As soon as water trickling from overflow line stops, overflow valve „6‟ is to be closed.
c) The blank below drain valve „4‟ is to be removed and the drain valves „4‟& „5‟ are to be opened.
d) The gas isolating valve „1‟ is to be opened.
e) Water seal breaking is now done.
ISOLATION WITH BLANKING
Following steps are to be followed for isolation of gas piping main with blanking:
a) Proper and safe location for inserting the blank in the gas line, preferably with nitrogen flooding arrangement, is
to be selected/deigned.
b) Standard scaffolding with suitable platform, toe-guard, railing and proper approach is to be provided for
overhead pipework.
c) Suitable gas mask/breathing apparatus (as required) are to be kept at site to meet any emergency situation, such
as blower type gas mask. Carbon monoxide detector should be kept near the suction point of the blower during
use to ensure that no carbon monoxide is sucked in the blower.
d) Fire tender is to be stationed near the blanking site.
e) Any possible presence of ignition source in the vicinity must be taken care off.
f) Blank of the right size to be kept ready along with gasket/ceramic rope/ring joint.
g) Gas line isolation valve is to be closed after getting clearance from consumer.
h) Water sealing of respective gas line is to be completed and the line is required to be depressurized by opening
end bleeder at approachable and safe location.
i) Nitrogen/inert gas purging of gas line must be completed before doing blanking job in order to evacuate the toxic
gas from the piping/pipeline.
j) Fasteners are to be opened, but without gas cutting or chiseling.
k) It must be ensured that isolation valves are fully shut-off; the amount of concentration of gas leakage, if any,
must be under permissible limit (50 ppm). In case blanking is to done in the event/environment of gas leakage, it
must be done by using appropriate gas mask.
l) All persons engaged for blanking/de-blanking job must wear fire-retardant cloth.

Engineers for Viable Technology and $5 Trillion Economy
317 Technical Volume of 36th Indian Engineering Congress, December 26-28, 2021 ISBN 978-81-955500-1-2
m) Non-ferrous tools such as hydraulic flange spreader are to be used for making gap between the flanges.
n) While inserting the blank in the gas main, personnel working in the vicinity must unfasten their safety belt and
stand away from the flange joint(s) on the scaffolding platform. This is for ensuring that they can escape away in
case of any unwarranted fire hazard.
o) While blanking/de-blanking, sufficient of water must be sprayed over the flange joints.
p) Gasket/rope should be put on both side of the blank.
q) Same precautions are to be followed during removing of blank from gas line.
Figure 6 Purging of gas main with nitrogen.[2]
ISOLATION WITH GOGGLE VALVE
Goggle Valve is a positive isolation device, comprising of two components, a solid disc and an expansion joint.
Operation of this valve requires that the faces of flanges are be separated by thermo-mechanical or hydraulic means,
in order to allow the solid disc to be inserted into the gas stream flowing though conveying piping/pipeline, either
manually or by a small electric motor. Once the solid disc has been inserted into the gas path, the separation means
is reversed, which in turn seals up the flange faces.[3]
SAFETY ARRANGEMENT IN FLARE STACK
Prevention of Air Ingress in Flare System
Typically flare system operates at a low pressure close to atmospheric pressure. This pressure is actually the built-up
back pressure due to continuous flared or purged gas flow in flare stack. Pressure at flare stack tip is atmospheric
and back-pressure in the clean gas piping is atmospheric pressure plus frictional pressure drop from continuous
venting/purging of gas. If flow of gas to flare stack stops for some reason, there is a possibility of air ingress into
flare stack and subsequently into the clean gas piping. This can result in an explosive mixture of air and
hydrocarbons in the flare network, which would perhaps be catastrophic.
Liquid (Water) Seal at Base of Flare Stack
Water seal at flare stack base is a cylindrical volume of liquid into which the gas inlet to flare stack is dipped. The
„seal-height‟ is so maintained (depending on network gas pressure) that it just allows the flow of flared gas from
inlet pipe to the stack (initially by bubbling through the water, and then by dispersing the water from the inlet pipe
level). Water seal does not permit air ingress into the gas inlet pipe. Liquid (water) also helps in extinguishing any
fire that would have accidentally travelled up to the bottom of flare stack. This is already a proven arrangement
(Figure 7).

Engineers for Viable Technology and $5 Trillion Economy
318 Technical Volume of 36th Indian Engineering Congress, December 26-28, 2021 ISBN 978-81-955500-1-2
However, in the subject case, this common arrangement has been improvised further with additional safety feature
working in tandem, with significant reduction of cost and plant area.
Figure 7 Common liquid seal arrangement at base of flare stack
Goggle valves (Figure 2) are heavy in construction and involve considerable cost, both in procurement and
installation, as well. It requires a robust supporting structure and considerably big maintenance platform, with
stair/ladder. On the other hand, U seals (Figure 3) are easier to design, install and operate, and ensuring 100%
positive isolation. However, U seals require much larger space, in plant layout, compared to goggle valve.
Table 3 Indicates a comparison between two options
Table 3 Comparison Between Goggle Valve and U-seal
Sl. No. Description Features
1 Goggle Valve Either of the two is a must
technically Costly item
Heavy structure
2 U-seal (min seal height shall be
„500 mm Water Col. plus actual
gas pressure‟ or „2000 mm Water
Col.‟, whichever is higher)
Cost comparatively less than
goggle valve
More space required
The „constraints‟ gave rise to an „innovation in design‟:
• To avoid Goggle Valve (high cost consideration)
• To avoid U-seal (space limitation)

Engineers for Viable Technology and $5 Trillion Economy
319 Technical Volume of 36th Indian Engineering Congress, December 26-28, 2021 ISBN 978-81-955500-1-2
• To offer an alternative „positive isolation‟ for blast furnace gas
• To retain conventional water seal
To overcome the constraints and satisfy technical/functional requirements, an „out-of-the-box‟ solution had been
designed and implemented, i.e. to merge conventional „water seal‟ (to prevent air ingress and propagation of back
fire) with a device (hereafter referred as „water lock‟) to provide positive isolation (substitute of goggle valve and/or
U-seal).
In this route, following challenges had to be overcome:
1. Pre-requisite of water seal: Height of water must be less than 900 mm, so that forward gas can bubble through
towards stack, but any possible fire cannot travel backward.
2. Pre-requisite of water lock: Height of water not to be less than 2000 mm, which is a technical requirement, in
order to prevent/isolate any flow of gas, whenever required.
Figure 8 Combined „water seal‟ cum „water lock‟ arrangement.
From the above, it is evident that the above requirements are contradictory to each other under normal condition.
Hence, the real challenge was to satisfy/incorporate both requirements simultaneously, after incorporating „extra-
ordinary‟ modifications, as required, in the system.
Features of „water seal‟ cum „water lock‟
It is a combined equipment with inner diameter of the order of 7000 mm at the base of flare stack, with provision to
maintain either of the two pre-defined levels of water inside the equipment by means of piping and valves:
Lower level providing 800 mm Water Column, for „water seal‟

Engineers for Viable Technology and $5 Trillion Economy
320 Technical Volume of 36th Indian Engineering Congress, December 26-28, 2021 ISBN 978-81-955500-1-2
Upper level providing 2000 mm Water Column for „water lock‟
To supply water, there would be a DN 200 water header for the equipment, along with two branches:
DN 200 supply line for higher level i.e. „water lock‟ with a bypass line with isolation valve of DN 50 - to be
operated during maintenance period only, to maintain continuous supply of water, yet avoid its wastage during
that period.
Inlet branch line DN 80 with solenoid valve, which will be kept open during normal operation, to maintain the
level in „water seal‟
There would be a DN 200 overflow line for the equipment, discharging through drip pot (safety against possible gas
leak). This overflow line would consist of isolation valve (manually operated). This valve is to remain open during
normal operation of flare System, so that lower level of water is maintained inside the equipment, same functioning
as normal „water seal‟. When isolation of the blast furnace gas line would be required, this valve has to be closed to
stop the lower level overflow and allow the level to increase (up to the pre-defined level, by means of overflow
line), creating and maintaining water level required for „water lock‟. Also, there would be a common drain valve of
DN 150 at the bottom, for occasional cleaning of equipment. The material of construction of the seal is carbon steel
as per IS 2062 Gr. B with Copper content of 0.25 - 0.35%.
VALUE ENGINEERING
This proposition reduced the installation cost of the flare system significantly, along with occupying much less plant
area. Table 4 shows the comparison of costs for different options.
Table 4 Comparison of costs for different options
Sl. No. Description Estimated Cost (INR Lakhs) Remarks
1 Perforated gas inlet + base plate + shell with
dished end
23.80
2 Riser pipe and derrick structure 164.80
3 BF Gas header with platform + 1 no. 4-legged
tower + 1 no. 2-legged trestle
4.00
4 Control valve 1 no. 16.00
5 Flare tip + Panel + utility piping with valves +
cabling
50.00
6 Civil foundation for flare stack, 4-legged tower &
2-legged trestle
92.16
SUB TOTAL 350.76
7 Goggle valve 100.00 Option-A
TOTAL – Option-A (Sum of 1 to 7) 450.76
8 U-seal with pipes & valves 13.20 Option-B
TOTAL – Option-B (Sum of 1 to 6 plus 8) 363.96
9 „Water seal‟ cum „water lock‟ with piping,
valves, level gauge and extension of perforated
gas inlet
2.28 Option-C
TOTAL – Option-C (Sum of 1 to 6 plus 9) 353.04
Therefore, proposed arrangement yielded a cost savings of INR 97.72 Lakhs (21.67%) when compared with
installation of goggle valve, and INR 10.92 Lakhs (3%) when compared with installation of U-seal. Further,
intangible effect of value engineering is even higher (in case of the innovative safety device), if the requirement of
lesser plant area is taken into account. However, it is to be noted that cost comparison presented in Table IV above is

Engineers for Viable Technology and $5 Trillion Economy
321 Technical Volume of 36th Indian Engineering Congress, December 26-28, 2021 ISBN 978-81-955500-1-2
as of the year 2015, and a 15% – 20% escalation may be considered, if this proposition is to be implemented in any
project today.
CONCLUSION
In upcoming and future steel plants in India and abroad, this integrated „water seal‟ cum „water lock‟ arrangement
can open a new horizon in plant and process safety.
ACKNOWLEDGMENT
The authors sincerely acknowledge the guidance and support provided by Mr. Subrata Chatterjee, Former Deputy
General Manager, Fluid System & Piping Department, MECON Limited, and Mrs. Oindrila Dey Mukherjee, Lead
Engineer – Inline Component & Piping, GE India.
REFERENCES
1. Safety Code for Iron & Steel Sector, Handling Fuel Gas, Doc. No: SC/21, Ministry of Steel, Govt. of India, pp. 1
2. Inter Plant Standard – Steel Industry, Safety Standard for Working on Gas Lines in Steel Industry, Steel
Authority of India, pp. 1, 2, 3, 7, 8, 9, 10
3. Safety and Industrial Hygiene Safety Standard Practices, Isolation, Purging, and Re-Introduction of Gas Safety
Standard Practices, pp. 20

Engineers for Viable Technology and $5 Trillion Economy
323 Technical Volume of 36th Indian Engineering Congress, December 26-28, 2021
ISBN 978-81-955500-1-2
MC_071_14_237
Experience of Belt Jump and Sway in a Short Belt Conveyor
Bhaskar Dutta1 and Anirban Datta
2*
1Thyssen Krupp Industries
2MESCIA Engineers, Salt Lake City, Kolkata, West Bengal
*e-mail: [email protected]
Abstract: A limestone handling belt conveyor intended to carry 200 metric tonnes per hour met challenges during
the start of operation. Simple conveyor, simple design parameters and rather simple layout yet engineers were
rather struggling to tame the running of the conveyor.
This paper intends to provide the problems faced, analysis/diagnosis of the problem and remedial measures
suggested. It is really an eye opener for young bulk material handling engineers working in the industry. It is also
lesson learning for experienced engineers of the industry to create checks and balances in the working system to
eliminate any lapse that can creep in but could be avoided.
Keywords: Conveyor; Material handling; Belt; Troughability; Sway; Jump.
INTRODUCTION
Bulk Material Handling Industry can‟t be thought of without Belt Conveyors. A Belt Conveyor consists of Idler,
Pulley, Belt, Scrappers, Skirt Boards, Take Up, Protection & Safety switches, Couplings, Gear boxes, Motors, Drive
options like Drive without soft start, Drive with soft start, Hydraulic Drive, VVFD drive, CST Drive, Gearless
Drives and Supporting Structures. Experience would give us the clue that there is inherent and intrinsic tendency of
Business Managers to make it too simplistic for short conveyors with small capacities thinking it to be too simple
and trying to intrude in the design & operational features of Belt Conveyors sometimes unknowingly and unintended
intrusion as well.
Associated with the above parts or components, some technical terms are Belt Speed, Troughing angle, Tensions
(allowable, running, starting, empty belt), eµØ
, µ, TIR (total indicated runout) of an idler, troughability of the
conveyor belt, allowable material cross sectional area of belt, cosine correction and some more.
There are number of established books, codes and standards available in the archives to enable the engineer to get
into the design aspects of Bulk Material Handling Industry at large and belt conveyor in particular. While high
capacity, high speed, long belt conveyors in complex layout feature with/without curvatures in vertical and/or
horizontal plane with multiple drives with/without regeneration receives due attention from experienced engineers,
the smaller ones are left to younger engineers and allowed to be released from designer table to site for installation.
However, the intended example that is presented here shows that the industry engineers ought to exercise caution to
obtain desired results of operations even for small conveyors like the one presented in this article.
BELT CONVEYOR IN DISCUSSION – ITS PARAMETERS
Material handled – Limestone
Lump Size – 50 mm and down
Bulk density – 1360 kg/m3

Engineers for Viable Technology and $5 Trillion Economy
324 Technical Volume of 36th Indian Engineering Congress, December 26-28, 2021 ISBN 978-81-955500-1-2
Angle of repose – 38O
Angle of surcharge – 20O
Rated Capacity – 200 MTPH
Design Capacity – 230 MTPH
Belt conveyor c/c – 180000 mm approx.
Lift – 35 m (approx.)
No of feed points – 2 (Two)
Type of take up – Vertical Gravity
Troughing angle – 35O
Drive margin – 1.36 at rated MTPH & 1.21 at design MTPH
Type of Drive – Direct if selected motor is 75 KW or below
Other stipulation – Top & bottom cover thickness of Belt shall not be less than 7 & 3.5 mm respectively.
LAYOUT DRAWING OF THE CONVEYOR
Following Figure 1 indicates the layout (plan & profile) of the conveyor in discussion.
Figure 1 Conveyor Layout
Designed Parameters
Belt – 600 mm wide, 35O troughed, 630/4 with 7 mm top & 3.5 mm bottom EP belt
127 mm toughed equal roll idlers
Drive – Snub drive with 45 kW Sq. Cage Induction Motor (with no soft start), Bevel Helical Drive, matching Pin
Bush Coupling between Motor & Gearbox & Gearbox & Drive Pulley

Engineers for Viable Technology and $5 Trillion Economy
325 Technical Volume of 36th Indian Engineering Congress, December 26-28, 2021
ISBN 978-81-955500-1-2
Take up – Vertical Gravity
What was the Problem?
When the plant was taken up for operation, “no load” trials were being taken; the project site team noticed that:
The belt is not touching the central idler. And the gap between belt and roller is uneven throughout the length of
the belt conveyor.
At the curvature zone, belt jumped quite a bit during no load trial.
When the conveyor was taken for no load trial, the belt jumped & swayed too much on one side. There was no
consistency in such sway i.e. sometimes it swayed on one side and in another time it swayed on opposite side.
And the sway in carrying run was on one side where as the sway on return run was on the opposite side.
During no load start, it appeared that the belt slipped a while and then the belt started running. Apparently, this
introduced lagging wear rate more.
Figure 2 Belt jump
Figure 3 Belt sway

Engineers for Viable Technology and $5 Trillion Economy
326 Technical Volume of 36th Indian Engineering Congress, December 26-28, 2021 ISBN 978-81-955500-1-2
And ironically, the problems listed above were visible at two Project sites where two separate site teams were
working.
Since the problems were repetitive at both sites, installation errors were practically ruled out.
Figure 2 & Figure 3 showing the „jump‟ and „sway‟ of the belt are given for the comprehension of the problem and
visual understanding.
Design team studied the problem in detail and their findings are outlined below.
Analysis of the Problem
Careful scrutiny of the design revealed the following:
Empty belt power is hardly around double-digit mark. Whereas the motor selected was 45 kW. And the starting
torque of motor of the selected vendor was 260% of full load torque (FLT) at rated voltage and rated frequency.
Since Pin bush Coupling was installed between Motor & Gearbox, the starting torque of 260% of FLT was being
witnessed by the belt resulting in abnormal jump of belt from the alignment.
And once belt jumped, the return of the belt was getting largely influenced by weight of the belt, behaviour of the
belt in free fall condition and such other.
That explained the unpredictable sway of belt conveyor and the reason of the abnormal jump at curvature zone.
Layout of the belt conveyor would give a geometrical calculation of the maximum radius of curvature and that
worked out as 309 m (when the belt is partially loaded up to the start of concave curve) though there are other
conditions also that need checks.
Could the layout engineer have increased the radius of curvature feasibility at least geometrically without
compromising the engineering norms of such layout engineering?
Answer is yes. Then why was it not done? Apparently, the engineer designed the conveyor preliminarily and did not
refresh it with the actual equipment procured. May be it was too late to introduce any geometrical change in layout
of the conveyor since the structural works proceeded much ahead without a room for trace back even if the plant
engineer wanted to effect any change.
This is where the experience would have played a role. And that is why, this paper intends to bring it to the notice of
the industry that small conveyors, be it small belt width, small capacity, short length and little height also deserve
attention of experienced engineers.
The problem got complex since the base document stipulated direct drive for drives below 75 kW. And the young
engineers who were a bit of inexperienced relied heavily on such stipulation and preferred not to raise the flag on the
mother stipulation. One has to reckon the fact that the mother stipulation in the base document might have been
done to cover most of the drives where such a stipulation might have proved to more than logical. That same needed
a closer scrutiny is best realised by experienced engineers only. And that is why this deliberation stresses the need
for checks & balances.
Second problem of troughability was looked at as follows:
Catalogues from reputed belt manufacturers provides recommendation for troughability purely on the bulk density
(range given by belt manufacturer) and belt width (Table 1). From that consideration, the designer, due to his/her
lack of experience, found it to be okay for troughability of 600 mm conveyor belt at 35O for a bulk density of 1.36
t/m3, and abnormal cover thickness was not given credence that ought to have been given.

Engineers for Viable Technology and $5 Trillion Economy
327 Technical Volume of 36th Indian Engineering Congress, December 26-28, 2021
ISBN 978-81-955500-1-2
Table 1 Conveyor belt load support table[1]
Belt
Rating
Minimum belt width for
satisfactory troughing
Max. width for satisfactory load support
35O 45
O Upto 1 ton/m
3 Over 1 to 1.6 ton/m
3 Over 1.6 to 2.5 ton/m
3
kN/m mm mm mm
315/3 500 600 1200 1000 800
400/3 500 600 1200 1050 900
500/3 500 600 1400 1200 900
500/4 500 600 1400 1200 900
630/3 600 650 1400 1200 1050
630/4 600 650 1600 1400 1200
800/4 650 800 1800 1600 1400
800/5 750 800 1800 1600 1400
1000/4 650 800 1800 1600 1400
1000/5 800 1000 2000 1600 1400
1250/4 800 1000 2000 1800 1600
1250/5 900 1050 2000 1800 1800
1400/4 1000 1200 2000 1800 1800
1600/4 800 1050 2000 2000 2000
1600/5 1000 1200 2200 2000 2000
2000/4 1050 1200 2000 2000 2000
Result: The practical experience showed that the belt is not touching the central idler. Some opinion was expressed
that the belt would trough once the belt receives load and the troughability recommendation in the belt catalogue is
with load.
Geometrical Dimensions
Resilience of the conveyor geometry with respect to its behaviour to radius of curvature was checked for below
conditions for young engineers to take note of.
Radius of Curvature
With direct drive considering the selected motor and its torque – speed characteristic curve:
At no load belt
At partially loaded belt up to the start of the curvature with design tonnage
At fully loaded belt at design tonnage
All the above conditions with 105% of rated frequency
All the above conditions with 95% of rated frequency
With soft start introduced between Motor & Gear box:
This soft start shall be considered as 150% of FLT irrespective of motor torque with 4% slip (an average of 3 to 5%
slip recommended by Hydraulic Coupling manufacturer)
At no load belt
At partially loaded belt up to the start of the curvature with design tonnage
At fully loaded belt at design tonnage

Engineers for Viable Technology and $5 Trillion Economy
328 Technical Volume of 36th Indian Engineering Congress, December 26-28, 2021 ISBN 978-81-955500-1-2
All the above conditions with 105% of rated frequency
All the above conditions with 95% of rated frequency
One can also calculate the radii of curvatures with 3% slip and 5% slip. This slip largely depends on the Fluid
Coupling model selected for a specific supplier
Loading cycle calculation for top cover thickness
Table 2 Recommendations for cold bulk materials with normal loading conditions[2]
Table 2 indicate that:
600 mm width is non-standard belt width in Indian context. Standard width is 650 mm
35O troughing for such small width was a question mark. Designers relied too much on the customer
requirement.
Tension mandated that 630 kN/m shall have to be provided by the belt selected. Designer had the option of
selecting 630/3 but designer selected 630/4 from other consideration that magnified the troughability issue of the
belt not touching the central idler.
Selection of EP belt instead of NN for the fabric of the belt also added stiffness.
Loading cycle calculation indicated that 5 mm top cover would have been more than adequate. But customer
stipulation of minimum top cover thickness indicated it to be 7 mm. That made the belt to be procured with top
cover of 7 mm. And corresponding bottom cover though could have been made to be 3 mm to maintain the
engineering practice of 1:3 between bottom & top cover but was selected as 3.5 mm based on customer

Engineers for Viable Technology and $5 Trillion Economy
329 Technical Volume of 36th Indian Engineering Congress, December 26-28, 2021
ISBN 978-81-955500-1-2
requirement. Extra thickness also added stiffness to the belt for the flexural rigidity and thereby making trough
further complex.
Drive was stipulated as direct. That means the torque vs. speed in the transient period of the motor was being
witnessed by the belt resulting lifting of the belt in no load condition. Procured motor was producing 260% of
FLT at rated voltage and frequency. Torque speed characteristics curve of the motor is referred to.
Critical look back of the conveyor calculation indicated that empty belt power was close to single digit and the
loaded belt power with margin was close to 30 kW. But the designer selected a 45 kW drive presumably insisted
upon by customer to make the selection extra safe.
Above would give the clue that the conveyor though small, in terms of layout parameters, width, capacity, belt speed
and material conveyance, was installed with rather loaded parameters than required and without a soft start
provision.
Design team of customer, contractor, component supplier and all other stakeholders have contributed in varying
proportions to the parameters in building such over margin in the system.
MODIFICATION RECOMMENDATION
1. To introduce a fluid coupling of adequate rating to have smooth start with due checks for the space, ease of
maintenance, finer parameters of bore checks of shaft (input & output) including tolerances
2. To reduce the trough angle of idlers to 20O.
3. To introduce Guide roller in zigzag manner on both side of the conveyor at the cost of some additional wear at
an interval of 20 m on carrying side and 40 m on return side
These modifications though not simple during commissioning phase because of time pressure were carried out
successfully and the conveyors were running satisfactorily.
CONCLUSION
This paper is presented for young engineers to take cognizance of the inherent checks that they need to provide as
also it is an eye opener for experienced belt conveyor specialists to properly guide young engineers to be aware of
such complexities and raise flag at appropriate stage of execution so amends are possible avoiding loss of precious
time of execution especially during end phase of a project when schedule is crashed.
ACKNOWLEDGEMENT
The authors sincerely acknowledge the guidance and support provided by Mr. Amit Bhaduri, Former General
Manager, Development Consultants Private Limited and Former Senior Consultant, ThyssenKrupp Industries, and
convey thanks to the complete project team (Owner, Owner‟s consultant, contracting company, equipment &
component manufacturers & suppliers) of the subject case study with experts providing their valued comments for
rectification.
REFERENCES
1. Belt Conveyors for Bulk Materials, 6th
Ed., 2nd
printing, published by Conveyor Equipment Manufacturers
Association (CEMA), pp. 208
2. Selecting the Proper Conveyor Belt, Fenner Dunlop – Conveyor Belting Americas, pp. 13

Engineers for Viable Technology and $5 Trillion Economy
331 Technical Volume of 36th Indian Engineering Congress, December 26-28, 2021
ISBN 978-81-955500-1-2
MC_076_15_258
Overview of Wet Flue Gas Desulphurisation System and
Condensate Flow Study in View of New Stringent Environment
Regulations for Fossil Fuel based Power Plants in India
Pradeep Kumar Sharma* and Rahul Singh
Bharat Heavy Electricals Limited, PPEI Building, HRDI & ESI Complex, Noida
*e-mail: [email protected]
Abstract: In this article a general review of recent environment norms given by Ministry of Environment, Forest and
Climate Change (MoEF&CC), Government of India to control the sulphur dioxide (SO2) emission generated from
fossil-fuel based power plants are discussed. The leading technology for sulphur dioxide reduction i.e. limestone
based Wet Flue Gas Desulphurisation (FGD) owing to its high desulphurisation efficiency and long term stability is
reviewed. Issues like corrosion problem to the inner side of the stack wall, stack liquid discharge and plume
downwash are presented. It can be stated that selection of liner material for chimney is a critical aspect while
considering the wet FGD. Effect of condensate on liner material is analyzed to provide insights into selection of
liner material for chimney operated under wet FGD. This work also includes the review of Condensate Flow Study
(CFS)required to know the effect of acid condensation and presents viable means to minimize the effect of acid
condensation by providing suitable condensate collection system.
Keywords: Carryover; Wet Stack; Re-Entrainment; Plumedownwash; Stack Liquid Discharge (SLD); Corrosion
Resistant Material
INTRODUCTION
The combustion of fossil fuels such as coal and Heavy Fuel Oil (HFO) emits three major air pollutants viz. sulphur
dioxide (SO2), nitrogen oxide (NOx), and particulates. SO2 from the flue gas can be reduced at three stages, before
combustion, during combustion and after combustion. Sulphur dioxide is a colourless & corrosive gas represents the
major source of air pollution [1]. There is catastrophic effect of Sulphur dioxide (SO2) on the environment and
createsecological imbalance in the planet earth. To mitigate the problem of sulphur emissions, the Flue-Gas
Desulfurization (FGD) system is utilized as an effective solution.
In recent times “Ministry of Environment, Forest and Climate Change” (MoEF&CC) has released notifications,
making environment norms more stringent for thermal power plants which emits various pollutant through exhaust
flue gas into the atmosphere. Our scope of discussion revolves around the effect of SO2 present in the exhaust flue
gas generated from fossil-fuel based thermal power plants. In this article the number of issues involved in wet FGD
along with its benefits are discussed. A review of the Condensate Flow Study and its importance are presented in the
work along with technical insights for chimney (stack) selection with respect to the current norms released by
MoEF&CC, Government of India to curb the level of SO2 in fossil-fuel based thermal power plants in India [5,6,10].
Commonabsorbent medium i.e. Limestone or lime in the form of slurry is sprayed over dry flue gas from boiler and
forms gypsum as a byproduct in the scrubber also known as absorber. Independent of the classification, most of the
available literature [1-3,5] conveys that most dominantly used FGD system i.e. 87 % is based on wet limestone and
globally accepted in view of high SO2 removal efficiency level and lower O&M cost [3].
This paper summarize a general review of the Condensate Flow Study and its methodology while implementing wet
limestone based FGD technologies for the thermal power plants in India. The paper call attention to therequirement

Engineers for Viable Technology and $5 Trillion Economy
332 Technical Volume of 36th Indian Engineering Congress, December 26-28, 2021 ISBN 978-81-955500-1-2
to study the wet stack in detail and address probable issues associated with FGD in view of the growing FGD market
scenario in our country.
BACKGROUND
The FGD systems in the coal based thermal power plants emerged during the industrialera in the early 1970s
majorly in the developed countries such as United States (US) and Japan, and swiftly utilized during 1980s in
European market [3]. In order to reduce the emissions from power plants, countries, have formulated stringent
regulations. Targets for greenhouse gas emission reductions has been set through International agreements such as
the Kyoto Protocol. Moreover, in order to mitigate the sulphur oxide emissions, many countries emerged with
enforcement of laws and regulations to protect the environmental damage. Clean Air Interstate Rule was launched
by the government of US and subsequently after detailed review the Acid Rain Program was revised during 2005 to
control the sulphur dioxideemissions. During 2008 the Large Combustion Plant Directive (LCPD) was reviewed and
revised by UK, to set newsulphur dioxide emission limits. During 2005, China modified Atmospheric Pollution
Prevention and Control Law (APPCL) and given directives for installation of flue gas desulphurization and dust
separation equipment in all thermal power plants that exceed the set SO2 emission levels [2]. In India, all stack
emissions are measured in terms of concentrations only & not total emission per plant [11]. MoEF&CC vide
Notification amendment as shown in Table 1, has set new emission norms for thermal power stations[5].
Table 1 Environmental (Protection) Amendment rules, 07 December, 2015
Pollutant *TPPs (units) installed after 01.04. 2004
up to 31.12. 2016’
TPPs (units) to be installed
from 01.01.2017
Sulphur Dioxide (SO2) 600 mg/Nm3 (< 500MW capacity units) and 100 mg/Nm
3
200 mg/Nm3 ( ≥ 500MW capacity units )
*TPP – Thermal power plant
Installation of flue gas desulphurization plant (FGD) has become essential in all thermal power plants already
operating or under construction[5, 10]. These regulations have become more stringent as time progressed, leading to
the new market for FGD systems.
Most of the thermal power plant stations in India are in operation without FGD. In view of recent stringent
regulations for emission the market for FGD system is expected to grow rapidly. Demand for FGD will be
substantial for both a new power plants or retrofitting in the existing power plants. Wet limestone FGD technology
is going to dominate FGD market because of its high desulphurisation performance and low operating cost.
Globally reheat system were used in FGD plants to reheat the flue gas in order to make it dry before it exit the stack,
by the utilizing Gas to Gas Heater (GGH). However, owing to need of decreased SO2 emission in power plants
and/or high energy consumption cost flue gas heating are not in use these days in the new plants.Thus, eliminated
from existing plants in service[4].
The dry stacks without FGD were designed for the higher flue gas velocity than the new wet stacks [19]. When
operating these wet stacks often results in velocity higher than the recommended liner velocity, which makes the
liquid collection difficult. Thus the majority of the liquid should to be collected in the absorber outlet ductwork [9].
MoEF&CC prescribed SO2 emission limits to be mandated in all power plants at normal operating conditions.
Suitable margins are considered by the purchaser in view of variable coal quality, peak load operation etc [10]. The
proposed guaranteed SO2 limit for clean flue gas after FGD system is to be mentioned by the purchaser in the bidas
per Table 2.

Engineers for Viable Technology and $5 Trillion Economy
333 Technical Volume of 36th Indian Engineering Congress, December 26-28, 2021
ISBN 978-81-955500-1-2
Table 2 Proposed guaranteed SO2 limit in the clean flue gas under full load condition
SO2 level stipulated by MoEF& CC ‘Guaranteed SO2 level in the treated flue gas under guarantee
condition’ (100% TMCR* load)
600 mg/Nm3 500 mg/Nm
3
200 mg/Nm3 150 mg/Nm
3
100 mg/Nm3 70 mg/Nm
3
For many years wet FGD plants have been in use across the world,however, most of them were operated with dry
stacks. However, to mitigate the unacceptable high levels of Stack Liquid Discharge (SLD) some power stations in
late 1970s, have envisaged wet ducts and wet stacks [4].
LITERATURE REVIEW
A „wet stack‟ commonly named as chimney which is enclosed with one or moreflue linerssubjected to wet (i.e.
containing acid & moisture) exhaust flue gasesand is located downstream of FGD plant. These FGD plant utilizes
absorber wherein generally limestone based slurry is sprayed over the incoming flue gases emitted after combustion
of fuel in the boiler.This spraying action reduces the content of sulphur dioxide (SO2) in the absorber but the flue gas
gets saturated with water vapour and reduces the temperature of the flue gas in the range of 46°C to 55°C for
bituminous and hard coals and in the range of 57°C to 63°C for lignite and sub-bituminous coals [9].
Wet limestone based FGD have advantages like high desulfurization efficiency, wide adaptation, long-run stability
and low operating cost. However, it creates serious corrosion problems inside surface of stack wall[7]. Due to the
high moisture content in the flue gas after the absorber, condensation occurs in these stacks during steady-state and
start-up conditions[9]. Condensation will take place if the flue gas temperature gets lower than the acid dew point
temperature resulting in chimney corrosion.The minor constituent in the flue gas is in the form of sulphur trioxide
(SO3). The SO3 is due to oxidation of a small part of the more abundant SO2 and owing to its greater affinity towards
moisture, the traces of SO3 present in the flue gas condenses in the form of fine mist [13].
Flue gas condensation occursdue to self or heterogeneous nucleation phenomena. Self-nucleation is defined as
vapour condensation by collision of vapour molecules and the formation of tiny liquid droplets that grows by
coagulation. Heterogeneous nucleation occurs at the surface of the dust particles. More complex situations can be
arisen due to presence of two different molecular species [13]. Roedel (1979) studied formation of sulphuric acid
whichtakes place due to collision of water & SO3 molecules under saturated condition (high relative humidity).
Theoretically condensation will also take place even when flue gas temperature is above dew point of sulphuric acid
in case the relative humidityis higher approximately 80% or above [13].
A study by Dyna flow System Laboratory for Israel Electric Company (IEC) at Rutenberg power station found that
the main source of liquid droplets is condensation. Mainly bulk & surface condensation processes are responsible to
condense most of the water. Mist eliminator carryover is found to be less than 0.15 kg/s. While, the amount of
condensation on liner wall is around 8.1 kg/s. The dew point calculation was carried out to know the condensation
rate. To know the rate of condensation dew point of the flue gas at stack inlet was calculated 0.09 kg of water
vapour is found to be present per kg of flue gas. Bulk condensation majorly contributes to 7.5 kg/s approximately,
anda very small amount of thermal condensation will take place. The latent heat ofvapour is absorbed in the gas
during bulk condensation. As no heat transfer takes place in this process it is termed as"adiabatic condensation"
[16].
Thus, it is absolutely necessary to protect stack corrosion after the FGD installation. In 1980s Electric Power
Research Institute (EPRI) has sponsored many programs to understand the wet FGD systems‟ process and to
determine the key factors contributing to liquid entrainment [15]. By the late 1990s, power plants were installed with
liquid collectors for wet stack & ductwork to understand the practical basis of Wet stack design guidelines, resulting
in publication of second report by EPRI [4].

Engineers for Viable Technology and $5 Trillion Economy
334 Technical Volume of 36th Indian Engineering Congress, December 26-28, 2021 ISBN 978-81-955500-1-2
PROBLEMS ASSOCIATED WITH WET FGD
The condensation in the duct and stack will not take place due to higher outlet temperature of flue gas coming out of
Air preheater, which is in the range of 120°C to 140°C and exceeds the acid dew point (40°C to 60°C). Whereas,
vice-versa will take place if the outlet temperature is lower than acid dew point resulting in chimney corrosion.
Further, Internal pressure and irregular geometry of structure are also contributing to corrosion in Chimney [12].
The major factors of the chimney corrosion are:
Production of Corrosive Medium
Coal contains sulphur which is converted to sulphur dioxide (SO2) during the burning process. Usually 1 to 5% of
sulphur dioxide is converted to sulphur trioxide(SO3) which has greater affinity to combine with water vapour in the
flue gas to form gaseous sulphuric acid [14]. After the wet FGD, SO2 and SO3 conversion in the flue gas is 95% &
20% respectively [12]. Acid dew point is often 100°C to150°C considering H2O & SO3 concentration by volume.
The outlet temperature of wet FGD are typically 80°C with GGH and 40°C to 50°C without GGH. Thus, the
corrosive fluid medium will remain even after installation of GGH, however the situation gets worsen after
elimination of GGH. If the chimney surface in contact with flue gas is cooler than the acid dew point, sulphuric acid
can condense on it and is the majorculprit for corrosion in stack & ductwork [12].
The rate of deposition of acid (H2SO4) on the stack linerismore significant for corrosion because of the difference in
temperature of acid dew point & liner [8]. The cooling effect of flue gas will take place due to leakage losses, heat
conduction processthrough the surface of ducts & stacks and chimney draft [13].
Chimney Internal Pressure
An important factor in chimney design is gas temperature and pressure inside the chimney. Negative pressure is
required inside the chimney to prevent the venting out of the corrosive and acidic flue gas to the ambient air through
the cracks in the wall, various openings, manholes etc. provided in the concrete shell. If maintained with positive
pressure inside the chimney it is not possible to prevent venting. Flue gas temperature is low for the FGD plants
without GGH, density of gas & positive pressure region will expand [12].
WET STACK SELECTION
Chimney or wet stack in the industries is used for venting hot flue gases or smoke from a boiler to the outside
atmosphere [18]. Maximum negative pressure to be obtained in the flue gas during Chimney selection [8]. Sizing of
chimney depends on many factors that are difficult to quantify. Chimney is sized such that it can exhaust a given
quantity of flue gases at suitable elevation with a velocity that will ensure the ground level concentration of
pollutants within the prescribed pollution-regulation standards [19].
Chimney Diameter & Height Selection
The chimney flue internal diameter is selected based on exit flue gas velocity limitation, draft requirement, and
environmental regulation consideration which in turn decides the major dimensions of the chimney concrete shell
with the consideration of power station capacity and no. of the units. Sizing of chimney/flue depends on flue gas
flow & temperature, ambient temperature, barometric pressure, available draft (see (1)), friction losses and exit
losses of the chimney, future expansion and maintenance requirement [19].
Theoretical draft = pressure of air – pressure of flue gas (both at the level at which flue gas enter a chimney
= 0.029 B x Hd{├ 1/(Va.Ta)- 1/(Vg.Tg)} ┤mm of Hg (1)
Chimney height is assumed and then mid-height elevation for portion Hd is determined, Ta is ambient temperature at
this height and B is corresponding barometric pressure. Tg is average flue gas temperature at flue entry.

Engineers for Viable Technology and $5 Trillion Economy
335 Technical Volume of 36th Indian Engineering Congress, December 26-28, 2021
ISBN 978-81-955500-1-2
Different chimney arrangements are commonly being employed in the power stations, single flue chimney & multi-
flue chimney. Individual chimney arrangement where each unit of the power station has individual chimney and exit
stack velocity is constant with an advantage of ease in maintenance during the annual shutdown or overhauling of
the power station. Multi-flue chimney arrangement is common for two or more units of the power station. The flues
of each unit is located inside the concrete shell which supports the flue and take care of the wind, seismic and
provide structural stability [19]. There was no mandate for SO2 emission but only stack heights are mandated to
disperse far away diluting plume concentration. MoEF&CC directed power plants more than 500 MW to build 275
m stack height, those between 210 to 500 MW, stack height of 220 m height and for less than 210 MW, stack height
(H) is calculated based on the SO2 emission using H = ln (Q)^0.3 where Q is Emission rate of SO2 (kh/hr)[11].
The required height of the chimney for thermal power stations fitted with FGD depends on flow rate of SO2 being
emitted from the chimney, stipulated by MOEF & CC notification [6], as shown in Table 3.
Table 3Stack height in Thermal power plant with wet FGD
Power Generation Capacity Stack Height
100 MW and above H = 6.902 (Q x 0.277)0.555
or
100 m whichever is more
Less than 100 MW H = 6.902 (Q x 0.277)0.555
or
30 m whichever is more
Q = Emission rate of SO2 kg/hr
H = Physical stack height in meter
As the saturated flue gas enters the stack directly, water vapour content in the flue gas condenses creating a liquid
film over the outlet duct and stack liner which needs collection and drainage system called as 'wet stack operation'.
In the event of no proper collection and drainage system being installed in the stack, results in the exit of large liquid
droplets from the stack top to the ground resulting in the phenomena called Stack liquid discharge (SLD) or spitting
or acid mist fall out or rain out. These large acidic droplets on reaching ground shall corrode the metallic structures
and equipment in the vicinity of the stack. In view of this, there is a reduction in the allowable velocity in the range
of 16.8 to 18.3 m/s for different types of liner materials being used in the wet stack such as C276, Titanium alloy,
Fibre reinforced plastic (FRP) and Borosilicate materials resulting in the larger diameter chimneys[9]. Velocities
recommendation values as shown in Table 4 are based on the laboratory testing values by EPRI in the vertical wind
tunnel under ideal condition of smooth surface without surface discontinuities in the liner considering the slight
reduction in the velocities to accommodate practical constraints in the field erection quality.
Table 4 Recommended wet stack design velocity
Liner Material (m/s)
Borosilicate Block 18.3
FRP 16.8
Alloy 16.8
Coatings 16.8
Acid Resistant Brick 13.7
The value of recommended design velocity is optimally selected in lower side to accommodate the increase in flow
of flue gas due to increase in plant output, plant efficiency or change in the fuel source [9]. Earlier optimum
chimney flue sizing is carried out considering the stack exit gas velocity without FGD system in the range of 20 to
25 m/sec. for mild steel flue lined stacks ensuring positive draft requirement [19].

Engineers for Viable Technology and $5 Trillion Economy
336 Technical Volume of 36th Indian Engineering Congress, December 26-28, 2021 ISBN 978-81-955500-1-2
In India Central Electricity Authority (CEA) has suggested a standard technical specification for chimney height for
retrofitted wet FGD in power plants installed as on 31st December, 2016 [10] as shown in Table 5.
Table 5 Suggested height of chimney, in meters in retrofitted wet FGD
Unit size Stack Height
„No. of units connected to the chimney‟
1 2
„Suggested height of wet chimney‟ (m)
< 250 MW 100 125
≥ 250 MW and < 500 MW 125 150
≥ 500 MW 150 150
However, the criteria are different for the new power plants which are going to be equipped with wet FGD after 1st
January, 2017 as shown in Table 6.
Table 6 Suggested height of chimney, in meters, in new power plants with wet FGD
Unit Size Stack Height
„No. of Units Connected to the Chimney‟
1 2
„Suggested Height of Wet Chimney‟ (m)
< 250 MW 100 100
≥ 250 MW and < 500 MW 125 125
≥ 500 MW 150 150
Chimney Liner Material
The trend to use wet flue gas desulfurization (FGD) has had a great impact on the choice of chimney liners used
today. With theresulting 49 – 54°C flue gas temperature, the use of induced draft fans rather than buoyancy moves
the gas through the ductwork and chimney liner.
Wet lime/limestone based FGD system is a widely accepted FGD techniques in power plants industry worldwide.
However, it comes with some serious issues like corrosion to the inside surface of stack due to three most common
conditions in a FGD based power plant such as: (1) FGD with bypass fully open. In that case temperature of flue gas
is above 120°C. Flue gas is completely dry which leave no chance of corrosion, which happens due to presence of
water contents in flue gas at lower temperature. (2) Bypass is fully closed (FGD installed without GGH is
completely in operation). Flue gas enters into the stack is at around 50°C with high humidity which leads to
considerable acid condensation on the inside of stack liner (3) FGD in operation with partial opening of bypass
which leads to cyclic wet-dry condition. Acid condensation occurs due to lower flue gas temperature in the both
conditions (2) & (3) where FGD is used without GGH. This leads to corrosion which would generates a need for
good corrosion resistant material [7].
Zhao (2016) in an experiment based analysis tested some corrosion resistant materials in real operation like in coal
based thermal power station. As per literature laboratory experiments and prevailing engineering practices, materials
selected such as epoxy glass coatings, corrosion resistant steels, fibre reinforced plastics (FRP), polyurea, titanium
alloy& Borosilicate (i.e. foam glass blocks)are popularlyconsidered as corrosion resistant materials. In this study, six
corrosion resistant materials are classified in three categories, such as coating materials includes Polyurea and vinyl
ester glass flake (VEGF), lining materials includes ND steel (Fe, Mn, Cu, and Cr, etc), titanium alloy & fiberglass
reinforced plastics (FRP) and the last category of lightweight insulation material include foam glass blocks. Even a

Engineers for Viable Technology and $5 Trillion Economy
337 Technical Volume of 36th Indian Engineering Congress, December 26-28, 2021
ISBN 978-81-955500-1-2
short period of thermal shocks could make a significant impact on VEGF‟s the corrosion resistance property. FRP
has also shown the sign of degradation under high temperature of above 180°C even for shorter duration. It was
observed that vinyl ester glass flake can withstand upto 120°C temperature but it is not suitable for exhaust flue gas
at high temperature as high as 180°C. FRP may cause corrosion failure under prolonged exposure in power plant
stacks. On the other hand, weight & appearance of ND steel, Borosilicate and Titanium alloy remained almost same
because of their high thermal conductivity, better heat resistant and excellent heat dissipation property[7].
Ghanem et al. (1996) demonstrated the heat resistant property of a low alloy steelby measuring the weight of the
corrosion film over the material after an exposure for 480 hours within the temperature range of 75°C to 250°C. Cai
et al. (2010) reported the significant increment of tensile ductility & thermal stability for the temperature above
150°C. Better anti corrosive behaviour of foam glass block at higher temperatures due to its low viscosity was noted
by Song et. al (2010). Thus it was concluded that low alloy steel, Borosilicate and ND steel can be applied in higher
temperature flue gas stacks in thermal power station[7].
During the tests at variable temperature, VEGF failed with significant mass loss on the other hand all other materials
viz. polyurea, titanium alloy, ND steel and foam glass blocks did not fail in similar corrosive conditions, However
FRP shown significant appearance change so not suitable with this standpoint. Thus, it was concluded that FRP &
VEGF are not suitable for cyclic temperature change and high temperature. However, in long run corrosion failure
may occur in FRP material. The three material viz. titanium alloy, Borosilicate and ND steel are able to withstand
for variable temperature condition following wet stack operation in power station [7].
Bloyce et al. (1998) and Mabilleau et al. (2006) observed cracks with craters appeared on ND steel sample subjected
to acid condition in cyclic wet-dry operation. However, nearly zero rate of corrosion for Titanium alloy was
observed in samples during static & dynamic conditions, because of formation of oxide film on the material surface
which prevented further corrosion. Unlike other materials, no significant change in colour or corrosion signs were
observed which shows its good corrosion resistant property in acidic and cyclic conditions. The formation of TiO2
layer on the metal surface of Titanium alloy makes it an excellent corrosion resistant material, thus can be used as
material for stacksdespite being expensive [7].
Contrary to titanium‟s excellent performance under accelerated acid condition and variable & static high
temperature condition its corrosion resistance was poor in sulphuric acid at high temperature. However, Borosilicate
has not shown any significant impact due to exposure in acidic environment or cyclic wet & dry conditions. The
formation of protective SiO2 & B2O3 over the surface of borosilicate material makes it better resistant to corrosive
environment during experiments explained by Soo Park et al. (1999) [7].
The comparative performance analysis of above mentioned six materials in respect of corrosion prevention in stacks
due to acidic environment were evaluated for wet stacks in coal based thermal power station. To prevent corrosion
Titanium alloy and Borosilicate glass blocks could be applied in the stack for the best performanceto prevent
chimney corrosion [7].
In India, Alloy steel lining materials are found to be expensive for power generation chimney applications.
However, the same is being used in various power plants such as 250 MW Rourkela project at Jharkhandand 2X800
MW NTPC Karimnagar project at Telangana in view of the long material life. However, FRP is being used as liner
material in under construction 2X660 MW Maitree project at Bangladesh whereinitially no provision of FGD bypass
was envisaged, so the flue gas inlet temperature is less hence FRP is suitable. Borosilicate block lining systems are
also being installed in the short height chimney forpower station, despite having less life than alloy but
comparatively cheaper option, such as in 2X490 MW NTPC Dadri project at Uttar Pradesh on a mild steel liner.
CONDENSATE FLOW STUDY
As per the two reports of EPRI as mentioned in the literature review, a detailed fluid dynamic analysis is required to
design & install effective wet stack in wet FGD outlet ducting/stack system, liquid collectionand drainage system.
The design of wet stack by the use of flow modelling is carried out in the laboratory. There are five different phases
to carry out the complete wet stack study [4].

Engineers for Viable Technology and $5 Trillion Economy
338 Technical Volume of 36th Indian Engineering Congress, December 26-28, 2021 ISBN 978-81-955500-1-2
Phase I - Initial review of the proposed system design
Phase II - Condensation calculations
Phase III - Design and development of the liquid collection system
Phase IV - Study of the plume downwash
Phase V - Field installation and operational inspections
The design of wet stack system can be finalized by using the results of above first four phases. and the same are
being utilized to prepare technical bids & specification The liquid collection system is reviewed by field engineer
during installation & inspection which is defined in fifth phase.The preliminary design review based on experience
is carried out to review proposed geometry of absorber outlet duct and stack breach by analysing the change in
system geometry such as breach aspect ratio and expansion joint locations. Comparison of gas velocities, breaching
height to width ratio & size of liner with the existing plants that have effective wet stacks can be done. The liquid
collection and preliminary evaluation of the condensation rate in the duct & stack is estimated [4,9].
Water droplet in wet stack system originates from two source, first from the mist eliminator at FGD absorber, and
second & major sources of liquid droplet is flue gas condensation at FGD outlet ducting and stack liner wall. There
are two kinds of condensation which are encountered in the wet stack and FGD outlet ductwork. Firstly, thermal
condensationtakes place at the FGD outlet ducting and wet stack liner due to difference in the flue gas and ambient
air temperature. The transfer of heat energy occurs from the flue gas through the liner, insulation, air in annular
space and the outer concrete wall to the ambient air.The amount of thermal condensation changes with outsideair
temperature, wind speed & direction, flue gas flow, thermal conductivity and stack geometry. Other kind of
condensation is adiabatic condensation which takes place in the majority of the flue gas flow as a result of decrease
in flue gas pressure along the stack height. However, it does not add up to the SLD as very small sized liquid droplet
evaporates before it reaches the ground [15].
Physical model in the scale range of 1:8 to 1:16 is built fromoutlet of mist eliminator of absorber up to
approximately four stack liner diameter above the top elevation of breaching duct. Physical model is fabricated from
transparent thermoplastic i.e. acrylic or plexiglass which cater the requirement of the accurate visualization of flue
gas and liquid droplet flow patterns. This allow better visual droplet trajectories, liquid film movements and flow
pattern. Behaviour of liquid droplet in the flue gas flow and motion of liquid film on liner wall is evaluated by the
physical model being fabricated in the laboratory [9]. On the basis of the flow pattern observed through physical
model, Liquid Collection Systems (LCS) viz. gutters, ring collectors etc. are placed, fabricated and put in place.
Commercial available materials such as FRP or Haste alloy (C276) are used to fabricate LCS.
Plume downwash is a phenomena of flue gas entrainment between the stack shell & liner in downwind side,
normally occurs at stack top due to lower flue gas velocity and high crosswind velocity resulting in lower pressure
region. The vertical component of flue acidic flue gas is deflected towards wind direction resulting of shell
corrosion.If the system is designed considering the high flue gas velocity, it resulted in stack liquid discharge and if
the system is designed at low flue gas velocity, it will result in plume downwash mostly at higher wind speed. It
normally occurs due to lowerflue gas velocity during part load operation in power plant & high wind episodes.
Plume downwash is more pronounced in multiple liners because of large size of shell enclosing multiple liners.
During plume downwash condition, saturated flue gas enters into the extension, stack hood, and stack shell resulting
in acidic corrosion [4].
To avoid plume downwash, momentum ratio should be above two for single flue chimney. Momentum ratio is
calculated by knowing the ratio of vertical component of plume momentum to the horizontal component of wind
momentum. The same can be achieved by increasing liner height above the shell or reduction of flue liner diameter
or by installing a nozzle like geometry (known as „Choke‟) at the top of stack liner[4].
Computational fluid dynamic (CFD) modelling is ideally suited for plume downwash study in different weather &
plant operating condition. A study is conducted by constructing a 3-D model of the stack for the portion covering
one-third from the stack top[9]. Small to medium sized droplet gets drifted at the liner surface while large droplet

Engineers for Viable Technology and $5 Trillion Economy
339 Technical Volume of 36th Indian Engineering Congress, December 26-28, 2021
ISBN 978-81-955500-1-2
getsdeformed due to drag velocity of the gas and no longer have spherical shape [16]. Correlation explained by Ishii
et al. (1979) predicted the distortion limit of 1.7 mm droplet diameter at the stack, so, droplets less than 1.7 mm
flowin sphericalshape whilethe larger droplets are deformed or distorted. Drift velocity of distorted or deformed
droplet is asymptotic & does not dependon droplet diameter. The droplet drift is simulated in the CFD model
[16,17]. However, CFD model is incapable of accurately simulating the development of liquid film and its motion in
the liner wall and ductwork are difficult to simulate accurately by the use of CFD models but it is useful to predict
movement of the droplets and flow pattern [4,9].
The last phase includes the review and support of field construction and inspection. The correct installation of LCS
is checked for proper installation and the changes / deviations at the site w.r.t the installation drawings are evaluated
and rectified. Site inspection is highly recommended when 80-90% installation is complete to identify errors, on the
spot modifications & corrective actions on site. Inspection of LCS need to be carried out during operation on routine
basis to ensure satisfactory long term operation of LCS without plugging, deposition and drainage problems [4, 9].
The sole purpose of wet stack study is toensure maximum collection of moisture and acidic content in condensate
formed inside the stack and ductwork through the help of liquid collection & drainage system and to prevent the
stack liquid discharge (SLD) with least possible re-entrainment by the use of liquid collectors and the drain collected
is connected to the absorber [4,9,15].
CONCLUSION
Alloys are expensive & can be operated at 16.8 m/s velocity. Acid resistance bricks are in use but has velocity
limitation of 13.7 m/s as they have rough surfaces. Borosilicate lining can be effectively operated above 18.3 m/s
velocity which can optimize the chimney diameter and found to be cheaper option as compared to the alloys. In
India, most of the power generating industries have also followed for the non-reheat option in view of associated
cheaper operation and maintenance cost, however there are some power plants which are still going for wet FGD
with GGH in operation.
New FGD plant including a wet stack are designed to take care of chimney corrosion to prevent the stack liquid
discharge, minimize potential for droplet re-entrainement & retrofit. Considering the outage time required for the
lining modifications in the existing chimney, it is economical to build new low height stack & use existing chimney
for emergency FGD bypass condition. One can opt for GGH as per the assessment on the basis of results of techno-
economic analysis. Gas to gas heater (GGH) usage influe gas desulphurization plant requires additional space, more
pressure drop leading to higher energy consumption with the leakage issues which makes it anunviable solution.
Technical specification for the design of effective wet stack system need to be prepared for complete FGD absorber
outlet ducting to the stack top. Wet stack study is conducted for each unit if the layout of FGD ductwork up to the
stack top is different. In order to control stack liquid discharge and corrosion problem, a proven liquid collection
system is required to be designed for efficient chimney operation. Liquid collection system for the stack and
ductwork is developed by considering different phases of the wet stack study as discussed in previous section.
This arrangement requires longer flue gas duct work from ID fan outlet resulting in the higher pressure drop and
thereby increase in ID fan rating and thus, additional power consumption. Lastly, in India, in view of new stringent
environmental norms it is imperative that a thorough study for implementation of wet FGD is required, to enable
utility engineer for arriving at right techno-economical decision suited well in the project(s).
REFERENCES
1. Poullikkas, A.: „Review of design, operating, and financial considerations in flue gas desulfurization systems‟,
Energy Technology & Policy, 2015, 2, (1), 92-103
2. „Flue-gas desulfurization systems market analysis to 2020, 2013 update‟, https://www.marketresearch.com/
product/sample-7906426.pdf, accessed 14 September 2018

Engineers for Viable Technology and $5 Trillion Economy
340 Technical Volume of 36th Indian Engineering Congress, December 26-28, 2021 ISBN 978-81-955500-1-2
3. Cordoba, P.: 'Status of Flue Gas Desulphurisation (FGD) systems from coal-fired power plants: Overview of
the physic-chemical control processes of wet limestone FGDs', FUEL 144., 2015, pp. 274–286
4. Anderson, D.K., Maroti, L.A., 'Solving stack drain problem', in Brown: (Powermag, March 2006, Vol.150)
5. „Ministry of Environment, Forest & Climate change, Government of India‟, Notification (7 December 2015),
http://www.moef.gov.in/sites/default/files/Thermal%20plant%20gazette%20scan.pdf, accessed 14 September
2018
6. Ministry of Environment, Forest & Climate change, government of India, Notification (29 June 2018),
http://www.moef.nic.in/sites/default/files/Final-Amd-TPPs-Notifi.pdf, accessed 14 September 2018,
7. Zhao, S., et al, Prevention of stack corrosion under wet flue gas desulfurization conditions in a coalfired power
plant: performance analysis and comparative study, Environmental system research, 2016, 5, (21)
8. Krakowiak, S., Darowicki, K.:„Degradation of protective coatings in steel chimney of flue gas desulphurization
systems‟, Progress in Organic Coatings, 2018, 117, pp 141-145
9. Anderson, D., Maroti, L.: „Revised wet stack design guide‟ EPRI Technical report 1026742, 2012
10. CEA., „Standard Technical Specification for Retrofit of Wet Limestone Based FGD System in a Typical 2 x
500 MW Coal Based Thermal Power Plant‟, December 2017
11. Guttikunda, S., Jawahar, P., Goenka, D.: „Regulating air pollution from coal-fired power plants in india‟,
Economic & political weekly, 2015, 1
12. Pei, Z., Kun, W.: „Analysis on Chimney inner wall anit-corrosion in GGH eliminated wet desulphurisation
system‟. 11th international conference on electrostatic precipitation, Hangzhou, 2008, pp. 597-601
13. Jarman, R.T., Turville, C.M.D.: „Condensation of flue gas vapour in ducts and chimneys‟, Atmospheric
environment, 1983, 17, (9), pp 1873-1844
14. Ganapathy, V.: „Steam plant calculation manual‟ (Marcel dekker, Inc, 1994, 2nd edn. 1994)
15. Maroti, L.A: „Entrainment in Wet stacks‟ Final report EPRI-CS-2520, August 1982
16. Minzer, U., Moses, E.J., Toren, M., et al.: „Two-Phase Phenomena In Wet Flue Gas Desulfurization Process‟,
In Ben-Haim, Y. (Ed.). Conference Proceedings, Israel, May 1998, pp. 705.
17. Ishii, M., Zuber, N.: „Drag coefficient and relative velocity in bubbly, droplet or particulate flows‟, AICHE,
1979, 25, (5), pp 843
18. Chandra, K., Kain, V, Dey, G.K.: „Accelerated corrosion of a boiler chimney: causes and preventive steps‟,
ASME International, 2011, 11, pp 466-472
19. Manohar, S.N.: „Tall chimneys design and construction‟, (Tata McGraw-hill, 1985)

En
gin
eers
fo
r V
iab
le T
ech
no
log
y a
nd
$5
Tri
llio
n E
con
om
y
Materials
and
Metallurgical
Engineering


Engineers for Viable Technology and $5 Trillion Economy
343 Technical Volume of 36th Indian Engineering Congress, December 26-28, 2021
ISBN 978-81-955500-1-2
Optimization of Annealing Cycle and Microstructural
Characterization of Cold Rolled Titanium-stabilized Interstitial
Free Steel
Santosh Kumar1*, M Deepa
1, Janak Lal
2, K K Singh
1, N Mondal
1 and Vinod
Kumar1
1R&D Centre for Iron and Steel, Steel Authority of India Limited, Ranchi, Jharkhand
2Reserach & Product Development, MukandSumi Special Steel Ltd, Koppal, Karnataka
*email: [email protected]
Abstract: Interstitial free (IF) steels having carbon level at 30 ppm are extensively used for outer panel fabrication
of four-wheeler. IF steel poses a mild strength with excellent elongation, high plastic strain ratio (r-bar; 𝑟 ) and
excellent formability. After hot rolling, the Ti-stabilized IF grade steel having Carbon around 30 ppm are cold
rolled and annealed at different annealing temperature. Mechanical properties i.e. YS, UTS & % El are evaluated at
every step for understanding the change of material behaviour in terms of their strength and other formable
parameters. Hardness in HRB scale evaluated and 𝑟 (plastic strain ratio) is calculated by using resonant frequency
method in modul-𝑟 drawability tester. Cold rolled and annealed at 650°C, 700°C and 725°C samples shows the
elongation 40% and above. Similarly, 𝑟 are more than 2.0 for annealing temperature 650°C, 700°C and725°C. The
best combination of properties achieved when cold rolled sheet was annealing at 700°C i.e. % elongation is 48%
and 𝑟 is 2.25.
Keywords: Interstitial Free Steels; Annealing; Plastic Strain Ratio and Formability
INTRODUCTION
Industrial production of Interstitial Free (IF) steels began around 50 years back and in last two decades, the demand
increased for IF steel due to their superior formability over conventional extra deep drawing (EDD) steel. IF steels
having C in the range of 20-40 ppm, are extensively used for outer panel fabrication in automotive segment. Heat of
IF steel are made by keeping interstitial elements i.e C and N below 30 ppm by refining liquid steel in vacuum
degassers, and stabilizing these interstitial elements by micro-Alloying addition of Titanium or Niobium or both.
Carbide and nitride precipitates of these elements makes matrix almost free from interstitial elements.
IF steel poses a typically non aging properties as no free C & N availableand have mild strength with excellent
elongation, high plastic strain ratio and excellent formability. The minimum amount of Ti required for full
stabilization, based on a stoichiometric approach(1)
, is:
Tistab = 4 × % C + 3.42 × % N + 1.5 × % S
Titanium precipitation took place in form of nitride and sulphide (TiN, TiS) at higher temperature and formed Ti-
carbide and Ti-Carbo-Nitride at lower temperature i.e at inter-critical (austenite–ferrite transformation) temperature
region during hot rolling transform to Ti4C2S2, Ti-CN &TiC by the absorption of titanium and carbon(2,3)
.
Cold rolling plays an important role in the formation of favourable textures for deep drawing during annealing;
however, has little effect on other properties(4,5)
.This was attributed to the fact that the precipitates formed during hot

Engineers for Viable Technology and $5 Trillion Economy
344 Technical Volume of 36th Indian Engineering Congress, December 26-28, 2021
ISBN 978-81-955500-1-2
rolling and coiling were not large enough to compromise the r during annealing. A reduction of 90% produced the
highest 𝑟 in all the steels; however, these reductions were rarely achieved in practice, 75-80% being more common.
EXPERIMENTAL
2 nos. of hot rolled coiled samples of size 200 mm × 300 mm has been cold rolled at Experimental rolling mill,
RDCIS, Ranchi (Figure 4a). The chemical composition of experimental IF steel (Table 3) was tested in Optical
Emission Spectrometer(Model: Spectro-lab LAVMC05A).
Table 3 Chemical Composition of the IF steel
C Mn P S Si Al Ti
0.003 0.080 0.012 0.006 0.008 0.040 0.053
In both sheet, the reduction draft was kept 75% as per draft schedule shown in Table 4. The cold reduced sheet was
shown in Figure 4b.
Table 4 Draft schedule of hot rolled IF sheet in Experimental rolling mill, RDCIS
Sample No. Initial Thickness Final Thickness % Reduction
15 4.8 1.2 75.0
18 4.8 1.2 75.0
Annealing of cold rolled sheet was carried out at different temperature in muffle furnace (KANTHAL make as
shown in Figure 4c) as per chart given below in Table 5.
Table 5 Annealing Temperature given to IF cold rolled sheet
SN Annealing Temp Sample thickness Sample Heating
Rate
Holding time Sample Cooling (f/c
cooling)
1 550oC 1.20 mm 12
oC/min 5 mnt. 10
oC/min
2 600oC 1.20 mm 12
oC/min 5 mnt. 10
oC/min
3 650oC 1.20 mm 12
oC/min 5 mnt. 10
oC/min
4 700oC 1.20 mm 12
oC/min 5 mnt. 10
oC/min
5 725oC 1.20 mm 12
oC/min 5 mnt. 10
oC/min
Figure 4 Experimental set-up (a) Rolling of IF grade steel at Experimental Rolling mill, RDCIS; (b) Muffle furnace
for annealing, Kanthal Make.
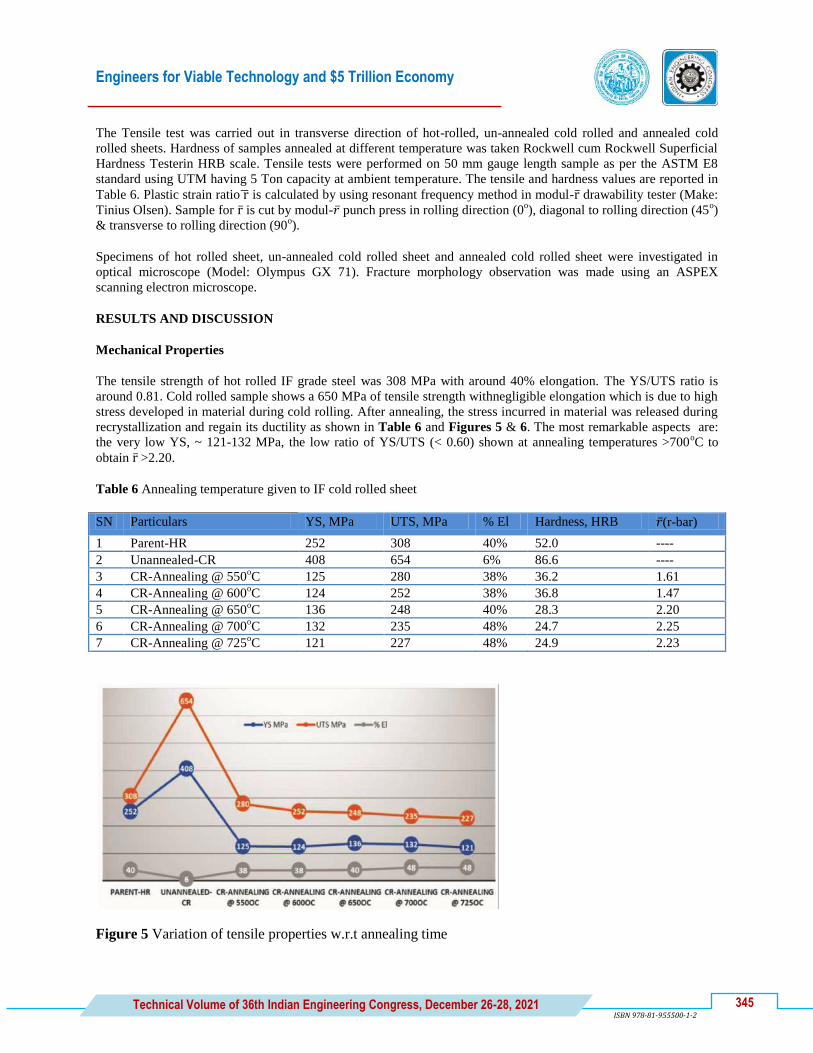
Engineers for Viable Technology and $5 Trillion Economy
345 Technical Volume of 36th Indian Engineering Congress, December 26-28, 2021
ISBN 978-81-955500-1-2
The Tensile test was carried out in transverse direction of hot-rolled, un-annealed cold rolled and annealed cold
rolled sheets. Hardness of samples annealed at different temperature was taken Rockwell cum Rockwell Superficial
Hardness Testerin HRB scale. Tensile tests were performed on 50 mm gauge length sample as per the ASTM E8
standard using UTM having 5 Ton capacity at ambient temperature. The tensile and hardness values are reported in
Table 6. Plastic strain ratio r is calculated by using resonant frequency method in modul-r drawability tester (Make:
Tinius Olsen). Sample for r is cut by modul-𝑟 punch press in rolling direction (0o), diagonal to rolling direction (45
o)
& transverse to rolling direction (90o).
Specimens of hot rolled sheet, un-annealed cold rolled sheet and annealed cold rolled sheet were investigated in
optical microscope (Model: Olympus GX 71). Fracture morphology observation was made using an ASPEX
scanning electron microscope.
RESULTS AND DISCUSSION
Mechanical Properties
The tensile strength of hot rolled IF grade steel was 308 MPa with around 40% elongation. The YS/UTS ratio is
around 0.81. Cold rolled sample shows a 650 MPa of tensile strength withnegligible elongation which is due to high
stress developed in material during cold rolling. After annealing, the stress incurred in material was released during
recrystallization and regain its ductility as shown in Table 6 and Figures 5 & 6. The most remarkable aspects are:
the very low YS, ~ 121-132 MPa, the low ratio of YS/UTS (< 0.60) shown at annealing temperatures >700oC to
obtain r >2.20.
Table 6 Annealing temperature given to IF cold rolled sheet
SN Particulars YS, MPa UTS, MPa % El Hardness, HRB 𝑟 (r-bar)
1 Parent-HR 252 308 40% 52.0 ----
2 Unannealed-CR 408 654 6% 86.6 ----
3 CR-Annealing @ 550oC 125 280 38% 36.2 1.61
4 CR-Annealing @ 600oC 124 252 38% 36.8 1.47
5 CR-Annealing @ 650oC 136 248 40% 28.3 2.20
6 CR-Annealing @ 700oC 132 235 48% 24.7 2.25
7 CR-Annealing @ 725oC 121 227 48% 24.9 2.23
Figure 5 Variation of tensile properties w.r.t annealing time

Engineers for Viable Technology and $5 Trillion Economy
346 Technical Volume of 36th Indian Engineering Congress, December 26-28, 2021
ISBN 978-81-955500-1-2
Figure 6 Variation of r w.r.t annealing time
Optical Microstructure
Optical Microstructure of hot rolled sheet (as shown in Figure 7) showing ferrite grains having a partially
recovered, partially recrystallised and pancake microstructure, bearing evidence of the α-region hot-rolling schedule.
The cold rolled Unannealed sample shows an elongated grain of ferrite (in Figure 8).
Figure 7 Optical Micrograph of hot rolled IF steel sheet X200
Figure 8 Optical microstructure of Cold rolled-Unannealed IF steel sheet X200

Engineers for Viable Technology and $5 Trillion Economy
347 Technical Volume of 36th Indian Engineering Congress, December 26-28, 2021
ISBN 978-81-955500-1-2
After annealing the recrystallization of elongated grains took place and observed in Figure 9 to Figure 13. The
scattered grains belong to the class of the smallest grains (approximately 10±20 μm) are observed in lower
temperature annealing i.e annealing at 550oC, 600
oC & 650
oC. The size ferrite grains increased with increasing
annealing temperature and almost equiaxed at 700oC.
Figure 9 Optical microstructure of Cold rolled-annealed at 550oC X200
Figure 10 Optical microstructure of Cold rolled-annealed at 600oC X200
Figure 11 Optical microstructure of Cold rolled-annealed at 650oC X200

Engineers for Viable Technology and $5 Trillion Economy
348 Technical Volume of 36th Indian Engineering Congress, December 26-28, 2021
ISBN 978-81-955500-1-2
Figure 12 Optical microstructure of Cold rolled-annealed at 700oC X200
Figure 13 Optical microstructure of Cold rolled-annealed at 725oC X200
Scanning Electron Microscope Image
Fracture morphology of tensile test sample of Hot rolled and cold rolled-annealed at 700oC has been analyzed and
shown in Figures 14 & 15. It is observed that the entire void formation is not of first generation but also smaller
second-generation voids created in the matrix. In hot rolled sample the void size is as large as 117μm whereas void
size in cold rolled annealed sample is smaller i.e. 32-38 μm.
Figure 14 Fractographic image of tensile sample of Hot rolled steel

Engineers for Viable Technology and $5 Trillion Economy
349 Technical Volume of 36th Indian Engineering Congress, December 26-28, 2021
ISBN 978-81-955500-1-2
Figure 15 Fractographic image of tensile sample of Cold rolled-annealed at 700oC
CONCLUSIONS
Ti-stabilized interstitial free steel are applied for complex shaped part of inner and outer door panels, side partsetc in
four wheeler. Carbon in the range of 20-40 ppm generally produced and stabilized by Ti for complete fixation of
carbon and nitrogen and formed precipitates of nitrides (TiN), carbides (TiC), or carbo-nitrides (TiCN).This gives
excellent formability, low yield points, and at the same time, high forminganisotropy.
Cold rolled and annealed at 650oC, 700
oC & 725
oC samples shows the elongation 40% & above. Similarly, r are
more than 2.0 for annealing temperature 650oC, 700
oC &725
oC.
The optimized condition for annealing cycle was 700oC, preceded by 75% cold reduction,which resulted in an r of
as high as 2.25 & 48% elongation.
ACKNOWLEDGEMENTS
The taskforce members express their sincere gratitude and thanks to the management of BSL and RDCIS for the
kind help and guidance to complete the above assignment.
REFERENCES
1. Tither G. & Stuart H, HSLA Steels '95', ed. L. Guoxun et al.., Chinese Society for Metals, Beijing, 1995, pp. 22-
31.
2. Krauss G., Wilshynsky D. O. & Matlock D. K., Interstitial Free Steel Sheet: Processing, Fabrication and
Properties, eds. L. E. Collins and D. L. Baragar, CIM/ICM1,Ottawa, 1991, pp. 1- 14.
3. Tither G., Garcia C. I., Hua M. &Deardo A. J, Int. Forum for. Physical Metallurgy in IF Steels, Iron and Steel
Institute of Japan, Tokyo, 1994, pp. 293-322.
4. Tokunaga Y. & Yamada M., Method for the Production of Cold Rolled Steel Sheet Having Super Deep
Drawability, US Patent 4,1985, 504,326.
5. Banerjee K., Verma A. K. &Venugopalan T., "Improvement of Drawability of Titanium-Stabilized Interstitial-
Free Steel by Optimization of Process Parameters and Texture" Metall. and Mater. Trans. A, Vol. 39, No. June,
2008, pp. 1410-1425.


En
gin
eers
fo
r V
iab
le T
ech
no
log
y a
nd
$5
Tri
llio
n E
con
om
y
Mining
Engineering


Engineers for Viable Technology and $5 Trillion Economy
353 Technical Volume of 36th Indian Engineering Congress, December 26-28, 2021 ISBN 978-81-955500-1-2
MN_036_01_214
Prediction of Roof Falls and induced Caving in Continuous
Miner Panel using Machine Learning
D Laxmi Narayana and M S Venkataramayya*
Department of Mining Engineering, Malla Reddy Engineering College, Maisammaguda, Secunderabad
*e-mail: [email protected]
Abstract: Continuous Miners are deployed in underground mining for extraction of coal by caving method. The
safety conditions require regular caving in the goaf to release the stress in the roof. These falls depend upon various
geo-mining and specific characteristics in the area under extraction. Prediction of roof cavability is conducted by
emprerical calculations and also numerical modeling. The cavability is assesed by monitoring of convergence in the
front abutment zone. A threshold limit of 5mm convergence is considered for cavabilty in the goaf. In some cases,
the roof fall does not occur beyond the threshold limit and requires induced caving of the roof in the goaf. In this
paper 336 data sets of roof falls in five continuous miner panels were analyzed by logistic regression and machine
learning algorithms, to predict the need for induced caving or not. The comparison of the field data in 336 sets, with
the logistic regression was found to be about 74%. The variation is because of the varying depths and dimensions of
the five panels in the mine under study. It is concluded that the logistic regression and machine learning algorithms
of prediction is a useful tool for the decision of induced caving in a continuous miner panel based on the sufficient
field data of 336 sets.
Keywords: Continuous Miner Panel; Roof Falls; Induced Caving; Machine Learning; Logistic Regression
INTRODUCTION
Coal seams at the deeper depths are suitable for underground mining technologies. It is suggested that, ―the Power
Roof Support Longwall mining and Continuous Miner technology‖ would be used successfully in several mines,
and there is a requirement to propagate and develop it as the primary underground coal mining technique for mass
production [1]. The Continuous Miner Technology has been used for development (i.e., virgin seam or developed
pillar) and depillaring (i.e., split & fender or fishbone) with caving method for extraction of coal. In the case of the
caving method after the extraction of coal from the developed pillars, the roof is allowed to fall into the goaf, this
fall occurs periodically (i.e., periodical roof falls) [2]. But sometimes the roof will not fall periodically and increase
the hanging goaf area which interrupts the mining operations and also cause problems like crushing of goaf edge
pillar, air blast, trapping of machinery inside the goaf because of advanced fall and accidents in depillaring panels
[3]. To avoid these problems induced blasting is conducted, if necessary for caving and filling the goaf. The caving
due to natural or induced periodic falls will increase, the productivity, safety, and overall performance of mining
activities in the panel. Prediction of roof falls in the goaf has been carried out in different approaches such as
Experiences from previous panels, Empirical Formulas, Numerical Modeling methods, and Machine Learning
Techniques.
In this paper, Machine Learning Techniques of Supervised Learning with Logistic Regression with 336 datasets of
roof falls in five panels of continuious miner working of GDK 11 Inc mine of SCCL is used for the prediction of
roof falls in the goaf [4]. Factors considered for prediction of roof falls in the goaf are:
1. Extracted Area in the Panel in Sq.m (EA)
2. Hanging Goaf Area in Sq.m (HG)
3. Fall Area in Sq.m (FA)

Engineers for Viable Technology and $5 Trillion Economy
354 Technical Volume of 36th Indian Engineering Congress, December 26-28, 2021 ISBN 978-81-955500-1-2
4. Roof Convergence before falling in mm (RC)
5. Induced Blasting (IB)
Figure 1 Extracted Area & Hanging Goaf Area
INDUCED BLASTING
Induced caving by blasting has received narrow attention. Induced caving by blasting (induced blasting) is critical to
fetch downcast the hanging goaf roof area during the depillaring stage. In the mechanized bord & pillar system of
coal extraction, a wide-ranging area of overlying roof strata is generally uncovered after depillaring. The weight
accumulation characteristic ahead of the working face is neutralized by regular caving of underlying strata [5]. This
is unlikely to happen if extraction is unfolding under a competent roof. Hard roof management schemes in
underground coal mines could benefit from induced blasting.
The paramount purpose of induced blasting is to avoid rock bursts at the working faces, which is similar to pre-
conditioning/distressing in deep mines [6]. By drilling holes into the uncaved roof and blasting with explosives, the
roof rock can be brought down or fractured so that caving can be controlled. In the case of induced blasting, blast
fragmentation is not the most important factor. However, the rock should be fractured by the induced blast to
facilitate roof fall [7]. Once the roof span exceeds 120–190 Sq.m, induced blasting is commonly done regularly
unless the overhanging roof does not fall inside the goaf by its weight. Roof convergence and stress on the goaf edge
pillars are monitored continuously. Induced blasting will be used to avoid uncontrolled roof collapse with associated
air blast once the daily rise in roof convergence is > 5 mm or the strata pressure increases by 2 t [8].
FIELD STUDY
The field study has done from GDK-11 Inc in Ramagudam-I Area, Singareni Collieries Company Limited where 1
seam is working with Continuous Miner Technology. Total Block-A property is divided into 6 panels for the
continuous miner and 5 panels that have been successfully completed. Details of Continuous Miner Panels worked
in 1 seam are:
Table 1 Details of Continuous Miner Panels worked in 1 seam
Panel No Panel Size in
Sq.m
Panel Depth in m No of Pillars Panel Dimensions in
m (D x S)
Total No of
falls Min Max
A-1A 98,980 160 217 74 157 x 630 81
A-1B 91,462 162 221 80 139 x 658 80
A-2 86,955 166 225 75 128 x 682 64
A-3 1,00,195 172 237 93 145 x 691 63
A-4 72,000 172 235 58 120 x 600 48
Overall Data - 160 237 380 140 x 640 336

Engineers for Viable Technology and $5 Trillion Economy
355 Technical Volume of 36th Indian Engineering Congress, December 26-28, 2021 ISBN 978-81-955500-1-2
In this paper, a statistical approach of Supervised Machine Learning’s logistic regression using machine learning is
adopted for the prediction of roof falls in the goaf.
Machine Learning
Machine learning technology-enabled computer programs to study without been explicitly trained. Machine learning
is widely used in almost many fields in the world including healthcare sector. Machine learning is an application of
artificial intelligence (AI) that provides systems the ability to automatically learn and improve from experience
without being explicitly programmed [9]. Further, machine learning at its most basic is the practice of using
algorithms to parse data, learn from it, and then make a determination or prediction about something in the world
[10]. There are two major categories of problems often solved by machine learning i.e. regression and classification.
Mainly, the regression algorithms are used for numeric data and classification problems include binary and multi-
category problems [11].Machine learning algorithms are further divided into two categories such as supervised
learning and unsupervised learning [12]. Basically, supervised learning is performed by using prior knowledge in
output values whereas unsupervised learning does not predefined labels hence the goal of this is to infer the natural
structures within the dataset [13]. Therefore, selection of machine learning algorithm need to carefully evaluated.In
machine learning, data is the key driving element for analysis.
Data Collection
The data collected from the field study is formulated to a CSV file and imported to the machine learning
program of Logisitic regression using liberires and Sklearn codes which are equipped with statistical
paramters of different algorithms.
Table 2 Dataset Collected from Continuous Miner Panels
S No Extracted Area
in Sq.m
Hanging
Goaf Area in
Sq.m
Fall Area
in Sq.m
Strata
Parting in
mm
Nature of Fall Induced
Blasting (IB)
1 5339 5339 684 6 Induced Fall 1
2 5829 5145 1017 5 Induced Fall 1
3 7970 6269 2459 5 Induced Fall 1
4 10663 6503 568 4 Periodic Fall 0
5 11953 7225 2410 25 Induced Fall 1
' ' ' ' ' ' '
' ' ' ' ' ' '
' ' ' ' ' ' '
332 54692 1168 1168 5 Induced Fall 1
333 57794 3102 1570 5 Periodic Fall 0
334 58850 2588 818 3 Periodic Fall 0
335 58850 1770 1102 7 Periodic Fall 0
336 60996 2814 668 6 Periodic Fall 0
Analyzing Data
Data analysis is crucial in the area to identify challenges that such an organization has and to evaluate information in
relevant ways. Data is nothing more than facts and numbers. Data analysis is the process of organizing, interpreting,
structuring, and presenting a dataset into valuable evidence that gives meaning to the information[14].
Interpreted or combined graphs are used for the graphical representation of two or more variables in a single plot.
Here induced blasting and strata parting readings are interpreted in count plot Figure 3. From the graphs, it is seen
that the majority of induced blasting is conducted between the 0 to 6 mm strata parting and the periodical roof falls

Engineers for Viable Technology and $5 Trillion Economy
356 Technical Volume of 36th Indian Engineering Congress, December 26-28, 2021 ISBN 978-81-955500-1-2
are noted between 5 to 8 mm and also in some cases periodical roof and induced blasting are correlated at the same
strata readings which are difficult to predict. By combining variables of the induced blast with correlation graph of
Hanging goaf and Fall area shows that the outliers are major problems in the depillaring stage with a large area of
hanging goaf with fewer strata parting reading Figure 3.
Exploratory Data Analysis
Figure 2 Count plot of Induced blasting and Strata parting
Figure 3 Correlation graph of Hanging Goaf and Fall Area Induced Blasting
Predictive Data Analysis
Predictive analytics is to establish the probability of upcoming occurrences depending on historical data. The
purpose is to provide the best judgment of what will happen in the future, rather than actually acknowledging what
has happened. Predictive models generate (or train) a model that could forecast values for various or new data based
on previous findings shown in Figure 4. Modeling generates predictions, which indicate the probability of the
response variable based on the anticipated consequence of a collection of input variables. In these models the
training and testing data is divided into 70:30 ratio i.e., out of 336 datasets, 235 datasets are given to train the dataset
to predict the dependent variable induced blasting, and the remaining 101 datasets are later used for testing of the
model with its predicted values. In these 101 datasets, actual falls are 71 periodic falls and 30 induced falls but the

Engineers for Viable Technology and $5 Trillion Economy
357 Technical Volume of 36th Indian Engineering Congress, December 26-28, 2021 ISBN 978-81-955500-1-2
model predictions are concluded that there are 89 periodic falls and only 12 were induced falls. So the evaluation of
the model or program is validated based on the accuracy of predictive values to actual values in the testing dataset.
Model Building
Figure 4 Logistic Regression Predictive model
The roof falls are categorized according to the panels in which there are occurred. Predictions of these roof falls are
also carried out panel-wise. This panel-wise roof falls analysis is carried out with 70% data with the training subset
and 30% data for the testing purpose. The outcomes from the different panels are tested and predicted data values
are given with no. of Periodical falls and no. of Induced falls occurring in their respective panels are shown in table
3. And the graphical representation of periodical falls and induced falls with the tested and predicted values
according to the panels in which there are occurred in Figures 5 & 6 respectively.
Table 3 Panel wise Predictive analysis of falls
Panel No Total No
of Falls
Total Test Data Predicted Data
Train
Data
70%
Test
Data
30%
No of
Periodic falls
No of
Induced
falls
No of
Periodic falls
No of
Induced falls
A-1A 81 56 25 20 5 19 6
A-1B 80 56 24 20 4 22 2
A-2 64 44 20 9 11 14 6
A-3 63 44 19 17 2 16 3
A-4 48 33 15 6 9 5 10
Overall
Data
336 225 101 71 30 89 12

Engineers for Viable Technology and $5 Trillion Economy
358 Technical Volume of 36th Indian Engineering Congress, December 26-28, 2021 ISBN 978-81-955500-1-2
Figure 5 Panel wise Tested & Predicted Periodical Falls
Figure 6 Panel wise Tested & Predicted Induced Falls
Confusion Matrix
The confusion matrix is used for the description of the relationship between the tested values and predicted values of
the dependent variable i.e., Induced blasting. The confusion matrix and its heatmap of the above model are shown in
Figure 7. And also the classification report of the model is provided along with the confusion matrix.
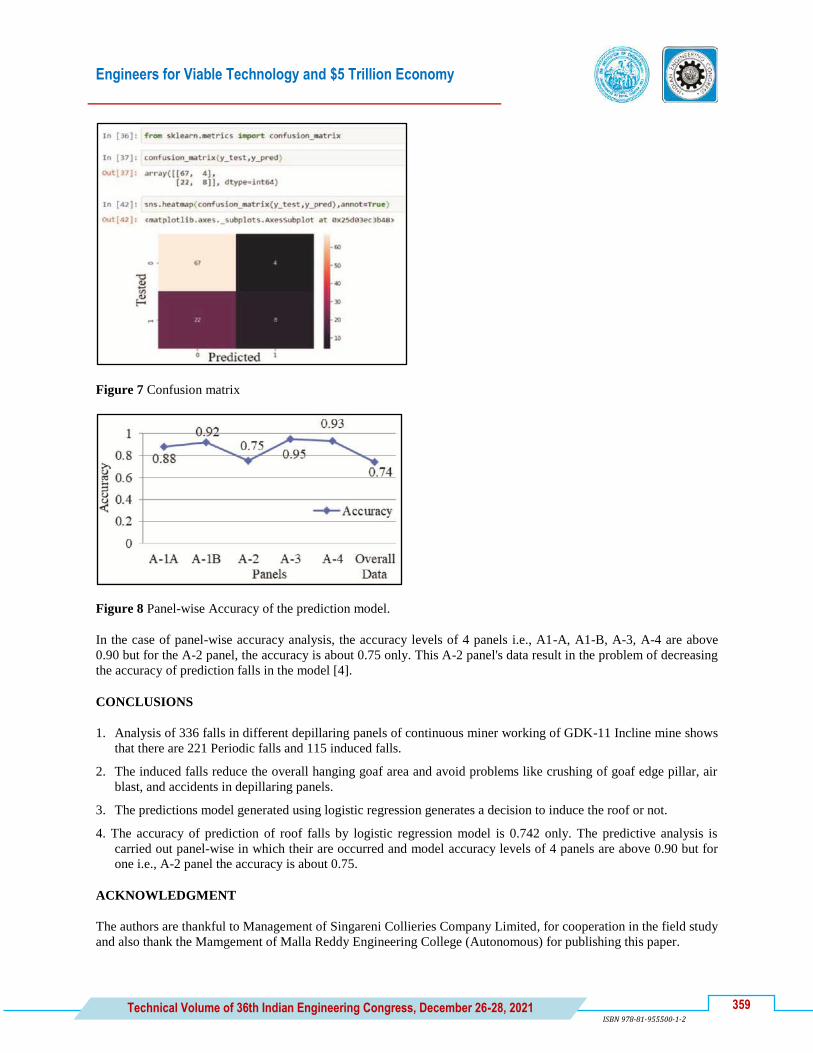
Engineers for Viable Technology and $5 Trillion Economy
359 Technical Volume of 36th Indian Engineering Congress, December 26-28, 2021 ISBN 978-81-955500-1-2
Figure 7 Confusion matrix
Figure 8 Panel-wise Accuracy of the prediction model.
In the case of panel-wise accuracy analysis, the accuracy levels of 4 panels i.e., A1-A, A1-B, A-3, A-4 are above
0.90 but for the A-2 panel, the accuracy is about 0.75 only. This A-2 panel's data result in the problem of decreasing
the accuracy of prediction falls in the model [4].
CONCLUSIONS
1. Analysis of 336 falls in different depillaring panels of continuous miner working of GDK-11 Incline mine shows
that there are 221 Periodic falls and 115 induced falls.
2. The induced falls reduce the overall hanging goaf area and avoid problems like crushing of goaf edge pillar, air
blast, and accidents in depillaring panels.
3. The predictions model generated using logistic regression generates a decision to induce the roof or not.
4. The accuracy of prediction of roof falls by logistic regression model is 0.742 only. The predictive analysis is
carried out panel-wise in which their are occurred and model accuracy levels of 4 panels are above 0.90 but for
one i.e., A-2 panel the accuracy is about 0.75.
ACKNOWLEDGMENT
The authors are thankful to Management of Singareni Collieries Company Limited, for cooperation in the field study
and also thank the Mamgement of Malla Reddy Engineering College (Autonomous) for publishing this paper.

Engineers for Viable Technology and $5 Trillion Economy
360 Technical Volume of 36th Indian Engineering Congress, December 26-28, 2021 ISBN 978-81-955500-1-2
REFERENCES
1. Arun Kumar Singh, Ashok Kumar, Dheeraj Kumar, Rajendra Singh, Sahendra Ram, Rakesh Kumar, and Amit
Kumar Singh, (2021), ―Field and Simulation Studies for Mechanized Depillaring below Incompetent
Geological Formations of an Indian Coal Mine‖, Journal of the Geological Society of India.
2. Arun Kumar Singh, Rakesh Kumar, Sahendra Ram, Amit Kumar Singh, and Rajendra Singh, (2013), ―Rock
mechanics considerations during continuous miner based coal pillar extraction in Indian Coalfields‖,
Conference on National Workshop on Continuous Miner, DGMS, Dhanbad.
3. Palei S.K. and Das S.K., (2009), ―Logistic regression model for prediction of roof fall risk in Bord and Pillar
workings in Coal mines: An Approach‖, Safety Science.
4. Laxmi Narayana, D. (2021), ―Study & Prediction of Roof Falls in an Underground Depillaring Panel worked
with Continuous Miner using Logistic Regression‖, ME Thesis, under the Supervision of Dr.
M.S.Venkataramayya, submitted to Osmania University.
5. Saharan, M.R., Mitri, H.S., (2009), ―Numerical Simulation for Rock Fracturing by Destress Blasting-As
Applied to Hard Rock Mining Conditions‖, VDM Verlag Dr. Müller, Germany. ISBN: 978-3-639-11064-7.
6. Konicek, P., Saharan, M.R., Mitri, H. (2011), ―Destress blasting in coal mining—state-of-the-art review‖, In:
Proceedings of the First International Symposium on Mine Safety Science and Engineering, part B, Beijing,
27–28 October. China Academy of Safety Science and Technology. Proceedia Engineering 2011, pp. 179–194.
7. Roy, P.P., Sawmliana, Ch., Bhagat Narayan & Madhu, M. (2003), ―Induced caving by blasting: Innovative
experiments in blasting gallery panels of underground coal mines of India‖, Transactions of The Institution of
Mining and Metallurgy Section A-mining Technology - TRANS INST MIN METALL A-MIN T. 112. 57-63.
10.1179/0371745032 25011036.
8. Roy, P.P., Swamliana, C., Singh, R.K., Singh, S.K., Kushwaha, A. (2009), ―Scientific Study for Induced
Caving by Blasting in the Continuous Miner Depillaring Panel at Jhanjra Colliery, ECL‖, (Project No.:
GC/MT/89/2008-09). Central Institute of Mining and Fuel Research, India.
9. Das, S., Dey, A., Pal, A., Roy, N. (2015), ―Applications of Artificial Intelligence in Machine Learning‖,
International Journal of Computer Applications, 115(9), 31-41. doi: 10.5120/20182-2402
10. Abduljabbar, R., Dia, H., Liyanage, S., & Bagloee, S. (2019). ―Applications of Artificial Intelligence in
Transport: An Overview‖, Sustainability, 11(1), 189. doi: 10.3390/su11010189
11. Strecht, Pedro., Cruz., Luís, Soares, Carlos., Moreira, João., Abreu, Rui. (2015). ―A Comparative Study of
Classification and Regression Algorithms for Modelling Students' Academic Performance‖,
https://www.researchgate.net/publication/278030689_A_Comparative_Study_of_Classification_and_Regressio
n_Algorithms_for_Modelling_Students'_Academic_Performance, viewed: 10th June 2019
https://pdfs.semanticscholar.org/3305/2b1d2363aee3ad290612109dcea0aed2a89e.pdf, viewed : 10th June 2019
12. Sathya, R & Abraham, A (2013) International Journal of Advanced Research in Artificial Intelligence,
Vol.2, No. 2,2013, http://ijarai.thesai.org/Downloads/IJARAI/Volume2 No2/Paper_6-
Comparison_of_Supervised_and_Unsupervie _Learning_Algorithms_for_Pattern_Classification.pdf, viewed:
10th June 2019.
13. Mitchell, T. M. (1997), ―Machine Learning‖, New York: McGraw-Hill. ISBN: 978-0-07-042807-2
14. Sebastian Raschka, Vahid Mirjalili, (2019), ―Python Machine Learning-Third Edition, Machine Learning and
Deep Learning with Python, scikit-learn, and TensorFlow2‖.

En
gin
eers
fo
r V
iab
le T
ech
no
log
y a
nd
$5
Tri
llio
n E
con
om
y
Production
Engineering


Engineers for Viable Technology and $5 Trillion Economy
363 Technical Volume of 36th Indian Engineering Congress, December 26-28, 2021 ISBN 978-81-955500-1-2
The Sustainable Development in Madurai Jewellery Cluster
E Bhaskaran
Department of Industries and Commerce, Government of Tamil Nadu, Guindy, Chennai, Tamil Nadu
e-mail: [email protected]
Abstract: Global market for the Gold is estimated 3300 Metric Tons (in 2019). India is the 2nd largest consumer of
the Gold followed by China. China (355 Tons) is the largest producer of Gold, followed by Australia (270 tons) and
USA (237 tons) around 45% of total gold production. The Madurai Jewelry Cluster was formed during 2010 with 28
Micro Enterprises whose investment is less than Rs.1 crore with less than Rs. 5 crore turnovers as per MSMED Act
2006. The objective is to find the physical and financial the performance of Madurai Jewelry Cluster before and
after Cluster Development Approach (CDA), to find the Productivity of the cluster by taking independent variable
like No. of Units, Employment and Production and dependent variable like Turnover and to find performance of
Madurai Jewelry Cluster before and after Cluster Development Approach. The methodology adopted by collecting
the primary data like no of units [Un], employment in no’s [En], production in crores [Pcr] and turnover in crores
[Tcr]from the Madurai Jewellery Cluster before and after cluster development approach and analysing using
Compound Annual Growth Rate (CAGR), Descriptive Analysis, Correlation Analysis, Trend Analysis, Regression
Analysis and Structural Equation Modelling. There is increase in no. of units, employment, production and turnover
after Cluster Development Approach when compared to before CDA and which leads to increase in productivity.
Keywords: Cluster Development Approach
INTRODUCTION
Global market for the Gold is estimated 3300 Metric Tons (in 2019). India is the 2nd largest consumer of the Gold
followed by China. China (355 Tons) is the largest producer of Gold, followed by Australia (270 Tons) and USA
(237 Tons) around 45% of total gold production. The details of Jewellery Sector in India are given in Table 1.
Table 1 Gold Jewellery Sector in India
City Jewellery
Jaipur Polishing Precious & Semi Precious Gemstones
Surat Diamond Processing Centre
Mumbai Machine & Handmade Jewellery, Diamond Bourse,
Tiruchur Gold Jewellery, Diamond
Delhi Silver Jewellery Article
Kolkata Light weight plain Gold Jewellery
Hyderabad Precious and semi-precious studded Jewellery
Nellore Handmade jewellery
Chennai Gold Jewellery, Bangles
Coimbatore Gold Chain, Bracelets, Studs, Ring

Engineers for Viable Technology and $5 Trillion Economy
364 Technical Volume of 36th Indian Engineering Congress, December 26-28, 2021 ISBN 978-81-955500-1-2
TECHNICAL SURVEY
Tamil Nadu consumes about 175 Tons which is 17% of the gold consumption of the Country. Gold Jewellery
manufacturing is led by Chennai, Coimbatore, Madurai, Trichy and Tirunelveli.
These 5 locations major manufacturing of the Gold Jewellery and their performance are shown in Figure 1.
Figure 1 Performance of Jewellery Cluster in Tamil Nadu
The Madurai Jewellery Cluster was formed during 2010 with 28 Micro Enterprises whose investment is less than
Rs.1 crore with less than Rs. 5 crore turnovers as per MSMED Act 2006. The status of the cluster is given in
Table 2.
The Study was conducted to know the various interventions needed for empowering the entrepreneurs
engaged in Jewellery Manufacturing in the areas of Social, Technological, infrastructure related, Financial and
Marketing for the successful promotion of Cluster. [1] The Ministry of Micro, Small and Medium Enterprises
(MSME), Government of India (GoI) has adopted the Cluster Development approach as a key strategy for enhancing
the productivity and competitiveness as well as capacity building of Micro and Small Enterprises (MSEs) and their
collectives in the country. [2]
Many studies have been made to identify performance for Clusters under Cluster Development Approach like
Match, Printing, Auto components, Leather, Plastic, Hosiery, Textile, Lorry Body Building, Pharmaceutical,
Ceramic, Wet Grinder, Jewelry and Rice Mill [3]. Tamil Nadu is first to implement 24 clusters in India which
includes Jewellery Manufacturing Cluster [4][5][6]. A cluster is identified by two constituents – the product and the
place, and is generally localized. [6] However the Jewellery Cluster is not studied yet and this leads to study on the
performance of Madurai Jewellery Cluster before and after CDA.
Under Micro Small Enterprises Cluster Development Programme of Ministry of Micro, Small and Medium
Enterprises, Government of India the Madurai Jewellery Cluster has got funding from Government of India, and
Government of Tamil Nadu. The SPV also contributed and obtained bank loan to finish the project about Rs.3.56
crore. The details of project cost are given Figure 2.

Engineers for Viable Technology and $5 Trillion Economy
365 Technical Volume of 36th Indian Engineering Congress, December 26-28, 2021 ISBN 978-81-955500-1-2
Table 2 Status of Madurai Jewellery Cluster
Name of the Cluster Madurai Jewellery Cluster, Madurai
Created in 28-07-2010
Category of Products Jewellery and Allied Services
Extent of Land 4200 Sq. Feet
No. of Units intended 28
No. of units created/established 46
No of occupancies 80
Present Board of Management 1.Managing Director
2. 6 Directors
Regularity of Conducting Meetings
Once in 2 months
No. of Members
31 MSMEs
Access to members/others
(As per original plan)
SPV members and non-members
Existing facilities/Maintenance 1. Testing facility
2. Melting facility
3. Laser Marking and Soldering
4. Refining
5. Electro Plating
6. Hydraulic Pressing (Coins)
Financial Performance Bank loan closed
Self sufficient
Product refining etc as per original
Proposal
As per the customer requirement model of design has changed.
Date of completion 24.10.2018
Figure 2 Project Cost of Cluster

Engineers for Viable Technology and $5 Trillion Economy
366 Technical Volume of 36th Indian Engineering Congress, December 26-28, 2021 ISBN 978-81-955500-1-2
OBJECTIVE OF THE STUDY
The objective of study is to
1. To find the physical and financial the performance of Madurai Jewellery Cluster before and after Cluster
Development Approach (CDA).
2. To find the Productivity of the cluster by taking independent variable like No. of Units, Employment and
Production and dependent variable like Turnover.
3. To find performance of Madurai Jewellery Cluster before and after Cluster Development Approach.
METHODOLOGY OF THE STUDY
The methodology adopted by collecting the primary data like no of units [Un], employment in no’s [En], production
in crores [Pcr] and turnover in crores [Tcr] from the Madurai Jewellery Cluster before and after cluster development
approach and analysing using Compound Annual Growth Rate (CAGR), Descriptive Analysis, Correlation Analysis,
Trend Analysis, Regression Analysis and Structural Equation Modelling.
TECHNICAL ANALYSIS
Before adopting Cluster Development Approach, the Micro Enterprises manufacturing jewellery were manually
doing different types of Jewellery.
The cluster members do not use modern and sophisticated technology.
Many Units still following traditional methods
Household type of venture
Unorganised sector
Obsolete machineries with cluster members – Need for technology infusion.
Limited market. Mostly doing job work to Traders and Wholesalers / Retailers.
Over dependence on Traders
Poor Backward (Raw material and Advanced machineries) and Forward integration (Job order, Design, whole
sale market and Export)
Poor R & D activity – No new design development by cluster units
Lack of in-house testing facilities
Lack of training to work with modern machineries
NEED FOR COMMON FACILITY CENTRE
Need for modern machineries for product making which are capable of making large number of homogeneous
products in short period.
Lack of Credit / limited resources for Investment in Latest Technology Machineries
Need for reduction in the cost of production and wastages to compete with big players.
Investment in latest technology machineries for various activities like gold melting, sheet and wire drawing,
different types of chain making, laser welding, laser marking, cutting, refining etc., are beyond the reach of
these micro artisan goldsmiths.
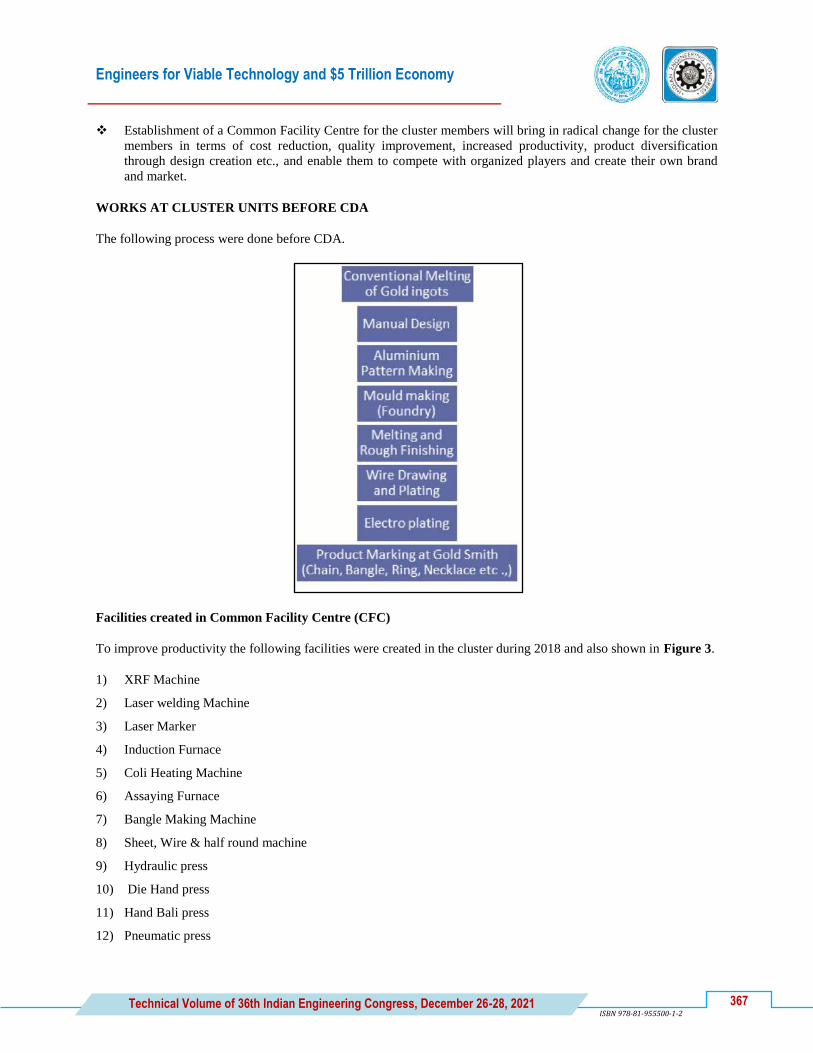
Engineers for Viable Technology and $5 Trillion Economy
367 Technical Volume of 36th Indian Engineering Congress, December 26-28, 2021 ISBN 978-81-955500-1-2
Establishment of a Common Facility Centre for the cluster members will bring in radical change for the cluster
members in terms of cost reduction, quality improvement, increased productivity, product diversification
through design creation etc., and enable them to compete with organized players and create their own brand
and market.
WORKS AT CLUSTER UNITS BEFORE CDA
The following process were done before CDA.
Facilities created in Common Facility Centre (CFC)
To improve productivity the following facilities were created in the cluster during 2018 and also shown in Figure 3.
1) XRF Machine
2) Laser welding Machine
3) Laser Marker
4) Induction Furnace
5) Coli Heating Machine
6) Assaying Furnace
7) Bangle Making Machine
8) Sheet, Wire & half round machine
9) Hydraulic press
10) Die Hand press
11) Hand Bali press
12) Pneumatic press

Engineers for Viable Technology and $5 Trillion Economy
368 Technical Volume of 36th Indian Engineering Congress, December 26-28, 2021 ISBN 978-81-955500-1-2
Figure 3 CFC created in Cluster
The Value Chain Analysis after CDA is as follows and also shown in Table 3.
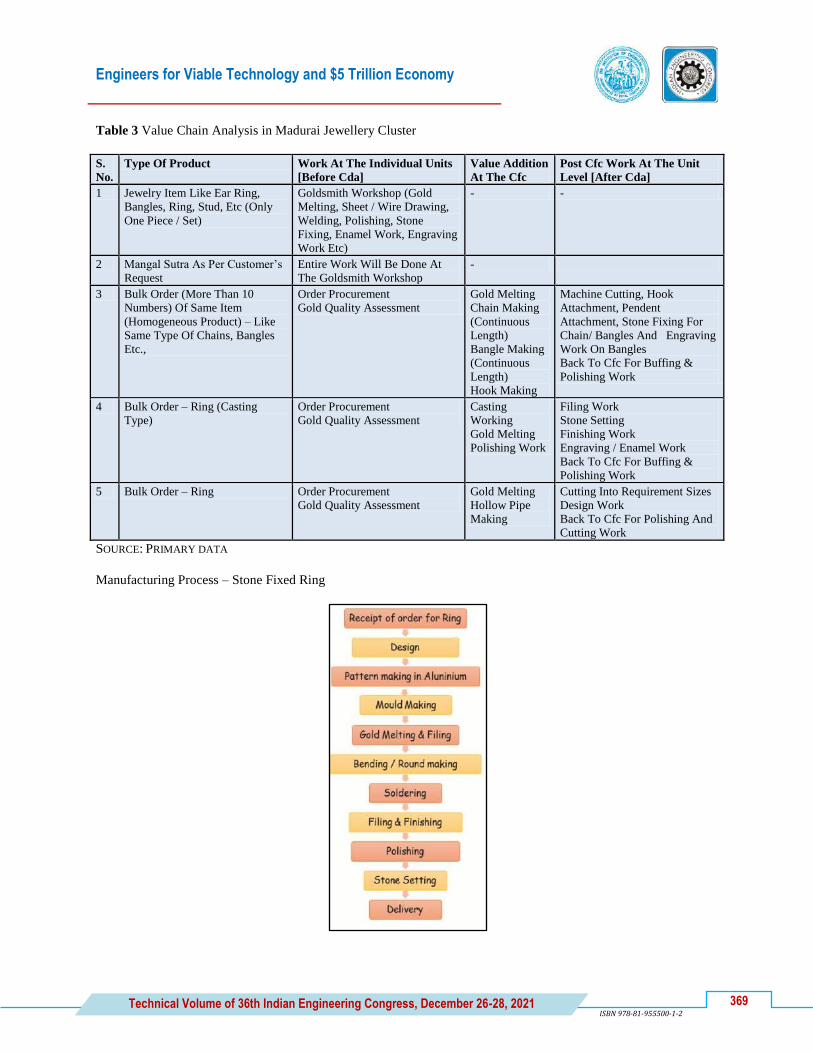
Engineers for Viable Technology and $5 Trillion Economy
369 Technical Volume of 36th Indian Engineering Congress, December 26-28, 2021 ISBN 978-81-955500-1-2
Table 3 Value Chain Analysis in Madurai Jewellery Cluster
S.
No.
Type Of Product Work At The Individual Units
[Before Cda]
Value Addition
At The Cfc
Post Cfc Work At The Unit
Level [After Cda]
1 Jewelry Item Like Ear Ring,
Bangles, Ring, Stud, Etc (Only
One Piece / Set)
Goldsmith Workshop (Gold
Melting, Sheet / Wire Drawing,
Welding, Polishing, Stone
Fixing, Enamel Work, Engraving
Work Etc)
- -
2 Mangal Sutra As Per Customer’s
Request
Entire Work Will Be Done At
The Goldsmith Workshop
-
3 Bulk Order (More Than 10
Numbers) Of Same Item
(Homogeneous Product) – Like
Same Type Of Chains, Bangles
Etc.,
Order Procurement
Gold Quality Assessment
Gold Melting
Chain Making
(Continuous
Length)
Bangle Making
(Continuous
Length)
Hook Making
Machine Cutting, Hook
Attachment, Pendent
Attachment, Stone Fixing For
Chain/ Bangles And Engraving
Work On Bangles
Back To Cfc For Buffing &
Polishing Work
4 Bulk Order – Ring (Casting
Type)
Order Procurement
Gold Quality Assessment
Casting
Working
Gold Melting
Polishing Work
Filing Work
Stone Setting
Finishing Work
Engraving / Enamel Work
Back To Cfc For Buffing &
Polishing Work
5 Bulk Order – Ring Order Procurement
Gold Quality Assessment
Gold Melting
Hollow Pipe
Making
Cutting Into Requirement Sizes
Design Work
Back To Cfc For Polishing And
Cutting Work
SOURCE: PRIMARY DATA
Manufacturing Process – Stone Fixed Ring

Engineers for Viable Technology and $5 Trillion Economy
370 Technical Volume of 36th Indian Engineering Congress, December 26-28, 2021 ISBN 978-81-955500-1-2
PHYSICAL PERFORMANCE
The physical performance is shown in Figure 4
Figure 4 Physical performance
As per Figure 4, CAGR for Un = 19.13% and for En = 9.5%
FINANCIAL PERFORMANCE
The financial performance is shown in Figure 5
Figure 5 Financial Performance
As per figure 5, CAGR for Pcr = 24.57% and for Tcr = 26.57%

Engineers for Viable Technology and $5 Trillion Economy
371 Technical Volume of 36th Indian Engineering Congress, December 26-28, 2021 ISBN 978-81-955500-1-2
DESCRIPTIVE ANALYSIS
Table 4
Un En Pcr Tcr
Mean 78.40 920.00 91.00 3.70
Standard Error 11.83 67.40 19.84 0.68
Median 72 960 75 4
Standard Deviation 26.46 150.71 44.36 1.52
Sample Variance 700.30 22712.50 1967.50 2.33
Kurtosis 1.38 0.31 -2.18 0.00
Skewness 1.05 -0.58 0.60 -0.54
Range 70 400 100 4
Minimum 50 700 50 1.5
Maximum 120 1100 150 5.5
Sum 392 4600 455 18.5
Count 5 5 5 5
TREND ANALYSIS
Un = 30.4 + 16 T [ p = 0.01, R2 = 0.91] [1]
The annual average increase in no. of units is 16.
En = 641 + 93 T [ p = 0.01, R2 = 0.95] [2]
The annual average increase in employment is 93.
Pcr = 10 + 27 T [ p = 0.01, R2= 0.92] [3]
The annual average increase in production is Rs.27 crores.
Tcr = 0.85 + 0.95 T [p = 0.002, R2 = 0.97] [4]
The annual average increase in turnover is Rs.0.95 crores.
STRUCTURAL EQUATION MODELLING
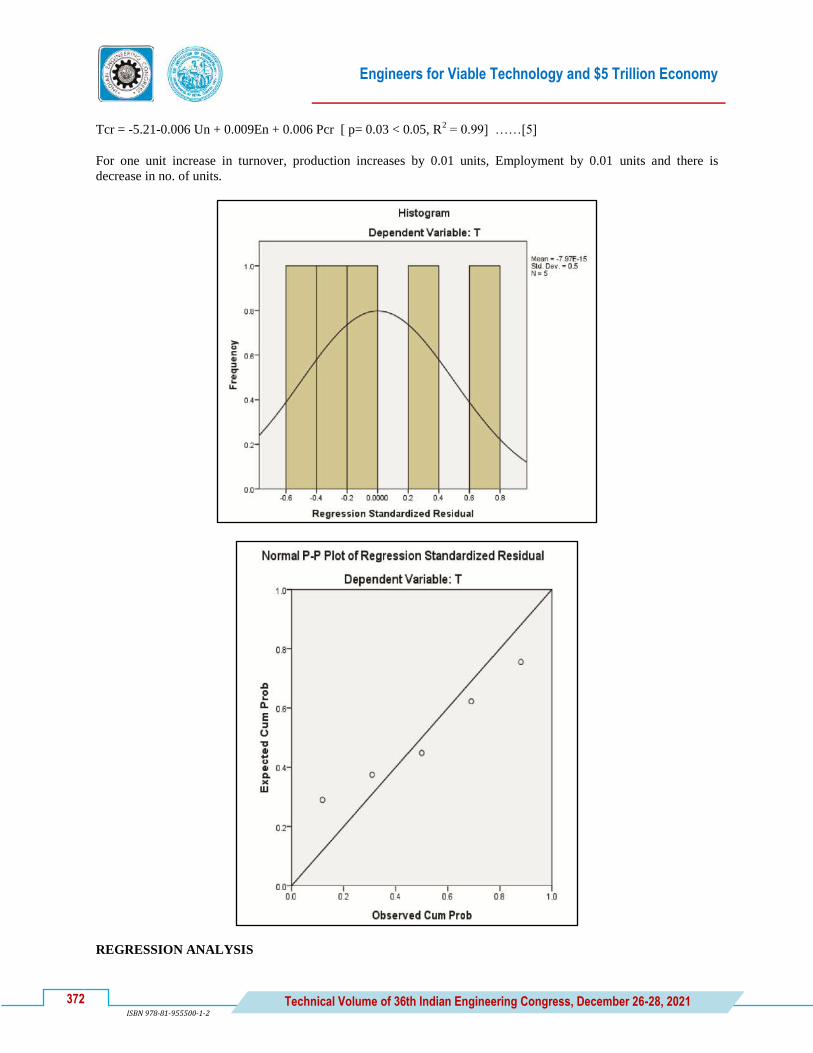
Engineers for Viable Technology and $5 Trillion Economy
372 Technical Volume of 36th Indian Engineering Congress, December 26-28, 2021 ISBN 978-81-955500-1-2
Tcr = -5.21-0.006 Un + 0.009En + 0.006 Pcr [ p= 0.03 < 0.05, R2 = 0.99] ……[5]
For one unit increase in turnover, production increases by 0.01 units, Employment by 0.01 units and there is
decrease in no. of units.
REGRESSION ANALYSIS

Engineers for Viable Technology and $5 Trillion Economy
373 Technical Volume of 36th Indian Engineering Congress, December 26-28, 2021 ISBN 978-81-955500-1-2
Pcr = -40.27+1.5 Un + 0.015En [ p= 0.11 > 0.05, R2 = 0.94] [6]
For one unit increase in production, employment increases by 0.02 units and no. of units by 1.5 units.
Tcr = 0.88+0.03 Pcr [ p= 0.04 < 0.05, R2 = 0.90] [7]
For one unit increase in turnover, production increases by 0.03 units.
T TEST
t-Test: Paired Two Sample for Means
Ua Ub
Mean 92.33333 62.33333
Variance 616.3333 126.3333
Observations 3 3
Pearson Correlation 0.893539
Hypothesized Mean Difference 0
df 2
t Stat 3.326496
P(T<=t) one-tail 0.039857
t Critical one-tail 2.919986
P(T<=t) two-tail 0.079714
t Critical two-tail 4.302653
Ho: Ua = Ub , p = 0.03 < 0.05 (Rejected)
Ha: Ua # Ub (Accepted) Ua > Ub
t-Test: Paired Two Sample for Means
Ea Eb
Mean 1015 838.3333
Variance 5575 17108.33
Observations 3 3
Pearson Correlation 0.893386
Hypothesized Mean Difference 0
df 2
t Stat 4.22986
P(T<=t) one-tail 0.025802
t Critical one-tail 2.919986
P(T<=t) two-tail 0.051604
t Critical two-tail 4.302653
Ho: Ea = Eb , p = 0.02 < 0.05 (Rejected)
Ha: Ea # Eb (Accepted) Ea > Eb
t-Test: Paired Two Sample for Means
Pcra Pcrb
Mean 116.6667 60
Variance 1458.333 175
Observations 3 3
Pearson Correlation 0.866025
Hypothesized Mean Difference 0
df 2
t Stat 3.564168

Engineers for Viable Technology and $5 Trillion Economy
374 Technical Volume of 36th Indian Engineering Congress, December 26-28, 2021 ISBN 978-81-955500-1-2
P(T<=t) one-tail 0.035248
t Critical one-tail 2.919986
P(T<=t) two-tail 0.070497
t Critical two-tail 4.302653
Ho: Pcra = Pcrb , p = 0.03 < 0.05 (Rejected)
Ha: Pcra # Pcrb (Accepted) Pcra > Pcrb
t-Test: Paired Two Sample for Means
Tcra Tcrb
Mean 4.666667 2.833333
Variance 0.583333 1.583333
Observations 3 3
Pearson Correlation 0.953821
Hypothesized Mean Difference 0
df 2
t Stat 5.5
P(T<=t) one-tail 0.015752
t Critical one-tail 2.919986
P(T<=t) two-tail 0.031504
t Critical two-tail 4.302653
Ho: Tcra = Tcrb , p = 0.02 < 0.05 (Rejected)
Ha: Tcrb # Tcrb (Accepted) Tcra > Tcrb
FINDINGS, SUGGESTIONS AND CONCLUSION
A study was conducted to find the productivity of Madurai Jewellery Cluster before and after cluster development
approach. There is increase in CAGR after CDA. There is increase in mean value after CDA. There exists strong
relationship between dependent variables like turnover and independent variables like no. of units, employment and
production. There is annual average increase in no. of units, employment, production and turnover. There is increase
in no. of units, employment, production and turnover after Cluster Development Approach. There is cost reduction
in individual unit after CDA. Due to CDA, The Jewellery products are diversified, new design has been developed,
direct export by cluster units has taken place and brand creation has been developed in Madurai Jewellery Cluster.
ACKNOWLEDGMENT
The author acknowledges Department of Industries and Commerce, Government of Tamil Nadu for sending him for
UNIDO cluster development training at EDII, Ahmedabad and acknowledges University of Madras for giving Ph.D.
in Industrial Cluster Development Approach.
REFERENCES
1. https://www.unido.org/sites/default/files/2008-05/Supplier_Networks-EN_0.pdf, p.no.3 UNIDO website
assessed on 10.11.2021
2. http://www.dcmsme.gov.in/MSE-CDProg.htm Ministry of MSME, Government of India website assessed on
10.11.2021
3. http://www.msmetamilnadu.tn.gov.in Department of Industries and Commerce, Government of Tamil Nadu
website assessed on 01.11.2021
4. http://www.tansidco.tn.gov.in assessed on 01.11.21
5. Policy Note, 2021-22, MSME Department, Government of Tamil Nadu p.no.148

En
gin
eers
fo
r V
iab
le T
ech
no
log
y a
nd
$5
Tri
llio
n E
con
om
y
Textile
Engineering


Engineers for Viable Technology and $5 Trillion Economy
377 Technical Volume of 36th Indian Engineering Congress, December 26-28, 2021 ISBN 978-81-955500-1-2
Modelling Multi-phase Machine Repairable System for a Textile
Industry
S Karpagam
Assistant Professor, Vel Tech Rangarajan Dr Sagunthala R&D Institute of Science and Technology, Chennai
email: [email protected]
Abstract: In this article, we analyse multi stages of service queuing model which undergoes multi-phases of repair
due to active breakdown in a manufacturing industry like textile industry with restricted arrivals of unfinished
products in line.. During each stage of manufacturing process, whenever breakdown of machine occurs, it is
immediately sent for its corresponding repair stage. After repair completion, the machine resumes it’s remaining
service. We carried out the steady-state analysis of the system using the method of supplementary variable technique
and important performance measures and stability conditions are obtained such as the expected que length and
expecyed waiting time of the the orders. The results were reported with interesting illustrative numerical example.
Keywords: General Bulk Service; Non-Markovian Queue; Multi Stage Service and Repair, Active Breakdown
Mathematics Subject Classification: 60K25, 90B22, 68M20.
INTRODUCTION
The fabric enterprise imposes a number of constraints regarding the mixing of an usual scheduling procedure. For
example, the weaving technique is characterized by using lengthy planning horizons and relatively slow speed of
machines, very long setup instances, very huge manufacturing batches, and combined order and stock-based totally
production. on the contrary, the warp making process is characterized by way of short planning horizons and
excessive velocity of machines, short setup instances, small production batches and simplest orders-based
manufacturing. The above phases pose the maximum complex production scheduling problems.
In any manufacturing industry, machine break-down during operation is a general phenomena that brings an impact
on the system efficiency, productivity, job completion time, waiting time in the queue and system. In multi stage
manufacturing process such as textile, Leather industries etc., the server provides N stages of heterogeneous service
in succession. This types of model finds real time application in heterogenous multi stage manufacturing process.
The server (machine) starts the first stage of service only, if minimum „a‟ customers are in the queue. After first
stage service completion, the server starts second stage service to the same batch of customers ( unfinished product),
then remaining stage of services are served to the same batch of customers to complete the production cycle. During
this process. If the machine breaks-down at „i‟th
stage, then it is immediately sent for repair. For each stage of
service station, we have different break-down rates. This types of model finds real time application in heterogenous
multi stage manufacturing process in textile industry from fibre to garment. Our major problem is to enhance the
overall performance of multi-phase store manufacturing technique via way of means of disposing of the waiting
time of every technique at some point of the breakdown. Bulk queueing systems with active server break-down of
differing time interval following probabilistic phenomena are considered by several researchers.
In textile industries, the manufacturing machine requires immediate repair after breakdown for proficient output of
the creation and delivery of goods as per schedule. Motivated through those observations, we've got advanced a
model bulk service queue model with multiple stages of services and multiple repairs to complete the production
process. We carried out the steady-state analysis of the system using the method of supplementary variable
technique to obtain measures such as joint distribution of the server state, expected system size, expected queue size,
availability of the server and failure frequency. The results were reported with interesting illustrative numerical
examples. The brief outline of the present paper is presented here.

Engineers for Viable Technology and $5 Trillion Economy
378 Technical Volume of 36th Indian Engineering Congress, December 26-28, 2021 ISBN 978-81-955500-1-2
LITERATURE REVIEW
Very few authors have dealt with the concepts of multi stages of service and breakdown server: Bagyam et al.
(2018) and Radha et al. (2017). Zhou et al. (2017), Fazlollahtabar et al. (2019) and Vladimir Alexeev et al. (2020)
have analysed a single server and batch arrival with a multiple stages of service queuing system and determined the
various performance measures based on queueing characteristics.
Sethi et al. (2017) investigated transient evaluation of Markovian queue with multi stage service, finite capability
and breakdowns. Runge-Kutta approach has been used to have a look at the transient analysis of finite Markovian
queueing version. various overall performance measures like waiting time, queue duration, throughput, and service
kingdom probabilities have additionally been obtained.Bogatyrev et al. (2017) designed answers on the employer of
multi-degree redundant service of copies of requests in multi-tier cluster that makes it possible to boom the
possibility of well timed servicing of requests crucial to the overall waiting time for all machine tiers (stages of
protection). They derived the life of efficient redundant carrier of requests in multi-tier clusters, and the ultimate
multiplicity of redundancy of request copies relying at the machine load and constraints at the allowable total time
of staged ready inside the queues of the nodes within the clusters at all degrees.
A multi stage of heterogeneous service in a batch arrival queue is analysed through Vignesh et al. (2017). through
employing producing features and supplementary variable strategies, the brief answer and the corresponding
consistent kingdom results were acquired explicitly with practical rationalisation / validation model.Another
application, of this type of Queue model is healthcare system. Wu et al. (2019) advanced two effective heuristics
strategies to estimate the patient-blocking opportunity, which can be then used to broaden an included mathematical
version for bed allocation and validated it with actual time data amassed from a tertiary hospital in China . They
discovered that increasing the range of beds at some stage in the primary level is greater powerful in reducing
blockage than doing so later in case of a confined number of beds.
Zhou et al. (2019) considered an appointment scheduling problem in multi-level sequential provider structures and
hooked up linear relationships amongst waiting instances and idle times in unique ranges, and transform the
stochastic application into a two-level software. And sooner or later, they behavior numerical experiments and
shown that the optimal agenda famous a "dome" shape when service instances of all clients are unbiased and
identically disbursed in every stage, and the "dome" form varies with specific parameters.
Klassen et al. (2019) considers the situations under which adding an Mid-degree provider carriers (MLSP) to a
unmarried-physician outpatient workplace turns into the exceptional method for the sanatorium, and determines how
scheduling guidelines from the widely-researched unmarried-stage surroundings must be adjusted for a multi-stage
environment. They display that adding an MLSP can reduce patient waiting time, patient drift time, and health
practitioner service time with sufferers. Ebadi et al. (2020) develops control charts for monitoring the provider
instances on the exceptional degrees of a congested device that gives a multistage service to its clients and carried
out this approach to a quick food eating place with waiting ranges. Thai et al. (2020) discussed the observe of multi-
stage production with several service areas in order to in addition optimise the excellent of the control of the
distribution of jobs. Modelling is carried out and methods of fixing the discrete optimisation hassle are proposed.
MATHEMATICAL DESCRIPTION OF OUR MODEL
A multi-stage service process in Textile industry is given in Figure 1 for the understanding of the textile process to
the reader. In this paperM[X]/G(a, b)/1 queue model with single server, multi-stages service with customers arrive
in batch according to a Poisson process with restricted arrivals is discussed. The server provides multiple stages of
heterogeneous service in succession. Server serves the customers under General Bulk Service Rule (GBSR) with
FCFS queue discipline. After first stage service completion, the server starts second stage service to the same batch
of customers then depends upon request with probability p third stage or with probability q fourth stage service
served to the batch after fifth, six and seventh stage of services are served to complete the production cycle. During
this process. If the machine break-down, then it is immediately sent for repair. For each stage of service station we
have different types of break-down rates. This types of model finds real time application in heterogenous multi stage
manufacturing process in textile industry from fibre to garment. Our main concern is to improve the performance of
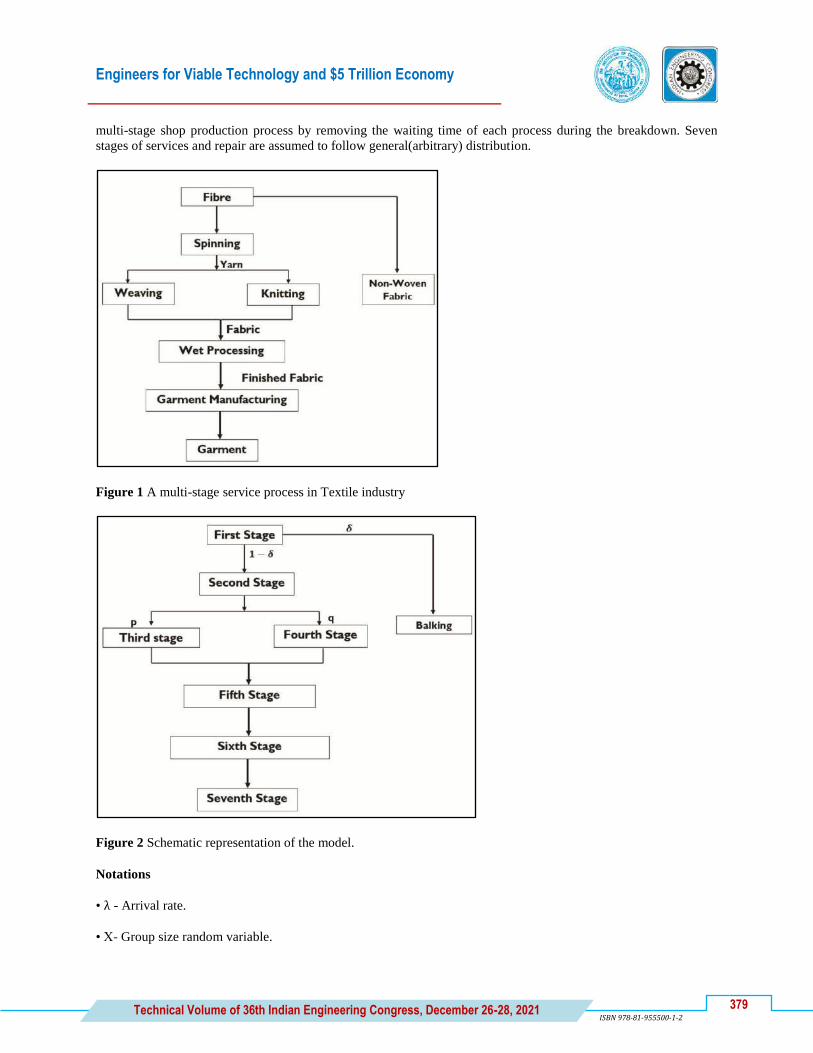
Engineers for Viable Technology and $5 Trillion Economy
379 Technical Volume of 36th Indian Engineering Congress, December 26-28, 2021 ISBN 978-81-955500-1-2
multi-stage shop production process by removing the waiting time of each process during the breakdown. Seven
stages of services and repair are assumed to follow general(arbitrary) distribution.
Figure 1 A multi-stage service process in Textile industry
Figure 2 Schematic representation of the model.
Notations
• λ - Arrival rate.
• X- Group size random variable.

Engineers for Viable Technology and $5 Trillion Economy
380 Technical Volume of 36th Indian Engineering Congress, December 26-28, 2021 ISBN 978-81-955500-1-2
• Pr(X = k) = gk .
• X(z) - the Probability Generating Function (PGF) of X.
• 𝒮i(. ), ℛi(. ) (i=1, 2,...,7) represents the Cumulative Distribution Function (CDF) of ith stage service time, ith stage
repair time and their corresponding probability density functions are si(w) and ri(w) respectively.
• 𝒮i0(t) and ℛi
(0)(t) represents the remaining ith stage service time, remaining ith stage repair time at time „t‟
respectively.
• 𝒮 i(τ) and ℛ i(τ) represent the Laplace Stieltjes Transform (LST) of 𝒮i and ℛi respectively.
For the further development of the queueing system, let us define the following probabilities:
ℐn(t)Δt = Pr{Nq(t) = n, ϕ(t) = 1}, n ≥ 0,
ℳi,n(w, t)Δt = Pr{Nq(t) = n, w ≤ 𝒮i0(t) ≤ w + Δt, ϕ(t) = 2}, n ≥ 1
ℛi,n(w, y, t)Δt = Pr{N2 t = n, 𝒮i0 t = xy ≤ ℛi
0(t) ≤ y + Δtϕ(t) = 3}, n ≥ a.
where ϕ(t) = (1), (2) and (3) denotes server is in idle, busy in ith stage service and ith stage repair respectively.
Nq(t), be number of customers in queue at time „t‟ respectively.
QUEUE SIZE DISTRIBUTION
The Kolmogorov backward equation governing the system for the proposed model is:
Server is in idle
λℐ0 = ℳ7,0(0), (1)
λℐn = ℳ7,0(0) + nk=1 ℐn−kλgk , 1 ≤ n ≤ a − 1, (2)
Server is in service
−ℳ1,0′ (w) = −(λ + α1)ℳ1,0(w) +
b
d=a
ℳ7,d(0)s1(w) + ℛ1,0(w, 0)
+ a−1k=0 b
d=a Ikλgd−ks1(w) + λδℳ1,0(w), (3)
−ℳ1,n′ (w) = −(λ + α1)ℳ1,n(w) + λδℳ1,n(w) + ℛ1,n(w, 0)
+ℳ7,b+n(0)s1(w) + a−1k=0 Ikλgb+n−ks1(w)
+(1 − δ) nj=1 ℳ1,n−j(w)λgj , n ≥ 1, (4)
−ℳ2,0′ (w) = −(λ + α2)ℳ2,0(w) + ℳ1,0(0)s2(w) + ℛ2,0(w, 0) + λδℳ2,0(w) (5)
−ℳ2,n′ (w) = −(λ + α2)ℳ2,n(w) + λδℳ2,n(w) + ℛ2,n (w, 0)

Engineers for Viable Technology and $5 Trillion Economy
381 Technical Volume of 36th Indian Engineering Congress, December 26-28, 2021 ISBN 978-81-955500-1-2
+ℳ1,n(0)s2(w) + (1 − δ) nj=1 ℳ2,n−j(w)λgj , n ≥ 1 (6)
−ℳ3,0′ (w) = −(λ + α3)ℳ3,0(w) + pℳ2,0(0)s3(w) + ℛ3,0(w, 0) + λδℳ3,0(w) (7)
−ℳ3,n′ (w) = −(λ + α3)ℳ3,n(w) + λδℳ3,n(w) + ℛ3,n (w, 0)
+pℳ2,n(0)s3(w) + (1 − δ) nj=1 ℳ3,n−j(w)λgj , n ≥ 1 (8)
−ℳ4,0′ (w) = −(λ + α4)ℳ4,0(w) + qℳ2,0(0)s4(w) + ℛ4,0(w, 0) + λδℳ4,0(w) (9)
−ℳ4,n′ (w) = −(λ + α4)ℳ4,n(w) + λδℳ4,n(w) + ℛ4,n (w, 0)
+qℳ2,n(0)s4(w) + (1 − δ) nj=1 ℳ4,n−j(w)λgj , n ≥ 1 (10)
−ℳ5,0′ (w) = −(λ + α5)ℳ5,0(w) + (ℳ3,0(0) + ℳ4,0(0))s5(w)
+ℛ5,0(w, 0) + λδℳ5,0(w) (11)
−ℳ5,n′ (w) = −(λ + α5)ℳ5,n(w) + (ℳ3,n(0) + ℳ4,n (0))s5(w)
+ℛ5,0(w, 0) + λδℳ5,n(w) + (1 − δ) nj=1 ℳ5,n−j(w)λgj , n ≥ 1, (12)
−ℳ6,0′ (w) = −(λ + α6)ℳ6,0(w) + ℳ5,0(0)s6(w) + ℛ6,0(w, 0) + λδℳ6,0(w) (13)
−ℳ6,n′ (w) = −(λ + α6)ℳ6,n(w) + λδℳ6,n(w) + ℛ6,n (w, 0)
+ℳ5,n(0)s6(w) + (1 − δ) nj=1 ℳ6,n−j(w)λgj , n ≥ 1 (14)
−ℳ7,0′ (w) = −(λ + α7)ℳ7,0(w) + ℳ6,0(0)s7(w) + ℛ7,0(w, 0) + λδℳ7,0(w), (15)
−ℳ7,n′ (w) = −(λ + α7)ℳ7,n(w) + λδℳ7,n(w) + ℛ7,n (w, 0)
+ℳ6,n(0)s7(w) + (1 − δ) nj=1 ℳ7,n−j(w)λgj , n ≥ 1, (16)
Server is on repair
−∂Ri ,0(w,y)
∂y= −λRi,0(w, y) + αiℳi,0(w)ri(y), i = 1,2, . . . ,7, (17)
−∂Ri,n(w, y)
∂y= −λRi,n(w, y) + αiℳi,n(w)ri(y) +
n
k=1
ℛi,n−k(w, y)λgk ,
i = 1,2, . . . ,7, n ≥ 1. (18)
While applying LST to the above equations (2) to (18), we get,
τℳ 1,0(τ) − ℳ1,0(0) = (λ + α1)ℳ 1,0(τ) −
b
d=a
ℳ7,d (0)𝒮 1(τ) − ℛ 1,0(τ, 0)

Engineers for Viable Technology and $5 Trillion Economy
382 Technical Volume of 36th Indian Engineering Congress, December 26-28, 2021 ISBN 978-81-955500-1-2
− a−1k=0 b
d=a Ikλgd−k𝒮 1(w) − λδℳ 1,0(τ), (19)
τℳ 1,n(τ) − ℳ1,n(0) = (λ + α1)ℳ 1,n(τ) − λδℳ 1,n(τ) − ℛ 1,n(τ, 0)
−ℳ7,b+n(0)𝒮 1(τ) − a−1k=0 ℐkλgb+n−k𝒮 1(τ)
−(1 − δ) nj=1 ℳ 1,n−j(τ)λgj , n ≥ 1 (20)
τℳ 2,0(τ) − ℳ2,0(0) = (λ + α2)ℳ 2,0(τ) − ℳ1,0(0)𝒮 2(τ) − ℛ 2,0(τ, 0) − λδℳ 2,0(τ)
(21)
τℳ 2,n(τ) − ℳ2,n(0) = (λ + α2)ℳ 2,n(τ) − λδℳ 2,n(τ) − ℛ 2,n(τ, 0)
−ℳ1,n(0)𝒮 2(τ) − (1 − δ) nj=1 ℳ 2,n−j(τ)λgj , n ≥ 1 (22)
τℳ 3,0(τ) − ℳ3,0(0) = (λ + α3)ℳ 3,0(τ) − pℳ2,0(0)𝒮 3(τ) − ℛ 3,0(τ, 0) − λδℳ 3,0(τ)
(23)
τℳ 3,n(τ) − ℳ3,n(0) = (λ + α3)ℳ 3,n(τ) − λδℳ 3,n(τ) − ℛ 3,n(τ, 0)
−pℳ2,n(0)𝒮 3(τ) − (1 − δ) nj=1 ℳ 3,n−j(τ)λgj , n ≥ 1 (24)
τℳ 4,0(τ) − ℳ4,0(0) = (λ + α4)ℳ 4,0(τ) − qℳ2,0(0)𝒮 4(τ) − ℛ 4,0(τ, 0) − λδℳ 4,0(τ)
(25)
τℳ 4,n(τ) − ℳ4,n(0) = (λ + α4)ℳ 4,n(τ) − λδℳ 4,n(τ) − ℛ 4,n(τ, 0)
−qℳ2,n(0)𝒮 4(τ) − (1 − δ) nj=1 ℳ 4,n−j(τ)λgj , n ≥ 1, (26)
τℳ 5,0(τ) − ℳ5,0(0) = (λ + α5)ℳ 5,0(τ) − (ℳ3,0(0) + ℳ4,0(0))𝒮 5(τ)
−ℛ 5,0(τ, 0) − λδℳ 5,0(τ) (27)
τℳ 5,n(τ) − ℳ5,n(0) = (λ + α5)ℳ 5,n(τ) − (ℳ3,n(0) + ℳ4,n(0))𝒮 5(τ)
−ℛ 5,n(τ, 0) − (1 − δ) nj=1 ℳ 5,n−j(τ)λgj − λδℳ 5,n(τ), n ≥ 1, (28)
τℳ 6,0(τ) − ℳ6,0(0) = (λ + α6)ℳ 6,0(τ) − ℳ5,0(0)𝒮 6(τ) − ℛ 6,0(τ, 0) − λδℳ 6,0(τ)
(29)
τℳ 6,n(τ) − ℳ6,n(0) = (λ + α6)ℳ 6,n(τ) − ℳ5,n(0)𝒮 6(τ) − λδℳ 6,n(τ)
−ℛ 6,n(τ, 0) − (1 − δ) nj=1 ℳ 6,n−j(τ)λgj , n ≥ 1 (30)
τℳ 7,0(τ) − ℳ7,0(0) = (λ + α7)ℳ 7,0(τ) − ℳ6,0(0)𝒮 7(τ) − ℛ 7,0(τ, 0) − λδℳ 7,0(τ)

Engineers for Viable Technology and $5 Trillion Economy
383 Technical Volume of 36th Indian Engineering Congress, December 26-28, 2021 ISBN 978-81-955500-1-2
(31)
τℳ 7,n(τ) − ℳ7,n(0) = (λ + α7)ℳ 7,n(τ) − ℳ6,n(0)𝒮 7(τ) − λδℳ 7,n(τ)
−ℛ 7,n(τ, 0) − (1 − δ) nj=1 ℳ 7,n−j(τ)λgj , n ≥ 1 (32)
−∂R i ,0(τ,y)
∂y= λR i,0(τ, y) − αiℳ i,0(τ)ri(y), i = 1,2, . . . ,7, (33)
−∂R i ,n (τ,y)
∂y= λR i,n(τ, y) − n
k=1 R i,n−k(τ, y)λgk − αiℳ i,n(τ)ri(y), i = 1,2, . . . ,7, n ≥ 1. (34)
Again applying LST to the above equations 33 and 34 , we get,
θR i,0
∗(τ,θ) − R i,0(τ, 0) = λR i,0
∗(τ, θ) − αiℳ i,0(τ)Ri
∗(θ), i = 1,2, . . . ,7, (35)
θR i,n
∗(τ,θ) − R i,n(τ, 0) = λR i,n
∗(τ, θ) −
n
k=1
R i,n−k
∗(τ, θ)λgk − αiℳ i,n(τ)ℛ
∗(θ), i = 1,2, . . . ,7, n ≥ 1.
(36)
Let us define the following PGF‟s:
ℳ d (z, τ) =
∞
j=0
ℳ d,j(τ)zj , ℳd (z, 0) =
∞
j=0
ℳd,j(0)zj , 1 ≤ d ≤ 7,
R d
∗(z, τ, θ) = ∞
j=0 R d,j
∗(τ,θ)zj , R d (z, τ, 0) = ∞
j=0 R d,j(τ, 0)zj , 1 ≤ d ≤ 7. (37)
Simplifying equations (19) to (32), (35) and (36) using (37), we get,
ℳ 1(z, 0) =(1−𝒮 1(u1(z)))
zb u1(z)f(z) (38)
ℳ 2(z, 0) =(1−𝒮 2(u2(z)))
u2(z)ℳ1(z, 0) (39)
ℳ 3(z, 0) =p(1−𝒮 3(u3(z)))
u3(z)ℳ2(z, 0) (40)
ℳ 4(z, 0) =q(1−𝒮 4(u4(z)))
u4(z)ℳ2(z, 0) (41)
ℳ 5(z, 0) =(1−𝒮 5(u5(z)))
u5(z)(ℳ3(z, 0) + ℳ4(z, 0)) (42)
ℳ 6(z, 0) =(1−𝒮 6(u6(z)))
u6(z)ℳ5(z, 0) (43)
ℳ 7(z, 0) =(1−𝒮 7(u7(z)))
u7(z)ℳ6(z, 0) (44)
ℛ i(z, τ, 0) = αiℛi∗(v(z))ℳ i(z, τ), 1 ≤ i ≤ 7. (45)

Engineers for Viable Technology and $5 Trillion Economy
384 Technical Volume of 36th Indian Engineering Congress, December 26-28, 2021 ISBN 978-81-955500-1-2
ℛ
i(z, 0,0) =α iℛi
∗(v(z))ℳ i (z,0)
v(z), 1 ≤ i ≤ 7. (46)
where
f(z) = zb br=a ℳ7,r(0) + ℳ7(z, 0) − b−1
n=0 ℳ7,n(0)zn
+zb b−1r=a a−1
k=0 ℐkλgr−k + ∞n=b a−1
k=0 ℐkzkλgn−kzn−k . (47)
PROBABILITY GENERATING FUNCTION OF QUEUE SIZE
The PGF of the queue size at an arbitrary time epoch
Let P(z) be the PGF of the queue size at an arbitrary time epoch.
P(z) = 7i=1 ℳ i(z, 0) + 7
i=1 ℛ
i(z, 0,0) + ℐ(z). (48)
P(z) =
A(z)[ b−1n =a (zb−zn )mn + b−1
n =a a−1k =0 ℐk λgn−k (zb−zn )]
I(z)[−v(z)A(z)−D(z)]
D(z). (49)
where
mn = ℳ7(z, 0),
ui(z) = λ + αi − λδ − (1 − δ)λX(z) − αiℛi∗(v(z)),
u(z) = u1(z)u2(z)u3(z)u4(z)u5(z)u6(z)u7(z)
S(z) = [zb − 𝒮 1(u1(z))𝒮 2(u2(z))[p𝒮 3(u3(z)) + q𝒮 4(u4(z))]𝒮 5(u5(z))𝒮 6(u6(z))𝒮 7(u7(z))]
ℛi∗(v(z)) = ℛi
∗(λ − λX(z)),
D(z) = v(z)u(z)S(z)
A(z) = u2(z)u3(z)u4(z)u5(z)u6(z)u7(z)[v(z) + α1(1 − ℛ1∗(v(z)))](1 − 𝒮 1(u1(z)))
u1(z)u5(z)u6(z)u7(z)𝒮 1(u1(z))[u3(z)u4(z)[v(z) + α2(1 − ℛ2∗(v(z)))](1 − 𝒮 2(u2(z)))
+ u2(z)𝒮 2(u2(z))(u4(z)[v(z) + α3(1 − ℛ3∗(v(z)))]p(1 − 𝒮 3(u3(z)))
+ u3(z)[v(z) + α4(1 − ℛ4∗(v(z)))](1 − 𝒮 4(u4(z))))]
+ u1(z)u2(z)u3(z)u4(z)𝒮 1(u1(z))𝒮 2(u2(z))[p𝒮 3(u3(z)) + q𝒮 4(u4(z))]∗ (u6(z)u7(z)[v(z) + α5(1 − ℛ5
∗(v(z)))](1 − 𝒮 5(u5(z)))
u5(z)u7(z)[v(z) + α6(1 − ℛ6∗(v(z)))](1 − 𝒮 6(u6(z)))𝒮 5(u5(z))
u5(z)u6(z)[v(z) + α7(1 − ℛ7∗(v(z)))](1 − 𝒮 7(u7(z)))𝒮 5(u5(z))𝒮 6(u6(z)))
PGF of queue size at various completion epochs
Server is busy:
M(z) =Nr (z)
u(z)S(z) (50)

Engineers for Viable Technology and $5 Trillion Economy
385 Technical Volume of 36th Indian Engineering Congress, December 26-28, 2021 ISBN 978-81-955500-1-2
Where
Nr(z) = g(z) ∗ [u2(z)u3(z)u4(z)u5(z)u6(z)u7(z)S(z)(1 − 𝒮 1(u1(z))) +
𝒮 1(u1(z))[u5(z)u6(z)u7(z)(u3(z)u4(z)(1 − 𝒮 2(u2(z)))
+pu2(z)u4(z)𝒮 2(u2(z))(1 − 𝒮 3(u3(z)))
+qu2(z)u3(z)𝒮 2(u2(z))(1 − 𝒮 4(u4(z))))
+u2(z)u3(z)u4(z)[p𝒮 3(u3(z)) + q𝒮 4(u4(z))]
∗ (u6(z)u7(z)(1 − 𝒮 5(u5(z)))
+u5(z)u7(z)𝒮 5(u5(z))(1 − 𝒮 6(u6(z)))
+u5(z)u6(z)𝒮 5(u5(z))𝒮 6(u6(z))(1 − 𝒮 7(u7(z))))]],
g(z) = zb b−1r=a mn − b−1
n=0 mnzn + zb b−1r=a a−1
k=0 ℐkλgr−k
+ ∞n=b a−1
k=0 ℐkzkλgn−kzn−k .
Server is on repair:
R(z) = 7
i=1 α i (1−ℛ∗(v(z)))ℳ i (z,0)
v(z) (51)
Steady State Condition
The PGF of the queue length has to satisfy "P(1) = 1, for that we apply L‟ Hopital‟s rule and evaluating
limz→1P(z), then equating to 1, we have, N′′ = D′′.Since mi and Ii represents the probabilities of ′i′ customers
waiting in the queue, it follows that N′′ must be positive. Thus P(1) = 1 is satisfied iff D′′ > 0”. If
ρ =S11 +S21 +pS31 +qS41 +S51 +S61 +S71
b< 1 (52)
is the traffic intensity for the model.
Computational Aspects
Equation (49) has b unknowns ma , ma+1, . . . , mb−1 , I0, I1, . . . , Ia−1 Now from equation (49) which is PGF of number
of customers involves b unknowns. By Rouches‟s theorem “S(z) has one zero on the boundary and b-1 inside the
unit circle. Due to analyticity of P(z) the numerator must vanish at these points and gives b equations with b
unknowns”, which can be solved by numerical technique.
Expected Queue Length
The mean queue length E(Q) at an arbitrary time epoch is given by
E(Q) =Nr(X )Dr(IX )−Nr(IX )Dr(X )
10Dr(IX )Dr(IX ) , (53)
Expected Waiting Time

Engineers for Viable Technology and $5 Trillion Economy
386 Technical Volume of 36th Indian Engineering Congress, December 26-28, 2021 ISBN 978-81-955500-1-2
The expected waiting time is obtained by using the Little‟s formula as;
E(W) =E(Q)
λE(X) (54)
NUMERICAL EXAMPLE
A numerical illustration of our above discussed model is analysed for a specific case with the following
assumptions:
1. Service time distribution is 2-Erlang (For all stage of service).
2. Batch size distribution of the arrival is geometric with mean 2.
3. Repair time is exponential with parameters η
4. E (Q) and E (W) presets are calculated and the results are tabulated for different arrival rates and service rates.
Table 1 Arrival Rate vs Service rate vs Performance measures
If a = 8, b = 15, μ = μi , i = 1,2, . . . ,7, δ = 0.2, α = 1, η = 5
𝛍 𝛌 𝛒 𝐄(𝐐) 𝐄(𝐖)
40
2 0.8428 0.9848 0.2462
7 0.8998 3.4375 0.2148
8 0.9112 3.4139 0.2439
50
4 0.8565 2.2032 0.2754
7 0.8838 3.3154 0.1972
9 0.9021 3.5487 0.2368
60
4 0.8504 1.7696 0.2212
7 0.8732 3.0908 0.1942
9 0.8884 3.4949 0.2208
70
4 0.8461 1.3839 0.1730
7 0.8656 2.8203 0.1856
9 0.8786 3.3410 0.2014
80
2 0.8314 0.5881 0.1470
7 0.8599 2.5399 0.1744
9 0.8713 3.1398 0.1814
Table 2 Breakdown rate vs Performance measures
a = 8, b = 15, λ = 5, μi = 20, i = 1,2, . . . ,7, δ = 0.2, η = 7
𝛂 𝛒 𝐄(𝐐) 𝐄(𝐖)
0.0 0.5323 1.1346 0.1135
0.5 0.5459 1.5043 0.1504
1.5 0.5730 1.9421 0.1942
2.0 0.5866 2.4543 0.2454
3.0 0.6137 2.7409 0.2741
4.0 0.6409 3.3827 0.3383
5.0 0.6680 3.7419 0.3742

Engineers for Viable Technology and $5 Trillion Economy
387 Technical Volume of 36th Indian Engineering Congress, December 26-28, 2021 ISBN 978-81-955500-1-2
CONCLUSION
In this article, multi stages of service queuing model which undergoes multi-phases of repair due to active
breakdown in a manufacturing industry like textile industry with restricted arrivals is anlysed to arrive at expected
waiting time and quelength in each and every process of the manufacturing system. Probability generating function
of distribution of queue length at an arbitrary time is obtained. Some important performance measures and particular
case of the model are also presented. From the numerical results, it is observed that the performance measures E(Q)
and E(W) decreases as service rate increases by quick repair of the system. It is also observed that if the breakdown
rate decreases, then the performance measures also decreases.
REFERENCES
1. Bogatyrev V.A., Bogatyrev S.V.. Multi-step service of requests critical to queueing delays in multi-tier
systems, Scientific and Technical Journal of Information Technologies, Mechanics and Optics. 2017, Vol. 17,
pp. 872-878.
2. Ebenesar Anna Bagyam, and Udaya Chandrika, K. Multi-stage bulk arrival retrial queue with active
breakdown and delayed repair, International Journal of Pure and Applied Mathematics. 2018, Vol. 119, pp.
16045-16058.
3. Hamed Fazlollahtabar and Hadi Gholizadeh. Application of queuing theory in Quality control of multi-
stage Flexible flow shop, Yugoslav Journal of Operations Research . 2020, Vol. 30, pp. 101-108.
4. Klassen, K.J., and Reena Yoogalingam. Appointment scheduling in multi-stage outpatient clinics, Health
Care Manag Sci. 2019, Vol. 22, pp. 229-244.
5. Mohsen Ebadi and Amir Ahmadi-Javid. Control charts for monitoring multi-stage service processes with
optimal queue performance, Communications in Statistics - Simulation and Computation. 2020, Vol. 49, pp.
2472-2484.
6. Phuong Truc Thai, Ton Lam Nguyen, Oleinikova, Svetlana Aleksandrovna, Kravets and Oleg Jakovlevich.
Quality Management Optimisation of Job Distribution for Multi-Stage Production with Unequal
Servers., Quality - Access to Success. 2020, Vol. 21, pp. 39-42.
7. Radha, J., KIndhira and Chandrasekaran, V.M. Multi stage unreliable retrial Queueing system with
Bernoulli vacation, IOP Conf. Ser.: Mater. Sci. Eng. 2017, Vol. 263, pp. 042148(1-9).
8. Sethi, R., Sharma, R. and Bhagat. A. Markovian queue with multi stage service, finite capacity and
breakdowns , 2nd International Conference on System Reliability and Safety (ICSRS). 2017, pp. 125-129.
9. Vignesh, P., Srinivasan, S. and Maragatha Sundari, S. Analysis of non-Markovian batch arrival queueing
model with multi stages of service of restricted admissibility, feedback service and three optional
vacations in production and manufacturing, International Journal of Mathematics in Operational Research,.
2017, Vol. 11, pp. 285-309.
10. Vladimir Alexeev and Pavel Domashnev. Development of an Approach to Implement an Electronic Queue
System with Multi-Stage Customer Service , 2nd International Conference on Control Systems,
Mathematical Modeling, Automation and Energy Efficiency (SUMMA). 2020, pp. 692-695.
11. Wu, X., Juan Li and Chao-Hsien Chu. Modelling multi-stage healthcare systems with service interactions
under blocking for bed allocation, European Journal of Operational Research,. 2019, Vol. 278, pp. 927-941.
12. Zhou, F.L., Wang, S., He., Y.D. and Goh, M. Production lot-sizing decision making considering bottleneck
drift in multi-stage manufacturing system, Advances in Production Engineering & Management. 2017, Vol.
12, pp. 213-220.
13. Zhou, S. and Yue, Q.. Appointment scheduling for multi-stage sequential service systems with stochastic
service durations, Comput. Oper. Res.. 2019, Vol. 112, pp. 104757.

Engineers for Viable Technology and $5 Trillion Economy
388 Technical Volume of 36th Indian Engineering Congress, December 26-28, 2021 ISBN 978-81-955500-1-2
Appendix
The expressions used in 53 are defined as follows:
Nr(IX) = 9A(VIII )[B1 − I. v1] − I. Dr(IX)
Dr(IX ) = −362880. λX1u11u21u31u41u51u61u71 l1
Nr(X) = 45A(VIII )[B2 − I. v2 − 2. I′. v1] + 10A(IX)[B1 − I. v1] − 10. I′. Dr(IX ) − I. Dr(X)
Dr(X) = −1814400[λX1u11u21u31u41u51[u61u71 l2 + l1[u62u71 + u61u72]]
+u61u71 l1[λX1u11u22 + u21(λX2u11 + λX1u12)]u31u41u51
+[u31u41u52 + u51(u32u41 + u31u42)]λX1u11u21]
l1 = b − S11 − S21 − pS31 − qS41 − S51 − S61 − S71
l2 = S12 + 2S11 S21 + S22 + 2(S11 + S21 )(pS31 + qS41 ) + (pS32 + qS42)
2(S51 + S61 + S71)[S11 + S21 + pS31 + qS41] + [S52 + 2S51S61 + S62 ]
+2S71(S51 + S61 ) + S72
AVIII = JVIII + KVIII + LVIII
JVIII = 40320u21u31u41u51u61u71S11 [λX1 + α1R11]
KVIII = 40320u11u51u61u71(u31u41S21 [λX1 + α2R21] + u21 ∗
(pu41S31[λX1 + α3R31] + qu31S41[λX1 + α4R41]))
LVIII = 40320u11u21u31u41[u61u71S51[λX1 + α5R51] + u51u71S61 [λX1 + α6R61]
+u51u61S71[λX1 + α7R71]]
AIX = JIX + KIX + LIX
JIX = 181440[(u41u51[u22u31 + u21u32] + u21u31[u42u51 + u41u52])
∗ u61u71S11[λX1 + α1R11]
+u21u31u41u51(S11 [λX1 + α1R11][u62u71 + u61u72]
+u61u71(S11 [λX1 + α1R12 ] + S12[λX1 + α1R11]))]
KIX = 756. [10. l3[. u61u71(u11u52 + u12u51)+. u11u51(2. S11 u61u71 + 3(u62u71 + u61u72))]] + 6.2.2. u11u51u61u71 l4
l4 = 60. [[S21(u32u41 + u31u42)[λX1 + α2R21]
+u31u41(S21[λX2 + α2R22] + S22[λX1 + α2R21])]

Engineers for Viable Technology and $5 Trillion Economy
389 Technical Volume of 36th Indian Engineering Congress, December 26-28, 2021 ISBN 978-81-955500-1-2
+[u22 + 2u21S21][pu41S31[λX1 + α3R31] + qu41S31 [λX1 + α4R41]]
+pu21[u41S32[λX1 + α3R31] + S31 [u42[λX1 + α3R31] + u41[λX2 + α3R32]]]
+qu21[u31S42[λX1 + α4R41] + S41[u32[λX1 + α4R41] + u31[λX2 + α4R42]]]]
l3 = 24. [u31u41S21[λX1 + α2R21]u21[pu41[λX1 + α3R31]S31 + qu31S41 [λX1 + α4R41]]]
LIX = [24(u61u71S51[λX1 + α5R51] + u51u71S61[λX1 + α6R61]
+u51u61S71[λX1 + α7R71])
∗ (120u11u21u31u41 ∗ [S11 + S21 + pS31 + qS41]
+60. (u11u21[u32u41 + u31u42] + u31u41[u12u21 + u11u22]))
+24. u11u21u31u41 l5]
l5 = 60. [u61u71(S51[λX2 + α5R52] + S52[λX1 + α5R51]) + S51[λX1 + α5R51][u62u71 + u61u72]+ u51u71(S61[λX2 + α6R62] + S62[λX1 + α6R61]) + S61[λX1 + α6R61][u52u71 + u51u72]+ 2. u51u71[λX1 + α6R61]S61S51
+u51u61(S71 [λX2 + α7R72] + S72 [λX1 + α7R71]) + S71 [λX1α7R71][u52u61 + u51u62] + 2. u51u61[λX1 + α7R71]S71 (S61 + S51)]


En
gin
eers
fo
r V
iab
le T
ech
no
log
y a
nd
$5
Tri
llio
n E
con
om
y
Interdisciplinary


Engineers for Viable Technology and $5 Trillion Economy
393 Technical Volume of 36th Indian Engineering Congress, December 26-28, 2021
ISBN 978-81-955500-1-2
ID_010_01_167
Atmanirbhar Bharat: Indigenization for Defence Forces
Ashok Kumar Panda
Faculty of Electrical and Mechanical Engineering, Military College of Electronics and Mechanical Engineering,
Secunderabad, Telengana State
e-mail: [email protected]
Abstract: Self sustenance in terms of „Atmanirbhar Bharat‟ is a delayed need for Indian subcontinent. The slogan of
“Make in India” and the reality of “Made in India”
are the matter of intensive realization for actual need based implementation. A missing link between above two
realities are visible on ground. Professional affiliation with national and international institutions, capital
expenditure for capacity enhancement in terms of machineries, test equipments and single window hassle free
clearance are the challenges encountered by Atmanirbhar Bharat Aviyan in general and indigenization program for
defence sectors in particular. Transfer of Technology (ToT), Memorandum of Understanding (MoU) with Original
Equipment Manufacturers (OEMs) for sustenance, Capacity Requirement Planning (CRP), Research and
Development (R&D) entities for time bound desired deliverables are the critical issues of „Atmanirbhar Bharat‟
realization. Vendor developments, Affillate Marketing, Automation and Modernization of industries, Adoption of
IoTs, uses of AI & ML with effective data analytics are key criteria of success to Indinigesation for Defence forces in
particular. Under „Atmanirbhar Bharat‟ program. Additive manufacturing, 3D printing, non conventional
machining , global marketing , alternative fuel source identification and Industry-Academia integration for research
advancement for gap filling with respect to conventional entities like CSIR, DRDO, RDSO and others.
Keywords: Make in India, Made in India; International Standards; Industrial Best Practices; Participative
Management and Single Window Clearance
INTRODUCTION
The steps taken by Indian subcontinent on “Make in India” and “Made in India” are two mile stones of “
Atmanirbhar Bharat” . However “Make in India” is a concept and “Made in India” is the reality. The challenges
encounter by Defence forces and associated manufacturers for spares and equipment indigenization are unique in
terms of technology infusion, war field requirements, matching performance with advance countries products and
the most important is capital expenditure requirements. The aspects of vendor developments, acquisition of state of
art plant and machineries including test and diagnostic equipments, Up skilling and Re skilling facilities and
adopting international standards with industrial best practices are the other areas of critical concern. Further the self
sufficiency in Defence forces is critical time bound requirement but other sectors like health care, educational
facilities, agricultural upliftment, infrastructure provisioning and creation of world class centre of excellence R & D
institutions are the pressing requirements to realize desired deliverables.
NEED FOR ATMANIRBHAR BHARAT
Few good examples of emerging needs which are in current demand for sustainable Atmanirbhar Bharat are as
follows:
PPP models
Disinvestment of non performing assets
Organisation to be headed by domain experts
Autonomy
Intensive Industry – Academia interface for mutual developments

Engineers for Viable Technology and $5 Trillion Economy
394 Technical Volume of 36th Indian Engineering Congress, December 26-28, 2021
ISBN 978-81-955500-1-2
Affiliate Marketing
Adaptability
Artificial Intelligence and Machine Learning
Blockchain
Cloud Computing
Coding
Creativity on Ideas and innovations
Cyber Security
Telemetry and Data Analytics
Dedicated Funding Institutions
Prescriptive Maintenance
Participative Management in decision making
Professional Affiliations
Continual Up skilling and Re skilling
Close monitoring of R & D institutions
INDIGENISATION IN DEFENCE FORCES
Keeping in view of diversified unique nature equipment used in depth and range by Armed Forces having most
origin to advance nations and rapidity of modernization taking place in short span of time, the Atmanirbhar Bharat
program is a critical time bound compulsion for Indian Subcontinent. The technical features required by Armed
Forces during field trials and war situations demands customized specification changes and design modifications.
Eventually these aspects calls for complete dependency on foreign manufacturers and involves higher expenditure
and foreign currency drain. Therefore all out efforts are being made to carryout substantial indigenization on defence
requirements. Both government and private entities are involved to accelerate the indigenization program under
Atmanirbhar Bharat initiatives.
SCOPE OF INDIGENISATION IN DEFENCE FORCES
The scope of indigenization in respect of Defence forces of Indian Sub continent is intensive and extensive as well.
The facilities and equipment required for day to day activities and war requirements are all high end techno
dependent. The priority requirement of indigenization are in the domain of the following:
Armoured Technology and Autonomous Vehicles
Secured Communication Devices
Radars , Interceptors and Surveillance systems
Guns and Ammunitions
Unmanned Arial Vehicles and Drones
Night Vision and Optical Devices
Solider comfort equipments
Rare Earth Material Applications
Non Conventional and Additive Manufacturing
Test and Diagnostic Equipment
AI & ML
Cloud Computing, Quantum computing and Data Analytics
Cyber Security for protection from cyber attacks
Nano Materials and Sensors with Telemetry
Laser Beam Technology as war head
Simulator developments for Augmented Reality and Virtual Reality
Identification of Foe and Friend in War field
Camouflaging and Image Analysis Technology
R & D set up
Nuclear, Biological, Chemical and Radiation Protection
Prescriptive Maintenance on IoT platform

Engineers for Viable Technology and $5 Trillion Economy
395 Technical Volume of 36th Indian Engineering Congress, December 26-28, 2021 ISBN 978-81-955500-1-2
Integrated Tactical Power Management System
Uninterrupted Navigation
Blockchain
Non Lethal Weapon
ORGANISATIONS CONTRIBUTING TO DEFENCE INDIGENISATION PROGRAM
Due to restrictions on commercial exploitation front and stringent requirements on field trials, very limited
government and private entities are engaged in Indigenisation support program in particular in product development
and manufacturing. The rate of failure of prototypes are nearly 50% and time required to complete different rounds
of pilot testing , user extensive validation and maintenance trials is unexpectedly high. The cost factor involved
during these validation processes are much beyond anticipated project cost. Further by the time all set to roll on
indigenized product, there is every possibilities of modification required keeping in view of current situations.
Keeping in view of above attributes the following entities are engaged in indigenization support work:
Dedicated eight Army Base Workshops
Directorate of Indigenization under Army HQ
Ministry of Science and Technology, Govt of India through Council of Scientific and Industrial Research
(CSIR).
Defence PSUs like MIDHANI, BEL,GRSE,BDL,BEML, MDL,Hal
Defence Laboratories
Advanced Centre for Energetic Materials
Defence Metallurgical Research Laboratory
Defence Research and Development Laboratory
Research Centre Imarat
Naval Science & Technology Laboratory
Combat Vehicles Research & Development Establishment
Microwave Tube Research & Development Centre
Solid State Physics Laboratory
Restructured Ordnance Factories into seven DPSU clusters of specialization
Munition India Limited
Armoured Vehicle Nigam Limited
Advance Weapons and Equipment India Limited
Troops Comfort Limited
Yantra India Limited
India Optel Limited
Gliders India Limited
Other Prominent Institutions extending support
International Advanced Research Centre for Powder Metallurgy and New Materials
Raja Ramanna Centre for Advanced Technology
Indian Rare Earths Limited (India)
Semiconductor Complex limited
PROGRESS MADE ON INDIGENISATION PROGRAM
The deliverables of above mentioned entities are restricted due several intrinsic factors of unique nature involved
since war like equipments and associated components are under indigenization. Athugh the program is exhaustive
and time consuming, following definite progress were achieved in recent past:
Manufacturing of Special Maintenance Tools and Special Test Equipments in respect of most of foreign origin
equipment
Spares manufacturing in respect of routine maintenance requirements of imported equipments

Engineers for Viable Technology and $5 Trillion Economy
396 Technical Volume of 36th Indian Engineering Congress, December 26-28, 2021
ISBN 978-81-955500-1-2
Establishing facilities for Metallurgical investigation as per international standards, product development using
additive manufacturing and 3 D printing. Also creating facilities for non contact quality assurance systems and
progressing product development on Rare Earth Elements.
Restructuring of 41 Ordnance Factories to seven specialized clusters with effect from 01 October 2021 as
DPSUs having autonomy to carry out intensive indigenization activities.
PRIORITIES OF INDIGENISATION
The basic elements of indigenization under Atmanirbhar program in Defence sector are summarized below:
Self Sufficiency in all fronts (Atma Nirbhar)
Made in India Realization (MSMEs)
Export Orientation (Up Skill, Re Skill)
Import Substitution ( Alternatives)
Infrastructure Development (R & D, Reverse Engg , Vendor Development)
Special Economic Zones (SEZs)
Dedicated Financial Institutions (EXIM, SIDBI, NABARD, ICICI, DIC, IDBI, IFC)
Professional Affiliation with Standards bodies
Resource mobilization
Adoption of Green Technology
Identification of Alternative Fuels
Emphasis on Reuse, Re cycle and Reduce
Eco compatibility
Academia – Industry interface
FEATURES OF INDIGENISATION
Continuous Evolution
Intermittent Evaluation
Mechanization & Automation
Security Classification
Unique Coding for Defence Applications
Capacity Requirement Planning (CRP)
Coded Design Communication
Shop Floor Control (SFC)
Material Requirement Planning (MRP)
Computer Aided Process Planning (CAPP)
Concurrent Engineering
IT Enabled Service (ITES)
Discrete & Continuous Manufacturing
Simulation
Aesthetic Approach as per Defence Requirement
Reliability Assessment at Field level
Creative & Innovative Design
Brain Storming & Participative Management
Quality Cycles
Ergonomic Approach
INDIGENISATION CYCLE FOR DEFENCE FORCES
As the indigenization activities is unique to Defence requirements , hence following customized cyclic steps are
used in product development:
Need Analysis of Product or Service

Engineers for Viable Technology and $5 Trillion Economy
397 Technical Volume of 36th Indian Engineering Congress, December 26-28, 2021 ISBN 978-81-955500-1-2
Formulation of Blue Print of Model
Prototype or Pilot Sample
Prototype Trial on Select Users in field formation
Amendment to Design Parameters on the basis of user trial
SWOT Analysis on the basis of friendly foreign countries
Continuous Vendor Rating
Bulk or Mass Production
Warehousing by supply chain
Packaging & Preservation for extreme temperature and weather conditions
Shipment and Customized Delivery in remote locations and diversified terrains
User Feedback after field use or exercises
Competitors SWOT Analysis
Need Analysis for Continual Improvements on user feedback
Design Modifications as per real time threat perceptions
Discard Policy for implementing new features on time bound manner and prevailing threats
CHALLENGES IN INDIGENISATION PROCESS
As the indigenization process in India may upset many potential countries in terms of supplying defence items hence
many challenges are created by those countries and few limitations are inherent in our system. Few extreme
challenges encountered by various entities are mentioned below for immediate attention and follow up remedies:
Cyber Security since indigenization programme is intensively IoT dependant
Data capturing, Telemetry and Data Analytics are techno intensive hence requires required infrastructure and
experts for handling systems
Adequate dedicated funding
Uses of Predictive & Prescriptive Maintenance to keep functioning Plants, Machineries and Specialist
Equipment meant for indigenization
Participative Management to share ideas & smooth functioning
Adequate professional affiliation with standards bodies, Academia & R & D institutions
Continuous Upgrdation & Reskilling to match with competitors
Development of in lieu materials to reduce cost and making ease of functioning
Introduction of Alternative fuels and Non Conventional energy source during indigenization process to adhere
green technology requirements and eco balance
CONCLUSIONS
Keeping in view of current hostile situations and strained relationships with neighbors, it is felt by higher leadership
to go for indigenization program in war footing manner under Atmanirbhar Bharat Aviyan to develop technology,
infrastructure, best practices, trained highly skilled manpower, working ambience and above all making government
entities autonomous. However the under mentioned critical aspects are required to be I fore front always:
Field users first
Continuous Requirement Assessment as per ground reality
Identification and up keeping of Skills for Sustenance
On Job Training for Up Skilling and Re Skilling
Affiliation with Professional Institutions like BIS , CII, FICCI, CSIR, DRDO and others
Global Standards Adoption
Set Up SEZs to support indigenization and substantiate foreign currency reserve
Single Window Clearance for rapid materialization of projects

Engineers for Viable Technology and $5 Trillion Economy
398 Technical Volume of 36th Indian Engineering Congress, December 26-28, 2021
ISBN 978-81-955500-1-2
REFERENCES
The author was posted as OIC manufacturing in Army Base Workshop for more than two decades and intensively
involved in indigenisation and method engineering, process planning, formulation of operation planned schedule and
trial evaluation of indigenized products of Defence equipments. The author was posted as Deputy Director , IHQ
(Army), MoD New Delhi during 2015 to 2020 dealing with HR issues and skill development of civilian workforce
engaged in indigenisation activities. Presently the author is posted as course control officer in premier Military
College of Electronics and Mechanical Engineering of Indian Army where besides routine work, established modern
manufacturing training facilities which involves Additive manufacturing, 3 D printing, powder metallurgy, Rare
Earth Materials applications in collaboration with IREL(India), CSIR-IMMT, DRDO, MIDHANI, ARCI and
Ordnance Factories. The technical papers of the author were selected and presented during 34th
and 35th
Indian
Engineering Congress and 35th
National Convention of Production Engineers (35Th
NCPE) conducted by The
Institution of Engineers (India) . The author also contributes technical articles regularly to EME journal published by
Military College of EME Secunderabad.

Engineers for Viable Technology and $5 Trillion Economy
399 Technical Volume of 36th Indian Engineering Congress, December 26-28, 2021 ISBN 978-81-955500-1-2
ID_063_02_241
Expertise Collaboration and Data Integration in Industries
Anuj Kumar
Power & Utility Department, Indian Oil Corporation Limited, Barauni Refinery, Begusarai, Bihar
email: [email protected]
Abstract: Tracing clues of revolutionary moments in the recent past that have given economic development a
breakthrough leap worldwide, one cannot forget to mention the phrase Fourth Industrial Revolution (4IR or
Industry 4.0) which was introduced by a team of scientists developing a high-tech strategy for the German
government and was later introduced to a wider audience through including it in the theme “Mastering the Fourth
Industrial Revolution” of World Economic Forum Meeting for the year 2016 held in Switzerland.
While institutionalizing new ventures of innovation is widely being considered as the way ahead for India to achieve
its aspirations of becoming a $5 trillion economy, exploring ways towards extracting maximum yield out of its
existing industrial resources is another important pillar which is needed to be given equal attention upon.
Undoubtedly, the next leap of industrial transformation lies in combining the power and value of data. Interestingly,
data is already there, industry owners have struggled to see through or make sense, to access or harness its value.
As the theme here is Engineers for Viable Technology and $5 Trillion Economy, which is a Techno-Philosophical
subject, let's explore the correlation between the technical human resource and their scientific deliverables.
Keywords: Expertise Collaboration; Data Integration; Shared Supervision
INTRODUCTION
The existing practice of supervising operation and maintenance of all machines including rotating machines in major
industrial institutions have infamous stream wise departmental segregation that too in a multilayer manner which is
there because of few of its well justified administrative reasons that are mainly aimed at setting accountability and
authority in order to get precise and efficient functioning. There is no problem with this approach as far as the
administrative control is concerned but, there is this fact cannot be denied that midst long run of discharging this
methodology somewhere an invisible boundary line gets drawn unintentionally in the delivery approach of the
personnel involved at all layers. Not to blame anyone of these departmental verticals since this conduct is a natural
outcome of the established framework that they are bound to adhere with. However, here comes the need of
envisioning a solution that can address this immeasurable problem in a précised way and chalk out a platform where
deliverables of all involved stakeholders can be defined and integrated in a measurable manner. Once all such
streams & verticals come together and join hands not only for solving problems but also for developing new
techniques capable of mitigating the root causes, it is then only our aspirations can come true.
CASE STUDY
While this is a popular phenomenon happening across all segments of industries, here for better understanding of the
subject and it’s detailed analysis purpose we will consider the case of rotating machines (pumps & blowers) in
industries.
Few of the outlined demerits of not having a digital mechanism of integrating the outlooks of all stakeholders at a
common platform, are as follows:-
1) No digital tracking system for supervising the running pattern of rotating machines.

Engineers for Viable Technology and $5 Trillion Economy
400 Technical Volume of 36th Indian Engineering Congress, December 26-28, 2021
ISBN 978-81-955500-1-2
2) Total continuous running hours of these vital rotating machines are not known in lack of digital record system.
Even if it is available in some of the upgraded PLCs[2]
(Programmable Logic Controller) realizing them into
useful data is still a complex process.
3) No robust reference for supervising timely changeover of pumps & blowers in lack of a guiding feedback
system.
4) No tracking system for supervising the frequency of breakdown of a particular pump or blower leading in
ambiguity of corrective action.
5) No tracking system for ensuring whether timely preventive maintenance of a particular rotating machine has
been performed or not.
6) Sometimes few of the above inputs are available in the manual log-books but owing to their scattered possession
and that too across a wider timeline, combining them manually in the form of a useful data is totally impractical.
SOLUTION
Digitization of the above referred activities and statistics by feeding them in the DCS[3]
(Distributed Control System)
and their integration in the form of Timer and Trend can dramatically improve the practice of supervising the service
pattern of rotating machines with respect to their maintenance events which ultimately will result in optimization of
their usability for a comparatively extended life span, which is usually not harnessed otherwise. Salient features of
implementing integrated timelines of rotating machines in industries are as follows:
1) The Timer on DCS will instantly guide the operating personnel to changeover the pumps & blowers upon
attaining the preset standardized running hours for respective rotating machines.
2) The Trend which is produced by data logging of multiple activities taken place across the timelines of
respective rotating machines can be used for producing self generated preventive maintenance calls in the form
of alarms, which will also eliminate the delayed preventive maintenance due to human errors or overlooking.
3) Additional provision of tagging events of all repair & maintenance jobs performed on the respective rotating
machine’s trend in the forms of color coded pegs will be of great use in assessing the machine’s performance
as well will be helpful in planning suitable future course of action. Kindly refer Figure 1 for typical view of
activity timeline of a rotating machine.
Figure 1 Typical view of an activity timeline
4) Further, drop down selection provision will instantly provide list of all previously performed maintenance
activities of specific category for a particular rotating machine, during any desired period.

Engineers for Viable Technology and $5 Trillion Economy
401 Technical Volume of 36th Indian Engineering Congress, December 26-28, 2021 ISBN 978-81-955500-1-2
5) These above provisions altogether will largely enable engineers in reaching data driven decision making s.
BENEFITS
Few of tangible & intangible benefits of implementing the integrated timeline scheme are enlisted as follows:
1) Huge financial savings can be made on account of avoiding the maintenance cost by preventing the rotating
machines from premature breakdown through ensuring timely “changeover” and “preventive maintenance”,
which otherwise happen due to continuous overrun.
2) Financial savings in terms of protecting opportunity loses which otherwise happen if breakdown of rotating
machines occur resulting in production interruption and material wastage which were under process chain at
that particular time.
3) Lifecycle enhancement of rotating machines.
4) By tracking preventive maintenance of equipments on their own timeline with the facility of producing self-
generated preventive maintenance calls, will raise the practice of comprehensive monitoring & TPM[4]
(Total
Productive Maintenance) to next level.
5) Facility of tracking records for all repair & maintenance jobs performed on a particular rotating machine in a
trend form will be largely helpful in better assessment by engineers across department verticals. This
collaboration of expertise and knowledge sharing will also help engineer’s develop their problem solving
skills.
CONCLUSION
It is widely known that major technology suppliers across the globe these days are pushing for inclusion of artificial
intelligence, advance robotics & IIOT[5]
(Industrial Internet of Things) in their technology packages as much as
possible, in order to uphold their competitiveness in luring industries by providing all in one solutions. In fact, many
of the contemporary economists have already termed this ongoing business strategy in their references as a data
driven economy.
From the above explained case study we saw how sharing data & their useful integration can help & guide us in
deciding the right course of action. It is therefore true need of the hour for the Indian engineers to realize this
transforming trend of swift transition of technology and should come forward in joining hands across streams &
functional verticals to collaborate and share their expertise making value addition in their existing resources and
yield more returns.
ACKNOWLEDGEMENT
Author extends his gratitude towards Indian Oil Corporation Limited for incubating & promoting the culture of
learning & development among its human resource.
REFERENCES
1. https://en.wikipedia.org/wiki/Fourth_Industrial_Revolution
2. https://en.wikipedia.org/wiki/Programmable_logic_controller
3. https://en.wikipedia.org/wiki/Distributed_control_system
4. https://en.wikipedia.org/wiki/Total_productive_maintenance
5. https://en.wikipedia.org/wiki/Industrial_internet_of_things


Engineers for Viable Technology and $5 Trillion Economy
403 Technical Volume of 36th Indian Engineering Congress, December 26-28, 2021
ISBN 978-81-955500-1-2
ID_072_03_255
Opportunity for Made in India Medical Devices in Global
Markets: Role of Quality
Balram Sankaran* and Shiyas C R
Cochin University College of Engineering Kuttanad, Cochin University of Science and Technology, Kerala
*e-mail: [email protected]
Abstract: Medical Device industry consist of a large number of small and medium enterprises that produce a wide
variety of heterogeneous products known as medical devices. Medical devices play an important role in healthcare
delivery and has a growing global demand. The domestic manufacturers of medical devices in India have a good
opportunity to supply to the increasing demand in expanding global market with made in India medical devices. The
quality of medical devices made in India will determine the success of Indian medical device manufacturers to
become a global player.
Keywords: Medical Device; Quality; Medical Device Industry
INTRODUCTION
The current pandemic has brought out the significant role played by medical devices in healthcare delivery in the
modern world. Even though modern healthcare system is dependent on hundreds of products coming under the
category of medical devices, these products are not known much to people at large and remain confined to the
professionals within the healthcare system. These products at times significantly impact the healthcare costs as well.
The products are of diverse nature, utilising different technologies from different disciplines, with varying role in
prevention, diagnosis or therapeutic use and interaction with the patients. These products are made in large numbers
by a thriving industry, known as medical device industry, in different parts of the world, employing a large number
of people and contributing to the economy. Yet just like the medical devices, the medical device industry is also not
in the limelight unlike other industry segments such as automobile or consumer electronics etc in India. The medical
device industry in India is still in a nascent stage, yet to make use of the emerging opportunity. This paper attempts
to analyse the factors that herald the growing opportunity for made in India medical devices to capture a growing
demand world wide and the role of quality in facilitating the Indian medical device domestic industry manufactures
to capture the global market.
MEDICAL DEVICES AND INDUSTRY SCENARIO IN INDIA
Healthcare industry is generally considered as a recession free industry and medical products are always in demand.
The market growth rate of medical products including medical devices is generally very positive and encouraging
for the manufacturers. The market is always expanding irrespective of the cycles of growth and slump in other
industry segments. Access to good quality, affordable and appropriate medic products is essential for good health
care delivery system. There are a large number of products, from seemingly simple items such as a bandage to
ubiquitous products such as a stethoscope or a thermometer to highly complex equipment like an X ray or CT
imaging device that are considered broadly as a medical device. There are products like a syringe that temporarily
go inside the body to implants like knee joint that are placed permanently inside the body. All these hundreds of
myriad products that interact with a patient for a short/long duration in an invasive/non-invasive mode and which
have different roles such as for prevention, diagnosis or treatment, are broadly termed as a medical device. In a
modern world, it would be impossible to imagine any healthcare delivery without the use of one or other kind of
medical device. It is estimated that there are over a million different kinds of medical devices in the global market,
which are divided into intosome 7000 generic devices groups. Medical devices also include reagents for in vitro
diagnosis and software used in medical application. For the sake of regulation purposes, the vast number of medical
devices are classified based on the risks associated with the use of such devices.

Engineers for Viable Technology and $5 Trillion Economy
404 Technical Volume of 36th Indian Engineering Congress, December 26-28, 2021
ISBN 978-81-955500-1-2
Medical devices are made by manufacturers which belong to the medical device industry. With the exception of
some large multinational corporations, globally, medical devices are made by small and medium scale
enterprises.The worldwide medical device market was estimated to be US$455.34 billion in 2021 and is estimated to
be growing at the rate of 5% [1]. The major market share of the global market is addressed by medical device
manufacturers located in the USA. The Indian medical device market is estimated to be worth US$ 10 Billion in
2021. Most of the demand for the medical devices in India is said to be through import. Medical devices worth about
US$ 2.1 Billion was exported from India in 2019 [2]
There is a growing domestic medical device manufacturing company base in India. These are mainly small and
medium size enterprises and present in some prominent informal clusters in different parts of the country. Most of
Indian domestic manufacturers are engaged in manufacturing of low value low technology disposables, medical
electronics based devices etc. There are some areas in which India is already exporting in a big way and this
includes Intraocular lenses and coronary stents Now we are witnessing a trend of startups coming with innovative
devices trying to address unmet needs. These startups are employing new and emerging technologies like artificial
intelligence, machine learning etc and using Industry 4.0 technologies. India is suited for medical device innovation
and manufacturing. India offers natural advantages such as lower manufacturing costs and availability of skilled
manpower. Specifically for medical device manufacturing, there is a need to implement standard operating practices
(SOPs) and personal hygiene is essential for implementing a good manufacturing practice environment, for which it
is important that the people are educated and able to understand the importance of these factors and not to cut
corners. In spite of these positive factors, in India medical device manufacturing has been a lowkey affair in the past.
However, in the recent times, due to several initiatives, there is a push towards increasing domestic or make in India
for medical devices. New medical device parks are being announced in several regions of the country. These
exclusive parks will provide the right ecosystem for medical device manufacturing and will have tie up scientific
and technological institutions, incubators, testing houses, certification bodies etc. The regulatory system in India was
not adequate and was often cited as the reason for lack of domestic manufacturers to export or capture global
markets. However, the regulatory system for medical devices in India is set to change for better with the publication
of medical devices rules 2017 by Central Drugs Standards Control Organisation (CDSCO). The new regulatory
system will make it necessary for the Indian medical device manufacturers to adopt quality management systems for
their operations. For gaining market acceptance, medical device manufacturers must adhere to safety standards and
performance benchmarks in their products. These are to be established through rigorous testing and validation
processes followed by a regulatory approval.
ROLE OF QUALITY IN MEDICAL DEVICE MANUFACTURING INDUSTRY
Quality is not an accident. It comes by design and willingness of top management to implement a quality
management system in the company. Indian manufacturers of medical devices need to understand the various
benefits of implementing quality management system and not just as a pre requisite to meet the regulatory
requirements. Improving quality can bring costs down significantly and will help in more customer acquisition and
market expansion. The need for quality in the design, manufacture, and distribution of medical devices is today
much more relevant than ever before for the medical device manufacturers in India. Good quality practices in
manufacturing operations alone can save revenue losses due to defects and rejections. Manufacturers may adopt
several practices that lead to good quality outcomes in their products. These include training and implementation of
right quality tools that are widely applied in other manufacturing enterprises such as automobile or consumer
electronics sectors. Application of proper quality tools and techniques in manufacturing will lead to reduced
manufacturing costs and reduced lead times. A robust quality culture and practice across the organisation can
transform the quality outcomes. Quality control tools are building blocks for any quality improvement project and
with proper methods to collect and analyse data, process improvements can be achieved. Selection of the right set of
quality control tools such as pareto analysis, fish bone diagram etc are simple, easy to implement yet powerful in
bring out a quality change. Reducing variation by capturing and analysing data using process control charts can be
effective in reducing rework and wastages. The cost of ensuring good quality is only a fraction of the loss due to
poor quality. In the case of medical devices, poor quality may be at times life threatening and may have wider
implications such as regulatory actions such as recalls, shutting down of facility etc. These have much more
implications than direct costs and indirectly affect the image and brand.

Engineers for Viable Technology and $5 Trillion Economy
405 Technical Volume of 36th Indian Engineering Congress, December 26-28, 2021 ISBN 978-81-955500-1-2
Medical device manufacturers can adopt the ISO standards which serve as valuable guides to achieving quality goals
of an organisation and product. ISO 13485 is a standard that specifies the quality management system specifically
for manufacturers of medical devices. This standard sets out the requirements that a manufacturer of medical devices
must adhere to in order to demonstrate that it is capable of producing medical devices that meet both customer
requirements and regulatory requirements where applicable. This standard covers the entire lifecycle of a medical
device right from design stage to production and manufacturing, logistics operations, installation and after sales
servicing. This is a standard that can be applied by all types of manufacturers of medical devices irrespective of the
size or nature of product. This standard is a specific standard applicable for medical device manufacturers and
emanates from the generic ISO 9000 quality management system standard that can be applied across all industry
segments. Like in ISO 9000, this standard also is process oriented and gives thrust on instilling a process-based
quality management system
CONCLUSION
Indian manufacturers of medical devices have a growth led market demand, cost competitiveness, skilled manpower
and an emerging world class infrastructure and regulatory regime. Therefore, now it is an opportune time for Indian
manufacturers of medical devices to focus on quality. This can open up to the opportunity to get a share of the
growing global market for medical devices. The healthcare industry has been witnessing unprecedented attention
due to pandemic and has expanded the scope of the industry. There is a great need and opportunity to cater to unmet
clinical needs of the world with good quality affordable products. Medical device companies that embrace the
quality and emerging demand will be able to grab the emerging opportunities. It is an opportune time for Indian
companies to not only meet the customer expectation, but to exceed them. By giving quality its due in medical
device manufacturing, Indian companies are well poised to become a supplier to the world thereby creating huge
economic benefits to the country
REFERENCES:
1. Fortune Business Insights Market Research report, September 2021
2. https://www.investindia.gov.in/sector/medical-devices


Engineers for Viable Technology and $5 Trillion Economy
407 Technical Volume of 36th Indian Engineering Congress, December 26-28, 2021 ISBN 978-81-955500-1-2
ID_048_09_186
Drastic Change in Technical Education in India
Arun Chandra Sawhney
Arnish Consultants
e-mail: [email protected]
Abstract: There is lack of Holistic approach in our education system to prepare entrepreneursfor manufacturing
and service sectors required in line with our national objectives. The present Education system neither motivates
nor train or provide assistance to students to start their own venture after graduation or make them employable.
If we have to achieve the desired growth rate to become 5 trillion-dollar economy, every Government unit shall
work in unison focusing on total needs and demands of products and services in each sector for the coming decade.
Based on demand and available capacity, the short fall shall be estimated for each sector and translated into skills
demand and a holistic planning model shall be prepared for every sector.
Accordingly, whole education system shall be planned to fill the gap by skills development and engaging students in
above chosen field after finishing their education.
Technical Colleges shall become the hub for turning engineers into entrepreneurs and also for supply of any kind of
technical skills manpower to the industry and service industries.
The salient features of new education system are discussed in this article to fulfill above objectives.
There will be two streams of education and training. One for entrepreneurship and the other for employment.
The group selected for entrepreneurship goal is to set up the industry after the completion of the course. The choice
of the industry/industries will be madeat the beginning of the course.
The group opting for employment the goal is to getthem trained for joining the industry as operating engineers in
proposed and existing industries as per planned requirements received by University in advance so that immediately
after study/training they can straight way be employed without any further training.
The technical university will have two distinct departments. One will be for training entrepreneurs the other will be
for technical employment both working in unison.
The objective of the Entrepreneurship department is to develop multi-disciplinary skills so students can start their
own industry (manufacturing or service) after finishing the education.
The objective of the Employment Generating department is toenhance the standard of technical education and
training so students become immediately employable in the industries being started by fellow student entrepreneur
or full fill the demand of the existing industries communicated to them at the beginning of the course.
These schools will become the main platform for accessing the skills required to get into industry.
This will also meet the needs of unemployed and non-employable engineering graduates and to improve their
communication as well as technical skills.

Engineers for Viable Technology and $5 Trillion Economy
408 Technical Volume of 36th Indian Engineering Congress, December 26-28, 2021
ISBN 978-81-955500-1-2
Keywords: Entrepreneurship; Employment; Technical; Education; System; Training; Holistic Approach; Skills
Development; Manufacturing; Service Industry
INTRODUCTION
As per the present economic industrial scenario and based on experience of last 50 years, it is found that there is
acute shortage of engineers in core disciplines. Even if fresh engineers from core branches are available they require
extensive training for 2-3 years to take up assignment in the field of technology (know how), process engineering,
design & engineering, operation, maintenance, manufacturing, production, procurement, logistics, technical
marketing, construction, erection testing and commissioning, Techno Economics , Finance andCosting.
There is huge gap between the need and demand placed by the fast-technological changes and the emerging global
market trends that are making the growth of core industries brings out the demand for complementing and
supplementing the formal education through the non formal education and training
The profiles of the career opportunities keep dynamically changing as newer and newer technologies emerge and the
global market requirements change.
The formal education focuses on the too much theory and fundamental concepts in different subjects and does
neither inculcate any kind of entrepreneurship skills to prepare them to set up their own industries nor prepare them
with practical skills to make them directly employable in any manufacturing, construction or service industry. This
calls for urgent need for bringing drastic changes in technical education to bridge the gap that existing between the
needs of the industry and the academic curricula.
With the increase in population, increase in urbanization and service industry, the basic needs of the masses like
Food, Clothing, Housing, Telecommunication Information highway, Transport, Education, Health & Hospitality
Sectors, Insurance, Entertainments, Tourism & Event Management, Digital Marketing & Payment, Pharmacy,
House Hold appliances, the demand for products related to above (For example Food grains, Pulses, Vegetable Oils,
Fruits & Vegetables, Houses, House hold appliances like Smart TVs, Air Conditioners, Refrigerators, Ovens,
Lighting Equipment, Water Supply & Sanitation wares, Furnitures, Smart Mobile Phones, Tablets, Smart
Televisions , Two & Four wheelers, Petroleum Products, Chemicals & Fertilizers, Hospitals, Schools, Banking ,
Entertainment games, movies) are bound to increase and it shall be the duty of the Central/State Government
Agencies to estimate the short term, medium term and long term demands in each sector. Based on the demand
estimated by these agencies and available capacity, the short fall shall be estimated for each sector. These short falls
shall be translated into skills demand and a holistic planning model shall be prepared for every field right from
Agriculture to space industry. Accordingly, whole education system shall be planned to fill the gap by skills
development and engaging students in production activities after finishing their education. Technical Colleges shall
become the hub for turning engineers into entrepreneurs and also for supply of any kind of technical skills
manpower to the industry and service industries.
The salient features of new education system will be:
For BE Students
1. There will be two streams of education and training. One for entrepreneurship and the other for employment.
2. Those who chose entrepreneur ship will choose any four industries out of listed industries pertaining to various
disciplines.
3. Each student will be trained for setting up of these four industries for full four years.
4. Each student will start any one of the four industries after graduation.
5. He will help and guide to start other three industries to his family members, friends and other members of the
community in which he lives and will be their mentor and guide.

Engineers for Viable Technology and $5 Trillion Economy
409 Technical Volume of 36th Indian Engineering Congress, December 26-28, 2021 ISBN 978-81-955500-1-2
6. The other group who opt for employment will be trained for joining the industry as operating engineers in those
industries started by fellow students as above or as per the planned and demand requirements of the
manufacturing, construction and service industries received by Colleges in advance so that immediately after
four years of study/training they straight way join the industry as working engineer without any further training.
For Diploma Holders
1. There will be two streams of training. One for entrepreneurship and the other for employment.
2. Those who chose entrepreneur ship will choose any Two industries out of listed industries pertaining to various
disciplines.
3. Each student will be trained for setting up of these two industries for full three years.
4. Each student will start any one of the two industries after graduation.
5. He will help and guide to start other industry to his family members, friend and other member of the community
in which he lives and will be his mentor and guide.
6. Those who chose employment as their career will be trained as supervisors, operators, foreman, inspectors or
such fields needed for those industries started by Graduate Engineers and Diploma holders as per the
needs/requirements sent to them from engineering colleges and Polytechnics and existing industries as per
planned forecasting.
7. The other group who opt for employment will be trained for joining the industry as operating engineers in those
industries started by fellow students as above or as per the demand of the Industry received by Colleges in
advance so that immediately after three years of study/training he straight way join the industry as working
supervisors, operators, foreman, inspectors or such fields needed by those industries without any further training.
For ITI Students
1. There will be two streams of training. One for entrepreneurship and the other for employment.
2. Those who chose entrepreneur ship will choose one industry (Small scale industries, Kutir Udyog or small scale
venture based on forest produce, food processing, masala udyog, mason, cycle & two wheeler mechanic,
plumber, tyre tube repairing, house hold appliances’ repairing, metal art work, tailoring, knitting, tile work,
painting, polishing work, growing mushrooms, vegetables, fruits, herbs and similar items not requiring higher
skills).
3. Such student will be trained for setting up of above such industry.
4. Those who chose employment as their career will be trained as masons, fitters, mechanic, skilled workers,
electrician, machinist, data entry operators, CAD operators, or such fields needed for those industries started by
Graduate Engineers and Diploma holders as per the needs/requirements sent to them from engineering colleges
and Polytechnics and existing industries as per planned forecasting so that immediately after one year of training
he straight way join the industry as needed by those industries without any further training.
Common to All
1. There will be a technical university under which all the three streams BE, Diploma and ITI will be functioning.
2. There will be two distinct departments. One will be for training entrepreneurs the other will be technical
employment. Both working in unison.
3. The department will work in close coordination with Neeti Aayog and various chambers/federations
ofCommerce and Industries, Central & State Industries Departments, Technical Consultancy Organizations,
WTO, Import/Export Cell and all other such departments/companies who will supply them List of Industries to
be setup in near future (Next Five years) for which demand outstrips supply or import outstrips exports. Based
on this, departments will freeze/short list items for manufacturing or skill sets require for service industries

Engineers for Viable Technology and $5 Trillion Economy
410 Technical Volume of 36th Indian Engineering Congress, December 26-28, 2021
ISBN 978-81-955500-1-2
which will be taken up for start up by their students. This list can be further classified based on investment
required under three categories (May be more). First category may be those industries (manufacturing or service
requiring investment of Rs 50 lakh or less) and run by Single student entrepreneur trained by them. The other
group may be run by two students with investment limits of Rs 1 Crore and similarly other group of 3 or more
students with an investment of more than one crore.
4. There will be a lead bank or more than one bank in the University who will be responsible for disbursing the
loans to those students at the end of their study who opt for entrepreneurship and choose to start any one of the
chosen industries trained by the college/university
5. The guarantor of the student for recovery of the loan will be the Technical University as University is solely
responsible for imparting such education and training that will train such students to venture for
entrepreneurship.
6. The loan returned will be kept in separate account maintained by the University. This will become future corpus
for distribution of loans to student entrepreneurs. This will receive donations from industries, old student
entrepreneurs and aid from World Bank, Asian bank, Bricks, Mudra Bank and ultimately become self fund
generating body.
The main objectives of the entrepreneurship department will be as follows:
1. To develop entrepreneur skills in the students so that they can to start their own industry (Manufacturing or
Service) in their chosen field of specialization immediately after graduation.
2. To train StudentEntrepreneur in all the gamut of the chosen industries (Four for BE, two for Diploma and one for
ITI) to enable him to start the industry at the end of his course.
3. The whole education will be based on imparting such multi disciplinary subjects as may be required to help him
starting the newventure (Manufacturing or service industry)
4. Normally disciplines /subjects required to start an industry are given in Annexure-1, This is only indicative and
not exhaustive and will depend upon the industry chosen for start up. Once the above engineering and
managerial concepts are taught there is nothing additionally is required to run an industry. There is no reason for
any failure. (except red tapism-but this can be taken care by university being guarantor, mentor and guide and
any problems faced by student entrepreneur can be promptly taken up by university with respective
Government/Chancellor)
The main objective of the Employment Generating department will be as follows:
To enhance and guaranteethe employability of technical students.
To enhance the standard of technical education and training so that he becomes immediately employable in the
industries being started by student entrepreneur or full fill the demand of the respective specific industry already
communicated to the department by the industries at the beginning of the first year session as per skill gap
supply demand requirements given by industries (Manufacturing or Service)
To reinforce the student skills and acquire industry–specific knowledge from trained faculty and experts from
industries.
To identify and inform the concerned industries about the selected candidate for their requirements as per skill
demand supply gap furnished by them.
To prepare and finalize the broad syllabus for study and training in consultation with concerned industry. To
provide both technical and soft skills to the students as required.
Performance appraisal of the student after each semester will be done jointly by College and the concerned
industry to ensure that the training is undergoing in line with the needs of the industry. If required mid course
changes may be carried out.

Engineers for Viable Technology and $5 Trillion Economy
411 Technical Volume of 36th Indian Engineering Congress, December 26-28, 2021 ISBN 978-81-955500-1-2
Such students are required to go for internship after each semester in the concerned industry who will give them
a feel what is expected from them after completion of their course.
After the completion of the course concerned industry will give them employment on the terms and conditions
pre-finalized in consultation with Industry as per Govt formulated norms.
In case any further special training is required the same can be given after employment by the concerned
industry. (However, in most of the cases it may not be required)
To bridge the gap between industry and technical institutions fully.
This will be the only platform for accessing the skills required to get into industry.
To meet the needs of unemployed and non-employable engineering graduates and to improve their
communication as well as technical skills.
To offer suitable candidates to different industries.
To help young graduates to find jobs through appropriate training.
To run finishing school to impart above training for those engineers/technicians who have finished their
education earlier and need such skills to make them employable or who want to start their own industry.
Financing
(i) By Banks situated in the university
(ii) Loan to be disbursed by the University bank.
(iii) University to be Guaranteer.
(iv) Loan will be return to university by student entrepreneurs.
(v) Loan refunds, grant from Government, Asian Dev Fund/World bank/BRICKS,Donations from old student
Entrepreneurs, Industries/Individuals/Foundations all will contribute to corpus fund.
(vi) After sometime this will become Corpus fund of bank of the university.
Training of Faculty members
(i) Existing to be retained for theory and its application to real life situation
(ii) New faculty from Industry
(iii) Services of Retired Professionals/businessman/professors/Technicians/engineers to be utilized for finishing
school
Annexure-I
Basic Entrepreneurship/Engineering Skill (Common to All)
1. Site Location & Layout Considerations
A. Site: Location for Minimization of Total “t.km” route length and cost, rail road, power, water, gas, soil condition,
Layout:Rational flow of materials, Provision for future expansion, Shortest possible communication network, entry
gates., existing terrain, Roads & Drainage system, Road & Rail linkage Seismic design, Environmental factors,
Water Reservoir, Rain Harvesting, Switch Yard, Segregation, Minimum Over head & Ground Clearances.

Engineers for Viable Technology and $5 Trillion Economy
412 Technical Volume of 36th Indian Engineering Congress, December 26-28, 2021
ISBN 978-81-955500-1-2
2. Technological Considerations
Process Selection, Basic Engineering
3 Design Considerations
Desired Production, Quantity/Quality, Modular Design , Standard Spacing of columns, building sizes Productivity
of machines, Inbuilt capacity for future expansion, Safety Factors/Dynamic Loading Factors/Slope Factors/Filling
Factors/Free Board, Availability of machines per year, Life span of plant/machines, Materials Characteristics,
Specific Consumptions of utilities, Checking for Strength, Stability & Deflection, Requirements of all utilities,
auxiliary facilities, power, water, air, gases, hoisting & handling, mounted electrics, instruments., Provision of
Ramps, Lifts, Platforms, stairs, doors, corridors, restrooms of desired slopes, widths & dimensions considering
normal persons, disability and old age.
A holistic design is a solution that is greater than sum of its parts.
4. Operation Considerations
Ease of operation,Flexibility in operation. Degree of automation desired, Degree of protection desired, duty cycles,
all weather operation,quick changeover of parts, Comfortable environment, Lower pollution –Air, Water & Noise,
Operators manuals
5. Maintenance Considerations
Should require lesser maintenance, Minimum Down time, Fit & forget concept, easily approachable-all parts
needing maintenance to have proper hoisting and handling with adequate headroom, Easy lowering & lifting into
Truck/Trailer, Corrosion & Abrasion prevention, Repair Workshop, Maintenance Manuals etc.
6. Standardisation/Interchangability
BIS Codes & Standards. Must comply to some reputed standards –Firstly it shall comply with Indian Standards. If
the same is not available, the it may comply with any International standards acceptable., IRC Codes &
Standards,National Building code Of India, Piping, Pressure Vessels codes, TAC Rules for firefighting facilities.
7. Safety Requirements
All the buildings, plant & equipment shall comply with all the safety requirements for the Safe & accident free
operation.
8. Statutory Requirements
All plants, Buildings, equipment must comply with the law of the place where it is being
erected/constructed/installed. Each State may have different provisions pertaining to same requirements.
9. Erection Considerations
Erection Sequence, Erection Methodology, Special Requirements /OD consignment, building roof erection,
Minimizing Erection Time. In situ,Temp Protection Batching Plants-Capacity & Number, alignment, lining,
levelling & grouting, Inserts Placements, Water requirement, Temporary Power requirement, Manpower
requirements, Interfacing with other units, Welding requirements, Space requirements-Fabrication, storage and temp
assembly.

Engineers for Viable Technology and $5 Trillion Economy
413 Technical Volume of 36th Indian Engineering Congress, December 26-28, 2021 ISBN 978-81-955500-1-2
10. Project Management
Financial tie-up, Finalization of modus-operandi for project, Clearance from statutory authorities, Land acquisition
Estimation of duration of construction period of the project, implementation schedule, resources requirements,
Quality Control, ProcurementServices, Selection of Vendors, Cost and Time Control, Project Monitoring, Specialist
Supervision,Enabling Works, Construction Planning
Measurement and Certification, Safety & Security Management, Store & inventory management
Site survey and soil investigation
Completion of basic engineering, detailed Engineering, Tendering &Procurement, Civil& Structural work, Erection
of Equipment, Commissioning
11. Ergonomics
Ergonomics is the science of making things simple, comfortable and efficient.If a plant or machine is simple to
operate, it will be more acceptable.Comfort in the human-machine interface and the mental aspects of the product or
service.
12. Transportation Logistics
Ship/Rail/Road/Air/ Conveyor, Pipeline, Water way transport, OD Size of consignment, Packaging, Container or
Loose,Special Requirements-Special Bogie, Trailer,
13. Normal Spares Two Years, Commissioning & Insurance Spares
14. Financial Management: Capital Cost, Operating Cost, Profit & Loss, Financial Indices, IRR, DSCR, Pay Back
Period.
15. Contracts Management
Legal aspects of contracts: definition of contracts, elements of a valid contract, offer and acceptance, capacity of the
parties to the contract, types of mistakes encountered in contracts, misrepresentation, consideration, express and
implied terms and statute of limitations. Contract documents: drawings, specifications, bill of quantities, General
conditions of Contracts, Special Conditions of contracts.Types of Contracts-Supply, Semi Turn key, Turn Key
contracts.
16. Marketing Research
Demand-Supply analysis Identification of potential markets, Analysis of Competitors’ positioning Pricing trends
Performance-gap analysis Formulation of growth strategy


Engineers for Viable Technology and $5 Trillion Economy
415 Technical Volume of 36th Indian Engineering Congress, December 26-28, 2021 ISBN 978-81-955500-1-2
ID_049_10_182
Basic Engineering Considerations for Engineers and
Entreprenures
Arun Chandra Sawhney
Arnish Consultants
e-mail: [email protected]
Abstract: Paradigm shift in technical education is needed to bridge the gap existing between the needs of the
industry and the academic curriculum.During50 years of engineering practice author hasfound that our engineers
are not trained to think in holistic engineering manner. This led author to write a book (under publication) on the
above subject. The purpose of this article is to highlight such basic engineering considerations and skills to be
included in the engineering curriculum for all engineering and technical education for developing “holistic
engineering and entrepreneurship thinking” This approach means that once any engineer applies the basic
engineering considerations given in this paper to any project/venture/ system then it is ensured no major technical
glitch is left.
Even non-technical persons can benefit by learning these principles and apply them in their day to day working in
industrial and service sectors or even buying any equipment.
The following 16 basic skills need to be learned by every engineer to train him for holistic thinking.
1. Marketing considerations
2. Site location & layout
3. Technological
4. Design
5. Operation
6. Maintenance
7. Standardization/interchangeability
8. Safety requirements & considerations
9. Statutory requirements
10. Erection considerations
11. Implementation / project management
12. Ergonomics
13. Transportation logistics
14. Normal, commissioning & insurance spares
15. Financial management
16. Contracts management
It is recommended that all the above concepts shall become part of curriculum of all hard-core degree and diploma
engineering courses. Also, this shall form part of one-year entrepreneurship course to be introduced as finishing
school for the engineering graduates and diploma holders who have already finished their education and wish to
become entrepreneurs in near future.
Keywords: Marketing; Site Selection; Layout; Technological; Technical; Design; Operation; Maintenance;
Standardization; Interchangeability; Safety; Statutory; Erection; Implementation; Project Management;
Ergonomics; Transportation; Logistics; Spares; Financial Indices; Legal; Contracts; Capital Cost; Operating Cost;
IRR; DSCR; Pay Back

Engineers for Viable Technology and $5 Trillion Economy
416 Technical Volume of 36th Indian Engineering Congress, December 26-28, 2021
ISBN 978-81-955500-1-2
INTRODUCTION
During my 50 years of engineering practice author has learnt that our engineers are not trained to think in holistic
manner. There exists a wide gap in our technical education between the needs of the industry and the academic
curriculum. Almost all fresh as well as experienced engineers from core branches require extensive training for 2-3
years to take up assignment in the field of technology (know how), process engineering, design & engineering,
operation, maintenance, manufacturing, production, procurement, logistics, technical marketing, construction,
erection testing and commissioning, Techno Economics , Finance and costing.This prompted him to write a book
on the above subject.
The purpose of this article is to highlight such basic engineering considerations and skills to be included in the
engineering curriculum for all engineering and technical curriculum for developing “holistic engineering and
entrepreneurship thinking”.
These considerations can then be applied to tackle any kind of engineering challenges with ease, for setting up of
any industry, service organization. Once any engineer applies these basic engineering skills given in this paper to
any project/venture/ system then it can be ensured that no major technical glitch has been overlooked/omitted
The following basic engineering considerations have been given in brief here and are taken from my forthcoming
book on the same subject. Full description of each consideration is beyond scope of this article due to its length.
Following are the Sixteen Basic Engineering/Entrepreneurshipskills
1. Marketing
2. Site Location & Layout
3. Technological
4. Design
5. Operation
6. Maintenance
7. Standardization/Interchangeability
8. Safety
9. Statutory Requirements
10. Erection
11. Implementation / Project Management
12. Ergonomics
13. Transportation Logistics
14. Normal, Commissioning & Insurance Spares
15. Financial Management.
16. Contracts Management
MARKETING
Any engineer/ entrepreneur must have basic knowledge of following aspects of marketing considerations before
setting up of a new industry or recommending the same for others.
Challenges facing the given industry

Engineers for Viable Technology and $5 Trillion Economy
417 Technical Volume of 36th Indian Engineering Congress, December 26-28, 2021 ISBN 978-81-955500-1-2
Key drivers for stimulating growth
Demand – Supply analysis
Identification of potential markets
Analysis of Competitors’ positioning
Pricing trends
Performance-gap analysis
Formulation of growth strategy
Export Potential
Market Share & Inter Shifting of demands
An engineer/entrepreneur must be able to comprehend the challenges being faced in the present industry at macro &
micro level.
An engineer must be able to recognize the key drivers of the industry to estimate demand forecastingbefore
venturing out for any new industry/project.
Conventional demand forecasting methods like Time Series Analysis, Trend Projection, A Barometric Forecasting,
Casual Forecasting, Expert Demand forecasting are useful but becoming less relevant due to growth of e commerce,
on line marketing, B2B Marketing, B to C marketing.
The other factors to be considered are Pricing, Growth, Marketing / Distribution Channels, Trade Practicesand
Export Potential.
SITE LOCATION & LAYOUT
Every engineer shall be given an exposure for site selection and preparation of layout for any new venture whether
small, medium or large industry. If due attention is not paid for this, it may have serious techno economic,
commercial, social and environmental considerations after the investment is made and the factory/shop/industry is
set up.
Site Selection
Following aspects shall be studied and looked into before any site is chosen.
1. Location proximity to Raw Materials & Market. Minimization of Total “t-km” route length and cost.
2. Proximity to Rail connection
3. Road Connection: Proximity to all weather road,
4. Proximity to airport &Sea Ports.
5. Easy all-round availability of Water& Power
6. Skilled Manpower:
7. Metrological data
8. Soil Conditions

Engineers for Viable Technology and $5 Trillion Economy
418 Technical Volume of 36th Indian Engineering Congress, December 26-28, 2021
ISBN 978-81-955500-1-2
Layout
Finalization of the layout of plant is an important area needing attention.If proper or optimum layout is not made, it
may result in higher capital cost, higher handling and operating cost. Following factors need attention for the
preparation of layout.
1. The layout must ensure Rational flow of materials.
2. The types of layouts-Horse Shoe Type, Straight, L shapedParallel/Parallel,Parallel Perpendicular Oblique
angle,Saw Tooth typeas per shape and size of plot.
3. Provision for future expansion
4. Shortest possible communication network.
5. Predominant wind direction.
6. Existing road around the plot & exit & entry gates.
7. Existing Terrainand slope avoid large scale cutting and filling of soil.
8. Roads & drainage system inside the plant.
9. Soil conditions
10. Direction of possible railway link/yard for receipt and dispatch of goods.
11. Landscaping & Green Belt (33% as per Statutory Requirements)
12. Water Reservoir&Rain Harvesting.
13. Switch Yard near to the external HT tower.
14. Vaastu Requirements
15. Space for Construction, Fabrication, Steel storage & Pre assembly yard
16. BIS:8091 Code of Safe Practice forIndustrial Plant Layout
17. Segregation –Explosives/hazardous to be isolated.
18. Minimum Over head & Ground Clearances to be maintained
19. Seismic design of buildings
20. Environmental factors.
21. Miscellaneous Facilities such as fire station, fire water pump house, fire water tanks, fire fighting network,
security office, medical post, parking facilities, welfare facilities like Canteens, rest rooms, recreation rooms,
crèche shall be planned
TECHNOLOGY
Selection of technology plays crucial role for setting up of any venture/plant/industry as there may be many
available technologies, processes, methods to produce the desired end products.
Technology Selection Parameters
Grade and quality of finished product desired. Higher Productivity
Process Control& Equipment Design
Desired Mechanical, Chemical, Metallurgical properties
Flexible to suit fluctuations in input raw materials quality

Engineers for Viable Technology and $5 Trillion Economy
419 Technical Volume of 36th Indian Engineering Congress, December 26-28, 2021 ISBN 978-81-955500-1-2
Selection of single machine/unit carrying multiple operations.
Economics of scale of Production
Better yield of product
Lower Downtime, Capital &Production Cost
Minimum Specific consumption of Raw Materials, Water, Energy, Fuel, Power, auxiliary facilities,
Minimum Generation of waste materials/recycling orZero discharge
Minimum Air Water and Noise Pollution.
Commercially Proven Technology.
Minimum Space requirement
Gestation Period
Design
Design Considerations is the soul of engineering.Any lapse will result in tangible and intangible losses which cannot
be made up after the plant is set up and commissioned. Major design considerations are briefly given below:
1. Desired Production, Quantity/Quality
2. Raw Materials, Water Balance, Energy Balance
3. Sizing and balancing of Plant Capacities
4. Modular Design
5. Numberand productivity of machines
6. Inbuilt capacity for future
7. Rated Capacity & Design Capacity
8. Safety Factors, Dynamic Loading Factors, Slope Factors, Filling Factorsetc.
9. Availability of machines per year.
10. Life span of Plant/machines.
11. Materials Characteristics
12. Specific Consumptions of utilities, power, water, fuel, refractories, spares, grinding media per t/unit
13. Checking for Strength, Stability & Deflection
14. Degree of automation.
15. Requirements of Inserts.
16. Check for installed power, weight of plant& equipment
17. Man power for operation and maintenance
18. Requirements of all utilities, auxiliary facilities, power, water, air, gases, hoisting & handling, mounted
electrics, instruments.
19. Check for painting requirements
20. Provision of Ramps, Lifts, Platforms, stairs, doors, corridors, restrooms of desired slopes, widths & dimensions
considering normal persons, disability and old age
21. Nature of the Project: Category as per as per the prevailing EIA Notification, dated 14th September 2006.

Engineers for Viable Technology and $5 Trillion Economy
420 Technical Volume of 36th Indian Engineering Congress, December 26-28, 2021
ISBN 978-81-955500-1-2
22. Use of Thumb rules for Checking weight, horse power, capacity
Operation
Any plant or equipment shall be selected for ease and simplicity of operation, with minimum man power, pollution
and maximum safety. Following operating parameters to be considered while selecting a plant and equipment:
1. Ease of operation
2. Flexibility in operation. (Increase decrease capacity, flow rate, product mix, ambient conditions)
3. Degree of automation desired
4. Degree of protection desired
5. Type of duty-Light, Medium, Heavy
6. Quick changeover of parts or streams
7. Comfortable environment
8. Lower pollution Noise
9. Easy access to control switches, pedals
10. Operators manuals
11. Operators Room
Maintenance
The plant or equipment shall be selected which need minimum maintenance&less downtime. Following are the
maintenance aspects
1. Should require lesser maintenance, Minimum Down time, Fit & forget concept
2. Easily approachable-all parts needing maintenance
3. Proper hoisting and handling facility with adequate headroom, within easy reach of part. Weight of heaviest
part/equipment to be lifted
4. Easy lowering & lifting into Truck/Trailer
5. Inspection covers, manholes, lifting lugs provision
6. All main & Auxiliary buildings Junction Houses, Pump Houses, MCC, ECRs to be within road approach.
7. Choice of lubrication system
8. Repair Bay/Repair station/Workshop/stores
9. Maintenance Manuals/ Quality Assurance Plans (QAPs), Inspection Reports
Standardization/Interchangeability
The plant and equipment to be procured, manufactured shall conform to national or international standards. It must
comply with BIS Codes & Standards or some other reputed standards.
To the extent possible every endeavor shall be made to limit the type of equipment by selecting similar types e.g.
Motors, Gear Boxes, Couplings, Bearings, Idlers, Beltings, Pumps, Sections of Steels, Steel Plate Thickness and
sizes, Reinforcement bars diameters, doors & windows sizes,pipes and their diameter, flanges, gaskets etc.This will
reduce the cost of inventory.

Engineers for Viable Technology and $5 Trillion Economy
421 Technical Volume of 36th Indian Engineering Congress, December 26-28, 2021 ISBN 978-81-955500-1-2
Safety
Safety requirements for all the buildings, plant & equipment as specified by State & Central Government
bodies/agencies shall be strictly complied for the Safe & accident free operation.
All buildings /plant/equipment shall be provided withRamps, Elevators, Toe Guards & Handrails. Operating and
maintenance Platforms, Walkways, Stairs & landings, Doors/Windows, Ventilation/Air Conditioning, Fire
Protection, Escape & exits, Earthing, Lightening protection/Civil aviation lights, Under/over voltage/current.
Frequency/Load protection (As required)
Apart from above every engineer shall have knowledge of safety requirements during construction of plant &
buildings.
Statutory Requirements
All plants, Buildings, equipment must comply with the law of the place where the plant is being
erected/constructed/installed. Each State may have different provisions pertaining to same requirements.
Some of the important laws for Industrial Buildings and installation of equipment thereinare given below:
1. Factories Acts for approval
2. CPCB, CEA, IEGuidelines & Rules
3. Indian Boiler Acts & BoilerInspector approval for Steam & HP pipelines, pressure vessels and boilers
4. Fire safety TAC Rules
5. Min Widths, Overhead Clearances, Curvatures for road/rail etc. as per IRC/RDSO
6. Doors & windows Sizes
7. MCC Rooms, Switch Yards, Overhead HT Lines –Minimum side, front, back & OH clearances Special
requirements for the above shall be checked pertaining to Central and Concerned State rules.
Erection
It is seen that if proper erection sequence and methodology is not followed, it may result in time and cost overrun,
duplication of jobs, dismantling & re-erection, accidents, loss of life and property. The following erection
considerations shall be taken into account
1. Erection Sequence&Erection Methodology
2. Special Requirements/OD consignment,
3. Minimizing Erection Time
4. Erection of Cranes-Tower Cranes, Jib Cranes
5. Batching Plants-Capacity & Number
6. Alignment, lining, levelling & grouting
7. Inserts Placements
8. Rate of RCC, fabrication, Structural, Refractories, Piping, mechanical electrical equipment erection per month
9. Water, Manpower & Power requirements Peak &Average
10. Interfacing with other units

Engineers for Viable Technology and $5 Trillion Economy
422 Technical Volume of 36th Indian Engineering Congress, December 26-28, 2021
ISBN 978-81-955500-1-2
11. Space requirements-Fabrication, storage and temp assembly.
12. Safety considerations in erection/construction
Project Management
Basic knowledge of project management for the smooth implementation of the project is necessary to identifymajor
activities involved in the implementing of the project and to estimate average completion time for each of the
activities. This ensures estimated ratesof construction work required and proposed time schedule for completion of
project.
Project Implementation
For the project to be commissioned within schedule, the following advance actions have to be initiated by Project
Authority to meet the proposed schedule.
Financial tie-up and modus-operandi of project
EMP/EIA approval
Leveling, Cutting & Filling
Selection of Technology Supplier, Consultant, Contractors for civil, structural, mechanical electrical works
Quality Control set up
Planning for enabling works at site
Planning and organizing structural steel availability
Enabling facilities at site include construction of temporary offices, open and covered storage, fabrication yard,
temporary firefighting construction water and power and drainage facilityetc.
After above zero activities the following activities are taken up in sequence or in parallel
Basic Engineering
Tender Specification, placement of orders for Main & Auxiliary Equipment
Issue of Civil buildings Drawings
Site Preparation for civil & steel fabrication work
Issue of Structural Design and fabrication Drawings.
Civil Construction Work
Receipt of load data and issue for equipment Foundationdrawings
Fabrication and erection of Steel Structures
Issue of installation drawings for equipment and electrical
Inspection & supply of equipment at site
Erection of mechanical equipment, electrical equipment, instrumentation and cable laying work
Cold start,Testing, trial run and commissioning
The timely completion of the project depends on the association of proven construction agencieswho can mobilize
requisite resources of men, materials and construction machinery as well as construction and erection expertise to
execute the above project.

Engineers for Viable Technology and $5 Trillion Economy
423 Technical Volume of 36th Indian Engineering Congress, December 26-28, 2021 ISBN 978-81-955500-1-2
An engineer must have basic knowledge of Bar Charts, CPM/PERT Network (Master Network L1, L2, L3 types) for
project monitoring and controlling time and cost overruns.
ERGONOMICS
Every engineer and entrepreneur must have a basic understanding of Ergonomics principles.Ergonomics is the
science of making things simple, comfortable and efficient& more acceptable.
Following are the prime ergonomic considerations:
Reducing the number of steps in a task makes it quicker to complete.
Reducing the nos. parts, switches, gadgets, manual effort, soothing ambience, optimum temperature and
humidity, less noisy atmosphere increase the efficiency of operation
Reducing the amount of training needed,
Transportation Logistics
An engineer should have knowledge of transportation logistics to understand the economics of transport of material
within and outside plant. Whereas for longer distances Rail, Ship Inland Water Ways and Pipe Line transport are
cheaper, for shorter distances Road, Conveyor, Aerial Ropeway, Pneumatic Transport may be cheaper. The manta is
that total tonne-km cost must be minimum.
Similarly, before ordering an engineer must have the knowledge of overall dimensions and size of equipment (OD
Dimensions) so that the same can be freely transported to site by rail or road without any obstruction/hinderance on
the way.
Similarly, due attention shall be paid to packaging considering the nature of material, and equipment with respect to
damage due to breakage, humidity, self-ignition, loss due to evaporation, pilferage, hazardous nature of substance,
parts identification etc.
Spares
Spare part for two Years Normal Operation shall be considered.
All spare parts and consumables required for Construction, Pre-Commissioning, and Commissioning shall be
identified and ordered
Insurance spare parts are those parts of equipment, equipment assemblies or complete items of equipment that are
required for replacement of items not subject to deterioration by normal use, but failure of which is critical for
continued and safe operation of equipment or plant.
FINANCIAL MANAGEMENT
Engineer shall have knowledge to enable him to carry out Estimation of capital cost of Project, Working capital,
margin money, Interest during construction, term loan interest, Cost of Raw materials, Energy, Utilities, power,
water, fuel, consumables, manpower cost, repair and maintenance costs, production cost, Sales realization, profit &
loss statements, payback period, internal rate of return, Debt Service Coverage Ratio, Break Even Point.
Capital Cost
Estimation of capital cost, cost of capital, interest rates, duration of payment are the factors to be considered:

Engineers for Viable Technology and $5 Trillion Economy
424 Technical Volume of 36th Indian Engineering Congress, December 26-28, 2021
ISBN 978-81-955500-1-2
There are various ways to calculate the capital cost.
1 From the budgetary offers.
2 From historical costs.
3 From similar cost of recently constructed plants
4 Detailed estimation
5 By indexing
6 Byadopting Percentage Cost Method
7 By relative cost index method
Methods from 1 to 5 are common but the method at 6 & 7 are new and developed by author over a period spanning
50 years of Consultancy Practice.
Percentage Cost method is based on the analysis of historical data of similar plants. It is discovered that cost of
various activities of a plant fall within some percentage of total cost of Mechanical Equipment.
Relative Cost Ratio/Index Method
This is another interesting and novel method developed by author and is based on the concept that relative cost of
any plant and equipment/industrial products remain constant and fixed over the period of time and place. For
example, relative cost ratio of motor and matching gear box is constant not affected by time or place. Similarly,
relative cost ratio of one Million Tonnessteel plant &four MT steel plant is constant. By knowing the cost of one the
cost of other can be easily calculated.
Operating Cost
This consists of Fixed Cost and Variable Cost. Fixed costs are those business costs that are not directly related to the
level of production or output. Variable costs are those costs which vary directly with the level of output..
Profit & Loss
Every engineer/entrepreneur must learn to calculate profit and loss for the industry being set up and this shall be part
of curriculum.
Financial Indices
Knowledge of following financial indices is important for taking investment decision.
Debt-Service Coverage Ratio, Internal Rate of Return, Break-Even Capacity,Pay Back Period
CONTRACTS MANAGEMENT
Engineer shall have following basic knowledge of managing contracts:
Definition of contracts, elements of a valid contract, offer and acceptance, capacity of the parties to the contract,
types of mistakes encountered in contracts, misrepresentation, consideration, express and implied terms and
statute of limitations.
Contract documents: drawings, specifications, bill of quantities.

Engineers for Viable Technology and $5 Trillion Economy
425 Technical Volume of 36th Indian Engineering Congress, December 26-28, 2021 ISBN 978-81-955500-1-2
General&Special Conditions of contracts.clauses of conditions, quality of work during construction, contractor
duties, site engineer contractual job, costs of construction, essence of time factor of construction, insurance and
bonds and arbitration
Types of Contracts-Supply, Semi Turn key, Turn Key
Contracts on BOO, BOOT etc.
CONCLUSION
All the aspects discussed above are necessary to be learned during course of technical education for development
of entrepreneurshiptemperament.Onceany entrepreneur/engineer applies above concepts for implementing any
project, then it can be ensured that the project has been taken care holistically and nothing more is left to chance.
Thisall-round approach can turn all young engineers to think in holistic sense or “Engineered Thinking”
It is recommended that all the above concepts shall become part of curriculum of all hard-core degree and diploma
engineering courses.Also, this shall form part of one-year entrepreneurship course for the engineering graduates
and diploma holders who havealready finished their education and wish to become entrepreneurs in near future.


ISBN 978-81-955500-1-2Technical Volume of
36th Indian Engineering Congress
The Institution of Engineers (India)8 Gokhale Road, Kolkata 700020Phone: +91 (033) 40106299/248
E-mail: [email protected]; [email protected]: https://www.ieindia.org